UNITED STATES
SECURITIES AND EXCHANGE COMMISSION
Washington, D.C. 20549
FORM N-CSR
CERTIFIED SHAREHOLDER REPORT OF REGISTERED
MANAGEMENT INVESTMENT COMPANIES
Investment Company Act file number: 811-00242
Natixis Funds Trust II
(Exact name of Registrant as specified in charter)
888 Boylston Street, Suite 800, Boston, Massachusetts 02199-8197
(Address of principal executive offices) (Zip code)
Russell L. Kane, Esq.
Natixis Distribution, L.P.
888 Boylston Street, Suite 800
Boston, Massachusetts 02199-8197
(Name and address of agent for service)
Registrant’s telephone number, including area code: (617) 449-2822
Date of fiscal year end: December 31
Date of reporting period: December 31, 2020
| Item 1. | Reports to Stockholders. |
The Registrant’s annual report transmitted to shareholders pursuant to Rule 30e-1 under the Investment Company Act of 1940 is as follows:


Annual Report
December 31, 2020
AlphaSimplex Global Alternatives Fund
AlphaSimplex Managed Futures Strategy Fund
AlphaSimplex Multi-Asset Fund
Table of Contents

ALPHASIMPLEX GLOBAL ALTERNATIVES FUND
| | |
| |
| Managers | | Symbols |
| |
| Alexander D. Healy, PhD | | Class A GAFAX |
| |
| David E. Kuenzi, CFA®* | | Class C GAFCX |
| |
| Peter A. Lee | | Class N GAFNX |
| |
| Philippe P. Lüdi, CFA®, PhD | | Class Y GAFYX |
| |
| Robert S. Rickard | | |
| |
| AlphaSimplex Group, LLC (Adviser) | | |
| * | Effective December 31, 2020, David E. Kuenzi will no longer serve as a portfolio manager of the Fund. Additionally, effective December 31, 2020, Kathryn M. Kaminiski and Timothy J. Kang will join the portfolio management team of the Fund. |
Investment Goal
The Fund pursues an absolute return strategy that seeks to provide capital appreciation consistent with the risk-return characteristics of a diversified portfolio of hedge funds. The secondary goal of the Fund is to achieve these returns with less volatility than major equity indices.
Market Conditions
Given the onset of a global pandemic in 2020, the year was one with many different themes as the world sought to solve a global health crisis. The first quarter started off cautiously optimistic in equity markets. Equity markets surged to new highs while oil prices began to see the first signs of caution. Bond yields also began to fall as markets started to wonder how serious the Covid-19 crisis might be. In late February, volatility exploded across global markets in response to the global pandemic. Energy markets plummeted, as did yields, and equity markets spent over three weeks in crisis.
Towards the end of the first quarter, supported by fiscal and monetary intervention from central banks and policymakers around the world, the freefall halted and began to reverse. Over the rest of the year, equity markets rallied strongly, led by technology stocks and those businesses less fazed by a global health crisis. As risk-on sentiments entered the markets, the US dollar began to weaken against other global currencies. Commodities began to reflate.
The second quarter brought a continuation of the “V-shaped” (sharp) recovery, especially in domestic equities. A rise in longer yields and the Fed’s commitment to keep short-term rates near zero until 2022 led to a steepening of the yield curve. The dollar continued to fall, with some dispersion in both developed and emerging markets. In commodities, oil prices hit a historical low in April, with some futures prices even going to negative territory. Volatility remained high throughout the quarter.
Markets saw a strong reflationary theme in the third quarter, given continued economic recovery and impending fiscal stimulus. Global assets rose in response as the US dollar continued to weaken. Metals were in high demand, agricultural commodities strengthened significantly, and energies showed downward price pressure. Equity markets saw strong returns especially among the largest developed markets, with the Nasdaq strongly outpacing its peers due to technology stocks that continued to thrive during the pandemic. Volatility slowed slightly in comparison to the first and second quarter.
In the fourth quarter, unrest around the US presidential election, rising Covid-19 cases, and ongoing Brexit negotiations led to somewhat increased volatility in September and October. Markets weighed the balance between hope for a vaccine and fear of further lockdowns and restrictions. At the start of December hope seemed to prevail, with the election generally resolved and the development and testing of vaccines. Equity and commodity markets surged and the US dollar continued to weaken as risk-on themes dominated.
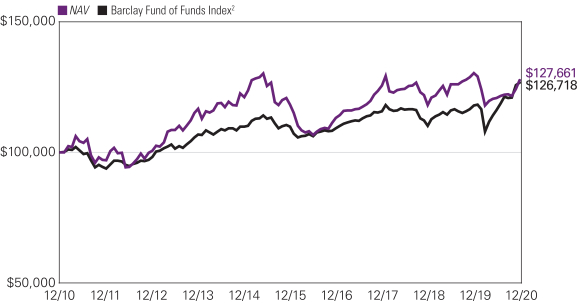
Performance Results
For the 12 months ended December 31, 2020, Class Y shares of the AlphaSimplex Global Alternatives Fund returned -2.12% at net asset value. Although the Fund does not seek to track any particular index, the Barclay Fund of Funds Index may be used as a benchmark for performance analysis. This benchmark returned 7.46% for the same period. It is important to note that there are material differences between the Fund and this benchmark.
Explanation of Fund Performance
The Fund seeks to earn returns from sources like those that drive a typical diversified portfolio of hedge funds. Accordingly, the Fund employs two primary sets of strategies. The hedge fund consensus component seeks to take on exposures that reflect the liquid, broad market exposures of the hedge fund industry as identified by a proprietary quantitative process. The Fund’s alternative risk premia1 (ARP) strategies, on the other hand, attempt to provide uncorrelated, alpha-like returns reflective of the diversifying and opportunistic trading strategies employed by hedge funds.
| 1 | Risk premia refers to the amount by which the return of a risky asset is expected to outperform the known return on a risk-free asset. Strategies that seek to replicate the premia of hedge fund strategies are known as alternative risk premia |
1 |
When the Fund takes on a “long” exposure to a market, the long exposure generally profits as the price of the underlying security rises but incurs losses when the price falls. When the Fund takes on a “short” exposure, the short exposure generally experiences losses as the price of the underlying security rises but profits as the price falls. The Fund typically makes extensive use of futures and forward contracts on global stock indices, fixed income securities, currencies, and commodities, as well as long and short (through equity basket total return swaps and/or short sales) positions in single-name equities. As market events unfold, these exposures result in a profit or loss for the Fund.
During 2020, the Fund experienced a small loss while its benchmark earned positive returns. The pandemic was a driver of the Fund’s relative underperformance in two ways: First and foremost, the pandemic caused a very dramatic and volatile V-shaped collapse and rebound in stock indices. Because the Fund, which tends to have long exposure to equities, reduced the size of its positions as a risk management measure when volatility spiked, it participated more in the initial downside than in the subsequent upside. Second, the single-name equity portion of the portfolio had more exposure to stocks that underperformed amidst the initial shock of the pandemic than ones that outperformed, contributing to the Fund’s losses.
The ARP component of the portfolio includes a number of strategies designed to provide access to uncorrelated sources of return. In 2020, the ARP strategies overall contributed positively to performance despite the impact of the pandemic and the negative performance of the broader universe of ARP strategies.
The contribution from the Fund’s money market holdings was under 0.5%, as short-maturity interest rates fell due to actions from the Federal Reserve amidst the pandemic. The Fund’s portfolio is adjusted on a daily and monthly basis to incorporate new information about hedge funds’ exposures and changing market dynamics or to update risk premia positioning, and on a daily basis to control risk. The risk control mechanism is designed to target an average annual volatility of 9% or less – greater than the typical volatility of bonds, but less than the typical volatility of stocks. The Fund’s realized volatility in 2020 was 7.5%, which is in line with our expectations and consistent with the long-run average level. We continue to scale the size of the Fund’s positions to keep total portfolio risk at or below its target.
Outlook
Although 2020 ended on a strong economic note, the start of 2021 shows increased uncertainty. This is driven by increased Covid-19 cases, a slow start to the vaccine rollout, concerns around the US presidential transition, and other geopolitical questions such as the practical implications of the recent Brexit negotiations. After the run-up in risk assets in 2020, it remains to be seen how voracious investors’ risk appetite will be this year.
Fiscal and monetary policy will remain at the forefront of investors’ minds in 2021. Coordinated easing and market intervention of central banks around the world halted the correlated freefall in assets in the beginning of 2020, but the long-term implication of these interventions is yet to be felt.
Democratic leadership in the US may lead to a more globalist approach, including less friction on trade and more investment flow into emerging markets, particularly China. However, looser fiscal policy and the possibility of tax increases may lead to more risk on the inflationary front. There may also be a question as to whether expansionary fiscal and monetary policy can sustain the continued rally in risk assets.
| 2
ALPHASIMPLEX GLOBAL ALTERNATIVES FUND
Hypothetical Growth of $100,000 Investment in Class Y Shares3
December 31, 2010 through December 31, 2020
Average Annual Total Returns – December 31, 20203
| | | | | | | | | | | | | | | | | | | | | | | | |
| | | | | | |
| | | | | | | | | | | | Life of Class N | | | Expense Ratios4 | |
| | | 1 Year | | | 5 Years | | | 10 Years | | | Gross | | | Net | |
| | | | | | | |
| Class Y (Inception 9/30/08) | | | | | | | | | | | | | | | | | | | | | | | | |
| NAV | | | -2.12 | % | | | 1.54 | % | | | 2.47 | % | | | — | % | | | 1.37 | % | | | 1.34 | % |
| | | | | | | |
| Class A (Inception 9/30/08) | | | | | | | | | | | | | | | | | | | | | | | | |
| NAV | | | -2.38 | | | | 1.30 | | | | 2.21 | | | | — | | | | 1.62 | | | | 1.59 | |
| With 5.75% Maximum Sales Charge | | | -7.98 | | | | 0.10 | | | | 1.61 | | | | — | | | | | | | | | |
| | | | | | | |
| Class C (Inception 9/30/08) | | | | | | | | | | | | | | | | | | | | | | | | |
| NAV | | | -3.17 | | | | 0.53 | | | | 1.44 | | | | — | | | | 2.37 | | | | 2.34 | |
| With CDSC1 | | | -4.12 | | | | 0.53 | | | | 1.44 | | | | — | | | | | | | | | |
| | | | | | | |
| Class N (Inception 5/1/13) | | | | | | | | | | | | | | | | | | | | | | | | |
| NAV | | | -2.06 | | | | 1.59 | | | | — | | | | 2.22 | | | | 1.31 | | | | 1.29 | |
| | | | | | | |
| Comparative Performance | | | | | | | | | | | | | | | | | | | | | | | | |
| Barclay Fund of Funds Index2 | | | 7.46 | | | | 2.91 | | | | 2.40 | | | | 2.84 | | | | | | | | | |
Performance data shown represents past performance and is no guarantee of, and not necessarily indicative of, future results. Total return and value will vary, and you may have a gain or loss when shares are sold. Current performance may be lower or higher than quoted. For most recent month-end performance, visit im.natixis.com/performance. Performance for other share classes will be greater or less than shown based on differences in fees and sales charges. You may not invest directly in an index. Performance for periods less than one year is cumulative, not annualized. Returns reflect changes in share price and reinvestment of dividends and capital gains, if any. The table(s) do not reflect taxes shareholders might owe on any fund distributions or when they redeem their shares.
| 1 | Performance for Class C shares assumes a 1% contingent deferred sales charge (“CDSC”) applied when you sell shares within one year of purchase. |
| 2 | Barclay Fund of Funds Index is a measure of the average return of all Fund of Funds (“FoFs”) in the Barclay database. The index is simply the arithmetic average of the net returns of all the FoFs that have reported that month. Index returns are recalculated by BarclayHedge, Ltd. throughout each month. The fund does not expect to update the index returns provided if subsequent recalculations cause such returns to change. In addition, because of these recalculations, the Barclay Fund of Funds Index returns reported by the fund may differ from the index returns for the same period published by others. The performance of the Index reflects the managed fees and other expenses of both the funds of funds in the Index and the hedge funds in which these fund of funds invest. |
| 3 | Fund performance has been increased by fee waivers and/or expense reimbursements, if any, without which performance would have been lower. |
| 4 | Expense ratios are as shown in the Fund’s prospectus in effect as of the date of this report. The expense ratios for the current reporting period can be found in the Financial Highlights section of this report under Ratios to Average Net Assets. Net expenses reflect contractual expense limitations set to expire on 4/30/22. When a Fund’s expenses are below the limitation, gross and net expense ratios will be the same. See Note 6 of the Notes to Financial Statements for more information about the Fund’s expense limitations. |
3 |
ALPHASIMPLEX MANAGED FUTURES STRATEGY FUND
| | |
| |
| Managers | | Symbols |
| |
| Alexander D. Healy, PhD | | Class A AMFAX |
| |
| Kathryn M. Kaminski, PhD | | Class C ASFCX |
| |
| Philippe P. Lüdi, CFA®, PhD | | Class N AMFNX |
| |
| John C. Perry, PhD | | Class Y ASFYX |
| |
| Robert S. Rickard | | |
| |
| AlphaSimplex Group, LLC (Adviser) | | |
Investment Goal
The Fund pursues an absolute return strategy that seeks to provide capital appreciation.
Market Conditions
Given the onset of a global pandemic in 2020, the year was one with many different themes as the world sought to solve a global health crisis. The first quarter started off cautiously optimistic in equity markets. Equity markets surged to new highs while oil prices began to see the first signs of caution. Bond yields also began to fall as markets started to wonder how serious the Covid-19 crisis might be. In late February, volatility exploded across global markets in response to the global pandemic. Energy markets plummeted, as did yields, and equity markets spent over three weeks in crisis.
Towards the end of the first quarter, supported by fiscal and monetary intervention from central banks and policymakers around the world, the freefall halted and began to reverse. Over the rest of the year, equity markets rallied strongly, led by technology stocks and those businesses less fazed by a global health crisis. As risk-on sentiments entered the markets, the US dollar began to weaken against other global currencies. Commodities began to reflate.
The second quarter brought a continuation of the “V-shaped” recovery, especially in domestic equities. A rise in longer yields and the Fed’s commitment to keep short-term rates near zero until 2022 led to a steepening of the yield curve. The dollar continued to fall, with some dispersion in both developed and emerging markets. In commodities, oil prices hit a historical low in April, with some futures prices even going to negative territory. Volatility remained high throughout the quarter.
Markets saw a strong reflationary theme in the third quarter, given continued economic recovery and impending fiscal stimulus. Global assets rose in response as the US dollar continued to weaken. Metals were in high demand, agricultural commodities strengthened significantly, and energies showed downward price pressure. Equity markets saw strong returns especially among the largest developed markets, with the Nasdaq strongly outpacing its peers due to technology stocks that continued to thrive during the pandemic. Volatility slowed slightly in comparison to the first and second quarter.
In the fourth quarter, unrest around the US presidential election, rising Covid-19 cases, and ongoing Brexit negotiations led to somewhat increased volatility in September and October. Markets weighed the balance between hope for a vaccine and fear of further lockdowns and restrictions. At the start of December hope seemed to prevail, with the election generally resolved and the development and testing of vaccines. Equity and commodity markets surged and the US dollar continued to weaken as risk-on themes dominated.
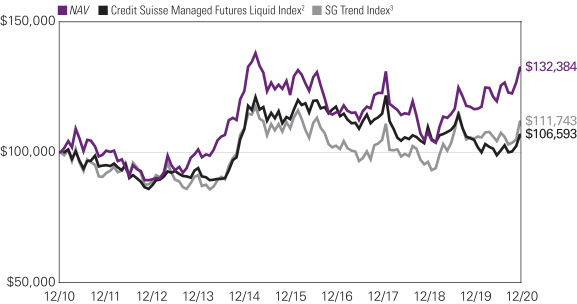
Performance Results
For the 12 months ended December 31, 2020, Class Y shares of AlphaSimplex Managed Futures Strategy Fund returned 13.56% at net asset value. Although the Fund does not seek to track any particular index, the Credit Suisse Managed Futures Liquid Index may be used as a benchmark for performance analysis. This benchmark returned 1.81% over the same period. The SG Trend Index may also be used as a benchmark for performance analysis; this benchmark returned 6.28% over the same period. It is important to note that there are material differences between the Fund and these benchmarks.
Explanation of Fund Performance
The Fund uses a set of proprietary quantitative models to identify trends in global stock, fixed income, currency, and commodity markets. When the Fund takes on a “long” exposure to a market, that exposure generally profits as the price of the underlying security rises but suffers losses when its price falls. When it takes on a “short” exposure, that exposure generally suffers losses as the price of the underlying security rises but profits as its price falls. The Fund uses derivative instruments, such as futures and forward contracts, to capture these exposures.
For the 12-month period that ended December 31, 2020, the Fund’s performance benefited from large moves in global markets. Gains came primarily from fixed income markets, commodity markets, and, to a lesser extent, currency markets. Losses came primarily from equity markets.
| 4
ALPHASIMPLEX MANAGED FUTURES STRATEGY FUND
In fixed income, the Fund saw gains in both US and international markets as global bond yields fell drastically during the height of the Covid-19 crisis in the first quarter. The Fund was able to retain most of these first-quarter gains as bond yields remained range bound for the remainder of the year.
Commodities provided gains across all sectors: energies, agricultural commodities, base metals, and precious metals. The Fund benefited from short positions in energies during the first quarter. The Fund also benefited from the strong reflationary theme in markets after equities began to recover, with strong gains from long positions in both base and precious metals. Agricultural commodities were also beneficial during the last quarter of 2020.
In currencies, the Fund benefited from short US dollar positions as the dollar weakened throughout the year. The gains were primarily driven by US dollar weakness versus European currencies, such as the euro and the Swedish krona, as well as other developed market currencies, such as the Australian dollar and New Zealand dollar. Losses came from positions in the Japanese yen and some emerging currencies such as the Mexican peso.
In equities, the Fund started the year with long positions and subsequently was caught in the drawdown stemming from the Covid-19 crisis. The Fund recovered some of these losses during the remainder of the year as equity markets rebounded from sharp losses in the first quarter. The largest losses were concentrated in international developed market equities, where the recovery was less pronounced than in North American and emerging market equities.
The contribution from the Fund’s money market holdings was approximately 0.6%, as short-maturity interest rates fell due to actions from the Federal Reserve amidst the pandemic. The Fund’s portfolio is adjusted on a daily basis to reflect market trends as well as to control risk.
The risk control mechanism is designed to target an annualized portfolio volatility of 17% or less. The Fund’s realized volatility in 2020 was 11.6%, which is consistent with our risk management objectives. We continue to scale the size of the Fund’s positions to keep total portfolio risk at or below its target.
Outlook
Although 2020 ended on a strong economic note, the start of 2021 shows increased uncertainty. This is driven by increased Covid-19 cases, a slow start to the vaccine rollout, concerns around the US presidential transition, and other geopolitical questions such as the practical implications of the recent Brexit negotiations. After the run-up in risk assets in 2020, it remains to be seen how voracious investors’ risk appetite will be this year.
Fiscal and monetary policy will remain at the forefront of investors’ minds in 2021. Coordinated easing and market intervention of central banks around the world halted the correlated freefall in assets in the beginning of 2020, but the long-term implication of these interventions is yet to be felt.
Democratic leadership in the US may lead to a more globalist approach, including less friction on trade and more investment flow into emerging markets, particularly China. However, looser fiscal policy and the possibility of tax increases may lead to more risk on the inflationary front. There may also be a question as to whether expansionary fiscal and monetary policy can sustain the continued rally in risk assets.
5 |
Hypothetical Growth of $100,000 Investment in Class Y Shares4
December 31, 2010 through December 31, 2020
Average Annual Total Returns – December 31, 20204
| | | | | | | | | | | | | | | | | | | | | | | | |
| | | | | | |
| | | 1 Year | | | 5 Years | | | 10 Years | | | Life of Class N | | | Expense Ratios5 | |
| | Gross | | | Net | |
| | | | | | | |
| Class Y (Inception 7/30/10) | | | | | | | | | | | | | | | | | | | | | | | | |
| NAV | | | 13.56 | % | | | 1.65 | % | | | 2.85 | % | | | — | % | | | 1.53 | % | | | 1.45 | % |
| | | | | | | |
| Class A (Inception 7/30/10) | | | | | | | | | | | | | | | | | | | | | | | | |
| NAV | | | 13.27 | | | | 1.39 | | | | 2.58 | | | | — | | | | 1.79 | | | | 1.70 | |
| With 5.75% Maximum Sales Charge | | | 6.81 | | | | 0.21 | | | | 1.98 | | | | — | | | | | | | | | |
| | | | | | | |
| Class C (Inception 7/30/10) | | | | | | | | | | | | | | | | | | | | | | | | |
| NAV | | | 12.48 | | | | 0.65 | | | | 1.82 | | | | — | | | | 2.53 | | | | 2.45 | |
| With CDSC1 | | | 11.48 | | | | 0.65 | | | | 1.82 | | | | — | | | | | | | | | |
| | | | | | | |
| Class N (Inception 5/01/17) | | | | | | | | | | | | | | | | | | | | | | | | |
| NAV | | | 13.77 | | | | — | | | | — | | | | 4.03 | | | | 1.36 | | | | 1.36 | |
| | | | | | | |
| Comparative Performance | | | | | | | | | | | | | | | | | | | | | | | | |
| Credit Suisse Managed Futures Liquid Index2 | | | 1.81 | | | | -1.11 | | | | 0.66 | | | | -1.10 | | | | | | | | | |
| SG Trend Index3 | | | 6.28 | | | | 0.46 | | | | 1.12 | | | | 2.98 | | | | | | | | | |
Performance data shown represents past performance and is no guarantee of, and not necessarily indicative of, future results. Total return and value will vary, and you may have a gain or loss when shares are sold. Current performance may be lower or higher than quoted. For most recent month-end performance, visit im.natixis.com/performance. Performance for other share classes will be greater or less than shown based on differences in fees and sales charges. You may not invest directly in an index. Performance for periods less than one year is cumulative, not annualized. Returns reflect changes in share price and reinvestment of dividends and capital gains, if any. The table(s) do not reflect taxes shareholders might owe on any fund distributions or when they redeem their shares.
| 1 | Performance for Class C shares assumes a 1% contingent deferred sales charge (“CDSC”) applied when you sell shares within one year of purchase. |
| 2 | Credit Suisse Managed Futures Liquid Index seeks to gain broad exposure to the Managed Futures strategy using a pre-defined quantitative methodology to invest in a range of asset classes including equities, fixed-income, commodities and currencies. Relative performance for the Credit Suisse Managed Futures Liquid Index is not available prior to January 31, 2011, which is the inception date of the index. |
| 3 | SG Trend Index is equal-weighted, reconstituted and rebalanced annually. The index calculates the net daily rate of return for a pool of Commodity Trading Advisors (CTAs) selected from the larger managers that are open to new investment. AlphaSimplex Group, LLC is part of this index. |
| 4 | Fund performance has been increased by fee waivers and/or expense reimbursements, if any, without which performance would have been lower. |
| 5 | Expense ratios are as shown in the Fund’s prospectus in effect as of the date of this report. The expense ratios for the current reporting period can be found in the Financial Highlights section of this report under Ratios to Average Net Assets. Net expenses reflect contractual expense limitations set to expire on 4/30/21. When a Fund’s expenses are below the limitation, gross and net expense ratios will be the same. See Note 6 of the Notes to Financial Statements for more information about the Fund’s expense limitations. |
| 6
ALPHASIMPLEX MULTI-ASSET FUND
| | |
| |
| Managers | | Symbols |
| |
| Alexander D. Healy, PhD | | Class A DAAFX |
| |
| John C. Perry* | | Class C DACFX |
| |
| Robert S. Rickard | | Class Y DAYFX |
| |
| Derek M. Schug, CFA® | | |
| |
| AlphaSimplex Group, LLC (Adviser) | | |
Investment Goal
The Fund seeks long-term capital appreciation. The secondary goal of the Fund is the protection of capital during unfavorable market conditions.
Market Conditions
Given the onset of a global pandemic in 2020, the year was one with many different themes as the world sought to solve a global health crisis. The first quarter started off cautiously optimistic in equity markets. Equity markets surged to new highs while oil prices began to see the first signs of caution. Bond yields also began to fall as markets started to wonder how serious the Covid-19 crisis might be. In late February, volatility exploded across global markets in response to the global pandemic. Energy markets plummeted, as did yields, and equity markets spent over three weeks in crisis.
Towards the end of the first quarter, supported by fiscal and monetary intervention from central banks and policymakers around the world, the freefall halted and began to reverse. Over the rest of the year, equity markets rallied strongly, led by technology stocks and those businesses less fazed by a global health crisis. As risk-on sentiments entered the markets, the US dollar began to weaken against other global currencies. Commodities began to reflate.
The second quarter brought a continuation of the “V-shaped” recovery, especially in domestic equities. A rise in longer yields and the Fed’s commitment to keep short-term rates near zero until 2022 led to a steepening of the yield curve. The dollar continued to fall, with some dispersion in both developed and emerging markets. In commodities, oil prices hit a historical low in April, with some futures prices even going to negative territory. Volatility remained high throughout the quarter.
Markets saw a strong reflationary theme in the third quarter, given continued economic recovery and impending fiscal stimulus. Global assets rose in response as the US dollar continued to weaken. Metals were in high demand, agricultural commodities strengthened significantly, and energies showed downward price pressure. Equity markets saw strong returns especially among the largest developed markets, with the Nasdaq strongly outpacing its peers due to technology stocks that continued to thrive during the pandemic. Volatility slowed slightly in comparison to the first and second quarter.
In the fourth quarter, unrest around the US presidential election, rising Covid-19 cases, and ongoing Brexit negotiations led to somewhat increased volatility in September and October. Markets weighed the balance between hope for a vaccine and fear of further lockdowns and restrictions. At the start of December hope seemed to prevail, with the election generally resolved and the development and testing of vaccines. Equity and commodity markets surged and the US dollar continued to weaken as risk-on themes dominated.
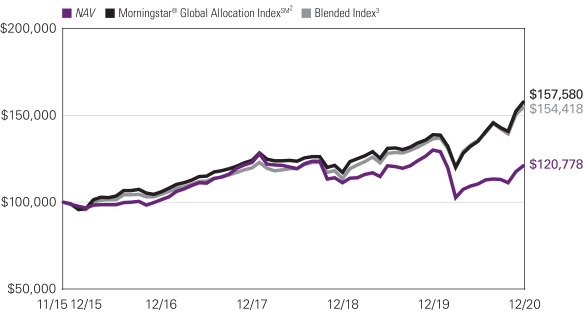
Performance Results
For the 12 months ended December 31, 2020, Class Y shares of the AlphaSimplex Multi-Asset Fund returned -7.03% at net asset value. Although the Fund does not seek to track any particular index, the Morningstar Global Allocation Index may be used as a benchmark for performance analysis. This benchmark returned 13.55% over the same period. It is important to note that there are material differences between the Fund and this benchmark.
Explanation of Fund Performance
The Fund uses a set of proprietary quantitative models to invest in global stock, fixed income, and currency markets. The Fund’s investment process was adjusted at the beginning of May while maintaining the overall investment objective. These changes were made to improve the Fund’s diversification potential when used as a component of an overall investment portfolio. The changes included enhancing the Fund’s risk management, expanding its investment universe, increasing the number of systematic models used, and allowing the Fund to take short positions. Our goal with these changes was for investors to consider the Fund as an alternative investment strategy as opposed to a more traditional asset allocation strategy.
The Fund’s strategy was to vary its asset class exposures according to three types of systematic investment models: core, trend, and diversifying. The core models provide risk-managed exposures to stocks and bonds through the use of exchange-traded funds and derivative instruments, such as futures contracts. The trend models look to capture momentum in prices by adjusting exposures based
7 |
on the performance and risk behavior of individual assets over multiple horizons using several different mathematical techniques. Finally, additional models that seek to identify opportunities with inputs other than trend make up the remainder of the strategy. The Fund’s strategy is to overweight and/or underweight global stocks, bonds and currencies, including the use of short exposures, within this universe based on these models.
Prior to the Fund’s strategy changes in May, the biggest detractor from performance came from its average overweight to global stocks during the Covid-19-induced equity drawdown in February and March. The Fund’s stock exposures contributed positively to absolute performance since May. However, due primarily to the elevated volatility and poor price trends over the prior months, the Fund maintained a significantly lower exposure to stocks than its benchmark throughout the period, leading to smaller relative gains.
The Fund’s bond exposure contributed positively to performance by being overweight relative to the benchmark for the majority of the year. Holding higher exposures to bonds during the first seven months of the year contributed the majority of the Fund’s bond-related gains. The Fund’s bond exposures peaked in early November as intermediate and longer-term yields were generally rising during the last several months of the year. Currencies detracted overall from performance.
Each of the three model sets generated positive returns for the Fund between May and year-end, although they all underperformed the benchmark during this period. Additionally, since May the Fund seeks to maintain an annualized volatility of 13% or less. The Fund’s realized volatility in 2020 was 20.1%; the realized volatility since May 1, 2020 was 7.3%, which was below the benchmark’s 9.5% over the same period. Because we use historical volatility to estimate future volatility, we will generally take smaller position sizes coming out of high-volatility periods like the first part of this year. This prevented the Fund from taking larger exposures, especially in stocks. While modest, the contribution from the Fund’s money market holdings was positive over the year.
The Fund closed as of January 14, 2021, and as it closed, primary consideration was given to clients and their interests. There was no unusual market action that affected our trading of the portfolio during liquidation. All Fund assets were subsequently redeemed or distributed to Fund shareholders.
Hypothetical Growth of $100,000 Investment in Class Y Shares4
November 30, 2015 (inception) through December 31, 2020
See notes to chart on page 9.
| 8
ALPHASIMPLEX MULTI-ASSET FUND
Average Annual Total Returns – December 31, 20204
| | | | | | | | | | | | | | | | | | | | |
| | | | | |
| | | | | | | | | | | | Expense Ratios5 | |
| | | | | | |
| | | 1 Year | | | 5 Years | | | Life of Fund | | | Gross | | | Net | |
| | | | | | |
| Class Y (Inception 11/30/15) | | | | | | | | | | | | | | | | | | | | |
| NAV | | | -7.03 | % | | | 4.11 | % | | | 3.78 | % | | | 1.42 | % | | | 0.95 | % |
| | | | | | |
| Class A (Inception 11/30/15) | | | | | | | | | | | | | | | | | | | | |
| NAV | | | -7.28 | | | | 3.86 | | | | 3.53 | | | | 1.67 | | | | 1.20 | |
| With 5.75% Maximum Sales Charge | | | -12.65 | | | | 2.64 | | | | 2.34 | | | | | | | | | |
| | | | | | |
| Class C (Inception 11/30/15) | | | | | | | | | | | | | | | | | | | | |
| NAV | | | -8.04 | | | | 3.08 | | | | 2.75 | | | | 2.43 | | | | 1.95 | |
| With CDSC1 | | | -8.93 | | | | 3.08 | | | | 2.75 | | | | | | | | | |
| | | | | | |
| Comparative Performance | | | | | | | | | | | | | | | | | | | | |
| Morningstar® Global Allocation IndexSM2 | | | 13.55 | | | | 9.76 | | | | 9.35 | | | | | | | | | |
| Blended Index3 | | | 13.31 | | | | 9.34 | | | | 8.88 | | | | | | | | | |
Performance data shown represents past performance and is no guarantee of, and not necessarily indicative of, future results. Total return and value will vary, and you may have a gain or loss when shares are sold. Current performance may be lower or higher than quoted. For most recent month-end performance, visit im.natixis.com/performance. Performance for other share classes will be greater or less than shown based on differences in fees and sales charges. You may not invest directly in an index. Performance for periods less than one year is cumulative, not annualized. Returns reflect changes in share price and reinvestment of dividends and capital gains, if any. The table(s) do not reflect taxes shareholders might owe on any fund distributions or when they redeem their shares.
| 1 | Performance for Class C shares assumes a 1% contingent deferred sales charge (“CDSC”) applied when you sell shares within one year of purchase. |
| 2 | The Morningstar® Global Allocation IndexSM represents a diverse multi-asset-class portfolio of liquid global asset classes that reflects the global investment opportunities available to an investor with a moderate risk tolerance. |
| 3 | The Blended Index is an unmanaged, blended index composed of the following weights: 60% MSCI World Index (Net)/40% Bloomberg Barclays U.S. Aggregate Bond Index. The weightings of the indices that compose the Blended Index are rebalanced on a monthly basis to maintain the allocations as described above. These rebalancings will not necessarily correspond to the rebalancing of the Fund’s investment portfolio, and the relative weightings of the asset classes in the Fund will generally differ to some extent from the weightings in the Blended Index. |
| 4 | Fund performance has been increased by fee waivers and/or expense reimbursements, if any, without which performance would have been lower. |
| 5 | Expense ratios are as shown in the Fund’s prospectus in effect as of the date of this report. The expense ratios for the current reporting period can be found in the Financial Highlights section of this report under Ratios to Average Net Assets. Net expenses reflect contractual expense limitations set to expire on 4/30/21. When a Fund’s expenses are below the limitation, gross and net expense ratios will be the same. See Note 6 of the Notes to Financial Statements for more information about the Fund’s expense limitations. |
9 |
ADDITIONAL INFORMATION
The views expressed in this report reflect those of the portfolio managers as of the dates indicated. The managers’ views are subject to change at any time without notice based on changes in market or other conditions. References to specific securities or industries should not be regarded as investment advice. Because the Fund is actively managed, there is no assurance that they will continue to invest in the securities or industries mentioned.
All investing involves risk, including the risk of loss. There is no assurance that any investment will meet its performance objectives or that losses will be avoided.
ADDITIONAL INDEX INFORMATION
This document may contain references to third party copyrights, indexes, and trademarks, each of which is the property of its respective owner. Such owner is not affiliated with Natixis Investment Managers or any of its related or affiliated companies (collectively “Natixis Affiliates”) and does not sponsor, endorse or participate in the provision of any Natixis Affiliates services, funds or other financial products.
The index information contained herein is derived from third parties and is provided on an “as is” basis. The user of this information assumes the entire risk of use of this information. Each of the third party entities involved in compiling, computing or creating index information disclaims all warranties (including, without limitation, any warranties of originality, accuracy, completeness, timeliness, non-infringement, merchantability and fitness for a particular purpose) with respect to such information.
PROXY VOTING INFORMATION
A description of the Natixis Funds proxy voting policies and procedures is available without charge, upon request, by calling Natixis Funds at 800-225-5478; on the Natixis Funds’ website at im.natixis.com; and on the Securities and Exchange Commission’s (“SEC’s”) website at www.sec.gov. Information regarding how the Natixis Funds voted proxies relating to portfolio securities during the most recent 12-month period ended June 30 is available from the Natixis Funds’ website and the SEC’s website.
QUARTERLY PORTFOLIO SCHEDULES
The Natixis Funds file a complete schedule of portfolio holdings with the SEC for the first and third quarters of each fiscal year as an exhibit to its reports on Form N-PORT. The Funds’ Form N-PORT reports are available on the SEC’s website at www.sec.gov. First and third quarter schedules of portfolio holdings are also available at im.natixis.com/funddocuments. A hard copy may be requested from the Fund at no charge by calling 800-225-5478.
CFA® and Chartered Financial Analyst® are registered trademarks owned by the CFA Institute.
| 10
UNDERSTANDING FUND EXPENSES
As a mutual fund shareholder, you incur different types of costs: transaction costs, including sales charges (loads) on purchases, contingent deferred sales charges on redemptions, and ongoing costs, including management fees, distribution and/or service fees (12b-1 fees), and other fund expenses. Certain exemptions may apply. These costs are described in more detail in the Funds’ prospectus. The following examples are intended to help you understand the ongoing costs of investing in the Funds and help you compare these with the ongoing costs of investing in other mutual funds.
The first line in the table for each class of Fund shares shows the actual account values and actual Fund expenses you would have paid on a $1,000 investment in the Fund from July 1, 2020 through December 31, 2020. To estimate the expenses you paid over the period, simply divide your account value by $1,000 (for example, $8,600 account value divided by $1,000 = 8.60) and multiply the result by the number in the Expenses Paid During Period column as shown for your Class.
The second line for the table of each class provides information about hypothetical account values and hypothetical expenses based on the Fund’s actual expense ratios and an assumed rate of return of 5% per year before expenses, which is not the Fund’s actual return. The hypothetical account values and expenses may not be used to estimate the actual ending account balance or expenses you paid on your investment for the period. You may use this information to compare the ongoing costs of investing in the Fund to other funds. To do so, compare this 5% hypothetical example with the 5% hypothetical examples that appear in the shareholder reports of the other funds.
Please note that the expenses shown reflect ongoing costs only, and do not include any transaction costs, such as sales charges. Therefore, the second line in the table of each Fund is useful in comparing ongoing costs only, and will not help you determine the relative costs of owning different funds. If transaction costs were included, total costs would be higher.
| | | | | | | | | | | | |
| ALPHASIMPLEX GLOBAL ALTERNATIVES FUND | | BEGINNING
ACCOUNT VALUE
7/1/2020 | | | ENDING
ACCOUNT VALUE
12/31/2020 | | | EXPENSES PAID
DURING PERIOD*
7/1/2020 – 12/31/2020 | |
| Class A | | | | | | | | | | | | |
| Actual | | | $1,000.00 | | | | $1,055.50 | | | | $7.70 | |
| Hypothetical (5% return before expenses) | | | $1,000.00 | | | | $1,017.65 | | | | $7.56 | |
| Class C | | | | | | | | | | | | |
| Actual | | | $1,000.00 | | | | $1,051.60 | | | | $11.55 | |
| Hypothetical (5% return before expenses) | | | $1,000.00 | | | | $1,013.88 | | | | $11.34 | |
| Class N | | | | | | | | | | | | |
| Actual | | | $1,000.00 | | | | $1,056.70 | | | | $6.15 | |
| Hypothetical (5% return before expenses) | | | $1,000.00 | | | | $1,019.15 | | | | $6.04 | |
| Class Y | | | | | | | | | | | | |
| Actual | | | $1,000.00 | | | | $1,057.00 | | | | $6.41 | |
| Hypothetical (5% return before expenses) | | | $1,000.00 | | | | $1,018.90 | | | | $6.29 | |
| * | Expenses are equal to the Fund’s annualized expense ratio (after waiver/reimbursement): 1.49%, 2.24%, 1.19% and 1.24% for Class A, C, N and Y, respectively, multiplied by the average account value over the period, multiplied by the number of days in the most recent fiscal half-year (184), divided by 366 (to reflect the half-year period). |
11 |
| | | | | | | | | | | | |
| ALPHASIMPLEX MANAGED FUTURES STRATEGY FUND | | BEGINNING
ACCOUNT VALUE
7/1/2020 | | | ENDING
ACCOUNT VALUE
12/31/2020 | | | EXPENSES PAID
DURING PERIOD*
7/1/2020 – 12/31/2020 | |
| Class A | | | | | | | | | | | | |
| Actual | | | $1,000.00 | | | | $1,105.20 | | | | $9.00 | |
| Hypothetical (5% return before expenses) | | | $1,000.00 | | | | $1,016.59 | | | | $8.62 | |
| Class C | | | | | | | | | | | | |
| Actual | | | $1,000.00 | | | | $1,101.00 | | | | $12.94 | |
| Hypothetical (5% return before expenses) | | | $1,000.00 | | | | $1,012.82 | | | | $12.40 | |
| Class N | | | | | | | | | | | | |
| Actual | | | $1,000.00 | | | | $1,107.00 | | | | $7.15 | |
| Hypothetical (5% return before expenses) | | | $1,000.00 | | | | $1,018.35 | | | | $6.85 | |
| Class Y | | | | | | | | | | | | |
| Actual | | | $1,000.00 | | | | $1,107.30 | | | | $7.68 | |
| Hypothetical (5% return before expenses) | | | $1,000.00 | | | | $1,017.85 | | | | $7.35 | |
| * | Expenses are equal to the Fund’s annualized expense ratio (after waiver/reimbursement): 1.70%, 2.45%, 1.35% and 1.45% for Class A, C, N and Y, respectively, multiplied by the average account value over the period, multiplied by the number of days in the most recent fiscal half-year (184), divided by 366 (to reflect the half-year period). |
| | | | | | | | | | | | |
| ALPHASIMPLEX MULTI-ASSET FUND | | BEGINNING
ACCOUNT VALUE
7/1/2020 | | | ENDING
ACCOUNT VALUE
12/31/2020 | | | EXPENSES PAID
DURING PERIOD*
7/1/2020 – 12/31/2020 | |
| Class A | | | | | | | | | | | | |
| Actual | | | $1,000.00 | | | | $1,093.20 | | | | $6.05 | |
| Hypothetical (5% return before expenses) | | | $1,000.00 | | | | $1,019.36 | | | | $5.84 | |
| Class C | | | | | | | | | | | | |
| Actual | | | $1,000.00 | | | | $1,089.30 | | | | $9.98 | |
| Hypothetical (5% return before expenses) | | | $1,000.00 | | | | $1,015.59 | | | | $9.63 | |
| Class Y | | | | | | | | | | | | |
| Actual | | | $1,000.00 | | | | $1,094.70 | | | | $4.74 | |
| Hypothetical (5% return before expenses) | | | $1,000.00 | | | | $1,020.61 | | | | $4.57 | |
| * | Expenses are equal to the Fund’s annualized expense ratio (after waiver/reimbursement): 1.15%, 1.90% and 0.90% for Class A, C and Y, respectively, multiplied by the average account value over the period, multiplied by the number of days in the most recent fiscal half-year (184), divided by 366 (to reflect the half-year period). Expense ratios do not include the expenses of the underlying funds in which the Fund invests. The annualized expense ratios, as stated in the fee table of the Prospectus, may differ from the expense ratios disclosed in this report. |
| 12
Consolidated Portfolio of Investments – as of December 31, 2020
AlphaSimplex Global Alternatives Fund
| | | | | | | | |
| Shares | | | Description | |
Value (†) | |
| | Common Stocks — 52.0% of Net Assets | |
| | | | Aerospace & Defense — 0.3% | |
| | 23,627 | | | Howmet Aerospace, Inc. | | $ | 674,315 | |
| | 2,187 | | | Lockheed Martin Corp. | | | 776,341 | |
| | | | | | | | |
| | | | | | | 1,450,656 | |
| | | | | | | | |
| | | | Air Freight & Logistics — 0.7% | |
| | 8,685 | | | C.H. Robinson Worldwide, Inc. | | | 815,261 | |
| | 28,626 | | | Expeditors International of Washington, Inc. | | | 2,722,619 | |
| | | | | | | | |
| | | | | | | 3,537,880 | |
| | | | | | | | |
| | | | Auto Components — 0.2% | |
| | 22,561 | | | Gentex Corp. | | | 765,495 | |
| | | | | | | | |
| | | | Automobiles — 0.3% | |
| | 78,559 | | | Fisker, Inc.(a) | | | 1,150,889 | |
| | 380 | | | Tesla, Inc.(a) | | | 268,155 | |
| | | | | | | | |
| | | | | | | 1,419,044 | |
| | | | | | | | |
| | | | Banks — 1.3% | |
| | 13,759 | | | Citigroup, Inc. | | | 848,380 | |
| | 5,520 | | | Credicorp Ltd. | | | 905,390 | |
| | 92,292 | | | Dime Community Bancshares, Inc. | | | 1,455,445 | |
| | 72,150 | | | TCF Financial Corp. | | | 2,670,993 | |
| | 14,456 | | | Westamerica BanCorp. | | | 799,272 | |
| | | | | | | | |
| | | | | | | 6,679,480 | |
| | | | | | | | |
| | | | Beverages — 1.2% | |
| | 5,413 | | | Brown-Forman Corp., Class B | | | 429,955 | |
| | 30,703 | | | Coca-Cola Co. (The) | | | 1,683,752 | |
| | 26,028 | | | Keurig Dr Pepper, Inc. | | | 832,896 | |
| | 16,462 | | | PepsiCo, Inc. | | | 2,441,315 | |
| | 50,849 | | | Primo Water Corp. | | | 797,312 | |
| | | | | | | | |
| | | | | | | 6,185,230 | |
| | | | | | | | |
| | | | Biotechnology — 0.3% | |
| | 1,980 | | | Alnylam Pharmaceuticals, Inc.(a) | | | 257,341 | |
| | 85,236 | | | Immatics NV(a) | | | 919,696 | |
| | 447 | | | Regeneron Pharmaceuticals, Inc.(a) | | | 215,950 | |
| | 1,280 | | | Seagen, Inc.(a) | | | 224,179 | |
| | | | | | | | |
| | | | | | | 1,617,166 | |
| | | | | | | | |
| | | | Building Products — 0.7% | |
| | 10,588 | | | Allegion PLC | | | 1,232,231 | |
| | 16,712 | | | Johnson Controls International PLC | | | 778,612 | |
| | 6,345 | | | Masonite International Corp.(a) | | | 623,967 | |
| | 25,845 | | | Resideo Technologies, Inc.(a) | | | 549,465 | |
| | 4,536 | | | Trane Technologies PLC | | | 658,446 | |
| | | | | | | | |
| | | | | | | 3,842,721 | |
| | | | | | | | |
| | | | Capital Markets — 2.3% | |
| | 5,116 | | | Blackstone Group, Inc. (The), Class A | | | 331,568 | |
| | 17,574 | | | Freedom Holding Corp.(a) | | | 901,722 | |
| | 33,773 | | | Houlihan Lokey, Inc. | | | 2,270,559 | |
| | 4,680 | | | Intercontinental Exchange, Inc. | | | 539,557 | |
| | 38,170 | | | Invesco Ltd. | | | 665,303 | |
| | 26,180 | | | Janus Henderson Group PLC | | | 851,112 | |
| | 3,920 | | | Morningstar, Inc. | | | 907,754 | |
| | 10,077 | | | Nasdaq, Inc. | | | 1,337,621 | |
| | 57,448 | | | Open Lending Corp., Class A(a) | | | 2,008,382 | |
| | 12,654 | | | PJT Partners, Inc., Class A | | | 952,214 | |
| | 22,274 | | | SEI Investments Co. | | | 1,280,087 | |
| | | | | | | | |
| | | | | | | 12,045,879 | |
| | | | | | | | |
| | | | Chemicals — 0.9% | |
| | 23,946 | | | Corteva, Inc. | | | 927,189 | |
| | 33,819 | | | GCP Applied Technologies, Inc.(a) | | | 799,819 | |
| | 3,699 | | | NewMarket Corp. | | | 1,473,275 | |
| | | | Chemicals — continued | |
| | 73,800 | | | Orion Engineered Carbons S.A. | | $ | 1,264,932 | |
| | | | | | | | |
| | | | | | | 4,465,215 | |
| | | | | | | | |
| | | | Commercial Services & Supplies — 1.1% | |
| | 3,259 | | | Cintas Corp. | | | 1,151,926 | |
| | 7,317 | | | Copart, Inc.(a) | | | 931,088 | |
| | 11,258 | | | IAA, Inc.(a) | | | 731,545 | |
| | 13,344 | | | Republic Services, Inc. | | | 1,285,027 | |
| | 9,219 | | | Ritchie Bros. Auctioneers, Inc. | | | 641,182 | |
| | 15,610 | | | Rollins, Inc. | | | 609,883 | |
| | 3,067 | | | Waste Management, Inc. | | | 361,691 | |
| | | | | | | | |
| | | | | | | 5,712,342 | |
| | | | | | | | |
| | | | Communications Equipment — 0.3% | |
| | 59,933 | | | Radware Ltd.(a) | | | 1,663,141 | |
| | | | | | | | |
| | | | Construction & Engineering — 0.3% | |
| | 17,934 | | | AECOM(a) | | | 892,754 | |
| | 7,034 | | | Jacobs Engineering Group, Inc. | | | 766,425 | |
| | | | | | | | |
| | | | | | | 1,659,179 | |
| | | | | | | | |
| | | | Construction Materials — 0.1% | |
| | 7,548 | | | Eagle Materials, Inc. | | | 764,990 | |
| | | | | | | | |
| | | | Consumer Finance — 0.9% | |
| | 3,982 | | | Credit Acceptance Corp.(a) | | | 1,378,330 | |
| | 15,451 | | | FirstCash, Inc. | | | 1,082,188 | |
| | 11,075 | | | Green Dot Corp., Class A(a) | | | 617,985 | |
| | 13,863 | | | Nelnet, Inc., Class A | | | 987,600 | |
| | 12,927 | | | Synchrony Financial | | | 448,696 | |
| | | | | | | | |
| | | | | | | 4,514,799 | |
| | | | | | | | |
| | | | Containers & Packaging — 0.4% | |
| | 2,851 | | | AptarGroup, Inc. | | | 390,273 | |
| | 6,335 | | | Avery Dennison Corp. | | | 982,622 | |
| | 22,473 | | | Silgan Holdings, Inc. | | | 833,299 | |
| | | | | | | | |
| | | | | | | 2,206,194 | |
| | | | | | | | |
| | | | Distributors — 0.1% | |
| | 19,992 | | | LKQ Corp.(a) | | | 704,518 | |
| | | | | | | | |
| | | | Diversified Consumer Services — 0.2% | |
| | 15,853 | | | Service Corp. International | | | 778,382 | |
| | | | | | | | |
| | | | Diversified Financial Services — 0.3% | |
| | 5 | | | Berkshire Hathaway, Inc., Class A(a) | | | 1,739,075 | |
| | | | | | | | |
| | | | Diversified Telecommunication Services — 0.5% | |
| | 24,873 | | | AT&T, Inc. | | | 715,347 | |
| | 35,617 | | | Verizon Communications, Inc. | | | 2,092,499 | |
| | | | | | | | |
| | | | | | | 2,807,846 | |
| | | | | | | | |
| | | | Electric Utilities — 1.3% | |
| | 7,513 | | | Alliant Energy Corp. | | | 387,145 | |
| | 14,960 | | | American Electric Power Co., Inc. | | | 1,245,719 | |
| | 6,945 | | | Avangrid, Inc. | | | 315,650 | |
| | 10,921 | | | Duke Energy Corp. | | | 999,927 | |
| | 3,252 | | | Entergy Corp. | | | 324,680 | |
| | 3,783 | | | Eversource Energy | | | 327,267 | |
| | 19,432 | | | Exelon Corp. | | | 820,419 | |
| | 9,642 | | | Hawaiian Electric Industries, Inc. | | | 341,230 | |
| | 3,768 | | | IDACORP, Inc. | | | 361,841 | |
| | 4,692 | | | NextEra Energy, Inc. | | | 361,988 | |
| | 12,803 | | | OGE Energy Corp. | | | 407,903 | |
| | 3,987 | | | Pinnacle West Capital Corp. | | | 318,761 | |
| | 5,589 | | | Southern Co. (The) | | | 343,332 | |
| | 4,780 | | | Xcel Energy, Inc. | | | 318,683 | |
| | | | | | | | |
| | | | | | | 6,874,545 | |
| | | | | | | | |
See accompanying notes to financial statements.
13 |
Consolidated Portfolio of Investments – as of December 31, 2020
AlphaSimplex Global Alternatives Fund – (continued)
| | | | | | | | |
| Shares | | | Description | |
Value (†) | |
| | | | Electrical Equipment — 0.6% | |
| | 7,041 | | | AMETEK, Inc. | | $ | 851,539 | |
| | 14,084 | | | Emerson Electric Co. | | | 1,131,931 | |
| | 5,376 | | | Generac Holdings, Inc.(a) | | | 1,222,556 | |
| | | | | | | | |
| | | | | | | 3,206,026 | |
| | | | | | | | |
| | | | Electronic Equipment, Instruments & Components — 0.7% | |
| | 8,368 | | | Amphenol Corp., Class A | | | 1,094,283 | |
| | 8,618 | | | CDW Corp. | | | 1,135,766 | |
| | 8,642 | | | Dolby Laboratories, Inc., Class A | | | 839,398 | |
| | 37,090 | | | Flex Ltd.(a) | | | 666,878 | |
| | | | | | | | |
| | | | | | | 3,736,325 | |
| | | | | | | | |
| | | | Entertainment — 0.5% | |
| | 75,105 | | | Lions Gate Entertainment Corp., Class A(a) | | | 853,944 | |
| | 4,307 | | | Madison Square Garden Sports Corp.(a) | | | 792,919 | |
| | 5,647 | | | Walt Disney Co. (The)(a) | | | 1,023,123 | |
| | | | | | | | |
| | | | | | | 2,669,986 | |
| | | | | | | | |
| | | | Food & Staples Retailing — 0.4% | |
| | 1,695 | | | Costco Wholesale Corp. | | | 638,642 | |
| | 1,862 | | | Sysco Corp. | | | 138,272 | |
| | 1,885 | | | U.S. Foods Holding Corp.(a) | | | 62,790 | |
| | 9,348 | | | Walmart, Inc. | | | 1,347,514 | |
| | | | | | | | |
| | | | | | | 2,187,218 | |
| | | | | | | | |
| | | | Food Products — 2.1% | |
| | 7,398 | | | Campbell Soup Co. | | | 357,693 | |
| | 40,177 | | | Conagra Brands, Inc. | | | 1,456,818 | |
| | 14,492 | | | Flowers Foods, Inc. | | | 327,954 | |
| | 5,892 | | | General Mills, Inc. | | | 346,450 | |
| | 23,786 | | | Hain Celestial Group, Inc. (The)(a) | | | 955,008 | |
| | 2,326 | | | Hershey Co. (The) | | | 354,319 | |
| | 6,875 | | | Hormel Foods Corp. | | | 320,444 | |
| | 54,408 | | | Hostess Brands, Inc.(a) | | | 796,533 | |
| | 5,189 | | | Kellogg Co. | | | 322,911 | |
| | 3,822 | | | McCormick & Co., Inc. | | | 365,383 | |
| | 32,555 | | | Mondelez International, Inc., Class A | | | 1,903,491 | |
| | 25,140 | | | Nomad Foods Ltd.(a) | | | 639,059 | |
| | 7,790 | | | Post Holdings, Inc.(a) | | | 786,868 | |
| | 62,742 | | | SunOpta, Inc.(a) | | | 732,199 | |
| | 68,810 | | | Utz Brands, Inc. | | | 1,517,949 | |
| | | | | | | | |
| | | | | | | 11,183,079 | |
| | | | | | | | |
| | | | Gas Utilities — 0.3% | |
| | 12,982 | | | Atmos Energy Corp. | | | 1,238,872 | |
| | 6,753 | | | Spire, Inc. | | | 432,462 | |
| | | | | | | | |
| | | | | | | 1,671,334 | |
| | | | | | | | |
| | | | Health Care Equipment & Supplies — 1.3% | |
| | 9,553 | | | Baxter International, Inc. | | | 766,533 | |
| | 3,255 | | | Becton Dickinson & Co. | | | 814,466 | |
| | 12,000 | | | Danaher Corp. | | | 2,665,680 | |
| | 665 | | | DexCom, Inc.(a) | | | 245,864 | |
| | 1,072 | | | Insulet Corp.(a) | | | 274,035 | |
| | 6,648 | | | Medtronic PLC | | | 778,747 | |
| | 14,818 | | | Merit Medical Systems, Inc.(a) | | | 822,547 | |
| | 1,246 | | | Quidel Corp.(a) | | | 223,844 | |
| | 2,252 | | | STERIS PLC | | | 426,844 | |
| | | | | | | | |
| | | | | | | 7,018,560 | |
| | | | | | | | |
| | | | Health Care Providers & Services — 1.5% | |
| | 1,190 | | | Chemed Corp. | | | 633,806 | |
| | 10,134 | | | DaVita, Inc.(a) | | | 1,189,732 | |
| | 13,240 | | | Encompass Health Corp. | | | 1,094,816 | |
| | 2,572 | | | Humana, Inc. | | | 1,055,214 | |
| | 8,063 | | | Magellan Health, Inc.(a) | | | 667,939 | |
| | | | Health Care Providers & Services — continued | |
| | 26,725 | | | MEDNAX, Inc.(a) | | | 655,831 | |
| | 12,699 | | | Quest Diagnostics, Inc. | | | 1,513,340 | |
| | 3,353 | | | UnitedHealth Group, Inc. | | | 1,175,830 | |
| | | | | | | | |
| | | | | | | 7,986,508 | |
| | | | | | | | |
| | | | Health Care Technology — 0.6% | |
| | 29,497 | | | Cerner Corp. | | | 2,314,924 | |
| | 35,535 | | | Evolent Health, Inc., Class A(a) | | | 569,626 | |
| | 1,161 | | | Teladoc Health, Inc.(a) | | | 232,154 | |
| | | | | | | | |
| | | | | | | 3,116,704 | |
| | | | | | | | |
| | | | Hotels, Restaurants & Leisure — 0.9% | |
| | 26,036 | | | Bloomin’ Brands, Inc. | | | 505,619 | |
| | 70 | | | Chipotle Mexican Grill, Inc.(a) | | | 97,070 | |
| | 9,135 | | | Hilton Worldwide Holdings, Inc. | | | 1,016,360 | |
| | 6,421 | | | McDonald’s Corp. | | | 1,377,818 | |
| | 10,169 | | | Starbucks Corp. | | | 1,087,880 | |
| | 7,083 | | | Yum! Brands, Inc. | | | 768,930 | |
| | | | | | | | |
| | | | | | | 4,853,677 | |
| | | | | | | | |
| | | | Household Durables — 0.5% | |
| | 12,945 | | | Garmin Ltd. | | | 1,548,999 | |
| | 8,774 | | | Installed Building Products, Inc.(a) | | | 894,334 | |
| | | | | | | | |
| | | | | | | 2,443,333 | |
| | | | | | | | |
| | | | Household Products — 1.4% | |
| | 15,004 | | | Church & Dwight Co., Inc. | | | 1,308,799 | |
| | 1,742 | | | Clorox Co. (The) | | | 351,745 | |
| | 11,831 | | | Colgate-Palmolive Co. | | | 1,011,669 | |
| | 2,592 | | | Kimberly-Clark Corp. | | | 349,479 | |
| | 19,598 | | | Procter & Gamble Co. (The) | | | 2,726,866 | |
| | 5,918 | | | WD-40 Co. | | | 1,572,294 | |
| | | | | | | | |
| | | | | | | 7,320,852 | |
| | | | | | | | |
| | | | Independent Power & Renewable Electricity Producers — 0.2% | |
| | 32,572 | | | Atlantica Sustainable Infrastructure PLC | | | 1,237,085 | |
| | | | | | | | |
| | | | Industrial Conglomerates — 0.1% | |
| | 1,504 | | | Roper Technologies, Inc. | | | 648,359 | |
| | | | | | | | |
| | | | Insurance — 1.3% | |
| | 19,355 | | | AMERISAFE, Inc. | | | 1,111,558 | |
| | 3,653 | | | Aon PLC, Class A | | | 771,769 | |
| | 3,129 | | | Arthur J. Gallagher & Co. | | | 387,088 | |
| | 7,606 | | | Brown & Brown, Inc. | | | 360,600 | |
| | 3,833 | | | Erie Indemnity Co., Class A | | | 941,385 | |
| | 13,487 | | | Marsh & McLennan Cos., Inc. | | | 1,577,979 | |
| | 10,593 | | | Progressive Corp. (The) | | | 1,047,436 | |
| | 754 | | | White Mountains Insurance Group Ltd. | | | 754,498 | |
| | | | | | | | |
| | | | | | | 6,952,313 | |
| | | | | | | | |
| | | | Interactive Media & Services — 0.3% | |
| | 409 | | | Alphabet, Inc., Class A(a) | | | 716,830 | |
| | 3,774 | | | Facebook, Inc., Class A(a) | | | 1,030,906 | |
| | | | | | | | |
| | | | | | | 1,747,736 | |
| | | | | | | | |
| | | | Internet & Direct Marketing Retail — 0.6% | |
| | 637 | | | Amazon.com, Inc.(a) | | | 2,074,665 | |
| | 23,505 | | | eBay, Inc. | | | 1,181,126 | |
| | | | | | | | |
| | | | | | | 3,255,791 | |
| | | | | | | | |
| | | | IT Services — 3.1% | |
| | 7,313 | | | Accenture PLC, Class A | | | 1,910,229 | |
| | 22,833 | | | Amdocs Ltd. | | | 1,619,545 | |
| | 6,928 | | | Black Knight, Inc.(a) | | | 612,089 | |
| | 21,289 | | | Booz Allen Hamilton Holding Corp. | | | 1,855,975 | |
| | 11,258 | | | Broadridge Financial Solutions, Inc. | | | 1,724,726 | |
| | 7,479 | | | Fidelity National Information Services, Inc. | | | 1,057,979 | |
See accompanying notes to financial statements.
| 14
Consolidated Portfolio of Investments – as of December 31, 2020
AlphaSimplex Global Alternatives Fund – (continued)
| | | | | | | | |
| Shares | | | Description | |
Value (†) | |
| | | | IT Services — continued | |
| | 3,856 | | | Jack Henry & Associates, Inc. | | $ | 624,633 | |
| | 25,006 | | | KBR, Inc. | | | 773,435 | |
| | 2,209 | | | Leidos Holdings, Inc. | | | 232,210 | |
| | 8,412 | | | MAXIMUS, Inc. | | | 615,674 | |
| | 114,719 | | | Paya Holdings, Inc., Class A(a) | | | 1,557,884 | |
| | 12,178 | | | Paychex, Inc. | | | 1,134,746 | |
| | 34,234 | | | Perspecta, Inc. | | | 824,355 | |
| | 5,659 | | | Visa, Inc., Class A | | | 1,237,793 | |
| | 2,107 | | | Wix.com Ltd.(a) | | | 526,666 | |
| | | | | | | | |
| | | | | | | 16,307,939 | |
| | | | | | | | |
| | | | Leisure Products — 0.3% | |
| | 18,446 | | | Acushnet Holdings Corp. | | | 747,801 | |
| | 23,114 | | | Callaway Golf Co. | | | 554,967 | |
| | | | | | | | |
| | | | | | | 1,302,768 | |
| | | | | | | | |
| | | | Life Sciences Tools & Services — 0.4% | |
| | 15,751 | | | Agilent Technologies, Inc. | | | 1,866,336 | |
| | | | | | | | |
| | | | Machinery — 1.0% | |
| | 18,618 | | | Donaldson Co., Inc. | | | 1,040,374 | |
| | 9,479 | | | Lincoln Electric Holdings, Inc. | | | 1,101,934 | |
| | 9,116 | | | PACCAR, Inc. | | | 786,528 | |
| | 16,670 | | | Toro Co. (The) | | | 1,580,983 | |
| | 34,784 | | | Trinity Industries, Inc. | | | 917,950 | |
| | | | | | | | |
| | | | | | | 5,427,769 | |
| | | | | | | | |
| | | | Media — 1.1% | |
| | 29,224 | | | Altice USA, Inc., Class A(a) | | | 1,106,713 | |
| | 3,652 | | | Charter Communications, Inc., Class A(a) | | | 2,415,980 | |
| | 39,229 | | | Comcast Corp., Class A | | | 2,055,600 | |
| | | | | | | | |
| | | | | | | 5,578,293 | |
| | | | | | | | |
| | | | Metals & Mining — 0.2% | |
| | 6,417 | | | Reliance Steel & Aluminum Co. | | | 768,436 | |
| | | | | | | | |
| | | | Multi-Utilities — 0.9% | |
| | 4,337 | | | Ameren Corp. | | | 338,546 | |
| | 17,132 | | | CMS Energy Corp. | | | 1,045,223 | |
| | 17,543 | | | Consolidated Edison, Inc. | | | 1,267,833 | |
| | 4,169 | | | Dominion Energy, Inc. | | | 313,509 | |
| | 3,623 | | | DTE Energy Co. | | | 439,868 | |
| | 14,499 | | | NiSource, Inc. | | | 332,607 | |
| | 5,868 | | | Public Service Enterprise Group, Inc. | | | 342,104 | |
| | 3,500 | | | Sempra Energy | | | 445,935 | |
| | 3,618 | | | WEC Energy Group, Inc. | | | 332,965 | |
| | | | | | | | |
| | | | | | | 4,858,590 | |
| | | | | | | | |
| | | | Multiline Retail — 0.2% | |
| | 6,030 | | | Dollar General Corp. | | | 1,268,109 | |
| | | | | | | | |
| | | | Oil, Gas & Consumable Fuels — 2.2% | |
| | 15,974 | | | Cheniere Energy, Inc.(a) | | | 958,919 | |
| | 43,071 | | | Concho Resources, Inc. | | | 2,513,193 | |
| | 34,441 | | | CVR Energy, Inc. | | | 513,171 | |
| | 32,727 | | | Enviva Partners LP | | | 1,486,460 | |
| | 84,867 | | | Holly Energy Partners LP | | | 1,205,112 | |
| | 25,109 | | | Magellan Midstream Partners LP | | | 1,065,626 | |
| | 153,331 | | | Parsley Energy, Inc., Class A | | | 2,177,300 | |
| | 700,524 | | | QEP Resources, Inc. | | | 1,674,252 | |
| | | | | | | | |
| | | | | | | 11,594,033 | |
| | | | | | | | |
| | | | Personal Products — 0.5% | |
| | 7,333 | | | Estee Lauder Cos., Inc. (The), Class A | | | 1,951,971 | |
| | 3,399 | | | Medifast, Inc. | | | 667,360 | |
| | | | | | | | |
| | | | | | | 2,619,331 | |
| | | | | | | | |
| | | | Pharmaceuticals — 1.0% | |
| | 12,156 | | | Bristol-Myers Squibb Co. | | | 754,036 | |
| | 29,076 | | | Elanco Animal Health, Inc.(a) | | | 891,761 | |
| | 4,442 | | | Eli Lilly & Co. | | | 749,987 | |
| | 3,301 | | | Horizon Therapeutics PLC(a) | | | 241,468 | |
| | 5,023 | | | Johnson & Johnson | | | 790,520 | |
| | 5,376 | | | Merck & Co., Inc. | | | 439,757 | |
| | 19,649 | | | Pfizer, Inc. | | | 723,280 | |
| | 5,004 | | | Zoetis, Inc. | | | 828,162 | |
| | | | | | | | |
| | | | | | | 5,418,971 | |
| | | | | | | | |
| | | | Professional Services — 0.9% | |
| | 12,968 | | | Exponent, Inc. | | | 1,167,509 | |
| | 42,212 | | | Nielsen Holdings PLC | | | 880,965 | |
| | 11,787 | | | Verisk Analytics, Inc. | | | 2,446,863 | |
| | | | | | | | |
| | | | | | | 4,495,337 | |
| | | | | | | | |
| | | | Real Estate Management & Development — 0.4% | |
| | 11,647 | | | CBRE Group, Inc., Class A(a) | | | 730,500 | |
| | 5,786 | | | Howard Hughes Corp. (The)(a) | | | 456,689 | |
| | 46,618 | | | Kennedy-Wilson Holdings, Inc. | | | 833,996 | |
| | | | | | | | |
| | | | | | | 2,021,185 | |
| | | | | | | | |
| | | | REITs – Apartments — 0.1% | |
| | 3,790 | | | Camden Property Trust | | | 378,697 | |
| | 3,028 | | | Mid-America Apartment Communities, Inc. | | | 383,617 | |
| | | | | | | | |
| | | | | | | 762,314 | |
| | | | | | | | |
| | | | REITs – Diversified — 0.2% | |
| | 3,838 | | | CoreSite Realty Corp. | | | 480,824 | |
| | 53,001 | | | Uniti Group, Inc. | | | 621,702 | |
| | | | | | | | |
| | | | | | | 1,102,526 | |
| | | | | | | | |
| | | | REITs – Mortgage — 0.7% | |
| | 115,143 | | | AGNC Investment Corp. | | | 1,796,231 | |
| | 77,508 | | | Broadmark Realty Capital, Inc. | | | 790,581 | |
| | 48,187 | | | KKR Real Estate Finance Trust, Inc. | | | 863,511 | |
| | | | | | | | |
| | | | | | | 3,450,323 | |
| | | | | | | | |
| | | | REITs – Office Property — 0.4% | |
| | 2,161 | | | Alexandria Real Estate Equities, Inc. | | | 385,133 | |
| | 21,666 | | | Easterly Government Properties, Inc. | | | 490,735 | |
| | 47,889 | | | Equity Commonwealth | | | 1,306,412 | |
| | | | | | | | |
| | | | | | | 2,182,280 | |
| | | | | | | | |
| | | | REITs – Storage — 0.3% | |
| | 10,601 | | | CubeSmart | | | 356,300 | |
| | 3,027 | | | Extra Space Storage, Inc. | | | 350,708 | |
| | 3,116 | | | Life Storage, Inc. | | | 372,019 | |
| | 1,514 | | | Public Storage | | | 349,628 | |
| | | | | | | | |
| | | | | | | 1,428,655 | |
| | | | | | | | |
| | | | REITs – Warehouse/Industrials — 0.1% | |
| | 5,865 | | | Terreno Realty Corp. | | | 343,161 | |
| | | | | | | | |
| | | | Road & Rail — 0.9% | |
| | 9,687 | | | CSX Corp. | | | 879,095 | |
| | 41,669 | | | Heartland Express, Inc. | | | 754,209 | |
| | 7,198 | | | Landstar System, Inc. | | | 969,283 | |
| | 5,851 | | | Old Dominion Freight Line, Inc. | | | 1,141,998 | |
| | 4,903 | | | Union Pacific Corp. | | | 1,020,903 | |
| | | | | | | | |
| | | | | | | 4,765,488 | |
| | | | | | | | |
| | | | Semiconductors & Semiconductor Equipment — 1.8% | |
| | 16,548 | | | Inphi Corp.(a) | | | 2,655,458 | |
| | 26,865 | | | Maxim Integrated Products, Inc. | | | 2,381,582 | |
| | 173 | | | Monolithic Power Systems, Inc. | | | 63,358 | |
| | 1,839 | | | Qorvo, Inc.(a) | | | 305,770 | |
See accompanying notes to financial statements.
15 |
Consolidated Portfolio of Investments – as of December 31, 2020
AlphaSimplex Global Alternatives Fund – (continued)
| | | | | | | | |
| Shares | | | Description | |
Value (†) | |
| | | | Semiconductors & Semiconductor Equipment — continued | |
| | 817 | | | SolarEdge Technologies, Inc.(a) | | $ | 260,721 | |
| | 2,286 | | | Teradyne, Inc. | | | 274,069 | |
| | 4,818 | | | Texas Instruments, Inc. | | | 790,778 | |
| | 17,608 | | | Xilinx, Inc. | | | 2,496,286 | |
| | | | | | | | |
| | | | | | | 9,228,022 | |
| | | | | | | | |
| | | | Software — 3.7% | |
| | 49,054 | | | Box, Inc., Class A(a) | | | 885,425 | |
| | 21,750 | | | Check Point Software Technologies Ltd.(a) | | | 2,890,792 | |
| | 5,912 | | | Citrix Systems, Inc. | | | 769,151 | |
| | 19,373 | | | CommVault Systems, Inc.(a) | | | 1,072,683 | |
| | 753 | | | Coupa Software, Inc.(a) | | | 255,199 | |
| | 1,478 | | | Crowdstrike Holdings, Inc., Class A(a) | | | 313,070 | |
| | 2,290 | | | Datadog, Inc., Class A(a) | | | 225,428 | |
| | 994 | | | DocuSign, Inc.(a) | | | 220,966 | |
| | 61,312 | | | NortonLifeLock, Inc. | | | 1,274,063 | |
| | 23,246 | | | Nuance Communications, Inc.(a) | | | 1,024,916 | |
| | 43,497 | | | Open Text Corp. | | | 1,977,374 | |
| | 12,295 | | | Oracle Corp. | | | 795,363 | |
| | 7,164 | | | Pegasystems, Inc. | | | 954,675 | |
| | 9,319 | | | PTC, Inc.(a) | | | 1,114,646 | |
| | 761 | | | RingCentral, Inc., Class A(a) | | | 288,396 | |
| | 1,414 | | | ServiceNow, Inc.(a) | | | 778,308 | |
| | 43,197 | | | Slack Technologies, Inc., Class A(a) | | | 1,824,641 | |
| | 251 | | | Trade Desk, Inc. (The), Class A(a) | | | 201,051 | |
| | 4,884 | | | Tyler Technologies, Inc.(a) | | | 2,131,964 | |
| | 503 | | | Zoom Video Communications, Inc., Class A(a) | | | 169,672 | |
| | | | | | | | |
| | | | | | | 19,167,783 | |
| | | | | | | | |
| | | | Specialty Retail — 1.4% | |
| | 5,434 | | | Advance Auto Parts, Inc. | | | 855,909 | |
| | 7,906 | | | Asbury Automotive Group, Inc.(a) | | | 1,152,220 | |
| | 1,184 | | | AutoZone, Inc.(a) | | | 1,403,561 | |
| | 9,167 | | | Best Buy Co., Inc. | | | 914,775 | |
| | 34,663 | | | Buckle, Inc. (The) | | | 1,012,160 | |
| | 2,311 | | | Home Depot, Inc. (The) | | | 613,848 | |
| | 4,697 | | | Lowe’s Cos., Inc. | | | 753,916 | |
| | 21,624 | | | Rent-A-Center, Inc. | | | 827,983 | |
| | | | | | | | |
| | | | | | | 7,534,372 | |
| | | | | | | | |
| | | | Technology Hardware, Storage & Peripherals — 0.2% | |
| | 16,824 | | | Seagate Technology PLC | | | 1,045,780 | |
| | | | | | | | |
| | | | Textiles, Apparel & Luxury Goods — 0.2% | |
| | 5,612 | | | NIKE, Inc., Class B | | | 793,930 | |
| | | | | | | | |
| | | | Thrifts & Mortgage Finance — 0.9% | |
| | 124,574 | | | Columbia Financial, Inc.(a) | | | 1,938,371 | |
| | 109,286 | | | MGIC Investment Corp. | | | 1,371,539 | |
| | 14,483 | | | Walker & Dunlop, Inc. | | | 1,332,726 | |
| | | | | | | | |
| | | | | | | 4,642,636 | |
| | | | | | | | |
| | | | Tobacco — 0.2% | |
| | 9,364 | | | Philip Morris International, Inc. | | | 775,246 | |
| | | | | | | | |
| | | | Trading Companies & Distributors — 1.2% | |
| | 52,197 | | | BMC Stock Holdings, Inc.(a) | | | 2,801,935 | |
| | 4,906 | | | United Rentals, Inc.(a) | | | 1,137,750 | |
| | 2,290 | | | W.W. Grainger, Inc. | | | 935,099 | |
| | 5,556 | | | Watsco, Inc. | | | 1,258,712 | |
| | | | | | | | |
| | | | | | | 6,133,496 | |
| | | | | | | | |
| | | | Water Utilities — 0.2% | |
| | 6,465 | | | American Water Works Co., Inc. | | | 992,184 | |
| | | | | | | | |
| | | | Wireless Telecommunication Services — 0.3% | |
| | 12,966 | | | T-Mobile US, Inc.(a) | | | 1,748,465 | |
| | | | | | | | |
| | | | Total Common Stocks
(Identified Cost $241,815,002) | | | 272,292,421 | |
| | | | | | | | |
| | Exchange-Traded Funds — 0.7% | |
| | 41,081 | | | iShares® iBoxx $ High Yield Corporate Bond ETF
(Identified Cost $3,383,798) | | | 3,586,371 | |
| | | | | | | | |
| | | | | | | | |
Principal
Amount | | | | | | |
| | Short-Term Investments — 35.4% | |
| | | | Certificates of Deposit — 26.3% | |
| $ | 15,000,000 | | | National Bank of Kuwait (NY), 0.210%, 1/04/2021 | | | 15,000,167 | |
| | 10,000,000 | | | KBC Bank NV (NY), 0.110%, 1/07/2021 | | | 10,000,000 | |
| | 19,000,000 | | | Mizuho Bank Ltd. (NY), 0.150%, 2/02/2021 | | | 19,000,122 | |
| | 8,500,000 | | | Landesbank Baden-Wuerttemberg (NY), 0.250%, 2/08/2021(b) | | | 8,500,349 | |
| | 10,000,000 | | | Oversea-Chinese Banking Corp. Ltd. (NY), 0.190%, 2/16/2021(b) | | | 9,999,516 | |
| | 15,000,000 | | | Sumitomo Mitsui Banking Corp. (NY), 0.200%, 2/16/2021(b) | | | 15,000,899 | |
| | 10,000,000 | | | Landesbank Hessen-Thueringen Girozentrale (NY), 0.210%, 2/18/2021(b) | | | 10,000,693 | |
| | 15,000,000 | | | Toronto-Dominion Bank (NY), 0.200%, 2/19/2021 | | | 14,999,791 | |
| | 10,000,000 | | | DZ Bank (NY), 0.190%, 3/03/2021 | | | 10,000,120 | |
| | 5,000,000 | | | Royal Bank of Canada (NY), 3-month LIBOR + 0.110%, 0.331%, 6/11/2021(b)(c) | | | 5,002,366 | |
| | 10,000,000 | | | Bank of Montreal (IL), 0.240%, 6/23/2021 | | | 9,999,130 | |
| | 10,000,000 | | | Cooperatieve Rabobank UA, 0.230%, 7/20/2021(b) | | | 10,000,050 | |
| | | | | | | | |
| | | | | | | 137,503,203 | |
| | | | | | | | |
| | | | Time Deposits — 5.3% | |
| | 13,400,000 | | | Skandinaviska Enskilda Banken (NY), 0.040%, 1/04/2021 | | | 13,400,000 | |
| | 14,200,000 | | | Canadian Imperial Bank of Commerce, 0.080%, 1/04/2021 | | | 14,200,000 | |
| | | | | | | | |
| | | | | | | 27,600,000 | |
| | | | | | | | |
| | | | Treasuries — 3.8% | |
| | 8,300,000 | | | U.S. Treasury Bills, 0.065%-0.090%, 1/07/2021(d)(e)(f)(g) | | | 8,299,979 | |
| | 9,800,000 | | | U.S. Treasury Bills, 0.090%, 2/04/2021(d)(f)(g) | | | 9,799,536 | |
| | 2,000,000 | | | U.S. Treasury Bills, 0.075%, 3/04/2021(d)(f) | | | 1,999,771 | |
| | | | | | | | |
| | | | | | | 20,099,286 | |
| | | | | | | | |
| | | | Total Short-Term Investments
(Identified Cost $185,199,327) | | | 185,202,489 | |
| | | | | | | | |
| | | | | | | | |
| | | | Total Investments — 88.1%
(Identified Cost $430,398,127) | | | 461,081,281 | |
| | | | Other assets less liabilities — 11.9% | | | 62,208,334 | |
| | | | | | | | |
| | | | Net Assets — 100.0% | | $ | 523,289,615 | |
| | | | | | | | |
| | | | | | | | |
| | (†) | | | See Note 2 of Notes to Financial Statements. | |
| | (a) | | | Non-income producing security. | |
| | (b) | | | Security (or a portion thereof) has been designated to cover the Fund’s obligations under open derivative contracts. | |
| | (c) | | | Variable rate security. Rate as of December 31, 2020 is disclosed. | |
| | (d) | | | Interest rate represents discount rate at time of purchase; not a coupon rate. | |
| | (e) | | | The Fund’s investment in U.S. Government/Agency securities is comprised of various lots with differing discount rates. These separate investments, which have the same maturity date, have been aggregated for the purpose of presentation in the Portfolio of Investments. | |
| | (f) | | | Security (or a portion thereof) has been pledged as collateral for open derivative contracts. | |
| | (g) | | | A portion of the security is held by AlphaSimplex Global Alternatives Cayman Fund Ltd., a wholly-owned subsidiary. See Note 1 of Notes to Financial Statements. | |
See accompanying notes to financial statements.
| 16
Consolidated Portfolio of Investments – as of December 31, 2020
AlphaSimplex Global Alternatives Fund – (continued)
| | | | | | |
| | ETF | | | Exchange-Traded Fund |
| | LIBOR | | | London Interbank Offered Rate |
| | REITs | | | Real Estate Investment Trusts |
| | | | |
| | CHF | | | Swiss Franc |
| | NOK | | | Norwegian Krone |
| | NZD | | | New Zealand Dollar |
| | PLN | | | Polish Zloty |
| | SEK | | | Swedish Krona |
| | SGD | | | Singapore Dollar |
| | ZAR | | | South African Rand |
At December 31, 2020, the Fund had the following open forward foreign currency contracts:
| | | | | | | | | | | | | | | | | | | | | | | | | | | | |
| Counterparty | | Delivery
Date | | | Currency
Bought/
Sold (B/S) | | | Units
of
Currency | | | In Exchange
for | | | Notional
Value | | | Unrealized
Appreciation
(Depreciation) | |
| UBS AG | | | 3/17/2021 | | | | CHF | | | | B | | | | 7,250,000 | | | $ | 8,179,951 | | | $ | 8,206,626 | | | $ | 26,675 | |
| UBS AG | | | 3/17/2021 | | | | CHF | | | | B | | | | 24,250,000 | | | | 27,515,239 | | | | 27,449,749 | | | | (65,490 | ) |
| UBS AG | | | 3/17/2021 | | | | CHF | | | | S | | | | 11,750,000 | | | | 13,331,800 | | | | 13,300,394 | | | | 31,406 | |
| UBS AG | | | 3/17/2021 | | | | CHF | | | | S | | | | 57,250,000 | | | | 64,696,054 | | | | 64,804,046 | | | | (107,992 | ) |
| UBS AG | | | 3/17/2021 | | | | NOK | | | | B | | | | 14,000,000 | | | | 1,607,722 | | | | 1,632,391 | | | | 24,669 | |
| UBS AG | | | 3/17/2021 | | | | NOK | | | | S | | | | 6,000,000 | | | | 684,217 | | | | 699,596 | | | | (15,379 | ) |
| UBS AG | | | 3/17/2021 | | | | NZD | | | | B | | | | 50,900,000 | | | | 36,184,575 | | | | 36,633,873 | | | | 449,298 | |
| UBS AG | | | 3/17/2021 | | | | NZD | | | | S | | | | 31,300,000 | | | | 22,050,727 | | | | 22,527,313 | | | | (476,586 | ) |
| UBS AG | | | 3/17/2021 | | | | PLN | | | | B | | | | 3,000,000 | | | | 815,621 | | | | 803,324 | | | | (12,297 | ) |
| UBS AG | | | 3/17/2021 | | | | SEK | | | | B | | | | 228,000,000 | | | | 27,053,320 | | | | 27,733,173 | | | | 679,853 | |
| UBS AG | | | 3/17/2021 | | | | SEK | | | | S | | | | 158,000,000 | | | | 19,302,416 | | | | 19,218,603 | | | | 83,813 | |
| UBS AG | | | 3/17/2021 | | | | SEK | | | | S | | | | 46,000,000 | | | | 5,565,488 | | | | 5,595,289 | | | | (29,801 | ) |
| UBS AG | | | 3/17/2021 | | | | SGD | | | | B | | | | 5,250,000 | | | | 3,923,999 | | | | 3,972,743 | | | | 48,744 | |
| UBS AG | | | 3/17/2021 | | | | ZAR | | | | B | | | | 10,500,000 | | | | 712,134 | | | | 708,041 | | | | (4,093 | ) |
| | | | | | | | | | | | | | | | | | | | | | | | | | | | |
| Total | | | $ | 632,820 | |
| | | | | | | | | | | | | | | | | | | | | | | | | | | | |
At December 31, 2020, open long futures contracts were as follows:
| | | | | | | | | | | | | | | | | | | | |
| Financial and Currency Futures | | Expiration
Date | | | Contracts | | | Notional
Amount | | | Value | | | Unrealized
Appreciation
(Depreciation) | |
2 Year U.S. Treasury Note | | | 3/31/2021 | | | | 3,423 | | | $ | 755,578,239 | | | $ | 756,402,772 | | | $ | 824,533 | |
3 Year Australia Government Bond | | | 3/15/2021 | | | | 230 | | | | 20,812,884 | | | | 20,823,949 | | | | 11,065 | |
5 Year U.S. Treasury Note | | | 3/31/2021 | | | | 669 | | | | 84,179,461 | | | | 84,403,758 | | | | 224,297 | |
10 Year Australia Government Bond | | | 3/15/2021 | | | | 927 | | | | 104,923,885 | | | | 105,221,015 | | | | 297,130 | |
10 Year Canada Government Bond | | | 3/22/2021 | | | | 464 | | | | 54,155,283 | | | | 54,350,224 | | | | 194,941 | |
10 Year U.S. Treasury Note | | | 3/22/2021 | | | | 521 | | | | 71,813,187 | | | | 71,938,703 | | | | 125,516 | |
AEX-Index® | | | 1/15/2021 | | | | 7 | | | | 1,053,808 | | | | 1,068,140 | | | | 14,332 | |
ASX SPI 200™ | | | 3/18/2021 | | | | 5 | | | | 632,083 | | | | 629,963 | | | | (2,120 | ) |
British Pound | | | 3/15/2021 | | | | 199 | | | | 16,707,875 | | | | 16,988,381 | | | | 280,506 | |
Canadian Dollar | | | 3/16/2021 | | | | 577 | | | | 45,244,270 | | | | 45,202,180 | | | | (42,090 | ) |
DAX | | | 3/19/2021 | | | | 62 | | | | 25,130,350 | | | | 26,028,843 | | | | 898,493 | |
E-mini NASDAQ 100 | | | 3/19/2021 | | | | 5 | | | | 1,236,567 | | | | 1,288,550 | | | | 51,983 | |
E-mini Russell 2000 | | | 3/19/2021 | | | | 654 | | | | 62,466,777 | | | | 64,575,960 | | | | 2,109,183 | |
E-mini S&P MidCap 400® | | | 3/19/2021 | | | | 7 | | | | 1,569,495 | | | | 1,612,450 | | | | 42,955 | |
Euribor | | | 3/15/2021 | | | | 49 | | | | 15,045,965 | | | | 15,046,774 | | | | 809 | |
Euro | | | 3/15/2021 | | | | 571 | | | | 86,804,836 | | | | 87,405,825 | | | | 600,989 | |
Euro Schatz | | | 3/08/2021 | | | | 97 | | | | 13,309,334 | | | | 13,304,594 | | | | (4,740 | ) |
EURO STOXX 50® | | | 3/19/2021 | | | | 128 | | | | 5,481,593 | | | | 5,551,178 | | | | 69,585 | |
Euro-BTP | | | 3/08/2021 | | | | 29 | | | | 5,385,779 | | | | 5,385,388 | | | | (391 | ) |
Euro-Buxl® 30 Year Bond | | | 3/08/2021 | | | | 9 | | | | 2,460,647 | | | | 2,476,480 | | | | 15,833 | |
FTSE 100 Index | | | 3/19/2021 | | | | 142 | | | | 12,596,768 | | | | 12,466,684 | | | | (130,084 | ) |
FTSE Taiwan Index | | | 1/28/2021 | | | | 24 | | | | 1,179,660 | | | | 1,224,720 | | | | 45,060 | |
FTSE/JSE Top 40 Index | | | 3/18/2021 | | | | 26 | | | | 969,237 | | | | 966,450 | | | | (2,787 | ) |
German Euro BOBL | | | 3/08/2021 | | | | 50 | | | | 8,256,522 | | | | 8,257,133 | | | | 611 | |
Hang Seng Index® | | | 1/28/2021 | | | | 8 | | | | 1,350,231 | | | | 1,404,407 | | | | 54,176 | |
Indian Rupee | | | 1/27/2021 | | | | 136 | | | | 3,663,400 | | | | 3,714,160 | | | | 50,760 | |
Japanese Yen | | | 3/15/2021 | | | | 334 | | | | 40,308,770 | | | | 40,451,575 | | | | 142,805 | |
See accompanying notes to financial statements.
17 |
Consolidated Portfolio of Investments – as of December 31, 2020
AlphaSimplex Global Alternatives Fund – (continued)
| | | | | | | | | | | | | | | | | | | | |
| Financial and Currency Futures | | Expiration
Date | | | Contracts | | | Notional
Amount | | | Value | | | Unrealized
Appreciation
(Depreciation) | |
MSCI EAFE Index | | | 3/19/2021 | | | | 8 | | | $ | 838,720 | | | $ | 852,320 | | | $ | 13,600 | |
MSCI Emerging Markets Index | | | 3/19/2021 | | | | 145 | | | | 9,021,900 | | | | 9,339,450 | | | | 317,550 | |
Nikkei 225™ | | | 3/11/2021 | | | | 8 | | | | 2,040,482 | | | | 2,125,999 | | | | 85,517 | |
OMXS30® | | | 1/15/2021 | | | | 80 | | | | 1,839,516 | | | | 1,826,292 | | | | (13,224 | ) |
S&P/TSX 60 Index | | | 3/18/2021 | | | | 13 | | | | 2,125,958 | | | | 2,101,611 | | | | (24,347 | ) |
Short Sterling | | | 3/17/2021 | | | | 148 | | | | 25,294,748 | | | | 25,296,235 | | | | 1,487 | |
Short-Term Euro-BTP | | | 3/08/2021 | | | | 50 | | | | 6,907,210 | | | | 6,916,983 | | | | 9,773 | |
TOPIX | | | 3/11/2021 | | | | 27 | | | | 4,593,773 | | | | 4,718,561 | | | | 124,788 | |
U.S. Dollar Index | | | 3/15/2021 | | | | 467 | | | | 42,355,261 | | | | 41,980,498 | | | | (374,763 | ) |
| | | | | | | | | | | | | | | | | | | | |
Total | | | $ | 6,013,731 | |
| | | | | |
| | | | | |
| Commodity Futures1 | | Expiration
Date | | | Contracts | | | Notional
Amount | | | Value | | | Unrealized
Appreciation
(Depreciation) | |
Aluminum LME | | | 3/17/2021 | | | | 263 | | | $ | 12,782,240 | | | $ | 13,002,062 | | | $ | 219,822 | |
Brent Crude Oil | | | 1/29/2021 | | | | 42 | | | | 2,074,110 | | | | 2,175,600 | | | | 101,490 | |
Cocoa | | | 3/16/2021 | | | | 40 | | | | 1,009,860 | | | | 1,041,200 | | | | 31,340 | |
Copper | | | 3/29/2021 | | | | 25 | | | | 2,007,425 | | | | 2,199,375 | | | | 191,950 | |
Copper LME | | | 3/17/2021 | | | | 226 | | | | 40,194,406 | | | | 43,882,137 | | | | 3,687,731 | |
Cotton | | | 3/09/2021 | | | | 260 | | | | 9,834,470 | | | | 10,155,600 | | | | 321,130 | |
Gold | | | 2/24/2021 | | | | 75 | | | | 14,148,210 | | | | 14,213,250 | | | | 65,040 | |
New York Harbor ULSD | | | 1/29/2021 | | | | 185 | | | | 11,449,007 | | | | 11,530,680 | | | | 81,673 | |
Nickel LME | | | 3/17/2021 | | | | 41 | | | | 3,975,768 | | | | 4,085,568 | | | | 109,800 | |
Soybean | | | 3/12/2021 | | | | 38 | | | | 2,451,962 | | | | 2,490,900 | | | | 38,938 | |
Soybean Oil | | | 3/12/2021 | | | | 684 | | | | 15,316,086 | | | | 17,400,960 | | | | 2,084,874 | |
Sugar | | | 2/26/2021 | | | | 1,062 | | | | 17,531,651 | | | | 18,424,425 | | | | 892,774 | |
Wheat | | | 3/12/2021 | | | | 470 | | | | 14,034,775 | | | | 15,051,750 | | | | 1,016,975 | |
Zinc LME | | | 3/17/2021 | | | | 73 | | | | 4,881,444 | | | | 5,017,528 | | | | 136,084 | |
| | | | | | | | | | | | | | | | | | | | |
Total | | | $ | 8,979,621 | |
| | | | | |
At December 31, 2020, open short futures contracts were as follows:
| | | | | | | | | | | | | | | | | | | | |
| Financial and Currency Futures | | Expiration
Date | | | Contracts | | | Notional
Amount | | | Value | | | Unrealized
Appreciation
(Depreciation) | |
30 Year U.S. Treasury Bond | | | 3/22/2021 | | | | 279 | | | $ | 48,473,914 | | | $ | 48,319,313 | | | $ | 154,601 | |
Australian Dollar | | | 3/15/2021 | | | | 232 | | | | 17,494,290 | | | | 17,864,000 | | | | (369,710 | ) |
Brazilian Real | | | 1/29/2021 | | | | 52 | | | | 1,016,340 | | | | 999,700 | | | | 16,640 | |
E-mini S&P 500® | | | 3/19/2021 | | | | 549 | | | | 101,394,813 | | | | 102,904,560 | | | | (1,509,747 | ) |
Euro-OAT | | | 3/08/2021 | | | | 313 | | | | 63,918,980 | | | | 64,185,715 | | | | (266,735 | ) |
Eurodollar | | | 6/14/2021 | | | | 87 | | | | 21,707,588 | | | | 21,714,113 | | | | (6,525 | ) |
German Euro Bund | | | 3/08/2021 | | | | 660 | | | | 143,165,075 | | | | 143,229,187 | | | | (64,112 | ) |
Mexican Peso | | | 3/15/2021 | | | | 1,058 | | | | 26,217,110 | | | | 26,312,460 | | | | (95,350 | ) |
UK Long Gilt | | | 3/29/2021 | | | | 19 | | | | 3,522,969 | | | | 3,521,670 | | | | 1,299 | |
| | | | | | | | | | | | | | | | | | | | |
Total | | | $ | (2,139,639 | ) |
| | | | | |
| | | | | |
| Commodity Futures1 | | Expiration
Date | | | Contracts | | | Notional
Amount | | | Value | | | Unrealized
Appreciation
(Depreciation) | |
Aluminum LME | | | 3/17/2021 | | | | 302 | | | $ | 14,989,943 | | | $ | 14,930,125 | | | $ | 59,818 | |
Coffee | | | 3/19/2021 | | | | 11 | | | | 524,550 | | | | 529,031 | | | | (4,481 | ) |
Copper LME | | | 3/17/2021 | | | | 46 | | | | 8,459,089 | | | | 8,931,763 | | | | (472,674 | ) |
Corn | | | 3/12/2021 | | | | 501 | | | | 11,073,587 | | | | 12,124,200 | | | | (1,050,613 | ) |
Gasoline | | | 1/29/2021 | | | | 56 | | | | 3,079,070 | | | | 3,316,555 | | | | (237,485 | ) |
Live Cattle | | | 2/26/2021 | | | | 201 | | | | 9,026,950 | | | | 9,248,010 | | | | (221,060 | ) |
Low Sulfur Gasoil | | | 2/11/2021 | | | | 366 | | | | 15,035,700 | | | | 15,481,800 | | | | (446,100 | ) |
Natural Gas | | | 1/27/2021 | | | | 210 | | | | 5,297,860 | | | | 5,331,900 | | | | (34,040 | ) |
Nickel LME | | | 3/17/2021 | | | | 9 | | | | 932,337 | | | | 896,832 | | | | 35,505 | |
Silver | | | 3/29/2021 | | | | 18 | | | | 2,213,000 | | | | 2,377,080 | | | | (164,080 | ) |
Soybean Meal | | | 3/12/2021 | | | | 114 | | | | 4,749,030 | | | | 4,895,160 | | | | (146,130 | ) |
WTI Crude Oil | | | 1/20/2021 | | | | 140 | | | | 6,547,960 | | | | 6,792,800 | | | | (244,840 | ) |
Zinc LME | | | 3/17/2021 | | | | 133 | | | | 9,172,816 | | | | 9,141,522 | | | | 31,294 | |
| | | | | | | | | | | | | | | | | | | | |
Total | | | $ | (2,894,886 | ) |
| | | | | |
1 Commodity futures are held by AlphaSimplex Global Alternatives Cayman Fund Ltd., a wholly-owned subsidiary. See Note 1 of Notes to Financial Statements.
See accompanying notes to financial statements.
| 18
Consolidated Portfolio of Investments – as of December 31, 2020
AlphaSimplex Global Alternatives Fund – (continued)
Bilateral Equity Basket Total Return Swaps (a)
| | | | | | | | | | | | | | | | | | | | | | |
| Reference Entity | | Counterparty | | Expiration
Date | | | Notional
Amount | | | Unrealized
Appreciation
(Depreciation) | | | Value of
Reference
Entities | | | Notional
Amount
Net Asset
Percentage | |
Equity Securities Short | | Morgan Stanley Capital Services LLC | | | 5/19/2021 | | | $ | (135,849,616 | ) | | $ | — | | | $ | (135,849,616 | ) | | | (26.0 | %) |
| | | | | | | | | | | | | | | | | | | | | | |
| (a) | The Fund receives or pays, on a monthly basis, the total return on a portfolio of short equity positions net of one day U.S. Federal Funds Effective Rate minus a spread of 0.45%-0.59% as calculated on the notional amount. See Note 2 of Notes to Financial Statements. |
The following table represents the reference entities underlying the total return swap with Morgan Stanley Capital Services LLC as of December 31, 2020:
| | | | | | | | | | | | |
| Common Stocks — Short | | Shares | | | Value | | | % of Basket Value | |
Aerospace & Defense | | | | | | | | | | | | |
| Axon Enterprise, Inc. | | | (3,535 | ) | | $ | (433,144 | ) | | | (0.3 | %) |
| Boeing Co. (The) | | | (1,106 | ) | | | (236,750 | ) | | | (0.2 | %) |
| Hexcel Corp. | | | (4,482 | ) | | | (217,332 | ) | | | (0.2 | %) |
| TransDigm Group, Inc. | | | (790 | ) | | | (488,892 | ) | | | (0.4 | %) |
| | | | | | | | | | | | |
| | | | (1,376,118 | ) | | | | |
| | | | | | | | | | | | |
Air Freight & Logistics | | | | | | | | | | | | |
| XPO Logistics, Inc. | | | (3,534 | ) | | | (421,253 | ) | | | (0.3 | %) |
| | | | | | | | | | | | |
Airlines | | | | | | | | | | | | |
| Alaska Air Group, Inc. | | | (14,084 | ) | | | (732,368 | ) | | | (0.5 | %) |
| Delta Air Lines, Inc. | | | (21,655 | ) | | | (870,747 | ) | | | (0.6 | %) |
| JetBlue Airways Corp. | | | (89,924 | ) | | | (1,307,495 | ) | | | (1.0 | %) |
| Southwest Airlines Co. | | | (14,923 | ) | | | (695,561 | ) | | | (0.5 | %) |
| United Airlines Holdings, Inc. | | | (14,867 | ) | | | (642,998 | ) | | | (0.5 | %) |
| | | | | | | | | | | | |
| | | | (4,249,169 | ) | | | | |
| | | | | | | | | | | | |
Auto Components | | | | | | | | | | | | |
| Goodyear Tire & Rubber Co. (The) | | | (23,582 | ) | | | (257,280 | ) | | | (0.2 | %) |
| | | | | | | | | | | | |
Automobiles | | | | | | | | | | | | |
| General Motors Co. | | | (15,794 | ) | | | (657,662 | ) | | | (0.5 | %) |
| Harley-Davidson, Inc. | | | (9,402 | ) | | | (345,054 | ) | | | (0.3 | %) |
| | | | | | | | | | | | |
| | | | (1,002,716 | ) | | | | |
| | | | | | | | | | | | |
Banks | | | | | | | | | | | | |
| Banc of California, Inc. | | | (74,499 | ) | | | (1,095,880 | ) | | | (0.8 | %) |
| Bridge Bancorp, Inc. | | | (59,169 | ) | | | (1,430,706 | ) | | | (1.1 | %) |
| Huntington Bancshares, Inc. | | | (216,671 | ) | | | (2,736,555 | ) | | | (2.0 | %) |
| Live Oak Bancshares, Inc. | | | (22,649 | ) | | | (1,074,922 | ) | | | (0.8 | %) |
| Wells Fargo & Co. | | | (6,937 | ) | | | (209,359 | ) | | | (0.2 | %) |
| | | | | | | | | | | | |
| | | | (6,547,422 | ) | | | | |
| | | | | | | | | | | | |
Biotechnology | | | | | | | | | | | | |
| Alexion Pharmaceuticals, Inc. | | | (5,300 | ) | | | (828,072 | ) | | | (0.6 | %) |
| Allakos, Inc. | | | (3,008 | ) | | | (421,120 | ) | | | (0.3 | %) |
| Biogen, Inc. | | | (1,708 | ) | | | (418,221 | ) | | | (0.3 | %) |
| Insmed, Inc. | | | (19,606 | ) | | | (652,684 | ) | | | (0.5 | %) |
| TG Therapeutics, Inc. | | | (12,503 | ) | | | (650,406 | ) | | | (0.5 | %) |
| | | | | | | | | | | | |
| | | | (2,970,503 | ) | | | | |
| | | | | | | | | | | | |
Building Products | | | | | | | | | | | | |
| Advanced Drainage Systems, Inc. | | | (15,144 | ) | | | (1,265,736 | ) | | | (0.9 | %) |
| Builders FirstSource, Inc. | | | (68,508 | ) | | | (2,795,811 | ) | | | (2.1 | %) |
| | | | | | | | | | | | |
| | | | (4,061,547 | ) | | | | |
| | | | | | | | | | | | |
Capital Markets | | | | | | | | | | | | |
| Ares Management Corp., Class A | | | (21,019 | ) | | | (988,944 | ) | | | (0.7 | %) |
| Blucora, Inc. | | | (17,012 | ) | | | (270,661 | ) | | | (0.2 | %) |
| Carlyle Group, Inc. (The) | | | (28,854 | ) | | | (907,170 | ) | | | (0.7 | %) |
| Virtus Investment Partners, Inc. | | | (5,366 | ) | | | (1,164,422 | ) | | | (0.9 | %) |
| | | | | | | | | | | | |
| | | | (3,331,197 | ) | | | | |
| | | | | | | | | | | | |
Chemicals | | | | | | | | | | | | |
| Chemours Co. (The) | | | (28,150 | ) | | | (697,838 | ) | | | (0.5 | %) |
| DuPont de Nemours, Inc. | | | (3,767 | ) | | | (267,871 | ) | | | (0.2 | %) |
| Mosaic Co. (The) | | | (67,925 | ) | | | (1,562,954 | ) | | | (1.2 | %) |
| Olin Corp. | | | (21,794 | ) | | | (535,261 | ) | | | (0.4 | %) |
| Scotts Miracle-Gro Co. (The) | | | (4,241 | ) | | | (844,553 | ) | | | (0.6 | %) |
| Trinseo S.A. | | | (24,113 | ) | | | (1,234,827 | ) | | | (0.9 | %) |
| | | | | | | | | | | | |
| | | | (5,143,304 | ) | | | | |
| | | | | | | | | | | | |
Commercial Services & Supplies | | | | | | | | | | | | |
| Brink’s Co. (The) | | | (3,723 | ) | | | (268,056 | ) | | | (0.2 | %) |
| Clean Harbors, Inc. | | | (6,367 | ) | | | (484,529 | ) | | | (0.4 | %) |
| KAR Auction Services, Inc. | | | (13,632 | ) | | | (253,691 | ) | | | (0.2 | %) |
| | | | | | | | | | | | |
| | | | (1,006,276 | ) | | | | |
| | | | | | | | | | | | |
Communications Equipment | | | | | | | | | | | | |
| ViaSat, Inc. | | | (6,472 | ) | | | (211,311 | ) | | | (0.2 | %) |
| | | | | | | | | | | | |
Construction & Engineering | | | | | | | | | | | | |
| APi Group Corp. | | | (64,748 | ) | | | (1,175,176 | ) | | | (0.9 | %) |
| Fluor Corp. | | | (55,786 | ) | | | (890,902 | ) | | | (0.7 | %) |
| Granite Construction, Inc. | | | (39,132 | ) | | | (1,045,216 | ) | | | (0.8 | %) |
| | | | | | | | | | | | |
| | | | (3,111,294 | ) | | | | |
| | | | | | | | | | | | |
Consumer Finance | | | | | | | | | | | | |
| Capital One Financial Corp. | | | (19,247 | ) | | | (1,902,566 | ) | | | (1.4 | %) |
| PROG Holdings, Inc. | | | (7,786 | ) | | | (419,432 | ) | | | (0.3 | %) |
| | | | | | | | | | | | |
| | | | (2,321,998 | ) | | | | |
| | | | | | | | | | | | |
Diversified Consumer Services | | | | | | | | | | | | |
| H&R Block, Inc. | | | (12,938 | ) | | | (205,197 | ) | | | (0.2 | %) |
| Terminix Global Holdings, Inc. | | | (5,544 | ) | | | (282,799 | ) | | | (0.2 | %) |
| | | | | | | | | | | | |
| | | | (487,996 | ) | | | | |
| | | | | | | | | | | | |
Diversified Financial Services | | | | | | | | | | | | |
| Cannae Holdings, Inc. | | | (23,799 | ) | | | (1,053,582 | ) | | | (0.8 | %) |
| | | | | | | | | | | | |
Diversified Telecommunication Services | | | | | | | | | | | | |
| Anterix, Inc. | | | (32,260 | ) | | | (1,212,976 | ) | | | (0.9 | %) |
| | | | | | | | | | | | |
Electric Utilities | | | | | | | | | | | | |
| FirstEnergy Corp. | | | (26,910 | ) | | | (823,715 | ) | | | (0.6 | %) |
| Portland General Electric Co. | | | (6,578 | ) | | | (281,341 | ) | | | (0.2 | %) |
| | | | | | | | | | | | |
| | | | (1,105,056 | ) | | | | |
| | | | | | | | | | | | |
Electrical Equipment | | | | | | | | | | | | |
| GrafTech International Ltd. | | | (26,200 | ) | | | (279,292 | ) | | | (0.2 | %) |
| Sunrun, Inc. | | | (17,636 | ) | | | (1,223,586 | ) | | | (0.9 | %) |
| | | | | | | | | | | | |
| | | | (1,502,878 | ) | | | | |
| | | | | | | | | | | | |
Energy Equipment & Services | | | | | | | | | | | | |
| Helmerich & Payne, Inc. | | | (8,943 | ) | | | (207,120 | ) | | | (0.2 | %) |
| Schlumberger Ltd. | | | (29,299 | ) | | | (639,597 | ) | | | (0.5 | %) |
| TechnipFMC PLC | | | (66,486 | ) | | | (624,968 | ) | | | (0.5 | %) |
| | | | | | | | | | | | |
| | | | (1,471,685 | ) | | | | |
| | | | | | | | | | | | |
See accompanying notes to financial statements.
19 |
Consolidated Portfolio of Investments – as of December 31, 2020
AlphaSimplex Global Alternatives Fund – (continued)
| | | | | | | | | | | | |
| Common Stocks — Short | | Shares | | | Value | | | % of Basket Value | |
Entertainment | | | | | | | | | | | | |
| Liberty Media Corp. – Liberty Formula One, Class A | | | (29,755 | ) | | $ | (1,130,393 | ) | | | (0.8 | %) |
| Live Nation Entertainment, Inc. | | | (9,907 | ) | | | (727,966 | ) | | | (0.5 | %) |
| | | | | | | | | | | | |
| | | | (1,858,359 | ) | | | | |
| | | | | | | | | | | | |
Equity Real Estate Investment Trusts | | | | | | | | | | | | |
| Colony Capital, Inc. | | | (235,542 | ) | | | (1,132,957 | ) | | | (0.8 | %) |
| Cousins Properties, Inc. | | | (31,869 | ) | | | (1,067,612 | ) | | | (0.8 | %) |
| iStar, Inc. | | | (76,985 | ) | | | (1,143,227 | ) | | | (0.8 | %) |
| NexPoint Residential Trust, Inc. | | | (21,274 | ) | | | (900,103 | ) | | | (0.7 | %) |
| Pebblebrook Hotel Trust | | | (12,936 | ) | | | (243,197 | ) | | | (0.2 | %) |
| SITE Centers Corp. | | | (24,371 | ) | | | (246,635 | ) | | | (0.2 | %) |
| SL Green Realty Corp. | | | (3,857 | ) | | | (229,800 | ) | | | (0.2 | %) |
| Vornado Realty Trust | | | (6,607 | ) | | | (246,705 | ) | | | (0.2 | %) |
| Welltower, Inc. | | | (4,297 | ) | | | (277,672 | ) | | | (0.2 | %) |
| | | | | | | | | | | | |
| | | | (5,487,908 | ) | | | | |
| | | | | | | | | | | | |
Food & Staples Retailing | | | | | | | | | | | | |
| Andersons, Inc. (The) | | | (45,407 | ) | | | (1,112,926 | ) | | | (0.8 | %) |
| | | | | | | | | | | | |
Food Products | | | | | | | | | | | | |
| Beyond Meat, Inc. | | | (3,067 | ) | | | (383,375 | ) | | | (0.3 | %) |
| Bunge Ltd. | | | (16,333 | ) | | | (1,071,118 | ) | | | (0.8 | %) |
| Pilgrim’s Pride Corp. | | | (48,343 | ) | | | (948,006 | ) | | | (0.7 | %) |
| | | | | | | | | | | | |
| | | | (2,402,499 | ) | | | | |
| | | | | | | | | | | | |
Health Care Equipment & Supplies | | | | | | | | | | | | |
| ABIOMED, Inc. | | | (750 | ) | | | (243,150 | ) | | | (0.2 | %) |
| Align Technology, Inc. | | | (1,324 | ) | | | (707,519 | ) | | | (0.5 | %) |
| Tandem Diabetes Care, Inc. | | | (3,296 | ) | | | (315,361 | ) | | | (0.2 | %) |
| | | | | | | | | | | | |
| | | | (1,266,030 | ) | | | | |
| | | | | | | | | | | | |
Health Care Providers & Services | | | | | | | | | | | | |
| Tenet Healthcare Corp. | | | (10,464 | ) | | | (417,828 | ) | | | (0.3 | %) |
| Universal Health Services, Inc., Class B | | | (6,224 | ) | | | (855,800 | ) | | | (0.6 | %) |
| | | | | | | | | | | | |
| | | | (1,273,628 | ) | | | | |
| | | | | | | | | | | | |
Hotels, Restaurants & Leisure | | | | | | | | | | | | |
| Darden Restaurants, Inc. | | | (3,640 | ) | | | (433,597 | ) | | | (0.3 | %) |
| Golden Entertainment, Inc. | | | (34,272 | ) | | | (681,670 | ) | | | (0.5 | %) |
| Hyatt Hotels Corp., Class A | | | (13,386 | ) | | | (993,910 | ) | | | (0.7 | %) |
| Marriott Vacations Worldwide Corp. | | | (3,209 | ) | | | (440,339 | ) | | | (0.3 | %) |
| MGM Resorts International | | | (38,902 | ) | | | (1,225,802 | ) | | | (0.9 | %) |
| Royal Caribbean Cruises Ltd. | | | (8,317 | ) | | | (621,197 | ) | | | (0.5 | %) |
| Scientific Games Corp. | | | (15,783 | ) | | | (654,837 | ) | | | (0.5 | %) |
| SeaWorld Entertainment, Inc. | | | (8,872 | ) | | | (280,266 | ) | | | (0.2 | %) |
| Shake Shack, Inc., Class A | | | (3,410 | ) | | | (289,100 | ) | | | (0.2 | %) |
| Wendy’s Co. (The) | | | (7,199 | ) | | | (157,802 | ) | | | (0.1 | %) |
| Wynn Resorts Ltd. | | | (5,935 | ) | | | (669,646 | ) | | | (0.5 | %) |
| | | | | | | | | | | | |
| | | | (6,448,166 | ) | | | | |
| | | | | | | | | | | | |
Household Durables | | | | | | | | | | | | |
| Toll Brothers, Inc. | | | (10,364 | ) | | | (450,523 | ) | | | (0.3 | %) |
| | | | | | | | | | | | |
Independent Power & Renewable Electricity Producers | | | | | | | | | | | | |
| AES Corp. (The) | | | (38,064 | ) | | | (894,504 | ) | | | (0.7 | %) |
| Sunnova Energy International, Inc. | | | (24,408 | ) | | | (1,101,533 | ) | | | (0.8 | %) |
| | | | | | | | | | | | |
| | | | (1,996,037 | ) | | | | |
| | | | | | | | | | | | |
Industrial Conglomerates | | | | | | | | | | | | |
| General Electric Co. | | | (104,734 | ) | | | (1,131,127 | ) | | | (0.8 | %) |
| | | | | | | | | | | | |
Insurance | | | | | | | | | | | | |
| American International Group, Inc. | | | (7,476 | ) | | | (283,041 | ) | | | (0.2 | %) |
| Assured Guaranty Ltd. | | | (9,197 | ) | | | (289,614 | ) | | | (0.2 | %) |
| BRP Group, Inc., Class A | | | (37,218 | ) | | | (1,115,424 | ) | | | (0.8 | %) |
| Cincinnati Financial Corp. | | | (3,272 | ) | | | (285,875 | ) | | | (0.2 | %) |
| First American Financial Corp. | | | (16,607 | ) | | | (857,419 | ) | | | (0.6 | %) |
| Lincoln National Corp. | | | (4,094 | ) | | | (205,969 | ) | | | (0.2 | %) |
| Reinsurance Group of America, Inc. | | | (1,698 | ) | | | (196,798 | ) | | | (0.1 | %) |
| Third Point Reinsurance Ltd. | | | (106,552 | ) | | | (1,014,375 | ) | | | (0.7 | %) |
| | | | | | | | | | | | |
| | | | (4,248,515 | ) | | | | |
| | | | | | | | | | | | |
Interactive Media & Entertainment | | | | | | | | | | | | |
| Snap, Inc., Class A | | | (3,309 | ) | | | (165,682 | ) | | | (0.1 | %) |
| TripAdvisor, Inc. | | | (7,529 | ) | | | (216,684 | ) | | | (0.2 | %) |
| Twitter, Inc. | | | (15,572 | ) | | | (843,224 | ) | | | (0.6 | %) |
| | | | | | | | | | | | |
| | | | (1,225,590 | ) | | | | |
| | | | | | | | | | | | |
Internet & Direct Marketing Retail | | | | | | | | | | | | |
| Etsy, Inc. | | | (1,088 | ) | | | (193,566 | ) | | | (0.1 | %) |
| Expedia Group, Inc. | | | (5,443 | ) | | | (720,653 | ) | | | (0.5 | %) |
| Farfetch Ltd., Class A | | | (18,794 | ) | | | (1,199,245 | ) | | | (0.9 | %) |
| Overstock.com, Inc. | | | (13,420 | ) | | | (643,757 | ) | | | (0.5 | %) |
| Realreal, Inc. (The) | | | (62,863 | ) | | | (1,228,343 | ) | | | (0.9 | %) |
| Wayfair, Inc. | | | (2,807 | ) | | | (633,849 | ) | | | (0.5 | %) |
| | | | | | | | | | | | |
| | | | (4,619,413 | ) | | | | |
| | | | | | | | | | | | |
IT Services | | | | | | | | | | | | |
| DXC Technology Co. | | | (18,391 | ) | | | (473,568 | ) | | | (0.3 | %) |
| Euronet Worldwide, Inc. | | | (1,685 | ) | | | (244,190 | ) | | | (0.2 | %) |
| LiveRamp Holdings, Inc. | | | (3,686 | ) | | | (269,778 | ) | | | (0.2 | %) |
| MongoDB, Inc. | | | (1,142 | ) | | | (410,024 | ) | | | (0.3 | %) |
| | | | | | | | | | | | |
| | | | (1,397,560 | ) | | | | |
| | | | | | | | | | | | |
Leisure Products | | | | | | | | | | | | |
| Mattel, Inc. | | | (46,405 | ) | | | (809,767 | ) | | | (0.6 | %) |
| Peloton Interactive, Inc., Class A | | | (8,850 | ) | | | (1,342,722 | ) | | | (1.0 | %) |
| | | | | | | | | | | | |
| | | | (2,152,489 | ) | | | | |
| | | | | | | | | | | | |
Machinery | | | | | | | | | | | | |
| Kornit Digital Ltd. | | | (12,505 | ) | | | (1,114,571 | ) | | | (0.8 | %) |
| Middleby Corp. (The) | | | (1,757 | ) | | | (226,512 | ) | | | (0.2 | %) |
| | | | | | | | | | | | |
| | | | (1,341,083 | ) | | | | |
| | | | | | | | | | | | |
Marine | | | | | | | | | | | | |
| Kirby Corp. | | | (4,275 | ) | | | (221,573 | ) | | | (0.2 | %) |
| | | | | | | | | | | | |
Media | | | | | | | | | | | | |
| Boston Omaha Corp., Class A | | | (44,756 | ) | | | (1,237,503 | ) | | | (0.9 | %) |
| Liberty Broadband Corp., Class A | | | (1,727 | ) | | | (272,141 | ) | | | (0.2 | %) |
| ViacomCBS, Inc., Class B | | | (27,793 | ) | | | (1,035,567 | ) | | | (0.8 | %) |
| | | | | | | | | | | | |
| | | | (2,545,211 | ) | | | | |
| | | | | | | | | | | | |
Metals & Mining | | | | | | | | | | | | |
| Agnico Eagle Mines Ltd. | | | (5,938 | ) | | | (418,688 | ) | | | (0.3 | %) |
| Alcoa Corp. | | | (9,531 | ) | | | (219,690 | ) | | | (0.2 | %) |
| Allegheny Technologies, Inc. | | | (15,277 | ) | | | (256,195 | ) | | | (0.2 | %) |
| Barrick Gold Corp. | | | (26,217 | ) | | | (597,223 | ) | | | (0.4 | %) |
| Century Aluminum Co. | | | (84,595 | ) | | | (933,083 | ) | | | (0.7 | %) |
| Coeur Mining, Inc. | | | (89,648 | ) | | | (927,857 | ) | | | (0.7 | %) |
| Hecla Mining Co. | | | (66,531 | ) | | | (431,121 | ) | | | (0.3 | %) |
| Kinross Gold Corp. | | | (21,559 | ) | | | (158,243 | ) | | | (0.1 | %) |
| Newmont Corp. | | | (11,706 | ) | | | (701,072 | ) | | | (0.5 | %) |
| Pan American Silver Corp. | | | (13,725 | ) | | | (473,650 | ) | | | (0.3 | %) |
| | | | | | | | | | | | |
| | | | (5,116,822 | ) | | | | |
| | | | | | | | | | | | |
Mortgage Real Estate Investment Trusts (REITs) | | | | | | | | | | | | |
| Capstead Mortgage Corp. | | | (172,505 | ) | | | (1,002,254 | ) | | | (0.7 | %) |
| | | | | | | | | | | | |
See accompanying notes to financial statements.
| 20
Consolidated Portfolio of Investments – as of December 31, 2020
AlphaSimplex Global Alternatives Fund – (continued)
| | | | | | | | | | | | |
| Common Stocks — Short | | Shares | | | Value | | | % of Basket Value | |
Multi-Utilities | | | | | | | | | | | | |
| CenterPoint Energy, Inc. | | | (9,857 | ) | | $ | (213,305 | ) | | | (0.2 | %) |
| | | | | | | | | | | | |
Multiline Retail | | | | | | | | | | | | |
| Dollar Tree, Inc. | | | (7,516 | ) | | | (812,028 | ) | | | (0.6 | %) |
| Kohl’s Corp. | | | (14,117 | ) | | | (574,421 | ) | | | (0.4 | %) |
| | | | | | | | | | | | |
| | | | (1,386,449 | ) | | | | |
| | | | | | | | | | | | |
Oil, Gas & Consumable Fuels | | | | | | | | | | | | |
| Cabot Oil & Gas Corp. | | | (12,085 | ) | | | (196,744 | ) | | | (0.1 | %) |
| Chevron Corp. | | | (11,051 | ) | | | (933,257 | ) | | | (0.7 | %) |
| CNX Resources Corp. | | | (83,839 | ) | | | (905,461 | ) | | | (0.7 | %) |
| ConocoPhillips | | | (65,957 | ) | | | (2,637,620 | ) | | | (1.9 | %) |
| Devon Energy Corp. | | | (34,587 | ) | | | (546,821 | ) | | | (0.4 | %) |
| Diamondback Energy, Inc. | | | (34,103 | ) | | | (1,650,585 | ) | | | (1.2 | %) |
| Energy Transfer LP | | | (129,491 | ) | | | (800,254 | ) | | | (0.6 | %) |
| EOG Resources, Inc. | | | (12,698 | ) | | | (633,249 | ) | | | (0.5 | %) |
| EQT Corp. | | | (93,720 | ) | | | (1,191,181 | ) | | | (0.9 | %) |
| Equitrans Midstream Corp. | | | (40,208 | ) | | | (323,272 | ) | | | (0.2 | %) |
| Exxon Mobil Corp | | | (4,706 | ) | | | (193,981 | ) | | | (0.1 | %) |
| HollyFrontier Corp. | | | (21,528 | ) | | | (556,499 | ) | | | (0.4 | %) |
| Marathon Oil Corp. | | | (62,329 | ) | | | (415,734 | ) | | | (0.3 | %) |
| Marathon Petroleum Corp. | | | (2,312 | ) | | | (95,624 | ) | | | (0.1 | %) |
| MPLX LP | | | (18,479 | ) | | | (400,070 | ) | | | (0.3 | %) |
| New Fortress Energy, Inc. | | | (19,479 | ) | | | (1,043,880 | ) | | | (0.8 | %) |
| Occidental Petroleum Corp. | | | (17,253 | ) | | | (298,650 | ) | | | (0.2 | %) |
| PDC Energy, Inc. | | | (60,278 | ) | | | (1,237,507 | ) | | | (0.9 | %) |
| Phillips 66 | | | (3,440 | ) | | | (240,594 | ) | | | (0.2 | %) |
| Pioneer Natural Resources Co. | | | (21,171 | ) | | | (2,411,165 | ) | | | (1.8 | %) |
| Plains All American Pipeline LP | | | (51,203 | ) | | | (421,913 | ) | | | (0.3 | %) |
| REX American Resources Corp. | | | (10,323 | ) | | | (758,431 | ) | | | (0.6 | %) |
| Targa Resources Corp. | | | (15,283 | ) | | | (403,166 | ) | | | (0.3 | %) |
| Valero Energy Corp. | | | (15,629 | ) | | | (884,133 | ) | | | (0.7 | %) |
| WPX Energy, Inc. | | | (50,799 | ) | | | (414,012 | ) | | | (0.3 | %) |
| | | | | | | | | | | | |
| | | | (19,593,803 | ) | | | | |
| | | | | | | | | | | | |
Personal Products | | | | | | | | | | | | |
| Coty, Inc. | | | (32,569 | ) | | | (228,634 | ) | | | (0.2 | %) |
| Herbalife Nutrition Ltd. | | | (3,314 | ) | | | (159,238 | ) | | | (0.1 | %) |
| | | | | | | | | | | | |
| | | | (387,872 | ) | | | | |
| | | | | | | | | | | | |
Professional Services | | | | | | | | | | | | |
| Clarivate PLC | | | (33,734 | ) | | | (1,002,237 | ) | | | (0.7 | %) |
| | | | | | | | | | | | |
Road & Rail | | | | | | | | | | | | |
| ArcBest Corp. | | | (22,988 | ) | | | (980,898 | ) | | | (0.7 | %) |
| Lyft, Inc., Class A | | | (17,139 | ) | | | (842,039 | ) | | | (0.6 | %) |
| | | | | | | | | | | | |
| | | | (1,822,937 | ) | | | | |
| | | | | | | | | | | | |
Semiconductors & Semiconductor Equipment | | | | | | | | | | | | |
| Advanced Micro Devices, Inc. | | | (27,429 | ) | | | (2,515,514 | ) | | | (1.9 | %) |
| Analog Devices, Inc. | | | (16,716 | ) | | | (2,469,455 | ) | | | (1.8 | %) |
| Applied Materials, Inc. | | | (8,625 | ) | | | (744,338 | ) | | | (0.5 | %) |
| Enphase Energy, Inc. | | | (2,596 | ) | | | (455,520 | ) | | | (0.3 | %) |
| Lam Research Corp. | | | (609 | ) | | | (287,613 | ) | | | (0.2 | %) |
| Marvell Technology Group Ltd. | | | (38,441 | ) | | | (1,827,485 | ) | | | (1.3 | %) |
| Microchip Technology, Inc. | | | (831 | ) | | | (114,769 | ) | | | (0.1 | %) |
| MKS Instruments, Inc. | | | (2,492 | ) | | | (374,921 | ) | | | (0.3 | %) |
| NVIDIA Corp. | | | (777 | ) | | | (405,749 | ) | | | (0.3 | %) |
| Ultra Clean Holdings, Inc. | | | (9,029 | ) | | | (281,253 | ) | | | (0.2 | %) |
| Veeco Instruments, Inc. | | | (27,885 | ) | | | (484,084 | ) | | | (0.4 | %) |
| | | | | | | | | | | | |
| | | | (9,960,701 | ) | | | | |
| | | | | | | | | | | | |
Software | | | | | | | | | | | | |
| Blackbaud, Inc. | | | (12,609 | ) | | | (725,774 | ) | | | (0.5 | %) |
| Cloudflare, Inc., Class A | | | (5,184 | ) | | | (393,932 | ) | | | (0.3 | %) |
| Nutanix, Inc., Class A | | | (9,015 | ) | | | (287,308 | ) | | | (0.2 | %) |
Software — continued | | | | | | | | | | | | |
| PROS Holdings, Inc. | | | (5,826 | ) | | | (295,786 | ) | | | (0.2 | %) |
| salesforce.com, Inc. | | | (3,269 | ) | | | (727,451 | ) | | | (0.5 | %) |
| Teradata Corp. | | | (11,043 | ) | | | (248,136 | ) | | | (0.2 | %) |
| | | | | | | | | | | | |
| | | | (2,678,387 | ) | | | | |
| | | | | | | | | | | | |
Specialty Retail | | | | | | | | | | | | |
| At Home Group, Inc. | | | (13,382 | ) | | | (206,886 | ) | | | (0.2 | %) |
| Carvana Co. | | | (4,386 | ) | | | (1,050,623 | ) | | | (0.8 | %) |
| Foot Locker, Inc. | | | (5,861 | ) | | | (237,019 | ) | | | (0.2 | %) |
| Gap, Inc. (The) | | | (33,439 | ) | | | (675,133 | ) | | | (0.5 | %) |
| L Brands, Inc. | | | (10,958 | ) | | | (407,528 | ) | | | (0.3 | %) |
| RH | | | (964 | ) | | | (431,409 | ) | | | (0.3 | %) |
| | | | | | | | | | | | |
| | | | (3,008,598 | ) | | | | |
| | | | | | | | | | | | |
Technology Hardware, Storage & Peripherals | | | | | | | | | | | | |
| Western Digital Corp. | | | (5,337 | ) | | | (295,617 | ) | | | (0.2 | %) |
| Xerox Holdings Corp. | | | (10,902 | ) | | | (252,817 | ) | | | (0.2 | %) |
| | | | | | | | | | | | |
| | | | (548,434 | ) | | | | |
| | | | | | | | | | | | |
Textiles, Apparel & Luxury Goods | | | | | | | | | | | | |
| PVH Corp. | | | (7,180 | ) | | | (674,130 | ) | | | (0.5 | %) |
| Ralph Lauren Corp. | | | (6,873 | ) | | | (713,005 | ) | | | (0.5 | %) |
| Steven Madden Ltd. | | | (7,200 | ) | | | (254,304 | ) | | | (0.2 | %) |
| Tapestry, Inc. | | | (22,826 | ) | | | (709,432 | ) | | | (0.5 | %) |
| | | | | | | | | | | | |
| | | | (2,350,871 | ) | | | | |
| | | | | | | | | | | | |
Thrifts & Mortgage Finance | | | | | | | | | | | | |
| Mr. Cooper Group, Inc. | | | (37,107 | ) | | | (1,151,430 | ) | | | (0.8 | %) |
| NMI Holdings, Inc., Class A | | | (10,993 | ) | | | (248,992 | ) | | | (0.1 | %) |
| | | | | | | | | | | | |
| | | | (1,400,422 | ) | | | | |
| | | | | | | | | | | | |
Trading Companies & Distributors | | | | | | | | | | | | |
| Beacon Roofing Supply, Inc. | | | (26,946 | ) | | | (1,082,960 | ) | | | (0.7 | %) |
| | | | | | | | | | | | |
Wireless Telecommunication Services | | | | | | | | | | | | |
| Millicom International Cellular S.A. | | | (6,946 | ) | | | (269,366 | ) | | | (0.1 | %) |
| | | | | | | | | | | | |
| Total Common Stocks – Short | | | $ | (135,849,616 | ) | | | | |
| | | | | | | | | | | | |
Investment Summary at December 31, 2020
| | | | |
Common Stocks | | | 52.0 | % |
Certificates of Deposit | | | 26.3 | |
Time Deposits | | | 5.3 | |
Treasuries | | | 3.8 | |
Exchange-Traded Funds | | | 0.7 | |
| | | | |
Total Investments | | | 88.1 | |
Other assets less liabilities (including swap agreements, forward foreign currency and futures contracts) | | | 11.9 | |
| | | | |
Net Assets | | | 100.0 | % |
| | | | |
See accompanying notes to financial statements.
21 |
Consolidated Portfolio of Investments – as of December 31, 2020
AlphaSimplex Managed Futures Strategy Fund
| | | | | | | | |
Principal
Amount | | | Description | | Value (†) | |
| | Short-Term Investments — 93.0% of Net Assets | |
| | | | Certificates of Deposit — 56.6% | |
| $ | 60,000,000 | | | National Bank of Kuwait (NY), 0.210%, 1/04/2021 | | $ | 60,000,667 | |
| | 50,000,000 | | | Svenska Handelsbanken (NY), 1-month LIBOR + 0.250%, 0.402%, 1/04/2021(a) | | | 50,001,462 | |
| | 60,000,000 | | | KBC Bank NV (NY), 0.110%, 1/07/2021 | | | 60,000,000 | |
| | 26,000,000 | | | Royal Bank of Canada (NY), 0.140%, 1/13/2021 | | | 26,000,310 | |
| | 50,000,000 | | | Sumitomo Mitsui Trust Bank (NY), 0.210%, 1/15/2021 | | | 50,002,019 | |
| | 30,000,000 | | | Sumitomo Mitsui Banking Corp. (NY), 0.110%, 1/19/2021 | | | 29,999,921 | |
| | 20,000,000 | | | Landesbank Hessen-Thueringen Girozentrale (NY), 0.170%, 1/27/2021 | | | 20,000,509 | |
| | 60,000,000 | | | Mizuho Bank Ltd. (NY), 0.150%, 2/02/2021 | | | 60,000,384 | |
| | 60,000,000 | | | Landesbank Baden-Wuerttemberg (NY), 0.250%, 2/08/2021(b) | | | 60,002,461 | |
| | 58,000,000 | | | Mitsubishi UFJ Trust & Banking Corp. (NY), 0.230%, 2/10/2021 | | | 58,005,673 | |
| | 31,000,000 | | | Oversea-Chinese Banking Corp. Ltd. (NY), 0.190%, 2/16/2021 | | | 30,998,499 | |
| | 30,000,000 | | | Sumitomo Mitsui Banking Corp. (NY), 0.200%, 2/16/2021(b) | | | 30,001,799 | |
| | 25,000,000 | | | Landesbank Hessen-Thueringen Girozentrale (NY), 0.210%, 2/18/2021 | | | 25,001,734 | |
| | 25,000,000 | | | Toronto-Dominion Bank (NY), 0.200%, 2/19/2021 | | | 24,999,651 | |
| | 50,000,000 | | | DZ Bank (NY), 0.190%, 3/03/2021 | | | 50,000,601 | |
| | 60,000,000 | | | Westpac Banking Corp. (NY), 0.190%, 3/10/2021 | | | 60,000,917 | |
| | 37,000,000 | | | Toronto-Dominion Bank (NY), 0.250%, 3/23/2021 | | | 37,001,936 | |
| | 30,000,000 | | | Royal Bank of Canada (NY), 3-month LIBOR + 0.110%, 0.331%, 6/11/2021(a)(b) | | | 30,014,195 | |
| | 50,000,000 | | | Bank of Montreal (IL), 0.240%, 6/23/2021 | | | 49,995,652 | |
| | 30,000,000 | | | Cooperatieve Rabobank UA, 0.230%, 7/20/2021(b) | | | 30,000,150 | |
| | | | | | | | |
| | | | | | | 842,028,540 | |
| | | | | | | | |
| | | | Treasuries — 22.9% | |
| | 25,000,000 | | | U.S. Treasury Bills, 0.060%, 1/05/2021(c) | | | 24,999,997 | |
| | 25,700,000 | | | U.S. Treasury Bills, 0.090%, 1/07/2021(c)(d)(f) | | | 25,699,936 | |
| | 25,000,000 | | | U.S. Treasury Bills, 0.065%, 1/26/2021(c) | | | 24,999,274 | |
| | 47,700,000 | | | U.S. Treasury Bills, 0.070%-0.100%, 2/04/2021(c)(d)(e)(f) | | | 47,697,741 | |
| | 11,700,000 | | | U.S. Treasury Bills, 0.075%, 2/18/2021(c) | | | 11,699,049 | |
| | 25,000,000 | | | U.S. Treasury Bills, 0.070%, 2/23/2021(c) | | | 24,997,830 | |
| | 19,400,000 | | | U.S. Treasury Bills, 0.090%, 3/04/2021(c)(d) | | | 19,397,774 | |
| | 3,000,000 | | | U.S. Treasury Bills, 0.060%, 3/11/2021(c) | | | 2,999,588 | |
| | 50,000,000 | | | U.S. Treasury Bills, 0.085%, 4/01/2021(c) | | | 49,990,334 | |
| | 25,000,000 | | | U.S. Treasury Cash Management Bills, 0.075%, 4/20/2021(c) | | | 24,994,111 | |
| | 20,000,000 | | | U.S. Treasury Cash Management Bills, 0.080%, 5/04/2021(c) | | | 19,994,333 | |
| | 34,000,000 | | | U.S. Treasury Cash Management Bills, 0.080%, 5/18/2021(c) | | | 33,989,875 | |
| | 29,000,000 | | | U.S. Treasury Bills, 0.070%, 6/17/2021(c) | | | 28,989,101 | |
| | | | | | | | |
| | | | | | | 340,448,943 | |
| | | | | | | | |
| | | | Time Deposits — 8.8% | |
| | 61,000,000 | | | Skandinaviska Enskilda Banken (NY), 0.040%, 1/04/2021 | | | 61,000,000 | |
| | 70,000,000 | | | Canadian Imperial Bank of Commerce, 0.080%, 1/04/2021 | | | 70,000,000 | |
| | | | | | | | |
| | | | | | | 131,000,000 | |
| | | | | | | | |
| | | | Commercial Paper — 4.6% | |
| | 8,250,000 | | | Cofco Capital Corp., (Credit Support: Australian & New Zealand Banking Group Ltd.), 0.200%, 1/05/2021(c) | | | 8,249,843 | |
| | | | Commercial Paper — continued | |
| $ | 60,000,000 | | | Santander UK PLC, 0.180%, 2/09/2021(c) | | $ | 59,988,200 | |
| | | | | | | | |
| | | | | | | 68,238,043 | |
| | | | | | | | |
| | | | Repurchase Agreements — 0.1% | |
| | 826,932 | | | Tri-Party Repurchase Agreement with Fixed Income Clearing Corporation, dated 12/31/2020 at 0.000% to be repurchased at $826,932 on 1/04/2021 collateralized by $844,500 U.S. Treasury Bill, Zero Coupon due 12/30/2021 valued at $843,518 including accrued interest (Note 2 of Notes to Financial Statements) | | | 826,932 | |
| | | | | | | | |
| | | | Total Short-Term Investments
(Identified Cost $1,382,514,102) | | | 1,382,542,458 | |
| | | | | | | | |
| | | | | | | | |
| | | | Total Investments — 93.0%
(Identified Cost $1,382,514,102) | | | 1,382,542,458 | |
| | | | Other assets less liabilities — 7.0% | | | 103,544,217 | |
| | | | | | | | |
| | | | Net Assets — 100.0% | | $ | 1,486,086,675 | |
| | | | | | | | |
| | | | | | | | |
| | (†) | | | See Note 2 of Notes to Financial Statements. | |
| | (a) | | | Variable rate security. Rate as of December 31, 2020 is disclosed. | |
| | (b) | | | Security (or a portion thereof) has been designated to cover the Fund’s obligations under open derivative contracts. | |
| | (c) | | | Interest rate represents discount rate at time of purchase; not a coupon rate. | |
| | (d) | | | Security (or a portion thereof) has been pledged as collateral for open derivative contracts. | |
| | (e) | | | The Fund’s investment in U.S. Government/Agency securities is comprised of various lots with differing discount rates. These separate investments, which have the same maturity date, have been aggregated for the purpose of presentation in the Portfolio of Investments. | |
| | (f) | | | A portion of the security is held by AlphaSimplex Managed Futures Strategy Cayman Fund Ltd., a wholly-owned subsidiary. See Note 1 of Notes to Financial Statements. | |
| | | | | |
| | LIBOR | | | London Interbank Offered Rate | |
| | | | | |
| | CHF | | | Swiss Franc | |
| | CNH | | | Chinese Yuan Renminbi Offshore | |
| | MXN | | | Mexican Peso | |
| | NOK | | | Norwegian Krone | |
| | NZD | | | New Zealand Dollar | |
| | PLN | | | Polish Zloty | |
| | SEK | | | Swedish Krona | |
| | SGD | | | Singapore Dollar | |
| | TRY | | | Turkish Lira | |
| | ZAR | | | South African Rand | |
See accompanying notes to financial statements.
| 22
Consolidated Portfolio of Investments – as of December 31, 2020
AlphaSimplex Managed Futures Strategy Fund – (continued)
At December 31, 2020, the Fund had the following open forward foreign currency contracts:
| | | | | | | | | | | | | | | | | | | | | | | | | | |
| Counterparty | | Delivery
Date | | | Currency
Bought/
Sold (B/S) | | Units
of
Currency | | | In Exchange
for | | | Notional
Value | | | Unrealized
Appreciation
(Depreciation) | |
| UBS AG | | | 3/17/2021 | | | CHF | | | B | | | | 70,250,000 | | | $ | 79,275,688 | | | $ | 79,519,375 | | | $ | 243,687 | |
| UBS AG | | | 3/17/2021 | | | CHF | | | B | | | | 6,125,000 | | | | 6,937,829 | | | | 6,933,184 | | | | (4,645 | ) |
| UBS AG | | | 3/17/2021 | | | CHF | | | S | | | | 4,375,000 | | | | 4,940,466 | | | | 4,952,274 | | | | (11,808 | ) |
| UBS AG | | | 3/17/2021 | | | CNH | | | B | | | | 732,000,000 | | | | 111,567,117 | | | | 112,035,308 | | | | 468,191 | |
| UBS AG | | | 3/17/2021 | | | CNH | | | S | | | | 62,000,000 | | | | 9,462,514 | | | | 9,489,329 | | | | (26,815 | ) |
| UBS AG | | | 3/17/2021 | | | MXN | | | B | | | | 664,000,000 | | | | 33,067,097 | | | | 33,097,324 | | | | 30,227 | |
| UBS AG | | | 3/17/2021 | | | MXN | | | S | | | | 35,000,000 | | | | 1,737,908 | | | | 1,744,588 | | | | (6,680 | ) |
| UBS AG | | | 3/17/2021 | | | NOK | | | B | | | | 286,000,000 | | | | 32,688,794 | | | | 33,347,422 | | | | 658,628 | |
| UBS AG | | | 3/17/2021 | | | NZD | | | B | | | | 211,100,000 | | | | 148,760,270 | | | | 151,933,408 | | | | 3,173,138 | |
| UBS AG | | | 3/17/2021 | | | NZD | | | S | | | | 46,400,000 | | | | 32,779,508 | | | | 33,395,121 | | | | (615,613 | ) |
| UBS AG | | | 3/17/2021 | | | PLN | | | B | | | | 143,500,000 | | | | 39,142,684 | | | | 38,425,646 | | | | (717,038 | ) |
| UBS AG | | | 3/17/2021 | | | SEK | | | B | | | | 536,000,000 | | | | 63,599,034 | | | | 65,197,285 | | | | 1,598,251 | |
| UBS AG | | | 3/17/2021 | | | SEK | | | B | | | | 70,000,000 | | | | 8,556,823 | | | | 8,514,570 | | | | (42,253 | ) |
| UBS AG | | | 3/17/2021 | | | SGD | | | B | | | | 263,625,000 | | | | 197,040,782 | | | | 199,488,438 | | | | 2,447,656 | |
| UBS AG | | | 3/17/2021 | | | SGD | | | S | | | | 8,000,000 | | | | 6,008,008 | | | | 6,053,703 | | | | (45,695 | ) |
| UBS AG | | | 3/17/2021 | | | TRY | | | B | | | | 41,100,000 | | | | 5,132,566 | | | | 5,375,849 | | | | 243,283 | |
| UBS AG | | | 3/17/2021 | | | TRY | | | B | | | | 59,100,000 | | | | 7,832,957 | | | | 7,730,236 | | | | (102,721 | ) |
| UBS AG | | | 3/17/2021 | | | TRY | | | S | | | | 148,500,000 | | | | 18,207,917 | | | | 19,423,689 | | | | (1,215,772 | ) |
| UBS AG | | | 3/17/2021 | | | ZAR | | | B | | | | 423,000,000 | | | | 27,784,981 | | | | 28,523,946 | | | | 738,965 | |
| | | | | | | | | | | | | | | | | | | | | | | | | | |
| Total | | | $ | 6,812,986 | |
| | | | | | | | | | | | | | | | | | | | | | | | | | |
At December 31, 2020, open long futures contracts were as follows:
| | | | | | | | | | | | | | | | | | | | |
| Financial and Currency Futures | | Expiration
Date | | | Contracts | | | Notional
Amount | | | Value | | | Unrealized
Appreciation
(Depreciation) | |
2 Year U.S. Treasury Note | | | 3/31/2021 | | | | 2,827 | | | $ | 623,955,567 | | | $ | 624,700,741 | | | $ | 745,174 | |
3 Year Australia Government Bond | | | 3/15/2021 | | | | 2,484 | | | | 224,782,876 | | | | 224,898,651 | | | | 115,775 | |
5 Year U.S. Treasury Note | | | 3/31/2021 | | | | 1,701 | | | | 214,007,062 | | | | 214,605,071 | | | | 598,009 | |
10 Year Australia Government Bond | | | 3/15/2021 | | | | 343 | | | | 38,819,724 | | | | 38,932,910 | | | | 113,186 | |
10 Year Canada Government Bond | | | 3/22/2021 | | | | 409 | | | | 47,721,486 | | | | 47,907,848 | | | | 186,362 | �� |
10 Year U.S. Treasury Note | | | 3/22/2021 | | | | 612 | | | | 84,336,468 | | | | 84,503,812 | | | | 167,344 | |
30 Year U.S. Treasury Bond | | | 3/22/2021 | | | | 128 | | | | 22,253,000 | | | | 22,168,000 | | | | (85,000 | ) |
AEX-Index® | | | 1/15/2021 | | | | 77 | | | | 11,591,883 | | | | 11,749,539 | | | | 157,656 | |
ASX SPI 200™ | | | 3/18/2021 | | | | 215 | | | | 27,179,553 | | | | 27,088,388 | | | | (91,165 | ) |
Australian Dollar | | | 3/15/2021 | | | | 1,657 | | | | 124,363,070 | | | | 127,589,000 | | | | 3,225,930 | |
Brazilian Real | | | 1/29/2021 | | | | 10 | | | | 195,500 | | | | 192,250 | | | | (3,250 | ) |
British Pound | | | 3/15/2021 | | | | 743 | | | | 62,321,472 | | | | 63,428,981 | | | | 1,107,509 | |
CAC 40® | | | 1/15/2021 | | | | 102 | | | | 6,901,431 | | | | 6,905,792 | | | | 4,361 | |
Canadian Dollar | | | 3/16/2021 | | | | 1,570 | | | | 122,793,522 | | | | 122,993,800 | | | | 200,278 | |
DAX | | | 3/19/2021 | | | | 32 | | | | 13,086,911 | | | | 13,434,241 | | | | 347,330 | |
E-mini Dow | | | 3/19/2021 | | | | 198 | | | | 29,608,360 | | | | 30,192,030 | | | | 583,670 | |
E-mini NASDAQ 100 | | | 3/19/2021 | | | | 151 | | | | 37,344,321 | | | | 38,914,210 | | | | 1,569,889 | |
E-mini Russell 2000 | | | 3/19/2021 | | | | 375 | | | | 35,787,492 | | | | 37,027,500 | | | | 1,240,008 | |
E-mini S&P 500® | | | 3/19/2021 | | | | 238 | | | | 43,956,817 | | | | 44,610,720 | | | | 653,903 | |
E-mini S&P MidCap 400® | | | 3/19/2021 | | | | 187 | | | | 42,125,615 | | | | 43,075,450 | | | | 949,835 | |
Euribor | | | 3/15/2021 | | | | 1,203 | | | | 369,402,674 | | | | 369,413,654 | | | | 10,980 | |
Euro | | | 3/15/2021 | | | | 1,335 | | | | 203,237,870 | | | | 204,355,125 | | | | 1,117,255 | |
Euro Schatz | | | 3/08/2021 | | | | 674 | | | | 92,479,290 | | | | 92,446,354 | | | | (32,936 | ) |
EURO STOXX 50® | | | 3/19/2021 | | | | 348 | | | | 14,918,791 | | | | 15,092,265 | | | | 173,474 | |
Euro-BTP | | | 3/08/2021 | | | | 385 | | | | 70,807,425 | | | | 71,495,666 | | | | 688,241 | |
Euro-Buxl® 30 Year Bond | | | 3/08/2021 | | | | 116 | | | | 31,715,013 | | | | 31,919,077 | | | | 204,064 | |
Euro-OAT | | | 3/08/2021 | | | | 604 | | | | 123,215,981 | | | | 123,859,974 | | | | 643,993 | |
Eurodollar | | | 6/14/2021 | | | | 4,316 | | | | 1,076,842,000 | | | | 1,077,219,650 | | | | 377,650 | |
FTSE 100 Index | | | 3/19/2021 | | | | 56 | | | | 4,967,747 | | | | 4,916,438 | | | | (51,309 | ) |
FTSE China A50 Index | | | 1/28/2021 | | | | 1,601 | | | | 27,097,694 | | | | 28,356,912 | | | | 1,259,218 | |
FTSE MIB | | | 3/19/2021 | | | | 63 | | | | 8,352,513 | | | | 8,515,677 | | | | 163,164 | |
FTSE Taiwan Index | | | 1/28/2021 | | | | 348 | | | | 17,105,040 | | | | 17,758,440 | | | | 653,400 | |
FTSE/JSE Top 40 Index | | | 3/18/2021 | | | | 84 | | | | 3,131,381 | | | | 3,122,376 | | | | (9,005 | ) |
German Euro BOBL | | | 3/08/2021 | | | | 564 | | | | 93,133,569 | | | | 93,140,459 | | | | 6,890 | |
See accompanying notes to financial statements.
23 |
Consolidated Portfolio of Investments – as of December 31, 2020
AlphaSimplex Managed Futures Strategy Fund – (continued)
| | | | | | | | | | | | | | | | | | | | |
| Financial and Currency Futures | | Expiration
Date | | | Contracts | | | Notional
Amount | | | Value | | | Unrealized
Appreciation
(Depreciation) | |
German Euro Bund | | | 3/08/2021 | | | | 275 | | | $ | 59,399,986 | | | $ | 59,678,828 | | | $ | 278,842 | |
Hang Seng China Enterprises Index | | | 1/28/2021 | | | | 194 | | | | 13,049,462 | | | | 13,389,277 | | | | 339,815 | |
Hang Seng Index® | | | 1/28/2021 | | | | 73 | | | | 12,320,860 | | | | 12,815,220 | | | | 494,360 | |
IBEX 35 | | | 1/15/2021 | | | | 58 | | | | 5,727,602 | | | | 5,718,551 | | | | (9,051 | ) |
Indian Rupee | | | 1/27/2021 | | | | 758 | | | | 20,418,066 | | | | 20,700,980 | | | | 282,914 | |
Japanese Yen | | | 3/15/2021 | | | | 826 | | | | 99,348,769 | | | | 100,038,925 | | | | 690,156 | |
MSCI EAFE Index | | | 3/19/2021 | | | | 445 | | | | 46,937,295 | | | | 47,410,300 | | | | 473,005 | |
MSCI Emerging Markets Index | | | 3/19/2021 | | | | 679 | | | | 42,247,380 | | | | 43,734,390 | | | | 1,487,010 | |
MSCI Singapore | | | 1/28/2021 | | | | 78 | | | | 1,888,029 | | | | 1,908,096 | | | | 20,067 | |
Nikkei 225™ | | | 3/11/2021 | | | | 121 | | | | 30,862,428 | | | | 32,155,731 | | | | 1,293,303 | |
OMXS30® | | | 1/15/2021 | | | | 690 | | | | 15,865,709 | | | | 15,751,768 | | | | (113,941 | ) |
S&P/TSX 60 Index | | | 3/18/2021 | | | | 238 | | | | 38,923,172 | | | | 38,475,638 | | | | (447,534 | ) |
Short Sterling | | | 3/17/2021 | | | | 2,169 | | | | 370,714,620 | | | | 370,726,577 | | | | 11,957 | |
Short-Term Euro-BTP | | | 3/08/2021 | | | | 422 | | | | 58,296,849 | | | | 58,379,335 | | | | 82,486 | |
TOPIX | | | 3/11/2021 | | | | 134 | | | | 22,798,702 | | | | 23,418,042 | | | | 619,340 | |
UK Long Gilt | | | 3/29/2021 | | | | 415 | | | | 76,332,335 | | | | 76,920,689 | | | | 588,354 | |
Ultra 10 Year U.S. Treasury Note | | | 3/22/2021 | | | | 196 | | | | 30,768,938 | | | | 30,646,438 | | | | (122,500 | ) |
Ultra Long U.S. Treasury Bond | | | 3/22/2021 | | | | 59 | | | | 12,645,359 | | | | 12,600,187 | | | | (45,172 | ) |
| | | | | | | | | | | | | | | | | | | | |
Total | | | $ | 22,915,294 | |
| | | | | |
| | | | | |
| Commodity Futures1 | | Expiration
Date | | | Contracts | | | Notional
Amount | | | Value | | | Unrealized
Appreciation
(Depreciation) | |
Aluminum LME | | | 3/17/2021 | | | | 670 | | | $ | 31,200,225 | | | $ | 33,123,125 | | | $ | 1,922,900 | |
Brent Crude Oil | | | 1/29/2021 | | | | 141 | | | | 7,188,520 | | | | 7,303,800 | | | | 115,280 | |
Cocoa | | | 3/16/2021 | | | | 123 | | | | 3,379,880 | | | | 3,201,690 | | | | (178,190 | ) |
Coffee | | | 3/19/2021 | | | | 27 | | | | 1,267,950 | | | | 1,298,531 | | | | 30,581 | |
Copper | | | 3/29/2021 | | | | 770 | | | | 63,083,100 | | | | 67,740,750 | | | | 4,657,650 | |
Copper LME | | | 3/17/2021 | | | | 275 | | | | 48,153,531 | | | | 53,396,406 | | | | 5,242,875 | |
Corn | | | 3/12/2021 | | | | 1,280 | | | | 26,918,575 | | | | 30,976,000 | | | | 4,057,425 | |
Cotton | | | 3/09/2021 | | | | 355 | | | | 12,657,835 | | | | 13,866,300 | | | | 1,208,465 | |
Gasoline | | | 1/29/2021 | | | | 74 | | | | 4,200,437 | | | | 4,382,591 | | | | 182,154 | |
Gold | | | 2/24/2021 | | | | 142 | | | | 26,843,460 | | | | 26,910,420 | | | | 66,960 | |
Low Sulfur Gasoil | | | 2/11/2021 | | | | 27 | | | | 1,132,725 | | | | 1,142,100 | | | | 9,375 | |
New York Harbor ULSD | | | 1/29/2021 | | | | 119 | | | | 7,417,372 | | | | 7,417,032 | | | | (340 | ) |
Nickel LME | | | 3/17/2021 | | | | 257 | | | | 24,646,611 | | | | 25,609,536 | | | | 962,925 | |
Palladium | | | 3/29/2021 | | | | 8 | | | | 1,864,790 | | | | 1,963,040 | | | | 98,250 | |
Platinum | | | 4/28/2021 | | | | 61 | | | | 3,175,580 | | | | 3,291,560 | | | | 115,980 | |
Silver | | | 3/29/2021 | | | | 107 | | | | 13,247,985 | | | | 14,130,420 | | | | 882,435 | |
Soybean | | | 3/12/2021 | | | | 651 | | | | 33,936,350 | | | | 42,673,050 | | | | 8,736,700 | |
Soybean Meal | | | 3/12/2021 | | | | 748 | | | | 28,172,300 | | | | 32,119,120 | | | | 3,946,820 | |
Soybean Oil | | | 3/12/2021 | | | | 607 | | | | 12,749,526 | | | | 15,442,080 | | | | 2,692,554 | |
Sugar | | | 2/26/2021 | | | | 680 | | | | 11,230,139 | | | | 11,797,184 | | | | 567,045 | |
Wheat | | | 3/12/2021 | | | | 445 | | | | 13,689,712 | | | | 14,251,125 | | | | 561,413 | |
WTI Crude Oil | | | 1/20/2021 | | | | 33 | | | | 1,585,060 | | | | 1,601,160 | | | | 16,100 | |
Zinc LME | | | 3/17/2021 | | | | 295 | | | | 18,999,471 | | | | 20,276,308 | | | | 1,276,837 | |
| | | | | | | | | | | | | | | | | | | | |
Total | | | $ | 37,172,194 | |
| | | | | |
At December 31, 2020, open short futures contracts were as follows:
| | | | | | | | | | | | | | | | | | | | |
| Commodity Futures1 | | Expiration
Date | | | Contracts | | | Notional
Amount | | | Value | | | Unrealized
Appreciation
(Depreciation) | |
Copper LME | | | 3/17/2021 | | | | 89 | | | $ | 15,663,080 | | | $ | 17,281,019 | | | $ | (1,617,939 | ) |
Lean Hog | | | 2/12/2021 | | | | 29 | | | | 745,920 | | | | 815,190 | | | | (69,270 | ) |
Live Cattle | | | 2/26/2021 | | | | 185 | | | | 8,243,020 | | | | 8,511,850 | | | | (268,830 | ) |
Natural Gas | | | 1/27/2021 | | | | 401 | | | | 9,750,150 | | | | 10,181,390 | | | | (431,240 | ) |
Nickel LME | | | 3/17/2021 | | | | 102 | | | | 9,834,046 | | | | 10,164,096 | | | | (330,050 | ) |
Zinc LME | | | 3/17/2021 | | | | 40 | | | | 2,829,938 | | | | 2,749,330 | | | | 80,608 | |
| | | | | | | | | | | | | | | | | | | | |
Total | | | $ | (2,636,721 | ) |
| | | | | |
1 Commodity futures are held by AlphaSimplex Managed Futures Strategy Cayman Fund Ltd., a wholly-owned subsidiary. See Note 1 of Notes to Financial Statements.
See accompanying notes to financial statements.
| 24
Consolidated Portfolio of Investments – as of December 31, 2020
AlphaSimplex Managed Futures Strategy Fund – (continued)
Investment Summary at December 31, 2020
| | | | |
Certificates of Deposit | | | 56.6 | % |
Treasuries | | | 22.9 | |
Time Deposits | | | 8.8 | |
Commercial Paper | | | 4.6 | |
Repurchase Agreements | | | 0.1 | |
| | | | |
Total Investments | | | 93.0 | |
Other assets less liabilities (including forward foreign currency and futures contracts) | | | 7.0 | |
| | | | |
Net Assets | | | 100.0 | % |
| | | | |
See accompanying notes to financial statements.
25 |
Portfolio of Investments – as of December 31, 2020
AlphaSimplex Multi-Asset Fund
| | | | | | | | |
Shares | | | Description | | Value (†) | |
| | Exchange-Traded Funds — 32.2% of Net Assets | |
| | 13,272 | | | iShares® Core U.S. Aggregate Bond ETF | | $ | 1,568,618 | |
| | 4,958 | | | iShares® JP Morgan USD Emerging Markets Bond ETF | | | 574,682 | |
| | 6,965 | | | iShares® MSCI Emerging Markets Minimum Volatility Factor ETF | | | 425,422 | |
| | 11,425 | | | SPDR® Bloomberg Barclays International Treasury Bond ETF | | | 356,803 | |
| | 3,312 | | | Vanguard FTSE All World ex-U.S. Small-Cap ETF | | | 403,534 | |
| | 14,957 | | | Vanguard FTSE Developed Markets ETF | | | 706,120 | |
| | 9,818 | | | Vanguard FTSE Emerging Markets ETF | | | 491,980 | |
| | 12,387 | | | Vanguard FTSE Europe ETF | | | 746,193 | |
| | 9,489 | | | Vanguard FTSE Pacific ETF | | | 755,229 | |
| | 7,960 | | | Vanguard Intermediate-Term Corporate Bond ETF | | | 773,234 | |
| | 5,453 | | | Vanguard Mid-Cap ETF | | | 1,127,517 | |
| | 13,202 | | | Vanguard Total International Bond ETF | | | 772,977 | |
| | 5,812 | | | Vanguard Total Stock Market ETF | | | 1,131,248 | |
| | 9,362 | | | Vanguard Value ETF | | | 1,113,704 | |
| | | | | | | | |
| | | | Total Exchange-Traded Funds
(Identified Cost $8,946,876) | | | 10,947,261 | |
| | | | | | | | |
| | | | | | | | |
Principal
Amount | | | Description | | Value (†) | |
| | Short-Term Investments — 62.9% | |
| | | | Treasuries — 28.0% | |
| $ | 8,900,000 | | | U.S. Treasury Bills, 0.055%-0.060%, 1/05/2021(a)(b) | | | 8,899,999 | |
| | 300,000 | | | U.S. Treasury Bills, 0.065%, 1/07/2021(a)(c) | | | 299,999 | |
| | 300,000 | | | U.S. Treasury Bills, 0.090%, 2/04/2021(a)(c) | | | 299,986 | |
| | | | | | | | |
| | | | | | | 9,499,984 | |
| | | | | | | | |
| | | | Certificates of Deposit — 14.7% | |
| | 1,500,000 | | | Svenska Handelsbanken (NY), 1-month LIBOR + 0.250%, 0.402%, 1/04/2021(d) | | | 1,500,044 | |
| | 1,000,000 | | | Landesbank Hessen-Thueringen Girozentrale (NY), 0.170%, 1/27/2021(e) | | | 1,000,025 | |
| | 1,000,000 | | | Mitsubishi UFJ Trust & Banking Corp. (NY), 0.230%, 2/10/2021(e) | | | 1,000,098 | |
| | 1,000,000 | | | Landesbank Hessen-Thueringen Girozentrale (NY), 0.210%, 2/18/2021(e) | | | 1,000,069 | |
| | 500,000 | | | Royal Bank of Canada (NY), 3-month LIBOR + 0.110%, 0.331%, 6/11/2021(d)(e) | | | 500,237 | |
| | | | | | | | |
| | | | | | | 5,000,473 | |
| | | | | | | | |
| | | | Time Deposits — 9.4% | |
| $ | 1,600,000 | | | Skandinaviska Enskilda Banken (NY), 0.040%, 1/04/2021 | | $ | 1,600,000 | |
| | 1,600,000 | | | Canadian Imperial Bank of Commerce, 0.080%, 1/04/2021 | | | 1,600,000 | |
| | | | | | | | |
| | | | | | | 3,200,000 | |
| | | | | | | | |
| | | | Commercial Paper — 3.5% | |
| | 1,200,000 | | | Santander UK PLC, 0.180%, 2/09/2021(a)(e) | | | 1,199,764 | |
| | | | | | | | |
| | | | Repurchase Agreements — 7.3% | |
| | 2,466,749 | | | Tri-Party Repurchase Agreement with Fixed Income Clearing Corporation, dated 12/31/2020 at 0.000% to be repurchased at $2,466,749 on 1/04/2021 collateralized by $2,519,100 U.S. Treasury Bill, Zero Coupon due 12/30/2021 valued at $2,516,170 including accrued interest (Note 2 of Notes to Financial Statements) | | | 2,466,749 | |
| | | | | | | | |
| | | | Total Short-Term Investments
(Identified Cost $21,366,459) | | | 21,366,970 | |
| | | | | | | | |
| | | | | | | | |
| | | | Total Investments — 95.1%
(Identified Cost $30,313,335) | | | 32,314,231 | |
| | | | Other assets less liabilities — 4.9% | | | 1,681,165 | |
| | | | | | | | |
| | | | Net Assets — 100.0% | | $ | 33,995,396 | |
| | | | | | | | |
| | | | | | | | |
| | (†) | | | See Note 2 of Notes to Financial Statements. | |
| | (a) | | | Interest rate represents discount rate at time of purchase; not a coupon rate. | |
| | (b) | | | The Fund’s investment in U.S. Government/Agency securities is comprised of various lots with differing discount rates. These separate investments, which have the same maturity date, have been aggregated for the purpose of presentation in the Portfolio of Investments. | |
| | (c) | | | Security (or a portion thereof) has been pledged as collateral for open derivative contracts. | |
| | (d) | | | Variable rate security. Rate as of December 31, 2020 is disclosed. | |
| | (e) | | | Security (or a portion thereof) has been designated to cover the Fund’s obligations under open derivative contracts. | |
| | | | | |
| | ETF | | | Exchange-Traded Fund | |
| | LIBOR | | | London Interbank Offered Rate | |
| | SPDR® | | | Standard & Poor’s Depositary Receipt | |
At December 31, 2020, open long futures contracts were as follows:
| | | | | | | | | | | | | | | | | | | | |
| Financial and Currency Futures | | Expiration
Date | | | Contracts | | | Notional
Amount | | | Value | | | Unrealized
Appreciation
(Depreciation) | |
10 Year Australia Government Bond | | | 3/15/2021 | | | | 78 | | | $ | 8,827,809 | | | $ | 8,853,548 | | | $ | 25,739 | |
10 Year Canada Government Bond | | | 3/22/2021 | | | | 75 | | | | 8,750,884 | | | | 8,785,058 | | | | 34,174 | |
10 Year U.S. Treasury Note | | | 3/22/2021 | | | | 89 | | | | 12,267,851 | | | | 12,288,953 | | | | 21,102 | |
30 Year U.S. Treasury Bond | | | 3/22/2021 | | | | 15 | | | | 2,592,938 | | | | 2,597,813 | | | | 4,875 | |
ASX SPI 200™ | | | 3/18/2021 | | | | 11 | | | | 1,390,582 | | | | 1,385,918 | | | | (4,664 | ) |
Australian Dollar | | | 3/15/2021 | | | | 4 | | | | 304,880 | | | | 308,000 | | | | 3,120 | |
Canadian Dollar | | | 3/16/2021 | | | | 18 | | | | 1,409,351 | | | | 1,410,120 | | | | 769 | |
E-mini Dow | | | 3/19/2021 | | | | 7 | | | | 1,046,965 | | | | 1,067,395 | | | | 20,430 | |
E-mini NASDAQ 100 | | | 3/19/2021 | | | | 3 | | | | 756,051 | | | | 773,130 | | | | 17,079 | |
E-mini Russell 2000 | | | 3/19/2021 | | | | 8 | | | | 767,968 | | | | 789,920 | | | | 21,952 | |
E-mini S&P 500® | | | 3/19/2021 | | | | 5 | | | | 922,927 | | | | 937,200 | | | | 14,273 | |
EURO STOXX 50® | | | 3/19/2021 | | | | 28 | | | | 1,199,098 | | | | 1,214,320 | | | | 15,222 | |
Euro-BTP | | | 3/08/2021 | | | | 26 | | | | 4,788,844 | | | | 4,828,279 | | | | 39,435 | |
Euro-OAT | | | 3/08/2021 | | | | 23 | | | | 4,695,522 | | | | 4,716,522 | | | | 21,000 | |
See accompanying notes to financial statements.
| 26
Portfolio of Investments – as of December 31, 2020
AlphaSimplex Multi-Asset Fund – (continued)
| | | | | | | | | | | | | | | | | | | | |
| Financial and Currency Futures | | Expiration
Date | | | Contracts | | | Notional
Amount | | | Value | | | Unrealized
Appreciation
(Depreciation) | |
FTSE 100 Index | | | 3/19/2021 | | | | 11 | | | $ | 976,792 | | | $ | 965,729 | | | $ | (11,063 | ) |
Hang Seng Index® | | | 1/28/2021 | | | | 2 | | | | 337,558 | | | | 351,102 | | | | 13,544 | |
MSCI EAFE Index | | | 3/19/2021 | | | | 13 | | | | 1,362,920 | | | | 1,385,020 | | | | 22,100 | |
MSCI Emerging Markets Index | | | 3/19/2021 | | | | 22 | | | | 1,368,840 | | | | 1,417,020 | | | | 48,180 | |
New Zealand Dollar | | | 3/15/2021 | | | | 29 | | | | 2,050,900 | | | | 2,084,520 | | | | 33,620 | |
S&P/TSX 60 Index | | | 3/18/2021 | | | | 7 | | | | 1,145,042 | | | | 1,131,636 | | | | (13,406 | ) |
TOPIX | | | 3/11/2021 | | | | 9 | | | | 1,531,161 | | | | 1,572,854 | | | | 41,693 | |
UK Long Gilt | | | 3/29/2021 | | | | 34 | | | | 6,235,913 | | | | 6,301,936 | | | | 66,023 | |
| | | | | | | | | | | | | | | | | | | | |
Total | | | $ | 435,197 | |
| | | | | |
At December 31, 2020, open short futures contracts were as follows:
| | | | | | | | | | | | | | | | | | | | |
| Financial and Currency Futures | | Expiration
Date | | | Contracts | | | Notional
Amount | | | Value | | | Unrealized
Appreciation
(Depreciation) | |
Euro | | | 3/15/2021 | | | | 13 | | | $ | 1,974,689 | | | $ | 1,989,975 | | | $ | (15,286 | ) |
German Euro Bund | | | 3/08/2021 | | | | 4 | | | | 867,921 | | | | 868,056 | | | | (135 | ) |
U.S. Dollar Index | | | 3/15/2021 | | | | 36 | | | | 3,264,984 | | | | 3,236,184 | | | | 28,800 | |
| | | | | | | | | | | | | | | | | | | | |
Total | | | $ | 13,379 | |
| | | | | |
Investment Summary at December 31, 2020
| | | | |
Exchange-Traded Funds | | | 32.2 | % |
Treasuries | | | 28.0 | |
Certificates of Deposit | | | 14.7 | |
Time Deposits | | | 9.4 | |
Repurchase Agreements | | | 7.3 | |
Commercial Paper | | | 3.5 | |
| | | | |
Total Investments | | | 95.1 | |
Other assets less liabilities (including futures contracts) | | | 4.9 | |
| | | | |
Net Assets | | | 100.0 | % |
| | | | |
See accompanying notes to financial statements.
27 |
Statements of Assets and Liabilities
December 31, 2020
| | | | | | | | | | | | |
| | | AlphaSimplex
Global
Alternatives
Fund
(Consolidated*) | | | AlphaSimplex
Managed
Futures Strategy
Fund
(Consolidated*) | | | AlphaSimplex
Multi-Asset
Fund | |
ASSETS | | | | | | | | | | | | |
Investments at cost | | $ | 430,398,127 | | | $ | 1,382,514,102 | | | $ | 30,313,335 | |
Net unrealized appreciation | | | 30,683,154 | | | | 28,356 | | | | 2,000,896 | |
| | | | | | | | | | | | |
Investments at value | | | 461,081,281 | | | | 1,382,542,458 | | | | 32,314,231 | |
Cash | | | 8,816,364 | | | | 14,816,630 | | | | — | |
Due from brokers (including variation margin on futures contracts) (Note 2) | | | 42,907,715 | | | | 59,477,421 | | | | 983,533 | |
Receivable for Fund shares sold | | | 1,392,616 | | | | 6,224,470 | | | | 787 | |
Receivable for securities sold | | | 210,436 | | | | — | | | | 422,891 | |
Dividends and interest receivable | | | 308,659 | | | | 238,629 | | | | 3,512 | |
Unrealized appreciation on forward foreign currency contracts (Note 2) | | | 1,344,458 | | | | 9,602,026 | | | | — | |
Unrealized appreciation on futures contracts (Note 2) | | | 15,887,055 | | | | 61,357,489 | | | | 493,130 | |
Prepaid expenses (Note 8) | | | 48 | | | | 100 | | | | 2 | |
| | | | | | | | | | | | |
TOTAL ASSETS | | | 531,948,632 | | | | 1,534,259,223 | | | | 34,218,086 | |
| | | | | | | | | | | | |
LIABILITIES | | | | | | | | | | | | |
Payable for Fund shares redeemed | | | 699,147 | | | | 1,306,300 | | | | 9,881 | |
Unrealized depreciation on forward foreign currency contracts (Note 2) | | | 711,638 | | | | 2,789,040 | | | | — | |
Due to brokers (including variation margin on futures contracts) (Note 2) | | | 336,160 | | | | 37,879,994 | | | | 64,656 | |
Unrealized depreciation on futures contracts (Note 2) | | | 5,928,228 | | | | 3,906,722 | | | | 44,554 | |
Management fees payable (Note 6) | | | 462,881 | | | | 1,494,668 | | | | 3,987 | |
Deferred Trustees’ fees (Note 6) | | | 309,566 | | | | 295,965 | | | | 30,878 | |
Administrative fees payable (Note 6) | | | 33,058 | | | | 74,285 | | | | 1,389 | |
Payable to distributor (Note 6d) | | | 4,515 | | | | 18,119 | | | | 1,063 | |
Other accounts payable and accrued expenses | | | 173,824 | | | | 407,455 | | | | 66,282 | |
| | | | | | | | | | | | |
TOTAL LIABILITIES | | | 8,659,017 | | | | 48,172,548 | | | | 222,690 | |
| | | | | | | | | | | | |
NET ASSETS | | $ | 523,289,615 | | | $ | 1,486,086,675 | | | $ | 33,995,396 | |
| | | | | | | | | | | | |
NET ASSETS CONSIST OF: | | | | | | | | | | | | |
Paid-in capital | | $ | 607,757,357 | | | $ | 1,509,991,114 | | | $ | 34,860,038 | |
Accumulated loss | | | (84,467,742 | ) | | | (23,904,439 | ) | | | (864,642 | ) |
| | | | | | | | | | | | |
NET ASSETS | | $ | 523,289,615 | | | $ | 1,486,086,675 | | | $ | 33,995,396 | |
| | | | | | | | | | | | |
COMPUTATION OF NET ASSET VALUE AND OFFERING PRICE: | | | | | | | | | | | | |
Class A shares: | | | | | | | | | | | | |
Net assets | | $ | 15,583,964 | | | $ | 170,441,782 | | | $ | 341,182 | |
| | | | | | | | | | | | |
Shares of beneficial interest | | | 1,461,045 | | | | 16,755,533 | | | | 34,019 | |
| | | | | | | | | | | | |
Net asset value and redemption price per share | | $ | 10.67 | | | $ | 10.17 | | | $ | 10.03 | |
| | | | | | | | | | | | |
Offering price per share (100/94.25 of net asset value) (Note 1) | | $ | 11.32 | | | $ | 10.79 | | | $ | 10.64 | |
| | | | | | | | | | | | |
Class 81C shares: (redemption price per share is equal to net asset value less any applicable contingent deferred sales charge) (Note 1) | | | | | | | | | | | | |
Net assets | | $ | 5,058,541 | | | $ | 19,792,691 | | | $ | 21,692 | |
| | | | | | | | | | | | |
Shares of beneficial interest | | | 504,790 | | | | 2,055,859 | | | | 2,195 | |
| | | | | | | | | | | | |
Net asset value and offering price per share | | $ | 10.02 | | | $ | 9.63 | | | $ | 9.88 | |
| | | | | | | | | | | | |
Class N shares: | |
Net assets | | $ | 130,516 | | | $ | 133,730,527 | | | $ | — | |
| | | | | | | | | | | | |
Shares of beneficial interest | | | 12,066 | | | | 12,986,680 | | | | — | |
| | | | | | | | | | | | |
Net asset value, offering and redemption price per share | | $ | 10.82 | | | $ | 10.30 | | | $ | — | |
| | | | | | | | | | | | |
Class Y shares: | |
Net assets | | $ | 502,516,594 | | | $ | 1,162,121,675 | | | $ | 33,632,522 | |
| | | | | | | | | | | | |
Shares of beneficial interest | | | 46,375,193 | | | | 113,069,089 | | | | 3,346,665 | |
| | | | | | | | | | | | |
Net asset value, offering and redemption price per share | | $ | 10.84 | | | $ | 10.28 | | | $ | 10.05 | |
| | | | | | | | | | | | |
| * | See Notes 1 and 2 of the Notes to Financial Statements. |
See accompanying notes to financial statements.
| 28
Statements of Operations
For the Year Ended December 31, 2020
| | | | | | | | | | | | |
| | | AlphaSimplex
Global
Alternatives
Fund
(Consolidated*) | | | AlphaSimplex
Managed
Futures Strategy
Fund
(Consolidated*) | | | AlphaSimplex
Multi-Asset
Fund | |
INVESTMENT INCOME | | | | | | | | | | | | |
Interest | | $ | 3,674,016 | | | $ | 10,275,169 | | | $ | 133,214 | |
Dividends | | | 4,043,649 | | | | — | | | | 302,318 | |
Less net foreign taxes withheld | | | (6,142 | ) | | | — | | | | — | |
| | | | | | | | | | | | |
| | | 7,711,523 | | | | 10,275,169 | | | | 435,532 | |
| | | | | | | | | | | | |
Expenses | | | | | | | | | | | | |
Management fees (Note 6) | | | 7,490,248 | | | | 19,498,755 | | | | 282,566 | |
Service and distribution fees (Note 6) | | | 125,875 | | | | 703,113 | | | | 1,380 | |
Administrative fees (Note 6) | | | 370,585 | | | | 814,248 | | | | 17,766 | |
Trustees’ and directors’ fees and expenses (Note 6) | | | 95,786 | | | | 125,506 | | | | 21,034 | |
Transfer agent fees and expenses (Notes 6 and 7) | | | 460,948 | | | | 2,769,677 | | | | 63,619 | |
Audit and tax services fees | | | 87,423 | | | | 75,978 | | | | 59,615 | |
Custodian fees and expenses | | | 102,543 | | | | 181,982 | | | | 12,276 | |
Legal fees (Note 8) | | | 22,183 | | | | 44,198 | | | | 1,293 | |
Registration fees | | | 75,946 | | | | 103,508 | | | | 45,657 | |
Shareholder reporting expenses | | | 33,400 | | | | 137,769 | | | | 16,070 | |
Miscellaneous expenses (Note 8) | | | 76,281 | | | | 102,147 | | | | 32,546 | |
| | | | | | | | | | | | |
Total expenses | | | 8,941,218 | | | | 24,556,881 | | | | 553,822 | |
Less waiver and/or expense reimbursement (Note 6) | | | (395,129 | ) | | | (1,355,795 | ) | | | (189,097 | ) |
| | | | | | | | | | | | |
Net expenses | | | 8,546,089 | | | | 23,201,086 | | | | 364,725 | |
| | | | | | | | | | | | |
Net investment income (loss) | | | (834,566 | ) | | | (12,925,917 | ) | | | 70,807 | |
| | | | | | | | | | | | |
NET REALIZED AND UNREALIZED GAIN (LOSS) ON INVESTMENTS, FUTURES CONTRACTS, SWAP AGREEMENTS, FORWARD FOREIGN CURRENCY CONTRACTS AND FOREIGN CURRENCY TRANSACTIONS | | | | | | | | | | | | |
Net realized gain (loss) on: | | | | | | | | | | | | |
Investments | | | (8,957,549 | ) | | | 132 | | | | 137,540 | |
Futures contracts | | | (20,920,384 | ) | | | 150,604,650 | | | | (2,767,109 | ) |
Swap agreements | | | (27,001,268 | ) | | | — | | | | — | |
Forward foreign currency contracts (Note 2e) | | | 711,523 | | | | (2,679,889 | ) | | | — | |
Foreign currency transactions (Note 2d) | | | 843,188 | | | | (1,131,483 | ) | | | 70,668 | |
Distributions of capital gains received from investments | | | — | | | | — | | | | 2,765 | |
Net change in unrealized appreciation (depreciation) on: | | | | | | | | | | | | |
Investments | | | 16,501,325 | | | | (58,702 | ) | | | (236,163 | ) |
Futures contracts | | | 5,354,406 | | | | 46,907,372 | | | | (97,136 | ) |
Forward foreign currency contracts (Note 2e) | | | 1,890,310 | | | | 9,986,341 | | | | — | |
Foreign currency translations (Note 2d) | | | (10,673 | ) | | | (22,808 | ) | | | (2,632 | ) |
| | | | | | | | | | | | |
Net realized and unrealized gain (loss) on investments, futures contracts, swap agreements, forward foreign currency contracts and foreign currency transactions | | | (31,589,122 | ) | | | 203,605,613 | | | | (2,892,067 | ) |
| | | | | | | | | | | | |
NET INCREASE (DECREASE) IN NET ASSETS RESULTING FROM OPERATIONS | | $ | (32,423,688 | ) | | $ | 190,679,696 | | | $ | (2,821,260 | ) |
| | | | | | | | | | | | |
| * | See Notes 1 and 2 of the Notes to Financial Statements. |
See accompanying notes to financial statements.
29 |
Statements of Changes in Net Assets
| | | | | | | | | | | | | | | | |
| | | AlphaSimplex Global
Alternatives Fund
(Consolidated*) | | | AlphaSimplex Managed
Futures Strategy Fund
(Consolidated*) | |
| | | Year Ended
December 31,
2020 | | | Year Ended
December 31,
2019 | | | Year Ended
December 31,
2020 | | | Year Ended
December 31,
2019 | |
FROM OPERATIONS: | | | | | | | | | | | | | | | | |
Net investment income (loss) | | $ | (834,566 | ) | | $ | 12,779,334 | | | $ | (12,925,917 | ) | | $ | 12,884,018 | |
Net realized gain (loss) on investments, futures contracts, swap agreements, forward foreign currency contracts and foreign currency transactions | | | (55,324,490 | ) | | | 46,725,936 | | | | 146,793,410 | | | | 172,692,001 | |
Net change in unrealized appreciation (depreciation) on investments, futures contracts, forward foreign currency contracts and foreign currency translations | | | 23,735,368 | | | | 44,540,700 | | | | 56,812,203 | | | | (46,336,670 | ) |
| | | | | | | | | | | | | | | | |
Net increase (decrease) in net assets resulting from operations | | | (32,423,688 | ) | | | 104,045,970 | | | | 190,679,696 | | | | 139,239,349 | |
| | | | | | | | | | | | | | | | |
FROM DISTRIBUTIONS TO SHAREHOLDERS: | | | | | | | | | | | | | | | | |
Class A | | | (350,065 | ) | | | (228,062 | ) | | | (5,200,492 | ) | | | (10,061,550 | ) |
Class C | | | (63,850 | ) | | | (8,948 | ) | | | (498,058 | ) | | | (839,596 | ) |
Class N | | | (3,354 | ) | | | (6,327 | ) | | | (4,653,921 | ) | | | (5,760,322 | ) |
Class Y | | | (12,812,860 | ) | | | (9,035,275 | ) | | | (38,834,778 | ) | | | (57,921,320 | ) |
| | | | | | | | | | | | | | | | |
Total distributions | | | (13,230,129 | ) | | | (9,278,612 | ) | | | (49,187,249 | ) | | | (74,582,788 | ) |
| | | | | | | | | | | | | | | | |
NET DECREASE IN NET ASSETS FROM CAPITAL SHARE TRANSACTIONS (NOTE 11) | | | (252,979,174 | ) | | | (468,465,733 | ) | | | (229,316,445 | ) | | | (559,082,083 | ) |
| | | | | | | | | | | | | | | | |
Net decrease in net assets | | | (298,632,991 | ) | | | (373,698,375 | ) | | | (87,823,998 | ) | | | (494,425,522 | ) |
NET ASSETS | | | | | | | | | | | | | | | | |
Beginning of the year | | | 821,922,606 | | | | 1,195,620,981 | | | | 1,573,910,673 | | | | 2,068,336,195 | |
| | | | | | | | | | | | | | | | |
End of the year | | $ | 523,289,615 | | | $ | 821,922,606 | | | $ | 1,486,086,675 | | | $ | 1,573,910,673 | |
| | | | | | | | | | | | | | | | |
| * | See Notes 1 and 2 of the Notes to Financial Statements. |
See accompanying notes to financial statements.
| 30
Statements of Changes in Net Assets (continued)
| | | | | | | | |
| | |
AlphaSimplex Multi-Asset
Fund | |
| | | Year Ended
December 31,
2020 | | | Year Ended
December 31,
2019 | |
FROM OPERATIONS: | | | | | | | | |
Net investment income | | $ | 70,807 | | | $ | 712,436 | |
Net realized gain (loss) on investments, futures contracts and foreign currency transactions | | | (2,556,136 | ) | | | 3,192,731 | |
Net change in unrealized appreciation (depreciation) on investments, futures contracts and foreign currency translations | | | (335,931 | ) | | | 2,576,585 | |
| | | | | | | | |
Net increase (decrease) in net assets resulting from operations | | | (2,821,260 | ) | | | 6,481,752 | |
| | | | | | | | |
FROM DISTRIBUTIONS TO SHAREHOLDERS: | | | | | | | | |
Class A | | | (8,048 | ) | | | (8,974 | ) |
Class C | | | (3,365 | ) | | | (421 | ) |
Class Y | | | (888,624 | ) | | | (1,018,840 | ) |
| | | | | | | | |
Total distributions | | | (900,037 | ) | | | (1,028,235 | ) |
| | | | | | | | |
NET INCREASE (DECREASE) IN NET ASSETS FROM CAPITAL SHARE TRANSACTIONS (NOTE 11) | | | (6,444,168 | ) | | | 415,711 | |
| | | | | | | | |
Net increase (decrease) in net assets | | | (10,165,465 | ) | | | 5,869,228 | |
NET ASSETS | | | | | | | | |
Beginning of the year | | | 44,160,861 | | | | 38,291,633 | |
| | | | | | | | |
End of the year | | $ | 33,995,396 | | | $ | 44,160,861 | |
| | | | | | | | |
See accompanying notes to financial statements.
31 |
Financial Highlights
For a share outstanding throughout each period
| | | | | | | | | | | | | | | | | | | | |
| | | AlphaSimplex Global Alternatives Fund (Consolidated*)—Class A | |
| | | Year Ended
December 31,
2020
| | | Year Ended
December 31,
2019
| | | Year Ended
December 31,
2018
| | | Year Ended
December 31,
2017
| | | Year Ended
December 31,
2016
| |
Net asset value, beginning of the period | | $ | 11.18 | | | $ | 10.24 | | | $ | 11.04 | | | $ | 10.02 | | | $ | 10.48 | |
| | | | | | | | | | | | | | | | | | | | |
INCOME (LOSS) FROM INVESTMENT OPERATIONS: | | | | | | | | | | | | | | | | | | | | |
Net investment income (loss)(a) | | | (0.03 | ) | | | 0.11 | | | | 0.06 | | | | (0.03 | ) | | | (0.09 | ) |
Net realized and unrealized gain (loss) | | | (0.24 | ) | | | 0.93 | | | | (0.75 | ) | | | 1.10 | | | | (0.37 | ) |
| | | | | | | | | | | | | | | | | | | | |
Total from Investment Operations | | | (0.27 | ) | | | 1.04 | | | | (0.69 | ) | | | 1.07 | | | | (0.46 | ) |
| | | | | | | | | | | | | | | | | | | | |
LESS DISTRIBUTIONS FROM: | | | | | | | | | | | | | | | | | | | | |
Net investment income | | | (0.24 | ) | | | (0.10 | ) | | | (0.11 | ) | | | (0.05 | ) | | | — | |
| | | | | | | | | | | | | | | | | | | | |
Net asset value, end of the period | | $ | 10.67 | | | $ | 11.18 | | | $ | 10.24 | | | $ | 11.04 | | | $ | 10.02 | |
| | | | | | | | | | | | | | | | | | | | |
Total return(b) | | | (2.38 | )%(c) | | | 10.26 | %(c) | | | (6.35 | )%(c) | | | 10.66 | % | | | (4.39 | )% |
RATIOS TO AVERAGE NET ASSETS: | | | | | | | | | | | | | | | | | | | | |
Net assets, end of the period (000’s) | | $ | 15,584 | | | $ | 25,341 | | | $ | 33,649 | | | $ | 49,904 | | | $ | 76,207 | |
Net expenses | | | 1.52 | %(d)(e) | | | 1.54 | %(d) | | | 1.54 | %(d) | | | 1.57 | %(f)(g) | | | 1.56 | %(h) |
Gross expenses | | | 1.58 | % | | | 1.57 | % | | | 1.55 | % | | | 1.57 | %(f) | | | 1.56 | %(h) |
Net investment income (loss) | | | (0.33 | )% | | | 0.97 | % | | | 0.58 | % | | | (0.26 | )% | | | (0.93 | )% |
Portfolio turnover rate(i) | | | 232 | %(j) | | | 125 | % | | | 59 | % | | | — | % | | | — | % |
| * | See Notes 1 and 2 of the Notes to Financial Statements. |
| (a) | Per share net investment income (loss) has been calculated using the average shares outstanding during the period. |
| (b) | A sales charge for Class A shares is not reflected in total return calculations. |
| (c) | Had certain expenses not been waived/reimbursed during the period, total returns would have been lower. |
| (d) | The investment adviser agreed to waive its fees and/or reimburse a portion of the Fund’s expenses during the period. Without this waiver/reimbursement, expenses would have been higher. |
| (e) | Effective July 1, 2020, the expense limit decreased from 1.54% to 1.49%. See Note 6 of Notes to Financial Statements. |
| (f) | Includes interest expense. Without this expense the ratio of net expenses would have been 1.55% and the ratio of gross expenses would have been 1.56%. |
| (g) | Effective July 1, 2017, the expense limit decreased from 1.60% to 1.54%. |
| (h) | Includes interest expense. Without this expense the ratio of net expenses would have been 1.54% and the ratio of gross expenses would have been 1.54%. |
| (i) | Prior to 2018, the portfolio turnover rate was not reported due to the short term nature of the portfolio of investments. |
| (j) | The variation in the Fund’s turnover rate from 2019 to 2020 was primarily due to an increase in shareholder activity and reallocations in investment models resulting in increased equity security transactions. |
See accompanying notes to financial statements.
| 32
Financial Highlights (continued)
For a share outstanding throughout each period
| | | | | | | | | | | | | | | | | | | | |
| | | AlphaSimplex Global Alternatives Fund (Consolidated*)—Class C | |
| | | Year Ended
December 31,
2020
| | | Year Ended
December 31,
2019
| | | Year Ended
December 31,
2018
| | | Year Ended
December 31,
2017
| | | Year Ended
December 31,
2016
| |
Net asset value, beginning of the period | | $ | 10.48 | | | $ | 9.59 | | | $ | 10.33 | | | $ | 9.40 | | | $ | 9.91 | |
| | | | | | | | | | | | | | | | | | | | |
INCOME (LOSS) FROM INVESTMENT OPERATIONS: | | | | | | | | | | | | | | | | | | | | |
Net investment income (loss)(a) | | | (0.11 | ) | | | 0.02 | | | | (0.02 | ) | | | (0.10 | ) | | | (0.15 | ) |
Net realized and unrealized gain (loss) | | | (0.22 | ) | | | 0.88 | | | | (0.70 | ) | | | 1.03 | | | | (0.36 | ) |
| | | | | | | | | | | | | | | | | | | | |
Total from Investment Operations | | | (0.33 | ) | | | 0.90 | | | | (0.72 | ) | | | 0.93 | | | | (0.51 | ) |
| | | | | | | | | | | | | | | | | | | | |
LESS DISTRIBUTIONS FROM: | | | | | | | | | | | | | | | | | | | | |
Net investment income | | | (0.13 | ) | | | (0.01 | ) | | | (0.02 | ) | | | — | | | | — | |
| | | | | | | | | | | | | | | | | | | | |
Net asset value, end of the period | | $ | 10.02 | | | $ | 10.48 | | | $ | 9.59 | | | $ | 10.33 | | | $ | 9.40 | |
| | | | | | | | | | | | | | | | | | | | |
Total return(b) | | | (3.17 | )%(c) | | | 9.48 | %(c) | | | (7.09 | )%(c) | | | 9.89 | % | | | (5.15 | )% |
RATIOS TO AVERAGE NET ASSETS: | | | | | | | | | | | | | | | | | | | | |
Net assets, end of the period (000’s) | | $ | 5,059 | | | $ | 11,171 | | | $ | 15,537 | | | $ | 24,521 | | | $ | 38,412 | |
Net expenses | | | 2.27 | %(d)(e) | | | 2.29 | %(d) | | | 2.29 | %(d) | | | 2.32 | %(f)(g) | | | 2.31 | %(h) |
Gross expenses | | | 2.33 | % | | | 2.32 | % | | | 2.30 | % | | | 2.32 | %(g) | | | 2.31 | %(h) |
Net investment income (loss) | | | (1.08 | )% | | | 0.23 | % | | | (0.17 | )% | | | (1.00 | )% | | | (1.68 | )% |
Portfolio turnover rate(i) | | | 232 | %(j) | | | 125 | % | | | 59 | % | | | — | % | | | — | % |
| * | See Notes 1 and 2 of the Notes to Financial Statements. |
| (a) | Per share net investment income (loss) has been calculated using the average shares outstanding during the period. |
| (b) | A contingent deferred sales charge for Class C shares is not reflected in total return calculations. |
| (c) | Had certain expenses not been waived/reimbursed during the period, total returns would have been lower. |
| (d) | The investment adviser agreed to waive its fees and/or reimburse a portion of the Fund’s expenses during the period. Without this waiver/reimbursement, expenses would have been higher. |
| (e) | Effective July 1, 2020, the expense limit decreased from 2.29% to 2.24%. See Note 6 of Notes to Financial Statements. |
| (f) | Effective July 1, 2017, the expense limit decreased from 2.35% to 2.29%. |
| (g) | Includes interest expense. Without this expense the ratio of net expenses would have been 2.30% and the ratio of gross expenses would have been 2.31%. |
| (h) | Includes interest expense. Without this expense the ratio of net expenses would have been 2.29% and the ratio of gross expenses would have been 2.29%. |
| (i) | Prior to 2018, the portfolio turnover rate was not reported due to the short term nature of the portfolio of investments. |
| (j) | The variation in the Fund’s turnover rate from 2019 to 2020 was primarily due to an increase in shareholder activity and reallocations in investment models resulting in increased equity security transactions. |
See accompanying notes to financial statements.
33 |
Financial Highlights (continued)
For a share outstanding throughout each period
| | | | | | | | | | | | | | | | | | | | |
| | | AlphaSimplex Global Alternatives Fund (Consolidated*)—Class N | |
| | | Year Ended
December 31,
2020
| | | Year Ended
December 31,
2019
| | | Year Ended
December 31,
2018
| | | Year Ended
December 31,
2017
| | | Year Ended
December 31,
2016
| |
Net asset value, beginning of the period | | $ | 11.35 | | | $ | 10.40 | | | $ | 11.22 | | | $ | 10.19 | | | $ | 10.63 | |
| | | | | | | | | | | | | | | | | | | | |
INCOME (LOSS) FROM INVESTMENT OPERATIONS: | | | | | | | | | | | | | | | | | | | | |
Net investment income (loss)(a) | | | 0.00 | (b) | | | 0.15 | | | | 0.10 | | | | 0.01 | | | | (0.06 | ) |
Net realized and unrealized gain (loss) | | | (0.24 | ) | | | 0.94 | | | | (0.77 | ) | | | 1.11 | | | | (0.38 | ) |
| | | | | | | | | | | | | | | | | | | | |
Total from Investment Operations | | | (0.24 | ) | | | 1.09 | | | | (0.67 | ) | | | 1.12 | | | | (0.44 | ) |
| | | | | | | | | | | | | | | | | | | | |
LESS DISTRIBUTIONS FROM: | | | | | | | | | | | | | | | | | | | | |
Net investment income | | | (0.29 | ) | | | (0.14 | ) | | | (0.15 | ) | | | (0.09 | ) | | | — | |
| | | | | | | | | | | | | | | | | | | | |
Net asset value, end of the period | | $ | 10.82 | | | $ | 11.35 | | | $ | 10.40 | | | $ | 11.22 | | | $ | 10.19 | |
| | | | | | | | | | | | | | | | | | | | |
Total return | | | (2.06 | )%(c) | | | 10.48 | %(c) | | | (6.08 | )%(c) | | | 10.98 | % | | | (4.05 | )% |
RATIOS TO AVERAGE NET ASSETS: | | | | | | | | | | | | | | | | | | | | |
Net assets, end of the period (000’s) | | $ | 131 | | | $ | 526 | | | $ | 14,377 | | | $ | 10,376 | | | $ | 9,639 | |
Net expenses | | | 1.22 | %(d)(e) | | | 1.24 | %(d) | | | 1.24 | %(d) | | | 1.26 | %(f)(g) | | | 1.24 | %(h) |
Gross expenses | | | 1.68 | % | | | 1.26 | % | | | 1.25 | % | | | 1.26 | %(g) | | | 1.24 | %(h) |
Net investment income (loss) | | | 0.02 | % | | | 1.38 | % | | | 0.94 | % | | | 0.09 | % | | | (0.56 | )% |
Portfolio turnover rate(i) | | | 232 | %(j) | | | 125 | % | | | 59 | % | | | — | % | | | — | % |
| * | See Notes 1 and 2 of the Notes to Financial Statements. |
| (a) | Per share net investment income (loss) has been calculated using the average shares outstanding during the period. |
| (b) | Amount rounds to less than $0.01 per share. |
| (c) | Had certain expenses not been waived/reimbursed during the period, total returns would have been lower. |
| (d) | The investment adviser agreed to waive its fees and/or reimburse a portion of the Fund’s expenses during the period. Without this waiver/reimbursement, expenses would have been higher. |
| (e) | Effective July 1, 2020, the expense limit decreased from 1.24% to 1.19%. See Note 6 of Notes to Financial Statements. |
| (f) | Effective July 1, 2017, the expense limit decreased from 1.30% to 1.24%. |
| (g) | Includes interest expense. Without this expense the ratio of net expenses would have been 1.24% and the ratio of gross expenses would have been 1.24%. |
| (h) | Includes interest expense. Without this expense the ratio of net expenses would have been 1.22% and the ratio of gross expenses would have been 1.22%. |
| (i) | Prior to 2018, the portfolio turnover rate was not reported due to the short term nature of the portfolio of investments. |
| (j) | The variation in the Fund’s turnover rate from 2019 to 2020 was primarily due to an increase in shareholder activity and reallocations in investment models resulting in increased equity security transactions. |
See accompanying notes to financial statements.
| 34
Financial Highlights (continued)
For a share outstanding throughout each period
| | | | | | | | | | | | | | | | | | | | |
| | | AlphaSimplex Global Alternatives Fund (Consolidated*)—Class Y | |
| | | Year Ended
December 31,
2020
| | | Year Ended
December 31,
2019
| | | Year Ended
December 31,
2018
| | | Year Ended
December 31,
2017
| | | Year Ended
December 31,
2016
| |
Net asset value, beginning of the period | | $ | 11.36 | | | $ | 10.40 | | | $ | 11.22 | | | $ | 10.19 | | | $ | 10.64 | |
| | | | | | | | | | | | | | | | | | | | |
INCOME (LOSS) FROM INVESTMENT OPERATIONS: | | | | | | | | | | | | | | | | | | | | |
Net investment income (loss)(a) | | | (0.01 | ) | | | 0.14 | | | | 0.09 | | | | 0.00 | (b) | | | (0.07 | ) |
Net realized and unrealized gain (loss) | | | (0.23 | ) | | | 0.95 | | | | (0.77 | ) | | | 1.11 | | | | (0.38 | ) |
| | | | | | | | | | | | | | | | | | | | |
Total from Investment Operations | | | (0.24 | ) | | | 1.09 | | | | (0.68 | ) | | | 1.11 | | | | (0.45 | ) |
| | | | | | | | | | | | | | | | | | | | |
LESS DISTRIBUTIONS FROM: | | | | | | | | | | | | | | | | | | | | |
Net investment income | | | (0.28 | ) | | | (0.13 | ) | | | (0.14 | ) | | | (0.08 | ) | | | — | |
| | | | | | | | | | | | | | | | | | | | |
Net asset value, end of the period | | $ | 10.84 | | | $ | 11.36 | | | $ | 10.40 | | | $ | 11.22 | | | $ | 10.19 | |
| | | | | | | | | | | | | | | | | | | | |
Total return | | | (2.12 | )%(c) | | | 10.49 | %(c) | | | (6.04 | )%(c) | | | 10.93 | % | | | (4.23 | )% |
RATIOS TO AVERAGE NET ASSETS: | | | | | | | | | | | | | | | | | | | | |
Net assets, end of the period (000’s) | | $ | 502,517 | | | $ | 784,884 | | | $ | 1,132,058 | | | $ | 1,559,650 | | | $ | 1,504,641 | |
Net expenses | | | 1.27 | %(d)(e) | | | 1.29 | %(d) | | | 1.29 | %(d) | | | 1.32 | %(f)(g) | | | 1.31 | %(h) |
Gross expenses | | | 1.33 | % | | | 1.32 | % | | | 1.30 | % | | | 1.32 | %(g) | | | 1.31 | %(h) |
Net investment income (loss) | | | (0.11 | )% | | | 1.23 | % | | | 0.85 | % | | | 0.02 | % | | | (0.67 | )% |
Portfolio turnover rate(i) | | | 232 | %(j) | | | 125 | % | | | 59 | % | | | — | % | | | — | % |
| * | See Notes 1 and 2 of the Notes to Financial Statements. |
| (a) | Per share net investment income (loss) has been calculated using the average shares outstanding during the period. |
| (b) | Amount rounds to less than $0.01 per share. |
| (c) | Had certain expenses not been waived/reimbursed during the period, total returns would have been lower. |
| (d) | The investment adviser agreed to waive its fees and/or reimburse a portion of the Fund’s expenses during the period. Without this waiver/reimbursement, expenses would have been higher. |
| (e) | Effective July 1, 2020, the expense limit decreased from 1.29% to 1.24%. See Note 6 of Notes to Financial Statements. |
| (f) | Effective July 1, 2017, the expense limit decreased from 1.35% to 1.29%. |
| (g) | Includes interest expense. Without this expense the ratio of net expenses would have been 1.30% and the ratio of gross expenses would have been 1.31%. |
| (h) | Includes interest expense. Without this expense the ratio of net expenses would have been 1.29% and the ratio of gross expenses would have been 1.29%. |
| (i) | Prior to 2018, the portfolio turnover rate was not reported due to the short term nature of the portfolio of investments. |
| (j) | The variation in the Fund’s turnover rate from 2019 to 2020 was primarily due to an increase in shareholder activity and reallocations in investment models resulting in increased equity security transactions. |
See accompanying notes to financial statements.
35 |
Financial Highlights (continued)
For a share outstanding throughout each period
| | | | | | | | | | | | | | | | | | | | |
| | | AlphaSimplex Managed Futures Strategy Fund (Consolidated*)—Class A | |
| | | Year Ended
December 31,
2020
| | | Year Ended
December 31,
2019
| | | Year Ended
December 31,
2018
| | | Year Ended
December 31,
2017
| | | Year Ended
December 31,
2016
| |
Net asset value, beginning of the period | | $ | 9.26 | | | $ | 8.97 | | | $ | 10.38 | | | $ | 9.78 | | | $ | 10.37 | |
| | | | | | | | | | | | | | | | | | | | |
INCOME (LOSS) FROM INVESTMENT OPERATIONS: | | | | | | | | | | | | | | | | | | | | |
Net investment income (loss)(a) | | | (0.10 | ) | | | 0.04 | | | | 0.02 | | | | (0.06 | ) | | | (0.12 | ) |
Net realized and unrealized gain (loss) | | | 1.33 | | | | 0.69 | | | | (1.31 | ) | | | 0.66 | | | | (0.47 | ) |
| | | | | | | | | | | | | | | | | | | | |
Total from Investment Operations | | | 1.23 | | | | 0.73 | | | | (1.29 | ) | | | 0.60 | | | | (0.59 | ) |
| | | | | | | | | | | | | | | | | | | | |
LESS DISTRIBUTIONS FROM: | | | | | | | | | | | | | | | | | | | | |
Net investment income | | | (0.32 | ) | | | (0.44 | ) | | | — | | | | — | | | | — | |
Net realized capital gains | | | — | | | | — | | | | (0.12 | ) | | | — | | | | — | |
| | | | | | | | | | | | | | | | | | | | |
Total Distributions | | | (0.32 | ) | | | (0.44 | ) | | | (0.12 | ) | | | — | | | | — | |
| | | | | | | | | | | | | | | | | | | | |
Net asset value, end of the period | | $ | 10.17 | | | $ | 9.26 | | | $ | 8.97 | | | $ | 10.38 | | | $ | 9.78 | |
| | | | | | | | | | | | | | | | | | | | |
Total return(b) | | | 13.27 | %(c) | | | 8.09 | %(c) | | | (12.55 | )% | | | 6.13 | % | | | (5.69 | )%(c) |
RATIOS TO AVERAGE NET ASSETS: | | | | | | | | | | | | | | | | | | | | |
Net assets, end of the period (000’s) | | $ | 170,442 | | | $ | 222,059 | | | $ | 133,996 | | | $ | 299,505 | | | $ | 463,235 | |
Net expenses | | | 1.70 | %(d) | | | 1.70 | %(d) | | | 1.70 | % | | | 1.75 | %(e)(f) | | | 1.74 | %(d)(g) |
Gross expenses | | | 1.80 | % | | | 1.79 | % | | | 1.70 | % | | | 1.75 | %(e)(f) | | | 1.75 | %(g) |
Net investment income (loss) | | | (0.99 | )% | | | 0.47 | % | | | 0.21 | % | | | (0.61 | )% | | | (1.11 | )% |
Portfolio turnover rate(h) | | | — | % | | | — | % | | | — | % | | | — | % | | | — | % |
| * | See Notes 1 and 2 of the Notes to Financial Statements. |
| (a) | Per share net investment income (loss) has been calculated using the average shares outstanding during the period. |
| (b) | A sales charge for Class A shares is not reflected in total return calculations. |
| (c) | Had certain expenses not been waived/reimbursed during the period, total returns would have been lower. |
| (d) | The investment adviser agreed to waive its fees and/or reimburse a portion of the Fund’s expenses during the period. Without this waiver/reimbursement, expenses would have been higher. |
| (e) | Includes interest expense. Without this expense the ratio of net expenses would have been 1.70% and the ratio of gross expenses would have been 1.70%. |
| (f) | Includes fee/expense recovery of 0.01%. |
| (g) | Includes interest expense. Without this expense the ratio of net expenses would have been 1.70% and the ratio of gross expenses would have been 1.71%. |
| (h) | Due to the short-term nature of the portfolio of investments there is no portfolio turnover calculation. |
See accompanying notes to financial statements.
| 36
Financial Highlights (continued)
For a share outstanding throughout each period
| | | | | | | | | | | | | | | | | | | | |
| | | AlphaSimplex Managed Futures Strategy Fund (Consolidated*)—Class C | |
| | | Year Ended
December 31,
2020
| | | Year Ended
December 31,
2019
| | | Year Ended
December 31,
2018
| | | Year Ended
December 31,
2017
| | | Year Ended
December 31,
2016
| |
Net asset value, beginning of the period | | $ | 8.78 | | | $ | 8.51 | | | $ | 9.93 | | | $ | 9.42 | | | $ | 10.07 | |
| | | | | | | | | | | | | | | | | | | | |
INCOME (LOSS) FROM INVESTMENT OPERATIONS: | | | | | | | | | | | | | | | | | | | | |
Net investment loss(a) | | | (0.16 | ) | | | (0.02 | ) | | | (0.05 | ) | | | (0.13 | ) | | | (0.19 | ) |
Net realized and unrealized gain (loss) | | | 1.26 | | | | 0.64 | | | | (1.25 | ) | | | 0.64 | | | | (0.46 | ) |
| | | | | | | | | | | | | | | | | | | | |
Total from Investment Operations | | | 1.10 | | | | 0.62 | | | | (1.30 | ) | | | 0.51 | | | | (0.65 | ) |
| | | | | | | | | | | | | | | | | | | | |
LESS DISTRIBUTIONS FROM: | | | | | | | | | | | | | | | | | | | | |
Net investment income | | | (0.25 | ) | | | (0.35 | ) | | | — | | | | — | | | | — | |
Net realized capital gains | | | — | | | | — | | | | (0.12 | ) | | | — | | | | — | |
| | | | | | | | | | | | | | | | | | | | |
Total Distributions | | | (0.25 | ) | | | (0.35 | ) | | | (0.12 | ) | | | — | | | | — | |
| | | | | | | | | | | | | | | | | | | | |
Net asset value, end of the period | | $ | 9.63 | | | $ | 8.78 | | | $ | 8.51 | | | $ | 9.93 | | | $ | 9.42 | |
| | | | | | | | | | | | | | | | | | | | |
Total return(b) | | | 12.48 | %(c) | | | 7.30 | %(c) | | | (13.22 | )% | | | 5.41 | % | | | (6.45 | )%(c) |
RATIOS TO AVERAGE NET ASSETS: | | | | | | | | | | | | | | | | | | | | |
Net assets, end of the period (000’s) | | $ | 19,793 | | | $ | 21,621 | | | $ | 29,421 | | | $ | 53,661 | | | $ | 71,184 | |
Net expenses | | | 2.45 | %(d) | | | 2.45 | %(d) | | | 2.45 | % | | | 2.50 | %(e)(f) | | | 2.49 | %(d)(g) |
Gross expenses | | | 2.54 | % | | | 2.53 | % | | | 2.45 | % | | | 2.50 | %(e)(f) | | | 2.50 | %(g) |
Net investment loss | | | (1.78 | )% | | | (0.24 | )% | | | (0.52 | )% | | | (1.36 | )% | | | (1.86 | )% |
Portfolio turnover rate(h) | | | — | % | | | — | % | | | — | % | | | — | % | | | — | % |
| * | See Notes 1 and 2 of the Notes to Financial Statements. |
| (a) | Per share net investment loss has been calculated using the average shares outstanding during the period. |
| (b) | A contingent deferred sales charge for Class C shares is not reflected in total return calculations. |
| (c) | Had certain expenses not been waived/reimbursed during the period, total returns would have been lower. |
| (d) | The investment adviser agreed to waive its fees and/or reimburse a portion of the Fund’s expenses during the period. Without this waiver/reimbursement, expenses would have been higher. |
| (e) | Includes interest expense. Without this expense the ratio of net expenses would have been 2.45% and the ratio of gross expenses would have been 2.45%. |
| (f) | Includes fee/expense recovery of 0.01%. |
| (g) | Includes interest expense. Without this expense the ratio of net expenses would have been 2.45% and the ratio of gross expenses would have been 2.46%. |
| (h) | Due to the short-term nature of the portfolio of investments there is no portfolio turnover calculation. |
See accompanying notes to financial statements.
37 |
Financial Highlights (continued)
For a share outstanding throughout each period
| | | | | | | | | | | | | | | | |
| | | AlphaSimplex Managed Futures Strategy Fund (Consolidated*)—Class N | |
| | | Year Ended
December 31,
2020 | | | Year Ended
December 31,
2019 | | | Year Ended
December 31,
2018 | | | Period Ended
December 31,
2017** | |
Net asset value, beginning of the period | | $ | 9.38 | | | $ | 9.07 | | | $ | 10.46 | | | $ | 9.81 | |
| | | | | | | | | | | | | | | | |
INCOME (LOSS) FROM INVESTMENT OPERATIONS: | | | | | | | | | | | | | | | | |
Net investment income (loss)(a) | | | (0.07 | ) | | | 0.08 | | | | 0.08 | | | | (0.01 | ) |
Net realized and unrealized gain (loss) | | | 1.35 | | | | 0.70 | | | | (1.35 | ) | | | 0.67 | |
| | | | | | | | | | | | | | | | |
Total from Investment Operations | | | 1.28 | | | | 0.78 | | | | (1.27 | ) | | | 0.66 | |
| | | | | | | | | | | | | | | | |
LESS DISTRIBUTIONS FROM: | | | | | | | | | | | | | | | | |
Net investment income | | | (0.36 | ) | | | (0.47 | ) | | | — | | | | (0.01 | ) |
Net realized capital gains | | | — | | | | — | | | | (0.12 | ) | | | — | |
| | | | | | | | | | | | | | | | |
Total Distributions | | | (0.36 | ) | | | (0.47 | ) | | | (0.12 | ) | | | (0.01 | ) |
| | | | | | | | | | | | | | | | |
Net asset value, end of the period | | $ | 10.30 | | | $ | 9.38 | | | $ | 9.07 | | | $ | 10.46 | |
| | | | | | | | | | | | | | | | |
Total return | | | 13.77 | % | | | 8.45 | % | | | (12.26 | )% | | | 6.76 | %(b)(c) |
RATIOS TO AVERAGE NET ASSETS: | |
Net assets, end of the period (000’s) | | $ | 133,731 | | | $ | 117,258 | | | $ | 67,957 | | | $ | 1,017 | |
Net expenses | | | 1.35 | % | | | 1.36 | % | | | 1.36 | % | | | 1.34 | %(d)(e)(f) |
Gross expenses | | | 1.35 | % | | | 1.36 | % | | | 1.36 | % | | | 14.83 | %(d)(f) |
Net investment income (loss) | | | (0.73 | )% | | | 0.79 | % | | | 0.83 | % | | | (0.17 | )%(d) |
Portfolio turnover rate(g) | | | — | % | | | — | % | | | — | % | | | — | % |
| * | See Notes 1 and 2 of the Notes to Financial Statements. |
| ** | From commencement of Class operations on May 1, 2017 through December 31, 2017. |
| (a) | Per share net investment income (loss) has been calculated using the average shares outstanding during the period. |
| (b) | Periods less than one year are not annualized. |
| (c) | Had certain expenses not been waived/reimbursed during the period, total returns would have been lower. |
| (d) | Computed on an annualized basis for periods less than one year. |
| (e) | The investment adviser agreed to waive its fees and/or reimburse a portion of the Fund’s expenses during the period. Without this waiver/reimbursement, expenses would have been higher. |
| (f) | Includes interest expense. Without this expense the ratio of net expenses would have been 1.29% and the ratio of gross expenses would have been 14.78%. |
| (g) | Due to the short-term nature of the portfolio of investments there is no portfolio turnover calculation. |
See accompanying notes to financial statements.
| 38
Financial Highlights (continued)
For a share outstanding throughout each period
| | | | | | | | | | | | | | | | | | | | |
| | | AlphaSimplex Managed Futures Strategy Fund (Consolidated*)—Class Y | |
| | | Year Ended
December 31,
2020
| | | Year Ended
December 31,
2019
| | | Year Ended
December 31,
2018
| | | Year Ended
December 31,
2017
| | | Year Ended
December 31,
2016
| |
Net asset value, beginning of the period | | $ | 9.36 | | | $ | 9.06 | | | $ | 10.46 | | | $ | 9.83 | | | $ | 10.40 | |
| | | | | | | | | | | | | | | | | | | | |
INCOME (LOSS) FROM INVESTMENT OPERATIONS: | | | | | | | | | | | | | | | | | | | | |
Net investment income (loss)(a) | | | (0.08 | ) | | | 0.07 | | | | 0.05 | | | | (0.03 | ) | | | (0.09 | ) |
Net realized and unrealized gain (loss) | | | 1.35 | | | | 0.69 | | | | (1.33 | ) | | | 0.67 | | | | (0.48 | ) |
| | | | | | | | | | | | | | | | | | | | |
Total from Investment Operations | | | 1.27 | | | | 0.76 | | | | (1.28 | ) | | | 0.64 | | | | (0.57 | ) |
| | | | | | | | | | | | | | | | | | | | |
LESS DISTRIBUTIONS FROM: | |
Net investment income | | | (0.35 | ) | | | (0.46 | ) | | | — | | | | (0.01 | ) | | | — | |
Net realized capital gains | | | — | | | | — | | | | (0.12 | ) | | | — | | | | — | |
| | | | | | | | | | | | | | | | | | | | |
Total Distributions | | | (0.35 | ) | | | (0.46 | ) | | | (0.12 | ) | | | (0.01 | ) | | | — | |
| | | | | | | | | | | | | | | | | | | | |
Net asset value, end of the period | | $ | 10.28 | | | $ | 9.36 | | | $ | 9.06 | | | $ | 10.46 | | | $ | 9.83 | |
| | | | | | | | | | | | | | | | | | | | |
Total return | | | 13.56 | %(b) | | | 8.35 | %(b) | | | (12.35 | )% | | | 6.48 | % | | | (5.47 | )%(b) |
RATIOS TO AVERAGE NET ASSETS: | |
Net assets, end of the period (000’s) | | $ | 1,162,122 | | | $ | 1,212,973 | | | $ | 1,836,962 | | | $ | 3,102,626 | | | $ | 2,629,920 | |
Net expenses | | | 1.45 | %(c) | | | 1.45 | %(c) | | | 1.45 | % | | | 1.50 | %(d)(e) | | | 1.49 | %(c)(f) |
Gross expenses | | | 1.54 | % | | | 1.53 | % | | | 1.45 | % | | | 1.50 | %(d)(e) | | | 1.50 | %(f) |
Net investment income (loss) | | | (0.80 | )% | | | 0.77 | % | | | 0.49 | % | | | (0.34 | )% | | | (0.85 | )% |
Portfolio turnover rate(g) | | | — | % | | | — | % | | | — | % | | | — | % | | | — | % |
| * | See Notes 1 and 2 of the Notes to Financial Statements. |
| (a) | Per share net investment income (loss) has been calculated using the average shares outstanding during the period. |
| (b) | Had certain expenses not been waived/reimbursed during the period, total returns would have been lower. |
| (c) | The investment adviser agreed to waive its fees and/or reimburse a portion of the Fund’s expenses during the period. Without this waiver/reimbursement, expenses would have been higher. |
| (d) | Includes fee/expense recovery of 0.01%. |
| (e) | Includes interest expense. Without this expense the ratio of net expenses would have been 1.45% and the ratio of gross expenses would have been 1.45%. |
| (f) | Includes interest expense. Without this expense the ratio of net expenses would have been 1.45% and the ratio of gross expenses would have been 1.46%. |
| (g) | Due to the short-term nature of the portfolio of investments there is no portfolio turnover calculation. |
See accompanying notes to financial statements.
39 |
Financial Highlights (continued)
For a share outstanding throughout each period
| | | | | | | | | | | | | | | | | | | | |
| | | AlphaSimplex Multi-Asset Fund—Class A | |
| | | Year Ended
December 31,
2020
| | | Year Ended
December 31,
2019
| | | Year Ended
December 31,
2018
| | | Year Ended
December 31,
2017
| | | Year Ended
December 31,
2016
| |
Net asset value, beginning of the period | | $ | 11.08 | | | $ | 9.71 | | | $ | 11.10 | | | $ | 10.08 | | | $ | 9.86 | |
| | | | | | | | | | | | | | | | | | | | |
INCOME (LOSS) FROM INVESTMENT OPERATIONS: | |
Net investment income (loss)(a) | | | (0.00 | )(b) | | | 0.16 | | | | 0.14 | | | | 0.10 | | | | 0.03 | |
Net realized and unrealized gain (loss) | | | (0.83 | ) | | | 1.45 | | | | (1.19 | ) | | | 1.99 | | | | 0.21 | |
| | | | | | | | | | | | | | | | | | | | |
Total from Investment Operations | | | (0.83 | ) | | | 1.61 | | | | (1.05 | ) | | | 2.09 | | | | 0.24 | |
| | | | | | | | | | | | | | | | | | | | |
LESS DISTRIBUTIONS FROM: | |
Net investment income | | | (0.01 | ) | | | (0.24 | ) | | | (0.13 | ) | | | (0.07 | ) | | | (0.02 | ) |
Net realized capital gains | | | (0.21 | ) | | | — | | | | (0.21 | ) | | | (1.00 | ) | | | — | |
| | | | | | | | | | | | | | | | | | | | |
Total Distributions | | | (0.22 | ) | | | (0.24 | ) | | | (0.34 | ) | | | (1.07 | ) | | | (0.02 | ) |
| | | | | | | | | | | | | | | | | | | | |
Net asset value, end of the period | | $ | 10.03 | | | $ | 11.08 | | | $ | 9.71 | | | $ | 11.10 | | | $ | 10.08 | |
| | | | | | | | | | | | | | | | | | | | |
Total return(c)(d) | | | (7.28 | )% | | | 16.59 | % | | | (9.61 | )% | | | 20.79 | % | | | 2.41 | % |
RATIOS TO AVERAGE NET ASSETS: | |
Net assets, end of the period (000’s) | | $ | 341 | | | $ | 423 | | | $ | 323 | | | $ | 134 | | | $ | 29 | |
Net expenses(e) | | | 1.15 | %(f) | | | 1.15 | % | | | 1.15 | % | | | 1.17 | %(g) | | | 1.17 | %(h) |
Gross expenses | | | 1.62 | %(f) | | | 1.62 | % | | | 1.62 | % | | | 1.74 | %(g) | | | 1.80 | %(h) |
Net investment income (loss) | | | (0.05 | )% | | | 1.50 | % | | | 1.31 | % | | | 0.90 | % | | | 0.31 | % |
Portfolio turnover rate | | | 49 | % | | | 23 | % | | | 46 | % | | | 8 | % | | | 115 | %(i) |
| (a) | Per share net investment income (loss) has been calculated using the average shares outstanding during the period. |
| (b) | Amount rounds to less than $0.01 per share. |
| (c) | A sales charge for Class A shares is not reflected in total return calculations. |
| (d) | Had certain expenses not been waived/reimbursed during the period, total returns would have been lower. |
| (e) | The investment adviser agreed to waive its fees and/or reimburse a portion of the Fund’s expenses during the period. Without this waiver/reimbursement, expenses would have been higher. |
| (f) | Does not include expenses of the underlying funds in which the Fund invests. Had underlying fund expenses been included, the net and gross expense ratios to average net assets would have been 1.19% and 1.66%, respectively. |
| (g) | Includes interest expense. Without this expense the ratio of net expenses would have been 1.15% and the ratio of gross expenses would have been 1.72%. |
| (h) | Includes interest expense. Without this expense the ratio of net expenses would have been 1.15% and the ratio of gross expenses would have been 1.78%. |
| (i) | The variation in the Fund’s turnover rate from 2015 to 2016 was primarily due to sales of equity securities in early 2016 in an effort to reduce risk. By mid-2016, in an effort to gain more exposure, the Fund returned to its normal investment strategy. |
See accompanying notes to financial statements.
| 40
Financial Highlights (continued)
For a share outstanding throughout each period
| | | | | | | | | | | | | | | | | | | | |
| | | AlphaSimplex Multi-Asset Fund—Class C | |
| | | Year Ended
December 31,
2020
| | | Year Ended
December 31,
2019
| | | Year Ended
December 31,
2018
| | | Year Ended
December 31,
2017
| | | Year Ended
December 31,
2016
| |
Net asset value, beginning of the period | | $ | 11.00 | | | $ | 9.66 | | | $ | 10.99 | | | $ | 10.01 | | | $ | 9.85 | |
| | | | | | | | | | | | | | | | | | | | |
INCOME (LOSS) FROM INVESTMENT OPERATIONS: | |
Net investment income (loss)(a) | | | (0.08 | ) | | | 0.08 | | | | 0.04 | | | | (0.00 | )(b) | | | (0.07 | ) |
Net realized and unrealized gain (loss) | | | (0.83 | ) | | | 1.44 | | | | (1.16 | ) | | | 1.99 | | | | 0.23 | |
| | | | | | | | | | | | | | | | | | | | |
Total from Investment Operations | | | (0.91 | ) | | | 1.52 | | | | (1.12 | ) | | | 1.99 | | | | 0.16 | |
| | | | | | | | | | | | | | | | | | | | |
LESS DISTRIBUTIONS FROM: | |
Net investment income | | | — | | | | (0.18 | ) | | | (0.00 | )(b) | | | (0.01 | ) | | | (0.00 | )(b) |
Net realized capital gains | | | (0.21 | ) | | | — | | | | (0.21 | ) | | | (1.00 | ) | | | — | |
| | | | | | | | | | | | | | | | | | | | |
Total Distributions | | | (0.21 | ) | | | (0.18 | ) | | | (0.21 | ) | | | (1.01 | ) | | | (0.00 | ) |
| | | | | | | | | | | | | | | | | | | | |
Net asset value, end of the period | | $ | 9.88 | | | $ | 11.00 | | | $ | 9.66 | | | $ | 10.99 | | | $ | 10.01 | |
| | | | | | | | | | | | | | | | | | | | |
Total return(c)(d) | | | (8.04 | )% | | | 15.75 | % | | | (10.30 | )% | | | 19.92 | % | | | 1.63 | % |
RATIOS TO AVERAGE NET ASSETS: | |
Net assets, end of the period (000’s) | | $ | 22 | | | $ | 27 | | | $ | 14 | | | $ | 15 | | | $ | 9 | |
Net expenses(e) | | | 1.90 | %(f) | | | 1.90 | % | | | 1.90 | % | | | 1.92 | %(g) | | | 1.91 | %(h) |
Gross expenses | | | 2.38 | %(f) | | | 2.38 | % | | | 2.34 | % | | | 2.49 | %(g) | | | 2.51 | %(h) |
Net investment income (loss) | | | (0.85 | )% | | | 0.81 | % | | | 0.37 | % | | | (0.02 | )% | | | (0.75 | )% |
Portfolio turnover rate | | | 49 | % | | | 23 | % | | | 46 | % | | | 8 | % | | | 115 | %(i) |
| (a) | Per share net investment income (loss) has been calculated using the average shares outstanding during the period. |
| (b) | Amount rounds to less than $0.01 per share. |
| (c) | A contingent deferred sales charge for Class C shares is not reflected in total return calculations. |
| (d) | Had certain expenses not been waived/reimbursed during the period, total returns would have been lower. |
| (e) | The investment adviser agreed to waive its fees and/or reimburse a portion of the Fund’s expenses during the period. Without this waiver/reimbursement, expenses would have been higher. |
| (f) | Does not include expenses of the underlying funds in which the Fund invests. Had underlying fund expenses been included, the net and gross expense ratios to average net assets would have been 1.94% and 2.42%, respectively. |
| (g) | Includes interest expense. Without this expense the ratio of net expenses would have been 1.90% and the ratio of gross expenses would have been 2.47%. |
| (h) | Includes interest expense. Without this expense the ratio of net expenses would have been 1.90% and the ratio of gross expenses would have been 2.50%. |
| (i) | The variation in the Fund’s turnover rate from 2015 to 2016 was primarily due to sales of equity securities in early 2016 in an effort to reduce risk. By mid-2016, in an effort to gain more exposure, the Fund returned to its normal investment strategy. |
See accompanying notes to financial statements.
41 |
Financial Highlights (continued)
For a share outstanding throughout each period
| | | | | | | | | | | | | | | | | | | | |
| | | AlphaSimplex Multi-Asset Fund— Class Y | |
| | | Year Ended
December 31,
2020
| | | Year Ended
December 31,
2019
| | | Year Ended
December 31,
2018
| | | Year Ended
December 31,
2017
| | | Year Ended
December 31,
2016
| |
Net asset value, beginning of the period | | $ | 11.11 | | | $ | 9.73 | | | $ | 11.12 | | | $ | 10.09 | | | $ | 9.86 | |
| | | | | | | | | | | | | | | | | | | | |
INCOME (LOSS) FROM INVESTMENT OPERATIONS: | |
Net investment income(a) | | | 0.02 | | | | 0.18 | | | | 0.15 | | | | 0.11 | | | | 0.03 | |
Net realized and unrealized gain (loss) | | | (0.84 | ) | | | 1.46 | | | | (1.18 | ) | | | 2.01 | | | | 0.23 | |
| | | | | | | | | | | | | | | | | | | | |
Total from Investment Operations | | | (0.82 | ) | | | 1.64 | | | | (1.03 | ) | | | 2.12 | | | | 0.26 | |
| | | | | | | | | | | | | | | | | | | | |
LESS DISTRIBUTIONS FROM: | |
Net investment income | | | (0.03 | ) | | | (0.26 | ) | | | (0.15 | ) | | | (0.09 | ) | | | (0.03 | ) |
Net realized capital gains | | | (0.21 | ) | | | — | | | | (0.21 | ) | | | (1.00 | ) | | | — | |
| | | | | | | | | | | | | | | | | | | | |
Total Distributions | | | (0.24 | ) | | | (0.26 | ) | | | (0.36 | ) | | | (1.09 | ) | | | (0.03 | ) |
| | | | | | | | | | | | | | | | | | | | |
Net asset value, end of the period | | $ | 10.05 | | | $ | 11.11 | | | $ | 9.73 | | | $ | 11.12 | | | $ | 10.09 | |
| | | | | | | | | | | | | | | | | | | | |
Total return(b) | | | (7.03 | )% | | | 16.82 | % | | | (9.39 | )% | | | 21.19 | % | | | 2.57 | % |
RATIOS TO AVERAGE NET ASSETS: | |
Net assets, end of the period (000’s) | | $ | 33,633 | | | $ | 43,712 | | | $ | 37,955 | | | $ | 39,571 | | | $ | 22,334 | |
Net expenses(c) | | | 0.90 | %(d) | | | 0.90 | % | | | 0.90 | % | | | 0.92 | %(e) | | | 0.91 | %(f) |
Gross expenses | | | 1.37 | %(d) | | | 1.37 | % | | | 1.35 | % | | | 1.50 | %(e) | | | 1.54 | %(f) |
Net investment income | | | 0.18 | % | | | 1.74 | % | | | 1.41 | % | | | 0.95 | % | | | 0.32 | % |
Portfolio turnover rate | | | 49 | % | | | 23 | % | | | 46 | % | | | 8 | % | | | 115 | %(g) |
| (a) | Per share net investment income has been calculated using the average shares outstanding during the period. |
| (b) | Had certain expenses not been waived/reimbursed during the period, total returns would have been lower. |
| (c) | The investment adviser agreed to waive its fees and/or reimburse a portion of the Fund’s expenses during the period. Without this waiver/reimbursement, expenses would have been higher. |
| (d) | Does not include expenses of the underlying funds in which the Fund invests. Had underlying fund expenses been included, the net and gross expense ratios to average net assets would have been 0.94% and 1.41%, respectively. |
| (e) | Includes interest expense. Without this expense the ratio of net expenses would have been 0.90% and the ratio of gross expenses would have been 1.48%. |
| (f) | Includes interest expense. Without this expense the ratio of net expenses would have been 0.90% and the ratio of gross expenses would have been 1.53%. |
| (g) | The variation in the Fund’s turnover rate from 2015 to 2016 was primarily due to sales of equity securities in early 2016 in an effort to reduce risk. By mid-2016, in an effort to gain more exposure, the Fund returned to its normal investment strategy. |
See accompanying notes to financial statements.
| 42
Notes to Financial Statements
December 31, 2020
1. Organization. Natixis Funds Trust II (the “Trust”) is organized as a Massachusetts business trust. The Trust is registered under the Investment Company Act of 1940, as amended (the “1940 Act”), as an open-end management investment company. The Declaration of Trust permits the Board of Trustees to authorize the issuance of an unlimited number of shares of the Trust in multiple series. The financial statements for certain funds of the Trust are presented in separate reports. The following funds (individually, a “Fund” and collectively, the “Funds”) are included in this report:
AlphaSimplex Global Alternatives Fund (the “Global Alternatives Fund”)
AlphaSimplex Managed Futures Strategy Fund (the “Managed Futures Strategy Fund”)
AlphaSimplex Multi-Asset Fund (the “Multi-Asset Fund”)
At close of business on April 30, 2020, Multi-Asset Fund adjusted its investment process, which included changes to enhance the Fund’s risk management and to allow the Fund to take short positions, among other items.
Each Fund is a diversified investment company, except for Multi-Asset Fund, which is a non-diversified investment company.
Each Fund offers Class A, Class C and Class Y shares. Global Alternatives Fund and Managed Futures Strategy Fund also offer Class N shares.
Class A shares are sold with a maximum front-end sales charge of 5.75%. Class C shares do not pay a front-end sales charge, pay higher Rule 12b-1 fees than Class A shares for ten years (at which point they automatically convert to Class A shares) and may be subject to a contingent deferred sales charge (“CDSC”) of 1.00% if those shares are redeemed within one year of acquisition, except for reinvested distributions. Class N and Class Y shares do not pay a front-end sales charge, a CDSC or Rule 12b-1 fees. Class N shares are offered with an initial minimum investment of $1,000,000. Class Y shares are offered with an initial minimum investment of $100,000. Certain categories of investors are exempted from the minimum investment amounts for Class N and Class Y as outlined in the relevant Fund’s prospectus.
Most expenses can be directly attributed to a Fund. Expenses which cannot be directly attributed to a Fund are generally apportioned based on the relative net assets of each of the funds in Natixis Funds Trust I, Natixis Funds Trust II, Natixis Funds Trust IV and Gateway Trust (“Natixis Funds Trusts”), Loomis Sayles Funds I and Loomis Sayles Funds II (“Loomis Sayles Funds Trusts”) and Natixis ETF Trust and Natixis ETF Trust II (“Natixis ETF Trusts”). Expenses of a Fund are borne pro rata by the holders of each class of shares, except that each class bears expenses unique to that class (such as the Rule 12b-1 fees applicable to Class A and Class C), and transfer agent fees are borne collectively for Class A, Class C, Class Y, and individually for Class N. In addition, each class votes as a class only with respect to its own Rule 12b-1 Plan. Shares of each class would receive their pro rata share of the net assets of a Fund if the Fund were liquidated. The Trustees approve separate distributions from net investment income on each class of shares.
Global Alternatives Fund and Managed Futures Strategy Fund invest in commodity-related instruments through AlphaSimplex Global Alternatives Cayman Fund Ltd. and AlphaSimplex Managed Futures Strategy Cayman Fund Ltd., wholly-owned subsidiaries (individually, a “Subsidiary” and collectively, the “Subsidiaries”) of Global Alternatives Fund and Managed Futures Strategy Fund, respectively, organized under the laws of the Cayman Islands. Subscription agreements were entered into between the Funds and their respective Subsidiaries with the intent that each Fund will remain the sole shareholder and primary beneficiary of its respective Subsidiary. The Subsidiaries are governed by a separate Board of Directors that is independent of the Funds’ Board of Trustees.
As of December 31, 2020, the value of each Fund’s investment in its respective Subsidiary was as follows:
| | | | | | | | |
Fund | | Investment in Subsidiary | | | Percentage of Net Assets | |
Global Alternatives Fund | | $ | 16,914,689 | | | | 3.23 | % |
Managed Futures Strategy Fund | | | 46,532,942 | | | | 3.13 | % |
2. Significant Accounting Policies. The following is a summary of significant accounting policies consistently followed by each Fund in the preparation of its financial statements. The Funds’ financial statements follow the accounting and reporting guidelines provided for investment companies and are prepared in accordance with accounting principles generally accepted in the United States of America which require the use of management estimates that affect the reported amounts and disclosures in the financial statements. Actual results could differ from those estimates. Management has evaluated the events and transactions subsequent to year-end through the date the financial statements were issued and has determined that there were no material events that would require disclosure in the Funds’ financial statements.
a. Consolidation. The accompanying financial statements of Global Alternatives Fund and Managed Futures Strategy Fund present the consolidated accounts of the Funds and their respective Subsidiaries. All interfund accounts and transactions have been eliminated in consolidation.
43 |
Notes to Financial Statements (continued)
December 31, 2020
b. Valuation. Fund securities and other investments are valued at market value based on market quotations obtained or determined by independent pricing services recommended by the adviser and approved by the Board of Trustees. Fund securities and other investments for which market quotations are not readily available are valued at fair value as determined in good faith by the adviser pursuant to procedures approved by the Board of Trustees, as described below. Market value is determined as follows:
Debt securities and unlisted preferred equity securities are valued based on evaluated bids furnished to the Funds by an independent pricing service or bid prices obtained from broker-dealers. Listed equity securities (including shares of closed-end investment companies and exchange-traded funds) are valued at the last sale price quoted on the exchange where they are traded most extensively or, if there is no reported sale during the day, the closing bid quotation as reported by an independent pricing service. Securities traded on the NASDAQ Global Select Market, NASDAQ Global Market and NASDAQ Capital Market are valued at the NASDAQ Official Closing Price (“NOCP”), or if lacking an NOCP, at the most recent bid quotations on the applicable NASDAQ Market. Unlisted equity securities (except unlisted preferred equity securities) are valued at the last sale price quoted in the market where they are traded most extensively or, if there is no reported sale during the day, the closing bid quotation as reported by an independent pricing service. If there is no last sale price or closing bid quotation available, unlisted equity securities will be valued using evaluated bids furnished by an independent pricing service, if available. In some foreign markets, an official close price and a last sale price may be available from the foreign exchange or market. In those cases, the official close price is used. Broker-dealer bid prices may be used to value debt and unlisted equity securities where an independent pricing service is unable to price a security or where an independent pricing service does not provide a reliable price for the security. Forward foreign currency contracts are valued utilizing interpolated rates determined based on information provided by an independent pricing service. Futures contracts are valued at the most recent settlement price on the exchange on which the adviser or subadviser believes that, over time, they are traded most extensively. Equity basket total return swaps are valued based on the value of the underlying listed equity securities as reported by an independent pricing service. If prices from an independent pricing service are not available, prices from a broker-dealer may be used.
Fund securities and other investments for which market quotations are not readily available are valued at fair value as determined in good faith by the adviser pursuant to procedures approved by the Board of Trustees. The Funds may also value securities and other investments at fair value in other circumstances such as when extraordinary events occur after the close of a foreign market but prior to the close of the New York Stock Exchange. This may include situations relating to a single issuer (such as a declaration of bankruptcy or a delisting of the issuer’s security from the primary market on which it has traded) as well as events affecting the securities markets in general (such as market disruptions or closings and significant fluctuations in U.S. and/or foreign markets). When fair valuing its securities or other investments, the Funds may, among other things, use modeling tools or other processes that may take into account factors such as securities or other market activity and/or significant events that occur after the close of the foreign market and before the time the Fund’s net asset value (“NAV”) is calculated. Fair value pricing may require subjective determinations about the value of a security, and fair values used to determine a Fund’s NAV may differ from quoted or published prices, or from prices that are used by others, for the same securities. In addition, the use of fair value pricing may not always result in adjustments to the prices of securities held by a Fund.
As of December 31, 2020, futures contracts were fair valued pursuant to procedures approved by the Board of Trustees as events occurring after the close of the foreign market were believed to materially affect the value of the contracts, as follows:
| | | | | | | | | | | | |
| | | Notional Value | | | Unrealized Appreciation/ Depreciation* | | | Unrealized as a Percentage of Net Assets | |
Global Alternatives Fund | | $ | 55,687,841 | | | $ | 1,395,106 | | | | 0.27 | % |
Managed Futures Strategy Fund | | | 219,740,696 | | | | 5,146,559 | | | | 0.35 | % |
Multi-Asset Fund | | | 5,435,191 | | | | 86,186 | | | | 0.25 | % |
| * | Amounts represent gross unrealized appreciation/(depreciation) at absolute value. |
c. Investment Transactions and Related Investment Income. Investment transactions are accounted for on a trade date plus one day basis for daily NAV calculation. However, for financial reporting purposes, investment transactions are reported on trade date. Dividend income (including income reinvested) and foreign withholding tax, if applicable, is recorded on the ex-dividend date, or in the case of certain foreign securities, as soon as the Fund is notified, and interest income is recorded on an accrual basis. Interest income is increased by the accretion of discount and decreased by the amortization of premium, if applicable. In determining net gain or loss on securities sold, the cost of securities has been determined on an identified cost basis. Investment income, non-class specific expenses and realized and unrealized gains and losses are allocated on a pro rata basis to each class based on the relative net assets of each class to the total net assets of the Fund.
| 44
Notes to Financial Statements (continued)
December 31, 2020
d. Foreign Currency Translation. The books and records of the Funds are maintained in U.S. dollars. The values of securities, currencies and other assets and liabilities denominated in currencies other than U.S. dollars, if any, are translated into U.S. dollars based upon foreign exchange rates prevailing at the end of the period. Purchases and sales of investment securities, income and expenses are translated into U.S. dollars on the respective dates of such transactions.
Net realized foreign exchange gains or losses arise from sales of foreign currency, changes in exchange rates between the trade and settlement dates on securities transactions and the difference between the amounts of dividends, interest and foreign withholding taxes recorded on the Funds’ books and the U.S. dollar equivalent of the amounts actually received or paid. Net unrealized foreign exchange gains or losses arise from changes in the value of assets and liabilities, other than investment securities, as of the end of the fiscal period, resulting from changes in exchange rates. Net realized foreign exchange gains or losses and the net change in unrealized foreign exchange gains or losses are disclosed in the Statements of Operations.
The values of investment securities are presented at the foreign exchange rates prevailing at the end of the period for financial reporting purposes. Net realized and unrealized gains or losses on investments reported in the Statements of Operations reflect gains or losses resulting from changes in exchange rates and fluctuations which arise due to changes in market prices of investment securities.
The Funds may use foreign currency exchange contracts to facilitate transactions in foreign-denominated investments. Losses may arise from changes in the value of the foreign currency or if the counterparties do not perform under the contracts’ terms.
e. Forward Foreign Currency Contracts. The Funds may enter into forward foreign currency contracts including forward foreign cross currency contracts, to acquire exposure to foreign currencies or to hedge the Funds’ investments against currency fluctuation. A contract can also be used to offset a previous contract. These contracts involve market risk in excess of the unrealized appreciation (depreciation) reflected in the Funds’ Statements of Assets and Liabilities. The U.S. dollar value of the currencies a Fund has committed to buy or sell represents the aggregate exposure to each currency a Fund has acquired or hedged through currency contracts outstanding at period end. Gains or losses are recorded for financial statement purposes as unrealized until settlement date. Contracts are traded over-the-counter directly with a counterparty. Risks may arise upon entering into these contracts from the potential inability of counterparties to meet the terms of their contracts and from unanticipated movements in the value of a foreign currency relative to the U.S. dollar. When a Fund enters into a forward foreign currency contract, it is required to pledge cash or high-quality securities equal to a percentage of the notional amount of the contract to the counterparty as an independent amount of collateral. The Funds may pledge additional collateral to the counterparty to the extent of mark-to-market losses on open contracts.
f. Futures Contracts. The Funds and the Subsidiaries may enter into futures contracts. Futures contracts are agreements between two parties to buy and sell a particular commodity, instrument or index for a specified price on a specified future date.
When a Fund or a Subsidiary enters into a futures contract, it is required to deposit with (or for the benefit of) its broker an amount of cash or short-term high-quality securities as “initial margin.” As the value of the contract changes, the value of the futures contract position increases or declines. Subsequent payments, known as “variation margin,” are made or received by a Fund or the Subsidiary, depending on the price fluctuations in the fair value of the contract and the value of cash or securities on deposit with the broker. Gross unrealized appreciation (depreciation) on futures contracts is recorded in the Statements of Assets and Liabilities as an asset (liability). The aggregate principal amounts of the contracts are not recorded in the financial statements. Fluctuations in the value of the contracts are recorded in the Statements of Operations as unrealized appreciation (depreciation) until the contracts are closed, when they are recorded as realized gains (losses). Realized gain or loss on a futures position is equal to the difference between the value of the contract at the time it was opened and the value at the time it was closed, minus brokerage commissions. When a Fund or a Subsidiary enters into a futures contract certain risks may arise, such as illiquidity in the futures market, which may limit a Fund’s or a Subsidiary’s ability to close out a futures contract prior to settlement date, and unanticipated movements in the value of securities, commodities or interest rates.
Futures contracts are exchange-traded. Exchange-traded futures contracts are standardized and are settled through a clearing house with fulfillment supported by the credit of the exchange. Therefore, counterparty credit risks to the Funds and the Subsidiaries are reduced; however, in the event that a counterparty enters into bankruptcy, a Fund’s claim against initial/variation margin on deposit with the counterparty may be subject to terms of a final settlement in bankruptcy court.
g. Swap Agreements. Global Alternatives Fund may enter into equity basket total return swap agreements. An equity basket total return swap is an agreement between two parties to exchange, for a specified period and based on the notional amount, the total return on an underlying basket of equity securities for, typically, fixed or floating interest payments. When a Fund pays interest in exchange for the total return of an underlying asset and the value of the underlying asset decreases, the Fund may be required to pay the change in value to the counterparty in addition to the interest payment; conversely, when a Fund receives interest in exchange for the total return of an underlying asset and the value of the underlying asset decreases, the Fund may receive the change in value in
45 |
Notes to Financial Statements (continued)
December 31, 2020
addition to the interest payment. The Fund receives net interest or pays net total return depending on whether the values of the underlying assets decrease or increase. Dividends declared on short reference entity common stocks are accrued and paid to the counterparty. Equity basket total return swap agreements typically reset on a monthly basis.
The notional amounts of equity basket total return swap agreements are not recorded in the financial statements. Equity basket total return swap agreements are valued daily, and fluctuations in value are recorded as change in unrealized appreciation (depreciation) on swap agreements in the Consolidated Statement of Operations. Fees are accrued in accordance with the terms of the agreement and are included in due to/from brokers on the Consolidated Statement of Assets and Liabilities. Payments made or received by the Fund as a result of a reset or termination of the agreement are recorded as realized gain or loss on the Consolidated Statement of Operations.
Equity basket total return swap agreements are privately negotiated in the over-the-counter market and are entered into as bilateral contracts. Bilateral swap agreements are traded between counterparties and, as such, are subject to the risk that a party to the agreement will not be able to meet its obligations. Bilateral swap agreements may require the movement of cash and/or securities as collateral for the Fund’s or counterparty’s net obligations under the contracts. The Fund covers its net obligations under outstanding equity basket total return swap agreements by segregating or earmarking cash or securities.
h. Due to/from Brokers. Transactions and positions in certain futures, forward foreign currency contracts and swap agreements are maintained and cleared by registered U.S. broker/dealers pursuant to customer agreements between the Funds or the Subsidiaries and the various broker/dealers. The due from brokers’ balances in the Statements of Assets and Liabilities for the Funds represent cash and foreign currency on deposit with brokers for open futures contracts and cash pledged as collateral for forward foreign currency contracts and swap agreements (including accrued interest receivable on equity basket total return swap agreements and net dividends payable on short reference entity common stocks). The due to brokers’ balances in the Statements of Assets and Liabilities for the Funds represent net cash and foreign currency debit balances related to futures contracts. In certain circumstances the Funds’ or Subsidiaries’ use of cash, and/or foreign currency held at brokers is restricted by regulation or broker mandated limits.
i. Federal and Foreign Income Taxes. The Trust treats each Fund as a separate entity for federal income tax purposes. Each Fund intends to meet the requirements of the Internal Revenue Code of 1986, as amended, applicable to regulated investment companies, and to distribute to its shareholders substantially all of its net investment income and any net realized capital gains at least annually. Management has performed an analysis of each Fund’s tax positions for the open tax years as of December 31, 2020 and has concluded that no provisions for income tax are required. The Funds’ federal tax returns for the prior three fiscal years remain subject to examination by the Internal Revenue Service. Management is not aware of any events that are reasonably possible to occur in the next twelve months that would result in the amounts of any unrecognized tax benefits significantly increasing or decreasing for the Funds. However, management’s conclusions regarding tax positions taken may be subject to review and adjustment at a later date based on factors including, but not limited to, new tax laws and accounting regulations and interpretations thereof.
A Fund may be subject to foreign withholding taxes on investment income and taxes on capital gains on investments that are accrued and paid based upon the Fund’s understanding of the tax rules and regulations that exist in the countries in which the Fund invests. Foreign withholding taxes on dividend and interest income are reflected on the Statements of Operations as a reduction of investment income, net of amounts eligible to be reclaimed. Dividends and interest receivable on the Statements of Assets and Liabilities are net of foreign withholding taxes. Foreign withholding taxes where reclaims have been or will be filed are reflected on the Statements of Assets and Liabilities as tax reclaims receivable. Capital gains taxes paid are included in net realized gain (loss) on investments in the Statements of Operations. Accrued but unpaid capital gains taxes are reflected as foreign taxes payable on the Statements of Assets and Liabilities, if applicable, and reduce unrealized gains on investments. In the event that realized gains on investments are subsequently offset by realized losses, taxes paid on realized gains may be returned to a Fund. Such amounts, if applicable, are reflected as foreign tax rebates receivable on the Statements of Assets and Liabilities and are recorded as a realized gain when received.
j. Dividends and Distributions to Shareholders. Dividends and distributions are recorded on the ex-dividend date. The timing and characterization of certain income and capital gain distributions are determined in accordance with federal tax regulations, which may differ from accounting principles generally accepted in the United States of America. Permanent differences are primarily due to differing treatments for book and tax purposes of items such as capital gain and return of capital distributions received, foreign currency gains and losses, partnership basis adjustments, deferred Trustees’ fees, distribution re-designations, futures and forward foreign currency contract mark-to-market, swap adjustments, passive foreign investment company adjustments, and Cayman blocker adjustments. Permanent book and tax basis differences relating to shareholder distributions, net investment income and net realized gains will result in reclassifications to capital accounts reported on the Statements of Assets and Liabilities. Temporary differences between book and tax distributable earnings are primarily due to deferred Trustees’ fees, partnership basis adjustments, wash sales, return of capital distributions received, futures and forward foreign currency contract mark-to-market and foreign currency gains and
| 46
Notes to Financial Statements (continued)
December 31, 2020
losses, passive foreign investment company adjustments, capital gain distributions received and Cayman blocker adjustments. Amounts of income and capital gain available to be distributed on a tax basis are determined annually, and at other times during the Funds’ fiscal year as may be necessary to avoid knowingly declaring and paying a return of capital distribution. Distributions from net investment income and net realized short-term capital gains are reported as distributed from ordinary income for tax purposes.
The tax characterization of distributions is determined on an annual basis. The tax character of distributions paid to shareholders during the years ended December 31, 2020 and 2019 were as follows:
| | | | | | | | | | | | | | | | | | | | | | | | |
| | | 2020 Distributions | | | 2019 Distributions | |
Fund | | Ordinary
Income | | | Long-Term
Capital
Gains | | | Total | | | Ordinary
Income | | | Long-Term
Capital
Gains | | | Total | |
Global Alternatives Fund | | $ | 13,230,129 | | | $ | — | | | $ | 13,230,129 | | | $ | 9,278,612 | | | $ | — | | | $ | 9,278,612 | |
Managed Futures Strategy Fund | | | 49,187,249 | | | | — | | | | 49,187,249 | | | | 74,582,788 | | | | — | | | | 74,582,788 | |
Multi-Asset Fund | | | 107,076 | | | | 792,961 | | | | 900,037 | | | | 1,028,235 | | | | — | | | | 1,028,235 | |
Distributions paid to shareholders from net investment income and net realized capital gains, based on accounting principles generally accepted in the United States of America, are consolidated and reported on the Statements of Changes in Net Assets as Distributions to Shareholders. Distributions paid to shareholders from net investment income and net realized capital gains expressed in per-share amounts, based on accounting principles generally accepted in the United States of America, are separately stated and reported within the Financial Highlights.
As of December 31, 2020, the components of distributable earnings on a tax basis were as follows:
| | | | | | | | | | | | |
| | | Global
Alternatives
Fund | | | Managed
Futures
Strategy
Fund | | | Multi-Asset
Fund | |
Capital loss carryforward: | | | | | | | | | | | | |
Short-term: | | | | | | | | | | | | |
No expiration date | | $ | (88,477,554 | ) | | $ | (66,108,457 | ) | | $ | (1,496,019 | ) |
Long-term: | |
No expiration date | | | (6,554,643 | ) | | | — | | | | (601,980 | ) |
| | | | | | | | | | | | |
Total capital loss carryforward | | | (95,032,197 | ) | | | (66,108,457 | ) | | | (2,097,999 | ) |
| | | | | | | | | | | | |
Late-year ordinary and post-October capital loss deferrals* | | | (29,680,113 | ) | | | — | | | | (285,593 | ) |
| | | | | | | | | | | | |
Unrealized appreciation | | | 40,554,134 | | | | 42,499,983 | | | | 1,549,828 | |
| | | | | | | | | | | | |
Total accumulated losses | | $ | (84,158,176 | ) | | $ | (23,608,474 | ) | | $ | (833,764 | ) |
| | | | | | | | | | | | |
Capital loss carryforward utilized in the current year | | $ | — | | | $ | 88,460,757 | | | $ | — | |
| | | | | | | | | | | | |
| * | Under current tax law, capital losses, foreign currency losses, losses on passive foreign investment companies, total return swap resets and contingent payment debt instruments after October 31 or December 31, as applicable, may be deferred and treated as occurring on the first day of the following taxable year. Managed Futures Strategy Fund and Multi-Asset Fund are deferring foreign currency losses. Global Alternatives Fund is deferring foreign currency losses and losses on total return swap resets. |
As of December 31, 2020, the tax cost of investments (including derivatives) and unrealized appreciation (depreciation) on a federal tax basis were as follows:
| | | | | | | | | | | | |
| | | Global
Alternatives
Fund | | | Managed
Futures
Strategy
Fund | | | Multi-Asset
Fund | |
Federal tax cost | | $ | 427,498,929 | | | $ | 1,382,452,448 | | | $ | 30,858,076 | |
| | | | | | | | | | | | |
Gross tax appreciation | | $ | 42,360,220 | | | $ | 49,119,331 | | | $ | 1,553,237 | |
Gross tax depreciation | | | (1,809,098 | ) | | | (6,705,499 | ) | | | (1 | ) |
| | | | | | | | | | | | |
Net tax appreciation | | $ | 40,551,122 | | | $ | 42,413,832 | | | $ | 1,553,236 | |
| | | | | | | | | | | | |
47 |
Notes to Financial Statements (continued)
December 31, 2020
The difference between these amounts and those reported in the components of distributable earnings are primarily attributable to foreign currency mark-to-market.
k. Repurchase Agreements. Each Fund may enter into repurchase agreements, under the terms of a Master Repurchase Agreement, under which each Fund acquires securities as collateral and agrees to resell the securities at an agreed upon time and at an agreed upon price. It is each Fund’s policy that the market value of the collateral for repurchase agreements be at least equal to 102% of the repurchase price, including interest. Certain repurchase agreements are tri-party arrangements whereby the collateral is held in a segregated account for the benefit of the Fund and on behalf of the counterparty. Repurchase agreements could involve certain risks in the event of default or insolvency of the counterparty, including possible delays or restrictions upon a Fund’s ability to dispose of the underlying securities. As of December 31, 2020, each Fund, as applicable, had investments in repurchase agreements for which the value of the related collateral exceeded the value of the repurchase agreement. The gross value of repurchase agreements is included in the Statements of Assets and Liabilities for financial reporting purposes.
l. Indemnifications. Under the Trust’s organizational documents, its officers and Trustees are indemnified against certain liabilities arising out of the performance of their duties to the Funds. Additionally, in the normal course of business, the Funds enter into contracts with service providers that contain general indemnification clauses. The Funds’ maximum exposure under these arrangements is unknown as this would involve future claims that may be made against the Funds that have not yet occurred. However, based on experience, the Funds expect the risk of loss to be remote.
m. New Accounting Pronouncement. In March 2020, the Financial Accounting Standards Board issued Accounting Standard Update 2020-04, Reference Rate Reform (Topic 848) (“ASU 2020-04”). In response to concerns about structural risks of interbank offered rates, and particularly the risk of cessation of the London Interbank Offered Rate (“LIBOR”), which is expected to occur no later than December 31, 2021, regulators have undertaken reference rate reform initiatives to identify alternative reference rates that are more observable or transaction based and less susceptible to manipulation. ASU 2020-04 provides temporary guidance to ease the potential burden in accounting for (or recognizing the effects of) reference rate reform on financial reporting. ASU 2020-04 is elective and applies to all entities, subject to meeting certain criteria, that have contracts that reference LIBOR or another reference rate expected to be discontinued because of reference rate reform. ASU 2020-04 amendments offer optional expedients for contract modifications that would allow an entity to account for such modifications by prospectively adjusting the effective interest rate, instead of evaluating each contract, in accordance with existing accounting standards, as to whether reference rate modifications constitute the establishment of new contracts or the continuation of existing contracts. ASU 2020-04 amendments are currently effective and an entity may elect to apply its provisions as of any date from the beginning of an interim period that includes or is subsequent to March 12, 2020. No Fund contracts have yet been impacted by reference rate reform. Management expects to apply the optional expedients when appropriate.
3. Fair Value Measurements. In accordance with accounting standards related to fair value measurements and disclosures, the Funds have categorized the inputs utilized in determining the value of each Fund’s assets or liabilities. These inputs are summarized in the three broad levels listed below:
| | • | | Level 1 – quoted prices in active markets for identical assets or liabilities; |
| | • | | Level 2 – prices determined using other significant inputs that are observable either directly, or indirectly through corroboration with observable market data (which could include quoted prices for similar assets or liabilities, interest rates, credit risk, etc.); and |
| | • | | Level 3 – prices determined using significant unobservable inputs when quoted prices or observable inputs are unavailable such as when there is little or no market activity for an asset or liability (unobservable inputs reflect each Fund’s own assumptions in determining the fair value of assets or liabilities and would be based on the best information available). |
The inputs or methodology used for valuing securities are not necessarily an indication of the risk associated with investing in those securities.
| 48
Notes to Financial Statements (continued)
December 31, 2020
The following is a summary of the inputs used to value the Funds’ investments as of December 31, 2020, at value:
Global Alternatives Fund
Asset Valuation Inputs
| | | | | | | | | | | | | | | | |
Description | | Level 1 | | | Level 2 | | | Level 3 | | | Total | |
Common Stocks(a) | | $ | 272,292,421 | | | $ | — | | | $ | — | | | $ | 272,292,421 | |
Exchange-Traded Funds | | | 3,586,371 | | | | — | | | | — | | | | 3,586,371 | |
Short-Term Investments(a) | | | — | | | | 185,202,489 | | | | — | | | | 185,202,489 | |
Forward Foreign Currency Contracts (unrealized appreciation) | | | — | | | | 1,344,458 | | | | — | | | | 1,344,458 | |
Futures Contracts (unrealized appreciation) | | | 14,640,164 | | | | 1,246,891 | | | | — | | | | 15,887,055 | |
| | | | | | | | | | | | | | | | |
Total | | $ | 290,518,956 | | | $ | 187,793,838 | | | $ | — | | | $ | 478,312,794 | |
| | | | | | | | | | | | | | | | |
Liability Valuation Inputs
| | | | | | | | | | | | | | | | |
Description | | Level 1 | | | Level 2 | | | Level 3 | | | Total | |
Equity Basket Total return Swap | | $ | — | (b) | | $ | — | | | $ | — | | | $ | — | |
Forward Foreign Currency Contracts (unrealized depreciation) | | | — | | | | (711,638 | ) | | | — | | | | (711,638 | ) |
Futures Contracts (unrealized depreciation) | | | (5,780,013 | ) | | | (148,215 | ) | | | — | | | | (5,928,228 | ) |
| | | | | | | | | | | | | | | | |
Total | | $ | (5,780,013 | ) | | $ | (859,853 | ) | | $ | — | | | $ | (6,639,866 | ) |
| | | | | | | | | | | | | | | | |
| (a) | Details of the major categories of the Fund’s investments are reflected within the Consolidated Portfolio of Investments. |
| (b) | Represents net unrealized appreciation (depreciation) of $0, as reflected within the Consolidated Portfolio of Investments. |
Managed Futures Strategy Fund
Asset Valuation Inputs
| | | | | | | | | | | | | | | | |
Description | | Level 1 | | | Level 2 | | | Level 3 | | | Total | |
Short-Term Investments(a) | | $ | — | | | $ | 1,382,542,458 | | | $ | — | | | $ | 1,382,542,458 | |
Forward Foreign Currency Contracts (unrealized appreciation) | | | — | | | | 9,602,026 | | | | — | | | | 9,602,026 | |
Futures Contracts (unrealized appreciation) | | | 56,485,401 | | | | 4,872,088 | | | | — | | | | 61,357,489 | |
| | | | | | | | | | | | | | | | |
Total | | $ | 56,485,401 | | | $ | 1,397,016,572 | | | $ | — | | | $ | 1,453,501,973 | |
| | | | | | | | | | | | | | | | |
Liability Valuation Inputs
| | | | | | | | | | | | | | | | |
Description | | Level 1 | | | Level 2 | | | Level 3 | | | Total | |
Forward Foreign Currency Contracts (unrealized depreciation) | | $ | — | | | $ | (2,789,040 | ) | | $ | — | | | $ | (2,789,040 | ) |
Futures Contracts (unrealized depreciation) | | | (3,632,251 | ) | | | (274,471 | ) | | | — | | | | (3,906,722 | ) |
| | | | | | | | | | | | | | | | |
Total | | $ | (3,632,251 | ) | | $ | (3,063,511 | ) | | $ | — | | | $ | (6,695,762 | ) |
| | | | | | | | | | | | | | | | |
| (a) | Details of the major categories of the Fund’s investments are reflected within the Consolidated Portfolio of Investments. |
Multi-Asset Fund
Asset Valuation Inputs
| | | | | | | | | | | | | | | | |
Description | | Level 1 | | | Level 2 | | | Level 3 | | | Total | |
Exchange-Traded Funds | | $ | 10,947,261 | | | $ | — | | | $ | — | | | $ | 10,947,261 | |
Short-Term Investments(a) | | | — | | | | 21,366,970 | | | | — | | | | 21,366,970 | |
Futures Contracts (unrealized appreciation) | | | 422,671 | | | | 70,459 | | | | — | | | | 493,130 | |
| | | | | | | | | | | | | | | | |
Total | | $ | 11,369,932 | | | $ | 21,437,429 | | | $ | — | | | $ | 32,807,361 | |
| | | | | | | | | | | | | | | | |
Liability Valuation Inputs
| | | | | | | | | | | | | | | | |
Description | | Level 1 | | | Level 2 | | | Level 3 | | | Total | |
Futures Contracts (unrealized depreciation) | | $ | (28,827 | ) | | $ | (15,727 | ) | | $ | — | | | $ | (44,554 | ) |
| | | | | | | | | | | | | | | | |
| (a) | Details of the major categories of the Fund’s investments are reflected within the Portfolio of Investments. |
49 |
Notes to Financial Statements (continued)
December 31, 2020
4. Derivatives. Derivative instruments are defined as financial instruments whose value and performance are based on the value and performance of an underlying asset, reference rate or index. Derivative instruments that the Funds used during the period include forward foreign currency contracts, futures contracts and swap agreements.
Global Alternatives Fund seeks to achieve long and short exposure to global equity, bond, currency and commodity markets through a wide range of derivative instruments and direct investments. These investments are intended to provide the Fund with risk and return characteristics similar to those of a diversified portfolio of hedge funds. The Fund uses quantitative models to estimate the market exposures that drive the aggregate returns of a diverse set of hedge funds, and seeks to use a variety of derivative instruments to capture such exposures in the aggregate. The Fund may also use various strategies commonly used by hedge funds that seek to profit from underlying risk factors, such as merger arbitrage. Under normal market conditions, the Fund will make extensive use of derivative instruments, in particular futures and forward contracts on global equity and fixed income securities, securities indices, currencies, commodities and other instruments and equity basket total return swap agreements. During the year ended December 31, 2020, the Fund used long and short contracts on U.S. and foreign government bonds, U.S. and foreign equity market indices, foreign currencies, and commodities (through investments in the Subsidiary), long contracts on short-term interest rates, and short contracts on equity basket total return swaps in accordance with these objectives.
Managed Futures Strategy Fund seeks to generate positive absolute returns over time. The Fund uses a set of proprietary quantitative models to identify price trends in equity, fixed income, currency and commodity instruments, and may have both short and long exposures within an asset class based on an analysis of asset price trends. Under normal market conditions, the Fund will make extensive use of derivative instruments, in particular futures and forward contracts, to capture the exposures suggested by its absolute return strategy while also adding value through volatility management. These market exposures, which are expected to change over time, may include exposures to global equity and fixed income securities, securities indices, currencies, commodities and other instruments. During the year ended December 31, 2020, the Fund used long and short contracts on U.S. and foreign equity market indices, short-term interest rates, foreign currencies and commodities (through investments in the Subsidiary), and long contracts on U.S. and foreign government bonds to capture the exposures suggested by the quantitative investment models.
Multi-Asset Fund tactically allocates its investments across a range of asset classes and global markets. The Fund will typically use a variety of derivative instruments, in particular long positions in futures and forward contracts, to achieve exposures to global equity and fixed income securities. The Fund may also hold short positions in derivatives for hedging purposes . During the year ended December 31, 2020, the Fund used long and short contracts on foreign government bonds, U.S. dollar index and foreign currency, and long contracts on U.S. and foreign equity market indices and U.S. government bonds, to gain investment exposures in accordance with its objectives.
The following is a summary of derivative instruments for Global Alternatives Fund as of December 31, 2020, as reflected within the Statements of Assets and Liabilities:
| | | | | | | | |
Assets | | Unrealized
appreciation
on forward
foreign
currency
contracts | | | Unrealized
appreciation
on futures
contracts | |
Over-the-counter asset derivatives | | | | | | | | |
Foreign exchange contracts | | $ | 1,344,458 | | | $ | — | |
| | | | | | | | |
Exchange-traded asset derivatives | |
Interest rate contracts | | $ | — | | | $ | 1,861,895 | |
Foreign exchange contracts | | | — | | | | 1,091,700 | |
Commodity contracts | | | — | | | | 9,106,238 | |
Equity contracts | | | — | | | | 3,827,222 | |
| | | | | | | | |
Total exchange-traded asset derivatives | | $ | — | | | $ | 15,887,055 | |
| | | | | | | | |
Total asset derivatives | | $ | 1,344,458 | | | $ | 15,887,055 | |
| | | | | | | | |
| 50
Notes to Financial Statements (continued)
December 31, 2020
| | | | | | | | | | | | |
Liabilities | | Unrealized
depreciation
on forward
foreign
currency
contracts | | | Unrealized
depreciation
on futures
contracts | | | Swap
agreements
at value1 | |
Over-the-counter liability derivatives | | | | | | | | | | | | |
Foreign exchange contracts | | $ | (711,638 | ) | | $ | — | | | $ | — | |
Equity contracts | | | — | | | | — | | | | (135,849,616 | ) |
| | | | | | | | | | | | |
Total over-the counter liability derivatives | | $ | (711,638 | ) | | $ | — | | | $ | (135,849,616 | ) |
| | | | | | | | | | | | |
Exchange-traded liability derivatives | |
Interest rate contracts | | $ | — | | | $ | (342,503 | ) | | $ | — | |
Foreign exchange contracts | | | — | | | | (881,913 | ) | | | — | |
Commodity contracts | | | — | | | | (3,021,503 | ) | | | — | |
Equity contracts | | | — | | | | (1,682,309 | ) | | | — | |
| | | | | | | | | | | | |
Total exchange-traded liability derivatives | | $ | — | | | $ | (5,928,228 | ) | | $ | — | |
| | | | | | | | | | | | |
Total liability derivatives | | $ | (711,638 | ) | | $ | (5,928,228 | ) | | $ | (135,849,616 | ) |
| | | | | | | | | | | | |
| 1 | Represents swap agreements, at value. Market value of swap agreements is reported in the Consolidated Portfolio of Investments. |
Transactions in derivative instruments for Global Alternatives Fund during the year ended December 31, 2020, as reflected within the Statements of Operations were as follows:
| | | | | | | | | | | | |
Net Realized Gain (Loss) on: | | Futures
contracts | | | Forward foreign
currency
transactions | | | Swap
agreements | |
Interest rate contracts | | $ | 19,099,670 | | | $ | — | | | $ | — | |
Foreign exchange contracts | | | (7,450,520 | ) | | | 711,523 | | | | — | |
Commodity contracts | | | (21,388,176 | ) | | | — | | | | — | |
Equity contracts | | | (11,181,358 | ) | | | — | | | | (27,001,268 | ) |
| | | | | | | | | | | | |
Total | | $ | (20,920,384 | ) | | $ | 711,523 | | | $ | (27,001,268 | ) |
| | | | | | | | | | | | |
| | | |
Net Change in Unrealized
Appreciation (Depreciation) on: | | Futures
contracts | | | Forward foreign
currency
transactions | | | | |
Interest rate contracts | | $ | 2,126,547 | | | $ | — | | | | | |
Foreign exchange contracts | | | 477,488 | | | | 1,890,310 | | | | | |
Commodity contracts | | | 2,961,919 | | | | — | | | | | |
Equity contracts | | | (211,548 | ) | | | — | | | | | |
| | | | | | | | | | | | |
Total | | $ | 5,354,406 | | | $ | 1,890,310 | | | | | |
| | | | | | | | | | | | |
51 |
Notes to Financial Statements (continued)
December 31, 2020
The following is a summary of derivative instruments for Managed Futures Strategy Fund as of December 31, 2020, as reflected within the Statements of Assets and Liabilities:
| | | | | | | | |
Assets | | Unrealized
appreciation
on forward
foreign
currency
contracts | | | Unrealized
appreciation
on futures
contracts | |
Over-the-counter asset derivatives | |
Foreign exchange contracts | | $ | 9,602,026 | | | $ | — | |
| | | | | | | | |
Exchange-traded asset derivatives | |
Interest rate contracts | | $ | — | | | $ | 4,819,307 | |
Foreign exchange contracts | | | — | | | | 6,624,042 | |
Commodity contracts | | | — | | | | 37,431,332 | |
Equity contracts | | | — | | | | 12,482,808 | |
| | | | | | | | |
Total exchange-traded asset derivatives | | $ | — | | | $ | 61,357,489 | |
| | | | | | | | |
Total asset derivatives | | $ | 9,602,026 | | | $ | 61,357,489 | |
| | | | | | | | |
| | |
Liabilities | | Unrealized
depreciation
on forward
foreign
currency
contracts | | | Unrealized
depreciation
on futures
contracts | |
Over-the-counter liability derivatives | |
Foreign exchange contracts | | $ | (2,789,040 | ) | | $ | — | |
| | | | | | | | |
Exchange-traded liability derivatives | |
Interest rate contracts | | $ | — | | | $ | (285,608 | ) |
Foreign exchange contracts | | | — | | | | (3,250 | ) |
Commodity contracts | | | — | | | | (2,895,859 | ) |
Equity contracts | | | — | | | | (722,005 | ) |
| | | | | | | | |
Total exchange-traded liability derivatives | | $ | — | | | $ | (3,906,722 | ) |
| | | | | | | | |
Total liability derivatives | | $ | (2,789,040 | ) | | $ | (3,906,722 | ) |
| | | | | | | | |
Transactions in derivative instruments for Managed Futures Strategy Fund during the year ended December 31, 2020, as reflected within the Statements of Operations were as follows:
| | | | | | | | |
Net Realized Gain (Loss) on: | | Futures
contracts | | | Forward foreign
currency
transactions | |
Interest rate contracts | | $ | 202,824,015 | | | $ | — | |
Foreign exchange contracts | | | (1,406,969 | ) | | | (2,679,889 | ) |
Commodity contracts | | | (103,840,882 | ) | | | — | |
Equity contracts | | | 53,028,486 | | | | — | |
| | | | | | | | |
Total | | $ | 150,604,650 | | | $ | (2,679,889 | ) |
| | | | | | | | |
| 52
Notes to Financial Statements (continued)
December 31, 2020
| | | | | | | | |
Net Change in Unrealized
Appreciation (Depreciation) on: | | Futures
contracts | | | Forward foreign
currency
transactions | |
Interest rate contracts | | $ | 20,499,021 | | | $ | — | |
Foreign exchange contracts | | | 8,812,472 | | | | 9,986,341 | |
Commodity contracts | | | 27,210,989 | | | | — | |
Equity contracts | | | (9,615,110 | ) | | | — | |
| | | | | | | | |
Total | | $ | 46,907,372 | | | $ | 9,986,341 | |
| | | | | | | | |
The following is a summary of derivative instruments for Multi-Asset Fund as of December 31, 2020, as reflected within the Statements of Assets and Liabilities:
| | | | |
Assets | | Unrealized
appreciation on
futures contracts | |
Exchange-traded asset derivatives | |
Interest rate contracts | | $ | 212,348 | |
Foreign exchange contracts | | | 66,309 | |
Equity contracts | | | 214,473 | |
| | | | |
Total exchange-traded asset derivatives | | $ | 493,130 | |
| | | | |
| |
Liabilities | | Unrealized
depreciation on
futures contracts | |
Exchange-traded liability derivatives | |
Interest rate contracts | | $ | (135 | ) |
Foreign exchange contracts | | | (15,286 | ) |
Equity contracts | | | (29,133 | ) |
| | | | |
Total exchange-traded liability derivatives | | $ | (44,554 | ) |
| | | | |
Transactions in derivative instruments for Multi-Asset Fund during the year ended December 31, 2020, as reflected within the Statements of Operations were as follows:
| | | | |
Net Realized Gain (Loss) on: | | Futures contracts | |
Interest rate contracts | | $ | 984,826 | |
Foreign exchange contracts | | | (672,054 | ) |
Equity contracts | | | (3,079,881 | ) |
| | | | |
Total | | $ | (2,767,109 | ) |
| | | | |
| |
Net Change in Unrealized
Appreciation (Depreciation) on: | | Futures contracts | |
Interest rate contracts | | $ | 324,422 | |
Foreign exchange contracts | | | (75,558 | ) |
Equity contracts | | | (346,000 | ) |
| | | | |
Total | | $ | (97,136 | ) |
| | | | |
The volume of forward foreign currency contract, futures contract and swap agreement activity, as a percentage of net assets, based on gross month-end notional amounts outstanding during the period, including long and short positions at absolute value, was as follows for the year ended December 31, 2020:
| | | | | | | | | | | | |
Global Alternatives Fund | | Forwards | | | Futures | | | Total
Return
Swaps | |
Average Notional Amount Outstanding | | | 34.52 | % | | | 262.11 | % | | | 9.14 | % |
Highest Notional Amount Outstanding | | | 118.72 | % | | | 526.83 | % | | | 25.96 | % |
Lowest Notional Amount Outstanding | | | 9.51 | % | | | 98.48 | % | | | 2.44 | % |
Notional Amount Outstanding as of December 31, 2020 | | | 44.58 | % | | | 425.59 | % | | | 25.96 | % |
53 |
Notes to Financial Statements (continued)
December 31, 2020
| | | | | | | | | | | | |
Managed Futures Strategy Fund | | Forwards | | | Futures | | | | |
Average Notional Amount Outstanding | | | 95.61 | % | | | 638.83 | % | | | | |
Highest Notional Amount Outstanding | | | 266.63 | % | | | 940.94 | % | | | | |
Lowest Notional Amount Outstanding | | | 40.90 | % | | | 316.61 | % | | | | |
Notional Amount Outstanding as of December 31, 2020 | | | 56.87 | % | | | 364.35 | % | | | | |
| | | |
Multi-Asset Fund | | | | | Futures | | | | |
Average Notional Amount Outstanding | | | | | | | 164.12 | % | | | | |
Highest Notional Amount Outstanding | | | | | | | 237.85 | % | | | | |
Lowest Notional Amount Outstanding | | | | | | | 48.33 | % | | | | |
Notional Amount Outstanding as of December 31, 2020 | | | | | | | 209.62 | % | | | | |
Notional amounts outstanding at the end of the prior period, if applicable, are included in the average notional amount outstanding.
Unrealized gain and/or loss on open forwards, futures and swaps is recorded in the Statements of Assets and Liabilities. The aggregate notional values of forward, futures and swap contracts are not recorded in the Statements of Assets and Liabilities, and therefore are not included in the net assets.
Over-the-counter derivatives, including forward foreign currency contracts and swap agreements, are entered into pursuant to International Swaps and Derivatives Association, Inc. (“ISDA”) agreements negotiated between the Funds and their counterparties. ISDA agreements typically contain, among other things, terms for the posting of collateral and master netting provisions in the event of a default or other termination event. Collateral is posted by a Fund or the counterparty to the extent of the net mark-to-market exposure to the other party of all open contracts under the agreement, subject to minimum transfer requirements. Master netting provisions allow the Funds and the counterparty, in the event of a default or other termination event, to offset amounts owed by each related to derivative contracts, including any posted collateral, to one net amount payable by either the Funds or the counterparty. The Funds’ ISDA agreements typically contain provisions that allow a counterparty to terminate open contracts early if the NAV of a Fund declines beyond a certain threshold. For financial reporting purposes, the Funds do not offset derivative assets and liabilities, and any related collateral received or pledged, on the Statements of Assets and Liabilities.
As of December 31, 2020, gross amounts of over-the-counter derivative assets and liabilities not offset in the Statements of Assets and Liabilities and the related net amounts after taking into account master netting arrangements, by counterparty, are as follows:
Global Alternatives Fund
| | | | | | | | | | | | | | | | | | | | |
Counterparty | | Gross Amounts of
Assets | | | Offset
Amount | | | Net
Asset
Balance | | | Collateral
(Received)/
Pledged | | | Net
Amount | |
UBS AG | | $ | 1,344,458 | | | $ | (711,638 | ) | | $ | 632,820 | | | $ | — | | | $ | 632,820 | |
| | | | | |
Counterparty | | Gross Amounts of
Liabilities | | | Offset
Amount | | | Net
Liability
Balance | | | Collateral
(Received)/
Pledged | | | Net
Amount | |
UBS AG | | $ | (711,638 | ) | | $ | 711,638 | | | $ | — | | | $ | — | | | $ | — | |
Managed Futures Strategy Fund
| | | | | | | | | | | | | | | | | | | | |
Counterparty | | Gross Amounts of
Assets | | | Offset
Amount | | | Net
Asset
Balance | | | Collateral
(Received)/
Pledged | | | Net
Amount | |
UBS AG | | $ | 9,602,026 | | | $ | (2,789,040 | ) | | $ | 6,812,986 | | | $ | — | | | $ | 6,812,986 | |
| | | | | |
Counterparty | | Gross Amounts of
Liabilities | | | Offset
Amount | | | Net
Liability
Balance | | | Collateral
(Received)/
Pledged | | | Net
Amount | |
UBS AG | | $ | (2,789,040 | ) | | $ | 2,789,040 | | | $ | — | | | $ | — | | | $ | — | |
The Funds are required to pledge an independent amount of collateral to the counterparty for open forward foreign currency contracts. In addition to the independent amount, the amount of collateral pledged to the counterparty is subsequently increased (for losses) or
| 54
Notes to Financial Statements (continued)
December 31, 2020
decreased (for gains) based on the change in value of the contracts, as calculated by the counterparty under the terms of the Funds’ ISDA agreements. As of December 31, 2020, amounts pledged to the counterparty (which may exceed the amounts shown in the table above) are as follows:
| | | | | | | | | | | | | | | | | | | | |
| | | Independent
Amount of
Collateral | | | Increase
(Decrease)
For Change
in Value | | | Required
Collateral | | | Collateral
Pledged | | | Excess/
(Shortfall) | |
Global Alternatives Fund | | $ | 2,808,676 | | | $ | (575,319 | ) | | $ | 2,233,357 | | | $ | 2,930,092 | | | $ | 696,735 | |
Managed Futures Strategy Fund | | | 39,377,213 | | | | (6,963,315 | ) | | | 32,413,898 | | | | 31,746,909 | | | | (666,989 | ) |
Amounts in excess or short of the required collateral amount are received or paid by the Funds on the next business day, subject to collateral thresholds and minimum transfer requirements. The ISDA agreements include a tri-party control agreement under which collateral pledged from the Fund to the broker is held for the benefit of the broker, as secured party, at a third party custodian, State Street Bank and Trust Company (“State Street Bank”). Collateral pledged to the broker is reflected in “due from brokers” on the Statements of Assets and Liabilities.
Counterparty risk is managed based on policies and procedures established by each Fund’s adviser. Such policies and procedures may include, but are not limited to, minimum counterparty credit rating requirements, monitoring of counterparty credit default swap spreads and posting of collateral. A Fund’s risk of loss from counterparty credit risk on OTC derivatives is generally limited to the Fund’s aggregated unrealized gains and the amount of any collateral pledged to the counterparty, which may be offset by any collateral posted to the Fund by the counterparty. ISDA master agreements can help to manage counterparty risk by specifying collateral posting arrangements at pre-arranged exposure levels. Under these ISDA agreements, collateral is routinely transferred if the total net exposure in respect of certain transactions, net of existing collateral already in place, exceeds a specified amount (typically $250,000, depending on the counterparty). With exchange-traded derivatives, there is minimal counterparty credit risk to the Fund because the exchange’s clearing house, as counterparty to these instruments, stands between the buyer and the seller of the contract. Credit risk still exists in exchange-traded derivatives with respect to initial and variation margin that is held in a broker’s customer accounts. While brokers are required to segregate customer margin from their own assets, in the event that a broker becomes insolvent or goes into bankruptcy and at that time there is a shortfall in the aggregate amount of margin held by the broker for all its clients, U.S. bankruptcy laws will typically allocate that shortfall on a pro rata basis across all of the broker’s customers, potentially resulting in losses to the Fund. Based on balances reflected on each Fund’s Statement of Assets and Liabilities, the following table shows (i) the maximum amount of loss due to credit risk that, based on the gross fair value of the financial instrument, the applicable Fund would incur if parties (including OTC derivative counterparties and brokers holding margin for exchange-traded derivatives) to the relevant financial instruments failed completely to perform according to the terms of the contracts and the collateral or other security, if any, for the amount due proved to be of no value to the Fund, and (ii) the amount of loss that the applicable Fund would incur after taking into account master netting provisions pursuant to ISDA agreements, as of December 31, 2020:
| | | | | | | | |
Fund | | Maximum Amount of Loss - Gross | | | Maximum Amount of Loss - Net | |
Global Alternatives Fund | | | | | | |
Over-the-counter counterparty credit risk | | | | | | | | |
Forward foreign currency contracts | | $ | 1,344,458 | | | $ | 632,820 | |
Collateral pledged to UBS AG | | | 2,930,092 | | | | 2,930,092 | |
Collateral pledged to Morgan Stanley | | | 40,326,618 | | | | 40,326,618 | |
| | | | | | | | |
Total over-the-counter counterparty credit risk | | | 44,601,168 | | | | 43,889,530 | |
| | | | | | | | |
Exchange-traded counterparty credit risk | | | | | | | | |
Futures contracts | | | 15,887,055 | | | | 15,887,055 | |
Margin with brokers | | | 29,748,010 | | | | 29,748,010 | |
| | | | | | | | |
Total exchange-traded counterparty credit risk | | | 45,635,065 | | | | 45,635,065 | |
| | | | | | | | |
Total counterparty credit risk | | $ | 90,236,233 | | | $ | 89,524,595 | |
| | | | | | | | |
55 |
Notes to Financial Statements (continued)
December 31, 2020
| | | | | | | | |
Fund | | Maximum Amount of Loss - Gross | | | Maximum Amount of Loss - Net | |
Managed Futures Strategy Fund | | | | | | |
Over-the-counter counterparty credit risk | | | | | | | | |
Forward foreign currency contracts | | $ | 9,602,026 | | | $ | 6,812,986 | |
Collateral pledged to UBS AG | | | 31,746,909 | | | | 31,746,909 | |
| | | | | | | | |
Total over-the-counter counterparty credit risk | | | 41,348,935 | | | | 38,559,895 | |
| | | | | | | | |
Exchange-traded counterparty credit risk | | | | | | | | |
Futures contracts | | | 61,357,489 | | | | 61,357,489 | |
Margin with brokers | | | 96,548,910 | | | | 96,548,910 | |
| | | | | | | | |
Total exchange-traded counterparty credit risk | | | 157,906,399 | | | | 157,906,399 | |
| | | | | | | | |
Total counterparty credit risk | | $ | 199,255,334 | | | $ | 196,466,294 | |
| | | | | | | | |
| | |
Multi-Asset Fund | | | | | | |
Exchange-traded counterparty credit risk | | | | | | | | |
Futures contracts | | $ | 493,130 | | | $ | 493,130 | |
Margin with brokers | | | 1,757,743 | | | | 1,757,743 | |
| | | | | | | | |
Total exchange-traded counterparty credit risk | | $ | 2,250,873 | | | $ | 2,250,873 | |
| | | | | | | | |
5. Purchases and Sales of Securities. For the year ended December 31, 2020, purchases and sales of securities (excluding short-term investments) were as follows:
| | | | | | | | |
Fund | | Purchases | | | Sales | |
Global Alternatives Fund | | $ | 474,847,099 | | | $ | 427,081,834 | |
Multi-Asset Fund | | | 7,423,802 | | | | 18,840,587 | |
6. Management Fees and Other Transactions with Affiliates.
a. Management Fees. AlphaSimplex Group, LLC (“AlphaSimplex”), which is a subsidiary of Natixis Investment Managers, LLC (“Natixis”), serves as investment adviser to the Funds. Under the terms of the management agreements, each Fund pays a management fee at the following annual rates, calculated daily and payable monthly, based on each Fund’s average daily net assets.
Global Alternatives Fund pays a management fee at an annual rate of 1.10% on the first $2 billion of the Fund’s average daily net assets (including the net asset value of the Subsidiary), and 1.05% thereafter, calculated daily and payable monthly, less the management fees paid by the Subsidiary.
Prior to July 1, 2020, Global Alternatives Fund paid a management fee at the annual rates of 1.15% on the first $2 billion of the Fund’s average daily net assets (including the net asset value of the Subsidiary), and 1.10% thereafter, calculated daily and payable monthly, less the management fees paid by the Subsidiary.
Managed Futures Strategy Fund pays a management fee at an annual rate of 1.25% on the first $2.5 billion of the Fund’s average daily net assets (including the net asset value of the Subsidiary), and 1.20% thereafter, calculated daily and payable monthly, less the management fees paid by the Subsidiary.
Multi-Asset Fund pays a management fee at an annual rate of 0.70% of the Fund’s average daily net assets, calculated daily and payable monthly.
AlphaSimplex also serves as investment adviser to AlphaSimplex Global Alternatives Cayman Fund Ltd. and AlphaSimplex Managed Futures Strategy Cayman Fund Ltd., which pay AlphaSimplex a management fee at the annual rate of 1.10% and 1.25%, respectively, of its average daily net assets.
Prior to July 1, 2020, AlphaSimplex Global Alternatives Cayman Fund Ltd. paid a management fee at the annual rate of 1.15% of its average daily net assets.
AlphaSimplex has given binding undertakings to the Funds to waive management fees and/or reimburse certain expenses, including expenses of each Subsidiary, if applicable, to limit the Funds’ operating expenses, exclusive of acquired fund fees and expenses, brokerage expenses, interest expense, substitute dividend expenses on securities sold short (Global Alternatives Fund only), taxes, organizational and extraordinary expenses, such as litigation and indemnification expenses. These undertakings are in effect until
| 56
Notes to Financial Statements (continued)
December 31, 2020
April 30, 2021, except for Global Alternatives Fund which is in effect until April 30, 2022, may be terminated before then only with the consent of the Funds’ Board of Trustees, and are reevaluated on an annual basis. Management fees payable, as reflected on the Statements of Assets and Liabilities, is net of waivers and/or expense reimbursements, if any, pursuant to these undertakings. Waivers/reimbursements that exceed management fees payable are reflected on the Statements of Assets and Liabilities as receivable from investment adviser.
For the year ended December 31, 2020, the expense limits as a percentage of average daily net assets under the expense limitation agreements were as follows:
| | | | | | | | | | | | | | | | |
| | | Expense Limit as a Percentage of
Average Daily Net Assets | |
Fund | | Class A | | | Class C | | | Class N | | | Class Y | |
Global Alternatives Fund | | | 1.49 | % | | | 2.24 | % | | | 1.19 | % | | | 1.24 | % |
Managed Futures Strategy Fund | | | 1.70 | % | | | 2.45 | % | | | 1.40 | % | | | 1.45 | % |
Multi-Asset Fund | | | 1.15 | % | | | 1.90 | % | | | — | | | | 0.90 | % |
Prior to July 1, 2020, the expense limits as a percentage of average daily net assets under the expense limitation agreements for Global Alternatives Fund was as follows:
| | | | | | | | | | | | | | | | |
| | | Expense Limit as a Percentage of
Average Daily Net Assets | |
Fund | | Class A | | | Class C | | | Class N | | | Class Y | |
Global Alternatives Fund | | | 1.54 | % | | | 2.29 | % | | | 1.24 | % | | | 1.29 | % |
AlphaSimplex shall be permitted to recover expenses borne under the expense limitation agreements (whether through waiver of management fees or otherwise) on a class by class basis in later periods to the extent the annual operating expenses of a class fall below a class’ expense limits, provided, however, that a class is not obligated to pay such waived/reimbursed fees or expenses more than one year after the end of the fiscal year in which the fees or expenses were waived/reimbursed.
For the year ended December 31, 2020, the management fees and waivers of management fees for each Fund were as follows:
| | | | | | | | | | | | | | | | | | | | |
Fund | | Gross
Management
Fees | | | Contractual
Waivers of
Management
Fees1 | | | Net
Management
Fees | | | Percentage of
Average
Daily Net Assets | |
| | Gross | | | Net | |
Global Alternatives Fund | | $ | 7,490,248 | | | $ | 394,328 | | | $ | 7,095,920 | | | | 1.13 | % | | | 1.07 | % |
Managed Futures Strategy Fund | | | 19,498,755 | | | | — | | | | 19,498,755 | | | | 1.25 | % | | | 1.25 | % |
Multi-Asset Fund | | | 282,566 | | | | 189,097 | | | | 93,469 | | | | 0.70 | % | | | 0.23 | % |
| 1 | Management fee waivers are subject to possible recovery until December 31, 2021. |
For the year ended December 31, 2020, class-specific expenses have been reimbursed as follows:
| | | | | | | | | | | | | | | | | | | | |
| | | Reimbursement1 | |
Fund | | Class A | | | Class C | | | Class N | | | Class Y | | | Total | |
Managed Futures Strategy Fund | | $ | 188,029 | | | $ | 20,066 | | | $ | — | | | $ | 1,147,700 | | | $ | 1,355,795 | |
| 1 | Expense reimbursement is subject to possible recovery until December 31, 2021. |
No expenses were recovered for any of the Funds during the year ended December 31, 2020 under the terms of the expense limitation agreements.
b. Service and Distribution Fees. Natixis Distribution, L.P. (“Natixis Distribution”), which is a wholly-owned subsidiary of Natixis, has entered into a distribution agreement with the Trust. Pursuant to this agreement, Natixis Distribution serves as principal underwriter of the Funds of the Trust.
Pursuant to Rule 12b-1 under the 1940 Act, the Trust has adopted a Service Plan relating to each Fund’s Class A shares (the “Class A Plans”) and a Distribution and Service Plan relating to each Fund’s Class C shares (the “Class C Plans”).
Under the Class A Plans, each Fund pays Natixis Distribution a monthly service fee at an annual rate not to exceed 0.25% of the average daily net assets attributable to the Funds’ Class A shares, as reimbursement for expenses incurred by Natixis Distribution in providing personal services to investors in Class A shares and/or the maintenance of shareholder accounts.
57 |
Notes to Financial Statements (continued)
December 31, 2020
Under the Class C Plans, each Fund pays Natixis Distribution a monthly service fee at an annual rate not to exceed 0.25% of the average daily net assets attributable to the Funds’ Class C shares, as compensation for services provided by Natixis Distribution in providing personal services to investors in Class C shares and/or the maintenance of shareholder accounts.
Also under the Class C Plans, each Fund pays Natixis Distribution a monthly distribution fee at the annual rate of 0.75% of the average daily net assets attributable to the Funds’ Class C shares, as compensation for services provided by Natixis Distribution in connection with the marketing or sale of Class C shares.
For the year ended December 31, 2020, the service and distribution fees for each Fund were as follows:
| | | | | | | | | | | | |
| | | Service Fees | | | Distribution Fees | |
Fund | | Class A | | | Class C | | | Class C | |
Global Alternatives Fund | | $ | 50,789 | | | $ | 18,771 | | | $ | 56,315 | |
Managed Futures Strategy Fund | | | 491,639 | | | | 52,868 | | | | 158,606 | |
Multi-Asset Fund | | | 950 | | | | 108 | | | | 322 | |
c. Administrative Fees. Natixis Advisors, L.P. (“Natixis Advisors”) provides certain administrative services for the Funds and contracts with State Street Bank to serve as sub-administrator. Pursuant to an agreement among Natixis Funds Trusts, Loomis Sayles Funds Trusts, Natixis ETF Trusts and Natixis Advisors, each Fund pays Natixis Advisors monthly its pro rata portion of fees equal to an annual rate of 0.0540% of the first $15 billion of the average daily net assets of the Natixis Funds Trusts, Loomis Sayles Funds Trusts and Natixis ETF Trusts, 0.0500% of the next $15 billion, 0.0400% of the next $30 billion, 0.0275% of the next $30 billion and 0.0225% of such assets in excess of $90 billion, subject to an annual aggregate minimum fee for the Natixis Funds Trusts, Loomis Sayles Funds Trusts and Natixis ETF Trusts of $10 million, which is reevaluated on an annual basis.
For the year ended December 31, 2020, the administrative fees paid to Natixis Advisors for each Fund were as follows (exclusive of sub-administrative fees paid to State Street Bank by the Subsidiaries):
| | | | |
Fund | | Administrative
Fees | |
Global Alternatives Fund | | $ | 294,432 | |
Managed Futures Strategy Fund | | | 688,159 | |
Multi-Asset Fund | | | 17,766 | |
d. Sub-Transfer Agent Fees. Natixis Distribution has entered into agreements, which include servicing agreements, with financial intermediaries that provide recordkeeping, processing, shareholder communications and other services to customers of the intermediaries that hold positions in the Funds and has agreed to compensate the intermediaries for providing those services. Intermediaries transact with the Funds primarily through the use of omnibus accounts on behalf of their customers who hold positions in the Funds. These services would have been provided by the Funds’ transfer agent and other service providers if the shareholders’ accounts were maintained directly at the Funds’ transfer agent. Accordingly, the Funds have agreed to reimburse Natixis Distribution for all or a portion of the servicing fees paid to these intermediaries. The reimbursement amounts (sub-transfer agent fees) paid to Natixis Distribution are subject to a current per-account equivalent fee limit approved by the Funds’ Board of Trustees, which is based on fees for similar services paid to the Funds’ transfer agent and other service providers. Class N shares do not bear such expenses.
For the year ended December 31, 2020, the sub-transfer agent fees (which are reflected in transfer agent fees and expenses in the Statements of Operations) for each Fund were as follows:
| | | | |
Fund | | Sub-Transfer
Agent Fees | |
Global Alternatives Fund | | $ | 352,978 | |
Managed Futures Strategy Fund | | | 1,512,221 | |
Multi-Asset Fund | | | 56,773 | |
As of December 31, 2020, the Funds owe Natixis Distribution the following reimbursements for sub-transfer agent fees (which are reflected in the Statements of Assets and Liabilities as payable to distributor):
| | | | |
Fund | | Reimbursements
of Sub-Transfer
Agent Fees | |
Global Alternatives Fund | | $ | 4,515 | |
Managed Futures Strategy Fund | | | 18,119 | |
Multi-Asset Fund | | | 1,063 | |
| 58
Notes to Financial Statements (continued)
December 31, 2020
Sub-transfer agent fees attributable to Class A, Class C and Class Y are allocated on a pro rata basis to each class based on the relative net assets of each class to the total net assets of those classes.
e. Commissions. Commissions (including CDSCs) on Fund shares retained by Natixis Distribution during the year ended December 31, 2020 were as follows:
| | | | |
Fund | | Commissions | |
Global Alternatives Fund | | $ | 3,685 | |
Managed Futures Strategy Fund | | | 23,252 | |
Multi-Asset Fund | | | 138 | |
f. Trustees Fees and Expenses. The Trust does not pay any compensation directly to its officers or Trustees who are directors, officers or employees of Natixis Advisors, Natixis Distribution, Natixis or their affiliates. The Chairperson of the Board of Trustees receives a retainer fee at the annual rate of $369,000. The Chairperson does not receive any meeting attendance fees for Board of Trustees meetings or committee meetings that he attends. Each Independent Trustee (other than the Chairperson) receives, in the aggregate, a retainer fee at the annual rate of $199,000. Each Independent Trustee also receives a meeting attendance fee of $10,000 for each meeting of the Board of Trustees that he or she attends in person and $5,000 for each meeting of the Board of Trustees that he or she attends telephonically. In addition, the chairperson of the Contract Review Committee, the chairperson of the Audit Committee and the chairperson of the Governance Committee each receive an additional retainer fee at the annual rate of $20,000. Each Contract Review Committee member is compensated $6,000 for each Committee meeting that he or she attends in person and $3,000 for each meeting that he or she attends telephonically. Each Audit Committee member is compensated $6,000 for each Committee meeting that he or she attends in person and $3,000 for each meeting that he or she attends telephonically. These fees are allocated among the funds in the Natixis Funds Trusts, Loomis Sayles Funds Trusts and Natixis ETF Trusts based on a formula that takes into account, among other factors, the relative net assets of each fund. Trustees are reimbursed for travel expenses in connection with attendance at meetings.
A deferred compensation plan (the “Plan”) is available to the Trustees on a voluntary basis. Deferred amounts remain in the Funds until distributed in accordance with the provisions of the Plan. The value of a participating Trustee’s deferral account is based on theoretical investments of deferred amounts, on the normal payment dates, in certain funds of the Natixis Funds Trusts, Loomis Sayles Funds Trusts and Natixis ETF Trusts as designated by the participating Trustees. Changes in the value of participants’ deferral accounts are allocated pro rata among the funds in the Natixis Funds Trusts, Loomis Sayles Funds Trusts and Natixis ETF Trusts, and are normally reflected as Trustees’ fees and expenses in the Statements of Operations. The portions of the accrued obligations allocated to the Funds under the Plan are reflected as Deferred Trustees’ fees in the Statements of Assets and Liabilities.
Certain officers and employees of Natixis Advisors and its affiliates are also officers and/or Trustees of the Trust.
g. Affiliated Ownership. As of December 31, 2020, Natixis and affiliates held shares of Multi-Asset Fund representing less than 0.01% of the Fund’s net assets.
h. Reimbursement of Transfer Agent Fees and Expenses. Effective May 1, 2020, Natixis Advisors has given a binding contractual undertaking to Global Alternatives Fund to reimburse any and all transfer agency expenses for the Funds’ Class N shares. This undertaking is in effect through April 30, 2021 and is not subject to recovery under the expense limitation agreement described above.
For the period May 1, 2020 through December 31, 2020, Natixis Advisors reimbursed the Fund $801 for transfer agency expenses related to Class N shares.
i. Payment by Affiliates. For the year ended December 31, 2020, AlphaSimplex reimbursed Multi-Asset Fund $2,814 for transaction costs incurred in conjunction with investment process adjustments (see Note 1 of Notes to Financial Statements). This amount is included in realized gains in the Statements of Operations.
7. Class-Specific Transfer Agent Fees and Expenses. Transfer agent fees and expenses for Global Alternatives Fund and Managed Futures Strategy Fund attributable to Class A, Class C, and Class Y are allocated on a pro rata basis to each class based on the relative net assets of each class to the total net assets of those classes. Transfer agent fees and expenses attributable to Class N are allocated to Class N.
Multi-Asset Fund allocates transfer agent fees and expenses on a pro rata basis based on the relative net assets of each class to the total net assets of those classes.
59 |
Notes to Financial Statements (continued)
December 31, 2020
For the year ended December 31, 2020, Global Alternatives Fund and Managed Futures Strategy Fund incurred the following class-specific transfer agent fees and expenses (including sub-transfer agent fees, where applicable):
| | | | | | | | | | | | | | | | |
| | | Transfer Agent Fees and Expenses | |
Fund | | Class A | | | Class C | | | Class N | | | Class Y | |
Global Alternatives Fund | | $ | 14,032 | | | $ | 5,236 | | | $ | 1,058 | | | $ | 440,622 | |
Managed Futures Strategy Fund | | | 380,464 | | | | 40,816 | | | | 3,035 | | | | 2,345,362 | |
8. Line of Credit. Each Fund, together with certain other funds of Natixis Funds Trusts, Loomis Sayles Funds Trusts and Natixis ETF Trusts, entered into a $400,000,000 committed unsecured line of credit provided by State Street Bank. Any one Fund may borrow up to $350,000,000 under the line of credit agreement (as long as all borrowings by all Funds in the aggregate do not exceed the $400,000,000 limit at any time), subject to each Fund’s investment restrictions and its contractual obligations under the line of credit. Interest is charged to the Funds based upon the terms set forth in the agreement. In addition, a commitment fee of 0.15% per annum, payable at the end of each calendar quarter, is accrued and apportioned among the participating funds based on their average daily unused portion of the line of credit. The Funds paid an arrangement fee, an upfront fee, and certain other legal fees in connection with the line of credit agreement, which are being amortized over a period of 364 days and are reflected in legal fees and/or miscellaneous expenses on the Statements of Operations. The unamortized balance is reflected as prepaid expenses on the Statements of Assets and Liabilities.
For the year ended December 31, 2020, none of the Funds had borrowings under these agreements.
9. Risk. Each Fund’s investments in foreign securities may be subject to greater political, economic, environmental, credit/counterparty and information risks. The Fund’s investments in foreign securities also are subject to foreign currency fluctuations and other foreign currency-related risks. Foreign securities may be subject to higher volatility than U.S. securities, varying degrees of regulation and limited liquidity.
The Funds’ (excluding Multi-Asset Fund) investments in commodity-related instruments may subject the Funds to greater volatility than investments in other securities. The value of these investments may be affected by changes in overall market movements, commodity index volatility, changes in interest rates, or factors affecting a particular industry or commodity.
Multi-Asset Fund is non-diversified, which means that it is not limited under the 1940 Act to a percentage of assets that it may invest in any one issuer. Because the Fund may invest in the securities of a limited number of issuers, an investment in the Fund may involve a higher degree of risk than would be present in a diversified portfolio.
Global markets have experienced periods of high volatility triggered by the ongoing public health emergency known as coronavirus (“Covid-19”). As the situation continues, the extent and duration of the impact that the Covid-19 outbreak may have on financial markets and the economy as a whole remains highly uncertain. If the effects of the Covid-19 outbreak on financial markets and the economy continue for an extended period of time, the Funds’ future financial and investment results may be adversely affected.
10. Concentration of Ownership. From time to time, a Fund may have a concentration of one or more accounts constituting a significant percentage of shares outstanding. Investment activities by holders of such accounts could have material impacts on the Funds. As of December 31, 2020, based on management’s evaluation of the shareholder account base, the Funds had accounts representing controlling ownership of more than 5% of the Funds’ total outstanding shares. The number of such accounts, based on accounts that represent more than 5% of an individual class of shares, and the aggregate percentage of net assets represented by such holdings were as follows:
| | | | | | | | |
Fund | | Number of 5%
Account Holders | | | Total
Percentage of
Ownership | |
Global Alternatives Fund | | | 3 | | | | 38.17 | % |
Managed Futures Strategy Fund | | | 2 | | | | 14.38 | %(a) |
Multi-Asset Fund | | | 2 | | | | 81.42 | %(a) |
Omnibus shareholder accounts for which Natixis Advisors understands that the intermediary has discretion over the underlying shareholder accounts or investment models where a shareholder account may be invested for a non-discretionary customer are included in the table above. For other omnibus accounts, the Funds do not have information on the individual shareholder accounts underlying the omnibus accounts; therefore, there could be other 5% shareholders in addition to those disclosed in the table above.
| (a) | Certain Fund shareholders may be invested in a Fund as a result of the Fund’s inclusion in an investment portfolio model, utilized by certain third party intermediaries, which have been developed and controlled by an affiliate of the Funds (Natixis Advisors). Without these models or as a result of changes in individual models (that may be made by Natixis Advisors), these shareholder positions may not exist or could change in a material amount. Natixis Advisors has no involvement in the decisions to invest in the models provided to third party intermediaries. |
| 60
Notes to Financial Statements (continued)
December 31, 2020
11. Capital Shares. Each Fund may issue an unlimited number of shares of beneficial interest, without par value. Transactions in capital shares were as follows:
| | | | | | | | | | | | | | | | |
| |
| Year Ended
December 31, 2020 |
| |
| Year Ended
December 31, 2019 |
|
Global Alternatives Fund | | | Shares | | | | Amount | | | | Shares | | | | Amount | |
| Class A | | | | | | | | | | | | | | | | |
Issued from the sale of shares | | | 1,623,558 | | | $ | 17,678,688 | | | | 644,252 | | | $ | 6,988,601 | |
Issued in connection with the reinvestment of distributions | | | 22,575 | | | | 240,420 | | | | 12,875 | | | | 143,942 | |
Redeemed | | | (2,451,082 | ) | | | (25,713,402 | ) | | | (1,678,431 | ) | | | (18,199,118 | ) |
| | | | | | | | | | | | | | | | |
Net change | | | (804,949 | ) | | $ | (7,794,294 | ) | | | (1,021,304 | ) | | $ | (11,066,575 | ) |
| | | | | | | | | | | | | | | | |
| Class C | | | | | | | | | | | | | | | | |
Issued from the sale of shares | | | 26,154 | | | $ | 257,854 | | | | 87,743 | | | $ | 893,373 | |
Issued in connection with the reinvestment of distributions | | | 6,287 | | | | 62,874 | | | | 603 | | | | 6,317 | |
Redeemed | | | (593,632 | ) | | | (5,826,318 | ) | | | (642,998 | ) | | | (6,478,230 | ) |
| | | | | | | | | | | | | | | | |
Net change | | | (561,191 | ) | | $ | (5,505,590 | ) | | | (554,652 | ) | | $ | (5,578,540 | ) |
| | | | | | | | | | | | | | | | |
| Class N | | | | | | | | | | | | | | | | |
Issued from the sale of shares | | | 6,700 | | | $ | 71,749 | | | | 28,333 | | | $ | 327,145 | |
Issued in connection with the reinvestment of distributions | | | 311 | | | | 3,354 | | | | 496 | | | | 5,620 | |
Redeemed | | | (41,302 | ) | | | (460,526 | ) | | | (1,365,297 | ) | | | (14,957,535 | ) |
| | | | | | | | | | | | | | | | |
Net change | | | (34,291 | ) | | $ | (385,423 | ) | | | (1,336,468 | ) | | $ | (14,624,770 | ) |
| | | | | | | | | | | | | | | | |
| Class Y | | | | | | | | | | | | | | | | |
Issued from the sale of shares | | | 15,988,607 | | | $ | 171,911,642 | | | | 17,200,887 | | | $ | 188,500,365 | |
Issued in connection with the reinvestment of distributions | | | 585,919 | | | | 6,333,788 | | | | 350,454 | | | | 3,981,153 | |
Redeemed | | | (39,266,251 | ) | | | (417,539,297 | ) | | | (57,313,299 | ) | | | (629,677,366 | ) |
| | | | | | | | | | | | | | | | |
Net change | | | (22,691,725 | ) | | $ | (239,293,867 | ) | | | (39,761,958 | ) | | $ | (437,195,848 | ) |
| | | | | | | | | | | | | | | | |
Decrease from capital share transactions | | | (24,092,156 | ) | | $ | (252,979,174 | ) | | | (42,674,382 | ) | | $ | (468,465,733 | ) |
| | | | | | | | | | | | | | | | |
| | | | | | | | | | | | | | | | |
| |
| Year Ended
December 31, 2020 |
| |
| Year Ended
December 31, 2019 |
|
Managed Futures Strategy Fund | | | Shares | | | | Amount | | | | Shares | | | | Amount | |
| Class A | | | | | | | | | | | | | | | | |
Issued from the sale of shares | | | 8,897,011 | | | $ | 87,245,646 | | | | 18,897,616 | | | $ | 175,081,342 | |
Issued in connection with the reinvestment of distributions | | | 482,693 | | | | 4,913,814 | | | | 977,144 | | | | 9,058,160 | |
Redeemed | | | (16,594,015 | ) | | | (161,779,589 | ) | | | (10,842,429 | ) | | | (103,378,255 | ) |
| | | | | | | | | | | | | | | | |
Net change | | | (7,214,311 | ) | | $ | (69,620,129 | ) | | | 9,032,331 | | | $ | 80,761,247 | |
| | | | | | | | | | | | | | | | |
| Class C | | | | | | | | | | | | | | | | |
Issued from the sale of shares | | | 266,678 | | | $ | 2,459,016 | | | | 120,006 | | | $ | 1,092,355 | |
Issued in connection with the reinvestment of distributions | | | 47,343 | | | | 455,914 | | | | 79,212 | | | | 696,274 | |
Redeemed | | | (719,340 | ) | | | (6,694,265 | ) | | | (1,193,953 | ) | | | (10,506,738 | ) |
| | | | | | | | | | | | | | | | |
Net change | | | (405,319 | ) | | $ | (3,779,335 | ) | | | (994,735 | ) | | $ | (8,718,109 | ) |
| | | | | | | | | | | | | | | | |
| Class N | | | | | | | | | | | | | | | | |
Issued from the sale of shares | | | 3,733,338 | | | $ | 36,574,955 | | | | 8,843,736 | | | $ | 84,693,165 | |
Issued in connection with the reinvestment of distributions | | | 168,681 | | | | 1,737,419 | | | | 232,102 | | | | 2,179,433 | |
Redeemed | | | (3,418,614 | ) | | | (33,981,990 | ) | | | (4,062,833 | ) | | | (39,555,270 | ) |
| | | | | | | | | | | | | | | | |
Net change | | | 483,405 | | | $ | 4,330,384 | | | | 5,013,005 | | | $ | 47,317,328 | |
| | | | | | | | | | | | | | | | |
| Class Y | | | | | | | | | | | | | | | | |
Issued from the sale of shares | | | 68,367,766 | | | $ | 676,556,286 | | | | 60,717,853 | | | $ | 572,143,631 | |
Issued in connection with the reinvestment of distributions | | | 2,517,010 | | | | 25,900,036 | | | | 3,967,764 | | | | 37,177,943 | |
Redeemed | | | (87,378,412 | ) | | | (862,703,687 | ) | | | (137,926,321 | ) | | | (1,287,764,123 | ) |
| | | | | | | | | | | | | | | | |
Net change | | | (16,493,636 | ) | | $ | (160,247,365 | ) | | | (73,240,704 | ) | | $ | (678,442,549 | ) |
| | | | | | | | | | | | | | | | |
Decrease from capital share transactions | | | (23,629,861 | ) | | $ | (229,316,445 | ) | | | (60,190,103 | ) | | $ | (559,082,083 | ) |
| | | | | | | | | | | | | | | | |
61 |
Notes to Financial Statements (continued)
December 31, 2020
11. Capital Shares (continued).
| | | | | | | | | | | | | | | | |
| |
| Year Ended
December 31, 2020 |
| |
| Year Ended
December 31, 2019 |
|
Multi-Asset Fund | | | Shares | | | | Amount | | | | Shares | | | | Amount | |
| Class A | | | | | | | | | | | | | | | | |
Issued from the sale of shares | | | 11,205 | | | $ | 104,090 | | | | 6,314 | | | $ | 63,879 | |
Issued in connection with the reinvestment of distributions | | | 923 | | | | 8,037 | | | | 815 | | | | 8,974 | |
Redeemed | | | (16,249 | ) | | | (154,481 | ) | | | (2,261 | ) | | | (24,204 | ) |
| | | | | | | | | | | | | | | | |
Net change | | | (4,121 | ) | | $ | (42,354 | ) | | | 4,868 | | | $ | 48,649 | |
| | | | | | | | | | | | | | | | |
| Class C | | | | | | | | | | | | | | | | |
Issued from the sale of shares | | | 25,279 | | | $ | 217,341 | | | | 995 | | | $ | 10,000 | |
Issued in connection with the reinvestment of distributions | | | 368 | | | | 3,161 | | | | 23 | | | | 252 | |
Redeemed | | | (25,870 | ) | | | (227,903 | ) | | | — | | | | — | |
| | | | | | | | | | | | | | | | |
Net change | | | (223 | ) | | $ | (7,401 | ) | | | 1,018 | | | $ | 10,252 | |
| | | | | | | | | | | | | | | | |
| Class Y | | | | | | | | | | | | | | | | |
Issued from the sale of shares | | | 2,415,389 | | | $ | 22,969,786 | | | | 916,457 | | | $ | 9,438,127 | |
Issued in connection with the reinvestment of distributions | | | 99,714 | | | | 882,601 | | | | 91,957 | | | | 1,015,455 | |
Redeemed | | | (3,103,812 | ) | | | (30,246,800 | ) | | | (975,483 | ) | | | (10,096,772 | ) |
| | | | | | | | | | | | | | | | |
Net change | | | (588,709 | ) | | $ | (6,394,413 | ) | | | 32,931 | | | $ | 356,810 | |
| | | | | | | | | | | | | | | | |
Increase (decrease) from capital share transactions | | | (593,053 | ) | | $ | (6,444,168 | ) | | | 38,817 | | | $ | 415,711 | |
| | | | | | | | | | | | | | | | |
12. Subsequent Event. On December 10, 2020, the Board of Trustees approved a plan to liquidate Multi-Asset Fund. Liquidation took place on January 14, 2021.
| 62
Report of Independent Registered Public Accounting Firm
To the Board of Trustees of Natixis Funds Trust II and Shareholders of AlphaSimplex Global Alternatives Fund, AlphaSimplex Managed Futures Strategy Fund and AlphaSimplex Multi-Asset Fund
Opinions on the Financial Statements
We have audited the accompanying statements of assets and liabilities, including the portfolios of investments, of AlphaSimplex Global Alternatives Fund, AlphaSimplex Managed Futures Strategy Fund and AlphaSimplex Multi-Asset Fund (three of the funds constituting Natixis Funds Trust II, hereafter collectively referred to as the “Funds”) as of December 31, 2020, the related statements of operations for the year ended December 31, 2020, the statements of changes in net assets for each of the two years in the period ended December 31, 2020, including the related notes, and the financial highlights for each of the periods indicated therein (collectively referred to as the “financial statements”). In our opinion, the financial statements present fairly, in all material respects, the financial position of each of the Funds as of December 31, 2020, the results of each of their operations for the year then ended, the changes in each of their net assets for each of the two years in the period ended December 31, 2020 and each of the financial highlights for each of the periods indicated therein in conformity with accounting principles generally accepted in the United States of America.
Basis for Opinions
These financial statements are the responsibility of the Funds’ management. Our responsibility is to express an opinion on the Funds’ financial statements based on our audits. We are a public accounting firm registered with the Public Company Accounting Oversight Board (United States) (PCAOB) and are required to be independent with respect to the Funds in accordance with the U.S. federal securities laws and the applicable rules and regulations of the Securities and Exchange Commission and the PCAOB.
We conducted our audits of these financial statements in accordance with the standards of the PCAOB. Those standards require that we plan and perform the audit to obtain reasonable assurance about whether the financial statements are free of material misstatement, whether due to error or fraud.
Our audits included performing procedures to assess the risks of material misstatement of the financial statements, whether due to error or fraud, and performing procedures that respond to those risks. Such procedures included examining, on a test basis, evidence regarding the amounts and disclosures in the financial statements. Our audits also included evaluating the accounting principles used and significant estimates made by management, as well as evaluating the overall presentation of the financial statements. Our procedures included confirmation of securities owned as of December 31, 2020 by correspondence with the custodian and brokers; when replies were not received from brokers, we performed other auditing procedures. We believe that our audits provide a reasonable basis for our opinions.
/s/PricewaterhouseCoopers LLP
Boston, Massachusetts
February 22, 2021
We have served as the auditor of one or more of the investment companies in the Natixis Investment Company Complex since at least 1995. We have not been able to determine the specific year we began serving as auditor.
63 |
2020 U.S. Tax Distribution Information to Shareholders (Unaudited)
Qualified Dividend Income. For the fiscal year ended December 31, 2020, a percentage of the ordinary income dividends paid by the Funds are considered qualified dividend income eligible for reduced tax rates. These lower rates range from 0% to 20% depending on an individual’s tax bracket. If the Funds paid a distribution during calendar year 2020, complete information will be reported in conjunction with Form 1099-DIV. These percentages are noted below:
| | | | |
Fund | | Qualifying
Percentage | |
Global Alternatives Fund | | | 20.00 | % |
Capital Gains Distributions. Pursuant to Internal Revenue Section 852(b), the following Funds paid distributions, which have been designated as capital gains distributions for the fiscal year ended December 31, 2020.
| | | | |
Fund | | Amount | |
Multi-Asset Fund | | $ | 792,961 | |
Corporate Dividends Received Deduction. For the fiscal year ended December 31, 2020, a percentage of dividends distributed by the Funds listed below qualify for the dividends received deduction for corporate shareholders. These percentages are as follows:
| | | | |
Fund | | Qualifying
Percentage | |
Global Alternatives Fund | | | 20.74 | % |
Qualified Business Income Deduction. For the fiscal year ended December 31, 2020, 1.85% of the ordinary income dividends paid by the Global Alternatives Fund are eligible for the Qualified Business Income Deduction.
| 64
Trustee and Officer Information
The tables below provide certain information regarding the trustees and officers of Natixis Funds Trust II (the “Trust”). Unless otherwise indicated, the address of all persons below is 888 Boylston Street, Suite 800, Boston, MA 02199-8197. The Funds’ Statement of Additional Information includes additional information about the trustees of the Trust and is available by calling Natixis Funds at 800-225-5478.
| | | | | | | | |
Name and Year of Birth | | Position(s) Held with
the Trust, Length of
Time Served and
Term of Office1 | | Principal
Occupation(s)
During Past 5 Years | | Number of Portfolios
in Fund Complex
Overseen2 and Other
Directorships Held
During Past 5 Years | | Experience,
Qualifications,
Attributes, Skills for
Board Membership |
| | | |
| INDEPENDENT TRUSTEES | | | | | | |
| | | | |
Edmond J. English (1953) | | Trustee since 2013 Chairperson of Governance Committee and Audit Committee Member | | Executive Chairman of Bob’s Discount Furniture (retail) | | 54 Director, Burlington Stores, Inc. (retail) | | Significant experience on the Board and on the boards of other business organizations (including retail companies and a bank); executive experience (including at a retail company) |
| | | | |
Richard A. Goglia (1951) | | Trustee since 2015 Contract Review Committee Member and Governance Committee Member | | Retired | | 54 Director of Triumph Group (aerospace industry) | | Significant experience on the Board and executive experience (including his role as vice president and treasurer of a defense company and experience at a financial services company) |
| | | | |
Wendell J. Knox (1948) | | Trustee since 2009 Chairperson of Contract Review Committee | | Retired | | 54 Director of Abt Associates Inc. (research and consulting); Director, The Hanover Insurance Group (property and casualty insurance); formerly, Director, Eastern Bank (bank) | | Significant experience on the Board and on the boards of other business organizations (including at a bank and at a property and casualty insurance firm); executive experience (including roles as president and chief executive officer of a research and consulting company) |
65 |
Trustee and Officer Information
| | | | | | | | |
Name and Year of Birth | | Position(s) Held with
the Trust, Length of
Time Served and
Term of Office1 | | Principal
Occupation(s)
During Past 5 Years | | Number of Portfolios
in Fund Complex
Overseen2 and Other
Directorships Held
During Past 5 Years | | Experience,
Qualifications,
Attributes, Skills for
Board Membership |
| | | |
| INDEPENDENT TRUSTEES – continued | | | | | | |
| | | | |
Martin T. Meehan (1956) | | Trustee since 2012 Audit Committee Member | | President, University of Massachusetts | | 54 None | | Significant experience on the Board and on the boards of other business organizations; experience as President of the University of Massachusetts; government experience (including as a member of the U.S. House of Representatives); academic experience |
| | | | |
Maureen B. Mitchell (1951) | | Trustee since 2017 Contract Review Committee Member and Governance Committee Member | | Retired; formerly President, Global Sales and Marketing, GE Asset Management, Inc. (financial services) | | 54 Director, Sterling Bancorp (bank) | | Experience on the Board; financial services industry and executive experience (including role as president of global sales and marketing at a financial services company) |
| | | | |
James P. Palermo (1955) | | Trustee since 2016 Contract Review Committee Member | | Founding Partner, Breton Capital Management, LLC (private equity); Partner, STEP Partners, LLC (private equity) | | 54 Director, FutureFuel.io (chemicals and biofuels) | | Experience on the Board; financial services industry and executive experience (including roles as chief executive officer of client management and asset servicing for a banking and financial services company) |
| | | | |
Erik R. Sirri (1958) | | Chairperson of the Board of Trustees since January 2021 Trustee since 2009 Ex Officio member of Audit Committee, Contract Review Committee and Governance Committee | | Professor of Finance at Babson College | | 54 None | | Significant experience on the Board; experience as Director of the Division of Trading and Markets at the Securities and Exchange Commission; academic experience; training as an economist |
| 66
Trustee and Officer Information
| | | | | | | | |
Name and Year of Birth | | Position(s) Held with
the Trust, Length of
Time Served and
Term of Office1 | | Principal
Occupation(s)
During Past 5 Years | | Number of Portfolios
in Fund Complex
Overseen2 and Other
Directorships Held
During Past 5 Years | | Experience,
Qualifications,
Attributes, Skills for
Board Membership |
| | | |
| INDEPENDENT TRUSTEES – continued | | | | | | |
| | | | |
Peter J. Smail (1952) | | Trustee since 2009 Audit Committee Member and Governance Committee Member | | Retired | | 54 None | | Significant experience on the Board; mutual fund industry and executive experience (including roles as president and chief executive officer for an investment adviser) |
| | | | |
Kirk A. Sykes (1958) | | Trustee since 2019 Contract Review Committee Member | | Managing Director of Accordia Partners, LLC (real estate development); President of Primary Corporation (real estate development); Managing Principal of Merrick Capital Partners (infrastructure finance); formerly, President of Urban Strategy America Fund (real estate fund manager) | | 54 Trustee, Eastern Bank (bank); formerly Director, Ares Commercial Real Estate Corporation (real estate investment trust); Director of Apartment Investment and Management Company (real estate investment trust) | | Experience on the Board and significant experience on the boards of other business organizations (including real estate companies and banks) |
| | | | |
Cynthia L. Walker (1956) | | Trustee since 2005 Chairperson of the Audit Committee and Governance Committee Member | | Retired; formerly, Deputy Dean for Finance and Administration, Yale University School of Medicine | | 54 None | | Significant experience on the Board; executive experience in a variety of academic organizations (including roles as dean for finance and administration) |
| | | |
| INTERESTED TRUSTEES | | | | | | |
| | | | |
Kevin P. Charleston3 (1965)
One Financial Center Boston, MA 02111 | | Trustee since 2015 | | President, Chief Executive Officer and Chairman of the Board of Directors, Loomis, Sayles & Company,
L.P. | | 54 None | | Significant experience on the Board; continuing service as President, Chief Executive Officer and Chairman of the Board of Directors of Loomis, Sayles & Company, L.P. |
67 |
Trustee and Officer Information
| | | | | | | | |
Name and Year of Birth | | Position(s) Held with
the Trust, Length of
Time Served and
Term of Office1 | | Principal
Occupation(s)
During Past 5 Years | | Number of Portfolios
in Fund Complex
Overseen2 and Other
Directorships Held
During Past 5 Years | | Experience,
Qualifications,
Attributes, Skills for
Board Membership |
| | | |
| INTERESTED TRUSTEES – continued | | | | | | |
| | | | |
David L. Giunta4
(1965) | | Trustee since 2011 President and Chief Executive Officer of the Trust | | President and Chief Executive Officer, Natixis Advisors, L.P., Natixis Distribution, L.P., Natixis Distribution Corporation and Chairman of the Board of Natixis Distribution Corporation | | 54 None | | Significant experience on the Board; experience as President and Chief Executive Officer of Natixis Advisors, L.P., Natixis Distribution, L.P., Natixis Distribution Corporation and Chairman of the Board of Natixis Distribution Corporation |
| 1 | Each trustee serves until retirement, resignation or removal from the Board. The current retirement age is 75. The position of Chairperson of the Board is appointed for a three-year term. |
| 2 | The trustees of the Trust serve as trustees of a fund complex that includes all series of the Natixis Funds Trust I, Natixis Funds Trust II, Natixis Funds Trust IV, Gateway Trust, Loomis Sayles Funds I, Loomis Sayles Funds II, Natixis ETF Trust and Natixis ETF Trust II (collectively, the “Fund Complex”). |
| 3 | Mr. Charleston is deemed an “interested person” of the Trust because he holds the following positions with an affiliated person of the Trust: President, Chief Executive Officer and Chairman of the Board of Directors of Loomis, Sayles & Company, L.P. |
| 4 | Mr. Giunta is deemed an “interested person” of the Trust because he holds the following positions with an affiliated person of the Trust: President and Chief Executive Officer, Natixis Advisors, L.P., Natixis Distribution, L.P., Natixis Distribution Corporation and Chairman of the Board of Natixis Distribution Corporation. |
| 68
Trustee and Officer Information
| | | | | | |
Name and Year of Birth | | Position(s) Held
with the [Trust/Trusts] | | Term of Office1 and Length
of Time Served | | Principal Occupation(s)
During Past 5 Years2 |
| |
| OFFICERS OF THE [TRUST/TRUSTS] | | |
| | | |
Russell L. Kane
(1969) | | Secretary, Clerk and Chief Legal Officer Chief Compliance Officer and Anti-Money Laundering Officer | | Since 2016 Since 2020 | | Executive Vice President, General Counsel, Secretary and Clerk, Natixis Distribution Corporation, Natixis Advisors, L.P. and Natixis Distribution, L.P.; formerly, Senior Vice President, Deputy General Counsel, Assistant Secretary and Assistant Clerk, Natixis Distribution Corporation, Natixis Advisors, L.P. and Natixis Distribution, L.P. |
| | | |
Michael C. Kardok
(1959) | | Treasurer, Principal Financial and Accounting Officer | | Since 2004 | | Senior Vice President, Natixis Advisors, L.P. and Natixis Distribution, L.P. |
| 1 | Each officer of the Trust serves for an indefinite term in accordance with the Trust’s current by-laws until the date his or her successor is elected and qualified, or until he or she sooner dies, retires, is removed or becomes disqualified. |
| 2 | Each person listed above, except as noted, holds the same position(s) with the Fund Complex. Previous positions during the past five years with Natixis Distribution, L.P., Natixis Advisors, L.P. or Loomis, Sayles & Company, L.P. are omitted, if not materially different from an officer’s current position with such entity. |
69 |


Annual Report
December 31, 2020
Loomis Sayles High Income Fund
Loomis Sayles Intermediate Municipal Bond Fund
Loomis Sayles International Growth Fund
Loomis Sayles Investment Grade Bond Fund
Loomis Sayles Strategic Alpha Fund
Loomis Sayles Strategic Income Fund
Table of Contents

LOOMIS SAYLES HIGH INCOME FUND
| | |
| |
| Managers | | Symbols |
| |
| Matthew J. Eagan, CFA® | | Class A NEFHX |
| |
| Brian P. Kennedy | | Class C NEHCX |
| |
| Elaine M. Stokes | | Class N LSHNX |
| |
| Todd P. Vandam, CFA® | | Class Y NEHYX |
| |
| Loomis, Sayles & Company, L.P. | | |
Investment Goal
The Fund seeks high current income plus the opportunity for capital appreciation to produce a high total return.
Market Conditions
The financial markets experienced significant volatility in 2020, as investors grappled with the persistent uncertainty surrounding Covid-19. The bulk of the market disruptions occurred in February and March, when world governments first aimed to contain the virus by locking down broad swaths of their economies. Higher-risk assets were hit hard in the ensuing selloff, while demand for “safe-haven” investments surged. The US Federal Reserve (Fed) sought to counter the extraordinary developments by cutting short-term interest rates to zero, reestablishing traditional quantitative easing (QE) through asset purchases in the Treasury and mortgage-backed securities markets, and establishing lending facilities which either have only been used during the Great Financial Crisis or were created for the first time in Fed history, such as the Corporate Credit facility. Aided by the $2.2 trillion stimulus package passed by the US Congress in late March, the Fed’s response fueled an impressive recovery in higher-risk assets from early spring onward. After pausing in the lead-up to the US elections, the rally gained steam in November thanks to the long-awaited headline that coronavirus vaccines would soon become available to the public. The markets took this as an indication that economic conditions could gradually return to normal in 2021, boosting sentiment into year-end.
US Treasurys were the primary beneficiaries of the first-quarter “flight to quality” and the Fed’s subsequent commitment to maintain its low-rate monetary policy indefinitely. Twelve-month returns were progressively higher along the yield curve (a curve that shows the relationship among bond yields across the maturity spectrum), with 30-year issues generating the largest gain.
Although investment-grade corporate bonds suffered a sharp downturn in the February-March selloff, the category finished as the top performing major segment of the fixed income market for the full, 12-month period. Corporates benefited from the gradual improvement in the credit outlook throughout the course of the year, together with rising demand for high-quality alternatives to low-yielding government debt.
High-yield bonds also delivered positive returns, although they were unable to keep pace with investment-grade corporates. The category was supported by hopes for an economic recovery and reduced investor risk aversion. Lower-quality debt was generally harder hit in the February-March downturn due low market liquidity, tempering its return for the full year. Nevertheless, yield spreads — the difference between yields on below investment-grade debt and Treasurys of similar maturities — finished the year close to where they stood in February prior to the selloff associated with Covid-19.
Securitized assets — including mortgage-backed securities (MBS), asset-backed securities (ABS), and commercial mortgage-backed securities (CMBS) — posted positive total returns but failed to keep pace with the broader US bond market. CMBS was the strongest performer in this segment despite concerns about the outlook for commercial real estate in the wake of the pandemic.
Performance Results
For the 12 months ended December 31, 2020, Class Y shares of the Loomis Sayles High Income Fund returned 8.19% at net asset value. The Fund outperformed its benchmark, the Bloomberg Barclays U.S. Corporate High-Yield Bond Index, which returned 7.11%.
Explanation of Fund Performance
The remarkable events of 2020 were dominated by the volatility created by the Covid-19 global pandemic. Fueled by extraordinary monetary and fiscal stimulus, markets came roaring back after a sharp selloff during the first quarter of the year, and continued to reach new highs as lockdowns eased and vaccine development progressed. This positive momentum was maintained throughout the final quarter of 2020 as a Covid vaccine was approved and distribution began. Security selection was the primary source of the Fund’s outperformance for the 12-month period. High yield and investment grade corporate credit positions were the largest positive contributors to relative return, aided by consumer cyclical and energy holdings. Exposures to the communications sector within high yield and capital goods sector within investment grade credit were also beneficial for performance.
An allocation to securitized assets detracted as this sector did not keep pace with high yield credit. Within convertible securities, selected energy and consumer non-cyclical holdings weighed on return.
1 |
Outlook
Looking ahead to the upcoming year, there are a number of structural economic factors in place that pose risks to our market outlook, including the ongoing impact of the pandemic, further delay in reaching a fiscal package and any resurgence of trade tensions between the US and China. That said, we are optimistic that economic conditions could continue to show improvement over the next year. This view is reflected in current market prices and appears to be shared by the consensus.
While the recent rise in coronavirus cases has led to renewed containment measures across the US, the likelihood of a vaccine has been priced into markets along with expectations for a fiscal package to arrive in the first quarter of the year. These measures help give us some confidence that the economic recovery could continue to show steady, if uneven, progress. GDP growth rebounded from the steep declines last year and we expect this trend to continue into 2021.
We anticipate limited changes in monetary policy, with the Fed likely maintaining its zero interest rate policy until at least 2023. The Fed has also indicated that full employment and longer-term inflation averages are additional factors in considering any future rate hikes. This accommodative stance should continue to boost investor confidence and demand for yield in a low global rate environment. In addition, we believe the overall health of the consumer, strong housing market and expected inventory rebuilding provide support to our outlook.
The credit markets have been progressing through the cycle,1 and we believe there are increasing signs of a shift towards recovery with corporate profits rebounding, easy monetary policy, balance sheet improvement and potential for large-scale vaccine distribution.
We have been maintaining a balance of liquidity, diversification and risk exposure in our portfolios. Within our credit allocation, we continue to focus on areas where we still see value based on our fundamental research. We are specifically focused on some of the sectors that were hardest hit by the pandemic including the transportation, recreational and hospitality industries. These areas of the economy include credits that have been cheap for their rating, have been able to access the capital markets for liquidity and are likely in a good position to benefit from the recovery.
Despite the higher valuations, we believe there are still selective opportunities in both the investment grade and high yield corporate sectors. Spreads have compressed but can potentially tighten further on improving fundamentals. We are selectively adding corporate credit, particularly in areas of the market that have lagged the recovery.
Our emerging market allocation largely represents US dollar-pay exposure to high quality securities with strong balance sheets and currently attractive real yields. We are holding little foreign currency but continue to evaluate opportunities in markets outside the US as we look for clarity on the outlook for global growth.
Market conditions in the past year have highlighted the notion that investors tend to overreact. The speed and severity of the recession and subsequent sharp rebound were unexpected, but also presented some favorable investment opportunities. These developments have served to reinforce our investment philosophy that markets are highly inefficient in the short term. We believe that we were able to capitalize on these developments in 2020 and that our portfolios are well-positioned to benefit from the expected economic growth and recovery in the new year.
| 1 | A credit cycle is a cyclical pattern that follows credit availability and corporate health. |
| 2
LOOMIS SAYLES HIGH INCOME FUND
Hypothetical Growth of $100,000 Investment in Class Y Shares3
December 31, 2010 through December 31, 2020
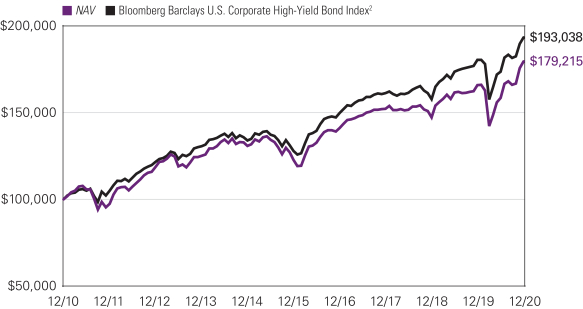
Average Annual Total Returns — December 31, 20203
| | | | | | | | | | | | | | | | | | | | | | | | |
| | | | | | |
| | | | | | | | | | | | | | | Express Ratios4 | |
| | | | | | | |
| | | 1 Year | | | 5 Years | | | 10 Years | | | Life of Class N | | | Gross | | | Net | |
| | | | | | | |
| Class Y (Inception 2/29/08) | | | | | | | | | | | | | | | | | | | | | | | | |
| NAV | | | 8.19 | % | | | 7.88 | % | | | 6.00 | % | | | — | % | | | 0.93 | % | | | 0.75 | % |
| | | | | | | |
| Class A (Inception 2/22/84) | | | | | | | | | | | | | | | | | | | | | | | | |
| NAV | | | 8.16 | | | | 7.59 | | | | 5.72 | | | | — | | | | 1.18 | | | | 1.00 | |
| With 4.25% Maximum Sales Charge | | | 3.53 | | | | 6.65 | | | | 5.27 | | | | — | | | | | | | | | |
| | | | | | | |
| Class C (Inception 3/2/98) | | | | | | | | | | | | | | | | | | | | | | | | |
| NAV | | | 7.30 | | | | 6.80 | | | | 4.96 | | | | — | | | | 1.93 | | | | 1.75 | |
| With CDSC1 | | | 6.30 | | | | 6.80 | | | | 4.96 | | | | — | | | | | | | | | |
| | | | | | | |
| Class N (Inception 11/30/16) | | | | | | | | | | | | | | | | | | | | | | | | |
| NAV | | | 8.48 | 5 | | | — | | | | — | | | | 6.49 | | | | 0.82 | | | | 0.70 | |
| | | | | | | |
| Comparative Performance | | | | | | | | | | | | | | | | | | | | | | | | |
| Bloomberg Barclays U.S. Corporate High-Yield Bond Index2 | | | 7.11 | | | | 8.59 | | | | 6.80 | | | | 6.86 | | | | | | | | | |
Performance data shown represents past performance and is no guarantee of, and not necessarily indicative of, future results. Total return and value will vary, and you may have a gain or loss when shares are sold. Current performance may be lower or higher than quoted. For most recent month-end performance, visit im.natixis.com/performance. Performance for other share classes will be greater or less than shown based on differences in fees and sales charges. You may not invest directly in an index. Performance for periods less than one year is cumulative, not annualized. Returns reflect changes in share price and reinvestment of dividends and capital gains, if any. The table(s) do not reflect taxes shareholders might owe on any fund distributions or when they redeem their shares.
| 1 | Class C shares performance assumes a 1% CDSC applied when you sell shares within one year of purchase. |
| 2 | The Bloomberg Barclays U.S. Corporate High-Yield Bond Index measures the market of USD-denominated, non-investment grade, fixed-rate, taxable corporate bonds. Securities are classified as high yield if the middle rating of Moody’s, Fitch, and S&P is Ba1/BB+/BB+ or below, excluding emerging market debt. The Bloomberg Barclays U.S. Corporate High-Yield Bond Index was created in 1986, with history backfilled to July 1, 1983, and rolls up into the Bloomberg Barclays U.S. Universal and Global High-Yield Indices. |
| 3 | Fund performance has been increased by fee waivers and/or expense reimbursements, if any, without which performance would have been lower. |
| 4 | Expense ratios are as shown in the Fund’s prospectus in effect as of the date of this report. The expense ratios for the current reporting period can be found in the Financial Highlights section of this report under Ratios to Average Net Assets. Net expenses reflect contractual expense limitations set to expire on 4/30/21. When a Fund’s expenses are below the limitation, gross and net expense ratios will be the same. See Note 6 of the Notes to Financial Statements for more information about the Fund’s expense limitations. |
| 5 | Generally accepted accounting principles require adjustments to be made to the net assets of the Fund for financial reporting purposes only, and as such, the total returns reflected above are different from the total returns reported in the financial highlights. The returns presented in the table above are what an investor would have actually experienced. |
3 |
LOOMIS SAYLES INTERMEDIATE MUNICIPAL BOND FUND
| | |
| |
| Managers | | Symbols |
| |
| Dawn Mangerson | | Class A MIMAX |
| |
| James Grabovac, CFA® | | Class C MIMCX |
| |
| Lawrence Jones | | Class Y MIMYX |
| |
| Loomis, Sayles & Company, L.P. | | |
Investment Goal
The Fund seeks a high level of federal tax-exempt current income, consistent with the preservation of capital.
Market Conditions
Capital markets concluded a tumultuous year producing positive returns across most asset classes. High-grade municipal yields declined between 70 and 90 basis points, with the largest declines occurring on the shorter end of the yield curve. The pandemic-induced market panic that occurred in March proved short-lived as a rapid and massive easing of monetary policy, combined with multiple rounds of fiscal relief, provided the medicine markets required to gain a foothold from the liquidity panic. Markets subsequently began their climb higher as the year progressed. Lower quality sectors of the municipal market underperformed higher quality, as participants weighed the continued impact of a deep recession caused by the necessity of shutting down large segments of the US and global economies. Recent economic improvement coincident with the approval and rollout of vaccines has increased optimism that the recession will end in 2021 and the path toward recovery will open. However, significant hurdles remain for large segments of the economy, and whether the severity of the pandemic will result in long-term or permanent changes in behavior continues to weigh on many sectors, including real estate related, mass transit, senior care and air travel, to note several. In addition, the disruption and dislocation in K-12 and higher education has been sharp, although federal aid has provided important support. Questions remain, however, about the evolution of the education sector and whether the steady expansion of higher education, in particular, has reached a secular peak in the US.
Performance Results
For the 12 months ended December 31, 2020, Class Y shares of the Loomis Sayles Intermediate Municipal Bond Fund returned 3.63% at net asset value. The Fund underperformed its benchmark, the Bloomberg Barclays Municipal Bond Index, which returned 5.21%.
Explanation of Fund Performance
Although the Fund produced a meaningfully positive return for the year, it underperformed its benchmark primarily due to yield curve posture, more specifically a 10.5% underweight to the longest portion of the yield curve (22 years and plus), which produced the greatest returns for the period. Additionally, overweight exposures to the higher education and hospital sectors hampered performance as spreads widened, while outperformance of the Fund’s allocations to the local general obligation, leasing and special tax sectors was additive to performance. Furthermore, underperformance in the Fund’s BBB-rated credits was a significant detractor from performance. With respect to state allocations, fund positioning in two of the largest states in the benchmark, California and New York, contributed positively; however, overall state exposure was a drag on performance.
Outlook
The economy and the markets withstood significant damage in the early stages of the pandemic and required unprecedented support from fiscal and monetary policymakers. The Federal Reserve has communicated clearly its intention to continue to keep the policy rate near the zero lower bound at least through this year and likely beyond. Sustaining an economic recovery is also expected to require continuing fiscal relief while the rollout of the vaccines continues and accelerates. We anticipate the new administration will attempt to bring both additional aid for state and local governments and an infrastructure package. We are hopeful that wide distribution of the vaccine alongside continued fiscal and monetary support will provide a glide path toward economic recovery. While we do not anticipate a significant rise in long-term interest rates, there could be modest upward pressure as the economic environment improves. Somewhat higher yields and an increase in municipal supply resulting from an infrastructure package would be welcome developments for municipal investors who have faced constrained supply and record low yields for most of the past year. Municipal investor appetite remains strong and we anticipate the market could absorb any increase in supply.
| 4
LOOMIS SAYLES INTERMEDIATE MUNICIPAL BOND FUND
Hypothetical Growth of $100,000 Investment in Class Y Shares1,4
December 31, 2012 (inception) through December 31, 2020
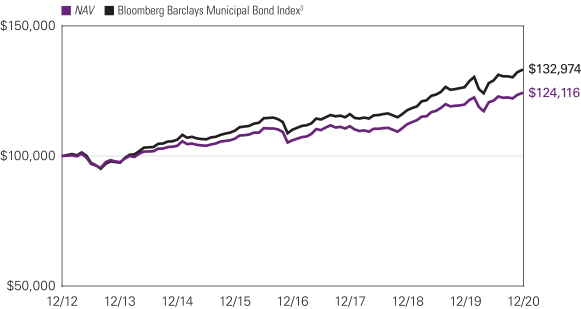
Average Annual Total Returns — December 31, 20204
| | | | | | | | | | | | | | | | | | | | |
| | | | | |
| | | | | | | | | | | | Expense Ratios5 | |
| | | | | | |
| | | 1 Year | | | 5 Years | | | Life of Fund | | | Gross | | | Net | |
| | | | | | |
| Class Y (Inception 12/31/12)1 | | | | | | | | | | | | | | | | | | | | |
| NAV | | | 3.63 | % | | | 3.08 | % | | | 2.74 | % | | | 1.61 | % | | | 0.46 | % |
| | | | | | |
| Class A (Inception 12/31/12)1 | | | | | | | | | | | | | | | | | | | | |
| NAV | | | 3.48 | | | | 2.83 | | | | 2.46 | | | | 1.85 | | | | 0.71 | |
| With 3.00% Maximum Sales Charge | | | 0.38 | | | | 2.21 | | | | 2.06 | | | | | | | | | |
| | | | | | |
| Class C (Inception 12/31/12)1 | | | | | | | | | | | | | | | | | | | | |
| NAV | | | 2.71 | | | | 2.06 | | | | 1.70 | | | | 2.61 | | | | 1.46 | |
| With CDSC2 | | | 1.71 | | | | 2.06 | | | | 1.70 | | | | | | | | | |
| | | | | | |
| Comparative Performance | | | | | | | | | | | | | | | | | | | | |
| Bloomberg Barclays Municipal Bond Index3 | | | 5.21 | | | | 3.91 | | | | 3.61 | | | | | | | | | |
Performance data shown represents past performance and is no guarantee of, and not necessarily indicative of, future results. Total return and value will vary, and you may have a gain or loss when shares are sold. Current performance may be lower or higher than quoted. For most recent month-end performance, visit im.natixis.com/performance. Performance for other share classes will be greater or less than shown based on differences in fees and sales charges. You may not invest directly in an index. Performance for periods less than one year is cumulative, not annualized. Returns reflect changes in share price and reinvestment of dividends and capital gains, if any. The table(s) do not reflect taxes shareholders might owe on any fund distributions or when they redeem their shares.
| 1 | December 31, 2012 represents the date shares were first registered for public sale under the Securities Act of 1933. November 16, 2012 represents commencement of operations for accounting and financial reporting purposes only. |
| 2 | Performance for Class C shares assumes a 1.00% contingent deferred sales charge (“CDSC”) applied when you sell shares within one year of purchase. |
| 3 | Bloomberg Barclays Municipal Bond Index is a market value-weighted index of investment-grade municipal bonds with maturities of one year or more. |
| 4 | Fund performance has been increased by fee waivers and/or expense reimbursements, if any, without which performance would have been lower. |
| 5 | Expense ratios are as shown in the Fund’s prospectus in effect as of the date of this report. The expense ratios for the current reporting period can be found in the Financial Highlights section of this report under Ratios to Average Net Assets. Net expenses reflect contractual expense limitations set to expire on 4/30/21. When a Fund’s expenses are below the limitation, gross and net expense ratios will be the same. See Note 6 of the Notes to Financial Statements for more information about the Fund’s expense limitations. |
5 |
LOOMIS SAYLES INTERNATIONAL GROWTH FUND
| | | | |
| | |
| Managers | | Symbols | | |
| | |
| Aziz V. Hamzaogullari, CFA® | | Class A | | LIGGX |
| | |
| Loomis, Sayles & Company, L.P. | | Class C | | LIGCX |
| | |
| | Class N | | LIGNX |
| | |
| | Class Y | | LIGYX |
Investment Goal
The Fund’s investment goal is long-term growth of capital.
Market Conditions
International equities moved modestly higher in the abbreviated reporting period that ran from December 15, 2020 to December 31, 2020. The market entered the period on a high note, having rallied significantly over the prior six weeks following the approval of a vaccine for Covid-19. The conclusion of the U.S. election provided a further boost to the markets in this time, as did the ongoing commitment of the world’s central banks to maintain their ultra-accommodative monetary policies indefinitely. The pace of the rally slowed in the final two weeks of the year, as investors paused to digest the previous gains and trading activity decelerated around the holidays. In addition, a number of European countries began to re-institute lockdown measures to combat rising cases of the coronavirus. The tone in the markets remained fairly positive, however, partially as a result of the passage of a long-awaited fiscal stimulus package in the United States. The upbeat close to the year allowed the major international indices to finish 2020 with double-digit Q4 returns despite the dramatic first-quarter selloff caused by Covid-19.
Performance Results
The Loomis Sayles International Growth Fund was launched on December 15, 2020. For the period ending December 31, 2020, Class Y shares of the Fund returned 1.38% at net asset value. The Fund underperformed its benchmark, the MSCI All Country World Index Ex USA Index, which returned 2.57%.
Explanation of Fund Performance
We are an active manager with a long-term, private equity approach to investing. Through our proprietary bottom-up research framework, we look to invest in those few high-quality businesses with sustainable competitive advantages and profitable growth when they trade at a significant discount to intrinsic value. Given the rare confluence of quality, growth, and valuation, we may study dozens of companies but may only invest in a select few businesses each year. We believe identifying those few businesses with these characteristics is an art, not a science. As a result of this rigorous approach, ours is a selective, high-conviction portfolio of typically 30-45 securities.
During the brief period, the Fund’s positions in Baidu, Vipshop, and Kweichow Moutai contributed the most to performance. Stock selection in the communication services and consumer staples sectors, as well as our allocation in the energy sector, contributed positively to relative performance. The Fund’s positions in Alibaba, Tencent, and Sodexo detracted the most from performance. Stock selection in the consumer discretionary and information technology sectors were the biggest detractors from relative performance.
Outlook
Our investment process is characterized by bottom-up fundamental research and a long-term investment time horizon. The nature of the process leads to a lower-turnover portfolio in which sector positioning is the result of stock selection. The Fund ended the year with overweight positions in the consumer staples, consumer discretionary, healthcare, communication services, and information technology sectors and was underweight in the industrials and energy sectors. We had no exposure to stocks in the financials, materials, utilities or real estate sectors. From a geographic standpoint we were overweight in emerging markets and North America and underweight in developed Asia and Europe. We remain committed to our long-term investment approach to invest in those few high-quality businesses with sustainable competitive advantages and profitable growth when they trade at a significant discount to intrinsic value.
| 6
LOOMIS SAYLES INTERNATIONAL GROWTH FUND
Top Ten Holdings as of December 31, 2020
| | | | | | | | |
| | |
| Security Name | | % of
Assets | |
| | 1 | | | MercadoLibre, Inc. | | | 7.69 | % |
| | 2 | | | Tencent Holdings Ltd. | | | 6.62 | |
| | 3 | | | Alibaba Group Holding Ltd., Sponsored ADR | | | 5.61 | |
| | 4 | | | Roche Holding AG | | | 5.51 | |
| | 5 | | | Novartis AG, (Registered) | | | 4.94 | |
| | 6 | | | Adyen NV | | | 4.89 | |
| | 7 | | | Kweichow Moutai Co. Ltd., Class A | | | 4.44 | |
| | 8 | | | FANUC Corp. | | | 4.22 | |
| | 9 | | | Ambev S.A., ADR | | | 3.90 | |
| | 10 | | | Baidu, Inc., Sponsored ADR | | | 3.65 | |
The portfolio is actively managed and holdings are subject to change. There is no guarantee the Fund continues to invest in the securities referenced. The holdings listed exclude any temporary cash investments.
Total Returns — December 31, 20203
| | | | | | | | | | | | |
| | | |
| | | | | | Expense Ratios4 | |
| | | | |
| | | Life of Fund | | | Gross | | | Net | |
| | | | |
| Class Y (Inception 12/15/20) | | | | | | | | | | | | |
| NAV | | | 1.38 | % | | | 22.50 | % | | | 0.95 | % |
| | | | |
| Class A (Inception 12/15/20) | | | | | | | | | | | | |
| NAV | | | 1.37 | | | | 22.75 | | | | 1.20 | |
| With 5.75% Maximum Sales Charge | | | -4.46 | | | | | | | | | |
| | | | |
| Class C (Inception 12/15/20) | | | | | | | | | | | | |
| NAV | | | 1.33 | | | | 23.50 | | | | 1.95 | |
| With CDSC1 | | | 0.33 | | | | | | | | | |
| | | | |
| Class N (Inception 12/15/20) | | | | | | | | | | | | |
| NAV | | | 1.38 | | | | 4.02 | | | | 0.90 | |
| | | | |
| Comparative Performance | | | | | | | | | | | | |
| MSCI ACWI ex USA Index2 | | | 2.39 | | | | | | | | | |
Performance data shown represents past performance and is no guarantee of, and not necessarily indicative of, future results. Total return and value will vary, and you may have a gain or loss when shares are sold. Current performance may be lower or higher than quoted. For most recent month-end performance, visit im.natixis.com. Performance for other share classes will be greater or less than shown based on differences in fees and sales charges. You may not invest directly in an index. Performance for periods less than one year is cumulative, not annualized. Returns reflect changes in share price and reinvestment of dividends and capital gains, if any. The table(s) do not reflect taxes shareholders might owe on any fund distributions or when they redeem their shares.
| 1 | Performance for Class C shares assumes a 1% contingent deferred sales charge (“CDSC”) applied when you sell shares within one year of purchase. |
| 2 | The MSCI ACWI ex USA Index captures large and mid cap representation across 22 of 23 Developed Markets (DM) countries (excluding the US) and 27 Emerging Markets (EM) countries. With 2,361 constituents, the index covers approximately 85% of the global equity opportunity set outside the US. |
| 3 | Fund performance has been increased by fee waivers and/or expense reimbursements, if any, without which performance would have been lower. |
| 4 | Expense ratios are as shown in the Fund’s prospectus in effect as of the date of this report. The expense ratios for the current reporting period can be found in the Financial Highlights section of this report under Ratios to Average Net Assets. Net expenses reflect contractual expense limitations set to expire on 4/30/22. When a Fund’s expenses are below the limitation, gross and net expense ratios will be the same. See Note 6 of the Notes to Financial Statements for more information about the Fund’s expense limitations. |
7 |
LOOMIS SAYLES INVESTMENT GRADE BOND FUND
| | | | |
| | |
| Managers | | Symbols | | |
| | |
| Matthew J. Eagan, CFA® | | Class A | | LIGRX |
| | |
| Brian P. Kennedy | | Class C | | LGBCX |
| | |
| Elaine M. Stokes | | Class N | | LGBNX |
| | |
| Loomis, Sayles & Company, L.P. | | Class Y | | LSIIX |
| | |
| | Admin Class | | LIGAX |
Investment Goal
The Fund seeks high total investment return through a combination of current income and capital appreciation.
Market Conditions
The financial markets experienced significant volatility in 2020, as investors grappled with the persistent uncertainty surrounding Covid-19. The bulk of the market disruptions occurred in February and March, when world governments first aimed to contain the virus by locking down broad swaths of their economies. Higher-risk assets were hit hard in the ensuing selloff, while demand for “safe-haven” investments surged. The US Federal Reserve (Fed) sought to counter the extraordinary developments by cutting short-term interest rates to zero, reestablishing traditional quantitative easing (QE) through asset purchases in the Treasury and mortgage-backed securities markets, and establishing lending facilities which either have only been used during the Great Financial Crisisor were created for the first time in Fed history, such as the Corporate Credit facility. Aided by the $2.2 trillion stimulus package passed by the US Congress in late March, the Fed’s response fueled an impressive recovery in higher-risk assets from early spring onward. After pausing in the lead-up to the US elections, the rally gained steam in November thanks to the long-awaited headline that coronavirus vaccines would soon become available to the public. The markets took this as an indication that economic conditions could gradually return to normal in 2021, boosting sentiment into year-end.
US Treasurys were the primary beneficiaries of the first-quarter “flight to quality” and the Fed’s subsequent commitment to maintain its low-rate monetary policy indefinitely. Twelve-month returns were progressively higher along the yield curve (a curve that shows the relationship among bond yields across the maturity spectrum), with 30-year issues generating the largest gain.
Although investment-grade corporate bonds suffered a sharp downturn in the February-March selloff, the category finished as the top performing major segment of the fixed income market for the full, 12-month period. Corporates benefited from the gradual improvement in the credit outlook throughout the course of the year, together with rising demand for high-quality alternatives to low-yielding government debt.
High-yield bonds also delivered positive returns, although they were unable to keep pace with investment-grade corporates. The category was supported by hopes for an economic recovery and reduced investor risk aversion. Lower-quality debt was generally harder hit in the February-March downturn due low market liquidity, tempering its return for the full year. Nevertheless, yield spreads — the difference between yields on below investment-grade debt and Treasurys of similar maturities — finished the year close to where they stood in February prior to the selloff associated with Covid-19.
Securitized assets — including mortgage-backed securities (MBS), asset-backed securities (ABS), and commercial mortgage-backed securities (CMBS) — posted positive total returns but failed to keep pace with the broader US bond market. CMBS was the strongest performer in this segment despite concerns about the outlook for commercial real estate in the wake of the pandemic.
Performance Results
For the 12 months ended December 31, 2020, Class Y shares of the Loomis Sayles Investment Grade Bond Fund returned 11.68% at net asset value. The Fund outperformed its benchmark, the Bloomberg Barclays U.S. Government/Credit Bond Index, which returned 8.93%. The Fund also outperformed its secondary benchmark, the Bloomberg Barclays U.S. Aggregate Bond Index, which returned 7.51%.
Explanation of Fund Performance
The remarkable events of 2020 were dominated by the volatility created by the Covid-19 global pandemic. Fueled by extraordinary monetary and fiscal stimulus, markets came roaring back after a sharp selloff during the first quarter of the year, and continued to reach new highs as lockdowns eased and vaccine development progressed. This positive momentum was maintained throughout the final quarter of 2020 as a Covid vaccine was approved and distribution began. Security selection was the primary source of the Fund’s outperformance for the 12-month period. The Fund’s exposure to investment grade corporate credit was the largest contributor to relative return, aided by banking, communications and consumer non-cyclical holdings. An allocation to high yield corporate credit, particularly within the basic industry and energy sectors, was positive for performance as well. An underweight to US Treasuries was also beneficial as investors favored riskier asset classes given the improving economic outlook.
Exposure to securitized assets and defensive, reserve-like positions detracted as these did not keep pace with corporate credit.
| 8
LOOMIS SAYLES INVESTMENT GRADE BOND FUND
Outlook
Looking ahead to the upcoming year, there are a number of structural economic factors in place that pose risks to our market outlook, including the ongoing impact of the pandemic, further delay in reaching a fiscal package and any resurgence of trade tensions between the US and China. That said, we are optimistic that economic conditions could continue to show improvement over the next year. This view is reflected in current market prices and appears to be shared by the consensus.
While the recent rise in coronavirus cases has led to renewed containment measures across the US, the likelihood of a vaccine has been priced into markets along with expectations for a fiscal package to arrive in the first quarter of the year. These measures help give us some confidence that the economic recovery could continue to show steady, if uneven, progress. GDP growth rebounded from the steep declines last year and we expect this trend to continue into 2021.
We anticipate limited changes in monetary policy, with the Fed likely maintaining its zero interest rate policy until at least 2023. The Fed has also indicated that full employment and longer-term inflation averages are additional factors in considering any future rate hikes. This accommodative stance should continue to boost investor confidence and demand for yield in a low global rate environment. In addition, we believe the overall health of the consumer, strong housing market and expected inventory rebuilding provide support to our outlook.
The credit markets have been progressing through the cycle,1 and we believe there are increasing signs of a shift towards recovery with corporate profits rebounding, easy monetary policy, balance sheet improvement and potential for large-scale vaccine distribution.
We have been maintaining a balance of liquidity, diversification and risk exposure in our portfolios. Within our credit allocation, we continue to focus on areas where we still see value based on our fundamental research. We are specifically focused on some of the sectors that were hardest hit by the pandemic including the transportation, recreational and hospitality industries. These areas of the economy include credits that have been cheap for their rating, have been able to access the capital markets for liquidity and are likely in a good position to benefit from the recovery.
Despite the higher valuations, we believe there are still selective opportunities in both the investment grade and high yield corporate sectors. Spreads have compressed but can potentially tighten further on improving fundamentals. We are selectively adding corporate credit, particularly in areas of the market that have lagged the recovery.
Our emerging market allocation largely represents US dollar-pay exposure to high quality securities with strong balance sheets and currently attractive real yields. We are holding little foreign currency but continue to evaluate opportunities in markets outside the US as we look for clarity on the outlook for global growth.
Market conditions in the past year have highlighted the notion that investors tend to overreact. The speed and severity of the recession and subsequent sharp rebound were unexpected, but also presented some favorable investment opportunities. These developments have served to reinforce our investment philosophy that markets are highly inefficient in the short term. We believe that we were able to capitalize on these developments in 2020 and that our portfolios are well-positioned to benefit from the expected economic growth and recovery in the new year.
| 1 | A credit cycle is a cyclical pattern that follows credit availability and corporate health. |
9 |
LOOMIS SAYLES INVESTMENT GRADE BOND FUND
Hypothetical Growth of $100,000 Investment in Class Y Shares4
December 31, 2010 through December 31, 2020
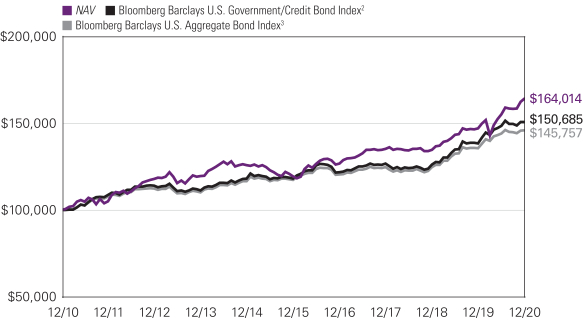
Average Annual Total Returns — December 31, 20204
| | | | | | | | | | | | | | | | | | | | | | | | |
| | | | | | |
| | | | | | | | | | | | | | | Expense Ratios5 | |
| | | | | | | |
| | | 1 Year | | | 5 Years | | | 10 Years | | | Life of Class N | | | Gross | | | Net | |
| | | | | | | |
| Class Y (Inception 12/31/96) | | | | | | | | | | | | | | | | | | | | | | | | |
| NAV | | | 11.68 | % | | | 6.57 | % | | | 5.07 | % | | | — | % | | | 0.56 | % | | | 0.50 | % |
| | | | | | | |
| Class A (Inception 12/31/96) | | | | | | | | | | | | | | | | | | |
| NAV | | | 11.41 | | | | 6.31 | | | | 4.80 | | | | — | | | | 0.81 | | | | 0.75 | |
| With 4.25% Maximum Sales Charge | | | 6.70 | | | | 5.39 | | | | 4.35 | | | | — | | | | | | | | | |
| | | | | | | |
| Class C (Inception 9/12/03) | | | | | | | | | | | | | | | | | | | | | | | | |
| NAV | | | 10.61 | | | | 5.52 | | | | 4.02 | | | | — | | | | 1.56 | | | | 1.50 | |
| With CDSC1 | | | 9.61 | | | | 5.52 | | | | 4.02 | | | | — | | | | | | | | | |
| | | | | | | |
| Class N (Inception 2/1/13) | | | | | | | | | | | | | | | | | | | | | | | | |
| NAV | | | 11.74 | | | | 6.65 | | | | — | | | | 4.24 | | | | 0.47 | | | | 0.45 | |
| | | | | | | |
| Admin Class (Inception 2/1/10) | | | | | | | | | | | | | | | | | | | | | | | | |
| NAV | | | 11.17 | | | | 6.07 | | | | 4.56 | | | | — | | | | 1.06 | | | | 1.00 | |
| | | | | | | |
| Comparative Performance | | | | | | | | | | | | | | | | | | | | | | | | |
| Bloomberg Barclays U.S. Government/Credit Bond Index2 | | | 8.93 | | | | 4.98 | | | | 4.19 | | | | 3.70 | | | | | | | | | |
| Bloomberg Barclays U.S. Aggregate Bond Index3 | | | 7.51 | | | | 4.44 | | | | 3.84 | | | | 3.43 | | | | | | | | | |
Performance data shown represents past performance and is no guarantee of, and not necessarily indicative of, future results. Total return and value will vary, and you may have a gain or loss when shares are sold. Current performance may be lower or higher than quoted. For most recent month-end performance, visit im.natixis.com. Performance for other share classes will be greater or less than shown based on differences in fees and sales charges. You may not invest directly in an index. Performance for periods less than one year is cumulative, not annualized. Returns reflect changes in share price and reinvestment of dividends and capital gains, if any. The table(s) do not reflect taxes shareholders might owe on any fund distributions or when they redeem their shares.
| 1 | Performance for Class C shares assumes a 1% contingent deferred sales charge (“CDSC”) applied when you sell shares within one year of purchase. |
| 2 | The Bloomberg Barclays U.S. Government/Credit Bond Index is the non-securitized component of the U.S. Aggregate Index and was the first macro index launched by Barclays Capital. The U.S. Government/Credit Bond Index includes investment grade, US dollar denominated, fixed rate Treasuries (i.e., public obligations of the U.S. Treasury that have remaining maturities of more than one year), government-related issues (i.e., agency, sovereign, supranational, and local authority debt), and corporate securities. The U.S. Government/Credit Index was launched on January 1, 1979, with index history backfilled to 1973, and is a subset of the Bloomberg Barclays U.S. Aggregate Index. |
| 3 | The Bloomberg Barclays U.S. Aggregate Bond Index is a broad based index that covers the U.S.-dollar-denominated, investment-grade, fixed-rate, taxable bond market of SEC-registered securities. The index includes bonds from the U.S. Treasury, government-related, corporate, mortgage-backed securities, asset-backed securities, and collateralized mortgage-backed securities sectors. |
| 4 | Fund performance has been increased by fee waivers and/or expense reimbursements, if any, without which performance would have been lower. |
| 5 | Expense ratios are as shown in the Fund’s prospectus in effect as of the date of this report. The expense ratios for the current reporting period can be found in the Financial Highlights section of this report under Ratios to Average Net Assets. Net expenses reflect contractual expense limitations set to expire on 4/30/22. When a Fund’s expenses are below the limitation, gross and net expense ratios will be the same. See Note 6 of the Notes to Financial Statements for more information about the Fund’s expense limitations. |
| 10
LOOMIS SAYLES STRATEGIC ALPHA FUND
| | |
| |
| Managers | | Symbols |
| |
| Matthew J. Eagan, CFA® | | Class A LABAX |
| |
| Kevin P. Kearns* | | Class C LABCX |
| |
| Brian P. Kennedy** | | Class N LASNX |
| |
| Elaine M. Stokes** | | Class Y LASYX |
| |
| Todd P. Vandam, CFA® | | |
| |
| Loomis, Sayles & Company, L.P. | | |
| * | Effective January 8, 2021, Kevin P. Kearns no longer serves as portfolio manager of the Fund. |
| ** | Effective January 8, 2021, Brian P. Kennedy and Elaine M. Stokes will join the portfolio management team of the Fund. |
Investment Goal
The Fund seeks to provide an attractive absolute total return, complemented by prudent investment management designed to manage risks and protect investor capital. The secondary goal of the Fund is to achieve these returns with relatively low volatility.
Market Conditions
Although investment-grade corporate bonds suffered a sharp downturn in the February-March 2020 selloff, the category finished as the top performing major segment of the fixed income market for the full 12-month period. Corporates benefited from the gradual improvement in the credit outlook throughout the course of the year, together with rising demand for high-quality alternatives to low-yielding government debt.
High-yield bonds also delivered positive returns, although they were unable to keep pace with investment-grade corporates. The category was supported by hopes for an economic recovery and reduced investor risk aversion. Lower-quality debt was generally harder hit in the February-March downturn due to low market liquidity, tempering its return for the full year. Nevertheless, yield spreads (the yield differential provided by corporate issues relative to comparable maturity Treasuries) finished the year close to where they stood in February prior to the selloff associated with Covid-19.
Emerging market bonds, while performing poorly in the first quarter, rebounded to finish the year with a solid total return. The asset class was aided by the combination of gradually improving investor sentiment, robust growth in Asia, steadily improving commodity prices, and persistent weakness in the US dollar.
Performance Results
For the 12 months ended December 31, 2020, Class Y shares of the Loomis Sayles Strategic Alpha Fund returned 10.19% at net asset value. The Fund outperformed its benchmark, 3-Month LIBOR, which returned 0.66% for the period. The Fund follows an absolute return strategy and is not managed to an index.
Explanation of Fund Performance
Investment grade corporate credit made the largest positive contribution during the period as spreads narrowed. To support the flow of credit to households and businesses, the Federal Reserve (Fed) will likely continue to purchase Treasury securities. With the coronavirus continuing to spread and disrupt markets, the Fed has taken many additional measures to keep the economy afloat such as buying investment grade corporate bonds with the intent of providing a safety net to corporations and their employees. However, one of President Joe Biden’s campaign promises was to reverse the excesses of the Trump tax cuts for corporations, so whether this impacts the current assistance measures the Fed is providing remains to be seen. Within the portfolio, consumer, banking and communications names in particular were the strongest contributors to returns.
High yield corporate bonds bolstered return during the period. Consumer, communications and finance company names led contributions within the high yield allocation as spreads narrowed. A portion of our high yield exposure was expressed through being long the market with High Yield CDX (credit default swap index), where we took advantage of the relatively strong liquidity profile that this instrument provided during the sharp market correction that occurred in the first quarter of 2020. The position performed well during the rest of the year and contributed positively to the overall performance of the Fund. The use of credit default swap/CDX instruments provided individual name and broad index exposure, and as a result, the ability to access overall credit markets and express an investment view quickly and efficiently. High yield bonds have outperformed stocks during the past few economic recoveries, but that has not happened this time around. As noted, against the backdrop of the coronavirus pandemic the Fed intervened with interest rate cuts, to which high yield bonds responded favorably. During the final quarter of 2020, multiple pharmaceutical and biotech companies confirmed they would soon make a Covid-19 vaccine available (while awaiting FDA approval) and verified effectiveness rates in the 95% range. As
11 |
administration of the initial vaccines to healthcare workers and high risk individuals began, the resulting optimism fueled gains in the high yield bond market during the final quarter of 2020.
Emerging markets contributed to returns for the year with owned-no-guarantee oil securities in Mexico aiding performance the most. Since his inauguration in late 2018, Mexican President Andrés Manuel López Obrador has pledged to restore the dominance of local companies such as Pemex by reviving competition among energy companies and ending reforms that were implemented in 2013. Additionally, with the economy struggling due to the global pandemic, Mexico’s energy companies have worked hard to recover and build a solid future.
Currency positioning weighed on performance during the year as the dollar began 2020 as the world’s strongest currency only to see the coronavirus pandemic rock markets. A long forward position in the Norwegian krone particularly detracted. With the Fed’s extreme policy accommodation since late March the dollar has weakened against most major currencies. The US dollar is expected to continue to weaken in 2021 as Fed policies including historically low interest rates remain intact, the economy continues to repair and President Biden begins his first 100 days in office with less reliance on tariffs against China than his predecessor. The interest rate positioning was done using US Treasury futures, with gross notional exposure averaging approximately 10% of overall market value, to establish a duration underweight, which helped contribute positively to the overall performance of the Fund.
Our minimal allocation to bank loans hurt performance in 2020 with the energy sub-sector as the largest detractor. It should be noted that energy lending includes a wide range of financing activities with examples including oil and gas reserves, solar financing, solar farm financing, wind capital, wind farm financing, renewable and sustainable energy financing and biomass fuels financing. Furthermore, the Fed established the Primary Market Corporate Credit Facility for new bond and loan issuance to assist with the flow of credit to large employers impacted by the pandemic.
Outlook
Looking ahead to the upcoming year, there are a number of structural economic factors in place that pose risks to our market outlook, including the ongoing impact of the pandemic, potential delays in reaching agreement on further fiscal stimulus and any resurgence of trade tensions between the US and China. That said, we are optimistic that economic conditions could continue to show improvement over the next year. This view is reflected in current market prices and appears to be shared by the consensus.
We anticipate limited changes in monetary policy, with the Fed likely maintaining its zero interest rate stance until at least 2023. The Fed has also indicated that progress toward attaining full employment and longer-term inflation averages are additional factors in considering any future rate hikes. This accommodative stance should continue to boost investor confidence and demand for yield in a low global rate environment. In addition, we believe the overall health of the consumer, strong housing market and expected inventory rebuilding provide support to our outlook.
We have been maintaining a balance of liquidity, diversification and risk exposure. Within our credit allocation, we continue to focus on areas where we still see value based on our fundamental research. We are specifically focused on some of the sectors that were hardest hit by the pandemic including the transportation, recreation and hospitality industries. These areas of the economy include credits that we view as cheap for their rating, have been able to access the capital markets for liquidity and are likely in a good position to benefit from the recovery.
Despite their higher valuations, we believe there are still selective opportunities in both the investment grade and high yield corporate sectors. Spreads have compressed but can potentially tighten further on improving fundamentals. We are selectively adding corporate credit, particularly in areas of the market that have lagged the recovery.
Market conditions in the past year have highlighted the notion that investors tend to overreact. The speed and severity of the recession and subsequent sharp rebound were unexpected, but also presented some favorable investment opportunities. These developments have served to reinforce our belief that markets are highly inefficient in the short term. We believe that we were able to capitalize on these developments in 2020 and that the Fund is well-positioned to benefit from the expected economic growth and recovery in the new year.
Our emerging market allocation largely represents US dollar-pay exposure to high quality securities with strong balance sheets and currently attractive real yields. We are holding little foreign currency but continue to evaluate opportunities in markets outside the US as we look for clarity on the outlook for global growth.
| 12
LOOMIS SAYLES STRATEGIC ALPHA FUND
Hypothetical Growth of $100,000 Investment in Class Y Shares4
December 31, 2010 through December 31, 2020
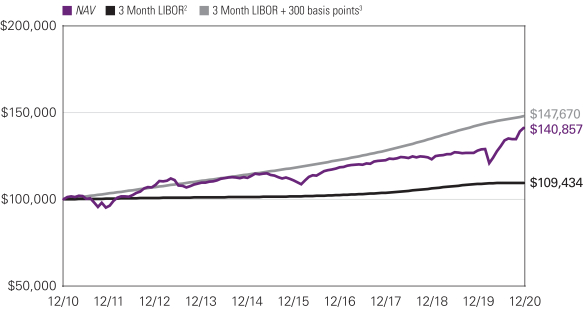
Average Annual Total Returns — December 31, 20204
| | | | | | | | | | | | | | | | | | | | | | | | |
| | | | | | |
| | | | | | | | | | | | | | | Expense Ratios5 | |
| | | | | | | |
| | | 1 Year | | | 5 Years | | | 10 Years | | | Life of Class N | | | Gross | | | Net | |
| | | | | | | |
| Class Y (Inception 12/15/10) | | | | | | | | | | | | | | | | | | | | | | | | |
| NAV | | | 10.19 | % | | | 4.93 | % | | | 3.49 | % | | | — | % | | | 0.74 | % | | | 0.74 | % |
| | | | | | | |
| Class A (Inception 12/15/10) | | | | | | | | | | | | | | | | | | | | | | | | |
| NAV | | | 9.97 | | | | 4.67 | | | | 3.24 | | | | — | | | | 0.99 | | | | 0.99 | |
| With 4.25% Maximum Sales Charge | | | 5.30 | | | | 3.77 | | | | 2.79 | | | | — | | | | | | | | | |
| | | | | | | |
| Class C (Inception 12/15/10) | | | | | | | | | | | | | | | | | | | | | | | | |
| NAV | | | 9.12 | | | | 3.89 | | | | 2.46 | | | | — | | | | 1.74 | | | | 1.74 | |
| With CDSC1 | | | 8.12 | | | | 3.89 | | | | 2.46 | | | | — | | | | | | | | | |
| | | | | | | |
| Class N (Inception 5/1/17) | | | | | | | | | | | | | | | | | | | | | | | | |
| NAV | | | 10.36 | | | | — | | | | — | | | | 4.56 | | | | 0.67 | | | | 0.67 | |
| | | | | | | |
| Comparative Performance | | | | | | | | | | | | | | | | | | | | | | | | |
| 3-Month LIBOR2 | | | 0.66 | | | | 1.46 | | | | 0.89 | | | | 1.68 | | | | | | | | | |
| 3-Month LIBOR + 300 basis points3 | | | 3.66 | | | | 4.46 | | | | 3.89 | | | | 4.66 | | | | | | | | | |
Performance data shown represents past performance and is no guarantee of, and not necessarily indicative of, future results. Total return and value will vary, and you may have a gain or loss when shares are sold. Current performance may be lower or higher than quoted. For most recent month-end performance, visit im.natixis.com/performance. Performance for other share classes will be greater or less than shown based on differences in fees and sales charges. You may not invest directly in an index. Performance for periods less than one year is cumulative, not annualized. Returns reflect changes in share price and reinvestment of dividends and capital gains, if any. The table(s) do not reflect taxes shareholders might owe on any fund distributions or when they redeem their shares.
| 1 | Performance for Class C shares assumes a 1% contingent deferred sales charge (“CDSC”) applied when you sell shares within one year of purchase. |
| 2 | 3-Month LIBOR, or the London Interbank Offered Rate, represents the average rate at which a leading bank, for a given currency (in this case U.S. dollars), can obtain unsecured funding, and is representative of short-term interest rates. |
| 3 | 3-Month LIBOR + 300 basis points is created by adding 3.00% to the annual return of 3-Month LIBOR. The calculation is performed on a monthly basis and is subject to the effects of compounding. |
| 4 | Fund performance has been increased by fee waivers and/or expense reimbursements, if any, without which performance would have been lower. |
| 5 | Expense ratios are as shown in the Fund’s prospectus in effect as of the date of this report. The expense ratios for the current reporting period can be found in the Financial Highlights section of this report under Ratios to Average Net Assets. Net expenses reflect contractual expense limitations set to expire on 4/30/21. When a Fund’s expenses are below the limitation, gross and net expense ratios will be the same. See Note 6 of the Notes to Financial Statements for more information about the Fund’s expense limitations. |
13 |
LOOMIS SAYLES STRATEGIC INCOME FUND
| | | | |
| | |
| Managers | | Symbols | | |
| | |
| Matthew J. Eagan, CFA® | | Class A | | NEFZX |
| | |
| Daniel J. Fuss, CFA®, CIC* | | Class C | | NECZX |
| | |
| Brian P. Kennedy | | Class N | | NEZNX |
| | |
| Elaine M. Stokes | | Class Y | | NEZYX |
| | |
| Loomis, Sayles & Company, L.P. | | Admin Class | | NEZAX |
| * | Effective March 1, 2021, Dan Fuss no longer serves as portfolio manager of the Fund. |
Investment Goal
The Fund seeks high current income with a secondary objective of capital growth.
Market Conditions
Investors’ appetite for risk surged in the fourth quarter, which contributed to a broad range of nearly all positive returns across credit asset classes. In early November, investors were treated to the long-awaited news that coronavirus vaccines were effective and would soon become available to the public. The prospect of a gradual return to normal economic conditions in 2021 allowed market participants to look beyond recent adverse headlines, including the emergence of a new strain of the virus, ongoing Brexit negotiations, and a slowdown in the economic recovery. Investors instead were focused on and encouraged by the US Federal Reserve (Fed) statements indicating its intention to keep short-term interest rates near zero for a multiyear period. Not least, the resolution to the US election removed a factor that had weighed on sentiment in early autumn.
The developments mentioned above acted as a headwind for the Treasury market. While short-term yields were largely unchanged due to the steady outlook for Fed policy, longer-term yields rose (as prices fell). With Treasurys already having rallied significantly in the first nine months of the year, there was little room for further improvement — particularly in light of rising estimates for both economic growth and inflation in 2021. In addition, demand for “safe haven” assets was muted due to generally positive headlines.
Investment-grade corporate bonds delivered sizable outperformance in the quarter, closing out an impressive year. The combination of an improving credit outlook and stable Fed policy prompted investors to move further out on the risk spectrum in search of more attractive yields.
High yield corporate issues performed very well and finished as the best performing major segment of the bond market for the quarter. Yield spreads — the difference between yields on below investment-grade debt and Treasurys of similar maturities — declined to a level close to where they stood in February prior to the selloff associated with Covid-19.
Securitized assets — including mortgage-backed securities (MBS), asset-backed securities (ABS) and commercial mortgage-backed securities (CMBS) — outperformed Treasurys but trailed both corporates and high yield. The category benefited from the same search for yield that aided other credit-sensitive segments of the fixed-income market, with CMBS outpacing ABS and MBS, respectively.
Emerging market bonds also moved higher in the quarter, with the bulk of the gain occurring in November and December. The asset class made up all of the ground it lost in the February-March selloff, allowing it to finish the full year firmly in positive territory. Emerging-markets debt was boosted by the combination of the “risk-on” environment, rising commodity prices and the persistent weakness in the US dollar.
Performance Results1
For the three months ended December 31, 2020, Class Y shares of the Loomis Sayles Strategic Income Fund returned 5.44% at net asset value. The Fund outperformed its primary benchmark, the Bloomberg Barclays U.S. Aggregate Bond Index, which returned 0.67%.
Explanation of Fund Performance
Markets finished the year on a positive note as a Covid-19 vaccine was approved and distribution began on a global scale. Credit sectors continued to perform well under these conditions. The Fund’s exposure to high yield corporate credit was the biggest
| 1 | Effective December 2, 2020, the Board of Trustees approved a change in the fiscal year-end of the Fund from September 30 to December 31. The Fund performance provided in this section reflects the three-month fiscal period ended December 31, 2020. |
| 14
LOOMIS SAYLES STRATEGIC INCOME FUND
contributor to relative return, largely driven by consumer cyclical, energy, and finance company holdings. Exposure to non-US-dollar securities, particularly those denominated in the Mexican peso, helped performance during the period. Within equities, allocations to the communications, consumer non-cyclical and technology sectors generated positive relative performance as stock markets posted strong gains for the quarter.
The Fund’s longer-than-benchmark positioning with respect to duration (and corresponding interest rate sensitivity) within US Treasuries detracted from relative performance.
Outlook
Looking ahead to the upcoming year, there are a number of structural economic factors in place that pose risks to our market outlook, including the ongoing impact of the pandemic, further delay in reaching a fiscal package and any resurgence of trade tensions between the US and China. That said, we are optimistic that economic conditions could continue to show improvement over the next year. This view is reflected in current market prices and appears to be shared by the consensus.
While the recent rise in coronavirus cases has led to renewed containment measures across the US, the likelihood of a vaccine has been priced into markets along with expectations for a fiscal package to arrive in the first quarter of the year. These measures help give us some confidence that the economic recovery could continue to show steady, if uneven, progress. GDP growth rebounded from the steep declines last year and we expect this trend to continue into 2021.
We anticipate limited changes in monetary policy, with the Fed likely maintaining its zero interest rate policy until at least 2023. The Fed has also indicated that full employment and longer-term inflation averages are additional factors in considering any future rate hikes. This accommodative stance should continue to boost investor confidence and demand for yield in a low global rate environment. In addition, we believe the overall health of the consumer, strong housing market and expected inventory rebuilding provide support to our outlook.
The credit markets have been progressing through the cycle,2 and we believe there are increasing signs of a shift towards recovery with corporate profits rebounding, easy monetary policy, balance sheet improvement and potential for large-scale vaccine distribution.
We have been maintaining a balance of liquidity, diversification and risk exposure in our portfolios. Within our credit allocation, we continue to focus on areas where we still see value based on our fundamental research. We are specifically focused on some of the sectors that were hardest hit by the pandemic including the transportation, recreational and hospitality industries. These areas of the economy include credits that have been cheap for their rating, have been able to access the capital markets for liquidity and are likely in a good position to benefit from the recovery.
Despite the higher valuations, we believe there are still selective opportunities in both the investment grade and high yield corporate sectors. Spreads have compressed but can potentially tighten further on improving fundamentals. We are selectively adding corporate credit, particularly in areas of the market that have lagged the recovery.
Our emerging market allocation largely represents US dollar-pay exposure to high quality securities with strong balance sheets and currently attractive real yields. We are holding little foreign currency but continue to evaluate opportunities in markets outside the US as we look for clarity on the outlook for global growth.
Market conditions in the past year have highlighted the notion that investors tend to overreact. The speed and severity of the recession and subsequent sharp rebound were unexpected, but also presented some favorable investment opportunities. These developments have served to reinforce our investment philosophy that markets are highly inefficient in the short term. We believe that we were able to capitalize on these developments in 2020 and that our portfolios are well-positioned to benefit from the expected economic growth and recovery in the new year.
During periods in which the US dollar appreciates relative to foreign currencies, funds that hold non-US-dollar-denominated bonds may realize currency losses in connection with the maturity or sale of certain bonds. These losses impact a fund’s ordinary income distributions (to the extent that losses are not offset by realized currency gains within the fund’s fiscal year). A recognized currency loss, in accordance with federal tax rules, decreases the amount of ordinary income a fund has available to distribute, even though these bonds continue to generate coupon income.
Fund officers have analyzed the Fund’s current portfolio of investments, realized currency gains and losses, schedule of maturities, and the corresponding amounts of unrealized currency losses that may become realized during the 2021 fiscal year. This analysis is performed regularly to determine how realized currency losses will impact periodic ordinary income distributions for the Fund. Based on the limited foreign currency exposures held by the Fund on the most recent quarterly analysis (as of December 31, 2020), Fund
| 2 | A credit cycle is a cyclical pattern that follows credit availability and corporate health. |
15 |
officers do not anticipate realized currency losses will have an impact on the distributions in the 2021 fiscal year. This analysis is based on certain assumptions including, but not limited to, the level of foreign currency exchange rates, security prices, interest rates, the Fund adviser’s ability to manage realized currency losses, and the net asset level of the Fund. Changes to these assumptions could materially impact the analysis and the amounts of future Fund distributions. Fund officers will continue to monitor these amounts on a regular basis and take the necessary actions required to manage the Fund’s distributions to address realized currency losses while seeking to avoid a return of capital distribution.
Hypothetical Growth of $100,000 Investment in Class Y Shares4
December 31, 2010 through December 31, 2020
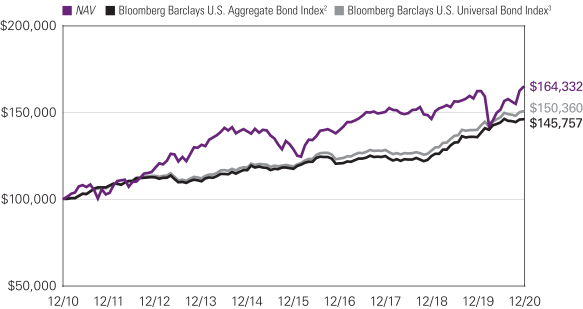
See notes to chart on page 17.
| 16
LOOMIS SAYLES STRATEGIC INCOME FUND
Average Annual Total Returns — December 31, 20204
| | | | | | | | | | | | | | | | | | | | | | | | | | | | |
| | | | | | | |
| | | | | | | | | | | | | | | | | | Expense Ratios5 | |
| | | | | | | | |
| | | 3 Months | | | 1 Year | | | 5 Years | | | 10 Years | | | Life of Class N | | | Gross | | | Net | |
| | | | | | | | |
| Class Y (Inception 12/1/99) | | | | | | | | | | | | | | | | | | | | | | | | | | | | |
| NAV | | | 5.44 | % | | | 1.40 | % | | | 5.04 | % | | | 5.09 | % | | | — | % | | | 0.71 | % | | | 0.71 | % |
| | | | | | | | |
| Class A (Inception 5/1/95) | | | | | | | | | | | | | | | | | | | | | | | | | | | | |
| NAV | | | 5.37 | | | | 1.15 | | | | 4.77 | | | | 4.83 | | | | — | | | | 0.96 | | | | 0.96 | |
| With 4.25% Maximum Sales Charge | | | 0.91 | | | | -3.14 | | | | 3.86 | | | | 4.37 | | | | — | | | | | | | | | |
| | | | | | | | |
| Class C (Inception 5/1/95) | | | | | | | | | | | | | | | | | | | | | | | | | | | | |
| NAV | | | 5.17 | | | | 0.38 | | | | 3.98 | | | | 4.04 | | | | — | | | | 1.71 | | | | 1.71 | |
| With CDSC1 | | | 4.17 | | | | -0.59 | | | | 3.98 | | | | 4.04 | | | | — | | | | | | | | | |
| | | | | | | | |
| Class N (Inception 2/1/13) | | | | | | | | | | | | | �� | | | | | | | | | | | | | | | |
| NAV | | | 5.39 | | | | 1.49 | | | | 5.12 | | | | — | | | | 4.04 | | | | 0.63 | | | | 0.63 | |
| | | | | | | | |
| Admin Class (Inception 2/1/10) | | | | | | | | | | | | | | | | | | | | | | | | | | | | |
| NAV | | | 5.24 | | | | 0.82 | | | | 4.52 | | | | 4.57 | | | | — | | | | 1.20 | | | | 1.20 | |
| | | | | | | | |
| Comparative Performance | | | | | | | | | | | | | | | | | | | | | | | | | | | | |
| Bloomberg Barclays U.S. Aggregate Bond Index2 | | | 0.67 | | | | 7.51 | | | | 4.44 | | | | 3.84 | | | | 3.43 | | | | | | | | | |
| Bloomberg Barclays U.S. Universal Bond Index3 | | | 1.29 | | | | 7.58 | | | | 4.87 | | | | 4.16 | | | | 3.70 | | | | | | | | | |
Performance data shown represents past performance and is no guarantee of, and not necessarily indicative of, future results. Total return and value will vary, and you may have a gain or loss when shares are sold. Current performance may be lower or higher than quoted. For most recent month-end performance, visit im.natixis.com. Performance for other share classes will be greater or less than shown based on differences in fees and sales charges. You may not invest directly in an index. Performance for periods less than one year is cumulative, not annualized. Returns reflect changes in share price and reinvestment of dividends and capital gains, if any. The table(s) do not reflect taxes shareholders might owe on any fund distributions or when they redeem their shares.
| 1 | Class C share performance assumes a 1% CDSC applied when you sell shares within one year of purchase. |
| 2 | The Bloomberg Barclays U.S. Aggregate Bond Index is an unmanaged index that covers the U.S.-dollar-denominated, investment-grade, fixed-rate, taxable bond market of SEC-registered securities. The index includes bonds from the Treasury, government-related, corporate, mortgage-backed securities, asset-backed securities, and collateralized mortgage-backed securities sectors. |
| 3 | The Bloomberg Barclays U.S. Universal Bond Index represents the union of the U.S. Aggregate Index, the U.S. High-Yield Corporate Index, the 144A Index, the Eurodollar Index, the Emerging Markets Index, and the non-ERISA portion of the CMBS Index. Municipal debt, private placements, and non-dollar-denominated issues are excluded from the Universal Bond Index. The only constituent of the index that includes floating-rate debt is the Emerging Markets Index. |
| 4 | Fund performance has been increased by fee waivers and/or expense reimbursements, if any, without which performance would have been lower. |
| 5 | Expense ratios are as shown in the Fund’s prospectus in effect as of the date of this report. The expense ratios for the current reporting period can be found in the Financial Highlights section of this report under Ratios to Average Net Assets. Net expenses reflect contractual expense limitations set to expire on 1/31/22. When a Fund’s expenses are below the limitation, gross and net expense ratios will be the same. See Note 5 of the Notes to Financial Statements for more information about the Fund’s expense limitations. |
17 |
ADDITIONAL INFORMATION
The views expressed in this report reflect those of the portfolio managers as of the dates indicated. The managers’ views are subject to change at any time without notice based on changes in market or other conditions. References to specific securities or industries should not be regarded as investment advice. Because the Funds are actively managed, there is no assurance that they will continue to invest in the securities or industries mentioned.
All investing involves risk, including the risk of loss. There is no assurance that any investment will meet its performance objectives or that losses will be avoided.
ADDITIONAL INDEX INFORMATION
This document may contain references to third party copyrights, indexes, and trademarks, each of which is the property of its respective owner. Such owner is not affiliated with Natixis Investment Managers or any of its related or affiliated companies (collectively “Natixis affiliates”) and does not sponsor, endorse or participate in the provision of any Natixis affiliates services, funds or other financial products.
The index information contained herein is derived from third parties and is provided on an “as is” basis. The user of this information assumes the entire risk of use of this information. Each of the third party entities involved in compiling, computing or creating index information, disclaims all warranties (including, without limitation, any warranties of originality, accuracy, completeness, timeliness, non-infringement, merchantability and fitness for a particular purpose) with respect to such information.
PROXY VOTING INFORMATION
A description of the Natixis Funds’ proxy voting policies and procedures is available without charge, upon request, by calling Natixis Funds at 800-225-5478; on Natixis Funds’ website at im.natixis.com; and on the Securities and Exchange Commission’s (SEC) website at www.sec.gov. Information regarding how Natixis Funds voted proxies relating to portfolio securities during the most recent 12-month period ended June 30 is available from Natixis Funds’ website and the SEC’s website.
QUARTERLY PORTFOLIO SCHEDULES
The Natixis Funds file a complete schedule of portfolio holdings with the SEC for the first and third quarters of each fiscal year as an exhibit to its reports on Form N-PORT. The Funds’ Form N-PORT reports are available on the SEC’s website at www.sec.gov. First and third quarter schedules of portfolio holdings are also available at im.natixis.com/funddocuments. A hard copy may be requested from the Fund at no charge by calling 800-225-5478.
CFA® and Chartered Financial Analyst® are registered trademarks owned by the CFA Institute.
| 18
UNDERSTANDING FUND EXPENSES
As a mutual fund shareholder, you incur different costs: transaction costs, including sales charges (loads) on purchases and contingent deferred sales charges on redemptions, and ongoing costs, including management fees, distribution and/or service fees (12b-1 fees), and other fund expenses. Certain exemptions may apply. These costs are described in more detail in the Funds’ prospectuses. The following examples are intended to help you understand the ongoing costs of investing in the Funds and help you compare these with the ongoing costs of investing in other mutual funds.
The first line in the table of each class of Fund shares shows the actual account values and actual Fund expenses you would have paid on a $1,000 investment in the Fund from July 1, 2020 through December 31, 2020. To estimate the expenses you paid over the period, simply divide your account value by $1,000 (for example $8,600 account value divided by $1,000 = 8.60) and multiply the result by the number in the Expenses Paid During Period column as shown for your class.
The second line in the table for each class of Fund shares provides information about hypothetical account values and hypothetical expenses based on the Fund’s actual expense ratios and an assumed rate of return of 5% per year before expenses, which is not the Fund’s actual return. The hypothetical account values and expenses may not be used to estimate the actual ending account balance or expenses you paid on your investment for the period. You may use this information to compare the ongoing costs of investing in each Fund and other funds. To do so, compare this 5% hypothetical example with the 5% hypothetical examples that appear in the shareholder reports of the other funds.
Please note that the expenses shown reflect ongoing costs only, and do not include any transaction costs, such as sales charges. Therefore, the second line in the table of each Fund is useful in comparing ongoing costs only, and will not help you determine the relative costs of owning different funds. If transaction costs were included, total costs would be higher.
| | | | | | | | | | | | |
| LOOMIS SAYLES HIGH INCOME FUND | | BEGINNING
ACCOUNT VALUE
7/1/2020 | | | ENDING
ACCOUNT VALUE
12/31/2020 | | | EXPENSES PAID
DURING PERIOD*
7/1/2020 – 12/31/2020 | |
| Class A | | | | | | | | | | | | |
| Actual | | | $1,000.00 | | | | $1,129.80 | | | | $5.35 | |
| Hypothetical (5% return before expenses) | | | $1,000.00 | | | | $1,020.11 | | | | $5.08 | |
| Class C | | | | | | | | | | | | |
| Actual | | | $1,000.00 | | | | $1,127.70 | | | | $9.36 | |
| Hypothetical (5% return before expenses) | | | $1,000.00 | | | | $1,016.34 | | | | $8.87 | |
| Class N | | | | | | | | | | | | |
| Actual | | | $1,000.00 | | | | $1,134.20 | | | | $3.76 | ** |
| Hypothetical (5% return before expenses) | | | $1,000.00 | | | | $1,021.62 | | | | $3.56 | |
| Class Y | | | | | | | | | | | | |
| Actual | | | $1,000.00 | | | | $1,131.60 | | | | $4.02 | |
| Hypothetical (5% return before expenses) | | | $1,000.00 | | | | $1,021.37 | | | | $3.81 | |
| * | Expenses are equal to the Fund’s annualized expense ratio (after waiver/reimbursement): 1.00%, 1.75%, 0.70% and 0.75% for Class A, C, N and Y Class, respectively, multiplied by the average account value over the period, multiplied by the number of days in the most recent fiscal half-year (184), divided by 366 (to reflect the half-year period). |
| ** | Generally accepted accounting principles require adjustments to be made to the net assets of the Fund at period end for financial reporting purposes. Amounts expressed in the table include the effect of such adjustments. |
19 |
| | | | | | | | | | | | |
| LOOMIS SAYLES INTERMEDIATE MUNICIPAL BOND FUND | | BEGINNING
ACCOUNT VALUE
7/1/2020 | | | ENDING
ACCOUNT VALUE
12/31/2020 | | | EXPENSES PAID
DURING PERIOD
7/1/2020 – 12/31/2020* | |
| Class A | | | | | | | | | | | | |
| Actual | | | $1,000.00 | | | | $1,022.00 | | | | $3.56 | |
| Hypothetical (5% return before expenses) | | | $1,000.00 | | | | $1,021.62 | | | | $3.56 | |
| Class C | | | | | | | | | | | | |
| Actual | | | $1,000.00 | | | | $1,018.20 | | | | $7.36 | |
| Hypothetical (5% return before expenses) | | | $1,000.00 | | | | $1,017.85 | | | | $7.35 | |
| Class Y | | | | | | | | | | | | |
| Actual | | | $1,000.00 | | | | $1,023.30 | | | | $2.29 | |
| Hypothetical (5% return before expenses) | | | $1,000.00 | | | | $1,022.87 | | | | $2.29 | |
| * | Expenses are equal to the Fund’s annualized expense ratio (after waiver/reimbursement): 0.70%, 1.45% and 0.45% for Class A, C and Y, respectively, multiplied by the average account value over the period, multiplied by the number of days in the most recent fiscal half-year (184), divided by 366 (to reflect the half-year period). |
| | | | | | | | | | | | |
| LOOMIS SAYLES INTERNATIONAL GROWTH FUND | | BEGINNING
ACCOUNT VALUE
7/1/20201 | | | ENDING
ACCOUNT VALUE
12/31/2020 | | | EXPENSES PAID
DURING PERIOD
7/1/20201 – 12/31/2020 | |
| Class A | | | | | | | | | | | | |
| Actual | | | $1,000.00 | | | | $1,013.70 | | | | $0.53 | 1 |
| Hypothetical (5% return before expenses) | | | $1,000.00 | | | | $1,019.10 | | | | $6.09 | * |
| Class C | | | | | | | | | | | | |
| Actual | | | $1,000.00 | | | | $1,013.30 | | | | $0.86 | 1 |
| Hypothetical (5% return before expenses) | | | $1,000.00 | | | | $1,015.33 | | | | $9.88 | * |
| Class N | | | | | | | | | | | | |
| Actual | | | $1,000.00 | | | | $1,013.80 | | | | $0.40 | 1 |
| Hypothetical (5% return before expenses) | | | $1,000.00 | | | | $1,020.61 | | | | $4.57 | * |
| Class Y | | | | | | | | | | | | |
| Actual | | | $1,000.00 | | | | $1,013.80 | | | | $0.42 | 1 |
| Hypothetical (5% return before expenses) | | | $1,000.00 | | | | $1,020.36 | | | | $4.82 | * |
| * | Expenses are equal to the Fund’s annualized expense ratio (after waiver/reimbursement): 1.20%, 1.95%, 0.90% and 0.95% for Class A, C, N and Y, respectively, multiplied by the average account value over the period, multiplied by the number of days in the most recent fiscal half-year (184), divided by 366 (to reflect the half-year period). |
| 1 | Fund commenced operations on December 15, 2020. Actual expenses are equal to the Fund’s annualized expense ratio (after waiver/reimbursement) of 1.20%, 1.95%, 0.90% and 0.95% for Class A, C, N and Y, respectively, multiplied by the average account value over the period, multiplied by the number of days in the most recent fiscal period (16), divided by 366 (to reflect the partial period). |
| 20
| | | | | | | | | | | | |
| LOOMIS SAYLES INVESTMENT GRADE BOND FUND | | BEGINNING
ACCOUNT VALUE
7/1/2020 | | | ENDING
ACCOUNT VALUE
12/31/2020 | | | EXPENSES PAID
DURING PERIOD*
7/1/2020 – 12/31/2020 | |
| Class A | | | | | | | | | | | | |
| Actual | | | $1,000.00 | | | | $1,056.30 | | | | $3.88 | |
| Hypothetical (5% return before expenses) | | | $1,000.00 | | | | $1,021.37 | | | | $3.81 | |
| Class C | | | | | | | | | | | | |
| Actual | | | $1,000.00 | | | | $1,052.80 | | | | $7.74 | |
| Hypothetical (5% return before expenses) | | | $1,000.00 | | | | $1,017.60 | | | | $7.61 | |
| Class N | | | | | | | | | | | | |
| Actual | | | $1,000.00 | | | | $1,057.90 | | | | $2.33 | |
| Hypothetical (5% return before expenses) | | | $1,000.00 | | | | $1,022.87 | | | | $2.29 | |
| Class Y | | | | | | | | | | | | |
| Actual | | | $1,000.00 | | | | $1,057.60 | | | | $2.59 | |
| Hypothetical (5% return before expenses) | | | $1,000.00 | | | | $1,022.62 | | | | $2.54 | |
| Admin Class | | | | | | | | | | | | |
| Actual | | | $1,000.00 | | | | $1,055.10 | | | | $5.17 | |
| Hypothetical (5% return before expenses) | | | $1,000.00 | | | | $1,020.11 | | | | $5.08 | |
| * | Expenses are equal to the Fund’s annualized expense ratio (after waiver/reimbursement): 0.75%, 1.50%, 0.45%, 0.50% and 1.00% for Class A, C, N, Y and Admin Class, respectively, multiplied by the average account value over the period, multiplied by the number of days in the most recent fiscal half-year (184), divided by 366 (to reflect the half-year period). |
| | | | | | | | | | | | |
| LOOMIS SAYLES STRATEGIC ALPHA FUND | | BEGINNING
ACCOUNT VALUE
7/1/2020 | | | ENDING
ACCOUNT VALUE
12/31/2020 | | | EXPENSES PAID
DURING PERIOD*
7/1/2020 – 12/31/2020 | |
| Class A | | | | | | | | | | | | |
| Actual | | | $1,000.00 | | | | $1,078.10 | | | | $5.17 | |
| Hypothetical (5% return before expenses) | | | $1,000.00 | | | | $1,020.16 | | | | $5.03 | |
| Class C | | | | | | | | | | | | |
| Actual | | | $1,000.00 | | | | $1,073.50 | | | | $9.02 | |
| Hypothetical (5% return before expenses) | | | $1,000.00 | | | | $1,016.44 | | | | $8.77 | |
| Class N | | | | | | | | | | | | |
| Actual | | | $1,000.00 | | | | $1,080.00 | | | | $3.56 | |
| Hypothetical (5% return before expenses) | | | $1,000.00 | | | | $1,021.72 | | | | $3.46 | |
| Class Y | | | | | | | | | | | | |
| Actual | | | $1,000.00 | | | | $1,079.70 | | | | $3.87 | |
| Hypothetical (5% return before expenses) | | | $1,000.00 | | | | $1,021.42 | | | | $3.76 | |
| * | Expenses are equal to the Fund’s annualized expense ratio: 0.99%, 1.73%, 0.68% and 0.74% for Class A, C, N and Y, respectively, multiplied by the average account value over the period, multiplied by the number of days in the most recent fiscal half-year (184), divided by 366 (to reflect the half-year period). |
21 |
| | | | | | | | | | | | |
| LOOMIS SAYLES STRATEGIC INCOME FUND | | BEGINNING
ACCOUNT VALUE
7/1/2020 | | | ENDING
ACCOUNT VALUE
12/31/2020 | | | EXPENSES PAID
DURING PERIOD*
7/1/2020 – 12/31/2020 | |
| Class A | | | | | | | | | | | | |
| Actual | | | $1,000.00 | | | | $1,084.90 | | | | $5.10 | |
| Hypothetical (5% return before expenses) | | | $1,000.00 | | | | $1,020.32 | | | | $4.94 | |
| Class C | | | | | | | | | | | | |
| Actual | | | $1,000.00 | | | | $1,080.90 | | | | $9.02 | |
| Hypothetical (5% return before expenses) | | | $1,000.00 | | | | $1,016.54 | | | | $8.74 | |
| Class N | | | | | | | | | | | | |
| Actual | | | $1,000.00 | | | | $1,086.10 | | | | $3.42 | |
| Hypothetical (5% return before expenses) | | | $1,000.00 | | | | $1,021.93 | | | | $3.31 | |
| Class Y | | | | | | | | | | | | |
| Actual | | | $1,000.00 | | | | $1,086.40 | | | | $3.79 | |
| Hypothetical (5% return before expenses) | | | $1,000.00 | | | | $1,021.58 | | | | $3.67 | |
| Admin Class | | | | | | | | | | | | |
| Actual | | | $1,000.00 | | | | $1,083.10 | | | | $6.41 | |
| Hypothetical (5% return before expenses) | | | $1,000.00 | | | | $1,019.06 | | | | $6.21 | |
| * | Expenses are equal to the Fund’s annualized expense ratio: 0.97%, 1.72%, 0.65%, 0.72% and 1.22% for Class A, C, N, Y and Admin Class, respectively, multiplied by the average account value over the period, multiplied by the number of days in the most recent fiscal half-year (184), divided by 365 (to reflect the half-year period). |
| 22
BOARD APPROVAL OF THE INITIAL ADVISORY AGREEMENT FOR LOOMIS SAYLES INTERNATIONAL GROWTH FUND
The Investment Company Act of 1940, as amended (the “1940 Act”), requires that both the full Board of Trustees of the Trust (the “Board”) and a majority of the Trustees who are not “interested persons” (as defined in the 1940 Act) of the Trust (the “Independent Trustees”), voting separately, initially approve any new investment advisory agreements for a registered investment company, including a newly formed fund such as the Loomis Sayles International Growth Fund (the “Fund”). The Trustees, including the Independent Trustees, unanimously approved, for an initial two-year term, the proposed investment advisory agreement (the “Agreement”) for the Fund at a meeting held on December 3, 2020.
In connection with this review, Fund management and other representatives of the Fund’s adviser, Loomis, Sayles & Company, L.P. (the “Adviser”), distributed to the Trustees materials including, among other items, information regarding (i) the Fund’s investment objective, strategies and risks, (ii) the proposed advisory fee and other expenses to be charged to the Fund, including information comparing the Fund’s expenses to those of peer groups and categories of funds and the proposed expense cap, (iii) the size, education and experience of the Adviser’s investment staff and the investment strategies proposed to be used in managing the Fund, (iv) proposed arrangements for the distribution of the Fund’s shares, (v) information about the Adviser’s performance, and (vi) the general economic outlook with particular emphasis on the asset management industry.
The Trustees also considered the fact that they oversee other funds advised by the Adviser as well as information about the Adviser they had received in connection with their oversight of those other funds. Because the Fund is newly formed and had not commenced operations at the time of the Trustees’ review, certain information, including data relating to Fund performance, was not available, and therefore could not be distributed to the Trustees. Throughout the process, the Trustees were afforded the opportunity to ask questions of, and request additional materials from, the Adviser.
In considering whether to initially approve the Agreement, the Board, including the Independent Trustees, did not identify any single factor as determinative. Individual Trustees may have evaluated the information presented differently from one another, giving different weights to various factors. Matters considered by the Trustees, including the Independent Trustees, in connection with their approval of the Agreement included, but were not limited to, the factors listed below.
The nature, extent and quality of the services to be provided to the Fund under the Agreement. The Trustees considered the nature, extent and quality of the services to be provided by the Adviser and its affiliates to the Fund and the resources to be dedicated to the Fund by the Adviser and its affiliates. The Trustees considered their experience with other funds advised by the Adviser, as well as the affiliation between the Adviser and Natixis Investment Managers, LLC (“Natixis Investment Managers”), whose affiliates provide investment advisory services to other funds in the same family of mutual funds. In this regard, the Trustees considered not only the advisory services proposed to be provided by the Adviser to the Fund, but also the monitoring and oversight services proposed to be provided by Natixis Advisors, L.P. (“Natixis Advisors”). They also considered the administrative and shareholder services proposed to be provided by Natixis Advisors and its affiliates to the Fund.
The Trustees also considered the benefits to shareholders of investing in a mutual fund that is part of a family of funds that offers shareholders the right to exchange shares of one type of fund for shares of another type of fund, and provides a variety of fund and shareholder services.
After reviewing these and related factors, the Trustees concluded, within the context of their overall conclusions regarding the Agreement, that the scope of the services to be provided to the Fund under the Agreement seemed consistent with the Fund’s operational requirements, and that the Adviser had the capabilities, resources and personnel necessary to provide the advisory services that would be required by the Fund. The Trustees determined that the nature, extent and quality of services proposed to be provided under the Agreement supported approval of the Agreement.
Investment performance of the Fund and the Adviser. Because the Fund had not yet commenced operations, performance information for the Fund was not considered; however, the Board considered the performance of other funds managed by the Adviser.
The Trustees also considered the Adviser’s performance and reputation generally, the performance of the fund family generally, and the historical responsiveness of the Adviser to Trustee concerns about performance and the willingness of the Adviser to take steps intended to improve performance.
After reviewing these and related factors, the Trustees concluded, within the context of their overall conclusions regarding the Agreement, that these relevant factors supported approval of the Agreement.
The costs of the services to be provided by the Adviser and profits to be realized by the Adviser and its affiliates from their respective relationships with the Fund. Although the Fund had not yet commenced operations at the time of the Trustees’ review of the Agreement, the Trustees reviewed information comparing the proposed advisory fees and estimated total expenses of the Fund with the fees and expenses of comparable funds identified by the Adviser, including information about how those funds were selected and information about differences in such fees. In evaluating the Fund’s proposed advisory fee, the Trustees also took into account the demands,
23 |
complexity and quality of the investment management of the Fund. The Trustees also noted that the Fund would have an expense cap in place. In addition, the Trustees considered information regarding the administrative and distribution fees to be paid by the Fund to the Adviser’s affiliates.
Because the Fund had not yet commenced operations, historical profitability information with respect to the Fund was not considered. However, the Trustees noted the information provided in court cases in which adviser profitability was an issue, the estimated expense level of the Fund, and that the Fund would be subject to an expense cap.
After reviewing these and related factors, the Trustees concluded, within the context of their overall conclusions regarding the Agreement, that the advisory fee and expenses proposed to be charged to the Fund were fair and reasonable, and supported the approval of the Agreement.
Economies of scale. The Trustees considered the extent to which the Adviser may realize economies of scale in the provision of services by the Adviser, and whether those economies could be shared with the Fund through breakpoints in its investment advisory fee or other means, such as expense caps. The Trustees noted that the Fund will be subject to an expense cap. After reviewing these and related factors, the Trustees concluded, within the context of their overall conclusions regarding the Agreement, that the extent to which economies of scale might be shared with the Fund supported the approval of the Agreement.
The Trustees also considered other factors, which included but were not limited to the following:
| • | | The compliance-related resources the Adviser and its affiliates would provide to the Fund. |
| • | | The nature, quality, cost and extent of administrative and shareholder services to be performed by the Adviser and its affiliates, both under the Agreement and under separate agreements covering administrative services. |
| • | | So-called “fallout benefits” to the Adviser and its affiliates, such as the engagement of affiliates of the Adviser to provide distribution and administrative services to the Fund, and the benefits of research made available to the Adviser by reason of brokerage commissions (if any) generated by the Fund’s securities transactions. The Trustees also considered the benefits to the parent company of Natixis Advisors from the retention of the Adviser. The Trustees considered the possible conflicts of interest associated with these fallout and other benefits, and the reporting, disclosure and other processes in place to disclose and monitor such possible conflicts of interest. |
Based on their evaluation of all factors that they deemed to be material, including those factors described above, and assisted by the advice of independent counsel, the Trustees, including the Independent Trustees, concluded that the Agreement should be approved.
| 24
Portfolio of Investments – as of December 31, 2020
Loomis Sayles High Income Fund
| | | | | | | | |
Principal
Amount | | | Description | | Value (†) | |
| | Bonds and Notes — 88.3% of Net Assets | |
| | Non-Convertible Bonds — 83.6% | |
| | | | ABS Home Equity — 0.3% | |
| $ | 205,000 | | | Credit Suisse Mortgage Trust, Series 2018-RPL8, Class A2, 4.164%, 7/25/2058, 144A(a) | | $ | 205,038 | |
| | 138,646 | | | DSLA Mortgage Loan Trust, Series 2005-AR5, Class 2A1A, 1-month LIBOR + 0.330%, 0.482%, 9/19/2045(b) | | | 104,068 | |
| | | | | | | | |
| | | | | | | 309,106 | |
| | | | | | | | |
| | | | Aerospace & Defense — 4.8% | |
| | 30,000 | | | Boeing Co. (The), 3.250%, 2/01/2035 | | | 30,765 | |
| | 155,000 | | | Boeing Co. (The), 3.375%, 6/15/2046 | | | 151,250 | |
| | 45,000 | | | Boeing Co. (The), 3.500%, 3/01/2039 | | | 45,526 | |
| | 20,000 | | | Boeing Co. (The), 3.550%, 3/01/2038 | | | 20,404 | |
| | 105,000 | | | Boeing Co. (The), 3.625%, 3/01/2048 | | | 105,867 | |
| | 30,000 | | | Boeing Co. (The), 3.650%, 3/01/2047 | | | 30,367 | |
| | 60,000 | | | Boeing Co. (The), 3.750%, 2/01/2050 | | | 62,748 | |
| | 5,000 | | | Boeing Co. (The), 3.825%, 3/01/2059 | | | 5,079 | |
| | 10,000 | | | Boeing Co. (The), 3.850%, 11/01/2048 | | | 10,315 | |
| | 15,000 | | | Boeing Co. (The), 3.900%, 5/01/2049 | | | 15,918 | |
| | 1,065,000 | | | Boeing Co. (The), 5.150%, 5/01/2030 | | | 1,288,918 | |
| | 10,000 | | | Boeing Co. (The), 5.705%, 5/01/2040 | | | 12,977 | |
| | 630,000 | | | Boeing Co. (The), 5.805%, 5/01/2050 | | | 868,231 | |
| | 50,000 | | | Boeing Co. (The), 5.930%, 5/01/2060 | | | 70,930 | |
| | 260,000 | | | Bombardier, Inc., 6.000%, 10/15/2022, 144A | | | 255,229 | |
| | 370,000 | | | Bombardier, Inc., 6.125%, 1/15/2023, 144A | | | 361,675 | |
| | 100,000 | | | Embraer Netherlands Finance BV, 5.050%, 6/15/2025 | | | 106,001 | |
| | 140,000 | | | Embraer Netherlands Finance BV, 5.400%, 2/01/2027 | | | 148,751 | |
| | 263,000 | | | Leonardo U.S. Holdings, Inc., 6.250%, 1/15/2040, 144A | | | 311,608 | |
| | 60,000 | | | Moog, Inc., 4.250%, 12/15/2027, 144A | | | 62,250 | |
| | 350,000 | | | Spirit AeroSystems, Inc., 4.600%, 6/15/2028 | | | 346,062 | |
| | 190,000 | | | Spirit AeroSystems, Inc., 7.500%, 4/15/2025, 144A | | | 203,775 | |
| | 100,000 | | | TransDigm, Inc., 5.500%, 11/15/2027 | | | 105,130 | |
| | 450,000 | | | TransDigm, Inc., 6.250%, 3/15/2026, 144A | | | 479,250 | |
| | 205,000 | | | TransDigm, Inc., 6.500%, 5/15/2025 | | | 210,637 | |
| | 70,000 | | | Wolverine Escrow LLC, 9.000%, 11/15/2026, 144A | | | 66,259 | |
| | | | | | | | |
| | | | | | | 5,375,922 | |
| | | | | | | | |
| | | | Airlines — 0.4% | | | | |
| | 30,000 | | | American Airlines Group, Inc., 5.000%, 6/01/2022, 144A | | | 26,970 | |
| | 160,000 | | | American Airlines, Inc., 11.750%, 7/15/2025, 144A | | | 184,520 | |
| | 200,000 | | | Delta Air Lines, Inc., 7.375%, 1/15/2026 | | | 228,461 | |
| | | | | | | | |
| | | | | | | 439,951 | |
| | | | | | | | |
| | | | Automotive — 4.4% | | | | |
| | 200,000 | | | Clarios Global LP/Clarios U.S. Finance Co., 8.500%, 5/15/2027, 144A | | | 217,282 | |
| | 75,000 | | | Dana Financing Luxembourg S.a.r.l., 5.750%, 4/15/2025, 144A | | | 77,813 | |
| | 1,510,000 | | | Ford Motor Co., 9.000%, 4/22/2025 | | | 1,851,275 | |
| | 1,170,000 | | | Ford Motor Credit Co. LLC, 4.000%, 11/13/2030 | | | 1,228,500 | |
| | 200,000 | | | Ford Motor Credit Co. LLC, 5.113%, 5/03/2029 | | | 222,740 | |
| | 555,000 | | | General Motors Co., 5.200%, 4/01/2045 | | | 674,007 | |
| | 150,000 | | | General Motors Co., 6.750%, 4/01/2046 | | | 216,111 | |
| | 105,000 | | | Goodyear Tire & Rubber Co. (The), 4.875%, 3/15/2027 | | | 107,362 | |
| | 115,000 | | | Goodyear Tire & Rubber Co. (The), 5.000%, 5/31/2026 | | | 117,012 | |
| | 40,000 | | | Meritor, Inc., 4.500%, 12/15/2028, 144A | | | 41,000 | |
| | 100,000 | | | PM General Purchaser LLC, 9.500%, 10/01/2028, 144A | | | 110,750 | |
| | | | Automotive — continued | | | | |
| 40,000 | | | Tenneco, Inc., 7.875%, 1/15/2029, 144A | | | 44,910 | |
| | | | | | | | |
| | | | | | | 4,908,762 | |
| | | | | | | | |
| | | | Banking — 1.0% | | | | |
| | 400,000 | | | Deutsche Bank AG, (fixed rate to 12/01/2027, variable rate thereafter), 4.875%, 12/01/2032 | | | 418,560 | |
| | 265,000 | | | Intesa Sanpaolo SpA, 5.710%, 1/15/2026, 144A | | | 303,317 | |
| | 400,000 | | | UniCredit SpA, (fixed rate to 6/30/2030, variable rate thereafter), 5.459%, 6/30/2035, 144A | | | 440,135 | |
| | | | | | | | |
| | | | | | | 1,162,012 | |
| | | | | | | | |
| | | | Building Materials — 1.8% | |
| | 20,000 | | | Boise Cascade Co., 4.875%, 7/01/2030, 144A | | | 21,650 | |
| | 265,000 | | | Builders FirstSource, Inc., 5.000%, 3/01/2030, 144A | | | 287,027 | |
| | 285,000 | | | Cemex SAB de CV, 5.200%, 9/17/2030, 144A | | | 312,502 | |
| | 430,000 | | | Cemex SAB de CV, 5.700%, 1/11/2025, 144A | | | 439,460 | |
| | 125,000 | | | Cornerstone Building Brands, Inc., 6.125%, 1/15/2029, 144A | | | 132,812 | |
| | 50,000 | | | CP Atlas Buyer, Inc., 7.000%, 12/01/2028, 144A | | | 52,000 | |
| | 240,000 | | | James Hardie International Finance DAC, 5.000%, 1/15/2028, 144A | | | 254,921 | |
| | 55,000 | | | LBM Acquisition LLC, 6.250%, 1/15/2029, 144A | | | 56,788 | |
| | 45,000 | | | Summit Materials LLC/Summit Materials Finance Corp., 5.250%, 1/15/2029, 144A | | | 47,250 | |
| | 165,000 | | | U.S. Concrete, Inc., 5.125%, 3/01/2029, 144A | | | 169,950 | |
| | 189,000 | | | U.S. Concrete, Inc., 6.375%, 6/01/2024 | | | 193,725 | |
| | 30,000 | | | White Cap Buyer LLC, 6.875%, 10/15/2028, 144A | | | 31,988 | |
| | | | | | | | |
| | | | | | | 2,000,073 | |
| | | | | | | | |
| | | | Cable Satellite — 5.4% | |
| | 210,000 | | | Altice Financing S.A., 5.000%, 1/15/2028, 144A | | | 215,173 | |
| | 80,000 | | | Block Communications, Inc., 4.875%, 3/01/2028, 144A | | | 82,400 | |
| | 1,310,000 | | | CCO Holdings LLC/CCO Holdings Capital Corp., 4.250%, 2/01/2031, 144A | | | 1,380,321 | |
| | 165,000 | | | CCO Holdings LLC/CCO Holdings Capital Corp., 4.500%, 5/01/2032, 144A | | | 176,174 | |
| | 835,000 | | | CCO Holdings LLC/CCO Holdings Capital Corp., 4.750%, 3/01/2030, 144A | | | 900,965 | |
| | 205,000 | | | Connect Finco S.a.r.l./Connect U.S. Finco LLC, 6.750%, 10/01/2026, 144A | | | 220,826 | |
| | 605,000 | | | CSC Holdings LLC, 4.125%, 12/01/2030, 144A | | | 632,588 | |
| | 650,000 | | | CSC Holdings LLC, 4.625%, 12/01/2030, 144A | | | 678,437 | |
| | 150,000 | | | DISH DBS Corp., 7.375%, 7/01/2028 | | | 159,750 | |
| | 290,000 | | | DISH DBS Corp., 7.750%, 7/01/2026 | | | 324,803 | |
| | 185,000 | | | Radiate Holdco LLC/Radiate Finance, Inc., 6.500%, 9/15/2028, 144A | | | 194,944 | |
| | 250,000 | | | Sirius XM Radio, Inc., 4.125%, 7/01/2030, 144A | | | 266,094 | |
| | 200,000 | | | ViaSat, Inc., 6.500%, 7/15/2028, 144A | | | 216,442 | |
| | 225,000 | | | Virgin Media Finance PLC, 5.000%, 7/15/2030, 144A | | | 233,437 | |
| | 200,000 | | | Ziggo BV, 4.875%, 1/15/2030, 144A | | | 210,204 | |
| | 201,000 | | | Ziggo BV, 5.500%, 1/15/2027, 144A | | | 209,794 | |
| | | | | | | | |
| | | | | | | 6,102,352 | |
| | | | | | | | |
| | | | Chemicals — 0.9% | |
| | 125,000 | | | Chemours Co. (The), 5.375%, 5/15/2027 | | | 133,125 | |
| | 330,000 | | | Hercules LLC, 6.500%, 6/30/2029 | | | 351,915 | |
| | 140,000 | | | Hexion, Inc., 7.875%, 7/15/2027, 144A | | | 149,800 | |
| | 20,000 | | | Methanex Corp., 5.250%, 12/15/2029 | | | 21,675 | |
| | 85,000 | | | Methanex Corp., 5.650%, 12/01/2044 | | | 91,163 | |
| | 185,000 | | | Olin Corp., 5.000%, 2/01/2030 | | | 197,025 | |
| | 65,000 | | | Olin Corp., 5.125%, 9/15/2027 | | | 67,999 | |
| | 5,000 | | | Olin Corp., 5.625%, 8/01/2029 | | | 5,431 | |
| | | | | | | | |
| | | | | | | 1,018,133 | |
| | | | | | | | |
See accompanying notes to financial statements.
25 |
Portfolio of Investments – as of December 31, 2020
Loomis Sayles High Income Fund – (continued)
| | | | | | | | |
Principal
Amount | | | Description | | Value (†) | |
| | | | Consumer Cyclical Services — 5.4% | |
| $ | 130,000 | | | ANGI Group LLC, 3.875%, 8/15/2028, 144A | | $ | 132,275 | |
| | 35,000 | | | Arches Buyer, Inc., 6.125%, 12/01/2028, 144A | | | 36,145 | |
| | 1,005,000 | | | Expedia Group, Inc., 3.250%, 2/15/2030 | | | 1,045,945 | |
| | 170,000 | | | Expedia Group, Inc., 4.625%, 8/01/2027, 144A | | | 189,934 | |
| | 405,000 | | | Expedia Group, Inc., 6.250%, 5/01/2025, 144A | | | 469,436 | |
| | 205,000 | | | Expedia Group, Inc., 7.000%, 5/01/2025, 144A | | | 225,953 | |
| | 420,000 | | | Prime Security Services Borrower LLC/Prime Finance, Inc., 6.250%, 1/15/2028, 144A | | | 450,908 | |
| | 10,000 | | | QVC, Inc., 4.450%, 2/15/2025 | | | 10,678 | |
| | 10,000 | | | QVC, Inc., 4.850%, 4/01/2024 | | | 10,775 | |
| | 185,000 | | | Realogy Group LLC/Realogy Co-Issuer Corp., 7.625%, 6/15/2025, 144A | | | 200,858 | |
| | 80,000 | | | Realogy Group LLC/Realogy Co-Issuer Corp., 9.375%, 4/01/2027, 144A | | | 88,600 | |
| | 240,000 | | | ServiceMaster Co. LLC (The), 7.450%, 8/15/2027 | | | 279,300 | |
| | 200,000 | | | Staples, Inc., 7.500%, 4/15/2026, 144A | | | 208,854 | |
| | 605,000 | | | Uber Technologies, Inc., 6.250%, 1/15/2028, 144A | | | 657,937 | |
| | 410,000 | | | Uber Technologies, Inc., 7.500%, 9/15/2027, 144A | | | 451,000 | |
| | 1,485,000 | | | Uber Technologies, Inc., 8.000%, 11/01/2026, 144A | | | 1,620,684 | |
| | | | | | | | |
| | | | | | | 6,079,282 | |
| | | | | | | | |
| | | | Consumer Products — 0.5% | |
| | 160,000 | | | Energizer Holdings, Inc., 4.375%, 3/31/2029, 144A | | | 165,683 | |
| | 115,000 | | | Mattel, Inc., 5.875%, 12/15/2027, 144A | | | 127,794 | |
| | 65,000 | | | Newell Brands, Inc., 4.875%, 6/01/2025 | | | 71,519 | |
| | 175,000 | | | Prestige Brands, Inc., 5.125%, 1/15/2028, 144A | | | 186,594 | |
| | | | | | | | |
| | | | | | | 551,590 | |
| | | | | | | | |
| | | | Diversified Manufacturing — 0.4% | |
| | 200,000 | | | Vertical U.S. Newco, Inc., 5.250%, 7/15/2027, 144A | | | 212,000 | |
| | 215,000 | | | WESCO Distribution, Inc., 7.250%, 6/15/2028, 144A | | | 244,517 | |
| | | | | | | | |
| | | | | | | 456,517 | |
| | | | | | | | |
| | | | Electric — 1.2% | |
| | 510,000 | | | Calpine Corp., 5.125%, 3/15/2028, 144A | | | 536,505 | |
| | 300,000 | | | FirstEnergy Transmission LLC, 5.450%, 7/15/2044, 144A | | | 380,659 | |
| | 140,000 | | | PG&E Corp., 5.000%, 7/01/2028 | | | 149,100 | |
| | 135,000 | | | PG&E Corp., 5.250%, 7/01/2030 | | | 148,500 | |
| | 110,000 | | | Talen Energy Supply LLC, 10.500%, 1/15/2026, 144A | | | 97,848 | |
| | | | | | | | |
| | | | | | | 1,312,612 | |
| | | | | | | | |
| | | | Environmental — 0.2% | |
| | 175,000 | | | GFL Environmental, Inc., 4.000%, 8/01/2028, 144A | | | 176,313 | |
| | | | | | | | |
| | | | Finance Companies — 3.4% | |
| | 180,000 | | | AerCap Ireland Capital DAC/AerCap Global Aviation Trust, 6.500%, 7/15/2025 | | | 215,181 | |
| | 355,000 | | | Aviation Capital Group LLC, 5.500%, 12/15/2024, 144A | | | 393,009 | |
| | 260,000 | | | Freedom Mortgage Corp., 7.625%, 5/01/2026, 144A | | | 275,002 | |
| | 170,000 | | | Navient Corp., 5.000%, 3/15/2027 | | | 171,488 | |
| | 250,000 | | | Navient Corp., 6.500%, 6/15/2022 | | | 264,560 | |
| | 400,000 | | | Navient Corp., 6.750%, 6/25/2025 | | | 435,000 | |
| | 460,000 | | | OneMain Finance Corp., 7.125%, 3/15/2026 | | | 543,950 | |
| | 170,000 | | | Provident Funding Associates LP/PFG Finance Corp., 6.375%, 6/15/2025, 144A | | | 174,250 | |
| | 490,000 | | | Quicken Loans LLC, 5.250%, 1/15/2028, 144A | | | 523,075 | |
| | 325,000 | | | Quicken Loans LLC/Quicken Loans Co-Issuer, Inc., 3.625%, 3/01/2029, 144A | | | 331,500 | |
| | 485,000 | | | Quicken Loans LLC/Quicken Loans Co-Issuer, Inc., 3.875%, 3/01/2031, 144A | | | 503,187 | |
| | | | | | | | |
| | | | | | | 3,830,202 | |
| | | | | | | | |
| | | | Financial Other — 1.6% | |
| 1,295,000 | | | Icahn Enterprises LP/Icahn Enterprises Finance Corp., 5.250%, 5/15/2027 | | | 1,388,240 | |
| | 225,000 | | | Nationstar Mortgage Holdings, Inc., 5.125%, 12/15/2030, 144A | | | 235,175 | |
| | 120,000 | | | Nationstar Mortgage Holdings, Inc., 6.000%, 1/15/2027, 144A | | | 127,350 | |
| | | | | | | | |
| | | | | | | 1,750,765 | |
| | | | | | | | |
| | | | Food & Beverage — 2.4% | |
| | 45,000 | | | Aramark Services, Inc., 4.750%, 6/01/2026 | | | 46,325 | |
| | 65,000 | | | Aramark Services, Inc., 5.000%, 2/01/2028, 144A | | | 68,494 | |
| | 230,000 | | | Aramark Services, Inc., 6.375%, 5/01/2025, 144A | | | 245,813 | |
| | 635,000 | | | Kraft Heinz Foods Co., 4.375%, 6/01/2046 | | | 684,320 | |
| | 320,000 | | | Kraft Heinz Foods Co., 4.875%, 10/01/2049, 144A | | | 373,319 | |
| | 180,000 | | | Kraft Heinz Foods Co., 5.000%, 6/04/2042 | | | 210,825 | |
| | 10,000 | | | Kraft Heinz Foods Co., 5.200%, 7/15/2045 | | | 11,891 | |
| | 75,000 | | | Kraft Heinz Foods Co., 5.500%, 6/01/2050, 144A | | | 94,481 | |
| | 120,000 | | | Performance Food Group, Inc., 5.500%, 10/15/2027, 144A | | | 126,600 | |
| | 270,000 | | | Pilgrim’s Pride Corp., 5.875%, 9/30/2027, 144A | | | 292,845 | |
| | 110,000 | | | Post Holdings, Inc., 5.500%, 12/15/2029, 144A | | | 120,038 | |
| | 335,000 | | | Post Holdings, Inc., 5.750%, 3/01/2027, 144A | | | 354,681 | |
| | 120,000 | | | TreeHouse Foods, Inc., 4.000%, 9/01/2028 | | | 124,125 | |
| | | | | | | | |
| | | | | | | 2,753,757 | |
| | | | | | | | |
| | | | Gaming — 3.2% | |
| | 375,000 | | | Boyd Gaming Corp., 4.750%, 12/01/2027 | | | 389,531 | |
| | 220,000 | | | Caesars Entertainment, Inc., 6.250%, 7/01/2025, 144A | | | 234,300 | |
| | 235,000 | | | Caesars Entertainment, Inc., 8.125%, 7/01/2027, 144A | | | 260,150 | |
| | 140,000 | | | Caesars Resort Collection LLC/CRC Finco, Inc., 5.250%, 10/15/2025, 144A | | | 141,483 | |
| | 100,000 | | | Caesars Resort Collection LLC/CRC Finco, Inc., 5.750%, 7/01/2025, 144A | | | 105,958 | |
| | 490,000 | | | International Game Technology PLC, 5.250%, 1/15/2029, 144A | | | 527,975 | |
| | 205,000 | | | MGM Growth Properties Operating Partnership LP/MGP Finance Co-Issuer, Inc., 4.500%, 1/15/2028 | | | 218,095 | |
| | 255,000 | | | MGM Resorts International, 5.500%, 4/15/2027 | | | 284,197 | |
| | 115,000 | | | Scientific Games International, Inc., 7.000%, 5/15/2028, 144A | | | 123,649 | |
| | 115,000 | | | Scientific Games International, Inc., 7.250%, 11/15/2029, 144A | | | 126,213 | |
| | 230,000 | | | Studio City Finance Ltd., 6.500%, 1/15/2028, 144A | | | 246,066 | |
| | 155,000 | | | VICI Properties LP/VICI Note Co., Inc., 4.125%, 8/15/2030, 144A | | | 163,623 | |
| | 370,000 | | | Wynn Las Vegas LLC/Wynn Las Vegas Capital Corp., 5.500%, 3/01/2025, 144A | | | 386,187 | |
| | 250,000 | | | Wynn Macau Ltd., 5.125%, 12/15/2029, 144A | | | 255,312 | |
| | 165,000 | | | Wynn Resorts Finance LLC/Wynn Resorts Capital Corp., 5.125%, 10/01/2029, 144A | | | 172,838 | |
| | | | | | | | |
| | | | | | | 3,635,577 | |
| | | | | | | | |
| | | | Government Owned – No Guarantee — 0.5% | |
| | 340,000 | | | Petroleos Mexicanos, 5.950%, 1/28/2031 | | | 339,150 | |
| | 280,000 | | | YPF S.A., 6.950%, 7/21/2027, 144A | | | 201,600 | |
| | | | | | | | |
| | | | | | | 540,750 | |
| | | | | | | | |
| | | | Healthcare — 4.8% | |
| | 235,000 | | | CHS/Community Health Systems, Inc., 6.000%, 1/15/2029, 144A | | | 253,861 | |
| | 440,000 | | | CHS/Community Health Systems, Inc., 5.625%, 3/15/2027, 144A | | | 473,110 | |
See accompanying notes to financial statements.
| 26
Portfolio of Investments – as of December 31, 2020
Loomis Sayles High Income Fund – (continued)
| | | | | | | | |
Principal
Amount | | | Description | | Value (†) | |
| | | | Healthcare — continued | |
| $ | 615,000 | | | CHS/Community Health Systems, Inc., 6.625%, 2/15/2025, 144A | | $ | 647,275 | |
| | 300,000 | | | CHS/Community Health Systems, Inc., 8.000%, 3/15/2026, 144A | | | 323,250 | |
| | 95,000 | | | CHS/Community Health Systems, Inc., 8.125%, 6/30/2024, 144A | | | 98,325 | |
| | 240,000 | | | DaVita, Inc., 3.750%, 2/15/2031, 144A | | | 243,686 | |
| | 155,000 | | | Encompass Health Corp., 4.500%, 2/01/2028 | | | 161,975 | |
| | 300,000 | | | Encompass Health Corp., 4.750%, 2/01/2030 | | | 321,375 | |
| | 170,000 | | | HCA, Inc., 7.050%, 12/01/2027 | | | 205,913 | |
| | 145,000 | | | HCA, Inc., 7.500%, 11/06/2033 | | | 201,550 | |
| | 515,000 | | | HCA, Inc., MTN, 7.750%, 7/15/2036 | | | 665,637 | |
| | 270,000 | | | LifePoint Health, Inc., 5.375%, 1/15/2029, 144A | | | 269,420 | |
| | 85,000 | | | MPH Acquisition Holdings LLC, 5.750%, 11/01/2028, 144A | | | 83,538 | |
| | 40,000 | | | Providence Service Corp. (The), 5.875%, 11/15/2025, 144A | | | 42,300 | |
| | 75,000 | | | RP Escrow Issuer LLC, 5.250%, 12/15/2025, 144A | | | 78,380 | |
| | 75,000 | | | Select Medical Corp., 6.250%, 8/15/2026, 144A | | | 80,769 | |
| | 100,000 | | | Surgery Center Holdings, Inc., 6.750%, 7/01/2025, 144A | | | 101,750 | |
| | 100,000 | | | Tenet Healthcare Corp., 4.625%, 6/15/2028, 144A | | | 104,750 | |
| | 685,000 | | | Tenet Healthcare Corp., 6.125%, 10/01/2028, 144A | | | 713,756 | |
| | 355,000 | | | Tenet Healthcare Corp., 6.250%, 2/01/2027, 144A | | | 376,300 | |
| | | | | | | | |
| | | | | | | 5,446,920 | |
| | | | | | | | |
| | | | Home Construction — 1.1% | |
| | 215,000 | | | Brookfield Residential Properties, Inc./Brookfield Residential U.S Corp., 4.875%, 2/15/2030, 144A | | | 222,268 | |
| | 1,200,000 | | | Corporacion GEO SAB de CV, 8.875%, 3/27/2022, 144A(c)(d)(e) | | | — | |
| | 100,000 | | | Empire Communities Corp., 7.000%, 12/15/2025, 144A | | | 105,386 | |
| | 230,000 | | | KB Home, 4.800%, 11/15/2029 | | | 252,425 | |
| | 165,000 | | | Mattamy Group Corp., 4.625%, 3/01/2030, 144A | | | 176,260 | |
| | 195,000 | | | Taylor Morrison Communities, Inc., 5.125%, 8/01/2030, 144A | | | 218,400 | |
| | 185,000 | | | Taylor Morrison Communities, Inc., 5.750%, 1/15/2028, 144A | | | 209,512 | |
| | 90,000 | | | TRI Pointe Group, Inc., 5.700%, 6/15/2028 | | | 101,610 | |
| | | | | | | | |
| | | | | | | 1,285,861 | |
| | | | | | | | |
| | | | Independent Energy — 5.5% | |
| | 35,000 | | | Antero Resources Corp., 8.375%, 7/15/2026, 144A | | | 35,724 | |
| | 190,000 | | | Apache Corp., 4.250%, 1/15/2030 | | | 199,500 | |
| | 105,000 | | | Apache Corp., 4.250%, 1/15/2044 | | | 103,596 | |
| | 115,000 | | | Ascent Resources Utica Holdings LLC/ARU Finance Corp., 7.000%, 11/01/2026, 144A | | | 108,963 | |
| | 195,000 | | | Centennial Resource Production LLC, 8.000%, 6/01/2025, 144A | | | 171,600 | |
| | 130,000 | | | Comstock Resources, Inc., 9.750%, 8/15/2026 | | | 140,075 | |
| | 185,000 | | | Continental Resources, Inc., 3.800%, 6/01/2024 | | | 191,033 | |
| | 30,000 | | | Continental Resources, Inc., 4.375%, 1/15/2028 | | | 30,756 | |
| | 160,000 | | | Continental Resources, Inc., 4.900%, 6/01/2044 | | | 158,242 | |
| | 50,000 | | | Continental Resources, Inc., 5.750%, 1/15/2031, 144A | | | 55,499 | |
| | 65,000 | | | Devon Energy Corp., 5.600%, 7/15/2041 | | | 79,494 | |
| | 30,000 | | | Endeavor Energy Resources LP/EER Finance, Inc., 5.500%, 1/30/2026, 144A | | | 30,785 | |
| | 50,000 | | | Endeavor Energy Resources LP/EER Finance, Inc., 6.625%, 7/15/2025, 144A | | | 53,500 | |
| | 5,000 | | | EQT Corp., 5.000%, 1/15/2029 | | | 5,272 | |
| | 55,000 | | | EQT Corp., 7.875%, 2/01/2025 | | | 62,631 | |
| | 225,000 | | | EQT Corp., 8.750%, 2/01/2030 | | | 275,625 | |
| | 85,000 | | | Leviathan Bond Ltd., 6.125%, 6/30/2025, 144A | | | 93,093 | |
| | | | Independent Energy — continued | |
| 125,000 | | | Leviathan Bond Ltd., 6.500%, 6/30/2027, 144A | | | 140,834 | |
| | 70,000 | | | Matador Resources Co., 5.875%, 9/15/2026 | | | 68,600 | |
| | 130,000 | | | MEG Energy Corp., 7.125%, 2/01/2027, 144A | | | 134,225 | |
| | 130,000 | | | Murphy Oil Corp., 6.375%, 12/01/2042 | | | 114,563 | |
| | 590,000 | | | Occidental Petroleum Corp., 2.900%, 8/15/2024 | | | 567,875 | |
| | 40,000 | | | Occidental Petroleum Corp., 3.000%, 2/15/2027 | | | 35,600 | |
| | 20,000 | | | Occidental Petroleum Corp., 3.400%, 4/15/2026 | | | 19,068 | |
| | 620,000 | | | Occidental Petroleum Corp., 3.500%, 6/15/2025 | | | 598,895 | |
| | 155,000 | | | Occidental Petroleum Corp., 3.500%, 8/15/2029 | | | 141,851 | |
| | 50,000 | | | Occidental Petroleum Corp., 4.100%, 2/15/2047 | | | 40,873 | |
| | 60,000 | | | Occidental Petroleum Corp., 4.200%, 3/15/2048 | | | 48,900 | |
| | 325,000 | | | Occidental Petroleum Corp., 4.400%, 8/15/2049 | | | 273,910 | |
| | 145,000 | | | Occidental Petroleum Corp., 5.550%, 3/15/2026 | | | 151,371 | |
| | 225,000 | | | Occidental Petroleum Corp., 5.875%, 9/01/2025 | | | 239,625 | |
| | 110,000 | | | Occidental Petroleum Corp., 8.500%, 7/15/2027 | | | 126,945 | |
| | 100,000 | | | Occidental Petroleum Corp., 8.875%, 7/15/2030 | | | 117,375 | |
| | 165,000 | | | Ovintiv Exploration, Inc., 5.375%, 1/01/2026 | | | 177,069 | |
| | 150,000 | | | Ovintiv, Inc., 6.500%, 8/15/2034 | | | 173,706 | |
| | 30,000 | | | Ovintiv, Inc., 6.625%, 8/15/2037 | | | 33,474 | |
| | 10,000 | | | Ovintiv, Inc., 7.375%, 11/01/2031 | | | 11,873 | |
| | 110,000 | | | Parsley Energy LLC/Parsley Finance Corp., 5.375%, 1/15/2025, 144A | | | 113,124 | |
| | 135,000 | | | Range Resources Corp., 9.250%, 2/01/2026 | | | 141,075 | |
| | 38,000 | | | Range Resources Corp., 5.000%, 3/15/2023 | | | 37,050 | |
| | 270,000 | | | Seven Generations Energy Ltd., 5.375%, 9/30/2025, 144A | | | 274,725 | |
| | 86,000 | | | SM Energy Co., 10.000%, 1/15/2025, 144A | | | 92,780 | |
| | 200,000 | | | Southwestern Energy Co., 6.450%, 1/23/2025 | | | 208,000 | |
| | 30,000 | | | Southwestern Energy Co., 7.500%, 4/01/2026 | | | 31,470 | |
| | 20,000 | | | Southwestern Energy Co., 7.750%, 10/01/2027 | | | 21,594 | |
| | 115,000 | | | Vine Oil & Gas LP/Vine Oil & Gas Finance Corp., 9.750%, 4/15/2023, 144A(f)(g) | | | 92,000 | |
| | 60,000 | | | WPX Energy, Inc., 5.250%, 10/15/2027 | | | 63,577 | |
| | 100,000 | | | WPX Energy, Inc., 5.875%, 6/15/2028 | | | 109,003 | |
| | | | | | | | |
| | | | | | | 6,196,418 | |
| | | | | | | | |
| | | | Industrial Other — 0.6% | |
| | 65,000 | | | Hillenbrand, Inc., 5.750%, 6/15/2025 | | | 70,200 | |
| | 445,000 | | | HTA Group Ltd. Co., 7.000%, 12/18/2025, 144A | | | 478,375 | |
| | 130,000 | | | Installed Building Products, Inc., 5.750%, 2/01/2028, 144A | | | 138,450 | |
| | | | | | | | |
| | | | | | | 687,025 | |
| | | | | | | | |
| | | | Integrated Energy — 0.6% | |
| | 30,000 | | | Cenovus Energy, Inc., 4.250%, 4/15/2027 | | | 32,761 | |
| | 20,000 | | | Cenovus Energy, Inc., 5.250%, 6/15/2037 | | | 22,642 | |
| | 110,000 | | | Cenovus Energy, Inc., 5.375%, 7/15/2025 | | | 124,019 | |
| | 200,000 | | | Cenovus Energy, Inc., 5.400%, 6/15/2047 | | | 234,781 | |
| | 200,000 | | | Geopark Ltd., 6.500%, 9/21/2024, 144A | | | 207,344 | |
| | | | | | | | |
| | | | | | | 621,547 | |
| | | | | | | | |
| | | | Leisure — 1.4% | |
| | 150,000 | | | Carnival Corp., 7.625%, 3/01/2026, 144A | | | 163,423 | |
| | 135,000 | | | Carnival Corp., 9.875%, 8/01/2027, 144A | | | 155,250 | |
| | 120,000 | | | Cedar Fair LP/Canada’s Wonderland Co./Magnum Management Corp., 5.375%, 6/01/2024 | | | 120,300 | |
| | 145,000 | | | Cedar Fair LP/Canada’s Wonderland Co./Magnum Management Corp., 6.500%, 10/01/2028, 144A | | | 157,238 | |
| | 110,000 | | | Live Nation Entertainment, Inc., 3.750%, 1/15/2028, 144A | | | 111,144 | |
| | 380,000 | | | Live Nation Entertainment, Inc., 4.750%, 10/15/2027, 144A | | | 389,470 | |
| | 175,000 | | | Royal Caribbean Cruises Ltd., 11.500%, 6/01/2025, 144A | | | 204,584 | |
See accompanying notes to financial statements.
27 |
Portfolio of Investments – as of December 31, 2020
Loomis Sayles High Income Fund – (continued)
| | | | | | | | |
Principal
Amount | | | Description | | Value (†) | |
| | | | Leisure — continued | |
| $ | 120,000 | | | Six Flags Entertainment Corp., 4.875%, 7/31/2024, 144A | | $ | 120,104 | |
| | 180,000 | | | Speedway Motorsports LLC/Speedway Funding II, Inc., 4.875%, 11/01/2027, 144A | | | 178,200 | |
| | | | | | | | |
| | | | | | | 1,599,713 | |
| | | | | | | | |
| | | | Lodging — 1.5% | |
| | 605,000 | | | Marriott Ownership Resorts, Inc., 4.750%, 1/15/2028 | | | 614,075 | |
| | 10,000 | | | Marriott Ownership Resorts, Inc., 6.125%, 9/15/2025, 144A | | | 10,650 | |
| | 130,000 | | | Marriott Ownership Resorts, Inc./ILG LLC, 6.500%, 9/15/2026 | | | 135,850 | |
| | 20,000 | | | Wyndham Destinations, Inc., 3.900%, 3/01/2023 | | | 20,400 | |
| | 570,000 | | | Wyndham Destinations, Inc., 4.625%, 3/01/2030, 144A | | | 602,775 | |
| | 235,000 | | | Wyndham Destinations, Inc., 6.625%, 7/31/2026, 144A | | | 269,075 | |
| | | | | | | | |
| | | | | | | 1,652,825 | |
| | | | | | | | |
| | | | Media Entertainment — 4.3% | |
| | 200,000 | | | Clear Channel International BV, 6.625%, 8/01/2025, 144A | | | 211,000 | |
| | 160,000 | | | Clear Channel Worldwide Holdings, Inc., 9.250%, 2/15/2024 | | | 162,000 | |
| | 255,000 | | | Diamond Sports Group LLC/Diamond Sports Finance Co., 5.375%, 8/15/2026, 144A | | | 207,187 | |
| | 180,000 | | | Diamond Sports Group LLC/Diamond Sports Finance Co., 6.625%, 8/15/2027, 144A | | | 108,900 | |
| | 265,000 | | | Gray Television, Inc., 4.750%, 10/15/2030, 144A | | | 269,969 | |
| | 260,000 | | | iHeartCommunications, Inc., 4.750%, 1/15/2028, 144A | | | 266,825 | |
| | 1,166,125 | | | iHeartCommunications, Inc., 8.375%, 5/01/2027 | | | 1,244,792 | |
| | 335,000 | | | Lamar Media Corp., 3.750%, 2/15/2028 | | | 344,279 | |
| | 235,000 | | | Meredith Corp., 6.875%, 2/01/2026 | | | 229,125 | |
| | 675,000 | | | Netflix, Inc., 4.875%, 6/15/2030, 144A | | | 776,250 | |
| | 105,000 | | | Nexstar Broadcasting, Inc., 5.625%, 7/15/2027, 144A | | | 112,481 | |
| | 190,000 | | | Nielsen Finance LLC/Nielsen Finance Co., 5.625%, 10/01/2028, 144A | | | 206,445 | |
| | 180,000 | | | Nielsen Finance LLC/Nielsen Finance Co., 5.875%, 10/01/2030, 144A | | | 203,666 | |
| | 120,000 | | | Outfront Media Capital LLC/Outfront Media Capital Corp., 4.625%, 3/15/2030, 144A | | | 122,657 | |
| | 35,000 | | | Outfront Media Capital LLC/Outfront Media Capital Corp., 6.250%, 6/15/2025, 144A | | | 36,925 | |
| | 170,000 | | | Terrier Media Buyer, Inc., 8.875%, 12/15/2027, 144A | | | 187,425 | |
| | 45,000 | | | Townsquare Media, Inc., 6.875%, 2/01/2026, 144A | | | 47,130 | |
| | 100,000 | | | Univision Communications, Inc., 6.625%, 6/01/2027, 144A | | | 107,405 | |
| | | | | | | | |
| | | | | | | 4,844,461 | |
| | | | | | | | |
| | | | Metals & Mining — 4.0% | |
| | 405,000 | | | ABJA Investment Co. Pte Ltd., 5.450%, 1/24/2028 | | | 426,501 | |
| | 210,000 | | | Alcoa Nederland Holding BV, 5.500%, 12/15/2027, 144A | | | 229,797 | |
| | 60,000 | | | Allegheny Technologies, Inc., 5.875%, 12/01/2027 | | | 63,150 | |
| | 175,000 | | | ArcelorMittal S.A., 7.000%, 3/01/2041 | | | 241,164 | |
| | 25,000 | | | Carpenter Technology Corp., 6.375%, 7/15/2028 | | | 27,589 | |
| | 285,000 | | | Cleveland-Cliffs, Inc., 9.875%, 10/17/2025, 144A | | | 335,231 | |
| | 265,000 | | | First Quantum Minerals Ltd., 6.500%, 3/01/2024, 144A | | | 272,287 | |
| | 845,000 | | | First Quantum Minerals Ltd., 6.875%, 3/01/2026, 144A | | | 880,912 | |
| | 255,000 | | | First Quantum Minerals Ltd., 6.875%, 10/15/2027, 144A | | | 276,675 | |
| | | | Metals & Mining — continued | |
| 210,000 | | | First Quantum Minerals Ltd., 7.500%, 4/01/2025, 144A | | | 218,663 | |
| | 190,000 | | | Freeport-McMoRan, Inc., 4.125%, 3/01/2028 | | | 199,263 | |
| | 340,000 | | | Freeport-McMoRan, Inc., 4.250%, 3/01/2030 | | | 366,350 | |
| | 20,000 | | | Freeport-McMoRan, Inc., 5.400%, 11/14/2034 | | | 25,025 | |
| | 60,000 | | | GrafTech Finance, Inc., 4.625%, 12/15/2028, 144A | | | 60,675 | |
| | 350,000 | | | Mineral Resources Ltd., 8.125%, 5/01/2027, 144A | | | 387,187 | |
| | 320,000 | | | Novelis Corp., 4.750%, 1/30/2030, 144A | | | 344,757 | |
| | 125,000 | | | United States Steel Corp., 6.250%, 3/15/2026 | | | 114,375 | |
| | 75,000 | | | United States Steel Corp., 6.875%, 8/15/2025 | | | 71,625 | |
| | | | | | | | |
| | | | | | | 4,541,226 | |
| | | | | | | | |
| | | | Midstream — 4.1% | |
| | 30,000 | | | Blue Racer Midstream LLC/Blue Racer Finance Corp., 7.625%, 12/15/2025, 144A | | | 31,950 | |
| | 80,000 | | | Buckeye Partners LP, 5.600%, 10/15/2044 | | | 76,900 | |
| | 55,000 | | | Buckeye Partners LP, 5.850%, 11/15/2043 | | | 54,117 | |
| | 40,000 | | | DCP Midstream Operating LP, 5.125%, 5/15/2029 | | | 44,365 | |
| | 230,000 | | | DCP Midstream Operating LP, 5.625%, 7/15/2027 | | | 254,992 | |
| | 185,000 | | | Energy Transfer Operating LP, 5.000%, 5/15/2050 | | | 200,335 | |
| | 5,000 | | | EnLink Midstream Partners LP, 5.450%, 6/01/2047 | | | 4,026 | |
| | 420,000 | | | EnLink Midstream Partners LP, 5.600%, 4/01/2044 | | | 337,050 | |
| | 110,000 | | | EQM Midstream Partners LP, 6.000%, 7/01/2025, 144A | | | 120,450 | |
| | 200,000 | | | EQM Midstream Partners LP, 6.500%, 7/01/2027, 144A | | | 225,207 | |
| | 80,000 | | | EQM Midstream Partners LP, Series 10Y, 5.500%, 7/15/2028 | | | 87,428 | |
| | 225,000 | | | Genesis Energy LP/Genesis Energy Finance Corp., 7.750%, 2/01/2028 | | | 215,438 | |
| | 105,000 | | | Harvest Midstream I LP, 7.500%, 9/01/2028, 144A | | | 111,694 | |
| | 665,000 | | | Hess Midstream Operations LP, 5.625%, 2/15/2026, 144A | | | 691,600 | |
| | 355,000 | | | New Fortress Energy, Inc., 6.750%, 9/15/2025, 144A | | | 377,074 | |
| | 105,000 | | | NGL Energy Partners LP/NGL Energy Finance Corp., 6.125%, 3/01/2025 | | | 66,544 | |
| | 145,000 | | | NuStar Logistics LP, 5.750%, 10/01/2025 | | | 154,425 | |
| | 115,000 | | | Sunoco Logistics Partners Operations LP, 5.400%, 10/01/2047 | | | 128,493 | |
| | 130,000 | | | Sunoco LP/Sunoco Finance Corp., 4.500%, 5/15/2029, 144A | | | 135,200 | |
| | 3,000 | | | Tallgrass Energy Partners LP/Tallgrass Energy Finance Corp., 5.500%, 9/15/2024, 144A | | | 3,053 | |
| | 5,000 | | | Tallgrass Energy Partners LP/Tallgrass Energy Finance Corp., 5.500%, 1/15/2028, 144A | | | 5,106 | |
| | 245,000 | | | Tallgrass Energy Partners LP/Tallgrass Energy Finance Corp., 6.000%, 3/01/2027, 144A | | | 253,881 | |
| | 255,000 | | | Targa Resources Partners LP/Targa Resources Partners Finance Corp., 5.500%, 3/01/2030 | | | 276,853 | |
| | 95,000 | | | Targa Resources Partners LP/Targa Resources Partners Finance Corp., 4.250%, 11/15/2023 | | | 95,475 | |
| | 155,000 | | | Targa Resources Partners LP/Targa Resources Partners Finance Corp., 4.875%, 2/01/2031, 144A | | | 168,886 | |
| | 200,000 | | | Western Midstream Operating LP, 5.050%, 2/01/2030 | | | 223,962 | |
| | 110,000 | | | Western Midstream Operating LP, 5.450%, 4/01/2044 | | | 111,240 | |
| | 105,000 | | | Western Midstream Operating LP, 6.250%, 2/01/2050 | | | 115,500 | |
| | | | | | | | |
| | | | | | | 4,571,244 | |
| | | | | | | | |
| | | | Non-Agency Commercial Mortgage-Backed Securities — 1.4% | |
| | 100,000 | | | CG-CCRE Commercial Mortgage Trust, Series 2014-FL2, Class COL1, 1-month LIBOR + 3.500%, 3.659%, 11/15/2031, 144A(b)(f)(g) | | | 70,471 | |
See accompanying notes to financial statements.
| 28
Portfolio of Investments – as of December 31, 2020
Loomis Sayles High Income Fund – (continued)
| | | | | | | | |
Principal
Amount | | | Description | | Value (†) | |
| | | | Non-Agency Commercial Mortgage-Backed Securities — continued | |
| $ | 225,000 | | | CG-CCRE Commercial Mortgage Trust, Series 2014-FL2, Class COL2, 1-month LIBOR + 4.500%, 4.659%, 11/15/2031, 144A(b)(f)(g) | | $ | 142,609 | |
| | 1,020,000 | | | Credit Suisse Mortgage Trust, Series 2014-USA, Class E, 4.373%, 9/15/2037, 144A(f)(g) | | | 746,845 | |
| | 380,000 | | | Starwood Retail Property Trust, Series 2014-STAR, Class D, 1-month LIBOR + 3.500%, 3.659%, 11/15/2027, 144A(b)(d)(e)(f) | | | 245,827 | |
| | 420,000 | | | Starwood Retail Property Trust, Series 2014-STAR, Class E, 1-month LIBOR + 4.400%, 4.559%, 11/15/2027, 144A(b)(d)(e)(f) | | | 144,277 | |
| | 60,000 | | | Wells Fargo Commercial Mortgage Trust, Series 2016-C36, Class C, 4.183%, 11/15/2059(a) | | | 43,273 | |
| | 130,000 | | | WFRBS Commercial Mortgage Trust, Series 2011-C3, Class D, 5.642%, 3/15/2044, 144A(a) | | | 60,620 | |
| | 80,000 | | | WFRBS Commercial Mortgage Trust, Series 2012-C10, Class C, 4.362%, 12/15/2045(a) | | | 49,100 | |
| | 125,000 | | | WFRBS Commercial Mortgage Trust, Series 2012-C7, Class E, 4.810%, 6/15/2045, 144A(a) | | | 55,467 | |
| | | | | | | | |
| | | | | | | 1,558,489 | |
| | | | | | | | |
| | | | Oil Field Services — 0.4% | |
| | 61,250 | | | Nabors Industries, Inc., 9.000%, 2/01/2025, 144A | | | 58,893 | |
| | 315,000 | | | Shelf Drilling Holdings Ltd., 8.250%, 2/15/2025, 144A | | | 144,900 | |
| | 198,900 | | | Transocean Guardian Ltd., 5.875%, 1/15/2024, 144A | | | 167,076 | |
| | 57,000 | | | Transocean Proteus Ltd., 6.250%, 12/01/2024, 144A | | | 53,509 | |
| | | | | | | | |
| | | | | | | 424,378 | |
| | | | | | | | |
| | | | Packaging — 1.4% | |
| | 570,000 | | | ARD Finance S.A., 7.250% PIK or 6.500% Cash, 6/30/2027, 144A(h) | | | 608,475 | |
| | 500,000 | | | Ardagh Packaging Finance PLC/Ardagh Holdings USA, Inc., 5.250%, 8/15/2027, 144A | | | 524,905 | |
| | 75,000 | | | Graham Packaging Co., Inc., 7.125%, 8/15/2028, 144A | | | 82,875 | |
| | 80,000 | | | Intelligent Packaging Ltd Finco, Inc./Intelligent Packaging Ltd. Co-Issuer LLC, 6.000%, 9/15/2028, 144A | | | 82,200 | |
| | 290,000 | | | Mauser Packaging Solutions Holding Co., 7.250%, 4/15/2025, 144A | | | 292,900 | |
| | | | | | | | |
| | | | | | | 1,591,355 | |
| | | | | | | | |
| | | | Pharmaceuticals — 3.5% | |
| | 725,000 | | | Bausch Health Cos., Inc., 5.250%, 1/30/2030, 144A | | | 761,250 | |
| | 430,000 | | | Bausch Health Cos., Inc., 5.250%, 2/15/2031, 144A | | | 449,230 | |
| | 155,000 | | | Catalent Pharma Solutions, Inc., 4.875%, 1/15/2026, 144A | | | 158,100 | |
| | 200,000 | | | Cheplapharm Arzneimittel GmbH, 5.500%, 1/15/2028, 144A | | | 207,902 | |
| | 195,000 | | | Endo Dac/Endo Finance LLC/Endo Finco, Inc., 6.000%, 6/30/2028, 144A | | | 165,750 | |
| | 170,000 | | | Jaguar Holding Co. II/PPD Development LP, 5.000%, 6/15/2028, 144A | | | 181,475 | |
| | 97,000 | | | Par Pharmaceutical, Inc., 7.500%, 4/01/2027, 144A | | | 105,245 | |
| | 320,000 | | | Teva Pharmaceutical Finance Netherlands III BV, 3.150%, 10/01/2026 | | | 307,603 | |
| | 1,845,000 | | | Teva Pharmaceutical Finance Netherlands III BV, 4.100%, 10/01/2046 | | | 1,642,050 | |
| | | | | | | | |
| | | | | | | 3,978,605 | |
| | | | | | | | |
| | | | Property & Casualty Insurance — 0.4% | |
| | 80,000 | | | AmWINS Group, Inc., 7.750%, 7/01/2026, 144A | | | 85,912 | |
| | 200,000 | | | Ardonagh Midco 2 PLC, 11.500%, 1/15/2027, 144A | | | 213,500 | |
| | | | Property & Casualty Insurance — continued | |
| 105,000 | | | AssuredPartners, Inc., 5.625%, 1/15/2029, 144A | | | 109,594 | |
| | | | | | | | |
| | | | | | | 409,006 | |
| | | | | | | | |
| | | | Refining — 0.5% | |
| | 50,000 | | | CVR Energy, Inc., 5.250%, 2/15/2025, 144A | | | 48,250 | |
| | 395,000 | | | Parkland Corp., 5.875%, 7/15/2027, 144A | | | 427,086 | |
| | 65,000 | | | PBF Holding Co. LLC/PBF Finance Corp., 6.000%, 2/15/2028 | | | 37,131 | |
| | 80,000 | | | PBF Holding Co. LLC/PBF Finance Corp., 9.250%, 5/15/2025, 144A | | | 78,872 | |
| | | | | | | | |
| | | | | | | 591,339 | |
| | | | | | | | |
| | | | REITs – Hotels — 0.3% | |
| | 75,000 | | | Service Properties Trust, 4.350%, 10/01/2024 | | | 74,062 | |
| | 240,000 | | | Service Properties Trust, 4.750%, 10/01/2026 | | | 237,000 | |
| | 65,000 | | | Service Properties Trust, 7.500%, 9/15/2025 | | | 74,901 | |
| | | | | | | | |
| | | | | | | 385,963 | |
| | | | | | | | |
| | | | REITs – Mortgage — 0.5% | |
| | 50,000 | | | Ladder Capital Finance Holdings LLLP/Ladder Capital Finance Corp., 4.250%, 2/01/2027, 144A | | | 49,125 | |
| | 540,000 | | | Ladder Capital Finance Holdings LLLP/Ladder Capital Finance Corp., 5.250%, 10/01/2025, 144A | | | 538,650 | |
| | 16,000 | | | Ladder Capital Finance Holdings LLLP/Ladder Capital Finance Corp., 5.875%, 8/01/2021, 144A | | | 16,000 | |
| | | | | | | | |
| | | | | | | 603,775 | |
| | | | | | | | |
| | | | REITs – Regional Malls — 0.2% | |
| | 175,000 | | | Brookfield Property REIT, Inc./BPR Cumulus LLC/BPR Nimbus LLC/GGSI Sellco LLC, 5.750%, 5/15/2026, 144A | | | 172,375 | |
| | | | | | | | |
| | | | Restaurants — 0.9% | |
| | 540,000 | | | 1011778 BC ULC/New Red Finance, Inc., 4.000%, 10/15/2030, 144A | | | 547,252 | |
| | 95,000 | | | Golden Nugget, Inc., 6.750%, 10/15/2024, 144A | | | 94,318 | |
| | 350,000 | | | Yum! Brands, Inc., 3.625%, 3/15/2031 | | | 353,791 | |
| | | | | | | | |
| | | | | | | 995,361 | |
| | | | | | | | |
| | | | Retailers — 1.4% | |
| | 75,000 | | | Asbury Automotive Group, Inc., 4.500%, 3/01/2028 | | | 78,188 | |
| | 83,000 | | | Asbury Automotive Group, Inc., 4.750%, 3/01/2030 | | | 89,017 | |
| | 370,000 | | | Carvana Co., 5.625%, 10/01/2025, 144A | | | 379,783 | |
| | 125,000 | | | Carvana Co., 5.875%, 10/01/2028, 144A | | | 129,695 | |
| | 35,000 | | | Group 1 Automotive, Inc., 4.000%, 8/15/2028, 144A | | | 36,077 | |
| | 50,000 | | | Ken Garff Automotive LLC, 4.875%, 9/15/2028, 144A | | | 52,000 | |
| | 140,000 | | | L Brands, Inc., 5.250%, 2/01/2028 | | | 146,101 | |
| | 75,000 | | | L Brands, Inc., 6.625%, 10/01/2030, 144A | | | 83,437 | |
| | 105,000 | | | L Brands, Inc., 6.750%, 7/01/2036 | | | 116,983 | |
| | 55,000 | | | L Brands, Inc., 6.875%, 11/01/2035 | | | 61,738 | |
| | 90,000 | | | Lithia Motors, Inc., 4.375%, 1/15/2031, 144A | | | 96,525 | |
| | 115,000 | | | Nordstrom, Inc., 5.000%, 1/15/2044 | | | 108,249 | |
| | 200,000 | | | PetSmart, Inc., 7.125%, 3/15/2023, 144A | | | 200,000 | |
| | 40,000 | | | PetSmart, Inc., 8.875%, 6/01/2025, 144A | | | 41,100 | |
| | | | | | | | |
| | | | | | | 1,618,893 | |
| | | | | | | | |
| | | | Supermarkets — 0.2% | |
| | 245,000 | | | Albertsons Cos., Inc./Safeway, Inc./New Albertsons LP/Albertsons LLC, 4.875%, 2/15/2030, 144A | | | 269,961 | |
| | | | | | | | |
| | | | Technology — 3.9% | |
| | 110,000 | | | BY Crown Parent LLC/BY Bond Finance, Inc., 4.250%, 1/31/2026, 144A | | | 112,750 | |
| | 145,000 | | | Camelot Finance S.A., 4.500%, 11/01/2026, 144A | | | 151,344 | |
| | 1,005,000 | | | CommScope Technologies LLC, 5.000%, 3/15/2027, 144A | | | 989,925 | |
See accompanying notes to financial statements.
29 |
Portfolio of Investments – as of December 31, 2020
Loomis Sayles High Income Fund – (continued)
| | | | | | | | |
Principal
Amount | | | Description | | Value (†) | |
| | | | Technology — continued | |
| $ | 86,000 | | | CommScope Technologies LLC, 6.000%, 6/15/2025, 144A | | $ | 87,935 | |
| | 405,000 | | | CommScope, Inc., 7.125%, 7/01/2028, 144A | | | 431,325 | |
| | 125,000 | | | Dell International LLC/EMC Corp., 8.350%, 7/15/2046, 144A | | | 189,102 | |
| | 465,000 | | | Iron Mountain, Inc., 4.875%, 9/15/2029, 144A | | | 490,575 | |
| | 80,000 | | | J2 Global, Inc., 4.625%, 10/15/2030, 144A | | | 84,400 | |
| | 95,000 | | | LogMeIn, Inc., 5.500%, 9/01/2027, 144A | | | 99,513 | |
| | 60,000 | | | NCR Corp., 5.000%, 10/01/2028, 144A | | | 63,300 | |
| | 70,000 | | | NCR Corp., 5.250%, 10/01/2030, 144A | | | 75,075 | |
| | 50,000 | | | NCR Corp., 8.125%, 4/15/2025, 144A | | | 55,682 | |
| | 260,000 | | | Open Text Holdings, Inc., 4.125%, 2/15/2030, 144A | | | 276,588 | |
| | 110,000 | | | Presidio Holdings, Inc., 4.875%, 2/01/2027, 144A | | | 116,686 | |
| | 110,000 | | | Presidio Holdings, Inc., 8.250%, 2/01/2028, 144A | | | 121,275 | |
| | 90,000 | | | Rackspace Technology Global, Inc., 5.375%, 12/01/2028, 144A | | | 94,293 | |
| | 65,000 | | | Sabre GLBL, Inc., 7.375%, 9/01/2025, 144A | | | 70,525 | |
| | 260,000 | | | Sabre GLBL, Inc., 9.250%, 4/15/2025, 144A | | | 309,400 | |
| | 15,000 | | | Science Applications International Corp., 4.875%, 4/01/2028, 144A | | | 15,900 | |
| | 90,000 | | | Sensata Technologies, Inc., 3.750%, 2/15/2031, 144A | | | 93,292 | |
| | 60,000 | | | Shift4 Payments LLC/Shift4 Payments Finance Sub, Inc., 4.625%, 11/01/2026, 144A | | �� | 62,400 | |
| | 210,000 | | | Veritas U.S., Inc./Veritas Bermuda Ltd., 7.500%, 9/01/2025, 144A | | | 215,512 | |
| | 105,000 | | | Xerox Holdings Corp., 5.000%, 8/15/2025, 144A | | | 111,748 | |
| | 105,000 | | | Xerox Holdings Corp., 5.500%, 8/15/2028, 144A | | | 111,421 | |
| | | | | | | | |
| | | | | | | 4,429,966 | |
| | | | | | | | |
| | | | Transportation Services — 0.2% | |
| | 185,000 | | | Avis Budget Car Rental LLC/Avis Budget Finance, Inc., 5.750%, 7/15/2027, 144A | | | 188,931 | |
| | | | | | | | |
| | | | Treasuries — 0.7% | |
| | 840,000 | | | U.S. Treasury Note, 1.125%, 8/31/2021 | | | 845,709 | |
| | | | | | | | |
| | | | Wireless — 0.9% | |
| | 440,000 | | | Altice France S.A., 5.125%, 1/15/2029, 144A | | | 455,400 | |
| | 505,000 | | | Kenbourne Invest S.A., 6.875%, 11/26/2024, 144A | | | 547,612 | |
| | | | | | | | |
| | | | | | | 1,003,012 | |
| | | | | | | | |
| | | | Wirelines — 1.1% | |
| | 200,000 | | | Cablevision Lightpath LLC, 5.625%, 9/15/2028, 144A | | | 209,250 | |
| | 25,000 | | | CenturyLink, Inc., 5.125%, 12/15/2026, 144A | | | 26,399 | |
| | 130,000 | | | Cincinnati Bell Telephone Co. LLC, 6.300%, 12/01/2028 | | | 137,872 | |
| | 225,000 | | | Telecom Italia Capital S.A., 6.375%, 11/15/2033 | | | 276,750 | |
| | 120,000 | | | Telecom Italia Capital S.A., 7.200%, 7/18/2036 | | | 161,900 | |
| | 130,000 | | | Uniti Group LP/Uniti Fiber Holdings, Inc./CSL Capital LLC, 7.875%, 2/15/2025, 144A | | | 139,647 | |
| | 235,000 | | | Uniti Group LP/Uniti Group Finance, Inc./CSL Capital LLC, 8.250%, 10/15/2023 | | | 236,763 | |
| | 100,000 | | | Windstream Escrow LLC/Windstream Escrow Finance Corp., 7.750%, 8/15/2028, 144A | | | 100,700 | |
| | | | | | | | |
| | | | | | | 1,289,281 | |
| | | | | | | | |
| | | | Total Non-Convertible Bonds
(Identified Cost $88,664,186) | | | 94,207,315 | |
| | | | | | | | |
| | | | | | | | |
| | Convertible Bonds — 4.7% | |
| | | | Airlines — 0.2% | |
| | 130,000 | | | Southwest Airlines Co., 1.250%, 5/01/2025 | | | 188,825 | |
| | | | | | | | |
| | | | Cable Satellite — 1.8% | |
| | 235,000 | | | DISH Network Corp., Zero Coupon, 12/15/2025, 144A | | | 236,112 | |
| | 1,615,000 | | | DISH Network Corp., 3.375%, 8/15/2026 | | | 1,539,469 | |
| | | | Cable Satellite — continued | |
| 240,000 | | | Liberty Media Corp., 0.500%, 12/01/2050, 144A | | | 255,751 | |
| | | | | | | | |
| | | | | | | 2,031,332 | |
| | | | | | | | |
| | | | Consumer Cyclical Services — 0.2% | |
| | 35,000 | | | Fiverr International Ltd., Zero Coupon, 11/01/2025, 144A | | | 42,242 | |
| | 140,000 | | | Uber Technologies, Inc., Zero Coupon, 12/15/2025, 144A | | | 143,225 | |
| | | | | | | | |
| | | | | | | 185,467 | |
| | | | | | | | |
| | | | Diversified Manufacturing — 0.1% | |
| | 160,000 | | | Greenbrier Cos., Inc. (The), 2.875%, 2/01/2024 | | | 161,675 | |
| | | | | | | | |
| | | | Healthcare — 0.5% | |
| | 180,000 | | | Integra LifeSciences Holdings Corp., 0.500%, 8/15/2025, 144A | | | 199,382 | |
| | 315,000 | | | Teladoc Health, Inc., 1.250%, 6/01/2027, 144A | | | 377,277 | |
| | | | | | | | |
| | | | | | | 576,659 | |
| | | | | | | | |
| | | | Industrial Other — 0.0% | |
| | 45,000 | | | Chegg, Inc., Zero Coupon, 9/01/2026, 144A | | | 50,320 | |
| | | | | | | | |
| | | | Oil Field Services — 0.1% | |
| | 150,000 | | | Oil States International, Inc., 1.500%, 2/15/2023 | | | 113,867 | |
| | | | | | | | |
| | | | Pharmaceuticals — 1.4% | |
| | 145,000 | | | Aerie Pharmaceuticals, Inc., 1.500%, 10/01/2024 | | | 132,956 | |
| | 185,000 | | | BioMarin Pharmaceutical, Inc., 0.599%, 8/01/2024 | | | 198,521 | |
| | 755,000 | | | BioMarin Pharmaceutical, Inc., 1.250%, 5/15/2027, 144A | | | 788,975 | |
| | 130,000 | | | Flexion Therapeutics, Inc., 3.375%, 5/01/2024 | | | 114,725 | |
| | 120,000 | | | Guardant Health, Inc., Zero Coupon, 11/15/2027, 144A | | | 140,403 | |
| | 150,000 | | | Neurocrine Biosciences, Inc., 2.250%, 5/15/2024 | | | 206,966 | |
| | | | | | | | |
| | | | | | | 1,582,546 | |
| | | | | | | | |
| | | | Technology — 0.4% | |
| | 95,000 | | | LivePerson, Inc., Zero Coupon, 12/15/2026, 144A | | | 103,771 | |
| | 55,000 | | | Lumentum Holdings, Inc., 0.500%, 12/15/2026 | | | 67,067 | |
| | 10,000 | | | Palo Alto Networks, Inc., 0.375%, 6/01/2025, 144A | | | 13,168 | |
| | 170,000 | | | Shift4 Payments, Inc., Zero Coupon, 12/15/2025, 144A | | | 207,449 | |
| | | | | | | | |
| | | | | | | 391,455 | |
| | | | | | | | |
| | | | Total Convertible Bonds
(Identified Cost $5,320,365) | | | 5,282,146 | |
| | | | | | | | |
| | | | Total Bonds and Notes
(Identified Cost $93,984,551) | | | 99,489,461 | |
| | | | | | | | |
| | | | | | | | |
| | Collateralized Loan Obligations — 0.4% | |
| | 250,000 | | | Carlyle Global Market Strategies CLO Ltd., Series 2015-2A, Class CR, 3-month LIBOR + 2.250%, 2.467%, 4/27/2027, 144A(b) | | | 241,429 | |
| | 250,000 | | | OZLM XXIII Ltd., Series 2019-23A, Class E, 3-month LIBOR + 6.800%, 7.037%, 4/15/2032, 144A(b) | | | 247,206 | |
| | | | | | | | |
| | | | Total Collateralized Loan Obligations
(Identified Cost $460,312) | | | 488,635 | |
| | | | | | | | |
| | | | | | | | |
| | Loan Participations — 0.2% | |
| | | | ABS Other — 0.2% | |
| | 294,855 | | | Harbour Aircraft Investments Ltd., Series 2017-1, Class C, 8.000%, 11/15/2037(d)(e)
(Identified Cost $294,231) | | | 161,345 | |
| | | | | | | | |
| | | | | | | | |
See accompanying notes to financial statements.
| 30
Portfolio of Investments – as of December 31, 2020
Loomis Sayles High Income Fund – (continued)
| | | | | | | | |
Shares | | | Description | | Value (†) | |
| | Preferred Stocks — 1.9% | |
| | | | Banking — 0.4% | |
| | 95 | | | Bank of America Corp., Series L, 7.250% | | $ | 144,265 | |
| | 197 | | | Wells Fargo & Co., Class A, Series L, 7.500% | | | 299,026 | |
| | | | | | | | |
| | | | | | | 443,291 | |
| | | | | | | | |
| | | | Electric — 0.1% | |
| | 2,008 | | | NextEra Energy, Inc., 5.279% | | | 102,087 | |
| | | | | | | | |
| | | | Energy — 0.0% | |
| | 137 | | | Chesapeake Energy Corp., 5.750%(d)(e)(f)(i) | | | — | |
| | 988 | | | Chesapeake Energy Corp., 5.750%(d)(e)(f)(i) | | | — | |
| | 20 | | | Chesapeake Energy Corp., 5.750%, 144A(d)(e)(f)(i) | | | — | |
| | | | | | | | |
| | | | | | | — | |
| | | | | | | | |
| | | | Food & Beverage — 1.2% | |
| | 13,040 | | | Bunge Ltd., 4.875% | | | 1,418,544 | |
| | | | | | | | |
| | | | Healthcare — 0.2% | |
| | 2,038 | | | Boston Scientific Corp., Series A, 5.500% | | | 223,303 | |
| | | | | | | | |
| | | | Total Preferred Stocks
(Identified Cost $2,796,913) | | | 2,187,225 | |
| | | | | | | | |
| | | | | | | | |
| | Common Stocks — 0.7% | |
| | | | Chemicals — 0.1% | |
| | 12,177 | | | Hexion Holdings Corp., Class B(i) | | | 157,449 | |
| | | | | | | | |
| | | | Energy Equipment & Services — 0.0% | |
| | 10,149 | | | McDermott International Ltd.(i) | | | 8,221 | |
| | | | | | | | |
| | | | Media — 0.3% | |
| | 41,970 | | | Clear Channel Outdoor Holdings, Inc.(i) | | | 69,250 | |
| | 17,204 | | | iHeartMedia, Inc., Class A(i) | | | 223,308 | |
| | | | | | | | |
| | | | | | | 292,558 | |
| | | | | | | | |
| | | | Oil, Gas & Consumable Fuels — 0.3% | |
| | 3,650 | | | Battalion Oil Corp.(i) | | | 30,295 | |
| | 10,363 | | | Whiting Petroleum Corp.(i) | | | 259,075 | |
| | | | | | | | |
| | | | | | | 289,370 | |
| | | | | | | | |
| | | | Total Common Stocks
(Identified Cost $2,139,376) | | | 747,598 | |
| | | | | | | | |
| | | | | | | | |
| | Other Investments — 0.1% | |
| | | | Aircraft ABS — 0.1% | |
| | 100 | | | ECAF I Blocker Ltd.(d)(e)(f)(j)
(Identified Cost $1,000,000) | | | 125,600 | |
| | | | | | | | |
| | | | | | | | |
| | Warrants — 0.0% | |
| | 20,319 | | | McDermott International Ltd., Expiration on 5/1/2024(d)(e)(i) | | | 19,303 | |
| | 22,577 | | | McDermott International Ltd., Expiration on 5/1/2024(d)(e)(i) | | | 12,643 | |
| | 466 | | | iHeartMedia, Inc., Expiration on 5/1/2039(d)(e)(i) | | | 6,049 | |
| | | | | | | | |
| | | | Total Warrants
(Identified Cost $38,915) | | | 37,995 | |
| | | | | | | | |
| | | | | | | | |
| | Short-Term Investments — 7.6% | |
| $ | 8,523,047 | | | Tri-Party Repurchase Agreement with Fixed Income Clearing Corporation, dated 12/31/2020 at 0.000% to be repurchased at $8,523,047 on 1/04/2021 collateralized by $8,349,100 U.S. Treasury Note,1.750% due 1/31/2023 valued at $8,693,582 including accrued interest (Note 2 of Notes to Financial Statements) (Identified Cost $8,523,047) | | | 8,523,047 | |
| | | | | | | | |
| | | | | | | | |
| | | | Total Investments — 99.2%
(Identified Cost $109,237,345) | | | 111,760,906 | |
| | | | Other assets less liabilities — 0.8% | | | 957,121 | |
| | | | | | | | |
| | | | Net Assets — 100.0% | | $ | 112,718,027 | |
| | | | | | | | |
| | | | | | | | |
| | (†) | | | See Note 2 of Notes to Financial Statements. | |
| | (a) | | | Variable rate security. The interest rate adjusts periodically based on; (i) changes in current interest rates and/or prepayments on underlying pools of assets, if applicable, (ii) reference to a base lending rate plus or minus a margin, and/or (iii) reference to a base lending rate adjusted by a multiplier and/or subject to certain floors or caps. Rate as of December 31, 2020 is disclosed. | |
| | (b) | | | Variable rate security. Rate as of December 31, 2020 is disclosed. | |
| | (c) | | | The issuer is in default with respect to interest and/or principal payments. Income is not being accrued. | |
| | (d) | | | Level 3 security. Value has been determined using significant unobservable inputs. See Note 3 of Notes to Financial Statements. | |
| | (e) | | | Fair valued by the Fund’s adviser. At December 31, 2020, the value of these securities amounted to $715,044 or 0.6% of net assets. See Note 2 of Notes to Financial Statements. | |
| | (f) | | | Illiquid security. (Unaudited) | | | | |
| | (g) | | | Securities classified as fair valued pursuant to the Fund’s pricing policies and procedures. At December 31, 2020, the value of these securities amounted to $1,051,925 or 0.9% of net assets. See Note 2 of Notes to Financial Statements. | |
| | (h) | | | Payment-in-kind security for which the issuer, at each interest payment date, may make interest payments in cash and/or additional principal. For the period ended December 31, 2020, interest payments were made in cash. | |
| | (i) | | | Non-income producing security. | | | | |
| | (j) | | | Securities subject to restriction on resale. At December 31, 2020, the restricted securities held by the Fund are as follows: | |
| | | | | |
| | | | | | | | | | | | | | |
| | | Acquisition
Date | | | Cost | | Value | | | % of
Net Assets | |
| ECAF I Blocker Ltd. | | | 12/20/2016 | | | $1,000,000 | | $ | 125,600 | | | | 0.1 | % |
| | | | | | |
| | | | | | |
| | 144A | | | All or a portion of these securities are exempt from registration under Rule 144A of the Securities Act of 1933. These securities may be resold in transactions exempt from registration, normally to qualified institutional buyers. At December 31, 2020, the value of Rule 144A holdings amounted to $60,735,106 or 53.9% of net assets. |
| | ABS | | | Asset-Backed Securities | | |
| | LIBOR | | | London Interbank Offered Rate | | |
| | MTN | | | Medium Term Note | | |
| | PIK | | | Payment-in-Kind | | |
| | REITs | | | Real Estate Investment Trusts | | |
See accompanying notes to financial statements.
31 |
Portfolio of Investments – as of December 31, 2020
Loomis Sayles High Income Fund – (continued)
Industry Summary at December 31, 2020
| | | | |
Cable Satellite | | | 7.2 | % |
Consumer Cyclical Services | | | 5.6 | |
Healthcare | | | 5.5 | |
Independent Energy | | | 5.5 | |
Pharmaceuticals | | | 4.9 | |
Aerospace & Defense | | | 4.8 | |
Automotive | | | 4.4 | |
Media Entertainment | | | 4.3 | |
Technology | | | 4.3 | |
Midstream | | | 4.1 | |
Metals & Mining | | | 4.0 | |
Food & Beverage | | | 3.6 | |
Finance Companies | | | 3.4 | |
Gaming | | | 3.2 | |
Other Investments, less than 2% each | | | 26.4 | |
Short-Term Investments | | | 7.6 | |
Collateralized Loan Obligations | | | 0.4 | |
| | | | |
Total Investments | | | 99.2 | |
Other assets less liabilities | | | 0.8 | |
| | | | |
Net Assets | | | 100.0 | % |
| | | | |
See accompanying notes to financial statements.
| 32
Portfolio of Investments – as of December 31, 2020
Loomis Sayles Intermediate Municipal Bond Fund
| | | | | | | | |
Principal
Amount | | | Description | | Value (†) | |
| | Bonds and Notes — 94.7% of Net Assets | |
| | Municipals — 94.7% | |
| | | | Arizona — 0.7% | |
| $ | 200,000 | | | City of Mesa, Excise Tax Revenue, 4.000%, 7/01/2037 | | $ | 246,546 | |
| | | | | | | | |
| | | | California — 3.3% | |
| | 1,000,000 | | | California State, GO, Various Purpose, Refunding, 4.000%, 3/01/2037 | | | 1,234,930 | |
| | | | | | | | |
| | | | Colorado — 6.2% | |
| | 260,000 | | | Colorado Springs Utilities System Revenue, Series B-2, 5.000%, 11/15/2033 | | | 292,581 | |
| | 400,000 | | | Denver City & County School District No. 1, GO, Prerefunded 12/01/2022@100, Series B, (State Aid Withholding), 5.000%, 12/01/2026 | | | 436,416 | |
| | 250,000 | | | Denver City & County, Airport System Revenue, Series A, AMT, 5.000%, 11/15/2030 | | | 309,107 | |
| | 500,000 | | | Regional Transportation District Sales Tax Revenue, Series A, 5.000%, 11/01/2028 | | | 662,730 | |
| | 500,000 | | | State of Colorado, Certificate of Participation, Series A, 4.000%, 12/15/2035 | | | 622,440 | |
| | | | | | | | |
| | | | | | | 2,323,274 | |
| | | | | | | | |
| | | | Delaware — 1.1% | |
| | 250,000 | | | University of Delaware, Revenue Bond, 5.000%, 11/01/2043 | | | 391,558 | |
| | | | | | | | |
| | | | Florida — 11.7% | |
| | 500,000 | | | Alachua County School Board, Certificate of Participation, (AGM Insured), 5.000%, 7/01/2028 | | | 638,540 | |
| | 340,000 | | | Bay County School Board, Certificate of Participation, Series A, (AGM Insured), 5.000%, 7/01/2033 | | | 441,398 | |
| | 230,000 | | | City of Cape Coral FL Utility Improvement Assessment, Various Areas, Water & Sewer Revenue, (AGM Insured), 3.000%, 9/01/2027 | | | 259,649 | |
| | 90,000 | | | City of Cape Coral FL Utility Improvement Assessment, Various Areas, Water & Sewer Revenue, (AGM Insured), 3.000%, 9/01/2028 | | | 102,538 | |
| | 200,000 | | | Clay County, Sales Surtax Revenue, 4.000%, 10/01/2039 | | | 236,154 | |
| | 225,000 | | | County of Collier FL Special Obligation, Revenue Bonds, Series A, 4.000%, 10/01/2036 | | | 280,501 | |
| | 500,000 | | | Fernandina Beach Utility System Revenue, Refunding, Series A, 5.000%, 9/01/2027 | | | 558,680 | |
| | 500,000 | | | Miami-Dade County FL Aviation Revenue, Refunding, Series A, 4.000%, 10/01/2039 | | | 596,420 | |
| | 400,000 | | | Sarasota County FL Utility System Revenue, 5.000%, 10/01/2023 | | | 452,364 | |
| | 225,000 | | | Sarasota County FL Utility System Revenue, Series A, 5.000%, 10/01/2027 | | | 293,353 | |
| | 400,000 | | | Volusia County Educational Facility Authority Revenue, Embry-Riddle Aeronautical University, Inc., Series B, 5.000%, 10/15/2025 | | | 478,508 | |
| | | | | | | | |
| | | | | | | 4,338,105 | |
| | | | | | | | |
| | | | Georgia — 3.1% | |
| | 650,000 | | | Georgia State Road & Tollway Authority, 5.000%, 6/01/2032 | | | 880,438 | |
| | 250,000 | | | Savannah Hospital Authority Revenue, St. Joseph’s/Candler Health System Obligated Group, Series A, 5.500%, 7/01/2027 | | | 277,620 | |
| | | | | | | | |
| | | | | | | 1,158,058 | |
| | | | | | | | |
| | | | Illinois — 3.1% | |
| 540,000 | | | Chicago Midway International Airport Revenue, Second Lien, Refunding, Series A, AMT, 5.000%, 1/01/2031 | | | 595,204 | |
| | 500,000 | | | Chicago O’Hare International Airport, Series C, AMT, 5.000%, 1/01/2046 | | | 563,705 | |
| | | | | | | | |
| | | | | | | 1,158,909 | |
| | | | | | | | |
| | | | Louisiana — 1.4% | |
| | 200,000 | | | New Orleans Aviation Board, General Airport Revenue, North Terminal Project, Series B, AMT, 5.000%, 1/01/2035 | | | 237,356 | |
| | 250,000 | | | New Orleans Aviation Board, General Airport Revenue, North Terminal Project, Series B, AMT, 5.000%, 1/01/2036 | | | 295,990 | |
| | | | | | | | |
| | | | | | | 533,346 | |
| | | | | | | | |
| | | | Maryland — 1.2% | |
| | 360,000 | | | Maryland Health & Higher Educational Facilities Authority, Series B2, 5.000%, 7/01/2045 | | | 447,782 | |
| | | | | | | | |
| | | | Massachusetts — 4.0% | |
| | 500,000 | | | Commonwealth of Massachusetts, GO, Series D, 5.000%, 7/01/2045 | | | 655,945 | |
| | 500,000 | | | Massachusetts State Development Finance Agency Revenue, Series P, 5.000%, 7/01/2050 | | | 825,975 | |
| | | | | | | | |
| | | | | | | 1,481,920 | |
| | | | | | | | |
| | | | Michigan — 2.0% | |
| | 600,000 | | | University of Michigan, 5.000%, 4/01/2032 | | | 733,506 | |
| | | | | | | | |
| | | | Nebraska — 0.9% | |
| | 250,000 | | | Douglas County Hospital Authority No. 2, Series A, 5.000%, 11/15/2030 | | | 339,020 | |
| | | | | | | | |
| | | | Nevada — 2.9% | |
| | 500,000 | | | City of Henderson, GO, Various Purpose, Refunding, 5.000%, 6/01/2026 | | | 580,485 | |
| | 240,000 | | | Las Vegas Convention & Visitors Authority, Refunding, Series C, 5.000%, 7/01/2032 | | | 264,986 | |
| | 200,000 | | | Washoe County School District, GO, Series A, 5.000%, 10/01/2025 | | | 242,060 | |
| | | | | | | | |
| | | | | | | 1,087,531 | |
| | | | | | | | |
| | | | New Jersey — 2.3% | |
| | 265,000 | | | New Jersey Health Care Facilities Financing Authority Revenue, Refunding, Virtua Health, Inc., 5.000%, 7/01/2023 | | | 295,870 | |
| | 500,000 | | | New Jersey State Turnpike Authority Revenue, Series A, 5.000%, 1/01/2032 | | | 568,865 | |
| | | | | | | | |
| | | | | | | 864,735 | |
| | | | | | | | |
| | | | New Mexico — 1.6% | |
| | 500,000 | | | New Mexico Hospital Equipment Loan Council Revenue, Presbyterian Healthcare Services Obligated Group, Refunding, 5.000%, 8/01/2031 | | | 588,865 | |
| | | | | | | | |
| | | | New York — 5.2% | |
| | 500,000 | | | Metropolitan Transportation Authority, Series D, 4.000%, 11/15/2032 | | | 537,250 | |
| | 500,000 | | | New York City Transitional Finance Authority Future Tax Secured Revenue, Series D, 4.000%, 11/01/2038 | | | 607,975 | |
| | 400,000 | | | New York City, GO, Series A1, 5.000%, 8/01/2030 | | | 547,064 | |
| | 200,000 | | | New York State Dormitory Authority, Series D, 4.000%, 2/15/2038 | | | 239,080 | |
| | | | | | | | |
| | | | | | | 1,931,369 | |
| | | | | | | | |
See accompanying notes to financial statements.
33 |
Portfolio of Investments – as of December 31, 2020
Loomis Sayles Intermediate Municipal Bond Fund – (continued)
| | | | | | | | |
Principal
Amount | | | Description | | Value (†) | |
| | | | North Carolina — 1.8% | |
| $ | 180,000 | | | Buncombe County, Limited Obligation, Revenue, Series A, 4.000%, 6/01/2034 | | $ | 223,720 | |
| | 400,000 | | | North Carolina Agricultural & Technical University System Revenue, Series A, 4.000%, 10/01/2045 | | | 437,592 | |
| | | | | | | | |
| | | | | | | 661,312 | |
| | | | | | | | |
| | | | North Dakota — 2.1% | |
| | 250,000 | | | City of West Fargo, GO, Refunding, Series A, 4.000%, 5/01/2026 | | | 290,960 | |
| | 350,000 | | | North Dakota Building Authority, Series A, 5.000%, 12/01/2030 | | | 482,542 | |
| | | | | | | | |
| | | | | | | 773,502 | |
| | | | | | | | |
| | | | Ohio — 4.7% | |
| | 500,000 | | | Columbus, GO, Various Purpose, Series A, 5.000%, 8/15/2023 | | | 562,590 | |
| | 500,000 | | | Hamilton County Hospital Facilities Revenue, UC Health Obligated Group, 5.000%, 2/01/2024 | | | 567,670 | |
| | 500,000 | | | Ohio State University (The), Series A, 5.000%, 12/01/2026 | | | 635,100 | |
| | | | | | | | |
| | | | | | | 1,765,360 | |
| | | | | | | | |
| | | | Oklahoma — 3.4% | |
| | 1,000,000 | | | Oklahoma Water Resources Board, Series A, 5.000%, 4/01/2027 | | | 1,282,650 | |
| | | | | | | | |
| | | | Oregon — 0.8% | |
| | 230,000 | | | Port of Portland, Airport Revenue, Portland International Airport, Series 25-B, 5.000%, 7/01/2028 | | | 292,404 | |
| | | | | | | | |
| | | | Pennsylvania — 0.8% | |
| | 270,000 | | | Allegheny County Higher Education Building Authority, Refunding, Series A, 5.000%, 3/01/2029 | | | 311,010 | |
| | | | | | | | |
| | | | Rhode Island — 1.5% | |
| | 500,000 | | | Rhode Island Clean Water Finance Agency Pollution Control Agency Revolving Fund-Pooled Loan, Series A, 5.000%, 10/01/2024 | | | 565,455 | |
| | | | | | | | |
| | | | Tennessee — 2.3% | |
| | 185,000 | | | Greeneville Health & Educational Facilities Board, Series A, 5.000%, 7/01/2028 | | | 234,286 | |
| | 500,000 | | | Metropolitan Government Nashville & Davidson County Health & Educational Facilities Board Revenue, Vanderbilt University Medical Center Obligated Group, Series A, 5.000%, 7/01/2030 | | | 602,885 | |
| | | | | | | | |
| | | | | | | 837,171 | |
| | | | | | | | |
| | | | Texas — 15.3% | |
| | 1,000,000 | | | Bexar County TX, GO, Series B, Prerefunded 6/15/2023@100, 5.000%, 6/15/2043 | | | 1,117,770 | |
| | 500,000 | | | Grand Parkway Transportation Corp, Series A, Prerefunded 10/01/2023@100, 5.500%, 4/01/2053 | | | 571,900 | |
| | 500,000 | | | Harris County Toll Road Authority (The), 4.000%, 8/15/2038 | | | 620,715 | |
| | 1,000,000 | | | Houston TX Combined Utility System Revenue, Refunding, Series A, (AGM Insured), Zero Coupon, 12/01/2025 | | | 971,210 | |
| | 300,000 | | | Lower Colorado River Authority, Refunding, 5.000%, 5/15/2030 | | | 395,004 | |
| | 500,000 | | | New Braunfels TX Utility System Revenue, 5.000%, 7/01/2029 | | | 653,100 | |
| | 400,000 | | | Tarrant County Cultural Education Facilities Finance Corp. Revenue, Methodist Hospitals of Dallas, 5.000%, 10/01/2024 | | | 449,864 | |
| | 250,000 | | | Texas City Independent School District, GO, (PSF-GTD), 4.000%, 8/15/2034 | | | 300,602 | |
| | | | Texas — continued | |
| 500,000 | | | Texas Public Finance Authority, Refunding, 4.000%, 2/01/2034 | | | 610,090 | |
| | | | | | | | |
| | | | | | | 5,690,255 | |
| | | | | | | | |
| | | | Utah — 2.2% | |
| | 500,000 | | | Utah County Hospital Revenue, IHC Health Services, Inc., Series A, 4.000%, 5/15/2043 | | | 601,085 | |
| | 180,000 | | | Utah Transit Authority Sales Tax Revenue, Series A, Prerefunded 06/15/2025@100, 5.000%, 6/15/2038 | | | 217,766 | |
| | | | | | | | |
| | | | | | | 818,851 | |
| | | | | | | | |
| | | | Virginia — 0.8% | |
| | 225,000 | | | Fairfax County, GO, Series A, 5.000%, 10/01/2034 | | | 305,159 | |
| | | | | | | | |
| | | | Washington — 7.6% | |
| | 750,000 | | | Auburn School District No. 408 of King & Pierce Counties, GO, (SCH BD GTY), 3.000%, 12/01/2035 | | | 871,380 | |
| | 500,000 | | | King County Public Hospital District No. 2, GO, Evergreen Healthcare, Series B, 5.000%, 12/01/2032 | | | 581,865 | |
| | 500,000 | | | Port of Seattle Revenue, AMT, 5.000%, 7/01/2029 | | | 547,245 | |
| | 500,000 | | | Snohomish County School District No. 15 Edmonds, GO, 5.000%, 12/01/2031 | | | 571,420 | |
| | 200,000 | | | State of Washington, GO, Series 2015-C, Class R, 5.000%, 7/01/2029 | | | 235,934 | |
| | | | | | | | |
| | | | | | | 2,807,844 | |
| | | | | | | | |
| | | | Wisconsin — 0.7% | |
| | 225,000 | | | Wisconsin Health & Educational Facilities Authority Revenue, Aspirus, Inc. Obligated Group, Refunding, Series A, 5.000%, 8/15/2031 | | | 258,075 | |
| | | | | | | | |
| | | | Total Bonds and Notes
(Identified Cost $33,626,252) | | | 35,228,502 | |
| | | | | | | | |
| | | | | | | | |
| | Short-Term Investments — 8.4% | | | | |
| | 1,100,000 | | | Northern Institutional Municipal Portfolio | | | 1,100,000 | |
| | 2,032,420 | | | Tri-Party Repurchase Agreement with Fixed Income Clearing Corporation, dated 12/31/2020 at 0.000% to be repurchased at $2,032,420 on 1/04/2021 collateralized by $2,003,700 U.S. Treasury Note, 1.500% due 2/28/2023 valued at $2,073,157 including accrued interest (Note 2 of Notes to Financial Statements) | | | 2,032,420 | |
| | | | | | | | |
| | | | Total Short-Term Investments
(Identified Cost $3,132,420) | | | 3,132,420 | |
| | | | | | | | |
| | | | | | | | |
| | | | Total Investments — 103.1%
(Identified Cost $36,758,672) | | | 38,360,922 | |
| | | | Other assets less liabilities — (3.1)% | | | (1,169,459 | ) |
| | | | | | | | |
| | | | Net Assets — 100.0% | | $ | 37,191,463 | |
| | | | | | | | |
| | | | | | | | |
| | (†) | | | See Note 2 of Notes to Financial Statements. | |
| | | | | | | | |
| | AGM | | | Assured Guaranty Municipal Corporation | |
| | AMT | | | Alternative Minimum Tax | |
| | GO | �� | | General Obligation | |
| | PSF-GTD | | | Permanent School Fund Guarantee Program | |
See accompanying notes to financial statements.
| 34
Portfolio of Investments – as of December 31, 2020
Loomis Sayles Intermediate Municipal Bond Fund – (continued)
Industry Summary at December 31, 2020
| | | | |
General Purpose Public Improvement | | | 18.4 | % |
Hospitals | | | 14.1 | |
Higher Education | | | 11.0 | |
Water and Sewer | | | 10.5 | |
Primary Secondary Education | | | 9.9 | |
Airports | | | 9.2 | |
Toll Roads, Streets & Highways | | | 7.1 | |
Mass Rapid Transportation | | | 3.9 | |
Pre-Refunded | | | 3.0 | |
Combined Utilities | | | 2.6 | |
Other Investments, less than 2% each | | | 5.0 | |
Short-Term Investments | | | 8.4 | |
| | | | |
Total Investments | | | 103.1 | |
Other assets less liabilities | | | (3.1 | ) |
| | | | |
Net Assets | | | 100.0 | % |
| | | | |
See accompanying notes to financial statements.
35 |
Portfolio of Investments – as of December 31, 2020
Loomis Sayles International Growth Fund
| | | | | | | | |
| Shares | | | Description | | Value (†) | |
| | Common Stocks — 98.7% of Net Assets | |
| | | | Argentina — 7.7% | |
| | 699 | | | MercadoLibre, Inc.(a) | | $ | 1,170,979 | |
| | | | | | | | |
| | | | Australia — 3.2% | |
| | 20,711 | | | WiseTech Global Ltd. | | | 492,201 | |
| | | | | | | | |
| | | | Belgium — 2.3% | |
| | 5,045 | | | Anheuser-Busch InBev S.A. | | | 351,973 | |
| | | | | | | | |
| | | | Brazil — 3.9% | |
| | 193,906 | | | Ambev S.A., ADR | | | 593,350 | |
| | | | | | | | |
| | | | China — 31.7% | |
| | 3,666 | | | Alibaba Group Holding Ltd., Sponsored ADR(a) | | | 853,189 | |
| | 2,568 | | | Baidu, Inc., Sponsored ADR(a) | | | 555,304 | |
| | 36,500 | | | Budweiser Brewing Co. APAC Ltd., 144A | | | 120,572 | |
| | 288,000 | | | Dali Foods Group Co. Ltd., 144A | | | 164,609 | |
| | 2,200 | | | Kweichow Moutai Co. Ltd., Class A | | | 676,137 | |
| | 14,000 | | | Tencent Holdings Ltd. | | | 1,007,353 | |
| | 14,862 | | | Trip.com Group Ltd., ADR(a) | | | 501,295 | |
| | 16,172 | | | Vipshop Holdings Ltd., ADR(a) | | | 454,595 | |
| | 8,688 | | | Yum China Holdings, Inc. | | | 495,998 | |
| | | | | | | | |
| | | | | | | 4,829,052 | |
| | | | | | | | |
| | | | Denmark — 2.4% | |
| | 5,161 | | | Novo Nordisk A/S, Class B | | | 360,027 | |
| | | | | | | | |
| | | | France — 4.2% | |
| | 1,556 | | | EssilorLuxottica S.A. | | | 242,479 | |
| | 4,630 | | | Sodexo S.A. | | | 391,576 | |
| | | | | | | | |
| | | | | | | 634,055 | |
| | | | | | | | |
| | | | Germany — 3.0% | |
| | 3,482 | | | SAP SE | | | 450,984 | |
| | | | | | | | |
| | | | Japan — 5.3% | |
| | 2,600 | | | FANUC Corp. | | | 641,807 | |
| | 3,500 | | | Unicharm Corp. | | | 165,991 | |
| | | | | | | | |
| | | | | | | 807,798 | |
| | | | | | | | |
| | | | Macau — 1.3% | |
| | 25,000 | | | Galaxy Entertainment Group Ltd. | | | 194,613 | |
| | | | | | | | |
| | | | Netherlands — 7.2% | |
| | 320 | | | Adyen NV, 144A(a) | | | 743,534 | |
| | 2,214 | | | NXP Semiconductors NV | | | 352,048 | |
| | | | | | | | |
| | | | | | | 1,095,582 | |
| | | | | | | | |
| | | | Switzerland — 15.4% | |
| | 1,069 | | | Kuehne & Nagel International AG, (Registered) | | | 242,576 | |
| | 4,275 | | | Nestle S.A., (Registered) | | | 505,353 | |
| | 7,982 | | | Novartis AG, (Registered) | | | 751,568 | |
| | 2,408 | | | Roche Holding AG | | | 838,703 | |
| | | | | | | | |
| | | | | | | 2,338,200 | |
| | | | | | | | |
| | | | United Kingdom — 9.8% | |
| | 4,043 | | | Diageo PLC | | | 159,977 | |
| | 11,162 | | | Experian PLC | | | 424,029 | |
| | 5,939 | | | Reckitt Benckiser Group PLC | | | 530,081 | |
| | 6,348 | | | Unilever PLC | | | 384,378 | |
| | | | | | | | |
| | | | | | | 1,498,465 | |
| | | | | | | | |
| | | | United States — 1.3% | |
| | 2,568 | | | Core Laboratories NV | | $ | 68,078 | |
| | 6,034 | | | Schlumberger NV | | | 131,722 | |
| | | | | | | | |
| | | | | | | 199,800 | |
| | | | | | | | |
| | | | Total Common Stocks
(Identified Cost $14,828,544) | | | 15,017,079 | |
| | | | | | | | |
| | | | | | | | |
| | | | Total Investments — 98.7%
(Identified Cost $14,828,544) | | | 15,017,079 | |
| | | | Other assets less liabilities — 1.3% | | | 202,753 | |
| | | | | | | | |
| | | | Net Assets — 100.0% | | $ | 15,219,832 | |
| | | | | | | | |
| | | | | | | | |
| | (†) | | | See Note 2 of Notes to Financial Statements. | |
| | (a) | | | Non-income producing security. | |
| | | | | |
| | 144A | | | All or a portion of these securities are exempt from registration under Rule 144A of the Securities Act of 1933. These securities may be resold in transactions exempt from registration, normally to qualified institutional buyers. At December 31, 2020, the value of Rule 144A holdings amounted to $1,028,715 or 6.8% of net assets. | |
| | ADR | | | An American Depositary Receipt is a certificate issued by a custodian bank representing the right to receive securities of the foreign issuer described. The values of ADRs may be significantly influenced by trading on exchanges not located in the United States. | |
Industry Summary at December 31, 2020
| | | | |
Internet & Direct Marketing Retail | | | 19.6 | % |
Pharmaceuticals | | | 12.9 | |
Beverages | | | 12.4 | |
Interactive Media & Services | | | 10.2 | |
Hotels, Restaurants & Leisure | | | 7.2 | |
Software | | | 6.2 | |
IT Services | | | 4.9 | |
Household Products | | | 4.6 | |
Food Products | | | 4.4 | |
Machinery | | | 4.2 | |
Professional Services | | | 2.8 | |
Personal Products | | | 2.5 | |
Semiconductors & Semiconductor Equipment | | | 2.3 | |
Other Investments, less than 2% each | | | 4.5 | |
| | | | |
Total Investments | | | 98.7 | |
Other assets less liabilities | | | 1.3 | |
| | | | |
Net Assets | | | 100.0 | % |
| | | | |
Currency Exposure Summary at December 31, 2020
| | | | |
United States Dollar | | | 34.0 | % |
Euro | | | 16.9 | |
Swiss Franc | | | 15.4 | |
Hong Kong Dollar | | | 9.8 | |
British Pound | | | 7.3 | |
Japanese Yen | | | 5.3 | |
Yuan Renminbi | | | 4.4 | |
Australian Dollar | | | 3.2 | |
Danish Krone | | | 2.4 | |
| | | | |
Total Investments | | | 98.7 | |
Other assets less liabilities | | | 1.3 | |
| | | | |
Net Assets | | | 100.0 | % |
| | | | |
See accompanying notes to financial statements.
| 36
Portfolio of Investments – as of December 31, 2020
Loomis Sayles Investment Grade Bond Fund
| | | | | | | | |
Principal
Amount | | | Description | | Value (†) | |
| | Bonds and Notes — 91.9% of Net Assets | |
| | Non-Convertible Bonds — 90.5% | |
| | | | ABS Car Loan — 6.3% | |
| $ | 13,891,077 | | | Ally Auto Receivables Trust, Series 2019-1, Class A3, 2.910%, 9/15/2023 | | $ | 14,119,821 | |
| | 7,865,000 | | | American Credit Acceptance Receivables Trust, Series 2019-3, Class D, 2.890%, 9/12/2025, 144A | | | 8,114,481 | |
| | 1,965,000 | | | AmeriCredit Automobile Receivables Trust, Series 2018-2, Class D, 4.010%, 7/18/2024 | | | 2,081,733 | |
| | 10,515,000 | | | AmeriCredit Automobile Receivables Trust, Series 2018-3, Class D, 4.040%, 11/18/2024 | | | 11,190,408 | |
| | 25,880,000 | | | AmeriCredit Automobile Receivables Trust, Series 2019-1, Class D, 3.620%, 3/18/2025 | | | 27,518,478 | |
| | 12,340,000 | | | AmeriCredit Automobile Receivables Trust, Series 2019-2, Class D, 2.990%, 6/18/2025 | | | 12,910,483 | |
| | 1,395,000 | | | AmeriCredit Automobile Receivables Trust, Series 2020-2, Class D, 2.130%, 3/18/2026 | | | 1,442,950 | |
| | 4,800,000 | | | Avis Budget Rental Car Funding AESOP LLC, Series 2020-2A, Class A, 2.020%, 2/20/2027, 144A | | | 4,879,800 | |
| | 3,650,000 | | | CarMax Auto Owner Trust, Series 2018-3, Class D, 3.910%, 1/15/2025 | | | 3,780,873 | |
| | 13,585,000 | | | CarMax Auto Owner Trust, Series 2019-1, Class D, 4.040%, 8/15/2025 | | | 14,278,817 | |
| | 5,811,000 | | | CarMax Auto Owner Trust, Series 2019-2, Class D, 3.410%, 10/15/2025 | | | 6,046,495 | |
| | 2,315,000 | | | CarMax Auto Owner Trust, Series 2019-3, Class D, 2.850%, 1/15/2026 | | | 2,393,911 | |
| | 4,625,000 | | | CarMax Auto Owner Trust, Series 2020-1, Class D, 2.640%, 7/15/2026 | | | 4,769,739 | |
| | 1,800,000 | | | Credit Acceptance Auto Loan Trust, Series 2017-3A, Class C, 3.480%, 10/15/2026, 144A | | | 1,815,489 | |
| | 23,320,000 | | | Credit Acceptance Auto Loan Trust, Series 2019-1A, Class C, 3.940%, 6/15/2028, 144A | | | 24,376,550 | |
| | 2,525,000 | | | Credit Acceptance Auto Loan Trust, Series 2020-2A, Class C, 2.730%, 11/15/2029, 144A | | | 2,570,632 | |
| | 275,000 | | | Credit Acceptance Auto Loan Trust, Series 2020-3A, Class C, 2.280%, 2/15/2030, 144A | | | 279,258 | |
| | 6,555,000 | | | Drive Auto Receivables Trust, Series 2018-5, Class D, 4.300%, 4/15/2026 | | | 6,920,566 | |
| | 16,395,000 | | | Drive Auto Receivables Trust, Series 2019-1, Class D, 4.090%, 6/15/2026 | | | 17,173,238 | |
| | 3,700,000 | | | Drive Auto Receivables Trust, Series 2019-2, Class D, 3.690%, 8/17/2026 | | | 3,891,092 | |
| | 10,760,000 | | | DT Auto Owner Trust, Series 2019-1A, Class D, 3.870%, 11/15/2024, 144A | | | 11,200,279 | |
| | 3,950,000 | | | DT Auto Owner Trust, Series 2019-2A, Class D, 3.480%, 2/18/2025, 144A | | | 4,080,619 | |
| | 3,400,000 | | | DT Auto Owner Trust, Series 2019-3A, Class D, 2.960%, 4/15/2025, 144A | | | 3,514,868 | |
| | 3,790,000 | | | First Investors Auto Owner Trust, Series 2019-1A, Class D, 3.550%, 4/15/2025, 144A | | | 3,937,650 | |
| | 4,610,000 | | | Flagship Credit Auto Trust, Series 2019-3, Class D, 2.860%, 12/15/2025, 144A | | | 4,803,669 | |
| | 30,600,000 | | | Ford Credit Auto Owner Trust, Series 2020-B, Class A3, 0.560%, 10/15/2024 | | | 30,736,078 | |
| | 15,340,000 | | | Ford Credit Auto Owner Trust, Series 2020-C, Class A3, 0.410%, 7/15/2025 | | | 15,397,405 | |
| | 8,555,000 | | | GLS Auto Receivables Trust, Series 2019-2A, Class C, 3.540%, 2/18/2025, 144A | | | 8,936,549 | |
| | | | ABS Car Loan — continued | |
| 10,962,227 | | | GM Financial Consumer Automobile Receivables Trust, Series 2019-1, Class A3, 2.970%, 11/16/2023 | | | 11,150,561 | |
| | 6,255,000 | | | GM Financial Consumer Automobile Receivables Trust, Series 2020-1, Class A3, 1.840%, 9/16/2024 | | | 6,390,602 | |
| | 1,400,000 | | | GMF Floorplan Owner Revolving Trust, Series 2020-1, Class C, 1.480%, 8/15/2025, 144A | | | 1,407,134 | |
| | 5,594,448 | | | Honda Auto Receivables Owner Trust, Series 2019-1, Class A3, 2.830%, 3/20/2023 | | | 5,689,587 | |
| | 6,655,000 | | | Nissan Auto Receivables Owner Trust, Series 2019-C, Class A3, 1.930%, 7/15/2024 | | | 6,790,729 | |
| | 18,955,000 | | | Nissan Auto Receivables Owner Trust, Series 2020-B, Class A3, 0.550%, 7/15/2024 | | | 19,036,639 | |
| | 12,815,000 | | | Santander Drive Auto Receivables Trust, Series 2020-1, Class D, 5.350%, 3/15/2028 | | | 14,279,063 | |
| | 27,665,000 | | | Santander Drive Auto Receivables Trust, Series 2019-1, Class D, 3.650%, 4/15/2025 | | | 28,854,816 | |
| | 6,995,000 | | | Santander Drive Auto Receivables Trust, Series 2019-2, Class D, 3.220%, 7/15/2025 | | | 7,274,339 | |
| | 8,455,000 | | | Santander Drive Auto Receivables Trust, Series 2019-3, Class D, 2.680%, 10/15/2025 | | | 8,689,844 | |
| | 2,900,000 | | | Santander Drive Auto Receivables Trust, Series 2020-2, Class D, 2.220%, 9/15/2026 | | | 2,987,386 | |
| | 15,495,000 | | | Westlake Automobile Receivables Trust, Series 2019-1A, Class D, 3.670%, 3/15/2024, 144A | | | 16,099,152 | |
| | | | | | | | |
| | | | | | | 381,811,783 | |
| | | | | | | | |
| | | | ABS Credit Card — 0.4% | |
| | 939,000 | | | American Express Credit Account Master Trust, Series 2018-8, Class A, 3.180%, 4/15/2024 | | | 958,370 | |
| | 8,000,000 | | | American Express Credit Account Master Trust, Series 2019-1, Class A, 2.870%, 10/15/2024 | | | 8,254,403 | |
| | 11,730,000 | | | Capital One Multi-Asset Execution Trust, Series 2019-A1, Class A1, 2.840%, 12/15/2024 | | | 12,073,149 | |
| | 1,690,000 | | | Citibank Credit Card Issuance Trust, Series 2016-A2, Class A2, 2.190%, 11/20/2023 | | | 1,719,359 | |
| | | | | | | | |
| | | | | | | 23,005,281 | |
| | | | | | | | |
| | | | ABS Home Equity — 5.3% | |
| | 15,451,000 | | | American Homes 4 Rent, Series 2015-SFR1, Class E, 5.639%, 4/17/2052, 144A | | | 17,191,637 | |
| | 2,663,718 | | | Bayview Opportunity Master Fund IVb Trust, Series 2019-RN4, Class A1, 3.278%, 10/28/2034, 144A(a) | | | 2,667,553 | |
| | 1,250,000 | | | Bayview Opportunity Master Fund IVb Trust, Series 2017-SPL4, Class B2, 4.750%, 1/28/2055, 144A(a) | | | 1,349,721 | |
| | 3,721,149 | | | Bayview Opportunity Master Fund V Trust, Series 2020-RN3, Class A1, 3.228%, 9/25/2035, 144A(a) | | | 3,756,034 | |
| | 4,014,499 | | | Brass PLC, Series 8A, Class A1, 3-month LIBOR + 0.700%, 0.921%, 11/16/2066, 144A(b) | | | 4,028,517 | |
| | 1,878,115 | | | Citigroup Mortgage Loan Trust, Series 2019-E, Class A1, 3.228%, 11/25/2070, 144A(a) | | | 1,887,212 | |
| | 435,538 | | | Citigroup Mortgage Loan Trust, Series 2018-A, Class A1, 4.000%, 1/25/2068, 144A(a) | | | 437,404 | |
| | 5,067,106 | | | Citigroup Mortgage Loan Trust, Series 2019-B, Class A1, 3.258%, 4/25/2066, 144A(a) | | | 5,171,935 | |
| | 6,382,230 | | | Citigroup Mortgage Loan Trust, Series 2019-RP1, Class A1, 3.500%, 1/25/2066, 144A(a) | | | 6,834,360 | |
See accompanying notes to financial statements.
37 |
Portfolio of Investments – as of December 31, 2020
Loomis Sayles Investment Grade Bond Fund – (continued)
| | | | | | | | |
Principal
Amount | | | Description | | Value (†) | |
| | | | ABS Home Equity — continued | |
| $ | 2,434,000 | | | CoreVest American Finance Trust, Series 2019-1, Class D, 4.818%, 3/15/2052, 144A | | $ | 2,673,381 | |
| | 5,373,048 | | | CoreVest American Finance Trust, Series 2019-3, Class A, 2.705%, 10/15/2052, 144A | | | 5,662,569 | |
| | 2,929,000 | | | CoreVest American Finance Trust, Series 2019-3, Class B, 3.163%, 10/15/2052, 144A | | | 3,036,834 | |
| | 1,259,000 | | | CoreVest American Finance Trust, Series 2020-2, Class C, 4.845%, 5/15/2052, 144A(a) | | | 1,440,341 | |
| | 4,584,871 | | | Credit Suisse Mortgage Trust, Series 2020-RPL3, Class A1, 2.691%, 3/25/2060, 144A(a) | | | 4,589,683 | |
| | 11,696,000 | | | FirstKey Homes Trust, Series 2020-SFR2, Class D, 1.968%, 10/19/2037, 144A | | | 11,529,962 | |
| | 3,083,000 | | | FirstKey Homes Trust, Series 2020-SRF1, Class D, 2.241%, 9/17/2025, 144A | | | 3,080,158 | |
| | 1,515,000 | | | FirstKey Homes Trust, Series 2020-SRF1, Class E, 2.791%, 8/17/2037, 144A | | | 1,543,771 | |
| | 7,581,441 | | | GCAT Trust, Series 2019-RPL1, Class A1, 2.650%, 10/25/2068, 144A(a) | | | 7,829,220 | |
| | 561,995 | | | Gosforth Funding PLC, Series 2018-1A, Class A1, 3-month LIBOR + 0.450%, 0.657%, 8/25/2060, 144A(b) | | | 562,027 | |
| | 2,782,767 | | | Home Partners of America Trust, Series 2019-1, Class D, 3.406%, 9/17/2039, 144A | | | 2,879,173 | |
| | 2,573,435 | | | Home Partners of America Trust, Series 2019-2, Class D, 3.121%, 10/19/2039, 144A | | | 2,671,812 | |
| | 3,050,000 | | | Invitation Homes Trust, Series 2018-SFR4, Class D, 1-month LIBOR + 1.650%, 1.803%, 1/17/2038, 144A(b) | | | 3,042,590 | |
| | 7,020,000 | | | Lanark Master Issuer PLC, Series 2019-2A, Class 1A, 2.710%, 12/22/2069, 144A(a) | | | 7,139,537 | |
| | 895,000 | | | Lanark Master Issuer PLC, Series 2020-1A, Class 1A, 2.277%, 12/22/2069, 144A(a) | | | 910,018 | |
| | 10,777,946 | | | Legacy Mortgage Asset Trust, Series 2019-GS7, Class A1, 3.250%, 11/25/2059, 144A(a) | | | 10,795,736 | |
| | 3,699,605 | | | Legacy Mortgage Asset Trust, Series 2019-GS3, Class A1, 3.750%, 4/25/2059, 144A(a) | | | 3,734,334 | |
| | 7,753,820 | | | Legacy Mortgage Asset Trust, Series 2020-GS1, Class A1, 2.882%, 10/25/2059, 144A(a) | | | 7,777,535 | |
| | 2,011,896 | | | Legacy Mortgage Asset Trust, Series 2020-GS5, Class A1, 3.250%, 6/25/2060, 144A | | | 2,026,201 | |
| | 1,467,786 | | | Mill City Mortgage Loan Trust, Series 2018-2, Class M1, 3.750%, 5/25/2058, 144A(a) | | | 1,604,542 | |
| | 2,744,944 | | | Mill City Mortgage Loan Trust, Series 2019-1, Class M1, 3.500%, 10/25/2069, 144A(a) | | | 3,015,590 | |
| | 4,206,586 | | | Mill City Mortgage Loan Trust, Series 2019-1, Class A1, 3.250%, 10/25/2069, 144A(a) | | | 4,439,117 | |
| | 10,204,144 | | | Mill City Mortgage Loan Trust, Series 2019-GS1, Class A1, 2.750%, 7/25/2059, 144A(a) | | | 10,604,872 | |
| | 5,520,124 | | | OSW Structured Asset Trust, Series 2020-RPL1, Class A1, 3.072%, 12/26/2059, 144A(a) | | | 5,593,316 | |
| | 2,738,349 | | | Preston Ridge Partners Mortgage LLC, Series 2019-3A, Class A1, 3.351%, 7/25/2024, 144A(a) | | | 2,744,084 | |
| | 4,650,969 | | | Preston Ridge Partners Mortgage LLC, Series 2019-4A, Class A1, 3.351%, 11/25/2024, 144A(a) | | | 4,658,648 | |
| | 16,495,761 | | | Preston Ridge Partners Mortgage LLC, Series 2020-1A, Class A1, 2.981%, 2/25/2025, 144A(a) | | | 16,532,565 | |
| | 2,105,741 | | | Preston Ridge Partners Mortgage LLC, Series 2020-2, Class A1, 3.671%, 8/25/2025, 144A(a) | | | 2,125,805 | |
| | | | ABS Home Equity — continued | |
| 6,828,234 | | | Preston Ridge Partners Mortgage LLC, Series 2020-3, Class A1, 2.857%, 9/25/2025, 144A(a) | | | 6,883,839 | |
| | 6,007,356 | | | Preston Ridge Partners Mortgage LLC, Series 2020-4, Class A1, 2.951%, 10/25/2025, 144A(a) | | | 6,030,282 | |
| | 13,032,522 | | | Preston Ridge Partners Mortgage LLC, Series 2020-5, Class A1, 3.104%, 11/25/2025, 144A(a) | | | 13,110,510 | |
| | 1,332,000 | | | Progress Residential Trust, Series 2018-SFR2, Class E, 4.656%, 8/17/2035, 144A | | | 1,354,463 | |
| | 2,290,000 | | | Progress Residential Trust, Series 2018-SFR3, Class D, 4.427%, 10/17/2035, 144A | | | 2,335,265 | |
| | 2,530,000 | | | Progress Residential Trust, Series 2018-SFR3, Class E, 4.873%, 10/17/2035, 144A | | | 2,589,330 | |
| | 2,830,000 | | | Progress Residential Trust, Series 2019-SFR1, Class D, 4.168%, 8/17/2035, 144A | | | 2,909,123 | |
| | 4,732,000 | | | Progress Residential Trust, Series 2019-SFR2, Class D, 3.794%, 5/17/2036, 144A | | | 4,883,396 | |
| | 1,690,000 | | | Progress Residential Trust, Series 2019-SFR2, Class E, 4.142%, 5/17/2036, 144A | | | 1,743,033 | |
| | 3,860,000 | | | Progress Residential Trust, Series 2019-SFR4, Class D, 3.136%, 10/17/2036, 144A | | | 3,982,042 | |
| | 155,000 | | | Progress Residential Trust, Series 2020-SFR2, Class C, 3.077%, 6/17/2037, 144A | | | 160,538 | |
| | 295,000 | | | Progress Residential Trust, Series 2020-SFR3, Class B, 1.495%, 10/17/2027, 144A | | | 295,009 | |
| | 1,818,000 | | | Progress Residential Trust, Series 2020-SFR3, Class E, 2.296%, 10/17/2027, 144A | | | 1,820,107 | |
| | 3,548,200 | | | RCO V Mortgage LLC, Series 2020-1, Class A1, 3.105%, 9/25/2025, 144A(a) | | | 3,554,415 | |
| | 1,828,293 | | | Sequoia Mortgage Trust, Series 2017-CH2, Class A1, 4.000%, 12/25/2047, 144A(a) | | | 1,882,318 | |
| | 3,216,191 | | | Sequoia Mortgage Trust, Series 2019-CH2, Class A1, 4.500%, 8/25/2049, 144A(a) | | | 3,298,789 | |
| | 4,930,000 | | | Towd Point Mortgage Trust, Series 2017-4, Class M2, 3.250%, 6/25/2057, 144A(a) | | | 5,218,344 | |
| | 6,390,000 | | | Towd Point Mortgage Trust, Series 2017-5, Class M2, 1-month LIBOR + 1.500%, 1.648%, 2/25/2057, 144A(b) | | | 6,422,315 | |
| | 1,362,493 | | | Towd Point Mortgage Trust, Series 2015-2, Class 1A13, 2.500%, 11/25/2060, 144A(a) | | | 1,365,627 | |
| | 716,300 | | | Towd Point Mortgage Trust, Series 2016-1, Class A1B, 2.750%, 2/25/2055, 144A(a) | | | 724,085 | |
| | 1,775,000 | | | Towd Point Mortgage Trust, Series 2018-4, Class A2, 3.000%, 6/25/2058, 144A(a) | | | 1,873,573 | |
| | 1,943,340 | | | Towd Point Mortgage Trust, Series 2018-5, Class M1, 3.250%, 7/25/2058, 144A(a) | | | 2,053,022 | |
| | 17,610,000 | | | Towd Point Mortgage Trust, Series 2019-2, Class M1, 3.750%, 12/25/2058, 144A(a) | | | 19,128,012 | |
| | 9,086,005 | | | Towd Point Mortgage Trust, Series 2019-4, Class A1, 2.900%, 10/25/2059, 144A(a) | | | 9,590,814 | |
| | 3,325,000 | | | Towd Point Mortgage Trust, Series 2020-1, Class A2B, 3.250%, 1/25/2060, 144A(a) | | | 3,518,668 | |
| | 3,950,000 | | | Tricon American Homes, Series 2020-SFR1, Class D, 2.548%, 7/17/2038, 144A | | | 4,018,043 | |
| | 2,575,000 | | | Tricon American Homes Trust, Series 2019-SFR1, Class D, 3.198%, 3/17/2038, 144A | | | 2,660,213 | |
| | 7,846,832 | | | Vericrest Opportunity Loan Trust, Series 2019-NPL8, Class A1A, 3.278%, 11/25/2049, 144A(a) | | | 7,850,371 | |
See accompanying notes to financial statements.
| 38
Portfolio of Investments – as of December 31, 2020
Loomis Sayles Investment Grade Bond Fund – (continued)
| | | | | | | | |
Principal
Amount | | | Description | | Value (†) | |
| | | | ABS Home Equity — continued | |
| $ | 8,273,283 | | | Vericrest Opportunity Loan Trust, Series 2019-NPL5, Class A1A, 3.352%, 9/25/2049, 144A(a) | | $ | 8,283,876 | |
| | 3,064,740 | | | Vericrest Opportunity Loan Trust, Series 2019-NPL9, Class A1A, 3.327%, 11/26/2049, 144A(a) | | | 3,073,516 | |
| | 6,408,731 | | | Vericrest Opportunity Loan Trust, Series 2020-NPL1, Class A1A, 3.228%, 1/25/2050, 144A(a) | | | 6,426,705 | |
| | 4,233,838 | | | Vericrest Opportunity Loan Trust, Series 2020-NPL2, Class A1A, 2.981%, 2/25/2050, 144A(a) | | | 4,237,149 | |
| | 210,423 | | | Vericrest Opportunity Loan Trust, Series 2020-NPL3, Class A1A, 2.981%, 2/25/2050, 144A(a) | | | 210,498 | |
| | | | | | | | |
| | | | | | | 321,055,084 | |
| | | | | | | | |
| | | | ABS Other — 3.0% | |
| | 8,378,088 | | | CLI Funding VI LLC, Series 2020-3A, Class A, 2.070%, 10/18/2045, 144A | | | 8,449,878 | |
| | 940,000 | | | Dell Equipment Finance Trust, Series 2020-2, Class C, 1.370%, 1/22/2024, 144A | | | 944,088 | |
| | 945,000 | | | Dell Equipment Finance Trust, Series 2020-2, Class D, 1.920%, 3/23/2026, 144A | | | 953,485 | |
| | 39,262,848 | | | FAN Engine Securitization Ltd., Series 2013-1A, Class 1A, 4.625%, 10/15/2043, 144A(c)(d)(e) | | | 21,594,566 | |
| | 12,067,388 | | | Horizon Aircraft Finance I Ltd., Series 2018-1, Class A, 4.458%, 12/15/2038, 144A | | | 11,656,177 | |
| | 2,833,211 | | | Horizon Aircraft Finance II Ltd., Series 2019-1, Class A, 3.721%, 7/15/2039, 144A | | | 2,733,228 | |
| | 1,975,000 | | | HPEFS Equipment Trust, Series 2019-1A, Class C, 2.490%, 9/20/2029, 144A | | | 2,013,799 | |
| | 3,645,000 | | | HPEFS Equipment Trust, Series 2020-1A, Class D, 2.260%, 2/20/2030, 144A | | | 3,680,276 | |
| | 1,980,000 | | | HPEFS Equipment Trust, Series 2020-2A, Class C, 2.000%, 7/22/2030, 144A | | | 2,020,917 | |
| | 7,423,807 | | | Kestrel Aircraft Funding Ltd., Series 2018-1A, Class A, 4.250%, 12/15/2038, 144A | | | 6,875,628 | |
| | 12,845,584 | | | MAPS Ltd., Series 2018-1A, Class A, 4.212%, 5/15/2043, 144A | | | 12,241,490 | |
| | 3,778,006 | | | MAPS Ltd., Series 2019-1A, Class A, 4.458%, 3/15/2044, 144A | | | 3,591,524 | |
| | 11,712,721 | | | Mariner Finance Issuance Trust, Series 2018-AA, Class A, 4.200%, 11/20/2030, 144A | | | 11,847,064 | |
| | 2,435,977 | | | Marlette Funding Trust, Series 2019-4A, Class A, 2.390%, 12/17/2029, 144A | | | 2,455,015 | |
| | 761,581 | | | Marlette Funding Trust, Series 2019-1A, Class A, 3.440%, 4/16/2029, 144A | | | 767,648 | |
| | 1,026,051 | | | MVW LLC, Series 2020-1A, Class C, 4.210%, 10/20/2037, 144A | | | 1,089,970 | |
| | 664,309 | | | MVW Owner Trust, Series 2019-1A, Class C, 3.330%, 11/20/2036, 144A | | | 676,120 | |
| | 8,040,000 | | | OneMain Financial Issuance Trust, Series 2019-1A, Class D, 4.220%, 2/14/2031, 144A | | | 8,307,794 | |
| | 4,675,000 | | | OneMain Financial Issuance Trust, Series 2020-1A, Class B, 4.830%, 5/14/2032, 144A | | | 5,000,324 | |
| | 6,585,000 | | | OneMain Financial Issuance Trust, Series 2020-2A, Class A, 1.750%, 9/14/2035, 144A | | | 6,692,105 | |
| | 15,252,711 | | | S-Jets Ltd., Series 2017-1, Class A, 3.967%, 8/15/2042, 144A | | | 14,800,385 | |
| | | | ABS Other — continued | |
| 740,000 | | | SLM Private Credit Student Loan Trust, Series 2003-C, Class A3, 28-day ARS, 3.630%, 9/15/2032(b) | | | 736,911 | |
| | 1,145,000 | | | SLM Private Credit Student Loan Trust, Series 2003-C, Class A4, 28-day ARS, 3.230%, 9/15/2032(b) | | | 1,140,221 | |
| | 13,765,000 | | | SoFi Consumer Loan Program Trust, Series 2019-1, Class C, 3.730%, 2/25/2028, 144A | | | 14,050,679 | |
| | 3,659,000 | | | SoFi Consumer Loan Program Trust, Series 2018-1, Class B, 3.650%, 2/25/2027, 144A | | | 3,764,066 | |
| | 6,720,000 | | | SoFi Consumer Loan Program Trust, Series 2018-4, Class C, 4.170%, 11/26/2027, 144A | | | 6,887,752 | |
| | 6,805,000 | | | SoFi Consumer Loan Program Trust, Series 2019-2, Class C, 3.460%, 4/25/2028, 144A | | | 6,969,995 | |
| | 12,755,000 | | | SoFi Consumer Loan Program Trust, Series 2019-3, Class C, 3.350%, 5/25/2028, 144A | | | 13,199,624 | |
| | 7,370,000 | | | SoFi Consumer Loan Program Trust, Series 2019-4, Class C, 2.840%, 8/25/2028, 144A | | | 7,574,282 | |
| | | | | | | | |
| | | | | | | 182,715,011 | |
| | | | | | | | |
| | | | ABS Student Loan — 1.0% | |
| | 6,356,550 | | | Commonbond Student Loan Trust, Series 2020-1, Class A, 1.690%, 10/25/2051, 144A | | | 6,402,192 | |
| | 7,045,987 | | | ELFI Graduate Loan Program LLC, Series 2019-A, Class A, 2.540%, 3/25/2044, 144A | | | 7,244,131 | |
| | 8,825,000 | | | Laurel Road Prime Student Loan Trust, Series 2020-A, Class A2FX, 1.400%, 11/25/2050, 144A | | | 8,866,084 | |
| | 615,000 | | | SLM Private Credit Student Loan Trust, Series 2003-A, Class A3, 28-day ARS, 3.180%, 6/15/2032(b) | | | 611,444 | |
| | 463,000 | | | SLM Private Credit Student Loan Trust, Series 2003-A, Class A4, 28-day ARS, 3.170%, 6/15/2032(b) | | | 460,323 | |
| | 905,000 | | | SLM Private Credit Student Loan Trust, Series 2003-B, Class A3, 3.200%, 3/15/2033(a) | | | 899,024 | |
| | 612,000 | | | SLM Private Credit Student Loan Trust, Series 2003-B, Class A4, 28-day ARS, 3.658%, 3/15/2033(b) | | | 607,959 | |
| | 2,500,000 | | | SMB Private Education Loan Trust, Series 2015-C, Class B, 3.500%, 9/15/2043, 144A | | | 2,618,560 | |
| | 565,000 | | | SMB Private Education Loan Trust, Series 2018-B, Class B, 4.000%, 7/15/2042, 144A | | | 601,064 | |
| | 1,525,000 | | | SMB Private Education Loan Trust, Series 2018-C, Class B, 4.000%, 11/17/2042, 144A | | | 1,607,817 | |
| | 10,051,750 | | | SMB Private Education Loan Trust, Series 2019-A, Class A2A, 3.440%, 7/15/2036, 144A | | | 10,637,861 | |
| | 16,265,000 | | | SMB Private Education Loan Trust, Series 2019-B, Class A2A, 2.840%, 6/15/2037, 144A | | | 17,174,986 | |
| | | | | | | | |
| | | | | | | 57,731,445 | |
| | | | | | | | |
| | | | ABS Whole Business — 1.2% | |
| | 10,006,577 | | | Adams Outdoor Advertising LP, Series 2018-1, Class A, 4.810%, 11/15/2048, 144A | | | 10,551,461 | |
| | 3,595,000 | | | Adams Outdoor Advertising LP, Series 2018-1, Class B, 5.653%, 11/15/2048, 144A | | | 3,802,433 | |
| | 13,288,050 | | | Coinstar Funding LLC, Series 2017-1A, Class A2, 5.216%, 4/25/2047, 144A | | | 12,959,447 | |
| | 7,205,788 | | | DB Master Finance LLC, Series 2019-1A, Class A23, 4.352%, 5/20/2049, 144A | | | 7,786,934 | |
| | 2,543,340 | | | Domino’s Pizza Master Issuer LLC, Series 2017-1A, Class A23, 4.118%, 7/25/2047, 144A | | | 2,724,680 | |
See accompanying notes to financial statements.
39 |
Portfolio of Investments – as of December 31, 2020
Loomis Sayles Investment Grade Bond Fund – (continued)
| | | | | | | | |
Principal
Amount | | | Description | | Value (†) | |
| | | | ABS Whole Business — continued | |
| $ | 5,191,503 | | | Domino’s Pizza Master Issuer LLC, Series 2018-1A, Class A2II, 4.328%, 7/25/2048, 144A | | $ | 5,642,748 | |
| | 4,073,850 | | | Domino’s Pizza Master Issuer LLC, Series 2019-1A, Class A2, 3.668%, 10/25/2049, 144A | | | 4,327,284 | |
| | 1,672,110 | | | Planet Fitness Master Issuer LLC, Series 2019-1A, Class A2, 3.858%, 12/05/2049, 144A | | | 1,576,900 | |
| | 17,404,950 | | | Stack Infrastructure Issuer LLC, Series 2019-1A, Class A2, 4.540%, 2/25/2044, 144A | | | 18,641,678 | |
| | 2,230,000 | | | Wingstop Funding LLC, Series 2020-1A, Class A2, 2.841%, 12/05/2050, 144A | | | 2,275,202 | |
| | | | | | | | |
| | | | | | | 70,288,767 | |
| | | | | | | | |
| | | | Aerospace & Defense — 3.6% | |
| | 13,620,000 | | | BAE Systems PLC, 3.400%, 4/15/2030, 144A | | | 15,429,757 | |
| | 3,780,000 | | | Boeing Co. (The), 2.250%, 6/15/2026 | | | 3,868,868 | |
| | 4,874,000 | | | Boeing Co. (The), 2.950%, 2/01/2030 | | | 5,040,983 | |
| | 655,000 | | | Boeing Co. (The), 3.100%, 5/01/2026 | | | 701,371 | |
| | 3,225,000 | | | Boeing Co. (The), 3.200%, 3/01/2029 | | | 3,404,420 | |
| | 2,036,000 | | | Boeing Co. (The), 3.250%, 2/01/2035 | | | 2,087,928 | |
| | 9,088,000 | | | Boeing Co. (The), 3.375%, 6/15/2046 | | | 8,868,140 | |
| | 1,427,000 | | | Boeing Co. (The), 3.500%, 3/01/2039 | | | 1,443,677 | |
| | 850,000 | | | Boeing Co. (The), 3.550%, 3/01/2038 | | | 867,163 | |
| | 3,564,000 | | | Boeing Co. (The), 3.625%, 3/01/2048 | | | 3,593,416 | |
| | 2,111,000 | | | Boeing Co. (The), 3.650%, 3/01/2047 | | | 2,136,835 | |
| | 14,352,000 | | | Boeing Co. (The), 3.750%, 2/01/2050 | | | 15,009,322 | |
| | 1,932,000 | | | Boeing Co. (The), 3.825%, 3/01/2059 | | | 1,962,548 | |
| | 3,241,000 | | | Boeing Co. (The), 3.850%, 11/01/2048 | | | 3,342,961 | |
| | 7,330,000 | | | Boeing Co. (The), 3.900%, 5/01/2049 | | | 7,778,684 | |
| | 4,795,000 | | | Boeing Co. (The), 3.950%, 8/01/2059 | | | 5,131,883 | |
| | 8,060,000 | | | Boeing Co. (The), 5.150%, 5/01/2030 | | | 9,754,627 | |
| | 5,676,000 | | | Boeing Co. (The), 5.705%, 5/01/2040 | | | 7,365,863 | |
| | 37,793,000 | | | Boeing Co. (The), 5.805%, 5/01/2050 | | | 52,084,236 | |
| | 8,696,000 | | | Boeing Co. (The), 5.930%, 5/01/2060 | | | 12,336,093 | |
| | 4,760,000 | | | Embraer Netherlands Finance BV, 5.050%, 6/15/2025 | | | 5,045,648 | |
| | 4,350,000 | | | Embraer Netherlands Finance BV, 5.400%, 2/01/2027 | | | 4,621,918 | |
| | 6,885,000 | | | Huntington Ingalls Industries, Inc., 3.844%, 5/01/2025 | | | 7,650,460 | |
| | 4,245,000 | | | Huntington Ingalls Industries, Inc., 4.200%, 5/01/2030 | | | 5,027,951 | |
| | 650,000 | | | Leonardo U.S. Holdings, Inc., 7.375%, 7/15/2039 | | | 840,281 | |
| | 1,335,000 | | | Spirit AeroSystems, Inc., 4.600%, 6/15/2028 | | | 1,319,981 | |
| | 29,075,000 | | | Textron, Inc., 3.000%, 6/01/2030 | | | 31,341,375 | |
| | | | | | | | |
| | | | | | | 218,056,389 | |
| | | | | | | | |
| | | | Airlines — 1.0% | |
| | 2,410,489 | | | Air Canada Pass Through Trust, Series 2013-1, Class B, 5.375%, 11/15/2022, 144A | | | 2,405,258 | |
| | 7,001,850 | | | American Airlines Pass Through Certificates, Series 2016-1, Class B, 5.250%, 7/15/2025 | | | 5,910,542 | |
| | 12,726,245 | | | American Airlines Pass Through Certificates, Series 2016-3, Class A, 3.250%, 4/15/2030 | | | 11,528,252 | |
| | 1,506,441 | | | American Airlines Pass Through Certificates, Series 2016-3, Class B, 3.750%, 4/15/2027 | | | 1,211,962 | |
| | 5,486,481 | | | American Airlines Pass Through Certificates, Series 2017-2, Class A, 3.600%, 4/15/2031 | | | 5,068,967 | |
| | 3,331,919 | | | American Airlines Pass Through Certificates, Series 2017-2, Class B, 3.700%, 4/15/2027 | | | 2,816,834 | |
| | 1,791,550 | | | American Airlines Pass Through Trust, Series 2015-2, Class B, 4.400%, 3/22/2025 | | | 1,377,344 | |
| | | | Airlines — continued | |
| 21,871,211 | | | American Airlines Pass Through Trust, Series 2019-1, Class B, 3.850%, 8/15/2029 | | | 18,364,381 | |
| | 6,523,391 | | | British Airways Pass Through Trust, Series 2019-1, Class A, 3.350%, 12/15/2030, 144A | | | 6,165,518 | |
| | 246,393 | | | Continental Airlines Pass Through Certificates, Series 2001-1, Class A-1, 6.703%, 12/15/2022 | | | 246,393 | |
| | 924,352 | | | Delta Air Lines Pass Through Trust, Series 2007-1, Class A, 6.821%, 2/10/2024 | | | 941,869 | |
| | 3,959,577 | | | Delta Air Lines Pass Through Trust, Series 2007-1, Class B, 8.021%, 2/10/2024 | | | 3,867,980 | |
| | 2,583,954 | | | United Airlines Pass Through Trust, Series 2018-1, Class A, 3.700%, 9/01/2031 | | | 2,452,215 | |
| | | | | | | | |
| | | | | | | 62,357,515 | |
| | | | | | | | |
| | | | Automotive — 2.0% | |
| | 18,836,000 | | | Cummins, Inc., 5.650%, 3/01/2098 | | | 27,680,444 | |
| | 5,274,000 | | | Cummins, Inc., 6.750%, 2/15/2027 | | | 6,683,596 | |
| | 8,176,000 | | | General Motors Co., 5.200%, 4/01/2045 | | | 9,929,151 | |
| | 27,915,000 | | | General Motors Co., 5.400%, 4/01/2048 | | | 35,154,208 | |
| | 640,000 | | | General Motors Co., 5.950%, 4/01/2049 | | | 865,549 | |
| | 9,600,000 | | | General Motors Co., 6.250%, 10/02/2043 | | | 12,950,107 | |
| | 95,000 | | | General Motors Co., 6.750%, 4/01/2046 | | | 136,870 | |
| | 24,360,000 | | | Volkswagen Group of America Finance LLC, 0.875%, 11/22/2023, 144A | | | 24,497,229 | |
| | 2,895,000 | | | Volkswagen Group of America Finance LLC, 3.350%, 5/13/2025, 144A | | | 3,182,633 | |
| | | | | | | | |
| | | | | | | 121,079,787 | |
| | | | | | | | |
| | | | Banking — 8.0% | |
| | 300,000 | | | Ally Financial, Inc., 3.875%, 5/21/2024 | | | 328,723 | |
| | 39,613,000 | | | Ally Financial, Inc., 4.625%, 3/30/2025 | | | 45,151,548 | |
| | 2,835,000 | | | Ally Financial, Inc., 5.750%, 11/20/2025 | | | 3,300,625 | |
| | 1,468,000 | | | Ally Financial, Inc., 8.000%, 11/01/2031 | | | 2,088,539 | |
| | 10,155,000 | | | Banco Santander Mexico S.A. Institucion de Banca Multiple Grupo Financiero Santander, 5.375%, 4/17/2025, 144A | | | 11,666,673 | |
| | 5,800,000 | | | Banco Santander S.A., 2.749%, 12/03/2030 | | | 5,978,216 | |
| | 49,304,000 | | | Bank of America Corp., (fixed rate to 12/20/2027, variable rate thereafter), 3.419%, 12/20/2028 | | | 55,691,042 | |
| | 100,000 | | | Bank of America Corp., MTN, 4.250%, 10/22/2026 | | | 117,297 | |
| | 25,627,000 | | | Bank of America Corp., Series L, MTN, 4.183%, 11/25/2027 | | | 29,729,519 | |
| | 4,287,000 | | | Barclays PLC, (fixed rate to 6/20/2029, variable rate thereafter), 5.088%, 6/20/2030 | | | 5,142,616 | |
| | 18,255,000 | | | Barclays PLC, (fixed rate to 9/23/2030, variable rate thereafter), 3.564%, 9/23/2035 | | | 19,780,023 | |
| | 3,335,000 | | | BBVA Bancomer S.A., 1.875%, 9/18/2025, 144A | | | 3,368,350 | |
| | 22,500,000 | | | BNP Paribas S.A., (fixed rate to 3/01/2028, variable rate thereafter), 4.375%, 3/01/2033, 144A | | | 25,780,055 | |
| | 460,000 | | | Capital One Financial Corp., 4.200%, 10/29/2025 | | | 525,187 | |
| | 1,230,000 | | | Citigroup, Inc., 4.125%, 7/25/2028 | | | 1,438,707 | |
| | 7,155,000 | | | Credit Agricole S.A., (fixed rate to 1/10/2028, variable rate thereafter), 4.000%, 1/10/2033, 144A | | | 7,987,126 | |
| | 14,200,000 | | | Danske Bank A/S, 5.375%, 1/12/2024, 144A | | | 16,019,873 | |
| | 3,390,000 | | | Danske Bank A/S, (fixed rate to 12/20/2024, variable rate thereafter), 3.244%, 12/20/2025, 144A | | | 3,627,615 | |
| | 2,640,000 | | | Deutsche Bank AG, (fixed rate to 12/01/2027, variable rate thereafter), 4.875%, 12/01/2032 | | | 2,762,496 | |
| | 9,260,000 | | | Deutsche Bank AG, (fixed rate to 9/18/2023, variable rate thereafter), 2.222%, 9/18/2024 | | | 9,526,121 | |
See accompanying notes to financial statements.
| 40
Portfolio of Investments – as of December 31, 2020
Loomis Sayles Investment Grade Bond Fund – (continued)
| | | | | | | | |
Principal
Amount | | | Description | | Value (†) | |
| | | | Banking — continued | |
| $ | 6,235,000 | | | Deutsche Bank AG, (fixed rate to 9/18/2030, variable rate thereafter), 3.547%, 9/18/2031 | | $ | 6,757,127 | |
| | 70,245,000 | | | JPMorgan Chase & Co., 4.125%, 12/15/2026 | | | 82,120,901 | |
| | 28,715,000 | | | JPMorgan Chase & Co., (fixed rate to 3/24/2030, variable rate thereafter), 4.493%, 3/24/2031 | | | 35,323,125 | |
| | 100,000 | | | KeyBank NA, 6.950%, 2/01/2028 | | | 130,314 | |
| | 1,845,000 | | | Morgan Stanley, GMTN, 4.350%, 9/08/2026 | | | 2,175,233 | |
| | 20,695,000 | | | Morgan Stanley, MTN, 4.100%, 5/22/2023 | | | 22,458,923 | |
| | 15,160,000 | | | Santander Holdings USA, Inc., 3.244%, 10/05/2026 | | | 16,464,056 | |
| | 20,295,000 | | | Societe Generale S.A., 4.250%, 4/14/2025, 144A | | | 22,383,355 | |
| | 11,950,000 | | | Societe Generale S.A., (fixed rate to 7/08/2030, variable rate thereafter), 3.653%, 7/08/2035, 144A | | | 12,940,548 | |
| | 16,790,000 | | | Standard Chartered PLC, (fixed rate to 11/18/2030, variable rate thereafter), 3.265%, 2/18/2036, 144A | | | 17,578,818 | |
| | 7,090,000 | | | Standard Chartered PLC, (fixed rate to 4/01/2030, variable rate thereafter), 4.644%, 4/01/2031, 144A | | | 8,576,770 | |
| | 3,865,000 | | | Synchrony Financial, 4.375%, 3/19/2024 | | | 4,255,237 | |
| | | | | | | | |
| | | | | | | 481,174,758 | |
| | | | | | | | |
| | | | Brokerage — 0.8% | |
| | 19,498,000 | | | Jefferies Group LLC, 6.250%, 1/15/2036 | | | 26,003,814 | |
| | 8,760,000 | | | Jefferies Group LLC, 6.450%, 6/08/2027 | | | 11,105,393 | |
| | 8,460,000 | | | Nasdaq, Inc., 0.445%, 12/21/2022 | | | 8,469,896 | |
| | | | | | | | |
| | | | | | | 45,579,103 | |
| | | | | | | | |
| | | | Building Materials — 1.1% | |
| | 16,180,000 | | | Cemex SAB de CV, 5.200%, 9/17/2030, 144A | | | 17,741,370 | |
| | 5,955,000 | | | Cemex SAB de CV, 5.450%, 11/19/2029, 144A | | | 6,550,560 | |
| | 1,665,000 | | | Cemex SAB de CV, 5.700%, 1/11/2025, 144A | | | 1,701,630 | |
| | 460,000 | | | Cemex SAB de CV, 7.750%, 4/16/2026, 144A | | | 485,070 | |
| | 3,285,000 | | | Ferguson Finance PLC, 3.250%, 6/02/2030, 144A | | | 3,663,132 | |
| | 23,975,000 | | | Owens Corning, 7.000%, 12/01/2036 | | | 34,182,443 | |
| | 2,655,000 | | | Vulcan Materials Co., 3.500%, 6/01/2030 | | | 3,049,564 | |
| | | | | | | | |
| | | | | | | 67,373,769 | |
| | | | | | | | |
| | | | Cable Satellite — 2.2% | |
| | 9,425,000 | | | CCO Holdings LLC/CCO Holdings Capital Corp., 4.250%, 2/01/2031, 144A | | | 9,930,934 | |
| | 2,826,000 | | | CCO Holdings LLC/CCO Holdings Capital Corp., 4.500%, 8/15/2030, 144A | | | 2,999,092 | |
| | 315,000 | | | CCO Holdings LLC/CCO Holdings Capital Corp., 4.500%, 5/01/2032, 144A | | | 336,332 | |
| | 550,000 | | | CCO Holdings LLC/CCO Holdings Capital Corp., 5.375%, 6/01/2029, 144A | | | 602,937 | |
| | 30,810,000 | | | Charter Communications Operating LLC/Charter Communications Operating Capital Corp., 4.800%, 3/01/2050 | | | 36,799,466 | |
| | 6,695,000 | | | Charter Communications Operating LLC/Charter Communications Operating Capital Corp., 5.750%, 4/01/2048 | | | 8,760,026 | |
| | 10,320,000 | | | Cox Communications, Inc., 4.500%, 6/30/2043, 144A | | | 12,982,106 | |
| | 5,820,000 | | | Cox Communications, Inc., 4.700%, 12/15/2042, 144A | | | 7,515,742 | |
| | 240,000 | | | CSC Holdings LLC, 5.750%, 1/15/2030, 144A | | | 263,100 | |
| | 2,360,000 | | | CSC Holdings LLC, 6.500%, 2/01/2029, 144A | | | 2,664,558 | |
| | 470,000 | | | Sirius XM Radio, Inc., 4.625%, 7/15/2024, 144A | | | 487,038 | |
| | 2,416,000 | | | Sirius XM Radio, Inc., 5.000%, 8/01/2027, 144A | | | 2,567,024 | |
| | 865,000 | | | Sirius XM Radio, Inc., 5.375%, 7/15/2026, 144A | | | 901,762 | |
| | 200,000 | | | Sirius XM Radio, Inc., 5.500%, 7/01/2029, 144A | | | 220,063 | |
| | | | Cable Satellite — continued | |
| 17,891,000 | | | Time Warner Cable LLC, 4.500%, 9/15/2042 | | | 20,964,618 | |
| | 15,815,000 | | | Time Warner Cable LLC, 5.500%, 9/01/2041 | | | 20,319,937 | |
| | 800,000 | | | Videotron Ltd., 5.000%, 7/15/2022 | | | 841,008 | |
| | 2,185,000 | | | Virgin Media Secured Finance PLC, 5.500%, 8/15/2026, 144A | | | 2,269,669 | |
| | 1,600,000 | | | Ziggo BV, 5.500%, 1/15/2027, 144A | | | 1,670,000 | |
| | | | | | | | |
| | | | | | | 133,095,412 | |
| | | | | | | | |
| | | | Chemicals — 1.2% | |
| | 8,285,000 | | | Braskem Netherlands Finance BV, 4.500%, 1/31/2030, 144A | | | 8,502,481 | |
| | 1,635,000 | | | Braskem Netherlands Finance BV, 5.875%, 1/31/2050, 144A | | | 1,690,198 | |
| | 27,205,000 | | | CF Industries, Inc., 4.500%, 12/01/2026, 144A | | | 32,231,319 | |
| | 3,740,000 | | | FMC Corp., 3.450%, 10/01/2029 | | | 4,257,741 | |
| | 2,075,000 | | | FMC Corp., 4.500%, 10/01/2049 | | | 2,690,320 | |
| | 8,145,000 | | | LYB International Finance III LLC, 4.200%, 10/15/2049 | | | 9,520,873 | |
| | 11,480,000 | | | Nutrition & Biosciences, Inc., 2.300%, 11/01/2030, 144A | | | 11,824,654 | |
| | | | | | | | |
| | | | | | | 70,717,586 | |
| | | | | | | | |
| | | | Collateralized Mortgage Obligations — 0.0% | |
| | 1,544,401 | | | New Residential Mortgage Loan Trust, Series 2020-NPL2, Class A1, 3.228%, 8/25/2060, 144A(a) | | | 1,556,848 | |
| | | | | | | | |
| | | | Consumer Cyclical Services — 1.9% | |
| | 20,300,000 | | | Amazon.com, Inc., 2.500%, 6/03/2050 | | | 21,062,685 | |
| | 9,850,000 | | | Booking Holdings, Inc., 4.500%, 4/13/2027 | | | 11,715,171 | |
| | 16,000,000 | | | Booking Holdings, Inc., 4.625%, 4/13/2030 | | | 19,881,266 | |
| | 1,205,000 | | | eBay, Inc., 4.000%, 7/15/2042 | | | 1,371,911 | |
| | 26,082,000 | | | Expedia Group, Inc., 3.250%, 2/15/2030 | | | 27,144,607 | |
| | 2,426,000 | | | Expedia Group, Inc., 3.800%, 2/15/2028 | | | 2,605,847 | |
| | 9,925,000 | | | Expedia Group, Inc., 4.625%, 8/01/2027, 144A | | | 11,088,806 | |
| | 5,385,000 | | | Expedia Group, Inc., 6.250%, 5/01/2025, 144A | | | 6,241,757 | |
| | 2,755,000 | | | Expedia Group, Inc., 7.000%, 5/01/2025, 144A | | | 3,036,593 | |
| | 4,402,000 | | | IHS Markit Ltd., 4.250%, 5/01/2029 | | | 5,347,814 | |
| | 6,030,000 | | | Uber Technologies, Inc., 6.250%, 1/15/2028, 144A | | | 6,557,625 | |
| | | | | | | | |
| | | | | | | 116,054,082 | |
| | | | | | | | |
| | | | Consumer Products — 0.2% | |
| | 7,458,000 | | | Hasbro, Inc., 6.600%, 7/15/2028 | | | 9,340,770 | |
| | 4,580,000 | | | Kimberly-Clark de Mexico SAB de CV, 2.431%, 7/01/2031, 144A | | | 4,731,232 | |
| | | | | | | | |
| | | | | | | 14,072,002 | |
| | | | | | | | |
| | | | Diversified Manufacturing — 0.5% | |
| | 13,920,000 | | | Carrier Global Corp., 2.722%, 2/15/2030 | | | 14,886,231 | |
| | 6,010,000 | | | General Electric Co., 3.625%, 5/01/2030 | | | 6,868,751 | |
| | 2,865,000 | | | General Electric Co., 4.350%, 5/01/2050 | | | 3,484,265 | |
| | 5,305,000 | | | General Electric Co., Series A, MTN, 3-month LIBOR + 0.300%, 0.537%, 5/13/2024(b) | | | 5,137,673 | |
| | | | | | | | |
| | | | | | | 30,376,920 | |
| | | | | | | | |
| | | | Electric — 3.2% | |
| | 7,435,000 | | | AES Corp. (The), 2.450%, 1/15/2031, 144A | | | 7,529,573 | |
| | 3,695,000 | | | AES Corp. (The), 3.950%, 7/15/2030, 144A | | | 4,176,865 | |
| | 17,820,017 | | | Alta Wind Holdings LLC, 7.000%, 6/30/2035, 144A | | | 20,941,627 | |
| | 14,855,000 | | | Calpine Corp., 3.750%, 3/01/2031, 144A | | | 14,711,352 | |
| | 13,025,000 | | | Enel Finance International NV, 6.000%, 10/07/2039, 144A | | | 18,583,781 | |
| | 9,007,000 | | | Enel Finance International NV, 6.800%, 9/15/2037, 144A | | | 13,255,491 | |
| | 21,030,000 | | | FirstEnergy Corp., Series C, 3.400%, 3/01/2050 | | | 20,143,226 | |
See accompanying notes to financial statements.
41 |
Portfolio of Investments – as of December 31, 2020
Loomis Sayles Investment Grade Bond Fund – (continued)
| | | | | | | | |
Principal
Amount | | | Description | | Value (†) | |
| | | | Electric — continued | |
| $ | 2,355,000 | | | IPALCO Enterprises, Inc., 4.250%, 5/01/2030, 144A | | $ | 2,718,694 | |
| | 9,641,000 | | | NRG Energy, Inc., 4.450%, 6/15/2029, 144A | | | 11,180,172 | |
| | 1,435,000 | | | NRG Energy, Inc., 5.250%, 6/15/2029, 144A | | | 1,578,500 | |
| | 4,437,000 | | | NRG Energy, Inc., 5.750%, 1/15/2028 | | | 4,847,423 | |
| | 8,915,000 | | | Pacific Gas & Electric Co., 3.500%, 8/01/2050 | | | 8,860,717 | |
| | 10,400,000 | | | Pacific Gas & Electric Co., 4.300%, 3/15/2045 | | | 11,088,069 | |
| | 1,250,000 | | | Pacific Gas & Electric Co., 4.950%, 7/01/2050 | | | 1,489,517 | |
| | 2,970,000 | | | Southern California Edison Co., 3.650%, 2/01/2050 | | | 3,373,363 | |
| | 850,000 | | | Southern California Edison Co., 4.000%, 4/01/2047 | | | 998,408 | |
| | 1,060,000 | | | Southern California Edison Co., Series C, 4.125%, 3/01/2048 | | | 1,263,278 | |
| | 40,595,000 | | | Vistra Operations Co. LLC, 3.700%, 1/30/2027, 144A | | | 44,763,549 | |
| | 1,105,000 | | | Vistra Operations Co. LLC, 4.300%, 7/15/2029, 144A | | | 1,254,201 | |
| | | | | | | | |
| | | | | | | 192,757,806 | |
| | | | | | | | |
| | | | Finance Companies — 2.2% | |
| | 1,245,000 | | | Air Lease Corp., 2.250%, 1/15/2023 | | | 1,278,265 | |
| | 23,900,000 | | | Air Lease Corp., 3.125%, 12/01/2030 | | | 24,879,409 | |
| | 2,235,000 | | | Air Lease Corp., 3.250%, 10/01/2029 | | | 2,362,058 | |
| | 10,270,000 | | | Air Lease Corp., 3.375%, 7/01/2025 | | | 11,044,337 | |
| | 345,000 | | | Air Lease Corp., 4.625%, 10/01/2028 | | | 396,313 | |
| | 8,426,000 | | | Air Lease Corp., MTN, 3.000%, 2/01/2030 | | | 8,650,126 | |
| | 12,430,000 | | | Aircastle Ltd., 4.125%, 5/01/2024 | | | 13,146,458 | |
| | 8,070,000 | | | Aircastle Ltd., 4.400%, 9/25/2023 | | | 8,551,453 | |
| | 8,160,000 | | | Aircastle Ltd., 5.000%, 4/01/2023 | | | 8,697,781 | |
| | 6,700,000 | | | Antares Holdings LP, 6.000%, 8/15/2023, 144A | | | 6,832,814 | |
| | 7,510,000 | | | Aviation Capital Group LLC, 5.500%, 12/15/2024, 144A | | | 8,314,077 | |
| | 9,530,000 | | | GE Capital Funding LLC, 4.400%, 5/15/2030, 144A | | | 11,234,236 | |
| | 3,460,000 | | | GE Capital International Funding Co. Unlimited Co., 4.418%, 11/15/2035 | | | 4,129,669 | |
| | 3,425,000 | | | Navient Corp., 5.000%, 3/15/2027 | | | 3,454,969 | |
| | 50,000 | | | Navient Corp., 5.875%, 10/25/2024 | | | 53,125 | |
| | 35,000 | | | Navient Corp., 6.500%, 6/15/2022 | | | 37,038 | |
| | 145,000 | | | Navient Corp., 6.750%, 6/15/2026 | | | 157,506 | |
| | 370,000 | | | Navient Corp., 7.250%, 9/25/2023 | | | 405,513 | |
| | 20,000 | | | Navient Corp., MTN, 6.125%, 3/25/2024 | | | 21,350 | |
| | 165,000 | | | Navient Corp., MTN, 7.250%, 1/25/2022 | | | 172,425 | |
| | 7,805,000 | | | Quicken Loans LLC, 5.250%, 1/15/2028, 144A | | | 8,331,837 | |
| | 3,645,000 | | | Quicken Loans LLC/Quicken Loans Co-Issuer, Inc., 3.625%, 3/01/2029, 144A | | | 3,717,900 | |
| | 4,955,000 | | | Quicken Loans LLC/Quicken Loans Co-Issuer, Inc., 3.875%, 3/01/2031, 144A | | | 5,140,813 | |
| | | | | | | | |
| | | | | | | 131,009,472 | |
| | | | | | | | |
| | | | Financial Other — 0.1% | |
| | 2,415,000 | | | Icahn Enterprises LP/Icahn Enterprises Finance Corp., 4.750%, 9/15/2024 | | | 2,508,581 | |
| | 3,182,000 | | | Icahn Enterprises LP/Icahn Enterprises Finance Corp., 5.250%, 5/15/2027 | | | 3,411,104 | |
| | | | | | | | |
| | | | | | | 5,919,685 | |
| | | | | | | | |
| | | | Food & Beverage — 2.6% | |
| | 2,040,000 | | | Anheuser-Busch Cos. LLC/Anheuser-Busch InBev Worldwide, Inc., 4.900%, 2/01/2046 | | | 2,652,470 | |
| | 14,470,000 | | | Anheuser-Busch InBev Worldwide, Inc., 4.500%, 6/01/2050 | | | 18,264,900 | |
| | 6,002,000 | | | Anheuser-Busch InBev Worldwide, Inc., 4.600%, 4/15/2048 | | | 7,594,939 | |
| | | | Food & Beverage — continued | |
| 15,285,000 | | | Fomento Economico Mexicano SAB de CV, 3.500%, 1/16/2050 | | | 17,009,067 | |
| | 4,910,000 | | | JBS USA LUX S.A./JBS USA Finance, Inc., 6.750%, 2/15/2028, 144A | | | 5,516,385 | |
| | 10,660,000 | | | JBS USA LUX S.A./JBS USA Food Co./JBS USA Finance, Inc., 5.500%, 1/15/2030, 144A | | | 12,245,782 | |
| | 25,875,000 | | | Kraft Heinz Foods Co., 4.375%, 6/01/2046 | | | 27,884,711 | |
| | 6,470,000 | | | NBM U.S Holdings, Inc., 7.000%, 5/14/2026, 144A | | | 7,044,277 | |
| | 9,535,000 | | | PepsiCo, Inc., 1.700%, 10/06/2021 | | | 9,626,525 | |
| | 45,980,000 | | | PepsiCo, Inc., 2.000%, 4/15/2021 | | | 46,145,795 | |
| | 1,920,000 | | | Smithfield Foods, Inc., 3.000%, 10/15/2030, 144A | | | 2,031,508 | |
| | | | | | | | |
| | | | | | | 156,016,359 | |
| | | | | | | | |
| | | | Government Owned – No Guarantee — 0.6% | |
| | 4,000,000 | | | Empresa de los Ferrocarriles del Estado, 3.068%, 8/18/2050, 144A | | | 3,893,560 | |
| | 8,080,000 | | | Equinor ASA, 3.700%, 4/06/2050 | | | 9,737,553 | |
| | 20,145,000 | | | Saudi Arabian Oil Co., 3.250%, 11/24/2050, 144A | | | 20,428,391 | |
| | | | | | | | |
| | | | | | | 34,059,504 | |
| | | | | | | | |
| | | | Government Sponsored — 0.1% | |
| | 6,130,000 | | | Petrobras Global Finance BV, 6.900%, 3/19/2049 | | | 7,769,775 | |
| | | | | | | | |
| | | | Health Insurance — 0.0% | |
| | 565,000 | | | Centene Corp., 4.625%, 12/15/2029 | | | 627,269 | |
| | | | | | | | |
| | | | Healthcare — 1.8% | |
| | 19,420,000 | | | Cigna Corp., 4.375%, 10/15/2028 | | | 23,472,700 | |
| | 1,261,000 | | | Cigna Corp., 7.875%, 5/15/2027 | | | 1,715,425 | |
| | 7,210,000 | | | CVS Health Corp., 3.250%, 8/15/2029 | | | 8,120,151 | |
| | 685,000 | | | Encompass Health Corp., 4.750%, 2/01/2030 | | | 733,806 | |
| | 8,810,000 | | | HCA, Inc., 4.125%, 6/15/2029 | | | 10,220,319 | |
| | 16,050,000 | | | HCA, Inc., 4.500%, 2/15/2027 | | | 18,669,390 | |
| | 22,730,000 | | | HCA, Inc., 5.250%, 6/15/2049 | | | 30,021,696 | |
| | 4,806,000 | | | HCA, Inc., 7.050%, 12/01/2027 | | | 5,821,267 | |
| | 1,592,000 | | | HCA, Inc., 7.500%, 11/06/2033 | | | 2,212,880 | |
| | 1,295,000 | | | HCA, Inc., 7.690%, 6/15/2025 | | | 1,554,000 | |
| | 2,480,000 | | | HCA, Inc., MTN, 7.580%, 9/15/2025 | | | 2,988,400 | |
| | 3,068,000 | | | HCA, Inc., MTN, 7.750%, 7/15/2036 | | | 3,965,390 | |
| | | | | | | | |
| | | | | | | 109,495,424 | |
| | | | | | | | |
| | | | Home Construction — 0.1% | |
| | 2,450,000 | | | Lennar Corp., 4.750%, 11/29/2027 | | | 2,895,410 | |
| | 560,000 | | | Lennar Corp., 4.875%, 12/15/2023 | | | 618,800 | |
| | 55,000 | | | Lennar Corp., 5.000%, 6/15/2027 | | | 64,763 | |
| | 2,755,000 | | | MDC Holdings, Inc., 6.000%, 1/15/2043 | | | 3,693,201 | |
| | | | | | | | |
| | | | | | | 7,272,174 | |
| | | | | | | | |
| | | | Independent Energy — 1.1% | |
| | 3,195,000 | | | Aker BP ASA, 3.000%, 1/15/2025, 144A | | | 3,353,116 | |
| | 9,925,000 | | | Aker BP ASA, 3.750%, 1/15/2030, 144A | | | 10,424,312 | |
| | 16,455,000 | | | Aker BP ASA, 4.000%, 1/15/2031, 144A | | | 17,824,841 | |
| | 9,310,000 | | | Continental Resources, Inc., 3.800%, 6/01/2024 | | | 9,613,599 | |
| | 10,475,000 | | | Hess Corp., 4.300%, 4/01/2027 | | | 11,548,398 | |
| | 4,675,000 | | | Leviathan Bond Ltd., 6.125%, 6/30/2025, 144A | | | 5,120,107 | |
| | 6,090,000 | | | Occidental Petroleum Corp., 5.550%, 3/15/2026 | | | 6,357,595 | |
| | | | | | | | |
| | | | | | | 64,241,968 | |
| | | | | | | | |
| | | | Integrated Energy — 0.9% | |
| | 52,303,000 | | | Shell International Finance BV, 1.875%, 5/10/2021 | | | 52,601,282 | |
| | | | | | | | |
| | | | Life Insurance — 3.7% | |
| | 5,653,000 | | | American International Group, Inc., 4.200%, 4/01/2028 | | | 6,710,829 | |
| | 21,550,000 | | | Athene Global Funding, 2.550%, 11/19/2030, 144A | | | 21,566,206 | |
See accompanying notes to financial statements.
| 42
Portfolio of Investments – as of December 31, 2020
Loomis Sayles Investment Grade Bond Fund – (continued)
| | | | | | | | |
Principal
Amount | | | Description | | Value (†) | |
| | | | Life Insurance — continued | |
| $ | 7,385,000 | | | Athene Holding Ltd., 3.500%, 1/15/2031 | | $ | 7,804,532 | |
| | 8,255,000 | | | CNO Financial Group, Inc., 5.250%, 5/30/2029 | | | 9,956,933 | |
| | 19,600,000 | | | Fidelity & Guaranty Life Holdings, Inc., 5.500%, 5/01/2025, 144A | | | 22,873,200 | |
| | 15,000,000 | | | Global Atlantic Fin Co., 8.625%, 4/15/2021, 144A | | | 15,252,351 | |
| | 2,565,000 | | | Massachusetts Mutual Life Insurance Co., 3.375%, 4/15/2050, 144A | | | 2,802,036 | |
| | 5,895,000 | | | Metropolitan Life Global Funding I, 3-month LIBOR + 0.230%, 0.460%, 1/08/2021, 144A(b) | | | 5,895,157 | |
| | 30,030,000 | | | Metropolitan Life Global Funding I, 3.375%, 1/11/2022, 144A | | | 30,923,307 | |
| | 9,063,000 | | | Mutual of Omaha Insurance Co., 6.800%, 6/15/2036, 144A | | | 12,158,037 | |
| | 26,914,000 | | | National Life Insurance Co., 10.500%, 9/15/2039, 144A(d)(e) | | | 46,341,871 | |
| | 5,760,000 | | | New York Life Insurance Co., 3.750%, 5/15/2050, 144A | | | 6,890,306 | |
| | 6,440,000 | | | NLV Financial Corp., 7.500%, 8/15/2033, 144A(d)(e) | | | 8,869,039 | |
| | 2,872,000 | | | Penn Mutual Life Insurance Co. (The), 6.650%, 6/15/2034, 144A | | | 3,683,134 | |
| | 14,489,000 | | | Penn Mutual Life Insurance Co. (The), 7.625%, 6/15/2040, 144A(d)(e) | | | 20,881,896 | |
| | | | | | | | |
| | | | | | | 222,608,834 | |
| | | | | | | | |
| | | | Local Authorities — 0.3% | |
| | 14,455,000 | | | Province of Quebec Canada, 0.600%, 7/23/2025 | | | 14,515,422 | |
| | | | | | | | |
| | | | Lodging — 0.0% | |
| | 1,795,000 | | | Marriott International, Inc., 4.625%, 6/15/2030 | | | 2,106,395 | |
| | | | | | | | |
| | | | Media Entertainment — 1.2% | |
| | 23,830,000 | | | Discovery Communications LLC, 4.650%, 5/15/2050 | | | 29,805,250 | |
| | 265,000 | | | iHeartCommunications, Inc., 4.750%, 1/15/2028, 144A | | | 271,956 | |
| | 3,225,000 | | | iHeartCommunications, Inc., 5.250%, 8/15/2027, 144A | | | 3,386,250 | |
| | 1,530,000 | | | iHeartCommunications, Inc., 6.375%, 5/01/2026 | | | 1,637,100 | |
| | 4,640,000 | | | iHeartCommunications, Inc., 8.375%, 5/01/2027 | | | 4,953,014 | |
| | 245,000 | | | Netflix, Inc., 4.875%, 4/15/2028 | | | 276,287 | |
| | 2,625,000 | | | Netflix, Inc., 4.875%, 6/15/2030, 144A | | | 3,018,750 | |
| | 870,000 | | | Netflix, Inc., 5.375%, 11/15/2029, 144A | | | 1,025,513 | |
| | 2,700,000 | | | ViacomCBS, Inc., 4.200%, 6/01/2029 | | | 3,229,800 | |
| | 3,010,000 | | | ViacomCBS, Inc., 4.200%, 5/19/2032 | | | 3,627,492 | |
| | 18,215,000 | | | ViacomCBS, Inc., 4.950%, 1/15/2031 | | | 22,862,158 | |
| | | | | | | | |
| | | | | | | 74,093,570 | |
| | | | | | | | |
| | | | Metals & Mining — 3.1% | |
| | 550,000 | | | Anglo American Capital PLC, 2.625%, 9/10/2030, 144A | | | 575,129 | |
| | 6,260,000 | | | Anglo American Capital PLC, 4.000%, 9/11/2027, 144A | | | 7,188,357 | |
| | 34,334,000 | | | Anglo American Capital PLC, 4.500%, 3/15/2028, 144A | | | 40,316,085 | |
| | 8,785,000 | | | Anglo American Capital PLC, 4.750%, 4/10/2027, 144A | | | 10,363,187 | |
| | 3,130,000 | | | Antofagasta PLC, 2.375%, 10/14/2030, 144A | | | 3,137,825 | |
| | 11,990,000 | | | ArcelorMittal S.A., 7.000%, 3/01/2041 | | | 16,523,163 | |
| | 5,890,000 | | | First Quantum Minerals Ltd., 6.875%, 10/15/2027, 144A | | | 6,390,650 | |
| | 2,930,000 | | | Freeport-McMoRan, Inc., 4.375%, 8/01/2028 | | | 3,113,125 | |
| | 1,975,000 | | | Freeport-McMoRan, Inc., 4.625%, 8/01/2030 | | | 2,167,563 | |
| | 5,760,000 | | | Freeport-McMoRan, Inc., 5.400%, 11/14/2034 | | | 7,207,200 | |
| | 1,770,000 | | | Freeport-McMoRan, Inc., 5.450%, 3/15/2043 | | | 2,203,650 | |
| | | | Metals & Mining — continued | |
| 7,688,000 | | | Glencore Funding LLC, 3.875%, 10/27/2027, 144A | | | 8,690,131 | |
| | 39,092,000 | | | Glencore Funding LLC, 4.000%, 3/27/2027, 144A | | | 44,220,182 | |
| | 11,700,000 | | | Glencore Funding LLC, 4.125%, 3/12/2024, 144A | | | 12,874,600 | |
| | 4,280,000 | | | Newcrest Finance Pty Ltd., 3.250%, 5/13/2030, 144A | | | 4,727,516 | |
| | 1,855,000 | | | Reliance Steel & Aluminum Co., 2.150%, 8/15/2030 | | | 1,905,873 | |
| | 395,000 | | | Steel Dynamics, Inc., 3.250%, 1/15/2031 | | | 441,707 | |
| | 14,125,000 | | | Steel Dynamics, Inc., 3.450%, 4/15/2030 | | | 15,989,320 | |
| | | | | | | | |
| | | | | | | 188,035,263 | |
| | | | | | | | |
| | | | Midstream — 2.5% | |
| | 22,495,000 | | | Cheniere Corpus Christi Holdings LLC, 3.700%, 11/15/2029 | | | 25,042,863 | |
| | 650,000 | | | DCP Midstream Operating LP, 6.450%, 11/03/2036, 144A | | | 702,000 | |
| | 7,000,000 | | | Energy Transfer Operating LP, 4.950%, 6/15/2028 | | | 8,068,299 | |
| | 36,405,000 | | | Energy Transfer Operating LP, 5.250%, 4/15/2029 | | | 42,504,951 | |
| | 1,435,000 | | | Gray Oak Pipeline LLC, 3.450%, 10/15/2027, 144A | | | 1,498,882 | |
| | 14,660,000 | | | Kinder Morgan Energy Partners LP, 3.500%, 9/01/2023 | | | 15,702,917 | |
| | 85,000 | | | Kinder Morgan Energy Partners LP, 5.000%, 8/15/2042 | | | 99,704 | |
| | 375,000 | | | Kinder Morgan, Inc., 5.050%, 2/15/2046 | | | 456,731 | |
| | 14,040,000 | | | MPLX LP, 4.250%, 12/01/2027 | | | 16,485,357 | |
| | 85,000 | | | NGPL PipeCo LLC, 7.768%, 12/15/2037, 144A | | | 114,918 | |
| | 225,000 | | | Plains All American Pipeline LP/PAA Finance Corp., 2.850%, 1/31/2023 | | | 232,991 | |
| | 2,890,000 | | | Plains All American Pipeline LP/PAA Finance Corp., 3.800%, 9/15/2030 | | | 3,106,897 | |
| | 7,365,000 | | | Plains All American Pipeline LP/PAA Finance Corp., 4.300%, 1/31/2043 | | | 7,246,418 | |
| | 6,870,000 | | | Plains All American Pipeline LP/PAA Finance Corp., 4.700%, 6/15/2044 | | | 7,123,565 | |
| | 620,000 | | | Plains All American Pipeline LP/PAA Finance Corp., 4.900%, 2/15/2045 | | | 658,003 | |
| | 12,445,000 | | | Sabine Pass Liquefaction LLC, 4.500%, 5/15/2030, 144A | | | 14,750,779 | |
| | 8,405,000 | | | Williams Cos., Inc. (The), 3.350%, 8/15/2022 | | | 8,741,480 | |
| | | | | | | | |
| | | | | | | 152,536,755 | |
| | | | | | | | |
| | | | Mortgage Related — 0.0% | |
| | 1,204 | | | FNMA, 6.000%, 7/01/2029 | | | 1,374 | |
| | | | | | | | |
| | | | Non-Agency Commercial Mortgage-Backed Securities — 0.8% | |
| | 1,410,000 | | | Commercial Mortgage Pass Through Certificates, Series 2012-CR3, Class AM, 3.416%, 10/15/2045, 144A | | | 1,430,032 | |
| | 785,000 | | | Commercial Mortgage Pass Through Certificates, Series 2012-LTRT, Class A2, 3.400%, 10/05/2030, 144A | | | 759,273 | |
| | 405,000 | | | Commercial Mortgage Trust, Series 2012-LC4, Class C, 5.535%, 12/10/2044(a) | | | 365,118 | |
| | 3,205,000 | | | Credit Suisse Commercial Mortgage Securities Corp., Series 2019-SKLZ, Class D, 1-month LIBOR + 3.600%, 3.759%, 1/15/2034, 144A(b) | | | 3,023,939 | |
| | 12,790,000 | | | Credit Suisse Mortgage Trust, Series 2014-USA, Class D, 4.373%, 9/15/2037, 144A | | | 10,558,657 | |
| | 5,095,000 | | | DBUBS Mortgage Trust, Series 2017-BRBK, Class D, 3.530%, 10/10/2034, 144A(a) | | | 5,327,230 | |
| | 9,406,000 | | | GS Mortgage Securities Corp. Trust, Series 2013-PEMB, Class D, 3.550%, 3/05/2033, 144A(a) | | | 7,584,087 | |
See accompanying notes to financial statements.
43 |
Portfolio of Investments – as of December 31, 2020
Loomis Sayles Investment Grade Bond Fund – (continued)
| | | | | | | | |
Principal
Amount | | | Description | | Value (†) | |
| | | | Non-Agency Commercial Mortgage-Backed Securities — continued | |
| $ | 2,390,000 | | | GS Mortgage Securities Corp. Trust, Series 2013-PEMB, Class A, 3.550%, 3/05/2033, 144A(a) | | $ | 2,308,024 | |
| | 3,094,000 | | | GS Mortgage Securities Trust, Series 2014-GC18, Class B, 4.885%, 1/10/2047(a) | | | 2,997,171 | |
| | 1,405,000 | | | Morgan Stanley Bank of America Merrill Lynch Trust, Series 2013-C12, Class C, 4.763%, 10/15/2046(a) | | | 1,257,334 | |
| | 3,989,000 | | | Morgan Stanley Capital I Trust, Series 2011-C2, Class B, 5.200%, 6/15/2044, 144A(a) | | | 3,978,486 | |
| | 3,456,000 | | | Morgan Stanley Capital I Trust, Series 2011-C2, Class E, 5.477%, 6/15/2044, 144A(a) | | | 2,122,142 | |
| | 6,706,000 | | | UBS-Barclays Commercial Mortgage Trust, Series 2012-C2, Class E, 4.888%, 5/10/2063, 144A(a)(d)(e) | | | 3,107,873 | |
| | 1,290,000 | | | WFRBS Commercial Mortgage Trust, Series 2014-C24, Class B, 4.204%, 11/15/2047(a) | | | 1,284,729 | |
| | 939,546 | | | WFRBS Commercial Mortgage Trust, Series 2011-C2, Class D, 5.523%, 2/15/2044, 144A(a) | | | 936,953 | |
| | 2,125,000 | | | WFRBS Commercial Mortgage Trust, Series 2011-C3, Class D, 5.642%, 3/15/2044, 144A(a) | | | 990,905 | |
| | 1,746,000 | | | WFRBS Commercial Mortgage Trust, Series 2012-C7, Class C, 4.810%, 6/15/2045(a) | | | 1,359,810 | |
| | 865,000 | | | WFRBS Commercial Mortgage Trust, Series 2012-C7, Class E, 4.810%, 6/15/2045, 144A(a) | | | 383,832 | |
| | | | | | | | |
| | | | | | | 49,775,595 | |
| | | | | | | | |
| | | | Paper — 0.6% | |
| | 10,460,000 | | | Suzano Austria GmbH, 3.750%, 1/15/2031 | | | 11,098,060 | |
| | 16,595,000 | | | Weyerhaeuser Co., 4.000%, 4/15/2030 | | | 19,652,196 | |
| | 2,745,000 | | | WRKCo, Inc., 3.000%, 6/15/2033 | | | 3,015,840 | |
| | | | | | | | |
| | | | | | | 33,766,096 | |
| | | | | | | | |
| | | | Pharmaceuticals — 1.5% | |
| | 8,370,000 | | | Merck & Co., Inc., 2.450%, 6/24/2050 | | | 8,666,038 | |
| | 2,459,000 | | | Mylan, Inc., 5.200%, 4/15/2048 | | | 3,201,276 | |
| | 9,724,000 | | | Mylan, Inc., 5.400%, 11/29/2043 | | | 12,942,897 | |
| | 3,100,000 | | | Perrigo Finance UnLtd. Co., 3.150%, 6/15/2030 | | | 3,313,145 | |
| | 980,000 | | | Teva Pharmaceutical Finance Co. LLC, 6.150%, 2/01/2036 | | | 1,041,250 | |
| | 9,335,000 | | | Teva Pharmaceutical Finance Netherlands III BV, 2.800%, 7/21/2023 | | | 9,236,142 | |
| | 15,105,000 | | | Teva Pharmaceutical Finance Netherlands III BV, 3.150%, 10/01/2026 | | | 14,519,832 | |
| | 6,270,000 | | | Teva Pharmaceutical Finance Netherlands III BV, 4.100%, 10/01/2046 | | | 5,580,300 | |
| | 12,646,000 | | | Utah Acquisition Sub, Inc., 5.250%, 6/15/2046 | | | 16,567,275 | |
| | 11,805,000 | | | Viatris, Inc., 4.000%, 6/22/2050, 144A | | | 13,524,846 | |
| | | | | | | | |
| | | | | | | 88,593,001 | |
| | | | | | | | |
| | | | Property & Casualty Insurance — 0.4% | |
| | 16,635,000 | | | Fidelity National Financial, Inc., 3.400%, 6/15/2030 | | | 18,268,093 | |
| | 2,740,000 | | | Fidelity National Financial, Inc., 5.500%, 9/01/2022 | | | 2,951,877 | |
| | 3,159,000 | | | Sirius International Group Ltd., 4.600%, 11/01/2026, 144A | | | 3,137,045 | |
| | 1,605,000 | | | Travelers Cos., Inc. (The), 2.550%, 4/27/2050 | | | 1,689,575 | |
| | | | | | | | |
| | | | | | | 26,046,590 | |
| | | | | | | | |
| | | | REITs – Health Care — 0.1% | |
| 5,972,000 | | | Welltower, Inc., 6.500%, 3/15/2041 | | | 8,349,736 | |
| | | | | | | | |
| | | | REITs – Regional Malls — 0.2% | |
| | 6,815,000 | | | Simon Property Group LP, 2.650%, 7/15/2030 | | | 7,223,046 | |
| | 4,945,000 | | | Simon Property Group LP, 3.800%, 7/15/2050 | | | 5,516,718 | |
| | | | | | | | |
| | | | | | | 12,739,764 | |
| | | | | | | | |
| | | | REITs – Shopping Centers — 0.1% | |
| | 2,280,000 | | | Brixmor Operating Partnership LP, 4.050%, 7/01/2030 | | | 2,616,926 | |
| | | | | | | | |
| | | | Restaurants — 0.1% | |
| | 2,375,000 | | | Yum! Brands, Inc., 4.750%, 1/15/2030, 144A | | | 2,604,188 | |
| | 1,890,000 | | | Yum! Brands, Inc., 7.750%, 4/01/2025, 144A | | | 2,093,175 | |
| | | | | | | | |
| | | | | | | 4,697,363 | |
| | | | | | | | |
| | | | Retailers — 1.1% | |
| | 1,960,000 | | | AutoNation, Inc., 4.750%, 6/01/2030 | | | 2,358,535 | |
| | 9,720,000 | | | AutoZone, Inc., 3.625%, 4/15/2025 | | | 10,887,990 | |
| | 14,585,000 | | | AutoZone, Inc., 4.000%, 4/15/2030 | | | 17,278,994 | |
| | 370,746 | | | CVS Pass-Through Trust, 5.773%, 1/10/2033, 144A | | | 436,064 | |
| | 392,236 | | | CVS Pass-Through Trust, 6.036%, 12/10/2028 | | | 453,339 | |
| | 11,141,351 | | | CVS Pass-Through Trust, Series 2013, 4.704%, 1/10/2036, 144A | | | 12,621,702 | |
| | 1,168,350 | | | CVS Pass-Through Trust, Series 2014, 4.163%, 8/11/2036, 144A | | | 1,279,694 | |
| | 5,620,000 | | | Dollar General Corp., 3.500%, 4/03/2030 | | | 6,451,605 | |
| | 8,064,000 | | | Marks & Spencer PLC, 7.125%, 12/01/2037, 144A | | | 9,014,101 | |
| | 3,755,000 | | | PVH Corp., 7.750%, 11/15/2023 | | | 4,399,658 | |
| | | | | | | | |
| | | | | | | 65,181,682 | |
| | | | | | | | |
| | | | Sovereigns — 0.5% | |
| | 30,040,000 | | | Mexico Government International Bond, 3.771%, 5/24/2061 | | | 31,398,108 | |
| | | | | | | | |
| | | | Supermarkets — 0.0% | |
| | 325,000 | | | Koninklijke Ahold Delhaize NV, 5.700%, 10/01/2040 | | | 465,625 | |
| | | | | | | | |
| | | | Technology — 4.8% | |
| | 27,985,000 | | | Avnet, Inc., 4.625%, 4/15/2026 | | | 31,676,746 | |
| | 1,300,000 | | | Broadcom Corp./Broadcom Cayman Finance Ltd., 3.500%, 1/15/2028 | | | 1,432,870 | |
| | 10,158,000 | | | Broadcom, Inc., 4.150%, 11/15/2030 | | | 11,760,549 | |
| | 17,895,000 | | | Broadcom, Inc., 4.300%, 11/15/2032 | | | 21,214,326 | |
| | 31,450,000 | | | Broadcom, Inc., 4.750%, 4/15/2029 | | | 37,511,104 | |
| | 12,400,000 | | | Broadcom, Inc., 5.000%, 4/15/2030 | | | 15,073,588 | |
| | 1,620,000 | | | CommScope Technologies LLC, 5.000%, 3/15/2027, 144A | | | 1,595,700 | |
| | 3,900,000 | | | CommScope, Inc., 6.000%, 3/01/2026, 144A | | | 4,109,040 | |
| | 3,950,000 | | | CommScope, Inc., 7.125%, 7/01/2028, 144A | | | 4,206,750 | |
| | 10,115,000 | | | Equinix, Inc., 2.150%, 7/15/2030 | | | 10,288,475 | |
| | 17,195,000 | | | Equinix, Inc., 3.200%, 11/18/2029 | | | 18,876,101 | |
| | 4,610,000 | | | Jabil, Inc., 3.000%, 1/15/2031 | | | 4,888,050 | |
| | 7,440,000 | | | Jabil, Inc., 4.700%, 9/15/2022 | | | 7,926,428 | |
| | 16,735,000 | | | KLA Corp., 5.650%, 11/01/2034 | | | 22,564,124 | |
| | 25,479,000 | | | Micron Technology, Inc., 4.663%, 2/15/2030 | | | 31,266,472 | |
| | 10,622,000 | | | Micron Technology, Inc., 5.327%, 2/06/2029 | | | 13,286,913 | |
| | 3,980,000 | | | NXP BV/NXP Funding LLC/NXP USA, Inc., 3.150%, 5/01/2027, 144A | | | 4,388,157 | |
| | 2,225,000 | | | NXP BV/NXP Funding LLC/NXP USA, Inc., 3.400%, 5/01/2030, 144A | | | 2,523,183 | |
| | 1,055,000 | | | Open Text Corp., 3.875%, 2/15/2028, 144A | | | 1,097,179 | |
| | 1,015,000 | | | Open Text Holdings, Inc., 4.125%, 2/15/2030, 144A | | | 1,079,757 | |
| | 25,480,000 | | | Oracle Corp., 3.600%, 4/01/2050 | | | 29,686,328 | |
See accompanying notes to financial statements.
| 44
Portfolio of Investments – as of December 31, 2020
Loomis Sayles Investment Grade Bond Fund – (continued)
| | | | | | | | |
Principal
Amount | | | Description | | Value (†) | |
| | | | Technology — continued | |
| $ | 970,000 | | | SS&C Technologies, Inc., 5.500%, 9/30/2027, 144A | | $ | 1,035,979 | |
| | 9,135,000 | | | Verisk Analytics, Inc., 4.125%, 3/15/2029 | | | 10,977,720 | |
| | | | | | | | |
| | | | | | | 288,465,539 | |
| | | | | | | | |
| | | | Transportation Services — 0.2% | |
| | 9,670,000 | | | Adani Ports & Special Economic Zone Ltd., 4.200%, 8/04/2027, 144A | | | 10,377,686 | |
| | | | | | | | |
| | | | Treasuries — 12.8% | |
| | 267,555,000 | | | U.S. Treasury Note, 0.125%, 4/30/2022 | | | 267,617,710 | |
| | 173,275,000 | | | U.S. Treasury Note, 0.125%, 6/30/2022 | | | 173,302,074 | |
| | 119,815,000 | | | U.S. Treasury Note, 0.125%, 12/31/2022 | | | 119,829,041 | |
| | 209,930,000 | | | U.S. Treasury Note, 0.375%, 3/31/2022 | | | 210,594,231 | |
| | | | | | | | |
| | | | | | | 771,343,056 | |
| | | | | | | | |
| | | | Wireless — 1.8% | |
| | 21,805,000 | | | American Tower Corp., 2.100%, 6/15/2030 | | | 22,380,814 | |
| | 2,295,000 | | | Crown Castle International Corp., 2.250%, 1/15/2031 | | | 2,380,692 | |
| | 3,725,000 | | | Crown Castle International Corp., 3.300%, 7/01/2030 | | | 4,169,314 | |
| | 22,660,000 | | | Crown Castle International Corp., 3.650%, 9/01/2027 | | | 25,582,808 | |
| | 6,615,000 | | | Crown Castle International Corp., 4.000%, 3/01/2027 | | | 7,597,027 | |
| | 730,000 | | | Crown Castle International Corp., 4.150%, 7/01/2050 | | | 884,643 | |
| | 610,000 | | | Sprint Capital Corp., 6.875%, 11/15/2028 | | | 804,273 | |
| | 1,545,000 | | | Sprint Corp., 7.250%, 9/15/2021 | | | 1,607,573 | |
| | 36,385,000 | | | T-Mobile USA, Inc., 3.875%, 4/15/2030, 144A | | | 42,141,107 | |
| | 980,000 | | | T-Mobile USA, Inc., 4.500%, 2/01/2026 | | | 1,001,888 | |
| | | | | | | | |
| | | | | | | 108,550,139 | |
| | | | | | | | |
| | | | Wirelines — 2.3% | |
| | 9,487,000 | | | AT&T, Inc., 3.500%, 9/15/2053, 144A | | | 9,500,924 | |
| | 364,000 | | | AT&T, Inc., 3.550%, 9/15/2055, 144A | | | 362,764 | |
| | 20,495,000 | | | AT&T, Inc., 3.650%, 6/01/2051 | | | 21,460,171 | |
| | 515,000 | | | AT&T, Inc., 3.650%, 9/15/2059, 144A | | | 520,015 | |
| | 3,245,000 | | | AT&T, Inc., 3.800%, 12/01/2057, 144A | | | 3,390,820 | |
| | 61,415,000 | | | AT&T, Inc., 4.300%, 2/15/2030 | | | 73,362,515 | |
| | 857,000 | | | Level 3 Financing, Inc., 4.625%, 9/15/2027, 144A | | | 895,081 | |
| | 20,585,000 | | | Telefonica Emisiones S.A., 5.520%, 3/01/2049 | | | 27,562,286 | |
| | | | | | | | |
| | | | | | | 137,054,576 | |
| | | | | | | | |
| | | | Total Non-Convertible Bonds
(Identified Cost $4,967,750,678) | | | 5,453,191,355 | |
| | | | | | | | |
| | | | | | | | |
| | Convertible Bonds — 1.3% | |
| | | | Airlines — 0.1% | |
| | 2,865,000 | | | Southwest Airlines Co., 1.250%, 5/01/2025 | | | 4,161,413 | |
| | | | | | | | |
| | | | Cable Satellite — 0.3% | |
| | 9,050,000 | | | DISH Network Corp., 2.375%, 3/15/2024 | | | 8,433,965 | |
| | 13,110,000 | | | DISH Network Corp., 3.375%, 8/15/2026 | | | 12,496,867 | |
| | | | | | | | |
| | | | | | | 20,930,832 | |
| | | | | | | | |
| | | | Consumer Cyclical Services — 0.1% | |
| | 3,845,000 | | | Uber Technologies, Inc., Zero Coupon, 12/15/2025, 144A | | | 3,933,584 | |
| | | | | | | | |
| | | | Diversified Manufacturing — 0.1% | |
| | 5,165,000 | | | Greenbrier Cos., Inc. (The), 2.875%, 2/01/2024 | | | 5,219,082 | |
| | | | | | | | |
| | | | Electric — 0.1% | |
| | 4,030,000 | | | NRG Energy, Inc., 2.750%, 6/01/2048 | | | 4,579,289 | |
| | | | | | | | |
| | | | Healthcare — 0.1% | |
| 6,355,000 | | | Teladoc Health, Inc., 1.250%, 6/01/2027, 144A | | | 7,611,414 | |
| | | | | | | | |
| | | | Pharmaceuticals — 0.4% | |
| | 5,120,000 | | | BioMarin Pharmaceutical, Inc., 0.599%, 8/01/2024 | | | 5,494,207 | |
| | 13,985,000 | | | BioMarin Pharmaceutical, Inc., 1.250%, 5/15/2027, 144A | | | 14,614,325 | |
| | 3,445,000 | | | Neurocrine Biosciences, Inc., 2.250%, 5/15/2024 | | | 4,753,318 | |
| | | | | | | | |
| | | | | | | 24,861,850 | |
| | | | | | | | |
| | | | Technology — 0.1% | |
| | 3,925,000 | | | Shift4 Payments, Inc., Zero Coupon, 12/15/2025, 144A | | | 4,789,618 | |
| | | | | | | | |
| | | | Total Convertible Bonds
(Identified Cost $72,996,585) | | | 76,087,082 | |
| | | | | | | | |
| | | | | | | | |
| | Municipals — 0.1% | |
| | | | Virginia — 0.1% | |
| | 7,515,000 | | | Tobacco Settlement Financing Corp., Series A-1, 6.706%, 6/01/2046
(Identified Cost $7,253,731) | | | 7,862,719 | |
| | | | | | | | |
| | | | Total Bonds and Notes
(Identified Cost $5,048,000,994) | | | 5,537,141,156 | |
| | | | | | | | |
| | | | | | | | |
| | Collateralized Loan Obligations — 3.8% | |
| | 14,785,000 | | | Alinea CLO Ltd., Series 2018-1A, Class B, 3-month LIBOR + 1.650%, 1.868%, 7/20/2031, 144A(b) | | | 14,768,250 | |
| | 5,715,000 | | | Allegro CLO I Ltd., Series 2013-1A, Class BR, 3-month LIBOR + 2.450%, 2.664%, 1/30/2026, 144A(b) | | | 5,714,024 | |
| | 4,650,000 | | | Allegro CLO VIII Ltd., Series 2018-2A, Class B1, 3-month LIBOR + 1.670%, 1.907%, 7/15/2031, 144A(b) | | | 4,560,214 | |
| | 4,075,000 | | | Ares XXXVII CLO Ltd., Series 2015-4A, Class A3R, 3-month LIBOR + 1.500%, 1.737%, 10/15/2030, 144A(b) | | | 4,044,116 | |
| | 2,774,916 | | | Atrium XII, Series 12A, Class AR, 3-month LIBOR + 0.830%, 1.046%, 4/22/2027, 144A(b) | | | 2,766,001 | |
| | 39,708 | | | Avery Point IV CLO Ltd., Series 2014-1A, Class AR, 3-month LIBOR + 1.100%, 1.315%, 4/25/2026, 144A(b) | | | 39,698 | |
| | 2,240,000 | | | Battalion CLO XIV Ltd., Series 2019-14A, Class B1, 3-month LIBOR + 2.100%, 2.318%, 4/20/2032, 144A(b) | | | 2,251,086 | |
| | 6,995,000 | | | Benefit Street Partners CLO VII Ltd., Series 2015-VIIA, Class BR, 3-month LIBOR + 1.550%, 1.768%, 7/18/2027, 144A(b) | | | 6,991,907 | |
| | 3,339,042 | | | Black Diamond CLO Ltd., Series 2013-1A, Class BR, 3-month LIBOR + 2.500%, 2.718%, 2/06/2026, 144A(b) | | | 3,336,061 | |
| | 2,525,000 | | | Canyon CLO Ltd., Series 2018-1A, Class B, 3-month LIBOR + 1.700%, 1.937%, 7/15/2031, 144A(b) | | | 2,508,040 | |
| | 6,500,000 | | | CIFC Funding Ltd., Series 2014-5A, Class BR2, 3-month LIBOR + 1.800%, 2.018%, 10/17/2031, 144A(b) | | | 6,536,477 | |
| | 2,331,808 | | | CVP Cascade CLO Ltd., Series 2014-2A, Class A1R, 3-month LIBOR + 1.200%, 1.418%, 7/18/2026, 144A(b) | | | 2,331,484 | |
| | 3,335,000 | | | Dryden 53 CLO Ltd., Series 2017-53A, Class B, 3-month LIBOR + 1.400%, 1.637%, 1/15/2031, 144A(b) | | | 3,287,643 | |
See accompanying notes to financial statements.
45 |
Portfolio of Investments – as of December 31, 2020
Loomis Sayles Investment Grade Bond Fund – (continued)
| | | | | | | | |
Principal
Amount | | | Description | | Value (†) | |
| | Collateralized Loan Obligations — continued | |
| $ | 1,030,000 | | | Dryden 86 CLO Ltd., Series 2020-86A, Class B, 3-month LIBOR + 2.200%, 2.434%, 7/17/2030, 144A(b) | | $ | 1,032,752 | |
| | 2,422,818 | | | Elevation CLO Ltd., Series 2015-4A, Class AR, 3-month LIBOR + 0.990%, 1.208%, 4/18/2027, 144A(b) | | | 2,422,819 | |
| | 1,150,351 | | | Flatiron CLO Ltd., Series 2015-1A, Class AR, 3-month LIBOR + 0.890%, 1.127%, 4/15/2027, 144A(b) | | | 1,150,010 | |
| | 5,405,000 | | | Goldentree Loan Management U.S CLO 3 Ltd., Series 2018-3A, Class B1, 3-month LIBOR + 1.550%, 1.768%, 4/20/2030, 144A(b) | | | 5,323,525 | |
| | 5,490,000 | | | Halcyon Loan Advisors Funding Ltd., Series 2014-3A, Class B1R, 3-month LIBOR + 1.700%, 1.916%, 10/22/2025, 144A(b) | | | 5,477,438 | |
| | 13,735,000 | | | Hayfin US XII Ltd, Series 2018-8A, Class B, 3-month LIBOR + 1.480%, 1.698%, 4/20/2031, 144A(b) | | | 13,520,575 | |
| | 1,000,000 | | | Jamestown CLO IX Ltd., Series 2016-9A, Class A2R, 3-month LIBOR + 1.850%, 2.068%, 10/20/2028, 144A(b) | | | 989,919 | |
| | 6,512,487 | | | Jamestown CLO VII Ltd., Series 2015-7A, Class A1R, 3-month LIBOR + 0.830%, 1.045%, 7/25/2027, 144A(b) | | | 6,481,260 | |
| | 417,434 | | | Limerock CLO III LLC, Series 2014-3A, Class A1R, 3-month LIBOR + 1.200%, 1.418%, 10/20/2026, 144A(b) | | | 417,406 | |
| | 4,475,000 | | | Madison Park Funding XII Ltd., Series 2014-12A, Class CR, 3-month LIBOR + 2.350%, 2.568%, 7/20/2026, 144A(b) | | | 4,468,264 | |
| | 13,180,000 | | | Madison Park Funding XIV Ltd., Series 2014-14A, Class BRR, 3-month LIBOR + 1.700%, 1.916%, 10/22/2030, 144A(b) | | | 13,081,487 | |
| | 2,770,000 | | | Madison Park Funding XVI Ltd., Series 2015-16A, Class A2R, 3-month LIBOR + 1.900%, 2.118%, 4/20/2026, 144A(b) | | | 2,767,326 | |
| | 1,450,000 | | | Marble Point CLO X Ltd., Series 2017-1A, Class B, 3-month LIBOR + 1.800%, 2.037%, 10/15/2030, 144A(b) | | | 1,427,720 | |
| | 7,275,000 | | | Marble Point CLO XIV Ltd., Series 2018-2A, Class A1, 3-month LIBOR + 1.330%, 1.548%, 1/20/2032, 144A(b) | | | 7,259,858 | |
| | 10,868,676 | | | Mountain View CLO X Ltd., Series 2015-10A, Class AR, 3-month LIBOR + 0.820%, 1.044%, 10/13/2027, 144A(b) | | | 10,807,743 | |
| | 14,755,000 | | | OCP CLO Ltd., Series 2020-8RA, Class A2, 3-month LIBOR + 1.550%, 0.000%, 1/17/2032, 144A(b)(c)(d)(e) | | | 14,755,000 | |
| | 8,816,295 | | | OCP CLO Ltd., Series 2015-10A, Class A1R, 3-month LIBOR + 0.820%, 1.035%, 10/26/2027, 144A(b) | | | 8,796,299 | |
| | 8,705,000 | | | OCP CLO Ltd., Series 2015-8A, Class A2AR, 3-month LIBOR + 1.450%, 1.668%, 4/17/2027, 144A(b) | | | 8,700,509 | |
| | 1,750,000 | | | OCP CLO Ltd., Series 2015-9A, Class BR, 3-month LIBOR + 1.750%, 1.987%, 7/15/2027, 144A(b) | | | 1,726,551 | |
| | 3,605,000 | | | OZLM XXIV Ltd., Series 2019-24A, Class A2A, 3-month LIBOR + 2.250%, 2.468%, 7/20/2032, 144A(b) | | | 3,617,731 | |
| | 1,551,988 | | | Palmer Square Loan Funding Ltd., Series 2020-3A, Class A1, 3-month LIBOR + 1.700%, 1.918%, 7/20/2028, 144A(b) | | | 1,560,907 | |
| | Collateralized Loan Obligations — continued | |
| 6,959,020 | | | Parallel Ltd., Series 2015-1A, Class AR, 3-month LIBOR + 0.850%, 1.068%, 7/20/2027, 144A(b) | | | 6,929,170 | |
| | 4,600,940 | | | Recette CLO Ltd., Series 2015-1A, Class AR, 3-month LIBOR + 0.920%, 1.138%, 10/20/2027, 144A(b) | | | 4,590,304 | |
| | 1,800,000 | | | Recette CLO Ltd., Series 2015-1A, Class BR, 3-month LIBOR + 1.300%, 1.518%, 10/20/2027, 144A(b) | | | 1,785,459 | |
| | 1,400,000 | | | Recette CLO Ltd., Series 2015-1A, Class CR, 3-month LIBOR + 1.700%, 1.918%, 10/20/2027, 144A(b) | | | 1,396,419 | |
| | 1,015,000 | | | Regatta XV Funding Ltd., Series 2018-4A, Class A2, 3-month LIBOR + 1.850%, 2.065%, 10/25/2031, 144A(b) | | | 1,008,954 | |
| | 3,870,013 | | | Venture XII CLO Ltd., Series 2012-12A, Class ARR, 3-month LIBOR + 0.800%, 1.024%, 2/28/2026, 144A(b) | | | 3,845,138 | |
| | 2,580,375 | | | Venture XX CLO Ltd., Series 2015-20A, Class AR, 3-month LIBOR + 0.820%, 1.057%, 4/15/2027, 144A(b) | | | 2,571,383 | |
| | 5,863,058 | | | Venture XXI CLO Ltd., Series 2015-21A, Class AR, 3-month LIBOR + 0.880%, 1.117%, 7/15/2027, 144A(b) | | | 5,857,202 | |
| | 6,235,000 | | | Voya CLO Ltd., Series 2018-3A, Class B, 3-month LIBOR + 1.650%, 1.887%, 10/15/2031, 144A(b) | | | 6,234,980 | |
| | 3,335,000 | | | Voya CLO Ltd., Series 2013-3A, Class A2RR, 3-month LIBOR + 1.700%, 1.918%, 10/18/2031, 144A(b) | | | 3,276,942 | |
| | 141,894 | | | Voya CLO Ltd., Series 2014-3A, Class A1R, 3-month LIBOR + 0.720%, 0.935%, 7/25/2026, 144A(b) | | | 141,452 | |
| | 14,756,924 | | | Zais CLO 6 Ltd., Series 2017-1A, Class A1, 3-month LIBOR + 1.370%, 1.607%, 7/15/2029, 144A(b) | | | 14,633,359 | |
| | | | | | | | |
| | | | Total Collateralized Loan Obligations
(Identified Cost $223,509,095) | | | 227,190,862 | |
| | | | | | | | |
| | | | | | | | |
| Shares | | | | | | |
| | Preferred Stocks — 0.9% | |
| | | | Banking — 0.5% | |
| | 8,763 | | | Bank of America Corp., Series L, 7.250% | | | 13,307,317 | |
| | 10,730 | | | Wells Fargo & Co., Class A, Series L, 7.500% | | | 16,287,067 | |
| | | | | | | | |
| | | | | | | 29,594,384 | |
| | | | | | | | |
| | | | Electric — 0.1% | |
| | 113,793 | | | NextEra Energy, Inc., 5.279% | | | 5,785,236 | |
| | | | | | | | |
| | | | Energy — 0.0% | |
| | 40,860 | | | Chesapeake Energy Corp., 5.000%(c)(d)(f)(g) | | | — | |
| | | | | | | | |
| | | | Food & Beverage — 0.2% | |
| | 138,889 | | | Bunge Ltd., 4.875% | | | 15,108,904 | |
| | | | | | | | |
| | | | Healthcare — 0.1% | |
| | 55,158 | | | Boston Scientific Corp., Series A, 5.500% | | | 6,043,662 | |
| | | | | | | | |
| | | | Total Preferred Stocks
(Identified Cost $54,907,364) | | | 56,532,186 | |
| | | | | | | | |
| | | | | | | | |
See accompanying notes to financial statements.
| 46
Portfolio of Investments – as of December 31, 2020
Loomis Sayles Investment Grade Bond Fund – (continued)
| | | | | | | | |
Principal
Amount | | | Description | | Value (†) | |
| | Short-Term Investments — 2.9% | |
| $ | 172,892,299 | | | Tri-Party Repurchase Agreement with Fixed Income Clearing Corporation, dated 12/31/2020 at 0.000% to be repurchased at $172,892,299 on 1/04/2021 collateralized by $176,350,201 U.S. Treasury Note, 0.125% due 12/31/2022 valued at $176,350,201 including accrued interest (Note 2 of Notes to Financial Statements) (Identified Cost $172,892,299) | | $ | 172,892,299 | |
| | | | | | | | |
| | | | | | | | |
| | | | Total Investments — 99.5%
(Identified Cost $5,499,309,752) | | | 5,993,756,503 | |
| | | | Other assets less liabilities — 0.5% | | | 31,005,541 | |
| | | | | | | | |
| | | | Net Assets — 100.0% | | $ | 6,024,762,044 | |
| | | | | | | | |
| | | | | | | | |
| | (†) | | | See Note 2 of Notes to Financial Statements. | |
| | (a) | | | Variable rate security. The interest rate adjusts periodically based on; (i) changes in current interest rates and/or prepayments on underlying pools of assets, if applicable, (ii) reference to a base lending rate plus or minus a margin, and/or (iii) reference to a base lending rate adjusted by a multiplier and/or subject to certain floors or caps. Rate as of December 31, 2020 is disclosed. | |
| | (b) | | | Variable rate security. Rate as of December 31, 2020 is disclosed. | |
| | (c) | | | Level 3 security. Value has been determined using significant unobservable inputs. See Note 3 of Notes to Financial Statements. | |
| | (d) | | | Illiquid security. (Unaudited) | |
| | (e) | | | Securities classified as fair valued pursuant to the Fund’s pricing policies and procedures. At December 31, 2020, the value of these securities amounted to $115,550,245 or 1.9% of net assets. See Note 2 of Notes to Financial Statements. | |
| | (f) | | | Non-income producing security. | |
| | (g) | | | Fair valued by the Fund’s adviser. At December 31, 2020, the value of this security amounted to $0. See Note 2 of Notes to Financial Statements. | |
| | | | | |
| | 144A | | | All or a portion of these securities are exempt from registration under Rule 144A of the Securities Act of 1933. These securities may be resold in transactions exempt from registration, normally to qualified institutional buyers. At December 31, 2020, the value of Rule 144A holdings amounted to $2,134,096,969 or 35.4% of net assets. | |
| | ABS | | | Asset-Backed Securities | |
| | ARS | | | Auction Rate Security | |
| | FNMA | | | Federal National Mortgage Association | |
| | GMTN | | | Global Medium Term Note | |
| | LIBOR | | | London Interbank Offered Rate | |
| | MTN | | | Medium Term Note | |
| | REITs | | | Real Estate Investment Trusts | |
| | SLM | | | Sallie Mae | |
Industry Summary at December 31, 2020
| | | | |
Treasuries | | | 12.8 | % |
Banking | | | 8.5 | |
ABS Car Loan | | | 6.3 | |
ABS Home Equity | | | 5.3 | |
Technology | | | 4.9 | |
Life Insurance | | | 3.7 | |
Aerospace & Defense | | | 3.6 | |
Electric | | | 3.4 | |
Metals & Mining | | | 3.1 | |
ABS Other | | | 3.0 | |
Food & Beverage | | | 2.8 | |
Cable Satellite | | | 2.5 | |
Midstream | | | 2.5 | |
Wirelines | | | 2.3 | |
Finance Companies | | | 2.2 | |
Healthcare | | | 2.0 | |
Automotive | | | 2.0 | |
Consumer Cyclical Services | | | 2.0 | |
Other Investments, less than 2% each | | | 19.9 | |
Collateralized Loan Obligations | | | 3.8 | |
Short-Term Investments | | | 2.9 | |
| | | | |
Total Investments | | | 99.5 | |
Other assets less liabilities | | | 0.5 | |
| | | | |
Net Assets | | | 100.0 | % |
| | | | |
See accompanying notes to financial statements.
47 |
Portfolio of Investments – as of December 31, 2020
Loomis Sayles Strategic Alpha Fund
| | | | | | | | |
Principal
Amount (‡) | | | Description | | Value (†) | |
| | Bonds and Notes — 70.4% of Net Assets | |
| | Non-Convertible Bonds — 67.5% | |
| | | | ABS Car Loan — 5.5% | |
| $ | 2,590,000 | | | American Credit Acceptance Receivables Trust, Series 2020-3, Class D, 2.400%, 6/15/2026, 144A | | $ | 2,686,433 | |
| | 2,660,000 | | | American Credit Acceptance Receivables Trust, Series 2020-4, Class D, 1.770%, 12/14/2026, 144A | | | 2,679,686 | |
| | 2,805,000 | | | AmeriCredit Automobile Receivables Trust, Series 2018-2, Class D, 4.010%, 7/18/2024(a) | | | 2,971,634 | |
| | 3,845,000 | | | AmeriCredit Automobile Receivables Trust, Series 2018-3, Class D, 4.040%, 11/18/2024(a) | | | 4,091,975 | |
| | 715,000 | | | AmeriCredit Automobile Receivables Trust, Series 2020-2, Class D, 2.130%, 3/18/2026 | | | 739,577 | |
| | 1,210,000 | | | Avid Automobile Receivables Trust, Series 2019-1, Class C, 3.140%, 7/15/2026, 144A(a) | | | 1,234,439 | |
| | 1,035,000 | | | Avid Automobile Receivables Trust, Series 2019-1, Class D, 4.030%, 7/15/2026, 144A | | | 1,041,627 | |
| | 845,000 | | | Avis Budget Rental Car Funding AESOP LLC, Series 2020-2A, Class B, 2.960%, 2/20/2027, 144A(a) | | | 865,693 | |
| | 1,785,000 | | | California Republic Auto Receivables Trust, Series 2018-1, Class D, 4.330%, 4/15/2025(a) | | | 1,856,740 | |
| | 135,000 | | | CarMax Auto Owner Trust, Series 2018-1, Class D, 3.370%, 7/15/2024(a) | | | 139,604 | |
| | 1,435,000 | | | CarMax Auto Owner Trust, Series 2018-2, Class D, 3.990%, 4/15/2025(a) | | | 1,486,236 | |
| | 1,125,000 | | | CarMax Auto Owner Trust, Series 2018-4, Class D, 4.150%, 4/15/2025 | | | 1,186,709 | |
| | 2,350,000 | | | CarMax Auto Owner Trust, Series 2019-1, Class D, 4.040%, 8/15/2025 | | | 2,470,020 | |
| | 525,000 | | | Credit Acceptance Auto Loan Trust, Series 2017-3A, Class C, 3.480%, 10/15/2026, 144A(a) | | | 529,518 | |
| | 1,205,000 | | | Credit Acceptance Auto Loan Trust, Series 2018-2A, Class C, 4.160%, 9/15/2027, 144A(a) | | | 1,236,340 | |
| | 4,745,000 | | | Credit Acceptance Auto Loan Trust, Series 2019-1A, Class C, 3.940%, 6/15/2028, 144A(a) | | | 4,959,980 | |
| | 1,180,000 | | | Credit Acceptance Auto Loan Trust, Series 2020-3A, Class C, 2.280%, 2/15/2030, 144A(a) | | | 1,198,271 | |
| | 195,000 | | | Drive Auto Receivables Trust, Series 2018-3, Class D, 4.300%, 9/16/2024(a) | | | 201,848 | |
| | 2,395,000 | | | Drive Auto Receivables Trust, Series 2018-5, Class D, 4.300%, 4/15/2026(a) | | | 2,528,567 | |
| | 1,330,000 | | | Drive Auto Receivables Trust, Series 2019-1, Class D, 4.090%, 6/15/2026(a) | | | 1,393,132 | |
| | 1,655,000 | | | DT Auto Owner Trust, Series 2019-2A, Class D, 3.480%, 2/18/2025, 144A(a) | | | 1,709,728 | |
| | 1,110,000 | | | DT Auto Owner Trust, Series 2020-3A, Class D, 1.840%, 6/15/2026, 144A | | | 1,130,596 | |
| | 1,265,000 | | | Exeter Automobile Receivables Trust, Series 2020-2A, Class D, 4.730%, 4/15/2026, 144A(a) | | | 1,374,245 | |
| | 800,000 | | | Exeter Automobile Receivables Trust, Series 2020-3A, Class C, 1.320%, 7/15/2025(a) | | | 804,167 | |
| | 635,000 | | | First Investors Auto Owner Trust , Series 2019-2A, Class D, 2.800%, 12/15/2025, 144A | | | 653,213 | |
| | 1,475,000 | | | First Investors Auto Owner Trust , Series 2019-2A, Class E, 3.880%, 1/15/2026, 144A | | | 1,507,764 | |
| | 3,305,000 | | | Flagship Credit Auto Trust, Series 2019-2, Class D, 3.530%, 5/15/2025, 144A(a) | | | 3,483,878 | |
| | | | ABS Car Loan — continued | |
| 1,165,822 | | | GLS Auto Receivables Trust, Series 2018-3A, Class B, 3.780%, 8/15/2023, 144A(a) | | | 1,184,845 | |
| | 5,030,000 | | | GLS Auto Receivables Trust, Series 2019-2A, Class C, 3.540%, 2/18/2025, 144A(a) | | | 5,254,335 | |
| | 4,540,000 | | | GLS Auto Receivables Trust, Series 2020-3A, Class C, 1.920%, 5/15/2025, 144A(a) | | | 4,630,877 | |
| | 2,590,000 | | | NextGear Floorplan Master Owner Trust, Series 2018-1A, Class A1, 1-month LIBOR + 0.640%, 0.799%, 2/15/2023, 144A(a)(b) | | | 2,591,183 | |
| | 910,000 | | | Prestige Auto Receivables Trust, Series 2019-1A, Class E, 3.900%, 5/15/2026, 144A | | | 937,299 | |
| | 3,210,000 | | | Santander Drive Auto Receivables Trust, Series 2020-1, Class D, 5.350%, 3/15/2028(a) | | | 3,576,730 | |
| | 4,140,000 | | | Santander Drive Auto Receivables Trust, Series 2019-2, Class D, 3.220%, 7/15/2025(a) | | | 4,305,327 | |
| | 1,140,000 | | | Santander Drive Auto Receivables Trust, Series 2020-2, Class D, 2.220%, 9/15/2026(a) | | | 1,174,352 | |
| | 353,000 | | | Tidewater Auto Receivables Trust, Series 2018-AA, Class D, 4.300%, 11/15/2024, 144A(a) | | | 361,226 | |
| | 1,675,000 | | | Westlake Automobile Receivables Trust, Series 2020-3A, Class D, 1.650%, 2/17/2026, 144A | | | 1,694,999 | |
| | | | | | | | |
| | | | | | | 71,872,793 | |
| | | | | | | | |
| | | | ABS Credit Card — 0.6% | |
| | 640,000 | | | Genesis Sales Finance Master Trust, Series 2019-AA, Class A, 4.680%, 8/20/2023, 144A(a) | | | 642,891 | |
| | 6,995,000 | | | World Financial Network Credit Card Master Trust, Series 2019-C, Class M, 2.710%, 7/15/2026(a) | | | 7,215,579 | |
| | | | | | | | |
| | | | | | | 7,858,470 | |
| | | | | | | | |
| | | | ABS Home Equity — 6.9% | |
| | 958,144 | | | Ajax Mortgage Loan Trust, Series 2017-B, Class A, 3.163%, 9/25/2056, 144A(a)(c) | | | 960,411 | |
| | 237,740 | | | Alternative Loan Trust, Series 2004-16CB, Class 1A1, 5.500%, 7/25/2034(a) | | | 245,319 | |
| | 270,396 | | | Alternative Loan Trust, Series 2004-16CB, Class 3A1, 5.500%, 8/25/2034(a) | | | 279,374 | |
| | 370,569 | | | Alternative Loan Trust, Series 2005-J1, Class 2A1, 5.500%, 2/25/2025 | | | 375,647 | |
| | 300,000 | | | American Homes 4 Rent, Series 2014-SFR2, Class D, 5.149%, 10/17/2036, 144A(a) | | | 327,540 | |
| | 2,170,000 | | | American Homes 4 Rent, Series 2014-SFR2, Class E, 6.231%, 10/17/2036, 144A(a) | | | 2,407,805 | |
| | 1,200,000 | | | American Homes 4 Rent, Series 2014-SFR3, Class E, 6.418%, 12/17/2036, 144A(a) | | | 1,344,685 | |
| | 3,138,000 | | | American Homes 4 Rent, Series 2015-SFR1, Class E, 5.639%, 4/17/2052, 144A(a) | | | 3,491,512 | |
| | 401,923 | | | Banc of America Alternative Loan Trust, Series 2003-8, Class 1CB1, 5.500%, 10/25/2033 | | | 403,783 | |
| | 421,987 | | | Banc of America Funding Trust, Series 2005-7, Class 3A1, 5.750%, 11/25/2035 | | | 458,427 | |
| | 219,940 | | | Banc of America Funding Trust, Series 2007-4, Class 5A1, 5.500%, 11/25/2034 | | | 220,138 | |
| | 1,506,179 | | | Bayview Opportunity Master Fund V Trust, Series 2020-RN3, Class A1, 3.228%, 9/25/2035, 144A(c) | | | 1,520,299 | |
| | 1,084,489 | | | Citigroup Mortgage Loan Trust, Series 2018-A, Class A1, 4.000%, 1/25/2068, 144A(c) | | | 1,089,136 | |
| | 2,564,531 | | | Citigroup Mortgage Loan Trust, Series 2018-C, Class A1, 4.125%, 3/25/2059, 144A(c) | | | 2,564,740 | |
See accompanying notes to financial statements.
| 48
Portfolio of Investments – as of December 31, 2020
Loomis Sayles Strategic Alpha Fund – (continued)
| | | | | | | | |
Principal
Amount (‡) | | | Description | | Value (†) | |
| | | | ABS Home Equity — continued | |
| $ | 1,984,376 | | | Citigroup Mortgage Loan Trust, Series 2019-B, Class A1, 3.258%, 4/25/2066, 144A(c) | | $ | 2,025,429 | |
| | 3,835,455 | | | Citigroup Mortgage Loan Trust, Series 2019-E, Class A1, 3.228%, 11/25/2070, 144A(a)(c) | | | 3,854,034 | |
| | 496,989 | | | Colony American Finance Ltd., Series 2016-1, Class C, 4.638%, 6/15/2048, 144A(a)(c) | | | 496,391 | |
| | 1,304,000 | | | Connecticut Avenue Securities Trust, Series 2020-R01, Class 1M2, 1-month LIBOR + 2.050%, 2.198%, 1/25/2040, 144A(b) | | | 1,297,090 | |
| | 1,830,000 | | | CoreVest American Finance Ltd., Series 2019-2, Class B, 3.424%, 6/15/2052, 144A(a) | | | 1,958,812 | |
| | 1,340,000 | | | Corevest American Finance Trust, Series 2020-4, Class C, 2.250%, 12/15/2052, 144A | | | 1,348,070 | |
| | 395,025 | | | Countrywide Alternative Loan Trust, Series 2003-22CB, Class 1A1, 5.750%, 12/25/2033(a) | | | 411,388 | |
| | 657,790 | | | Countrywide Alternative Loan Trust, Series 2004-J10, Class 2CB1, 6.000%, 9/25/2034 | | | 688,974 | |
| | 45,426 | | | Countrywide Home Loan Mortgage Pass Through Trust, Series 2004-HYB4, Class 2A1, 2.967%, 9/20/2034(a)(c) | | | 44,549 | |
| | 4,055,000 | | | Credit Suisse Mortgage Trust, Series 2018-RPL8, Class A2, 4.164%, 7/25/2058, 144A(c) | | | 4,055,750 | |
| | 2,479,844 | | | Credit Suisse Mortgage Trust, Series 2019-RP10, Class A1, 3.089%, 12/26/2059, 144A(c) | | | 2,486,691 | |
| | 1,844,656 | | | Credit Suisse Mortgage Trust, Series 2020-RPL3, Class A1, 2.691%, 3/25/2060, 144A(c) | | | 1,846,592 | |
| | 162,259 | | | CSFB Mortgage-Backed Pass-Through Certificates, Series 2003-27, Class 4A4, 5.750%, 11/25/2033(a) | | | 167,522 | |
| | 448,271 | | | DSLA Mortgage Loan Trust, Series 2005-AR5, Class 2A1A, 1-month LIBOR + 0.330%, 0.482%, 9/19/2045(b) | | | 336,473 | |
| | 1,236,688 | | | Dukinfield II PLC, Series 2, Class A, GBP 3-month LIBOR + 1.250%, 1.284%, 12/20/2052, (GBP)(a)(b) | | | 1,696,572 | |
| | 1,097,613 | | | Federal National Mortgage Association Connecticut Avenue Securities, Series 2017-C05, Class 1M2, 1-month LIBOR + 2.200%, 2.348%, 1/25/2030(b) | | | 1,096,226 | |
| | 1,715,000 | | | FirstKey Homes Trust, Series 2020-SFR1, Class E, 2.791%, 8/17/2037, 144A | | | 1,747,569 | |
| | 4,165,000 | | | FirstKey Homes Trust, Series 2020-SFR2, Class E, 2.668%, 10/19/2037, 144A | | | 4,153,530 | |
| | 112,468 | | | Freddie Mac Structured Agency Credit Risk Debt Notes, Series 2018-DNA1, Class M2, 1-month LIBOR + 1.800%, 1.948%, 7/25/2030(b) | | | 111,509 | |
| | 4,435,000 | | | GCAT LLC, Series 2020-4, Class A1, 2.611%, 12/25/2025, 144A(c) | | | 4,434,446 | |
| | 522,341 | | | IndyMac Index Mortgage Loan Trust, Series 2004-AR7, Class A5, 1-month LIBOR + 1.220%, 1.368%, 9/25/2034(b) | | | 491,994 | |
| | 2,245,066 | | | IndyMac Index Mortgage Loan Trust, Series 2006-AR2, Class 2A1, 1-month LIBOR + 0.420%, 0.568%, 2/25/2046(b) | | | 1,799,570 | |
| | 1,080,838 | | | JPMorgan Mortgage Trust, Series 2004-S1, Class 2A1, 6.000%, 9/25/2034 | | | 1,142,645 | |
| | 3,233,746 | | | Legacy Mortgage Asset Trust, Series 2018-GS2, Class A1, 4.000%, 4/25/2058, 144A(c) | | | 3,254,715 | |
| | 2,130,251 | | | Legacy Mortgage Asset Trust, Series 2019-GS3, Class A1, 3.750%, 4/25/2059, 144A(c) | | | 2,150,248 | |
| | 1,929,323 | | | Legacy Mortgage Asset Trust, Series 2020-GS1, Class A1, 2.882%, 10/25/2059, 144A(c) | | | 1,935,224 | |
| | 839,108 | | | Legacy Mortgage Asset Trust, Series 2020-GS5, Class A1, 3.250%, 6/25/2060, 144A | | | 845,074 | |
| | | | ABS Home Equity — continued | |
| 386,176 | | | Lehman XS Trust, Series 2006-2N, Class 1A1, 1-month LIBOR + 0.520%, 0.668%, 2/25/2046(b) | | | 346,437 | |
| | 181,107 | | | MASTR Adjustable Rate Mortgages Trust, Series 2004-4, Class 5A1, 3.375%, 5/25/2034(a)(c) | | | 181,345 | |
| | 253,435 | | | MASTR Alternative Loan Trust, Series 2003-9, Class 4A1, 5.250%, 11/25/2033(a) | | | 261,175 | |
| | 223,039 | | | MASTR Alternative Loan Trust, Series 2004-5, Class 1A1, 5.500%, 6/25/2034(a) | | | 229,357 | |
| | 282,721 | | | MASTR Alternative Loan Trust, Series 2004-5, Class 2A1, 6.000%, 6/25/2034(a) | | | 293,413 | |
| | 751,617 | | | MASTR Alternative Loan Trust, Series 2004-8, Class 2A1, 6.000%, 9/25/2034 | | | 777,126 | |
| | 43,190 | | | Merrill Lynch Mortgage Investors Trust, Series 2006-2, Class 2A, 2.403%, 5/25/2036(a)(c) | | | 43,338 | |
| | 368,514 | | | Morgan Stanley Mortgage Loan Trust, Series 2005-7, Class 4A2, 5.500%, 11/25/2035 | | | 325,623 | |
| | 753,969 | | | Morgan Stanley Mortgage Loan Trust, Series 2005-7, Class 7A5, 5.500%, 11/25/2035 | | | 750,279 | |
| | 1,565,673 | | | Preston Ridge Partners Mortgage LLC, Series 2019-4A, Class A1, 3.351%, 11/25/2024, 144A(c) | | | 1,568,258 | |
| | 3,395,174 | | | Preston Ridge Partners Mortgage LLC, Series 2020-1A, Class A1, 2.981%, 2/25/2025, 144A(a)(c) | | | 3,402,749 | |
| | 5,598,650 | | | Preston Ridge Partners Mortgage LLC, Series 2020-5, Class A1, 3.104%, 11/25/2025, 144A(c) | | | 5,632,153 | |
| | 564,000 | | | Progress Residential Trust, Series 2018-SFR2, Class E, 4.656%, 8/17/2035, 144A | | | 573,512 | |
| | 715,000 | | | Progress Residential Trust, Series 2018-SFR3, Class E, 4.873%, 10/17/2035, 144A | | | 731,767 | |
| | 2,398,000 | | | Progress Residential Trust, Series 2019-SFR1, Class E, 4.466%, 8/17/2035, 144A | | | 2,471,824 | |
| | 1,005,000 | | | Progress Residential Trust, Series 2019-SFR3, Class D, 2.871%, 9/17/2036, 144A | | | 1,019,101 | |
| | 785,000 | | | Progress Residential Trust, Series 2020-SFR3, Class E, 2.296%, 10/17/2027, 144A | | | 785,910 | |
| | 1,452,009 | | | RCO V Mortgage LLC, Series 2020-1, Class A1, 3.105%, 9/25/2025, 144A(c) | | | 1,454,553 | |
| | 2,589,997 | | | Structured Adjustable Rate Mortgage Loan Trust, Series 2005-14, Class A1, 1-month LIBOR + 0.310%, 0.458%, 7/25/2035(b) | | | 1,877,605 | |
| | 545,893 | | | Towd Point Mortgage Trust, Series 2015-2, Class 1A13, 2.500%, 11/25/2060, 144A(a)(c) | | | 547,149 | |
| | 1,040,000 | | | Tricon American Homes, Series 2020-SFR1, Class E, 3.544%, 7/17/2038, 144A | | | 1,074,409 | |
| | 1,170,000 | | | Tricon American Homes Trust, Series 2020-SFR2, Class E1, 2.730%, 11/17/2039, 144A | | | 1,158,375 | |
| | 3,231,004 | | | Vericrest Opportunity Loan Trust, Series 2019-NPL5, Class A1A, 3.352%, 9/25/2049, 144A(c) | | | 3,235,141 | |
| | 1,022,543 | | | Vericrest Opportunity Loan Trust, Series 2019-NPL9, Class A1A, 3.327%, 11/26/2049, 144A(c) | | | 1,025,471 | |
| | | | | | | | |
| | | | | | | 91,331,973 | |
| | | | | | | | |
| | | | ABS Other — 4.9% | |
| | 634,706 | | | Accelerated Assets LLC, Series 2018-1, Class B, 4.510%, 12/02/2033, 144A | | | 648,580 | |
| | 2,218,114 | | | AIM Aviation Finance Ltd., Series 2015-1A, Class B1, 5.072%, 2/15/2040, 144A(c) | | | 930,532 | |
| | 350,000 | | | Ascentium Equipment Receivables Trust, Series 2017-2A, Class C, 2.870%, 8/10/2022, 144A(a) | | | 355,614 | |
See accompanying notes to financial statements.
49 |
Portfolio of Investments – as of December 31, 2020
Loomis Sayles Strategic Alpha Fund – (continued)
| | | | | | | | |
Principal
Amount (‡) | | | Description | | Value (†) | |
| | | | ABS Other — continued | |
| $ | 937,398 | | | Blackbird Capital Aircraft Lease Securitization Ltd., Series 2016-1A, Class A, 4.213%, 12/16/2041, 144A(a)(c) | | $ | 893,373 | |
| | 1,266,094 | | | Blackbird Capital Aircraft Lease Securitization Ltd., Series 2016-1A, Class B, 5.682%, 12/16/2041, 144A(a)(c) | | | 1,102,680 | |
| | 250,000 | | | CCG Receivables Trust, Series 2018-1, Class C, 3.420%, 6/16/2025, 144A(a) | | | 252,501 | |
| | 580,000 | | | Chesapeake Funding II LLC, Series 2017-2A, Class D, 3.710%, 5/15/2029, 144A | | | 582,879 | |
| | 775,000 | | | Chesapeake Funding II LLC, Series 2017-4A, Class D, 3.260%, 11/15/2029, 144A | | | 785,742 | |
| | 790,000 | | | Chesapeake Funding II LLC, Series 2018-1A, Class C, 3.570%, 4/15/2030, 144A(a) | | | 806,406 | |
| | 2,125,000 | | | Chesapeake Funding II LLC, Series 2018-1A, Class D, 3.920%, 4/15/2030, 144A | | | 2,169,425 | |
| | 281,432 | | | Diamond Resorts Owner Trust, Series 2017-1A, Class C, 6.070%, 10/22/2029, 144A | | | 287,000 | |
| | 1,106,483 | | | Diamond Resorts Owner Trust, Series 2018-1, Class C, 4.530%, 1/21/2031, 144A | | | 1,132,694 | |
| | 1,513,262 | | | Diamond Resorts Owner Trust, Series 2019-1, Class B, 3.530%, 2/20/2032, 144A(a) | | | 1,550,105 | |
| | 3,100,000 | | | Fairstone Financial Issuance Trust I, Series 2019-1A, Class A, 3.948%, 3/21/2033, 144A, (CAD)(a) | | | 2,457,083 | |
| | 2,267,063 | | | GCA2014 Holdings Ltd., Series 2014-1, Class C, 6.000%, 1/05/2030, 144A(d)(e)(f)(g) | | | 765,157 | |
| | 1,027,860 | | | GCA2014 Holdings Ltd., Series 2014-1, Class D, 7.500%, 1/05/2030, 144A(d)(e)(f)(g) | | | 138,946 | |
| | 3,410,000 | | | GCA2014 Holdings Ltd., Series 2014-1, Class E, Zero Coupon, 1/05/2030, 144A(d)(e)(f)(g)(h) | | | — | |
| | 659,470 | | | Global Container Assets Ltd., Series 2015-1A, Class B, 4.500%, 2/05/2030, 144A(d)(e)(i) | | | 571,140 | |
| | 472,942 | | | Hilton Grand Vacations Trust, Series 2018-AA, Class C, 4.000%, 2/25/2032, 144A(a) | | | 493,047 | |
| | 4,460,362 | | | Horizon Aircraft Finance I Ltd., Series 2018-1, Class A, 4.458%, 12/15/2038, 144A(a) | | | 4,308,370 | |
| | 975,000 | | | HPEFS Equipment Trust, Series 2020-1A, Class D, 2.260%, 2/20/2030, 144A(a) | | | 984,436 | |
| | 5,900,000 | | | HPEFS Equipment Trust, Series 2020-2A, Class D, 2.790%, 7/22/2030, 144A(a) | | | 5,979,845 | |
| | 2,073,047 | | | Kestrel Aircraft Funding Ltd., Series 2018-1A, Class A, 4.250%, 12/15/2038, 144A(a) | | | 1,919,972 | |
| | 1,244,019 | | | MAPS Ltd., Series 2018-1A, Class A, 4.212%, 5/15/2043, 144A(a) | | | 1,185,515 | |
| | 1,712,048 | | | MAPS Ltd., Series 2018-1A, Class B, 5.193%, 5/15/2043, 144A | | | 1,422,198 | |
| | 472,165 | | | MVW LLC, Series 2020-1A, Class C, 4.210%, 10/20/2037, 144A | | | 501,579 | |
| | 464,106 | | | MVW Owner Trust, Series 2019-1A, Class C, 3.330%, 11/20/2036, 144A(a) | | | 472,358 | |
| | 3,120,000 | | | OneMain Financial Issuance Trust, Series 2015-3A, Class B, 4.160%, 11/20/2028, 144A(a) | | | 3,124,954 | |
| | 3,230,000 | | | OneMain Financial Issuance Trust, Series 2019-1A, Class D, 4.220%, 2/14/2031, 144A(a) | | | 3,337,584 | |
| | 1,110,000 | | | OneMain Financial Issuance Trust, Series 2020-1A, Class B, 4.830%, 5/14/2032, 144A(a) | | | 1,187,243 | |
| | 1,020,000 | | | OneMain Financial Issuance Trust, Series 2020-2A, Class C, 2.760%, 9/14/2035, 144A(a) | | | 1,044,272 | |
| | | | ABS Other — continued | |
| 3,980,000 | | | Republic Finance Issuance Trust, Series 2019-A, Class A, 3.430%, 11/22/2027, 144A(a) | | | 4,041,936 | |
| | 4,026,636 | | | S-Jets Ltd., Series 2017-1, Class A, 3.967%, 8/15/2042, 144A(a) | | | 3,907,224 | |
| | 3,718,000 | | | SCF Equipment Trust LLC, Series 2018-1A, Class C, 4.210%, 4/20/2027, 144A(a) | | | 3,747,422 | |
| | 523,313 | | | Sierra Timeshare Receivables Funding LLC, Series 2020-2A, Class C, 3.510%, 7/20/2037, 144A | | | 534,092 | |
| | 580,000 | | | SoFi Consumer Loan Program Trust, Series 2018-1, Class B, 3.650%, 2/25/2027, 144A(a) | | | 596,654 | |
| | 1,690,000 | | | SoFi Consumer Loan Program Trust, Series 2018-2, Class B, 3.790%, 4/26/2027, 144A(a) | | | 1,726,737 | |
| | 1,010,000 | | | SoFi Consumer Loan Program Trust, Series 2018-4, Class C, 4.170%, 11/26/2027, 144A(a) | | | 1,035,213 | |
| | 3,783,546 | | | SpringCastle America Funding LLC, Series 2020-AA, Class A, 1.970%, 9/25/2037, 144A(a) | | | 3,811,465 | |
| | 533,846 | | | Sprite Ltd., Series 2017-1, Class A, 4.250%, 12/15/2037, 144A | | | 503,875 | |
| | 1,021,957 | | | Sprite Ltd., Series 2017-1, Class B, 5.750%, 12/15/2037, 144A | | | 777,000 | |
| | 424,637 | | | Textainer Marine Containers VII Ltd., Series 2020-1A, Class A, 2.730%, 8/21/2045, 144A(a) | | | 436,300 | |
| | 1,037,652 | | | Wave LLC, Series 2017-1A, Class B, 5.682%, 11/15/2042, 144A | | | 821,590 | |
| | 809,466 | | | Willis Engine Structured Trust V, Series 2020-A, Class A, 3.228%, 3/15/2045, 144A(a) | | | 691,737 | |
| | | | | | | | |
| | | | | | | 64,022,475 | |
| | | | | | | | |
| | | | ABS Student Loan — 1.2% | |
| | 2,307,071 | | | Education Funding Trust, Series 2020-A, Class A, 2.790%, 7/25/2041, 144A(a) | | | 2,383,862 | |
| | 3,410,000 | | | Navient Private Education Refi Loan Trust, Series 2019-FA, Class B, 3.120%, 8/15/2068, 144A(a) | | | 3,510,926 | |
| | 1,035,000 | | | Navient Private Education Refi Loan Trust, Series 2018-A, Class B, 3.680%, 2/18/2042, 144A(a) | | | 1,056,393 | |
| | 695,000 | | | Navient Private Education Refi Loan Trust, Series 2019-GA, Class B, 3.080%, 10/15/2068, 144A(a) | | | 721,735 | |
| | 840,000 | | | Navient Private Education Refi Loan Trust, Series 2020-FA, Class B, 2.690%, 7/15/2069, 144A(a) | | | 847,502 | |
| | 639,000 | | | SLM Private Credit Student Loan Trust, Series 2003-A, Class A3, 28-day ARS, 3.180%, 6/15/2032(a)(b) | | | 635,305 | |
| | 1,814,000 | | | SLM Private Credit Student Loan Trust, Series 2003-B, Class A3, 3.200%, 3/15/2033(a)(c) | | | 1,802,022 | |
| | 195,000 | | | SLM Private Credit Student Loan Trust, Series 2003-B, Class A4, 28-day ARS, 3.658%, 3/15/2033(a)(b) | | | 193,712 | |
| | 800,000 | | | SMB Private Education Loan Trust, Series 2015-C, Class B, 3.500%, 9/15/2043, 144A(a) | | | 837,939 | |
| | 921,246 | | | SMB Private Education Loan Trust, Series 2017-B, Class A2B, 1-month LIBOR + 0.750%, 0.909%, 10/15/2035, 144A(a)(b) | | | 921,042 | |
See accompanying notes to financial statements.
| 50
Portfolio of Investments – as of December 31, 2020
Loomis Sayles Strategic Alpha Fund – (continued)
| | | | | | | | |
Principal
Amount (‡) | | | Description | | Value (†) | |
| | | | ABS Student Loan — continued | |
| $ | 190,000 | | | SMB Private Education Loan Trust, Series 2018-B, Class B, 4.000%, 7/15/2042, 144A(a) | | $ | 202,128 | |
| | 510,000 | | | SMB Private Education Loan Trust, Series 2018-C, Class B, 4.000%, 11/17/2042, 144A(a) | | | 537,696 | |
| | 569,421 | | | SoFi Professional Loan Program LLC, Series 2016-A, Class B, 3.570%, 1/26/2038, 144A(a) | | | 579,615 | |
| | 125,000 | | | SoFi Professional Loan Program LLC, Series 2016-C, Class B, 3.350%, 5/25/2037, 144A(a)(c) | | | 127,749 | |
| | 1,350,000 | | | SoFi Professional Loan Program Trust, Series 2020-A, Class BFX, 3.120%, 5/15/2046, 144A(a) | | | 1,395,108 | |
| | | | | | | | |
| | | | | | | 15,752,734 | |
| | | | | | | | |
| | | | ABS Whole Business — 1.8% | |
| | 4,170,205 | | | Adams Outdoor Advertising LP, Series 2018-1, Class A, 4.810%, 11/15/2048, 144A(a) | | | 4,397,283 | |
| | 982,538 | | | Arbys Funding LLC, Series 2020-1A, Class A2, 3.237%, 7/30/2050, 144A | | | 1,000,788 | |
| | 1,650,150 | | | Coinstar Funding LLC, Series 2017-1A, Class A2, 5.216%, 4/25/2047, 144A | | | 1,609,343 | |
| | 493,750 | | | DB Master Finance LLC, Series 2019-1A, Class A23, 4.352%, 5/20/2049, 144A | | | 533,571 | |
| | 2,821,730 | | | Domino’s Pizza Master Issuer LLC, Series 2017-1A, Class A23, 4.118%, 7/25/2047, 144A(a) | | | 3,022,919 | |
| | 1,165,000 | | | Hardee’s Funding LLC, Series 2020-1A, Class A2, 3.981%, 12/20/2050, 144A | | | 1,195,096 | |
| | 1,178,865 | | | Planet Fitness Master Issuer LLC, Series 2018-1A, Class A2I, 4.262%, 9/05/2048, 144A | | | 1,175,741 | |
| | 2,687,850 | | | Planet Fitness Master Issuer LLC, Series 2019-1A, Class A2, 3.858%, 12/05/2049, 144A | | | 2,534,804 | |
| | 2,562,150 | | | Stack Infrastructure Issuer LLC, Series 2019-1A, Class A2, 4.540%, 2/25/2044, 144A(a) | | | 2,744,206 | |
| | 3,341,650 | | | Wendy’s Funding LLC, Series 2018-1A, Class A2II, 3.884%, 3/15/2048, 144A(a) | | | 3,545,792 | |
| | 709,275 | | | Wendy’s Funding LLC, Series 2019-1A, Class A2II, 4.080%, 6/15/2049, 144A | | | 757,008 | |
| | 900,000 | | | Wingstop Funding LLC, Series 2020-1A, Class A2, 2.841%, 12/05/2050, 144A | | | 918,243 | |
| | | | | | | | |
| | | | | | | 23,434,794 | |
| | | | | | | | |
| | | | Aerospace & Defense — 3.1% | |
| | 1,635,000 | | | Boeing Co. (The), 2.250%, 6/15/2026 | | | 1,673,439 | |
| | 700,000 | | | Boeing Co. (The), 2.950%, 2/01/2030 | | | 723,982 | |
| | 70,000 | | | Boeing Co. (The), 3.100%, 5/01/2026 | | | 74,956 | |
| | 290,000 | | | Boeing Co. (The), 3.250%, 2/01/2035 | | | 297,396 | |
| | 1,065,000 | | | Boeing Co. (The), 3.375%, 6/15/2046 | | | 1,039,235 | |
| | 30,000 | | | Boeing Co. (The), 3.550%, 3/01/2038 | | | 30,606 | |
| | 90,000 | | | Boeing Co. (The), 3.625%, 3/01/2048 | | | 90,743 | |
| | 295,000 | | | Boeing Co. (The), 3.650%, 3/01/2047 | | | 298,610 | |
| | 2,135,000 | | | Boeing Co. (The), 3.750%, 2/01/2050 | | | 2,232,783 | |
| | 375,000 | | | Boeing Co. (The), 3.825%, 3/01/2059 | | | 380,929 | |
| | 325,000 | | | Boeing Co. (The), 3.850%, 11/01/2048 | | | 335,224 | |
| | 1,420,000 | | | Boeing Co. (The), 3.900%, 5/01/2049 | | | 1,506,921 | |
| | 575,000 | | | Boeing Co. (The), 3.950%, 8/01/2059 | | | 615,398 | |
| | 3,185,000 | | | Boeing Co. (The), 5.150%, 5/01/2030(a) | | | 3,854,651 | |
| | 1,105,000 | | | Boeing Co. (The), 5.705%, 5/01/2040 | | | 1,433,981 | |
| | 8,950,000 | | | Boeing Co. (The), 5.805%, 5/01/2050(a) | | | 12,334,398 | |
| | | | Aerospace & Defense — continued | |
| 1,685,000 | | | Boeing Co. (The), 5.930%, 5/01/2060 | | | 2,390,331 | |
| | 1,430,000 | | | Embraer Netherlands Finance BV, 5.050%, 6/15/2025 | | | 1,515,814 | |
| | 895,000 | | | Embraer Netherlands Finance BV, 5.400%, 2/01/2027 | | | 950,947 | |
| | 2,550,000 | | | Leonardo U.S. Holdings, Inc., 6.250%, 1/15/2040, 144A | | | 3,021,291 | |
| | 305,000 | | | Spirit AeroSystems, Inc., 4.600%, 6/15/2028 | | | 301,569 | |
| | 2,580,000 | | | Spirit AeroSystems, Inc., 7.500%, 4/15/2025, 144A | | | 2,767,050 | |
| | 3,010,000 | | | TransDigm, Inc., 6.250%, 3/15/2026, 144A | | | 3,205,650 | |
| | | | | | | | |
| | | | | | | 41,075,904 | |
| | | | | | | | |
| | | | Airlines — 0.5% | |
| | 6,644,106 | | | United Airlines Pass Through Trust, Series 2019-2, Class B, 3.500%, 11/01/2029(a) | | | 6,179,018 | |
| | | | | | | | |
| | | | Automotive — 2.0% | |
| | 1,775,000 | | | Allison Transmission, Inc., 3.750%, 1/30/2031, 144A | | | 1,816,047 | |
| | 2,960,000 | | | FCE Bank PLC, EMTN, 0.869%, 9/13/2021, (EUR) | | | 3,607,044 | |
| | 370,000 | | | FCE Bank PLC, EMTN, 1.134%, 2/10/2022, (EUR) | | | 450,881 | |
| | 1,580,000 | | | FCE Bank PLC, EMTN, 1.875%, 6/24/2021, (EUR) | | | 1,930,207 | |
| | 1,530,000 | | | Ford Motor Co., 8.500%, 4/21/2023 | | | 1,722,030 | |
| | 1,800,000 | | | Ford Motor Co., 9.000%, 4/22/2025 | | | 2,206,818 | |
| | 400,000 | | | Ford Motor Co., 9.625%, 4/22/2030 | | | 564,500 | |
| | 655,000 | | | Ford Motor Credit Co. LLC, 1.514%, 2/17/2023, (EUR) | | | 797,638 | |
| | 2,530,000 | | | General Motors Co., 5.400%, 4/01/2048 | | | 3,186,106 | |
| | 7,195,000 | | | General Motors Co., 5.950%, 4/01/2049(a) | | | 9,730,666 | |
| | | | | | | | |
| | | | | | | 26,011,937 | |
| | | | | | | | |
| | | | Banking — 2.6% | |
| | 345,000 | | | Ally Financial, Inc., 3.875%, 5/21/2024 | | | 378,032 | |
| | 325,000 | | | Ally Financial, Inc., 4.625%, 3/30/2025 | | | 370,440 | |
| | 2,000,000 | | | Ally Financial, Inc., 5.750%, 11/20/2025 | | | 2,328,483 | |
| | 44,570,000 | | | Banco Hipotecario S.A., Argentina Deposit Rates Badlar Pvt Banks + 4.000%, 35.750%, 11/07/2022, 144A, (ARS)(b) | | | 299,223 | |
| | 21,970,000 | | | Banco Macro S.A., 17.500%, 5/08/2022, 144A, (ARS) | | | 111,334 | |
| | 1,200,000 | | | Banco Santander S.A., 2.749%, 12/03/2030(a) | | | 1,236,872 | |
| | 4,460,000 | | | Barclays PLC, (fixed rate to 9/23/2030, variable rate thereafter), 3.564%, 9/23/2035(a) | | | 4,832,588 | |
| | 685,000 | | | BBVA Bancomer S.A., 1.875%, 9/18/2025, 144A(a) | | | 691,850 | |
| | 1,430,000 | | | Danske Bank A/S, (fixed rate to 12/20/2024, variable rate thereafter), 3.244%, 12/20/2025, 144A(a) | | | 1,530,233 | |
| | 1,265,000 | | | Deutsche Bank AG, (fixed rate to 9/18/2030, variable rate thereafter), 3.547%, 9/18/2031 | | | 1,370,933 | |
| | 6,690,000 | | | JPMorgan Chase & Co., (fixed rate to 3/24/2030, variable rate thereafter), 4.493%, 3/24/2031(a) | | | 8,229,556 | |
| | 5,195,000 | | | Societe Generale S.A., (fixed rate to 7/08/2030, variable rate thereafter), 3.653%, 7/08/2035, 144A(a) | | | 5,625,619 | |
| | 3,550,000 | | | Standard Chartered PLC, (fixed rate to 11/18/2030, variable rate thereafter), 3.265%, 2/18/2036, 144A(a) | | | 3,716,784 | |
| | 1,100,000 | | | Standard Chartered PLC, (fixed rate to 4/01/2030, variable rate thereafter), 4.644%, 4/01/2031, 144A(a) | | | 1,330,670 | |
| | 2,255,000 | | | UniCredit SpA, (fixed rate to 9/22/2025, variable rate thereafter), 2.569%, 9/22/2026, 144A | | | 2,301,577 | |
| | | | | | | | |
| | | | | | | 34,354,194 | |
| | | | | | | | |
See accompanying notes to financial statements.
51 |
Portfolio of Investments – as of December 31, 2020
Loomis Sayles Strategic Alpha Fund – (continued)
| | | | | | | | |
Principal
Amount (‡) | | | Description | | Value (†) | |
| | | | Building Materials — 0.9% | |
| $ | 1,915,000 | | | Builders FirstSource, Inc., 6.750%, 6/01/2027, 144A | | $ | 2,077,220 | |
| | 3,360,000 | | | Cemex SAB de CV, 5.200%, 9/17/2030, 144A | | | 3,684,240 | |
| | 1,725,000 | | | Cemex SAB de CV, 5.450%, 11/19/2029, 144A | | | 1,897,517 | |
| | 615,000 | | | Cemex SAB de CV, 5.700%, 1/11/2025, 144A | | | 628,530 | |
| | 210,000 | | | Cemex SAB de CV, 7.750%, 4/16/2026, 144A | | | 221,445 | |
| | 1,970,000 | | | Standard Industries, Inc., 4.375%, 7/15/2030, 144A | | | 2,107,368 | |
| | 805,000 | | | Vulcan Materials Co., 3.500%, 6/01/2030(a) | | | 924,632 | |
| | | | | | | | |
| | | | | | | 11,540,952 | |
| | | | | | | | |
| | | | Cable Satellite — 1.8% | |
| | 5,670,000 | | | CCO Holdings LLC/CCO Holdings Capital Corp., 4.250%, 2/01/2031, 144A | | | 5,974,366 | |
| | 1,585,000 | | | CCO Holdings LLC/CCO Holdings Capital Corp., 4.500%, 8/15/2030, 144A | | | 1,682,081 | |
| | 1,050,000 | | | CCO Holdings LLC/CCO Holdings Capital Corp., 4.500%, 5/01/2032, 144A | | | 1,121,106 | |
| | 310,000 | | | CCO Holdings LLC/CCO Holdings Capital Corp., 5.375%, 6/01/2029, 144A | | | 339,838 | |
| | 1,610,000 | | | CSC Holdings LLC, 4.125%, 12/01/2030, 144A | | | 1,683,416 | |
| | 2,710,000 | | | CSC Holdings LLC, 4.625%, 12/01/2030, 144A | | | 2,828,562 | |
| | 1,060,000 | | | CSC Holdings LLC, 6.500%, 2/01/2029, 144A | | | 1,196,793 | |
| | 265,000 | | | Sirius XM Radio, Inc., 4.625%, 7/15/2024, 144A | | | 274,606 | |
| | 1,355,000 | | | Sirius XM Radio, Inc., 5.000%, 8/01/2027, 144A | | | 1,439,701 | |
| | 485,000 | | | Sirius XM Radio, Inc., 5.375%, 7/15/2026, 144A | | | 505,613 | |
| | 110,000 | | | Sirius XM Radio, Inc., 5.500%, 7/01/2029, 144A | | | 121,034 | |
| | 1,660,000 | | | Virgin Media Finance PLC, 5.000%, 7/15/2030, 144A | | | 1,722,250 | |
| | 1,225,000 | | | Virgin Media Secured Finance PLC, 5.500%, 8/15/2026, 144A | | | 1,272,469 | |
| | 1,725,000 | | | Ziggo BV, 4.875%, 1/15/2030, 144A | | | 1,813,009 | |
| | 1,545,000 | | | Ziggo BV, 5.500%, 1/15/2027, 144A | | | 1,612,594 | |
| | | | | | | | |
| | | | | | | 23,587,438 | |
| | | | | | | | |
| | | | Chemicals — 0.4% | |
| | 1,910,000 | | | Braskem Netherlands Finance BV, 4.500%, 1/31/2030, 144A | | | 1,960,138 | |
| | 470,000 | | | Braskem Netherlands Finance BV, 5.875%, 1/31/2050, 144A | | | 485,867 | |
| | 2,305,000 | | | Nutrition & Biosciences, Inc., 2.300%, 11/01/2030, 144A | | | 2,374,201 | |
| | | | | | | | |
| | | | | | | 4,820,206 | |
| | | | | | | | |
| | | | Collateralized Mortgage Obligations — 0.1% | |
| | 695,432 | | | New Residential Mortgage Loan Trust, Series 2020-NPL2, Class A1, 3.228%, 8/25/2060, 144A(c) | | | 701,037 | |
| | | | | | | | |
| | | | Construction Machinery — 0.4% | |
| | 5,460,000 | | | United Rentals North America, Inc., 4.000%, 7/15/2030 | | | 5,746,650 | |
| | | | | | | | |
| | | | Consumer Cyclical Services — 2.5% | |
| | 3,325,000 | | | Booking Holdings, Inc., 4.625%, 4/13/2030(a) | | | 4,131,576 | |
| | 270,000 | | | eBay, Inc., 4.000%, 7/15/2042(a) | | | 307,399 | |
| | 6,190,000 | | | Expedia Group, Inc., 3.250%, 2/15/2030 | | | 6,442,187 | |
| | 730,000 | | | Expedia Group, Inc., 3.800%, 2/15/2028 | | | 784,117 | |
| | 1,375,000 | | | Expedia Group, Inc., 4.625%, 8/01/2027, 144A | | | 1,536,232 | |
| | 4,395,000 | | | Expedia Group, Inc., 6.250%, 5/01/2025, 144A | | | 5,094,247 | |
| | 2,250,000 | | | Expedia Group, Inc., 7.000%, 5/01/2025, 144A | | | 2,479,976 | |
| | 515,000 | | | Uber Technologies, Inc., 7.500%, 5/15/2025, 144A | | | 556,313 | |
| | 265,000 | | | Uber Technologies, Inc., 6.250%, 1/15/2028, 144A | | | 288,188 | |
| | 4,580,000 | | | Uber Technologies, Inc., 7.500%, 9/15/2027, 144A | | | 5,038,000 | |
| | 5,160,000 | | | Uber Technologies, Inc., 8.000%, 11/01/2026, 144A | | | 5,631,469 | |
| | | | | | | | |
| | | | | | | 32,289,704 | |
| | | | | | | | |
| | | | Consumer Products — 0.1% | |
| 930,000 | | | Kimberly-Clark de Mexico SAB de CV, 2.431%, 7/01/2031, 144A(a) | | | 960,709 | |
| | | | | | | | |
| | | | Diversified Manufacturing — 0.2% | |
| | 1,515,000 | | | General Electric Co., 3.625%, 5/01/2030(a) | | | 1,731,474 | |
| | 720,000 | | | General Electric Co., 4.350%, 5/01/2050(a) | | | 875,627 | |
| | | | | | | | |
| | | | | | | 2,607,101 | |
| | | | | | | | |
| | | | Electric — 2.0% | |
| | 965,000 | | | AES Corp. (The), 3.950%, 7/15/2030, 144A | | | 1,090,846 | |
| | 5,295,000 | | | Calpine Corp., 3.750%, 3/01/2031, 144A | | | 5,243,797 | |
| | 1,165,000 | | | Calpine Corp., 5.125%, 3/15/2028, 144A | | | 1,225,545 | |
| | 270,000 | | | IPALCO Enterprises, Inc., 4.250%, 5/01/2030, 144A | | | 311,697 | |
| | 480,000 | | | NRG Energy, Inc., 5.250%, 6/15/2029, 144A | | | 528,000 | |
| | 1,075,000 | | | NRG Energy, Inc., 5.750%, 1/15/2028 | | | 1,174,437 | |
| | 1,785,000 | | | Pacific Gas & Electric Co., 3.500%, 8/01/2050 | | | 1,774,131 | |
| | 2,135,000 | | | Pacific Gas & Electric Co., 4.300%, 3/15/2045 | | | 2,276,253 | |
| | 255,000 | | | Pacific Gas & Electric Co., 4.950%, 7/01/2050 | | | 303,862 | |
| | 605,000 | | | Southern California Edison Co., 3.650%, 2/01/2050(a) | | | 687,166 | |
| | 170,000 | | | Southern California Edison Co., 4.000%, 4/01/2047(a) | | | 199,682 | |
| | 215,000 | | | Southern California Edison Co., Series C, 4.125%, 3/01/2048(a) | | | 256,231 | |
| | 10,765,000 | | | Vistra Operations Co. LLC, 3.700%, 1/30/2027, 144A(a) | | | 11,870,418 | |
| | | | | | | | |
| | | | | | | 26,942,065 | |
| | | | | | | | |
| | | | Finance Companies — 4.2% | |
| | 905,000 | | | AerCap Ireland Capital DAC/AerCap Global Aviation Trust, 3.650%, 7/21/2027 | | | 983,439 | |
| | 2,430,000 | | | AerCap Ireland Capital DAC/AerCap Global Aviation Trust, 3.875%, 1/23/2028 | | | 2,617,304 | |
| | 2,745,000 | | | AerCap Ireland Capital DAC/AerCap Global Aviation Trust, 4.500%, 9/15/2023(a) | | | 2,976,191 | |
| | 1,140,000 | | | AerCap Ireland Capital DAC/AerCap Global Aviation Trust, 6.500%, 7/15/2025 | | | 1,362,812 | |
| | 5,165,000 | | | Air Lease Corp., 3.125%, 12/01/2030 | | | 5,376,659 | |
| | 2,755,000 | | | Air Lease Corp., 3.375%, 7/01/2025(a) | | | 2,962,722 | |
| | 6,000,000 | | | Aircastle Ltd., 4.250%, 6/15/2026(a) | | | 6,318,939 | |
| | 1,480,000 | | | Aviation Capital Group LLC, 5.500%, 12/15/2024, 144A | | | 1,638,460 | |
| | 5,205,000 | | | FS KKR Capital Corp., 3.400%, 1/15/2026 | | | 5,172,712 | |
| | 5,755,000 | | | GE Capital Funding LLC, 4.400%, 5/15/2030, 144A(a) | | | 6,784,158 | |
| | 90,000 | | | Navient Corp., 5.875%, 10/25/2024 | | | 95,625 | |
| | 5,000 | | | OneMain Finance Corp., 6.875%, 3/15/2025 | | | 5,806 | |
| | 1,595,000 | | | OneMain Finance Corp., 8.875%, 6/01/2025 | | | 1,804,344 | |
| | 4,160,000 | | | Owl Rock Capital Corp., 3.400%, 7/15/2026 | | | 4,219,565 | |
| | 5,865,000 | | | Quicken Loans LLC, 5.250%, 1/15/2028, 144A | | | 6,260,888 | |
| | 2,095,000 | | | Quicken Loans LLC/Quicken Loans Co-Issuer, Inc., 3.625%, 3/01/2029, 144A | | | 2,136,900 | |
| | 3,790,000 | | | Quicken Loans LLC/Quicken Loans Co-Issuer, Inc., 3.875%, 3/01/2031, 144A | | | 3,932,125 | |
| | | | | | | | |
| | | | | | | 54,648,649 | |
| | | | | | | | |
| | | | Financial Other — 0.4% | |
| | 2,595,000 | | | Icahn Enterprises LP/Icahn Enterprises Finance Corp., 4.750%, 9/15/2024 | | | 2,695,556 | |
| | 2,525,000 | | | Icahn Enterprises LP/Icahn Enterprises Finance Corp., 5.250%, 5/15/2027 | | | 2,706,800 | |
| | 485,000 | | | Icahn Enterprises LP/Icahn Enterprises Finance Corp., 6.250%, 5/15/2026 | | | 513,567 | |
| | | | | | | | |
| | | | | | | 5,915,923 | |
| | | | | | | | |
See accompanying notes to financial statements.
| 52
Portfolio of Investments – as of December 31, 2020
Loomis Sayles Strategic Alpha Fund – (continued)
| | | | | | | | |
Principal
Amount (‡) | | | Description | | Value (†) | |
| | | | Food & Beverage — 0.9% | |
| $ | 3,256,000 | | | Fomento Economico Mexicano SAB de CV, 3.500%, 1/16/2050(a) | | $ | 3,623,259 | |
| | 1,455,000 | | | Kraft Heinz Foods Co., 4.375%, 6/01/2046 | | | 1,568,010 | |
| | 2,305,000 | | | Kraft Heinz Foods Co., 4.875%, 10/01/2049, 144A | | | 2,689,067 | |
| | 715,000 | | | Kraft Heinz Foods Co., 5.000%, 6/04/2042 | | | 837,444 | |
| | 680,000 | | | Lamb Weston Holdings, Inc., 4.875%, 5/15/2028, 144A | | | 759,050 | |
| | 1,300,000 | | | NBM U.S Holdings, Inc., 7.000%, 5/14/2026, 144A | | | 1,415,388 | |
| | 1,135,000 | | | Post Holdings, Inc., 5.750%, 3/01/2027, 144A | | | 1,201,681 | |
| | 385,000 | | | Smithfield Foods, Inc., 3.000%, 10/15/2030, 144A | | | 407,360 | |
| | | | | | | | |
| | | | | | | 12,501,259 | |
| | | | | | | | |
| | | | Gaming — 0.2% | |
| | 2,670,000 | | | MGM Growth Properties Operating Partnership LP/MGP Finance Co-Issuer, Inc., 3.875%, 2/15/2029, 144A | | | 2,730,075 | |
| | | | | | | | |
| | | | Government Owned – No Guarantee — 1.8% | |
| | 4,801,000,000 | | | Financiera de Desarrollo Territorial S.A., 7.875%, 8/12/2024, 144A, (COP)(a) | | | 1,496,315 | |
| | 12,050,000 | | | Petroleos Mexicanos, 5.950%, 1/28/2031(a) | | | 12,019,875 | |
| | 5,290,000 | | | Petroleos Mexicanos, 6.625%, 6/15/2035(a) | | | 5,237,100 | |
| | 4,075,000 | | | Saudi Arabian Oil Co., 3.250%, 11/24/2050, 144A(a) | | | 4,132,325 | |
| | 1,770,000 | | | YPF S.A., 6.950%, 7/21/2027, 144A | | | 1,274,400 | |
| | | | | | | | |
| | | | | | | 24,160,015 | |
| | | | | | | | |
| | | | Government Sponsored — 0.1% | |
| | 950,000 | | | Petrobras Global Finance BV, 7.250%, 3/17/2044 | | | 1,225,500 | |
| | | | | | | | |
| | | | Health Insurance — 0.0% | |
| | 300,000 | | | Centene Corp., 4.625%, 12/15/2029 | | | 333,063 | |
| | | | | | | | |
| | | | Healthcare — 0.5% | |
| | 380,000 | | | Encompass Health Corp., 4.750%, 2/01/2030 | | | 407,075 | |
| | 3,240,000 | | | Hologic, Inc., 3.250%, 2/15/2029, 144A | | | 3,296,700 | |
| | 735,000 | | | IQVIA, Inc., 5.000%, 5/15/2027, 144A | | | 781,323 | |
| | 890,000 | | | Tenet Healthcare Corp., 4.625%, 6/15/2028, 144A | | | 932,275 | |
| | 340,000 | | | Tenet Healthcare Corp., 4.875%, 1/01/2026, 144A | | | 355,677 | |
| | 135,000 | | | Tenet Healthcare Corp., 5.125%, 5/01/2025 | | | 137,631 | |
| | 625,000 | | | Tenet Healthcare Corp., 6.125%, 10/01/2028, 144A | | | 651,238 | |
| | 255,000 | | | Tenet Healthcare Corp., 6.250%, 2/01/2027, 144A | | | 270,300 | |
| | | | | | | | |
| | | | | | | 6,832,219 | |
| | | | | | | | |
| | | | Home Construction — 0.1% | |
| | 1,361,000 | | | Lennar Corp., 4.750%, 11/29/2027 | | | 1,608,430 | |
| | 310,000 | | | Lennar Corp., 4.875%, 12/15/2023 | | | 342,550 | |
| | 30,000 | | | Lennar Corp., 5.000%, 6/15/2027 | | | 35,325 | |
| | | | | | | | |
| | | | | | | 1,986,305 | |
| | | | | | | | |
| | | | Independent Energy — 1.0% | |
| | 4,360,000 | | | Aker BP ASA, 3.750%, 1/15/2030, 144A | | | 4,579,345 | |
| | 1,670,000 | | | Aker BP ASA, 4.000%, 1/15/2031, 144A | | | 1,809,024 | |
| | 140,000 | | | EQT Corp., 5.000%, 1/15/2029 | | | 147,605 | |
| | 1,300,000 | | | Hess Corp., 5.600%, 2/15/2041 | | | 1,586,465 | |
| | 1,790,000 | | | Leviathan Bond Ltd., 6.125%, 6/30/2025, 144A | | | 1,960,426 | |
| | 1,295,000 | | | Leviathan Bond Ltd., 6.500%, 6/30/2027, 144A | | | 1,459,038 | |
| | 62,000 | | | Occidental Petroleum Corp., 2.700%, 2/15/2023 | | | 61,941 | |
| | 885,000 | | | Occidental Petroleum Corp., 2.900%, 8/15/2024 | | | 851,812 | |
| | | | Independent Energy — continued | |
| 340,000 | | | Occidental Petroleum Corp., 3.500%, 6/15/2025 | | | 328,426 | |
| | 75,000 | | | Occidental Petroleum Corp., 5.550%, 3/15/2026 | | | 78,295 | |
| | | | | | | | |
| | | | | | | 12,862,377 | |
| | | | | | | | |
| | | | Industrial Other — 0.4% | |
| | 4,365,000 | | | HTA Group Ltd. Co., 7.000%, 12/18/2025, 144A | | | 4,692,375 | |
| | | | | | | | |
| | | | Life Insurance — 1.3% | |
| | 5,240,000 | | | American International Group, Inc., 4.375%, 6/30/2050(a) | | | 6,861,089 | |
| | 1,530,000 | | | Athene Holding Ltd., 3.500%, 1/15/2031(a) | | | 1,616,917 | |
| | 1,110,000 | | | Global Atlantic Finance Co., 4.400%, 10/15/2029, 144A | | | 1,223,469 | |
| | 6,780,000 | | | New York Life Global Funding, 3-month LIBOR + 0.320%, 0.552%, 8/06/2021, 144A(a)(b) | | | 6,790,545 | |
| | | | | | | | |
| | | | | | | 16,492,020 | |
| | | | | | | | |
| | | | Local Authorities — 0.1% | |
| | 67,000,000 | | | Provincia de Buenos Aires, Argentina Deposit Rates Badlar Pvt Banks + 3.750%, 37.811%, 4/12/2025, 144A, (ARS)(b) | | | 349,793 | |
| | 216,360,000 | | | Provincia de Buenos Aires, Argentina Deposit Rates Badlar Pvt Banks + 3.830%, 34.187%, 5/31/2022, (ARS)(b) | | | 1,317,900 | |
| | | | | | | | |
| | | | | | | 1,667,693 | |
| | | | | | | | |
| | | | Lodging — 0.4% | |
| | 2,055,000 | | | Hilton Domestic Operating Co., Inc., 4.000%, 5/01/2031, 144A | | | 2,167,039 | |
| | 360,000 | | | Hyatt Hotels Corp., 5.375%, 4/23/2025 | | | 406,842 | |
| | 665,000 | | | Hyatt Hotels Corp., 5.750%, 4/23/2030 | | | 817,477 | |
| | 440,000 | | | Marriott International, Inc., Series EE, 5.750%, 5/01/2025 | | | 514,669 | |
| | 695,000 | | | Marriott International, Inc., 4.625%, 6/15/2030 | | | 815,568 | |
| | 735,000 | | | Wyndham Destinations, Inc., 6.625%, 7/31/2026, 144A | | | 841,575 | |
| | | | | | | | |
| | | | | | | 5,563,170 | |
| | | | | | | | |
| | | | Media Entertainment — 1.4% | |
| | 2,745,000 | | | Clear Channel Worldwide Holdings, Inc., 5.125%, 8/15/2027, 144A | | | 2,772,450 | |
| | 2,830,000 | | | iHeartCommunications, Inc., 4.750%, 1/15/2028, 144A | | | 2,904,287 | |
| | 2,400,000 | | | iHeartCommunications, Inc., 5.250%, 8/15/2027, 144A | | | 2,520,000 | |
| | 750,000 | | | iHeartCommunications, Inc., 6.375%, 5/01/2026 | | | 802,500 | |
| | 3,150,000 | | | iHeartCommunications, Inc., 8.375%, 5/01/2027 | | | 3,362,499 | |
| | 415,000 | | | Lamar Media Corp., 3.750%, 2/15/2028 | | | 426,496 | |
| | 825,000 | | | Lamar Media Corp., 4.000%, 2/15/2030 | | | 855,937 | |
| | 615,000 | | | Netflix, Inc., 4.875%, 4/15/2028 | | | 693,536 | |
| | 2,030,000 | | | Netflix, Inc., 4.875%, 6/15/2030, 144A | | | 2,334,500 | |
| | 490,000 | | | Netflix, Inc., 5.375%, 11/15/2029, 144A | | | 577,588 | |
| | 1,075,000 | | | Outfront Media Capital LLC/Outfront Media Capital Corp., 4.625%, 3/15/2030, 144A | | | 1,098,799 | |
| | | | | | | | |
| | | | | | | 18,348,592 | |
| | | | | | | | |
| | | | Metals & Mining — 1.5% | |
| | 2,655,000 | | | ABJA Investment Co. Pte Ltd., 5.450%, 1/24/2028 | | | 2,795,954 | |
| | 400,000 | | | ABJA Investment Co. Pte Ltd., 5.950%, 7/31/2024 | | | 428,412 | |
| | 690,000 | | | Antofagasta PLC, 2.375%, 10/14/2030, 144A(a) | | | 691,725 | |
| | 4,515,000 | | | First Quantum Minerals Ltd., 6.875%, 3/01/2026, 144A | | | 4,706,887 | |
| | 425,000 | | | First Quantum Minerals Ltd., 7.250%, 4/01/2023, 144A | | | 438,037 | |
| | 1,755,000 | | | First Quantum Minerals Ltd., 7.500%, 4/01/2025, 144A | | | 1,827,394 | |
See accompanying notes to financial statements.
53 |
Portfolio of Investments – as of December 31, 2020
Loomis Sayles Strategic Alpha Fund – (continued)
| | | | | | | | |
Principal
Amount (‡) | | | Description | | Value (†) | |
| | | | Metals & Mining — continued | |
| $ | 1,270,000 | | | Freeport-McMoRan, Inc., 4.375%, 8/01/2028 | | $ | 1,349,375 | |
| | 885,000 | | | Freeport-McMoRan, Inc., 4.625%, 8/01/2030 | | | 971,288 | |
| | 2,465,000 | | | Freeport-McMoRan, Inc., 5.400%, 11/14/2034 | | | 3,084,331 | |
| | 735,000 | | | Freeport-McMoRan, Inc., 5.450%, 3/15/2043 | | | 915,075 | |
| | 1,155,000 | | | Newcrest Finance Pty Ltd., 3.250%, 5/13/2030, 144A | | | 1,275,767 | |
| | 625,000 | | | Novelis Corp., 4.750%, 1/30/2030, 144A | | | 673,353 | |
| | 360,000 | | | Reliance Steel & Aluminum Co., 2.150%, 8/15/2030(a) | | | 369,873 | |
| | | | | | | | |
| | | | | | | 19,527,471 | |
| | | | | | | | |
| | | | Midstream — 0.9% | |
| | 5,460,000 | | | Cheniere Corpus Christi Holdings LLC, 3.700%, 11/15/2029 | | | 6,078,419 | |
| | 290,000 | | | Gray Oak Pipeline LLC, 3.450%, 10/15/2027, 144A | | | 302,910 | |
| | 300,000 | | | Kinder Morgan, Inc., 5.050%, 2/15/2046 | | | 365,385 | |
| | 3,745,000 | | | Sabine Pass Liquefaction LLC, 4.500%, 5/15/2030, 144A | | | 4,438,864 | |
| | 800,000 | | | Tennessee Gas Pipeline Co. LLC, 7.000%, 3/15/2027 | | | 998,250 | |
| | | | | | | | |
| | | | | | | 12,183,828 | |
| | | | | | | | |
| | | | Non-Agency Commercial Mortgage-Backed Securities — 3.4% | |
| | 2,995,000 | | | Barclays Commercial Mortgage Securities, Series 2020-BID, Class B, 1-month LIBOR + 2.540%, 2.699%, 10/15/2037, 144A(a)(b) | | | 2,995,932 | |
| | 4,565,000 | | | CFCRE Commercial Mortgage Trust, Series 2011-C1, Class D, 6.043%, 4/15/2044, 144A(a)(c) | | | 4,519,204 | |
| | 140,000 | | | Commercial Mortgage Trust, Series 2012-LC4, Class C, 5.535%, 12/10/2044(a)(c) | | | 126,214 | |
| | 790,000 | | | Credit Suisse Commercial Mortgage Securities Corp., Series 2019-SKLZ, Class D, 1-month LIBOR + 3.600%, 3.759%, 1/15/2034, 144A(b) | | | 745,370 | |
| | 5,680,000 | | | Credit Suisse Mortgage Trust, Series 2014-USA, Class E, 4.373%, 9/15/2037, 144A(e)(i) | | | 4,158,901 | |
| | 750,000 | | | DBUBS Mortgage Trust, Series 2017-BRBK, Class D, 3.530%, 10/10/2034, 144A(c) | | | 784,185 | |
| | 2,552,340 | | | DBUBS Mortgage Trust, Series 2011-LC1A, Class E, 5.565%, 11/10/2046, 144A(a)(c) | | | 2,552,704 | |
| | 3,195,000 | | | GS Mortgage Securities Corp. Trust, Series 2013-PEMB, Class D, 3.550%, 3/05/2033, 144A(c) | | | 2,576,138 | |
| | 2,170,000 | | | GS Mortgage Securities Trust, Series 2011-GC5, Class D, 5.388%, 8/10/2044, 144A(c)(e)(i) | | | 1,857,784 | |
| | 300,000 | | | GS Mortgage Securities Trust, Series 2014-GC18, Class B, 4.885%, 1/10/2047(a)(c) | | | 290,611 | |
| | 1,594,528 | | | Hospitality Mortgage Trust, Series 2019-HIT, Class C, 1-month LIBOR + 1.600%, 1.759%, 11/15/2036, 144A(a)(b) | | | 1,558,552 | |
| | 785,000 | | | Morgan Stanley Capital I Trust, Series 2011-C2, Class B, 5.200%, 6/15/2044, 144A(a)(c) | | | 782,931 | |
| | 1,570,000 | | | Morgan Stanley Capital I Trust, Series 2011-C2, Class D, 5.477%, 6/15/2044, 144A(c) | | | 1,366,809 | |
| | 2,515,000 | | | Morgan Stanley Capital I Trust, Series 2011-C2, Class E, 5.477%, 6/15/2044, 144A(c) | | | 1,544,325 | |
| | 2,706,718 | | | Motel 6 Trust, Series 2017-M6MZ, Class M, 1-month LIBOR + 6.927%, 7.085%, 8/15/2024, 144A(b) | | | 2,450,895 | |
| | 1,060,000 | | | Starwood Retail Property Trust, Series 2014-STAR, Class C, 1-month LIBOR + 2.750%, 2.909%, 11/15/2027, 144A(b)(d)(e)(g) | | | 769,163 | |
| | | | Non-Agency Commercial Mortgage-Backed Securities — continued | |
| 4,243,654 | | | Starwood Retail Property Trust, Series 2014-STAR, Class D, 1-month LIBOR + 3.500%, 3.659%, 11/15/2027, 144A(b)(d)(e)(g) | | | 2,745,280 | |
| | 3,575,000 | | | Starwood Retail Property Trust, Series 2014-STAR, Class E, 1-month LIBOR + 4.400%, 4.559%, 11/15/2027, 144A(b)(d)(e)(g) | | | 1,228,068 | |
| | 1,370,000 | | | UBS-Barclays Commercial Mortgage Trust, Series 2012-C2, Class E, 4.888%, 5/10/2063, 144A(c)(e)(i) | | | 634,922 | |
| | 440,000 | | | Wells Fargo Commercial Mortgage Trust, Series 2016-C36, Class C, 4.183%, 11/15/2059(a)(c) | | | 317,337 | |
| | 4,885,000 | | | Wells Fargo Commercial Mortgage Trust, Series 2019-JWDR, Class C, 3.038%, 9/15/2031, 144A(a)(c) | | | 4,748,083 | |
| | 789,118 | | | WFRBS Commercial Mortgage Trust, Series 2011-C2, Class D, 5.523%, 2/15/2044, 144A(a)(c) | | | 786,940 | |
| | 3,739,189 | | | WFRBS Commercial Mortgage Trust, Series 2011-C3, Class D, 5.642%, 3/15/2044, 144A(c) | | | 1,743,614 | |
| | 1,699,593 | | | WFRBS Commercial Mortgage Trust, Series 2011-C4, Class E, 5.193%, 6/15/2044, 144A(c) | | | 1,020,952 | |
| | 2,245,000 | | | WFRBS Commercial Mortgage Trust, Series 2012-C10, Class C, 4.362%, 12/15/2045(c) | | | 1,377,851 | |
| | 605,000 | | | WFRBS Commercial Mortgage Trust, Series 2012-C7, Class C, 4.810%, 6/15/2045(a)(c) | | | 471,183 | |
| | 975,000 | | | WFRBS Commercial Mortgage Trust, Series 2012-C7, Class E, 4.810%, 6/15/2045, 144A(c) | | | 432,644 | |
| | | | | | | | |
| | | | | | | 44,586,592 | |
| | | | | | | | |
| | | | Paper — 0.2% | |
| | 2,235,000 | | | Suzano Austria GmbH, 3.750%, 1/15/2031 | | | 2,371,335 | |
| | | | | | | | |
| | | | Pharmaceuticals — 1.3% | |
| | 645,000 | | | Perrigo Finance UnLtd. Co., 3.150%, 6/15/2030 | | | 689,348 | |
| | 1,665,000 | | | Teva Pharmaceutical Finance Netherlands II BV, 6.000%, 1/31/2025, (EUR) | | | 2,206,941 | |
| | 10,035,000 | | | Teva Pharmaceutical Finance Netherlands III BV, 4.100%, 10/01/2046 | | | 8,931,150 | |
| | 1,860,000 | | | Teva Pharmaceutical Finance Netherlands III BV, 7.125%, 1/31/2025 | | | 2,055,858 | |
| | 2,445,000 | | | Viatris, Inc., 4.000%, 6/22/2050, 144A | | | 2,801,207 | |
| | | | | | | | |
| | | | | | | 16,684,504 | |
| | | | | | | | |
| | | | REITs – Mortgage — 0.2% | |
| | 1,630,000 | | | Ladder Capital Finance Holdings LLLP/Ladder Capital Finance Corp., 4.250%, 2/01/2027, 144A | | | 1,601,475 | |
| | 1,065,000 | | | Ladder Capital Finance Holdings LLLP/Ladder Capital Finance Corp., 5.250%, 10/01/2025, 144A | | | 1,062,337 | |
| | | | | | | | |
| | | | | | | 2,663,812 | |
| | | | | | | | |
| | | | Restaurants — 0.9% | |
| | 435,000 | | | 1011778 B.C. ULC/New Red Finance, Inc., 3.875%, 1/15/2028, 144A | | | 441,860 | |
| | 5,765,000 | | | 1011778 B.C. ULC/New Red Finance, Inc., 4.375%, 1/15/2028, 144A | | | 5,937,950 | |
| | 2,115,000 | | | McDonald’s Corp., MTN, 3.625%, 9/01/2049(a) | | | 2,481,991 | |
| | 2,100,000 | | | Yum! Brands, Inc., 3.625%, 3/15/2031 | | | 2,122,743 | |
| | 920,000 | | | Yum! Brands, Inc., 4.750%, 1/15/2030, 144A | | | 1,008,780 | |
| | | | | | | | |
| | | | | | | 11,993,324 | |
| | | | | | | | |
See accompanying notes to financial statements.
| 54
Portfolio of Investments – as of December 31, 2020
Loomis Sayles Strategic Alpha Fund – (continued)
| | | | | | | | |
Principal
Amount (‡) | | | Description | | Value (†) | |
| | | | Retailers — 0.3% | |
| $ | 525,000 | | | AutoNation, Inc., 4.750%, 6/01/2030 | | $ | 631,750 | |
| | 1,325,000 | | | Carvana Co., 5.625%, 10/01/2025, 144A | | | 1,360,033 | |
| | 1,325,000 | | | Carvana Co., 5.875%, 10/01/2028, 144A | | | 1,374,767 | |
| | 400,000 | | | Dollar General Corp., 3.500%, 4/03/2030 | | | 459,189 | |
| | 420,000 | | | Lithia Motors, Inc., 4.375%, 1/15/2031, 144A | | | 450,450 | |
| | | | | | | | |
| | | | | | | 4,276,189 | |
| | | | | | | | |
| | | | Sovereigns — 0.5% | |
| | 6,270,000 | | | Mexico Government International Bond, 3.771%, 5/24/2061(a) | | | 6,553,467 | |
| | | | | | | | |
| | | | Supermarkets — 0.0% | |
| | 402,000 | | | Albertson’s Cos. LLC/Safeway, Inc./New Albertson’s LP/Albertson’s LLC, 5.750%, 3/15/2025 | | | 414,060 | |
| | | | | | | | |
| | | | Technology — 4.1% | |
| | 100,000 | | | Broadcom Corp./Broadcom Cayman Finance Ltd., 3.500%, 1/15/2028 | | | 110,221 | |
| | 475,000 | | | Broadcom, Inc., 4.150%, 11/15/2030 | | | 549,937 | |
| | 6,185,000 | | | Broadcom, Inc., 4.300%, 11/15/2032 | | | 7,332,250 | |
| | 6,220,000 | | | Broadcom, Inc., 4.750%, 4/15/2029 | | | 7,418,730 | |
| | 1,655,000 | | | Broadcom, Inc., 5.000%, 4/15/2030 | | | 2,011,838 | |
| | 1,650,000 | | | CDW LLC/CDW Finance Corp., 4.125%, 5/01/2025 | | | 1,726,197 | |
| | 1,615,000 | | | CommScope Technologies LLC, 5.000%, 3/15/2027, 144A | | | 1,590,775 | |
| | 2,070,000 | | | CommScope, Inc., 6.000%, 3/01/2026, 144A | | | 2,180,952 | |
| | 3,815,000 | | | CommScope, Inc., 7.125%, 7/01/2028, 144A | | | 4,062,975 | |
| | 3,610,000 | | | Equinix, Inc., 2.150%, 7/15/2030 | | | 3,671,912 | |
| | 375,000 | | | Equinix, Inc., 3.200%, 11/18/2029 | | | 411,662 | |
| | 1,365,000 | | | Gartner, Inc., 3.750%, 10/01/2030, 144A | | | 1,438,382 | |
| | 1,375,000 | | | Iron Mountain, Inc., 5.000%, 7/15/2028, 144A | | | 1,460,759 | |
| | 1,375,000 | | | Iron Mountain, Inc., 5.250%, 7/15/2030, 144A | | | 1,485,000 | |
| | 1,585,000 | | | Micron Technology, Inc., 4.663%, 2/15/2030 | | | 1,945,027 | |
| | 5,645,000 | | | Micron Technology, Inc., 5.327%, 2/06/2029 | | | 7,061,253 | |
| | 2,305,000 | | | MSCI, Inc., 3.625%, 9/01/2030, 144A | | | 2,408,725 | |
| | 1,660,000 | | | Nokia OYJ, EMTN, 2.000%, 3/11/2026, (EUR) | | | 2,101,452 | |
| | 575,000 | | | NXP BV/NXP Funding LLC/NXP USA, Inc., 3.150%, 5/01/2027, 144A | | | 633,967 | |
| | 330,000 | | | NXP BV/NXP Funding LLC/NXP USA, Inc., 3.400%, 5/01/2030, 144A | | | 374,225 | |
| | 570,000 | | | Open Text Corp., 3.875%, 2/15/2028, 144A | | | 592,789 | |
| | 530,000 | | | Open Text Holdings, Inc., 4.125%, 2/15/2030, 144A | | | 563,814 | |
| | 1,550,000 | | | Qorvo, Inc., 3.375%, 4/01/2031, 144A | | | 1,600,375 | |
| | 240,000 | | | Sabre GLBL, Inc., 9.250%, 4/15/2025, 144A | | | 285,600 | |
| | 535,000 | | | SS&C Technologies, Inc., 5.500%, 9/30/2027, 144A | | | 571,391 | |
| | | | | | | | |
| | | | | | | 53,590,208 | |
| | | | | | | | |
| | | | Transportation Services — 0.3% | |
| | 1,855,000 | | | Adani Ports & Special Economic Zone Ltd., 4.200%, 8/04/2027, 144A | | | 1,990,756 | |
| | 1,645,000 | | | GMR Hyderabad International Airport Ltd., 5.375%, 4/10/2024 | | | 1,670,020 | |
| | | | | | | | |
| | | | | | | 3,660,776 | |
| | | | | | | | |
| | | | Treasuries — 1.4% | |
| | 338,660,000 | | | Republic of South Africa Government Bond, Series 2037, 8.500%, 1/31/2037, (ZAR) | | | 19,071,493 | |
| | | | | | | | |
| | | | Wireless — 1.7% | |
| | 2,375,000 | | | American Tower Corp., 2.100%, 6/15/2030(a) | | | 2,437,718 | |
| | 5,430,000 | | | Crown Castle International Corp., 2.250%, 1/15/2031(a) | | | 5,632,748 | |
| | 3,769,000 | | | Kenbourne Invest S.A., 6.875%, 11/26/2024, 144A | | | 4,087,028 | |
| | | | Wireless — continued | |
| 225,000 | | | Millicom International Cellular S.A., 4.500%, 4/27/2031, 144A | | | 243,000 | |
| | 730,000 | | | Millicom International Cellular S.A., 5.125%, 1/15/2028, 144A | | | 775,917 | |
| | 330,000 | | | Sprint Capital Corp., 6.875%, 11/15/2028 | | | 435,099 | |
| | 6,700,000 | | | T-Mobile USA, Inc., 3.875%, 4/15/2030, 144A(a) | | | 7,759,940 | |
| | 550,000 | | | T-Mobile USA, Inc., 4.500%, 2/01/2026 | | | 562,284 | |
| | | | | | | | |
| | | | | | | 21,933,734 | |
| | | | | | | | |
| | | | Wirelines — 0.5% | |
| | 5,990,000 | | | AT&T, Inc., 3.650%, 6/01/2051(a) | | | 6,272,087 | |
| | 470,000 | | | Level 3 Financing, Inc., 4.625%, 9/15/2027, 144A | | | 490,885 | |
| | | | | | | | |
| | | | | | | 6,762,972 | |
| | | | | | | | |
| | | | Total Non-Convertible Bonds
(Identified Cost $864,134,736) | | | 887,323,154 | |
| | | | | | | | |
| | | | | | | | |
| | Convertible Bonds — 2.9% | |
| | | | Airlines — 0.1% | |
| | 1,050,000 | | | Southwest Airlines Co., 1.250%, 5/01/2025(a) | | | 1,525,125 | |
| | | | | | | | |
| | | | Cable Satellite — 1.1% | |
| | 1,635,000 | | | DISH Network Corp., Zero Coupon, 12/15/2025, 144A | | | 1,642,732 | |
| | 4,280,000 | | | DISH Network Corp., 2.375%, 3/15/2024 | | | 3,988,660 | |
| | 7,230,000 | | | DISH Network Corp., 3.375%, 8/15/2026 | | | 6,891,865 | |
| | 1,635,000 | | | Liberty Media Corp., 0.500%, 12/01/2050, 144A | | | 1,742,305 | |
| | | | | | | | |
| | | | | | | 14,265,562 | |
| | | | | | | | |
| | | | Consumer Cyclical Services — 0.1% | |
| | 1,670,000 | | | Uber Technologies, Inc., Zero Coupon, 12/15/2025, 144A | | | 1,708,475 | |
| | | | | | | | |
| | | | Diversified Manufacturing — 0.0% | |
| | 600,000 | | | Greenbrier Cos., Inc. (The), 2.875%, 2/01/2024 | | | 606,283 | |
| | | | | | | | |
| | | | Healthcare — 0.3% | |
| | 3,120,000 | | | Teladoc Health, Inc., 1.250%, 6/01/2027, 144A | | | 3,736,839 | |
| | | | | | | | |
| | | | Industrial Other — 0.0% | |
| | 530,000 | | | Chegg, Inc., Zero Coupon, 9/01/2026, 144A | | | 592,655 | |
| | | | | | | | |
| | | | Pharmaceuticals — 1.0% | |
| | 1,270,000 | | | BioMarin Pharmaceutical, Inc., 0.599%, 8/01/2024 | | | 1,362,821 | |
| | 7,130,000 | | | BioMarin Pharmaceutical, Inc., 1.250%, 5/15/2027, 144A | | | 7,450,850 | |
| | 855,000 | | | Guardant Health, Inc., Zero Coupon, 11/15/2027, 144A | | | 1,000,372 | |
| | 605,000 | | | Jazz Investments I Ltd., 2.000%, 6/15/2026, 144A | | | 787,319 | |
| | 1,840,000 | | | Neurocrine Biosciences, Inc., 2.250%, 5/15/2024 | | | 2,538,783 | |
| | | | | | | | |
| | | | | | | 13,140,145 | |
| | | | | | | | |
| | | | Technology — 0.3% | |
| | 785,000 | | | LivePerson, Inc., Zero Coupon, 12/15/2026, 144A | | | 857,476 | |
| | 470,000 | | | Lumentum Holdings, Inc., 0.500%, 12/15/2026 | | | 573,118 | |
| | 160,000 | | | Palo Alto Networks, Inc., 0.375%, 6/01/2025, 144A | | | 210,693 | |
| | 1,410,000 | | | Shift4 Payments, Inc., Zero Coupon, 12/15/2025, 144A | | | 1,720,601 | |
| | | | | | | | |
| | | | | | | 3,361,888 | |
| | | | | | | | |
| | | | Total Convertible Bonds
(Identified Cost $37,668,514) | | | 38,936,972 | |
| | | | | | | | |
| | | | | | | | |
| | | | Total Bonds and Notes
(Identified Cost $901,803,250) | | | 926,260,126 | |
| | | | | | | | |
| | | | | | | | |
See accompanying notes to financial statements.
55 |
Portfolio of Investments – as of December 31, 2020
Loomis Sayles Strategic Alpha Fund – (continued)
| | | | | | | | |
Principal
Amount (‡) | | | Description | | Value (†) | |
| | Senior Loans — 0.5% | |
| | | | Building Materials — 0.1% | |
| $ | 340,000 | | | CP Atlas Buyer, Inc., 2020 Delayed Draw Term Loan B2, 3-month LIBOR + 4.500%, 5.250%, 11/23/2027(b) | | $ | 340,425 | |
| | 1,020,000 | | | CP Atlas Buyer, Inc., 2020 Term Loan B1, 3-month LIBOR + 4.500%, 5.250%, 11/23/2027(b) | | | 1,021,275 | |
| | | | | | | | |
| | | | | | | 1,361,700 | |
| | | | | | | | |
| | | | Cable Satellite — 0.2% | |
| | 1,930,000 | | | Ziggo BV, 2019 EUR Term Loan H, 6-month EURIBOR + 3.000%, 3.000%, 1/31/2029, (EUR)(b) | | | 2,348,943 | |
| | | | | | | | |
| | | | Consumer Products — 0.1% | |
| | 1,195,000 | | | Weber-Stephen Products LLC, Term Loan B, 1-month LIBOR + 3.250%, 4.000%, 10/30/2027(b) | | | 1,195,597 | |
| | | | | | | | |
| | | | Restaurants — 0.1% | |
| | 1,380,000 | | | IRB Holding Corp., 2020 Fourth Amendment Incremental Term Loan, 12/15/2027(j) | | | 1,380,428 | |
| | | | | | | | |
| | | | Total Senior Loans
(Identified Cost $6,044,499) | | | 6,286,668 | |
| | | | | | | | |
| | | | | | | | |
| | Collateralized Loan Obligations — 5.3% | |
| | 1,740,000 | | | AGL CLO 3 Ltd., Series 2020-3A, Class D, 3-month LIBOR + 3.300%, 3.537%, 1/15/2033, 144A(b) | | | 1,696,637 | |
| | 1,350,000 | | | AGL CLO 3 Ltd., Series 2020-3A, Class C, 3-month LIBOR + 2.150%, 2.387%, 1/15/2033, 144A(a)(b) | | | 1,325,997 | |
| | 865,000 | | | Anchorage Capital CLO 9 Ltd., Series 2016-9A, Class DR, 3-month LIBOR + 4.000%, 4.237%, 7/15/2032, 144A(b) | | | 852,119 | |
| | 480,000 | | | Apidos CLO XX, Series 2015-20A, Class BRR, 3-month LIBOR + 1.950%, 2.180%, 7/16/2031, 144A(a)(b) | | | 469,056 | |
| | 3,175,000 | | | Apidos CLO XXIII, Series 2015-23A, Class CR, 3-month LIBOR + 2.000%, 2.237%, 4/15/2033, 144A(a)(b) | | | 3,089,848 | |
| | 2,940,000 | | | ARES XLIV CLO Ltd., Series 2017-44A, Class E, 3-month LIBOR + 8.050%, 8.287%, 10/15/2029, 144A(b) | | | 2,605,985 | |
| | 400,000 | | | Ballyrock CLO Ltd., Series 2018-1A, Class C, 3-month LIBOR + 3.150%, 3.368%, 4/20/2031, 144A(b) | | | 385,560 | |
| | 850,000 | | | Barings CLO Ltd., Series 2019-4A, Class C, 3-month LIBOR + 2.800%, 3.037%, 1/15/2033, 144A(a)(b) | | | 845,108 | |
| | 560,000 | | | Battalion CLO XIV Ltd., Series 2019-14A, Class E, 3-month LIBOR + 6.680%, 6.898%, 4/20/2032, 144A(b) | | | 540,644 | |
| | 500,000 | | | Battalion CLO XVI Ltd., Series 2019-16A, Class D, 3-month LIBOR + 4.360%, 4.578%, 12/19/2032, 144A(b) | | | 501,761 | |
| | 1,915,000 | | | BlueMountain CLO XXIV Ltd., Series 2019-24A, Class C, 3-month LIBOR + 2.700%, 2.918%, 4/20/2031, 144A(a)(b) | | | 1,923,306 | |
| | 915,000 | | | Bristol Park CLO Ltd., Series 2016-1A, Class CR, 3-month LIBOR + 1.950%, 2.187%, 4/15/2029, 144A(a)(b) | | | 905,844 | |
| | 455,000 | | | Burnham Park CLO Ltd., Series 2016-1A, Class CR, 3-month LIBOR + 2.150%, 2.368%, 10/20/2029, 144A(a)(b) | | | 442,394 | |
| | 400,000 | | | Carbone CLO Ltd., Series 2017-1A, Class B, 3-month LIBOR + 1.800%, 2.018%, 1/20/2031, 144A(a)(b) | | | 391,972 | |
| | Collateralized Loan Obligations — continued | |
| 1,575,000 | | | Carlyle Global Market Strategies CLO Ltd., Series 2015-2A, Class CR, 3-month LIBOR + 2.250%, 2.467%, 4/27/2027, 144A(b) | | | 1,521,004 | |
| | 500,000 | | | Catamaran CLO Ltd., Series 2013-1A, Class CR, 3-month LIBOR + 1.800%, 2.017%, 1/27/2028, 144A(a)(b) | | | 488,591 | |
| | 265,000 | | | CIFC Funding II Ltd., Series 2014-2RA, Class A3, 3-month LIBOR + 1.900%, 2.115%, 4/24/2030, 144A(a)(b) | | | 259,752 | |
| | 730,000 | | | CIFC Funding II Ltd., Series 2013-2A, Class A3LR, 3-month LIBOR + 1.950%, 2.168%, 10/18/2030, 144A(a)(b) | | | 719,159 | |
| | 2,410,000 | | | Cole Park CLO Ltd., Series 2015-1A, Class DR, 3-month LIBOR + 3.150%, 3.368%, 10/20/2028, 144A(b) | | | 2,374,684 | |
| | 875,000 | | | Dryden 45 Senior Loan Fund, Series 2016-45A, Class ER, 3-month LIBOR + 5.850%, 6.087%, 10/15/2030, 144A(b) | | | 834,730 | |
| | 250,000 | | | Dryden 64 CLO Ltd., Series 2018-64A, Class C, 3-month LIBOR + 1.750%, 1.968%, 4/18/2031, 144A(a)(b) | | | 234,030 | |
| | 615,000 | | | Dryden 80 CLO Ltd., Series 2019-80A, Class D1, 3-month LIBOR + 4.100%, 4.318%, 1/17/2033, 144A(b) | | | 618,001 | |
| | 300,000 | | | Dryden XXVI Senior Loan Fund, Series 2013-26A, Class CR, 3-month LIBOR + 1.8500%, 2.087%, 4/15/2029, 144A(a)(b) | | | 283,176 | |
| | 330,000 | | | Galaxy XXIX CLO Ltd., Series 2018-29A, Class D, 3-month LIBOR + 2.400%, 2.621%, 11/15/2026, 144A(b) | | | 322,036 | |
| | 1,405,000 | | | Galaxy XXVI CLO Ltd., Series 2018-26A, Class E, 3-month LIBOR + 5.850%, 6.063%, 11/22/2031, 144A(b) | | | 1,340,629 | |
| | 650,000 | | | Gilbert Park CLO Ltd., Series 2017-1A, Class D, 3-month LIBOR + 2.950%, 3.187%, 10/15/2030, 144A(b) | | | 643,904 | |
| | 320,000 | | | Goldentree Loan Management U.S. CLO 3 Ltd., Series 2018-3A, Class C, 3-month LIBOR + 1.900%, 2.118%, 4/20/2030, 144A(a)(b) | | | 311,631 | |
| | 990,000 | | | Hayfin US XII Ltd, Series 2019-2A, Class E, 3-month LIBOR + 6.900%, 7.118%, 7/20/2032, 144A(b) | | | 985,987 | |
| | 1,110,000 | | | LCM 30 Ltd., Series 30A, Class D, 3-month LIBOR + 3.750%, 3.968%, 4/20/2031, 144A(b) | | | 1,095,449 | |
| | 475,000 | | | Madison Park Funding XXXI Ltd., Series 2018-31A, Class C, 3-month LIBOR + 2.150%, 2.359%, 1/23/2031, 144A(a)(b) | | | 475,516 | |
| | 300,000 | | | Madison Park Funding XXXI Ltd., Series 2018-31A, Class D, 3-month LIBOR + 3.000%, 3.209%, 1/23/2031, 144A(b) | | | 299,996 | |
| | 3,300,000 | | | Neuberger Berman CLO Ltd., Series 2013-14A, Class CR2, 3-month LIBOR + 1.900%, 2.122%, 1/28/2030, 144A(a)(b) | | | 3,187,314 | |
| | 725,000 | | | Neuberger Berman Loan Advisers CLO Ltd., Series 2018-30A, Class E, 3-month LIBOR + 6.750%, 6.968%, 1/20/2031, 144A(b) | | | 712,977 | |
| | 2,100,000 | | | Oaktree CLO Ltd., Series 2019-4A, Class E, 3-month LIBOR + 7.230%, 7.448%, 10/20/2032, 144A(b) | | | 2,024,144 | |
| | 495,000 | | | Octagon Investment Partners 39 Ltd., Series 2018-3A, Class E, 3-month LIBOR + 5.750%, 5.968%, 10/20/2030, 144A(b) | | | 461,685 | |
See accompanying notes to financial statements.
| 56
Portfolio of Investments – as of December 31, 2020
Loomis Sayles Strategic Alpha Fund – (continued)
| | | | | | | | |
Principal
Amount (‡) | | | Description | | Value (†) | |
| | Collateralized Loan Obligations — continued | |
| $ | 1,420,000 | | | Octagon Investment Partners 40 Ltd., Series 2019-1A, Class D, 3-month LIBOR + 3.800%, 4.018%, 4/20/2031, 144A(b) | | $ | 1,424,201 | |
| | 920,000 | | | Octagon Investment Partners XXII Ltd., Series 2014-1A, Class CRR, 3-month LIBOR + 1.900%, 2.116%, 1/22/2030, 144A(a)(b) | | | 904,118 | |
| | 1,980,000 | | | OHA Credit Funding 3 Ltd., Series 2019-3A, Class E1, 3-month LIBOR + 5.000%, 5.218%, 7/20/2032, 144A(b) | | | 1,881,888 | |
| | 1,745,000 | | | OHA Credit Funding 5 Ltd., Series 2020-5A, Class C, 3-month LIBOR + 2.000%, 2.218%, 4/18/2033, 144A(a)(b) | | | 1,670,078 | |
| | 1,585,000 | | | OHA Credit Funding Ltd., Series 2019-4A, Class E, 3-month LIBOR + 6.100%, 6.316%, 10/22/2032, 144A(b) | | | 1,558,089 | |
| | 2,245,000 | | | OHA Loan Funding Ltd., Series 2013-1A, Class DR2, 3-month LIBOR + 3.050%, 3.259%, 7/23/2031, 144A(b) | | | 2,223,763 | |
| | 1,570,000 | | | OHA Loan Funding Ltd., Series 2016-1A, Class CR, 3-month LIBOR + 1.950%, 2.168%, 1/20/2033, 144A(a)(b) | | | 1,540,223 | |
| | 232,235 | | | OZLM XIII Ltd., Series 2015-13A, Class A1R, 3-month LIBOR + 1.080%, 1.294%, 7/30/2027, 144A(a)(b) | | | 231,692 | |
| | 2,070,000 | | | OZLM XXIII Ltd., Series 2019-23A, Class E, 3-month LIBOR + 6.800%, 7.037%, 4/15/2032, 144A(b) | | | 2,046,868 | |
| | 325,000 | | | Palmer Square CLO Ltd., Series 2015-1A, Class CR2, 3-month LIBOR + 3.150%, 3.363%, 5/21/2029, 144A(b) | | | 319,494 | |
| | 300,000 | | | Palmer Square CLO Ltd., Series 2015-2A, Class BR2, 3-month LIBOR + 1.950%, 2.168%, 7/20/2030, 144A(a)(b) | | | 295,398 | |
| | 2,610,000 | | | Parallel Ltd., Series 2017-1A, Class CR, 3-month LIBOR + 2.000%, 2.218%, 7/20/2029, 144A(a)(b) | | | 2,527,903 | |
| | 1,645,000 | | | Parallel Ltd., Series 2018-2A, Class B, 3-month LIBOR + 2.150%, 2.368%, 10/20/2031, 144A(a)(b) | | | 1,574,559 | |
| | 1,045,000 | | | Pikes Peak CLO 1, Series 2018-1A, Class D, 3-month LIBOR + 3.150%, 3.365%, 7/24/2031, 144A(b) | | | 1,012,184 | |
| | 3,885,000 | | | Pikes Peak CLO 3, Series 2019-3A, Class E, 3-month LIBOR + 6.860%, 7.075%, 4/25/2030, 144A(b) | | | 3,848,332 | |
| | 340,000 | | | Recette CLO LLC, Series 2015-1A, Class DR, 3-month LIBOR + 2.750%, 2.968%, 10/20/2027, 144A(a)(b) | | | 339,148 | |
| | 920,000 | | | Regatta XIII Funding Ltd., Series 2018-2A, Class C, 3-month LIBOR + 3.100%, 3.337%, 7/15/2031, 144A(b) | | | 908,529 | |
| | 2,565,000 | | | Rockford Tower CLO Ltd., Series 2017-2A, Class CR, 3-month LIBOR + 1.900%, 2.137%, 10/15/2029, 144A(a)(b) | | | 2,477,180 | |
| | 740,000 | | | Symphony CLO XX Ltd., Series 2018-20A, Class D, 3-month LIBOR + 3.8600%, 4.090%, 1/16/2032, 144A(b) | | | 739,890 | |
| | 920,000 | | | TCW CLO Ltd., Series 2018-1, Class D, 3-month LIBOR + 2.910%, 3.125%, 4/25/2031, 144A(b) | | | 913,096 | |
| | 1,030,000 | | | TICP CLO VII Ltd., Series 2017-7A, Class CR, 3-month LIBOR + 2.150%, 2.387%, 4/15/2033, 144A(a)(b) | | | 1,026,231 | |
| | 610,000 | | | TICP CLO XV Ltd., Series 2020-15A, Class C, 3-month LIBOR + 2.150%, 2.368%, 4/20/2033, 144A(a)(b) | | | 603,455 | |
| | Collateralized Loan Obligations — continued | |
| 895,000 | | | TRESTLES CLO II Ltd., Series 2018-2A, Class D, 3-month LIBOR + 5.750%, 5.965%, 7/25/2031, 144A(b) | | | 839,679 | |
| | 780,000 | | | VERDE CLO Ltd., Series 2019-1A, Class E, 3-month LIBOR + 6.900%, 7.137%, 4/15/2032, 144A(b) | | | 780,014 | |
| | 695,000 | | | Voya CLO Ltd, Series 2019-3A, Class D, 3-month LIBOR + 3.850%, 4.068%, 10/17/2032, 144A(b) | | | 694,988 | |
| | 2,435,000 | | | York CLO-7 Ltd., Series 2019-2A, Class D, 3-month LIBOR + 3.800%, 4.016%, 1/22/2033, 144A(b) | | | 2,442,912 | |
| | | | | | | | |
| | | | Total Collateralized Loan Obligations
(Identified Cost $66,196,676) | | | 69,994,538 | |
| | | | | | | | |
| | | | | | | | |
| | Loan Participations — 0.0% | |
| | | | ABS Other — 0.0% | |
| | 1,061,479 | | | Harbour Aircraft Investments Ltd., Series 2017-1, Class C, 8.000%, 11/15/2037 (d)(g)
(Identified Cost $1,059,231) | | | 580,841 | |
| | | | | | | | |
| | | | | | | | |
| Shares | | | | | | |
| | Common Stocks — 3.5% | |
| | | | Aerospace & Defense — 0.0% | |
| | 1,095 | | | Lockheed Martin Corp. | | | 388,703 | |
| | | | | | | | |
| | | | Air Freight & Logistics — 0.1% | |
| | 6,552 | | | Expeditors International of Washington, Inc. | | | 623,161 | |
| | 2,153 | | | United Parcel Service, Inc., Class B | | | 362,565 | |
| | | | | | | | |
| | | | | | | 985,726 | |
| | | | | | | | |
| | | | Airlines — 0.1% | |
| | 36,229 | | | Delta Air Lines, Inc. | | | 1,456,768 | |
| | | | | | | | |
| | | | Automobiles — 0.0% | |
| | 9,332 | | | General Motors Co. | | | 388,585 | |
| | | | | | | | |
| | | | Banks — 0.1% | |
| | 2,721 | | | Bank of America Corp. | | | 82,474 | |
| | 6,483 | | | Citigroup, Inc. | | | 399,742 | |
| | 3,927 | | | Fifth Third Bancorp | | | 108,267 | |
| | | | | | | | |
| | | | | | | 590,483 | |
| | | | | | | | |
| | | | Biotechnology — 0.0% | |
| | 1,446 | | | Amgen, Inc. | | | 332,464 | |
| | | | | | | | |
| | | | Building Products — 0.0% | |
| | 7,034 | | | Masco Corp. | | | 386,378 | |
| | | | | | | | |
| | | | Capital Markets — 0.1% | |
| | 537 | | | BlackRock, Inc. | | | 387,467 | |
| | 6,016 | | | Morgan Stanley | | | 412,277 | |
| | 1,221 | | | S&P Global, Inc. | | | 401,379 | |
| | 9,332 | | | Virtu Financial, Inc., Class A | | | 234,886 | |
| | | | | | | | |
| | | | | | | 1,436,009 | |
| | | | | | | | |
| | | | Chemicals — 0.1% | |
| | 138,555 | | | Hexion Holdings Corp., Class B(h) | | | 1,791,516 | |
| | | | | | | | |
| | | | Communications Equipment — 0.0% | |
| | 9,221 | | | Cisco Systems, Inc. | | | 412,640 | |
| | | | | | | | |
| | | | Construction Materials — 0.2% | |
| | 362,679 | | | Cemex SAB de CV, Sponsored ADR(h) | | | 1,875,050 | |
| | | | | | | | |
| | | | Diversified Telecommunication Services — 0.3% | |
| | 130,464 | | | AT&T, Inc. | | | 3,752,144 | |
| | 6,301 | | | Verizon Communications, Inc. | | | 370,184 | |
| | | | | | | | |
| | | | | | | 4,122,328 | |
| | | | | | | | |
See accompanying notes to financial statements.
57 |
Portfolio of Investments – as of December 31, 2020
Loomis Sayles Strategic Alpha Fund – (continued)
| | | | | | | | |
| Shares | | | Description | | Value (†) | |
| | | | Entertainment — 0.0% | |
| | 4,583 | | | Activision Blizzard, Inc. | | $ | 425,532 | |
| | | | | | | | |
| | | | Food & Staples Retailing — 0.1% | |
| | 1,056 | | | Costco Wholesale Corp. | | | 397,880 | |
| | 2,642 | | | Walmart, Inc. | | | 380,844 | |
| | | | | | | | |
| | | | | | | 778,724 | |
| | | | | | | | |
| | | | Health Care Equipment & Supplies — 0.0% | |
| | 3,209 | | | Abbott Laboratories | | | 351,353 | |
| | | | | | | | |
| | | | Health Care Providers & Services — 0.2% | |
| | 1,217 | | | Anthem, Inc. | | | 390,766 | |
| | 17,950 | | | CVS Health Corp. | | | 1,225,985 | |
| | 2,372 | | | HCA Healthcare, Inc. | | | 390,099 | |
| | 980 | | | Humana, Inc. | | | 402,065 | |
| | 1,135 | | | UnitedHealth Group, Inc. | | | 398,022 | |
| | | | | | | | |
| | | | | | | 2,806,937 | |
| | | | | | | | |
| | | | Hotels, Restaurants & Leisure — 0.1% | |
| | 1,699 | | | McDonald’s Corp. | | | 364,572 | |
| | 6,587 | | | Starbucks Corp. | | | 704,677 | |
| | | | | | | | |
| | | | | | | 1,069,249 | |
| | | | | | | | |
| | | | Household Durables — 0.0% | |
| | 5,277 | | | DR Horton, Inc. | | | 363,691 | |
| | | | | | | | |
| | | | Household Products — 0.1% | |
| | 7,192 | | | Procter & Gamble Co. (The) | | | 1,000,695 | |
| | | | | | | | |
| | | | Insurance — 0.1% | |
| | 3,654 | | | Allstate Corp. (The) | | | 401,684 | |
| | 8,421 | | | MetLife, Inc. | | | 395,366 | |
| | 3,965 | | | Progressive Corp. (The) | | | 392,059 | |
| | | | | | | | |
| | | | | | | 1,189,109 | |
| | | | | | | | |
| | | | Internet & Direct Marketing Retail — 0.1% | |
| | 305 | | | Booking Holdings, Inc.(h) | | | 679,317 | |
| | | | | | | | |
| | | | IT Services — 0.2% | |
| | 1,461 | | | Accenture PLC, Class A | | | 381,628 | |
| | 2,672 | | | Fidelity National Information Services, Inc. | | | 377,981 | |
| | 264 | | | Global Payments, Inc. | | | 56,871 | |
| | 3,048 | | | MasterCard, Inc., Class A | | | 1,087,953 | |
| | 2,990 | | | Visa, Inc., Class A | | | 654,003 | |
| | | | | | | | |
| | | | | | | 2,558,436 | |
| | | | | | | | |
| | | | Life Sciences Tools & Services — 0.0% | |
| | 840 | | | Thermo Fisher Scientific, Inc. | | | 391,255 | |
| | | | | | | | |
| | | | Machinery — 0.0% | |
| | 1,477 | | | Deere & Co. | | | 397,387 | |
| | | | | | | | |
| | | | Media — 0.1% | |
| | 7,845 | | | Comcast Corp., Class A | | | 411,078 | |
| | 6,485 | | | Interpublic Group of Cos., Inc. (The) | | | 152,527 | |
| | 3,741 | | | Nexstar Media Group, Inc., Class A | | | 408,480 | |
| | | | | | | | |
| | | | | | | 972,085 | |
| | | | | | | | |
| | | | Metals & Mining — 0.0% | |
| | 6,366 | | | Newmont Corp. | | | 381,260 | |
| | | | | | | | |
| | | | Multiline Retail — 0.1% | |
| | 1,834 | | | Dollar General Corp. | | | 385,690 | |
| | 2,196 | | | Target Corp. | | | 387,660 | |
| | | | | | | | |
| | | | | | | 773,350 | |
| | | | | | | | |
| | | | Oil, Gas & Consumable Fuels — 0.2% | |
| | 14,685 | | | California Resources Corp.(h) | | | 346,419 | |
| | 4,426 | | | Chevron Corp. | | | 373,776 | |
| | 11,580 | | | Enterprise Products Partners LP | | | 226,852 | |
| | 16,959 | | | MPLX LP | | | 367,162 | |
| | 26,879 | | | Western Midstream Partners LP | | | 371,468 | |
| | | | Oil, Gas & Consumable Fuels — continued | |
| | 32,298 | | | Whiting Petroleum Corp.(h) | | | 807,450 | |
| | | | | | | | |
| | | | | | | 2,493,127 | |
| | | | | | | | |
| | | | Personal Products — 0.1% | |
| | 2,679 | | | Estee Lauder Cos., Inc. (The), Class A | | | 713,123 | |
| | | | | | | | |
| | | | Pharmaceuticals — 0.2% | |
| | 6,247 | | | Bristol-Myers Squibb Co. | | | 387,502 | |
| | 2,270 | | | Eli Lilly & Co. | | | 383,267 | |
| | 10,856 | | | Johnson & Johnson | | | 1,708,517 | |
| | 4,613 | | | Merck & Co., Inc. | | | 377,343 | |
| | | | | | | | |
| | | | | | | 2,856,629 | |
| | | | | | | | |
| | | | REITs – Diversified — 0.0% | |
| | 1,535 | | | American Tower Corp. | | | 344,546 | |
| | | | | | | | |
| | | | REITs – Storage — 0.0% | |
| | 12,458 | | | Iron Mountain, Inc. | | | 367,262 | |
| | | | | | | | |
| | | | Road & Rail — 0.0% | |
| | 1,723 | | | Union Pacific Corp. | | | 358,763 | |
| | | | | | | | |
| | | | Semiconductors & Semiconductor Equipment — 0.3% | |
| | 4,431 | | | Applied Materials, Inc. | | | 382,395 | |
| | 4,241 | | | KLA Corp. | | | 1,098,037 | |
| | 798 | | | Lam Research Corp. | | | 376,871 | |
| | 734 | | | NVIDIA Corp. | | | 383,295 | |
| | 2,629 | | | QUALCOMM, Inc. | | | 400,502 | |
| | 1,528 | | | Teradyne, Inc. | | | 183,192 | |
| | 2,512 | | | Texas Instruments, Inc. | | | 412,295 | |
| | | | | | | | |
| | | | | | | 3,236,587 | |
| | | | | | | | |
| | | | Software — 0.1% | |
| | 1,063 | | | Intuit, Inc. | | | 403,781 | |
| | 1,782 | | | Microsoft Corp. | | | 396,353 | |
| | 18,912 | | | NortonLifeLock, Inc. | | | 392,991 | |
| | 6,073 | | | Oracle Corp. | | | 392,862 | |
| | | | | | | | |
| | | | | | | 1,585,987 | |
| | | | | | | | |
| | | | Specialty Retail — 0.1% | |
| | 3,762 | | | Best Buy Co., Inc. | | | 375,410 | |
| | 1,427 | | | Home Depot, Inc. (The) | | | 379,040 | |
| | 3,094 | | | L Brands, Inc. | | | 115,066 | |
| | 2,373 | | | Lowe’s Cos., Inc. | | | 380,890 | |
| | | | | | | | |
| | | | | | | 1,250,406 | |
| | | | | | | | |
| | | | Technology Hardware, Storage & Peripherals — 0.2% | |
| | 12,330 | | | Apple, Inc. | | | 1,636,067 | |
| | 16,147 | | | HP, Inc. | | | 397,055 | |
| | | | | | | | |
| | | | | | | 2,033,122 | |
| | | | | | | | |
| | | | Textiles, Apparel & Luxury Goods — 0.1% | |
| | 1,234 | | | LVMH Moet Hennessy Louis Vuitton SE | | | 772,485 | |
| | 2,696 | | | NIKE, Inc., Class B | | | 381,403 | |
| | | | | | | | |
| | | | | | | 1,153,888 | |
| | | | | | | | |
| | | | Tobacco — 0.1% | |
| | 8,707 | | | Altria Group, Inc. | | | 356,987 | |
| | 4,604 | | | Philip Morris International, Inc. | | | 381,165 | |
| | | | | | | | |
| | | | | | | 738,152 | |
| | | | | | | | |
| | | | Total Common Stocks
(Identified Cost $44,154,260) | | | 45,436,622 | |
| | | | | | | | |
| | | | | | | | |
| | Preferred Stocks — 1.4% | |
| | Convertible Preferred Stocks — 1.1% | |
| | | | Banking — 0.3% | |
| | 926 | | | Bank of America Corp., Series L, 7.250% | | | 1,406,205 | |
| | 2,053 | | | Wells Fargo & Co., Class A, Series L, 7.500% | | | 3,116,249 | |
| | | | | | | | |
| | | | | | | 4,522,454 | |
| | | | | | | | |
See accompanying notes to financial statements.
| 58
Portfolio of Investments – as of December 31, 2020
Loomis Sayles Strategic Alpha Fund – (continued)
| | | | | | | | |
Shares | | | Description | | Value (†) | |
| | | | Electric — 0.1% | |
| | 23,032 | | | NextEra Energy, Inc., 5.279% | | $ | 1,170,947 | |
| | | | | | | | |
| | | | Energy — 0.0% | |
| | 1,714 | | | Chesapeake Energy Corp., 5.750%(d)(e)(g)(h) | | | — | |
| | | | | | | | |
| | | | Food & Beverage — 0.4% | |
| | 42,272 | | | Bunge Ltd., 4.875% | | | 4,598,518 | |
| | | | | | | | |
| | | | Healthcare — 0.3% | |
| | 29,421 | | | Boston Scientific Corp., Series A, 5.500% | | | 3,223,659 | |
| | | | | | | | |
| | | | Midstream — 0.0% | |
| | 2,329 | | | El Paso Energy Capital Trust I, 4.750% | | | 120,549 | |
| | | | | | | | |
| | | | Total Convertible Preferred Stocks
(Identified Cost $13,447,269) | | | 13,636,127 | |
| | | | | | | | |
| | | | | | | | |
| | Non-Convertible Preferred Stocks — 0.3% | |
| | | | Cable Satellite — 0.3% | |
| | 4,040,000 | | | NBCUniversal Enterprise, Inc., 5.250%, 144A(a) (Identified Cost $4,040,000) | | | 4,120,800 | |
| | | | | | | | |
| | | | Total Preferred Stocks
(Identified Cost $17,487,269) | | | 17,756,927 | |
| | | | | | | | |
| | | | | | | | |
Principal
Amount (‡) | | | | | | |
| | Other Investments — 0.1% | |
| | | | Aircraft ABS — 0.1% | |
| $ | 900 | | | ECAF I Blocker Ltd.(d)(e)(f)(g)
(Identified Cost $9,000,000) | | | 1,130,400 | |
| | | | | | | | |
| | Short-Term Investments — 16.0% | |
| 56,101,944 | | | Tri-Party Repurchase Agreement with Fixed Income Clearing Corporation, dated 12/31/2020 at 0.000% to be repurchased at $56,101,944 on 1/04/2021 collateralized by $55,014,900 U.S. Treasury Note 2.125% due 12/31/2022 valued at $57,224,079 including accrued interest (Note 2 of Notes to Financial Statements) | | | 56,101,944 | |
| | 25,330,000 | | | U.S. Treasury Bills, 0.094% - 0.129%, 10/07/2021(a)(k)(l) | | | 25,312,522 | |
| | 12,670,000 | | | U.S. Treasury Bills, 0.105% - 0.118%, 11/04/2021(k)(l)(m) | | | 12,660,237 | |
| | 24,695,000 | | | U.S. Treasury Bills, 0.113%, 9/09/2021(k) | | | 24,680,284 | |
| | 22,330,000 | | | U.S. Treasury Bills, 0.115%, 6/17/2021(a)(k) | | | 22,321,608 | |
| | 22,800,000 | | | U.S. Treasury Bills, 0.121%, 5/20/2021(k) | | | 22,793,002 | |
| | 22,840,000 | | | U.S. Treasury Bills, 0.135%, 7/15/2021(k) | | | 22,829,798 | |
| | 23,500,000 | | | U.S. Treasury Bills, 0.136%, 8/12/2021(k) | | | 23,487,578 | |
| | | | | | | | |
| | | | Total Short-Term Investments
(Identified Cost $210,153,754) | | | 210,186,973 | |
| | | | | | | | |
| | | | | | | | |
| | | | Total Investments — 97.2%
(Identified Cost $1,255,898,939) | | | 1,277,633,095 | |
| | | | Other assets less liabilities — 2.8% | | | 37,383,254 | |
| | | | | | | | |
| | | | Net Assets — 100.0% | | $ | 1,315,016,349 | |
| | | | | | | | |
| | | | | | | | | | | | | | | | | | | | | | | | |
Written Options — (0.0%) | |
| Description | | Expiration
Date | | | Exercise
Price | | | Shares(††) | | | Notional
Amount | | | Premiums
(Received) | | | Value (†) | |
| Options on Securities — (0.0%) | |
Abbott Laboratories, Call | | | 2/19/2021 | | | | 115.00 | | | | (1,200 | ) | | $ | (131,388 | ) | | $ | (2,193 | ) | | $ | (2,310 | ) |
Accenture PLC, Call | | | 2/19/2021 | | | | 280.00 | | | | (500 | ) | | | (130,605 | ) | | | (1,734 | ) | | | (975 | ) |
Activision Blizzard, Inc., Call | | | 2/19/2021 | | | | 95.00 | | | | (2,700 | ) | | | (250,695 | ) | | | (6,675 | ) | | | (10,058 | ) |
Anthem, Inc., Call | | | 2/19/2021 | | | | 340.00 | | | | (900 | ) | | | (288,981 | ) | | | (3,840 | ) | | | (6,435 | ) |
Applied Materials, Inc., Call | | | 2/19/2021 | | | | 97.50 | | | | (3,500 | ) | | | (302,050 | ) | | | (5,275 | ) | | | (4,270 | ) |
Bank of America Corp., Call | | | 2/19/2021 | | | | 32.00 | | | | (1,900 | ) | | | (57,589 | ) | | | (1,477 | ) | | | (1,453 | ) |
BlackRock, Inc., Call | | | 2/19/2021 | | | | 750.00 | | | | (300 | ) | | | (216,462 | ) | | | (3,900 | ) | | | (4,680 | ) |
Chevron Corp., Call | | | 2/19/2021 | | | | 95.00 | | | | (3,000 | ) | | | (253,350 | ) | | | (6,021 | ) | | | (3,765 | ) |
Cisco Systems, Inc., Call | | | 2/19/2021 | | | | 49.00 | | | | (5,500 | ) | | | (246,125 | ) | | | (2,459 | ) | | | (2,118 | ) |
Comcast Corp., Call | | | 2/19/2021 | | | | 55.00 | | | | (5,400 | ) | | | (282,960 | ) | | | (4,140 | ) | | | (5,508 | ) |
Deere & Co., Call | | | 2/19/2021 | | | | 290.00 | | | | (1,000 | ) | | | (269,050 | ) | | | (5,367 | ) | | | (4,075 | ) |
DR Horton, Inc., Call | | | 2/19/2021 | | | | 82.50 | | | | (3,600 | ) | | | (248,112 | ) | | | (5,877 | ) | | | (2,034 | ) |
Eli Lilly & Co., Call | | | 2/19/2021 | | | | 185.00 | | | | (1,500 | ) | | | (253,260 | ) | | | (4,333 | ) | | | (3,870 | ) |
Fidelity National Information Services, Inc., Call | | | 2/19/2021 | | | | 155.00 | | | | (1,800 | ) | | | (254,628 | ) | | | (2,683 | ) | | | (2,835 | ) |
Fifth Third Bancorp, Call | | | 2/19/2021 | | | | 30.00 | | | | (2,700 | ) | | | (74,439 | ) | | | (1,585 | ) | | | (1,620 | ) |
Global Payments, Inc., Call | | | 2/19/2021 | | | | 210.00 | | | | (100 | ) | | | (21,542 | ) | | | (797 | ) | | | (1,215 | ) |
HCA Healthcare, Inc., Call | | | 2/19/2021 | | | | 180.00 | | | | (1,600 | ) | | | (263,136 | ) | | | (5,387 | ) | | | (4,520 | ) |
HP, Inc., Call | | | 2/19/2021 | | | | 25.00 | | | | (4,800 | ) | | | (118,032 | ) | | | (3,970 | ) | | | (4,560 | ) |
Interpublic Group of Cos., Inc. (The), Call | | | 2/19/2021 | | | | 26.00 | | | | (4,500 | ) | | | (105,840 | ) | | | (1,967 | ) | | | (1,800 | ) |
Intuit, Inc., Call | | | 2/19/2021 | | | | 400.00 | | | | (600 | ) | | | (227,910 | ) | | | (4,609 | ) | | | (4,290 | ) |
Iron Mountain, Inc., Call | | | 2/19/2021 | | | | 32.50 | | | | (8,700 | ) | | | (256,476 | ) | | | (1,979 | ) | | | (1,957 | ) |
Johnson & Johnson, Call | | | 2/19/2021 | | | | 165.00 | | | | (1,200 | ) | | | (188,856 | ) | | | (3,213 | ) | | | (3,678 | ) |
KLA Corp., Call | | | 2/19/2021 | | | | 290.00 | | | | (1,000 | ) | | | (258,910 | ) | | | (5,267 | ) | | | (4,450 | ) |
L Brands, Inc., Call | | | 2/19/2021 | | | | 45.00 | | | | (1,800 | ) | | | (66,942 | ) | | | (2,479 | ) | | | (1,386 | ) |
Lam Research Corp., Call | | | 2/19/2021 | | | | 550.00 | | | | (500 | ) | | | (236,135 | ) | | | (4,983 | ) | | | (2,950 | ) |
Lockheed Martin Corp., Call | | | 2/19/2021 | | | | 375.00 | | | | (500 | ) | | | (177,490 | ) | | | (3,034 | ) | | | (2,650 | ) |
Masco Corp., Call | | | 2/19/2021 | | | | 60.00 | | | | (4,900 | ) | | | (269,157 | ) | | | (5,033 | ) | | | (3,308 | ) |
MasterCard, Inc., Call | | | 2/19/2021 | | | | 370.00 | | | | (500 | ) | | | (178,470 | ) | | | (2,359 | ) | | | (5,250 | ) |
Merck & Co., Inc., Call | | | 2/19/2021 | | | | 85.00 | | | | (1,800 | ) | | | (147,240 | ) | | | (1,687 | ) | | | (2,655 | ) |
MetLife, Inc., Call | | | 2/19/2021 | | | | 50.00 | | | | (4,200 | ) | | | (197,190 | ) | | | (3,143 | ) | | | (4,032 | ) |
See accompanying notes to financial statements.
59 |
Portfolio of Investments – as of December 31, 2020
Loomis Sayles Strategic Alpha Fund – (continued)
| | | | | | | | | | | | | | | | | | | | | | | | |
Written Options — continued | |
| Description | | Expiration
Date | | | Exercise
Price | | | Shares(††) | | | Notional
Amount | | | Premiums
(Received) | | | Value (†) | |
| Options on Securities — continued | |
Microsoft Corp., Call | | | 2/19/2021 | | | | 240.00 | | | | (1,000 | ) | | $ | (222,420 | ) | | $ | (4,667 | ) | | $ | (3,025 | ) |
Morgan Stanley, Call | | | 2/19/2021 | | | | 72.50 | | | | (2,400 | ) | | | (164,472 | ) | | | (4,649 | ) | | | (4,224 | ) |
Newmont Corp., Call | | | 2/19/2021 | | | | 70.00 | | | | (4,400 | ) | | | (263,516 | ) | | | (4,167 | ) | | | (2,398 | ) |
Nexstar Media Group, Inc., Call | | | 2/19/2021 | | | | 115.00 | | | | (2,200 | ) | | | (240,218 | ) | | | (2,810 | ) | | | (7,260 | ) |
NIKE, Inc., Call | | | 2/19/2021 | | | | 155.00 | | | | (1,300 | ) | | | (183,911 | ) | | | (3,655 | ) | | | (1,449 | ) |
NortonLifeLock, Inc., Call | | | 2/19/2021 | | | | 24.00 | | | | (9,400 | ) | | | (195,332 | ) | | | (4,297 | ) | | | (2,867 | ) |
NVIDIA Corp., Call | | | 2/19/2021 | | | | 620.00 | | | | (500 | ) | | | (261,100 | ) | | | (4,808 | ) | | | (2,663 | ) |
Oracle Corp., Call | | | 2/19/2021 | | | | 70.00 | | | | (3,000 | ) | | | (194,070 | ) | | | (2,571 | ) | | | (1,500 | ) |
Philip Morris International, Inc., Call | | | 2/19/2021 | | | | 90.00 | | | | (2,300 | ) | | | (190,417 | ) | | | (2,132 | ) | | | (1,587 | ) |
QUALCOMM, Inc., Call | | | 2/19/2021 | | | | 175.00 | | | | (1,300 | ) | | | (198,042 | ) | | | (2,324 | ) | | | (2,795 | ) |
Target Corp., Call | | | 2/19/2021 | | | | 185.00 | | | | (1,000 | ) | | | (176,530 | ) | | | (2,947 | ) | | | (3,575 | ) |
Teradyne, Inc., Call | | | 2/19/2021 | | | | 140.00 | | | | (1,000 | ) | | | (119,890 | ) | | | (1,954 | ) | | | (1,850 | ) |
Texas Instruments, Inc., Call | | | 2/19/2021 | | | | 180.00 | | | | (1,200 | ) | | | (196,956 | ) | | | (2,049 | ) | | | (2,178 | ) |
Thermo Fisher Scientific, Inc., Call | | | 2/19/2021 | | | | 490.00 | | | | (400 | ) | | | (186,312 | ) | | | (4,827 | ) | | | (4,040 | ) |
Union Pacific Corp., Call | | | 2/19/2021 | | | | 220.00 | | | | (1,000 | ) | | | (208,220 | ) | | | (3,238 | ) | | | (4,025 | ) |
United Parcel Service, Inc., Call | | | 2/19/2021 | | | | 195.00 | | | | (1,200 | ) | | | (202,080 | ) | | | (3,560 | ) | | | (1,476 | ) |
UnitedHealth Group, Inc., Call | | | 2/19/2021 | | | | 360.00 | | | | (600 | ) | | | (210,408 | ) | | | (3,520 | ) | | | (6,720 | ) |
Walmart, Inc., Call | | | 2/19/2021 | | | | 160.00 | | | | (1,300 | ) | | | (187,395 | ) | | | (2,492 | ) | | | (1,462 | ) |
| | | | | | | | | | | | | | | | | | | | | | | | |
Total | | | | | | | | | | | | | | | | | | $ | (168,133 | ) | | $ | (159,801 | ) |
| | | | | | | | | | | | | | | | | | | | | | | | |
| | | | | | | | | | | | | | |
| | (‡) | | | Principal Amount/Par Value stated in U.S. dollars unless otherwise noted. |
| | (†) | | | See Note 2 of Notes to Financial Statements. |
| | (††) | | | Options on securities are expressed as shares. |
| | (a) | | | Security (or a portion thereof) has been designated to cover the Fund’s obligations under open derivative contracts. |
| | (b) | | | Variable rate security. Rate as of December 31, 2020 is disclosed. |
| | (c) | | | Variable rate security. The interest rate adjusts periodically based on; (i) changes in current interest rates and/or prepayments on underlying pools of assets, if applicable, (ii) reference to a base lending rate plus or minus a margin, and/or (iii) reference to a base lending rate adjusted by a multiplier and/or subject to certain floors or caps. Rate as of December 31, 2020 is disclosed. |
| | (d) | | | Level 3 security. Value has been determined using significant unobservable inputs. See Note 3 of Notes to Financial Statements. |
| | (e) | | | Illiquid security. (Unaudited) |
| | (f) | | | Securities subject to restriction on resale. At December 31, 2020, the restricted securities held by the Fund are as follows: |
| | | | | | | | | | | | | | | | |
| | | Acquisition
Date | | | Cost | | | Value | | | % of Net
Assets | |
ECAF I Blocker Ltd. | | | 6/18/2015 | | | $ | 9,000,000 | | | $ | 1,130,400 | | | | 0.1 | % |
GCA2014 Holdings Ltd., Series 2014-1, Class C | | | 12/18/2014 | | | | 2,272,583 | | | | 765,157 | | | | 0.1 | % |
GCA2014 Holdings Ltd., Series 2014-1, Class D | | | 12/18/2014 | | | | 1,027,860 | | | | 138,946 | | | | Less than 0.1 | % |
GCA2014 Holdings Ltd., Series 2014-1, Class E | | | 12/18/2014 | | | | 2,657,606 | | | | — | | | | — | |
| | | | |
| | (g) | | | Fair valued by the Fund’s adviser. At December 31, 2020, the value of these securities amounted to $7,357,855 or 0.6% of net assets. See Note 2 of Notes to Financial Statements. |
| | (h) | | | Non-income producing security. |
| | (i) | | | Securities classified as fair valued pursuant to the Fund’s pricing policies and procedures. At December 31, 2020, the value of these securities amounted to $7,222,747 or 0.5% of net assets. See Note 2 of Notes to Financial Statements. |
| | (j) | | | Position is unsettled. Contract rate was not determined at December 31, 2020 and does not take effect until settlement date. Maturity date is not finalized until settlement date. |
| | (k) | | | Interest rate represents discount rate at time of purchase; not a coupon rate. |
| | (l) | | | The Fund’s investment in U.S. Government/Agency securities is comprised of various lots with differing discount rates. These separate investments, which have the same maturity date, have been aggregated for the purpose of presentation in the Portfolio of Investments. |
| | (m) | | | Security (or a portion thereof) has been pledged as collateral for open derivative contracts. |
| | | | |
| | 144A | | | All or a portion of these securities are exempt from registration under Rule 144A of the Securities Act of 1933. These securities may be resold in transactions exempt from registration, normally to qualified institutional buyers. At December 31, 2020, the value of Rule 144A holdings amounted to $612,228,021 or 46.6% of net assets. |
| | ABS | | | Asset-Backed Securities |
| | ADR | | | An American Depositary Receipt is a certificate issued by a custodian bank representing the right to receive securities of the foreign issuer described. The values of ADRs may be significantly influenced by trading on exchanges not located in the United States. |
| | ARS | | | Auction Rate Security |
| | EMTN | | | Euro Medium Term Note |
| | EURIBOR | | | Euro Interbank Offered Rate |
| | JIBAR | | | Johannesburg Interbank Agreed Rate |
| | LIBOR | | | London Interbank Offered Rate |
| | MTN | | | Medium Term Note |
| | REITs | | | Real Estate Investment Trusts |
| | SAFEX | | | South African Futures Exchange |
| | SLM | | | Sallie Mae |
| | ARS | | | Argentine Peso |
| | CAD | | | Canadian Dollar |
| | COP | | | Colombian Peso |
| | EUR | | | Euro |
| | GBP | | | British Pound |
| | ZAR | | | South African Rand |
See accompanying notes to financial statements.
| 60
Portfolio of Investments – as of December 31, 2020
Loomis Sayles Strategic Alpha Fund – (continued)
At December 31, 2020, the Fund had the following open bilateral credit default swap agreements:
Buy Protection
| | | | | | | | | | | | | | | | | | | | | | | | | | |
| Counterparty | | Reference Obligation | | (Pay)/
Receive
Fixed Rate1 | | | Expiration
Date | | | Notional
Value(‡) | | | Unamortized
Up Front
Premium
Paid/(Received) | | | Market Value | | | Unrealized
Appreciation
(Depreciation) | |
Barclays Bank PLC | | United Mexican States | | | (1.00 | %) | | | 12/20/2025 | | | | 21,525,000 | | | $ | 320,410 | | | $ | (205,829 | ) | | $ | (526,239 | ) |
| | | | | | | | | | | | | | | | | | | | | | | | | | |
At December 31, 2020, the Fund had the following open centrally cleared interest rate swap agreements:
| | | | | | | | | | | | | | | | | | | | | | | | |
Notional
Value | | Currency | | | Expiration Date | | | Fund Pays1 | | | Fund Receives1 | | | Market Value | | | Unrealized
Appreciation
(Depreciation)2 | |
330,000,000 | | | ZAR | | | | 5/07/2030 | | | | 7.580 | % | | | 3-month SAFEX-JIBAR | | | $ | (2,049,100 | ) | | $ | (2,050,576 | ) |
| | | | | | | | | | | | | | | | | | | | | | | | |
At December 31, 2020, the Fund had the following open centrally cleared credit default swap agreements:
Sell Protection
| | | | | | | | | | | | | | | | | | | | | | | | | | | | |
| Reference Obligation | | (Pay)/Receive
Fixed Rate | | | Expiration
Date | | | Implied Credit
Spread^ | | | Notional
Value(‡) | | | Unamortized
Up Front
Premium
Paid/(Received) | | | Market
Value | | | Unrealized
Appreciation
(Depreciation) | |
CDX.NA HY* Series 35 500, 5-Year | | | 5.00 | % | | | 12/20/2025 | | | | 2.94 | % | | | 86,880,000 | | | $ | 3,427,889 | | | $ | 8,223,433 | | | $ | 4,795,544 | |
| | | | | | | | | | | | | | | | | | | | | | | | | | | | |
| (‡) | Notional value stated in U.S. dollars unless otherwise noted. |
| 1 | Payments are made quarterly. |
| 2 | Differences between unrealized appreciation (depreciation) and market value, if any, are due to interest booked as part of the initial trades. |
| ^ | Implied credit spreads, represented in absolute terms, serve as an indicator of the current status of the payment/performance risk and represent the likelihood or risk of default for the credit derivative. The implied credit spread of a particular reference entity reflects the cost of buying/selling protection and may include upfront payments required to be made to enter into the agreement. Wider credit spreads represent a deterioration of the reference entity’s credit soundness and a greater likelihood or risk of default or other credit event occurring as defined under the terms of the agreement. |
| * | CDX.NA.HY is an index composed of North American high yield credit default swaps. |
At December 31, 2020, the Fund had the following open forward foreign currency contracts:
| | | | | | | | | | | | | | | | | | | | | | | | | | |
| Counterparty | | Delivery
Date | | | Currency
Bought/
Sold (B/S) | | Units of Currency | | | In Exchange
for | | | Notional
Value | | | Unrealized
Appreciation
(Depreciation) | |
Bank of America, N.A. | | | 1/25/2021 | | | CAD | | | S | | | | 3,020,000 | | | $ | 2,305,822 | | | $ | 2,372,755 | | | $ | (66,933 | ) |
Bank of America, N.A. | | | 1/25/2021 | | | EUR | | | S | | | | 1,665,000 | | | | 1,982,118 | | | | 2,035,059 | | | | (52,941 | ) |
Barclays Bank PLC | | | 1/25/2021 | | | EUR | | | S | | | | 1,955,000 | | | | 2,327,838 | | | | 2,389,513 | | | | (61,675 | ) |
Deutsche Bank AG | | | 1/29/2021 | | | GBP | | | S | | | | 1,400,000 | | | | 1,817,368 | | | | 1,914,873 | | | | (97,505 | ) |
HSBC Bank USA | | | 2/16/2021 | | | EUR | | | S | | | | 590,000 | | | | 695,334 | | | | 721,484 | | | | (26,150 | ) |
Morgan Stanley Capital Services, Inc. | | | 1/08/2021 | | | COP | | | B | | | | 4,872,711,000 | | | | 1,275,578 | | | | 1,426,646 | | | | 151,068 | |
Morgan Stanley Capital Services, Inc. | | | 1/08/2021 | | | COP | | | S | | | | 10,059,585,000 | | | | 2,606,920 | | | | 2,945,274 | | | | (338,354 | ) |
Morgan Stanley Capital Services, Inc. | | | 1/29/2021 | | | EUR | | | S | | | | 1,480,000 | | | | 1,815,057 | | | | 1,809,104 | | | | 5,953 | |
Morgan Stanley Capital Services, Inc. | | | 1/29/2021 | | | ZAR | | | S | | | | 315,790,000 | | | | 19,100,355 | | | | 21,416,247 | | | | (2,315,892 | ) |
Standard Chartered Bank | | | 1/04/2021 | | | EUR | | | B | | | | 5,280,000 | | | | 6,490,440 | | | | 6,450,312 | | | | (40,128 | ) |
Standard Chartered Bank | | | 1/04/2021 | | | EUR | | | S | | | | 5,280,000 | | | | 6,191,201 | | | | 6,450,312 | | | | (259,111 | ) |
Standard Chartered Bank | | | 4/06/2021 | | | EUR | | | S | | | | 5,280,000 | | | | 6,503,772 | | | | 6,463,671 | | | | 40,101 | |
| | | | | | | | | | | | | | | | | | | | | | | | | | |
Total | | | $ | (3,061,567 | ) |
| | | | | |
See accompanying notes to financial statements.
61 |
Portfolio of Investments – as of December 31, 2020
Loomis Sayles Strategic Alpha Fund – (continued)
At December 31, 2020, open short futures contracts were as follows:
| | | | | | | | | | | | | | | | | | | | |
| Financial Futures | | Expiration
Date | | | Contracts | | | Notional
Amount | | | Value | | | Unrealized
Appreciation
(Depreciation) | |
Ultra Long U.S. Treasury Bond | | | 3/22/2021 | | | | 182 | | | $ | 38,845,941 | | | $ | 38,868,375 | | | $ | (22,434 | ) |
| | | | | | | | | | | | | | | | | | | | |
Industry Summary at December 31, 2020
| | | | |
ABS Home Equity | | | 6.9 | % |
ABS Car Loan | | | 5.5 | |
ABS Other | | | 4.9 | |
Technology | | | 4.4 | |
Finance Companies | | | 4.2 | |
Non-Agency Commercial Mortgage-Backed Securities | | | 3.4 | |
Cable Satellite | | | 3.4 | |
Aerospace & Defense | | | 3.1 | |
Banking | | | 2.9 | |
Consumer Cyclical Services | | | 2.6 | |
Pharmaceuticals | | | 2.5 | |
Electric | | | 2.1 | |
Automotive | | | 2.0 | |
Other Investments, less than 2% each | | | 28.0 | |
Short-Term Investments | | | 16.0 | |
Collateralized Loan Obligations | | | 5.3 | |
| | | | |
Total Investments | | | 97.2 | |
Other assets less liabilities (including open written options, swap agreements, forward foreign currency and futures contracts) | | | 2.8 | |
| | | | |
Net Assets | | | 100.0 | % |
| | | | |
See accompanying notes to financial statements.
| 62
Portfolio of Investments – as of December 31, 2020
Loomis Sayles Strategic Income Fund
| | | | | | | | |
Principal
Amount (‡) | | | Description | | Value (†) | |
| | Bonds and Notes — 67.2% of Net Assets | |
| | Non-Convertible Bonds — 61.4% | |
| | | | ABS Home Equity — 0.1% | |
| $ | 8,377,805 | | | Legacy Mortgage Asset Trust, Series 2018-GS2, Class A1, 4.000%, 4/25/2058, 144A(a) | | $ | 8,432,129 | |
| | | | | | | | |
| | | | ABS Other — 0.2% | |
| | 23,436,010 | | | GCA2014 Holdings Ltd., Series 2014-1, Class C, 6.000%, 1/05/2030, 144A(b)(c)(d)(e) | | | 7,909,888 | |
| | 10,635,332 | | | GCA2014 Holdings Ltd., Series 2014-1, Class D, 7.500%, 1/05/2030, 144A(b)(c)(d)(e) | | | 1,437,684 | |
| | 42,000,000 | | | GCA2014 Holdings Ltd., Series 2014-1, Class E, Zero Coupon, 1/05/2030, 144A(b)(c)(d)(e)(f) | | | — | |
| | 5,623,618 | | | Global Container Assets Ltd., Series 2015-1A, Class B, 4.500%, 2/05/2030, 144A(b)(c)(g) | | | 4,870,390 | |
| | | | | | | | |
| | | | | | | 14,217,962 | |
| | | | | | | | |
| | | | Aerospace & Defense — 3.6% | |
| | 90,000 | | | Boeing Co. (The), 3.100%, 5/01/2026 | | | 96,372 | |
| | 380,000 | | | Boeing Co. (The), 3.250%, 2/01/2035 | | | 389,692 | |
| | 2,505,000 | | | Boeing Co. (The), 3.550%, 3/01/2038 | | | 2,555,581 | |
| | 3,280,000 | | | Boeing Co. (The), 3.600%, 5/01/2034 | | | 3,453,648 | |
| | 14,845,000 | | | Boeing Co. (The), 3.625%, 2/01/2031 | | | 16,246,087 | |
| | 1,995,000 | | | Boeing Co. (The), 3.625%, 3/01/2048 | | | 2,011,466 | |
| | 1,985,000 | | | Boeing Co. (The), 3.650%, 3/01/2047 | | | 2,009,293 | |
| | 1,385,000 | | | Boeing Co. (The), 3.750%, 2/01/2050 | | | 1,448,433 | |
| | 415,000 | | | Boeing Co. (The), 3.850%, 11/01/2048 | | | 428,056 | |
| | 12,949,000 | | | Boeing Co. (The), 3.950%, 8/01/2059 | | | 13,858,759 | |
| | 4,755,000 | | | Boeing Co. (The), 5.150%, 5/01/2030 | | | 5,754,746 | |
| | 30,413,000 | | | Boeing Co. (The), 5.805%, 5/01/2050 | | | 41,913,525 | |
| | 14,314,000 | | | Boeing Co. (The), 5.930%, 5/01/2060 | | | 20,305,753 | |
| | 2,535,000 | | | Bombardier, Inc., 7.450%, 5/01/2034, 144A | | | 2,217,187 | |
| | 3,145,000 | | | Embraer Netherlands Finance BV, 5.400%, 2/01/2027 | | | 3,341,594 | |
| | 9,576,000 | | | Leonardo U.S. Holdings, Inc., 6.250%, 1/15/2040, 144A | | | 11,345,836 | |
| | 8,815,000 | | | Leonardo U.S. Holdings, Inc., 7.375%, 7/15/2039, 144A | | | 11,395,503 | |
| | 5,310,000 | | | Textron Financial Corp., 3-month LIBOR + 1.735%, 1.956%, 2/15/2067, 144A(h) | | | 3,900,514 | |
| | 6,485,000 | | | TransDigm, Inc., 5.500%, 11/15/2027 | | | 6,817,681 | |
| | 24,513,000 | | | TransDigm, Inc., 6.500%, 7/15/2024 | | | 24,947,370 | |
| | 17,765,000 | | | TransDigm, Inc., 6.500%, 5/15/2025 | | | 18,253,537 | |
| | 370,000 | | | TransDigm, Inc., 7.500%, 3/15/2027 | | | 394,975 | |
| | 19,475,000 | | | TransDigm, Inc., 8.000%, 12/15/2025, 144A | | | 21,525,717 | |
| | | | | | | | |
| | | | | | | 214,611,325 | |
| | | | | | | | |
| | | | Airlines — 1.6% | |
| | 17,495,000 | | | Air Canada Pass Through Trust, Series 2020-2A, 5.250%, 10/01/2030, 144A | | | 18,527,030 | |
| | 240,000 | | | American Airlines Group, Inc., 3.750%, 3/01/2025, 144A | | | 185,587 | |
| | 20,000,000 | | | American Airlines Group, Inc., 5.000%, 6/01/2022, 144A | | | 17,980,200 | |
| | 1,506,441 | | | American Airlines Pass Through Certificates, Series 2016-3, Class B, 3.750%, 4/15/2027 | | | 1,211,962 | |
| | 872,770 | | | American Airlines Pass Through Certificates, Series 2017-2, Class B, 3.700%, 4/15/2027 | | | 737,848 | |
| | 146,817 | | | Continental Airlines Pass Through Certificates, Series 2001-1, Class A-1, 6.703%, 12/15/2022 | | | 146,817 | |
| | 26,975,000 | | | Mileage Plus Holdings LLC/Mileage Plus Intellectual Property Assets Ltd., 6.500%, 6/20/2027, 144A | | | 28,998,125 | |
| | | | Airlines — continued | |
| 120,264 | | | Northwest Airlines Pass Through Trust, Series 2002-1, Class G2, (MBIA Insured), 6.264%, 5/20/2023 | | | 121,614 | |
| | 25,085,000 | | | United Airlines Pass Through Trust, Series 2020-1, Class A, 5.875%, 4/15/2029 | | | 27,063,705 | |
| | | | | | | | |
| | | | | | | 94,972,888 | |
| | | | | | | | |
| | | | Automotive — 3.1% | |
| | 1,210,000 | | | Allison Transmission, Inc., 4.750%, 10/01/2027, 144A | | | 1,273,525 | |
| | 46,535,000 | | | Ford Motor Co., 4.750%, 1/15/2043 | | | 47,465,700 | |
| | 10,745,000 | | | Ford Motor Co., 5.291%, 12/08/2046 | | | 11,228,525 | |
| | 1,220,000 | | | Ford Motor Co., 6.625%, 2/15/2028 | | | 1,379,381 | |
| | 1,345,000 | | | Ford Motor Co., 7.500%, 8/01/2026 | | | 1,565,567 | |
| | 1,500,000 | | | Ford Motor Credit Co. LLC, 5.113%, 5/03/2029 | | | 1,670,550 | |
| | 5,000,000 | | | Ford Motor Credit Co. LLC, 5.125%, 6/16/2025 | | | 5,436,500 | |
| | 18,565,000 | | | Ford Motor Credit Co. LLC, 5.596%, 1/07/2022 | | | 19,190,269 | |
| | 2,845,000 | | | General Motors Co., 5.200%, 4/01/2045 | | | 3,455,044 | |
| | 2,120,000 | | | General Motors Co., 6.250%, 10/02/2043 | | | 2,859,815 | |
| | 62,220,000 | | | General Motors Financial Co., Inc., 3.600%, 6/21/2030 | | | 69,374,286 | |
| | 11,130,000 | | | Goodyear Tire & Rubber Co. (The), 4.875%, 3/15/2027 | | | 11,380,425 | |
| | 1,585,000 | | | Goodyear Tire & Rubber Co. (The), 5.000%, 5/31/2026 | | | 1,612,737 | |
| | 4,977,000 | | | Goodyear Tire & Rubber Co. (The), 7.000%, 3/15/2028 | | | 5,400,692 | |
| | | | | | | | |
| | | | | | | 183,293,016 | |
| | | | | | | | |
| | | | Banking — 5.1% | |
| | 6,000,000 | | | Ally Financial, Inc., 8.000%, 11/01/2031 | | | 8,807,220 | |
| | 11,000,000 | | | Banco Santander Mexico S.A. Institucion de Banca Multiple Grupo Financiero Santander, 5.375%, 4/17/2025, 144A | | | 12,637,460 | |
| | 9,275,000 | | | Bank of America Corp., (fixed rate to 10/24/2030, variable rate thereafter), MTN, 1.922%, 10/24/2031 | | | 9,397,621 | |
| | 983,000 | | | Bank of America Corp., (fixed rate to 12/20/2027, variable rate thereafter), 3.419%, 12/20/2028 | | | 1,110,342 | |
| | 8,355,000 | | | Bank of America Corp., (fixed rate to 4/29/2030, variable rate thereafter), 2.592%, 4/29/2031 | | | 8,954,541 | |
| | 5,895,000 | | | Bank of America Corp., (fixed rate to 7/23/2030, variable rate thereafter), MTN, 1.898%, 7/23/2031 | | | 5,955,961 | |
| | 265,000 | | | Bank of America Corp., MTN, 4.250%, 10/22/2026 | | | 310,836 | |
| | 7,045,000 | | | Bank of America Corp., Series L, MTN, 4.183%, 11/25/2027 | | | 8,172,804 | |
| | 31,380,000 | | | Barclays PLC, (fixed rate to 9/23/2030, variable rate thereafter), 3.564%, 9/23/2035 | | | 34,001,485 | |
| | 9,462,000 | | | BNP Paribas S.A., (fixed rate to 8/12/2030, variable rate thereafter), 2.588%, 8/12/2035, 144A | | | 9,646,509 | |
| | 26,680,000 | | | Citigroup, Inc., (fixed rate to 3/31/2030, variable rate thereafter), 4.412%, 3/31/2031 | | | 32,353,691 | |
| | 1,965,000 | | | Citigroup, Inc., (fixed rate to 6/03/2030, variable rate thereafter), 2.572%, 6/03/2031 | | | 2,094,415 | |
| | 3,450,000 | | | Cooperatieve Rabobank UA, 3.950%, 11/09/2022 | | | 3,662,661 | |
| | 1,995,000 | | | Credit Agricole S.A., 3.250%, 1/14/2030, 144A | | | 2,185,323 | |
| | 1,709,000 | | | Deutsche Bank AG, (fixed rate to 12/01/2027, variable rate thereafter), 4.875%, 12/01/2032 | | | 1,788,298 | |
See accompanying notes to financial statements.
63 |
Portfolio of Investments – as of December 31, 2020
Loomis Sayles Strategic Income Fund – (continued)
| | | | | | | | |
Principal
Amount (‡) | | | Description | | Value (†) | |
| | | | Banking — continued | |
| $ | 19,245,000 | | | Intesa Sanpaolo SpA, 5.017%, 6/26/2024, 144A | | $ | 21,055,530 | |
| | 5,531,000 | | | JPMorgan Chase & Co., (fixed rate to 10/15/2029, variable rate thereafter), 2.739%, 10/15/2030 | | | 6,014,038 | |
| | 18,750,000 | | | JPMorgan Chase & Co., (fixed rate to 11/19/2030, variable rate thereafter), 1.764%, 11/19/2031 | | | 18,927,875 | |
| | 30,335,000 | | | Morgan Stanley, (fixed rate to 2/13/2031, variable rate thereafter), MTN, 1.794%, 2/13/2032 | | | 30,551,898 | |
| | 36,195,000 | | | Morgan Stanley, GMTN, 4.350%, 9/08/2026 | | | 42,673,480 | |
| | 10,000,000 | | | Morgan Stanley, MTN, 6.250%, 8/09/2026 | | | 12,759,009 | |
| | 14,965,000 | | | Natwest Group PLC, (fixed rate to 8/28/2030, variable rate thereafter), 3.032%, 11/28/2035 | | | 15,458,396 | |
| | 13,520,000 | | | UniCredit SpA, (fixed rate to 6/30/2030, variable rate thereafter), 5.459%, 6/30/2035, 144A | | | 14,876,564 | |
| | | | | | | | |
| | | | | | | 303,395,957 | |
| | | | | | | | |
| | | | Brokerage — 0.8% | |
| | 14,755,000 | | | Jefferies Group LLC, 6.250%, 1/15/2036 | | | 19,678,238 | |
| | 15,215,000 | | | Jefferies Group LLC, 6.450%, 6/08/2027 | | | 19,288,647 | |
| | 7,155,000 | | | Owl Rock Technology Finance Corp., 4.750%, 12/15/2025, 144A | | | 7,471,572 | |
| | | | | | | | |
| | | | | | | 46,438,457 | |
| | | | | | | | |
| | | | Building Materials — 0.9% | |
| | 5,565,000 | | | American Woodmark Corp., 4.875%, 3/15/2026, 144A | | | 5,704,125 | |
| | 2,395,000 | | | Cemex SAB de CV, 5.200%, 9/17/2030, 144A | | | 2,626,118 | |
| | 19,041,000 | | | Cemex SAB de CV, 5.700%, 1/11/2025, 144A | | | 19,459,902 | |
| | 3,255,000 | | | JELD-WEN, Inc., 4.875%, 12/15/2027, 144A | | | 3,442,162 | |
| | 1,859,000 | | | Masco Corp., 6.500%, 8/15/2032 | | | 2,482,086 | |
| | 1,226,000 | | | Masco Corp., 7.750%, 8/01/2029 | | | 1,704,210 | |
| | 10,800,000 | | | Owens Corning, 7.000%, 12/01/2036 | | | 15,398,139 | |
| | | | | | | | |
| | | | | | | 50,816,742 | |
| | | | | | | | |
| | | | Cable Satellite — 2.0% | |
| | 4,360,000 | | | CCO Holdings LLC/CCO Holdings Capital Corp., 5.875%, 5/01/2027, 144A | | | 4,528,950 | |
| | 3,905,000 | | | Charter Communications Operating LLC/Charter Communications Operating Capital Corp., 2.800%, 4/01/2031 | | | 4,130,242 | |
| | 47,650,000 | | | Charter Communications Operating LLC/Charter Communications Operating Capital Corp., 3.700%, 4/01/2051 | | | 49,482,369 | |
| | 3,900,000 | | | Charter Communications Operating LLC/Charter Communications Operating Capital Corp., 5.125%, 7/01/2049 | | | 4,760,006 | |
| | 17,880,000 | | | CSC Holdings LLC, 5.375%, 2/01/2028, 144A | | | 19,086,900 | |
| | 17,679,000 | | | DISH DBS Corp., 5.875%, 11/15/2024 | | | 18,537,050 | |
| | 4,865,000 | | | DISH DBS Corp., 7.750%, 7/01/2026 | | | 5,448,849 | |
| | 4,835,000 | | | Time Warner Cable LLC, 4.500%, 9/15/2042 | | | 5,665,638 | |
| | 135,000 | | | Time Warner Cable LLC, 5.875%, 11/15/2040 | | | 180,193 | |
| | 5,530,000 | | | Ziggo BV, 5.500%, 1/15/2027, 144A | | | 5,771,937 | |
| | | | | | | | |
| | | | | | | 117,592,134 | |
| | | | | | | | |
| | | | Chemicals — 0.4% | |
| | 19,810,000 | | | Aruba Investments, Inc., 8.750%, 2/15/2023, 144A | | | 20,008,100 | |
| | 6,275,000 | | | Minerals Technologies, Inc., 5.000%, 7/01/2028, 144A | | | 6,572,058 | |
| | | | | | | | |
| | | | | | | 26,580,158 | |
| | | | | | | | |
| | | | Construction Machinery — 0.0% | |
| 1,310,000 | | | United Rentals North America, Inc., 4.875%, 1/15/2028 | | | 1,395,150 | |
| | | | | | | | |
| | | | Consumer Cyclical Services — 0.7% | |
| | 4,370,000 | | | Expedia Group, Inc., 3.250%, 2/15/2030 | | | 4,548,038 | |
| | 14,115,000 | | | Expedia Group, Inc., 3.800%, 2/15/2028 | | | 15,161,387 | |
| | 5,500,000 | | | ServiceMaster Co. LLC (The), 7.450%, 8/15/2027 | | | 6,400,625 | |
| | 7,180,000 | | | Uber Technologies, Inc., 6.250%, 1/15/2028, 144A | | | 7,808,250 | |
| | 9,375,000 | | | Uber Technologies, Inc., 7.500%, 9/15/2027, 144A | | | 10,312,500 | |
| | | | | | | | |
| | | | | | | 44,230,800 | |
| | | | | | | | |
| | | | Consumer Products — 0.3% | |
| | 11,880,000 | | | Avon Products, Inc., 8.950%, 3/15/2043 | | | 15,533,100 | |
| | 2,405,000 | | | Whirlpool Corp., 4.600%, 5/15/2050 | | | 3,111,914 | |
| | | | | | | | |
| | | | | | | 18,645,014 | |
| | | | | | | | |
| | | | Electric — 1.0% | |
| | 24,386,618 | | | Alta Wind Holdings LLC, 7.000%, 6/30/2035, 144A | | | 28,658,527 | |
| | 835,000 | | | Edison International, 4.950%, 4/15/2025 | | | 950,459 | |
| | 3,570,000 | | | Empresa Nacional de Electricidad S.A., 7.875%, 2/01/2027 | | | 4,241,155 | |
| | 4,365,000 | | | Pacific Gas & Electric Co., 3.500%, 8/01/2050 | | | 4,338,422 | |
| | 5,515,000 | | | Pacific Gas & Electric Co., 4.250%, 3/15/2046 | | | 5,920,592 | |
| | 7,435,000 | | | Pacific Gas & Electric Co., 4.300%, 3/15/2045 | | | 7,926,903 | |
| | 7,860,000 | | | Pacific Gas & Electric Co., 4.750%, 2/15/2044 | | | 8,830,822 | |
| | | | | | | | |
| | | | | | | 60,866,880 | |
| | | | | | | | |
| | | | Finance Companies — 6.4% | |
| | 4,665,000 | | | Air Lease Corp., 3.125%, 12/01/2030 | | | 4,856,169 | |
| | 1,020,000 | | | Antares Holdings LP, 6.000%, 8/15/2023, 144A | | | 1,040,219 | |
| | 20,000,000 | | | Antares Holdings LP, 8.500%, 5/18/2025, 144A | | | 21,559,852 | |
| | 40,505,000 | | | GE Capital Funding LLC, 4.550%, 5/15/2032, 144A | | | 48,610,784 | |
| | 11,150,000 | | | GE Capital International Funding Co. Unlimited Co., 4.418%, 11/15/2035 | | | 13,308,038 | |
| | 135,000 | | | Navient Corp., 5.000%, 3/15/2027 | | | 136,181 | |
| | 22,945,000 | | | Navient Corp., 5.500%, 1/25/2023 | | | 23,977,525 | |
| | 3,030,000 | | | Navient Corp., 5.875%, 10/25/2024 | | | 3,219,375 | |
| | 109,950(††) | | | Navient Corp., 6.000%, 12/15/2043 | | | 2,757,913 | |
| | 950,000 | | | Navient Corp., 6.750%, 6/15/2026 | | | 1,031,938 | |
| | 54,470,000 | | | Navient Corp., MTN, 5.625%, 8/01/2033 | | | 52,291,200 | |
| | 47,984,000 | | | Navient Corp., MTN, 6.125%, 3/25/2024 | | | 51,222,920 | |
| | 6,490,000 | | | Navient Corp., MTN, 7.250%, 1/25/2022 | | | 6,782,050 | |
| | 23,115,000 | | | OneMain Finance Corp., 6.875%, 3/15/2025 | | | 26,842,294 | |
| | 4,075,000 | | | OneMain Finance Corp., 7.125%, 3/15/2026 | | | 4,818,688 | |
| | 26,970,000 | | | OneMain Finance Corp., 7.750%, 10/01/2021 | | | 28,385,925 | |
| | 55,015,000 | | | OneMain Finance Corp., 8.250%, 10/01/2023 | | | 63,129,712 | |
| | 14,750,000 | | | Owl Rock Capital Corp., 4.250%, 1/15/2026 | | | 15,536,596 | |
| | 4,360,000 | | | Quicken Loans LLC, 5.250%, 1/15/2028, 144A | | | 4,654,300 | |
| | 2,455,000 | | | Quicken Loans LLC/Quicken Loans Co-Issuer, Inc., 3.625%, 3/01/2029, 144A | | | 2,504,100 | |
| | 7,325,000 | | | Quicken Loans LLC/Quicken Loans Co-Issuer, Inc., 3.875%, 3/01/2031, 144A | | | 7,599,687 | |
| | | | | | | | |
| | | | | | | 384,265,466 | |
| | | | | | | | |
| | | | Financial Other — 0.3% | |
| | 3,580,000 | | | Icahn Enterprises LP/Icahn Enterprises Finance Corp., 5.250%, 5/15/2027 | | | 3,837,760 | |
| | 11,820,000 | | | Nationstar Mortgage Holdings, Inc., 5.500%, 8/15/2028, 144A | | | 12,411,000 | |
| | | | | | | | |
| | | | | | | 16,248,760 | |
| | | | | | | | |
See accompanying notes to financial statements.
| 64
Portfolio of Investments – as of December 31, 2020
Loomis Sayles Strategic Income Fund – (continued)
| | | | | | | | |
Principal
Amount (‡) | | | Description | | Value (†) | |
| | | | Food & Beverage — 1.0% | |
| $ | 24,865,000 | | | Anheuser-Busch InBev Worldwide, Inc., 4.500%, 6/01/2050 | | $ | 31,386,091 | |
| | 28,650,000 | | | Kraft Heinz Foods Co., 4.375%, 6/01/2046 | | | 30,875,245 | |
| | | | | | | | |
| | | | | | | 62,261,336 | |
| | | | | | | | |
| | | | Gaming — 0.1% | |
| | 5,475,000 | | | International Game Technology PLC, 6.250%, 1/15/2027, 144A | | | 6,269,696 | |
| | | | | | | | |
| | | | Government Owned – No Guarantee — 0.6% | |
| | 6,535,000 | | | Pertamina Persero PT, 6.450%, 5/30/2044, 144A | | | 8,855,474 | |
| | 6,586,000 | | | Petroleos Mexicanos, 6.625%, 6/15/2035 | | | 6,520,140 | |
| | 12,239,000 | | | Petroleos Mexicanos, 6.950%, 1/28/2060 | | | 11,512,615 | |
| | 10,230,000 | | | Saudi Arabian Oil Co., 3.250%, 11/24/2050, 144A | | | 10,373,911 | |
| | | | | | | | |
| | | | | | | 37,262,140 | |
| | | | | | | | |
| | | | Government Sponsored — 0.4% | |
| | 16,800,000 | | | Petrobras Global Finance BV, 6.750%, 6/03/2050 | | | 20,874,000 | |
| | 2,525,000 | | | Petrobras Global Finance BV, 6.900%, 3/19/2049 | | | 3,200,437 | |
| | | | | | | | |
| | | | | | | 24,074,437 | |
| | | | | | | | |
| | | | Healthcare — 2.8% | |
| | 14,620,000 | | | HCA, Inc., 7.050%, 12/01/2027 | | | 17,708,475 | |
| | 24,215,000 | | | HCA, Inc., 7.500%, 11/06/2033 | | | 33,658,850 | |
| | 9,492,000 | | | HCA, Inc., MTN, 7.750%, 7/15/2036 | | | 12,268,410 | |
| | 19,785,000 | | | Tenet Healthcare Corp., 5.125%, 5/01/2025 | | | 20,170,610 | |
| | 19,895,000 | | | Tenet Healthcare Corp., 6.125%, 10/01/2028, 144A | | | 20,730,192 | |
| | 17,240,000 | | | Tenet Healthcare Corp., 6.750%, 6/15/2023 | | | 18,489,900 | |
| | 43,749,000 | | | Tenet Healthcare Corp., 6.875%, 11/15/2031 | | | 46,155,195 | |
| | | | | | | | |
| | | | | | | 169,181,632 | |
| | | | | | | | |
| | | | Home Construction — 1.4% | |
| | 47,260,000 | | | PulteGroup, Inc., 6.000%, 2/15/2035 | | | 64,259,422 | |
| | 13,190,000 | | | PulteGroup, Inc., 6.375%, 5/15/2033 | | | 18,071,619 | |
| | 195,000 | | | TRI Pointe Group, Inc./TRI Pointe Homes, Inc., 5.875%, 6/15/2024 | | | 212,842 | |
| | | | | | | | |
| | | | | | | 82,543,883 | |
| | | | | | | | |
| | | | Independent Energy — 2.4% | |
| | 2,685,000 | | | Aker BP ASA, 3.750%, 1/15/2030, 144A | | | 2,820,078 | |
| | 6,638,000 | | | Ascent Resources Utica Holdings LLC/ARU Finance Corp., 9.000%, 11/01/2027, 144A | | | 7,384,775 | |
| | 8,225,000 | | | Baytex Energy Corp., 5.625%, 6/01/2024, 144A | | | 5,658,142 | |
| | 39,985,000 | | | Chesapeake Energy Corp., 8.000%, 6/15/2027(c)(g)(i) | | | 1,799,325 | |
| | 15,215,000 | | | Continental Resources, Inc., 3.800%, 6/01/2024 | | | 15,711,161 | |
| | 1,091,000 | | | Continental Resources, Inc., 4.500%, 4/15/2023 | | | 1,124,930 | |
| | 2,340,000 | | | Diamondback Energy, Inc., 3.500%, 12/01/2029 | | | 2,499,859 | |
| | 11,535,000 | | | Hess Corp., 5.600%, 2/15/2041 | | | 14,076,823 | |
| | 550,000 | | | Leviathan Bond Ltd., 6.125%, 6/30/2025, 144A | | | 602,366 | |
| | 1,000,000 | | | Leviathan Bond Ltd., 6.500%, 6/30/2027, 144A | | | 1,126,670 | |
| | 7,644,000 | | | MEG Energy Corp., 7.000%, 3/31/2024, 144A | | | 7,720,440 | |
| | 17,908,000 | | | Mesquite Energy, Inc., 6.125%, 1/15/2023(c)(g)(i) | | | 80,228 | |
| | 9,520,000 | | | Mesquite Energy, Inc., 7.750%, 6/15/2021(c)(g)(i) | | | 11,234 | |
| | 540,000 | | | Occidental Petroleum Corp., 4.500%, 7/15/2044 | | | 465,302 | |
| | 32,720,000 | | | Occidental Petroleum Corp., 6.625%, 9/01/2030 | | | 35,525,740 | |
| | 2,390,000 | | | Pan American Energy LLC, 7.875%, 5/07/2021, 144A | | | 2,411,653 | |
| | | | Independent Energy — continued | |
| 4,850,000 | | | Parsley Energy LLC/Parsley Finance Corp., 4.125%, 2/15/2028, 144A | | | 5,092,500 | |
| | 2,055,000 | | | QEP Resources, Inc., 5.250%, 5/01/2023 | | | 2,162,887 | |
| | 14,852,000 | | | SM Energy Co., 10.000%, 1/15/2025, 144A | | | 16,022,932 | |
| | 1,110,000 | | | Southwestern Energy Co., 6.450%, 1/23/2025 | | | 1,154,400 | |
| | 14,955,000 | | | Vine Oil & Gas LP/Vine Oil & Gas Finance Corp., 8.750%, 4/15/2023, 144A(c)(g) | | | 11,814,450 | |
| | 2,530,000 | | | Vine Oil & Gas LP/Vine Oil & Gas Finance Corp., 9.750%, 4/15/2023, 144A(c)(g) | | | 2,024,000 | |
| | 6,145,000 | | | WPX Energy, Inc., 4.500%, 1/15/2030 | | | 6,513,700 | |
| | | | | | | | |
| | | | | | | 143,803,595 | |
| | | | | | | | |
| | | | Industrial Other — 0.0% | |
| | 1,200,000 | | | HTA Group Ltd. Co., 7.000%, 12/18/2025, 144A | | | 1,290,000 | |
| | | | | | | | |
| | | | Life Insurance — 1.4% | |
| | 3,575,000 | | | Brighthouse Financial, Inc., 4.700%, 6/22/2047 | | | 3,733,179 | |
| | 13,830,000 | | | Brighthouse Financial, Inc., 5.625%, 5/15/2030 | | | 17,072,872 | |
| | 15,000,000 | | | Global Atlantic Fin Co., 8.625%, 4/15/2021, 144A | | | 15,252,351 | |
| | 20,000,000 | | | National Life Insurance Co., 10.500%, 9/15/2039, 144A(c)(g) | | | 34,437,000 | |
| | 8,920,000 | | | NLV Financial Corp., 7.500%, 8/15/2033, 144A(c)(g) | | | 12,284,445 | |
| | 2,500,000 | | | Prudential Financial, Inc., MTN, 3.700%, 3/13/2051 | | | 3,005,350 | |
| | | | | | | | |
| | | | | | | 85,785,197 | |
| | | | | | | | |
| | | | Media Entertainment — 0.5% | |
| | 6,785,000 | | | Discovery Communications LLC, 4.000%, 9/15/2055, 144A | | | 7,594,440 | |
| | 4,635,000 | | | iHeartCommunications, Inc., 8.375%, 5/01/2027 | | | 4,947,677 | |
| | 2,475,000 | | | ViacomCBS, Inc., 4.375%, 3/15/2043 | | | 2,924,133 | |
| | 4,469,000 | | | ViacomCBS, Inc., 4.900%, 8/15/2044 | | | 5,573,614 | |
| | 4,600,000 | | | ViacomCBS, Inc., 4.950%, 5/19/2050 | | | 5,958,474 | |
| | | | | | | | |
| | | | | | | 26,998,338 | |
| | | | | | | | |
| | | | Metals & Mining — 1.2% | |
| | 2,795,000 | | | Anglo American Capital PLC, 2.625%, 9/10/2030, 144A | | | 2,922,699 | |
| | 25,271,000 | | | ArcelorMittal S.A., 7.000%, 3/01/2041 | | | 34,825,426 | |
| | 1,970,000 | | | Barrick North America Finance LLC, 5.750%, 5/01/2043 | | | 2,873,321 | |
| | 2,630,000 | | | First Quantum Minerals Ltd., 6.875%, 3/01/2026, 144A | | | 2,741,775 | |
| | 13,616,000 | | | First Quantum Minerals Ltd., 6.875%, 10/15/2027, 144A | | | 14,773,360 | |
| | 1,810,000 | | | First Quantum Minerals Ltd., 7.500%, 4/01/2025, 144A | | | 1,884,662 | |
| | 3,930,000 | | | Glencore Funding LLC, 2.500%, 9/01/2030, 144A | | | 4,016,696 | |
| | 2,730,000 | | | Kaiser Aluminum Corp., 6.500%, 5/01/2025, 144A | | | 2,921,100 | |
| | 7,180,000 | | | United States Steel Corp., 6.650%, 6/01/2037 | | | 6,031,200 | |
| | | | | | | | |
| | | | | | | 72,990,239 | |
| | | | | | | | |
| | | | Midstream — 0.4% | |
| | 13,667,000 | | | NGL Energy Partners LP/NGL Energy Finance Corp., 6.125%, 3/01/2025 | | | 8,661,461 | |
| | 505,000 | | | NGPL PipeCo LLC, 7.768%, 12/15/2037, 144A | | | 682,750 | |
| | 185,000 | | | Plains All American Pipeline LP/PAA Finance Corp., 4.300%, 1/31/2043 | | | 182,021 | |
| | 9,690,000 | | | Plains All American Pipeline LP/PAA Finance Corp., 4.700%, 6/15/2044 | | | 10,047,648 | |
| | 1,180,000 | | | Plains All American Pipeline LP/PAA Finance Corp., 4.900%, 2/15/2045 | | | 1,252,328 | |
See accompanying notes to financial statements.
65 |
Portfolio of Investments – as of December 31, 2020
Loomis Sayles Strategic Income Fund – (continued)
| | | | | | | | |
Principal
Amount (‡) | | | Description | | Value (†) | |
| | | | Midstream — continued | |
| $ | 11,980,000 | | | Summit Midstream Partners LP, Series A, (fixed rate to 12/15/2022, variable rate thereafter), 9.500%(c)(g)(i)(j) | | $ | 3,834,798 | |
| | | | | | | | |
| | | | | | | 24,661,006 | |
| | | | | | | | |
| | | | Oil Field Services — 0.6% | |
| | 2,080,000 | | | Shelf Drilling Holdings Ltd., 8.250%, 2/15/2025, 144A | | | 956,800 | |
| | 2,770,000 | | | Transocean, Inc., 7.500%, 4/15/2031 | | | 962,575 | |
| | 48,755,000 | | | Transocean, Inc., 11.500%, 1/30/2027, 144A | | | 34,859,825 | |
| | | | | | | | |
| | | | | | | 36,779,200 | |
| | | | | | | | |
| | | | Packaging — 0.2% | |
| | 8,750,000 | | | Owens-Brockway Glass Container, Inc., 6.625%, 5/13/2027, 144A | | | 9,471,875 | |
| | | | | | | | |
| | | | Paper — 0.8% | |
| | 15,225,000 | | | Georgia-Pacific LLC, 7.750%, 11/15/2029 | | | 22,522,805 | |
| | 4,865,000 | | | WestRock MWV LLC, 7.950%, 2/15/2031 | | | 6,946,205 | |
| | 8,750,000 | | | WestRock MWV LLC, 8.200%, 1/15/2030 | | | 12,469,479 | |
| | 2,840,000 | | | Weyerhaeuser Co., 6.950%, 10/01/2027 | | | 3,698,149 | |
| | | | | | | | |
| | | | | | | 45,636,638 | |
| | | | | | | | |
| | | | Property & Casualty Insurance — 0.8% | |
| | 12,510,000 | | | MBIA Insurance Corp., 3-month LIBOR + 11.260%, 11.497%, 1/15/2033, 144A(f)(h) | | | 4,378,500 | |
| | 1,500,000 | | | MGIC Investment Corp., 5.250%, 8/15/2028 | | | 1,605,000 | |
| | 14,480,000 | | | Nationwide Mutual Insurance Co., 4.350%, 4/30/2050, 144A | | | 17,009,976 | |
| | 20,810,000 | | | Radian Group, Inc., 6.625%, 3/15/2025 | | | 23,567,325 | |
| | | | | | | | |
| | | | | | | 46,560,801 | |
| | | | | | | | |
| | | | REITs – Diversified — 0.0% | |
| | 665,000 | | | iStar, Inc., 4.750%, 10/01/2024 | | | 673,313 | |
| | | | | | | | |
| | | | REITs – Hotels — 0.2% | |
| | 545,000 | | | Service Properties Trust, 3.950%, 1/15/2028 | | | 526,606 | |
| | 5,965,000 | | | Service Properties Trust, 4.350%, 10/01/2024 | | | 5,890,437 | |
| | 1,690,000 | | | Service Properties Trust, 4.500%, 6/15/2023 | | | 1,698,450 | |
| | 940,000 | | | Service Properties Trust, 4.650%, 3/15/2024 | | | 930,600 | |
| | 915,000 | | | Service Properties Trust, 4.750%, 10/01/2026 | | | 903,563 | |
| | 2,750,000 | | | Service Properties Trust, 4.950%, 2/15/2027 | | | 2,763,750 | |
| | | | | | | | |
| | | | | | | 12,713,406 | |
| | | | | | | | |
| | | | Retailers — 0.4% | |
| | 3,325,000 | | | Dillard’s, Inc., 7.000%, 12/01/2028 | | | 3,558,282 | |
| | 1,500,000 | | | Dillard’s, Inc., 7.750%, 7/15/2026 | | | 1,692,855 | |
| | 1,795,000 | | | Hanesbrands, Inc., 5.375%, 5/15/2025, 144A | | | 1,899,146 | |
| | 6,365,000 | | | Marks & Spencer PLC, 7.125%, 12/01/2037, 144A | | | 7,114,924 | |
| | 6,905,000 | | | Michaels Stores, Inc., 8.000%, 7/15/2027, 144A | | | 7,422,875 | |
| | | | | | | | |
| | | | | | | 21,688,082 | |
| | | | | | | | |
| | | | Sovereigns — 0.3% | |
| | 19,105,000 | | | Mexico Government International Bond, 3.771%, 5/24/2061 | | | 19,968,737 | |
| | | | | | | | |
| | | | Supermarkets — 0.1% | |
| | 1,840,000 | | | Albertson’s Cos. LLC/Safeway, Inc./New Albertson’s LP/Albertson’s LLC, 5.750%, 3/15/2025 | | | 1,895,200 | |
| | 2,290,000 | | | Safeway, Inc., 7.250%, 2/01/2031 | | | 2,681,201 | |
| | | | | | | | |
| | | | | | | 4,576,401 | |
| | | | | | | | |
| | | | Technology — 2.8% | |
| | 5,500,000 | | | Broadcom, Inc., 4.150%, 11/15/2030 | | | 6,367,692 | |
| | 23,110,000 | | | Broadcom, Inc., 4.300%, 11/15/2032 | | | 27,396,652 | |
| | 9,820,000 | | | Broadcom, Inc., 5.000%, 4/15/2030 | | | 11,937,309 | |
| | | | Technology — continued | |
| 15,295,000 | | | CommScope Technologies LLC, 5.000%, 3/15/2027, 144A | | | 15,065,575 | |
| | 23,345,000 | | | Iron Mountain, Inc., 4.875%, 9/15/2029, 144A | | | 24,628,975 | |
| | 9,350,000 | | | Jabil, Inc., 3.600%, 1/15/2030 | | | 10,404,820 | |
| | 8,250,000 | | | Jabil, Inc., 3.950%, 1/12/2028 | | | 9,330,113 | |
| | 15,170,000 | | | KLA Corp., 5.650%, 11/01/2034 | | | 20,454,004 | |
| | 26,380,000 | | | Microchip Technology, Inc., 0.972%, 2/15/2024, 144A | | | 26,444,573 | |
| | 3,145,000 | | | Micron Technology, Inc., 4.663%, 2/15/2030 | | | 3,859,377 | |
| | 3,970,000 | | | Micron Technology, Inc., 4.975%, 2/06/2026 | | | 4,692,355 | |
| | 3,800,000 | | | Micron Technology, Inc., 5.327%, 2/06/2029 | | | 4,753,368 | |
| | 105,000 | | | Samsung Electronics Co. Ltd., 7.700%, 10/01/2027, 144A | | | 127,119 | |
| | 1,829,000 | | | Seagate HDD Cayman, 4.091%, 6/01/2029, 144A | | | 1,958,950 | |
| | 1,688,000 | | | Seagate HDD Cayman, 4.875%, 6/01/2027 | | | 1,899,354 | |
| | | | | | | | |
| | | | | | | 169,320,236 | |
| | | | | | | | |
| | | | Transportation Services — 0.8% | |
| | 10,630,000 | | | Adani Ports & Special Economic Zone Ltd., 4.200%, 8/04/2027, 144A | | | 11,407,942 | |
| | 810,000 | | | Avis Budget Car Rental LLC/Avis Budget Finance, Inc., 5.750%, 7/15/2027, 144A | | | 822,150 | |
| | 10,503,000 | | | Fenix Marine Service Holdings Ltd., 8.000%, 1/15/2024(c)(g) | | | 9,511,517 | |
| | 20,980,000 | | | Penske Truck Leasing Co. LP/PTL Finance Corp., 4.000%, 7/15/2025, 144A | | | 23,791,635 | |
| | | | | | | | |
| | | | | | | 45,533,244 | |
| | | | | | | | |
| | | | Treasuries — 12.7% | |
| | 222,225,000 | | | U.S. Treasury Bond, 1.250%, 5/15/2050 | | | 201,599,742 | |
| | 224,690,000 | | | U.S. Treasury Bond, 1.375%, 8/15/2050 | | | 210,436,228 | |
| | 290,985,000 | | | U.S. Treasury Note, 0.125%, 11/30/2022 | | | 291,019,101 | |
| | 59,525,000 | | | U.S. Treasury Note, 0.125%, 12/31/2022 | | | 59,531,976 | |
| | | | | | | | |
| | | | | | | 762,587,047 | |
| | | | | | | | |
| | | | Wireless — 1.2% | |
| | 1,705,000 | | | American Tower Corp., 1.875%, 10/15/2030 | | | 1,719,870 | |
| | 1,255,000 | | | American Tower Corp., 2.100%, 6/15/2030 | | | 1,288,141 | |
| | 1,965,000 | | | American Tower Corp., 2.950%, 1/15/2051 | | | 1,969,688 | |
| | 7,885,000 | | | American Tower Corp., 3.100%, 6/15/2050 | | | 8,121,766 | |
| | 6,415,000 | | | Crown Castle International Corp., 2.250%, 1/15/2031 | | | 6,654,527 | |
| | 6,735,000 | | | Crown Castle International Corp., 3.250%, 1/15/2051 | | | 7,106,089 | |
| | 1,490,000 | | | Crown Castle International Corp., 3.300%, 7/01/2030 | | | 1,667,726 | |
| | 4,388,000 | | | IHS Netherlands Holdco BV, 8.000%, 9/18/2027, 144A | | | 4,734,169 | |
| | 2,115,000 | | | Millicom International Cellular S.A., 5.125%, 1/15/2028, 144A | | | 2,248,034 | |
| | 4,695,000 | | | Millicom International Cellular S.A., 6.250%, 3/25/2029, 144A | | | 5,281,875 | |
| | 26,485,000 | | | T-Mobile USA, Inc., 3.875%, 4/15/2030, 144A | | | 30,674,927 | |
| | | | | | | | |
| | | | | | | 71,466,812 | |
| | | | | | | | |
| | | | Wirelines — 1.8% | |
| | 18,163,000 | | | AT&T, Inc., 3.650%, 9/15/2059, 144A | | | 18,339,879 | |
| | 11,177,000 | | | AT&T, Inc., 3.800%, 12/01/2057, 144A | | | 11,679,259 | |
| | 1,240,000 | | | CenturyLink, Inc., 5.625%, 4/01/2025 | | | 1,337,650 | |
| | 350,000 | | | Cincinnati Bell Telephone Co. LLC, 6.300%, 12/01/2028 | | | 371,193 | |
| | 2,160,000 | | | Cincinnati Bell, Inc., 8.000%, 10/15/2025, 144A | | | 2,303,100 | |
| | 30,646,000 | | | Telecom Italia Capital S.A., 6.000%, 9/30/2034 | | | 37,329,586 | |
| | 16,440,000 | | | Telecom Italia Capital S.A., 6.375%, 11/15/2033 | | | 20,221,200 | |
See accompanying notes to financial statements.
| 66
Portfolio of Investments – as of December 31, 2020
Loomis Sayles Strategic Income Fund – (continued)
| | | | | | | | |
Principal
Amount (‡) | | | Description | | Value (†) | |
| | | | Wirelines — continued | |
| $ | 14,223,000 | | | Verizon Communications, Inc., 4.329%, 9/21/2028 | | $ | 17,100,597 | |
| | | | | | | | |
| | | | | | | 108,682,464 | |
| | | | | | | | |
| | | | Total Non-Convertible Bonds
(Identified Cost $3,578,126,472) | | | 3,678,782,593 | |
| | | | | | | | |
| | | | | | | | |
| | Convertible Bonds — 4.2% | |
| | | | Airlines — 0.2% | |
| | 6,970,000 | | | Southwest Airlines Co., 1.250%, 5/01/2025 | | | 10,123,925 | |
| | | | | | | | |
| | | | Cable Satellite — 2.5% | |
| | 14,660,000 | | | DISH Network Corp., 2.375%, 3/15/2024 | | | 13,662,091 | |
| | 143,750,000 | | | DISH Network Corp., 3.375%, 8/15/2026 | | | 137,027,050 | |
| | | | | | | | |
| | | | | | | 150,689,141 | |
| | | | | | | | |
| | | | Consumer Cyclical Services — 0.1% | |
| | 7,860,000 | | | Uber Technologies, Inc., Zero Coupon, 12/15/2025, 144A | | | 8,041,085 | |
| | | | | | | | |
| | | | Energy — 0.0% | |
| | 30,642,000 | | | Chesapeake Energy Corp., 5.500%, 9/15/2026(c)(g)(i) | | | 1,378,890 | |
| | | | | | | | |
| | | | Healthcare — 0.1% | |
| | 2,635,000 | | | Teladoc Health, Inc., 1.250%, 6/01/2027, 144A | | | 3,155,952 | |
| | | | | | | | |
| | | | Oil Field Services — 0.1% | |
| | 10,170,195 | | | Pioneer Energy Services Corp., 5.000% PIK or 5.000% Cash, 11/15/2025, 144A(b)(c)(d)(e)(k)(l) | | | 6,330,947 | |
| | | | | | | | |
| | | | Pharmaceuticals — 0.2% | |
| | 6,445,000 | | | BioMarin Pharmaceutical, Inc., 0.599%, 8/01/2024 | | | 6,916,047 | |
| | 2,155,000 | | | BioMarin Pharmaceutical, Inc., 1.250%, 5/15/2027, 144A | | | 2,251,975 | |
| | 1,545,000 | | | Neurocrine Biosciences, Inc., 2.250%, 5/15/2024 | | | 2,131,750 | |
| | | | | | | | |
| | | | | | | 11,299,772 | |
| | | | | | | | |
| | | | REITs – Diversified — 0.2% | |
| | 11,465,000 | | | iStar, Inc., 3.125%, 9/15/2022 | | | 13,490,086 | |
| | | | | | | | |
| | | | Technology — 0.8% | |
| | 10,415,000 | | | Booking Holdings, Inc., 0.900%, 9/15/2021 | | | 12,071,275 | |
| | 1,380,000 | | | Evolent Health, Inc., 3.500%, 12/01/2024, 144A | | | 1,573,776 | |
| | 7,290,000 | | | Nuance Communications, Inc., 1.250%, 4/01/2025 | | | 16,595,758 | |
| | 398,000 | | | Nuance Communications, Inc., 1.500%, 11/01/2035 | | | 851,640 | |
| | 17,000,000 | | | Western Digital Corp., 1.500%, 2/01/2024 | | | 16,897,080 | |
| | | | | | | | |
| | | | | | | 47,989,529 | |
| | | | | | | | |
| | | | Total Convertible Bonds
(Identified Cost $274,728,949) | | | 252,499,327 | |
| | | | | | | | |
| | | | | | | | |
| | Municipals — 1.6% | |
| | | | Illinois — 0.4% | |
| | 21,645,000 | | | State of Illinois, 5.100%, 6/01/2033 | | | 23,294,566 | |
| | | | | | | | |
| | | | Virginia — 1.2% | |
| | 68,005,000 | | | Tobacco Settlement Financing Corp., Series A-1, 6.706%, 6/01/2046 | | | 71,151,591 | |
| | | | | | | | |
| | | | Total Municipals
(Identified Cost $86,430,751) | | | 94,446,157 | |
| | | | | | | | |
| | | | | | | | |
| | | | Total Bonds and Notes
(Identified Cost $3,939,286,172) | | | 4,025,728,077 | |
| | | | | | | | |
| | Senior Loans — 0.5% | |
| | | | Chemicals — 0.1% | |
| 7,037,600 | | | Aruba Investments, Inc., 2020 2nd Lien Term Loan, 3-month LIBOR + 7.750%, 8.500%, 11/24/2028(h) | | | 7,037,600 | |
| | | | | | | | |
| | | | Construction Machinery — 0.2% | |
| | 18,538,000 | | | Onsite Rental Group Pty Ltd., Note, 6.100%, 10/26/2023(b)(c)(d)(e) | | | 9,862,216 | |
| | | | | | | | |
| | | | Independent Energy — 0.2% | |
| | 12,660,906 | | | Ascent Resources – Utica, 2020 Fixed 2nd Lien Term Loan, 11/01/2025(m) | | | 13,721,257 | |
| | | | | | | | |
| | | | Total Senior Loans
(Identified Cost $35,539,273) | | | 30,621,073 | |
| | | | | | | | |
| | | | | | | | |
| Shares | | | | | | |
| | Common Stocks — 11.8% | |
| | | | Aerospace & Defense — 0.0% | |
| | 7,475 | | | Lockheed Martin Corp. | | | 2,653,476 | |
| | | | | | | | |
| | | | Air Freight & Logistics — 0.0% | |
| | 15,186 | | | United Parcel Service, Inc., Class B | | | 2,557,322 | |
| | | | | | | | |
| | | | Beverages — 0.1% | |
| | 49,551 | | | Coca-Cola Co. (The) | | | 2,717,377 | |
| | | | | | | | |
| | | | Capital Markets — 0.1% | |
| | 3,804 | | | BlackRock, Inc. | | | 2,744,738 | |
| | 41,218 | | | Morgan Stanley | | | 2,824,670 | |
| | | | | | | | |
| | | | | | | 5,569,408 | |
| | | | | | | | |
| | | | Chemicals — 0.1% | |
| | 664,252 | | | Hexion Holdings Corp., Class B(f) | | | 8,588,778 | |
| | | | | | | | |
| | | | Communications Equipment — 0.0% | |
| | 58,584 | | | Cisco Systems, Inc. | | | 2,621,634 | |
| | | | | | | | |
| | | | Diversified Telecommunication Services — 3.8% | |
| | 7,868,481 | | | AT&T, Inc. | | | 226,297,514 | |
| | | | | | | | |
| | | | Electric Utilities — 0.1% | |
| | 29,485 | | | Duke Energy Corp. | | | 2,699,646 | |
| | 35,699 | | | NextEra Energy, Inc. | | | 2,754,178 | |
| | | | | | | | |
| | | | | | | 5,453,824 | |
| | | | | | | | |
| | | | Electronic Equipment, Instruments & Components — 1.6% | |
| | 2,575,992 | | | Corning, Inc. | | | 92,735,712 | |
| | | | | | | | |
| | | | Food & Staples Retailing — 0.0% | |
| | 18,218 | | | Walmart, Inc. | | | 2,626,125 | |
| | | | | | | | |
| | | | Health Care Equipment & Supplies — 0.0% | |
| | 24,421 | | | Abbott Laboratories | | | 2,673,855 | |
| | | | | | | | |
| | | | Health Care Providers & Services — 0.1% | |
| | 8,625 | | | Anthem, Inc. | | | 2,769,401 | |
| | 7,865 | | | UnitedHealth Group, Inc. | | | 2,758,098 | |
| | | | | | | | |
| | | | | | | 5,527,499 | |
| | | | | | | | |
| | | | Hotels, Restaurants & Leisure — 0.1% | |
| | 25,758 | | | Starbucks Corp. | | | 2,755,591 | |
| | | | | | | | |
| | | | Household Products — 0.0% | |
| | 19,142 | | | Procter & Gamble Co. (The) | | | 2,663,418 | |
| | | | | | | | |
| | | | Insurance — 0.1% | |
| | 27,418 | | | Progressive Corp. (The) | | | 2,711,092 | |
| | | | | | | | |
| | | | IT Services — 0.1% | |
| | 9,990 | | | Accenture PLC, Class A | | | 2,609,488 | |
| | 14,845 | | | Automatic Data Processing, Inc. | | | 2,615,689 | |
| | | | | | | | |
| | | | | | | 5,225,177 | |
| | | | | | | | |
See accompanying notes to financial statements.
67 |
Portfolio of Investments – as of December 31, 2020
Loomis Sayles Strategic Income Fund – (continued)
| | | | | | | | |
| Shares | | | Description | | Value (†) | |
| | | | Machinery — 0.0% | |
| | 9,825 | | | Deere & Co. | | $ | 2,643,416 | |
| | | | | | | | |
| | | | Media — 0.2% | |
| | 2,500,188 | | | Clear Channel Outdoor Holdings, Inc.(f) | | | 4,125,310 | |
| | 52,277 | | | Comcast Corp., Class A | | | 2,739,315 | |
| | 279,162 | | | iHeartMedia, Inc., Class A(f) | | | 3,623,523 | |
| | | | | | | | |
| | | | | | | 10,488,148 | |
| | | | | | | | |
| | | | Metals & Mining — 0.0% | |
| | 43,945 | | | Newmont Corp. | | | 2,631,866 | |
| | | | | | | | |
| | | | Oil Field Services — 0.0% | |
| | 60,638 | | | Pioneer Energy Services Corp.(b)(c)(d)(e)(f)(k) | | | — | |
| | | | | | | | |
| | | | Oil, Gas & Consumable Fuels — 0.5% | |
| | 9,229 | | | Battalion Oil Corp.(f) | | | 76,601 | |
| | 30,525 | | | Chevron Corp. | | | 2,577,836 | |
| | 500,544 | | | Lonestar Resources U.S., Inc.(b)(c)(d)(e)(f)(k) | | | 3,473,775 | |
| | 225,503 | | | Paragon Offshore Ltd., Litigation Units, Class B(e)(f) | | | 1,465,770 | |
| | 156,902 | | | Paragon Offshore Ltd., Litigation Units, Class A(b)(c)(d)(e)(f) | | | — | |
| | 758,253 | | | Whiting Petroleum Corp.(f) | | | 18,956,325 | |
| | 125,866 | | | Williams Cos., Inc. (The) | | | 2,523,613 | |
| | | | | | | | |
| | | | | | | 29,073,920 | |
| | | | | | | | |
| | | | Pharmaceuticals — 4.6% | |
| | 4,315,200 | | | Bristol-Myers Squibb Co. | | | 267,671,856 | |
| | 17,221 | | | Johnson & Johnson | | | 2,710,241 | |
| | 33,307 | | | Merck & Co., Inc. | | | 2,724,513 | |
| | | | | | | | |
| | | | | | | 273,106,610 | |
| | | | | | | | |
| | | | REITs – Diversified — 0.0% | |
| | 12,010 | | | American Tower Corp. | | | 2,695,765 | |
| | | | | | | | |
| | | | Road & Rail — 0.1% | |
| | 13,061 | | | Union Pacific Corp. | | | 2,719,561 | |
| | | | | | | | |
| | | | Software — 0.1% | |
| | 23,768 | | | iQor Holdings, Inc.(f) | | | 263,825 | |
| | 12,147 | | | Microsoft Corp. | | | 2,701,736 | |
| | | | | | | | |
| | | | | | | 2,965,561 | |
| | | | | | | | |
| | | | Specialty Retail — 0.0% | |
| | 9,831 | | | Home Depot, Inc. (The) | | | 2,611,310 | |
| | 10,161,347 | | | Onsite Rental Group Pty Ltd.(b)(c)(d)(e)(f) | | | — | |
| | | | | | | | |
| | | | | | | 2,611,310 | |
| | | | | | | | |
| | | | Technology Hardware, Storage & Peripherals — 0.1% | |
| | 20,996 | | | Apple, Inc. | | | 2,785,959 | |
| | | | | | | | |
| | | | Total Common Stocks
(Identified Cost $653,340,198) | | | 705,099,918 | |
| | | | | | | | |
| | | | | | | | |
| | Preferred Stocks — 0.8% | |
| | Convertible Preferred Stocks — 0.6% | |
| | | | Banking — 0.3% | |
| | 10,064 | | | Bank of America Corp., Series L, 7.250% | | | 15,282,989 | |
| | | | | | | | |
| | | | Communications — 0.0% | |
| | 3,704 | | | Cincinnati Bell, Inc., Series B, 6.750% | | | 183,651 | |
| | | | | | | | |
| | | | Energy — 0.0% | |
| | 172,972 | | | Chesapeake Energy Corp., 4.500%(b)(c)(d)(f) | | | — | |
| | 240,916 | | | Chesapeake Energy Corp., 5.000%(b)(c)(d)(f) | | | — | |
| | 32,522 | | | Chesapeake Energy Corp., 5.750%, 144A(b)(c)(d)(f) | | | — | |
| | 43,178 | | | Chesapeake Energy Corp., 5.750%, 144A(b)(c)(d)(f) | | | — | |
| | 6,017 | | | Chesapeake Energy Corp., 5.750%(b)(c)(d)(f) | | | — | |
| | 23,928 | | | Chesapeake Energy Corp., 5.750%(b)(c)(d)(f) | | | — | |
| | | | | | | | |
| | | | | | | — | |
| | | | | | | | |
| | | | Food & Beverage — 0.0% | |
| | 16,481 | | | Bunge Ltd., 4.875% | | | 1,792,870 | |
| | | | | | | | |
| | | | Healthcare — 0.1% | |
| | 57,041 | | | Boston Scientific Corp., Series A, 5.500% | | | 6,249,982 | |
| | | | | | | | |
| | | | Midstream — 0.2% | |
| | 242,297 | | | El Paso Energy Capital Trust I, 4.750%(c)(g) | | | 12,541,293 | |
| | | | | | | | |
| | | | Total Convertible Preferred Stocks
(Identified Cost $149,967,465) | | | 36,050,785 | |
| | | | | | | | |
| | | | | | | | |
| | Non-Convertible Preferred Stocks — 0.2% | |
| | | | Finance Companies — 0.0% | |
| | 10,425 | | | iStar, Inc., Series G, 7.650% | | | 262,216 | |
| | | | | | | | |
| | | | Home Construction — 0.0% | |
| | 208,246 | | | Hovnanian Enterprises, Inc., 7.625%(f) | | | 1,699,287 | |
| | | | | | | | |
| | | | REITs – Office Property — 0.0% | |
| | 1,596 | | | Highwoods Properties, Inc., Series A, 8.625% | | | 1,915,200 | |
| | | | | | | | |
| | | | REITs – Warehouse/Industrials — 0.2% | |
| | 116,192 | | | Prologis, Inc., Series Q, 8.540% | | | 8,017,248 | |
| | | | | | | | |
| | | | Total Non-Convertible Preferred Stocks
(Identified Cost $8,540,569) | | | 11,893,951 | |
| | | | | | | | |
| | | | | | | | |
| | | | Total Preferred Stocks
(Identified Cost $158,508,034) | | | 47,944,736 | |
| | | | | | | | |
| | | | | | | | |
| | Warrants — 0.2% | |
| | 751,946 | | | iHeartMedia, Inc., Expiration on 5/1/2039(b)(d)(f)
(Identified Cost $18,045,316) | | | 9,760,259 | |
| | | | | | | | |
| | | | | | | | |
| | Closed-End Investment Companies — 0.0% | |
| | 170,282 | | | NexPoint Strategic Opportunities Fund
(Identified Cost $10,230,310) | | | 1,791,367 | |
| | | | | | | | |
| | | | | | | | |
Principal
Amount (‡) | | | | | | |
| | Short-Term Investments — 18.3% | |
| | 1,906,507,718 | | | Central Bank of Iceland, 0.000%, (ISK)(h)(n) | | | 14,920,236 | |
| | 187,845,906 | | | Tri-Party Repurchase Agreement with Fixed Income Clearing Corporation, dated 12/31/2020 at 0.000% to be repurchased at $187,845,906 on 1/04/2021 collateralized by $131,367,600 U.S. Treasury Inflation Indexed Note, 0.125% due 1/15/2023 valued at $153,933,049; $36,392,700 U.S. Treasury Note, 1.500% due 1/15/2023 valued at $37,669,778 including accrued interest (Note 2 of Notes to Financial Statements) | | | 187,845,906 | |
| | 302,470,000 | | | U.S. Treasury Bills, 0.070% - 0.071%, 3/11/2021(o)(p) | | | 302,428,410 | |
| | 200,000,000 | | | U.S. Treasury Bills, 0.081%, 1/21/2021(o) | | | 199,995,750 | |
| | 100,000,000 | | | U.S. Treasury Bills, 0.091% - 0.120%, 1/28/2021(o)(p) | | | 99,996,167 | |
| | 292,125,000 | | | U.S. Treasury Bills, 0.107% - 0.111%, 4/15/2021(o)(p) | | | 292,057,385 | |
| | | | | | | | |
| | | | Total Short-Term Investments
(Identified Cost $1,097,811,230) | | | 1,097,243,854 | |
| | | | | | | | |
| | | | | | | | |
| | | | Total Investments — 98.8%
(Identified Cost $5,912,760,533) | | | 5,918,189,284 | |
| | | | Other assets less liabilities — 1.2% | | | 70,975,507 | |
| | | | | | | | |
| | | | Net Assets — 100.0% | | $ | 5,989,164,791 | |
| | | | | | | | |
See accompanying notes to financial statements.
| 68
Portfolio of Investments – as of December 31, 2020
Loomis Sayles Strategic Income Fund – (continued)
| | | | | | | | |
| | | | | | | | |
| | (‡) | | | Principal Amount stated in U.S. dollars unless otherwise noted. | |
| | (†) | | | See Note 2 of Notes to Financial Statements. | |
| | (††) | | | Amount shown represents units. One unit represents a principal amount of 25. | |
| | (a) | | | Variable rate security. The interest rate adjusts periodically based on; (i) changes in current interest rates and/or prepayments on underlying pools of assets, if applicable, (ii) reference to a base lending rate plus or minus a margin, and/or (iii) reference to a base lending rate adjusted by a multiplier and/or subject to certain floors or caps. Rate as of December 31, 2020 is disclosed. | |
| | (b) | | | Level 3 security. Value has been determined using significant unobservable inputs. See Note 3 of Notes to Financial Statements. | |
| | (c) | | | Illiquid security. (Unaudited) | |
| | (d) | | | Fair valued by the Fund’s adviser. At December 31, 2020, the value of these securities amounted to $38,774,769 or 0.6% of net assets. See Note 2 of Notes to Financial Statements. | |
| | (e) | | | Securities subject to restriction on resale. At December 31, 2020, the restricted securities held by the Fund are as follows: | |
| | | | | | | | | | | | | | | | |
| | | Acquisition
Date | | | Cost | | | Value | | | % of Net
Assets | |
| GCA2014 Holdings Ltd., Series 2014-1, Class C | | | 12/18/2014 | | | $ | 23,493,070 | | | $ | 7,909,888 | | | | 0.1% | |
| GCA2014 Holdings Ltd., Series 2014-1, Class D | | | 12/18/2014 | | | | 10,635,332 | | | | 1,437,684 | | | | Less than 0.1% | |
| GCA2014 Holdings Ltd., Series 2014-1, Class E | | | 12/18/2014 | | | | 32,732,982 | | | | — | | | | — | |
| Lonestar Resources U.S., Inc. | | | 12/01/2020 | | | | 3,473,775 | * | | | 3,473,775 | | | | 0.1% | |
| Onsite Rental Group Pty Ltd. | | | 10/26/2017 | | | | — | | | | — | | | | — | |
| Onsite Rental Group Pty Ltd., Note | | | 10/01/2017 | | | | 13,532,740 | | | | 9,862,216 | | | | 0.2% | |
| Paragon Offshore Ltd., Litigation Units, Class B | | | 7/18/2017 | | | | 22,768,653 | | | | 1,465,770 | | | | Less than 0.1% | |
| Paragon Offshore Ltd., Litigation Units, Class A | | | 7/18/2017 | | | | 1,167,146 | | | | — | | | | — | |
| Pioneer Energy Services Corp., 5.000% PIK or 5.000% Cash | | | 5/29/2020 | | | | 9,434,195 | | | | 6,330,947 | | | | 0.1% | |
| Pioneer Energy Services Corp. | | | 5/29/2020 | | | | 17,677,239 | ** | | | — | | | | — | |
| * | Represents basis assigned upon receipt in a taxable restructuring. |
| ** | Represents basis carried over in a non-taxable restructuring. |
| | | | | | |
| | | | | | |
| | (f) | | | Non-income producing security. |
| | (g) | | | Securities classified as fair valued pursuant to the Fund’s pricing policies and procedures. At December 31, 2020, the value of these securities amounted to $94,587,570 or 1.6% of net assets. See Note 2 of Notes to Financial Statements. |
| | (h) | | | Variable rate security. Rate as of December 31, 2020 is disclosed. |
| | (i) | | | The issuer is in default with respect to interest and/or principal payments. Income is not being accrued. |
| | (j) | | | Perpetual bond with no specified maturity date. |
| | (k) | | | Affiliated issuer. See Note 6i for a summary of transactions in securities of affiliated issuers. |
| | | | | | | | |
| | (l) | | | Payment-in-kind security for which the issuer, at each interest payment date, may make interest payments in cash and/or additional principal. For the period ended December 31, 2020, interest payments were made in additional principal. | |
| | (m) | | | Position is unsettled. Contract rate was not determined at December 31, 2020 and does not take effect until settlement date. Maturity date is not finalized until settlement date. | |
| | (n) | | | Security callable by issuer at any time. No specified maturity date. | |
| | (o) | | | Interest rate represents discount rate at time of purchase; not a coupon rate. | |
| | (p) | | | The Fund’s investment in U.S. Government/Agency securities is comprised of various lots with differing discount rates. These separate investments, which have the same maturity date, have been aggregated for the purpose of presentation in the Portfolio of Investments. | |
| | | | | |
| | 144A | | | All or a portion of these securities are exempt from registration under Rule 144A of the Securities Act of 1933. These securities may be resold in transactions exempt from registration, normally to qualified institutional buyers. At December 31, 2020, the value of Rule 144A holdings amounted to $933,916,119 or 15.6% of net assets. | |
| | ABS | | | Asset-Backed Securities | |
| | GMTN | | | Global Medium Term Note | |
| | LIBOR | | | London Interbank Offered Rate | |
| | MBIA | | | Municipal Bond Investors Assurance Corp. | |
| | MTN | | | Medium Term Note | |
| | PIK | | | Payment-in-Kind | |
| | REITs | | | Real Estate Investment Trusts | |
| | | | | |
| | ISK | | | Icelandic Krona | |
Industry Summary at December 31, 2020
| | | | |
Treasuries | | | 12.7 | % |
Finance Companies | | | 6.4 | |
Banking | | | 5.4 | |
Pharmaceuticals | | | 4.8 | |
Cable Satellite | | | 4.5 | |
Diversified Telecommunication Services | | | 3.8 | |
Technology | �� | | 3.6 | |
Aerospace & Defense | | | 3.6 | |
Automotive | | | 3.1 | |
Healthcare | | | 3.0 | |
Independent Energy | | | 2.6 | |
Other Investments, less than 2% each | | | 27.0 | |
Short-Term Investments | | | 18.3 | |
Closed-End Investment Companies | | | 0.0 | *** |
| | | | |
Total Investments | | | 98.8 | |
Other assets less liabilities | | | 1.2 | |
| | | | |
Net Assets | | | 100.0 | % |
| | | | |
See accompanying notes to financial statements.
69 |
Statements of Assets and Liabilities
December 31, 2020
| | | | | | | | | | | | | | | | |
| | | High
Income
Fund | | | Intermediate
Municipal
Bond Fund | | | International
Growth Fund | | | Investment
Grade Bond
Fund | |
ASSETS | |
Investments at cost | | $ | 109,237,345 | | | $ | 36,758,672 | | | $ | 14,828,544 | | | $ | 5,499,309,752 | |
Net unrealized appreciation | | | 2,523,561 | | | | 1,602,250 | | | | 188,535 | | | | 494,446,751 | |
| | | | | | | | | | | | | | | | |
Investments at value | | | 111,760,906 | | | | 38,360,922 | | | | 15,017,079 | | | | 5,993,756,503 | |
Cash | | | — | | | | — | | | | 192,827 | | | | 14,830,352 | |
Foreign currency at value (identified cost $0, $0, $1,570 and $0, respectively) | | | — | | | | — | | | | 1,574 | | | | — | |
Receivable for Fund shares sold | | | 316,700 | | | | 135,534 | | | | 500 | | | | 21,395,747 | |
Receivable from investment adviser (Note 6) | | | — | | | | 7,460 | | | | 29,991 | | | | — | |
Receivable for securities sold | | | 19,582 | | | | — | | | | — | | | | 104,000 | |
Dividends and interest receivable | | | 1,428,354 | | | | 338,890 | | | | 13,473 | | | | 35,215,993 | |
Tax reclaims receivable | | | — | | | | — | | | | 312 | | | | — | |
Prepaid expenses (Note 9) | | | 9 | | | | — | | | | — | | | | 344 | |
| | | | | | | | | | | | | | | | |
TOTAL ASSETS | | | 113,525,551 | | | | 38,842,806 | | | | 15,255,756 | | | | 6,065,302,939 | |
| | | | | | | | | | | | | | | | |
LIABILITIES | |
Payable for securities purchased | | | 217,949 | | | | 1,506,827 | | | | — | | | | 30,216,735 | |
Payable for Fund shares redeemed | | | 265,256 | | | | 2,418 | | | | — | | | | 6,845,243 | |
Distributions payable | | | — | | | | 12,074 | | | | — | | | | — | |
Management fees payable (Note 6) | | | 31,482 | | | | — | | | | — | | | | 1,839,588 | |
Deferred Trustees’ fees (Note 6) | | | 209,387 | | | | 68,214 | | | | 45 | | | | 1,128,346 | |
Administrative fees payable (Note 6) | | | 4,019 | | | | 1,256 | | | | 284 | | | | 204,122 | |
Payable to distributor (Note 6d) | | | 645 | | | | 95 | | | | — | | | | 40,327 | |
Audit and tax services fees payable | | | 53,437 | | | | 47,385 | | | | 33,774 | | | | 63,389 | |
Other accounts payable and accrued expenses | | | 25,349 | | | | 13,074 | | | | 1,821 | | | | 203,145 | |
| | | | | | | | | | | | | | | | |
TOTAL LIABILITIES | | | 807,524 | | | | 1,651,343 | | | | 35,924 | | | | 40,540,895 | |
| | | | | | | | | | | | | | | | |
NET ASSETS | | $ | 112,718,027 | | | $ | 37,191,463 | | | $ | 15,219,832 | | | $ | 6,024,762,044 | |
| | | | | | | | | | | | | | | | |
NET ASSETS CONSIST OF: | |
Paid-in capital | | $ | 121,158,018 | | | $ | 35,982,121 | | | $ | 15,026,195 | | | $ | 5,530,405,616 | |
Accumulated earnings (loss) | | | (8,439,991 | ) | | | 1,209,342 | | | | 193,637 | | | | 494,356,428 | |
| | | | | | | | | | | | | | | | |
NET ASSETS | | $ | 112,718,027 | | | $ | 37,191,463 | | | $ | 15,219,832 | | | $ | 6,024,762,044 | |
| | | | | | | | | | | | | | | | |
COMPUTATION OF NET ASSET VALUE AND OFFERING PRICE: | |
Class A shares: | |
Net assets | | $ | 41,547,054 | | | $ | 8,941,414 | | | $ | 1,014 | | | $ | 872,976,203 | |
| | | | | | | | | | | | | | | | |
Shares of beneficial interest | | | 9,546,291 | | | | 847,603 | | | | 100 | | | | 74,926,282 | |
| | | | | | | | | | | | | | | | |
Net asset value and redemption price per share | | $ | 4.35 | | | $ | 10.55 | | | $ | 10.13 | * | | $ | 11.65 | |
| | | | | | | | | | | | | | | | |
Offering price per share (100/[100-maximum sales charge] of net asset value) (Note 1) | | $ | 4.54 | | | $ | 10.88 | | | $ | 10.75 | | | $ | 12.17 | |
| | | | | | | | | | | | | | | | |
Class C shares: (redemption price per share is equal to net asset value less any applicable contingent deferred sales charge) (Note 1) | | | | | | | | | | | | | | | | |
Net assets | | $ | 2,932,542 | | | $ | 1,049,719 | | | $ | 1,013 | | | $ | 132,606,024 | |
| | | | | | | | | | | | | | | | |
Shares of beneficial interest | | | 670,989 | | | | 99,475 | | | | 100 | | | | 11,522,133 | |
| | | | | | | | | | | | | | | | |
Net asset value and offering price per share | | $ | 4.37 | | | $ | 10.55 | | | $ | 10.13 | | | $ | 11.51 | |
| | | | | | | | | | | | | | | | |
Class N shares: | |
Net assets | | $ | 14,782,679 | | | $ | — | | | $ | 15,206,010 | | | $ | 1,188,772,411 | |
| | | | | | | | | | | | | | | | |
Shares of beneficial interest | | | 3,394,087 | | | | — | | | | 1,501,224 | | | | 102,021,062 | |
| | | | | | | | | | | | | | | | |
Net asset value, offering and redemption price per share | | $ | 4.36 | | | $ | — | | | $ | 10.13 | | | $ | 11.65 | |
| | | | | | | | | | | | | | | | |
Class Y shares: | |
Net assets | | $ | 53,455,752 | | | $ | 27,200,330 | | | $ | 11,795 | | | $ | 3,704,947,861 | |
| | | | | | | | | | | | | | | | |
Shares of beneficial interest | | | 12,305,187 | | | | 2,574,753 | | | | 1,164 | | | | 317,756,637 | |
| | | | | | | | | | | | | | | | |
Net asset value, offering and redemption price per share | | $ | 4.34 | | | $ | 10.56 | | | $ | 10.13 | | | $ | 11.66 | |
| | | | | | | | | | | | | | | | |
Admin Class shares: | |
Net assets | | $ | — | | | $ | — | | | $ | — | | | $ | 125,459,545 | |
| | | | | | | | | | | | | | | | |
Shares of beneficial interest | | | — | | | | — | | | | — | | | | 10,799,218 | |
| | | | | | | | | | | | | | | | |
Net asset value, offering and redemption price per share | | $ | — | | | $ | — | | | $ | — | | | $ | 11.62 | |
| | | | | | | | | | | | | | | | |
| * | Net asset value calculations have been determined utilizing fractional share and penny amounts. |
See accompanying notes to financial statements.
| 70
Statements of Assets and Liabilities (continued)
December 31, 2020
| | | | |
| | |
Strategic
Alpha Fund | |
ASSETS | |
Investments at cost | | $ | 1,255,898,939 | |
Net unrealized appreciation | | | 21,734,156 | |
| | | | |
Investments at value | | | 1,277,633,095 | |
Cash | | | 2,620,307 | |
Due from brokers (Note 2) | | | 22,999,979 | |
Foreign currency at value (identified cost $1,692,995) | | | 1,759,150 | |
Receivable for Fund shares sold | | | 5,915,676 | |
Receivable for securities sold | | | 1,793,317 | |
Dividends and interest receivable | | | 8,505,171 | |
Unrealized appreciation on forward foreign currency contracts (Note 2) | | | 197,122 | |
Receivable for variation margin on futures contracts (Note 2) | | | 85,181 | |
Receivable for variation margin on centrally cleared swap agreements (Note 2) | | | 108,466 | |
Unamortized upfront premiums paid on bilateral swap agreements (Note 2) | | | 320,410 | |
Prepaid expenses (Note 9) | | | 75 | |
| | | | |
TOTAL ASSETS | | | 1,321,937,949 | |
| | | | |
LIABILITIES | |
Options written, at value (premiums received $168,133) (Note 2) | | | 159,801 | |
Payable for securities purchased | | | 1,659,759 | |
Unrealized depreciation on bilateral swap agreements (Note 2) | | | 526,239 | |
Payable for Fund shares redeemed | | | 263,135 | |
Unrealized depreciation on forward foreign currency contracts (Note 2) | | | 3,258,689 | |
Management fees payable (Note 6) | | | 651,664 | |
Deferred Trustees’ fees (Note 6) | | | 209,496 | |
Administrative fees payable (Note 6) | | | 46,922 | |
Payable to distributor (Note 6d) | | | 4,862 | |
Audit and tax services fees payable | | | 76,866 | |
Other accounts payable and accrued expenses | | | 64,167 | |
| | | | |
TOTAL LIABILITIES | | | 6,921,600 | |
| | | | |
NET ASSETS | | $ | 1,315,016,349 | |
| | | | |
NET ASSETS CONSIST OF: | |
Paid-in capital | | $ | 1,340,332,829 | |
Accumulated loss | | | (25,316,480 | ) |
| | | | |
NET ASSETS | | $ | 1,315,016,349 | |
| | | | |
COMPUTATION OF NET ASSET VALUE AND OFFERING PRICE: | |
Class A shares: | |
Net assets | | $ | 36,066,854 | |
| | | | |
Shares of beneficial interest | | | 3,456,494 | |
| | | | |
Net asset value and redemption price per share | | $ | 10.43 | |
| | | | |
Offering price per share (100/[100-maximum sales charge] of net asset value) (Note 1) | | $ | 10.89 | |
| | | | |
Class C shares: (redemption price per share is equal to net asset value less any applicable contingent deferred sales charge) (Note 1) | | | | |
Net assets | | $ | 8,961,911 | |
| | | | |
Shares of beneficial interest | | | 861,373 | |
| | | | |
Net asset value and offering price per share | | $ | 10.40 | |
| | | | |
Class N shares: | |
Net assets | | $ | 527,494,097 | |
| | | | |
Shares of beneficial interest | | | 50,669,098 | |
| | | | |
Net asset value, offering and redemption price per share | | $ | 10.41 | |
| | | | |
Class Y shares: | |
Net assets | | $ | 742,493,487 | |
| | | | |
Shares of beneficial interest | | | 71,356,694 | |
| | | | |
Net asset value, offering and redemption price per share | | $ | 10.41 | |
| | | | |
See accompanying notes to financial statements.
71 |
Statements of Assets and Liabilities (continued)
December 31, 2020
| | | | |
| | |
Strategic
Income Fund | |
ASSETS | |
Unaffiliated investments at cost | | $ | 5,882,107,417 | |
Affiliated investments at cost | | | 30,653,116 | |
Net unrealized appreciation on unaffiliated investments | | | 26,277,144 | |
Net unrealized depreciation on affiliated investments | | | (20,848,393 | ) |
| | | | |
Investments at value | | | 5,918,189,284 | |
Cash | | | 1,744,847 | |
Receivable for Fund shares sold | | | 6,328,728 | |
Receivable for securities sold | | | 35,706,023 | |
Dividends and interest receivable | | | 48,065,652 | |
Tax reclaims receivable | | | 247 | |
Prepaid expenses (Note 9) | | | 18,222 | |
| | | | |
TOTAL ASSETS | | | 6,010,053,003 | |
| | | | |
LIABILITIES | |
Payable for securities purchased | | | 4,577,589 | |
Payable for Fund shares redeemed | | | 10,467,446 | |
Management fees payable (Note 6) | | | 2,902,459 | |
Deferred Trustees’ fees (Note 6) | | | 1,920,758 | |
Administrative fees payable (Note 6) | | | 220,867 | |
Payable to distributor (Note 6d) | | | 54,289 | |
Audit and tax services fees payable | | | 49,247 | |
Other accounts payable and accrued expenses | | | 695,557 | |
| | | | |
TOTAL LIABILITIES | | | 20,888,212 | |
| | | | |
NET ASSETS | | $ | 5,989,164,791 | |
| | | | |
NET ASSETS CONSIST OF: | |
Paid-in capital | | $ | 6,204,471,225 | |
Accumulated loss | | | (215,306,434 | ) |
| | | | |
NET ASSETS | | $ | 5,989,164,791 | |
| | | | |
COMPUTATION OF NET ASSET VALUE AND OFFERING PRICE: | |
Class A shares: | |
Net assets | | $ | 1,682,561,893 | |
| | | | |
Shares of beneficial interest | | | 119,965,406 | |
| | | | |
Net asset value and redemption price per share | | $ | 14.03 | |
| | | | |
Offering price per share (100/[100-maximum sales charge] of net asset value) (Note 1) | | $ | 14.65 | |
| | | | |
Class C shares: (redemption price per share is equal to net asset value less any applicable contingent deferred sales charge) (Note 1) | | | | |
Net assets | | $ | 259,780,136 | |
| | | | |
Shares of beneficial interest | | | 18,323,287 | |
| | | | |
Net asset value and offering price per share | | $ | 14.18 | |
| | | | |
Class N shares: | |
Net assets | | $ | 247,696,592 | |
| | | | |
Shares of beneficial interest | | | 17,680,941 | |
| | | | |
Net asset value, offering and redemption price per share | | $ | 14.01 | |
| | | | |
Class Y shares: | |
Net assets | | $ | 3,693,954,001 | |
| | | | |
Shares of beneficial interest | | | 263,723,388 | |
| | | | |
Net asset value, offering and redemption price per share | | $ | 14.01 | |
| | | | |
Admin Class shares: | |
Net assets | | $ | 105,172,169 | |
| | | | |
Shares of beneficial interest | | | 7,526,348 | |
| | | | |
Net asset value, offering and redemption price per share | | $ | 13.97 | |
| | | | |
See accompanying notes to financial statements.
| 72
Statements of Operations
For the Year Ended December 31, 2020
| | | | | | | | | | | | | | | | |
| | | High
Income
Fund | | | Intermediate
Municipal
Bond Fund | | | International
Growth
Fund(a) | | | Investment
Grade Bond
Fund | |
INVESTMENT INCOME | | | | | | | | | | | | | | | | |
Interest | | $ | 6,457,564 | | | $ | 547,211 | | | $ | — | | | $ | 194,944,479 | |
Dividends | | | 263,269 | | | | 5,591 | | | | 18,033 | | | | 1,659,402 | |
Less net foreign taxes withheld | | | — | | | | — | | | | (2,678 | ) | | | — | |
| | | | | | | | | | | | | | | | |
| | | 6,720,833 | | | | 552,802 | | | | 15,355 | | | | 196,603,881 | |
| | | | | | | | | | | | | | | | |
Expenses | |
Management fees (Note 6) | | | 669,082 | | | | 92,759 | | | | 4,945 | | | | 22,550,836 | |
Service and distribution fees (Note 6) | | | 82,881 | | | | 33,912 | | | | 1 | | | | 4,251,630 | |
Administrative fees (Note 6) | | | 49,521 | | | | 10,156 | | | | 284 | | | | 2,463,304 | |
Trustees’ fees and expenses (Note 6) | | | 46,813 | | | | 24,996 | | | | 180 | | | | 362,630 | |
Transfer agent fees and expenses (Notes 6 and 8) | | | 102,304 | | | | 11,410 | | | | 36 | | | | 3,481,271 | |
Audit and tax services fees | | | 52,641 | | | | 52,788 | | | | 33,774 | | | | 63,588 | |
Custodian fees and expenses (Note 7) | | | 16,661 | | | | 5,287 | | | | 954 | | | | 168,320 | |
Legal fees (Note 9) | | | 3,172 | | | | 781 | | | | 30 | | | | 143,878 | |
Registration fees | | | 78,199 | | | | 44,138 | | | | 100 | | | | 202,137 | |
Shareholder reporting expenses | | | 26,529 | | | | 3,391 | | | | 549 | | | | 264,616 | |
Miscellaneous expenses (Notes 7 and 9) | | | 30,583 | | | | 25,403 | | | | 1,905 | | | | 189,220 | |
| | | | | | | | | | | | | | | | |
Total expenses | | | 1,158,386 | | | | 305,021 | | | | 42,758 | | | | 34,141,430 | |
Less waiver and/or expense reimbursement (Notes 6 and 7) | | | (244,500 | ) | | | (166,707 | ) | | | (36,823 | ) | | | (2,021,089 | ) |
| | | | | | | | | | | | | | | | |
Net expenses | | | 913,886 | | | | 138,314 | | | | 5,935 | | | | 32,120,341 | |
| | | | | | | | | | | | | | | | |
Net investment income | | | 5,806,947 | | | | 414,488 | | | | 9,420 | | | | 164,483,540 | |
| | | | | | | | | | | | | | | | |
NET REALIZED AND UNREALIZED GAIN (LOSS) ON INVESTMENTS, SWAP AGREEMENTS AND FOREIGN CURRENCY TRANSACTIONS | | | | | | | | | | | | | | | | |
Net realized gain (loss) on: | |
Investments | | | (4,673,658 | ) | | | 184,411 | | | | 1,756 | | | | 266,643,665 | |
Swap agreements | | | — | | | | — | | | | — | | | | 8,539,507 | |
Foreign currency transactions (Note 2c) | | | — | | | | — | | | | 6,367 | | | | 120,794 | |
Net change in unrealized appreciation (depreciation) on: | |
Investments | | | 2,338,998 | | | | 430,359 | | | | 188,535 | | | | 176,877,938 | |
Foreign currency translations (Note 2c) | | | — | | | | — | | | | 4 | | | | (514 | ) |
| | | | | | | | | | | | | | | | |
Net realized and unrealized gain (loss) on investments, swap agreements and foreign currency transactions | | | (2,334,660 | ) | | | 614,770 | | | | 196,662 | | | | 452,181,390 | |
| | | | | | | | | | | | | | | | |
NET INCREASE IN NET ASSETS RESULTING FROM OPERATIONS | | $ | 3,472,287 | | | $ | 1,029,258 | | | $ | 206,082 | | | $ | 616,664,930 | |
| | | | | | | | | | | | | | | | |
| (a) | From commencement of operations on December 15, 2020 through December 31, 2020. |
See accompanying notes to financial statements.
73 |
Statements of Operations (continued)
For the Year Ended December 31, 2020
| | | | |
| | | Strategic
Alpha Fund | |
INVESTMENT INCOME | |
Dividends | | $ | 2,304,150 | |
Interest | | | 42,573,101 | |
Less net foreign taxes withheld | | | (227 | ) |
| | | | |
| | | 44,877,024 | |
| | | | |
Expenses | |
Management fees (Note 6) | | | 7,083,082 | |
Service and distribution fees (Note 6) | | | 213,573 | |
Administrative fees (Note 6) | | | 521,998 | |
Trustees’ fees and expenses (Note 6) | | | 83,812 | |
Transfer agent fees and expenses (Notes 6 and 8) | | | 417,755 | |
Audit and tax services fees | | | 84,034 | |
Custodian fees and expenses (Note 7) | | | 68,201 | |
Legal fees (Note 9) | | | 28,767 | |
Registration fees | | | 76,959 | |
Shareholder reporting expenses | | | 36,452 | |
Miscellaneous expenses (Notes 7 and 9) | | | 84,998 | |
| | | | |
Total expenses | | | 8,699,631 | |
| | | | |
Net investment income | | | 36,177,393 | |
| | | | |
NET REALIZED AND UNREALIZED GAIN (LOSS) ON INVESTMENTS, FUTURES CONTRACTS, OPTIONS WRITTEN, SWAP AGREEMENTS, FORWARD FOREIGN CURRENCY CONTRACTS AND FOREIGN CURRENCY TRANSACTIONS | | | | |
Net realized gain (loss) on: | |
Investments | | | (14,523,238 | ) |
Futures contracts | | | 7,117,555 | |
Options written | | | (50,234 | ) |
Swap agreements | | | 8,284,641 | |
Forward foreign currency contracts (Note 2d) | | | (1,382,516 | ) |
Foreign currency transactions (Note 2c) | | | (511,098 | ) |
Net change in unrealized appreciation (depreciation) on: | |
Investments | | | 70,567,697 | |
Futures contracts | | | (19,222 | ) |
Options written | | | 1,016 | |
Swap agreements | | | 2,422,592 | |
Forward foreign currency contracts (Note 2d) | | | (1,956,477 | ) |
Foreign currency translations (Note 2c) | | | 342,563 | |
| | | | |
Net realized and unrealized gain on investments, futures contracts, options written, swap agreements, forward foreign currency contracts and foreign currency transactions | | | 70,293,279 | |
| | | | |
NET INCREASE IN NET ASSETS RESULTING FROM OPERATIONS | | $ | 106,470,672 | |
| | | | |
See accompanying notes to financial statements.
| 74
Statements of Operations (continued)
For the Period Ended December 31, 2020
| | | | | | | | |
| | | Strategic Income Fund | |
| | | Period Ended
December 31,
2020(a) | | | Year Ended
September 30,
2020 | |
INVESTMENT INCOME | |
Dividends | | $ | 9,894,395 | | | $ | 34,983,468 | |
Interest from unaffiliated investments | | | 46,785,252 | | | | 251,044,579 | |
Interest from affiliated investments (Note 6) | | | 154,917 | | | | 441,094 | |
Less net foreign taxes withheld | | | (9,115 | ) | | | (430,452 | ) |
| | | | | | | | |
| | | 56,825,449 | | | | 286,038,689 | |
| | | | | | | | |
Expenses | |
Management fees (Note 6) | | | 8,602,302 | | | | 36,847,870 | |
Service and distribution fees (Note 6) | | | 1,867,823 | | | | 9,532,359 | |
Administrative fees (Note 6) | | | 656,953 | | | | 2,869,683 | |
Trustees’ fees and expenses (Note 6) | | | 146,927 | | | | 463,045 | |
Transfer agent fees and expenses (Notes 6 and 8) | | | 1,163,199 | | | | 5,217,792 | |
Audit and tax services fees | | | 46,201 | | | | 63,555 | |
Custodian fees and expenses (Note 7) | | | 75,366 | | | | 324,017 | |
Legal fees (Note 9) | | | 17,882 | | | | 159,823 | |
Registration fees | | | 52,790 | | | | 176,399 | |
Shareholder reporting expenses | | | 96,403 | | | | 300,076 | |
Miscellaneous expenses (Notes 7 and 9) | | | 53,126 | | | | 212,464 | |
| | | | | | | | |
Total expenses | | | 12,778,972 | | | | 56,167,083 | |
| | | | | | | | |
Net investment income | | | 44,046,477 | | | | 229,871,606 | |
| | | | | | | | |
NET REALIZED AND UNREALIZED GAIN (LOSS) ON INVESTMENTS AND FOREIGN CURRENCY TRANSACTIONS | | | | | | | | |
Net realized gain (loss) on: | |
Unaffiliated investments | | | (327,676,709 | ) | | | (85,265,323 | ) |
Affiliated investments (Note 6) | | | — | | | | (13,528,848 | ) |
Foreign currency transactions (Note 2c) | | | 437,744 | | | | (1,837,713 | ) |
Net change in unrealized appreciation (depreciation) on: | |
Unaffiliated investments | | | 595,993,246 | | | | (188,843,675 | ) |
Affiliated investments (Note 6) | | | (31,212 | ) | | | (11,115,666 | ) |
Foreign currency translations (Note 2c) | | | (87,631 | ) | | | 498,421 | |
| | | | | | | | |
Net realized and unrealized gain (loss) on investments and foreign currency transactions | | | 268,635,438 | | | | (300,092,804 | ) |
| | | | | | | | |
NET INCREASE (DECREASE) IN NET ASSETS RESULTING FROM OPERATIONS | | $ | 312,681,915 | | | $ | (70,221,198 | ) |
| | | | | | | | |
| (a) | For the three month period ended December 31, 2020. See Note 1 of Notes to Financial Statements. |
See accompanying notes to financial statements.
75 |
Statements of Changes in Net Assets
| | | | | | | | | | | | | | | | |
| | | High Income Fund | | | Intermediate Municipal Bond
Fund | |
| | | Year Ended
December 31,
2020 | | | Year Ended
December 31,
2019 | | | Year Ended
December 31,
2020 | | | Year Ended
December 31,
2019 | |
FROM OPERATIONS: | |
Net investment income | | $ | 5,806,947 | | | $ | 7,362,208 | | | $ | 414,488 | | | $ | 488,192 | |
Net realized gain (loss) on investments | | | (4,673,658 | ) | | | (430,482 | ) | | | 184,411 | | | | 156,434 | |
Net change in unrealized appreciation (depreciation) on investments | | | 2,338,998 | | | | 9,756,973 | | | | 430,359 | | | | 682,883 | |
| | | | | | | | | | | | | | | | |
Net increase in net assets resulting from operations | | | 3,472,287 | | | | 16,688,699 | | | | 1,029,258 | | | | 1,327,509 | |
| | | | | | | | | | | | | | | | |
FROM DISTRIBUTIONS TO SHAREHOLDERS: | |
Class A | | | (1,244,423 | ) | | | (1,135,803 | ) | | | (151,821 | ) | | | (157,363 | ) |
Class C | | | (131,410 | ) | | | (194,240 | ) | | | (13,774 | ) | | | (23,074 | ) |
Class N | | | (739,980 | ) | | | (609,528 | ) | | | — | | | | — | |
Class Y | | | (4,149,317 | ) | | | (5,638,962 | ) | | | (249,452 | ) | | | (307,772 | ) |
| | | | | | | | | | | | | | | | |
Total distributions | | | (6,265,130 | ) | | | (7,578,533 | ) | | | (415,047 | ) | | | (488,209 | ) |
| | | | | | | | | | | | | | | | |
NET INCREASE (DECREASE) IN NET ASSETS FROM CAPITAL SHARE TRANSACTIONS (NOTE 12) | | | (31,816,114 | ) | | | 1,738,584 | | | | 17,552,248 | | | | (4,018,800 | ) |
| | | | | | | | | | | | | | | | |
Net increase (decrease) in net assets | | | (34,608,957 | ) | | | 10,848,750 | | | | 18,166,459 | | | | (3,179,500 | ) |
NET ASSETS | |
Beginning of the year | | | 147,326,984 | | | | 136,478,234 | | | | 19,025,004 | | | | 22,204,504 | |
| | | | | | | | | | | | | | | | |
End of the year | | $ | 112,718,027 | | | $ | 147,326,984 | | | $ | 37,191,463 | | | $ | 19,025,004 | |
| | | | | | | | | | | | | | | | |
See accompanying notes to financial statements.
| 76
Statements of Changes in Net Assets (continued)
| | | | | | | | | | | | |
| | | International
Growth Fund | | | Investment Grade Bond Fund | |
| | | Period Ended
December 31,
2020(a) | | | Year Ended
December 31,
2020 | | | Year Ended
December 31,
2019 | |
FROM OPERATIONS: | |
Net investment income | | $ | 9,420 | | | $ | 164,483,540 | | | $ | 180,954,803 | |
Net realized gain on investments, swap agreements and foreign currency transactions | | | 8,123 | | | | 275,303,966 | | | | 74,860,931 | |
Net change in unrealized appreciation (depreciation) on investments and foreign currency translations | | | 188,539 | | | | 176,877,424 | | | | 216,386,447 | |
| | | | | | | | | | | | |
Net increase in net assets resulting from operations | | | 206,082 | | | | 616,664,930 | | | | 472,202,181 | |
| | | | | | | | | | | | |
FROM DISTRIBUTIONS TO SHAREHOLDERS: | |
Class A | | | (1 | ) | | | (66,337,702 | ) | | | (25,364,474 | ) |
Class C | | | — | (b) | | | (10,552,630 | ) | | | (6,942,862 | ) |
Class N | | | (12,450 | ) | | | (96,560,712 | ) | | | (47,788,079 | ) |
Class Y | | | (9 | ) | | | (284,270,221 | ) | | | (111,238,434 | ) |
Admin Class | | | — | | | | (8,996,534 | ) | | | (3,581,152 | ) |
| | | | | | | | | | | | |
Total distributions | | | (12,460 | ) | | | (466,717,799 | ) | | | (194,915,001 | ) |
| | | | | | | | | | | | |
NET INCREASE (DECREASE) IN NET ASSETS FROM CAPITAL SHARE TRANSACTIONS (NOTE 12) | | | 15,026,210 | | | | 300,818,816 | | | | (31,559,822 | ) |
| | | | | | | | | | | | |
Net increase in net assets | | | 15,219,832 | | | | 450,765,947 | | | | 245,727,358 | |
NET ASSETS | |
Beginning of the year | | | — | | | | 5,573,996,097 | | | | 5,328,268,739 | |
| | | | | | | | | | | | |
End of the year | | $ | 15,219,832 | | | $ | 6,024,762,044 | | | $ | 5,573,996,097 | |
| | | | | | | | | | | | |
| (a) | From commencement of operations on December 15, 2020 through December 31, 2020. |
| (b) | Amount rounds to less than $1.00. |
See accompanying notes to financial statements.
77 |
Statements of Changes in Net Assets (continued)
| | | | | | | | |
| | | Strategic Alpha Fund | |
| | | Year Ended
December 31,
2020 | | | Year Ended
December 31,
2019 | |
FROM OPERATIONS: | |
Net investment income | | $ | 36,177,393 | | | $ | 49,850,113 | |
Net realized loss on investments, futures contracts, options written, swap agreements, forward foreign currency contracts and foreign currency transactions | | | (1,064,890 | ) | | | (8,071,488 | ) |
Net change in unrealized appreciation (depreciation) on investments, futures contracts, options written, swap agreements, forward foreign currency contracts and foreign currency translations | | | 71,358,169 | | | | 15,971,337 | |
| | | | | | | | |
Net increase in net assets resulting from operations | | | 106,470,672 | | | | 57,749,962 | |
| | | | | | | | |
FROM DISTRIBUTIONS TO SHAREHOLDERS: | |
Class A | | | (708,457 | ) | | | (1,581,199 | ) |
Class C | | | (158,470 | ) | | | (411,487 | ) |
Class N | | | (11,490,422 | ) | | | (8,768,965 | ) |
Class Y | | | (15,871,781 | ) | | | (34,262,581 | ) |
| | | | | | | | |
Total distributions | | | (28,229,130 | ) | | | (45,024,232 | ) |
| | | | | | | | |
NET DECREASE IN NET ASSETS FROM CAPITAL SHARE TRANSACTIONS (NOTE 12) | | | (63,947,948 | ) | | | (216,962,192 | ) |
| | | | | | | | |
Net increase (decrease) in net assets | | | 14,293,594 | | | | (204,236,462 | ) |
NET ASSETS | |
Beginning of the year | | | 1,300,722,755 | | | | 1,504,959,217 | |
| | | | | | | | |
End of the year | | $ | 1,315,016,349 | | | $ | 1,300,722,755 | |
| | | | | | | | |
See accompanying notes to financial statements.
| 78
Statements of Changes in Net Assets (continued)
| | | | | | | | | | | | |
| | | Strategic Income Fund | |
| | | Period Ended
December 31,
2020(a) | | | Year Ended
September 30,
2020 | | | Year Ended
September 30,
2019 | |
FROM OPERATIONS: | |
Net investment income | | $ | 44,046,477 | | | $ | 229,871,606 | | | $ | 312,461,598 | |
Net realized loss on investments and foreign currency transactions | | | (327,238,965 | ) | | | (100,631,884 | ) | | | (25,505,488 | ) |
Net change in unrealized appreciation (depreciation) on investments and foreign currency translations | | | 595,874,403 | | | | (199,460,920 | ) | | | (96,424,261 | ) |
| | | | | | | | | | | | |
Net increase (decrease) in net assets resulting from operations | | | 312,681,915 | | | | (70,221,198 | ) | | | 190,531,849 | |
| | | | | | | | | | | | |
FROM DISTRIBUTIONS TO SHAREHOLDERS: | |
Class A | | | (33,250,024 | ) | | | (60,755,051 | ) | | | (71,533,316 | ) |
Class C | | | (4,600,466 | ) | | | (12,091,933 | ) | | | (27,624,605 | ) |
Class N | | | (4,334,379 | ) | | | (7,404,708 | ) | | | (8,091,999 | ) |
Class Y | | | (75,910,796 | ) | | | (150,040,710 | ) | | | (189,621,495 | ) |
Admin Class | | | (1,932,234 | ) | | | (3,669,167 | ) | | | (4,619,879 | ) |
| | | | | | | | | | | | |
Total distributions | | | (120,027,899 | ) | | | (233,961,569 | ) | | | (301,491,294 | ) |
| | | | | | | | | | | | |
NET DECREASE IN NET ASSETS FROM CAPITAL SHARE TRANSACTIONS (NOTE 12) | | | (255,047,276 | ) | | | (797,576,770 | ) | | | (1,303,567,589 | ) |
| | | | | | | | | | | | |
Net decrease in net assets | | | (62,393,260 | ) | | | (1,101,759,537 | ) | | | (1,414,527,034 | ) |
NET ASSETS | |
Beginning of the year | | | 6,051,558,051 | | | | 7,153,317,588 | | | | 8,567,844,622 | |
| | | | | | | | | | | | |
End of the year | | $ | 5,989,164,791 | | | $ | 6,051,558,051 | | | $ | 7,153,317,588 | |
| | | | | | | | | | | | |
| (a) | For the three month period ended December 31, 2020. See Note 1 of Notes to Financial Statements. |
See accompanying notes to financial statements.
79 |
Financial Highlights
For a share outstanding throughout each period.
| | | | | | | | | | | | | | | | | | | | | | | | |
| | | High Income Fund—Class A | |
| | | Year Ended
December 31,
2020 | | | Year Ended
December 31,
2019 | | | Period Ended
December 31,
2018* | | | Year Ended
September 30,
2018 | | | Year Ended
September 30,
2017 | | | Year Ended
September 30,
2016 | |
Net asset value, beginning of the period | | $ | 4.25 | | | $ | 3.99 | | | $ | 4.25 | | | $ | 4.37 | | | $ | 4.23 | | | $ | 3.99 | |
| | | | | | | | | | | | | | | | | | | | | | | | |
INCOME (LOSS) FROM INVESTMENT OPERATIONS: | |
Net investment income(a) | | | 0.20 | | | | 0.20 | | | | 0.05 | | | | 0.20 | | | | 0.22 | | | | 0.20 | |
Net realized and unrealized gain (loss) | | | 0.12 | (b) | | | 0.27 | | | | (0.24 | ) | | | (0.14 | ) | | | 0.12 | | | | 0.21 | |
| | | | | | | | | | | | | | | | | | | | | | | | |
Total from Investment Operations | | | 0.32 | | | | 0.47 | | | | (0.19 | ) | | | 0.06 | | | | 0.34 | | | | 0.41 | |
| | | | | | | | | | | | | | | | | | | | | | | | |
LESS DISTRIBUTIONS FROM: | |
Net investment income | | | (0.22 | ) | | | (0.21 | ) | | | (0.06 | ) | | | (0.18 | ) | | | (0.20 | ) | | | (0.16 | ) |
Net realized capital gains | | | — | | | | — | | | | (0.01 | ) | | | — | | | | — | | | | (0.01 | ) |
| | | | | | | | | | | | | | | | | | | | | | | | |
Total Distributions | | | (0.22 | ) | | | (0.21 | ) | | | (0.07 | ) | | | (0.18 | ) | | | (0.20 | ) | | | (0.17 | ) |
| | | | | | | | | | | | | | | | | | | | | | | | |
Net asset value, end of the period | | $ | 4.35 | | | $ | 4.25 | | | $ | 3.99 | | | $ | 4.25 | | | $ | 4.37 | | | $ | 4.23 | |
| | | | | | | | | | | | | | | | | | | | | | | | |
Total return(c)(d) | | | 8.16 | % | | | 11.94 | % | | | (4.54 | )%(e) | | | 1.41 | % | | | 8.17 | % | | | 10.66 | % |
RATIOS TO AVERAGE NET ASSETS: | |
Net assets, end of the period (000’s) | | $ | 41,547 | | | $ | 23,199 | | | $ | 23,125 | | | $ | 26,175 | | | $ | 34,039 | | | $ | 34,820 | |
Net expenses(f) | | | 1.00 | % | | | 1.03 | %(g) | | | 1.05 | %(h) | | | 1.05 | % | | | 1.09 | %(i) | | | 1.10 | % |
Gross expenses | | | 1.22 | % | | | 1.18 | % | | | 1.27 | %(h) | | | 1.16 | % | | | 1.15 | % | | | 1.14 | % |
Net investment income | | | 4.91 | % | | | 4.84 | % | | | 5.13 | %(h) | | | 4.73 | % | | | 5.03 | % | | | 5.16 | % |
Portfolio turnover rate | | | 99 | %(j) | | | 48 | % | | | 17 | % | | | 55 | % | | | 46 | % | | | 38 | % |
| * | For the three month period ended December 31, 2018 due to change in fiscal year end. |
| (a) | Per share net investment income has been calculated using the average shares outstanding during the period. |
| (b) | The amount shown for a share outstanding does not correspond with the aggregate realized and unrealized gain (loss) on investments for the period due to the timing of sales and redemptions of fund shares in relation to fluctuating market values of investments of the Fund. |
| (c) | A sales charge for Class A shares is not reflected in total return calculations. |
| (d) | Had certain expenses not been waived/reimbursed during the period, total returns would have been lower. |
| (e) | Periods less than one year are not annualized. |
| (f) | The investment adviser agreed to waive its fees and/or reimburse a portion of the Fund’s expenses during the period. Without this waiver/reimbursement, expenses would have been higher. |
| (g) | Effective July 1, 2019, the expense limit decreased from 1.05% to 1.00%. |
| (h) | Computed on an annualized basis for periods less than one year. |
| (i) | Effective July 1, 2017, the expense limit decreased to 1.05%. |
| (j) | The variation in the Fund’s turnover rate from 2019 to 2020 was primarily due to a significant repositioning of the portfolio as a result of increased market volatility. |
See accompanying notes to financial statements.
| 80
Financial Highlights (continued)
For a share outstanding throughout each period.
| | | | | | | | | | | | | | | | | | | | | | | | |
| | | High Income Fund—Class C | |
| | | Year Ended
December 31,
2020 | | | Year Ended
December 31,
2019 | | | Period Ended
December 31,
2018* | | | Year Ended
September 30,
2018 | | | Year Ended
September 30,
2017 | | | Year Ended
September 30,
2016 | |
Net asset value, beginning of the period | | $ | 4.27 | | | $ | 4.00 | | | $ | 4.27 | | | $ | 4.38 | | | $ | 4.24 | | | $ | 4.00 | |
| | | | | | | | | | | | | | | | | | | | | | | | |
INCOME (LOSS) FROM INVESTMENT OPERATIONS: | |
Net investment income(a) | | | 0.17 | | | | 0.17 | | | | 0.05 | | | | 0.17 | | | | 0.18 | | | | 0.18 | |
Net realized and unrealized gain (loss) | | | 0.12 | (b) | | | 0.28 | | | | (0.26 | ) | | | (0.13 | ) | | | 0.12 | | | | 0.20 | |
| | | | | | | | | | | | | | | | | | | | | | | | |
Total from Investment Operations | | | 0.29 | | | | 0.45 | | | | (0.21 | ) | | | 0.04 | | | | 0.30 | | | | 0.38 | |
| | | | | | | | | | | | | | | | | | | | | | | | |
LESS DISTRIBUTIONS FROM: | |
Net investment income | | | (0.19 | ) | | | (0.18 | ) | | | (0.05 | ) | | | (0.15 | ) | | | (0.16 | ) | | | (0.13 | ) |
Net realized capital gains | | | — | | | | — | | | | (0.01 | ) | | | — | | | | — | | | | (0.01 | ) |
| | | | | | | | | | | | | | | | | | | | | | | | |
Total Distributions | | | (0.19 | ) | | | (0.18 | ) | | | (0.06 | ) | | | (0.15 | ) | | | (0.16 | ) | | | (0.14 | ) |
| | | | | | | | | | | | | | | | | | | | | | | | |
Net asset value, end of the period | | $ | 4.37 | | | $ | 4.27 | | | $ | 4.00 | | | $ | 4.27 | | | $ | 4.38 | | | $ | 4.24 | |
| | | | | | | | | | | | | | | | | | | | | | | | |
Total return(c)(d) | | | 7.30 | % | | | 11.32 | % | | | (4.95 | )%(e) | | | 0.86 | % | | | 7.33 | % | | | 9.81 | % |
RATIOS TO AVERAGE NET ASSETS: | |
Net assets, end of the period (000’s) | | $ | 2,933 | | | $ | 3,836 | | | $ | 5,351 | | | $ | 6,248 | | | $ | 11,227 | | | $ | 12,288 | |
Net expenses(f) | | | 1.75 | % | | | 1.78 | %(g) | | | 1.80 | %(h) | | | 1.80 | % | | | 1.84 | %(i) | | | 1.85 | % |
Gross expenses | | | 1.97 | % | | | 1.93 | % | | | 2.02 | %(h) | | | 1.91 | % | | | 1.90 | % | | | 1.89 | % |
Net investment income | | | 4.24 | % | | | 4.11 | % | | | 4.38 | %(h) | | | 3.99 | % | | | 4.29 | % | | | 4.43 | % |
Portfolio turnover rate | | | 99 | %(j) | | | 48 | % | | | 17 | % | | | 55 | % | | | 46 | % | | | 38 | % |
| * | For the three month period ended December 31, 2018 due to change in fiscal year end. |
| (a) | Per share net investment income has been calculated using the average shares outstanding during the period. |
| (b) | The amount shown for a share outstanding does not correspond with the aggregate realized and unrealized gain (loss) on investments for the period due to the timing of sales and redemptions of fund shares in relation to fluctuating market values of investments of the Fund. |
| (c) | A contingent deferred sales charge for Class C shares is not reflected in total return calculations. |
| (d) | Had certain expenses not been waived/reimbursed during the period, total returns would have been lower. |
| (e) | Periods less than one year are not annualized. |
| (f) | The investment adviser agreed to waive its fees and/or reimburse a portion of the Fund’s expenses during the period. Without this waiver/reimbursement, expenses would have been higher. |
| (g) | Effective July 1, 2019, the expense limit decreased from 1.80% to 1.75%. |
| (h) | Computed on an annualized basis for periods less than one year. |
| (i) | Effective July 1, 2017, the expense limit decreased to 1.80%. |
| (j) | The variation in the Fund’s turnover rate from 2019 to 2020 was primarily due to a significant repositioning of the portfolio as a result of increased market volatility. |
See accompanying notes to financial statements.
81 |
Financial Highlights (continued)
For a share outstanding throughout each period.
| | | | | | | | | | | | | | | | | | | | |
| | | High Income Fund—Class N | |
| | | Year Ended
December 31,
2020 | | | Year Ended
December 31,
2019 | | | Period Ended
December 31,
2018* | | | Year Ended
September 30,
2018 | | | Period Ended
September 30,
2017** | |
Net asset value, beginning of the period | | $ | 4.25 | | | $ | 3.99 | | | $ | 4.25 | | | $ | 4.36 | | | $ | 4.16 | |
| | | | | | | | | | | | | | | | | | | | |
INCOME (LOSS) FROM INVESTMENT OPERATIONS: | |
Net investment income(a) | | | 0.21 | | | | 0.22 | | | | 0.06 | | | | 0.20 | | | | 0.19 | |
Net realized and unrealized gain (loss) | | | 0.14 | (b) | | | 0.26 | | | | (0.25 | ) | | | (0.12 | ) | | | 0.18 | |
| | | | | | | | | | | | | | | | | | | | |
Total from Investment Operations | | | 0.35 | | | | 0.48 | | | | (0.19 | ) | | | 0.08 | | | | 0.37 | |
| | | | | | | | | | | | | | | | | | | | |
LESS DISTRIBUTIONS FROM: | |
Net investment income | | | (0.24 | ) | | | (0.22 | ) | | | (0.06 | ) | | | (0.19 | ) | | | (0.17 | ) |
Net realized capital gains | | | — | | | | — | | | | (0.01 | ) | | | — | | | | — | |
| | | | | | | | | | | | | | | | | | | | |
Total Distributions | | | (0.24 | ) | | | (0.22 | ) | | | (0.07 | ) | | | (0.19 | ) | | | (0.17 | ) |
| | | | | | | | | | | | | | | | | | | | |
Net asset value, end of the period | | $ | 4.36 | | | $ | 4.25 | | | $ | 3.99 | | | $ | 4.25 | | | $ | 4.36 | |
| | | | | | | | | | | | | | | | | | | | |
Total return(c) | | | 8.73 | %(d) | | | 12.28 | % | | | (4.47 | )%(e) | | | 1.96 | % | | | 8.99 | %(e) |
RATIOS TO AVERAGE NET ASSETS: | |
Net assets, end of the period (000’s) | | $ | 14,783 | | | $ | 11,977 | | | $ | 10,417 | | | $ | 10,338 | | | $ | 1 | |
Net expenses(f) | | | 0.70 | % | | | 0.72 | %(g) | | | 0.75 | %(h) | | | 0.75 | % | | | 0.75 | %(h)(i) |
Gross expenses | | | 0.88 | % | | | 0.82 | % | | | 0.89 | %(h) | | | 0.79 | % | | | 31.73 | %(h) |
Net investment income | | | 5.28 | % | | | 5.13 | % | | | 5.45 | %(h) | | | 4.65 | % | | | 5.19 | %(h) |
Portfolio turnover rate | | | 99 | %(j) | | | 48 | % | | | 17 | % | | | 55 | % | | | 46 | %(k) |
| * | For the three month period ended December 31, 2018 due to change in fiscal year end. |
| ** | From commencement of Class operations on November 30, 2016 through September 30, 2017. |
| (a) | Per share net investment income has been calculated using the average shares outstanding during the period. |
| (b) | The amount shown for a share outstanding does not correspond with the aggregate realized and unrealized gain(loss) on investments for the period due to the timing of sales and redemptions of fund shares in relation to fluctuating market values of investments of the Fund. |
| (c) | Had certain expenses not been waived/reimbursed during the period, total returns would have been lower. |
| (d) | Generally accepted accounting principles require certain adjustments to be made to the net assets of the Fund for financial reporting purposes only, and as such, the total returns based on the adjusted net asset values per share may differ from the total returns reported in the average annual total return table. |
| (e) | Periods less than one year are not annualized. |
| (f) | The investment adviser agreed to waive its fees and/or reimburse a portion of the Fund’s expenses during the period. Without this waiver/reimbursement, expenses would have been higher. |
| (g) | Effective July 1, 2019, the expense limit decreased from 0.75% to 0.70%. |
| (h) | Computed on an annualized basis for periods less than one year. |
| (i) | Effective July 1, 2017, the expense limit decreased to 0.75%. |
| (j) | The variation in the Fund’s turnover rate from 2019 to 2020 was primarily due to a significant repositioning of the portfolio as a result of increased market volatility. |
| (k) | Represents the Fund’s portfolio turnover rate for the year ended September 30, 2017. |
See accompanying notes to financial statements.
| 82
Financial Highlights (continued)
For a share outstanding throughout each period.
| | | | | | | | | | | | | | | | | | | | | | | | |
| | | High Income Fund—Class Y | |
| | | Year Ended
December 31,
2020 | | | Year Ended
December 31,
2019 | | | Period Ended
December 31,
2018* | | | Year Ended
September 30,
2018 | | | Year Ended
September 30,
2017 | | | Year Ended
September 30,
2016 | |
Net asset value, beginning of the period | | $ | 4.25 | | | $ | 3.98 | | | $ | 4.24 | | | $ | 4.36 | | | $ | 4.22 | | | $ | 3.98 | |
| | | | | | | | | | | | | | | | | | | | | | | | |
INCOME (LOSS) FROM INVESTMENT OPERATIONS: | |
Net investment income(a) | | | 0.22 | | | | 0.21 | | | | 0.06 | | | | 0.21 | | | | 0.23 | | | | 0.21 | |
Net realized and unrealized gain (loss) | | | 0.10 | (b) | | | 0.28 | | | | (0.25 | ) | | | (0.14 | ) | | | 0.12 | | | | 0.21 | |
| | | | | | | | | | | | | | | | | | | | | | | | |
Total from Investment Operations | | | 0.32 | | | | 0.49 | | | | (0.19 | ) | | | 0.07 | | | | 0.35 | | | | 0.42 | |
| | | | | | | | | | | | | | | | | | | | | | | | |
LESS DISTRIBUTIONS FROM: | |
Net investment income | | | (0.23 | ) | | | (0.22 | ) | | | (0.06 | ) | | | (0.19 | ) | | | (0.21 | ) | | | (0.17 | ) |
Net realized capital gains | | | — | | | | — | | | | (0.01 | ) | | | — | | | | — | | | | (0.01 | ) |
| | | | | | | | | | | | | | | | | | | | | | | | |
Total Distributions | | | (0.23 | ) | | | (0.22 | ) | | | (0.07 | ) | | | (0.19 | ) | | | (0.21 | ) | | | (0.18 | ) |
| | | | | | | | | | | | | | | | | | | | | | | | |
Net asset value, end of the period | | $ | 4.34 | | | $ | 4.25 | | | $ | 3.98 | | | $ | 4.24 | | | $ | 4.36 | | | $ | 4.22 | |
| | | | | | | | | | | | | | | | | | | | | | | | |
Total return(c) | | | 8.19 | % | | | 12.52 | % | | | (4.49 | )%(d) | | | 1.68 | % | | | 8.47 | % | | | 10.98 | % |
RATIOS TO AVERAGE NET ASSETS: | |
Net assets, end of the period (000’s) | | $ | 53,456 | | | $ | 108,315 | | | $ | 97,585 | | | $ | 127,699 | | | $ | 133,940 | | | $ | 129,169 | |
Net expenses(e) | | | 0.75 | % | | | 0.77 | %(f) | | | 0.80 | %(g) | | | 0.80 | % | | | 0.84 | %(h) | | | 0.85 | % |
Gross expenses | | | 0.98 | % | | | 0.93 | % | | | 1.02 | %(g) | | | 0.91 | % | | | 0.90 | % | | | 0.89 | % |
Net investment income | | | 5.32 | % | | | 5.07 | % | | | 5.39 | %(g) | | | 4.98 | % | | | 5.28 | % | | | 5.43 | % |
Portfolio turnover rate | | | 99 | %(i) | | | 48 | % | | | 17 | % | | | 55 | % | | | 46 | % | | | 38 | % |
| * | For the three month period ended December 31, 2018 due to change in fiscal year end. |
| (a) | Per share net investment income has been calculated using the average shares outstanding during the period. |
| (b) | The amount shown for a share outstanding does not correspond with the aggregate realized and unrealized gain (loss) on investments for the period due to the timing of sales and redemptions of fund shares in relation to fluctuating market values of investments of the Fund. |
| (c) | Had certain expenses not been waived/reimbursed during the period, total returns would have been lower. |
| (d) | Periods less than one year are not annualized. |
| (e) | The investment adviser agreed to waive its fees and/or reimburse a portion of the Fund’s expenses during the period. Without this waiver/reimbursement, expenses would have been higher. |
| (f) | Effective July 1, 2019, the expense limit decreased from 0.80% to 0.75%. |
| (g) | Computed on an annualized basis for periods less than one year. |
| (h) | Effective July 1, 2017, the expense limit decreased to 0.80%. |
| (i) | The variation in the Fund’s turnover rate from 2019 to 2020 was primarily due to a significant repositioning of the portfolio as a result of increased market volatility. |
See accompanying notes to financial statements.
83 |
Financial Highlights (continued)
For a share outstanding throughout each period.
| | | | | | | | | | | | | | | | | | | | |
| | | Intermediate Municipal Bond Fund—Class A | |
| | | Year Ended
December 31,
2020 | | | Year Ended
December 31,
2019 | | | Year Ended
December 31,
2018 | | | Year Ended
December 31,
2017 | | | Year Ended
December 31,
2016 | |
Net asset value, beginning of the period | | $ | 10.38 | | | $ | 9.97 | | | $ | 10.17 | | | $ | 9.89 | | | $ | 10.09 | |
| | | | | | | | | | | | | | | | | | | | |
INCOME (LOSS) FROM INVESTMENT OPERATIONS: | |
Net investment income(a) | | | 0.19 | | | | 0.24 | | | | 0.22 | | | | 0.19 | | | | 0.12 | |
Net realized and unrealized gain (loss) | | | 0.17 | | | | 0.41 | | | | (0.19 | ) | | | 0.28 | | | | (0.20 | ) |
| | | | | | | | | | | | | | | | | | | | |
Total from Investment Operations | | | 0.36 | | | | 0.65 | | | | 0.03 | | | | 0.47 | | | | (0.08 | ) |
| | | | | | | | | | | | | | | | | | | | |
LESS DISTRIBUTIONS FROM: | |
Net investment income | | | (0.19 | ) | | | (0.24 | ) | | | (0.23 | ) | | | (0.19 | ) | | | (0.12 | ) |
| | | | | | | | | | | | | | | | | | | | |
Net asset value, end of the period | | $ | 10.55 | | | $ | 10.38 | | | $ | 9.97 | | | $ | 10.17 | | | $ | 9.89 | |
| | | | | | | | | | | | | | | | | | | | |
Total return(b)(c) | | | 3.48 | % | | | 6.54 | % | | | 0.33 | % | | | 4.77 | % | | | (0.79 | )% |
RATIOS TO AVERAGE NET ASSETS: | |
Net assets, end of the period (000’s) | | $ | 8,941 | | | $ | 7,567 | | | $ | 6,019 | | | $ | 6,004 | | | $ | 5,474 | |
Net expenses(d) | | | 0.70 | % | | | 0.70 | % | | | 0.70 | % | | | 0.70 | % | | | 0.70 | % |
Gross expenses | | | 1.42 | % | | | 1.84 | % | | | 1.30 | % | | | 1.10 | % | | | 0.88 | % |
Net investment income | | | 1.78 | % | | | 2.31 | % | | | 2.24 | % | | | 1.87 | % | | | 1.19 | % |
Portfolio turnover rate | | | 41 | % | | | 11 | % | | | 65 | % | | | 34 | % | | | 48 | % |
| (a) | Per share net investment income has been calculated using the average shares outstanding during the period. |
| (b) | A sales charge for Class A shares is not reflected in total return calculations. |
| (c) | Had certain expenses not been waived/reimbursed during the period, total returns would have been lower. |
| (d) | The investment adviser agreed to waive its fees and/or reimburse a portion of the Fund’s expenses during the period. Without this waiver/reimbursement, expenses would have been higher. |
See accompanying notes to financial statements.
| 84
Financial Highlights (continued)
For a share outstanding throughout each period.
| | | | | | | | | | | | | | | | | | | | |
| | | Intermediate Municipal Bond Fund—Class C | |
| | | Year Ended
December 31,
2020 | | | Year Ended
December 31,
2019 | | | Year Ended
December 31,
2018 | | | Year Ended
December 31,
2017 | | | Year Ended
December 31,
2016 | |
Net asset value, beginning of the period | | $ | 10.38 | | | $ | 9.98 | | | $ | 10.18 | | | $ | 9.90 | | | $ | 10.09 | |
| | | | | | | | | | | | | | | | | | | | |
INCOME (LOSS) FROM INVESTMENT OPERATIONS: | |
Net investment income(a) | | | 0.11 | | | | 0.16 | | | | 0.15 | | | | 0.11 | | | | 0.04 | |
Net realized and unrealized gain (loss) | | | 0.17 | | | | 0.40 | | | | (0.19 | ) | | | 0.28 | | | | (0.18 | ) |
| | | | | | | | | | | | | | | | | | | | |
Total from Investment Operations | | | 0.28 | | | | 0.56 | | | | (0.04 | ) | | | 0.39 | | | | (0.14 | ) |
| | | | | | | | | | | | | | | | | | | | |
LESS DISTRIBUTIONS FROM: | |
Net investment income | | | (0.11 | ) | | | (0.16 | ) | | | (0.16 | ) | | | (0.11 | ) | | | (0.05 | ) |
| | | | | | | | | | | | | | | | | | | | |
Net asset value, end of the period | | $ | 10.55 | | | $ | 10.38 | | | $ | 9.98 | | | $ | 10.18 | | | $ | 9.90 | |
| | | | | | | | | | | | | | | | | | | | |
Total return(b)(c) | | | 2.71 | % | | | 5.64 | % | | | (0.42 | )% | | | 3.98 | % | | | (1.44 | )% |
RATIOS TO AVERAGE NET ASSETS: | |
Net assets, end of the period (000’s) | | $ | 1,050 | | | $ | 1,420 | | | $ | 1,675 | | | $ | 2,395 | | | $ | 4,015 | |
Net expenses(d) | | | 1.45 | % | | | 1.45 | % | | | 1.45 | % | | | 1.45 | % | | | 1.45 | % |
Gross expenses | | | 2.18 | % | | | 2.60 | % | | | 2.05 | % | | | 1.83 | % | | | 1.63 | % |
Net investment income | | | 1.08 | % | | | 1.57 | % | | | 1.49 | % | | | 1.10 | % | | | 0.44 | % |
Portfolio turnover rate | | | 41 | % | | | 11 | % | | | 65 | % | | | 34 | % | | | 48 | % |
| (a) | Per share net investment income has been calculated using the average shares outstanding during the period. |
| (b) | A contingent deferred sales charge for Class C shares is not reflected in total return calculations. |
| (c) | Had certain expenses not been waived/reimbursed during the period, total returns would have been lower. |
| (d) | The investment adviser agreed to waive its fees and/or reimburse a portion of the Fund’s expenses during the period. Without this waiver/reimbursement, expenses would have been higher. |
See accompanying notes to financial statements.
85 |
Financial Highlights (continued)
For a share outstanding throughout each period.
| | | | | | | | | | | | | | | | | | | | |
| | | Intermediate Municipal Bond Fund—Class Y | |
| | | Year Ended
December 31,
2020 | | | Year Ended
December 31,
2019 | | | Year Ended
December 31,
2018 | | | Year Ended
December 31,
2017 | | | Year Ended
December 31,
2016 | |
Net asset value, beginning of the period | | $ | 10.40 | | | $ | 9.99 | | | $ | 10.19 | | | $ | 9.90 | | | $ | 10.10 | |
| | | | | | | | | | | | | | | | | | | | |
INCOME (LOSS) FROM INVESTMENT OPERATIONS: | |
Net investment income(a) | | | 0.19 | | | | 0.26 | | | | 0.25 | | | | 0.21 | | | | 0.15 | |
Net realized and unrealized gain (loss) | | | 0.18 | | | | 0.41 | | | | (0.20 | ) | | | 0.29 | | | | (0.20 | ) |
| | | | | | | | | | | | | | | | | | | | |
Total from Investment Operations | | | 0.37 | | | | 0.67 | | | | 0.05 | | | | 0.50 | | | | (0.05 | ) |
| | | | | | | | | | | | | | | | | | | | |
LESS DISTRIBUTIONS FROM: | |
Net investment income | | | (0.21 | ) | | | (0.26 | ) | | | (0.25 | ) | | | (0.21 | ) | | | (0.15 | ) |
| | | | | | | | | | | | | | | | | | | | |
Net asset value, end of the period | | $ | 10.56 | | | $ | 10.40 | | | $ | 9.99 | | | $ | 10.19 | | | $ | 9.90 | |
| | | | | | | | | | | | | | | | | | | | |
Total return(b) | | | 3.63 | % | | | 6.80 | % | | | 0.58 | % | | | 5.13 | % | | | (0.55 | )% |
RATIOS TO AVERAGE NET ASSETS: | |
Net assets, end of the period (000’s) | | $ | 27,200 | | | $ | 10,039 | | | $ | 14,510 | | | $ | 28,960 | | | $ | 49,179 | |
Net expenses(c) | | | 0.45 | % | | | 0.45 | % | | | 0.45 | % | | | 0.45 | % | | | 0.45 | % |
Gross expenses | | | 1.16 | % | | | 1.60 | % | | | 1.04 | % | | | 0.83 | % | | | 0.63 | % |
Net investment income | | | 1.86 | % | | | 2.57 | % | | | 2.47 | % | | | 2.09 | % | | | 1.44 | % |
Portfolio turnover rate | | | 41 | % | | | 11 | % | | | 65 | % | | | 34 | % | | | 48 | % |
| (a) | Per share net investment income has been calculated using the average shares outstanding during the period. |
| (b) | Had certain expenses not been waived/reimbursed during the period, total returns would have been lower. |
| (c) | The investment adviser agreed to waive its fees and/or reimburse a portion of the Fund’s expenses during the period. Without this waiver/reimbursement, expenses would have been higher. |
See accompanying notes to financial statements.
| 86
Financial Highlights (continued)
For a share outstanding throughout each period.
| | | | |
| | | International Growth
Fund—Class A | |
| | | Period Ended
December 31,
2020* | |
Net asset value, beginning of the period | | $ | 10.00 | |
| | | | |
INCOME (LOSS) FROM INVESTMENT OPERATIONS: | |
Net investment income(a) | | | 0.01 | |
Net realized and unrealized gain (loss) | | | 0.13 | |
| | | | |
Total from Investment Operations | | | 0.14 | |
| | | | |
LESS DISTRIBUTIONS FROM: | |
Net investment income | | | (0.01 | ) |
| | | | |
Net asset value, end of the period | | $ | 10.13 | |
| | | | |
Total return(b)(c)(d) | | | 1.37 | % |
RATIOS TO AVERAGE NET ASSETS: | | | | |
Net assets, end of the period (000’s) | | $ | 1 | |
Net expenses(e)(f) | | | 1.20 | % |
Gross expenses(f) | | | 13.05 | % |
Net investment income(f) | | | 1.28 | % |
Portfolio turnover rate | | | 1 | % |
| * | From commencement of operations on December 15, 2020 through December 31, 2020. |
| (a) | Per share net investment income has been calculated using the average shares outstanding during the period. |
| (b) | A sales charge for Class A shares is not reflected in total return calculations. |
| (c) | Had certain expenses not been waived/reimbursed during the period, total returns would have been lower. |
| (d) | Periods less than one year are not annualized. |
| (e) | The investment adviser agreed to waive its fees and/or reimburse a portion of the Fund’s expenses during the period. Without this waiver/reimbursement, expenses would have been higher. |
| (f) | Computed on an annualized basis for periods less than one year. |
See accompanying notes to financial statements.
87 |
Financial Highlights (continued)
For a share outstanding throughout each period.
| | | | |
| | | International Growth
Fund—Class C | |
| | | Period Ended
December 31,
2020* | |
Net asset value, beginning of the period | | $ | 10.00 | |
| | | | |
INCOME (LOSS) FROM INVESTMENT OPERATIONS: | |
Net investment income(a) | | | 0.00 | (b) |
Net realized and unrealized gain (loss) | | | 0.13 | |
| | | | |
Total from Investment Operations | | | 0.13 | |
| | | | |
LESS DISTRIBUTIONS FROM: | |
Net investment income | | | (0.00 | )(b) |
| | | | |
Net asset value, end of the period | | $ | 10.13 | |
| | | | |
Total return(c)(d)(e) | | | 1.33 | % |
RATIOS TO AVERAGE NET ASSETS: | |
Net assets, end of the period (000’s) | | $ | 1 | |
Net expenses(f)(g) | | | 1.95 | % |
Gross expenses(g) | | | 13.78 | % |
Net investment(g) | | | 0.55 | % |
Portfolio turnover rate | | | 1 | % |
| * | From commencement of operations on December 15, 2020 through December 31, 2020. |
| (a) | Per share net investment income has been calculated using the average shares outstanding during the period. |
| (b) | Amount rounds to less than $0.01 per share. |
| (c) | A contingent deferred sales charge for Class C shares is not reflected in total return calculations. |
| (d) | Had certain expenses not been waived/reimbursed during the period, total returns would have been lower. |
| (e) | Periods less than one year are not annualized. |
| (f) | The investment adviser agreed to waive its fees and/or reimburse a portion of the Fund’s expenses during the period. Without this waiver/reimbursement, expenses would have been higher. |
| (g) | Computed on an annualized basis for periods less than one year. |
See accompanying notes to financial statements.
| 88
Financial Highlights (continued)
For a share outstanding throughout each period.
| | | | |
| | | International Growth
Fund—Class N | |
| | | Period Ended
December 31,
2020* | |
Net asset value, beginning of the period | | $ | 10.00 | |
| | | | |
INCOME (LOSS) FROM INVESTMENT OPERATIONS: | |
Net investment income(a) | | | 0.01 | |
Net realized and unrealized gain (loss) | | | 0.13 | |
| | | | |
Total from Investment Operations | | | 0.14 | |
| | | | |
LESS DISTRIBUTIONS FROM: | |
Net investment income | | | (0.01 | ) |
| | | | |
Net asset value, end of the period | | $ | 10.13 | |
| | | | |
Total return(b)(c) | | | 1.38 | % |
RATIOS TO AVERAGE NET ASSETS: | |
Net assets, end of the period (000’s) | | $ | 15,206 | |
Net expenses(d)(e) | | | 0.90 | % |
Gross expenses(e) | | | 6.48 | % |
Net investment income(e) | | | 1.43 | % |
Portfolio turnover rate | | | 1 | % |
| * | From commencement of operations on December 15, 2020 through December 31, 2020. |
| (a) | Per share net investment income has been calculated using the average shares outstanding during the period. |
| (b) | Had certain expenses not been waived/reimbursed during the period, total returns would have been lower. |
| (c) | Periods less than one year are not annualized. |
| (d) | The investment adviser agreed to waive its fees and/or reimburse a portion of the Fund’s expenses during the period. Without this waiver/reimbursement, expenses would have been higher. |
| (e) | Computed on an annualized basis for periods less than one year. |
See accompanying notes to financial statements.
89 |
Financial Highlights (continued)
For a share outstanding throughout each period.
| | | | |
| | | International Growth
Fund—Class Y | |
| | | Period Ended
December 31,
2020*
| |
Net asset value, beginning of the period | | $ | 10.00 | |
| | | | |
INCOME (LOSS) FROM INVESTMENT OPERATIONS: | |
Net investment income(a) | | | 0.01 | |
Net realized and unrealized gain (loss) | | | 0.13 | |
| | | | |
Total from Investment Operations | | | 0.14 | |
| | | | |
LESS DISTRIBUTIONS FROM: | |
Net investment income | | | (0.01 | ) |
| | | | |
Net asset value, end of the period | | $ | 10.13 | |
| | | | |
Total return(b)(c) | | | 1.38 | % |
RATIOS TO AVERAGE NET ASSETS: | |
Net assets, end of the period (000’s) | | $ | 12 | |
Net expenses(d)(e) | | | 0.95 | % |
Gross expenses(e) | | | 12.58 | % |
Net investment income(e) | | | 1.63 | % |
Portfolio turnover rate | | | 1 | % |
| * | From commencement of operations on December 15, 2020 through December 31, 2020. |
| (a) | Per share net investment income has been calculated using the average shares outstanding during the period. |
| (b) | Had certain expenses not been waived/reimbursed during the period, total returns would have been lower. |
| (c) | Periods less than one year are not annualized. |
| (d) | The investment adviser agreed to waive its fees and/or reimburse a portion of the Fund’s expenses during the period. Without this waiver/reimbursement, expenses would have been higher. |
| (e) | Computed on an annualized basis for periods less than one year. |
See accompanying notes to financial statements.
| 90
Financial Highlights (continued)
For a share outstanding throughout each period.
| | | | | | | | | | | | | | | | | | | | | | | | |
| | | Investment Grade Bond Fund—Class A | |
| | | Year Ended
December 31,
2020
| | | Year Ended
December 31,
2019
| | | Period Ended
December 31,
2018*
| | | Year Ended
September 30,
2018
| | | Year Ended
September 30,
2017
| | | Year Ended
September 30,
2016
| |
Net asset value, beginning of the period | | $ | 11.33 | | | $ | 10.77 | | | $ | 10.98 | | | $ | 11.30 | | | $ | 11.59 | | | $ | 11.10 | |
| | | | | | | | | | | | | | | | | | | | | | | | |
INCOME (LOSS) FROM INVESTMENT OPERATIONS: | | | | | | | | | | | | | | | | | | | | | | | | |
Net investment income(a) | | | 0.32 | | | | 0.35 | | | | 0.08 | | | | 0.30 | | | | 0.36 | | | | 0.39 | |
Net realized and unrealized gain (loss) | | | 0.94 | | | | 0.58 | | | | (0.16 | ) | | | (0.28 | ) | | | 0.05 | | | | 0.48 | |
| | | | | | | | | | | | | | | | | | | | | | | | |
Total from Investment Operations | | | 1.26 | | | | 0.93 | | | | (0.08 | ) | | | 0.02 | | | | 0.41 | | | | 0.87 | |
| | | | | | | | | | | | | | | | | | | | | | | | |
LESS DISTRIBUTIONS FROM: | | | | | | | | | | | | | | | | | | | | | | | | |
Net investment income | | | (0.32 | ) | | | (0.36 | ) | | | (0.08 | ) | | | (0.21 | ) | | | (0.26 | ) | | | (0.23 | ) |
Net realized capital gains | | | (0.62 | ) | | | (0.01 | ) | | | (0.05 | ) | | | (0.13 | ) | | | (0.44 | ) | | | (0.15 | ) |
| | | | | | | | | | | | | | | | | | | | | | | | |
Total Distributions | | | (0.94 | ) | | | (0.37 | ) | | | (0.13 | ) | | | (0.34 | ) | | | (0.70 | ) | | | (0.38 | ) |
| | | | | | | | | | | | | | | | | | | | | | | | |
Net asset value, end of the period | | $ | 11.65 | | | $ | 11.33 | | | $ | 10.77 | | | $ | 10.98 | | | $ | 11.30 | | | $ | 11.59 | |
| | | | | | | | | | | | | | | | | | | | | | | | |
Total return(b) | | | 11.41 | %(c) | | | 8.78 | %(c) | | | (0.66 | )%(c)(d) | | | 0.19 | %(c) | | | 3.88 | % | | | 8.06 | % |
RATIOS TO AVERAGE NET ASSETS: | | | | | | | | | | | | | | | | | | | | | | | | |
Net assets, end of the period (000’s) | | $ | 872,976 | | | $ | 772,485 | | | $ | 721,110 | | | $ | 777,391 | | | $ | 902,955 | | | $ | 1,130,260 | |
Net expenses | | | 0.76 | %(e)(f) | | | 0.77 | %(e)(g) | | | 0.78 | %(e)(h) | | | 0.80 | %(e)(i) | | | 0.82 | %(j) | | | 0.85 | % |
Gross expenses | | | 0.80 | % | | | 0.81 | % | | | 0.82 | %(h) | | | 0.82 | % | | | 0.82 | % | | | 0.85 | % |
Net investment income | | | 2.73 | % | | | 3.10 | % | | | 3.09 | %(h) | | | 2.73 | % | | | 3.23 | % | | | 3.49 | % |
Portfolio turnover rate | | | 70 | %(l) | | | 44 | %(k) | | | 39 | %(k) | | | 3 | % | | | 10 | % | | | 11 | % |
| * | For the three month period ended December 31, 2018 due to change in fiscal year end. |
| (a) | Per share net investment income has been calculated using the average shares outstanding during the period. |
| (b) | A sales charge for Class A shares is not reflected in total return calculations. |
| (c) | Had certain expenses not been waived/reimbursed during the period, total returns would have been lower. |
| (d) | Periods less than one year are not annualized. |
| (e) | The investment adviser agreed to waive its fees and/or reimburse a portion of the Fund’s expenses during the period. Without this waiver/reimbursement, expenses would have been higher. |
| (f) | Effective July 1, 2020, the expense limit decreased from 0.76% to 0.75%. See Note 6 of Notes to Financial Statements. |
| (g) | Effective July 1, 2019, the expense limit decreased from 0.78% to 0.76%. |
| (h) | Computed on an annualized basis for periods less than one year. |
| (i) | Effective July 1, 2018, the expense limit decreased to 0.78%. |
| (j) | Effective July 1, 2017, the expense limit decreased to 0.80%. |
| (k) | The variation in the Fund’s turnover rate from the year ended September 30, 2018 to the period ended December 31, 2018 was primarily due to changes in the investment strategy and portfolio management team of the Fund. During 2019, turnover has remained elevated due to a continued repositioning of the Fund. |
| (l) | The variation in the Fund’s turnover rate from 2019 to 2020 was primarily due to a significant repositioning of the portfolio as a result of increased market volatility. |
See accompanying notes to financial statements.
91 |
Financial Highlights (continued)
For a share outstanding throughout each period.
| | | | | | | | | | | | | | | | | | | | | | | | |
| | | Investment Grade Bond Fund—Class C | |
| | | Year Ended
December 31,
2020
| | | Year Ended
December 31,
2019
| | | Period Ended
December 31,
2018*
| | | Year Ended
September 30,
2018
| | | Year Ended
September 30,
2017
| | | Year Ended
September 30,
2016
| |
Net asset value, beginning of the period | | $ | 11.20 | | | $ | 10.65 | | | $ | 10.86 | | | $ | 11.19 | | | $ | 11.48 | | | $ | 11.00 | |
| | | | | | | | | | | | | | | | | | | | | | | | |
INCOME (LOSS) FROM INVESTMENT OPERATIONS: | | | | | | | | | | | | | | | | | | | | | | | | |
Net investment income(a) | | | 0.23 | | | | 0.26 | | | | 0.06 | | | | 0.22 | | | | 0.27 | | | | 0.30 | |
Net realized and unrealized gain (loss) | | | 0.93 | | | | 0.58 | | | | (0.16 | ) | | | (0.28 | ) | | | 0.06 | | | | 0.47 | |
| | | | | | | | | | | | | | | | | | | | | | | | |
Total from Investment Operations | | | 1.16 | | | | 0.84 | | | | (0.10 | ) | | | (0.06 | ) | | | 0.33 | | | | 0.77 | |
| | | | | | | | | | | | | | | | | | | | | | | | |
LESS DISTRIBUTIONS FROM: | | | | | | | | | | | | | | | | | | | | | | | | |
Net investment income | | | (0.23 | ) | | | (0.28 | ) | | | (0.06 | ) | | | (0.14 | ) | | | (0.18 | ) | | | (0.14 | ) |
Net realized capital gains | | | (0.62 | ) | | | (0.01 | ) | | | (0.05 | ) | | | (0.13 | ) | | | (0.44 | ) | | | (0.15 | ) |
| | | | | | | | | | | | | | | | | | | | | | | | |
Total Distributions | | | (0.85 | ) | | | (0.29 | ) | | | (0.11 | ) | | | (0.27 | ) | | | (0.62 | ) | | | (0.29 | ) |
| | | | | | | | | | | | | | | | | | | | | | | | |
Net asset value, end of the period | | $ | 11.51 | | | $ | 11.20 | | | $ | 10.65 | | | $ | 10.86 | | | $ | 11.19 | | | $ | 11.48 | |
| | | | | | | | | | | | | | | | | | | | | | | | |
Total return(b) | | | 10.61 | %(c) | | | 7.94 | %(c) | | | (0.86 | )%(c)(d) | | | (0.53 | )%(c) | | | 3.12 | % | | | 7.18 | % |
RATIOS TO AVERAGE NET ASSETS: | | | | | | | | | | | | | | | | | | | | | | | | |
Net assets, end of the period (000’s) | | $ | 132,606 | | | $ | 204,395 | | | $ | 366,068 | | | $ | 412,788 | | | $ | 689,798 | | | $ | 1,001,522 | |
Net expenses | | | 1.51 | %(e)(f) | | | 1.52 | %(e)(g) | | | 1.53 | %(e)(h) | | | 1.55 | %(e)(i) | | | 1.57 | %(j) | | | 1.60 | % |
Gross expenses | | | 1.55 | % | | | 1.56 | % | | | 1.57 | %(h) | | | 1.57 | % | | | 1.57 | % | | | 1.60 | % |
Net investment income | | | 2.01 | % | | | 2.35 | % | | | 2.34 | %(h) | | | 1.96 | % | | | 2.49 | % | | | 2.74 | % |
Portfolio turnover rate | | | 70 | %(l) | | | 44 | %(k) | | | 39 | %(k) | | | 3 | % | | | 10 | % | | | 11 | % |
| * | For the three month period ended December 31, 2018 due to change in fiscal year end. |
| (a) | Per share net investment income has been calculated using the average shares outstanding during the period. |
| (b) | A contingent deferred sales charge for Class C shares is not reflected in total return calculations. |
| (c) | Had certain expenses not been waived/reimbursed during the period, total returns would have been lower. |
| (d) | Periods less than one year are not annualized. |
| (e) | The investment adviser agreed to waive its fees and/or reimburse a portion of the Fund’s expenses during the period. Without this waiver/reimbursement, expenses would have been higher. |
| (f) | Effective July 1, 2020, the expense limit decreased from 1.51% to 1.50%. See Note 6 of Notes to Financial Statements. |
| (g) | Effective July 1, 2019, the expense limit decreased from 1.53% to 1.51%. |
| (h) | Computed on an annualized basis for periods less than one year. |
| (i) | Effective July 1, 2018, the expense limit decreased to 1.53%. |
| (j) | Effective July 1, 2017, the expense limit decreased to 1.55%. |
| (k) | The variation in the Fund’s turnover rate from the year ended September 30, 2018 to the period ended December 31, 2018 was primarily due to changes in the investment strategy and portfolio management team of the Fund. During 2019, turnover has remained elevated due to a continued repositioning of the Fund. |
| (l) | The variation in the Fund’s turnover rate from 2019 to 2020 was primarily due to a significant repositioning of the portfolio as a result of increased market volatility. |
See accompanying notes to financial statements.
| 92
Financial Highlights (continued)
For a share outstanding throughout each period.
| | | | | | | | | | | | | | | | | | | | | | | | |
| | | Investment Grade Bond Fund—Class N | |
| | | Year Ended
December 31,
2020 | | | Year Ended
December 31,
2019 | | | Period Ended
December 31,
2018* | | | Year Ended
September 30,
2018 | | | Year Ended
September 30,
2017 | | | Year Ended
September 30,
2016 | |
Net asset value, beginning of the period | | $ | 11.33 | | | $ | 10.78 | | | $ | 10.98 | | | $ | 11.30 | | | $ | 11.58 | | | $ | 11.11 | |
| | | | | | | | | | | | | | | | | | | | | | | | |
INCOME (LOSS) FROM INVESTMENT OPERATIONS: | | | | | | | | | | | | | | | | | | | | | | | | |
Net investment income(a) | | | 0.35 | | | | 0.38 | | | | 0.09 | | | | 0.34 | | | | 0.39 | | | | 0.43 | |
Net realized and unrealized gain (loss) | | | 0.94 | | | | 0.58 | | | | (0.15 | ) | | | (0.28 | ) | | | 0.07 | | | | 0.47 | |
| | | | | | | | | | | | | | | | | | | | | | | | |
Total from Investment Operations | | | 1.29 | | | | 0.96 | | | | (0.06 | ) | | | 0.06 | | | | 0.46 | | | | 0.90 | |
| | | | | | | | | | | | | | | | | | | | | | | | |
LESS DISTRIBUTIONS FROM: | | | | | | | | | | | | | | | | | | | | | | | | |
Net investment income | | | (0.35 | ) | | | (0.40 | ) | | | (0.09 | ) | | | (0.25 | ) | | | (0.30 | ) | | | (0.28 | ) |
Net realized capital gains | | | (0.62 | ) | | | (0.01 | ) | | | (0.05 | ) | | | (0.13 | ) | | | (0.44 | ) | | | (0.15 | ) |
| | | | | | | | | | | | | | | | | | | | | | | | |
Total Distributions | | | (0.97 | ) | | | (0.41 | ) | | | (0.14 | ) | | | (0.38 | ) | | | (0.74 | ) | | | (0.43 | ) |
| | | | | | | | | | | | | | | | | | | | | | | | |
Net asset value, end of the period | | $ | 11.65 | | | $ | 11.33 | | | $ | 10.78 | | | $ | 10.98 | | | $ | 11.30 | | | $ | 11.58 | |
| | | | | | | | | | | | | | | | | | | | | | | | |
Total return | | | 11.74 | %(b) | | | 9.11 | % | | | (0.58 | )%(c) | | | 0.50 | % | | | 4.34 | % | | | 8.31 | % |
RATIOS TO AVERAGE NET ASSETS: | | | | | | | | | | | | | | | | | | | | | | | | |
Net assets, end of the period (000’s) | | $ | 1,188,772 | | | $ | 1,367,172 | | | $ | 1,216,690 | | | $ | 1,251,189 | | | $ | 1,203,169 | | | $ | 47,343 | |
Net expenses | | | 0.46 | %(d)(e) | | | 0.47 | %(f) | | | 0.48 | %(g) | | | 0.47 | %(h) | | | 0.48 | %(i) | | | 0.47 | % |
Gross expenses | | | 0.47 | % | | | 0.47 | % | | | 0.48 | %(g) | | | 0.47 | % | | | 0.48 | % | | | 0.47 | % |
Net investment income | | | 3.04 | % | | | 3.40 | % | | | 3.40 | %(g) | | | 3.05 | % | | | 3.51 | % | | | 3.88 | % |
Portfolio turnover rate | | | 70 | %(k) | | | 44 | %(j) | | | 39 | %(j) | | | 3 | % | | | 10 | % | | | 11 | % |
| * | For the three month period ended December 31, 2018 due to change in fiscal year end. |
| (a) | Per share net investment income has been calculated using the average shares outstanding during the period. |
| (b) | Had certain expenses not been waived/reimbursed during the period, total returns would have been lower. |
| (c) | Periods less than one year are not annualized. |
| (d) | The investment adviser agreed to waive its fees and/or reimburse a portion of the Fund’s expenses during the period. Without this waiver/reimbursement, expenses would have been higher. |
| (e) | Effective July 1, 2020, the expense limit decreased from 0.46% to 0.45%. See Note 6 of Notes to Financial Statements. |
| (f) | Effective July 1, 2019, the expense limit decreased from 0.48% to 0.46%. |
| (g) | Computed on an annualized basis for periods less than one year. |
| (h) | Effective July 1, 2018, the expense limit decreased to 0.48%. |
| (i) | Effective July 1, 2017, the expense limit decreased to 0.50%. |
| (j) | The variation in the Fund’s turnover rate from the year ended September 30, 2018 to the period ended December 31, 2018 was primarily due to changes in the investment strategy and portfolio management team of the Fund. During 2019, turnover has remained elevated due to a continued repositioning of the Fund. |
| (k) | The variation in the Fund’s turnover rate from 2019 to 2020 was primarily due to a significant repositioning of the portfolio as a result of increased market volatility. |
See accompanying notes to financial statements.
93 |
Financial Highlights (continued)
For a share outstanding throughout each period.
| | | | | | | | | | | | | | | | | | | | | | | | |
| | | Investment Grade Bond Fund—Class Y | |
| | | Year Ended
December 31,
2020 | | | Year Ended
December 31,
2019 | | | Period Ended
December 31,
2018* | | | Year Ended
September 30,
2018 | | | Year Ended
September 30,
2017 | | | Year Ended
September 30,
2016 | |
Net asset value, beginning of the period | | $ | 11.34 | | | $ | 10.78 | | | $ | 10.99 | | | $ | 11.31 | | | $ | 11.59 | | | $ | 11.11 | |
| | | | | | | | | | | | | | | | | | | | | | | | |
INCOME (LOSS) FROM INVESTMENT OPERATIONS: | | | | | | | | | | | | | | | | | | | | | | | | |
Net investment income(a) | | | 0.35 | | | | 0.37 | | | | 0.09 | | | | 0.33 | | | | 0.39 | | | | 0.42 | |
Net realized and unrealized gain (loss) | | | 0.94 | | | | 0.59 | | | | (0.16 | ) | | | (0.28 | ) | | | 0.06 | | | | 0.47 | |
| | | | | | | | | | | | | | | | | | | | | | | | |
Total from Investment Operations | | | 1.29 | | | | 0.96 | | | | (0.07 | ) | | | 0.05 | | | | 0.45 | | | | 0.89 | |
| | | | | | | | | | | | | | | | | | | | | | | | |
LESS DISTRIBUTIONS FROM: | | | | | | | | | | | | | | | | | | | | | | | | |
Net investment income | | | (0.35 | ) | | | (0.39 | ) | | | (0.09 | ) | | | (0.24 | ) | | | (0.29 | ) | | | (0.26 | ) |
Net realized capital gains | | | (0.62 | ) | | | (0.01 | ) | | | (0.05 | ) | | | (0.13 | ) | | | (0.44 | ) | | | (0.15 | ) |
| | | | | | | | | | | | | | | | | | | | | | | | |
Total Distributions | | | (0.97 | ) | | | (0.40 | ) | | | (0.14 | ) | | | (0.37 | ) | | | (0.73 | ) | | | (0.41 | ) |
| | | | | | | | | | | | | | | | | | | | | | | | |
Net asset value, end of the period | | $ | 11.66 | | | $ | 11.34 | | | $ | 10.78 | | | $ | 10.99 | | | $ | 11.31 | | | $ | 11.59 | |
| | | | | | | | | | | | | | | | | | | | | | | | |
Total return | | | 11.68 | %(b) | | | 9.04 | %(b) | | | (0.59 | )%(b)(c) | | | 0.43 | %(b) | | | 4.24 | % | | | 8.25 | % |
RATIOS TO AVERAGE NET ASSETS: | | | | | | | | | | | | | | | | | | | | | | | | |
Net assets, end of the period (000’s) | | $ | 3,704,948 | | | $ | 3,118,505 | | | $ | 2,912,537 | | | $ | 3,001,906 | | | $ | 3,453,137 | | | $ | 4,571,167 | |
Net expenses | | | 0.51 | %(d)(e) | | | 0.52 | %(d)(f) | | | 0.53 | %(d)(g) | | | 0.55 | %(d)(h) | | | 0.57 | %(i) | | | 0.60 | % |
Gross expenses | | | 0.55 | % | | | 0.56 | % | | | 0.57 | %(g) | | | 0.57 | % | | | 0.57 | % | | | 0.60 | % |
Net investment income | | | 2.98 | % | | | 3.35 | % | | | 3.35 | %(g) | | | 2.98 | % | | | 3.48 | % | | | 3.74 | % |
Portfolio turnover rate | | | 70 | %(k) | | | 44 | %(j) | | | 39 | %(j) | | | 3 | % | | | 10 | % | | | 11 | % |
| * | For the three month period ended December 31, 2018 due to change in fiscal year end. |
| (a) | Per share net investment income has been calculated using the average shares outstanding during the period. |
| (b) | Had certain expenses not been waived/reimbursed during the period, total returns would have been lower. |
| (c) | Periods less than one year are not annualized. |
| (d) | The investment adviser agreed to waive its fees and/or reimburse a portion of the Fund’s expenses during the period. Without this waiver/reimbursement, expenses would have been higher. |
| (e) | Effective July 1, 2020, the expense limit decreased from 0.51% to 0.50%. See Note 6 of Notes to Financial Statements. |
| (f) | Effective July 1, 2019, the expense limit decreased from 0.53% to 0.51%. |
| (g) | Computed on an annualized basis for periods less than one year. |
| (h) | Effective July 1, 2018, the expense limit decreased to 0.53%. |
| (i) | Effective July 1, 2017, the expense limit decreased to 0.55%. |
| (j) | The variation in the Fund’s turnover rate from the year ended September 30, 2018 to the period ended December 31, 2018 was primarily due to changes in the investment strategy and portfolio management team of the Fund. During 2019, turnover has remained elevated due to a continued repositioning of the Fund. |
| (k) | The variation in the Fund’s turnover rate from 2019 to 2020 was primarily due to a significant repositioning of the portfolio as a result of increased market volatility. |
See accompanying notes to financial statements.
| 94
Financial Highlights (continued)
For a share outstanding throughout each period.
| | | | | | | | | | | | | | | | | | | | | | | | |
| | | Investment Grade Bond Fund—Admin Class | |
| | | Year Ended
December 31,
2020
| | | Year Ended
December 31,
2019
| | | Period Ended
December 31,
2018*
| | | Year Ended
September 30,
2018
| | | Year Ended
September 30,
2017
| | | Year Ended
September 30,
2016
| |
Net asset value, beginning of the period | | $ | 11.30 | | | $ | 10.75 | | | $ | 10.95 | | | $ | 11.28 | | | $ | 11.56 | | | $ | 11.08 | |
| | | | | | | | | | | | | | | | | | | | | | | | |
INCOME (LOSS) FROM INVESTMENT OPERATIONS: | | | | | | | | | | | | | | | | | | | | | | | | |
Net investment income(a) | | | 0.29 | | | | 0.32 | | | | 0.08 | | | | 0.28 | | | | 0.34 | | | | 0.37 | |
Net realized and unrealized gain (loss) | | | 0.94 | | | | 0.58 | | | | (0.15 | ) | | | (0.28 | ) | | | 0.06 | | | | 0.47 | |
| | | | | | | | | | | | | | | | | | | | | | | | |
Total from Investment Operations | | | 1.23 | | | | 0.90 | | | | (0.07 | ) | | | 0.00 | (b) | | | 0.40 | | | | 0.84 | |
| | | | | | | | | | | | | | | | | | | | | | | | |
LESS DISTRIBUTIONS FROM: | | | | | | | | | | | | | | | | | | | | | | | | |
Net investment income | | | (0.29 | ) | | | (0.34 | ) | | | (0.08 | ) | | | (0.20 | ) | | | (0.24 | ) | | | (0.21 | ) |
Net realized capital gains | | | (0.62 | ) | | | (0.01 | ) | | | (0.05 | ) | | | (0.13 | ) | | | (0.44 | ) | | | (0.15 | ) |
| | | | | | | | | | | | | | | | | | | | | | | | |
Total Distributions | | | (0.91 | ) | | | (0.35 | ) | | | (0.13 | ) | | | (0.33 | ) | | | (0.68 | ) | | | (0.36 | ) |
| | | | | | | | | | | | | | | | | | | | | | | | |
Net asset value, end of the period | | $ | 11.62 | | | $ | 11.30 | | | $ | 10.75 | | | $ | 10.95 | | | $ | 11.28 | | | $ | 11.56 | |
| | | | | | | | | | | | | | | | | | | | | | | | |
Total return | | | 11.17 | %(c) | | | 8.43 | %(c) | | | (0.63 | )%(c)(d) | | | (0.07 | )%(c) | | | 3.76 | %(c) | | | 7.73 | % |
RATIOS TO AVERAGE NET ASSETS: | | | | | | | | | | | | | | | | | | | | | | | | |
Net assets, end of the period (000’s) | | $ | 125,460 | | | $ | 111,439 | | | $ | 111,864 | | | $ | 115,301 | | | $ | 25,521 | | | $ | 35,294 | |
Net expenses | | | 1.01 | %(e)(f) | | | 1.02 | %(e)(g) | | | 1.03 | %(e)(h) | | | 1.02 | %(e)(i)(j) | | | 1.02 | %(e)(k)(l) | | | 1.07 | %(m) |
Gross expenses | | | 1.05 | % | | | 1.06 | % | | | 1.07 | %(h) | | | 1.05 | %(j) | | | 1.03 | %(k) | | | 1.07 | %(m) |
Net investment income | | | 2.48 | % | | | 2.85 | % | | | 2.85 | %(h) | | | 2.56 | % | | | 3.03 | % | | | 3.27 | % |
Portfolio turnover rate | | | 70 | %(o) | | | 44 | %(n) | | | 39 | %(n) | | | 3 | % | | | 10 | % | | | 11 | % |
| * | For the three month period ended December 31, 2018 due to change in fiscal year end. |
| (a) | Per share net investment income has been calculated using the average shares outstanding during the period. |
| (b) | Amount rounds to less than $0.01 per share. |
| (c) | Had certain expenses not been waived/reimbursed during the period, total returns would have been lower. |
| (d) | Periods less than one year are not annualized. |
| (e) | The investment adviser agreed to waive its fees and/or reimburse a portion of the Fund’s expenses during the period. Without this waiver/reimbursement, expenses would have been higher. |
| (f) | Effective July 1, 2020, the expense limit decreased from 1.01% to 1.00%. See Note 6 of Notes to Financial Statements. |
| (g) | Effective July 1, 2019, the expense limit decreased from 1.03% to 1.01%. |
| (h) | Computed on an annualized basis for periods less than one year. |
| (i) | Effective July 1, 2018, the expense limit decreased to 1.03%. |
| (j) | Includes refund of prior year service fee of 0.02%. |
| (k) | Includes refund of prior year service fee of 0.05%. |
| (l) | Effective July 1, 2017, the expense limit decreased to 1.05%. |
| (m) | Includes refund of prior year service fee of 0.03%. |
| (n) | The variation in the Fund’s turnover rate from the year ended September 30, 2018 to the period ended December 31, 2018 was primarily due to changes in the investment strategy and portfolio management team of the Fund. During 2019, turnover has remained elevated due to a continued repositioning of the Fund. |
| (o) | The variation in the Fund’s turnover rate from 2019 to 2020 was primarily due to a significant repositioning of the portfolio as a result of increased market volatility. |
See accompanying notes to financial statements.
95 |
Financial Highlights (continued)
For a share outstanding throughout each period.
| | | | | | | | | | | | | | | | | | | | |
| | | Strategic Alpha Fund—Class A | |
| | | Year Ended
December 31,
2020 | | | Year Ended
December 31,
2019 | | | Year Ended
December 31,
2018 | | | Year Ended
December 31,
2017 | | | Year Ended
December 31,
2016 | |
Net asset value, beginning of the period | | $ | 9.69 | | | $ | 9.62 | | | $ | 9.92 | | | $ | 9.86 | | | $ | 9.45 | |
| | | | | | | | | | | | | | | | | | | | |
INCOME (LOSS) FROM INVESTMENT OPERATIONS: | |
Net investment income(a) | | | 0.28 | | | | 0.30 | | | | 0.33 | | | | 0.32 | | | | 0.30 | |
Net realized and unrealized gain (loss) | | | 0.67 | | | | 0.04 | | | | (0.30 | ) | | | (0.01 | ) | | | 0.31 | |
| | | | | | | | | | | | | | | | | | | | |
Total from Investment Operations | | | 0.95 | | | | 0.34 | | | | 0.03 | | | | 0.31 | | | | 0.61 | |
| | | | | | | | | | | | | | | | | | | | |
LESS DISTRIBUTIONS FROM: | |
Net investment income | | | (0.21 | ) | | | (0.27 | ) | | | (0.33 | ) | | | (0.25 | ) | | | (0.20 | ) |
| | | | | | | | | | | | | | | | | | | | |
Net asset value, end of the period | | $ | 10.43 | | | $ | 9.69 | | | $ | 9.62 | | | $ | 9.92 | | | $ | 9.86 | |
| | | | | | | | | | | | | | | | | | | | |
Total return(b) | | | 9.97 | % | | | 3.58 | % | | | 0.39 | % | | | 3.22 | %(c) | | | 6.57 | % |
RATIOS TO AVERAGE NET ASSETS: | |
Net assets, end of the period (000’s) | | $ | 36,067 | | | $ | 48,815 | | | $ | 36,528 | | | $ | 28,020 | | | $ | 67,746 | |
Net expenses | | | 0.99 | % | | | 0.99 | % | | | 1.00 | %(d) | | | 1.05 | %(e)(f) | | | 1.10 | % |
Gross expenses | | | 0.99 | % | | | 0.99 | % | | | 1.00 | %(d) | | | 1.06 | % | | | 1.10 | % |
Net investment income | | | 2.81 | % | | | 3.10 | % | | | 3.29 | % | | | 3.26 | % | | | 3.14 | % |
Portfolio turnover rate | | | 498 | % | | | 414 | %(g) | | | 379 | %(g) | | | 178 | %(h) | | | 72 | % |
| (a) | Per share net investment income has been calculated using the average shares outstanding during the period. |
| (b) | A sales charge for Class A shares is not reflected in total return calculations. |
| (c) | Had certain expenses not been waived/reimbursed during the period, total returns would have been lower. |
| (d) | Includes fee/expense recovery of less than 0.01%. |
| (e) | The investment adviser agreed to waive its fees and/or reimburse a portion of the Fund’s expenses during the period. Without this waiver/reimbursement, expenses would have been higher. |
| (f) | Effective July 1, 2017, the expense limit decreased from 1.30% to 1.00%. |
| (g) | The variation in the Fund’s turnover rate from 2017 to 2018 was primarily due to a repositioning of the portfolio. During 2019, turnover has remained elevated due to a larger volume of short duration securities held by the Fund. |
| (h) | The variation in the Fund’s turnover rate from 2016 to 2017 was primarily due to a repositioning of the portfolio. |
See accompanying notes to financial statements.
| 96
Financial Highlights (continued)
For a share outstanding throughout each period.
| | | | | | | | | | | | | | | | | | | | |
| | | Strategic Alpha Fund—Class C | |
| | | Year Ended
December 31,
2020 | | | Year Ended
December 31,
2019 | | | Year Ended
December 31,
2018 | | | Year Ended
December 31,
2017 | | | Year Ended
December 31,
2016 | |
Net asset value, beginning of the period | | $ | 9.66 | | | $ | 9.58 | | | $ | 9.88 | | | $ | 9.82 | | | $ | 9.42 | |
| | | | | | | | | | | | | | | | | | | | |
INCOME (LOSS) FROM INVESTMENT OPERATIONS: | |
Net investment income(a) | | | 0.21 | | | | 0.23 | | | | 0.26 | | | | 0.25 | | | | 0.23 | |
Net realized and unrealized gain (loss) | | | 0.66 | | | | 0.04 | | | | (0.31 | ) | | | 0.00 | (b)(c) | | | 0.30 | |
| | | | | | | | | | | | | | | | | | | | |
Total from Investment Operations | | | 0.87 | | | | 0.27 | | | | (0.05 | ) | | | 0.25 | | | | 0.53 | |
| | | | | | | | | | | | | | | | | | | | |
LESS DISTRIBUTIONS FROM: | |
Net investment income | | | (0.13 | ) | | | (0.19 | ) | | | (0.25 | ) | | | (0.19 | ) | | | (0.13 | ) |
| | | | | | | | | | | | | | | | | | | | |
Net asset value, end of the period | | $ | 10.40 | | | $ | 9.66 | | | $ | 9.58 | | | $ | 9.88 | | | $ | 9.82 | |
| | | | | | | | | | | | | | | | | | | | |
Total return(d) | | | 9.12 | % | | | 2.87 | %(e) | | | (0.42 | )% | | | 2.53 | % | | | 5.70 | % |
RATIOS TO AVERAGE NET ASSETS: | |
Net assets, end of the period (000’s) | | $ | 8,962 | | | $ | 16,337 | | | $ | 26,883 | | | $ | 33,759 | | | $ | 45,674 | |
Net expenses | | | 1.74 | % | | | 1.73 | %(f) | | | 1.75 | %(g) | | | 1.81 | %(h) | | | 1.85 | % |
Gross expenses | | | 1.74 | % | | | 1.74 | % | | | 1.75 | %(g) | | | 1.81 | % | | | 1.85 | % |
Net investment income | | | 2.14 | % | | | 2.33 | % | | | 2.61 | % | | | 2.52 | % | | | 2.40 | % |
Portfolio turnover rate | | | 498 | % | | | 414 | %(i) | | | 379 | %(i) | | | 178 | %(j) | | | 72 | % |
| (a) | Per share net investment income has been calculated using the average shares outstanding during the period. |
| (b) | The amount shown for a share outstanding does not correspond with the aggregate realized and unrealized gain (loss) on investments for the period due to the timing of sales and redemptions of fund shares in relation to fluctuating market values of investments of the Fund. |
| (c) | Amount rounds to less than $0.01 per share. |
| (d) | A contingent deferred sales charge for Class C shares is not reflected in total return calculations. |
| (e) | Had certain expenses not been waived/reimbursed during the period, total returns would have been lower. |
| (f) | The administrator agreed to waive its fees and/or reimburse a portion of the Fund’s expenses during the period. Without this waiver/reimbursement, expenses would have been higher. |
| (g) | Includes fee/expense recovery of less than 0.01%. |
| (h) | Effective July 1, 2017, the expense limit decreased from 2.05% to 1.75%. |
| (i) | The variation in the Fund’s turnover rate from 2017 to 2018 was primarily due to a repositioning of the portfolio. During 2019, turnover has remained elevated due to a larger volume of short duration securities held by the Fund. |
| (j) | The variation in the Fund’s turnover rate from 2016 to 2017 was primarily due to a repositioning of the portfolio. |
See accompanying notes to financial statements.
97 |
Financial Highlights (continued)
For a share outstanding throughout each period.
| | | | | | | | | | | | | | | | |
| | | Strategic Alpha Fund—Class N | |
| | | Year Ended
December 31,
2020 | | | Year Ended
December 31,
2019 | | | Year Ended
December 31,
2018 | | | Period Ended
December 31,
2017* | |
Net asset value, beginning of the period | | $ | 9.67 | | | $ | 9.60 | | | $ | 9.90 | | | $ | 9.90 | |
| | | | | | | | | | | | | | | | |
INCOME (LOSS) FROM INVESTMENT OPERATIONS: | |
Net investment income(a) | | | 0.31 | | | | 0.33 | | | | 0.34 | | | | 0.25 | |
Net realized and unrealized gain (loss) | | | 0.67 | | | | 0.04 | | | | (0.28 | ) | | | (0.04 | ) |
| | | | | | | | | | | | | | | | |
Total from Investment Operations | | | 0.98 | | | | 0.37 | | | | 0.06 | | | | 0.21 | |
| | | | | | | | | | | | | | | | |
LESS DISTRIBUTIONS FROM: | |
Net investment income | | | (0.24 | ) | | | (0.30 | ) | | | (0.36 | ) | | | (0.21 | ) |
| | | | | | | | | | | | | | | | |
Net asset value, end of the period | | $ | 10.41 | | | $ | 9.67 | | | $ | 9.60 | | | $ | 9.90 | |
| | | | | | | | | | | | | | | | |
Total return | | | 10.36 | % | | | 3.92 | % | | | 0.68 | % | | | 2.11 | %(b)(c) |
RATIOS TO AVERAGE NET ASSETS: | |
Net assets, end of the period (000’s) | | $ | 527,494 | | | $ | 297,300 | | | $ | 255,226 | | | $ | 59,282 | |
Net expenses | | | 0.68 | % | | | 0.67 | % | | | 0.70 | %(d) | | | 0.70 | %(e)(f)(g) |
Gross expenses | | | 0.68 | % | | | 0.67 | % | | | 0.70 | %(d) | | | 0.72 | %(e) |
Net investment income | | | 3.13 | % | | | 3.39 | % | | | 3.44 | % | | | 3.83 | %(e) |
Portfolio turnover rate | | | 498 | % | | | 414 | %(h) | | | 379 | %(h) | | | 178 | %(i) |
| * | From commencement of Class operations on May 1, 2017 through December 31, 2017. |
| (a) | Per share net investment income has been calculated using the average shares outstanding during the period. |
| (b) | Periods less than one year are not annualized. |
| (c) | Had certain expenses not been waived/reimbursed during the period, total returns would have been lower. |
| (d) | Includes fee/expense recovery of 0.01%. |
| (e) | Computed on an annualized basis for periods less than one year. |
| (f) | The investment adviser agreed to waive its fees and/or reimburse a portion of the Fund’s expenses during the period. Without this waiver/reimbursement, expenses would have been higher. |
| (g) | Effective July 1, 2017, the expense limit decreased from 1.00% to 0.70%. |
| (h) | The variation in the Fund’s turnover rate from 2017 to 2018 was primarily due to a repositioning of the portfolio. During 2019, turnover has remained elevated due to a larger volume of short duration securities held by the Fund. |
| (i) | Represents the Fund’s portfolio turnover rate for the year ended December 31, 2017. |
See accompanying notes to financial statements.
| 98
Financial Highlights (continued)
For a share outstanding throughout each period.
| | | | | | | | | | | | | | | | | | | | |
| | | Strategic Alpha Fund—Class Y | |
| | | Year Ended
December 31,
2020 | | | Year Ended
December 31,
2019 | | | Year Ended
December 31,
2018 | | | Year Ended
December 31,
2017 | | | Year Ended
December 31,
2016 | |
Net asset value, beginning of the period | | $ | 9.67 | | | $ | 9.59 | | | $ | 9.90 | | | $ | 9.85 | | | $ | 9.44 | |
| | | | | | | | | | | | | | | | | | | | |
INCOME (LOSS) FROM INVESTMENT OPERATIONS: | |
Net investment income(a) | | | 0.30 | | | | 0.32 | | | | 0.35 | | | | 0.35 | | | | 0.32 | |
Net realized and unrealized gain (loss) | | | 0.68 | | | | 0.06 | | | | (0.31 | ) | | | (0.01 | ) | | | 0.32 | |
| | | | | | | | | | | | | | | | | | | | |
Total from Investment Operations | | | 0.98 | | | | 0.38 | | | | 0.04 | | | | 0.34 | | | | 0.64 | |
| | | | | | | | | | | | | | | | | | | | |
LESS DISTRIBUTIONS FROM: | |
Net investment income | | | (0.24 | ) | | | (0.30 | ) | | | (0.35 | ) | | | (0.29 | ) | | | (0.23 | ) |
| | | | | | | | | | | | | | | | | | | | |
Net asset value, end of the period | | $ | 10.41 | | | $ | 9.67 | | | $ | 9.59 | | | $ | 9.90 | | | $ | 9.85 | |
| | | | | | | | | | | | | | | | | | | | |
Total return | | | 10.19 | % | | | 3.96 | % | | | 0.53 | % | | | 3.48 | %(b) | | | 6.86 | % |
RATIOS TO AVERAGE NET ASSETS: | |
Net assets, end of the period (000’s) | | $ | 742,493 | | | $ | 938,271 | | | $ | 1,186,322 | | | $ | 1,031,537 | | | $ | 1,083,527 | |
Net expenses | | | 0.74 | % | | | 0.74 | % | | | 0.75 | %(c) | | | 0.80 | %(d)(e) | | | 0.85 | % |
Gross expenses | | | 0.74 | % | | | 0.74 | % | | | 0.75 | %(c) | | | 0.81 | % | | | 0.85 | % |
Net investment income | | | 3.05 | % | | | 3.33 | % | | | 3.51 | % | | | 3.53 | % | | | 3.39 | % |
Portfolio turnover rate | | | 498 | % | | | 414 | %(f) | | | 379 | %(f) | | | 178 | %(g) | | | 72 | % |
| (a) | Per share net investment income has been calculated using the average shares outstanding during the period. |
| (b) | Had certain expenses not been waived/reimbursed during the period, total returns would have been lower. |
| (c) | Includes fee/expense recovery of less than 0.01%. |
| (d) | The investment adviser agreed to waive its fees and/or reimburse a portion of the Fund’s expenses during the period. Without this waiver/reimbursement, expenses would have been higher. |
| (e) | Effective July 1, 2017, the expense limit decreased from 1.05% to 0.75%. |
| (f) | The variation in the Fund’s turnover rate from 2017 to 2018 was primarily due to a repositioning of the portfolio. During 2019, turnover has remained elevated due to a larger volume of short duration securities held by the Fund. |
| (g) | The variation in the Fund’s turnover rate from 2016 to 2017 was primarily due to a repositioning of the portfolio. |
See accompanying notes to financial statements.
99 |
Financial Highlights (continued)
For a share outstanding throughout each period.
| | | | | | | | | | | | | | | | | | | | | | | | |
| | | Strategic Income Fund—Class A | |
| | | Period Ended
December 31,
2020* | | | Year Ended
September 30,
2020 | | | Year Ended
September 30,
2019 | | | Year Ended
September 30,
2018 | | | Year Ended
September 30,
2017 | | | Year Ended
September 30,
2016 | |
Net asset value, beginning of the period | | $ | 13.58 | | | $ | 14.25 | | | $ | 14.39 | | | $ | 14.84 | | | $ | 14.70 | | | $ | 14.70 | |
| | | | | | | | | | | | | | | | | | | | | | | | |
INCOME (LOSS) FROM INVESTMENT OPERATIONS: | |
Net investment income(a) | | | 0.10 | | | | 0.47 | | | | 0.57 | | | | 0.52 | | | | 0.56 | | | | 0.57 | |
Net realized and unrealized gain (loss) | | | 0.63 | | | | (0.66 | ) | | | (0.16 | ) | | | (0.33 | ) | | | 0.42 | | | | 0.61 | |
| | | | | | | | | | | | | | | | | | | | | | | | |
Total from Investment Operations | | | 0.73 | | | | (0.19 | ) | | | 0.41 | | | | 0.19 | | | | 0.98 | | | | 1.18 | |
| | | | | | | | | | | | | | | | | | | | | | | | |
LESS DISTRIBUTIONS FROM: | |
Net investment income | | | (0.16 | ) | | | (0.45 | ) | | | (0.48 | ) | | | (0.57 | ) | | | (0.52 | ) | | | (0.36 | ) |
Net realized capital gains | | | (0.12 | ) | | | (0.03 | ) | | | (0.07 | ) | | | (0.07 | ) | | | (0.32 | ) | | | (0.82 | ) |
| | | | | | | | | | | | | | | | | | | | | | | | |
Total Distributions | | | (0.28 | ) | | | (0.48 | ) | | | (0.55 | ) | | | (0.64 | ) | | | (0.84 | ) | | | (1.18 | ) |
| | | | | | | | | | | | | | | | | | | | | | | | |
Net asset value, end of the period | | $ | 14.03 | | | $ | 13.58 | | | $ | 14.25 | | | $ | 14.39 | | | $ | 14.84 | | | $ | 14.70 | |
| | | | | | | | | | | | | | | | | | | | | | | | |
Total return(b) | | | 5.37 | %(c) | | | (1.39 | )% | | | 3.02 | % | | | 1.34 | % | | | 7.01 | % | | | 8.72 | % |
RATIOS TO AVERAGE NET ASSETS: | |
Net assets, end of the period (000’s) | | $ | 1,682,562 | | | $ | 1,683,547 | | | $ | 1,835,813 | | | $ | 1,986,300 | | | $ | 1,999,385 | | | $ | 2,514,770 | |
Net expenses | | | 0.97 | %(d) | | | 0.97 | %(e) | | | 0.96 | % | | | 0.96 | % | | | 0.96 | % | | | 0.96 | % |
Gross expenses | | | 0.97 | %(d) | | | 0.97 | % | | | 0.96 | % | | | 0.96 | % | | | 0.96 | % | | | 0.96 | % |
Net investment income | | | 2.78 | %(d) | | | 3.42 | % | | | 4.03 | % | | | 3.57 | % | | | 3.82 | % | | | 4.01 | % |
Portfolio turnover rate | | | 30 | %(f) | | | 30 | % | | | 13 | % | | | 6 | % | | | 11 | % | | | 17 | % |
| * | For the three month period ended December 31, 2020. See Note 1 of Notes to Financial Statements. |
| (a) | Per share net investment income has been calculated using the average shares outstanding during the period. |
| (b) | A sales charge for Class A shares is not reflected in total return calculations. |
| (c) | Periods less than one year are not annualized. |
| (d) | Computed on an annualized basis for periods less than one year. |
| (e) | Effective July 1, 2020, the expense limit decreased from 1.25% to 1.00%. |
| (f) | The variation in the Fund’s turnover rate, if annualized, from the year ended September 30, 2020 to the period ended December 31, 2020 was primarily due to the disposition and realignment of certain foreign currency-denominated positions. |
See accompanying notes to financial statements.
| 100
Financial Highlights (continued)
For a share outstanding throughout each period.
| | | | | | | | | | | | | | | | | | | | | | | | |
| | | Strategic Income Fund—Class C | |
| | | Period Ended
December 31,
2020* | | | Year Ended
September 30,
2020 | | | Year Ended
September 30,
2019 | | | Year Ended
September 30,
2018 | | | Year Ended
September 30,
2017 | | | Year Ended
September 30,
2016 | |
Net asset value, beginning of the period | | $ | 13.72 | | | $ | 14.39 | | | $ | 14.52 | | | $ | 14.97 | | | $ | 14.81 | | | $ | 14.80 | |
| | | | | | | | | | | | | | | | | | | | | | | | |
INCOME (LOSS) FROM INVESTMENT OPERATIONS: | |
Net investment income(a) | | | 0.07 | | | | 0.38 | | | | 0.47 | | | | 0.41 | | | | 0.45 | | | | 0.47 | |
Net realized and unrealized gain (loss) | | | 0.64 | | | | (0.68 | ) | | | (0.16 | ) | | | (0.33 | ) | | | 0.44 | | | | 0.61 | |
| | | | | | | | | | | | | | | | | | | | | | | | |
Total from Investment Operations | | | 0.71 | | | | (0.30 | ) | | | 0.31 | | | | 0.08 | | | | 0.89 | | | | 1.08 | |
| | | | | | | | | | | | | | | | | | | | | | | | |
LESS DISTRIBUTIONS FROM: | |
Net investment income | | | (0.13 | ) | | | (0.34 | ) | | | (0.37 | ) | | | (0.46 | ) | | | (0.41 | ) | | | (0.25 | ) |
Net realized capital gains | | | (0.12 | ) | | | (0.03 | ) | | | (0.07 | ) | | | (0.07 | ) | | | (0.32 | ) | | | (0.82 | ) |
| | | | | | | | | | | | | | | | | | | | | | | | |
Total Distributions | | | (0.25 | ) | | | (0.37 | ) | | | (0.44 | ) | | | (0.53 | ) | | | (0.73 | ) | | | (1.07 | ) |
| | | | | | | | | | | | | | | | | | | | | | | | |
Net asset value, end of the period | | $ | 14.18 | | | $ | 13.72 | | | $ | 14.39 | | | $ | 14.52 | | | $ | 14.97 | | | $ | 14.81 | |
| | | | | | | | | | | | | | | | | | | | | | | | |
Total return(b) | | | 5.17 | %(c) | | | (2.18 | )% | | | 2.27 | % | | | 0.60 | % | | | 6.20 | % | | | 7.91 | % |
RATIOS TO AVERAGE NET ASSETS: | |
Net assets, end of the period (000’s) | | $ | 259,780 | | | $ | 277,896 | | | $ | 676,602 | | | $ | 1,153,853 | | | $ | 2,248,939 | | | $ | 3,433,204 | |
Net expenses | | | 1.72 | %(d) | | | 1.72 | %(e) | | | 1.71 | % | | | 1.71 | % | | | 1.71 | % | | | 1.71 | % |
Gross expenses | | | 1.72 | %(d) | | | 1.72 | % | | | 1.71 | % | | | 1.71 | % | | | 1.71 | % | | | 1.71 | % |
Net investment income | | | 2.04 | %(d) | | | 2.75 | % | | | 3.30 | % | | | 2.79 | % | | | 3.08 | % | | | 3.26 | % |
Portfolio turnover rate | | | 30 | %(f) | | | 30 | % | | | 13 | % | | | 6 | % | | | 11 | % | | | 17 | % |
| * | For the three month period ended December 31, 2020. See Note 1 of Notes to Financial Statements. |
| (a) | Per share net investment income has been calculated using the average shares outstanding during the period. |
| (b) | A contingent deferred sales charge for Class C shares is not reflected in total return calculations. |
| (c) | Periods less than one year are not annualized. |
| (d) | Computed on an annualized basis for periods less than one year. |
| (e) | Effective July 1, 2020, the expense limit decreased from 2.00% to 1.75%. |
| (f) | The variation in the Fund’s turnover rate, if annualized, from the year ended September 30, 2020 to the period ended December 31, 2020 was primarily due to the disposition and realignment of certain foreign currency-denominated positions. |
See accompanying notes to financial statements.
101 |
Financial Highlights (continued)
For a share outstanding throughout each period.
| | | | | | | | | | | | | | | | | | | | | | | | |
| | | Strategic Income Fund—Class N | |
| | | Period Ended
December 31,
2020* | | | Year Ended
September 30,
2020 | | | Year Ended
September 30,
2019 | | | Year Ended
September 30,
2018 | | | Year Ended
September 30,
2017 | | | Year Ended
September 30,
2016 | |
Net asset value, beginning of the period | | $ | 13.57 | | | $ | 14.24 | | | $ | 14.38 | | | $ | 14.83 | | | $ | 14.69 | | | $ | 14.69 | |
| | | | | | | | | | | | | | | | | | | | | | | | |
INCOME (LOSS) FROM INVESTMENT OPERATIONS: | | | | | | | | | | | | | | | | | | | | | | | | |
Net investment income(a) | | | 0.11 | | | | 0.52 | | | | 0.61 | | | | 0.56 | | | | 0.60 | | | | 0.61 | |
Net realized and unrealized gain (loss) | | | 0.62 | | | | (0.66 | ) | | | (0.16 | ) | | | (0.32 | ) | | | 0.43 | | | | 0.62 | |
| | | | | | | | | | | | | | | | | | | | | | | | |
Total from Investment Operations | | | 0.73 | | | | (0.14 | ) | | | 0.45 | | | | 0.24 | | | | 1.03 | | | | 1.23 | |
| | | | | | | | | | | | | | | | | | | | | | | | |
LESS DISTRIBUTIONS FROM: | | | | | | | | | | | | | | | | | | | | | | | | |
Net investment income | | | (0.17 | ) | | | (0.50 | ) | | | (0.52 | ) | | | (0.62 | ) | | | (0.57 | ) | | | (0.41 | ) |
Net realized capital gains | | | (0.12 | ) | | | (0.03 | ) | | | (0.07 | ) | | | (0.07 | ) | | | (0.32 | ) | | | (0.82 | ) |
| | | | | | | | | | | | | | | | | | | | | | | | |
Total Distributions | | | (0.29 | ) | | | (0.53 | ) | | | (0.59 | ) | | | (0.69 | ) | | | (0.89 | ) | | | (1.23 | ) |
| | | | | | | | | | | | | | | | | | | | | | | | |
Net asset value, end of the period | | $ | 14.01 | | | $ | 13.57 | | | $ | 14.24 | | | $ | 14.38 | | | $ | 14.83 | | | $ | 14.69 | |
| | | | | | | | | | | | | | | | | | | | | | | | |
Total return | | | 5.39 | %(b) | | | (1.06 | )% | | | 3.37 | % | | | 1.67 | % | | | 7.38 | % | | | 9.09 | % |
RATIOS TO AVERAGE NET ASSETS: | | | | | | | | | | | | | | | | | | | | | | | | |
Net assets, end of the period (000’s) | | $ | 247,697 | | | $ | 212,804 | | | $ | 202,989 | | | $ | 176,456 | | | $ | 141,695 | | | $ | 130,637 | |
Net expenses | | | 0.65 | %(c) | | | 0.64 | %(d) | | | 0.63 | % | | | 0.63 | % | | | 0.63 | % | | | 0.63 | % |
Gross expenses | | | 0.65 | %(c) | | | 0.64 | % | | | 0.63 | % | | | 0.63 | % | | | 0.63 | % | | | 0.63 | % |
Net investment income | | | 3.13 | %(c) | | | 3.77 | % | | | 4.36 | % | | | 3.91 | % | | | 4.13 | % | | | 4.34 | % |
Portfolio turnover rate | | | 30 | %(e) | | | 30 | % | | | 13 | % | | | 6 | % | | | 11 | % | | | 17 | % |
| * | For the three month period ended December 31, 2020. See Note 1 of Notes to Financial Statements. |
| (a) | Per share net investment income has been calculated using the average shares outstanding during the period. |
| (b) | Periods less than one year are not annualized. |
| (c) | Computed on an annualized basis for periods less than one year. |
| (d) | Effective July 1, 2020, the expense limit decreased from 0.95% to 0.70%. |
| (e) | The variation in the Fund’s turnover rate, if annualized, from the year ended September 30, 2020 to the period ended December 31, 2020 was primarily due to the disposition and realignment of certain foreign currency-denominated positions. |
See accompanying notes to financial statements.
| 102
Financial Highlights (continued)
For a share outstanding throughout each period.
| | | | | | | | | | | | | | | | | | | | | | | | |
| | | Strategic Income Fund—Class Y | |
| | | Period Ended
December 31,
2020* | | | Year Ended
September 30,
2020 | | | Year Ended
September 30,
2019 | | | Year Ended
September 30,
2018 | | | Year Ended
September 30,
2017 | | | Year Ended
September 30,
2016 | |
Net asset value, beginning of the period | | $ | 13.56 | | | $ | 14.23 | | | $ | 14.38 | | | $ | 14.83 | | | $ | 14.69 | | | $ | 14.69 | |
| | | | | | | | | | | | | | | | | | | | | | | | |
INCOME (LOSS) FROM INVESTMENT OPERATIONS: | | | | | | | | | | | | | | | | | | | | | | | | |
Net investment income(a) | | | 0.11 | | | | 0.51 | | | | 0.60 | | | | 0.55 | | | | 0.59 | | | | 0.61 | |
Net realized and unrealized gain (loss) | | | 0.62 | | | | (0.66 | ) | | | (0.17 | ) | | | (0.32 | ) | | | 0.43 | | | | 0.61 | |
| | | | | | | | | | | | | | | | | | | | | | | | |
Total from Investment Operations | | | 0.73 | | | | (0.15 | ) | | | 0.43 | | | | 0.23 | | | | 1.02 | | | | 1.22 | |
| | | | | | | | | | | | | | | | | | | | | | | | |
LESS DISTRIBUTIONS FROM: | | | | | | | | | | | | | | | | | | | | | | | | |
Net investment income | | | (0.16 | ) | | | (0.49 | ) | | | (0.51 | ) | | | (0.61 | ) | | | (0.56 | ) | | | (0.40 | ) |
Net realized capital gains | | | (0.12 | ) | | | (0.03 | ) | | | (0.07 | ) | | | (0.07 | ) | | | (0.32 | ) | | | (0.82 | ) |
| | | | | | | | | | | | | | | | | | | | | | | | |
Total Distributions | | | (0.28 | ) | | | (0.52 | ) | | | (0.58 | ) | | | (0.68 | ) | | | (0.88 | ) | | | (1.22 | ) |
| | | | | | | | | | | | | | | | | | | | | | | | |
Net asset value, end of the period | | $ | 14.01 | | | $ | 13.56 | | | $ | 14.23 | | | $ | 14.38 | | | $ | 14.83 | | | $ | 14.69 | |
| | | | | | | | | | | | | | | | | | | | | | | | |
Total return | | | 5.44 | %(b) | | | (1.14 | )% | | | 3.22 | % | | | 1.66 | % | | | 7.22 | % | | | 9.00 | % |
RATIOS TO AVERAGE NET ASSETS: | | | | | | | | | | | | | | | | | | | | | | | | |
Net assets, end of the period (000’s) | | $ | 3,693,954 | | | $ | 3,774,113 | | | $ | 4,316,010 | | | $ | 5,118,016 | | | $ | 5,702,607 | | | $ | 5,350,759 | |
Net expenses | | | 0.72 | %(c) | | | 0.72 | %(d) | | | 0.71 | % | | | 0.71 | % | | | 0.71 | % | | | 0.71 | % |
Gross expenses | | | 0.72 | %(c) | | | 0.72 | % | | | 0.71 | % | | | 0.71 | % | | | 0.71 | % | | | 0.71 | % |
Net investment income | | | 3.03 | %(c) | | | 3.68 | % | | | 4.28 | % | | | 3.82 | % | | | 4.04 | % | | | 4.26 | % |
Portfolio turnover rate | | | 30 | %(e) | | | 30 | % | | | 13 | % | | | 6 | % | | | 11 | % | | | 17 | % |
| * | For the three month period ended December 31, 2020. See Note 1 of Notes to Financial Statements. |
| (a) | Per share net investment income has been calculated using the average shares outstanding during the period. |
| (b) | Periods less than one year are not annualized. |
| (c) | Computed on an annualized basis for periods less than one year. |
| (d) | Effective July 1, 2020, the expense limit decreased from 1.00% to 0.75%. |
| (e) | The variation in the Fund’s turnover rate, if annualized, from the year ended September 30, 2020 to the period ended December 31, 2020 was primarily due to the disposition and realignment of certain foreign currency-denominated positions. |
See accompanying notes to financial statements.
103 |
Financial Highlights (continued)
For a share outstanding throughout each period.
| | | | | | | | | | | | | | | | | | | | | | | | |
| | | Strategic Income Fund—Admin Class | |
| | | Period Ended
December 31,
2020* | | | Year Ended
September 30,
2020 | | | Year Ended
September 30,
2019 | | | Year Ended
September 30,
2018 | | | Year Ended
September 30,
2017 | | | Year Ended
September 30,
2016 | |
Net asset value, beginning of the period | | $ | 13.53 | | | $ | 14.20 | | | $ | 14.34 | | | $ | 14.79 | | | $ | 14.65 | | | $ | 14.66 | |
| | | | | | | | | | | | | | | | | | | | | | | | |
INCOME (LOSS) FROM INVESTMENT OPERATIONS: | |
Net investment income(a) | | | 0.09 | | | | 0.44 | | | | 0.53 | | | | 0.48 | | | | 0.52 | | | | 0.53 | |
Net realized and unrealized gain (loss) | | | 0.62 | | | | (0.66 | ) | | | (0.16 | ) | | | (0.33 | ) | | | 0.43 | | | | 0.61 | |
| | | | | | | | | | | | | | | | | | | | | | | | |
Total from Investment Operations | | | 0.71 | | | | (0.22 | ) | | | 0.37 | | | | 0.15 | | | | 0.95 | | | | 1.14 | |
| | | | | | | | | | | | | | | | | | | | | | | | |
LESS DISTRIBUTIONS FROM: | |
Net investment income | | | (0.15 | ) | | | (0.42 | ) | | | (0.44 | ) | | | (0.53 | ) | | | (0.49 | ) | | | (0.33 | ) |
Net realized capital gains | | | (0.12 | ) | | | (0.03 | ) | | | (0.07 | ) | | | (0.07 | ) | | | (0.32 | ) | | | (0.82 | ) |
| | | | | | | | | | | | | | | | | | | | | | | | |
Total Distributions | | | (0.27 | ) | | | (0.45 | ) | | | (0.51 | ) | | | (0.60 | ) | | | (0.81 | ) | | | (1.15 | ) |
| | | | | | | | | | | | | | | | | | | | | | | | |
Net asset value, end of the period | | $ | 13.97 | | | $ | 13.53 | | | $ | 14.20 | | | $ | 14.34 | | | $ | 14.79 | | | $ | 14.65 | |
| | | | | | | | | | | | | | | | | | | | | | | | |
Total return | | | 5.24 | %(b) | | | (1.64 | )% | | | 2.78 | % | | | 1.09 | % | | | 6.79 | % | | | 8.42 | % |
RATIOS TO AVERAGE NET ASSETS: | |
Net assets, end of the period (000’s) | | $ | 105,172 | | | $ | 103,197 | | | $ | 121,903 | | | $ | 133,220 | | | $ | 142,871 | | | $ | 143,275 | |
Net expenses | | | 1.22 | %(c) | | | 1.22 | %(d) | | | 1.20 | %(e) | | | 1.20 | %(e) | | | 1.19 | %(f) | | | 1.20 | %(e) |
Gross expenses | | | 1.22 | %(c) | | | 1.22 | % | | | 1.20 | %(e) | | | 1.20 | %(e) | | | 1.19 | %(f) | | | 1.20 | %(e) |
Net investment income | | | 2.53 | %(c) | | | 3.19 | % | | | 3.80 | % | | | 3.33 | % | | | 3.57 | % | | | 3.76 | % |
Portfolio turnover rate | | | 30 | %(g) | | | 30 | % | | | 13 | % | | | 6 | % | | | 11 | % | | | 17 | % |
| * | For the three month period ended December 31, 2020. See Note 1 of Notes to Financial Statements. |
| (a) | Per share net investment income has been calculated using the average shares outstanding during the period. |
| (b) | Periods less than one year are not annualized. |
| (c) | Computed on an annualized basis for periods less than one year. |
| (d) | Effective July 1, 2020, the expense limit decreased from 1.50% to 1.25%. |
| (e) | Includes refund of prior year service fee of 0.01%. |
| (f) | Includes refund of prior year service fee of 0.02%. |
| (g) | The variation in the Fund’s turnover rate, if annualized, from the year ended September 30, 2020 to the period ended December 31, 2020 was primarily due to the disposition and realignment of certain foreign currency-denominated positions. |
See accompanying notes to financial statements.
| 104
Notes to Financial Statements
December 31, 2020
1. Organization. Loomis Sayles Funds II and Natixis Funds Trust II (the “Trusts” and each a “Trust”) are each organized as a Massachusetts business trust. Each Trust is registered under the Investment Company Act of 1940, as amended (the “1940 Act”), as an open-end management investment company. Each Declaration of Trust permits the Board of Trustees to authorize the issuance of an unlimited number of shares of the Trust in multiple series. The financial statements for certain funds of the Trusts are presented in separate reports. The following funds (individually, a “Fund” and collectively, the “Funds”) are included in this report:
Loomis Sayles Funds II:
Loomis Sayles High Income Fund (the “High Income Fund”)
Loomis Sayles International Growth Fund (the “International Growth Fund”)
Loomis Sayles Investment Grade Bond Fund (the “Investment Grade Bond Fund”)
Loomis Sayles Strategic Income Fund (the “Strategic Income Fund”)
Natixis Funds Trust II:
Loomis Sayles Intermediate Municipal Bond Fund (the “Intermediate Municipal Bond Fund”)
Loomis Sayles Strategic Alpha Fund (the “Strategic Alpha Fund”)
International Growth Fund commenced operations on December 15, 2020 via contributions to the Fund by Natixis Investment Managers, LLC (“Natixis”) and affiliates of $15,003,000.
Each Fund is a diversified investment company, except for International Growth Fund and Strategic Alpha Fund, which are each a non-diversified investment company.
On December 2, 2020, the Board of Trustees approved a change to the fiscal year end of Strategic Income Fund from September 30 to December 31. Accordingly, the Fund’s financial statements and related notes include information as of and for the three month period ended December 31, 2020, and the years ended September 30, 2020, and September 30, 2019, where applicable.
Each Fund offers Class A, Class C, Class N and Class Y shares, except for Intermediate Municipal Bond Fund, which does not offer Class N shares. In addition, Investment Grade Bond Fund and Strategic Income Fund also offer Admin Class shares.
Class A shares are sold with a maximum front-end sales charge of 4.25% for each Fund, except for Intermediate Municipal Bond Fund and International Growth Fund, which are sold with a maximum front-end sales charge of 3.00% and 5.75%, respectively. Class C shares do not pay a front-end sales charge, pay higher Rule 12b-1 fees than Class A shares for ten years (at which point they automatically convert to Class A shares) and may be subject to a contingent deferred sales charge (“CDSC”) of 1.00% if those shares are redeemed within one year of acquisition, except for reinvested distributions. Class N and Class Y shares do not pay a front-end sales charge, a CDSC or Rule 12b-1 fees. Class N shares are offered with an initial minimum investment of $1,000,000. Class Y shares are offered with an initial minimum investment of $100,000. Certain categories of investors are exempted from the minimum investment amounts for Class N and Class Y as outlined in the relevant Funds’ prospectus. Admin Class shares do not pay a front-end sales charge or a CDSC, but do pay a Rule 12b-1 fee. Admin Class shares are offered exclusively through intermediaries.
Most expenses can be directly attributed to a Fund. Expenses which cannot be directly attributed to a Fund are generally apportioned based on the relative net assets of each of the funds in Natixis Funds Trust I, Natixis Funds Trust II, Natixis Funds Trust IV and Gateway Trust (“Natixis Funds Trusts”), Loomis Sayles Funds I and Loomis Sayles Funds II (“Loomis Sayles Funds Trusts”), and Natixis ETF Trust and Natixis ETF Trust II (“Natixis ETF Trusts”). Expenses of a Fund are borne pro rata by the holders of each class of shares, except that each class bears expenses unique to that class (such as the Rule 12b-1 fee applicable to Class A, Class C and Admin Class) and transfer agent fees are borne collectively for Class A, Class C, Class Y and Admin Class, and individually for Class N. In addition, each class votes as a class only with respect to its own Rule 12b-1 Plan. Shares of each class would receive their pro rata share of the net assets of a Fund if the Fund were liquidated. The Trustees approve separate distributions from net investment income on each class of shares.
2. Significant Accounting Policies. The following is a summary of significant accounting policies consistently followed by each Fund in the preparation of its financial statements. The Funds’ financial statements follow the accounting and reporting guidelines provided for investment companies and are prepared in accordance with accounting principles generally accepted in the United States of America which require the use of management estimates that affect the reported amounts and disclosures in the financial statements. Actual results could differ from those estimates. Management has evaluated the events and transactions subsequent to year-end through the date the financial statements were issued and has determined that there were no material events that would require disclosure in the Funds’ financial statements.
a. Valuation. Fund securities and other investments are valued at market value based on market quotations obtained or determined by independent pricing services recommended by the adviser or sub-adviser and approved by the Board of Trustees. Fund securities
105 |
Notes to Financial Statements (continued)
December 31, 2020
and other investments for which market quotations are not readily available are valued at fair value as determined in good faith by the adviser or sub-adviser pursuant to procedures approved by the Board of Trustees, as described below. Market value is determined as follows:
Listed equity securities (including shares of closed-end investment companies and exchange-traded funds) are valued at the last sale price quoted on the exchange where they are traded most extensively or, if there is no reported sale during the day, the closing bid quotation as reported by an independent pricing service. Securities traded on the NASDAQ Global Select Market, NASDAQ Global Market and NASDAQ Capital Market are valued at the NASDAQ Official Closing Price (“NOCP”), or if lacking an NOCP, at the most recent bid quotations on the applicable NASDAQ Market. Unlisted equity securities (except unlisted preferred equity securities) are valued at the last sale price quoted in the market where they are traded most extensively or, if there is no reported sale during the day, the closing bid quotation as reported by an independent pricing service. If there is no last sale price or closing bid quotation available, unlisted equity securities will be valued using evaluated bids furnished by an independent pricing service, if available. In some foreign markets, an official close price and a last sale price may be available from the foreign exchange or market. In those cases, the official close price is used. Debt securities and unlisted preferred equity securities are valued based on evaluated bids furnished to the Funds by an independent pricing service or bid prices obtained from broker-dealers. Senior loans and collateralized loan obligations are valued at bid prices supplied by an independent pricing service, if available. Equity linked notes are valued using broker-dealer bid prices. Broker-dealer bid prices may be used to value debt, unlisted equity securities, senior loans and collateralized loan obligations where an independent pricing service is unable to price a security or where an independent pricing service does not provide a reliable price for the security. Forward foreign currency contracts are valued utilizing interpolated rates determined based on information provided by an independent pricing service. Futures contracts are valued at the most recent settlement price on the exchange on which the adviser believes that, over time, they are traded most extensively. Centrally cleared swap agreements are valued at settlement prices of the clearing house on which the contracts were traded or prices obtained from broker-dealers. Bilateral credit default swaps are valued based on mid prices (between the bid price and the ask price) supplied by an independent pricing service. Bilateral interest rate swaps are valued based on prices supplied by an independent pricing source. Domestic exchange-traded index and single name equity option contracts (including options on exchange-traded funds) are valued at the mean of the National Best Bid and Offer quotations as determined by the Options Price Reporting Authority. Options on futures contracts are valued using the current settlement price on the exchange on which, over time, they are traded most extensively. Option contracts on foreign indices are priced at the most recent settlement price. Other exchange-traded options are valued at the average of the closing bid and ask quotations on the exchange on which, over time, they are traded most extensively. Over-the-counter (“OTC”) currency options and swaptions are valued at mid prices (between the bid and the ask price) supplied by an independent pricing service, if available. Other OTC option contracts (including currency options and swaptions not priced through an independent pricing service) are valued based on quotations obtained from broker-dealers. Shares of open-end investment companies are valued at net asset value per share.
Fund securities and other investments for which market quotations are not readily available are valued at fair value as determined in good faith by the adviser pursuant to procedures approved by the Board of Trustees. The Funds may also value securities and other investments at fair value in other circumstances such as when extraordinary events occur after the close of a foreign market but prior to the close of the New York Stock Exchange. This may include situations relating to a single issuer (such as a declaration of bankruptcy or a delisting of the issuer’s security from the primary market on which it has traded) as well as events affecting the securities markets in general (such as market disruptions or closings and significant fluctuations in U.S. and/or foreign markets). When fair valuing its securities or other investments, the Funds may, among other things, use modeling tools or other processes that may take into account factors such as securities or other market activity and/or significant events that occur after the close of the foreign market and before the time the Fund’s net asset value (“NAV”) is calculated. Fair value pricing may require subjective determinations about the value of a security, and fair values used to determine a Fund’s NAV may differ from quoted or published prices, or from prices that are used by others, for the same securities. In addition, the use of fair value pricing may not always result in adjustments to the prices of securities held by a Fund.
Illiquid securities for which market quotations are readily available and have been evaluated by the adviser are considered and classified as fair valued securities pursuant to the Funds’ pricing policies and procedures.
| 106
Notes to Financial Statements (continued)
December 31, 2020
As of December 31, 2020, securities and other investments of the funds included in net assets were fair valued as follows:
| | | | | | | | | | | | | | | | | | | | | | | | |
Fund | | Equity Securities1 | | | Percentage
of Net Assets | | | Securities
classified
as fair
valued | | | Percentage
of Net Assets | | | Securities
fair valued
by the
Fund’s
adviser | | | Percentage
of Net Assets | |
High Income Fund | | $ | — | | | | — | | | $ | 1,051,925 | | | | 0.9 | % | | $ | 715,044 | | | | 0.6 | % |
International Growth Fund | | | 9,456,143 | | | | 62.1 | % | | | — | | | | — | | | | — | | | | — | |
Investment Grade Bond Fund | | | — | | | | — | | | | 115,550,245 | | | | 1.9 | % | | | — | | | | Less than 0.1 | % |
Strategic Alpha Fund | | | 772,485 | | | | 0.1 | % | | | 7,222,747 | | | | 0.5 | % | | | 7,357,855 | | | | 0.6 | % |
Strategic Income Fund | | | — | | | | — | | | | 94,587,570 | | | | 1.6 | % | | | 38,774,769 | | | | 0.6 | % |
| 1 | Certain foreign equity securities were fair valued pursuant to procedures approved by the Board of Trustees as events occurring after the close of the foreign market were believed to materially affect the value of those securities. |
b. Investment Transactions and Related Investment Income. Investment transactions are accounted for on a trade date plus one day basis for daily NAV calculation. However, for financial reporting purposes, investment transactions are reported on trade date. Dividend income (including income reinvested) and foreign withholding tax, if applicable, is recorded on the ex-dividend date, or in the case of certain foreign securities, as soon as a Fund is notified, and interest income is recorded on an accrual basis. Interest income is increased by the accretion of discount and decreased by the amortization of premium, if applicable. For payment-in-kind securities, income received in-kind is reflected as an increase to the principal and cost basis of the securities. Periodic principal adjustments for inflation-protected securities are recorded to interest income. Negative principal adjustments (in the event of deflation) are recorded as reductions of interest income to the extent of interest income earned, not to exceed the amount of positive principal adjustments on a cumulative basis. Distributions received from investments in securities that represent a return of capital or capital gain are recorded as a reduction of cost of the investments or as a realized gain, respectively. The calendar year-end amounts of ordinary income, capital gains, and return of capital included in distributions received from the Funds’ investments in real estate investment trusts (“REITs”) are reported to the Funds after the end of the fiscal year; accordingly, the Funds estimate these amounts for accounting purposes until the characterization of REIT distributions is reported to the Funds after the end of the fiscal year. Estimates are based on the most recent REIT distribution information available. In determining net gain or loss on securities sold, the cost of securities has been determined on an identified cost basis. Investment income, non-class specific expenses and realized and unrealized gains and losses are allocated on a pro rata basis to each class based on the relative net assets of each class to the total net assets of the Fund.
c. Foreign Currency Translation. The books and records of the Funds are maintained in U.S. dollars. The values of securities, currencies and other assets and liabilities denominated in currencies other than U.S. dollars, if any, are translated into U.S. dollars based upon foreign exchange rates prevailing at the end of the period. Purchases and sales of investment securities, income and expenses are translated into U.S. dollars on the respective dates of such transactions.
Net realized foreign exchange gains or losses arise from sales of foreign currency, changes in exchange rates between the trade and settlement dates on securities transactions and the difference between the amounts of dividends, interest and foreign withholding taxes recorded on the Funds’ books and the U.S. dollar equivalent of the amounts actually received or paid. Net unrealized foreign exchange gains or losses arise from changes in the value of assets and liabilities, other than investment securities, as of the end of the fiscal period, resulting from changes in exchange rates. Net realized foreign exchange gains or losses and the net change in unrealized foreign exchange gains or losses are disclosed in the Statements of Operations. For federal income tax purposes, net realized foreign exchange gains or losses are characterized as ordinary income, and may, if the Funds have net losses, reduce the amount of income available to be distributed by the Funds.
The values of investment securities are presented at the foreign exchange rates prevailing at the end of the period for financial reporting purposes. Net realized and unrealized gains or losses on investments reported in the Statements of Operations reflect gains or losses resulting from changes in exchange rates and fluctuations which arise due to changes in market prices of investment securities. For federal income tax purposes, a portion of the net realized gain or loss on investments arising from changes in exchange rates, which is reflected in the Statements of Operations, may be characterized as ordinary income and may, if the Funds have net losses, reduce the amount of income available to be distributed by the Funds.
For the year ended (period ended for Strategic Income Fund) December 31, 2020, the amount of income available to be distributed has been reduced by the following amounts as a result of losses arising from changes in exchange rates:
| | | | |
Strategic Alpha Fund | | $ | 11,482,189 | |
Strategic Income Fund | | | 382,188,661 | |
107 |
Notes to Financial Statements (continued)
December 31, 2020
The Funds may use foreign currency exchange contracts to facilitate transactions in foreign-denominated investments. Losses may arise from changes in the value of the foreign currency or if the counterparties do not perform under the contracts’ terms.
d. Forward Foreign Currency Contracts. The Funds may enter into forward foreign currency contracts, including forward foreign cross currency contracts, to acquire exposure to foreign currencies or to hedge the Fund’s investments against currency fluctuation. A contract can also be used to offset a previous contract. These contracts involve market risk in excess of the unrealized appreciation (depreciation) reflected in the Funds’ Statements of Assets and Liabilities. The U.S. dollar value of the currencies a Fund has committed to buy or sell represents the aggregate exposure to each currency a Fund has acquired or hedged through currency contracts outstanding at period end. Gains or losses are recorded for financial statement purposes as unrealized until settlement date. Contracts are traded over-the-counter directly with a counterparty. Risks may arise upon entering into these contracts from the potential inability of counterparties to meet the terms of their contracts and from unanticipated movements in the value of a foreign currency relative to the U.S. dollar. Certain contracts may require the movement of cash and/or securities as collateral for the Fund’s or counterparty’s net obligations under the contracts.
e. Futures Contracts. The Funds may enter into futures contracts. Futures contracts are agreements between two parties to buy and sell a particular instrument or index for a specified price on a specified future date.
When a Fund enters into a futures contract, it is required to deposit with (or for the benefit of) its broker an amount of cash or short-term high-quality securities as “initial margin.” As the value of the contract changes, the value of the futures contract position increases or declines. Subsequent payments, known as “variation margin,” are made or received by a Fund, depending on the price fluctuations in the fair value of the contract and the value of cash or securities on deposit with the broker. The aggregate principal amounts of the contracts are not recorded in the financial statements. Daily fluctuations in the value of the contracts are recorded in the Statements of Assets and Liabilities as a receivable (payable) and in the Statements of Operations as unrealized appreciation (depreciation) until the contracts are closed, when they are recorded as realized gains (losses). Realized gain or loss on a futures position is equal to the difference between the value of the contract at the time it was opened and the value at the time it was closed, minus brokerage commissions. When a Fund enters into a futures contract certain risks may arise, such as illiquidity in the futures market, which may limit a Fund’s ability to close out a futures contract prior to settlement date, and unanticipated movements in the value of securities or interest rates.
Futures contracts are exchange-traded. Exchange-traded futures contracts are standardized and are settled through a clearing house with fulfillment supported by the credit of the exchange. Therefore, counterparty credit risks to the Funds are reduced; however, in the event that a counterparty enters into bankruptcy, a Fund’s claim against initial/variation margin on deposit with the counterparty may be subject to terms of a final settlement in bankruptcy court.
f. Option Contracts. Intermediate Municipal Bond Fund, International Growth Fund and Strategic Alpha Fund may enter into option contracts. When a Fund purchases an option, it pays a premium and the option is subsequently marked-to-market to reflect current value. Premiums paid for purchasing options which expire are treated as realized losses. Premiums paid for purchasing options which are exercised are added to the cost or deducted from the proceeds on the underlying instrument to determine the realized gain or loss. If the Fund enters into a closing sale transaction, the difference between the premium paid and the proceeds of the closing sale transaction is treated as a realized gain or loss. The risk associated with purchasing options is limited to the premium paid.
When a Fund writes an option, an amount equal to the net premium received (the premium less commission) is recorded as a liability and is subsequently adjusted to the current value. Net premiums received for written options which expire are treated as realized gains. Net premiums received for written options which are exercised are deducted from the cost or added to the proceeds on the underlying instrument to determine the realized gain or loss. If the Fund enters into a closing purchase transaction, the difference between the net premium received and any amount paid on effecting a closing purchase transaction, including commissions, is treated as a realized gain or, if the net premium received is less than the amount paid, as a realized loss. The Fund, as writer of a written option, bears the risk of an unfavorable change in the market value of the instrument or index underlying the written option.
Exchange-traded options contracts are standardized and are settled through a clearing house with fulfillment supported by the credit of the exchange. Therefore, counterparty credit risks to the Funds are reduced. OTC options are subject to the risk that the counterparty is unable or unwilling to meet its obligations under the option.
g. Swap Agreements. The Funds, except for International Growth Fund, may enter into credit default and interest rate swaps. A credit default swap is an agreement between two parties (the “protection buyer��� and “protection seller”) to exchange the credit risk of an issuer (“reference obligation”) for a specified time period. The reference obligation may be one or more debt securities or an index of such securities. The Funds may be either the protection buyer or the protection seller. As a protection buyer, the Funds have the ability to hedge the downside risk of an issuer or group of issuers. As a protection seller, the Funds have the ability to gain exposure to an issuer or group of issuers whose bonds are unavailable or in short supply in the cash bond market, as well as realize additional income
| 108
Notes to Financial Statements (continued)
December 31, 2020
in the form of fees paid by the protection buyer. The protection buyer is obligated to pay the protection seller a stream of payments (“fees”) over the term of the contract, provided that no credit event, such as a default or a downgrade in credit rating, occurs on the reference obligation. The Funds may also pay or receive upfront premiums. If a credit event occurs, the protection seller must pay the protection buyer the difference between the agreed upon notional value and market value of the reference obligation. Market value in this case is determined by a facilitated auction whereby a minimum number of allowable broker bids, together with a specified valuation method, are used to calculate the value. The maximum potential amount of undiscounted future payments that a Fund as the protection seller could be required to make under a credit default swap agreement would be an amount equal to the notional amount of the agreement.
Implied credit spreads, represented in absolute terms, are disclosed in the Portfolio of Investments for those agreements for which the Fund is the protection seller. Implied credit spreads serve as an indicator of the current status of the payment/performance risk and represent the likelihood or risk of default for the credit derivative. The implied credit spread of a particular reference entity reflects the cost of buying/selling protection and may include upfront payments required to be made to enter into the agreement. Wider credit spreads represent a deterioration of the reference entity’s credit soundness and a greater likelihood or risk of default or other credit event occurring as defined under the terms of the agreement.
An interest rate swap is an agreement with another party to receive or pay interest (e.g., an exchange of fixed rate payments for floating rate payments) to protect themselves from interest rate fluctuations. This type of swap is an agreement that obligates two parties to exchange a series of cash flows at specified intervals based upon or calculated by reference to a specified interest rate(s) for a specified notional amount. The payment flows are usually netted against each other, with the difference being paid by one party to the other.
The notional amounts of swap agreements are not recorded in the financial statements. Swap agreements are valued daily, and fluctuations in value are recorded in the Statements of Operations as change in unrealized appreciation (depreciation) on swap agreements. Fees are accrued in accordance with the terms of the agreement and are recorded in the Statements of Assets and Liabilities as part of unrealized appreciation (depreciation) on swap agreements. When received or paid, fees are recorded in the Statements of Operations as realized gain or loss. Upfront premiums paid or received by the Funds are recorded on the Statements of Assets and Liabilities as an asset or liability, respectively, and are amortized or accreted over the term of the agreement and recorded as realized gain or loss. Payments made or received by the Funds as a result of a credit event or termination of the agreement are recorded as realized gain or loss.
Swap agreements are privately negotiated in the OTC market and may be entered into as a bilateral contract or centrally cleared (“centrally cleared swaps”). Bilateral swap agreements are traded between counterparties and, as such, are subject to the risk that a party to the agreement will not be able to meet its obligations. In a centrally cleared swap, immediately following execution of the swap agreement, the swap agreement is novated to a central counterparty (the “CCP”) and the Funds face the CCP through a broker. Upon entering into a centrally cleared swap, the Funds are required to deposit initial margin with the broker in the form of cash or securities in an amount that varies depending on the size and risk profile of the particular swap. Subsequent payments, known as “variation margin,” are made or received by the Funds based on the daily change in the value of the centrally cleared swap agreement. For centrally cleared swaps, the Funds’ counterparty credit risk is reduced as the CCP stands between the Funds and the counterparty. The Funds cover their net obligations under outstanding swap agreements by segregating or earmarking cash or securities.
h. Swaptions. The Funds, except for International Growth Fund, may enter into interest rate swaptions. An interest rate swaption gives the holder the right, but not the obligation, to enter into or cancel an interest rate swap agreement at a future date. Interest rate swaptions may be either purchased or written. The buyer of an interest rate swaption may purchase either the right to receive a fixed rate in the underlying swap (known as a “receiver swaption”) or to pay a fixed rate (known as a “payer swaption”), based on the notional amount of the swap agreement, in exchange for a floating rate. The notional amounts of swaptions are not recorded in the financial statements.
When a Fund purchases an interest rate swaption, it pays a premium and the swaption is subsequently marked-to-market to reflect current value. Premiums paid for purchasing interest rate swaptions which expire are treated as realized losses. Premiums paid for purchasing interest rate swaptions which are exercised are added to the cost or deducted from the proceeds on the underlying swap to determine the realized gain or loss. If a Fund enters into a closing sale transaction, the difference between the premium paid and the proceeds of the closing sale transaction is treated as a realized gain or loss. The risk associated with purchasing interest rate swaptions is limited to the premium paid.
When a Fund writes an interest rate swaption, an amount equal to the premium received is recorded as a liability and is subsequently adjusted to the current value. Premiums received for written interest rate swaptions which expire are treated as realized gains. Premiums received for written interest rate swaptions which are exercised are deducted from the cost or added to the proceeds on the
109 |
Notes to Financial Statements (continued)
December 31, 2020
underlying swap to determine the realized gain or loss. If a Fund enters into a closing purchase transaction, the difference between the premium received and any amount paid on effecting a closing purchase transaction, including commission, is treated as a realized gain or, if the premium received is less than the amount paid, as a realized loss. A Fund, as writer of a written interest rate swaption, bears the risk of an unfavorable change in the market value of the swap underlying the written interest rate swaption.
OTC interest rate swaptions are subject to the risk that the counterparty is unable or unwilling to meet its obligations under the swaption.
There were no swaptions held by the Funds as of December 31, 2020.
i. Due from Brokers. Transactions and positions in certain options, futures, forward foreign currency contracts and swap agreements are maintained and cleared by registered U.S. broker/dealers pursuant to customer agreements between the Funds and the various broker/dealers. The due from brokers balance in the Statements of Assets and Liabilities for Strategic Alpha Fund represents cash pledged as collateral for forward foreign currency contracts, options, bilateral swap agreements and as initial margin for futures contracts and centrally cleared swap agreements. In certain circumstances the Funds’ use of cash, securities and/or foreign currency held at brokers is restricted by regulation or broker mandated limits.
j. Federal and Foreign Income Taxes. The Trusts treat each Fund as a separate entity for federal income tax purposes. Each Fund intends to meet the requirements of the Internal Revenue Code of 1986, as amended, applicable to regulated investment companies, and to distribute to its shareholders substantially all of its net investment income and any net realized capital gains at least annually. Management has performed an analysis of each Fund’s tax positions for the open tax years as of December 31, 2020 and has concluded that no provisions for income tax are required. The Funds’ federal tax returns for the prior three fiscal years, where applicable, remain subject to examination by the Internal Revenue Service. Management is not aware of any events that are reasonably possible to occur in the next twelve months that would result in the amounts of any unrecognized tax benefits significantly increasing or decreasing for the Funds. However, management’s conclusions regarding tax positions taken may be subject to review and adjustment at a later date based on factors including, but not limited to, new tax laws and accounting regulations and interpretations thereof.
A Fund may be subject to foreign withholding taxes on investment income and taxes on capital gains on investments that are accrued and paid based upon the Fund’s understanding of the tax rules and regulations that exist in the countries in which the Fund invests. Foreign withholding taxes on dividend and interest income are reflected on the Statements of Operations as a reduction of investment income, net of amounts eligible to be reclaimed. Dividends and interest receivable on the Statements of Assets and Liabilities are net of foreign withholding taxes. Foreign withholding taxes where reclaims have been or will be filed are reflected on the Statements of Assets and Liabilities as tax reclaims receivable. Capital gains taxes paid are included in net realized gain (loss) on investments in the Statements of Operations. Accrued but unpaid capital gains taxes are reflected as foreign taxes payable on the Statements of Assets and Liabilities, if applicable, and reduce unrealized gains on investments. In the event that realized gains on investments are subsequently offset by realized losses, taxes paid on realized gains may be returned to a Fund. Such amounts, if applicable, are reflected as foreign tax rebates receivable on the Statements of Assets and Liabilities and are recorded as a realized gain when received.
k. Dividends and Distributions to Shareholders. Dividends and distributions are recorded on the ex-dividend date. The timing and characterization of certain income and capital gain distributions are determined in accordance with federal tax regulations, which may differ from accounting principles generally accepted in the United States of America. Permanent differences are primarily due to differing treatments for book and tax purposes of items such as paydown gains and losses, defaulted and/or non-income producing securities, swap adjustments, foreign currency gains and losses, distribution re-designations, deferred Trustees’ fees, non-deductible expenses, distributions in excess of income and/or capital gains, forward foreign currency contract mark-to-market, futures contract mark-to-market, net operating losses, return of capital distributions received, partnership basis adjustments, capital gain distributions received, trust preferred securities, convertible bond adjustments, corporate actions, contingent payment debt instruments and premium amortization. Permanent book and tax basis differences relating to shareholder distributions, net investment income and net realized gains will result in reclassifications to capital accounts reported on the Statements of Assets and Liabilities. Temporary differences between book and tax distributable earnings are primarily due to deferred Trustees’ fees, premium amortization, defaulted and/or non-income producing securities, swap adjustments, wash sales, foreign currency gains and losses, paydown gains and losses, distributions in excess of income and/or capital gains, forward foreign currency contract mark-to-market, futures contract mark-to-market, return of capital distributions received, net operating losses, partnership basis adjustments, capital gain distributions received, trust preferred securities, convertible bond adjustments, corporate actions, contingent payment debt instruments and straddle loss deferral adjustments. Amounts of income and capital gain available to be distributed on a tax basis are determined annually, and at other times during the Funds’ fiscal year as may be necessary to avoid knowingly declaring and paying a return of capital distribution. Distributions from net investment income and net realized short-term capital gains are reported as distributed from ordinary income for tax purposes.
| 110
Notes to Financial Statements (continued)
December 31, 2020
The tax characterization of distributions is determined on an annual basis. The tax character of distributions paid to shareholders during the years ended December 31, 2020 and 2019 (period ended December 31, 2020 and years ended September 30, 2020 and September 30, 2019 for Strategic Income Fund) were as follows:
| | | | | | | | | | | | | | | | |
| | | December 31, 2020
Distributions | |
Fund | | Ordinary
Income | | | Tax
Exempt
Income | | | Long-Term
Capital
Gains | | | Total | |
High Income Fund | | $ | 6,265,130 | | | $ | — | | | $ | — | | | $ | 6,265,130 | |
Intermediate Municipal Bond Fund | | | 791 | | | | 414,256 | | | | — | | | | 415,047 | |
International Growth Fund | | | 12,460 | | | | — | | | | — | | | | 12,460 | |
Investment Grade Bond Fund | | | 312,629,628 | | | | — | | | | 154,088,171 | | | | 466,717,799 | |
Strategic Alpha Fund | | | 28,229,130 | | | | — | | | | — | | | | 28,229,130 | |
Strategic Income Fund | | | 77,888,540 | | | | — | | | | 42,139,359 | | | | 120,027,899 | |
| |
| | | December 31, 2019
Distributions | |
Fund | | Ordinary
Income | | | Tax
Exempt
Income | | | Long-Term
Capital
Gains | | | Total | |
High Income Fund | | $ | 7,578,533 | | | $ | — | | | $ | — | | | $ | 7,578,533 | |
Intermediate Municipal Bond Fund | | | 3,751 | | | | 484,458 | | | | — | | | | 488,209 | |
International Growth Fund | | | — | | | | — | | | | — | | | | — | |
Investment Grade Bond Fund | | | 194,915,001 | | | | — | | | | — | | | | 194,915,001 | |
Strategic Alpha Fund | | | 45,024,232 | | | | — | | | | — | | | | 45,024,232 | |
| | | | | | | | | | | | | | | | | | | | | | | | |
| | | September 30, 2020
Distributions | | | September 30, 2019
Distributions | |
Fund | | Ordinary
Income | | | Long-Term
Capital
Gains | | | Total | | | Ordinary
Income | | | Long-Term
Capital
Gains | | | Total | |
Strategic Income Fund | | $ | 222,956,339 | | | $ | 11,005,230 | | | $ | 233,961,569 | | | $ | 263,812,130 | | | $ | 37,679,164 | | | $ | 301,491,294 | |
Distributions paid to shareholders from net investment income and net realized capital gains, based on accounting principles generally accepted in the United States of America, are consolidated and reported on the Statements of Changes in Net Assets as Distributions to Shareholders. Distributions paid to shareholders from net investment income and net realized capital gains expressed in per-share amounts, based on accounting principles generally accepted in the United States of America, are separately stated and reported within the Financial Highlights.
As of December 31, 2020, the components of distributable earnings on a tax basis were as follows:
| | | | | | | | | | | | | | | | | | | | | | | | |
| | | High Income
Fund | | | Intermediate
Municipal
Bond Fund | | | International
Growth
Fund | | | Investment
Grade
Bond Fund | | | Strategic
Alpha
Fund | | | Strategic
Income
Fund | |
Undistributed ordinary income | | $ | 18,741 | | | $ | — | | | $ | 5,098 | | | $ | 445,365 | | | $ | — | | | $ | — | |
Undistributed tax exempt income | | | — | | | | 19,144 | | | | — | | | | — | | | | — | | | | — | |
Undistributed long-term capital gains | | | — | | | | — | | | | — | | | | 3,011,559 | | | | — | | | | — | |
| | | | | | | | | | | | | | | | | | | | | | | | |
Total undistributed earnings | | | 18,741 | | | | 19,144 | | | | 5,098 | | | | 3,456,924 | | | | — | | | | — | |
| | | | | | | | | | | | | | | | | | | | | | | | |
111 |
Notes to Financial Statements (continued)
December 31, 2020
| | | | | | | | | | | | | | | | | | | | | | | | |
| | | High Income
Fund | | | Intermediate
Municipal
Bond Fund | | | International
Growth
Fund | | | Investment
Grade Bond
Fund | | | Strategic
Alpha Fund | | | Strategic
Income Fund | |
Capital loss carryforward: | | | | | | | | | | | | | | | | | | | | | | | | |
Short-term: | | | | | | | | | | | | | | | | | | | | | | | | |
No expiration date | | $ | — | | | $ | (343,372 | ) | | $ | — | | | $ | — | | | $ | — | | | $ | — | |
Long-term: | | | | | | | | | | | | | | | | | | | | | | | | |
No expiration date | | | (10,466,344 | ) | | | — | | | | — | | | | — | | | | (45,069,017 | ) | | | — | |
| | | | | | | | | | | | | | | | | | | | | | | | |
Late-year ordinary and post-October capital loss deferrals* | | | — | | | | — | | | | — | | | | — | | | | (3,300,526 | ) | | | (189,804,643 | ) |
| | | | | | | | | | | | | | | | | | | | | | | | |
Unrealized appreciation (depreciation) | | | 2,217,000 | | | | 1,601,784 | | | | 188,539 | | | | 492,027,849 | | | | 23,318,470 | | | | (6,921,959 | ) |
| | | | | | | | | | | | | | | | | | | | | | | | |
Total accumulated earnings (losses) | | $ | (8,230,603 | ) | | $ | 1,277,556 | | | $ | 193,637 | | | $ | 495,484,773 | | | $ | (25,051,073 | ) | | $ | (196,726,602 | ) |
| | | | | | | | | | | | | | | | | | | | | | | | |
Capital loss carryforward utilized in the current year | | $ | — | | | $ | 184,411 | | | $ | — | | | $ | — | | | $ | 5,289,686 | | | $ | 97,476,314 | |
| | | | | | | | | | | | | | | | | | | | | | | | |
| * | Under current tax law, capital losses, foreign currency losses, and losses on passive foreign investment companies and contingent payment debt instruments after October 31 or December 31, as applicable, may be deferred and treated as occurring on the first day of the following taxable year. Strategic Alpha Fund is deferring capital and foreign currency losses. Strategic Income Fund is deferring capital losses. |
As of December 31, 2020, unrealized appreciation (depreciation) as a component of distributable earnings were as follows:
| | | | | | | | | | | | | | | | | | | | | | | | |
| | | High Income
Fund | | | Intermediate
Municipal
Bond Fund | | | International
Growth Fund | | | Investment
Grade Bond
Fund | | | Strategic
Alpha Fund | | | Strategic Income Fund | |
Unrealized appreciation (depreciation) | | | | | | | | | | | | | | | | | | | | | | | | |
Investments | | $ | 2,217,000 | | | $ | 1,601,784 | | | $ | 188,535 | | | $ | 492,027,849 | | | $ | 46,743,540 | | | $ | (6,323,760 | ) |
Foreign currency translations | | | — | | | | — | | | | 4 | | | | — | | | | (23,425,070 | ) | | | (598,199 | ) |
| | | | | | | | | | | | | | | | | | | | | | | | |
Total unrealized appreciation (depreciation) | | $ | 2,217,000 | | | $ | 1,601,784 | | | $ | 188,539 | | | $ | 492,027,849 | | | $ | 23,318,470 | | | $ | (6,921,959 | ) |
| | | | | | | | | | | | | | | | | | | | | | | | |
As of December 31, 2020, the tax cost of investments (including derivatives, if applicable) and unrealized appreciation (depreciation) on a federal tax basis were as follows:
| | | | | | | | | | | | | | | | | | | | | | | | |
| | | High Income
Fund | | | Intermediate
Municipal
Bond Fund | | | International
Growth
Fund | | | Investment
Grade Bond
Fund | | | Strategic
Alpha Fund | | | Strategic Income Fund | |
Federal tax cost | | $ | 109,543,906 | | | $ | 36,759,138 | | | $ | 14,828,544 | | | $ | 5,501,728,654 | | | $ | 1,260,473,225 | | | $ | 5,925,110,534 | |
| | | | | | | | | | | | | | | | | | | | | | | | |
Gross tax appreciation | | $ | 8,068,336 | | | $ | 1,609,997 | | | $ | 372,084 | | | $ | 532,649,637 | | | $ | 86,876,118 | | | $ | 543,364,061 | |
Gross tax depreciation | | | (5,851,336 | ) | | | (8,213 | ) | | | (183,549 | ) | | | (40,621,788 | ) | | | (63,779,539 | ) | | | (550,285,311 | ) |
| | | | | | | | | | | | | | | | | | | | | | | | |
Net tax appreciation (depreciation) | | $ | 2,217,000 | | | $ | 1,601,784 | | | $ | 188,535 | | | $ | 492,027,849 | | | $ | 23,096,579 | | | $ | (6,921,250 | ) |
| | | | | | | | | | | | | | | | | | | | | | | | |
The difference between these amounts and those reported in the components of distributable earnings are primarily attributable to foreign currency mark-to-market.
l. Senior Loans. Each Fund may invest in senior loans to corporate, governmental or other borrowers. Senior loans, which include both secured and unsecured loans made by banks and other financial institutions to corporate customers, typically hold the most senior position in a borrower’s capital structure, may be secured by the borrower’s assets and have interest rates that reset frequently. Senior Loans can include term loans, revolving credit facility loans and second lien loans. A senior loan is often administered by a bank or other financial institution that acts as agent for all holders. The agent administers the terms of the senior loan, as specified in the loan agreement. Large loans may be shared or syndicated among several lenders. The Fund may enter into the primary syndicate for a loan or it may also purchase all or a portion of loans from other lenders (sometimes referred to as loan assignments), in either case becoming a direct lender. Senior loans outstanding at the end of the period , if any, are listed in each applicable Fund’s Portfolio of Investments.
m. Loan Participations. A Fund’s investments in senior loans may be in the form of participations in loans. When investing in a loan participation, the Fund has the right to receive payments of principal, interest and any fees to which it is entitled only from the party from whom the Fund has purchased the participation and only upon receipt by that party of payments from the borrower. The Fund generally has no right to enforce compliance by the borrower with the terms of the loan agreement or to vote on matters arising under
| 112
Notes to Financial Statements (continued)
December 31, 2020
the loan agreement. Thus, the Fund may be subject to credit risk from both the party from whom it purchased the loan participation and the borrower. Additionally, the Fund may have minimal control over the terms of any loan modification. Loan participations outstanding at the end of the period, if any, are listed in each applicable Fund’s Portfolio of Investments.
n. Collateralized Loan Obligations. Each Fund may invest in collateralized loan obligations (“CLOs”). A CLO is a type of asset-backed security designed to redirect the cash flows from a pool of leveraged loans to investors based on their risk preferences. Cash flows from a CLO are split into two or more portions, called tranches, varying in risk and yield. The risk of an investment in a CLO depends largely on the type of the collateralized securities and the class of the instrument in which the Fund invests. The intent of the Funds when investing in CLOs is to purchase only higher level, investment grade level select tranches. CLOs outstanding at the end of the period, if any, are listed in each applicable Fund’s Portfolio of Investments.
o. Equity Linked Notes. Strategic Alpha Fund may invest in equity linked notes. An equity linked note is a structured product that differs from a standard debt instrument where the cash payouts will be based on the return of an underlying equity. An equity linked note is typically purchased at a full nominal amount and includes a coupon with an enhanced yield relative to the dividend yield of the underlying security. At maturity the Fund will receive a redemption amount based on the final price of the underlying equity. The risk of investment in an equity linked note depends on the principal protection offered. Some equity linked notes may guarantee total principal or partial principal amounts while others may not provide any guarantee of principal. The maturity value may also be impacted to the extent of any limit on the return value as part of the note structure. Equity linked notes outstanding at the end of the period, if any, are listed in the Fund’s Portfolio of Investments.
The Fund did not hold any equity linked notes as of December 31, 2020.
p. Repurchase Agreements. Each Fund may enter into repurchase agreements, under the terms of a Master Repurchase Agreement, under which each Fund acquires securities as collateral and agrees to resell the securities at an agreed upon time and at an agreed upon price. It is each Fund’s policy that the market value of the collateral for repurchase agreements be at least equal to 102% of the repurchase price, including interest. Certain repurchase agreements are tri-party arrangements whereby the collateral is held in a segregated account for the benefit of the Fund and on behalf of the counterparty. Repurchase agreements could involve certain risks in the event of default or insolvency of the counterparty, including possible delays or restrictions upon a Fund’s ability to dispose of the underlying securities. As of December 31, 2020, each Fund, as applicable, had investments in repurchase agreements for which the value of the related collateral exceeded the value of the repurchase agreement. The gross value of repurchase agreements is included in the Statements of Assets and Liabilities for financial reporting purposes.
q. When-Issued and Delayed Delivery Transactions. The Funds may enter into when-issued or delayed delivery transactions. When-issued refers to transactions made conditionally because a security, although authorized, has not been issued. Delayed delivery refers to transactions for which delivery or payment will occur at a later date, beyond the normal settlement period. The price of when-issued and delayed delivery securities and the date when the securities will be delivered and paid for are fixed at the time the transaction is negotiated. The security and the obligation to pay for it are recorded by the Funds at the time the commitment is entered into. The value of the security may vary with market fluctuations during the time before the Funds take delivery of the security. No interest accrues to the Funds until the transaction settles.
Delayed delivery transactions include those designated as To Be Announced (“TBAs”) in the Portfolios of Investments. For TBAs, the actual security that will be delivered to fulfill the transaction is not designated at the time of the trade. The security is “to be announced” 48 hours prior to the established trade settlement date. Certain transactions require the Funds or counterparty to post cash and/or securities as collateral for the net mark-to-market exposure to the other party. The Funds cover their net obligations under outstanding delayed delivery commitments by segregating or earmarking cash or securities at the custodian.
Purchases of when-issued or delayed delivery securities may have a similar effect on the Funds’ NAV as if the Funds’ had created a degree of leverage in the portfolio. Risks may arise upon entering into such transactions from the potential inability of counterparties to meet their obligations under the transactions. Additionally, losses may arise due to changes in the value of the underlying securities.
There were no when-issued or delayed delivery securities held by the Funds as of December 31, 2020.
r. Stripped Securities. Each Fund may invest in stripped securities, which are usually structured with two or more classes that receive different proportions of the interest and principal distribution on a pool of U.S. or foreign government securities or mortgage assets. In some cases, one class will receive all of the interest (the interest-only or “IO” class), while the other class will receive all of the principal (the principal-only or “PO” class). Stripped securities commonly have greater market volatility than other types of fixed-income securities. In the case of stripped mortgage securities, if the underlying mortgage assets experience greater than anticipated prepayments of principal, a Fund may fail to recoup fully its investments in IOs.
The Funds did not hold any stripped securities as of December 31, 2020.
113 |
Notes to Financial Statements (continued)
December 31, 2020
s. Securities Lending. High Income Fund, Investment Grade Bond Fund and Strategic Income Fund have entered into an agreement with State Street Bank and Trust Company (“State Street Bank”), as agent of the Funds, to lend securities to certain designated borrowers. The loans are collateralized with cash or securities in an amount equal to at least 105% or 102% of the market value (including accrued interest) of the loaned international or domestic securities, respectively, when the loan is initiated. Thereafter, the value of the collateral must remain at least 102% of the market value (including accrued interest) of loaned securities for U.S. equities and U.S. corporate debt; at least 105% of the market value (including accrued interest) of loaned securities for non-U.S. equities; and at least 100% of the market value (including accrued interest) of loaned securities for U.S. Government securities, sovereign debt issued by non-U.S. Governments and non-U.S. corporate debt. In the event that the market value of the collateral falls below the required percentages described above, the borrower will deliver additional collateral on the next business day. As with other extensions of credit, the Funds may bear the risk of loss with respect to the investment of the collateral. The Funds invest cash collateral in short-term investments, a portion of the income from which is remitted to the borrowers and the remainder allocated between the Funds and State Street Bank as lending agent.
For the year ended (period ended for Strategic Income Fund) December 31, 2020, the Funds did not loan securities under this agreement.
t. Unfunded Loan Commitments. The Funds may enter into unfunded loan commitments, which are contractual obligations for future funding at the option of the borrower. Unfunded loan commitments represent a future obligation, in full, even though a percentage of the committed amount may not be utilized by the borrower. Unfunded loan commitments, and the obligation for future funding, are recorded as a liability on the Statements of Assets and Liabilities at par value at the time the commitment is entered into. Purchases of unfunded loan commitments may have a similar effect on the Fund’s NAV as if the Fund had created a degree of leverage in the portfolio. Market risk exists with these commitments to the same extent as if the securities were owned on a settled basis. Losses may arise due to changes in the value of the unfunded loan commitments.
As of December 31, 2020, the Funds did not have any unfunded loan commitments.
u. Indemnifications. Under the Trusts’ organizational documents, its officers and Trustees are indemnified against certain liabilities arising out of the performance of their duties to the Funds. Additionally, in the normal course of business, the Funds enter into contracts with service providers that contain general indemnification clauses. The Funds’ maximum exposure under these arrangements is unknown as this would involve future claims that may be made against the Funds that have not yet occurred. However, based on experience, the Funds expect the risk of loss to be remote.
v. New Accounting Pronouncement. In March 2020, the Financial Accounting Standards Board issued Accounting Standard Update 2020-04, Reference Rate Reform (Topic 848) (“ASU 2020-04”). In response to concerns about structural risks of interbank offered rates, and particularly the risk of cessation of the London Interbank Offered Rate (“LIBOR”), which is expected to occur no later than December 31, 2021, regulators have undertaken reference rate reform initiatives to identify alternative reference rates that are more observable or transaction based and less susceptible to manipulation. ASU 2020-04 provides temporary guidance to ease the potential burden in accounting for (or recognizing the effects of) reference rate reform on financial reporting. ASU 2020-04 is elective and applies to all entities, subject to meeting certain criteria, that have contracts that reference LIBOR or another reference rate expected to be discontinued because of reference rate reform. ASU 2020-04 amendments offer optional expedients for contract modifications that would allow an entity to account for such modifications by prospectively adjusting the effective interest rate, instead of evaluating each contract, in accordance with existing accounting standards, as to whether reference rate modifications constitute the establishment of new contracts or the continuation of existing contracts. ASU 2020-04 amendments are currently effective and an entity may elect to apply its provisions as of any date from the beginning of an interim period that includes or is subsequent to March 12, 2020. No Fund contracts have yet been impacted by reference rate reform. Management expects to apply the optional expedients when appropriate.
3. Fair Value Measurements. In accordance with accounting standards related to fair value measurements and disclosures, the Funds have categorized the inputs utilized in determining the value of each Fund’s assets or liabilities. These inputs are summarized in the three broad levels listed below:
| | • | | Level 1 – quoted prices in active markets for identical assets or liabilities; |
| | • | | Level 2 – prices determined using other significant inputs that are observable either directly, or indirectly through corroboration with observable market data (which could include quoted prices for similar assets or liabilities, interest rates, credit risk, etc.); and |
| | • | | Level 3 – prices determined using significant unobservable inputs when quoted prices or observable inputs are unavailable such as when there is little or no market activity for an asset or liability (unobservable inputs reflect each Fund’s own assumptions in determining the fair value of assets or liabilities and would be based on the best information available). |
| 114
Notes to Financial Statements (continued)
December 31, 2020
The inputs or methodology used for valuing securities are not necessarily an indication of the risk associated with investing in those securities.
The Funds’ pricing policies and procedures are recommended by the adviser and approved by the Board of Trustees. Debt securities are valued based on evaluated bids furnished to the Funds by an independent pricing service. Broker-dealer bid prices may be used if an independent pricing service either is unable to price a security or does not provide a reliable price for a security. The Funds’ adviser may use internally developed models to validate broker-dealer bid prices that are only available from a single broker or market maker. Such securities are considered and classified as fair valued. Broker-dealer bid prices for which the Funds do not have knowledge of the inputs used by the broker-dealer are categorized in Level 3. Securities for which market quotations are not readily available are valued at fair value as determined in good faith by the Funds’ adviser pursuant to procedures approved by the Board of Trustees. Fair valued securities may be categorized in Level 3.
The following is a summary of the inputs used to value the Funds’ investments as of December 31, 2020, at value:
High Income Fund
Asset Valuation Inputs
| | | | | | | | | | | | | | | | |
Description | | Level 1 | | | Level 2 | | | Level 3 | | | Total | |
Bonds and Notes | | | | | | | | | | | | | | | | |
Non-Convertible Bonds | | | | | | | | | | | | | | | | |
Home Construction | | $ | — | | | $ | 1,285,861 | | | $ | — | (b) | | $ | 1,285,861 | |
Non-Agency Commercial Mortgage-Backed Securities | | | — | | | | 1,168,385 | | | | 390,104 | (c) | | | 1,558,489 | |
All Other Non-Convertible Bonds(a) | | | — | | | | 91,362,965 | | | | — | | | | 91,362,965 | |
| | | | | | | | | | | | | | | | |
Total Non-Convertible Bonds | | | — | | | | 93,817,211 | | | | 390,104 | | | | 94,207,315 | |
| | | | | | | | | | | | | | | | |
Convertible Bonds(a) | | | — | | | | 5,282,146 | | | | — | | | | 5,282,146 | |
| | | | | | | | | | | | | | | | |
Total Bonds and Notes | | | — | | | | 99,099,357 | | | | 390,104 | | | | 99,489,461 | |
| | | | | | | | | | | | | | | | |
Collateralized Loan Obligations | | | — | | | | 488,635 | | | | — | | | | 488,635 | |
Loan Participations(a) | | | — | | | | — | | | | 161,345 | (c) | | | 161,345 | |
Preferred Stocks | | | | | | | | | | | | | | | | |
Energy | | | — | | | | — | | | | — | (b) | | | — | |
Food & Beverage | | | — | | | | 1,418,544 | | | | — | | | | 1,418,544 | |
All Other Preferred Stocks(a) | | | 768,681 | | | | — | | | | — | | | | 768,681 | |
| | | | | | | | | | | | | | | | |
Total Preferred Stocks | | | 768,681 | | | | 1,418,544 | | | | — | | | | 2,187,225 | |
| | | | | | | | | | | | | | | | |
Common Stocks | | | | | | | | | | | | | | | | |
Chemicals | | | — | | | | 157,449 | | | | — | | | | 157,449 | |
All Other Common Stocks(a) | | | 590,149 | | | | — | | | | — | | | | 590,149 | |
| | | | | | | | | | | | | | | | |
Total Common Stocks | | | 590,149 | | | | 157,449 | | | | — | | | | 747,598 | |
| | | | | | | | | | | | | | | | |
Other Investments(a) | | | — | | | | — | | | | 125,600 | (c) | | | 125,600 | |
Warrants | | | — | | | | — | | | | 37,995 | (c) | | | 37,995 | |
Short-Term Investments | | | — | | | | 8,523,047 | | | | — | | | | 8,523,047 | |
| | | | | | | | | | | | | | | | |
Total | | $ | 1,358,830 | | | $ | 109,687,032 | | | $ | 715,044 | | | $ | 111,760,906 | |
| | | | | | | | | | | | | | | | |
| (a) | Details of the major categories of the Fund’s investments are reflected within the Portfolio of Investments. |
| (b) | Includes a security fair valued at zero by the Fund’s adviser using Level 3 inputs. |
| (c) | Fair valued by the Fund’s adviser. |
Intermediate Municipal Bond Fund
Asset Valuation Inputs
| | | | | | | | | | | | | | | | |
Description | | Level 1 | | | Level 2 | | | Level 3 | | | Total | |
Bonds and Notes(a) | | $ | — | | | $ | 35,228,502 | | | $ | — | | | $ | 35,228,502 | |
Short-Term Investments | | | 1,100,000 | | | | 2,032,420 | | | | — | | | | 3,132,420 | |
| | | | | | | | | | | | | | | | |
Total | | $ | 1,100,000 | | | $ | 37,260,922 | | | $ | — | | | $ | 38,360,922 | |
| | | | | | | | | | | | | | | | |
| (a) | Details of the major categories of the Fund’s investments are reflected within the Portfolio of Investments. |
115 |
Notes to Financial Statements (continued)
December 31, 2020
International Growth Fund
Asset Valuation Inputs
| | | | | | | | | | | | | | | | |
Description | | Level 1 | | | Level 2 | | | Level 3 | | | Total | |
Common Stocks | | | | | | | | | | | | | | | | |
Australia | | $ | — | | | $ | 492,201 | | | $ | — | | | $ | 492,201 | |
Belgium | | | — | | | | 351,973 | | | | — | | | | 351,973 | |
China | | | 2,860,381 | | | | 1,968,671 | | | | — | | | | 4,829,052 | |
Denmark | | | — | | | | 360,027 | | | | — | | | | 360,027 | |
France | | | — | | | | 634,055 | | | | — | | | | 634,055 | |
Germany | | | — | | | | 450,984 | | | | — | | | | 450,984 | |
Japan | | | — | | | | 807,798 | | | | — | | | | 807,798 | |
Macau | | | — | | | | 194,613 | | | | — | | | | 194,613 | |
Netherlands | | | 352,048 | | | | 743,534 | | | | — | | | | 1,095,582 | |
Switzerland | | | — | | | | 2,338,200 | | | | — | | | | 2,338,200 | |
United Kingdom | | | 384,378 | | | | 1,114,087 | | | | — | | | | 1,498,465 | |
All Other Common Stocks(a) | | | 1,964,129 | | | | — | | | | — | | | | 1,964,129 | |
| | | | | | | | | | | | | | | | |
Total | | $ | 5,560,936 | | | $ | 9,456,143 | | | $ | — | | | $ | 15,017,079 | |
| | | | | | | | | | | | | | | | |
| (a) | Details of the major categories of the Fund’s investments are reflected within the Portfolio of Investments. |
Investment Grade Bond Fund
Asset Valuation Inputs
| | | | | | | | | | | | | | | | |
Description | | Level 1 | | | Level 2 | | | Level 3 | | | Total | |
Bonds and Notes | | | | | | | | | | | | | | | | |
Non-Convertible Bonds | | | | | | | | | | | | | | | | |
ABS Other | | $ | — | | | $ | 161,120,445 | | | $ | 21,594,566 | (b) | | $ | 182,715,011 | |
All Other Non-Convertible Bonds(a) | | | — | | | | 5,270,476,344 | | | | — | | | | 5,270,476,344 | |
| | | | | | | | | | | | | | | | |
Total Non-Convertible Bonds | | | — | | | | 5,431,596,789 | | | | 21,594,566 | | | | 5,453,191,355 | |
| | | | | | | | | | | | | | | | |
Convertible Bonds(a) | | | — | | | | 76,087,082 | | | | — | | | | 76,087,082 | |
Municipals(a) | | | — | | | | 7,862,719 | | | | — | | | | 7,862,719 | |
| | | | | | | | | | | | | | | | |
Total Bonds and Notes | | | — | | | | 5,515,546,590 | | | | 21,594,566 | | | | 5,537,141,156 | |
| | | | | | | | | | | | | | | | |
Collateralized Loan Obligations | | | — | | | | 212,435,862 | | | | 14,755,000 | (b) | | | 227,190,862 | |
Preferred Stocks | | | | | | | | | | | | | | | | |
Energy | | | — | | | | — | | | | — | (c) | | | — | |
Food & Beverage | | | — | | | | 15,108,904 | | | | — | | | | 15,108,904 | |
All Other Preferred Stocks(a) | | | 41,423,282 | | | | — | | | | — | | | | 41,423,282 | |
| | | | | | | | | | | | | | | | |
Total Preferred Stocks | | | 41,423,282 | | | | 15,108,904 | | | | — | | | | 56,532,186 | |
| | | | | | | | | | | | | | | | |
Short-Term Investments | | | — | | | | 172,892,299 | | | | — | | | | 172,892,299 | |
| | | | | | | | | | | | | | | | |
Total | | $ | 41,423,282 | | | $ | 5,915,983,655 | | | $ | 36,349,566 | | | $ | 5,993,756,503 | |
| | | | | | | | | | | | | | | | |
| (a) | Details of the major categories of the Fund’s investments are reflected within the Portfolio of Investments. |
| (b) | Valued using broker-dealer bid prices. |
| (c) | Includes a security fair valued at zero by the Fund’s adviser using level 3 inputs. |
| 116
Notes to Financial Statements (continued)
December 31, 2020
Strategic Alpha Fund
Asset Valuation Inputs
| | | | | | | | | | | | | | | | |
Description | | Level 1 | | | Level 2 | | | Level 3 | | | Total | |
Bonds and Notes | | | | | | | | | | | | | | | | |
Non-Convertible Bonds | | | | | | | | | | | | | | | | |
ABS Other | | $ | — | | | $ | 62,547,232 | | | $ | 1,475,243 | (b)(c) | | $ | 64,022,475 | |
Non-Agency Commercial Mortgage-Backed Securities | | | — | | | | 39,844,081 | | | | 4,742,511 | (d) | | | 44,586,592 | |
All Other Non-Convertible Bonds(a) | | | — | | | | 778,714,087 | | | | — | | | | 778,714,087 | |
| | | | | | | | | | | | | | | | |
Total Non-Convertible Bonds | | | — | | | | 881,105,400 | | | | 6,217,754 | | | | 887,323,154 | |
| | | | | | | | | | | | | | | | |
Convertible Bonds(a) | | | — | | | | 38,936,972 | | | | — | | | | 38,936,972 | |
| | | | | | | | | | | | | | | | |
Total Bonds and Notes | | | — | | | | 920,042,372 | | | | 6,217,754 | | | | 926,260,126 | |
| | | | | | | | | | | | | | | | |
Senior Loans(a) | | | — | | | | 6,286,668 | | | | — | | | | 6,286,668 | |
Collateralized Loan Obligations | | | — | | | | 69,994,538 | | | | — | | | | 69,994,538 | |
Loan Participations(a) | | | — | | | | — | | | | 580,841 | (d) | | | 580,841 | |
Common Stocks | | | | | | | | | | | | | | | | |
Chemicals | | | — | | | | 1,791,516 | | | | — | | | | 1,791,516 | |
Textiles, Apparel & Luxury Goods | | | 381,403 | | | | 772,485 | | | | — | | | | 1,153,888 | |
All Other Common Stocks(a) | | | 42,491,218 | | | | — | | | | — | | | | 42,491,218 | |
| | | | | | | | | | | | | | | | |
Total Common Stocks | | | 42,872,621 | | | | 2,564,001 | | | | — | | | | 45,436,622 | |
| | | | | | | | | | | | | | | | |
Preferred Stocks | | | | | | | | | | | | | | | | |
Convertible Preferred Stocks | | | | | | | | | | | | | | | | |
Energy | | | — | | | | — | | | | — | (c) | | | — | |
Food & Beverage | | | — | | | | 4,598,518 | | | | — | | | | 4,598,518 | |
All Other Convertible Preferred Stocks(a) | | | 9,037,609 | | | | — | | | | — | | | | 9,037,609 | |
| | | | | | | | | | | | | | | | |
Total Convertible Preferred Stocks | | | 9,037,609 | | | | 4,598,518 | | | | — | | | | 13,636,127 | |
| | | | | | | | | | | | | | | | |
Non-Convertible Preferred Stocks(a) | | | — | | | | 4,120,800 | | | | — | | | | 4,120,800 | |
| | | | | | | | | | | | | | | | |
Total Preferred Stocks | | | 9,037,609 | | | | 8,719,318 | | | | — | | | | 17,756,927 | |
| | | | | | | | | | | | | | | | |
Other Investments(a) | | | — | | | | — | | | | 1,130,400 | (d) | | | 1,130,400 | |
Short-Term Investments | | | — | | | | 210,186,973 | | | | — | | | | 210,186,973 | |
| | | | | | | | | | | | | | | | |
Total Investments | | | 51,910,230 | | | | 1,217,793,870 | | | | 7,928,995 | | | | 1,277,633,095 | |
| | | | | | | | | | | | | | | | |
Centrally Cleared Credit Default Swap Agreements (unrealized appreciation) | | | — | | | | 4,795,544 | | | | — | | | | 4,795,544 | |
Forward Foreign Currency Contracts (unrealized appreciation) | | | — | | | | 197,122 | | | | — | | | | 197,122 | |
| | | | | | | | | | | | | | | | |
Total | | $ | 51,910,230 | | | $ | 1,222,786,536 | | | $ | 7,928,995 | | | $ | 1,282,625,761 | |
| | | | | | | | | | | | | | | | |
|
| Liability Valuation Inputs | |
Description | | Level 1 | | | Level 2 | | | Level 3 | | | Total | |
Written Options(a) | | $ | (159,801 | ) | | $ | — | | | $ | — | | | $ | (159,801 | ) |
Bilateral Credit Default Swap Agreements (unrealized depreciation) | | | — | | | | (526,239 | ) | | | — | | | | (526,239 | ) |
Centrally Cleared Interest Rate Swap Agreements (unrealized depreciation) | | | — | | | | (2,050,576 | ) | | | — | | | | (2,050,576 | ) |
Forward Foreign Currency Contracts (unrealized depreciation) | | | — | | | | (3,258,689 | ) | | | — | | | | (3,258,689 | ) |
Futures Contracts (unrealized depreciation) | | | (22,434 | ) | | | — | | | | — | | | | (22,434 | ) |
| | | | | | | | | | | | | | | | |
Total | | $ | (182,235 | ) | | $ | (5,835,504 | ) | | $ | — | | | $ | (6,017,739 | ) |
| | | | | | | | | | | | | | | | |
| (a) | Details of the major categories of the Fund’s investments are reflected within the Portfolio of Investments. |
| (b) | Fair valued by the Fund’s adviser using a broker dealer bid price provided by a single market maker ($904,103) or valued using broker-dealer bid prices ($571,140). |
| (c) | Includes securities fair valued at zero by the Fund’s adviser using level 3 inputs. |
| (d) | Fair valued by the Fund’s adviser. |
117 |
Notes to Financial Statements (continued)
December 31, 2020
Strategic Income Fund
Asset Valuation Inputs
| | | | | | | | | | | | | | | | |
Description | | Level 1 | | | Level 2 | | | Level 3 | | | Total | |
Bonds and Notes | | | | | | | | | | | | | | | | |
Non-Convertible Bonds | | | | | | | | | | | | | | | | |
ABS Other | | $ | — | | | $ | — | | | $ | 14,217,962 | (b)(c) | | $ | 14,217,962 | |
Finance Companies | | | 2,757,913 | | | | 381,507,553 | | | | — | | | | 384,265,466 | |
All Other Non-Convertible Bonds(a) | | | — | | | | 3,280,299,165 | | | | — | | | | 3,280,299,165 | |
| | | | | | | | | | | | | | | | |
Total Non-Convertible Bonds | | | 2,757,913 | | | | 3,661,806,718 | | | | 14,217,962 | | | | 3,678,782,593 | |
| | | | | | | | | | | | | | | | |
Convertible Bonds | | | | | | | | | | | | | | | | |
Oil Field Services | | | — | | | | — | | | | 6,330,947 | (d) | | | 6,330,947 | |
All Other Convertible Bonds(a) | | | — | | | | 246,168,380 | | | | — | | | | 246,168,380 | |
| | | | | | | | | | | | | | | | |
Total Convertible Bonds | | | — | | | | 246,168,380 | | | | 6,330,947 | | | | 252,499,327 | |
| | | | | | | | | | | | | | | | |
Municipals(a) | | | — | | | | 94,446,157 | | | | — | | | | 94,446,157 | |
| | | | | | | | | | | | | | | | |
Total Bonds and Notes | | | 2,757,913 | | | | 4,002,421,255 | | | | 20,548,909 | | | | 4,025,728,077 | |
| | | | | | | | | | | | | | | | |
Senior Loans | | | | | | | | | | | | | | | | |
Construction Machinery | | | — | | | | — | | | | 9,862,216 | (d) | | | 9,862,216 | |
All Other Senior Loans(a) | | | — | | | | 20,758,857 | | | | — | | | | 20,758,857 | |
| | | | | | | | | | | | | | | | |
Total Senior Loans | | | — | | | | 20,758,857 | | | | 9,862,216 | | | | 30,621,073 | |
| | | | | | | | | | | | | | | | |
Common Stocks | | | | | | | | | | | | | | | | |
Chemicals | | | — | | | | 8,588,778 | | | | — | | | | 8,588,778 | |
Oil Field Services | | | — | | | | — | | | | — | (c) | | | — | |
Oil, Gas & Consumable Fuels | | | 24,134,375 | | | | 1,465,770 | | | | 3,473,775 | (c)(d) | | | 29,073,920 | |
Software | | | 2,701,736 | | | | 263,825 | | | | — | | | | 2,965,561 | |
Specialty Retail | | | 2,611,310 | | | | — | | | | — | (c) | | | 2,611,310 | |
All Other Common Stocks(a) | | | 661,860,349 | | | | — | | | | — | | | | 661,860,349 | |
| | | | | | | | | | | | | | | | |
Total Common Stocks | | | 691,307,770 | | | | 10,318,373 | | | | 3,473,775 | | | | 705,099,918 | |
| | | | | | | | | | | | | | | | |
Preferred Stocks | | | | | | | | | | | | | | | | |
Convertible Preferred Stocks | | | | | | | | | | | | | | | | |
Energy | | | — | | | | — | | | | — | (c) | | | — | |
Food & Beverage | | | — | | | | 1,792,870 | | | | — | | | | 1,792,870 | |
All Other Convertible Preferred Stocks(a) | | | 34,257,915 | | | | — | | | | — | | | | 34,257,915 | |
| | | | | | | | | | | | | | | | |
Total Convertible Preferred Stocks | | | 34,257,915 | | | | 1,792,870 | | | | — | | | | 36,050,785 | |
| | | | | | | | | | | | | | | | |
Non-Convertible Preferred Stocks | | | | | | | | | | | | | | | | |
REITs – Office Property | | | — | | | | 1,915,200 | | | | — | | | | 1,915,200 | |
REITs – Warehouse/Industrials | | | — | | | | 8,017,248 | | | | — | | | | 8,017,248 | |
All Other Non-Convertible Preferred Stocks(a) | | | 1,961,503 | | | | — | | | | — | | | | 1,961,503 | |
| | | | | | | | | | | | | | | | |
Total Non-Convertible Preferred Stocks | | | 1,961,503 | | | | 9,932,448 | | | | — | | | | 11,893,951 | |
| | | | | | | | | | | | | | | | |
Total Preferred Stocks | | | 36,219,418 | | | | 11,725,318 | | | | — | | | | 47,944,736 | |
| | | | | | | | | | | | | | | | |
Warrants | | | — | | | | — | | | | 9,760,259 | (d) | | | 9,760,259 | |
Closed-End Investment Companies | | | 1,791,367 | | | | — | | | | — | | | | 1,791,367 | |
Short-Term Investments | | | — | | | | 1,097,243,854 | | | | — | | | | 1,097,243,854 | |
| | | | | | | | | | | | | | | | |
Total | | $ | 732,076,468 | | | $ | 5,142,467,657 | | | $ | 43,645,159 | | | $ | 5,918,189,284 | |
| | | | | | | | | | | | | | | | |
| (a) | Details of the major categories of the Fund’s investments are reflected within the Portfolio of Investments. |
| (b) | Fair valued by the Fund’s adviser using a broker dealer bid price provided by a single market maker ($9,347,572) or valued using broker-dealer bid prices ($4,870,390). |
| (c) | Includes securities fair valued at zero by the Fund’s adviser using level 3 inputs. |
| (d) | Fair valued by the Fund’s adviser. |
| 118
Notes to Financial Statements (continued)
December 31, 2020
The following is a reconciliation of Level 3 investments for which significant unobservable inputs were used to determine fair value as of September 30, 2020, December 31, 2019 and/or December 31, 2020:
High Income Fund
Asset Valuation Inputs
| | | | | | | | | | | | | | | | | | | | | | | | | | | | | | | | | | | | | | | | |
Investments in Securities | | Balance
as of
December 31,
2019 | | | Accrued
Discounts
(Premiums) | | | Realized
Gain
(Loss) | | | Change in
Unrealized
Appreciation
(Depreciation) | | | Purchases | | | Sales | | | Transfers
into
Level 3 | | | Transfers
out of
Level 3 | | | Balance
as of
December 31,
2020 | | | Change in
Unrealized
Appreciation
(Depreciation)
from
Investments
Still Held at
December 31,
2020 | |
Bonds and Notes | | | | | | | | | | | | | | | | | | | | | | | | | | | | | | | | | | | | | | | | |
Non-Convertible Bonds | | | | | | | | | | | | | | | | | | | | | | | | | | | | | | | | | | | | | | | | |
Home Construction | | $ | — | (a) | | $ | 88,870 | | | $ | 1,050,446 | | | $ | (1,139,316 | ) | | $ | — | | | $ | — | | | $ | — | | | $ | — | | | $ | — | (a) | | $ | (1,139,316 | ) |
Non-Agency Commercial Mortgage-Backed Securities | | | 325,435 | | | | — | | | | — | | | | (258,242 | ) | | | — | | | | — | | | | 322,911 | | | | — | | | | 390,104 | | | | (258,242 | ) |
Loan Participations | | | | | | | | | | | | | | | | | | | | | | | | | | | | | | | | | | | | | | | | |
ABS Other | | | — | | | | 26 | | | | 226 | | | | (134,422 | ) | | | — | | | | (102,858 | ) | | | 398,373 | | | | — | | | | 161,345 | | | | (134,422 | ) |
Preferred Stocks | | | | | | | | | | | | | | | | | | | | | | | | | | | | | | | | | | | | | | | | |
Energy | | | 196,350 | | | | — | | | | — | | | | (196,350 | ) | | | — | | | | — | | | | — | | | | — | | | | — | (a) | | | (196,350 | ) |
Common Stocks | | | | | | | | | | | | | | | | | | | | | | | | | | | | | | | | | | | | | | | | |
Oil, Gas & Consumable Fuels | | | 52,304 | | | | — | | | | — | | | | — | | | | — | | | | — | | | | — | | | | (52,304 | ) | | | — | | | | — | |
Other Investments | | | | | | | | | | | | | | | | | | | | | | | | | | | | | | | | | | | | | | | | |
Aircraft ABS | | | 864,000 | | | | — | | | | — | | | | (738,400 | ) | | | — | | | | — | | | | — | | | | — | | | | 125,600 | | | | (738,400 | ) |
Warrants | | | — | | | | — | | | | — | | | | (920 | ) | | | 38,915 | | | | — | | | | — | | | | — | | | | 37,995 | | | | (920 | ) |
| | | | | | | | | | | | | | | | | | | | | | | | | | | | | | | | | | | | | | | | |
Total | | $ | 1,438,089 | | | $ | 88,896 | | | $ | 1,050,672 | | | $ | (2,467,650 | ) | | $ | 38,915 | | | $ | (102,858 | ) | | $ | 721,284 | | | $ | (52,304 | ) | | $ | 715,044 | | | $ | (2,467,650 | ) |
| | | | | | | | | | | | | | | | | | | | | | | | | | | | | | | | | | | | | | | | |
| (a) | Includes a security fair valued at zero using level 3 inputs. |
A debt security valued at $322,911 was transferred from Level 2 to Level 3 during the period ended December 31, 2020. At December 31, 2019, this security was valued on the basis of evaluated bids furnished to the Fund by an independent pricing service in accordance with the Fund’s valuation policies. At December 31, 2020, this security was valued at fair value as determined in good faith by the Fund’s adviser as an independent pricing service did not provide a reliable price for the security.
A debt security valued at $398,373 was transferred from Level 2 to Level 3 during the period ended December 31, 2020. At December 31, 2019, this security was valued at a bid price furnished to the Fund by an independent pricing service in accordance with the Fund’s valuation policies. At December 31, 2020, this security was valued at fair value as determined in good faith by the Fund’s adviser as an independent pricing service did not provide a reliable price for the security.
A common stock valued at $52,304 was transferred from Level 3 to Level 1 during the period ended December 31, 2020. At December 31, 2019, this security was valued at fair value as determined in good faith by the Fund’s investment adviser as an independent pricing service was unable to price the security. At December 31, 2020, this security was valued at the market price in accordance with the Fund’s valuation policies.
119 |
Notes to Financial Statements (continued)
December 31, 2020
Investment Grade Bond Fund
Asset Valuation Inputs
| | | | | | | | | | | | | | | | | | | | | | | | | | | | | | | | | | | | | | | | |
Investments in Securities | | Balance
as of
December 31,
2019 | | | Accrued
Discounts
(Premiums) | | | Realized
Gain
(Loss) | | | Change in
Unrealized
Appreciation
(Depreciation) | | | Purchases | | | Sales | | | Transfers
into
Level 3 | | | Transfers
out of
Level 3 | | | Balance
as of
December 31,
2020 | | | Change in
Unrealized
Appreciation
(Depreciation)
from
Investments
Still Held at
December 31,
2020 | |
Bonds and Notes | | | | | | | | | | | | | | | | | | | | | | | | | | | | | | | | | | | | | | | | |
Non-Convertible Bonds | | | | | | | | | | | | | | | | | | | | | | | | | | | | | | | | | | | | | | | | |
ABS Other | | $ | — | | | $ | — | | | $ | — | | | $ | (17,667,175 | ) | | $ | — | | | $ | — | | | $ | 39,261,741 | | | $ | — | | | $ | 21,594,566 | | | $ | (17,667,175 | ) |
Collateralized Loan Obligations | | | — | | | | — | | | | — | | | | — | | | | 14,755,000 | | | | — | | | | — | | | | — | | | | 14,755,000 | | | | — | |
Preferred Stocks | | | | | | | | | | | | | | | | | | | | | | | | | | | | | | | | | | | | | | | | |
Energy | | | 721,179 | | | | — | | | | — | | | | (721,179 | ) | | | — | | | | — | | | | — | | | | — | | | | — | (a) | | | (721,179 | ) |
| | | | | | | | | | | | | | | | | | | | | | | | | | | | | | | | | | | | | | | | |
Total | | $ | 721,179 | | | $ | — | | | $ | — | | | $ | (18,388,354 | ) | | $ | 14,755,000 | | | $ | — | | | $ | 39,261,741 | | | $ | — | | | $ | 36,349,566 | | | $ | (18,388,354 | ) |
| | | | | | | | | | | | | | | | | | | | | | | | | | | | | | | | | | | | | | | | |
| (a) | Includes a security fair valued at zero using level 3 inputs. |
A debt security valued at $39,261,741 was transferred from Level 2 to Level 3 during the period ended December 31, 2020. At December 31, 2019, this security was valued on the basis of evaluated bids furnished to the Fund by an independent pricing service in accordance with the Fund’s valuation policies. At December 31, 2020, this security was valued using broker-dealer bid prices based on inputs unobservable to the Fund as an independent pricing service did not provide a reliable price for the security.
Strategic Alpha Fund
Asset Valuation Inputs
| | | | | | | | | | | | | | | | | | | | | | | | | | | | | | | | | | | | | | | | |
Investments in
Securities | | Balance
as of
December 31,
2019 | | | Accrued
Discounts
(Premiums) | | | Realized
Gain
(Loss) | | | Change in
Unrealized
Appreciation
(Depreciation) | | | Purchases | | | Sales | | | Transfers
into Level 3 | | | Transfers
out of
Level 3 | | | Balance
as of
December 31,
2020 | | | Change in
Unrealized
Appreciation
(Depreciation)
from
Investments
Held at
December 31,
2020 | |
Bonds and Notes | | | | | | | | | | | | | | | | | | | | | | | | | | | | | | | | | | | | | | | | |
Non-Convertible Bonds | | | | | | | | | | | | | | | | | | | | | | | | | | | | | | | | | | | | | | | | |
ABS Home Equity | | $ | 801,522 | | | $ | — | | | $ | — | | | $ | — | | | $ | — | | | $ | — | | | $ | — | | | $ | (801,522 | ) | | $ | — | | | $ | — | |
ABS Other | | | 2,337,230 | (a) | | | — | | | | 71 | | | | (1,733,400 | ) | | | 222,417 | | | | (213,614 | ) | | | 862,539 | | | | — | | | | 1,475,243 | (a) | | | (1,733,400 | ) |
Independent Energy | | | 523,200 | (a) | | | 22,686 | | | | (1,472,185 | ) | | | 926,299 | | | | — | | | | — | | | | — | | | | — | | | | — | | | | — | |
Non-Agency Commercial Mortgage-Backed Securities | | | 2,770,066 | | | | — | | | | — | | | | (2,682,824 | ) | | | — | | | | — | | | | 4,655,269 | | | | — | | | | 4,742,511 | | | | (2,682,824 | ) |
Collateralized Loan Obligations | | | 475,000 | | | | — | | | | 238 | | | | — | | | | — | | | | (475,238 | ) | | | — | | | | — | | | | — | | | | — | |
Loan Participations | | | | | | | | | | | | | | | | | | | | | | | | | | | | | | | | | | | | | | | | |
ABS Other | | | — | | | | 137 | | | | 14,430 | | | | (497,677 | ) | | | — | | | | (3,939,608 | ) | | | 5,003,559 | | | | — | | | | 580,841 | | | | (497,677 | ) |
Common Stocks | | | | | | | | | | | | | | | | | | | | | | | | | | | | | | | | | | | | | | | | |
Oil, Gas & Consumable Fuels | | | — | (a) | | | — | | | | (439,289 | ) | | | 439,289 | | | | — | | | | — | | | | — | | | | — | | | | — | | | | — | |
| 120
Notes to Financial Statements (continued)
December 31, 2020
Strategic Alpha Fund — continued
Asset Valuation Inputs — continued
| | | | | | | | | | | | | | | | | | | | | | | | | | | | | | | | | | | | | | | | |
Investments in
Securities | | Balance
as of
December 31,
2019 | | | Accrued
Discounts
(Premiums) | | | Realized
Gain
(Loss) | | | Change in
Unrealized
Appreciation
(Depreciation) | | | Purchases | | | Sales | | | Transfers
into
Level 3 | | | Transfers
out of
Level 3 | | | Balance
as of
December 31,
2020 | | | Change in
Unrealized
Appreciation
(Depreciation)
from
Investments
Held at
December 31,
2020 | |
Preferred Stocks | | | | | | | | | | | | | | | | | | | | | | | | | | | | | | | | | | | | | | | | |
Energy | | $ | 293,900 | | | $ | — | | | $ | — | | | $ | (293,900 | ) | | $ | — | | | $ | — | | | $ | — | | | $ | — | | | $ | — | (a) | | $ | (293,900 | ) |
Other Investments | | | | | | | | | | | | | | | | | | | | | | | | | | | | | | | | | | | | | | | | |
Aircraft ABS | | | 7,776,000 | | | | — | | | | — | | | | (6,645,600 | ) | | | — | | | | — | | | | — | | | | — | | | | 1,130,400 | | | | (6,645,600 | ) |
Equity Linked Notes | | | 688,113 | | | | — | | | | 36,124 | | | | (30,859 | ) | | | — | | | | (693,378 | ) | | | — | | | | — | | | | — | | | | — | |
| | | | | | | | | | | | | | | | | | | | | | | | | | | | | | | | | | | | | | | | |
Total | | $ | 15,665,031 | | | $ | 22,823 | | | $ | (1,860,611 | ) | | $ | (10,518,672 | ) | | $ | 222,417 | | | $ | (5,321,838 | ) | | $ | 10,521,367 | | | $ | (801,522 | ) | | $ | 7,928,995 | | | $ | (11,853,401 | ) |
| | | | | | | | | | | | | | | | | | | | | | | | | | | | | | | | | | | | | | | | |
| (a) | Includes a security fair valued at zero using level 3 inputs. |
Debt securities valued at $801,522 were transferred from Level 3 to Level 2 during the period ended December 31, 2020. At December 31, 2019, these securities were valued at fair value as determined in good faith by the Fund’s investment adviser as an independent pricing service did not provide a reliable price for the securities. At December 31, 2020, these securities were valued on the basis of evaluated bids furnished to the Fund by an independent pricing service in accordance with the Fund’s valuation policies.
A debt security valued at $862,539 was transferred from Level 2 to Level 3 during the period ended December 31, 2020. At December 31, 2019, this security was valued on the basis of evaluated bids furnished to the Fund by an independent pricing service in accordance with the Fund’s valuation policies. At December 31, 2020, this security was valued using broker-dealer bid prices based on inputs unobservable to the Fund as an independent pricing service did not provide a reliable price for the security.
Debt securities valued at $9,658,828 were transferred from Level 2 to Level 3 during the period ended December 31, 2020. At December 31, 2019, these securities were valued on the basis of evaluated bids furnished to the Fund by an independent pricing service in accordance with the Fund’s valuation policies. At December 31, 2020, these securities were valued at fair value as determined in good faith by the Fund’s adviser as an independent pricing service did not provide a reliable price for the securities.
Strategic Income Fund
Asset Valuation Inputs
| | | | | | | | | | | | | | | | | | | | | | | | | | | | | | | | | | | | | | | | |
Investments in Securities | | Balance as of
September 30,
2020 | | | Accrued
Discounts
(Premiums) | | | Realized
Gain
(Loss) | | | Change in
Unrealized
Appreciation
(Depreciation) | | | Purchases | | | Sales | | | Transfers
into
Level 3 | | | Transfers
out of
Level 3 | | | Balance as of
December 31,
2020 | | | Change in
Unrealized
Appreciation
(Depreciation)
from
Investments
Still Held at
December 31,
2020 | |
Bonds and Notes | | | | | | | | | | | | | | | | | | | | | | | | | | | | | | | | | | | | | | | | |
Non-Convertible Bonds | | | | | | | | | | | | | | | | | | | | | | | | | | | | | | | | | | | | | | | | |
ABS Other | | $ | 14,229,305 | (a) | | $ | — | | | | 152 | | | $ | (29,929 | ) | | $ | 472,905 | | | $ | (454,471 | ) | | $ | — | | | $ | — | | | $ | 14,217,962 | (a) | | $ | (94,355 | ) |
Convertible Bonds | | | | | | | | | | | | | | | | | | | | | | | | | | | | | | | | | | | | | | | | |
Oil Field Services | | | 6,103,774 | | | | 29,190 | | | | — | | | | (31,212 | ) | | | 229,195 | | | | — | | | | — | | | | — | | | | 6,330,947 | | | | (31,212 | ) |
Senior Loans | | | | | | | | | | | | | | | | | | | | | | | | | | | | | | | | | | | | | | | | |
Construction Machinery | | | 11,064,036 | | | | 242,118 | | | | (918,610 | ) | | | 981,118 | | | | — | | | | (1,506,446 | ) | | | — | | | | — | | | | 9,862,216 | | | | 222,456 | |
Common Stocks | | | | | | | | | | | | | | | | | | | | | | | | | | | | | | | | | | | | | | | | |
Oil Field Services | | | — | (a) | | | — | | | | — | | | | — | | | | — | | | | — | | | | — | | | | — | | | | — | (a) | | | — | |
Oil, Gas & Consumable Fuels | | | 100,378 | (a) | | | — | | | | (2,215,133 | ) | | | 2,114,755 | | | | 3,473,775 | | | | — | | | | — | | | | — | | | | 3,473,775 | (a) | | | — | |
Specialty Retail | | | — | (a) | | | — | | | | — | | | | — | | | | — | | | | — | | | | — | | | | — | | | | — | (a) | | | — | |
121 |
Notes to Financial Statements (continued)
December 31, 2020
Strategic Income Fund — continued
Asset Valuation Inputs — continued
| | | | | | | | | | | | | | | | | | | | | | | | | | | | | | | | | | | | | | | | |
Investments in
Securities | | Balance as of
September 30,
2020 | | | Accrued
Discounts
(Premiums) | | | Realized
Gain
(Loss) | | | Change in
Unrealized
Appreciation
(Depreciation) | | | Purchases | | | Sales | | | Transfers
into
Level 3 | | | Transfers
out of
Level 3 | | | Balance as of
December 31,
2020 | | | Change in
Unrealized
Appreciation
(Depreciation)
from
Investments
Still Held at
December 31,
2020 | |
Preferred Stocks | | | | | | | | | | | | | | | | | | | | | | | | | | | | | | | | | | | | | | | | |
Convertible Preferred Stocks | | | | | | | | | | | | | | | | | | | | | | | | | | | | | | | | | | | | | | | | |
Energy | | $ | — | (a) | | $ | — | | | $ | — | | | $ | — | | | $ | — | | | $ | — | | | $ | — | | | $ | — | | | $ | — | (a) | | $ | — | |
Warrants | | | — | | | | — | | | | — | | | | 3,838,684 | | | | — | | | | — | | | | 5,921,575 | | | | — | | | | 9,760,259 | | | | 3,838,684 | |
| | | | | | | | | | | | | | | | | | | | | | | | | | | | | | | | | | | | | | | | �� |
Total | | $ | 31,497,493 | | | $ | 271,308 | | | $ | (3,133,591 | ) | | $ | 6,873,416 | | | $ | 4,175,875 | | | $ | (1,960,917 | ) | | $ | 5,921,575 | | | $ | — | | | $ | 43,645,159 | | | $ | 3,935,573 | |
| | | | | | | | | | | | | | | | | | | | | | | | | | | | | | | | | | | | | | | | |
| (a) | Includes a security fair valued at zero using Level 3 inputs. |
A warrant valued at $5,921,575 was transferred from Level 2 to Level 3 during the period ended December 31, 2020. At December 31, 2019, this security was valued on the basis of closing bid quotations furnished to the Fund by an independent pricing service in accordance with the Fund’s valuation policies. At December 31, 2020, this security was valued at fair value as determined in good faith by the Fund’s adviser as an independent pricing service did not provide a reliable price for the security.
4. Derivatives. Derivative instruments are defined as financial instruments whose value and performance are based on the value and performance of an underlying asset, reference rate or index. Derivative instruments that Investment Grade Bond Fund and Strategic Alpha Fund used during the period include forward foreign currency contracts, futures contracts, option contracts and swap agreements.
Investment Grade Bond Fund and Strategic Alpha Fund are subject to the risk that companies in which the Fund invests will fail financially or otherwise be unwilling or unable to meet their obligations to the Fund. The Funds may use credit default swaps, as a protection buyer, to hedge its credit exposure to issuers of bonds it holds without having to sell the bonds. The Funds may also use credit default swaps, as a protection seller, to gain investment exposure. During the year ended December 31, 2020, Strategic Alpha Fund engaged in credit default swap agreements (as a protection buyer) to hedge its credit exposure, and Investment Grade Bond Fund and Strategic Alpha Fund engaged in credit default swap agreements (as a protection seller) to gain investment exposure.
Strategic Alpha Fund is subject to the risk that changes in foreign currency exchange rates will have an unfavorable effect on the value of Fund assets denominated in foreign currencies. The Fund may enter into forward foreign currency exchange contracts for hedging purposes to protect the value of the Fund’s holdings of foreign securities. The Fund may also use forward foreign currency contracts to gain exposure to foreign currencies, regardless of whether securities denominated in such currencies are held in the Fund. During the year ended December 31, 2020, the Fund engaged in forward foreign currency contracts for hedging purposes and to gain exposure to foreign currencies.
Strategic Alpha Fund is subject to the risk that changes in interest rates will affect the value of the Fund’s investments in fixed-income securities. The Fund will be subject to increased interest rate risk to the extent that it invests in fixed-income securities with longer maturities or durations, as compared to investing in fixed-income securities with shorter maturities or durations. The Fund may use futures contracts and interest rate swap agreements to hedge against changes in interest rates and to manage duration without having to buy or sell portfolio securities. The Fund may also use futures contracts and interest rate swap agreements to gain investment exposure. During the year ended December 31, 2020, the Fund engaged in futures contracts for hedging and duration management purposes and to gain investment exposure, and interest rate swap agreements for hedging purposes and to gain investment exposure.
Strategic Alpha Fund is subject to the risk of unpredictable declines in the value of individual equity securities and periods of below-average performance in individual securities or in the equity market as a whole. The Fund may use futures contracts, purchased put options and written call options to hedge against a decline in value of an equity security that it owns. The Fund may also write put options to offset the cost of options used for hedging purposes and use futures and option contracts to gain investment exposure. During the year ended December 31, 2020, the Fund engaged in futures contracts for hedging purposes and option contracts for hedging purposes and to gain investment exposure.
| 122
Notes to Financial Statements (continued)
December 31, 2020
Transactions in derivative instruments for Investment Grade Bond Fund during the year ended December 31, 2020, as reflected within the Statements of Operations, were as follows:
| | | | |
Net Realized Gain (Loss) on: | | Swap agreements | |
Credit contracts | | $ | 8,539,507 | |
The following is a summary of derivative instruments for Strategic Alpha Fund as of December 31, 2020, as reflected within the Statements of Assets and Liabilities:
| | | | | | | | | | | | |
Assets | | Unrealized
appreciation
on forward
foreign
currency
contracts | | | Swap
agreements
at value1 | | | Total | |
Over-the-counter asset derivatives | |
Foreign exchange contracts | | $ | 197,122 | | | $ | — | | | $ | 197,122 | |
| | | | | | | | | | | | |
Exchange-traded/cleared asset derivatives | |
Credit contracts | | $ | — | | | $ | 8,223,433 | | | $ | 8,223,433 | |
| | | | | | | | | | | | |
Total asset derivatives | | $ | 197,122 | | | $ | 8,223,433 | | | $ | 8,420,555 | |
| | | | | | | | | | | | |
| | | | | | | | | | | | | | | | | | | | |
Liabilities | | Options
written
at value | | | Unrealized
depreciation
on forward
foreign
currency
contracts | | | Unrealized
depreciation
on futures
contracts2 | | | Swap
agreements
at value1 | | | Total | |
Over-the-counter liability derivatives | |
Foreign exchange contracts | | $ | — | | | $ | (3,258,689 | ) | | $ | — | | | $ | — | | | $ | (3,258,689 | ) |
Credit contracts | | | — | | | | — | | | | — | | | | (205,829 | ) | | | (205,829 | ) |
| | | | | | | | | | | | | | | | | | | | |
Total over-the counter liability derivatives | | $ | — | | | $ | (3,258,689 | ) | | $ | — | | | $ | (205,829 | ) | | $ | (3,464,518 | ) |
| | | | | | | | | | | | | | | | | | | | |
Exchange-traded/cleared liability derivatives | | | | | |
Interest rate contracts | | $ | — | | | $ | — | | | $ | (22,434 | ) | | $ | (2,049,100 | ) | | $ | (2,071,534 | ) |
Equity contracts | | | (159,801 | ) | | | — | | | | — | | | | — | | | | (159,801 | ) |
| | | | | | | | | | | | | | | | | | | | |
Total exchange-traded/cleared liability derivatives | | $ | (159,801 | ) | | $ | — | | | $ | (22,434 | ) | | $ | (2,049,100 | ) | | $ | (2,231,335 | ) |
| | | | | | | | | | | | | | | | | | | | |
Total liability derivatives | | $ | (159,801 | ) | | $ | (3,258,689 | ) | | $ | (22,434 | ) | | $ | (2,254,929 | ) | | $ | (5,695,853 | ) |
| | | | | | | | | | | | | | | | | | | | |
| 1 | Represents swap agreements, at value. Market value of swap agreements is reported in the Portfolio of Investments along with the unamortized upfront premium paid (received), if any, and unrealized appreciation (depreciation) on each individual contract. Unrealized appreciation (depreciation) and upfront premiums paid (received) for bilateral swap agreements are reported within the Statements of Assets and Liabilities. Only the current day’s variation margin on centrally cleared swap agreements is reported within the Statements of Assets and Liabilities as receivable or payable for variation margin, as applicable. |
| 2 | Represents cumulative unrealized appreciation (depreciation) on futures contracts. Only the current day’s variation margin on futures contracts is reported within the Statements of Assets and Liabilities as receivable or payable for variation margin, as applicable. |
123 |
Notes to Financial Statements (continued)
December 31, 2020
Transactions in derivative instruments for Strategic Alpha Fund during the year ended December 31, 2020, as reflected within the Statements of Operations were as follows:
| | | | | | | | | | | | | | | | | | | | |
Net Realized Gain (Loss) on: | | Investments3 | | | Futures
contracts | | | Options
written | | | Swap
agreements | | | Forward
foreign
currency
contracts | |
Interest rate contracts | | $ | — | | | $ | 5,475,650 | | | $ | — | | | $ | (317,110 | ) | | $ | — | |
Foreign exchange contracts | | | — | | | | — | | | | — | | | | — | | | | (1,382,516 | ) |
Credit contracts | | | — | | | | — | | | | — | | | | 8,601,751 | | | | — | |
Equity contracts | | | (94,053 | ) | | | 1,641,905 | | | | (50,234 | ) | | | — | | | | — | |
| | | | | | | | | | | | | | | | | | | | |
Total | | $ | (94,053 | ) | | $ | 7,117,555 | | | $ | (50,234 | ) | | $ | 8,284,641 | | | $ | (1,382,516 | ) |
| | | | | | | | | | | | | | | | | | | | |
| | | | | |
Net Change in Unrealized
Appreciation (Depreciation) on: | | Investments3 | | | Futures
contracts | | | Options
written | | | Swap
agreements | | | Forward
foreign
currency
contracts | |
Interest rate contracts | | $ | — | | | $ | (19,222 | ) | | $ | — | | | $ | (136,676 | ) | | $ | — | |
Foreign exchange contracts | | | — | | | | — | | | | — | | | | — | | | | (1,956,477 | ) |
Credit contracts | | | — | | | | — | | | | — | | | | 2,559,268 | | | | — | |
Equity contracts | | | 21,464 | | | | — | | | | 1,016 | | | | — | | | | — | |
| | | | | | | | | | | | | | | | | | | | |
Total | | $ | 21,464 | | | $ | (19,222 | ) | | $ | 1,016 | | | $ | 2,422,592 | | | $ | (1,956,477 | ) |
| | | | | | | | | | | | | | | | | | | | |
| 3 | Represents realized loss and change in unrealized appreciation (depreciation), respectively, for purchased options during the period. |
As the Funds value their derivatives at fair value and recognize changes in fair value through the Statements of Operations, they do not qualify for hedge accounting under authoritative guidance for derivative instruments. The Funds’ investments in derivatives may represent an economic hedge; however, they are considered to be non-hedge transactions for the purpose of these disclosures.
The volume of forward foreign currency contract, futures contract and swap agreement activity, as a percentage of net assets for Investment Grade Bond Fund and Strategic Alpha Fund, based on gross month-end or daily (as applicable) notional amounts outstanding during the period, including long and short positions at absolute value, was as follows for the year ended December 31, 2020:
| | | | |
Investment Grade Bond Fund | | Credit
Default
Swaps | |
Average Notional Amount Outstanding | | | 1.70 | % |
Highest Notional Amount Outstanding | | | 4.77 | % |
Lowest Notional Amount Outstanding | | | 0.00 | % |
Notional Amount Outstanding as of December 31, 2020 | | | 0.00 | % |
| | | | | | | | | | | | | | | | |
Strategic Alpha Fund | | Forwards | | | Futures | | | Credit Default Swaps | | | Interest Rate Swaps | |
Average Notional Amount Outstanding | | | 9.97 | % | | | 2.80 | % | | | 9.58 | % | | | 1.04 | % |
Highest Notional Amount Outstanding | | | 25.04 | % | | | 3.68 | % | | | 13.60 | % | | | 1.76 | % |
Lowest Notional Amount Outstanding | | | 3.57 | % | | | 1.45 | % | | | 6.52 | % | | | 0.00 | % |
Notional Amount Outstanding as of December 31, 2020 | | | 4.29 | % | | | 2.96 | % | | | 8.24 | % | | | 1.71 | % |
Unrealized gain and/or loss on open forwards, futures and swaps is recorded in the Statements of Assets and Liabilities. The aggregate notional values of forward, futures and swap contracts are not recorded in the Statements of Assets and Liabilities, and therefore are not included in the net assets.
| 124
Notes to Financial Statements (continued)
December 31, 2020
The volume of option contract activity, as a percentage of net assets for Strategic Alpha Fund, based on the month-end market values of instruments underlying purchased and written options, at absolute value, was as follows for the year ended December 31, 2020:
| | | | | | | | |
Strategic Alpha Fund | | Put Options Purchased* | | | Call Options Written* | |
Average Market Value of Underlying Instruments | | | 0.65 | % | | | 0.43 | % |
Highest Market Value of Underlying Instruments | | | 4.18 | % | | | 0.73 | % |
Lowest Market Value of Underlying Instruments | | | 0.00 | % | | | 0.23 | % |
Market Value of Underlying Instruments as of December 31, 2020 | | | 0.00 | % | | | 0.73 | % |
| * | Market value of underlying instruments is determined by multiplying option shares by the price of the option’s underlying security. |
Amounts outstanding at the end of the prior period, if applicable, are included in the average amount outstanding.
Over-the-counter derivatives, including forward foreign currency contracts and swap agreements, are entered into pursuant to International Swaps and Derivatives Association, Inc. (“ISDA”) agreements negotiated between the Funds and their counterparties. ISDA agreements typically contain, among other things, terms for the posting of collateral and master netting provisions in the event of a default or other termination event. Collateral is posted by a Fund or the counterparty to the extent of the net mark-to-market exposure to the other party of all open contracts under the agreement, subject to minimum transfer requirements. Master netting provisions allow the Funds and the counterparty, in the event of a default or other termination event, to offset amounts owed by each related to derivative contracts, including any posted collateral, to one net amount payable by either the Funds or the counterparty. The Funds’ ISDA agreements typically contain provisions that allow a counterparty to terminate open contracts early if the NAV of a Fund declines beyond a certain threshold. For financial reporting purposes, the Funds do not offset derivative assets and liabilities, and any related collateral received or pledged, on the Statements of Assets and Liabilities.
As of December 31, 2020, gross amounts of over-the-counter derivative assets and liabilities not offset in the Statements of Assets and Liabilities and the related net amounts after taking into account master netting arrangements, by counterparty, are as follows:
| | | | | | | | | | | | | | | | | | | | |
Strategic Alpha Fund | |
Counterparty | | Gross Amounts
of Assets | | | Offset
Amount | | | Net
Asset
Balance | | | Collateral
(Received)/
Pledged | | | Net
Amount | |
Morgan Stanley Capital Services, Inc. | | $ | 157,021 | | | $ | (157,021 | ) | | $ | — | | | $ | — | | | $ | — | |
Standard Chartered Bank | | | 40,101 | | | | (40,101 | ) | | | — | | | | — | | | | — | |
| | | | | | | | | | | | | | | | | | | | |
| | $ | 197,122 | | | $ | (197,122 | ) | | $ | — | | | $ | — | | | $ | — | |
| | | | | | | | | | | | | | | | | | | | |
| | | | | |
Counterparty | | Gross Amounts
of Liabilities | | | Offset
Amount | | | Net
Liability
Balance | | | Collateral
(Received)/
Pledged | | | Net
Amount | |
Bank of America, N.A. | | $ | (119,874 | ) | | $ | — | | | $ | (119,874 | ) | | $ | — | | | $ | (119,874 | ) |
Barclays Bank PLC | | | (267,504 | ) | | | — | | | | (267,504 | ) | | | 267,504 | | | | — | |
Deutsche Bank AG | | | (97,505 | ) | | | — | | | | (97,505 | ) | | | — | | | | (97,505 | ) |
HSBC Bank USA | | | (26,150 | ) | | | — | | | | (26,150 | ) | | | — | | | | (26,150 | ) |
Morgan Stanley Capital Services, Inc. | | | (2,654,246 | ) | | | 157,021 | | | | (2,497,225 | ) | | | 2,497,225 | | | | — | |
Standard Chartered Bank | | | (299,239 | ) | | | 40,101 | | | | (259,138 | ) | | | — | | | | (259,138 | ) |
| | | | | | | | | | | | | | | | | | | | |
| | $ | (3,464,518 | ) | | $ | 197,122 | | | $ | (3,267,396 | ) | | $ | 2,764,729 | | | $ | (502,667 | ) |
| | | | | | | | | | | | | | | | | | | | |
The actual collateral received or pledged, if any, may exceed the amounts shown in the table due to overcollateralization. Timing differences may exist between when contracts under the ISDA agreements are marked-to-market and when collateral moves. The ISDA agreements include tri-party control agreements under which collateral is held for the benefit of the secured party at a third party custodian, State Street Bank.
Counterparty risk is managed based on policies and procedures established by each Fund’s adviser. Such policies and procedures may include, but are not limited to, minimum counterparty credit rating requirements, monitoring of counterparty credit default swap
125 |
Notes to Financial Statements (continued)
December 31, 2020
spreads and posting of collateral. A Fund’s risk of loss from counterparty credit risk on over-the-counter derivatives is generally limited to the Fund’s aggregated unrealized gains and the amount of any collateral pledged to the counterparty, which may be offset by any collateral posted to the Fund by the counterparty. ISDA master agreements can help to manage counterparty risk by specifying collateral posting arrangements at pre-arranged exposure levels. Under these ISDA agreements, collateral is routinely transferred if the total net exposure in respect of certain transactions, net of existing collateral already in place, exceeds a specified amount (typically $250,000, depending on the counterparty). With exchange-traded derivatives, there is minimal counterparty credit risk to the Fund because the exchange’s clearing house, as counterparty to these instruments, stands between the buyer and the seller of the contract. Credit risk still exists in exchange-traded derivatives with respect to initial and variation margin that is held in a broker’s customer accounts. While brokers are required to segregate customer margin from their own assets, in the event that a broker becomes insolvent or goes into bankruptcy and at that time there is a shortfall in the aggregate amount of margin held by the broker for all its clients, U.S. bankruptcy laws will typically allocate that shortfall on a pro rata basis across all of the broker’s customers, potentially resulting in losses to the Fund. Based on balances reflected on each Fund’s Statement of Assets and Liabilities, the following table shows (i) the maximum amount of loss due to credit risk that, based on the gross fair value of the financial instrument, the Fund would incur if parties (including OTC derivative counterparties and brokers holding margin for exchange-traded derivatives) to the relevant financial instruments failed completely to perform according to the terms of the contracts and the collateral or other security, if any, for the amount due proved to be of no value to the Fund, and (ii) the amount of loss that the Fund would incur after taking into account master netting provisions pursuant to ISDA agreements, as of December 31, 2020:
| | | | | | | | |
Fund | | Maximum Amount of Loss - Gross | | | Maximum Amount of Loss - Net | |
Strategic Alpha Fund | | $ | 26,463,379 | | | $ | 23,501,528 | |
5. Purchases and Sales of Securities. For the year ended (period ended for International Growth Fund and Strategic Income Fund) December 31, 2020, purchases and sales of securities (excluding short-term investments and option/swaption contracts and including paydowns) were as follows:
| | | | | | | | | | | | | | | | |
| | | U.S. Government/Agency
Securities | | | Other Securities | |
Fund | | Purchases | | | Sales | | | Purchases | | | Sales | |
High Income Fund | | $ | — | | | $ | 719,832 | | | $ | 105,225,652 | | | $ | 144,317,795 | |
Intermediate Municipal Bond Fund | | | — | | | | — | | | | 26,855,591 | | | | 9,378,291 | |
International Growth Fund | | | — | | | | — | | | | 14,904,858 | | | | 78,069 | |
Investment Grade Bond Fund | | | 1,006,992,460 | | | | 1,417,835,771 | | | | 2,798,186,728 | | | | 2,389,546,038 | |
Strategic Alpha Fund | | | 4,144,853,650 | | | | 4,146,862,569 | | | | 923,314,599 | | | | 1,100,948,094 | |
Strategic Income Fund | | | 507,154,634 | | | | 991,690,968 | | | | 1,033,946,501 | | | | 1,798,142,188 | |
6. Management Fees and Other Transactions with Affiliates.
a. Management Fees. Loomis, Sayles & Company, L.P. (“Loomis Sayles”) serves as investment adviser to High Income Fund, International Growth Fund, Investment Grade Bond Fund, Strategic Alpha Fund and Strategic Income Fund. Loomis Sayles is a limited partnership whose sole general partner, Loomis, Sayles & Company, Inc., is indirectly owned by Natixis, which is part of Natixis Investment Managers, an international asset management group based in Paris, France.
Under the terms of the management agreements, each Fund pays a management fee at the following annual rates, calculated daily and payable monthly, based on each Fund’s average daily net assets:
| | | | | | | | | | | | | | | | | | | | | | | | |
| | | Percentage of Average Daily Net Assets | |
Fund | | First $200 million | | | Next $1.05 billion | | | Next $750 million | | | Next
$13 billion | | | Next
$10 billion | | | Over
$25 billion | |
High Income Fund | | | 0.60 | % | | | 0.60 | % | | | 0.60 | % | | | 0.60 | % | | | 0.60 | % | | | 0.60 | % |
International Growth Fund | | | 0.75 | % | | | 0.75 | % | | | 0.75 | % | | | 0.75 | % | | | 0.75 | % | | | 0.75 | % |
Investment Grade Bond Fund | | | 0.40 | % | | | 0.40 | % | | | 0.40 | % | | | 0.40 | % | | | 0.38 | % | | | 0.38 | % |
Strategic Alpha Fund | | | 0.60 | % | | | 0.60 | % | | | 0.55 | % | | | 0.55 | % | | | 0.55 | % | | | 0.55 | % |
Strategic Income Fund | | | 0.65 | % | | | 0.60 | % | | | 0.60 | % | | | 0.55 | % | | | 0.54 | % | | | 0.53 | % |
Natixis Advisors, L.P. (“Natixis Advisors”) serves as investment adviser to Intermediate Municipal Bond Fund. Natixis Advisors is a wholly-owned subsidiary of Natixis.
| 126
Notes to Financial Statements (continued)
December 31, 2020
Under the terms of the management agreement, Intermediate Municipal Bond Fund pays a management fee at the annual rate of 0.40% of the Fund’s average daily net assets, calculated daily and payable monthly.
Natixis Advisors has entered into a subadvisory agreement for the Fund with Loomis Sayles. Under the terms of the subadvisory agreement, the Fund has agreed to pay Loomis Sayles a subadvisory fee at the annual rate of 0.20% of the Fund’s average daily net assets, calculated daily and payable monthly.
Payments to Natixis Advisors are reduced by the amounts of payments to Loomis Sayles, as calculated based on the above.
Natixis Advisors and Loomis Sayles have given binding undertakings to the Funds to waive management fees and/or reimburse certain expenses to limit the Funds’ operating expenses, exclusive of acquired fund fees and expenses, brokerage expenses, interest expense, taxes, organizational and extraordinary expenses such as litigation and indemnification expenses. These undertakings are in effect until April 30, 2021 for High Income Fund, Intermediate Municipal Bond Fund and Strategic Alpha Fund, until April 30, 2022 for International Growth Fund and Investment Grade Bond Fund and until January 31, 2022 for Strategic Income Fund, may be terminated before then only with the consent of the Funds’ Board of Trustees, and are reevaluated on an annual basis. Management fees payable, as reflected on the Statements of Assets and Liabilities, is net of waivers and/or expense reimbursements, if any, pursuant to these undertakings. Waivers/reimbursements that exceed management fees payable are reflected on the Statements of Assets and Liabilities as receivable from investment adviser.
For the year ended (period ended for International Growth Fund and Strategic Income Fund) December 31, 2020, the expense limits as a percentage of average daily net assets under the expense limitation agreement were as follows:
| | | | | | | | | | | | | | | | | | | | |
| | | Expense Limit as a Percentage of
Average Daily Net Assets | |
Fund | | Class A | | | Class C | | | Class N | | | Class Y | | | Admin Class | |
High Income Fund | | | 1.00 | % | | | 1.75 | % | | | 0.70 | % | | | 0.75 | % | | | — | |
Intermediate Municipal Bond Fund | | | 0.70 | % | | | 1.45 | % | | | — | | | | 0.45 | % | | | — | |
International Growth Fund | | | 1.20 | % | | | 1.95 | % | | | 0.90 | % | | | 0.95 | % | | | — | |
Investment Grade Bond Fund | | | 0.75 | % | | | 1.50 | % | | | 0.45 | % | | | 0.50 | % | | | 1.00 | % |
Strategic Alpha Fund | | | 1.00 | % | | | 1.75 | % | | | 0.70 | % | | | 0.75 | % | | | — | |
Strategic Income Fund | | | 1.00 | % | | | 1.75 | % | | | 0.70 | % | | | 0.75 | % | | | 1.25 | % |
Prior to July 1, 2020, the expense limits as a percentage of average daily net assets under the expense limitation agreements for Investment Grade Bond Fund and Strategic Income Fund were as follows:
| | | | | | | | | | | | | | | | | | | | |
| | | Expense Limit as a Percentage of
Average Daily Net Assets | |
Fund | | Class A | | | Class C | | | Class N | | | Class Y | | | Admin Class | |
Investment Grade Bond Fund | | | 0.76 | % | | | 1.51 | % | | | 0.46 | % | | | 0.51 | % | | | 1.01 | % |
Strategic Income Fund | | | 1.25 | % | | | 2.00 | % | | | 0.95 | % | | | 1.00 | % | | | 1.50 | % |
Natixis Advisors and Loomis Sayles shall be permitted to recover expenses borne under the expense limitation agreements (whether through waiver of management fees or otherwise) on a class by class basis in later periods to the extent the annual operating expenses of a class fall below a class’ expense limits, provided, however, that a class is not obligated to pay such waived/reimbursed fees or expenses more than one year after the end of the fiscal year in which the fees or expenses were waived/reimbursed.
For the year ended (period ended for International Growth Fund and Strategic Income Fund) December 31, 2020, the management fees and waivers of management fees for each Fund were as follows:
| | | | | | | | | | | | | | | | | | | | |
| | | Gross
Management Fees | | | Contractual
Waivers of
Management Fees1 | | | Net
Management Fees | | | Percentage
of Average
Daily Net Assets | |
Fund | | Gross | | | Net | |
High Income Fund | | $ | 669,082 | | | $ | 243,461 | | | $ | 425,621 | | | | 0.60 | % | | | 0.38 | % |
Intermediate Municipal Bond Fund | | | 92,759 | | | | 92,759 | | | | — | | | | 0.40 | % | | | — | % |
International Growth Fund | | | 4,945 | | | | 4,945 | | | | — | | | | 0.75 | % | | | — | % |
Investment Grade Bond Fund | | | 22,550,836 | | | | 2,021,089 | | | | 20,529,747 | | | | 0.40 | % | | | 0.36 | % |
Strategic Alpha Fund | | | 7,083,082 | | | | — | | | | 7,083,082 | | | | 0.60 | % | | | 0.60 | % |
Strategic Income Fund | | | 8,602,302 | | | | — | | | | 8,602,302 | | | | 0.57 | % | | | 0.57 | % |
| 1 | Management fee waivers are subject to possible recovery until December 31, 2021. |
127 |
Notes to Financial Statements (continued)
December 31, 2020
For the year ended December 31, 2020, expenses have been reimbursed as follows:
| | | | |
Fund | | Reimbursement | |
Intermediate Municipal Bond Fund | | $ | 73,948 | |
International Growth Fund | | | 29,987 | |
No expenses were recovered for any of the Funds during the year ended (period ended for Strategic Income Fund) December 31, 2020 under the terms of the expense limitation agreements.
b. Service and Distribution Fees. Natixis Distribution, L.P. (“Natixis Distribution), which is a wholly-owned subsidiary of Natixis, has entered into a distribution agreement with the Trusts. Pursuant to this agreement, Natixis Distribution serves as principal underwriter of the Funds of the Trusts.
Pursuant to Rule 12b-1 under the 1940 Act, the Trusts have adopted a Service Plan relating to each Fund’s Class A shares (the “Class A Plans”), a Distribution and Service Plan relating to each Fund’s Class C shares (the “Class C Plans”), and Investment Grade Bond Fund and Strategic Income Fund have adopted a Distribution Plan relating to their Admin Class shares (the “Admin Class Plans”).
Under the Class A Plans, each Fund pays Natixis Distribution a monthly service fee at an annual rate not to exceed 0.25% of the average daily net assets attributable to the Fund’s Class A shares, as reimbursement for expenses incurred by Natixis Distribution in providing personal services to investors in Class A shares and/or the maintenance of shareholder accounts.
Under the Class C Plans, each Fund pays Natixis Distribution a monthly service fee at an annual rate not to exceed 0.25% of the average daily net assets attributable to the Fund’s Class C shares, as compensation for services provided by Natixis Distribution in providing personal services to investors in Class C shares and/or the maintenance of shareholder accounts.
Also under the Class C Plans, each Fund pays Natixis Distribution a monthly distribution fee at an annual rate of 0.75% of the average daily net assets attributable to the Fund’s Class C shares, as compensation for services provided by Natixis Distribution in connection with the marketing or sale of Class C shares.
Under the Admin Class Plans, Investment Grade Bond Fund and Strategic Income Fund pay Natixis Distribution a monthly distribution fee at an annual rate not to exceed 0.25% of the average daily net assets attributable to the Funds’ Admin Class shares, as compensation for services provided by Natixis Distribution in connection with the marketing or sale of Admin Class shares or for payments made by Natixis Distribution to securities dealers or other financial intermediaries as commissions, asset-based sales charges or other compensation with respect to the sale of Admin Class shares, or for providing personal services to investors and/or the maintenance of shareholder accounts.
In addition, the Admin Class shares of Investment Grade Bond Fund and Strategic Income Fund may pay Natixis Distribution an administrative service fee, at an annual rate not to exceed 0.25% of the average daily net assets attributable to Admin Class shares. These fees are subsequently paid to securities dealers or financial intermediaries for providing personal services and/or account maintenance for their customers who hold such shares.
For the year ended (period ended for International Growth Fund and Strategic Income Fund) December 31, 2020, the service and distribution fees for each Fund were as follows:
| | | | | | | | | | | | | | | | | | | | |
| | | Service Fees | | | Distribution Fees | |
Fund | | Class A | | | Class C | | | Admin Class | | | Class C | | | Admin Class | |
High Income Fund | | $ | 54,502 | | | $ | 7,095 | | | $ | — | | | $ | 21,284 | | | $ | — | |
Intermediate Municipal Bond Fund | | | 21,311 | | | | 3,150 | | | | — | | | | 9,451 | | | | — | |
International Growth Fund | | | — | 1 | | | — | 1 | | | — | | | | 1 | | | | — | |
Investment Grade Bond Fund | | | 2,037,993 | | | | 411,503 | | | | 283,813 | | | | 1,234,508 | | | | 283,813 | |
Strategic Alpha Fund | | | 89,110 | | | | 31,116 | | | | — | | | | 93,347 | | | | — | |
Strategic Income Fund | | | 1,063,191 | | | | 169,163 | | | | 63,990 | | | | 507,489 | | | | 63,990 | |
c. Administrative Fees. Natixis Advisors provides certain administrative services for the Funds and contracts with State Street Bank to serve as sub-administrator. Pursuant to an agreement among Natixis Funds Trusts, Loomis Sayles Funds Trusts, Natixis ETF Trusts and Natixis Advisors, each Fund pays Natixis Advisors monthly its pro rata portion of fees equal to an annual rate of 0.0540% of the first $15 billion of the average daily net assets of the Natixis Funds Trusts, Loomis Sayles Funds Trusts and Natixis ETF Trusts, 0.0500% of the next $15 billion, 0.0400% of the next $30 billion, 0.0275% of the next $30 billion and 0.0225% of such assets in excess of $90 billion, subject to an annual aggregate minimum fee for the Natixis Funds Trusts, Loomis Sayles Funds Trusts and Natixis ETF Trusts of $10 million, which is reevaluated on an annual basis.
| 128
Notes to Financial Statements (continued)
December 31, 2020
For the year ended (period ended for International Growth Fund and Strategic Income Fund) December 31, 2020, the administrative fees for each Fund were as follows:
| | | | |
Fund | | Administrative
Fees | |
High Income Fund | | $ | 49,521 | |
Intermediate Municipal Bond Fund | | | 10,156 | |
International Growth Fund | | | 284 | |
Investment Grade Bond Fund | | | 2,463,304 | |
Strategic Alpha Fund | | | 521,998 | |
Strategic Income Fund | | | 656,953 | |
d. Sub-Transfer Agent Fees. Natixis Distribution has entered into agreements, which include servicing agreements, with financial intermediaries that provide recordkeeping, processing, shareholder communications and other services to customers of the intermediaries that hold positions in the Funds and has agreed to compensate the intermediaries for providing those services. Intermediaries transact with the Funds primarily through the use of omnibus accounts on behalf of their customers who hold positions in the Funds. These services would have been provided by the Funds’ transfer agent and other service providers if the shareholders’ accounts were maintained directly at the Funds’ transfer agent. Accordingly, the Funds have agreed to reimburse Natixis Distribution for all or a portion of the servicing fees paid to these intermediaries. The reimbursement amounts (sub-transfer agent fees) paid to Natixis Distribution are subject to a current per-account equivalent fee limit approved by the Funds’ Board of Trustees, which is based on fees for similar services paid to the Funds’ transfer agent and other service providers. Class N shares do not bear such expenses.
For the year ended (period ended for Strategic Income Fund) December 31, 2020, the sub-transfer agent fees (which are reflected in transfer agent fees and expenses in the Statements of Operations) for each Fund were as follows:
| | | | |
Fund | | Sub-Transfer
Agent Fees | |
High Income Fund | | $ | 79,873 | |
Intermediate Municipal Bond Fund | | | 5,105 | |
Investment Grade Bond Fund | | | 3,297,339 | |
Strategic Alpha Fund | | | 394,176 | |
Strategic Income Fund | | | 1,100,338 | |
As of December 31, 2020, the Funds owe Natixis Distribution the following reimbursements for sub-transfer agent fees (which are reflected in the Statements of Assets and Liabilities as payable to distributor):
| | | | |
Fund | | Reimbursements
of Sub-Transfer
Agent Fees | |
High Income Fund | | $ | 645 | |
Intermediate Municipal Bond Fund | | | 95 | |
Investment Grade Bond Fund | | | 40,327 | |
Strategic Alpha Fund | | | 4,862 | |
Strategic Income Fund | | | 54,289 | |
Sub-transfer agent fees attributable to Class A, Class C, Class Y, and Admin Class are allocated on a pro rata basis to each class based on the relative net assets of each class to the total net assets of those classes.
e. Commissions. Commissions (including CDSCs) on Fund shares retained by Natixis Distribution during the year ended (period ended for International Growth Fund and Strategic Income Fund) December 31, 2020 were as follows:
| | | | |
Fund | | Commissions | |
High Income Fund | | $ | 2,357 | |
Intermediate Municipal Bond Fund | | | 1,912 | |
International Growth Fund | | | 1 | |
Investment Grade Bond Fund | | | 119,731 | |
Strategic Alpha Fund | | | 8,936 | |
Strategic Income Fund | | | 6,502 | |
129 |
Notes to Financial Statements (continued)
December 31, 2020
f. Trustees Fees and Expenses. The Trusts do not pay any compensation directly to their officers or Trustees who are directors, officers or employees of Natixis Advisors, Natixis Distribution, Natixis or their affiliates. The Chairperson of the Board of Trustees receives a retainer fee at the annual rate of $369,000. The Chairperson does not receive any meeting attendance fees for Board of Trustees meetings or committee meetings that he attends. Each Independent Trustee (other than the Chairperson) receives, in the aggregate, a retainer fee at the annual rate of $199,000. Each Independent Trustee also receives a meeting attendance fee of $10,000 for each meeting of the Board of Trustees that he or she attends in person and $5,000 for each meeting of the Board of Trustees that he or she attends telephonically. In addition, the chairperson of the Contract Review Committee, the chairperson of the Audit Committee and the chairperson of the Governance Committee each receive an additional retainer fee at the annual rate of $20,000. Each Contract Review Committee member is compensated $6,000 for each Committee meeting that he or she attends in person and $3,000 for each meeting that he or she attends telephonically. Each Audit Committee member is compensated $6,000 for each Committee meeting that he or she attends in person and $3,000 for each meeting that he or she attends telephonically. These fees are allocated among the funds in the Natixis Funds Trusts, Loomis Sayles Funds Trusts and Natixis ETF Trusts based on a formula that takes into account, among other factors, the relative net assets of each fund. Trustees are reimbursed for travel expenses in connection with attendance at meetings.
A deferred compensation plan (the “Plan”) is available to the Trustees on a voluntary basis. Deferred amounts remain in the Funds until distributed in accordance with the provisions of the Plan. The value of a participating Trustee’s deferral account is based on theoretical investments of deferred amounts, on the normal payment dates, in certain funds of the Natixis Funds Trusts, Loomis Sayles Funds Trusts and Natixis ETF Trusts as designated by the participating Trustees. Changes in the value of participants’ deferral accounts are allocated pro rata among the funds in the Natixis Funds Trusts, Loomis Sayles Funds Trusts and Natixis ETF Trusts, and are normally reflected as Trustees’ fees and expenses in the Statements of Operations. The portions of the accrued obligations allocated to the Funds under the Plan are reflected as Deferred Trustees’ fees in the Statements of Assets and Liabilities.
Certain officers and employees of Natixis Advisors and Loomis Sayles are also officers and/or Trustees of the Trusts.
g. Reimbursement of Transfer Agent Fees and Expenses. Natixis Advisors has given a binding contractual undertaking to High Income Fund and International Growth Fund to reimburse any and all transfer agency expenses for the Funds’ Class N shares. This undertaking is in effect through April 30, 2021 for High Income Fund and April 30, 2022 for International Growth Fund, and is not subject to recovery under the expense limitation agreement described above.
For the year ended December 31, 2020, Natixis Advisors reimbursed the Funds for transfer agency expenses as follows:
| | | | |
Fund | | Reimbursement
of Transfer
Agency
Expenses | |
| | | Class N | |
High Income Fund | | $ | 1,039 | |
International Growth Fund | | | 4 | |
h. Affiliated Ownership. As of December 31, 2020, Natixis and affiliates and Loomis Sayles Employees’ Profit Sharing Retirement Plan (“Retirement Plan”) held shares of the following Funds’ net assets.
| | | | | | | | |
Fund | | Natixis and
affiliates | | | Retirement
Plan | |
International Growth Fund | | | 100 | % | | | — | |
Investment Grade Bond Fund | | | — | | | | 0.12 | % |
Strategic Alpha Fund | | | — | | | | 0.22 | % |
Investment activities of affiliated shareholders could have material impacts on the Fund.
| 130
Notes to Financial Statements (continued)
December 31, 2020
i. Affiliated Transactions. As a result of a business restructuring, Strategic Income Fund received common shares of Pioneer Energy Services Corp. (the “Company”) constituting more than 5% of the voting securities of the Company. As such, the Company is considered to be an affiliate at December 31, 2020. Similarly, as a result of a business restructuring, the Fund received common shares of Lonestar Resources U.S., Inc. (the “Company”) constituting more than 5% of the voting securities of the Company. As such, the Company is considered to be an affiliate at December 31, 2020. A summary of affiliated transactions for the period ended December 31, 2020, is as follows:
| | | | | | | | | | | | | | | | | | | | | | | | | | | | | | | | |
| | | Beginning
Value | | | Purchase
Cost | | | Sales
Proceeds | | | Accrued
Discounts
(Premiums) | | | Realized
Gain
(Loss) | | | Change in
Unrealized
Gain
(Loss) | | | Ending
Value | | | Investment
Income | |
Pioneer Energy Services Corp., 5.000% PIK or 5.000% Cash | | $ | 6,103,774 | | | $ | 229,195 | * | | $ | — | | | $ | 29,190 | | | $ | — | | | $ | (31,212 | ) | | $ | 6,330,947 | | | $ | 125,727 | |
Pioneer Energy Services Corp. | | | — | | | | — | | | | — | | | | — | | | | — | | | | — | | | | — | | | | — | |
Lonestar Resources U.S., Inc. | | | — | | | | 3,473,775 | ** | | | — | | | | — | | | | — | | | | — | | | | 3,473,775 | | | | — | |
| | | | | | | | | | | | | | | | | | | | | | | | | | | | | | | | |
| | $ | 6,103,774 | | | $ | 3,702,970 | | | $ | — | | | $ | 29,190 | | | $ | — | | | $ | (31,212 | ) | | $ | 9,804,722 | | | $ | 125,727 | |
| | | | | | | | | | | | | | | | | | | | | | | | | | | | | | | | |
| * | Represents interest paid in additional principal. |
| ** | Represents basis assigned upon receipt in a taxable restructuring. |
j. Payment by Affiliates. For the year ended December 31, 2020, Loomis Sayles reimbursed Strategic Alpha Fund $52,333 in connection with a trading error.
7. Custodian Fees and Expenses. State Street Bank, custodian to the Funds, has agreed to waive the custodian fees and certain other expenses for the first 12 months of operations for International Growth Fund. For the period ended December 31, 2020, total fees waived for the Fund were $1,887.
8. Class-Specific Transfer Agent Fees and Expenses. Transfer agent fees and expenses for High Income Fund, International Growth Fund, Investment Grade Bond Fund, Strategic Alpha Fund and Strategic Income Fund attributable to Class A, Class C, Class Y and Admin Class are allocated on a pro rata basis to each class based on the relative net assets of each class to the total net assets of those classes. Transfer agent fees and expenses attributable to Class N are allocated to Class N.
Intermediate Municipal Bond Fund allocates transfer agent fees and expenses on a pro rata basis based on the relative net assets of each class to the total net assets of those classes.
For the year ended (period ended for International Growth Fund and Strategic Income Fund) December 31, 2020, the Funds incurred the following class-specific transfer agent fees and expenses (including sub-transfer agent fees, where applicable):
| | | | | | | | | | | | | | | | | | | | |
| | | Transfer Agent Fees and Expenses | |
Fund | | Class A | | | Class C | | | Class N | | | Class Y | | | Admin
Class | |
High Income Fund | | $ | 21,489 | | | $ | 2,888 | | | $ | 1,039 | | | $ | 76,888 | | | $ | — | |
International Growth Fund | | | 3 | | | | 3 | | | | 4 | | | | 26 | | | | — | |
Investment Grade Bond Fund | | | 640,456 | | | | 130,191 | | | | 5,345 | | | | 2,616,004 | | | | 89,275 | |
Strategic Alpha Fund | | | 20,283 | | | | 7,122 | | | | 1,740 | | | | 388,610 | | | | — | |
Strategic Income Fund | | | 338,601 | | | | 53,912 | | | | 752 | | | | 749,551 | | | | 20,383 | |
9. Line of Credit. Each Fund except for International Growth Fund, together with certain other funds of Natixis Funds Trusts, Loomis Sayles Funds Trusts and Natixis ETF Trusts, entered into a $400,000,000 committed unsecured line of credit provided by State Street Bank. Any one Fund may borrow up to $350,000,000 under the line of credit agreement (as long as all borrowings by all Funds in the aggregate do not exceed the $400,000,000 limit at any time), subject to each Fund’s investment restrictions and its contractual obligations under the line of credit. Interest is charged to the Funds based upon the terms set forth in the agreement. In addition, a commitment fee of 0.15% per annum, payable at the end of each calendar quarter, is accrued and apportioned among the participating funds based on their average daily unused portion of the line of credit. The Funds paid an arrangement fee, an upfront fee, and certain other legal fees in connection with the line of credit agreement, which are being amortized over a period of 364 days and are reflected in legal fees and/or miscellaneous expenses on the Statements of Operations. The unamortized balance is reflected as prepaid expenses on the Statements of Assets and Liabilities.
For the year ended December 31, 2020, none of the Funds had borrowings under this agreement.
131 |
Notes to Financial Statements (continued)
December 31, 2020
10. Risk. The Funds’ investments in foreign securities, as applicable, may be subject to greater political, economic, environmental, credit/counterparty and information risks. The Funds’ investments in foreign securities also are subject to foreign currency fluctuations and other foreign currency-related risks. Foreign securities may be subject to higher volatility than U.S. securities, varying degrees of regulation and limited liquidity.
International Growth Fund and Strategic Alpha Fund are non-diversified, which means that they are not limited under the 1940 Act to a percentage of assets that they may invest in any one issuer. Because the Funds may invest in the securities of a limited number of issuers, an investment in the Funds may involve a higher degree of risk than would be present in a diversified portfolio.
Global markets have experienced periods of high volatility triggered by the ongoing public health emergency known as coronavirus (“Covid-19”). As the situation continues, the extent and duration of the impact that the Covid-19 outbreak may have on financial markets and the economy as a whole remains highly uncertain. If the effects of the Covid-19 outbreak on financial markets and the economy continue for an extended period of time, the Funds’ future financial and investment results may be adversely affected.
11. Concentration of Ownership. From time to time, a Fund may have a concentration of one or more accounts constituting a significant percentage of shares outstanding. Investment activities by holders of such accounts could have material impacts on the Funds. As of December 31, 2020, based on management’s evaluation of the shareholder account base, the Funds had accounts representing controlling ownership of more than 5% of the Fund’s total outstanding shares. The number of such accounts, based on accounts that represent more than 5% of an individual class of shares, and the aggregate percentage of net assets represented by such holdings were as follows:
| | | | | | | | |
Fund | | Number of 5%
Account Holders | | | Percentage of
Ownership | |
High Income Fund | | | 2 | | | | 24.41 | % |
Intermediate Municipal Bond Fund | | | 3 | | | | 54.02 | % |
Investment Grade Bond Fund | | | 1 | | | | 9.47 | % |
Strategic Alpha Fund | | | 4 | | | | 49.53 | % |
Omnibus shareholder accounts for which Natixis Advisors understands that the intermediary has discretion over the underlying shareholder accounts or investment models where a shareholder account may be invested for a non-discretionary customer are included in the table above. For other omnibus accounts, the Fund does not have information on the individual shareholder accounts underlying the omnibus accounts; therefore, there could be other 5% shareholders in addition to those disclosed in the table above.
12. Capital Shares. Each Fund may issue an unlimited number of shares of beneficial interest, without par value. Transactions in capital shares were as follows:
| | | | | | | | | | | | | | | | |
| |
| Year Ended
December 31, 2020 |
| |
| Year Ended
December 31, 2019 |
|
High Income Fund | | | Shares | | | | Amount | | | | Shares | | | | Amount | |
| Class A | |
Issued from the sale of shares | | | 5,472,929 | | | $ | 23,366,332 | | | | 1,181,562 | | | $ | 4,961,757 | |
Issued in connection with the reinvestment of distributions | | | 265,043 | | | | 1,081,552 | | | | 224,427 | | | | 943,693 | |
Redeemed | | | (1,646,663 | ) | | | (6,698,230 | ) | | | (1,744,701 | ) | | | (7,332,092 | ) |
| | | | | | | | | | | | | | | | |
Net change | | | 4,091,309 | | | $ | 17,749,654 | | | | (338,712 | ) | | $ | (1,426,642 | ) |
| | | | | | | | | | | | | | | | |
| Class C | |
Issued from the sale of shares | | | 204,929 | | | $ | 851,367 | | | | 104,622 | | | $ | 442,064 | |
Issued in connection with the reinvestment of distributions | | | 27,930 | | | | 113,438 | | | | 40,123 | | | | 169,298 | |
Redeemed | | | (460,672 | ) | | | (1,851,801 | ) | | | (582,159 | ) | | | (2,454,372 | ) |
| | | | | | | | | | | | | | | | |
Net change | | | (227,813 | ) | | $ | (886,996 | ) | | | (437,414 | ) | | $ | (1,843,010 | ) |
| | | | | | | | | | | | | | | | |
| Class N | |
Issued from the sale of shares | | | 636,909 | | | $ | 2,492,319 | | | | 347,075 | | | $ | 1,464,639 | |
Issued in connection with the reinvestment of distributions | | | 182,577 | | | | 739,980 | | | | 144,891 | | | | 609,528 | |
Redeemed | | | (240,181 | ) | | | (982,234 | ) | | | (290,834 | ) | | | (1,225,972 | ) |
| | | | | | | | | | | | | | | | |
Net change | | | 579,305 | | | $ | 2,250,065 | | | | 201,132 | | | $ | 848,195 | |
| | | | | | | | | | | | | | | | |
| Class Y | |
Issued from the sale of shares | | | 8,276,302 | | | $ | 32,427,807 | | | | 5,715,875 | | | $ | 23,998,846 | |
Issued in connection with the reinvestment of distributions | | | 953,466 | | | | 3,824,624 | | | | 1,050,566 | | | | 4,412,148 | |
Redeemed | | | (22,428,758 | ) | | | (87,181,268 | ) | | | (5,779,231 | ) | | | (24,250,953 | ) |
| | | | | | | | | | | | | | | | |
Net change | | | (13,198,990 | ) | | $ | (50,928,837 | ) | | | 987,210 | | | $ | 4,160,041 | |
| | | | | | | | | | | | | | | | |
Increase (decrease) from capital share transactions | | | (8,756,189 | ) | | $ | (31,816,114 | ) | | | 412,216 | | | $ | 1,738,584 | |
| | | | | | | | | | | | | | | | |
| 132
Notes to Financial Statements (continued)
December 31, 2020
12. Capital Shares (continued).
| | | | | | | | | | | | | | | | |
| |
| Year Ended
December 31, 2020 |
| |
| Year Ended
December 31, 2019 |
|
Intermediate Municipal Bond Fund | | | Shares | | | | Amount | | | | Shares | | | | Amount | |
| Class A | |
Issued from the sale of shares | | | 269,748 | | | $ | 2,831,550 | | | | 172,592 | | | $ | 1,769,797 | |
Issued in connection with the reinvestment of distributions | | | 11,723 | | | | 121,983 | | | | 12,521 | | | | 128,813 | |
Redeemed | | | (162,733 | ) | | | (1,679,297 | ) | | | (59,824 | ) | | | (609,217 | ) |
| | | | | | | | | | | | | | | | |
Net change | | | 118,738 | | | $ | 1,274,236 | | | | 125,289 | | | $ | 1,289,393 | |
| | | | | | | | | | | | | | | | |
| Class C | |
Issued from the sale of shares | | | 47,897 | | | $ | 494,485 | | | | 43,687 | | | $ | 451,336 | |
Issued in connection with the reinvestment of distributions | | | 777 | | | | 8,083 | | | | 967 | | | | 9,940 | |
Redeemed | | | (85,913 | ) | | | (898,719 | ) | | | (75,820 | ) | | | (777,366 | ) |
| | | | | | | | | | | | | | | | |
Net change | | | (37,239 | ) | | $ | (396,151 | ) | | | (31,166 | ) | | $ | (316,090 | ) |
| | | | | | | | | | | | | | | | |
| Class Y | |
Issued from the sale of shares | | | 2,146,197 | | | $ | 22,275,909 | | | | 118,355 | | | $ | 1,214,783 | |
Issued in connection with the reinvestment of distributions | | | 19,854 | | | | 207,580 | | | | 14,927 | | | | 153,521 | |
Redeemed | | | (556,921 | ) | | | (5,809,326 | ) | | | (620,551 | ) | | | (6,360,407 | ) |
| | | | | | | | | | | | | | | | |
Net change | | | 1,609,130 | | | $ | 16,674,163 | | | | (487,269 | ) | | $ | (4,992,103 | ) |
| | | | | | | | | | | | | | | | |
Increase (decrease) from capital share transactions | | | 1,690,629 | | | $ | 17,552,248 | | | | (393,146 | ) | | $ | (4,018,800 | ) |
| | | | | | | | | | | | | | | | |
| | | | | | | | |
| |
| Period Ended
December 31, 2020(a) |
|
International Growth Fund | | | Shares | | | | Amount | |
| Class A | |
Issued from the sale of shares | | | 100 | | | $ | 1,000 | |
Issued in connection with the reinvestment of distributions | | | – | (b) | | | 1 | |
| | | | | | | | |
Net change | | | 100 | | | $ | 1,001 | |
| | | | | | | | |
| Class C | |
Issued from the sale of shares | | | 100 | | | $ | 1,000 | |
Issued in connection with the reinvestment of distributions | | | – | (b) | | | – | (c) |
| | | | | | | | |
Net change | | | 100 | | | $ | 1,000 | |
| | | | | | | | |
| Class N | |
Issued from the sale of shares | | | 1,500,000 | | | $ | 15,000,000 | |
Issued in connection with the reinvestment of distributions | | | 1,224 | | | | 12,450 | |
| | | | | | | | |
Net change | | | 1,501,224 | | | $ | 15,012,450 | |
| | | | | | | | |
| Class Y | |
Issued from the sale of shares | | | 1,163 | | | $ | 11,750 | |
Issued in connection with the reinvestment of distributions | | | 1 | | | | 9 | |
| | | | | | | | |
Net change | | | 1,164 | | | $ | 11,759 | |
| | | | | | | | |
Increase from capital share transactions | | | 1,502,588 | | | $ | 15,026,210 | |
| | | | | | | | |
| (a) | From commencement of operations on December 15, 2020 through December 31, 2020. |
| (b) | Amount rounds to less than one share. |
| (c) | Amount rounds to less than $1.00. |
133 |
Notes to Financial Statements (continued)
December 31, 2020
12. Capital Shares (continued).
| | | | | | | | | | | | | | | | |
| |
| Year Ended
December 31, 2020 |
| |
| Year Ended
December 31, 2019 |
|
Investment Grade Bond Fund | | | Shares | | | | Amount | | | | Shares | | | | Amount | |
| Class A | |
Issued from the sale of shares | | | 20,934,113 | | | $ | 243,643,227 | | | | 21,746,077 | | | $ | 242,390,732 | |
Issued in connection with the reinvestment of distributions | | | 4,472,710 | | | | 51,487,111 | | | | 1,759,350 | | | | 19,703,186 | |
Redeemed | | | (18,660,738 | ) | | | (215,501,248 | ) | | | (22,252,474 | ) | | | (248,006,281 | ) |
| | | | | | | | | | | | | | | | |
Net change | | | 6,746,085 | | | $ | 79,629,090 | | | | 1,252,953 | | | $ | 14,087,637 | |
| | | | | | | | | | | | | | | | |
| Class C | |
Issued from the sale of shares | | | 1,837,724 | | | $ | 21,073,918 | | | | 1,602,835 | | | $ | 17,702,080 | |
Issued in connection with the reinvestment of distributions | | | 812,986 | | | | 9,217,940 | | | | 469,346 | | | | 5,182,790 | |
Redeemed | | | (9,377,842 | ) | | | (108,032,709 | ) | | | (18,184,031 | ) | | | (200,209,503 | ) |
| | | | | | | | | | | | | | | | |
Net change | | | (6,727,132 | ) | | $ | (77,740,851 | ) | | | (16,111,850 | ) | | $ | (177,324,633 | ) |
| | | | | | | | | | | | | | | | |
| Class N | |
Issued from the sale of shares | | | 35,059,681 | | | $ | 407,348,565 | | | | 30,937,052 | | | $ | 345,100,891 | |
Issued in connection with the reinvestment of distributions | | | 8,107,642 | | | | 93,301,449 | | | | 4,168,997 | | | | 46,698,958 | |
Redeemed | | | (61,802,905 | ) | | | (713,421,603 | ) | | | (27,365,168 | ) | | | (305,705,875 | ) |
| | | | | | | | | | | | | | | | |
Net change | | | (18,635,582 | ) | | $ | (212,771,589 | ) | | | 7,740,881 | | | $ | 86,093,974 | |
| | | | | | | | | | | | | | | | |
| Class Y | |
Issued from the sale of shares | | | 116,069,530 | | | $ | 1,338,576,662 | | | | 75,690,305 | | | $ | 842,848,095 | |
Issued in connection with the reinvestment of distributions | | | 21,359,279 | | | | 246,149,320 | | | | 8,703,543 | | | | 97,536,256 | |
Redeemed | | | (94,728,720 | ) | | | (1,084,178,153 | ) | | | (79,477,156 | ) | | | (888,490,131 | ) |
| | | | | | | | | | | | | | | | |
Net change | | | 42,700,089 | | | $ | 500,547,829 | | | | 4,916,692 | | | $ | 51,894,220 | |
| | | | | | | | | | | | | | | | |
| Admin Class | |
Issued from the sale of shares | | | 2,273,836 | | | $ | 26,516,127 | | | | 1,693,129 | | | $ | 18,816,328 | |
Issued in connection with the reinvestment of distributions | | | 764,671 | | | | 8,774,511 | | | | 297,880 | | | | 3,326,874 | |
Redeemed | | | (2,101,154 | ) | | | (24,136,301 | ) | | | (2,538,140 | ) | | | (28,454,222 | ) |
| | | | | | | | | | | | | | | | |
Net change | | | 937,353 | | | $ | 11,154,337 | | | | (547,131 | ) | | $ | (6,311,020 | ) |
| | | | | | | | | | | | | | | | |
Increase (decrease) from capital share transactions | | | 25,020,813 | | | $ | 300,818,816 | | | | (2,748,455 | ) | | $ | (31,559,822 | ) |
| | | | | | | | | | | | | | | | |
| | | | | | | | | | | | | | | | |
| |
| Year Ended
December 31, 2020 |
| |
| Year Ended
December 31, 2019 |
|
Strategic Alpha Fund | | | Shares | | | | Amount | | | | Shares | | | | Amount | |
| Class A | |
Issued from the sale of shares | | | 1,023,731 | | | $ | 10,060,502 | | | | 4,057,576 | | | $ | 39,431,401 | |
Issued in connection with the reinvestment of distributions | | | 62,078 | | | | 605,195 | | | | 153,689 | | | | 1,492,303 | |
Redeemed | | | (2,666,522 | ) | | | (25,934,557 | ) | | | (2,971,674 | ) | | | (28,966,949 | ) |
| | | | | | | | | | | | | | | | |
Net change | | | (1,580,713 | ) | | $ | (15,268,860 | ) | | | 1,239,591 | | | $ | 11,956,755 | |
| | | | | | | | | | | | | | | | |
| Class C | |
Issued from the sale of shares | | | 126,434 | | | $ | 1,222,512 | | | | 166,733 | | | $ | 1,611,447 | |
Issued in connection with the reinvestment of distributions | | | 10,648 | | | | 103,121 | | | | 26,221 | | | | 253,548 | |
Redeemed | | | (966,909 | ) | | | (9,480,056 | ) | | | (1,308,080 | ) | | | (12,656,029 | ) |
| | | | | | | | | | | | | | | | |
Net change | | | (829,827 | ) | | $ | (8,154,423 | ) | | | (1,115,126 | ) | | $ | (10,791,034 | ) |
| | | | | | | | | | | | | | | | |
| Class N | |
Issued from the sale of shares | | | 29,423,113 | | | $ | 288,816,017 | | | | 3,995,830 | | | $ | 38,781,677 | |
Issued in connection with the reinvestment of distributions | | | 814,373 | | | | 7,933,168 | | | | 905,302 | | | | 8,768,965 | |
Redeemed | | | (10,308,071 | ) | | | (98,238,299 | ) | | | (750,043 | ) | | | (7,281,454 | ) |
| | | | | | | | | | | | | | | | |
Net change | | | 19,929,415 | | | $ | 198,510,886 | | | | 4,151,089 | | | $ | 40,269,188 | |
| | | | | | | | | | | | | | | | |
| Class Y | |
Issued from the sale of shares | | | 25,133,973 | | | $ | 249,260,831 | | | | 33,476,137 | | | $ | 325,247,908 | |
Issued in connection with the reinvestment of distributions | | | 1,488,360 | | | | 14,469,017 | | | | 2,397,834 | | | | 23,222,284 | |
Redeemed | | | (52,322,387 | ) | | | (502,765,399 | ) | | | (62,461,312 | ) | | | (606,867,293 | ) |
| | | | | | | | | | | | | | | | |
Net change | | | (25,700,054 | ) | | $ | (239,035,551 | ) | | | (26,587,341 | ) | | $ | (258,397,101 | ) |
| | | | | | | | | | | | | | | | |
Decrease from capital share transactions | | | (8,181,179 | ) | | $ | (63,947,948 | ) | | | (22,311,787 | ) | | $ | (216,962,192 | ) |
| | | | | | | | | | | | | | | | |
| 134
Notes to Financial Statements (continued)
December 31, 2020
12. Capital Shares (continued).
| | | | | | | | | | | | | | | | |
| |
| Period Ended
December 31, 2020(a) |
| |
| Year Ended
September 30, 2020 |
|
Strategic Income Fund | | | Shares | | | | Amount | | | | Shares | | | | Amount | |
| Class A | |
Issued from the sale of shares | | | 3,166,668 | | | $ | 43,973,781 | | | | 32,299,438 | | | $ | 444,080,248 | |
Issued in connection with the reinvestment of distributions | | | 1,651,138 | | | | 22,982,383 | | | | 3,167,184 | | | | 43,610,276 | |
Redeemed | | | (8,809,951 | ) | | | (122,112,304 | ) | | | (40,330,246 | ) | | | (554,003,991 | ) |
| | | | | | | | | | | | | | | | |
Net change | | | (3,992,145 | ) | | $ | (55,156,140 | ) | | | (4,863,624 | ) | | $ | (66,313,467 | ) |
| | | | | | | | | | | | | | | | |
| Class C | |
Issued from the sale of shares | | | 264,507 | | | $ | 3,697,602 | | | | 1,902,282 | | | $ | 26,312,714 | |
Issued in connection with the reinvestment of distributions | | | 294,227 | | | | 4,142,720 | | | | 600,408 | | | | 8,382,443 | |
Redeemed | | | (2,483,699 | ) | | | (34,767,841 | ) | | | (29,280,757 | ) | | | (408,234,280 | ) |
| | | | | | | | | | | | | | | | |
Net change | | | (1,924,965 | ) | | $ | (26,927,519 | ) | | | (26,778,067 | ) | | $ | (373,539,123 | ) |
| | | | | | | | | | | | | | | | |
| Class N | |
Issued from the sale of shares | | | 3,263,554 | | | $ | 45,457,643 | | | | 8,682,262 | | | $ | 119,974,137 | |
Issued in connection with the reinvestment of distributions | | | 271,195 | | | | 3,768,709 | | | | 464,321 | | | | 6,391,355 | |
Redeemed | | | (1,539,785 | ) | | | (21,376,606 | ) | | | (7,719,864 | ) | | | (106,340,515 | ) |
| | | | | | | | | | | | | | | | |
Net change | | | 1,994,964 | | | $ | 27,849,746 | | | | 1,426,719 | | | $ | 20,024,977 | |
| | | | | | | | | | | | | | | | |
| Class Y | |
Issued from the sale of shares | | | 10,433,588 | | | $ | 144,445,628 | | | | 85,620,721 | | | $ | 1,132,582,915 | |
Issued in connection with the reinvestment of distributions | | | 3,910,477 | | | | 54,349,355 | | | | 8,028,339 | | | | 110,319,204 | |
Redeemed | | | (28,856,379 | ) | | | (398,330,570 | ) | | | (118,624,705 | ) | | | (1,608,285,687 | ) |
| | | | | | | | | | | | | | | | |
Net change | | | (14,512,314 | ) | | $ | (199,535,587 | ) | | | (24,975,645 | ) | | $ | (365,383,568 | ) |
| | | | | | | | | | | | | | | | |
| Admin Class | |
Issued from the sale of shares | | | 315,634 | | | $ | 4,401,178 | | | | 1,076,312 | | | $ | 15,079,460 | |
Issued in connection with the reinvestment of distributions | | | 136,204 | | | | 1,889,249 | | | | 252,576 | | | | 3,465,330 | |
Redeemed | | | (551,434 | ) | | | (7,568,203 | ) | | | (2,287,176 | ) | | | (30,910,379 | ) |
| | | | | | | | | | | | | | | | |
Net change | | | (99,596 | ) | | $ | (1,277,776 | ) | | | (958,288 | ) | | $ | (12,365,589 | ) |
| | | | | | | | | | | | | | | | |
Decrease from capital share transactions | | | (18,534,056 | ) | | $ | (255,047,276 | ) | | | (56,148,905 | ) | | $ | (797,576,770 | ) |
| | | | | | | | | | | | | | | | |
| (a) | For the period October 1, 2020 through December 31, 2020. |
| | | | | | | | |
| |
| Year Ended
September 30, 2019 |
|
| | | | Shares | | | | Amount | |
| Class A | |
Issued from the sale of shares | | | 27,644,005 | | | $ | 388,066,928 | |
Issued in connection with the reinvestment of distributions | | | 3,733,655 | | | | 52,153,952 | |
Redeemed | | | (40,562,001 | ) | | | (568,498,683 | ) |
| | | | | | | | |
Net change | | | (9,184,341 | ) | | $ | (128,277,803 | ) |
| | | | | | | | |
| Class C | |
Issued from the sale of shares | | | 2,930,132 | | | $ | 41,347,083 | |
Issued in connection with the reinvestment of distributions | | | 1,354,833 | | | | 19,052,625 | |
Redeemed | | | (36,710,107 | ) | | | (519,364,178 | ) |
| | | | | | | | |
Net change | | | (32,425,142 | ) | | $ | (458,964,470 | ) |
| | | | | | | | |
| Class N | |
Issued from the sale of shares | | | 5,710,006 | | | $ | 80,153,591 | |
Issued in connection with the reinvestment of distributions | | | 502,914 | | | | 7,022,689 | |
Redeemed | | | (4,226,437 | ) | | | (59,477,704 | ) |
| | | | | | | | |
Net change | | | 1,986,483 | | | $ | 27,698,576 | |
| | | | | | | | |
| Class Y | |
Issued from the sale of shares | | | 60,558,641 | | | $ | 847,970,819 | |
Issued in connection with the reinvestment of distributions | | | 10,011,095 | | | | 139,677,190 | |
Redeemed | | | (123,342,737 | ) | | | (1,721,792,645 | ) |
| | | | | | | | |
Net change | | | (52,773,001 | ) | | $ | (734,144,636 | ) |
| | | | | | | | |
| Admin Class | |
Issued from the sale of shares | | | 1,029,988 | | | $ | 14,399,151 | |
Issued in connection with the reinvestment of distributions | | | 293,184 | | | | 4,080,471 | |
Redeemed | | | (2,027,234 | ) | | | (28,358,878 | ) |
| | | | | | | | |
Net change | | | (704,062 | ) | | $ | (9,879,256 | ) |
| | | | | | | | |
Decrease from capital share transactions | | | (93,100,063 | ) | | $ | (1,303,567,589 | ) |
| | | | | | | | |
135 |
Report of Independent Registered Public Accounting Firm
To the Board of Trustees of Loomis Sayles Funds II and Natixis Funds Trust II and Shareholders of Loomis Sayles High Income Fund, Loomis Sayles Intermediate Municipal Bond Fund, Loomis Sayles International Growth Fund, Loomis Sayles Investment Grade Bond Fund, Loomis Sayles Strategic Alpha Fund and Loomis Sayles Strategic Income Fund
Opinions on the Financial Statements
We have audited the accompanying statements of assets and liabilities, including the portfolios of investments, of Loomis Sayles High Income Fund, Loomis Sayles International Growth Fund, Loomis Sayles Investment Grade Bond Fund and Loomis Sayles Strategic Income Fund (four of the funds constituting Loomis Sayles Funds II) and Loomis Sayles Intermediate Municipal Bond Fund and Loomis Sayles Strategic Alpha Fund (two of the funds constituting Natixis Funds Trust II) (hereafter collectively referred to as the “Funds”) as of December 31, 2020, the related statements of operations and of changes in net assets for each of the periods indicated in the table below, including the related notes, and the financial highlights for each of the periods indicated therein (collectively referred to as the “financial statements”). In our opinion, the financial statements present fairly, in all material respects, the financial position of each of the Funds as of December 31, 2020, the results of each of their operations and the changes in each of their net assets for the periods indicated in the table below, and each of the financial highlights for each of the periods indicated therein, in conformity with accounting principles generally accepted in the United States of America.
| | | | |
Fund | | Statements of operations | | Statements of changes in net assets |
Loomis Sayles High Income Fund | | For the year ended December 31, 2020 | | For the years ended December 31, 2020 and 2019 |
Loomis Sayles Intermediate Municipal Bond Fund | | For the year ended December 31, 2020 | | For the years ended December 31, 2020 and 2019 |
Loomis Sayles International Growth Fund | | For the period from December 15, 2020 (commencement of operations) through December 31, 2020 | | For the period from December 15, 2020 (commencement of operations) through December 31, 2020 |
Loomis Sayles Investment Grade Bond Fund | | For the year ended December 31, 2020 | | For the years ended December 31, 2020 and 2019 |
Loomis Sayles Strategic Alpha Fund | | For the year ended December 31, 2020 | | For the years ended December 31, 2020 and 2019 |
Loomis Sayles Strategic Income Fund | | For the three month period ended December 31, 2020 and for the year ended September 30, 2020 | | For the three month period ended December 31, 2020 and for the years ended September 30, 2020 and 2019 |
Basis for Opinions
These financial statements are the responsibility of the Funds’ management. Our responsibility is to express an opinion on the Funds’ financial statements based on our audits. We are a public accounting firm registered with the Public Company Accounting Oversight Board (United States) (PCAOB) and are required to be independent with respect to the Funds in accordance with the U.S. federal securities laws and the applicable rules and regulations of the Securities and Exchange Commission and the PCAOB.
We conducted our audits of these financial statements in accordance with the standards of the PCAOB. Those standards require that we plan and perform the audit to obtain reasonable assurance about whether the financial statements are free of material misstatement, whether due to error or fraud.
Our audits included performing procedures to assess the risks of material misstatement of the financial statements, whether due to error or fraud, and performing procedures that respond to those risks. Such procedures included examining, on a test basis, evidence regarding the amounts and disclosures in the financial statements. Our audits also included evaluating the accounting principles used and significant estimates made by management, as well as evaluating the overall presentation of the financial statements. Our procedures included confirmation of securities owned as of December 31, 2020 by correspondence with the custodian, short-term investee manager, agent banks and brokers; when replies were not received from brokers, we performed other auditing procedures. We believe that our audits provide a reasonable basis for our opinions.
/s/PricewaterhouseCoopers LLP
Boston, Massachusetts
February 22, 2021
We have served as the auditor of one or more of the investment companies in the Natixis Investment Company Complex since at least 1995. We have not been able to determine the specific year we began serving as auditor.
| 136
2020 U.S. Tax Distribution Information to Shareholders (Unaudited)
Corporate Dividends Received Deduction. For the fiscal year ended December 31, 2020, a percentage of dividends distributed by the Funds listed below qualify for the dividends received deduction for corporate shareholders. These percentages are as follows:
| | | | |
Fund | | Qualifying
Percentage | |
High Income Fund | | | 0.50 | % |
Investment Grade Bond Fund | | | 0.33 | % |
Strategic Alpha Fund | | | 2.40 | % |
Strategic Income Fund | | | 2.96 | % |
Capital Gains Distributions. Pursuant to Internal Revenue Section 852(b), the following Funds paid distributions, which have been designated as capital gains distributions for the fiscal year ended December 31, 2020.
| | | | |
Fund | | Amount | |
Investment Grade Bond Fund | | $ | 154,088,171 | |
Strategic Income Fund | | | 42,139,359 | |
Qualified Dividend Income. For the fiscal year ended December 31, 2020, the Funds below will designate up to the maximum amount allowable pursuant to the Internal Revenue Code as qualified dividend income eligible for reduced tax rates. These lower rates range from 0% to 20% depending on an individual’s tax bracket. If the Funds pay a distribution during calendar year 2020, complete information will be reported in conjunction with Form 1099-DIV. These percentages are noted below:
| | | | |
Fund | | Qualifying
Percentage | |
High Income Fund | | | 2.49 | % |
International Growth Fund | | | 100.00 | % |
Investment Grade Bond Fund | | | 0.61 | % |
Strategic Alpha Fund | | | 3.49 | % |
Strategic Income Fund | | | 13.69 | % |
137 |
Trustee and Officer Information
The tables below provide certain information regarding the trustees and officers of Natixis Funds Trust II and Loomis Sayles Funds II (the “Trusts”). Unless otherwise indicated, the address of all persons below is 888 Boylston Street, Suite 800, Boston, MA 02199-8197. The Funds’ Statements of Additional Information include additional information about the trustees of the Trusts and are available by calling Natixis Funds at 800-225-5478.
| | | | | | | | |
Name and Year of Birth | | Position(s) Held with the Trusts, Length of Time Served and Term of Office1 | | Principal Occupation(s) During Past 5 Years | | Number of Portfolios in Fund Complex Overseen2 and Other
Directorships Held During Past 5 Years | | Experience,
Qualifications,
Attributes, Skills for Board Membership |
|
| INDEPENDENT TRUSTEES |
| | | | |
Edmond J. English
(1953) | | Trustee since 2013 Chairperson of Governance Committee and Audit Committee Member | | Executive Chairman of Bob’s Discount Furniture (retail) | | 54 Director, Burlington Stores, Inc. (retail) | | Significant experience on the Board and on the boards of other business organizations (including retail companies and a bank); executive experience (including at a retail company) |
| | | | |
Richard A. Goglia
(1951) | | Trustee since 2015 Contract Review Committee Member and Governance Committee Member | | Retired | | 54 Director of Triumph Group (aerospace industry) | | Significant experience on the Board and executive experience (including his role as vice president and treasurer of a defense company and experience at a financial services company) |
| | | | |
Wendell J. Knox
(1948) | | Trustee since 2009 Chairperson of Contract Review Committee | | Retired | | 54 Director of Abt Associates Inc. (research and consulting); Director, The Hanover Insurance Group (property and casualty insurance); formerly, Director, Eastern Bank (bank) | | Significant experience on the Board and on the boards of other business organizations (including at a bank and at a property and casualty insurance firm); executive experience (including roles as president and chief executive officer of a research and consulting company) |
| 138
Trustee and Officer Information
| | | | | | | | |
Name and Year of Birth | | Position(s) Held with the Trusts, Length of Time Served and Term of Office1 | | Principal Occupation(s) During Past 5 Years | | Number of Portfolios in Fund Complex Overseen2 and Other
Directorships Held During Past 5 Years | | Experience,
Qualifications,
Attributes, Skills for Board Membership |
|
| INDEPENDENT TRUSTEES – continued |
| | | | |
Martin T. Meehan
(1956) | | Trustee since 2012 Audit Committee Member | | President, University of Massachusetts | | 54 None | | Significant experience on the Board and on the boards of other business organizations; experience as President of the University of Massachusetts; government experience (including as a member of the U.S. House of Representatives); academic experience |
| | | | |
Maureen B. Mitchell
(1951) | | Trustee since 2017 Contract Review Committee Member and Governance Committee Member | | Retired; formerly President, Global Sales and Marketing, GE Asset Management, Inc. (financial services) | | 54 Director, Sterling Bancorp (bank) | | Experience on the Board; financial services industry and executive experience (including role as president of global sales and marketing at a financial services company) |
| | | | |
James P. Palermo
(1955) | | Trustee since 2016 Contract Review Committee Member | | Founding Partner, Breton Capital Management, LLC (private equity); Partner, STEP Partners, LLC (private equity) | | 54 Director, FutureFuel.io (chemicals and biofuels) | | Experience on the Board; financial services industry and executive experience (including roles as chief executive officer of client management and asset servicing for a banking and financial services company) |
| | | | |
Erik R. Sirri
(1958) | | Chairperson of the Board of Trustees since January 2021 Trustee since 2009 Ex Officio member of Audit Committee, Contract Review Committee and Governance Committee | | Professor of Finance at Babson College | | 54 None | | Significant experience on the Board; experience as Director of the Division of Trading and Markets at the Securities and Exchange Commission; academic experience; training as an economist |
139 |
Trustee and Officer Information
| | | | | | | | |
Name and Year of Birth | | Position(s) Held with the Trusts, Length of Time Served and Term of Office1 | | Principal Occupation(s) During Past 5 Years | | Number of Portfolios in Fund Complex Overseen2 and Other
Directorships Held During Past 5 Years | | Experience,
Qualifications,
Attributes, Skills for Board Membership |
|
| INDEPENDENT TRUSTEES – continued |
| | | | |
Peter J. Smail
(1952) | | Trustee since 2009 Audit Committee Member and Governance Committee Member | | Retired | | 54 None | | Significant experience on the Board; mutual fund industry and executive experience (including roles as president and chief executive officer for an investment adviser) |
| | | | |
Kirk A. Sykes
(1958) | | Trustee since 2019 Contract Review Committee Member | | Managing Director of Accordia Partners, LLC (real estate development); President of Primary Corporation (real estate development); Managing Principal of Merrick Capital Partners (infrastructure finance); formerly, President of Urban Strategy America Fund (real estate fund manager) | | 54 Trustee, Eastern Bank (bank); Director of Apartment Investment and Management Company (real estate investment trust); formerly Director, Ares Commercial Real Estate Corporation (real estate investment trust) | | Experience on the Board and significant experience on the boards of other business organizations (including real estate companies and banks) |
| | | | |
Cynthia L. Walker
(1956) | | Trustee since 2005 Chairperson of the Audit Committee and Governance Committee Member | | Retired; formerly, Deputy Dean for Finance and Administration, Yale University School of Medicine | | 54 None | | Significant experience on the Board; executive experience in a variety of academic organizations (including roles as dean for finance and administration) |
|
| INTERESTED TRUSTEES |
| | | | |
Kevin P. Charleston3
(1965) One Financial Center Boston, MA 02111 | | Trustee since 2015 | | President, Chief Executive Officer and Chairman of the Board of Directors, Loomis, Sayles & Company, L.P. | | 54 None | | Significant experience on the Board; continuing service as President, Chief Executive Officer and Chairman of the Board of Directors of Loomis, Sayles & Company, L.P. |
| 140
Trustee and Officer Information
| | | | | | | | |
Name and Year of Birth | | Position(s) Held with the Trusts, Length of Time Served and Term of Office1 | | Principal Occupation(s) During Past 5 Years | | Number of Portfolios in Fund Complex Overseen2 and Other
Directorships Held During Past 5 Years | | Experience,
Qualifications,
Attributes, Skills for Board Membership |
|
| INTERESTED TRUSTEES – continued |
| | | | |
David L. Giunta4
(1965) | | Trustee since 2011 President and Chief Executive Officer of Natixis Funds Trust II and President of Loomis Sayles Funds II since 2008; Chief Executive Officer of Loomis Sayles Funds II since 2015 | | President and Chief Executive Officer, Natixis Advisors, L.P., Natixis Distribution, L.P., Natixis Distribution Corporation and Chairman of the Board of Natixis Distribution Corporation | | 54 None | | Significant experience on the Board; experience as President and Chief Executive Officer of Natixis Advisors, L.P., Natixis Distribution, L.P., Natixis Distribution Corporation and Chairman of the Board of Natixis Distribution Corporation |
| 1 | Each trustee serves until retirement, resignation or removal from the Board. The current retirement age is 75. The position of Chairperson of the Board is appointed for a three-year term. |
| 2 | The trustees of the Trusts serve as trustees of a fund complex that includes all series of the Natixis Funds Trust I, Natixis Funds Trust II, Natixis Funds Trust IV, Gateway Trust, Loomis Sayles Funds I, Loomis Sayles Funds II, Natixis ETF Trust and Natixis ETF Trust II (collectively, the “Fund Complex”). |
| 3 | Mr. Charleston is deemed an “interested person” of the Trusts because he holds the following positions with an affiliated person of the Trusts: President, Chief Executive Officer and Chairman of the Board of Directors of Loomis, Sayles & Company, L.P. |
| 4 | Mr. Giunta is deemed an “interested person” of the Trusts because he holds the following positions with an affiliated person of the Trusts: President and Chief Executive Officer, Natixis Advisors, L.P., Natixis Distribution, L.P., Natixis Distribution Corporation and Chairman of the Board of Natixis Distribution Corporation. |
141 |
Trustee and Officer Information
| | | | | | |
Name and Year of Birth | | Position(s) Held with the Trusts | | Term of Office1 and Length of Time Served | | Principal Occupation(s) During Past 5 Years2 |
|
| OFFICERS OF THE TRUSTS |
| | | |
Russell L. Kane
(1969) | | Secretary, Clerk and Chief Legal Officer Chief Compliance Officer and Anti-Money Laundering Officer | | Since 2016 Since 2020 | | Executive Vice President, General Counsel, Secretary and Clerk, Natixis Distribution Corporation, Natixis Advisors, L.P. and Natixis Distribution, L.P.; formerly, Chief Compliance Officer for Mutual Funds, Senior Vice President, Deputy General Counsel, Assistant Secretary and Assistant Clerk, Natixis Distribution Corporation, Natixis Advisors, L.P. and Natixis Distribution, L.P. |
| | | |
Michael C. Kardok
(1959) | | Treasurer, Principal Financial and Accounting Officer | | Since 2004 | | Senior Vice President, Natixis Advisors, L.P. and Natixis Distribution, L.P. |
| 1 | Each officer of the Trusts serves for an indefinite term in accordance with the Trusts’ current by-laws until the date his or her successor is elected and qualified, or until he or she sooner dies, retires, is removed or becomes disqualified. |
| 2 | Each person listed above, except as noted, holds the same position(s) with the Fund Complex. Previous positions during the past five years with Natixis Distribution, L.P., Natixis Advisors, L.P. or Loomis, Sayles & Company, L.P. are omitted, if not materially different from an officer’s current position with such entity. |
| 142


Annual Report
December 31, 2020
Gateway Fund
Gateway Equity Call Premium Fund
Mirova Global Green Bond Fund
Mirova Global Sustainable Equity Fund
Mirova International Sustainable Equity Fund
Mirova U.S. Sustainable Equity Fund
Natixis Oakmark Fund
Natixis Oakmark International Fund
Natixis U.S. Equity Opportunities Fund
Vaughan Nelson Mid Cap Fund
Vaughan Nelson Small Cap Value Fund
Table of Contents

GATEWAY FUND
| | |
| |
| Managers | | Symbols |
| |
| Daniel M. Ashcraft, CFA® | | Class A GATEX |
| |
| Michael T. Buckius, CFA® | | Class C GTECX |
| |
| Paul R. Stewart, CFA® | | Class N GTENX |
| |
| Kenneth H. Toft, CFA® | | Class Y GTEYX |
|
| Gateway Investment Advisers, LLC |
Investment Goal
The Fund seeks to capture the majority of returns associated with equity market investments, while exposing investors to less risk than other equity investments.
Market Conditions
The above-average annual return of the S&P 500® Index in 2020 belies the economic and market turmoil wrought by the Covid-19 pandemic during the year. As investors processed the potential economic impact of the virus in March, equities experienced record-setting volatility and fell into a bear market faster than any other market decline in history. Nearly as shocking was how swiftly the equity market recovered to new highs, which also happened in record time. The recovery was led primarily by technology businesses that helped facilitate home-based work, entertainment and shopping, while more economically sensitive businesses lagged behind. After the recovery reached a temporary peak in early September, the market experienced an additional sharp decline as investors processed a resurging pandemic case count and election uncertainty. In November, as election results became clearer and progress was made on Covid-19 vaccines, losses were recovered and the equity market delivered its second highest total return of any November on record. The S&P 500® Index continued to trend upward in December and ended the year at a new all-time high.
The turmoil caused by the pandemic drove a significant shift in measures of realized volatility, implied volatility, and the dynamic relationship between the two. Volatility measures at the beginning of 2020 were consistent with the below-average readings persistent in recent years. The Cboe® Volatility Index® (the VIX®) set a 2020 closing low of 12.10 on January 17 and did not break above its long-term average of 19.47 until February 24, the first day in 2020 in which the S&P 500® Index had a loss exceeding 3%. The VIX® rose as high as 85.47 on March 18, just shy of its all-time intra-day high reading of 89.53 set in 2008.
Realized volatility measures in 2020 were even more extreme. The S&P 500® Index would record 16 more one-day losses exceeding 3%, eight of which occurred in March alone. The large swings resulted in a 93.44% annualized standard deviation of daily returns for the S&P 500® Index in March, the highest reading of monthly standard deviation in history, dating back to 1928. The massive spike in realized volatility caused the typical relationship between implied and realized volatility to invert. Typically, implied volatility measures exceed realized volatility, and this relationship has held about 90% of the time on a monthly basis since 1990. The March 2020 inversion was the largest on record, nearly 50% larger than the previous record established in September 2008. While it was extreme, the inversion was temporary, as realized volatility normalized more quickly than implied volatility. After implied volatility peaked in mid-March, the VIX® trended lower while the spread between implied and realized volatility flipped back to positive in April and remained positive each subsequent month of the year. Moreover, the August and December measures were the highest and second-highest implied versus realized spreads in history.
Performance Results
For the 12 months ended December 31, 2020, Class Y shares of the Gateway Fund returned 7.19% at net asset value. The Fund’s primary benchmark, the S&P 500® Index, returned 18.40% for the same period, while its secondary benchmark, the Bloomberg Barclays U.S. Aggregate Bond Index, returned 7.51%.
Explanation of Fund Performance
The Fund invests in a broadly diversified portfolio of common stocks that is designed to track the performance of the S&P 500® Index, while also selling index call options and purchasing index put options. The Fund seeks to generate returns by creating cash flow through writing at-the-money index call options against the full value of its underlying equity portfolio. The written call options, premium levels of which have a high correlation to volatility, provide cash flow into the Fund, yet may limit upside participation in an equity market advance. The Fund uses some of the cash flow from index call option writing to purchase out-of-the-money index put options to mitigate sudden and severe price declines in the equity portfolio. An index call option is described as being at-the-money when the price of the underlying index is the same as the option’s strike price. Additionally, an index put option is described as being out-of-the-money when its strike price is below the price of the underlying index. It is the net premium-to-earn from selling index call options less the price of protective index put options that is a significant factor in determining how much participation the Fund will
1 |
have in a rising market and how much downside protection is delivered in a declining market. In the long term, the combination of the diversified stock portfolio, steady cash flow from the sale of index call options and downside protection from index put options is intended to provide the Fund with the majority of the returns associated with equity market investments while exposing investors to less risk.
The Fund underperformed its primary benchmark for the year while achieving the risk component of its objective by exhibiting significantly less risk than the equity market. Throughout 2020, the Fund’s two-part option strategy delivered equity market participation during the periods in which the equity market advanced and significant downside protection during market declines. Specifically, from the beginning of the year to the pre-Covid equity market high on February 19, the Fund returned 1.79%, underperforming the S&P 500® Index by 3.29 percentage points. When the equity market has a strong advance combined with below-average implied volatility levels, underperformance is expected as the risk-reducing option strategy generates losses that detract from the return of the Fund’s index-tracking equity portfolio. During the pandemic-driven bear market from February 19 to March 23, the Fund declined 16.10%, less than half the loss of its primary benchmark, as gains from its option strategy provided 17.69 percentage points of downside protection relative to the S&P 500® Index. The Fund returned 20.61% during the market recovery from March 23 to the temporary recovery peak on September 2. The S&P 500® Index returned 61.39% over this period and the Fund’s return differential with its benchmark was primarily due to losses from the Fund’s option strategy, though above-average implied volatility levels resulted in smaller losses than would have otherwise been incurred. From September 2 through year-end, during a market advance that was far from steady, sustained implied volatility levels helped the Fund deliver strong market participation with a return of 4.06% compared to the S&P 500® Index return of 5.45% for the same period. This volatile timeframe included a decline of 8.48% for the S&P 500® Index from September 2 through October 31. The Fund again provided downside protection with a return of -3.39% over the same period.
The Fund’s equity portfolio returned 20.06% for the year, a performance differential of positive 166 basis points versus the S&P 500® Index. Consistent with its investment objective, the measured risk of the Fund was low relative to the US equity market, as its standard deviation of daily returns for 2020 was 13.87% versus 34.43% for the S&P 500® Index.
The Fund began the year with full index put option coverage. Amid heightened equity market volatility during the pandemic-driven bear market, the investment team closed out two index put option positions at a profit on February 27, resulting in a put coverage range of 65%–80%. The team further reduced the Fund’s put coverage three additional times in March, ending the first quarter of 2020 with a put coverage range of 40%–50%. These actions monetized the higher volatility that was priced into index put option contracts and preserved index put option gains. As put coverage was reduced, in an effort to keep the Fund’s risk profile consistent, the index put option portfolio had a weighted-average strike price closer than usual to the equity market level. As the equity market recovered, implied volatility moderated from extreme levels and created opportunities for the investment team to selectively increase index put option coverage in a cost-effective way, while maintaining a consistent risk profile. From early April to August, the team gradually increased put option coverage to a range of 80%–95%. Over the remainder of the year, the Fund’s put option coverage range was unchanged while a typical risk profile was maintained. The Fund maintained a portfolio of written index call options on the full value of its equity holdings over the course of the year while making active adjustments to positions in response to changing market conditions.
Outlook
Gateway’s investment philosophy is informed by its long history and maintains that the equity market is the most reliable source of attractive long-term returns, despite its high volatility relative to other asset classes and tendency to periodically deliver significant short-term losses. Gateway’s investment philosophy also holds that consistency is key to long-term success and that generating cash flow with index options, rather than seeking to forecast the market, can be a lower-risk way to participate in equity markets. By staying true to this philosophy and continuing to manage strategies consistent with the firm’s historical approach, Gateway assists Fund shareholders in managing risk while pursuing long-term returns in an uncertain environment. As always, Gateway will avoid incorporating forecasts into its investment approach and will not attempt to anticipate how events will unfold.
| 2
GATEWAY FUND
Hypothetical Growth of $100,000 Investment in Class Y Shares4
December 31, 2010 through December 31, 2020
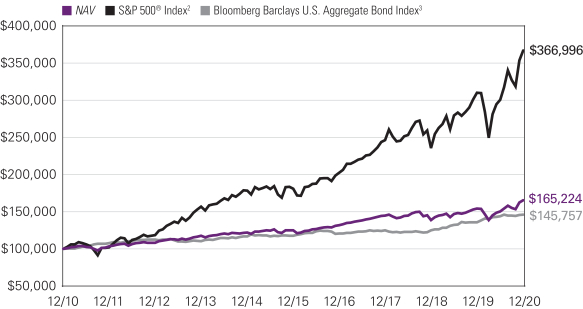
Top Ten Holdings as of December 31, 2020
| | | | | | | | |
| | |
| Security Name | | % of
Assets | |
| | 1 | | | Apple, Inc. | | | 7.00 | % |
| | 2 | | | Microsoft Corp. | | | 5.68 | |
| | 3 | | | Amazon.com, Inc. | | | 4.57 | |
| | 4 | | | Alphabet, Inc., Class C | | | 2.28 | |
| | 5 | | | Facebook, Inc., Class A | | | 2.20 | |
| | 6 | | | Berkshire Hathaway, Inc., Class B | | | 1.69 | |
| | 7 | | | JPMorgan Chase & Co. | | | 1.62 | |
| | 8 | | | Visa, Inc., Class A | | | 1.45 | |
| | 9 | | | Johnson & Johnson | | | 1.31 | |
| | 10 | | | UnitedHealth Group, Inc. | | | 1.29 | |
The portfolio is actively managed and holdings are subject to change. There is no guarantee the Fund continues to invest in the securities referenced. The holdings listed exclude any temporary cash investments.
3 |
Average Annual Total Returns – December 31, 20204
| | | | | | | | | | | | | | | | | | | | | | | | |
| | | | | | |
| | | 1 Year | | | 5 Years | | | 10 Years | | | Life of
Class N | | | Expense Ratios5 | |
| | Gross | | | Net | |
| | | | | | | |
Class Y (Inception 2/19/08) | | | | | | | | | | | | | | | | | | | | | | | | |
NAV | | | 7.19 | % | | | 5.77 | % | | | 5.15 | % | | | — | % | | | 0.76 | % | | | 0.70 | % |
| | | | | | | |
Class A (Inception 12/07/77) | | | | | | | | | | | | | | | | | | | | | | | | |
NAV | | | 6.92 | | | | 5.51 | | | | 4.90 | | | | — | | | | 1.01 | | | | 0.94 | |
With 5.75% Maximum Sales Charge | | | 0.76 | | | | 4.27 | | | | 4.28 | | | | — | | | | | | | | | |
| | | | | | | |
Class C (Inception 2/19/08) | | | | | | | | | | | | | | | | | | | | | | | | |
NAV | | | 6.13 | | | | 4.71 | | | | 4.10 | | | | — | | | | 1.76 | | | | 1.70 | |
With CDSC1 | | | 5.13 | | | | 4.71 | | | | 4.10 | | | | — | | | | | | | | | |
| | | | | | | |
Class N (Inception 5/1/17) | | | | | | | | | | | | | | | | | | | | | | | | |
NAV | | | 7.25 | | | | — | | | | — | | | | 5.36 | | | | 0.69 | | | | 0.65 | |
| | | | | | | |
Comparative Performance | | | | | | | | | | | | | | | | | | | | | | | | |
S&P 500® Index2 | | | 18.40 | | | | 15.22 | | | | 13.88 | | | | 15.30 | | | | | | | | | |
Bloomberg Barclays U.S. Aggregate Bond Index3 | | | 7.51 | | | | 4.44 | | | | 3.84 | | | | 4.93 | | | | | | | | | |
Performance data shown represents past performance and is no guarantee of, and not necessarily indicative of, future results. Total return and value will vary, and you may have a gain or loss when shares are sold. Current performance may be lower or higher than quoted. For more recent month-end performance, visit im.natixis.com/performance. Performance for other share classes will be greater or less than shown based on differences in fees and sales charges. You may not invest directly in an index. Performance for periods less than one year is cumulative, not annualized. Returns reflect changes in share price and reinvestment of dividends and capital gains, if any. The table(s) do not reflect taxes shareholders might owe on any fund distributions or when they redeem their shares.
| 1 | Performance for Class C shares assumes a 1% contingent deferred sales charge (“CDSC”) applied when you sell shares within one year of purchase. |
| 2 | S&P 500® Index is a widely recognized measure of U.S. stock market performance. It is an unmanaged index of 500 common stocks chosen for market size, liquidity, and industry group representation, among other factors. It also measures the performance of the large cap segment of the US equities market. |
| 3 | The Bloomberg Barclays U.S. Aggregate Bond Index is a broad-based index that covers the U.S. dollar-denominated, investment-grade, fixed-rate, taxable bond market of SEC-registered securities. The index includes bonds from the Treasury, government-related, corporate, mortgage-backed securities, asset-backed securities, and collateralized mortgage-backed securities sectors. |
| 4 | Fund performance has been increased by fee waivers and/or expense reimbursements, if any, without which performance would have been lower. |
| 5 | Expense ratios are as shown in the Fund’s prospectus in effect as of the date of this report. The expense ratios for the current reporting period can be found in the Financial Highlights section of this report under Ratios to Average Net Assets. Net expenses reflect contractual expense limitations set to expire on 4/30/21. When a Fund’s expenses are below the limitation, gross and net expense ratios will be the same. See Note 6 of the Notes to Financial Statements for more information about the Fund’s expense limitations. |
| 4
GATEWAY EQUITY CALL PREMIUM FUND
| | |
| |
| Managers | | Symbols |
| |
| Daniel M. Ashcraft, CFA® | | Class A GCPAX |
| |
| Michael T. Buckius, CFA® | | Class C GCPCX |
| |
| Kenneth H. Toft, CFA® | | Class N GCPNX |
| |
| Gateway Investment Advisers, LLC | | Class Y GCPYX |
Investment Goal
The Fund seeks total return with less risk than U.S. equity markets.
Market Conditions
The S&P 500® Index returned 18.40% for the year. The above-average calendar year return and positive note on which 2020 ended nearly disguised the turmoil with which it began. During the pre-Covid period of January 1 through February 19, 2020 the S&P 500® Index returned 5.08%, continuing its positive momentum from 2019 as investors reflected on the passage of major global trade deals and strong backward-looking economic data. A pandemic-driven bear market combined with government policies that severely restricted economic activity drove the S&P 500® Index down 33.79% from February 19 through March 23. The recovery from the bear market was led primarily by technology businesses that helped facilitate home-based work, entertainment and shopping, and powered the S&P 500® Index to a 61.39% return from March 23 to the recovery period peak on September 2. From September 2 through year-end, the S&P 500® Index returned 5.45%, but the advance was far from steady. The same businesses that drove the recovery period led a decline of 8.48% from September 2 through October 31 as investors processed a resurging pandemic case count and election uncertainty. In November, as election results became clearer and progress was made on Covid-19 vaccines, losses from September and October were recovered and the equity market delivered its second highest total return of any November on record. The market continued to trend upward in December, with the S&P 500® Index ending the year at a new all-time high.
The turmoil caused by the pandemic drove a significant shift in measures of realized volatility, implied volatility and the dynamic relationship between the two. Volatility measures at the beginning of 2020 were consistent with the below-average readings persistent in recent years. The Cboe® Volatility Index® (the VIX®) set a 2020 closing low of 12.10 on January 17 and did not break above its long-term average of 19.47 until February 24, the first day in 2020 in which the S&P 500® Index had a loss exceeding 3%. The VIX® rose as high as 85.47 on March 18, just shy of its all-time intra-day high reading of 89.53 set in 2008.
Realized volatility measures in 2020 were even more extreme. The S&P 500® Index would record 16 more one-day losses exceeding 3%, eight of which occurred in March alone. The large swings resulted in a 93.44% annualized standard deviation of daily returns for the S&P 500® Index in March, the highest reading of monthly standard deviation in history, dating back to 1928. The massive spike in realized volatility caused the typical relationship between implied and realized volatility to invert. Typically, implied volatility measures exceed realized volatility, and this relationship has held about 90% of the time on a monthly basis since 1990. The inversion in March 2020 was the largest on record, nearly 50% larger than the previous record established in September 2008. While it was extreme, the inversion was temporary, as realized volatility normalized more quickly than implied volatility. After implied volatility peaked in mid-March, the VIX® trended lower while the spread between implied and realized volatility flipped back to positive in April and remained positive each subsequent month of the year. Moreover, the August and December measures were the highest and second-highest implied versus realized spreads in history.
Performance Results
For the 12 months ended December 31, 2020, Class Y shares of the Gateway Equity Call Premium Fund returned 8.38% at net asset value. The Fund outperformed its primary benchmark, the Cboe S&P 500 BuyWrite Index (“BXMSM”), which returned -2.75% for the same period.
Explanation of Fund Performance
The Fund invests in a broadly diversified portfolio of common stocks that is designed to track the performance of the S&P 500® Index and support its index option-based risk management strategy as efficiently as possible while seeking to enhance the Fund’s after-tax total return. The Fund seeks to generate returns by writing at- and near-the-money index call options against the full value of its underlying equity portfolio. The steady cash flow from call option writing is intended to be an important source of the Fund’s return, although it reduces the Fund’s ability to profit from increases in the value of its equity portfolio. The index call options written by the Fund often have similar characteristics to the single index call option present in the BXMSM at any given time. However, unlike the BXMSM, the Fund employs an active strategy that gives its management team discretion to diversify expiration dates and strike prices across a portfolio of index call options and to opportunistically pursue attractive call premiums while maintaining a relatively consistent risk profile.
5 |
The Fund outperformed the BXMSM by 1,113 basis points for the year. Throughout 2020, the Fund’s diversified and active index call option writing approach generated risk-reducing cash flow and delivered equity market participation during periods in which the equity market advanced and downside protection during market declines. Specifically, the Fund provided consistent market exposure during the pre-Covid advance from January 1 through February 19, with a return of 2.83% compared to the BXMSM return of 2.25%. During the pandemic-driven bear market from February 19 to March 23, the Fund returned -25.24% compared to the BXMSM return of -30.23%. The BXM’sSM passive, single contract approach produced less cash flow and resulted in increasing market exposure during the market decline while the Fund’s diversified and actively managed approach generated higher cash flow from written index call options and lower market exposure, resulting in better downside protection.
During the market recovery from March 23 to the temporary recovery peak on September 2, the Fund returned 32.13%, outperforming the BXMSM return of 27.22%, as the Fund’s approach again provided consistent equity exposure and higher cash flow. From September 2 through year-end, during a market advance that was far from steady, the Fund returned 6.70%, underperforming the BXMSM return of 7.13%. The Fund’s underperformance for the period was primarily due to a larger loss than the BXMSM for the month of September. Consistent with its active approach, the Fund began September with the weighted-average strike price of its written index call option portfolio approximately at-the-money, resulting in relatively more exposure to the market’s decline than the BXMSM, which began the month with very low market exposure as the strong market advance in August put its written index call option deep in-the-money.
The Fund’s equity portfolio returned 20.08% for the year, a performance differential of positive 168 basis points versus the S&P 500® Index. The measured risk of the Fund was lower than that of the US equity market and the BXMSM, as its standard deviation of daily returns for 2020 was 22.71%, versus 34.43% and 27.01% for the S&P 500® Index and the BXMSM, respectively.
Outlook
Gateway’s investment philosophy is informed by its long history and maintains that the equity market is the most reliable source of attractive long-term returns, despite its high volatility relative to other asset classes and tendency to periodically deliver significant short-term losses. Gateway’s investment philosophy also holds that consistency is key to long-term success and that generating cash flow with index options, rather than seeking to forecast the market, can be a lower-risk way to participate in equity markets. By staying true to this philosophy and continuing to manage strategies consistent with the firm’s historical approach, Gateway assists Fund shareholders in managing risk while pursuing long-term returns in an uncertain environment. As always, Gateway will avoid incorporating forecasts into its investment approach and will not attempt to anticipate how events will unfold.
Hypothetical Growth of $100,000 Investment in Class Y Shares4
September 30, 2014 (inception) through December 31, 2020
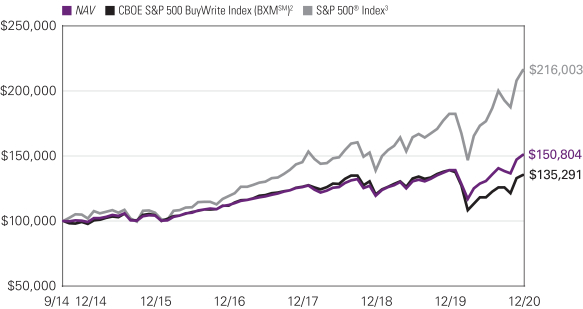
See notes to chart on page 7.
| 6
GATEWAY EQUITY CALL PREMIUM FUND
Top Ten Holdings as of December 31, 2020
| | | | | | | | |
| | |
| Security Name | | % of
Assets | |
| | 1 | | | Apple, Inc. | | | 6.95 | % |
| | 2 | | | Microsoft Corp. | | | 5.50 | |
| | 3 | | | Amazon.com, Inc. | | | 4.49 | |
| | 4 | | | Facebook, Inc., Class A | | | 2.16 | |
| | 5 | | | Alphabet, Inc., Class C | | | 2.00 | |
| | 6 | | | JPMorgan Chase & Co. | | | 1.70 | |
| | 7 | | | Berkshire Hathaway, Inc., Class B | | | 1.62 | |
| | 8 | | | Visa, Inc., Class A | | | 1.57 | |
| | 9 | | | UnitedHealth Group, Inc. | | | 1.41 | |
| | 10 | | | Procter & Gamble Co. (The) | | | 1.40 | |
The portfolio is actively managed and holdings are subject to change. There is no guarantee the Fund continues to invest in the securities referenced. The holdings listed exclude any temporary cash investments.
Average Annual Total Returns – December 31, 20204
| | | | | | | | | | | | | | | | | | | | | | | | |
| | | | | |
| | | 1 Year | | | 5 Years | | | Life of Class | | | Expense Ratios5 | |
| | Gross | | | Net | |
| | | | | | | |
| Class Y (Inception 9/30/14) | | | | | | | | | | | Class Y/A/C | | | | Class N | | | | | | | | | |
| NAV | | | 8.38 | % | | | 7.68 | % | | | 6.79 | % | | | — | % | | | 1.17 | % | | | 0.95 | % |
| | | | | | | |
| Class A (Inception 9/30/14) | | | | | | | | | | | | | | | | | | | | | | | | |
| NAV | | | 8.06 | | | | 7.40 | | | | 6.53 | | | | — | | | | 1.42 | | | | 1.20 | |
| With 5.75% Maximum Sales Charge | | | 1.83 | | | | 6.14 | | | | 5.52 | | | | — | | | | | | | | | |
| | | | | | | |
| Class C (Inception 9/30/14) | | | | | | | | | | | | | | | | | | | | | | | | |
| NAV | | | 7.23 | | | | 6.61 | | | | 5.74 | | | | — | | | | 2.17 | | | | 1.95 | |
| With CDSC1 | | | 6.23 | | | | 6.61 | | | | 5.74 | | | | — | | | | | | | | | |
| | | | | | | |
| Class N (Inception 5/1/17) | | | | | | | | | | | | | | | | | | | | | | | | |
| NAV | | | 8.36 | | | | — | | | | — | | | | 7.13 | | | | 1.63 | | | | 0.90 | |
| | | | | | | |
| Comparative Performance | | | | | | | | | | | | | | | | | | | | | | | | |
| Cboe S&P 500 BuyWrite Index (BXMSM)2 | | | -2.75 | | | | 5.33 | | | | 6.14 | | | | 3.95 | | | | | | | | | |
| S&P 500® Index3 | | | 18.40 | | | | 15.22 | | | | 13.88 | | | | 15.30 | | | | | | | | | |
Performance data shown represents past performance and is no guarantee of, and not necessarily indicative of, future results. Total return and value will vary, and you may have a gain or loss when shares are sold. Current performance may be lower or higher than quoted. For most recent month-end performance, visit im.natixis.com/performance. Performance for other share classes will be greater or less than shown based on differences in fees and sales charges. You may not invest directly in an index. Performance for periods less than one year is cumulative, not annualized. Returns reflect changes in share price and reinvestment of dividends and capital gains, if any. The table(s) do not reflect taxes shareholders might owe on any fund distributions or when they redeem their shares.
| 1 | Performance for Class C shares assumes a 1% contingent deferred sales charge (“CDSC”) applied when you sell shares within one year of purchase. |
| 2 | The Cboe S&P 500 BuyWrite IndexSM (BXMSM) is a benchmark index designed to track the performance of a hypothetical buy-write strategy on the S&P 500® Index. The BXM is a passive total return index based on (1) buying an S&P 500 stock index portfolio, and (2) “writing” (or selling) the near-term S&P 500® Index (SPXSM) “covered” call option, generally on the third Friday of each month. The SPX call written will have about one month remaining to expiration, with an exercise price just above the prevailing index level (i.e., slightly out of the money). The SPX call is held until expiration and cash settled, at which time a new one-month, near-the-money call is written. |
| 3 | S&P 500® Index is a widely recognized measure of U.S. stock market performance. It is an unmanaged index of 500 common stocks chosen for market size, liquidity, and industry group representation, among other factors. It also measures the performance of the large cap segment of the US equities market. |
| 4 | Fund performance has been increased by fee waivers and/or expense reimbursements, if any, without which performance would have been lower. |
| 5 | Expense ratios are as shown in the Fund’s prospectus in effect as of the date of this report. The expense ratios for the current reporting period can be found in the Financial Highlights section of this report under Ratios to Average Net Assets. Net expenses reflect contractual expense limitations set to expire on 4/30/21. When a Fund’s expenses are below the limitation, gross and net expense ratios will be the same. See Note 6 of the Notes to Financial Statements for more information about the Fund’s expense limitations. |
7 |
MIROVA GLOBAL GREEN BOND FUND
| | |
| |
| Managers | | Symbols |
| |
| Marc Briand | | Class A MGGAX |
| |
| Charles Portier | | Class N MGGNX |
| |
| Bertrand Rocher | | Class Y MGGYX |
| |
| Mirova US LLC | | |
| * | Effective September 1, 2020, Bertrand Rocher joined the portfolio management team of the Fund. |
Investment Goal
The Fund seeks to provide total return, through a combination of capital appreciation and current income, by investing in green bonds.
Market Conditions
Had an investor been told at the beginning of 2020 that during the following year, global unemployment would hit unprecedented levels, almost 2 million people would die from a virus that affected over 87 million people around the world, that this virus would require people to stay in their homes, would cause large global contractions in economic growth even with unprecedented levels of monetary and fiscal stimulus globally — had that investor been then asked their expectations for global markets for that year, it is challenging to believe many would see the market as rising significantly for the year under these circumstances. Yet this is exactly what has unfolded over the last 12 months.
In early November specifically, the announcement that several vaccines were found effective triggered a wave of market optimism that further buoyed the already supportive momentum observed over October after the late September sell-off. This occurred amid the backdrop that it was likely the United States would have a more conventional president in the White House and a Brexit agreement between the UK and the EU came to fruition. This further boosted markets: All credit segments rallied with Investment Grade (IG) and High Yield (HY) spreads having retraced back to their mid-February 2020 levels, i.e. the period prior to the pandemic-driven panic. More specifically, the Bloomberg Barclays Euro Aggregate Corporate Average Option-Adjusted Spread Index stood at 0.92% as of December 31, 2020 — a relatively tight level, from a historical point of view. In such a one-way, risk-on market, high betas — be it in the form of subordinated debts or of pure senior high yield — logically outperformed investment grade. Of course, cyclical credits also performed well as market makers were modelling scenarios under which the probability of a rapid recovery in mobility, travel or leisure, amongst a flurry of other sectors, was growing, something that has subsequently fueled spread tightening for industries such as automotive, transportation, and gaming.
Once again, the backbone of all those moves remains central bank policies: the Federal Reserve, European Central Bank, Bank of England, and Bank of Japan with accommodative measures, such as massive bond purchase programs, continued to play their role, as they had all over the second and third quarters; this is of course exacerbating the impact of a relatively modest net supply.
Performance Results
For the 12 months ended December 31, 2020, Class Y shares of the Mirova Global Green Bond Fund returned 7.85%, at net asset value. The Fund outperformed its benchmark, the Bloomberg Barclays MSCI Green Bond Index, which returned 6.67%.
Explanation of Fund Performance
The Fund faced some challenges during the first quarter where it underperformed its benchmark by 1.61%. This under-performance was due to both allocation and security selection. At that time, the long position on corporate versus government bonds (specifically German bonds) detracted as did the long exposure on high beta issuers within the corporates (hybrids), financials (Tier 2) and quasi sovereign (hybrids). During this time, corporate issues became very attractive considering the full support of central banks, and the Fund increased its exposure to corporate issuers during March, accordingly.
After closing the books on the first quarter of 2020, we’ve seen a steady, V-shaped market recovery and, broadly speaking, corporate credit outperformed for the remainder of 2020, primarily within investment grade, and high yield followed later in the fourth quarter of 2020.
Amid this backdrop we saw the Fund outperform its benchmark by 1.15%, 0.69%, and 0.97%, respectively, over the second, third, and fourth quarters.
In the fourth quarter, the continued market recovery took credit spreads to almost pre-pandemic levels, which led us to take profit by reducing corporate credit exposure from 70% down to 56%. Alternatively, we have been investing in emerging market green sovereigns
| 8
MIROVA GLOBAL GREEN BOND FUND
(Chile, Hungary, Mexico) which offered attractive returns and kept our high-yield exposure at ~10%. From a credit-cycle point-of-view, we have been increasing our cyclical exposure (mainly through automotive and capital goods) versus more defensive securities in order to take advantage of the economic recovery post-pandemic.
All in all, the majority of outperformance in 2020 came from allocation. Security selection was costly until November from which point it recovered enough to close the year slightly positive as a contributor to outperformance as well. Yield curve positioning and duration acted in a somewhat opposite manner as our long duration positioning for the US which paid off until August when it pulled-back and ended up flat year-to-date.
Outlook
In many ways, it seems as though we are picking-up 2021 right where we thought we were to start 2020. It is reminiscent in terms of market configuration where investors are seeking yield, compression trading is predominantly driving the market, and we see historical lows spread-wise and highs in price (including in some equity indices). However, as we have just witnessed with the Covid-19 pandemic derailing commonly accepted outlook for 2020; 2021 could too, be full of surprises, but we believe those will be positive on the economic front, with vaccine execution taking center stage. According to our constructive scenario, main performance contributors will be security selection, duration, geopolitical pressures tied to changing administrations in the United States, and Covid-19 related knock-on effects tied to vaccine dissemination and pandemic related-spending.
Hypothetical Growth of $100,000 Investment in Class Y Shares2
February 28, 2017 (inception) through December 31, 2020
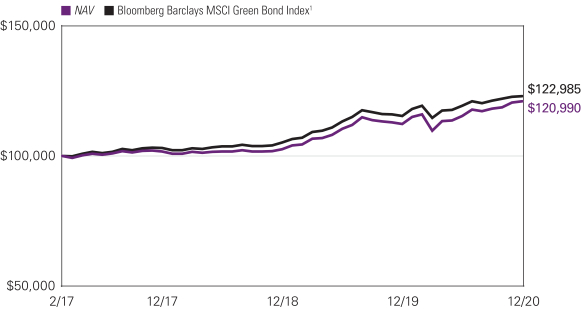
9 |
Average Annual Total Returns – December 31, 20202
| | | | | | | | | | | | | | | | |
| | | | |
| | | 1 Year | | | Life of Fund | | | Expense Ratios3 | |
| | | Gross | | | Net | |
| | | | | |
| Class Y (Inception 2/28/17) | | | | | | | | | | | | | | | | |
| NAV | | | 7.85 | % | | | 5.09 | % | | | 1.28 | % | | | 0.71 | % |
| | | | | |
| Class A (Inception 2/28/17) | | | | | | | | | | | | | | | | |
| NAV | | | 7.61 | | | | 4.85 | | | | 1.56 | | | | 0.96 | |
| With 4.25% Maximum Sales Charge | | | 3.04 | | | | 3.68 | | | | | | | | | |
| | | | | |
| Class N (Inception 2/28/17) | | | | | | | | | | | | | | | | |
| NAV | | | 7.89 | | | | 5.17 | | | | 1.08 | | | | 0.66 | |
| | | | | |
| Comparative Performance | | | | | | | | | | | | | | | | |
| Bloomberg Barclays MSCI Green Bond Index1 | | | 6.67 | | | | 5.52 | | | | | | | | | |
Performance data shown represents past performance and is no guarantee of, and not necessarily indicative of, future results. Total return and value will vary, and you may have a gain or loss when shares are sold. Current performance may be lower or higher than quoted. For most recent month-end performance, visit im.natixis.com/performance. Performance for other share classes will be greater or less than shown based on differences in fees and sales charges. You may not invest directly in an index. Performance for periods less than one year is cumulative, not annualized. Returns reflect changes in share price and reinvestment of dividends and capital gains, if any. The table(s) do not reflect taxes shareholders might owe on any fund distributions or when they redeem their shares.
| 1 | The Bloomberg Barclays MSCI Green Bond Index provides a broad-based measure of global fixed-income securities issued to fund projects with direct environmental benefits according to MSCI ESG Research’s green bond criteria. The green bonds are primarily investment-grade, or may be classified by other sources when bond ratings are not available. The Index may include green bonds from the corporate, securitized, Treasury, or government-related sectors. |
| 2 | Fund performance has been increased by fee waivers and/or expense reimbursements, if any, without which performance would have been lower. |
| 3 | Expense ratios are as shown in the Fund’s prospectus in effect as of the date of this report. The expense ratios for the current reporting period can be found in the Financial Highlights section of this report under Ratios to Average Net Assets. Net expenses reflect contractual expense limitations set to expire on 4/30/21. When a Fund’s expenses are below the limitation, gross and net expense ratios will be the same. See Note 6 of the Notes to Financial Statements for more information about the Fund’s expense limitations. |
| 10
MIROVA GLOBAL SUSTAINABLE EQUITY FUND
| | |
| |
| Managers | | Symbols |
| |
| Jens Peers, CFA® | | Class A ESGMX |
| |
| Hua Cheng, CFA®, PhD | | Class C ESGCX |
| |
| Amber Fairbanks, CFA® | | Class N ESGNX |
| |
| Mirova US LLC | | Class Y ESGYX |
Investment Goal
The Fund seeks long-term capital appreciation.
Market Conditions
Had investors been told at the beginning of 2020 that in the upcoming year global unemployment would hit unprecedented levels, almost 2 million people would die from a virus that affected over 87 million people around the world, that this virus would require people to stay in their homes and would cause large global contractions in economic growth even with unprecedented levels of monetary and fiscal stimulus globally — it is unlikely that many would have predicted the market rising significantly for the year. Yet this is exactly what unfolded over the last 12 months.
Monetary policy that encouraged risk taking can be partially credited for the strong performance of equities for much of the year after a sharp decline in March, but perhaps a stronger driver has been hope. The fourth quarter of the year certainly served to boost hope and optimism that the world would soon return to something closer to normal as pharmaceutical companies announced the development of effective vaccines to treat the Covid-19 virus. It is often said that the stock market is forward looking, though not well explored is whether the stock market is accurate in its forward-looking view. Many are happy to put 2020 in the rear-view mirror, and if the market is accurate in its view, 2021 should be a much better year — certainly one can hope that is the case.
Performance Results
For the 12 months ended December 31, 2020, Class Y Shares of the Mirova Global Sustainable Equity Fund returned 32.42% at net asset value. The Fund outperformed its benchmark, the MSCI World Index (Net), which returned 15.90% over the same period. It is important to note that there are material differences between the Fund and this benchmark.
Explanation of Fund Performance
The biggest contributors to relative performance were stock selection, particularly in Industrials, Utilities and Healthcare. Stocks held in Industrials and Utilities benefited from growth in alternative energy, particularly Vestas Wind Systems A/S, a wind turbine manufacturer, and Orsted A/S, an offshore wind utility. Both increased sharply on strong growth in demand for alternative energy during the year as well as a very positive outlook for growth given the objectives outlined by the Biden administration around climate change. Within Healthcare, Danaher Corp. and Thermo Fisher Scientific Inc., two companies broadly exposed to increased spending in healthcare, were strong performers for the year.
The biggest detractors from relative performance were stock selection in Consumer Discretionary and cash held in the portfolio. Within Consumer Discretionary, companies affected by cyclical demand and companies with a brick and mortar presence declined as Covid-19 detracted from performance. This included building company Sekisui House, eyeglass manufacturer EssilorLuxottica and auto component manufacturer Valeo. The worst performing stock for 2020 was Danone SA, which reported weak organic growth. Investors remain concerned about the company’s ability to reinvigorate its revenue growth.
The portfolio invests in companies that offer solutions to and/or are expected to benefit from the demographic, technological, environmental and governance-related transitions that Mirova believes will transform the world’s economies and societies during the next decade.
With many governments still committed to keeping global warming limited to a 2-degree Celsius scenario, we expect climate change to remain a driver of political debate and the portfolio will continue to shy away from fossil fuel extraction in favor of renewables and companies focused on energy efficiency. Although cyclical exposure increased modestly during the quarter as a result of portfolio adjustments (see below), the team continues to like the downside protection that companies with strong balance sheets, solid management teams and positive exposure to long-term secular trends potentially offer.
During the year, the investment team initiated positions in Intuitive Surgical, Inc., Bright Horizons Family Solutions, Inc., Ball Corp., and Orpea SA and sold outright Fresenius SE & Co. and Gilead Sciences, Inc.
11 |
Intuitive Surgical was added in April. The company’s main product is an advanced surgical system, daVinci Surgical System, and its related instruments and services. The system includes surgeon’s console, patient-side cart, and high performance vision system. Intuitive Surgical provides solutions for global healthcare challenges as it innovates and manufactures surgical robotic systems that allow minimally invasive surgery and provide real-life images of the patient’s anatomy during surgery. It is uniquely positioned with the best system in the robotic surgery industry and provides a very attractive value proposition for hospitals, patients and doctors. Its competitive advantage is well protected, its financials are very strong, and its top management team has a very good track record over the long run. The position was initiated after its valuation became more attractive.
The position in Bright Horizons was also initiated in April. Bright Horizons is a provider of childcare, early education and back-up dependent care services primarily under multi-year contracts with employers who offer childcare services as part of their employee benefits package. They are the leader in employer-sponsored center-based child care. As the market leader in daycare centers, Bright Horizons is a strong beneficiary of a secular trend towards two-working-parent households. Economies of scale should continue to drive operating leverage, and Bright Horizons is a well-run company with attractive business return metrics. We initiated the position after the valuation became much more attractive given the long-term prospects of the company.
In July, Fresenius was sold because of the deterioration of both the sustainability and fundamental opinions. Regarding the sustainability opinion, there are several recent controversies pertaining to the business of Fresenius Medical Care, of which Fresenius owns more than 30% of the shares. There was a $231 million fine for international misconduct allegations by the SEC/DOJ including kickbacks to the American Kidney Fund in exchange for business and an ongoing investigation by the US Department of Health and Human Services for healthcare fraud. For our fundamental opinion, the execution track record of the management team is below our expectations and we had lower conviction on the update.
A position in Ball Corp. was initiated in September. Founded in 1880 and headquartered in Broomfield, Colorado, Ball Corp. supplies aluminum packaging products to the beverage, personal care, automotive, paint, healthcare, and household products industries. It operates in four segments: Beverage Packaging, North and Central America; Beverage Packaging, South America; Beverage Packaging, Europe; and Aerospace. Ball Corp. is well positioned to benefit from increased awareness and regulation around single-use plastic as the largest aluminum packaging manufacturer. Aluminum cans have significantly higher recycling rates than other materials and are composed of more recycled content than competing packaging types. In addition, they are infinitely recyclable in a true “closed loop” as opposed to plastic which is typically “down-cycled” into products like carpet fiber or landfill liner. While glass is also infinitely recyclable, it is heavier than aluminum and thus requires more energy to transport. As the value per ton of aluminum is quite high and recycled content is desirable for manufacturers as it reduces manufacturing costs, aluminum recycling rates and recycled content should remain at high levels relative to plastic and glass which are less economical to recycle. As the largest player in all three geographic regions in which it operates, the company benefits from economies of scale from its manufacturing footprint. Ball Corp. has been divesting businesses over the past several years and focusing growth capital expenditures on faster growing markets, positioning the company to post stronger revenue growth and sustained margin improvement in the years ahead.
In November, Gilead Sciences was sold. While the company remains the global leader in HIV treatment, its HCV franchise has been declining and lack of a robust product pipeline raises concerns around future growth drivers for the company.
Also in November, we initiated a position in Orpea. Orpea is the leading European provider of dependency care through nursing homes, assisted-living facilities, post-acute and rehabilitation hospitals, and psychiatric hospitals. Orpea is addressing the increasingly important need for senior healthcare in all its forms, from retirement homes to homecare and home services. The company is well positioned to benefit from strong growth drivers including an aging population and public financing constraints. The company has a strong strategic position given its high-quality network and attractive locations and has solid opportunities for growth through its pipeline in Latin America and Central East Europe.
Finally in November, the team trimmed several existing positions in companies that had done very well year-to-date and used the proceeds to invest in existing positions in financials and other cyclically exposed sectors of the market that had underperformed. Announcements from Pfizer and AstraZeneca at the beginning of the month removed risks around when and if a vaccine would be developed, and provided a higher level of visibility into the timing of the economic recovery. These announcements removed a sizable overhang on holdings that had cyclical exposure and increased the team’s conviction in these companies.
Although cyclical exposure increased modestly by the end of the year, the team continues to like the downside protection that companies with strong balance sheets and positive exposure to long-term secular trends potentially offer. Geographically, the portfolio currently has a small bias to European names (mainly euro-zone), while being underweight US names. This is mainly a function of where the team is currently finding attractively valued opportunities. In terms of sector exposure, the portfolio currently has no exposure to energy (oil and gas extraction) or real estate, and it is underweight financials. This is mainly driven by valuation (real estate) and the thematic and sustainability approach of the team.
| 12
MIROVA GLOBAL SUSTAINABLE EQUITY FUND
As the team expects trends like the digitalization of our economy to accelerate along with support for the healthcare sector in response to Covid-19, the portfolio remains overweight technology and healthcare. There is also an underweight position in the more defensive consumer staples sector, which to some extent is offset by an overweight position in materials (mainly natural food ingredients). With many governments still committed to keeping global warming limited to a 2-degree Celsius scenario, the team expects climate change to remain a driver of political debate and the portfolio will continue to avoid fossil fuel extraction in favor of renewable energy and energy efficiency companies.
Outlook
The portfolio remains focused on long-term secular trends around demographics, technology, the environment and governance. Several of these trends have seen strong growth and higher levels of visibility during this pandemic. While demand for energy has fallen due to the economic slowdown, market share of renewable energy continues to increase, and climate change remains an important topic that many countries are addressing through policies around increased generation from renewable energy. The digitalization of the economy is accelerating as people continue to work from home and shop online. These trends are expected to continue to grow after the pandemic, and the portfolio will continue to focus its holdings on companies well positioned for a changing world.
Looking longer-term, the team continues to believe companies addressing long-term secular trends will continue to outperform. There has been a sharp increase in healthcare spending in an effort to find a vaccine and treatment for Covid-19, but even before this year spending on healthcare has shown robust growth as populations age in developed countries and, globally, populations increase their focus on health and well-being. Some trends within technology also saw sharp growth in 2020, as people shopping and working from home benefited companies exposed to e-commerce and cloud computing. It seems unlikely this growth will reverse after the pandemic is behind us. The team sees a long runway for continued growth for companies positively exposed to these trends, and expects robust growth for renewable energy as government policies, as well as pure economics, will provide strong tailwinds.
Equities broadly look expensive in absolute terms, particularly in the US, which has outperformed other markets for several years. However, when compared to bonds, equities look inexpensive on a relative basis and are supported by the prospect of a strong economic recovery. It will be incredibly important, however, to have a solid equity valuation discipline as there are several stocks, particularly in the US, whose prices appear to have dislocated from long-term fundamentals. The team also continues to see risk around the pace of inoculations and the trajectory of the global recovery. While we expect to see a strong economic recovery in 2021, numerous people have lost their jobs, their savings or their small businesses. These will take time to rebuild — even longer in emerging countries — and there is some risk around the market’s idea that the economic recovery is V-shaped.
13 |
Hypothetical Growth of $100,000 Investment in Class Y Shares3
March 31, 2016 (inception) through December 31, 2020
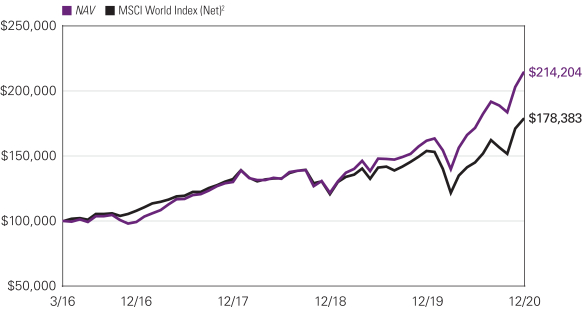
See notes to chart on page 15.
Top Ten Holdings as of December 31, 2020
| | | | | | | | |
| | | |
| | | | Security Name | | % of
Assets | |
| | 1 | | | Orsted A/S | | | 5.09 | % |
| | 2 | | | Vestas Wind Systems A/S | | | 4.18 | |
| | 3 | | | Microsoft Corp. | | | 4.15 | |
| | 4 | | | MasterCard, Inc., Class A | | | 4.01 | |
| | 5 | | | Ecolab, Inc. | | | 3.81 | |
| | 6 | | | Thermo Fisher Scientific, Inc. | | | 3.60 | |
| | 7 | | | Symrise AG | | | 3.45 | |
| | 8 | | | eBay, Inc. | | | 3.36 | |
| | 9 | | | Eaton Corp. PLC | | | 3.27 | |
| | 10 | | | Danaher Corp. | | | 3.12 | |
The portfolio is actively managed and holdings are subject to change. There is no guarantee the Fund continues to invest in the securities referenced. The holdings listed exclude any temporary cash investments.
| 14
MIROVA GLOBAL SUSTAINABLE EQUITY FUND
Average Annual Total Returns – December 31, 20203
| | | | | | | | | | | | | | | | | | | | |
| | | | |
| | | 1 Year | | | Life of Class | | | Expense Ratios4 | |
| | Gross | | | Net | |
| | | | | | |
| Class Y (Inception 3/31/16) | | | | | | | Class Y/A/C | | | | Class N | | | | | | | | | |
| NAV | | | 32.42 | % | | | 17.38 | % | | | — | % | | | 1.14 | % | | | 0.96 | % |
| | | | | | |
| Class A (Inception 3/31/16) | | | | | | | | | | | | | | | | | | | | |
| NAV | | | 32.07 | | | | 17.09 | | | | — | | | | 1.39 | | | | 1.21 | |
| With 5.75% Maximum Sales Charge | | | 24.47 | | | | 15.64 | | | | — | | | | | | | | | |
| | | | | | |
| Class C (Inception 3/31/16) | | | | | | | | | | | | | | | | | | | | |
| NAV | | | 31.07 | | | | 16.22 | | | | — | | | | 2.14 | | | | 1.96 | |
| With CDSC1 | | | 30.07 | | | | 16.22 | | | | — | | | | | | | | | |
| | | | | | |
| Class N (Inception 5/1/17) | | | | | | | | | | | | | | | | | | | | |
| NAV | | | 32.44 | | | | — | | | | 19.06 | | | | 1.08 | | | | 0.90 | |
| | | | | | |
| Comparative Performance | | | | | | | | | | | | | | | | | | | | |
| MSCI World Index (Net)2 | | | 15.90 | | | | 12.90 | | | | 12.20 | | | | | | | | | |
Performance data shown represents past performance and is no guarantee of, and not necessarily indicative of, future results. Total return and value will vary, and you may have a gain or loss when shares are sold. Current performance may be lower or higher than quoted. For most recent month-end performance, visit im.natixis.com/performance. Performance for other share classes will be greater or less than shown based on differences in fees and sales charges. You may not invest directly in an index. Performance for periods less than one year is cumulative, not annualized. Returns reflect changes in share price and reinvestment of dividends and capital gains, if any. The table(s) do not reflect taxes shareholders might owe on any fund distributions or when they redeem their shares.
| 1 | Performance for Class C shares assumes a 1.00% contingent deferred sales charge (“CDSC”) applied when you sell shares within one year of purchase. |
| 2 | MSCI World Index (Net) is an unmanaged index that is designed to measure the equity market performance of developed markets. It is composed of common stocks of companies representative of the market structure of developed market countries in North America, Europe, and the Asia/Pacific Region. The index is calculated without dividends, with net or with gross dividends reinvested, in both U.S. dollars and local currencies. |
| 3 | Fund performance has been increased by fee waivers and/or expense reimbursements, if any, without which performance would have been lower. |
| 4 | Expense ratios are as shown in the Fund’s prospectus in effect as of the date of this report. The expense ratios for the current reporting period can be found in the Financial Highlights section of this report under Ratios to Average Net Assets. Net expenses reflect contractual expense limitations set to expire on 4/30/21. When a Fund’s expenses are below the limitation, gross and net expense ratios will be the same. See Note 6 of the Notes to Financial Statements for more information about the Fund’s expense limitations. |
15 |
MIROVA INTERNATIONAL SUSTAINABLE EQUITY FUND
| | |
| |
| Managers | | Symbols |
| |
| Jens Peers, CFA® | | Class A MRVAX |
| |
| Hua Cheng, CFA® PhD | | Class N MRVNX |
| |
| Amber Fairbanks, CFA® | | Class Y MRVYX |
|
| Mirova US LLC |
Investment Goal
The Fund seeks long-term capital appreciation.
Market Conditions
Had investors been told at the beginning of 2020 that in the upcoming year global unemployment would hit unprecedented levels, almost 2 million people would die from a virus that affected over 87 million people around the world, that this virus would require people to stay in their homes and would cause large global contractions in economic growth even with unprecedented levels of monetary and fiscal stimulus globally — it is unlikely that many would have predicted the market rising significantly for the year. Yet this is exactly what unfolded over the last 12 months.
Monetary policy that encouraged risk taking can be partially credited for the strong performance of equities for much of the year after a sharp decline in March, but perhaps a stronger driver has been hope. The fourth quarter of the year certainly served to boost hope and optimism that the world would soon return to something closer to normal as pharmaceutical companies announced the development of effective vaccines to treat the Covid-19 virus. It is often said that the stock market is forward looking, though not well explored is whether the stock market is accurate in its forward-looking view. Many are happy to put 2020 in the rear-view mirror, and if the market is accurate in its view, 2021 should be a much better year — certainly one can hope that is the case.
Performance Results
For the 12 months ended December 31, 2020, Class Y shares of the Mirova International Sustainable Equity Fund returned 23.60% at net asset value. The Fund outperformed its benchmark, the MSCI EAFE Index (Net), which returned 7.82%.
Explanation of Fund Performance
Broadly, stock selection across sectors made the biggest contribution to returns, with allocation detracting from relative performance. The largest performance driver was stock selection within Utilities, where offshore wind utility Orsted performed very well. Also contributing strongly to performance was stock selection within Financials, where all six financial names had positive returns for the year. Detracting from performance were two Materials names, Symrise and Chr. Hansen, two natural ingredient manufacturers.
The portfolio invests in companies that offer solutions to and/or are expected to benefit from the demographic, technological, environmental and governance-related transitions that Mirova believes will transform the world’s economies and societies during the next decade.
As trends like the digitalization of our economy, which saw strong growth as a result of Covid-19, are expected to continue to grow strongly, the portfolio remains overweight Technology. There is also an underweight position in the more defensive Consumer Staples sector which, to some extent, is offset by an overweight position in Materials. With many governments still committed to keeping global warming limited to a 2-degree Celsius scenario, we expect climate change to remain a driver of political debate and the portfolio will continue to shy away from fossil fuel extraction in favor of renewables and companies focused on energy efficiency. Although cyclical exposure increased modestly as a result of portfolio adjustments (see below), the team continues to like the downside protection that companies with strong balance sheets, solid management teams and positive exposure to long-term secular trends potentially offer.
The investment team trimmed several existing positions in companies that had done very well year-to-date and used the proceeds to invest in held positions that had underperformed in Financials and other cyclically exposed sectors of the market. Announcements from Pfizer and AstraZeneca at the beginning of November removed risks around when and if a vaccine would be developed and provided a higher level of visibility into the timing of the economic recovery. These announcements removed a sizable overhang on stocks held that had cyclical exposure and increased the team’s conviction in these companies.
| 16
MIROVA INTERNATIONAL SUSTAINABLE EQUITY FUND
Outlook
Looking longer-term, the team continues to believe companies addressing long-term secular trends will continue to outperform. There has been a sharp increase in healthcare spending in an effort to find a vaccine and treatment for Covid-19, but even before this year spending on healthcare has shown robust growth as populations age in developed countries and, globally, populations increase their focus on health and well-being. Some trends within technology also saw sharp growth in 2020, as people shopping and working from home benefited companies exposed to e-commerce and cloud computing. It seems unlikely this growth will reverse after the pandemic is behind us. The team sees a long runway for continued growth for companies positively exposed to these trends, and expects robust growth for renewable energy as government policies, as well as pure economics, will provide strong tailwinds.
Equities broadly look expensive in absolute terms, particularly in the US, which has outperformed other markets for several years. However, when compared to bonds, equities look inexpensive on a relative basis and are supported by the prospect of a strong economic recovery. It will be incredibly important, however, to have a solid equity valuation discipline as there are several stocks, particularly in the US, whose prices appear to have dislocated from long-term fundamentals. The team also continues to see risk around the pace of inoculations and the trajectory of the global recovery. While we expect to see a strong economic recovery in 2021, numerous people have lost their jobs, their savings or their small businesses. These will take time to rebuild — even longer in emerging countries — and there is some risk around the market’s idea that the economic recovery is V-shaped.
Hypothetical Growth of $100,000 Investment in Class Y Shares2
December 28, 2018 (inception) through December 31, 2020
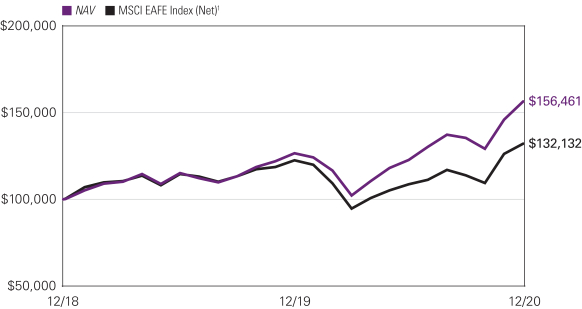
17 |
Top Ten Holdings as of December 31, 2020
| | | | | | | | |
| | |
| Security Name | | % of
Assets | |
| | 1 | | | Vestas Wind Systems A/S | | | 4.95 | % |
| | 2 | | | Taiwan Semiconductor Manufacturing Co. Ltd., Sponsored ADR | | | 4.90 | |
| | 3 | | | Orsted A/S | | | 4.88 | |
| | 4 | | | AIA Group Ltd. | | | 4.28 | |
| | 5 | | | ASML Holding NV | | | 3.88 | |
| | 6 | | | KBC Group NV | | | 3.53 | |
| | 7 | | | Novo Nordisk A/S, Class B | | | 3.24 | |
| | 8 | | | Legal & General Group PLC | | | 3.22 | |
| | 9 | | | Adyen NV | | | 3.14 | |
| | 10 | | | Kubota Corp. | | | 2.75 | |
The portfolio is actively managed and holdings are subject to change. There is no guarantee the Fund continues to invest in the securities referenced. The holdings listed exclude any temporary cash investments.
Average Annual Total Returns – December 31, 20202
| | | | | | | | | | | | | | | | |
| | | | |
| | | 1 Year | | | Life of Fund | | | Expense Ratios3 | |
| | | Gross | | | Net | |
| | | | | |
Class Y (Inception 12/28/18) | | | | | | | | | | | | | | | | |
NAV | | | 23.60 | % | | | 24.97 | % | | | 94.13 | % | | | 0.96 | % |
| | | | | |
Class A (Inception 12/28/18) | | | | | | | | | | | | | | | | |
NAV | | | 23.18 | | | | 24.64 | | | | 107.91 | | | | 1.21 | |
With 5.75% Maximum Sales Charge | | | 16.13 | | | | 21.02 | | | | | | | | | |
| | | | | |
Class N (Inception 12/28/18) | | | | | | | | | | | | | | | | |
NAV | | | 23.60 | | | | 25.02 | | | | 1.99 | | | | 0.92 | |
| | | | | |
Comparative Performance | | | | | | | | | | | | | | | | |
MSCI EAFE Index (Net)1 | | | 7.82 | | | | 14.83 | | | | | | | | | |
Performance data shown represents past performance and is no guarantee of, and not necessarily indicative of, future results. Total return and value will vary, and you may have a gain or loss when shares are sold. Current performance may be lower or higher than quoted. For most recent month-end performance, visit im.natixis.com/performance. Performance for other share classes will be greater or less than shown based on differences in fees and sales charges. You may not invest directly in an index. Performance for periods less than one year is cumulative, not annualized. Returns reflect changes in share price and reinvestment of dividends and capital gains, if any. The table(s) do not reflect taxes shareholders might owe on any fund distributions or when they redeem their shares.
| 1 | The MSCI EAFE (Net) is a free float-adjusted market capitalization index designed to measure large and mid-cap equity performance in developed markets, excluding the U.S. and Canada. The Index includes countries in Europe, Australasia, and the Far East. |
| 2 | Fund performance has been increased by fee waivers and/or expense reimbursements, if any, without which performance would have been lower. |
| 3 | Expense ratios are as shown in the Fund’s prospectus in effect as of the date of this report. The expense ratios for the current reporting period can be found in the Financial Highlights section of this report under Ratios to Average Net Assets. Net expenses reflect contractual expense limitations set to expire on 4/30/21. When a Fund’s expenses are below the limitation, gross and net expense ratios will be the same. See Note 6 of the Notes to Financial Statements for more information about the Fund’s expense limitations. |
| 18
MIROVA U.S. SUSTAINABLE EQUITY FUND
| | |
| |
| Managers | | Symbols |
| |
| Jens Peers, CFA® | | Class A MUSAX |
| |
| Hua Cheng, CFA® PhD | | Class Y MUSYX |
| |
| Amber Fairbanks, CFA® | | Class N MUSNX |
| |
| Mirova US LLC | | Class C MUSCX |
Investment Goal
The Fund seeks long-term capital appreciation.
Market Conditions
The Mirova U.S. Sustainable Equity Fund was launched on December 15, 2020 as we were very much in the home stretch of a year, marred by the Covid-19 pandemic, which many will be happy to put in the rear-view mirror, and, if the market is accurate in its view, 2021 should be a much better year.
For the ~2-week period where the Fund did participate, there broad market saw continued positive news around a Covid-19 vaccine announced in November which fueled continued optimism in December.
Performance Results
Mirova U.S. Sustainable Equity Fund was launched on December 15, 2020. For the period ended December 31, 2020, Class Y shares of the Fund returned 2.10% at net asset value. The Fund outperformed its benchmark, the S&P 500® Index, which returned 1.72%.
Explanation of Fund Performance
Energy was the strongest performing theme. The top performing stocks were alternative energy holdings, First Solar and Ormat, which performed strongly on policies President-Elect Biden has outlined supporting the growth of alternative energy. The Mobility theme also performed well, both on the expectation of a cyclical rebound in 2021 and on exposure in that sector to electrification of vehicles through Aptiv, which should see more robust growth if Biden’s proposed policies are enacted.
The biggest detractors from relative performance were stock selection in Materials and the Healthcare sector. Within Materials, Ecolab declined on continued investor concern over the lingering impact of Covid-19 on its hospitality business. Stock selection in Healthcare detracted from performance as some names held in the portfolio that had performed well year-to-date saw profit taking at year-end. Within Healthcare, Thermo Fisher declined slightly as investors took some profits after strong performance of the stock throughout the year. Verizon also declined slightly for the two-week period on minimal news.
Outlook
The portfolio focuses on long-term secular trends around demographics, technology, the environment and governance. Several of these trends have seen strong growth and higher levels of visibility through this pandemic. While demand for energy has fallen due to the economic slowdown, market share of renewable energy continues to increase, and climate change remains an important topic that many countries are addressing through policies related to renewable energy. The digitalization of the economy is accelerating as people continue to work from home and shop online. These trends are expected to continue growing after the pandemic. The portfolio will continue to focus its holdings on companies well positioned for a changing world.
19 |
Top Ten Holdings as of December 31, 2020
| | | | | | | | |
| | |
| Security Name | | % of
Assets | |
| | 1 | | | Microsoft Corp. | | | 6.67 | % |
| | 2 | | | Thermo Fisher Scientific, Inc. | | | 5.54 | |
| | 3 | | | Danaher Corp. | | | 5.53 | |
| | 4 | | | Adobe, Inc. | | | 4.93 | |
| | 5 | | | MasterCard, Inc., Class A | | | 4.73 | |
| | 6 | | | NextEra Energy, Inc. | | | 4.53 | |
| | 7 | | | Ecolab, Inc. | | | 4.33 | |
| | 8 | | | Eaton Corp. PLC | | | 4.14 | |
| | 9 | | | eBay, Inc. | | | 3.84 | |
| | 10 | | | American Water Works Co., Inc. | | | 3.76 | |
The portfolio is actively managed and holdings are subject to change. There is no guarantee the Fund continues to invest in the securities referenced. The holdings listed exclude any temporary cash investments.
Total Returns – December 31, 20203
| | | | | | | | | | | | |
| | | |
| | | Life of Fund | | | Expense Ratios4 | |
| | | Gross | | | Net | |
| | | | |
Class Y (Inception 12/15/20) | | | | | | | | | | | | |
NAV | | | 2.10 | % | | | 34.34 | % | | | 0.80 | % |
| | | | |
Class A (Inception 12/15/20) | | | | | | | | | | | | |
NAV | | | 2.10 | | | | 34.59 | | | | 1.05 | |
With 5.75% Maximum Sales Charge | | | -3.77 | | | | | | | | | |
| | | | |
Class C (Inception 12/15/20) | | | | | | | | | | | | |
NAV | | | 2.10 | | | | 35.34 | | | | 1.80 | |
With CDSC1 | | | 1.10 | | | | | | | | | |
| | | | |
Class N (Inception 12/15/20) | | | | | | | | | | | | |
NAV | | | 2.10 | | | | 15.87 | | | | 0.75 | |
| | | | |
Comparative Performance | | | | | | | | | | | | |
S&P 500® Index2 | | | 1.72 | | | | | | | | | |
Performance data shown represents past performance and is no guarantee of, and not necessarily indicative of, future results. Total return and value will vary, and you may have a gain or loss when shares are sold. Current performance may be lower or higher than quoted. For most recent month-end performance, visit im.natixis.com/performance. Performance for other share classes will be greater or less than shown based on differences in fees and sales charges. You may not invest directly in an index. Performance for periods less than one year is cumulative, not annualized. Returns reflect changes in share price and reinvestment of dividends and capital gains, if any. The table(s) do not reflect taxes shareholders might owe on any fund distributions or when they redeem their shares.
| 1 | Class C share performance assumes a 1% CDSC applied when you sell shares within one year of purchase. |
| 2 | S&P 500® Index is a widely recognized measure of U.S. stock market performance. It is an unmanaged index of 500 common stocks chosen for market size, liquidity, and industry group representation, among other factors. It also measures the performance of the large cap segment of the U.S. equities market. |
| 3 | Fund performance has been increased by fee waivers and/or expense reimbursements, if any, without which performance would have been lower. |
| 4 | Expense ratios are as shown in the Fund’s prospectus in effect as of the date of this report. The expense ratios for the current reporting period can be found in the Financial Highlights section of this report under Ratios to Average Net Assets. Net expenses reflect contractual expense limitations set to expire on 4/30/22. When a Fund’s expenses are below the limitation, gross and net expense ratios will be the same. See Note 6 of the Notes to Financial Statements for more information about the Fund’s expense limitations. |
| 20
NATIXIS OAKMARK FUND
| | |
| |
| Managers | | Symbols |
| |
| William C. Nygren, CFA® | | Class A NEFOX |
| |
| Kevin G. Grant, CFA® | | Class C NECOX |
| |
| M. Colin Hudson, CFA® | | Class N NOANX |
| |
| Michael J. Mangan, CFA® | | Class Y NEOYX |
| |
| Michael A. Nicolas, CFA®* | | |
| |
| Harris Associates L.P. | | |
| * | Effective January 28, 2020, Michael A. Nicolas joined the portfolio management team of the Fund. |
Investment Goal
The Fund seeks long-term capital appreciation.
Market Conditions
Despite ongoing economic impacts from Covid-19, key US indexes touched record high levels in the fourth quarter of 2020 and both the Dow Jones Industrial Average and S&P 500® closed out the year at record levels. Reports in November about the greater than 90% efficacy of two vaccine candidates and the subsequent emergency use authorizations and inoculation rollout led to increased investor confidence that a recovery was within sight. The certification of presidential election results and the creation of a new stimulus program likely further soothed investor anxiety.
Even though a forward-looking market proved advantageous to investors, near-term conditions for the real economy, especially Main Street businesses, remained challenging. However, we took note of some positive indicators, such as accelerated manufacturing activity that reached its highest level in 17 years in October, according to the Institute for Supply Management. In addition, the National Association of Realtors disclosed that existing home sales jumped 26.6% in October from the prior year helped by near-record low mortgage rates, while home prices increased due to tight inventory. Also, consumer sentiment climbed past economists’ expectations in November and early December. At the same time, retail sales fell in October and November. Nevertheless, the National Retail Federation projected holiday spending will increase between 3.6% and 5.2% compared with last year, owing to limited travel and entertainment spending along with low energy costs. While we await final holiday retail data, we are hopeful that the shift to online purchasing, which was predicted to surge up to 34% above 2019 levels, compensated for dramatically reduced in-person shopping due to Covid-19 circumstances.
Performance Results
For the 12 months ended December 31, 2020, Class Y shares of Natixis Oakmark Fund returned 13.28% at net asset value. The Fund underperformed its benchmark, the S&P 500® Index, which returned 18.40%.
Explanation of Fund Performance
As value investors with an emphasis on individual stock selection, our sector weights are a byproduct of our bottom-up process. On an absolute-return basis, the communication services sector gained the most value, and holdings in the energy sector lost the most value.
Wells Fargo and American Airlines Group were the largest detractors from fund performance for the calendar year. Legacy regulatory issues and a temporarily inflated cost base, including a $3.1 billion reserve build, negatively impacted Wells Fargo and compounded an already challenging operating environment. The company’s first-quarter earnings per share amounted to $0.01, down from $1.20 at the year-ago period. Wells Fargo guided for an 11% reduction in fiscal year 2020 net interest income and indicated that the US Federal Reserve’s (the “Fed”) decision to cap dividend payments would translate to a dividend cut for the company. In mid-July, the company released second-quarter results that were weaker than we had expected and also lagged market projections. Total revenue fell nearly 16% from a year earlier to $17.8 billion, partly driven by net interest income that declined $2.2 billion (18%), while expenses rose $1.1 billion. Total credit loss provisions increased more than $8 billion in the second quarter to $20.4 billion, and the allowance coverage for total loans reached 2.2% at quarter-end. This provision level is essentially in line with the annualized severely adverse scenario for net charge-offs. CFO John Shrewsberry stated that the current allowance adequately captures the expected loss content in the loan portfolio. We spoke with CEO Charles Scharf in September and discussed progress the bank has achieved in its recently announced $10 billion cost reduction program. While Scharf declined to provide specific details of the cost cuts, he did point to inflated layers of management, high staffing numbers, too many branches and duplicative cost structures across divisions given the highly decentralized nature of the business as potential areas for improvement. Wells Fargo’s third-quarter results included total revenue that was about 5% stronger than market expectations, while earnings per share fell short of projections by about 5%. The
21 |
company booked a charge of $961 million for legacy customer remediation expenses related to sales practices issues. In addition, Wells Fargo realized a $718 million restructuring charge (predominantly related to severance costs), which management expects will lead to savings of $1 billion per year. On an operational basis, customer deposits grew 8% from the previous year and loans shrank by 2%, both of which were heavily impacted by the asset cap imposed by the Fed. Later, the company announced plans to suspend compensation increases for top earners (employees who are paid more than $150,000 annually) as part of its effort to contain costs. Management has started gauging bidders’ interest in a variety of businesses with talks emerging in recent weeks to potentially sell a $607 billion asset manager, a corporate-trust unit and a $10 billion student-loan portfolio. We are pleased that management is taking action that we think can strengthen the company’s performance and benefit shareholders.
In the latter part of January 2020, American Airlines Group reported fourth-quarter results that aligned with market expectations. We were pleased that the company’s operational performance improved despite disruptions caused by the Boeing MAX aircraft grounding and ongoing contract negotiations with the Transport Workers Union and International Association of Mechanics and Aerospace Workers (fortunately, American Airlines and union members reached a tentative agreement on the last day of January). However, the share price of American Airlines plunged in February, along with share prices of other travel-related firms, from escalating concerns over the spread of Covid-19. Ultimately, we sold out of our position in favor of other investments we believed had healthier risk/reward profiles.
The leading contributors to fund performance for the year were Netflix and Facebook. Fourth-quarter earnings from Netflix included paid net additions of 8.8 million, which exceeded management’s guidance for 7.6 million net additions for the quarter. For the full year, net additions amounted to 27.8 million. Later, Netflix’s first-quarter earnings report included paid net subscriber additions of 15.8 million, which handily bested guidance for 7 million additions. The stay-at-home conditions prompted by Covid-19 led to the addition of 26 million new paying subscriptions year-to-date through June, compared with 28 million additions achieved in total for 2019. Revenues for the six-month period rose 26% from the year-ago period, and earnings per share more than doubled. In October, the company released third-quarter results with revenue of $6.44 billion that surpassed market forecasts of $6.39 billion, while earnings per share and total streaming paid net subscription additions fell short of expectations. Along with the release, management issued fourth-quarter guidance for revenue of $6.57 billion, earnings per share of $1.35 and total net additions of 6.00 million. These projections indicated to us that Netflix is on track to exceed our full-year 2020 estimates by a large margin, and if the company achieves these targets, it can likely surpass 200 million global subscribers by year-end, leading to revenue of roughly $25 billion, earnings of nearly $5 billion and $2 billion of free cash flow. In November, Netflix announced plans to increase prices for US subscribers, and investors reacted positively to the news. Notably, generating additional near-term revenue and cash flow enables Netflix to accelerate its competitive momentum by investing more in content and spreading the cost over a larger subscriber base. Although its share price advanced in recent months, we still believe our investment in Netflix offers investors sufficient upside potential.
Facebook’s first-quarter earnings report included year-over-year increases in revenue and earnings per share of 18% and 101%, respectively. Management stated that the current pandemic has produced increased engagement on the platform as averages of daily active users rose 11% and monthly active users increased 10%. However, the company indicated that demand for advertising had declined and pressured pricing for ads in the latter part of the first quarter. We found it noteworthy that for the first time CEO Mark Zuckerberg stated his intention to expand margins over the long term and that management is looking for ways to control expenses over time. The company continues to invest heavily in products and new engineering talent, which we think could pave the way for future growth. Facebook’s second-quarter results were good compared with our expectations, with year-over-year organic revenue growth of 12%. Furthermore, total revenue of $18.69 billion and earnings per share of $1.80 exceeded market forecasts by nearly 8% and 29%, respectively. Notably, daily and monthly active users each advanced 12% and new monthly average users grew by 287 million, which reflects an increase of 59% over the trailing 12-month additions in the previous year. Facebook now estimates that 3.1 billion people use one of its services every month and 2.5 billion engage every day. Later, the company reported third-quarter revenue growth of 22% from the prior year to $21.47 billion, which beat market forecasts of $19.80 billion by a healthy margin. Earnings per share rose 28% to $2.71 and were also stronger than market projections of $1.90. Interestingly, the company achieved these results while realizing a slight decline from the prior quarter in both daily and monthly active users in the US and Canada. The sequential decrease was an outcome management expected since Covid-19 had boosted user activity significantly in the second quarter, though daily and monthly active users each grew 12% from a year ago. Also in the fourth quarter, the US Federal Trade Commission (FTC) filed an antitrust lawsuit against Facebook regarding its acquisitions of Instagram and WhatsApp. In response, Facebook noted that the FTC approved both acquisitions. Later, multiple states sued Google for alleged collusion with Facebook in the online advertising marketplace. In the meantime, management announced its intentions for increased monetization of WhatsApp via advertising, e-commerce and payments. While we continue to monitor the situation, Facebook still trades at a meaningful discount to our perception of its intrinsic value and, thus, offers a compelling reason to own.
| 22
NATIXIS OAKMARK FUND
Outlook
A recent survey conducted by the National Association for Business Economics revealed that 73% of its 48-member panel of professional forecasters expect the economy will return to a pre-pandemic level by late 2021. This latest survey reflects greater optimism than the results from the prior survey, when just 38% of respondents said they thought a full recovery could occur before 2022. We, too, are optimistic about the future and contend that pent-up demand today for face-to-face experiences, such as travel, restaurant dining and event attendance, can lead to an outsized economic rebound after restrictions are lifted. We have worked diligently throughout 2020 to best position our portfolios to benefit from the eventual turnaround. Meanwhile, we continue to opportunistically seek out new investment candidates and rebalance portfolios when appropriate.
Hypothetical Growth of $100,000 Investment in Class Y Shares3
December 31, 2010 through December 31, 2020
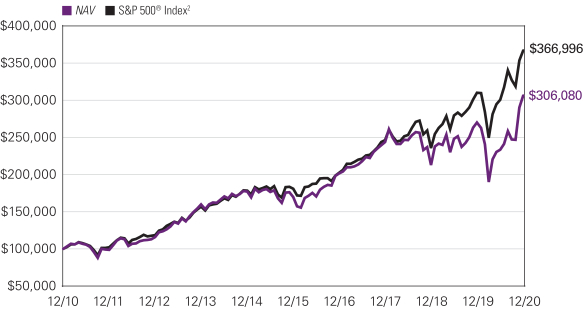
Top Ten Holdings as of December 31, 2020
| | | | | | | | |
| | |
| Security Name | | % of
Assets | |
| | 1 | | | Alphabet, Inc., Class A | | | 3.78 | % |
| | 2 | | | Ally Financial, Inc. | | | 3.69 | |
| | 3 | | | Capital One Financial Corp. | | | 3.31 | |
| | 4 | | | Citigroup, Inc. | | | 3.30 | |
| | 5 | | | Facebook, Inc., Class A | | | 3.20 | |
| | 6 | | | Bank of America Corp. | | | 3.15 | |
| | 7 | | | Charles Schwab Corp. (The) | | | 3.07 | |
| | 8 | | | Comcast Corp., Class A | | | 2.96 | |
| | 9 | | | Booking Holdings, Inc. | | | 2.65 | |
| | 10 | | | Constellation Brands, Inc., Class A | | | 2.53 | |
The portfolio is actively managed and holdings are subject to change. There is no guarantee the Fund continues to invest in the securities referenced. The holdings listed exclude any temporary cash investments.
23 |
Average Annual Total Returns – December 31, 20203
| | | | | | | | | | | | | | | | | | | | | | | | |
| | | | | | |
| | | | | | | | | | | | Life of Class N | | | Expense Ratios4 | |
| | | 1 Year | | | 5 Years | | | 10 Years | | | Gross | | | Net | |
| | | | | | | |
| Class Y (Inception 11/18/98) | | | | | | | | | | | | | | | | | | | | | | | | |
| NAV | | | 13.28 | % | | | 12.52 | % | | | 11.83 | % | | | — | % | | | 0.92 | % | | | 0.92 | % |
| | | | | | | |
| Class A (Inception 5/6/31) | | | | | | | | | | | | | | | | | | | | | | | | |
| NAV | | | 13.01 | | | | 12.24 | | | | 11.56 | | | | — | | | | 1.17 | | | | 1.17 | |
| With 5.75% Maximum Sales Charge | | | 6.51 | | | | 10.91 | | | | 10.90 | | | | — | | | | | | | | | |
| | | | | | | |
| Class C (Inception 5/1/95) | | | | | | | | | | | | | | | | | | | | | | | | |
| NAV | | | 12.15 | | | | 11.40 | | | | 10.73 | | | | — | | | | 1.92 | | | | 1.92 | |
| With CDSC1 | | | 11.15 | | | | 11.40 | | | | 10.73 | | | | — | | | | | | | | | |
| | | | | | | |
| Class N (Inception 5/1/17) | | | | | | | | | | | | | | | | | | | | | | | | |
| NAV | | | 13.41 | | | | — | | | | — | | | | 10.77 | | | | 1.25 | | | | 0.83 | |
| | | | | | | |
| Comparative Performance | | | | | | | | | | | | | | | | | | | | | | | | |
| S&P 500® Index2 | | | 18.40 | | | | 15.22 | | | | 13.88 | | | | 15.30 | | | | | | | | | |
Performance data shown represents past performance and is no guarantee of, and not necessarily indicative of, future results. Total return and value will vary, and you may have a gain or loss when shares are sold. Current performance may be lower or higher than quoted. For most recent month-end performance, visit im.natixis.com/performance. Performance for other share classes will be greater or less than shown based on differences in fees and sales charges. You may not invest directly in an index. Performance for periods less than one year is cumulative, not annualized. Returns reflect changes in share price and reinvestment of dividends and capital gains, if any. The table(s) do not reflect taxes shareholders might owe on any fund distributions or when they redeem their shares.
| 1 | Performance for Class C shares assumes a 1.00% contingent deferred sales charge (“CDSC”) applied when you sell shares within one year of purchase. |
| 2 | S&P 500® Index is a widely recognized measure of U.S. stock market performance. It is an unmanaged index of 500 common stocks chosen for market size, liquidity, and industry group representation, among other factors. It also measures the performance of the large cap segment of the U.S. equities market. |
| 3 | Fund performance has been increased by fee waivers and/or expense reimbursements, if any, without which performance would have been lower. |
| 4 | Expense ratios are as shown in the Fund’s prospectus in effect as of the date of this report. The expense ratios for the current reporting period can be found in the Financial Highlights section of this report under Ratios to Average Net Assets. Net expenses reflect contractual expense limitations set to expire on 4/30/21. When a Fund’s expenses are below the limitations, gross and net expense ratios will be the same. See Note 6 of the Notes to Financial Statements for more information about the Fund’s expense limitations. |
| 24
NATIXIS OAKMARK INTERNATIONAL FUND
| | |
| |
| Managers | | Symbols |
| |
| David G. Herro, CFA® | | Class A NOIAX |
| |
| Michael L. Manelli, CFA® | | Class C NOICX |
| |
| Harris Associates L.P. | | Class N NIONX |
| |
| | Class Y NOIYX |
Investment Goal
The Fund seeks long-term capital appreciation.
Market Conditions
Similar to 2016, 2020 was a year of extremes, driven by exogenous factors ranging from the Covid-19 pandemic to Brexit negotiations with elections in between. Most recently, markets reacted favorably to events in the fourth quarter, particularly the approval and emergency use authorization of multiple vaccines aimed at preventing the spread of Covid-19.
Meanwhile, the UK and European Union negotiated arduously throughout the year, finally accomplishing an agreement in December that eliminated the possibility of a hard Brexit outcome. In the US, the four-year presidential election cycle produced a more balanced outcome than many had expected. The market proved relieved at both the elimination of uncertainty and the lower probability of big changes. Later in the fourth quarter, President Trump signed the country’s long-debated second economic relief bill into law, sending direct payments to some individuals and families as well as further extending unemployment benefits.
These events propelled equity prices higher across the globe for a strong finish to a year that had earlier experienced a bear market. Ultimately, the Nikkei 225 Index soared to a 30-year high in Japan, the German DAX Index surged to a record figure, and both the Dow Jones Industrial Average and S&P 500 Index® closed out the year at record levels.
Performance Results
For the 12 months ended December 31, 2020, Class Y shares of Natixis Oakmark International Fund returned 4.32% at net asset value. The Fund underperformed its benchmark, the MSCI World ex USA Index (Net), which returned 7.59%.
Explanation of Fund Performance
Geographically, our average weightings for the year were 82% in Europe, 3% in Australia and 3% in Japan. The remaining positions were in Canada, South Korea, South Africa, China, India, Mexico, Indonesia, Taiwan and the United States.
On an absolute-return basis, shares in the information technology sector produced the most positive collective return, while shares in the energy sector lost the most value.
The largest detractors from return were Rolls-Royce Holdings and Lloyds Banking Group. Effects from Covid-19 drove the share price decline of Rolls-Royce Holdings for the reporting period. Ahead of issuing full-year results in February 2020, management stated that design fixes for the Trent 1000 engine and higher costs associated with the Trent 1000 TEN engine would impact 2019 free cash flow and earnings. In May, management stated expectations for a significant net cash outflow during the second quarter. Rolls-Royce issued a trading update in July, which proved disappointing to investors. The company indicated it would experience a GBP 3 billion cash outflow in the first half and projected a GBP 4 billion outflow for the entire year, which was worse than we had expected. Rolls-Royce also anticipates a 55% decline in wide-body flight hours this year, which was also a larger decrease than we had anticipated. We spoke with management early in September and learned it wanted to execute an equity raise as a buffer given the huge amount of uncertainty related to the timing of a recovery. Ultimately, Rolls-Royce opted not to sell a stake in the company to a sovereign wealth fund, but did announce a ten-for-three issuance at GBP 0.32 per share to raise approximately GBP 2 billion. This is part of a GBP 5 billion recapitalization package meant to strengthen its balance sheet and ensure adequate liquidity even if flight hours show only modest improvement versus current trends in 2021. In December, the company downgraded its full-year free cash flow guidance from GBP -4 billion to GBP -4.2 billion. We spoke with CEO Warren East in December and discussed credits provided to airlines to compensate for missed flights to be used against future maintenance spend, which we believe will have a negative impact on free cash flow in 2021. The company announced its first disposal of its civil nuclear instruments business earlier in December, and East noted further disposals would include ITP Aero and Bergen. Although we continue to believe that Covid-19 will cause a material and long-lasting disruption to the company’s civil business, we also think its power systems and defense business face less disruption. While we still hold a position in Rolls-Royce, we are monitoring the situation closely.
Lloyds Banking Group’s fourth-quarter results issued early in 2020 fell short of market projections as revenue, underlying profit and pretax income all underperformed forecasts. For the full fiscal year, total revenue fell 4%, underlying profit fell 7% and pre-provision
25 |
profit declined 3% from a year earlier. Results were also weaker than our estimates, which we attributed to a very difficult 2019 operating environment that was dominated by uncertainty surrounding Brexit and the formation of a UK government. Later, Lloyds’ first-quarter results included net income and underlying profit that declined 11% and 74%, respectively, from the prior year. Although quarterly underlying profit missed our estimates by roughly 7%, after adjusting for a number of one-time items, underlying profit was in line with our full-year expectations. We subsequently spoke with CEO António Horta-Osório who sees scope for material cost savings by redirecting resources and eliminating other expenses, such as travel. Lloyds’ results for the first half of 2020 were also disappointing. Key metrics fell far short of our estimates primarily because of Covid-19. Total revenue from core operations declined 16% from a year ago and operating profit realized a loss of GBP 281 million, driven by a significant impairment provision charge. Management stated that the larger than anticipated provision amount was due to a significantly depressed economic outlook. However, Lloyds’ loan book continues to perform well and actual defaults to date remain stable. In December, a trade agreement between the UK and European Union secured a new economic and security partnership, which reassured investors. Lloyds also released third-quarter earnings that we found to be reasonable considering present macroeconomic conditions. For the full fiscal nine-month period, total revenue fell 17% and underlying operating profit declined 85% from a year earlier. Results were significantly impacted by impairment charges that rose dramatically (+334%) for the full period. However, the vast majority of the impairment charge increase occurred in the first two quarters and eased in the third quarter, which helped drive strong sequential growth of underlying operating profit that totaled GBP 1.2 billion. Other important metrics showed evidence of improvement as well, including retail deposits that rose 7%, which resulted in a loan-to-deposit ratio of 98%, reflecting a healthy liquidity position. Importantly, Lloyds’ balance sheet remains strong as its common equity Tier 1 ratio reached 15.2% in the third quarter (up from 14.6% in the second quarter), which exceeded both management’s target of 12.5% and regulatory requirements of roughly 11%. Management cited additional encouraging signs of a business recovery, including increased mortgage activity, that we think positions the company advantageously as the general economy normalizes. As we have expressed previously, we contend that Lloyds possesses a wide range of strengths to draw upon to reinforce its business during current near-term challenges. Even including its strong fourth-quarter stock price performance, we still believe the company’s shares remain undervalued compared with our estimate of intrinsic value.
The top contributors to the yearly return were Daimler and NAVER. Daimler suspended the majority of its production in Europe in the first quarter due to Covid-19 weighing on its share price. The company’s fiscal full-year results aligned with management’s pre-announcement. Revenue rose across industrial business segments and produced total revenue growth of 1.2% from a year ago, while the operating margin largely met our expectations. However, earnings, net profit and earnings per share all fell in excess of 60% year-over-year, owing to litigation costs and electric vehicle production initiatives. Importantly, Daimler produced EUR 1.4 billion of free cash flow from industrial operations in 2019, which far exceeded our cash flow forecasts. Daimler’s first-quarter earnings report bested market expectations as exhibited by revenues (EUR 37.22 billion vs. EUR 34.18 billion) and adjusted earnings (EUR 719 million vs. EUR 648 million). Management confirmed its previous outlook for a decline in total revenue and earnings for 2020 compared to the year-ago period. The company also noted it planned to gradually accelerate production. To that point, Daimler resumed manufacturing passenger cars in two German plants at the end of April. We spoke with CEO Ola Källenius and CFO Harald Wilhelm and discussed some short-term measures enacted to boost profitability, which include utilizing a short-time work program in coordination with the German government to reduce payroll expenses. Importantly, management committed to not postponing any projects that are important for the future of Daimler, including production of the new Mercedes-Benz S-Class vehicle (which accounts for 3%–4% of volumes and 15% or more of profits) and electrification (Daimler’s battery plant in Germany is the only plant globally that has never shut down). Though year-to-date Mercedes-Benz cars and vans volumes were down 22% and 29% in the second quarter, respectively, we appreciate that revenue in the segment was only down 14.8%. We think this reflects significant product mix benefits within both markets as well as resilient pricing dynamics. China also contributed with 17% year-over-year growth, despite the overall Chinese auto market being down 4%. Free cash flow was also significantly stronger than had been expected, and we believe this is a result of management’s stringent focus on improving cash flow generation. Later, Daimler announced that it reached an agreement in principle with various US authorities to settle civil and environmental claims regarding emissions control systems on about 250,000 diesel passenger cars and vans in the US. The company also reached an agreement with the plaintiffs’ counsel to settle the ongoing class action lawsuit. Importantly, the costs associated with the settlements are covered by existing provisions, which removes a material area of uncertainty for Daimler. The company’s third-quarter revenue largely met market expectations, and earnings per share of EUR 1.92 were well ahead of market forecasts of EUR 1.66. Early in December, CEO Ola Källenius commented that the company is seeing a “remarkable” Mercedes-Benz sales recovery in China, its largest and most profitable market, as the segment reached the sixth consecutive month of double-digit sales growth in November.
NAVER’s full-year results met our estimates. Year-over-year total revenue advanced 18%, which led to operating profit of KRW 1.2 trillion. Revenue in the core business platform segment grew 13% in the fourth quarter after the company realized 17% growth in the previous two quarters. In addition, NAVER indicated plans to prioritize shareholder returns and compensate for heightened spending that occurred in the past two years. To that end, management committed to distribute 30% of the company’s average two-year free cash flow to shareholders by way of dividend payments and share repurchases. Later, NAVER’s first-quarter results reflected year-over-year advances in revenues and operating profit of 15% and 7%, respectively. Elevated shopping-search advertisement activity
| 26
NATIXIS OAKMARK INTERNATIONAL FUND
drove revenue to increase 12% in the business platform unit, which we view as a key operating segment. At the same time, display and general search advertisement revenues were weak, which was not surprising considering pressure from Covid-19. We spoke with management in May and learned that April advertising sales weakened versus the first quarter. However, NAVER planned to launch a new advertising service called Smart Channel, which places cost-per-click banner advertisements at the top of various key tabs on the NAVER app. Later, the company received regulatory approval to merge its Japanese subsidiary, Line Corp, with Yahoo Japan (Z Holdings). This combination will create one of the largest internet companies in Japan, and we are optimistic about its long-term prospects. NAVER also spun out its financial technology business, NAVER Financial, and received a sizable investment from an outside party. We expect this business to generate strong revenue growth in the coming years and to be among the leaders in South Korea’s fintech industry. In our view, the company maintains a dominant market position owing to its high-quality search results that stem from its expertise in processing South Korean syntax. Compared with competitor Google, NAVER’s search capabilities tend to produce results that have more relevance for its users, which we believe can lead to ongoing benefits to the company and shareholders.
Outlook
This year amounted to a volatile 12 months for investors. Though traumatic and difficult to tolerate, we recognize that market instability can unearth investment opportunities for those who are patient and willing to weather the storm. In times when others chase performance or lose conviction based on news headlines and irrational reactions, we remain alert to subsequent opportunities caused by short-term investors to build positions in quality companies that are trading at large discounts to our perception of their intrinsic value. This discipline is deeply embedded in our philosophy and process.
The Nikkei Stock Average (Nikkei 225) is a price-weighted average of 225 Japanese companies listed in the First Section of the Tokyo Stock Exchange. Constituents are selected based on liquidity and industry representation. This index is unmanaged and investors cannot invest directly in this index.
The Deutsche Boerse AG German Stock index is an equity index that measures the share performance of the 30 largest German companies in terms of exchange turnover and market capitalization, and is thus an established indicator for the performance of the German economy as a whole. This index is unmanaged and investors cannot invest directly in this index.
The Dow Jones Industrial Average is a price-weighted measure of 30 U.S. blue-chip companies. The index covers all industries except transportation and utilities. This index is unmanaged and investors cannot invest directly in this index.
The S&P 500 Total Return Index is a float-adjusted, capitalization-weighted index of 500 U.S. large-capitalization stocks representing all major industries. It is a widely recognized index of broad, U.S. equity market performance. Returns reflect the reinvestment of dividends. This index is unmanaged and investors cannot invest directly in this index.
Hypothetical Growth of $100,000 Investment in Class Y Shares1,4
December 31, 2010 through December 31, 2020
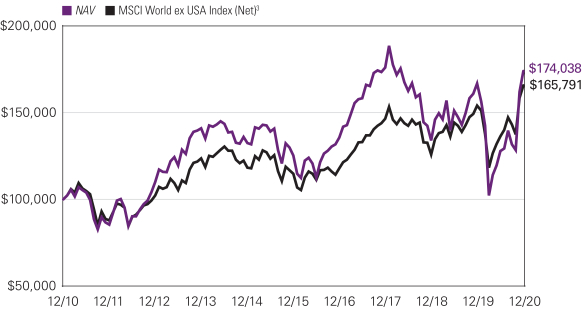
27 |
Top Ten Holdings as of December 31, 2020
| | | | | | | | |
| | |
| Security Name | | % of
Assets | |
| | 1 | | | Glencore PLC | | | 4.86 | % |
| | 2 | | | Lloyds Banking Group PLC | | | 4.36 | |
| | 3 | | | Intesa Sanpaolo SpA | | | 4.11 | |
| | 4 | | | Credit Suisse Group AG, (Registered) | | | 4.07 | |
| | 5 | | | Daimler AG, (Registered) | | | 3.72 | |
| | 6 | | | BNP Paribas S.A. | | | 3.72 | |
| | 7 | | | Bayer AG, (Registered) | | | 3.66 | |
| | 8 | | | CNH Industrial NV | | | 3.58 | |
| | 9 | | | Bayerische Motoren Werke AG | | | 3.24 | |
| | 10 | | | Allianz SE, (Registered) | | | 3.07 | |
The portfolio is actively managed and holdings are subject to change. There is no guarantee the Fund continues to invest in the securities referenced. The holdings listed exclude any temporary cash investments.
Average Annual Total Returns – December 31, 20204
| | | | | | | | | | | | | | | | | | | | | | | | |
| | | | | | |
| | | | | | | | | | | | Life of
Class N | | | Expense Ratios5 | |
| | | 1 Year | | | 5 Years | | | 10 Years | | | Gross | | | Net | |
| | | | | | | |
| Class Y (Inception 5/1/17) | | | | | | | | | | | | | | | | | | | | | | | | |
| NAV1 | | | 4.32 | % | | | 6.79 | % | | | 5.70 | % | | | — | % | | | 0.99 | % | | | 0.95 | % |
| | | | | | | |
| Class A (Inception 12/15/10) | | | | | | | | | | | | | | | | | | | | | | | | |
| NAV | | | 4.06 | | | | 6.59 | | | | 5.60 | | | | — | | | | 1.24 | | | | 1.20 | |
| With 5.75% Maximum Sales Charge | | | -1.91 | | | | 5.33 | | | | 4.98 | | | | — | | | | | | | | | |
| | | | | | | |
| Class C (Inception 12/15/10) | | | | | | | | | | | | | | | | | | | | | | | | |
| NAV | | | 3.28 | | | | 5.78 | | | | 4.82 | | | | — | | | | 1.99 | | | | 1.95 | |
| With CDSC2 | | | 2.28 | | | | 5.78 | | | | 4.82 | | | | — | | | | | | | | | |
| | | | | | | |
| Class N (Inception 5/1/17) | | | | | | | | | | | | | | | | | | | | | | | | |
| NAV | | | 4.44 | | | | — | | | | — | | | | 3.12 | | | | 1.03 | | | | 0.89 | |
| | | | | | | |
| Comparative Performance | | | | | | | | | | | | | | | | | | | | | | | | |
| MSCI World ex USA Index (Net)3 | | | 7.59 | | | | 7.64 | | | | 5.19 | | | | 7.06 | | | | | | | | | |
Performance data shown represents past performance and is no guarantee of, and not necessarily indicative of, future results. Total return and value will vary, and you may have a gain or loss when shares are sold. Current performance may be lower or higher than quoted. For most recent month-end performance, visit im.natixis.com/performance. Performance for other share classes will be greater or less than shown based on differences in fees and sales charges. You may not invest directly in an index. Performance for periods less than one year is cumulative, not annualized. Returns reflect changes in share price and reinvestment of dividends and capital gains, if any. The table(s) do not reflect taxes shareholders might owe on any fund distributions or when they redeem their shares.
| 1 | Prior to the inception of Class Y shares (5/1/2017), performance is that of Class A shares and reflects the higher net expenses of that share class. |
| 2 | Performance for Class C shares assumes a 1.00% contingent deferred sales charge (“CDSC”) applied when you sell shares within one year of purchase. |
| 3 | MSCI World ex USA Index (Net) is an unmanaged index that is designed to measure the equity market performance of developed markets, excluding the United States. |
| 4 | Fund performance has been increased by fee waivers and/or expense reimbursements, if any, without which performance would have been lower. |
| 5 | Expense ratios are as shown in the Funds prospectus in effect as of the date of this report. The expense ratios for the current reporting period can be found in the Financial Highlights section of this report under Ratios to Average Net Assets. Net expenses reflect contractual expense limitations set to expire on 4/30/22. When a Funds expenses are below the limitation, gross and net expense ratios will be the same. See Note 6 of the Notes to Financial Statements for more information about the Funds expense limitations. |
| 28
NATIXIS U.S. EQUITY OPPORTUNITIES FUND
| | | | |
| |
| Managers | | Symbols |
| | |
| Large Cap Value Segment | | Class A | | NEFSX |
| | |
| Harris Associates L.P. | | Class C | | NECCX |
| | |
| All Cap Growth Segment | | Class N | | NESNX |
| | |
| Loomis, Sayles & Company, L.P. | | Class Y | | NESYX |
Investment Goal
The Fund seeks long-term growth of capital.
Market Conditions
Despite beginning the year on a high note, Covid-19 flattened the global economy like a pancake as it spread out from China in January. Pre-Covid, stocks were hitting record highs and the unemployment rate was 3.5%. In April, after a nationwide shutdown order, the unemployment rate shot up to 14.7 percent, stocks crashed and the economic outlook seemed dire.
Initially, the Trump administration, Congress and the Federal Reserve Board (the Fed) responded rapidly to the economic crisis. The Fed lowered benchmark rates to near zero, the lowest rate since the 2007-08 financial crisis, and Congress passed a $3 trillion economic relief bill that was immediately signed by President Trump. Despite this quick action, 20.8 million Americans either lost their jobs or were laid off in April. Hospitalizations climbed in the Northeast. Gross Domestic Product (GDP), a proxy for US economic activity, declined by a record 31.4 percent in the second quarter of the year.
In the spring, many states began to reopen their economies as the Covid-19 curve flattened. However, by the end of May, more than 100,000 Americans died from the coronavirus. The Federal government began to enter into contracts with pharmaceutical companies to develop Covid-19 vaccines, an effort known as Operation Warp Speed. Over the summer, fall and winter, Covid spread throughout the country, affecting large cities and rural areas alike.
Despite the mounting numbers of cases and deaths, the US economy demonstrated some resilience, with unemployment rates falling through the summer and into the fall, edging down to 6.7 percent by November. While the overall economy followed suit, Moody’s Analytics estimated that the economy had only recovered about 75 percent of the strength it had demonstrated pre-pandemic by the end of the year. In December, the US Food and Drug Administration approved two vaccines for distribution. Just before the end of the year, Congress and the Trump Administration agreed to a $900 billion stimulus to continue the economic recovery.
After the initial plunge in February and March, stocks rallied strongly, with the S&P 500 ending the year with a 16.26 percent gain in price (excluding reinvested dividends); the Dow Jones Industrial Average rose by 7.25 percent and the Nasdaq Composite Index by 43.64 percent. The yield on the benchmark U.S. 10-Year Treasury bond ended the year at .93 percent.
As 2020 drew to a close, the country waited to welcome a new administration and Congress in 2021 and looked forward to the wide-spread deployment of two Covid-19 vaccines, which many hoped would lead to a return to normalcy after a year in which anything was normal.
Performance Results
For the 12 months ended December 31, 2020, Class Y shares of Natixis U.S. Equity Opportunities Fund returned 22.36% at net asset value. The Fund outperformed its primary benchmark, the S&P 500® Index, which returned 18.40%. The Fund also outperformed its secondary benchmark, the Russell 1000® Index, which returned 20.96%.
Explanation of Fund Performance
Each of the portfolio’s segments uses a distinct investment style, providing shareholders with exposure to a variety of different stocks:
| | • | | The Harris Associates L.P. Large Cap Value segment invests primarily in the common stocks of larger-capitalization companies that Harris Associates believes are trading at a substantial discount to the company’s “true business value.” |
| | • | | The Loomis, Sayles & Company, L.P. All Cap Growth segment invests primarily in equity securities and may invest in companies of any size. The segment employs a growth style of equity management that emphasizes companies with sustainable competitive advantages, long-term structural growth drivers, attractive cash flow returns on invested capital, and management teams focused on creating long-term value for shareholders. The segment aims to invest in companies when they trade at a significant discount to the estimate of intrinsic value. |
Harris Associates Large Cap Value Segment
As value investors with an emphasis on individual stock selection, our sector weights are a byproduct of our bottom-up process. On an absolute-return basis, the healthcare sector gained the most value, while holdings in the energy sector lost the most value.
29 |
additions amounted to 27.8 million. Later, Netflix’s first-quarter earnings report included paid net subscriber additions of 15.8 million, which handily bested guidance for 7 million additions. The stay-at-home conditions prompted by Covid-19 led to the addition of 26 million new paying subscriptions year-to-date through June, compared with 28 million additions achieved in total for 2019. Revenues for the six-month period rose 26% from the year-ago period, and earnings per share more than doubled. In October, the company released third-quarter results with revenue of $6.44 billion that surpassed market forecasts of $6.39 billion, while earnings per share and total streaming paid net subscription additions fell short of expectations. Along with the release, management issued fourth-quarter guidance for revenue of $6.57 billion, earnings per share of $1.35 and total net additions of 6.00 million. These projections indicated to us that Netflix is on track to exceed our full-year 2020 estimates by a large margin, and if the company achieves these targets, it can likely surpass 200 million global subscribers by year-end, leading to revenue of roughly $25 billion, earnings of nearly $5 billion and $2 billion of free cash flow. In November, Netflix announced plans to increase prices for US subscribers, and investors reacted positively to the news. Notably, generating additional near-term revenue and cash flow enables Netflix to accelerate its competitive momentum by investing more in content and spreading the cost over a larger subscriber base. Although its share price advanced in recent months, we still believe our investment in Netflix offers investors sufficient upside potential.
Fiat Chrysler was the largest detractor to fund performance for the calendar year. Like a majority of other companies, Covid-19 negatively impacted Fiat Chrysler in the first quarter, causing its share price to decline by about half. We opted to eliminate our exposure to the company when it became engaged in a proposed merger at what we found to be a disappointing price.
Loomis, Sayles and Company All Cap Growth Segment
We are an active manager with a long-term, private equity approach to investing. Through our proprietary bottom-up research framework, we look to invest in those few high-quality businesses with sustainable competitive advantages and profitable growth when they trade at a significant discount to intrinsic value. For the period, the All Cap Growth segment posted a positive absolute return. Our holdings in the information technology, consumer discretionary, communication services, healthcare, industrials, financials, and consumer staples sectors contributed positively to results.
Amazon, Nvidia, and Autodesk were the largest contributors to performance during the period. Online retailer Amazon offers millions of products — sold by Amazon or by third parties — with the value proposition to consumers of selection, price, and convenience. Amazon’s enterprise IT business, Amazon Web Services (AWS), offers a suite of secure, on-demand cloud-computing services, with a value proposition to clients of speed, agility, and savings. In both of its core markets, we believe Amazon possesses strong and sustainable competitive advantages that would be difficult for competitors to replicate. During the period, we estimate Amazon’s gross merchandise volume grew faster than either global retail sales or US e-commerce, indicating the company expanded its market share. AWS also posted strong revenue growth that was well above our estimate of growth in global enterprise-IT spending. Revenue growth during the period exceeded consensus expectations and accelerated following the outbreak of Covid-19. In order to manage the increase in demand while protecting the safety of employees and customers, Amazon incurred over $7.5 billion of Covid-19-related costs, while also investing rapidly in new fulfillment capacity. Reiterating Amazon’s long-standing practice of investing aggressively to better position the company for the long term, CEO Jeff Bezos recently stated that he believes the measures taken to get essential products to customers while continuing to ensure the safety and well-being of its hundreds of thousands of employees represents the best long-term investment the company could make. We believe Amazon is one of the best-positioned companies in e-commerce and enterprise IT — in each case addressing large, underpenetrated markets that benefit from secular growth that is still in its early stages. We believe the current share price shows a lack of appreciation for Amazon’s significant long-term growth opportunities and the sustainability of its business model. As a result, we believe the company is selling at a significant discount to our estimate of intrinsic value and offers a compelling reward-to-risk opportunity.
Nvidia is the world leader in graphic processing units (GPUs), which enable computers to produce and utilize highly realistic 3D graphic imagery and models. We believe the company’s competitive advantages include its intellectual property, brands, and a large and growing ecosystem of developers and applications utilizing GPU technology. A segment holding since January 2019, Nvidia reported better-than-expected results, driven by recovery in its gaming business and rising demand in its data center business. In gaming, Nvidia is benefiting from the rollout of Turing, its newest GPU architecture, which is becoming the industry norm for the latest blockbuster titles. Data center revenue also rebounded after a period of softness with quarterly data center revenue exceeding $1 billion for the first time in each of the past three quarters. The company saw strong traction for its latest architecture, Ampere, which for the first time enables clients to address both training and inferencing through a single architecture, with performance that surpasses its already leading T4 inferencing and V100 training products. Over our investment horizon, we believe Nvidia can sustain high-teens revenue growth, driven by secular growth in spending on GPUs. As Nvidia’s business mix shifts increasingly towards its more profitable data center segment, we believe operating profits and free cash flow will grow faster than revenues. We believe Nvidia’s strong free cash flow growth prospects are not currently reflected in its share price. As a result, we believe the company’s shares trade at a significant discount to our estimate of intrinsic value and offer a compelling long-term reward-to-risk opportunity.
| 30
NATIXIS U.S. EQUITY OPPORTUNITIES FUND
A global leader in 3D design software and services, the Autodesk name is synonymous with computer-aided design — a degree of brand recognition that takes years, if not decades, to develop. The company offers a broad suite of products that are viewed as mission critical among its clients and create high switching costs for its global installed user base. In early 2016, the company began transitioning its business model from an up-front, licensing-plus-maintenance model to a cloud-delivered, subscription-based model where fees are recognized ratably over the life of the customer relationship. During the transition, margins, earnings, and cash flow have been predictably under pressure and operating margins were negative in the company’s 2017 and 2018 fiscal years, which we believe represented the trough for cash flow and operating margins. We believe the subscription model will result in increased visibility of future revenue streams and higher lifetime customer value, leading to increased revenue, profitability, and free cash flow. During the year, Autodesk reported strong results that exceeded consensus expectations for revenues, billings, earnings, and free cash flow. Importantly, Autodesk demonstrated continued progress in its model transition, which is now largely complete, including recurring revenue that grew to 95% of the revenue mix from approximately 50% prior to the transition. As the business model transition matures over time, we believe Autodesk will be able to improve operating leverage and increase adjusted operating margins to approximately 40%, from approximately 12% in its 2019 fiscal year and 30% in the most recent quarter, resulting in high and sustainable free cash flow that we believe is not currently reflected in the share price. As a result, Autodesk’s shares are selling at a significant discount to our estimate of intrinsic value, creating a compelling reward-to-risk opportunity.
Under Armour, Schlumberger, and Coca-Cola were the three lowest contributors during the period. Under Armour is a leading provider of performance-centric, branded sportswear and footwear. In twenty years, Under Armour has become a credible number three global sportswear brand behind Nike and Adidas. We believe the company’s strong and sustainable competitive advantages include its brand, distribution, and the benefits of scale needed to compete globally. A segment holding since the fourth quarter of 2017, Under Armour reported weak financial results that reflected the temporary closure of as much as 80% of its points of sale through mid-May due to Covid-19. While we expect this near-term weakness to continue, we do not believe the company or the industry will be structurally impacted in the long term. In China, the company’s largest market outside the US and the country which first experienced the impact of Covid-19, stores were closed earlier than in the US and Europe, and results have begun to improve with their re-opening in late March. Further, Under Armour’s more-recent results have begun to reflect the benefits of the company’s multi-year restructuring. While the company’s challenges pre-date Covid-19, Under Armour has spent the past three years refocusing on its premium segment and resizing its expense base to improve profitability. We believe Under Armour is well positioned to benefit from secular growth in global per capita consumption of sportswear. As a result of its actions, we believe the company will be able to reignite growth when the current downturn ends and can realize market share gains in footwear and in international markets. We believe the current share price embeds growth and profitability assumptions that are substantially below our long-term estimates. As a result, we believe the company is trading at a significant discount to our estimate of intrinsic value and offers a compelling reward-to-risk opportunity.
Schlumberger is the world’s leading supplier of technology, equipment, project management, and information solutions to the oil and gas exploration and production (E&P) industry. A long-term segment holding, Schlumberger reported financial results that deteriorated substantially due to the oil price environment. Following record oil price declines in the first quarter due to Covid-19-related demand weakness in China and a price war between OPEC and Russia, demand and prices fell further in the second quarter as a result of the global lockdown, and continued travel restrictions and a resurgence of Covid-19 cases continues to delay a recovery in demand. As a result, global service activity in 2020 is now expected to decline by 25% to 30% year over year. Given the ongoing uncertainty, Schlumberger has taken prudent steps to increase liquidity, including cutting its dividend, raising cash by issuing debt, and cutting headcount, while lowering structural costs and capital intensity that should contribute to improved returns. While we expect near-term results to remain under pressure, the company continues to generate positive free cash flow, and we believe Schlumberger’s products remain a necessary part of the solution for efficiently extracting energy resources, even in times of substantial commodity price compression. Secular growth in the long-term global demand for oil, arising primarily from the need to replace naturally depleting reserves, is driving the need to extract hydrocarbons from harsher environments that are increasingly difficult to reach or extract from. Because oilfield services companies are key to making difficult-to-reach resources more accessible, we believe services like those Schlumberger provides are essential to profitably meeting long-term demand. We believe that Schlumberger will continue to execute well and that the company is positioned to weather the current environment and capitalize on growth in oilfield services as market supply and demand normalizes. The company’s growing leadership in digital solutions should also create further differentiation versus peers. We believe shares of Schlumberger are selling at a significant discount to our estimate of intrinsic value, and offer a compelling reward-to-risk opportunity.
The Coca-Cola Company is the world’s leading owner and marketer of non-alcoholic beverage brands and employs an unrivaled global beverage distribution network. A long-term segment holding, we believe Coca-Cola’s strong and sustainable competitive advantages include its iconic global brands, difficult-to-replicate beverage distribution network, and unmatched scale. With emerging markets accounting for over 60% of the company’s sales by volume, we believed Coca-Cola was well positioned to benefit from long-term secular growth in emerging market spending on non-alcoholic ready-to-drink beverages, driven by both urbanization and growth
31 |
in disposable income. We believed the sustainability of the company’s cash flow growth drivers and the positive impact of the refranchising of its bottling operations had been underappreciated by the market. In late January, the company reported strong financial results which surpassed management’s already-increased guidance, and the company recorded its 10th consecutive quarter of mid-single-digit organic revenue growth. We believed these results demonstrated the company’s renewed focus on innovation and brand building following the nearly completed refranchising of its bottling operations. The refranchising culminated a decade-long effort to restructure the company’s largest bottling partners to meet best-in-class operational standards and position them for sustainable long-term growth. That effort was largely completed in 2017 and is being reflected in the company’s improved execution and returns. While management expected its strong growth to continue, the current level of growth exceeded our long-term forecasts. We exited our position in March to reallocate capital to more attractive reward-to-risk opportunities. Due to the timing of the sale in the March downturn, the company is among the biggest detractors for the period.
Outlook
The Natixis U.S. Equity Opportunities Fund is comprised of two separate segments combining the value expertise of Harris Associates with the growth expertise of Loomis Sayles. The two segments have common investment philosophies and a rigorous long-term, bottom-up research process focused on high quality businesses trading at a significant discount to intrinsic value. Given encouraging news around Covid-19 vaccines and treatments, we think economic activity in 2021 will look more like 2019, than 2020, and we expect to start seeing signs of that in the second half of 2021. Our thesis for each investment, almost by definition, differs from consensus. Our responsibility is, and always has been, to monitor any new information to constantly challenge those theses. If we are correct that normal will return faster than others expect it will, we believe our stocks are well-positioned. We are patient investors and maintain coverage of high-quality businesses in order to take advantage of meaningful price dislocations if and when they occur.
Hypothetical Growth of $100,000 Investment in Class Y Shares4
December 31, 2010 through December 31, 2020
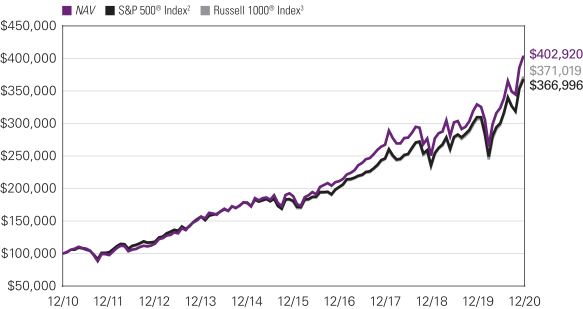
See notes to chart on page 33.
| 32
NATIXIS U.S. EQUITY OPPORTUNITIES FUND
Top Ten Holdings as of December 31, 2020
| | | | | | | | |
| | | |
| | | | Security Name | | % of Assets | |
| | 1 | | | Facebook, Inc., Class A | | | 4.68 | % |
| | 2 | | | Amazon.com, Inc. | | | 3.78 | |
| | 3 | | | Alphabet, Inc., Class A | | | 3.53 | |
| | 4 | | | Autodesk, Inc. | | | 2.84 | |
| | 5 | | | NVIDIA Corp. | | | 2.53 | |
| | 6 | | | Alibaba Group Holding Ltd., Sponsored ADR | | | 2.46 | |
| | 7 | | | Monster Beverage Corp. | | | 2.35 | |
| | 8 | | | Boeing Co. (The) | | | 2.23 | |
| | 9 | | | Visa, Inc., Class A | | | 2.21 | |
| | 10 | | | Capital One Financial Corp. | | | 2.20 | |
The portfolio is actively managed and holdings are subject to change. There is no guarantee the Fund continues to invest in the securities referenced. The holdings listed exclude any temporary cash investments.
Average Annual Total Returns – December 31, 20204
| | | | | | | | | | | | | | | | | | | | | | | | |
| | | | | | |
| | | | | | | | | | | | Life of
Class N | | | Expense Ratios5 | |
| | | 1 Year | | | 5 Years | | | 10 Years | | | Gross | | | Net | |
| | | | | | | |
| Class Y (Inception 11/15/94) | | | | | | | | | | | | | | | | | | | | | | | | |
| NAV | | | 22.36 | % | | | 16.43 | % | | | 14.95 | % | | | — | % | | | 0.92 | % | | | 0.92 | % |
| | | | | | | |
| Class A (Inception 7/7/94) | | | | | | | | | | | | | | | | | | | | | | | | |
| NAV | | | 22.09 | | | | 16.14 | | | | 14.66 | | | | — | | | | 1.17 | | | | 1.17 | |
| With 5.75% Maximum Sales Charge | | | 15.06 | | | | 14.78 | | | | 13.98 | | | | — | | | | | | | | | |
| | | | | | | |
| Class C (Inception 7/7/94) | | | | | | | | | | | | | | | | | | | | | | | | |
| NAV | | | 21.15 | | | | 15.27 | | | | 13.80 | | | | — | | | | 1.92 | | | | 1.92 | |
| With CDSC1 | | | 20.18 | | | | 15.27 | | | | 13.80 | | | | — | | | | | | | | | |
| | | | | | | |
| Class N (Inception 5/1/17) | | | | | | | | | | | | | | | | | | | | | | | | |
| NAV | | | 22.48 | | | | — | | | | — | | | | 16.75 | | | | 1.42 | | | | 0.83 | |
| | | | | | | |
| Comparative Performance | | | | | | | | | | | | | | | | | | | | | | | | |
| S&P 500® Index2 | | | 18.40 | | | | 15.22 | | | | 13.88 | | | | 15.30 | | | | | | | | | |
| Russell 1000® Index3 | | | 20.96 | | | | 15.60 | | | | 14.01 | | | | 15.78 | | | | | | | | | |
Performance data shown represents past performance and is no guarantee of, and not necessarily indicative of, future results. Total return and value will vary, and you may have a gain or loss when shares are sold. Current performance may be lower or higher than quoted. For most recent month-end performance, visit im.natixis.com/performance. Performance for other share classes will be greater or less than shown based on differences in fees and sales charges. You may not invest directly in an index. Performance for periods less than one year is cumulative, not annualized. Returns reflect changes in share price and reinvestment of dividends and capital gains, if any. The table(s) do not reflect taxes shareholders might owe on any fund distributions or when they redeem their shares.
| 1 | Performance for Class C shares assumes a 1.00% contingent deferred sales charge (“CDSC”) applied when you sell shares within one year of purchase. |
| 2 | S&P 500® Index is a widely recognized measure of U.S. stock market performance. It is an unmanaged index of 500 common stocks chosen for market size, liquidity, and industry group representation, among other factors. It also measures the performance of the large cap segment of the US equities market. |
| 3 | Russell 1000® Index measures the performance of the large-cap segment of the U.S. equity universe. It is a subset of the Russell 3000® Index and includes approximately 1000 of the largest securities based on a combination of their market cap and current index membership. The Russell 1000® Index represents approximately 92% of the U.S. market and is constructed to provide a comprehensive and unbiased barometer for the large-cap segment and is completely reconstituted annually to ensure new and growing equities are reflected. |
| 4 | Fund performance has been increased by fee waivers and/or expense reimbursements, if any, without which performance would have been lower. |
| 5 | Expense ratios are as shown in the Fund’s prospectus in effect as of the date of this report. The expense ratios for the current reporting period can be found in the Financial Highlights section of this report under Ratios to Average Net Assets. Net expenses reflect contractual expense limitations set to expire on 4/30/21. When a Fund’s expenses are below the limitation, gross and net expense ratios will be the same. See Note 6 of the Notes to Financial Statements for more information about the Fund’s expense limitations. |
33 |
VAUGHAN NELSON MID CAP FUND
| | |
| |
| Managers | | Symbols |
| |
| Dennis G. Alff, CFA® | | Class A VNVAX |
| |
| Chad D. Fargason | | Class C VNVCX |
| |
| Chris D. Wallis, CFA® | | Class N VNVNX |
| |
| | Class Y VNVYX |
| |
| Vaughan Nelson Investment Management, L.P. | | |
Investment Goal
The Fund seeks long-term capital appreciation.
Market Conditions
During 2020, the equity market continued to recover from the steep selloff due to the economic lockdown in response to the global pandemic. The equity market rally is consistent with the unprecedented monetary and fiscal policy support that went into the economy and with the bottoming of economic activity in late March to early April. The United States has finally reached the point where the federal government has become the marginal lender and spender of last resort. While policy support is very much warranted, investors will be dealing with the intended and unintended consequences of these actions for many years. The industrial recovery remains strong, boosted by the need to rebuild inventories and robust demand for housing that has left the supply of homes at record low levels. Without additional shocks to the economy, we expect the inventory rebuilding process to last several months and hopefully jumpstart a broader self-reinforcing recovery. The recovery in the service sector continues, but at a slower pace than the industrial sector.
Performance Results
For the 12 months ended December 31, 2020, Class Y shares of Vaughan Nelson Mid Cap Fund returned 10.76% at net asset value. The Fund outperformed its benchmark, the Russell Midcap® Value Index, which returned 4.96%.
Explanation of Fund Performance
The Fund outperformed the benchmark for the year due primarily to stock selection and weightings in Real Estate, Information Technology, Utilities, Consumer Staples, Energy, Healthcare, and Consumer Discretionary.
REITs were the top performing relative sector in 2020. Both an underweight to the struggling space and performance from CyrusOne, Inc. resulted in excess return. CyrusOne owns and operates data centers and benefited from continued demand for cloud storage.
A significant overweight to Information Technology resulted in a strong performance in the space. The top performer was Entegris, a provider of consumables for the semi-conductor industry. Entegris sales accelerated during the year as demand in end markets levered to 5G and data center/cloud strengthened.
After two years as the top performing sector, Utilities struggled in 2020, but the Fund’s security selection helped outperform the sector. The largest contributor was Eversource Energy, a public utility providing service in Connecticut, New Hampshire and Massachusetts. The Fund sold its Eversource position well, cutting it in half in April at its relative highs vs. Utilities, and then completely unwinding the position in July.
Strong stock selection in Consumer Staples, namely Performance Food Group Company, also contributed to the Fund’s return for the year. Performance Food Group is a foodservice distributor, selling mainly to restaurants. The Fund purchased the stock in early June during Covid-19 lockdowns, believing Performance Food Group Company’s strong balance sheet and high-touch sales force would enable the company to take share during the crisis. The stock strongly rebounded as sales recovered and positive vaccine news arrived.
While Energy struggled throughout 2020, limited exposure and better company performance led to positive relative results. Baker Hughes Company was the top performer for the Fund. Baker Hughes is a leading oil field services provider and outperformed peers due to a relatively stronger balance sheet. We exited our position in September to refocus our energy sector exposure.
Healthcare performed well in 2020, and security selection aided the Fund’s performance. Hologic was the top pick in the space. Hologic is a developer and manufacturer of diagnostics products, medical imaging and surgical products. The company was quick to develop testing for Covid-19 and benefited greatly from the ramp-up of Covid-19 testing.
Lastly, company specifics aided relative performance in Consumer Discretionary. Terminix Global Holdings was the top driver of returns. Previously ServiceMaster, the company divested its namesake business to Roark Capital in October 2020 for $1.5 billion,
| 34
VAUGHAN NELSON MID CAP FUND
renaming the remaining company Terminix (TMX). With a new management team and a strengthened balance sheet from divestiture proceeds, TMX is a focused pure play in the pest control space.
The largest sector detractor from performance in 2020 was Communication Services, led by Nexstar Media Group, Inc. Nexstar owns and operates 195 TV stations across the US and traded down as advertisers pulled spending due to Covid-19 lockdowns.
Within Industrials, Brink’s Company was the biggest impairment to returns. Brink’s provides secure transport of cash and other valuables for businesses and institutions around the world. The stock traded down as Covid-19 led to an acceleration into electronic payments and a slowdown in business activity in general. The Fund exited the position in July.
Financials lagged throughout the year, and New Residential Investment Corp. (NRZ) was the largest drag on the portfolio. New Residential is a REIT focused on investing in and actively managing investments related to residential real estate. Due to Covid-19 pressures, the company unwound a large chunk of its residential securities and slashed its dividend by 90%. The Fund held onto its position, as originations have remained strong and the Fund believes management will be able to rebuild book value. Additionally, on 11/23/20, NRZ announced it has filed a registration statement for the IPO of its subsidiary.
Finally, despite strong absolute performance, Material holdings underperformed the sector. Within the sector, Axalta Coating Systems trailed. Axalta manufactures and distributes coatings for automotive, transportation and industrial end markets. While the stock strongly recovered, it lagged peers with more exposure to commodities, e.g., metals.
Outlook
After decades of reliance on monetary stimulus, the economy and capital markets suffer from excess leverage, malinvestment and structural imbalances that hamper the effectiveness of monetary tools. With the election behind us, we expect fiscal policy in close coordination with the US Federal Reserve to take center stage in driving economic growth.
The last bout of loose fiscal policy was combined with tight monetary policy, which sustained US dollar strength. The next round of loose fiscal policy will likely be combined with loose monetary policy, which will pressure the US dollar. Should such economic policy be pursued, and successfully increase nominal GDP growth, it will represent a fundamental shift in the underlying economic conditions that have not been witnessed in years. Such a shift in the economic environment will likely lead to increased market volatility and broad changes in market leadership.
Hypothetical Growth of $100,000 Investment in Class Y Shares3
December 31, 2010 through December 31, 2020
35 |
Top Ten Holdings as of December 31, 2020
| | | | | | | | |
| | | |
| | | | Security Name | | % of Assets | |
| | 1 | | | iShares® Russell 2000 Value Index ETF | | | 4.87 | % |
| | 2 | | | CACI International, Inc., Class A | | | 3.36 | |
| | 3 | | | Cabot Microelectronics Corp. | | | 2.93 | |
| | 4 | | | Nexstar Media Group, Inc., Class A | | | 2.51 | |
| | 5 | | | Element Solutions, Inc. | | | 2.49 | |
| | 6 | | | MGIC Investment Corp. | | | 2.43 | |
| | 7 | | | Brady Corp., Class A | | | 2.32 | |
| | 8 | | | TEGNA, Inc. | | | 2.32 | |
| | 9 | | | Entegris, Inc. | | | 2.32 | |
| | 10 | | | Landstar System, Inc. | | | 2.18 | |
The portfolio is actively managed and holdings are subject to change. There is no guarantee the Fund continues to invest in the securities referenced. The holdings listed exclude any temporary cash investments.
Average Annual Total Returns — December 31, 20203
| | | | | | | | | | | | | | | | | | | | | | | | |
| | | | | | |
| | | | | | | | | | | | Life of
Class N | | | Expense Ratios4 | |
| | | 1 Year | | | 5 Years | | | 10 Years | | | Gross | | | Net | |
| | | | | | | |
| Class Y (Inception 10/31/08) | | | | | | | | | | | | | | | | | | | | | | | | |
| NAV | | | 10.76 | % | | | 7.89 | % | | | 9.67 | % | | | — | % | | | 1.04 | % | | | 0.99 | % |
| | | | | | | |
| Class A (Inception 10/31/08) | | | | | | | | | | | | | | | | | | | | | | | | |
| NAV | | | 10.46 | | | | 7.60 | | | | 9.40 | | | | — | | | | 1.30 | | | | 1.24 | |
| With 5.75% Maximum Sales Charge | | | 4.10 | | | | 6.34 | | | | 8.75 | | | | — | | | | | | | | | |
| | | | | | | |
| Class C (Inception 10/31/08) | | | | | | | | | | | | | | | | | | | | | | | | |
| NAV | | | 9.60 | | | | 6.80 | | | | 8.58 | | | | — | | | | 2.04 | | | | 1.98 | |
| With CDSC1 | | | 8.64 | | | | 6.80 | | | | 8.58 | | | | — | | | | | | | | | |
| | | | | | | |
| Class N (Inception 5/1/13) | | | | | | | | | | | | | | | | | | | | | | | | |
| NAV | | | 10.83 | | | | 7.98 | | | | — | | | | 9.23 | | | | 0.95 | | | | 0.93 | |
| | | | | | | |
| Comparative Performance | | | | | | | | | | | | | | | | | | | | | | | | |
| Russell Midcap® Value Index2 | | | 4.96 | | | | 9.73 | | | | 10.49 | | | | 9.67 | | | | | | | | | |
Performance data shown represents past performance and is no guarantee of, and not necessarily indicative of, future results. Total return and value will vary, and you may have a gain or loss when shares are sold. Current performance may be lower or higher than quoted. For most recent month-end performance, visit im.natixis.com/performance. Performance for other share classes will be greater or less than shown based on differences in fees and sales charges. You may not invest directly in an index. Performance for periods less than one year is cumulative, not annualized. Returns reflect changes in share price and reinvestment of dividends and capital gains, if any. The table(s) do not reflect taxes shareholders might owe on any fund distributions or when they redeem their shares.
| 1 | Performance for Class C shares assumes a 1.00% contingent deferred sales charge (“CDSC”) applied when you sell shares within one year of purchase. |
| 2 | Russell Midcap® Value Index is an unmanaged index that measures the performance of the mid-cap value segment of the U.S. equity universe. It includes those Russell Midcap® Index companies with lower price-to-book ratios and lower forecasted growth values. |
| 3 | Fund performance has been increased by fee waivers and/or expense reimbursements, if any, without which performance would have been lower. |
| 4 | Expense ratios are as shown in the Fund’s prospectus in effect as of the date of this report. The expense ratios for the current reporting period can be found in the Financial Highlights section of this report under Ratios to Average Net Assets. Net expenses reflect contractual expense limitations set to expire on 4/30/21. When a Fund’s expenses are below the limitation, gross and net expense ratios will be the same. See Note 6 of the Notes to Financial Statements for more information about the Fund’s expense limitations. |
| 36
VAUGHAN NELSON SMALL CAP VALUE FUND
| | |
| |
| Managers | | Symbols |
| |
| Chris D. Wallis, CFA® | | Class A NEFJX |
| |
| Stephen Davis, CFA® | | Class C NEJCX |
| |
| | Class N VSCNX |
| |
| | Class Y NEJYX |
| |
| Vaughan Nelson Investment Management, L.P. | | |
Investment Goal
The Fund seeks capital appreciation.
Market Conditions
During 2020, the equity market continued to recover from the steep selloff due to the economic lockdown in response to the global pandemic. The equity market rally is consistent with the unprecedented monetary and fiscal policy support that went into the economy and with the bottoming of economic activity in late March to early April. The United States has finally reached the point where the federal government has become the marginal lender and spender of last resort. While policy support is very much warranted, investors will be dealing with the intended and unintended consequences of these actions for many years. The industrial recovery remains strong, boosted by the need to rebuild inventories and robust demand for housing that has left the supply of homes at record low levels. Without additional shocks to the economy, we expect the inventory rebuilding process to last several months and hopefully jumpstart a broader self-reinforcing recovery. The recovery in the service sector continues, but at a slower pace than the industrial sector.
Performance Results
For the 12 months ended December 31, 2020, Class Y shares of Vaughan Nelson Small Cap Value Fund returned 9.23% at net asset value. The Fund outperformed its benchmark, the Russell 2000® Value Index, which returned 4.63%.
Explanation of Fund Performance
The Fund outperformed the benchmark, coupling strong stock selection with positive sector allocation.
The Information Technology sector contributed the most to the Fund’s performance for the year. The Fund was overweight in the sector, which was up over 20% in 2020. The top performing IT name was Entegris, Inc. Entegris performed well due to continued strength in semiconductor end markets throughout the Covid pandemic. The Fund was underweight the challenged REIT sector, but also had solid relative performance from the companies held, specifically Physicians Trust Realty.
Underweighting Utilities throughout the course of 2020 proved positive to the relative attribution given the challenges in the space. Southwest Gas provided a boost. In 2020, Financials had a difficult year. The Fund was underweight throughout 2020 and held a handful of companies that performed well, namely, Virtu Financial, Inc. Rounding out the substantial contributors was Industrials, with Builders FirstSource, Inc. as the top contributor. Builders FirstSource performed well due to strong residential housing demand and the announced merger with BMC Stock Holdings which will be highly accretive to growth, margins and returns.
For the third year in a row, Energy was the worst performing sector in the Russell 2000® Value Index, down nearly 35%. The Fund had an underweight to Energy and overcame some stock-specific challenges. The result was a slight positive relative year with Callon Petroleum Company and ChampionX Corporation as the top names. Callon Petroleum was a top energy name due to the Fund selling its position at the end of January 2020, before the price of oil came under pressure from the collapse in demand caused by the Covid-19 pandemic. ChampionX performed well because of well-timed purchase as vaccine news and economic reopening helped drive the price of oil higher, which improved the outlook for the ChampionX end market and its customer base.
Healthcare was the largest relative detractor in 2020, specifically Lantheus Holdings, Inc. The stock performed poorly due to delays in elective surgeries, which is the company’s primary end market, due to the Covid-19 pandemic and the long timeline to recover to pre-Covid levels.
Materion Corporation lagged the strong returning Materials sector. Materion end markets are not as cyclical as other material names. Further, the company has less margin leverage to rising commodity prices than other small-cap material names. An overweight to a challenged Communication Services sector also detracted, with Tegna, Inc. the biggest headwind to performance. Excellent security selection was not enough to overcome a substantial underweight in Consumer Discretionary. Lastly, limited exposure to the outperforming Consumer Staples sector was a drag on performance.
37 |
Outlook
After decades of reliance on monetary stimulus, the economy and capital markets suffer from excess leverage, malinvestment and structural imbalances that hamper the effectiveness of monetary tools. With the election behind us, we expect fiscal policy in close coordination with the US Federal Reserve to take center stage in driving economic growth.
The last bout of loose fiscal policy was combined with tight monetary policy, which sustained US dollar strength. The next round of loose fiscal policy will likely be combined with loose monetary policy, which will pressure the US dollar. Should such economic policy be pursued, and successfully increase nominal GDP growth, it will represent a fundamental shift in the underlying economic conditions that have not been witnessed in years. Such a shift in the economic environment will likely lead to increased market volatility and broad changes in market leadership.
Hypothetical Growth of $100,000 Investment in Class Y Shares3
December 31, 2010 through December 31, 2020
See notes to chart on page 39.
Top Ten Holdings as of December 31, 2020
| | | | | | | | |
| | |
| Security Name | | % of
Assets | |
| | 1 | | | Nexstar Media Group, Inc., Class A | | | 3.46 | % |
| | 2 | | | TCF Financial Corp. | | | 2.95 | |
| | 3 | | | Fiserv, Inc. | | | 2.63 | |
| | 4 | | | CACI International, Inc., Class A | | | 2.57 | |
| | 5 | | | Fidelity National Information Services, Inc. | | | 2.43 | |
| | 6 | | | Global Payments, Inc. | | | 2.26 | |
| | 7 | | | Evergy, Inc. | | | 2.25 | |
| | 8 | | | Vistra Energy Corp. | | | 2.23 | |
| | 9 | | | IQVIA Holdings, Inc. | | | 2.10 | |
| | 10 | | | Allstate Corp. (The) | | | 2.09 | |
The portfolio is actively managed and holdings are subject to change. There is no guarantee the Fund continues to invest in the securities referenced. The holdings listed exclude any temporary cash investments.
| 38
VAUGHAN NELSON SMALL CAP VALUE FUND
Average Annual Total Returns – December 31, 20203
| | | | | | | | | | | | | | | | | | | | | | | | |
| | | | | | |
| | | | | | | | | | | | Life of Class N | | | Expense Ratios4 | |
| | | 1 Year | | | 5 Years | | | 10 Years | | | Gross | | | Net | |
| | | | | | | |
| Class Y (Inception 8/31/06) | | | | | | | | | | | | | | | | | | | | | | | | |
| NAV | | | 9.23 | % | | | 8.40 | % | | | 9.71 | % | | | — | % | | | 1.27 | % | | | 1.09 | % |
| | | | | | | |
| Class A (Inception 12/31/96) | | | | | | | | | | | | | | | | | | | | | | | | |
| NAV | | | 8.91 | | | | 8.12 | | | | 9.44 | | | | — | | | | 1.51 | | | | 1.34 | |
| With 5.75% Maximum Sales Charge | | | 2.66 | | | | 6.85 | | | | 8.79 | | | | — | | | | | | | | | |
| | | | | | |
| Class C (Inception 12/31/96) | | | | | | | | | | | | | | | | | | | | | |
| NAV | | | 8.08 | | | | 7.29 | | | | 8.61 | | | | — | | | | 2.27 | | | | 2.09 | |
| With CDSC1 | | | 7.08 | | | | 7.29 | | | | 8.61 | | | | — | | | | | | | | | |
| | | | | | | |
| Class N (Inception 5/1/17) | | | | | | | | | | | | | | | | | | | | | | | | |
| NAV | | | 9.27 | | | | — | | | | — | | | | 6.33 | | | | 11.84 | | | | 1.04 | |
| | | | | | | |
| Comparative Performance | | | | | | | | | | | | | | | | | | | | | | | | |
| Russell 2000® Value Index2 | | | 4.63 | | | | 9.65 | | | | 8.66 | | | | 4.96 | | | | | | | | | |
Performance data shown represents past performance and is no guarantee of, and not necessarily indicative of, future results. Total return and value will vary, and you may have a gain or loss when shares are sold. Current performance may be lower or higher than quoted. For most recent month-end performance, visit im.natixis.com/performance. Performance for other share classes will be greater or less than shown based on differences in fees and sales charges. You may not invest directly in an index. Performance for periods less than one year is cumulative, not annualized. Returns reflect changes in share price and reinvestment of dividends and capital gains, if any. The table(s) do not reflect taxes shareholders might owe on any fund distributions or when they redeem their shares.
| 1 | Performance for Class C shares assumes a 1.00% contingent deferred sales charge (“CDSC”) applied when you sell shares within one year of purchase. |
| 2 | Russell 2000® Value Index is an unmanaged index that measures the performance of the small-cap value segment of the U.S. equity universe. It includes those Russell 2000® companies with lower price-to-book ratios and lower forecasted growth values. |
| 3 | Fund performance has been increased by fee waivers and/or expense reimbursements, if any, without which performance would have been lower. |
| 4 | Expense ratios are as shown in the Fund’s prospectus in effect as of the date of this report. The expense ratios for the current reporting period can be found in the Financial Highlights section of this report under Ratios to Average Net Assets. Net expenses reflect contractual expense limitations set to expire on 4/30/22. When a Fund’s expenses are below the limitation, gross and net expense ratios will be the same. See Note 6 of the Notes to Financial Statements for more information about the Fund’s expense limitations. |
39 |
ADDITIONAL INFORMATION
The views expressed in this report reflect those of the portfolio managers as of the dates indicated. The managers’ views are subject to change at any time without notice based on changes in market or other conditions. References to specific securities or industries should not be regarded as investment advice. Because the Funds are actively managed, there is no assurance that they will continue to invest in the securities or industries mentioned.
All investing involves risk, including the risk of loss. There is no assurance that any investment will meet its performance objectives or that losses will be avoided.
ADDITIONAL INDEX INFORMATION
This document may contain references to third party copyrights, indexes, and trademarks, each of which is the property of its respective owner. Such owner is not affiliated with Natixis Investment Managers or any of its related or affiliated companies (collectively “Natixis Affiliates”) and does not sponsor, endorse or participate in the provision of any Natixis Affiliates services, funds or other financial products.
The index information contained herein is derived from third parties and is provided on an “as is” basis. The user of this information assumes the entire risk of use of this information. Each of the third party entities involved in compiling, computing or creating index information disclaims all warranties (including, without limitation, any warranties of originality, accuracy, completeness, timeliness, non-infringement, merchantability and fitness for a particular purpose) with respect to such information.
PROXY VOTING INFORMATION
A description of the Natixis Funds’ proxy voting policies and procedures is available without charge, upon request, by calling Natixis Funds at 800-225-5478; on the Natixis Funds’ website at im.natixis.com; and on the Securities and Exchange Commission’s (“SEC’s”) website at www.sec.gov. Information regarding how the Natixis Funds voted proxies relating to portfolio securities during the most recent 12-month period ended June 30 is available from the Natixis Funds’ website and the SEC’s website.
QUARTERLY PORTFOLIO SCHEDULES
The Natixis Funds file a complete schedule of portfolio holdings with the SEC for the first and third quarters of each fiscal year as an exhibit to it reports on Form N-PORT. The Funds’ Form N-PORT reports are available on the SEC’s website at www.sec.gov. First and third quarter schedules of portfolio holdings are also available at im.natixis.com/funddocuments. A hard copy may be requested from the Fund at no charge by calling 800-225-5478.
CFA® and Chartered Financial Analyst® are registered trademarks owned by the CFA Institute.
| 40
UNDERSTANDING FUND EXPENSES
As a mutual fund shareholder, you incur different costs: transaction costs, including sales charges (loads) on purchases and contingent deferred sales charges on redemptions, and ongoing costs, including management fees, distribution and/or service fees (12b-1 fees), and other fund expenses. Certain exemptions may apply. These costs are described in more detail in the Funds’ prospectus. The following examples are intended to help you understand the ongoing costs of investing in the Funds and help you compare these with the ongoing costs of investing in other mutual funds.
The first line in the table of each class of Fund shares shows the actual account values and actual Fund expenses you would have paid on a $1,000 investment in the Fund from July 1, 2020 through December 31, 2020. To estimate the expenses you paid over the period, simply divide your account value by $1,000 (for example $8,600 account value divided by $1,000 = 8.60) and multiply the result by the number in the Expenses Paid During Period column as shown for your class.
The second line in the table for each class of fund shares provides information about hypothetical account values and hypothetical expenses based on the Fund’s actual expense ratios and an assumed rate of return of 5% per year before expenses, which is not the Fund’s actual return. The hypothetical account values and expenses may not be used to estimate the actual ending account balance or expenses you paid on your investment for the period. You may use this information to compare the ongoing costs of investing in the Fund and other funds. To do so, compare this 5% hypothetical example with the 5% hypothetical examples that appear in the shareholder reports of the other funds.
Please note that the expenses shown reflect ongoing costs only, and do not include any transaction costs, such as sales charges. Therefore, the second line in the table of each fund is useful in comparing ongoing costs only, and will not help you determine the relative costs of owning funds. If transaction costs were included, total costs would be higher.
| | | | | | | | | | | | |
| GATEWAY FUND | | BEGINNING
ACCOUNT VALUE
7/1/2020 | | | ENDING
ACCOUNT` VALUE
12/31/2020 | | | EXPENSES PAID
DURING PERIOD*
7/1/2020 – 12/31/2020 | |
| Class A | | | | | | | | | | | | |
| Actual | | | $1,000.00 | | | | $1,097.80 | | | | $4.96 | |
| Hypothetical (5% return before expenses) | | | $1,000.00 | | | | $1,020.41 | | | | $4.77 | |
| Class C | | | | | | | | | | | | |
| Actual | | | $1,000.00 | | | | $1,093.80 | | | | $8.95 | |
| Hypothetical (5% return before expenses) | | | $1,000.00 | | | | $1,016.59 | | | | $8.62 | |
| Class N | | | | | | | | | | | | |
| Actual | | | $1,000.00 | | | | $1,099.50 | | | | $3.43 | |
| Hypothetical (5% return before expenses) | | | $1,000.00 | | | | $1,021.87 | | | | $3.30 | |
| Class Y | | | | | | | | | | | | |
| Actual | | | $1,000.00 | | | | $1,099.20 | | | | $3.69 | |
| Hypothetical (5% return before expenses) | | | $1,000.00 | | | | $1,021.62 | | | | $3.56 | |
| * | Expenses are equal to the Fund’s annualized expense ratio (after waiver/reimbursement): 0.94%, 1.70%, 0.65% and 0.70% for Class A, C, N and Y, respectively, multiplied by the average account value over the period, multiplied by the number of days in the most recent fiscal half-year (184), divided by 366 (to reflect the half-year period). |
41 |
| | | | | | | | | | | | |
| GATEWAY EQUITY CALL PREMIUM FUND | | BEGINNING
ACCOUNT VALUE
7/1/2020 | | | ENDING
ACCOUNT VALUE
12/31/2020 | | | EXPENSES PAID
DURING PERIOD*
7/1/2020 – 12/31/2020 | |
| Class A | | | | | | | | | | | | |
| Actual | | | $1,000.00 | | | | $1,151.80 | | | | $6.49 | |
| Hypothetical (5% return before expenses) | | | $1,000.00 | | | | $1,019.10 | | | | $6.09 | |
| Class C | | | | | | | | | | | | |
| Actual | | | $1,000.00 | | | | $1,147.10 | | | | $10.52 | |
| Hypothetical (5% return before expenses) | | | $1,000.00 | | | | $1,015.33 | | | | $9.88 | |
| Class N | | | | | | | | | | | | |
| Actual | | | $1,000.00 | | | | $1,154.00 | | | | $4.87 | |
| Hypothetical (5% return before expenses) | | | $1,000.00 | | | | $1,020.61 | | | | $4.57 | |
| Class Y | | | | | | | | | | | | |
| Actual | | | $1,000.00 | | | | $1,153.60 | | | | $5.14 | |
| Hypothetical (5% return before expenses) | | | $1,000.00 | | | | $1,020.36 | | | | $4.82 | |
| * | Expenses are equal to the Fund’s annualized expense ratio (after waiver/reimbursement): 1.20%, 1.95%, 0.90% and 0.95% for Class A, C, N and Y, respectively, multiplied by the average account value over the period, multiplied by the number of days in the most recent fiscal half-year (184), divided by 366 (to reflect the half-year period). |
| | | | | | | | | | | | |
| MIROVA GLOBAL GREEN BOND FUND | | BEGINNING
ACCOUNT VALUE
7/1/2020 | | | ENDING
ACCOUNT VALUE
12/31/2020 | | | EXPENSES PAID
DURING PERIOD*
7/1/2020 – 12/31/2020 | |
| Class A | | | | | | | | | | | | |
| Actual | | | $1,000.00 | | | | $1,047.40 | | | | $4.99 | |
| Hypothetical (5% return before expenses) | | | $1,000.00 | | | | $1,020.26 | | | | $4.93 | |
| Class N | | | | | | | | | | | | |
| Actual | | | $1,000.00 | | | | $1,049.70 | | | | $3.45 | |
| Hypothetical (5% return before expenses) | | | $1,000.00 | | | | $1,021.77 | | | | $3.40 | |
| Class Y | | | | | | | | | | | | |
| Actual | | | $1,000.00 | | | | $1,048.60 | | | | $3.71 | |
| Hypothetical (5% return before expenses) | | | $1,000.00 | | | | $1,021.52 | | | | $3.66 | |
| * | Expenses are equal to the Fund’s annualized expense ratio (after waiver/reimbursement): 0.97%, 0.67% and 0.72% for Class A, N and Y, respectively, multiplied by the average account value over the period, multiplied by the number of days in the most recent fiscal half-year (184), divided by 366 (to reflect the half-year period). |
| 42
| | | | | | | | | | | | |
| MIROVA GLOBAL SUSTAINABLE EQUITY FUND | | BEGINNING
ACCOUNT VALUE
7/1/2020 | | | ENDING
ACCOUNT VALUE
12/31/2020 | | | EXPENSES PAID
DURING PERIOD*
7/1/2020 –12/31/2020 | |
| Class A | | | | | | | | | | | | |
| Actual | | | $1,000.00 | | | | $1,246.50 | | | | $6.78 | |
| Hypothetical (5% return before expenses) | | | $1,000.00 | | | | $1,019.10 | | | | $6.09 | |
| Class C | | | | | | | | | | | | |
| Actual | | | $1,000.00 | | | | $1,242.60 | | | | $10.99 | |
| Hypothetical (5% return before expenses) | | | $1,000.00 | | | | $1,015.33 | | | | $9.88 | |
| Class N | | | | | | | | | | | | |
| Actual | | | $1,000.00 | | | | $1,248.80 | | | | $5.09 | |
| Hypothetical (5% return before expenses) | | | $1,000.00 | | | | $1,020.61 | | | | $4.57 | |
| Class Y | | | | | | | | | | | | |
| Actual | | | $1,000.00 | | | | $1,248.50 | | | | $5.37 | |
| Hypothetical (5% return before expenses) | | | $1,000.00 | | | | $1,020.36 | | | | $4.82 | |
| * | Expenses are equal to the Fund’s annualized expense ratio (after waiver/reimbursement): 1.20%, 1.95%, 0.90% and 0.95% for Class A, C, N and Y, respectively, multiplied by the average account value over the period, multiplied by the number of days in the most recent fiscal half-year (184), divided by 366 (to reflect the half-year period). |
| | | | | | | | | | | | |
| MIROVA INTERNATIONAL SUSTAINABLE EQUITY FUND | | BEGINNING
ACCOUNT VALUE
7/1/2020 | | | ENDING
ACCOUNT VALUE
12/31/2020 | | | EXPENSES PAID
DURING PERIOD*
7/1/2020 – 12/31/2020 | |
| Class A | | | | | | | | | | | | |
| Actual | | | $1,000.00 | | | | $1,273.70 | | | | $7.20 | |
| Hypothetical (5% return before expenses) | | | $1,000.00 | | | | $1,018.80 | | | | $6.39 | |
| Class N | | | | | | | | | | | | |
| Actual | | | $1,000.00 | | | | $1,274.90 | | | | $5.43 | |
| Hypothetical (5% return before expenses) | | | $1,000.00 | | | | $1,020.36 | | | | $4.82 | |
| Class Y | | | | | | | | | | | | |
| Actual | | | $1,000.00 | | | | $1,274.90 | | | | $5.78 | |
| Hypothetical (5% return before expenses) | | | $1,000.00 | | | | $1,020.06 | | | | $5.13 | |
| * | Expenses are equal to the Fund’s annualized expense ratio (after waiver/reimbursement): 1.26%, 0.95% and 1.01% for Class A, N and Y, respectively, multiplied by the average account value over the period, multiplied by the number of days in the most recent fiscal half-year (184), divided by 366 (to reflect the half-year period). |
43 |
| | | | | | | | | | | | |
| MIROVA U.S. SUSTAINABLE EQUITY FUND | | BEGINNING
ACCOUNT VALUE
7/1/20201 | | | ENDING
ACCOUNT VALUE
12/31/2020 | | | EXPENSES PAID
DURING PERIOD
7/1/20201 – 12/31/2020 | |
| Class A | | | | | | | | | | | | |
| Actual | | | $1,000.00 | | | | $1,021.00 | | | | $0.46 | 1 |
| Hypothetical (5% return before expenses) | | | $1,000.00 | | | | $1,019.86 | | | | $5.33 | * |
| Class C | | | | | | | | | | | | |
| Actual | | | $1,000.00 | | | | $1,021.00 | | | | $0.80 | 1 |
| Hypothetical (5% return before expenses) | | | $1,000.00 | | | | $1,016.09 | | | | $9.12 | * |
| Class N | | | | | | | | | | | | |
| Actual | | | $1,000.00 | | | | $1,021.00 | | | | $0.33 | 1 |
| Hypothetical (5% return before expenses) | | | $1,000.00 | | | | $1,021.37 | | | | $3.81 | * |
| Class Y | | | | | | | | | | | | |
| Actual | | | $1,000.00 | | | | $1,021.00 | | | | $0.35 | 1 |
| Hypothetical (5% return before expenses) | | | $1,000.00 | | | | $1,021.12 | | | | $4.06 | * |
| * | Expenses are equal to the Fund’s annualized expense ratio (after waiver/reimbursement): 1.05%, 1.80%, 0.75% and 0.80% for Class A, C, N and Y, respectively, multiplied by the average account value over the period, multiplied by the number of days in the most recent fiscal half-year (184), divided by 366 (to reflect the half-year period). |
| 1 | Fund commenced operations on December 15, 2020. Actual expenses are equal to the Fund’s annualized expense ratio (after waiver/reimbursement) of 1.05%, 1.80%, 0.75% and 0.80% for Class A, C, N and Y, respectively, multiplied by the average account value over the period, multiplied by the number of days in the most recent fiscal period (16), divided by 366 (to reflect the partial period). |
| | | | | | | | | | | | |
| NATIXIS OAKMARK FUND | | BEGINNING
ACCOUNT VALUE
7/1/2020 | | | ENDING
ACCOUNT VALUE
12/31/2020 | | | EXPENSES PAID
DURING PERIOD*
7/1/2020 – 12/31/2020 | |
| Class A | | | | | | | | | | | | |
| Actual | | | $1,000.00 | | | | $1,310.70 | | | | $7.14 | |
| Hypothetical (5% return before expenses) | | | $1,000.00 | | | | $1,018.95 | | | | $6.24 | |
| Class C | | | | | | | | | | | | |
| Actual | | | $1,000.00 | | | | $1,306.00 | | | | $11.54 | |
| Hypothetical (5% return before expenses) | | | $1,000.00 | | | | $1,015.13 | | | | $10.08 | |
| Class N | | | | | | | | | | | | |
| Actual | | | $1,000.00 | | | | $1,312.50 | | | | $5.23 | |
| Hypothetical (5% return before expenses) | | | $1,000.00 | | | | $1,020.61 | | | | $4.57 | |
| Class Y | | | | | | | | | | | | |
| Actual | | | $1,000.00 | | | | $1,311.90 | | | | $5.75 | |
| Hypothetical (5% return before expenses) | | | $1,000.00 | | | | $1,020.16 | | | | $5.03 | |
| * | Expenses are equal to the Fund’s annualized expense ratio: 1.23%, 1.99%, 0.90% and 0.99% for Class A, C, N and Y, respectively, multiplied by the average account value over the period, multiplied by the number of days in the most recent fiscal half-year (184), divided by 366 (to reflect the half-year period). |
| 44
| | | | | | | | | | | | |
| NATIXIS OAKMARK INTERNATIONAL FUND | | BEGINNING
ACCOUNT VALUE
7/1/2020 | | | ENDING
ACCOUNT VALUE
12/31/2020 | | | EXPENSES PAID
DURING PERIOD*
7/1/2020 – 12/31/2020 | |
| Class A | | | | | | | | | | | | |
| Actual | | | $1,000.00 | | | | $1,358.50 | | | | $7.11 | |
| Hypothetical (5% return before expenses) | | | $1,000.00 | | | | $1,019.10 | | | | $6.09 | |
| Class C | | | | | | | | | | | | |
| Actual | | | $1,000.00 | | | | $1,353.90 | | | | $11.54 | |
| Hypothetical (5% return before expenses) | | | $1,000.00 | | | | $1,015.33 | | | | $9.88 | |
| Class N | | | | | | | | | | | | |
| Actual | | | $1,000.00 | | | | $1,360.50 | | | | $5.34 | |
| Hypothetical (5% return before expenses) | | | $1,000.00 | | | | $1,020.61 | | | | $4.57 | |
| Class Y | | | | | | | | | | | | |
| Actual | | | $1,000.00 | | | | $1,361.50 | | | | $5.64 | |
| Hypothetical (5% return before expenses) | | | $1,000.00 | | | | $1,020.36 | | | | $4.82 | |
| * | Expenses are equal to the Fund’s annualized expense ratio (after waiver/reimbursement): 1.20%, 1.95%, 0.90% and 0.95% for Class A, C, N and Y, respectively, multiplied by the average account value over the period, multiplied by the number of days in the most recent fiscal half-year (184), divided by 366 (to reflect the half-year period). |
| | | | | | | | | | | | |
| NATIXIS U.S. EQUITY OPPORTUNITIES FUND | | BEGINNING
ACCOUNT VALUE
7/1/2020 | | | ENDING
ACCOUNT VALUE
12/31/2020 | | | EXPENSES PAID
DURING PERIOD*
7/1/2020 – 12/31/2020 | |
| Class A | | | | | | | | | | | | |
| Actual | | | $1,000.00 | | | | $1,241.80 | | | | $6.54 | |
| Hypothetical (5% return before expenses) | | | $1,000.00 | | | | $1,019.31 | | | | $5.89 | |
| Class C | | | | | | | | | | | | |
| Actual | | | $1,000.00 | | | | $1,237.00 | | | | $10.68 | |
| Hypothetical (5% return before expenses) | | | $1,000.00 | | | | $1,015.59 | | | | $9.63 | |
| Class N | | | | | | | | | | | | |
| Actual | | | $1,000.00 | | | | $1,243.50 | | | | $4.68 | |
| Hypothetical (5% return before expenses) | | | $1,000.00 | | | | $1,020.96 | | | | $4.22 | |
| Class Y | | | | | | | | | | | | |
| Actual | | | $1,000.00 | | | | $1,243.10 | | | | $5.13 | |
| Hypothetical (5% return before expenses) | | | $1,000.00 | | | | $1,020.56 | | | | $4.62 | |
| * | Expenses are equal to the Fund’s annualized expense ratio: 1.16%, 1.90%, 0.83% and 0.91% for Class A, C, N and Y, respectively, multiplied by the average account value over the period, multiplied by the number of days in the most recent fiscal half-year (184), divided by 366 (to reflect the half-year period). |
45 |
| | | | | | | | | | | | |
| VAUGHAN NELSON MID CAP FUND | | BEGINNING
ACCOUNT VALUE
7/1/2020 | | | ENDING
ACCOUNT VALUE
12/31/2020 | | | EXPENSES PAID
DURING PERIOD*
7/1/2020 – 12/31/2020 | |
| Class A | | | | | | | | | | | | |
| Actual | | | $1,000.00 | | | | $1,297.10 | | | | $6.93 | |
| Hypothetical (5% return before expenses) | | | $1,000.00 | | | | $1,019.10 | | | | $6.09 | |
| Class C | | | | | | | | | | | | |
| Actual | | | $1,000.00 | | | | $1,292.20 | | | | $11.24 | |
| Hypothetical (5% return before expenses) | | | $1,000.00 | | | | $1,015.33 | | | | $9.88 | |
| Class N | | | | | | | | | | | | |
| Actual | | | $1,000.00 | | | | $1,299.00 | | | | $5.20 | |
| Hypothetical (5% return before expenses) | | | $1,000.00 | | | | $1,020.61 | | | | $4.57 | |
| Class Y | | | | | | | | | | | | |
| Actual | | | $1,000.00 | | | | $1,298.50 | | | | $5.49 | |
| Hypothetical (5% return before expenses) | | | $1,000.00 | | | | $1,020.36 | | | | $4.82 | |
| * | Expenses are equal to the Fund’s annualized expense ratio (after waiver/reimbursement): 1.20%, 1.95%, 0.90% and 0.95% for Class A, C, N and Y, respectively, multiplied by the average account value over the period, multiplied by the number of days in the most recent fiscal half-year (184), divided by 366 (to reflect the half-year period). |
| | | | | | | | | | | | |
| VAUGHAN NELSON SMALL CAP VALUE FUND | | BEGINNING
ACCOUNT VALUE
7/1/2020 | | | ENDING
ACCOUNT VALUE
12/31/2020 | | | EXPENSES PAID
DURING PERIOD*
7/1/2020 – 12/31/2020 | |
| Class A | | | | | | | | | | | | |
| Actual | | | $1,000.00 | | | | $1,336.40 | | | | $7.63 | |
| Hypothetical (5% return before expenses) | | | $1,000.00 | | | | $1,018.60 | | | | $6.60 | |
| Class C | | | | | | | | | | | | |
| Actual | | | $1,000.00 | | | | $1,330.10 | | | | $12.01 | |
| Hypothetical (5% return before expenses) | | | $1,000.00 | | | | $1,014.83 | | | | $10.38 | |
| Class N | | | | | | | | | | | | |
| Actual | | | $1,000.00 | | | | $1,338.90 | | | | $5.88 | |
| Hypothetical (5% return before expenses) | | | $1,000.00 | | | | $1,020.11 | | | | $5.08 | |
| Class Y | | | | | | | | | | | | |
| Actual | | | $1,000.00 | | | | $1,338.60 | | | | $6.17 | |
| Hypothetical (5% return before expenses) | | | $1,000.00 | | | | $1,019.86 | | | | $5.33 | |
| * | Expenses are equal to the Fund’s annualized expense ratio (after waiver/reimbursement): 1.30%, 2.05%, 1.00% and 1.05% for Class A, C, N and Y, respectively, multiplied by the average account value over the period, multiplied by the number of days in the most recent fiscal half-year (184), divided by 366 (to reflect the half-year period). |
| 46
BOARD APPROVAL OF THE INITIAL ADVISORY AGREEMENT FOR MIROVA U.S. SUSTAINABLE EQUITY FUND
The Investment Company Act of 1940, as amended (the “1940 Act”), requires that both the full Board of Trustees of the Trust (the “Board”) and a majority of the Trustees who are not “interested persons” (as defined in the 1940 Act) of the Trust (the “Independent Trustees”), voting separately, initially approve any new investment advisory agreements for a registered investment company, including a newly formed fund such as the Mirova U.S. Sustainable Equity Fund (the “Fund”). The Trustees, including the Independent Trustees, unanimously approved, for an initial two-year term, the proposed investment advisory agreement (the “Agreement”) for the Fund at a meeting held on December 3, 2020.
In connection with this review, Fund management and other representatives of the Fund’s adviser, Mirova US LLC (the “Adviser”), distributed to the Trustees materials including, among other items, information regarding (i) the Fund’s investment objective, strategies and risks, (ii) the proposed advisory fee and other expenses to be charged to the Fund, including information comparing the Fund’s expenses to those of peer groups and categories of funds and the proposed expense cap, (iii) the size, education and experience of the Adviser’s investment staff and the investment strategies proposed to be used in managing the Fund, (iv) proposed arrangements for the distribution of the Fund’s shares, (v) information about the Adviser’s performance, and (vi) the general economic outlook with particular emphasis on the asset management industry.
The Trustees also considered the fact that they oversee other funds advised by the Adviser as well as information about the Adviser they had received in connection with their oversight of those other funds. Because the Fund is newly formed and had not commenced operations at the time of the Trustees’ review, certain information, including data relating to Fund performance, was not available, and therefore could not be distributed to the Trustees. Throughout the process, the Trustees were afforded the opportunity to ask questions of, and request additional materials from, the Adviser.
In considering whether to initially approve the Agreement, the Board, including the Independent Trustees, did not identify any single factor as determinative. Individual Trustees may have evaluated the information presented differently from one another, giving different weights to various factors. Matters considered by the Trustees, including the Independent Trustees, in connection with their approval of the Agreement included, but were not limited to, the factors listed below.
The nature, extent and quality of the services to be provided to the Fund under the Agreement. The Trustees considered the nature, extent and quality of the services to be provided by the Adviser and its affiliates to the Fund and the resources to be dedicated to the Fund by the Adviser and its affiliates. The Trustees considered their experience with other funds advised by the Adviser, as well as the affiliation between the Adviser and Natixis Investment Managers, LLC (“Natixis Investment Managers”), whose affiliates provide investment advisory services to other funds in the same family of mutual funds. In this regard, the Trustees considered not only the advisory services proposed to be provided by the Adviser to the Fund, but also the monitoring and oversight services proposed to be provided by Natixis Advisors, L.P. (“Natixis Advisors”). They also considered the administrative and shareholder services proposed to be provided by Natixis Advisors and its affiliates to the Fund.
The Trustees also considered the benefits to shareholders of investing in a mutual fund that is part of a family of funds that offers shareholders the right to exchange shares of one type of fund for shares of another type of fund, and provides a variety of fund and shareholder services.
After reviewing these and related factors, the Trustees concluded, within the context of their overall conclusions regarding the Agreement, that the scope of the services to be provided to the Fund under the Agreement seemed consistent with the Fund’s operational requirements, and that the Adviser had the capabilities, resources and personnel necessary to provide the advisory services that would be required by the Fund. The Trustees determined that the nature, extent and quality of services proposed to be provided under the Agreement supported approval of the Agreement.
Investment performance of the Fund and the Adviser. Because the Fund had not yet commenced operations, performance information for the Fund was not considered; however, the Board considered the performance of other funds managed by the Adviser.
The Trustees also considered the Adviser’s performance and reputation generally, the performance of the fund family generally, and the historical responsiveness of the Adviser to Trustee concerns about performance and the willingness of the Adviser to take steps intended to improve performance.
After reviewing these and related factors, the Trustees concluded, within the context of their overall conclusions regarding the Agreement, that these relevant factors supported approval of the Agreement.
The costs of the services to be provided by the Adviser and profits to be realized by the Adviser and its affiliates from their respective relationships with the Fund. Although the Fund had not yet commenced operations at the time of the Trustees’ review of the Agreement, the Trustees reviewed information comparing the proposed advisory fees and estimated total expenses of the Fund with the fees and expenses of comparable funds identified by the Adviser, including information about how those funds were selected and information about differences in such fees. In evaluating the Fund’s proposed advisory fee, the Trustees also took into account the demands,
47 |
complexity and quality of the investment management of the Fund. The Trustees also noted that the Fund would have an expense cap in place. In addition, the Trustees considered information regarding the administrative and distribution fees to be paid by the Fund to the Adviser’s affiliates.
Because the Fund had not yet commenced operations, historical profitability information with respect to the Fund was not considered. However, the Trustees noted the information provided in court cases in which adviser profitability was an issue, the estimated expense level of the Fund, and that the Fund would be subject to an expense cap.
After reviewing these and related factors, the Trustees concluded, within the context of their overall conclusions regarding the Agreement, that the advisory fee and expenses proposed to be charged to the Fund were fair and reasonable, and supported the approval of the Agreement.
Economies of scale. The Trustees considered the extent to which the Adviser may realize economies of scale in the provision of services by the Adviser, and whether those economies could be shared with the Fund through breakpoints in its investment advisory fee or other means, such as expense caps. The Trustees noted that the Fund will be subject to an expense cap. After reviewing these and related factors, the Trustees concluded, within the context of their overall conclusions regarding the Agreement, that the extent to which economies of scale might be shared with the Fund supported the approval of the Agreement.
The Trustees also considered other factors, which included but were not limited to the following:
| • | | The compliance-related resources the Adviser and its affiliates would provide to the Fund. |
| • | | The nature, quality, cost and extent of administrative and shareholder services to be performed by the Adviser and its affiliates, both under the Agreement and under separate agreements covering administrative services. |
| • | | So-called “fallout benefits” to the Adviser and its affiliates, such as the engagement of affiliates of the Adviser to provide distribution and administrative services to the Fund, and the benefits of research made available to the Adviser by reason of brokerage commissions (if any) generated by the Fund’s securities transactions. The Trustees also considered the benefits to the parent company of Natixis Advisors from the retention of the Adviser. The Trustees considered the possible conflicts of interest associated with these fallout and other benefits, and the reporting, disclosure and other processes in place to disclose and monitor such possible conflicts of interest. |
Based on their evaluation of all factors that they deemed to be material, including those factors described above, and assisted by the advice of independent counsel, the Trustees, including the Independent Trustees, concluded that the Agreement should be approved.
| 48
Portfolio of Investments – as of December 31, 2020
Gateway Fund
| | | | | | | | |
| Shares | | | Description | |
Value (†) | |
| | Common Stocks — 99.4% of Net Assets | |
| | | | Aerospace & Defense — 1.5% | |
| | 148,078 | | | Boeing Co. (The)(a) | | $ | 31,697,577 | |
| | 47,308 | | | HEICO Corp.(a) | | | 6,263,579 | |
| | 40,717 | | | Huntington Ingalls Industries, Inc.(a) | | | 6,941,434 | |
| | 552,963 | | | Raytheon Technologies Corp.(a) | | | 39,542,384 | |
| | 26,442 | | | Teledyne Technologies, Inc.(a)(b) | | | 10,364,735 | |
| | 24,274 | | | TransDigm Group, Inc.(a)(b) | | | 15,021,965 | |
| | | | | | | | |
| | | | | | | 109,831,674 | |
| | | | | | | | |
| | | | Air Freight & Logistics — 0.6% | |
| | 229,517 | | | United Parcel Service, Inc., Class B(a) | | | 38,650,663 | |
| | 36,648 | | | XPO Logistics, Inc.(a)(b) | | | 4,368,441 | |
| | | | | | | | |
| | | | | | | 43,019,104 | |
| | | | | | | | |
| | | | Airlines — 0.4% | |
| | 169,745 | | | Alaska Air Group, Inc.(a) | | | 8,826,740 | |
| | 552,192 | | | JetBlue Airways Corp.(a)(b) | | | 8,028,872 | |
| | 195,382 | | | United Airlines Holdings, Inc.(a)(b) | | | 8,450,271 | |
| | | | | | | | |
| | | | | | | 25,305,883 | |
| | | | | | | | |
| | | | Auto Components — 0.1% | |
| | 36,852 | | | Autoliv, Inc.(a) | | | 3,394,069 | |
| | 117,162 | | | Cooper Tire & Rubber Co.(a) | | | 4,745,061 | |
| | | | | | | | |
| | | | | | | 8,139,130 | |
| | | | | | | | |
| | | | Automobiles — 0.6% | |
| | 2,063,880 | | | Ford Motor Co.(a) | | | 18,141,505 | |
| | 31,800 | | | Tesla, Inc.(a)(b) | | | 22,440,306 | |
| | | | | | | | |
| | | | | | | 40,581,811 | |
| | | | | | | | |
| | | | Banks — 3.8% | |
| | 266,138 | | | Associated Banc-Corp(a) | | | 4,537,653 | |
| | 2,978,880 | | | Bank of America Corp.(a) | | | 90,289,853 | |
| | 658,424 | | | Citigroup, Inc.(a) | | | 40,598,424 | |
| | 1,208,989 | | | Huntington Bancshares, Inc.(a) | | | 15,269,531 | |
| | 910,038 | | | JPMorgan Chase & Co.(a) | | | 115,638,529 | |
| | 106,660 | | | Old National Bancorp(a) | | | 1,766,289 | |
| | 31,007 | | | Signature Bank(a) | | | 4,194,937 | |
| | | | | | | | |
| | | | | | | 272,295,216 | |
| | | | | | | | |
| | | | Beverages — 1.5% | |
| | 399,654 | | | Keurig Dr Pepper, Inc.(a) | | | 12,788,928 | |
| | 254,709 | | | Monster Beverage Corp.(a)(b) | | | 23,555,489 | |
| | 477,871 | | | PepsiCo, Inc.(a) | | | 70,868,269 | |
| | | | | | | | |
| | | | | | | 107,212,686 | |
| | | | | | | | |
| | | | Biotechnology — 2.0% | |
| | 486,427 | | | AbbVie, Inc.(a) | | | 52,120,653 | |
| | 174,028 | | | Amgen, Inc.(a) | | | 40,012,518 | |
| | 54,745 | | | Biogen, Inc.(a)(b) | | | 13,404,861 | |
| | 16,975 | | | Exact Sciences Corp.(a)(b) | | | 2,249,018 | |
| | 36,830 | | | Ionis Pharmaceuticals, Inc.(a)(b) | | | 2,082,368 | |
| | 21,063 | | | Seagen, Inc.(a)(b) | | | 3,688,974 | |
| | 113,484 | | | Vertex Pharmaceuticals, Inc.(a)(b) | | | 26,820,808 | |
| | | | | | | | |
| | | | | | | 140,379,200 | |
| | | | | | | | |
| | | | Building Products — 0.3% | |
| | 355,197 | | | Carrier Global Corp.(a) | | | 13,398,031 | |
| | 20,800 | | | Lennox International, Inc.(a) | | | 5,698,576 | |
| | | | | | | | |
| | | | | | | 19,096,607 | |
| | | | | | | | |
| | | | Capital Markets — 2.2% | |
| | 471,448 | | | Charles Schwab Corp. (The)(a) | | | 25,005,602 | |
| | 84,407 | | | Eaton Vance Corp.(a) | | | 5,733,768 | |
| | 14,601 | | | FactSet Research Systems, Inc.(a) | | | 4,854,832 | |
| | 247,065 | | | Intercontinental Exchange, Inc.(a) | | | 28,484,124 | |
| | 509,430 | | | Morgan Stanley(a) | | | 34,911,238 | |
| | | | Capital Markets — continued | |
| | 41,804 | | | MSCI, Inc.(a) | | | 18,666,740 | |
| | 108,064 | | | S&P Global, Inc.(a) | | | 35,523,879 | |
| | | | | | | | |
| | | | | | | 153,180,183 | |
| | | | | | | | |
| | | | Chemicals — 1.7% | |
| | 83,434 | | | Ashland Global Holdings, Inc.(a) | | | 6,607,973 | |
| | 104,391 | | | Celanese Corp.(a) | | | 13,564,567 | |
| | 370,979 | | | Corteva, Inc.(a) | | | 14,364,307 | |
| | 336,299 | | | Dow, Inc.(a) | | | 18,664,594 | |
| | 138,886 | | | Eastman Chemical Co.(a) | | | 13,927,488 | |
| | 31,084 | | | Ingevity Corp.(a)(b) | | | 2,353,991 | |
| | 83,709 | | | International Flavors & Fragrances, Inc.(a) | | | 9,110,888 | |
| | 171,772 | | | LyondellBasell Industries NV, Class A(a) | | | 15,744,622 | |
| | 251,019 | | | Mosaic Co. (The)(a) | | | 5,775,947 | |
| | 158,400 | | | Olin Corp.(a) | | | 3,890,304 | |
| | 95,921 | | | RPM International, Inc.(a) | | | 8,707,708 | |
| | 195,010 | | | Valvoline, Inc.(a) | | | 4,512,531 | |
| | | | | | | | |
| | | | | | | 117,224,920 | |
| | | | | | | | |
| | | | Commercial Services & Supplies — 0.7% | |
| | 122,157 | | | Copart, Inc.(a)(b) | | | 15,544,478 | |
| | 78,126 | | | Waste Connections, Inc.(a) | | | 8,013,384 | |
| | 244,724 | | | Waste Management, Inc.(a) | | | 28,860,301 | |
| | | | | | | | |
| | | | | | | 52,418,163 | |
| | | | | | | | |
| | | | Communications Equipment — 0.9% | |
| | 1,344,808 | | | Cisco Systems, Inc.(a) | | | 60,180,158 | |
| | | | | | | | |
| | | | Construction Materials — 0.2% | |
| | 49,497 | | | Martin Marietta Materials, Inc.(a) | | | 14,055,663 | |
| | | | | | | | |
| | | | Consumer Finance — 0.5% | |
| | 121,623 | | | Ally Financial, Inc.(a) | | | 4,337,076 | |
| | 180,444 | | | Discover Financial Services(a) | | | 16,335,595 | |
| | 512,919 | | | Synchrony Financial(a) | | | 17,803,419 | |
| | | | | | | | |
| | | | | | | 38,476,090 | |
| | | | | | | | |
| | | | Containers & Packaging — 0.5% | |
| | 73,855 | | | Avery Dennison Corp.(a) | | | 11,455,649 | |
| | 86,722 | | | Crown Holdings, Inc.(a)(b) | | | 8,689,545 | |
| | 120,681 | | | Sonoco Products Co.(a) | | | 7,150,349 | |
| | 259,559 | | | WestRock Co.(a) | | | 11,298,603 | |
| | | | | | | | |
| | | | | | | 38,594,146 | |
| | | | | | | | |
| | | | Distributors — 0.2% | |
| | 107,529 | | | Genuine Parts Co.(a) | | | 10,799,137 | |
| | | | | | | | |
| | | | Diversified Consumer Services — 0.1% | |
| | 67,454 | | | Service Corp. International | | | 3,311,991 | |
| | | | | | | | |
| | | | Diversified Financial Services — 1.8% | |
| | 520,417 | | | Berkshire Hathaway, Inc., Class B(a)(b) | | | 120,669,090 | |
| | 133,431 | | | Voya Financial, Inc.(a) | | | 7,847,077 | |
| | | | | | | | |
| | | | | | | 128,516,167 | |
| | | | | | | | |
| | | | Diversified Telecommunication Services — 1.7% | |
| | 2,088,779 | | | AT&T, Inc.(a) | | | 60,073,284 | |
| | 586,963 | | | CenturyLink, Inc.(a) | | | 5,722,889 | |
| | 119,721 | | | Liberty Global PLC, Class C(a)(b) | | | 2,831,402 | |
| | 862,921 | | | Verizon Communications, Inc.(a) | | | 50,696,609 | |
| | | | | | | | |
| | | | | | | 119,324,184 | |
| | | | | | | | |
| | | | Electric Utilities — 1.4% | |
| | 323,243 | | | Alliant Energy Corp.(a) | | | 16,656,712 | |
| | 396,896 | | | American Electric Power Co., Inc.(a) | | | 33,049,530 | |
| | 275,794 | | | Edison International(a) | | | 17,325,379 | |
| | 188,786 | | | Entergy Corp.(a) | | | 18,848,394 | |
| | 198,810 | | | Evergy, Inc.(a) | | | 11,035,943 | |
| | 13,545 | | | Hawaiian Electric Industries, Inc. | | | 479,358 | |
See accompanying notes to financial statements.
49 |
Portfolio of Investments – as of December 31, 2020
Gateway Fund – (continued)
| | | | | | | | |
| Shares | | | Description | |
Value (†) | |
| | | | Electric Utilities — continued | |
| | 154,286 | | | OGE Energy Corp.(a) | | $ | 4,915,552 | |
| | | | | | | | |
| | | | | | | 102,310,868 | |
| | | | | | | | |
| | | | Electrical Equipment — 0.8% | |
| | 197,284 | | | Eaton Corp. PLC(a) | | | 23,701,700 | |
| | 318,411 | | | Emerson Electric Co.(a) | | | 25,590,692 | |
| | 50,567 | | | Hubbell, Inc.(a) | | | 7,928,400 | |
| | | | | | | | |
| | | | | | | 57,220,792 | |
| | | | | | | | |
| | | | Electronic Equipment, Instruments & Components — 0.6% | |
| | 97,069 | | | CDW Corp.(a) | | | 12,792,724 | |
| | 375,436 | | | Corning, Inc.(a) | | | 13,515,696 | |
| | 60,225 | | | Trimble, Inc.(a)(b) | | | 4,021,223 | |
| | 33,350 | | | Zebra Technologies Corp., Class A(a)(b) | | | 12,817,405 | |
| | | | | | | | |
| | | | | | | 43,147,048 | |
| | | | | | | | |
| | | | Energy Equipment & Services — 0.3% | |
| | 398,661 | | | Baker Hughes Co.(a) | | | 8,312,082 | |
| | 448,161 | | | Halliburton Co.(a) | | | 8,470,243 | |
| | 168,318 | | | Helmerich & Payne, Inc.(a) | | | 3,898,245 | |
| | | | | | | | |
| | | | | | | 20,680,570 | |
| | | | | | | | |
| | | | Entertainment — 2.2% | |
| | 81,510 | | | Live Nation Entertainment, Inc.(a)(b) | | | 5,989,355 | |
| | 113,738 | | | Netflix, Inc.(a)(b) | | | 61,501,549 | |
| | 6,573 | | | Roku, Inc.(b) | | | 2,182,367 | |
| | 477,589 | | | Walt Disney Co. (The)(a)(b) | | | 86,529,575 | |
| | | | | | | | |
| | | | | | | 156,202,846 | |
| | | | | | | | |
| | | | Food & Staples Retailing — 1.6% | |
| | 26,487 | | | Casey’s General Stores, Inc.(a) | | | 4,731,108 | |
| | 138,994 | | | Costco Wholesale Corp.(a) | | | 52,370,159 | |
| | 20,166 | | | U.S. Foods Holding Corp.(b) | | | 671,730 | |
| | 405,865 | | | Walmart, Inc.(a) | | | 58,505,440 | |
| | | | | | | | |
| | | | | | | 116,278,437 | |
| | | | | | | | |
| | | | Food Products — 0.8% | |
| | 94,003 | | | Bunge Ltd.(a) | | | 6,164,717 | |
| | 97,614 | | | Lamb Weston Holdings, Inc.(a) | | | 7,686,126 | |
| | 698,295 | | | Mondelez International, Inc., Class A(a) | | | 40,829,309 | |
| | 43,185 | | | Post Holdings, Inc.(a)(b) | | | 4,362,117 | |
| | | | | | | | |
| | | | | | | 59,042,269 | |
| | | | | | | | |
| | | | Gas Utilities — 0.1% | |
| | 8,726 | | | National Fuel Gas Co. | | | 358,900 | |
| | 76,973 | | | UGI Corp.(a) | | | 2,690,976 | |
| | | | | | | | |
| | | | | | | 3,049,876 | |
| | | | | | | | |
| | | | Health Care Equipment & Supplies — 3.5% | |
| | 519,079 | | | Abbott Laboratories(a) | | | 56,833,960 | |
| | 233,533 | | | Baxter International, Inc.(a) | | | 18,738,688 | |
| | 636,298 | | | Boston Scientific Corp.(a)(b) | | | 22,874,913 | |
| | 263,594 | | | Edwards Lifesciences Corp.(a)(b) | | | 24,047,681 | |
| | 19,792 | | | Insulet Corp.(a)(b) | | | 5,059,429 | |
| | 45,456 | | | Intuitive Surgical, Inc.(a)(b) | | | 37,187,554 | |
| | 416,725 | | | Medtronic PLC(a) | | | 48,815,166 | |
| | 55,109 | | | STERIS PLC(a) | | | 10,445,360 | |
| | 29,772 | | | Teleflex, Inc.(a) | | | 12,253,262 | |
| | 48,078 | | | West Pharmaceutical Services, Inc.(a) | | | 13,620,978 | |
| | | | | | | | |
| | | | | | | 249,876,991 | |
| | | | | | | | |
| | | | Health Care Providers & Services — 2.6% | |
| | 83,702 | | | Anthem, Inc.(a) | | | 26,875,875 | |
| | 450,841 | | | CVS Health Corp.(a) | | | 30,792,440 | |
| | 120,815 | | | HCA Healthcare, Inc.(a) | | | 19,869,235 | |
| | 16,707 | | | Molina Healthcare, Inc.(a)(b) | | | 3,553,245 | |
| | 263,072 | | | UnitedHealth Group, Inc.(a) | | | 92,254,089 | |
| | | | Health Care Providers & Services — continued | |
| | 65,316 | | | Universal Health Services, Inc., Class B(a) | | | 8,980,950 | |
| | | | | | | | |
| | | | | | | 182,325,834 | |
| | | | | | | | |
| | | | Health Care Technology — 0.1% | |
| | 35,189 | | | Veeva Systems, Inc., Class A(a)(b) | | | 9,580,205 | |
| | | | | | | | |
| | | | Hotels, Restaurants & Leisure — 1.4% | |
| | 19,132 | | | Domino’s Pizza, Inc.(a) | | | 7,336,357 | |
| | 153,850 | | | Hilton Grand Vacations, Inc.(a)(b) | | | 4,823,197 | |
| | 168,770 | | | Hilton Worldwide Holdings, Inc.(a) | | | 18,777,350 | |
| | 228,480 | | | McDonald’s Corp.(a) | | | 49,027,238 | |
| | 69,731 | | | Melco Resorts & Entertainment Ltd., Sponsored ADR(a) | | | 1,293,510 | |
| | 163,196 | | | Restaurant Brands International, Inc.(a) | | | 9,972,908 | |
| | 12,225 | | | Vail Resorts, Inc.(a) | | | 3,410,286 | |
| | 208,390 | | | Wendy’s Co. (The)(a) | | | 4,567,909 | |
| | | | | | | | |
| | | | | | | 99,208,755 | |
| | | | | | | | |
| | | | Household Durables — 0.5% | |
| | 232,925 | | | Lennar Corp., Class A(a) | | | 17,755,873 | |
| | 205,127 | | | Newell Brands, Inc.(a) | | | 4,354,846 | |
| | 2,093 | | | NVR, Inc.(a)(b) | | | 8,539,147 | |
| | 47,442 | | | Toll Brothers, Inc. | | | 2,062,304 | |
| | | | | | | | |
| | | | | | | 32,712,170 | |
| | | | | | | | |
| | | | Household Products — 1.3% | |
| | 657,113 | | | Procter & Gamble Co. (The)(a) | | | 91,430,703 | |
| | | | | | | | |
| | | | Industrial Conglomerates — 1.3% | |
| | 205,207 | | | 3M Co.(a) | | | 35,868,131 | |
| | 267,207 | | | Honeywell International, Inc.(a) | | | 56,834,929 | |
| | | | | | | | |
| | | | | | | 92,703,060 | |
| | | | | | | | |
| | | | Insurance — 2.0% | |
| | 599,078 | | | Aflac, Inc.(a) | | | 26,640,999 | |
| | 2,432 | | | Alleghany Corp.(a) | | | 1,468,174 | |
| | 175,397 | | | Allstate Corp. (The)(a) | | | 19,281,392 | |
| | 62,761 | | | American Financial Group, Inc.(a) | | | 5,499,119 | |
| | 103,353 | | | Aon PLC, Class A(a) | | | 21,835,388 | |
| | 214,576 | | | Arch Capital Group Ltd.(a)(b) | | | 7,739,756 | |
| | 187,556 | | | Arthur J. Gallagher & Co.(a) | | | 23,202,553 | |
| | 164,470 | | | Brown & Brown, Inc.(a) | | | 7,797,523 | |
| | 74,687 | | | Fidelity National Financial, Inc.(a) | | | 2,919,515 | |
| | 137,456 | | | Lincoln National Corp.(a) | | | 6,915,411 | |
| | 10,251 | | | Markel Corp.(a)(b) | | | 10,592,358 | |
| | 29,196 | | | RenaissanceRe Holdings Ltd.(a) | | | 4,841,281 | |
| | 245,220 | | | Unum Group(a) | | | 5,625,347 | |
| | | | | | | | |
| | | | | | | 144,358,816 | |
| | | | | | | | |
| | | | Interactive Media & Services — 5.7% | |
| | 48,536 | | | Alphabet, Inc., Class A(a)(b) | | | 85,066,135 | |
| | 92,726 | | | Alphabet, Inc., Class C(a)(b) | | | 162,444,825 | |
| | 573,699 | | | Facebook, Inc., Class A(a)(b) | | | 156,711,619 | |
| | 15,605 | | | Match Group, Inc.(a)(b) | | | 2,359,320 | |
| | 15,415 | | | Zillow Group, Inc., Class C(b) | | | 2,000,867 | |
| | | | | | | | |
| | | | | | | 408,582,766 | |
| | | | | | | | |
| | | | Internet & Direct Marketing Retail — 5.0% | |
| | 100,079 | | | Amazon.com, Inc.(a)(b) | | | 325,950,297 | |
| | 12,391 | | | Booking Holdings, Inc.(a)(b) | | | 27,598,103 | |
| | 2,538 | | | MercadoLibre, Inc.(a)(b) | | | 4,251,708 | |
| | | | | | | | |
| | | | | | | 357,800,108 | |
| | | | | | | | |
| | | | IT Services — 5.3% | |
| | 151,443 | | | Automatic Data Processing, Inc.(a) | | | 26,684,257 | |
| | 10,167 | | | Black Knight, Inc.(b) | | | 898,254 | |
| | 12,340 | | | Booz Allen Hamilton Holding Corp.(a) | | | 1,075,801 | |
| | 14,418 | | | EPAM Systems, Inc.(a)(b) | | | 5,166,690 | |
See accompanying notes to financial statements.
| 50
Portfolio of Investments – as of December 31, 2020
Gateway Fund – (continued)
| | | | | | | | |
| Shares | | | Description | |
Value (†) | |
| | | | IT Services — continued | |
| | 202,834 | | | Fidelity National Information Services, Inc.(a) | | $ | 28,692,898 | |
| | 90,261 | | | Leidos Holdings, Inc.(a) | | | 9,488,236 | |
| | 233,549 | | | MasterCard, Inc., Class A(a) | | | 83,362,980 | |
| | 205,367 | | | Paychex, Inc.(a) | | | 19,136,097 | |
| | 302,437 | | | PayPal Holdings, Inc.(a)(b) | | | 70,830,745 | |
| | 4,575 | | | Shopify, Inc., Class A(a)(b) | | | 5,178,671 | |
| | 15,642 | | | Square, Inc., Class A(a)(b) | | | 3,404,325 | |
| | 8,665 | | | Twilio, Inc., Class A(a)(b) | | | 2,933,103 | |
| | 84,449 | | | VeriSign, Inc.(a)(b) | | | 18,274,764 | |
| | 471,372 | | | Visa, Inc., Class A(a) | | | 103,103,198 | |
| | | | | | | | |
| | | | | | | 378,230,019 | |
| | | | | | | | |
| | | | Leisure Products — 0.0% | |
| | 1,696 | | | Polaris, Inc. | | | 161,595 | |
| | | | | | | | |
| | | | Life Sciences Tools & Services — 1.1% | |
| | 50,834 | | | Illumina, Inc.(a)(b) | | | 18,808,580 | |
| | 58,491 | | | PRA Health Sciences, Inc.(a)(b) | | | 7,337,111 | |
| | 117,622 | | | Thermo Fisher Scientific, Inc.(a) | | | 54,785,975 | |
| | | | | | | | |
| | | | | | | 80,931,666 | |
| | | | | | | | |
| | | | Machinery — 1.8% | |
| | 183,760 | | | Caterpillar, Inc.(a) | | | 33,447,995 | |
| | 89,903 | | | Cummins, Inc.(a) | | | 20,416,971 | |
| | 122,856 | | | Deere & Co.(a) | | | 33,054,407 | |
| | 80,596 | | | Parker-Hannifin Corp.(a) | | | 21,955,156 | |
| | 121,067 | | | Pentair PLC(a) | | | 6,427,447 | |
| | 45,690 | | | Snap-on, Inc.(a) | | | 7,819,387 | |
| | 63,733 | | | Timken Co. (The)(a) | | | 4,930,385 | |
| | 13,869 | | | Woodward, Inc.(a) | | | 1,685,500 | |
| | | | | | | | |
| | | | | | | 129,737,248 | |
| | | | | | | | |
| | | | Media — 1.2% | |
| | 1,233,702 | | | Comcast Corp., Class A(a) | | | 64,645,985 | |
| | 33,220 | | | Liberty Broadband Corp., Class C(a)(b) | | | 5,261,051 | |
| | 230,860 | | | News Corp., Class B(a) | | | 4,102,382 | |
| | 98,543 | | | Omnicom Group, Inc.(a) | | | 6,146,127 | |
| | 994,343 | | | Sirius XM Holdings, Inc.(a) | | | 6,333,965 | |
| | | | | | | | |
| | | | | | | 86,489,510 | |
| | | | | | | | |
| | | | Metals & Mining — 0.3% | |
| | 118,198 | | | Southern Copper Corp.(a) | | | 7,697,054 | |
| | 172,113 | | | Steel Dynamics, Inc.(a) | | | 6,345,806 | |
| | 81,631 | | | Worthington Industries, Inc.(a) | | | 4,190,936 | |
| | | | | | | | |
| | | | | | | 18,233,796 | |
| | | | | | | | |
| | | | Multi-Utilities — 1.2% | |
| | 260,977 | | | Ameren Corp.(a) | | | 20,371,865 | |
| | 301,545 | | | CenterPoint Energy, Inc.(a) | | | 6,525,434 | |
| | 254,981 | | | Consolidated Edison, Inc.(a) | | | 18,427,477 | |
| | 335,214 | | | Public Service Enterprise Group, Inc.(a) | | | 19,542,976 | |
| | 227,581 | | | WEC Energy Group, Inc.(a) | | | 20,944,279 | |
| | | | | | | | |
| | | | | | | 85,812,031 | |
| | | | | | | | |
| | | | Multiline Retail — 0.5% | |
| | 44,499 | | | Nordstrom, Inc.(a) | | | 1,388,814 | |
| | 182,363 | | | Target Corp.(a) | | | 32,192,540 | |
| | | | | | | | |
| | | | | | | 33,581,354 | |
| | | | | | | | |
| | | | Oil, Gas & Consumable Fuels — 1.9% | |
| | 61,621 | | | Cheniere Energy, Inc.(a)(b) | | | 3,699,109 | |
| | 550,320 | | | Chevron Corp.(a) | | | 46,474,524 | |
| | 411,601 | | | ConocoPhillips(a) | | | 16,459,924 | |
| | 683,914 | | | Exxon Mobil Corp.(a) | | | 28,190,935 | |
| | 89,664 | | | HollyFrontier Corp.(a) | | | 2,317,814 | |
| | 198,785 | | | Marathon Petroleum Corp.(a) | | | 8,221,748 | |
| | 164,607 | | | ONEOK, Inc.(a) | | | 6,317,617 | |
| | 199,417 | | | Phillips 66(a) | | | 13,947,225 | |
| | | | Oil, Gas & Consumable Fuels — continued | |
| | 156,053 | | | Valero Energy Corp.(a) | | $ | 8,827,918 | |
| | | | | | | | |
| | | | | | | 134,456,814 | |
| | | | | | | | |
| | | | Personal Products — 0.0% | |
| | 29,528 | | | Herbalife Nutrition Ltd.(a)(b) | | | 1,418,820 | |
| | | | | | | | |
| | | | Pharmaceuticals — 4.0% | |
| | 659,768 | | | Bristol-Myers Squibb Co.(a) | | | 40,925,409 | |
| | 221,729 | | | Eli Lilly & Co.(a) | | | 37,436,724 | |
| | 1,556 | | | Jazz Pharmaceuticals PLC(b) | | | 256,818 | |
| | 590,946 | | | Johnson & Johnson(a) | | | 93,003,082 | |
| | 597,588 | | | Merck & Co., Inc.(a) | | | 48,882,698 | |
| | 1,406,346 | | | Pfizer, Inc.(a) | | | 51,767,596 | |
| | 459,428 | | | Viatris, Inc.(a)(b) | | | 8,609,681 | |
| | | | | | | | |
| | | | | | | 280,882,008 | |
| | | | | | | | |
| | | | Professional Services — 0.3% | |
| | 9,784 | | | CoStar Group, Inc.(a)(b) | | | 9,043,155 | |
| | 50,361 | | | ManpowerGroup, Inc.(a) | | | 4,541,555 | |
| | 101,786 | | | TransUnion(a) | | | 10,099,207 | |
| | | | | | | | |
| | | | | | | 23,683,917 | |
| | | | | | | | |
| | | | REITs – Apartments — 0.5% | |
| | 252,006 | | | American Homes 4 Rent, Class A(a) | | | 7,560,180 | |
| | 85,332 | | | Camden Property Trust(a) | | | 8,526,373 | |
| | 346,842 | | | Invitation Homes, Inc.(a) | | | 10,301,207 | |
| | 265,036 | | | UDR, Inc.(a) | | | 10,185,334 | |
| | | | | | | | |
| | | | | | | 36,573,094 | |
| | | | | | | | |
| | | | REITs – Diversified — 0.7% | |
| | 138,899 | | | American Tower Corp.(a) | | | 31,177,270 | |
| | 361,090 | | | Duke Realty Corp.(a) | | | 14,432,767 | |
| | 87,309 | | | W.P. Carey, Inc.(a) | | | 6,162,269 | |
| | | | | | | | |
| | | | | | | 51,772,306 | |
| | | | | | | | |
| | | | REITs – Health Care — 0.4% | |
| | 260,504 | | | Healthcare Realty Trust, Inc.(a) | | | 7,710,918 | |
| | 453,565 | | | Medical Properties Trust, Inc.(a) | | | 9,883,181 | |
| | 194,772 | | | Sabra Health Care REIT, Inc.(a) | | | 3,383,190 | |
| | 169,170 | | | Ventas, Inc.(a) | | | 8,296,097 | |
| | | | | | | | |
| | | | | | | 29,273,386 | |
| | | | | | | | |
| | | | REITs – Manufactured Homes — 0.2% | |
| | 143,552 | | | Equity LifeStyle Properties, Inc.(a) | | | 9,095,455 | |
| | 48,503 | | | Sun Communities, Inc.(a) | | | 7,370,031 | |
| | | | | | | | |
| | | | | | | 16,465,486 | |
| | | | | | | | |
| | | | REITs – Mortgage — 0.0% | |
| | 129,902 | | | Annaly Capital Management, Inc.(a) | | | 1,097,672 | |
| | | | | | | | |
| | | | REITs – Office Property — 0.2% | |
| | 188,262 | | | Douglas Emmett, Inc.(a) | | | 5,493,485 | |
| | 146,251 | | | Kilroy Realty Corp.(a) | | | 8,394,808 | |
| | 52,998 | | | Mack-Cali Realty Corp. | | | 660,355 | |
| | | | | | | | |
| | | | | | | 14,548,648 | |
| | | | | | | | |
| | | | REITs – Single Tenant — 0.1% | |
| | 144,199 | | | National Retail Properties, Inc.(a) | | | 5,900,623 | |
| | | | | | | | |
| | | | REITs – Storage — 0.2% | |
| | 127,880 | | | CubeSmart(a) | | | 4,298,047 | |
| | 101,683 | | | Extra Space Storage, Inc.(a) | | | 11,780,992 | |
| | | | | | | | |
| | | | | | | 16,079,039 | |
| | | | | | | | |
| | | | Road & Rail — 1.0% | |
| | 23,108 | | | Canadian Pacific Railway Ltd.(a) | | | 8,011,313 | |
| | 391,922 | | | CSX Corp.(a) | | | 35,566,921 | |
| | 71,461 | | | J.B. Hunt Transport Services, Inc.(a) | | | 9,765,146 | |
| | 72,596 | | | Lyft, Inc., Class A(a)(b) | | | 3,566,641 | |
| | 62,946 | | | Old Dominion Freight Line, Inc.(a) | | | 12,285,800 | |
See accompanying notes to financial statements.
51 |
Portfolio of Investments – as of December 31, 2020
Gateway Fund – (continued)
| | | | | | | | |
| Shares | | | Description | |
Value (†) | |
| | | | Road & Rail — continued | |
| | 53,335 | | | Uber Technologies, Inc.(b) | | $ | 2,720,085 | |
| | | | | | | | |
| | | | | | | 71,915,906 | |
| | | | | | | | |
| | | | Semiconductors & Semiconductor Equipment — 5.4% | |
| | 326,538 | | | Advanced Micro Devices, Inc.(a)(b) | | | 29,946,800 | |
| | 170,421 | | | Analog Devices, Inc.(a) | | | 25,176,294 | |
| | 115,110 | | | Broadcom, Inc.(a) | | | 50,400,914 | |
| | 1,069,923 | | | Intel Corp.(a) | | | 53,303,564 | |
| | 83,719 | | | Marvell Technology Group Ltd.(a) | | | 3,980,001 | |
| | 363,386 | | | Micron Technology, Inc.(a)(b) | | | 27,319,360 | |
| | 154,967 | | | NVIDIA Corp.(a) | | | 80,923,767 | |
| | 308,330 | | | QUALCOMM, Inc.(a) | | | 46,970,992 | |
| | 28,999 | | | Taiwan Semiconductor Manufacturing Co. Ltd., Sponsored ADR | | | 3,162,051 | |
| | 106,600 | | | Teradyne, Inc.(a) | | | 12,780,274 | |
| | 322,410 | | | Texas Instruments, Inc.(a) | | | 52,917,153 | |
| | | | | | | | |
| | | | | | | 386,881,170 | |
| | | | | | | | |
| | | | Software — 9.4% | |
| | 140,675 | | | Adobe, Inc.(a)(b) | | | 70,354,381 | |
| | 188,193 | | | Cadence Design Systems, Inc.(a)(b) | | | 25,675,171 | |
| | 78,761 | | | Fortinet, Inc.(a)(b) | | | 11,698,371 | |
| | 1,820,436 | | | Microsoft Corp.(a) | | | 404,901,375 | |
| | 114,308 | | | Nuance Communications, Inc.(a)(b) | | | 5,039,840 | |
| | 606,841 | | | Oracle Corp.(a) | | | 39,256,544 | |
| | 23,688 | | | Palo Alto Networks, Inc.(a)(b) | | | 8,418,478 | |
| | 21,050 | | | Paycom Software, Inc.(a)(b) | | | 9,519,863 | |
| | 41,380 | | | PTC, Inc.(a)(b) | | | 4,949,462 | |
| | 230,063 | | | salesforce.com, Inc.(a)(b) | | | 51,195,920 | |
| | 57,151 | | | ServiceNow, Inc.(a)(b) | | | 31,457,625 | |
| | 21,371 | | | SS&C Technologies Holdings, Inc. | | | 1,554,740 | |
| | 22,602 | | | Workday, Inc., Class A(a)(b) | | | 5,415,665 | |
| | 2,398 | | | Zoom Video Communications, Inc., Class A(b) | | | 808,893 | |
| | | | | | | | |
| | | | | | | 670,246,328 | |
| | | | | | | | |
| | | | Specialty Retail — 2.3% | |
| | 112,737 | | | American Eagle Outfitters, Inc. | | | 2,262,631 | |
| | 17,696 | | | Burlington Stores, Inc.(a)(b) | | | 4,628,389 | |
| | 38,409 | | | Foot Locker, Inc.(a) | | | 1,553,260 | |
| | 304,299 | | | Home Depot, Inc. (The)(a) | | | 80,827,900 | |
| | 244,064 | | | Lowe’s Cos., Inc.(a) | | | 39,174,713 | |
| | 49,846 | | | Tiffany & Co.(a) | | | 6,552,257 | |
| | 430,238 | | | TJX Cos., Inc. (The)(a) | | | 29,380,953 | |
| | | | | | | | |
| | | | | | | 164,380,103 | |
| | | | | | | | |
| | | | Technology Hardware, Storage & Peripherals — 7.1% | |
| | 3,756,396 | | | Apple, Inc.(a) | | | 498,436,185 | |
| | 94,102 | | | Dell Technologies, Inc., Class C(a)(b) | | | 6,896,736 | |
| | | | | | | | |
| | | | | | | 505,332,921 | |
| | | | | | | | |
| | | | Textiles, Apparel & Luxury Goods — 0.8% | |
| | 16,507 | | | Lululemon Athletica, Inc.(a)(b) | | | 5,744,931 | |
| | 358,542 | | | NIKE, Inc., Class B(a) | | | 50,722,937 | |
| | | | | | | | |
| | | | | | | 56,467,868 | |
| | | | | | | | |
| | | | Tobacco — 1.0% | |
| | 688,417 | | | Altria Group, Inc.(a) | | | 28,225,097 | |
| | 526,193 | | | Philip Morris International, Inc.(a) | | | 43,563,519 | |
| | | | | | | | |
| | | | | | | 71,788,616 | |
| | | | | | | | |
| | | | Trading Companies & Distributors — 0.0% | |
| | 29,008 | | | GATX Corp.(a) | | | 2,412,885 | |
| | | | | | | | |
| | | | Total Common Stocks
(Identified Cost $3,063,991,275) | | | 7,083,209,056 | |
| | | | | | | | |
| | | | | | | | |
| | | | Total Purchased Options — 0.6%
(Identified Cost $79,365,667) (see detail below) | | | 41,615,160 | |
| | | | | | | | |
Principal
Amount | | | Description | | Value (†) | |
| | Short-Term Investments — 3.7% | |
| $ | 266,720,480 | | | Tri-Party Repurchase Agreement with Fixed Income Clearing Corporation, dated 12/31/2020 at 0.000% to be repurchased at $266,720,480 on 1/04/2021 collateralized by $81,185,600 U.S. Treasury Note, 2.125% due 12/31/2022 valued at $84,445,689; 160,107,100 U.S. Treasury Inflation Indexed Note, 0.125% due 1/15/2023 valued at $187,609,228 including accrued interest (Note 2 of Notes to Financial Statements)
(Identified Cost $266,720,480) | | | 266,720,480 | |
| | | | | | | | |
| | | | | | | | |
| | | | Total Investments — 103.7%
(Identified Cost $3,410,077,422) | | | 7,391,544,696 | |
| | | | Other assets less liabilities — (3.7)% | | | (266,581,413 | ) |
| | | | | | | | |
| | | | Net Assets — 100.0% | | $ | 7,124,963,283 | |
| | | | | | | | |
| | | | | | | | | | | | | | | | | | | | | | |
Purchased Options — 0.6% | |
| Description | | Expiration
Date | | | Exercise
Price | | Contracts | | | Notional
Amount | | | Cost | | | Value (†) | |
| Index Options — 0.6% | |
| S&P 500® Index, Put(b) | | | 2/19/2021 | | | 3,175 | | | 2,856 | | | $ | 1,072,733,592 | | | $ | 16,491,972 | | | $ | 3,984,120 | |
| S&P 500® Index, Put(b) | | | 2/19/2021 | | | 3,200 | | | 1,920 | | | | 721,165,440 | | | | 12,474,835 | | | | 2,889,600 | |
| S&P 500® Index, Put(b) | | | 2/19/2021 | | | 3,250 | | | 1,920 | | | | 721,165,440 | | | | 7,742,400 | | | | 3,388,800 | |
| S&P 500® Index, Put(b) | | | 2/19/2021 | | | 3,350 | | | 1,920 | | | | 721,165,440 | | | | 7,222,080 | | | | 4,742,400 | |
| S&P 500® Index, Put(b) | | | 3/19/2021 | | | 3,250 | | | 1,920 | | | | 721,165,440 | | | | 10,618,560 | | | | 6,787,200 | |
| S&P 500® Index, Put(b) | | | 3/19/2021 | | | 3,300 | | | 2,856 | | | | 1,072,733,592 | | | | 16,186,380 | | | | 11,538,240 | |
| S&P 500® Index, Put(b) | | | 3/19/2021 | | | 3,325 | | | 1,920 | | | | 721,165,440 | | | | 8,629,440 | | | | 8,284,800 | |
| | | | | | | | | | | | | | | | | | | | | | |
| Total | | | | | | | | | | | | | | | | $ | 79,365,667 | | | $ | 41,615,160 | |
| | | | | | | | | | | | | | | | | | | | | | |
| | | | | | | | | | | | | | | | | | | | | | |
Written Options — (3.4%) | |
| Description | | Expiration
Date | | | Exercise
Price | | Contracts | | | Notional
Amount | | | Premiums
(Received) | | | Value (†) | |
| Index Options — (3.4%) | |
| S&P 500® Index, Call | | | 1/15/2021 | | | 3,600 | | | (2,075 | ) | | $ | (779,384,525 | ) | | $ | (20,844,412 | ) | | $ | (36,250,250 | ) |
| S&P 500® Index, Call | | | 1/15/2021 | | | 3,650 | | | (2,075 | ) | | | (779,384,525 | ) | | | (24,214,213 | ) | | | (27,182,500 | ) |
| S&P 500® Index, Call | | | 1/15/2021 | | | 3,700 | | | (2,076 | ) | | | (779,760,132 | ) | | | (12,990,570 | ) | | | (18,704,760 | ) |
| S&P 500® Index, Call | | | 1/15/2021 | | | 3,750 | | | (2,092 | ) | | | (785,769,844 | ) | | | (10,915,010 | ) | | | (11,338,640 | ) |
| S&P 500® Index, Call | | | 1/29/2021 | | | 3,750 | | | (2,076 | ) | | | (779,760,132 | ) | | | (12,720,690 | ) | | | (16,140,900 | ) |
| S&P 500® Index, Call | | | 2/19/2021 | | | 3,600 | | | (2,075 | ) | | | (779,384,525 | ) | | | (27,268,612 | ) | | | (43,969,250 | ) |
| S&P 500® Index, Call | | | 2/19/2021 | | | 3,625 | | | (2,075 | ) | | | (779,384,525 | ) | | | (32,912,613 | ) | | | (39,850,375 | ) |
| S&P 500® Index, Call | | | 2/19/2021 | | | 3,725 | | | (2,076 | ) | | | (779,760,132 | ) | | | (22,832,886 | ) | | | (24,673,260 | ) |
| S&P 500® Index, Call | | | 3/19/2021 | | | 3,800 | | | (2,075 | ) | | | (779,384,525 | ) | | | (19,385,687 | ) | | | (21,113,125 | ) |
| | | | | | | | | | | | | | | | | | | | | | |
| Total | | | | | | | | | | | | | | | | $ | (184,084,693 | ) | | $ | (239,223,060 | ) |
| | | | | | | | | | | | | | | | | | | | | | |
See accompanying notes to financial statements.
| 52
Portfolio of Investments – as of December 31, 2020
Gateway Fund – (continued)
| | | | |
| | | | |
| | (†) | | | See Note 2 of Notes to Financial Statements. |
| | (a) | �� | | Security (or a portion thereof) has been pledged as collateral for open derivative contracts. |
| | (b) | | | Non-income producing security. |
| | | | |
| | ADR | | | An American Depositary Receipt is a certificate issued by a custodian bank representing the right to receive securities of the foreign issuer described. The values of ADRs may be significantly influenced by trading on exchanges not located in the United States. |
| | REITs | | | Real Estate Investment Trusts |
Industry Summary at December 31, 2020
| | | | |
Software | | | 9.4 | % |
Technology Hardware, Storage & Peripherals | | | 7.1 | |
Interactive Media & Services | | | 5.7 | |
Semiconductors & Semiconductor Equipment | | | 5.4 | |
IT Services | | | 5.3 | |
Internet & Direct Marketing Retail | | | 5.0 | |
Pharmaceuticals | | | 4.0 | |
Banks | | | 3.8 | |
Health Care Equipment & Supplies | | | 3.5 | |
Health Care Providers & Services | | | 2.6 | |
Specialty Retail | | | 2.3 | |
Entertainment | | | 2.2 | |
Capital Markets | | | 2.2 | |
Insurance | | | 2.0 | |
Biotechnology | | | 2.0 | |
Other Investments, less than 2% each | | | 37.5 | |
Short-Term Investments | | | 3.7 | |
| | | | |
Total Investments | | | 103.7 | |
Other assets less liabilities (including open written options) | | | (3.7 | ) |
| | | | |
Net Assets | | | 100.0 | % |
| | | | |
See accompanying notes to financial statements.
53 |
Portfolio of Investments – as of December 31, 2020
Gateway Equity Call Premium Fund
| | | | | | | | |
| Shares | | | Description | | Value (†) | |
| | Common Stocks — 100.5% of Net Assets | |
| | | | Aerospace & Defense — 1.5% | |
| | 1,232 | | | Boeing Co. (The)(a) | | $ | 263,722 | |
| | 231 | | | Huntington Ingalls Industries, Inc.(a) | | | 39,381 | |
| | 950 | | | Lockheed Martin Corp.(a) | | | 337,231 | |
| | 3,469 | | | Raytheon Technologies Corp.(a) | | | 248,068 | |
| | | | | | | | |
| | | | | | | 888,402 | |
| | | | | | | | |
| | | | Air Freight & Logistics — 0.5% | |
| | 853 | | | FedEx Corp.(a) | | | 221,456 | |
| | 397 | | | XPO Logistics, Inc.(a)(b) | | | 47,322 | |
| | | | | | | | |
| | | | | | | 268,778 | |
| | | | | | | | |
| | | | Airlines — 0.4% | |
| | 2,273 | | | Delta Air Lines, Inc.(a) | | | 91,397 | |
| | 8,959 | | | JetBlue Airways Corp.(a)(b) | | | 130,264 | |
| | | | | | | | |
| | | | | | | 221,661 | |
| | | | | | | | |
| | | | Auto Components — 0.2% | |
| | 858 | | | Adient PLC(b) | | | 29,833 | |
| | 884 | | | Gentex Corp.(a) | | | 29,994 | |
| | 343 | | | Lear Corp.(a) | | | 54,547 | |
| | 388 | | | Magna International, Inc.(a) | | | 27,471 | |
| | | | | | | | |
| | | | | | | 141,845 | |
| | | | | | | | |
| | | | Automobiles — 0.5% | |
| | 400 | | | Tesla, Inc.(b) | | | 282,268 | |
| | | | | | | | |
| | | | Banks — 4.2% | |
| | 24,046 | | | Bank of America Corp.(a) | | | 728,834 | |
| | 4,502 | | | Citigroup, Inc.(a) | | | 277,594 | |
| | 1,199 | | | Comerica, Inc.(a) | | | 66,976 | |
| | 200 | | | East West Bancorp, Inc.(a) | | | 10,142 | |
| | 5,480 | | | Fifth Third Bancorp(a) | | | 151,084 | |
| | 839 | | | First Republic Bank(a) | | | 123,274 | |
| | 8,001 | | | JPMorgan Chase & Co.(a) | | | 1,016,687 | |
| | 375 | | | SVB Financial Group(a)(b) | | | 145,436 | |
| | | | | | | | |
| | | | | | | 2,520,027 | |
| | | | | | | | |
| | | | Beverages — 1.6% | |
| | 8,010 | | | Coca-Cola Co. (The)(a) | | | 439,268 | |
| | 3,562 | | | PepsiCo, Inc.(a) | | | 528,245 | |
| | | | | | | | |
| | | | | | | 967,513 | |
| | | | | | | | |
| | | | Biotechnology — 2.0% | |
| | 3,834 | | | AbbVie, Inc.(a) | | | 410,813 | |
| | 830 | | | Alexion Pharmaceuticals, Inc.(a)(b) | | | 129,679 | |
| | 128 | | | Alnylam Pharmaceuticals, Inc.(b) | | | 16,636 | |
| | 1,455 | | | Amgen, Inc.(a) | | | 334,534 | |
| | 401 | | | Biogen, Inc.(a)(b) | | | 98,189 | |
| | 2,787 | | | Gilead Sciences, Inc.(a) | | | 162,371 | |
| | 222 | | | Seagen, Inc.(a)(b) | | | 38,881 | |
| | | | | | | | |
| | | | | | | 1,191,103 | |
| | | | | | | | |
| | | | Building Products — 0.8% | |
| | 1,115 | | | A.O. Smith Corp.(a) | | | 61,124 | |
| | 2,331 | | | Carrier Global Corp.(a) | | | 87,925 | |
| | 1,240 | | | Fortune Brands Home & Security, Inc.(a) | | | 106,293 | |
| | 4,110 | | | Johnson Controls International PLC(a) | | | 191,485 | |
| | 203 | | | Lennox International, Inc.(a) | | | 55,616 | |
| | | | | | | | |
| | | | | | | 502,443 | |
| | | | | | | | |
| | | | Capital Markets — 2.7% | |
| | 2,496 | | | Bank of New York Mellon Corp. (The)(a) | | | 105,930 | |
| | 424 | | | BlackRock, Inc.(a) | | | 305,933 | |
| | 4,019 | | | Charles Schwab Corp. (The)(a) | | | 213,168 | |
| | 221 | | | FactSet Research Systems, Inc.(a) | | | 73,483 | |
| | 1,192 | | | Goldman Sachs Group, Inc. (The)(a) | | | 314,342 | |
| | 5,055 | | | Morgan Stanley(a) | | | 346,419 | |
| | | | Capital Markets — continued | |
| | 429 | | | MSCI, Inc.(a) | | | 191,561 | |
| | 685 | | | Raymond James Financial, Inc.(a) | | | 65,534 | |
| | | | | | | | |
| | | | | | | 1,616,370 | |
| | | | | | | | |
| | | | Chemicals — 1.8% | |
| | 849 | | | AdvanSix, Inc.(a)(b) | | | 16,972 | |
| | 922 | | | Air Products & Chemicals, Inc.(a) | | | 251,909 | |
| | 379 | | | Ashland Global Holdings, Inc.(a) | | | 30,017 | |
| | 2,051 | | | Huntsman Corp.(a) | | | 51,562 | |
| | 1,620 | | | Linde PLC(a) | | | 426,886 | |
| | 658 | | | Nutrien Ltd.(a) | | | 31,689 | |
| | 1,137 | | | PPG Industries, Inc.(a) | | | 163,978 | |
| | 848 | | | RPM International, Inc.(a) | | | 76,982 | |
| | 1,880 | | | Valvoline, Inc.(a) | | | 43,503 | |
| | | | | | | | |
| | | | | | | 1,093,498 | |
| | | | | | | | |
| | | | Commercial Services & Supplies — 0.4% | |
| | 226 | | | Waste Connections, Inc.(a) | | | 23,181 | |
| | 2,066 | | | Waste Management, Inc.(a) | | | 243,643 | |
| | | | | | | | |
| | | | | | | 266,824 | |
| | | | | | | | |
| | | | Communications Equipment — 0.9% | |
| | 763 | | | Ciena Corp.(a)(b) | | | 40,324 | |
| | 10,347 | | | Cisco Systems, Inc.(a) | | | 463,028 | |
| | 2,069 | | | Telefonaktiebolaget LM Ericsson, Sponsored ADR | | | 24,725 | |
| | | | | | | | |
| | | | | | | 528,077 | |
| | | | | | | | |
| | | | Consumer Finance — 0.5% | |
| | 2,148 | | | Ally Financial, Inc.(a) | | | 76,598 | |
| | 6,190 | | | Synchrony Financial(a) | | | 214,855 | |
| | | | | | | | |
| | | | | | | 291,453 | |
| | | | | | | | |
| | | | Containers & Packaging — 0.3% | |
| | 938 | | | Crown Holdings, Inc.(a)(b) | | | 93,988 | |
| | 723 | | | Packaging Corp. of America(a) | | | 99,709 | |
| | | | | | | | |
| | | | | | | 193,697 | |
| | | | | | | | |
| | | | Diversified Financial Services — 1.6% | |
| | 4,183 | | | Berkshire Hathaway, Inc., Class B(a)(b) | | | 969,912 | |
| | | | | | | | |
| | | | Diversified Telecommunication Services — 1.6% | |
| | 15,637 | | | AT&T, Inc.(a) | | | 449,720 | |
| | 9,058 | | | Verizon Communications, Inc.(a) | | | 532,158 | |
| | | | | | | | |
| | | | | | | 981,878 | |
| | | | | | | | |
| | | | Electric Utilities — 1.6% | |
| | 4,416 | | | Alliant Energy Corp.(a) | | | 227,557 | |
| | 3,734 | | | American Electric Power Co., Inc.(a) | | | 310,930 | |
| | 1,600 | | | Evergy, Inc.(a) | | | 88,816 | |
| | 1,669 | | | OGE Energy Corp.(a) | | | 53,174 | |
| | 4,156 | | | Southern Co. (The)(a) | | | 255,303 | |
| | | | | | | | |
| | | | | | | 935,780 | |
| | | | | | | | |
| | | | Electrical Equipment — 0.6% | |
| | 231 | | | Acuity Brands, Inc.(a) | | | 27,972 | |
| | 2,795 | | | Emerson Electric Co.(a) | | | 224,634 | |
| | 403 | | | Hubbell, Inc.(a) | | | 63,187 | |
| | 1,368 | | | Sensata Technologies Holding PLC(a)(b) | | | 72,148 | |
| | | | | | | | |
| | | | | | | 387,941 | |
| | | | | | | | |
| | | | Electronic Equipment, Instruments & Components — 0.5% | |
| | 512 | | | Arrow Electronics, Inc.(a)(b) | | | 49,818 | |
| | 793 | | | Avnet, Inc.(a) | | | 27,842 | |
| | 688 | | | CDW Corp.(a) | | | 90,672 | |
| | 4,536 | | | Flex Ltd.(a)(b) | | | 81,557 | |
| | 565 | | | Trimble, Inc.(a)(b) | | | 37,725 | |
| | | | | | | | |
| | | | | | | 287,614 | |
| | | | | | | | |
See accompanying notes to financial statements.
| 54
Portfolio of Investments – as of December 31, 2020
Gateway Equity Call Premium Fund – (continued)
| | | | | | | | |
| Shares | | | Description | | Value (†) | |
| | | | Entertainment — 2.5% | |
| | 1,995 | | | Activision Blizzard, Inc.(a) | | $ | 185,236 | |
| | 760 | | | Live Nation Entertainment, Inc.(a)(b) | | | 55,845 | |
| | 121 | | | Madison Square Garden Entertainment Corp.(a)(b) | | | 12,710 | |
| | 121 | | | Madison Square Garden Sports Corp.(a)(b) | | | 22,276 | |
| | 943 | | | Netflix, Inc.(a)(b) | | | 509,908 | |
| | 51 | | | Roku, Inc.(b) | | | 16,933 | |
| | 3,972 | | | Walt Disney Co. (The)(a)(b) | | | 719,647 | |
| | | | | | | | |
| | | | | | | 1,522,555 | |
| | | | | | | | |
| | | | Food & Staples Retailing — 1.8% | |
| | 961 | | | Costco Wholesale Corp.(a) | | | 362,086 | |
| | 2,216 | | | Sysco Corp.(a) | | | 164,560 | |
| | 1,732 | | | Walgreens Boots Alliance, Inc.(a) | | | 69,072 | |
| | 3,408 | | | Walmart, Inc.(a) | | | 491,263 | |
| | | | | | | | |
| | | | | | | 1,086,981 | |
| | | | | | | | |
| | | | Food Products — 0.7% | |
| | 1,143 | | | Bunge Ltd.(a) | | | 74,958 | |
| | 885 | | | Hain Celestial Group, Inc. (The)(a)(b) | | | 35,533 | |
| | 614 | | | Ingredion, Inc.(a) | | | 48,303 | |
| | 1,635 | | | Kellogg Co.(a) | | | 101,746 | |
| | 1,168 | | | Post Holdings, Inc.(a)(b) | | | 117,980 | |
| | 816 | | | TreeHouse Foods, Inc.(a)(b) | | | 34,672 | |
| | | | | | | | |
| | | | | | | 413,192 | |
| | | | | | | | |
| | | | Gas Utilities — 0.3% | |
| | 1,197 | | | Atmos Energy Corp.(a) | | | 114,230 | |
| | 1,531 | | | UGI Corp.(a) | | | 53,524 | |
| | | | | | | | |
| | | | | | | 167,754 | |
| | | | | | | | |
| | | | Health Care Equipment & Supplies — 3.7% | |
| | 4,804 | | | Abbott Laboratories(a) | | | 525,990 | |
| | 798 | | | Alcon, Inc.(b) | | | 52,652 | |
| | 370 | | | Align Technology, Inc.(a)(b) | | | 197,721 | |
| | 336 | | | Cooper Cos., Inc. (The)(a) | | | 122,075 | |
| | 388 | | | Hill-Rom Holdings, Inc.(a) | | | 38,012 | |
| | 2,290 | | | Hologic, Inc.(a)(b) | | | 166,781 | |
| | 532 | | | IDEXX Laboratories, Inc.(a)(b) | | | 265,931 | |
| | 3,635 | | | Medtronic PLC(a) | | | 425,804 | |
| | 898 | | | ResMed, Inc.(a) | | | 190,879 | |
| | 583 | | | STERIS PLC(a) | | | 110,502 | |
| | 362 | | | Teleflex, Inc.(a) | | | 148,988 | |
| | | | | | | | |
| | | | | | | 2,245,335 | |
| | | | | | | | |
| | | | Health Care Providers & Services — 2.5% | |
| | 741 | | | Anthem, Inc.(a) | | | 237,928 | |
| | 1,510 | | | Centene Corp.(a)(b) | | | 90,645 | |
| | 1,142 | | | Cigna Corp.(a) | | | 237,742 | |
| | 2,386 | | | MEDNAX, Inc.(a)(b) | | | 58,552 | |
| | 260 | | | Molina Healthcare, Inc.(a)(b) | | | 55,297 | |
| | 2,414 | | | UnitedHealth Group, Inc.(a) | | | 846,541 | |
| | | | | | | | |
| | | | | | | 1,526,705 | |
| | | | | | | | |
| | | | Health Care Technology — 0.1% | |
| | 171 | | | Veeva Systems, Inc., Class A(a)(b) | | | 46,555 | |
| | | | | | | | |
| | | | Hotels, Restaurants & Leisure — 1.8% | |
| | 68 | | | Domino’s Pizza, Inc.(a) | | | 26,075 | |
| | 404 | | | Hilton Grand Vacations, Inc.(a)(b) | | | 12,665 | |
| | 683 | | | Hilton Worldwide Holdings, Inc.(a) | | | 75,991 | |
| | 1,174 | | | Las Vegas Sands Corp.(a) | | | 69,970 | |
| | 1,761 | | | McDonald’s Corp.(a) | | | 377,875 | |
| | 374 | | | Melco Resorts & Entertainment Ltd., Sponsored ADR(a) | | | 6,938 | |
| | 1,576 | | | MGM Resorts International(a) | | | 49,660 | |
| | 1,408 | | | Restaurant Brands International, Inc.(a) | | | 86,043 | |
| | 3,495 | | | Starbucks Corp.(a) | | | 373,895 | |
| | | | Hotels, Restaurants & Leisure — continued | |
| | 9 | | | Vail Resorts, Inc.(a) | | | 2,511 | |
| | | | | | | | |
| | | | | | | 1,081,623 | |
| | | | | | | | |
| | | | Household Durables — 0.3% | |
| | 1,384 | | | Leggett & Platt, Inc.(a) | | | 61,311 | |
| | 2,218 | | | Toll Brothers, Inc.(a) | | | 96,417 | |
| | | | | | | | |
| | | | | | | 157,728 | |
| | | | | | | | |
| | | | Household Products — 1.6% | |
| | 521 | | | Clorox Co. (The)(a) | | | 105,201 | |
| | 6,045 | | | Procter & Gamble Co. (The)(a) | | | 841,101 | |
| | | | | | | | |
| | | | | | | 946,302 | |
| | | | | | | | |
| | | | Industrial Conglomerates — 1.2% | |
| | 1,356 | | | 3M Co.(a) | | | 237,015 | |
| | 2,134 | | | Honeywell International, Inc.(a) | | | 453,902 | |
| | | | | | | | |
| | | | | | | 690,917 | |
| | | | | | | | |
| | | | Insurance — 1.5% | |
| | 3,115 | | | Arch Capital Group Ltd.(a)(b) | | | 112,358 | |
| | 1,480 | | | Chubb Ltd.(a) | | | 227,802 | |
| | 438 | | | Cincinnati Financial Corp.(a) | | | 38,268 | |
| | 5,403 | | | Manulife Financial Corp.(a) | | | 96,281 | |
| | 2,318 | | | Prudential Financial, Inc.(a) | | | 180,966 | |
| | 301 | | | RenaissanceRe Holdings Ltd.(a) | | | 49,912 | |
| | 801 | | | Willis Towers Watson PLC(a) | | | 168,755 | |
| | | | | | | | |
| | | | | | | 874,342 | |
| | | | | | | | |
| | | | Interactive Media & Services — 5.6% | |
| | 470 | | | Alphabet, Inc., Class A(a)(b) | | | 823,741 | |
| | 685 | | | Alphabet, Inc., Class C(a)(b) | | | 1,200,038 | |
| | 4,727 | | | Facebook, Inc., Class A(a)(b) | | | 1,291,227 | |
| | 152 | | | Match Group, Inc.(b) | | | 22,981 | |
| | | | | | | | |
| | | | | | | 3,337,987 | |
| | | | | | | | |
| | | | Internet & Direct Marketing Retail — 4.7% | |
| | 826 | | | Amazon.com, Inc.(a)(b) | | | 2,690,224 | |
| | 257 | | | JD.com, Inc., ADR(b) | | | 22,590 | |
| | 29 | | | MercadoLibre, Inc.(a)(b) | | | 48,582 | |
| | 905 | | | Trip.com Group Ltd., ADR(a)(b) | | | 30,526 | |
| | | | | | | | |
| | | | | | | 2,791,922 | |
| | | | | | | | |
| | | | IT Services — 4.9% | |
| | 1,895 | | | Accenture PLC, Class A(a) | | | 494,993 | |
| | 91 | | | EPAM Systems, Inc.(a)(b) | | | 32,610 | |
| | 373 | | | FleetCor Technologies, Inc.(a)(b) | | | 101,766 | |
| | 784 | | | Global Payments, Inc.(a) | | | 168,889 | |
| | 2,033 | | | International Business Machines Corp.(a) | | | 255,914 | |
| | 739 | | | Leidos Holdings, Inc.(a) | | | 77,684 | |
| | 2,297 | | | MasterCard, Inc., Class A(a) | | | 819,891 | |
| | 15 | | | Shopify, Inc., Class A(b) | | | 16,979 | |
| | 122 | | | Square, Inc., Class A(b) | | | 26,552 | |
| | 4,313 | | | Visa, Inc., Class A(a) | | | 943,382 | |
| | | | | | | | |
| | | | | | | 2,938,660 | |
| | | | | | | | |
| | | | Leisure Products — 0.1% | |
| | 590 | | | Brunswick Corp.(a) | | | 44,981 | |
| | 345 | | | Polaris, Inc.(a) | | | 32,872 | |
| | | | | | | | |
| | | | | | | 77,853 | |
| | | | | | | | |
| | | | Life Sciences Tools & Services — 1.3% | |
| | 118 | | | Bio-Rad Laboratories, Inc., Class A(a)(b) | | | 68,787 | |
| | 482 | | | Illumina, Inc.(a)(b) | | | 178,340 | |
| | 625 | | | PRA Health Sciences, Inc.(a)(b) | | | 78,400 | |
| | 959 | | | Thermo Fisher Scientific, Inc.(a) | | | 446,683 | |
| | | | | | | | |
| | | | | | | 772,210 | |
| | | | | | | | |
See accompanying notes to financial statements.
55 |
Portfolio of Investments – as of December 31, 2020
Gateway Equity Call Premium Fund – (continued)
| | | | | | | | |
| Shares | | | Description | | Value (†) | |
| | | | Machinery — 1.7% | |
| | 471 | | | AGCO Corp.(a) | | $ | 48,555 | |
| | 1,820 | | | Caterpillar, Inc.(a) | | | 331,276 | |
| | 822 | | | Cummins, Inc.(a) | | | 186,676 | |
| | 990 | | | Deere & Co.(a) | | | 266,360 | |
| | 616 | | | IDEX Corp.(a) | | | 122,707 | |
| | 1,165 | | | Otis Worldwide Corp.(a) | | | 78,696 | |
| | | | | | | | |
| | | | | | | 1,034,270 | |
| | | | | | | | |
| | | | Media — 1.2% | |
| | 11,513 | | | Comcast Corp., Class A(a) | | | 603,281 | |
| | 91 | | | Liberty Broadband Corp., Class C(b) | | | 14,412 | |
| | 17,870 | | | Sirius XM Holdings, Inc.(a) | | | 113,832 | |
| | | | | | | | |
| | | | | | | 731,525 | |
| | | | | | | | |
| | | | Metals & Mining — 0.4% | |
| | 2,674 | | | Alcoa Corp.(a)(b) | | | 61,636 | |
| | 1,619 | | | Barrick Gold Corp.(a) | | | 36,881 | |
| | 316 | | | Rio Tinto PLC, Sponsored ADR | | | 23,769 | |
| | 590 | | | Southern Copper Corp.(a) | | | 38,421 | |
| | 833 | | | Steel Dynamics, Inc.(a) | | | 30,713 | |
| | 4,124 | | | Vale S.A., Sponsored ADR(a) | | | 69,118 | |
| | | | | | | | |
| | | | | | | 260,538 | |
| | | | | | | | |
| | | | Multi-Utilities — 0.4% | |
| | 3,723 | | | Public Service Enterprise Group, Inc.(a) | | | 217,051 | |
| | | | | | | | |
| | | | Multiline Retail — 0.5% | |
| | 1,576 | | | Nordstrom, Inc.(a) | | | 49,187 | |
| | 1,470 | | | Target Corp.(a) | | | 259,499 | |
| | | | | | | | |
| | | | | | | 308,686 | |
| | | | | | | | |
| | | | Oil, Gas & Consumable Fuels — 2.4% | |
| | 2,853 | | | Canadian Natural Resources Ltd.(a) | | | 68,615 | |
| | 1,062 | | | Cheniere Energy, Inc.(a)(b) | | | 63,752 | |
| | 4,533 | | | Chevron Corp.(a) | | | 382,812 | |
| | 1,642 | | | Concho Resources, Inc.(a) | | | 95,811 | |
| | 1,822 | | | Enbridge, Inc.(a) | | | 58,286 | |
| | 1,230 | | | EQT Corp. | | | 15,633 | |
| | 10,937 | | | Exxon Mobil Corp.(a) | | | 450,823 | |
| | 1,235 | | | HollyFrontier Corp.(a) | | | 31,925 | |
| | 2,149 | | | Ovintiv, Inc. | | | 30,860 | |
| | 586 | | | Pioneer Natural Resources Co.(a) | | | 66,739 | |
| | 3,117 | | | Suncor Energy, Inc.(a) | | | 52,303 | |
| | 1,014 | | | TC Energy Corp. | | | 41,290 | |
| | 7,684 | | | WPX Energy, Inc.(a)(b) | | | 62,624 | |
| | | | | | | | |
| | | | | | | 1,421,473 | |
| | | | | | | | |
| | | | Pharmaceuticals — 4.1% | |
| | 5,070 | | | Bristol-Myers Squibb Co.(a) | | | 314,492 | |
| | 2,189 | | | Eli Lilly & Co.(a) | | | 369,591 | |
| | 62 | | | Jazz Pharmaceuticals PLC(a)(b) | | | 10,233 | |
| | 5,321 | | | Johnson & Johnson(a) | | | 837,419 | |
| | 5,458 | | | Merck & Co., Inc.(a) | | | 446,464 | |
| | 306 | | | Novartis AG, Sponsored ADR(a) | | | 28,896 | |
| | 11,688 | | | Pfizer, Inc.(a) | | | 430,235 | |
| | 1,000 | | | Teva Pharmaceutical Industries Ltd., Sponsored ADR(a)(b) | | | 9,650 | |
| | 1,450 | | | Viatris, Inc.(b) | | | 27,173 | |
| | | | | | | | |
| | | | | | | 2,474,153 | |
| | | | | | | | |
| | | | Professional Services — 0.6% | |
| | 57 | | | CoStar Group, Inc.(a)(b) | | | 52,684 | |
| | 342 | | | ManpowerGroup, Inc.(a) | | | 30,841 | |
| | 650 | | | TransUnion(a) | | | 64,493 | |
| | 998 | | | Verisk Analytics, Inc.(a) | | | 207,175 | |
| | | | | | | | |
| | | | | | | 355,193 | |
| | | | | | | | |
| | | | Real Estate Management & Development — 0.0% | |
| | 176 | | | Jones Lang LaSalle, Inc.(b) | | | 26,113 | |
| | | | | | | | |
| | | | REITs – Apartments — 0.8% | |
| | 1,056 | | | American Campus Communities, Inc.(a) | | | 45,165 | |
| | 836 | | | Camden Property Trust(a) | | | 83,533 | |
| | 566 | | | Essex Property Trust, Inc.(a) | | | 134,380 | |
| | 3,100 | | | Invitation Homes, Inc.(a) | | | 92,070 | |
| | 1,125 | | | Mid-America Apartment Communities, Inc.(a) | | | 142,526 | |
| | | | | | | | |
| | | | | | | 497,674 | |
| | | | | | | | |
| | | | REITs – Diversified — 1.2% | |
| | 1,350 | | | Crown Castle International Corp.(a) | | | 214,906 | |
| | 862 | | | Digital Realty Trust, Inc.(a) | | | 120,258 | |
| | 2,963 | | | Duke Realty Corp.(a) | | | 118,431 | |
| | 723 | | | Gaming & Leisure Properties, Inc.(a) | | | 30,655 | |
| | 516 | | | SBA Communications Corp.(a) | | | 145,579 | |
| | 846 | | | VICI Properties, Inc.(a) | | | 21,573 | |
| | 724 | | | W.P. Carey, Inc.(a) | | | 51,100 | |
| | | | | | | | |
| | | | | | | 702,502 | |
| | | | | | | | |
| | | | REITs – Health Care — 0.1% | |
| | 2,686 | | | Medical Properties Trust, Inc.(a) | | | 58,528 | |
| | | | | | | | |
| | | | REITs – Hotels — 0.1% | |
| | 2,742 | | | Park Hotels & Resorts, Inc.(a) | | | 47,025 | |
| | | | | | | | |
| | | | REITs – Mortgage — 0.1% | |
| | 4,312 | | | Annaly Capital Management, Inc.(a) | | | 36,436 | |
| | | | | | | | |
| | | | REITs – Office Property — 0.1% | |
| | 1,073 | | | Kilroy Realty Corp.(a) | | | 61,590 | |
| | | | | | | | |
| | | | REITs – Single Tenant — 0.2% | |
| | 368 | | | National Retail Properties, Inc.(a) | | | 15,059 | |
| | 1,329 | | | Realty Income Corp.(a) | | | 82,624 | |
| | | | | | | | |
| | | | | | | 97,683 | |
| | | | | | | | |
| | | | REITs – Storage — 0.2% | |
| | 984 | | | Extra Space Storage, Inc.(a) | | | 114,006 | |
| | | | | | | | |
| | | | Road & Rail — 1.4% | |
| | 1,142 | | | Norfolk Southern Corp.(a) | | | 271,351 | |
| | 542 | | | Old Dominion Freight Line, Inc.(a) | | | 105,787 | |
| | 2,100 | | | Union Pacific Corp.(a) | | | 437,262 | |
| | | | | | | | |
| | | | | | | 814,400 | |
| | | | | | | | |
| | | | Semiconductors & Semiconductor Equipment — 5.2% | |
| | 2,588 | | | Advanced Micro Devices, Inc.(a)(b) | | | 237,345 | |
| | 3,752 | | | Applied Materials, Inc.(a) | | | 323,798 | |
| | 51 | | | ASML Holding NV, (Registered) | | | 24,874 | |
| | 377 | | | First Solar, Inc.(a)(b) | | | 37,293 | |
| | 8,921 | | | Intel Corp.(a) | | | 444,444 | |
| | 1,569 | | | Marvell Technology Group Ltd.(a) | | | 74,590 | |
| | 2,228 | | | Maxim Integrated Products, Inc.(a) | | | 197,512 | |
| | 1,304 | | | NVIDIA Corp.(a) | | | 680,949 | |
| | 310 | | | NXP Semiconductors NV(a) | | | 49,293 | |
| | 1,366 | | | ON Semiconductor Corp.(a)(b) | | | 44,709 | |
| | 2,815 | | | QUALCOMM, Inc.(a) | | | 428,837 | |
| | 1,002 | | | Teradyne, Inc.(a) | | | 120,130 | |
| | 2,732 | | | Texas Instruments, Inc.(a) | | | 448,403 | |
| | | | | | | | |
| | | | | | | 3,112,177 | |
| | | | | | | | |
| | | | Software — 9.1% | |
| | 1,290 | | | Adobe, Inc.(a)(b) | | | 645,155 | |
| | 1,069 | | | Cadence Design Systems, Inc.(a)(b) | | | 145,844 | |
| | 256 | | | CDK Global, Inc.(a) | | | 13,269 | |
| | 297 | | | Check Point Software Technologies Ltd.(a)(b) | | | 39,474 | |
| | 582 | | | Fortinet, Inc.(a)(b) | | | 86,444 | |
| | 14,803 | | | Microsoft Corp.(a) | | | 3,292,483 | |
| | 4,225 | | | Oracle Corp.(a) | | | 273,315 | |
See accompanying notes to financial statements.
| 56
Portfolio of Investments – as of December 31, 2020
Gateway Equity Call Premium Fund – (continued)
| | | | | | | | |
| Shares | | | Description | | Value (†) | |
| | | | Software — continued | |
| | 165 | | | Palo Alto Networks, Inc.(a)(b) | | $ | 58,639 | |
| | 1,996 | | | salesforce.com, Inc.(a)(b) | | | 444,170 | |
| | 425 | | | ServiceNow, Inc.(a)(b) | | | 233,933 | |
| | 475 | | | SS&C Technologies Holdings, Inc.(a) | | | 34,556 | |
| | 745 | | | Synopsys, Inc.(a)(b) | | | 193,134 | |
| | | | | | | | |
| | | | | | | 5,460,416 | |
| | | | | | | | |
| | | | Specialty Retail — 2.1% | |
| | 326 | | | Advance Auto Parts, Inc.(a) | | | 51,348 | |
| | 529 | | | Burlington Stores, Inc.(a)(b) | | | 138,360 | |
| | 933 | | | Dick’s Sporting Goods, Inc.(a) | | | 52,444 | |
| | 1,030 | | | Foot Locker, Inc.(a) | | | 41,653 | |
| | 3,009 | | | Home Depot, Inc. (The)(a) | | | 799,250 | |
| | 392 | | | Ulta Beauty, Inc.(a)(b) | | | 112,567 | |
| | 583 | | | Williams-Sonoma, Inc.(a) | | | 59,373 | |
| | | | | | | | |
| | | | | | | 1,254,995 | |
| | | | | | | | |
| | | | Technology Hardware, Storage & Peripherals — 7.3% | |
| | 31,376 | | | Apple, Inc.(a) | | | 4,163,282 | |
| | 346 | | | Dell Technologies, Inc., Class C(b) | | | 25,358 | |
| | 5,591 | | | Hewlett Packard Enterprise Co.(a) | | | 66,253 | |
| | 5,561 | | | HP, Inc.(a) | | | 136,745 | |
| | | | | | | | |
| | | | | | | 4,391,638 | |
| | | | | | | | |
| | | | Textiles, Apparel & Luxury Goods — 1.0% | |
| | 309 | | | Carter’s, Inc. | | | 29,068 | |
| | 232 | | | Lululemon Athletica, Inc.(a)(b) | | | 80,743 | |
| | 3,384 | | | NIKE, Inc., Class B(a) | | | 478,734 | |
| | 762 | | | Skechers U.S.A., Inc., Class A(b) | | | 27,386 | |
| | | | | | | | |
| | | | | | | 615,931 | |
| | | | | | | | |
| | | | Tobacco — 0.9% | |
| | 4,687 | | | Altria Group, Inc.(a) | | | 192,167 | |
| | 206 | | | British American Tobacco PLC, Sponsored ADR(a) | | | 7,723 | |
| | 3,941 | | | Philip Morris International, Inc.(a) | | | 326,275 | |
| | | | | | | | |
| | | | | | | 526,165 | |
| | | | | | | | |
| | | | Water Utilities — 0.5% | |
| | 1,833 | | | American Water Works Co., Inc.(a) | | | 281,311 | |
| | | | | | | | |
| | | | Wireless Telecommunication Services — 0.1% | |
| | 1,994 | | | America Movil SAB de CV, Series L, ADR | | | 28,993 | |
| | 1,721 | | | Vodafone Group PLC, Sponsored ADR | | | 28,362 | |
| | | | | | | | |
| | | | | | | 57,355 | |
| | | | | | | | |
| | | | Total Common Stocks
(Identified Cost $28,569,600) | | | 60,174,539 | |
| | | | | | | | |
| | | | | | | | |
Principal
Amount | | | | | | |
| | Short-Term Investments — 3.5% | |
| $ | 2,100,121 | | | Tri-Party Repurchase Agreement with Fixed Income Clearing Corporation, dated 12/31/2020 at 0.000% to be repurchased at $2,100,121 on 1/04/2021 collateralized by $2,059,500 U.S. Treasury Note, 2.125% due 12/31/2022 valued at $2,142,201 including accrued interest (Note 2 of Notes to Financial Statements) (Identified Cost $2,100,121) | | | 2,100,121 | |
| | | | | | | | |
| | | | | | | | |
| | | | Total Investments — 104.0%
(Identified Cost $30,669,721) | | | 62,274,660 | |
| | | | | | | | |
| | | | Other assets less liabilities — (4.0)% | | | (2,371,114 | ) |
| | | | | | | | |
| | | | Net Assets — 100.0% | | $ | 59,903,546 | |
| | | | | | | | |
| | | | | | | | | | | | | | | | | | | | | | |
| Written Options — (3.4%) | |
| | | | | | |
| Description | | Expiration
Date | | | Exercise
Price | | Contracts | | | Notional
Amount | | | Premiums
(Received) | | | Value (†) | |
| Index Options — (3.4%) | |
| S&P 500® Index, Call | | | 1/15/2021 | | | 3,600 | | | (18 | ) | | $ | (6,760,926 | ) | | $ | (180,819 | ) | | $ | (314,460 | ) |
| S&P 500® Index, Call | | | 1/15/2021 | | | 3,650 | | | (17 | ) | | | (6,385,319 | ) | | | (198,382 | ) | | | (222,700 | ) |
| S&P 500® Index, Call | | | 1/15/2021 | | | 3,700 | | | (17 | ) | | | (6,385,319 | ) | | | (106,377 | ) | | | (153,170 | ) |
| S&P 500® Index, Call | | | 1/15/2021 | | | 3,750 | | | (17 | ) | | | (6,385,319 | ) | | | (88,697 | ) | | | (92,140 | ) |
| S&P 500® Index, Call | | | 1/29/2021 | | | 3,750 | | | (18 | ) | | | (6,760,926 | ) | | | (110,295 | ) | | | (139,950 | ) |
| S&P 500® Index, Call | | | 2/19/2021 | | | 3,600 | | | (17 | ) | | | (6,385,319 | ) | | | (223,406 | ) | | | (360,230 | ) |
| S&P 500® Index, Call | | | 2/19/2021 | | | 3,625 | | | (18 | ) | | | (6,760,926 | ) | | | (285,507 | ) | | | (345,690 | ) |
| S&P 500® Index, Call | | | 2/19/2021 | | | 3,725 | | | (18 | ) | | | (6,760,926 | ) | | | (196,823 | ) | | | (213,930 | ) |
| S&P 500® Index, Call | | | 3/19/2021 | | | 3,800 | | | (18 | ) | | | (6,760,926 | ) | | | (168,165 | ) | | | (183,150 | ) |
| | | | | | | | | | | | | | | | | | | | | | |
| Total | | | | | | | | | | | | | | | | $ | (1,558,471 | ) | | $ | (2,025,420 | ) |
| | | | | | | | | | | | | | | | | | | | | | |
| | | | |
| | | | | |
| | (†) | | | See Note 2 of Notes to Financial Statements. |
| | (a) | | | Security (or a portion thereof) has been pledged as collateral for open derivative contracts. |
| | (b) | | | Non-income producing security. |
| | | | |
| | ADR | | | An American Depositary Receipt is a certificate issued by a custodian bank representing the right to receive securities of the foreign issuer described. The values of ADRs may be significantly influenced by trading on exchanges not located in the United States. |
| | REITs | | | Real Estate Investment Trusts |
Industry Summary at December 31, 2020
| | | | |
Software | | | 9.1 | % |
Technology Hardware, Storage & Peripherals | | | 7.3 | |
Interactive Media & Services | | | 5.6 | |
Semiconductors & Semiconductor Equipment | | | 5.2 | |
IT Services | | | 4.9 | |
Internet & Direct Marketing Retail | | | 4.7 | |
Banks | | | 4.2 | |
Pharmaceuticals | | | 4.1 | |
Health Care Equipment & Supplies | | | 3.7 | |
Capital Markets | | | 2.7 | |
Health Care Providers & Services | | | 2.5 | |
Entertainment | | | 2.5 | |
Oil, Gas & Consumable Fuels | | | 2.4 | |
Specialty Retail | | | 2.1 | |
Biotechnology | | | 2.0 | |
Other Investments, less than 2% each | | | 37.5 | |
Short-Term Investments | | | 3.5 | |
| | | | |
Total Investments | | | 104.0 | |
Other assets less liabilities (including open written options) | | | (4.0 | ) |
| | | | |
Net Assets | | | 100.0 | % |
| | | | |
See accompanying notes to financial statements.
57 |
Portfolio of Investments – as of December 31, 2020
Mirova Global Green Bond Fund
| | | | | | | | |
Principal
Amount (‡) | | | Description | | Value (†) | |
| | Bonds and Notes — 87.1% of Net Assets | |
| | | | Brazil — 1.4% | |
| $ | 500,000 | | | Banco Nacional de Desenvolvimento Economico e Social, 4.750%, 5/09/2024(a) | | $ | 545,005 | |
| | | | | | | | |
| | | | Canada — 2.2% | |
| | 1,000,000 | | | Province of Ontario Canada, 1.950%, 1/27/2023, (CAD)(a) | | | 811,910 | |
| | 50,000 | | | Province of Quebec Canada, 2.600%, 7/06/2025, (CAD)(a) | | | 42,791 | |
| | | | | | | | |
| | | | | | | 854,701 | |
| | | | | | | | |
| | | | Chile — 3.1% | |
| | 500,000 | | | Chile Government International Bond, 1.250%, 1/29/2040, (EUR)(a) | | | 642,576 | |
| | 500,000 | | | Chile Government International Bond, 3.500%, 1/25/2050(a) | | | 573,755 | |
| | | | | | | | |
| | | | | | | 1,216,331 | |
| | | | | | | | |
| | | | Denmark — 3.2% | |
| | 300,000 | | | Orsted A/S, 1.500%, 11/26/2029, (EUR)(a) | | | 411,306 | |
| | 700,000 | | | Orsted A/S, (fixed rate to 9/09/2027, variable rate thereafter), 1.750%, 12/09/3019, (EUR)(a) | | | 875,893 | |
| | | | | | | | |
| | | | | | | 1,287,199 | |
| | | | | | | | |
| | | | Finland — 1.5% | |
| | 500,000 | | | Citycon OYJ, (fixed rate to 11/24/2024, variable rate thereafter), 4.496%, (EUR)(a)(b) | | | 607,618 | |
| | | | | | | | |
| | | | France — 14.4% | |
| | 400,000 | | | Covivio, 1.125%, 9/17/2031, (EUR)(a) | | | 499,972 | |
| | 400,000 | | | Covivio, 1.875%, 5/20/2026, (EUR)(a) | | | 527,785 | |
| | 800,000 | | | Electricite de France S.A., 3.625%, 10/13/2025(a) | | | 896,809 | |
| | 1,000,000 | | | France Government Bond OAT, 1.750%, 6/25/2039, 144A, (EUR)(a) | | | 1,613,995 | |
| | 300,000 | | | Getlink SE, 3.500%, 10/30/2025, (EUR)(a) | | | 377,798 | |
| | 600,000 | | | ICADE, 1.500%, 9/13/2027, (EUR)(a) | | | 797,257 | |
| | 600,000 | | | Societe du Grand Paris EPIC, EMTN, 1.700%, 5/25/2050, (EUR)(a) | | | 970,596 | |
| | | | | | | | |
| | | | | | | 5,684,212 | |
| | | | | | | | |
| | | | Germany — 7.4% | |
| | 500,000 | | | BayWa AG, EMTN, 3.125%, 6/26/2024, (EUR)(a) | | | 644,421 | |
| | 600,000 | | | E.ON SE, EMTN, 0.350%, 2/28/2030, (EUR)(a) | | | 744,656 | |
| | 500,000 | | | EnBW Energie Baden-Wuerttemberg AG, (fixed rate to 3/30/2026, variable rate thereafter), 1.875%, 6/29/2080, (EUR)(a) | | | 631,440 | |
| | 300,000 | | | Landesbank Baden-Wuerttemberg, Series 809, MTN, 0.375%, 7/29/2026, (EUR)(a) | | | 373,719 | |
| | 400,000 | | | Volkswagen International Finance NV, EMTN, 1.250%, 9/23/2032, (EUR)(a) | | | 518,521 | |
| | | | | | | | |
| | | | | | | 2,912,757 | |
| | | | | | | | |
| | | | Hungary — 2.4% | |
| | 700,000 | | | Hungary Government International Bond, 1.750%, 6/05/2035, (EUR)(a) | | | 946,015 | |
| | | | | | | | |
| | | | India — 1.7% | |
| | 600,000 | | | Indian Railway Finance Corp. Ltd., 3.835%, 12/13/2027(a) | | | 661,592 | |
| | | | | | | | |
| | | | Indonesia — 2.7% | |
| | 500,000 | | | Perusahaan Penerbit SBSN Indonesia III, 3.750%, 3/01/2023(a) | | | 532,670 | |
| | 500,000 | | | Perusahaan Penerbit SBSN Indonesia III, MTN, 3.900%, 8/20/2024(a) | | | 551,095 | |
| | | | | | | | |
| | | | | | | 1,083,765 | |
| | | | | | | | |
| | | | Italy — 6.5% | |
| | 400,000 | | | A2A SpA, EMTN, 1.000%, 7/16/2029, (EUR)(a) | | | 524,835 | |
| | 600,000 | | | Assicurazioni Generali SpA, EMTN, 2.124%, 10/01/2030, (EUR)(a) | | | 778,802 | |
| | 500,000 | | | Ferrovie dello Stato Italiane SpA, EMTN, 1.125%, 7/09/2026, (EUR)(a) | | | 642,207 | |
| | 500,000 | | | Intesa Sanpaolo SpA, EMTN, 0.750%, 12/04/2024, (EUR)(a) | | | 626,028 | |
| | | | | | | | |
| | | | | | | 2,571,872 | |
| | | | | | | | |
| | | | Korea — 1.6% | |
| | 400,000 | | | Hyundai Capital Services, Inc., EMTN, 2.875%, 3/16/2021(a) | | | 401,675 | |
| | 200,000 | | | Korea Water Resources Corp., EMTN, 3.875%, 5/15/2023(a) | | | 215,563 | |
| | | | | | | | |
| | | | | | | 617,238 | |
| | | | | | | | |
| | | | Lithuania — 3.0% | |
| | 500,000 | | | AB Ignitis Grupe, EMTN, 1.875%, 7/10/2028, (EUR)(a) | | | 669,831 | |
| | 400,000 | | | AB Ignitis Grupe, EMTN, 2.000%, 7/14/2027, (EUR)(a) | | | 536,284 | |
| | | | | | | | |
| | | | | | | 1,206,115 | |
| | | | | | | | |
| | | | Luxembourg — 0.9% | |
| | 300,000 | | | Eurofins Scientific SE, (fixed rate to 8/11/2022, variable rate thereafter), 2.875%, (EUR)(b) | | | 373,572 | |
| | | | | | | | |
| | | | Netherlands — 5.9% | |
| | 600,000 | | | de Volksbank NV, EMTN, (fixed rate to 10/22/2025, variable rate thereafter), 1.750%, 10/22/2030, (EUR)(a) | | | 772,711 | |
| | 500,000 | | | Royal Schiphol Group NV, EMTN, 1.500%, 11/05/2030, (EUR)(a) | | | 682,969 | |
| | 300,000 | | | TenneT Holding BV, (fixed rate to 3/01/2024, variable rate thereafter), 2.995%, (EUR)(a)(b) | | | 387,118 | |
| | 150,000 | | | TenneT Holding BV, EMTN, 1.250%, 10/24/2033, (EUR)(a) | | | 207,281 | |
| | 200,000 | | | TenneT Holding BV, EMTN, 1.875%, 6/13/2036, (EUR)(a) | | | 299,301 | |
| | | | | | | | |
| | | | | | | 2,349,380 | |
| | | | | | | | |
| | | | Portugal — 1.7% | |
| | 500,000 | | | EDP - Energias de Portugal S.A., (fixed rate to 1/30/2024, variable rate thereafter), 4.496%, 4/30/2079, (EUR)(a) | | | 670,075 | |
| | | | | | | | |
| | | | Singapore — 1.0% | |
| | 400,000 | | | Vena Energy Capital Pte Ltd., EMTN, 3.133%, 2/26/2025(a) | | | 404,914 | |
| | | | | | | | |
| | | | Spain — 8.0% | |
| | 500,000 | | | ACS Servicios Comunicaciones y Energia, S.L., 1.875%, 4/20/2026, (EUR)(a) | | | 655,895 | |
| | 400,000 | | | Banco Bilbao Vizcaya Argentaria S.A., 1.000%, 6/21/2026, (EUR)(a) | | | 513,679 | |
| | 500,000 | | | Bankinter S.A., 0.625%, 10/06/2027, (EUR)(a) | | | 621,566 | |
| | 500,000 | | | Iberdrola International BV, (fixed rate to 2/22/2023, variable rate thereafter), 1.875%, (EUR)(a)(b) | | | 626,096 | |
| | 600,000 | | | Telefonica Europe BV, (fixed rate to 2/05/2027, variable rate thereafter), 2.502%, (EUR)(a)(b) | | | 746,668 | |
| | | | | | | | |
| | | | | | | 3,163,904 | |
| | | | | | | | |
| | | | Supranationals — 1.7% | |
| | 600,000 | | | European Investment Bank, 2.375%, 5/24/2027(a) | | | 662,543 | |
| | | | | | | | |
| | | | Sweden — 1.6% | |
| | 500,000 | | | SKF AB, EMTN, 0.875%, 11/15/2029, (EUR)(a) | | | 647,316 | |
| | | | | | | | |
| | | | United Kingdom — 5.2% | |
| | 500,000 | | | Anglian Water Services Financing PLC, EMTN, 1.625%, 8/10/2025, (GBP)(a) | | | 718,536 | |
See accompanying notes to financial statements.
| 58
Portfolio of Investments – as of December 31, 2020
Mirova Global Green Bond Fund – (continued)
| | | | | | | | |
Principal
Amount (‡) | | | Description | | Value (†) | |
| | | | United Kingdom — continued | |
| | 200,000 | | | SSE PLC, EMTN, 1.375%, 9/04/2027, (EUR)(a) | | $ | 264,317 | |
| | 600,000 | | | Standard Chartered PLC, (fixed rate to 7/02/2026, variable rate thereafter), EMTN, 0.900%, 7/02/2027, (EUR)(a) | | | 766,029 | |
| | 200,000 | | | Transport for London, EMTN, 2.125%, 4/24/2025, (GBP)(a) | | | 293,375 | |
| | | | | | | | |
| | | | | | | 2,042,257 | |
| | | | | | | | |
| | | | United States — 10.0% | |
| | 500,000 | | | Air Products & Chemicals, Inc., 2.050%, 5/15/2030(a) | | | 533,374 | |
| | 600,000 | | | Digital Dutch Finco BV, 1.500%, 3/15/2030, (EUR)(a) | | | 789,987 | |
| | 400,000 | | | Digital Euro Finco LLC, 2.500%, 1/16/2026, (EUR)(a) | | | 543,986 | |
| | 300,000 | | | DTE Electric Co., Series A, 4.050%, 5/15/2048(a) | | | 394,300 | |
| | 100,000 | | | Southern Power Co., 1.850%, 6/20/2026, (EUR)(a) | | | 133,495 | |
| | 400,000 | | | Southern Power Co., 4.150%, 12/01/2025(a) | | | 458,809 | |
| | 200,000 | | | Thermo Fisher Scientific, Inc., 4.100%, 8/15/2047(a) | | | 268,174 | |
| | 700,000 | | | Verizon Communications, Inc., 3.875%, 2/08/2029(a) | | | 823,969 | |
| | | | | | | | |
| | | | | | | 3,946,094 | |
| | | | | | | | |
| | | | Total Bonds and Notes
(Identified Cost $31,051,174) | | | 34,454,475 | |
| | | | | | | | |
| | | | | | | | |
| | Short-Term Investments — 5.4% | |
| | 2,129,169 | | | Tri-Party Repurchase Agreement with Fixed Income Clearing Corporation, dated 12/31/2020 at 0.000% to be repurchased at $2,129,169 on 1/04/2021 collateralized by $2,088,000 U.S. Treasury Note, 2.125% due 12/31/2022 valued at $2,171,846 including accrued interest (Note 2 of Notes to Financial Statements) (Identified Cost $2,129,169) | | | 2,129,169 | |
| | | | | | | | |
| | | | | | | | |
| | | | Total Investments — 92.5%
(Identified Cost $33,180,343) | | | 36,583,644 | |
| | | | Other assets less liabilities — 7.5% | | | 2,952,153 | |
| | | | | | | | |
| | | | Net Assets — 100.0% | | $ | 39,535,797 | |
| | | | | | | | |
| | | | | | | | |
| | (‡) | | | Principal Amount stated in U.S. dollars unless otherwise noted. | |
| | (†) | | | See Note 2 of Notes to Financial Statements. | |
| | (a) | | | Security (or a portion thereof) has been designated to cover the Fund’s obligations under open derivative contracts. | |
| | (b) | | | Perpetual bond with no specified maturity date. | |
| | | | | |
| | 144A | | | All or a portion of these securities are exempt from registration under Rule 144A of the Securities Act of 1933. These securities may be resold in transactions exempt from registration, normally to qualified institutional buyers. At December 31, 2020, the value of Rule 144A holdings amounted to $1,613,995 or 4.1% of net assets. | |
| | EMTN | | | Euro Medium Term Note | |
| | MTN | | | Medium Term Note | |
| | | | | |
| | CAD | | | Canadian Dollar | |
| | EUR | | | Euro | |
| | GBP | | | British Pound | |
At December 31, 2020, open long futures contracts were as follows:
| | | | | | | | | | | | | | | | | | | | |
| Financial Futures | | Expiration
Date | | | Contracts | | | Notional
Amount | | | Value | | | Unrealized
Appreciation
(Depreciation) | |
10 Year Canada Government Bond | | | 3/22/2021 | | | | 6 | | | $ | 700,071 | | | $ | 702,805 | | | $ | 2,734 | |
30 Year U.S. Treasury Bond | | | 3/22/2021 | | | | 3 | | | | 521,953 | | | | 519,562 | | | | (2,391 | ) |
Euro-Buxl® 30 Year Bond | | | 3/08/2021 | | | | 7 | | | | 1,909,561 | | | | 1,926,151 | | | | 16,590 | |
| | | | | | | | | | | | | | | | | | | | |
Total | | | $ | 16,933 | |
| | | | | | | | | | | | | | | | | | | | |
At December 31, 2020, open short futures contracts were as follows:
| | | | | | | | | | | | | | | | | | | | |
Financial and
Currency Futures | | Expiration
Date | | | Contracts | | | Notional
Amount | | | Value | | | Unrealized
Appreciation
(Depreciation) | |
10 Year U.S. Treasury Note | | | 3/22/2021 | | | | 2 | | | $ | 275,781 | | | $ | 276,156 | | | $ | (375 | ) |
British Pound | | | 3/15/2021 | | | | 12 | | | | 1,000,575 | | | | 1,024,425 | | | | (23,850 | ) |
Canadian Dollar | | | 3/16/2021 | | | | 11 | | | | 845,383 | | | | 861,740 | | | | (16,357 | ) |
Euro | | | 3/15/2021 | | | | 163 | | | | 24,365,713 | | | | 24,951,225 | | | | (585,512 | ) |
| | | | | | | | | | | | | | | | | | | | |
Total | | | $ | (626,094 | ) |
| | | | | | | | | | | | | | | | | | | | |
Industry Summary at December 31, 2020
| | | | |
Utility - Electric | | | 19.8 | % |
Financial | | | 12.8 | |
Government National | | | 12.3 | |
Industrial | | | 11.7 | |
Bank | | | 9.3 | |
Special Purpose | | | 5.5 | |
Government Regional | | | 4.6 | |
Telephone | | | 4.0 | |
Transportation - Rail | | | 2.4 | |
Government Agency | | | 2.0 | |
Supra - National | | | 1.7 | |
Trans - Non Rail | | | 1.0 | |
Short-Term Investments | | | 5.4 | |
| | | | |
Total Investments | | | 92.5 | |
Other assets less liabilities (including futures contracts) | | | 7.5 | |
| | | | |
Net Assets | | | 100.0 | % |
| | | | |
Currency Exposure Summary at December 31, 2020
| | | | |
Euro | | | 62.1 | % |
United States Dollar | | | 25.6 | |
British Pound | | | 2.6 | |
Canadian Dollar | | | 2.2 | |
| | | | |
Total Investments | | | 92.5 | |
Other assets less liabilities (including futures contracts) | | | 7.5 | |
| | | | |
Net Assets | | | 100.0 | % |
| | | | |
See accompanying notes to financial statements.
59 |
Portfolio of Investments – as of December 31, 2020
Mirova Global Sustainable Equity Fund
| | | | | | | | |
| Shares | | | Description | | Value (†) | |
| | Common Stocks — 93.7% of Net Assets | |
| | | | Belgium — 1.7% | |
| | 208,515 | | | KBC Group NV(a) | | $ | 14,592,121 | |
| | | | | | | | |
| | | | Denmark — 13.9% | |
| | 73,146 | | | Chr. Hansen Holding A/S(a) | | | 7,557,566 | |
| | 43,821 | | | Coloplast A/S, Series B | | | 6,701,495 | |
| | 381,538 | | | Novo Nordisk A/S, Class B | | | 26,615,762 | |
| | 218,510 | | | Orsted A/S, 144A | | | 44,708,279 | |
| | 155,498 | | | Vestas Wind Systems A/S | | | 36,733,185 | |
| | | | | | | | |
| | | | | | | 122,316,287 | |
| | | | | | | | |
| | | | France — 4.4% | |
| | 128,750 | | | Danone S.A. | | | 8,472,541 | |
| | 79,704 | | | EssilorLuxottica S.A. | | | 12,420,625 | |
| | 65,966 | | | Orpea S.A.(a) | | | 8,650,254 | |
| | 240,514 | | | Valeo S.A. | | | 9,486,894 | |
| | | | | | | | |
| | | | | | | 39,030,314 | |
| | | | | | | | |
| | | | Germany — 5.3% | |
| | 43,338 | | | Allianz SE, (Registered) | | | 10,646,970 | |
| | 45,623 | | | SAP SE | | | 5,909,030 | |
| | 227,951 | | | Symrise AG | | | 30,304,566 | |
| | | | | | | | |
| | | | | | | 46,860,566 | |
| | | | | | | | |
| | | | Hong Kong — 2.2% | |
| | 1,605,489 | | | AIA Group Ltd. | | | 19,564,679 | |
| | | | | | | | |
| | | | Japan — 4.1% | |
| | 730,300 | | | Sekisui House Ltd. | | | 14,877,525 | |
| | 132,841 | | | Takeda Pharmaceutical Co. Ltd. | | | 4,807,430 | |
| | 384,300 | | | Terumo Corp. | | | 16,081,517 | |
| | | | | | | | |
| | | | | | | 35,766,472 | |
| | | | | | | | |
| | | | Netherlands — 3.6% | |
| | 8,737 | | | Adyen NV, 144A(a) | | | 20,300,776 | |
| | 22,884 | | | ASML Holding NV | | | 11,079,905 | |
| | | | | | | | |
| | | | | | | 31,380,681 | |
| | | | | | | | |
| | | | Switzerland — 1.2% | |
| | 16,292 | | | Geberit AG, (Registered) | | | 10,198,312 | |
| | | | | | | | |
| | | | Taiwan — 2.8% | |
| | 226,036 | | | Taiwan Semiconductor Manufacturing Co. Ltd., Sponsored ADR | | | 24,646,966 | |
| | | | | | | | |
| | | | United Kingdom — 5.0% | |
| | 4,188,626 | | | Legal & General Group PLC | | | 15,265,088 | |
| | 1,005,493 | | | Prudential PLC | | | 18,488,968 | |
| | 166,825 | | | Unilever PLC | | | 10,101,435 | |
| | | | | | | | |
| | | | | | | 43,855,491 | |
| | | | | | | | |
| | | | United States — 49.5% | |
| | 40,768 | | | Adobe, Inc.(a) | | | 20,388,892 | |
| | 14,729 | | | Alphabet, Inc., Class A(a) | | | 25,814,635 | |
| | 77,845 | | | American Water Works Co., Inc. | | | 11,946,872 | |
| | 182,037 | | | Aptiv PLC | | | 23,717,601 | |
| | 106,118 | | | Ball Corp. | | | 9,888,075 | |
| | 28,328 | | | Bright Horizons Family Solutions, Inc.(a) | | | 4,900,461 | |
| | 123,286 | | | Danaher Corp. | | | 27,386,752 | |
| | 239,054 | | | Eaton Corp. PLC | | | 28,719,948 | |
| | 587,199 | | | eBay, Inc. | | | 29,506,750 | |
| | 154,628 | | | Ecolab, Inc. | | | 33,455,314 | |
| | 36,457 | | | Estee Lauder Cos., Inc. (The), Class A | | | 9,704,489 | |
| | 11,317 | | | Intuitive Surgical, Inc.(a) | | | 9,258,438 | |
| | 98,649 | | | MasterCard, Inc., Class A | | | 35,211,774 | |
| | 163,678 | | | Microsoft Corp. | | | 36,405,261 | |
| | 170,693 | | | NextEra Energy, Inc. | | | 13,168,965 | |
| | 98,028 | | | Oracle Corp. | | | 6,341,431 | |
| | 59,402 | | | Roper Technologies, Inc. | | | 25,607,608 | |
| | | | United States — continued | |
| | 140,005 | | | Signature Bank | | | 18,941,276 | |
| | 67,900 | | | Thermo Fisher Scientific, Inc. | | | 31,626,462 | |
| | 115,002 | | | Visa, Inc., Class A | | | 25,154,387 | |
| | 60,080 | | | Watts Water Technologies, Inc., Series A | | | 7,311,736 | |
| | | | | | | | |
| | | | | | | 434,457,127 | |
| | | | | | | | |
| | | | Total Common Stocks
(Identified Cost $683,740,104) | | | 822,669,016 | |
| | | | | | | | |
| | | | | | | | |
Principal
Amount | | | | | | |
| | Short-Term Investments — 4.9% | |
| $ | 43,085,058 | | | Tri-Party Repurchase Agreement with Fixed Income Clearing Corporation, dated 12/31/2020 at 0.000% to be repurchased at $43,085,058 on 1/04/2021 collateralized by $42,250,200 U.S. Treasury Note, 2.125% due 12/31/2022 valued at $43,946,799 including accrued interest (Note 2 of Notes to Financial Statements)
(Identified Cost $43,085,058) | | | 43,085,058 | |
| | | | | | | | |
| | | | | | | | |
| | | | Total Investments — 98.6%
(Identified Cost $726,825,162) | | | 865,754,074 | |
| | | | Other assets less liabilities — 1.4% | | | 12,016,577 | |
| | | | | | | | |
| | | | Net Assets — 100.0% | | $ | 877,770,651 | |
| | | | | | | | |
| | | | | | | | |
| | (†) | | | See Note 2 of Notes to Financial Statements. | |
| | (a) | | | Non-income producing security. | |
| | | | | |
| | 144A | | | All or a portion of these securities are exempt from registration under Rule 144A of the Securities Act of 1933. These securities may be resold in transactions exempt from registration, normally to qualified institutional buyers. At December 31, 2020, the value of Rule 144A holdings amounted to $65,009,055 or 7.4% of net assets. | |
| | ADR | | | An American Depositary Receipt is a certificate issued by a custodian bank representing the right to receive securities of the foreign issuer described. The values of ADRs may be significantly influenced by trading on exchanges not located in the United States. | |
Industry Summary at December 31, 2020
| | | | |
IT Services | | | 9.2 | % |
Chemicals | | | 8.0 | |
Software | | | 7.8 | |
Electrical Equipment | | | 7.5 | |
Insurance | | | 7.2 | |
Health Care Equipment & Supplies | | | 6.8 | |
Electric Utilities | | | 6.6 | |
Semiconductors & Semiconductor Equipment | | | 4.1 | |
Banks | | | 3.9 | |
Auto Components | | | 3.8 | |
Life Sciences Tools & Services | | | 3.6 | |
Pharmaceuticals | | | 3.6 | |
Internet & Direct Marketing Retail | | | 3.4 | |
Interactive Media & Services | | | 2.9 | |
Industrial Conglomerates | | | 2.9 | |
Personal Products | | | 2.3 | |
Other Investments, less than 2% each | | | 10.1 | |
Short-Term Investments | | | 4.9 | |
| | | | |
Total Investments | | | 98.6 | |
Other assets less liabilities | | | 1.4 | |
| | | | |
Net Assets | | | 100.0 | % |
| | | | |
See accompanying notes to financial statements.
| 60
Portfolio of Investments – as of December 31, 2020
Mirova Global Sustainable Equity Fund – (continued)
Currency Exposure Summary at December 31, 2020
| | | | |
United States Dollar | | | 57.2 | % |
Euro | | | 16.2 | |
Danish Krone | | | 13.9 | |
Japanese Yen | | | 4.1 | |
British Pound | | | 3.8 | |
Hong Kong Dollar | | | 2.2 | |
Swiss Franc | | | 1.2 | |
| | | | |
Total Investments | | | 98.6 | |
Other assets less liabilities | | | 1.4 | |
| | | | |
Net Assets | | | 100.0 | % |
| | | | |
See accompanying notes to financial statements.
61 |
Portfolio of Investments – as of December 31, 2020
Mirova International Sustainable Equity Fund
| | | | | | | | |
| Shares | | | Description | | Value (†) | |
| | Common Stocks — 95.2% of Net Assets | |
| | | | Australia — 2.1% | |
| | 20,487 | | | Brambles Ltd. | | $ | 168,040 | |
| | 56,365 | | | Stockland | | | 181,979 | |
| | | | | | | | |
| | | | | | | 350,019 | |
| | | | | | | | |
| | | | Belgium — 4.6% | |
| | 8,385 | | | KBC Group NV(a) | | | 586,792 | |
| | 3,745 | | | Umicore S.A. | | | 180,004 | |
| | | | | | | | |
| | | | | | | 766,796 | |
| | | | | | | | |
| | | | Denmark — 16.1% | |
| | 2,711 | | | Chr. Hansen Holding A/S(a) | | | 280,105 | |
| | 1,458 | | | Coloplast A/S, Series B | | | 222,970 | |
| | 7,713 | | | Novo Nordisk A/S, Class B | | | 538,052 | |
| | 3,967 | | | Orsted A/S, 144A | | | 811,669 | |
| | 3,487 | | | Vestas Wind Systems A/S | | | 823,732 | |
| | | | | | | | |
| | | | | | | 2,676,528 | |
| | | | | | | | |
| | | | France — 16.9% | |
| | 1,361 | | | Air Liquide S.A. | | | 223,132 | |
| | 21,633 | | | Credit Agricole S.A.(a) | | | 273,483 | |
| | 4,851 | | | Danone S.A. | | | 319,226 | |
| | 1,289 | | | Dassault Systemes SE | | | 261,434 | |
| | 1,433 | | | EssilorLuxottica S.A. | | | 223,311 | |
| | 664 | | | L’Oreal S.A. | | | 253,350 | |
| | 2,759 | | | Orpea S.A.(a) | | | 361,793 | |
| | 11,471 | | | Suez S.A. | | | 227,347 | |
| | 7,542 | | | Valeo S.A. | | | 297,488 | |
| | 3,769 | | | Worldline S.A., 144A(a) | | | 366,151 | |
| | | | | | | | |
| | | | | | | 2,806,715 | |
| | | | | | | | |
| | | | Germany — 6.4% | |
| | 1,440 | | | Allianz SE, (Registered) | | | 353,769 | |
| | 3,442 | | | SAP SE | | | 445,803 | |
| | 2,008 | | | Symrise AG | | | 266,950 | |
| | | | | | | | |
| | | | | | | 1,066,522 | |
| | | | | | | | |
| | | | Hong Kong — 4.3% | |
| | 58,395 | | | AIA Group Ltd. | | | 711,608 | |
| | | | | | | | |
| | | | Ireland — 3.6% | |
| | 4,802 | | | Kingspan Group PLC(a) | | | 336,269 | |
| | 5,717 | | | Smurfit Kappa Group PLC | | | 267,231 | |
| | | | | | | | |
| | | | | | | 603,500 | |
| | | | | | | | |
| | | | Japan — 11.2% | |
| | 2,600 | | | Kao Corp. | | | 200,866 | |
| | 20,900 | | | Kubota Corp. | | | 456,615 | |
| | 13,600 | | | Sekisui House Ltd. | | | 277,057 | |
| | 700 | | | Shimano, Inc. | | | 163,855 | |
| | 7,038 | | | Takeda Pharmaceutical Co. Ltd. | | | 254,701 | |
| | 8,800 | | | Terumo Corp. | | | 368,247 | |
| | 2,700 | | | West Japan Railway Co. | | | 141,372 | |
| | | | | | | | |
| | | | | | | 1,862,713 | |
| | | | | | | | |
| | | | Netherlands — 7.0% | |
| | 225 | | | Adyen NV, 144A(a) | | | 522,796 | |
| | 1,332 | | | ASML Holding NV | | | 644,924 | |
| | | | | | | | |
| | | | | | | 1,167,720 | |
| | | | | | | | |
| | | | Norway — 0.6% | |
| | 5,236 | | | Telenor ASA | | | 88,880 | |
| | | | | | | | |
| | | | Switzerland — 2.4% | |
| | 643 | | | Geberit AG, (Registered) | | | 402,499 | |
| | | | | | | | |
| | | | Taiwan — 4.9% | |
| | 7,475 | | | Taiwan Semiconductor Manufacturing Co. Ltd., Sponsored ADR | | | 815,074 | |
| | | | | | | | |
| | | | United Kingdom — 15.1% | |
| | 4,229 | | | Croda International PLC | | | 380,314 | |
| | 11,813 | | | Halma PLC | | | 395,621 | |
| | 4,255 | | | Johnson Matthey PLC | | | 140,971 | |
| | 19,647 | | | Land Securities Group PLC | | | 181,460 | |
| | 147,076 | | | Legal & General Group PLC | | | 536,006 | |
| | 21,596 | | | Prudential PLC | | | 397,106 | |
| | 1,286 | | | Spirax-Sarco Engineering PLC | | | 198,512 | |
| | 4,684 | | | Unilever PLC | | | 283,621 | |
| | | | | | | | |
| | | | | | | 2,513,611 | |
| | | | | | | | |
| | | | Total Common Stocks
(Identified Cost $11,220,562) | | | 15,832,185 | |
| | | | | | | | |
| | | | | | | | |
Principal
Amount | | | | | | |
| | Short-Term Investments — 1.2% | |
| $ | 201,105 | | | Tri-Party Repurchase Agreement with Fixed Income Clearing Corporation, dated 12/31/2020 at 0.000% to be repurchased at $201,105 on 1/04/2021 collateralized by $197,300 U.S. Treasury Note, 2.125% due 12/31/2022 valued at $205,223 including accrued interest (Note 2 of Notes to Financial Statements) (Identified Cost $201,105) | | | 201,105 | |
| | | | | | | | |
| | | | | | | | |
| | | | Total Investments — 96.4%
(Identified Cost $11,421,667) | | | 16,033,290 | |
| | | | Other assets less liabilities — 3.6% | | | 596,019 | |
| | | | | | | | |
| | | | Net Assets — 100.0% | | $ | 16,629,309 | |
| | | | | | | | |
| | | | | | | | |
| | (†) | | | See Note 2 of Notes to Financial Statements. | |
| | (a) | | | Non-income producing security. | |
| | | | | |
| | 144A | | | All or a portion of these securities are exempt from registration under Rule 144A of the Securities Act of 1933. These securities may be resold in transactions exempt from registration, normally to qualified institutional buyers. At December 31, 2020, the value of Rule 144A holdings amounted to $1,700,616 or 10.2% of net assets. | |
| | ADR | | | An American Depositary Receipt is a certificate issued by a custodian bank representing the right to receive securities of the foreign issuer described. The values of ADRs may be significantly influenced by trading on exchanges not located in the United States. | |
Industry Summary at December 31, 2020
| | | | |
Insurance | | | 12.0 | % |
Chemicals | | | 8.8 | |
Semiconductors & Semiconductor Equipment | | | 8.8 | |
IT Services | | | 5.3 | |
Banks | | | 5.2 | |
Electrical Equipment | | | 5.0 | |
Electric Utilities | | | 4.9 | |
Pharmaceuticals | | | 4.7 | |
Building Products | | | 4.4 | |
Personal Products | | | 4.4 | |
Software | | | 4.3 | |
Machinery | | | 3.9 | |
Health Care Equipment & Supplies | | | 3.5 | |
Electronic Equipment, Instruments & Components | | | 2.4 | |
Health Care Providers & Services | | | 2.2 | |
Other Investments, less than 2% each | | | 15.4 | |
Short-Term Investments | | | 1.2 | |
| | | | |
Total Investments | | | 96.4 | |
Other assets less liabilities | | | 3.6 | |
| | | | |
Net Assets | | | 100.0 | % |
| | | | |
See accompanying notes to financial statements.
| 62
Portfolio of Investments – as of December 31, 2020
Mirova International Sustainable Equity Fund – (continued)
Currency Exposure Summary at December 31, 2020
| | | | |
Euro | | | 40.2 | % |
Danish Krone | | | 16.1 | |
British Pound | | | 13.4 | |
Japanese Yen | | | 11.2 | |
United States Dollar | | | 6.1 | |
Hong Kong Dollar | | | 4.3 | �� |
Swiss Franc | | | 2.4 | |
Australian Dollar | | | 2.1 | |
Norwegian Krone | | | 0.6 | |
| | | | |
Total Investments | | | 96.4 | |
Other assets less liabilities | | | 3.6 | |
| | | | |
Net Assets | | | 100.0 | % |
| | | | |
See accompanying notes to financial statements.
63 |
Portfolio of Investments – as of December 31, 2020
Mirova U.S. Sustainable Equity Fund
| | | | | | | | |
| Shares | | | Description | | Value (†) | |
| | Common Stocks — 97.3% of Net Assets | |
| | | | Auto Components — 2.6% | |
| | 1,003 | | | Aptiv PLC | | $ | 130,681 | |
| | | | | | | | |
| | | | Banks — 1.6% | |
| | 616 | | | Signature Bank | | | 83,339 | |
| | | | | | | | |
| | | | Chemicals — 4.3% | |
| | 1,023 | | | Ecolab, Inc. | | | 221,336 | |
| | | | | | | | |
| | | | Commercial Services & Supplies — 3.0% | |
| | 1,281 | | | Waste Management, Inc. | | | 151,068 | |
| | | | | | | | |
| | | | Communications Equipment — 0.9% | |
| | 981 | | | Cisco Systems, Inc. | | | 43,900 | |
| | | | | | | | |
| | | | Containers & Packaging — 1.5% | |
| | 844 | | | Ball Corp. | | | 78,644 | |
| | | | | | | | |
| | | | Diversified Consumer Services — 2.1% | |
| | 610 | | | Bright Horizons Family Solutions, Inc.(a) | | | 105,524 | |
| | | | | | | | |
| | | | Diversified Telecommunication Services — 1.3% | |
| | 1,102 | | | Verizon Communications, Inc. | | | 64,743 | |
| | | | | | | | |
| | | | Electric Utilities — 4.5% | |
| | 3,000 | | | NextEra Energy, Inc. | | | 231,450 | |
| | | | | | | | |
| | | | Electrical Equipment — 4.1% | |
| | 1,759 | | | Eaton Corp. PLC | | | 211,326 | |
| | | | | | | | |
| | | | Electronic Equipment, Instruments & Components — 1.3% | |
| | 963 | | | Trimble, Inc.(a) | | | 64,300 | |
| | | | | | | | |
| | | | Health Care Equipment & Supplies — 8.4% | |
| | 1,271 | | | Danaher Corp. | | | 282,340 | |
| | 179 | | | Intuitive Surgical, Inc.(a) | | | 146,440 | |
| | | | | | | | |
| | | | | | | 428,780 | |
| | | | | | | | |
| | | | Household Products — 1.5% | |
| | 867 | | | Colgate-Palmolive Co. | | | 74,137 | |
| | | | | | | | |
| | | | Independent Power & Renewable Electricity Producers — 2.5% | |
| | 1,426 | | | Ormat Technologies, Inc. | | | 128,739 | |
| | | | | | | | |
| | | | Industrial Conglomerates — 3.7% | |
| | 434 | | | Roper Technologies, Inc. | | | 187,093 | |
| | | | | | | | |
| | | | Interactive Media & Services — 2.0% | |
| | 59 | | | Alphabet, Inc., Class A(a) | | | 103,406 | |
| | | | | | | | |
| | | | Internet & Direct Marketing Retail — 3.8% | |
| | 3,908 | | | eBay, Inc. | | | 196,377 | |
| | | | | | | | |
| | | | IT Services — 8.1% | |
| | 216 | | | Accenture PLC, Class A | | | 56,421 | |
| | 677 | | | MasterCard, Inc., Class A | | | 241,648 | |
| | 538 | | | Visa, Inc., Class A | | | 117,677 | |
| | | | | | | | |
| | | | | | | 415,746 | |
| | | | | | | | |
| | | | Life Sciences Tools & Services — 5.5% | |
| | 608 | | | Thermo Fisher Scientific, Inc. | | | 283,194 | |
| | | | | | | | |
| | | | Machinery — 4.5% | |
| | 826 | | | Watts Water Technologies, Inc., Series A | | | 100,524 | |
| | 1,262 | | | Xylem, Inc. | | | 128,459 | |
| | | | | | | | |
| | | | | | | 228,983 | |
| | | | | | | | |
| | | | Personal Products — 2.7% | |
| | 526 | | | Estee Lauder Cos., Inc. (The), Class A | | | 140,016 | |
| | | | | | | | |
| | | | Pharmaceuticals — 2.0% | |
| | 614 | | | Eli Lilly & Co. | | | 103,668 | |
| | | | | | | | |
| | | | Semiconductors & Semiconductor Equipment — 8.5% | |
| | 1,139 | | | First Solar, Inc.(a) | | | 112,670 | |
| | 281 | | | NVIDIA Corp. | | | 146,738 | |
| | | | Semiconductors & Semiconductor Equipment — continued | |
| | 1,600 | | | Taiwan Semiconductor Manufacturing Co. Ltd., Sponsored ADR | | $ | 174,464 | |
| | | | | | | | |
| | | | | | | 433,872 | |
| | | | | | | | |
| | | | Software — 13.1% | |
| | 504 | | | Adobe, Inc.(a) | | | 252,061 | |
| | 1,533 | | | Microsoft Corp. | | | 340,970 | |
| | 1,151 | | | Oracle Corp. | | | 74,458 | |
| | | | | | | | |
| | | | | | | 667,489 | |
| | | | | | | | |
| | | | Water Utilities — 3.8% | |
| | 1,252 | | | American Water Works Co., Inc. | | | 192,144 | |
| | | | | | | | |
| | | | Total Common Stocks
(Identified Cost $4,863,312) | | | 4,969,955 | |
| | | | | | | | |
| | | | | | | | |
| | | | Total Investments — 97.3%
(Identified Cost $4,863,312) | | | 4,969,955 | |
| | | | Other assets less liabilities — 2.7% | | | 138,824 | |
| | | | | | | | |
| | | | Net Assets — 100.0% | | $ | 5,108,779 | |
| | | | | | | | |
| | | | | | | | |
| | (†) | | | See Note 2 of Notes to Financial Statements. | |
| | (a) | | | Non-income producing security. | |
| | | | | | | | |
| | ADR | | | An American Depositary Receipt is a certificate issued by a custodian bank representing the right to receive securities of the foreign issuer described. The values of ADRs may be significantly influenced by trading on exchanges not located in the United States. | |
Industry Summary at December 31, 2020
| | | | |
Software | | | 13.1 | % |
Semiconductors & Semiconductor Equipment | | | 8.5 | |
Health Care Equipment & Supplies | | | 8.4 | |
IT Services | | | 8.1 | |
Life Sciences Tools & Services | | | 5.5 | |
Electric Utilities | | | 4.5 | |
Machinery | | | 4.5 | |
Chemicals | | | 4.3 | |
Electrical Equipment | | | 4.1 | |
Internet & Direct Marketing Retail | | | 3.8 | |
Water Utilities | | | 3.8 | |
Industrial Conglomerates | | | 3.7 | |
Commercial Services & Supplies | | | 3.0 | |
Personal Products | | | 2.7 | |
Auto Components | | | 2.6 | |
Independent Power & Renewable Electricity Producers | | | 2.5 | |
Diversified Consumer Services | | | 2.1 | |
Pharmaceuticals | | | 2.0 | |
Interactive Media & Services | | | 2.0 | |
Other Investments, less than 2% each | | | 8.1 | |
| | | | |
Total Investments | | | 97.3 | |
Other assets less liabilities | | | 2.7 | |
| | | | |
Net Assets | | | 100.0 | % |
| | | | |
See accompanying notes to financial statements.
| 64
Portfolio of Investments – as of December 31, 2020
Natixis Oakmark Fund
| | | | | | | | |
| Shares | | | Description | | Value (†) | |
| | Common Stocks — 96.9% of Net Assets | |
| | | | Aerospace & Defense — 0.9% | |
| | 14,400 | | | General Dynamics Corp. | | $ | 2,143,008 | |
| | | | | | | | |
| | | | Auto Components — 2.0% | |
| | 36,600 | | | Aptiv PLC | | | 4,768,614 | |
| | | | | | | | |
| | | | Automobiles — 2.5% | |
| | 147,600 | | | General Motors Co. | | | 6,146,064 | |
| | | | | | | | |
| | | | Banks — 8.0% | |
| | 254,300 | | | Bank of America Corp. | | | 7,707,833 | |
| | 130,900 | | | Citigroup, Inc. | | | 8,071,294 | |
| | 125,045 | | | Wells Fargo & Co. | | | 3,773,858 | |
| | | | | | | | |
| | | | | | | 19,552,985 | |
| | | | | | | | |
| | | | Beverages — 3.9% | |
| | 28,200 | | | Constellation Brands, Inc., Class A | | | 6,177,210 | |
| | 104,404 | | | Keurig Dr Pepper, Inc. | | | 3,340,928 | |
| | | | | | | | |
| | | | | | | 9,518,138 | |
| | | | | | | | |
| | | | Biotechnology — 0.6% | |
| | 3,040 | | | Regeneron Pharmaceuticals, Inc.(a) | | | 1,468,654 | |
| | | | | | | | |
| | | | Capital Markets — 12.0% | |
| | 85,700 | | | Bank of New York Mellon Corp. (The) | | | 3,637,108 | |
| | 141,800 | | | Charles Schwab Corp. (The) | | | 7,521,072 | |
| | 19,865 | | | Goldman Sachs Group, Inc. (The) | | | 5,238,599 | |
| | 44,600 | | | KKR & Co., Inc. | | | 1,805,854 | |
| | 9,285 | | | Moody’s Corp. | | | 2,694,878 | |
| | 8,605 | | | S&P Global, Inc. | | | 2,828,722 | |
| | 77,800 | | | State Street Corp. | | | 5,662,284 | |
| | | | | | | | |
| | | | | | | 29,388,517 | |
| | | | | | | | |
| | | | Consumer Finance — 8.8% | |
| | 253,300 | | | Ally Financial, Inc. | | | 9,032,678 | |
| | 36,044 | | | American Express Co. | | | 4,358,080 | |
| | 81,905 | | | Capital One Financial Corp. | | | 8,096,309 | |
| | | | | | | | |
| | | | | | | 21,487,067 | |
| | | | | | | | |
| | | | Electronic Equipment, Instruments & Components — 1.8% | |
| | 35,900 | | | TE Connectivity Ltd. | | | 4,346,413 | |
| | | | | | | | |
| | | | Entertainment — 2.1% | |
| | 9,585 | | | Netflix, Inc.(a) | | | 5,182,897 | |
| | | | | | | | |
| | | | Health Care Providers & Services — 5.5% | |
| | 55,985 | | | CVS Health Corp. | | | 3,823,775 | |
| | 30,207 | | | HCA Healthcare, Inc. | | | 4,967,843 | |
| | 11,280 | | | Humana, Inc. | | | 4,627,846 | |
| | | | | | | | |
| | | | | | | 13,419,464 | |
| | | | | | | | |
| | | | Hotels, Restaurants & Leisure — 4.1% | |
| | 46,145 | | | Hilton Worldwide Holdings, Inc. | | | 5,134,093 | |
| | 156,400 | | | MGM Resorts International | | | 4,928,164 | |
| | | | | | | | |
| | | | | | | 10,062,257 | |
| | | | | | | | |
| | | | Industrial Conglomerates — 2.0% | |
| | 457,800 | | | General Electric Co. | | | 4,944,240 | |
| | | | | | | | |
| | | | Insurance — 3.8% | |
| | 130,095 | | | American International Group, Inc. | | | 4,925,397 | |
| | 38,420 | | | Reinsurance Group of America, Inc. | | | 4,452,878 | |
| | | | | | | | |
| | | | | | | 9,378,275 | |
| | | | | | | | |
| | | | Interactive Media & Services — 7.0% | |
| | 5,280 | | | Alphabet, Inc., Class A(a) | | | 9,253,940 | |
| | 28,695 | | | Facebook, Inc., Class A(a) | | | 7,838,326 | |
| | | | | | | | |
| | | | | | | 17,092,266 | |
| | | | | | | | |
| | | | Internet & Direct Marketing Retail — 5.1% | |
| | 2,905 | | | Booking Holdings, Inc.(a) | | | 6,470,219 | |
| | 76,911 | | | eBay, Inc. | | | 3,864,778 | |
| | | | Internet & Direct Marketing Retail — continued | |
| | 183,230 | | | Qurate Retail, Inc., Class A | | | 2,010,033 | |
| | | | | | | | |
| | | | | | | 12,345,030 | |
| | | | | | | | |
| | | | IT Services — 8.2% | |
| | 20,620 | | | Automatic Data Processing, Inc. | | | 3,633,244 | |
| | 164,300 | | | DXC Technology Co. | | | 4,230,725 | |
| | 18,100 | | | Fiserv, Inc.(a) | | | 2,060,866 | |
| | 29,665 | | | Gartner, Inc.(a) | | | 4,752,036 | |
| | 5,545 | | | MasterCard, Inc., Class A | | | 1,979,232 | |
| | 15,805 | | | Visa, Inc., Class A | | | 3,457,028 | |
| | | | | | | | |
| | | | | | | 20,113,131 | |
| | | | | | | | |
| | | | Machinery — 5.1% | |
| | 26,681 | | | Caterpillar, Inc. | | | 4,856,476 | |
| | 15,205 | | | Cummins, Inc. | | | 3,453,055 | |
| | 15,080 | | | Parker-Hannifin Corp. | | | 4,107,943 | |
| | | | | | | | |
| | | | | | | 12,417,474 | |
| | | | | | | | |
| | | | Media — 5.0% | |
| | 7,660 | | | Charter Communications, Inc., Class A(a) | | | 5,067,473 | |
| | 138,100 | | | Comcast Corp., Class A | | | 7,236,440 | |
| | | | | | | | |
| | | | | | | 12,303,913 | |
| | | | | | | | |
| | | | Oil, Gas & Consumable Fuels — 5.1% | |
| | 246,898 | | | Apache Corp. | | | 3,503,483 | |
| | 23,000 | | | Concho Resources, Inc. | | | 1,342,050 | |
| | 45,830 | | | Diamondback Energy, Inc. | | | 2,218,172 | |
| | 109,424 | | | EOG Resources, Inc. | | | 5,456,975 | |
| | | | | | | | |
| | | | | | | 12,520,680 | |
| | | | | | | | |
| | | | Real Estate Management & Development — 0.9% | |
| | 35,700 | | | CBRE Group, Inc., Class A(a) | | | 2,239,104 | |
| | | | | | | | |
| | | | Software — 1.5% | |
| | 15,398 | | | Workday, Inc., Class A(a) | | | 3,689,515 | |
| | | | | | | | |
| | | | Wireless Telecommunication Services — 1.0% | |
| | 17,500 | | | T-Mobile US, Inc.(a) | | | 2,359,875 | |
| | | | | | | | |
| | | | Total Common Stocks
(Identified Cost $180,154,080) | | | 236,887,581 | |
| | | | | | | | |
| | | | | | | | |
Principal
Amount | | | | | | |
| | Short-Term Investments — 3.1% | |
| $ | 7,690,879 | | | Tri-Party Repurchase Agreement with Fixed Income Clearing Corporation, dated 12/31/2020 at 0.000% to be repurchased at $7,690,879 on 1/04/2021 collateralized by $7,541,900 U.S. Treasury Note, 2.125% due 12/31/2022 valued at $7,844,753 including accrued interest (Note 2 of Notes to Financial Statements)
(Identified Cost $7,690,879) | | | 7,690,879 | |
| | | | | | | | |
| | | | | | | | |
| | | | Total Investments — 100.0%
(Identified Cost $187,844,959) | | | 244,578,460 | |
| | | | Other assets less liabilities — 0.0% | | | 23,483 | |
| | | | | | | | |
| | | | Net Assets — 100.0% | | $ | 244,601,943 | |
| | | | | | | | |
| | | | | | | | |
| | (†) | | | See Note 2 of Notes to Financial Statements. | |
| | (a) | | | Non-income producing security. | |
See accompanying notes to financial statements.
65 |
Portfolio of Investments – as of December 31, 2020
Natixis Oakmark Fund – (continued)
Industry Summary at December 31, 2020
| | | | |
Capital Markets | | | 12.0 | % |
Consumer Finance | | | 8.8 | |
IT Services | | | 8.2 | |
Banks | | | 8.0 | |
Interactive Media & Services | | | 7.0 | |
Health Care Providers & Services | | | 5.5 | |
Oil, Gas & Consumable Fuels | | | 5.1 | |
Machinery | | | 5.1 | |
Internet & Direct Marketing Retail | | | 5.1 | |
Media | | | 5.0 | |
Hotels, Restaurants & Leisure | | | 4.1 | |
Beverages | | | 3.9 | |
Insurance | | | 3.8 | |
Automobiles | | | 2.5 | |
Entertainment | | | 2.1 | |
Industrial Conglomerates | | | 2.0 | |
Auto Components | | | 2.0 | |
Other Investments, less than 2% each | | | 6.7 | |
Short-Term Investments | | | 3.1 | |
| | | | |
Total Investments | | | 100.0 | |
Other assets less liabilities | | | 0.0 | * |
| | | | |
Net Assets | | | 100.0 | % |
| | | | |
See accompanying notes to financial statements.
| 66
Portfolio of Investments – as of December 31, 2020
Natixis Oakmark International Fund
| | | | | | | | |
| Shares | | | Description | | Value (†) | |
| | Common Stocks — 97.7% of Net Assets | |
| | | | Australia — 3.4% | |
| | 4,726,650 | | | AMP Ltd. | | $ | 5,680,120 | |
| | 498,900 | | | Brambles Ltd. | | | 4,092,123 | |
| | 631,058 | | | Orica Ltd. | | | 7,380,728 | |
| | | | | | | | |
| | | | | | | 17,152,971 | |
| | | | | | | | |
| | | | Belgium — 1.0% | |
| | 72,500 | | | Anheuser-Busch InBev S.A. | | | 5,058,085 | |
| | | | | | | | |
| | | | Canada — 3.0% | |
| | 1,343,767 | | | Cenovus Energy, Inc. | | | 8,181,471 | |
| | 109,900 | | | Open Text Corp. | | | 4,993,806 | |
| | 31,400 | | | Restaurant Brands International, Inc. | | | 1,918,854 | |
| | | | | | | | |
| | | | | | | 15,094,131 | |
| | | | | | | | |
| | | | China — 1.3% | |
| | 10,000 | | | Alibaba Group Holding Ltd., Sponsored ADR(a) | | | 2,327,300 | |
| | 67,800 | | | Alibaba Group Holding Ltd.(a) | | | 1,971,929 | |
| | 59,500 | | | Trip.com Group Ltd., ADR(a) | | | 2,006,935 | |
| | | | | | | | |
| | | | | | | 6,306,164 | |
| | | | | | | | |
| | | | Finland — 1.0% | |
| | 140,900 | | | UPM-Kymmene OYJ | | | 5,254,393 | |
| | | | | | | | |
| | | | France — 9.8% | |
| | 308,405 | | | Accor S.A.(a) | | | 11,189,176 | |
| | 355,291 | | | BNP Paribas S.A.(a)(b) | | | 18,756,591 | |
| | 73,705 | | | Bureau Veritas S.A.(a) | | | 1,967,535 | |
| | 24,300 | | | EssilorLuxottica S.A. | | | 3,786,776 | |
| | 182,568 | | | Publicis Groupe S.A. | | | 9,073,874 | |
| | 117,412 | | | Valeo S.A. | | | 4,631,228 | |
| | | | | | | | |
| | | | | | | 49,405,180 | |
| | | | | | | | |
| | | | Germany — 20.5% | |
| | 63,010 | | | Allianz SE, (Registered) | | | 15,479,846 | |
| | 313,530 | | | Bayer AG, (Registered) | | | 18,470,414 | |
| | 700 | | | Bayer AG, (Registered) | | | 41,220 | |
| | 185,200 | | | Bayerische Motoren Werke AG | | | 16,345,113 | |
| | 102,359 | | | Continental AG | | | 15,234,621 | |
| | 264,914 | | | Daimler AG, (Registered) | | | 18,776,917 | |
| | 90,500 | | | Fresenius Medical Care AG & Co. KGaA | | | 7,546,556 | |
| | 35,200 | | | Henkel AG & Co. KGaA | | | 3,391,891 | |
| | 813,800 | | | thyssenkrupp AG(a) | | | 8,064,012 | |
| | | | | | | | |
| | | | | | | 103,350,590 | |
| | | | | | | | |
| | | | India — 1.6% | |
| | 960,775 | | | Axis Bank Ltd.(a) | | | 8,178,047 | |
| | | | | | | | |
| | | | Indonesia — 0.6% | |
| | 6,322,400 | | | Bank Mandiri Persero Tbk PT | | | 2,852,976 | |
| | | | | | | | |
| | | | Ireland — 1.2% | |
| | 50,763 | | | Ryanair Holdings PLC, Sponsored ADR(a) | | | 5,582,915 | |
| | 24,200 | | | Ryanair Holdings PLC(a) | | | 480,585 | |
| | | | | | | | |
| | | | | | | 6,063,500 | |
| | | | | | | | |
| | | | Italy — 4.1% | |
| | 8,771,000 | | | Intesa Sanpaolo SpA(a) | | | 20,732,162 | |
| | | | | | | | |
| | | | Japan — 2.4% | |
| | 208,800 | | | Komatsu Ltd. | | | 5,762,518 | |
| | 81,500 | | | Toyota Motor Corp. | | | 6,289,361 | |
| | | | | | | | |
| | | | | | | 12,051,879 | |
| | | | | | | | |
| | | | Korea — 1.6% | |
| | 20,550 | | | NAVER Corp.(a) | | | 5,539,644 | |
| | 31,800 | | | Samsung Electronics Co. Ltd. | | | 2,374,680 | |
| | | | | | | | |
| | | | | | | 7,914,324 | |
| | | | | | | | |
| | | | Mexico — 1.0% | |
| | 621,800 | | | Grupo Televisa SAB, Sponsored ADR(a) | | | 5,123,632 | |
| | | | | | | | |
| | | | Netherlands — 2.2% | |
| | 136,244 | | | EXOR NV | | | 11,066,703 | |
| | | | | | | | |
| | | | South Africa — 2.5% | |
| | 62,035 | | | Naspers Ltd., N Shares | | | 12,703,192 | |
| | | | | | | | |
| | | | Spain — 1.0% | |
| | 68,130 | | | Amadeus IT Group S.A. | | | 5,029,169 | |
| | | | | | | | |
| | | | Sweden — 4.0% | |
| | 358,555 | | | Hennes & Mauritz AB, B Shares(a) | | | 7,526,810 | |
| | 241,000 | | | SKF AB, B Shares | | | 6,270,641 | |
| | 273,000 | | | Volvo AB, B Shares(a) | | | 6,462,753 | |
| | | | | | | | |
| | | | | | | 20,260,204 | |
| | | | | | | | |
| | | | Switzerland — 14.2% | |
| | 57,900 | | | Cie Financiere Richemont S.A., (Registered) | | | 5,230,800 | |
| | 1,590,634 | | | Credit Suisse Group AG, (Registered)(b) | | | 20,536,468 | |
| | 7,721,280 | | | Glencore PLC(a)(b) | | | 24,521,192 | |
| | 103,521 | | | LafargeHolcim Ltd., (Registered) | | | 5,682,036 | |
| | 66,300 | | | Novartis AG, (Registered) | | | 6,242,668 | |
| | 11,100 | | | Roche Holding AG | | | 3,866,113 | |
| | 19,555 | | | Swatch Group AG (The) | | | 5,315,892 | |
| | | | | | | | |
| | | | | | | 71,395,169 | |
| | | | | | | | |
| | | | United Kingdom — 21.3% | |
| | 110,967 | | | Ashtead Group PLC | | | 5,226,656 | |
| | 49,481 | | | Bunzl PLC | | | 1,652,067 | |
| | 1,434,200 | | | CNH Industrial NV(a) | | | 18,028,483 | |
| | 260,700 | | | Compass Group PLC | | | 4,862,408 | |
| | 1,323,000 | | | G4S PLC(a) | | | 4,595,473 | |
| | 411,132 | | | Liberty Global PLC, Class A(a) | | | 9,957,617 | |
| | 44,094,900 | | | Lloyds Banking Group PLC(a) | | | 21,983,864 | |
| | 3,699,300 | | | NatWest Group PLC(a) | | | 8,456,541 | |
| | 564,100 | | | Prudential PLC | | | 10,372,650 | |
| | 3,169,300 | | | Rolls-Royce Holdings PLC(a) | | | 4,796,499 | |
| | 163,289 | | | Schroders PLC | | | 7,445,324 | |
| | 100 | | | Schroders PLC, (Non Voting) | | | 3,124 | |
| | 143,100 | | | Smiths Group PLC | | | 2,943,425 | |
| | 648,900 | | | WPP PLC | | | 7,031,473 | |
| | | | | | | | |
| | | | | | | 107,355,604 | |
| | | | | | | | |
| | | | Total Common Stocks
(Identified Cost $459,600,389) | | | 492,348,075 | |
| | | | | | | | |
| | | | Warrants — 0.0% | | | | |
| | 156,400 | | | Cie Financiere Richemont S.A., Expiration on 11/22/2023(a)
(Identified Cost $0) | | | 40,632 | |
| | | | | | | | |
| | | | | | | | |
Principal
Amount | | | | | | |
| | Short-Term Investments — 1.9% | |
| | $9,793,804 | | | Tri-Party Repurchase Agreement with Fixed Income Clearing Corporation, dated 12/31/2020 at 0.000% to be repurchased at $9,793,804 on 1/04/2021 collateralized by $8,525,300 U.S. Treasury Inflation Indexed Note, 0.125% due 1/15/2023 valued at $9,989,719 including accrued interest (Note 2 of Notes to Financial Statements)
(Identified Cost $9,793,804) | | | 9,793,804 | |
| | | | | | | | |
| | | | | | | | |
| | | | Total Investments — 99.6%
(Identified Cost $469,394,193) | | | 502,182,511 | |
| | | | Other assets less liabilities — 0.4% | | | 1,976,843 | |
| | | | | | | | |
| | | | Net Assets — 100.0% | | $ | 504,159,354 | |
| | | | | | | | |
| | | | | | | | |
See accompanying notes to financial statements.
67 |
Portfolio of Investments – as of December 31, 2020
Natixis Oakmark International Fund – (continued)
| | | | | | | | |
| | | | | | | | |
| | (†) | | | See Note 2 of Notes to Financial Statements. | |
| | (a) | | | Non-income producing security. | |
| | (b) | | | Security (or a portion thereof) has been designated to cover the Fund’s obligations under open derivative contracts. | |
| | | | | |
| | ADR | | | An American Depositary Receipt is a certificate issued by a custodian bank representing the right to receive securities of the foreign issuer described. The values of ADRs may be significantly influenced by trading on exchanges not located in the United States. | |
| | CHF | | | Swiss Franc | |
At December 31, 2020, the Fund had the following open forward foreign currency contracts:
| | | | | | | | | | | | | | | | | | | | | | | | |
| Counterparty | | Delivery
Date | | | Currency
Bought/
Sold (B/S) | | | Units of
Currency | | | In Exchange
for | | | Notional
Value | | | Unrealized
Appreciation
(Depreciation) | |
State Street Bank and Trust Company | | | 6/16/2021 | | | | CHF | | | $ | 5,897,000 | | | $ | 6,683,576 | | | $ | 6,692,695 | | | $ | (9,119 | ) |
| | | | | | | | | | | | | | | | | | | | | | | | |
Industry Summary at December 31, 2020
| | | | |
Banks | | | 16.1 | % |
Automobiles | | | 8.2 | |
Machinery | | | 7.2 | |
Metals & Mining | | | 6.5 | |
Pharmaceuticals | | | 5.7 | |
Capital Markets | | | 5.6 | |
Insurance | | | 5.1 | |
Media | | | 4.2 | |
Auto Components | | | 3.9 | |
Internet & Direct Marketing Retail | | | 3.8 | |
Hotels, Restaurants & Leisure | | | 3.6 | |
Diversified Financial Services | | | 3.3 | |
Textiles, Apparel & Luxury Goods | | | 2.9 | |
Diversified Telecommunication Services | | | 2.0 | |
Other Investments, less than 2% each | | | 19.6 | |
Short-Term Investments | | | 1.9 | |
| | | | |
Total Investments | | | 99.6 | |
Other assets less liabilities (including forward foreign currency contracts) | | | 0.4 | |
| | | | |
Net Assets | | | 100.0 | % |
| | | | |
Currency Exposure Summary at December 31, 2020
| | | | |
Euro | | | 43.3 | % |
British Pound | | | 20.6 | |
Swiss Franc | | | 9.3 | |
United States Dollar | | | 7.3 | |
Swedish Krona | | | 4.0 | |
Australian Dollar | | | 3.4 | |
Canadian Dollar | | | 2.6 | |
South African Rand | | | 2.5 | |
Japanese Yen | | | 2.4 | |
Other, less than 2% each | | | 4.2 | |
| | | | |
Total Investments | | | 99.6 | |
Other assets less liabilities (including forward foreign currency contracts) | | | 0.4 | |
| | | | |
Net Assets | | | 100.0 | % |
| | | | |
See accompanying notes to financial statements.
| 68
Portfolio of Investments – as of December 31, 2020
Natixis U.S. Equity Opportunities Fund
| | | | | | | | |
Shares | | | Description | | Value (†) | |
| | Common Stocks — 96.1% of Net Assets | |
| | | | Aerospace & Defense — 2.2% | |
| | 99,842 | | | Boeing Co. (The) | | $ | 21,372,178 | |
| | | | | | | | |
| | | | Air Freight & Logistics — 1.5% | |
| | 151,905 | | | Expeditors International of Washington, Inc. | | | 14,447,685 | |
| | | | | | | | |
| | | | Automobiles — 1.5% | |
| | 340,600 | | | General Motors Co. | | | 14,182,584 | |
| | | | | | | | |
| | | | Banks — 5.3% | |
| | 692,160 | | | Bank of America Corp. | | | 20,979,370 | |
| | 340,605 | | | Citigroup, Inc. | | | 21,001,704 | |
| | 290,900 | | | Wells Fargo & Co. | | | 8,779,362 | |
| | | | | | | | |
| | | | | | | 50,760,436 | |
| | | | | | | | |
| | | | Beverages — 3.9% | |
| | 66,391 | | | Constellation Brands, Inc., Class A | | | 14,542,949 | |
| | 243,450 | | | Monster Beverage Corp.(a) | | | 22,514,256 | |
| | | | | | | | |
| | | | | | | 37,057,205 | |
| | | | | | | | |
| | | | Biotechnology — 1.9% | |
| | 60,644 | | | BioMarin Pharmaceutical, Inc.(a) | | | 5,317,872 | |
| | 27,615 | | | Regeneron Pharmaceuticals, Inc.(a) | | | 13,341,083 | |
| | | | | | | | |
| | | | | | | 18,658,955 | |
| | | | | | | | |
| | | | Capital Markets — 7.2% | |
| | 372,045 | | | Charles Schwab Corp. (The) | | | 19,733,267 | |
| | 21,187 | | | FactSet Research Systems, Inc. | | | 7,044,677 | |
| | 40,200 | | | Moody’s Corp. | | | 11,667,648 | |
| | 17,926 | | | MSCI, Inc. | | | 8,004,497 | |
| | 131,634 | | | SEI Investments Co. | | | 7,565,006 | |
| | 204,600 | | | State Street Corp. | | | 14,890,788 | |
| | | | | | | | |
| | | | | | | 68,905,883 | |
| | | | | | | | |
| | | | Communications Equipment — 0.7% | |
| | 151,996 | | | Cisco Systems, Inc. | | | 6,801,821 | |
| | | | | | | | |
| | | | Consumer Finance — 3.3% | |
| | 87,100 | | | American Express Co. | | | 10,531,261 | |
| | 213,285 | | | Capital One Financial Corp. | | | 21,083,222 | |
| | | | | | | | |
| | | | | | | 31,614,483 | |
| | | | | | | | |
| | | | Electronic Equipment, Instruments & Components — 1.1% | |
| | 89,400 | | | TE Connectivity Ltd. | | | 10,823,658 | |
| | | | | | | | |
| | | | Energy Equipment & Services — 0.7% | |
| | 293,394 | | | Schlumberger NV | | | 6,404,791 | |
| | | | | | | | |
| | | | Entertainment — 3.9% | |
| | 31,815 | | | Netflix, Inc.(a) | | | 17,203,325 | |
| | 108,635 | | | Walt Disney Co. (The)(a) | | | 19,682,489 | |
| | | | | | | | |
| | | | | | | 36,885,814 | |
| | | | | | | | |
| | | | Health Care Equipment & Supplies — 0.6% | |
| | 6,746 | | | Intuitive Surgical, Inc.(a) | | | 5,518,903 | |
| | | | | | | | |
| | | | Health Care Providers & Services — 3.4% | |
| | 144,100 | | | CVS Health Corp. | | | 9,842,030 | |
| | 73,100 | | | HCA Healthcare, Inc. | | | 12,022,026 | |
| | 26,020 | | | Humana, Inc. | | | 10,675,225 | |
| | | | | | | | |
| | | | | | | 32,539,281 | |
| | | | | | | | |
| | | | Health Care Technology — 0.9% | |
| | 110,817 | | | Cerner Corp. | | | 8,696,918 | |
| | | | | | | | |
| | | | Hotels, Restaurants & Leisure — 5.3% | |
| | 105,400 | | | Hilton Worldwide Holdings, Inc. | | | 11,726,804 | |
| | 422,500 | | | MGM Resorts International | | | 13,312,975 | |
| | 122,932 | | | Starbucks Corp. | | | 13,151,265 | |
| | 128,947 | | | Yum China Holdings, Inc. | | | 7,361,584 | |
| | 46,462 | | | Yum! Brands, Inc. | | | 5,043,915 | |
| | | | | | | | |
| | | | | | | 50,596,543 | |
| | | | | | | | |
| | | | Household Products — 0.6% | |
| | 63,885 | | | Colgate-Palmolive Co. | | | 5,462,806 | |
| | | | | | | | |
| | | | Industrial Conglomerates — 1.4% | |
| | 1,236,750 | | | General Electric Co. | | | 13,356,900 | |
| | | | | | | | |
| | | | Insurance — 2.7% | |
| | 403,355 | | | American International Group, Inc. | | | 15,271,020 | |
| | 92,600 | | | Reinsurance Group of America, Inc. | | | 10,732,340 | |
| | | | | | | | |
| | | | | | | 26,003,360 | |
| | | | | | | | |
| | | | Interactive Media & Services — 9.4% | |
| | 19,253 | | | Alphabet, Inc., Class A(a) | | | 33,743,578 | |
| | 6,567 | | | Alphabet, Inc., Class C(a) | | | 11,504,596 | |
| | 163,917 | | | Facebook, Inc., Class A(a) | | | 44,775,568 | |
| | | | | | | | |
| | | | | | | 90,023,742 | |
| | | | | | | | |
| | | | Internet & Direct Marketing Retail — 8.3% | |
| | 101,011 | | | Alibaba Group Holding Ltd., Sponsored ADR(a) | | | 23,508,290 | |
| | 11,109 | | | Amazon.com, Inc.(a) | | | 36,181,235 | |
| | 8,665 | | | Booking Holdings, Inc.(a) | | | 19,299,295 | |
| | | | | | | | |
| | | | | | | 78,988,820 | |
| | | | | | | | |
| | | | IT Services — 3.6% | |
| | 19,373 | | | Automatic Data Processing, Inc. | | | 3,413,523 | |
| | 384,300 | | | DXC Technology Co. | | | 9,895,725 | |
| | 96,644 | | | Visa, Inc., Class A | | | 21,138,942 | |
| | | | | | | | |
| | | | | | | 34,448,190 | |
| | | | | | | | |
| | | | Life Sciences Tools & Services — 1.2% | |
| | 32,203 | | | Illumina, Inc.(a) | | | 11,915,110 | |
| | | | | | | | |
| | | | Machinery — 3.1% | |
| | 66,300 | | | Caterpillar, Inc. | | | 12,067,926 | |
| | 65,098 | | | Deere & Co. | | | 17,514,617 | |
| | | | | | | | |
| | | | | | | 29,582,543 | |
| | | | | | | | |
| | | | Media — 3.1% | |
| | 18,555 | | | Charter Communications, Inc., Class A(a) | | | 12,275,060 | |
| | 326,080 | | | Comcast Corp., Class A | | | 17,086,592 | |
| | | | | | | | |
| | | | | | | 29,361,652 | |
| | | | | | | | |
| | | | Oil, Gas & Consumable Fuels — 2.3% | |
| | 690,541 | | | Apache Corp. | | | 9,798,777 | |
| | 238,738 | | | EOG Resources, Inc. | | | 11,905,864 | |
| | | | | | | | |
| | | | | | | 21,704,641 | |
| | | | | | | | |
| | | | Pharmaceuticals — 3.3% | |
| | 164,016 | | | Novartis AG, Sponsored ADR | | | 15,488,031 | |
| | 55,025 | | | Novo Nordisk A/S, Sponsored ADR | | | 3,843,496 | |
| | 281,938 | | | Roche Holding AG, Sponsored ADR | | | 12,360,162 | |
| | | | | | | | |
| | | | | | | 31,691,689 | |
| | | | | | | | |
| | | | Semiconductors & Semiconductor Equipment — 3.8% | |
| | 46,405 | | | NVIDIA Corp. | | | 24,232,691 | |
| | 82,377 | | | QUALCOMM, Inc. | | | 12,549,312 | |
| | | | | | | | |
| | | | | | | 36,782,003 | |
| | | | | | | | |
| | | | Software — 9.0% | |
| | 88,795 | | | Autodesk, Inc.(a) | | | 27,112,665 | |
| | 56,702 | | | Microsoft Corp. | | | 12,611,659 | |
| | 282,089 | | | Oracle Corp. | | | 18,248,337 | |
| | 61,671 | | | salesforce.com, Inc.(a) | | | 13,723,648 | |
| | 59,760 | | | Workday, Inc., Class A(a) | | | 14,319,094 | |
| | | | | | | | |
| | | | | | | 86,015,403 | |
| | | | | | | | |
| | | | Textiles, Apparel & Luxury Goods — 0.9% | |
| | 481,830 | | | Under Armour, Inc., Class A(a) | | | 8,273,021 | |
| | | | | | | | |
| | | | Total Common Stocks
(Identified Cost $606,907,349) | | | 918,877,018 | |
| | | | | | | | |
See accompanying notes to financial statements.
69 |
Portfolio of Investments – as of December 31, 2020
Natixis U.S. Equity Opportunities Fund – (continued)
| | | | | | | | |
Principal
Amount | | | Description | | Value (†) | |
| | Short-Term Investments — 3.7% | |
| $ | 35,645,829 | | | Tri-Party Repurchase Agreement with Fixed Income Clearing Corporation, dated 12/31/2020 at 0.000% to be repurchased at $35,645,829 on 1/04/2021 collateralized by $32,708,800 U.S. Treasury Note, 2.125% due 12/31/2022 valued at $34,022,255; $2,258,300 U.S. Treasury Note, 1.500% due 2/28/2023 valued at $2,336,582 including accrued interest (Note 2 of Notes to Financial Statements)
(Identified Cost $35,645,829) | | $ | 35,645,829 | |
| | | | | | | | |
| | | | | | | | |
| | | | Total Investments — 99.8%
(Identified Cost $642,553,178) | | | 954,522,847 | |
| | | | Other assets less liabilities — 0.2% | | | 1,831,299 | |
| | | | | | | | |
| | | | Net Assets — 100.0% | | $ | 956,354,146 | |
| | | | | | | | |
| | | | | | | | |
| | (†) | | | See Note 2 of Notes to Financial Statements. | |
| | (a) | | | Non-income producing security. | |
| | | | | �� | | | |
| | ADR | | | An American Depositary Receipt is a certificate issued by a custodian bank representing the right to receive securities of the foreign issuer described. The values of ADRs may be significantly influenced by trading on exchanges not located in the United States. | |
Industry Summary at December 31, 2020
| | | | |
Interactive Media & Services | | | 9.4 | % |
Software | | | 9.0 | |
Internet & Direct Marketing Retail | | | 8.3 | |
Capital Markets | | | 7.2 | |
Banks | | | 5.3 | |
Hotels, Restaurants & Leisure | | | 5.3 | |
Beverages | | | 3.9 | |
Entertainment | | | 3.9 | |
Semiconductors & Semiconductor Equipment | | | 3.8 | |
IT Services | | | 3.6 | |
Health Care Providers & Services | | | 3.4 | |
Pharmaceuticals | | | 3.3 | |
Consumer Finance | | | 3.3 | |
Machinery | | | 3.1 | |
Media | | | 3.1 | |
Insurance | | | 2.7 | |
Oil, Gas & Consumable Fuels | | | 2.3 | |
Aerospace & Defense | | | 2.2 | |
Other Investments, less than 2% each | | | 13.0 | |
Short-Term Investments | | | 3.7 | |
| | | | |
Total Investments | | | 99.8 | |
Other assets less liabilities | | | 0.2 | |
| | | | |
Net Assets | | | 100.0 | % |
| | | | |
See accompanying notes to financial statements.
| 70
Portfolio of Investments – as of December 31, 2020
Vaughan Nelson Mid Cap Fund
| | | | | | | | |
| Shares | | | Description | | Value (†) | |
| | Common Stocks — 99.3% of Net Assets | |
| | | | Banks — 4.0% | |
| | 111,350 | | | Bank of N.T. Butterfield & Son Ltd. (The) | | $ | 3,469,666 | |
| | 82,975 | | | PacWest Bancorp | | | 2,107,565 | |
| | 164,225 | | | TCF Financial Corp. | | | 6,079,609 | |
| | | | | | | | |
| | | | | | | 11,656,840 | |
| | | | | | | | |
| | | | Beverages — 2.1% | |
| | 27,205 | | | Constellation Brands, Inc., Class A | | | 5,959,255 | |
| | | | | | | | |
| | | | Building Products — 0.9% | |
| | 21,275 | | | Allegion PLC | | | 2,475,985 | |
| | | | | | | | |
| | | | Capital Markets — 5.8% | |
| | 57,825 | | | Ares Management Corp., Class A | | | 2,720,666 | |
| | 257,100 | | | Brightsphere Investment Group, Inc. | | | 4,956,888 | |
| | 22,350 | | | Nasdaq, Inc. | | | 2,966,739 | |
| | 65,350 | | | Raymond James Financial, Inc. | | | 6,252,035 | |
| | | | | | | | |
| | | | | | | 16,896,328 | |
| | | | | | | | |
| | | | Chemicals — 5.5% | |
| | 165,725 | | | Axalta Coating Systems Ltd.(a) | | | 4,731,449 | |
| | 47,925 | | | FMC Corp. | | | 5,508,020 | |
| | 62,125 | | | LyondellBasell Industries NV, Class A | | | 5,694,377 | |
| | | | | | | | |
| | | | | | | 15,933,846 | |
| | | | | | | | |
| | | | Commercial Services & Supplies — 1.9% | |
| | 86,850 | | | IAA, Inc.(a) | | | 5,643,513 | |
| | | | | | | | |
| | | | Communications Equipment — 2.8% | |
| | 47,500 | | | Motorola Solutions, Inc. | | | 8,077,850 | |
| | | | | | | | |
| | | | Construction & Engineering — 2.9% | |
| | 357,275 | | | WillScot Mobile Mini Holdings Corp.(a) | | | 8,278,062 | |
| | | | | | | | |
| | | | Consumer Finance — 0.7% | |
| | 60,625 | | | Synchrony Financial | | | 2,104,294 | |
| | | | | | | | |
| | | | Containers & Packaging — 2.9% | |
| | 17,625 | | | Avery Dennison Corp. | | | 2,733,814 | |
| | 56,975 | | | Crown Holdings, Inc.(a) | | | 5,708,895 | |
| | | | | | | | |
| | | | | | | 8,442,709 | |
| | | | | | | | |
| | | | Diversified Consumer Services — 3.2% | |
| | 27,525 | | | Grand Canyon Education, Inc.(a) | | | 2,562,853 | |
| | 166,375 | | | Laureate Education, Inc., Class A(a) | | | 2,422,420 | |
| | 84,700 | | | Terminix Global Holdings, Inc.(a) | | | 4,320,547 | |
| | | | | | | | |
| | | | | | | 9,305,820 | |
| | | | | | | | |
| | | | Electric Utilities — 2.2% | |
| | 45,575 | | | Alliant Energy Corp. | | | 2,348,480 | |
| | 70,300 | | | Evergy, Inc. | | | 3,902,353 | |
| | | | | | | | |
| | | | | | | 6,250,833 | |
| | | | | | | | |
| | | | Electrical Equipment — 6.8% | |
| | 52,025 | | | AMETEK, Inc. | | | 6,291,903 | |
| | 40,200 | | | Hubbell, Inc. | | | 6,302,958 | |
| | 304,175 | | | nVent Electric PLC | | | 7,084,236 | |
| | | | | | | | |
| | | | | | | 19,679,097 | |
| | | | | | | | |
| | | | Electronic Equipment, Instruments & Components — 2.1% | |
| | 13,125 | | | CDW Corp. | | | 1,729,744 | |
| | 33,975 | | | Keysight Technologies, Inc.(a) | | | 4,487,757 | |
| | | | | | | | |
| | | | | | | 6,217,501 | |
| | | | | | | | |
| | | | Food & Staples Retailing — 2.0% | |
| | 118,875 | | | Performance Food Group Co.(a) | | | 5,659,639 | |
| | | | | | | | |
| | | | Health Care Equipment & Supplies — 2.0% | |
| | 10,785 | | | Cooper Cos., Inc. (The) | | | 3,918,406 | |
| | 26,000 | | | Hologic, Inc.(a) | | | 1,893,580 | |
| | | | | | | | |
| | | | | | | 5,811,986 | |
| | | | | | | | |
| | | | Health Care Providers & Services — 0.7% | |
| | 34,400 | | | Centene Corp.(a) | | | 2,065,032 | |
| | | | | | | | |
| | | | Hotels, Restaurants & Leisure — 1.2% | |
| | 86,850 | | | Aramark | | | 3,341,988 | |
| | | | | | | | |
| | | | Independent Power & Renewable Electricity Producers — 2.5% | |
| | 365,000 | | | Vistra Corp. | | | 7,175,900 | |
| | | | | | | | |
| | | | Insurance — 7.4% | |
| | 32,900 | | | Allstate Corp. (The) | | | 3,616,697 | |
| | 21,500 | | | Arthur J. Gallagher & Co. | | | 2,659,765 | |
| | 144,250 | | | Athene Holding Ltd., Class A(a) | | | 6,222,945 | |
| | 86,850 | | | First American Financial Corp. | | | 4,484,065 | |
| | 39,350 | | | Reinsurance Group of America, Inc. | | | 4,560,665 | |
| | | | | | | | |
| | | | | | | 21,544,137 | |
| | | | | | | | |
| | | | IT Services — 4.8% | |
| | 13,975 | | | Booz Allen Hamilton Holding Corp. | | | 1,218,341 | |
| | 24,165 | | | CACI International, Inc., Class A(a) | | | 6,025,059 | |
| | 17,745 | | | Global Payments, Inc. | | | 3,822,628 | |
| | 39,350 | | | MAXIMUS, Inc. | | | 2,880,026 | |
| | | | | | | | |
| | | | | | | 13,946,054 | |
| | | | | | | | |
| | | | Life Sciences Tools & Services — 5.6% | |
| | 18,050 | | | Agilent Technologies, Inc. | | | 2,138,745 | |
| | 317,925 | | | Avantor, Inc.(a) | | | 8,949,589 | |
| | 28,437 | | | IQVIA Holdings, Inc.(a) | | | 5,095,057 | |
| | | | | | | | |
| | | | | | | 16,183,391 | |
| | | | | | | | |
| | | | Machinery — 10.5% | |
| | 104,675 | | | Crane Co. | | | 8,129,060 | |
| | 70,950 | | | Oshkosh Corp. | | | 6,106,667 | |
| | 109,200 | | | Otis Worldwide Corp. | | | 7,376,460 | |
| | 114,800 | | | Timken Co. (The) | | | 8,880,928 | |
| | | | | | | | |
| | | | | | | 30,493,115 | |
| | | | | | | | |
| | | | Media — 3.0% | |
| | 79,325 | | | Nexstar Media Group, Inc., Class A | | | 8,661,497 | |
| | | | | | | | |
| | | | Metals & Mining — 1.9% | |
| | 399,625 | | | Constellium SE(a) | | | 5,590,754 | |
| | | | | | | | |
| | | | Multi-Utilities — 1.1% | |
| | 25,150 | | | Ameren Corp. | | | 1,963,209 | |
| | 20,625 | | | CMS Energy Corp. | | | 1,258,331 | |
| | | | | | | | |
| | | | | | | 3,221,540 | |
| | | | | | | | |
| | | | Multiline Retail — 0.6% | |
| | 8,825 | | | Dollar General Corp. | | | 1,855,898 | |
| | | | | | | | |
| | | | Oil, Gas & Consumable Fuels — 3.4% | |
| | 47,925 | | | Pioneer Natural Resources Co. | | | 5,458,178 | |
| | 556,550 | | | WPX Energy, Inc.(a) | | | 4,535,883 | |
| | | | | | | | |
| | | | | | | 9,994,061 | |
| | | | | | | | |
| | | | REITs – Diversified — 0.7% | |
| | 209,150 | | | New Residential Investment Corp. | | | 2,078,951 | |
| | | | | | | | |
| | | | REITs – Warehouse/Industrials — 1.2% | |
| | 47,300 | | | CyrusOne, Inc. | | | 3,459,995 | |
| | | | | | | | |
| | | | Semiconductors & Semiconductor Equipment — 3.1% | |
| | 18,475 | | | Analog Devices, Inc. | | | 2,729,312 | |
| | 16,975 | | | CMC Materials, Inc. | | | 2,568,317 | |
| | 37,400 | | | Entegris, Inc. | | | 3,594,140 | |
| | | | | | | | |
| | | | | | | 8,891,769 | |
| | | | | | | | |
| | | | Software — 1.7% | |
| | 9,450 | | | Check Point Software Technologies Ltd.(a) | | | 1,256,000 | |
| | 5,020 | | | RingCentral, Inc., Class A(a) | | | 1,902,429 | |
| | 117,375 | | | SolarWinds Corp.(a) | | | 1,754,756 | |
| | | | | | | | |
| | | | | | | 4,913,185 | |
| | | | | | | | |
See accompanying notes to financial statements.
71 |
Portfolio of Investments – as of December 31, 2020
Vaughan Nelson Mid Cap Fund – (continued)
| | | | | | | | |
| Shares | | | Description | | Value (†) | |
| | | | Specialty Retail — 1.7% | |
| | 180,150 | | | Leslie’s, Inc.(a) | | $ | 4,999,162 | |
| | | | | | | | |
| | | | Thrifts & Mortgage Finance — 0.4% | |
| | 29,875 | | | Essent Group Ltd. | | | 1,290,600 | |
| | | | | | | | |
| | | | Total Common Stocks
(Identified Cost $237,205,306) | | | 288,100,587 | |
| | | | | | | | |
| | | | | | | | |
Principal
Amount | | | Description | | Value (†) | |
| | Short-Term Investments — 0.8% | |
| $ | 2,314,371 | | | Tri-Party Repurchase Agreement with Fixed Income Clearing Corporation, dated 12/31/2020 at 0.000% to be repurchased at $2,314,371 on 1/04/2021 collateralized by $2,361,000 U.S. Treasury Note, 0.125% due 8/15/2023 valued at $2,360,723 including accrued interest (Note 2 of Notes to Financial Statements)
(Identified Cost $2,314,371) | | | 2,314,371 | |
| | | | | | | | |
| | | | | | | | |
| | | | Total Investments — 100.1%
(Identified Cost $239,519,677) | | | 290,414,958 | |
| | | | Other assets less liabilities — (0.1)% | | | (359,636 | ) |
| | | | | | | | |
| | | | Net Assets — 100.0% | | $ | 290,055,322 | |
| | | | | | | | |
| | | | | | | | |
| | (†) | | | See Note 2 of Notes to Financial Statements. | |
| | (a) | | | Non-income producing security. | |
| | | | | | | | |
| | REITs | | | Real Estate Investment Trusts | |
Industry Summary at December 31, 2020
| | | | |
Machinery | | | 10.5 | % |
Insurance | | | 7.4 | |
Electrical Equipment | | | 6.8 | |
Capital Markets | | | 5.8 | |
Life Sciences Tools & Services | | | 5.6 | |
Chemicals | | | 5.5 | |
IT Services | | | 4.8 | |
Banks | | | 4.0 | |
Oil, Gas & Consumable Fuels | | | 3.4 | |
Diversified Consumer Services | | | 3.2 | |
Semiconductors & Semiconductor Equipment | | | 3.1 | |
Media | | | 3.0 | |
Containers & Packaging | | | 2.9 | |
Construction & Engineering | | | 2.9 | |
Communications Equipment | | | 2.8 | |
Independent Power & Renewable Electricity Producers | | | 2.5 | |
Electric Utilities | | | 2.2 | |
Electronic Equipment, Instruments & Components | | | 2.1 | |
Beverages | | | 2.1 | |
Health Care Equipment & Supplies | | | 2.0 | |
Food & Staples Retailing | | | 2.0 | |
Other Investments, less than 2% each | | | 14.7 | |
Short-Term Investments | | | 0.8 | |
| | | | |
Total Investments | | | 100.1 | |
Other assets less liabilities | | | (0.1 | ) |
| | | | |
Net Assets | | | 100.0 | % |
| | | | |
See accompanying notes to financial statements.
| 72
Portfolio of Investments – as of December 31, 2020
Vaughan Nelson Small Cap Value Fund
| | | | | | | | |
| Shares | | | Description | | Value (†) | |
| | Common Stocks — 98.1% of Net Assets | |
| | | | Biotechnology — 3.0% | |
| | 63,275 | | | Coherus BioSciences, Inc.(a) | | $ | 1,099,719 | |
| | 25,438 | | | Emergent BioSolutions, Inc.(a) | | | 2,279,245 | |
| | | | | | | | |
| | | | | | | 3,378,964 | |
| | | | | | | | |
| | | | Building Products — 3.9% | |
| | 80,275 | | | Builders FirstSource, Inc.(a) | | | 3,276,022 | |
| | 11,975 | | | Simpson Manufacturing Co., Inc. | | | 1,119,064 | |
| | | | | | | | |
| | | | | | | 4,395,086 | |
| | | | | | | | |
| | | | Capital Markets — 4.8% | |
| | 41,000 | | | LPL Financial Holdings, Inc. | | | 4,273,020 | |
| | 23,725 | | | Moelis & Co., Class A | | | 1,109,381 | |
| | | | | | | | |
| | | | | | | 5,382,401 | |
| | | | | | | | |
| | | | Chemicals — 6.1% | |
| | 119,300 | | | Axalta Coating Systems Ltd.(a) | | | 3,406,015 | |
| | 190,175 | | | Element Solutions, Inc. | | | 3,371,803 | |
| | | | | | | | |
| | | | | | | 6,777,818 | |
| | | | | | | | |
| | | | Commercial Services & Supplies — 4.8% | |
| | 32,000 | | | Brady Corp., Class A | | | 1,690,240 | |
| | 25,250 | | | Ritchie Bros. Auctioneers, Inc. | | | 1,756,138 | |
| | 9,050 | | | UniFirst Corp. | | | 1,915,794 | |
| | | | | | | | |
| | | | | | | 5,362,172 | |
| | | | | | | | |
| | | | Electronic Equipment, Instruments & Components — 5.7% | |
| | 30,505 | | | Fabrinet(a) | | | 2,366,883 | |
| | 53,350 | | | Insight Enterprises, Inc.(a) | | | 4,059,401 | |
| | | | | | | | |
| | | | | | | 6,426,284 | |
| | | | | | | | |
| | | | Energy Equipment & Services — 1.0% | |
| | 74,425 | | | ChampionX Corp.(a) | | | 1,138,703 | |
| | | | | | | | |
| | | | Food & Staples Retailing — 1.7% | |
| | 39,950 | | | Performance Food Group Co.(a) | | | 1,902,020 | |
| | | | | | | | |
| | | | Health Care Providers & Services — 0.9% | |
| | 15,575 | | | AMN Healthcare Services, Inc.(a) | | | 1,062,994 | |
| | | | | | | | |
| | | | Hotels, Restaurants & Leisure — 5.0% | |
| | 22,750 | | | Caesars Entertainment, Inc.(a) | | | 1,689,642 | |
| | 136,650 | | | International Game Technology PLC | | | 2,314,851 | |
| | 37,150 | | | Scientific Games Corp., Class A(a) | | | 1,541,354 | |
| | | | | | | | |
| | | | | | | 5,545,847 | |
| | | | | | | | |
| | | | Insurance — 5.8% | |
| | 62,275 | | | First American Financial Corp. | | | 3,215,258 | |
| | 167,425 | | | Old Republic International Corp. | | | 3,299,947 | |
| | | | | | | | |
| | | | | | | 6,515,205 | |
| | | | | | | | |
| | | | IT Services — 4.5% | |
| | 8,205 | | | CACI International, Inc., Class A(a) | | | 2,045,753 | |
| | 56,075 | | | DXC Technology Co. | | | 1,443,931 | |
| | 95,250 | | | Switch, Inc., Class A | | | 1,559,242 | |
| | | | | | | | |
| | | | | | | 5,048,926 | |
| | | | | | | | |
| | | | Life Sciences Tools & Services — 2.8% | |
| | 24,750 | | | PRA Health Sciences, Inc.(a) | | | 3,104,640 | |
| | | | | | | | |
| | | | Machinery — 9.3% | |
| | 11,875 | | | Alamo Group, Inc. | | | 1,638,156 | |
| | 73,975 | | | Federal Signal Corp. | | | 2,453,751 | |
| | 28,050 | | | SPX Corp.(a) | | | 1,529,847 | |
| | 93,500 | | | Trinity Industries, Inc. | | | 2,467,465 | |
| | 172,650 | | | Welbilt, Inc.(a) | | | 2,278,980 | |
| | | | | | | | |
| | | | | | | 10,368,199 | |
| | | | | | | | |
| | | | Media — 3.7% | |
| | 60,725 | | | Sinclair Broadcast Group, Inc., Class A | | | 1,934,091 | |
| | | | Media — continued | |
| | 158,750 | | | TEGNA, Inc. | | | 2,214,563 | |
| | | | | | | | |
| | | | | | | 4,148,654 | |
| | | | | | | | |
| | | | Metals & Mining — 1.6% | |
| | 27,350 | | | Materion Corp. | | | 1,742,742 | |
| | | | | | | | |
| | | | Oil, Gas & Consumable Fuels — 1.7% | |
| | 134,450 | | | Parsley Energy, Inc., Class A | | | 1,909,190 | |
| | | | | | | | |
| | | | Professional Services — 3.1% | |
| | 25,475 | | | ASGN, Inc.(a) | | | 2,127,927 | |
| | 12,525 | | | FTI Consulting, Inc.(a) | | | 1,399,293 | |
| | | | | | | | |
| | | | | | | 3,527,220 | |
| | | | | | | | |
| | | | Real Estate Management & Development — 2.5% | |
| | 109,600 | | | Cushman & Wakefield PLC(a) | | | 1,625,368 | |
| | 32,850 | | | Marcus & Millichap, Inc.(a) | | | 1,223,005 | |
| | | | | | | | |
| | | | | | | 2,848,373 | |
| | | | | | | | |
| | | | REITs – Hotels — 2.1% | |
| | 206,150 | | | Sunstone Hotel Investors, Inc. | | | 2,335,680 | |
| | | | | | | | |
| | | | Road & Rail — 2.3% | |
| | 13,975 | | | Saia, Inc.(a) | | | 2,526,680 | |
| | | | | | | | |
| | | | Semiconductors & Semiconductor Equipment — 10.8% | |
| | 21,450 | | | CMC Materials, Inc. | | | 3,245,385 | |
| | 18,125 | | | MKS Instruments, Inc. | | | 2,726,906 | |
| | 16,525 | | | Nova Measuring Instruments Ltd.(a) | | | 1,166,665 | |
| | 47,875 | | | Onto Innovation, Inc.(a) | | | 2,276,456 | |
| | 101,350 | | | Tower Semiconductor Ltd.(a) | | | 2,616,857 | |
| | | | | | | | |
| | | | | | | 12,032,269 | |
| | | | | | | | |
| | | | Specialty Retail — 1.2% | |
| | 10,250 | | | Group 1 Automotive, Inc. | | | 1,344,185 | |
| | | | | | | | |
| | | | Textiles, Apparel & Luxury Goods — 1.7% | |
| | 44,425 | | | Capri Holdings Ltd.(a) | | | 1,865,850 | |
| | | | | | | | |
| | | | Thrifts & Mortgage Finance — 1.3% | |
| | 116,525 | | | MGIC Investment Corp. | | | 1,462,389 | |
| | | | | | | | |
| | | | Trading Companies & Distributors — 6.8% | |
| | 26,625 | | | GATX Corp. | | | 2,214,667 | |
| | 46,125 | | | Rush Enterprises, Inc., Class A | | | 1,910,498 | |
| | 183,975 | | | Univar Solutions, Inc.(a) | | | 3,497,365 | |
| | | | | | | | |
| | | | | | | 7,622,530 | |
| | | | | | | | |
| | | | Total Common Stocks
(Identified Cost $86,031,867) | | | 109,775,021 | |
| | | | | | | | |
| | | | | | | | |
Principal
Amount | | | | | | |
| | Short-Term Investments — 2.2% | |
| $ | 2,403,822 | | | Tri-Party Repurchase Agreement with Fixed Income Clearing Corporation, dated 12/31/2020 at 0.000% to be repurchased at $2,403,822 on 1/04/2021 collateralized by $2,452,200 U.S.Treasury Note, 0.125% due 8/15/2023 valued at $2,451,912 including accrued interest (Note 2 of Notes to Financial Statements)
(Identified Cost $2,403,822) | | | 2,403,822 | |
| | | | | | | | |
| | | | | | | | |
| | | | Total Investments — 100.3%
(Identified Cost $88,435,689) | | | 112,178,843 | |
| | | | Other assets less liabilities — (0.3)% | | | (285,678 | ) |
| | | | | | | | |
| | | | Net Assets — 100.0% | | $ | 111,893,165 | |
| | | | | | | | |
| | | | | | | | |
| | (†) | | | See Note 2 of Notes to Financial Statements. | | | | |
| | (a) | | | Non-income producing security. | | | | |
| | | | | | | | |
| | REITs | | | Real Estate Investment Trusts | | | | |
See accompanying notes to financial statements.
73 |
Portfolio of Investments – as of December 31, 2020
Vaughan Nelson Small Cap Value Fund – (continued)
Industry Summary at December 31, 2020
| | | | |
Semiconductors & Semiconductor Equipment | | | 10.8 | % |
Machinery | | | 9.3 | |
Trading Companies & Distributors | | | 6.8 | |
Chemicals | | | 6.1 | |
Insurance | | | 5.8 | |
Electronic Equipment, Instruments & Components | | | 5.7 | |
Hotels, Restaurants & Leisure | | | 5.0 | |
Capital Markets | | | 4.8 | |
Commercial Services & Supplies | | | 4.8 | |
IT Services | | | 4.5 | |
Building Products | | | 3.9 | |
Media | | | 3.7 | |
Professional Services | | | 3.1 | |
Biotechnology | | | 3.0 | |
Life Sciences Tools & Services | | | 2.8 | |
Real Estate Management & Development | | | 2.5 | |
Road & Rail | | | 2.3 | |
REITs – Hotels | | | 2.1 | |
Other Investments, less than 2% each | | | 11.1 | |
Short-Term Investments | | | 2.2 | |
| | | | |
Total Investments | | | 100.3 | |
Other assets less liabilities | | | (0.3 | ) |
| | | | |
Net Assets | | | 100.0 | % |
| | | | |
See accompanying notes to financial statements.
| 74
Statements of Assets and Liabilities
December 31, 2020
| | | | | | | | | | | | | | | | |
| | | Gateway
Fund | | |
Gateway Equity
Call Premium
Fund | | | Mirova Global
Green Bond
Fund | | | Mirova Global
Sustainable
Equity Fund | |
ASSETS | |
Investments at cost | | $ | 3,410,077,422 | | | $ | 30,669,721 | | | $ | 33,180,343 | | | $ | 726,825,162 | |
Net unrealized appreciation | | | 3,981,467,274 | | | | 31,604,939 | | | | 3,403,301 | | | | 138,928,912 | |
| | | | | | | | | | | | | | | | |
Investments at value | | | 7,391,544,696 | | | | 62,274,660 | | | | 36,583,644 | | | | 865,754,074 | |
Cash | | | — | | | | — | | | | 4,100 | | | | — | |
Due from brokers (including variation margin on futures contracts) (Note 2) | | | — | | | | — | | | | 1,726,471 | | | | — | |
Foreign currency at value (identified cost $0, $0, $1,110,809 and $13,244,928, respectively) | | | — | | | | — | | | | 1,120,479 | | | | 13,248,783 | |
Receivable for Fund shares sold | | | 13,088,126 | | | | 22,982 | | | | 498,789 | | | | 8,589,355 | |
Receivable for securities sold | | | 20,016,408 | | | | 168,165 | | | | — | | | | — | |
Dividends and interest receivable | | | 5,416,352 | | | | 44,778 | | | | 283,942 | | | | 172,189 | |
Tax reclaims receivable | | | — | | | | — | | | | 4,627 | | | | 196,532 | |
Unrealized appreciation on futures contracts (Note 2) | | | — | | | | — | | | | 19,324 | | | | — | |
Prepaid expenses (Note 9) | | | 476 | | | | 4 | | | | 2 | | | | 12 | |
| | | | | | | | | | | | | | | | |
TOTAL ASSETS | | | 7,430,066,058 | | | | 62,510,589 | | | | 40,241,378 | | | | 887,960,945 | |
| | | | | | | | | | | | | | | | |
LIABILITIES | |
Options written, at value (premiums received $184,084,693, $1,558,471, $0 and $0, respectively) (Note 2) | | | 239,223,060 | | | | 2,025,420 | | | | — | | | | — | |
Payable for securities purchased | | | 51,529,028 | | | | 372,141 | | | | — | | | | 9,276,398 | |
Payable for Fund shares redeemed | | | 9,134,781 | | | | 56,055 | | | | 400 | | | | 243,805 | |
Unrealized depreciation on futures contracts (Note 2) | | | — | | | | — | | | | 628,485 | | | | — | |
Management fees payable (Note 6) | | | 3,443,689 | | | | 19,036 | | | | 5,710 | | | | 538,730 | |
Deferred Trustees’ fees (Note 6) | | | 1,116,489 | | | | 49,646 | | | | 15,636 | | | | 27,129 | |
Administrative fees payable (Note 6) | | | 258,085 | | | | 2,147 | | | | 1,392 | | | | 27,870 | |
Payable to distributor (Note 6d) | | | 48,473 | | | | 224 | | | | 227 | | | | 10,902 | |
Audit and tax services fees payable | | | 46,479 | | | | 45,027 | | | | 37,419 | | | | 37,244 | |
Other accounts payable and accrued expenses | | | 302,691 | | | | 37,347 | | | | 16,312 | | | | 28,216 | |
| | | | | | | | | | | | | | | | |
TOTAL LIABILITIES | | | 305,102,775 | | | | 2,607,043 | | | | 705,581 | | | | 10,190,294 | |
| | | | | | | | | | | | | | | | |
NET ASSETS | | $ | 7,124,963,283 | | | $ | 59,903,546 | | | $ | 39,535,797 | | | $ | 877,770,651 | |
| | | | | | | | | | | | | | | | |
NET ASSETS CONSIST OF: | |
Paid-in capital | | $ | 4,359,137,546 | | | $ | 38,616,237 | | | $ | 37,154,146 | | | $ | 726,110,558 | |
Accumulated earnings | | | 2,765,825,737 | | | | 21,287,309 | | | | 2,381,651 | | | | 151,660,093 | |
| | | | | | | | | | | | | | | | |
NET ASSETS | | $ | 7,124,963,283 | | | $ | 59,903,546 | | | $ | 39,535,797 | | | $ | 877,770,651 | |
| | | | | | | | | | | | | | | | |
COMPUTATION OF NET ASSET VALUE AND OFFERING PRICE: | |
Class A shares: | |
Net assets | | $ | 987,701,660 | | | $ | 1,456,130 | | | $ | 5,673,564 | | | $ | 33,624,853 | |
| | | | | | | | | | | | | | | | |
Shares of beneficial interest | | | 26,872,195 | | | | 103,784 | | | | 526,963 | | | | 1,717,849 | |
| | | | | | | | | | | | | | | | |
Net asset value and redemption price per share | | $ | 36.76 | | | $ | 14.03 | | | $ | 10.77 | | | $ | 19.57 | |
| | | | | | | | | | | | | | | | |
Offering price per share (100/[100-maximum sales charge] of net asset value) (Note 1) | | $ | 39.00 | | | $ | 14.89 | | | $ | 11.25 | | | $ | 20.76 | |
| | | | | | | | | | | | | | | | |
Class C shares: (redemption price per share is equal to net asset value less any applicable contingent deferred sales charge) (Note 1) | | | | | | | | | | | | | | | | |
Net assets | | $ | 142,622,605 | | | $ | 740,570 | | | $ | — | | | $ | 11,196,093 | |
| | | | | | | | | | | | | | | | |
Shares of beneficial interest | | | 3,896,544 | | | | 53,032 | | | | — | | | | 590,914 | |
| | | | | | | | | | | | | | | | |
Net asset value and offering price per share | | $ | 36.60 | | | $ | 13.96 | | | $ | — | | | $ | 18.95 | |
| | | | | | | | | | | | | | | | |
Class N shares: | |
Net assets | | $ | 369,828,593 | | | $ | 727,931 | | | $ | 11,781,066 | | | $ | 72,768,324 | |
| | | | | | | | | | | | | | | | |
Shares of beneficial interest | | | 10,067,407 | | | | 51,952 | | | | 1,091,109 | | | | 3,691,816 | |
| | | | | | | | | | | | | | | | |
Net asset value, offering and redemption price per share | | $ | 36.74 | | | $ | 14.01 | | | $ | 10.80 | | | $ | 19.71 | |
| | | | | | | | | | | | | | | | |
Class Y shares: | |
Net assets | | $ | 5,624,810,425 | | | $ | 56,978,915 | | | $ | 22,081,167 | | | $ | 760,181,381 | |
| | | | | | | | | | | | | | | | |
Shares of beneficial interest | | | 153,139,528 | | | | 4,063,899 | | | | 2,047,318 | | | | 38,566,656 | |
| | | | | | | | | | | | | | | | |
Net asset value, offering and redemption price per share | | $ | 36.73 | | | $ | 14.02 | | | $ | 10.79 | | | $ | 19.71 | |
| | | | | | | | | | | | | | | | |
See accompanying notes to financial statements.
75 |
Statements of Assets and Liabilities (continued)
December 31, 2020
| | | | | | | | | | | | | | | | |
| | | Mirova
International
Sustainable
Equity Fund | | | Mirova U.S.
Sustainable
Equity Fund | | | Natixis
Oakmark Fund | | | Natixis
Oakmark
International
Fund | |
ASSETS | |
Investments at cost | | $ | 11,421,667 | | | $ | 4,863,312 | | | $ | 187,844,959 | | | $ | 469,394,193 | |
Net unrealized appreciation | | | 4,611,623 | | | | 106,643 | | | | 56,733,501 | | | | 32,788,318 | |
| | | | | | | | | | | | | | | | |
Investments at value | | | 16,033,290 | | | | 4,969,955 | | | | 244,578,460 | | | | 502,182,511 | |
Cash | | | — | | | | 139,688 | | | | — | | | | — | |
Foreign currency at value (identified cost $597,223, $0, $0 and $203, respectively) | | | 612,144 | | | | — | | | | — | | | | 205 | |
Receivable for Fund shares sold | | | — | | | | — | | | | 1,425,041 | | | | 510,941 | |
Receivable from investment adviser (Note 6) | | | 5,745 | | | | 33,247 | | | | — | | | | — | |
Receivable for securities sold | | | — | | | | — | | | | 175,236 | | | | 1,042,374 | |
Dividends receivable | | | 15,685 | | | | 787 | | | | 72,098 | | | | 104,845 | |
Tax reclaims receivable | | | 28,090 | | | | — | | | | 68,912 | | | | 2,594,226 | |
Prepaid expenses (Note 9) | | | 1 | | | | — | | | | 15 | | | | 32 | |
| | | | | | | | | | | | | | | | |
TOTAL ASSETS | | | 16,694,955 | | | | 5,143,677 | | | | 246,319,762 | | | | 506,435,134 | |
| | | | | | | | | | | | | | | | |
LIABILITIES | |
Payable for securities purchased | | | — | | | | — | | | | — | | | | 296,222 | |
Payable for Fund shares redeemed | | | 70 | | | | — | | | | 828,285 | | | | 1,055,932 | |
Unrealized depreciation on forward foreign currency contracts (Note 2) | | | — | | | | — | | | | — | | | | 9,119 | |
Foreign taxes payable (Note 2) | | | — | | | | — | | | | — | | | | 343,817 | |
Management fees payable (Note 6) | | | — | | | | — | | | | 141,887 | | | | 281,631 | |
Deferred Trustees’ fees (Note 6) | | | 7,651 | | | | 45 | | | | 653,263 | | | | 121,833 | |
Administrative fees payable (Note 6) | | | 586 | | | | 95 | | | | 8,823 | | | | 18,823 | |
Payable to distributor (Note 6d) | | | 3 | | | | — | | | | 1,183 | | | | 12,190 | |
Audit and tax services fees payable | | | 37,229 | | | | 33,774 | | | | 36,647 | | | | 56,434 | |
Other accounts payable and accrued expenses | | | 20,107 | | | | 984 | | | | 47,731 | | | | 79,779 | |
| | | | | | | | | | | | | | | | |
TOTAL LIABILITIES | | | 65,646 | | | | 34,898 | | | | 1,717,819 | | | | 2,275,780 | |
| | | | | | | | | | | | | | | | |
NET ASSETS | | $ | 16,629,309 | | | $ | 5,108,779 | | | $ | 244,601,943 | | | $ | 504,159,354 | |
| | | | | | | | | | | | | | | | |
NET ASSETS CONSIST OF: | |
Paid-in capital | | $ | 11,771,336 | | | $ | 5,002,136 | | | $ | 194,324,598 | | | $ | 620,321,097 | |
Accumulated earnings (loss) | | | 4,857,973 | | | | 106,643 | | | | 50,277,345 | | | | (116,161,743 | ) |
| | | | | | | | | | | | | | | | |
NET ASSETS | | $ | 16,629,309 | | | $ | 5,108,779 | | | $ | 244,601,943 | | | $ | 504,159,354 | |
| | | | | | | | | | | | | | | | |
COMPUTATION OF NET ASSET VALUE AND OFFERING PRICE: | |
Class A shares: | |
Net assets | | $ | 75,880 | | | $ | 1,021 | | | $ | 170,702,342 | | | $ | 131,629,650 | |
| | | | | | | | | | | | | | | | |
Shares of beneficial interest | | | 5,438 | | | | 100 | | | | 7,359,397 | | | | 9,302,602 | |
| | | | | | | | | | | | | | | | |
Net asset value and redemption price per share | | $ | 13.95 | | | $ | 10.21 | | | $ | 23.20 | | | $ | 14.15 | |
| | | | | | | | | | | | | | | | |
Offering price per share (100/94.25 of net asset value) (Note 1) | | $ | 14.80 | | | $ | 10.83 | | | $ | 24.62 | | | $ | 15.01 | |
| | | | | | | | | | | | | | | | |
Class C shares: (redemption price per share is equal to net asset value less any applicable contingent deferred sales charge) (Note 1) | | | | | | | | | | | | | | | | |
Net assets | | $ | — | | | $ | 1,021 | | | $ | 35,940,294 | | | $ | 96,771,791 | |
| | | | | | | | | | | | | | | | |
Shares of beneficial interest | | | — | | | | 100 | | | | 1,875,249 | | | | 6,984,910 | |
| | | | | | | | | | | | | | | | |
Net asset value and offering price per share | | $ | — | | | $ | 10.21 | | | $ | 19.17 | | | $ | 13.85 | |
| | | | | | | | | | | | | | | | |
Class N shares: | |
Net assets | | $ | 16,478,271 | | | $ | 5,105,716 | | | $ | 364,214 | | | $ | 290,055 | |
| | | | | | | | | | | | | | | | |
Shares of beneficial interest | | | 1,177,575 | | | | 500,000 | | | | 14,735 | | | | 20,582 | |
| | | | | | | | | | | | | | | | |
Net asset value, offering and redemption price per share | | $ | 13.99 | | | $ | 10.21 | | | $ | 24.72 | | | $ | 14.09 | |
| | | | | | | | | | | | | | | | |
Class Y shares: | |
Net assets | | $ | 75,158 | | | $ | 1,021 | | | $ | 37,595,093 | | | $ | 275,467,858 | |
| | | | | | | | | | | | | | | | |
Shares of beneficial interest | | | 5,375 | | | | 100 | | | | 1,523,265 | | | | 19,565,450 | |
| | | | | | | | | | | | | | | | |
Net asset value, offering and redemption price per share | | $ | 13.98 | | | $ | 10.21 | | | $ | 24.68 | | | $ | 14.08 | |
| | | | | | | | | | | | | | | | |
See accompanying notes to financial statements.
| 76
Statements of Assets and Liabilities (continued)
December 31, 2020
| | | | | | | | | | | | |
| | | Natixis
U.S. Equity
Opportunities
Fund | | | Vaughan
Nelson Mid
Cap Fund | | | Vaughan
Nelson
Small Cap
Value Fund | |
ASSETS | |
Investments at cost | | $ | 642,553,178 | | | $ | 239,519,677 | | | $ | 88,435,689 | |
Net unrealized appreciation | | | 311,969,669 | | | | 50,895,281 | | | | 23,743,154 | |
| | | | | | | | | | | | |
Investments at value | | | 954,522,847 | | | | 290,414,958 | | | | 112,178,843 | |
Cash | | | 114 | | | | — | | | | — | |
Receivable for Fund shares sold | | | 108,474 | | | | 94,499 | | | | 59,436 | |
Receivable for securities sold | | | 2,661,017 | | | | — | | | | — | |
Dividends receivable | | | 315,860 | | | | 174,213 | | | | 22,939 | |
Tax reclaims receivable | | | 474,222 | | | | — | | | | — | |
Prepaid expenses (Note 9) | | | 55 | | | | 19 | | | | 6 | |
| | | | | | | | | | | | |
TOTAL ASSETS | | | 958,082,589 | | | | 290,683,689 | | | | 112,261,224 | |
| | | | | | | | | | | | |
LIABILITIES | |
Payable for Fund shares redeemed | | | 439,429 | | | | 180,472 | | | | 15,741 | |
Management fees payable (Note 6) | | | 605,623 | | | | 171,606 | | | | 55,170 | |
Deferred Trustees’ fees (Note 6) | | | 519,467 | | | | 188,240 | | | | 227,199 | |
Administrative fees payable (Note 6) | | | 33,572 | | | | 10,339 | | | | 3,989 | |
Payable to distributor (Note 6d) | | | 4,523 | | | | 2,675 | | | | 631 | |
Audit and tax services fees payable | | | 38,197 | | | | 37,185 | | | | 36,658 | |
Other accounts payable and accrued expenses | | | 87,632 | | | | 37,850 | | | | 28,671 | |
| | | | | | | | | | | | |
TOTAL LIABILITIES | | | 1,728,443 | | | | 628,367 | | | | 368,059 | |
| | | | | | | | | | | | |
NET ASSETS | | $ | 956,354,146 | | | $ | 290,055,322 | | | $ | 111,893,165 | |
| | | | | | | | | | | | |
NET ASSETS CONSIST OF: | |
Paid-in capital | | $ | 611,405,332 | | | $ | 240,791,073 | | | $ | 93,511,847 | |
Accumulated earnings | | | 344,948,814 | | | | 49,264,249 | | | | 18,381,318 | |
| | | | | | | | | | | | |
NET ASSETS | | $ | 956,354,146 | | | $ | 290,055,322 | | | $ | 111,893,165 | |
| | | | | | | | | | | | |
COMPUTATION OF NET ASSET VALUE AND OFFERING PRICE: | |
Class A shares: | |
Net assets | | $ | 649,753,707 | | | $ | 30,567,274 | | | $ | 61,571,494 | |
| | | | | | | | | | | | |
Shares of beneficial interest | | | 16,645,405 | | | | 1,402,808 | | | | 3,688,523 | |
| | | | | | | | | | | | |
Net asset value and redemption price per share | | $ | 39.04 | | | $ | 21.79 | | | $ | 16.69 | |
| | | | | | | | | | | | |
Offering price per share (100/94.25 of net asset value) (Note 1) | | $ | 41.42 | | | $ | 23.12 | | | $ | 17.71 | |
| | | | | | | | | | | | |
Class C shares: (redemption price per share is equal to net asset value less any applicable contingent deferred sales charge) (Note 1) | | | | | | | | | | | | |
Net assets | | $ | 63,126,230 | | | $ | 14,022,744 | | | $ | 983,253 | |
| | | | | | | | | | | | |
Shares of beneficial interest | | | 2,883,714 | | | | 695,747 | | | | 117,832 | |
| | | | | | | | | | | | |
Net asset value and offering price per share | | $ | 21.89 | | | $ | 20.15 | | | $ | 8.34 | |
| | | | | | | | | | | | |
Class N shares: | |
Net assets | | $ | 172,237 | | | $ | 17,964,791 | | | $ | 23,220 | |
| | | | | | | | | | | | |
Shares of beneficial interest | | | 3,600 | | | | 814,099 | | | | 1,326 | |
| | | | | | | | | | | | |
Net asset value, offering and redemption price per share | | $ | 47.84 | | | $ | 22.07 | | | $ | 17.52 | * |
| | | | | | | | | | | | |
Class Y shares: | |
Net assets | | $ | 243,301,972 | | | $ | 227,500,513 | | | $ | 49,315,198 | |
| | | | | | | | | | | | |
Shares of beneficial interest | | | 5,095,976 | | | | 10,293,592 | | | | 2,816,252 | |
| | | | | | | | | | | | |
Net asset value, offering and redemption price per share | | $ | 47.74 | | | $ | 22.10 | | | $ | 17.51 | |
| | | | | | | | | | | | |
| * | Net asset value calculations have been determined utilizing fractional share and penny amounts. |
See accompanying notes to financial statements.
77 |
Statements of Operations
For the Year Ended December 31, 2020
| | | | | | | | | | | | | | | | |
| | | Gateway
Fund | | | Gateway Equity
Call Premium
Fund | | | Mirova Global
Green Bond
Fund | | | Mirova Global
Sustainable
Equity Fund | |
INVESTMENT INCOME | |
Dividends | | $ | 129,837,610 | | | $ | 1,045,529 | | | $ | — | | | $ | 3,611,778 | |
Interest | | | 319,689 | | | | 2,792 | | | | 597,312 | | | | 13,242 | |
Less net foreign taxes withheld | | | (69,851 | ) | | | (2,801 | ) | | | — | | | | (250,039 | ) |
| | | | | | | | | | | | | | | | |
| | | 130,087,448 | | | | 1,045,520 | | | | 597,312 | | | | 3,374,981 | |
| | | | | | | | | | | | | | | | |
Expenses | |
Management fees (Note 6) | | | 45,426,590 | | | | 366,204 | | | | 199,574 | | | | 2,655,276 | |
Service and distribution fees (Note 6) | | | 4,129,419 | | | | 12,145 | | | | 9,170 | | | | 123,018 | |
Administrative fees (Note 6) | | | 3,152,031 | | | | 24,814 | | | | 15,988 | | | | 145,476 | |
Trustees’ fees and expenses (Note 6) | | | 415,321 | | | | 24,110 | | | | 18,993 | | | | 31,426 | |
Transfer agent fees and expenses (Notes 6 and 8) | | | 4,573,314 | | | | 30,449 | | | | 22,026 | | | | 179,490 | |
Audit and tax services fees | | | 52,196 | | | | 50,699 | | | | 42,723 | | | | 42,338 | |
Custodian fees and expenses (Note 7) | | | 262,382 | | | | 65,113 | | | | 12,467 | | | | 46,177 | |
Interest expense (Note 11) | | | — | | | | 243 | | | | 7,309 | | | | 14,256 | |
Legal fees (Note 9) | | | 176,409 | | | | 1,666 | | | | 1,239 | | | | 7,020 | |
Registration fees | | | 130,752 | | | | 65,650 | | | | 50,332 | | | | 81,560 | |
Shareholder reporting expenses | | | 225,360 | | | | 4,996 | | | | 9,396 | | | | 21,989 | |
Miscellaneous expenses (Notes 7 and 9) | | | 213,157 | | | | 28,450 | | | | 26,503 | | | | 34,854 | |
| | | | | | | | | | | | | | | | |
Total expenses | | | 58,756,931 | | | | 674,539 | | | | 415,720 | | | | 3,382,880 | |
Less waiver and/or expense reimbursement (Notes 6 and 7) | | | (4,823,475 | ) | | | (127,227 | ) | | | (154,739 | ) | | | (107,456 | ) |
| | | | | | | | | | | | | | | | |
Net expenses | | | 53,933,456 | | | | 547,312 | | | | 260,981 | | | | 3,275,424 | |
| | | | | | | | | | | | | | | | |
Net investment income | | | 76,153,992 | | | | 498,208 | | | | 336,331 | | | | 99,557 | |
| | | | | | | | | | | | | | | | |
NET REALIZED AND UNREALIZED GAIN (LOSS) ON INVESTMENTS, FUTURES CONTRACTS, OPTIONS WRITTEN AND FOREIGN CURRENCY TRANSACTIONS | | | | | | | | | | | | | | | | |
Net realized gain (loss) on: | |
Investments | | | 774,364,455 | | | | 2,251,759 | | | | 1,483,621 | | | | 14,289,267 | |
Futures contracts | | | — | | | | — | | | | (1,057,769 | ) | | | — | |
Options written | | | (727,504,128 | ) | | | (5,568,743 | ) | | | — | | | | — | |
Foreign currency transactions (Note 2c) | | | 364 | | | | 19 | | | | 53,414 | | | | 198,677 | |
Net change in unrealized appreciation (depreciation) on: | |
Investments | | | 259,536,264 | | | | 5,742,221 | | | | 2,110,493 | | | | 109,253,716 | |
Futures contracts | | | — | | | | — | | | | (213,438 | ) | | | — | |
Options written | | | 17,165,193 | | | | 111,673 | | | | — | | | | — | |
Foreign currency translations (Note 2c) | | | (59 | ) | | | 3 | | | | 38,341 | | | | 15,857 | |
| | | | | | | | | | | | | | | | |
Net realized and unrealized gain on investments, futures contracts, options written and foreign currency transactions | | | 323,562,089 | | | | 2,536,932 | | | | 2,414,662 | | | | 123,757,517 | |
| | | | | | | | | | | | | | | | |
NET INCREASE IN NET ASSETS RESULTING FROM OPERATIONS | | $ | 399,716,081 | | | $ | 3,035,140 | | | $ | 2,750,993 | | | $ | 123,857,074 | |
| | | | | | | | | | | | | | | | |
See accompanying notes to financial statements.
| 78
Statements of Operations (continued)
For the Year Ended December 31, 2020
| | | | | | | | | | | | | | | | |
| | | Mirova
International
Sustainable
Equity Fund | | | Mirova U.S.
Sustainable
Equity Fund(a) | | | Natixis
Oakmark Fund | | | Natixis
Oakmark
International
Fund | |
INVESTMENT INCOME | | | | | | | | | | | | | | | | |
Dividends | | $ | 283,081 | | | $ | 937 | | | $ | 3,893,021 | (b) | | $ | 7,357,991 | |
Non-cash dividends (Note 2b) | | | — | | | | — | | | | — | | | | 368,713 | |
Interest | | | 778 | | | | — | | | | 17,838 | | | | 18,574 | |
Less net foreign taxes withheld | | | (30,406 | ) | | | (149 | ) | | | (1,216 | ) | | | (930,539 | ) |
| | | | | | | | | | | | | | | | |
| | | 253,453 | | | | 788 | | | | 3,909,643 | | | | 6,814,739 | |
| | | | | | | | | | | | | | | | |
Expenses | |
Management fees (Note 6) | | | 133,936 | | | | 1,431 | | | | 1,564,875 | | | | 3,896,753 | |
Service and distribution fees (Note 6) | | | 54 | | | | 1 | | | | 754,175 | | | | 1,385,832 | |
Administrative fees (Note 6) | | | 7,372 | | | | 95 | | | | 99,193 | | | | 220,057 | |
Trustees’ fees and expenses (Note 6) | | | 17,306 | | | | 180 | | | | 104,888 | | | | 48,953 | |
Transfer agent fees and expenses (Notes 6 and 8) | | | 3,311 | | | | 12 | | | | 214,934 | | | | 944,753 | |
Audit and tax services fees | | | 42,321 | | | | 33,774 | | | | 41,110 | | | | 61,458 | |
Custodian fees and expenses (Note 7) | | | 20,733 | | | | 178 | | | | 9,806 | | | | 173,309 | |
Interest expense (Note 11) | | | 5,788 | | | | — | | | | 334 | | | | 3,016 | |
Legal fees (Note 9) | | | 702 | | | | 10 | | | | 5,810 | | | | 12,313 | |
Registration fees | | | 46,654 | | | | 100 | | | | 54,840 | | | | 100,649 | |
Shareholder reporting expenses | | | 4,809 | | | | 219 | | | | 24,629 | | | | 49,479 | |
Miscellaneous expenses (Notes 7 and 9) | | | 25,924 | | | | 1,591 | | | | 32,163 | | | | 46,057 | |
| | | | | | | | | | | | | | | | |
Total expenses | | | 308,910 | | | | 37,591 | | | | 2,906,757 | | | | 6,942,629 | |
Less waiver and/or expense reimbursement (Notes 6 and 7) | | | (152,365 | ) | | | (35,939 | ) | | | (1,020 | ) | | | (373,638 | ) |
| | | | | | | | | | | | | | | | |
Net expenses | | | 156,545 | | | | 1,652 | | | | 2,905,737 | | | | 6,568,991 | |
| | | | | | | | | | | | | | | | |
Net investment income (loss) | | | 96,908 | | | | (864 | ) | | | 1,003,906 | | | | 245,748 | |
| | | | | | | | | | | | | | | | |
NET REALIZED AND UNREALIZED GAIN (LOSS) ON INVESTMENTS, FORWARD FOREIGN CURRENCY CONTRACTS AND FOREIGN CURRENCY TRANSACTIONS | | | | | | | | | | | | | | | | |
Net realized gain (loss) on: | | | | | | | | | | | | | | | | |
Investments | | | 1,551,490 | | | | — | | | | 14,582,175 | | | | (97,339,953 | ) |
Payments by affiliates (Note 6) | | | 66,060 | | | | — | | | | — | | | | — | |
Forward foreign currency contracts (Note 2d) | | | — | | | | — | | | | — | | | | (378,942 | ) |
Foreign currency transactions (Note 2c) | | | 43,535 | | | | — | | | | — | | | | (50,110 | ) |
Net change in unrealized appreciation (depreciation) on: | | | | | | | | | | | | | | | | |
Investments | | | 1,720,232 | | | | 106,643 | | | | 5,121,754 | | | | 79,503,626 | |
Forward foreign currency contracts (Note 2d) | | | — | | | | — | | | | — | | | | 61,140 | |
Foreign currency translations (Note 2c) | | | 12,113 | | | | — | | | | — | | | | 217,930 | |
| | | | | | | | | | | | | | | | |
Net realized and unrealized gain (loss) on investments, forward foreign currency contracts and foreign currency transactions | | | 3,393,430 | | | | 106,643 | | | | 19,703,929 | | | | (17,986,309 | ) |
| | | | | | | | | | | | | | | | |
NET INCREASE (DECREASE) IN NET ASSETS RESULTING FROM OPERATIONS | | $ | 3,490,338 | | | $ | 105,779 | | | $ | 20,707,835 | | | $ | (17,740,561 | ) |
| | | | | | | | | | | | | | | | |
| (a) | From commencement of operations on December 15, 2020 through December 31, 2020. |
| (b) | Includes non-recurring dividends of $573,645. |
See accompanying notes to financial statements.
79 |
Statements of Operations (continued)
For the Year Ended December 31, 2020
| | | | | | | | | | | | |
| | | Natixis
U.S. Equity
Opportunities
Fund | | | Vaughan
Nelson Mid
Cap Fund | | | Vaughan
Nelson
Small Cap
Value Fund | |
INVESTMENT INCOME | | | | | | | | | | | | |
Dividends | | $ | 9,082,023 | | | $ | 4,315,081 | | | $ | 1,241,208 | |
Interest | | | 30,834 | | | | 4,793 | | | | 5,341 | |
Less net foreign taxes withheld | | | (133,133 | ) | | | — | | | | (1,285 | ) |
| | | | | | | | | | | | |
| | | 8,979,724 | | | | 4,319,874 | | | | 1,245,264 | |
| | | | | | | | | | | | |
Expenses | | | | | | | | | | | | |
Management fees (Note 6) | | | 6,544,600 | | | | 2,229,300 | | | | 840,431 | |
Service and distribution fees (Note 6) | | | 2,083,978 | | | | 223,434 | | | | 144,395 | |
Administrative fees (Note 6) | | | 383,038 | | | | 123,422 | | | | 41,239 | |
Trustees’ fees and expenses (Note 6) | | | 113,843 | | | | 49,368 | | | | 48,032 | |
Transfer agent fees and expenses (Notes 6 and 8) | | | 668,296 | | | | 288,903 | | | | 107,514 | |
Audit and tax services fees | | | 43,095 | | | | 41,999 | | | | 41,109 | |
Custodian fees and expenses (Note 7) | | | 47,132 | | | | 15,557 | | | | 11,746 | |
Interest expense (Note 11) | | | 453 | | | | 2,419 | | | | 187 | |
Legal fees (Note 9) | | | 21,937 | | | | 6,573 | | | | 2,418 | |
Registration fees | | | 70,370 | | | | 67,356 | | | | 57,127 | |
Shareholder reporting expenses | | | 50,938 | | | | 20,402 | | | | 13,475 | |
Miscellaneous expenses (Notes 7 and 9) | | | 46,149 | | | | 32,872 | | | | 28,773 | |
| | | | | | | | | | | | |
Total expenses | | | 10,073,829 | | | | 3,101,605 | | | | 1,336,446 | |
Less waiver and/or expense reimbursement (Notes 6 and 7) | | | (1,022 | ) | | | (237,006 | ) | | | (193,163 | ) |
| | | | | | | | | | | | |
Net expenses | | | 10,072,807 | | | | 2,864,599 | | | | 1,143,283 | |
| | | | | | | | | | | | |
Net investment income (loss) | | | (1,093,083 | ) | | | 1,455,275 | | | | 101,981 | |
| | | | | | | | | | | | |
NET REALIZED AND UNREALIZED GAIN (LOSS) ON INVESTMENTS | | | | | | | | | | | | |
Net realized gain (loss) on: | | | | | | | | | | | | |
Investments | | | 130,277,857 | | | | 27,799,575 | | | | (3,132,416 | ) |
Net change in unrealized appreciation (depreciation) on: | | | | | | | | | | | | |
Investments | | | 34,019,289 | | | | (16,338,813 | ) | | | 10,854,499 | |
| | | | | | | | | | | | |
Net realized and unrealized gain on investments | | | 164,297,146 | | | | 11,460,762 | | | | 7,722,083 | |
| | | | | | | | | | | | |
NET INCREASE IN NET ASSETS RESULTING FROM OPERATIONS | | $ | 163,204,063 | | | $ | 12,916,037 | | | $ | 7,824,064 | |
| | | | | | | | | | | | |
See accompanying notes to financial statements.
| 80
Statements of Changes in Net Assets
| | | | | | | | | | | | | | | | |
| | | Gateway Fund | | |
Gateway Equity Call
Premium Fund | |
| | | Year Ended
December 31,
2020 | | | Year Ended
December 31,
2019 | | | Year Ended
December 31,
2020 | | | Year Ended
December 31,
2019 | |
FROM OPERATIONS: | |
Net investment income | | $ | 76,153,992 | | | $ | 105,912,778 | | | $ | 498,208 | | | $ | 633,336 | |
Net realized gain (loss) on investments, options written and foreign currency transactions | | | 46,860,691 | | | | (1,125,482,443 | ) | | | (3,316,965 | ) | | | (4,575,650 | ) |
Net change in unrealized appreciation (depreciation) on investments, options written and foreign currency translations | | | 276,701,398 | | | | 1,872,931,084 | | | | 5,853,897 | | | | 13,729,955 | |
| | | | | | | | | | | | | | | | |
Net increase in net assets resulting from operations | | | 399,716,081 | | | | 853,361,419 | | | | 3,035,140 | | | | 9,787,641 | |
| | | | | | | | | | | | | | | | |
FROM DISTRIBUTIONS TO SHAREHOLDERS: | |
Class A | | | (8,569,381 | ) | | | (12,705,939 | ) | | | (11,504 | ) | | | (19,337 | ) |
Class C | | | (262,085 | ) | | | (840,122 | ) | | | (567 | ) | | | (1,035 | ) |
Class N | | | (4,232,561 | ) | | | (3,571,259 | ) | | | (5,747 | ) | | | (2,711 | ) |
Class Y | | | (63,649,192 | ) | | | (88,571,859 | ) | | | (479,450 | ) | | | (629,887 | ) |
| | | | | | | | | | | | | | | | |
Total distributions | | | (76,713,219 | ) | | | (105,689,179 | ) | | | (497,268 | ) | | | (652,970 | ) |
| | | | | | | | | | | | | | | | |
NET DECREASE IN NET ASSETS FROM CAPITAL SHARE TRANSACTIONS (NOTE 13) | | | (1,355,251,327 | ) | | | (728,793,632 | ) | | | (7,048,972 | ) | | | (15,070,318 | ) |
| | | | | | | | | | | | | | | | |
Net increase (decrease) in net assets | | | (1,032,248,465 | ) | | | 18,878,608 | | | | (4,511,100 | ) | | | (5,935,647 | ) |
NET ASSETS | |
Beginning of the year | | | 8,157,211,748 | | | | 8,138,333,140 | | | | 64,414,646 | | | | 70,350,293 | |
| | | | | | | | | | | | | | | | |
End of the year | | $ | 7,124,963,283 | | | $ | 8,157,211,748 | | | $ | 59,903,546 | | | $ | 64,414,646 | |
| | | | | | | | | | | | | | | | |
See accompanying notes to financial statements.
81 |
Statements of Changes in Net Assets (continued)
| | | | | | | | | | | | | | | | |
| | | Mirova Global
Green Bond Fund | | |
Mirova Global Sustainable
Equity Fund | |
| | | Year Ended
December 31,
2020 | | | Year Ended
December 31,
2019 | | | Year Ended
December 31,
2020 | | | Year Ended
December 31,
2019 | |
FROM OPERATIONS: | |
Net investment income | | $ | 336,331 | | | $ | 371,311 | | | $ | 99,557 | | | $ | 471,120 | |
Net realized gain on investments, futures contracts and foreign currency transactions | | | 479,266 | | | | 1,000,007 | | | | 14,487,944 | | | | 1,868,979 | |
Net change in unrealized appreciation (depreciation) on investments, futures contracts and foreign currency translations | | | 1,935,396 | | | | 1,256,056 | | | | 109,269,573 | | | | 27,311,333 | |
| | | | | | | | | | | | | | | | |
Net increase in net assets resulting from operations | | | 2,750,993 | | | | 2,627,374 | | | | 123,857,074 | | | | 29,651,432 | |
| | | | | | | | | | | | | | | | |
FROM DISTRIBUTIONS TO SHAREHOLDERS: | |
Class A | | | (169,497 | ) | | | (48,042 | ) | | | (119,993 | ) | | | (181,226 | ) |
Class C | | | — | | | | — | | | | (49,885 | ) | | | (68,161 | ) |
Class N | | | (504,197 | ) | | | (686,274 | ) | | | (227,737 | ) | | | (139,240 | ) |
Class Y | | | (699,849 | ) | | | (140,394 | ) | | | (2,280,679 | ) | | | (1,933,861 | ) |
| | | | | | | | | | | | | | | | |
Total distributions | | | (1,373,543 | ) | | | (874,710 | ) | | | (2,678,294 | ) | | | (2,322,488 | ) |
| | | | | | | | | | | | | | | | |
NET INCREASE IN NET ASSETS FROM CAPITAL SHARE TRANSACTIONS (NOTE 13) | | | 1,227,038 | | | | 6,110,172 | | | | 609,269,464 | | | | 38,380,676 | |
| | | | | | | | | | | | | | | | |
Net increase in net assets | | | 2,604,488 | | | | 7,862,836 | | | | 730,448,244 | | | | 65,709,620 | |
NET ASSETS | |
Beginning of the year | | | 36,931,309 | | | | 29,068,473 | | | | 147,322,407 | | | | 81,612,787 | |
| | | | | | | | | | | | | | | | |
End of the year | | $ | 39,535,797 | | | $ | 36,931,309 | | | $ | 877,770,651 | | | $ | 147,322,407 | |
| | | | | | | | | | | | | | | | |
See accompanying notes to financial statements.
| 82
Statements of Changes in Net Assets (continued)
| | | | | | | | | | | | |
| | | Mirova International
Sustainable Equity Fund | | | Mirova U.S.
Sustainable
Equity Fund | |
| | | Year Ended
December 31,
2020 | | | Year Ended
December 31,
2019 | | | Period Ended
December 31,
2020(a) | |
FROM OPERATIONS: | | | | | | | | | | | | |
Net investment income (loss) | | $ | 96,908 | | | $ | 184,654 | | | $ | (864 | ) |
Net realized gain on investments and foreign currency transactions | | | 1,661,085 | | | | 41,973 | | | | — | |
Net change in unrealized appreciation (depreciation) on investments and foreign currency translations | | | 1,732,345 | | | | 2,861,207 | | | | 106,643 | |
| | | | | | | | | | | | |
Net increase in net assets resulting from operations | | | 3,490,338 | | | | 3,087,834 | | | | 105,779 | |
| | | | | | | | | | | | |
FROM DISTRIBUTIONS TO SHAREHOLDERS: | |
Class A | | | (6,930 | ) | | | (12 | ) | | | — | |
Class N | | | (1,544,820 | ) | | | (205,624 | ) | | | — | |
Class Y | | | (6,899 | ) | | | (86 | ) | | | — | |
| | | | | | | | | | | | |
Total distributions | | | (1,558,649 | ) | | | (205,722 | ) | | | — | |
| | | | | | | | | | | | |
NET INCREASE (DECREASE) IN NET ASSETS FROM CAPITAL SHARE TRANSACTIONS (NOTE 13) | | | (2,508,593 | ) | | | 4,287,311 | | | | 5,003,000 | |
| | | | | | | | | | | | |
Net increase (decrease) in net assets | | | (576,904 | ) | | | 7,169,423 | | | | 5,108,779 | |
NET ASSETS | |
Beginning of the year | | | 17,206,213 | | | | 10,036,790 | | | | — | |
| | | | | | | | | | | | |
End of the year | | $ | 16,629,309 | | | $ | 17,206,213 | | | $ | 5,108,779 | |
| | | | | | | | | | | | |
| (a) | From commencement of operations on December 15, 2020 through December 31, 2020. |
See accompanying notes to financial statements.
83 |
Statements of Changes in Net Assets (continued)
| | | | | | | | | | | | | | | | |
| | | Natixis Oakmark Fund | | |
Natixis Oakmark
International Fund | |
| | | Year Ended
December 31,
2020 | | | Year Ended
December 31,
2019 | | | Year Ended
December 31,
2020 | | | Year Ended
December 31,
2019 | |
FROM OPERATIONS: | |
Net investment income | | $ | 1,003,906 | | | $ | 2,288,224 | | | $ | 245,748 | | | $ | 17,206,258 | |
Net realized gain (loss) on investments, forward foreign currency contracts and foreign currency transactions | | | 14,582,175 | | | | 14,578,257 | | | | (97,769,005 | ) | | | (15,858,364 | ) |
Net change in unrealized appreciation (depreciation) on investments, forward foreign currency contracts and foreign currency translations | | | 5,121,754 | | | | 50,910,323 | | | | 79,782,696 | | | | 136,447,696 | |
| | | | | | | | | | | | | | | | |
Net increase (decrease) in net assets resulting from operations | | | 20,707,835 | | | | 67,776,804 | | | | (17,740,561 | ) | | | 137,795,590 | |
| | | | | | | | | | | | | | | | |
FROM DISTRIBUTIONS TO SHAREHOLDERS: | |
Class A | | | (14,572,150 | ) | | | (16,820,039 | ) | | | (310,049 | ) | | | (5,093,122 | ) |
Class C | | | (3,470,297 | ) | | | (5,798,979 | ) | | | — | | | | (4,034,677 | ) |
Class N | | | (30,687 | ) | | | (37,043 | ) | | | (1,852 | ) | | | (27,558 | ) |
Class Y | | | (3,143,507 | ) | | | (5,261,958 | ) | | | (1,281,600 | ) | | | (8,066,849 | ) |
| | | | | | | | | | | | | | | | |
Total distributions | | | (21,216,641 | ) | | | (27,918,019 | ) | | | (1,593,501 | ) | | | (17,222,206 | ) |
| | | | | | | | | | | | | | | | |
NET DECREASE IN NET ASSETS FROM CAPITAL SHARE TRANSACTIONS (NOTE 13) | | | (38,326,966 | ) | | | (28,613,857 | ) | | | (74,342,754 | ) | | | (208,787,046 | ) |
| | | | | | | | | | | | | | | | |
Net increase (decrease) in net assets | | | (38,835,772 | ) | | | 11,244,928 | | | | (93,676,816 | ) | | | (88,213,662 | ) |
NET ASSETS | |
Beginning of the year | | | 283,437,715 | | | | 272,192,787 | | | | 597,836,170 | | | | 686,049,832 | |
| | | | | | | | | | | | | | | | |
End of the year | | $ | 244,601,943 | | | $ | 283,437,715 | | | $ | 504,159,354 | | | $ | 597,836,170 | |
| | | | | | | | | | | | | | | | |
See accompanying notes to financial statements.
| 84
Statements of Changes in Net Assets (continued)
| | | | | | | | | | | | | | | | |
| | | Natixis U.S. Equity
Opportunities Fund | | |
Vaughan Nelson
Mid Cap Fund | |
| | | Year Ended
December 31,
2020 | | | Year Ended
December 31,
2019 | | | Year Ended
December 31,
2020 | | | Year Ended
December 31,
2019 | |
FROM OPERATIONS: | |
Net investment income (loss) | | $ | (1,093,083 | ) | | $ | 4,347,188 | | | $ | 1,455,275 | | | $ | 1,697,453 | |
Net realized gain on investments | | | 130,277,857 | | | | 90,186,547 | | | | 27,799,575 | | | | 26,643,511 | |
Net change in unrealized appreciation (depreciation) on investments | | | 34,019,289 | | | | 167,414,696 | | | | (16,338,813 | ) | | | 96,669,546 | |
| | | | | | | | | | | | | | | | |
Net increase in net assets resulting from operations | | | 163,204,063 | | | | 261,948,431 | | | | 12,916,037 | | | | 125,010,510 | |
| | | | | | | | | | | | | | | | |
FROM DISTRIBUTIONS TO SHAREHOLDERS: | |
Class A | | | (78,012,779 | ) | | | (63,482,836 | ) | | | (3,468,834 | ) | | | (293,257 | ) |
Class C | | | (13,186,942 | ) | | | (12,360,421 | ) | | | (1,857,110 | ) | | | (183,363 | ) |
Class N | | | (21,295 | ) | | | (44,503 | ) | | | (2,038,286 | ) | | | (212,174 | ) |
Class Y | | | (24,792,696 | ) | | | (26,597,489 | ) | | | (26,620,537 | ) | | | (3,167,841 | ) |
| | | | | | | | | | | | | | | | |
Total distributions | | | (116,013,712 | ) | | | (102,485,249 | ) | | | (33,984,767 | ) | | | (3,856,635 | ) |
| | | | | | | | | | | | | | | | |
NET DECREASE IN NET ASSETS FROM CAPITAL SHARE TRANSACTIONS (NOTE 13) | | | (70,200,600 | ) | | | (78,802,617 | ) | | | (61,208,438 | ) | | | (340,544,321 | ) |
| | | | | | | | | | | | | | | | |
Net increase (decrease) in net assets | | | (23,010,249 | ) | | | 80,660,565 | | | | (82,277,168 | ) | | | (219,390,446 | ) |
NET ASSETS | |
Beginning of the year | | | 979,364,395 | | | | 898,703,830 | | | | 372,332,490 | | | | 591,722,936 | |
| | | | | | | | | | | | | | | | |
End of the year | | $ | 956,354,146 | | | $ | 979,364,395 | | | $ | 290,055,322 | | | $ | 372,332,490 | |
| | | | | | | | | | | | | | | | |
See accompanying notes to financial statements.
85 |
Statements of Changes in Net Assets (continued)
| | | | | | | | |
| | |
Vaughan Nelson Small Cap
Value Fund | |
| | | Year Ended
December 31,
2020 | | | Year Ended
December 31,
2019 | |
FROM OPERATIONS: | |
Net investment income | | $ | 101,981 | | | $ | 258,053 | |
Net realized gain (loss) on investments | | | (3,132,416 | ) | | | 3,647,835 | |
Net change in unrealized appreciation (depreciation) on investments | | | 10,854,499 | | | | 24,895,047 | |
| | | | | | | | |
Net increase in net assets resulting from operations | | | 7,824,064 | | | | 28,800,935 | |
| | | | | | | | |
FROM DISTRIBUTIONS TO SHAREHOLDERS: | |
Class A | | | (376,748 | ) | | | (475,801 | ) |
Class C | | | (14,118 | ) | | | (18,939 | ) |
Class N | | | (179 | ) | | | (194 | ) |
Class Y | | | (344,758 | ) | | | (411,969 | ) |
| | | | | | | | |
Total distributions | | | (735,803 | ) | | | (906,903 | ) |
| | | | | | | | |
NET DECREASE IN NET ASSETS FROM CAPITAL SHARE TRANSACTIONS (NOTE 13) | | | (8,673,052 | ) | | | (42,810,460 | ) |
| | | | | | | | |
Net decrease in net assets | | | (1,584,791 | ) | | | (14,916,428 | ) |
NET ASSETS | |
Beginning of the year | | | 113,477,956 | | | | 128,394,384 | |
| | | | | | | | |
End of the year | | $ | 111,893,165 | | | $ | 113,477,956 | |
| | | | | | | | |
See accompanying notes to financial statements.
| 86
Financial Highlights
For a share outstanding throughout each period.
| | | | | | | | | | | | | | | | | | | | |
| | | Gateway Fund—Class A | |
| | | Year Ended
December 31,
2020 | | | Year Ended
December 31,
2019 | | | Year Ended
December 31,
2018 | | | Year Ended
December 31,
2017 | | | Year Ended
December 31,
2016 | |
Net asset value, beginning of the period | | $ | 34.69 | | | $ | 31.65 | | | $ | 33.47 | | | $ | 30.84 | | | $ | 29.72 | |
| | | | | | | | | | | | | | | | | | | | |
INCOME (LOSS) FROM INVESTMENT OPERATIONS: | |
Net investment income(a) | | | 0.30 | | | | 0.37 | | | | 0.34 | | | | 0.39 | | | | 0.41 | |
Net realized and unrealized gain (loss) | | | 2.08 | | | | 3.05 | | | | (1.80 | ) | | | 2.58 | | | | 1.13 | |
| | | | | | | | | | | | | | | | | | | | |
Total from Investment Operations | | | 2.38 | | | | 3.42 | | | | (1.46 | ) | | | 2.97 | | | | 1.54 | |
| | | | | | | | | | | | | | | | | | | | |
LESS DISTRIBUTIONS FROM: | |
Net investment income | | | (0.31 | ) | | | (0.38 | ) | | | (0.36 | ) | | | (0.34 | ) | | | (0.42 | ) |
| | | | | | | | | | | | | | | | | | | | |
Net asset value, end of the period | | $ | 36.76 | | | $ | 34.69 | | | $ | 31.65 | | | $ | 33.47 | | | $ | 30.84 | |
| | | | | | | | | | | | | | | | | | | | |
Total return(b)(c) | | | 6.92 | % | | | 10.84 | % | | | (4.39 | )% | | | 9.66 | % | | | 5.23 | % |
RATIOS TO AVERAGE NET ASSETS: | |
Net assets, end of the period (000’s) | | $ | 987,702 | | | $ | 1,125,464 | | | $ | 1,177,641 | | | $ | 1,669,272 | | | $ | 1,755,576 | |
Net expenses(d) | | | 0.94 | % | | | 0.94 | % | | | 0.94 | % | | | 0.94 | % | | | 0.94 | % |
Gross expenses | | | 1.02 | % | | | 1.01 | % | | | 1.01 | % | | | 1.02 | % | | | 1.02 | % |
Net investment income | | | 0.88 | % | | | 1.12 | % | | | 1.03 | % | | | 1.20 | % | | | 1.39 | % |
Portfolio turnover rate | | | 22 | % | | | 12 | % | | | 10 | % | | | 34 | % | | | 14 | % |
| (a) | Per share net investment income has been calculated using the average shares outstanding during the period. |
| (b) | Had certain expenses not been waived/reimbursed during the period, total returns would have been lower. |
| (c) | A sales charge for Class A shares is not reflected in total return calculations. |
| (d) | The investment adviser agreed to waive its fees and/or reimburse a portion of the Fund’s expenses during the period. Without this waiver/reimbursement, expenses would have been higher. |
See accompanying notes to financial statements.
87 |
Financial Highlights (continued)
For a share outstanding throughout each period.
| | | | | | | | | | | | | | | | | | | | |
| | | Gateway Fund—Class C | |
| | | Year Ended
December 31,
2020 | | | Year Ended
December 31,
2019 | | | Year Ended
December 31,
2018 | | | Year Ended
December 31,
2017 | | | Year Ended
December 31,
2016 | |
Net asset value, beginning of the period | | $ | 34.54 | | | $ | 31.50 | | | $ | 33.32 | | | $ | 30.72 | | | $ | 29.61 | |
| | | | | | | | | | | | | | | | | | | | |
INCOME (LOSS) FROM INVESTMENT OPERATIONS: | |
Net investment income(a) | | | 0.04 | | | | 0.12 | | | | 0.09 | | | | 0.14 | | | | 0.19 | |
Net realized and unrealized gain (loss) | | | 2.07 | | | | 3.03 | | | | (1.80 | ) | | | 2.57 | | | | 1.11 | |
| | | | | | | | | | | | | | | | | | | | |
Total from Investment Operations | | | 2.11 | | | | 3.15 | | | | (1.71 | ) | | | 2.71 | | | | 1.30 | |
| | | | | | | | | | | | | | | | | | | | |
LESS DISTRIBUTIONS FROM: | |
Net investment income | | | (0.05 | ) | | | (0.11 | ) | | | (0.11 | ) | | | (0.11 | ) | | | (0.19 | ) |
| | | | | | | | | | | | | | | | | | | | |
Net asset value, end of the period | | $ | 36.60 | | | $ | 34.54 | | | $ | 31.50 | | | $ | 33.32 | | | $ | 30.72 | |
| | | | | | | | | | | | | | | | | | | | |
Total return(b)(c) | | | 6.13 | % | | | 10.02 | % | | | (5.15 | )% | | | 8.85 | % | | | 4.42 | % |
RATIOS TO AVERAGE NET ASSETS: | |
Net assets, end of the period (000’s) | | $ | 142,623 | | | $ | 215,947 | | | $ | 272,904 | | | $ | 336,891 | | | $ | 366,584 | |
Net expenses(d) | | | 1.70 | % | | | 1.70 | % | | | 1.70 | % | | | 1.70 | % | | | 1.70 | % |
Gross expenses | | | 1.77 | % | | | 1.76 | % | | | 1.76 | % | | | 1.77 | % | | | 1.77 | % |
Net investment income | | | 0.12 | % | | | 0.37 | % | | | 0.27 | % | | | 0.44 | % | | | 0.63 | % |
Portfolio turnover rate | | | 22 | % | | | 12 | % | | | 10 | % | | | 34 | % | | | 14 | % |
| (a) | Per share net investment income has been calculated using the average shares outstanding during the period. |
| (b) | Had certain expenses not been waived/reimbursed during the period, total returns would have been lower. |
| (c) | A contingent deferred sales charge for Class C shares is not reflected in total return calculations. |
| (d) | The investment adviser agreed to waive its fees and/or reimburse a portion of the Fund’s expenses during the period. Without this waiver/reimbursement, expenses would have been higher. |
See accompanying notes to financial statements.
| 88
Financial Highlights (continued)
For a share outstanding throughout each period.
| | | | | | | | | | | | | | | | |
| | | Gateway Fund—Class N | |
| | | Year Ended
December 31,
2020
| | | Year Ended
December 31,
2019
| | | Year Ended
December 31,
2018
| | | Period Ended
December 31,
2017*
| |
Net asset value, beginning of the period | | $ | 34.68 | | | $ | 31.63 | | | $ | 33.46 | | | $ | 31.89 | |
| | | | | | | | | | | | | | | | |
INCOME (LOSS) FROM INVESTMENT OPERATIONS: | |
Net investment income(a) | | | 0.40 | | | | 0.47 | | | | 0.44 | | | | 0.32 | |
Net realized and unrealized gain (loss) | | | 2.07 | | | | 3.06 | | | | (1.81 | ) | | | 1.56 | |
| | | | | | | | | | | | | | | | |
Total from Investment Operations | | | 2.47 | | | | 3.53 | | | | (1.37 | ) | | | 1.88 | |
| | | | | | | | | | | | | | | | |
LESS DISTRIBUTIONS FROM: | |
Net investment income | | | (0.41 | ) | | | (0.48 | ) | | | (0.46 | ) | | | (0.31 | ) |
| | | | | | | | | | | | | | | | |
Net asset value, end of the period | | $ | 36.74 | | | $ | 34.68 | | | $ | 31.63 | | | $ | 33.46 | |
| | | | | | | | | | | | | | | | |
Total return(b) | | | 7.25 | % | | | 11.17 | % | | | (4.13 | )% | | | 5.93 | %(c) |
RATIOS TO AVERAGE NET ASSETS: | |
Net assets, end of the period (000’s) | | $ | 369,829 | | | $ | 369,793 | | | $ | 179,727 | | | $ | 126,262 | |
Net expenses(d) | | | 0.65 | % | | | 0.65 | % | | | 0.65 | % | | | 0.65 | %(e) |
Gross expenses | | | 0.70 | % | | | 0.69 | % | | | 0.70 | % | | | 0.74 | %(e) |
Net investment income | | | 1.17 | % | | | 1.40 | % | | | 1.32 | % | | | 1.42 | %(e) |
Portfolio turnover rate | | | 22 | % | | | 12 | % | | | 10 | % | | | 34 | %(f) |
| * | From commencement of Class operations on May 1, 2017 through December 31, 2017. |
| (a) | Per share net investment income has been calculated using the average shares outstanding during the period. |
| (b) | Had certain expenses not been waived/reimbursed during the period, total returns would have been lower. |
| (c) | Periods less than one year are not annualized. |
| (d) | The investment adviser agreed to waive its fees and/or reimburse a portion of the Fund’s expenses during the period. Without this waiver/reimbursement, expenses would have been higher. |
| (e) | Computed on an annualized basis for periods less than one year. |
| (f) | Represents the Fund’s portfolio turnover rate for the year ended December 31, 2017. |
See accompanying notes to financial statements.
89 |
Financial Highlights (continued)
For a share outstanding throughout each period.
| | | | | | | | | | | | | | | | | | | | |
| | | Gateway Fund—Class Y | |
| | | Year Ended
December 31,
2020 | | | Year Ended
December 31,
2019 | | | Year Ended
December 31,
2018 | | | Year Ended
December 31,
2017 | | | Year Ended
December 31,
2016 | |
Net asset value, beginning of the period | | $ | 34.67 | | | $ | 31.63 | | | $ | 33.46 | | | $ | 30.83 | | | $ | 29.71 | |
| | | | | | | | | | | | | | | | | | | | |
INCOME (LOSS) FROM INVESTMENT OPERATIONS: | |
Net investment income(a) | | | 0.38 | | | | 0.46 | | | | 0.43 | | | | 0.47 | | | | 0.49 | |
Net realized and unrealized gain (loss) | | | 2.07 | | | | 3.04 | | | | (1.81 | ) | | | 2.58 | | | | 1.12 | |
| | | | | | | | | | | | | | | | | | | | |
Total from Investment Operations | | | 2.45 | | | | 3.50 | | | | (1.38 | ) | | | 3.05 | | | | 1.61 | |
| | | | | | | | | | | | | | | | | | | | |
LESS DISTRIBUTIONS FROM: | |
Net investment income | | | (0.39 | ) | | | (0.46 | ) | | | (0.45 | ) | | | (0.42 | ) | | | (0.49 | ) |
| | | | | | | | | | | | | | | | | | | | |
Net asset value, end of the period | | $ | 36.73 | | | $ | 34.67 | | | $ | 31.63 | | | $ | 33.46 | | | $ | 30.83 | |
| | | | | | | | | | | | | | | | | | | | |
Total return(b) | | | 7.19 | % | | | 11.12 | % | | | (4.18 | )% | | | 9.93 | % | | | 5.48 | % |
RATIOS TO AVERAGE NET ASSETS: | |
Net assets, end of the period (000’s) | | $ | 5,624,810 | | | $ | 6,446,007 | | | $ | 6,508,061 | | | $ | 6,392,640 | | | $ | 5,550,008 | |
Net expenses(c) | | | 0.70 | % | | | 0.70 | % | | | 0.70 | % | | | 0.70 | % | | | 0.70 | % |
Gross expenses | | | 0.77 | % | | | 0.76 | % | | | 0.76 | % | | | 0.77 | % | | | 0.77 | % |
Net investment income | | | 1.12 | % | | | 1.37 | % | | | 1.28 | % | | | 1.44 | % | | | 1.63 | % |
Portfolio turnover rate | | | 22 | % | | | 12 | % | | | 10 | % | | | 34 | % | | | 14 | % |
| (a) | Per share net investment income has been calculated using the average shares outstanding during the period. |
| (b) | Had certain expenses not been waived/reimbursed during the period, total returns would have been lower. |
| (c) | The investment adviser agreed to waive its fees and/or reimburse a portion of the Fund’s expenses during the period. Without this waiver/reimbursement, expenses would have been higher. |
See accompanying notes to financial statements.
| 90
Financial Highlights (continued)
For a share outstanding throughout each period.
| | | | | | | | | | | | | | | | | | | | |
| | | Gateway Equity Call Premium Fund—Class A | |
| | | Year Ended
December 31,
2020 | | | Year Ended
December 31,
2019 | | | Year Ended
December 31,
2018 | | | Year Ended
December 31,
2017 | | | Year Ended
December 31,
2016 | |
Net asset value, beginning of the period | | $ | 13.07 | | | $ | 11.32 | | | $ | 12.08 | | | $ | 10.89 | | | $ | 10.22 | |
| | | | | | | | | | | | | | | | | | | | |
INCOME (LOSS) FROM INVESTMENT OPERATIONS: | |
Net investment income(a) | | | 0.09 | | | | 0.10 | | | | 0.09 | | | | 0.10 | | | | 0.11 | |
Net realized and unrealized gain (loss) | | | 0.95 | | | | 1.76 | | | | (0.76 | ) | | | 1.18 | | | | 0.66 | |
| | | | | | | | | | | | | | | | | | | | |
Total from Investment Operations | | | 1.04 | | | | 1.86 | | | | (0.67 | ) | | | 1.28 | | | | 0.77 | |
| | | | | | | | | | | | | | | | | | | | |
LESS DISTRIBUTIONS FROM: | |
Net investment income | | | (0.08 | ) | | | (0.11 | ) | | | (0.09 | ) | | | (0.09 | ) | | | (0.10 | ) |
| | | | | | | | | | | | | | | | | | | | |
Net asset value, end of the period | | $ | 14.03 | | | $ | 13.07 | | | $ | 11.32 | | | $ | 12.08 | | | $ | 10.89 | |
| | | | | | | | | | | | | | | | | | | | |
Total return(b)(c) | | | 8.06 | % | | | 16.46 | % | | | (5.60 | )% | | | 11.80 | % | | | 7.58 | % |
RATIOS TO AVERAGE NET ASSETS: | |
Net assets, end of the period (000’s) | | $ | 1,456 | | | $ | 2,363 | | | $ | 2,375 | | | $ | 7,085 | | | $ | 6,507 | |
Net expenses(d) | | | 1.20 | % | | | 1.20 | % | | | 1.20 | % | | | 1.20 | % | | | 1.20 | % |
Gross expenses | | | 1.43 | % | | | 1.42 | % | | | 1.44 | % | | | 1.30 | % | | | 1.31 | % |
Net investment income | | | 0.69 | % | | | 0.82 | % | | | 0.73 | % | | | 0.85 | % | | | 1.02 | % |
Portfolio turnover rate | | | 15 | % | | | 17 | % | | | 58 | % | | | 19 | % | | | 24 | % |
| (a) | Per share net investment income has been calculated using the average shares outstanding during the period. |
| (b) | A sales charge for Class A shares is not reflected in total return calculations. |
| (c) | Had certain expenses not been waived/reimbursed during the period, total returns would have been lower. |
| (d) | The investment adviser agreed to waive its fees and/or reimburse a portion of the Fund’s expenses during the period. Without this waiver/reimbursement, expenses would have been higher. |
See accompanying notes to financial statements.
91 |
Financial Highlights (continued)
For a share outstanding throughout each period.
| | | | | | | | | | | | | | | | | | | | |
| | | Gateway Equity Call Premium Fund—Class C | |
| | | Year Ended
December 31,
2020 | | | Year Ended
December 31,
2019 | | | Year Ended
December 31,
2018 | | | Year Ended
December 31,
2017 | | | Year Ended
December 31,
2016 | |
Net asset value, beginning of the period | | $ | 13.03 | | | $ | 11.29 | | | $ | 12.05 | | | $ | 10.87 | | | $ | 10.22 | |
| | | | | | | | | | | | | | | | | | | | |
INCOME (LOSS) FROM INVESTMENT OPERATIONS: | |
Net investment income (loss)(a) | | | (0.01 | ) | | | 0.01 | | | | 0.00 | (b) | | | 0.01 | | | | 0.02 | |
Net realized and unrealized gain (loss) | | | 0.95 | | | | 1.74 | | | | (0.75 | ) | | | 1.18 | | | | 0.68 | |
| | | | | | | | | | | | | | | | | | | | |
Total from Investment Operations | | | 0.94 | | | | 1.75 | | | | (0.75 | ) | | | 1.19 | | | | 0.70 | |
| | | | | | | | | | | | | | | | | | | | |
LESS DISTRIBUTIONS FROM: | |
Net investment income | | | (0.01 | ) | | | (0.01 | ) | | | (0.01 | ) | | | (0.01 | ) | | | (0.05 | ) |
| | | | | | | | | | | | | | | | | | | | |
Net asset value, end of the period | | $ | 13.96 | | | $ | 13.03 | | | $ | 11.29 | | | $ | 12.05 | | | $ | 10.87 | |
| | | | | | | | | | | | | | | | | | | | |
Total return(c)(d) | | | 7.23 | % | | | 15.54 | % | | | (6.24 | )% | | | 10.95 | % | | | 6.85 | % |
RATIOS TO AVERAGE NET ASSETS: | |
Net assets, end of the period (000’s) | | $ | 741 | | | $ | 727 | | | $ | 849 | | | $ | 648 | | | $ | 524 | |
Net expenses(e) | | | 1.95 | % | | | 1.95 | % | | | 1.95 | % | | | 1.95 | % | | | 1.95 | % |
Gross expenses | | | 2.17 | % | | | 2.17 | % | | | 2.19 | % | | | 2.05 | % | | | 1.98 | % |
Net investment income (loss) | | | (0.10 | )% | | | 0.07 | % | | | 0.02 | % | | | 0.10 | % | | | 0.23 | % |
Portfolio turnover rate | | | 15 | % | | | 17 | % | | | 58 | % | | | 19 | % | | | 24 | % |
| (a) | Per share net investment income (loss) has been calculated using the average shares outstanding during the period. |
| (b) | Amount rounds to less than $0.01 per share. |
| (c) | A contingent deferred sales charge for Class C shares is not reflected in total return calculations. |
| (d) | Had certain expenses not been waived/reimbursed during the period, total returns would have been lower. |
| (e) | The investment adviser agreed to waive its fees and/or reimburse a portion of the Fund’s expenses during the period. Without this waiver/reimbursement, expenses would have been higher. |
See accompanying notes to financial statements.
| 92
Financial Highlights (continued)
For a share outstanding throughout each period.
| | | | | | | | | | | | | | | | |
| | | Gateway Equity Call Premium Fund—Class N | |
| | | Year Ended
December 31,
2020 | | | Year Ended
December 31,
2019 | | | Year Ended
December 31,
2018 | | | Period Ended
December 31,
2017* | |
Net asset value, beginning of the period | | $ | 13.06 | | | $ | 11.32 | | | $ | 12.09 | | | $ | 11.34 | |
| | | | | | | | | | | | | | | | |
INCOME (LOSS) FROM INVESTMENT OPERATIONS: | |
Net investment income(a) | | | 0.12 | | | | 0.13 | | | | 0.13 | | | | 0.10 | |
Net realized and unrealized gain (loss) | | | 0.95 | | | | 1.76 | | | | (0.77 | ) | | | 0.75 | |
| | | | | | | | | | | | | | | | |
Total from Investment Operations | | | 1.07 | | | | 1.89 | | | | (0.64 | ) | | | 0.85 | |
| | | | | | | | | | | | | | | | |
LESS DISTRIBUTIONS FROM: | |
Net investment income | | | (0.12 | ) | | | (0.15 | ) | | | (0.13 | ) | | | (0.10 | ) |
| | | | | | | | | | | | | | | | |
Net asset value, end of the period | | $ | 14.01 | | | $ | 13.06 | | | $ | 11.32 | | | $ | 12.09 | |
| | | | | | | | | | | | | | | | |
Total return(b) | | | 8.36 | % | | | 16.73 | % | | | (5.32 | )% | | | 7.50 | %(c) |
RATIOS TO AVERAGE NET ASSETS: | |
Net assets, end of the period (000’s) | | $ | 728 | | | $ | 530 | | | $ | 1 | | | $ | 1 | |
Net expenses(d) | | | 0.90 | % | | | 0.90 | % | | | 0.90 | % | | | 0.90 | %(e) |
Gross expenses | | | 1.29 | % | | | 1.63 | % | | | 15.41 | % | | | 14.26 | %(e) |
Net investment income | | | 0.95 | % | | | 1.03 | % | | | 1.04 | % | | | 1.22 | %(e) |
Portfolio turnover rate | | | 15 | % | | | 17 | % | | | 58 | % | | | 19 | %(f) |
| * | From commencement of Class operations on May 1, 2017 through December 31, 2017. |
| (a) | Per share net investment income has been calculated using the average shares outstanding during the period. |
| (b) | Had certain expenses not been waived/reimbursed during the period, total returns would have been lower. |
| (c) | Periods less than one year are not annualized. |
| (d) | The investment adviser agreed to waive its fees and/or reimburse a portion of the Fund’s expenses during the period. Without this waiver/reimbursement, expenses would have been higher. |
| (e) | Computed on an annualized basis for periods less than one year. |
| (f) | Represents the Fund’s portfolio turnover rate for the year ended December 31, 2017. |
See accompanying notes to financial statements.
93 |
Financial Highlights (continued)
For a share outstanding throughout each period.
| | | | | | | | | | | | | | | | | | | | |
| | | Gateway Equity Call Premium Fund—Class Y | |
| | | Year Ended
December 31,
2020
| | | Year Ended
December 31,
2019
| | | Year Ended
December 31,
2018
| | | Year Ended
December 31,
2017
| | | Year Ended
December 31,
2016
| |
Net asset value, beginning of the period | | $ | 13.07 | | | $ | 11.32 | | | $ | 12.09 | | | $ | 10.89 | | | $ | 10.22 | |
| | | | | | | | | | | | | | | | | | | | |
INCOME (LOSS) FROM INVESTMENT OPERATIONS: | |
Net investment income(a) | | | 0.11 | | | | 0.13 | | | | 0.12 | | | | 0.13 | | | | 0.13 | |
Net realized and unrealized gain (loss) | | | 0.96 | | | | 1.76 | | | | (0.76 | ) | | | 1.19 | | | | 0.67 | |
| | | | | | | | | | | | | | | | | | | | |
Total from Investment Operations | | | 1.07 | | | | 1.89 | | | | (0.64 | ) | | | 1.32 | | | | 0.80 | |
| | | | | | | | | | | | | | | | | | | | |
LESS DISTRIBUTIONS FROM: | |
Net investment income | | | (0.12 | ) | | | (0.14 | ) | | | (0.13 | ) | | | (0.12 | ) | | | (0.13 | ) |
| | | | | | | | | | | | | | | | | | | | |
Net asset value, end of the period | | $ | 14.02 | | | $ | 13.07 | | | $ | 11.32 | | | $ | 12.09 | | | $ | 10.89 | |
| | | | | | | | | | | | | | | | | | | | |
Total return(b) | | | 8.38 | % | | | 16.67 | % | | | (5.37 | )% | | | 12.21 | % | | | 7.83 | % |
RATIOS TO AVERAGE NET ASSETS: | |
Net assets, end of the period (000’s) | | $ | 56,979 | | | $ | 60,794 | | | $ | 67,125 | | | $ | 73,255 | | | $ | 63,578 | |
Net expenses(c) | | | 0.95 | % | | | 0.95 | % | | | 0.95 | % | | | 0.95 | % | | | 0.95 | % |
Gross expenses | | | 1.17 | % | | | 1.17 | % | | | 1.19 | % | | | 1.05 | % | | | 1.06 | % |
Net investment income | | | 0.90 | % | | | 1.06 | % | | | 1.01 | % | | | 1.10 | % | | | 1.27 | % |
Portfolio turnover rate | | | 15 | % | | | 17 | % | | | 58 | % | | | 19 | % | | | 24 | % |
| (a) | Per share net investment income has been calculated using the average shares outstanding during the period. |
| (b) | Had certain expenses not been waived/reimbursed during the period, total returns would have been lower. |
| (c) | The investment adviser agreed to waive its fees and/or reimburse a portion of the Fund’s expenses during the period. Without this waiver/reimbursement, expenses would have been higher. |
See accompanying notes to financial statements.
| 94
Financial Highlights (continued)
For a share outstanding throughout each period.
| | | | | | | | | | | | | | | | |
| | | Mirova Global Green Bond—Class A | |
| | | Year Ended
December 31,
2020
| | | Year Ended
December 31,
2019
| | | Year Ended
December 31,
2018
| | | Period Ended
December 31,
2017*
| |
Net asset value, beginning of the period | | $ | 10.36 | | | $ | 9.71 | | | $ | 9.96 | | | $ | 10.00 | |
| | | | | | | | | | | | | | | | |
INCOME (LOSS) FROM INVESTMENT OPERATIONS: | | | | | | | | | | | | | | | | |
Net investment income(a) | | | 0.07 | | | | 0.09 | | | | 0.08 | | | | 0.04 | |
Net realized and unrealized gain (loss) | | | 0.71 | | | | 0.80 | | | | (0.02 | ) | | | 0.11 | |
| | | | | | | | | | | | | | | | |
Total from Investment Operations | | | 0.78 | | | | 0.89 | | | | 0.06 | | | | 0.15 | |
| | | | | | | | | | | | | | | | |
LESS DISTRIBUTIONS FROM: | | | | | | | | | | | | | | | | |
Net investment income | | | (0.18 | ) | | | (0.10 | ) | | | (0.31 | ) | | | (0.19 | ) |
Net realized capital gains | | | (0.19 | ) | | | (0.14 | ) | | | — | | | | — | |
| | | | | | | | | | | | | | | | |
Total Distributions | | | (0.37 | ) | | | (0.24 | ) | | | (0.31 | ) | | | (0.19 | ) |
| | | | | | | | | | | | | | | | |
Net asset value, end of the period | | $ | 10.77 | | | $ | 10.36 | | | $ | 9.71 | | | $ | 9.96 | |
| | | | | | | | | | | | | | | | |
Total return(b)(c) | | | 7.61 | % | | | 9.16 | % | | | 0.64 | % | | | 1.46 | %(d) |
RATIOS TO AVERAGE NET ASSETS: | | | | | | | | | | | | | | | | |
Net assets, end of the period (000’s) | | $ | 5,674 | | | $ | 2,549 | | | $ | 814 | | | $ | 139 | |
Net expenses(e) | | | 0.97 | %(f) | | | 0.96 | %(g) | | | 0.96 | %(h) | | | 0.96 | %(i)(j) |
Gross expenses | | | 1.43 | %(f) | | | 1.56 | %(g) | | | 1.75 | %(h) | | | 5.23 | %(i)(j) |
Net investment income | | | 0.69 | % | | | 0.86 | % | | | 0.85 | % | | | 0.49 | %(j) |
Portfolio turnover rate | | | 53 | % | | | 25 | % | | | 46 | % | | | 46 | % |
| * | From commencement of operations on February 28, 2017 through December 31, 2017. |
| (a) | Per share net investment income has been calculated using the average shares outstanding during the period. |
| (b) | A sales charge for Class A shares is not reflected in total return calculations. |
| (c) | Had certain expenses not been waived/reimbursed during the period, total returns would have been lower. |
| (d) | Periods less than one year are not annualized. |
| (e) | The investment adviser agreed to waive its fees and/or reimburse a portion of the Fund’s expenses during the period. Without this waiver/reimbursement, expenses would have been higher. |
| (f) | Includes interest expense. Without this expense the ratio of net expenses would have been 0.95% and the ratio of gross expenses would have been 1.41%. |
| (g) | Includes interest expense. Without this expense the ratio of net expenses would have been 0.95% and the ratio of gross expenses would have been 1.55%. |
| (h) | Includes interest expense. Without this expense the ratio of net expenses would have been 0.95% and the ratio of gross expenses would have been 1.74%. |
| (i) | Includes interest expense. Without this expense the ratio of net expenses would have been 0.95% and the ratio of gross expenses would have been 5.22%. |
| (j) | Computed on an annualized basis for periods less than one year. |
See accompanying notes to financial statements.
95 |
Financial Highlights (continued)
For a share outstanding throughout each period.
| | | | | | | | | | | | | | | | |
| | | Mirova Global Green Bond—Class N | |
| | | Year Ended
December 31,
2020
| | | Year Ended
December 31,
2019
| | | Year Ended
December 31,
2018
| | | Period Ended
December 31,
2017*
| |
Net asset value, beginning of the period | | $ | 10.39 | | | $ | 9.73 | | | $ | 9.98 | | | $ | 10.00 | |
| | | | | | | | | | | | | | | | |
INCOME (LOSS) FROM INVESTMENT OPERATIONS: | |
Net investment income(a) | | | 0.10 | | | | 0.12 | | | | 0.11 | | | | 0.06 | |
Net realized and unrealized gain (loss) | | | 0.71 | | | | 0.80 | | | | (0.02 | ) | | | 0.12 | |
| | | | | | | | | | | | | | | | |
Total from Investment Operations | | | 0.81 | | | | 0.92 | | | | 0.09 | | | | 0.18 | |
| | | | | | | | | | | | | | | | |
LESS DISTRIBUTIONS FROM: | |
Net investment income | | | (0.21 | ) | | | (0.12 | ) | | | (0.34 | ) | | | (0.20 | ) |
Net realized capital gains | | | (0.19 | ) | | | (0.14 | ) | | | — | | | | — | |
| | | | | | | | | | | | | | | | |
Total Distributions | | | (0.40 | ) | | | (0.26 | ) | | | (0.34 | ) | | | (0.20 | ) |
| | | | | | | | | | | | | | | | |
Net asset value, end of the period | | $ | 10.80 | | | $ | 10.39 | | | $ | 9.73 | | | $ | 9.98 | |
| | | | | | | | | | | | | | | | |
Total return(b) | | | 7.89 | % | | | 9.52 | % | | | 0.93 | % | | | 1.77 | %(c) |
RATIOS TO AVERAGE NET ASSETS: | |
Net assets, end of the period (000’s) | | $ | 11,781 | | | $ | 27,322 | | | $ | 27,050 | | | $ | 25,805 | |
Net expenses(d) | | | 0.67 | %(e) | | | 0.66 | %(f) | | | 0.66 | %(g) | | | 0.67 | %(h)(i) |
Gross expenses | | | 1.07 | %(e) | | | 1.08 | %(f) | | | 1.12 | %(g) | | | 1.11 | %(h)(i) |
Net investment income | | | 0.96 | % | | | 1.17 | % | | | 1.13 | % | | | 0.75 | %(i) |
Portfolio turnover rate | | | 53 | % | | | 25 | % | | | 46 | % | | | 46 | % |
| * | From commencement of operations on February 28, 2017 through December 31, 2017. |
| (a) | Per share net investment income has been calculated using the average shares outstanding during the period. |
| (b) | Had certain expenses not been waived/reimbursed during the period, total returns would have been lower. |
| (c) | Periods less than one year are not annualized. |
| (d) | The investment adviser agreed to waive its fees and/or reimburse a portion of the Fund’s expenses during the period. Without this waiver/reimbursement, expenses would have been higher. |
| (e) | Includes interest expense. Without this expense the ratio of net expenses would have been 0.65% and the ratio of gross expenses would have been 1.05%. |
| (f) | Includes interest expense. Without this expense the ratio of net expenses would have been 0.65% and the ratio of gross expenses would have been 1.07%. |
| (g) | Includes interest expense. Without this expense the ratio of net expenses would have been 0.65% and the ratio of gross expenses would have been 1.11%. |
| (h) | Includes interest expense. Without this expense the ratio of net expenses would have been 0.65% and the ratio of gross expenses would have been 1.10%. |
| (i) | Computed on an annualized basis for periods less than one year. |
See accompanying notes to financial statements.
| 96
Financial Highlights (continued)
For a share outstanding throughout each period.
| | | | | | | | | | | | | | | | |
| | | Mirova Global Green Bond—Class Y | |
| | | Year Ended
December 31,
2020 | | | Year Ended
December 31,
2019 | | | Year Ended
December 31,
2018 | | | Period Ended
December 31,
2017* | |
Net asset value, beginning of the period | | $ | 10.37 | | | $ | 9.72 | | | $ | 9.97 | | | $ | 10.00 | |
| | | | | | | | | | | | | | | | |
INCOME (LOSS) FROM INVESTMENT OPERATIONS: | |
Net investment income(a) | | | 0.10 | | | | 0.11 | | | | 0.12 | | | | 0.06 | |
Net realized and unrealized gain (loss) | | | 0.72 | | | | 0.80 | | | | (0.03 | ) | | | 0.11 | |
| | | | | | | | | | | | | | | | |
Total from Investment Operations | | | 0.82 | | | | 0.91 | | | | 0.09 | | | | 0.17 | |
| | | | | | | | | | | | | | | | |
LESS DISTRIBUTIONS FROM: | |
Net investment income | | | (0.21 | ) | | | (0.12 | ) | | | (0.34 | ) | | | (0.20 | ) |
Net realized capital gains | | | (0.19 | ) | | | (0.14 | ) | | | — | | | | — | |
| | | | | | | | | | | | | | | | |
Total Distributions | | | (0.40 | ) | | | (0.26 | ) | | | (0.34 | ) | | | (0.20 | ) |
| | | | | | | | | | | | | | | | |
Net asset value, end of the period | | $ | 10.79 | | | $ | 10.37 | | | $ | 9.72 | | | $ | 9.97 | |
| | | | | | | | | | | | | | | | |
Total return(b) | | | 7.85 | % | | | 9.38 | % | | | 0.89 | % | | | 1.66 | %(c) |
RATIOS TO AVERAGE NET ASSETS: | |
Net assets, end of the period (000’s) | | $ | 22,081 | | | $ | 7,060 | | | $ | 1,205 | | | $ | 43 | |
Net expenses(d) | | | 0.72 | %(e) | | | 0.71 | %(f) | | | 0.71 | %(g) | | | 0.71 | %(h)(i) |
Gross expenses | | | 1.18 | %(e) | | | 1.28 | %(f) | | | 1.39 | %(g) | | | 3.62 | %(h)(i) |
Net investment income | | | 0.94 | % | | | 1.10 | % | | | 1.19 | % | | | 0.71 | %(i) |
Portfolio turnover rate | | | 53 | % | | | 25 | % | | | 46 | % | | | 46 | % |
| * | From commencement of operations on February 28, 2017 through December 31, 2017. |
| (a) | Per share net investment income has been calculated using the average shares outstanding during the period. |
| (b) | Had certain expenses not been waived/reimbursed during the period, total returns would have been lower. |
| (c) | Periods less than one year are not annualized. |
| (d) | The investment adviser agreed to waive its fees and/or reimburse a portion of the Fund’s expenses during the period. Without this waiver/reimbursement, expenses would have been higher. |
| (e) | Includes interest expense. Without this expense the ratio of net expenses would have been 0.70% and the ratio of gross expenses would have been 1.16%. |
| (f) | Includes interest expense. Without this expense the ratio of net expenses would have been 0.70% and the ratio of gross expenses would have been 1.27%. |
| (g) | Includes interest expense. Without this expense the ratio of net expenses would have been 0.70% and the ratio of gross expenses would have been 1.39%. |
| (h) | Includes interest expense. Without this expense the ratio of net expenses would have been 0.70% and the ratio of gross expenses would have been 3.62%. |
| (i) | Computed on an annualized basis for periods less than one year. |
See accompanying notes to financial statements.
97 |
Financial Highlights (continued)
For a share outstanding throughout each period.
| | | | | | | | | | | | | | | | | | | | |
| | | Mirova Global Sustainable Equity Fund—Class A | |
| | | Year Ended
December 31,
2020 | | | Year Ended
December 31,
2019 | | | Year Ended
December 31,
2018 | | | Year Ended
December 31,
2017 | | | Period Ended
December 31,
2016* | |
Net asset value, beginning of the period | | $ | 14.92 | | | $ | 11.45 | | | $ | 12.77 | | | $ | 9.90 | | | $ | 10.00 | |
| | | | | | | | | | | | | | | | | | | | |
INCOME (LOSS) FROM INVESTMENT OPERATIONS: | |
Net investment income (loss)(a) | | | (0.02 | ) | | | 0.03 | | | | 0.00 | (b) | | | (0.04 | ) | | | 0.02 | |
Net realized and unrealized gain (loss) | | | 4.77 | | | | 3.69 | | | | (0.84 | ) | | | 3.06 | | | | (0.11 | ) |
| | | | | | | | | | | | | | | | | | | | |
Total from Investment Operations | | | 4.75 | | | | 3.72 | | | | (0.84 | ) | | | 3.02 | | | | (0.09 | ) |
| | | | | | | | | | | | | | | | | | | | |
LESS DISTRIBUTIONS FROM: | |
Net investment income | | | (0.00 | )(b) | | | (0.03 | ) | | | (0.00 | )(b) | | | (0.03 | ) | | | (0.00 | )(b) |
Net realized capital gains | | | (0.10 | ) | | | (0.22 | ) | | | (0.48 | ) | | | (0.12 | ) | | | (0.01 | ) |
| | | | | | | | | | | | | | | | | | | | |
Total Distributions | | | (0.10 | ) | | | (0.25 | ) | | | (0.48 | ) | | | (0.15 | ) | | | (0.01 | ) |
| | | | | | | | | | | | | | | | | | | | |
Net asset value, end of the period | | $ | 19.57 | | | $ | 14.92 | | | $ | 11.45 | | | $ | 12.77 | | | $ | 9.90 | |
| | | | | | | | | | | | | | | | | | | | |
Total return(c)(d) | | | 32.07 | % | | | 32.63 | % | | | (6.54 | )% | | | 30.44 | % | | | (0.85 | )%(e) |
RATIOS TO AVERAGE NET ASSETS: | |
Net assets, end of the period (000’s) | | $ | 33,625 | | | $ | 12,884 | | | $ | 6,360 | | | $ | 3,260 | | | $ | 71 | |
Net expenses(f) | | | 1.20 | % | | | 1.21 | %(g) | | | 1.30 | %(h)(i) | | | 1.29 | % | | | 1.30 | %(j) |
Gross expenses | | | 1.24 | % | | | 1.39 | %(g) | | | 1.39 | %(h) | | | 1.43 | % | | | 1.72 | %(j) |
Net investment income (loss) | | | (0.14 | )% | | | 0.21 | % | | | 0.03 | % | | | (0.36 | )% | | | 0.23 | %(j) |
Portfolio turnover rate | | | 11 | % | | | 23 | % | | | 19 | % | | | 20 | % | | | 20 | % |
| * | From commencement of operations on March 31, 2016 through December 31, 2016. |
| (a) | Per share net investment income (loss) has been calculated using the average shares outstanding during the period. |
| (b) | Amount rounds to less than $0.01 per share. |
| (c) | Had certain expenses not been waived/reimbursed during the period, total returns would have been lower. |
| (d) | A sales charge for Class A shares is not reflected in total return calculations. |
| (e) | Periods less than one year are not annualized. |
| (f) | The investment adviser agreed to waive its fees and/or reimburse a portion of the Fund’s expenses during the period. Without this waiver/reimbursement, expenses would have been higher. |
| (g) | Includes interest expense. Without this expense the ratio of net expenses would have been 1.20% and the ratio of gross expenses would have been 1.38%. |
| (h) | Includes interest expense of less than 0.01%. |
| (i) | Effective December 28, 2018, the expense limit decreased from 1.30% to 1.20%. |
| (j) | Computed on an annualized basis for periods less than one year. |
See accompanying notes to financial statements.
| 98
Financial Highlights (continued)
For a share outstanding throughout each period.
| | | | | | | | | | | | | | | | | | | | |
| | | Mirova Global Sustainable Equity Fund—Class C | |
| | | Year Ended
December 31,
2020 | | | Year Ended
December 31,
2019 | | | Year Ended
December 31,
2018 | | | Year Ended
December 31,
2017 | | | Period Ended
December 31,
2016* | |
Net asset value, beginning of the period | | $ | 14.56 | | | $ | 11.24 | | | $ | 12.63 | | | $ | 9.85 | | | $ | 10.00 | |
| | | | | | | | | | | | | | | | | | | | |
INCOME (LOSS) FROM INVESTMENT OPERATIONS: | |
Net investment loss(a) | | | (0.13 | ) | | | (0.07 | ) | | | (0.09 | ) | | | (0.12 | ) | | | (0.06 | ) |
Net realized and unrealized gain (loss) | | | 4.62 | | | | 3.61 | | | | (0.82 | ) | | | 3.02 | | | | (0.08 | ) |
| | | | | | | | | | | | | | | | | | | | |
Total from Investment Operations | | | 4.49 | | | | 3.54 | | | | (0.91 | ) | | | 2.90 | | | | (0.14 | ) |
| | | | | | | | | | | | | | | | | | | | |
LESS DISTRIBUTIONS FROM: | |
Net investment income | | | (0.00 | )(b) | | | — | | | | — | | | | — | | | | — | |
Net realized capital gains | | | (0.10 | ) | | | (0.22 | ) | | | (0.48 | ) | | | (0.12 | ) | | | (0.01 | ) |
| | | | | | | | | | | | | | | | | | | | |
Total Distributions | | | (0.10 | ) | | | (0.22 | ) | | | (0.48 | ) | | | (0.12 | ) | | | (0.01 | ) |
| | | | | | | | | | | | | | | | | | | | |
Net asset value, end of the period | | $ | 18.95 | | | $ | 14.56 | | | $ | 11.24 | | | $ | 12.63 | | | $ | 9.85 | |
| | | | | | | | | | | | | | | | | | | | |
Total return(c)(d) | | | 31.07 | % | | | 31.66 | % | | | (7.20 | )% | | | 29.40 | % | | | (1.39 | )%(e) |
RATIOS TO AVERAGE NET ASSETS: | |
Net assets, end of the period (000’s) | | $ | 11,196 | | | $ | 5,406 | | | $ | 2,706 | | | $ | 1,164 | | | $ | 52 | |
Net expenses(f) | | | 1.95 | % | | | 1.96 | %(g) | | | 2.05 | %(h)(i) | | | 2.04 | % | | | 2.05 | %(j) |
Gross expenses | | | 1.99 | % | | | 2.14 | %(g) | | | 2.14 | %(h) | | | 2.18 | % | | | 2.20 | %(j) |
Net investment loss | | | (0.84 | )% | | | (0.52 | )% | | | (0.72 | )% | | | (1.02 | )% | | | (0.77 | )%(j) |
Portfolio turnover rate | | | 11 | % | | | 23 | % | | | 19 | % | | | 20 | % | | | 20 | % |
| * | From commencement of operations on March 31, 2016 through December 31, 2016. |
| (a) | Per share net investment loss has been calculated using the average shares outstanding during the period. |
| (b) | Amount rounds to less than $0.01 per share. |
| (c) | Had certain expenses not been waived/reimbursed during the period, total returns would have been lower. |
| (d) | A contingent deferred sales charge for Class C shares is not reflected in total return calculations. |
| (e) | Periods less than one year are not annualized. |
| (f) | The investment adviser agreed to waive its fees and/or reimburse a portion of the Fund’s expenses during the period. Without this waiver/reimbursement, expenses would have been higher. |
| (g) | Includes interest expense. Without this expense the ratio of net expenses would have been 1.95% and the ratio of gross expenses would have been 2.13%. |
| (h) | Includes interest expense of less than 0.01%. |
| (i) | Effective December 28, 2018, the expense limit decreased from 2.05% to 1.95%. |
| (j) | Computed on an annualized basis for periods less than one year. |
See accompanying notes to financial statements.
99 |
Financial Highlights (continued)
For a share outstanding throughout each period.
| | | | | | | | | | | | | | | | |
| | | Mirova Global Sustainable Equity Fund—Class N | |
| | | Year Ended
December 31,
2020 | | | Year Ended
December 31,
2019 | | | Year Ended
December 31,
2018 | | | Period Ended
December 31,
2017* | |
Net asset value, beginning of the period | | $ | 14.99 | | | $ | 11.49 | | | $ | 12.81 | | | $ | 11.29 | |
| | | | | | | | | | | | | | | | |
INCOME (LOSS) FROM INVESTMENT OPERATIONS: | |
Net investment income (loss)(a) | | | 0.01 | | | | 0.06 | | | | (0.01 | ) | | | 0.02 | |
Net realized and unrealized gain (loss) | | | 4.82 | | | | 3.72 | | | | (0.79 | ) | | | 1.66 | |
| | | | | | | | | | | | | | | | |
Total from Investment Operations | | | 4.83 | | | | 3.78 | | | | (0.80 | ) | | | 1.68 | |
| | | | | | | | | | | | | | | | |
LESS DISTRIBUTIONS FROM: | |
Net investment income | | | (0.01 | ) | | | (0.06 | ) | | | (0.04 | ) | | | (0.04 | ) |
Net realized capital gains | | | (0.10 | ) | | | (0.22 | ) | | | (0.48 | ) | | | (0.12 | ) |
| | | | | | | | | | | | | | | | |
Total Distributions | | | (0.11 | ) | | | (0.28 | ) | | | (0.52 | ) | | | (0.16 | ) |
| | | | | | | | | | | | | | | | |
Net asset value, end of the period | | $ | 19.71 | | | $ | 14.99 | | | $ | 11.49 | | | $ | 12.81 | |
| | | | | | | | | | | | | | | | |
Total return(b) | | | 32.44 | % | | | 33.05 | % | | | (6.26 | )% | | | 14.81 | %(c) |
RATIOS TO AVERAGE NET ASSETS: | |
Net assets, end of the period (000’s) | | $ | 72,768 | | | $ | 11,000 | | | $ | 2,842 | | | $ | 1 | |
Net expenses(d) | | | 0.90 | % | | | 0.90 | %(e) | | | 1.01 | %(f)(g) | | | 1.00 | %(h) |
Gross expenses | | | 0.93 | % | | | 1.08 | %(e) | | | 1.08 | %(f) | | | 14.30 | %(h) |
Net investment income (loss) | | | 0.08 | % | | | 0.46 | % | | | (0.08 | )% | | | 0.29 | %(h) |
Portfolio turnover rate | | | 11 | % | | | 23 | % | | | 19 | % | | | 20 | %(i) |
| * | From commencement of Class operations on May 1, 2017 through December 31, 2017. |
| (a) | Per share net investment income (loss) has been calculated using the average shares outstanding during the period. |
| (b) | Had certain expenses not been waived/reimbursed during the period, total returns would have been lower. |
| (c) | Periods less than one year are not annualized. |
| (d) | The investment adviser agreed to waive its fees and/or reimburse a portion of the Fund’s expenses during the period. Without this waiver/reimbursement, expenses would have been higher. |
| (e) | Includes interest expense of less than 0.01%. |
| (f) | Includes interest expense. Without this expense the ratio of net expenses would have been 0.99% and the ratio of gross expenses would have been 1.07%. |
| (g) | Effective December 28, 2018, the expense limit decreased from 1.00% to 0.90%. |
| (h) | Computed on an annualized basis for periods less than one year. |
| (i) | Represents the Fund’s portfolio turnover rate for the year ended December 31, 2017. |
See accompanying notes to financial statements.
| 100
Financial Highlights (continued)
For a share outstanding throughout each period.
| | | | | | | | | | | | | | | | | | | | |
| | | Mirova Global Sustainable Equity Fund—Class Y | |
| | | Year Ended
December 31,
2020 | | | Year Ended
December 31,
2019 | | | Year Ended
December 31,
2018 | | | Year Ended
December 31,
2017 | | | Period Ended
December 31,
2016* | |
Net asset value, beginning of the period | | $ | 14.99 | | | $ | 11.49 | | | $ | 12.81 | | | $ | 9.91 | | | $ | 10.00 | |
| | | | | | | | | | | | | | | | | | | | |
INCOME (LOSS) FROM INVESTMENT OPERATIONS: | |
Net investment income(a) | | | 0.01 | | | | 0.07 | | | | 0.04 | | | | 0.03 | | | | 0.03 | |
Net realized and unrealized gain (loss) | | | 4.81 | | | | 3.70 | | | | (0.85 | ) | | | 3.02 | | | | (0.10 | ) |
| | | | | | | | | | | | | | | | | | | | |
Total from Investment Operations | | | 4.82 | | | | 3.77 | | | | (0.81 | ) | | | 3.05 | | | | (0.07 | ) |
| | | | | | | | | | | | | | | | | | | | |
LESS DISTRIBUTIONS FROM: | |
Net investment income | | | (0.00 | )(b) | | | (0.05 | ) | | | (0.03 | ) | | | (0.03 | ) | | | (0.01 | ) |
Net realized capital gains | | | (0.10 | ) | | | (0.22 | ) | | | (0.48 | ) | | | (0.12 | ) | | | (0.01 | ) |
| | | | | | | | | | | | | | | | | | | | |
Total Distributions | | | (0.10 | ) | | | (0.27 | ) | | | (0.51 | ) | | | (0.15 | ) | | | (0.02 | ) |
| | | | | | | | | | | | | | | | | | | | |
Net asset value, end of the period | | $ | 19.71 | | | $ | 14.99 | | | $ | 11.49 | | | $ | 12.81 | | | $ | 9.91 | |
| | | | | | | | | | | | | | | | | | | | |
Total return(c) | | | 32.42 | % | | | 32.99 | % | | | (6.32 | )% | | | 30.75 | % | | | (0.70 | )%(d) |
RATIOS TO AVERAGE NET ASSETS: | |
Net assets, end of the period (000’s) | | $ | 760,181 | | | $ | 118,032 | | | $ | 69,705 | | | $ | 63,359 | | | $ | 49,593 | |
Net expenses(e) | | | 0.95 | % | | | 0.96 | %(f) | | | 1.05 | %(g)(h) | | | 1.04 | % | | | 1.05 | %(i) |
Gross expenses | | | 0.99 | % | | | 1.14 | %(f) | | | 1.15 | %(g) | | | 1.16 | % | | | 1.21 | %(i) |
Net investment income | | | 0.06 | % | | | 0.50 | % | | | 0.29 | % | | | 0.26 | % | | | 0.35 | %(i) |
Portfolio turnover rate | | | 11 | % | | | 23 | % | | | 19 | % | | | 20 | % | | | 20 | % |
| * | From commencement of operations on March 31, 2016 through December 31, 2016. |
| (a) | Per share net investment income has been calculated using the average shares outstanding during the period. |
| (b) | Amount rounds to less than $0.01 per share. |
| (c) | Had certain expenses not been waived/reimbursed during the period, total returns would have been lower. |
| (d) | Periods less than one year are not annualized. |
| (e) | The investment adviser agreed to waive its fees and/or reimburse a portion of the Fund’s expenses during the period. Without this waiver/reimbursement, expenses would have been higher. |
| (f) | Includes interest expense. Without this expense the ratio of net expenses would have been 0.95% and the ratio of gross expenses would have been 1.13%. |
| (g) | Includes interest expense of less than 0.01%. |
| (h) | Effective December 28, 2018, the expense limit decreased from 1.05% to 0.95%. |
| (i) | Computed on an annualized basis for periods less than one year. |
See accompanying notes to financial statements.
101 |
Financial Highlights (continued)
For a share outstanding throughout each period.
| | | | | | | | | | | | |
| | | Mirova International Sustainable Equity Fund—Class A | |
| | | Year Ended
December 31,
2020 | | | Year Ended
December 31,
2019 | | | Period Ended
December 31,
2018* | |
Net asset value, beginning of the period | | $ | 12.51 | | | $ | 10.03 | | | $ | 10.00 | |
| | | | | | | | | | | | |
INCOME (LOSS) FROM INVESTMENT OPERATIONS: | |
Net investment income (loss)(a) | | | (0.01 | ) | | | 0.12 | | | | (0.00 | )(b) |
Net realized and unrealized gain (loss) | | | 2.87 | | | | 2.48 | | | | 0.03 | |
| | | | | | | | | | | | |
Total from Investment Operations | | | 2.86 | | | | 2.60 | | | | 0.03 | |
| | | | | | | | | | | | |
LESS DISTRIBUTIONS FROM: | |
Net investment income | | | (0.12 | ) | | | (0.12 | ) | | | — | |
Net realized capital gains | | | (1.30 | ) | | | — | | | | — | |
| | | | | | | | | | | | |
Total Distributions | | | (1.42 | ) | | | (0.12 | ) | | | — | |
| | | | | | | | | | | | |
Net asset value, end of the period | | $ | 13.95 | | | $ | 12.51 | | | $ | 10.03 | |
| | | | | | | | | | | | |
Total return(c)(d) | | | 23.18 | % | | | 25.97 | %(e) | | | 0.30 | %(f) |
RATIOS TO AVERAGE NET ASSETS: | |
Net assets, end of the period (000’s) | | $ | 76 | | | $ | 4 | | | $ | 1 | |
Net expenses(g) | | | 1.26 | %(h) | | | 1.21 | %(i) | | | 1.20 | %(j) |
Gross expenses | | | 5.69 | %(h) | | | 107.91 | %(i) | | | 22.87 | %(j) |
Net investment income (loss) | | | (0.04 | )% | | | 1.09 | % | | | (1.20 | )%(j) |
Portfolio turnover rate | | | 11 | % | | | 8 | % | | | 0 | % |
| * | From commencement of operations on December 28, 2018 through December 31, 2018. |
| (a) | Per share net investment income (loss) has been calculated using the average shares outstanding during the period. |
| (b) | Amount rounds to less than $0.01 per share. |
| (c) | A sales charge for Class A shares is not reflected in total return calculations. |
| (d) | Had certain expenses not been waived/reimbursed during the period, total returns would have been lower. |
| (e) | Generally accepted accounting principles require certain adjustments to be made to the net assets of the Fund for financial reporting purposes only, and as such, the total returns based on the adjusted net asset values per share may differ from the total returns reported in the average annual total return table. |
| (f) | Periods less than one year are not annualized. |
| (g) | The investment adviser agreed to waive its fees and/or reimburse a portion of the Fund’s expenses during the period. Without this waiver/reimbursement, expenses would have been higher. |
| (h) | Includes interest expense. Without this expense the ratio of net expenses would have been 1.20% and the ratio of gross expenses would have been 5.64%. |
| (i) | Includes interest expense. Without this expense the ratio of net expenses would have been 1.20% and the ratio of gross expenses would have been 107.90%. |
| (j) | Computed on an annualized basis for periods less than one year. |
See accompanying notes to financial statements.
| 102
Financial Highlights (continued)
For a share outstanding throughout each period.
| | | | | | | | | | | | |
| | | Mirova International Sustainable Equity Fund—Class N | |
| | | Year Ended
December 31,
2020 | | | Year Ended
December 31,
2019 | | | Period Ended
December 31,
2018* | |
Net asset value, beginning of the period | | $ | 12.51 | | | $ | 10.03 | | | $ | 10.00 | |
| | | | | | | | | | | | |
INCOME (LOSS) FROM INVESTMENT OPERATIONS: | |
Net investment income (loss)(a) | | | 0.07 | | | | 0.15 | | | | (0.00 | )(b) |
Net realized and unrealized gain (loss) | | | 2.84 | | | | 2.49 | | | | 0.03 | |
| | | | | | | | | | | | |
Total from Investment Operations | | | 2.91 | | | | 2.64 | | | | 0.03 | |
| | | | | | | | | | �� | | |
LESS DISTRIBUTIONS FROM: | |
Net investment income | | | (0.13 | ) | | | (0.16 | ) | | | — | |
Net realized capital gains | | | (1.30 | ) | | | — | | | | — | |
| | | | | | | | | | | | |
Total Distributions | | | (1.43 | ) | | | (0.16 | ) | | | — | |
| | | | | | | | | | | | |
Net asset value, end of the period | | $ | 13.99 | | | $ | 12.51 | | | $ | 10.03 | |
| | | | | | | | | | | | |
Total return(c) | | | 23.60 | % | | | 26.31 | %(d) | | | 0.30 | %(e) |
RATIOS TO AVERAGE NET ASSETS: | |
Net assets, end of the period (000’s) | | $ | 16,478 | | | $ | 17,193 | | | $ | 10,035 | |
Net expenses(f) | | | 0.93 | %(g) | | | 0.92 | %(h) | | | 0.90 | %(i) |
Gross expenses | | | 1.83 | %(g) | | | 1.99 | %(h) | | | 22.55 | %(i) |
Net investment income (loss) | | | 0.58 | % | | | 1.36 | % | | | (0.90 | )%(i) |
Portfolio turnover rate | | | 11 | % | | | 8 | % | | | 0 | % |
| * | From commencement of operations on December 28, 2018 through December 31, 2018. |
| (a) | Per share net investment income (loss) has been calculated using the average shares outstanding during the period. |
| (b) | Amount rounds to less than $0.01 per share. |
| (c) | Had certain expenses not been waived/reimbursed during the period, total returns would have been lower. |
| (d) | Generally accepted accounting principles require certain adjustments to be made to the net assets of the Fund for financial reporting purposes only, and as such, the total returns based on the adjusted net asset values per share may differ from the total returns reported in the average annual total return table. |
| (e) | Periods less than one year are not annualized. |
| (f) | The investment adviser agreed to waive its fees and/or reimburse a portion of the Fund’s expenses during the period. Without this waiver/reimbursement, expenses would have been higher. |
| (g) | Includes interest expense. Without this expense the ratio of net expenses would have been 0.90% and the ratio of gross expenses would have been 1.80%. |
| (h) | Includes interest expense. Without this expense the ratio of net expenses would have been 0.90% and the ratio of gross expenses would have been 1.97%. |
| (i) | Computed on an annualized basis for periods less than one year. |
See accompanying notes to financial statements.
103 |
Financial Highlights (continued)
For a share outstanding throughout each period.
| | | | | | | | | | | | |
| | | Mirova International Sustainable Equity Fund—Class Y | |
| | | Year Ended
December 31,
2020 | | | Year Ended
December 31,
2019 | | | Period Ended
December 31,
2018* | |
Net asset value, beginning of the period | | $ | 12.50 | | | $ | 10.03 | | | $ | 10.00 | |
| | | | | | | | | | | | |
INCOME (LOSS) FROM INVESTMENT OPERATIONS: | |
Net investment income (loss)(a) | | | 0.03 | | | | 0.15 | | | | (0.00 | )(b) |
Net realized and unrealized gain (loss) | | | 2.88 | | | | 2.48 | | | | 0.03 | |
| | | | | | | | | | | | |
Total from Investment Operations | | | 2.91 | | | | 2.63 | | | | 0.03 | |
| | | | | | | | | | | | |
LESS DISTRIBUTIONS FROM: | |
Net investment income | | | (0.13 | ) | | | (0.16 | ) | | | — | |
Net realized capital gains | | | (1.30 | ) | | | — | | | | — | |
| | | | | | | | | | | | |
Total Distributions | | | (1.43 | ) | | | (0.16 | ) | | | — | |
| | | | | | | | | | | | |
Net asset value, end of the period | | $ | 13.98 | | | $ | 12.50 | | | $ | 10.03 | |
| | | | | | | | | | | | |
Total return(c) | | | 23.60 | % | | | 26.21 | %(d) | | | 0.30 | %(e) |
RATIOS TO AVERAGE NET ASSETS: | |
Net assets, end of the period (000’s) | | $ | 75 | | | $ | 9 | | | $ | 1 | |
Net expenses(f) | | | 1.00 | %(g) | | | 0.96 | %(h) | | | 0.95 | %(i) |
Gross expenses | | | 6.51 | %(g) | | | 94.13 | %(h) | | | 22.51 | %(i) |
Net investment income (loss) | | | 0.21 | % | | | 1.36 | % | | | (0.95 | )%(i) |
Portfolio turnover rate | | | 11 | % | | | 8 | % | | | 0 | % |
| * | From commencement of operations on December 28, 2018 through December 31, 2018. |
| (a) | Per share net investment income (loss) has been calculated using the average shares outstanding during the period. |
| (b) | Amount rounds to less than $0.01 per share. |
| (c) | Had certain expenses not been waived/reimbursed during the period, total returns would have been lower. |
| (d) | Generally accepted accounting principles require certain adjustments to be made to the net assets of the Fund for financial reporting purposes only, and as such, the total returns based on the adjusted net asset values per share may differ from the total returns reported in the average annual total return table. |
| (e) | Periods less than one year, if applicable, are not annualized. |
| (f) | The investment adviser agreed to waive its fees and/or reimburse a portion of the Fund’s expenses during the period. Without this waiver/reimbursement, expenses would have been higher. |
| (g) | Includes interest expense. Without this expense the ratio of net expenses would have been 0.95% and the ratio of gross expenses would have been 6.46%. |
| (h) | Includes interest expense. Without this expense the ratio of net expenses would have been 0.95% and the ratio of gross expenses would have been 94.12%. |
| (i) | Computed on an annualized basis for periods less than one year. |
See accompanying notes to financial statements.
| 104
Financial Highlights (continued)
For a share outstanding throughout each period.
| | | | |
| | | Mirova U.S. Sustainable
Equity Fund—Class A | |
| | | Period Ended
December 31,
2020* | |
Net asset value, beginning of the period | | $ | 10.00 | |
| | | | |
INCOME (LOSS) FROM INVESTMENT OPERATIONS: | |
Net investment loss(a) | | | (0.00 | )(b) |
Net realized and unrealized gain (loss) | | | 0.21 | |
| | | | |
Total from Investment Operations | | | 0.21 | |
| | | | |
Net asset value, end of the period | | $ | 10.21 | |
| | | | |
Total return(c)(d)(e) | | | 2.10 | % |
RATIOS TO AVERAGE NET ASSETS: | |
Net assets, end of the period (000’s) | | $ | 1 | |
Net expenses(f)(g) | | | 1.05 | % |
Gross expenses(g) | | | 23.61 | % |
Net investment loss(g) | | | (0.73 | )% |
Portfolio turnover rate | | | 0 | % |
| * | From commencement of operations on December 15, 2020 through December 31, 2020. |
| (a) | Per share net investment loss has been calculated using the average shares outstanding during the period. |
| (b) | Amount rounds to less than $0.01 per share. |
| (c) | Had certain expenses not been waived/reimbursed during the period, total returns would have been lower. |
| (d) | A sales charge for Class A shares is not reflected in total return calculations. |
| (e) | Periods less than one year are not annualized. |
| (f) | The investment adviser agreed to waive its fees and/or reimburse a portion of the Fund’s expenses during the period. Without this waiver/reimbursement, expenses would have been higher. |
| (g) | Computed on an annualized basis for periods less than one year. |
See accompanying notes to financial statements.
105 |
Financial Highlights (continued)
For a share outstanding throughout each period.
| | | | |
| | | Mirova U.S. Sustainable
Equity Fund—Class C | |
| | | Period Ended
December 31,
2020* | |
Net asset value, beginning of the period | | $ | 10.00 | |
| | | | |
INCOME (LOSS) FROM INVESTMENT OPERATIONS: | |
Net investment loss(a) | | | (0.01 | ) |
Net realized and unrealized gain (loss) | | | 0.22 | |
| | | | |
Total from Investment Operations | | | 0.21 | |
| | | | |
Net asset value, end of the period | | $ | 10.21 | |
| | | | |
Total return(b)(c)(d) | | | 2.10 | % |
RATIOS TO AVERAGE NET ASSETS: | |
Net assets, end of the period (000’s) | | $ | 1 | |
Net expenses(e)(f) | | | 1.80 | % |
Gross expenses(f) | | | 24.34 | % |
Net investment loss(f) | | | (1.45 | )% |
Portfolio turnover rate | | | 0 | % |
| * | From commencement of operations on December 15, 2020 through December 31, 2020. |
| (a) | Per share net investment loss has been calculated using the average shares outstanding during the period. |
| (b) | Had certain expenses not been waived/reimbursed during the period, total returns would have been lower. |
| (c) | A contingent deferred sales charge for Class C shares is not reflected in total return calculations. |
| (d) | Periods less than one year are not annualized. |
| (e) | The investment adviser agreed to waive its fees and/or reimburse a portion of the Fund’s expenses during the period. Without this waiver/reimbursement, expenses would have been higher. |
| (f) | Computed on an annualized basis for periods less than one year. |
See accompanying notes to financial statements.
| 106
Financial Highlights (continued)
For a share outstanding throughout each period.
| | | | |
| | | Mirova U.S. Sustainable
Equity Fund—Class N | |
| | | Period Ended
December 31,
2020*
| |
Net asset value, beginning of the period | | $ | 10.00 | |
| | | | |
INCOME (LOSS) FROM INVESTMENT OPERATIONS: | |
Net investment loss(a) | | | (0.00 | )(b) |
Net realized and unrealized gain (loss) | | | 0.21 | |
| | | | |
Total from Investment Operations | | | 0.21 | |
| | | | |
Net asset value, end of the period | | $ | 10.21 | |
| | | | |
Total return(c)(d) | | | 2.10 | % |
RATIOS TO AVERAGE NET ASSETS: | |
Net assets, end of the period (000’s) | | $ | 5,106 | |
Net expenses(e)(f) | | | 0.75 | % |
Gross expenses(f) | | | 17.07 | % |
Net investment loss(f) | | | (0.39 | )% |
Portfolio turnover rate | | | 0 | % |
| * | From commencement of operations on December 15, 2020 through December 31, 2020. |
| (a) | Per share net investment loss has been calculated using the average shares outstanding during the period. |
| (b) | Amount rounds to less than $0.01 per share. |
| (c) | Had certain expenses not been waived/reimbursed during the period, total returns would have been lower. |
| (d) | Periods less than one year are not annualized. |
| (e) | The investment adviser agreed to waive its fees and/or reimburse a portion of the Fund’s expenses during the period. Without this waiver/reimbursement, expenses would have been higher. |
| (f) | Computed on an annualized basis for periods less than one year. |
See accompanying notes to financial statements.
107 |
Financial Highlights (continued)
For a share outstanding throughout each period.
| | | | |
| | | Mirova U.S. Sustainable
Equity Fund—Class Y | |
| | | Period Ended
December 31,
2020* | |
Net asset value, beginning of the period | | $ | 10.00 | |
| | | | |
INCOME (LOSS) FROM INVESTMENT OPERATIONS: | |
Net investment loss(a) | | | (0.00 | )(b) |
Net realized and unrealized gain (loss) | | | 0.21 | |
| | | | |
Total from Investment Operations | | | 0.21 | |
| | | | |
Net asset value, end of the period | | $ | 10.21 | |
| | | | |
Total return(c)(d) | | | 2.10 | % |
RATIOS TO AVERAGE NET ASSETS: | |
Net assets, end of the period (000’s) | | $ | 1 | |
Net expenses(e)(f) | | | 0.80 | % |
Gross expenses(f) | | | 23.24 | % |
Net investment loss(f) | | | (0.36 | )% |
Portfolio turnover rate | | | 0 | % |
| * | From commencement of operations on December 15, 2020 through December 31, 2020. |
| (a) | Per share net investment loss has been calculated using the average shares outstanding during the period. |
| (b) | Amount rounds to less than $0.01 per share. |
| (c) | Had certain expenses not been waived/reimbursed during the period, total returns would have been lower. |
| (d) | Periods less than one year are not annualized. |
| (e) | The investment adviser agreed to waive its fees and/or reimburse a portion of the Fund’s expenses during the period. Without this waiver/reimbursement, expenses would have been higher. |
| (f) | Computed on an annualized basis for periods less than one year. |
See accompanying notes to financial statements.
| 108
Financial Highlights (continued)
For a share outstanding throughout each period.
| | | | | | | | | | | | | | | | | | | | |
| | | Natixis Oakmark Fund—Class A | |
| | | Year Ended
December 31,
2020 | | | Year Ended
December 31,
2019 | | | Year Ended
December 31,
2018 | | | Year Ended
December 31,
2017 | | | Year Ended
December 31,
2016 | |
Net asset value, beginning of the period | | $ | 22.45 | | | $ | 19.44 | | | $ | 24.72 | | | $ | 21.37 | | | $ | 18.79 | |
| | | | | | | | | | | | | | | | | | | | |
INCOME (LOSS) FROM INVESTMENT OPERATIONS: | |
Net investment income(a) | | | 0.11 | (b) | | | 0.18 | (c) | | | 0.10 | | | | 0.11 | | | | 0.16 | |
Net realized and unrealized gain (loss) | | | 2.78 | | | | 4.93 | | | | (3.28 | ) | | | 4.28 | | | | 3.20 | |
| | | | | | | | | | | | | | | | | | | | |
Total from Investment Operations | | | 2.89 | | | | 5.11 | | | | (3.18 | ) | | | 4.39 | | | | 3.36 | |
| | | | | | | | | | | | | | | | | | | | |
LESS DISTRIBUTIONS FROM: | |
Net investment income | | | (0.12 | ) | | | (0.21 | ) | | | (0.08 | ) | | | (0.10 | ) | | | (0.16 | ) |
Net realized capital gains | | | (2.02 | ) | | | (1.89 | ) | | | (2.02 | ) | | | (0.94 | ) | | | (0.62 | ) |
| | | | | | | | | | | | | | | | | | | | |
Total Distributions | | | (2.14 | ) | | | (2.10 | ) | | | (2.10 | ) | | | (1.04 | ) | | | (0.78 | ) |
| | | | | | | | | | | | | | | | | | | | |
Net asset value, end of the period | | $ | 23.20 | | | $ | 22.45 | | | $ | 19.44 | | | $ | 24.72 | | | $ | 21.37 | |
| | | | | | | | | | | | | | | | | | | | |
Total return(d) | | | 13.01 | %(b) | | | 26.77 | %(c) | | | (13.01 | )% | | | 20.75 | % | | | 18.37 | % |
RATIOS TO AVERAGE NET ASSETS: | |
Net assets, end of the period (000’s) | | $ | 170,702 | | | $ | 181,417 | | | $ | 164,748 | | | $ | 203,792 | | | $ | 173,036 | |
Net expenses | | | 1.20 | %(e) | | | 1.17 | % | | | 1.13 | % | | | 1.18 | % | | | 1.18 | % |
Gross expenses | | | 1.20 | %(e) | | | 1.17 | % | | | 1.13 | % | | | 1.18 | % | | | 1.18 | % |
Net investment income | | | 0.53 | %(b) | | | 0.85 | %(c) | | | 0.41 | % | | | 0.48 | % | | | 0.82 | % |
Portfolio turnover rate | | | 22 | % | | | 15 | % | | | 39 | % | | | 16 | % | | | 16 | % |
| (a) | Per share net investment income has been calculated using the average shares outstanding during the period. |
| (b) | Includes a non-recurring dividend. Without this dividend, net investment income per share would have been $0.05, total return would have been 12.72% and the ratio of net investment income to average net assets would have been 0.27%. |
| (c) | Includes a non-recurring dividend. Without this dividend, net investment income per share would have been $0.13, total return would have been 26.50% and the ratio of net investment income to average net assets would have been 0.62%. |
| (d) | A sales charge for Class A shares is not reflected in total return calculations. |
| (e) | Includes refund of prior year service fee of 0.01%. See Note 6b of Notes to Financial Statements. |
See accompanying notes to financial statements.
109 |
Financial Highlights (continued)
For a share outstanding throughout each period.
| | | | | | | | | | | | | | | | | | | | |
| | | Natixis Oakmark Fund—Class C | |
| | | Year Ended
December 31,
2020 | | | Year Ended
December 31,
2019 | | | Year Ended
December 31,
2018 | | | Year Ended
December 31,
2017 | | | Year Ended
December 31,
2016 | |
Net asset value, beginning of the period | | $ | 18.92 | | | $ | 16.66 | | | $ | 21.58 | | | $ | 18.83 | | | $ | 16.65 | |
| | | | | | | | | | | | | | | | | | | | |
INCOME (LOSS) FROM INVESTMENT OPERATIONS: | |
Net investment income (loss)(a) | | | (0.04 | )(b) | | | 0.02 | (c) | | | (0.07 | ) | | | (0.05 | ) | | | 0.01 | |
Net realized and unrealized gain (loss) | | | 2.31 | | | | 4.20 | | | | (2.83 | ) | | | 3.74 | | | | 2.80 | |
| | | | | | | | | | | | | | | | | | | | |
Total from Investment Operations | | | 2.27 | | | | 4.22 | | | | (2.90 | ) | | | 3.69 | | | | 2.81 | |
| | | | | | | | | | | | | | | | | | | | |
LESS DISTRIBUTIONS FROM: | |
Net investment income | | | — | | | | (0.07 | ) | | | — | | | | (0.00 | )(d) | | | (0.01 | ) |
Net realized capital gains | | | (2.02 | ) | | | (1.89 | ) | | | (2.02 | ) | | | (0.94 | ) | | | (0.62 | ) |
| | | | | | | | | | | | | | | | | | | | |
Total Distributions | | | (2.02 | ) | | | (1.96 | ) | | | (2.02 | ) | | | (0.94 | ) | | | (0.63 | ) |
| | | | | | | | | | | | | | | | | | | | |
Net asset value, end of the period | | $ | 19.17 | | | $ | 18.92 | | | $ | 16.66 | | | $ | 21.58 | | | $ | 18.83 | |
| | | | | | | | | | | | | | | | | | | | |
Total return(e) | | | 12.15 | %(b) | | | 25.82 | %(c) | | | (13.63 | )% | | | 19.85 | % | | | 17.45 | % |
RATIOS TO AVERAGE NET ASSETS: | |
Net assets, end of the period (000’s) | | $ | 35,940 | | | $ | 54,384 | | | $ | 53,606 | | | $ | 62,272 | | | $ | 55,910 | |
Net expenses | | | 1.95 | % | | | 1.92 | % | | | 1.88 | % | | | 1.93 | % | | | 1.93 | % |
Gross expenses | | | 1.95 | % | | | 1.92 | % | | | 1.88 | % | | | 1.93 | % | | | 1.93 | % |
Net investment income (loss) | | | (0.23 | )%(b) | | | 0.12 | %(c) | | | (0.33 | )% | | | (0.27 | )% | | | 0.09 | % |
Portfolio turnover rate | | | 22 | % | | | 15 | % | | | 39 | % | | | 16 | % | | | 16 | % |
| (a) | Per share net investment income (loss) has been calculated using the average shares outstanding during the period. |
| (b) | Includes a non-recurring dividend. Without this dividend, net investment loss per share would have been $(0.08), total return would have been 11.85% and the ratio of net investment loss to average net assets would have been (0.46%). |
| (c) | Includes a non-recurring dividend. Without this dividend, net investment loss per share would have been $(0.02), total return would have been 25.50% and the ratio of net investment loss to average net assets would have been (0.12)%. |
| (d) | Amount rounds to less than $0.01 per share. |
| (e) | A contingent deferred sales charge for Class C shares is not reflected in total return calculations. |
See accompanying notes to financial statements.
| 110
Financial Highlights (continued)
For a share outstanding throughout each period.
| | | | | | | | | | | | | | | | |
| | | Natixis Oakmark Fund—Class N | |
| | | Year Ended
December 31,
2020 | | | Year Ended
December 31,
2019 | | | Year Ended
December 31,
2018 | | | Period Ended
December 31,
2017* | |
Net asset value, beginning of the period | | $ | 23.78 | | | $ | 20.49 | | | $ | 25.91 | | | $ | 23.13 | |
| | | | | | | | | | | | | | | | |
INCOME (LOSS) FROM INVESTMENT OPERATIONS: | |
Net investment income(a) | | | 0.18 | (b) | | | 0.22 | (c) | | | 0.22 | | | | 0.14 | |
Net realized and unrealized gain (loss) | | | 2.98 | | | | 5.25 | | | | (3.45 | ) | | | 3.44 | |
| | | | | | | | | | | | | | | | |
Total from Investment Operations | | | 3.16 | | | | 5.47 | | | | (3.23 | ) | | | 3.58 | |
| | | | | | | | | | | | | | | | |
LESS DISTRIBUTIONS FROM: | |
Net investment income | | | (0.20 | ) | | | (0.29 | ) | | | (0.17 | ) | | | (0.17 | ) |
Net realized capital gains | | | (2.02 | ) | | | (1.89 | ) | | | (2.02 | ) | | | (0.63 | ) |
| | | | | | | | | | | | | | | | |
Total Distributions | | | (2.22 | ) | | | (2.18 | ) | | | (2.19 | ) | | | (0.80 | ) |
| | | | | | | | | | | | | | | | |
Net asset value, end of the period | | $ | 24.72 | | | $ | 23.78 | | | $ | 20.49 | | | $ | 25.91 | |
| | | | | | | | | | | | | | | | |
Total return(d) | | | 13.41 | %(b) | | | 27.16 | %(c) | | | (12.60 | )% | | | 15.46 | %(e) |
RATIOS TO AVERAGE NET ASSETS: | |
Net assets, end of the period (000’s) | | $ | 364 | | | $ | 801 | | | $ | 10 | | | $ | 1 | |
Net expenses(f) | | | 0.86 | % | | | 0.83 | % | | | 0.75 | % | | | 0.75 | %(g) |
Gross expenses | | | 1.05 | % | | | 1.25 | % | | | 3.79 | % | | | 13.79 | %(g) |
Net investment income | | | 0.85 | %(b) | | | 0.93 | %(c) | | | 0.88 | % | | | 0.84 | %(g) |
Portfolio turnover rate | | | 22 | % | | | 15 | % | | | 39 | % | | | 16 | %(h) |
| * | From commencement of Class operations on May 1, 2017 through December 31, 2017. |
| (a) | Per share net investment income has been calculated using the average shares outstanding during the period. |
| (b) | Includes a non-recurring dividend. Without this dividend, net investment income per share would have been $0.14, total return would have been 13.13% and the ratio of net investment income to average net assets would have been 0.67%. |
| (c) | Includes a non-recurring dividend. Without this dividend, net investment income per share would have been $0.22, total return would have been 26.90% and the ratio of net investment income to average net assets would have been 0.92%. |
| (d) | Had certain expenses not been waived/reimbursed during the period, total returns would have been lower. |
| (e) | Periods less than one year are not annualized. |
| (f) | The investment adviser agreed to waive its fees and/or reimburse a portion of the Fund’s expenses during the period. Without this waiver/reimbursement, expenses would have been higher. |
| (g) | Computed on an annualized basis for periods less than one year. |
| (h) | Represents the Fund’s portfolio turnover rate for the year ended December 31, 2017. |
See accompanying notes to financial statements.
111 |
Financial Highlights (continued)
For a share outstanding throughout each period.
| | | | | | | | | | | | | | | | | | | | |
| | | Natixis Oakmark Fund—Class Y | |
| | | Year Ended
December 31,
2020 | | | Year Ended
December 31,
2019 | | | Year Ended
December 31,
2018 | | | Year Ended
December 31,
2017 | | | Year Ended
December 31,
2016 | |
Net asset value, beginning of the period | | $ | 23.75 | | | $ | 20.46 | | | $ | 25.90 | | | $ | 22.34 | | | $ | 19.60 | |
| | | | | | | | | | | | | | | | | | | | |
INCOME (LOSS) FROM INVESTMENT OPERATIONS: | |
Net investment income(a) | | | 0.17 | (b) | | | 0.27 | (c) | | | 0.17 | | | | 0.17 | | | | 0.21 | |
Net realized and unrealized gain (loss) | | | 2.95 | | | | 5.17 | | | | (3.44 | ) | | | 4.48 | | | | 3.36 | |
| | | | | | | | | | | | | | | | | | | | |
Total from Investment Operations | | | 3.12 | | | | 5.44 | | | | (3.27 | ) | | | 4.65 | | | | 3.57 | |
| | | | | | | | | | | | | | | | | | | | |
LESS DISTRIBUTIONS FROM: | |
Net investment income | | | (0.17 | ) | | | (0.26 | ) | | | (0.15 | ) | | | (0.15 | ) | | | (0.21 | ) |
Net realized capital gains | | | (2.02 | ) | | | (1.89 | ) | | | (2.02 | ) | | | (0.94 | ) | | | (0.62 | ) |
| | | | | | | | | | | | | | | | | | | | |
Total Distributions | | | (2.19 | ) | | | (2.15 | ) | | | (2.17 | ) | | | (1.09 | ) | | | (0.83 | ) |
| | | | | | | | | | | | | | | | | | | | |
Net asset value, end of the period | | $ | 24.68 | | | $ | 23.75 | | | $ | 20.46 | | | $ | 25.90 | | | $ | 22.34 | |
| | | | | | | | | | | | | | | | | | | | |
Total return | | | 13.28 | %(b) | | | 27.06 | %(c)(d) | | | (12.76 | )% | | | 21.05 | % | | | 18.69 | % |
RATIOS TO AVERAGE NET ASSETS: | |
Net assets, end of the period (000’s) | | $ | 37,595 | | | $ | 46,836 | | | $ | 53,829 | | | $ | 49,955 | | | $ | 26,252 | |
Net expenses | | | 0.95 | % | | | 0.91 | %(e) | | | 0.88 | % | | | 0.93 | % | | | 0.92 | % |
Gross expenses | | | 0.95 | % | | | 0.92 | % | | | 0.88 | % | | | 0.93 | % | | | 0.92 | % |
Net investment income | | | 0.79 | %(b) | | | 1.16 | %(c) | | | 0.68 | % | | | 0.71 | % | | | 1.05 | % |
Portfolio turnover rate | | | 22 | % | | | 15 | % | | | 39 | % | | | 16 | % | | | 16 | % |
| (a) | Per share net investment income has been calculated using the average shares outstanding during the period. |
| (b) | Includes a non-recurring dividend. Without this dividend, net investment income per share would have been $0.12, total return would have been 13.00% and the ratio of net investment income to average net assets would have been 0.55%. |
| (c) | Includes a non-recurring dividend. Without this dividend, net investment income per share would have been $0.20, total return would have been 26.80% and the ratio of net investment income to average net assets would have been 0.90%. |
| (d) | Had certain expenses not been waived/reimbursed during the period, total returns would have been lower. |
| (e) | The administrator agreed to waive its fees and/or reimburse a portion of the Fund’s expenses during the period. Without this waiver/reimbursement, expenses would have been higher. |
See accompanying notes to financial statements.
| 112
Financial Highlights (continued)
For a share outstanding throughout each period.
| | | | | | | | | | | | | | | | | | | | |
| | | Natixis Oakmark International Fund—Class A | |
| | | Year Ended
December 31,
2020
| | | Year Ended
December 31,
2019
| | | Year Ended
December 31,
2018
| | | Year Ended
December 31,
2017
| | | Year Ended
December 31,
2016
| |
Net asset value, beginning of the period | | $ | 13.63 | | | $ | 11.29 | | | $ | 15.58 | | | $ | 12.15 | | | $ | 11.47 | |
| | | | | | | | | | | | | | | | | | | | |
INCOME (LOSS) FROM INVESTMENT OPERATIONS: | |
Net investment income (loss)(a) | | | (0.00 | )(b) | | | 0.37 | (c) | | | 0.25 | | | | 0.18 | | | | 0.17 | |
Net realized and unrealized gain (loss) | | | 0.55 | (d) | | | 2.38 | | | | (4.02 | ) | | | 3.41 | | | | 0.76 | |
| | | | | | | | | | | | | | | | | | | | |
Total from Investment Operations | | | 0.55 | | | | 2.75 | | | | (3.77 | ) | | | 3.59 | | | | 0.93 | |
| | | | | | | | | | | | | | | | | | | | |
LESS DISTRIBUTIONS FROM: | |
Net investment income | | | (0.03 | ) | | | (0.41 | ) | | | (0.29 | ) | | | (0.16 | ) | | | (0.21 | ) |
Net realized capital gains | | | — | | | | — | | | | (0.23 | ) | | | — | | | | (0.04 | ) |
| | | | | | | | | | | | | | | | | | | | |
Total Distributions | | | (0.03 | ) | | | (0.41 | ) | | | (0.52 | ) | | | (0.16 | ) | | | (0.25 | ) |
| | | | | | | | | | | | | | | | | | | | |
Net asset value, end of the period | | $ | 14.15 | | | $ | 13.63 | | | $ | 11.29 | | | $ | 15.58 | | | $ | 12.15 | |
| | | | | | | | | | | | | | | | | | | | |
Total return(e) | | | 4.06 | %(f) | | | 24.35 | %(c) | | | (24.15 | )% | | | 29.56 | % | | | 8.19 | % |
RATIOS TO AVERAGE NET ASSETS: | |
Net assets, end of the period (000’s) | | $ | 131,630 | | | $ | 172,906 | | | $ | 257,551 | | | $ | 603,988 | | | $ | 533,112 | |
Net expenses | | | 1.29 | %(g)(h) | | | 1.29 | % | | | 1.31 | % | | | 1.32 | % | | | 1.34 | % |
Gross expenses | | | 1.36 | % | | | 1.29 | % | | | 1.31 | % | | | 1.32 | % | | | 1.34 | % |
Net investment income (loss) | | | (0.03 | )% | | | 2.91 | %(c) | | | 1.72 | % | | | 1.28 | % | | | 1.54 | % |
Portfolio turnover rate | | | 63 | % | | | 28 | % | | | 50 | % | | | 40 | % | | | 41 | % |
| (a) | Per share net investment income (loss) has been calculated using the average shares outstanding during the period. |
| (b) | Amount rounds to less than $0.01 per share. |
| (c) | Includes non-recurring dividends. Without this dividend, net investment income per share would have been $0.29, total return would have been 23.55% and the ratio of net investment income to average net assets would have been 2.26%. |
| (d) | The amount shown for a share outstanding does not correspond with the aggregate realized and unrealized gain (loss) on investments for the period due to the timing of sales and redemptions of fund shares in relation to fluctuating market values of investments of the Fund. |
| (e) | A sales charge for Class A shares is not reflected in total return calculations. |
| (f) | Had certain expenses not been waived/reimbursed during the period, total returns would have been lower. |
| (g) | The investment adviser agreed to waive its fees and/or reimburse a portion of the Fund’s expenses during the period. Without this waiver/reimbursement, expenses would have been higher. |
| (h) | Effective July 1, 2020, the expense limit decreased from 1.37% to 1.20%. See Note 6 of Notes to Financial Statements. |
See accompanying notes to financial statements.
113 |
Financial Highlights (continued)
For a share outstanding throughout each period.
| | | | | | | | | | | | | | | | | | | | |
| | | Natixis Oakmark International Fund—Class C | |
| | | Year Ended
December 31,
2020 | | | Year Ended
December 31,
2019 | | | Year Ended
December 31,
2018 | | | Year Ended
December 31,
2017 | | | Year Ended
December 31,
2016 | |
Net asset value, beginning of the period | | $ | 13.41 | | | $ | 11.11 | | | $ | 15.30 | | | $ | 11.96 | | | $ | 11.29 | |
| | | | | | | | | | | | | | | | | | | | |
INCOME (LOSS) FROM INVESTMENT OPERATIONS: | |
Net investment income (loss)(a) | | | (0.08 | ) | | | 0.26 | (b) | | | 0.13 | | | | 0.06 | | | | 0.08 | |
Net realized and unrealized gain (loss) | | | 0.52 | (c) | | | 2.34 | | | | (3.92 | ) | | | 3.35 | | | | 0.74 | |
| | | | | | | | | | | | | | | | | | | | |
Total from Investment Operations | | | 0.44 | | | | 2.60 | | | | (3.79 | ) | | | 3.41 | | | | 0.82 | |
| | | | | | | | | | | | | | | | | | | | |
LESS DISTRIBUTIONS FROM: | |
Net investment income | | | — | | | | (0.30 | ) | | | (0.17 | ) | | | (0.07 | ) | | | (0.11 | ) |
Net realized capital gains | | | — | | | | — | | | | (0.23 | ) | | | — | | | | (0.04 | ) |
| | | | | | | | | | | | | | | | | | | | |
Total Distributions | | | — | | | | (0.30 | ) | | | (0.40 | ) | | | (0.07 | ) | | | (0.15 | ) |
| | | | | | | | | | | | | | | | | | | | |
Net asset value, end of the period | | $ | 13.85 | | | $ | 13.41 | | | $ | 11.11 | | | $ | 15.30 | | | $ | 11.96 | |
| | | | | | | | | | | | | | | | | | | | |
Total return(d) | | | 3.28 | %(e) | | | 23.44 | %(b) | | | (24.74 | )% | | | 28.55 | % | | | 7.36 | % |
RATIOS TO AVERAGE NET ASSETS: | |
Net assets, end of the period (000’s) | | $ | 96,772 | | | $ | 179,533 | | | $ | 212,618 | | | $ | 363,018 | | | $ | 255,249 | |
Net expenses | | | 2.05 | %(f)(g) | | | 2.04 | % | | | 2.07 | % | | | 2.07 | % | | | 2.09 | % |
Gross expenses | | | 2.11 | % | | | 2.04 | % | | | 2.07 | % | | | 2.07 | % | | | 2.09 | % |
Net investment income (loss) | | | (0.76 | )% | | | 2.09 | %(b) | | | 0.94 | % | | | 0.42 | % | | | 0.73 | % |
Portfolio turnover rate | | | 63 | % | | | 28 | % | | | 50 | % | | | 40 | % | | | 41 | % |
| (a) | Per share net investment income (loss) has been calculated using the average shares outstanding during the period. |
| (b) | Includes non-recurring dividends. Without this dividend, net investment income per share would have been $0.18, total return would have been 22.63% and the ratio of net investment income to average net assets would have been 1.43%. |
| (c) | The amount shown for a share outstanding does not correspond with the aggregate realized and unrealized gain (loss) on investments for the period due to the timing of sales and redemptions of fund shares in relation to fluctuating market values of investments of the Fund. |
| (d) | A contingent deferred sales charge for Class C shares is not reflected in total return calculations. |
| (e) | Had certain expenses not been waived/reimbursed during the period, total returns would have been lower. |
| (f) | The investment adviser agreed to waive its fees and/or reimburse a portion of the Fund’s expenses during the period. Without this waiver/reimbursement, expenses would have been higher. |
| (g) | Effective July 1, 2020, the expense limit decreased from 2.12% to 1.95%. See Note 6 of Notes to Financial Statements. |
See accompanying notes to financial statements.
| 114
Financial Highlights (continued)
For a share outstanding throughout each period.
| | | | | | | | | | | | | | | | |
| | | Natixis Oakmark International Fund—Class N | |
| | | Year Ended
December 31,
2020 | | | Year Ended
December 31,
2019 | | | Year Ended
December 31,
2018 | | | Period Ended
December 31,
2017* | |
Net asset value, beginning of the period | | $ | 13.56 | | | $ | 11.25 | | | $ | 15.58 | | | $ | 13.98 | |
| | | | | | | | | | | | | | | | |
INCOME (LOSS) FROM INVESTMENT OPERATIONS: | |
Net investment income(a) | | | 0.04 | | | | 0.33 | (b) | | | 0.28 | | | | 0.15 | |
Net realized and unrealized gain (loss) | | | 0.56 | (c) | | | 2.45 | | | | (4.02 | ) | | | 1.66 | |
| | | | | | | | | | | | | | | | |
Total from Investment Operations | | | 0.60 | | | | 2.78 | | | | (3.74 | ) | | | 1.81 | |
| | | | | | | | | | | | | | | | |
LESS DISTRIBUTIONS FROM: | |
Net investment income | | | (0.07 | ) | | | (0.47 | ) | | | (0.36 | ) | | | (0.21 | ) |
Net realized capital gains | | | — | | | | — | | | | (0.23 | ) | | | — | |
| | | | | | | | | | | | | | | | |
Total Distributions | | | (0.07 | ) | | | (0.47 | ) | | | (0.59 | ) | | | (0.21 | ) |
| | | | | | | | | | | | | | | | |
Net asset value, end of the period | | $ | 14.09 | | | $ | 13.56 | | | $ | 11.25 | | | $ | 15.58 | |
| | | | | | | | | | | | | | | | |
Total return(d) | | | 4.44 | % | | | 24.75 | %(b) | | | (23.94 | )% | | | 12.96 | %(e) |
RATIOS TO AVERAGE NET ASSETS: | |
Net assets, end of the period (000’s) | | $ | 290 | | | $ | 811 | | | $ | 758 | | | $ | 1 | |
Net expenses(f) | | | 0.92 | %(g) | | | 0.94 | % | | | 0.99 | % | | | 0.92 | %(h) |
Gross expenses | | | 1.17 | % | | | 1.08 | % | | | 1.02 | % | | | 25.21 | %(h) |
Net investment income | | | 0.37 | % | | | 2.56 | %(b) | | | 2.04 | % | | | 1.54 | %(h) |
Portfolio turnover rate | | | 63 | % | | | 28 | % | | | 50 | % | | | 40 | %(i) |
| * | From commencement of Class operations on May 1, 2017 through December 31, 2017. |
| (a) | Per share net investment income has been calculated using the average shares outstanding during the period. |
| (b) | Includes non-recurring dividends. Without this dividend, net investment income per share would have been $0.27, total return would have been 23.94% and the ratio of net investment income to average net assets would have been 2.15%. |
| (c) | The amount shown for a share outstanding does not correspond with the aggregate realized and unrealized gain (loss) on investments for the period due to the timing of sales and redemptions of fund shares in relation to fluctuating market values of investments of the Fund. |
| (d) | Had certain expenses not been waived/reimbursed during the period, total returns would have been lower. |
| (e) | Periods less than one year are not annualized. |
| (f) | The investment adviser agreed to waive its fees and/or reimburse a portion of the Fund’s expenses during the period. Without this waiver/reimbursement, expenses would have been higher. |
| (g) | Effective July 1, 2020, the expense limit decreased from 1.07% to 0.90%. See Note 6 of Notes to Financial Statements. |
| (h) | Computed on an annualized basis for periods less than one year. |
| (i) | Represents the Fund’s portfolio turnover rate for the year ended December 31, 2017. |
See accompanying notes to financial statements.
115 |
Financial Highlights (continued)
For a share outstanding throughout each period.
| | | | | | | | | | | | | | | | |
| | | Natixis Oakmark International Fund—Class Y | |
| | | Year Ended
December 31,
2020 | | | Year Ended
December 31,
2019 | | | Year Ended
December 31,
2018 | | | Period Ended
December 31,
2017* | |
Net asset value, beginning of the period | | $ | 13.56 | | | $ | 11.25 | | | $ | 15.56 | | | $ | 13.98 | |
| | | | | | | | | | | | | | | | |
INCOME (LOSS) FROM INVESTMENT OPERATIONS: | |
Net investment income(a) | | | 0.04 | | | | 0.37 | (b) | | | 0.26 | | | | 0.00 | (c) |
Net realized and unrealized gain (loss) | | | 0.55 | (d) | | | 2.40 | | | | (3.99 | ) | | | 1.79 | |
| | | | | | | | | | | | | | | | |
Total from Investment Operations | | | 0.59 | | | | 2.77 | | | | (3.73 | ) | | | 1.79 | |
| | | | | | | | | | | | | | | | |
LESS DISTRIBUTIONS FROM: | |
Net investment income | | | (0.07 | ) | | | (0.46 | ) | | | (0.35 | ) | | | (0.21 | ) |
Net realized capital gains | | | — | | | | — | | | | (0.23 | ) | | | — | |
| | | | | | | | | | | | | | | | |
Total Distributions | | | (0.07 | ) | | | (0.46 | ) | | | (0.58 | ) | | | (0.21 | ) |
| | | | | | | | | | | | | | | | |
Net asset value, end of the period | | $ | 14.08 | | | $ | 13.56 | | | $ | 11.25 | | | $ | 15.56 | |
| | | | | | | | | | | | | | | | |
Total return | | | 4.32 | %(e) | | | 24.64 | %(b) | | | (23.93 | )% | | | 12.79 | %(f) |
RATIOS TO AVERAGE NET ASSETS: | |
Net assets, end of the period (000’s) | | $ | 275,468 | | | $ | 244,586 | | | $ | 215,123 | | | $ | 172,978 | |
Net expenses | | | 1.03 | %(g)(h) | | | 1.04 | % | | | 1.07 | % | | | 1.07 | %(i) |
Gross expenses | | | 1.11 | % | | | 1.04 | % | | | 1.07 | % | | | 1.07 | %(i) |
Net investment income | | | 0.41 | % | | | 2.91 | %(b) | | | 1.85 | % | | | 0.03 | %(i) |
Portfolio turnover rate | | | 63 | % | | | 28 | % | | | 50 | % | | | 40 | %(j) |
| * | From commencement of Class operations on May 1, 2017 through December 31, 2017. |
| (a) | Per share net investment income has been calculated using the average shares outstanding during the period. |
| (b) | Includes non-recurring dividends. Without this dividend, net investment income per share would have been $0.29, total return would have been 23.84% and the ratio of net investment income to average net assets would have been 2.29%. |
| (c) | Amount rounds to less than $0.01 per share. |
| (d) | The amount shown for a share outstanding does not correspond with the aggregate realized and unrealized gain (loss) on investments for the period due to the timing of sales and redemptions of fund shares in relation to fluctuating market values of investments of the Fund. |
| (e) | Had certain expenses not been waived/reimbursed during the period, total returns would have been lower. |
| (f) | Periods less than one year are not annualized. |
| (g) | The investment adviser agreed to waive its fees and/or reimburse a portion of the Fund’s expenses during the period. Without this waiver/reimbursement, expenses would have been higher. |
| (h) | Effective July 1, 2020, the expense limit decreased from 1.12% to 0.95%. See Note 6 of Notes to Financial Statements. |
| (i) | Computed on an annualized basis for periods less than one year. |
| (j) | Represents the Fund’s portfolio turnover rate for the year ended December 31, 2017. |
See accompanying notes to financial statements.
| 116
Financial Highlights (continued)
For a share outstanding throughout each period.
| | | | | | | | | | | | | | | | | | | | |
| | | Natixis U.S. Equity Opportunities Fund—Class A | |
| | | Year Ended
December 31,
2020 | | | Year Ended
December 31,
2019 | | | Year Ended
December 31,
2018 | | | Year Ended
December 31,
2017 | | | Year Ended
December 31,
2016 | |
Net asset value, beginning of the period | | $ | 36.53 | | | $ | 31.00 | | | $ | 36.90 | | | $ | 30.27 | | | $ | 27.60 | |
| | | | | | | | | | | | | | | | | | | | |
INCOME (LOSS) FROM INVESTMENT OPERATIONS: | |
Net investment income (loss)(a) | | | (0.05 | ) | | | 0.15 | (b) | | | 0.08 | | | | 0.06 | | | | 0.12 | |
Net realized and unrealized gain (loss) | | | 7.66 | | | | 9.34 | | | | (2.51 | ) | | | 7.88 | | | | 3.12 | |
| | | | | | | | | | | | | | | | | | | | |
Total from Investment Operations | | | 7.61 | | | | 9.49 | | | | (2.43 | ) | | | 7.94 | | | | 3.24 | |
| | | | | | | | | | | | | | | | | | | | |
LESS DISTRIBUTIONS FROM: | |
Net investment income | | | — | | | | (0.17 | ) | | | (0.05 | ) | | | (0.06 | ) | | | (0.12 | ) |
Net realized capital gains | | | (5.10 | ) | | | (3.79 | ) | | | (3.42 | ) | | | (1.25 | ) | | | (0.45 | ) |
| | | | | | | | | | | | | | | | | | | | |
Total Distributions | | | (5.10 | ) | | | (3.96 | ) | | | (3.47 | ) | | | (1.31 | ) | | | (0.57 | ) |
| | | | | | | | | | | | | | | | | | | | |
Net asset value, end of the period | | $ | 39.04 | | | $ | 36.53 | | | $ | 31.00 | | | $ | 36.90 | | | $ | 30.27 | |
| | | | | | | | | | | | | | | | | | | | |
Total return(c) | | | 22.09 | % | | | 31.03 | %(b) | | | (6.48 | )% | | | 26.28 | % | | | 11.86 | % |
RATIOS TO AVERAGE NET ASSETS: | |
Net assets, end of the period (000’s) | | $ | 649,754 | | | $ | 616,922 | | | $ | 523,665 | | | $ | 604,330 | | | $ | 472,436 | |
Net expenses | | | 1.17 | % | | | 1.17 | % | | | 1.16 | % | | | 1.21 | %(d) | | | 1.23 | %(e) |
Gross expenses | | | 1.17 | % | | | 1.17 | % | | | 1.16 | % | | | 1.21 | % | | | 1.23 | %(e) |
Net investment income (loss) | | | (0.14 | )% | | | 0.42 | %(b) | | | 0.20 | % | | | 0.16 | % | | | 0.42 | % |
Portfolio turnover rate | | | 26 | % | | | 12 | % | | | 23 | % | | | 17 | % | | | 17 | % |
| (a) | Per share net investment income (loss) has been calculated using the average shares outstanding during the period. |
| (b) | Includes non-recurring dividends. Without this dividend, net investment income per share would have been $0.09, total return would have been 30.87% and the ratio of net investment income to average net assets would have been 0.26%. |
| (c) | A sales charge for Class A shares is not reflected in total return calculations. |
| (d) | Effective July 1, 2017, the expense limit decreased from 1.25% to 1.20%. |
| (e) | Includes fee/expense recovery of less than 0.01%. |
See accompanying notes to financial statements.
117 |
Financial Highlights (continued)
For a share outstanding throughout each period.
| | | | | | | | | | | | | | | | | | | | |
| | | Natixis U.S. Equity Opportunities Fund—Class C | |
| | | Year Ended
December 31,
2020 | | | Year Ended
December 31,
2019 | | | Year Ended
December 31,
2018 | | | Year Ended
December 31,
2017 | | | Year Ended
December 31,
2016 | |
Net asset value, beginning of the period | | $ | 22.65 | | | $ | 20.42 | | | $ | 25.73 | | | $ | 21.54 | | | $ | 19.86 | |
| | | | | | | | | | | | | | | | | | | | |
INCOME (LOSS) FROM INVESTMENT OPERATIONS: | |
Net investment loss(a) | | | (0.19 | ) | | | (0.07 | )(b) | | | (0.14 | ) | | | (0.14 | ) | | | (0.07 | ) |
Net realized and unrealized gain (loss) | | | 4.53 | | | | 6.10 | | | | (1.75 | ) | | | 5.58 | | | | 2.22 | |
| | | | | | | | | | | | | | | | | | | | |
Total from Investment Operations | | | 4.34 | | | | 6.03 | | | | (1.89 | ) | | | 5.44 | | | | 2.15 | |
| | | | | | | | | | | | | | | | | | | | |
LESS DISTRIBUTIONS FROM: | |
Net investment income | | | — | | | | (0.01 | ) | | | — | | | | (0.00 | )(c) | | | (0.02 | ) |
Net realized capital gains | | | (5.10 | ) | | | (3.79 | ) | | | (3.42 | ) | | | (1.25 | ) | | | (0.45 | ) |
| | | | | | | | | | | | | | | | | | | | |
Total Distributions | | | (5.10 | ) | | | (3.80 | ) | | | (3.42 | ) | | | (1.25 | ) | | | (0.47 | ) |
| | | | | | | | | | | | | | | | | | | | |
Net asset value, end of the period | | $ | 21.89 | | | $ | 22.65 | | | $ | 20.42 | | | $ | 25.73 | | | $ | 21.54 | |
| | | | | | | | | | | | | | | | | | | | |
Total return(d) | | | 21.15 | % | | | 30.06 | %(b) | | | (7.18 | )% | | | 25.35 | % | | | 11.02 | % |
RATIOS TO AVERAGE NET ASSETS: | |
Net assets, end of the period (000’s) | | $ | 63,126 | | | $ | 77,924 | | | $ | 78,783 | | | $ | 112,615 | | | $ | 72,768 | |
Net expenses | | | 1.92 | % | | | 1.92 | % | | | 1.91 | % | | | 1.96 | %(e) | | | 1.98 | %(f) |
Gross expenses | | | 1.92 | % | | | 1.92 | % | | | 1.91 | % | | | 1.96 | % | | | 1.98 | %(f) |
Net investment loss | | | (0.87 | )% | | | (0.31 | )%(b) | | | (0.54 | )% | | | (0.59 | )% | | | (0.33 | )% |
Portfolio turnover rate | | | 26 | % | | | 12 | % | | | 23 | % | | | 17 | % | | | 17 | % |
| (a) | Per share net investment loss has been calculated using the average shares outstanding during the period. |
| (b) | Includes non-recurring dividends. Without this dividend, net investment loss per share would have been $(0.11), total return would have been 29.85% and the ratio of net investment loss to average net assets would have been (0.48)%. |
| (c) | Amount rounds to less than $0.01 per share. |
| (d) | A contingent deferred sales charge for Class C shares is not reflected in total return calculations. |
| (e) | Effective July 1, 2017, the expense limit decreased from 2.00% to 1.95%. |
| (f) | Includes fee/expense recovery of less than 0.01%. |
See accompanying notes to financial statements.
| 118
Financial Highlights (continued)
For a share outstanding throughout each period.
| | | | | | | | | | | | | | | | |
| | | Natixis U.S. Equity Opportunities Fund—Class N | |
| | | Year Ended
December 31,
2020 | | | Year Ended
December 31,
2019 | | | Year Ended
December 31,
2018 | | | Period Ended
December 31,
2017* | |
Net asset value, beginning of the period | | $ | 43.61 | | | $ | 36.37 | | | $ | 42.63 | | | $ | 37.62 | |
| | | | | | | | | | | | | | | | |
INCOME (LOSS) FROM INVESTMENT OPERATIONS: | |
Net investment income(a) | | | 0.13 | | | | 0.19 | (b) | | | 0.25 | | | | 0.12 | |
Net realized and unrealized gain (loss) | | | 9.20 | | | | 11.14 | | | | (2.91 | ) | | | 6.20 | |
| | | | | | | | | | | | | | | | |
Total from Investment Operations | | | 9.33 | | | | 11.33 | | | | (2.66 | ) | | | 6.32 | |
| | | | | | | | | | | | | | | | |
LESS DISTRIBUTIONS FROM: | |
Net investment income | | | — | | | | (0.30 | ) | | | (0.18 | ) | | | (0.16 | ) |
Net realized capital gains | | | (5.10 | ) | | | (3.79 | ) | | | (3.42 | ) | | | (1.15 | ) |
| | | | | | | | | | | | | | | | |
Total Distributions | | | (5.10 | ) | | | (4.09 | ) | | | (3.60 | ) | | | (1.31 | ) |
| | | | | | | | | | | | | | | | |
Net asset value, end of the period | | $ | 47.84 | | | $ | 43.61 | | | $ | 36.37 | | | $ | 42.63 | |
| | | | | | | | | | | | | | | | |
Total return(c) | | | 22.48 | % | | | 31.44 | %(b) | | | (6.11 | )% | | | 16.78 | %(d) |
RATIOS TO AVERAGE NET ASSETS: | |
Net assets, end of the period (000’s) | | $ | 172 | | | $ | 654 | | | $ | 1 | | | $ | 1 | |
Net expenses(e) | | | 0.84 | % | | | 0.83 | % | | | 0.76 | % | | | 0.78 | %(f)(g) |
Gross expenses | | | 1.13 | % | | | 1.42 | % | | | 13.35 | % | | | 13.41 | %(f) |
Net investment income | | | 0.31 | % | | | 0.44 | %(b) | | | 0.56 | % | | | 0.44 | %(f) |
Portfolio turnover rate | | | 26 | % | | | 12 | % | | | 23 | % | | | 17 | %(h) |
| * | From commencement of Class operations on May 1, 2017 through December 31, 2017. |
| (a) | Per share net investment income has been calculated using the average shares outstanding during the period. |
| (b) | Includes non-recurring dividends. Without this dividend, net investment income per share would have been $0.19, total return would have been 31.27% and the ratio of net investment income to average net assets would have been 0.44%. |
| (c) | Had certain expenses not been waived/reimbursed during the period, total returns would have been lower. |
| (d) | Periods less than one year are not annualized. |
| (e) | The investment adviser agreed to waive its fees and/or reimburse a portion of the Fund’s expenses during the period. Without this waiver/reimbursement, expenses would have been higher. |
| (f) | Computed on an annualized basis for periods less than one year. |
| (g) | Effective July 1, 2017, the expense limit decreased from 0.95% to 0.90%. |
| (h) | Represents the Fund’s portfolio turnover rate for the year ended December 31, 2017. |
See accompanying notes to financial statements.
119 |
Financial Highlights (continued)
For a share outstanding throughout each period.
| | | | | | | | | | | | | | | | | | | | |
| | | Natixis U.S. Equity Opportunities Fund—Class Y | |
| | | Year Ended
December 31,
2020 | | | Year Ended
December 31,
2019 | | | Year Ended
December 31,
2018 | | | Year Ended
December 31,
2017 | | | Year Ended
December 31,
2016 | |
Net asset value, beginning of the period | | $ | 43.56 | | | $ | 36.33 | | | $ | 42.61 | | | $ | 34.77 | | | $ | 31.61 | |
| | | | | | | | | | | | | | | | | | | | |
INCOME (LOSS) FROM INVESTMENT OPERATIONS: | |
Net investment income(a) | | | 0.05 | | | | 0.29 | (b) | | | 0.20 | | | | 0.16 | | | | 0.21 | |
Net realized and unrealized gain (loss) | | | 9.23 | | | | 10.99 | | | | (2.92 | ) | | | 9.07 | | | | 3.59 | |
| | | | | | | | | | | | | | | | | | | | |
Total from Investment Operations | | | 9.28 | | | | 11.28 | | | | (2.72 | ) | | | 9.23 | | | | 3.80 | |
| | | | | | | | | | | | | | | | | | | | |
LESS DISTRIBUTIONS FROM: | |
Net investment income | | | — | | | | (0.26 | ) | | | (0.14 | ) | | | (0.14 | ) | | | (0.19 | ) |
Net realized capital gains | | | (5.10 | ) | | | (3.79 | ) | | | (3.42 | ) | | | (1.25 | ) | | | (0.45 | ) |
| | | | | | | | | | | | | | | | | | | | |
Total Distributions | | | (5.10 | ) | | | (4.05 | ) | | | (3.56 | ) | | | (1.39 | ) | | | (0.64 | ) |
| | | | | | | | | | | | | | | | | | | | |
Net asset value, end of the period | | $ | 47.74 | | | $ | 43.56 | | | $ | 36.33 | | | $ | 42.61 | | | $ | 34.77 | |
| | | | | | | | | | | | | | | | | | | | |
Total return | | | 22.36 | % | | | 31.36 | %(b)(c) | | | (6.24 | )% | | | 26.60 | % | | | 12.13 | % |
RATIOS TO AVERAGE NET ASSETS: | |
Net assets, end of the period (000’s) | | $ | 243,302 | | | $ | 283,864 | | | $ | 296,255 | | | $ | 285,008 | | | $ | 143,231 | |
Net expenses | | | 0.92 | % | | | 0.91 | %(d) | | | 0.91 | % | | | 0.95 | %(e) | | | 0.98 | %(f) |
Gross expenses | | | 0.92 | % | | | 0.92 | % | | | 0.91 | % | | | 0.95 | % | | | 0.98 | %(f) |
Net investment income | | | 0.13 | % | | | 0.69 | %(b) | | | 0.45 | % | | | 0.40 | % | | | 0.63 | % |
Portfolio turnover rate | | | 26 | % | | | 12 | % | | | 23 | % | | | 17 | % | | | 17 | % |
| (a) | Per share net investment income has been calculated using the average shares outstanding during the period. |
| (b) | Includes non-recurring dividends. Without this dividend, net investment income per share would have been $0.22, total return would have been 31.16% and the ratio of net investment income to average net assets would have been 0.53%. |
| (c) | Had certain expenses not been waived/reimbursed during the period, total returns would have been lower. |
| (d) | The administrator agreed to waive its fees and/or reimburse a portion of the Fund’s expenses during the period. Without this waiver/reimbursement, expenses would have been higher. |
| (e) | Effective July 1, 2017, the expense limit decreased from 1.00% to 0.95%. |
| (f) | Includes fee/expense recovery of less than 0.01%. |
See accompanying notes to financial statements.
| 120
Financial Highlights (continued)
For a share outstanding throughout each period.
| | | | | | | | | | | | | | | | | | | | |
| | | Vaughan Nelson Mid Cap Fund—Class A | |
| | | Year Ended
December 31,
2020 | | | Year Ended
December 31,
2019 | | | Year Ended
December 31,
2018 | | | Year Ended
December 31,
2017 | | | Year Ended
December 31,
2016 | |
Net asset value, beginning of the period | | $ | 22.42 | | | $ | 17.37 | | | $ | 22.65 | | | $ | 20.55 | | | $ | 20.04 | |
| | | | | | | | | | | | | | | | | | | | |
INCOME (LOSS) FROM INVESTMENT OPERATIONS: | |
Net investment income(a) | | | 0.07 | | | | 0.03 | | | | 0.09 | | | | 0.17 | (b) | | | 0.07 | |
Net realized and unrealized gain (loss) | | | 1.96 | | | | 5.21 | | | | (3.71 | ) | | | 2.48 | | | | 1.05 | |
| | | | | | | | | | | | | | | | | | | | |
Total from Investment Operations | | | 2.03 | | | | 5.24 | | | | (3.62 | ) | | | 2.65 | | | | 1.12 | |
| | | | | | | | | | | | | | | | | | | | |
LESS DISTRIBUTIONS FROM: | |
Net investment income | | | (0.04 | ) | | | (0.02 | ) | | | (0.15 | ) | | | (0.18 | ) | | | (0.05 | ) |
Net realized capital gains | | | (2.62 | ) | | | (0.17 | ) | | | (1.51 | ) | | | (0.37 | ) | | | (0.56 | ) |
| | | | | | | | | | | | | | | | | | | | |
Total Distributions | | | (2.66 | ) | | | (0.19 | ) | | | (1.66 | ) | | | (0.55 | ) | | | (0.61 | ) |
| | | | | | | | | | | | | | | | | | | | |
Net asset value, end of the period | | $ | 21.79 | | | $ | 22.42 | | | $ | 17.37 | | | $ | 22.65 | | | $ | 20.55 | |
| | | | | | | | | | | | | | | | | | | | |
Total return(c) | | | 10.46 | %(d) | | | 30.21 | %(d) | | | (16.10 | )% | | | 12.93 | %(b) | | | 5.85 | % |
RATIOS TO AVERAGE NET ASSETS: | |
Net assets, end of the period (000’s) | | $ | 30,567 | | | $ | 33,434 | | | $ | 43,769 | | | $ | 67,186 | | | $ | 87,536 | |
Net expenses | | | 1.20 | %(e) | | | 1.25 | %(e)(f)(g) | | | 1.24 | % | | | 1.22 | % | | | 1.23 | % |
Gross expenses | | | 1.29 | % | | | 1.28 | %(f) | | | 1.24 | % | | | 1.22 | % | | | 1.23 | % |
Net investment income | | | 0.35 | % | | | 0.16 | % | | | 0.42 | % | | | 0.77 | %(b) | | | 0.35 | % |
Portfolio turnover rate | | | 52 | % | | | 52 | % | | | 44 | % | | | 42 | % | | | 57 | % |
| (a) | Per share net investment income has been calculated using the average shares outstanding during the period. |
| (b) | Includes a non-recurring dividend. Without this dividend, net investment income per share would have been $0.09, total return would have been 12.53% and the ratio of net investment income to average net assets would have been 0.41%. |
| (c) | A sales charge for Class A shares is not reflected in total return calculations. |
| (d) | Had certain expenses not been waived/reimbursed during the period, total returns would have been lower. |
| (e) | The investment adviser agreed to waive its fees and/or reimburse a portion of the Fund’s expenses during the period. Without this waiver/reimbursement, expenses would have been higher. |
| (f) | Includes interest expense. Without this expense the ratio of net expenses would have been 1.23% and the ratio of gross expenses would have been 1.26%. |
| (g) | Effective July 1, 2019, the expense limit decreased from 1.40% to 1.20%. |
See accompanying notes to financial statements.
121 |
Financial Highlights (continued)
For a share outstanding throughout each period.
| | | | | | | | | | | | | | | | | | | | |
| | | Vaughan Nelson Mid Cap Fund—Class C | |
| | | Year Ended
December 31,
2020
| | | Year Ended
December 31,
2019
| | | Year Ended
December 31,
2018
| | | Year Ended
December 31,
2017
| | | Year Ended
December 31,
2016 | |
Net asset value, beginning of the period | | $ | 21.06 | | | $ | 16.43 | | | $ | 21.50 | | | $ | 19.51 | | | $ | 19.16 | |
| | | | | | | | | | | | | | | | | | | | |
INCOME (LOSS) FROM INVESTMENT OPERATIONS: | |
Net investment income (loss)(a) | | | (0.08 | ) | | | (0.10 | ) | | | (0.08 | ) | | | 0.00 | (b)(c) | | | (0.07 | ) |
Net realized and unrealized gain (loss) | | | 1.79 | | | | 4.90 | | | | (3.48 | ) | | | 2.36 | | | | 0.98 | |
| | | | | | | | | | | | | | | | | | | | |
Total from Investment Operations | | | 1.71 | | | | 4.80 | | | | (3.56 | ) | | | 2.36 | | | | 0.91 | |
| | | | | | | | | | | | | | | | | | | | |
LESS DISTRIBUTIONS FROM: | |
Net investment income | | | — | | | | (0.00 | )(b) | | | — | | | | — | | | | (0.00 | )(b) |
Net realized capital gains | | | (2.62 | ) | | | (0.17 | ) | | | (1.51 | ) | | | (0.37 | ) | | | (0.56 | ) |
| | | | | | | | | | | | | | | | | | | | |
Total Distributions | | | (2.62 | ) | | | (0.17 | ) | | | (1.51 | ) | | | (0.37 | ) | | | (0.56 | ) |
| | | | | | | | | | | | | | | | | | | | |
Net asset value, end of the period | | $ | 20.15 | | | $ | 21.06 | | | $ | 16.43 | | | $ | 21.50 | | | $ | 19.51 | |
| | | | | | | | | | | | | | | | | | | | |
Total return(d) | | | 9.60 | %(e) | | | 29.25 | %(e) | | | (16.71 | )% | | | 12.11 | %(c) | | | 5.03 | % |
RATIOS TO AVERAGE NET ASSETS: | |
Net assets, end of the period (000’s) | | $ | 14,023 | | | $ | 21,932 | | | $ | 23,967 | | | $ | 47,559 | | | $ | 68,923 | |
Net expenses | | | 1.95 | %(f) | | | 1.99 | %(f)(g)(h) | | | 1.98 | % | | | 1.97 | % | | | 1.98 | % |
Gross expenses | | | 2.04 | % | | | 2.02 | %(g) | | | 1.98 | % | | | 1.97 | % | | | 1.98 | % |
Net investment income (loss) | | | (0.42 | )% | | | (0.50 | )% | | | (0.36 | )% | | | 0.00 | %(c)(i) | | | (0.38 | )% |
Portfolio turnover rate | | | 52 | % | | | 52 | % | | | 44 | % | | | 42 | % | | | 57 | % |
| (a) | Per share net investment income (loss) has been calculated using the average shares outstanding during the period. |
| (b) | Amount rounds to less than $0.01 per share. |
| (c) | Includes a non-recurring dividend. Without this dividend, net investment loss per share would have been $(0.07), total return would have been 11.70% and the ratio of net investment loss to average net assets would have been (0.35)%. |
| (d) | A contingent deferred sales charge for Class C shares is not reflected in total return calculations. |
| (e) | Had certain expenses not been waived/reimbursed during the period, total returns would have been lower. |
| (f) | The investment adviser agreed to waive its fees and/or reimburse a portion of the Fund’s expenses during the period. Without this waiver/reimbursement, expenses would have been higher. |
| (g) | Includes interest expense. Without this expense the ratio of net expenses would have been 1.98% and the ratio of gross expenses would have been 2.01%. |
| (h) | Effective July 1, 2019, the expense limit decreased from 2.15% to 1.95%. |
| (i) | Amount rounds to less than 0.01%. |
See accompanying notes to financial statements.
| 122
Financial Highlights (continued)
For a share outstanding throughout each period.
| | | | | | | | | | | | | | | | | | | | |
| | | Vaughan Nelson Mid Cap Fund—Class N | |
| | | Year Ended
December 31,
2020
| | | Year Ended
December 31,
2019
| | | Year Ended
December 31,
2018
| | | Year Ended
December 31,
2017
| | | Year Ended
December 31,
2016
| |
Net asset value, beginning of the period | | $ | 22.66 | | | $ | 17.54 | | | $ | 22.87 | | | $ | 20.75 | | | $ | 20.26 | |
| | | | | | | | | | | | | | | | | | | | |
INCOME (LOSS) FROM INVESTMENT OPERATIONS: | |
Net investment income(a) | | | 0.13 | | | | 0.11 | | | | 0.17 | | | | 0.25 | (b) | | | 0.16 | |
Net realized and unrealized gain (loss) | | | 2.00 | | | | 5.27 | | | | (3.75 | ) | | | 2.51 | | | | 1.04 | |
| | | | | | | | | | | | | | | | | | | | |
Total from Investment Operations | | | 2.13 | | | | 5.38 | | | | (3.58 | ) | | | 2.76 | | | | 1.20 | |
| | | | | | | | | | | | | | | | | | | | |
LESS DISTRIBUTIONS FROM: | |
Net investment income | | | (0.10 | ) | | | (0.09 | ) | | | (0.24 | ) | | | (0.27 | ) | | | (0.15 | ) |
Net realized capital gains | | | (2.62 | ) | | | (0.17 | ) | | | (1.51 | ) | | | (0.37 | ) | | | (0.56 | ) |
| | | | | | | | | | | | | | | | | | | | |
Total Distributions | | | (2.72 | ) | | | (0.26 | ) | | | (1.75 | ) | | | (0.64 | ) | | | (0.71 | ) |
| | | | | | | | | | | | | | | | | | | | |
Net asset value, end of the period | | $ | 22.07 | | | $ | 22.66 | | | $ | 17.54 | | | $ | 22.87 | | | $ | 20.75 | |
| | | | | | | | | | | | | | | | | | | | |
Total return | | | 10.83 | %(c) | | | 30.67 | %(c) | | | (15.78 | )% | | | 13.31 | %(b) | | | 6.21 | % |
RATIOS TO AVERAGE NET ASSETS: | |
Net assets, end of the period (000’s) | | $ | 17,965 | | | $ | 18,262 | | | $ | 70,902 | | | $ | 134,205 | | | $ | 148,365 | |
Net expenses | | | 0.90 | %(d) | | | 0.92 | %(d)(e)(f) | | | 0.88 | % | | | 0.88 | % | | | 0.88 | % |
Gross expenses | | | 0.94 | % | | | 0.93 | %(e) | | | 0.88 | % | | | 0.88 | % | | | 0.88 | % |
Net investment income | | | 0.65 | % | | | 0.51 | % | | | 0.76 | % | | | 1.16 | %(b) | | | 0.78 | % |
Portfolio turnover rate | | | 52 | % | | | 52 | % | | | 44 | % | | | 42 | % | | | 57 | % |
| (a) | Per share net investment income has been calculated using the average shares outstanding during the period. |
| (b) | Includes a non-recurring dividend. Without this dividend, net investment income per share would have been $0.17, total return would have been 12.92% and the ratio of net investment income to average net assets would have been 0.76%. |
| (c) | Had certain expenses not been waived/reimbursed during the period, total returns would have been lower. |
| (d) | The investment adviser agreed to waive its fees and/or reimburse a portion of the Fund’s expenses during the period. Without this waiver/reimbursement, expenses would have been higher. |
| (e) | Includes interest expense. Without this expense the ratio of net expenses would have been 0.91% and the ratio of gross expenses would have been 0.91%. |
| (f) | Effective July 1, 2019, the expense limit decreased from 1.10% to 0.90%. |
See accompanying notes to financial statements.
123 |
Financial Highlights (continued)
For a share outstanding throughout each period.
| | | | | | | | | | | | | | | | | | | | |
| | | Vaughan Nelson Mid Cap Fund—Class Y | |
| | | Year Ended
December 31,
2020
| | | Year Ended
December 31,
2019
| | | Year Ended
December 31,
2018
| | | Year Ended
December 31,
2017
| | | Year Ended
December 31,
2016
| |
Net asset value, beginning of the period | | $ | 22.69 | | | $ | 17.57 | | | $ | 22.89 | | | $ | 20.77 | | | $ | 20.27 | |
| | | | | | | | | | | | | | | | | | | | |
INCOME (LOSS) FROM INVESTMENT OPERATIONS: | |
Net investment income(a) | | | 0.12 | | | | 0.10 | | | | 0.15 | | | | 0.23 | (b) | | | 0.12 | |
Net realized and unrealized gain (loss) | | | 2.00 | | | | 5.26 | | | | (3.75 | ) | | | 2.51 | | | | 1.07 | |
| | | | | | | | | | | | | | | | | | | | |
Total from Investment Operations | | | 2.12 | | | | 5.36 | | | | (3.60 | ) | | | 2.74 | | | | 1.19 | |
| | | | | | | | | | | | | | | | | | | | |
LESS DISTRIBUTIONS FROM: | |
Net investment income | | | (0.09 | ) | | | (0.07 | ) | | | (0.21 | ) | | | (0.25 | ) | | | (0.13 | ) |
Net realized capital gains | | | (2.62 | ) | | | (0.17 | ) | | | (1.51 | ) | | | (0.37 | ) | | | (0.56 | ) |
| | | | | | | | | | | | | | | | | | | | |
Total Distributions | | | (2.71 | ) | | | (0.24 | ) | | | (1.72 | ) | | | (0.62 | ) | | | (0.69 | ) |
| | | | | | | | | | | | | | | | | | | | |
Net asset value, end of the period | | $ | 22.10 | | | $ | 22.69 | | | $ | 17.57 | | | $ | 22.89 | | | $ | 20.77 | |
| | | | | | | | | | | | | | | | | | | | |
Total return | | | 10.76 | %(c) | | | 30.52 | %(c) | | | (15.85 | )% | | | 13.19 | %(b) | | | 6.14 | % |
RATIOS TO AVERAGE NET ASSETS: | |
Net assets, end of the period (000’s) | | $ | 227,501 | | | $ | 298,705 | | | $ | 453,085 | | | $ | 774,304 | | | $ | 903,545 | |
Net expenses | | | 0.95 | %(d) | | | 1.00 | %(d)(e)(f) | | | 0.99 | % | | | 0.97 | % | | | 0.98 | % |
Gross expenses | | | 1.04 | % | | | 1.02 | %(e) | | | 0.99 | % | | | 0.97 | % | | | 0.98 | % |
Net investment income | | | 0.60 | % | | | 0.48 | % | | | 0.66 | % | | | 1.04 | %(b) | | | 0.62 | % |
Portfolio turnover rate | | | 52 | % | | | 52 | % | | | 44 | % | | | 42 | % | | | 57 | % |
| (a) | Per share net investment income has been calculated using the average shares outstanding during the period. |
| (b) | Includes a non-recurring dividend. Without this dividend, net investment income per share would have been $0.15, total return would have been 12.80% and the ratio of net investment income to average net assets would have been 0.67%. |
| (c) | Had certain expenses not been waived/reimbursed during the period, total returns would have been lower. |
| (d) | The investment adviser agreed to waive its fees and/or reimburse a portion of the Fund’s expenses during the period. Without this waiver/reimbursement, expenses would have been higher. |
| (e) | Includes interest expense. Without this expense the ratio of net expenses would have been 0.98% and the ratio of gross expenses would have been 1.01%. |
| (f) | Effective July 1, 2019, the expense limit decreased from 1.15% to 0.95%. |
See accompanying notes to financial statements.
| 124
Financial Highlights (continued)
For a share outstanding throughout each period.
| | | | | | | | | | | | | | | | | | | | |
| | | Vaughan Nelson Small Cap Value Fund—Class A | |
| | | Year Ended
December 31,
2020 | | | Year Ended
December 31,
2019 | | | Year Ended
December 31,
2018 | | | Year Ended
December 31,
2017 | | | Year Ended
December 31,
2016 | |
Net asset value, beginning of the period | | $ | 15.45 | | | $ | 12.48 | | | $ | 18.71 | | | $ | 19.79 | | | $ | 17.74 | |
| | | | | | | | | | | | | | | | | | | | |
INCOME (LOSS) FROM INVESTMENT OPERATIONS: | |
Net investment income (loss)(a) | | | 0.00 | (b) | | | 0.02 | | | | 0.01 | | | | (0.01 | ) | | | 0.02 | |
Net realized and unrealized gain (loss) | | | 1.33 | | | | 3.06 | | | | (2.76 | ) | | | 1.21 | | | | 3.49 | |
| | | | | | | | | | | | | | | | | | | | |
Total from Investment Operations | | | 1.33 | | | | 3.08 | | | | (2.75 | ) | | | 1.20 | | | | 3.51 | |
| | | | | | | | | | | | | | | | | | | | |
LESS DISTRIBUTIONS FROM: | |
Net investment income | | | (0.00 | )(b) | | | (0.03 | ) | | | (0.00 | )(b) | | | (0.00 | )(b) | | | (0.01 | ) |
Net realized capital gains | | | (0.09 | ) | | | (0.08 | ) | | | (3.48 | ) | | | (2.28 | ) | | | (1.45 | ) |
| | | | | | | | | | | | | | | | | | | | |
Total Distributions | | | (0.09 | ) | | | (0.11 | ) | | | (3.48 | ) | | | (2.28 | ) | | | (1.46 | ) |
| | | | | | | | | | | | | | | | | | | | |
Net asset value, end of the period | | $ | 16.69 | | | $ | 15.45 | | | $ | 12.48 | | | $ | 18.71 | | | $ | 19.79 | |
| | | | | | | | | | | | | | | | | | | | |
Total return(c) | | | 8.91 | %(d) | | | 24.66 | %(d) | | | (14.84 | )% | | | 6.28 | % | | | 20.24 | % |
RATIOS TO AVERAGE NET ASSETS: | |
Net assets, end of the period (000’s) | | $ | 61,571 | | | $ | 67,525 | | | $ | 66,376 | | | $ | 93,751 | | | $ | 106,447 | |
Net expenses | | | 1.32 | %(e)(f) | | | 1.40 | %(e)(g) | | | 1.38 | % | | | 1.36 | % | | | 1.35 | % |
Gross expenses | | | 1.53 | % | | | 1.47 | % | | | 1.38 | % | | | 1.36 | % | | | 1.35 | % |
Net investment income (loss) | | | 0.02 | % | | | 0.12 | % | | | 0.03 | % | | | (0.03 | )% | | | 0.11 | % |
Portfolio turnover rate | | | 105 | % | | | 61 | % | | | 70 | % | | | 92 | % | | | 74 | % |
| (a) | Per share net investment income (loss) has been calculated using the average shares outstanding during the period. |
| (b) | Amount rounds to less than $0.01 per share. |
| (c) | A sales charge for Class A shares is not reflected in total return calculations. |
| (d) | Had certain expenses not been waived/reimbursed during the period, total returns would have been lower. |
| (e) | The investment adviser agreed to waive its fees and/or reimburse a portion of the Fund’s expenses during the period. Without this waiver/reimbursement, expenses would have been higher. |
| (f) | Effective July 1, 2020, the expense limit decreased from 1.34% to 1.30%. See Note 6 of Notes to Financial Statements. |
| (g) | Effective July 1, 2019, the expense limit decreased from 1.45% to 1.34%. |
See accompanying notes to financial statements.
125 |
Financial Highlights (continued)
For a share outstanding throughout each period.
| | | | | | | | | | | | | | | | | | | | |
| | | Vaughan Nelson Small Cap Value Fund—Class C | |
| | | Year Ended
December 31,
2020 | | | Year Ended
December 31,
2019 | | | Year Ended
December 31,
2018 | | | Year Ended
December 31,
2017 | | | Year Ended
December 31,
2016 | |
Net asset value, beginning of the period | | $ | 7.84 | | | $ | 6.41 | | | $ | 11.67 | | | $ | 13.26 | | | $ | 12.39 | |
| | | | | | | | | | | | | | | | | | | | |
INCOME (LOSS) FROM INVESTMENT OPERATIONS: | |
Net investment loss(a) | | | (0.05 | ) | | | (0.05 | ) | | | (0.09 | ) | | | (0.10 | ) | | | (0.08 | ) |
Net realized and unrealized gain (loss) | | | 0.64 | | | | 1.57 | | | | (1.69 | ) | | | 0.79 | | | | 2.40 | |
| | | | | | | | | | | | | | | | | | | | |
Total from Investment Operations | | | 0.59 | | | | 1.52 | | | | (1.78 | ) | | | 0.69 | | | | 2.32 | |
| | | | | | | | | | | | | | | | | | | | |
LESS DISTRIBUTIONS FROM: | |
Net investment income | | | (0.00 | )(b) | | | (0.01 | ) | | | (0.00 | )(b) | | | (0.00 | )(b) | | | — | |
Net realized capital gains | | | (0.09 | ) | | | (0.08 | ) | | | (3.48 | ) | | | (2.28 | ) | | | (1.45 | ) |
| | | | | | | | | | | | | | | | | | | | |
Total Distributions | | | (0.09 | ) | | | (0.09 | ) | | | (3.48 | ) | | | (2.28 | ) | | | (1.45 | ) |
| | | | | | | | | | | | | | | | | | | | |
Net asset value, end of the period | | $ | 8.34 | | | $ | 7.84 | | | $ | 6.41 | | | $ | 11.67 | | | $ | 13.26 | |
| | | | | | | | | | | | | | | | | | | | |
Total return(c) | | | 8.08 | %(d) | | | 23.69 | %(d) | | | (15.51 | )% | | | 5.50 | % | | | 19.32 | % |
RATIOS TO AVERAGE NET ASSETS: | |
Net assets, end of the period (000’s) | | $ | 983 | | | $ | 1,450 | | | $ | 3,480 | | | $ | 15,756 | | | $ | 20,379 | |
Net expenses | | | 2.07 | %(e)(f) | | | 2.16 | %(e)(g) | | | 2.12 | % | | | 2.11 | % | | | 2.10 | % |
Gross expenses | | | 2.28 | % | | | 2.23 | % | | | 2.12 | % | | | 2.11 | % | | | 2.10 | % |
Net investment loss | | | (0.71 | )% | | | (0.68 | )% | | | (0.83 | )% | | | (0.79 | )% | | | (0.64 | )% |
Portfolio turnover rate | | | 105 | % | | | 61 | % | | | 70 | % | | | 92 | % | | | 74 | % |
| (a) | Per share net investment loss has been calculated using the average shares outstanding during the period. |
| (b) | Amount rounds to less than $0.01 per share. |
| (c) | A contingent deferred sales charge for Class C shares is not reflected in total return calculations. |
| (d) | Had certain expenses not been waived/reimbursed during the period, total returns would have been lower. |
| (e) | The investment adviser agreed to waive its fees and/or reimburse a portion of the Fund’s expenses during the period. Without this waiver/reimbursement, expenses would have been higher. |
| (f) | Effective July 1, 2020, the expense limit decreased from 2.09% to 2.05%. See Note 6 of Notes to Financial Statements. |
| (g) | Effective July 1, 2019, the expense limit decreased from 2.20% to 2.09%. |
See accompanying notes to financial statements.
| 126
Financial Highlights (continued)
For a share outstanding throughout each period.
| | | | | | | | | | | | | | | | |
| | | Vaughan Nelson Small Cap Value Fund—Class N | |
| | | Year Ended
December 31,
2020 | | | Year Ended
December 31,
2019 | | | Year Ended
December 31,
2018 | | | Period Ended
December 31,
2017* | |
Net asset value, beginning of the period | | $ | 16.20 | | | $ | 13.08 | | | $ | 19.37 | | | $ | 19.55 | |
| | | | | | | | | | | | | | | | |
INCOME (LOSS) FROM INVESTMENT OPERATIONS: | |
Net investment income(a) | | | 0.04 | | | | 0.08 | | | | 0.08 | | | | 0.07 | |
Net realized and unrealized gain (loss) | | | 1.42 | | | | 3.20 | | | | (2.86 | ) | | | 1.35 | |
| | | | | | | | | | | | | | | | |
Total from Investment Operations | | | 1.46 | | | | 3.28 | | | | (2.78 | ) | | | 1.42 | |
| | | | | | | | | | | | | | | | |
LESS DISTRIBUTIONS FROM: | |
Net investment income | | | (0.05 | ) | | | (0.08 | ) | | | (0.03 | ) | | | (0.02 | ) |
Net realized capital gains | | | (0.09 | ) | | | (0.08 | ) | | | (3.48 | ) | | | (1.58 | ) |
| | | | | | | | | | | | | | | | |
Total Distributions | | | (0.14 | ) | | | (0.16 | ) | | | (3.51 | ) | | | (1.60 | ) |
| | | | | | | | | | | | | | | | |
Net asset value, end of the period | | $ | 17.52 | | | $ | 16.20 | | | $ | 13.08 | | | $ | 19.37 | |
| | | | | | | | | | | | | | | | |
Total return(b) | | | 9.27 | % | | | 25.08 | % | | | (14.48 | )% | | | 7.17 | %(c) |
RATIOS TO AVERAGE NET ASSETS: | |
Net assets, end of the period (000’s) | | $ | 23 | | | $ | 21 | | | $ | 1 | | | $ | 1 | |
Net expenses(d) | | | 1.02 | %(e) | | | 1.03 | %(f) | | | 0.96 | % | | | 0.96 | %(g) |
Gross expenses | | | 6.54 | % | | | 11.80 | % | | | 15.17 | % | | | 14.68 | %(g) |
Net investment income | | | 0.31 | % | | | 0.52 | % | | | 0.43 | % | | | 0.56 | %(g) |
Portfolio turnover rate | | | 105 | % | | | 61 | % | | | 70 | % | | | 92 | %(h) |
| * | From commencement of Class operations on May 1, 2017 through December 31, 2017. |
| (a) | Per share net investment income has been calculated using the average shares outstanding during the period. |
| (b) | Had certain expenses not been waived/reimbursed during the period, total returns would have been lower. |
| (c) | Periods less than one year are not annualized. |
| (d) | The investment adviser agreed to waive its fees and/or reimburse a portion of the Fund’s expenses during the period. Without this waiver/reimbursement, expenses would have been higher. |
| (e) | Effective July 1, 2020, the expense limit decreased from 1.04% to 1.00%. See Note 6 of Notes to Financial Statements. |
| (f) | Effective July 1, 2019, the expense limit decreased from 1.15% to 1.04%. |
| (g) | Computed on an annualized basis for periods less than one year. |
| (h) | Represents the Fund’s portfolio turnover rate for the year ended December 31, 2017. |
See accompanying notes to financial statements.
127 |
Financial Highlights (continued)
For a share outstanding throughout each period.
| | | | | | | | | | | | | | | | | | | | |
| | | Vaughan Nelson Small Cap Value Fund—Class Y | |
| | | Year Ended
December 31,
2020 | | | Year Ended
December 31,
2019 | | | Year Ended
December 31,
2018 | | | Year Ended
December 31,
2017 | | | Year Ended
December 31,
2016 | |
Net asset value, beginning of the period | | $ | 16.19 | | | $ | 13.08 | | | $ | 19.37 | | | $ | 20.36 | | | $ | 18.21 | |
| | | | | | | | | | | | | | | | | | | | |
INCOME (LOSS) FROM INVESTMENT OPERATIONS: | |
Net investment income(a) | | | 0.04 | | | | 0.05 | | | | 0.04 | | | | 0.05 | | | | 0.07 | |
Net realized and unrealized gain (loss) | | | 1.41 | | | | 3.21 | | | | (2.84 | ) | | | 1.25 | | | | 3.59 | |
| | | | | | | | | | | | | | | | | | | | |
Total from Investment Operations | | | 1.45 | | | | 3.26 | | | | (2.80 | ) | | | 1.30 | | | | 3.66 | |
| | | | | | | | | | | | | | | | | | | | |
LESS DISTRIBUTIONS FROM: | |
Net investment income | | | (0.04 | ) | | | (0.07 | ) | | | (0.01 | ) | | | (0.01 | ) | | | (0.06 | ) |
Net realized capital gains | | | (0.09 | ) | | | (0.08 | ) | | | (3.48 | ) | | | (2.28 | ) | | | (1.45 | ) |
| | | | | | | | | | | | | | | | | | | | |
Total Distributions | | | (0.13 | ) | | | (0.15 | ) | | | (3.49 | ) | | | (2.29 | ) | | | (1.51 | ) |
| | | | | | | | | | | | | | | | | | | | |
Net asset value, end of the period | | $ | 17.51 | | | $ | 16.19 | | | $ | 13.08 | | | $ | 19.37 | | | $ | 20.36 | |
| | | | | | | | | | | | | | | | | | | | |
Total return | | | 9.23 | %(b) | | | 24.88 | %(b) | | | (14.61 | )% | | | 6.60 | % | | | 20.53 | % |
RATIOS TO AVERAGE NET ASSETS: | |
Net assets, end of the period (000’s) | | $ | 49,315 | | | $ | 44,482 | | | $ | 58,538 | | | $ | 176,940 | | | $ | 183,145 | |
Net expenses | | | 1.07 | %(c)(d) | | | 1.15 | %(c)(e) | | | 1.12 | % | | | 1.11 | % | | | 1.10 | % |
Gross expenses | | | 1.28 | % | | | 1.23 | % | | | 1.12 | % | | | 1.11 | % | | | 1.10 | % |
Net investment income | | | 0.26 | % | | | 0.35 | % | | | 0.22 | % | | | 0.23 | % | | | 0.36 | % |
Portfolio turnover rate | | | 105 | % | | | 61 | % | | | 70 | % | | | 92 | % | | | 74 | % |
| (a) | Per share net investment income has been calculated using the average shares outstanding during the period. |
| (b) | Had certain expenses not been waived/reimbursed during the period, total returns would have been lower. |
| (c) | The investment adviser agreed to waive its fees and/or reimburse a portion of the Fund’s expenses during the period. Without this waiver/reimbursement, expenses would have been higher. |
| (d) | Effective July 1, 2020, the expense limit decreased from 1.09% to 1.05%. See Note 6 of Notes to Financial Statements. |
| (e) | Effective July 1, 2019, the expense limit decreased from 1.20% to 1.09%. |
See accompanying notes to financial statements.
| 128
Notes to Financial Statements
December 31, 2020
1. Organization. Gateway Trust, Natixis Funds Trust I and Natixis Funds Trust II (the “Trusts” and each a “Trust”) are each organized as a Massachusetts business trust. Each Trust is registered under the Investment Company Act of 1940, as amended (the “1940 Act”), as an open-end management investment company. Each Declaration of Trust permits the Board of Trustees to authorize the issuance of an unlimited number of shares of the Trust in multiple series. The financial statements for certain funds of the Trusts are presented in separate reports. The following funds (individually, a “Fund” and collectively, the “Funds”) are included in this report:
Gateway Trust:
Gateway Fund
Gateway Equity Call Premium Fund
Natixis Funds Trust I:
Mirova Global Green Bond Fund (the “Global Green Bond Fund”)
Mirova Global Sustainable Equity Fund (the “Global Sustainable Equity Fund”)
Mirova International Sustainable Equity Fund (the “International Sustainable Equity Fund”)
Mirova U.S. Sustainable Equity Fund (the “U.S. Sustainable Equity Fund”)
Natixis Oakmark International Fund
Natixis U.S. Equity Opportunities Fund (the “U.S. Equity Opportunities Fund”)
Vaughan Nelson Small Cap Value Fund (the “Small Cap Value Fund”)
Natixis Funds Trust II:
Natixis Oakmark Fund
Vaughan Nelson Mid Cap Fund (the “Mid Cap Fund”)
U.S. Sustainable Equity Fund commenced operations on December 15, 2020 via contributions to the Fund by Natixis Investment Managers, LLC (“Natixis”) and affiliates of $5,003,000.
At close of business on June 30, 2020, Mid Cap Fund changed its investment strategy.
Each Fund is a diversified investment company, except for Global Green Bond Fund which is a non-diversified investment company.
Each Fund offers Class A, Class C, Class N and Class Y shares, except for Global Green Bond Fund and International Sustainable Equity Fund, which do not offer Class C shares.
Small Cap Value Fund was closed to new investors effective July 31, 2009. The Fund re-opened to new investors effective March 31, 2020.
Class A shares are sold with a maximum front-end sales charge of 5.75% for all Funds except for Global Green Bond Fund which are sold with a maximum front-end sales charge of 4.25%. Class C shares do not pay a front-end sales charge, pay higher Rule 12b-1 fees than Class A shares for ten years (at which point they automatically convert to Class A shares) and may be subject to a contingent deferred sales charge (“CDSC”) of 1.00% if those shares are redeemed within one year of acquisition, except for reinvested distributions. Class N and Class Y shares do not pay a front-end sales charge, a CDSC or Rule 12b-1 fees. Class N shares are offered with an initial minimum investment of $1,000,000. Class Y shares are offered with an initial minimum investment of $100,000. Certain categories of investors are exempted from the minimum investment amounts for Class N and Class Y as outlined in the relevant Funds’ prospectus.
Most expenses can be directly attributed to a Fund. Expenses which cannot be directly attributed to a Fund are generally apportioned based on the relative net assets of each of the funds in Natixis Funds Trust I, Natixis Funds Trust II, Natixis Funds Trust IV and Gateway Trust (“Natixis Funds Trusts”), Loomis Sayles Funds I and Loomis Sayles Funds II (“Loomis Sayles Funds Trusts”) and Natixis ETF Trust and Natixis ETF Trust II (“Natixis ETF Trusts”). Expenses of a Fund are borne pro rata by the holders of each class of shares, except that each class bears expenses unique to that class (such as the Rule 12b-1 fees applicable to Class A and Class C), and transfer agent fees are borne collectively for Class A, Class C and Class Y, and individually for Class N. In addition, each class votes as a class only with respect to its own Rule 12b-1 Plan. Shares of each class would receive their pro rata share of the net assets of the Fund if the Fund were liquidated. The Trustees approve separate distributions from net investment income on each class of shares.
2. Significant Accounting Policies. The following is a summary of significant accounting policies consistently followed by each Fund in the preparation of its financial statements. The Funds’ financial statements follow the accounting and reporting guidelines provided for investment companies and are prepared in accordance with accounting principles generally accepted in the United States of America which require the use of management estimates that affect the reported amounts and disclosures in the financial statements. Actual results could differ from those estimates. Management has evaluated the events and transactions subsequent to year-end through the date the financial statements were issued and has determined that there were no material events that would require disclosure in the Funds’ financial statements.
129 |
Notes to Financial Statements (continued)
December 31, 2020
a. Valuation. Fund securities and other investments are valued at market value based on market quotations obtained or determined by independent pricing services recommended by the adviser or sub-adviser and approved by the Board of Trustees. Fund securities and other investments for which market quotations are not readily available are valued at fair value as determined in good faith by the adviser or sub-adviser pursuant to procedures approved by the Board of Trustees, as described below. Market value is determined as follows:
Listed equity securities (including shares of closed-end investment companies and exchange-traded funds) are valued at the last sale price quoted on the exchange where they are traded most extensively or, if there is no reported sale during the day, the closing bid quotation as reported by an independent pricing service. Securities traded on the NASDAQ Global Select Market, NASDAQ Global Market and NASDAQ Capital Market are valued at the NASDAQ Official Closing Price (“NOCP”), or if lacking an NOCP, at the most recent bid quotations on the applicable NASDAQ Market. Unlisted equity securities (except unlisted preferred equity securities) are valued at the last sale price quoted in the market where they are traded most extensively or, if there is no reported sale during the day, the closing bid quotation as reported by an independent pricing service. If there is no last sale price or closing bid quotation available, unlisted equity securities will be valued using evaluated bids furnished by an independent pricing service, if available. In some foreign markets, an official close price and a last sale price may be available from the foreign exchange or market. In those cases, the official close price is used. Debt securities and unlisted preferred equity securities are valued based on evaluated bids furnished to the Funds by an independent pricing service or bid prices obtained from broker-dealers. Broker-dealer bid prices may be used to value debt and unlisted equity securities where an independent pricing service is unable to price a security or where an independent pricing service does not provide a reliable price for the security. Forward foreign currency contracts are valued utilizing interpolated rates determined based on information provided by an independent pricing service. Futures contracts are valued at the most recent settlement price on the exchange on which the adviser believes that, over time, they are traded most extensively. Domestic exchange-traded index and single name equity option contracts (including options on exchange-traded funds) are valued at the mean of the National Best Bid and Offer quotations as determined by the Options Price Reporting Authority.
Fund securities and other investments for which market quotations are not readily available are valued at fair value as determined in good faith by the adviser pursuant to procedures approved by the Board of Trustees. The Funds may also value securities and other investments at fair value in other circumstances such as when extraordinary events occur after the close of a foreign market but prior to the close of the New York Stock Exchange. This may include situations relating to a single issuer (such as a declaration of bankruptcy or a delisting of the issuer’s security from the primary market on which it has traded) as well as events affecting the securities markets in general (such as market disruptions or closings and significant fluctuations in U.S. and/or foreign markets). When fair valuing its securities or other investments, the Funds may, among other things, use modeling tools or other processes that may take into account factors such as securities or other market activity and/or significant events that occur after the close of the foreign market and before the time the Fund’s net asset value (“NAV”) is calculated. Fair value pricing may require subjective determinations about the value of a security, and fair values used to determine a Fund’s NAV may differ from quoted or published prices, or from prices that are used by others, for the same securities. In addition, the use of fair value pricing may not always result in adjustments to the prices of securities held by a Fund.
As of December 31, 2020, securities held by the Funds were fair valued as follows:
| | | | | | | | |
Fund | | Equity securities1 | | | Percentage of
Net Assets | |
Global Sustainable Equity Fund | | $ | 353,463,488 | | | | 40.3 | % |
International Sustainable Equity Fund | | | 14,733,490 | | | | 88.6 | % |
Natixis Oakmark International Fund | | | 452,255,545 | | | | 89.7 | % |
| 1 | Certain foreign equity securities were fair valued pursuant to procedures approved by the Board of Trustees as events occurring after the close of the foreign market were believed to materially affect the value of those securities. |
b. Investment Transactions and Related Investment Income. Investment transactions are accounted for on a trade date plus one day basis for daily NAV calculation. However, for financial reporting purposes, investment transactions are reported on trade date. Dividend income (including income reinvested) and foreign withholding tax, if applicable, is recorded on the ex-dividend date, or in the case of certain foreign securities, as soon as a Fund is notified, and interest income is recorded on an accrual basis. Dividends reinvested are reflected as non-cash dividends on the Statements of Operations. Interest income is increased by the accretion of discount and decreased by the amortization of premium, if applicable. Distributions received from investments in securities that represent a return of capital or capital gain are recorded as a reduction of cost of investments or as a realized gain, respectively. The calendar year-end amounts of ordinary income, capital gains, and return of capital included in distributions received from the Funds’ investments in real estate investment trusts (“REITs”) are reported to the Funds after the end of the fiscal year; accordingly, the Funds estimate these amounts for accounting purposes until the characterization of REIT distributions is reported to the Funds after the end of
| 130
Notes to Financial Statements (continued)
December 31, 2020
the fiscal year. Estimates are based on the most recent REIT distribution information available. In determining net gain or loss on securities sold, the cost of securities has been determined on an identified cost basis. Investment income, non-class specific expenses and realized and unrealized gains and losses are allocated on a pro rata basis to each class based on the relative net assets of each class to the total net assets of the Fund.
c. Foreign Currency Translation. The books and records of the Funds are maintained in U.S. dollars. The values of securities, currencies and other assets and liabilities denominated in currencies other than U.S. dollars, if any, are translated into U.S. dollars based upon foreign exchange rates prevailing at the end of the period. Purchases and sales of investment securities, income and expenses are translated into U.S. dollars on the respective dates of such transactions.
Net realized foreign exchange gains or losses arise from sales of foreign currency, changes in exchange rates between the trade and settlement dates on securities transactions and the difference between the amounts of dividends, interest and foreign withholding taxes recorded on the Funds’ books and the U.S. dollar equivalent of the amounts actually received or paid. Net unrealized foreign exchange gains or losses arise from changes in the value of assets and liabilities, other than investment securities, as of the end of the fiscal period, resulting from changes in exchange rates. Net realized foreign exchange gains or losses and the net change in unrealized foreign exchange gains or losses are disclosed in the Statements of Operations. For federal income tax purposes, net realized foreign exchange gains or losses are characterized as ordinary income, and may, if the Funds have net losses, reduce the amount of income available to be distributed by the Funds.
The values of investment securities are presented at the foreign exchange rates prevailing at the end of the period for financial reporting purposes. Net realized and unrealized gains or losses on investments reported in the Statements of Operations reflect gains or losses resulting from changes in exchange rates and fluctuations which arise due to changes in market prices of investment securities. For federal income tax purposes, a portion of the net realized gain or loss on investments arising from changes in exchange rates, which is reflected in the Statements of Operations, may be characterized as ordinary income and may, if the Funds have net losses, reduce the amount of income available to be distributed by the Funds.
The Funds may use foreign currency exchange contracts to facilitate transactions in foreign-denominated investments. Losses may arise from changes in the value of the foreign currency or if the counterparties do not perform under the contracts’ terms.
d. Forward Foreign Currency Contracts. Certain Funds may enter into forward foreign currency contracts, including forward foreign cross currency contracts, to acquire exposure to foreign currencies or to hedge the Fund’s investments against currency fluctuation. A contract can also be used to offset a previous contract. These contracts involve market risk in excess of the unrealized appreciation (depreciation) reflected in the Funds’ Statements of Assets and Liabilities. The U.S. dollar value of the currencies a Fund has committed to buy or sell represents the aggregate exposure to each currency a Fund has acquired or hedged through currency contracts outstanding at period end. Gains or losses are recorded for financial statement purposes as unrealized until settlement date. Contracts are traded over-the-counter directly with a counterparty. Risks may arise upon entering into these contracts from the potential inability of counterparties to meet the terms of their contracts and from unanticipated movements in the value of a foreign currency relative to the U.S. dollar. Certain contracts may require the movement of cash and/or securities as collateral for the Fund’s or counterparty’s net obligations under the contracts.
e. Futures Contracts. Certain Funds may enter into futures contracts. Futures contracts are agreements between two parties to buy and sell a particular instrument or index for a specified price on a specified future date.
When a Fund enters into a futures contract, it is required to deposit with (or for the benefit of) its broker an amount of cash or short-term high-quality securities as “initial margin.” As the value of the contract changes, the value of the futures contract position increases or declines. Subsequent payments, known as “variation margin,” are made or received by a Fund, depending on the price fluctuations in the fair value of the contract and the value of cash or securities on deposit with the broker. Gross unrealized appreciation (depreciation) on futures contracts is recorded in the Statements of Assets and Liabilities as an asset (liability). The aggregate principal amounts of the contracts are not recorded in the financial statements. Fluctuations in the value of the contracts are recorded in the Statements of Operations as unrealized appreciation (depreciation) until the contracts are closed, when they are recorded as realized gains (losses). Realized gain or loss on a futures position is equal to the difference between the value of the contract at the time it was opened and the value at the time it was closed, minus brokerage commissions. When a Fund enters into a futures contract certain risks may arise, such as illiquidity in the futures market, which may limit a Fund’s ability to close out a futures contract prior to settlement date, and unanticipated movements in the value of securities or interest rates.
Futures contracts are exchange-traded. Exchange-traded futures contracts are standardized and are settled through a clearing house with fulfillment supported by the credit of the exchange. Therefore, counterparty credit risks to the Funds are reduced; however, in the event that a counterparty enters into bankruptcy, a Fund’s claim against initial/variation margin on deposit with the counterparty may be subject to terms of a final settlement in bankruptcy court.
131 |
Notes to Financial Statements (continued)
December 31, 2020
f. Option Contracts. Gateway Fund and Gateway Equity Call Premium Fund’s investment strategies make use of exchange-traded options. Exchange-traded options are standardized contracts and are settled through a clearing house with fulfillment supported by the credit of the exchange. Therefore, counterparty credit risks to a Fund are reduced.
When a Fund writes an index call option, an amount equal to the net premium received (the premium less commission) is recorded as a liability and is subsequently adjusted to the current value until the option expires or a Fund enters into a closing purchase transaction. When an index call option expires or a Fund enters into a closing purchase transaction, the difference between the net premium received and any amount paid at expiration or on effecting a closing purchase transaction, including commission, is treated as a realized gain or, if the net premium received is less than the amount paid, as a realized loss. A Fund, as writer of an index call option, bears the risk of an unfavorable change in the market value of the index underlying the written option.
When a Fund purchases an index put option, it pays a premium and the index put option is subsequently marked-to-market to reflect current value until the option expires or a Fund enters into a closing sale transaction. Premiums paid for purchasing index put options which expire are treated as realized losses. When a Fund enters into a closing sale transaction, the difference between the premium paid and the proceeds of the closing sale transaction is treated as a realized gain or loss. The risk associated with purchasing index put options is limited to the premium paid.
g. Due from Brokers. Transactions and positions in certain futures contracts are maintained and cleared by registered U.S. broker/dealers pursuant to customer agreements between a Fund and the various broker/dealers. The due from brokers balance in the Statements of Assets and Liabilities for Global Green Bond Fund represents cash pledged as collateral for futures contracts (including variation margin, as applicable). In certain circumstances the Fund’s use of cash held at brokers is restricted by regulation or broker mandated limits.
h. Federal and Foreign Income Taxes. The Trusts treat each Fund as a separate entity for federal income tax purposes. Each Fund intends to meet the requirements of the Internal Revenue Code of 1986, as amended, applicable to regulated investment companies, and to distribute to its shareholders substantially all of its net investment income and any net realized capital gains at least annually. Management has performed an analysis of each Fund’s tax positions for the open tax years as of December 31, 2020 and has concluded that no provisions for income tax are required. The Funds’ federal tax returns for the prior three fiscal years, where applicable, remain subject to examination by the Internal Revenue Service. Management is not aware of any events that are reasonably possible to occur in the next twelve months that would result in the amounts of any unrecognized tax benefits significantly increasing or decreasing for the Funds. However, management’s conclusions regarding tax positions taken may be subject to review and adjustment at a later date based on factors including, but not limited to, new tax laws and accounting regulations and interpretations thereof.
A Fund may be subject to foreign withholding taxes on investment income and taxes on capital gains on investments that are accrued and paid based upon the Fund’s understanding of the tax rules and regulations that exist in the countries in which the Fund invests. Foreign withholding taxes on dividend and interest income are reflected on the Statements of Operations as a reduction of investment income, net of amounts that have been or are expected to be reclaimed and paid. Dividends and interest receivable on the Statements of Assets and Liabilities are net of foreign withholding taxes. Foreign withholding taxes where reclaims have been or are expected to be filed and paid are reflected on the Statements of Assets and Liabilities as tax reclaims receivable. Capital gains taxes paid are included in net realized gain (loss) on investments in the Statements of Operations. Accrued but unpaid capital gains taxes are reflected as foreign taxes payable on the Statements of Assets and Liabilities, if applicable, and reduce unrealized gains on investments. In the event that realized gains on investments are subsequently offset by realized losses, taxes paid on realized gains may be returned to a Fund. Such amounts, if applicable, are reflected as foreign tax rebates receivable on the Statements of Assets and Liabilities and are recorded as a realized gain when received.
In certain countries across the European Union, certain Funds filed tax reclaims for previously withheld taxes on dividends earned in certain countries (EU reclaims) and may continue to make such filings when it is determined to be in the best interest of the Funds and their shareholders. These filings are subject to various administrative proceedings by the local jurisdictions’ tax authorities within the European Union, as well as a number of related judicial proceedings. Income recognized, if any, for EU reclaims is reflected as other income in the Statements of Operations and any related receivable, if any, is reflected as tax reclaims receivable in the Statements of Assets and Liabilities. To date, no amounts have been received by any Funds and no amounts are included in any Funds financial statements for such EU reclaims, based on the uncertainty with the ultimate resolution of these proceedings, the potential collectibility and timing for payment, if any.
i. Dividends and Distributions to Shareholders. Dividends and distributions are recorded on the ex-dividend date. The timing and characterization of certain income and capital gain distributions are determined in accordance with federal tax regulations, which may differ from accounting principles generally accepted in the United States of America. Permanent differences are primarily due to differing treatments for book and tax purposes of items such as premium amortization, deferred Trustees’ fees, prior period adjustments, distribution re-designations, foreign currency gains and losses, futures and options contract mark-to-market, non-deductible expenses,
| 132
Notes to Financial Statements (continued)
December 31, 2020
net operating losses, return of capital distributions received, and capital gain distributions received. Permanent book and tax basis differences relating to shareholder distributions, net investment income and net realized gains will result in reclassifications to capital accounts reported on the Statements of Assets and Liabilities. Temporary differences between book and tax distributable earnings are primarily due to wash sales, deferred Trustees’ fees, premium amortization, foreign currency gains and losses, passive foreign investment company adjustments, futures and options contract mark-to-market, return of capital distributions received and capital gain distribution received. Amounts of income and capital gain available to be distributed on a tax basis are determined annually, and at other times during the Funds’ fiscal year as may be necessary to avoid knowingly declaring and paying a return of capital distribution. Distributions from net investment income and short-term capital gains are considered to be distributed from ordinary income for tax purposes.
The tax characterization of distributions is determined on an annual basis. The tax character of distributions paid to shareholders during the years ended December 31, 2020 and 2019 were as follows:
| | | | | | | | | | | | | | | | | | | | | | | | |
| | | 2020 Distributions | | | 2019 Distributions | |
Fund | | Ordinary
Income | | | Long-Term
Capital
Gains | | | Total | | | Ordinary
Income | | | Long-Term
Capital
Gains | | | Total | |
Gateway Fund | | $ | 76,713,219 | | | $ | — | | | $ | 76,713,219 | | | $ | 105,689,179 | | | $ | — | | | $ | 105,689,179 | |
Gateway Equity Call Premium Fund | | | 497,268 | | | | — | | | | 497,268 | | | | 652,970 | | | | — | | | | 652,970 | |
Global Green Bond Fund | | | 703,410 | | | | 670,133 | | | | 1,373,543 | | | | 608,967 | | | | 265,743 | | | | 874,710 | |
Global Sustainable Equity Fund | | | 262,732 | | | | 2,415,562 | | | | 2,678,294 | | | | 460,922 | | | | 1,861,566 | | | | 2,322,488 | |
International Sustainable Equity Fund | | | 508,537 | | | | 1,050,112 | | | | 1,558,649 | | | | 205,722 | | | | — | | | | 205,722 | |
Natixis Oakmark Fund | | | 3,185,140 | | | | 18,031,501 | | | | 21,216,641 | | | | 2,339,088 | | | | 25,578,931 | | | | 27,918,019 | |
Natixis Oakmark International Fund | | | 1,593,501 | | | | — | | | | 1,593,501 | | | | 17,222,206 | | | | — | | | | 17,222,206 | |
U.S. Equity Opportunities Fund | | | 297,964 | | | | 115,715,748 | | | | 116,013,712 | | | | 6,527,175 | | | | 95,958,074 | | | | 102,485,249 | |
Mid Cap Fund | | | 965,830 | | | | 33,018,937 | | | | 33,984,767 | | | | 996,088 | | | | 2,860,547 | | | | 3,856,635 | |
Small Cap Value Fund | | | 118,830 | | | | 616,973 | | | | 735,803 | | | | 348,253 | | | | 558,650 | | | | 906,903 | |
Distributions paid to shareholders from net investment income and net realized capital gains, based on accounting principles generally accepted in the United States of America, are consolidated and reported on the Statements of Changes in Net Assets as Distributions to Shareholders. Distributions paid to shareholders from net investment income and net realized capital gains expressed in per-share amounts, based on accounting principles generally accepted in the United States of America, are separately stated and reported within the Financial Highlights.
As of December 31, 2020, the components of distributable earnings on a tax basis were as follows:
| | | | | | | | | | | | | | | | | | | | |
| | | Gateway
Fund | | | Gateway
Equity Call
Premium Fund | | | Global
Green
Bond Fund | | | Global
Sustainable
Equity Fund | | | International
Sustainable
Equity Fund | |
Undistributed ordinary income | | $ | 562,758 | | | $ | 7,750 | | | $ | 125,283 | | | $ | 152,940 | | | $ | 152,114 | |
Undistributed long-term capital gains | | | — | | | | — | | | | — | | | | 12,624,770 | | | | 142,338 | |
| | | | | | | | | | | | | | | | | | | | |
Total undistributed earnings | | | 562,758 | | | | 7,750 | | | | 125,283 | | | | 12,777,710 | | | | 294,452 | |
| | | | | | | | | | | | | | | | | | | | |
Capital loss carryforward: | |
Short-term: | |
No expiration date | | | (810,609,623 | ) | | | (5,864,060 | ) | | | — | | | | — | | | | — | |
Long-term: | |
No expiration date | | | (445,293,905 | ) | | | (4,405,194 | ) | | | — | | | | — | | | | — | |
| | | | | | | | | | | | | | | | | | | | |
Total capital loss carryforward | | | (1,255,903,528 | ) | | | (10,269,254 | ) | | | — | | | | — | | | | — | |
| | | | | | | | | | | | | | | | | | | | |
Late-year ordinary and post-October capital loss deferrals* | | | — | | | | — | | | | (1,041,883 | ) | | | — | | | | — | |
| | | | | | | | | | | | | | | | | | | | |
Unrealized appreciation | | | 4,022,282,996 | | | | 31,598,459 | | | | 3,313,887 | | | | 138,909,512 | | | | 4,571,172 | |
| | | | | | | | | | | | | | | | | | | | |
Total accumulated earnings | | $ | 2,766,942,226 | | | $ | 21,336,955 | | | $ | 2,397,287 | | | $ | 151,687,222 | | | $ | 4,865,624 | |
| | | | | | | | | | | | | | | | | | | | |
Capital loss carryforward utilized in the current year | | $ | 45,786,009 | | | $ | — | | | $ | — | | | $ | — | | | $ | — | |
| | | | | | | | | | | | | | | | | | | | |
| * | Under current tax law, capital losses, foreign currency losses, and losses on passive foreign investment companies and contingent payment debt instruments after October 31 or December 31, as applicable, may be deferred and treated as occurring on the first day of the following taxable year. Global Green Bond Fund is deferring capital and foreign currency losses. |
133 |
Notes to Financial Statements (continued)
December 31, 2020
| | | | | | | | | | | | | | | | | | | | |
| | | U.S.
Sustainable
Equity Fund | | | Natixis
Oakmark
Fund | | | Natixis
Oakmark
International
Fund | | | U.S. Equity
Opportunities
Fund | | | Mid Cap
Fund | |
Undistributed ordinary income | | $ | — | | | $ | 54,262 | | | $ | 352,425 | | | $ | — | | | $ | 22,117 | |
Undistributed long-term capital gains | | | — | | | | 703,290 | | | | — | | | | 37,041,371 | | | | 3,640,303 | |
| | | | | | | | | | | | | | | | | | | | |
Total undistributed earnings | | | — | | | | 757,552 | | | | 352,425 | | | | 37,041,371 | | | | 3,662,420 | |
| | | | | | | | | | | | | | | | | | | | |
Capital loss carryforward: | |
Long-term: | |
No expiration date | | | — | | | | — | | | | (110,479,511 | ) | | | — | | | | — | |
| | | | | | | | | | | | | | | | | | | | |
Unrealized appreciation (depreciation) | | | 106,643 | | | | 50,173,056 | | | | (5,912,824 | ) | | | 308,426,910 | | | | 45,790,069 | |
| | | | | | | | | | | | | | | | | | | | |
Total accumulated earnings (losses) | | $ | 106,643 | | | $ | 50,930,608 | | | $ | (116,039,910 | ) | | $ | 345,468,281 | | | $ | 49,452,489 | |
| | | | | | | | | | | | | | | | | | | | |
| | | | |
| | | Small Cap
Value Fund | |
Undistributed ordinary income | | $ | 16,797 | |
| | | | |
Capital loss carryforward: | |
Long-term: | |
No expiration date | | | (4,098,262 | ) |
| | | | |
Unrealized appreciation | | | 22,689,982 | |
| | | | |
Total accumulated earnings | | $ | 18,608,517 | |
| | | | |
As of December 31, 2020, the tax cost of investments (including derivatives, if applicable) and unrealized appreciation (depreciation) on a federal tax basis were as follows:
| | | | | | | | | | | | | | | | | | | | |
| | | Gateway
Fund | | | Gateway
Equity Call
Premium Fund | | | Global Green
Bond Fund | | | Global
Sustainable
Equity Fund | | | International
Sustainable
Equity Fund | |
Federal tax cost | | $ | 3,327,646,580 | | | $ | 30,676,208 | | | $ | 33,305,838 | | | $ | 726,882,341 | | | $ | 11,479,577 | |
| | | | | | | | | | | | | | | | | | | | |
Gross tax appreciation | | $ | 4,066,418,003 | | | $ | 31,791,769 | | | $ | 3,288,952 | | | $ | 139,484,033 | | | $ | 4,749,796 | |
Gross tax depreciation | | | (44,135,047 | ) | | | (193,317 | ) | | | (8,412 | ) | | | (612,300 | ) | | | (196,083 | ) |
| | | | | | | | | | | | | | | | | | | | |
Net tax appreciation | | $ | 4,022,282,956 | | | $ | 31,598,452 | | | $ | 3,280,540 | | | $ | 138,871,733 | | | $ | 4,553,713 | |
| | | | | | | | | | | | | | | | | | | | |
| | | | | | | | | | | | | | | | | | | | | | | | |
| | | U.S.
Sustainable
Equity Fund | | | Natixis
Oakmark
Fund | | | Natixis
Oakmark
International
Fund | | | U.S. Equity
Opportunities
Fund | | | Mid Cap
Fund | | | Small Cap
Value Fund | |
Federal tax cost | | $ | 4,863,312 | | | $ | 194,405,404 | | | $ | 507,912,527 | | | $ | 646,095,937 | | | $ | 244,624,889 | | | $ | 89,488,861 | |
| | | | | | | | | | | | | | | | | | | | | | | | |
Gross tax appreciation | | $ | 131,319 | | | $ | 58,815,503 | | | $ | 27,494,389 | | | $ | 337,637,452 | | | $ | 52,640,179 | | | $ | 22,762,684 | |
Gross tax depreciation | | | (24,676 | ) | | | (8,642,447 | ) | | | (33,234,306 | ) | | | (29,210,542 | ) | | | (6,850,110 | ) | | | (72,702 | ) |
| | | | | | | | | | | | | | | | | | | | | | | | |
Net tax appreciation (depreciation) | | $ | 106,643 | | | $ | 50,173,056 | | | $ | (5,739,917 | ) | | $ | 308,426,910 | | | $ | 45,790,069 | | | $ | 22,689,982 | |
| | | | | | | | | | | | | | | | | | | | | | | | |
The difference between these amounts and those reported in the components of distributable earnings are primarily attributable to foreign currency mark-to-market and capital gains taxes.
| 134
Notes to Financial Statements (continued)
December 31, 2020
j. Repurchase Agreements. Each Fund may enter into repurchase agreements, under the terms of a Master Repurchase Agreement, under which each Fund acquires securities as collateral and agrees to resell the securities at an agreed upon time and at an agreed upon price. It is each Fund’s policy that the market value of the collateral for repurchase agreements be at least equal to 102% of the repurchase price, including interest. Certain repurchase agreements are tri-party arrangements whereby the collateral is held in a segregated account for the benefit of the Fund and on behalf of the counterparty. Repurchase agreements could involve certain risks in the event of default or insolvency of the counterparty, including possible delays or restrictions upon a Fund’s ability to dispose of the underlying securities. As of December 31, 2020, each Fund, as applicable, had investments in repurchase agreements for which the value of the related collateral exceeded the value of the repurchase agreement. The gross value of repurchase agreements is included in the Statements of Assets and Liabilities for financial reporting purposes.
k. Securities Lending. Certain Funds have entered into an agreement with State Street Bank and Trust Company (“State Street Bank”), as agent of the Funds, to lend securities to certain designated borrowers. The loans are collateralized with cash or securities in an amount equal to at least 105% or 102% of the market value (including accrued interest) of the loaned international or domestic securities, respectively, when the loan is initiated. Thereafter, the value of the collateral must remain at least 102% of the market value (including accrued interest) of loaned securities for U.S. equities and U.S. corporate debt; at least 105% of the market value (including accrued interest) of loaned securities for non-U.S. equities; and at least 100% of the market value (including accrued interest) of loaned securities for U.S. Government securities, sovereign debt issued by non-U.S. Governments and non-U.S. corporate debt. In the event that the market value of the collateral falls below the required percentages described above, the borrower will deliver additional collateral on the next business day. As with other extensions of credit, the Funds may bear the risk of loss with respect to the investment of the collateral. The Funds invest cash collateral in short-term investments, a portion of the income from which is remitted to the borrowers and the remainder allocated between the Funds and State Street Bank as lending agent.
For the year ended December 31, 2020, none of the Funds had loaned securities under this agreement.
l. Indemnifications. Under the Trusts’ organizational documents, their officers and Trustees are indemnified against certain liabilities arising out of the performance of their duties to the Funds. Additionally, in the normal course of business, the Funds enter into contracts with service providers that contain general indemnification clauses. The Funds’ maximum exposure under these arrangements is unknown as this would involve future claims that may be made against the Funds that have not yet occurred. However, based on experience, the Funds expect the risk of loss to be remote.
3. Fair Value Measurements. In accordance with accounting standards related to fair value measurements and disclosures, the Funds have categorized the inputs utilized in determining the value of each Fund’s assets or liabilities. These inputs are summarized in the three broad levels listed below:
| | • | | Level 1 – quoted prices in active markets for identical assets or liabilities; |
| | • | | Level 2 – prices determined using other significant inputs that are observable either directly, or indirectly through corroboration with observable market data (which could include quoted prices for similar assets or liabilities, interest rates, credit risk, etc.); and |
| | • | | Level 3 – prices determined using significant unobservable inputs when quoted prices or observable inputs are unavailable such as when there is little or no market activity for an asset or liability (unobservable inputs reflect each Fund’s own assumptions in determining the fair value of assets or liabilities and would be based on the best information available). |
The inputs or methodology used for valuing securities are not necessarily an indication of the risk associated with investing in those securities.
135 |
Notes to Financial Statements (continued)
December 31, 2020
The following is a summary of the inputs used to value the Funds’ investments as of December 31, 2020, at value:
Gateway Fund
Asset Valuation Inputs
| | | | | | | | | | | | | | | | |
Description | | Level 1 | | | Level 2 | | | Level 3 | | | Total | |
Common Stocks(a) | | $ | 7,083,209,056 | | | $ | — | | | $ | — | | | $ | 7,083,209,056 | |
Purchased Options(a) | | | 41,615,160 | | | | — | | | | — | | | | 41,615,160 | |
Short-Term Investments | | | — | | | | 266,720,480 | | | | — | | | | 266,720,480 | |
| | | | | | | | | | | | | | | | |
Total | | $ | 7,124,824,216 | | | $ | 266,720,480 | | | $ | — | | | $ | 7,391,544,696 | |
| | | | | | | | | | | | | | | | |
Liability Valuation Inputs | |
Description | | Level 1 | | | Level 2 | | | Level 3 | | | Total | |
Written Options(a) | | $ | (239,223,060 | ) | | $ | — | | | $ | — | | | $ | (239,223,060 | ) |
| | | | | | | | | | | | | | | | |
| (a) | Details of the major categories of the Fund’s investments are reflected within the Portfolio of Investments. |
Gateway Equity Call Premium Fund
Asset Valuation Inputs
| | | | | | | | | | | | | | | | |
Description | | Level 1 | | | Level 2 | | | Level 3 | | | Total | |
Common Stocks(a) | | $ | 60,174,539 | | | $ | — | | | $ | — | | | $ | 60,174,539 | |
Short-Term Investments | | | — | | | | 2,100,121 | | | | — | | | | 2,100,121 | |
| | | | | | | | | | | | | | | | |
Total | | $ | 60,174,539 | | | $ | 2,100,121 | | | $ | — | | | $ | 62,274,660 | |
| | | | | | | | | | | | | | | | |
Liability Valuation Inputs | |
Description | | Level 1 | | | Level 2 | | | Level 3 | | | Total | |
Written Options(a) | | $ | (2,025,420 | ) | | $ | — | | | $ | — | | | $ | (2,025,420 | ) |
| | | | | | | | | | | | | | | | |
| (a) | Details of the major categories of the Fund’s investments are reflected within the Portfolio of Investments. |
Global Green Bond Fund
Asset Valuation Inputs
| | | | | | | | | | | | | | | | |
Description | | Level 1 | | | Level 2 | | | Level 3 | | | Total | |
Bonds and Notes(a) | | $ | — | | | $ | 34,454,475 | | | $ | — | | | $ | 34,454,475 | |
Short-Term Investments | | | — | | | | 2,129,169 | | | | — | | | | 2,129,169 | |
Futures Contracts (unrealized appreciation) | | | 19,324 | | | | — | | | | — | | | | 19,324 | |
| | | | | | | | | | | | | | | | |
Total | | $ | 19,324 | | | $ | 36,583,644 | | | $ | — | | | $ | 36,602,968 | |
| | | | | | | | | | | | | | | | |
Liability Valuation Inputs | |
Description | | Level 1 | | | Level 2 | | | Level 3 | | | Total | |
Futures Contracts (unrealized depreciation) | | $ | (628,485 | ) | | $ | — | | | $ | — | | | $ | (628,485 | ) |
| | | | | | | | | | | | | | | | |
| (a) | Details of the major categories of the Fund’s investments are reflected within the Portfolio of Investments. |
| 136
Notes to Financial Statements (continued)
December 31, 2020
Global Sustainable Equity Fund
Asset Valuation Inputs
| | | | | | | | | | | | | | | | |
Description | | Level 1 | | | Level 2 | | | Level 3 | | | Total | |
Common Stocks | | | | | | | | | | | | | | | | |
Belgium | | $ | — | | | $ | 14,592,121 | | | $ | — | | | $ | 14,592,121 | |
Denmark | | | — | | | | 122,316,287 | | | | — | | | | 122,316,287 | |
France | | | — | | | | 39,030,314 | | | | — | | | | 39,030,314 | |
Germany | | | — | | | | 46,860,566 | | | | — | | | | 46,860,566 | |
Hong Kong | | | — | | | | 19,564,679 | | | | — | | | | 19,564,679 | |
Japan | | | — | | | | 35,766,472 | | | | — | | | | 35,766,472 | |
Netherlands | | | — | | | | 31,380,681 | | | | — | | | | 31,380,681 | |
Switzerland | | | — | | | | 10,198,312 | | | | — | | | | 10,198,312 | |
United Kingdom | | | 10,101,435 | | | | 33,754,056 | | | | — | | | | 43,855,491 | |
All Other Common Stocks(a) | | | 459,104,093 | | | | — | | | | — | | | | 459,104,093 | |
| | | | | | | | | | | | | | | | |
Total Common Stocks | | | 469,205,528 | | | | 353,463,488 | | | | — | | | | 822,669,016 | |
| | | | | | | | | | | | | | | | |
Short-Term Investments | | | — | | | | 43,085,058 | | | | — | | | | 43,085,058 | |
| | | | | | | | | | | | | | | | |
Total | | $ | 469,205,528 | | | $ | 396,548,546 | | | $ | — | | | $ | 865,754,074 | |
| | | | | | | | | | | | | | | | |
| (a) | Details of the major categories of the Fund’s investments are reflected within the Portfolio of Investments. |
International Sustainable Equity Fund
Asset Valuation Inputs
| | | | | | | | | | | | | | | | |
Description | | Level 1 | | | Level 2 | | | Level 3 | | | Total | |
Common Stocks | | | | | | | | | | | | | | | | |
Australia | | $ | — | | | $ | 350,019 | | | $ | — | | | $ | 350,019 | |
Belgium | | | — | | | | 766,796 | | | | — | | | | 766,796 | |
Denmark | | | — | | | | 2,676,528 | | | | — | | | | 2,676,528 | |
France | | | — | | | | 2,806,715 | | | | — | | | | 2,806,715 | |
Germany | | | — | | | | 1,066,522 | | | | — | | | | 1,066,522 | |
Hong Kong | | | — | | | | 711,608 | | | | — | | | | 711,608 | |
Ireland | | | — | | | | 603,500 | | | | — | | | | 603,500 | |
Japan | | | — | | | | 1,862,713 | | | | — | | | | 1,862,713 | |
Netherlands | | | — | | | | 1,167,720 | | | | — | | | | 1,167,720 | |
Norway | | | — | | | | 88,880 | | | | — | | | | 88,880 | |
Switzerland | | | — | | | | 402,499 | | | | — | | | | 402,499 | |
Taiwan | | | 815,074 | | | | — | | | | — | | | | 815,074 | |
United Kingdom | | | 283,621 | | | | 2,229,990 | | | | — | | | | 2,513,611 | |
| | | | | | | | | | | | | | | | |
Total Common Stocks | | | 1,098,695 | | | | 14,733,490 | | | | — | | | | 15,832,185 | |
| | | | | | | | | | | | | | | | |
Short-Term Investments | | | — | | | | 201,105 | | | | — | | | | 201,105 | |
| | | | | | | | | | | | | | | | |
Total | | $ | 1,098,695 | | | $ | 14,934,595 | | | $ | — | | | $ | 16,033,290 | |
| | | | | | | | | | | | | | | | |
U.S. Sustainable Equity Fund
Asset Valuation Inputs
| | | | | | | | | | | | | | | | |
Description | | Level 1 | | | Level 2 | | | Level 3 | | | Total | |
Common Stocks(a) | | $ | 4,969,955 | | | $ | — | | | $ | — | | | $ | 4,969,955 | |
| | | | | | | | | | | | | | | | |
| (a) | Details of the major categories of the Fund’s investments are reflected within the Portfolio of Investments. |
137 |
Notes to Financial Statements (continued)
December 31, 2020
Natixis Oakmark Fund
Asset Valuation Inputs
| | | | | | | | | | | | | | | | |
Description | | Level 1 | | | Level 2 | | | Level 3 | | | Total | |
Common Stocks(a) | | $ | 236,887,581 | | | $ | — | | | $ | — | | | $ | 236,887,581 | |
Short-Term Investments | | | — | | | | 7,690,879 | | | | — | | | | 7,690,879 | |
| | | | | | | | | | | | | | | | |
Total | | $ | 236,887,581 | | | $ | 7,690,879 | | | $ | — | | | $ | 244,578,460 | |
| | | | | | | | | | | | | | | | |
| (a) | Details of the major categories of the Fund’s investments are reflected within the Portfolio of Investments. |
Natixis Oakmark International Fund
Asset Valuation Inputs
| | | | | | | | | | | | | | | | |
Description | | Level 1 | | | Level 2 | | | Level 3 | | | Total | |
Common Stocks | | | | | | | | | | | | | | | | |
Australia | | $ | — | | | $ | 17,152,971 | | | $ | — | | | $ | 17,152,971 | |
Belgium | | | — | | | | 5,058,085 | | | | — | | | | 5,058,085 | |
China | | | 4,334,235 | | | | 1,971,929 | | | | — | | | | 6,306,164 | |
Finland | | | — | | | | 5,254,393 | | | | — | | | | 5,254,393 | |
France | | | — | | | | 49,405,180 | | | | — | | | | 49,405,180 | |
Germany | | | — | | | | 103,350,590 | | | | — | | | | 103,350,590 | |
India | | | — | | | | 8,178,047 | | | | — | | | | 8,178,047 | |
Indonesia | | | — | | | | 2,852,976 | | | | — | | | | 2,852,976 | |
Ireland | | | 5,582,915 | | | | 480,585 | | | | — | | | | 6,063,500 | |
Italy | | | — | | | | 20,732,162 | | | | — | | | | 20,732,162 | |
Japan | | | — | | | | 12,051,879 | | | | — | | | | 12,051,879 | |
Korea | | | — | | | | 7,914,324 | | | | — | | | | 7,914,324 | |
Netherlands | | | — | | | | 11,066,703 | | | | — | | | | 11,066,703 | |
South Africa | | | — | | | | 12,703,192 | | | | — | | | | 12,703,192 | |
Spain | | | — | | | | 5,029,169 | | | | — | | | | 5,029,169 | |
Sweden | | | — | | | | 20,260,204 | | | | — | | | | 20,260,204 | |
Switzerland | | | — | | | | 71,395,169 | | | | — | | | | 71,395,169 | |
United Kingdom | | | 9,957,617 | | | | 97,397,987 | | | | — | | | | 107,355,604 | |
All Other Common Stocks(a) | | | 20,217,763 | | | | — | | | | — | | | | 20,217,763 | |
| | | | | | | | | | | | | | | | |
Total Common Stocks | | | 40,092,530 | | | | 452,255,545 | | | | — | | | | 492,348,075 | |
| | | | | | | | | | | | | | | | |
Warrants | | | 40,632 | | | | — | | | | — | | | | 40,632 | |
Short-Term Investments | | | — | | | | 9,793,804 | | | | — | | | | 9,793,804 | |
| | | | | | | | | | | | | | | | |
Total | | $ | 40,133,162 | | | $ | 462,049,349 | | | $ | — | | | $ | 502,182,511 | |
| | | | | | | | | | | | | | | | |
Liability Valuation Inputs | |
Description | | Level 1 | | | Level 2 | | | Level 3 | | | Total | |
Forward Foreign Currency Contracts (unrealized depreciation) | | $ | — | | | $ | (9,119 | ) | | $ | — | | | $ | (9,119 | ) |
| | | | | | | | | | | | | | | | |
| (a) | Details of the major categories of the Fund’s investments are reflected within the Portfolio of Investments. |
U.S. Equity Opportunities Fund
Asset Valuation Inputs
| | | | | | | | | | | | | | | | |
Description | | Level 1 | | | Level 2 | | | Level 3 | | | Total | |
Common Stocks(a) | | $ | 918,877,018 | | | $ | — | | | $ | — | | | $ | 918,877,018 | |
Short-Term Investments | | | — | | | | 35,645,829 | | | | — | | | | 35,645,829 | |
| | | | | | | | | | | | | | | | |
Total | | $ | 918,877,018 | | | $ | 35,645,829 | | | $ | — | | | $ | 954,522,847 | |
| | | | | | | | | | | | | | | | |
| (a) | Details of the major categories of the Fund’s investments are reflected within the Portfolio of Investments. |
| 138
Notes to Financial Statements (continued)
December 31, 2020
Mid Cap Fund
Asset Valuation Inputs
| | | | | | | | | | | | | | | | |
Description | | Level 1 | | | Level 2 | | | Level 3 | | | Total | |
Common Stocks(a) | | $ | 288,100,587 | | | $ | — | | | $ | — | | | $ | 288,100,587 | |
Short-Term Investments | | | — | | | | 2,314,371 | | | | — | | | | 2,314,371 | |
| | | | | | | | | | | | | | | | |
Total | | $ | 288,100,587 | | | $ | 2,314,371 | | | $ | — | | | $ | 290,414,958 | |
| | | | | | | | | | | | | | | | |
| (a) | Details of the major categories of the Fund’s investments are reflected within the Portfolio of Investments. |
Small Cap Value Fund
Asset Valuation Inputs
| | | | | | | | | | | | | | | | |
Description | | Level 1 | | | Level 2 | | | Level 3 | | | Total | |
Common Stocks(a) | | $ | 109,775,021 | | | $ | — | | | $ | — | | | $ | 109,775,021 | |
Short-Term Investments | | | — | | | | 2,403,822 | | | | — | | | | 2,403,822 | |
| | | | | | | | | | | | | | | | |
Total | | $ | 109,775,021 | | | $ | 2,403,822 | | | $ | — | | | $ | 112,178,843 | |
| | | | | | | | | | | | | | | | |
| (a) | Details of the major categories of the Fund’s investments are reflected within the Portfolio of Investments. |
4. Derivatives. Derivative instruments are defined as financial instruments whose value and performance are based on the value and performance of an underlying asset, reference rate or index. Derivative instruments the Funds used during the period include written index call options, purchased index put options, forward foreign currency contracts and futures contracts.
Gateway Fund and Gateway Equity Call Premium Fund seek to capture the majority of the returns associated with equity market investments, while exposing investors to less risk than other equity investments. To meet this investment goal, the Funds invest in a broadly diversified portfolio of common stocks, while also writing index call options. Writing index call options can reduce the Fund’s volatility, provide a steady cash flow and be an important source of the Fund’s return, although it also may reduce the Funds’ ability to profit from increases in the value of its equity portfolio. Gateway Fund also buys index put options, which can protect the Fund from a significant market decline that may occur over a short period of time. The value of an index put option generally increases as the prices of stocks constituting the index decrease and decreases as those stocks increase in price. The combination of the diversified stock portfolio, the steady cash flow from writing of index call options and for Gateway Fund, the downside protection from purchased index put options is intended to provide the Funds with the majority of the returns associated with equity market investments while exposing investors to less risk than other equity investments. During the year ended December 31, 2020, Gateway Fund used written index call options and purchased index put options and Gateway Equity Call Premium Fund used written index call options in accordance with these objectives.
Global Green Bond Fund seeks to provide total return, through a combination of capital appreciation and current income, by investing in green bonds. The Fund pursues its objective by primarily investing in fixed-income securities. In connection with its principal investment strategies, the Fund may also invest in various types of futures contracts for investment purposes. During the year ended December 31, 2020, Global Green Bond Fund used U.S. and foreign Treasury bond futures to gain yield curve exposure.
Global Green Bond Fund is subject to the risk that changes in interest rates will affect the value of the Fund’s investments in fixed-income securities. The Fund will be subject to increased interest rate risk to the extent that it invests in fixed-income securities with longer maturities or durations, as compared to investing in fixed-income securities with shorter maturities or durations. The Fund may use futures contracts to hedge against changes in interest rates and to manage duration without having to buy or sell portfolio securities. During the year ended December 31, 2020, Global Green Bond Fund used U.S. and foreign Treasury bond futures to manage duration.
Global Green Bond Fund is also subject to the risk that changes in foreign currency exchange rates will have an unfavorable effect on the value of Fund assets denominated in foreign currencies. The Fund may use futures contracts for hedging purposes to protect the value of the Fund’s holdings of foreign securities. During the year ended December 31, 2020, Global Green Bond Fund used currency futures for hedging purposes.
Natixis Oakmark International Fund is subject to the risk that changes in foreign currency exchange rates will have an unfavorable effect on the value of Fund assets denominated in foreign currencies. The Fund may enter into forward foreign currency contracts for hedging purposes to protect the value of the Fund’s holdings of foreign securities. During the year ended December 31, 2020, Natixis Oakmark International Fund engaged in forward foreign currency transactions for hedging purposes.
139 |
Notes to Financial Statements (continued)
December 31, 2020
The following is a summary of derivative instruments for Gateway Fund as of December 31, 2020, as reflected within the Statements of Assets and Liabilities:
| | | | |
Assets | | Investments
at value1 | |
Exchange-traded asset derivatives | | | | |
Equity contracts | | $ | 41,615,160 | |
| |
Liabilities | | Options written
at value | |
Exchange-traded liability derivatives | | | | |
Equity contracts | | $ | (239,223,060 | ) |
| 1 | Represents purchased options, at value. |
Transactions in derivative instruments for Gateway Fund during the year ended December 31, 2020, as reflected within the Statements of Operations were as follows:
| | | | | | | | |
Net Realized Gain (Loss) on: | | Investments2 | | | Options written | |
Equity contracts | | $ | 20,409,122 | | | $ | (727,504,128 | ) |
| | |
Net Change in Unrealized
Appreciation (Depreciation) on: | | Investments2 | | | Options written | |
Equity contracts | | $ | (12,745,330 | ) | | $ | 17,165,193 | |
| 2 | Represents realized gain and change in unrealized appreciation (depreciation), respectively, for purchased options during the period. |
The following is a summary of derivative instruments for Gateway Equity Call Premium Fund as of December 31, 2020, as reflected within the Statements of Assets and Liabilities:
| | | | |
Liabilities | | Options written
at value | |
Exchange-traded liability derivatives | | | | |
Equity contracts | | $ | (2,025,420 | ) |
Transactions in derivative instruments for Gateway Equity Call Premium Fund during the year ended December 31, 2020, as reflected within the Statements of Operations were as follows:
| | | | |
Net Realized Gain (Loss) on: | | Options written | |
Equity contracts | | $ | (5,568,743 | ) |
| |
Net Change in Unrealized
Appreciation (Depreciation) on: | | Options written | |
Equity contracts | | $ | 111,673 | |
The following is a summary of derivative instruments for Global Green Bond Fund as of December 31, 2020, as reflected within the Statements of Assets and Liabilities:
| | | | |
Assets | | Unrealized
appreciation on
futures contracts | |
Exchange-traded asset derivatives | | | | |
Interest rate contracts | | $ | 19,324 | |
| |
Liabilities | | Unrealized
depreciation on
futures contracts | |
Exchange-traded liability derivatives | | | | |
Interest rate contracts | | $ | (2,766 | ) |
Foreign exchange contracts | | | (625,719 | ) |
| | | | |
Total exchange-traded liability derivatives | | $ | (628,485 | ) |
| | | | |
| 140
Notes to Financial Statements (continued)
December 31, 2020
Transactions in derivative instruments for Global Green Bond Fund during the year ended December 31, 2020, as reflected within the Statements of Operations were as follows:
| | | | |
Net Realized Gain (Loss) on: | | Futures contracts | |
Interest rate contracts | | $ | 246,366 | |
Foreign exchange contracts | | | (1,304,135 | ) |
| | | | |
Total | | $ | (1,057,769 | ) |
| | | | |
| |
Net Change in Unrealized
Appreciation (Depreciation) on: | | Futures contracts | |
Interest rate contracts | | $ | 101,063 | |
Foreign exchange contracts | | | (314,501 | ) |
| | | | |
Total | | $ | (213,438 | ) |
| | | | |
The following is a summary of derivative instruments for Natixis Oakmark International Fund as of December 31, 2020, as reflected within the Statements of Assets and Liabilities:
| | | | |
Liabilities | | Unrealized
depreciation on
forward foreign
currency contracts | |
Over-the-counter liability derivatives | | | | |
Foreign exchange contracts | | $ | (9,119 | ) |
Transactions in derivative instruments for Natixis Oakmark International Fund during the year ended December 31, 2020, as reflected within the Statements of Operations were as follows:
| | | | |
Net Realized Gain (Loss) on: | | Forward foreign
currency
contracts | |
Foreign exchange contracts | | $ | (378,942 | ) |
| |
Net Change in Unrealized
Appreciation (Depreciation) on: | | Forward foreign
currency
contracts | |
Foreign exchange contracts | | $ | 61,140 | |
As the Funds value their derivatives at fair value and recognize changes in fair value through the Statements of Operations, they do not qualify for hedge accounting under authoritative guidance for derivative instruments. The Funds’ investments in derivatives may represent an economic hedge; however, they are considered to be non-hedge transactions for the purpose of these disclosures.
The volume of option contract activity as a percentage of investments in common stocks, for Gateway Fund based on month-end notional amounts outstanding during the period, at absolute value, was as follows for the year ended December 31, 2020:
| | | | | | | | |
Gateway Fund | | Call Options
Written* | | | Put Options
Purchased* | |
Average Notional Amount Outstanding | | | 98.97 | % | | | 74.76 | % |
Highest Notional Amount Outstanding | | | 99.14 | % | | | 99.08 | % |
Lowest Notional Amount Outstanding | | | 98.75 | % | | | 41.90 | % |
Notional Amount Outstanding as of December 31, 2020 | | | 99.14 | % | | | 81.20 | % |
141 |
Notes to Financial Statements (continued)
December 31, 2020
The volume of option contract activity as a percentage of investments in common stocks, for Gateway Equity Call Premium Fund, based on month-end notional amounts outstanding during the period, at absolute value, was as follows for the year ended December 31, 2020:
| | | | |
Gateway Equity Call Premium Fund | | Call Options Written* | |
Average Notional Amount Outstanding | | | 98.84 | % |
Highest Notional Amount Outstanding | | | 99.24 | % |
Lowest Notional Amount Outstanding | | | 98.52 | % |
Notional Amount Outstanding as of December 31, 2020 | | | 98.62 | % |
| * | Notional amounts outstanding are determined by multiplying option contracts by the contract multiplier by the price of the option’s underlying index, the S&P 500® Index. |
The volume of futures contract activity as a percentage of net assets for Global Green Bond Fund, based on month-end notional amounts outstanding during the period, at absolute value, was as follows for the year ended December 31, 2020:
| | | | |
Global Green Bond Fund | | Futures | |
Average Notional Amount Outstanding | | | 83.26 | % |
Highest Notional Amount Outstanding | | | 96.00 | % |
Lowest Notional Amount Outstanding | | | 75.76 | % |
Notional Amount Outstanding as of December 31, 2020 | | | 76.54 | % |
The volume of forward foreign currency contract activity, as a percentage of net assets, for Natixis Oakmark International Fund, based on gross month-end notional amounts outstanding during the period, including long and short positions at absolute value, was as follows for the year ended December 31, 2020:
| | | | |
Natixis Oakmark International Fund | | Forwards | |
Average Notional Amount Outstanding | | | 0.98 | % |
Highest Notional Amount Outstanding | | | 1.33 | % |
Lowest Notional Amount Outstanding | | | 0.70 | % |
Notional Amount Outstanding as of December 31, 2020 | | | 1.33 | % |
Notional amounts outstanding at the end of the prior period are included in the averages above.
Unrealized gain and/or loss on open futures and forwards is recorded in the Statements of Assets and Liabilities. The aggregate notional values of futures and forward contracts are not recorded in the Statements of Assets and Liabilities, and therefore are not included in the net assets.
Natixis Oakmark International Fund enters into over-the-counter derivatives, including forward foreign currency contracts, pursuant to an International Swaps and Derivatives Association, Inc. (“ISDA”) agreement between the Fund and its counterparty. ISDA agreements typically contain master netting provisions in the event of a default or other termination event. Master netting provisions allow the Fund and the counterparty, in the event of a default or other termination event, to offset amounts owed by each related to derivative contracts to one net amount payable by either the Fund or the counterparty. For financial reporting purposes, the Fund does not offset derivative assets and liabilities on the Statements of Assets and Liabilities. As of December 31, 2020, gross amounts of derivative assets and liabilities not offset in the Statement of Assets and Liabilities and the related net amounts after taking into account master netting arrangements, by counterparty, are as follows:
| | | | | | | | | | | | |
Counterparty | | Gross Amounts of
Liabilities | | | Offset
Amount | | | Net
Amount | |
State Street Bank and Trust Company | | $ | (9,119 | ) | | $ | — | | | $ | (9,119 | ) |
Counterparty risk is managed based on policies and procedures established by each Fund’s adviser. Such policies and procedures may include, but are not limited to, minimum counterparty credit rating requirements, monitoring of counterparty credit default swap spreads and posting of collateral. With exchange-traded derivatives, there is minimal counterparty credit risk to the Fund because the exchange’s clearing house, as counterparty to these instruments, stands between the buyer and the seller of the contract. Credit risk still exists in exchange-traded derivatives with respect to initial and variation margin that is held in a broker’s customer accounts. While brokers are required to segregate customer margin from their own assets, in the event that a broker becomes insolvent or goes into bankruptcy and at that time there is a shortfall in the aggregate amount of margin held by the broker for all its clients, U.S. bankruptcy laws will typically allocate that shortfall on a pro rata basis across all of the broker’s customers, potentially resulting in
| 142
Notes to Financial Statements (continued)
December 31, 2020
losses to the Fund. The following table shows the maximum amount of loss due to credit risk that, based on the gross fair value of the financial instrument, the Fund would incur if parties to the relevant financial instruments failed completely to perform according to the terms of the contracts and the collateral or other security, if any, for the amount due proved to be of no value to the Fund, as of December 31, 2020:
| | | | | | | | |
Fund | | Maximum Amount
of Loss - Gross | | | Maximum Amount
of Loss - Net | |
Global Green Bond Fund | | $ | 1,745,795 | | | $ | 1,745,795 | |
5. Purchases and Sales of Securities. For the year ended (period ended for U.S. Sustainable Equity Fund) December 31, 2020, purchases and sales of securities (excluding short-term investments, option contracts and including paydowns) were as follows:
| | | | | | | | |
Fund | | Purchases | | | Sales | |
Gateway Fund | | $ | 1,550,156,436 | | | $ | 3,563,163,701 | |
Gateway Equity Call Premium Fund | | | 8,669,050 | | | | 21,157,282 | |
Global Green Bond Fund | | | 17,895,750 | | | | 21,345,123 | |
Global Sustainable Equity Fund | | | 592,780,644 | | | | 34,117,168 | |
International Sustainable Equity Fund | | | 1,662,700 | | | | 5,254,536 | |
U.S. Sustainable Equity Fund | | | 4,863,312 | | | | — | |
Natixis Oakmark Fund | | | 48,760,893 | | | | 109,741,075 | |
Natixis Oakmark International Fund | | | 306,603,431 | | | | 380,180,072 | |
U.S. Equity Opportunities Fund | | | 220,440,955 | | | | 428,965,713 | |
Mid Cap Fund | | | 143,075,526 | | | | 234,284,319 | |
Small Cap Value Fund | | | 96,687,696 | | | | 108,022,064 | |
6. Management Fees and Other Transactions with Affiliates.
a. Management Fees. Gateway Investment Advisers, LLC (“Gateway Advisers”) serves as investment adviser to Gateway Fund and Gateway Equity Call Premium Fund. Under the terms of the management agreements, each Fund pays a management fee at the following annual rates, calculated daily and payable monthly, based on each Fund’s average daily net assets:
| | | | | | | | | | | | |
| | | Percentage of Average
Daily Net Assets | |
Fund | | First $5 billion | | | Next $5 billion | | | Over $10 billion | |
Gateway Fund | | | 0.65 | % | | | 0.60 | % | | | 0.58 | % |
Gateway Equity Call Premium Fund | | | 0.65 | % | | | 0.65 | % | | | 0.65 | % |
Mirova US LLC (“Mirova US”) serves as investment adviser to Global Green Bond Fund, Global Sustainable Equity Fund, International Sustainable Equity Fund and U.S. Sustainable Equity Fund. Under the terms of the management agreements, each Fund pays a management fee at the following annual rates, calculated daily and payable monthly, based on each Fund’s average daily net assets:
| | | | |
Fund | | Percentage of
Average Daily
Net Assets | |
Global Green Bond Fund | | | 0.55 | % |
Global Sustainable Equity Fund | | | 0.80 | % |
International Sustainable Equity Fund | | | 0.80 | % |
U.S. Sustainable Equity Fund | | | 0.65 | % |
143 |
Notes to Financial Statements (continued)
December 31, 2020
Natixis Advisors, L.P. (“Natixis Advisors”) serves as investment adviser to Natixis Oakmark Fund, Natixis Oakmark International Fund, U.S. Equity Opportunities Fund, Mid Cap Fund and Small Cap Value Fund. Under the terms of the management agreements, each Fund pays a management fee at the following annual rates, calculated daily and payable monthly, based on each Fund’s average daily net assets:
| | | | | | | | | | | | | | | | | | | | | | | | |
| | | Percentage of Average Daily Net Assets | |
Fund | | First $150 million | | | Next $50 million | | | Next $300 million | | | Next $500 million | | | Next $500 million | | | Over $1.5 billion | |
Natixis Oakmark Fund | | | 0.70 | % | | | 0.70 | % | | | 0.65 | % | | | 0.60 | % | | | 0.60 | % | | | 0.60 | % |
Natixis Oakmark International Fund | | | 0.85 | % | | | 0.75 | % | | | 0.75 | % | | | 0.75 | % | | | 0.70 | % | | | 0.70 | % |
U.S. Equity Opportunities Fund | | | 0.75 | % | | | 0.75 | % | | | 0.75 | % | | | 0.75 | % | | | 0.75 | % | | | 0.75 | % |
Mid Cap Fund | | | 0.80 | % | | | 0.80 | % | | | 0.80 | % | | | 0.80 | % | | | 0.80 | % | | | 0.75 | % |
Small Cap Value Fund | | | 0.90 | % | | | 0.90 | % | | | 0.90 | % | | | 0.90 | % | | | 0.90 | % | | | 0.90 | % |
Natixis Advisors has entered into subadvisory agreements for each Fund as listed below.
| | |
Natixis Oakmark Fund | | Harris Associates L.P. (“Harris”) |
Natixis Oakmark International Fund | | Harris |
U.S. Equity Opportunities Fund | | Harris Loomis, Sayles & Company, L.P. (“Loomis Sayles”) |
Mid Cap Fund | | Vaughan Nelson Investment Management, L.P. (“Vaughan Nelson”) |
Small Cap Value Fund | | Vaughan Nelson |
Gateway Advisers, Natixis Advisors, Harris and Vaughan Nelson are subsidiaries of Natixis. Loomis Sayles is a limited partnership whose sole general partner, Loomis, Sayles & Company, Inc., is indirectly owned by Natixis.
Under the terms of the subadvisory agreements, each Fund has agreed to pay its respective subadviser a subadvisory fee at the following annual rates, calculated daily and payable monthly, based on each Fund’s average daily net assets:
| | | | | | | | | | | | | | | | | | | | | | |
| | | | | Percentage of Average Daily Net Assets | |
Fund | | Subadviser | | First $150 million | | | Next $50 million | | | Next $800 million | | | Next $500 million | | | Over $1.5 billion | |
Natixis Oakmark Fund | | Harris | | | 0.52 | % | | | 0.52 | % | | | 0.50 | % | | | 0.50 | % | | | 0.50 | % |
Natixis Oakmark International Fund | | Harris | | | 0.60 | % | | | 0.50 | % | | | 0.50 | % | | | 0.45 | % | | | 0.45 | % |
U.S. Equity Opportunities Fund | | | | | | | | | | | | | | | | | | | | | | |
Large Cap Value Segment | | Harris | | | 0.52 | % | | | 0.52 | % | | | 0.52 | % | | | 0.52 | % | | | 0.52 | % |
All Cap Growth Segment | | Loomis Sayles | | | 0.35 | % | | | 0.35 | % | | | 0.35 | % | | | 0.35 | % | | | 0.35 | % |
Mid Cap Fund | | Vaughan Nelson | | | 0.50 | % | | | 0.50 | % | | | 0.50 | % | | | 0.50 | % | | | 0.47 | % |
Small Cap Value Fund | | Vaughan Nelson | | | 0.55 | % | | | 0.55 | % | | | 0.55 | % | | | 0.55 | % | | | 0.55 | % |
Payments to Natixis Advisors are reduced by the amounts of payments to the subadvisers, as calculated based on the table above.
Gateway Advisers, Mirova US and Natixis Advisors have given binding undertakings to the Funds to waive management fees and/or reimburse certain expenses to limit the Funds’ operating expenses, exclusive of acquired fund fees and expenses, brokerage expenses, interest expense, substitute dividend expenses on securities sold short, taxes, organizational and extraordinary expenses such as litigation and indemnification expenses. These undertakings are in effect until April 30, 2021, except for Natixis Oakmark International Fund, U.S. Sustainable Equity Fund and Small Cap Value Fund, which are in effect until April 30, 2022, may be terminated before then only with the consent of the Funds’ Board of Trustees, and are reevaluated on an annual basis. Management fees payable, as reflected on the Statements of Assets and Liabilities, is net of waivers and/or expense reimbursements, if any, pursuant to these undertakings. Waivers/reimbursements that exceed management fees payable are reflected on the Statements of Assets and Liabilities as receivable from investment adviser.
| 144
Notes to Financial Statements (continued)
December 31, 2020
For the year ended (period ended for U.S. Sustainable Equity Fund) December 31, 2020, the expense limits as a percentage of average daily net assets under the expense limitation agreements were as follows:
| | | | | | | | | | | | | | | | |
| | | Expense Limit as a Percentage of Average
Daily Net Assets | |
Fund | | Class A | | | Class C | | | Class N | | | Class Y | |
Gateway Fund | | | 0.94 | % | | | 1.70 | % | | | 0.65 | % | | | 0.70 | % |
Gateway Equity Call Premium Fund | | | 1.20 | % | | | 1.95 | % | | | 0.90 | % | | | 0.95 | % |
Global Green Bond Fund | | | 0.95 | % | | | — | | | | 0.65 | % | | | 0.70 | % |
Global Sustainable Equity Fund | | | 1.20 | % | | | 1.95 | % | | | 0.90 | % | | | 0.95 | % |
International Sustainable Equity Fund | | | 1.20 | % | | | — | | | | 0.90 | % | | | 0.95 | % |
U.S. Sustainable Equity Fund | | | 1.05 | % | | | 1.80 | % | | | 0.75 | % | | | 0.80 | % |
Natixis Oakmark Fund | | | 1.30 | % | | | 2.05 | % | | | 1.00 | % | | | 1.05 | % |
Natixis Oakmark International Fund | | | 1.20 | % | | | 1.95 | % | | | 0.90 | % | | | 0.95 | % |
U.S. Equity Opportunities Fund | | | 1.20 | % | | | 1.95 | % | | | 0.90 | % | | | 0.95 | % |
Mid Cap Fund | | | 1.20 | % | | | 1.95 | % | | | 0.90 | % | | | 0.95 | % |
Small Cap Value Fund | | | 1.30 | % | | | 2.05 | % | | | 1.00 | % | | | 1.05 | % |
Prior to July 1, 2020, the expense limits as a percentage of average daily net assets under the expense limitation agreements for Natixis Oakmark International Fund and Small Cap Value Fund were as follows:
| | | | | | | | | | | | | | | | |
| | | Expense Limit as a Percentage of Average
Daily Net Assets | |
Fund | | Class A | | | Class C | | | Class N | | | Class Y | |
Natixis Oakmark International Fund | | | 1.37 | % | | | 2.12 | % | | | 1.07 | % | | | 1.12 | % |
Small Cap Value Fund | | | 1.34 | % | | | 2.09 | % | | | 1.04 | % | | | 1.09 | % |
Gateway Advisers, Mirova US and Natixis Advisors shall be permitted to recover expenses borne under the expense limitation agreements (whether through waiver of management fee or otherwise) on a class by class basis in later periods to the extent the annual operating expenses of a class fall below a class’ expense limits, provided, however, that a class is not obligated to pay such waived/reimbursed fees or expenses more than one year after the end of the fiscal year in which the fees or expenses were waived/reimbursed.
For the year ended (period ended for U.S. Sustainable Equity Fund) December 31, 2020, the management fees and waiver of management fees for each Fund were as follows:
| | | | | | | | | | | | | | | | | | | | |
Fund | | Gross
Management Fees | | | Contractual
Waivers of
Management Fees1 | | | Net
Management Fees | | | Percentage
of Average
Daily Net Assets
| |
| | Gross | | | Net | |
Gateway Fund | | $ | 45,426,590 | | | $ | 4,725,720 | | | $ | 40,700,870 | | | | 0.63 | % | | | 0.57 | % |
Gateway Equity Call Premium Fund | | | 366,204 | | | | 126,222 | | | | 239,982 | | | | 0.65 | % | | | 0.43 | % |
Global Green Bond Fund | | | 199,574 | | | | 153,758 | | | | 45,816 | | | | 0.55 | % | | | 0.13 | % |
Global Sustainable Equity Fund | | | 2,655,276 | | | | 106,348 | | | | 2,548,928 | | | | 0.80 | % | | | 0.77 | % |
International Sustainable Equity Fund | | | 133,936 | | | | 133,936 | | | | — | | | | 0.80 | % | | | — | % |
U.S. Sustainable Equity Fund | | | 1,431 | | | | 1,431 | | | | — | | | | 0.65 | % | | | — | % |
Natixis Oakmark Fund | | | 1,564,875 | | | | — | | | | 1,564,875 | | | | 0.69 | % | | | 0.69 | % |
Natixis Oakmark International Fund | | | 3,896,753 | | | | 372,574 | | | | 3,524,179 | | | | 0.78 | % | | | 0.71 | % |
U.S. Equity Opportunities Fund | | | 6,544,600 | | | | — | | | | 6,544,600 | | | | 0.75 | % | | | 0.75 | % |
Mid Cap Fund | | | 2,229,300 | | | | 237,006 | | | | 1,992,294 | | | | 0.80 | % | | | 0.71 | % |
Small Cap Value Fund | | | 840,431 | | | | 192,156 | | | | 648,275 | | | | 0.90 | % | | | 0.69 | % |
For the year ended December 31, 2020, class-specific expenses have been reimbursed as follows:
| | | | | | | | | | | | | | | | | | | | |
| | | Reimbursement1 | |
Fund | | Class A | | | Class C | | | Class N | | | Class Y | | | Total | |
Gateway Fund | | $ | 97,755 | | | $ | — | | | $ | — | | | $ | — | | | $ | 97,755 | |
| 1 | Waiver/expense reimbursements are subject to possible recovery until December 31, 2021. |
145 |
Notes to Financial Statements (continued)
December 31, 2020
In addition, Mirova US reimbursed non-class-specific expenses of International Sustainable Equity Fund and U.S. Sustainable Equity Fund in the amount of $17,961 and $33,244, respectively for the year ended December 31, 2020, which are subject to possible recovery until December 31, 2021.
No expenses were recovered for any of the Funds during the year ended (period ended for U.S. Sustainable Equity Fund) December 31, 2020 under the terms of the expense limitation agreements.
b. Service and Distribution Fees. Natixis Distribution, L.P. (“Natixis Distribution”), which is a wholly-owned subsidiary of Natixis, has entered into a distribution agreement with the Trusts. Pursuant to this agreement, Natixis Distribution serves as principal underwriter of the Funds of the Trusts.
Pursuant to Rule 12b-1 under the 1940 Act, the Trusts have adopted a Service Plan relating to each Fund’s Class A shares (the “Class A Plans”) and a Distribution and Service Plan relating to each Fund’s Class C shares (the “Class C Plans”).
Under the Class A Plans, each Fund pays Natixis Distribution a monthly service fee at an annual rate not to exceed 0.25% of the average daily net assets attributable to the Funds’ Class A shares, as reimbursement for expenses incurred by Natixis Distribution in providing personal services to investors in Class A shares and/or the maintenance of shareholder accounts.
Under the Class C Plans, each Fund pays Natixis Distribution a monthly service fee at an annual rate not to exceed 0.25% of the average daily net assets attributable to the Funds’ Class C shares, as compensation for services provided by Natixis Distribution in providing personal services to investors in Class C shares and/or the maintenance of shareholder accounts.
Also under the Class C Plans, each Fund pays Natixis Distribution a monthly distribution fee at an annual rate of 0.75% of the average daily net assets attributable to the Funds’ Class C shares, as compensation for services provided by Natixis Distribution in connection with the marketing or sale of Class C shares.
For the year ended (period ended for U.S. Sustainable Equity Fund) December 31, 2020, the service and distribution fees for each Fund were as follows:
| | | | | | | | | | | | |
| | | Service Fees | | | Distribution Fees | |
Fund | | Class A | | | Class C | | | Class C | |
Gateway Fund | | $ | 2,443,879 | | | $ | 421,385 | | | $ | 1,264,155 | |
Gateway Equity Call Premium Fund | | | 4,681 | | | | 1,866 | | | | 5,598 | |
Global Green Bond Fund | | | 9,170 | | | | — | | | | — | |
Global Sustainable Equity Fund | | | 45,727 | | | | 19,323 | | | | 57,968 | |
International Sustainable Equity Fund | | | 54 | | | | — | | | | — | |
U.S. Sustainable Equity Fund | | | — | 1 | | | — | 1 | | | 1 | |
Natixis Oakmark Fund | | | 370,208 | | | | 95,992 | | | | 287,975 | |
Natixis Oakmark International Fund | | | 304,215 | | | | 270,404 | | | | 811,213 | |
U.S. Equity Opportunities Fund | | | 1,438,095 | | | | 161,471 | | | | 484,412 | |
Mid Cap Fund | | | 68,426 | | | | 38,752 | | | | 116,256 | |
Small Cap Value Fund | | | 134,748 | | | | 2,412 | | | | 7,235 | |
For the year ended December 31, 2020, Natixis Distribution refunded Natixis Oakmark Fund $4,543 of prior year Class A service fees paid to Natixis Distribution in excess of amounts incurred by Natixis Distribution. Service and distribution fees on the Statements of Operations have been reduced by these amounts.
c. Administrative Fees. Natixis Advisors provides certain administrative services for the Funds and contracts with State Street Bank to serve as sub-administrator. Pursuant to an agreement among Natixis Funds Trusts, Loomis Sayles Funds Trusts, Natixis ETF Trusts and Natixis Advisors, each Fund pays Natixis Advisors monthly its pro rata portion of fees equal to an annual rate of 0.0540% of the first $15 billion of the average daily net assets of the Natixis Funds Trusts, Loomis Sayles Funds Trusts and Natixis ETF Trusts, 0.0500% of the next $15 billion, 0.0400% of the next $30 billion, 0.0275% of the next $30 billion and 0.0225% of such assets in excess of $90 billion, subject to an annual aggregate minimum fee for the Natixis Funds Trusts, Loomis Sayles Funds Trusts and Natixis ETF Trusts of $10 million, which is reevaluated on an annual basis.
| 146
Notes to Financial Statements (continued)
December 31, 2020
For the year ended (period ended for U.S. Sustainable Equity Fund) December 31, 2020, the administrative fees for each Fund were as follows:
| | | | |
Fund | | Administrative
Fees | |
Gateway Fund | | $ | 3,152,031 | |
Gateway Equity Call Premium Fund | | | 24,814 | |
Global Green Bond Fund | | | 15,988 | |
Global Sustainable Equity Fund | | | 145,476 | |
International Sustainable Equity Fund | | | 7,372 | |
U.S. Sustainable Equity Fund | | | 95 | |
Natixis Oakmark Fund | | | 99,193 | |
Natixis Oakmark International Fund | | | 220,057 | |
U.S. Equity Opportunities Fund | | | 383,038 | |
Mid Cap Fund | | | 123,422 | |
Small Cap Value Fund | | | 41,239 | |
d. Sub-Transfer Agent Fees. Natixis Distribution has entered into agreements, which include servicing agreements, with financial intermediaries that provide recordkeeping, processing, shareholder communications and other services to customers of the intermediaries that hold positions in the Funds and has agreed to compensate the intermediaries for providing those services. Intermediaries transact with the Funds primarily through the use of omnibus accounts on behalf of their customers who hold positions in the Funds. These services would have been provided by the Funds’ transfer agent and other service providers if the shareholders’ accounts were maintained directly at the Funds’ transfer agent. Accordingly, the Funds have agreed to reimburse Natixis Distribution for all or a portion of the servicing fees paid to these intermediaries. The reimbursement amounts (sub-transfer agent fees) paid to Natixis Distribution are subject to a current per-account equivalent fee limit approved by the Funds’ Board of Trustees, which is based on fees for similar services paid to the Funds’ transfer agent and other service providers. Class N shares do not bear such expenses.
For the year ended (period ended for U.S. Sustainable Equity Fund) December 31, 2020, the sub-transfer agent fees (which are reflected in transfer agent fees and expenses in the Statements of Operations) for each Fund were as follows:
| | | | |
Fund | | Sub-Transfer
Agent Fees | |
Gateway Fund | | $ | 4,055,111 | |
Gateway Equity Call Premium Fund | | | 20,508 | |
Global Green Bond Fund | | | 17,349 | |
Global Sustainable Equity Fund | | | 165,856 | |
International Sustainable Equity Fund | | | 106 | |
Natixis Oakmark Fund | | | 99,464 | |
Natixis Oakmark International Fund | | | 904,647 | |
U.S. Equity Opportunities Fund | | | 395,752 | |
Mid Cap Fund | | | 258,480 | |
Small Cap Value Fund | | | 53,851 | |
As of December 31, 2020, the Funds owe Natixis Distribution the following reimbursements for sub-transfer agent fees (which are reflected in the Statements of Assets and Liabilities as payable to distributor):
| | | | |
Fund | | Reimbursements
of Sub-Transfer
Agent Fees | |
Gateway Fund | | $ | 48,473 | |
Gateway Equity Call Premium Fund | | | 224 | |
Global Green Bond Fund | | | 227 | |
Global Sustainable Equity Fund | | | 10,902 | |
International Sustainable Equity Fund | | | 3 | |
Natixis Oakmark Fund | | | 1,183 | |
Natixis Oakmark International Fund | | | 12,190 | |
U.S. Equity Opportunities Fund | | | 4,523 | |
Mid Cap Fund | | | 2,675 | |
Small Cap Value Fund | | | 631 | |
147 |
Notes to Financial Statements (continued)
December 31, 2020
Sub-transfer agent fees attributable to Class A, Class C and Class Y are allocated on a pro rata basis to each class based on the relative net assets of each class to the total net assets of those classes.
e. Commissions. Commissions (including CDSCs) on Fund shares retained by Natixis Distribution during the year ended December 31, 2020 was as follows:
| | | | |
Fund | | Commissions | |
Gateway Fund | | $ | 93,874 | |
Gateway Equity Call Premium Fund | | | 3,970 | |
Global Green Bond Fund | | | 55 | |
Global Sustainable Equity Fund | | | 41,038 | |
International Sustainable Equity Fund | | | 414 | |
U.S. Sustainable Equity Fund | | | 1 | |
Natixis Oakmark Fund | | | 32,669 | |
Natixis Oakmark International Fund | | | 28,464 | |
U.S. Equity Opportunities Fund | | | 46,471 | |
Mid Cap Fund | | | 1,455 | |
Small Cap Value Fund | | | 3,029 | |
f. Trustees Fees and Expenses. The Trusts do not pay any compensation directly to their officers or Trustees who are directors, officers or employees of Natixis Advisors, Natixis Distribution, Natixis or their affiliates. The Chairperson of the Board of Trustees receives a retainer fee at the annual rate of $369,000. The Chairperson does not receive any meeting attendance fees for Board of Trustees meetings or committee meetings that he attends. Each Independent Trustee (other than the Chairperson) receives, in the aggregate, a retainer fee at the annual rate of $199,000. Each Independent Trustee also receives a meeting attendance fee of $10,000 for each meeting of the Board of Trustees that he or she attends in person and $5,000 for each meeting of the Board of Trustees that he or she attends telephonically. In addition, the chairperson of the Contract Review Committee, the chairperson of the Audit Committee and the chairperson of the Governance Committee each receive an additional retainer fee at the annual rate of $20,000. Each Contract Review Committee member is compensated $6,000 for each Committee meeting that he or she attends in person and $3,000 for each meeting that he or she attends telephonically. Each Audit Committee member is compensated $6,000 for each Committee meeting that he or she attends in person and $3,000 for each meeting that he or she attends telephonically. These fees are allocated among the funds in the Natixis Funds Trusts, Loomis Sayles Funds Trusts and Natixis ETF Trusts based on a formula that takes into account, among other factors, the relative net assets of each fund. Trustees are reimbursed for travel expenses in connection with attendance at meetings.
A deferred compensation plan (the “Plan”) is available to the Trustees on a voluntary basis. Deferred amounts remain in the Funds until distributed in accordance with the provisions of the Plan. The value of a participating Trustee’s deferral account is based on theoretical investments of deferred amounts, on the normal payment dates, in certain funds of the Natixis Funds Trusts, Loomis Sayles Funds Trusts and Natixis ETF Trusts as designated by the participating Trustees. Changes in the value of participants’ deferral accounts are allocated pro rata among the funds in the Natixis Funds Trusts, Loomis Sayles Funds Trusts and Natixis ETF Trusts, and are normally reflected as Trustees’ fees and expenses in the Statements of Operations. The portions of the accrued obligations allocated to the Funds under the Plan are reflected as Deferred Trustees’ fees in the Statements of Assets and Liabilities.
Certain officers and employees of Natixis Advisors and affiliates are also officers and/or Trustees of the Trusts.
g. Affiliated Ownership. As of December 31, 2020, the percentage of each Fund’s net assets owned by affiliates is as follows:
| | | | |
Global Green Bond Fund | | Percentage of
Net Assets | |
Natixis Sustainable Future 2015 Fund | | | 1.07% | |
Natixis Sustainable Future 2020 Fund | | | 0.68% | |
Natixis Sustainable Future 2025 Fund | | | 1.40% | |
Natixis Sustainable Future 2030 Fund | | | 1.23% | |
Natixis Sustainable Future 2035 Fund | | | 0.77% | |
Natixis Sustainable Future 2040 Fund | | | 0.48% | |
Natixis Sustainable Future 2045 Fund | | | 0.19% | |
Natixis Sustainable Future 2050 Fund | | | 0.18% | |
Natixis Sustainable Future 2055 Fund | | | 0.13% | |
Natixis Sustainable Future 2060 Fund | | | 0.13% | |
Natixis and affiliates | | | 13.67% | |
| | | | |
| | | 19.93% | |
| 148
Notes to Financial Statements (continued)
December 31, 2020
| | | | |
International Sustainable Equity Fund | | Percentage of
Net Assets | |
Natixis Sustainable Future 2015 Fund | | | 1.10% | |
Natixis Sustainable Future 2020 Fund | | | 0.87% | |
Natixis Sustainable Future 2025 Fund | | | 2.39% | |
Natixis Sustainable Future 2030 Fund | | | 3.35% | |
Natixis Sustainable Future 2035 Fund | | | 2.98% | |
Natixis Sustainable Future 2040 Fund | | | 2.79% | |
Natixis Sustainable Future 2045 Fund | | | 2.91% | |
Natixis Sustainable Future 2050 Fund | | | 2.68% | |
Natixis Sustainable Future 2055 Fund | | | 2.11% | |
Natixis Sustainable Future 2060 Fund | | | 1.98% | |
Natixis and affiliates | | | 75.88% | |
| | | | |
| | | 99.04% | |
| | |
U.S. Sustainable Equity Fund | | Percentage of
Net Assets |
Natixis and affiliates | | 100% |
| |
Small Cap Value Fund | | Percentage of
Net Assets |
Natixis and affiliates | | Less than 0.01% |
Investment activities of affiliated shareholders could have material impacts on the Fund.
h. Reimbursement of Transfer Agent Fees and Expenses. Natixis Advisors has given a binding contractual undertaking to Gateway Equity Call Premium Fund, Global Green Bond Fund (effective May 1, 2020), Global Sustainable Equity Fund, International Sustainable Equity Fund (effective May 1, 2020), U.S. Sustainable Equity Fund (effective December 15, 2020), Natixis Oakmark Fund, Natixis Oakmark International Fund, U.S. Equity Opportunities Fund, and Small Cap Value Fund to reimburse any and all transfer agency expenses for the Funds’ Class N shares. This undertaking is in effect through April 30, 2021, except for U.S. Sustainable Equity Fund which is in effect through April 30, 2022, and is not subject to recovery under the expense limitation agreement described above.
For the year ended December 31, 2020 (for the period May 1, 2020 through December 31, 2020 for Global Green Bond Fund and International Sustainable Equity Fund and for the period December 15, 2020 through December 31, 2020 for U.S. Sustainable Equity Fund), Natixis Advisors reimbursed the Funds for transfer agency expenses as follows:
| | | | |
Fund | | Reimbursement of
Transfer Agency
Expenses | |
| | | Class N | |
Gateway Equity Call Premium Fund | | $ | 1,005 | |
Global Green Bond Fund | | | 981 | |
Global Sustainable Equity Fund | | | 1,108 | |
International Sustainable Equity Fund | | | 468 | |
U.S. Sustainable Equity Fund | | | 3 | |
Natixis Oakmark Fund | | | 1,020 | |
Natixis Oakmark International Fund | | | 1,064 | |
U.S. Equity Opportunities Fund | | | 1,022 | |
Small Cap Value Fund | | | 1,007 | |
i. Payment by Affiliates. For the year ended December 31, 2020, Natixis Advisors reimbursed International Sustainable Equity Fund $66,060, Harris reimbursed Natixis Oakmark International Fund $2,108 and Vaughan Nelson reimbursed Small Cap Value Fund $6,512 in connection with trading errors.
j. Interfund Transactions. A Fund may purchase securities from, or sell securities to, an affiliated fund provided the affiliation is due solely to having a common investment adviser, common officers, or common Trustees. For the year ended December 31, 2020, Natixis Oakmark Fund engaged in purchase and sale transactions of $10,946 and $295,969, respectively, and U.S. Equity Opportunities Fund engaged in purchase transactions of $16,443 with an affiliate of Natixis in compliance with Rule 17a-7 of the 1940 Act pursuant to procedures adopted by the Board of Trustees.
149 |
Notes to Financial Statements (continued)
December 31, 2020
7. Custodian Fees and Expenses. State Street Bank, custodian to the Funds, has agreed to waive custodian fees and certain other expenses for the first 12 months of operations for the U.S. Sustainable Equity Fund. For the period ended December 31, 2020, total fees waived for the Fund were $1,261.
8. Class-Specific Transfer Agent Fees and Expenses. Transfer agent fees and expenses attributable to Class A, Class C and Class Y are allocated on a pro rata basis to each class based on the relative net assets of each class to the total net assets of those classes. Transfer agent fees and expenses attributable to Class N are allocated to Class N.
For the year ended (period ended for U.S. Sustainable Equity Fund) December 31, 2020, the Funds incurred the following class-specific transfer agent fees and expenses (including sub-transfer agent fees, where applicable):
| | | | | | | | | | | | | | | | |
| | | Transfer Agent Fees and Expenses | |
Fund | | Class A | | | Class C | | | Class N | | | Class Y | |
Gateway Fund | | $ | 657,146 | | | $ | 113,810 | | | $ | 2,202 | | | $ | 3,800,156 | |
Gateway Equity Call Premium Fund | | | 1,029 | | | | 387 | | | | 1,005 | | | | 28,028 | |
Global Green Bond Fund | | | 4,514 | | | | — | | | | 1,214 | | | | 16,298 | |
Global Sustainable Equity Fund | | | 11,172 | | | | 4,800 | | | | 1,108 | | | | 162,410 | |
International Sustainable Equity Fund | | | 769 | | | | — | | | | 1,151 | | | | 1,391 | |
U.S. Sustainable Equity Fund | | | 3 | | | | 3 | | | | 3 | | | | 3 | |
Natixis Oakmark Fund | | | 142,288 | | | | 36,745 | | | | 1,020 | | | | 34,881 | |
Natixis Oakmark International Fund | | | 229,102 | | | | 205,986 | | | | 1,064 | | | | 508,601 | |
U.S. Equity Opportunities Fund | | | 439,510 | | | | 49,786 | | | | 1,022 | | | | 177,978 | |
Mid Cap Fund | | | 29,787 | | | | 17,110 | | | | 1,151 | | | | 240,855 | |
Small Cap Value Fund | | | 61,643 | | | | 1,117 | | | | 1,007 | | | | 43,747 | |
9. Line of Credit. Each Fund (except U.S. Sustainable Equity Fund), together with certain other funds of Natixis Funds Trusts, Loomis Sayles Funds Trusts and Natixis ETF Trusts, entered into a $400,000,000 committed unsecured line of credit provided by State Street Bank. Any one Fund may borrow up to $350,000,000 under the line of credit agreement (as long as all borrowings by all Funds in the aggregate do not exceed the $400,000,000 limit at any time), subject to each Fund’s investment restrictions and its contractual obligations under the line of credit. Interest is charged to the Funds based upon the terms set forth in the agreement. In addition, a commitment fee of 0.15% per annum, payable at the end of each calendar quarter, is accrued and apportioned among the participating funds based on their average daily unused portion of the line of credit. The Funds paid an arrangement fee, an upfront fee, and certain other legal fees in connection with the line of credit agreement, which are being amortized over a period of 364 days and are reflected in legal fees and/or miscellaneous expenses on the Statements of Operations. The unamortized balance is reflected as prepaid expenses on the Statements of Assets and Liabilities.
For the year ended December 31, 2020, Natixis Oakmark International Fund had an average daily balance on the line of credit (for those days on which there were borrowings) of $10,266,667 at a weighted average interest rate of 1.17%. Interest expense incurred on the line of credit was $999. Mid Cap Fund had an average daily balance on the line of credit (for those days on which there were borrowings) of $21,300,000 at a weighted average interest rate of 1.16%. Interest expense incurred on the line of credit was $684.
10. Risk. The Funds’ investments in foreign securities may be subject to greater political, economic, environmental, credit/counterparty and information risks. The Fund’s investments in foreign securities also are subject to foreign currency fluctuations and other foreign currency-related risks. Foreign securities may be subject to higher volatility than U.S. securities, varying degrees of regulation and limited liquidity.
Global Green Bond Fund is non-diversified, which means that it is not limited under the 1940 Act to a percentage of assets that it may invest in any one issuer. Because the Fund may invest in the securities of a limited number of issuers, an investment in the Fund may involve a higher degree of risk than would be present in a diversified portfolio.
Global markets have experienced periods of high volatility triggered by the ongoing public health emergency known as coronavirus (“Covid-19”). As the situation continues, the extent and duration of the impact that the Covid-19 outbreak may have on financial markets and the economy as a whole remains highly uncertain. If the effects of the Covid-19 outbreak on financial markets and the economy continue for an extended period of time, the Funds’ future financial and investment results may be adversely affected.
11. Interest Expense. The Funds incur interest expense on cash (including foreign currency) overdrafts at the custodian bank, from use of the line of credit and, for Global Green Bond Fund, foreign currency debit balances at brokers. Interest expense incurred for the year ended December 31, 2020 is reflected on the Statements of Operations.
| 150
Notes to Financial Statements (continued)
December 31, 2020
12. Concentration of Ownership. From time to time, a Fund may have a concentration of one or more accounts constituting a significant percentage of shares outstanding. Investment activities by holders of such accounts could have material impacts on the Funds. As of December 31, 2020, based on management’s evaluation of the shareholder account base, the Funds had accounts representing controlling ownership of more than 5% of the Funds’ total outstanding shares. The number of such accounts, based on accounts that represent more than 5% of an individual class of shares, and the aggregate percentage of net assets represented by such holdings were as follows:
| | | | | | | | | | | | | | | | |
Fund | | Number of 5%
Non-Affiliated
Account Holders | | | Percentage of
Non-Affiliated
Ownership | | | Percentage
of Affiliated
Ownership
(Note 6g) | | | Total
Percentage of
Ownership | |
Gateway Equity Call Premium Fund | | | 2 | | | | 79.19 | % | | | — | | | | 79.19 | % |
Global Green Bond Fund | | | 2 | | | | 22.02 | % | | | 19.93 | % | | | 41.95 | % |
Global Sustainable Equity Fund | | | 1 | | | | 36.42 | % | | | — | | | | 36.42 | % |
Natixis Oakmark International Fund | | | 1 | | | | 25.98 | % | | | — | | | | 25.98 | % |
Mid Cap Fund | | | 2 | | | | 19.08 | % | | | — | | | | 19.08 | % |
Omnibus shareholder accounts for which Natixis Advisors understands that the intermediary has discretion over the underlying shareholder accounts or investment models where a shareholder account may be invested for a non-discretionary customer are included in the table above. For other omnibus accounts, the Funds do not have information on the individual shareholder accounts underlying the omnibus accounts; therefore, there could be other 5% shareholders in addition to those disclosed in the table above.
13. Capital Shares. Each Fund may issue an unlimited number of shares of beneficial interest, without par value. Transactions in capital shares were as follows:
| | | | | | | | | | | | | | | | |
| | | Year Ended
December 31, 2020 | | | Year Ended
December 31, 2019 | |
Gateway Fund | | Shares | | | Amount | | | Shares | | | Amount | |
| Class A | |
Issued from the sale of shares | | | 4,933,210 | | | $ | 166,881,524 | | | | 5,642,070 | | | $ | 187,727,250 | |
Issued in connection with the reinvestment of distributions | | | 226,078 | | | | 7,452,654 | | | | 340,366 | | | | 11,406,325 | |
Redeemed | | | (10,728,981 | ) | | | (357,437,934 | ) | | | (10,753,386 | ) | | | (356,593,296 | ) |
| | | | | | | | | | | | | | | | |
Net change | | | (5,569,693 | ) | | $ | (183,103,756 | ) | | | (4,770,950 | ) | | $ | (157,459,721 | ) |
| | | | | | | | | | | | | | | | |
| Class C | |
Issued from the sale of shares | | | 309,182 | | | $ | 10,611,120 | | | | 432,578 | | | $ | 14,310,216 | |
Issued in connection with the reinvestment of distributions | | | 6,581 | | | | 207,158 | | | | 20,474 | | | | 678,795 | |
Redeemed | | | (2,670,540 | ) | | | (90,111,982 | ) | | | (2,864,005 | ) | | | (94,753,228 | ) |
| | | | | | | | | | | | | | | | |
Net change | | | (2,354,777 | ) | | $ | (79,293,704 | ) | | | (2,410,953 | ) | | $ | (79,764,217 | ) |
| | | | | | | | | | | | | | | | |
| Class N | |
Issued from the sale of shares | | | 3,665,849 | | | $ | 124,426,497 | | | | 6,003,206 | | | $ | 203,490,332 | |
Issued in connection with the reinvestment of distributions | | | 59,627 | | | | 1,984,767 | | | | 51,248 | | | | 1,723,476 | |
Redeemed | | | (4,322,136 | ) | | | (146,692,114 | ) | | | (1,072,156 | ) | | | (35,774,420 | ) |
| | | | | | | | | | | | | | | | |
Net change | | | (596,660 | ) | | $ | (20,280,850 | ) | | | 4,982,298 | | | $ | 169,439,388 | |
| | | | | | | | | | | | | | | | |
| Class Y | |
Issued from the sale of shares | | | 41,200,429 | | | $ | 1,389,182,842 | | | | 40,784,585 | | | $ | 1,355,336,594 | |
Issued in connection with the reinvestment of distributions | | | 1,586,091 | | | | 52,425,527 | | | | 2,127,554 | | | | 71,298,540 | |
Redeemed | | | (75,560,637 | ) | | | (2,514,181,386 | ) | | | (62,764,917 | ) | | | (2,087,644,216 | ) |
| | | | | | | | | | | | | | | | |
Net change | | | (32,774,117 | ) | | $ | (1,072,573,017 | ) | | | (19,852,778 | ) | | $ | (661,009,082 | ) |
| | | | | | | | | | | | | | | | |
Decrease from capital share transactions | | | (41,295,247 | ) | | $ | (1,355,251,327 | ) | | | (22,052,383 | ) | | $ | (728,793,632 | ) |
| | | | | | | | | | | | | | | | |
151 |
Notes to Financial Statements (continued)
December 31, 2020
13. Capital Shares (continued).
| | | | | | | | | | | | | | | | |
| | | Year Ended
December 31, 2020 | | | Year Ended
December 31, 2019 | |
Gateway Equity Call Premium Fund | | Shares | | | Amount | | | Shares | | | Amount | |
| Class A | |
Issued from the sale of shares | | | 89,776 | | | $ | 1,165,671 | | | | 115,797 | | | $ | 1,436,549 | |
Issued in connection with the reinvestment of distributions | | | 973 | | | | 11,345 | | | | 1,519 | | | | 18,853 | |
Redeemed | | | (167,721 | ) | | | (2,061,010 | ) | | | (146,371 | ) | | | (1,790,405 | ) |
| | | | | | | | | | | | | | | | |
Net change | | | (76,972 | ) | | $ | (883,994 | ) | | | (29,055 | ) | | $ | (335,003 | ) |
| | | | | | | | | | | | | | | | |
| Class C | |
Issued from the sale of shares | | | 9,094 | | | $ | 114,580 | | | | 9,729 | | | $ | 122,297 | |
Issued in connection with the reinvestment of distributions | | | 49 | | | | 567 | | | | 85 | | | | 1,019 | |
Redeemed | | | (11,920 | ) | | | (161,150 | ) | | | (29,196 | ) | | | (363,655 | ) |
| | | | | | | | | | | | | | | | |
Net change | | | (2,777 | ) | | $ | (46,003 | ) | | | (19,382 | ) | | $ | (240,339 | ) |
| | | | | | | | | | | | | | | | |
| Class N | |
Issued from the sale of shares | | | 16,338 | | | $ | 204,818 | | | | 42,939 | | | $ | 532,639 | |
Issued in connection with the reinvestment of distributions | | | 475 | | | | 5,747 | | | | 213 | | | | 2,711 | |
Redeemed | | | (5,480 | ) | | | (64,140 | ) | | | (2,623 | ) | | | (33,360 | ) |
| | | | | | | | | | | | | | | | |
Net change | | | 11,333 | | | $ | 146,425 | | | | 40,529 | | | $ | 501,990 | |
| | | | | | | | | | | | | | | | |
| Class Y | |
Issued from the sale of shares | | | 870,053 | | | $ | 10,700,287 | | | | 1,271,009 | | | $ | 15,306,783 | |
Issued in connection with the reinvestment of distributions | | | 12,901 | | | | 152,845 | | | | 18,719 | | | | 232,437 | |
Redeemed | | | (1,471,881 | ) | | | (17,118,532 | ) | | | (2,567,908 | ) | | | (30,536,186 | ) |
| | | | | | | | | | | | | | | | |
Net change | | | (588,927 | ) | | $ | (6,265,400 | ) | | | (1,278,180 | ) | | $ | (14,996,966 | ) |
| | | | | | | | | | | | | | | | |
Decrease from capital share transactions | | | (657,343 | ) | | $ | (7,048,972 | ) | | | (1,286,088 | ) | | $ | (15,070,318 | ) |
| | | | | | | | | | | | | | | | |
| | |
| | | Year Ended
December 31, 2020 | | | Year Ended
December 31, 2019 | |
Global Green Bond Fund | | Shares | | | Amount | | | Shares | | | Amount | |
| Class A | |
Issued from the sale of shares | | | 357,151 | | | $ | 3,820,987 | | | | 213,955 | | | $ | 2,256,341 | |
Issued in connection with the reinvestment of distributions | | | 14,237 | | | | 152,385 | | | | 3,961 | | | | 41,148 | |
Redeemed | | | (90,528 | ) | | | (963,417 | ) | | | (55,616 | ) | | | (576,973 | ) |
| | | | | | | | | | | | | | | | |
Net change | | | 280,860 | | | $ | 3,009,955 | | | | 162,300 | | | $ | 1,720,516 | |
| | | | | | | | | | | | | | | | |
| Class N | |
Issued from the sale of shares | | | 445,619 | | | $ | 4,757,851 | | | | 197,653 | | | $ | 2,056,718 | |
Issued in connection with the reinvestment of distributions | | | 47,406 | | | | 504,197 | | | | 66,143 | | | | 686,274 | |
Redeemed | | | (2,032,767 | ) | | | (21,682,527 | ) | | | (412,919 | ) | | | (4,197,811 | ) |
| | | | | | | | | | | | | | | | |
Net change | | | (1,539,742 | ) | | $ | (16,420,479 | ) | | | (149,123 | ) | | $ | (1,454,819 | ) |
| | | | | | | | | | | | | | | | |
| Class Y | |
Issued from the sale of shares | | | 1,588,312 | | | $ | 16,962,425 | | | | 711,084 | | | $ | 7,480,033 | |
Issued in connection with the reinvestment of distributions | | | 59,234 | | | | 635,148 | | | | 11,941 | | | | 124,307 | |
Redeemed | | | (280,739 | ) | | | (2,960,011 | ) | | | (166,513 | ) | | | (1,759,865 | ) |
| | | | | | | | | | | | | | | | |
Net change | | | 1,366,807 | | | $ | 14,637,562 | | | | 556,512 | | | $ | 5,844,475 | |
| | | | | | | | | | | | | | | | |
Increase from capital share transactions | | | 107,925 | | | $ | 1,227,038 | | | | 569,689 | | | $ | 6,110,172 | |
| | | | | | | | | | | | | | | | |
| 152
Notes to Financial Statements (continued)
December 31, 2020
13. Capital Shares (continued).
| | | | | | | | | | | | | | | | |
| | | Year Ended
December 31, 2020 | | | Year Ended
December 31, 2019 | |
Global Sustainable Equity Fund | | Shares | | | Amount | | | Shares | | | Amount | |
| Class A | |
Issued from the sale of shares | | | 1,075,867 | | | $ | 18,317,282 | | | | 421,391 | | | $ | 5,771,615 | |
Issued in connection with the reinvestment of distributions | | | 4,893 | | | | 76,869 | | | | 9,280 | | | | 131,736 | |
Redeemed | | | (226,251 | ) | | | (3,533,077 | ) | | | (122,875 | ) | | | (1,613,835 | ) |
| | | | | | | | | | | | | | | | |
Net change | | | 854,509 | | | $ | 14,861,074 | | | | 307,796 | | | $ | 4,289,516 | |
| | | | | | | | | | | | | | | | |
| Class C | |
Issued from the sale of shares | | | 317,242 | | | $ | 4,892,971 | | | | 152,601 | | | $ | 2,081,444 | |
Issued in connection with the reinvestment of distributions | | | 1,026 | | | | 15,301 | | | | 1,646 | | | | 22,845 | |
Redeemed | | | (98,713 | ) | | | (1,588,779 | ) | | | (23,760 | ) | | | (318,560 | ) |
| | | | | | | | | | | | | | | | |
Net change | | | 219,555 | | | $ | 3,319,493 | | | | 130,487 | | | $ | 1,785,729 | |
| | | | | | | | | | | | | | | | |
| Class N | |
Issued from the sale of shares | | | 3,265,184 | | | $ | 55,475,365 | | | | 479,051 | | | $ | 6,954,884 | |
Issued in connection with the reinvestment of distributions | | | 13,079 | | | | 223,484 | | | | 9,538 | | | | 139,234 | |
Redeemed | | | (320,345 | ) | | | (5,566,304 | ) | | | (2,130 | ) | | | (31,125 | ) |
| | | | | | | | | | | | | | | | |
Net change | | | 2,957,918 | | | $ | 50,132,545 | | | | 486,459 | | | $ | 7,062,993 | |
| | | | | | | | | | | | | | | | |
| Class Y | |
Issued from the sale of shares | | | 33,728,583 | | | $ | 589,402,217 | | | | 4,887,232 | | | $ | 66,779,728 | |
Issued in connection with the reinvestment of distributions | | | 100,746 | | | | 1,724,842 | | | | 92,160 | | | | 1,315,613 | |
Redeemed | | | (3,134,944 | ) | | | (50,170,707 | ) | | | (3,173,224 | ) | | | (42,852,903 | ) |
| | | | | | | | | | | | | | | | |
Net change | | | 30,694,385 | | | $ | 540,956,352 | | | | 1,806,168 | | | $ | 25,242,438 | |
| | | | | | | | | | | | | | | | |
Increase from capital share transactions | | | 34,726,367 | | | $ | 609,269,464 | | | | 2,730,910 | | | $ | 38,380,676 | |
| | | | | | | | | | | | | | | | |
| | |
| | | Year Ended
December 31, 2020 | | | Year Ended
December 31, 2019 | |
International Sustainable Equity Fund | | Shares | | | Amount | | | Shares | | | Amount | |
| Class A | |
Issued from the sale of shares | | | 4,616 | | | $ | 62,533 | | | | 241 | | | $ | 3,002 | |
Issued in connection with the reinvestment of distributions | | | 505 | | | | 6,930 | | | | 1 | | | | 12 | |
Redeemed | | | (25 | ) | | | (337 | ) | | | — | | | | — | |
| | | | | | | | | | | | | | | | |
Net change | | | 5,096 | | | $ | 69,126 | | | | 242 | | | $ | 3,014 | |
| | | | | | | | | | | | | | | | |
| Class N | |
Issued from the sale of shares | | | 180,706 | | | $ | 2,022,459 | | | | 624,516 | | | $ | 6,901,909 | |
Issued in connection with the reinvestment of distributions | | | 113,091 | | | | 1,544,820 | | | | 16,672 | | | | 205,624 | |
Redeemed | | | (490,369 | ) | | | (6,206,793 | ) | | | (267,041 | ) | | | (2,830,518 | ) |
| | | | | | | | | | | | | | | | |
Net change | | | (196,572 | ) | | $ | (2,639,514 | ) | | | 374,147 | | | $ | 4,277,015 | |
| | | | | | | | | | | | | | | | |
| Class Y | |
Issued from the sale of shares | | | 4,191 | | | $ | 54,896 | | | | 575 | | | $ | 7,196 | |
Issued in connection with the reinvestment of distributions | | | 502 | | | | 6,899 | | | | 7 | | | | 86 | |
| | | | | | | | | | | | | | | | |
Net change | | | 4,693 | | | $ | 61,795 | | | | 582 | | | $ | 7,282 | |
| | | | | | | | | | | | | | | | |
Increase (decrease) from capital share transactions | | | (186,783 | ) | | $ | (2,508,593 | ) | | | 374,971 | | | $ | 4,287,311 | |
| | | | | | | | | | | | | | | | |
153 |
Notes to Financial Statements (continued)
December 31, 2020
13. Capital Shares (continued).
| | | | | | | | |
| | | Period Ended
December 31, 2020(a) | |
U.S. Sustainable Equity Fund | | Shares | | | Amount | |
| Class A | |
Issued from the sale of shares | | | 100 | | | $ | 1,000 | |
| | | | | | | | |
Net change | | | 100 | | | $ | 1,000 | |
| | | | | | | | |
| Class C | |
Issued from the sale of shares | | | 100 | | | $ | 1,000 | |
| | | | | | | | |
Net change | | | 100 | | | $ | 1,000 | |
| | | | | | | | |
| Class N | |
Issued from the sale of shares | | | 500,000 | | | $ | 5,000,000 | |
| | | | | | | | |
Net change | | | 500,000 | | | $ | 5,000,000 | |
| | | | | | | | |
| Class Y | |
Issued from the sale of shares | | | 100 | | | $ | 1,000 | |
| | | | | | | | |
Net change | | | 100 | | | $ | 1,000 | |
| | | | | | | | |
Increase from capital share transactions | | | 500,300 | | | $ | 5,003,000 | |
| | | | | | | | |
| (a) | From commencement of operations on December 15, 2020 through December 31, 2020. |
| | | | | | | | | | | | | | | | |
| | | Year Ended
December 31, 2020 | | | Year Ended
December 31, 2019 | |
Natixis Oakmark Fund | | Shares | | | Amount | | | Shares | | | Amount | |
| Class A | |
Issued from the sale of shares | | | 583,622 | | | $ | 11,675,703 | | | | 341,587 | | | $ | 7,422,550 | |
Issued in connection with the reinvestment of distributions | | | 589,672 | | | | 13,475,622 | | | | 707,759 | | | | 15,556,227 | |
Redeemed | | | (1,895,350 | ) | | | (37,988,760 | ) | | | (1,440,445 | ) | | | (31,399,881 | ) |
| | | | | | | | | | | | | | | | |
Net change | | | (722,056 | ) | | $ | (12,837,435 | ) | | | (391,099 | ) | | $ | (8,421,104 | ) |
| | | | | | | | | | | | | | | | |
| Class C | |
Issued from the sale of shares | | | 196,466 | | | $ | 3,196,499 | | | | 411,202 | | | $ | 7,542,498 | |
Issued in connection with the reinvestment of distributions | | | 166,000 | | | | 3,131,121 | | | | 258,850 | | | | 4,802,209 | |
Redeemed | | | (1,362,306 | ) | | | (22,568,463 | ) | | | (1,012,379 | ) | | | (18,545,938 | ) |
| | | | | | | | | | | | | | | | |
Net change | | | (999,840 | ) | | $ | (16,240,843 | ) | | | (342,327 | ) | | $ | (6,201,231 | ) |
| | | | | | | | | | | | | | | | |
| Class N | |
Issued from the sale of shares | | | 26 | | | $ | 561 | | | | 38,538 | | | $ | 856,493 | |
Issued in connection with the reinvestment of distributions | | | 1,266 | | | | 30,687 | | | | 1,564 | | | | 37,043 | |
Redeemed | | | (20,248 | ) | | | (414,541 | ) | | | (6,880 | ) | | | (164,534 | ) |
| | | | | | | | | | | | | | | | |
Net change | | | (18,956 | ) | | $ | (383,293 | ) | | | 33,222 | | | $ | 729,002 | |
| | | | | | | | | | | | | | | | |
| Class Y | |
Issued from the sale of shares | | | 898,502 | | | $ | 17,536,595 | | | | 1,091,333 | | | $ | 25,027,333 | |
Issued in connection with the reinvestment of distributions | | | 88,591 | | | | 2,151,945 | | | | 178,407 | | | | 4,126,503 | |
Redeemed | | | (1,435,875 | ) | | | (28,553,935 | ) | | | (1,928,446 | ) | | | (43,874,360 | ) |
| | | | | | | | | | | | | | | | |
Net change | | | (448,782 | ) | | $ | (8,865,395 | ) | | | (658,706 | ) | | $ | (14,720,524 | ) |
| | | | | | | | | | | | | | | | |
Decrease from capital share transactions | | | (2,189,634 | ) | | $ | (38,326,966 | ) | | | (1,358,910 | ) | | $ | (28,613,857 | ) |
| | | | | | | | | | | | | | | | |
| 154
Notes to Financial Statements (continued)
December 31, 2020
13. Capital Shares (continued).
| | | | | | | | | | | | | | | | |
| | | Year Ended
December 31, 2020 | | | Year Ended
December 31, 2019 | |
Natixis Oakmark International Fund | | Shares | | | Amount | | | Shares | | | Amount | |
| Class A | |
Issued from the sale of shares | | | 2,770,572 | | | $ | 30,737,529 | | | | 3,833,342 | | | $ | 48,961,166 | |
Issued in connection with the reinvestment of distributions | | | 14,764 | | | | 209,645 | | | | 293,582 | | | | 3,983,907 | |
Redeemed | | | (6,172,183 | ) | | | (66,211,902 | ) | | | (14,255,482 | ) | | | (182,428,373 | ) |
| | | | | | | | | | | | | | | | |
Net change | | | (3,386,847 | ) | | $ | (35,264,728 | ) | | | (10,128,558 | ) | | $ | (129,483,300 | ) |
| | | | | | | | | | | | | | | | |
| Class C | |
Issued from the sale of shares | | | 471,769 | | | $ | 5,126,354 | | | | 1,189,713 | | | $ | 14,652,748 | |
Issued in connection with the reinvestment of distributions | | | — | | | | — | | | | 235,439 | | | | 3,145,368 | |
Redeemed | | | (6,873,953 | ) | | | (71,978,638 | ) | | | (7,169,411 | ) | | | (88,659,492 | ) |
| | | | | | | | | | | | | | | | |
Net change | | | (6,402,184 | ) | | $ | (66,852,284 | ) | | | (5,744,259 | ) | | $ | (70,861,376 | ) |
| | | | | | | | | | | | | | | | |
| Class N | |
Issued from the sale of shares | | | 7,236 | | | $ | 76,266 | | | | 35,523 | | | $ | 453,334 | |
Issued in connection with the reinvestment of distributions | | | 131 | | | | 1,852 | | | | 2,041 | | | | 27,558 | |
Redeemed | | | (46,592 | ) | | | (500,123 | ) | | | (45,088 | ) | | | (565,153 | ) |
| | | | | | | | | | | | | | | | |
Net change | | | (39,225 | ) | | $ | (422,005 | ) | | | (7,524 | ) | | $ | (84,261 | ) |
| | | | | | | | | | | | | | | | |
| Class Y | |
Issued from the sale of shares | | | 22,716,726 | | | $ | 249,354,124 | | | | 7,903,073 | | | $ | 103,147,261 | |
Issued in connection with the reinvestment of distributions | | | 87,587 | | | | 1,237,605 | | | | 590,961 | | | | 7,977,970 | |
Redeemed | | | (21,280,488 | ) | | | (222,395,466 | ) | | | (9,581,271 | ) | | | (119,483,340 | ) |
| | | | | | | | | | | | | | | | |
Net change | | | 1,523,825 | | | $ | 28,196,263 | | | | (1,087,237 | ) | | $ | (8,358,109 | ) |
| | | | | | | | | | | | | | | | |
Decrease from capital share transactions | | | (8,304,431 | ) | | $ | (74,342,754 | ) | | | (16,967,578 | ) | | $ | (208,787,046 | ) |
| | | | | | | | | | | | | | | | |
| | |
| | | Year Ended
December 31, 2020 | | | Year Ended
December 31, 2019 | |
U.S. Equity Opportunities Fund | | Shares | | | Amount | | | Shares | | | Amount | |
| Class A | |
Issued from the sale of shares | | | 809,852 | | | $ | 28,587,906 | | | | 1,147,417 | | | $ | 39,768,929 | |
Issued in connection with the reinvestment of distributions | | | 1,934,829 | | | | 70,589,892 | | | | 1,642,521 | | | | 59,555,999 | |
Redeemed | | | (2,986,385 | ) | | | (103,892,894 | ) | | | (2,797,920 | ) | | | (100,075,167 | ) |
| | | | | | | | | | | | | | | | |
Net change | | | (241,704 | ) | | $ | (4,715,096 | ) | | | (7,982 | ) | | $ | (750,239 | ) |
| | | | | | | | | | | | | | | | |
| Class C | |
Issued from the sale of shares | | | 289,975 | | | $ | 6,110,793 | | | | 409,399 | | | $ | 9,361,060 | |
Issued in connection with the reinvestment of distributions | | | 553,577 | | | | 11,519,306 | | | | 443,035 | | | | 10,083,593 | |
Redeemed | | | (1,400,383 | ) | | | (29,908,911 | ) | | | (1,269,592 | ) | | | (29,351,029 | ) |
| | | | | | | | | | | | | | | | |
Net change | | | (556,831 | ) | | $ | (12,278,812 | ) | | | (417,158 | ) | | $ | (9,906,376 | ) |
| | | | | | | | | | | | | | | | |
| Class N | |
Issued from the sale of shares | | | 947 | | | $ | 37,836 | | | | 14,461 | | | $ | 605,261 | |
Issued in connection with the reinvestment of distributions | | | 500 | | | | 21,295 | | | | 1,020 | | | | 44,503 | |
Redeemed | | | (12,852 | ) | | | (496,375 | ) | | | (506 | ) | | | (22,193 | ) |
| | | | | | | | | | | | | | | | |
Net change | | | (11,405 | ) | | $ | (437,244 | ) | | | 14,975 | | | $ | 627,571 | |
| | | | | | | | | | | | | | | | |
| Class Y | |
Issued from the sale of shares | | | 1,666,973 | | | $ | 71,953,482 | | | | 1,739,715 | | | $ | 72,112,902 | |
Issued in connection with the reinvestment of distributions | | | 465,008 | | | | 20,643,018 | | | | 514,088 | | | | 22,126,509 | |
Redeemed | | | (3,552,649 | ) | | | (145,365,948 | ) | | | (3,890,590 | ) | | | (163,012,984 | ) |
| | | | | | | | | | | | | | | | |
Net change | | | (1,420,668 | ) | | $ | (52,769,448 | ) | | | (1,636,787 | ) | | $ | (68,773,573 | ) |
| | | | | | | | | | | | | | | | |
Decrease from capital share transactions | | | (2,230,608 | ) | | $ | (70,200,600 | ) | | | (2,046,952 | ) | | $ | (78,802,617 | ) |
| | | | | | | | | | | | | | | | |
155 |
Notes to Financial Statements (continued)
December 31, 2020
13. Capital Shares (continued).
| | | | | | | | | | | | | | | | |
| | | Year Ended
December 31, 2020 | | | Year Ended
December 31, 2019 | |
Mid Cap Fund | | Shares | | | Amount | | | Shares | | | Amount | |
| Class A | |
Issued from the sale of shares | | | 226,127 | | | $ | 4,488,446 | | | | 861,269 | | | $ | 17,619,199 | |
Issued in connection with the reinvestment of distributions | | | 162,666 | | | | 3,228,512 | | | | 12,533 | | | | 280,906 | |
Redeemed | | | (477,370 | ) | | | (9,158,673 | ) | | | (1,901,968 | ) | | | (37,334,239 | ) |
| | | | | | | | | | | | | | | | |
Net change | | | (88,577 | ) | | $ | (1,441,715 | ) | | | (1,028,166 | ) | | $ | (19,434,134 | ) |
| | | | | | | | | | | | | | | | |
| Class C | |
Issued from the sale of shares | | | 18,169 | | | $ | 328,156 | | | | 41,784 | | | $ | 804,347 | |
Issued in connection with the reinvestment of distributions | | | 92,379 | | | | 1,686,307 | | | | 7,533 | | | | 158,588 | |
Redeemed | | | (456,387 | ) | | | (8,272,196 | ) | | | (466,640 | ) | | | (9,000,145 | ) |
| | | | | | | | | | | | | | | | |
Net change | | | (345,839 | ) | | $ | (6,257,733 | ) | | | (417,323 | ) | | $ | (8,037,210 | ) |
| | | | | | | | | | | | | | | | |
| Class N | |
Issued from the sale of shares | | | 94,843 | | | $ | 1,960,180 | | | | 265,852 | | | $ | 5,433,660 | |
Issued in connection with the reinvestment of distributions | | | 99,203 | | | | 2,004,292 | | | | 9,232 | | | | 208,696 | |
Redeemed | | | (185,807 | ) | | | (3,709,379 | ) | | | (3,511,497 | ) | | | (74,546,739 | ) |
| | | | | | | | | | | | | | | | |
Net change | | | 8,239 | | | $ | 255,093 | | | | (3,236,413 | ) | | $ | (68,904,383 | ) |
| | | | | | | | | | | | | | | | |
| Class Y | |
Issued from the sale of shares | | | 2,378,301 | | | $ | 47,273,465 | | | | 2,842,232 | | | $ | 59,252,207 | |
Issued in connection with the reinvestment of distributions | | | 1,248,965 | | | | 25,109,423 | | | | 129,190 | | | | 2,931,301 | |
Redeemed | | | (6,496,334 | ) | | | (126,146,971 | ) | | | (15,601,071 | ) | | | (306,352,102 | ) |
| | | | | | | | | | | | | | | | |
Net change | | | (2,869,068 | ) | | $ | (53,764,083 | ) | | | (12,629,649 | ) | | $ | (244,168,594 | ) |
| | | | | | | | | | | | | | | | |
Decrease from capital share transactions | | | (3,295,245 | ) | | $ | (61,208,438 | ) | | | (17,311,551 | ) | | $ | (340,544,321 | ) |
| | | | | | | | | | | | | | | | |
| | |
| | | Year Ended
December 31, 2020 | | | Year Ended
December 31, 2019 | |
Small Cap Value Fund | | Shares | | | Amount | | | Shares | | | Amount | |
| Class A | |
Issued from the sale of shares | | | 158,490 | | | $ | 2,085,145 | | | | 291,593 | | | $ | 4,253,300 | |
Issued in connection with the reinvestment of distributions | | | 31,711 | | | | 358,304 | | | | 29,009 | | | | 447,550 | |
Redeemed | | | (872,436 | ) | | | (11,688,128 | ) | | | (1,267,013 | ) | | | (18,496,699 | ) |
| | | | | | | | | | | | | | | | |
Net change | | | (682,235 | ) | | $ | (9,244,679 | ) | | | (946,411 | ) | | $ | (13,795,849 | ) |
| | | | | | | | | | | | | | | | |
| Class C | |
Issued from the sale of shares | | | 40,156 | | | $ | 298,734 | | | | 14,584 | | | $ | 107,063 | |
Issued in connection with the reinvestment of distributions | | | 1,869 | | | | 10,560 | | | | 1,709 | | | | 13,304 | |
Redeemed | | | (109,068 | ) | | | (738,265 | ) | | | (374,191 | ) | | | (2,772,672 | ) |
| | | | | | | | | | | | | | | | |
Net change | | | (67,043 | ) | | $ | (428,971 | ) | | | (357,898 | ) | | $ | (2,652,305 | ) |
| | | | | | | | | | | | | | | | |
| Class N | |
Issued from the sale of shares | | | — | | | $ | — | | | | 2,117 | | | $ | 32,857 | |
Issued in connection with the reinvestment of distributions | | | 14 | | | | 179 | | | | 12 | | | | 194 | |
Redeemed | | | — | | | | — | | | | (887 | ) | | | (14,210 | ) |
| | | | | | | | | | | | | | | | |
Net change | | | 14 | | | $ | 179 | | | | 1,242 | | | $ | 18,841 | |
| | | | | | | | | | | | | | | | |
| Class Y | |
Issued from the sale of shares | | | 1,175,448 | | | $ | 16,303,249 | | | | 255,977 | | | $ | 3,867,153 | |
Issued in connection with the reinvestment of distributions | | | 25,025 | | | | 327,632 | | | | 24,035 | | | | 388,742 | |
Redeemed | | | (1,131,163 | ) | | | (15,630,462 | ) | | | (2,009,269 | ) | | | (30,637,042 | ) |
| | | | | | | | | | | | | | | | |
Net change | | | 69,310 | | | $ | 1,000,419 | | | | (1,729,257 | ) | | $ | (26,381,147 | ) |
| | | | | | | | | | | | | | | | |
Decrease from capital share transactions | | | (679,954 | ) | | $ | (8,673,052 | ) | | | (3,032,324 | ) | | $ | (42,810,460 | ) |
| | | | | | | | | | | | | | | | |
| 156
Report of Independent Registered Public Accounting Firm
To the Board of Trustees of Gateway Trust, Natixis Funds Trust I and Natixis Funds Trust II and Shareholders of Gateway Fund, Gateway Equity Call Premium Fund, Mirova Global Green Bond Fund, Mirova Global Sustainable Equity Fund, Mirova International Sustainable Equity Fund, Mirova U.S. Sustainable Equity Fund, Natixis Oakmark Fund, Natixis Oakmark International Fund, Natixis U.S. Equity Opportunities Fund, Vaughan Nelson Mid Cap Fund, and Vaughan Nelson Small Cap Value Fund
Opinions on the Financial Statements
We have audited the accompanying statements of assets and liabilities, including the portfolios of investments, of Gateway Fund and Gateway Equity Call Premium Fund (constituting Gateway Trust), Mirova Global Green Bond Fund, Mirova Global Sustainable Equity Fund, Mirova International Sustainable Equity Fund, Mirova U.S. Sustainable Equity Fund, Natixis Oakmark International Fund, Natixis U.S. Equity Opportunities Fund, and Vaughan Nelson Small Cap Value Fund (seven of the funds constituting Natixis Funds Trust I), and Natixis Oakmark Fund and Vaughn Nelson Mid Cap Fund (two of the funds constituting Natixis Funds Trust II) (hereafter collectively referred to as the “Funds”) as of December 31, 2020, the related statements of operations and of changes in net assets for each of the periods indicated in the table below, including the related notes, and the financial highlights for each of the periods indicated therein (collectively referred to as the “financial statements”). In our opinion, the financial statements present fairly, in all material respects, the financial position of each of the Funds as of December 31, 2020, the results of each of their operations and the changes in each of their net assets for the periods indicated in the table below, and each of the financial highlights for each of the periods indicated therein, in conformity with accounting principles generally accepted in the United States of America.
| | | | |
Fund | | Statements of operations | | Statements of changes in net assets |
Gateway Fund | | For the year ended December 31, 2020 | | For the years ended December 31, 2020 and 2019 |
Gateway Equity Call Premium Fund | | For the year ended December 31, 2020 | | For the years ended December 31, 2020 and 2019 |
Mirova Global Green Bond Fund | | For the year ended December 31, 2020 | | For the years ended December 31, 2020 and 2019 |
Mirova Global Sustainable Equity Fund | | For the year ended December 31, 2020 | | For the years ended December 31, 2020 and 2019 |
Mirova International Sustainable Equity Fund | | For the year ended December 31, 2020 | | For the years ended December 31, 2020 and 2019 |
Mirova U.S. Sustainable Equity Fund | | For the period from December 15, 2020 (commencement of operations) through December 31, 2020 | | For the period from December 15, 2020 (commencement of operations) through December 31, 2020 |
Natixis Oakmark Fund | | For the year ended December 31, 2020 | | For the years ended December 31, 2020 and 2019 |
Natixis Oakmark International Fund | | For the year ended December 31, 2020 | | For the years ended December 31, 2020 and 2019 |
Natixis U.S. Equity Opportunities Fund | | For the year ended December 31, 2020 | | For the years ended December 31, 2020 and 2019 |
Vaughan Nelson Mid Cap Fund | | For the year ended December 31, 2020 | | For the years ended December 31, 2020 and 2019 |
Vaughan Nelson Small Cap Value Fund | | For the year ended December 31, 2020 | | For the years ended December 31, 2020 and 2019 |
Basis for Opinions
These financial statements are the responsibility of the Funds’ management. Our responsibility is to express an opinion on the Funds’ financial statements based on our audits. We are a public accounting firm registered with the Public Company Accounting Oversight Board (United States) (PCAOB) and are required to be independent with respect to the Funds in accordance with the U.S. federal securities laws and the applicable rules and regulations of the Securities and Exchange Commission and the PCAOB.
We conducted our audits of these financial statements in accordance with the standards of the PCAOB. Those standards require that we plan and perform the audit to obtain reasonable assurance about whether the financial statements are free of material misstatement, whether due to error or fraud.
Our audits included performing procedures to assess the risks of material misstatement of the financial statements, whether due to error or fraud, and performing procedures that respond to those risks. Such procedures included examining, on a test basis, evidence regarding the amounts and disclosures in the financial statements. Our audits also included evaluating the accounting principles used and significant estimates made by management, as well as evaluating the overall presentation of the financial statements. Our procedures included confirmation of securities owned as of December 31, 2020 by correspondence with the custodian and brokers; when replies were not received from brokers, we performed other auditing procedures. We believe that our audits provide a reasonable basis for our opinions.
/s/PricewaterhouseCoopers LLP
Boston, Massachusetts
February 22, 2021
We have served as the auditor of one or more of the investment companies in the Natixis Investment Company Complex since at least 1995. We have not been able to determine the specific year we began serving as auditor.
157 |
2020 U.S. Tax Distribution Information to Shareholders (Unaudited)
Corporate Dividends Received Deduction. For the fiscal year ended December 31, 2020, a percentage of dividends distributed by the Funds listed below qualify for the dividends received deduction for corporate shareholders. These percentages are as follows:
| | | | |
Fund | | Qualifying
Percentage | |
Gateway Fund | | | 100.00 | % |
Gateway Equity Call Premium Fund | | | 100.00 | % |
Global Sustainable Equity Fund | | | 100.00 | % |
Natixis Oakmark Fund | | | 100.00 | % |
U.S. Equity Opportunities Fund | | | 99.49 | % |
Mid Cap Fund | | | 100.00 | % |
Small Cap Value Fund | | | 100.00 | % |
Capital Gains Distributions. Pursuant to Internal Revenue Section 852(b), the following Funds paid distributions, which have been designated as capital gains distributions for the fiscal year ended December 31, 2020.
| | | | |
Fund | | Amount | |
Global Green Bond Fund | | $ | 670,133 | |
Global Sustainable Equity Fund | | | 2,415,562 | |
International Sustainable Equity Fund | | | 1,050,112 | |
Natixis Oakmark Fund | | | 18,031,501 | |
U.S. Equity Opportunities Fund | | | 115,715,748 | |
Mid Cap Fund | | | 33,018,937 | |
Small Cap Value Fund | | | 616,973 | |
Qualified Dividend Income. For the fiscal year ended December 31, 2020, a percentage of the ordinary income dividends paid by the Funds are considered qualified dividend income eligible for reduced tax rates. These lower rates range from 0% to 20% depending on an individual’s tax bracket. If the Funds paid a distribution during calendar year 2020, complete information will be reported in conjunction with Form 1099-DIV. These percentages are noted below:
| | | | |
Fund | | Qualifying
Percentage | |
Gateway Fund | | | 100.00 | % |
Gateway Equity Call Premium Fund | | | 100.00 | % |
Global Sustainable Equity Fund | | | 100.00 | % |
International Sustainable Equity Fund | | | 48.36 | % |
Natixis Oakmark Fund | | | 100.00 | % |
Natixis Oakmark International Fund | | | 100.00 | % |
U.S. Equity Opportunities Fund | | | 100.00 | % |
Mid Cap Fund | | | 100.00 | % |
Small Cap Value Fund | | | 100.00 | % |
Foreign Tax Credit. For the year ended December 31, 2020, the Fund intends to pass through foreign tax credits and have derived gross income from sources within foreign countries amounting to:
| | | | | | | | |
Fund | | Foreign Tax
Credit Pass-Through | | | Foreign Source
Income | |
International Sustainable Equity Fund | | $ | 26,455 | | | $ | 283,081 | |
Natixis Oakmark International Fund | | | 907,109 | | | | 7,726,705 | |
| 158
Trustee and Officer Information
The tables below provide certain information regarding the trustees and officers of Natixis Funds Trust I, Natixis Funds Trust II and Gateway Trust (the “Trusts”). Unless otherwise indicated, the address of all persons below is 888 Boylston Street, Suite 800, Boston, MA 02199-8197. The Funds’ Statements of Additional Information include additional information about the trustees of the Trusts and are available by calling Natixis Funds at 800-225-5478.
| | | | | | | | |
Name and Year of Birth | | Position(s) Held with the Trusts, Length of
Time Served and Term of Office1 | | Principal Occupation(s) During Past 5 Years | | Number of Portfolios in Fund Complex Overseen2 and Other Directorships Held During Past 5 Years | | Experience, Qualifications, Attributes, Skills for Board Membership |
|
| INDEPENDENT TRUSTEES |
| | | | |
Edmond J. English
(1953) | | Trustee since 2013 Chairperson of Governance Committee and Audit Committee Member | | Executive Chairman of Bob’s Discount Furniture (retail) | | 54 Director, Burlington Stores, Inc. (retail) | | Significant experience on the Board and on the boards of other business organizations (including retail companies and a bank); executive experience (including at a retail company) |
| | | | |
Richard A. Goglia
(1951) | | Trustee since 2015 Contract Review Committee Member and Governance Committee Member | | Retired | | 54 Director of Triumph Group (aerospace industry) | | Significant experience on the Board and executive experience (including his role as vice president and treasurer of a defense company and experience at a financial services company) |
| | | | |
Wendell J. Knox
(1948) | | Trustee since 2009 Chairperson of Contract Review Committee | | Retired | | 54 Director of Abt Associates Inc. (research and consulting); Director, The Hanover Insurance Group (property and casualty insurance); formerly, Director, Eastern Bank (bank) | | Significant experience on the Board and on the boards of other business organizations (including at a bank and at a property and casualty insurance firm); executive experience (including roles as president and chief executive officer of a research and consulting company) |
159 |
Trustee and Officer Information
| | | | | | | | |
Name and Year of Birth | | Position(s) Held with the Trusts, Length of
Time Served and Term of Office1 | | Principal Occupation(s) During Past 5 Years | | Number of Portfolios in Fund Complex Overseen2 and Other Directorships Held During Past 5 Years | | Experience, Qualifications, Attributes, Skills for Board Membership |
|
| INDEPENDENT TRUSTEES – continued |
| | | | |
Martin T. Meehan
(1956) | | Trustee since 2012 Audit Committee Member | | President, University of Massachusetts | | 54 None | | Significant experience on the Board and on the boards of other business organizations; experience as President of the University of Massachusetts; government experience (including as a member of the U.S. House of Representatives); academic experience |
| | | | |
Maureen B. Mitchell
(1951) | | Trustee since 2017 Contract Review Committee Member and Governance Committee Member | | Retired; formerly President, Global Sales and Marketing, GE Asset Management, Inc. (financial services) | | 54 Director, Sterling Bancorp (bank) | | Experience on the Board; financial services industry and executive experience (including role as president of global sales and marketing at a financial services company) |
| | | | |
James P. Palermo
(1955) | | Trustee since 2016 Contract Review Committee Member | | Founding Partner, Breton Capital Management, LLC (private equity); Partner, STEP Partners, LLC (private equity) | | 54 Director, FutureFuel.io (chemicals and biofuels) | | Experience on the Board; financial services industry and executive experience (including roles as chief executive officer of client management and asset servicing for a banking and financial services company) |
| | | | |
Erik R. Sirri
(1958) | | Chairperson of the Board of Trustees since January 2021 Trustee since 2009 Ex Officio member of Audit Committee, Contract Review Committee and Governance Committee | | Professor of Finance at Babson College | | 54 None | | Significant experience on the Board; experience as Director of the Division of Trading and Markets at the Securities and Exchange Commission; academic experience; training as an economist |
| 160
Trustee and Officer Information
| | | | | | | | |
Name and Year of Birth | | Position(s) Held with the Trusts, Length of
Time Served and Term of Office1 | | Principal Occupation(s) During Past 5 Years | | Number of Portfolios in Fund Complex Overseen2 and Other Directorships Held During Past 5 Years | | Experience, Qualifications, Attributes, Skills for Board Membership |
|
| INDEPENDENT TRUSTEES – continued |
| | | | |
Peter J. Smail
(1952) | | Trustee since 2009 Audit Committee Member and Governance Committee Member | | Retired | | 54 None | | Significant experience on the Board; mutual fund industry and executive experience (including roles as president and chief executive officer for an investment adviser) |
| | | | |
Kirk A. Sykes
(1958) | | Trustee since 2019 Contract Review Committee Member | | Managing Director of Accordia Partners, LLC (real estate development); President of Primary Corporation (real estate development); Managing Principal of Merrick Capital Partners (infrastructure finance); formerly, President of Urban Strategy America Fund (real estate fund manager) | | 54 Trustee, Eastern Bank (bank); Director of Apartment Investment and Management Company (real estate investment trust); formerly Director, Ares Commercial Real Estate Corporation (real estate investment trust) | | Experience on the Board and significant experience on the boards of other business organizations (including real estate companies and banks) |
| | | | |
Cynthia L. Walker
(1956) | | Trustee since 2005 for Natixis Funds Trust I and Natixis Funds Trust II and 2007 for Gateway Trust Chairperson of the Audit Committee and Governance Committee Member | | Retired; formerly, Deputy Dean for Finance and Administration, Yale University School of Medicine | | 54 None | | Significant experience on the Board; executive experience in a variety of academic organizations (including roles as dean for finance and administration) |
|
| INTERESTED TRUSTEES |
| | | | |
Kevin P. Charleston3
(1965) One Financial Center Boston, MA 02111 | | Trustee since 2015 | | President, Chief Executive Officer and Chairman of the Board of Directors, Loomis, Sayles & Company, L. P. | | 54 None | | Significant experience on the Board; continuing service as President, Chief Executive Officer and Chairman of the Board of Directors of Loomis, Sayles & Company, L.P. |
161 |
Trustee and Officer Information
| | | | | | | | |
Name and Year of Birth | | Position(s) Held with the Trusts, Length of
Time Served and Term of Office1 | | Principal Occupation(s) During Past 5 Years | | Number of Portfolios in Fund Complex Overseen2 and Other Directorships Held During Past 5 Years | | Experience, Qualifications, Attributes, Skills for Board Membership |
|
| INTERESTED TRUSTEES – continued |
| | | | |
David L. Giunta4
(1965) | | Trustee since 2011 President and Chief Executive Officer | | President and Chief Executive Officer, Natixis Advisors, L.P., Natixis Distribution, L.P., Natixis Distribution Corporation and Chairman of the Board of Natixis Distribution Corporation | | 54 None | | Significant experience on the Board; experience as President and Chief Executive Officer of Natixis Advisors, L.P., Natixis Distribution, L.P., Natixis Distribution Corporation and Chairman of the Board of Natixis Distribution Corporation |
| 1 | Each trustee serves until retirement, resignation or removal from the Board. The current retirement age is 75. The position of Chairperson of the Board is appointed for a three-year term. |
| 2 | The trustees of the Trusts serve as trustees of a fund complex that includes all series of the Natixis Funds Trust I, Natixis Funds Trust II, Natixis Funds Trust IV, Gateway Trust, Loomis Sayles Funds I, Loomis Sayles Funds II, Natixis ETF Trust and Natixis ETF Trust II (collectively, the “Fund Complex”). |
| 3 | Mr. Charleston is deemed an “interested person” of the Trusts because he holds the following positions with an affiliated person of the Trusts: President, Chief Executive Officer and Chairman of the Board of Directors of Loomis, Sayles & Company, L.P. |
| 4 | Mr. Giunta is deemed an “interested person” of the Trusts because he holds the following positions with an affiliated person of the Trusts: President and Chief Executive Officer, Natixis Advisors, L.P., Natixis Distribution, L.P., Natixis Distribution Corporation and Chairman of the Board of Natixis Distribution Corporation. |
| 162
Trustee and Officer Information
| | | | | | |
Name and Year of Birth | | Position(s) Held with the Trusts | | Term of Office1 and Length of Time Served | | Principal Occupation(s) During Past 5 Years2 |
|
| OFFICERS OF THE TRUSTS |
| | | |
Russell L. Kane
(1969) | | Secretary, Clerk and Chief Legal Officer Chief Compliance Officer and Anti-Money Laundering Officer | | Since 2016 Since 2020 | | Executive Vice President, General Counsel, Secretary and Clerk, Natixis Distribution Corporation, Natixis Advisors, L.P. and Natixis Distribution, L.P.; formerly, Senior Vice President, Deputy General Counsel, Assistant Secretary and Assistant Clerk, Natixis Distribution Corporation, Natixis Advisors, L.P. and Natixis Distribution, L.P. |
| | | |
Michael C. Kardok
(1959) | | Treasurer, Principal Financial and Accounting Officer | | Since 2004 for Natixis Funds Trust I and Natixis Funds Trust II and 2007 for Gateway Trust | | Senior Vice President, Natixis Advisors, L.P. and Natixis Distribution, L.P. |
| 1 | Each officer of the Trusts serves for an indefinite term in accordance with the Trusts’ current by-laws until the date his or her successor is elected and qualified, or until he or she sooner dies, retires, is removed or becomes disqualified. |
| 2 | Each person listed above, except as noted, holds the same position(s) with the Fund Complex. Previous positions during the past five years with Natixis Distribution, L.P., Natixis Advisors, L.P. or Loomis, Sayles & Company, L.P. are omitted, if not materially different from an officer’s current position with such entity. |
163 |
The Registrant has adopted a code of ethics that applies to the Registrant’s principal executive officer, principal financial officer and persons performing similar functions. There have been no amendments or waivers of the Registrant’s code of ethics during the period.
| Item 3. | Audit Committee Financial Expert. |
The Board of Trustees of the Registrant has established an audit committee. Mr. Edmond J. English, Mr. Martin T. Meehan, Mr. Peter J. Smail and Ms. Cynthia L. Walker are members of the audit committee and have been designated as “audit committee financial experts” by the Board of Trustees. Each of these individuals is also an Independent Trustee of the Registrant.
| Item 4. | Principal Accountant Fees and Services. |
Fees billed by the Principal Accountant for services rendered to the Registrant.
The table below sets forth fees billed by the principal accountant, PricewaterhouseCoopers LLP, for the past two fiscal years for professional services rendered in connection with a) the audit of the Registrant’s annual financial statements and services provided in connection with regulatory filings; b) audit-related services (including services that are reasonably related to the performance of the audit of the Registrant’s financial statements but not reported under “Audit Fees”); c) tax compliance, tax advice and tax planning and d) all other fees billed for professional services rendered by the principal accountant to the Registrant, other than the services provided as reported as a part of (a) through (c) of this Item.
| | | | | | | | | | | | | | | | | | | | | | | | | | | | | | | | |
| | | Audit fees | | | Audit-related
fees1 | | | Tax fees2 | | | All other fees | |
| | | 1/1/19-
12/31/19 | | | 1/1/20-
12/31/20 | | | 1/1/19-
12/31/19 | | | 1/1/20-
12/31/20 | | | 1/1/19-
12/31/19 | | | 1/1/20-
12/31/20 | | | 1/1/19-
12/31/19 | | | 1/1/20-
12/31/20 | |
Natixis Funds Trust II (except Loomis Sayles Global Growth Fund, Loomis Sayles Senior Floating Rate and Fixed Income Fund and Vaughan Nelson Select Fund) | | $ | 384,766 | | | $ | 355,112 | | | $ | 1,237 | | | $ | 983 | | | $ | 124,109 | | | $ | 97,388 | | | $ | — | | | $ | — | |
| 1. | Audit-related fees consist of: |
2019 & 2020 – performance of agreed-upon procedures related to the Registrant’s deferred compensation.
2019 & 2020 – review of Registrant’s tax returns and tax compliance services.
Aggregate fees billed to the Registrant for non-audit services during 2019 and 2020 were $125,346 and $98,371, respectively.
Fees billed by the Principal Accountant for services rendered to the Adviser and Control Affiliates.
The following table sets forth the fees billed by the Registrant’s principal accountant for non-audit services rendered to AlphaSimplex Group, LLC (“ASG”), Loomis, Sayles & Company, L.P. (“Loomis”), Natixis Advisors, L.P. (“Natixis Advisors”), and entities controlling, controlled by or under common control with ASG, Loomis, and Natixis Advisors (“Control Affiliates”) that provide ongoing services to the Registrant, for engagements that related directly to the operations and financial reporting of the Registrant for the last two fiscal years.
| | | | | | | | | | | | | | | | | | | | | | | | |
| | | Audit-related fees | | | Tax fees | | | All other fees | |
| | | 1/1/19-
12/31/19 | | | 1/1/20-
12/31/20 | | | 1/1/19-
12/31/19 | | | 1/1/20-
12/31/20 | | | 1/1/19-
12/31/19 | | | 1/1/20-
12/31/20 | |
Control Affiliates | | $ | — | | | $ | — | | | $ | 26,750 | | | $ | 18,255 | | | $ | — | | | $ | 63,023 | |
The following table sets forth the aggregate fees billed by the Registrant’s principal accountant for non-audit services rendered to ASG, Loomis, Natixis Advisors and Control Affiliates that provide ongoing services to the Registrant, for the last two fiscal years, including the fees disclosed in the table above.
| | | | | | | | |
| | | Aggregate Non-Audit Fees | |
| | | 1/1/19-
12/31/19 | | | 1/1/20-
12/31/20 | |
Control Affiliates | | $ | 302,257 | | | $ | 308,800 | |
None of the services described above were approved pursuant to paragraph (c)(7)(i)(C) of Regulation S-X.
Audit Committee Pre Approval Policies.
Annually, the Registrant’s Audit Committee reviews the audit, audit-related, tax and other non-audit services together with the projected fees, for services proposed to be rendered to the Trust and/or other entities for which pre-approval is required during the upcoming year. Any subsequent revisions to already pre-approved services or fees (including fee increases) and requests for pre-approval of new services would be presented for consideration quarterly as needed.
If, in the opinion of management, a proposed engagement by the Registrant’s independent accountants needs to commence before the next regularly scheduled Audit Committee meeting, any member of the Audit Committee who is an independent Board member is authorized to pre-approve the engagement, but only for engagements to provide audit, audit related and tax services. This approval is subject to review of the full Audit Committee at its next quarterly meeting. All other engagements require the approval of all the members of the Audit Committee.
| Item 5. | Audit Committee of Listed Registrants. |
Not applicable.
| Item 6. | Schedule of Investments. |
Included as part of the Report to Shareholders filed as Item 1 herewith.
| Item 7. | Disclosure of Proxy Voting Policies and Procedures for Closed-End Management Investment Companies. |
Not applicable.
| Item 8. | Portfolio Managers of Closed-End Management Investment Companies. |
Not applicable.
| Item 9. | Purchases of Equity Securities by Closed-End Management Investment Companies and Affiliated Purchasers. |
Not applicable.
| Item 10. | Submission of Matters to a Vote of Securities Holders. |
There were no material changes to the procedures by which shareholders may recommend nominees to the Registrant’s Board of Trustees.
| Item 11. | Controls and Procedures. |
The Registrant’s principal executive officer and principal financial officer have concluded that the Registrant’s disclosure controls and procedures are sufficient to ensure that information required to be disclosed by the Registrant in this Form N-CSR was recorded, processed, summarized and reported within the time periods specified in the Securities and Exchange Commission’s rules and forms, based upon such officers’ evaluation of these controls and procedures as of a date within 90 days of the filing date of the report.
There were no changes in the Registrant’s internal control over financial reporting that occurred during the Registrant’s last fiscal quarter of the period covered by the report that has materially affected, or is reasonably likely to materially affect, the Registrant’s internal control over financial reporting.
| Item 12. | Disclosure of Securities Lending Activities for Closed-End Management Investment Companies. |
Not applicable.
SIGNATURES
Pursuant to the requirements of the Securities Exchange Act of 1934 and the Investment Company Act of 1940, the Registrant has duly caused this report to be signed on its behalf by the undersigned, thereunto duly authorized.
| | |
| Natixis Funds Trust II |
| |
| By: | | /s/ David L. Giunta |
| Name: | | David L. Giunta |
| Title: | | President and Chief Executive Officer |
| Date: | | February 22, 2021 |
Pursuant to the requirements of the Securities Exchange Act of 1934 and the Investment Company Act of 1940, this report has been signed by the following persons on behalf of the Registrant and in the capacities and on the dates indicated.
| | |
| By: | | /s/ David L. Giunta |
| Name: | | David L. Giunta |
| Title: | | President and Chief Executive Officer |
| Date: | | February 22, 2021 |
| |
| By: | | /s/ Michael C. Kardok |
| Name: | | Michael C. Kardok |
| Title: | | Treasurer and Principal Financial and |
| | Accounting Officer |
| Date: | | February 22, 2021 |