UNITED STATES
SECURITIES AND EXCHANGE COMMISSION
Washington, D.C. 20549
FORM N-CSR
CERTIFIED SHAREHOLDER REPORT OF REGISTERED
MANAGEMENT INVESTMENT COMPANIES
Investment Company Act file number: 811-00242
Natixis Funds Trust II
(Exact name of Registrant as specified in charter)
888 Boylston Street, Suite 800 Boston, Massachusetts 02199-8197
(Address of principal executive offices) (Zip code)
Natalie Wagner, Esq.
Natixis Distribution, LLC
888 Boylston Street, Suite 800
Boston, Massachusetts 02199-8197
(Name and address of agent for service)
Registrant’s telephone number, including area code: (617) 449-2810
Date of fiscal year end: November 30
Date of reporting period: November 30, 2021
Item 1. Reports to Stockholders.
| (a) | The Registrant’s annual report transmitted to shareholders pursuant to Rule 30e-1 under the Investment Company Act of 1940 is as follows: |


Annual Report
November 30, 2021
Loomis Sayles Global Growth Fund
Loomis Sayles Senior Floating Rate and Fixed Income Fund
Vaughan Nelson Select Fund
TABLE OF CONTENTS

LOOMIS SAYLES GLOBAL GROWTH FUND
| | |
| |
| Manager: | | Symbols: |
| |
| Aziz V. Hamzaogullari, CFA® | | Class A LSAGX |
| |
| Loomis, Sayles & Company, L.P. | | Class C LSCGX |
| |
| | Class N LSNGX |
| |
| | Class Y LSGGX |
Investment Goal
The Fund’s investment goal is long-term growth of capital.
Market Conditions
Global equities generated robust gains in the past 12 months, albeit with a wide dispersion of returns across regions. The rollout of multiple Covid-19 vaccines enabled a gradual lifting of virus-related restrictions as the period progressed, leading to a surge in both economic growth and corporate earnings. World monetary policy was also highly supportive, with most central banks holding interest rates near zero and maintaining stimulative quantitative easing programs through the autumn. Several stimulus packages enacted by the US government provided an additional tailwind for both economic growth and investor sentiment. Together, these developments outweighed periodic volatility caused by concerns about inflation, new variants of the coronavirus, and slower growth in China, fueling robust gains for equities. The US market outpaced its global peers, thanks in part to the country’s higher vaccination rate and the strong returns for mega-cap technology stocks. Large-cap equities, after underperforming in the first half of the period, ultimately finished ahead of small caps. At the style level, growth outperformed value stocks, though both strategies have posted robust returns for the past 12 months. Developed market international equities, while posting solid gains in absolute terms, lagged the United States. The shortfall reflected the combination of weak returns across Asia, unfavorable currency translation, and slower reopening trends. Emerging markets, which closed with only a narrow gain, were notable laggards due largely to pronounced underperformance for China.
Performance Results
For the 12 months ended November 30, 2021, Class Y shares of the Loomis Sayles Global Growth Fund returned 8.22% at net asset value. The Fund underperformed its benchmark, the MSCI All Country World Index (Net), which returned 19.27%.
Explanation of Fund Performance
We are an active manager with a long-term, private equity approach to investing. Through our proprietary bottom-up research framework, we look to invest in those few high-quality businesses with sustainable competitive advantages and profitable growth when they trade at a significant discount to intrinsic value. Given the rare confluence of quality, growth, and valuation, we may study dozens of companies but may only invest in a select few businesses each year. We believe identifying those few businesses with these characteristics is an art, not a science. As a result of this rigorous approach, ours is a selective, high-conviction portfolio of typically 30–45 names.
The Fund’s positions in Alibaba, MercadoLibre, and CRISPR Therapeutics detracted the most from performance. Stock selection in the consumer discretionary, healthcare, information technology, consumer staples, industrials, and financials sectors, as well as our allocations in the financials, consumer discretionary, communication services, energy, industrials, and consumer staples sectors, detracted from relative performance.
A Fund holding since inception, Alibaba Group is a leading China e-commerce and consumer-engagement platform provider. With approximately 60% of China’s e-commerce transactions estimated to take place through its marketplaces, Alibaba is the world’s largest retail platform, and we believe Alibaba’s scale and interconnected sites create an unparalleled and difficult-to-replicate business ecosystem. Shares have been under pressure since late 2020 due to investor concern regarding increasing regulatory intervention by the Chinese government. In April, China’s State Administration for Market Regulation concluded that Alibaba’s practices had violated antitrust law. The company was fined approximately $2.8 billion and ordered to carry out “comprehensive” self-inspections to standardize business practices and ensure compliance with anti-monopoly laws. Alibaba cooperated fully with the investigation and has changed certain business practices. In August, China passed the Personal Information Protection Law (PIPL), which is focused on protecting personal information rights and interests by standardizing the handling and usage of personal information by businesses. We believe the focus of PIPL is similar to the General Data Protection Regulation (GDPR), which went into effect in the European Union in 2018. The GDPR impacted other portfolio holdings such as Alphabet and Facebook, which incurred increased compliance costs and other disruptions as they adjusted certain business practices to comply with the new regulations. However, both companies continued to generate strong growth in revenue and free cash flow due to their competitive advantages and strong value propositions. While we expected that Alibaba would experience short-term disruptions as it modified its practices to fully comply with new
1 |
regulatory changes, we did not believe the changes would ultimately impair the company’s difficult-to-replicate competitive advantages. More recently, we have observed increasing competitive pressure in two of the company’s smaller but faster-growing contributors: video streaming and penetration in lower-tier cities. Through the company’s Taobao Live, Alibaba offers a leading live-streaming social commercial platform, enabling merchants to interact with consumers. The relatively new medium has become a fast-growing vehicle for e-commerce sales, growing from less than 5% of China e-commerce two years earlier to almost 10% in 2020. While Alibaba continues to have a leadership position in live streaming and short video production, we have seen increased competition and market share gains from companies such as Douyin (China’s version of TikTok, owned by ByteDance), and Kuaishou. We expect this newer format will grow to represent approximately 25% of e-commerce sales over time. And while we expect Alibaba to remain a leader, we expect growing competition to take an increasing share of this fast-growing market over time. Growing competitive intensity has also impacted our assessment of Alibaba’s ongoing penetration of lower-tier cities. As internet access in lower-tier cities approaches that of higher-tier cities, we expect growth in e-commerce to be approximately twice that of overall China e-commerce growth. We believe Alibaba maintains leading market share in lower-tier cities, but is likely to face heightened competition from companies such as Pinduoduo, JD.com, and Meituan. We have long assumed that Alibaba’s disproportionate share of China e-commerce would decline, from over 80% at the time of our initial analysis in 2013, to a level closer to 50% of a still-growing market. While the company remains the dominant e-commerce platform in China, we estimate that a meaningful percentage of the company’s incremental growth in the most recently reported quarter was from these markets where we are seeing signs of heightened competitive intensity. As a function of newer market entrants, faster growth from newer formats of e-commerce and lower-tier cities, and recent regulatory changes, we now expect the company’s market share to normalize at a lower level than we previously expected. While our ongoing analysis has lowered our assessment of intrinsic value for the company, it has not changed our assessment that Alibaba is a high-quality company that remains well positioned to benefit from secular growth in China e-commerce over our long-term investment horizon and continues to trade at a discount to our estimate of intrinsic value.
MercadoLibre is the largest online commerce platform in Latin America. The company operates in 18 countries representing over 95% of Latin American GDP, and its over 300 million registered buyers represent approximately 80% of the region’s estimated 430 million internet users. We believe MercadoLibre benefits from strong and sustainable competitive advantages that include its network and ecosystem, brand, and understanding of local markets that collectively contribute to its leadership position in each market it serves. A Fund holding since inception, the company delivered strong revenue growth, driven by growth in gross merchandise volume and payments, and continued market share gains in both e-commerce and payments. Growth was notable because it follows strong pandemic-fueled growth in the prior year period and reflects an acceleration of e-commerce due to the high value proposition to consumers. Despite strong fundamental performance, shares declined late in the period, which may have reflected investor concern over slower economic growth and rising rates in Brazil. MercadoLibre remains in an elevated investment cycle to build out a more powerful ecosystem focused on greater product selection, easier payment options, wider credit availability, and lower cost and faster speed of delivery. While these investments have impacted near-term profitability, we believe they have contributed to market share gains in e-commerce and payments and a stronger competitive position. With continued growth in internet access, increasing availability of credit, and the company’s continuing investments to improve the ease and convenience of transacting online, we believe MercadoLibre remains well positioned for sustained growth over the next decade, driven by the secular growth of e-commerce across Latin America. Over our forecast period, we believe the penetration of e-commerce can more than double, which would bring the penetration level into the high teens. We believe the current market price embeds expectations for key revenue and cash flow growth drivers that are well below our long-term assumptions. As a result, we believe the shares trade at a significant discount to our estimate of intrinsic value and offer a compelling long-term reward-to-risk opportunity.
Founded in 2013, CRISPR Therapeutics (“CRSP”) is a leading gene editing company, based in Switzerland. CRISPR, an acronym for “Clustered Regularly Interspaced Short Palindromic Repeats,” is a naturally occurring defense mechanism that protects bacteria against viral infections. Functioning as a “molecular scissors,” the process enables the bacteria to cut viral DNA, thereby disabling the virus. Dr. Emmanuelle Charpentier, a CRSP co-founder, elucidated the mechanism and developed a methodology to adapt and simplify its use for human gene therapy – for which she and a collaborator were awarded the 2020 Nobel Prize in Chemistry. The resulting gene editing technology enables precise alteration of DNA that can “silence” or correct undesirable sequences, potentially enabling a next generation of curative therapies for genetic diseases. Today, the company is focused on developing transformative gene-based medicines for serious diseases in areas including hemoglobinopathies (a group of inherited blood disorders including sickle cell disease), oncology, regenerative medicine, and rare diseases. A new purchase in the second quarter of 2021, CRSP reported financial results that demonstrated continued progress across its clinical and pre-clinical therapies, including the expectation for year-end 2022 regulatory filings for its CTX001 therapy for blood disorders including sickle cell disease. In October, the company reported that its CTX110 CAR-T program, which uses the body’s own immune system to fight cancer, showed good Phase 1 safety results that were comparable to but less efficacious than competing autologous therapies. While the numbers appeared below peer results, they showed promise and potential for the company to improve the results by refining its dosing regimen. CRSP’s therapy also remains differentiated from autologous therapies which are patient-specific and can only be used to treat a single patient, while CRSP’s allogenic “off-the-shelf” CAR-T therapies can be derived from a single healthy donor and then used to treat many patients.
| 2
LOOMIS SAYLES GLOBAL GROWTH FUND
While the results could impact the timing of potential approval and ultimate market share opportunity for its CAR-T therapies, they do not impact our assessment of the quality of CRSP’s platform, and we continue to expect the company to realize significant value from its CAR-T program. We took advantage of near-term price weakness to add to our holdings during the period. While CRSP has a number of therapies currently undergoing clinical trials, it has not yet commercialized any therapies and remains pre-revenue. However, at scale, we believe the company can attain the economics of a successful biotech company, including operating margins that could exceed 40% and cash flow returns on investment that substantially exceed its cost of capital. We believe the expectations embedded in CRSP’s market price substantially underestimate the potential of its curative therapies, its ability to rapidly innovate, and its structural advantages in the development process that should lift its probability of success compared to traditional biopharmaceutical therapies. We believe management is executing on a sound investment strategy that we expect will eventually generate meaningful free cash flow growth that is not reflected in current expectations. As a result, we believe the company is selling at a substantial discount to our estimate of its intrinsic value and offers a compelling reward-to-risk opportunity.
The Fund’s positions in Alphabet, Oracle, and Microsoft contributed the most to performance. Stock selection in the communication services sector, along with our allocation in the information technology sector, contributed positively to relative performance.
Alphabet is a holding company that owns a collection of businesses – the largest and most important of which by far is Google. Google is the global leader in online search and advertising, and also offers online cloud solutions to businesses and consumers globally. We believe Alphabet’s competitive advantages include its scale, brand strength, and the power of its network and business ecosystem, as well as its innovative culture that is reinforced by its massive investments in research and development (R&D). A holding in the Fund since inception, Alphabet reported financial results during the period that reflected a strong recovery in advertising spending, which had been depressed due to Covid-19, while revenue growth accelerated and adjusted operating margins expanded. Beginning in 2021, the company began presenting results in three segments. Google Services represents approximately 93% of total revenue and is driven by the secular shift of advertising to online and mobile platforms. The segment’s search and YouTube businesses both benefited from strong growth in direct response ads – particularly for YouTube, where in just three years direct response ads have grown from almost nothing to become one of the largest drivers. YouTube is also benefiting from strong demand from brand advertisers due to its reach and engagement with over 2 billion monthly users who recently spent over one billion hours daily on the platform. Google Cloud revenue represents approximately 7% of total revenue, and is driven by Google Cloud Platform, the company’s infrastructure-as-a-service (IAAS) and platform-as-a-service offerings (PAAS). Other bets include a number of early-stage and pre-revenue businesses and represents less than 1% of revenues. Google’s attractive financial model generates strong free cash flow and earns high returns on invested capital, enabling it to reinvest significantly in its business. Over the past five years, Google has invested over $100 billion in R&D, an amount very few companies could replicate. We believe the global secular shift from traditional advertising to online advertising is the biggest long-term growth driver for Google. Online advertising accounts for approximately $330 billion, or around 20% of the $1.5 trillion annual spending on global advertising and marketing. Over our investment horizon, we believe this penetration will increase to over 40%. We believe investors underestimate Alphabet’s growth opportunities and the intrinsic value of the business given its unique and difficult-to-replicate attributes and business model. We believe the company’s shares trade at a significant discount to our estimate of intrinsic value and offer a compelling reward-to-risk opportunity.
A Fund holding since inception, Oracle is a leader in the enterprise software market with a strong market position in database, infrastructure and application software, and cloud-based software and services. We believe the company’s competitive advantages include its large and experienced direct sales force, a founder-driven management team that reinvests relentlessly to maintain a leading intellectual property portfolio and differentiated product suite, and a large installed base of clients with high switching costs where it consistently achieves renewal and retention rates in the mid-90% range. We believe Oracle is well positioned to benefit from the continuing growth in data storage and enterprise application software, as well as the shift to cloud-based solutions. Oracle is the world leader in its largest business segment, enterprise database software used in customer on-site IT environments. However, the company continues to focus on transitioning its business from a traditional on-site, up-front software licensing and maintenance revenue model to a cloud computing subscription-based model where software revenue is recognized over the life of the client’s contract. While there has been pressure on year-over-year overall revenue comparisons during this transition as up-front license revenue shifts to subscription revenue, we expect this to lead to faster growth over time due to a higher customer lifetime value as the transition progresses. The cloud model also allows Oracle to monetize its services and technology more efficiently and yield savings to the customer. During the period, Oracle demonstrated continued progress in its transition and provided above-expectations guidance for mid-single-digit revenue growth in its 2022 fiscal year. The company also reported that its two largest cloud businesses, which include its software-as-a-service (SAAS) and infrastructure-as-a-service (IAAS) offerings, now represent 25% of total revenue and had an annual run rate of over $10 billion. Reflecting the strong cash generation ability of the business, free cash flow of $12.6 billion represented 90% of net income and rose 9% year over year. As the subscription-based, cloud-computing services model matures and increases in sales mix, we believe Oracle will realize stronger revenue, operating margins, and free cash flow growth. We believe Oracle’s stock price embeds free cash flow growth assumptions that are well below our long-term forecast. As a result, we believe its shares are selling at a significant discount to our estimate of intrinsic value and offer a compelling reward-to-risk opportunity.
3 |
Microsoft is the world’s largest software company, offering productivity and collaboration tools, cloud services, and personal computing products to businesses and consumers. The company has a massive installed base of over one billion customers for both its Windows operating system and Office software products, which are deeply embedded into enterprise workflows, resulting in significant switching costs and high customer retention. Microsoft’s unmatched scale has enabled it to invest tens of billions of dollars in research and development to sustain its competitive position as enterprise work processes and platforms increasingly shift to the cloud. We believe commercial cloud computing is the largest growth opportunity for Microsoft, where the company’s robust platform, productivity tools, and enterprise software include Azure, Office 365, and Dynamics 365. A Fund holding since inception, Microsoft reported financial results during the period that were strong and above management and consensus expectations on all key metrics, including revenue growth of approximately 20%, expanding operating margins, and strong double-digit growth in both operating income and free cash flow. Importantly, the company continued to show strong commercial cloud growth, with revenue rising approximately 30% year over year to reach an $84 billion annual run rate, up from a $13 billion run rate five years ago. We believe Microsoft’s competitive advantages, including its large installed client base with high switching costs, distribution strength, unmatched scale, and global brand leave it well positioned to benefit from secular growth in enterprise spending on information technology – in particular commercial cloud computing. As the company continues its transition to a cloud and subscription-based revenue model, we expect it to expand gross margins and realize higher lifetime customer value. We believe the assumptions embedded in Microsoft’s share price continue to show a lack of appreciation for the company’s significant long-term growth opportunities and the sustainability of its business model. As a result, we believe the shares are trading at a significant discount to our estimate of its intrinsic value and offer a compelling reward-to-risk opportunity.
All aspects of our quality-growth-valuation investment thesis must be present simultaneously for us to make an investment. Often our research is completed well in advance of the opportunity to invest. We are patient investors and maintain coverage of high-quality businesses in order to take advantage of meaningful price dislocations if and when they occur. During the period we initiated new positions in Alnylam Pharmaceuticals, CRISPR Therapeutics, and Vertex Pharmaceuticals. We added to our existing holdings in Alibaba, Tencent, and Visa. We trimmed our existing positions in Deere, Expeditors International, Qualcomm, Schlumberger, and Yum China. We also trimmed our position in MercadoLibre as it approached our maximum allowable position size.
Outlook
Our investment process is characterized by bottom-up fundamental research and a long-term investment time horizon. The nature of the process leads to a lower-turnover portfolio in which sector positioning is the result of stock selection. The Fund ended the year with overweight positions in the consumer discretionary, communication services, information technology, healthcare, industrials, and consumer staples sectors and underweight positions in the financials and energy sectors. We did not own positions in the materials, utilities or real estate sectors.
Hypothetical Growth of $100,000 Investment in Class Y Shares
March 31, 2016 (inception) through November 30, 20213
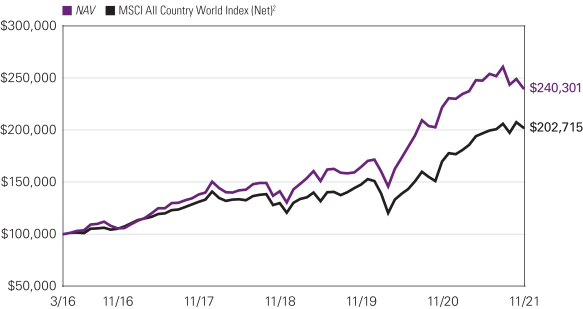
See notes to charts on page 5.
| 4
LOOMIS SAYLES GLOBAL GROWTH FUND
Top Ten Holdings as of November 30, 2021
| | | | | | | | |
| | | |
| | | | Security Name | | % of Net Assets | |
| | 1 | | | Amazon.com, Inc. | | | 7.27 | % |
| | 2 | | | Alphabet, Inc., Class A | | | 6.27 | % |
| | 3 | | | Meta Platforms, Inc., Class A | | | 4.99 | % |
| | 4 | | | Microsoft Corp. | | | 4.72 | % |
| | 5 | | | Adyen NV | | | 4.71 | % |
| | 6 | | | MercadoLibre, Inc. | | | 4.56 | % |
| | 7 | | | Oracle Corp. | | | 4.20 | % |
| | 8 | | | Novartis AG, (Registered) | | | 3.94 | % |
| | 9 | | | Boeing Co. (The) | | | 3.88 | % |
| | 10 | | | salesforce.com, Inc. | | | 3.74 | % |
The portfolio is actively managed and holdings are subject to change. There is no guarantee the Fund continues to invest in the securities referenced. The holdings listed exclude any temporary cash investments, are presented on an individual security basis and do not represent holdings of the issuer.
Average Annual Total Returns — November 30, 20213
| | | | | | | | | | | | | | | | | | | | | | | | |
| | | | | | | | | | | | | | | Expense Ratios4 | |
| | | 1 Year | | | 5 Years | | | Life of Class | | | Gross | | | Net | |
| | | | | | | |
| Class Y (Inception 3/31/16) | | | | | | | | | | | Class Y/A/C | | | | Class N | | | | | | | | | |
| NAV | | | 8.22 | % | | | 17.89 | % | | | 16.72 | % | | | — | % | | | 1.14 | % | | | 0.95 | % |
| | | | | | | |
| Class A (Inception 3/31/16) | | | | | | | | | | | | | | | | | | | | | | | | |
| NAV | | | 7.95 | | | | 17.59 | | | | 16.42 | | | | — | | | | 1.39 | | | | 1.20 | |
| With 5.75% Maximum Sales Charge | | | 1.71 | | | | 16.21 | | | | 15.21 | | | | — | | | | | | | | | |
| | | | | | | |
| Class C (Inception 3/31/16) | | | | | | | | | | | | | | | | | | | | | | | | |
| NAV | | | 7.15 | | | | 16.72 | | | | 15.54 | | | | — | | | | 2.14 | | | | 1.95 | |
| With CDSC1 | | | 6.15 | | | | 16.72 | | | | 15.54 | | | | — | | | | | | | | | |
| | | | | | | |
| Class N (Inception 3/31/17) | | | | | | | | | | | | | | | | | | | | | | | | |
| NAV | | | 8.21 | | | | — | | | | — | | | | 17.05 | | | | 1.08 | | | | 0.90 | |
| | | | | | | |
| Comparative Performance | | | | | | | | | | | | | | | | | | | | | | | | |
| MSCI All Country World Index (Net)2 | | | 19.27 | | | | 13.99 | | | | 13.24 | | | | 12.87 | | | | | | | | | |
Performance data shown represents past performance and is no guarantee of, and not necessarily indicative of, future results. Total return and value will vary, and you may have a gain or loss when shares are sold. Current performance may be lower or higher than quoted. For most recent month-end performance, visit im.natixis.com/performance. Performance for other share classes will be greater or less than shown based on differences in fees and sales charges. You may not invest directly in an index. Performance for periods less than one year is cumulative, not annualized. Returns reflect changes in share price and reinvestment of dividends and capital gains, if any. The table(s) do not reflect taxes shareholders might owe on any fund distributions or when they redeem their shares.
| 1 | Performance for Class C shares assumes a 1% contingent deferred sales charge (“CDSC”) applied when you sell shares within one year of purchase. |
| 2 | The MSCI All Country World Index (Net) is a free float-adjusted market capitalization weighted index that is designed to measure the equity market performance of developed and emerging markets. |
| 3 | Fund performance has been increased by fee waivers and/or expense reimbursements, if any, without which performance would have been lower. |
| 4 | Expense ratios are as shown in the Fund’s prospectus in effect as of the date of this report. The expense ratios for the current reporting period can be found in the Financial Highlights section of this report under Ratios to Average Net Assets. Net expenses reflect contractual expense limitations set to expire on 3/31/22. When a Fund’s expenses are below the limitation, gross and net expense ratios will be the same. See Note 5 of the Notes to Financial Statements for more information about the Fund’s expense limitations. |
5 |
LOOMIS SAYLES SENIOR FLOATING RATE AND FIXED INCOME FUND
| | |
| |
| Managers: | | Symbols: |
| |
| John R. Bell | | Class A LSFAX |
| |
| Michael L. Klawitter,CFA® | | Class C LSFCX |
| |
| Heather M. Young,CFA® | | Class N LSFNX |
| |
| Loomis, Sayles & Company, L.P. | | Class Y LSFYX |
Investment Goal
The Fund seeks to provide a high level of current income.
Market Conditions
The loan market was supported by strong risk sentiment throughout the period. Lower-rated loans generally outperformed higher-rated loans, defaults were minimal, and prices stayed close to par. At the end of the period, approximately 85% of loans in the S&P/LSTA Leveraged Loan Index were priced at or above 98, a level we believe is representative of a well-functioning market.
New loan issuance was very strong throughout the period, pushing the total value of loans outstanding to a record high of $1.33 trillion. Collateralized loan obligation (CLO) formation continued at a rapid pace, establishing both a new annual record in September and several monthly records. Loan mutual fund flows were positive in each of the last twelve months, reflecting investors’ search for yield.
Performance Results
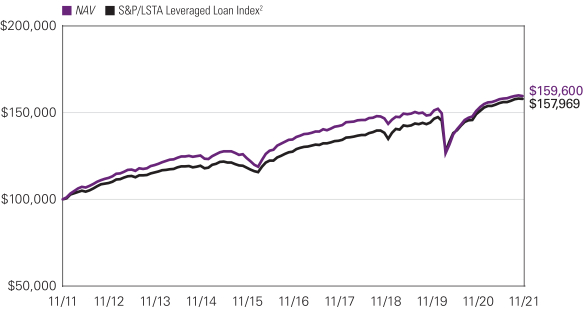
For the 12 months ended November 30, 2021, Class Y shares of the Loomis Sayles Senior Floating Rate and Fixed Income Fund returned 5.73% at net asset value. The Fund underperformed its benchmark, the S&P/LSTA Leveraged Loan Index, which returned 5.94% for the period.
Explanation of Fund Performance
The Fund underperformed its benchmark for the full period due mostly to the drag from its liquidity position (cash and exchange-traded funds (ETFs)) given the “risk-on” tone that persisted throughout the period.
The biggest positive driver of relative return was risk positioning in the bank loan segment of the Fund, namely an underweighting of higher-quality loans relative to the benchmark. A small position in equities, the result of prior loan restructures, produced strong returns and added to relative return. The portfolio experienced no defaults during the period.
We target a yield advantage for the Fund versus the benchmark in most market conditions. A yield advantage can be enhanced through primary market new issue discounts and by swapping into loans or bonds with more appealing risk/return characteristics as those opportunities arise. Maintaining an appropriate liquidity policy is paramount, though as noted above, cash generally creates a drag on returns in a “risk-on” environment. The Fund is currently positioned with about 91% bank loans (including ETFs), 5% bonds, and 4% held in cash on a trade-date basis.
We examine the relative attractiveness of the high yield corporate bond market in relation to bank loans based on potential risk-adjusted return. We judge potential return on high yield bonds in comparison to loans in assessing whether the additional volatility in the bond market is appropriately compensated versus our benchmark. Currently, we view that tradeoff as poorly-compensated in much of the bond market. We initiated a small position in a short-term high yield bond ETF during the third quarter of 2021 as part of our liquidity management program. That position provides us the option to swap into individual bonds when we see value but enables us to boost fund liquidity while earning a return.
Outlook
The environment for loan credit quality remains very constructive, and our credit selection remains focused on long-term risks, not short-term movements. Demand for loans has been very strong and we think that is likely to remain the case if the US economy continues to recover into 2022, though occasional market swoons are possible. Demand from CLO formation, retail investors and global institutional clients has increased given a lack of yield alternatives and the relative richness of the high yield bond market, despite sentiment shifts on longer rates.
We agree with the market’s expectation that default rates are poised for another very low year due to both company-specific circumstances (ample liquidity, few loan maturities, successful cost-savings programs, and revenue retention) and macroeconomic support in the form of fiscal and monetary stimulus. Inflationary cost pressures have, thus far, been well-absorbed by most companies to which we lend as a result of permanent cost cuts initiated in the early pandemic and the ability to pass through price increases to their customers.
| 6
LOOMIS SAYLES SENIOR FLOATING RATE AND FIXED INCOME FUND
Our macro base case is for expansion and a generally risk-on environment with the potential for setbacks due to lingering impacts from Covid-19 and its variants. Interim setbacks might allow us opportunities to buy value at a discount. Our goal is to discriminate between winners and losers, using higher quality positions as a source of funds to reinvest in loans or bonds with better return potential, while remaining true to our strategy of investing in compelling credit stories.
The Federal Reserve appears intent on accelerating its tightening schedule, and Loomis’ Yield Curve team now expects two 25 basis point increases in the fed funds rate in 2022. Loomis still believes that inflation pressures will begin to ease in 2022 and will not create cause for disruptive tightening.
Our goal, as it was before the pandemic, is to construct a portfolio that can withstand many pressures without suffering significant credit losses.
Hypothetical Growth of $100,000 Investment in Class Y Shares
November 30, 2011 through November 30, 20213
7 |
Average Annual Total Returns — November 30, 20213
| | | | | | | | | | | | | | | | | | | | | | | | |
| | | | | | |
| | | | | | | | | | | | | | | Expense Ratios4 | |
| | | 1 Year | | | 5 Years | | | 10 Years | | | Life of Class | | | Gross | | | Net | |
| | | | | | | |
| Class Y | | | | | | | | | | | | | | | Class N | | | | | | | | | |
| NAV | | | 5.73 | % | | | 3.48 | % | | | 4.78 | % | | | — | % | | | 0.95 | % | | | 0.82 | % |
| | | | | | | |
| Class A | | | | | | | | | | | | | | | | | | | | | | | | |
| NAV | | | 5.47 | | | | 3.22 | | | | 4.52 | | | | — | | | | 1.20 | | | | 1.07 | |
| With 3.50% Maximum Sales Charge | | | 1.77 | | | | 2.49 | | | | 4.15 | | | | — | | | | | | | | | |
| | | | | | | |
| Class C | | | | | | | | | | | | | | | | | | | | | | | | |
| NAV | | | 4.69 | | | | 2.45 | | | | 3.90 | | | | — | | | | 1.95 | | | | 1.82 | |
| With CDSC1 | | | 3.69 | | | | 2.45 | | | | 3.90 | | | | — | | | | | | | | | |
| | | | | | | |
| Class N (Inception 3/31/17) | | | | | | | | | | | | | | | | | | | | | | | | |
| NAV | | | 5.79 | | | | — | | | | — | | | | 3.22 | | | | 1.24 | | | | 0.77 | |
| | | | | | | |
| Comparative Performance | | | | | | | | | | | | | | | | | | | | | | | | |
| S&P/LSTA Leveraged Loan Index2 | | | 5.94 | | | | 4.38 | | | | 4.68 | | | | 4.19 | | | | | | | | | |
Performance data shown represents past performance and is no guarantee of, and not necessarily indicative of, future results. Total return and value will vary, and you may have a gain or loss when shares are sold. Current performance may be lower or higher than quoted. For most recent month-end performance, visit im.natixis.com/performance. Performance for other share classes will be greater or less than shown based on differences in fees and sales charges. You may not invest directly in an index. Performance for periods less than one year is cumulative, not annualized. Returns reflect changes in share price and reinvestment of dividends and capital gains, if any. The table(s) do not reflect taxes shareholders might owe on any fund distributions or when they redeem their shares.
| 1 | Performance for Class C shares assumes a 1% contingent deferred sales charge (“CDSC”) applied when you sell shares within one year of purchase, and includes automatic conversion to Class A shares after eight years. |
| 2 | The S&P/LSTA Leveraged Loan Index covers loan facilities and reflects the market-value-weighted performance of U.S. dollar-denominated institutional leveraged loans. |
| 3 | Fund performance has been increased by fee waivers and/or expense reimbursements, if any, without which performance would have been lower. |
| 4 | Expense ratios are as shown in the Fund’s prospectus in effect as of the date of this report. The expense ratios for the current reporting period can be found in the Financial Highlights section of this report under Ratios to Average Net Assets. Net expenses reflect contractual expense limitations set to expire on 3/31/22. When a Fund’s expenses are below the limitation, gross and net expense ratios will be the same. See Note 5 of the Notes to Financial Statements for more information about the Fund’s expense limitations. |
| 8
VAUGHAN NELSON SELECT FUND
| | |
| |
| Managers: | | Symbols: |
| |
| Chris D. Wallis, CFA® | | Class A VNSAX |
| |
| Scott J. Weber, CFA® | | Class C VNSCX |
| |
| Vaughan Nelson Investment Management, L.P. | | Class N VNSNX |
| |
| | Class Y VNSYX |
Investment Goal
The Fund seeks long-term capital appreciation.
Market Conditions
During the fiscal year ended November 30, 2021, the equity market continued to recover from the global pandemic. Buoyed by a new round of stimulus checks and an accelerated rollout of Covid-19 vaccines, cyclical sectors and securities with high beta and high short interest led the equity market to new all-time highs. As we moved through the fiscal year, growth stocks resumed their leadership over value. The leadership shift to larger-cap equities with growth characteristics is consistent with the modest decline in Treasury yields and flattening yield curve. As we neared the fiscal year-end, returns were mixed as global equity markets grappled with slowing economic growth, rising energy prices, material supply chain disruptions offset by falling Covid cases and improving employment conditions.
Performance Results
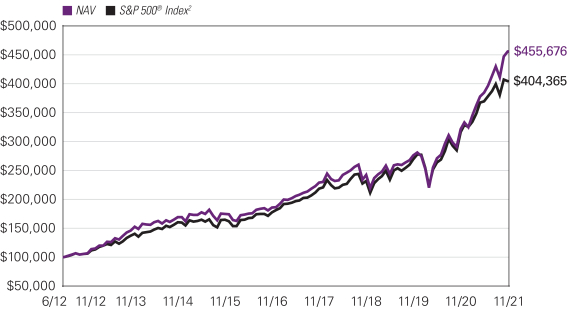
For the 12 months ended November 30, 2021, Class Y shares of the Vaughan Nelson Select Fund returned 41.81% at net asset value. The Fund outperformed its benchmark, the S&P 500® Index, which returned 27.92%.
Explanation of Fund Performance
The Fund outperformed on a relative basis during the period.
The largest contributor to outperformance was Health Care, driven by security selection. Within the sector, Moderna, Inc. drove the outperformance as its vaccine and mRNA pipeline were rewarded.
Information Technology (IT) was a significant contributor driven by an overweight position and stock selection. NVIDIA Corporation led the way in IT due to strong data center demand for Graphics Processing Units and leading artificial intelligence and machine learning software. In the Industrials segment, the fund experienced positive attribution, with Saia leading the way with strong pricing as they build out their national network in the LTL (less-than-truckload) market. LTL accommodates business transporting small batches of goods. Consolidating this market, in addition to tightening supply chains, allows Saia a strong pricing environment and surging operating margins.
The Fund held one Utility name during the fiscal year and, despite a challenging period for Utilities, NextEra delivered positive attribution as one of the largest renewables developer in the US, a space experiencing tailwinds.
The Communication Services sector was also driven by security selection. Alphabet Inc, Class A was the strongest name as it benefited from a solid core business in advertising as well as profitability improvement in its cloud business.
An underweight to a disappointing Consumer Staples sector aided with relative returns. Of the two Consumer Staples stocks held by the Fund, Clorox was the best performer in the sector as it continued to navigate unprecedented cost pressures that temporarily suppressed margins.
The final relative outperforming sector was Financials, with Aon Plc Class A the strongest name due to operational execution in a structurally attractive market as well as a strong pricing environment for insurance providers.
Within Materials, Sherwin-Williams Company was the most significant detractor, primarily because the Fund sold the name too early.
Energy was a negative relative sector primarily due to Technip Energies NV, which suffered from low enthusiasm for offshore energy investment.
The Fund’s Consumer Discretionary names slightly underperformed the sector with Home Depot being the largest detractor, largely due to the Fund selling the name early in 2021 before it went on to outperform the market.
Lastly from a relative contribution standpoint, the absence of REITs was a minor detractor.
9 |
Outlook
As Covid-19 cases began to decline late in the third quarter, markets embraced risk by boosting economically sensitive sectors and increasing sovereign interest rates globally. Economic growth continues to be hindered by supply chain disruptions, low inventories, and rising commodity prices. As we move into 2022, markets should start to get a glimpse of what the new “post-Covid-19 normal” looks like and to what extent inflation will be transitory. There is some solace in the fact that the inflationary cycle is now in a growth downturn, but such a downturn is no guarantee that inflation will be as low as it was for the last decade. Globally, there are significant geopolitical, demographic, and industry shifts under way that will materially change supply chains, trade flows, inflationary pressures, and currency flows. These shifts will become more apparent as we move through 2022 and could materially impact asset prices.
Hypothetical Growth of $100,000 Investment in Class Y Shares
June 29, 2012 (inception) through November 30, 20213
Top Ten Holdings as of November 30, 2021
| | | | | | | | |
| | | |
| | | | Security Name | | % of Net Assets | |
| | 1 | | | Microsoft Corp. | | | 5.47 | % |
| | 2 | | | NVIDIA Corp. | | | 5.33 | % |
| | 3 | | | Danaher Corp. | | | 5.28 | % |
| | 4 | | | Apple, Inc. | | | 5.18 | % |
| | 5 | | | Amazon.com, Inc. | | | 5.05 | % |
| | 6 | | | Alphabet, Inc., Class A | | | 4.99 | % |
| | 7 | | | Berkshire Hathaway, Inc., Class B | | | 4.90 | % |
| | 8 | | | Saia, Inc. | | | 4.39 | % |
| | 9 | | | Union Pacific Corp. | | | 4.38 | % |
| | 10 | | | Meta Platforms, Inc., Class A | | | 4.32 | % |
The portfolio is actively managed and holdings are subject to change. There is no guarantee the Fund continues to invest in the securities referenced. The holdings listed exclude any temporary cash investments, are presented on an individual security basis and do not represent holdings of the issuer.
See notes to charts on page 11.
| 10
VAUGHAN NELSON SELECT FUND
Average Annual Total Returns — November 30, 20213
| | | | | | | | | | | | | | | | | | | | | | | | |
| | | | | |
| | | | | | | | | | | | Expense Ratios4 | |
| | | 1 Year | | | 5 Years | | | Life of Class | | | Gross | | | Net | |
| | | | | | | |
| Class Y (Inception 6/29/12) | | | | | | | | | | | Class Y/A/C | | | | Class N | | | | | | | | | |
| NAV | | | 41.81 | % | | | 19.67 | % | | | 17.46 | % | | | — | % | | | 0.88 | % | | | 0.85 | % |
| | | | | | | |
| Class A (Inception 6/29/12) | | | | | | | | | | | | | | | | | | | | | | | | |
| NAV | | | 41.46 | | | | 19.38 | | | | 17.16 | | | | — | | | | 1.13 | | | | 1.10 | |
| With 5.75% Maximum Sales Charge | | | 33.33 | | | | 17.97 | | | | 16.43 | | | | — | | | | | | | | | |
| | | | | | | |
| Class C (Inception 6/29/12) | | | | | | | | | | | | | | | | | | | | | | | | |
| NAV | | | 40.44 | | | | 18.49 | | | | 16.42 | | | | — | | | | 1.88 | | | | 1.85 | |
| With CDSC1 | | | 39.44 | | | | 18.49 | | | | 16.42 | | | | — | | | | | | | | | |
| | | | | | | |
| Class N (Inception 3/31/17) | | | | | | | | | | | | | | | | | | | | | | | | |
| NAV | | | 41.87 | | | | — | | | | — | | | | 19.47 | | | | 71.80 | | | | 0.80 | |
| | | | | | | |
| Comparative Performance | | | | | | | | | | | | | | | | | | | | | | | | |
| S&P 500® Index2 | | | 27.92 | | | | 17.90 | | | | 15.93 | | | | 17.25 | | | | | | | | | |
Performance data shown represents past performance and is no guarantee of, and not necessarily indicative of, future results. Total return and value will vary, and you may have a gain or loss when shares are sold. Current performance may be lower or higher than quoted. For most recent month-end performance, visit im.natixis.com/performance. Performance for other share classes will be greater or less than shown based on differences in fees and sales charges. You may not invest directly in an index. Performance for periods less than one year is cumulative, not annualized. Returns reflect changes in share price and reinvestment of dividends and capital gains, if any. The table(s) do not reflect taxes shareholders might owe on any fund distributions or when they redeem their shares.
| 1 | Performance for Class C shares assumes a 1% contingent deferred sales charge (“CDSC”) applied when you sell shares within one year of purchase. |
| 2 | S&P 500® Index is a widely recognized measure of U.S. stock market performance. It is an unmanaged index of 500 common stocks chosen for market size, liquidity, and industry group representation, among other factors. It also measures the performance of the large cap segment of the U.S. equities market. |
| 3 | Fund performance has been increased by fee waivers and/or expense reimbursements, if any, without which performance would have been lower. |
| 4 | Expense ratios are as shown in the Fund’s prospectus in effect as of the date of this report. The expense ratios for the current reporting period can be found in the Financial Highlights section of this report under Ratios to Average Net Assets. Net expenses reflect contractual expense limitations set to expire on 3/31/23. When a Fund’s expenses are below the limitation, gross and net expense ratios will be the same. See Note 5 of the Notes to Financial Statements for more information about the Fund’s expense limitations. |
11 |
ADDITIONAL INFORMATION
All investing involves risk, including the risk of loss. There is no assurance that any investment will meet its performance objectives or that losses will be avoided.
The views expressed in this report reflect those of the portfolio managers as of the dates indicated. The managers’ views are subject to change at any time without notice based on changes in market or other conditions. References to specific securities or industries should not be regarded as investment advice. Because the Fund is actively managed, there is no assurance that they will continue to invest in the securities or industries mentioned.
ADDITIONAL INDEX INFORMATION
This document may contain references to third party copyrights, indexes, and trademarks, each of which is the property of its respective owner. Such owner is not affiliated with Natixis Investment Managers or any of its related or affiliated companies (collectively “Natixis Affiliates”) and does not sponsor, endorse or participate in the provision of any Natixis Affiliates services, funds or other financial products.
The index information contained herein is derived from third parties and is provided on an “as is” basis. The user of this information assumes the entire risk of use of this information. Each of the third party entities involved in compiling, computing or creating index information, disclaims all warranties (including, without limitation, any warranties of originality, accuracy, completeness, timeliness, non-infringement, merchantability and fitness for a particular purpose) with respect to such information.
PROXY VOTING INFORMATION
A description of the Natixis Funds’ proxy voting policies and procedures is available without charge, upon request, by calling Natixis Funds at 800-225-5478; on Natixis Funds’ website at im.natixis.com; and on the Securities and Exchange Commission’s (SEC) website at www.sec.gov. Information regarding how Natixis Funds voted proxies relating to portfolio securities during the most recent 12-month period ended June 30 is available from Natixis Funds’ website and the SEC’s website.
QUARTERLY PORTFOLIO SCHEDULES
The Natixis Funds file a complete schedule of portfolio holdings with the SEC for the first and third quarters of each fiscal year as an exhibit to its reports on Form N-PORT. The Funds’ Form N-PORT reports are available on the SEC’s website at www.sec.gov. First and third quarter schedules of portfolio holdings are also available at im.natixis.com/funddocuments. A hard copy may be requested from the Fund at no charge by calling 800-225-5478.
CFA® and Chartered Financial Analyst® are registered trademarks owned by the CFA Institute.
| 12
UNDERSTANDING FUND EXPENSES
As a mutual fund shareholder, you incur different costs: transaction costs, including sales charges (loads) on purchases and contingent deferred sales charges on redemptions and ongoing costs, including management fees, distribution and/or service fees (12b-1 fees), and other fund expenses. Certain exemptions may apply. These costs are described in more detail in the Funds’ prospectus. The following examples are intended to help you understand the ongoing costs of investing in the Funds and help you compare these with the ongoing costs of investing in other mutual funds.
The first line in the table of each class of Fund shares shows the actual account values and actual Fund expenses you would have paid on a $1,000 investment in the Fund from June 1, 2021 through November 30, 2021. To estimate the expenses you paid over the period, simply divide your account value by $1,000 (for example $8,600 account value divided by $1,000 = 8.60) and multiply the result by the number in the Expenses Paid During Period column as shown below for your class.
The second line in the table for each class of Fund shares provides information about hypothetical account values and hypothetical expenses based on the Fund’s actual expense ratios and an assumed rate of return of 5% per year before expenses, which is not the Fund’s actual return. The hypothetical account values and expenses may not be used to estimate the actual ending account balance or expenses you paid on your investment for the period. You may use this information to compare the ongoing costs of investing in each Fund and other funds. To do so, compare this 5% hypothetical example with the 5% hypothetical examples that appear in the shareholder reports of the other funds.
Please note that the expenses shown reflect ongoing costs only, and do not include any transaction costs, such as sales charges. Therefore, the second line in the table of each Fund is useful in comparing ongoing costs only, and will not help you determine the relative costs of owning different funds. If transaction costs were included, total costs would be higher.
| | | | | | | | | | | | |
| LOOMIS SAYLES GLOBAL GROWTH FUND | | BEGINNING
ACCOUNT VALUE
6/1/2021 | | | ENDING
ACCOUNT VALUE
11/30/2021 | | | EXPENSES PAID
DURING PERIOD*
6/1/2021 – 11/30/2021 | |
| Class A | | | | | | | | | | | | |
| Actual | | | $1,000.00 | | | | $967.50 | | | | $5.92 | |
| Hypothetical (5% return before expenses) | | | $1,000.00 | | | | $1,019.05 | | | | $6.07 | |
| Class C | | | | | | | | | | | | |
| Actual | | | $1,000.00 | | | | $964.30 | | | | $9.60 | |
| Hypothetical (5% return before expenses) | | | $1,000.00 | | | | $1,015.29 | | | | $9.85 | |
| Class N | | | | | | | | | | | | |
| Actual | | | $1,000.00 | | | | $969.30 | | | | $4.44 | |
| Hypothetical (5% return before expenses) | | | $1,000.00 | | | | $1,020.56 | | | | $4.56 | |
| Class Y | | | | | | | | | | | | |
| Actual | | | $1,000.00 | | | | $969.30 | | | | $4.69 | |
| Hypothetical (5% return before expenses) | | | $1,000.00 | | | | $1,020.31 | | | | $4.81 | |
| * | Expenses are equal to the Fund’s annualized expense ratio (after waiver/reimbursement): 1.20%, 1.95%, 0.90% and 0.95% for Class A, C, N and Y, respectively, multiplied by the average account value over the period, multiplied by the number of days in the most recent fiscal half-year (183), divided by 365 (to reflect the half-year period). |
13 |
| | | | | | | | | | | | |
| LOOMIS SAYLES SENIOR FLOATING RATE AND FIXED INCOME FUND | | BEGINNING
ACCOUNT VALUE
6/1/2021 | | | ENDING
ACCOUNT VALUE
11/30/2021 | | | EXPENSES PAID
DURING PERIOD*
6/1/2021 – 11/30/2021 | |
| Class A | | | | | | | | | | | | |
| Actual | | | $1,000.00 | | | | $1,010.70 | | | | $5.29 | |
| Hypothetical (5% return before expenses) | | | $1,000.00 | | | | $1,019.80 | | | | $5.32 | |
| Class C | | | | | | | | | | | | |
| Actual | | | $1,000.00 | | | | $1,006.80 | | | | $9.06 | |
| Hypothetical (5% return before expenses) | | | $1,000.00 | | | | $1,016.04 | | | | $9.10 | |
| Class N | | | | | | | | | | | | |
| Actual | | | $1,000.00 | | | | $1,012.20 | | | | $3.78 | |
| Hypothetical (5% return before expenses) | | | $1,000.00 | | | | $1,021.31 | | | | $3.80 | |
| Class Y | | | | | | | | | | | | |
| Actual | | | $1,000.00 | | | | $1,011.90 | | | | $4.03 | |
| Hypothetical (5% return before expenses) | | | $1,000.00 | | | | $1,021.06 | | | | $4.05 | |
| * | Expenses are equal to the Fund’s annualized expense ratio (after waiver/reimbursement): 1.05%, 1.80%, 0.75% and 0.80% for Class A, C, N and Y, respectively, multiplied by the average account value over the period, multiplied by the number of days in the most recent fiscal half-year (183), divided by 365 (to reflect the half-year period). |
| | | | | | | | | | | | |
| VAUGHAN NELSON SELECT FUND | | BEGINNING
ACCOUNT VALUE
6/1/2021 | | | ENDING
ACCOUNT VALUE
11/30/2021 | | | EXPENSES PAID
DURING PERIOD*
6/1/2021 – 11/30/2021 | |
| Class A | | | | | | | | | | | | |
| Actual | | | $1,000.00 | | | | $1,184.70 | | | | $5.91 | |
| Hypothetical (5% return before expenses) | | | $1,000.00 | | | | $1,019.65 | | | | $5.47 | |
| Class C | | | | | | | | | | | | |
| Actual | | | $1,000.00 | | | | $1,180.30 | | | | $10.00 | |
| Hypothetical (5% return before expenses) | | | $1,000.00 | | | | $1,015.89 | | | | $9.25 | |
| Class N | | | | | | | | | | | | |
| Actual | | | $1,000.00 | | | | $1,186.70 | | | | $4.44 | |
| Hypothetical (5% return before expenses) | | | $1,000.00 | | | | $1,021.01 | | | | $4.10 | |
| Class Y | | | | | | | | | | | | |
| Actual | | | $1,000.00 | | | | $1,186.20 | | | | $4.55 | |
| Hypothetical (5% return before expenses) | | | $1,000.00 | | | | $1,020.91 | | | | $4.20 | |
| * | Expenses are equal to the Fund’s annualized expense ratio (after waiver/reimbursement): 1.08%, 1.83%, 0.81% and 0.83% for Class A, C, N and Y, respectively, multiplied by the average account value over the period, multiplied by the number of days in the most recent fiscal half-year (183), divided by 365 (to reflect the half-year period). |
| 14
Portfolio of Investments – as of November 30, 2021
Loomis Sayles Global Growth Fund
| | | | | | | | |
Shares | | | Description | | Value (†) | |
| | | | | | | | |
| | Common Stocks — 99.5% of Net Assets | |
| | | | Argentina — 4.6% | |
| | 4,828 | | | MercadoLibre, Inc.(a) | | $ | 5,737,643 | |
| | | | | | | | |
| | | | Brazil — 1.6% | |
| | 731,047 | | | Ambev S.A., ADR | | | 2,061,553 | |
| | | | | | | | |
| | | | China — 13.6% | |
| | 29,465 | | | Alibaba Group Holding Ltd., Sponsored ADR(a)(b) | | | 3,757,672 | |
| | 14,416 | | | Baidu, Inc., Sponsored ADR(a)(b) | | | 2,160,093 | |
| | 195,632 | | | Budweiser Brewing Co. APAC Ltd., 144A | | | 496,776 | |
| | 14,581 | | | NXP Semiconductors NV | | | 3,256,812 | |
| | 65,700 | | | Tencent Holdings Ltd.(b) | | | 3,831,562 | |
| | 65,539 | | | Trip.com Group Ltd., ADR(a)(b) | | | 1,802,323 | |
| | 37,102 | | | Yum China Holdings, Inc. | | | 1,858,810 | |
| | | | | | | | |
| | | | | | | 17,164,048 | |
| | | | | | | | |
| | | | Denmark — 1.3% | |
| | 15,444 | | | Novo Nordisk A/S, Class B | | | 1,653,280 | |
| | | | | | | | |
| | | | France — 0.8% | |
| | 11,166 | | | Sodexo S.A.(a) | | | 939,480 | |
| | | | | | | | |
| | | | Japan — 1.9% | |
| | 12,000 | | | FANUC Corp. | | | 2,352,508 | |
| | | | | | | | |
| | | | Netherlands — 4.7% | |
| | 2,141 | | | Adyen NV, 144A(a) | | | 5,930,217 | |
| | | | | | | | |
| | | | Switzerland — 10.8% | |
| | 23,312 | | | CRISPR Therapeutics AG(a) | | | 1,862,629 | |
| | 17,232 | | | Nestle S.A., (Registered) | | | 2,208,655 | |
| | 62,125 | | | Novartis AG, (Registered) | | | 4,951,719 | |
| | 11,727 | | | Roche Holding AG | | | 4,578,340 | |
| | | | | | | | |
| | | | | | | 13,601,343 | |
| | | | | | | | |
| | | | United Kingdom — 4.6% | |
| | 72,153 | | | Experian PLC | | | 3,239,370 | |
| | 12,095 | | | Reckitt Benckiser Group PLC | | | 979,731 | |
| | 30,630 | | | Unilever PLC | | | 1,576,632 | |
| | | | | | | | |
| | | | | | | 5,795,733 | |
| | | | | | | | |
| | | | United States — 55.6% | |
| | 19,622 | | | Alnylam Pharmaceuticals, Inc.(a) | | | 3,606,524 | |
| | 2,779 | | | Alphabet, Inc., Class A(a) | | | 7,886,663 | |
| | 2,609 | | | Amazon.com, Inc.(a) | | | 9,149,946 | |
| | 7,360 | | | Autodesk, Inc.(a) | | | 1,870,838 | |
| | 24,686 | | | Boeing Co. (The)(a) | | | 4,884,125 | |
| | 19,497 | | | Colgate-Palmolive Co. | | | 1,462,665 | |
| | 3,933 | | | Core Laboratories NV | | | 90,026 | |
| | 7,770 | | | Deere & Co. | | | 2,684,846 | |
| | 9,543 | | | Expeditors International of Washington, Inc. | | | 1,160,620 | |
| | 19,356 | | | Meta Platforms, Inc., Class A(a) | | | 6,280,248 | |
| | 17,976 | | | Microsoft Corp. | | | 5,942,686 | |
| | 58,263 | | | Oracle Corp. | | | 5,286,785 | |
| | 16,446 | | | QUALCOMM, Inc. | | | 2,969,490 | |
| | 16,497 | | | salesforce.com, Inc.(a) | | | 4,700,985 | |
| | 29,782 | | | Schlumberger NV | | | 854,148 | |
| | 20,556 | | | SEI Investments Co. | | | 1,225,754 | |
| | 108,845 | | | Under Armour, Inc., Class A(a) | | | 2,567,653 | |
| | 9,273 | | | Vertex Pharmaceuticals, Inc.(a) | | | 1,733,495 | |
| | 24,029 | | | Visa, Inc., Class A | | | 4,656,099 | |
| | 7,366 | | | Yum! Brands, Inc. | | | 904,839 | |
| | | | | | | | |
| | | | | | | 69,918,435 | |
| | | | | | | | |
| | | | Total Common Stocks
(Identified Cost $99,923,383) | | | 125,154,240 | |
| | | | | | | | |
| | | | | | | | |
Principal
Amount | | | Description | | Value (†) | |
| | | | | | | | |
| | Short-Term Investments — 0.3% | | | | |
| $ | 337,309 | | | Tri-Party Repurchase Agreement with Fixed Income Clearing Corporation, dated 11/30/2021 at 0.000% to be repurchased at $337,309 on 12/01/2021 collateralized by $349,900 U.S. Treasury Note, 0.750% due 5/31/2026 valued at $344,077 including accrued interest (Note 2 of Notes to Financial Statements)
(Identified Cost $337,309) | | $ | 337,309 | |
| | | | | | | | |
| | | | | | | | |
| | | | Total Investments — 99.8%
(Identified Cost $100,260,692) | | | 125,491,549 | |
| | | | Other assets less liabilities — 0.2% | | | 298,706 | |
| | | | | | | | |
| | | | Net Assets — 100.0% | | $ | 125,790,255 | |
| | | | | | | | |
| | | | | | | | |
| | (†) | | | See Note 2 of Notes to Financial Statements. | |
| | (a) | | | Non-income producing security. | |
| | (b) | | | Security invests in variable interest entities based in China. See Note 8 of Notes to Financial Statements. | |
| | | | | | | | |
| | 144A | | | All or a portion of these securities are exempt from registration under Rule 144A of the Securities Act of 1933. These securities may be resold in transactions exempt from registration, normally to qualified institutional buyers. At November 30, 2021, the value of Rule 144A holdings amounted to $6,426,993 or 5.1% of net assets. | |
| | ADR | | | An American Depositary Receipt is a certificate issued by a custodian bank representing the right to receive securities of the foreign issuer described. The values of ADRs may be significantly influenced by trading on exchanges not located in the United States. | |
Industry Summary at November 30, 2021
| | | | |
Interactive Media & Services | | | 16.0 | % |
Internet & Direct Marketing Retail | | | 14.9 | |
Software | | | 14.1 | |
Pharmaceuticals | | | 8.8 | |
IT Services | | | 8.4 | |
Biotechnology | | | 5.8 | |
Semiconductors & Semiconductor Equipment | | | 4.9 | |
Hotels, Restaurants & Leisure | | | 4.4 | |
Machinery | | | 4.0 | |
Aerospace & Defense | | | 3.9 | |
Professional Services | | | 2.6 | |
Textiles, Apparel & Luxury Goods | | | 2.0 | |
Beverages | | | 2.0 | |
Household Products | | | 2.0 | |
Other Investments, less than 2% each | | | 5.7 | |
Short-Term Investments | | | 0.3 | |
| | | | |
Total Investments | | | 99.8 | |
Other assets less liabilities | | | 0.2 | |
| | | | |
Net Assets | | | 100.0 | % |
| | | | |
Currency Exposure Summary at November 30, 2021
| | | | |
United States Dollar | | | 73.8 | % |
Swiss Franc | | | 9.3 | |
Euro | | | 6.7 | |
Hong Kong Dollar | | | 3.4 | |
British Pound | | | 3.4 | |
Other, less than 2% each | | | 3.2 | |
| | | | |
Total Investments | | | 99.8 | |
Other assets less liabilities | | | 0.2 | |
| | | | |
Net Assets | | | 100.0 | % |
| | | | |
See accompanying notes to financial statements.
15 |
Portfolio of Investments – as of November 30, 2021
Loomis Sayles Senior Floating Rate and Fixed Income Fund
| | | | | | | | |
Principal
Amount | | | Description | | Value (†) | |
| | Senior Loans — 89.7% of Net Assets | |
| | | | Aerospace & Defense — 1.5% | |
| $ | 3,794,058 | | | Advanced Integration Technology LP, 2017 Term Loan B, 1-month LIBOR + 4.750%, 5.750%, 4/03/2023(a)(o) | | $ | 3,490,533 | |
| | 5,130,000 | | | Arcline FM Holdings LLC, 2021 1st Lien Term Loan, 3-month LIBOR + 4.750%, 5.500%, 6/23/2028(a)(n) | | | 5,101,169 | |
| | 2,964,122 | | | MAG DS Corp., Term Loan, 3-month LIBOR + 5.500%, 6.500%, 4/01/2027(a)(o) | | | 2,682,530 | |
| | 6,548,189 | | | Spirit Aerosystems, Inc., 2021 Term Loan B, 1/15/2025(b) | | | 6,535,944 | |
| | 4,997,000 | | | Vertex Aerospace Services Corp., 2021 First Lien Term Loan, 10/27/2028(b) | | | 4,962,671 | |
| | | | | | | | |
| | | | | | | 22,772,847 | |
| | | | | | | | |
| | | | Airlines — 1.1% | |
| | 3,595,000 | | | AAdvantage Loyalty IP Ltd., 2021 Term Loan, 3-month LIBOR + 4.750%, 5.500%, 4/20/2028(a)(n) | | | 3,687,859 | |
| | 2,489,000 | | | Air Canada, 2021 Term Loan B, 3-month LIBOR + 3.500%, 4.250%, 8/11/2028(a)(n) | | | 2,469,287 | |
| | 750,000 | | | KKR Apple Bidco LLC, 2021 2nd Lien Term Loan, 1-month LIBOR + 5.750%, 6.250%, 9/21/2029(a) | | | 756,098 | |
| | 2,474,000 | | | SkyMiles IP Ltd., 2020 SkyMiles Term Loan B, 3-month LIBOR + 3.750%, 4.750%, 10/20/2027(a)(o) | | | 2,597,180 | |
| | 8,149,050 | | | United Airlines, Inc., 2021 Term Loan B, 3-month LIBOR + 3.750%, 4.500%, 4/21/2028(a)(n) | | | 8,115,068 | |
| | | | | | | | |
| | | | | | | 17,625,492 | |
| | | | | | | | |
| | | | Automotive — 4.2% | |
| | 3,586,013 | | | Autokiniton U.S. Holdings, Inc., 2021 Term Loan B, 3-month LIBOR + 4.500%, 5.000%, 4/06/2028(a)(m) | | | 3,578,912 | |
| | 3,050,261 | | | Dayco Products LLC, 2017 Term Loan B, 3-month LIBOR + 4.250%, 4.425%, 5/19/2023(a) | | | 2,960,278 | |
| | 4,000,000 | | | First Brands Group LLC, 2021 2nd Lien Term Loan, 3-month LIBOR + 8.500%, 9.500%, 3/30/2028(a)(o) | | | 4,030,000 | |
| | 5,870,500 | | | First Brands Group LLC, 2021 Term Loan, 3-month LIBOR + 5.000%, 6.000%, 3/30/2027(a)(o) | | | 5,907,191 | |
| | 914,286 | | | Holley Purchaser, Inc., 2021 Delayed Draw Term Loan, 0.000%, 11/17/2028(c) | | | 909,147 | |
| | 5,485,714 | | | Holley Purchaser, Inc., 2021 Term Loan, 3-month LIBOR + 3.750%, 4.500%, 11/17/2028(a)(n) | | | 5,454,885 | |
| | 4,323,986 | | | IXS Holdings, Inc., 2020 Term Loan B, 3-month LIBOR + 4.250%, 5.000%, 3/05/2027(a)(n) | | | 4,259,126 | |
| | 4,928,755 | | | Les Schwab Tire Centers, Term Loan B, 3-month LIBOR + 3.250%, 4.000%, 11/02/2027(a)(n) | | | 4,908,202 | |
| | 3,491,250 | | | Mavis Tire Express Services Corp., 2021 Term Loan B, 1-month LIBOR + 4.000%, 4.750%, 5/04/2028(a)(n) | | | 3,487,375 | |
| | 6,009,580 | | | PAI Holdco, Inc., 2020 Term Loan B, 3-month LIBOR + 3.750%, 4.500%, 10/28/2027(a)(n) | | | 5,982,056 | |
| | 1,449,000 | | | Polaris Newco LLC, USD Term Loan B, 6-month LIBOR + 4.000%, 4.500%, 6/02/2028(a)(m) | | | 1,442,537 | |
| | 4,400,000 | | | Rough Country LLC, 2021 Term Loan, 1-month LIBOR + 3.500%, 4.250%, 7/28/2028(a) | | | 4,391,772 | |
| | 4,477,500 | | | Truck Hero, Inc., 2021 Term Loan B, 1-month LIBOR + 3.250%, 4.000%, 1/31/2028(a)(n) | | | 4,438,322 | |
| | 4,363,125 | | | U.S. Farathane LLC, 2021 Term Loan B, 3-month LIBOR + 4.250%, 5.250%, 12/23/2024(a)(o) | | | 4,057,706 | |
| | 5,754,720 | | | Wand NewCo 3, Inc., 2020 Term Loan, 3-month LIBOR + 3.000%, 3.175%, 2/05/2026(a) | | | 5,600,781 | |
| | 2,991,628 | | | Wheel Pros LLC, 2021 Term Loan, 1-month LIBOR + 4.500%, 5.250%, 5/11/2028(a)(n) | | | 2,970,866 | |
| | | | | | | | |
| | | | | | | 64,379,156 | |
| | | | | | | | |
| | | | Brokerage — 1.1% | |
| 2,464,140 | | | Advisor Group, Inc., 2021 Term Loan, 1-month LIBOR + 4.500%, 4.590%, 7/31/2026(a) | | | 2,456,008 | |
| | 4,852,045 | | | Edelman Financial Center LLC, 2018 2nd Lien Term Loan, 1-month LIBOR + 6.750%, 6.840%, 7/20/2026(a) | | | 4,835,887 | |
| | 4,229,274 | | | Edelman Financial Center LLC, 2021 Term Loan B, 1-month LIBOR + 3.500%, 4.250%, 4/07/2028(a)(n) | | | 4,205,844 | |
| | 698,200 | | | HighTower Holdings LLC, 2021 Delayed Draw Term Loan, 3-month LIBOR + 4.000%, 4.750%, 4/21/2028(a)(n) | | | 695,582 | |
| | 4,142,800 | | | HighTower Holdings LLC, 2021 Term Loan B, 3-month LIBOR + 4.000%, 4.750%, 4/21/2028(a)(n) | | | 4,127,264 | |
| | | | | | | | |
| | | | | | | 16,320,585 | |
| | | | | | | | |
| | | | Building Materials — 4.2% | |
| | 6,992,475 | | | ACProducts, Inc., 2021 Term Loan B, 3-month LIBOR + 4.250%, 4.750%, 5/17/2028(a)(m) | | | 6,896,328 | |
| | 2,404,000 | | | Chamberlain Group, Inc., Term Loan B, 11/03/2028(b) | | | 2,386,980 | |
| | 6,313,300 | | | CP Atlas Buyer, Inc., 2021 Term Loan B, 1-month LIBOR + 3.750%, 4.250%, 11/23/2027(a)(m) | | | 6,246,253 | |
| | 5,706,936 | | | Groupe Solmax, Inc., Term Loan, LIBOR + 4.750%, 5.500%, 5/29/2028(d)(n) | | | 5,678,402 | |
| | 8,547,843 | | | Janus International Group LLC, 2021 Term Loan B1, 1-month LIBOR + 3.250%, 4.250%, 2/12/2025(a)(o) | | | 8,521,174 | |
| | 383,333 | | | LBM Acquisition LLC, 2021 Incremental Delayed Draw Term Loan B2, 12/17/2027(b) | | | 377,173 | |
| | 764,745 | | | LBM Acquisition LLC, 2021 Incremental Term Loan B2, 3-month LIBOR + 3.750%, 4.500%, 12/17/2027(a)(n) | | | 752,456 | |
| | 2,487,516 | | | LBM Acquisition LLC, Term Loan B, 12/17/2027(b) | | | 2,447,541 | |
| | 1,739,850 | | | LBM Acquisition LLC, Term Loan B, 1-month LIBOR + 3.750%, 4.500%, 12/17/2027(a)(n) | | | 1,711,890 | |
| | 4,107,958 | | | MI Windows & Doors LLC, 2020 Term Loan, 1-month LIBOR + 3.750%, 4.500%, 12/18/2027(a)(n) | | | 4,093,580 | |
| | 4,480,622 | | | Park River Holdings, Inc., Term Loan, 3-month LIBOR + 3.250%, 4.000%, 12/28/2027(a)(n) | | | 4,437,205 | |
| | 6,867,788 | | | Signal Parent, Inc., Term Loan B, 1-month LIBOR + 3.500%, 4.250%, 4/03/2028(a)(n) | | | 6,690,392 | |
| | 5,295,000 | | | Specialty Building Products Holdings LLC, 2021 Term Loan B, 3-month LIBOR + 3.750%, 4.250%, 10/15/2028(a)(m) | | | 5,255,287 | |
| | 5,834,429 | | | White Cap Buyer LLC, Term Loan B, 1-month LIBOR + 4.000%, 4.500%, 10/19/2027(a)(m) | | | 5,804,207 | |
| | 3,529,973 | | | Wilsonart LLC, 2021 Term Loan E, 3-month LIBOR + 3.500%, 4.500%, 12/19/2026(a) | | | 3,512,324 | |
| | | | | | | | |
| | | | | | | 64,811,192 | |
| | | | | | | | |
| | | | Cable Satellite — 0.7% | |
| | 2,800,000 | | | DirecTV Financing LLC, Term Loan, 8/02/2027(b) | | | 2,793,000 | |
| | 7,523,000 | | | DirecTV Financing LLC, Term Loan, 3-month LIBOR + 5.000%, 5.750%, 8/02/2027(a)(n) | | | 7,504,193 | |
| | | | | | | | |
| | | | | | | 10,297,193 | |
| | | | | | | | |
| | | | Chemicals — 3.1% | |
| | 1,575,000 | | | Aruba Investments, Inc., 2020 2nd Lien Term Loan, 6-month LIBOR + 7.750%, 8.500%, 11/24/2028(a)(n) | | | 1,577,630 | |
| | 1,943,235 | | | Aruba Investments, Inc., 2020 USD Term Loan, 6-month LIBOR + 4.000%, 4.750%, 11/24/2027(a)(n) | | | 1,940,806 | |
| | 5,295,390 | | | CPC Acquisition Corp, Term Loan, 3-month LIBOR + 3.750%, 4.500%, 12/29/2027(a)(n) | | | 5,265,630 | |
See accompanying notes to financial statements.
| 16
Portfolio of Investments – as of November 30, 2021
Loomis Sayles Senior Floating Rate and Fixed Income Fund – (continued)
| | | | | | | | |
Principal
Amount | | | Description | | Value (†) | |
| | | | Chemicals — continued | |
| $ | 4,319,295 | | | DCG Acquisition Corp., Term Loan B, 1-month LIBOR + 4.500%, 4.592%, 9/30/2026(a) | | $ | 4,303,098 | |
| | 1,948,000 | | | GEON Performance Solutions LLC, 2021 Term Loan, 3-month LIBOR + 4.750%, 5.500%, 8/18/2028(a)(n) | | | 1,965,045 | |
| | 1,820,000 | | | Kraton Polymers LLC, 2021 USD Term Loan, 11/18/2028(b) | | | 1,804,075 | |
| | 5,598,968 | | | Lonza Group AG, USD Term Loan B, 6-month LIBOR + 4.000%, 4.750%, 7/03/2028(a) | | | 5,590,065 | |
| | 4,383,000 | | | LSF11 A5 Holdco LLC, Term Loan, 3-month LIBOR + 3.750%, 4.250%, 10/15/2028(a)(m) | | | 4,354,817 | |
| | 6,216,000 | | | Luxembourg Investment Co. 428 S.a.r.l., Term Loan B, 10/20/2028(b) | | | 6,184,920 | |
| | 7,691,000 | | | Olympus Water U.S. Holding Corp., 2021 USD Term Loan B, 1-month LIBOR + 3.750%, 4.250%, 11/09/2028(a)(m) | | | 7,619,858 | |
| | 5,429,000 | | | Sparta U.S. HoldCo LLC, 2021 Term Loan, 3-month LIBOR + 3.500%, 4.250%, 8/02/2028(a)(n) | | | 5,423,897 | |
| | 1,649,000 | | | W.R. Grace & Co. Conn., 2021 Term Loan B, 3-month LIBOR + 3.750%, 4.250%, 9/22/2028(a)(m) | | | 1,644,185 | |
| | | | | | | | |
| | | | | | | 47,674,026 | |
| | | | | | | | |
| | | | Construction Machinery — 0.3% | |
| | 1,012,061 | | | CMBF LLC, Delayed Draw Term Loan, 3.000%, 8/02/2028(c) | | | 996,880 | |
| | 3,388,899 | | | CMBF LLC, Term Loan, 1-month LIBOR + 6.000%, 6.500%, 8/02/2028(a)(m) | | | 3,338,065 | |
| | | | | | | | |
| | | | | | | 4,334,945 | |
| | | | | | | | |
| | | | Consumer Cyclical Services — 6.3% | |
| | 8,544,798 | | | Access CIG LLC, 2018 1st Lien Term Loan, LIBOR + 3.750%, 3.840%, 2/27/2025(d) | | | 8,465,417 | |
| | 6,975,000 | | | Access CIG LLC, 2018 2nd Lien Term Loan, 3-month LIBOR + 7.750%, 7.840%, 2/27/2026(a) | | | 6,947,100 | |
| | 3,931,000 | | | Allied Universal Holdco LLC, 2021 USD Incremental Term Loan B, 3-month LIBOR + 3.750%, 4.250%, 5/12/2028(a)(m) | | | 3,893,656 | |
| | 3,766,168 | | | APM Global Holdings Pty Ltd., Term Loan, 3-month LIBOR + 4.500%, 5.000%, 6/30/2026(a)(m) | | | 3,737,922 | |
| | 6,587,360 | | | BIFM CA Buyer, Inc., Term Loan B, 1-month LIBOR + 3.500%, 3.592%, 6/01/2026(a) | | | 6,513,252 | |
| | 7,112,775 | | | Conduent Business Services LLC, 2021 Term Loan B, 1-month LIBOR + 4.250%, 4.750%, 10/16/2028(a)(m) | | | 7,090,583 | |
| | 5,384,369 | | | Constant Contact, Inc., Term Loan, 3-month LIBOR + 4.000%, 4.750%, 2/10/2028(a)(n) | | | 5,354,109 | |
| | 9,556,448 | | | Creative Artists Agency LLC, 2019 Term Loan B, 1-month LIBOR + 3.750%, 3.840%, 11/27/2026(a) | | | 9,444,925 | |
| | 1,990,000 | | | Global Client Solutions LLC, Term Loan B, 1-month LIBOR + 6.000%, 7.000%, 3/16/2026(a) | | | 1,980,050 | |
| | 6,139,000 | | | Loyalty Ventures, Inc., Term Loan B, 11/03/2027(b) | | | 6,082,705 | |
| | 257,795 | | | Service Logic Acquisition, Inc, Delayed Draw Term Loan, 4.000%, 10/29/2027(c) | | | 257,150 | |
| | 148,175 | | | Service Logic Acquisition, Inc, Delayed Draw Term Loan, 1-month LIBOR + 4.000%, 4.750%, 10/29/2027(a)(n) | | | 147,805 | |
| | 3,826,718 | | | Service Logic Acquisition, Inc., Term Loan, LIBOR + 4.000%, 4.750%, 10/29/2027(d)(n) | | | 3,817,151 | |
| | 4,706,598 | | | SITEL Worldwide Corp., 2021 USD Term Loan, 1-month LIBOR + 3.750%, 4.250%, 8/28/2028(a)(m) | | | 4,685,419 | |
| | 4,203,563 | | | Sterling Midco Holdings, Inc., 1st Lien Term Loan, 3-month LIBOR + 3.500%, 4.500%, 6/19/2024(a)(o) | | | 4,187,800 | |
| | | | Consumer Cyclical Services — continued | | | | |
| 1,990,000 | | | Sunshine Luxembourg VII S.a.r.l., 2021 Term Loan B3, 3-month LIBOR + 3.750%, 4.500%, 10/01/2026(a)(n) | | | 1,981,164 | |
| | 9,256,000 | | | Trans Union LLC, 2021 2nd Lien Term Loan, 11/16/2029(b) | | | 9,232,860 | |
| | 4,416,930 | | | WebHelp, 2021 USD Term Loan, 8/04/2028(b) | | | 4,394,845 | |
| | 8,181,670 | | | William Morris Endeavor Entertainment LLC, 2018 1st Lien Term Loan, 1-month LIBOR + 2.750%, 2.850%, 5/18/2025(a) | | | 8,004,374 | |
| | | | | | | | |
| | | | | | | 96,218,287 | |
| | | | | | | | |
| | | | Consumer Products — 6.2% | |
| | 5,877,585 | | | Advantage Sales & Marketing, Inc., 2021 Term Loan, 3-month LIBOR + 4.500%, 5.250%, 10/28/2027(a)(n) | | | 5,881,288 | |
| | 2,293,000 | | | ASP Blade Holdings,, Inc., Initial Term Loan, 1-month LIBOR + 4.000%, 4.500%, 10/13/2028(a)(m) | | | 2,285,364 | |
| | 4,802,555 | | | Augusta Sportswear Group, Inc., Term Loan B, 3-month LIBOR + 4.500%, 5.500%, 10/26/2023(a)(o) | | | 4,718,511 | |
| | 1,837,662 | | | Callaway Golf Co., Term Loan B, 1-month LIBOR + 4.500%, 4.592%, 1/02/2026(a) | | | 1,844,939 | |
| | 2,797,405 | | | Canada Goose, Inc., 2021 Term Loan, 3-month LIBOR + 3.500%, 4.250%, 10/07/2027(a)(n) | | | 2,790,412 | |
| | 5,996,970 | | | CBI Buyer, Inc., Term Loan, 3-month LIBOR + 3.250%, 3.750%, 1/06/2028(a)(m) | | | 5,935,501 | |
| | 5,996,000 | | | Conair Holdings LLC, Term Loan B, 3-month LIBOR + 3.750%, 4.250%, 5/17/2028(a)(m) | | | 5,979,751 | |
| | 2,226,000 | | | Illuminate Merger Sub Corp., Term Loan, 3-month LIBOR + 3.500%, 4.000%, 7/21/2028(a) | | | 2,196,082 | |
| | 7,672,264 | | | Inmar Holdings, Inc., 2017 1st Lien Term Loan, 3-month LIBOR + 4.000%, 5.000%, 5/01/2024(a)(o) | | | 7,638,967 | |
| | 2,714,000 | | | Lakeshore Intermediate LLC, Term Loan, 3-month LIBOR + 3.500%, 4.000%, 9/29/2028(a)(m) | | | 2,714,000 | |
| | 5,336,000 | | | Mattress Firm, Inc., 2021 Term Loan B, 3-month LIBOR + 4.250%, 5.000%, 9/25/2028(a)(n) | | | 5,274,636 | |
| | 4,278,972 | | | Ozark Holdings LLC, 2020 Term Loan B, 1-month LIBOR + 3.750%, 4.250%, 12/16/2027(a)(m) | | | 4,255,780 | |
| | 5,602,666 | | | Polyconcept Investments BV, USD 2016 Term Loan B, 3-month LIBOR + 4.500%, 5.500%, 8/16/2023(a)(o) | | | 5,572,916 | |
| | 5,247,310 | | | RVR Dealership Holdings LLC, Term Loan B, 3-month LIBOR + 4.000%, 4.750%, 2/08/2028(a)(n) | | | 5,217,820 | |
| | 5,363,050 | | | S&S Holdings LLC, Term Loan, 3-month LIBOR + 5.000%, 5.500%, 3/11/2028(a)(m) | | | 5,342,938 | |
| | 6,650,000 | | | Springs Windows Fashions LLC, 2021 Term Loan B, 1-month LIBOR + 4.000%, 4.750%, 10/06/2028(a)(n) | | | 6,550,250 | |
| | 157,107 | | | TGP Holdings III LLC, 2021 Delayed Draw Term Loan, 1.750%, 6/29/2028(c) | | | 155,798 | |
| | 1,187,287 | | | TGP Holdings III LLC, 2021 Term Loan, 3-month LIBOR + 3.250%, 4.000%, 6/29/2028(a)(n) | | | 1,177,397 | |
| | 5,196,975 | | | Tory Burch LLC, Term Loan B, 1-month LIBOR + 3.000%, 3.500%, 4/16/2028(a)(m) | | | 5,177,486 | |
| | 4,774,896 | | | Wellness Merger Sub, Inc., 1st Lien Term Loan, 1-month LIBOR + 4.000%, 4.090%, 6/30/2024(a) | | | 4,745,053 | |
| | 9,796,468 | | | WW International, Inc., 2021 Term Loan B, 1-month LIBOR + 3.500%, 4.000%, 4/13/2028(a)(m) | | | 9,666,664 | |
| | | | | | | | |
| | | | | | | 95,121,553 | |
| | | | | | | | |
| | | | Diversified Manufacturing — 0.7% | |
| | 2,041,000 | | | Granite Holdings U.S. Acquisition Co., 2021 Term Loan B, 9/30/2026(b) | | | 2,024,427 | |
| | 3,414,649 | | | Granite Holdings U.S. Acquisition Co., 2021 Term Loan B, 3-month LIBOR + 4.000%, 4.132%, 9/30/2026(a) | | | 3,386,922 | |
See accompanying notes to financial statements.
17 |
Portfolio of Investments – as of November 30, 2021
Loomis Sayles Senior Floating Rate and Fixed Income Fund – (continued)
| | | | | | | | |
Principal
Amount | | | Description | | Value (†) | |
| | | | Diversified Manufacturing — continued | |
| $ | 5,985,000 | | | Schweitzer-Mauduit International, Inc., 2021 Term Loan B, 1-month LIBOR + 3.750%, 4.500%, 4/20/2028(a) | | $ | 5,920,182 | |
| | | | | | | | |
| | | | | | | 11,331,531 | |
| | | | | | | | |
| | | | Electric — 0.9% | |
| | 4,285,185 | | | CRCI Longhorn Holdings, Inc., 2018 1st Lien Term Loan, 1-month LIBOR + 3.500%, 3.586%, 8/08/2025(a) | | | 4,243,662 | |
| | 5,126,378 | | | KAMC Holdings, Inc., 2019 Term Loan, 3-month LIBOR + 4.000%, 4.175%, 8/14/2026(a) | | | 4,357,421 | |
| | 2,139,169 | | | Pacific Gas & Electric Co., 2020 Term Loan, 3-month LIBOR + 3.000%, 3.500%, 6/23/2025(a)(m) | | | 2,111,766 | |
| | 4,226,154 | | | West Deptford Energy Holdings LLC, Term Loan B, 1-month LIBOR + 3.750%, 3.840%, 8/03/2026(a) | | | 3,662,131 | |
| | | | | | | | |
| | | | | | | 14,374,980 | |
| | | | | | | | |
| | | | Environmental — 1.3% | |
| | 2,143,062 | | | Array Technologies, Inc., Term Loan B, 3-month LIBOR + 3.250%, 3.750%, 10/14/2027(a)(m) | | | 2,113,595 | |
| | 4,449,000 | | | Bingo Industries Ltd., Term Loan, 3-month LIBOR + 3.500%, 4.000%, 7/08/2028(a) | | | 4,410,071 | |
| | 4,270,298 | | | Liberty Tire Recycling Holdco LLC, 2021 Term Loan, 3-month LIBOR + 4.500%, 5.500%, 5/05/2028(a)(o) | | | 4,243,608 | |
| | 5,478,750 | | | Northstar Group Services, Inc., 2020 Term Loan B, 1-month LIBOR + 5.500%, 6.500%, 11/12/2026(a)(o) | | | 5,485,599 | |
| | 3,070,000 | | | PECF USS Intermediate Holding III Corp., Term Loan B, 11/04/2028(b) | | | 3,056,584 | |
| | | | | | | | |
| | | | | | | 19,309,457 | |
| | | | | | | | |
| | | | Financial Other — 4.1% | |
| | 3,068,000 | | | Acrisure LLC, 2021 First Lien Term Loan B, 2/15/2027(b) | | | 3,050,758 | |
| | 3,980,000 | | | Acrisure LLC, 2021 Incremental Term Loan B, 3-month LIBOR + 3.750%, 4.250%, 2/15/2027(a)(m) | | | 3,942,707 | |
| | 6,768,885 | | | Amynta Agency Borrower, Inc., 2018 1st Lien Term Loan, 1-month LIBOR + 4.500%, 4.590%, 2/28/2025(a) | | | 6,740,659 | |
| | 500,000 | | | AqGen Ascensus, Inc., 2021 2nd Lien Term Loan, 8/02/2029(b) | | | 500,415 | |
| | 3,005,000 | | | AqGen Island Holdings, Inc., Term Loan, 3-month LIBOR + 3.500%, 4.000%, 8/02/2028(a) | | | 2,978,706 | |
| | 5,025,000 | | | DRW Holdings LLC, 2021 Term Loan, 1-month LIBOR + 3.750%, 3.840%, 3/01/2028(a) | | | 5,012,438 | |
| | 654,545 | | | Eisner Advisory Group LLC, Delayed Draw Term Loan, 5.250%, 7/28/2028(c) | | | 652,909 | |
| | 6,545,455 | | | Eisner Advisory Group LLC, Term Loan, 3-month LIBOR + 5.250%, 6.000%, 7/28/2028(a)(n) | | | 6,529,091 | |
| | 4,619,036 | | | GT Polaris, Inc., 2021 Term Loan, 3-month LIBOR + 3.750%, 4.500%, 9/24/2027(a)(n) | | | 4,611,831 | |
| | 4,322,000 | | | LifeMiles Ltd., 2021 Term Loan B, 3-month LIBOR + 5.250%, 6.250%, 8/30/2026(a)(o) | | | 4,284,183 | |
| | 787,000 | | | Mariner Wealth Advisors LLC, Delayed Draw Term Loan, 0.000%, 8/18/2028(c) | | | 777,163 | |
| | 5,513,000 | | | Mariner Wealth Advisors LLC, Term Loan B, 3-month LIBOR + 3.250%, 3.750%, 8/18/2028(a)(m) | | | 5,444,087 | |
| | 3,329,917 | | | Mermaid BidCo., Inc., 2021 USD Term Loan, 3-month LIBOR + 3.750%, 4.500%, 12/22/2027(a) | | | 3,304,942 | |
| | 5,127,124 | | | Resolute Investment Managers, Inc., 2020 Term Loan C, 3-month LIBOR + 4.250%, 5.250%, 4/30/2024(a)(o) | | | 5,101,488 | |
| | | | Financial Other — continued | | | | |
| 9,652,713 | | | Teneo Holdings LLC, Term Loan, 1-month LIBOR + 5.250%, 6.250%, 7/11/2025(a)(o) | | | 9,618,928 | |
| | | | | | | | |
| | | | | | | 62,550,305 | |
| | | | | | | | |
| | | | Food & Beverage — 2.7% | |
| | 292,222 | | | AI Aqua Merger Sub, Inc., 2021 1st Lien Delayed Draw Term Loan, 7/31/2028(b) | | | 291,796 | |
| | 2,337,778 | | | AI Aqua Merger Sub, Inc., 2021 1st Lien Term Loan B, 1-month LIBOR + 4.000%, 4.500%, 7/31/2028(a) | | | 2,334,365 | |
| | 3,767,000 | | | Alltech, Inc., Term Loan B, 1-month LIBOR + 4.000%, 4.500%, 10/13/2028(a)(m) | | | 3,752,874 | |
| | 6,077,745 | | | City Brewing Company LLC, Closing Date Term Loan, 3-month LIBOR + 3.500%, 4.250%, 4/05/2028(a)(n) | | | 5,991,623 | |
| | 5,249,217 | | | Packers Holdings LLC, 2021 Term Loan, 3-month LIBOR + 3.250%, 4.000%, 3/09/2028(a)(n) | | | 5,193,470 | |
| | 5,544,105 | | | Proampac PG Borrower LLC, 2020 Term Loan, 3-month LIBOR + 3.750%, 4.500%, 11/03/2025(a)(n) | | | 5,514,998 | |
| | 13,965 | | | Proampac PG Borrower LLC, 2020 Term Loan, PRIME + 2.750%, 6.000%, 11/03/2025(a) | | | 13,892 | |
| | 4,436,274 | | | Shearer’s Foods, Inc., 2021 Term Loan, 3-month LIBOR + 3.500%, 4.250%, 9/23/2027(a)(n) | | | 4,401,139 | |
| | 6,654,323 | | | Triton Water Holdings, Inc., Term Loan, 3-month LIBOR + 3.500%, 4.000%, 3/31/2028(a)(m) | | | 6,618,589 | |
| | 3,582,000 | | | Whole Earth Brands, Inc., Term Loan B, 3-month LIBOR + 4.500%, 5.500%, 2/05/2028(a)(o) | | | 3,559,612 | |
| | 4,175,020 | | | WOOF Holdings, Inc., 1st Lien Term Loan, 3-month LIBOR + 3.750%, 4.500%, 12/21/2027(a)(n) | | | 4,154,145 | |
| | | | | | | | |
| | | | | | | 41,826,503 | |
| | | | | | | | |
| | | | Gaming — 0.7% | |
| | 1,456,290 | | | Caesars Resort Collection LLC, 2020 Term Loan B1, 1-month LIBOR + 3.500%, 3.590%, 7/21/2025(a) | | | 1,453,101 | |
| | 455,000 | | | J&J Ventures Gaming LLC, Term Loan, 4/26/2028(b) | | | 452,725 | |
| | 3,488,000 | | | J&J Ventures Gaming LLC, Term Loan, 1-month LIBOR + 4.000%, 4.750%, 4/26/2028(a)(n) | | | 3,470,560 | |
| | 5,500,000 | | | Lucky Bucks LLC, Term Loan, 3-month LIBOR + 5.500%, 6.250%, 7/30/2027(a)(n) | | | 5,383,125 | |
| | | | | | | | |
| | | | | | | 10,759,511 | |
| | | | | | | | |
| | | | Health Insurance — 0.6% | |
| | 3,964,506 | | | Sedgwick Claims Management Services, Inc., 2018 Term Loan B, 1-month LIBOR + 3.250%, 3.340%, 12/31/2025(a) | | | 3,883,352 | |
| | 5,797,002 | | | Sedgwick Claims Management Services, Inc., 2019 Term Loan B, 1-month LIBOR + 3.750%, 3.840%, 9/03/2026(a) | | | 5,756,655 | |
| | | | | | | | |
| | | | | | | 9,640,007 | |
| | | | | | | | |
| | | | Healthcare — 8.5% | |
| | 6,672,600 | | | Ascend Learning LLC, 2020 Incremental Term Loan, 1-month LIBOR + 3.750%, 4.750%, 7/12/2024(a)(o) | | | 6,672,600 | |
| | 3,482,500 | | | Athenahealth, Inc., 2021 Term Loan B1, LIBOR + 4.250%, 4.399%, 2/11/2026(d) | | | 3,473,794 | |
| | 4,692,889 | | | Carestream Dental Equipment, Inc., 2017 1st Lien Term Loan, 3-month LIBOR + 3.250%, 4.250%, 9/01/2024(a)(o) | | | 4,688,994 | |
| | 1,361,000 | | | Carestream Dental Equipment, Inc., 2021 Term Loan, 3-month LIBOR + 4.500%, 5.000%, 11/09/2028(a) | | | 1,354,195 | |
| | 2,363,050 | | | CHG Healthcare Services, Inc., 2021 Term Loan, 3-month LIBOR + 3.500%, 4.000%, 9/29/2028(a) | | | 2,349,605 | |
See accompanying notes to financial statements.
| 18
Portfolio of Investments – as of November 30, 2021
Loomis Sayles Senior Floating Rate and Fixed Income Fund – (continued)
| | | | | | | | |
Principal
Amount | | | Description | | Value (†) | |
| | | | Healthcare — continued | | | | |
| $ | 5,481,228 | | | CT Technologies Intermediate Holdings, Inc., 2021 Term Loan B, 1-month LIBOR + 4.250%, 5.000%, 12/16/2025(a)(n) | | $ | 5,468,895 | |
| | 2,700,000 | | | Envision Healthcare Corp., 2018 1st Lien Term Loan, 10/10/2025(b) | | | 2,029,131 | |
| | 701,000 | | | EyeCare Partners LLC, 2021 Delayed Draw Term Loan, 0.000%, 11/15/2028(c) | | | 697,495 | |
| | 2,805,000 | | | EyeCare Partners LLC, 2021 Incremental Term Loan, 1-month LIBOR + 3.750%, 4.250%, 11/15/2028(a) | | | 2,790,975 | |
| | 7,582,193 | | | Gainwell Acquisition Corp., Term Loan B, 3-month LIBOR + 4.000%, 4.750%, 10/01/2027(a)(n) | | | 7,568,014 | |
| | 2,735,711 | | | GHX Ultimate Parent Corp., 2017 1st Lien Term Loan, 3-month LIBOR + 3.250%, 4.250%, 6/28/2024(a)(o) | | | 2,722,032 | |
| | 5,798,468 | | | Heartland Dental LLC, 2021 Incremental Term Loan, 1-month LIBOR + 4.000%, 4.089%, 4/30/2025(a) | | | 5,735,032 | |
| | 1,000,000 | | | MDVIP, Inc., 2021 2nd Lien Term Loan, 1-month LIBOR + 6.500%, 7.000%, 10/15/2029(a)(m) | | | 1,002,500 | |
| | 4,306,208 | | | MedAssets Software Intermediate Holdings, Inc., 2021 1st Lien Term Loan, 3-month LIBOR + 3.750%, 4.500%, 1/28/2028(a)(n) | | | 4,304,054 | |
| | 4,932,000 | | | MedAssets Software Intermediate Holdings, Inc., 2021 Term Loan, 11/17/2028(b) | | | 4,895,010 | |
| | 4,112,000 | | | MedRisk, Inc., 2021 Term Loan B, 1-month LIBOR + 3.750%, 4.500%, 5/10/2028(a)(n) | | | 4,098,307 | |
| | 1,174,000 | | | Midwest Physician Administrative Services LLC, 2021 Term Loan, 3/12/2028(b) | | | 1,165,688 | |
| | 6,205,000 | | | Midwest Veterinary Partners LLC, Term Loan, 3-month LIBOR + 4.000%, 4.750%, 4/26/2028(a)(n) | | | 6,197,244 | |
| | 7,255,000 | | | MPH Acquisition Holdings LLC, 2021 Term Loan B, 3-month LIBOR + 4.250%, 4.750%, 8/17/2028(a)(m) | | | 6,902,625 | |
| | 261,152 | | | National Mentor Holdings, Inc., 2021 Delayed Draw Term Loan, 3.750%, 3/02/2028(c) | | | 257,702 | |
| | 5,612,101 | | | National Mentor Holdings, Inc., 2021 Term Loan, LIBOR + 3.750%, 4.500%, 3/02/2028(d)(n) | | | 5,537,965 | |
| | 177,172 | | | National Mentor Holdings, Inc., 2021 Term Loan C, 3-month LIBOR + 3.750%, 4.500%, 3/02/2028(a)(n) | | | 174,831 | |
| | 4,438,875 | | | Onex TSG Intermediate Corp., 2021 Term Loan B, 3-month LIBOR + 4.750%, 5.500%, 2/28/2028(a)(n) | | | 4,436,123 | |
| | 1,000,000 | | | Pearl Intermediate Parent LLC, 2018 2nd Lien Term Loan, 2/13/2026(b) | | | 998,000 | |
| | 1,590,000 | | | PetVet Care Centers LLC, 2021 Term Loan B3, 1-month LIBOR + 3.500%, 4.250%, 2/14/2025(a)(n) | | | 1,585,532 | |
| | 4,643,000 | | | Radiology Partners, Inc., 2018 1st Lien Term Loan B, 1-month LIBOR + 4.250%, 4.339%, 7/09/2025(e) | | | 4,574,330 | |
| | 1,000,000 | | | Southern Veterinary Partners LLC, 2nd Lien Term Loan, 6-month LIBOR + 7.750%, 8.750%, 10/05/2028(a)(o) | | | 1,001,250 | |
| | 440,224 | | | Southern Veterinary Partners LLC, Delayed Draw Term Loan, 3-month LIBOR + 4.000%, 5.000%, 10/05/2027(a)(o) | | | 440,775 | |
| | 3,922,787 | | | Southern Veterinary Partners LLC, Term Loan, 3-month LIBOR + 4.000%, 5.000%, 10/05/2027(a)(o) | | | 3,927,691 | |
| | 3,484,000 | | | St. George’s University Scholastic Services, 2021 Term Loan B, 6/29/2028(b) | | | 3,463,688 | |
| | 4,479,815 | | | Surgery Center Holdings, Inc., 2021 Term Loan, 1-month LIBOR + 3.750%, 4.500%, 8/31/2026(a)(n) | | | 4,459,297 | |
| | 4,596,900 | | | Symplr Software, Inc., 2020 Term Loan, 3-month LIBOR + 4.500%, 5.250%, 12/22/2027(a)(n) | | | 4,595,475 | |
| | 5,712,000 | | | Think & Learn Private Ltd., Term Loan B, 11/05/2026(b) | | | 5,683,440 | |
| | | | Healthcare — continued | | | | |
| 1,418,000 | | | TTF Holdings LLC, Term Loan, 3/31/2028(b) | | | 1,410,910 | |
| | 2,036,430 | | | TTF Holdings LLC, Term Loan, 1-month LIBOR + 4.250%, 5.000%, 3/31/2028(a) | | | 2,026,248 | |
| | 5,329,000 | | | U.S. Anesthesia Partners, Inc., 2021 Term Loan, 6-month LIBOR + 4.250%, 4.750%, 10/01/2028(a)(m) | | | 5,289,992 | |
| | 7,077,803 | | | Verscend Holding Corp., 2021 Term Loan B, 1-month LIBOR + 4.000%, 4.090%, 8/27/2025(a) | | | 7,060,108 | |
| | | | | | | | |
| | | | | | | 131,039,547 | |
| | | | | | | | |
| | | | Industrial Other — 5.5% | |
| | 7,551,848 | | | ABG Intermediate Holdings 2 LLC, 2021 Term Loan B, 3-month LIBOR + 3.250%, 4.000%, 9/27/2024(a)(n) | | | 7,514,089 | |
| | 1,000,000 | | | AEA International Holdings (Lux) S.a.r.l., Term Loan B, 3-month LIBOR + 3.750%, 4.250%, 9/07/2028(a) | | | 1,000,830 | |
| | 6,090,000 | | | Anticimex International AB, 2018 Term Loan B, 7/21/2028(b) | | | 6,049,380 | |
| | 2,977,330 | | | Connect Finco S.a.r.l., 2021 Term Loan B, 1-month LIBOR + 3.500%, 4.500%, 12/11/2026(a)(o) | | | 2,967,088 | |
| | 9,081,427 | | | Element Materials Technology Group U.S. Holdings, Inc., 2017 USD Term Loan B, 3-month LIBOR + 3.500%, 4.500%, 6/28/2024(a) | | | 8,998,150 | |
| | 3,623,000 | | | Filtration Group Corp., 2021 Incremental Term Loan, 1-month LIBOR + 3.500%, 4.000%, 10/21/2028(a)(m) | | | 3,601,262 | |
| | 704,000 | | | Hyperion Materials & Technologies, Inc., 2021 Term Loan B, 8/30/2028(b) | | | 699,382 | |
| | 2,882,000 | | | Hyperion Materials & Technologies, Inc., 2021 Term Loan B, 3-month LIBOR + 4.500%, 5.000%, 8/30/2028(a)(m) | | | 2,863,094 | |
| | 2,777,040 | | | Infinite Bidco LLC, 1st Lien Term Loan, 1-month LIBOR + 3.750%, 4.250%, 3/02/2028(a)(m) | | | 2,761,433 | |
| | 3,000,000 | | | Infinite Bidco LLC, 2nd Lien Term Loan, 1-month LIBOR + 7.000%, 7.500%, 3/02/2029(a)(m) | | | 3,003,750 | |
| | 4,555,382 | | | International Textile Group, Inc., 1st Lien Term Loan, 3-month LIBOR + 5.000%, 5.131%, 5/01/2024(a) | | | 4,177,103 | |
| | 7,828,000 | | | International Textile Group, Inc., 2nd Lien Term Loan, 3-month LIBOR + 9.000%, 9.131%, 5/01/2025(a) | | | 5,683,128 | |
| | 10,461,504 | | | NES Global Talent Finance U.S. LLC, 2018 1st Lien Term Loan B, 3-month LIBOR + 5.500%, 6.500%, 5/11/2023(a)(o) | | | 9,833,814 | |
| | 5,397,000 | | | Pelican Products, Inc., 2021 Term Loan, 11/16/2028(b) | | | 5,356,523 | |
| | 587,251 | | | Refficiency Holdings LLC, 2021 Delayed Draw Term Loan, 4.000%, 12/31/2027(c) | | | 586,270 | |
| | 3,030,801 | | | Refficiency Holdings LLC, 2021 Term Loan, 1-month LIBOR + 3.750%, 4.500%, 12/16/2027(a)(n) | | | 3,025,740 | |
| | 2,654,295 | | | Shape Technologies Group, Inc., Term Loan, 1-month LIBOR + 3.000%, 3.090%, 4/21/2025(a) | | | 2,476,457 | |
| | 522,170 | | | VT Topco, Inc., 2021 Delayed Draw Term Loan, 1.875%, 8/01/2025(c) | | | 521,846 | |
| | 2,983,830 | | | VT Topco, Inc., 2021 Incremental Term Loan, 1-month LIBOR + 3.750%, 4.500%, 8/01/2025(a)(n) | | | 2,981,980 | |
| | 5,348,125 | | | Watlow Electric Manufacturing Co.,
Term Loan B, 3/02/2028(b) | | | 5,313,041 | |
| | 5,750,000 | | | WireCo WorldGroup, Inc., 2021 Term Loan, 6-month LIBOR + 4.250%, 4.750%, 10/27/2028(a) | | | 5,714,062 | |
| | | | | | | | |
| | | | | | | 85,128,422 | |
| | | | | | | | |
| | | | Integrated Energy — 0.5% | |
| | 7,304,760 | | | Matador Bidco S.a.r.l., Term Loan, 1-month LIBOR + 4.750%, 4.840%, 10/15/2026(a) | | | 7,310,823 | |
| | | | | | | | |
See accompanying notes to financial statements.
19 |
Portfolio of Investments – as of November 30, 2021
Loomis Sayles Senior Floating Rate and Fixed Income Fund – (continued)
| | | | | | | | |
Principal
Amount | | | Description | | Value (†) | |
| | | | Internet & Data — 2.5% | |
| $ | 2,853,527 | | | A&V Holdings Midco LLC, 2020 Term Loan B, 3-month LIBOR + 5.375%, 6.375%, 3/10/2027(a)(o) | | $ | 2,832,126 | |
| | 6,554,985 | | | Castle U.S. Holding Corp., USD Term Loan B, 3-month LIBOR + 3.750%, 3.882%, 1/29/2027(a) | | | 6,465,902 | |
| | 3,292,829 | | | Crown Subsea Communications Holding, Inc., 2021 Term Loan, 1-month LIBOR + 5.000%, 5.750%, 4/27/2027(a)(n) | | | 3,303,794 | |
| | 6,124,650 | | | ION Trading Finance Ltd., 2021 USD Term Loan, 3-month LIBOR + 4.750%, 4.917%, 4/01/2028(a) | | | 6,107,440 | |
| | 7,400,654 | | | MH Sub I LLC, 2017 1st Lien Term Loan, 1-month LIBOR + 3.500%, 3.590%, 9/13/2024(a) | | | 7,287,350 | |
| | 2,865,720 | | | MH Sub I LLC, 2020 Incremental Term Loan, 1-month LIBOR + 3.750%, 4.750%, 9/13/2024(a)(o) | | | 2,852,108 | |
| | 4,000,000 | | | MH Sub I LLC, 2021 2nd Lien Term Loan, 1-month LIBOR + 6.250%, 6.342%, 2/12/2029(a) | | | 4,027,520 | |
| | 5,195,353 | | | WeddingWire, Inc., 1st Lien Term Loan, LIBOR + 4.500%, 4.629%, 12/19/2025(d) | | | 5,191,041 | |
| | | | | | | | |
| | | | | | | 38,067,281 | |
| | | | | | | | |
| | | | Leisure — 2.4% | |
| | 3,166,825 | | | Arcis Golf LLC, Term Loan B, 11/24/2028(b) | | | 3,147,033 | |
| | 5,271,567 | | | Kingpin Intermediate Holdings LLC, 2018 Term Loan B, 1-month LIBOR + 3.500%, 4.500%, 7/03/2024(a)(o) | | | 5,225,441 | |
| | 5,638,868 | | | MajorDrive Holdings IV LLC, Term Loan B, 3-month LIBOR + 4.000%, 4.500%, 5/12/2028(a)(m) | | | 5,615,974 | |
| | 1,869,105 | | | Playpower, Inc., 2019 Term Loan, 3-month LIBOR + 5.500%, 5.632%, 5/08/2026(a) | | | 1,828,601 | |
| | 8,774,969 | | | PUG LLC, USD Term Loan, 1-month LIBOR + 3.500%, 3.590%, 2/12/2027(a) | | | 8,606,753 | |
| | 5,624,261 | | | Recess Holdings, Inc., 2017 1st Lien Term Loan, LIBOR + 3.750%, 4.750%, 9/30/2024(d)(o) | | | 5,624,261 | |
| | 7,505,700 | | | Thunder Finco Pty Ltd., Term Loan B, 1-month LIBOR + 4.250%, 5.000%, 11/26/2026(a)(n) | | | 7,267,994 | |
| | | | | | | | |
| | | | | | | 37,316,057 | |
| | | | | | | | |
| | | | Lodging — 0.4% | |
| | 6,854,652 | | | Aimbridge Acquisition Co., Inc., 2019 Term Loan B, 1-month LIBOR + 3.750%, 3.840%, 2/02/2026(a) | | | 6,677,596 | |
| | | | | | | | |
| | | | Media Entertainment — 2.9% | |
| | 6,400,000 | | | Cengage Learning, Inc., 2021 Term Loan B, 3-month LIBOR + 4.750%, 5.750%, 7/14/2026(a)(o) | | | 6,371,200 | |
| | 2,631,405 | | | Cimpress Public Ltd. Co., USD Term Loan B, 1-month LIBOR + 3.500%, 4.000%, 5/17/2028(a)(m) | | | 2,624,826 | |
| | 3,345,956 | | | Diamond Sports Group LLC, Term Loan, 1-month LIBOR + 3.250%, 3.350%, 8/24/2026(a) | | | 1,398,610 | |
| | 2,713,220 | | | Emerald Expositions Holding, Inc., 2017 Term Loan B, 1-month LIBOR + 2.500%, 2.590%, 5/22/2024(a) | | | 2,590,446 | |
| | 6,257,000 | | | McGraw-Hill Global Education Holdings LLC, 2021 Term Loan, 1-month LIBOR + 4.750%, 5.250%, 7/28/2028(a)(m) | | | 6,174,095 | |
| | 3,814,688 | | | Meredith Corp., 2020 Incremental Term Loan B, 3-month LIBOR + 4.250%, 5.250%, 1/31/2025(a)(o) | | | 3,886,213 | |
| | 9,700,000 | | | Metro-Goldwyn-Mayer, Inc., 2018 2nd Lien Term Loan, 1-month LIBOR + 4.500%, 5.500%, 7/03/2026(a)(o) | | | 9,651,500 | |
| | 253,342 | | | National CineMedia LLC, 2021 Incremental Term Loan, 1-month LIBOR + 8.000%, 9.000%, 12/20/2024(a)(o) | | | 253,342 | |
| | 3,700,000 | | | Summer (BC) Holdco B S.a.r.l., 2021 USD Term Loan B2, 12/04/2026(b) | | | 3,686,125 | |
| | 2,205,000 | | | Summer (BC) Holdco B S.a.r.l., 2021 USD Term Loan B2, 3-month LIBOR + 4.500%, 5.250%, 12/04/2026(a) | | | 2,196,731 | |
| | | | Media Entertainment — continued | | | | |
| 997,500 | | | Univision Communications, Inc., 2021 First Lien Term Loan B, 1-month LIBOR + 3.250%, 4.000%, 3/15/2026(a)(n) | | | 994,388 | |
| | 4,069,000 | | | Univision Communications, Inc., 2021 Term Loan B, 5/05/2028(b) | | | 4,055,206 | |
| | | | | | | | |
| | | | | | | 43,882,682 | |
| | | | | | | | |
| | | | Metals & Mining — 1.1% | |
| | 7,000,000 | | | AMG Advanced Metallurgical Group N.V., 2021 Term Loan, 11/16/2028(b) | | | 6,921,250 | |
| | 749,000 | | | Grinding Media, Inc., 2021 Term Loan B, 3-month LIBOR + 4.000%, 4.750%, 10/12/2028(a)(n) | | | 745,255 | |
| | 4,721,853 | | | SCIH Salt Holdings, Inc., 2021 Incremental Term Loan B, 3-month LIBOR + 4.000%, 4.750%, 3/16/2027(a)(n) | | | 4,658,108 | |
| | 5,450,095 | | | U.S. Silica Co., 2018 Term Loan B, 1-month LIBOR + 4.000%, 5.000%, 5/01/2025(a)(o) | | | 5,325,451 | |
| | | | | | | | |
| | | | | | | 17,650,064 | |
| | | | | | | | |
| | | | Midstream — 1.1% | |
| | 2,757,090 | | | AL NGPL Holdings LLC, Term Loan B, 3-month LIBOR + 3.750%, 4.750%, 4/14/2028(a)(o) | | | 2,752,486 | |
| | 6,500,000 | | | Lucid Energy Group II Borrower LLC, 2021 Term Loan, 3-month LIBOR + 4.250%, 5.000%, 11/24/2028(a) | | | 6,388,980 | |
| | 4,403,562 | | | Navitas Midstream Midland Basin LLC, Term Loan B, 1-month LIBOR + 4.000%, 4.750%, 12/13/2024(a)(n) | | | 4,385,948 | |
| | 2,801,000 | | | Oryx Midstream Services Permian Basin LLC, Term Loan B, 3-month LIBOR + 3.250%, 3.750%, 10/05/2028(a)(m) | | | 2,771,981 | |
| | | | | | | | |
| | | | | | | 16,299,395 | |
| | | | | | | | |
| | | | Natural Gas — 0.3% | |
| | 5,000,000 | | | Freeport LNG Investments, LLLP, Term Loan B, 11/17/2028(b) | | | 4,948,450 | |
| | | | | | | | |
| | | | Packaging — 1.6% | |
| | 4,734,783 | | | Pretium PKG Holdings, Inc., 2021 1st Lien Term Loan, 6-month LIBOR + 4.000%, 4.500%, 10/02/2028(a)(m) | | | 4,715,323 | |
| | 2,812,745 | | | Reynolds Group Holdings, Inc., 2020 Term Loan B2, 1-month LIBOR + 3.250%, 3.340%, 2/05/2026(a) | | | 2,782,677 | |
| | 2,800,000 | | | Reynolds Group Holdings, Inc., 2021 Term Loan B, 1-month LIBOR + 3.500%, 4.000%, 9/20/2028(a)(m) | | | 2,782,500 | |
| | 4,383,057 | | | Ring Container Technologies Group LLC, 2021 Term Loan B, 3-month LIBOR + 3.750%, 4.250%, 8/12/2028(a)(m) | | | 4,361,142 | |
| | 975,354 | | | RLG Holdings LLC, 2021 Delayed Draw Term Loan, 3-month LIBOR + 4.250%, 5.000%, 7/07/2028(a)(n) | | | 969,872 | |
| | 3,852,646 | | | RLG Holdings LLC, 2021 Term Loan, 3-month LIBOR + 4.250%, 5.000%, 7/07/2028(a)(n) | | | 3,830,994 | |
| | 4,789,451 | | | TricorBraun Holdings, Inc., 2021 Term Loan, 1-month LIBOR + 3.250%, 3.750%, 3/03/2028(a) | | | 4,732,600 | |
| | | | | | | | |
| | | | | | | 24,175,108 | |
| | | | | | | | |
| | | | Paper — 0.6% | |
| | 2,196,774 | | | Domtar Corp., 2021 Delayed Draw Term Loan, 9/20/2028(b) | | | 2,166,569 | |
| | 4,613,226 | | | Domtar Corp., 2021 Term Loan B, 9/20/2028(b) | | | 4,549,794 | |
| | 2,678,557 | | | Spa Holdings 3 Oy, USD Term Loan B, 3-month LIBOR + 4.000%, 4.750%, 2/04/2028(a) | | | 2,671,860 | |
| | | | | | | | |
| | | | | | | 9,388,223 | |
| | | | | | | | |
See accompanying notes to financial statements.
| 20
Portfolio of Investments – as of November 30, 2021
Loomis Sayles Senior Floating Rate and Fixed Income Fund – (continued)
| | | | | | | | |
Principal
Amount | | | Description | | Value (†) | |
| | | | Pharmaceuticals — 0.7% | |
| $ | 2,264,552 | | | Akorn, Inc., 2020 Take Back Term Loan, 3-month LIBOR + 7.500%, 8.500%, 10/01/2025(a)(o) | | $ | 2,224,923 | |
| | 2,700,362 | | | Amneal Pharmaceuticals LLC, 2018 Term Loan B, 1-month LIBOR + 3.500%, 3.625%, 5/04/2025(a) | | | 2,648,055 | |
| | 4,358,000 | | | LSCS Holdings, Inc., 2021 1st Lien Term Loan, 11/23/2028(b) | | | 4,345,275 | |
| | 2,000,000 | | | LSCS Holdings, Inc., 2021 2nd Lien Term Loan, 11/01/2029(b) | | | 1,982,500 | |
| | | | | | | | |
| | | | | | | 11,200,753 | |
| | | | | | | | |
| | | | Property & Casualty Insurance — 1.5% | |
| | 2,629,604 | | | Alliant Holdings Intermediate LLC, 2021 Term Loan B4, 11/06/2027(b) | | | 2,613,642 | |
| | 4,478,979 | | | Baldwin Risk Partners LLC, 2021 Term Loan B, 1-month LIBOR + 3.500%, 4.000%, 10/14/2027(a)(m) | | | 4,450,986 | |
| | 869,552 | | | Belfor Holdings, Inc., Term Loan B, 1-month LIBOR + 3.750%, 3.840%, 4/06/2026(a) | | | 867,378 | |
| | 2,638,186 | | | Broadstreet Partners, Inc., 2020 Term Loan B, 1-month LIBOR + 3.000%, 3.090%, 1/27/2027(a) | | | 2,592,572 | |
| | 3,873,000 | | | Broadstreet Partners, Inc., 2021 Term Loan B2, 1-month LIBOR + 3.250%, 3.750%, 1/27/2027(a)(m) | | | 3,831,869 | |
| | 4,403,000 | | | Hyperion Insurance Group Ltd., 2021 Term Loan B, 11/12/2027(b) | | | 4,361,744 | |
| | 2,250,000 | | | Hyperion Insurance Group Ltd., 2021 Term Loan B, 1-month LIBOR + 3.250%, 4.000%, 11/12/2027(a)(n) | | | 2,228,917 | |
| | 2,545,689 | | | USI, Inc., 2019 Incremental Term Loan B, 3-month LIBOR + 3.250%, 3.382%, 12/02/2026(a) | | | 2,521,836 | |
| | | | | | | | |
| | | | | | | 23,468,944 | |
| | | | | | | | |
| | | | REITs – Other — 0.4% | |
| | 5,970,000 | | | Apollo Commercial Real Estate Finance, Inc., 2021 Incremental Term Loan B1, 1-month LIBOR + 3.500%, 4.000%, 3/11/2028(a)(m) | | | 5,910,300 | |
| | | | | | | | |
| | | | Restaurants — 1.1% | |
| | 2,193,851 | | | Carrols Restaurant Group, Inc., Term Loan B, 1-month LIBOR + 3.250%, 3.350%, 4/30/2026(a) | | | 2,148,153 | |
| | 5,138,303 | | | Flynn Restaurant Group LP, 1st Lien Term Loan, 1-month LIBOR + 3.500%, 3.590%, 6/27/2025(a) | | | 5,082,912 | |
| | 2,160,000 | | | Flynn Restaurant Group LP, 2021 Term Loan B, 11/22/2028(b) | | | 2,125,807 | |
| | 2,850,460 | | | IRB Holding Corp., 2020 Fourth Amendment Incremental Term Loan, 3-month LIBOR + 3.250%, 4.250%, 12/15/2027(a)(o) | | | 2,836,721 | |
| | 5,053,933 | | | Portillo’s Holdings LLC, 2019 1st Lien Term Loan B3, 1-month LIBOR + 5.500%, 6.500%, 9/06/2024(a)(o) | | | 5,047,616 | |
| | | | | | | | |
| | | | | | | 17,241,209 | |
| | | | | | | | |
| | | | Retailers — 3.2% | |
| | 5,969,000 | | | At Home Group, Inc., Term Loan B, 1-month LIBOR + 4.250%, 4.750%, 7/24/2028(a)(m) | | | 5,943,632 | |
| | 5,350,136 | | | BDF Acquisition Corp., 1st Lien Term Loan, 1-month LIBOR + 5.250%, 6.250%, 8/14/2023(a)(o) | | | 5,293,317 | |
| | 3,785,770 | | | Container Store, Inc. (The), 2020 Term Loan B3, 3-month LIBOR + 4.750%, 5.750%, 1/31/2026(a)(o) | | | 3,773,163 | |
| | 930,000 | | | Evergreen Acqco 1 LP, 2021 USD Term Loan, 4/21/2028(b) | | | 921,862 | |
| | 5,699,000 | | | Evergreen Acqco 1 LP, 2021 USD Term Loan, 3-month LIBOR + 5.750%, 6.500%, 4/21/2028(a)(n) | | | 5,649,134 | |
| | 5,210,000 | | | Great Outdoors Group LLC, 2021 Term Loan B1, 3/06/2028(b) | | | 5,203,487 | |
| | 5,291,000 | | | Michaels Cos., Inc., 2021 Term Loan B, 3-month LIBOR + 4.250%, 5.000%, 4/15/2028(a)(n) | | | 5,249,995 | |
| | | | Retailers — continued | |
| 7,970,945 | | | Petco Health & Wellness Company, Inc., 2021 Term Loan B, 3-month LIBOR + 3.250%, 4.000%, 3/03/2028(a) | | | 7,919,453 | |
| | 2,549,610 | | | PetSmart, Inc., 2021 Term Loan B, 3-month LIBOR + 3.750%, 4.500%, 2/11/2028(a)(n) | | | 2,536,225 | |
| | 6,595,000 | | | Sweetwater Borrower LLC, Term Loan B, 3-month LIBOR + 4.750%, 5.500%, 8/07/2028(a)(n) | | | 6,562,025 | |
| | | | | | | | |
| | | | | | | 49,052,293 | |
| | | | | | | | |
| | | | Technology — 11.9% | |
| | 2,856,000 | | | AP Core Holdings II LLC, Amortization Term Loan B1, 1-month LIBOR + 5.500%, 6.250%, 9/01/2027(a) | | | 2,846,175 | |
| | 2,856,000 | | | AP Core Holdings II LLC, High-Yield Term Loan B2, 1-month LIBOR + 5.500%, 6.250%, 9/01/2027(a) | | | 2,847,661 | |
| | 6,255,386 | | | Aptean, Inc., 2019 Term Loan, 1-month LIBOR + 4.250%, 4.342%, 4/23/2026(a) | | | 6,206,531 | |
| | 7,550,000 | | | Astra Acquisition Corp., 2021 1st Lien Term Loan, 1-month LIBOR + 5.250%, 5.750%, 10/25/2028(a)(m) | | | 7,323,500 | |
| | 1,260,000 | | | Brooks Automation, Inc., 2021 2nd Lien Term Loan, 11/04/2029(b) | | | 1,258,425 | |
| | 3,487,000 | | | Brooks Automation, Inc., 2021 Term Loan, 11/17/2028(b) | | | 3,463,044 | |
| | 4,600,000 | | | CommScope, Inc., 2019 Term Loan B, 4/06/2026(b) | | | 4,476,398 | |
| | 4,812,167 | | | CommScope, Inc., 2019 Term Loan B, 1-month LIBOR + 3.250%, 3.340%, 4/06/2026(a) | | | 4,682,864 | |
| | 5,996,251 | | | Corel Corp., 2019 Term Loan, 3-month LIBOR + 5.000%, 5.175%, 7/02/2026(a) | | | 5,966,269 | |
| | 7,263,000 | | | CoreLogic, Inc., Term Loan, 1-month LIBOR + 3.500%, 4.000%, 6/02/2028(a)(m) | | | 7,172,213 | |
| | 6,100,000 | | | Cornerstone OnDemand, Inc., 2021 Term Loan, 3-month LIBOR + 3.750%, 4.250%, 10/16/2028(a)(m) | | | 6,064,437 | |
| | 8,853,314 | | | Endure Digital Inc., Term Loan, 3-month LIBOR + 3.500%, 4.250%, 2/10/2028(a) | | | 8,676,248 | |
| | 2,792,317 | | | Finastra USA, Inc., USD 1st Lien Term Loan, 6/13/2024(b) | | | 2,764,393 | |
| | 6,363,851 | | | Finastra USA, Inc., USD 1st Lien Term Loan, 3-month LIBOR + 3.500%, 4.500%, 6/13/2024(a)(o) | | | 6,300,213 | |
| | 5,909,345 | | | Flexera Software LLC, 2021 Term Loan B, 3-month LIBOR + 3.750%, 4.500%, 3/03/2028(a)(n) | | | 5,891,794 | |
| | 6,598,140 | | | Greeneden U.S. Holdings II LLC, 2020 USD Term Loan B4, 1-month LIBOR + 4.000%, 4.750%, 12/01/2027(a)(n) | | | 6,578,874 | |
| | 2,621,000 | | | Helios Software Holdings, Inc., 2021 USD Term Loan B, 3-month LIBOR + 3.750%, 3.917%, 3/11/2028(a) | | | 2,593,689 | |
| | 8,380,829 | | | Hyland Software, Inc., 2021 2nd Lien Term Loan, 1-month LIBOR + 6.250%, 7.000%, 7/07/2025(a)(n) | | | 8,456,256 | |
| | 5,124,250 | | | IGT Holding IV AB, 2021 USD Term Loan B2, 3-month LIBOR + 3.500%, 4.000%, 3/31/2028(a)(m) | | | 5,098,629 | |
| | 7,265,275 | | | LogMeIn, Inc., Term Loan B, 1-month LIBOR + 4.750%, 4.839%, 8/31/2027(a) | | | 7,215,362 | |
| | 5,246,000 | | | Magenta Buyer LLC, 2021 USD 1st Lien Term Loan, 3-month LIBOR + 5.000%, 5.750%, 7/27/2028(a)(n) | | | 5,162,956 | |
| | 5,660,026 | | | Peraton Corp., Term Loan B, 1-month LIBOR + 3.750%, 4.500%, 2/01/2028(a)(n) | | | 5,639,820 | |
| | 5,585,205 | | | Project Alpha Intermediate Holding, Inc., 2021 Term Loan B, 1-month LIBOR + 4.000%, 4.100%, 4/26/2024(a) | | | 5,557,279 | |
| | 4,674,510 | | | Project Ruby Ultimate Parent Corp., 2021 Term Loan, 1-month LIBOR + 3.250%, 4.000%, 3/03/2028(a)(n) | | | 4,636,927 | |
See accompanying notes to financial statements.
21 |
Portfolio of Investments – as of November 30, 2021
Loomis Sayles Senior Floating Rate and Fixed Income Fund – (continued)
| | | | | | | | |
Principal
Amount | | | Description | | Value (†) | |
| | | | Technology — continued | |
| $ | 9,942,129 | | | Quest Software U.S. Holdings, Inc., 2018 1st Lien Term Loan, 3-month LIBOR + 4.250%, 4.379%, 5/16/2025(a) | | $ | 9,917,274 | |
| | 500,000 | | | Quest Software U.S. Holdings, Inc., 2018 2nd Lien Term Loan, 3-month LIBOR + 8.250%, 8.379%, 5/18/2026(a) | | | 498,750 | |
| | 4,400,000 | | | Redstone Buyer LLC, 2021 Term Loan, 3-month LIBOR + 4.750%, 5.500%, 4/27/2028(a)(n) | | | 4,169,000 | |
| | 6,035,346 | | | Rocket Software, Inc., 2018 Term Loan, 1-month LIBOR + 4.250%, 4.340%, 11/28/2025(a) | | | 5,976,079 | |
| | 5,662,242 | | | S2P Acquisition Borrower, Inc., Term Loan, 1-month LIBOR + 4.000%, 4.090%, 8/14/2026(a) | | | 5,633,931 | |
| | 8,775,374 | | | SurveyMonkey, Inc., 2018 Term Loan B, 1 Week LIBOR + 3.750%, 3.830%, 10/10/2025(a) | | | 8,720,528 | |
| | 1,000,000 | | | Syndigo LLC, 2020 2nd Lien Term Loan, 3-month LIBOR + 8.000%, 8.750%, 12/15/2028(a)(n) | | | 997,500 | |
| | 3,084,500 | | | Syndigo LLC, 2020 Term Loan, 3-month LIBOR + 4.500%, 5.250%, 12/15/2027(a)(n) | | | 3,076,789 | |
| | 500,000 | | | Ultimate Software Group, Inc. (The), 2020 2nd Lien Incremental Term Loan, 3-month LIBOR + 6.750%, 7.500%, 5/03/2027(a)(n) | | | 503,750 | |
| | 1,110,000 | | | Ultimate Software Group, Inc. (The), 2021 2nd Lien Term Loan, 5/03/2027(b) | | | 1,113,119 | |
| | 3,945,338 | | | Verifone Systems, Inc., 2018 1st Lien Term Loan, 3-month LIBOR + 4.000%, 4.178%, 8/20/2025(a) | | | 3,846,705 | |
| | 4,471,703 | | | Virtusa Corp., First Lien Term Loan B, 1-month LIBOR + 3.750%, 4.500%, 2/11/2028(a)(n) | | | 4,458,645 | |
| | 2,000,000 | | | Vision Solutions, Inc., 2021 2nd Lien Term Loan, 3-month LIBOR + 7.250%, 8.000%, 4/23/2029(a)(n) | | | 1,995,420 | |
| | 6,037,000 | | | Vision Solutions, Inc., 2021 Incremental Term Loan, 3-month LIBOR + 4.000%, 4.750%, 4/24/2028(a)(n) | | | 6,020,821 | |
| | | | | | | | |
| | | | | | | 183,808,268 | |
| | | | | | | | |
| | | | Transportation Services — 1.8% | |
| | 5,720,152 | | | Carriage Purchaser, Inc., 2021 Term Loan B, 2-month LIBOR + 4.250%, 5.000%, 9/30/2028(a)(n) | | | 5,716,606 | |
| | 5,000,525 | | | Deliver Buyer, Inc., Term Loan B, 3-month LIBOR + 5.000%, 5.132%, 5/01/2024(a) | | | 4,975,522 | |
| | 1,823,004 | | | Hertz Corp., (The), 2021 Term Loan B, 1-month LIBOR + 3.250%, 3.750%, 6/30/2028(a)(m) | | | 1,817,881 | |
| | 344,427 | | | Hertz Corp., (The), 2021 Term Loan C, 1-month LIBOR + 3.250%, 3.750%, 6/30/2028(a)(m) | | | 343,459 | |
| | 4,467,356 | | | Kenan Advantage Group, Inc., 2021 Term Loan B1, 1-month LIBOR + 3.750%, 4.500%, 3/24/2026(a)(n) | | | 4,453,954 | |
| | 6,621,000 | | | LaserShip, Inc., 2021 Term Loan, 3-month LIBOR + 4.500%, 5.250%, 5/07/2028(a)(n) | | | 6,621,000 | |
| | 4,550,000 | | | Michael Baker International LLC, 2021 Term Loan, 11/02/2028(b) | | | 4,538,625 | |
| | | | | | | | |
| | | | | | | 28,467,047 | |
| | | | | | | | |
| | | | Utility Other — 0.8% | |
| | 5,868,293 | | | Artera Services LLC, Incremental Term Loan, 3-month LIBOR + 3.500%, 4.500%, 3/06/2025(a)(o) | | | 5,651,929 | |
| | 3,496,238 | | | Tiger Acquisition LLC, 2021 Term Loan, 3-month LIBOR + 3.250%, 3.750%, 6/01/2028(a)(m) | | | 3,464,387 | |
| | 3,499,000 | | | USIC Holdings, Inc., 2021 Term Loan, 1-month LIBOR + 3.500%, 4.250%, 5/12/2028(a)(n) | | | 3,480,420 | |
| | | | | | | | |
| | | | | | | 12,596,736 | |
| | | | | | | | |
| | | | Wireless — 0.8% | |
| | 2,423,513 | | | Asurion LLC, 2020 Term Loan B8, 1-month LIBOR + 3.250%, 3.340%, 12/23/2026(a) | | | 2,384,737 | |
| | | | Wireless — continued | |
| 1,686,000 | | | Asurion LLC, 2021 2nd Lien Term Loan B3, 1-month LIBOR + 5.250%, 5.340%, 1/31/2028(a) | | | 1,669,983 | |
| | 4,946,170 | | | Asurion LLC, 2021 Term Loan B9, 1-month LIBOR + 3.250%, 3.340%, 7/31/2027(a) | | | 4,874,450 | |
| | 3,664,585 | | | CCI Buyer, Inc., Term Loan, 3-month LIBOR + 3.750%, 4.500%, 12/17/2027(a)(n) | | | 3,652,675 | |
| | | | | | | | |
| | | | | | | 12,581,845 | |
| | | | | | | | |
| | | | Wirelines — 0.4% | |
| | 3,035,745 | | | Frontier Communications Corp., 2021 DIP Term Loan B, 3-month LIBOR + 3.750%, 4.500%, 5/01/2028(a)(n) | | | 3,028,915 | |
| | 2,896,000 | | | Voyage Australia Pty Ltd., USD Term Loan B, 3-month LIBOR + 3.500%, 4.000%, 7/20/2028(a)(m) | | | 2,890,584 | |
| | | | | | | | |
| | | | | | | 5,919,499 | |
| | | | | | | | |
| | | | Total Senior Loans
(Identified Cost $1,388,781,762) | | | 1,381,478,112 | |
| | | | | | | | |
| | | | | | | | |
| | Bonds and Notes — 4.8% | |
| | Non-Convertible Bonds — 4.6% | |
| | | | Airlines — 0.4% | |
| | 5,750,000 | | | American Airlines, Inc./AAdvantage Loyalty IP Ltd., 5.500%, 4/20/2026, 144A | | | 5,872,188 | |
| | | | | | | | |
| | | | Cable Satellite — 0.5% | |
| | 7,500,000 | | | Sirius XM Radio, Inc., 3.125%, 9/01/2026, 144A | | | 7,387,575 | |
| | | | | | | | |
| | | | Chemicals — 0.5% | |
| | 1,715,000 | | | Avient Corp., 5.750%, 5/15/2025, 144A | | | 1,777,203 | |
| | 2,985,000 | | | Iris Holdings, Inc., 9.500% PIK or 8.750% Cash, 2/15/2026, 144A(f) | | | 2,999,925 | |
| | 3,405,000 | | | Kobe U.S. Midco 2, Inc., 10.000% PIK or 9.250% Cash, 11/01/2026, 144A(g) | | | 3,401,663 | |
| | | | | | | | |
| | | | | | | 8,178,791 | |
| | | | | | | | |
| | | | Consumer Cyclical Services — 0.4% | |
| | 5,500,000 | | | WASH Multifamily Acquisition, Inc., 5.750%, 4/15/2026, 144A | | | 5,665,000 | |
| | | | | | | | |
| | | | Consumer Products — 0.2% | |
| | 3,250,000 | | | Coty, Inc., 6.500%, 4/15/2026, 144A | | | 3,323,125 | |
| | | | | | | | |
| | | | Financial Other — 0.3% | |
| | 4,400,000 | | | Icahn Enterprises LP/Icahn Enterprises Finance Corp., 5.250%, 5/15/2027 | | | 4,463,008 | |
| | | | | | | | |
| | | | Gaming — 0.3% | |
| | 4,235,000 | | | Caesars Entertainment, Inc., 6.250%, 7/01/2025, 144A | | | 4,403,468 | |
| | | | | | | | |
| | | | Media Entertainment — 0.4% | |
| | 3,550,000 | | | Millennium Escrow Corp., 6.625%, 8/01/2026, 144A | | | 3,545,563 | |
| | 1,845,000 | | | Townsquare Media, Inc., 6.875%, 2/01/2026, 144A | | | 1,934,759 | |
| | | | | | | | |
| | | | | | | 5,480,322 | |
| | | | | | | | |
| | | | Property & Casualty Insurance — 0.3% | |
| | 4,000,000 | | | NMI Holdings, Inc., 7.375%, 6/01/2025, 144A | | | 4,532,280 | |
| | | | | | | | |
| | | | REITs – Hotels — 0.2% | |
| | 50,000 | | | Service Properties Trust, 3.950%, 1/15/2028 | | | 44,998 | |
| | 3,710,000 | | | Service Properties Trust, 4.950%, 2/15/2027 | | | 3,539,303 | |
| | | | | | | | |
| | | | | | | 3,584,301 | |
| | | | | | | | |
| | | | REITs – Mortgage — 0.7% | |
| | 4,000,000 | | | Blackstone Mortgage Trust, Inc.,
3.750%, 1/15/2027, 144A | | | 3,938,320 | |
See accompanying notes to financial statements.
| 22
Portfolio of Investments – as of November 30, 2021
Loomis Sayles Senior Floating Rate and Fixed Income Fund – (continued)
| | | | | | | | |
Principal
Amount | | | Description | | Value (†) | |
| | | | REITs – Mortgage — continued | |
| $ | 1,750,000 | | | Ladder Capital Finance Holdings LLLP/Ladder Capital Finance Corp., 5.250%, 10/01/2025, 144A | | $ | 1,758,925 | |
| | 5,750,000 | | | Starwood Property Trust, Inc., 3.625%, 7/15/2026, 144A | | | 5,683,760 | |
| | | | | | | | |
| | | | | | | 11,381,005 | |
| | | | | | | | |
| | | | Supermarkets — 0.4% | |
| | 5,750,000 | | | Albertsons Cos., Inc./Safeway, Inc./New Albertsons LP/Albertsons LLC,
4.625%, 1/15/2027, 144A | | | 5,960,737 | |
| | | | | | | | |
| | | | Total Non-Convertible Bonds
(Identified Cost $69,615,292) | | | 70,231,800 | |
| | | | | | | | |
| | | | | | | | |
| | Convertible Bonds — 0.2% | |
| | | | REITs – Mortgage — 0.2% | |
| | 3,250,000 | | | Blackstone Mortgage Trust, Inc., 4.375%, 5/05/2022
(Identified Cost $2,741,050) | | | 3,254,936 | |
| | | | | | | | |
| | | | Total Bonds and Notes
(Identified Cost $72,356,342) | | | 73,486,736 | |
| | | | | | | | |
| | | | | | | | |
| Shares | | | | | | |
| | Common Stocks — 0.4% | |
| | | | Chemicals — 0.3% | |
| | 193,746 | | | Hexion Holdings Corp., Class B(h) | | | 5,037,396 | |
| | | | | | | | |
| | | | Energy Equipment & Services — 0.0% | |
| | 61,854 | | | Ameriforge Group, Inc.(h)(i)(j)(k) | | | 8,814 | |
| | | | | | | | |
| | | | Pharmaceuticals — 0.1% | |
| | 192,793 | | | Akorn, Inc.(h)(l) | | | 1,654,742 | |
| | | | | | | | |
| | | | Total Common Stocks
(Identified Cost $10,111,616) | | | 6,700,952 | |
| | | | | | | | |
| | | | | | | | |
| | Exchange-Traded Funds — 1.8% | |
| | 1,010,000 | | | Invesco Senior Loan ETF | | | 22,018,000 | |
| | 220,000 | | | SPDR® Bloomberg Short Term High Yield Bond ETF | | | 5,926,800 | |
| | | | | | | | |
| | | | | | | | |
| | | | Total Exchange-Traded Funds
(Identified Cost $28,249,989) | | | 27,944,800 | |
| | | | | | | | |
| | | | | | | | |
Principal
Amount | | | | | | |
| | Short-Term Investments — 9.4% | |
| $ | 144,077,469 | | | Tri-Party Repurchase Agreement with Fixed Income Clearing Corporation, dated 11/30/2021 at 0.000% to be repurchased at $144,077,469 on 12/01/2021 collateralized by $148,073,800 U.S. Treasury Note, 0.750% due 5/31/2026 valued at $145,609,703; $1,342,100 U.S. Treasury Note, 1.125% due 2/28/2022 valued at $1,349,401 including accrued interest (Note 2 of Notes to Financial Statements)
(Identified Cost $144,077,469) | | | 144,077,469 | |
| | | | | | | | |
| | | | | | | | |
| | | | Total Investments — 106.1%
(Identified Cost $1,643,577,178) | | | 1,633,688,069 | |
| | | | Other assets less liabilities — (6.1)% | | | (93,966,070 | ) |
| | | | | | | | |
| | | | Net Assets — 100.0% | | $ | 1,539,721,999 | |
| | | | | | | | |
| | | | | | | | |
| | | | |
| | (†) | | | See Note 2 of Notes to Financial Statements. |
| | (a) | | | Variable rate security. Rate as of November 30, 2021 is disclosed. |
| | (b) | | | Position is unsettled. Contract rate was not determined at November 30, 2021 and does not take effect until settlement date. Maturity date is not finalized until settlement date. |
| | (c) | | | Unfunded loan commitment. An unfunded loan commitment is a contractual obligation for future funding at the option of the borrower. The Fund receives a stated coupon rate until the borrower draws on the loan commitment, at which time the rate will become the stated rate in the loan agreement. See Note 2 of Notes to Financial Statements. |
| | (d) | | | Variable rate security. Rate shown represents the weighted average rate of underlying contracts at November 30, 2021. Interest rates on contracts are primarily redetermined either weekly, monthly or quarterly by reference to the indicated base lending rate and spread and the reset period. |
| | (e) | | | Variable rate security. Rate shown represents the weighted average rate of underlying contracts at November 30, 2021. |
| | (f) | | | Payment-in-kind security for which the issuer, at each interest payment date, may make interest payments in cash and/or additional principal. For the period ended November 30, 2021, interest payments were made in cash. |
| | (g) | | | Payment-in-kind security for which the issuer, at each interest payment date, may make interest payments in cash and/or additional principal. No payments were made during the period. |
| | (h) | | | Non-income producing security. |
| | (i) | | | Illiquid security. (Unaudited) |
| | (j) | | | Fair valued by the Fund’s adviser. At November 30, 2021, the value of this security amounted to $8,814 or less than 0.1% of net assets. See Note 2 of Notes to Financial Statements. |
| | (k) | | | Level 3 security. Value has been determined using significant unobservable inputs. See Note 3 of Notes to Financial Statements. |
| | (l) | | | Securities subject to restriction on resale. At November 30, 2021, the restricted securities held by the Fund are as follows: |
| | | | | | | | | | | | | | | | |
| | | Acquisition
Date | | | Acquisition
Cost | | | Value | | | % of
Net Assets | |
| Akorn, Inc. | | | 10/06/2020 | | | $ | 2,530,723 | * | | $ | 1,654,742 | | | | 0.1 | % |
| | | | |
| | * | | | Represents basis carried over in a non-taxable restructuring. |
| | (m) | | | Stated interest rate has been determined in accordance with the provisions of the loan agreement and is subject to a minimum benchmark rate (LIBOR floor) of 0.50%, to which the spread is added. See Note 8 of Notes to Financial Statements. |
| | (n) | | | Stated interest rate has been determined in accordance with the provisions of the loan agreement and is subject to a minimum benchmark rate (LIBOR floor) of 0.75%, to which the spread is added. See Note 8 of Notes to Financial Statements. |
| | (o) | | | Stated interest rate has been determined in accordance with the provisions of the loan agreement and is subject to a minimum benchmark rate (LIBOR floor) of 1.00%, to which the spread is added. See Note 8 of Notes to Financial Statements. |
| | | | |
| | 144A | | | All or a portion of these securities are exempt from registration under Rule 144A of the Securities Act of 1933. These securities may be resold in transactions exempt from registration, normally to qualified institutional buyers. At November 30, 2021, the value of Rule 144A holdings amounted to $62,184,491 or 4.0% of net assets. |
| | DIP | | | Debtor In Possession |
| | ETF | | | Exchange-Traded Fund |
| | LIBOR | | | London Interbank Offered Rate |
| | PIK | | | Payment-in-Kind |
| | REITs | | | Real Estate Investment Trusts |
| | SPDR® | | | Standard & Poor’s Depositary Receipt |
See accompanying notes to financial statements.
23 |
Portfolio of Investments – as of November 30, 2021
Loomis Sayles Senior Floating Rate and Fixed Income Fund – (continued)
Industry Summary at November 30, 2021
| | | | |
Technology | | | 11.9 | % |
Healthcare | | | 8.5 | |
Consumer Cyclical Services | | | 6.7 | |
Consumer Products | | | 6.4 | |
Industrial Other | | | 5.5 | |
Financial Other | | | 4.4 | |
Building Materials | | | 4.2 | |
Automotive | | | 4.2 | |
Chemicals | | | 3.9 | |
Media Entertainment | | | 3.3 | |
Retailers | | | 3.2 | |
Food & Beverage | | | 2.7 | |
Internet & Data | | | 2.5 | |
Leisure | | | 2.4 | |
Other Investments, less than 2% each | | | 25.1 | |
Short-Term Investments | | | 9.4 | |
Exchange-Traded Funds | | | 1.8 | |
| | | | |
Total Investments | | | 106.1 | |
Other assets less liabilities | | | (6.1 | ) |
| | | | |
Net Assets | | | 100.0 | % |
| | | | |
See accompanying notes to financial statements.
| 24
Portfolio of Investments – as of November 30, 2021
Vaughan Nelson Select Fund
| | | | | | | | |
| Shares | | | Description | | Value (†) | |
| | Common Stocks — 98.1% of Net Assets | |
| | | | Auto Components — 0.7% | |
| | 114,650 | | | Luminar Technologies, Inc.(a) | | $ | 1,868,795 | |
| | | | | | | | |
| | | | Banks — 0.9% | |
| | 29,580 | | | Popular, Inc. | | | 2,301,916 | |
| | | | | | | | |
| | | | Biotechnology — 3.1% | |
| | 42,095 | | | Vertex Pharmaceuticals, Inc.(a) | | | 7,869,239 | |
| | | | | | | | |
| | | | Capital Markets — 2.1% | |
| | 39,965 | | | Intercontinental Exchange, Inc. | | | 5,224,225 | |
| | | | | | | | |
| | | | Communications Equipment — 3.9% | |
| | 38,400 | | | Motorola Solutions, Inc. | | | 9,722,112 | |
| | | | | | | | |
| | | | Diversified Financial Services — 4.9% | |
| | 44,620 | | | Berkshire Hathaway, Inc., Class B(a) | | | 12,345,908 | |
| | | | | | | | |
| | | | Diversified Telecommunication Services — 2.5% | |
| | 82,960 | | | Cogent Communications Holdings, Inc. | | | 6,216,193 | |
| | | | | | | | |
| | | | Electric Utilities — 4.1% | |
| | 118,255 | | | NextEra Energy, Inc. | | | 10,262,169 | |
| | | | | | | | |
| | | | Energy Equipment & Services — 1.0% | |
| | 466,325 | | | TechnipFMC PLC(a) | | | 2,644,063 | |
| | | | | | | | |
| | | | Health Care Equipment & Supplies — 4.1% | |
| | 37,300 | | | Masimo Corp.(a) | | | 10,373,876 | |
| | | | | | | | |
| | | | Household Products — 4.0% | |
| | 61,235 | | | Clorox Co. (The) | | | 9,972,120 | |
| | | | | | | | |
| | | | Insurance — 3.8% | |
| | 32,155 | | | Aon PLC, Class A | | | 9,510,484 | |
| | | | | | | | |
| | | | Interactive Media & Services — 9.3% | |
| | 4,428 | | | Alphabet, Inc., Class A(a) | | | 12,566,443 | |
| | 33,535 | | | Meta Platforms, Inc., Class A(a) | | | 10,880,766 | |
| | | | | | | | |
| | | | | | | 23,447,209 | |
| | | | | | | | |
| | | | Internet & Direct Marketing Retail — 5.0% | |
| | 3,627 | | | Amazon.com, Inc.(a) | | | 12,720,143 | |
| | | | | | | | |
| | | | IT Services — 4.7% | |
| | 46,025 | | | Jack Henry & Associates, Inc. | | | 6,978,771 | |
| | 15,745 | | | MasterCard, Inc., Class A | | | 4,958,415 | |
| | | | | | | | |
| | | | | | | 11,937,186 | |
| | | | | | | | |
| | | | Life Sciences Tools & Services — 5.3% | |
| | 41,375 | | | Danaher Corp. | | | 13,307,855 | |
| | | | | | | | |
| | | | Metals & Mining — 3.0% | |
| | 184,195 | | | Wheaton Precious Metals Corp. | | | 7,693,825 | |
| | | | | | | | |
| | | | Oil, Gas & Consumable Fuels — 2.0% | |
| | 1,355,525 | | | Kosmos Energy Ltd.(a) | | | 4,961,221 | |
| | | | | | | | |
| | | | Road & Rail — 8.8% | |
| | 33,420 | | | Saia, Inc.(a) | | | 11,068,036 | |
| | 46,850 | | | Union Pacific Corp. | | | 11,039,734 | |
| | | | | | | | |
| | | | | | | 22,107,770 | |
| | | | | | | | |
| | | | Semiconductors & Semiconductor Equipment — 11.4% | |
| | 51,500 | | | Entegris, Inc. | | | 7,523,120 | |
| | 14,065 | | | Monolithic Power Systems, Inc. | | | 7,784,415 | |
| | 41,085 | | | NVIDIA Corp. | | | 13,424,934 | |
| | | | | | | | |
| | | | | | | 28,732,469 | |
| | | | | | | | |
| | | | Software — 7.2% | |
| | 41,710 | | | Microsoft Corp. | | | 13,788,909 | |
| | 25,460 | | | Unity Software, Inc.(a) | | | 4,389,049 | |
| | | | | | | | |
| | | | | | | 18,177,958 | |
| | | | | | | | |
| | | | Technology Hardware, Storage & Peripherals — 5.2% | |
| | 78,915 | | | Apple, Inc. | | | 13,044,649 | |
| | | | | | | | |
| | | | Textiles, Apparel & Luxury Goods — 1.1% | |
| | 17,730 | | | Crocs, Inc.(a) | | $ | 2,908,075 | |
| | | | | | | | |
| | | | Total Common Stocks
(Identified Cost $200,562,594) | | | 247,349,460 | |
| | | | | | | | |
| | | | | | | | |
Principal
Amount | | | | | | |
| | Short-Term Investments — 1.9% | |
| $ | 4,779,474 | | | Tri-Party Repurchase Agreement with Fixed Income Clearing Corporation, dated 11/30/2021 at 0.000% to be repurchased at $4,779,474 on 12/01/2021 collateralized by $4,957,600 U.S. Treasury Note, 0.750% due 5/31/2026 valued at $4,875,101 including accrued interest (Note 2 of Notes to Financial Statements)
(Identified Cost $4,779,474) | | | 4,779,474 | |
| | | | | | | | |
| | | | | | | | |
| | | | Total Investments — 100.0%
(Identified Cost $205,342,068) | | | 252,128,934 | |
| | | | Other assets less liabilities — (0.0)% | | | (83,511 | ) |
| | | | | | | | |
| | | | Net Assets — 100.0% | | $ | 252,045,423 | |
| | | | | | | | |
| | | | | | | | |
| | (†) | | | See Note 2 of Notes to Financial Statements. | |
| | (a) | | | Non-income producing security. | |
Industry Summary at November 30, 2021
| | | | |
Semiconductors & Semiconductor Equipment | | | 11.4 | % |
Interactive Media & Services | | | 9.3 | |
Road & Rail | | | 8.8 | |
Software | | | 7.2 | |
Life Sciences Tools & Services | | | 5.3 | |
Technology Hardware, Storage & Peripherals | | | 5.2 | |
Internet & Direct Marketing Retail | | | 5.0 | |
Diversified Financial Services | | | 4.9 | |
IT Services | | | 4.7 | |
Health Care Equipment & Supplies | | | 4.1 | |
Electric Utilities | | | 4.1 | |
Household Products | | | 4.0 | |
Communications Equipment | | | 3.9 | |
Insurance | | | 3.8 | |
Biotechnology | | | 3.1 | |
Metals & Mining | | | 3.0 | |
Diversified Telecommunication Services | | | 2.5 | |
Capital Markets | | | 2.1 | |
Oil, Gas & Consumable Fuels | | | 2.0 | |
Other Investments, less than 2% each | | | 3.7 | |
Short-Term Investments | | | 1.9 | |
| | | | |
Total Investments | | | 100.0 | |
Other assets less liabilities | | | (0.0 | )* |
| | | | |
Net Assets | | | 100.0 | % |
| | | | |
See accompanying notes to financial statements.
25 |
Statements of Assets and Liabilities
November 30, 2021
| | | | | | | | | | | | |
| | | Loomis Sayles
Global Growth
Fund | | | Loomis Sayles
Senior Floating
Rate and Fixed
Income Fund | | | Vaughan Nelson
Select Fund | |
ASSETS | | | | | | | | | | | | |
Investments at cost | | $ | 100,260,692 | | | $ | 1,643,577,178 | | | $ | 205,342,068 | |
Net unrealized appreciation (depreciation) | | | 25,230,857 | | | | (9,889,109 | ) | | | 46,786,866 | |
| | | | | | | | | | | | |
Investments at value | | | 125,491,549 | | | | 1,633,688,069 | | | | 252,128,934 | |
Cash | | | — | | | | 1,238,179 | | | | — | |
Receivable for Fund shares sold | | | 287,696 | | | | 3,354,183 | | | | 466,027 | |
Receivable for securities sold | | | — | | | | 73,826,091 | | | | — | |
Dividends and interest receivable | | | 75,486 | | | | 5,922,859 | | | | 163,730 | |
Tax reclaims receivable | | | 137,321 | | | | — | | | | — | |
Prepaid expenses (Note 7) | | | 11 | | | | 624,969 | | | | 15 | |
| | | | | | | | | | | | |
TOTAL ASSETS | | | 125,992,063 | | | | 1,718,654,350 | | | | 252,758,706 | |
| | | | | | | | | | | | |
LIABILITIES | | | | | | | | | | | | |
Payable for securities purchased | | | — | | | | 168,226,870 | | | | — | |
Unfunded loan commitments (Note 2) | | | — | | | | 5,854,367 | | | | — | |
Payable for Fund shares redeemed | | | 11,311 | | | | 2,245,213 | | | | 422,987 | |
Distributions payable | | | — | | | | 1,015,266 | | | | — | |
Management fees payable (Note 5) | | | 81,134 | | | | 540,830 | | | | 118,915 | |
Deferred Trustees’ fees (Note 5) | | | 36,595 | | | | 334,154 | | | | 98,472 | |
Administrative fees payable (Note 5) | | | 4,620 | | | | 53,659 | | | | 8,833 | |
Payable to distributor (Note 5d) | | | 432 | | | | 28,046 | | | | 1,116 | |
Audit and tax services fees payable | | | 42,307 | | | | 86,395 | | | | 41,934 | |
Other accounts payable and accrued expenses | | | 25,409 | | | | 547,551 | | | | 21,026 | |
| | | | | | | | | | | | |
TOTAL LIABILITIES | | | 201,808 | | | | 178,932,351 | | | | 713,283 | |
| | | | | | | | | | | | |
NET ASSETS | | $ | 125,790,255 | | | $ | 1,539,721,999 | | | $ | 252,045,423 | |
| | | | | | | | | | | | |
NET ASSETS CONSIST OF: | | | | | | | | | | | | |
Paid-in capital | | $ | 94,660,168 | | | $ | 2,078,924,055 | | | $ | 134,563,976 | |
Accumulated earnings (loss) | | | 31,130,087 | | | | (539,202,056 | ) | | | 117,481,447 | |
| | | | | | | | | | | | |
NET ASSETS | | $ | 125,790,255 | | | $ | 1,539,721,999 | | | $ | 252,045,423 | |
| | | | | | | | | | | | |
COMPUTATION OF NET ASSET VALUE AND OFFERING PRICE: | | | | | | | | | | | | |
Class A shares: | | | | | | | | | | | | |
Net assets | | $ | 6,173,475 | | | $ | 219,989,361 | | | $ | 20,381,604 | |
| | | | | | | | | | | | |
Shares of beneficial interest | | | 323,671 | | | | 24,540,917 | | | | 771,025 | |
| | | | | | | | | | | | |
Net asset value and redemption price per share | | $ | 19.07 | | | $ | 8.96 | | | $ | 26.43 | |
| | | | | | | | | | | | |
Offering price per share (100/[100-maximum sales charge] of net asset value) (Note 1) | | $ | 20.23 | | | $ | 9.28 | | | $ | 28.04 | |
| | | | | | | | | | | | |
Class C shares: (redemption price per share is equal to net asset value less any applicable contingent deferred sales charge) (Note 1) | | | | | | | | | | | | |
Net assets | | $ | 1,296,593 | | | $ | 89,617,788 | | | $ | 5,356,803 | |
| | | | | | | | | | | | |
Shares of beneficial interest | | | 70,629 | | | | 10,031,593 | | | | 217,673 | |
| | | | | | | | | | | | |
Net asset value and offering price per share | | $ | 18.36 | | | $ | 8.93 | | | $ | 24.61 | |
| | | | | | | | | | | | |
Class N shares: | | | | | | | | | | | | |
Net assets | | $ | 12,292,531 | | | $ | 2,528,336 | | | $ | 2,297 | |
| | | | | | | | | | | | |
Shares of beneficial interest | | | 637,110 | | | | 282,169 | | | | 86 | |
| | | | | | | | | | | | |
Net asset value, offering and redemption price per share | | $ | 19.29 | | | $ | 8.96 | | | $ | 26.63 | * |
| | | | | | | | | | | | |
Class Y shares: | | | | | | | | | | | | |
Net assets | | $ | 106,027,656 | | | $ | 1,227,586,514 | | | $ | 226,304,719 | |
| | | | | | | | | | | | |
Shares of beneficial interest | | | 5,503,640 | | | | 136,781,875 | | | | 8,497,370 | |
| | | | | | | | | | | | |
Net asset value, offering and redemption price per share | | $ | 19.27 | | | $ | 8.97 | | | $ | 26.63 | |
| | | | | | | | | | | | |
| * | Net asset value calculations have been determined utilizing fractional share and penny amounts. |
See accompanying notes to financial statements.
| 26
Statements of Operations
For the Year Ended November 30, 2021
| | | | | | | | | | | | |
| | | Loomis
Sayles
Global
Growth
Fund | | | Loomis
Sayles
Senior
Floating
Rate and
Fixed
Income
Fund | | | Vaughan
Nelson
Select
Fund | |
INVESTMENT INCOME | |
Dividends | | $ | 1,033,209 | | | $ | 650,989 | | | $ | 1,841,419 | |
Non-cash dividends (Note 2b) | | | — | | | | — | | | | 1,197,334 | (a) |
Interest | | | — | | | | 63,437,818 | | | | — | |
Less net foreign taxes withheld | | | (75,031 | ) | | | — | | | | (31,944 | ) |
| | | | | | | | | | | | |
| | | 958,178 | | | | 64,088,807 | | | | 3,006,809 | |
| | | | | | | | | | | | |
Expenses | |
Management fees (Note 5) | | | 941,969 | | | | 8,354,950 | | | | 1,548,827 | |
Service and distribution fees (Note 5) | | | 30,342 | | | | 1,616,120 | | | | 96,747 | |
Administrative fees (Note 5) | | | 53,424 | | | | 593,560 | | | | 90,790 | |
Trustees’ fees and expenses (Note 5) | | | 23,227 | | | | 118,599 | | | | 38,190 | |
Transfer agent fees and expenses (Notes 5 and 6) | | | 76,783 | | | | 989,164 | | | | 52,628 | |
Audit and tax services fees | | | 41,392 | | | | 83,162 | | | | 40,992 | |
Commitment fees (Note 7) | | | 1,257 | | | | 2,491,241 | | | | 2,048 | |
Custodian fees and expenses | | | 37,770 | | | | 172,294 | | | | 9,073 | |
Legal fees (Note 7) | | | 4,157 | | | | 63,519 | | | | 6,869 | |
Registration fees | | | 70,189 | | | | 115,629 | | | | 71,104 | |
Shareholder reporting expenses | | | 12,950 | | | | 50,774 | | | | 6,850 | |
Miscellaneous expenses (Note 7) | | | 36,691 | | | | 802,028 | | | | 35,762 | |
| | | | | | | | | | | | |
Total expenses | | | 1,330,151 | | | | 15,451,040 | | | | 1,999,880 | |
Less waiver and/or expense reimbursement (Note 5) | | | (113,453 | ) | | | (2,694,663 | ) | | | (86,370 | ) |
| | | | | | | | | | | | |
Net expenses | | | 1,216,698 | | | | 12,756,377 | | | | 1,913,510 | |
| | | | | | | | | | | | |
Net investment income (loss) | | | (258,520 | ) | | | 51,332,430 | | | | 1,093,299 | |
| | | | | | | | | | | | |
NET REALIZED AND UNREALIZED GAIN (LOSS) ON INVESTMENTS AND FOREIGN CURRENCY TRANSACTIONS | |
Net realized gain (loss) on: | |
Investments | | | 8,847,443 | | | | (24,260,954 | ) | | | 71,247,074 | |
Foreign currency transactions (Note 2c) | | | 2,461 | | | | — | | | | — | |
Net change in unrealized appreciation (depreciation) on: | |
Investments | | | (240,889 | ) | | | 43,975,682 | | | | 1,343,536 | |
Foreign currency translations (Note 2c) | | | (3,809 | ) | | | — | | | | — | |
| | | | | | | | | | | | |
Net realized and unrealized gain on investments and foreign currency transactions | | | 8,605,206 | | | | 19,714,728 | | | | 72,590,610 | |
| | | | | | | | | | | | |
NET INCREASE IN NET ASSETS RESULTING FROM OPERATIONS | | $ | 8,346,686 | | | $ | 71,047,158 | | | $ | 73,683,909 | |
| | | | | | | | | | | | |
| (a) | Represents a non-recurring stock dividend. |
See accompanying notes to financial statements.
27 |
Statements of Changes in Net Assets
| | | | | | | | | | | | | | | | |
| | | Loomis Sayles Global Growth
Fund | | | Loomis Sayles Senior Floating
Rate and Fixed Income Fund | |
| | | Year Ended
November 30,
2021 | | | Year Ended
November 30,
2020 | | | Year Ended
November 30,
2021 | | | Year Ended
November 30,
2020 | |
FROM OPERATIONS: | |
Net investment income (loss) | | $ | (258,520 | ) | | $ | (60,968 | ) | | $ | 51,332,430 | | | $ | 80,232,500 | |
Net realized gain (loss) on investments and foreign currency transactions | | | 8,849,904 | | | | 4,270,031 | | | | (24,260,954 | ) | | | (263,337,785 | ) |
Net change in unrealized appreciation (depreciation) on investments and foreign currency translations | | | (244,698 | ) | | | 18,573,654 | | | | 43,975,682 | | | | 122,969,379 | |
| | | | | | | | | | | | | | | | |
Net increase (decrease) in net assets resulting from operations | | | 8,346,686 | | | | 22,782,717 | | | | 71,047,158 | | | | (60,135,906 | ) |
| | | | | | | | | | | | | | | | |
FROM DISTRIBUTIONS TO SHAREHOLDERS: | |
Class A | | | (302,254 | ) | | | (161,789 | ) | | | (7,816,936 | ) | | | (11,231,343 | ) |
Class C | | | (82,175 | ) | | | (61,682 | ) | | | (3,142,482 | ) | | | (7,435,495 | ) |
Class N | | | (686,183 | ) | | | (186,528 | ) | | | (35,590 | ) | | | (14,897 | ) |
Class Y | | | (5,268,903 | ) | | | (3,528,042 | ) | | | (41,173,659 | ) | | | (63,980,239 | ) |
| | | | | | | | | | | | | | | | |
Total distributions | | | (6,339,515 | ) | | | (3,938,041 | ) | | | (52,168,667 | ) | | | (82,661,974 | ) |
| | | | | | | | | | | | | | | | |
NET INCREASE (DECREASE) IN NET ASSETS FROM CAPITAL SHARE TRANSACTIONS (NOTE 10) | | | 19,288,502 | | | | 15,111,903 | | | | 310,703,802 | | | | (1,108,194,382 | ) |
| | | | | | | | | | | | | | | | |
Net increase (decrease) in net assets | | | 21,295,673 | | | | 33,956,579 | | | | 329,582,293 | | | | (1,250,992,262 | ) |
NET ASSETS | |
Beginning of the year | | | 104,494,582 | | | | 70,538,003 | | | | 1,210,139,706 | | | | 2,461,131,968 | |
| | | | | | | | | | | | | | | | |
End of the year | | $ | 125,790,255 | | | $ | 104,494,582 | | | $ | 1,539,721,999 | | | $ | 1,210,139,706 | |
| | | | | | | | | | | | | | | | |
See accompanying notes to financial statements.
| 28
Statements of Changes in Net Assets (continued)
| | | | | | | | |
| | | Vaughan Nelson Select Fund | |
| | | Year Ended
November 30,
2021 | | | Year Ended
November 30,
2020 | |
FROM OPERATIONS: | |
Net investment income | | $ | 1,093,299 | | | $ | 1,090,568 | |
Net realized gain on investments | | | 71,247,074 | | | | 10,433,510 | |
Net change in unrealized appreciation (depreciation) on investments | | | 1,343,536 | | | | 13,761,571 | |
| | | | | | | | |
Net increase in net assets resulting from operations | | | 73,683,909 | | | | 25,285,649 | |
| | | | | | | | |
FROM DISTRIBUTIONS TO SHAREHOLDERS: | |
Class A | | | (924,582 | ) | | | (1,194,514 | ) |
Class C | | | (347,176 | ) | | | (466,566 | ) |
Class N | | | (112 | ) | | | (111 | ) |
Class Y | | | (11,428,722 | ) | | | (16,481,886 | ) |
| | | | | | | | |
Total distributions | | | (12,700,592 | ) | | | (18,143,077 | ) |
| | | | | | | | |
NET DECREASE IN NET ASSETS FROM CAPITAL SHARE TRANSACTIONS (NOTE 10) | | | (33,464,710 | ) | | | (9,220,756 | ) |
| | | | | | | | |
Net increase (decrease) in net assets | | | 27,518,607 | | | | (2,078,184 | ) |
NET ASSETS | |
Beginning of the year | | | 224,526,816 | | | | 226,605,000 | |
| | | | | | | | |
End of the year | | $ | 252,045,423 | | | $ | 224,526,816 | |
| | | | | | | | |
See accompanying notes to financial statements.
29 |
Financial Highlights
For a share outstanding throughout each period.
| | | | | | | | | | | | | | | | | | | | |
| | | Loomis Sayles Global Growth Fund—Class A | |
| | | Year Ended
November 30,
2021
| | | Year Ended
November 30,
2020
| | | Year Ended
November 30,
2019
| | | Year Ended
November 30,
2018
| | | Year Ended
November 30,
2017
| |
Net asset value, beginning of the period | | $ | 18.78 | | | $ | 14.78 | | | $ | 13.28 | | | $ | 13.44 | | | $ | 10.53 | |
| | | | | | | | | | | | | | | | | | | | |
INCOME (LOSS) FROM INVESTMENT OPERATIONS: | | | | | | | | | | | | | | | | | | | | |
Net investment income (loss)(a) | | | (0.09 | ) | | | (0.05 | ) | | | 0.00 | (b) | | | 0.02 | | | | (0.00 | )(b) |
Net realized and unrealized gain (loss) | | | 1.52 | | | | 4.88 | | | | 2.03 | | | | 0.26 | (c) | | | 3.15 | |
| | | | | | | | | | | | | | | | | | | | |
Total from Investment Operations | | | 1.43 | | | | 4.83 | | | | 2.03 | | | | 0.28 | | | | 3.15 | |
| | | | | | | | | | | | | | | | | | | | |
LESS DISTRIBUTIONS FROM: | | | | | | | | | | | | | | | | | | | | |
Net investment income | | | — | | | | — | | | | (0.05 | ) | | | (0.03 | ) | | | (0.03 | ) |
Net realized capital gains | | | (1.14 | ) | | | (0.83 | ) | | | (0.48 | ) | | | (0.41 | ) | | | (0.21 | ) |
| | | | | | | | | | | | | | | | | | | | |
Total Distributions | | | (1.14 | ) | | | (0.83 | ) | | | (0.53 | ) | | | (0.44 | ) | | | (0.24 | ) |
| | | | | | | | | | | | | | | | | | | | |
Net asset value, end of the period | | $ | 19.07 | | | $ | 18.78 | | | $ | 14.78 | | | $ | 13.28 | | | $ | 13.44 | |
| | | | | | | | | | | | | | | | | | | | |
Total return(d)(e) | | | 7.95 | % | | | 34.37 | % | | | 16.25 | % | | | 2.05 | % | | | 30.63 | % |
RATIOS TO AVERAGE NET ASSETS: | | | | | | | | | | | | | | | | | | | | |
Net assets, end of the period (000’s) | | $ | 6,173 | | | $ | 4,913 | | | $ | 2,832 | | | $ | 1,851 | | | $ | 1,541 | |
Net expenses(f) | | | 1.20 | %(g) | | | 1.25 | % | | | 1.26 | %(h) | | | 1.27 | % | | | 1.29 | % |
Gross expenses | | | 1.29 | % | | | 1.44 | % | | | 1.49 | % | | | 1.62 | % | | | 2.56 | % |
Net investment income (loss) | | | (0.43 | )% | | | (0.33 | )% | | | 0.03 | % | | | 0.16 | % | | | (0.00 | )%(i) |
Portfolio turnover rate | | | 18 | % | | | 44 | % | | | 37 | % | | | 24 | % | | | 17 | % |
| (a) | Per share net investment income (loss) has been calculated using the average shares outstanding during the period. |
| (b) | Amount rounds to less than $0.01 per share. |
| (c) | The amount shown for a share outstanding does not correspond with the aggregate realized and unrealized gain (loss) on investments for the period due to the timing of sales and redemptions of fund shares in relation to fluctuating market values of investments of the Fund. |
| (d) | A sales charge for Class A shares is not reflected in total return calculations. |
| (e) | Had certain expenses not been waived/reimbursed during the period, total returns would have been lower. |
| (f) | The investment adviser agreed to waive its fees and/or reimburse a portion of the Fund’s expenses during the period. Without this waiver/reimbursement, expenses would have been higher. |
| (g) | Effective December 15, 2020, the expense limit decreased from 1.25% to 1.20%. |
| (h) | Effective July 1, 2019, the expense limit decreased from 1.30% to 1.25%. |
| (i) | Amount rounds to less than 0.01%. |
See accompanying notes to financial statements.
| 30
Financial Highlights (continued)
For a share outstanding throughout each period
| | | | | | | | | | | | | | | | | | | | |
| | | Loomis Sayles Global Growth Fund—Class C | |
| | | Year Ended
November 30,
2021
| | | Year Ended
November 30,
2020
| | | Year Ended
November 30,
2019
| | | Year Ended
November 30,
2018
| | | Year Ended
November 30,
2017
| |
Net asset value, beginning of the period | | $ | 18.24 | | | $ | 14.49 | | | $ | 13.06 | | | $ | 13.30 | | | $ | 10.47 | |
| | | | | | | | | | | | | | | | | | | | |
INCOME (LOSS) FROM INVESTMENT OPERATIONS: | |
Net investment loss(a) | | | (0.22 | ) | | | (0.16 | ) | | | (0.09 | ) | | | (0.09 | ) | | | (0.09 | ) |
Net realized and unrealized gain (loss) | | | 1.48 | | | | 4.74 | | | | 2.00 | | | | 0.26 | (b) | | | 3.13 | |
| | | | | | | | | | | | | | | | | | | | |
Total from Investment Operations | | | 1.26 | | | | 4.58 | | | | 1.91 | | | | 0.17 | | | | 3.04 | |
| | | | | | | | | | | | | | | | | | | | |
LESS DISTRIBUTIONS FROM: | |
Net investment income | | | — | | | | — | | | | (0.00 | )(c) | | | — | | | | (0.00 | )(c) |
Net realized capital gains | | | (1.14 | ) | | | (0.83 | ) | | | (0.48 | ) | | | (0.41 | ) | | | (0.21 | ) |
| | | | | | | | | | | | | | | | | | | | |
Total Distributions | | | (1.14 | ) | | | (0.83 | ) | | | (0.48 | ) | | | (0.41 | ) | | | (0.21 | ) |
| | | | | | | | | | | | | | | | | | | | |
Net asset value, end of the period | | $ | 18.36 | | | $ | 18.24 | | | $ | 14.49 | | | $ | 13.06 | | | $ | 13.30 | |
| | | | | | | | | | | | | | | | | | | | |
Total return(d)(e) | | | 7.15 | % | | | 33.44 | % | | | 15.40 | % | | | 1.25 | % | | | 29.67 | % |
RATIOS TO AVERAGE NET ASSETS: | |
Net assets, end of the period (000’s) | | $ | 1,297 | | | $ | 1,274 | | | $ | 1,079 | | | $ | 606 | | | $ | 134 | |
Net expenses(f) | | | 1.95 | %(g) | | | 2.00 | % | | | 2.01 | %(h) | | | 2.03 | % | | | 2.04 | % |
Gross expenses | | | 2.04 | % | | | 2.19 | % | | | 2.23 | % | | | 2.37 | % | | | 3.31 | % |
Net investment loss | | | (1.17 | )% | | | (1.05 | )% | | | (0.69 | )% | | | (0.71 | )% | | | (0.73 | )% |
Portfolio turnover rate | | | 18 | % | | | 44 | % | | | 37 | % | | | 24 | % | | | 17 | % |
| (a) | Per share net investment loss has been calculated using the average shares outstanding during the period. |
| (b) | The amount shown for a share outstanding does not correspond with the aggregate realized and unrealized gain (loss) on investments for the period due to the timing of sales and redemptions of fund shares in relation to fluctuating market values of investments of the Fund. |
| (c) | Amount rounds to less than $0.01 per share. |
| (d) | A contingent deferred sales charge for Class C shares is not reflected in total return calculations. |
| (e) | Had certain expenses not been waived/reimbursed during the period, total returns would have been lower. |
| (f) | The investment adviser agreed to waive its fees and/or reimburse a portion of the Fund’s expenses during the period. Without this waiver/reimbursement, expenses would have been higher. |
| (g) | Effective December 15, 2020, the expense limit decreased from 2.00% to 1.95%. |
| (h) | Effective July 1, 2019, the expense limit decreased from 2.05% to 2.00%. |
See accompanying notes to financial statements.
31 |
Financial Highlights (continued)
For a share outstanding throughout each period
| | | | | | | | | | | | | | | | | | | | |
| | | Loomis Sayles Global Growth Fund—Class N | |
| | | Year Ended
November 30,
2021
| | | Year Ended
November 30,
2020
| | | Year Ended
November 30,
2019
| | | Year Ended
November 30,
2018
| | | Period Ended
November 30,
2017*
| |
Net asset value, beginning of the period | | $ | 18.93 | | | $ | 14.85 | | | $ | 13.34 | | | $ | 13.49 | | | $ | 11.26 | |
| | | | | | | | | | | | | | | | | | | | |
INCOME (LOSS) FROM INVESTMENT OPERATIONS: | |
Net investment income (loss)(a) | | | (0.03 | ) | | | (0.01 | ) | | | 0.05 | | | | 0.05 | | | | 0.03 | |
Net realized and unrealized gain (loss) | | | 1.53 | | | | 4.92 | | | | 2.03 | | | | 0.26 | (b) | | | 2.20 | |
| | | | | | | | | | | | | | | | | | | | |
Total from Investment Operations | | | 1.50 | | | | 4.91 | | | | 2.08 | | | | 0.31 | | | | 2.23 | |
| | | | | | | | | | | | | | | | | | | | |
LESS DISTRIBUTIONS FROM: | |
Net investment income | | | — | | | | — | | | | (0.09 | ) | | | (0.05 | ) | | | — | |
Net realized capital gains | | | (1.14 | ) | | | (0.83 | ) | | | (0.48 | ) | | | (0.41 | ) | | | — | |
| | | | | | | | | | | | | | | | | | | | |
Total Distributions | | | (1.14 | ) | | | (0.83 | ) | | | (0.57 | ) | | | (0.46 | ) | | | — | |
| | | | | | | | | | | | | | | | | | | | |
Net asset value, end of the period | | $ | 19.29 | | | $ | 18.93 | | | $ | 14.85 | | | $ | 13.34 | | | $ | 13.49 | |
| | | | | | | | | | | | | | | | | | | | |
Total return(c) | | | 8.21 | % | | | 34.84 | % | | | 16.61 | % | | | 2.31 | % | | | 19.80 | %(d) |
RATIOS TO AVERAGE NET ASSETS: | |
Net assets, end of the period (000’s) | | $ | 12,293 | | | $ | 11,357 | | | $ | 3,319 | | | $ | 2,843 | | | $ | 1 | |
Net expenses(e) | | | 0.90 | %(f) | | | 0.95 | % | | | 0.98 | %(g) | | | 1.00 | % | | | 1.00 | %(h) |
Gross expenses | | | 0.98 | % | | | 1.13 | % | | | 1.22 | % | | | 1.35 | % | | | 15.78 | %(h) |
Net investment income (loss) | | | (0.14 | )% | | | (0.09 | )% | | | 0.35 | % | | | 0.38 | % | | | 0.30 | %(h) |
Portfolio turnover rate | | | 18 | % | | | 44 | % | | | 37 | % | | | 24 | % | | | 17 | %(i) |
| * | From commencement of Class operations on March 31, 2017 through November 30, 2017. |
| (a) | Per share net investment income (loss) has been calculated using the average shares outstanding during the period. |
| (b) | The amount shown for a share outstanding does not correspond with the aggregate realized and unrealized gain (loss) on investments for the period due to the timing of sales and redemptions of fund shares in relation to fluctuating market values of investments of the Fund. |
| (c) | Had certain expenses not been waived/reimbursed during the period, total returns would have been lower. |
| (d) | Periods less than one year are not annualized. |
| (e) | The investment adviser agreed to waive its fees and/or reimburse a portion of the Fund’s expenses during the period. Without this waiver/reimbursement, expenses would have been higher. |
| (f) | Effective December 15, 2020, the expense limit decreased from 0.95% to 0.90%. |
| (g) | Effective July 1, 2019, the expense limit decreased from 1.00% to 0.95%. |
| (h) | Computed on an annualized basis for periods less than one year. |
| (i) | Represents the Fund’s portfolio turnover rate for the year ended November 30, 2017. |
See accompanying notes to financial statements.
| 32
Financial Highlights (continued)
For a share outstanding throughout each period
| | | | | | | | | | | | | | | | | | | | |
| | | Loomis Sayles Global Growth Fund—Class Y | |
| | | Year Ended
November 30,
2021
| | | Year Ended
November 30,
2020
| | | Year Ended
November 30,
2019
| | | Year Ended
November 30,
2018
| | | Year Ended
November 30,
2017
| |
Net asset value, beginning of the period | | $ | 18.91 | | | $ | 14.85 | | | $ | 13.33 | | | $ | 13.48 | | | $ | 10.55 | |
| | | | | | | | | | | | | | | | | | | | |
INCOME (LOSS) FROM INVESTMENT OPERATIONS: | |
Net investment income (loss)(a) | | | (0.04 | ) | | | (0.01 | ) | | | 0.04 | | | | 0.04 | | | | 0.05 | |
Net realized and unrealized gain (loss) | | | 1.54 | | | | 4.90 | | | | 2.04 | | | | 0.27 | (b) | | | 3.14 | |
| | | | | | | | | | | | | | | | | | | | |
Total from Investment Operations | | | 1.50 | | | | 4.89 | | | | 2.08 | | | | 0.31 | | | | 3.19 | |
| | | | | | | | | | | | | | | | | | | | |
LESS DISTRIBUTIONS FROM: | |
Net investment income | | | — | | | | — | | | | (0.08 | ) | | | (0.05 | ) | | | (0.05 | ) |
Net realized capital gains | | | (1.14 | ) | | | (0.83 | ) | | | (0.48 | ) | | | (0.41 | ) | | | (0.21 | ) |
| | | | | | | | | | | | | | | | | | | | |
Total Distributions | | | (1.14 | ) | | | (0.83 | ) | | | (0.56 | ) | | | (0.46 | ) | | | (0.26 | ) |
| | | | | | | | | | | | | | | | | | | | |
Net asset value, end of the period | | $ | 19.27 | | | $ | 18.91 | | | $ | 14.85 | | | $ | 13.33 | | | $ | 13.48 | |
| | | | | | | | | | | | | | | | | | | | |
Total return(c) | | | 8.22 | % | | | 34.70 | % | | | 16.65 | % | | | 2.27 | % | | | 30.96 | % |
RATIOS TO AVERAGE NET ASSETS: | |
Net assets, end of the period (000’s) | | $ | 106,028 | | | $ | 86,950 | | | $ | 63,308 | | | $ | 52,147 | | | $ | 16,053 | |
Net expenses(d) | | | 0.95 | %(e) | | | 1.00 | % | | | 1.01 | %(f) | | | 1.02 | % | | | 1.04 | % |
Gross expenses | | | 1.04 | % | | | 1.19 | % | | | 1.23 | % | | | 1.37 | % | | | 2.31 | % |
Net investment income (loss) | | | (0.19 | )% | | | (0.05 | )% | | | 0.30 | % | | | 0.33 | % | | | 0.40 | % |
Portfolio turnover rate | | | 18 | % | | | 44 | % | | | 37 | % | | | 24 | % | | | 17 | % |
| (a) | Per share net investment income (loss) has been calculated using the average shares outstanding during the period. |
| (b) | The amount shown for a share outstanding does not correspond with the aggregate realized and unrealized gain (loss) on investments for the period due to the timing of sales and redemptions of fund shares in relation to fluctuating market values of investments of the Fund. |
| (c) | Had certain expenses not been waived/reimbursed during the period, total returns would have been lower. |
| (d) | The investment adviser agreed to waive its fees and/or reimburse a portion of the Fund’s expenses during the period. Without this waiver/reimbursement, expenses would have been higher. |
| (e) | Effective December 15, 2020, the expense limit decreased from 1.00% to 0.95%. |
| (f) | Effective July 1, 2019, the expense limit decreased from 1.05% to 1.00%. |
See accompanying notes to financial statements.
33 |
Financial Highlights (continued)
For a share outstanding throughout each period
| | | | | | | | | | | | | | | | | | | | |
| | | Loomis Sayles Senior Floating Rate and Fixed Income Fund—Class A | |
| | | Year Ended
November 30,
2021
| | | Year Ended
November 30,
2020
| | | Year Ended
November 30,
2019
| | | Year Ended
November 30,
2018
| | | Year Ended
November 30,
2017
| |
Net asset value, beginning of the period | | $ | 8.81 | | | $ | 9.16 | | | $ | 9.62 | | | $ | 9.89 | | | $ | 9.88 | |
| | | | | | | | | | | | | | | | | | | | |
INCOME (LOSS) FROM INVESTMENT OPERATIONS: | |
Net investment income(a) | | | 0.32 | | | | 0.43 | | | | 0.57 | | | | 0.53 | | | | 0.51 | |
Net realized and unrealized gain (loss) | | | 0.16 | | | | (0.34 | ) | | | (0.45 | ) | | | (0.26 | ) | | | 0.03 | |
| | | | | | | | | | | | | | | | | | | | |
Total from Investment Operations | | | 0.48 | | | | 0.09 | | | | 0.12 | | | | 0.27 | | | | 0.54 | |
| | | | | | | | | | | | | | | | | | | | |
LESS DISTRIBUTIONS FROM: | |
Net investment income | | | (0.33 | ) | | | (0.44 | ) | | | (0.58 | ) | | | (0.54 | ) | | | (0.53 | ) |
| | | | | | | | | | | | | | | | | | | | |
Net asset value, end of the period | | $ | 8.96 | | | $ | 8.81 | | | $ | 9.16 | | | $ | 9.62 | | | $ | 9.89 | |
| | | | | | | | | | | | | | | | | | | | |
Total return(b) | | | 5.47 | %(c) | | | 1.19 | %(c) | | | 1.23 | %(c) | | | 2.78 | % | | | 5.53 | %(c) |
RATIOS TO AVERAGE NET ASSETS: | |
Net assets, end of the period (000’s) | | $ | 219,989 | | | $ | 208,251 | | | $ | 297,634 | | | $ | 532,551 | | | $ | 450,633 | |
Net expenses | | | 1.05 | %(d) | | | 1.07 | %(d)(e) | | | 1.06 | %(d)(f) | | | 1.05 | % | | | 1.05 | %(d) |
Gross expenses | | | 1.24 | % | | | 1.20 | %(e) | | | 1.09 | %(f) | | | 1.05 | % | | | 1.08 | % |
Net investment income | | | 3.56 | % | | | 4.96 | % | | | 6.03 | % | | | 5.42 | % | | | 5.14 | % |
Portfolio turnover rate | | | 79 | % | | | 65 | % | | | 52 | % | | | 65 | % | �� | | 87 | % |
| (a) | Per share net investment income has been calculated using the average shares outstanding during the period. |
| (b) | A sales charge for Class A shares is not reflected in total return calculations. |
| (c) | Had certain expenses not been waived/reimbursed during the period, total returns would have been lower. |
| (d) | The investment adviser agreed to waive its fees and/or reimburse a portion of the Fund’s expenses during the period. Without this waiver/reimbursement, expenses would have been higher. |
| (e) | Includes interest expense. Without this expense the ratio of net expenses would have been 1.05% and the ratio of gross expenses would have been 1.18% |
| (f) | Includes interest expense. Without this expense the ratio of net expenses would have been 1.05% and the ratio of gross expenses would have been 1.08%. |
See accompanying notes to financial statements.
| 34
Financial Highlights (continued)
For a share outstanding throughout each period
| | | | | | | | | | | | | | | | | | | | |
| | | Loomis Sayles Senior Floating Rate and Fixed Income Fund—Class C | |
| | | Year Ended
November 30,
2021
| | | Year Ended
November 30,
2020
| | | Year Ended
November 30,
2019
| | | Year Ended
November 30,
2018
| | | Year Ended
November 30,
2017
| |
Net asset value, beginning of the period | | $ | 8.78 | | | $ | 9.12 | | | $ | 9.59 | | | $ | 9.86 | | | $ | 9.85 | |
| | | | | | | | | | | | | | | | | | | | |
INCOME (LOSS) FROM INVESTMENT OPERATIONS: | |
Net investment income(a) | | | 0.25 | | | | 0.37 | | | | 0.50 | | | | 0.46 | | | | 0.43 | |
Net realized and unrealized gain (loss) | | | 0.16 | | | | (0.34 | ) | | | (0.46 | ) | | | (0.26 | ) | | | 0.03 | |
| | | | | | | | | | | | | | | | | | | | |
Total from Investment Operations | | | 0.41 | | | | 0.03 | | | | 0.04 | | | | 0.20 | | | | 0.46 | |
| | | | | | | | | | | | | | | | | | | | |
LESS DISTRIBUTIONS FROM: | |
Net investment income | | | (0.26 | ) | | | (0.37 | ) | | | (0.51 | ) | | | (0.47 | ) | | | (0.45 | ) |
| | | | | | | | | | | | | | | | | | | | |
Net asset value, end of the period | | $ | 8.93 | | | $ | 8.78 | | | $ | 9.12 | | | $ | 9.59 | | | $ | 9.86 | |
| | | | | | | | | | | | | | | | | | | | |
Total return(b) | | | 4.69 | %(c) | | | 0.53 | %(c) | | | 0.36 | %(c) | | | 2.02 | % | | | 4.76 | %(c) |
RATIOS TO AVERAGE NET ASSETS: | |
Net assets, end of the period (000’s) | | $ | 89,618 | | | $ | 125,909 | | | $ | 233,387 | | | $ | 337,088 | | | $ | 318,635 | |
Net expenses | | | 1.80 | %(d) | | | 1.82 | %(d)(e) | | | 1.81 | %(d)(f) | | | 1.80 | % | | | 1.80 | %(d) |
Gross expenses | | | 1.99 | % | | | 1.95 | %(e) | | | 1.84 | %(f) | | | 1.80 | % | | | 1.83 | % |
Net investment income | | | 2.80 | % | | | 4.27 | % | | | 5.28 | % | | | 4.66 | % | | | 4.38 | % |
Portfolio turnover rate | | | 79 | % | | | 65 | % | | | 52 | % | | | 65 | % | | | 87 | % |
| (a) | Per share net investment income has been calculated using the average shares outstanding during the period. |
| (b) | A contingent deferred sales charge for Class C shares is not reflected in total return calculations. |
| (c) | Had certain expenses not been waived/reimbursed during the period, total returns would have been lower. |
| (d) | The investment adviser agreed to waive its fees and/or reimburse a portion of the Fund’s expenses during the period. Without this waiver/reimbursement, expenses would have been higher. |
| (e) | Includes interest expense. Without this expense the ratio of net expenses would have been 1.80% and the ratio of gross expenses would have been 1.93%. |
| (f) | Includes interest expense. Without this expense the ratio of net expenses would have been 1.80% and the ratio of gross expenses would have been 1.83%. |
See accompanying notes to financial statements.
35 |
Financial Highlights (continued)
For a share outstanding throughout each period
| | | | | | | | | | | | | | | | | | | | |
| | | Loomis Sayles Senior Floating Rate and Fixed Income Fund—Class N | |
| | | Year Ended
November 30,
2021
| | | Year Ended
November 30,
2020
| | | Year Ended
November 30,
2019
| | | Year Ended
November 30,
2018
| | | Period Ended
November 30,
2017*
| |
Net asset value, beginning of the period | | $ | 8.81 | | | $ | 9.17 | | | $ | 9.63 | | | $ | 9.90 | | | $ | 9.96 | |
| | | | | | | | | | | | | | | | | | | | |
INCOME (LOSS) FROM INVESTMENT OPERATIONS: | |
Net investment income(a) | | | 0.34 | | | | 0.46 | | | | 0.60 | | | | 0.57 | | | | 0.37 | |
Net realized and unrealized gain (loss) | | | 0.16 | | | | (0.36 | ) | | | (0.45 | ) | | | (0.27 | ) | | | (0.05 | ) |
| | | | | | | | | | | | | | | | | | | | |
Total from Investment Operations | | | 0.50 | | | | 0.10 | | | | 0.15 | | | | 0.30 | | | | 0.32 | |
| | | | | | | | | | | | | | | | | | | | |
LESS DISTRIBUTIONS FROM: | |
Net investment income | | | (0.35 | ) | | | (0.46 | ) | | | (0.61 | ) | | | (0.57 | ) | | | (0.38 | ) |
| | | | | | | | | | | | | | | | | | | | |
Net asset value, end of the period | | $ | 8.96 | | | $ | 8.81 | | | $ | 9.17 | | | $ | 9.63 | | | $ | 9.90 | |
| | | | | | | | | | | | | | | | | | | | |
Total return(b) | | | 5.79 | % | | | 1.37 | % | | | 1.54 | % | | | 3.08 | % | | | 3.28 | %(c) |
RATIOS TO AVERAGE NET ASSETS: | |
Net assets, end of the period (000’s) | | $ | 2,528 | | | $ | 151 | | | $ | 242 | | | $ | 191 | | | $ | 104 | |
Net expenses(d) | | | 0.75 | % | | | 0.77 | %(e) | | | 0.76 | %(f) | | | 0.74 | % | | | 0.75 | %(g) |
Gross expenses | | | 1.03 | % | | | 1.24 | %(e) | | | 1.11 | %(f) | | | 0.95 | % | | | 0.92 | %(g) |
Net investment income | | | 3.83 | % | | | 5.31 | % | | | 6.33 | % | | | 5.77 | % | | | 5.63 | %(g) |
Portfolio turnover rate | | | 79 | % | | | 65 | % | | | 52 | % | | | 65 | % | | | 87 | %(h) |
| * | From commencement of Class operations on March 31, 2017 through November 30, 2017. |
| (a) | Per share net investment income has been calculated using the average shares outstanding during the period. |
| (b) | Had certain expenses not been waived/reimbursed during the period, total returns would have been lower. |
| (c) | Periods less than one year are not annualized. |
| (d) | The investment adviser agreed to waive its fees and/or reimburse a portion of the Fund’s expenses during the period. Without this waiver/reimbursement, expenses would have been higher. |
| (e) | Includes interest expense. Without this expense the ratio of net expenses would have been 0.75% and the ratio of gross expenses would have been 1.22%. |
| (f) | Includes interest expense. Without this expense the ratio of net expenses would have been 0.75% and the ratio of gross expenses would have been 1.09%. |
| (g) | Computed on an annualized basis for periods less than one year. |
| (h) | Represents the Fund’s portfolio turnover rate for the year ended November 30, 2017. |
See accompanying notes to financial statements.
| 36
Financial Highlights (continued)
For a share outstanding throughout each period
| | | | | | | | | | | | | | | | | | | | |
| | | Loomis Sayles Senior Floating Rate and Fixed Income Fund—Class Y | |
| | | Year Ended
November 30,
2021
| | | Year Ended
November 30,
2020
| | | Year Ended
November 30,
2019
| | | Year Ended
November 30,
2018
| | | Year Ended
November 30,
2017
| |
Net asset value, beginning of the period | | $ | 8.82 | | | $ | 9.17 | | | $ | 9.63 | | | $ | 9.90 | | | $ | 9.89 | |
| | | | | | | | | | | | | | | | | | | | |
INCOME (LOSS) FROM INVESTMENT OPERATIONS: | |
Net investment income(a) | | | 0.34 | | | | 0.46 | | | | 0.59 | | | | 0.56 | | | | 0.54 | |
Net realized and unrealized gain (loss) | | | 0.16 | | | | (0.35 | ) | | | (0.45 | ) | | | (0.26 | ) | | | 0.02 | |
| | | | | | | | | | | | | | | | | | | | |
Total from Investment Operations | | | 0.50 | | | | 0.11 | | | | 0.14 | | | | 0.30 | | | | 0.56 | |
| | | | | | | | | | | | | | | | | | | | |
LESS DISTRIBUTIONS FROM: | |
Net investment income | | | (0.35 | ) | | | (0.46 | ) | | | (0.60 | ) | | | (0.57 | ) | | | (0.55 | ) |
| | | | | | | | | | | | | | | | | | | | |
Net asset value, end of the period | | $ | 8.97 | | | $ | 8.82 | | | $ | 9.17 | | | $ | 9.63 | | | $ | 9.90 | |
| | | | | | | | | | | | | | | | | | | | |
Total return | | | 5.73 | %(b) | | | 1.45 | %(b) | | | 1.49 | %(b) | | | 3.03 | % | | | 5.79 | %(b) |
RATIOS TO AVERAGE NET ASSETS: | |
Net assets, end of the period (000’s) | | $ | 1,227,587 | | | $ | 875,829 | | | $ | 1,929,869 | | | $ | 3,101,286 | | | $ | 2,179,284 | |
Net expenses | | | 0.80 | %(c) | | | 0.82 | %(c)(d) | | | 0.81 | %(c)(e) | | | 0.80 | % | | | 0.80 | %(c) |
Gross expenses | | | 0.99 | % | | | 0.95 | %(d) | | | 0.84 | %(e) | | | 0.80 | % | | | 0.83 | % |
Net investment income | | | 3.80 | % | | | 5.28 | % | | | 6.28 | % | | | 5.70 | % | | | 5.41 | % |
Portfolio turnover rate | | | 79 | % | | | 65 | % | | | 52 | % | | | 65 | % | | | 87 | % |
| (a) | Per share net investment income has been calculated using the average shares outstanding during the period. |
| (b) | Had certain expenses not been waived/reimbursed during the period, total returns would have been lower. |
| (c) | The investment adviser agreed to waive its fees and/or reimburse a portion of the Fund’s expenses during the period. Without this waiver/reimbursement, expenses would have been higher. |
| (d) | Includes interest expense. Without this expense the ratio of net expenses would have been 0.80% and the ratio of gross expenses would have been 0.93%. |
| (e) | Includes interest expense. Without this expense the ratio of net expenses would have been 0.80% and the ratio of gross expenses would have been 0.83%. |
See accompanying notes to financial statements.
37 |
Financial Highlights (continued)
For a share outstanding throughout each period
| | | | | | | | | | | | | | | | | | | | |
| | | Vaughan Nelson Select Fund—Class A | |
| | | Year Ended
November 30,
2021
| | | Year Ended
November 30,
2020
| | | Year Ended
November 30,
2019
| | | Year Ended
November 30,
2018
| | | Year Ended
November 30,
2017
| |
Net asset value, beginning of the period | | $ | 20.00 | | | $ | 18.63 | | | $ | 18.13 | | | $ | 18.59 | | | $ | 15.38 | |
| | | | | | | | | | | | | | | | | | | | |
INCOME (LOSS) FROM INVESTMENT OPERATIONS: | |
Net investment income(a) | | | 0.07 | (b) | | | 0.06 | | | | 0.14 | | | | 0.07 | | | | 0.06 | |
Net realized and unrealized gain (loss) | | | 7.70 | | | | 2.75 | | | | 1.90 | | | | 0.91 | | | | 3.41 | |
| | | | | | | | | | | | | | | | | | | | |
Total from Investment Operations | | | 7.77 | | | | 2.81 | | | | 2.04 | | | | 0.98 | | | | 3.47 | |
| | | | | | | | | | | | | | | | | | | | |
LESS DISTRIBUTIONS FROM: | |
Net investment income | | | (0.08 | ) | | | (0.13 | ) | | | — | | | | (0.10 | ) | | | (0.01 | ) |
Net realized capital gains | | | (1.26 | ) | | | (1.31 | ) | | | (1.54 | ) | | | (1.34 | ) | | | (0.25 | ) |
| | | | | | | | | | | | | | | | | | | | |
Total Distributions | | | (1.34 | ) | | | (1.44 | ) | | | (1.54 | ) | | | (1.44 | ) | | | (0.26 | ) |
| | | | | | | | | | | | | | | | | | | | |
Net asset value, end of the period | | $ | 26.43 | | | $ | 20.00 | | | $ | 18.63 | | | $ | 18.13 | | | $ | 18.59 | |
| | | | | | | | | | | | | | | | | | | | |
Total return(c)(d) | | | 41.46 | %(b) | | | 16.21 | % | | | 13.67 | % | | | 5.62 | % | | | 22.86 | % |
RATIOS TO AVERAGE NET ASSETS: | |
Net assets, end of the period (000’s) | | $ | 20,382 | | | $ | 13,722 | | | $ | 15,434 | | | $ | 17,703 | | | $ | 22,268 | |
Net expenses(e) | | | 1.10 | %(f)(g) | | | 1.13 | % | | | 1.16 | %(h) | | | 1.22 | %(i) | | | 1.28 | %(j) |
Gross expenses | | | 1.14 | % | | | 1.18 | % | | | 1.21 | % | | | 1.27 | % | | | 1.33 | % |
Net investment income | | | 0.30 | %(b) | | | 0.37 | % | | | 0.84 | % | | | 0.41 | % | | | 0.39 | % |
Portfolio turnover rate | | | 93 | % | | | 88 | % | | | 51 | % | | | 54 | % | | | 66 | % |
| (a) | Per share net investment income has been calculated using the average shares outstanding during the period. |
| (b) | Includes a non-recurring dividend. Without this dividend, net investment loss per share would have been $(0.06), total return would have been 40.82% and the ratio of net investment loss to average net assets would have been (0.25)%. |
| (c) | A sales charge for Class A shares is not reflected in total return calculations. |
| (d) | Had certain expenses not been waived/reimbursed during the period, total returns would have been lower. |
| (e) | The investment adviser agreed to waive its fees and/or reimburse a portion of the Fund’s expenses during the period. Without this waiver/reimbursement, expenses would have been higher. |
| (f) | Includes additional voluntary waiver of advisory fee of 0.03%. |
| (g) | Effective July 1, 2021, the expense limit decreased from 1.15% to 1.10%. |
| (h) | Effective July 1, 2019, the expense limit decreased from 1.20% to 1.15%. |
| (i) | Effective July 1, 2018, the expense limit decreased from 1.25% to 1.20%. |
| (j) | Effective July 1, 2017, the expense limit decreased from 1.30% to 1.25%. |
See accompanying notes to financial statements.
| 38
Financial Highlights (continued)
For a share outstanding throughout each period
| | | | | | | | | | | | | | | | | | | | |
| | | Vaughan Nelson Select Fund—Class C | |
| | | Year Ended
November 30,
2021
| | | Year Ended
November 30,
2020
| | | Year Ended
November 30,
2019
| | | Year Ended
November 30,
2018
| | | Year Ended
November 30,
2017
| |
Net asset value, beginning of the period | | $ | 18.76 | | | $ | 17.56 | | | $ | 17.31 | | | $ | 17.84 | | | $ | 14.87 | |
| | | | | | | | | | | | | | | | | | | | |
INCOME (LOSS) FROM INVESTMENT OPERATIONS: | |
Net investment income (loss)(a) | | | (0.08 | )(b) | | | (0.07 | ) | | | 0.02 | | | | (0.06 | ) | | | (0.06 | ) |
Net realized and unrealized gain (loss) | | | 7.19 | | | | 2.58 | | | | 1.77 | | | | 0.87 | | | | 3.28 | |
| | | | | | | | | | | | | | | | | | | | |
Total from Investment Operations | | | 7.11 | | | | 2.51 | | | | 1.79 | | | | 0.81 | | | | 3.22 | |
| | | | | | | | | | | | | | | | | | | | |
LESS DISTRIBUTIONS FROM: | |
Net realized capital gains | | | (1.26 | ) | | | (1.31 | ) | | | (1.54 | ) | | | (1.34 | ) | | | (0.25 | ) |
| | | | | | | | | | | | | | | | | | | | |
Net asset value, end of the period | | $ | 24.61 | | | $ | 18.76 | | | $ | 17.56 | | | $ | 17.31 | | | $ | 17.84 | |
| | | | | | | | | | | | | | | | | | | | |
Total return(c)(d) | | | 40.44 | %(b) | | | 15.31 | % | | | 12.86 | % | | | 4.77 | % | | | 21.96 | % |
RATIOS TO AVERAGE NET ASSETS: | |
Net assets, end of the period (000’s) | | $ | 5,357 | | | $ | 5,246 | | | $ | 6,313 | | | $ | 6,917 | | | $ | 7,429 | |
Net expenses(e) | | | 1.86 | %(f)(g) | | | 1.88 | % | | | 1.91 | %(h) | | | 1.96 | %(i) | | | 2.03 | %(j) |
Gross expenses | | | 1.89 | % | | | 1.93 | % | | | 1.96 | % | | | 2.01 | % | | | 2.08 | % |
Net investment income (loss) | | | (0.39 | )%(b) | | | (0.40 | )% | | | 0.09 | % | | | (0.32 | )% | | | (0.37 | )% |
Portfolio turnover rate | | | 93 | % | | | 88 | % | | | 51 | % | | | 54 | % | | | 66 | % |
| (a) | Per share net investment income (loss) has been calculated using the average shares outstanding during the period. |
| (b) | Includes a non-recurring dividend. Without this dividend, net investment loss per share would have been $(0.21), total return would have been 39.76% and the ratio of net investment loss to average net assets would have been (1.00)%. |
| (c) | A contingent deferred sales charge for Class C shares is not reflected in total return calculations. |
| (d) | Had certain expenses not been waived/reimbursed during the period, total returns would have been lower. |
| (e) | The investment adviser agreed to waive its fees and/or reimburse a portion of the Fund’s expenses during the period. Without this waiver/reimbursement, expenses would have been higher. |
| (f) | Includes additional voluntary waiver of advisory fee of 0.03%. |
| (g) | Effective July 1, 2021, the expense limit decreased from 1.90% to 1.85%. |
| (h) | Effective July 1, 2019, the expense limit decreased from 1.95% to 1.90%. |
| (i) | Effective July 1, 2018, the expense limit decreased from 2.00% to 1.95%. |
| (j) | Effective July 1, 2017, the expense limit decreased from 2.05% to 2.00%. |
See accompanying notes to financial statements.
39 |
Financial Highlights (continued)
For a share outstanding throughout each period
| | | | | | | | | | | | | | | | | | | | |
| | | Vaughan Nelson Select Fund—Class N | |
| | | Year Ended
November 30,
2021
| | | Year Ended
November 30,
2020
| | | Year Ended
November 30,
2019
| | | Year Ended
November 30,
2018
| | | Period Ended
November 30,
2017*
| |
Net asset value, beginning of the period | | $ | 20.14 | | | $ | 18.76 | | | $ | 18.26 | | | $ | 18.73 | | | $ | 16.28 | |
| | | | | | | | | | | | | | | | | | | | |
INCOME (LOSS) FROM INVESTMENT OPERATIONS: | |
Net investment income(a) | | | 0.13 | (b) | | | 0.11 | | | | 0.19 | | | | 0.13 | | | | 0.09 | |
Net realized and unrealized gain (loss) | | | 7.76 | | | | 2.77 | | | | 1.91 | | | | 0.89 | | | | 2.36 | |
| | | | | | | | | | | | | | | | | | | | |
Total from Investment Operations | | | 7.89 | | | | 2.88 | | | | 2.10 | | | | 1.02 | | | | 2.45 | |
| | | | | | | | | | | | | | | | | | | | |
LESS DISTRIBUTIONS FROM: | |
Net investment income | | | (0.14 | ) | | | (0.19 | ) | | | (0.06 | ) | | | (0.15 | ) | | | — | |
Net realized capital gains | | | (1.26 | ) | | | (1.31 | ) | | | (1.54 | ) | | | (1.34 | ) | | | — | |
| | | | | | | | | | | | | | | | | | | | |
Total Distributions | | | (1.40 | ) | | | (1.50 | ) | | | (1.60 | ) | | | (1.49 | ) | | | — | |
| | | | | | | | | | | | | | | | | | | | |
Net asset value, end of the period | | $ | 26.63 | | | $ | 20.14 | | | $ | 18.76 | | | $ | 18.26 | | | $ | 18.73 | |
| | | | | | | | | | | | | | | | | | | | |
Total return(c) | | | 41.87 | %(b) | | | 16.50 | % | | | 13.93 | % | | | 5.90 | % | | | 15.05 | %(d) |
RATIOS TO AVERAGE NET ASSETS: | |
Net assets, end of the period (000’s) | | $ | 2 | | | $ | 2 | | | $ | 1 | | | $ | 1 | | | $ | 1 | |
Net expenses(e) | | | 0.83 | %(f) | | | 0.85 | % | | | 0.87 | %(g) | | | 0.93 | %(h) | | | 0.97 | %(i)(j) |
Gross expenses | | | 49.27 | % | | | 71.85 | % | | | 63.51 | % | | | 13.54 | % | | | 14.62 | %(i) |
Net investment income | | | 0.56 | %(b) | | | 0.61 | % | | | 1.10 | % | | | 0.68 | % | | | 0.80 | %(i) |
Portfolio turnover rate | | | 93 | % | | | 88 | % | | | 51 | % | | | 54 | % | | | 66 | %(k) |
| * | From commencement of Class operations on March 31, 2017 through November 30, 2017. |
| (a) | Per share net investment income has been calculated using the average shares outstanding during the period. |
| (b) | Includes a non-recurring dividend. Without this dividend, net investment income per share would have been $0.01, total return would have been 41.24% and the ratio of net investment income to average net assets would have been 0.02%. |
| (c) | Had certain expenses not been waived/reimbursed during the period, total returns would have been lower. |
| (d) | Periods less than one year are not annualized. |
| (e) | The investment adviser agreed to waive its fees and/or reimburse a portion of the Fund’s expenses during the period. Without this waiver/reimbursement, expenses would have been higher. |
| (f) | Effective July 1, 2021, the expense limit decreased from 0.85% to 0.80%. |
| (g) | Effective July 1, 2019, the expense limit decreased from 0.90% to 0.85%. |
| (h) | Effective July 1, 2018, the expense limit decreased from 0.95% to 0.90%. |
| (i) | Computed on an annualized basis for periods less than one year. |
| (j) | Effective July 1, 2017, the expense limit decreased from 1.00% to 0.95%. |
| (k) | Represents the Fund’s portfolio turnover rate for the year ended November 30, 2017. |
See accompanying notes to financial statements.
| 40
Financial Highlights (continued)
For a share outstanding throughout each period
| | | | | | | | | | | | | | | | | | | | |
| | | Vaughan Nelson Select Fund—Class Y | |
| | | Year Ended
November 30,
2021
| | | Year Ended
November 30,
2020
| | | Year Ended
November 30,
2019
| | | Year Ended
November 30,
2018
| | | Year Ended
November 30,
2017
| |
Net asset value, beginning of the period | | $ | 20.14 | | | $ | 18.75 | | | $ | 18.25 | | | $ | 18.71 | | | $ | 15.48 | |
| | | | | | | | | | | | | | | | | | | | |
INCOME (LOSS) FROM INVESTMENT OPERATIONS: | |
Net investment income(a) | | | 0.13 | (b) | | | 0.11 | | | | 0.19 | | | | 0.13 | | | | 0.11 | |
Net realized and unrealized gain (loss) | | | 7.75 | | | | 2.77 | | | | 1.90 | | | | 0.90 | | | | 3.41 | |
| | | | | | | | | | | | | | | | | | | | |
Total from Investment Operations | | | 7.88 | | | | 2.88 | | | | 2.09 | | | | 1.03 | | | | 3.52 | |
| | | | | | | | | | | | | | | | | | | | |
LESS DISTRIBUTIONS FROM: | |
Net investment income | | | (0.13 | ) | | | (0.18 | ) | | | (0.05 | ) | | | (0.15 | ) | | | (0.04 | ) |
Net realized capital gains | | | (1.26 | ) | | | (1.31 | ) | | | (1.54 | ) | | | (1.34 | ) | | | (0.25 | ) |
| | | | | | | | | | | | | | | | | | | | |
Total Distributions | | | (1.39 | ) | | | (1.49 | ) | | | (1.59 | ) | | | (1.49 | ) | | | (0.29 | ) |
| | | | | | | | | | | | | | | | | | | | |
Net asset value, end of the period | | $ | 26.63 | | | $ | 20.14 | | | $ | 18.75 | | | $ | 18.25 | | | $ | 18.71 | |
| | | | | | | | | | | | | | | | | | | | |
Total return(c) | | | 41.81 | %(b) | | | 16.52 | % | | | 13.94 | % | | | 5.86 | % | | | 23.13 | % |
RATIOS TO AVERAGE NET ASSETS: | |
Net assets, end of the period (000’s) | | $ | 226,305 | | | $ | 205,557 | | | $ | 204,856 | | | $ | 175,017 | | | $ | 123,746 | |
Net expenses(d) | | | 0.85 | %(e)(f) | | | 0.88 | % | | | 0.91 | %(g) | | | 0.96 | %(h) | | | 1.03 | %(i) |
Gross expenses | | | 0.89 | % | | | 0.93 | % | | | 0.96 | % | | | 1.01 | % | | | 1.08 | % |
Net investment income | | | 0.56 | %(b) | | | 0.61 | % | | | 1.09 | % | | | 0.68 | % | | | 0.64 | % |
Portfolio turnover rate | | | 93 | % | | | 88 | % | | | 51 | % | | | 54 | % | | | 66 | % |
| (a) | Per share net investment income has been calculated using the average shares outstanding during the period. |
| (b) | Includes a non-recurring dividend. Without this dividend, net investment loss per share would have been less than $(0.01), total return would have been 41.17% and the ratio of net investment loss to average net assets would have been less than (0.01)%. |
| (c) | Had certain expenses not been waived/reimbursed during the period, total returns would have been lower. |
| (d) | The investment adviser agreed to waive its fees and/or reimburse a portion of the Fund’s expenses during the period. Without this waiver/reimbursement, expenses would have been higher. |
| (e) | Includes additional voluntary waiver of advisory fee of 0.03%. |
| (f) | Effective July 1, 2021, the expense limit decreased from 0.90% to 0.85%. |
| (g) | Effective July 1, 2019, the expense limit decreased from 0.95% to 0.90%. |
| (h) | Effective July 1, 2018, the expense limit decreased from 1.00% to 0.95%. |
| (i) | Effective July 1, 2017, the expense limit decreased from 1.05% to 1.00%. |
See accompanying notes to financial statements.
41 |
Notes to Financial Statements
November 30, 2021
1. Organization. Natixis Funds Trust II (the “Trust”) is organized as a Massachusetts business trust. The Trust is registered under the Investment Company Act of 1940, as amended (the “1940 Act”), as an open-end management investment company. The Declaration of Trust permits the Board of Trustees to authorize the issuance of an unlimited number of shares of the Trust in multiple series. The financial statements for certain funds of the Trust are presented in separate reports. The following funds (individually, a “Fund” and collectively, the “Funds”) are included in this report:
Loomis Sayles Global Growth Fund (the “Global Growth Fund”)
Loomis Sayles Senior Floating Rate and Fixed Income Fund (the “Senior Floating Rate and Fixed Income Fund”)
Vaughan Nelson Select Fund (the “Select Fund”)
Global Growth Fund and Senior Floating Rate and Fixed Income Fund are diversified investment companies. Select Fund is a non-diversified investment company.
Each Fund offers Class A, Class C, Class N and Class Y shares. Class A shares are sold with a maximum front-end sales charge of 5.75% for Global Growth Fund and Select Fund and 3.50% for Senior Floating Rate and Fixed Income Fund. Class C shares do not pay a front-end sales charge, pay higher Rule 12b-1 fees than Class A shares for eight years (at which point they automatically convert to Class A shares) (prior to May 1, 2021, Class C shares automatically converted to Class A shares after ten years) and may be subject to a contingent deferred sales charge (“CDSC”) of 1.00% if those shares are redeemed within one year of acquisition, except for reinvested distributions. Class N and Class Y shares do not pay a front-end sales charge, a CDSC or Rule 12b-1 fees. Class N shares are offered with an initial minimum investment of $1,000,000. Class Y shares are offered with an initial minimum investment of $100,000. Certain categories of investors are exempted from the minimum investment amounts for Class N and Class Y as outlined in the relevant Fund’s prospectus.
Most expenses can be directly attributed to a Fund. Expenses which cannot be directly attributed to a Fund are generally apportioned based on the relative net assets of each of the Funds in Natixis Funds Trust I, Natixis Funds Trust II, Natixis Funds Trust IV and Gateway Trust (“Natixis Funds Trusts”), Loomis Sayles Funds I and Loomis Sayles Funds II (“Loomis Sayles Funds Trusts”) and Natixis ETF Trust and Natixis ETF Trust II (“Natixis ETF Trusts”). Expenses of a Fund are borne pro rata by the holders of each class of shares, except that each class bears expenses unique to that class (such as the Rule 12b-1 fees applicable to Class A and Class C), and transfer agent fees are borne collectively for Class A, Class C and Class Y, and individually for Class N. In addition, each class votes as a class only with respect to its own Rule 12b-1 Plan. Shares of each class would receive their pro rata share of the net assets of a Fund if the Fund were liquidated. The Trustees approve separate distributions from net investment income on each class of shares.
2. Significant Accounting Policies. The following is a summary of significant accounting policies consistently followed by each Fund in the preparation of its financial statements. The Funds’ financial statements follow the accounting and reporting guidelines provided for investment companies and are prepared in accordance with accounting principles generally accepted in the United States of America which require the use of management estimates that affect the reported amounts and disclosures in the financial statements. Actual results could differ from those estimates. Management has evaluated the events and transactions subsequent to year-end through the date the financial statements were issued and has determined that there were no material events that would require disclosure in the Funds’ financial statements.
a. Valuation. Fund securities and other investments are valued at market value based on market quotations obtained or determined by independent pricing services recommended by the adviser or sub-adviser and approved by the Board of Trustees. Fund securities and other investments for which market quotations are not readily available are valued at fair value as determined in good faith by the adviser or sub-adviser pursuant to procedures approved by the Board of Trustees, as described below. Market value is determined as follows:
Listed equity securities (including shares of closed-end investment companies and exchange-traded funds) are valued at the last sale price quoted on the exchange where they are traded most extensively or, if there is no reported sale during the day, the closing bid quotation as reported by an independent pricing service. Securities traded on the NASDAQ Global Select Market, NASDAQ Global Market and NASDAQ Capital Market are valued at the NASDAQ Official Closing Price (“NOCP”), or if lacking an NOCP, at the most recent bid quotations on the applicable NASDAQ Market. Unlisted equity securities (except unlisted preferred equity securities) are valued at the last sale price quoted in the market where they are traded most extensively or, if there is no reported sale during the day, the closing bid quotation as reported by an independent pricing service. If there is no last sale price or closing bid quotation available, unlisted equity securities will be valued using evaluated bids furnished by an independent pricing service, if available. In some foreign markets, an official close price and a last sale price may be available from the foreign exchange or market. In those cases, the official close price is used. Debt securities and unlisted preferred equity securities are valued based on evaluated bids furnished to the Funds by an independent pricing service or bid prices obtained from broker-dealers. Senior loans are valued at bid prices supplied by an independent pricing service, if available. Broker-dealer bid prices may be used to value debt and unlisted equity securities and senior loans where an independent pricing service is unable to price a security or where an independent pricing service does not provide a
| 42
Notes to Financial Statements (continued)
November 30, 2021
reliable price for the security. Domestic exchange-traded index and single name equity option contracts (including options on exchange-traded funds) are valued at the mean of the National Best Bid and Offer quotations as determined by the Options Price Reporting Authority.
Fund securities and other investments for which market quotations are not readily available are valued at fair value as determined in good faith by the adviser or sub-adviser pursuant to procedures approved by the Board of Trustees. The Funds may also value securities and other investments at fair value in other circumstances such as when extraordinary events occur after the close of a foreign market but prior to the close of the New York Stock Exchange. This may include situations relating to a single issuer (such as a declaration of bankruptcy or a delisting of the issuer’s security from the primary market on which it has traded) as well as events affecting the securities markets in general (such as market disruptions or closings and significant fluctuations in U.S. and/or foreign markets). When fair valuing its securities or other investments, the Funds may, among other things, use modeling tools or other processes that may take into account factors such as securities or other market activity and/or significant events that occur after the close of the foreign market and before the time the Fund’s net asset value (“NAV”) is calculated. Fair value pricing may require subjective determinations about the value of a security, and fair values used to determine a Fund’s NAV may differ from quoted or published prices, or from prices that are used by others, for the same securities. In addition, the use of fair value pricing may not always result in adjustments to the prices of securities held by a Fund.
Illiquid securities for which market quotations are readily available and have been evaluated by the adviser are considered and classified as fair valued securities pursuant to the Funds’ pricing policies and procedures.
As of November 30, 2021, securities held by the Funds were fair valued as follows:
| | | | | | | | | | | | | | | | |
Fund | | Equity Securities1 | | | Percentage of Net Assets | | | Securities fair
valued by the
Fund’s adviser | | | Percentage of Net Assets | |
Global Growth Fund | | $ | 32,738,270 | | | | 26.0 | % | | $ | — | | | | — | |
Senior Floating Rate and Fixed Income Fund | | | — | | | | — | | | | 8,814 | | | | Less than 0.1 | % |
| 1 | Certain foreign equity securities were fair valued pursuant to procedures approved by the Board of Trustees as events occurring after the close of the foreign market were believed to materially affect the value of those securities. |
b. Investment Transactions and Related Investment Income. Investment transactions are accounted for on a trade date plus one day basis for daily NAV calculation. However, for financial reporting purposes, investment transactions are reported on trade date. Dividend income (including income reinvested) and foreign withholding tax, if applicable, are recorded on the ex-dividend date, or in the case of certain foreign securities, as soon as a Fund is notified, and interest income is recorded on an accrual basis. Dividends reinvested and stock dividends are reflected as non-cash dividends on the Statements of Operations. Loan consent fees, upfront origination fees and/or amendment fees are recorded when received and included in interest income on the Statements of Operations. Interest income is increased by the accretion of discount and decreased by the amortization of premium, if applicable. For securities with paydown provisions, principal payments received are treated as a proportionate reduction to the cost basis of the securities, and excess or shortfall amounts are recorded as income. For payment-in-kind securities, income received in-kind is reflected as an increase to the principal and cost basis of the securities. In determining net gain or loss on securities sold, the cost of securities has been determined on an identified cost basis. Investment income, non-class specific expenses and realized and unrealized gains and losses are allocated on a pro rata basis to each class based on the relative net assets of each class to the total net assets of the Fund.
c. Foreign Currency Translation. The books and records of the Funds are maintained in U.S. dollars. The values of securities, currencies and other assets and liabilities denominated in currencies other than U.S. dollars, if any, are translated into U.S. dollars based upon foreign exchange rates prevailing at the end of the period. Purchases and sales of investment securities, income and expenses are translated into U.S. dollars on the respective dates of such transactions.
Net realized foreign exchange gains or losses arise from sales of foreign currency, changes in exchange rates between the trade and settlement dates on securities transactions and the difference between the amounts of dividends, interest and foreign withholding taxes recorded on the Funds’ books and the U.S. dollar equivalent of the amounts actually received or paid. Net unrealized foreign exchange gains or losses arise from changes in the value of assets and liabilities, other than investment securities, as of the end of the fiscal period, resulting from changes in exchange rates. Net realized foreign exchange gains or losses and the net change in unrealized foreign exchange gains or losses are disclosed in the Statements of Operations. For federal income tax purposes, net realized foreign exchange gains or losses are characterized as ordinary income, and may, if the Funds have net losses, reduce or eliminate the amount of income available to be distributed by the Funds.
The values of investment securities are presented at the foreign exchange rates prevailing at the end of the period for financial reporting purposes. Net realized and unrealized gains or losses on investments reported in the Statements of Operations reflect gains
43 |
Notes to Financial Statements (continued)
November 30, 2021
or losses resulting from changes in exchange rates and fluctuations which arise due to changes in market prices of investment securities. For federal income tax purposes, a portion of the net realized gain or loss on investments arising from changes in exchange rates, which is reflected in the Statements of Operations, may be characterized as ordinary income and may, if the Funds have net losses, reduce the amount of income available to be distributed by the Funds.
The Funds may use foreign currency exchange contracts to facilitate transactions in foreign-denominated investments. Losses may arise from changes in the value of the foreign currency or if the counterparties do not perform under the contracts’ terms.
d. Option Contracts. Select Fund may enter into option contracts. When a Fund purchases an option, it pays a premium and the option is subsequently marked-to-market to reflect current value. Premiums paid for purchasing options which expire are treated as realized losses. Premiums paid for purchasing options which are exercised are added to the cost or deducted from the proceeds on the underlying instrument or index to determine the realized gain or loss. If the Fund enters into a closing sale transaction, the difference between the premium paid and the proceeds of the closing sale transaction is treated as a realized gain or loss. The risk associated with purchasing options is limited to the premium paid.
When a Fund writes an option, an amount equal to the net premium received (the premium less commission) is recorded as a liability and is subsequently adjusted to the current value. Net premiums received for written options which expire are treated as realized gains. Net premiums received for written options which are exercised are deducted from the cost or added to the proceeds on the underlying instrument or index to determine the realized gain or loss. If the Fund enters into a closing purchase transaction, the difference between the net premium received and any amount paid on effecting a closing purchase transaction, including commissions, is treated as a realized gain or, if the net premium received is less than the amount paid, as a realized loss. The Fund, as writer of a written option, bears the risk of an unfavorable change in the market value of the instrument underlying the written option.
Exchange-traded option contracts are standardized and are settled through a clearing house with fulfillment supported by the credit of the exchange. Therefore, counterparty credit risk to the Fund is reduced. Effective October 21, 2021, the Fund terminated its prime brokerage agreement and may no longer enter into option contracts.
e. Federal and Foreign Income Taxes. The Trust treats each Fund as a separate entity for federal income tax purposes. Each Fund intends to meet the requirements of the Internal Revenue Code of 1986, as amended, applicable to regulated investment companies, and to distribute to its shareholders substantially all of its net investment income and any net realized capital gains at least annually. Management has performed an analysis of each Fund’s tax positions for the open tax years as of November 30, 2021 and has concluded that no provisions for income tax are required. The Funds’ federal tax returns for the prior three fiscal years remain subject to examination by the Internal Revenue Service. Management is not aware of any events that are reasonably possible to occur in the next twelve months that would result in the amounts of any unrecognized tax benefits significantly increasing or decreasing for the Funds. However, management’s conclusions regarding tax positions taken may be subject to review and adjustment at a later date based on factors including, but not limited to, new tax laws and accounting regulations and interpretations thereof.
A Fund may be subject to foreign withholding taxes on investment income and taxes on capital gains on investments that are accrued and paid based upon the Fund’s understanding of the tax rules and regulations that exist in the countries in which the Fund invests. Foreign withholding taxes on dividend and interest income are reflected on the Statements of Operations as a reduction of investment income, net of amounts that have been or are expected to be reclaimed and paid. Dividends and interest receivable on the Statements of Assets and Liabilities are net of foreign withholding taxes. Foreign withholding taxes where reclaims have been or are expected to be filed and paid are reflected on the Statements of Assets and Liabilities as tax reclaims receivable. Capital gains taxes paid are included in net realized gain (loss) on investments in the Statements of Operations. Accrued but unpaid capital gains taxes are reflected as foreign taxes payable on the Statements of Assets and Liabilities, if applicable, and reduce unrealized gains on investments. In the event that realized gains on investments are subsequently offset by realized losses, taxes paid on realized gains may be returned to a Fund. Such amounts, if applicable, are reflected as foreign tax rebates receivable on the Statements of Assets and Liabilities and are recorded as a realized gain when received.
f. Dividends and Distributions to Shareholders. Dividends and distributions are recorded on the ex-dividend date. The timing and characterization of certain income and capital gain distributions are determined in accordance with federal tax regulations, which may differ from accounting principles generally accepted in the United States of America. Permanent differences are primarily due to differing treatments for book and tax purposes of items such as foreign currency gains and losses, partnership basis adjustments, premium amortization, paydown gains and losses, defaulted and/or non-income producing securities, deferred Trustees’ fees, net operating losses, distribution re-designations and return of capital distributions received. Permanent book and tax basis differences relating to shareholder distributions, net investment income, and net realized gains will result in reclassifications to capital accounts reported on the Statements of Assets and Liabilities. Temporary differences between book and tax distributable earnings are primarily due to premium amortization, defaulted and/or non-income producing securities, deferred Trustees’ fees, wash sales, partnership basis
| 44
Notes to Financial Statements (continued)
November 30, 2021
adjustments, dividends payable, foreign currency gains and losses, net operating losses, paydown gains and losses and return of capital distributions received. Amounts of income and capital gain available to be distributed on a tax basis are determined annually, and at other times during the Funds’ fiscal year as may be necessary to avoid knowingly declaring and paying a return of capital distribution. Distributions from net investment income and net realized short-term capital gains are reported as distributed from ordinary income for tax purposes.
The tax characterization of distributions is determined on an annual basis. The tax character of distributions paid to shareholders during the years ended November 30, 2021 and 2020 was as follows:
| | | | | | | | | | | | | | | | | | | | | | | | |
| | | 2021 Distributions | | | 2020 Distributions | |
Fund | | Ordinary
Income | | | Long-Term
Capital
Gains | | | Total | | | Ordinary
Income | | | Long-Term
Capital
Gains | | | Total | |
Global Growth Fund | | $ | 140,189 | | | $ | 6,199,326 | | | $ | 6,339,515 | | | $ | 129,775 | | | $ | 3,808,266 | | | $ | 3,938,041 | |
Senior Floating Rate and Fixed Income Fund | | | 52,168,667 | | | | — | | | | 52,168,667 | | | | 82,661,974 | | | | — | | | | 82,661,974 | |
Select Fund | | | 2,374,783 | | | | 10,325,809 | | | | 12,700,592 | | | | 2,839,145 | | | | 15,303,932 | | | | 18,143,077 | |
Distributions paid to shareholders from net investment income and net realized capital gains, based on accounting principles generally accepted in the United States of America, are consolidated and reported on the Statements of Changes in Net Assets as Distributions to Shareholders. Distributions paid to shareholders from net investment income and net realized capital gains expressed in per-share amounts, based on accounting principles generally accepted in the United States of America, are separately stated and reported within the Financial Highlights.
As of November 30, 2021, the components of distributable earnings on a tax basis were as follows:
| | | | | | | | | | | | |
| | | Global
Growth
Fund | | | Senior
Floating
Rate and
Fixed
Income Fund | | | Select Fund | |
Undistributed ordinary income | | $ | 18,398 | | | $ | 2,196,026 | | | $ | 38,158,967 | |
Undistributed long-term capital gains | | | 8,808,443 | | | | — | | | | 36,475,233 | |
| | | | | | | | | | | | |
Total undistributed earnings | | | 8,826,841 | | | | 2,196,026 | | | | 74,634,200 | |
| | | | | | | | | | | | |
Capital loss carryforward: | |
Short-term: | |
No expiration date | | | — | | | | (112,057,167 | ) | | | — | |
Long-term: | |
No expiration date | | | — | | | | (416,925,999 | ) | | | — | |
| | | | | | | | | | | | |
Total capital loss carryforward | | | — | | | | (528,983,166 | ) | | | — | |
| | | | | | | | | | | | |
Unrealized appreciation (depreciation) | | | 22,339,841 | | | | (10,831,746 | ) | | | 42,945,719 | |
| | | | | | | | | | | | |
Total accumulated earnings (losses) | | $ | 31,166,682 | | | $ | (537,618,886 | ) | | $ | 117,579,919 | |
| | | | | | | | | | | | |
As of November 30, 2021, the tax cost of investments (including derivatives, if applicable) and unrealized appreciation (depreciation) on a federal tax basis were as follows:
| | | | | | | | | | | | |
| | | Global
Growth
Fund | | | Senior
Floating Rate
and Fixed
Income Fund | | | Select Fund | |
Federal tax cost | | $ | 103,154,333 | | | $ | 1,644,519,815 | | | $ | 209,183,215 | |
| | | | | | | | | | | | |
Gross tax appreciation | | $ | 26,731,088 | | | $ | 8,124,731 | | | $ | 47,177,404 | |
Gross tax depreciation | | | (4,393,872 | ) | | | (18,956,477 | ) | | | (4,231,685 | ) |
| | | | | | | | | | | | |
Net tax appreciation (depreciation) | | $ | 22,337,216 | | | $ | (10,831,746 | ) | | $ | 42,945,719 | |
| | | | | | | | | | | | |
45 |
Notes to Financial Statements (continued)
November 30, 2021
The difference between these amounts and those reported in the components of distributable earnings, if any, are primarily attributable to foreign currency mark-to-market.
g. Senior Loans. Senior Floating Rate and Fixed Income Fund may invest in senior loans to corporate, governmental or other borrowers. Senior loans, which include both secured and unsecured loans made by banks and other financial institutions to corporate customers, typically hold the most senior position in a borrower’s capital structure, may be secured by the borrower’s assets and have interest rates that reset frequently. Senior loans can include term loans, revolving credit facility loans and second lien loans. A senior loan is often administered by a bank or other financial institution that acts as agent for all holders. The agent administers the terms of the senior loan, as specified in the loan agreement. Large loans may be shared or syndicated among several lenders. The Fund may enter into the primary syndicate for a loan or it may also purchase all or a portion of loans from other lenders (sometimes referred to as loan assignments), in either case becoming a direct lender. The settlement period for senior loans is uncertain as there is no standardized settlement schedule applicable to such investments. Senior loans outstanding at the end of the period are listed in the Fund’s Portfolio of Investments.
h. Repurchase Agreements. Each Fund may enter into repurchase agreements, under the terms of a Master Repurchase Agreement, under which each Fund acquires securities as collateral and agrees to resell the securities at an agreed upon time and at an agreed upon price. It is each Fund’s policy that the market value of the collateral for repurchase agreements be at least equal to 102% of the repurchase price, including interest. Certain repurchase agreements are tri-party arrangements whereby the collateral is held in a segregated account for the benefit of the Fund and on behalf of the counterparty. Repurchase agreements could involve certain risks in the event of default or insolvency of the counterparty, including possible delays or restrictions upon a Fund’s ability to dispose of the underlying securities. As of November 30, 2021, each Fund, as applicable, had investments in repurchase agreements for which the value of the related collateral exceeded the value of the repurchase agreement. The gross value of repurchase agreements is included in the Statements of Assets and Liabilities for financial reporting purposes.
i. Unfunded Loan Commitments. Senior Floating Rate and Fixed Income Fund may enter into unfunded loan commitments, which are contractual obligations for future funding at the option of the borrower. Unfunded loan commitments represent a future obligation, in full, even though a percentage of the committed amount may not be utilized by the borrower. Unfunded loan commitments, and the obligation for future funding, are recorded as a liability on the Statements of Assets and Liabilities at par value at the time the commitment is entered into. Purchases of unfunded loan commitments may have a similar effect on the Fund’s NAV as if the Fund had created a degree of leverage in the portfolio. Market risk exists with these commitments to the same extent as if the securities were owned on a settled basis. Losses may arise due to changes in the value of the unfunded loan commitments.
As of November 30, 2021, the Fund had unfunded loan commitments reflected on the Statement of Assets and Liabilities, which could be extended at the option of the borrower, pursuant to loan agreements with the following borrowers:
| | | | | | |
Borrower | | Type | | Principal Amount | |
CMBF LLC | | Delayed Draw Term Loan | | $ | 1,012,061 | |
Eisner Advisory Group LLC | | Delayed Draw Term Loan | | | 654,545 | |
EyeCare Partners LLC | | 2021 Delayed Draw Term Loan | | | 701,000 | |
Holley Purchaser, Inc. | | 2021 Delayed Draw Term Loan | | | 914,286 | |
Mariner Wealth Advisors LLC | | Delayed Draw Term Loan | | | 787,000 | |
National Mentor Holdings, Inc. | | 2021 Delayed Draw Term Loan | | | 261,152 | |
Refficiency Holdings LLC | | 2021 Delayed Draw Term Loan | | | 587,251 | |
Service Logic Acquisition, Inc | | Delayed Draw Term Loan | | | 257,795 | |
TGP Holdings III LLC | | 2021 Delayed Draw Term Loan | | | 157,107 | |
VT Topco, Inc. | | 2021 Delayed Draw Term Loan | | | 522,170 | |
| | | | | | |
| | | | $ | 5,854,367 | |
| | | | | | |
Under the terms of the contract, the Fund has the option to assign (sell) all or a portion of the unfunded loan commitment. Upon the completion of such assignment, the Fund is released from its rights and obligations pertaining to the portion of the unfunded loan commitment assigned. When the Fund sells a portion of an unfunded loan commitment, the portion sold is removed from the Portfolio of Investments and the unsettled amount is reflected as unfunded loan commitments sold on the Statement of Assets and Liabilities until settlement date. Once settled, the portion of the unfunded loan commitment assigned is relieved from the Fund’s unfunded loan commitments liability.
| 46
Notes to Financial Statements (continued)
November 30, 2021
j. Indemnifications. Under the Trust’s organizational documents, its officers and Trustees are indemnified against certain liabilities arising out of the performance of their duties to the Funds. Additionally, in the normal course of business, the Funds enter into contracts with service providers that contain general indemnification clauses. The Funds’ maximum exposure under these arrangements is unknown as this would involve future claims that may be made against the Funds that have not yet occurred. However, based on experience, the Funds expect the risk of loss to be remote.
k. New Accounting Pronouncement. In January 2021, the Financial Accounting Standards Board issued Accounting Standard Update 2021-01, Reference Rate Reform (Topic 848) (“ASU 2021-01”). ASU 2021-01 is an update of ASU 2020-04, which was issued in response to concerns about structural risks of interbank offered rates, and particularly the risk of cessation of the London Interbank Offered Rate (“LIBOR”), expected to occur no later than June 30, 2023. Regulators have undertaken reference rate reform initiatives to identify alternative reference rates that are more observable or transaction based and less susceptible to manipulation. ASU 2020-04 provides temporary guidance to ease the potential burden in accounting for (or recognizing the effects of) reference rate reform on financial reporting. ASU 2020-04 is elective and applies to all entities, subject to meeting certain criteria, that have contracts that reference LIBOR or another reference rate expected to be discontinued because of reference rate reform. ASU 2020-04 amendments offer optional expedients for contract modifications that would allow an entity to account for such modifications by prospectively adjusting the effective interest rate, instead of evaluating each contract, in accordance with existing accounting standards, as to whether reference rate modifications constitute the establishment of new contracts or the continuation of existing contracts. ASU 2021-01 clarifies that certain provisions in Topic 848, if elected by an entity, apply to derivative instruments that use an interest rate for margining, discounting, or contract price alignment that is modified as a result of reference rate reform. The amendments are currently effective and an entity may elect to apply its provisions as of any date from the beginning of an interim period that includes or is subsequent to March 12, 2020. Management expects to apply the optional expedients when appropriate.
3. Fair Value Measurements. In accordance with accounting standards related to fair value measurements and disclosures, the Funds have categorized the inputs utilized in determining the value of each Fund’s assets or liabilities. These inputs are summarized in the three broad levels listed below:
| | • | | Level 1 – quoted prices in active markets for identical assets or liabilities; |
| | • | | Level 2 – prices determined using other significant inputs that are observable either directly, or indirectly through corroboration with observable market data (which could include quoted prices for similar assets or liabilities, interest rates, credit risk, etc.); and |
| | • | | Level 3 – prices determined using significant unobservable inputs when quoted prices or observable inputs are unavailable such as when there is little or no market activity for an asset or liability (unobservable inputs reflect each Fund’s own assumptions in determining the fair value of assets or liabilities and would be based on the best information available). |
The inputs or methodology used for valuing securities are not necessarily an indication of the risk associated with investing in those securities.
The Funds’ pricing policies and procedures are recommended by the adviser and approved by the Board of Trustees. Debt securities are valued based on evaluated bids furnished to the Funds by an independent pricing service. Broker-dealer bid prices may be used if an independent pricing service either is unable to price a security or does not provide a reliable price for a security. The Funds’ adviser may use internally developed models to validate broker-dealer bid prices that are only available from a single broker or market maker. Such securities are considered and classified as fair valued. Broker-dealer bid prices for which the Funds do not have knowledge of the inputs used by the broker-dealer are categorized in Level 3. Securities for which market quotations are not readily available are valued at fair value as determined in good faith by the Funds’ adviser pursuant to procedures approved by the Board of Trustees. Fair valued securities may be categorized in Level 3.
47 |
Notes to Financial Statements (continued)
November 30, 2021
The following is a summary of the inputs used to value the Funds’ investments as of November 30, 2021, at value:
Global Growth Fund
Asset Valuation Inputs
| | | | | | | | | | | | | | | | |
Description | | Level 1 | | | Level 2 | | | Level 3 | | | Total | |
Common Stocks | | | | | | | | | | | | | | | | |
China | | $ | 12,835,710 | | | $ | 4,328,338 | | | $ | — | | | $ | 17,164,048 | |
Denmark | | | — | | | | 1,653,280 | | | | — | | | | 1,653,280 | |
France | | | — | | | | 939,480 | | | | — | | | | 939,480 | |
Japan | | | — | | | | 2,352,508 | | | | — | | | | 2,352,508 | |
Netherlands | | | — | | | | 5,930,217 | | | | — | | | | 5,930,217 | |
Switzerland | | | 1,862,629 | | | | 11,738,714 | | | | — | | | | 13,601,343 | |
United Kingdom | | | — | | | | 5,795,733 | | | | — | | | | 5,795,733 | |
All Other Common Stocks(a) | | | 77,717,631 | | | | — | | | | — | | | | 77,717,631 | |
| | | | | | | | | | | | | | | | |
Total Common Stocks | | | 92,415,970 | | | | 32,738,270 | | | | — | | | | 125,154,240 | |
| | | | | | | | | | | | | | | | |
Short-Term Investments | | | — | | | | 337,309 | | | | — | | | | 337,309 | |
| | | | | | | | | | | | | | | | |
Total | | $ | 92,415,970 | | | $ | 33,075,579 | | | $ | — | | | $ | 125,491,549 | |
| | | | | | | | | | | | | | | | |
| (a) | Details of the major categories of the Fund’s investments are reflected within the Portfolio of Investments. |
Senior Floating Rate and Fixed Income Fund
Asset Valuation Inputs
| | | | | | | | | | | | | | | | |
Description | | Level 1 | | | Level 2 | | | Level 3 | | | Total | |
Senior Loans(a) | | $ | — | | | $ | 1,381,478,112 | | | $ | — | | | $ | 1,381,478,112 | |
Bonds and Notes(a) | | | — | | | | 73,486,736 | | | | — | | | | 73,486,736 | |
Common Stocks | | | | | | | | | | | | | | | | |
Energy Equipment & Services | | | — | | | | — | | | | 8,814 | (b) | | | 8,814 | |
All Other Common Stocks(a) | | | — | | | | 6,692,138 | | | | — | | | | 6,692,138 | |
| | | | | | | | | | | | | | | | |
Total Common Stocks | | | — | | | | 6,692,138 | | | | 8,814 | | | | 6,700,952 | |
| | | | | | | | | | | | | | | | |
Exchange-Traded Funds | | | 27,944,800 | | | | — | | | | — | | | | 27,944,800 | |
Short-Term Investments | | | — | | | | 144,077,469 | | | | — | | | | 144,077,469 | |
| | | | | | | | | | | | | | | | |
Total | | $ | 27,944,800 | | | $ | 1,605,734,455 | | | $ | 8,814 | | | $ | 1,633,688,069 | |
| | | | | | | | | | | | | | | | |
| (a) | Details of the major categories of the Fund’s investments are reflected within the Portfolio of Investments. |
| (b) | Fair valued by the Fund’s adviser. |
Select Fund
Asset Valuation Inputs
| | | | | | | | | | | | | | | | |
Description | | Level 1 | | | Level 2 | | | Level 3 | | | Total | |
Common Stocks(a) | | $ | 247,349,460 | | | $ | — | | | $ | — | | | $ | 247,349,460 | |
Short-Term Investments | | | — | | | | 4,779,474 | | | | — | | | | 4,779,474 | |
| | | | | | | | | | | | | | | | |
Total | | $ | 247,349,460 | | | $ | 4,779,474 | | | $ | — | | | $ | 252,128,934 | |
| | | | | | | | | | | | | | | | |
| |
| (a) | Details of the major categories of the Fund’s investments are reflected within the Portfolio of Investments. |
| 48
Notes to Financial Statements (continued)
November 30, 2021
The following is a reconciliation of Level 3 investments for which significant unobservable inputs were used to determine fair value as of November 30, 2020 and/or November 30, 2021:
Senior Floating Rate and Fixed Income Fund
Asset Valuation Inputs
| | | | | | | | | | | | | | | | | | | | | | | | | | | | | | | | | | | | | | | | |
Investments in Securities | | Balance as of
November 30,
2020 | | | Accrued
Discounts
(Premiums) | | | Realized
Gain (Loss) | | | Change in
Unrealized
Appreciation
(Depreciation) | | | Purchases | | | Sales | | | Transfers
into
Level 3 | | | Transfers
out of
Level 3 | | | Balance as of
November 30,
2021 | | | Change in
Unrealized
Appreciation
(Depreciation)
from
Investments
Still Held at
November 30,
2021 | |
Senior Loans | | | | | | | | | | | | | | | | | | | | | | | | | | | | | | | | | | | | | | | | |
Construction Machinery | | $ | 1,737,804 | | | $ | 118,933 | | | $ | (572,628 | ) | | $ | 1,067,806 | | | $ | — | | | $ | (2,351,915 | ) | | $ | — | | | $ | — | | | $ | — | | | $ | — | |
Independent Energy | | | — | (a) | | | 1,077 | | | | (23,663,261 | ) | | | 23,662,184 | | | | — | | | | — | | | | — | | | | — | | | | — | | | | — | |
Common Stocks | | | | | | | | | | | | | | | | | | | | | | | | | | | | | | | | | | | | | | | | |
Energy Equipment & Services | | | 297,518 | | | | — | | | | — | | | | (288,704 | ) | | | — | | | | — | | | | — | | | | — | | | | 8,814 | | | | (288,704 | ) |
Specialty Retail | | | — | (a) | | | — | | | | — | | | | — | | | | — | | | | — | | | | — | | | | — | | | | — | | | | — | |
| | | | | | | | | | | | | | | | | | | | | | | | | | | | | | | | | | | | | | | | |
Total | | $ | 2,035,322 | | | $ | 120,010 | | | $ | (24,235,889 | ) | | $ | 24,441,286 | | | $ | — | | | $ | (2,351,915 | ) | | $ | — | | | $ | — | | | $ | 8,814 | | | $ | (288,704 | ) |
| | | | | | | | | | | | | | | | | | | | | | | | | | | | | | | | | | | | | | | | |
| (a) | Includes a security fair valued at zero by the Fund’s adviser using Level 3 inputs. |
4. Purchases and Sales of Securities. For the year ended November 30, 2021, purchases and sales of securities (excluding short-term investments and including paydowns) were as follows:
| | | | | | | | |
Fund | | Purchases | | | Sales | |
Global Growth Fund | | $ | 35,439,581 | | | $ | 22,095,859 | |
Senior Floating Rate and Fixed Income Fund | | | 1,426,036,194 | | | | 1,062,691,423 | |
Select Fund | | | 196,622,027 | | | | 242,140,694 | |
5. Management Fees and Other Transactions with Affiliates.
a. Management Fees. Loomis, Sayles & Company, L.P. (“Loomis Sayles”) serves as investment adviser to Global Growth Fund and Senior Floating Rate and Fixed Income Fund. Loomis Sayles is a limited partnership whose sole general partner, Loomis, Sayles & Company, Inc., is indirectly owned by Natixis Investment Managers, LLC (“Natixis”), which is part of Natixis Investment Managers, an international asset management group based in Paris, France.
Under the terms of the management agreements, each Fund pays a management fee at the following annual rates, calculated daily and payable monthly, based on each Fund’s average daily net assets:
| | | | |
Fund | | Percentage
of Average
Daily Net Assets | |
Global Growth Fund | | | 0.75 | % |
Senior Floating Rate and Fixed Income Fund | | | 0.60 | % |
Prior to December 15, 2020, Global Growth Fund paid a management fee at the annual rate of 0.80% of the Fund’s average daily net assets, calculated daily and payable monthly.
Natixis Advisors, LLC (“Natixis Advisors”), serves as investment adviser to Select Fund. Natixis Advisors is a wholly-owned subsidiary of Natixis. Under the terms of the management agreement, the Fund pays a management fee at the annual rate of 0.70%, calculated daily and payable monthly, based on the Fund’s average daily net assets.
Prior to July 1, 2021, Select Fund paid a management fee at the annual rate of 0.75% of the Fund’s average daily net assets, calculated daily and payable monthly.
Natixis Advisors has entered into a subadvisory agreement with Vaughan Nelson Investment Management, L.P. (“Vaughan Nelson”). Under the terms of the subadvisory agreement, the Fund pays a subadvisory fee at the annual rate of 0.47%, calculated daily and payable monthly, based on the Fund’s average daily net assets. Payments to Natixis Advisors are reduced by the amount of payments to Vaughan Nelson.
49 |
Notes to Financial Statements (continued)
November 30, 2021
Prior to July 1, 2021, Select Fund paid a subadvisory fee at the annual rate of 0.50%, calculated daily and payable monthly, based on the Fund’s average daily net assets.
Loomis Sayles and Natixis Advisors have given binding undertakings to the Funds to waive management fees and/or reimburse certain expenses to limit the Funds’ operating expenses, exclusive of acquired fund fees and expenses, brokerage expenses, interest expense, substitute dividend expenses on securities sold short, taxes, organizational and extraordinary expenses such as litigation and indemnification expenses. These undertakings are in effect until March 31, 2022, except for Select Fund, which is in effect until March 31, 2023, may be terminated before then only with the consent of the Funds’ Board of Trustees, and are reevaluated on an annual basis. Management fees payable, as reflected on the Statements of Assets and Liabilities, is net of waivers and/or expense reimbursements, if any, pursuant to these undertakings. Waivers/reimbursements that exceed management fees payable are reflected on the Statements of Assets and Liabilities as receivable from investment adviser.
For the year ended November 30, 2021, the expense limits as a percentage of average daily net assets under the expense limitation agreements were as follows:
| | | | | | | | | | | | | | | | |
| | | Expense Limit as a Percentage of
Average Daily Net Assets | |
Fund | | Class A | | | Class C | | | Class N | | | Class Y | |
Global Growth Fund | | | 1.20 | % | | | 1.95 | % | | | 0.90 | % | | | 0.95 | % |
Senior Floating Rate and Fixed Income Fund | | | 1.05 | % | | | 1.80 | % | | | 0.75 | % | | | 0.80 | % |
Select Fund | | | 1.10 | % | | | 1.85 | % | | | 0.80 | % | | | 0.85 | % |
Prior to December 15, 2020, the expense limits as a percentage of average daily net assets under the expense limitation agreements for Global Growth Fund were as follows:
| | | | | | | | | | | | | | | | |
| | | Expense Limit as a Percentage of
Average Daily Net Assets | |
Fund | | Class A | | | Class C | | | Class N | | | Class Y | |
Global Growth Fund | | | 1.25 | % | | | 2.00 | % | | | 0.95 | % | | | 1.00 | % |
Prior to July 1, 2021, the expense limits as a percentage of average daily net assets under the expense limitation agreements for Select Fund were as follows:
| | | | | | | | | | | | | | | | |
| | | Expense Limit as a Percentage of
Average Daily Net Assets | |
Fund | | Class A | | | Class C | | | Class N | | | Class Y | |
Select Fund | | | 1.15 | % | | | 1.90 | % | | | 0.85 | % | | | 0.90 | % |
Loomis Sayles and Natixis Advisors shall be permitted to recover expenses borne under the expense limitation agreements (whether through waiver of management fees or otherwise) on a class by class basis in later periods to the extent the annual operating expenses of a class fall below both (1) a class’ expense limitation ratio in place at the time such amounts were waived/reimbursed and (2) a class’ current applicable expense limitation ratio, provided, however, that a class is not obligated to pay such waived/reimbursed fees or expenses more than one year after the end of the fiscal year in which the fees or expenses were waived/reimbursed.
For the year ended November 30, 2021, the management fees and waivers of management fees for each Fund were as follows:
| | | | | | | | | | | | | | | | | | | | | | | | |
Fund | | Gross
Management Fees | | | Contractual
Waivers of
Management Fees1 | | | Voluntary
Waivers of
Management Fees2 | | | Net
Management Fees | | | Percentage
of Average
Daily Net Assets | |
| | Gross | | | Net | |
Global Growth Fund | | $ | 941,969 | | | $ | 112,467 | | | $ | — | | | $ | 829,502 | | | | 0.75 | % | | | 0.66 | % |
Senior Floating Rate and Fixed Income Fund | | | 8,354,950 | | | | 2,693,694 | | | | — | | | | 5,661,256 | | | | 0.60 | % | | | 0.41 | % |
Select Fund | | | 1,548,827 | | | | 31,606 | | | | 53,819 | | | | 1,463,402 | | | | 0.73 | % | | | 0.69 | % |
| 1 | Contractual management fee waivers are subject to possible recovery until November 30, 2022. |
| 2 | In order to ensure that the total annual fund operating expenses after fee waiver and/or expense reimbursement do not exceed limitations, Natixis Advisors may voluntarily waive additional management fees for the Select Fund. Voluntary management fee waivers are not subject to recovery under the expense limitation agreement described above. |
| 50
Notes to Financial Statements (continued)
November 30, 2021
No expenses were recovered for any of the Funds during the year ended November 30, 2021 under the terms of the expense limitation agreements.
b. Service and Distribution Fees. Natixis Distribution, LLC (“Natixis Distribution”), which is a wholly-owned subsidiary of Natixis Investment Managers, LLC, has entered into a distribution agreement with the Trust. Pursuant to this agreement, Natixis Distribution serves as principal underwriter of the Funds of the Trust.
Pursuant to Rule 12b-1 under the 1940 Act, the Trust has adopted a Service Plan relating to each Fund’s Class A shares (the “Class A Plans”) and a Distribution and Service Plan relating to each Fund’s Class C shares (the “Class C Plans”).
Under the Class A Plans, each Fund pays Natixis Distribution a monthly service fee at an annual rate not to exceed 0.25% of the average daily net assets attributable to the Fund’s Class A shares, as reimbursement for expenses incurred by Natixis Distribution in providing personal services to investors in Class A shares and/or the maintenance of shareholder accounts.
Under the Class C Plans, each Fund pays Natixis Distribution a monthly service fee at an annual rate not to exceed 0.25% of the average daily net assets attributable to the Fund’s Class C shares, as compensation for services provided by Natixis Distribution in providing personal services to investors in Class C shares and/or the maintenance of shareholder accounts.
Also under the Class C Plans, each Fund pays Natixis Distribution a monthly distribution fee at the annual rate of 0.75% of the average daily net assets attributable to the Fund’s Class C shares, as compensation for services provided by Natixis Distribution in connection with the marketing or sale of Class C shares.
For the year ended November 30, 2021, the service and distribution fees for each Fund were as follows:
| | | | | | | | | | | | |
| | | Service Fees | | | Distribution Fees | |
Fund | | Class A | | | Class C | | | Class C | |
Global Growth Fund | | $ | 16,007 | | | $ | 3,584 | | | $ | 10,751 | |
Senior Floating Rate and Fixed Income Fund | | | 540,300 | | | | 268,955 | | | | 806,865 | |
Select Fund | | | 40,646 | | | | 14,025 | | | | 42,076 | |
c. Administrative Fees. Natixis Advisors provides certain administrative services for the Funds and contracts with State Street Bank and Trust Company (“State Street Bank”) to serve as sub-administrator. Pursuant to an agreement among Natixis Funds Trusts, Loomis Sayles Funds Trusts, Natixis ETF Trusts and Natixis Advisors, each Fund pays Natixis Advisors monthly its pro rata portion of fees equal to an annual rate of 0.0540% of the first $15 billion of the average daily net assets of the Natixis Funds Trusts, Loomis Sayles Funds Trusts and Natixis ETF Trusts, 0.0500% of the next $15 billion, 0.0400% of the next $30 billion, 0.0275% of the next $30 billion and 0.0225% of such assets in excess of $90 billion, subject to an annual aggregate minimum fee for the Natixis Funds Trusts, Loomis Sayles Funds Trusts and Natixis ETF Trusts of $10 million, which is reevaluated on an annual basis.
For the year ended November 30, 2021, the administrative fees for each Fund were as follows:
| | | | |
Fund | | Administrative Fees | |
Global Growth Fund | | $ | 53,424 | |
Senior Floating Rate and Fixed Income Fund | | | 593,560 | |
Select Fund | | | 90,790 | |
d. Sub-Transfer Agent Fees. Natixis Distribution has entered into agreements, which include servicing agreements, with financial intermediaries that provide recordkeeping, processing, shareholder communications and other services to customers of the intermediaries that hold positions in the Funds and has agreed to compensate the intermediaries for providing those services. Intermediaries transact with the Funds primarily through the use of omnibus accounts on behalf of their customers who hold positions in the Funds. These services would have been provided by the Funds’ transfer agent and other service providers if the shareholders’ accounts were maintained directly at the Funds’ transfer agent. Accordingly, the Funds have agreed to reimburse Natixis Distribution for all or a portion of the servicing fees paid to these intermediaries. The reimbursement amounts (sub-transfer agent fees) paid to Natixis Distribution are subject to a current per-account equivalent fee limit approved by the Funds’ Board of Trustees, which is based on fees for similar services paid to the Funds’ transfer agent and other service providers. Class N shares do not bear such expenses.
51 |
Notes to Financial Statements (continued)
November 30, 2021
For the year ended November 30, 2021, the sub-transfer agent fees (which are reflected in transfer agent fees and expenses in the Statements of Operations) for each Fund were as follows:
| | | | |
Fund | | Sub-Transfer
Agent Fees | |
Global Growth Fund | | $ | 69,124 | |
Senior Floating Rate and Fixed Income Fund | | | 899,931 | |
Select Fund | | | 41,526 | |
As of November 30, 2021, the Funds owe Natixis Distribution the following reimbursements for sub-transfer agent fees (which are reflected in the Statements of Assets and Liabilities as payable to distributor):
| | | | |
Fund | | Reimbursements
of Sub-Transfer
Agent Fees | |
Global Growth Fund | | $ | 432 | |
Senior Floating Rate and Fixed Income Fund | | | 28,046 | |
Select Fund | | | 1,116 | |
Sub-transfer agent fees attributable to Class A, Class C and Class Y are allocated on a pro rata basis to each class based on the relative net assets of each class to the total net assets of those classes.
e. Commissions. Commissions (including CDSCs) on Fund shares retained by Natixis Distribution during the year ended November 30, 2021 were as follows:
| | | | |
Fund | | Commissions | |
Global Growth Fund | | $ | 3,047 | |
Senior Floating Rate and Fixed Income Fund | | | 14,486 | |
Select Fund | | | 1,552 | |
f. Trustees Fees and Expenses. The Trust does not pay any compensation directly to its officers or Trustees who are directors, officers or employees of Natixis Advisors, Natixis Distribution, Natixis Investment Managers, LLC or their affiliates. The Chairperson of the Board of Trustees receives a retainer fee at the annual rate of $369,000. The Chairperson does not receive any meeting attendance fees for Board of Trustees meetings or committee meetings that he attends. Each Independent Trustee (other than the Chairperson) receives, in the aggregate, a retainer fee at the annual rate of $199,000. Each Independent Trustee also receives a meeting attendance fee of $10,000 for each meeting of the Board of Trustees that he or she attends in person and $5,000 for each meeting of the Board of Trustees that he or she attends telephonically. In addition, the chairperson of the Contract Review Committee, the chairperson of the Audit Committee and the chairperson of the Governance Committee each receive an additional retainer fee at the annual rate of $20,000. Each Contract Review Committee member is compensated $6,000 for each Committee meeting that he or she attends in person and $3,000 for each meeting that he or she attends telephonically. Each Audit Committee member is compensated $6,000 for each Committee meeting that he or she attends in person and $3,000 for each meeting that he or she attends telephonically. These fees are allocated among the funds in the Natixis Funds Trusts, Loomis Sayles Funds Trusts and Natixis ETF Trusts based on a formula that takes into account, among other factors, the relative net assets of each fund. Trustees are reimbursed for travel expenses in connection with attendance at meetings.
Effective January 1, 2022, each Independent Trustee (other than the Chairperson) will receive, in the aggregate, a retainer fee at the annual rate of $210,000. All other Trustees fees will remain unchanged.
A deferred compensation plan (the “Plan”) is available to the Trustees on a voluntary basis. Deferred amounts remain in the Funds until distributed in accordance with the provisions of the Plan. The value of a participating Trustee’s deferral account is based on theoretical investments of deferred amounts, on the normal payment dates, in certain funds of the Natixis Funds Trusts, Loomis Sayles Funds Trusts and Natixis ETF Trusts as designated by the participating Trustees. Changes in the value of participants’ deferral accounts are allocated pro rata among the funds in the Natixis Funds Trusts, Loomis Sayles Funds Trusts and Natixis ETF Trusts, and are normally reflected as Trustees’ fees and expenses in the Statements of Operations. The portions of the accrued obligations allocated to the Funds under the Plan are reflected as Deferred Trustees’ fees in the Statements of Assets and Liabilities.
Certain officers and employees of Natixis Advisors and Loomis Sayles are also officers and/or Trustees of the Trust.
| 52
Notes to Financial Statements (continued)
November 30, 2021
g. Affiliated Ownership. As of November 30, 2021, Natixis and affiliates and Loomis Sayles Employees’ Profit Sharing Retirement Plan (“Retirement Plan”) held shares of the Funds representing the following percentages of the Funds’ net assets:
| | | | | | |
Fund | | Natixis | | | Retirement Plan |
Global Growth Fund | | | 9.75% | | | — |
Senior Floating Rate and Fixed Income Fund | | | — | | | 0.76% |
Select Fund | | | Less than 1 | % | | — |
Investment activities of affiliated shareholders could have material impacts on the Funds.
h. Reimbursement of Transfer Agent Fees and Expenses. Natixis Advisors has given a binding contractual undertaking to the Funds to reimburse any and all transfer agency expenses for the Funds’ Class N shares. This undertaking is in effect through March 31, 2022 and is not subject to recovery under the expense limitation agreement described above.
For the year ended November 30, 2021, Natixis Advisors reimbursed the Funds for transfer agency expenses as follows:
| | |
Fund | | Reimbursement of Transfer Agency Expenses Class N |
Global Growth Fund | | $986 |
Senior Floating Rate and Fixed Income Fund | | 969 |
Select Fund | | 945 |
6. Class-Specific Transfer Agent Fees and Expenses. Transfer agent fees and expenses attributable to Class A, Class C and Class Y are allocated on a pro rata basis to each class based on the relative net assets of each class to the total net assets of those classes. Transfer agent fees and expenses attributable to Class N are allocated to Class N.
For the year ended November 30, 2021, the Funds incurred the following class-specific transfer agent fees and expenses (including sub-transfer agent fees, where applicable):
| | | | | | | | | | | | | | | | |
| | | Transfer Agent Fees and Expenses | |
Fund | | Class A | | | Class C | | | Class N | | | Class Y | |
Global Growth Fund | | $ | 4,321 | | | $ | 965 | | | $ | 986 | | | $ | 70,511 | |
Senior Floating Rate and Fixed Income Fund | | | 153,628 | | | | 77,108 | | | | 969 | | | | 757,459 | |
Select Fund | | | 3,945 | | | | 1,358 | | | | 945 | | | | 46,380 | |
7. Line of Credit. Global Growth Fund and Select Fund, together with certain other funds of Natixis Funds Trusts, Loomis Sayles Funds Trusts and Natixis ETF Trusts, entered into a $500,000,000 committed unsecured line of credit provided by State Street Bank. Any one Fund may borrow up to $350,000,000 under the line of credit agreement (as long as all borrowings by all Funds in the aggregate do not exceed the $500,000,000 limit at any time), subject to each Fund’s investment restrictions and its contractual obligations under the line of credit. Interest is charged to the Funds based upon the terms set forth in the agreement. In addition, a commitment fee of 0.15% per annum, payable at the end of each calendar quarter, is accrued and apportioned among the participating funds based on their average daily unused portion of the line of credit. The Funds paid certain legal fees in connection with the line of credit agreement, which are being amortized over a period of 364 days and are reflected in legal fees on the Statements of Operations. The unamortized balance is reflected as prepaid expenses on the Statements of Assets and Liabilities.
Prior to April 8, 2021, Global Growth Fund and Select Fund, together with certain other funds of Natixis Funds Trusts, Loomis Sayles Funds Trusts and Natixis ETF Trusts, entered into a $400,000,000 committed unsecured line of credit provided by State Street Bank. Any one Fund may borrow up to $350,000,000 under the line of credit agreement (as long as all borrowings by all Funds in the aggregate do not exceed the $400,000,000 limit at any time), subject to each Fund’s investment restrictions and its contractual obligations under the line of credit.
For the year ended November 30, 2021, Select Fund had an average daily balance on the line of credit (for those days on which there were borrowings) of $13,420,000 at a weighted average interest rate of 1.13%. Interest expense incurred on the line of credit was $2,111.
Senior Floating Rate and Fixed Income Fund has entered into a syndicated, committed, secured line of credit with Sumitomo Mitsui Banking Corporation (the “Administrative Agent”), the Bank of Nova Scotia, Houston Branch, National Australia Bank Limited and Canadian Imperial Bank of Commerce, New York Branch (each a “Lender” and together with the Administrative Agent “Lenders”) under which it may borrow for investment or liquidity purposes. The commitment of the Lenders to make loans to the Fund shall not exceed $500,000,000 at any one time. Under the terms of the agreement, the Lenders are entitled to a security interest in the assets of the Fund as collateral. Interest is charged to the Fund based upon the terms set forth in the agreement. In addition, a commitment fee of 0.500% per annum payable to the Administrative Agent for the account of each Lender is accrued by the Fund based on the unused portion of the line of credit. The Fund paid the Administrative Agent an upfront fee of $625,000 and an administrative agent fee of $25,000, for a total of
53 |
Notes to Financial Statements (continued)
November 30, 2021
$650,000, which are being amortized over a period of 364 days and are reflected in legal fees and/or miscellaneous expenses on the Statements of Operations. The unamortized balance is reflected as prepaid expenses on the Statements of Assets and Liabilities.
For the year ended November 30, 2021, Senior Floating Rate and Fixed Income Fund had no borrowings under this agreement.
8. Risk. Global Growth Fund’s investments in foreign securities may be subject to greater political, economic, environmental, credit/counterparty and information risks. The Fund’s investments in foreign securities also are subject to foreign currency fluctuations and other foreign currency-related risks. Foreign securities may be subject to higher volatility than U.S. securities, varying degrees of regulation and limited liquidity.
The Global Growth Fund may invest to a significant extent in variable interest entity (“VIE”) structures. VIE structures can vary, but generally consist of a U.S.-listed company with contractual arrangements, through one or more wholly-owned special purpose vehicles, with a Chinese company that ultimately provides the U.S.-listed company with contractual rights to obtain economic benefits from the Chinese company. The VIE structure enables foreign investors, such as the Fund, to obtain investment exposure similar to that of an equity owner in a Chinese company in situations in which the Chinese government has restricted or prohibited the ownership of such company by foreign investors. The Fund’s exposure to VIE structures may pose additional risks because the VIE structure is not formally recognized under Chinese law. The Chinese government may cease to tolerate VIE structures at any time or impose new restrictions. In addition, Chinese companies using the VIE structure, and listed on stock exchanges in the U.S., could also face delisting or other ramifications for failure to meet the expectations and/or requirements of the U.S. Securities and Exchange Commission, the Public Company Accounting Oversight Board, or other U.S. regulators. Any of these risks could reduce the liquidity and value of these investments or render them valueless.
Select Fund is non-diversified, which means that it is not limited under the 1940 Act to a percentage of assets that it may invest in any one issuer. Because the Fund may invest in the securities of a limited number of issuers, an investment in the Fund may involve a higher degree of risk than would be present in a diversified portfolio.
The senior loans in which Senior Floating Rate and Fixed Income Fund expects to invest will generally not be rated investment grade by the rating agencies. Economic downturns generally increase non-payment rates and a senior loan could lose a substantial part of its value prior to default. Senior loans are subject to credit risk, and secured loans may not be adequately collateralized. The interest rates of senior loans reset frequently, and thus senior loans are subject to interest rate risk (including risks associated with the expected transition away from LIBOR by June 30, 2023). There may also be less public information available about senior loans as compared to other debt securities.
Many floating rate loans issued after 2008 include a “LIBOR floor”, or a minimum interest rate to which the loan’s spread is added, to calculate the loan’s overall interest rate. As short-term market rates rise, such loans will not pay higher interest until prevailing rates exceed the floor rate stated in the loan document. If the Fund uses floating rate leverage, its leverage costs may increase before its loan portfolio income increases, and the additional income provided by leverage may diminish until market rates exceed the LIBOR floor level.
Senior loans are generally less liquid than many other debt securities. Transactions in senior loans may settle on a delayed basis, such that the Fund may not receive the proceeds from the sale of a loan for a substantial period of time (greater than seven days) after the sale. As a result, the proceeds related to the sale of senior loans may not be available to make additional investments or to meet the Fund’s redemption obligations until substantial period (greater than seven days) after the sale of the loans.
Global markets have experienced periods of high volatility triggered by the Covid-19 pandemic. The impact of this pandemic and any other epidemic or pandemic that may arise in the future could adversely affect the economies of many nations or the entire global economy and the financial performance of individual issuers, sectors, industries, asset classes, and markets in significant and unforeseen ways. Such effects could impair the Funds’ ability to maintain operational standards, disrupt the operations of the Funds’ service providers, adversely affect the value and liquidity of the Funds’ investments and negatively impact the Funds’ performance.
9. Concentration of Ownership. From time to time, a Fund may have a concentration of one or more accounts constituting a significant percentage of shares outstanding. Investment activities by holders of such accounts could have material impacts on the Funds. As of November 30, 2021, based on management’s evaluation of the shareholder account base, the Funds had accounts representing controlling ownership of more than 5% of the Fund’s total outstanding shares. The number of such accounts, based on accounts that represent more than 5% of an individual class of shares, and the aggregate percentage of net assets represented by such holdings were as follows:
| | | | | | | | | | | | | | | | |
Fund | | Number of 5% Non-Affiliated Account Holders | | | Percentage of Non-Affiliated Ownership | | | Percentage
of Affiliated
Ownership Ownership
(Note 5g) | | | Total Percentage of Ownership | |
|
|
Global Growth Fund | | | 3 | | | | 40.53 | % | | | 9.75% | | | | 50.28 | % |
Select Fund | | | 3 | | | | 42.13 | % | | | Less than 1 | % | | | 42.13 | % |
| 54
Notes to Financial Statements (continued)
November 30, 2021
Omnibus shareholder accounts for which Natixis Advisors understands that the intermediary has discretion over the underlying shareholder accounts or investment models where a shareholder account may be invested for a non-discretionary customer are included in the table above. For other omnibus accounts, the Funds do not have information on the individual shareholder accounts underlying the omnibus accounts; therefore, there could be other 5% shareholders in addition to those disclosed in the table above.
10. Capital Shares. Each Fund may issue an unlimited number of shares of beneficial interest, without par value. Transactions in capital shares were as follows:
Global Growth Fund
| | | | | | | | | | | | | | | | |
| |
| Year Ended
November 30, 2021 |
| |
| Year Ended
November 30, 2020 |
|
| | | | Shares | | | | Amount | | | | Shares | | | | Amount | |
| Class A | | | | | | | | | | | | | | | | |
Issued from the sale of shares | | | 116,974 | | | $ | 2,219,531 | | | | 110,398 | | | $ | 1,696,231 | |
Issued in connection with the reinvestment of distributions | | | 16,100 | | | | 294,736 | | | | 10,981 | | | | 157,794 | |
Redeemed | | | (71,074 | ) | | | (1,395,205 | ) | | | (51,273 | ) | | | (741,407 | ) |
| | | | | | | | | | | | | | | | |
Net change | | | 62,000 | | | $ | 1,119,062 | | | | 70,106 | | | $ | 1,112,618 | |
| | | | | | | | | | | | | | | | |
| Class C | |
Issued from the sale of shares | | | 17,440 | | | $ | 325,352 | | | | 16,167 | | | $ | 236,148 | |
Issued in connection with the reinvestment of distributions | | | 4,631 | | | | 82,175 | | | | 4,387 | | | | 61,682 | |
Redeemed | | | (21,296 | ) | | | (400,488 | ) | | | (25,196 | ) | | | (349,111 | ) |
| | | | | | | | | | | | | | | | |
Net change | | | 775 | | | $ | 7,039 | | | | (4,642 | ) | | $ | (51,281 | ) |
| | | | | | | | | | | | | | | | |
| Class N | |
Issued from the sale of shares | | | 157 | | | $ | 3,250 | | | | 363,606 | | | $ | 5,000,000 | |
Issued in connection with the reinvestment of distributions | | | 37,161 | | | | 686,183 | | | | 12,918 | | | | 186,528 | |
Redeemed | | | (236 | ) | | | (4,801 | ) | | | (16 | ) | | | (209 | ) |
| | | | | | | | | | | | | | | | |
Net change | | | 37,082 | | | $ | 684,632 | | | | 376,508 | | | $ | 5,186,319 | |
| | | | | | | | | | | | | | | | |
| Class Y | |
Issued from the sale of shares | | | 1,914,884 | | | $ | 37,562,396 | | | | 2,374,152 | | | $ | 36,670,078 | |
Issued in connection with the reinvestment of distributions | | | 273,013 | | | | 5,036,022 | | | | 230,162 | | | | 3,323,545 | |
Redeemed | | | (1,282,373 | ) | | | (25,120,649 | ) | | | (2,270,314 | ) | | | (31,129,376 | ) |
| | | | | | | | | | | | | | | | |
Net change | | | 905,524 | | | $ | 17,477,769 | | | | 334,000 | | | $ | 8,864,247 | |
| | | | | | | | | | | | | | | | |
Increase from capital share transactions | | | 1,005,381 | | | $ | 19,288,502 | | | | 775,972 | | | $ | 15,111,903 | |
| | | | | | | | | | | | | | | | |
55 |
Notes to Financial Statements (continued)
November 30, 2021
10. Capital Shares (continued).
Senior Floating Rate and Fixed Income Fund
| | | | | | | | | | | | | | | | |
| |
| Year Ended
November 30, 2021 |
| |
| Year Ended
November 30, 2020 |
|
| | | | Shares | | | | Amount | | | | Shares | | | | Amount | |
| Class A | | | | | | | | | | | | | | | | |
Issued from the sale of shares | | | 11,198,760 | | | $ | 100,713,711 | | | | 8,082,626 | | | $ | 70,114,317 | |
Issued in connection with the reinvestment of distributions | | | 615,096 | | | | 5,528,400 | | | | 987,112 | | | | 8,486,746 | |
Redeemed | | | (10,910,618 | ) | | | (97,668,838 | ) | | | (17,942,499 | ) | | | (155,555,585 | ) |
| | | | | | | | | | | | | | | | |
Net change | | | 903,238 | | | $ | 8,573,273 | | | | (8,872,761 | ) | | $ | (76,954,522 | ) |
| | | | | | | | | | | | | | | | |
| Class C | |
Issued from the sale of shares | | | 1,354,413 | | | $ | 12,140,709 | | | | 1,575,157 | | | $ | 13,964,264 | |
Issued in connection with the reinvestment of distributions | | | 288,437 | | | | 2,581,347 | | | | 633,488 | | | | 5,417,575 | |
Redeemed | | | (5,948,394 | ) | | | (53,277,576 | ) | | | (13,448,926 | ) | | | (114,976,638 | ) |
| | | | | | | | | | | | | | | | |
Net change | | | (4,305,544 | ) | | $ | (38,555,520 | ) | | | (11,240,281 | ) | | $ | (95,594,799 | ) |
| | | | | | | | | | | | | | | | |
| Class N | |
Issued from the sale of shares | | | 266,781 | | | $ | 2,403,000 | | | | 212,516 | | | $ | 1,787,964 | |
Issued in connection with the reinvestment of distributions | | | 3,956 | | | | 35,590 | | | | 1,752 | | | | 14,897 | |
Redeemed | | | (5,666 | ) | | | (50,953 | ) | | | (223,563 | ) | | | (1,873,513 | ) |
| | | | | | | | | | | | | | | | |
Net change | | | 265,071 | | | $ | 2,387,637 | | | | (9,295 | ) | | $ | (70,652 | ) |
| | | | | | | | | | | | | | | | |
| Class Y | |
Issued from the sale of shares | | | 71,351,144 | | | $ | 642,588,404 | | | | 60,437,888 | | | $ | 524,848,928 | |
Issued in connection with the reinvestment of distributions | | | 3,527,028 | | | | 31,734,373 | | | | 5,513,888 | | | | 47,658,138 | |
Redeemed | | | (37,372,397 | ) | | | (336,024,365 | ) | | | (177,236,283 | ) | | | (1,508,081,475 | ) |
| | | | | | | | | | | | | | | | |
Net change | | | 37,505,775 | | | $ | 338,298,412 | | | | (111,284,507 | ) | | $ | (935,574,409 | ) |
| | | | | | | | | | | | | | | | |
Increase (decrease) from capital share transactions | | | 34,368,540 | | | $ | 310,703,802 | | | | (131,406,844 | ) | | $ | (1,108,194,382 | ) |
| | | | | | | | | | | | | | | | |
Select Fund
| | | | | | | | | | | | | | | | |
| |
| Year Ended
November 30, 2021 |
| |
| Year Ended
November 30, 2020 |
|
| | | | Shares | | | | Amount | | | | Shares | | | | Amount | |
| Class A | | | | | | | | | | | | | | | | |
Issued from the sale of shares | | | 226,662 | | | $ | 5,364,435 | | | | 132,582 | | | $ | 2,317,199 | |
Issued in connection with the reinvestment of distributions | | | 44,903 | | | | 855,396 | | | | 65,256 | | | | 1,140,030 | |
Redeemed | | | (186,594 | ) | | | (4,217,826 | ) | | | (340,170 | ) | | | (5,392,802 | ) |
| | | | | | | | | | | | | | | | |
Net change | | | 84,971 | | | $ | 2,002,005 | | | | (142,332 | ) | | $ | (1,935,573 | ) |
| | | | | | | | | | | | | | | | |
| Class C | |
Issued from the sale of shares | | | 32,268 | | | $ | 600,100 | | | | 22,290 | | | $ | 345,755 | |
Issued in connection with the reinvestment of distributions | | | 18,366 | | | | 328,014 | | | | 25,261 | | | | 417,050 | |
Redeemed | | | (112,547 | ) | | | (2,361,919 | ) | | | (127,526 | ) | | | (2,115,970 | ) |
| | | | | | | | | | | | | | | | |
Net change | | | (61,913 | ) | | $ | (1,433,805 | ) | | | (79,975 | ) | | $ | (1,353,165 | ) |
| | | | | | | | | | | | | | | | |
| Class N | |
Issued from the sale of shares | | | — | | | $ | — | | | | — | | | $ | — | |
Issued in connection with the reinvestment of distributions | | | 6 | | | | 112 | | | | 6 | | | | 111 | |
Redeemed | | | — | | | | — | | | | — | | | | — | |
| | | | | | | | | | | | | | | | |
Net change | | | 6 | | | $ | 112 | | | | 6 | | | $ | 111 | |
| | | | | | | | | | | | | | | | |
| Class Y | |
Issued from the sale of shares | | | 1,641,474 | | | $ | 37,234,397 | | | | 2,870,422 | | | $ | 52,767,927 | |
Issued in connection with the reinvestment of distributions | | | 564,849 | | | | 10,816,866 | | | | 835,036 | | | | 14,654,872 | |
Redeemed | | | (3,915,145 | ) | | | (82,084,285 | ) | | | (4,422,330 | ) | | | (73,354,928 | ) |
| | | | | | | | | | | | | | | | |
Net change | | | (1,708,822 | ) | | $ | (34,033,022 | ) | | | (716,872 | ) | | $ | (5,932,129 | ) |
| | | | | | | | | | | | | | | | |
Decrease from capital share transactions | | | (1,685,758 | ) | | $ | (33,464,710 | ) | | | (939,173 | ) | | $ | (9,220,756 | ) |
| | | | | | | | | | | | | | | | |
| 56
Report of Independent Registered Public Accounting Firm
To the Board of Trustees of Natixis Funds Trust II and Shareholders of Loomis Sayles Global Growth Fund, Loomis Sayles Senior Floating Rate and Fixed Income Fund, and Vaughan Nelson Select Fund:
Opinions on the Financial Statements
We have audited the accompanying statements of assets and liabilities, including the portfolios of investments, of Loomis Sayles Global Growth Fund, Loomis Sayles Senior Floating Rate and Fixed Income Fund, and Vaughan Nelson Select Fund (three of the funds constituting Natixis Funds Trust II, hereafter collectively referred to as the “Funds”) as of November 30, 2021, the related statements of operations for the year ended November 30, 2021, the statements of changes in net assets for each of the two years in the period ended November 30, 2021, including the related notes, and the financial highlights for each of the periods indicated therein (collectively referred to as the “financial statements”). In our opinion, the financial statements present fairly, in all material respects, the financial position of each of the Funds as of November 30, 2021, the results of each of their operations for the year then ended, the changes in each of their net assets for each of the two years in the period ended November 30, 2021 and each of the financial highlights for each of the periods indicated therein, in conformity with accounting principles generally accepted in the United States of America.
Basis for Opinions
These financial statements are the responsibility of the Funds’ management. Our responsibility is to express an opinion on the Funds’ financial statements based on our audits. We are a public accounting firm registered with the Public Company Accounting Oversight Board (United States) (PCAOB) and are required to be independent with respect to the Funds in accordance with the U.S. federal securities laws and the applicable rules and regulations of the Securities and Exchange Commission and the PCAOB.
We conducted our audits of these financial statements in accordance with the standards of the PCAOB. Those standards require that we plan and perform the audit to obtain reasonable assurance about whether the financial statements are free of material misstatement, whether due to error or fraud.
Our audits included performing procedures to assess the risks of material misstatement of the financial statements, whether due to error or fraud, and performing procedures that respond to those risks. Such procedures included examining, on a test basis, evidence regarding the amounts and disclosures in the financial statements. Our audits also included evaluating the accounting principles used and significant estimates made by management, as well as evaluating the overall presentation of the financial statements. Our procedures included confirmation of securities owned as of November 30, 2021, by correspondence with the custodian, agent banks and brokers; when replies were not received from brokers, we performed other auditing procedures. We believe that our audits provide a reasonable basis for our opinions.
/s/PricewaterhouseCoopers LLP
Boston, Massachusetts
January 24, 2022
We have served as the auditor of one or more investment companies in the Natixis Investment Company Complex since at least 1995. We have not determined the specific year we began serving as auditor.
57 |
2021 U.S. Tax Distribution Information to Shareholders (Unaudited)
Corporate Dividends Received Deduction. For the fiscal year ended November 30, 2021, a percentage of dividends distributed by the Funds listed below qualifies for the dividends received deduction for corporate shareholders. These percentages are as follows:
| | | | |
Fund | | Qualifying
Percentage | |
Global Growth Fund | | | 100.00 | % |
Select Fund | | | 96.27 | % |
Capital Gains Distributions. Pursuant to Internal Revenue Section 852(b), the following Funds paid distributions, which have been designated as capital gains distributions for the fiscal year ended November 30, 2021, unless subsequently determined to be different.
| | | | |
Fund | | Amount | |
Global Growth Fund | | $ | 6,199,326 | |
Select Fund | | | 10,325,809 | |
Qualified Dividend Income. For the fiscal year ended November 30, 2021, the Funds below will designate up to the maximum amount allowable pursuant to the Internal Revenue Code as qualified dividend income eligible for reduced tax rates. These lower rates range from 0% to 20% depending on an individual’s tax bracket. If the Funds pay a distribution during calendar year 2021, complete information will be reported in conjunction with Form 1099-DIV.
|
Fund |
Global Growth Fund |
Select Fund |
| 58
Trustee and Officer Information
The tables below provide certain information regarding the Trustees and officers of Natixis Funds Trust II, (the “Trust”). Unless otherwise indicated, the address of all persons below is 888 Boylston Street, Suite 800, Boston, MA 02199-8197. The Funds’ Statement of Additional Information includes additional information about the Trustees of the Trust and is available by calling Natixis Funds at 800-225-5478.
| | | | | | | | |
Name and Year of Birth | | Position(s) Held with the Trust, Length
of Time Served and Term of Office1 | | Principal Occupation(s)
During Past 5 Years | | Number of Portfolios in Fund Complex Overseen2 and Other Directorships Held During Past 5 Years | | Experience,
Qualifications,
Attributes, Skills for
Board Membership |
| | | |
| INDEPENDENT TRUSTEES | | | | | | |
| | | | |
Edmond J. English
(1953) | | Trustee since 2013 Chairperson of the Governance Committee and Contract Review Committee Member | | Executive Chairman of Bob’s Discount Furniture (retail) | | 55 Director, Burlington Stores, Inc. (retail) | | Significant experience on the Board and on the boards of other business organizations (including retail companies and a bank); executive experience (including at a retail company) |
| | | | |
Richard A. Goglia
(1951) | | Trustee since 2015 Contract Review Committee Member and Governance Committee Member | | Retired | | 55 Director of Triumph Group (aerospace industry) | | Significant experience on the Board and executive experience (including his role as vice president and treasurer of a defense company and experience at a financial services company) |
| | | | |
Wendell J. Knox
(1948) | | Trustee since 2009 Chairperson of the Contract Review Committee | | Retired | | 55 Director, Abt Associates Inc. (research and consulting); Director, The Hanover Insurance Group (property and casualty insurance); formerly, Director, Eastern Bank (bank) | | Significant experience on the Board and on the boards of other business organizations (including at a bank and at a property and casualty insurance firm); executive experience (including roles as president and chief executive officer of a research and consulting company) |
| | | | |
Martin T. Meehan
(1956) | | Trustee since 2012 Audit Committee Member and Governance Committee Member | | President, University of Massachusetts | | 55 None | | Significant experience on the Board and on the boards of other business organizations; experience as President of the University of Massachusetts; government experience (including as a member of the U.S. House of Representatives); academic experience |
59 |
Trustee and Officer Information
| | | | | | | | |
Name and Year of Birth | | Position(s) Held with the Trust, Length
of Time Served and Term of Office1 | | Principal Occupation(s)
During Past 5 Years | | Number of Portfolios in Fund Complex Overseen2 and Other Directorships Held During Past 5 Years | | Experience,
Qualifications,
Attributes, Skills for
Board Membership |
| | | |
| INDEPENDENT TRUSTEES – continued | | | | | | |
| | | | |
Maureen B. Mitchell
(1951) | | Trustee since 2017 Audit Committee Member and Governance Committee Member | | Retired | | 55 Director, Sterling Bancorp (bank) | | Experience on the Board; financial services industry and executive experience (including role as president of global sales and marketing at a financial services company) |
| | | | |
James P. Palermo
(1955) | | Trustee since 2016 Audit Committee Member | | Founding Partner, Breton Capital Management, LLC (private equity); Partner, STEP Partners, LLC (private equity) | | 55 Director, FutureFuel.io (chemicals and biofuels) | | Significant experience on the Board; financial services industry and executive experience (including roles as chief executive officer of client management and asset servicing for a banking and financial services company) |
| | | | |
Erik R. Sirri
(1958) | | Chairperson of the Board of Trustees since January 2021 Trustee since 2009 Ex Officio member of the Audit Committee, Contract Review Committee and Governance Committee | | Professor of Finance at Babson College | | 55 None | | Significant experience on the Board; experience as Director of the Division of Trading and Markets at the Securities and Exchange Commission; academic experience; training as an economist |
| | | | |
Peter J. Smail
(1952) | | Trustee since 2009 Audit Committee Member | | Retired | | 55 None | | Significant experience on the Board; mutual fund industry and executive experience (including roles as president and chief executive officer for an investment adviser) |
| 60
Trustee and Officer Information
| | | | | | | | |
Name and Year of Birth | | Position(s) Held with the Trust, Length
of Time Served and Term of Office1 | | Principal Occupation(s) During Past 5 Years | | Number of Portfolios in Fund Complex Overseen2 and Other Directorships Held During Past 5 Years | | Experience,
Qualifications,
Attributes, Skills for
Board Membership |
| | | |
| INDEPENDENT TRUSTEES – continued | | | | | | |
| | | | |
Kirk A. Sykes
(1958) | | Trustee since 2019 Contract Review Committee Member and Governance Committee Member | | Managing Director of Accordia Partners, LLC (real estate development); President of Primary Corporation (real estate development); Managing Principal of Merrick Capital Partners (infrastructure finance) | | 55 Trustee, Eastern Bank (bank); Director, Apartment Investment and Management Company (real estate investment trust) | | Experience on the Board and significant experience on the boards of other business organizations (including real estate companies and banks) |
| | | | |
Cynthia L. Walker
(1956) | | Trustee since 2005 Chairperson of the Audit Committee | | Retired; formerly, Deputy Dean for Finance and Administration, Yale University School of Medicine | | 55 None | | Significant experience on the Board; executive experience in a variety of academic organizations (including roles as dean for finance and administration) |
| | | |
| INTERESTED TRUSTEES | | | | | | |
| | | | |
Kevin P. Charleston3 (1965) One Financial Center Boston, MA 02111 | | Trustee since 2015 | | President, Chief Executive Officer and Chairman of the Board of Directors, Loomis, Sayles & Company, L.P. | | 55 None | | Significant experience on the Board; continuing service as President, Chief Executive Officer and Chairman of the Board of Directors of Loomis, Sayles & Company, L.P. |
| | | | |
David L. Giunta4
(1965) | | Trustee since 2011 President and Chief Executive Officer of Natixis Funds Trust II since 2008 | | President and Chief Executive Officer, Natixis Advisors, LLC and Natixis Distribution, LLC | | 55 None | | Significant experience on the Board; experience as President and Chief Executive Officer of Natixis Advisors, LLC and Natixis Distribution, LLC |
| 1 | Each Trustee serves until retirement, resignation or removal from the Board. The current retirement age is 75. The position of Chairperson of the Board is appointed for a three-year term. |
| 2 | The Trustees of the Trust serve as Trustees of a fund complex that includes all series of the Natixis Funds Trust I, Natixis Funds Trust II, Natixis Funds Trust IV, Gateway Trust, Loomis Sayles Funds I, Loomis Sayles Funds II, Natixis ETF Trust and Natixis ETF Trust II (collectively, the “Fund Complex”). |
| 3 | Mr. Charleston is deemed an “interested person” of the Trust because he holds the following positions with an affiliated person of the Trust: President, Chief Executive Officer and Chairman of the Board of Directors of Loomis, Sayles & Company, L.P. |
| 4 | Mr. Giunta is deemed an “interested person” of the Trust because he holds the following positions with an affiliated person of the Trust: President and Chief Executive Officer, Natixis Advisors, LLC and Natixis Distribution, LLC. |
61 |
Trustee and Officer Information
| | | | | | |
Name and Year of Birth | | Position(s) Held
with the Trust | | Term of Office1 and Length
of Time Served | | Principal Occupation(s)
During Past 5 Years2 |
| | |
| OFFICERS OF THE TRUST | | | | |
| | | |
Michael C. Kardok (1959) | | Treasurer, Principal Financial and Accounting Officer | | Since 2004 | | Senior Vice President, Natixis Advisors, LLC and Natixis Distribution, LLC |
| | | |
Natalie R. Wagner (1979) | | Chief Compliance Officer, Assistant Secretary and Anti-Money Laundering Officer Chief Legal Officer | | Since May 2021 Since July 2021 | | Senior Vice President, Natixis Advisors, LLC and Natixis Distribution, LLC ; Formerly, Vice President, Head of Corporate Compliance, Global Atlantic Financial Group |
| 1 | Each officer of the Trust serves for an indefinite term in accordance with the Trust’s current by-laws until the date his or her successor is elected and qualified, or until he or she sooner dies, retires, is removed or becomes disqualified. |
| 2 | Each person listed above, except as noted, holds the same position(s) with the Fund Complex. Previous positions during the past five years with Natixis Distribution, LLC, Natixis Advisors, LLC or Loomis, Sayles & Company, L.P. are omitted, if not materially different from an officer’s current position with such entity. |
| 62
Item 2. Code of Ethics.
The Registrant has adopted a code of ethics that applies to the Registrant’s principal executive officer, principal financial officer and persons performing similar functions. There have been no amendments or waivers of the Registrant’s code of ethics during the period.
Item 3. Audit Committee Financial Expert.
The Board of Trustees of the Registrant has established an audit committee. Mr. Martin T. Meehan, Ms.��Maureen Mitchell, Mr. James Palermo, Mr. Peter Smail, and Ms. Cynthia L. Walker are members of the audit committee and have been designated as “audit committee financial experts” by the Board of Trustees. Each of these individuals is also an Independent Trustee of the Registrant.
Item 4. Principal Accountant Fees and Services.
Fees billed by the Principal Accountant for services rendered to the Registrant.
The table below sets forth fees billed by the principal accountant, PricewaterhouseCoopers LLP, for the past two fiscal years for professional services rendered in connection with a) the audit of the Registrant’s annual financial statements and services provided in connection with regulatory filings; b) audit-related services (including services that are reasonably related to the performance of the audit of the Registrant’s financial statements but not reported under “Audit Fees”); c) tax compliance, tax advice and tax planning; and d) all other fees billed for professional services rendered by the principal accountant to the Registrant, other than the services reported as a part of (a) through (c) of this Item.
| | | | | | | | | | | | | | | | | | | | | | | | | | | | | | | | |
| | | Audit fees | | | Audit-related fees1 | | | Tax fees2 | | | All other fees | |
| | | 12/1/19-
11/30/20 | | | 12/1/20-
11/30/21 | | | 12/1/19-
11/30/20 | | | 12/1/20-
11/30/21 | | | 12/1/19-
11/30/20 | | | 12/1/20-
11/30/21 | | | 12/1/19-
11/30/20 | | | 12/1/20-
11/30/21 | |
Natixis Funds Trust II- Loomis Sayles Global Growth Fund, Loomis Sayles Senior Floating Rate and Fixed Income Fund and Vaughan Nelson Select Fund | | $ | 146,394 | | | $ | 146,394 | | | $ | 629 | | | $ | 300 | | | $ | 23,969 | | | $ | 23,969 | | | $ | — | | | $ | — | |
| 1. | Audit-related fees consist of: |
2020 & 2021 – performance of agreed-upon procedures related to the Registrant’s deferred compensation plan.
2020 & 2021 – review of Registrant’s tax returns
Aggregate fees billed to the Registrant for non-audit services during 2020 and 2021 were $24,598 and $24,269, respectively.
The following table sets forth the fees billed by the Registrant’s principal accountant for non-audit services rendered to Loomis, Sayles & Company, L.P. (“Loomis”), Natixis Advisors, LLC (“Natixis”) and entities controlling, controlled by or under common control with Loomis and Natixis (“Control Affiliates”) that provide ongoing services to the Registrant, for engagements that related directly to the operations and financial reporting of the Registrant for the last two fiscal years.
| | | | | | | | | | | | | | | | | | | | | | | | |
| | | Audit-related fees | | | Tax fees | | | All other fees | |
| | | 12/1/19-
11/30/20 | | | 12/1/20-
11/30/21 | | | 12/1/19-
11/30/20 | | | 12/1/20-
11/30/21 | | | 12/1/19-
11/30/20 | | | 12/1/20-
11/30/21 | |
Control Affiliates | | $ | — | | | $ | — | | | $ | — | | | $ | — | | | $ | — | | | $ | — | |
The following table sets forth the aggregate fees billed by the Registrant’s principal accountant for non-audit services rendered to Loomis, Natixis and Control Affiliates that provide ongoing services to the Registrant, for the last two fiscal years, including the fees disclosed in the table above.
| | | | | | | | |
| | | Aggregate Non-Audit Fees | |
| | | 12/1/19-
11/30/20 | | | 12/1/20-
11/30/21 | |
Control Affiliates | | $ | 1,646 | | | $ | 972 | |
None of the services described above were approved pursuant to (c)(7)(i)(C) of Regulation S-X.
Audit Committee Pre-Approval Policies.
Annually, the Registrant’s Audit Committee reviews the audit, audit-related, tax and other non-audit services together with the projected fees, for services proposed to be rendered to the Registrant and/or other entities for which pre-approval is required during the upcoming year. Any subsequent revisions to already pre-approved services or fees (including fee increases) and requests for pre-approval of new services would be presented for consideration quarterly as needed.
If, in the opinion of management, a proposed engagement by the Registrant’s independent accountants needs to commence before the next regularly scheduled Audit Committee meeting, any member of the Audit Committee who is an Independent Trustee of the Registrant is authorized to pre-approve the engagement, but only for engagements to provide audit, audit related and tax services. This approval is subject to review of the full Audit Committee at its next quarterly meeting. All other engagements require the approval of all the members of the Audit Committee.
Item 5. Audit Committee of Listed Registrants.
Not applicable.
Item 6. Schedule of Investments.
Included as part of the Report to Shareholders filed as Item 1 herewith.
Item 7. Disclosure of Proxy Voting Policies and Procedures for Closed-End Management Investment Companies.
Not applicable.
Item 8. Portfolio Managers of Closed-End Management Investment Companies.
Not applicable.
Item 9. Purchases of Equity Securities by Closed-End Management Investment Companies and Affiliated Purchasers.
Not applicable.
Item 10. Submission of Matters to a Vote of Securities Holders.
There were no material changes to the procedures by which shareholders may recommend nominees to the Registrant’s Board of Trustees.
| Item 11. | Controls and Procedures. |
The Registrant’s principal executive officer and principal financial officer have concluded that the Registrant’s disclosure controls and procedures are sufficient to ensure that information required to be disclosed by the Registrant in this Form N-CSR was recorded, processed, summarized and reported within the time periods specified in the Securities and Exchange Commission’s rules and forms, based upon such officers’ evaluation of these controls and procedures as of a date within 90 days of the filing date of the report.
There were no changes in the Registrant’s internal control over financial reporting that occurred during the period covered by the report that have materially affected, or is reasonably likely to materially affect, the Registrant’s internal control over financial reporting.
| Item 12. | Disclosure of Securities Lending Activities for Closed-End Management Investment Companies. |
Not applicable.
SIGNATURES
Pursuant to the requirements of the Securities Exchange Act of 1934 and the Investment Company Act of 1940, the Registrant has duly caused this report to be signed on its behalf by the undersigned, thereunto duly authorized.
| | |
| Natixis Funds Trust II |
| |
| By: | | /s/ David L. Giunta |
| Name: | | David L. Giunta |
| Title: | | President and Chief Executive Officer |
| Date: | | January 24, 2022 |
Pursuant to the requirements of the Securities Exchange Act of 1934 and the Investment Company Act of 1940, this report has been signed by the following persons on behalf of the Registrant and in the capacities and on the dates indicated.
| | |
| By: | | /s/ David L. Giunta |
| Name: | | David L. Giunta |
| Title: | | President and Chief Executive Officer |
| Date: | | January 24, 2022 |
| |
| By: | | /s/ Michael C. Kardok |
| Name: | | Michael C. Kardok |
| Title: | | Treasurer and Principal Financial and |
| | Accounting Officer |
| Date: | | January 24, 2022 |