UNITED STATES
SECURITIES AND EXCHANGE COMMISSION
Washington, D.C. 20549
FORM N-CSR
CERTIFIED SHAREHOLDER REPORT OF REGISTERED
MANAGEMENT INVESTMENT COMPANIES
Investment Company Act file number: 811-00242
Natixis Funds Trust II
(Exact name of Registrant as specified in charter)
| | |
| 888 Boylston Street, Suite 800 Boston, Massachusetts | | 02199-8197 |
| (Address of principal executive offices) | | (Zip code) |
Russell L. Kane, Esq.
Natixis Distribution, L.P.
888 Boylston Street, Suite 800
Boston, Massachusetts 02199-8197
(Name and address of agent for service)
Registrant’s telephone number, including area code: (617) 449-2822
Date of fiscal year end: November 30
Date of reporting period: November 30, 2020
Item 1. Reports to Stockholders.
The Registrant’s annual report transmitted to shareholders pursuant to Rule 30e-1 under the Investment Company Act of 1940 is as follows:


Annual Report
November 30, 2020
Loomis Sayles Global Growth Fund
Loomis Sayles Senior Floating Rate and Fixed Income Fund
Vaughan Nelson Select Fund
TABLE OF CONTENTS

LOOMIS SAYLES GLOBAL GROWTH FUND
| | |
| |
| Manager: | | Symbols: |
| |
| Aziz V. Hamzaogullari, CFA® | | Class A LSAGX |
| |
| Loomis, Sayles & Company, L.P. | | Class C LSCGX |
| |
| | Class N LSNGX |
| |
| | Class Y LSGGX |
Investment Goal
The Fund’s investment goal is long-term growth of capital.
Market Conditions
Global equities posted a gain, albeit with an unusually high level of volatility, during the annual period that ended on November 30, 2020. After performing well in December 2019 and early 2020, stocks began to slide in mid-February once the global spread of Covid-19 compelled analysts to slash their estimates for economic growth and corporate earnings. The world equity markets cratered in response, with most major indices falling over 30% in less than five weeks.
The investment backdrop abruptly changed for the better in late March, thanks to the extraordinary fiscal and monetary stimulus provided by world governments and central banks. Even though coronavirus remained a source of concern for investors, stocks moved steadily higher through late August due to the gradual reopening of the world economy and the US Federal Reserve’s pledge to keep interest rates near zero indefinitely. Although the rally stalled in the autumn due to a resurgence in Covid-19 cases and the uncertainty surrounding the US elections, stocks roared back to life in November once it became clear that multiple vaccines would be available by early 2021.
The major, broad-based global equity indices overcame the slowdown in economic growth to register double-digit gains for the one-year period. Mega-cap US technology companies led the market higher, resulting in a wide performance advantage for the growth style over value, and for large-cap stocks over small-caps. In addition, the United States exceeded the returns of the developed international markets. Emerging-market stocks outperformed their developed-market peers, led by China.
Performance Results
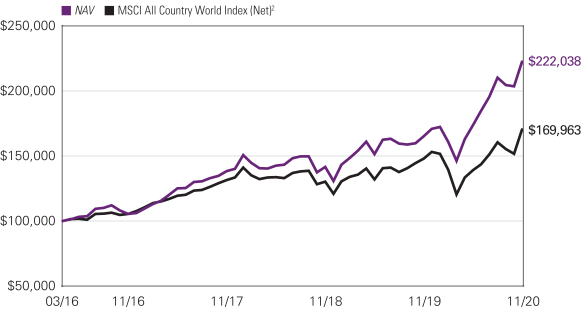
For the 12 months ended November 30, 2020, Class Y shares of the Loomis Sayles Global Growth Fund returned 34.70% at net asset value. The Fund outperformed its benchmark, the MSCI All Country World Index (Net), which returned 15.01%.
Explanation of Fund Performance
We are an active manager with a long-term, private equity approach to investing. Through our proprietary bottom-up research framework, we look to invest in those few high-quality businesses with sustainable competitive advantages and profitable growth when they trade at a significant discount to intrinsic value. Given the rare confluence of quality, growth, and valuation, we may study dozens of companies but may only invest in a select few businesses each year. We believe identifying those few businesses with these characteristics is an art, not a science. As a result of this rigorous approach, ours is a selective, high-conviction portfolio of typically 30-45 names.
The Fund’s positions in MercadoLibre, Amazon, and Adyen contributed the most to performance. Stock selection in the consumer discretionary, communication services, industrials and information technology sectors, along with our allocations in the financials, consumer discretionary, energy, consumer staples, healthcare, information technology, communication services, and industrials sectors, contributed positively to relative performance.
MercadoLibre hosts the largest online commerce platform in Latin America. A Fund holding since inception, the company delivered strong and above-expectations revenue growth, driven by growth in gross merchandise volume and payments and continued market share gains. MercadoLibre remains in an elevated investment cycle to build out a more powerful ecosystem focused on greater product selection, easier payment options, wider credit availability, and lower cost and faster speed of delivery. While these investments have impacted near-term profitability, we believe they have contributed to market share gains in e-commerce and payments and a stronger competitive position. We believe MercadoLibre’s competitive advantages include its network and ecosystem, brand, and understanding of local markets. The company operates in 18 countries representing over 95% of Latin American GDP, and its 320 million registered buyers as of December 31, 2019 represented approximately 80% of the region’s estimated 400 million internet users. The company’s brand and understanding of local-market challenges have contributed to its leadership position in each market it serves. We believe MercadoLibre is well positioned for sustained growth over the next decade, driven by the secular growth of e-commerce in Latin America. Over our forecast period, we believe the penetration of e-commerce can more than double, which would bring the penetration level into the mid-teens. We believe the current market price embeds expectations for key revenue and
1 |
cash flow growth drivers that are well below our long-term assumptions. As a result, we believe the shares trade at a significant discount to our estimate of intrinsic value and offer a compelling long-term reward-to-risk opportunity.
Online retailer Amazon offers millions of products — sold by Amazon or by third parties — with the value proposition to consumers of selection, price, and convenience. Amazon’s enterprise IT business, Amazon Web Services (AWS), offers a suite of secure, on-demand cloud-computing services, with a value proposition to clients of speed, agility, and savings. In both of its core markets, we believe Amazon possesses strong and sustainable competitive advantages that would be difficult for competitors to replicate. A Fund holding since inception, we estimate Amazon’s gross merchandise volume grew faster than both global retail sales and US e-commerce during the period, indicating the company expanded its market share. AWS also posted strong revenue growth that was well above our estimate of growth in global enterprise-IT spending. Revenue growth during the period exceeded consensus expectations and accelerated following the outbreak of Covid-19. In order to manage the increase in demand while protecting the safety of employees and customers, Amazon incurred over $7.5 billion of Covid-19-related costs, while also investing rapidly in new fulfillment capacity. Reiterating Amazon’s long-standing practice of investing aggressively to better position the company for the long term, CEO Jeff Bezos recently stated that he believes the measures taken to get essential products to customers while continuing to ensure the safety and well-being of its hundreds of thousands of employees represents the best long-term investment the company could make. We believe Amazon is one of the best-positioned companies in e-commerce and enterprise IT — each addressing large, underpenetrated markets that benefit from secular growth that is still in its early stages. We believe the current share price shows a lack of appreciation for Amazon’s significant long-term growth opportunities and the sustainability of its business model. As a result, we believe the company is selling at a significant discount to our estimate of intrinsic value and offers a compelling reward-to-risk opportunity.
Adyen is a global merchant acquisition and payment solutions provider based in Amsterdam. Adyen was founded in 2006 to serve as a next-generation, integrated provider of payment solutions to merchants, and today the company supports over 250 payment methods globally across online, mobile, and point-of-sale (POS) transactions for clients that include Facebook, McDonald’s, Microsoft, Netflix, and Uber. We believe Adyen’s strong and sustainable competitive advantages include its single, global platform and a high-profile client base with which it has built lasting relationships. A Fund holding since its initial public offering in the second quarter of 2018, Adyen reported financial results for the period that reflected strong fundamentals, including continued market share gains and revenues that exceeded consensus expectations. Existing clients accounted for over 80% of Adyen’s growth during the period — stemming from both organic growth at underlying clients and Adyen’s capture of increasing share — and client retention based on payment volumes remained above 99%. We believe the secular shift to electronic-based payments from traditional paper-based systems represents the most significant growth driver for Adyen. While Adyen has been growing substantially faster than the leading global merchant acquirers over the past four years, the company still captures only a small percentage of overall industry volumes estimated at approximately 0.7%. We believe a combination of industry- and company-specific factors will enable Adyen to continue to grow at more than twice the rate of growth in the overall payments industry over our long-term investment horizon. We also expect Adyen to benefit from the high incremental margins of its business, contributing to margin expansion and cash flow growth in excess of 20% over our forecast period. We believe Adyen’s strong growth prospects are not currently reflected in its share price. As a result, we believe the company’s shares are trading at a meaningful discount to our estimate of intrinsic value, offering an attractive reward-to-risk opportunity.
The Fund’s positions in Schlumberger, Coca-Cola, and Under Armour detracted the most from performance. Stock selection in the consumer staples, energy, and financials sectors detracted from relative performance.
Schlumberger is the world’s leading supplier of technology, equipment, project management, and information solutions to the oil and gas exploration and production (E&P) industry. A Fund holding since inception, Schlumberger reported financial results that deteriorated substantially due to the oil price environment. Following record oil price declines in the first quarter due to Covid-19-related demand weakness in China and a price war between OPEC and Russia, demand and prices fell further in the second quarter as a result of the global lockdown, and continued travel restrictions and a resurgence of Covid-19 cases continue to delay a recovery in demand. As a result, global service activity in 2020 is now expected to decline by 25% to 30% year over year. Given the ongoing uncertainty, Schlumberger has taken prudent steps to increase liquidity including cutting its dividend, raising cash by issuing debt, and cutting headcount, while also lowering structural costs and capital intensity, which should contribute to improved returns. While we expect near-term results to remain under pressure, the company continues to generate positive free cash flow, and we believe Schlumberger’s products remain a necessary part of the solution for efficiently extracting energy resources, even in times of substantial commodity price compression. Secular growth in the long-term global demand for oil, arising primarily from the need to replace naturally depleting reserves, is driving the need to extract hydrocarbons from harsher environments that are increasingly difficult to reach or extract from. Because oilfield services companies are key to making difficult-to-reach resources more accessible, we believe services like those Schlumberger provides are essential to profitably meeting long-term demand. We believe Schlumberger will continue to execute well and that the company is positioned to weather the current environment and capitalize on growth in oilfield services as market supply and demand normalizes.
| 2
LOOMIS SAYLES GLOBAL GROWTH FUND
The company’s growing leadership in digital solutions should also create further differentiation versus peers. We believe shares of Schlumberger are selling at a significant discount to our estimate of intrinsic value, and offer a compelling reward-to-risk opportunity.
The Coca-Cola Company is the world’s leading owner and marketer of non-alcoholic beverage brands and employs an unrivaled global beverage distribution network. A strategy holding since inception, we believe Coca-Cola’s strong and sustainable competitive advantages include its iconic global brands, difficult-to-replicate beverage distribution network, and unmatched scale. With emerging markets accounting for over 60% of the company’s sales by volume, we believed Coca-Cola was well positioned to benefit from long-term secular growth in emerging market spending on non-alcoholic ready-to-drink beverages, driven by both urbanization and growth in disposable income. We believed the sustainability of the company’s cash flow growth drivers and the positive impact of the refranchising of its owned bottling operations had been underappreciated by the market. In late January, the company reported strong financial results which surpassed management’s already-increased guidance, and the company recorded its tenth consecutive quarter of mid-single-digit organic revenue growth. We believed these results demonstrated the company’s renewed focus on innovation and brand building following the nearly completed refranchising of its bottling operations. The refranchising culminated a decade-long effort to restructure the company’s largest bottling partners to meet best-in-class operational standards and position them for sustainable long-term growth. That effort was largely completed in 2017 and is being reflected in the company’s improved execution and returns. While management expected its strong growth to continue, the current level of growth exceeded our long-term forecasts. We exited our position in March to reallocate capital to more attractive reward-to-risk opportunities, including Autodesk, Fanuc, NXP Semiconductors, and Salesforce.com. Due to the timing of the sale in the March downturn, the company is among the biggest detractors for the period.
Under Armour is a leading provider of performance-centric, branded sportswear and footwear. In 20 years, Under Armour has accomplished what few have achieved by becoming a credible number three global sportswear brand behind Nike and Adidas. We believe the company’s strong and sustainable competitive advantages include its brand, distribution, and the benefits of scale needed to compete globally. A portfolio holding since the fourth quarter of 2017, Under Armour reported weak financial results that reflected the temporary closure of as much as 80% of its points of sale through mid-May due to Covid-19. While we expect this near-term weakness to continue, we do not believe the company or the industry will be structurally impacted in the long term. In China, the company’s largest market outside the US and the country which first experienced the impact of the virus, stores were closed earlier than in the US and Europe, and results have begun to improve with their re-opening in late March. Further, Under Armour’s more-recent results have begun to reflect the benefits of the company’s multi-year restructuring. While the company’s challenges pre-date Covid-19, Under Armour has spent the past three years refocusing on its premium segment and resizing its operations and expense base to improve profitability. We believe Under Armour is well positioned to benefit from secular growth in global per capita consumption of sportswear. As a result of its actions, we believe the company will be able to reignite growth when the current downturn ends and can realize market share gains in footwear and in international markets. We believe the current share price embeds growth and profitability assumptions for the business that are substantially below our estimates for the company’s long-term growth. As a result, we believe the company is trading at a significant discount to our estimate of intrinsic value and offers a compelling reward-to-risk opportunity.
All aspects of our quality-growth-valuation investment thesis must be present simultaneously for us to make an investment. Often our research is completed well in advance of the opportunity to invest. We are patient investors and maintain coverage of high-quality businesses in order to take advantage of meaningful price dislocations if and when they occur. During the period we initiated new positions in Autodesk, Boeing, Fanuc, NXP Semiconductors, Salesforce.com, and Trip.com. We added to our existing holdings in Ambev, Novartis, Schlumberger, and Roche. We trimmed our existing positions in Novo Nordisk, Qualcomm, Yum! Brands, and Yum China. We also trimmed our position in MercadoLibre as it approached our maximum allowable position size. We sold our positions in Alcon, American Express, Amgen, Coca-Cola, Danone, Diageo, Prada, and Procter & Gamble. We sold Alcon, Coca-Cola, Prada, and Procter & Gamble on the basis of risk-reward to fund more attractive reward-to-risk opportunities. We sold American Express and Diageo as they approached our estimates of intrinsic value. We sold Danone due to a mistaken investment thesis.
Outlook
Our investment process is characterized by bottom-up fundamental research and a long-term investment time horizon. The nature of the process leads to a lower-turnover portfolio in which sector positioning is the result of stock selection. The Fund ended the year with overweight positions in the consumer discretionary, communication services, industrials, information technology, and consumer staples sectors and underweight positions in the financials, healthcare, and energy sectors. We did not own positions in the materials, utilities or real estate sectors.
3 |
LOOMIS SAYLES GLOBAL GROWTH FUND
Hypothetical Growth of $100,000 Investment in Class Y Shares3
March 31, 2016 (inception) through November 30, 2020
See notes to chart on page 5.
Top Ten Holdings as of November 30, 2020
| | | | | | | | |
| | | |
| | | | Security Name | | % of Assets | |
| | 1 | | | MercadoLibre, Inc. | | | 7.70 | % |
| | 2 | | | Amazon.com, Inc. | | | 6.85 | |
| | 3 | | | Alibaba Group Holding Ltd., Sponsored ADR | | | 4.85 | |
| | 4 | | | Novartis AG, (Registered) | | | 4.79 | |
| | 5 | | | Facebook, Inc., Class A | | | 4.62 | |
| | 6 | | | Boeing Co. (The) | | | 4.39 | |
| | 7 | | | Alphabet, Inc., Class A | | | 4.27 | |
| | 8 | | | Visa, Inc., Class A | | | 4.11 | |
| | 9 | | | Deere & Co. | | | 4.08 | |
| | 10 | | | Adyen NV | | | 3.58 | |
The portfolio is actively managed and holdings are subject to change. There is no guarantee the Fund continues to invest in the securities referenced. The holdings listed exclude any temporary cash investments.
| 4
LOOMIS SAYLES GLOBAL GROWTH FUND
Average Annual Total Returns — November 30, 20203
| | | | | | | | | | | | | | | | | | | | |
| | | | | | | | | | | | Expense Ratios4 | |
| | | 1 Year | | | Life of Class | | | Gross | | | Net | |
| | | | | | |
| Class Y (Inception 3/31/2016) | | | | | | | Class Y/A/C | | | | Class N | | | | | | | | | |
| NAV | | | 34.70 | % | | | 18.63 | % | | | — | % | | | 1.18 | % | | | 0.95 | % |
| | | | | | |
| Class A (Inception 3/31/2016) | | | | | | | | | | | | | | | | | | | | |
| NAV | | | 34.37 | | | | 18.32 | | | | — | | | | 1.44 | | | | 1.20 | |
| With 5.75% Maximum Sales Charge | | | 26.66 | | | | 16.82 | | | | — | | | | | | | | | |
| | | | | | |
| Class C (Inception 3/31/2016) | | | | | | | | | | | | | | | | | | | | |
| NAV | | | 33.44 | | | | 17.43 | | | | — | | | | 2.18 | | | | 1.95 | |
| With CDSC1 | | | 32.44 | | | | 17.43 | | | | — | | | | | | | | | |
| | | | | | |
| Class N (Inception 3/31/2017) | | | | | | | | | | | | | | | | | | | | |
| NAV | | | 34.84 | | | | — | | | | 19.59 | | | | 1.17 | | | | 0.90 | |
| | | | | | |
| Comparative Performance | | | | | | | | | | | | | | | | | | | | |
| MSCI All Country World Index (Net)2 | | | 15.01 | | | | 12.00 | | | | 11.20 | | | | | | | | | |
Performance data shown represents past performance and is no guarantee of, and not necessarily indicative of, future results. Total return and value will vary, and you may have a gain or loss when shares are sold. Current performance may be lower or higher than quoted. For most recent month-end performance, visit im.natixis.com/performance. Performance for other share classes will be greater or less than shown based on differences in fees and sales charges. You may not invest directly in an index. Performance for periods less than one year is cumulative, not annualized. Returns reflect changes in share price and reinvestment of dividends and capital gains, if any. The table(s) do not reflect taxes shareholders might owe on any fund distributions or when they redeem their shares.
| 1 | Performance for Class C shares assumes a 1% contingent deferred sales charge (“CDSC”) applied when you sell shares within one year of purchase. |
| 2 | The MSCI All Country World Index (Net) is a free float-adjusted market capitalization weighted index that is designed to measure the equity market performance of developed and emerging markets. |
| 3 | Fund performance has been increased by fee waivers and/or expense reimbursements, if any, without which performance would have been lower. |
| 4 | Expense ratios are as shown in the Fund’s prospectus in effect as of the date of this report. The expense ratios for the current reporting period can be found in the Financial Highlights section of this report under Ratios to Average Net Assets. Net expenses reflect contractual expense limitations set to expire on 3/31/22. When a Fund’s expenses are below the limitation, gross and net expense ratios will be the same. See Note 5 of the Notes to Financial Statements for more information about the Fund’s expense limitations. |
5 |
LOOMIS SAYLES SENIOR FLOATING RATE AND FIXED INCOME FUND
| | |
| |
| Managers: | | Symbols: |
| |
| John R. Bell | | Class A LSFAX |
| |
| Michael L. Klawitter,CFA® | | Class C LSFCX |
| |
| Heather M. Young,CFA® | | Class N LSFNX |
| |
| Loomis, Sayles & Company, L.P. | | Class Y LSFYX |
Investment Goal
The Fund seeks to provide a high level of current income.
Market Conditions
The loan market, alongside other risk markets, experienced several swings in sentiment over the course of the 12-month period. The period began with a risk-on tone, followed by a sharp and quick pandemic-induced downdraft. The end of March and beginning of April brought a quick rebound of higher rated loans, while lower rated loans experienced a more gradual but steady uptick from mid-April to the end of the period.
The loan market sustained significant outflows, mainly from retail investors, as it became clear that interest rates would be expected to remain low for at least twelve months. Outflows were strongest in the first quarter of 2020 and have since abated. Issuance of collateralized loan obligations (CLOs) was challenged compared to prior years, but remained a steady source of demand for leveraged loans.
Throughout most of the period, trading was quiet and limited, disappointing many investors who raised capital hoping to buy loans at cheap post-recession prices. Many feared high levels of defaults across the loan market as a result of the pandemic. The market did process a wave of downgrades, but that trend stabilized by the third quarter as it became evident in pricing that the market generally expected fewer defaults.
Performance Results
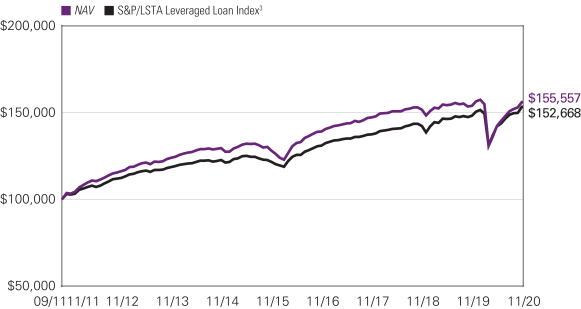
For the 12 months ended November 30, 2020, Class Y shares of the Loomis Sayles Senior Floating Rate and Fixed Income Fund returned 1.45% at net asset value. The Fund underperformed its benchmark, the S&P/LSTA Leveraged Loan Index, which returned 3.38% for the period.
Explanation of Fund Performance
The majority of the Fund’s underperformance occurred during the market dip late in March when we were providing liquidity to investors during a stressed market. Relative performance is more clearly viewed as having had three distinct segments over the last 12 months. The Fund performed in a tight range with its benchmark from the beginning of the period through the third week of February. Once the sharp downdraft of the pandemic took hold, the Fund underperformed the benchmark until mid-April as the higher rated segment surged, reversing its earlier downward price movement. When price recovery shifted to the lower rated portion of the loan market in mid-April, the Fund began to steadily outperform its benchmark through the end of the period.
The Fund carried more cash than usual for the bulk of the period to maintain liquidity in the face of lingering economic uncertainty. Cash hurt performance as the loan market bounced back from the downdraft seen in the first quarter of 2020. Our decision to allocate a small portion of cash to a bank loan ETF for liquidity purposes (when the market environment was supportive) made this cash drag smaller than it would have been had we used only cash. While the Fund’s bank loans, which averaged 87% of the portfolio during the period, outperformed the benchmark, a combination of small positions in other instruments such as corporate bonds detracted from returns. The Fund’s best performing industries, such as food/drug retailers and other retailers, generally reflected a rebound from poor performance related to the pandemic. Aerospace and defense was the industry with the most meaningful negative impact on returns, and the portfolio experienced a minimal impact from defaults during the period.
The Fund is currently positioned with about 84% bank loans (including ETFs), 7% bonds, 1% equity, and 8% held in cash on a trade-date basis. Because we believe that we are in the recovery phase of the cycle and that the sharp recession in the first half of the year was the recession we had expected, we have selectively added risk to the portfolio through bonds and loans that meet our credit and liquidity standards.
We have thoroughly assessed the ability of each loan in our portfolio to withstand the liquidity squeeze created by the pandemic, and we have assigned each loan an expected recovery pattern and probability of default. We have been pleased with the results of this analysis and feel confident that most of the loans we own have the liquidity to survive a significant period of pandemic-related challenges. Importantly, we expect a significant proportion of our loans to have sharp, “V-shaped” recoveries once the recession subsides even in a “U-shaped” economic recovery.
| 6
LOOMIS SAYLES SENIOR FLOATING RATE AND FIXED INCOME FUND
We continue to assess the relative attractiveness of the high yield corporate bond market in relation to bank loans based on risk-adjusted return. Our addition of bonds to the portfolio (as well as the sale of some of these bonds) reflected the consideration of both liquidity and excess return potential versus loans.
Outlook
As markets grapple with the juxtaposition of the negative near-term pandemic implications and longer-term vaccine-driven hope, as well as potential fiscal stimulus hanging in the balance of unsecured political races, we would not be surprised to see some price volatility between here and normalization. Sentiment in the loan market is likely to correlate with that of overall risk markets as companies are tested by the economic consequences of the pandemic.
Despite persisting volatility and uncertainty, we feel confident there are several roads back to par for most loans. Important to these scenarios is our belief that, for the vast majority of loans, companies have long-term values that fully cover the outstanding loan debt we hold.
With respect to the risk of a default cycle, less than 4% of the loan market matures before the end of 2022. While this is a modest proportion of the market, it does bear watching in regard to refinancing risk if the pandemic’s effects stretch out further than we expect.
The pace of downgrades has dropped considerably, and while we have seen some upgrades, ratings pressure may continue depending on the length of the pandemic’s impact on companies’ operating results. We have been surprised by many companies’ ability and willingness to cut costs in reaction to pandemic-related challenges, and by revenue resilience in the second half of this year, setting the stage for a more survivable next 12 months and possibly longer-term margin benefit.
Our stance is that the quick and sharp recession earlier this year reset the credit-cycle clock, leading us into eventual expansion rather than back to a late-cycle environment. This scenario is likely to create investment opportunities, and our goal is to discriminate between winners and losers in the post-pandemic world. We believe we are well-positioned to take advantage of such opportunities by using higher quality positions as a source to reinvest in loans or bonds with better return potential.
Hypothetical Growth of $100,000 Investment in Class Y Shares1,4
September 30, 2011 (inception) through November 30, 2020
7 |
Average Annual Total Returns — November 30, 20204
| | | | | | | | | | | | | | | | | | | | | | | | |
| | | | | |
| | | | | | | | | | | | Expense Ratios5 | |
| | | 1 Year | | | 5 Years | | | Life of Class | | | Gross | | | Net | |
| | | | | | | |
| Class Y (Inception 9/30/11)1 | | | | | | | | | | | Class Y/A/C | | | | Class N | | | | | | | | | |
| NAV | | | 1.45 | % | | | 4.03 | % | | | 4.94 | % | | | — | % | | | 0.84 | % | | | 0.81 | % |
| | | | | | | |
| Class A (Inception 9/30/11) | | | | | | | | | | | | | | | | | | | | | | | | |
| NAV | | | 1.19 | | | | 3.77 | | | | 4.67 | | | | — | | | | 1.09 | | | | 1.06 | |
| With 3.50% Maximum Sales Charge | | | -2.33 | | | | 3.04 | | | | 4.26 | | | | — | | | | | | | | | |
| | | | | | | |
| Class C (Inception 9/30/11) | | | | | | | | | | | | | | | | | | | | | | | | |
| NAV | | | 0.53 | | | | 2.98 | | | | 3.89 | | | | — | | | | 1.84 | | | | 1.81 | |
| With CDSC2 | | | -0.43 | | | | 2.98 | | | | 3.89 | | | | — | | | | | | | | | |
| | | | | | | |
| Class N (Inception 3/31/2017) | | | | | | | | | | | | | | | | | | | | | | | | |
| NAV | | | 1.37 | | | | — | | | | — | | | | 2.53 | | | | 1.11 | | | | 0.76 | |
| | | | | | | |
| Comparative Performance | | | | | | | | | | | | | | | | | | | | | | | | |
| S&P/LSTA Leveraged Loan Index3 | | | 3.35 | | | | 4.71 | | | | 4.68 | | | | 3.72 | | | | | | | | | |
Performance data shown represents past performance and is no guarantee of, and not necessarily indicative of, future results. Total return and value will vary, and you may have a gain or loss when shares are sold. Current performance may be lower or higher than quoted. For most recent month-end performance, visit im.natixis.com/performance. Performance for other share classes will be greater or less than shown based on differences in fees and sales charges. You may not invest directly in an index. Performance for periods less than one year is cumulative, not annualized. Returns reflect changes in share price and reinvestment of dividends and capital gains, if any. The table(s) do not reflect taxes shareholders might owe on any fund distributions or when they redeem their shares.
| 1 | 9/30/11 represents the date Class Y shares were first registered for public sale under the Securities Act of 1933. 9/16/11 represents commencement of operations for Class Y shares for accounting and financial reporting purposes only. |
| 2 | Performance for Class C shares assumes a 1% contingent deferred sales charge (“CDSC”) applied when you sell shares within one year of purchase. |
| 3 | The S&P/LSTA Leveraged Loan Index covers loan facilities and reflects the market-value-weighted performance of U.S. dollar-denominated institutional leveraged loans. |
| 4 | Fund performance has been increased by fee waivers and/or expense reimbursements, if any, without which performance would have been lower. |
| 5 | Expense ratios are as shown in the Fund’s prospectus in effect as of the date of this report. The expense ratios for the current reporting period can be found in the Financial Highlights section of this report under Ratios to Average Net Assets. Net expenses reflect contractual expense limitations set to expire on 3/31/21. When a Fund’s expenses are below the limitation, gross and net expense ratios will be the same. See Note 5 of the Notes to Financial Statements for more information about the Fund’s expense limitations. |
| 8
VAUGHAN NELSON SELECT FUND
| | |
| |
| Managers: | | Symbols: |
| |
| Chris D. Wallis, CFA® | | Class A VNSAX |
| |
| Scott J. Weber, CFA® | | Class C VNSCX |
| |
| Vaughan Nelson Investment Management, L.P. | | Class N VNSNX |
| |
| | Class Y VNSYX |
Investment Goal
The Fund seeks long-term capital appreciation.
Market Conditions
During 2020, the equity market continued to recover from the steep selloff due to the economic lockdown in response to the global pandemic. The equity market rally is consistent with the unprecedented monetary and fiscal policy support that went into the economy and with the bottoming of economic activity in late March to early April. The United States has finally reached the point where the federal government has become the marginal lender and spender of last resort. While policy support is very much warranted, investors will be dealing with the intended and unintended consequences of these actions for many years. The industrial recovery remains strong, boosted by the need to rebuild inventories and robust demand for housing that has left the supply of homes at record low levels. Without additional shocks to the economy, we expect the inventory rebuilding process to last several months and hopefully jumpstart a broader self-reinforcing recovery. The recovery in the service sector continues, but at a slower pace than the industrial sector.
Performance Results
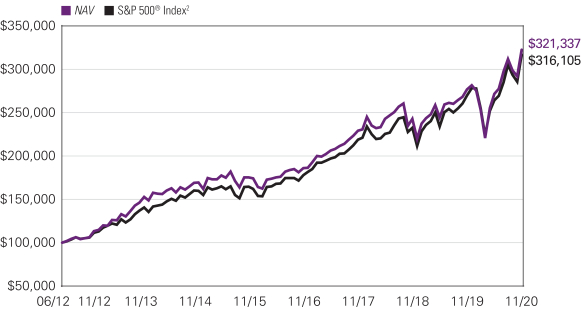
For the 12 months ended November 30, 2020, Class Y shares of the Vaughan Nelson Select Fund returned 16.52% at net asset value. The fund underperformed its benchmark, the S&P 500® Index, which returned 17.46%.
Explanation of Fund Performance
The Fund performed well on an absolute basis during the fiscal year and slightly underperformed relative to the benchmark. The largest detractor was energy. The strategy was both overweight in the space and had some challenged names. Kosmos Energy bore the brunt of the negative performance and relative drag as the price environment suffered from the sudden dislocation in demand and focus turned to the company’s leverage.
Attractive security selection could not overcome a sector underweight to information technology. With positive stock specifics, the Fund’s five percentage points underweight was too much to overcome and resulted in negative relative performance.
Within communication services, Cogent Communications and Walt Disney were significant detractors as both companies had sales and operations significantly disrupted by the pandemic.
Finally, consumer discretionary was a negative relative sector for us primarily due to an overall underweight of Amazon. The Fund took the opportunity to purchase Amazon in the early stages of the pandemic, and it was the highest returning name for the year, but being on average ~50bps underweight made it an overall relative detractor.
The primary contributors were stock selection within the health care and Materials sectors. Within Health Care, Thermo Fisher Scientific contributed the most due to its exposure to Covid testing and vaccine development while Wheaton Precious Metals was the greatest returner within Materials as it benefited from higher gold prices.
The consumer staples sector was a significant underweight for the Fund, and this contributed to a positive allocation effect. While the sector initially fared better than the overall market, it was unable to keep pace with the subsequent rally following the bottoming of economic activity. Lamb Weston had a strong year and further contributed in the sector.
An underweight to and positive selection within financials were additive to the Fund’s returns. From a name perspective, Virtu was the largest contributor as it capitalized on the sustained dislocation in the market leading to high retail participation, high trading volume, and high volatility.
Industrials have been heavily impacted by the pandemic, and our overweight of the sector resulted in a negative allocation effect. However, positive security selection, specifically from Union Pacific Corporation, resulted in overall positive relative performance from Industrials as companies that were able to execute and control costs in a tough operating environment were rewarded.
9 |
Lastly from a positive relative contribution standpoint, the absence of REITs and utilities was additive to the comparable performance as those sectors were unable to keep pace with the market rally.
Outlook
After decades of reliance on monetary stimulus, the economy and capital markets suffer from excess leverage, malinvestment (which is an incorrect or unwise investment) and structural imbalances that hamper the effectiveness of monetary tools. With the election behind us, we expect fiscal policy in close coordination with the Federal Reserve to take center stage in driving economic growth.
The last bout of loose fiscal policy was combined with tight monetary policy, which sustained US dollar strength. The next round of loose fiscal policy will likely be combined with loose monetary policy, which will pressure the US dollar. Should such economic policy be pursued, and successfully increase nominal GDP growth, it will represent a fundamental shift in the underlying economic conditions that have not been witnessed in years. Such a shift in the economic environment will likely lead to increased market volatility and broad changes in market leadership.
Hypothetical Growth of $100,000 Investment in Class Y Shares3
June 29, 2012 (inception) through November 30, 2020
See notes to chart on page 11.
| 10
VAUGHAN NELSON SELECT FUND
Top Ten Holdings as of November 30, 2020
| | | | | | | | |
| | | |
| | | | Security Name | | % of Assets | |
| | 1 | | | Facebook, Inc., Class A | | | 5.74 | % |
| | 2 | | | Microsoft Corp. | | | 5.73 | |
| | 3 | | | Union Pacific Corp. | | | 5.47 | |
| | 4 | | | Amazon.com, Inc. | | | 5.33 | |
| | 5 | | | Texas Instruments, Inc. | | | 5.20 | |
| | 6 | | | Sherwin-Williams Co. (The) | | | 5.16 | |
| | 7 | | | MasterCard, Inc., Class A | | | 4.84 | |
| | 8 | | | UnitedHealth Group, Inc. | | | 4.71 | |
| | 9 | | | ON Semiconductor Corp. | | | 4.60 | |
| | 10 | | | Aon PLC, Class A | | | 3.61 | |
The portfolio is actively managed and holdings are subject to change. There is no guarantee the Fund continues to invest in the securities referenced. The holdings listed exclude any temporary cash investments.
Average Annual Total Returns — November 30, 20203
| | | | | | | | | | | | | | | | | | | | | | | | |
| | | | | |
| | | | | | | | | | | | Expense Ratios4 | |
| | | 1 Year | | | 5 Years | | | Life of Class | | | Gross | | | Net | |
| | | | | | | |
| Class Y (Inception 6/29/2012) | | | | | | | | | | | Class Y/A/C | | | | Class N | | | | | | | | | |
| NAV | | | 16.52 | % | | | 12.95 | % | | | 14.86 | % | | | — | % | | | 0.93 | % | | | 0.90 | % |
| | | | | | | |
| Class A (Inception 6/29/2012) | | | | | | | | | | | | | | | | | | | | | | | | |
| NAV | | | 16.21 | | | | 12.67 | | | | 14.57 | | | | — | | | | 1.18 | | | | 1.15 | |
| With 5.75% Maximum Sales Charge | | | 9.51 | | | | 11.35 | | | | 13.76 | | | | — | | | | | | | | | |
| | | | | | | |
| Class C (Inception 6/29/2012) | | | | | | | | | | | | | | | | | | | | | | | | |
| NAV | | | 15.31 | | | | 11.82 | | | | 13.72 | | | | — | | | | 1.93 | | | | 1.90 | |
| With CDSC1 | | | 14.31 | | | | 11.82 | | | | 13.72 | | | | — | | | | | | | | | |
| | | | | | | |
| Class N (Inception 3/31/2017) | | | | | | | | | | | | | | | | | | | | | | | | |
| NAV | | | 16.50 | | | | — | | | | — | | | | 14.00 | | | | 63.48 | | | | 0.85 | |
| | | | | | | |
| Comparative Performance | | | | | | | | | | | | | | | | | | | | | | | | |
| S&P 500® Index2 | | | 17.46 | | | | 13.99 | | | | 14.60 | | | | 14.52 | | | | | | | | | |
Performance data shown represents past performance and is no guarantee of, and not necessarily indicative of, future results. Total return and value will vary, and you may have a gain or loss when shares are sold. Current performance may be lower or higher than quoted. For most recent month-end performance, visit im.natixis.com/performance. Performance for other share classes will be greater or less than shown based on differences in fees and sales charges. You may not invest directly in an index. Performance for periods less than one year is cumulative, not annualized. Returns reflect changes in share price and reinvestment of dividends and capital gains, if any. The table(s) do not reflect taxes shareholders might owe on any fund distributions or when they redeem their shares.
| 1 | Performance for Class C shares assumes a 1% contingent deferred sales charge (“CDSC”) applied when you sell shares within one year of purchase. |
| 2 | S&P 500® Index is a widely recognized measure of U.S. stock market performance. It is an unmanaged index of 500 common stocks chosen for market size, liquidity, and industry group representation, among other factors. It also measures the performance of the large cap segment of the U.S. equities market. |
| 3 | Fund performance has been increased by fee waivers and/or expense reimbursements, if any, without which performance would have been lower. |
| 4 | Expense ratios are as shown in the Fund’s prospectus in effect as of the date of this report. The expense ratios for the current reporting period can be found in the Financial Highlights section of this report under Ratios to Average Net Assets. Net expenses reflect contractual expense limitations set to expire on 3/31/21. When a Fund’s expenses are below the limitation, gross and net expense ratios will be the same. See Note 5 of the Notes to Financial Statements for more information about the Fund’s expense limitations. |
11 |
ADDITIONAL INFORMATION
The views expressed in this report reflect those of the portfolio managers as of the dates indicated. The managers’ views are subject to change at any time without notice based on changes in market or other conditions. References to specific securities or industries should not be regarded as investment advice. Because the Funds are actively managed, there is no assurance that they will continue to invest in the securities or industries mentioned.
All investing involves risk, including the risk of loss. There is no assurance that any investment will meet its performance objectives or that losses will be avoided.
ADDITIONAL INDEX INFORMATION
This document may contain references to third party copyrights, indexes, and trademarks, each of which is the property of its respective owner. Such owner is not affiliated with Natixis Investment Managers or any of its related or affiliated companies (collectively “Natixis Affiliates”) and does not sponsor, endorse or participate in the provision of any Natixis Affiliates services, funds or other financial products.
The index information contained herein is derived from third parties and is provided on an “as is” basis. The user of this information assumes the entire risk of use of this information. Each of the third party entities involved in compiling, computing or creating index information, disclaims all warranties (including, without limitation, any warranties of originality, accuracy, completeness, timeliness, non-infringement, merchantability and fitness for a particular purpose) with respect to such information.
PROXY VOTING INFORMATION
A description of the Natixis Funds’ proxy voting policies and procedures is available without charge, upon request, by calling Natixis Funds at 800-225-5478; on Natixis Funds’ website at im.natixis.com; and on the Securities and Exchange Commission’s (SEC) website at www.sec.gov. Information regarding how Natixis Funds voted proxies relating to portfolio securities during the most recent 12-month period ended June 30 is available from Natixis Funds’ website and the SEC’s website.
QUARTERLY PORTFOLIO SCHEDULES
The Natixis Funds file a complete schedule of portfolio holdings with the SEC for the first and third quarters of each fiscal year as an exhibit to its reports on Form N-PORT. The Funds’ Form N-PORT reports are available on the SEC’s website at www.sec.gov. First and third quarter schedules of portfolio holdings are also available at im.natixis.com/funddocuments. A hard copy may be requested from the Fund at no charge by calling 800-225-5478.
CFA® and Chartered Financial Analyst® are registered trademarks owned by the CFA Institute.
| 12
UNDERSTANDING FUND EXPENSES
As a mutual fund shareholder, you incur different costs: transaction costs, including sales charges (loads) on purchases and contingent deferred sales charges on redemptions and ongoing costs, including management fees, distribution and/or service fees (12b-1 fees), and other fund expenses. Certain exemptions may apply. These costs are described in more detail in the Funds’ prospectus. The following examples are intended to help you understand the ongoing costs of investing in the Funds and help you compare these with the ongoing costs of investing in other mutual funds.
The first line in the table of each class of Fund shares shows the actual account values and actual Fund expenses you would have paid on a $1,000 investment in the Fund from June 1, 2020 through November 30, 2020. To estimate the expenses you paid over the period, simply divide your account value by $1,000 (for example $8,600 account value divided by $1,000 = 8.60) and multiply the result by the number in the Expenses Paid During Period column as shown below for your class.
The second line in the table for each class of Fund shares provides information about hypothetical account values and hypothetical expenses based on the Fund’s actual expense ratios and an assumed rate of return of 5% per year before expenses, which is not the Fund’s actual return. The hypothetical account values and expenses may not be used to estimate the actual ending account balance or expenses you paid on your investment for the period. You may use this information to compare the ongoing costs of investing in each Fund and other funds. To do so, compare this 5% hypothetical example with the 5% hypothetical examples that appear in the shareholder reports of the other funds.
Please note that the expenses shown reflect ongoing costs only, and do not include any transaction costs, such as sales charges. Therefore, the second line in the table of each Fund is useful in comparing ongoing costs only, and will not help you determine the relative costs of owning different funds. If transaction costs were included, total costs would be higher.
| | | | | | | | | | | | |
| LOOMIS SAYLES GLOBAL GROWTH FUND | | BEGINNING
ACCOUNT VALUE
6/1/2020 | | | ENDING
ACCOUNT VALUE
11/30/2020 | | | EXPENSES PAID
DURING PERIOD*
6/1/2020 – 11/30/2020 | |
Class A | | | | | | | | | | | | |
Actual | | | $1,000.00 | | | | $1,278.60 | | | | $7.12 | |
Hypothetical (5% return before expenses) | | | $1,000.00 | | | | $1,018.75 | | | | $6.31 | |
Class C | | | | | | | | | | | | |
Actual | | | $1,000.00 | | | | $1,273.70 | | | | $11.37 | |
Hypothetical (5% return before expenses) | | | $1,000.00 | | | | $1,015.00 | | | | $10.07 | |
Class N | | | | | | | | | | | | |
Actual | | | $1,000.00 | | | | $1,280.80 | | | | $5.42 | |
Hypothetical (5% return before expenses) | | | $1,000.00 | | | | $1,020.25 | | | | $4.80 | |
Class Y | | | | | | | | | | | | |
Actual | | | $1,000.00 | | | | $1,280.30 | | | | $5.70 | |
Hypothetical (5% return before expenses) | | | $1,000.00 | | | | $1,020.00 | | | | $5.05 | |
| * | Expenses are equal to the Fund’s annualized expense ratio (after waiver/reimbursement): 1.25%, 2.00%, 0.95% and 1.00% for Class A, C, N and Y, respectively, multiplied by the average account value over the period, multiplied by the number of days in the most recent fiscal half-year (183), divided by 366 (to reflect the half-year period). |
13 |
| | | | | | | | | | | | |
| LOOMIS SAYLES SENIOR FLOATING RATE AND FIXED INCOME FUND | | BEGINNING
ACCOUNT VALUE
6/1/2020 | | | ENDING
ACCOUNT VALUE
11/30/2020 | | | EXPENSES PAID
DURING PERIOD*
6/1/2020 – 11/30/2020 | |
Class A | | | | | | | | | | | | |
Actual | | | $1,000.00 | | | | $1,096.20 | | | | $5.50 | |
Hypothetical (5% return before expenses) | | | $1,000.00 | | | | $1,019.75 | | | | $5.30 | |
Class C | | | | | | | | | | | | |
Actual | | | $1,000.00 | | | | $1,092.40 | | | | $9.42 | |
Hypothetical (5% return before expenses) | | | $1,000.00 | | | | $1,016.00 | | | | $9.07 | |
Class N | | | | | | | | | | | | |
Actual | | | $1,000.00 | | | | $1,096.30 | | | | $3.93 | |
Hypothetical (5% return before expenses) | | | $1,000.00 | | | | $1,021.25 | | | | $3.79 | |
Class Y | | | | | | | | | | | | |
Actual | | | $1,000.00 | | | | $1,097.50 | | | | $4.20 | |
Hypothetical (5% return before expenses) | | | $1,000.00 | | | | $1,021.00 | | | | $4.04 | |
| * | Expenses are equal to the Fund’s annualized expense ratio (after waiver/reimbursement): 1.05%, 1.80%, 0.75% and 0.80% for Class A, C, N and Y, respectively, multiplied by the average account value over the period, multiplied by the number of days in the most recent fiscal half-year (183), divided by 366 (to reflect the half-year period). |
| | | | | | | | | | | | |
| VAUGHAN NELSON SELECT FUND | | BEGINNING
ACCOUNT VALUE
6/1/2020 | | | ENDING
ACCOUNT VALUE
11/30/2020 | | | EXPENSES PAID
DURING PERIOD*
6/1/2020 – 11/30/2020 | |
Class A | | | | | | | | | | | | |
Actual | | | $1,000.00 | | | | $1,184.80 | | | | $6.17 | |
Hypothetical (5% return before expenses) | | | $1,000.00 | | | | $1,019.35 | | | | $5.70 | |
Class C | | | | | | | | | | | | |
Actual | | | $1,000.00 | | | | $1,180.60 | | | | $10.25 | |
Hypothetical (5% return before expenses) | | | $1,000.00 | | | | $1,015.60 | | | | $9.47 | |
Class N | | | | | | | | | | | | |
Actual | | | $1,000.00 | | | | $1,186.80 | | | | $4.65 | |
Hypothetical (5% return before expenses) | | | $1,000.00 | | | | $1,020.75 | | | | $4.29 | |
Class Y | | | | | | | | | | | | |
Actual | | | $1,000.00 | | | | $1,186.80 | | | | $4.81 | |
Hypothetical (5% return before expenses) | | | $1,000.00 | | | | $1,020.60 | | | | $4.45 | |
| * | Expenses are equal to the Fund’s annualized expense ratio (after waiver/reimbursement): 1.13%, 1.88%, 0.85% and 0.88% for Class A, C, N and Y, respectively, multiplied by the average account value over the period, multiplied by the number of days in the most recent fiscal half-year (183), divided by 366 (to reflect the half-year period). |
| 14
Portfolio of Investments – as of November 30, 2020
Loomis Sayles Global Growth Fund
| | | | | | | | |
Shares | | | Description | | Value (†) | |
| | Common Stocks — 98.8% of Net Assets | |
| | | | Argentina — 7.7% | |
| | 5,177 | | | MercadoLibre, Inc.(a) | | $ | 8,041,589 | |
| | | | | | | | |
| | | | Brazil — 1.7% | |
| | 663,547 | | | Ambev S.A., ADR | | | 1,765,035 | |
| | | | | | | | |
| | | | China — 15.4% | |
| | 19,228 | | | Alibaba Group Holding Ltd., Sponsored ADR(a) | | | 5,063,886 | |
| | 13,108 | | | Baidu, Inc., Sponsored ADR(a) | | | 1,821,881 | |
| | 170,832 | | | Budweiser Brewing Co. APAC Ltd., 144A | | | 586,467 | |
| | 49,000 | | | Tencent Holdings Ltd. | | | 3,571,986 | |
| | 59,487 | | | Trip.com Group Ltd., ADR(a) | | | 1,998,169 | |
| | 54,203 | | | Yum China Holdings, Inc. | | | 3,055,965 | |
| | | | | | | | |
| | | | | | | 16,098,354 | |
| | | | | | | | |
| | | | Denmark — 0.9% | |
| | 14,030 | | | Novo Nordisk A/S, Class B | | | 940,331 | |
| | | | | | | | |
| | | | France — 0.8% | |
| | 10,157 | | | Sodexo S.A. | | | 838,492 | |
| | | | | | | | |
| | | | Japan — 2.5% | |
| | 10,500 | | | FANUC Corp. | | | 2,575,547 | |
| | | | | | | | |
| | | | Netherlands — 5.6% | |
| | 1,958 | | | Adyen NV, 144A(a) | | | 3,740,080 | |
| | 13,254 | | | NXP Semiconductors NV | | | 2,099,699 | |
| | | | | | | | |
| | | | | | | 5,839,779 | |
| | | | | | | | |
| | | | Switzerland — 9.8% | |
| | 15,675 | | | Nestle S.A., (Registered) | | | 1,755,827 | |
| | 55,320 | | | Novartis AG, (Registered) | | | 5,008,423 | |
| | 10,670 | | | Roche Holding AG | | | 3,504,528 | |
| | | | | | | | |
| | | | | | | 10,268,778 | |
| | | | | | | | |
| | | | United Kingdom — 4.8% | |
| | 65,524 | | | Experian PLC | | | 2,321,507 | |
| | 11,005 | | | Reckitt Benckiser Group PLC | | | 960,599 | |
| | 27,868 | | | Unilever PLC | | | 1,689,377 | |
| | | | | | | | |
| | | | | | | 4,971,483 | |
| | | | | | | | |
| | | | United States — 49.6% | |
| | 2,546 | | | Alphabet, Inc., Class A(a) | | | 4,466,702 | |
| | 2,261 | | | Amazon.com, Inc.(a) | | | 7,162,938 | |
| | 6,694 | | | Autodesk, Inc.(a) | | | 1,875,860 | |
| | 21,783 | | | Boeing Co. (The) | | | 4,589,896 | |
| | 17,704 | | | Colgate-Palmolive Co. | | | 1,516,171 | |
| | 3,473 | | | Core Laboratories NV | | | 76,302 | |
| | 16,277 | | | Deere & Co. | | | 4,258,389 | |
| | 14,742 | | | Expeditors International of Washington, Inc. | | | 1,317,493 | |
| | 17,434 | | | Facebook, Inc., Class A(a) | | | 4,828,695 | |
| | 16,346 | | | Microsoft Corp. | | | 3,499,188 | |
| | 61,146 | | | Oracle Corp. | | | 3,529,347 | |
| | 16,655 | | | QUALCOMM, Inc. | | | 2,451,116 | |
| | 15,001 | | | salesforce.com, Inc.(a) | | | 3,687,246 | |
| | 47,699 | | | Schlumberger NV | | | 991,662 | |
| | 18,641 | | | SEI Investments Co. | | | 983,313 | |
| | 98,836 | | | Under Armour, Inc., Class A(a) | | | 1,637,712 | |
| | 20,415 | | | Visa, Inc., Class A | | | 4,294,295 | |
| | 6,691 | | | Yum! Brands, Inc. | | | 707,908 | |
| | | | | | | | |
| | | | | | | 51,874,233 | |
| | | | | | | | |
| | | | Total Common Stocks
(Identified Cost $77,741,875) | | | 103,213,621 | |
| | | | | | | | |
| | | | | | | | |
Principal
Amount | | | Description | | Value (†) | |
| | Short-Term Investments — 2.0% | |
| $ | 2,082,356 | | | Tri-Party Repurchase Agreement with Fixed Income Clearing Corporation, dated 11/30/2020 at 0.000% to be repurchased at $2,082,356 on 12/01/2020 collateralized by $2,123,200 U.S. Treasury Note, 0.375% due 11/30/2025 valued at $2,124,030 including accrued interest (Note 2 of Notes to Financial Statements)
(Identified Cost $2,082,356) | | $ | 2,082,356 | |
| | | | | | | | |
| | | | | | | | |
| | | | Total Investments — 100.8%
(Identified Cost $79,824,231) | | | 105,295,977 | |
| | | | Other assets less liabilities — (0.8)% | | | (801,395 | ) |
| | | | | | | | |
| | | | Net Assets — 100.0% | | $ | 104,494,582 | |
| | | | | | | | |
| | | | | | | | |
| | (†) | | | See Note 2 of Notes to Financial Statements. | |
| | (a) | | | Non-income producing security. | |
| | | | | | | | |
| | 144A | | | All or a portion of these securities are exempt from registration under Rule 144A of the Securities Act of 1933. These securities may be resold in transactions exempt from registration, normally to qualified institutional buyers. At November 30, 2020, the value of Rule 144A holdings amounted to $4,326,547 or 4.1% of net assets. | |
| | ADR | | | An American Depositary Receipt is a certificate issued by a custodian bank representing the right to receive securities of the foreign issuer described. The values of ADRs may be significantly influenced by trading on exchanges not located in the United States. | |
Industry Summary at November 30, 2020
| | | | |
Internet & Direct Marketing Retail | | | 21.4 | % |
Interactive Media & Services | | | 14.0 | |
Software | | | 12.0 | |
Pharmaceuticals | | | 9.0 | |
IT Services | | | 7.7 | |
Machinery | | | 6.6 | |
Hotels, Restaurants & Leisure | | | 4.4 | |
Aerospace & Defense | | | 4.4 | |
Semiconductors & Semiconductor Equipment | | | 4.3 | |
Household Products | | | 2.3 | |
Beverages | | | 2.3 | |
Professional Services | | | 2.3 | |
Other Investments, less than 2% each | | | 8.1 | |
Short-Term Investments | | | 2.0 | |
| | | | |
Total Investments | | | 100.8 | |
Other assets less liabilities | | | (0.8 | ) |
| | | | |
Net Assets | | | 100.0 | % |
| | | | |
Currency Exposure Summary at November 30, 2020
| | | | |
United States Dollar | | | 74.4 | % |
Swiss Franc | | | 9.8 | |
Euro | | | 6.0 | |
Hong Kong Dollar | | | 4.0 | |
British Pound | | | 3.2 | |
Japanese Yen | | | 2.5 | |
Danish Krone | | | 0.9 | |
| | | | |
Total Investments | | | 100.8 | |
Other assets less liabilities | | | (0.8 | ) |
| | | | |
Net Assets | | | 100.0 | % |
| | | | |
See accompanying notes to financial statements.
15 |
Portfolio of Investments – as of November 30, 2020
Loomis Sayles Senior Floating Rate and Fixed Income Fund
| | | | | | | | |
Principal
Amount | | | Description | | Value (†) | |
| | Senior Loans — 83.4% of Net Assets | |
| | | | Aerospace & Defense — 1.9% | |
| $ | 5,437,786 | | | Advanced Integration Technology LP, 2017 Term Loan B, 1-month LIBOR + 4.750%, 5.750%, 4/03/2023(a) | | $ | 4,513,363 | |
| | 3,740,602 | | | AI Convoy (Luxembourg) S.a.r.l., USD Term Loan B, LIBOR + 3.500%, 4.500%, 1/17/2027(b) | | | 3,724,255 | |
| | 3,047,000 | | | MAG DS Corp., Term Loan, 1-month LIBOR + 5.500%, 6.500%, 4/01/2027(a) | | | 2,909,885 | |
| | 2,436,000 | | | Spirit Aerosystems, Inc., 2020 Term Loan B, 1-month LIBOR + 5.250%, 6.000%, 1/15/2025(a) | | | 2,454,270 | |
| | 9,701,128 | | | TransDigm, Inc., 2020 Term Loan F, 1-month LIBOR + 2.250%, 2.396%, 12/09/2025(a) | | | 9,392,923 | |
| | | | | | | | |
| | | | | | | 22,994,696 | |
| | | | | | | | |
| | | | Airlines — 0.5% | |
| | 4,140,276 | | | Allegiant Travel Co., 2020 Term Loan, 3-month LIBOR + 3.000%, 3.214%, 2/05/2024(a) | | | 3,982,449 | |
| | 2,474,000 | | | SkyMiles IP Ltd., 2020 Skymiles Term Loan B, 3-month LIBOR + 3.750%, 4.750%, 10/20/2027(a) | | | 2,526,276 | |
| | | | | | | | |
| | | | | | | 6,508,725 | |
| | | | | | | | |
| | | | Automotive — 6.4% | |
| | 2,209,677 | | | American Axle & Manufacturing, Inc., Term Loan B, 3-month LIBOR + 2.250%, 3.000%, 4/06/2024(a) | | | 2,164,688 | |
| | 3,414,787 | | | Belron Finance U.S. LLC, 2019 USD Term Loan B3, 3-month LIBOR + 2.250%, 2.464%, 10/30/2026(a) | | | 3,329,417 | |
| | 5,852,116 | | | Clarios Global LP, USD Term Loan B, 1-month LIBOR + 3.500%, 3.646%, 4/30/2026(a) | | | 5,783,120 | |
| | 3,082,201 | | | Dayco Products LLC, 2017 Term Loan B, 3-month LIBOR + 4.250%, 4.483%, 5/19/2023(a) | | | 2,063,534 | |
| | 10,690,500 | | | Holley Purchaser, Inc., Term Loan B, 3-month LIBOR + 5.000%, 5.214%, 10/24/2025(a) | | | 10,302,969 | |
| | 4,369,009 | | | IXS Holdings, Inc., 2020 Term Loan B, 3-month LIBOR + 5.000%, 6.000%, 3/05/2027(a) | | | 4,325,319 | |
| | 4,966,000 | | | Les Schwab Tire Centers, Term Loan B, 3-month LIBOR + 3.500%, 4.250%, 11/02/2027(a) | | | 4,916,340 | |
| | 9,556,729 | | | Mister Car Wash Holdings, Inc., 2019 Term Loan B, 1-month LIBOR + 3.250%, 3.397%, 5/14/2026(a) | | | 9,134,130 | |
| | 5,084,000 | | | PAI Holdco, Inc., 2020 Term Loan B, 3-month LIBOR + 4.000%, 5.000%, 10/28/2027(a) | | | 5,077,645 | |
| | 3,460,000 | | | Rough Country LLC, 1st Lien Term Loan, 3-month LIBOR + 3.750%, 4.750%, 5/25/2023(a) | | | 3,421,075 | |
| | 9,822,453 | | | Trico Group LLC, 2020 Term Loan B, 3-month LIBOR + 7.500%, 8.500%, 2/02/2024(a) | | | 9,791,807 | |
| | 8,289,992 | | | Truck Hero, Inc., 1st Lien Term Loan, 1-month LIBOR + 3.750%, 3.896%, 4/22/2024(a) | | | 8,086,887 | |
| | 5,813,292 | | | Wand NewCo 3, Inc., 2020 Term Loan, 1-month LIBOR + 3.000%, 3.146%, 2/05/2026(a) | | | 5,647,962 | |
| | 3,550,000 | | | Wheel Pros LLC, 2020 Term Loan, 3-month LIBOR + 5.250%, 6.250%, 11/06/2027(a) | | | 3,479,000 | |
| | | | | | | | |
| | | | | | | 77,523,893 | |
| | | | | | | | |
| | | | Brokerage — 0.8% | |
| | 994,937 | | | Edelman Financial Center LLC, 2018 1st Lien Term Loan, 1-month LIBOR + 3.000%, 3.146%, 7/21/2025(a) | | | 974,421 | |
| | 3,852,045 | | | Edelman Financial Center LLC, 2018 2nd Lien Term Loan, 1-month LIBOR + 6.750%, 6.896%, 7/20/2026(a) | | | 3,832,785 | |
| | | | Brokerage — continued | |
| 5,486,250 | | | Jefferies Finance LLC, 2020 Incremental Term Loan B, 1-month LIBOR + 3.750%, 4.500%, 9/30/2027(a) | | | 5,445,103 | |
| | | | | | | | |
| | | | | | | 10,252,309 | |
| | | | | | | | |
| | | | Building Materials — 4.2% | |
| | 7,789,380 | | | Big Ass Fans LLC, 2018 Term Loan, 3-month LIBOR + 3.750%, 4.750%, 5/21/2024(a) | | | 7,633,592 | |
| | 6,364,366 | | | Cornerstone Building Brands, Inc., 2018 Term Loan, 1-month LIBOR + 3.750%, 3.880%, 4/12/2025(a) | | | 6,300,723 | |
| | 567,500 | | | CP Atlas Buyer, Inc., 2020 Delayed Draw Term Loan B2, 3-month LIBOR + 4.500%, 5.250%, 11/23/2027(a) | | | 566,268 | |
| | 1,702,500 | | | CP Atlas Buyer, Inc., 2020 Term Loan B1, 3-month LIBOR + 4.500%, 5.250%, 11/23/2027(a) | | | 1,698,806 | |
| | 3,990,000 | | | Floor & Decor Outlets of America, Inc., 2020 Incremental Term Loan B1, 1-month LIBOR + 4.000%, 5.000%, 2/15/2027(a) | | | 3,985,012 | |
| | 6,921,826 | | | Interior Logic Group Holdings IV LLC, 2018 Term Loan B, 1-month LIBOR + 4.000%, 4.146%, 5/30/2025(a) | | | 6,783,389 | |
| | 8,457,331 | | | Janus International Group LLC, 2018 1st Lien Term Loan, 2-month LIBOR + 3.750%, 4.750%, 2/12/2025(a) | | | 8,330,471 | |
| | 3,119,061 | | | Jeld-Wen, Inc., 2017 1st Lien Term Loan, 1-month LIBOR + 2.000%, 2.146%, 12/14/2024(a) | | | 3,054,995 | |
| | 6,661,057 | | | Mannington Mills, Inc., 2019 Term Loan B, 1-month LIBOR + 4.000%, 4.166%, 8/06/2026(a) | | | 6,469,552 | |
| | 4,043,295 | | | Quikrete Holdings, Inc., 2016 1st Lien Term Loan, 1-month LIBOR + 2.500%, 2.646%, 2/01/2027(a) | | | 3,982,645 | |
| | 1,846,965 | | | White Cap Buyer LLC, Term Loan B, 6-month LIBOR + 4.000%, 4.500%, 10/19/2027(a) | | | 1,829,493 | |
| | | | | | | | |
| | | | | | | 50,634,946 | |
| | | | | | | | |
| | | | Cable Satellite — 2.1% | |
| | 8,605,012 | | | CSC Holdings LLC, 2019 Term Loan B5, 1-month LIBOR + 2.500%, 2.639%, 4/15/2027(a) | | | 8,395,996 | |
| | 1,496,250 | | | Terrier Media Buyer, Inc., 2020 Term Loan B, 1-month LIBOR + 4.250%, 4.396%, 12/17/2026(a) | | | 1,471,936 | |
| | 3,815,170 | | | Terrier Media Buyer, Inc., Term Loan B, 1-month LIBOR + 4.250%, 4.396%, 12/17/2026(a) | | | 3,763,322 | |
| | 2,676,146 | | | UPC Broadband Holding BV, 2020 USD Term Loan B1, 2-month LIBOR + 3.500%, 3.673%, 1/31/2029(a) | | | 2,646,602 | |
| | 2,676,146 | | | UPC Broadband Holding BV, 2020 USD Term Loan B2, 2-month LIBOR + 3.500%, 3.677%, 1/31/2029(a) | | | 2,646,601 | |
| | 1,600,000 | | | Virgin Media Bristol LLC, 2020 USD Term Loan Q, 1/31/2029(c) | | | 1,586,000 | |
| | 5,000,000 | | | Virgin Media Bristol LLC, USD Term Loan N, 1-month LIBOR + 2.500%, 2.641%, 1/31/2028(a) | | | 4,899,500 | |
| | | | | | | | |
| | | | | | | 25,409,957 | |
| | | | | | | | |
| | | | Chemicals — 1.6% | |
| | 1,575,000 | | | Aruba Investments, Inc., 2020 2nd Lien Term Loan, 10/27/2028(c) | | | 1,572,370 | |
| | 1,953,000 | | | Aruba Investments, Inc., 2020 USD Term Loan, 10/28/2027(c) | | | 1,942,024 | |
| | 1,000,000 | | | Hexion, Inc., USD Exit Term Loan, 7/01/2026(c) | | | 983,750 | |
| | 3,961,490 | | | Hexion, Inc., USD Exit Term Loan, 6-month LIBOR + 3.500%, 3.730%, 7/01/2026(a) | | | 3,897,116 | |
See accompanying notes to financial statements.
| 16
Portfolio of Investments – as of November 30, 2020
Loomis Sayles Senior Floating Rate and Fixed Income Fund – (continued)
| | | | | | | | |
Principal
Amount | | | Description | | Value (†) | |
| | | | Chemicals — continued | |
| $ | 1,000,000 | | | Momentive Performance Materials, Inc., Term Loan B, 5/15/2024(c) | | $ | 968,330 | |
| | 3,537,141 | | | Momentive Performance Materials, Inc., Term Loan B, 1-month LIBOR + 3.250%, 3.400%, 5/15/2024(a) | | | 3,425,119 | |
| | 4,227,357 | | | Natgasoline LLC, Term Loan B, 3-month LIBOR + 3.500%, 3.750%, 11/14/2025(a) | | | 4,068,831 | |
| | 2,271,833 | | | Univar, Inc., 2019 USD Term Loan B5, 1-month LIBOR + 2.000%, 2.146%, 7/01/2026(a) | | | 2,223,147 | |
| | | | | | | | |
| | | | | | | 19,080,687 | |
| | | | | | | | |
| | | | Construction Machinery — 0.4% | |
| | 3,397,172 | | | CTOS LLC, 2020 Term Loan B, 1-month LIBOR + 4.250%, 4.393%, 4/18/2025(a) | | | 3,380,186 | |
| | 3,266,549 | | | Onsite Rental Group Pty Ltd., Note, 6.100%, 10/26/2023(d)(e)(f)(g) | | | 1,737,804 | |
| | | | | | | | |
| | | | | | | 5,117,990 | |
| | | | | | | | |
| | | | Consumer Cyclical Services — 7.5% | |
| | 11,548,215 | | | Access CIG LLC, 2018 1st Lien Term Loan, 3-month LIBOR + 3.750%, 3.975%, 2/27/2025(a) | | | 11,300,390 | |
| | 6,975,000 | | | Access CIG LLC, 2018 2nd Lien Term Loan, 3-month LIBOR + 7.750%, 7.975%, 2/27/2026(a) | | | 6,696,000 | |
| | 3,450,000 | | | American Residential Services LLC, 2020 Term Loan B, 3-month LIBOR + 3.500%, 4.250%, 10/15/2027(a) | | | 3,413,361 | |
| | 6,654,750 | | | BIFM CA Buyer, Inc., Term Loan B, 1-month LIBOR + 3.500%, 3.646%, 6/01/2026(a) | | | 6,521,655 | |
| | 6,158,221 | | | Boing U.S. Holdco, Inc., 2017 1st Lien Term Loan, 1-month LIBOR + 3.250%, 4.250%, 10/03/2024(a) | | | 6,027,359 | |
| | 7,920,667 | | | Boing U.S. Holdco, Inc., 2017 2nd Lien Term Loan, 1-month LIBOR + 7.500%, 8.500%, 10/03/2025(a) | | | 7,405,823 | |
| | 6,630,872 | | | Creative Artists Agency LLC, 2019 Term Loan B, 1-month LIBOR + 3.750%, 3.896%, 11/27/2026(a) | | | 6,507,936 | |
| | 9,079,373 | | | Cushman & Wakefield U.S. Borrower LLC, 2020 Term Loan B, 1-month LIBOR + 2.750%, 2.896%, 8/21/2025(a) | | | 8,784,294 | |
| | 1,000,000 | | | Deerfield Dakota Holding LLC, 2020 USD Term Loan B, 4/09/2027(c) | | | 995,940 | |
| | 1,890,000 | | | DG Investment Intermediate Holdings 2, Inc., 2018 2nd Lien Term Loan, 1-month LIBOR + 6.750%, 7.500%, 2/02/2026(a) | | | 1,757,700 | |
| | 923,912 | | | Lender MCS Acquisition Corp., 2020 Take Back Term Loan, 3-month LIBOR + 6.000%, 7.000%, 10/02/2025(a)(f)(h) | | | 831,520 | |
| | 2,584,087 | | | National Intergovernmental Purchasing Alliance Co., 1st Lien Term Loan, 3-month LIBOR + 3.750%, 3.970%, 5/23/2025(a) | | | 2,532,405 | |
| | 900,746 | | | Service Logic Acquisition, Inc., Delayed Draw Term Loan, 0.500%, 10/29/2027(i) | | | 899,620 | |
| | 50,746 | | | Service Logic Acquisition, Inc., Delayed Draw Term Loan, 2-month LIBOR + 4.000%, 4.750%, 10/29/2027(a) | | | 50,683 | |
| | 3,298,507 | | | Service Logic Acquisition, Inc., Term Loan, 3-month LIBOR + 4.000%, 4.750%, 10/29/2027(a) | | | 3,294,384 | |
| | 5,132,587 | | | Sterling Midco Holdings, Inc., 1st Lien Term Loan, 3-month LIBOR + 3.500%, 4.500%, 6/19/2024(a) | | | 4,794,709 | |
| | 1,995,000 | | | STG-Fairway Holdings LLC, Term Loan B, 1-month LIBOR + 3.250%, 3.396%, 1/31/2027(a) | | | 1,943,888 | |
| | 3,596,756 | | | Thoughtworks, Inc., 2020 Term Loan, 3-month LIBOR + 3.750%, 4.750%, 10/11/2024(a) | | | 3,569,781 | |
| | | | Consumer Cyclical Services — continued | |
| 2,487,212 | | | West Corp., 2017 Term Loan, LIBOR + 4.000%, 5.000%, 10/10/2024(b) | | | 2,362,553 | |
| | 6,515,238 | | | William Morris Endeavor Entertainment LLC, 2018 1st Lien Term Loan, 1-month LIBOR + 2.750%, 2.900%, 5/18/2025(a) | | | 5,881,631 | |
| | 5,439,034 | | | Xerox Business Services LLC, USD Term Loan B, 1-month LIBOR + 2.500%, 2.646%, 12/07/2023(a) | | | 5,293,975 | |
| | | | | | | | |
| | | | | | | 90,865,607 | |
| | | | | | | | |
| | | | Consumer Products — 5.8% | |
| | 5,222,000 | | | Advantage Sales & Marketing, Inc., 2020 Term Loan B, 3-month LIBOR + 5.250%, 6.000%, 10/28/2027(a) | | | 5,167,900 | |
| | 2,083,436 | | | Anastasia Parent LLC, 2018 Term Loan B, 3-month LIBOR + 3.750%, 3.970%, 8/11/2025(a) | | | 1,010,800 | |
| | 8,962,366 | | | Augusta Sportswear Group, Inc., Term Loan B, 3-month LIBOR + 4.500%, 5.500%, 10/26/2023(a) | | | 8,021,317 | |
| | 1,415,000 | | | Canada Goose Inc., Term Loan, 3-month LIBOR + 4.250%, 5.000%, 10/07/2027(a) | | | 1,411,462 | |
| | 7,241,842 | | | CWGS Group LLC, 2016 Term Loan, LIBOR + 2.750%, 3.500%, 11/08/2023(b) | | | 7,107,579 | |
| | 6,486,306 | | | Inmar Holdings, Inc., 2017 1st Lien Term Loan, 3-month LIBOR + 4.000%, 5.000%, 5/01/2024(a) | | | 6,252,215 | |
| | 5,697,559 | | | Polyconcept Investments BV, USD 2016 Term Loan B, 3-month LIBOR + 4.500%, 5.500%, 8/16/2023(a) | | | 5,213,266 | |
| | 4,202,371 | | | Serta Simmons Bedding LLC, 1st Lien Term Loan, 3-month LIBOR + 3.500%, 4.500%, 11/08/2023(a) | | | 2,073,156 | |
| | 8,684,028 | | | SIWF Holdings, Inc., 1st Lien Term Loan, 1-month LIBOR + 4.250%, 4.396%, 6/15/2025(a) | | | 8,513,995 | |
| | 5,098,695 | | | Strategic Partners Acquisition Corp., 2016 Term Loan, 1-month LIBOR + 3.750%, 4.750%, 6/30/2023(a) | | | 5,060,455 | |
| | 7,362,628 | | | Thor Industries, Inc., USD Term Loan B, 1-month LIBOR + 3.750%, 3.938%, 2/01/2026(a) | | | 7,307,408 | |
| | 2,122,000 | | | Weber-Stephen Products LLC, Term Loan B, 1-month LIBOR + 3.250%, 4.000%, 10/30/2027(a) | | | 2,111,920 | |
| | 5,832,013 | | | Weight Watchers International, Inc., 2017 Term Loan B, 1-month LIBOR + 4.750%, 5.500%, 11/29/2024(a) | | | 5,827,173 | |
| | 4,783,987 | | | Wellness Merger Sub, Inc., 1st Lien Term Loan, 3-month LIBOR + 4.000%, 4.233%, 6/30/2024(a) | | | 4,682,328 | |
| | | | | | | | |
| | | | | | | 69,760,974 | |
| | | | | | | | |
| | | | Diversified Manufacturing — 0.7% | |
| | 2,712,121 | | | Engineered Machinery Holdings, Inc., 2018 Incremental Term Loan, 3-month LIBOR + 4.250%, 5.250%, 7/19/2024(a) | | | 2,694,330 | |
| | 1,664,262 | | | Granite Holdings U.S. Acquisition Co., Term Loan B, 3-month LIBOR + 5.250%, 5.470%, 9/30/2026(a) | | | 1,616,414 | |
| | 4,525,000 | | | Vertical Midco GmbH, USD Term Loan B, 6-month LIBOR + 4.250%, 4.570%, 7/30/2027(a) | | | 4,510,565 | |
| | | | | | | | |
| | | | | | | 8,821,309 | |
| | | | | | | | |
| | | | Electric — 2.0% | |
| | 4,329,362 | | | CRCI Longhorn Holdings, Inc., 2018 1st Lien Term Loan, 1-month LIBOR + 3.500%, 3.643%, 8/08/2025(a) | | | 4,188,658 | |
| | 5,178,688 | | | KAMC Holdings, Inc., 2019 Term Loan, LIBOR + 4.000%, 4.233%, 8/14/2026(b) | | | 4,773,041 | |
| | 4,000,000 | | | Mirion Technologies, Inc., 2019 Term Loan B, 3/06/2026(c) | | | 3,967,000 | |
See accompanying notes to financial statements.
17 |
Portfolio of Investments – as of November 30, 2020
Loomis Sayles Senior Floating Rate and Fixed Income Fund – (continued)
| | | | | | | | |
Principal
Amount | | | Description | | Value (†) | |
| | | | Electric — continued | |
| $ | 2,303,256 | | | Oregon Clean Energy LLC, Term Loan, 1-month LIBOR + 3.750%, 4.750%, 3/01/2026(a) | | $ | 2,278,795 | |
| | 4,552,938 | | | Revere Power LLC, Term Loan B, 1-month LIBOR + 4.250%, 4.396%, 3/29/2026(a) | | | 4,256,997 | |
| | 331,985 | | | Revere Power LLC, Term Loan C, 1-month LIBOR + 4.250%, 4.396%, 3/29/2026(a) | | | 310,406 | |
| | 5,235,049 | | | West Deptford Energy Holdings LLC, Term Loan B, 1-month LIBOR + 3.750%, 3.896%, 8/03/2026(a) | | | 4,973,297 | |
| | | | | | | | |
| | | | | | | 24,748,194 | |
| | | | | | | | |
| | | | Environmental — 0.7% | |
| | 1,539,148 | | | Array Technologies, Inc., Term Loan B, 1-month LIBOR + 4.000%, 5.000%, 10/14/2027(a) | | | 1,527,604 | |
| | 3,100,972 | | | EnergySolutions LLC, 2018 Term Loan B, 3-month LIBOR + 3.750%, 4.750%, 5/09/2025(a) | | | 3,035,077 | |
| | 3,800,000 | | | Northstar Group Services, Inc., 2020 Term Loan B, 11/09/2026(c) | | | 3,724,000 | |
| | | | | | | | |
| | | | | | | 8,286,681 | |
| | | | | | | | |
| | | | Financial Other — 2.7% | |
| | 6,838,832 | | | Amynta Agency Borrower, Inc., 2018 1st Lien Term Loan, 1-month LIBOR + 4.500%, 4.646%, 2/28/2025(a) | | | 6,502,567 | |
| | 3,238,125 | | | AqGen Ascensus, Inc., 2020 Term Loan, 3-month LIBOR + 4.000%, 5.000%, 12/13/2026(a) | | | 3,210,601 | |
| | 2,701,000 | | | GT Polaris, Inc., Term Loan B, 3-month LIBOR + 4.000%, 5.000%, 9/24/2027(a) | | | 2,687,495 | |
| | 5,489,226 | | | LifeMiles Ltd., Term Loan B, 3-month LIBOR + 5.500%, 6.500%, 8/18/2022(a) | | | 5,054,644 | |
| | 2,984,694 | | | NAB Holdings LLC, 2017 Repriced Term Loan, 3-month LIBOR + 3.000%, 4.000%, 7/01/2024(a) | | | 2,928,104 | |
| | 3,214,000 | | | Resolute Investment Managers, Inc., 2020 Term Loan, 3-month LIBOR + 3.750%, 4.750%, 4/30/2024(a) | | | 3,185,877 | |
| | 9,751,210 | | | Teneo Holdings LLC, Term Loan, 1-month LIBOR + 5.250%, 6.250%, 7/11/2025(a)(f)(h) | | | 9,495,241 | |
| | | | | | | | |
| | | | | | | 33,064,529 | |
| | | | | | | | |
| | | | Food & Beverage — 0.5% | |
| | 1,737,000 | | | Arterra Wines Canada, Inc., 2020 Term Loan, 11/18/2027(c) | | | 1,737,000 | |
| | 4,481,000 | | | Shearer’s Foods, Inc., 2020 Term Loan B, 3-month LIBOR + 4.000%, 4.750%, 9/23/2027(a) | | | 4,465,585 | |
| | | | | | | | |
| | | | | | | 6,202,585 | |
| | | | | | | | |
| | | | Gaming — 0.8% | |
| | 4,974,425 | | | Caesars Resort Collection LLC, 2017 1st Lien Term Loan B, 1-month LIBOR + 2.750%, 2.896%, 12/23/2024(a) | | | 4,808,428 | |
| | 1,471,000 | | | Caesars Resort Collection LLC, 2020 Term Loan B1, 1-month LIBOR + 4.500%, 4.646%, 7/21/2025(a) | | | 1,456,055 | |
| | 3,717,404 | | | PCI Gaming Authority, Term Loan, 1-month LIBOR + 2.500%, 2.646%, 5/29/2026(a) | | | 3,637,554 | |
| | | | | | | | |
| | | | | | | 9,902,037 | |
| | | | | | | | |
| | | | Health Insurance — 0.8% | |
| | 4,005,272 | | | Sedgwick Claims Management Services, Inc., 2018 Term Loan B, 1-month LIBOR + 3.250%, 3.396%, 12/31/2025(a) | | | 3,910,146 | |
| | 5,856,307 | | | Sedgwick Claims Management Services, Inc., 2019 Term Loan B, 1-month LIBOR + 4.000%, 4.146%, 9/03/2026(a) | | | 5,782,049 | |
| | | | | | | | |
| | | | | | | 9,692,195 | |
| | | | | | | | |
| | | | Healthcare — 4.4% | |
| 6,740,000 | | | Ascend Learning LLC, 2020 Incremental Term Loan, 1-month LIBOR + 3.750%, 4.750%, 7/12/2024(a) | | | 6,723,150 | |
| | 4,741,773 | | | Carestream Dental Equipment, Inc., 2017 1st Lien Term Loan, 3-month LIBOR + 3.250%, 4.250%, 9/01/2024(a) | | | 4,473,057 | |
| | 2,350,000 | | | DuPage Medical Group Ltd., 2nd Lien Term Loan, 1-month LIBOR + 7.000%, 7.750%, 8/15/2025(a) | | | 2,185,500 | |
| | 6,126,825 | | | Gentiva Health Services, Inc., 2020 Term Loan, 1-month LIBOR + 3.250%, 3.438%, 7/02/2025(a) | | | 6,083,447 | |
| | 5,429,210 | | | Global Education Management Systems Establishment, Term Loan, 3-month LIBOR + 5.000%, 6.000%, 7/31/2026(a) | | | 5,334,199 | |
| | 5,444,000 | | | Milano Acquisition Corp., Term Loan B, 3-month LIBOR + 4.000%, 4.750%, 10/01/2027(a) | | | 5,385,041 | |
| | 2,764,277 | | | National Mentor Holdings, Inc., 2019 Term Loan B, 1-month LIBOR + 4.250%, 4.400%, 3/09/2026(a) | | | 2,738,625 | |
| | 126,180 | | | National Mentor Holdings, Inc., 2019 Term Loan C, 1-month LIBOR + 4.250%, 4.400%, 3/09/2026(a) | | | 125,009 | |
| | 1,000,000 | | | Southern Veterinary Partners LLC, 2nd Lien Term Loan, 3-month LIBOR + 7.750%, 8.750%, 10/05/2028(a) | | | 995,000 | |
| | 441,333 | | | Southern Veterinary Partners LLC, Delayed Draw Term Loan, 0.500%, 10/05/2027(i) | | | 436,920 | |
| | 3,199,667 | | | Southern Veterinary Partners LLC, Term Loan, 6-month LIBOR + 4.000%, 5.000%, 10/02/2027(a) | | | 3,167,670 | |
| | 4,274,359 | | | Surgery Center Holdings, Inc., 2017 Term Loan B, 1-month LIBOR + 3.250%, 4.250%, 9/03/2024(a) | | | 4,181,221 | |
| | 248,750 | | | Surgery Center Holdings, Inc., 2020 Incremental Term Loan, 1-month LIBOR + 8.000%, 9.000%, 9/03/2024(a) | | | 253,270 | |
| | 4,620,000 | | | Symplr Software, Inc., 2020 Term Loan, 11/23/2027(c) | | | 4,556,475 | |
| | 7,113,689 | | | Verscend Holding Corp., 2018 Term Loan B, 1-month LIBOR + 4.500%, 4.646%, 8/27/2025(a) | | | 7,080,325 | |
| | | | | | | | |
| | | | | | | 53,718,909 | |
| | | | | | | | |
| | | | Home Construction — 0.2% | |
| | 2,349,854 | | | Hayward Industries, Inc., 1st Lien Term Loan, 1-month LIBOR + 3.500%, 3.646%, 8/05/2024(a) | | | 2,302,363 | |
| | | | | | | | |
| | | | Independent Energy — 0.0% | |
| | 23,593,712 | | | Gavilan Resources LLC, 2nd Lien Term Loan, 3/01/2024(e)(g)(j) | | | — | |
| | | | | | | | |
| | | | Industrial Other — 4.6% | |
| | 7,928,852 | | | ABG Intermediate Holdings 2 LLC, 2017 1st Lien Add-On Term Loan, 3-month LIBOR + 3.500%, 4.500%, 9/27/2024(a) | | | 7,814,200 | |
| | 2,970,000 | | | Alliance Laundry Systems LLC, Term Loan B, 3-month LIBOR + 3.500%, 4.250%, 10/08/2027(a) | | | 2,961,328 | |
| | 824,000 | | | APi Group DE, Inc., 2020 Incremental Term Loan B, 1-month LIBOR + 2.750%, 2.896%, 10/01/2026(a) | | | 813,700 | |
| | 4,431,438 | | | APi Group DE, Inc., Term Loan B, 1-month LIBOR + 2.500%, 2.646%, 10/01/2026(a) | | | 4,353,887 | |
| | 6,040,373 | | | CIBT Global, Inc., 2017 1st Lien Term Loan, 3-month LIBOR + 3.750%, 4.750%, 6/03/2024(a) | | | 4,137,656 | |
| | 3,630,000 | | | Element Materials Technology Group U.S. Holdings, Inc., 2017 USD Term Loan B, 3-month LIBOR + 3.500%, 4.500%, 6/28/2024(a) | | | 3,489,337 | |
See accompanying notes to financial statements.
| 18
Portfolio of Investments – as of November 30, 2020
Loomis Sayles Senior Floating Rate and Fixed Income Fund – (continued)
| | | | | | | | |
Principal
Amount | | | Description | | Value (†) | |
| | | | Industrial Other — continued | |
| $ | 5,375,000 | | | Filtration Group Corp., 2020 Incremental Term Loan, 1-month LIBOR + 3.750%, 4.500%, 3/29/2025(a) | | $ | 5,350,382 | |
| | 1,267,384 | | | Harland Clarke Holdings Corp., Term Loan B7, 3-month LIBOR + 4.750%, 5.750%, 11/03/2023(a) | | | 1,089,051 | |
| | 6,421,092 | | | International Textile Group, Inc., 1st Lien Term Loan, 3-month LIBOR + 5.000%, 5.367%, 5/01/2024(a) | | | 5,573,508 | |
| | 7,828,000 | | | International Textile Group, Inc., 2nd Lien Term Loan, 3-month LIBOR + 9.000%, 9.367%, 5/01/2025(a)(f)(h) | | | 3,522,600 | |
| | 2,608,000 | | | Mavis Tire Express Services Corp., 2020 Add-On Term Loan B, 3/20/2025(c) | | | 2,583,563 | |
| | 10,570,970 | | | NES Global Talent Finance U.S. LLC, 2018 1st Lien Term Loan B, 3-month LIBOR + 5.500%, 6.500%, 5/11/2023(a) | | | 9,566,728 | |
| | 4,450,686 | | | Ventia Deco LLC, 2016 Term Loan B, 3-month LIBOR + 4.000%, 5.000%, 5/21/2026(a) | | | 4,372,799 | |
| | | | | | | | |
| | | | | | | 55,628,739 | |
| | | | | | | | |
| | | | Integrated Energy — 0.6% | |
| | 7,378,920 | | | Matador Bidco S.a.r.l., Term Loan, 1-month LIBOR + 4.750%, 4.896%, 10/15/2026(a) | | | 7,268,236 | |
| | | | | | | | |
| | | | Internet & Data — 3.4% | |
| | 4,307,772 | | | A&V Holdings Midco LLC, 2020 Term Loan B, 6-month LIBOR + 5.375%, 6.375%, 3/10/2027(a) | | | 4,038,537 | |
| | 849,000 | | | Adevinta ASA, USD Term Loan B, 10/13/2027(c) | | | 847,412 | |
| | 1,255,000 | | | Buzz Merger Sub Ltd., 2020 Term Loan B, 1-month LIBOR + 3.250%, 3.750%, 1/29/2027(a) | | | 1,250,294 | |
| | 1,491,000 | | | Cablevision Lightpath LLC, Term Loan B, 9/15/2027(c) | | | 1,481,681 | |
| | 4,139,134 | | | CareerBuilder LLC, Term Loan, 3-month LIBOR + 6.750%, 7.750%, 7/31/2023(a) | | | 3,732,133 | |
| | 5,279,734 | | | Castle U.S. Holding Corp., USD Term Loan B, 3-month LIBOR + 3.750%, 3.970%, 1/29/2027(a) | | | 5,089,188 | |
| | 7,477,745 | | | MH Sub I LLC, 2017 1st Lien Term Loan, 1-month LIBOR + 3.500%, 3.646%, 9/13/2024(a) | | | 7,315,104 | |
| | 8,830,000 | | | MH Sub I LLC, 2017 2nd Lien Term Loan, 1-month LIBOR + 7.500%, 7.646%, 9/15/2025(a) | | | 8,807,925 | |
| | 2,894,740 | | | MH Sub I LLC, 2020 Incremental Term Loan, 1-month LIBOR + 3.750%, 4.750%, 9/13/2024(a) | | | 2,862,174 | |
| | 5,248,776 | | | WeddingWire, Inc., 1st Lien Term Loan, LIBOR + 4.500%, 4.713%, 12/19/2025(b) | | | 5,117,556 | |
| | | | | | | | |
| | | | | | | 40,542,004 | |
| | | | | | | | |
| | | | Leisure — 2.3% | |
| | 7,832,307 | | | Kingpin Intermediate Holdings LLC, 2018 Term Loan B, 1-month LIBOR + 3.500%, 4.500%, 7/03/2024(a) | | | 7,254,674 | |
| | 1,977,201 | | | Playpower, Inc., 2019 Term Loan, 1-month LIBOR + 5.500%, 5.720%, 5/08/2026(a) | | | 1,838,797 | |
| | 6,854,155 | | | PUG LLC, USD Term Loan, 1-month LIBOR + 3.500%, 3.646%, 2/12/2027(a) | | | 6,400,067 | |
| | 5,682,847 | | | Recess Holdings, Inc., 2017 1st Lien Term Loan, 6-month LIBOR + 3.750%, 4.750%, 9/30/2024(a) | | | 5,370,291 | |
| | 7,581,900 | | | Thunder Finco Pty Ltd., Term Loan B, 1-month LIBOR + 4.000%, 5.000%, 11/26/2026(a) | | | 6,823,710 | |
| | | | | | | | |
| | | | | | | 27,687,539 | |
| | | | | | | | |
| | | | Lodging — 0.8% | |
| | 4,153,605 | | | Aimbridge Acquisition Co., Inc., 2019 Term Loan B, 1-month LIBOR + 3.750%, 3.896%, 2/02/2026(a) | | | 3,899,196 | |
| | | | Lodging — continued | |
| 6,022,121 | | | Golden Nugget, Inc., 2017 Incremental Term Loan B, 2-month LIBOR + 2.500%, 3.250%, 10/04/2023(a) | | | 5,730,711 | |
| | | | | | | | |
| | | | | | | 9,629,907 | |
| | | | | | | | |
| | | | Media Entertainment — 3.9% | |
| | 1,750,000 | | | Cambium Learning Group, Inc., Term Loan B, 12/18/2025(c) | | | 1,715,000 | |
| | 2,558,000 | | | Cambium Learning Group, Inc., Term Loan B, 3-month LIBOR + 4.500%, 4.720%, 12/18/2025(a) | | | 2,506,840 | |
| | 3,000,000 | | | Cengage Learning, Inc., 2016 Term Loan B, 6/07/2023(c) | | | 2,783,760 | |
| | 3,380,098 | | | Diamond Sports Group LLC, Term Loan, 1-month LIBOR + 3.250%, 3.400%, 8/24/2026(a) | | | 2,805,481 | |
| | 2,742,644 | | | Emerald Expositions Holding, Inc., 2017 Term Loan B, 1-month LIBOR + 2.500%, 2.646%, 5/22/2024(a) | | | 2,512,372 | |
| | 3,990,000 | | | iHeartCommunications, Inc., 2020 Incremental Term Loan, 1-month LIBOR + 4.000%, 4.750%, 5/01/2026(a) | | | 3,928,474 | |
| | 2,840,866 | | | iHeartCommunications, Inc., 2020 Term Loan, 1-month LIBOR + 3.000%, 3.146%, 5/01/2026(a) | | | 2,744,987 | |
| | 7,187,566 | | | ION Media Networks, Inc., 2019 Term Loan B, 1-month LIBOR + 3.000%, 3.188%, 12/18/2024(a) | | | 7,147,172 | |
| | 3,978,463 | | | McGraw-Hill Global Education Holdings LLC, 2016 Term Loan B, 3-month LIBOR + 4.000%, 5.000%, 5/04/2022(a) | | | 3,750,537 | |
| | 4,855,830 | | | Meredith Corp., 2020 Incremental Term Loan B, 3-month LIBOR + 4.250%, 5.250%, 1/31/2025(a) | | | 4,848,255 | |
| | 2,945,285 | | | Meredith Corp., 2020 Term Loan B2, 1-month LIBOR + 2.500%, 2.646%, 1/31/2025(a) | | | 2,890,061 | |
| | 9,700,000 | | | Metro-Goldwyn-Mayer, Inc., 2018 2nd Lien Term Loan, 1-month LIBOR + 4.500%, 5.500%, 7/03/2026(a) | | | 9,518,125 | |
| | | | | | | | |
| | | | | | | 47,151,064 | |
| | | | | | | | |
| | | | Metals & Mining — 1.0% | |
| | 5,255,647 | | | GrafTech Finance, Inc., 2018 Term Loan B, 1-month LIBOR + 3.500%, 4.500%, 2/12/2025(a) | | | 5,211,868 | |
| | 8,429,697 | | | U.S. Silica Co., 2018 Term Loan B, 1-month LIBOR + 4.000%, 5.000%, 5/01/2025(a) | | | 7,320,686 | |
| | | | | | | | |
| | | | | | | 12,532,554 | |
| | | | | | | | |
| | | | Midstream — 1.0% | |
| | 6,294,776 | | | Lower Cadence Holdings LLC, Term Loan B, 1-month LIBOR + 4.000%, 4.146%, 5/22/2026(a) | | | 5,982,681 | |
| | 6,832,305 | | | Prairie ECI Acquiror LP, Term Loan B, 1-month LIBOR + 4.750%, 4.896%, 3/11/2026(a) | | | 6,380,621 | |
| | | | | | | | |
| | | | | | | 12,363,302 | |
| | | | | | | | |
| | | | Packaging — 0.7% | |
| | 4,000,000 | | | Pretium Packaging LLC, 2020 Term Loan, 3-month LIBOR + 4.000%, 4.750%, 11/05/2027(a) | | | 3,950,000 | |
| | 2,834,000 | | | Reynolds Group Holdings Inc., 2020 Term Loan B2, 1-month LIBOR + 3.250%, 3.396%, 2/05/2026(a) | | | 2,785,284 | |
| | 1,250,000 | | | Titan Acquisition Ltd., 2018 Term Loan B, 3-month LIBOR + 3.000%, 3.361%, 3/28/2025(a) | | | 1,200,837 | |
| | | | | | | | |
| | | | | | | 7,936,121 | |
| | | | | | | | |
| | | | Pharmaceuticals — 0.5% | |
| | 2,264,552 | | | Akorn, Inc., 2020 Take Back Term Loan, 3-month LIBOR + 7.500%, 8.500%, 10/01/2025(a) | | | 2,263,148 | |
| | 2,742,983 | | | Amneal Pharmaceuticals LLC, 2018 Term Loan B, 1-month LIBOR + 3.500%, 3.688%, 5/04/2025(a) | | | 2,651,779 | |
See accompanying notes to financial statements.
19 |
Portfolio of Investments – as of November 30, 2020
Loomis Sayles Senior Floating Rate and Fixed Income Fund – (continued)
| | | | | | | | |
Principal
Amount | | | Description | | Value (†) | |
| | | | Pharmaceuticals — continued | |
| $ | 947,027 | | | Bausch Health Cos., Inc., Term Loan B, 1-month LIBOR + 2.750%, 2.893%, 11/27/2025(a) | | $ | 931,638 | |
| | | | | | | | |
| | | | | | | 5,846,565 | |
| | | | | | | | |
| | | | Property & Casualty Insurance — 2.1% | |
| | 756,956 | | | AssuredPartners Capital, Inc., 2020 Incremental Term Loan B, 1-month LIBOR + 4.500%, 5.500%, 2/12/2027(a) | | | 756,244 | |
| | 3,804,327 | | | AssuredPartners, Inc., 2020 Term Loan B, 1-month LIBOR + 3.500%, 3.646%, 2/12/2027(a) | | | 3,725,273 | |
| | 1,132,000 | | | Baldwin Risk Partners LLC, Term Loan B, 10/08/2027(c) | | | 1,126,340 | |
| | 3,027,000 | | | Baldwin Risk Partners LLC, Term Loan B, 1-month LIBOR + 4.000%, 4.750%, 10/08/2027(a) | | | 3,011,865 | |
| | 1,668,818 | | | Broadstreet Partners, Inc., 2020 Incremental Term Loan B, 1-month LIBOR + 3.750%, 4.750%, 1/27/2027(a) | | | 1,643,785 | |
| | 3,887,991 | | | Hyperion Insurance Group Ltd., 2020 Delayed Draw Term Loan, 11/12/2027(c) | | | 3,858,831 | |
| | 3,229,009 | | | Hyperion Insurance Group Ltd., 2020 Incremental Term Loan B, 3-month LIBOR + 3.750%, 3.971%, 11/12/2027(a) | | | 3,204,792 | |
| | 5,471,795 | | | USI, Inc., 2017 Repriced Term Loan, 3-month LIBOR + 3.000%, 3.220%, 5/16/2024(a) | | | 5,352,565 | |
| | 2,571,568 | | | USI, Inc., 2019 Incremental Term Loan B, 3-month LIBOR + 4.000%, 4.220%, 12/02/2026(a) | | | 2,559,353 | |
| | | | | | | | |
| | | | | | | 25,239,048 | |
| | | | | | | | |
| | | | Refining — 0.3% | |
| | 3,758,074 | | | Delek U.S. Holdings, Inc., 2018 Term Loan B, 1-month LIBOR + 2.250%, 2.396%, 3/31/2025(a) | | | 3,510,267 | |
| | | | | | | | |
| | | | REITs – Mortgage — 0.1% | |
| | 968,000 | | | Starwood Property Trust, Inc., 2020 Incremental Term Loan B2, 3-month LIBOR + 3.500%, 4.250%, 7/26/2026(a) | | | 963,160 | |
| | | | | | | | |
| | | | REITs – Retail — 0.6% | |
| | 6,101,395 | | | Brookfield Property REIT, Inc., 1st Lien Term Loan B, 1-month LIBOR + 2.500%, 2.646%, 8/27/2025(a) | | | 5,605,656 | |
| | 1,163,601 | | | Forest City Enterprises LP, 2019 Term Loan B, 1-month LIBOR + 3.500%, 3.646%, 12/08/2025(a) | | | 1,111,239 | |
| | | | | | | | |
| | | | | | | 6,716,895 | |
| | | | | | | | |
| | | | Restaurants — 3.1% | |
| | 1,490,981 | | | 1011778 B.C. Unlimited Liability Co., Term Loan B4, 1-month LIBOR + 1.750%, 1.896%, 11/19/2026(a) | | | 1,447,653 | |
| | 2,977,387 | | | Carrols Restaurant Group, Inc., Term Loan B, LIBOR + 3.250%, 3.438%, 4/30/2026(b) | | | 2,829,262 | |
| | 5,191,412 | | | Flynn Restaurant Group LP, 1st Lien Term Loan, 1-month LIBOR + 3.500%, 3.646%, 6/27/2025(a) | | | 4,956,345 | |
| | 2,872,000 | | | IRB Holding Corp., 2020 Fourth Amendment Incremental Term Loan, 11/18/2027(c) | | | 2,849,254 | |
| | 1,783,000 | | | IRB Holding Corp., 2020 Term Loan B, 2/05/2025(c) | | | 1,750,175 | |
| | 2,493,606 | | | IRB Holding Corp., 2020 Term Loan B, 3-month LIBOR + 2.750%, 3.750%, 2/05/2025(a) | | | 2,447,699 | |
| | 5,105,504 | | | Portillo’s Holdings LLC, 2019 1st Lien Term Loan B3, 3-month LIBOR + 5.500%, 6.500%, 9/06/2024(a) | | | 4,926,811 | |
| | 16,994,617 | | | Red Lobster Management LLC, Term Loan B, 1-month LIBOR + 5.250%, 6.250%, 7/28/2021(a) | | | 16,246,853 | |
| | | | | | | | |
| | | | | | | 37,454,052 | |
| | | | | | | | |
| | | | Retailers — 2.8% | |
| 6,482,659 | | | Array Canada, Inc., Term Loan B, 3-month LIBOR + 5.000%, 6.000%, 2/10/2023(a) | | | 4,291,520 | |
| | 5,407,819 | | | BDF Acquisition Corp., 1st Lien Term Loan, 1-month LIBOR + 5.250%, 6.250%, 8/14/2023(a) | | | 5,159,979 | |
| | 4,364,000 | | | Container Store, Inc. (The), 2020 Term Loan B3, 1/20/2026(c) | | | 4,298,540 | |
| | 2,496,497 | | | EG Group Ltd., 2018 USD Term Loan B, 3-month LIBOR + 4.000%, 4.220%, 2/07/2025(a) | | | 2,445,019 | |
| | 5,041,000 | | | Harbor Freight Tools USA, Inc., 2020 Term Loan B, 1-month LIBOR + 3.250%, 4.000%, 10/19/2027(a) | | | 5,000,924 | |
| | 4,729,740 | | | Kontoor Brands, Inc., Term Loan B, 1-month LIBOR + 4.250%, 4.397%, 5/15/2026(a) | | | 4,682,443 | |
| | 3,220,000 | | | Mattress Firm, Inc., 2020 Term Loan B, 11/24/2027(c) | | | 3,187,800 | |
| | 5,741,689 | | | Talbots, Inc. (The), 2018 Term Loan B, 3-month LIBOR + 7.000%, 8.000%, 11/28/2022(a) | | | 4,277,558 | |
| | | | | | | | |
| | | | | | | 33,343,783 | |
| | | | | | | | |
| | | | Technology — 8.7% | |
| | 4,908,802 | | | Aptean, Inc., 2019 Term Loan, 1-month LIBOR + 4.250%, 4.396%, 4/23/2026(a) | | | 4,812,688 | |
| | 1,583,033 | | | Cardtronics USA, Inc., Term Loan B, 1-month LIBOR + 4.000%, 5.000%, 6/29/2027(a) | | | 1,579,566 | |
| | 4,861,270 | | | CommScope, Inc., 2019 Term Loan B, 1-month LIBOR + 3.250%, 3.396%, 4/06/2026(a) | | | 4,773,184 | |
| | 6,154,047 | | | Corel Corp., 2019 Term Loan, 3-month LIBOR + 5.000%, 5.233%, 7/02/2026(a) | | | 6,012,504 | |
| | 391,000 | | | Dun & Bradstreet Corp. (The), Term Loan, 2/06/2026(c) | | | 388,251 | |
| | 6,433,895 | | | Finastra USA, Inc., USD 1st Lien Term Loan, 3-month LIBOR + 3.500%, 4.500%, 6/13/2024(a) | | | 6,226,273 | |
| | 5,000,000 | | | GlobalLogic Holdings, Inc., 2020 Incremental Term Loan B2, 1-month LIBOR + 3.750%, 4.500%, 9/14/2027(a) | | | 4,987,500 | |
| | 3,398,000 | | | Greeneden U.S. Holdings II LLC, 2020 USD Term Loan B, 10/08/2027(c) | | | 3,383,830 | |
| | 5,147,661 | | | Helios Software Holdings, Inc., USD Term Loan, 3-month LIBOR + 4.250%, 4.519%, 10/24/2025(a) | | | 5,070,446 | |
| | 8,380,829 | | | Hyland Software, Inc., 2017 2nd Lien Term Loan, 1-month LIBOR + 7.000%, 7.750%, 7/07/2025(a) | | | 8,422,733 | |
| | 3,654,663 | | | Project Alpha Intermediate Holding, Inc., 2019 Incremental Term Loan B, 3-month LIBOR + 4.250%, 4.480%, 4/26/2024(a) | | | 3,590,706 | |
| | 8,936,142 | | | Quest Software U.S. Holdings, Inc., 2018 1st Lien Term Loan, 3-month LIBOR + 4.250%, 4.464%, 5/16/2025(a)(f)(h) | | | 8,630,794 | |
| | 3,482,000 | | | Redstone Buyer LLC, Term Loan, 2-month LIBOR + 5.000%, 6.000%, 9/01/2027(a) | | | 3,468,942 | |
| | 3,590,886 | | | Rocket Software, Inc., 2018 Term Loan, 1-month LIBOR + 4.250%, 4.396%, 11/28/2025(a) | | | 3,527,291 | |
| | 5,293,944 | | | S2P Acquisition Borrower, Inc., Term Loan, 1-month LIBOR + 4.000%, 4.146%, 8/14/2026(a) | | | 5,225,123 | |
| | 6,871,688 | | | Sirius Computer Solutions, Inc., 2020 Term Loan, 1-month LIBOR + 3.500%, 3.646%, 7/01/2026(a) | | | 6,772,942 | |
| | 6,155,834 | | | Sophia L.P., 2020 1st Lien Term Loan, 3-month LIBOR + 3.750%, 4.500%, 10/07/2027(a) | | | 6,109,666 | |
| | 8,865,842 | | | SurveyMonkey, Inc., 2018 Term Loan B, 1 Week LIBOR + 3.750%, 3.850%, 10/10/2025(a) | | | 8,743,937 | |
| | 500,000 | | | Ultimate Software Group, Inc. (The), 2020 2nd Lien Incremental Term Loan, 3-month LIBOR + 6.750%, 7.500%, 5/03/2027(a) | | | 508,125 | |
See accompanying notes to financial statements.
| 20
Portfolio of Investments – as of November 30, 2020
Loomis Sayles Senior Floating Rate and Fixed Income Fund – (continued)
| | | | | | | | |
Principal
Amount | | | Description | | Value (†) | |
| | | | Technology — continued | |
| $ | 7,852,207 | | | Verifone Systems, Inc., 2018 1st Lien Term Loan, 3-month LIBOR + 4.000%, 4.224%, 8/20/2025(a) | | $ | 7,434,627 | |
| | 6,025,389 | | | Web.com Group, Inc., 2018 Term Loan B, 3-month LIBOR + 3.750%, 3.893%, 10/10/2025(a) | | | 5,884,456 | |
| | | | | | | | |
| | | | | | | 105,553,584 | |
| | | | | | | | |
| | | | Transportation Services — 1.5% | |
| | 4,148,074 | | | Deliver Buyer, Inc., Term Loan B, 3-month LIBOR + 5.000%, 5.220%, 5/01/2024(a) | | | 4,088,467 | |
| | 8,118,208 | | | Uber Technologies, Inc., 2018 Term Loan, 1-month LIBOR + 4.000%, 5.000%, 4/04/2025(a) | | | 8,098,968 | |
| | 5,639,317 | | | Verra Mobility Corp., 2020 Term Loan B, 1-month LIBOR + 3.250%, 3.396%, 2/28/2025(a) | | | 5,540,629 | |
| | | | | | | | |
| | | | | | | 17,728,064 | |
| | | | | | | | |
| | | | Utility Other — 0.4% | |
| | 4,990,881 | | | Pacific Gas & Electric Co., 2020 Term Loan, 3-month LIBOR + 4.500%, 5.500%, 6/23/2025(a) | | | 5,022,074 | |
| | | | | | | | |
| | | | Wireless — 0.3% | |
| | 3,886,640 | | | Asurion LLC, 2017 2nd Lien Term Loan, 1-month LIBOR + 6.500%, 6.646%, 8/04/2025(a) | | | 3,907,706 | |
| | | | | | | | |
| | | | Wirelines — 0.7% | |
| | 3,229,590 | | | Avaya, Inc., 2018 Term Loan B, 1-month LIBOR + 4.250%, 4.391%, 12/15/2024(a) | | | 3,223,939 | |
| | 2,000,000 | | | Coral-U.S. Co-Borrower LLC, 2020 Term Loan B2, 1-month LIBOR + 2.250%, 2.397%, 1/31/2028(a) | | | 1,955,000 | |
| | 2,209,000 | | | Frontier Communications Corp., 2020 DIP Exit Term Loan, 10/08/2021(c) | | | 2,206,239 | |
| | 842,000 | | | Frontier Communications Corp., 2020 DIP Exit Term Loan, 3-month LIBOR + 4.750%, 5.750%, 10/08/2021(a) | | | 840,947 | |
| | | | | | | | |
| | | | | | | 8,226,125 | |
| | | | | | | | |
| | | | Total Senior Loans
(Identified Cost $1,063,285,490) | | | 1,009,139,375 | |
| | | | | | | | |
| | | | | | | | |
| | Bonds and Notes — 6.6% | |
| | Non-Convertible Bonds — 6.3% | |
| | | | Aerospace & Defense — 0.8% | |
| | 3,500,000 | | | Spirit AeroSystems, Inc., 7.500%, 4/15/2025, 144A | | | 3,745,000 | |
| | 5,500,000 | | | TransDigm, Inc., 6.500%, 7/15/2024 | | | 5,582,500 | |
| | | | | | | | |
| | | | | | | 9,327,500 | |
| | | | | | | | |
| | | | Brokerage — 0.4% | |
| | 5,000,000 | | | Jefferies Finance LLC/JFIN Co-Issuer Corp., 6.250%, 6/03/2026, 144A | | | 5,266,250 | |
| | | | | | | | |
| | | | Building Materials — 0.3% | |
| | 4,250,000 | | | Beacon Roofing Supply, Inc., 4.875%, 11/01/2025, 144A | | | 4,307,375 | |
| | | | | | | | |
| | | | Chemicals — 0.6% | |
| | 5,019,423 | | | Atotech Alpha 2 BV, 9.500% PIK or 8.750% Cash, 6/01/2023, 144A(k) | | | 5,057,069 | |
| | 1,715,000 | | | Avient Corp., 5.750%, 5/15/2025, 144A | | | 1,832,906 | |
| | | | | | | | |
| | | | | | | 6,889,975 | |
| | | | | | | | |
| | | | Gaming — 0.4% | |
| | 4,235,000 | | | Caesars Entertainment, Inc., 6.250%, 7/01/2025, 144A | | | 4,508,348 | |
| | | | | | | | |
| | | | Lodging — 0.1% | |
| | 1,000,000 | | | Wyndham Destinations, Inc., 3.900%, 3/01/2023 | | | 1,015,000 | |
| | | | | | | | |
| | | | Media Entertainment — 0.5% | |
| 5,750,000 | | | AMC Networks, Inc., 4.750%, 8/01/2025 | | | 5,919,568 | |
| | | | | | | | |
| | | | Non-Agency Commercial Mortgage-Backed Securities — 0.4% | |
| | 5,089,107 | | | Motel 6 Trust, Series 2017-M6MZ, Class M, 1-month LIBOR + 6.927%, 7.067%, 8/15/2024, 144A(a) | | | 4,597,524 | |
| | | | | | | | |
| | | | Property & Casualty Insurance — 0.3% | |
| | 4,000,000 | | | NMI Holdings, Inc., 7.375%, 6/01/2025, 144A | | | 4,428,440 | |
| | | | | | | | |
| | | | REITs – Hotels — 0.3% | |
| | 50,000 | | | Service Properties Trust, 3.950%, 1/15/2028 | | | 45,000 | |
| | 550,000 | | | Service Properties Trust, 4.350%, 10/01/2024 | | | 526,625 | |
| | 20,000 | | | Service Properties Trust, 4.500%, 6/15/2023 | | | 20,137 | |
| | 3,040,000 | | | Service Properties Trust, 4.750%, 10/01/2026 | | | 2,856,992 | |
| | 100,000 | | | Service Properties Trust, 4.950%, 2/15/2027 | | | 95,375 | |
| | | | | | | | |
| | | | | | | 3,544,129 | |
| | | | | | | | |
| | | | REITs – Mortgage — 0.5% | |
| | 5,000,000 | | | Ladder Capital Finance Holdings LLLP/Ladder Capital Finance Corp., 5.250%, 3/15/2022, 144A | | | 4,987,500 | |
| | 1,750,000 | | | Ladder Capital Finance Holdings LLLP/Ladder Capital Finance Corp., 5.250%, 10/01/2025, 144A | | | 1,684,375 | |
| | | | | | | | |
| | | | | | | 6,671,875 | |
| | | | | | | | |
| | | | Supermarkets — 0.5% | |
| | 5,750,000 | | | Albertsons Cos., Inc./Safeway, Inc./New Albertsons LP/Albertsons LLC, 4.625%, 1/15/2027, 144A | | | 6,061,305 | |
| | | | | | | | |
| | | | Technology — 1.2% | |
| | 4,500,000 | | | Cardtronics, Inc./Cardtronics USA, Inc., 5.500%, 5/01/2025, 144A | | | 4,646,250 | |
| | 1,068,003 | | | Edmentum, Inc., Junior PIK Note, 10.000%, 6/09/2020(d)(k)(l) | | | 1,068,003 | |
| | 6,000,000 | | | EIG Investors Corp., 10.875%, 2/01/2024 | | | 6,243,000 | |
| | 2,235,000 | | | Sabre GLBL, Inc., 7.375%, 9/01/2025, 144A | | | 2,408,213 | |
| | | | | | | | |
| | | | | | | 14,365,466 | |
| | | | | | | | |
| | | | Total Non-Convertible Bonds
(Identified Cost $71,864,104) | | | 76,902,755 | |
| | | | | | | | |
| | | | | | | | |
| | Convertible Bonds — 0.3% | |
| | | | REITs – Mortgage — 0.3% | |
| | 3,250,000 | | | Blackstone Mortgage Trust, Inc., 4.375%, 5/05/2022
(Identified Cost $3,125,880) | | | 3,223,675 | |
| | | | | | | | |
| | | | Total Bonds and Notes
(Identified Cost $74,989,984) | | | 80,126,430 | |
| | | | | | | | |
| | | | | | | | |
| Shares | | | | | | |
| | Common Stocks — 0.7% | |
| | | | Chemicals — 0.2% | |
| | 193,746 | | | Hexion Holdings Corp., Class B(m) | | | 2,421,825 | |
| | | | | | | | |
| | | | Diversified Consumer Services — 0.0% | |
| | 8,680 | | | Edmentum Ultimate Holdings LLC, Class A(d)(m) | | | 115,740 | |
| | | | | | | | |
| | | | Energy Equipment & Services — 0.0% | |
| | 61,854 | | | Ameriforge Group, Inc.(e)(f)(g)(m) | | | 297,518 | |
| | | | | | | | |
| | | | Pharmaceuticals — 0.2% | |
| | 192,793 | | | Akorn, Inc.(d)(m) | | | 2,345,712 | |
| | | | | | | | |
| | | | Real Estate Management & Development — 0.3% | |
| | 36,956 | | | Lender MCS Holdings, Inc.(d)(f)(h)(m) | | | 3,510,820 | |
| | | | | | | | |
| | | | Software — 0.0% | |
| | 21,186 | | | iQor Holdings, Inc.(f)(h)(m) | | | 217,157 | |
| | | | | | | | |
See accompanying notes to financial statements.
21 |
Portfolio of Investments – as of November 30, 2020
Loomis Sayles Senior Floating Rate and Fixed Income Fund – (continued)
| | | | | | | | |
| Shares | | | Description | | Value (†) | |
| | | | Specialty Retail — 0.0% | |
| | 1,790,513 | | | Onsite Rental Group Pty Ltd.(d)(e)(f)(g)(m) | | $ | — | |
| | | | | | | | |
| | | | Total Common Stocks
(Identified Cost $13,855,482) | | | 8,908,772 | |
| | | | | | | | |
| | Exchange-Traded Funds — 1.0% | |
| | 560,000 | | | Invesco Senior Loan ETF
(Identified Cost $12,234,012) | | | 12,325,600 | |
| | | | | | | | |
| | | | | | | | |
Principal
Amount | | | | | | |
| | Short-Term Investments — 8.4% | |
| $ | 101,131,201 | | | Tri-Party Repurchase Agreement with Fixed Income Clearing Corporation, dated 11/30/2020 at 0.000% to be repurchased at $101,131,201 on 12/01/2020 collateralized by $1,143,300 U.S. Treasury Note, 1.375% due 1/31/2022 valued at $1,165,125; $101,949,000 U.S. Treasury Note, 0.375% due 11/30/2025 valued at $101,988,862 including accrued interest (Note 2 of Notes to Financial Statements)
(Identified Cost $101,131,201) | | | 101,131,201 | |
| | | | | | | | |
| | | | | | | | |
| | | | Total Investments — 100.1%
(Identified Cost $1,265,496,169) | | | 1,211,631,378 | |
| | | | Other assets less liabilities — (0.1)% | | | (1,491,672 | ) |
| | | | | | | | |
| | | | Net Assets — 100.0% | | $ | 1,210,139,706 | |
| | | | | | | | |
| | | | | | | | |
| | (†) | | | See Note 2 of Notes to Financial Statements. | |
| | (a) | | | Variable rate security. Rate as of November 30, 2020 is disclosed. | |
| | (b) | | | Variable rate security. Rate shown represents the weighted average rate of underlying contracts at November 30, 2020. Interest rates on contracts are primarily redetermined either weekly, monthly or quarterly by reference to the indicated base lending rate and spread and the reset period. | |
| | (c) | | | Position is unsettled. Contract rate was not determined at November 30, 2020 and does not take effect until settlement date. Maturity date is not finalized until settlement date. | |
| | (d) | | | Securities subject to restriction on resale. At November 30, 2020, the restricted securities held by the Fund are as follows: | |
| | | | | | | | | | | | | | | | |
| | | Acquisition
Date | | | Acquisition
Cost | | | Value | | | % of
Net Assets | |
| Akorn, Inc. | | | 10/06/2020 | | | $ | 2,530,723 | | | $ | 2,345,712 | | | | 0.2 | % |
| Edmentum, Inc., Junior PIK Note | | | 6/09/2015 | | | | — | | | | 1,068,003 | | | | 0.1 | % |
| Edmentum Ultimate Holdings LLC, Class A | | | 6/09/2015 | | | | — | | | | 115,740 | | | | Less than 0.1 | % |
| Lender MCS Holdings, Inc. | | | 9/30/2020 | | | | 3,510,820 | | | | 3,510,820 | | | | 0.3 | % |
| Onsite Rental Group Pty Ltd. | | | 11/03/2017 | | | | — | | | | — | | | | — | |
| Onsite Rental Group Pty Ltd., Note | | | 11/03/2017 | | | | 2,384,581 | | | | 1,737,804 | | | | 0.1 | % |
| | | | |
| | (e) | | | Fair valued by the Fund’s adviser. At November 30, 2020, the value of these securities amounted to $2,035,322 or 0.2% of net assets. See Note 2 of Notes to Financial Statements. |
| | (f) | | | Illiquid security. (Unaudited) |
| | (g) | | | Level 3 security. Value has been determined using significant unobservable inputs. See Note 3 of Notes to Financial Statements. |
| | (h) | | | Securities classified as fair valued pursuant to the Fund’s pricing policies and procedures. At November 30, 2020, the value of these securities amounted to $26,208,132 or 2.2% of net assets. See Note 2 of Notes to Financial Statements. |
| | (i) | | | Unfunded loan commitment. An unfunded loan commitment is a contractual obligation for future funding at the option of the borrower. The Fund receives a stated coupon rate until the borrower draws on the loan commitment, at which time the rate will become the stated rate in the loan agreement. See Note 2 of Notes to Financial Statements. |
| | (j) | | | The issuer is in default with respect to interest and/or principal payments. Income is not being accrued. |
| | (k) | | | Payment-in-kind security for which the issuer, at each interest payment date, may make interest payments in cash and/or additional principal. For the period ended November 30, 2020, interest payments were made in cash. |
| | (l) | | | Payment-in-kind security for which the issuer made all interest payments in additional principal for the period ended November 30, 2020. |
| | (m) | | | Non-income producing security. |
| | | | |
| | 144A | | | All or a portion of these securities are exempt from registration under Rule 144A of the Securities Act of 1933. These securities may be resold in transactions exempt from registration, normally to qualified institutional buyers. At November 30, 2020, the value of Rule 144A holdings amounted to $53,530,555 or 4.4% of net assets. |
| | DIP | | | Debtor In Possession |
| | ETF | | | Exchange-Traded Fund |
| | LIBOR | | | London Interbank Offered Rate |
| | PIK | | | Payment-in-Kind |
| | REITs | | | Real Estate Investment Trusts |
Industry Summary at November 30, 2020
| | | | |
Technology | | | 9.9 | % |
Consumer Cyclical Services | | | 7.5 | |
Automotive | | | 6.4 | |
Consumer Products | | | 5.8 | |
Industrial Other | | | 4.6 | |
Building Materials | | | 4.5 | |
Healthcare | | | 4.4 | |
Media Entertainment | | | 4.4 | |
Internet & Data | | | 3.4 | |
Restaurants | | | 3.1 | |
Retailers | | | 2.8 | |
Financial Other | | | 2.7 | |
Aerospace & Defense | | | 2.7 | |
Property & Casualty Insurance | | | 2.4 | |
Chemicals | | | 2.4 | |
Leisure | | | 2.3 | |
Cable Satellite | | | 2.1 | |
Electric | | | 2.0 | |
Other Investments, less than 2% each | | | 17.3 | |
Short-Term Investments | | | 8.4 | |
Exchange-Traded Funds | | | 1.0 | |
| | | | |
Total Investments | | | 100.1 | |
Other assets less liabilities | | | (0.1 | ) |
| | | | |
Net Assets | | | 100.0 | % |
| | | | |
See accompanying notes to financial statements.
| 22
Portfolio of Investments – as of November 30, 2020
Vaughan Nelson Select Fund
| | | | | | | | |
| Shares | | | Description | | Value (†) | |
| | Common Stocks — 98.2% of Net Assets | |
| | | | Capital Markets — 2.8% | |
| | 101,450 | | | Morgan Stanley | | $ | 6,272,653 | |
| | | | | | | | |
| | | | Chemicals — 7.7% | |
| | 115,200 | | | Nutrien Ltd. | | | 5,675,904 | |
| | 15,510 | | | Sherwin-Williams Co. (The) | | | 11,595,741 | |
| | | | | | | | |
| | | | | | | 17,271,645 | |
| | | | | | | | |
| | | | Communications Equipment — 3.1% | |
| | 39,850 | | | Motorola Solutions, Inc. | | | 6,835,470 | |
| | | | | | | | |
| | | | Distributors — 2.6% | |
| | 166,650 | | | LKQ Corp.(a) | | | 5,869,413 | |
| | | | | | | | |
| | | | Diversified Telecommunication Services — 2.0% | |
| | 75,350 | | | Cogent Communications Holdings, Inc. | | | 4,380,849 | |
| | | | | | | | |
| | | | Entertainment — 2.8% | |
| | 49,275 | | | Electronic Arts, Inc.(a) | | | 6,294,881 | |
| | | | | | | | |
| | | | Food Products — 2.3% | |
| | 70,275 | | | Lamb Weston Holdings, Inc. | | | 5,086,505 | |
| | | | | | | | |
| | | | Health Care Equipment & Supplies — 2.6% | |
| | 23,185 | | | Masimo Corp.(a) | | | 5,900,351 | |
| | | | | | | | |
| | | | Health Care Providers & Services — 7.0% | |
| | 34,050 | | | HCA Healthcare, Inc. | | | 5,111,245 | |
| | 31,440 | | | UnitedHealth Group, Inc. | | | 10,574,530 | |
| | | | | | | | |
| | | | | | | 15,685,775 | |
| | | | | | | | |
| | | | Insurance — 3.6% | |
| | 39,555 | | | Aon PLC, Class A | | | 8,104,424 | |
| | | | | | | | |
| | | | Interactive Media & Services — 5.7% | |
| | 46,525 | | | Facebook, Inc., Class A(a) | | | 12,886,029 | |
| | | | | | | | |
| | | | Internet & Direct Marketing Retail — 5.3% | |
| | 3,775 | | | Amazon.com, Inc.(a) | | | 11,959,351 | |
| | | | | | | | |
| | | | IT Services — 10.6% | |
| | 28,975 | | | Accenture PLC, Class A | | | 7,217,383 | |
| | 38,400 | | | Broadridge Financial Solutions, Inc. | | | 5,640,192 | |
| | 32,315 | | | MasterCard, Inc., Class A | | | 10,874,320 | |
| | | | | | | | |
| | | | | | | 23,731,895 | |
| | | | | | | | |
| | | | Life Sciences Tools & Services — 3.0% | |
| | 14,660 | | | Thermo Fisher Scientific, Inc. | | | 6,816,607 | |
| | | | | | | | |
| | | | Machinery — 2.9% | |
| | 28,375 | | | Cummins, Inc. | | | 6,559,449 | |
| | | | | | | | |
| | | | Metals & Mining — 2.5% | |
| | 140,575 | | | Wheaton Precious Metals Corp. | | | 5,502,106 | |
| | | | | | | | |
| | | | Oil, Gas & Consumable Fuels — 3.8% | |
| | 66,650 | | | Chevron Corp. | | | 5,810,547 | |
| | 1,529,575 | | | Kosmos Energy Ltd. | | | 2,692,052 | |
| | | | | | | | |
| | | | | | | 8,502,599 | |
| | | | | | | | |
| | | | Road & Rail — 6.8% | |
| | 17,475 | | | Saia, Inc.(a) | | | 3,050,086 | |
| | 60,150 | | | Union Pacific Corp. | | | 12,275,412 | |
| | | | | | | | |
| | | | | | | 15,325,498 | |
| | | | | | | | |
| | | | Semiconductors & Semiconductor Equipment — 12.4% | |
| | 61,600 | | | Entegris, Inc. | | | 5,705,392 | |
| | 359,375 | | | ON Semiconductor Corp.(a) | | | 10,332,031 | |
| | 72,450 | | | Texas Instruments, Inc. | | | 11,682,563 | |
| | | | | | | | |
| | | | | | | 27,719,986 | |
| | | | | | | | |
| | | | Software — 5.7% | |
| | 60,145 | | | Microsoft Corp. | | | 12,875,240 | |
| | | | | | | | |
| | | | Specialty Retail — 3.0% | |
| | 24,560 | | | Home Depot, Inc. (The) | | | 6,813,190 | |
| | | | | | | | |
| | | | Total Common Stocks
(Identified Cost $174,950,586) | | | 220,393,916 | |
| | | | | | | | |
| | | | | | | | |
Principal
Amount | | | | | | |
| | Short-Term Investments — 1.8% | | | | |
| $ | 4,147,612 | | | Tri-Party Repurchase Agreement with Fixed Income Clearing Corporation, dated 11/30/2020 at 0.000% to be repurchased at $4,147,612 on 12/01/2020 collateralized by $4,229,000 U.S. Treasury Note, 0.375% due 11/30/2025 valued at $4,230,654 including accrued interest (Note 2 of Notes to Financial Statements)
(Identified Cost $4,147,612) | | | 4,147,612 | |
| | | | | | | | |
| | | | | | | | |
| | | | Total Investments — 100.0%
(Identified Cost $179,098,198) | | | 224,541,528 | |
| | | | Other assets less liabilities — (0.0)% | | | (14,712 | ) |
| | | | | | | | |
| | | | Net Assets — 100.0% | | $ | 224,526,816 | |
| | | | | | | | |
| | | | | | | | |
| | (†) | | | See Note 2 of Notes to Financial Statements. | | | | |
| | (a) | | | Non-income producing security. | | | | |
Industry Summary at November 30, 2020
| | | | |
Semiconductors & Semiconductor Equipment | | | 12.4 | % |
IT Services | | | 10.6 | |
Chemicals | | | 7.7 | |
Health Care Providers & Services | | | 7.0 | |
Road & Rail | | | 6.8 | |
Interactive Media & Services | | | 5.7 | |
Software | | | 5.7 | |
Internet & Direct Marketing Retail | | | 5.3 | |
Oil, Gas & Consumable Fuels | | | 3.8 | |
Insurance | | | 3.6 | |
Communications Equipment | | | 3.1 | |
Life Sciences Tools & Services | | | 3.0 | |
Specialty Retail | | | 3.0 | |
Machinery | | | 2.9 | |
Entertainment | | | 2.8 | |
Capital Markets | | | 2.8 | |
Health Care Equipment & Supplies | | | 2.6 | |
Distributors | | | 2.6 | |
Metals & Mining | | | 2.5 | |
Food Products | | | 2.3 | |
Diversified Telecommunication Services | | | 2.0 | |
Short-Term Investments | | | 1.8 | |
| | | | |
Total Investments | | | 100.0 | |
Other assets less liabilities | | | (0.0 | )* |
| | | | |
Net Assets | | | 100.0 | % |
| | | | |
See accompanying notes to financial statements.
23 |
Statements of Assets and Liabilities
November 30, 2020
| | | | | | | | | | | | |
| | | Loomis Sayles
Global Growth
Fund | | | Loomis Sayles
Senior Floating
Rate and Fixed
Income Fund | | | Vaughan Nelson
Select Fund | |
ASSETS | |
Investments at cost | | $ | 79,824,231 | | | $ | 1,265,496,169 | | | $ | 179,098,198 | |
Net unrealized appreciation (depreciation) | | | 25,471,746 | | | | (53,864,791 | ) | | | 45,443,330 | |
| | | | | | | | | | | | |
Investments at value | | | 105,295,977 | | | | 1,211,631,378 | | | | 224,541,528 | |
Cash | | | — | | | | 1,944,646 | | | | — | |
Receivable for Fund shares sold | | | 89,948 | | | | 1,773,129 | | | | 21,461 | |
Receivable for securities sold | | | 497,103 | | | | 47,089,021 | | | | — | |
Dividends and interest receivable | | | 41,708 | | | | 6,976,655 | | | | 279,112 | |
Tax reclaims receivable | | | 100,353 | | | | — | | | | — | |
Prepaid expenses (Note 7) | | | 7 | | | | 637,021 | | | | 16 | |
| | | | | | | | | | | | |
TOTAL ASSETS | | | 106,025,096 | | | | 1,270,051,850 | | | | 224,842,117 | |
| | | | | | | | | | | | |
LIABILITIES | |
Payable for securities purchased | | | 1,329,360 | | | | 54,385,340 | | | | — | |
Unfunded loan commitments (Note 2) | | | — | | | | 1,342,079 | | | | — | |
Payable for Fund shares redeemed | | | 40,981 | | | | 1,971,637 | | | | 28,846 | |
Distributions payable | | | — | | | | 888,401 | | | | — | |
Management fees payable (Note 5) | | | 56,096 | | | | 431,551 | | | | 125,209 | |
Deferred Trustees’ fees (Note 5) | | | 26,316 | | | | 258,424 | | | | 75,342 | |
Administrative fees payable (Note 5) | | | 3,633 | | | | 42,624 | | | | 7,646 | |
Payable to distributor (Note 5d) | | | 449 | | | | 27,232 | | | | 1,203 | |
Other accounts payable and accrued expenses | | | 73,679 | | | | 564,856 | | | | 77,055 | |
| | | | | | | | | | | | |
TOTAL LIABILITIES | | | 1,530,514 | | | | 59,912,144 | | | | 315,301 | |
| | | | | | | | | | | | |
NET ASSETS | | $ | 104,494,582 | | | $ | 1,210,139,706 | | | $ | 224,526,816 | |
| | | | | | | | | | | | |
NET ASSETS CONSIST OF: | |
Paid-in capital | | $ | 75,371,242 | | | $ | 1,768,216,082 | | | $ | 168,025,693 | |
Accumulated earnings (loss) | | | 29,123,340 | | | | (558,076,376 | ) | | | 56,501,123 | |
| | | | | | | | | | | | |
NET ASSETS | | $ | 104,494,582 | | | $ | 1,210,139,706 | | | $ | 224,526,816 | |
| | | | | | | | | | | | |
COMPUTATION OF NET ASSET VALUE AND OFFERING PRICE: | |
Class A shares: | |
Net assets | | $ | 4,913,306 | | | $ | 208,251,155 | | | $ | 13,722,237 | |
| | | | | | | | | | | | |
Shares of beneficial interest | | | 261,671 | | | | 23,637,679 | | | | 686,054 | |
| | | | | | | | | | | | |
Net asset value and redemption price per share | | $ | 18.78 | | | $ | 8.81 | | | $ | 20.00 | |
| | | | | | | | | | | | |
Offering price per share (100/[100-maximum sales charge] of net asset value) (Note 1) | | $ | 19.93 | | | $ | 9.13 | | | $ | 21.22 | |
| | | | | | | | | | | | |
Class C shares: (redemption price per share is equal to net asset value less any applicable contingent deferred sales charge) (Note 1) | | | | | | | | | | | | |
Net assets | | $ | 1,274,268 | | | $ | 125,909,044 | | | $ | 5,245,809 | |
| | | | | | | | | | | | |
Shares of beneficial interest | | | 69,854 | | | | 14,337,137 | | | | 279,586 | |
| | | | | | | | | | | | |
Net asset value and offering price per share | | $ | 18.24 | | | $ | 8.78 | | | $ | 18.76 | |
| | | | | | | | | | | | |
Class N shares: | |
Net assets | | $ | 11,357,240 | | | $ | 150,642 | | | $ | 1,619 | |
| | | | | | | | | | | | |
Shares of beneficial interest | | | 600,028 | | | | 17,098 | | | | 80 | |
| | | | | | | | | | | | |
Net asset value, offering and redemption price per share | | $ | 18.93 | | | $ | 8.81 | | | $ | 20.14 | * |
| | | | | | | | | | | | |
Class Y shares: | |
Net assets | | $ | 86,949,768 | | | $ | 875,828,865 | | | $ | 205,557,151 | |
| | | | | | | | | | | | |
Shares of beneficial interest | | | 4,598,116 | | | | 99,276,100 | | | | 10,206,192 | |
| | | | | | | | | | | | |
Net asset value, offering and redemption price per share | | $ | 18.91 | | | $ | 8.82 | | | $ | 20.14 | |
| | | | | | | | | | | | |
| * | Net asset value calculations have been determined utilizing fractional share and penny amounts. |
See accompanying notes to financial statements.
| 24
Statements of Operations
For the Year Ended November 30, 2020
| | | | | | | | | | | | |
| | | Loomis Sayles
Global Growth
Fund | | | Loomis Sayles
Senior Floating
Rate and Fixed
Income Fund | | | Vaughan Nelson
Select Fund | |
INVESTMENT INCOME | |
Dividends | | $ | 804,508 | | | $ | 695,777 | | | $ | 2,899,176 | |
Interest | | | 3,633 | | | | 94,622,040 | | | | 8,925 | |
Less net foreign taxes withheld | | | (58,196 | ) | | | — | | | | (21,273 | ) |
| | | | | | | | | | | | |
| | | 749,945 | | | | 95,317,817 | | | | 2,886,828 | |
| | | | | | | | | | | | |
Expenses | |
Management fees (Note 5) | | | 635,910 | | | | 9,385,866 | | | | 1,452,815 | |
Service and distribution fees (Note 5) | | | 19,178 | | | | 2,232,467 | | | | 88,101 | |
Administrative fees (Note 5) | | | 35,027 | | | | 693,693 | | | | 85,639 | |
Trustees’ fees and expenses (Note 5) | | | 20,953 | | | | 87,523 | | | | 28,662 | |
Transfer agent fees and expenses (Notes 5 and 6) | | | 52,305 | | | | 1,258,344 | | | | 56,271 | |
Audit and tax services fees | | | 42,299 | | | | 86,753 | | | | 41,942 | |
Commitment fees (Note 7) | | | 731 | | | | 1,958,454 | | | | 1,728 | |
Custodian fees and expenses | | | 32,803 | | | | 178,899 | | | | 9,655 | |
Interest expense (Note 8) | | | 771 | | | | 338,500 | | | | 1,609 | |
Legal fees (Note 7) | | | 2,316 | | | | 67,272 | | | | 5,224 | |
Registration fees | | | 67,287 | | | | 87,987 | | | | 68,742 | |
Shareholder reporting expenses | | | 18,208 | | | | 121,390 | | | | 23,874 | |
Miscellaneous expenses (Note 7) | | | 28,912 | | | | 633,937 | | | | 29,082 | |
| | | | | | | | | | | | |
Total expenses | | | 956,700 | | | | 17,131,085 | | | | 1,893,344 | |
Less waiver and/or expense reimbursement (Note 5) | | | (145,787 | ) | | | (2,045,768 | ) | | | (97,084 | ) |
| | | | | | | | | | | | |
Net expenses | | | 810,913 | | | | 15,085,317 | | | | 1,796,260 | |
| | | | | | | | | | | | |
Net investment income (loss) | | | (60,968 | ) | | | 80,232,500 | | | | 1,090,568 | |
| | | | | | | | | | | | |
NET REALIZED AND UNREALIZED GAIN (LOSS) ON INVESTMENTS AND FOREIGN CURRENCY TRANSACTIONS | |
Net realized gain (loss) on: | |
Investments | | | 4,278,928 | | | | (263,337,785 | ) | | | 10,433,360 | |
Foreign currency transactions (Note 2c) | | | (8,897 | ) | | | — | | | | 150 | |
Net change in unrealized appreciation (depreciation) on: | |
Investments | | | 18,565,822 | | | | 122,969,379 | | | | 13,761,560 | |
Foreign currency translations (Note 2c) | | | 7,832 | | | | — | | | | 11 | |
| | | | | | | | | | | | |
Net realized and unrealized gain (loss) on investments and foreign currency transactions | | | 22,843,685 | | | | (140,368,406 | ) | | | 24,195,081 | |
| | | | | | | | | | | | |
NET INCREASE (DECREASE) IN NET ASSETS RESULTING FROM OPERATIONS | | $ | 22,782,717 | | | $ | (60,135,906 | ) | | $ | 25,285,649 | |
| | | | | | | | | | | | |
See accompanying notes to financial statements.
25 |
Statements of Changes in Net Assets
| | | | | | | | | | | | | | | | |
| | | Loomis Sayles Global
Growth Fund | | | Loomis Sayles Senior Floating
Rate and Fixed Income Fund | |
| | | Year Ended
November 30,
2020 | | | Year Ended
November 30,
2019 | | | Year Ended
November 30,
2020 | | | Year Ended
November 30,
2019 | |
FROM OPERATIONS: | |
Net investment income (loss) | | $ | (60,968 | ) | | $ | 180,061 | | | $ | 80,232,500 | | | $ | 199,203,062 | |
Net realized gain (loss) on investments and foreign currency transactions | | | 4,270,031 | | | | 3,570,737 | | | | (263,337,785 | ) | | | (100,995,097 | ) |
Net change in unrealized appreciation (depreciation) on investments and foreign currency translations | | | 18,573,654 | | | | 5,528,435 | | | | 122,969,379 | | | | (55,600,205 | ) |
| | | | | | | | | | | | | | | | |
Net increase (decrease) in net assets resulting from operations | | | 22,782,717 | | | | 9,279,233 | | | | (60,135,906 | ) | | | 42,607,760 | |
| | | | | | | | | | | | | | | | |
FROM DISTRIBUTIONS TO SHAREHOLDERS: | |
Class A | | | (161,789 | ) | | | (75,698 | ) | | | (11,231,343 | ) | | | (24,587,758 | ) |
Class C | | | (61,682 | ) | | | (22,333 | ) | | | (7,435,495 | ) | | | (15,323,348 | ) |
Class N | | | (186,528 | ) | | | (121,236 | ) | | | (14,897 | ) | | | (14,378 | ) |
Class Y | | | (3,528,042 | ) | | | (2,042,734 | ) | | | (63,980,239 | ) | | | (161,058,588 | ) |
| | | | | | | | | | | | | | | | |
Total distributions | | | (3,938,041 | ) | | | (2,262,001 | ) | | | (82,661,974 | ) | | | (200,984,072 | ) |
| | | | | | | | | | | | | | | | |
NET INCREASE (DECREASE) IN NET ASSETS FROM CAPITAL SHARE TRANSACTIONS (NOTE 11) | | | 15,111,903 | | | | 6,072,679 | | | | (1,108,194,382 | ) | | | (1,351,606,447 | ) |
| | | | | | | | | | | | | | | | |
Net increase (decrease) in net assets | | | 33,956,579 | | | | 13,089,911 | | | | (1,250,992,262 | ) | | | (1,509,982,759 | ) |
NET ASSETS | |
Beginning of the year | | | 70,538,003 | | | | 57,448,092 | | | | 2,461,131,968 | | | | 3,971,114,727 | |
| | | | | | | | | | | | | | | | |
End of the year | | $ | 104,494,582 | | | $ | 70,538,003 | | | $ | 1,210,139,706 | | | $ | 2,461,131,968 | |
| | | | | | | | | | | | | | | | |
See accompanying notes to financial statements.
| 26
Statements of Changes in Net Assets (continued)
| | | | | | | | |
| | | Vaughan Nelson Select Fund | |
| | | Year Ended
November 30,
2020 | | | Year Ended
November 30,
2019 | |
FROM OPERATIONS: | |
Net investment income | | $ | 1,090,568 | | | $ | 2,231,313 | |
Net realized gain on investments and foreign currency transactions | | | 10,433,510 | | | | 15,155,948 | |
Net change in unrealized appreciation (depreciation) on investments and foreign currency translations | | | 13,761,571 | | | | 11,891,343 | |
| | | | | | | | |
Net increase in net assets resulting from operations | | | 25,285,649 | | | | 29,278,604 | |
| | | | | | | | |
FROM DISTRIBUTIONS TO SHAREHOLDERS: | |
Class A | | | (1,194,514 | ) | | | (1,495,814 | ) |
Class C | | | (466,566 | ) | | | (612,885 | ) |
Class N | | | (111 | ) | | | (107 | ) |
Class Y | | | (16,481,886 | ) | | | (15,234,859 | ) |
| | | | | | | | |
Total distributions | | | (18,143,077 | ) | | | (17,343,665 | ) |
| | | | | | | | |
NET INCREASE (DECREASE) IN NET ASSETS FROM CAPITAL SHARE TRANSACTIONS (NOTE 11) | | | (9,220,756 | ) | | | 15,032,522 | |
| | | | | | | | |
Net increase (decrease) in net assets | | | (2,078,184 | ) | | | 26,967,461 | |
NET ASSETS | |
Beginning of the year | | | 226,605,000 | | | | 199,637,539 | |
| | | | | | | | |
End of the year | | $ | 224,526,816 | | | $ | 226,605,000 | |
| | | | | | | | |
See accompanying notes to financial statements.
27 |
Financial Highlights
For a share outstanding throughout each period.
| | | | | | | | | | | | | | | | | | | | |
| | | Loomis Sayles Global Growth Fund—Class A | |
| | | Year Ended
November 30,
2020
| | | Year Ended
November 30,
2019
| | | Year Ended
November 30,
2018
| | | Year Ended
November 30,
2017
| | | Period Ended
November 30,
2016*
| |
Net asset value, beginning of the period | | $ | 14.78 | | | $ | 13.28 | | | $ | 13.44 | | | $ | 10.53 | | | $ | 10.00 | |
| | | | | | | | | | | | | | | | | | | | |
INCOME (LOSS) FROM INVESTMENT OPERATIONS: | | | | | | | | | | | | | | | | | | | | |
Net investment income (loss)(a) | | | (0.05 | ) | | | 0.00 | (b) | | | 0.02 | | | | (0.00 | )(b) | | | 0.00 | (b) |
Net realized and unrealized gain (loss) | | | 4.88 | | | | 2.03 | | | | 0.26 | (c) | | | 3.15 | | | | 0.53 | |
| | | | | | | | | | | | | | | | | | | | |
Total from Investment Operations | | | 4.83 | | | | 2.03 | | | | 0.28 | | | | 3.15 | | | | 0.53 | |
| | | | | | | | | | | | | | | | | | | | |
LESS DISTRIBUTIONS FROM: | | | | | | | | | | | | | | | | | | | | |
Net investment income | | | — | | | | (0.05 | ) | | | (0.03 | ) | | | (0.03 | ) | | | — | |
Net realized capital gains | | | (0.83 | ) | | | (0.48 | ) | | | (0.41 | ) | | | (0.21 | ) | | | — | |
| | | | | | | | | | | | | | | | | | | | |
Total Distributions | | | (0.83 | ) | | | (0.53 | ) | | | (0.44 | ) | | | (0.24 | ) | | | — | |
| | | | | | | | | | | | | | | | | | | | |
Net asset value, end of the period | | $ | 18.78 | | | $ | 14.78 | | | $ | 13.28 | | | $ | 13.44 | | | $ | 10.53 | |
| | | | | | | | | | | | | | | | | | | | |
Total return(d)(e) | | | 34.37 | % | | | 16.25 | % | | | 2.05 | % | | | 30.63 | % | | | 5.30 | %(f) |
RATIOS TO AVERAGE NET ASSETS: | | | | | | | | | | | | | | | | | | | | |
Net assets, end of the period (000’s) | | $ | 4,913 | | | $ | 2,832 | | | $ | 1,851 | | | $ | 1,541 | | | $ | 195 | |
Net expenses(g) | | | 1.25 | % | | | 1.26 | %(h) | | | 1.27 | % | | | 1.29 | % | | | 1.30 | %(i) |
Gross expenses | | | 1.44 | % | | | 1.49 | % | | | 1.62 | % | | | 2.56 | % | | | 2.74 | %(i) |
Net investment income (loss) | | | (0.33 | )% | | | 0.03 | % | | | 0.16 | % | | | (0.00 | )%(j) | | | 0.00 | %(i)(j) |
Portfolio turnover rate | | | 44 | % | | | 37 | % | | | 24 | % | | | 17 | % | | | 12 | % |
| * | From commencement of Class operations on March 31, 2016 through November 30, 2016. |
| (a) | Per share net investment income (loss) has been calculated using the average shares outstanding during the period. |
| (b) | Amount rounds to less than $0.01 per share. |
| (c) | The amount shown for a share outstanding does not correspond with the aggregate realized and unrealized gain (loss) on investments for the period due to the timing of sales and redemptions of fund shares in relation to fluctuating market values of investments of the Fund. |
| (d) | A sales charge for Class A shares is not reflected in total return calculations. |
| (e) | Had certain expenses not been waived/reimbursed during the period, total returns would have been lower. |
| (f) | Periods less than one year are not annualized. |
| (g) | The investment adviser agreed to waive its fees and/or reimburse a portion of the Fund’s expenses during the period. Without this waiver/reimbursement, expenses would have been higher. |
| (h) | Effective July 1, 2019, the expense limit decreased from 1.30% to 1.25%. |
| (i) | Computed on an annualized basis for periods less than one year. |
| (j) | Amount rounds to less than 0.01%. |
See accompanying notes to financial statements.
| 28
Financial Highlights (continued)
For a share outstanding throughout each period.
| | | | | | | | | | | | | | | | | | | | |
| | | Loomis Sayles Global Growth Fund—Class C | |
| | | Year Ended
November 30,
2020
| | | Year Ended
November 30,
2019
| | | Year Ended
November 30,
2018
| | | Year Ended
November 30,
2017
| | | Period Ended
November 30,
2016*
| |
Net asset value, beginning of the period | | $ | 14.49 | | | $ | 13.06 | | | $ | 13.30 | | | $ | 10.47 | | | $ | 10.00 | |
| | | | | | | | | | | | | | | | | | | | |
INCOME (LOSS) FROM INVESTMENT OPERATIONS: | | | | | | | | | | | | | | | | | | | | |
Net investment loss(a) | | | (0.16 | ) | | | (0.09 | ) | | | (0.09 | ) | | | (0.09 | ) | | | (0.08 | ) |
Net realized and unrealized gain (loss) | | | 4.74 | | | | 2.00 | | | | 0.26 | (b) | | | 3.13 | | | | 0.55 | |
| | | | | | | | | | | | | | | | | | | | |
Total from Investment Operations | | | 4.58 | | | | 1.91 | | | | 0.17 | | | | 3.04 | | | | 0.47 | |
| | | | | | | | | | | | | | | | | | | | |
LESS DISTRIBUTIONS FROM: | | | | | | | | | | | | | | | | | | | | |
Net investment income | | | — | | | | (0.00 | )(c) | | | — | | | | (0.00 | )(c) | | | — | |
Net realized capital gains | | | (0.83 | ) | | | (0.48 | ) | | | (0.41 | ) | | | (0.21 | ) | | | — | |
| | | | | | | | | | | | | | | | | | | | |
Total Distributions | | | (0.83 | ) | | | (0.48 | ) | | | (0.41 | ) | | | (0.21 | ) | | | — | |
| | | | | | | | | | | | | | | | | | | | |
Net asset value, end of the period | | $ | 18.24 | | | $ | 14.49 | | | $ | 13.06 | | | $ | 13.30 | | | $ | 10.47 | |
| | | | | | | | | | | | | | | | | | | | |
Total return(d)(e) | | | 33.44 | % | | | 15.40 | % | | | 1.25 | % | | | 29.67 | % | | | 4.70 | %(f) |
RATIOS TO AVERAGE NET ASSETS: | | | | | | | | | | | | | | | | | | | | |
Net assets, end of the period (000’s) | | $ | 1,274 | | | $ | 1,079 | | | $ | 606 | | | $ | 134 | | | $ | 25 | |
Net expenses(g) | | | 2.00 | % | | | 2.01 | %(h) | | | 2.03 | % | | | 2.04 | % | | | 2.05 | %(i) |
Gross expenses | | | 2.19 | % | | | 2.23 | % | | | 2.37 | % | | | 3.31 | % | | | 3.18 | %(i) |
Net investment loss | | | (1.05 | )% | | | (0.69 | )% | | | (0.71 | )% | | | (0.73 | )% | | | (1.09 | )%(i) |
Portfolio turnover rate | | | 44 | % | | | 37 | % | | | 24 | % | | | 17 | % | | | 12 | % |
| * | From commencement of Class operations on March 31, 2016 through November 30, 2016. |
| (a) | Per share net investment loss has been calculated using the average shares outstanding during the period. |
| (b) | The amount shown for a share outstanding does not correspond with the aggregate realized and unrealized gain (loss) on investments for the period due to the timing of sales and redemptions of fund shares in relation to fluctuating market values of investments of the Fund. |
| (c) | Amount rounds to less than $0.01 per share. |
| (d) | A contingent deferred sales charge for Class C shares is not reflected in total return calculations. |
| (e) | Had certain expenses not been waived/reimbursed during the period, total returns would have been lower. |
| (f) | Periods less than one year are not annualized. |
| (g) | The investment adviser agreed to waive its fees and/or reimburse a portion of the Fund’s expenses during the period. Without this waiver/reimbursement, expenses would have been higher. |
| (h) | Effective July 1, 2019, the expense limit decreased from 2.05% to 2.00%. |
| (i) | Computed on an annualized basis for periods less than one year. |
See accompanying notes to financial statements.
29 |
Financial Highlights (continued)
For a share outstanding throughout each period.
| | | | | | | | | | | | | | | | |
| | | Loomis Sayles Global Growth Fund—Class N | |
| | | Year Ended
November 30,
2020
| | | Year Ended
November 30,
2019
| | | Year Ended
November 30,
2018
| | | Period Ended
November 30,
2017*
| |
Net asset value, beginning of the period | | $ | 14.85 | | | $ | 13.34 | | | $ | 13.49 | | | $ | 11.26 | |
| | | | | | | | | | | | | | | | |
INCOME (LOSS) FROM INVESTMENT OPERATIONS: | |
Net investment income (loss)(a) | | | (0.01 | ) | | | 0.05 | | | | 0.05 | | | | 0.03 | |
Net realized and unrealized gain (loss) | | | 4.92 | | | | 2.03 | | | | 0.26 | (b) | | | 2.20 | |
| | | | | | | | | | | | | | | | |
Total from Investment Operations | | | 4.91 | | | | 2.08 | | | | 0.31 | | | | 2.23 | |
| | | | | | | | | | | | | | | | |
LESS DISTRIBUTIONS FROM: | |
Net investment income | | | — | | | | (0.09 | ) | | | (0.05 | ) | | | — | |
Net realized capital gains | | | (0.83 | ) | | | (0.48 | ) | | | (0.41 | ) | | | — | |
| | | | | | | | | | | | | | | | |
Total Distributions | | | (0.83 | ) | | | (0.57 | ) | | | (0.46 | ) | | | — | |
| | | | | | | | | | | | | | | | |
Net asset value, end of the period | | $ | 18.93 | | | $ | 14.85 | | | $ | 13.34 | | | $ | 13.49 | |
| | | | | | | | | | | | | | | | |
Total return(c) | | | 34.84 | % | | | 16.61 | % | | | 2.31 | % | | | 19.80 | %(d) |
RATIOS TO AVERAGE NET ASSETS: | |
Net assets, end of the period (000’s) | | $ | 11,357 | | | $ | 3,319 | | | $ | 2,843 | | | $ | 1 | |
Net expenses(e) | | | 0.95 | % | | | 0.98 | %(f) | | | 1.00 | % | | | 1.00 | %(g) |
Gross expenses | | | 1.13 | % | | | 1.22 | % | | | 1.35 | % | | | 15.78 | %(g) |
Net investment income (loss) | | | (0.09 | )% | | | 0.35 | % | | | 0.38 | % | | | 0.30 | %(g) |
Portfolio turnover rate | | | 44 | % | | | 37 | % | | | 24 | % | | | 17 | %(h) |
| * | From commencement of Class operations on March 31, 2017 through November 30, 2017. |
| (a) | Per share net investment income (loss) has been calculated using the average shares outstanding during the period. |
| (b) | The amount shown for a share outstanding does not correspond with the aggregate realized and unrealized gain (loss) on investments for the period due to the timing of sales and redemptions of fund shares in relation to fluctuating market values of investments of the Fund. |
| (c) | Had certain expenses not been waived/reimbursed during the period, total returns would have been lower. |
| (d) | Periods less than one year are not annualized. |
| (e) | The investment adviser agreed to waive its fees and/or reimburse a portion of the Fund’s expenses during the period. Without this waiver/reimbursement, expenses would have been higher. |
| (f) | Effective July 1, 2019, the expense limit decreased from 1.00% to 0.95%. |
| (g) | Computed on an annualized basis for periods less than one year. |
| (h) | Represents the Fund’s portfolio turnover rate for the year ended November 30, 2017. |
See accompanying notes to financial statements.
| 30
Financial Highlights (continued)
For a share outstanding throughout each period.
| | | | | | | | | | | | | | | | | | | | |
| | | Loomis Sayles Global Growth Fund—Class Y | |
| | | Year Ended
November 30,
2020
| | | Year Ended
November 30,
2019
| | | Year Ended
November 30,
2018
| | | Year Ended
November 30,
2017
| | | Period Ended
November 30,
2016*
| |
Net asset value, beginning of the period | | $ | 14.85 | | | $ | 13.33 | | | $ | 13.48 | | | $ | 10.55 | | | $ | 10.00 | |
| | | | | | | | | | | | | | | | | | | | |
INCOME (LOSS) FROM INVESTMENT OPERATIONS: | |
Net investment income (loss)(a) | | | (0.01 | ) | | | 0.04 | | | | 0.04 | | | | 0.05 | | | | 0.03 | |
Net realized and unrealized gain (loss) | | | 4.90 | | | | 2.04 | | | | 0.27 | (b) | | | 3.14 | | | | 0.52 | |
| | | | | | | | | | | | | | | | | | | | |
Total from Investment Operations | | | 4.89 | | | | 2.08 | | | | 0.31 | | | | 3.19 | | | | 0.55 | |
| | | | | | | | | | | | | | | | | | | | |
LESS DISTRIBUTIONS FROM: | |
Net investment income | | | — | | | | (0.08 | ) | | | (0.05 | ) | | | (0.05 | ) | | | — | |
Net realized capital gains | | | (0.83 | ) | | | (0.48 | ) | | | (0.41 | ) | | | (0.21 | ) | | | — | |
| | | | | | | | | | | | | | | | | | | | |
Total Distributions | | | (0.83 | ) | | | (0.56 | ) | | | (0.46 | ) | | | (0.26 | ) | | | — | |
| | | | | | | | | | | | | | | | | | | | |
Net asset value, end of the period | | $ | 18.91 | | | $ | 14.85 | | | $ | 13.33 | | | $ | 13.48 | | | $ | 10.55 | |
| | | | | | | | | | | | | | | | | | | | |
Total return(c) | | | 34.70 | % | | | 16.65 | % | | | 2.27 | % | | | 30.96 | % | | | 5.50 | %(d) |
RATIOS TO AVERAGE NET ASSETS: | |
Net assets, end of the period (000’s) | | $ | 86,950 | | | $ | 63,308 | | | $ | 52,147 | | | $ | 16,053 | | | $ | 9,793 | |
Net expenses(e) | | | 1.00 | % | | | 1.01 | %(f) | | | 1.02 | % | | | 1.04 | % | | | 1.05 | %(g) |
Gross expenses | | | 1.19 | % | | | 1.23 | % | | | 1.37 | % | | | 2.31 | % | | | 2.55 | %(g) |
Net investment income (loss) | | | (0.05 | )% | | | 0.30 | % | | | 0.33 | % | | | 0.40 | % | | | 0.45 | %(g) |
Portfolio turnover rate | | | 44 | % | | | 37 | % | | | 24 | % | | | 17 | % | | | 12 | % |
| * | From commencement of Class operations on March 31, 2016 through November 30, 2016. |
| (a) | Per share net investment income (loss) has been calculated using the average shares outstanding during the period. |
| (b) | The amount shown for a share outstanding does not correspond with the aggregate realized and unrealized gain (loss) on investments for the period due to the timing of sales and redemptions of fund shares in relation to fluctuating market values of investments of the Fund. |
| (c) | Had certain expenses not been waived/reimbursed during the period, total returns would have been lower. |
| (d) | Periods less than one year are not annualized. |
| (e) | The investment adviser agreed to waive its fees and/or reimburse a portion of the Fund’s expenses during the period. Without this waiver/reimbursement, expenses would have been higher. |
| (f) | Effective July 1, 2019, the expense limit decreased from 1.05% to 1.00%. |
| (g) | Computed on an annualized basis for periods less than one year. |
See accompanying notes to financial statements.
31 |
Financial Highlights (continued)
For a share outstanding throughout each period.
| | | | | | | | | | | | | | | | | | | | |
| | | Loomis Sayles Senior Floating Rate and Fixed Income Fund—Class A | |
| | | Year Ended
November 30,
2020
| | | Year Ended
November 30,
2019
| | | Year Ended
November 30,
2018
| | | Year Ended
November 30,
2017
| | | Year Ended
November 30,
2016
| |
Net asset value, beginning of the period | | $ | 9.16 | | | $ | 9.62 | | | $ | 9.89 | | | $ | 9.88 | | | $ | 9.69 | |
| | | | | | | | | | | | | | | | | | | | |
INCOME (LOSS) FROM INVESTMENT OPERATIONS: | |
Net investment income(a) | | | 0.43 | | | | 0.57 | | | | 0.53 | | | | 0.51 | | | | 0.56 | |
Net realized and unrealized gain (loss) | | | (0.34 | ) | | | (0.45 | ) | | | (0.26 | ) | | | 0.03 | | | | 0.21 | |
| | | | | | | | | | | | | | | | | | | | |
Total from Investment Operations | | | 0.09 | | | | 0.12 | | | | 0.27 | | | | 0.54 | | | | 0.77 | |
| | | | | | | | | | | | | | | | | | | | |
LESS DISTRIBUTIONS FROM: | |
Net investment income | | | (0.44 | ) | | | (0.58 | ) | | | (0.54 | ) | | | (0.53 | ) | | | (0.58 | ) |
| | | | | | | | | | | | | | | | | | | | |
Net asset value, end of the period | | $ | 8.81 | | | $ | 9.16 | | | $ | 9.62 | | | $ | 9.89 | | | $ | 9.88 | |
| | | | | | | | | | | | | | | | | | | | |
Total return(b) | | | 1.19 | %(c) | | | 1.23 | %(c) | | | 2.78 | % | | | 5.53 | %(c) | | | 8.31 | %(c) |
RATIOS TO AVERAGE NET ASSETS: | |
Net assets, end of the period (000’s) | | $ | 208,251 | | | $ | 297,634 | | | $ | 532,551 | | | $ | 450,633 | | | $ | 367,850 | |
Net expenses | | | 1.07 | %(d)(e) | | | 1.06 | %(d)(f) | | | 1.05 | % | | | 1.05 | %(d) | | | 1.05 | %(d) |
Gross expenses | | | 1.20 | %(e) | | | 1.09 | %(f) | | | 1.05 | % | | | 1.08 | % | | | 1.13 | % |
Net investment income | | | 4.96 | % | | | 6.03 | % | | | 5.42 | % | | | 5.14 | % | | | 5.84 | % |
Portfolio turnover rate | | | 65 | % | | | 52 | % | | | 65 | % | | | 87 | % | | | 75 | % |
| (a) | Per share net investment income has been calculated using the average shares outstanding during the period. |
| (b) | A sales charge for Class A shares is not reflected in total return calculations. |
| (c) | Had certain expenses not been waived/reimbursed during the period, total returns would have been lower. |
| (d) | The investment adviser agreed to waive its fees and/or reimburse a portion of the Fund’s expenses during the period. Without this waiver/reimbursement, expenses would have been higher. |
| (e) | Includes interest expense. Without this expense the ratio of net expenses would have been 1.05% and the ratio of gross expenses would have been 1.18% |
| (f) | Includes interest expense. Without this expense the ratio of net expenses would have been 1.05% and the ratio of gross expenses would have been 1.08%. |
See accompanying notes to financial statements.
| 32
Financial Highlights (continued)
For a share outstanding throughout each period.
| | | | | | | | | | | | | | | | | | | | |
| | | Loomis Sayles Senior Floating Rate and Fixed Income Fund—Class C | |
| | | Year Ended
November 30,
2020
| | | Year Ended
November 30,
2019
| | | Year Ended
November 30,
2018
| | | Year Ended
November 30,
2017
| | | Year Ended
November 30,
2016
| |
Net asset value, beginning of the period | | $ | 9.12 | | | $ | 9.59 | | | $ | 9.86 | | | $ | 9.85 | | | $ | 9.67 | |
| | | | | | | | | | | | | | | | | | | | |
INCOME (LOSS) FROM INVESTMENT OPERATIONS: | | | | | | | | | | | | | | | | | | | | |
Net investment income(a) | | | 0.37 | | | | 0.50 | | | | 0.46 | | | | 0.43 | | | | 0.49 | |
Net realized and unrealized gain (loss) | | | (0.34 | ) | | | (0.46 | ) | | | (0.26 | ) | | | 0.03 | | | | 0.20 | |
| | | | | | | | | | | | | | | | | | | | |
Total from Investment Operations | | | 0.03 | | | | 0.04 | | | | 0.20 | | | | 0.46 | | | | 0.69 | |
| | | | | | | | | | | | | | | | | | | | |
LESS DISTRIBUTIONS FROM: | | | | | | | | | | | | | | | | | | | | |
Net investment income | | | (0.37 | ) | | | (0.51 | ) | | | (0.47 | ) | | | (0.45 | ) | | | (0.51 | ) |
| | | | | | | | | | | | | | | | | | | | |
Net asset value, end of the period | | $ | 8.78 | | | $ | 9.12 | | | $ | 9.59 | | | $ | 9.86 | | | $ | 9.85 | |
| | | | | | | | | | | | | | | | | | | | |
Total return(b) | | | 0.53 | %(c) | | | 0.36 | %(c) | | | 2.02 | % | | | 4.76 | %(c) | | | 7.41 | %(c) |
RATIOS TO AVERAGE NET ASSETS: | | | | | | | | | | | | | | | | | | | | |
Net assets, end of the period (000’s) | | $ | 125,909 | | | $ | 233,387 | | | $ | 337,088 | | | $ | 318,635 | | | $ | 300,811 | |
Net expenses | | | 1.82 | %(d)(e) | | | 1.81 | %(d)(f) | | | 1.80 | % | | | 1.80 | %(d) | | | 1.80 | %(d) |
Gross expenses | | | 1.95 | %(e) | | | 1.84 | %(f) | | | 1.80 | % | | | 1.83 | % | | | 1.88 | % |
Net investment income | | | 4.27 | % | | | 5.28 | % | | | 4.66 | % | | | 4.38 | % | | | 5.10 | % |
Portfolio turnover rate | | | 65 | % | | | 52 | % | | | 65 | % | | | 87 | % | | | 75 | % |
| (a) | Per share net investment income has been calculated using the average shares outstanding during the period. |
| (b) | A contingent deferred sales charge for Class C shares is not reflected in total return calculations. |
| (c) | Had certain expenses not been waived/reimbursed during the period, total returns would have been lower. |
| (d) | The investment adviser agreed to waive its fees and/or reimburse a portion of the Fund’s expenses during the period. Without this waiver/reimbursement, expenses would have been higher. |
| (e) | Includes interest expense. Without this expense the ratio of net expenses would have been 1.80% and the ratio of gross expenses would have been 1.93%. |
| (f) | Includes interest expense. Without this expense the ratio of net expenses would have been 1.80% and the ratio of gross expenses would have been 1.83%. |
See accompanying notes to financial statements.
33 |
Financial Highlights (continued)
For a share outstanding throughout each period.
| | | | | | | | | | | | | | | | |
| | | Loomis Sayles Senior Floating Rate and Fixed Income Fund—Class N | |
| | | Year Ended
November 30,
2020 | | | Year Ended
November 30,
2019 | | | Year Ended
November 30,
2018 | | | Period Ended
November 30,
2017* | |
Net asset value, beginning of the period | | $ | 9.17 | | | $ | 9.63 | | | $ | 9.90 | | | $ | 9.96 | |
| | | | | | | | | | | | | | | | |
INCOME (LOSS) FROM INVESTMENT OPERATIONS: | | | | | | | | | | | | | | | | |
Net investment income(a) | | | 0.46 | | | | 0.60 | | | | 0.57 | | | | 0.37 | |
Net realized and unrealized gain (loss) | | | (0.36 | ) | | | (0.45 | ) | | | (0.27 | ) | | | (0.05 | ) |
| | | | | | | | | | | | | | | | |
Total from Investment Operations | | | 0.10 | | | | 0.15 | | | | 0.30 | | | | 0.32 | |
| | | | | | | | | | | | | | | | |
LESS DISTRIBUTIONS FROM: | | | | | | | | | | | | | | | | |
Net investment income | | | (0.46 | ) | | | (0.61 | ) | | | (0.57 | ) | | | (0.38 | ) |
| | | | | | | | | | | | | | | | |
Net asset value, end of the period | | $ | 8.81 | | | $ | 9.17 | | | $ | 9.63 | | | $ | 9.90 | |
| | | | | | | | | | | | | | | | |
Total return(b) | | | 1.37 | % | | | 1.54 | % | | | 3.08 | % | | | 3.28 | %(c) |
RATIOS TO AVERAGE NET ASSETS: | | | | | | | | | | | | | | | | |
Net assets, end of the period (000’s) | | $ | 151 | | | $ | 242 | | | $ | 191 | | | $ | 104 | |
Net expenses(d) | | | 0.77 | %(e) | | | 0.76 | %(f) | | | 0.74 | % | | | 0.75 | %(g) |
Gross expenses | | | 1.24 | %(e) | | | 1.11 | %(f) | | | 0.95 | % | | | 0.92 | %(g) |
Net investment income | | | 5.31 | % | | | 6.33 | % | | | 5.77 | % | | | 5.63 | %(g) |
Portfolio turnover rate | | | 65 | % | | | 52 | % | | | 65 | % | | | 87 | %(h) |
| * | From commencement of Class operations on March 31, 2017 through November 30, 2017. |
| (a) | Per share net investment income has been calculated using the average shares outstanding during the period. |
| (b) | Had certain expenses not been waived/reimbursed during the period, total returns would have been lower. |
| (c) | Periods less than one year are not annualized. |
| (d) | The investment adviser agreed to waive its fees and/or reimburse a portion of the Fund’s expenses during the period. Without this waiver/reimbursement, expenses would have been higher. |
| (e) | Includes interest expense. Without this expense the ratio of net expenses would have been 0.75% and the ratio of gross expenses would have been 1.22%. |
| (f) | Includes interest expense. Without this expense the ratio of net expenses would have been 0.75% and the ratio of gross expenses would have been 1.09%. |
| (g) | Computed on an annualized basis for periods less than one year. |
| (h) | Represents the Fund’s portfolio turnover rate for the year ended November 30, 2017. |
See accompanying notes to financial statements.
| 34
Financial Highlights (continued)
For a share outstanding throughout each period.
| | | | | | | | | | | | | | | | | | | | |
| | | Loomis Sayles Senior Floating Rate and Fixed Income Fund—Class Y | |
| | | Year Ended
November 30,
2020
| | | Year Ended
November 30,
2019
| | | Year Ended
November 30,
2018
| | | Year Ended
November 30,
2017
| | | Year Ended
November 30,
2016
| |
Net asset value, beginning of the period | | $ | 9.17 | | | $ | 9.63 | | | $ | 9.90 | | | $ | 9.89 | | | $ | 9.70 | |
| | | | | | | | | | | | | | | | | | | | |
INCOME (LOSS) FROM INVESTMENT OPERATIONS: | | | | | | | | | | | | | | | | | | | | |
Net investment income(a) | | | 0.46 | | | | 0.59 | | | | 0.56 | | | | 0.54 | | | | 0.59 | |
Net realized and unrealized gain (loss) | | | (0.35 | ) | | | (0.45 | ) | | | (0.26 | ) | | | 0.02 | | | | 0.21 | |
| | | | | | | | | | | | | | | | | | | | |
Total from Investment Operations | | | 0.11 | | | | 0.14 | | | | 0.30 | | | | 0.56 | | | | 0.80 | |
| | | | | | | | | | | | | | | | | | | | |
LESS DISTRIBUTIONS FROM: | | | | | | | | | | | | | | | | | | | | |
Net investment income | | | (0.46 | ) | | | (0.60 | ) | | | (0.57 | ) | | | (0.55 | ) | | | (0.61 | ) |
| | | | | | | | | | | | | | | | | | | | |
Net asset value, end of the period | | $ | 8.82 | | | $ | 9.17 | | | $ | 9.63 | | | $ | 9.90 | | | $ | 9.89 | |
| | | | | | | | | | | | | | | | | | | | |
Total return | | | 1.45 | %(b) | | | 1.49 | %(b) | | | 3.03 | % | | | 5.79 | %(b) | | | 8.58 | %(b) |
RATIOS TO AVERAGE NET ASSETS: | | | | | | | | | | | | | | | | | | | | |
Net assets, end of the period (000’s) | | $ | 875,829 | | | $ | 1,929,869 | | | $ | 3,101,286 | | | $ | 2,179,284 | | | $ | 1,458,394 | |
Net expenses | | | 0.82 | %(c)(d) | | | 0.81 | %(c)(e) | | | 0.80 | % | | | 0.80 | %(c) | | | 0.80 | %(c) |
Gross expenses | | | 0.95 | %(d) | | | 0.84 | %(e) | | | 0.80 | % | | | 0.83 | % | | | 0.88 | % |
Net investment income | | | 5.28 | % | | | 6.28 | % | | | 5.70 | % | | | 5.41 | % | | | 6.09 | % |
Portfolio turnover rate | | | 65 | % | | | 52 | % | | | 65 | % | | | 87 | % | | | 75 | % |
| (a) | Per share net investment income has been calculated using the average shares outstanding during the period. |
| (b) | Had certain expenses not been waived/reimbursed during the period, total returns would have been lower. |
| (c) | The investment adviser agreed to waive its fees and/or reimburse a portion of the Fund’s expenses during the period. Without this waiver/reimbursement, expenses would have been higher. |
| (d) | Includes interest expense. Without this expense the ratio of net expenses would have been 0.80% and the ratio of gross expenses would have been 0.93%. |
| (e) | Includes interest expense. Without this expense the ratio of net expenses would have been 0.80% and the ratio of gross expenses would have been 0.83%. |
See accompanying notes to financial statements.
35 |
Financial Highlights (continued)
For a share outstanding throughout each period.
| | | | | | | | | | | | | | | | | | | | |
| | | Vaughan Nelson Select Fund—Class A | |
| | | Year Ended
November 30,
2020 | | | Year Ended
November 30,
2019 | | | Year Ended
November 30,
2018 | | | Year Ended
November 30,
2017 | | | Year Ended
November 30,
2016 | |
Net asset value, beginning of the period | | $ | 18.63 | | | $ | 18.13 | | | $ | 18.59 | | | $ | 15.38 | | | $ | 14.82 | |
| | | | | | | | | | | | | | | | | | | | |
INCOME (LOSS) FROM INVESTMENT OPERATIONS: | | | | | | | | | | | | | | | | | | | | |
Net investment income(a) | | | 0.06 | | | | 0.14 | | | | 0.07 | | | | 0.06 | | | | 0.03 | |
Net realized and unrealized gain (loss) | | | 2.75 | | | | 1.90 | | | | 0.91 | | | | 3.41 | | | | 0.83 | |
| | | | | | | | | | | | | | | | | | | | |
Total from Investment Operations | | | 2.81 | | | | 2.04 | | | | 0.98 | | | | 3.47 | | | | 0.86 | |
| | | | | | | | | | | | | | | | | | | | |
LESS DISTRIBUTIONS FROM: | | | | | | | | | | | | | | | | | | | | |
Net investment income | | | (0.13 | ) | | | — | | | | (0.10 | ) | | | (0.01 | ) | | | (0.00 | )(b) |
Net realized capital gains | | | (1.31 | ) | | | (1.54 | ) | | | (1.34 | ) | | | (0.25 | ) | | | (0.30 | ) |
| | | | | | | | | | | | | | | | | | | | |
Total Distributions | | | (1.44 | ) | | | (1.54 | ) | | | (1.44 | ) | | | (0.26 | ) | | | (0.30 | ) |
| | | | | | | | | | | | | | | | | | | | |
Net asset value, end of the period | | $ | 20.00 | | | $ | 18.63 | | | $ | 18.13 | | | $ | 18.59 | | | $ | 15.38 | |
| | | | | | | | | | | | | | | | | | | | |
Total return(c)(d) | | | 16.21 | % | | | 13.67 | % | | | 5.62 | % | | | 22.86 | % | | | 5.91 | % |
RATIOS TO AVERAGE NET ASSETS: | | | | | | | | | | | | | | | | | | | | |
Net assets, end of the period (000’s) | | $ | 13,722 | | | $ | 15,434 | | | $ | 17,703 | | | $ | 22,268 | | | $ | 20,502 | |
Net expenses(e) | | | 1.13 | % | | | 1.16 | %(f) | | | 1.22 | %(g) | | | 1.28 | %(h) | | | 1.34 | %(i) |
Gross expenses | | | 1.18 | % | | | 1.21 | % | | | 1.27 | % | | | 1.33 | % | | | 1.37 | % |
Net investment income | | | 0.37 | % | | | 0.84 | % | | | 0.41 | % | | | 0.39 | % | | | 0.18 | % |
Portfolio turnover rate | | | 88 | % | | | 51 | % | | | 54 | % | | | 66 | % | | | 64 | % |
| (a) | Per share net investment income has been calculated using the average shares outstanding during the period. |
| (b) | Amount rounds to less than $0.01 per share. |
| (c) | A sales charge for Class A shares is not reflected in total return calculations. |
| (d) | Had certain expenses not been waived/reimbursed during the period, total returns would have been lower. |
| (e) | The investment adviser agreed to waive its fees and/or reimburse a portion of the Fund’s expenses during the period. Without this waiver/reimbursement, expenses would have been higher. |
| (f) | Effective July 1, 2019, the expense limit decreased from 1.20% to 1.15%. |
| (g) | Effective July 1, 2018, the expense limit decreased from 1.25% to 1.20%. |
| (h) | Effective July 1, 2017, the expense limit decreased from 1.30% to 1.25%. |
| (i) | Effective July 1, 2016, the expense limit decreased from 1.40% to 1.30%. |
See accompanying notes to financial statements.
| 36
Financial Highlights (continued)
For a share outstanding throughout each period.
| | | | | | | | | | | | | | | | | | | | |
| | | Vaughan Nelson Select Fund—Class C | |
| | | Year Ended
November 30,
2020 | | | Year Ended
November 30,
2019 | | | Year Ended
November 30,
2018 | | | Year Ended
November 30,
2017 | | | Year Ended
November 30,
2016 | |
Net asset value, beginning of the period | | $ | 17.56 | | | $ | 17.31 | | | $ | 17.84 | | | $ | 14.87 | | | $ | 14.44 | |
| | | | | | | | | | | | | | | | | | | | |
INCOME (LOSS) FROM INVESTMENT OPERATIONS: | | | | | | | | | | | | | | | | | | | | |
Net investment income (loss)(a) | | | (0.07 | ) | | | 0.02 | | | | (0.06 | ) | | | (0.06 | ) | | | (0.08 | ) |
Net realized and unrealized gain (loss) | | | 2.58 | | | | 1.77 | | | | 0.87 | | | | 3.28 | | | | 0.81 | |
| | | | | | | | | | | | | | | | | | | | |
Total from Investment Operations | | | 2.51 | | | | 1.79 | | | | 0.81 | | | | 3.22 | | | | 0.73 | |
| | | | | | | | | | | | | | | | | | | | |
LESS DISTRIBUTIONS FROM: | | | | | | | | | | | | | | | | | | | | |
Net realized capital gains | | | (1.31 | ) | | | (1.54 | ) | | | (1.34 | ) | | | (0.25 | ) | | | (0.30 | ) |
| | | | | | | | | | | | | | | | | | | | |
Net asset value, end of the period | | $ | 18.76 | | | $ | 17.56 | | | $ | 17.31 | | | $ | 17.84 | | | $ | 14.87 | |
| | | | | | | | | | | | | | | | | | | | |
Total return(b)(c) | | | 15.31 | % | | | 12.86 | % | | | 4.77 | % | | | 21.96 | % | | | 5.14 | % |
RATIOS TO AVERAGE NET ASSETS: | | | | | | | | | | | | | | | | | | | | |
Net assets, end of the period (000’s) | | $ | 5,246 | | | $ | 6,313 | | | $ | 6,917 | | | $ | 7,429 | | | $ | 7,693 | |
Net expenses(d) | | | 1.88 | % | | | 1.91 | %(e) | | | 1.96 | %(f) | | | 2.03 | %(g) | | | 2.09 | %(h) |
Gross expenses | | | 1.93 | % | | | 1.96 | % | | | 2.01 | % | | | 2.08 | % | | | 2.12 | % |
Net investment income (loss) | | | (0.40 | )% | | | 0.09 | % | | | (0.32 | )% | | | (0.37 | )% | | | (0.58 | )% |
Portfolio turnover rate | | | 88 | % | | | 51 | % | | | 54 | % | | | 66 | % | | | 64 | % |
| (a) | Per share net investment income (loss) has been calculated using the average shares outstanding during the period. |
| (b) | A contingent deferred sales charge for Class C shares is not reflected in total return calculations. |
| (c) | Had certain expenses not been waived/reimbursed during the period, total returns would have been lower. |
| (d) | The investment adviser agreed to waive its fees and/or reimburse a portion of the Fund’s expenses during the period. Without this waiver/reimbursement, expenses would have been higher. |
| (e) | Effective July 1, 2019, the expense limit decreased from 1.95% to 1.90%. |
| (f) | Effective July 1, 2018, the expense limit decreased from 2.00% to 1.95%. |
| (g) | Effective July 1, 2017, the expense limit decreased from 2.05% to 2.00%. |
| (h) | Effective July 1, 2016, the expense limit decreased from 2.15% to 2.05%. |
See accompanying notes to financial statements.
37 |
Financial Highlights (continued)
For a share outstanding throughout each period.
| | | | | | | | | | | | | | | | |
| | | Vaughan Nelson Select Fund—Class N | |
| | | Year Ended
November 30,
2020
| | | Year Ended
November 30,
2019
| | | Year Ended
November 30,
2018
| | | Period Ended
November 30,
2017*
| |
Net asset value, beginning of the period | | $ | 18.76 | | | $ | 18.26 | | | $ | 18.73 | | | $ | 16.28 | |
| | | | | | | | | | | | | | | | |
INCOME (LOSS) FROM INVESTMENT OPERATIONS: | |
Net investment income(a) | | | 0.11 | | | | 0.19 | | | | 0.13 | | | | 0.09 | |
Net realized and unrealized gain (loss) | | | 2.77 | | | | 1.91 | | | | 0.89 | | | | 2.36 | |
| | | | | | | | | | | | | | | | |
Total from Investment Operations | | | 2.88 | | | | 2.10 | | | | 1.02 | | | | 2.45 | |
| | | | | | | | | | | | | | | | |
LESS DISTRIBUTIONS FROM: | |
Net investment income | | | (0.19 | ) | | | (0.06 | ) | | | (0.15 | ) | | | — | |
Net realized capital gains | | | (1.31 | ) | | | (1.54 | ) | | | (1.34 | ) | | | — | |
| | | | | | | | | | | | | | | | |
Total Distributions | | | (1.50 | ) | | | (1.60 | ) | | | (1.49 | ) | | | — | |
| | | | | | | | | | | | | | | | |
Net asset value, end of the period | | $ | 20.14 | | | $ | 18.76 | | | $ | 18.26 | | | $ | 18.73 | |
| | | | | | | | | | | | | | | | |
Total return(b) | | | 16.50 | % | | | 13.93 | % | | | 5.90 | % | | | 15.05 | %(c) |
RATIOS TO AVERAGE NET ASSETS: | |
Net assets, end of the period (000’s) | | $ | 2 | | | $ | 1 | | | $ | 1 | | | $ | 1 | |
Net expenses(d) | | | 0.85 | % | | | 0.87 | %(e) | | | 0.93 | %(f) | | | 0.97 | %(g)(h) |
Gross expenses | | | 71.85 | % | | | 63.51 | % | | | 13.54 | % | | | 14.62 | %(g) |
Net investment income | | | 0.61 | % | | | 1.10 | % | | | 0.68 | % | | | 0.80 | %(g) |
Portfolio turnover rate | | | 88 | % | | | 51 | % | | | 54 | % | | | 66 | %(i) |
| * | From commencement of Class operations on March 31, 2017 through November 30, 2017. |
| (a) | Per share net investment income has been calculated using the average shares outstanding during the period. |
| (b) | Had certain expenses not been waived/reimbursed during the period, total returns would have been lower. |
| (c) | Periods less than one year are not annualized. |
| (d) | The investment adviser agreed to waive its fees and/or reimburse a portion of the Fund’s expenses during the period. Without this waiver/reimbursement, expenses would have been higher. |
| (e) | Effective July 1, 2019, the expense limit decreased from 0.90% to 0.85%. |
| (f) | Effective July 1, 2018, the expense limit decreased from 0.95% to 0.90%. |
| (g) | Computed on an annualized basis for periods less than one year. |
| (h) | Effective July 1, 2017, the expense limit decreased from 1.00% to 0.95%. |
| (i) | Represents the Fund’s portfolio turnover rate for the year ended November 30, 2017. |
See accompanying notes to financial statements.
| 38
Financial Highlights (continued)
For a share outstanding throughout each period.
| | | | | | | | | | | | | | | | | | | | |
| | | Vaughan Nelson Select Fund—Class Y | |
| | | Year Ended
November 30,
2020
| | | Year Ended
November 30,
2019
| | | Year Ended
November 30,
2018
| | | Year Ended
November 30,
2017
| | | Year Ended
November 30,
2016
| |
Net asset value, beginning of the period | | $ | 18.75 | | | $ | 18.25 | | | $ | 18.71 | | | $ | 15.48 | | | $ | 14.90 | |
| | | | | | | | | | | | | | | | | | | | |
INCOME (LOSS) FROM INVESTMENT OPERATIONS: | |
Net investment income(a) | | | 0.11 | | | | 0.19 | | | | 0.13 | | | | 0.11 | | | | 0.06 | |
Net realized and unrealized gain (loss) | | | 2.77 | | | | 1.90 | | | | 0.90 | | | | 3.41 | | | | 0.85 | |
| | | | | | | | | | | | | | | | | | | | |
Total from Investment Operations | | | 2.88 | | | | 2.09 | | | | 1.03 | | | | 3.52 | | | | 0.91 | |
| | | | | | | | | | | | | | | | | | | | |
LESS DISTRIBUTIONS FROM: | |
Net investment income | | | (0.18 | ) | | | (0.05 | ) | | | (0.15 | ) | | | (0.04 | ) | | | (0.03 | ) |
Net realized capital gains | | | (1.31 | ) | | | (1.54 | ) | | | (1.34 | ) | | | (0.25 | ) | | | (0.30 | ) |
| | | | | | | | | | | | | | | | | | | | |
Total Distributions | | | (1.49 | ) | | | (1.59 | ) | | | (1.49 | ) | | | (0.29 | ) | | | (0.33 | ) |
| | | | | | | | | | | | | | | | | | | | |
Net asset value, end of the period | | $ | 20.14 | | | $ | 18.75 | | | $ | 18.25 | | | $ | 18.71 | | | $ | 15.48 | |
| | | | | | | | | | | | | | | | | | | | |
Total return(b) | | | 16.52 | % | | | 13.94 | % | | | 5.86 | % | | | 23.13 | % | | | 6.22 | % |
RATIOS TO AVERAGE NET ASSETS: | |
Net assets, end of the period (000’s) | | $ | 205,557 | | | $ | 204,856 | | | $ | 175,017 | | | $ | 123,746 | | | $ | 104,324 | |
Net expenses(c) | | | 0.88 | % | | | 0.91 | %(d) | | | 0.96 | %(e) | | | 1.03 | %(f) | | | 1.09 | %(g) |
Gross expenses | | | 0.93 | % | | | 0.96 | % | | | 1.01 | % | | | 1.08 | % | | | 1.12 | % |
Net investment income | | | 0.61 | % | | | 1.09 | % | | | 0.68 | % | | | 0.64 | % | | | 0.43 | % |
Portfolio turnover rate | | | 88 | % | | | 51 | % | | | 54 | % | | | 66 | % | | | 64 | % |
| (a) | Per share net investment income has been calculated using the average shares outstanding during the period. |
| (b) | Had certain expenses not been waived/reimbursed during the period, total returns would have been lower. |
| (c) | The investment adviser agreed to waive its fees and/or reimburse a portion of the Fund’s expenses during the period. Without this waiver/reimbursement, expenses would have been higher. |
| (d) | Effective July 1, 2019, the expense limit decreased from 0.95% to 0.90%. |
| (e) | Effective July 1, 2018, the expense limit decreased from 1.00% to 0.95%. |
| (f) | Effective July 1, 2017, the expense limit decreased from 1.05% to 1.00%. |
| (g) | Effective July 1, 2016, the expense limit decreased from 1.15% to 1.05%. |
See accompanying notes to financial statements.
39 |
Notes to Financial Statements
November 30, 2020
1. Organization. Natixis Funds Trust II (the “Trust”) is organized as a Massachusetts business trust. The Trust is registered under the Investment Company Act of 1940, as amended (the “1940 Act”), as an open-end management investment company. The Declaration of Trust permits the Board of Trustees to authorize the issuance of an unlimited number of shares of the Trust in multiple series. The financial statements for certain funds of the Trust are presented in separate reports. The following funds (individually, a “Fund” and collectively, the “Funds”) are included in this report:
Loomis Sayles Global Growth Fund (the “Global Growth Fund”)
Loomis Sayles Senior Floating Rate and Fixed Income Fund (the “Senior Floating Rate and Fixed Income Fund”)
Vaughan Nelson Select Fund (the “Select Fund”)
Global Growth Fund is a diversified investment company. Senior Floating Rate and Fixed Income Fund and Select Fund are non-diversified investment companies.
Each Fund offers Class A, Class C, Class N and Class Y shares. Class A shares are sold with a maximum front-end sales charge of 5.75% for Global Growth Fund and Select Fund and 3.50% for Senior Floating Rate and Fixed Income Fund. Class C shares do not pay a front-end sales charge, pay higher Rule 12b-1 fees than Class A shares for ten years (at which point they automatically convert to Class A shares) and may be subject to a contingent deferred sales charge (“CDSC”) of 1.00% if those shares are redeemed within one year of acquisition, except for reinvested distributions. Class N and Class Y shares do not pay a front-end sales charge, a CDSC or Rule 12b-1 fees. Class N shares are offered with an initial minimum investment of $1,000,000. Class Y shares are offered with an initial minimum investment of $100,000. Certain categories of investors are exempted from the minimum investment amounts for Class N and Class Y as outlined in the relevant Fund’s prospectus.
Most expenses can be directly attributed to a Fund. Expenses which cannot be directly attributed to a Fund are generally apportioned based on the relative net assets of each of the funds in Natixis Funds Trust I, Natixis Funds Trust II, Natixis Funds Trust IV and Gateway Trust (“Natixis Funds Trusts”), Loomis Sayles Funds I and Loomis Sayles Funds II (“Loomis Sayles Funds Trusts”) and Natixis ETF Trust and Natixis ETF Trust II (“Natixis ETF Trusts”). Expenses of a Fund are borne pro rata by the holders of each class of shares, except that each class bears expenses unique to that class (such as the Rule 12b-1 fees applicable to Class A and Class C), and transfer agent fees are borne collectively for Class A, Class C and Class Y, and individually for Class N. In addition, each class votes as a class only with respect to its own Rule 12b-1 Plan. Shares of each class would receive their pro rata share of the net assets of a Fund if the Fund were liquidated. The Trustees approve separate distributions from net investment income on each class of shares.
2. Significant Accounting Policies. The following is a summary of significant accounting policies consistently followed by each Fund in the preparation of its financial statements. The Funds’ financial statements follow the accounting and reporting guidelines provided for investment companies and are prepared in accordance with accounting principles generally accepted in the United States of America which require the use of management estimates that affect the reported amounts and disclosures in the financial statements. Actual results could differ from those estimates. Management has evaluated the events and transactions subsequent to year-end through the date the financial statements were issued and has determined that there were no material events that would require disclosure in the Funds’ financial statements.
a. Valuation. Fund securities and other investments are valued at market value based on market quotations obtained or determined by independent pricing services recommended by the adviser or sub-adviser and approved by the Board of Trustees. Fund securities and other investments for which market quotations are not readily available are valued at fair value as determined in good faith by the adviser or sub-adviser pursuant to procedures approved by the Board of Trustees, as described below. Market value is determined as follows:
Listed equity securities (including shares of closed-end investment companies and exchange-traded funds) are valued at the last sale price quoted on the exchange where they are traded most extensively or, if there is no reported sale during the day, the closing bid quotation as reported by an independent pricing service. Securities traded on the NASDAQ Global Select Market, NASDAQ Global Market and NASDAQ Capital Market are valued at the NASDAQ Official Closing Price (“NOCP”), or if lacking an NOCP, at the most recent bid quotations on the applicable NASDAQ Market. Unlisted equity securities (except unlisted preferred equity securities) are valued at the last sale price quoted in the market where they are traded most extensively or, if there is no reported sale during the day, the closing bid quotation as reported by an independent pricing service. If there is no last sale price or closing bid quotation available, unlisted equity securities will be valued using evaluated bids furnished by an independent pricing service, if available. In some foreign markets, an official close price and a last sale price may be available from the foreign exchange or market. In those cases, the official close price is used. Debt securities and unlisted preferred equity securities are valued based on evaluated bids furnished to the Funds by an independent pricing service or bid prices obtained from broker-dealers. Senior loans are valued at bid prices supplied by an independent pricing service, if available. Broker-dealer bid prices may be used to value debt and unlisted equity securities and senior loans where an independent pricing service is unable to price a security or where an independent pricing service does not provide a
| 40
Notes to Financial Statements (continued)
November 30, 2020
reliable price for the security. Domestic exchange-traded index and single name equity option contracts (including options on exchange-traded funds) are valued at the mean of the National Best Bid and Offer quotations as determined by the Options Price Reporting Authority.
Fund securities and other investments for which market quotations are not readily available are valued at fair value as determined in good faith by the adviser or sub-adviser pursuant to procedures approved by the Board of Trustees. The Funds may also value securities and other investments at fair value in other circumstances such as when extraordinary events occur after the close of a foreign market but prior to the close of the New York Stock Exchange. This may include situations relating to a single issuer (such as a declaration of bankruptcy or a delisting of the issuer’s security from the primary market on which it has traded) as well as events affecting the securities markets in general (such as market disruptions or closings and significant fluctuations in U.S. and/or foreign markets). When fair valuing its securities or other investments, the Funds may, among other things, use modeling tools or other processes that may take into account factors such as securities or other market activity and/or significant events that occur after the close of the foreign market and before the time the Fund’s net asset value (“NAV”) is calculated. Fair value pricing may require subjective determinations about the value of a security, and fair values used to determine a Fund’s NAV may differ from quoted or published prices, or from prices that are used by others, for the same securities. In addition, the use of fair value pricing may not always result in adjustments to the prices of securities held by a Fund.
Illiquid securities for which market quotations are readily available and have been evaluated by the adviser are considered and classified as fair valued securities pursuant to the Funds’ pricing policies and procedures.
As of November 30, 2020, securities held by the Funds were fair valued as follows:
| | | | | | | | | | | | | | | | | | | | | | | | |
Fund | | Equity Securities1 | | | Percentage of
Net Assets | | | Securities
classified
as
fair valued | | | Percentage of
Net Assets | | | Securities fair
valued by the
Fund’s adviser | | | Percentage of Net Assets | |
Global Growth Fund | | $ | 25,803,787 | | | | 24.7 | % | | $ | — | | | | — | | | $ | — | | | | — | |
Senior Floating Rate and Fixed Income Fund | | | — | | | | — | | | | 26,208,132 | | | | 2.2 | % | | | 2,035,322 | | | | 0.2 | % |
| 1 | Certain foreign equity securities were fair valued pursuant to procedures approved by the Board of Trustees as events occurring after the close of the foreign market were believed to materially affect the value of those securities. |
b. Investment Transactions and Related Investment Income. Investment transactions are accounted for on a trade date plus one day basis for daily NAV calculation. However, for financial reporting purposes, investment transactions are reported on trade date. Dividend income (including income reinvested) and foreign withholding tax, if applicable, is recorded on the ex-dividend date, or in the case of certain foreign securities, as soon as a Fund is notified, and interest income is recorded on an accrual basis. Interest income is increased by the accretion of discount and decreased by the amortization of premium, if applicable. For securities with paydown provisions, principal payments received are treated as a proportionate reduction to the cost basis of the securities, and excess or shortfall amounts are recorded as income. For payment-in-kind securities, income received in-kind is reflected as an increase to the principal and cost basis of the securities. In determining net gain or loss on securities sold, the cost of securities has been determined on an identified cost basis. Investment income, non-class specific expenses and realized and unrealized gains and losses are allocated on a pro rata basis to each class based on the relative net assets of each class to the total net assets of the Fund.
c. Foreign Currency Translation. The books and records of the Funds are maintained in U.S. dollars. The values of securities, currencies and other assets and liabilities denominated in currencies other than U.S. dollars, if any, are translated into U.S. dollars based upon foreign exchange rates prevailing at the end of the period. Purchases and sales of investment securities, income and expenses are translated into U.S. dollars on the respective dates of such transactions.
Net realized foreign exchange gains or losses arise from sales of foreign currency, changes in exchange rates between the trade and settlement dates on securities transactions and the difference between the amounts of dividends, interest and foreign withholding taxes recorded on the Funds’ books and the U.S. dollar equivalent of the amounts actually received or paid. Net unrealized foreign exchange gains or losses arise from changes in the value of assets and liabilities, other than investment securities, as of the end of the fiscal period, resulting from changes in exchange rates. Net realized foreign exchange gains or losses and the net change in unrealized foreign exchange gains or losses are disclosed in the Statements of Operations. For federal income tax purposes, net realized foreign exchange gains or losses are characterized as ordinary income, and may, if the Funds have net losses, reduce or eliminate the amount of income available to be distributed by the Funds.
The values of investment securities are presented at the foreign exchange rates prevailing at the end of the period for financial reporting purposes. Net realized and unrealized gains or losses on investments reported in the Statements of Operations reflect gains
41 |
Notes to Financial Statements (continued)
November 30, 2020
or losses resulting from changes in exchange rates and fluctuations which arise due to changes in market prices of investment securities. For federal income tax purposes, a portion of the net realized gain or loss on investments arising from changes in exchange rates, which is reflected in the Statements of Operations, may be characterized as ordinary income and may, if the Funds have net losses, reduce the amount of income available to be distributed by the Funds.
The Funds may use foreign currency exchange contracts to facilitate transactions in foreign-denominated investments. Losses may arise from changes in the value of the foreign currency or if the counterparties do not perform under the contracts’ terms.
d. Option Contracts. Select Fund may enter into option contracts. When a Fund purchases an option, it pays a premium and the option is subsequently marked-to-market to reflect current value. Premiums paid for purchasing options which expire are treated as realized losses. Premiums paid for purchasing options which are exercised are added to the cost or deducted from the proceeds on the underlying instrument or index to determine the realized gain or loss. If the Fund enters into a closing sale transaction, the difference between the premium paid and the proceeds of the closing sale transaction is treated as a realized gain or loss. The risk associated with purchasing options is limited to the premium paid.
When a Fund writes an option, an amount equal to the net premium received (the premium less commission) is recorded as a liability and is subsequently adjusted to the current value. Net premiums received for written options which expire are treated as realized gains. Net premiums received for written options which are exercised are deducted from the cost or added to the proceeds on the underlying instrument or index to determine the realized gain or loss. If the Fund enters into a closing purchase transaction, the difference between the net premium received and any amount paid on effecting a closing purchase transaction, including commissions, is treated as a realized gain or, if the net premium received is less than the amount paid, as a realized loss. The Fund, as writer of a written option, bears the risk of an unfavorable change in the market value of the instrument underlying the written option.
Exchange-traded option contracts are standardized and are settled through a clearing house with fulfillment supported by the credit of the exchange. Therefore, counterparty credit risk to the Fund is reduced.
There were no option contracts held by the Fund as of November 30, 2020.
e. Federal and Foreign Income Taxes. The Trust treats each Fund as a separate entity for federal income tax purposes. Each Fund intends to meet the requirements of the Internal Revenue Code of 1986, as amended, applicable to regulated investment companies, and to distribute to its shareholders substantially all of its net investment income and any net realized capital gains at least annually. Management has performed an analysis of each Fund’s tax positions for the open tax years as of November 30, 2020 and has concluded that no provisions for income tax are required. The Funds’ federal tax returns for the prior three fiscal years remain subject to examination by the Internal Revenue Service. Management is not aware of any events that are reasonably possible to occur in the next twelve months that would result in the amounts of any unrecognized tax benefits significantly increasing or decreasing for the Funds. However, management’s conclusions regarding tax positions taken may be subject to review and adjustment at a later date based on factors including, but not limited to, new tax laws and accounting regulations and interpretations thereof.
A Fund may be subject to foreign withholding taxes on investment income and taxes on capital gains on investments that are accrued and paid based upon the Fund’s understanding of the tax rules and regulations that exist in the countries in which the Fund invests. Foreign withholding taxes on dividend and interest income are reflected on the Statements of Operations as a reduction of investment income, net of amounts eligible to be reclaimed. Dividends and interest receivable on the Statements of Assets and Liabilities are net of foreign withholding taxes. Foreign withholding taxes where reclaims have been or will be filed are reflected on the Statements of Assets and Liabilities as tax reclaims receivable. Capital gains taxes paid are included in net realized gain (loss) on investments in the Statements of Operations. Accrued but unpaid capital gains taxes are reflected as foreign taxes payable on the Statements of Assets and Liabilities, if applicable, and reduce unrealized gains on investments. In the event that realized gains on investments are subsequently offset by realized losses, taxes paid on realized gains may be returned to a Fund. Such amounts, if applicable, are reflected as foreign tax rebates receivable on the Statements of Assets and Liabilities and are recorded as a realized gain when received.
f. Dividends and Distributions to Shareholders. Dividends and distributions are recorded on the ex-dividend date. The timing and characterization of certain income and capital gain distributions are determined in accordance with federal tax regulations, which may differ from accounting principles generally accepted in the United States of America. Permanent differences are primarily due to differing treatments for book and tax purposes of items such as foreign currency gains and losses, partnership basis adjustments, premium amortization, paydown gains and losses, defaulted and/or non-income producing securities, deferred Trustees’ fees, net operating losses, capital gain distribution received and return of capital distributions received. Permanent book and tax basis differences relating to shareholder distributions, net investment income, and net realized gains will result in reclassifications to capital accounts reported on the Statements of Assets and Liabilities. Temporary differences between book and tax distributable earnings are primarily due to premium amortization, defaulted and/or non-income producing securities, deferred Trustees’ fees, wash sales,
| 42
Notes to Financial Statements (continued)
November 30, 2020
partnership basis adjustments, dividends payable, foreign currency gains and losses, net operating losses, paydown gains and losses, capital gain distribution received and return of capital distributions received. Amounts of income and capital gain available to be distributed on a tax basis are determined annually, and at other times during the Funds’ fiscal year as may be necessary to avoid knowingly declaring and paying a return of capital distribution. Distributions from net investment income and net realized short-term capital gains are reported as distributed from ordinary income for tax purposes.
The tax characterization of distributions is determined on an annual basis. The tax character of distributions paid to shareholders during the years ended November 30, 2020 and 2019 were as follows:
| | | | | | | | | | | | | | | | | | | | | | | | |
| | | 2020 Distributions Paid From: | | | 2019 Distributions Paid From: | |
Fund | | Ordinary
Income | | | Long-Term
Capital
Gains | | | Total | | | Ordinary
Income | | | Long-Term
Capital
Gains | | | Total | |
Global Growth Fund | | $ | 129,775 | | | $ | 3,808,266 | | | $ | 3,938,041 | | | $ | 327,698 | | | $ | 1,934,303 | | | $ | 2,262,001 | |
Senior Floating Rate and Fixed Income Fund | | | 82,661,974 | | | | — | | | | 82,661,974 | | | | 200,984,072 | | | | — | | | | 200,984,072 | |
Select Fund | | | 2,839,145 | | | | 15,303,932 | | | | 18,143,077 | | | | 450,291 | | | | 16,893,374 | | | | 17,343,665 | |
Distributions paid to shareholders from net investment income and net realized capital gains, based on accounting principles generally accepted in the United States of America, are consolidated and reported on the Statements of Changes in Net Assets as Distributions to Shareholders. Distributions paid to shareholders from net investment income and net realized capital gains expressed in per-share amounts, based on accounting principles generally accepted in the United States of America, are separately stated and reported within the Financial Highlights.
As of November 30, 2020, the components of distributable earnings on a tax basis were as follows:
| | | | | | | | | | | | |
| | | Global
Growth
Fund | | | Senior
Floating
Rate and
Fixed
Income Fund | | | Select
Fund | |
Undistributed ordinary income | | $ | 139,805 | | | $ | 865,772 | | | $ | 2,367,671 | |
Undistributed long-term capital gains | | | 6,198,914 | | | | — | | | | 10,324,931 | |
| | | | | | | | | | | | |
Total undistributed earnings | | | 6,338,719 | | | | 865,772 | | | | 12,692,602 | |
| | | | | | | | | | | | |
Capital loss carryforward: | |
Short-term: | |
No expiration date | | | — | | | | (117,719,314 | ) | | | — | |
Long-term: | |
No expiration date | | | — | | | | (384,322,768 | ) | | | — | |
| | | | | | | | | | | | |
Total capital loss carryforward | | | — | | | | (502,042,082 | ) | | | — | |
| | | | | | | | | | | | |
Unrealized appreciation (depreciation) | | | 22,810,938 | | | | (55,035,600 | ) | | | 43,881,562 | |
| | | | | | | | | | | | |
Total accumulated earnings (losses) | | $ | 29,149,657 | | | $ | (556,211,910 | ) | | $ | 56,574,164 | |
| | | | | | | | | | | | |
As of November 30, 2020, the tax cost of investments (including derivatives, if applicable) and unrealized appreciation (depreciation) on a federal tax basis were as follows:
| | | | | | | | | | | | |
| | | Global
Growth
Fund | | | Senior
Floating Rate
and Fixed
Income Fund | | | Select Fund | |
Federal tax cost | | $ | 82,491,473 | | | $ | 1,266,666,978 | | | $ | 180,659,966 | |
| | | | | | | | | | | | |
Gross tax appreciation | | $ | 24,273,000 | | | $ | 23,880,081 | | | $ | 49,683,776 | |
Gross tax depreciation | | | (1,468,496 | ) | | | (78,915,681 | ) | | | (5,802,214 | ) |
| | | | | | | | | | | | |
Net tax appreciation (depreciation) | | $ | 22,804,504 | | | $ | (55,035,600 | ) | | $ | 43,881,562 | |
| | | | | | | | | | | | |
The difference between these amounts and those reported in the components of distributable earnings are primarily attributable to foreign currency mark-to-market.
43 |
Notes to Financial Statements (continued)
November 30, 2020
g. Senior Loans. Senior Floating Rate and Fixed Income Fund may invest in senior loans to corporate, governmental or other borrowers. Senior loans, which include both secured and unsecured loans made by banks and other financial institutions to corporate customers, typically hold the most senior position in a borrower’s capital structure, may be secured by the borrower’s assets and have interest rates that reset frequently. Senior loans can include term loans, revolving credit facility loans and second lien loans. A senior loan is often administered by a bank or other financial institution that acts as agent for all holders. The agent administers the terms of the senior loan, as specified in the loan agreement. Large loans may be shared or syndicated among several lenders. The Fund may enter into the primary syndicate for a loan or it may also purchase all or a portion of loans from other lenders (sometimes referred to as loan assignments), in either case becoming a direct lender. The settlement period for senior loans is uncertain as there is no standardized settlement schedule applicable to such investments. Senior loans outstanding at the end of the period are listed in the Fund’s Portfolio of Investments.
h. Repurchase Agreements. Each Fund may enter into repurchase agreements, under the terms of a Master Repurchase Agreement, under which each Fund acquires securities as collateral and agrees to resell the securities at an agreed upon time and at an agreed upon price. It is each Fund’s policy that the market value of the collateral for repurchase agreements be at least equal to 102% of the repurchase price, including interest. Certain repurchase agreements are tri-party arrangements whereby the collateral is held in a segregated account for the benefit of the Fund and on behalf of the counterparty. Repurchase agreements could involve certain risks in the event of default or insolvency of the counterparty, including possible delays or restrictions upon a Fund’s ability to dispose of the underlying securities. As of November 30, 2020, each Fund, as applicable, had investments in repurchase agreements for which the value of the related collateral exceeded the value of the repurchase agreement. The gross value of repurchase agreements is included in the Statements of Assets and Liabilities for financial reporting purposes.
i. Unfunded Loan Commitments. Senior Floating Rate and Fixed Income Fund may enter into unfunded loan commitments, which are contractual obligations for future funding at the option of the borrower. Unfunded loan commitments represent a future obligation, in full, even though a percentage of the committed amount may not be utilized by the borrower. Unfunded loan commitments, and the obligation for future funding, are recorded as a liability on the Statements of Assets and Liabilities at par value at the time the commitment is entered into. Purchases of unfunded loan commitments may have a similar effect on the Fund’s NAV as if the Fund had created a degree of leverage in the portfolio. Market risk exists with these commitments to the same extent as if the securities were owned on a settled basis. Losses may arise due to changes in the value of the unfunded loan commitments.
As of November 30, 2020, the Fund had unfunded loan commitments reflected on the Statement of Assets and Liabilities, which could be extended at the option of the borrower, pursuant to loan agreements with the following borrowers:
| | | | | | |
Borrower | | Type | | Principal Amount | |
Service Logic Acquisition, Inc | | Delayed Draw Term Loan | | $ | 900,746 | |
Southern Veterinary Partners, LLC | | Delayed Draw Term Loan | | | 441,333 | |
| | | | | | |
| | | | $ | 1,342,079 | |
| | | | | | |
Under the terms of the contract, the Fund has the option to assign (sell) all or a portion of the unfunded loan commitment. Upon the completion of such assignment, the Fund is released from its rights and obligations pertaining to the portion of the unfunded loan commitment assigned. When the Fund sells a portion of an unfunded loan commitment, the portion sold is removed from the Portfolio of Investments and the unsettled amount is reflected as unfunded loan commitments sold on the Statement of Assets and Liabilities until settlement date. Once settled, the portion of the unfunded loan commitment assigned is relieved from the Fund’s unfunded loan commitments liability.
j. Indemnifications. Under the Trust’s organizational documents, its officers and Trustees are indemnified against certain liabilities arising out of the performance of their duties to the Funds. Additionally, in the normal course of business, the Funds enter into contracts with service providers that contain general indemnification clauses. The Funds’ maximum exposure under these arrangements is unknown as this would involve future claims that may be made against the Funds that have not yet occurred. However, based on experience, the Funds expect the risk of loss to be remote.
k. New Accounting Pronouncement. In August 2018, the Financial Accounting Standards Board (“FASB”) issued Accounting Standards Update 2018-13, Fair Value Measurement (Topic 820): Disclosure Framework — Changes to the Disclosure Requirements for Fair Value Measurement (“ASU 2018-13”). The update introduces new fair value disclosure requirements, eliminates some prior fair value disclosure requirements, and modifies certain existing fair value disclosure requirements. ASU 2018-13 is effective for fiscal years beginning after December 15, 2019, including interim periods within those fiscal years. An entity is permitted to early adopt any eliminated or modified disclosures upon issuance of the update and delay adoption of any new disclosures until the required effective date. Management has evaluated the impact of the adoption of ASU 2018-13 and has determined to early adopt the removal of (i) the
| 44
Notes to Financial Statements (continued)
November 30, 2020
amount of and reasons for transfers between Level 1 and Level 2 of the fair value hierarchy and (ii) the policy for timing of transfers between levels. Amended disclosures required and permitted for early adoption by ASU 2018-13 have been incorporated in the Funds’ annual financial statements as of November 30, 2020.
In March 2020, the FASB issued Accounting Standard Update 2020-04, Reference Rate Reform (Topic 848) (“ASU 2020-04”). In response to concerns about structural risks of interbank offered rates, and particularly the risk of cessation of the London Interbank Offered Rate (“LIBOR”), which is expected to occur no later than December 31, 2021, regulators have undertaken reference rate reform initiatives to identify alternative reference rates that are more observable or transaction based and less susceptible to manipulation. ASU 2020-04 provides temporary guidance to ease the potential burden in accounting for (or recognizing the effects of) reference rate reform on financial reporting. ASU 2020-04 is elective and applies to all entities, subject to meeting certain criteria, that have contracts that reference LIBOR or another reference rate expected to be discontinued because of reference rate reform. ASU 2020-04 amendments offer optional expedients for contract modifications that would allow an entity to account for such modifications by prospectively adjusting the effective interest rate, instead of evaluating each contract, in accordance with existing accounting standards, as to whether reference rate modifications constitute the establishment of new contracts or the continuation of existing contracts. ASU 2020-04 amendments are currently effective and an entity may elect to apply its provisions as of any date from the beginning of an
interim period that includes or is subsequent to March 12, 2020. No Fund contracts have yet been impacted by reference rate reform. Management expects to apply the optional expedients when appropriate.
3. Fair Value Measurements. In accordance with accounting standards related to fair value measurements and disclosures, the Funds have categorized the inputs utilized in determining the value of each Fund’s assets or liabilities. These inputs are summarized in the three broad levels listed below:
| | • | | Level 1 – quoted prices in active markets for identical assets or liabilities; |
| | • | | Level 2 – prices determined using other significant inputs that are observable either directly, or indirectly through corroboration with observable market data (which could include quoted prices for similar assets or liabilities, interest rates, credit risk, etc.); and |
| | • | | Level 3 – prices determined using significant unobservable inputs when quoted prices or observable inputs are unavailable such as when there is little or no market activity for an asset or liability (unobservable inputs reflect each Fund’s own assumptions in determining the fair value of assets or liabilities and would be based on the best information available). |
The inputs or methodology used for valuing securities are not necessarily an indication of the risk associated with investing in those securities.
The Funds’ pricing policies and procedures are recommended by the adviser and approved by the Board of Trustees. Debt securities are valued based on evaluated bids furnished to the Funds by an independent pricing service. Broker-dealer bid prices may be used if an independent pricing service either is unable to price a security or does not provide a reliable price for a security. The Funds’ adviser may use internally developed models to validate broker-dealer bid prices that are only available from a single broker or market maker. Such securities are considered and classified as fair valued. Broker-dealer bid prices for which the Funds do not have knowledge of the inputs used by the broker-dealer are categorized in Level 3. Securities for which market quotations are not readily available are valued at fair value as determined in good faith by the Funds’ adviser pursuant to procedures approved by the Board of Trustees. Fair valued securities may be categorized in Level 3.
45 |
Notes to Financial Statements (continued)
November 30, 2020
The following is a summary of the inputs used to value the Funds’ investments as of November 30, 2020, at value:
Global Growth Fund
Asset Valuation Inputs
| | | | | | | | | | | | | | | | |
Description | | Level 1 | | | Level 2 | | | Level 3 | | | Total | |
Common Stocks | | | | | | | | | | | | | | | | |
China | | $ | 11,939,901 | | | $ | 4,158,453 | | | $ | — | | | $ | 16,098,354 | |
Denmark | | | — | | | | 940,331 | | | | — | | | | 940,331 | |
France | | | — | | | | 838,492 | | | | — | | | | 838,492 | |
Japan | | | — | | | | 2,575,547 | | | | — | | | | 2,575,547 | |
Netherlands | | | 2,099,699 | | | | 3,740,080 | | | | — | | | | 5,839,779 | |
Switzerland | | | — | | | | 10,268,778 | | | | — | | | | 10,268,778 | |
United Kingdom | | | 1,689,377 | | | | 3,282,106 | | | | — | | | | 4,971,483 | |
All Other Common Stocks(a) | | | 61,680,857 | | | | — | | | | — | | | | 61,680,857 | |
| | | | | | | | | | | | | | | | |
Total Common Stocks | | | 77,409,834 | | | | 25,803,787 | | | | — | | | | 103,213,621 | |
| | | | | | | | | | | | | | | | |
Short-Term Investments | | | — | | | | 2,082,356 | | | | — | | | | 2,082,356 | |
| | | | | | | | | | | | | | | | |
Total | | $ | 77,409,834 | | | $ | 27,886,143 | | | $ | — | | | $ | 105,295,977 | |
| | | | | | | | | | | | | | | | |
| (a) | Details of the major categories of the Fund’s investments are reflected within the Portfolio of Investments. |
Senior Floating Rate and Fixed Income Fund
Asset Valuation Inputs
| | | | | | | | | | | | | | | | |
Description | | Level 1 | | | Level 2 | | | Level 3 | | | Total | |
Senior Loans | | | | | | | | | | | | | | | | |
Construction Machinery | | $ | — | | | $ | 3,380,186 | | | $ | 1,737,804 | (b) | | $ | 5,117,990 | |
Independent Energy | | | — | | | | — | | | | — | (c) | | | — | |
All Other Senior Loans(a) | | | — | | | | 1,004,021,385 | | | | — | | | | 1,004,021,385 | |
| | | | | | | | | | | | | | | | |
Total Senior Loans | | | — | | | | 1,007,401,571 | | | $ | 1,737,804 | | | $ | 1,009,139,375 | |
| | | | | | | | | | | | | | | | |
Bonds and Notes(a) | | | — | | | | 80,126,430 | | | | — | | | | 80,126,430 | |
Common Stocks | | | | | | | | | | | | | | | | |
Energy Equipment & Services | | | — | | | | — | | | | 297,518 | (b) | | | 297,518 | |
Specialty Retail | | | — | | | | — | | | | — | (c) | | | — | |
All Other Common Stocks(a) | | | — | | | | 8,611,254 | | | | — | | | | 8,611,254 | |
| | | | | | | | | | | | | | | | |
Total Common Stocks | | | — | | | | 8,611,254 | | | | 297,518 | | | | 8,908,772 | |
| | | | | | | | | | | | | | | | |
Exchange-Traded Funds | | | 12,325,600 | | | | — | | | | — | | | | 12,325,600 | |
Short-Term Investments | | | — | | | | 101,131,201 | | | | — | | | | 101,131,201 | |
| | | | | | | | | | | | | | | | |
Total | | $ | 12,325,600 | | | $ | 1,197,270,456 | | | $ | 2,035,322 | | | $ | 1,211,631,378 | |
| | | | | | | | | | | | | | | | |
| (a) | Details of the major categories of the Fund’s investments are reflected within the Portfolio of Investments. |
| (b) | Fair valued by the Fund’s adviser. |
| (c) | Fair valued at zero by the Fund’s adviser using level 3 inputs. |
Select Fund
Asset Valuation Inputs
| | | | | | | | | | | | | | | | |
Description | | Level 1 | | | Level 2 | | | Level 3 | | | Total | |
Common Stocks(a) | | $ | 220,393,916 | | | $ | — | | | $ | — | | | $ | 220,393,916 | |
Short-Term Investments | | | — | | | | 4,147,612 | | | | — | | | | 4,147,612 | |
| | | | | | | | | | | | | | | | |
Total | | $ | 220,393,916 | | | $ | 4,147,612 | | | $ | — | | | $ | 224,541,528 | |
| | | | | | | | | | | | | | | | |
| (a) | Details of the major categories of the Fund’s investments are reflected within the Portfolio of Investments. |
| 46
Notes to Financial Statements (continued)
November 30, 2020
The following is a reconciliation of Level 3 investments for which significant unobservable inputs were used to determine fair value as of November 30, 2019 and/or November 30, 2020:
Senior Floating Rate and Fixed Income Fund
Asset Valuation Inputs
| | | | | | | | | | | | | | | | | | | | | | | | | | | | | | | | | | | | | | | | |
Investments in Securities | | Balance as of
November 30,
2019 | | | Accrued
Discounts
(Premiums) | | | Realized
Gain (Loss) | | | Change in
Unrealized
Appreciation
(Depreciation) | | | Purchases | | | Sales | | | Transfers
into
Level 3 | | | Transfers
out of
Level 3 | | | Balance as of
November 30,
2020 | | | Change in
Unrealized
Appreciation
(Depreciation)
from
Investments
Still Held at
November 30,
2020 | |
Senior Loans | | | | | | | | | | | | | | | | | | | | | | | | | | | | | | | | | | | | | | | | |
Construction Machinery | | $ | — | | | $ | 143,442 | | | $ | — | | | $ | (1,574,191 | ) | | $ | — | | | $ | — | | | $ | 3,168,553 | | | $ | — | | | $ | 1,737,804 | | | $ | (1,574,191 | ) |
Independent Energy | | | — | | | | 13,137 | | | | — | | | | (8,270,936 | ) | | | — | | | | — | | | | 8,257,799 | | | | — | | | | — | (a) | | | (8,270,936 | ) |
Internet & Data | | | 8,911,883 | | | | 1,790 | | | | (2,244,669 | ) | | | 1,613,805 | | | | — | | | | (8,282,809 | ) | | | — | | | | — | | | | — | | | | — | |
Leisure | | | 6,672,769 | | | | 5,793 | | | | (957,783 | ) | | | 1,077,808 | | | | — | | | | (6,798,587 | ) | | | — | | | | — | | | | — | | | | — | |
Bonds and Notes | | | | | | | | | | | | | | | | | | | | | | | | | | | | | | | | | | | | | | | | |
Independent Energy | | | 2,207,400 | (b) | | | 111,614 | | | | (6,457,526 | ) | | | 4,138,512 | | | | — | | | | — | | | | — | | | | — | | | | — | | | | — | |
Common Stocks | | | | | | | | | | | | | | | | | | | | | | | | | | | | | | | | | | | | | | | | |
Energy Equipment & Services | | | — | | | | — | | | | — | | | | (3,042,598 | ) | | | — | | | | — | | | | 3,340,116 | | | | — | | | | 297,518 | | | | (3,042,598 | ) |
Oil, Gas & Consumable Fuels | | | — | (a) | | | — | | | | (1,853,525 | ) | | | 1,853,525 | | | | — | | | | — | | | | — | | | | — | | | | — | | | | — | |
Specialty Retail | | | — | (a) | | | — | | | | — | | | | — | | | | — | | | | — | | | | — | | | | — | | | | — | (a) | | | — | |
| | | | | | | | | | | | | | | | | | | | | | | | | | | | | | | | | | | | | | | | |
Total | | $ | 17,792,052 | | | $ | 275,776 | | | $ | (11,513,503 | ) | | $ | (4,204,075 | ) | | $ | — | | | $ | (15,081,396 | ) | | $ | 14,766,468 | | | $ | — | | | $ | 2,035,322 | | | $ | (12,887,725 | ) |
| | | | | | | | | | | | | | | | | | | | | | | | | | | | | | | | | | | | | | | | |
| (b) | Includes a security fair valued at zero using Level 3 inputs. |
Debt securities valued at $11,426,352 were transferred from Level 2 to Level 3 during the period ended November 30, 2020. At November 30, 2019, these securities were valued at a bid price furnished to the Fund by an independent pricing service in accordance with the Fund’s valuation policies. At November 30, 2020, these securities were valued at fair value as determined in good faith by the Fund’s adviser as an independent pricing service did not provide a reliable price for the securities.
A common stock valued at $3,340,116 was transferred from Level 2 to Level 3 during the period ended November 30, 2020. At November 30, 2019, this security was valued on the basis of closing bid quotations furnished to the Fund by an independent pricing service in accordance with the Fund’s valuation policies. At November 30, 2020, this security was valued at fair value as determined in good faith by the Fund’s adviser as an independent pricing service did not provide a reliable price for the security.
4. Purchases and Sales of Securities. For the year ended November 30, 2020, purchases and sales of securities (excluding short-term investments and including paydowns) were as follows:
| | | | | | | | | | | | |
| | | U.S. Government/
Agency Securities | | | Other Securities | |
Fund | | Sales | | | Purchases | | | Sales | |
Global Growth Fund | | $ | — | | | $ | 45,927,692 | | | $ | 34,774,028 | |
Senior Floating Rate and Fixed Income Fund | | | 64,717,969 | | | | 962,900,876 | | | | 1,994,376,441 | |
Select Fund | | | — | | | | 167,294,201 | | | | 192,171,040 | |
5. Management Fees and Other Transactions with Affiliates.
a. Management Fees. Loomis, Sayles & Company, L.P. (“Loomis Sayles”) serves as investment adviser to Global Growth Fund and Senior Floating Rate and Fixed Income Fund. Loomis Sayles is a limited partnership whose sole general partner, Loomis, Sayles & Company, Inc., is indirectly owned by Natixis Investment Managers, LLC (“Natixis”), which is part of Natixis Investment Managers, an international asset management group based in Paris, France.
47 |
Notes to Financial Statements (continued)
November 30, 2020
Under the terms of the management agreements, each Fund pays a management fee at the following annual rates, calculated daily and payable monthly, based on each Fund’s average daily net assets:
| | | | |
Fund | | Percentage of Average Daily Net Assets | |
Global Growth Fund | | | 0.80 | % |
Senior Floating Rate and Fixed Income Fund | | | 0.60 | % |
Effective December 15, 2020, Global Growth Fund pays a management fee at the annual rate of 0.75% of the Fund’s average daily net assets, calculated daily and payable monthly.
Natixis Advisors, L.P. (“Natixis Advisors”), serves as investment adviser to Select Fund. Natixis Advisors is a wholly-owned subsidiary of Natixis. Under the terms of the management agreement, the Fund pays a management fee at the annual rate of 0.75%, calculated daily and payable monthly, based on the Fund’s average daily net assets.
Natixis Advisors has entered into a subadvisory agreement with Vaughan Nelson Investment Management, L.P. (“Vaughan Nelson”). Under the terms of the subadvisory agreement, the Fund pays a subadvisory fee at the annual rate of 0.50%, calculated daily and payable monthly, based on the Fund’s average daily net assets. Payments to Natixis Advisors are reduced by the amount of payments to Vaughan Nelson.
Loomis Sayles and Natixis Advisors have given binding undertakings to the Funds to waive management fees and/or reimburse certain expenses to limit the Funds’ operating expenses, exclusive of acquired fund fees and expenses, brokerage expenses, interest expense, substitute dividend expenses on securities sold short, taxes, organizational and extraordinary expenses such as litigation and indemnification expenses. These undertakings are in effect until March 31, 2021, may be terminated before then only with the consent of the Funds’ Board of Trustees, and are reevaluated on an annual basis. Management fees payable, as reflected on the Statements of Assets and Liabilities, is net of waivers and/or expense reimbursements, if any, pursuant to these undertakings. Waivers/reimbursements that exceed management fees payable are reflected on the Statements of Assets and Liabilities as receivable from investment adviser.
For the year ended November 30, 2020, the expense limits as a percentage of average daily net assets under the expense limitation agreements were as follows:
| | | | | | | | | | | | | | | | |
| | | Expense Limit as a Percentage of
Average Daily Net Assets | |
Fund | | Class A | | | Class C | | | Class N | | | Class Y | |
Global Growth Fund | | | 1.25 | % | | | 2.00 | % | | | 0.95 | % | | | 1.00 | % |
Senior Floating Rate and Fixed Income Fund | | | 1.05 | % | | | 1.80 | % | | | 0.75 | % | | | 0.80 | % |
Select Fund | | | 1.15 | % | | | 1.90 | % | | | 0.85 | % | | | 0.90 | % |
Effective December 15, 2020, the expense limits as a percentage of average daily net assets under the expense limitation agreements for Global Growth Fund are as follows:
| | | | | | | | | | | | | | | | |
| | | Expense Limit as a Percentage of
Average Daily Net Assets | |
Fund | | Class A | | | Class C | | | Class N | | | Class Y | |
Global Growth Fund | | | 1.20 | % | | | 1.95 | % | | | 0.90 | % | | | 0.95 | % |
This new undertaking is in effect until March 31, 2022, may be terminated before then only with the consent of the Funds’ Board of Trustees, and will be reevaluated on an annual basis.
Loomis Sayles and Natixis Advisors shall be permitted to recover expenses borne under the expense limitation agreements (whether through waiver of management fees or otherwise) on a class by class basis in later periods to the extent the annual operating expenses of a class fall below a class’ expense limits, provided, however, that a class is not obligated to pay such waived/reimbursed fees or expenses more than one year after the end of the fiscal year in which the fees or expenses were waived/reimbursed.
| 48
Notes to Financial Statements (continued)
November 30, 2020
For the year ended November 30, 2020, the management fees and waivers of management fees for each Fund were as follows:
| | | | | | | | | | | | | | | | | | | | | | | | |
Fund | | Gross
Management
Fees | | | Contractual
Waivers of
Management
Fees1 | | | Voluntary
Waivers of
Management
Fees2 | | | Net
Management
Fees | | | Percentage of
Average Daily
Net Assets | |
| | Gross | | | Net | |
Global Growth Fund | | $ | 635,910 | | | $ | 144,738 | | | $ | — | | | $ | 491,172 | | | | 0.80 | % | | | 0.62 | % |
Senior Floating Rate and Fixed Income Fund | | | 9,385,866 | | | | 2,044,745 | | | | — | | | | 7,341,121 | | | | 0.60 | % | | | 0.47 | % |
Select Fund | | | 1,452,815 | | | | 59,259 | | | | 36,827 | | | | 1,356,729 | | | | 0.75 | % | | | 0.70 | % |
| 1 | Contractual management fee waivers are subject to possible recovery until November 30, 2021. |
| 2 | Voluntary management fee waivers are not subject to recovery under the expense limitation agreement described above. |
No expenses were recovered for any of the Funds during the year ended November 30, 2020 under the terms of the expense limitation agreements.
b. Service and Distribution Fees. Natixis Distribution, L.P. (“Natixis Distribution”), which is a wholly-owned subsidiary of Natixis, has entered into a distribution agreement with the Trust. Pursuant to this agreement, Natixis Distribution serves as principal underwriter of the Funds of the Trust.
Pursuant to Rule 12b-1 under the 1940 Act, the Trust has adopted a Service Plan relating to each Fund’s Class A shares (the “Class A Plans”) and a Distribution and Service Plan relating to each Fund’s Class C shares (the “Class C Plans”).
Under the Class A Plans, each Fund pays Natixis Distribution a monthly service fee at an annual rate not to exceed 0.25% of the average daily net assets attributable to the Fund’s Class A shares, as reimbursement for expenses incurred by Natixis Distribution in providing personal services to investors in Class A shares and/or the maintenance of shareholder accounts.
Under the Class C Plans, each Fund pays Natixis Distribution a monthly service fee at an annual rate not to exceed 0.25% of the average daily net assets attributable to the Fund’s Class C shares, as compensation for services provided by Natixis Distribution in providing personal services to investors in Class C shares and/or the maintenance of shareholder accounts.
Also under the Class C Plans, each Fund pays Natixis Distribution a monthly distribution fee at the annual rate of 0.75% of the average daily net assets attributable to the Fund’s Class C shares, as compensation for services provided by Natixis Distribution in connection with the marketing or sale of Class C shares.
For the year ended November 30, 2020, the service and distribution fees for each Fund were as follows:
| | | | | | | | | | | | |
| | | Service Fees | | | Distribution Fees | |
Fund | | Class A | | | Class C | | | Class C | |
Global Growth Fund | | $ | 8,709 | | | $ | 2,617 | | | $ | 7,852 | |
Senior Floating Rate and Fixed Income Fund | | | 550,088 | | | | 420,595 | | | | 1,261,784 | |
Select Fund | | | 32,362 | | | | 13,935 | | | | 41,804 | |
c. Administrative Fees. Natixis Advisors provides certain administrative services for the Funds and contracts with State Street Bank and Trust Company (“State Street Bank”) to serve as sub-administrator. Pursuant to an agreement among Natixis Funds Trusts, Loomis Sayles Funds Trusts, Natixis ETF Trusts and Natixis Advisors, each Fund pays Natixis Advisors monthly its pro rata portion of fees equal to an annual rate of 0.0540% of the first $15 billion of the average daily net assets of the Natixis Funds Trusts, Loomis Sayles Funds Trusts and Natixis ETF Trusts, 0.0500% of the next $15 billion, 0.0400% of the next $30 billion, 0.0275% of the next $30 billion and 0.0225% of such assets in excess of $90 billion, subject to an annual aggregate minimum fee for the Natixis Funds Trusts, Loomis Sayles Funds Trusts and Natixis ETF Trusts of $10 million, which is reevaluated on an annual basis.
For the year ended November 30, 2020, the administrative fees for each Fund were as follows:
| | | | |
Fund | | Administrative
Fees | |
Global Growth Fund | | $ | 35,027 | |
Senior Floating Rate and Fixed Income Fund | | | 693,693 | |
Select Fund | | | 85,639 | |
49 |
Notes to Financial Statements (continued)
November 30, 2020
d. Sub-Transfer Agent Fees. Natixis Distribution has entered into agreements, which include servicing agreements, with financial intermediaries that provide recordkeeping, processing, shareholder communications and other services to customers of the intermediaries that hold positions in the Funds and has agreed to compensate the intermediaries for providing those services. Intermediaries transact with the Funds primarily through the use of omnibus accounts on behalf of their customers who hold positions in the Funds. These services would have been provided by the Funds’ transfer agent and other service providers if the shareholders’ accounts were maintained directly at the Funds’ transfer agent. Accordingly, the Funds have agreed to reimburse Natixis Distribution for all or a portion of the servicing fees paid to these intermediaries. The reimbursement amounts (sub-transfer agent fees) paid to Natixis Distribution are subject to a current per-account equivalent fee limit approved by the Funds’ Board of Trustees, which is based on fees for similar services paid to the Funds’ transfer agent and other service providers. Class N shares do not bear such expenses.
For the year ended November 30, 2020, the sub-transfer agent fees (which are reflected in transfer agent fees and expenses in the Statements of Operations) for each Fund were as follows:
| | | | |
Fund | | Sub-Transfer
Agent Fees | |
Global Growth Fund | | $ | 44,298 | |
Senior Floating Rate and Fixed Income Fund | | | 1,107,959 | |
Select Fund | | | 45,567 | |
As of November 30, 2020, the Funds owe Natixis Distribution the following reimbursements for sub-transfer agent fees (which are reflected in the Statements of Assets and Liabilities as payable to distributor):
| | | | |
Fund | | Reimbursements
of Sub-Transfer
Agent Fees | |
Global Growth Fund | | $ | 449 | |
Senior Floating Rate and Fixed Income Fund | | | 27,232 | |
Select Fund | | | 1,203 | |
Sub-transfer agent fees attributable to Class A, Class C and Class Y are allocated on a pro rata basis to each class based on the relative net assets of each class to the total net assets of those classes.
e. Commissions. Commissions (including CDSCs) on Fund shares retained by Natixis Distribution during the year ended November 30, 2020 were as follows:
| | | | |
Fund | | Commissions | |
Global Growth Fund | | $ | 942 | |
Senior Floating Rate and Fixed Income Fund | | | 83,401 | |
Select Fund | | | 768 | |
f. Trustees Fees and Expenses. The Trust does not pay any compensation directly to its officers or Trustees who are directors, officers or employees of Natixis Advisors, Natixis Distribution, Natixis or their affiliates. The Chairperson of the Board of Trustees receives a retainer fee at the annual rate of $369,000. The Chairperson does not receive any meeting attendance fees for Board of Trustees meetings or committee meetings that he attends. Each Independent Trustee (other than the Chairperson) receives, in the aggregate, a retainer fee at the annual rate of $199,000. Each Independent Trustee also receives a meeting attendance fee of $10,000 for each meeting of the Board of Trustees that he or she attends in person and $5,000 for each meeting of the Board of Trustees that he or she attends telephonically. In addition, the chairperson of the Contract Review Committee, the chairperson of the Audit Committee and the chairperson of the Governance Committee each receive an additional retainer fee at the annual rate of $20,000. Each Contract Review Committee member is compensated $6,000 for each Committee meeting that he or she attends in person and $3,000 for each meeting that he or she attends telephonically. Each Audit Committee member is compensated $6,000 for each Committee meeting that he or she attends in person and $3,000 for each meeting that he or she attends telephonically. These fees are allocated among the funds in the Natixis Funds Trusts, Loomis Sayles Funds Trusts and Natixis ETF Trusts based on a formula that takes into account, among other factors, the relative net assets of each fund. Trustees are reimbursed for travel expenses in connection with attendance at meetings.
| 50
Notes to Financial Statements (continued)
November 30, 2020
Prior to January 1, 2020, the Chairperson of the Board received a retainer fee at the annual rate of $360,000 and each Independent Trustee (other than the Chairperson) received, in the aggregate, a retainer fee at the annual rate of $190,000, and the chairperson of the Governance Committee received an additional retainer fee at the annual rate of $15,000. All other Trustee fees remained unchanged.
A deferred compensation plan (the “Plan”) is available to the Trustees on a voluntary basis. Deferred amounts remain in the Funds until distributed in accordance with the provisions of the Plan. The value of a participating Trustee’s deferral account is based on theoretical investments of deferred amounts, on the normal payment dates, in certain funds of the Natixis Funds Trusts, Loomis Sayles Funds Trusts and Natixis ETF Trusts as designated by the participating Trustees. Changes in the value of participants’ deferral accounts are allocated pro rata among the funds in the Natixis Funds Trusts, Loomis Sayles Funds Trusts and Natixis ETF Trusts, and are normally reflected as Trustees’ fees and expenses in the Statements of Operations. The portions of the accrued obligations allocated to the Funds under the Plan are reflected as Deferred Trustees’ fees in the Statements of Assets and Liabilities.
Certain officers and employees of Natixis Advisors and Loomis Sayles are also officers and/or Trustees of the Trust.
g. Affiliated Ownership. As of November 30, 2020, Natixis (and affiliates) and Loomis Sayles Employees’ Profit Sharing Retirement Plan (“Retirement Plan”) held shares of the Funds representing the following percentages of the Funds’ net assets:
| | | | | | | | |
Fund | | Natixis | | | Retirement Plan | |
Global Growth Fund | | | 10.85 | % | | | — | |
Senior Floating Rate and Fixed Income Fund | | | — | | | | 0.65 | % |
Select Fund | | | Less than 1 | % | | | — | |
Investment activities of affiliated shareholders could have material impacts on the Funds.
h. Reimbursement of Transfer Agent Fees and Expenses. Natixis Advisors has given a binding contractual undertaking to the Funds to reimburse any and all transfer agency expenses for the Funds’ Class N shares. This undertaking is in effect through March 31, 2021 and is not subject to recovery under the expense limitation agreement described above.
For the year ended November 30, 2020, Natixis Advisors reimbursed the Funds for transfer agency expenses as follows:
| | | | |
Fund | | Reimbursement
of Transfer
Agency
Expenses
Class N | |
Global Growth Fund | | $ | 1,049 | |
Senior Floating Rate and Fixed Income Fund | | | 1,023 | |
Select Fund | | | 998 | |
6. Class-Specific Transfer Agent Fees and Expenses. Transfer agent fees and expenses attributable to Class A, Class C and Class Y are allocated on a pro rata basis to each class based on the relative net assets of each class to the total net assets of those classes. Transfer agent fees and expenses attributable to Class N are allocated to Class N.
For the year ended November 30, 2020, the Funds incurred the following class-specific transfer agent fees and expenses (including sub-transfer agent fees, where applicable):
| | | | | | | | | | | | | | | | |
| | | Transfer Agent Fees and Expenses | |
Fund | | Class A | | | Class C | | | Class N | | | Class Y | |
Global Growth Fund | | $ | 2,479 | | | $ | 740 | | | $ | 1,049 | | | $ | 48,037 | |
Senior Floating Rate and Fixed Income Fund | | | 175,525 | | | | 136,566 | | | | 1,023 | | | | 945,230 | |
Select Fund | | | 3,687 | | | | 1,698 | | | | 998 | | | | 49,888 | |
7. Line of Credit. Global Growth Fund and Select Fund, together with certain other funds of Natixis Funds Trusts, Loomis Sayles Funds Trusts and Natixis ETF Trusts, entered into a $400,000,000 committed unsecured line of credit provided by State Street Bank. Any one Fund may borrow up to $350,000,000 under the line of credit agreement (as long as all borrowings by all Funds in the aggregate do not exceed the $400,000,000 limit at any time), subject to each Fund’s investment restrictions and its contractual obligations under the line of credit. Interest is charged to the Funds based upon the terms set forth in the agreement. In addition, a commitment fee of 0.15% per annum, payable at the end of each calendar quarter, is accrued and apportioned among the participating funds based on their average daily unused portion of the line of credit. The Funds paid an arrangement fee, an upfront fee, and certain other legal fees in connection
51 |
Notes to Financial Statements (continued)
November 30, 2020
with the line of credit agreement, which are being amortized over a period of 364 days and are reflected in legal fees and/or miscellaneous expenses on the Statements of Operations. The unamortized balance is reflected as prepaid expenses on the Statements of Assets and Liabilities.
For the year ended November 30, 2020, neither Fund had borrowings under this agreement.
Effective November 13, 2020, Senior Floating Rate and Fixed Income Fund has entered into a syndicated, committed, secured line of credit with Sumitomo Mitsui Banking Corporation (the “Administrative Agent”), the Bank of Nova Scotia, Houston Branch, National Australia Bank Limited and Canadian Imperial Bank of Commerce, New York Branch (each a “Lender” and together with the Administrative Agent “Lenders”) under which it may borrow for investment or liquidity purposes. The commitment of the Lenders to make loans to the Fund shall not exceed $500,000,000 at any one time. Under the terms of the agreement, the Lenders are entitled to a security interest in the assets of the Fund as collateral. Interest is charged to the Fund based upon the terms set forth in the agreement. In addition, a commitment fee of 0.500% per annum payable to the Administrative Agent for the account of each Lender is accrued by the Fund based on the unused portion of the line of credit. The Fund paid the Administrative Agent an upfront fee of $625,000 and an administrative agent fee of $25,000, for a total of $650,000, which are being amortized over a period of 364 days and are reflected in legal fees and/or miscellaneous expenses on the Statements of Operations. The unamortized balance is reflected as prepaid expenses on the Statements of Assets and Liabilities.
Prior to November 13, 2020, Senior Floating Rate and Fixed Income Fund had entered into a syndicated, committed, secured line of credit with Sumitomo Mitsui Banking Corporation (the “Administrative Agent”), the Bank of Nova Scotia, Houston Branch and National Australia Bank Limited (each a “Lender” and together with the Administrative Agent “Lenders”) under which it may borrow for investment or liquidity purposes. The commitment of the Lenders to make loans to the Fund shall not exceed $500,000,000 at any one time. Under the terms of the agreement, the Lenders are entitled to a security interest in the assets of the Fund as collateral. Interest is charged to the Fund based upon the terms set forth in the agreement. In addition, a commitment fee of 0.400% per annum payable to the Administrative Agent for the account of each Lender is accrued by the Fund based on the unused portion of the line of credit. The Fund paid the Administrative Agent an upfront fee of $500,000 and an administrative agent fee of $25,000, for a total of $525,000, which are being amortized over a period of 364 days and are reflected in legal fees and/or miscellaneous expenses on the Statements of Operations. The unamortized balance is reflected as prepaid expenses on the Statements of Assets and Liabilities.
For the year ended November 30, 2020, Senior Floating Rate and Fixed Income Fund had an average daily balance on the line of credit (for those days on which there were borrowings) of $123,928,571 at a weighted average interest rate of 2.01%. Interest expense incurred on the line of credit was $337,234.
8. Interest Expense. Senior Floating Rate and Fixed Income Fund may incur interest expense on cash overdrafts at the custodian or from use of the line of credit. Interest expense incurred for the year ended November 30, 2020 is reflected on the Statements of Operations.
9. Risk. Global Growth Fund and Select Fund’s investments in foreign securities may be subject to greater political, economic, environmental, credit/counterparty and information risks. The Fund’s investments in foreign securities also are subject to foreign currency fluctuations and other foreign currency-related risks. Foreign securities may be subject to higher volatility than U.S. securities, varying degrees of regulation and limited liquidity.
Senior Floating Rate and Fixed Income Fund and Select Fund are non-diversified, which means that they are not limited under the 1940 Act to a percentage of assets that each may invest in any one issuer. Because the Funds may invest in the securities of a limited number of issuers, an investment in the Funds may involve a higher degree of risk than would be present in a diversified portfolio.
The senior loans in which Senior Floating Rate and Fixed Income Fund expects to invest will generally not be rated investment grade by the rating agencies. Economic downturns generally increase non-payment rates and a senior loan could lose a substantial part of its value prior to default. Senior loans are subject to credit risk, and secured loans may not be adequately collateralized. The interest rates of senior loans reset frequently, and thus senior loans are subject to interest rate risk (including risks associated with the expected transition away from LIBOR at the end of 2021). There may also be less public information available about senior loans as compared to other debt securities.
Senior loans are generally less liquid than many other debt securities. Transactions in senior loans may settle on a delayed basis, such that the Fund may not receive the proceeds from the sale of a loan for a substantial period of time (greater than seven days) after the sale. As a result, the proceeds related to the sale of senior loans may not be available to make additional investments or to meet the Fund’s redemption obligations until substantial period (greater than seven days) after the sale of the loans.
Global markets have experienced periods of high volatility triggered by the ongoing public health emergency known as coronavirus (“Covid-19”). As the situation continues, the extent and duration of the impact that the Covid-19 outbreak may have on financial markets
| 52
Notes to Financial Statements (continued)
November 30, 2020
and the economy as a whole remains highly uncertain. If the effects of the Covid-19 outbreak on financial markets and the economy continue for an extended period of time, the Funds’ future financial and investment results may be adversely affected.
10. Concentration of Ownership. From time to time, a Fund may have a concentration of one or more accounts constituting a significant percentage of shares outstanding. Investment activities by holders of such accounts could have material impacts on the Funds. As of November 30, 2020, based on management’s evaluation of the shareholder account base, the Funds had accounts representing controlling ownership of more than 5% of the Fund’s total outstanding shares. The number of such accounts, based on accounts that represent more than 5% of an individual class of shares, and the aggregate percentage of net assets represented by such holdings were as follows:
| | | | | | | | | | | | | | | | |
Fund | | Number of 5%
Non-Affiliated
Account Holders | | | Percentage of
Non-Affiliated
Ownership | | | Percentage
of Affiliated
Ownership
(Note 5g) | | | Total
Percentage of
Ownership | |
Global Growth Fund | | | 2 | | | | 33.37 | % | | | 10.85 | % | | | 44.22 | % |
Select Fund | | | 3 | | | | 56.92 | % | | | Less than 1 | % | | | 56.92 | % |
Omnibus shareholder accounts for which Natixis Advisors understands that the intermediary has discretion over the underlying shareholder accounts or investment models where a shareholder account may be invested for a non-discretionary customer are included in the table above. For other omnibus accounts, the Funds do not have information on the individual shareholder accounts underlying the omnibus accounts; therefore, there could be other 5% shareholders in addition to those disclosed in the table above.
11. Capital Shares. Each Fund may issue an unlimited number of shares of beneficial interest, without par value. Transactions in capital shares were as follows:
| | | | | | | | | | | | | | | | |
| |
| Year Ended
November 30, 2020 |
| |
| Year Ended
November 30, 2019 |
|
Global Growth Fund | | | Shares | | | | Amount | | | | Shares | | | | Amount | |
| Class A | |
Issued from the sale of shares | | | 110,398 | | | $ | 1,696,231 | | | | 101,439 | | | $ | 1,389,641 | |
Issued in connection with the reinvestment of distributions | | | 10,981 | | | | 157,794 | | | | 6,102 | | | | 72,794 | |
Redeemed | | | (51,273 | ) | | | (741,407 | ) | | | (55,427 | ) | | | (758,099 | ) |
| | | | | | | | | | | | | | | | |
Net change | | | 70,106 | | | $ | 1,112,618 | | | | 52,114 | | | $ | 704,336 | |
| | | | | | | | | | | | | | | | |
| Class C | |
Issued from the sale of shares | | | 16,167 | | | $ | 236,148 | | | | 42,335 | | | $ | 518,227 | |
Issued in connection with the reinvestment of distributions | | | 4,387 | | | | 61,682 | | | | 1,896 | | | | 22,333 | |
Redeemed | | | (25,196 | ) | | | (349,111 | ) | | | (16,162 | ) | | | (217,094 | ) |
| | | | | | | | | | | | | | | | |
Net change | | | (4,642 | ) | | $ | (51,281 | ) | | | 28,069 | | | $ | 323,466 | |
| | | | | | | | | | | | | | | | |
| Class N | |
Issued from the sale of shares | | | 363,606 | | | $ | 5,000,000 | | | | 651 | | | $ | 8,568 | |
Issued in connection with the reinvestment of distributions | | | 12,918 | | | | 186,528 | | | | 10,137 | | | | 121,236 | |
Redeemed | | | (16 | ) | | | (209 | ) | | | (449 | ) | | | (6,324 | ) |
| | | | | | | | | | | | | | | | |
Net change | | | 376,508 | | | $ | 5,186,319 | | | | 10,339 | | | $ | 123,480 | |
| | | | | | | | | | | | | | | | |
| Class Y | |
Issued from the sale of shares | | | 2,374,152 | | | $ | 36,670,078 | | | | 2,246,566 | | | $ | 31,316,800 | |
Issued in connection with the reinvestment of distributions | | | 230,162 | | | | 3,323,545 | | | | 170,319 | | | | 2,037,028 | |
Redeemed | | | (2,270,314 | ) | | | (31,129,376 | ) | | | (2,063,704 | ) | | | (28,432,431 | ) |
| | | | | | | | | | | | | | | | |
Net change | | | 334,000 | | | $ | 8,864,247 | | | | 353,181 | | | $ | 4,921,397 | |
| | | | | | | | | | | | | | | | |
Increase from capital share transactions | | | 775,972 | | | $ | 15,111,903 | | | | 443,703 | | | $ | 6,072,679 | |
| | | | | | | | | | | | | | | | |
53 |
Notes to Financial Statements (continued)
November 30, 2020
11. Capital Shares (continued).
| | | | | | | | | | | | | | | | |
| |
| Year Ended
November 30, 2020 |
| |
| Year Ended
November 30, 2019 |
|
Senior Floating Rate and Fixed Income Fund | | | Shares | | | | Amount | | | | Shares | | | | Amount | |
| Class A | |
Issued from the sale of shares | | | 8,082,626 | | | $ | 70,114,317 | | | | 11,352,519 | | | $ | 107,268,254 | |
Issued in connection with the reinvestment of distributions | | | 987,112 | | | | 8,486,746 | | | | 2,072,528 | | | | 19,516,280 | |
Redeemed | | | (17,942,499 | ) | | | (155,555,585 | ) | | | (36,272,461 | ) | | | (342,204,148 | ) |
| | | | | | | | | | | | | | | | |
Net change | | | (8,872,761 | ) | | $ | (76,954,522 | ) | | | (22,847,414 | ) | | $ | (215,419,614 | ) |
| | | | | | | | | | | | | | | | |
| Class C | |
Issued from the sale of shares | | | 1,575,157 | | | $ | 13,964,264 | | | | 3,446,000 | | | $ | 32,420,123 | |
Issued in connection with the reinvestment of distributions | | | 633,488 | | | | 5,417,575 | | | | 1,147,744 | | | | 10,768,750 | |
Redeemed | | | (13,448,926 | ) | | | (114,976,638 | ) | | | (14,167,839 | ) | | | (132,923,527 | ) |
| | | | | | | | | | | | | | | | |
Net change | | | (11,240,281 | ) | | $ | (95,594,799 | ) | | | (9,574,095 | ) | | $ | (89,734,654 | ) |
| | | | | | | | | | | | | | | | |
| Class N | |
Issued from the sale of shares | | | 212,516 | | | $ | 1,787,964 | | | | 34,709 | | | $ | 325,455 | |
Issued in connection with the reinvestment of distributions | | | 1,752 | | | | 14,897 | | | | 1,523 | | | | 14,350 | |
Redeemed | | | (223,563 | ) | | | (1,873,513 | ) | | | (29,658 | ) | | | (281,223 | ) |
| | | | | | | | | | | | | | | | |
Net change | | | (9,295 | ) | | $ | (70,652 | ) | | | 6,574 | | | $ | 58,582 | |
| | | | | | | | | | | | | | | | |
| Class Y | |
Issued from the sale of shares | | | 60,437,888 | | | $ | 524,848,928 | | | | 112,517,435 | | | $ | 1,065,538,225 | |
Issued in connection with the reinvestment of distributions | | | 5,513,888 | | | | 47,658,138 | | | | 12,351,005 | | | | 116,400,274 | |
Redeemed | | | (177,236,283 | ) | | | (1,508,081,475 | ) | | | (236,452,634 | ) | | | (2,228,449,260 | ) |
| | | | | | | | | | | | | | | | |
Net change | | | (111,284,507 | ) | | $ | (935,574,409 | ) | | | (111,584,194 | ) | | $ | (1,046,510,761 | ) |
| | | | | | | | | | | | | | | | |
Decrease from capital share transactions | | | (131,406,844 | ) | | $ | (1,108,194,382 | ) | | | (143,999,129 | ) | | $ | (1,351,606,447 | ) |
| | | | | | | | | | | | | | | | |
| | |
| |
| Year Ended
November 30, 2020 |
| |
| Year Ended
November 30, 2019 |
|
Select Fund | | | Shares | | | | Amount | | | | Shares | | | | Amount | |
| Class A | |
Issued from the sale of shares | | | 132,582 | | | $ | 2,317,199 | | | | 73,087 | | | $ | 1,224,673 | |
Issued in connection with the reinvestment of distributions | | | 65,256 | | | | 1,140,030 | | | | 97,584 | | | | 1,414,973 | |
Redeemed | | | (340,170 | ) | | | (5,392,802 | ) | | | (318,610 | ) | | | (5,312,893 | ) |
| | | | | | | | | | | | | | | | |
Net change | | | (142,332 | ) | | $ | (1,935,573 | ) | | | (147,939 | ) | | $ | (2,673,247 | ) |
| | | | | | | | | | | | | | | | |
| Class C | |
Issued from the sale of shares | | | 22,290 | | | $ | 345,755 | | | | 39,205 | | | $ | 585,542 | |
Issued in connection with the reinvestment of distributions | | | 25,261 | | | | 417,050 | | | | 39,080 | | | | 537,740 | |
Redeemed | | | (127,526 | ) | | | (2,115,970 | ) | | | (118,410 | ) | | | (1,903,688 | ) |
| | | | | | | | | | | | | | | | |
Net change | | | (79,975 | ) | | $ | (1,353,165 | ) | | | (40,125 | ) | | $ | (780,406 | ) |
| | | | | | | | | | | | | | | | |
| Class N | |
Issued from the sale of shares | | | — | | | $ | — | | | | 1 | | | $ | 17 | |
Issued in connection with the reinvestment of distributions | | | 6 | | | | 111 | | | | 7 | | | | 107 | |
Redeemed | | | — | | | | — | | | | — | (a) | | | (17 | ) |
| | | | | | | | | | | | | | | | |
Net change | | | 6 | | | $ | 111 | | | | 8 | | | $ | 107 | |
| | | | | | | | | | | | | | | | |
| Class Y | |
Issued from the sale of shares | | | 2,870,422 | | | $ | 52,767,927 | | | | 2,740,064 | | | $ | 44,377,144 | |
Issued in connection with the reinvestment of distributions | | | 835,036 | | | | 14,654,872 | | | | 911,924 | | | | 13,277,611 | |
Redeemed | | | (4,422,330 | ) | | | (73,354,928 | ) | | | (2,318,049 | ) | | | (39,168,687 | ) |
| | | | | | | | | | | | | | | | |
Net change | | | (716,872 | ) | | $ | (5,932,129 | ) | | | 1,333,939 | | | $ | 18,486,068 | |
| | | | | | | | | | | | | | | | |
Increase (decrease) from capital share transactions | | | (939,173 | ) | | $ | (9,220,756 | ) | | | 1,145,883 | | | $ | 15,032,522 | |
| | | | | | | | | | | | | | | | |
| (a) | Amount rounds to less than one share. |
| 54
Report of Independent Registered Public Accounting Firm
To the Board of Trustees of Natixis Funds Trust II and Shareholders of Loomis Sayles Global Growth Fund, Loomis Sayles Senior Floating Rate and Fixed Income Fund and Vaughan Nelson Select Fund:
Opinions on the Financial Statements
We have audited the accompanying statements of assets and liabilities, including the portfolios of investments, of Loomis Sayles Global Growth Fund, Loomis Sayles Senior Floating Rate and Fixed Income Fund, and Vaughan Nelson Select Fund (three of the funds constituting Natixis Funds Trust II, hereafter collectively referred to as the “Funds”) as of November 30, 2020, the related statements of operations for the year ended November 30, 2020, the statements of changes in net assets for each of the two years in the period ended November 30, 2020, including the related notes, and the financial highlights for each of the periods indicated therein (collectively referred to as the “financial statements”). In our opinion, the financial statements present fairly, in all material respects, the financial position of each of the Funds as of November 30, 2020, the results of each of their operations for the year then ended, the changes in each of their net assets for each of the two years in the period ended November 30, 2020 and each of the financial highlights for each of the periods indicated therein in conformity with accounting principles generally accepted in the United States of America.
Basis for Opinions
These financial statements are the responsibility of the Funds’ management. Our responsibility is to express an opinion on the Funds’ financial statements based on our audits. We are a public accounting firm registered with the Public Company Accounting Oversight Board (United States) (PCAOB) and are required to be independent with respect to the Funds in accordance with the U.S. federal securities laws and the applicable rules and regulations of the Securities and Exchange Commission and the PCAOB.
We conducted our audits of these financial statements in accordance with the standards of the PCAOB. Those standards require that we plan and perform the audit to obtain reasonable assurance about whether the financial statements are free of material misstatement, whether due to error or fraud.
Our audits included performing procedures to assess the risks of material misstatement of the financial statements, whether due to error or fraud, and performing procedures that respond to those risks. Such procedures included examining, on a test basis, evidence regarding the amounts and disclosures in the financial statements. Our audits also included evaluating the accounting principles used and significant estimates made by management, as well as evaluating the overall presentation of the financial statements. Our procedures included confirmation of securities owned as of November 30, 2020 by correspondence with the custodian, agent banks and brokers; when replies were not received from brokers, we performed other auditing procedures. We believe that our audits provide a reasonable basis for our opinions.
/s/PricewaterhouseCoopers LLP
Boston, Massachusetts
January 22, 2021
We have served as the auditor of one or more investment companies in the Natixis Investment Company Complex since at least 1995. We have not determined the specific year we began serving as auditor.
55 |
2020 U.S. Tax Distribution Information to Shareholders (Unaudited)
Corporate Dividends Received Deduction. For the fiscal year ended November 30, 2020, a percentage of dividends distributed by the Funds listed below qualifies for the dividends received deduction for corporate shareholders. These percentages are as follows:
| | | | |
Fund | | Qualifying
Percentage | |
Global Growth Fund | | | 100.00 | % |
Select Fund | | | 100.00 | % |
Capital Gains Distributions. Pursuant to Internal Revenue Section 852(b), the following Funds paid distributions, which have been designated as capital gains distributions for the fiscal year ended November 30, 2020, unless subsequently determined to be different.
| | | | |
Fund | | Amount | |
Global Growth Fund | | $ | 3,808,266 | |
Select Fund | | | 15,303,932 | |
Qualified Dividend Income. For the fiscal year ended November 30, 2020, the Funds below will designate up to the maximum amount allowable pursuant to the Internal Revenue Code as qualified dividend income eligible for reduced tax rates. These lower rates range from 0% to 20% depending on an individual’s tax bracket. If the Funds pay a distribution during calendar year 2020, complete information will be reported in conjunction with Form 1099-DIV.
| | | | |
Fund | | | |
Global Growth Fund | | | | |
Select Fund | | | | |
| 56
Trustee and Officer Information
The tables below provide certain information regarding the trustees and officers of Natixis Funds Trust II (the “Trust”). Unless otherwise indicated, the address of all persons below is 888 Boylston Street, Suite 800, Boston, MA 02199-8197. The Funds’ Statement of Additional Information includes additional information about the trustees of the Trust and is available by calling Natixis Funds at 800-225-5478.
| | | | | | | | |
Name and Year of Birth | | Position(s) Held with
the Trust, Length of
Time Served and Term of Office1 | | Principal Occupation(s)
During Past 5 Years | | Number of Portfolios in
Fund Complex
Overseen2 and Other
Directorships Held
During Past 5 Years | | Experience,
Qualifications,
Attributes, and Skills for Board Membership |
|
| INDEPENDENT TRUSTEES |
| | | | |
Edmond J. English
(1953) | | Trustee since 2013 Chairperson of Governance Committee and Audit Committee Member | | Executive Chairman of Bob’s Discount Furniture (retail) | | 56 Director, Burlington Stores, Inc. (retail) | | Significant experience on the Board and on the boards of other business organizations (including retail companies and a bank); executive experience (including at a retail company) |
| | | | |
Richard A. Goglia
(1951) | | Trustee since 2015 Contract Review Committee Member and Governance Committee Member | | Retired | | 56 Director of Triumph Group (aerospace industry) | | Significant experience on the Board and executive experience (including his role as vice president and treasurer of a defense company and experience at a financial services company) |
| | | | |
Wendell J. Knox
(1948) | | Trustee since 2009 Chairperson of Contract Review Committee | | Retired | | 56 Director of Abt Associates Inc. (research and consulting); Director, The Hanover Insurance Group (property and casualty insurance); formerly, Director, Eastern Bank (bank) | | Significant experience on the Board and on the boards of other business organizations (including at a bank and at a property and casualty insurance firm); executive experience (including roles as president and chief executive officer of a research and consulting company) |
| | | | |
Martin T. Meehan
(1956) | | Trustee since 2012 Audit Committee Member | | President, University of Massachusetts | | 56 None | | Significant experience on the Board and on the boards of other business organizations; experience as President of the University of Massachusetts; government experience (including as a member of the U.S. House of Representatives); academic experience |
57 |
Trustee and Officer Information
| | | | | | | | |
Name and Year of Birth | | Position(s) Held with
the Trust, Length of
Time Served and Term of Office1 | | Principal Occupation(s)
During Past 5 Years | | Number of Portfolios in
Fund Complex
Overseen2 and Other
Directorships Held
During Past 5 Years | | Experience,
Qualifications,
Attributes, and Skills for Board Membership |
|
| INDEPENDENT TRUSTEES – continued |
| | | | |
Maureen B. Mitchell
(1951) | | Trustee since 2017 Contract Review Committee Member and Governance Committee Member | | Retired; formerly President, Global Sales and Marketing, GE Asset Management, Inc. (financial services) | | 56 Director, Sterling Bancorp (bank) | | Experience on the Board; financial services industry and executive experience (including role as president of global sales and marketing at a financial services company) |
| | | | |
James P. Palermo
(1955) | | Trustee since 2016 Contract Review Committee Member | | Founding Partner, Breton Capital Management, LLC (private equity); Partner, STEP Partners, LLC (private equity) | | 56 Director, FutureFuel.io (chemicals and biofuels) | | Experience on the Board; financial services industry and executive experience (including roles as chief executive officer of client management and asset servicing for a banking and financial services company) |
| | | | |
Erik R. Sirri
(1958) | | Chairperson of the Board of Trustees since January 2021 Trustee since 2008 Ex Officio member of Audit Committee, Contract Review Committee and Governance Committee | | Professor of Finance at Babson College | | 56 None | | Significant experience on the Board; experience as Director of the Division of Trading and Markets at the Securities and Exchange Commission; academic experience; training as an economist |
| | | | |
Peter J. Smail
(1952) | | Trustee since 2009 Audit Committee Member and Governance Committee Member | | Retired | | 56 None | | Significant experience on the Board; mutual fund industry and executive experience (including roles as president and chief executive officer for an investment adviser) |
| | | | |
Kirk A. Sykes
(1958) | | Trustee since 2019 Contract Review Committee Member | | Managing Director of Accordia Partners, LLC (real estate development); President of Primary Corporation (real estate development); Managing Principal of Merrick Capital Partners (infrastructure finance); formerly, President of Urban Strategy America Fund (real estate fund manager) | | 56 Trustee, Eastern Bank (bank); formerly Director, Ares Commercial Real Estate Corporation (real estate investment trust); Director of Apartment Investment and Management Company (real estate investment trust) | | Experience on the Board and significant experience on the boards of other business organizations (including real estate companies and banks) |
| 58
Trustee and Officer Information
| | | | | | | | |
Name and Year of Birth | | Position(s) Held with
the Trust, Length of
Time Served and Term of Office1 | | Principal Occupation(s)
During Past 5 Years | | Number of Portfolios in
Fund Complex
Overseen2 and Other
Directorships Held
During Past 5 Years | | Experience,
Qualifications,
Attributes, and Skills for Board Membership |
|
| INDEPENDENT TRUSTEES – continued |
| | | | |
Cynthia L. Walker (1956) | | Trustee since 2005 for Natixis Funds Trust II Chairperson of the Audit Committee and Governance Committee Member | | Retired; formerly, Deputy Dean for Finance and Administration, Yale University School of Medicine | | 56 None | | Significant experience on the Board; executive experience in a variety of academic organizations (including roles as dean for finance and administration) |
|
| INTERESTED TRUSTEES |
| | | | |
Kevin P. Charleston3 (1965) One Financial Center Boston, MA 02111 | | Trustee since 2015 | | President, Chief Executive Officer and Chairman of the Board of Directors; Loomis, Sayles & Company, L.P. | | 56 None | | Significant experience on the Board; continuing service as President, Chief Executive Officer and Chairman of the Board of Directors of Loomis, Sayles & Company, L.P. |
| | | | |
David L. Giunta4
(1965) | | Trustee since 2011 President and Chief Executive Officer of Natixis Funds Trust II since 2008 | | President and Chief Executive Officer, Natixis Advisors, L.P., Natixis Distribution, L.P., Natixis Distribution Corporation and Chairman of the Board of Natixis Distribution Corporation | | 56 None | | Significant experience on the Board; experience as President and Chief Executive Officer of Natixis Advisors, L.P., Natixis Distribution, L.P., Natixis Distribution Corporation and Chairman of the Board of Natixis Distribution Corporation |
| 1 | Each trustee serves until retirement, resignation or removal from the Board. The current retirement age is 75. The position of Chairperson of the Board is appointed for a three-year term. |
| 2 | The trustees of the Trust serve as trustees of a fund complex that includes all series of the Natixis Funds Trust I, Natixis Funds Trust II, Natixis Funds Trust IV, Gateway Trust, Loomis Sayles Funds I, Loomis Sayles Funds II, Natixis ETF Trust and Natixis ETF Trust II (collectively, the “Fund Complex”). |
| 3 | Mr. Charleston is deemed an “interested person” of the Trust because he holds the following positions with an affiliated person of the Trust: President, Chief Executive Officer and Chairman of the Board of Directors of Loomis, Sayles & Company, L.P. |
| 4 | Mr. Giunta is deemed an “interested person” of the [Trust/Trusts] because he holds the following positions with an affiliated person of the Trust: President and Chief Executive Officer, Natixis Advisors, L.P., Natixis Distribution, L.P., Natixis Distribution Corporation and Chairman of the Board of Natixis Distribution Corporation. |
59 |
Trustee and Officer Information
| | | | | | |
Name and Year of Birth | | Position(s) Held
with the [Trust/Trusts] | | Term of Office1 and Length
of Time Served | | Principal Occupation(s)
During Past 5 Years2 |
|
| OFFICERS OF THE TRUST |
| | | |
Russell L. Kane
(1969) | | Secretary, Clerk and Chief Legal Officer Chief Compliance Officer and Anti-Money Laundering Officer | | Since 2016 Since 2020 | | Executive Vice President, General Counsel, Secretary and Clerk, Natixis Distribution Corporation, Natixis Advisors, L.P. and Natixis Distribution, L.P.; formerly, Senior Vice President, Deputy General Counsel, Assistant Secretary and Assistant Clerk, Natixis Distribution Corporation, Natixis Advisors, L.P. and Natixis Distribution, L.P. |
| | | |
Michael C. Kardok
(1959) | | Treasurer, Principal Financial and Accounting Officer | | Since 2004 | | Senior Vice President, Natixis Advisors, L.P. and Natixis Distribution, L.P. |
| 1 | Each officer of the Trust serves for an indefinite term in accordance with the Trust’s current by-laws until the date his or her successor is elected and qualified, or until he or she sooner dies, retires, is removed or becomes disqualified. |
| 2 | Each person listed above, except as noted, holds the same position(s) with the Fund Complex. Previous positions during the past five years with Natixis Distribution, L.P., Natixis Advisors, L.P. or Loomis, Sayles & Company, L.P. are omitted, if not materially different from an officer’s current position with such entity. |
| 60
Item 2. Code of Ethics.
The Registrant has adopted a code of ethics that applies to the Registrant’s principal executive officer, principal financial officer and persons performing similar functions. There have been no amendments or waivers of the Registrant’s code of ethics during the period.
Item 3. Audit Committee Financial Expert.
The Board of Trustees of the Registrant has established an audit committee. Mr. Edmond J. English, Mr. Martin T. Meehan, Mr. Peter Smail, and Ms. Cynthia L. Walker are members of the audit committee and have been designated as “audit committee financial experts” by the Board of Trustees. Each of these individuals is also an Independent Trustee of the Registrant.
Item 4. Principal Accountant Fees and Services.
Fees billed by the Principal Accountant for services rendered to the Registrant.
The table below sets forth fees billed by the principal accountant, PricewaterhouseCoopers LLP, for the past two fiscal years for professional services rendered in connection with a) the audit of the Registrant’s annual financial statements and services provided in connection with regulatory filings; b) audit-related services (including services that are reasonably related to the performance of the audit of the Registrant’s financial statements but not reported under “Audit Fees”); c) tax compliance, tax advice and tax planning; and d) all other fees billed for professional services rendered by the principal accountant to the Registrant, other than the services provided reported as a part of (a) through (c) of this Item.
| | | | | | | | | | | | | | | | | | | | | | | | | | | | | | | | |
| | | Audit fees | | | Audit-related fees1 | | | Tax fees2 | | | All other fees | |
| | | 12/1/18-
11/30/19 | | | 12/1/19-
11/30/20 | | | 12/1/18-
11/30/19 | | | 12/1/19-
11/30/20 | | | 12/1/18-
11/30/19 | | | 12/1/19-
11/30/20 | | | 12/1/18-
11/30/19 | | | 12/1/19-
11/30/20 | |
Natixis Funds Trust II- Loomis Sayles Global Growth Fund, Loomis Sayles Senior Floating Rate and Fixed Income Fund and Vaughan Nelson Select Fund | | $ | 144,945 | | | $ | 146,394 | | | $ | 683 | | | $ | 629 | | | $ | 23,969 | | | $ | 23,969 | | | $ | — | | | $ | — | |
| 1. | Audit-related fees consist of: |
2019 & 2020 – performance of agreed-upon procedures related to the Registrant’s deferred compensation plan.
2019 & 2020 – review of Registrant’s tax returns
Aggregate fees billed to the Registrant for non-audit services during 2019 and 2020 were $24,652 and $24,598 respectively.
The following table sets forth the fees billed by the Registrant’s principal accountant for non-audit services rendered to Loomis, Sayles & Company, L.P. (“Loomis”), Natixis Advisors, L.P. (“Natixis”) and entities controlling, controlled by or under common control with Loomis and Natixis (“Control Affiliates”) that provide ongoing services to the Registrant, for engagements that related directly to the operations and financial reporting of the Registrant for the last two fiscal years.
| | | | | | | | | | | | | | | | | | | | | | | | |
| | | Audit-related fees | | | Tax fees | | | All other fees | |
| | | 12/1/18-
11/30/19 | | | 12/1/19-
11/30/20 | | | 12/1/18-
11/30/19 | | | 12/1/19-
11/30/20 | | | 12/1/18-
11/30/19 | | | 12/1/19-
11/30/20 | |
Control Affiliates | | $ | — | | | $ | — | | | $ | — | | | $ | — | | | $ | — | | | $ | — | |
The following table sets forth the aggregate fees billed by the Registrant’s principal accountant for non-audit services rendered to Loomis, Natixis and Control Affiliates that provide ongoing services to the Registrant, for the last two fiscal years, including the fees disclosed in the table above.
| | | | | | | | |
| | | Aggregate Non-Audit Fees | |
| | | 12/1/18-
11/30/19 | | | 12/1/19-
11/30/20 | |
Control Affiliates | | $ | 32,252 | | | $ | 1,646 | |
None of the services described above were approved pursuant to (c)(7)(i)(C) of Regulation S-X.
Audit Committee Pre-Approval Policies.
Annually, the Registrant’s Audit Committee reviews the audit, audit-related, tax and other non-audit services together with the projected fees, for services proposed to be rendered to the Trust and/or other entities for which pre-approval is required during the upcoming year. Any subsequent revisions to already pre-approved services or fees (including fee increases) and requests for pre-approval of new services would be presented for consideration quarterly as needed.
If, in the opinion of management, a proposed engagement by the Registrant’s independent accountants needs to commence before the next regularly scheduled Audit Committee meeting, any member of the Audit Committee who is an independent Board member is authorized to pre-approve the engagement, but only for engagements to provide audit, audit-related and tax services. This approval is subject to review of the full Audit Committee at its next quarterly meeting. All other engagements require the approval of all the members of the audit committee.
Item 5. Audit Committee of Listed Registrants.
Not applicable.
Item 6. Schedule of Investments.
Included as part of the Report to Shareholders filed as Item 1 herewith.
Item 7. Disclosure of Proxy Voting Policies and Procedures for Closed-End Management Investment Companies.
Not applicable.
Item 8. Portfolio Managers of Closed-End Management Investment Companies.
Not applicable.
Item 9. Purchases of Equity Securities by Closed-End Management Investment Companies and Affiliated Purchasers.
Not applicable.
Item 10. Submission of Matters to a Vote of Securities Holders.
There were no material changes to the procedures by which shareholders may recommend nominees to the Registrant’s Board of Trustees.
Item 11. Controls and Procedures.
The Registrant’s principal executive officer and principal financial officer have concluded that the Registrant’s disclosure controls and procedures are sufficient to ensure that information required to be disclosed by the Registrant in this Form N-CSR was recorded, processed, summarized and reported within the time periods specified in the Securities and Exchange Commission’s rules and forms, based upon such officers’ evaluation of these controls and procedures as of a date within 90 days of the filing date of the report.
There were no changes in the Registrant’s internal control over financial reporting that occurred during the period covered by this report that have materially affected, or is reasonably likely to materially affect, the Registrant’s internal control over financial reporting.
Item 12. Disclosure of Securities Lending Activities for Closed-End Management Investment Companies.
Not applicable.
Item 13. Exhibits.
SIGNATURES
Pursuant to the requirements of the Securities Exchange Act of 1934 and the Investment Company Act of 1940, the Registrant has duly caused this report to be signed on its behalf by the undersigned, thereunto duly authorized.
| | |
| Natixis Funds Trust II |
| |
| By: | | /s/ David L. Giunta |
| |
| Name: | | David L. Giunta |
| Title: | | President and Chief Executive Officer |
| Date: | | January 20, 2021 |
Pursuant to the requirements of the Securities Exchange Act of 1934 and the Investment Company Act of 1940, this report has been signed by the following persons on behalf of the Registrant and in the capacities and on the dates indicated.
| | |
| By: | | /s/ David L. Giunta |
| |
| Name: | | David L. Giunta |
| Title: | | President and Chief Executive Officer |
| Date: | | January 20, 2021 |
| |
| By: | | /s/ Michael C. Kardok |
| |
| Name: | | Michael C. Kardok |
| Title: | | Treasurer and Principal Financial and Accounting Officer |
| Date: | | January 20, 2021 |