Exhibit 2
| | | | |
| | | |  |
| | |
| | | | | 2012 Economic and Financial Document |
| | |
| | | | Section I: |
| | |
| | | | Italy’s Stability Programme |
| | |
The 2011 ECONOMIC AND FINANCIAL DOCUMENT is available on-line at the Internet address listed below: www.mef.gov.it www.dt.tesoro.it www.rgs.tesoro.it ISSN: 2239-5539 | |  | | |
Economic and Financial Document 2012
Section I:
Italy’s Stability Programme
Submitted by Prime Minister
and
Minister of the Economy and Finance
Mario Monti
Adopted by the Cabinet on 18 April 2012, endorsed by Parliament on 26 April
ECONOMICAND FINANCIAL DOCUMENT – ITALY’S STABILITY PROGRAMME
ITALY 2020: RIGOUR, GROWTH AND EQUITY
Let’s try to envision that in 2020 some 69 per cent of people between the ages of 24 and 65 years will have a job, almost 10 percentage points more than today. Let’s try to think that a woman will not have to face an obstacle course in attempting to make home life and career compatible, because there will be a modern parental leave system, an extensive network of accessible care structures for children and the elderly, and shops that are open during hours that will make it possible for her to manage her days according to her needs. Let’s imagine that the quality of essential public services in southern Italy is not systematically inferior to those in the rest of the country. Let’s contemplate being able to rely on an efficient, modern system of insurance against the risks of job loss, which covers all workers, regardless of the contract they have, and that the number of persons at risk of poverty is cut by 2.0 million with respect to 2010. Let’s imagine being able to start up a business activity without having to request authorisations and, if we’re under 30 years old, being able to start up a business with one euro in capital. In the event of business disputes, we can count on judicial proceedings that allow for concluding a civil court case in 394 days as in Germany, instead of the 1,210 days it takes today in Italy. Let’s imagine that at least one-third of the population between the ages of 30 and 34 has a university degree, also because there is increasingly less risk of dropping out of the school system in the early years of education, as occurs today with around 18.8 per cent of young people - one-third more than in Germany and France. Let’s imagine that it’s worthwhile for a young researcher to think about a career in Italy because investment in research has grown to 1.53 per cent of GDP and there are at least seven R&D jobs for every 1,000 inhabitants, as in France, Austria or Germany. Let’s imagine less polluted cities and less expensive utility bills, because Italy is on the cutting edge in energy efficiency. Let’s imagine citizens, workers and business people interacting with the public administration via the Internet, thanks to an ultra broadband connection accessible to 100 per cent of the population. And paying less in taxes because the government is more efficient and costs less. Meanwhile, the public debt has fallen below the threshold of 100 per cent of GDP, after having reached 120 per cent in 2012.
Reflecting on scenarios such as these and on the policy actions needed for realising them is not an abstract diversion. It is the essence of the exercise that Italy and the other EU Member States must complete each year in preparing a Stability Programme and a National Reform Programme as part of the Europe 2020 Strategy for intelligent, sustainable and inclusive growth.
Thinking about national economic policy within a European frame of reference and over the long term is one of the most important changes introduced into the European Union’s economic governance with the ‘European Semester’. Coordination of structural reforms among Member States of the Union is a necessary matter of fact. The European economies have a high degree of interdependence and the reforms of certain economies have an impact on others. Setting long-term objectives is instead a useful and pragmatic way of stimulating policy and public opinion to set targets toward the future we want for the country and for Europe, initiating work today so that this future can be realised.
| | |
| MINISTERODELL’ECONOMIAEOFTHE FINANZE | | |
| | III |
ECONOMICAND FINANCIAL DOCUMENT – ITALY’S STABILITY PROGRAMME
The Europe 2020 Strategy constitutes an integral part of the national agenda. On the one hand, it sheds light on the fundamental weaknesses of Italy’s economy that we have lived with for too long and that can no longer be tolerated. On the other hand, it sets long-term objectives that Italy must set in any case, even without the stimulus of Europe, in order to enable the economic and productive system to emerge stronger and reinforced from the crisis. None of these objectives is outside of Italy’s reach.
The Economic and Financial Document is thus a key step in the definition of national economic policy and represents an instrument for setting out a vision of how Italy must evolve in this decade and for plotting the path, year after year, of concrete reforms that can be verified in subsequent years.
v
The 2012 Economic and Financial Document, the second since the inauguration of the European Semester, has been drawn up against a distinct backdrop.
The financial crisis that hit Italy and the rest of Europe has seen some of its most difficult moments in the past months. Sovereign debt crisis, weakness in the financial sector and the slowdown of the international economy were intertwined, thereby causing a dangerous short circuit. The crisis steered Italy, with particular intensity, into a spiral that put the staying power of the economic and financial system at risk.
With this emergency, Parliament has instituted a Government in the national interest, supported by a broad majority of political parties that, despite their strong policy differences, have the general interest of the nation at heart, in a spirit of unity and collaboration among institutions. The experience of this Government originates from the urgency to act, but it is based on the awareness that it is not enough to focus on the short term to get over the critical phase. The flare-up of sovereign-risk premiums that led the country to the brink of a dramatic crisis is not the cause, but is the symptom of a greater malaise. The crisis originated from factors outside of the Italian economy that were linked to the European and international framework, but was furthered by the persistence of structural, fundamental weaknesses of our economy that had yet to be tackled.
It is for this reason that Italy has been hit harder by the crisis and is having difficulty emerging from it. At the end of 2011, the gross domestic product was still some five percentage points below where it was before the crisis. In the past two years, industrial production has recovered just over one-fifth of the loss experienced during the acute phase of the crisis, between 2008 and 2009. Household income has contracted by more than 4.0 per cent in real terms, while it rose during the same period, albeit only marginally, in Germany and France. The percentage of households experiencing economic hardship has risen. At the start of this year, the number of employed persons was still more than 600,000 below the peak level reached in April 2008. The crisis has had particularly hard repercussions on less educated and younger workers, workers with term contracts, and women. It has entailed a slowdown of credit to the private sector and in particular, credit to businesses, which has not yet been completely reversed.
In brief: Italy is today further away from its national objectives deriving from the Europe 2020 Strategy than when the Strategy was adopted two years ago.
| | |
| | MINISTERODELL’ECONOMIAEOFTHE FINANZE |
IV | | |
ECONOMICAND FINANCIAL DOCUMENT – ITALY’S STABILITY PROGRAMME
The message is clear. It is not possible to wait for the storm to pass and the current parenthesis to close. The crisis that we have been experiencing since 2008 can have a profound and long-term impact on Italy’s growth, even if a destructive shock has been avoided. The logic behind the Europe 2020 Strategy is that you do not tackle a structural crisis from a defensive position, with cyclical responses. It is necessary to instil a process of change at all levels, guided by clear objectives and by an idea of the future that we seek. For our country, this means tackling the critical aspects of the economic and productive system, which are well known, and defining the terms of a profound transformation.
For this reason, the Government has established an action plan based on two elements: fiscal consolidation and promotion of growth. And an agenda of reforms based on three underlying principles: rigour, growth, and equity.
The first sphere of action is fiscal consolidation. The public debt has reached its highest level since the start of the crisis. It is necessary to manage this heavy burden by outlining a gradual, but long-term, plan for its reduction. This is a compulsory decision, necessary to avoid jeopardising the country’s economic security, even at the cost of significant sacrifices to be made by individuals, households and businesses.
And it is because this financial rigour takes its toll on the entire nation, that it must be undertaken in an equitable fashion and have the smallest impact possible on growth potential. Although a substantial part of fiscal adjustment has inevitably been achieved by adjusting tax revenues, the measures have been implemented so as to be growth-oriented, to the extent possible, through a relative increase in taxation on consumption and real property, and a relative reduction of fiscal pressure on business activity and work. The commitment to fight unacceptable levels of tax avoidance and tax evasion in Italy is also based on equity. Tax evasion is a form of unfair competition between businesses, and a way in which dishonest citizens damage other citizens, triggering higher fiscal pressure for all taxpayers. For this reason the proceeds of the fight against tax evasion will need to be used for reducing tax rates in the future, as well.
In the medium term, debt reduction will need to rely increasingly on the reduction of current expenditure. From this standpoint, the spending review will play a key role as it will favour a higher quality of public expenditure in key sectors.
In order to be credible, debt reduction must be structural and isolated from decisional variability stemming from different political administrations. With regard to the first criterion, the pension reform which brings the retirement age in Italy to the highest level in Europe and the decision not to consider proceeds from the fight against tax evasion in estimates of government revenues are, indeed, structural factors. The second criterion is ensured by the commitment to a balanced budget to be sanctioned by the Constitution through amendment of Article 81, in line with the commitment undertaken in the Euro Plus Pact and the new ‘fiscal compact’, the international treaty that sets the rules for fiscal union between the Member States of the Euro Area.
| | |
| MINISTERODELL’ECONOMIAEOFTHE FINANZE | | |
| | V |
ECONOMICAND FINANCIAL DOCUMENT – ITALY’S STABILITY PROGRAMME
Still, the heart of Italy’s problem is how to get back to growth again. There is no reason to accept the fact that Italy has had a growth rate below the Euro Area average for more than 10 years. At the present time, growth cannot come from the expansionist stimuli of public spending. Nor can it be hoped that growth can be achieved by squeezing salaries and competing on price with emerging economies that have low labour costs and less protection of social rights.
The impulse to growth that will push Italy toward the Europe 2020 Strategy objectives will come from boosting the total factor productivity of the economy. In particular, this could be achieved by increasing efficiency, productivity and competitiveness in the currently more rigid structure.
Allowing more competition in the product and services market is fundamental. Experience shows that a more open market can lead to better services and lower costs, while also pushing productivity and thereby enhancing the value of the most dynamic and innovative businesses.
Liberalising the economy is a not an abstract principle, but a means for removing privileges and income arising from privileged positions. It helps to give more opportunity to do and to grow to whoever may have initiative without having inherited a certain profession or position.
The disconcerting growth of unemployment and the low level of employment, in particular of young people and women, point to the urgency of reforming the labour market, characterised by its injustices and a lack of order. It is a dual market in which workers with contracts without a termination date enjoy high levels of job security, while others with different types of contracts have modest prospects of improvement, little training and barely any job security. At present, the labour market is flexible only on the hiring side, and an all-encompassing unemployment protection system does not exist. It is necessary to reshape the labour market, as the Government has proposed with a legislative bill recently presented to Parliament, in order to help workers and businesses engage in the difficult phase of reorganisation and changing productive specialisation, and to tackle the dramatic problem of high unemployment among young people.
Tax regulations represent another fundamental part of the strategy for emerging from crisis and returning to growth. The fiscal system must be flexible, innovative and capable of giving incentives to investments in new sectors propelling growth. Tax regulations need to be simplified in order to make life easier for the honest citizen and taxpayer. These changes must also be accompanied by a public administration ever more efficient and consistent in its actions. A more transparent, result-oriented and streamlined administration will be able to make a more meaningful contribution to the nation’s economic productivity growth and will take less of a toll on the earnings of businesses and individuals.
Infrastructure investments can also provide a push to productivity. The Government has already freed up more than €22 billion within the Interministerial Committee for Economic Planning (CIPE) that will result in 180,000 new direct jobs, and another 100,000 indirect jobs. The ‘Cohesion Action Plan’ has begun the acceleration and requalification of investments of European Union structural funds concentrated in the southern regions of the country. It is also necessary to leverage the digital economy, which can generate new activities and help overcome territorial divides and the size limitations of Italian businesses. Furthermore, the Government is concerned about the access to credit for Italian businesses and it is determined to overcome the problem of payment delays stemming from the public administration. Broadening market accessibility is furthermore a primary objective for attracting more foreign investment to Italy.
| | |
| | MINISTERODELL’ECONOMIAEOFTHE FINANZE |
VI | | |
ECONOMICAND FINANCIAL DOCUMENT – ITALY’S STABILITY PROGRAMME
Prices, salaries, and costs matter, but so do the human and social capital available to the nation’s economy. Growth, as broadly defined, also depends on the capacity, the talents and the propensity to innovation of a nation’s researchers, workers and firms. Innovation, a skilled work force, and research are fundamental assets that allow firms to shift into high-technology sectors, or new markets such as those offered by the green or digital economy. Italy boasts significant strengths, examples of excellence in research, a quality education system, and firms that operate on the technological frontier. But looking at the situation from the perspective offered by the Europe 2020 Strategy, our country still invests too little in research, has an insufficient number of patents, and loses too much talent because of the high number of young people who emigrate abroad.
Social capital also constitutes a factor for the sustainable growth of an economy. It is thus necessary to break the vicious circle between corruption and the informal economy.
v
In past months, Italy has undertaken a considerable degree of reforms. The ‘Save Italy’, ‘Grow Italy’, ‘Simplify Italy’ decrees and the ‘Cohesion Action Plan’ have started to tackle structural weaknesses and have responded convincingly to the requests of European and international institutions. The analyses of this National Reform Programme demonstrate that the deregulation and simplification measures will have a cumulative positive effect on growth of 2.4 percentage points of GDP in 2020. Italy has secured its public accounts, and in 2013, will have a primary surplus equal to 3.9 per cent of GDP. Public debt is now on a gradual and long-term reduction path.
These sprint results have been realised through the collective effort of Parliament, the representatives of unions and of businesses, and the Government. But much remains to be done to overcome economic lags and deep-rooted weaknesses that have accumulated over the years. Getting back to growth is a lengthy undertaking, and much remains to be done. An agenda of the things to be done is set out in the final chapter of the National Reform Programme. The actions are concrete and wide-ranging, and they round out and enhance the initiatives of past months, having an impact on all key factors related to the competitiveness of the economic and productive system: furthering the opening of the market for goods and services; reshaping the labour market in line with the outlook for growth; investing in the value of education and innovation; revising the tax system; providing incentives for investments abroad and supporting exports; speeding up civil court proceedings; modernising the public administration; preventing and stifling corruption; and investing in transport infrastructure, the digital agenda and the green economy. Such a strategy needs to take into account the conditions of the backdrop of every area of the country, with particular attention to enhancing the value of the unused growth potential of the country’s southern regions.
There is still a brief, extraordinary window of opportunity that the country must not lose. The current situation still has its ups and downs, but is more favourable than in the recent past, as we have seen Italy’s capability of response and that of all its institutions. The situation of the Euro Area with respect to the financial markets shows signs of stabilisation and improvement, thanks to the pragmatic policy of the European Central Bank and the agreement reached at a European level for resolving the crisis in Greece. Important decisions have been made in order to complete the economic governance architecture, thus reinforcing measures of fiscal discipline and firewalls. The public debt inherited from the past remains a heavy burden for Italy to bear.
| | |
| MINISTERODELL’ECONOMIAEOFTHE FINANZE | | |
| | VII |
ECONOMICAND FINANCIAL DOCUMENT – ITALY’S STABILITY PROGRAMME
As indicated in the Stability Programme, the international cycle remains weak and uncertain. At a domestic level, growth cannot be expected to return until 2013. The lack of employment directly or indirectly affects almost one-half of Italian households. It is necessary to act with determination in order to complete the sequence of reforms and to enable the country to start up again, thus actively contributing to economic recovery. The year ahead must be a year of profound transformation for Italy, consistent with what has already occurred in past months.
v
In order to proceed without delay, we need to clear the field of some scepticism about the usefulness of the tool of reforms, scepticism coming from two erroneous perceptions: the first is the political timing of the reforms, and the second is the scope (of the economic and social interests) of the reforms.
With reference to the first aspect, according to some opinions it is risky to carry out structural reforms when the economy is contracting. In the short term, the reforms entail additional costs, whereas the benefits are produced only over the medium/long term. International experience demonstrates that the risk is true only in part and that it can be mitigated. Reforms do indeed require patience, but they will pay off. The most recent comparative analyses done by multilateral organisations show that the benefits of reforms may be seen earlier than expected if the measures are concentrated within a limited time period, and constructed with proper logic and over a time sequence. The Government’s action will thus be to link liberalisation and simplification measures to the reform of the labour market and the revision of the taxation system, combining them with measures to free up and to requalify investment in infrastructures, improve the effectiveness of education, strengthen childcare and care of the elderly, and promote opportunities for young people. Coordination among these measures will create virtuous circles mitigating the negative effects and allowing the positive effects to emerge more rapidly. Concentrating the reforms sends a clear signal to residents, consumers, businesses and investors, triggering a positive circuit of expectations that fuels growth.
The other aspect regards the scope of interests affected by the reforms. Reforms are difficult to pass because they affect interests concentrated in categories with strong political representation and instead bring advantages to a broad base of unorganized interests, such as consumers, or young people, or even future generations. This is an issue to that should be dealt with not in terms of political tactic, but in terms of equity. The sacrifices required for reducing the public debt and returning to economic must be distributed equitably in order to be sustainable. For this reason, the reform measures presented in past months have been conceived as systematic measures that have an effect on a wide range of sectors and issues. In this way, the weight of adjustment is not unduly put on any specific category or social group, but everyone is asked to accept a sacrifice in terms of their own particular interest in order to have advance in the general interest. The greater equity there is, the greater is the willingness to accept changes, even if difficult.
Implementing the Europe 2020 Strategy requires national reforms. But it is necessary for the European environment to supply the Member States with the best backdrop possible in order to ensure national reforms are effective and reward sacrifices made. For this reason, the Government immediately made its best effort to contribute directly and substantially to the Union’s policy orientation, so that there would be no priority higher than growth on the Union’s agenda. The Euro Area crisis is the product of short-sighted attitudes toward public finance, in particular during periods of expansion. But it was also caused by a deficit in both reforms and economic policies for growth. Focusing on growth and on its most important engine - integration of the single market - will produce the energy necessary to drive Europe out of the sovereign debt crisis.
| | |
| | MINISTERODELL’ECONOMIAEOFTHE FINANZE |
VIII | | |
ECONOMICAND FINANCIAL DOCUMENT – ITALY’S STABILITY PROGRAMME
Finally, one can ask if the 2020 Agenda is a technocratic agenda or if it has an inspiring vision of society and the market. For some, structural reforms are needed in order to preserve the European social model with its achievements in the face of a world that is changing. For others, reforms need to signal the point of departure from that model, which is outdated and financially unsustainable. The less visible, but essential, thread that links the reforms of the Europe 2020 Strategy together is the construction of a highly competitive social market economy at a European level, and thus an economy that creates more sustainable employment. This is the fundamental objective that the Lisbon Treaty assigned to the European Union. Getting growth started again within a model of stable public finance is the way to build a modern social market economy.
The 2012 National Reform Programme is one step in a process that will repeat itself every year until 2020. The reforms presented in this document inaugurate a series of projects, whose work must continue in the years to come. Growth requires planning continuity and consistency over time. In this regard, the Europe 2020 Strategy has one strong advantage. It is a reference framework that will remain valid over the long term, even in the face of changing governments with distinct programmatic visions. It is a stable framework that can be filled with somewhat different contents depending on specific views about concrete policies, but its orientation toward reaching the 2020 objectives for Italy does not change.
A Member State which has a clear and ambitious National Reform Programme consistent with public finance targets as identified in its Stability Programme, which has political parties that share such a strategy and believe it to be an integral part of their policies, and thus which commit to respecting it, even in the future, and finally, a Member State which has a government focused on the implementation of the programme of structural reforms and is supported by Parliament, the representatives of unions and of businesses, and the public at large, is a Member State that is credible and predictable, that contributes to guiding Europe, and that can be deemed to be increasingly reliable by the markets, but even more so, by its citizens.
This Economic and Financial Document proposes a vision for the development of the country and a way for moving ahead. I hope that it offers a stimulus for fuelling solid debate among political parties, representatives of unions and of businesses, and autonomous territorial entities, about the challenges that await the nation and about the best solutions for creating more growth, more employment and more equity.
| | |
| | Mario Monti |
| |
| | President of the Council of Ministers Minister of Economy and Finance |
| | |
| MINISTERODELL’ECONOMIAEOFTHE FINANZE | | |
| | IX |
ECONOMICAND FINANCIAL DOCUMENT – ITALY’S STABILITY PROGRAMME
| | |
| | MINISTERODELL’ECONOMIAEOFTHE FINANZE |
X | | |
ECONOMICAND FINANCIAL DOCUMENT –ITALY’S STABILITY PROGRAMME
TABLE OF CONTENTS
| | | | |
| I. | | OVERALL FRAMEWORKAND ECONOMIC-POLICY OBJECTIVES | | 1 |
| | |
| II. | | MACROECONOMIC SCENARIO | | 3 |
| II.1 | | The international scenario | | 3 |
| II.2 | | Italy’s economy | | 4 |
| II.3 | | Impact of key reforms on growth | | 10 |
| Box | | National accounts revisions | | |
| | |
| III. | | NET BORROWINGAND PUBLIC DEBT | | 12 |
| III.1 | | The path to a turnaround – Excessive Deficit Procedure | | 12 |
| III.2 | | Financial Impact of key Reforms | | 18 |
| III.3 | | The cyclically adjusted balance | | 19 |
| III.4 | | Public debt | | 21 |
| III.5 | | Trend of debt-to-GDP ratio | | 27 |
| Box | | The expenditure rule | | |
| | |
| IV. | | SENSITIVITY ANALYSIS | | 29 |
| IV.1 | | Sensitivity to economic growth | | 29 |
| IV.2 | | Sensitivity to interest rates | | 32 |
| | |
| V. | | SUSTAINABILITYOF PUBLIC FINANCES | | 35 |
| V.1 | | The impact of population ageing on public expenditure | | 35 |
| V.2 | | Debt sustainability | | 43 |
| V.3 | | Analysis of the sensitivity of public-debt dynamics over the long term | | 45 |
| V.4 | | The impact of pension reform on sustainability | | 50 |
| V.5 | | Other relevant factors | | 51 |
| Box | | The reform of the pension system | | |
| Box | | Sensitivity of the debt to interest rates in medium/long term | | |
| Box | | Guarantees granted by the State | | |
| Box | | The debt rule | | |
| | |
| MINISTERODELL’ECONOMIAEDELLE FINANZE | | |
| | XI |
ECONOMICAND FINANCIAL DOCUMENT –ITALY’S STABILITY PROGRAMME
| | | | |
| VI. | | QUALITYOF PUBLIC FINANCES | | 59 |
| VI.1 | | Actions taken and strategy for 2013-2015 | | 59 |
| Box | | Macroeconomic impact of fiscal consolidation measures adopted in 2011 | | |
| Box | | The fight against tax evasion | | |
| Box | | International outlook and policies for cooperation in development | | |
| | |
| VII. | | INSTITUTIONAL ASPECTSOF PUBLIC FINANCES | | 71 |
| VII.1 | | Fiscal rules | | 71 |
| VII.2 | | Strengthening of fiscal framework | | 74 |
| | |
| | MINISTERODELL’ECONOMIAEDELLE FINANZE |
XII | | |
ECONOMICAND FINANCIAL DOCUMENT –ITALY’S STABILITY PROGRAMME
TABLES
| | |
| Table I.1 | | Public finance indicators: objectives (% of GDP) |
| |
| Table II.1 | | Base assumptions |
| |
| Table II.2a | | Macroeconomic prospects |
| |
| Table II.2b | | Prices |
| |
| Table II.2c | | Labour market developments |
| |
| Table II.2d | | Sector accounts |
| |
| Table II.3 | | Overall macroeconomic effects of the structural reforms of Decree-Law No. 1/2012 and Decree-Law No. 5/2012 (percentage deviation compared with baseline simulation) |
| |
| Table II.4 | | Macroeconomic effects of the individual structural reform measures contained in Decree-Law No. 1/2012 and Decree-Law No. 5/2012 (percentage deviation compared with baseline simulation) |
| |
| Table III.1 | | Differences with respect to previous Stability Programme |
| |
| Table III.2 | | The path to a turnaround (% of GDP) |
| |
| Table III.3 | | General Government budgetary prospects |
| |
| Table III.4a | | General Government revenues: discretionary and based on unchanged policies |
| |
| Table III.4b | | Expenditures to be excluded by expenditure rule |
| |
| Table III.5 | | General Government account based on unchanged policies |
| |
| Table III.6 | | State Sector – Public Sector - cash balances (in € mn and % of GDP) |
| |
| Table III.7 | | Financial impact of NRP measures (in € mn) |
| |
| Table III.8 | | Cyclical developments (% of GDP) |
| |
| Table III.9 | | Public debt determinants (% of GDP) |
| |
| Table III.10 | | General Government debt by sub-sector (in € mn and % of GDP) |
| |
| Table IV.1 | | Sensitivity to GDP growth (percentage values) |
| |
| Table V.1 | | Public expenditure for pensions, healthcare, long-term care, education and unemployment compensation (2005-2060) |
| |
| Table V.2 | | Long-term sustainability indicators |
| |
| Table V.3 | | Intervention to support financial institutions (in € mn) |
| |
| Table V.4 | | Intervention to support financial institutions (% of GDP) |
| |
| Table VI.1 | | Cumulative impact of 2011 legislation on General Government’s net borrowing (before netting out induced effects; in € mn) |
| |
| Table VI.2 | | Cumulative impact of 2011 budget packages on General Government’s net borrowing (before netting out induced effects; in € mn) |
| |
| Table VI.3 | | Cumulative impact of 2011 budget packages on General Government’s net borrowing by sub-sector (before netting out induced effects; in € mn) |
| |
| Table VI.4 | | Impact of Decree Law No. 98/2011 - converted by Law No. 111/2011 (before netting out induced effects; in € mn) |
| |
| Table VI.5 | | Impact of Decree Law No. 138/2011 - converted by Law No. 148/2011 (before netting out induced effects; in € mn) |
| |
| Table VI.6 | | Impact of Law No. 183/2011 - 2012-2014 Stability Law (before netting out induced effects; in € mn) |
| |
| Table VI.7 | | Impact of Decree-Law No. 201/2011 - converted by Law No. 214/2011 (before netting out induced effects; in € mn) |
| |
| Table VI.8 | | Public finance policy scenario for 2012-2015 (% of GDP) |
| | |
| MINISTERODELL’ECONOMIAEDELLE FINANZE | | |
| | XIII |
ECONOMICAND FINANCIAL DOCUMENT –ITALY’S STABILITY PROGRAMME
CHARTS
| | |
| Chart II.1 | | Export and import volumes by geographic area 2011 (% change y/y) |
| |
| Chart III.1 | | 10-year BTP-bund yield differential since the introduction of the euro to February 2012 |
| |
| Chart III.2 | | Italian Government securities yield curves (February 2011-2012) |
| |
| Chart III.3 | | Debt-to-GDP ratio (inclusive of and net of support provided to Euro Area countries) |
| |
| Chart IV.1 | | Sensitivity of net borrowing to growth (% of GDP) |
| |
| Chart IV.2 | | Sensitivity of public debt to growth (% of GDP) |
| |
| Chart IV.3 | | Average life and financial duration of Government securities |
| |
| Chart IV.4 | | Ratio of interest expenditure to GDP and weighed average cost at issuance |
| |
| Chart V.1 | | Public debt projection compared with the previous Stability Programme (% of GDP) |
| |
| Chart V.2 | | Sensitivity of the public debt to a reduction of the net flow of immigrants and a 1-year increase in life expectancy (% of GDP) |
| |
| Chart V.3 | | Sensitivity of public debt to macroeconomic assumptions: higher (lower) growth of productivity (% of GDP) |
| |
| Chart V.4 | | Sensitivity of public debt to macroeconomic assumptions: employment rates and rates of activity of the elderly (% of GDP) |
| |
| Chart V.5 | | Sensitivity of public debt to changes in primary surplus (% of GDP) |
| |
| Chart V.6 | | The impact of reforms on the debt-to-GDP ratio (% of GDP) |
| |
Chart V.7 | | Private debt (% of GDP) |
| | |
| | MINISTERODELL’ECONOMIAEDELLE FINANZE |
XIV | | |
ECONOMICAND FINANCIAL DOCUMENT – ITALY’S STABILITY PROGRAMME
| I. | OVERALL FRAMEWORK AND ECONOMIC-POLICY OBJECTIVES |
The moderate recovery of Italy’s economy in the first half of 2011 was weakened by the slowdown of the global economic cycle and by growing tensions in the sovereign debt market for the Euro Area. In 2011, real GDP growth was 0.4 per cent, penalised by the recession in the final two quarters of the year. Therefore, during the current cyclical phase, the objective of fiscal consolidation must be considered equally with the growing need for providing a new impulse to economic recovery.
Budget rigour, growth and equity are the three pillars on which the Government’s strategy is based. These objectives coincide fully with those behind the renewed governance of Europe.
In 2011, the action of rebalancing of the public accounts was pursued with determination, with a view of achieving a balanced budget; such action required the adoption of a series of corrective measures, also in view of the deterioration of economic growth prospects and the renewal of tensions in the financial markets.
| | | | | | | | | | | | | | | | | | | | | | | | |
| TABLE I.1: PUBLIC FINANCE INDICATORS: OBJECTIVES (% of GDP) | | | | | | | | | | |
| | | | | | |
| | | 2010 | | | 2011 | | | 2012 | | | 2013 | | | 2014 | | | 2015 | |
UPDATED POLICY SCENARIO | | | | | | | | | | | | | | | | | | | | | | | | |
Net borrowing | | | -4.6 | | | | -3.9 | | | | -1.7 | | | | -0.5 | | | | -0.1 | | | | 0.0 | |
Net structural borrowing (1) | | | -3.6 | | | | -3.6 | | | | -0.4 | | | | 0.6 | | | | 0.6 | | | | 0.4 | |
Structural change | | | -0.4 | | | | 0.0 | | | | -3.2 | | | | -1.0 | | | | 0.0 | | | | 0.2 | |
Primary surplus | | | 0.0 | | | | 1.0 | | | | 3.6 | | | | 4.9 | | | | 5.5 | | | | 5.7 | |
Primary structural surplus (1) | | | 1.0 | | | | 1.3 | | | | 4.9 | | | | 6.1 | | | | 6.2 | | | | 6.1 | |
Public debt | | | 118.6 | | | | 120.1 | | | | 123.4 | | | | 121.5 | | | | 118.2 | | | | 114.4 | |
Public debt (net of EU Area financial support) (2) | | | 118.3 | | | | 119.2 | | | | 120.3 | | | | 117.9 | | | | 114.5 | | | | 110.8 | |
| | | | | | |
MEMO: Report to Parliament (3) | | | | | | | | | | | | | | | | | | | | | | | | |
Net borrowing | | | -4.6 | | | | -3.8 | | | | -1.2 | | | | 0.1 | | | | 0.4 | | | | | |
Structural net borrowing (1) | | | -3.5 | | | | -3.2 | | | | -0.1 | | | | 1.1 | | | | 1.0 | | | | | |
Structural change | | | -0.5 | | | | -0.3 | | | | -3.1 | | | | -1.2 | | | | 0.1 | | | | | |
Public debt (2) | | | 118.4 | | | | 119.8 | | | | 120.1 | | | | 117.5 | | | | 113.9 | | | | | |
| 1) | Net of one-off measures and the cyclical component. Estimates prepared on the basis of national accounting data available as of December 2011. |
| 2) | Net of direct loans to Greece, Italy’s portion of ESFS liabilities and Italy’s portion of ESM capital for the years from 2010 to 2015. |
| 3) | The projected data have not been published. |
As was the case in previous years, the budget law referred to the years of 2011-2014 was anticipated in the summer months, with the adoption of two specific budget packages: the first package in July1 was aimed at achieving a balanced budget in 2014, as targeted in the 2011 Economic and Financial Document (DEF); the second package in August2 was designed to move forward the achievement of a balanced budget to 2013 and to maintain that target in subsequent years. Altogether, the measures guaranteed a net correction of net borrowing by 2014 equal to approximately €60.0 billion, or 3.4 per cent
| 1 | Decree-Law No. 98/2011, converted by Law No. 111/2011. |
| 2 | Decree-Law No. 138/2011, converted by Law No. 148/2011. |
| | |
| MINISTERODELL’ECONOMIAEDELLE FINANZE | | |
| | 1 |
ECONOMICAND FINANCIAL DOCUMENT – ITALY’S STABILITY PROGRAMME
of GDP. With the Stability Law approved in December for the years 2012-2014, a different allocation of resources was established without altering the public finance balances3. At year end, in view of a further weakening of the macroeconomic scenario and a drastic deterioration of the European sovereign debt crisis, the new Government adopted an additional budget package4 which provided for a further correction of net borrowing by 2014 of the amount of €21 billion, or 1.4 per cent of GDP, so as to guarantee the achievement of a balanced budget in 2013. Altogether, the budget packages approved during 2011 will lead to a structural correction of €48.9 billion in 2012, or 3.1 per cent of GDP; the comparable figure for 2014 is €81.3 billion, or roughly 4.9 per cent of GDP.
Subsequent to December, Italy witnessed a further deterioration of economic conditions, but also a significant reduction in yields on government securities. Considering this latter development along with the measures already adopted and enacted into law, the Government substantially confirms the path to financial turnaround, as traced at year end : net borrowing falls well below the 3.0 per cent threshold of reference in 2012 and gradually decreases in subsequent years, making it possible to reach a balanced budget in structural terms in 2013.
The structural deficit is expected to contract by 3.2 percentage points in 2012 to reach a surplus of 0.6 per cent of GDP in 2013, thereby broadly surpassing the medium-term objective (MTO). In subsequent years, the structural balance is maintained well above the MTO.
The primary surplus rises in nominal terms, reaching 5.7 per cent of GDP in 2015, thus significantly increasing with respect to the 1.0 per cent recorded for 2011.
Fiscal consolidation measures have been accompanied by the adoption of various reforms5 aimed at removing the main obstacles that have compressed Italy’s growth potential. Such reforms are outlined in the National Reform Programme which is presented with the Stability Programme, in line with the stipulation for closer coordination of European Union economic policies as of 2011, with the inauguration of the European Semester.
| 3 | The Stability Law (Law No. 183/2011) provided for the use of resources under the Fund for Structural Economic-Policy Actions (ISPE) with Decree-Law No. 98 and Decree-Law No. 138 of 2011 and defined spending cuts for the Ministries as established by the decrees. |
| 4 | Decree-Law No. 201/2011, converted by Law No. 214/2011. |
| 5 | Decree-Law No. 201/2011, converted by Law No. 214/2011; Decree-Law No.1/2012, converted by Law No. 27/2012 and Decree-Law No. 5/2012, converted by Law No. 35/2012. |
| | |
| | MINISTERODELL’ECONOMIAEDELLE FINANZE |
2 | | |
ECONOMICAND FINANCIAL DOCUMENT – ITALY’S STABILITY PROGRAMME
| II. | MACROECONOMIC SCENARIO |
| II.1 | THE INTERNATIONAL SCENARIO |
The growth of the global economy slowed in 2011, with GDP estimated to have increased by 3.6 per cent and trade flows by 6.1 per cent. A disparity in growth continues to be evident between (i) the world’s developed nations and (ii) emerging markets and recently industrialised countries, with the latter having much higher growth rates and higher inflationary pressures.
The assumptions about growth of the global economy in 2012 have been revised downward to the present level of 3.1 per cent, while the rate of expansion of world trade has been scaled back to the current level of 3.4 per cent. Even though the international backdrop appears to have become more favourable in recent months, there are still elements of uncertainty regarding the future. Developed countries have high levels of indebtedness, the reduction of which will require restrictive fiscal policies over the medium term. In addition, developed economies could be affected by lower growth in the emerging markets. The prices of energy, food and industrial commodities remain at high levels, and there are continuing risks that geopolitical tensions may push up the prices even further, thereby limiting the economic recovery.
Economic growth in the Euro Area weakened overall in 2011, to the point of moving into negative territory in terms of the year-on-year change in GDP for the final quarter of the year. The governments of European countries decided to move forward the implementation of the European Stability Mechanism (ESM) to the first half of 2012. The European Central Bank has contributed to reducing financial market tensions by easing the monetary policy rate to 1.0 per cent and, more importantly, by undertaking two refinancing operations of the banking system over a three-year period and significantly expanding the range of financial assets eligible as collateral for transactions financed through the central bank.
In the United States, the economy gradually improved in 2011, with the momentum continuing into the first months of 2012. The labour market witnessed a sizeable reduction in the unemployment rate, despite some uncertainty in recent months, and inflation appears poised to remain under control. Instead, difficulties in the property market continue. The Federal Reserve Bank has announced that it will maintain, with all probability, an extremely accommodating monetary policy through the end of 2014.
In Japan, the economic recovery that took shape in the second half of 2011 came to an abrupt halt following the slowing of the global economy. The Bank of Japan set a medium-long-term inflation target of between 0 and 2.0 per cent, while also establishing a short-term target of 1.0 per cent.
| | |
| MINISTERODELL’ECONOMIAEDELLE FINANZE | | |
| | 3 |
ECONOMICAND FINANCIAL DOCUMENT – ITALY’S STABILITY PROGRAMME
The moderate recovery of Italy’s economy in the first half of 2011 was weakened by the slowdown of the global economic cycle and by growing tensions in the sovereign debt market for the Euro Area. Financial strains led to a sizeable increase in the spread between the yields on Italian and German ten-year government securities, reaching the highest level since the introduction of the euro (more than 5.5 percentage points). Though spreads later decreased significantly, falling below 3.0 percentage points, they have risen again in recent weeks.
In 2011, Italy’s economic activity grew by 0.4 per cent, decelerating due to the recession in the final two quarters of the year. The figure is slightly below the official 0.6 per cent estimate contained in the 2011 Report to Parliament presented at the start of December. GDP growth was sustained by net exports, which provided a positive contribution of 1.4 percentage points. Gross fixed investment and the change in inventories subtracted from GDP growth 0.4 and 0.5 percentage points, respectively. The contribution of final consumption to growth was nil.
The buoyant increase of exports proved significant (5.6 per cent) despite the appreciation of the euro. The increase in imports was instead modest (0.4 per cent) due to the weakening of domestic demand in the second half of the year.
Domestic demand
In 2011, gross fixed investment contracted significantly (-1.9 per cent). The drop was even more pronounced in the construction sector (-2.8 per cent) where an adjustment process is now in progress. The decline reported in machinery and equipment (-1.5 per cent) was instead offset by the increase in investments in transport equipment (1.5 per cent).
The growth of household spending was modest (0.2 per cent), and was impacted by both the limited increase in disposable income and the acceleration of inflation. A shift in the composition of household spending was observed in favour of services (1.6 per cent) to the detriment of the consumption of goods (-0.9 per cent).
Italian residents’ purchases abroad fell by 2.2 per cent against a 2.9 per cent increase in the spending of non-residents in Italy. Public expenditure fell by 0.9 per cent1 in line with fiscal consolidation measures.
In the labour market, the recovery of employment that began at the end of 2010 was weakened due to the slowdown of the economic cycle. On the whole, the year of 2011 yielded mixed results. Employment began to grow again, albeit modestly, after two years of contraction, while the number of employed reported by the Labour Force Survey was up by 0.4 per cent (with the increase in terms of full-time equivalents (FTEs) equal to 0.1 per cent). At a sector level, the increase was more dynamic in the industrial sector (excluding construction) and private services, contrasting a decrease in the construction sector. The labour supply also gained momentum, rising by 0.4 per cent. The unemployment rate averaged 8.4 per cent, remaining unchanged with respect to 2010.
| 1 | In nominal terms, the reduction of public expenditure is 1.0 per cent. |
| | |
| | MINISTERODELL’ECONOMIAEDELLE FINANZE |
4 | | |
ECONOMICAND FINANCIAL DOCUMENT – ITALY’S STABILITY PROGRAMME
The hours authorised for the wage-supplementation scheme (CIG) in 2011 decreased by approximately 19 per cent when compared with 2010, even though they remain at high levels (roughly 973 million hours). The ordinary CIG was reduced by 33 per cent, whereas the extraordinary and exceptional (in deroga) CIG fell to a more limited extent (-13 per cent and -14 per cent, respectively). The number of hours actually utilised by businesses (475 million hours) amounted to approximately 48 per cent of the hours authorised.
Despite a decelerating cost of labour, unit labour costs rose with respect to 2010 due to setbacks in productivity. The industrial sector (excluding construction) and the construction sector reported the highest increases in unit costs.
With reference to price developments, the GDP deflator rose by 1.3 per cent, while the consumption deflator was 2.7 per cent higher, reflecting increased prices for imported goods and services.
The harmonised index of consumer prices (HICP) rose by an average of 2.9 per cent in 2011, compared with 1.6 per cent for the prior year. Core inflation was 2.2 per cent higher, compared with 1.5 per cent in 2010.
On average, the harmonised index of prices for 2011 is 0.2 percentage points above the Euro Area average, with the variance essentially due to the timing with which the price increases in the more volatile components (energy and fresh food products) incorporate the trend of quotations on international markets. Core inflation reflects a higher differential (0.5 percentage points), which can be traced to the trend reported for non-energy durable goods for industry (whose prices grew by more than 1.5 percentage points over the Euro Area average) and services (0.7 percentage points).
NATIONAL ACCOUNTS REVISIONS
On 2 March 2012, ISTAT published ordinary revisions to 2009-2010 data, along with the publication of estimates for the 2011 annual accounts. The table below shows the differences between the two series of data for the main aggregates of GDP, and figures for prices and employment. The new estimates entail a downward revision of real GDP growth by 0.4 percentage points for 2009, with the final figure being -5.5 per cent; the change is mostly attributable to a sharper decrease in investments in machinery and equipment with respect to the previously published estimate. Final consumption was also revised downward due to a more limited increase in expenditure of public administrations which partially offset the slightly upward revision of expenditure of non-profit institutions serving households (NPISH). Economic growth for 2010 was revised upward by 0.3 percentage points compared with the previous estimate, to a total of 1.8 per cent. The revision resulted in a more positive variation in investment in machinery and equipment against a downward revision in the construction sector. The growth of household spending has been pegged at 1.2 per cent, improving by 0.2 percentage points. The revisions also affected exports, whose growth was lowered by 0.6 percentage points to 11.6 per cent. The nominal GDP growth rate was lowered by 0.4 percentage points in 2009, to -3.5 per cent, and increased in 2010 by 0.3 percentage points, to 2.2 per cent.
In October 2011, the national accounts data were revised in line with the new classification of economic activities (NACE II 2007) and the adoption of the European statistical classification of products by economic activities (CPA 2008).
| | |
| MINISTERODELL’ECONOMIAEDELLE FINANZE | | |
| | 5 |
ECONOMICAND FINANCIAL DOCUMENT – ITALY’S STABILITY PROGRAMME
Comparison between current and previous ISTAT series
| | | | | | | | | | | | | | | | | | | | |
| | | 2009 | | | 2010 | | | 2011 | |
| | | CURRENT | | | PREVIOUS | | | CURRENT | | | PREVIOUS | | | CURRENT | |
ITALY MACROECONOMIC DATA (VOLUMES) | | | | | | | | | | | | | | | | | | | | |
GDP | | | -5.5 | | | | -5.1 | | | | 1.8 | | | | 1.5 | | | | 0.4 | |
Imports | | | -13.4 | | | | -13.4 | | | | 12.7 | | | | 12.7 | | | | 0.4 | |
National final consumption | | | -1.0 | | | | -0.9 | | | | 0.7 | | | | 0.6 | | | | 0.0 | |
- Household consumption | | | -1.6 | | | | -1.6 | | | | 1.2 | | | | 1.0 | | | | 0.2 | |
- Public consumption | | | 0.8 | | | | 1.0 | | | | -0.6 | | | | -0.5 | | | | -0.9 | |
- NPISH consumption | | | 2.3 | | | | 2.2 | | | | -0.4 | | | | 1.0 | | | | 0.9 | |
Gross fixed investment | | | -11.7 | | | | -11.7 | | | | 2.1 | | | | 2.4 | | | | -1.9 | |
- Machinery and equipment | | | -16.1 | | | | -15.3 | | | | 13.9 | | | | 12.6 | | | | -1.5 | |
- Transport means | | | -18.9 | | | | -18.6 | | | | 4.4 | | | | 7.5 | | | | 1.5 | |
- Construction | | | -8.8 | | | | -8.9 | | | | -4.8 | | | | -4.0 | | | | -2.8 | |
- Intangible goods | | | -0.9 | | | | -5.7 | | | | -0.1 | | | | 0.2 | | | | -1.3 | |
Valuable goods | | | -29.3 | | | | -14.7 | | | | 11.0 | | | | -3.5 | | | | 1.1 | |
Exports | | | -17.5 | | | | -17.5 | | | | 11.6 | | | | 12.2 | | | | 5.6 | |
| | | | | |
PRICES | | | | | | | | | | | | | | | | | | | | |
GDP deflator | | | 2.1 | | | | 2.1 | | | | 0.4 | | | | 0.4 | | | | 1.3 | |
Import deflator | | | -7.7 | | | | -7.7 | | | | 6.7 | | | | 6.9 | | | | 7.3 | |
National final consumption deflator | | | 0.5 | | | | 0.5 | | | | 1.5 | | | | 1.5 | | | | 2.0 | |
Household consumption deflator | | | -0.1 | | | | 0.0 | | | | 1.5 | | | | 1.5 | | | | 2.7 | |
Public consumption deflator | | | 2.1 | | | | 2.0 | | | | 1.4 | | | | 1.4 | | | | -0.1 | |
NPISH consumption deflator | | | 0.9 | | | | 1.2 | | | | 2.6 | | | | 2.1 | | | | 1.5 | |
Gross fixed investment deflator | | | 1.0 | | | | 1.0 | | | | 1.2 | | | | 1.3 | | | | 3.3 | |
- Machinery and equipment | | | 1.3 | | | | 0.7 | | | | -0.4 | | | | 0.4 | | | | 2.2 | |
- Transport means | | | 1.0 | | | | 1.1 | | | | 1.1 | | | | 0.9 | | | | 2.9 | |
- Construction | | | 1.1 | | | | 1.1 | | | | 2.1 | | | | 2.0 | | | | 4.1 | |
- Intangible goods | | | -2.3 | | | | 0.9 | | | | 3.1 | | | | 1.8 | | | | 2.7 | |
Valuable goods deflator | | | 10.5 | | | | 6.5 | | | | 23.4 | | | | 23.7 | | | | 2.9 | |
Export deflator | | | -2.4 | | | | -2.4 | | | | 2.6 | | | | 2.4 | | | | 4.1 | |
| | | | | |
LABOUR | | | | | | | | | | | | | | | | | | | | |
Employment (FTEs) | | | -2.9 | | | | -2.9 | | | | -0.9 | | | | -0.7 | | | | 0.1 | |
Full-time employment (FTEs) | | | -2.8 | | | | -2.8 | | | | -1.3 | | | | -1.1 | | | | 0.4 | |
Foreign trade
In 2011, Italy’s foreign trade continued on the positive trend that first took shape in 2010, moving substantially in line with the expansion of global trade and international industrial production. Italy confirmed its position as the world’s seventh largest exporter2. The overall trade balance was a deficit of €24.6 billion (1.7 per cent of GDP), improving over the deficit of €30.0 billion in 2010 as a result of exports that grew at a higher rate (11.4 per cent) than imports (9.0 per cent). Both imports and exports hit historical highs in 2011, thus surpassing the records for 2008. Exports amounted to €376 billion, or €7 billion above the 2008 level, and imports came to €400 billion, exceeding the 2008 level by € 18.4 billion. From a geographic perspective, both imports and exports to non-European markets proved more dynamic than flows with European countries.
| 2 | In 2011, the top three exporting countries were China, the United States and Germany (Source: National Institute for Foreign Trade (ICE)). |
| | |
| | MINISTERODELL’ECONOMIAEDELLE FINANZE |
6 | | |
ECONOMICAND FINANCIAL DOCUMENT – ITALY’S STABILITY PROGRAMME
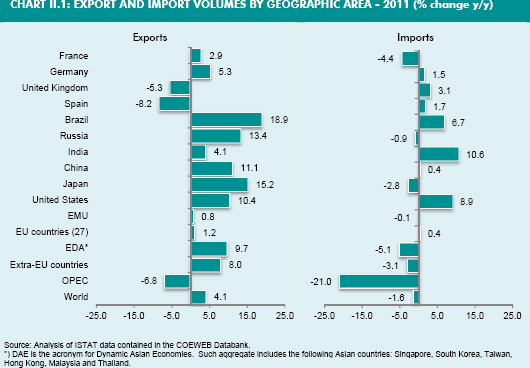
In 2011, Italy enjoyed good growth in total export volumes, particularly due to increased penetration of emerging markets. Exports rose by 4.1 per cent, while imports declined by 1.6 per cent with respect to 2010. More specifically, exports grew mainly toward BRIC (18.9 per cent to Brazil and 13.4 per cent to Russia) and Japan (15.2 per cent). With reference to Europe, increases in exports were registered mainly toward Germany and France (5.3 per cent and 2.9 per cent, respectively). Among non-European markets, import volumes rose markedly from India (10.6 per cent) and the United States (8.9 per cent). In Europe, imports from the UK registered the sharpest rate of increase (3.1 per cent). The only exception to the increase in trade was in the OPEC area, with respect to which both exports and imports contracted (by 6.8 per cent for exports and 21.0 per cent for imports).
A review of average unit values shows that imports performed better than exports in 2011, from both a geographic and sector perspective, with respective rates of growth equal to 10.9 per cent and 7.1 per cent. Such rates reflect increases of 0.4 and of 1.1 percentage points, respectively, over rates posted in the previous year. From a geographic perspective, the greatest increases in average unit values were realized for imports from non-European countries (from 25.3 per cent for OPEC and 24.2 per cent of the Russia to 11.0 per cent for the DAE countries), particularly as a result of energy imports. Instead, for exports, the highest growth in average unit values was seen with respect to the European area (from 10.4 per cent for Spain to 6.8 per cent for Germany).
CHART II.1: EXPORT AND IMPORT VOLUMES BY GEOGRAPHIC AREA - 2011 (% change y/y)
| | |
| MINISTERODELL’ECONOMIAEDELLE FINANZE | | |
| | 7 |
ECONOMICAND FINANCIAL DOCUMENT – ITALY’S STABILITY PROGRAMME
Italy’s share of world exports at current prices in the first half of 2011 remained unchanged with respect to the same period of 2010 (3.0 per cent). A similar performance was reported by the larger European and non-European countries3.
According to provisional data for 2011, inward foreign direct investment in Italy amounted to €25.4 billion, increasing by €18.4 billion over 2010 (€6.9 billion)4. A similar trend was seen all across the European area5.
Prospects for the Italian economy
Italy’s economic prospects continue to be influenced by the evolution of the global scenario and in particular, the European scenario, both of which appear to be improving since the start of 2012. The expansion of advanced economies in 2011 was adversely affected by exceptional factors (such as the natural disaster in Japan in the spring of 2011) and the pronounced financial tensions in the Euro Area, and remains subject to elements of uncertainty. The U.S. recovery that has been under way for about a year could weaken as a result of the deleveraging of households and businesses. Geopolitical tensions in the Middle East could cause increases in oil prices. Though conditions for credit in the Euro Area have improved as a result of the European Central Bank’s interventions, the risks connected to the fragility of the sovereign debt markets should not be overlooked. Possible sources of risk include the stronger-than-expected slowdown of the emerging economies (China, in particular) and/or new concerns regarding financial stability in Japan.
However, there are also upside risks worth mentioning: i) a more robust recovery of the U.S. economy, and ii) more positive fundamental conditions for the Euro Area due to implemented structural reforms.
The weakening of the domestic economic cycle that occurred in 2011 prompted a reduction in the estimate of real GDP growth for 2012; this estimate now stands at -1.2 per cent, and is approximately 0.8 percentage points lower than that forecast in December. The tone of the economy is expected to continue to be weak, although gradually improving, in the first half of 2012, due to the weakness of domestic demand and the effects of transmission of past tensions on the credit market. Such trends are likely to be partially offset by the support coming from net foreign demand. Business activity is expected to recover gradually, starting from the second half of the year. In 2013, GDP should grow moderately (0.5 per cent), slightly above the official estimate at December, accelerating in 2014 (1.0 per cent, unchanged with respect to the previous estimate) and in 2015 (1.2 per cent).
The forecast calls for the continuing expansion of exports over the time horizon of reference, though performance should be less impressive than in 2012. Instead, reflecting the weakness of domestic demand, imports should contract in 2012, and then recover in following years. The current balance of the balance of payments is projected to improve
| 3 | Ministry of the Economic Development, ‘Foreign Trade’, Update, Year 18, no. 4/2011. |
| 4 | Bank of Italy, ‘Balance of Payments and Capital Position Abroad’, Supplements to Statistical Bulletin, Monetary and Financial Indicators, no. 12, New Series, Year XXII, 22 February 2012. |
| 5 | UNCTAD, ‘Global Investment Trends Monitor’, no. 8, 24 January 2012. |
| | |
| | MINISTERODELL’ECONOMIAEDELLE FINANZE |
8 | | |
ECONOMICAND FINANCIAL DOCUMENT – ITALY’S STABILITY PROGRAMME
significantly in 2012-2015, going from -3.1 per cent in 2011 to -1.3 per cent in 2015. Fixed investment is likely to reflect the weakness of demand in 2012, and then expand anew over the three-year period 2013-2015. Household consumption is likely to be impacted in 2012 by the weakening of the labour market, but should then start to grow again gradually in the 2012-2015 period. A restrictive orientation for public spending is projected for 2013-2014.
In the labour market, employment as measured in full-time equivalents (FTEs) is poised to decline by 0.6 per cent in 2012. The unemployment rate would stand at 9.3 per cent. The recovery in terms of employment should materialize in 2013. The unemployment rate is projected to trend downward from 9.2 per cent in 2013 to 8.6 per cent in 2015. Despite another deceleration in the cost of labour, the unit labour cost is expected to grow by 1.7 per cent in 2012 due to setbacks in productivity, though the outlook for the three years thereafter points to moderation of the trend. The GDP deflator should stand at 1.8 per cent in 2012, rising to 1.9 per cent in the three-year period 2013-2015. Inflation as measured by the private consumption deflator is pegged at 2.8 per cent for 2012 (harmonised index of 3.0 per cent), accelerating slightly compared to the previous year, whereas it should remain at a lower level in the 2013-2015 period.
TABLE II.1: BASE ASSUMPTIONS
| | | | | | | | | | | | | | | | | | | | |
| | | 2011 | | | 2012 | | | 2013 | | | 2014 | | | 2015 | |
Short-term interest rate1 | | | 1.5 | | | | 1.0 | | | | 3.6 | | | | 4.3 | | | | 4.9 | |
Long-term interest rate | | | 5.3 | | | | 5.4 | | | | 5.6 | | | | 6.0 | | | | 6.2 | |
USD/EUR exchange rate | | | 1.39 | | | | 1.33 | | | | 1.33 | | | | 1.33 | | | | 1.33 | |
Change of the nominal effective exchange rate | | | -0.2 | | | | -5.8 | | | | 0.0 | | | | 0.0 | | | | 0.0 | |
World GDP, excluding EU | | | 4.2 | | | | 4.0 | | | | 4.2 | | | | 4.7 | | | | 4.7 | |
EU GDP growth | | | 1.5 | | | | 0.1 | | | | 1.4 | | | | 1.9 | | | | 2.3 | |
Growth in Italy’s key foreign markets | | | 4.9 | | | | 1.2 | | | | 2.7 | | | | 4.3 | | | | 4.7 | |
World import volumes, excluding EU | | | 7.4 | | | | 6.2 | | | | 6.8 | | | | 7.7 | | | | 7.8 | |
Oil price (Brent, USD/barrel) | | | 111.3 | | | | 119.5 | | | | 119.7 | | | | 119.7 | | | | 119.7 | |
| 1) | Short-term interest rate: the average of the forecast rates on 3-month government securities issued during the year; long-term interest rate: the average of the forecast rates on 10-year government securities issued during the year. |
TABLE II.2a: MACROECONOMIC PROSPECTS
| | | | | | | | | | | | | | | | | | | | | | | | |
| | | 2011
Level1 | | | 2011 | | | 2012 | | | 2013 | | | 2014 | | | 2015 | |
| | | | % Change | |
Real GDP | | | 1,425,627 | | | | 0.4 | | | | -1.2 | | | | 0.5 | | | | 1.0 | | | | 1.2 | |
Nominal GDP | | | 1,580,220 | | | | 1.7 | | | | 0.5 | | | | 2.4 | | | | 2.8 | | | | 3.2 | |
COMPONENTS OF REAL GDP | | | | | | | | | | | | | | | | | | | | | | | | |
Private consumption | | | 854,589 | | | | 0.2 | | | | -1.7 | | | | 0.2 | | | | 0.5 | | | | 0.7 | |
Public consumption 2 | | | 299,164 | | | | -0.9 | | | | -0.8 | | | | -1.1 | | | | -0.3 | | | | 0.2 | |
Gross fixed investment | | | 269,531 | | | | -1.9 | | | | -3.5 | | | | 1.7 | | | | 2.5 | | | | 2.8 | |
Inventories (% of GDP) | | | | | | | -0.5 | | | | -0.3 | | | | 0.1 | | | | 0.0 | | | | 0.0 | |
Exports of goods and services | | | 404,501 | | | | 5.6 | | | | 1.2 | | | | 2.6 | | | | 4.2 | | | | 4.6 | |
Imports of goods and services | | | 402,330 | | | | 0.4 | | | | -2.3 | | | | 2.2 | | | | 3.6 | | | | 3.9 | |
CONTRIBUTION TO REAL GDP GROWTH 3 | | | | | | | | | | | | | | | | | | | | | | | | |
Domestic demand | | | — | | | | -0.4 | | | | -1.8 | | | | 0.2 | | | | 0.7 | | | | 1.0 | |
Change in inventories | | | — | | | | -0.5 | | | | -0.3 | | | | 0.1 | | | | 0.0 | | | | 0.0 | |
Net exports | | | — | | | | 1.4 | | | | 1.0 | | | | 0.1 | | | | 0.2 | | | | 0.3 | |
| 2) | General Government and NPISH |
| 3) | Slight discrepancies, if any, are due to rounding. |
| | |
| MINISTERODELL’ECONOMIAEDELLE FINANZE | | |
| | 9 |
ECONOMICAND FINANCIAL DOCUMENT – ITALY’S STABILITY PROGRAMME
TABLE II.2b: PRICES
| | | | | | | | | | | | | | | | | | | | | | | | |
| | | 2011
Level | | | 2011 | | | 2012 | | | 2013
% Change | | | 2014 | | | 2015 | |
GDP deflator | | | 110.8 | | | | 1.3 | | | | 1.8 | | | | 1.9 | | | | 1.9 | | | | 1.9 | |
Private consumption deflator | | | 112.6 | | | | 2.7 | | | | 2.8 | | | | 2.1 | | | | 1.9 | | | | 1.9 | |
HICP | | | 113.8 | | | | 2.9 | | | | 3.0 | | | | 2.2 | | | | 2.0 | | | | 1.8 | |
Public consumption deflator | | | 110.5 | | | | -0.1 | | | | 0.5 | | | | 0.1 | | | | 0.5 | | | | 1.1 | |
Investment deflator | | | 114.5 | | | | 3.3 | | | | 1.9 | | | | 2.2 | | | | 2.3 | | | | 2.2 | |
Export deflator | | | 112.4 | | | | 4.1 | | | | 2.0 | | | | 2.2 | | | | 2.1 | | | | 2.0 | |
Import deflator | | | 118.7 | | | | 7.3 | | | | 3.9 | | | | 1.7 | | | | 1.6 | | | | 1.6 | |
TABLE II.2c: LABOUR MARKET DEVELOPMENTS
| | | | | | | | | | | | | | | | | | | | | | | | |
| | | 2011
Level1 | | | 2011 | | | 2012 | | | 2013
% Change | | | 2014 | | | 2015 | |
Employment, persons (national accounts) | | | 24,743 | | | | 0.3 | | | | -0.4 | | | | 0.3 | | | | 0.6 | | | | 0.7 | |
Employment, hours worked | | | 43,886,203 | | | | 0.3 | | | | -0.3 | | | | 0.0 | | | | 0.2 | | | | 1.0 | |
Unemployment rate | | | | | | | 8.4 | | | | 9.3 | | | | 9.2 | | | | 8.9 | | | | 8.6 | |
Labour productivity, persons | | | 57,618 | | | | 0.1 | | | | -0.8 | | | | 0.2 | | | | 0.3 | | | | 0.5 | |
Labour productivity, hours worked | | | 32,5 | | | | 0.2 | | | | -1.0 | | | | 0.4 | | | | 0.7 | | | | 0.2 | |
Compensation of employees | | | 668,298 | | | | 1.8 | | | | 0.7 | | | | 1.4 | | | | 2.1 | | | | 2.1 | |
Compensation per employee | | | 38,721 | | | | 1.4 | | | | 1.1 | | | | 1.1 | | | | 1.4 | | | | 1.3 | |
| 1) | Units of measure: employment (persons and hours worked) in thousands of units; labour productivity in euro at constant values; compensation of employees in millions of euro at current values; compensation per employee in euro. |
TABLE II.2d: SECTOR ACCOUNTS
| | | | | | | | | | | | | | | | | | | | | | | | | | | | |
| | | 2009 | | | 2010 | | | 2011 | | | 2012
% GDP | | | 2013 | | | 2014 | | | 2015 | |
Net lending/borrowing with the rest of the world | | | -2.0 | | | | -3.6 | | | | -3.1 | | | | -2.3 | | | | -2.0 | | | | -1.7 | | | | -1.3 | |
- Balance of goods and services | | | -0.5 | | | | -1.9 | | | | -1.5 | | | | -0.9 | | | | -0.6 | | | | -0.3 | | | | 0.0 | |
- Balance of primary income and transfers | | | -1.5 | | | | -1.6 | | | | -1.7 | | | | -1.4 | | | | -1.4 | | | | -1.4 | | | | -1.3 | |
- Capital account | | | 0.0 | | | | 0.0 | | | | 0.1 | | | | 0.0 | | | | 0.0 | | | | 0.0 | | | | 0.0 | |
Net lending/borrowing of private sector | | | 3.5 | | | | 1.0 | | | | 0.8 | | | | -0.6 | | | | -1.5 | | | | -1.5 | | | | -1.2 | |
Net lending/borrowing of the Public administrations1 | | | -5.4 | | | | -4.5 | | | | -3.8 | | | | n.a. | | | | n.a. | | | | n.a. | | | | n.a. | |
Net lending/borrowing of the Public administrations2 | | | -5.4 | | | | -4.6 | | | | -3.9 | | | | -1.7 | | | | -0.5 | | | | -0.1 | | | | 0.0 | |
Statistical discrepancies | | | | | | | | | | | | | | | | | | | | | | | | | | | | |
| 1) | ESA95 series. Most recent historical data available: 2011. |
| II.3 | IMPACT OF KEY REFORMS ON GROWTH |
The deregulation and simplification measures enacted by the Government at the start of 20126 and described in the National Reform Programme represent a package of wide-ranging structural reforms aimed at boosting the level of competition within various sectors of the economy and eliminating barriers to enterprises.
The measures in the overall package have been subdivided into three large standard macro areas in order to provide an initial quantitative evaluation of the effects of the
| 6 | Decree-Law No. 1/2012 converted into Law No. 27/2012 and Decree-Law No. 5/2012 converted into Law No. 35/2012. initiatives on growth, employment, consumption and investment. Each of the macro areas describes a specific area of action. |
| | |
| | MINISTERODELL’ECONOMIAEDELLE FINANZE |
10 | | |
ECONOMICAND FINANCIAL DOCUMENT – ITALY’S STABILITY PROGRAMME
For details about the simulations, reference should be made to the chapter in the National Reform Programme on the impact of reforms.
Altogether, the reforms (sum of the effects produced by the individual macro areas) have a total effect on growth equal to 2.4 percentage points of GDP over a nine-year time period7 (2012-2020), with an average annual impact of approximately 0.3 percentage points of GDP. Almost one-half of the contribution to GDP growth is realized in the first four years (0.9 percentage points in 2015).
| | | | | | | | | | | | | | | | | | | | |
TABLE II.3: OVERALL MACROECONOMIC EFFECTS OF THE STRUCTURAL REFORMS OF DECREE-LAW NO.
1/2012 AND DECREE-LAW NO. 5/2012 (percentage deviation compared with baseline simulation) | |
| | | 2012 | | | 2013 | | | 2014 | | | 2015 | | | 2020 | |
GDP | | | 0.2 | | | | 0.4 | | | | 0.7 | | | | 0.9 | | | | 2.4 | |
Consumption | | | 0.1 | | | | 0.1 | | | | 0.2 | | | | 0.3 | | | | 1.1 | |
Investments | | | 0.5 | | | | 1.1 | | | | 1.6 | | | | 2.0 | | | | 3.9 | |
Employment | | | 0.2 | | | | 0.2 | | | | 0.2 | | | | 0.1 | | | | 0.1 | |
|
| Source: Analyses with QUEST III—Italy (European Commission). | |
| | | | | | | | | | | | | | | | | | | | | | | | |
TABLE II.4: MACROECONOMIC EFFECTS OF THE INDIVIDUAL STRUCTURAL REFORM MEASURES CONTAINED IN DECREE-LAW NO. 1/2012 AND DECREE-LAW NO. 5/2012 (percentage deviation compared with baseline simulation) | |
Measure | | Description | | 2012 | | | 2013 | | | 2014 | | | 2015 | | | 2020 | |
Measures aimed at favouring competition and the opening of markets | | Reduction of the mark-up | | GDP Consumption Investments Employment | |
| 0.0
-0.6
0.7
0.0 |
| |
| 0.1
-1.0
1.5
0.0 |
| |
| 0.3
-1.0
2.1
0.0 |
| |
| 0.4
-0.9
2.6
0.1 |
| |
| 1.2
-0.5
4.2
0.3 |
|
| | | | | | | |
Reduction of the limitations on business activity, improvement of the business environment, administrative simplification | | Reduction of the entry barriers | | GDP Consumption Investments Employment | |
| 0.1
0.4
-0.2
0.1 |
| |
| 0.2
0.7
-0.4
0.1 |
| |
| 0.2
0.7
-0.5
0.1 |
| |
| 0.3
0.8
-0.6
0.0 |
| |
| 0.7
1.0
-0.5
-0.1 |
|
| | | | | | | |
| Reduction of administrative charges, administrative simplification | | Reduction of the time spent with the bureaucracy | | GDP Consumption Investments Employment | |
| 0.1
0.3
0.0
0.1 |
| |
| 0.1
0.4
0.0
0.1 |
| |
| 0.2
0.4
0.0
0.1 |
| |
| 0.2
0.5
0.0
0.0 |
| |
| 0.5
0.6
0.2
-0.1 |
|
| |
| Source: Analyses with QUEST III - Italy (European Commission). | | | | | |
| 7 | The simulation assumes that the reforms will be in effect as from the third quarter of 2012. |
| | |
| MINISTERODELL’ECONOMIAEDELLE FINANZE | | |
| | 11 |
ECONOMICAND FINANCIAL DOCUMENT – ITALY’S STABILITY PROGRAMME
| III. | NET BORROWING AND PUBLIC DEBT |
| III.1 | THE PATH TO A TURNAROUND – EXCESSIVE DEFICIT PROCEDURE |
With the launching of the excessive deficit procedure (EDP) against almost all European countries in late 2009, Italy was asked to bring its deficit under the limit of 3.0 per cent of GDP by 2012 and to guarantee an average annual budget correction equal to at least 0.5 percentage points of GDP during the 2010-2012 period.
The public-finance objectives set out in the previous Stability Programme were reinforced in 2011. Measures adopted repeatedly during the year succeeded in balancing the progressive weakening of the macroeconomic framework and the repercussions of financial-market tensions on public accounts.
| | | | | | | | | | | | | | | | | | |
TABLE III.1: DIFFERENCES WITH RESPECT TO PREVIOUS STABILITY PROGRAMME | |
| | | | | 2011 | | | 2012 | | | 2013 | | | 2014 | |
GDP GROWTH RATE | | | | | | | | | | | | | | | | | | |
| | 2011 Stability Programme | | | 1.1 | | | | 1.3 | | | | 1.5 | | | | 1.6 | |
| | 2012 Stability Programme | | | 0.4 | | | | -1.2 | | | | 0.5 | | | | 1.0 | |
| | Difference | | | -0.6 | | | | -2.4 | | | | -1.1 | | | | -0.7 | |
NET BORROWING (% of GDP) | | | | | | | | | | | | | | | | | | |
| | 2011 Stability Programme | | | -3.9 | | | | -2.7 | | | | -1.5 | | | | -0.2 | |
| | 2012 Stability Programme | | | -3.9 | | | | -1.7 | | | | -0.5 | | | | -0.1 | |
| | Difference | | | -0.1 | | | | 1.0 | | | | 1.0 | | | | 0.1 | |
PUBLIC DEBT (% of GDP) | | | | | | | | | | | | | | | | | | |
| | 2011 Stability Programme | | | 120.0 | | | | 119.4 | | | | 116.9 | | | | 112.8 | |
| | 2012 Stability Programme | | | 120.1 | | | | 123.4 | | | | 121.5 | | | | 118.2 | |
| | Difference | | | 0.1 | | | | 4.0 | | | | 4.6 | | | | 5.4 | |
In April 2011, with the presentation of the 2011 Economic and Financial Document (DEF), the overall financial objectives were confirmed through 2012, whereas the achievement of a balanced budget was planned for 2014 on the basis of a budget correction package for 2013-2014 equivalent to approximately 2.3 percentage points of GDP.
In view of the European Commission’s assessments of the macroeconomic situation and budget set out in the 2011 Stability Programme, the ECOFIN Council made a recommendation to Italy in July 2011, requesting the country to: implement the fiscal consolidation plan to ensure the correction of the excessive deficit; use any unforeseen revenue on the budget-policy front to accelerate the reduction of the deficit and debt, with a view toward achieving the balanced budget target for the years of 2013 and 2014; reinforce the financial framework with the introduction of caps on expenditure; and improve monitoring of expenditures linked to different sectors of the public administration.
As had occurred in previous years, the correction of the public accounts was moved forward, with the adoption of a sizeable budget-rebalancing package in the summer months for the years 2011-2014. This package guaranteed a roughly €60 billion
| | |
| | MINISTERODELL’ECONOMIAEDELLE FINANZE |
12 | | |
ECONOMICAND FINANCIAL DOCUMENT – ITALY’S STABILITY PROGRAMME
cumulative net correction in net borrowing by the end of 2014, equivalent to 3.4 per cent of GDP. Later, in September, with the DEF Update, forecasts of public accounts were updated, taking into consideration of: the weakening of the macroeconomic scenario set out for 2012-2014 (equal to a total of almost two percentage points for the entire three-year period); indications emerging about the trend of the macroeconomic aggregates; the effects of the three-year budget package approved during the summer through two decree-laws1; and the emergence of new financial-market tensions. In order to confirm the 2011 target of 3.9 per cent and reinforce the targets for the years thereafter by moving the balanced-budget up to 2013, it was necessary to adopt stronger corrective measures, of an amount exceeding that originally planned.
Taking into consideration repercussions on the year-on-year trend of public accounts stemming from a new downward revision of growth prospects for 2012-2014 (about 1.9 percentage points total for the three-year period) and the dramatic deterioration of the sovereign debt crisis in Europe, another package of corrective measures was adopted in December to assure that Italy would meet its commitment to balance its budget in 20132.
Another downward revision of growth projections for 2012 was made in December, with estimates regarding public accounts worsening as a consequence. This was, however, mostly (not totally) offset by an expected reduction in interest expenditure. The Government’s commitment to a balanced budget in 2013 was based on the scenario set out in December. As a consequence this target will be reached, and indeed far surpassed, in structural terms.
Given the more recent economic trend and the measures already adopted and transformed into law, the Government can substantially confirm the path to a turnaround as outlined back in December: net borrowing moves back to a point well below the reference value of 3.0 per cent in 2012 and continues to decrease in subsequent years, making it possible to achieve a structural budget surplus in 2013 and in the years thereafter. The primary surplus increases in nominal terms, reaching 5.7 per cent in 2015, and thus significantly grows with respect to the 1.0 per cent realized in 2011.
The following table shows the adjustment in public accounts for 2011-2014. Altogether, the three budget packages finalized in 2011 will allow for a cumulative correction in terms of net borrowing equivalent to 3.0 percentage points of GDP in 2012, 4.6 in 2013 and 4.8 in 20143.
The contribution of incremental revenues to the net budget represents the prevalent quota in the 2012-2014 period; savings on expenditure are nonetheless growing during the entire three-year period; the pension measures yield their full effects over an even longer time period (for a detailed analysis, see the box in Chapter V). Incremental net revenues are equal to 2.4 percentage points of GDP in 2012 and 3.0 in 2013 and 2014, while the net reduction in expenditure is respectively equal to 0.6 percentage points in 2012, 1.6 in 2013 and 1.9 in 2014.
| 1 | Decree-Law No. 98/2011 converted by Law No. 111/2011 and Decree-Law No. 138/2011 converted by Law No. 148/2011. |
| 2 | Decree-Law No. 201/2011 converted by Law No.214/2011. |
| 3 | The ratios are calculated based on GDP estimates updated as of the time when the measures were approved in 2011. |
| | |
| MINISTERODELL’ECONOMIAEDELLE FINANZE | | |
| | 13 |
ECONOMICAND FINANCIAL DOCUMENT – ITALY’S STABILITY PROGRAMME
| | | | | | | | | | | | | | | | | | | | |
TABLE III.2: THE PATH TO A TURNAROUND (% of GDP) | |
| | | 2010 | | | 2011 | | | 2012 | | | 2013 | | | 2014 | |
DEF (April 2011) | | | | | | | | | | | | | | | | | | | | |
Net borrowing at unchanged legislation | | | -4.6 | | | | -3.9 | | | | -2.7 | | | | -2.7 | | | | -2.6 | |
Cumulative net fiscal adjustment | | | | | | | | | | | | | | | -1.2 | | | | -2.3 | |
Net borrowing (policy scenario) | | | -4.6 | | | | -3.9 | | | | -2.7 | | | | -1.5 | | | | -0.2 | |
Structural balance (1) | | | -3.5 | | | | -3.0 | | | | -2.2 | | | | -1.4 | | | | -0.5 | |
Primary balance | | | -0.1 | | | | 0.9 | | | | 2.4 | | | | 3.9 | | | | 5.2 | |
Interest expenditure | | | 4.5 | | | | 4.8 | | | | 5.1 | | | | 5.4 | | | | 5.5 | |
Public debt | | | 119.0 | | | | 120.0 | | | | 119.4 | | | | 116.9 | | | | 112.8 | |
| | | | | |
1) Decree-Law no. 98 (July 2011) | | | | | | | | | | | | | | | | | | | | |
Impact on net borrowing | | | | | | | 0.13 | | | | 0.34 | | | | 1.44 | | | | 2.73 | |
Additional net revenues | | | | | | | 0.12 | | | | 0.40 | | | | 0.55 | | | | 0.46 | |
Expenditure net cuts | | | | | | | 0.01 | | | | -0.06 | | | | 0.66 | | | | 1.13 | |
Reduction in tax relief | | | | | | | | | | | | | | | 0.24 | | | | 1.14 | |
| | | | | |
2) Decree-Law no. 138 (August 2011) | | | | | | | | | | | | | | | | | | | | |
Impact on net borrowing | | | | | | | 0.05 | | | | 1.38 | | | | 1.76 | | | | 0.67 | |
Additional net revenues | | | | | | | 0.05 | | | | 0.61 | | | | 0.60 | | | | 0.60 | |
Net cuts to expenditure | | | | | | | | | | | 0.53 | | | | 0.46 | | | | 0.07 | |
Reduction in tax relief | | | | | | | | | | | 0.24 | | | | 0.71 | | | | — | |
| | | | | |
Impact of the revision in macroeconomic forecasts | | | | | | | -0.13 | | | | -0.43 | | | | -0.64 | | | | -0.84 | |
Impact of the revision in interest payments | | | | | | | -0.03 | | | | -0.11 | | | | 0.03 | | | | 0.19 | |
| | | | | |
Update of DEF (September 2011) | | | | | | | | | | | | | | | | | | | | |
Net borrowing | | | -4.6 | | | | -3.9 | | | | -1.6 | | | | -0.1 | | | | 0.2 | |
Structural balance (1) | | | -3.3 | | | | -2.8 | | | | -0.6 | | | | 0.6 | | | | 0.5 | |
Primary balance | | | -0.1 | | | | 0.9 | | | | 3.7 | | | | 5.4 | | | | 5.7 | |
Interest expenditure | | | 4.5 | | | | 4.8 | | | | 5.3 | | | | 5.5 | | | | 5.5 | |
Public debt | | | 119.0 | | | | 120.6 | | | | 119.5 | | | | 116.4 | | | | 112.6 | |
| | | | | |
3) Stability Law (October 2011) | | | | | | | | | | | | | | | | | | | | |
Impact on net borrowing | | | | | | | -0.04 | | | | 0.02 | | | | 0.00 | | | | 0.01 | |
Additional net revenues | | | | | | | -0.04 | | | | 0.01 | | | | 0.01 | | | | 0.00 | |
Net cuts to expenditure | | | | | | | | | | | 0.01 | | | | 0.00 | | | | 0.01 | |
| | | | | |
4) Decree-Law no.201 (December 2011) | | | | | | | | | | | | | | | | | | | | |
Impact on net borrowing | | | | | | | | | | | 1.27 | | | | 1.37 | | | | 1.41 | |
Additional net revenues | | | | | | | | | | | 1.38 | | | | 1.86 | | | | 1.91 | |
Net cuts to expenditure | | | | | | | | | | | 0.14 | | | | 0.48 | | | | 0.68 | |
Reduction in tax relief | | | | | | | | | | | -0.25 | | | | -0.97 | | | | -1.18 | |
| | | | | |
Impact of the revision in macroeconomic forecasts | | | | | | | | | | | -0.42 | | | | -0.42 | | | | -0.48 | |
Impact of the revision in interest payments | | | | | | | -0.05 | | | | -0.52 | | | | -0.64 | | | | -0.67 | |
Other adjustments | | | | | | | 0.13 | | | | 0.03 | | | | -0.09 | | | | -0.08 | |
| | | | | |
Report to Parliament (December 2011) (2) | | | | | | | | | | | | | | | | | | | | |
Net borrowing | | | -4.6 | | | | -3.8 | | | | -1.2 | | | | 0.1 | | | | 0.4 | |
Structural balance (3) | | | -3.5 | | | | -3.2 | | | | -0.1 | | | | 1.1 | | | | 1.0 | |
Primary balance | | | -0.1 | | | | 1.0 | | | | 4.6 | | | | 6.2 | | | | 6.4 | |
Interest expenditure | | | 4.5 | | | | 4.9 | | | | 5.8 | | | | 6.1 | | | | 6.1 | |
Public debt | | | 118.4 | | | | 119.8 | | | | 120.1 | | | | 117.5 | | | | 113.9 | |
| 1) | Cyclically adjusted balance, net of one-off measures. |
| 2) | Policy scenario data have not been published. |
| 3) | Estimates developed on the basis of national accounting data available as of December 2011. |
Note: The impact of the measures is valued in relation to net borrowing and, accordingly, includes the indirect effect in terms of lower interest expenditure. Inconsistencies, if any, between the values set out in the table are due to rounding to the first decimal point.
More detailed data on results for 2011 show that year end result was in line with that previously estimated. The few slight discrepancies are mainly to be attributed to a higher total expenditure-to-GDP ratio in comparison with the previous forecast (approximately 0.3 percentage points), which is entirely due to higher current expenditures and is fully offset by an increase in total revenues (approximately 0.3 percentage points). Current expenditures reflect a slight increase (approximately 0.1
| | |
| | MINISTERODELL’ECONOMIAEDELLE FINANZE |
14 | | |
ECONOMICAND FINANCIAL DOCUMENT – ITALY’S STABILITY PROGRAMME
percentage points) in almost all of the spending items, with the exception of social benefits in kind that declined marginally (-0.1 percentage points). On the revenue side, a change in the fiscal revenue mix occurs with direct and indirect taxes and social contributions having less weight (0.3 percentage points), more than offset by higher capital taxes.
Accordingly, compared with the results for 2010, net borrowing in 2011 decreased by approximately €9.1 billion, standing at around -€62.4 billion. The deficit-to-GDP ratio was -3.9 per cent, 0.7 percentage points lower than that of the previous year (-4.6 per cent). The primary balance moved into positive territory, from 0.0 per cent in 2010 to 1.0 per cent in 2011.
Total revenues rose by 1.9 per cent as compared with the previous year, mostly because of the increase in indirect taxes (2.0 per cent), due principally to the increase in value-added taxes (IVA) and taxes on mineral oils and natural gas. Direct taxes fell by 0.1 per cent, essentially due to a contraction of income taxes (IRPEF). Capital taxes increased substantially mainly because of one-off payments of the substitute tax concerning the voluntary realignment of values reported in financial statements to IAS principles. The increase in actual social contributions was 1.4 per cent. Total revenues amounted to 46.1 per cent of GDP in 2011. The tax burden came to 42.5 per cent, slightly lower with respect to the 42.6 per cent registered in 2010.
Total expenditures, accounting for 50.0 per cent of GDP, rose by 0.6 per cent with respect to 2010. Current expenditures increased by 1.3 per cent. In particular, employee compensation fell by 1.2 per cent, in response to a reduction in the number of employees in the public administrations. Expenditure on intermediate consumption was 1.2 per cent higher, while the outlays for social benefits in kind (which primarily include expenditures for contracted healthcare services) decreased by 2.2 per cent, inverting the trend reported in previous years. Social benefits in cash were up by 2.2 per cent, mainly driven by the growth in expenditure on pensions and annuities, while payments for employment severance indemnities were lower. Interest expenditure for 2011 was just over €78 billion, rising by 9.7 per cent with respect to 2010. The remaining current expenditure items decreased year on year. Turning to capital expenditure (which decreased 11.0 per cent year on year), gross fixed investment was 0.6 per cent lower. Investment subsidies and other capital outlays declined markedly; the negative balance of the latter items arises from the registration of sales of the rights of use of digital television frequencies as a reduction in expenditure.
| | |
| MINISTERODELL’ECONOMIAEDELLE FINANZE | | |
| | 15 |
ECONOMICAND FINANCIAL DOCUMENT – ITALY’S STABILITY PROGRAMME
| | | | | | | | | | | | | | | | | | | | | | | | |
TABLE III.3: GENERAL GOVERNMENT BUDGETARY PROSPECTS1 | |
| | | 2011 | | | 2012 | | | 2013 | | | 2014 | | | 2015 | |
| | | Level
(2) | | | % of GDP | | | % of GDP | |
| Net borrowing by sub-sector | |
1. General Government | | | -62,363 | | | | -3.9 | | | | -1.7 | | | | -0.5 | | | | -0.1 | | | | 0.0 | |
2. Central Government | | | -60,800 | | | | -3.8 | | | | -1.6 | | | | -0.5 | | | | 0.0 | | | | 0.1 | |
3. State Government | | | -59,813 | | | | -3.8 | | | | -1.5 | | | | -0.4 | | | | 0.1 | | | | 0.2 | |
4. Local Government | | | -4,569 | | | | -0.3 | | | | -0.3 | | | | -0.2 | | | | -0.3 | | | | -0.4 | |
5. Social Security Funds | | | 3,006 | | | | 0.2 | | | | 0.2 | | | | 0.2 | | | | 0.2 | | | | 0.2 | |
|
| General Government | |
| | | | | | |
6. Total revenues | | | 728,431 | | | | 46.1 | | | | 48.7 | | | | 49.1 | | | | 49.0 | | | | 48.7 | |
7. Total expenditures | | | 790,794 | | | | 50.0 | | | | 50.4 | | | | 49.6 | | | | 49.1 | | | | 48.7 | |
8. Net borrowing | | | -62,363 | | | | -3.9 | | | | -1.7 | | | | -0.5 | | | | -0.1 | | | | 0.0 | |
9. Interest expenditure | | | 78,021 | | | | 4.9 | | | | 5.3 | | | | 5.4 | | �� | | 5.6 | | | | 5.8 | |
10. Primary surplus | | | 15,658 | | | | 1.0 | | | | 3.6 | | | | 4.9 | | | | 5.5 | | | | 5.7 | |
11. One-off measures (3) | | | 11,062 | | | | 0.7 | | | | 0.2 | | | | 0.1 | | | | 0.2 | | | | 0.1 | |
|
| Selected revenue components | |
| | | | | | |
12. Total tax revenues | | | 455,303 | | | | 28.8 | | | | 31.2 | | | | 31.6 | | | | 31.6 | | | | 31.2 | |
12a. Indirect taxes | | | 222,313 | | | | 14.1 | | | | 15.6 | | | | 16.3 | | | | 16.2 | | | | 16.1 | |
12b. Direct taxes | | | 226,027 | | | | 14.3 | | | | 15.5 | | | | 15.3 | | | | 15.3 | | | | 15.1 | |
12c. Capital taxes | | | 6,963 | | | | 0.4 | | | | 0.1 | | | | 0.0 | | | | 0.0 | | | | 0.0 | |
13. Social contributions | | | 216,340 | | | | 13.7 | | | | 13.8 | | | | 13.7 | | | | 13.7 | | | | 13.7 | |
14. Property income | | | 9,458 | | | | 0.6 | | | | 0.5 | | | | 0.6 | | | | 0.6 | | | | 0.6 | |
15. Other revenues | | | 47,330 | | | | 3.0 | | | | 3.1 | | | | 3.2 | | | | 3.2 | | | | 3.2 | |
16. Total revenues | | | 728,431 | | | | 46.1 | | | | 48.7 | | | | 49.1 | | | | 49.0 | | | | 48.7 | |
Memo: Tax burden | | | | | | | 42.5 | | | | 45.1 | | | | 45.4 | | | | 45.3 | | | | 44.9 | |
|
| Selected expenditure components | |
| | | | | | |
17. Employee compensation + intermediate consumption | | | 261,579 | | | | 16.6 | | | | 16.3 | | | | 15.7 | | | | 15.3 | | | | 15.0 | |
17a. Employee compensation | | | 170,052 | | | | 10.8 | | | | 10.6 | | | | 10.3 | | | | 10.0 | | | | 9.8 | |
17b. Intermediate consumption | | | 91,527 | | | | 5.8 | | | | 5.7 | | | | 5.3 | | | | 5.3 | | | | 5.2 | |
18. Social payments | | | 349,721 | | | | 22.1 | | | | 22.5 | | | | 22.4 | | | | 22.3 | | | | 22.2 | |
including: Unemployment subsidies | | | 11,484 | | | | 0.7 | | | | 0.8 | | | | 0.7 | | | | 0.7 | | | | 0.6 | |
18a. Social payments in kind | | | 44,599 | | | | 2.8 | | | | 2.9 | | | | 2.9 | | | | 2.8 | | | | 2.8 | |
18b. Social payments other than in kind | | | 305,122 | | | | 19.3 | | | | 19.6 | | | | 19.5 | | | | 19.5 | | | | 19.4 | |
19. Interest expenditure | | | 78,021 | | | | 4.9 | | | | 5.3 | | | | 5.4 | | | | 5.6 | | | | 5.8 | |
20. Production subsidies | | | 16,673 | | | | 1.1 | | | | 1.0 | | | | 0.9 | | | | 0.9 | | | | 0.8 | |
21. Gross fixed investment | | | 32,030 | | | | 2.0 | | | | 1.9 | | | | 1.8 | | | | 1.8 | | | | 1.7 | |
22. Capital transfers | | | 19,545 | | | | 1.2 | | | | 1.1 | | | | 1.1 | | | | 1.0 | | | | 1.0 | |
23. Other expenditures | | | 33,225 | | | | 2.1 | | | | 2.3 | | | | 2.3 | | | | 2.2 | | | | 2.2 | |
24. Total expenditures | | | 790,794 | | | | 50.0 | | | | 50.4 | | | | 49.6 | | | | 49.1 | | | | 48.7 | |
Memo: Public consumption | | | 324,220 | | | | 20.5 | | | | 20.3 | | | | 19.6 | | | | 19.1 | | | | 18.8 | |
| 1) | Because the figures are rounded to the first decimal point, there may be differences between the sum of the various expenditure accounts and total expenditures and the sum of the revenue accounts and total revenues. |
| 3) | The plus sign indicates one-off measures to reduce the deficit. |
Note: The data for total revenues and total expenditures differ from those in the General Government account in Section II of the Economic and Financial Document 2012 due to a different method used for representing the account: according to EU Regulation no. 1500/2000 in Section I and according to the traditional method in Section II. The reconciliation between the two versions is to be published by ISTAT in the next few months. The data related to 2010 were reclassified by ISTAT on 2 September 2011, whereas the data for 2011 were drawn up by ISTAT, and are not yet final nor have they been published. For the years of 2012-2015, the data represent the forecasts of the Ministero dell’ Economia e delle Finanze.
As required by the Code of Conduct, for the second time this document indicates additional resources as projected on the basis of unchanged policies4 within the Programme’s time horizon.
| 4 | The methodology used for indicating additional resources is outlined in Paragraph II.3 of Section II of the Economic and Financial Document - Public Finance Trends. |
| | |
| | MINISTERODELL’ECONOMIAEDELLE FINANZE |
16 | | |
ECONOMICAND FINANCIAL DOCUMENT – ITALY’S STABILITY PROGRAMME
| | | | | | | | | | | | | | | | | | | | | | | | |
TABLE III. 4a: GENERAL GOVERNMENT REVENUES: DISCRETIONARY AND BASED ON UNCHANGED POLICIES | |
| | | 2011 | | | 2012 | | | 2013 | | | 2014 | | | 2015 | |
| | | Level (1) | | | % of GDP | | | | | | % of GDP | | | | |
Total revenues: unchanged policies | | | 723,383 | | | | 45.8 | | | | 46.0 | | | | 45.6 | | | | 45.6 | | | | 45.4 | |
Discretionary revenues (change versus previous year) (2) | | | 5,048 | | | | 0.3 | | | | 2.4 | | | | 0.8 | | | | 0.1 | | | | -0.1 | |
| 2) | The expected change in total tax revenues, with respect to final data for 2010, is derived from the main measures approved during the 2010-2011 two-year period (Decree-Law no. 40/2010, Decree-Law no. 78/2010, 2010 Budget Law no. 191/2009, Decree-Law no. 220/2010, Decree-Law no. 70/2011, Decree-Law no. 98/2011, Decree-Law no. 138/2011 and Decree-Law no. 201/2011). |
| | | | | | | | | | | | | | | | | | | | | | | | |
TABLE III.4b: EXPENDITURES TO BE EXCLUDED BY EXPENDITURE RULE | |
| | | 2011 | | | 2012 | | | 2013 | | | 2014 | | | 2015 | |
| | | Level (1) | | | % of GDP | | | | | | % of GDP | | | | |
EU programme expenditures 100% covered by EU funds | | | 3,508 | | | | 0.2 | | | | 0.2 | | | | 0.3 | | | | 0.3 | | | | 0.3 | |
Expenditures 100% covered by revenues already identified | | | 5,048 | | | | 0.3 | | | | 2.4 | | | | 0.8 | | | | 0.1 | | | | -0.1 | |
Change in non-discretionary expenditure for unemployment benefits | | | 95 | | | | 0.01 | | | | 0.03 | | | | -0.05 | | | | 0.00 | | | | 0.00 | |
| | | | | | | | | | | | | | | | | | | | | | | | | | | | |
TABLE III.5: GENERAL GOVERNMENT ACCOUNT BASED ON UNCHANGED POLICIES1 | |
| | | | | | Forecasts - Unchanged
Legislation | | | | | | Differential
Unchanged
Policies | | | Unchanged
Legislation | | | Unchanged
Policies (2) | |
| | | 2012 | | | 2013 | | | 2014 | | | 2015 | | | | |
| | | | | | Level (3) | | | | | | | | | % Change 2015/2014 | |
Current expenditures | | | | | | | | | | | | | | | | | | | 4,000 | | | | | | | | | |
Employee compensation (4) | | | 169,116 | | | | 168,243 | | | | 168,017 | | | | 168,937 | | | | 1,830 | | | | 0.5 | | | | 1.6 | |
Intermediate consumption | | | 136,104 | | | | 134,310 | | | | 134,896 | | | | 137,953 | | | | 930 | | | | 2.3 | | | | 3.0 | |
Other current expenditures | | | 59,902 | | | | 58,052 | | | | 58,396 | | | | 58,645 | | | | 1,240 | | | | 0.4 | | | | 2.5 | |
(net of interest and social benefits) | | | | | | | | | | | | | | | | | | | | | | | | | | | | |
Capital expenditures | | | | | | | | | | | | | | | | | | | | | | | | | | | | |
Gross fixed investment | | | 31,383 | | | | 30,941 | | | | 31,113 | | | | 31,472 | | | | 0 | | | | 1.2 | | | | -1.9 | |
(net of property disposals) | | | | | | | | | | | | | | | | | | | | | | | | | | | | |
Investment subsidies | | | 16,631 | | | | 16,618 | | | | 15,564 | | | | 15,622 | | | | 0 | | | | 0.4 | | | | -0.7 | |
| | | | | | | | | | | | | | | | | | | | | | | | | | | | |
Total resources | | | | | | | | | | | | | | | | | | | 4,000 | | | | | | | | | |
% of GDP | | | | | | | | | | | | | | | | | | | 0.23 | | | | | | | | | |
| 1) | The forecasts based on unchanged policies do not imply any deterioration of the public finance balances vis-à-vis the scenario defined on the basis of unchanged legislation since any new or greater expenditure and/or lower revenue with respect to existing legislation must be covered with offsetting measures of the same amount and term, pursuant to Article 81, Paragraph 4 of the Constitution. |
| 2) | Average rate observed over a sufficiently broad time horizon (4-6 years). |
| 4) | The additional resources estimated are stated net of the contractually due vacation sums already considered in the unchanged-legislation scenario. |
| | | | | | | | | | | | | | | | | | | | |
TABLE III.6: STATE SECTOR – PUBLIC SECTOR – CASH BALANCES (in € mn and % of GDP) | |
| | | 2011 | | | 2012 | | | 2013 | | | 2014 | | | 2015 | |
State Sector | | | -63,466 | | | | -26,4 8 | | | | -4,073 | | | | 4,529 | | | | 8,532 | |
% of GDP | | | -4.02 | | | | -1.67 | | | | -0.25 | | | | 0.27 | | | | 0.49 | |
General Government | | | -62,239 | | | | -27,000 | | | | -4,040 | | | | 4,539 | | | | 8,591 | |
% of GDP | | | -3.94 | | | | -1.70 | | | | -0.25 | | | | 0.27 | | | | 0.50 | |
Local Government | | | 689 | | | | 738 | | | | 606 | | | | 252 | | | | -297 | |
% of GDP | | | 0.04 | | | | 0.05 | | | | 0.04 | | | | 0.02 | | | | -0.02 | |
Social Security Funds | | | 0 | | | | 0 | | | | 0 | | | | 0 | | | | 0 | |
% of GDP | | | | | | | | | | | | | | | | | | | | |
Public Sector | | | -61,550 | | | | -26,262 | | | | -3,434 | | | | 4,791 | | | | 8,294 | |
% of GDP | | | -3.90 | | | | -1.65 | | | | -0.21 | | | | 0.29 | | | | 0.48 | |
| | |
| MINISTERODELL’ECONOMIAEDELLE FINANZE | | |
| | 17 |
ECONOMICAND FINANCIAL DOCUMENT – ITALY’S STABILITY PROGRAMME
| III.2 | FINANCIAL IMPACT OF KEY REFORMS |
The National Reform Programme (NRP) identifies nine policy areas (containment of public expenditure, federalism, competition and administrative efficiency, work and pensions, infrastructures, innovation and human capital, energy and environment, support to businesses and the financial system) which are detailed in a grid provided as an annex to the Programme.:5.
The impact of the new measures contained in the NRP is assessed in terms of expenditure cuts/additions or revenue additions/decreases for each macro area (Table III.9). Some measures were assessed as having no impact, either because it wasn’t possible to quantify their impact at the time of their approval or because they do not entail any new or incremental charges for the State budget.
For additional details about the measures, see Chapter II.5 of the National Reform Programme (Section III of the Economic and Financial Document).
TABLE III.7: FINANCIAL IMPACT OF NRP MEASURES1 (in € mn)
| | | | | | | | | | | | | | | | |
| | | 2011 | | | 2012 | | | 2013 | | | 2014 | |
CONTAINMENT OF PUBLIC EXPENDITURE | | | | | | | | | | | | | | | | |
Additional revenues | | | 700.0 | | | | 21,467.6 | | | | 33,224.6 | | | | 35,181.9 | |
Expenditure cuts | | | 26.2 | | | | 7,537.0 | | | | 8,535.9 | | | | 10,459.7 | |
Additional expenditures | | | 107.0 | | | | 104.5 | | | | 2.5 | | | | 2.5 | |
| | | | |
FEDERALISM | | | | | | | | | | | | | | | | |
Additional revenues | | | 0.0 | | | | 9,032.4 | | | | 9,167.4 | | | | 9,167.4 | |
Expenditure cuts | | | 0.0 | | | | 1,627.4 | | | | 2,762.4 | | | | 3,162.4 | |
Additional expenditure | | | 5.0 | | | | 5.0 | | | | 5.0 | | | | 0.0 | |
| | | | |
PRODUCT MARKET, COMPETITION AND ADMINISTRATIVE EFFICIENCY | | | | | | | | | | | | | | | | |
Additional revenues | | | 0.0 | | | | 0.0 | | | | 68.0 | | | | 0.0 | |
Expenditure cuts | | | 0.0 | | | | 0.0 | | | | 16.2 | | | | 16.2 | |
Decrease in revenues | | | 45.0 | | | | 90.0 | | | | 90.0 | | | | 34.0 | |
Additional expenditure | | | 636.1 | | | | 648.1 | | | | 637.1 | | | | 401.1 | |
| | | | |
WORK AND PENSIONS | | | | | | | | | | | | | | | | |
Additional revenues | | | 0.0 | | | | 1,471.0 | | | | 1,830.0 | | | | 2,110.0 | |
Expenditure cuts | | | 0.0 | | | | 2,643.0 | | | | 8,433.0 | | | | 10,432.0 | |
Decrease in revenues | | | 0.0 | | | | 3,333.2 | | | | 5,939.1 | | | | 5,055.5 | |
Additional expenditure | | | 1,053.0 | | | | 1,260.0 | | | | 300.0 | | | | 300.0 | |
| | | | |
INNOVATION AND HUMAN CAPITAL | | | | | | | | | | | | | | | | |
Additional revenues | | | 0.0 | | | | 285.4 | �� | | | 285.4 | | | | 285.4 | |
Decrease in revenues | | | 90.0 | | | | 90.0 | | | | 90.0 | | | | 0.0 | |
Additional expenditure | | | 110.0 | | | | 991.8 | | | | 560.2 | | | | 404.0 | |
| | | | |
SUPPORT TO BUSINESSES | | | | | | | | | | | | | | | | |
Additional revenues | | | 0.0 | | | | 0.0 | | | | 82.8 | | | | 100.1 | |
Decrease in revenues | | | 14.0 | | | | 985.7 | | | | 1,487.3 | | | | 2,944.0 | |
Additional expenditure | | | 0.0 | | | | 3,935.0 | | | | 235.0 | | | | 235.0 | |
| | | | |
ENERGY AND ENVIRONMENT | | | | | | | | | | | | | | | | |
Additional revenues | | | 0.0 | | | | 125.6 | | | | 411.5 | | | | 8.2 | |
Additional expenditure | | | 18.7 | | | | 4.0 | | | | 15.8 | | | | 20.9 | |
| | | | |
FINANCIAL SYSTEM | | | | | | | | | | | | | | | | |
Decrease in revenues | | | 0.0 | | | | 14.3 | | | | 26.5 | | | | 21.3 | |
Additional expenditure | | | 0.0 | | | | 287.6 | | | | 325.1 | | | | 321.7 | |
| 1) | EU resources are excluded, and in particular, the 2007-2013 National Strategic Framework resources. The fiscal measures related to the Decree-Law now in the process of being converted into law are not included. |
Source: analyses by the State’s General Accounting Office (Ragioneria Generale dello Stato) using data from three exhibits to the technical reports and information supplied by the ministries responsible.
| 5 | For a description of the construction of the grid and its contents, see ‘Description of the grid provided as an annex to the NRP’. |
| | |
| | MINISTERODELL’ECONOMIAEDELLE FINANZE |
18 | | |
ECONOMICAND FINANCIAL DOCUMENT – ITALY’S STABILITY PROGRAMME
| III.3 | THE CYCLICALLY ADJUSTED BALANCE |
The reformed Stability and Growth Pact (contained within the so-called ‘Six Pack’) has strengthened the notion that public finance objectives need to be assessed by netting out the impact of the economic cycle and has also established that countries with the highest levels of public debt need to reduce their structural budget deficits more rapidly. Furthermore, by introducing the so-called expenditure rule (see box below), the criteria for convergence to the medium-term objective (MTO) have been further reinforced.
In such a framework, the MTO is defined in cyclically adjusted terms, net of one-off and other temporary measures and differentiated for individual Member States to take into account specific indicators, such as: the long-term potential growth rate, the current level of the debt-to-GDP ratio, and the amount of implicit liabilities related to population ageing. The Italian Government has committed to achieving its MTO, namely, the balanced budget in structural terms, in 2013.
Following the modest growth of 2011, Italy’s economy is expected to contract in 2012, with important implications for the estimate of the potential growth rate which is projected to fall to -0.3 per cent in 2012, mainly as a result of the negative contribution of both labour factor and Total Factor Productivity (TFP)6.
Potential output should initially stop declining in 2013, and then should gradually return to a positive growth pattern in 2014, driving overall GDP growth. In 2015, potential growth should continue to increase at a rate equal to 0.4 per cent, as a result of the growing contribution of both the labour factor and the capital stock, whereas the TFP growth rate should instead continue to be marginally negative. Obviously these estimates are obtained by mechanically applying the methodology approved by the ECOFIN Council for deriving potential GDP and the output gaps7. Enacted structural reforms may actually result in higher-than-projected growth rates and a positive contribution of TFP to growth that could materialise as early as the end of the forecast time horizon.
With respect to 2011, the output gap (which measures the relative deviation of the level of current output with respect to the level of potential GDP) should widen further in 2012 reaching -3.0 per cent of potential GDP. However, between 2013 and 2015, the output gap should gradually diminish again, hovering around -1.0 per cent at the end of the projection horizon.
As a result, the cyclical budgetary component (which approximates the automatic change of both tax revenues and expenditures on social safety nets due to cyclical
| | |
6 Total Factor Productivity (TFP) approximates the output growth component which is structurally attributable to the effects of technological progress. According to the methodology agreed at the European level, by netting out the impact of the economic cycle from the so-called Solow residual (namely, the difference between the rate of GDP growth and the rates of growth of the labour input and the stock of capital, weighted with respective distributive quotas), TFP is obtained through a Bayesian Kalman filter approach which considers capacity utilisation as a dependant variable. As a result, Total Factor Productivity provides a measure of the qualitative and efficiency improvements in the use of productive inputs. 7 The method used for deriving potential GDP and the output gap is based on the estimate of a production function. For additional information, see: Denis, C., Grenouilleau, D., Mc Morrow, K., and W. Röger (2006); ‘Calculating potential growth rates and output gaps – A revised production function approach’; European Economy, European Commission, Directorate-General for Economic and Financial Affairs; Economic Paper No.247. MINISTERODELL’ECONOMIAEDELLE FINANZE | | |
| | 19 |
ECONOMICAND FINANCIAL DOCUMENT – ITALY’S STABILITY PROGRAMME
fluctuations of the economy8) would go from -1.1 in 2011 to -1.5 per cent of GDP in 2012. The cyclical component would then significantly shrink to -0.5 per cent of GDP in 2015, in line with the narrowing of the output gap.
As a result of the massive fiscal consolidation measures adopted in 2011, the structural deficit (i.e. the cyclically adjusted budget balance, net of one-off measures) should diminish by 3.2 percentage points in 2012, going from -3.6 per cent of GDP to -0.4 per cent. The reduction should continue into 2013, when Italy moves well beyond its MTO, achieving a structural surplus equal to 0.6 per cent of GDP. In 2014, the structural balance is projected to remain almost unchanged, whereas it should contract by 0.2 percentage points in 2015, while still remaining well above the MTO.
TABLE III.8: CYCLICAL DEVELOPMENTS1 (% of GDP)
| | | | | | | | | | | | | | | | | | | | |
| | | 2011 | | | 2012 | | | 2013 | | | 2014 | | | 2015 | |
Real GDP growth rate | | | 0.4 | | | | -1.2 | | | | 0.5 | | | | 1.0 | | | | 1.2 | |
Net borrowing | | | -3.9 | | | | -1.7 | | | | -0.5 | | | | -0.1 | | | | 0.0 | |
Interest expenditure | | | 4.9 | | | | 5.3 | | | | 5.4 | | | | 5.6 | | | | 5.8 | |
Potential GDP growth | | | 0.1 | | | | -0.3 | | | | 0.0 | | | | 0.2 | | | | 0.4 | |
Contribution to potential growth: | | | | | | | | | | | | | | | | | | | | |
Labour | | | 0.1 | | | | -0.2 | | | | 0.1 | | | | 0.1 | | | | 0.2 | |
Capital | | | 0.2 | | | | 0.2 | | | | 0.2 | | | | 0.2 | | | | 0.3 | |
Total factor productivity | | | -0.3 | | | | -0.3 | | | | -0.2 | | | | -0.1 | | | | -0.1 | |
Output gap | | | -2.1 | | | | -3.0 | | | | -2.6 | | | | -1.8 | | | | -1.0 | |
Cyclical budgetary component | | | -1.1 | | | | -1.5 | | | | -1.3 | | | | -0.9 | | | | -0.5 | |
Cyclically-adjusted budget balance | | | -2.9 | | | | -0.2 | | | | 0.8 | | | | 0.8 | | | | 0.5 | |
Cyclically-adjusted primary balance | | | 2.0 | | | | 5.1 | | | | 6.2 | | | | 6.4 | | | | 6.2 | |
One-off and other temporary measures | | | 0.7 | | | | 0.2 | | | | 0.1 | | | | 0.2 | | | | 0.1 | |
Budget balance, net of one-off measures | | | -4.6 | | | | -1.9 | | | | -0.7 | | | | -0.3 | | | | -0.1 | |
Cyclically-adjusted budget balance, net of one-off measures | | | -3.6 | | | | -0.4 | | | | 0.6 | | | | 0.6 | | | | 0.4 | |
Cyclically-adjusted primary surplus, net of one-off measures | | | 1.3 | | | | 4.9 | | | | 6.1 | | | | 6.2 | | | | 6.1 | |
Change in budget balance, net of one-off measures | | | -0.2 | | | | -2.8 | | | | -1.2 | | | | -0.4 | | | | -0.2 | |
Change in cyclically-adjusted budget balance, net of one-off measures | | | 0.0 | | | | -3.2 | | | | -1.0 | | | | 0.0 | | | | 0.2 | |
| 1) | The rounding to the first decimal may cause inconsistencies between the figures presented in the table. |
THE EXPENDITURE RULE
The new Stability and Growth Pact introduces an expenditure benchmark in order to assess progress towards the Medium Term Objectives. At present, convergence to the MTOs should proceed through reductions in the structural budget balance at least equal to 0.5 per cent of GDP per year. The expenditure rule reinforces this constraint and further qualifies the convergence toward the MTO.
More specifically, the General Government expenditure aggregate to be assessed every year should exclude: interest expenditure, expenditure on EU programmes fully matched by EU funds revenue, and non-discretionary changes in unemployment benefit expenditure. Furthermore, in order to take into consideration the volatility of investment outlays, the General Government expenditure aggregate should be adjusted by averaging investment expenditure over four years, substituting the annual value of the investments with the average of the same computed between year t and the preceding three years.
| 8 | The cyclical budgetary component is calculated as the product between the output gap and the elasticity of the budget balance to economic growth. The value of the elasticity parameter is determined at a European level and, for Italy, it is equal to 0.5. |
| | |
| | MINISTERODELL’ECONOMIAEDELLE FINANZE |
20 | | |
ECONOMICAND FINANCIAL DOCUMENT – ITALY’S STABILITY PROGRAMME
Member States that have already reached their MTO are allowed to let the public expenditure aggregate expressed in real terms grow in line with the medium-term potential GDP growth rate. For those countries that are still a far away from their MTO, the growth of the expenditure aggregate must be reduced with respect to the medium-term potential growth rate by an amount (shortfall) that will in any event guarantee a reduction of the structural budget balance of at least 0.5 percentage points per year. The expenditure rule provides that any overshooting in the growth of the expenditure aggregate vis-à-vis the reference rate of potential growth will need to be promptly offset by discretionary revenue increases of the same amount.
For Italy, the maximum limit for the growth of the expenditure aggregate has been set at a European level at -0.8 per cent per year as long as the MTO is not met and at 0.3 per cent when the MTO is met. On the basis of these parameters, the public finance framework (Table III.3) is in line with the provisions of the expenditure rule. However, the respect of the rule in the years ahead is conditioned on the maintenance of stringent public finance conditions that contemplate, for the final part of the projection period, the maintenance of ambitious structural balances at least in line with the MTO.
Application of the expenditure rule
| | | | | | | | | | | | | | | | | | | | |
| | | 2011 | | | 2012 | | | 2013 | | | 2014 | | | 2015 | |
| | | | | | | | | (in € mn) | | | | | | | |
1.Total expenditure | | | 790,794 | | | | 801,422 | | | | 807,370 | | | | 821,925 | | | | 840,313 | |
2.Incremental expenditures with unchanged policies | | | | | | | | | | | | | | | | | | | 4,000 | |
3. Expenditure on EU programmes fully matched by EU funds revenue | | | 3,508 | | | | 3,900 | | | | 4,100 | | | | 4,300 | | | | 4,500 | |
4. Non-discretionary changes in unemployment benefit expenditure | | | 95 | | | | 475 | | | | -886 | | | | 15 | | | | -66 | |
5. Interest | | | 78,021 | | | | 84,217 | | | | 88,456 | | | | 93,832 | | | | 99,249 | |
6. Gross fixed investment | | | 32,030 | | | | 29,953 | | | | 29,491 | | | | 29,813 | | | | 30,172 | |
7. Gross fixed investment - past 4-year average (1) | | | 34,453 | | | | 33,135 | | | | 30,923 | | | | 30,322 | | | | 29,857 | |
8. Reference expenditure aggregate (1+2-3-4-5-6+7) | | | 711,593 | | | | 716,012 | | | | 717,132 | | | | 724,287 | | | | 740,315 | |
9. Real expenditure aggregate | | | 641,978 | | | | 634,678 | | | | 623,639 | | | | 618,399 | | | | 620,278 | |
| | | | | |
10.Real growth rate of expenditure aggregate | | | -1.4 | | | | -1.1 | | | | -1.7 | | | | -0.8 | | | | 0.3 | |
11.Benchmark (maximum limit on growth of expenditureaggregate) | | | -0.8 | | | | -0.8 | | | | -0.8 | | | | 0.3 | | | | 0.3 | |
| (1) | As from 2011, the investment estimates refer to the average (from t to t-3) of the expenditure amount. |
| Note: | The benchmark was calculated by assuming the MTO is achieved in 2013 and maintained in 2014 and in 2015. The reference expenditure aggregate is obtained on the basis of the values set out in the General Government budgetary prospects (Table III.3), by (i) subtracting the following from total expenditures based on unchanged policies: interest expenditure, expenditures financed with EU funds, changes in non- discretionary expenditures for unemployment benefits; and (ii) considering the change in expenditure for investments compared with the average aggregate (from t to t-3). The reference expenditure aggregate is then expressed in real terms (through the GDP deflator) (see Table II.2b). The growth rate of the reference aggregate in real terms is derived thereafter. |
The year of 2011 was a particularly difficult one for public debt management due to the propagation of the sovereign debt crisis in Europe.
Several countries in the Euro Area were, at times, precluded from funding themselves on the market: this was the case for Greece in May 2010, Ireland in November 2010 and Portugal in April 2011. For Greece, a bilateral loan mechanism was set up with the direct involvement of all of the other countries in the Euro Area. For
| | |
| MINISTERODELL’ECONOMIAEDELLE FINANZE | | |
| | 21 |
ECONOMICAND FINANCIAL DOCUMENT – ITALY’S STABILITY PROGRAMME
Ireland and Portugal, the problem was addressed through the implementation of the European Financial Stability Facility (EFSF). The EFSF raises funds in the financial market through issuance of securities guaranteed by the Euro Area countries, with the proceeds transferred as financial support9 to distressed countries. Italy’s position at the end of 2011 included loans of just over €10 billion to Greece, and a portion of EFSF liabilities amounting to approximately €3.1 billion.
Although the market for Italian public debt was only marginally impacted in the first half of 2011 by an extremely volatile climate and an increasing lack of investor confidence, the situation deteriorated markedly in July. The expansion of yield differentials especially affected the medium-long-term end of the yield curve, though an initial impact on shorter term securities was also felt. In August, amidst growing concern for the financial and credit stability of the entire euro system, the ECB decided to extend its Securities Market Programme (SMP) of purchasing securities on the secondary market to include Italian and Spanish Government securities10. The situation concerning sectors not covered by ECB purchases became even more problematic: the spreads on securities indexed to inflation (BTP€i), variable-rate securities (CCTs/CCTeus) and those with long-term maturities (15 and 30 years), from August on, grew significantly, especially with respect to other Italian Government securities just because, unlike the other types, these securities did not stand to benefit from the buyer of last resort, namely, the ECB.
The overall picture grew even more troubling in October and in particular, in November. New rules for valuing Government securities within bank portfolios contributed to the propagation of the crisis, which translated into a negative spiral: on the one hand, some of the key domestic buyers of Government securities, such as banks, fell into difficulty11, at a time when investors abroad were progressively shying away from the Treasury’s new issues12; on the other hand, banks faced increasing problems in accessing liquidity, thereby limiting their capacity to grant credit to businesses and posing risks to the real economy. The month of November signalled the most acute phase of Italy’s debt problems. Gradually moving upward and without any sudden jumps, yields on 10-year Italian Government securities had progressed from 5.0 per cent to 6.0 per cent from the start of September to the end of October; this was followed by a sudden jump in November that took the yield to 7.0 per cent in a matter of a few days. At the same time, the differential between yields on Italian and German Government securities reached 500 basis points for the 10-year maturity, whereas on some days of November, it reached around 650 basis points for the 5-year maturity and hovered around 700 basis points for the 2-year maturity13. One of the most worrisome aspects was the considerable increase in
| 9 | Since the EFSF has no financial autonomy, the liabilities automatically become liabilities of the various Euro Area nations, each on the basis of its percentage of participation in the European Central Bank budget. |
| 10 | The SMP had previously regarded mostly Greek, Irish and Portuguese Government securities. |
| 11 | For example, according to data compiled by the Bank of Italy, Italian banks were holding more than €210 billion of Government securities through the end of August 2011. |
| 12 | On the other hand, using data compiled by Bank of Italy on Financial Accounts - Balance of Payments and Capital Position Abroad, it is possible to verify that non-resident investors sold off Italian Government securities in record amounts during the second half of 2011, with the monthly counter-value averaging €15 billion. |
| 13 | The widening of the spread is the result of the increase in the interest rate on Italian securities and the decrease in the interest rate on German securities, the latter of which benefited from strong inflows of funds from investors seeking to buy investments perceived as more secure: both phenomena were seen in almost all of the phases of turbulence. |
| | |
| | MINISTERODELL’ECONOMIAEDELLE FINANZE |
22 | | |
ECONOMICAND FINANCIAL DOCUMENT – ITALY’S STABILITY PROGRAMME
interest rates on short-term maturities, and as a result, the yield curve either levelled off completely or became inverted, indicating the perception of a particularly acute liquidity risk over a short time horizon. This climate also caused substantial damage to secondary-market trading, impairing its significance thereof.
European institutions responded by sharply accelerating processes of reforming governance and the mechanisms for monitoring fiscal policies and economic-financial imbalances14. At the same time, the ECB renewed its commitment to ease the pressure on the financial system with the injection of huge amounts of liquidity (under different forms) with respect to financial and credit intermediaries15.
The combination of the initiatives undertaken by the European authorities, the intervention of the ECB, and the prompt action of the Italian Government in adjusting public finances, had the effect of initially interrupting the growing tension. Still, at the end of 2011, the rates on Italian Government securities were at historically high levels, with trading volumes still extremely thin as the result of very evident shifts away from the Italian sovereign debt market and the Euro Area as a whole16.
The new year brought renewed confidence in Italy’s capacity to keep the public finance balances under control and to inaugurate structural reforms capable of stimulating economic development.
| 14 | Reference is made in particular to (i) the strengthening of the Stability and Growth Pact (contained within the so-called ‘Six Pack’), in effect since December 2011, and (ii) the Fiscal Compact, an intergovernmental agreement signed in January 2012 by almost all of the countries in the European Union which sharply binds the Member States via stricter rules about budget discipline. |
| 15 | The ECB intervention involved a series of initiatives: from the reduction of the monetary policy rate (refi rate) and the Main Refinancing Operation (MRO) rate applicable to key refinancing transactions, to the introduction of the Long-Term Refinancing Operation (LTRO) for up to three years (one in December 2011 and another in February 2012), and from the 50 per cent reduction in banks’ obligatory reserves as of January 2012, to the expansion of the range of securities eligible as guarantees for refinancing transactions. |
| 16 | On the other hand, expectations around decisions by main rating agencies took their toll on the markets in October and November, as they alluded to the possibility of a downgrade of Italy’s rating on the basis of the common conclusion about the vulnerability of nations with high debt and low economic growth with respect to the tensions continuing in the Euro Area (tensions coming from political difficulties regarding solutions to be adopted for countries with financial difficulties). In January and February 2012, these anticipations were confirmed, thereby corroborating the expectations expressed by the markets in the weeks beforehand. |
| | |
| MINISTERODELL’ECONOMIAEDELLE FINANZE | | |
| | 23 |
ECONOMICAND FINANCIAL DOCUMENT – ITALY’S STABILITY PROGRAMME
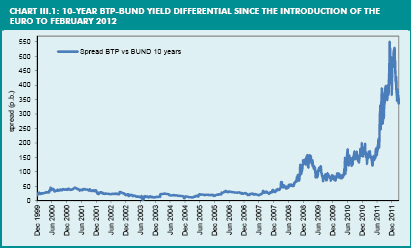
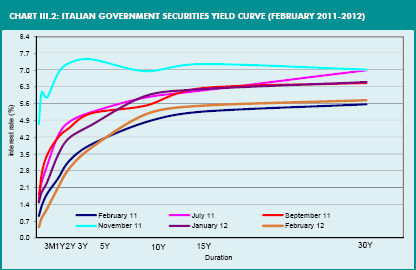
The entire yield curve has experienced a very significant reduction, with a particularly pronounced trend for all maturities up to three years (the maturities most affected by the ECB’s initiative to boost liquidity, via the three-year LTRO operation in December). The yield on one-year securities went from 5.5 per cent at the start of December to 1.0 per cent at the end of February, while that on ten-year securities fell from 7.2 per cent to 4.9 per cent; the spread with Germany on two-year maturities
| | |
| | MINISTERODELL’ECONOMIAEDELLE FINANZE |
24 | | |
ECONOMICAND FINANCIAL DOCUMENT – ITALY’S STABILITY PROGRAMME
declined over the same period from 620 basis points to 160 basis points, while on the 10-year maturity, it shifted from roughly 510 basis points to 310 basis points. The shape of the yield curve has also moved back to a more regular level: the difference between 10- and 2-year maturities was slightly negative at the end of November, but by the end of February, it was back to around 330 basis points17. Though gradual, all categories of Italian Government securities enjoyed a return to normal conditions: with the improvement of the perception of credit risk, both BTP€i and the CCTs/CCTeus saw their prices rebound. Liquidity on the secondary market also experienced a sizeable increase, with market prices reverting to acceptable levels of efficiency, thereby allowing for a significant recovery of trading in February.
Tensions gradually re-emerged in March. Prices of Government securities have continued to be influenced by uncertainties linked to the European convergence process, and more in general, expectations of very low economic growth for many European countries (Italy included) in the coming quarters.
Despite the complexities of 2011, the Treasury managed to implement a consistent and continual policy for debt issuance and the management of outstanding liabilities throughout the whole period, pursuing a strategy aimed at guaranteeing an efficient allocation of the debt in terms of both cost and minimization of refinancing risk. For the entire year, Italian Government securities were suitably placed from the standpoint of demand, considering the high values of the bid-to-cover ratio (ratio between the demand and supply of the security), at prices substantially in line with those on the secondary market.
In the first half of 2011, debt issuance in various segments was quite regular, and the new BTP€i benchmark (15-year maturity) was issued in June with a syndicated placement. The first half was also marked by a gradual reduction of BOT issues, with the aim of reducing the volumes of securities maturing in the first half of 2012 (given the weighty volumes of medium- and long-term issues due to mature). In the second half of 2011, shifts were seen in all segments, and the Treasury thus moderately increased short-term issues in order to make up for the more cautious sentiment on instruments with maturities beyond 10 years; at the same time, the Treasury intensified the offer of off-the-run issues. Finally, the Treasury frequently effected exchange transactions, thus mainly redeeming various securities maturing in 2012, but also CCT/CCTeus and BTPs indexed to Euro Area inflation; the same criterion was the basis for effecting an auction to repurchase securities using the Italian Government Securities Amortization Fund.
| 17 | The improvement of the market was also facilitated by the positive outcome on the agreement for the restructuring of Greece’s debt. |
| | |
| MINISTERODELL’ECONOMIAEDELLE FINANZE | | |
| | 25 |
ECONOMICAND FINANCIAL DOCUMENT – ITALY’S STABILITY PROGRAMME
TABLE III.9: PUBLIC DEBT DETERMINANTS (% of GDP) 1
| | | | | | | | | | | | | | | | | | | | | | | | | | |
| | | 2010 | | | 2011 | | | 2012 | | | 2013 | | | 2014 | | | 2015 | |
Public debt | | | | | | | | | | | | | | | | | | | | | | | | |
| | | | | | |
Amount, net of Euro Area financial support | | | 118.3 | | | | 119.2 | | | | 120.3 | | | | 117.9 | | | | 114.5 | | | | 110.8 | |
Impact of Euro Area financial support (2) | | | 0.3 | | | | 0.9 | | | | 3.1 | | | | 3.6 | | | | 3.7 | | | | 3.6 | |
| | | | | | |
Amount, inclusive of Euro Area financial support | | | 118.6 | | | | 120.1 | | | | 123.4 | | | | 121.5 | | | | 118.2 | | | | 114.4 | |
Change versus previous year | | | 2.6 | | | | 1.5 | | | | 3.3 | | | | -1.9 | | | | -3.3 | | | | -3.8 | |
| | | | | | |
Factors contributing to change in public debt (% of GDP) | | | | | | | | | | | | | | | | | | | | | | | | |
Primary surplus (accrual basis) | | | | | 0.0 | | | | -1.0 | | | | -3.6 | | | | -4.9 | | | | -5.5 | | | | -5.7 | |
Snowball effect | | | 2.0 | | | | 2.9 | | | | 4.6 | | | | 2.5 | | | | 2.2 | | | | 2.1 | |
of which: | | Interest (accrual basis) | | | 4.6 | | | | 4.9 | | | | 5.3 | | | | 5.4 | | | | 5.6 | | | | 5.8 | |
Stock - Flow adjustment | | | | | 0.6 | | | | -0.4 | | | | 2.3 | | | | 0.5 | | | | 0.0 | | | | -0.2 | |
of which: | | Difference between cash and accrual basis | | | -0.5 | | | | -0.6 | | | | -0.3 | | | | -0.7 | | | | -0.8 | | | | -1.0 | |
| | Net accumulation of financial assets (3) | | | 0.4 | | | | 0.6 | | | | 0.1 | | | | 0.4 | | | | 0.3 | | | | 0.3 | |
| | of which: Privatization proceeds | | | 0.0 | | | | 0.0 | | | | 0.0 | | | | 0.0 | | | | 0.0 | | | | 0.0 | |
| | Public debt evaluation effects | | | 0.0 | | | | 0.7 | | | | 0.3 | | | | 0.5 | | | | 0.2 | | | | 0.3 | |
| | Other (4) | | | 0.7 | | | | -1.0 | | | | 2.1 | | | | 0.2 | | | | 0.3 | | | | 0.1 | |
Memo item: Implicit interest rate on the debt | | | 4.0 | | | | 4.2 | | | | 4.4 | | | | 4.5 | | | | 4.7 | | | | 5.0 | |
| 1) | The rounding to the first decimal may cause inconsistencies between the figures presented in the table. |
| 2) | The figure includes the effects of Italy’s contribution to the Euro Area support: contributions to Greece; the European Financial Stability Facility (EFSF) programme and the European Stability Mechanism (ESM) capital. |
| 3) | Include the effects of the contributions to Greece and to ESM capital. |
| 4) | The item Other is residual with respect to the prior periods, and includes: changes in the MEF’s deposits with the Bank of Italy; statistical discrepancies; contributions to support the Euro Area as provided by the EFSF programme; and for the year of 2011, the restitution of the “Tremonti bonds” which flow to the Government Securities Amortization Fund. |
TABLE III.10: GENERAL GOVERNMENT DEBT BY SUB-SECTOR (in € mn and % of GDP) 1
| | | | | | | | | | | | | | | | | | | | | | | | | | |
| | | 2010 | | | 2011 | | | 2012 | | | 2013 | | | 2014 | | | 2015 | |
Amount, net of Euro Area financial support (2) | | | | | | | | | | | | | | | | | | | | | | | | |
General Government | | | 1,838,003 | | | | 1,884,062 | | | | 1,911,426 | | | | 1,918,122 | | | | 1,914,572 | | | | 1,911,074 | |
% of GDP | | | 118.3 | | | | 119.2 | | | | 120.3 | | | | 117.9 | | | | 114.5 | | | | 110.8 | |
| | Central Government (3) | | | 1,734,790 | | | | 1,781,300 | | | | 1,809,402 | | | | 1,816,704 | | | | 1,813,406 | | | | 1,809,611 | |
| | Local Government (3) | | | 127,923 | | | | 128,624 | | | | 127,886 | | | | 127,280 | | | | 127,028 | | | | 127,325 | |
| | Social Security Funds (3) | | | 37 | | | | 55 | | | | 55 | | | | 55 | | | | 55 | | | | 55 | |
| | | | | | |
Amount, inclusive of Euro Area financial support (2) | | | | | | | | | | | | | | | | | | | | | | | | |
General Government | | | 1,841,912 | | | | 1,897,179 | | | | 1,959,645 | | | | 1,977,120 | | | | 1,977,520 | | | | 1,974,023 | |
% of GDP | | | 118.6 | | | | 120.1 | | | | 123.4 | | | | 121.5 | | | | 118.2 | | | | 114.4 | |
| | Central Government (3) | | | 1,738,699 | | | | 1,794,417 | | | | 1,857,621 | | | | 1,875,702 | | | | 1,876,354 | | | | 1,872,560 | |
| | Local Government (3) | | | 127,923 | | | | 128,624 | | | | 127,886 | | | | 127,280 | | | | 127,028 | | | | 127,325 | |
| | Social Security Funds (3) | | | 37 | | | | 55 | | | | 55 | | | | 55 | | | | 55 | | | | 55 | |
| 1) | The rounding to the first decimal may cause inconsistencies between the figures presented in the table. |
| 2) | Excluding or including direct loans to Greece (2010 and 2011), Italy’s EFSF portion, and the ESM programme (from 2012 to 2015). |
| 3) | Inclusive of non-consolidated interest. |
Source: Bank of Italy, Supplement to Statistical Bulletin no. 20 of 16 April 2012 - includes EFSF and direct loans to Greece: for 2010, the amount of the direct loans to Greece is equal to €3,909 million; for 2011, the amount of the direct loans to Greece is equal to €6,098 million and the EFSF share is €3,110 million.
| | |
| | MINISTERODELL’ECONOMIAEDELLE FINANZE |
26 | | |
ECONOMICAND FINANCIAL DOCUMENT – ITALY’S STABILITY PROGRAMME
| III.5 | TREND OF DEBT-TO-GDP RATIO |
The debt-to-GDP ratios for 2010 and 2011 came to 118.6 per cent and 120.1 per cent, respectively (Chart III.3), within a limited range of one another, and both below the forecasts indicated in the Update to the Economic and Financial Document published last year. In the case of 2010, the negative difference of 0.4 percentage points is almost entirely attributable to an upward revision of GDP by ISTAT. In the case of 2011, the negative difference of 0.5 percentage points is due to: actual nominal growth that was approximately 0.1 percentage points less than the forecast; a lower-than-expected debt stock equivalent to approximately 0.6 percentage points of GDP; and the combination of a better-than-expected trend of the public sector’s borrowing requirement equivalent to roughly 0.4 percentage points and a slowdown in debt issues that was more pronounced than the decrease in the borrowing requirement due to tensions on the financial markets. When considering the two years in aggregate, it should be noted that debt dynamics were influenced by the loans Italy disbursed to Greece and, via the European Financial Stability Facility (EFSF), to Ireland and Portugal; such financing amounted to €3.9 billion in 2010 (0.25 per cent of GDP) and €6.2 billion in 2011 (0.58 per cent of GDP).
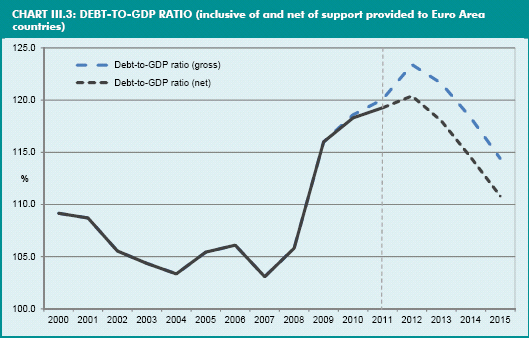
In 2012 the debt-to-GDP ratio is slated to rise further to end the year at 123.4 per cent, approximately 3.9 percentage points above last year’s estimate that had projected 2012 as the first year of a turnaround in the trend. This significant difference can be explained essentially by three factors: support provided to Euro Area countries, the forecast trend of the borrowing requirement, and the outlook for the economy. In 2011, the additional funding for Greece in 2012 was pegged at approximately 0.2 percentage points of GDP and included in the borrowing requirement: between late 2011 and early 2012, European agreements were amended to provide that aid to Greece would go through the EFSF, along with funding for Portugal and Ireland, that was approved after the publication of the 2011 Stability Programme (which did not include any funding to
| | |
| MINISTERODELL’ECONOMIAEDELLE FINANZE | | |
| | 27 |
ECONOMICAND FINANCIAL DOCUMENT – ITALY’S STABILITY PROGRAMME
Portugal and Ireland). It is projected that Italy’s share of EFSF debt issues will be approximately €29.5 billion; this figure then needs to be increased for the capital tranche of approximately €5.6 billion to be paid into the permanent European Stability Mechanism (ESM) in 2012 (this, too, was not included in the estimate published last year). Overall, such funding represents approximately 2.2 per cent of GDP, and thus 2.0 percentage points over the estimate published last year. On the other hand, the public sector borrowing requirement is forecast to be lower than the estimate published last year (by approximately 0.2 percentage points of GDP) because of the revision in the mechanism for disbursements to Greece. Added to this trend of the debt stock is markedly slower growth of nominal GDP.
The forecast for 2013 incorporates an initial downturn in the debt-to-GDP ratio, which amounts to 121.5 per cent. This threshold is higher than that published in September 2011 by approximately 5.1 percentage points, which is the sum of the 2.0 percentage points of aid contemplated for 2012, another 0.7 percentage points not included in 2011 for an amount equal to approximately €10.8 billion (€5.6 billion for the capital contributed to the ESM and €5.2 billion for the ESFS), and nominal GDP growth that is approximately 2.4 percentage points below that estimated in September.
It is interesting to note that estimates for 2014 and the 2015 reflect a very substantial reduction in the debt-to-GDP ratio which is expected to stand at 118.2 per cent and 114.4 per cent, respectively, even after taking into account the significant burden of aid to other Euro Area countries and a nominal growth trend well below the estimates of September 2011. For 2014, the difference between the current estimate of the absolute value of the debt versus that in September (5.6 percentage points) is due to an additional €3.9 billion of funding to be provided to the EFSF (€1.1 billion) and the ESM (€2.8 billion). However, if measured with respect to the GDP forecast for 2014, this difference amounts to 2.4 percentage points, which is well below the cumulative sum of financial support for the 2010-2014 period which is equal to 3.8 per cent of GDP (almost €63 billion). On the other hand, estimates effected net of the support clearly demonstrate the magnitude of adjustment due to public finance measures adopted in 2011: in 2015, the debt net of the support is projected to equal 110.8 per cent of GDP, for an overall reduction of the debt-to-GDP ratio of 9.5 percentage points between 2012 and 2015.
| | |
| | MINISTERODELL’ECONOMIAEDELLE FINANZE |
28 | | |
ECONOMICAND FINANCIAL DOCUMENT – ITALY’S STABILITY PROGRAMME
| IV.1 | SENSITIVITY TO ECONOMIC GROWTH |
The sensitivity of Italy’s public finance to economic growth for the 2012-2015 period is assessed by simulating the pattern of net borrowing and public debt vis-à-vis two alternative macroeconomic scenarios which are developed in line with the trend of certain international economic variables, and which assume that real annual GDP growth starting from 2012 is 0.5 percentage points above or below the forecast of the baseline scenario1.
The different pattern in real GDP growth in the alternative scenarios impacts potential output and, in turn, the output gap. Accordingly, the primary surplus moves in both its structural and cyclical components. The structural component is obtained by the difference between the structural revenues and structural expenditure resulting from the individual simulation scenarios2. The cyclical component is obtained by multiplying the output gap of the alternative scenarios by the elasticity of the budget balance to economic growth3. The new profile of the primary surplus changes the trend of debt and, consequently, interest expenditure. For each scenario, the value of the debt-to-GDP ratio is computed by assuming that the stock-flow adjustment and the implicit interest rate remain unchanged vis-à-vis the baseline scenario (Chapter III, Table III.9).
In the pessimistic scenario, with GDP growth that is 0.5 percentage points lower over the current year, net borrowing would be 0.3 percentage points higher than in the baseline scenario (-2.0 per cent of GDP). In 2013, net borrowing would continue to decline, but at a slower pace, hovering around -0.8 per cent of GDP vis-à-vis the -0.5 per cent target set by the Government. In the following year, net borrowing would continue to decline, hovering around -0.7 per cent of GDP, but it would start rising again in 2015 when it would reach -1.0 per cent of GDP. By contrast, in the higher growth scenario, net borrowing would be around -1.1 per cent of GDP in 2012, about 0.6 percentage points less than in the baseline scenario, and would continue to fall rapidly in the years thereafter, with a surplus of 0.3 per cent of GDP achieved in 2013. In the 2014-2015 period, the budget surplus would continue to increase, reaching 1.2 per cent of GDP in 2015.
| 1 | The optimistic scenario assumes stronger growth of the global economy for both developed countries and emerging markets. In particular, it is assumed that: both the U.S. and the Euro Area will grow faster; international trade will be stronger; and geopolitical tensions will ease with a consequent positive effect on the price of oil, which would hover around USD 105/barrel. Furthermore, it is assumed that yield differentials will experience a stronger reduction with respect to the benchmark for the European sovereign debt market and that the euro will appreciate more than in the baseline scenario. In the pessimistic scenario, the international outlook is less favorable than in the baseline scenario, with regard to both developed countries and emerging markets, as a result of the withdrawal of expansionary policy measures. More specifically, it is assumed that the economic cycle will be weaker in the U.S. and Euro Area as a consequence of a new upsurge of tensions in the market for sovereign debt and a larger contractionary impact of the fiscal consolidation policies. |
| 2 | Structural revenues and expenditures in the alternative scenarios are obtained by applying a correction parameter to the corresponding variable in the baseline scenario. Accordingly, to obtain structural revenues in the higher (lower) growth scenario, the structural revenues (as a ratio of GDP) of the baseline scenario are to be multiplied by an index expressing the ratio of the baseline nominal GDP to that of the alternative scenario. Thereafter, the resulting figure is multiplied by the product of the semi-elasticity of revenues and the relative difference between the potential GDP in the alternative scenario and that of the baseline scenario. |
| 3 | According to the methodology agreed at a European level, this elasticity is 0.5. |
| | |
| MINISTERODELL’ECONOMIAEDELLE FINANZE | | |
| | 29 |
ECONOMICAND FINANCIAL DOCUMENT – ITALY’S STABILITY PROGRAMME
TABLE IV.1: SENSITIVITY TO GDP GROWTH1 (percentage values)
| | | | | | | | | | | | | | | | | | | | | | | | | | |
| | | | | |
| | | | | 2011 | | | 2012 | | | 2013 | | | 2014 | | | 2015 | | | | |
| | Higher growth scenario | | | 1.7 | | | | 1.3 | | | | 2.7 | | | | 3.4 | | | | 3.7 | | | | | |
Nominal GDP growth rate | | Baseline scenario | | | 1.7 | | | | 0.5 | | | | .4 | | | | .8 | | | | .2 | | | | 3 | |
| | Lower growth scenario | | | 1.7 | | | | 0.0 | | | | 2.0 | | | | 2.4 | | | | 2.6 | | | | | |
| | | | | | | | | | | | | | | | | | | | | | | | | | |
| | Higher growth scenario | | | 0.4 | | | | -0.7 | | | | 1.0 | | | | 1.5 | | | | 1.7 | | | | | |
Real GDP growth rate | | Baseline scenario | | | 0.4 | | | | -1.2 | | | | 0.5 | | | | 1.0 | | | | 1.2 | | | | | |
| | Lower growth scenario | | | 0.4 | | | | -1.7 | | | | 0.0 | | | | 0.5 | | | | 0.7 | | | | | |
| | | | | | | | | | | | | | | | | | | | | | | | | | |
| | Higher growth scenario | | | 0.2 | | | | -0.1 | | | | 0.3 | | | | 0.5 | | | | 0.7 | | | | | |
Potential GDP growth rate | | Baseline scenario | | | 0.0 | | | | -0.3 | | | | 0.0 | | | | 0.2 | | | | 0.4 | | | | | |
| | Lower growth scenario | | | 0.0 | | | | -0.5 | | | | -0.2 | | | | -0.1 | | | | 0.1 | | | | | |
| | | | | | | | | | | | | | | | | | | | | | | | | | |
| | Higher growth scenario | | | -2.4 | | | | -2.8 | | | | -2.3 | | | | -1.4 | | | | -0.4 | | | | | |
Output gap | | Baseline scenario | | | -2.0 | | | | -3.0 | | | | -2.6 | | | | -1.8 | | | | -1.0 | | | | | |
| | Lower growth scenario | | | -1.8 | | | | -3.2 | | | | -2.8 | | | | -2.2 | | | | -1.5 | | | | | |
| | | | | | | | | | | | | | | | | | | | | | | | | | |
| | Higher growth scenario | | | -3.9 | | | | -1.1 | | | | 0.3 | | | | 1.0 | | | | 1.2 | | | | | |
Net borrowing | | Baseline scenario | | | -3.9 | | | | -1.7 | | | | -0.5 | | | | -0.1 | | | | 0.0 | | | | | |
| | Lower growth scenario | | | -3.9 | | | | -2.0 | | | | -0.8 | | | | -0.7 | | | | -1.0 | | | | | |
| | | | | | | | | | | | | | | | | | | | | | | | | | |
| | Higher growth scenario | | | -2.9 | | | | 0.3 | | | | 1.5 | | | | 1.7 | | | | 1.4 | | | | | |
Cyclically adjusted budget balance | | Baseline scenario | | | -2.9 | | | | -0.2 | | | | 0.8 | | | | 0.8 | | | | 0.5 | | | | | |
| | Lower growth scenario | | | -2.9 | | | | -0.4 | | | | 0.6 | | | | 0.4 | | | | -0.3 | | | | | |
| | | | | | | | | | | | | | | | | | | | | | | | | | |
| | Higher growth scenario | | | 1.0 | | | | 4.1 | | | | 5.7 | | | | 6.4 | | | | 6.7 | | | | | |
Primary balance | | Baseline scenario | | | 1.0 | | | | 3.6 | | | | 4.9 | | | | 5.5 | | | | 5.7 | | | | | |
| | Lower growth scenario | | | 1.0 | | | | 3.3 | | | | 4.7 | | | | 5.0 | | | | 4.9 | | | | | |
| | | | | | | | | | | | | | | | | | | | | | | | | | |
| | Higher growth scenario | | | 2.0 | | | | 5.5 | | | | 6.8 | | | | 7.1 | | | | 6.9 | | | | | |
Cyclically adjusted primary balance | | Baseline scenario | | | 2.0 | | | | 5.1 | | | | 6.2 | | | | 6.4 | | | | 6.2 | | | | | |
| | Lower growth scenario | | | 2.0 | | | | 5.0 | | | | 5.9 | | | | 6.1 | | | | 5.6 | | | | | |
| | | | | | | | | | | | | | | | | | | | | | | | | | |
| | Higher growth scenario | | | 120.1 | | | | 122.1 | | | | 119.1 | | | | 114.2 | | | | 108.7 | | | | | |
Public debt | | Baseline scenario | | | 120.1 | | | | 123.4 | | | | 121.5 | | | | 118.2 | | | | 114.4 | | | | | |
| | Lower growth scenario | | | 120.1 | | | | 124.3 | | | | 123.2 | | | | 120.9 | | | | 118.7 | | | | | |
| | | | | | | | | | | | | | | | | | | | | | | | | | |
| 1) | The rounding to the first decimal point may cause inconsistency between the variables. |
Note: The structural balances for the alternative scenarios have been calculated by using the elasticity of the revenues (1.2) and of the
expenditure (-0.04) with respect to economic growth rather than the usual parameter expressing the sensitivity of the net borrowing to growth (0.5).
Due to the effect of higher (lower) growth, the debt-to-GDP ratio for 2012 decreases (increases) by about 1 percentage point of GDP vis-à-vis the baseline scenario. In the higher growth scenario, public debt in 2013 would amount to 119.1 per cent of GDP, with a reduction of 2.4 percentage points vis-à-vis the baseline scenario. In subsequent years, the debt-to-GDP ratio would continue to decrease rapidly, hovering around 108.7 per cent in 2015, vis-à-vis the 114.4 per cent set by the Government. By contrast, in the lower growth scenario, the debt-to-GDP ratio would decrease in 2013 but at a slower pace than in the baseline scenario, hitting 118.7 per cent at the end of the forecast period.
| | |
| | MINISTERODELL’ECONOMIAEDELLE FINANZE |
30 | | |
ECONOMICAND FINANCIAL DOCUMENT – ITALY’S STABILITY PROGRAMME
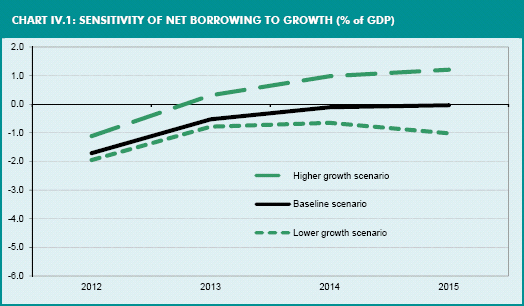
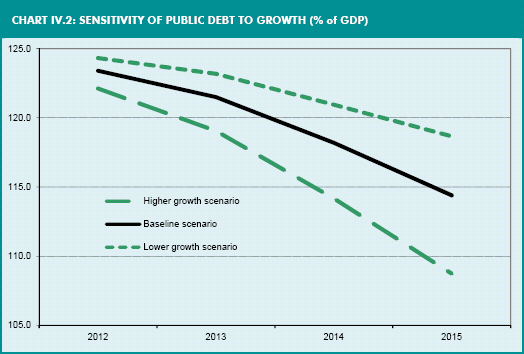
| | |
| MINISTERODELL’ECONOMIAEDELLE FINANZE | | |
| | 31 |
ECONOMICAND FINANCIAL DOCUMENT – ITALY’S STABILITY PROGRAMME
| IV.2 | SENSITIVITY TO INTEREST RATES |
This section describes the sensitivity of interest expenditure on government securities to fluctuations in interest rates.
The analysis is based on the current and future composition of the stock of negotiable government securities, which had risen by about 4 per cent between 31 December 2010 and 31 December 2011. By the end of December 2011, the total amount of negotiable government securities was composed of domestic securities, i.e. issued on the domestic market, accounting for 95.71 per cent, and foreign securities, i.e. issued on foreign markets in either euros or foreign currencies, accounting for the remaining 4.29 per cent.
Despite market turmoil, particularly in the second half of the year, there were no significant deviations from the pattern emerging in recent years in terms of the composition of debt, with reference to the component of negotiable government securities. It should be noted, in particular, that the reduction in outstanding short-term securities and variable-rate securities is the result of both a cautious strategy aimed at avoiding the addition of new maturities to those already scheduled for 2012, and market conditions for the CCT/CCTeu bonds which made it difficult to place any new issues as from August onward. At the same time, the fixed-rate BTP component increased, partly due to increased issuance for maturities up to 10 years (due to continuing demand over the entire year, and the additional momentum as of August due to the ECB’s market intervention)4. The reduction of the foreign component is the result of a perception of greater credit risk, which made it impossible to issue on foreign markets at competitive cost conditions. The fixed-rate component of domestic securities rose further, albeit only marginally, going from 73.18 per cent in 2010 to 73.89 per cent in 2011, while the variable-rate component declined from 19.70 per cent in 2010 to 18.14 per cent in 2011. A slight increase was also seen in European HICP-indexed securities, whose share went from 7.11 per cent in 2010 to 7.97 per cent in 2011.
The sensitivity to interest rates has been analysed on the basis of summary indicators which condense the above-mentioned strategy in debt management during 2011. As can be observed, exposure to refinancing and interest-rate risks slightly increased between 2010 and 2011, while remaining in line with levels reported in recent years (Chart IV.3). The overall average life of all government securities at 31 December 2011 was 6.99 years, thus declining slightly with respect to the 7.20-year average at 31 December 2010. Similarly, the financial duration at 31 December 2011 was 4.66 years, or below the 4.9-year duration for 2010. A comparable trend was seen for the Average Refixing Period5 (calculated only for government securities included in the domestic programme), which went from 5.98 years at the end of 2010 to 5.81 years at the end of 2011. The increase in risk exposure, albeit only modest, was inevitably caused by market conditions manifested during the second half of 2011; such conditions made it more difficult to place securities
| 4 | Despite numerous market tensions, the activity of issuing securities with maturities of 10 years or more with respect to total domestic issues was still robust in 2011, though scaled down somewhat with respect to 2010 (18.66 per cent in 2011 versus 21.17 per cent in 2010). |
| 5 | The Average Refixing Period (ARP) measures the average time interval over which debt coupons are reset. For zero-coupon or fixed coupon bonds, the ARP corresponds to the residual life of the security. For floating-rate securities, the ARP is the time remaining until the setting of the next coupon. |
| | |
| | MINISTERODELL’ECONOMIAEDELLE FINANZE |
32 | | |
ECONOMICAND FINANCIAL DOCUMENT – ITALY’S STABILITY PROGRAMME
with 15-/30-year maturities, as they had become more costly and more exposed to execution risk. Increases were made in 10-year issues, thereby partially mitigating the effects of the reduction in placements of longer term maturities.
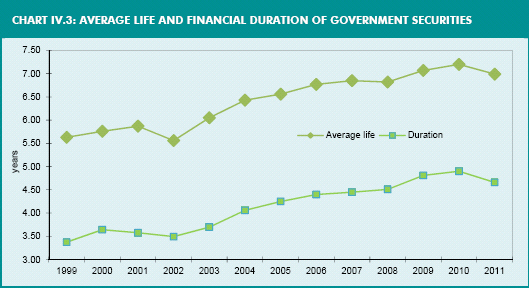
From the standpoint of sensitivity to interest rates, the latest trends in the structure of the debt were more than offset by the improvement in public finance conditions. The calculation made in March 2012 shows that if the yield curve experiences an immediate and permanent increase of one percentage point, the impact on the debt burden is equal to 0.19 points of GDP in the first year, 0.36 points of GDP in the second, 0.44 in the third and 0.54 points of GDP in the fourth. Such increase is transferred entirely to the cost of the debt after 5.81 years.
These results, which are slightly lower than those in the DEF 2011 (April 2011), are explained by the strong decline in the state sector borrowing requirement projected in the coming years vis-à-vis the estimates presented last year, and the fact that such decline counterbalances even the slower economic cycle over the horizon.
The General Government’s interest expenditure rose by around €7 billion in 2011, going from 4.6 per cent of GDP in 2010 to 4.9 per cent in 2011. The weighted average cost of Government securities upon issuance also rose by a conspicuous amount, going from 2.1 per cent in 2010 to 3.61 per cent in 2011 (Chart IV.4).
For successive years, using the rates implicit in the yield curve in the current market (end of March 2012), it is possible to project a gradual increase in general government’s interest expenditure, albeit to a lesser extent than that occurred between 2010 and 2011. The current shape of the yield curve suggests rates will also be rising on short-term maturities (where most of the debt coming due is to be refinanced), as an effect of an improvement in the macroeconomic outlook for coming years, but also as a result of the presence of a risk premium that tends to persist over time, without rapidly returning to the level where it stood before the Euro Area sovereign debt crisis. The trend as a ratio of GDP also tends to rise gradually by a limited extent, increasing the most in 2012 (due to the recession) and then climbing by a few tenths of one per cent per year as a ratio of GDP, reaching 5.8 per cent in 2015.
| | |
| MINISTERODELL’ECONOMIAEDELLE FINANZE | | |
| | 33 |
ECONOMICAND FINANCIAL DOCUMENT – ITALY’S STABILITY PROGRAMME
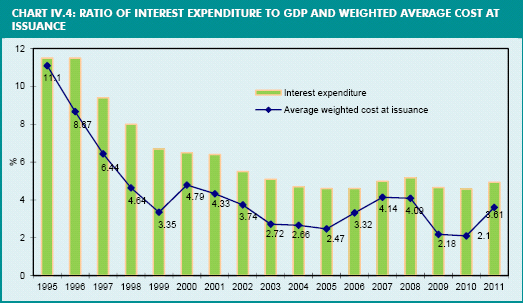
| | |
| | MINISTERODELL’ECONOMIAEDELLE FINANZE |
34 | | |
ECONOMICAND FINANCIAL DOCUMENT – ITALY’S STABILITY PROGRAMME
| V. | SUSTAINABILITY OF PUBLIC FINANCES |
| V.1 | THE IMPACT OF POPULATION AGEING ON PUBLIC EXPENDITURE |
The rapid ageing of the population is a process with inevitable socio-economic repercussions affecting, with a varying degree of intensity, all European countries. Even though the latest figures on birth-rates point to a gradual recovery in the number of births in recent years, this will not be sufficient to offset the general expansion of population of the older age cohorts produced by the sharp increase in both average age and life expectancy. The current demographic structure is expected to lead to a situation in which the older age cohorts will account for an increasing percentage of the population in the decades ahead. The working-age population should gradually contract, being offset only partially by the expected increase in immigrant flows. Against this backdrop, Italy’s population is expected to age more rapidly than elsewhere1 over the next 50 years. Notwithstanding this, thanks to reforms of the past 20 years and the restructuring of the pension system through Law no. 214 of 2011 (see box), the impact of population ageing on certain components of public spending, either directly or indirectly linked to demographic developments, is under control in the case of Italy.
The medium- and long-term projections of age-related public expenditure have been developed on the basis of methods and convergence assumptions agreed at an EU level2. However, the macroeconomic and demographic scenario has been revised over the medium-term so as to take into account the latest updates3.
On the basis of these assumptions, the rate of the average annual change in real productivity is projected to grow during the first part of the projection period, before converging to 1.54 per cent as of 2030. The rate of employment defined with reference to the 15-64 age bracket is expected to increase from 58.7 per cent in 2008 to 60.3 per cent
| 1 | Considering the baseline scenario developed by EUROSTAT in 2010, the old-age dependency ratio in the 20-64 age bracket was 33.3 per cent in 2010, one of the highest among the EU-27, and it is projected to reach 61.6 per cent in 2060. |
| 2 | The projections have been carried out using the medium-/long-term forecast models of the State’s General Accounting Office (RGS), on the basis of the assumptions agreed by the Working Group on Ageing of the Economic Policy Committee of the European Council (EPC-WGA). These assumptions also represent the starting point for the projections of age-related expenditures for the 2012 EPC-WGA baseline scenario (still to be finalised) which will be presented in the forthcoming publication of the second volume of the ‘2012 Ageing Report’, jointly prepared by the European Commission and EPC-WGA. |
| 3 | The projections for the 2012 Stability Programme are based on demographic assumptions of the EUROSTAT baseline scenario with 2010 as base year (EUROPOP 2010). The macroeconomic assumptions of the baseline scenario are those agreed by the EPC-WGA and contained in the first volume of the 2012 Ageing Report published in September 2011. However, the macroeconomic projections for the 2012 Stability Programme are somewhat different from the EPC-WGA baseline scenario, being generally more conservative, especially for the near- and medium-term projections and regarding the assumptions linking the initial figures to the structural convergence values. More specifically, the macroeconomic projections have been updated over the near term to incorporate national accounts data for 2010 and 2011. For the 2012-2015 period, the projections include the macroeconomic outlook of the 2012 Stability Programme, which has been revised significantly downward vis-à-vis the point of departure of the EPC- WGA baseline projections represented by the outlook of the European Commission’s Spring 2011 forecast. For the medium and long term, the macroeconomic projections fully take into account the structural assumptions agreed upon for the EPC-WGA baseline scenario. However, the link between short- and long-term trends occurs through a realignment, over several years, of the differences in unemployment and participation rates that are reported for 2015. |
| | |
| MINISTERODELL’ECONOMIAEDELLE FINANZE | | |
| | 35 |
ECONOMICAND FINANCIAL DOCUMENT – ITALY’S STABILITY PROGRAMME
in 20604. As a result, the real GDP growth rate will reach, on average, 1.45 per cent during the 2015-2060 period. Finally, the GDP deflator and the rate of inflation are assumed to be constant and equal to 2.0 per cent starting from 2016.
TABLE V.1: PUBLIC EXPENDITURE FOR PENSIONS, HEALTHCARE, LONG-TERM CARE, EDUCATION AND UNEMPLOYMENT COMPENSATION (2005-2060)1
| | | | | | | | | | | | | | | | | | | | | | | | | | | | | | | | | | | | | | | | | | | | | | | | |
| | | 2005 | | | 2010 | | | 2015 | | | 2020 | | | 2025 | | | 2030 | | | 2035 | | | 2040 | | | 2045 | | | 2050 | | | 2055 | | | 2060 | |
| | | | | | | | | | | | | | | | | | % of GDP | | | | | | | | | | | | | | | | |
Total expenditure (1) | | | 47.9 | | | | 50.6 | | | | 48.7 | | | | 47.2 | | | | 45.3 | | | | 43.9 | | | | 43.3 | | | | 42.7 | | | | 41.9 | | | | 40.6 | | | | 38.6 | | | | 36.3 | |
of which: Age-related expenditure (1) | | | 26.0 | | | | 28.4 | | | | 28.0 | | | | 27.6 | | | | 27.2 | | | | 27.3 | | | | 28.1 | | | | 28.9 | | | | 29.5 | | | | 29.5 | | | | 29.0 | | | | 28.4 | |
Pension expenditure | | | 13.9 | | | | 15.3 | | | | 15.6 | | | | 15.2 | | | | 14.8 | | | | 14.8 | | | | 15.3 | | | | 15.8 | | | | 16.0 | | | | 15.7 | | | | 15.0 | | | | 14.4 | |
Healthcare expenditure | | | 6.7 | | | | 7.3 | | | | 6.9 | | | | 7.0 | | | | 7.2 | | | | 7.4 | | | | 7.6 | | | | 7.8 | | | | 8.0 | | | | 8.1 | | | | 8.2 | | | | 8.2 | |
of which: Long-term care component | | | 0.8 | | | | 0.9 | | | | 0.8 | | | | 0.8 | | | | 0.8 | | | | 0.9 | | | | 0.9 | | | | 1.0 | | | | 1.1 | | | | 1.1 | | | | 1.2 | | | | 1.2 | |
Long-term care expenditures | | | 0.8 | | | | 1.0 | | | | 1.0 | | | | 1.1 | | | | 1.1 | | | | 1.1 | | | | 1.2 | | | | 1.3 | | | | 1.4 | | | | 1.5 | | | | 1.6 | | | | 1.7 | |
Education expenditures | | | 4.2 | | | | 4.1 | | | | 3.9 | | | | 3.8 | | | | 3.6 | | | | 3.5 | | | | 3.5 | | | | 3.5 | | | | 3.6 | | | | 3.7 | | | | 3.7 | | | | 3.6 | |
Unemployment benefits | | | 0.4 | | | | 0.7 | | | | 0.6 | | | | 0.6 | | | | 0.5 | | | | 0.5 | | | | 0.5 | | | | 0.5 | | | | 0.5 | | | | 0.5 | | | | 0.5 | | | | 0.5 | |
Interest expenditure | | | 4.7 | | | | 4.6 | | | | 5.8 | | | | 4.6 | | | | 3.2 | | | | 1.7 | | | | 0.2 | | | | -1.2 | | | | -2.5 | | | | -3.8 | | | | -5.3 | | | | -7.0 | |
Total revenues | | | 43.3 | | | | 46.0 | | | | 48.7 | | | | 48.7 | | | | 48.7 | | | | 48.6 | | | | 48.6 | | | | 48.6 | | | | 48.6 | | | | 48.6 | | | | 48.6 | | | | 48.6 | |
of which: property income | | | 0.6 | | | | 0.6 | | | | 0.6 | | | | 0.6 | | | | 0.6 | | | | 0.5 | | | | 0.5 | | | | 0.5 | | | | 0.5 | | | | 0.5 | | | | 0.5 | | | | 0.5 | |
| | | | | | | | | | | |
ASSUMPTIONS | | | | | | | | | | | | | | | | | | | | | | | % | | | | | | | | | | | | | | | | | | | | | |
Labour productivity growth rate | | | 0.8 | | | | 2.7 | | | | 0.2 | | | | 0.9 | | | | 1.5 | | | | 1.5 | | | | 1.5 | | | | 1.5 | | | | 1.5 | | | | 1.5 | | | | 1.5 | | | | 1.5 | |
Real GDP growth rate | | | 0.9 | | | | 1.8 | | | | 1.2 | | | | 1.8 | | | | 2.0 | | | | 1.4 | | | | 1.2 | | | | 1.2 | | | | 1.3 | | | | 1.4 | | | | 1.5 | | | | 1.4 | |
Male participation rate (20-64) (2) | | | 79.2 | | | | 78.5 | | | | 77.8 | | | | 78.1 | | | | 78.7 | | | | 78.4 | | | | 78.4 | | | | 78.7 | | | | 79.1 | | | | 79.2 | | | | 79.2 | | | | 79.2 | |
Female participation rate (20-64) (2) | | | 53.6 | | | | 54.6 | | | | 56.2 | | | | 58.2 | | | | 58.9 | | | | 59.1 | | | | 59.4 | | | | 59.8 | | | | 60.0 | | | | 60.2 | | | | 60.2 | | | | 60.2 | |
Total participation rate (20-64) (2) | | | 66.4 | | | | 66.5 | | | | 67.0 | | | | 68.2 | | | | 68.8 | | | | 68.9 | | | | 69.0 | | | | 69.4 | | | | 69.8 | | | | 69.9 | | | | 70.0 | | | | 70.0 | |
Unemployment rate | | | 7.7 | | | | 8.4 | | | | 8.6 | | | | 7.8 | | | | 7.0 | | | | 6.9 | | | | 6.9 | | | | 6.9 | | | | 6.9 | | | | 6.9 | | | | 6.9 | | | | 6.8 | |
Population of age 65 and over/total population (3) | | | 19.5 | | | | 20.2 | | | | 21.4 | | | | 22.3 | | | | 23.5 | | | | 25.5 | | | | 27.8 | | | | 29.8 | | | | 31.1 | | | | 31.5 | | | | 31.6 | | | | 31.7 | |
Old-age dependency ratio (age 65 and over/[20-64]) (3) | | | 31.7 | | | | 33.3 | | | | 35.7 | | | | 37.6 | | | | 40.1 | | | | 44.5 | | | | 50.3 | | | | 56.0 | | | | 59.8 | | | | 61.2 | | | | 61.5 | | | | 61.6 | |
| (1) | The rounding to the first decimal may cause inconsistencies between the figures presented in the table. |
| (2) | As of 2016, the value of the rate of participation rate is the same as the one underlying the EPC-WGA scenario for projecting the components of public age-related expenditures for the 2012 (Ageing Report). However, with respect to the original EPC-WGA figure obtained with the cohort simulation model (CSM), the projection values underlying the 2012 Stability Programme are reduced by 2.3 per cent, which is the difference between employment levels actually incorporated into the GDP forecast underlying the EPC-WGA baseline scenario, and the employment levels provided by the CSM. This inconsistency within the EPC-WGA baseline scenario stems from the overlap of the two employment forecasts for the 2011-2015 period: that based on the 2011 spring forecast, extrapolated to 2015, and that obtained by the CSM, which is 2.3 per cent higher from 2015 through the end of the projection period. |
| (3) | Source: EUROSTAT, baseline scenario with base year of 2010. |
| 4 | As it is conceived, the EPC-WGA’s 2012 baseline macroeconomic scenario combines two sets of projections for the employment variables: those produced by the European Commission in the 2011 Spring Forecast, which cover the 2011-2012 period and are extended to 2015 through an extrapolation based on the agreed method for computing potential output, and the long-term projections obtained with the so-called Cohort Simulation Model (CSM). The method used for linking the short- and long-term projections produces, for all European countries, a ‘jump’ in growth rates between 2015 and 2016. The magnitude and the sign of this jump vary from country to country. In Italy’s case, the ‘jump’ in growth rates translates into a 2.3 per cent reduction of employment levels used for projecting GDP vis-à-vis the figures that would have been obtained by using the CSM. As a result, starting in 2016, the values of the underlying participation rates have been adjusted so as to be consistent with the values of the short term projections resulting 2.3 per cent below those produced in the EPC-WGA scenario. |
| | |
| | MINISTERODELL’ECONOMIAEDELLE FINANZE |
36 | | |
ECONOMICAND FINANCIAL DOCUMENT – ITALY’S STABILITY PROGRAMME
The projections of age-related expenditures reported in Table V.1 have been updated in line with the legislative framework in place as of April 2012. The projections of pension expenditure incorporate the financial effects of the measures5 adopted in 2011 and, in particular, the reform approved in December 2011 (Law no. 214/2011) (see box).
The projections of healthcare expenditure for the years 2012-2015 take into consideration the financial effects of the cost-containment measures enacted on the basis of previous legislation for the 2012-2013 period6 and their expected impact in the years thereafter7. The most recent changes to legislation covering unemployment benefits8 and education9 are also included in the projections.
Overall, age-related expenditure should increase by approximately 2.4 points of GDP during the 2005-2060 period (Table V.1). However, most of the increase is concentrated in 2008-2009, and is mainly attributable to the contraction of GDP due to the crisis. In the years subsequent to 2010, age-related expenditure falls slightly and then, in 2027, in correspondence with the retirement of the baby-boom generation, it starts to rise again until 2044-2050, hovering around 29.5 per cent of GDP. Toward the end of the projection horizon, age-related expenditure falls significantly and converges (as a percentage of GDP) to levels similar to those experienced in 2010.
After an initial phase of substantial stability at around 15.7 per cent of GDP, pension expenditure begins to fall significantly as of 2015, mainly due to the effects of the recent reform, totalling 14.7 per cent of GDP in 2028. Thereafter, given the effect of retirement of the baby-boom generation, pension expenditure starts to grow again to reach a high of 16.0 per cent of GDP in 2045. In the final years of the forecast horizon, pension expenditure decreases rapidly until reaching a level of 14.4 per cent of GDP in 2060.
| 5 | The projection of pension expenditure incorporates the financial effects of the reforms adopted in 2011 and, notably, the measures provided by Decree-Law No. 98/2011 (converted with amendments by Law No. 111/2011), Decree-Law No. 138/2011 (converted with amendments by Law No. 148/2011) and Decree-Law No. 201/2011 (converted with amendments by Law No. 214/2011). |
| 6 | Decree-Law No. 112/2008, as redesigned following the approval of the 2010-2012 Health Care Pact (ratified by the 2010 Budget Law). |
| 7 | In particular, healthcare projections take into account the savings on expenditure for pharmaceuticals administered in hospitals and the wage freeze (for the period 2010-2012 and without any possibility for subsequent recovery) for employees of the National Healthcare System (NHS) and the prohibition against paying total compensation during the 2011-2013 period that exceeds that paid in 2010, except for the allowance deriving from the deferral in renewing labour contracts (indennità di vacanza contrattuale) (Decree-Law No. 78/2010, converted by Law No. 122/2010). The projections also incorporate the additional measures (Decree-Law No. 98/2011 converted by Law No. 111/2011) approved in 2011 for the containment of expenditure for hospitals’ pharmaceuticals, for purchases of goods and services and medical devices, and the extension to 2014 of the salary freeze for NHS staff as already provided by previous law (Decree-Law No. 78/2010 converted by Law No. 122/2010). Finally, the projections include measures for increasing NHS revenues following the introduction of co-payment on pharmaceuticals and other healthcare provisions. |
| 8 | The projection of unemployment benefits incorporate, for 2012 only, the refunding of special wage supplementation schemes (ammortizzatori sociali in deroga) (Law No. 183/2011). Under current legislation, these subsidies will not be refinanced as of 2013. |
| 9 | The projections of education expenditure include the savings derived from the process of streamlining the work force in public schools, with the aim of reducing the gap in the student/teacher ratio vis-à-vis other European countries (Decree-Law No. 112/2008 converted by Law No. 133/2008), as well as the effects of the measures that provide, inter alia, for the freeze of both contractual procedures and the automatic wage-indexing mechanism (Decree-Law No. 78/2010, converted by Law No. 122/2010 and Decree-Law No. 98/2011 converted by Law No. 111/2011). |
| | |
| MINISTERODELL’ECONOMIAEDELLE FINANZE | | |
| | 37 |
ECONOMICAND FINANCIAL DOCUMENT – ITALY’S STABILITY PROGRAMME
The projection of healthcare expenditure is carried out according to the methodology used for the reference scenario which takes into consideration not only the effects of ageing, but also the consequences caused by other explicative factors10. After initially declining because of spending curtailment, the ratio of healthcare expenditure to GDP shows a growing profile, hovering around 8.2 per cent during the 2050-2060 period.
Expenditure for long-term care11 shows an upward trend for the whole projection period, amounting to 1.7 per cent of GDP in 2060. The ratio of education expenditure12 to GDP presents a significant reduction during the initial years of the projection horizon as a result of measures to reduce spending on staff. Thereafter, the ratio continues to decrease gradually for another 20 years due to the structural reduction of the school-age population. The ratio starts to rise again modestly after 2050, hovering around 3.6 per cent of GDP in 2060.
Unemployment benefits as a ratio of GDP are projected to decrease from 0.7 per cent in 2010 to 0.6 per cent in 2015, staying constant at around 0.5 per cent of GDP for the remainder of the projection period.
| 10 | In general, such explicative factors include the assumptions about the years that elderly persons can count on living in good health and the trend of per capita GDP. In this regard, the reference scenario assumes, for the acute component of healthcare expenditure, that 50 per cent of the increase in life expectancy is spent in good health and that the trend of the unit cost is correlated to per capita GDP with an elasticity equal to more than 1.0 (but converging on a linear basis during the projection period, going from an initial value of 1.1 to 1.0 in 2060). With regard to the long-term care (LTC) component of healthcare expenditure, the reference scenario incorporates an assumption similar to that for the acute component of healthcare expenditure. Nonetheless, the trend of the unit cost is correlated to GDP per hours worked, and the elasticity of the unit cost to GDP per person employed is equal to 1.0 for the entire the forecast period. |
| 11 | Public expenditure for long-term care consists of cash benefits (around 80 per cent) and services provided at a local level (20 per cent). The projection of the ratio of expenditure to GDP for the latter component was carried out in line with the assumptions of the reference scenario. For the cash benefits, the projections were developed in line with methods agreed by the EPC-WGA, with the amount of the benefit correlated to the trend of per capita GDP. However, vis-à-vis the methodology of the EPC-WGA, the projections are differentiated by the fact that they take into account the age distribution of the persons receiving the benefits which, if not considered, would cause an underestimation of the trend of such expenditures. |
| 12 | The definition of education expenditure encompasses the International Standard Classification of Education (ISCED) levels of education 1-6. Pre-primary school and life-long learning are thus excluded from the aggregate. |
| | |
| | MINISTERODELL’ECONOMIAEDELLE FINANZE |
38 | | |
ECONOMICAND FINANCIAL DOCUMENT – ITALY’S STABILITY PROGRAMME
THE REFORM OF THE PENSION SYSTEM
The reform of the pension system enacted with Law no. 214/2011 produces positive effects for Italy’s public finance which, net of the fiscal effects generated, are equal to approximately €7.3 billion through 2014 and almost €22 billion through 2020. The principal measures include: the complete freeze in 2012 and 2013 on the indexing of pensions that are more than three times above the minimum provision (€3.1 billion of savings through 2014), a comprehensive revision of the pension system with new rules for early retirement (€2.9 billion, which increases to €15.6 billion of savings through 2020), and an increase in the rate of pension contributions for self-employed workers, from 20 per cent to 24 per cent through 2018 (€1.5 billion to €3.2 billion in 2020).
The new rules introduced by the reform significantly change the pension system, contributing to improving its sustainability in the medium/long term and guaranteeing greater equity among generations.
The reform of the pension system establishes the extension of the contributions-based system to all workers as of 2012, including those who, on the basis of previous legislation, would have received a pension calculated on the earnings-related system (namely, the workers who had accrued more than 18 years of contributions by 31 December 1995).
In line with the regulatory frameworks of most European countries, the reform confirms two well-defined channels for retirement: 1) old age retirement based on, as a general rule, at least 20 years of contributions and an age requirement set by law and modified in line with changes in life expectancy; 2) early retirement permitted at an age below that for old age retirement, but with a longer period of contributions. The requisites for early retirement are also adjusted in relation to life expectancy.
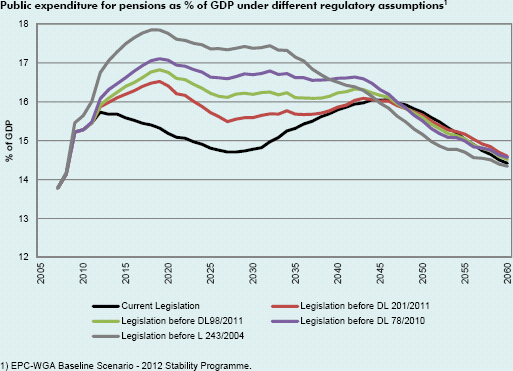
| | |
| MINISTERODELL’ECONOMIAEDELLE FINANZE | | |
| | 39 |
ECONOMICAND FINANCIAL DOCUMENT – ITALY’S STABILITY PROGRAMME
More specifically, with regard to old age pensions, the reform provides for accelerating the increase in the statutory retirement age for the female workers in the private sector so as to align their eligibility requirement with that in force for the aggregate of other workers in general .
Thanks to the abolition of the so-called ‘windows’ mechanism, the law establishes that, as from 2012, the age requirement for old age retirement increases from 65 to 66 for women in the public sector and for all men, regardless of whether they are self-employed, or employees of the public or private sector.
For female workers in the private sector, the statutory requirement age increases from 60 to 62 (63 years, 6 months for self-employed female workers) as of 2012. Additional increases are foreseen in subsequent years so as to align their age requirement with that for all workers by 1 January 2018, the year in which the age requirement for old age pensions will be the same for all categories of workers. As of 2018 and in line with the statutory age requirement for old age pensions, the law also provides for a one-year increase in the minimum age requirement for obtaining old age social allowances. Finally, Law no. 214/2011 establishes that, in order to be entitled to an old age pension, all workers hired after 1996, i.e. those who have participated only in the contribution-based system, must have accumulated at least 20 years of contributions and must be eligible for a pension at least equal to an amount corresponding to 1.5 times the old age allowance13.
The reform of the pension system also provides for a major restructuring of the rules applicable to early retirement. The joint requisite of age and years of contributions (the so-called ‘quotas’ system) and the so-called ‘windows’ have been abolished. Early retirement will thus be possible only through two distinct rules respectively applicable to workers under the earnings-related and mixed system and those under the contributions-based system. Accordingly, as from 2012, all workers will be able to retire earlier, regardless of their age, if they have accrued at least 42 years and one month of contributions (for men) or at least 41 years and one month (for women). Such contribution requirements will increase by one month in 2013 and an additional month in 2014 14. For workers under the contributions-based system, the law foresees another option to access early retirement provided that they have reached an age three years lower than the age required for old age retirement, accrued at least 20 years of contributions and are eligible for pension benefits amounting to at least 2.8 times the old age allowance15.
In addition, starting in 2013, all the requirements for old age and early retirement (including those for obtaining social allowances), namely, the age and the number of contributory years, will be indexed to changes in life expectancy as measured by ISTAT with reference to the three preceding years. The adjustment of such requirements to changes in life expectancy will occur every three years and, following the adjustment after 2019, every two years, on the basis of a purely administrative
| 13 | Equal to approximately €644 per month in 2012 and re-valued annually on the basis of the average five-year change in nominal GDP, as calculated by ISTAT with reference to the preceding five-year period. In the event workers hired after 1996 attain retirement age four years later with respect to the age required by law for entitlement to old age retirement (in 2012, such requirement would be 66+4 = 70, but it should be noted that this eligibility criterion is also moving in line with changes in life expectancy), old age retirement will be possible with 5 years of contributions and without a minimum cap on the amount of the pension benefit. |
| 14 | In order smooth the transition to the new rules, the reform provides certain exceptions. In particular, special rules are to apply to workers in the private sector who have met the eligibility requirements by 2012 (on the basis of the legislation in force before the reform). For those, retirement is not allowed at an age below 64. |
| 15 | Equal to approximately €1,200 per month in 2012 and re-valued annually on the basis of the average five-year change in nominal GDP, calculated by ISTAT, with reference to the preceding five-year period. |
| | |
| | MINISTERODELL’ECONOMIAEDELLE FINANZE |
| 40 | | |
ECONOMICAND FINANCIAL DOCUMENT – ITALY’S STABILITY PROGRAMME
procedure16. The most recent demographic projections (ISTAT baseline scenario with 2011 as base year) suggest that the statutory age requirement for old age pensions will be 67 for all workers as early as 2019, resulting from the adjustment to changes in life expectancy. In any event, should the 67-year threshold not be reached due to insufficient cumulative increases in life expectancy, the reform provides for a ‘safeguard clause’ (previously introduced by Law No. 183/2011) that guarantees that the statutory retirement age will be lifted to 67 for all workers in 2021, by virtue of a purely administrative procedure. Furthermore, as of 2013, as a result of the increase in the age requirements, the calculation of the transformation coefficients17 at the time of retirement is extended up to the age of 70.
Given overall reformist interventions implemented since 2004 and completed with Law No. 214/2011, the average retirement age (taking into consideration both the old age and early retirement) increases from 60-61 in the 2006-2010 period to approximately 64 in 2020, 67 in 2040 and then to around 68 in 2050. In the medium term, the reform of the pension system will produce substantial savings in pension expenditure with savings amounting approximately to 0.1 percentage points of GDP in 2012, rising to around 1.2 percentage points in 2020. Thereafter, the savings should decrease to 0.8 percentage points of GDP in 2030, 0.4 percentage points in 2035 and become nil in 2045. Overall, the cumulative savings derived from the reform process implemented since 2004 amount to approximately 60 percentage points of GDP through the end of 2050. Approximately two-thirds of such savings are due to previous interventions, whereas one-third stems from the reform recently introduced with Law No. 214/2011.
Finally, the tables below outline the minimum age and contributions requirements for entitlement to an old age and early retirement pensions as well as for social allowances, calculated on the basis of the expected trend in life expectancy as measured by the ISTAT baseline demographic scenario with 2011 as base year. In such scenario, the adjustment of pension requirement to changes in life expectancy entails a cumulative increase in the age retirement of four years through 2050 (and 5 years, three months if calculated to 2065). The actual gains in life expectancy will obviously be those estimated ex post by ISTAT in accordance with the procedures defined by law. The adjustment of pension entitlement criteria to changes in life expectancy represents an additional tool for strengthening the mechanisms built into the Italian pension system for neutralising the financial effects of demographic transition. Another important mechanism already incorporated in the pension system is represented by the periodic updating of the transformation coefficients. Besides generating significant fiscal savings, adjustment of the age requirement to changes in life expectancy also improves social adequacy as it entails an improvement in the level of pension benefits obtained through the contributions-based system vis-à-vis those that would have been obtained on the basis of previous legislation.
| 16 | As provided by the law, the adjustment of pension requirements coming into effect in 2013 has already been adopted, with managerial decree of 6 December 2011, published in the Official Journal of the Republic of Italy on 13 December 2011, twelve months earlier than the effective application of such provision. Such adjustment is equal to three months, as the legislative provision (Article 12, Paragraph 12-ter of the cited Decree-Law no. 78/2010, converted with amendment with Law No. 122/2010) expressly determined that the first adjustment not exceed such limit, even if the increase in life-expectancy in the preceding three years were to be greater (as was actually the case). In effect, the increase in life expectancy at age 65, as measured by ISTAT in relation to the average of the resident population, was 5 months between 2007 and 2010. |
| 17 | Adjustment of the transformation coefficients is to be undertaken with the same periodicity as that set out for adjustment of the eligibility criteria due to changes in life expectancy. |
| | |
| MINISTERODELL’ECONOMIAEDELLE FINANZE | | |
| | 41 |
ECONOMICAND FINANCIAL DOCUMENT – ITALY’S STABILITY PROGRAMME
| | | | | | | | | | |
Age requirement for old age retirement (Contributions must be made for a minimum of 20 years) |
| | | | | | | | | | |
| | | Male employees and self-employed | | Female employees in the public sector | | Female employees in the private sector | | Self-employed females in the private sector | | Social allowance |
| Year | | Age (*) | | Age (*) | | Age (*) | | Age (*) | | Age requirement |
| 2012 | | 66 | | 66 | | 62 | | 63, 6 months | | 65 |
| 2013 | | 66, 3 months | | 66, 3 months | | 62, 3 months | | 63, 9 months | | 65, 3 months |
| 2014 | | 66, 3 months | | 66, 3 months | | 63, 9 months | | 64, 9 months | | 65, 3 months |
| 2015 | | 66, 3 months | | 66, 3 months | | 63, 9 months | | 64, 9 months | | 65, 3 months |
| 2016 | | 66, 7 months | | 66, 7 months | | 65, 7 months | | 66, 1 month | | 65, 7 months |
| 2017 | | 66, 7 months | | 66, 7 months | | 65, 7 months | | 66, 1 month | | 65, 7 months |
| 2018 | | 66, 7 months | | 66, 7 months | | 66, 7 months | | 66, 7 months | | 66, 7 months |
| 2019 | | 67 | | 67 | | 67 | | 67 | | 67 |
| 2020 | | 67 | | 67 | | 67 | | 67 | | 67 |
| 2021 | | 67, 3 months | | 67, 3 months | | 67, 3 months | | 67, 3 months | | 67, 3 months |
| 2025 | | 67, 9 months | | 67, 9 months | | 67, 9 months | | 67, 9 months | | 67, 9 months |
| 2030 | | 68, 2 months | | 68, 2 months | | 68, 2 months | | 68, 2 months | | 68, 2 months |
| 2035 | | 68, 10 months | | 68, 10 months | | 68, 10 months | | 68, 10 months | | 68, 10 months |
| 2040 | | 69, 2 months | | 69, 2 months | | 69, 2 months | | 69, 2 months | | 69, 2 months |
| 2045 | | 69, 8 months | | 69, 8 months | | 69, 8 months | | 69, 8 months | | 69, 8 months |
| 2050 | | 70 | | 70 | | 70 | | 70 | | 70 |
| 2055 | | 70, 6 months | | 70, 6 months | | 70, 6 months | | 70, 6 months | | 70, 6 months |
| 2060 | | 70, 10 months | | 70, 10 months | | 70, 10 months | | 70, 10 months | | 70, 10 months |
| 2065 | | 71, 3 months | | 71, 3 months | | 71, 3 months | | 71, 3 months | | 71, 3 months |
| (*) | According to the Law, contributions for being entitled to a pension must be accrued for a minimum of 20 years. In addition, workers hired after 1 January 1996 whose pension is entirely computed under the contribution-based system must be able to receive a minimum level of pension which in 2012 should approximately equal to €644 per month (1.5 times the social allowance for 2012) re-valued on the basis of GDP. |
It should be noted that age and contributions requirements will be adjusted in line with changes in life expectancy, including after 2065. In any event, actual entitlement requirements will be determined on the basis of the increase in life expectancy as ascertained ex post by ISTAT according to the timing and procedure established by the law.
Note: ISTAT baseline scenario, with base year of 2011
Requirements for early retirement
| | | | | | |
| | | Male employees in the public and private sectors and self- employed males | | Female employees in the public and private sectors and self-employed females | | Employees in the public and private sector and self-employed workers: additional option for workers hired after 1 January 1996 |
| | | Years of contributions regardless of age | | Years of contributions regardless of age | | Minimum retirement age if a minimum of 20 years of contributions has been made, with
minimum pension equal to approximately €1,200 per month in 2012 (2.8 times’ the social allowance in 2012) re-valued on the basis of the trend of nominal GDP (for workers hired after 1 January 1996) |
| | | |
| 2012 | | 42 years, 1 month | | 41 years, 1 month | | 63 years |
| | | |
| 2013 | | 42 years, 5 months | | 41 years, 5 months | | 63 years, 3 months |
| | | |
| 2014 | | 42 years, 6 months | | 41 years, 6 months | | 63 years, 3 months |
| | | |
| 2015 | | 42 years, 6 months | | 41 years, 6 months | | 63 years, 3 months |
| | | |
| 2016 | | 42 years, 10 months | | 41 years, 10 months | | 63 years, 7 months |
| | | |
| 2017 | | 42 years, 10 months | | 41 years, 10 months | | 63 years, 7 months |
| | | |
| 2018 | | 42 years, 10 months | | 41 years, 10 months | | 63 years, 7 months |
| | | |
| 2019 | | 43 years, 3 months | | 42 years, 3 months | | 64 years |
| | | |
| 2020 | | 43 years, 3 months | | 42 years, 3 months | | 64 years |
| | | |
| 2021 | | 43 years, 6 months | | 42 years, 6 months | | 64 years, 3 months |
| | | |
| 2025 | | 44 years | | 43 years | | 64 years, 9 months |
| | | |
| 2030 | | 44 years, 5 months | | 43 years, 5 months | | 65 years, 2 months |
| | | |
| 2035 | | 45 years, 1 month | | 44 years, 1 month | | 65 years, 10 months |
| | | |
| 2040 | | 45 years, 5 months | | 44 years, 5 months | | 66 years, 2 months |
| | | |
| 2045 | | 45 years, 11 months | | 44 years, 11 months | | 66 years, 8 months |
| | | |
| 2050 | | 46 years, 3 months | | 45 years, 3 months | | 67 years |
| | | |
| 2055 | | 46 years, 9 months | | 45 years, 9 months | | 67 years, 6 months |
| | | |
| 2060 | | 47 years, 1 month | | 46 years, 1 month | | 67 years, 10 months |
| | | |
| 2065 | | 47 years, 6 months | | 46 years, 6 months | | 68 years, 3 months |
It should be noted that age and contribution requirements will be adjusted in line with changes in life expectancy, including after 2065. In any event, actual entitlement requirements will be determined on the basis of the increase in life expectancy as ascertained ex post by ISTAT according to the timing and procedure established by the law.
Note: ISTAT baseline scenario, with base year of 2011.
| | |
| | MINISTERODELL’ECONOMIAEDELLE FINANZE |
42 | | |
ECONOMICAND FINANCIAL DOCUMENT – ITALY’S STABILITY PROGRAMME
On the basis of long-term demographic and macroeconomic trends, and taking into consideration the projections of age-related expenditures described in the previous section (Table V.1), the sustainability of public finances is assessed both through the projection of the debt-to-GDP ratio over the 2016-2060 period, and through the computation of several sustainability indicators, such as the sustainability gaps (S1 and S2) and the required primary balance (RPB)18.
The debt-to-GDP ratio and the structural primary surplus, net of the one-off measures indicated for 2015, represent the starting point for the exercise. It is also assumed that the real rate of interest (3.0 per cent per year) is kept constant over the entire forecast period, while the structural primary surplus moves according to the changes in age-related expenditure and property income19.
The results of the simulation with regard to the baseline scenario show a decreasing trend of the debt-to-GDP ratio over the entire forecast period. In comparison with the previous Stability Programme, the initial level of the debt-to-GDP ratio is higher, due mainly to Italy’s contributions to financial programmes in support of Greece and the EFSF and ESM which, in 2012, account for more than 3 percentage points of GDP. However, rapid convergence to the threshold of 60 per cent of GDP is achieved through a structural primary surplus that is higher than the figure reported in the 2011 Stability Programme. Accordingly, the debt drops below the threshold of 60 per cent of GDP as early as 2025, one year earlier than the date indicated in the 2011 Stability Programme.
| 18 | S1 measures the permanent adjustment of the structural primary balance (as a percentage of GDP) needed for achieving a debt level of 60 per cent of GDP in 2060. Instead, S2 measures the permanent adjustment of the structural primary balance needed so that the pattern of public debt fulfils the inter-temporal budget constraint over an infinite time horizon. Finally, the required primary balance (RPB) measures the average primary surplus during the first five years of the projection period (in this case, 2015 to 2019) consistent with the adjustment suggested by the value of S2. The indicators S1 and S2 may also be broken down into sub-components that provide useful information about the origin and the timing of the fiscal adjustments needed to guarantee the sustainability of the debt over the long term. For a more thorough explanation of the indicators, see Annex I of the ‘The Long Term Sustainability of Public Finances – A report by the Commission services’, European Economy n. 4/2006. |
| 19 | Property income corresponds to investment income (bonds and stocks) and annuities from ownership of natural resources. The long-term trend of such income for the 2012-2060 period is projected on the basis of the methodology agreed at the level of the EPC-WGA. |
| | |
| MINISTERODELL’ECONOMIAEDELLE FINANZE | | |
| | 43 |
ECONOMICAND FINANCIAL DOCUMENT – ITALY’S STABILITY PROGRAMME
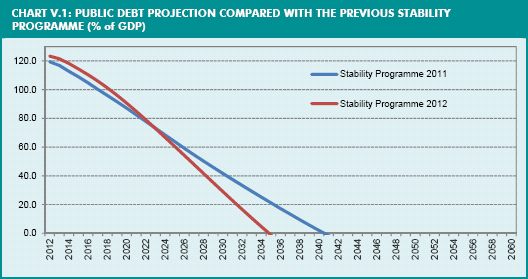
Even though the updated method for projecting the GDP growth rate over the long term incorporates an average downward revision of 0.1 per cent over the 2015-2060 period, the pattern of age-related expenditure is relatively stable compared to the figures reported in the 2011 Stability Programme as the decrease in pension expenditure due to the pension reform (Law No. 214/2011) has been, to some extent, offset by an increase in healthcare and long-term care expenditures.
As the value of the two sustainability gaps is negative in both cases, it follows that the fiscal consolidation planned for 2015 would be more than sufficient to ensure sustainable public finances over the long term. This result is confirmed by the required primary balance which, at a value of 2.3 per cent, is lower than the primary surplus planned for 2015.
Compared with the 2011 Stability Programme, both S1 and S2 improve significantly. However, in both cases, a change in composition between the respective components of the sustainability gap is witnessed which leads to an improvement, for both indicators, of roughly 1.0 percentage point in the value of the initial budget conditions, whereas the contribution of the cost of ageing remains virtually unchanged with respect to estimates published last year.
TABLE V.2: LONG-TERM SUSTAINABILITY INDICATORS
| | | | | | | | | | | | |
| | | Sustainability Indicators | |
| | | S1 | | | S2 | | | RPB | |
Value | | | -3.3 | | | | -4.0 | | | | 2.3 | |
of which: | | | | | | | | | | | | |
Initial budgetary position | | | -4.4 | | | | -4.4 | | | | — | |
Debt requirement in 2060 | | | 0.8 | | | | — | | | | — | |
Long-term changes in the primary balance | | | 0.2 | | | | 0.3 | | | | — | |
| | |
| | MINISTERODELL’ECONOMIAEDELLE FINANZE |
44 | | |
ECONOMICAND FINANCIAL DOCUMENT – ITALY’S STABILITY PROGRAMME
Despite the deterioration of the initial conditions due to a higher level of debt projected for the 2012-2015 period, the significant increase in the structural primary balance allows the Government (i) to finance the fiscal effort needed to guarantee convergence of the debt toward the level of 60 per cent of GDP required by the Stability and Growth Pact, (ii) to cover the implicit liabilities due to population ageing and (iii) to leave a further, comfortable margin for manoeuvring for financing possible structural reforms. In addition, the fact that the value of the initial budgetary position remains negative for both S1 and S2 is an indication of the capacity of Italy’s public finances, given budget conditions projected for 2015, to handle relatively easily the accumulation of expenditure for interest/GDP (snowball effect) expected over the long term.
| V.3 | ANALYSIS OF THE SENSITIVITY OF PUBLIC-DEBT DYNAMICS OVER THE LONG TERM |
The sensitivity analysis carried out in this section is aimed at testing the robustness of the projections in view of their intrinsic uncertainty, as well as verifying under which reform scenario and on the basis of which budget conditions the sustainability of the debt can either be guaranteed or put at risk.
Accordingly, in order to measure the impact of permanent changes to the assumptions in the baseline scenario, three different kind of sensitivity analysis are performed with regard to (i) some demographic variables, (ii) a set of macroeconomic assumptions, and (iii) the change in the initial level of the primary surplus. Given the tensions on the secondary market in the final part of 2011, the sensitivity of the debt-to-GDP ratio to changes in both the real interest rate and to an upward shift of the yield curve (by 100 and 300 basis points, respectively) is presented in a box..
The sensitivity analysis with respect to demographic variables
Population ageing represents one of the most critical aspects that Italy will need to tackle in the coming decades. In this regard, it is particularly important to evaluate properly the relevance of migratory flows expected in coming decades, measuring their impact on Italy’s public finances, and quantify the long-term consequences of a rise in life expectancy.
With reference to the impact of immigration, the simulation, in line with the assumptions agreed at the level of the EPC-WGA and on the basis of an ad-hoc demographic scenario developed by EUROSTAT, assumes that during the 2016-2060 period, the yearly average net flow of immigrants will decrease by 10 per cent with respect to the baseline assumption. As a result, the average annual flow of immigrants is reduced from 303,000 units to 272,000 units during the 2016-2060 period, while the age/sex structure of the baseline scenario is maintained unchanged.
With regard to the simulation of the impact of one additional year in life expectancy, it is assumed that the probabilities of death of both sexes are adjusted downward so as to determine, by 2060, a one-year increase in life expectancy vis-à-vis the assumptions of the baseline scenario.
| | |
| MINISTERODELL’ECONOMIAEDELLE FINANZE | | |
| | 45 |
ECONOMICAND FINANCIAL DOCUMENT – ITALY’S STABILITY PROGRAMME
The pattern of the public debt under the assumptions of a decrease in immigration and greater life expectancy is reported in Chart V.2. Assuming the level of public debt and structural primary balance planned by the Government for 2015 as starting points, the effects of reduced migration inflows on debt sustainability appear negligible. Similarly, the expected impact of an increase in life expectancy seems barely relevant, mainly due to the introduction of mechanisms that link eligibility requirements for being entitled to a pension to changes in life expectancy. In both cases, the debt-to-GDP ratio falls rapidly and, under the assumption of a reduction in the average flow of immigrants, dips below 60 per cent with a one-year delay vis-à-vis the baseline scenario.
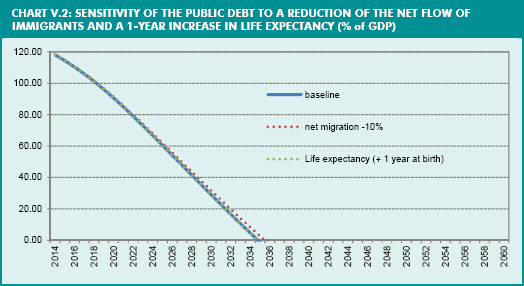
The sensitivity analysis with respect to macroeconomic variables
The sensitivity analysis with respect to macroeconomic variables aims at testing the robustness of the results of the baseline scenario vis-à-vis different scenarios that assume alternative patterns for labour productivity, the rate of employment, and the activity rate of elderly workers.
With reference to productivity, the simulations are based on two alternative scenarios in which, as of 2016, the growth rate of labour productivity is increased or decreased by 0.1 percentage points with respect to the baseline scenario. The impact on sustainability of a better (worse) trend of productivity appears only marginally significant (Chart V.3).
Another simulation assumes that the rate of employment is increased gradually through 2060 with its value being one percentage point higher than that in the baseline assumptions. In this scenario, the impact on the debt of a higher rate of employment appears significant (Chart V.4).
The expected increase in the participation rate of elderly workers will most likely affect employment rates in the coming decades. These developments are mostly attributable to the deferral of retirement as a result, inter alia, of the tightening of eligibility requirements for entitlement to a pension.
| | |
| | MINISTERODELL’ECONOMIAEDELLE FINANZE |
46 | | |
ECONOMICAND FINANCIAL DOCUMENT – ITALY’S STABILITY PROGRAMME
In this regard, the simulation assumes that the rate of activity of elderly workers is to increase gradually so as to reach in 2060 a value that is it 5 percentage points above that in the baseline scenario. The results show that the impact of a gradual increase in the rate of activity of elderly workers on the declining pattern of the debt-to-GDP ratio (Chart V.4) immediately begins to be significant, becoming particularly relevant as from 2025.
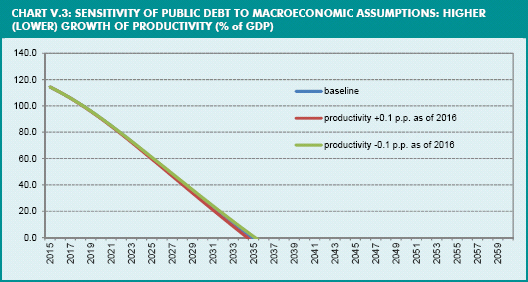
Although the magnitude of the fiscal adjustment planned by the Government up to 2015 is seen as a necessary condition for achieving long-term sustainability of the public finances, the sensitivity tests on alternative scenarios show that the adoption of structural reforms aimed at spurring growth in real productivity over the medium term and favouring the participation of women and elderly workers in the labour market, will be a useful element in accelerating, ceteris paribus, expected reduction of public debt without additional budgetary costs.
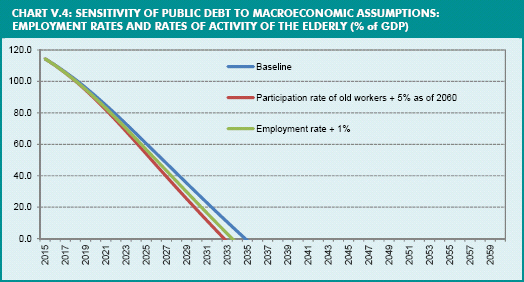
| | |
| MINISTERODELL’ECONOMIAEDELLE FINANZE | | |
| | 47 |
ECONOMICAND FINANCIAL DOCUMENT – ITALY’S STABILITY PROGRAMME
The sensitivity analysis with respect to the primary surplus
The final simulation exercise is aimed at testing the robustness of the results for the sustainability of public finances with respect to different targets for the structural primary surplus in 2015.
In order to simulate a less restrictive fiscal stance by the Government, the initial value of the structural primary surplus as a percentage of GDP is lowered by 1.0 percentage point in each case, with the value going from a high of 6.0 per cent compatible with the baseline scenario to 2.0 per cent (Chart V.5).
The long-term projections of public debt are significantly modified according to the change in the primary surplus in 2015. In structural terms, when the primary surplus is around 3.0 per cent of GDP, the debt-to-GDP ratio keeps decreasing, but reaches the threshold of 60 per cent only in 2050. In the case of a primary surplus below 3.0 per cent of GDP, the debt-to-GDP ratio is instead projected to increase over the long term. A structural primary surplus of 2.0 per cent of GDP in 2015 would lead to a growing debt in 2060 that would not be sustainable over the long term. As shown by these simulations, sustainability of the public finances is assured by the outlook and the public finance targets set out in this Stability Programme as well as by the on-going action of fiscal consolidation which is aimed at maintaining sizeable primary surpluses.
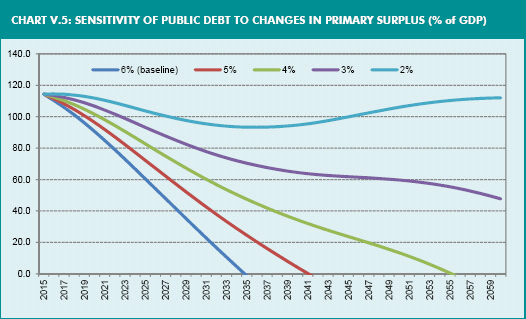
| | |
| | MINISTERODELL’ECONOMIAEDELLE FINANZE |
48 | | |
ECONOMICAND FINANCIAL DOCUMENT – ITALY’S STABILITY PROGRAMME
SENSITIVITY OF THE DEBT TO INTEREST RATES IN THE MEDIUM/LONG TERM
The analysis of public debt sensitivity to a change in interest rates was carried out by assuming as the starting point the composition and structure of Italian public debt in 2012 (see Chapter 3) and by simulating two alternative scenarios that consider, as of 2012, a permanent and immediate increase of, respectively, 100 and 300 basis points in the yield curve.
For the medium term, namely the years 2013 to 2015, the first scenario is identical to that presented in Chapter IV.2. An immediate and permanent increase of 100 basis points in the yield curve for the 2012-2015 period produces additional interest expenditure equal to 0.19 points of GDP in the first year, 0.36 points in the second, 0.44 in the third and 0.54 points of GDP in the fourth. Accordingly, the resulting implicit interest rate following the shock would be 4.8 per cent in 2013, 5.1 per cent in 2014 and 5.4 per cent in 2015. In this scenario, the debt-to-GDP ratio rises by approximately 1.5 percentage points in 2015 vis-à-vis the figure programmed by the Government .
Instead, the scenario that simulates an immediate and permanent increase of 300 basis points in the yield curve represents an attempt to replicate quantitatively the market tensions experienced during the second half of 2011, which pushed the spread between the BTP and the German Bund to above 500 points. In this scenario, the implicit interest rate increases to 5.4 per cent in 2013, 5.9 per cent in 2014 and 6.3 per cent in 2015. In this scenario, the debt-to-GDP ratio rises by approximately 4.7 percentage points in 2015 vis-à-vis the figure programmed by the Government.
Shocks over entire yield curve in the near term: impact on debt and implicit interest rate
| | | | | | | | | | | | |
| | | Baseline | | +100bp | | +300bp |
| | | Debt/GDP | | Implicit Interest
Rate | | Debt/GDP | | Implicit Interest
Rate | | Debt/GDP | | Implicit Interest
Rate |
| 2013 | | 121.5 | | 4.5 | | 122.0 | | 4.8 | | 123.2 | | 5.4 |
| 2014 | | 118.2 | | 4.7 | | 119.2 | | 5.1 | | 121.3 | | 5.9 |
| 2015 | | 114.4 | | 5.0 | | 115.9 | | 5.4 | | 119.1 | | 6.3 |
In the long term, namely for the years beyond the time horizon of the Stability Programme, it is assumed that, on the basis of the structure and composition of Italian public debt, shocks to the yield curve will continue to propagate through at least 2020. This assumption implies that, in the scenario that simulates an upward shift of 100 basis points in the yield curve, the implicit interest rate on the debt would continue to grow, reaching 6.3 per cent in 2020. In the scenario that assumes an increase of 300 basis points in the yield curve, the implicit interest rate would instead rise to 7.5 per cent in 2020. Against this backdrop, it is further assumed that the implicit interest rates reached in 2020 would remain constant until 2060. Finally, in both scenarios it is assumed that the primary surplus will move in line with changes in age-related expenditures.
The chart below shows that the debt-to-GDP ratio will continue to decline over the long term, but at a slower rate than in the baseline scenario. In the scenario incorporating a 100-basis-point upward shift in the yield curve, the debt reaches the threshold of 60 per cent of GDP in 2028, with a 3-year delay compared with the results of the baseline simulations. Instead, under the assumption of a permanent 300-basis-point increase in the yield curve, the debt continues to fall, but reaches 60 per cent of GDP in 2034 with a 9-year delay compared to the baseline.
| | |
| MINISTERODELL’ECONOMIAEDELLE FINANZE | | |
| | 49 |
ECONOMICAND FINANCIAL DOCUMENT – ITALY’S STABILITY PROGRAMME
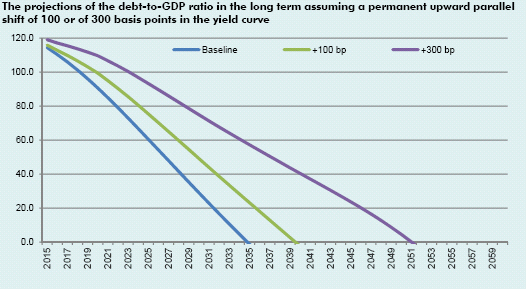
| V.4 | THE IMPACT OF PENSION REFORM ON SUSTAINABILITY |
Based on the Government’s programmed budget objectives up to 2015, namely, the achievement and maintenance of the MTO, the sensitivity tests presented in the previous section demonstrate that the long-term pattern in age-related expenditures should not put the sustainability of Italy’s public debt at risk, even if macroeconomic, demographic or fiscal conditions were to differ. This conclusion is the result of a series of pension reforms, culminating with the adoption of the measures contained in Law No. 214/2011.
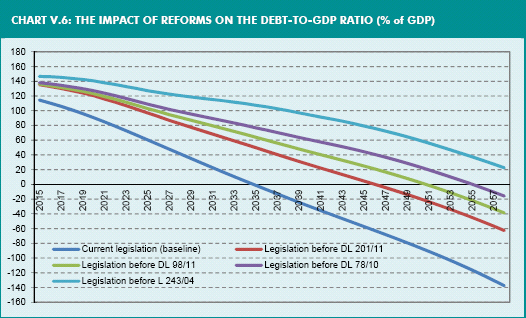
| | |
| | MINISTERODELL’ECONOMIAEDELLE FINANZE |
50 | | |
ECONOMICAND FINANCIAL DOCUMENT – ITALY’S STABILITY PROGRAMME
Chart V.6 illustrates the implications of the various measures adopted from 2004 to 2011 on the debt-to-GDP ratio on the basis of a counterfactual analysis by which the initial levels of the debt and the primary surplus are computed assuming the absence of the pension reforms considered. All pension reforms implemented from 2004 to the most recent one adopted with Law No. 214/2011 have entailed structural effects and have led to an overall reduction in the ratio of pension expenditure to GDP vis-à-vis the forecasts based on legislation previously in force, thereby impacting the present value of the expected expenditure flows (see box on pension reform).
The results show that the debt-to-GDP ratio would continue to decline under the scenario that excludes the reforms adopted since 2004, but that the ratio would decline from levels that are permanently higher than those reflected in the baseline scenario, which instead incorporates the financial effects of the reform adopted with Law No. 214/2011.
| V.5 | OTHER RELEVANT FACTORS |
The debt rule and ‘other relevant factors’
The new rule for public-debt reduction introduced with the reform of the Stability and Growth Pact will contribute to reinforcing budget-policy surveillance. In particular, Regulation (EU) n. 1177/2011 provides a numerical criterion for evaluating the reduction of EU Member States’ debt-to-GDP ratios. More specifically, in order for the reduction to be considered ‘adequate’, the gap between the actual debt-to-GDP ratio and the 60 per cent threshold must be reduced by one-twentieth per year, calculated with reference to the average of the three years preceding the valuation.
To prevent interference with fiscal consolidation plans already approved, the new regulation provides that the debt rule enter into force following a three-year transition period, beginning with the closure of the current excessive deficit procedures20. However, in order to prevent Member States from entirely deferring adjustment (thus weakening the effectiveness and the credibility of the process), each Member State must show sufficient progress during the transition period, judged on the basis of a minimum linear adjustment. Furthermore, once the new rule is fully in effect, two aspects will be taken into consideration in the application of the rule, even in the case in which the debt-to-GDP ratio is higher than the benchmark: a) whether, on the basis of the Commission’s forecasts based on unchanged policies, a correction is expected over the two following years and b) whether there are effects attributable to the economic cycle.
Finally, should the debt-to-GDP ratio be higher than the benchmark, including after cyclical adjustment, the Commission will be required to publish a report pursuant to Article 126(3) of the Treaty on the Functioning of the European Union (TFEU) in which assessments are carried out with reference to both the numerical benchmark and to a set of ‘other relevant factors’. The analysis of such factors is thus a necessary part of the assessments that may lead to the opening of an excessive deficit procedure against a
| 20 | For Italy, the closing of the EDP is contemplated for 2012, meaning the transition period will end in 2015. |
| | |
| MINISTERODELL’ECONOMIAEDELLE FINANZE | | |
| | 51 |
ECONOMICAND FINANCIAL DOCUMENT – ITALY’S STABILITY PROGRAMME
country for debt not being reduced at a “suitable pace”. The ‘other relevant factors’ are represented by: i) trends regarding the country’s medium-term debt position, as well as risk factors such as the structure of the debt by maturity and the currency in which the debt is denominated; ii) the stock-flow adjustment of the debt; iii) reserves set aside and other assets within the public budget; iv) guarantees, particularly those related to the financial sector; v) explicit and implicit liabilities related to population ageing; and vi) the level of private debt, to the extent to which it represents an implicit liability for the public sector. Importantly, in accordance with Regulation (EU) No. 1177/2011, within the evaluation of compliance with the criteria on government deficits and public debt, particular attention will be paid to financial contributions linked to bilateral and multilateral support within the framework of the instruments for safeguarding financial stability21 which cannot, on their own, be the cause of the opening of the excessive deficit/debt procedure and are thus to be excluded from the computation.
These are all very important factors that explain how the Stability and Growth Pact’s new rules on the reduction and containment of debt are nonetheless considered a necessary, but not completely sufficient, condition for preventing financial crisis. Accordingly, in making the rules for public-debt reduction operational in a credible manner, with the explicit reference to ‘other relevant factors’, it is also recognised that the trend of debt can vary due to implicit liabilities arising from potential risks inherent to various sectors, including, for instance, the pension system and the banking-financial sector. The range of elements used in evaluating long-term sustainability has thus been enhanced, taking into account, as other aggravating or mitigating factors, all the “other factors” of risk. With specific reference to Italy, in addition to the high degree of sustainability of its pension system and the effective debt-issuance policy in terms of maturity and composition (see section III.3), it is appropriate to point out the relative solidity of the Italian banking and financial sector.
The economic and financial crisis has highlighted how imbalances built up in the banking sector can have repercussions on public finances, even in countries considered relatively solid from a fiscal standpoint. As a result, the need for considering and statistically measuring the aforementioned risks on the basis of indicators of the implicit liabilities derived from the banking sector’s potential losses is a concept that has gained important recognition, both at a technical and political level. From a theoretical perspective, the recent analyses of the International Monetary Fund (IMF) warrant particular attention, since they confirm the need to refashion the traditional tools for analysing the sustainability of national debt positions. In terms of policy guidelines, the G-20 of Cannes reiterated full support to initiatives favouring the extension and deepening of the IMF’s multilateral surveillance to fully take into account the risk of spreading financial crisis22. Such need is particularly relevant for EU countries in view of the entry into force of the new regulations underlying the Stability and Growth Pact.
The possible repercussions of a banking system failure on public budgets vary from country to country, also considering the availability of new financial-support tools
| 21 | Examples include the bilateral loans to Greece, the contributions made to transactions undertaken by the European Financial Stability Facility (EFSF) and the capital contributed to the European Stability Mechanism (ESM). |
| 22 | G-20 Summit, Cannes, final press release, 3-4 November 2011. |
| | |
| | MINISTERODELL’ECONOMIAEDELLE FINANZE |
52 | | |
ECONOMICAND FINANCIAL DOCUMENT – ITALY’S STABILITY PROGRAMME
that can be activated when bank intermediaries encounter a crisis (guarantees on deposits, forms of resolution funds, and capital requisites). The risk of having to use public funds to counteract losses stemming from a systemic banking crisis significantly depends on the risk of the banking crisis spilling over to other banks through the interbank market or other channels (such as, for example, the common exposure of banks to the sovereign debt securities of countries facing financial difficulties or exposure to illiquid and high-risk financial instruments). In this regard, the Italian banking system presents a relatively limited risk of contagion with respect to other European countries, due to: a low percentage of interbank funding; the relative limited propensity of Italian banks to engage in trading of highly volatile instruments in financial markets with limited liquidity; and limited exposure to countries with the greatest sovereign risk (obviously barring the recent, transitory tensions on Italian sovereign debt). Alongside these characteristics, the Italian banking system enjoys a relatively positive and stable base of funding (deposits) and a good level of capitalisation in relation to risks, and it is thus reasonable to expect basically limited risks for Italy’s public finances.
Private-sector debt and the public sector’s contingent liabilities arising from banking activity
The tensions emerging in the second half of 2011 with regard to the public debt of countries in the Euro Area and the government securities market served to fuel uncertainty within financial markets, thereby affecting conditions for the supply of credit. In any event, Italy’s banks are solid and the Government’s measures to alleviate tensions on the credit system did support the Italian banking system. The moratorium on debt to businesses (according to an agreement signed on 28 February by the Government, the Italian Banking Association and associations representing businesses which makes it possible for companies with positive business prospects to obtain adequate resources) represents a positive development in support of small- and medium-sized enterprises. It is important to point out the limited propensity of the Italian private sector (inclusive of households and non-financial businesses) to take on debt, and that as such, the Italian private sector’s level of debt is lower than the EU average, according to the most recent data (September 2011). The debt of non-financial businesses in September was equal to 81.8 per cent of GDP, which is 20 percentage points below the Euro Area average (101.9 per cent of GDP); instead, the debt of Italian households is equal to 45.5 per cent of GDP, compared with the Euro Area average of 65.0 per cent of GDP. In a comparison among EU-14 countries23 for the year 201024, Italian households had debt equal to 45.0 per cent of GDP, which made it the lowest-ranking of the EU-14 countries (with Italy’s figure equal to just over one-half of the average of 81.9 per cent).
According to EUROSTAT data, initiatives undertaken to support financial institutions in 2010 had a very limited impact on Italy’s public debt, and were equal to €4 billion, or 0.3 per cent of GDP. The value of the stock of financial liabilities incurred for the EU-27 countries amounted to 5.0 per cent of GDP in 2010, whereas the comparable figure for the Euro Area was 5.1 per cent of GDP. The total value of contingent liabilities
| 23 | EU-15, excluding Luxembourg. |
| | |
| MINISTERODELL’ECONOMIAEDELLE FINANZE | | |
| | 53 |
ECONOMICAND FINANCIAL DOCUMENT – ITALY’S STABILITY PROGRAMME
for the EU in 2010 was 8.6 per cent of GDP, while the figure for the Euro Area was 6.5 per cent of GDP. With reference to the structure of the contingent liabilities arising from government measures, roughly 77 per cent of the total value is attributable to guarantees issued in favour of financial institutions, 17 per cent to the value of securities issued with respect to liquidity programmes for banks and 6 per cent to transactions of special-purpose companies.
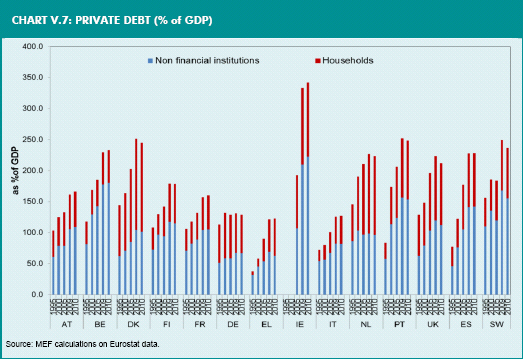
In the EU-27 countries, the value of the stock of financial assets held by the government rose from 2.6 per cent of GDP in 2009 to 4.2 per cent of GDP in 2010. With reference to the structure of the assets acquired by EU governments, roughly 41 per cent of the total value is attributable to the purchase of equity investments in financial institutions, a similar percentage to the purchase of fixed-rate securities, and the remaining 18 per cent to the granting of loans.
| | |
| | MINISTERODELL’ECONOMIAEDELLE FINANZE |
54 | | |
ECONOMICAND FINANCIAL DOCUMENT – ITALY’S STABILITY PROGRAMME
TABLE V.3: INTERVENTION TO SUPPORT FINANCIAL INSTITUTIONS (in € mn)
| | | | | | | | | | | | | | | | | | | | | | | | | | | | | | | | |
EDP notification
October 2011 | | Net revenue/cost for general
government | | General government assets | | General government liabilities | | Contingent liabilities |
| | | 2007 | | 2008 | | 2009 | | 2010 | | 2007 | | 2008 | | 2009 | | 2010 | | 2007 | | 2008 | | 2009 | | 2010 | | 2007 | | 2008 | | 2009 | | 2010 |
BE | | — | | -27 | | -33 | | 250 | | — | | 21,546 | | 20,193 | | 18,727 | | — | | 21,546 | | 20,890 | | 20,890 | | — | | 36,235 | | 62,047 | | 55,829 |
BG | | — | | — | | — | | — | | — | | — | | — | | — | | — | | — | | — | | — | | — | | — | | — | | — |
CZ | | — | | — | | — | | — | | — | | — | | — | | — | | — | | — | | — | | — | | — | | — | | — | | — |
DK | | — | | 1 | | 162 | | 561 | | — | | 587 | | 10,072 | | 9,614 | | — | | 587 | | 10,072 | | 9,614 | | — | | — | | 7,122 | | 27,222 |
DE | | — | | -3,493 | | -3,436 | | -32,599 | | — | | 47,925 | | 87,119 | | 268,961 | | — | | 51,418 | | 94,048 | | 308,489 | | — | | 66,300 | | 159,030 | | 89,477 |
EE | | — | | — | | — | | — | | — | | — | | — | | — | | — | | — | | — | | — | | — | | — | | — | | — |
IE | | — | | — | | -3,830 | | -31,892 | | — | | — | | 1,416 | | 3,268 | | — | | — | | 5,246 | | 35,859 | | — | | 352,329 | | 281,176 | | 165,931 |
GR | | — | | 6 | | -5 | | 403 | | — | | — | | 3,769 | | 3,769 | | — | | — | | 3,769 | | 3,769 | | — | | 1,890 | | 7,617 | | 57,834 |
ES | | — | | -12 | | 696 | | 772 | | — | | 9,337 | | 19,335 | | 25,982 | | — | | 9,337 | | 19,335 | | 25,982 | | — | | — | | 49,008 | | 59,506 |
FR | | — | | 48 | | 1,356 | | 995 | | — | | 10,823 | | 6,751 | | 2,463 | | — | | 11,452 | | 5,896 | | 801 | | — | | 39,211 | | 100,111 | | 90,579 |
IT | | — | | — | | -14 | | 142 | | — | | — | | 4,050 | | 4,050 | | — | | — | | 4,050 | | 4,050 | | — | | — | | — | | — |
CY | | — | | — | | 3 | | 27 | | — | | — | | — | | — | | — | | — | | — | | — | | — | | — | | — | | 3,000 |
LV | | — | | 2 | | -181 | | -388 | | — | | 951 | | 921 | | 687 | | — | | 951 | | 921 | | 687 | | — | | — | | 663 | | 356 |
LT | | — | | — | | — | | -32 | | — | | — | | — | | — | | — | | — | | — | | 32 | | — | | — | | — | | — |
LU | | — | | -20 | | -68 | | 52 | | — | | 2,506 | | 2,535 | | 2,535 | | — | | 2,500 | | 2,500 | | 2,500 | | — | | 1,777 | | 1,513 | | 1,333 |
HU | | — | | — | | 4 | | 8 | | — | | — | | 1,758 | | 995 | | — | | — | | 1,758 | | 995 | | — | | — | | — | | — |
MT | | — | | — | | — | | — | | — | | — | | — | | — | | — | | — | | — | | — | | — | | — | | — | | — |
NL | | — | | 73 | | -2,265 | | -1,171 | | — | | 81,431 | | 56,009 | | 49,925 | | — | | 81,358 | | 57,761 | | 52,717 | | — | | 2,740 | | 79,712 | | 39,948 |
AT | | — | | 2 | | -43 | | -1,325 | | — | | 900 | | 5,644 | | 5,644 | | — | | 900 | | 5,765 | | 7,440 | | — | | 7,000 | | 23,300 | | 22,170 |
PL | | — | | — | | — | | — | | — | | — | | — | | — | | — | | — | | — | | — | | — | | — | | — | | — |
PT | | — | | 2 | | 9 | | - 2,225 | | 150 | | 930 | | 1,930 | | 6,225 | | 150 | | 550 | | 1,550 | | 6,294 | | — | | 1,750 | | 8,350 | | 5,425 |
RO | | — | | — | | — | | — | | — | | — | | — | | — | | — | | — | | — | | — | | — | | — | | — | | — |
SI | | — | | — | | 8 | | 20 | | — | | — | | — | | — | | — | | — | | — | | — | | — | | — | | 2,000 | | 2,200 |
SK | | — | | — | | — | | — | | — | | — | | — | | — | | — | | — | | — | | — | | — | | — | | — | | — |
FI | | — | | — | | — | | — | | — | | — | | — | | — | | — | | — | | — | | — | | — | | 115 | | — | | — |
SE | | — | | -1 | | 129 | | 268 | | — | | 222 | | 2,107 | | 2,342 | | — | | 222 | | 637 | | 654 | | — | | 13,623 | | 26,406 | | 19,670 |
UK | | 61 | | -5,587 | | -8,182 | | -578 | | — | | 37,068 | | 80,687 | | 108,911 | | -1 | | 64,512 | | 124,816 | | 137,705 | | 36,719 | | 325,008 | | 620,686 | | 417,261 |
Euro area (EA17) | | — | | -3,422 | | -7,623 | | -66,549 | | 150 | | 175,398 | | 208,750 | | 391,548 | | 150 | | 179,061 | | 220,809 | | 468,790 | | — | | 509,346 | | 773,864 | | 593,232 |
EU27 | | 61 | | -9,007 | | -15,690 | | -66,709 | | 150 | | 214,226 | | 304,295 | | 514,097 | | 149 | | 245,333 | | 359,013 | | 618,477 | | 36,719 | | 847,977 | | 1,428,741 | | 1,057,741 |
| | Exchange rate - average | | Exchange rate - end of year | | Exchange rate - end of year | | Exchange rate - end of year |
Source: EUROSTAT. |
TABLE V.4: INTERVENTION TO SUPPORT FINANCIAL INSTITUTIONS (% of GDP)
| | | | | | | | | | | | | | | | | | | | | | | | | | | | | | | | |
EDP notification
October 2011 | | Net revenue/cost for general government | | General government assets | | General government liabilities | | Contingent liabilities |
| | | 2007 | | 2008 | | 2009 | | 2010 | | 2007 | | 2008 | | 2009 | | 2010 | | 2007 | | 2008 | | 2009 | | 2010 | | 2007 | | 2008 | | 2009 | | 2010 |
BE | | — | | -0.0 | | -0.0 | | 0.1 | | — | | 6.2 | | 5.9 | | 5.3 | | — | | 6.2 | | 6.1 | | 5.9 | | — | | 10.5 | | 18.2 | | 15.8 |
DK | | — | | 0.0 | | 0.1 | | 0.2 | | — | | 0.2 | | 4.5 | | 4.1 | | — | | 0.2 | | 4.5 | | 4.1 | | — | | — | | 3.2 | | 11.6 |
DE | | — | | -0.1 | | -0.1 | | -1.3 | | — | | 1.9 | | 3.7 | | 10.9 | | — | | 2.1 | | 4.0 | | 12.5 | | — | | 2.7 | | 6.7 | | 3.6 |
IE | | — | | — | | -2.4 | | -20.4 | | — | | — | | 0.9 | | 2.1 | | — | | — | | 3.3 | | 23.0 | | — | | 195.7 | | 175.1 | | 106.4 |
GR | | — | | 0.0 | | -0.0 | | 0.2 | | — | | — | | 1.6 | | 1.7 | | — | | — | | 1.6 | | 1.7 | | — | | 0.8 | | 3.3 | | 25.4 |
ES | | — | | -0.0 | | 0.1 | | 0.1 | | — | | 0.9 | | 1.8 | | 2.5 | | — | | 0.9 | | 1.8 | | 2.5 | | — | | — | | 4.7 | | 5.7 |
FR | | — | | 0.0 | | 0.1 | | 0.1 | | — | | 0.6 | | 0.4 | | 0.1 | | — | | 0.6 | | 0.3 | | 0.0 | | — | | 2.0 | | 5.3 | | 4.7 |
IT | | — | | — | | -0.0 | | 0.0 | | — | | — | | 0.3 | | 0.3 | | — | | — | | 0.3 | | 0.3 | | — | | — | | — | | — |
LV | | — | | 0.0 | | -1.0 | | -2.2 | | — | | 4.2 | | 5.0 | | 3.8 | | — | | 4.2 | | 5.0 | | 3.8 | | — | | — | | 3.6 | | 2.0 |
LU | | — | | -0.1 | | -0.2 | | 0.1 | | — | | 6.4 | | 6.8 | | 6.3 | | — | | 6.3 | | 6.7 | | 6.2 | | — | | 4.5 | | 4.0 | | 3.3 |
HU | | — | | — | | 0.0 | | 0.0 | | — | | — | | 1.9 | | 1.0 | | — | | — | | 1.9 | | 1.0 | | — | | — | | — | | — |
NL | | — | | 0.0 | | -0.4 | | -0.2 | | — | | 13.7 | | 9.8 | | 8.5 | | — | | 13.7 | | 10.1 | | 9.0 | | — | | 0.5 | | 14.0 | | 6.8 |
AT | | — | | 0.0 | | -0.0 | | -0.5 | | — | | 0.3 | | 2.1 | | 2.0 | | — | | 0.3 | | 2.1 | | 2.6 | | — | | 2.5 | | 8.5 | | 7.7 |
PT | | — | | 0.0 | | 0.0 | | -1.3 | | 0.1 | | 0.5 | | 1.1 | | 3.6 | | 0.1 | | 0.3 | | 0.9 | | 3.6 | | — | | 1.0 | | 5.0 | | 3.1 |
SE | | — | | -0.0 | | 0.0 | | 0.1 | | — | | 0.1 | | 0.7 | | 0.7 | | — | | 0.1 | | 0.2 | | 0.2 | | — | | 4.1 | | 9.0 | | 5.6 |
UK | | 0.0 | | -0.3 | | -0.5 | | -0.0 | | — | | 2.1 | | 5.2 | | 6.4 | | 0.0 | | 3.6 | | 8.0 | | 8.1 | | 1.8 | | 18.0 | | 39.7 | | 24.5 |
Euro area (EA17) | | — | | -0.0 | | -0.1 | | -0.7 | | 0.0 | | 1.9 | | 2.3 | | 4.3 | | 0.0 | | 1.9 | | 2.5 | | 5.1 | | — | | 5.5 | | 8.7 | | 6.5 |
EU27 | | 0.0 | | -0.1 | | -0.1 | | -0.5 | | 0.0 | | 1.7 | | 2.6 | | 4.2 | | 0.0 | | 2.0 | | 3.1 | | 5.0 | | 0.3 | | 6.8 | | 12.2 | | 8.6 |
| | Exchange rate - average | | Exchange rate - end of year | | Exchange rate - end of year | | Exchange rate -end of year |
Source: EUROSTAT. |
| | |
| MINISTERODELL’ECONOMIAEDELLE FINANZE | | |
| | 55 |
ECONOMICAND FINANCIAL DOCUMENT – ITALY’S STABILITY PROGRAMME
GUARANTEES GRANTED BY THE STATE
On 31 December 2011, guarantees granted by the State amounted to €56.3 billion, or 3.6 per cent of GDP, whereas those granted to credit institutions following the recent financial crisis had reached a total of €43.7 billion, or 2.8 per cent of GDP25.
Public guarantees (in € mn)
| | | | | | | | |
| | | 2011 | |
| | | Amount | | | % of GDP | |
Stock of guarantees | | | 56,278 | | | | 3.6 | |
Including: to the financial sector | | | 43,715 | | | | 2.8 | |
The following components contributed to the total:
| - | Central guarantee fund for small- and medium-sized enterprises. As an industrial policy tool of the Ministry of Economic Development, the fund operates through three distinct channels: direct guarantees to banks and financial intermediaries; counter-guarantees on guarantees granted by collective loan-guarantee consortiums (Confidi) and other guarantee funds; co-guarantees granted directly in favour of financing entities and jointly with the Confidi and other guarantee funds, or to guarantee funds set up within the sphere of the EU or co-financed by the EU. On 31 December 2011, the total residual debt guaranteed amounted to €7.4 billion. |
| - | TAV S.p.A. The Ministry of the Treasury guarantees the fulfilment of Ferrovie dello Stato S.p.A.’s obligations to TAV S.p.A., in relation to the concession, planning, construction and management of the high-speed train system. The guarantee is a surety aimed at making it possible to raise funds on the financial market to be employed in the design and construction of the high-speed network. On 31 December 2011, the residual debt guaranteed amounted to approximately €2.43 billion. |
| - | Central guarantee fund for toll highways and urban underground transportation systems. The 2007 Budget Law established the central guarantee fund and, as from 1 January 2007, the entry of ANAS S.p.A. as manager of all the fund’s assets, receivables and residual commitments with respect to toll-highway concessionaires, and the manager of all employment relationships. On 31 December 2011, the residual debt guaranteed had been extinguished (in 2008 and 2009, it was €360 million, whereas in 2010, it was €9 million). |
| - | Local government guarantees. The data in relation to local government guarantees are provided by the Bank of Italy, which tracks them through regulatory reporting done by the financial institutions that benefit from them. On 31 December 2011, the residual debt guaranteed amounted to €2.733 billion. |
| - | Italian banks. In 2011, State guarantees were given on liabilities of Italian banks to 19 credit institutions. On 31 December 2011, the residual debt guaranteed amounted to €43.715 billion. |
| 25 | These data were supplied to EUROSTAT through the two tables provided as exhibits to the ‘Reporting of Government deficit and debt levels for the excessive deficit procedure’ in April 2012: the first table (Government guarantees in public accounts) shows the guarantees of non-financial activity; the second table (Supplementary table for the financial crisis) refers to the guarantees granted to credit institutions following the recent financial crisis. |
| | |
| | MINISTERODELL’ECONOMIAEDELLE FINANZE |
56 | | |
ECONOMICAND FINANCIAL DOCUMENT – ITALY’S STABILITY PROGRAMME
THE DEBT RULE
The debt rule introduced in the Stability and Growth Pact with the ‘Six Pack’ provides that the debt-to-GDP ratio is reduced each year by at least one-twentieth of the gap between the existing ratio and the target ratio of 60 per cent, computed as the weighted average over the three preceding years26. The European Commission’s and European Council’s first assessment on the compliance of Italian public debt to the rule will occur in 2016, i.e. three years after the abrogation of the excessive deficit procedure for Italy planned for 2012.
The identification of the debt benchmark is obtained on the basis of initial data for the debt-to-GDP ratio, i.e. observations for the 2013-2015 period. In Italy’s case, projections of the debt-to-GDP ratio show a ratio of 121.5 per cent in 2013, which falls to 114.4 per cent in 2015. Accordingly, on the basis of the application of the computation formula agreed at a European level, the debt benchmark is 112.3 per cent of GDP in 2016, 109.6 per cent in 2017 and 107.0 per cent in 2018.
In order to evaluate conformity with respect to the rule’s benchmark, it is necessary to project the debt-to-GDP ratio beyond the time horizon of the Stability Programme. Accordingly, for the years 2016-2018, debt was projected by assuming that the structural primary surplus moves in line with the changes in age-related expenditures, remaining around 6 per cent of GDP after 2015. It is furthermore assumed that the nominal interest rate is constant and equal to 5 per cent of GDP. Growth in real terms is to be determined on the basis of the assumption of the output gap closing by 2018, while it is assumed that the GDP deflator remains constant at 2 per cent. On the basis of these assumptions, nominal GDP growth for the 2016-2018 period is equal, on average, to 2.9 per cent of GDP, in line with that projected for 2013-2015 in the macroeconomic outlook of the Stability Programme (see Chapter 2).
On the basis of such assumptions, the debt-to-GDP ratio is projected to decline steadily during the simulation period with values that, on average, will be 3 percentage points of GDP below those of the benchmark. Based on this simulation, Italy will l be able to comply with the benchmark set by the rule over the years of 2016-2018.
Another simulation has been carried out to assess the quality of the adjustment toward the debt benchmark. The chart below shows the isoquant of the possible combinations between primary surplus (Y axis) and the differential between GDP growth and the implicit interest rate (X axis) that will allow for achieving a debt-to-GDP ratio equal to the benchmark (112.3 per cent of GDP) in 2016, i.e. the first year in which the rule is to be applied to Italy.
The intersection of the dotted red lines summarises the public finance situation at 2012, while the intersection of the dotted blue lines indicates the combination between primary surplus and the differential between growth and the interest rates in 2015. The chart confirms that the Government’s budget targets will allow for fully complying with the debt rule in 2016. However, the Government’s fiscal targets incorporate an increase in the primary surplus well above the average of the past decade as well as the return to a differential between growth and interest rates equal to the average of the past decade (intersection of the dotted black lines).
| 26 | For additional information about the formula for computing the benchmark for the debt rule, see the Code of Conduct for Implementation of the Stability and Growth Pact. |
| | (http://ec.europa.eu/economy_finance/economic_governance/sgp/pdf/coc/code_of_conduct_en.pdf ) |
| | |
| MINISTERODELL’ECONOMIAEDELLE FINANZE | | |
| | 57 |
ECONOMICAND FINANCIAL DOCUMENT – ITALY’S STABILITY PROGRAMME
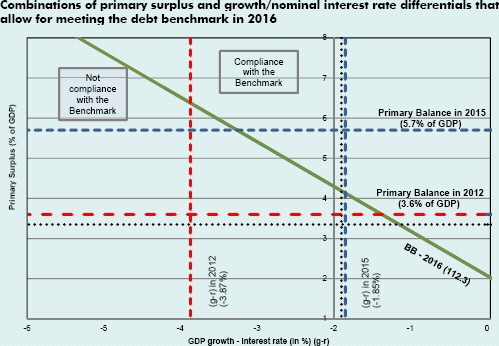
| | |
| | MINISTERODELL’ECONOMIAEDELLE FINANZE |
58 | | |
ECONOMICAND FINANCIAL DOCUMENT – ITALY’S STABILITY PROGRAMME
| VI. | QUALITY OF PUBLIC FINANCES |
| VI.1 | ACTIONS TAKEN AND STRATEGY FOR 2013-2015 |
Actions taken
Action taken to rebalance public accounts for the three-year period 2012-2014 has been developed through various steps, while maintaining the firm commitment to achieve the financial objectives approved by Parliament and agreed with the European Union.
The net correction to General Government’s net borrowing through measures adopted in 2011 is equal to €49.9 billion in cumulative terms in 2012, €75.7 billion in 2013, and €81.3 billion in 2014. Such amounts are the result of gross budget measures of approximately €74.0 billion in 2012, €92.4 billion in 2013 and €101.2 billion in 2014, partially offset by expansionist measures totalling approximately €25.0 billion in 2012, €16.7 billion in 2013, and €19.9 billion in 2014. When measured against GDP, the net correction respectively equals around 3.1 per cent, 4.7 per cent and 4.9 per cent in the three years indicated.
Revenue-increasing measures initially make the greater contribution to the net correction, though gradually diminishing over the years, when measures to contain the trend of expenditure are fully on stream; the latter measures include: reduction of budget appropriations to Ministries; streamlining of healthcare expenditure; revision of mechanisms governing the Domestic Stability Pact for Local Government Bodies; and initiatives related to the pension system. Altogether, the net reduction of expenditure comes to €8.7 billion in 2012, €23.6 billion in 2013 and €27.7 billion in 2014, and is primarily achieved through current expenditures (approximately 70.0 per cent of the total correction). Such ratio is projected to increase in later years as the effects of the structural reform of the pension system gradually become stronger as provided by Decree-Law No. 201/2011.
Regarding different levels of government, containment measures mainly affect Central Government, which is also the primary beneficiary of the revenue increases. The contribution of Local Governments and Social Security Funds is also significant, particularly in 2013 and in 2014, mostly through measures related to expenditure.
TABLE VI.1: CUMULATIVE IMPACT OF 2011 LEGISLATION ON GENERAL GOVERNMENT’S NET BORROWING (before netting out induced effects; in € mn)
| | | | | | | | | | | | | | | | |
| | | 2011 | | | 2012 | | | 2013 | | | 2014 | |
Law No. 111/2011 (Decree-Law No. 98/2011) | | | 2,108 | | | | 5,578 | | | | 24,406 | | | | 47,973 | |
Law No. 148/2011 (Decree-Law No. 138/2011) | | | 732 | | | | 22,698 | | | | 29,859 | | | | 11,822 | |
Law No. 183/2011 (2012-2014 Stability Law) | | | 0 | | | | 391 | | | | 162 | | | | 102 | |
Law No. 214/2011 (Decree-Law No. 201/2011) | | | 0 | | | | 20,245 | | | | 21,320 | | | | 21,430 | |
| | | | |
TOTAL | | | 2,840 | | | | 48,912 | | | | 75,747 | | | | 81,327 | |
% of GDP | | | 0.2 | | | | 3.1 | | | | 4.7 | | | | 4.9 | |
| | |
| MINISTERODELL’ECONOMIAEDELLE FINANZE | | |
| | 59 |
ECONOMICAND FINANCIAL DOCUMENT – ITALY’S STABILITY PROGRAMME
TABLE VI.2: CUMULATIVE IMPACT OF 2011 BUDGET PACKAGES ON GENERAL GOVERNMENT’S NET BORROWING (before netting out induced effects; in € mn)
| | | | | | | | | | | | | | | | |
| | | 2011 | | | 2012 | | | 2013 | | | 2014 | |
FREEING OF FUNDS | | | 5,625 | | | | 73,928 | | | | 92,431 | | | | 101,177 | |
Incremental revenues | | | 3,654 | | | | 49,459 | | | | 63,325 | | | | 67,170 | |
Expenditure cuts | | | 1,971 | | | | 24,469 | | | | 29,106 | | | | 34,007 | |
- current expenditure | | | 937 | | | | 17,437 | | | | 19,803 | | | | 25,806 | |
- capital expenditure | | | 1,034 | | | | 7,032 | | | | 9,304 | | | | 8,201 | |
USE OF FUNDS | | | 2,785 | | | | 25,016 | | | | 16,685 | | | | 19,850 | |
Decrease in revenues | | | 1,051 | | | | 9,211 | | | | 11,185 | | | | 13,510 | |
Incremental expenditure | | | 1,734 | | | | 15,805 | | | | 5,500 | | | | 6,340 | |
- current expenditure | | | 1,103 | | | | 12,377 | | | | 2,961 | | | | 2,828 | |
- capital expenditure | | | 631 | | | | 3,428 | | | | 2,539 | | | | 3,511 | |
Reduction of net borrowing | | | 2,840 | | | | 48,912 | | | | 75,747 | | | | 81,327 | |
| | | | |
Net change in revenues | | | 2,603 | | | | 40,248 | | | | 52,140 | | | | 53,659 | |
Net change in expenditure | | | -237 | | | | -8,664 | | | | -23,606 | | | | -27,667 | |
- current expenditure | | | 166 | | | | -5,060 | | | | -16,842 | | | | -22,978 | |
- capital expenditure | | | -403 | | | | -3,604 | | | | -6,765 | | | | -4,689 | |
TABLE VI.3: CUMULATIVE IMPACT OF 2011 BUDGET PACKAGES ON GENERAL GOVERNMENT’S NET BORROWING BY SUB-SECTOR (before netting out induced effects; in € mn)
| | | | | | | | | | | | | | | | |
| | | 2011 | | | 2012 | | | 2013 | | | 2014 | |
CENTRAL GOVERNMENT | | | 3,423 | | | | 35,724 | | | | 51,418 | | | | 51,730 | |
- net change in revenues | | | 2,628 | | | | 33,984 | | | | 46,613 | | | | 47,509 | |
- net change in expenditure | | | -795 | | | | -1,741 | | | | -4,805 | | | | -4,221 | |
| | | | |
LOCAL GOVERNMENT | | | -474 | | | | 9,167 | | | | 14,320 | | | | 17,443 | |
- net change in revenues | | | 31 | | | | 4,717 | | | | 3,756 | | | | 4,366 | |
- net change in expenditure | | | 505 | | | | -4,450 | | | | -10,564 | | | | -13,077 | |
| | | | |
SOCIAL SECURITY FUNDS | | | -110 | | | | 4,021 | | | | 10,009 | | | | 12,154 | |
- net change in revenues | | | -57 | | | | 1,547 | | | | 1,771 | | | | 1,784 | |
- net change in expenditure | | | 53 | | | | -2,474 | | | | -8,238 | | | | -10,370 | |
| | | | |
TOTAL | | | 2,840 | | | | 48,912 | | | | 75,747 | | | | 81,327 | |
Revenue measures
The net increase in General Government revenues projected as a result of the measures provided for the 2012-2014 three-year period is equal in cumulative terms to €40.2 billion in 2012, €52.1 billion in 2013 and €53.7 billion in 2014. These measures work in the sense of shifting the tax system away from earned income toward a greater taxation of capital and consumption.
Tax measures with respect to real estate property include the early implementation (on an experimental basis) of a municipal tax on real estate property, with an increase in the multiplier coefficient of property registry income. With reference to taxation on consumption, Decree-Law No. 138/2011 provided for increasing the VAT rate from 20 to 21 per cent. As of October 2012, an additional increase of two percentage points will be made to the existing VAT rates of 10 per cent and 21 per cent, and another increase of
| | |
| | MINISTERODELL’ECONOMIAEDELLE FINANZE |
60 | | |
ECONOMICAND FINANCIAL DOCUMENT – ITALY’S STABILITY PROGRAMME
one-half percentage point as of 2014 was established by a decree-law at year end1. A portion of these incremental revenues will be used to substitute revenues that were foreseen to be recovered from reform of the tax relief and welfare systems. The increase in excise taxes on fuels should yield incremental revenue of €7.0 billion per year in each of the three years in the forecast period.
With reference to financial services, the revision of the stamp duty for communications in relation to financial instruments and products has been established, as well as a new schedule of stamp duties for bank and postal account statements and savings books and the harmonisation of tax rates on financial income at 20 per cent2.
TABLE VI.4: IMPACT OF DECREE LAW NO.98/2011 - CONVERTED BY LAW NO. 111/2011 (before netting out induced effects; in € mn)
| | | | | | | | | | | | | | | | |
| | | 2011 | | | 2012 | | | 2013 | | | 2014 | |
FREEING OF FUNDS | | | 4,028 | | | | 10,162 | | | | 26,267 | | | | 50,858 | |
| | | | | | | | | | | | | | | | |
Incremental revenues | | | 2,065 | | | | 7,083 | | | | 13,807 | | | | 29,540 | |
Increase in stamp duties on deposit accounts | | | 725 | | | | 1,323 | | | | 3,800 | | | | 2,525 | |
Increase in excise taxes | | | 0 | | | | 2,092 | | | | 2,002 | | | | 2,041 | |
Increase IRAP (0.75 p.p. for banks and 2 p.p. for insurance companies) | | | 0 | | | | 912 | | | | 493 | | | | 493 | |
Revision of depreciation rates | | | 0 | | | | 0 | | | | 0 | | | | 1,312 | |
Measures to combat tax avoidance and tax evasion | | | 113 | | | | 1,883 | | | | 2,310 | | | | 2,246 | |
Gaming revenues | | | 443 | | | | 481 | | | | 501 | | | | 501 | |
Reduction of tax and welfare relief | | | 0 | | | | 0 | | | | 4,000 | | | | 20,000 | |
Other | | | 785 | | | | 392 | | | | 702 | | | | 422 | |
| | | | |
Expenditure cuts | | | 1,963 | | | | 3,079 | | | | 12,461 | | | | 21,317 | |
Expenditure cuts by Ministries | | | 0 | | | | 1,000 | | | | 3,500 | | | | 5,000 | |
Expenditure cuts by Ministries (auction of digital TV frequencies) | | | 1,700 | | | | 400 | | | | 300 | | | | 0 | |
Domestic Stability Pact | | | 0 | | | | 0 | | | | 3,200 | | | | 6,400 | |
Streamlining of healthcare expenditure | | | 0 | | | | 0 | | | | 2,500 | | | | 5,000 | |
Welfare measures | | | 0 | | | | 611 | | | | 1,363 | | | | 1,880 | |
Measures covering public-sector employment | | | 0 | | | | 0 | | | | 64 | | | | 1,104 | |
Other | | | 264 | | | | 1,068 | | | | 1,534 | | | | 1,934 | |
| | | | | | | | | | | | | | | | |
USE OF RESOURCES | | | 1,920 | | | | 4,584 | | | | 1,862 | | | | 2,885 | |
| | | | | | | | | | | | | | | | |
Decrease in revenues | | | 194 | | | | 474 | | | | 521 | | | | 1,245 | |
Reduction of charges for cottage-industry businesses | | | 180 | | | | 216 | | | | 0 | | | | 0 | |
Induced effects of welfare and public-sector employment measures | | | 6 | | | | 202 | | | | 471 | | | | 976 | |
Other | | | 8 | | | | 56 | | | | 51 | | | | 269 | |
| | | | |
Incremental expenditure | | | 1,726 | | | | 4,110 | | | | 1,340 | | | | 1,640 | |
ISPE Fund | | | 835 | | | | 2,850 | | | | 0 | | | | 0 | |
Local public transport | | | 400 | | | | 400 | | | | 400 | | | | 400 | |
Infrastructures Fund | | | 0 | | | | 250 | | | | 500 | | | | 800 | |
Other | | | 491 | | | | 610 | | | | 440 | | | | 440 | |
| | | | | | | | | | | | | | | | |
IMPACT ON PRIMARY BALANCE | | | 2,108 | | | | 5,578 | | | | 24,406 | | | | 47,973 | |
| | | | | | | | | | | | | | | | |
With reference to corporate taxation, an increase in the rates of regional tax on productive activity (IRAP) to be paid by banks and insurance companies has been established, along with a revision of depreciation rates and a corporate income tax (IRES) surcharge to be levied on companies operating in the energy sector. A significant part of interventions on the revenue side is related to measures to fight tax evasion (see box at the end of the chapter), though, as a matter of prudence, these have not been taken into
| 1 | The two tax rates will thus become 12.5 per cent and 23.5 per cent after the increases. |
| 2 | With exclusion of government and equivalent securities, interest-bearing certificates issued by the post office, securities issued by other countries, savings securities for southern Italy, and investments in plans to supplement State pensions. |
| | |
| MINISTERODELL’ECONOMIAEDELLE FINANZE | | |
| | 61 |
ECONOMICAND FINANCIAL DOCUMENT – ITALY’S STABILITY PROGRAMME
consideration when calculating the effects of the budget package. Repressive measures have been rounded out by the introduction of a bonus system to encourage fiscal transparency on the part of individual businesspeople, self-employed artists and professionals and partnerships.
TABLE VI. 5: IMPACT OF DECREE LAW NO. 138/2011 - CONVERTED BY LAW NO. 148/2011
(before netting out induced effects; in € mn)
| | | | | | | | | | | | | | | | |
| | | 2011 | | | 2012 | | | 2013 | | | 2014 | |
FREEING OF FUNDS | | | 739 | | | | 24,937 | | | | 30,072 | | | | 12,143 | |
| | | | | | | | | | | | | | | | |
Incremental revenues | | | 732 | | | | 14,283 | | | | 22,246 | | | | 10,646 | |
Reduction of tax relief | | | 0 | | | | 4,000 | | | | 12,000 | | | | 0 | |
Increase in VAT rate (from 20% to 21%) | | | 700 | | | | 4,236 | | | | 4,236 | | | | 4,236 | |
Enabling bill regarding gaming revenues and excise taxes on tobacco products | | | 0 | | | | 1,500 | | | | 1,500 | | | | 1,500 | |
Financial income | | | 0 | | | | 1,421 | | | | 1,534 | | | | 1,915 | |
Measures to combat tax avoidance and tax evasion | | | 32 | | | | 896 | | | | 1,526 | | | | 1,580 | |
Corporate income tax (IRES) surcharge on energy sector | | | 0 | | | | 1,800 | | | | 900 | | | | 900 | |
Other | | | 0 | | | | 430 | | | | 551 | | | | 515 | |
Expenditure cuts | | | 7 | | | | 10,654 | | | | 7,826 | | | | 1,497 | |
Expenditure cuts by Ministries | | | 0 | | | | 6,000 | | | | 2,500 | | | | 0 | |
Domestic Stability Pact | | | 0 | | | | 4,200 | | | | 3,200 | | | | 0 | |
Welfare initiatives | | | 0 | | | | 430 | | | | 2,096 | | | | 1,497 | |
Other | | | 7 | | | | 24 | | | | 30 | | | | 0 | |
| | | | | | | | | | | | | | | | |
USE OF RESOURCES | | | 7 | | | | 2,239 | | | | 213 | | | | 321 | |
| | | | | | | | | | | | | | | | |
Decrease in revenues | | | 0 | | | | 215 | | | | 125 | | | | 125 | |
Incremental expenditure | | | 7 | | | | 2,024 | | | | 88 | | | | 196 | |
ISPE Fund | | | 0 | | | | 2,000 | | | | 0 | | | | 0 | |
Other | | | 7 | | | | 24 | | | | 88 | | | | 196 | |
| | | | | | | | | | | | | | | | |
IMPACT ON PRIMARY BALANCE | | | 732 | | | | 22,698 | | | | 29,859 | | | | 11,822 | |
| | | | | | | | | | | | | | | | |
TABLE VI. 6: IMPACT OF LAW NO. 183/2011 – 2012-2014 STABILITY LAW
(before netting out induced effects; in € mn)
| | | | | | | | | | | | | | | | |
| | | 2011 | | | 2012 | | | 2013 | | | 2014 | |
FREEING OF FUNDS | | | 858 | | | | 6,750 | | | | 1,320 | | | | 1,494 | |
| | | | | | | | | | | | | | | | |
Incremental revenues | | | 857 | | | | 1,458 | | | | 467 | | | | 488 | |
Increase in rate of social contributions for separately managed assets | | | | | | | 309 | | | | 314 | | | | 318 | |
Incremental revenues from auction of digital TV frequencies | | | 750 | | | | | | | | | | | | | |
Personal income tax balance (for effect of reduction of prepayment in 2011) | | | | | | | 750 | | | | | | | | | |
Other | | | 107 | | | | 399 | | | | 153 | | | | 170 | |
Expenditure cuts | | | 1 | | | | 5,292 | | | | 853 | | | | 1,006 | |
ISPE Fund | | | | | | | 4,799 | | | | | | | | | |
Fund for discounting subsidies of two years or more | | | 1 | | | | 50 | | | | 413 | | | | 525 | |
Other | | | 0 | | | | 443 | | | | 440 | | | | 482 | |
| | | | | | | | | | | | | | | | |
USE OF RESOURCES | | | 858 | | | | 6,359 | | | | 1,158 | | | | 1,392 | |
| | | | | | | | | | | | | | | | |
Decrease in revenues | | | 857 | | | | 1,252 | | | | 695 | | | | 535 | |
Reduction of prepayments of personal income tax | | | 750 | | | | | | | | | | | | | |
Tax exemption on productivity contracts | | | | | | | 895 | | | | 263 | | | | | |
Other | | | 107 | | | | 357 | | | | 432 | | | | 535 | |
Incremental expenditure | | | 1 | | | | 5,107 | | | | 463 | | | | 857 | |
Fund for financing various measures | | | | | | | 750 | | | | | | | | | |
Fund for non-deferrable expenditure | | | | | | | 1,143 | | | | | | | | | |
Road transport | | | | | | | 422 | | | | 13 | | | | 13 | |
Employment fund | | | | | | | 600 | | | | | | | | | |
Reformulation of expenditure cuts by Ministries D.L. 138/2011 | | | 0 | | | | 366 | | | | 155 | | | | 439 | |
Other | | | 1 | | | | 1,826 | | | | 295 | | | | 405 | |
| | | | | | | | | | | | | | | | |
IMPACT ON PRIMARY BALANCE | | | 0 | | | | 391 | | | | 162 | | | | 102 | |
| | | | | | | | | | | | | | | | |
A portion of the incremental resources obtained is to be used for financing measures to support growth, businesses and employment.
| | |
| | MINISTERODELL’ECONOMIAEDELLE FINANZE |
62 | | |
ECONOMICAND FINANCIAL DOCUMENT – ITALY’S STABILITY PROGRAMME
In order to encourage the recapitalisation of businesses, companies that finance themselves with equity capital will be able to deduct the notional return on the new capital invested from business income.
In order to bolster employment and reduce the tax wedge on labour, companies will be able to deduct the regional tax on productive activity (IRAP) paid for amounts corresponding to expenditure on full-time and equivalent personnel from business income3.
TABLE VI.7: IMPACT OF DECREE-LAW NO. 201/2011 - CONVERTED BY LAW NO. 214/2011
(before netting out induced effects; in € mn)
| | | | | | | | | | | | |
| | | 2012 | | | 2013 | | | 2014 | |
FREEING OF FUNDS | | | 32,079 | | | | 34,773 | | | | 36,683 | |
| | | | | | | | | | | | |
Incremental revenues | | | 26,636 | | | | 26,806 | | | | 26,496 | |
Municipal property tax (IMU) and revaluation of land registry income | | | 10,660 | | | | 10,930 | | | | 11,330 | |
Municipal tax on waste and services (TARES) | | | 0 | | | | 1,000 | | | | 1,000 | |
Excise taxes on fuels | | | 5,901 | | | | 5,635 | | | | 5,720 | |
Regional personal income tax surcharge | | | 2,215 | | | | 2,215 | | | | 2,215 | |
Stamp duties on financial securities, instruments and products | | | 1,223 | | | | 1,221 | | | | 737 | |
Taxes on repatriated capital | | | 1,461 | | | | 1,987 | | | | 559 | |
Realignment of values of equity holdings (substitute tax) | | | 0 | | | | 903 | | | | 1,889 | |
Increase in social contributions from artisans and store owners | | | 1,063 | | | | 1,471 | | | | 1,886 | |
Increase in VAT rates | | | 3,280 | | | | 0 | | | | 0 | |
Other | | | 833 | | | | 1,445 | | | | 1,160 | |
| | | |
Expenditure cuts | | | 5,443 | | | | 7,967 | | | | 10,187 | |
Revision of pension system | | | -248 | | | | 793 | | | | 2,960 | |
De-indexing of pensions in amounts exceeding three times the minimum | | | 2,450 | | | | 4,210 | | | | 4,210 | |
Reduction of expenditure of Local Government Bodies | | | 2,785 | | | | 2,785 | | | | 2,785 | |
Other | | | 456 | | | | 179 | | | | 232 | |
| | | | | | | | | | | | |
USE OF RESOURCES | | | 11,834 | | | | 13,453 | | | | 15,252 | |
| | | | | | | | | | | | |
Decrease in revenues | | | 7,270 | | | | 9,844 | | | | 11,605 | |
Deductibility for return on own capital invested (ACE) | | | 951 | | | | 1,446 | | | | 2,929 | |
Deductibility of labour cost from IRAP-imposable business income | | | 1,475 | | | | 1,921 | | | | 2,042 | |
Deductibility of IRAP for costs of employing young people and women | | | 149 | | | | 1,690 | | | | 994 | |
Reduction of safeguard clause | | | 4,000 | | | | 2,881 | | | | 3,600 | |
Other | | | 695 | | | | 1,905 | | | | 2,041 | |
| | | |
Incremental expenditure | | | 4,564 | | | | 3,609 | | | | 3,647 | |
Fund to offset initiatives for development | | | 1,000 | | | | 1,000 | | | | 1,000 | |
Tax credit for road transport (excise taxes) | | | 1,074 | | | | 1,074 | | | | 1,074 | |
Fund for local public transport | | | 800 | | | | 800 | | | | 800 | |
Other | | | 1,690 | | | | 735 | | | | 773 | |
| | | | | | | | | | | | |
IMPACT ON PRIMARY BALANCE | | | 20,245 | | | | 21,320 | | | | 21,430 | |
| | | | | | | | | | | | |
Spending measures
The spending measures mainly involve principal sectors of the public budget with corrections expected to yield gross savings of €24.5 billion in 2012, €29.1 billion in 2013 and €34 billion in 2014.
| 3 | Tax relief is increased in the case of female full-time personnel or employees younger than 35 years old, and is further increased if the worker is employed in one of the Regions of southern Italy. |
| | |
| MINISTERODELL’ECONOMIAEDELLE FINANZE | | |
| | 63 |
ECONOMICAND FINANCIAL DOCUMENT – ITALY’S STABILITY PROGRAMME
For the State budget, the total spending reductions of Ministries established by the decree-laws adopted in the summer of 20114 are to be achieved through the assignment of a spending target to each Ministry, and the requirement for Ministries to outline the measures to be adopted for reaching the target. With this procedure, the emphasis is on eliminating linear cuts, and simultaneously making Ministries accountable for the management of resources available to them.
Measures concerning public-sector employment are designed to consolidate the effects of the 2011-2013 budget package and to secure additional savings, including through the extension to 2014 of the provisions limiting hiring and salary increases.
Local Government entities will contribute to spending reduction through the Domestic Stability Pact, for a total amount of €7.0 billion in 2012 and €9.2 billion as from 2013. Savings on healthcare expenditure are projected to amount to €2.5 billion in 2013 and €5.0 billion in 2014. The measures outlined provide that a new State-Regions agreement will be signed by 30 April 2012, in order to indicate the means for achieving a trend of expenditure consistent with increases in the financing of the National Healthcare System in the order of 0.5 per cent in 2013 and 1.4 per cent in 2014. In the case of Regions subject to financial recovery plans to cut healthcare deficits, regulations are to be adopted for safeguarding the legal effectiveness of the plans.
Welfare-related measures include the overall structural revision of the pension system (the expected savings on expenditure amount to approximately €3.2 billion in 2012, €8.5 billion in 2013 and €10.5 billion in 2014). Additional and increasing savings on spending are expected in later years, once the budget measures come fully into effect.
A portion of the savings will be used for financing specific programmes related to non-deferrable expenditures and measures to support development. Such expenditures include resources appropriated for compensating the road transport sector for increased fuel costs, local public transport projects, financing of maintenance contracts for the Italian State Railways, and financing of universities and the related financing fund. The budget package also provides for setting up a fund to cover the financing of programmes to facilitate increased employment of young people and women, and the financing of the Social fund for employment. Finally, regional co-financing of projects realised with the contribution of structural EU funds has been excluded from the limits of the Domestic Stability Pact (for up to €1.0 billion per year).
The strategy for 2013-2015
The Government believes that fiscal consolidation must continue to be the focal point of its action. It is a compulsory decision to avoid jeopardising economic security, even at the cost of significant sacrifices to be made by individuals, households and businesses. Debt reduction must be structural; it must also have the smallest impact possible on short-term growth, while being accompanied by measures to support development.
| 4 | Reference is made in particular to the measures provided by Article 10 of Decree-Law No. 98/2011 and by Article 1 of Decree-Law No. 138/2011. |
| | |
| | MINISTERODELL’ECONOMIAEDELLE FINANZE |
64 | | |
ECONOMICAND FINANCIAL DOCUMENT – ITALY’S STABILITY PROGRAMME
The burden of financial rigour must be distributed equitably. The commitment to fight unacceptable levels of tax avoidance and tax evasion in Italy is also based on equity. Tax evasion is a form of unfair competition between businesses, and it causes inequitable and inefficient re-distribution among taxpayers, thereby causing higher fiscal pressure.
The general objectives of fiscal policy and fiscal management have the following priorities: i) to consolidate the path toward fiscal consolidation and to support the recognition of public property assets; ii) to continue to operate using prudently the fiscal lever, so as to re-establish conditions for more robust growth in the medium-long term and contribute to re-launching productivity and economic growth; to complete implementation of the enabling act regarding fiscal federalism; iii) to reinforce the fight against tax evasion, tax avoidance and illegal gaming; to improve the level of fiscal transparency and the exchange of information between countries; to strengthen tax collection activity; to maintain a rigorous policy for gaming concessions; and iv) to adopt the structural reforms that will contribute to reinforcing economic governance of the European Union.
In the medium term, debt reduction and more efficient re-allocation of resources will need to rely increasingly on reduction of current expenditure. From this standpoint, the spending review will play a key role since it will favour a better quality of public expenditure in key sectors. Using this tool, as reinforced in the budget package approved in the summer of 2011, the Government intends to embark on a medium-term programme aimed at a better allocation of resources, overcoming a ‘linear cuts’ rationale and the ‘historical expenditure’ criterion. The new guidelines for the spending review regard the definition of both costs and borrowing requirements of expenditure programmes for Central Government offices in headquarters and branches and the identification of any critical situations, if any, inherent to the production and delivery of public services.
A separate reference is warranted with regard to international cooperation initiatives to aid development of the world’s poorest countries. During the 2013-2015 period, the Government’s action will be addressed to implementing concrete actions for gradually aligning Italy to the international standard for cooperation in development (see box at the end of the chapter).
TABLE VI.8: PUBLIC FINANCE POLICY SCENARIO FOR 2012-2015 1 (% of GDP)
| | | | | | | | | | | | | | | | | | | | |
| | | 2011 | | | 2012 | | | 2013 | | | 2014 | | | 2015 | |
POLICY SCENARIO | | | | | | | | | | | | | | | | | | | | |
Primary surplus | | | 1.0 | | | | 3.6 | | | | 4.9 | | | | 5.5 | | | | 5.7 | |
Interest expenditure | | | 4.9 | | | | 5.3 | | | | 5.4 | | | | 5.6 | | | | 5.8 | |
Net borrowing | | | -3.9 | | | | -1.7 | | | | -0.5 | | | | -0.1 | | | | 0.0 | |
Structural balance (2) | | | -3.6 | | | | -0.4 | | | | 0.6 | | | | 0.6 | | | | 0.4 | |
Structural primary surplus (2) | | | 1.3 | | | | 4.9 | | | | 6.1 | | | | 6.2 | | | | 6.1 | |
| | | | | |
Public debt | | | 120.1 | | | | 123.4 | | | | 121.5 | | | | 118.2 | | | | 114.4 | |
Public debt (net of financial support to Euro Area) (3) | | | 119.2 | | | | 120.3 | | | | 117.9 | | | | 114.5 | | | | 110.8 | |
| 1) | The rounding to the first decimal may cause inconsistencies between the figures presented in the table. |
| 2) | Net of one-off measures and the cyclical component. |
| 3) | Net of direct loans to Greece, Italy’s portion of ESFS liabilities, and Italy’s portion of ESM capital for 2010-2015. |
| | |
| MINISTERODELL’ECONOMIAEDELLE FINANZE | | |
| | 65 |
ECONOMICAND FINANCIAL DOCUMENT – ITALY’S STABILITY PROGRAMME
MACROECONOMIC IMPACT OF FISCAL CONSOLIDATION MEASURES ADOPTED IN 2011
In order to evaluate the macroeconomic impact of the measures to correct the public accounts and the measures for development contained in the budget packages adopted in 2011 (summer and December 2011), the starting point for the analysis is a basic simulation (using ITEM, the Treasury’s econometric model) that generates a projection of the various aggregates without taking into consideration the aforementioned measures. The framework of the exogenous variables for public finance is then modified by incorporating the measures adopted into the model and simulating the new scenario. The comparison between the results of these two simulations makes it possible to estimate the impact of the two budget packages on GDP and on other aggregates. The difference between the percentage rates of change per year obtained by taking into account the budget packages and those obtained in the base simulation is reported for each aggregate, with the effects of the two budget packages summed so as to obtain the overall effect.
The simulations show how the two packages of fiscal consolidation measures, when considered together, produce negative effects on the level of economic activity. The total impact on GDP during the three years considered (calculated as the cumulative difference with respect to the base simulation between the rates of change) is 2.6 percentage points. As it is possible to observe by comparing the results subdivided according to the two large budget packages, the overall impact is significantly greater in the case of the two decree-laws approved during the summer because the total amount of correction of the balances is higher. In addition to the direct effect on domestic demand (via reduction of public expenditure), the channels for transmission of the measures approved regard first and foremost the change in household disposable income and the earnings of businesses. Furthermore, the increase in the VAT rate and in other indirect taxes causes an increase in inflation in 2012 that is partially re-absorbed in the two subsequent years as a result of lower domestic demand.
Impact of the fiscal consolidation measures (differences in the percentage rate of change)
| | | | | | | | | | | | |
| | | |
| | | 2012 | | | 2013 | | | 2014 | |
GDP | | | | | | | | | | | | |
Summer 2011 budget package | | | -0.8 | | | | -0.7 | | | | -0.5 | |
December 2011 budget package | | | -0.2 | | | | -0.3 | | | | -0.1 | |
| | | -1.0 | | | | -1.0 | | | | -0.6 | |
Private consumption | | | | | | | | | | | | |
Summer 2011 budget package | | | -0.5 | | | | -1.1 | | | | -0.9 | |
December 2011 budget package | | | -0.4 | | | | -0.3 | | | | -0.3 | |
| | | -0.9 | | | | -1.4 | | | | -1.2 | |
Gross fixed investment | | | | | | | | | | | | |
Summer 2011 budget package | | | -1.7 | | | | -1.5 | | | | -1.2 | |
December 2011 budget package | | | 0.1 | | | | -0.1 | | | | -0.3 | |
| | | -1.6 | | | | -1.6 | | | | -1.5 | |
Consumer prices (household consumption deflator) | | | | | | | | | | | | |
Summer 2011 budget package | | | 0.5 | | | | -0.1 | | | | -0.2 | |
December 2011 budget package | | | 0.5 | | | | 0.3 | | | | 0.0 | |
| | | 1.0 | | | | 0.2 | | | | -0.2 | |
Employment | | | | | | | | | | | | |
Summer 2011 budget package | | | -0.3 | | | | -0.5 | | | | -0.7 | |
December 2011 budget package | | | -0.1 | | | | -0.1 | | | | -0.2 | |
| | | -0.4 | | | | -0.6 | | | | -0.9 | |
All of the measures approved should have a negative effect on private consumption for which the rate of change declines, with respect to the baseline scenario, by 0.9 percentage points in 2012, 1.4 points in 2013 and 1.2 points in 2014. Gross fixed investment shows a rate of change with respect to the baseline scenario that is lower by approximately 1.6 percentage points in 2012 and
| | |
| | MINISTERODELL’ECONOMIAEDELLE FINANZE |
66 | | |
ECONOMICAND FINANCIAL DOCUMENT – ITALY’S STABILITY PROGRAMME
in 2013, and by 1.5 percentage points in 2014. More specifically, the measures of summer 2011 determined a sharp contraction (approximately 10.0 per cent) as from 2012 of public investment (especially investment by local entities), while private investment was positively impacted in 2012 only by an increase in investment subsidies of approximately €2 billion. Instead, the negative effects derived from the multiplier/accelerator mechanism prevail as from 2013. By contrast, the December budget package does not include any cuts to public investment expenditure; instead, it contemplates development initiatives for approximately €1 billion that should cause a slight increase in investment in 2012. Turning to imports, the reduction (in both budget packages) is primarily due to shrinking domestic demand, though it is mitigated by the slight positive change in exports, which reflects improvement in the terms of trade as a result of declining producer prices in Italy. Finally, the weakening of demand generates negative effects on employment, which are more pronounced toward the end of the simulation period. Repeating this exercise through the QUEST5 model (which unlike ITEM, takes into account certain mechanisms capable of generating possible positive effects on private expenditure as a result of credible fiscal consolidation policies), the results improve6.
Impact of the fiscal consolidation measures with QUEST III ITALIA (differences in the percentage rate of change)
| | | | | | | | | | | | |
| | | 2012 | | | 2013 | | | 2014 | |
GDP | | | | | | | | | | | | |
Summer 2011 budget package | | | -0.6 | | | | -0.9 | | | | -0.4 | |
December 2011 budget package | | | -0.1 | | | | -0.1 | | | | 0.0 | |
| | | -0.7 | | | | -1.0 | | | | -0.4 | |
Private consumption | | | | | | | | | | | | |
Summer 2011 budget package | | | -0.6 | | | | -0.8 | | | | -0.2 | |
December 2011 budget package | | | -0.5 | | | | 0.0 | | | | 0.1 | |
| | | -1.1 | | | | -0.7 | | | | -0.1 | |
Gross fixed investment | | | | | | | | | | | | |
Summer 2011 budget package | | | -1.2 | | | | -0.8 | | | | -0.5 | |
December 2011 budget package | | | -0.1 | | | | -0.1 | | | | 0.0 | |
| | | -1.3 | | | | -0.9 | | | | -0.5 | |
Employment | | | | | | | | | | | | |
Summer 2011 budget package | | | -0.8 | | | | -1.0 | | | | -0.5 | |
December 2011 budget package | | | -0.1 | | | | -0.2 | | | | 0.0 | |
| | | -0.9 | | | | -1.1 | | | | -0.5 | |
In comparing the results from the QUEST simulations in terms of percentage rates of change with those generated with the ITEM model, it is possible to note important differences in terms of GDP, and more importantly, consumption and investment. While the cumulative change in aggregate consumption in 2014 would decrease by 3.5 per cent with respect to the base simulation according to the ITEM model, the presence of ‘Ricardian consumers’ (those who plan consumption based on expected future income) in the QUEST model significantly mitigates the recessionary impact of the budget package, with the cumulative reduction in consumption in 2014 estimated to be 1.9 per cent lower than the base simulation. With reference to the budget package’s effects on GDP, the
| 5 | Dynamic General Equilibrium (DGE) model developed by the European Commission and adapted to the Italian economy. |
| 6 | The Government’s actions could trigger improvement in expectations with regard to the level of future taxation, which could be perceived as less burdensome following the policy implemented for reaching a balanced budget. In particular, in the fiscal consolidation measures described, the reduction of public expenditure and the deficit could pave the way to an increase in the present value of household income expected in the future, and as such, generating a positive wealth effect that would contribute to lifting consumption, meaning that the negative impact estimated with the model in absence of such mechanism would be less pronounced. |
| | |
| MINISTERODELL’ECONOMIAEDELLE FINANZE | | |
| | 67 |
Economic and Financial Document – Italy’s Stability Programme
simulations with the QUEST model identify a less pronounced recessionary impact with respect to that forecast by the ITEM model (-2.1 per cent for QUEST versus -2.6 per cent for ITEM). Instead, the effects on employment are more pronounced with QUEST (-2.5 per cent versus -1.9 per cent with ITEM) due to the greater ‘disincentive’ effect exerted by increased taxation on labour within the model7.
THE FIGHT AGAINST TAX EVASION
In recent years, tax authorities have achieved encouraging results in their efforts to fight tax evasion and tax fraud: more than €27.0 billion of incremental tax revenues were ensured to the Treasury during the 2008-2010 three-year period and another €12.7 billion were collected in 2011, representing an increase of 15.0 per cent with respect to 2010.
Results of the fight against tax evasion: tax and non-tax revenues (in € mn)
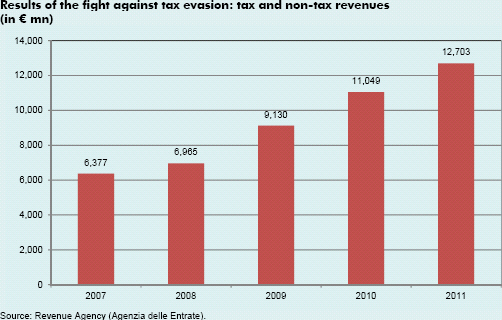
The emergence of hidden income and the fight against tax fraud are amongst the key elements that make it possible to reconcile rigour and equity, while also guaranteeing more resources to be used for growth.
Measures to counter tax evasion were already included in the financial package approved in the summer of 20118. The main initiatives included were: the participation of Municipalities in tax assessments; the easing of banking secrecy; the revision of the discipline of shell companies and the
| 7 | Finally, it is noted that the estimates produced with the QUEST model, which incorporates the effects on expectations of economic agents, cannot consider the significant reduction of the spread between 10-year BTPs and Bunds, and the consequences that this may have had on the economy’s cost of financing. The December budget package, together with economic reforms, has significantly contributed to changing financial markets’ expectations - a development that cannot be registered by the models. Accordingly, even the estimates produced with the QUEST model are probably an over-estimation of the total impact of the measures adopted. |
| 8 | Decree-Law No. 98/2011, converted by Law No. 111/2011 and Decree-Law No. 138/2011, converted by Law No. 148/2011. |
| | |
| | MINISTERODELL’ECONOMIAEDELLE FINANZE |
68 | | |
ECONOMICAND FINANCIAL DOCUMENT – ITALY’S STABILITY PROGRAMME
extension of the discipline to firms repeatedly reporting losses; the enhancement of sector studies and provisions in relation to the obligation to disclose material transactions to the Revenue Agency for the purposes of VAT ; and measures for streamlining and strengthening financial surveys, thanks to enlarged groups of participants (which now include companies and insurance companies) The law also provided for stepping up sanctions against tax crimes, strengthening controls through the processing of specific lists based on information sent to the tax authorities by financial institutions. With the decree-law approved in December9, five concrete actions to fight evasion were identified:
– a reward system for small businesses and self-employed workers for being transparent with respect to the tax authorities: transparency entails the electronic transmission to the tax authorities of all data related to transfers made or received and services rendered or received and the use of a single current account dedicated to financial movements in relation to business activity;
– a reward system for small businesses and self-employed workers who are in line with the sector studies on the condition that the data declared for the application of the studies are true and consistent with the profile of the activity carried out: the advantages consist of fewer controls, a reduction in the terms of controls (from four to three years) and a limitation of the application of the income meter (‘redditometro’). The audits of small businesses and self-employed workers will be concentrated mostly on those who are not in line with sector studies, thereby providing taxpayers with incentives to declare their true business volume and income;
– limits on the use of cash: the limits on the use of cash and bearer securities have been decreased from €2,500 to €1,000 in order to reinforce the mechanisms to prevent the use of the financial system for money laundering;
– availability to the tax authorities of all entries through financial accounts: as of 1 January 2012, banks and all other financial intermediaries are required to send to the tax authorities the entries made to all accounts with customers, and the tax authority will use such information in selecting taxpayers to be audited;
– the criminalisation of the act of making false declarations to the tax authorities: the relationship with the tax authorities must be based on transparency and collaboration, including within the sphere of audits regarding the regularity of tax returns.
In order to ensure a further impulse to the fight against evasion, the legislation also called for a ‘Task Force to fight tax evasion’, which met for the first time in February. The tax force meetings to be held periodically are charged with: strengthening coordination among all operational units involved in checking and controlling possible incidents of tax evasion and the monitoring of the results achieved.
Finally, in March, other provisions were finalised in order to simplify tax regulations and to reinforce even further the fight against tax evasion10.
According to such provisions:
– taxpayers who are no longer on instalment payment plans may apply for a new instalment plan in the event of temporary economic difficulty;
– the tax police may use inquiries in the course of financial investigations and may request precautionary measures (mortgage and seizure of assets) through the Revenue Agency;
– any breach of the regulation on the use of cash will no longer be reported directly to the Revenue Agency, but to the tax police which, should it consider a tax audit necessary, will provide prompt notice thereof to the Revenue Agency.
– the VAT license will be revoked if it is not used in carrying out business activity, the arts or professions, or if the annual VAT return is not filed for a period of three years.
| 9 | Decree-Law No. 201, converted by Law No. 214/2011. |
| 10 | Decree-Law No. 16/2011 covering ‘Urgent measures on the subject of fiscal simplification, and measures to increase efficiency and to strengthen the assessment process’. |
| | |
| MINISTERODELL’ECONOMIAEDELLE FINANZE | | |
| | 69 |
ECONOMICAND FINANCIAL DOCUMENT – ITALY’S STABILITY PROGRAMME
INTERNATIONAL OUTLOOK AND POLICIES FOR COOPERATION IN DEVELOPMENT
During the 2013-2015 period, the Government’s action will be addressed to implementing concrete actions for gradually aligning Italy to the international standard for cooperation in development, with the objective of improving the quality and quantity of public aid to development. The gradual realignment of cooperation in development will allow for re-launching Italy’s international profile, Italy’s presence in strategic areas, superiority and comparative advantages, thus serving as an investment with returns in terms of credibility.
According to preliminary data, in 2011, Italy’s public aid to development amounted to 0.19 per cent of gross national income, against an average for OECD-DAC countries of 0.32 per cent (2010 figure) and a European country average of 0.46 per cent (2010 figure).
Public aid to development consists of: (a) annual appropriations (bilateral cooperation, multilateral UN cooperation, development banks and funds); (b) subsidised loans through the Fund for Cooperation; (c) mandatory subsidies through the EU; and (d) debt cancellation. While subsidised loans tend to amount to zero over the long run due to their repayment, the components (c) and (d) are independent variables. Accordingly, public action will be concentrated on the quantity and quality of annual appropriations, especially through:
| • | | the redefinition of coordinated and synergetic strategic priorities at an inter-ministerial level with the contribution of all participants in the Italian development cooperation system (businesses, individuals, civil society, territorial entities, etc.); |
| • | | the re-planning and streamlining of expenditure for cooperation in development (spending review: bilateral, with specific valuations; multilateral, through an overall review of Italy’s presence in the various institutions); |
| • | | the revision of priorities in relation to appropriations to development banks and funds, with the identification of proper mechanisms, including regulatory mechanisms, to allow international obligations undertaken to be respected (the amounts coming due in 2013-2015 are estimated at approximately €1 billion); |
| • | | a gradual annual increase in appropriations provided for by Law No. 49 of 1987 of at least 10 per cent , using 2011 as the initial year of reference. |
In addition, in order to accelerate the gradual plan for realigning public aid to development and for improving the capacity of forecasting such aid, additional measures can be further studied such as new innovative mechanisms for financing development (from the revenue side) and laws covering 10-/20-year periods with annual restraint amounts that are constant over time (expenditure side). Alongside the strategy toward gradual realignment, action will be taken to reform legislation governing cooperation to be based on principles of unified action and efficiency, in concert with the Parliament. From this perspective, the presence of a Minister for international cooperation and integration is to be considered a guarantee for the consistency of public policies in the field of cooperation.
| | |
| | MINISTERODELL’ECONOMIAEDELLE FINANZE |
70 | | |
ECONOMICAND FINANCIAL DOCUMENT – ITALY’S STABILITY PROGRAMME
| VII. | INSTITUTIONAL ASPECTS OF PUBLIC FINANCES |
VII.1 FISCAL RULES
The new European economic governance framework requires that Member States establish national rules within their legal systems so as to guarantee compliance with fiscal parameters set by the European Union. Such requirement was incorporated in the proposed directive concerning national budget frameworks presented by the European Commission in September 20101. Later, as part of the Euro Plus Pact2, adopted by Heads of State and Government in the Euro Area on 11 March 2011 and endorsed by the European Council of 24-25 March 2011, the countries within the Euro Area and several other Member States took on the additional obligation of introducing the rules of the Stability and Growth Pact within their constitutions or national legislation.
Italy has for years been pursuing the objective of more rigorous fiscal discipline through the reinforcement of rules and national institutions governing the conduct of fiscal policy, with the aim of guaranteeing the respect of constraints on net borrowing and the debt-to-GDP ratio3. Improvements to the rules and budget procedures have already been made, first with the law approved in 2009 on accounting and public finance4, and then with additional amendments introduced in 20115. The process was pursued in 2011 via the presentation of a special constitutional law bill that provides for the introduction of a balanced-budget restriction within the Constitution6.
Italy’s fiscal governance already incorporates a series of fiscal rules to guarantee budget discipline: the Domestic Stability Pact, designed to identify the means through which local entities and Regions contribute to the achievement of public-finance targets; the Healthcare Pact and pharmaceutical expenditure ceilings, designed to achieve proper planning of public healthcare spending and keep growth of pharmaceutical spending in check.
The Domestic Stability Pact7 defines specific constraints that the Local Government authorities must comply with, together with information, communication
| 1 | The directive was finally adopted by the ECOFIN Council on 4 October 2011, together with regulations for reinforcing the Stability Pact and for surveillance of macroeconomic imbalances. |
| 2 | The conclusions reached by the Heads of State and Government, which were included in the ‘Pact for the Euro’, are aimed at establishing closer coordination of economic policies in the Euro Area, improving competitiveness and increasing convergence. |
| 3 | In accordance with the definition agreed at a European level, national fiscal rules are permanent provisions expressed through summary fiscal performance indicators. The provisions aim at reaching specific targets in terms of budget balances, public expenditure and revenues or their most important components, as well as targets relating to public debt. |
| 6 | Senate Act 3047-B ‘Introduction of the principle of a balanced budget in the Constitution’, definitively approved on 17 April 2012. |
| 7 | The Domestic Stability Pact was introduced by Art. 28 of the additional package of the Financial Law 1999. The Pact underwent a series of reforms over the years until the redrafting of its rules in 2008 as the 2009- 2011 three-year plan to balance the budget was introduced (Decree Law No.112/2008, confirmed as converted by Law No. 133/2008, Article 77-bis). On that occasion various mechanisms were introduced to reward ‘virtuous’ entities: these mechanisms were based on two economic indicators relating to the degree of structural rigidity and financial independence, as well as more effective sanctions in case of failure to comply. |
| | |
| MINISTERODELL’ECONOMIAEDELLE FINANZE | | |
| | 71 |
ECONOMICAND FINANCIAL DOCUMENT – ITALY’S STABILITY PROGRAMME
and certification requirements vis-à-vis the Ministry of the Economy and Finance, and a system of sanctions in case of failure to comply. The Domestic Stability Pact is reinforced by the more general principle, of a permanent nature, enshrined in Article 119 of the Constitution, whereby local authorities may borrow exclusively for the purpose of financing investment8. The Pact establishes a rule expressed in terms of budget balances9 for Municipalities and Provinces, and a constraint on the nominal growth of final expenditure for Regions.
With the financial package for the 2012-2014 period10, the Domestic Stability Pact regulations on Local Government bodies have been modified. The most significant changes regard the introduction of a performance-based mechanism for dividing up the expected contribution to public-finance targets among individual entities and the extension of the Pact’s constraints to a broader array of entities. As from 2013, targets related to the Domestic Stability Pact are assigned to individual Local Government entities on the basis of a weighted evaluation of their performance based on several parameters11. With regard to the sphere of application as of 2013, the new rules will be applicable not only to the Provinces and Municipalities with a population of more than 5,000 inhabitants, but also to Municipalities with a population between 1,001 and 5,000 inhabitants, and special companies and institutions12; starting in 2014, the rules will apply to Unions of Municipalities formed by entities with populations of less than 1,000 inhabitants13. Even in-house companies to which direct mandates for managing local public services have been attributed will be subject to the Pact. The rules for deciding which entities will be subject to the Pact are to be identified by means of a decree of the Ministry of the Economy and Finance, in concert with the Ministry of Interior, following due consultation with the Joint Conference14.
Some revenue and expenditure items have been excluded from the computation of the financial balance, in addition to the exceptions that were already provided for in the 2011 Pact. Such items include resources provided directly or indirectly by the European
| 8 | The principle of complying with the objective of a balanced current budget for Local Government bodies has been included in the Constitution through the reform of Title V of the Constitution in 2001. |
| 9 | For the purpose of determining the specific programmed target, the financial balance between final revenues and final expenditures (net of revenues from credit collections and expenditure for granting of loans) is again proposed as the Domestic Stability Pact’s parameter of reference. Such balance is computed on a mixed-accrual basis (i.e. assuming ascertained revenues and spending commitments for the current part, and collected revenue and payments for the capital account). For 2012, 2013 and the years thereafter, the target financial balance is obtained by multiplying average current expenditure for the 2006-2008 three-year period, reported in terms of commitments as stated in the final accounts, for a fixed percentage. More recent amendments have essentially provided for exclusion of revenue and expenditure items from the computation of the targets, mostly to facilitate the realisation of public investment at a local level and to 10 cover extraordinary events. |
| 10 | Decree-Law No. 98/2011, Article 20, Paragraph 5, converted by Law No. 111/2011; Decree-Law No. 138/2011, Article 1, Paragraph 8, converted by Law No. 148/2011; Law No. 183/2011 (2012 Stability Law). |
| 11 | Paragraph 2, Article 20 of the Decree-Law No. 98/2011 was initially amended by Paragraph 9, letter a) of Article 1 of the Decree-Law No. 138/2011, which moved the application of performance parameters ahead from 2013 to 2012. Later, Article 30, Paragraph 3 of the Law No. 183/2011, in further amending the referenced Paragraph 2 of Article 20, postponed some of the performance parameters to 2013, and likewise repealed Paragraph 2-ter of Article 20 that called for a correction coefficient connected with the trend of improvement achieved by the individual Local Governments with regard to the performance parameters. |
| 12 | Decree-Law No. 1/2012, Article 25, Paragraph 6, converted by Law No. 27/2012 |
| 13 | Decree-Law No. 138/2011, Article 6, Paragraph 1, converted by Law No. 148/2011. |
| 14 | Decree-Law No. 138/2011, Article 4, Paragraph 4, converted by Law No. 148/2011. |
| | |
| | MINISTERODELL’ECONOMIAEDELLE FINANZE |
72 | | |
ECONOMICAND FINANCIAL DOCUMENT – ITALY’S STABILITY PROGRAMME
Union, expenditures sustained by the State for the management and maintenance of assets transferred15 by the federal State property allocation. With regard to 2013 and 2014 only, part of the expenditures for the infrastructure investments of Local Government entities16 are also excluded.
To strengthen the consolidation process and to reduce the debt-to-GDP ratio, as already provided for by budgetary rules already in force, the mechanism to curb the nominal rate of growth of local authorities’ debt has been confirmed. Local authorities may take on new long-term secured loans and may source other forms of financing through the market only if their annual debt-servicing expenditure, when summed with the charges for other financial obligations outstanding17, does not exceed the limit of 8 per cent in 2012, 6 per cent in 2013 and the 4 per cent from 2014, with respect to the first three revenue items in accounting statements made two years prior to the year in which loans are expected to be taken out18. Furthermore, as from 2013, Local Government entities will have to reduce the magnitude of the public debt. The procedures for reaching the debt reduction target are to be outlined by decree of the Ministry of the Economy and Finance, following consultation with the Joint Conference. Some of the sanctions foreseen in the case of non-compliance with the Domestic Stability Pact will be applied to entities failing to reduce their debt, including, for example, limitation on current expenditure and personnel hiring.
In order to meet the saving targets of ordinary statute Regions, the rule of checking final expenditure, introduced as of 2002, will continue to be applied. In line with the previous three-year period, distinct targets are set for expenditure, based on a cash basis and on an accrual basis. Healthcare expenditure, which is governed by specific regulations, is not included in the calculation nor is expenditure for granting loans; similarly, current and capital expenditure for programmes co-funded by the European Union, for the part related to EU funds, are excluded from the calculation.
In addition to the Domestic Stability Pact, among the rules concerning Regions those pertinent to the “Healthcare Pact” are emphasized as they aim at achieving proper planning of public health spending, not covered by the Domestic Stability Pact budgetary rules.
The Healthcare Pact fixes the amount of resources to be allotted to the National Health Service and is aimed at improving the quality of services by ensuring uniformity throughout the system. In line with the federalist reform of public healthcare, the Pact has confirmed and reinforced the model of ‘shared governance’ between the central and Local Government bodies. The level of State financing of the NHS for 2013-201419 was defined within the budget measures approved in the summer of 2011, and will permit savings on the order of €2.5 billion in 2013 and €5.0 billion as from 2014. The provisions require that the share of savings to be realized in terms of each expenditure item (goods
| 15 | Law No. 183/2011, Article 31, Paragraph 15. |
| 16 | Law No. 183/2011, Article 31, Paragraph 16. |
| 17 | Charges for previously contracted long-term secured loans, previously issued bond loans, credit lines and guarantees granted pursuant to Article 207 of the Consolidated Act for Local Entities, net of the state and regional interest subsidies. |
| 19 | Decree-Law No. 98/2011, Article 17, converted by Law No. 111/2011 |
| | |
| MINISTERODELL’ECONOMIAEDELLE FINANZE | | |
| | 73 |
ECONOMICAND FINANCIAL DOCUMENT – ITALY’S STABILITY PROGRAMME
and services, pharmaceuticals, medical devices, co-participation in healthcare expenditure) be defined through the State-Regions agreement to be signed by 30 April 2012. Should the agreement not be reached by this deadline, the due share of savings will be computed and applied based on the percentages outlined in the regulation for guaranteeing the containment of expenditure.
The pharmaceutical expenditure ceilings, as envisaged in already existing regulations, have been confirmed for 201220. In addition, with regard to pharmaceuticals administered in hospitals, as of 2013, the pharmaceutical companies will have to shoulder up to 35 per cent of any amounts over the ceiling on the expenditure at a national level (2.4 per cent). The procedures for applying this provision are to be defined by regulation to be handed down by 30 June 2012. Should the regulation not be issued by this date, the ceiling on pharmaceutical expenditure at the Local Government level as from 2013 will be re-set at an amount equal to 12.5 per cent.
VII.2 STRENGTHENING OF FISCAL FRAMEWORK
The process of consolidating the economic pillar of the Economic and Monetary Union, which began in 2009, is proceeding through stronger coordination of economic and budget policies and the adoption of more rigorous fiscal rules.
In December 2011, the package of six legislative proposals regarding economic governance that amended the Stability and Growth Pact went into effect. The new provisions reinforce the preventive and corrective arms of the Pact, providing for the introduction of new rules on national budget frameworks, the surveillance of excessive macroeconomic imbalances, the introduction of an expenditure benchmark, and the attribution of greater significance to the public debt parameter. In November 2011, two new regulations21 were proposed by the European Commission for (i) reinforcing economic and budget surveillance of the Member States that are experiencing, or risk experiencing, serious difficulty concerning their financial stability, and (ii) common provisions for monitoring and evaluating budgetary planning documents and for correcting excessive deficits of the Member States in the Euro Area. In March 2012, 25 countries of the European Union signed the Treaty22 on Stability, Coordination and Governance (the so-called Fiscal Compact)23 which aims to reinforce the economic pillar of the Economic and Monetary Union through rules on budget discipline, the coordination of economic policies and governance within the Euro Area, for the pursuit of EU objectives regarding sustainable growth, employment, competitiveness and social cohesion.
| 20 | With Decree-Law No. 78 of 2009, converted by Law No. 122/2009, the pharmaceutical expenditure ceiling at a national and regional level (inclusive of the amounts paid by patients) was reduced for 2010 from 14.0 to 13.3 per cent, while the expenditure ceiling for the provision of pharmaceuticals in hospitals remained unchanged for each individual Region at the level of 2.4 per cent |
| 21 | These are regulatory proposals of the European Parliament and the European Council - COM (2011) 819 and COM (2011) 821 - presented by the European Commission on 23 November 2011. |
| 22 | Treaty on the Stability, Coordination and Governance of the Economic and Monetary Union, signed in Brussels on 2 March 2012 by 25 Member States of the European Union, with the exception of the UK and the Czech Republic. |
| 23 | The Treaty goes into effect on 1 January 2013 provided that at least 12 countries in the Euro Area have ratified the treaty through instruments provided by their national legal systems. |
| | |
| | MINISTERODELL’ECONOMIAEDELLE FINANZE |
74 | | |
ECONOMICAND FINANCIAL DOCUMENT – ITALY’S STABILITY PROGRAMME
The budget pact specifically provides for the incorporation of a rule in national laws (and preferably at a constitutional level) that requires a balanced budget or budget surplus position for General Government and the institution of corrective mechanisms in case of non-compliance with the rule. More specifically, the budget is considered balanced if the annual structural balance complies with the specific medium-term objective for the country, with the lower limit being a structural deficit of 0.5 per cent of GDP. Each contracting country is authorised to submit any non-compliance of other countries to the Court of Justice, which can evaluate the non-compliance and possibly impose sanctions.
In this regard, Italy has continued the process of assimilating European fiscal rules into national legislation, a process initiated in 2009 with the law approved in 2009 on accounting and public finance (Law No. 196/2009), as subsequently amended due to the new rules adopted by the European Union regarding coordination of the economic policies of the Member States (Law No. 39/2011).
At a constitutional level, and on a basis consistent with the commitment undertaken in the Euro Plus Pact and the indications formulated with the Fiscal Compact of 2 March 2012, Italy is currently in the process of approving reform for the introduction of the balanced-budget principle24.
More specifically, two general principles are expected to be introduced for General Government with the amendment of Article 97 of the Constitution: the balancing of budgets and the sustainability of the public debt, in accordance with the referred EU law. A specific recommendation regarding the State budget is expected to be adopted through amendment of Article 81 of the Constitution, which will introduce the requirement of structural balance between revenues and expenditures, and prohibit new indebtedness, except in the case of effects due to the economic cycle and, subject to the absolute majority of Parliament, extraordinary events. Similarly, for Local Governments, the principle of balanced budgets and the obligation to contribute (along with the State and other public entities) to ensuring compliance with EU economic and financial constraints are expected to be introduced through amendment of Article 119 of the Constitution. As an exception to the general principle, Local Government entities will be allowed to incur new debt for investment expenditure only, as long as two conditions are respected: the predisposition of amortisation plans and the need to ensure a balanced budget in all entities within each Region.
These principles are to be implemented in concrete terms through laws to be approved by the absolute majority of the members of the Chamber of Deputies and the Senate by 28 February 2013. The most important provisions refer to:
| | • | | the introduction of preventive and final checks regarding the trend of public finance; |
| 24 | Senate Act 3047-B ‘Introduction of the principle of a balanced budget in the Constitution’, definitively approved on 17 April 2012. |
| | |
| MINISTERODELL’ECONOMIAEDELLE FINANZE | | |
| | 75 |
ECONOMICAND FINANCIAL DOCUMENT – ITALY’S STABILITY PROGRAMME
| | • | | the adoption of corrective measures in the event of negative variances with respect to the forecasts; |
| | • | | the precise definition of the extraordinary events that could allow for incurring new debt for the State budget; |
| | • | | the introduction of fiscal rules regarding expenditure to safeguard balanced budgets and ensure reduction of the debt-to-GDP ratio over the long term. |
| | |
| | MINISTERODELL’ECONOMIAEDELLE FINANZE |
76 | | |