Exhibit 4
| | | | |
| | | |  |
| | |
| | | | Update of the 2012 Economic and Financial Document |
| | |
The Update of the 2012 ECONOMIC AND FINANCIAL DOCUMENT is available on-line at the Internet address listed below: www.mef.gov.it www.dt.tesoro.it www. rgs.tesoro.it ISSN: 2214-3280 | |  | | |
Update of the 2012
Economic and Financial Document
Submitted by the Prime Minister
Mario Monti
and
the Minister of the Economy and Finance
Vittorio Grilli
to the Cabinet on 20 September 2012
UPDATEOFTHE 2012 ECONOMICAND FINANCIAL DOCUMENT
CONTENTS
| | | | | | |
| | |
| 1. | | SUMMARY | | | 1 | |
| | |
| 2. | | THE ECONOMY: MACROECONOMICFRAMEWORK | | | 3 | |
| | | | | | |
| 3. | | EU COUNCILECONOMICPOLICYRECOMMENDATIONSTO ITALY | | | 8 | |
| | |
| 4. | | PUBLIC FINANCE | | | 9 | |
| 4.1 | | Public finance framework | | | 9 | |
| 4.2 | | Spending review process | | | 17 | |
| 4.3 | | Multi-year public assets evaluation plan | | | 21 | |
| 4.4 | | State budget | | | 22 | |
| 4.5 | | Content of the Domestic Stability and Convergence Pacts | | | 23 | |
| | | | | | |
| | | | Box | | Medium/long-term trends in Italy’s pension system |
| | | | Box | | Macroeconomic impact of Decree Law 95/2012 |
ANNEXES
Reports on investment expenditure and relevant multi-year laws (Volume I)
Reports on investment expenditure and relevant multi-year laws (Volume II)
| | |
TABLES | | |
| |
Table 1 | | Public finance indicators |
Table 2 | | Macroeconomic framework |
Table 3 | | General government account at unchanged legislation |
Table 4 | | Updated synoptic outline of public finance |
Table 5 | | Cyclically adjusted public finance |
Table 6 | | One-off measures |
Table 7 | | General government debt by subsector |
Table 8 | | Impact of Decree Law 95/2012 on key sectors affected |
Table 9 | | Decree Law 95/2012: breakdown of financial effects by subsector |
Table 10 | | 2013-2015 State budget |
| | |
| MINISTERODELL’ECONOMIAEDELLE FINANZE | | |
| | III |
UPDATEOFTHE 2012 ECONOMICAND FINANCIAL DOCUMENT
| | |
| | MINISTERODELL’ECONOMIAEDELLE FINANZE |
IV | | |
UPDATEOFTHE 2012 ECONOMICAND FINANCIAL DOCUMENT
Since the presentation of the Economic and Financial Document (DEF) in April the macroeconomic scenario deteriorated further as a result of heightened tensions on sovereign debt markets and the uncertainty that has characterised the euro area, and only recently does there seem to be a turning point in terms of financial stability that should lead, albeit with an inevitable delay, also to better economic performance.
According to the economic forecasts of this Update, GDP is expected to contract by 2.4 per cent in 2012. In 2013, based on the assumed path, growth should be slightly negative, to further improve in the following two years. On a yearly average, GDP in 2013 should decrease by 0.2 per cent, mainly due to the negative carryover of the previous year’s decline; quarterly GDP should in fact begin to be positive as early as the first quarter. In 2014-2015, economic activity should grow by 1.1 and 1.3 per cent respectively, benefiting both from the improvement in global demand and the impact of recent measures approved by the Government.
TABLE 1: PUBLIC FINANCE INDICATORS (as a % of GDP)1
| | | | | | | | | | | | | | | | | | | | | | | | |
| | | 2010 | | | 2011 | | | 2012 | | | 2013 | | | 2014 | | | 2015 | |
UPDATED SCENARIO BASED ON UNCHANGED LEGISLATION | | | | | | | | | | | | | | | | | | | | | | | | |
Net borrowing | | | -4.6 | | | | -3.9 | | | | -2.6 | | | | -1.6 | | | | -1.5 | | | | -1.4 | |
Primary balance | | | 0.0 | | | | 1.0 | | | | 2.9 | | | | 4.0 | | | | 4.4 | | | | 4.8 | |
Interest | | | 4.6 | | | | 4.9 | | | | 5.5 | | | | 5.6 | | | | 6.0 | | | | 6.3 | |
Structural net borrowing (2) | | | -3.6 | | | | -3.6 | | | | -0.9 | | | | 0.2 | | | | -0.2 | | | | -0.5 | |
Change in structural balance | | | -0.4 | | | | 0.0 | | | | -2.8 | | | | -1.1 | | | | 0.5 | | | | 0.3 | |
Public debt (including aid) (3) | | | 119.2 | | | | 120.7 | | | | 126.4 | | | | 127.1 | | | | 125.1 | | | | 122.9 | |
Public debt (net of aid) (4) | | | 118.9 | | | | 119.9 | | | | 123.3 | | | | 123.3 | | | | 121.3 | | | | 119.1 | |
| | | | | | | | | | | | | | | | | | | | | | | | |
Reduction of public debt stock (in aggregate terms) | | | | | | | | | | | | | | | 1.0 | | | | 2.0 | | | | 3.0 | |
| | | | | | | | | | | | | | | | | | | | | | | | |
UPDATED POLICY SCENARIO FRAMEWORK | | | | | | | | | | | | | | | | | | | | | | | | |
Net borrowing | | | -4.6 | | | | -3.9 | | | | -2.6 | | | | -1.8 | | | | -1.5 | | | | -1.3 | |
Primary balance | | | 0.0 | | | | 1.0 | | | | 2.9 | | | | 3.8 | | | | 4.4 | | | | 4.8 | |
Interest | | | 4.6 | | | | 4.9 | | | | 5.5 | | | | 5.6 | | | | 5.9 | | | | 6.1 | |
Structural net borrowing (2) | | | -3.6 | | | | -3.6 | | | | -0.9 | | | | 0.0 | | | | -0.2 | | | | -0.4 | |
Change in structural balance | | | -0.4 | | | | 0.0 | | | | -2.8 | | | | -0.9 | | | | 0.3 | | | | 0.2 | |
Public debt (including aid) (3) | | | 119.2 | | | | 120.7 | | | | 126.4 | | | | 126.1 | | | | 123.1 | | | | 119.9 | |
Public debt (net of aid) (4) | | | 118.9 | | | | 119.9 | | | | 123.3 | | | | 122.3 | | | | 119.3 | | | | 116.1 | |
| | | | | | |
Memo item: Economic and Financial Document (April 2012) | | | | | | | | | | | | | | | | | | | | | | | | |
Net borrowing | | | -4.6 | | | | -3.9 | | | | -1.7 | | | | -0.5 | | | | -0.1 | | | | 0.0 | |
Primary balance | | | 0.0 | | | | 1.0 | | | | 3.6 | | | | 4.9 | | | | 5.5 | | | | 5.7 | |
Interest | | | 4.6 | | | | 4.9 | | | | 5.3 | | | | 5.4 | | | | 5.6 | | | | 5.8 | |
Structural net borrowing (2) | | | -3.6 | | | | -3.6 | | | | -0.4 | | | | 0.6 | | | | 0.6 | | | | 0.4 | |
Change in structural balance | | | -0.4 | | | | 0.0 | | | | -3.2 | | | | -1.0 | | | | 0.0 | | | | 0.2 | |
Public debt (including aid) (3) | | | 118.6 | | | | 120.1 | | | | 123.4 | | | | 121.5 | | | | 118.2 | | | | 114.4 | |
Public debt (net of aid) (4) | | | 118.3 | | | | 119.2 | | | | 120.3 | | | | 117.9 | | | | 114.5 | | | | 110.8 | |
| | | | | | | | | | | | | | | | | | | | | | | | |
Nominal GDP (absolute values x 1000) | | | 1,553.2 | | | | 1,580.2 | | | | 1,564.4 | | | | 1,582.4 | | | | 1,629.1 | | | | 1,680.4 | |
| | | | | | | | | | | | | | | | | | | | | | | | |
| 1) | Any inaccuracies are due to rounding off. |
| 2) | Net of one-off measures and of the cyclical component. |
| 3) | Including: loans to Greece, Italy’s share in the EFSF (not including aid to recapitalise the Spanish banking sector) and in the ESM programme for the years 2010-2015. |
| 4) | Net of loans to Greece, of Italy’s share in the EFSF and ESM capital for the years 2010-2015. |
| | |
| MINISTERODELL’ECONOMIAEDELLE FINANZE | | |
| | 1 |
UPDATEOFTHE 2012 ECONOMICAND FINANCIAL DOCUMENT
Besides maintaining financial stability, the Government is now providing strong support to economic growth and productivity through some fundamental pillars: i) improvement of labour market mechanisms; ii) liberalisation of the economy and other interventions that favour competition; iii) simplification and greater efficiency of general government; iv) promotion of R&D and education; v) new mechanisms to hasten the construction of infrastructure; vi) improvement in efficiency of the civil justice system.
The evolution of public finances reflects the worsening economic cycle generated by tensions on sovereign debt markets, with the consequent increase in interest rates and slowdown in global growth. In 2012, general government net borrowing at unchanged legislation is estimated at 2.6 per cent of GDP, about 1 percentage point above the amount specified in the DEF. The higher deficit is correlated with a decrease in revenues with respect to those envisaged and a higher cost of servicing debt, partially offset by a more moderate increase in other items of current expenditure. In 2013-2015, the deficit is expected to decline gradually, in line with the rate of decline projected in the DEF. The primary surplus is expected to gradually increase from 2.9 per cent of GDP estimated for the current year to 4.8 per cent in 2015.
In structural terms, that is net of the cyclical component and of one-off measures, the path towards fiscal consolidation remains broadly unchanged from that projected in the 2012 DEF for the years 2012 and 2013. The structural budget balance under unchanged legislation is expected to decline by 2.8 percentage points this year, settling at around -0.9 per cent of GDP in 2012. A structural balance in line with the medium-term objective of a balanced budget is expected to be achieved in 2013 and subsequent years. In 2013, this balance presents a 0.2 per cent of GDP surplus, better than the balanced budget agreed at European level. Taking into account this surplus, the Government confirms its target of a balanced budget, as indicated in the table, despite the impact of adverse natural events – such as the earthquake that struck the Emilia Romagna region in 2012 – and of a more significant economic downturn than that expected in the DEF, which results in unavoidable expenditure.
The achievement of a balanced budget is a necessary condition to ensure the sustainability of public debt. In view of this goal the Government’s action in the coming months will focus on reducing public debt, by implementing tools designed for better management and divestiture of State assets, both properties and public shareholdings. Given expected proceeds of about 1 percentage point of GDP per year, the debt/GDP ratio (including support paid or to be paid to euro area countries) is estimated at 126.1 per cent in 2013, 123.1 per cent in 2014 and 119.9 per cent in 2015. Net of support the debt/GDP ratio would stand at 122.3 per cent in 2013 then decrease to 119.3 per cent in 2014 and 116.1 per cent in 2015. These estimates indicate a slowdown in debt reduction due, on the one hand, to the worsening macroeconomic framework and the related impact on government borrowing requirements, and on the other hand, to the reclassifications made on the basis of recent Eurostat decisions, which raised the debt level in 2010 and 2011.
| | |
| | MINISTERODELL’ECONOMIAEDELLE FINANZE |
2 | | |
UPDATEOFTHE 2012 ECONOMICAND FINANCIAL DOCUMENT
| 2. | THE ECONOMY: MACROECONOMIC FRAMEWORK |
The macroeconomic scenario deteriorated compared to the April EFD. In the second quarter of this year, international trade and global production slowed down compared to the previous quarter’s growth rate. In August, the Purchasing Managers’ Index (PMI) for the manufacturing sector stood below the expansion area, as in the previous two months, and in line with other indicators regarding the global cycle. In the second quarter of 2012, euro area GDP declined by 0.2 per cent on the previous quarter, after a stable first quarter. In September, the European Central Bank forecast, for the year 2012, a growth rate for the euro area between -0.6 and -0.2 per cent , and a rate between -0.4 and 1.4 per cent for 2013, representing a downward revision compared with estimates published last June.
The uncertainty characterising the economic situation of the euro area last spring increased tensions on financial markets, leading to a widening of differentials between bond yields of some European States compared to those of the German bund.
According to the main international organisations, the widespread slowdown is also due to critical aspects of the management of the euro area sovereign debt crisis and to fears tied to imminent US fiscal policy decisions. European authorities introduced new instruments to contrast pressure on euro area sovereign debt in the beginning of the summer: on 9 July the Euro Group agreed to recapitalise Spanish banks through the EFSF/ESM; on 6 September the European Central Bank declared that, in order to restore proper market functioning, it reserved itself the right to purchase unlimited quantities of member state government bonds, especially those with maturities of less than three years, though subject to strict conditions dictated by European Governments.
Italy’s economic trend, already penalised in the short-term by the ineluctable fiscal consolidation package, was further hit by financial and credit market tensions. The result was, not only a widening of the gap between yields on Italian and German government bonds, but also an increase in the volatility of spreads, which discouraged international investors from holding Italian bonds. Banks operating in the domestic market were affected by the situation as there followed a hefty increase in their borrowing costs, which they consequently passed through to household and business borrowing rates. There was, moreover, a gradual slowdown in the growth of credit offered to the private sector, which showed, in the end, some signs of contraction. The real economy, already badly affected by a weakening international economic cycle and by a deterioration of household and business confidence, was thus further penalised.
During the days preceding the final draft of this report there were encouraging signs on financial markets linked to the untangling of some knots that have been hindering progress on European institutional processes. Should these developments be confirmed, the uncertainty that has till now contributed to stifle economic recovery could rapidly reduce.
| | |
| MINISTERODELL’ECONOMIAEDELLE FINANZE | | |
| | 3 |
UPDATEOFTHE 2012 ECONOMICAND FINANCIAL DOCUMENT
GDP recorded a new contraction of 0.8 per cent in the second quarter compared to the previous one. Domestic demand net of inventories lowered growth by 1.0 percentage point due to a further decline in consumption and investment expenditure. Net foreign demand contributed a positive 0.2 percentage points, determined by a marked deceleration of imports, while exports held steady. Inventories contributed virtually nil to growth. The most recent trend indicators show a continuation of the recession into the third quarter. Industrial production has continued to contract. Forecast indicators remain at historically low levels.
Having taken into account the various components of the macroeconomic scenario, the growth of the Italian economy has been revised downwards with respect to the estimates made in April’s EFD. Economic activity is forecast to fall by 2.4 per cent in 2012 and by 0.2 per cent in 2013. Growth in 2013, net of the negative carryover from the previous year, would actually be positive: 0.4 per cent. The average annualised growth profile of the four quarters of 2013 would be 0.7 per cent, showing a positive value already in the first quarter. In 2014 and 2015 economic activity is forecast to grow by 1.1 and 1.3 per cent respectively, benefitting both from an improvement in global demand and positive effects deriving from the recent structural reforms passed by the Government.
With reference to the components, during the current year domestic demand is projected to be particularly weak. Labour market and disposable income trends will weigh on household spending decisions, with confidence at historic lows. In the medium term, household spending should return to grow at moderate rates.
Investments in machinery, particularly sensitive to cyclical developments, are projected to contract by 10.6 per cent in the present year. Recovery is expected by about the end of 2013, strengthening over the following two years.
The construction sector should also remain weak, where investments still suffer from the crisis in the real estate sector. Most recent signs show a weakening of both activity and sales in the residential sector. A slight recovery is forecast for 2014-2015.
Even with the envisaged decrease in global trade, net exports should be positive for the entire period considered. Indeed, the current account trade deficit should record a net improvement thanks to trade dynamics.
The employed, measured in standard units, are forecast to decrease over the entire year 2013. In July of this year, the unemployment rate reached 10.7 per cent (seasonally adjusted data), an increase of 2.5 percentage points compared to the previous year. The marked increase in the unemployment rate is to be ascribed mainly to the increase in labour supply. Contrary to what happened in the 2008-2009 crisis, job seeking intensified in the latest months. The increase in the pension age following the reforms adopted during the previous years has also contributed to the rise in the participation rate. The unemployment rate is forecast to reach 10.8 per cent in 2012 to then rise to 11.4 per cent in 2013. Notwithstanding the expected increase in the participation rate, unemployment should fall to 10.9 per cent in 2015.
Unit labour costs should rise in 2012. While the increase in wages has been moderate, the drop in employment will be less significant than that of value added, resulting in a fall in productivity. In the medium term, contained wage growth, together with a gradual recovery of productivity, should bring about a decisive curbing of the increase in unit labour costs.
| | |
| | MINISTERODELL’ECONOMIAEDELLE FINANZE |
4 | | |
UPDATEOFTHE 2012 ECONOMICAND FINANCIAL DOCUMENT
As regards prices, there remain risks of exogenous pressures linked to the geopolitical situation in the Middle East. However, with respect to the EFD, the private consumption deflator for the current year is revised downwards due to the postponement of the VAT increase from October 2012 to July 2013. The deflator is now estimated to increase to 2.6 per cent in 2012, then decrease to 2.0 per cent in 2013 and 1.9 per cent in the following two years.
TABLE 2: MACROECONOMIC FRAMEWORK (percentage change unless stated otherwise)
| | | | | | | | | | | | | | | | | | | | | | | | |
| | | 2010 | | | 2011 | | | 2012 | | | 2013 | | | 2014 | | | 2015 | |
INTERNATIONAL EXOGENOUS VARIABLES | | | | | | | | | | | | | | | | | | | | | | | | |
International trade | | | 12.8 | | | | 5.9 | | | | 3.3 | | | | 5.1 | | | | 6.1 | | | | 6.4 | |
Oil price (FOB Brent dollar/barrel) | | | 80.2 | | | | 111.3 | | | | 113.2 | | | | 115.4 | | | | 115.4 | | | | 115.4 | |
Dollar/euro exchange rate | | | 1,327 | | | | 1,392 | | | | 1,272 | | | | 1,242 | | | | 1,242 | | | | 1,242 | |
| | | | | | |
ITALY MACRO (VOLUMES) | | | | | | | | | | | | | | | | | | | | | | | | |
GDP | | | 1.8 | | | | 0.4 | | | | -2.4 | | | | -0.2 | | | | 1.1 | | | | 1.3 | |
Imports | | | 12.7 | | | | 0.4 | | | | -6.9 | | | | 1.7 | | | | 3.5 | | | | 3.9 | |
Final domestic consumption | | | 0.7 | | | | 0.0 | | | | -2.6 | | | | -0.7 | | | | 0.3 | | | | 0.6 | |
- Resident household expenditure | | | 1.2 | | | | 0.2 | | | | -3.3 | | | | -0.5 | | | | 0.6 | | | | 0.8 | |
- General government expenditure and NPISH | | | -0.6 | | | | -0.9 | | | | -0.6 | | | | -1.4 | | | | -0.5 | | | | 0.2 | |
Gross fixed investment | | | 2.1 | | | | -1.9 | | | | -8.3 | | | | 0.1 | | | | 2.6 | | | | 2.8 | |
- Machinery, equipment and other items | | | 10.4 | | | | -0.9 | | | | -10.6 | | | | 0.9 | | | | 4.2 | | | | 4.4 | |
- Construction | | | -4.8 | | | | -2.8 | | | | -6.1 | | | | -0.6 | | | | 1.0 | | | | 1.2 | |
Exports | | | 11.6 | | | | 5.6 | | | | 1.2 | | | | 2.4 | | | | 3.9 | | | | 4.2 | |
Memo item: BoP current account as a % of GDP | | | -3.5 | | | | -3.3 | | | | -1.4 | | | | -1.3 | | | | -1.1 | | | | -1.0 | |
| | | | | | |
CONTRIBUTIONS TO GDP GROWTH (*) | | | | | | | | | | | | | | | | | | | | | | | | |
Net exports | | | -0.4 | | | | 1.4 | | | | 2.3 | | | | 0.2 | | | | 0.2 | | | | 0.2 | |
Inventories | | | 1.2 | | | | -0.5 | | | | -0.9 | | | | 0.1 | | | | 0.1 | | | | 0.0 | |
Domestic demand net of inventories | | | 1.0 | | | | -0.4 | | | | -3.6 | | | | -0.6 | | | | 0.7 | | | | 1.0 | |
| | | | | | |
PRICES | | | | | | | | | | | | | | | | | | | | | | | | |
Import deflator | | | 6.7 | | | | 7.3 | | | | 3.6 | | | | 2.3 | | | | 1.9 | | | | 2.0 | |
Export deflator | | | 2.6 | | | | 4.1 | | | | 2.3 | | | | 2.3 | | | | 2.2 | | | | 2.0 | |
GDP deflator | | | 0.4 | | | | 1.3 | | | | 1.4 | | | | 1.4 | | | | 1.9 | | | | 1.9 | |
Nominal GDP | | | 2.2 | | | | 1.7 | | | | -1.0 | | | | 1.2 | | | | 3.0 | | | | 3.2 | |
Consumption deflator | | | 1.5 | | | | 2.7 | | | | 2.6 | | | | 2.0 | | | | 1.9 | | | | 1.9 | |
Inflation (planned) | | | 1.5 | | | | 2.0 | | | | 1.5 | | | | 1.5 | | | | 1.5 | | | | 1.5 | |
HICP net of imported energy products (**) | | | 1.1 | | | | 2.6 | | | | 3.0 | | | | 2.0 | | | | 1.8 | | | | 2.1 | |
| | | | | | |
LABOUR | | | | | | | | | | | | | | | | | | | | | | | | |
Compensation | | | 2.3 | | | | 1.4 | | | | 1.1 | | | | 0.9 | | | | 1.2 | | | | 1.2 | |
Productivity (measured on GDP) | | | 2.7 | | | | 0.3 | | | | -1.2 | | | | 0.1 | | | | 0.6 | | | | 0.7 | |
Unit Labour Cost (measured on GDP) | | | -0.4 | | | | 1.0 | | | | 2.3 | | | | 0.8 | | | | 0.5 | | | | 0.5 | |
Employment (ULA) | | | -0.9 | | | | 0.1 | | | | -1.2 | | | | -0.3 | | | | 0.4 | | | | 0.6 | |
Unemployment rate | | | 8.4 | | | | 8.4 | | | | 10.8 | | | | 11.4 | | | | 11.3 | | | | 10.9 | |
Employment rate (15-64 age group) | | | 56.9 | | | | 56.9 | | | | 57.0 | | | | 57.0 | | | | 57.3 | | | | 57.7 | |
| | | | | | | | | | | | | | | | | | | | | | | | |
Memo item: Nominal GDP (absolute values in € millions) | | | 1,553,166 | | | | 1,580,220 | | | | 1,564,378 | | | | 1,582,375 | | | | 1,629,056 | | | | 1,680,441 | |
| | | | | | | | | | | | | | | | | | | | | | | | |
| (*) | Any inaccuracies are due to rounding off. |
Note: The macroeconomic scenario was drawn up according to information available on 12 September 2012. Assumptions on oil prices and on the dollar/euro exchange rate are based on the average of the 10 working days ending 28 August 2012. GDP and components are in volumes (chained prices with 2005 reference year), data is not corrected for working days.
| | |
| MINISTERODELL’ECONOMIAEDELLE FINANZE | | |
| | 5 |
UPDATEOFTHE 2012 ECONOMICAND FINANCIAL DOCUMENT
CREDIT IN ITALY
Jitters in financial markets have also weighed on credit trends. In the case of banks, difficulties on the supply side and uncertainties regarding the solidity of credit portfolios has generated a tightening of credit policies with an increase in bank credit rates.
Euro level refinancing operations have contributed decisively to guarantee the availability of bank liquidity, but this has not resulted in a proportionate increase of credit to the economy.
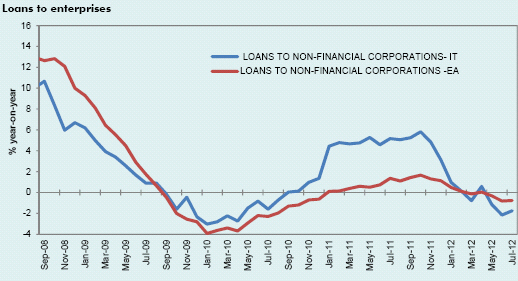
After the recovery recorded in 2011, the annual change in financial institutions’ credit aggregates1 to the private sector2 entered once again into negative territory over the last months. The negative trend is particularly obvious for businesses.
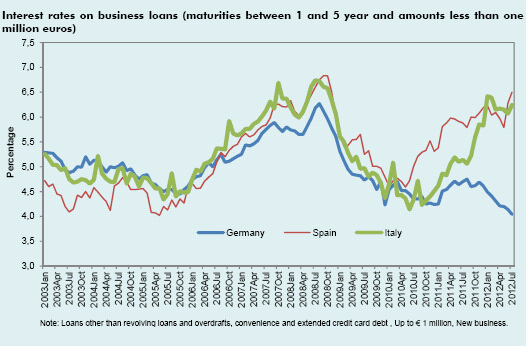
In July the interest rate on new one- to five-year loans of up to one million euros to Italian enterprises was 6.2 per cent compared to 4.0 per cent for German enterprises. This differential partially reflects the fragmentation of the euro area financial markets since 2010 and the non-uniform transmission of monetary policy decisions to the countries of the area.
As per the quarterly survey on bank lending3, the supply side in the second quarter of 2012 presents a notable improvement with respect to tensions present last January. Conditions on loans to large enterprises are less tense while those on loans to SMEs remain stable.
Loan conditions for households during the second quarter were constant for property mortgages while consumption loans recorded a slight fall. Demand contracted by a fraction in both sections notwithstanding the small decrease in interest rates4 (on mortgages and on consumer credit) from February on.
| 1 | Bank of Italy: Moneta e Banca, no. 45/2012, non-financial enterprises and households, data is net of the impact of ECB Regulation 2008/32 and of some changes in the statistical control signposts. |
| 2 | Non-financial enterprises and households. |
| 3 | Bank Lending Survey of 25 July 2012. |
| | |
| | MINISTERODELL’ ECONOMIAEDELLE FINANZE |
6 | | |
UPDATEOFTHE 2012 ECONOMICAND FINANCIAL DOCUMENT
| | |
| MINISTERODELL’ ECONOMIAEDELLE FINANZE | | |
| | 7 |
UPDATEOFTHE 2012 ECONOMICAND FINANCIAL DOCUMENT
| 3. | EU COUNCIL ECONOMIC POLICY RECOMMENDATIONS TO ITALY |
During July, as part of the European Semester process, the Ecofin Council addressed specific recommendations to Italy based on the European Commission’s assessment of the country’s macroeconomic and budget scenarios set out in the Stability Programme and the National Reform Programme.
These recommendations include, among others, the fact that public debt, albeit high, is under strict control through the Stability and Growth Pact and that macroeconomic trends with regard to exports and competitiveness deserve particular attention.
The Ecofin Council requests that Italy implement its fiscal consolidation so as to: guarantee the correction of the excessive deficit by 2012; pursue structural primary surpluses to put the debt/GDP ratio on a downward trend by 2013; ensure adequate progress towards the medium-term objective (MTO) (while respecting the expenditure benchmark); and make adequate progress on debt reduction. Ecofin recommends, at the same time, to introduce provisions implementing the new constitutional requirement of a balanced budget, guaranteeing appropriate coordination between different administrative levels and respecting the European regulatory framework.
The recommendations urge the Government to: i) adopt further measures to counter youth unemployment, improving training and easing entry into the workforce also through incentives to set up new enterprises and hire employees; ii) make the reform of the labour market a priority, to address the segmentation of the market and establish an integrated system for unemployment benefits, stimulate women’s participation to the labour market, providing services of assistance for children and elderly, improve the regulatory framework regarding wage bargaining to contribute to the alignment of wage dynamics to productivity at sector and enterprise levels; iii) continue the fight against tax evasion, the informal economy and undeclared work by intensifying checks and controls; iv) implement liberalisation and simplification measures already adopted in the services sector; v) further simplify the regulatory framework for enterprises and strengthen administrative capacity, enact the envisaged reorganisation of the civil justice system and promote the use of alternative mechanisms to resolve disputes.
| | |
| | MINISTERODELL’ ECONOMIAEDELLE FINANZE |
8 | | |
UPDATEOFTHE 2012 ECONOMICAND FINANCIAL DOCUMENT
| 4.1 | PUBLIC FINANCE FRAMEWORK |
Since the presentation of the Economic and Financial Document (DEF) in April the macroeconomic outlook became bleaker following intensified tensions on sovereign debt markets and as an effect of the uncertainty that prevailed in the euro area.
In July, the Government adopted a spending review decree law with a view to strengthen the financial consolidation path begun in 2011 and pursue a lasting improvement of the efficiency and quality of spending, in line with EU recommendations. The decree, now signed into law, contains specific provisions for structural cost savings through streamlining and selective cuts1. The spending review was accompanied by norms to evaluate and divest public assets through investment funds so as to reduce public debt stock2.
Significant interventions to guarantee a higher level of healthcare were adopted in September as a continuation of the streamlining process and within the framework of a general overhaul of local healthcare, taking into account the need to curb health and pharmaceutical spending through reorganisation and greater efficiency3.
These actions are reflected in the trend of public finances presented here. The General Government account for the years 2012-2015 is therefore updated to take into account the latest economic developments and prospects for growth, as well as adopted legislation and results of the monitoring process.
In 2012 net borrowing should stand at 2.6 per cent of GDP, an increase of 0.9 percentage points above the figure in the DEF. The larger deficit is linked to a lower-than-expected trend in revenues and a higher cost of debt servicing, more than offset by a lower trend in other current account expenses, particularly those deriving from employee’s wages and intermediate consumption.
During 2013-2015 the deficit should progressively decrease in line with the DEF trend. The primary surplus should increase from 2.9 per cent of GDP estimated for the present year to 4.8 per cent in 2015. Fiscal pressure, after the net increase of more than 2 percentage points envisaged for this year, should rise slightly in 2013 and then fall to finally settle at values just below those at the end of 2012.
| 1 | Decree Law No. 95/2012 converted by Law No. 135/2012. |
| 2 | Decree Law No. 87/2012, merged during conversion into Law No. 135/2012. |
| 3 | Decree Law No. 158/2012. |
| | |
| MINISTERODELL’ ECONOMIAEDELLE FINANZE | | |
| | 9 |
UPDATEOFTHE 2012 ECONOMICAND FINANCIAL DOCUMENT
TABLE 3a: GENERAL GOVERNMENT ACCOUNT AT UNCHANGED LEGISLATION (in €mn)
| | | | | | | | | | | | | | | | | | | | | | | | |
| | | 2010 | | | 2011 | | | 2012 | | | 2013 | | | 2014 | | | 2015 | |
EXPENDITURE | | | | | | | | | | | | | | | | | | | | | | | | |
Compensation for employees | | | 172,085 | | | | 170,052 | | | | 167,080 | | | | 166,490 | | | | 165,485 | | | | 166,148 | |
Intermediate consumption | | | 136,098 | | | | 136,126 | | | | 134,740 | | | | 129,597 | | | | 129,294 | | | | 131,235 | |
Welfare benefits | | | 298,418 | | | | 305,122 | | | | 311,720 | | | | 319,664 | | | | 329,811 | | | | 338,685 | |
Pensions | | | 237,346 | | | | 244,243 | | | | 249,930 | | | | 255,070 | | | | 262,536 | | | | 269,605 | |
Other welfare benefits | | | 61,072 | | | | 60,879 | | | | 61,790 | | | | 64,594 | | | | 67,275 | | | | 69,080 | |
Other current expenditure | | | 63,780 | | | | 61,327 | | | | 59,225 | | | | 58,574 | | | | 57,560 | | | | 58,198 | |
Total current expenditure net of interest | | | 670,381 | | | | 672,627 | | | | 672,765 | | | | 674,325 | | | | 682,150 | | | | 694,266 | |
| | | | | | |
Interest | | | 71,112 | | | | 78,021 | | | | 86,119 | | | | 89,243 | | | | 96,971 | | | | 105,394 | |
| | | | | | |
Total current expenditure | | | 741,493 | | | | 750,648 | | | | 758,884 | | | | 763,568 | | | | 779,121 | | | | 799,660 | |
of which: Health expenditure | | | 112,742 | | | | 112,039 | | | | 113,597 | | | | 112,927 | | | | 113,421 | | | | 116,397 | |
| | | | | | |
Total capital expenditure 53,818 | | | 47,917 | | | | 46,827 | | | | 45,975 | | | | 45,600 | | | | 45,736 | | | | | |
Gross fixed investment | | | 32,346 | | | | 32,099 | | | | 29,664 | | | | 28,282 | | | | 28,545 | | | | 28,934 | |
Capital account contributions | | | 20,027 | | | | 17,815 | | | | 15,777 | | | | 15,803 | | | | 15,091 | | | | 15,042 | |
Other transfers | | | 1,445 | | | | -1,997 | | | | 1,386 | | | | 1,890 | | | | 1,964 | | | | 1,760 | |
| | | | | | |
Total final expenditure net of interest | | | 724,199 | | | | 720,544 | | | | 719,592 | | | | 720,300 | | | | 727,750 | | | | 740,002 | |
Total final expenditure | | | 795,311 | | | | 798,565 | | | | 805,711 | | | | 809,543 | | | | 824,721 | | | | 845,396 | |
| | | | | | |
REVENUES | | | | | | | | | | | | | | | | | | | | | | | | |
Total tax revenues | | | 447,592 | | | | 455,303 | | | | 481,367 | | | | 494,955 | | | | 503,323 | | | | 515,616 | |
Direct taxes | | | 226,235 | | | | 226,027 | | | | 243,196 | | | | 241,234 | | | | 246,743 | | | | 252,541 | |
Indirect taxes | | | 217,860 | | | | 222,313 | | | | 236,986 | | | | 253,146 | | | | 256,000 | | | | 262,489 | |
Capital account taxes | | | 3,497 | | | | 6,963 | | | | 1,185 | | | | 575 | | | | 580 | | | | 586 | |
Social security contributions | | | 213,398 | | | | 216,340 | | | | 218,217 | | | | 221,298 | | | | 226,666 | | | | 233,506 | |
Actual | | | 209,265 | | | | 212,100 | | | | 213,914 | | | | 216,924 | | | | 222,227 | | | | 229,002 | |
Deemed | | | 4,133 | | | | 4,240 | | | | 4,303 | | | | 4,374 | | | | 4,439 | | | | 4,504 | |
Other current revenues | | | 59,237 | | | | 61,032 | | | | 60,834 | | | | 62,750 | | | | 64,218 | | | | 65,917 | |
Total current revenues | | | 716,730 | | | | 725,712 | | | | 759,233 | | | | 778,428 | | | | 793,627 | | | | 814,454 | |
| | | | | | |
Non tax capital account revenues | | | 3,627 | | | | 3,527 | | | | 4,080 | | | | 5,123 | | | | 5,406 | | | | 6,038 | |
| | | | | | |
Total final revenues | | | 723,854 | | | | 736,202 | | | | 764,498 | | | | 784,126 | | | | 799,613 | | | | 821,078 | |
Memo item: Tax burden | | | 42.6 | | | | 42.5 | | | | 44.7 | | | | 45.3 | | | | 44.8 | | | | 44.6 | |
| | | | | | |
BALANCES | | | | | | | | | | | | | | | | | | | | | | | | |
Primary balance | | | -345 | | | | 15,658 | | | | 44,906 | | | | 63,826 | | | | 71,864 | | | | 81,076 | |
(as a % of GDP) | | | 0.0 | | | | 1.0 | | | | 2.9 | | | | 4.0 | | | | 4.4 | | | | 4.8 | |
Current balance | | | -24,763 | | | | -24,936 | | | | 349 | | | | 14,860 | | | | 14,507 | | | | 14,794 | |
(as a % of GDP) | | | -1.6 | | | | -1.6 | | | | 0.0 | | | | 0.9 | | | | 0.9 | | | | 0.9 | |
Net borrowing | | | -71,457 | | | | -62,363 | | | | -41,213 | | | | -25,417 | | | | -25,108 | | | | -24,318 | |
(as a % of GDP) | | | -4.6 | | | | -3.9 | | | | -2.6 | | | | -1.6 | | | | -1.5 | | | | -1.4 | |
| | | | | | | | | | | | | | | | | | | | | | | | |
Nominal GDP | | | 1,553.2 | | | | 1,580.2 | | | | 1,564.4 | | | | 1,582.4 | | | | 1,629.1 | | | | 1,680.4 | |
| | | | | | | | | | | | | | | | | | | | | | | | |
Tax revenues as a percentage of GDP rise from 46.6 per cent in 2011 to 48.9 per cent in 2015. The profile of tax revenues incorporates changes introduced in July regarding VAT rates4. Final expenditure net of interest, benefiting from saving initiatives introduced in 2011 which will increasingly produce benefits during 2012-2014, and from further structural rationalisation effects on expenditure undertaken with the spending review, is reduced by 1.6 percentage points of GDP, going from 45.6 per cent in 2011 to 44.0 per cent in 2015; in particular, current expenditure net of interest records a fall equivalent to 1.3 percentage points of GDP. Interest expenditure has a greater impact on GDP compared to the amount expected in the 2012 DEF, going from 4.9 per cent in
| 4 | Decree Law No. 95/2012, modifying previous legislation, determined the postponement of the entry into force of the two percentage point VAT rate increase, from 10 to 12 percent and from 21 to 23 percent, to the 1 July - 31 December 2013 period, and reduced the increase of the same to 11 and 22 percent, from 1 January 2014. |
| | |
| | MINISTERODELL’ ECONOMIAEDELLE FINANZE |
10 | | |
UPDATEOFTHE 2012 ECONOMICAND FINANCIAL DOCUMENT
2011 to 6.3 per cent in 2015, as an effect of the heightening of tensions on financial markets that began in April, which later abated, and of the related impact on the interest rate profiles of government securities.
TABLE 3b: GENERAL GOVERNMENT ACCOUNT AT UNCHANGED LEGISLATION (as a % of GDP)
| | | | | | | | | | | | | | | | | | | | | | | | |
| | | 2010 | | | 2011 | | | 2012 | | | 2013 | | | 2014 | | | 2015 | |
EXPENDITURE | | | | | | | | | | | | | | | | | | | | | | | | |
Compensation for employees | | | 11.1 | | | | 10.8 | | | | 10.7 | | | | 10.5 | | | | 10.2 | | | | 9.9 | |
Intermediate consumption | | | 8.8 | | | | 8.6 | | | | 8.6 | | | | 8.2 | | | | 7.9 | | | | 7.8 | |
Welfare benefits | | | 19.2 | | | | 19.3 | | | | 19.9 | | | | 20.2 | | | | 20.2 | | | | 20.2 | |
of which: Pensions | | | 15.3 | | | | 15.5 | | | | 16.0 | | | | 16.1 | | | | 16.1 | | | | 16.0 | |
Other welfare benefits | | | 3.9 | | | | 3.9 | | | | 3.9 | | | | 4.1 | | | | 4.1 | | | | 4.1 | |
Other current expenditure | | | 4.1 | | | | 3.9 | | | | 3.8 | | | | 3.7 | | | | 3.5 | | | | 3.5 | |
Total current expenditure net of interest | | | 43.2 | | | | 42.6 | | | | 43.0 | | | | 42.6 | | | | 41.9 | | | | 41.3 | |
| | | | | | |
Interest | | | 4.6 | | | | 4.9 | | | | 5.5 | | | | 5.6 | | | | 6.0 | | | | 6.3 | |
| | | | | | |
Total current expenditure | | | 47.7 | | | | 47.5 | | | | 48.5 | | | | 48.3 | | | | 47.8 | | | | 47.6 | |
of which: Health expenditure | | | 7.3 | | | | 7.1 | | | | 7.3 | | | | 7.1 | | | | 7.0 | | | | 6.9 | |
| | | | | | |
Total capital expenditure | | | 3.5 | | | | 3.0 | | | | 3.0 | | | | 2.9 | | | | 2.8 | | | | 2.7 | |
Gross fixed investment | | | 2.1 | | | | 2.0 | | | | 1.9 | | | | 1.8 | | | | 1.8 | | | | 1.7 | |
Capital account contributions | | | 1.3 | | | | 1.1 | | | | 1.0 | | | | 1.0 | | | | 0.9 | | | | 0.9 | |
Other transfers | | | 0.1 | | | | -0.1 | | | | 0.1 | | | | 0.1 | | | | 0.1 | | | | 0.1 | |
| | | | | | |
Total final expenditure net of interest | | | 46.6 | | | | 45.6 | | | | 46.0 | | | | 45.5 | | | | 44.7 | | | | 44.0 | |
Total final expenditure | | | 51.2 | | | | 50.5 | | | | 51.5 | | | | 51.2 | | | | 50.6 | | | | 50.3 | |
| | | | | | |
REVENUES | | | | | | | | | | | | | | | | | | | | | | | | |
Total tax revenues | | | 28.8 | | | | 28.8 | | | | 30.8 | | | | 31.3 | | | | 30.9 | | | | 30.7 | |
Direct taxes | | | 14.6 | | | | 14.3 | | | | 15.5 | | | | 15.2 | | | | 15.1 | | | | 15.0 | |
Indirect taxes | | | 14.0 | | | | 14.1 | | | | 15.1 | | | | 16.0 | | | | 15.7 | | | | 15.6 | |
Capital account taxes | | | 0.2 | | | | 0.4 | | | | 0.1 | | | | 0.0 | | | | 0.0 | | | | 0.0 | |
Social security contributions | | | 13.7 | | | | 13.7 | | | | 13.9 | | | | 14.0 | | | | 13.9 | | | | 13.9 | |
Actual | | | 13.5 | | | | 13.4 | | | | 13.7 | | | | 13.7 | | | | 13.6 | | | | 13.6 | |
Deemed | | | 0.3 | | | | 0.3 | | | | 0.3 | | | | 0.3 | | | | 0.3 | | | | 0.3 | |
Other current revenues | | | 3.8 | | | | 3.9 | | | | 3.9 | | | | 4.0 | | | | 3.9 | | | | 3.9 | |
Total current revenues | | | 46.1 | | | | 45.9 | | | | 48.5 | | | | 49.2 | | | | 48.7 | | | | 48.5 | |
| | | | | | |
Non tax capital account revenues | | | 0.2 | | | | 0.2 | | | | 0.3 | | | | 0.3 | | | | 0.3 | | | | 0.4 | |
| | | | | | |
Total final revenues | | | 46.6 | | | | 46.6 | | | | 48.9 | | | | 49.6 | | | | 49.1 | | | | 48.9 | |
Memo item: Tax burden | | | 42.6 | | | | 42.5 | | | | 44.7 | | | | 45.3 | | | | 44.8 | | | | 44.6 | |
| | | | | | |
BALANCES | | | | | | | | | | | | | | | | | | | | | | | | |
Primary balance | | | 0.0 | | | | 1.0 | | | | 2.9 | | | | 4.0 | | | | 4.4 | | | | 4.8 | |
Current account balance | | | -1.6 | | | | -1.6 | | | | 0.0 | | | | 0.9 | | | | 0.9 | | | | 0.9 | |
Net borrowing | | | -4.6 | | | | -3.9 | | | | -2.6 | | | | -1.6 | | | | -1.5 | | | | -1.4 | |
| | |
| MINISTERODELL’ ECONOMIAEDELLE FINANZE | | |
| | 11 |
UPDATEOFTHE 2012 ECONOMICAND FINANCIAL DOCUMENT
TABLE 3c: GENERAL GOVERNMENT ACCOUNT AT UNCHANGED LEGISLATION (% change)
| | | | | | | | | | | | | | | | | | | | |
| | | 2011 | | | 2012 | | | 2013 | | | 2014 | | | 2015 | |
EXPENDITURE | | | | | | | | | | | | | | | | | | | | |
Compensation for employees | | | -1.2 | | | | -1.7 | | | | -0.4 | | | | -0.6 | | | | 0.4 | |
Intermediate consumption | | | 0.0 | | | | -1.0 | | | | -3.8 | | | | -0.2 | | | | 1.5 | |
Welfare benefits | | | 2.2 | | | | 2.2 | | | | 2.5 | | | | 3.2 | | | | 2.7 | |
of which: Pensions | | | 2.9 | | | | 2.3 | | | | 2.1 | | | | 2.9 | | | | 2.7 | |
Other welfare benefits | | | -0.3 | | | | 1.5 | | | | 4.5 | | | | 4.2 | | | | 2.7 | |
Other current expenditure | | | -3.8 | | | | -3.4 | | | | -1.1 | | | | -1.7 | | | | 1.1 | |
Total current expenditure net of interest | | | 0.3 | | | | 0.0 | | | | 0.2 | | | | 1.2 | | | | 1.8 | |
| | | | | |
Interest | | | 9.7 | | | | 10.4 | | | | 3.6 | | | | 8.7 | | | | 8.7 | |
| | | | | |
Total current expenditure | | | 1.2 | | | | 1.1 | | | | 0.6 | | | | 2.0 | | | | 2.6 | |
of which: Health expenditure | | | -0.6 | | | | 1.4 | | | | -0.6 | | | | 0.4 | | | | 2.6 | |
| | | | | |
Total capital account expenditure | | | -11.0 | | | | -2.3 | | | | -1.8 | | | | -0.8 | | | | 0.3 | |
of which: Gross fixed investment | | | -0.8 | | | | -7.6 | | | | -4.7 | | | | 0.9 | | | | 1.4 | |
Capital account contributions | | | -11.0 | | | | -11.4 | | | | 0.2 | | | | -4.5 | | | | -0.3 | |
Other transfers | | | -238.2 | | | | -169.4 | | | | 36.4 | | | | 3.9 | | | | -10.4 | |
| | | | | |
Total final expenditure net of interest | | | -0.5 | | | | -0.1 | | | | 0.1 | | | | 1.0 | | | | 1.7 | |
Total final expenditure | | | 0.4 | | | | 0.9 | | | | 0.5 | | | | 1.9 | | | | 2.5 | |
| | | | | |
REVENUES | | | | | | | | | | | | | | | | | | | | |
Total tax revenues | | | 1.7 | | | | 5.7 | | | | 2.8 | | | | 1.7 | | | | 2.4 | |
of which: Direct taxes | | | -0.1 | | | | 7.6 | | | | -0.8 | | | | 2.3 | | | | 2.3 | |
Indirect taxes | | | 2.0 | | | | 6.6 | | | | 6.8 | | | | 1.1 | | | | 2.5 | |
Capital account taxes | | | 99.1 | | | | -83.0 | | | | -51.5 | | | | 0.9 | | | | 1.0 | |
Social security contributions | | | 1.4 | | | | 0.9 | | | | 1.4 | | | | 2.4 | | | | 3.0 | |
of which: Actual | | | 1.4 | | | | 0.9 | | | | 1.4 | | | | 2.4 | | | | 3.0 | |
Deemed | | | 2.6 | | | | 1.5 | | | | 1.7 | | | | 1.5 | | | | 1.5 | |
Other current revenues | | | 3.0 | | | | -0.3 | | | | 3.1 | | | | 2.3 | | | | 2.6 | |
Total current revenues | | | 1.3 | | | | 4.6 | | | | 2.5 | | | | 2.0 | | | | 2.6 | |
| | | | | |
Non tax capital account revenues | | | -2.8 | | | | 15.7 | | | | 25.6 | | | | 5.5 | | | | 11.7 | |
| | | | | |
Total final revenues | | | 1.7 | | | | 3.8 | | | | 2.6 | | | | 2.0 | | | | 2.7 | |
TABLE 4: UPDATED SYNOPTIC OUTLINE OF PUBLIC FINANCE (as a % of GDP)
| | | | | | | | | | | | | | | | | | | | | | | | | | |
| | | | | 2010 | | | 2011 | | | 2012 | | | 2013 | | | 2014 | | | 2015 | |
NET BORROWING | | (EFD Update) | | | -4.6 | | | | -3.9 | | | | -2.6 | | | | -1.6 | | | | -1.5 | | | | -1.4 | |
| | (2012 EFD) | | | -4.6 | | | | -3.9 | | | | -1.7 | | | | -0.5 | | | | -0.1 | | | | 0.0 | |
| | | | | | | |
INTEREST | | (EFD Update) | | | 4.6 | | | | 4.9 | | | | 5.5 | | | | 5.6 | | | | 6.0 | | | | 6.3 | |
| | (2012 EFD) | | | 4.6 | | | | 4.9 | | | | 5.3 | | | | 5.4 | | | | 5.6 | | | | 5.8 | |
| | | | | | | |
PRIMARY BALANCE | | (EFD Update) | | | 0.0 | | | | 1.0 | | | | 2.9 | | | | 4.0 | | | | 4.4 | | | | 4.8 | |
| | (2012 EFD) | | | 0.0 | | | | 1.0 | | | | 3.6 | | | | 4.9 | | | | 5.5 | | | | 5.7 | |
| | | | | | | |
NET STRUCTURAL BORROWING (1) | | (EFD Update) | | | -3.7 | | | | -3.7 | | | | -0.9 | | | | 0.2 | | | | -0.2 | | | | -0.5 | |
| | (2012 EFD) | | | -3.6 | | | | -3.6 | | | | -0.4 | | | | 0.6 | | | | 0.6 | | | | 0.4 | |
| | | | | | | |
| | (EFD Update) | | | 119.2 | | | | 120.7 | | | | 126.4 | | | | 127.1 | | | | 125.1 | | | | 122.9 | |
DEBT (2) | | (2012 EFD) | | | 118.6 | | | | 120.1 | | | | 123.4 | | | | 121.5 | | | | 118.2 | | | | 114.4 | |
| | | | | | | |
DEBT (3) | | (EFD Update) | | | 118.9 | | | | 119.9 | | | | 123.3 | | | | 123.3 | | | | 121.3 | | | | 119.1 | |
| | (2012 EFD) | | | 118.3 | | | | 119.2 | | | | 120.3 | | | | 117.9 | | | | 114.5 | | | | 110.8 | |
| | | | | | | |
STATE SECTOR BALANCE | | (EFD Update) | | | -4.3 | | | | -4.0 | | | | -2.9 | | | | -1.5 | | | | -1.3 | | | | -1.2 | |
| | (2012 EFD) | | | -4.3 | | | | -4.0 | | | | -1.7 | | | | -0.3 | | | | 0.3 | | | | 0.5 | |
| | | | | | | |
PUBLIC SECTOR BALANCE | | (EFD Update) | | | -4.4 | | | | -3.9 | | | | -2.9 | | | | -1.5 | | | | -1.2 | | | | -1.3 | |
| | (2012 EFD) | | | -4.4 | | | | -3.9 | | | | -1.7 | | | | -0.2 | | | | 0.3 | | | | 0.5 | |
| (1) | Cyclically adjusted and net of one-off measures. |
| (2) | Including: loans to Greece, Italy’s EFSF share (it does not include aid to recapitalise the Spanish banking sector) and its share of the ESM programme for the years 2010 to 2015 |
| (3) | Net of loans to Greece, of Italy’s share in the EFSF and ESM capital for the years 2010 to 2015. |
| | |
| | MINISTERODELL’ ECONOMIAEDELLE FINANZE |
12 | | |
UPDATEOFTHE 2012 ECONOMICAND FINANCIAL DOCUMENT
The worsening macroeconomic scenario for 2012 and the downward revision of growth forecasts for 2013-2015 determine a reduction in potential growth with respect to estimates reported in the 2012 DEF, given the estimate methodology adopted at the European level. Compared to the 2012 DEF estimates, the output gap is negative and wider for the entire forecast period.
In structural terms, the public finance recovery path is broadly the same as that projected in the 2012 DEF for 2012 and 2013. The structural balance (that is, net of the cyclical component and one-off measures) should fall by 2.8 percentage points this year, settling at around -0.9 per cent of GDP. In 2013 and the following years, the structural balance should be broadly in line with the medium-term goal of a balanced budget.
TABLE 5: CYCLICALLY ADJUSTED PUBLIC FINANCE (as a % of GDP)
| | | | | | | | | | | | | | | | | | | | | | | | | | | | | | | | |
| | | 2008 | | | 2009 | | | 2010 | | | 2011 | | | 2012 | | | 2013 | | | 2014 | | | 2015 | |
GDP growth rate at constant prices | | | -1.2 | | | | -5.5 | | | | 1.8 | | | | 0.4 | | | | -2.4 | | | | -0.2 | | | | 1.1 | | | | 1.3 | |
Net borrowing | | | -2.7 | | | | -5.4 | | | | -4.6 | | | | -3.9 | | | | -2.6 | | | | -1.6 | | | | -1.5 | | | | -1.4 | |
Interest | | | 5.2 | | | | 4.7 | | | | 4.6 | | | | 4.9 | | | | 5.5 | | | | 5.6 | | | | 6.0 | | | | 6.3 | |
Potential GDP growth | | | 0.4 | | | | -0.1 | | | | 0.0 | | | | 0.0 | | | | -0.6 | | | | -0.2 | | | | 0.0 | | | | 0.2 | |
Contribution of factors to potential growth: | | | | | | | | | | | | | | | | | | | | | | | | | | | | | | | | |
Labour | | | -0.1 | | | | -0.3 | | | | -0.2 | | | | 0.0 | | | | -0.4 | | | | 0.0 | | �� | | 0.0 | | | | 0.1 | |
Capital | | | 0.5 | | | | 0.2 | | | | 0.3 | | | | 0.2 | | | | 0.1 | | | | 0.1 | | | | 0.1 | | | | 0.2 | |
Total factor productivity | | | 0.0 | | | | -0.1 | | | | -0.1 | | | | -0.2 | | | | -0.3 | | | | -0.2 | | | | -0.1 | | | | -0.1 | |
Output gap | | | 1.3 | | | | -4.1 | | | | -2.4 | | | | -2.0 | | | | -3.7 | | | | -3.8 | | | | -2.7 | | | | -1.7 | |
Cyclical component of the budget balance | | | 0.7 | | | | -2.1 | | | | -1.2 | | | | -1.0 | | | | -1.9 | | | | -1.9 | | | | -1.4 | | | | -0.8 | |
Cyclically adjusted budget balance | | | -3.4 | | | | -3.4 | | | | -3.4 | | | | -2.9 | | | | -0.8 | | | | 0.3 | | | | -0.2 | | | | -0.6 | |
Cyclically adjusted primary surplus | | | 1.8 | | | | 1.3 | | | | 1.2 | | | | 2.0 | | | | 4.7 | | | | 5.9 | | | | 5.8 | | | | 5.7 | |
One-off measures | | | 0.2 | | | | 0.7 | | | | 0.2 | | | | 0.7 | | | | 0.1 | | | | 0.0 | | | | 0.1 | | | | -0.1 | |
Budget balance net of one-off measures | | | -2.9 | | | | -6.1 | | | | -4.8 | | | | -4.6 | | | | -2.7 | | | | -1.6 | | | | -1.6 | | | | -1.4 | |
Cyclically adjusted budget balance net of one-off measures | | | -3.6 | | | | -4.0 | | | | -3.6 | | | | -3.6 | | | | -0.9 | | | | 0.2 | | | | -0.2 | | | | -0.5 | |
Cyclically adjusted primary surplus net of one-off measures | | | 1.6 | | | | 0.6 | | | | 1.0 | | | | 1.3 | | | | 4.6 | | | | 5.9 | | | | 5.7 | | | | 5.7 | |
Change in budget balance net of one-off measures | | | | | | | 3.2 | | | | -1.3 | | | | -0.2 | | | | -1.9 | | | | -1.1 | | | | 0.0 | | | | -0.2 | |
Cyclically adjusted change in budget balance net of one-off measures | | | | | | | 0.5 | | | | -0.4 | | | | 0.0 | | | | -2.8 | | | | -1.1 | | | | 0.5 | | | | 0.3 | |
Note: Any inaccuracies are due to rounding off.
In 2013 this balance should show a surplus of 0.2 percentage points of GDP, higher than the balanced budget agreed at the European level. Given this surplus, the Government confirms its goal of a balanced budget5 notwithstanding the impact of adverse natural phenomena – such as the earthquake that hit the Emilia Romagna region in 2012 – and a more significant slowdown of the economy than that forecast in the DEF, that result in some unavoidable expenditure.
| 5 | See Table 1 of the Summary. |
| | |
| MINISTERODELL’ ECONOMIAEDELLE FINANZE | | |
| | 13 |
UPDATEOFTHE 2012 ECONOMICAND FINANCIAL DOCUMENT
TABLE 6: ONE-OFF MEASURES (in €mn)
| | | | | | | | | | | | | | | | | | | | | | | | |
| | | | | | | | | FORECASTS | |
| | | 2010 | | | 2011 | | | 2012 | | | 2013 | | | 2014 | | | 2015 | |
Total one-off measures | | | 3,092 | | | | 10,707 | | | | 1,602 | | | | 411 | | | | 1,103 | | | | -1,080 | |
% of GDP | | | 0.2 | | | | 0.7 | | | | 0.1 | | | | 0.0 | | | | 0.1 | | | | -0.1 | |
a) Revenues | | | 4,103 | | | | 6,755 | | | | 1,443 | | | | 1,141 | | | | 2,103 | | | | 120 | |
- Various substitutive taxes | | | 3,388 | | | | 6,709 | | | | 1,413 | | | | 1,121 | | | | 2,093 | | | | 120 | |
- Capital repatriation / Tax shield III | | | 656 | | | | 5 | | | | 0 | | | | 0 | | | | 0 | | | | 0 | |
- Amnesty on illegal building | | | 59 | | | | 41 | | | | 30 | | | | 20 | | | | 10 | | | | 0 | |
| | | | | | |
b) Expenditure | | | -2,207 | | | | 2,801 | | | | -1,271 | | | | -2,180 | | | | -2,300 | | | | -2,500 | |
- VAT on company vehicles | | | -77 | | | | -37 | | | | -15 | | | | 0 | | | | 0 | | | | 0 | |
- Interventions due to natural disasters: | | | -1,953 | | | | -841 | | | | -981 | | | | -2,115 | | | | -2,300 | | | | -2,500 | |
- Abruzzo earthquake 2009 | | | -1,953 | | | | -841 | | | | -981 | | | | -315 | | | | -200 | | | | -400 | |
- Emilia Romagna earthquake 2012 | | | | | | | | | | | 0 | | | | -1,800 | | | | -2,100 | | | | -2,100 | |
- Dividends to be paid | | | -176 | | | | -149 | | | | -100 | | | | 0 | | | | 0 | | | | 0 | |
- Tax offsets for local broadcasters | | | | | | | 0 | | | | -175 | | | | -65 | | | | | | | | | |
- Auctioning of licenses | | | | | | | 3,827 | | | | 0 | | | | | | | | | | | | | |
| | | | | | |
c) Sale of real estate | | | 1,196 | | | | 1,151 | | | | 1,430 | | | | 1,450 | | | | 1,300 | | | | 1,300 | |
GDP (x 1,000) | | | 1,553 | | | | 1,580 | | | | 1,563 | | | | 1,581 | | | | 1,628 | | | | 1,679 | |
| | | | | | |
Breakdown by subsectors | | | | | | | | | | | | | | | | | | | | | | | | |
Central Government | | | 1,661 | | | | 9,501 | | | | 208 | | | | -873 | | | | -110 | | | | -2,234 | |
Local Government | | | 1,279 | | | | 983 | | | | 943 | | | | 834 | | | | 763 | | | | 704 | |
Social Security Funds | | | 153 | | | | 222 | | | | 450 | | | | 450 | | | | 450 | | | | 450 | |
Note: Any inaccuracies are due to rounding off.
The profile of the debt/GDP ratio is expected to follow a downward trend from 2013 onwards, even if the latest estimates show a higher level for each year with respect to the forecasts of the April DEF, which envisaged that a decrease already next year.
There are mainly three factors that explain why estimates have been revised.
First, the Bank of Italy revised the final outcome for 2010 and 2011, by a total of around 0.6 percentage points of GDP for each year. This was due in the measure of 0.1 per cent to ordinary statistical changes and for the remaining 0.5 per cent to reclassifications made on the basis of a recent Eurostat6 decision which established that General Government trade debt sold with non-recourse clauses to non-bank financial institutions be included in member States’ debt7. Clearly the effect of these revisions applies to the whole horizon beyond the forecast period, making for a significant change to the estimates made last April.
Second, the present document considers a less favourable macroeconomic trend than that envisaged around six months ago. Slower expected economic growth is responsible for around 2 percentage points of the increase in the debt/GDP ratio in 2012 compared to the DEF, 3.5 percentage points of the increase in 2013, and little more than 3 percentage points in 2014 and 2015.
| 6 | Eurostat decision of 31 July 2012 The statistical recording of some operations related to trade credits incurred by government units. |
| 7 | The reclassification of general government’s trade debt ceded with non-recourse clauses to banks had been enacted previously, for an amount equal to around 2.2 billion euros. |
| | |
| | MINISTERODELL’ECONOMIAEDELLE FINANZE |
14 | | |
UPDATEOFTHE 2012 ECONOMICAND FINANCIAL DOCUMENT
Third, as an effect of the economic cycle, general government borrowing requirements are also deemed to be higher than the April estimates. This effect adds about 1.2 percentage points of GDP to debt estimates for 2012 and 2013, while in 2013 and 2014 this contribution increases to 1.5 and 1.7 points.
TABLE 7: GENERAL GOVERNMENT DEBT BY SUBSECTOR (in €mn and as a % of GDP)
| | | | | | | | | | | | | | | | | | | | | | | | |
| | | 2010 | | | 2011 | | | 2012 | | | 2013 | | | 2014 | | | 2015 | |
Level net of Euro Area financial support (1) | | | | | | | | | | | | | | | | | | | | | | | | |
General Government | | | 1,847,309 | | | | 1,894,630 | | | | 1,928,404 | | | | 1,951,746 | | | | 1,975,661 | | | | 2,002,123 | |
as a % of GDP | | | 118.9 | | | | 119.9 | | | | 123.3 | | | | 123.3 | | | | 121.3 | | | | 119.1 | |
| | | | | | |
Central Government (2) | | | 1,737,722 | | | | 1,785,216 | | | | 1,819,727 | | | | 1,843,676 | | | | 1,867,843 | | | | 1,894,007 | |
Local Government (2) | | | 116,118 | | | | 117,359 | | | | 116,621 | | | | 116,015 | | | | 115,763 | | | | 116,060 | |
Social Security Funds (2) | | | 108 | | | | 135 | | | | 135 | | | | 135 | | | | 135 | | | | 135 | |
| | | | | | |
Level including Euro Area financial support(1) | | | | | | | | | | | | | | | | | | | | | | | | |
General government | | | 1,851,218 | | | | 1,907,748 | | | | 1,976,622 | | | | 2,010,744 | | | | 2,038,610 | | | | 2,065,072 | |
as a % of GDP | | | 119.2 | | | | 120.7 | | | | 126.4 | | | | 127.1 | | | | 125.1 | | | | 122.9 | |
| | | | | | |
Central Government (2) | | | 1,741,631 | | | | 1,798,333 | | | | 1,867,946 | | | | 1,902,673 | | | | 1,930,792 | | | | 1,956,956 | |
Local Government (2) | | | 116,118 | | | | 117,359 | | | | 116,621 | | | | 116,015 | | | | 115,763 | | | | 116,060 | |
Social Security Funds (2) | | | 108 | | | | 135 | | | | 135 | | | | 135 | | | | 135 | | | | 135 | |
| 1) | Net of or including loans to Greece, Italy’s share of EFSF (it does not include aid that should recapitalise the Spanish banking sector) and of the ESM programme for the years 2010 to 2015. |
| 2) | Including non-consolidated interest. |
Note: Values for 2010 and 2011 are net of or including EFSF and loans to Greece: in particular in 2010 the amount of loans to Greece is equal to 3,909 €mn; in 2011 it is equal to 6,098 €mn and the EFSF share is 3,110 €mn. Furthermore, figures for 2010 and 2011 include the reclassification made by the Bank of Italy as per the Eurostat decision of 31 July 2012 on general government trade debt ceded with non- recourse clauses to non-bank financial institutes.
Privatisation of Sace, Fintecna and Simest is counter to this trend; their complition is expected this year, with an impact of around 0.6 points of GDP.
All these factors thus produces an estimate of debt/GDP at 126.4 per cent for the present year, with a slight increase in 2013, when it should peak at 127.1 per cent. A significant fall is expected thereafter, to reach 122.9 per cent in 2015.
If the effects of the aid paid or to be paid to euro area countries are factored out, which have not changed significantly since April’s DEF estimates, the ratio should be about 119.1 per cent in 2015, a non-negligible increase compared to April’s forecasts, due almost entirely to the economic contraction and its automatic effects on public finance, as well as the revisions to the debt series previously described.
In the upcoming months the Government will especially concentrate on the reduction of public debt, making effective the instruments created to create value and then divest State assets, both real estates and shareholdings.
Considering an amount of proceeds of about 1 percentage point of GDP per year, the debt/GDP ratio (including aid allocated or to be allocated to Euro Area countries) is estimated at 126.1 per cent in 2013, 123.1 in 2014 and 119.9 in 2015. The debt/GDP ratio net of aid would be 122.3 per cent in 2013 to drop to 119.3 in 2014 and 116.1 in 2015.
| | |
| MINISTERODELL’ECONOMIAEDELLE FINANZE | | |
| | 15 |
UPDATEOFTHE 2012 ECONOMICAND FINANCIAL DOCUMENT
MEDIUM/LONG-TERM TRENDS IN ITALY’S PENSION SYSTEM
The medium/long-term trend forecast of the pension expenditure to GDP ratio8 takes into account assumptions on fertility, mortality and net migration flows as derived from the scenario calculated by ISTAT, with reference to 20119.
As for the macroeconomic framework, real GDP growth hovers at around 1.5 per cent per annum over the long term. The employment rate increases by 9-10 percentage points in the 15-64 age group with respect to the 2010 value. For 2012-2015 growth estimates are in line with those presented in this document.
The forecast at unchanged legislation takes into account effects of the measures delineated in the reform interventions adopted in 201110 as well as a three-year period adjustment (two-year period from 2021) of the transformation coefficients and, with the same frequency, pension eligibility requirements according to life expectancy. This adjustment takes place through an entirely administrative procedure that guarantees certainty forfuture review schedules11.
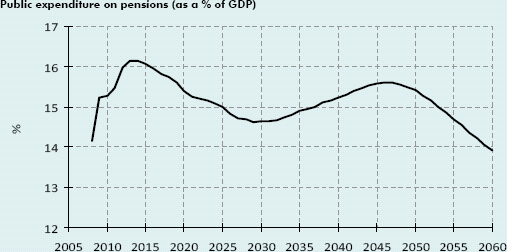
Following a rise in 2008-2010 exclusively as a result of the deep recession,, pension expenditure to GDP is negatively affected by the low growth profile projected ib subsequent years (especially by the contraction expected in 2012), although mostly offset by more stringent requirements for pension eligibility between 2013-2014.
From 2015, with more favourable growth and a strengthening of the process of increasing the minimum requirements for pension eligibility, pension expenditure to GDP decreases decisively for around fifteen years, settling at 14.6 per cent around 2030. This is an effect both of the restraint stemming from tighter eligibility requisites and the introduction of a system fully based on contributions, which more than offset the negative impact of the demographic transition.
In the following fifteen year period, the strengthening of the negative trends in demographic dynamics and the effects on pension payments resulting from the postponement of the retirement age effettuated in the previous years, outstrip the curbing effects of the legislative framework. Pension expenditure to GDP growth will continue in the 2045-2047 period, reaching its peak at 15.6 per cent. At the end of the forecast period, the ratio declinessignificantly till it settles at 13.9 per cent in 2060. The decline is mainly due to the completion of the shift from a mixed to a fully contributory calculation system, resulting in a payment reduction for new pensions (also as a result of the revision of transformation coefficients), as well as the progressive dwindling of the cohorts born in the baby boom.
Estimates show how pension reforms of the past two decades can substantially counterbalance the potential medium/long-term effects of demographic transition. Indeed, as highlighted at
| 8 | The medium/long-term trend of the pension expenditure/GDP ratio is reported as per the provisions of article 1, paragraph 5 of Law No. 335/1995. |
| 9 | In particular, the following is assumed: i) an increase in life expectancy in 2060 of 6.7 years for men and 6.5 years for women, compared to 2011 figures; ii) a fertility rate that gradually reaches 1.6; and iii) a net immigration flow going from an average annual figure of about 280 thousand in the first decade of the forecast period, to an annual value of around 180 thousand at the end of the period. See, however, Istat (2011), http://demo.istat.it. |
| 10 | Including those provided for in Decree Law No. 201/2011, converted and amended by Law no. 214/2011. |
| 11 | Beginning in 2013, changes to the requisites for pension eligibility were adopted with a managerial decree of 6 December 2011, published in the Official Journal of the Republic on 13 December 2011, and changes to the transformation coefficients with a managerial decree of 15 May 2012, published in the Official Journal of the Republic on 24 May 2012. |
| | |
| | MINISTERODELL’ECONOMIAEDELLE FINANZE |
16 | | |
UPDATEOFTHE 2012 ECONOMICAND FINANCIAL DOCUMENT
international level12, Italy presents an evolution in pension expenditure relative to GDP that is exactly the opposite of what forecast for most other European countries, despite having less favourable demographics.
| 4.2 | SPENDING REVIEW PROCESS |
During 2012, government action on public accounts focused on the structural correction of expenditure trends.
The ordinary spending review of the Central State Government, carried out by the Ministries and coordinated by the Ministry of the Economy and Finance, State General Accounting Office, was reinforced by the decree law signed in the summer13. With regards to the first aspect, the general government spending report, recently published on the Ministry of the Economy and Finance’s website, illustrates central government spending trends within those relative to the wider aggregate of general government. The report delves into some of the main spending sectors, it analyses activity carried out by some of the Central State Government’s peripheral structures – by also assessing differences in the efficiency and requirements of resources – and contains a set of indicators on most of the ministries’ programmes.
The interventions established with the decree law determine the net reduction of General Government spending by about 4 billion euros in 2012, 6.8 billion in 2013 and, in aggregate terms, 10.3 billion as of 2014.
| 12 | Economic Policy Committee-European Commission (2012), The 2012 Ageing Report: Economic and Budgetary Projections for the EU-27 Member States, 2010-2060. In this regard, it is to be noted how EU countries face an average increase in the value of pension expenditure/GDP of 1.6 percentage points during the 2010-2060 period; instead, in Italy’s case the ratio falls by 0.9 percentage points. This denotes, for this aspect, a contained risk in terms of the impact of an ageing population on the sustainability of public finances. |
| 13 | Decree Law No. 95/2012 converted by Law No. 135/2012. |
| | |
| MINISTERODELL’ECONOMIAEDELLE FINANZE | | |
| | 17 |
UPDATEOFTHE 2012 ECONOMICAND FINANCIAL DOCUMENT
TABLE 8: IMPACT OF DECREE LAW 95/2012 ON KEY SECTORS AFFECTED (values in millions of euros; including induced effects)
| | | | | | | | | | | | | | | | |
| | | 2012 | | | 2013 | | | 2014 | | | 2015 | |
FREEING UP OF RESOURCES | | | 4,568 | | | | 10,839 | | | | 11,559 | | | | 12,073 | |
| | | | |
Incremental revenue | | | 0 | | | | 72 | | | | 0 | | | | 0 | |
| | | | | | | | | | | | | | | | |
Lower expenditure | | | 4,568 | | | | 10,767 | | | | 11,559 | | | | 12,073 | |
Ministries’ spending cuts | | | 0 | | | | 1,528 | | | | 1,574 | | | | 1,649 | |
Local authorities’ contribution | | | 2,300 | | | | 5,200 | | | | 5,500 | | | | 5,775 | |
Reduction of National Health Service funding | | | 900 | | | | 1,800 | | | | 2,000 | | | | 2,100 | |
Cuts in spending to purchase goods and services | | | 141 | | | | 615 | | | | 615 | | | | 615 | |
Cuts to the multi-year contribution fund | | | 500 | | | | 500 | | | | 400 | | | | 400 | |
Cuts to research bodies’ financing | | | 153 | | | | 410 | | | | 410 | | | | 410 | |
Civil service measures | | | | | | | | | | | | | | | | |
(including turnover of Fire Fighters and Police forces) | | | 107 | | | | 319 | | | | 665 | | | | 730 | |
Other | | | 467 | | | | 394 | | | | 394 | | | | 393 | |
| | | | |
USE OF FUNDS | | | 3,966 | | | | 10,823 | | | | 11,532 | | | | 11,445 | |
| | | | |
Lower revenues | | | 3,392 | | | | 6,837 | | | | 10,237 | | | | 10,300 | |
VAT rate reduction | | | 3,280 | | | | 6,560 | | | | 9,840 | | | | 9,840 | |
Other | | | 112 | | | | 277 | | | | 397 | | | | 460 | |
| | | | | | | | | | | | | | | | |
Incremental expenditure | | | 574 | | | | 3,986 | | | | 1,295 | | | | 1,145 | |
Tax credits on mortgage amortisation instalments for the reconstruction in Emilia | | | 0 | | | | 450 | | | | 450 | | | | 450 | |
Earthquake | | | 0 | | | | 550 | | | | 550 | | | | 0 | |
Measures to support road transport | | | 0 | | | | 400 | | | | 0 | | | | 0 | |
International peace missions | | | 0 | | | | 1,000 | | | | 0 | | | | 0 | |
Workers protected in the pension reform | | | 0 | | | | 0 | | | | 190 | | | | 590 | |
Fund for article 7-quinquies, paragraph 1, Decree law no. 5/2009 | | | 0 | | | | 658 | | | | 0 | | | | 0 | |
North Africa emergency requirement | | | 495 | | | | 0 | | | | 0 | | | | 0 | |
5 * 1000 tax donation | | | 0 | | | | 400 | | | | 0 | | | | 0 | |
Other | | | 79 | | �� | | 528 | | | | 105 | | | | 105 | |
| | | | | | | | | | | | | | | | |
IMPACT ON PRIMARY BALANCE | | | 602 | | | | 16 | | | | 27 | | | | 627 | |
| | | | |
Net impact on revenue | | | -3,392 | | | | -6,766 | | | | -10,237 | | | | -10,300 | |
Net impact on expenditure | | | -3,994 | | | | -6,781 | | | | -10,264 | | | | -10,928 | |
Relinquished (or freed up) resources are to compensate for the deferral and the lightening of the VAT rate increase which was foreseen to begin in October 2012. Another portion of savings are to be used to finance reconstruction interventions linked to the Emilia Romagna earthquake, for international peace missions (in 2013) and expand the group of ‘protected’ subjects within the recent pension reform.
On the spending side, corrective measures regard the purchase of goods and services by the General Government with the strengthening of the centralised purchasing system for some categories of goods (using Consip S.p.A. or regional purchasing centres), as well as the nullity of contracts that breach this obligation. The expenditure benchmarks for General Government, and the ensuing savings, are calculated based on the statistical comparison of management costs that are presently sustained by the different bodies.
In order to reorganise the administrative structure (with the exclusion of the school sector since it targeted in a previous reform), executive structures are to be reduced, with a reduction equivalent to at least 20 per cent of the Central State Government workforce at the executive level, and at least 10 per cent of non-managerial personnel. Current limits regarding turnover are to be extended to Fire Fighters, Police forces and Universities and Research foundations, according to specific parameters for each sector.
For the Central State Government there should be further savings deriving from spending objectives to be assigned to each Ministry. The objectives are to be based on proposals by the Ministries themselves regarding corrective measures as will be defined within the 2012 Stability Law.
| | |
| | MINISTERODELL’ECONOMIAEDELLE FINANZE |
18 | | |
UPDATEOFTHE 2012 ECONOMICAND FINANCIAL DOCUMENT
Additional savings are expected from interventions on Local Authorities and the Healthcare sector. For the prior, as a contribution to reaching public finance aims, provision is made to reduce transfers corresponding to aims assigned to them within the Internal Stability Pact or, in the case of insufficiency, the payment to the State of residual sums. The division among the single Local Authorities of each sector is made, in case there is no agreement between the parties (to be defined by 30 September), according to the expenses incurred for intermediate consumption. In the healthcare sector, the decree law provides for interventions in those spending sectors that present management inefficiencies or misuse of resources. In particular, in terms of spending on pharmaceuticals, the mandatory discount to the National Healthcare Service was raised, the cap on local pharmaceutical assistance was lowered, and the cap on hospital pharmaceutical spending was redefined. As regards the National Healthcare Service, there will be: a 5 per cent cut on compensation and the corresponding purchase of volumes of goods and services, that is to be achieved also by reinforcing the sector’s governance; a lowering of the spending ceiling for the purchase of medical equipment from 5.2 to 4.9 per cent (4.8 per cent in 2014); a reduction of private suppliers’ purchases for outpatient specialised assistance services and hospital care, sufficient to lower spending compared to 2011 by 0.5 per cent in 2012, 1 percent in 2013 and 2 per cent from 2014 onward.
The decree law also establishes measures to streamline the use of State assets and reduce the costs of leasing. Benchmark values in terms of area/employee to rationalise the use of space were determined, and the procedures to divest the Defence Department’s properties were redefined. Rents to be paid by public entities will be exempt from adjustments based on ISTAT indexes for 2012-2014. As of 2015 the general government will benefit from a 15 per cent cut in tax burdens deriving from rental contracts reserving the lessor’s withdrawal right.
Finally, to allow a more efficient management of financial resources by the Central State Government, instruments to ensure budget flexibility were introduced that should allow quicker delivery of payments due.
The effects of the decree law, broken down by General Government subsectors, are reported in the following table.
TABLE 9: DECREE LAW 95/2012 – BREAKDOWN OF FINANCIAL EFFECTS BY SUBSECTOR (values in millions of euros; including induced effects)
| | | | | | | | | | | | | | | | |
| | | 2012 | | | 2013 | | | 2014 | | | 2015 | |
GENERAL GOVERNMENT | | | | | | | | | | | | | | | | |
Effects on primary balance | | | 602 | | | | 16 | | | | 27 | | | | 627 | |
| | | | |
CENTRAL GOVERNMENT | | | -1,990 | | | | -6,685 | | | | -7,709 | | | | -6,466 | |
| | | | | | | | | | | | | | | | |
Effects on revenues | | | -3,304 | | | | -6,617 | | | | -9,978 | | | | -9,976 | |
Effects on expenditure | | | -1,314 | | | | 68 | | | | -2,269 | | | | -3,511 | |
| | | | |
LOCAL GOVERNMENT | | | 2,670 | | | | 7,038 | | | | 8,014 | | | | 7,931 | |
Effects on revenues | | | -10 | | | | -19 | | | | -33 | | | | -41 | |
Effects on expenditure | | | -2,680 | | | | -7,057 | | | | -8,047 | | | | -7,972 | |
| | | | |
SOCIAL SECURITY FUNDS | | | -78 | | | | -338 | | | | -278 | | | | -838 | |
Effects on revenues | | | -78 | | | | -130 | | | | -226 | | | | -283 | |
Effects on expenditure | | | 0 | | | | 208 | | | | 52 | | | | 555 | |
| | |
| MINISTERODELL’ECONOMIAEDELLE FINANZE | | |
| | 19 |
UPDATEOFTHE 2012 ECONOMICAND FINANCIAL DOCUMENT
MACROECONOMIC IMPACT OF DECREE LAW 95/201214
Decree Law No. 95/201215 contains various provisions with the common purpose of restraining and streamlining public expenditure. Key measures regard the improvement of the General Government’s efficiency of spending for goods and services, the downsizing of some categories of civil servants, a better use of public assets. Also included are provisions regarding public companies, spending cuts for central government and local authorities, the reduction of the number of provinces and lastly, norms to restrain spending in the healthcare and pharmaceutical sectors. Among the measures set up by the this law, there is the rescheduling of the introduction of the two percentage point VAT increase, from 10 and 21 per cent, delayed from 1 October 2012 to 1 July 2013. In addition, from 1 January 2014 the resulting rates are lowered to 11 and 22 per cent respectively, instead of the expected 12.5 and 23.5 per cent.
To analyse the macroeconomic impact of all the measures adopted, the starting point was the base simulation that generates a profile for the aggregates in the absence of this legislation. The exogenous public finance variables were then modified by factoring into the model the measures adopted and simulating the new scenario. The comparison of these two simulations allows the estimation of the impact of the law in question on GDP and on the other aggregates.
The report indicates the difference between the annual percentage changes obtained by considering the manoeuvre and those of the base simulation. These simulations show how the measures provided by Decree Law No. 95/2012 have nearly no effect on the economic activity and employment levels for the forecast period. Nonetheless, the impact is felt on the composition of domestic demand, which, on the one hand suffers the direct effect of the cut in public spending, both in terms of collective consumption and reduced investments, but on the other hand benefits from the positive effects on consumption of the VAT rate cuts. These rate cuts also determine a fall in inflation for the period considered. It must be underlined, finally, that the improvement in the efficiency of public spending will probably have positive effects on long-term growth; these are not present in the econometric models and go well beyond the present programme’s scope.
Macroeconomic impacts of the spending review
Differences in percentage change rates
| | | | | | | | | | | | | | | | |
| | | 2012 | | | 2013 | | | 2014 | | | 2015 | |
GDP | | | -0.1 | | | | 0.0 | | | | -0.1 | | | | 0.1 | |
Private consumption | | | 0.0 | | | | 0.2 | | | | 0.2 | | | | 0.1 | |
Collective consumption | | | -0.4 | | | | -0.4 | | | | -0.4 | | | | -0.2 | |
Investments | | | 0.0 | | | | -1.1 | | | | -1.2 | | | | -0.5 | |
Exports | | | 0.0 | | | | 0.0 | | | | 0.1 | | | | 0.1 | |
Imports | | | 0.0 | | | | -0.3 | | | | 0.0 | | | | -0.1 | |
Private consumption deflator | | | -0.3 | | | | -0.3 | | | | -0.3 | | | | -0.1 | |
| 14 | The simulation was performed using the Treasury’s econometric model (ITEM). |
| 15 | Converted by Law No. 135/2012. |
| | |
| | MINISTERODELL’ECONOMIAEDELLE FINANZE |
20 | | |
UPDATEOFTHE 2012 ECONOMICAND FINANCIAL DOCUMENT
| 4.3 | MULTI-YEAR EVALUATION PLAN OF PUBLIC ASSETS |
A special plan to evaluate and sell assets belonging to general government was recently launched in order to reduce the stock of public debt. Once this multi-year plan is at full regime it will ensure resources for about 1 percentage point of GDP per year, for the next five years, that will primarily be assigned to the Public Debt Sinking Fund.
Evaluation initiatives provided for the introduction of a digital census in February 2010 as per the 2010 Finance Act. The ‘Public asset’ project establishes that all bodies of general government, both at central and local levels, transmit detailed information on their assets each year to the Ministry of the Economy and Finance. The communication of data for the year 2011 ended in July and included real estate properties, land and shareholdings. According to initial estimates, based on data sent by 31 March 2011, the value of public property assets (including land) hovers between 251 and 369 billion euros. At the end of 2011 the value of State shareholdings should amount to over 80 billion euros.
The new legislative reforms introduced provide many instruments to coordinate the different public bodies so as to facilitate the evaluation and sale operations. These include the creation of an asset management company (SGR) belonging to the Ministry of the Economy and Finance through Decree Law No. 98/201116, later supplemented with Decree Law No. 201/201117 and Decree Law No. 95/2012 containing clauses regarding the spending review18. The SGR has the goal of putting in place a single evaluation strategy to create revenue and sell public assets through the establishment of one or more investment funds which, in turn, can participate to investment funds set up or participated by local authorities, public bodies and associated companies. Decree Law No. 87/201219, which amended the previous decree no. 98, provided for the establishment within the SGR of a property fund into which also State owned property (including military barracks) would be transferred.
In compensation for the assignment of the property, government entities will obtain liquid resources to be used primarily to reduce their own debt. The remaining resources can be used to finance investment expenses, in the case of property belonging to local authorities, and the payment of general government trade debt, in the case of state owned properties.
Properties assigned to the funds will be evaluated and placed on the market with the assistance of the Cassa Depositi e Prestiti (CDP). The latter will be able to purchase local authorities’ properties by creating ad hoc property funds within the existing CDP Investments in the SGR property fund.
Legal reforms increased the powers of the State Property Office which can, also of its own, restructure properties and regularise situations on the cadastre so as to allow their placement on the market at the best conditions. This same office can participate to the SGR created by the government and even promote the incorporation of companies, syndicates or property funds, including with the participation of private entities. The Office has already begun a process to optimise work space within public buildings
assigned to institutional uses, to reduce utilisation costs and free-up properties, once offices are merged.
| 16 | Converted by Law No. 111/2011. |
| 17 | Converted by Law No. 214/2012. |
| 18 | Converted by Law No. 135/2012. |
| 19 | Merged during conversion into Law No. 135/2012. |
| | |
| MINISTERODELL’ECONOMIAEDELLE FINANZE | | |
| | 21 |
UPDATEOFTHE 2012 ECONOMICAND FINANCIAL DOCUMENT
Decree Law No. 87/2012 provided for a first round of privatisations of public shareholdings that will produce significant results already this year. The provision gave CDP subscription rights to purchase government shareholdings in Sace, Fintecna, and Simest. The operation will be at market prices and requires a payment of 60 per cent of the company’s net equity book value at purchase. CDP may exercise subscription rights. Resources deriving from this operation are firstly assigned to public debt reduction and secondly to the payment of trade debt to suppliers.
| | | | | | | | | | | | | | | | | | | | | | | | | | | | | | |
TABLE 10: 2013-2015 STATE BUDGET (in €billions and net of accounting settlements, payables and VAT reimbursements) | |
| | | | | 2011
Balance sheet | | | 2012
Budget Law | | | 2012
Statement
Budget Law | | | 2013 | | | 2014 | | | 2015 | | | Average
change rates
2013-2015 | |
Tax revenues | | | | | 433.8 | | | | 454.6 | | | | 457.7 | | | | 460.6 | | | | 466.9 | | | | 477.3 | | | | 1.8 | |
| | As a % of GDP | | | 27.5 | | | | 29.1 | | | | 29.3 | | | | 29.1 | | | | 28.7 | | | | 28.4 | | | | | |
| | | | | | | |
Other revenues | | | 67.6 | | | | 44.4 | | | | 44.4 | | | | 44.3 | | | | 44.9 | | | | 45.0 | | | | 0.8 | |
| | As a % of GDP | | | 4.3 | | | | 2.8 | | | | 2.8 | | | | 2.8 | | | | 2.8 | | | | 2.7 | | | | | |
| | | | | | | |
FINAL REVENUES | | | 501.4 | | | | 499.0 | | | | 502.1 | | | | 504.9 | | | | 511.8 | | | | 522.3 | | | | 1.7 | |
| | As a % of GDP | | | 31.7 | | | | 31.9 | | | | 32.1 | | | | 31.9 | | | | 31.4 | | | | 31.1 | | | | | |
| | | | | | | |
TOTAL REVENUES | | | 501.4 | | | | 499.0 | | | | 502.1 | | | | 504.9 | | | | 511.8 | | | | 522.3 | | | | 1.7 | |
| | | | | | | |
Current expenditure net of interest | | | 369.4 | | | | 376.1 | | | | 373.8 | | | | 378.0 | | | | 379.9 | | | | 384.0 | | | | 0.8 | |
| | As a % of GDP | | | 23.4 | | | | 24.0 | | | | 23.9 | | | | 23.9 | | | | 23.3 | | | | 22.9 | | | | | |
| | | | | | | | |
Interest | | | | | 73.7 | | | | 88.8 | | | | 86.8 | | | | 91.9 | | | | 96.9 | | | | 103.9 | | | | 6.3 | |
| | As a % of GDP | | | 4.7 | | | | 5.7 | | | | 5.5 | | | | 5.8 | | | | 5.9 | | | | 6.2 | | | | | |
| | | | | | | |
Capital account expenditure | | | 48.5 | | | | 35.6 | | | | 38.0 | | | | 41.5 | | | | 39.0 | | | | 35.2 | | | | -7.9 | |
| | As a % of GDP | | | 3.1 | | | | 2.3 | | | | 2.4 | | | | 2.6 | | | | 2.4 | | | | 2.1 | | | | | |
| | | | | | | |
FINAL EXPENDITURE | | | 491.6 | | | | 500.5 | | | | 498.6 | | | | 511.4 | | | | 515.8 | | | | 523.1 | | | | 1.1 | |
| | As a % of GDP | | | 31.1 | | | | 32.0 | | | | 31.9 | | | | 32.3 | | | | 31.7 | | | | 31.1 | | | | | |
| | | | | | | | |
PUBLIC SAVING | | | | | 56.4 | | | | 32.8 | | | | 40.3 | | | | 34.9 | | | | 34.9 | | | | 34.3 | | | | | |
| | As a % of GDP | | | 3.6 | | | | 2.1 | | | | 2.6 | | | | 2.2 | | | | 2.1 | | | | 2.0 | | | | | |
| | | | | | | |
NET BALANCE TO BE FINANCED | | | 9.8 | | | | -1.5 | | | | 3.5 | | | | -6.6 | | | | -4.1 | | | | -0.9 | | | | | |
| | As a % of GDP | | | 0.6 | | | | -0.1 | | | | 0.2 | | | | -0.4 | | | | -0.2 | | | | -0.1 | | | | | |
| | | | | | | |
PRIMARY SURPLUS | | | 83.5 | | | | 87.3 | | | | 90.3 | | | | 85.4 | | | | 92.8 | | | | 103.0 | | | | | |
| | As a % of GDP | | | 5.3 | | | | 5.6 | | | | 5.8 | | | | 5.4 | | | | 5.7 | | | | 6.1 | | | | | |
| | | | | | | |
NET BALANCE TO BE FINANCED EXCLUDING FINANCIAL ITEMS | | | 13.6 | | | | -1.5 | | | | 4.7 | | | | -6.6 | | | | -4.1 | | | | -1.0 | | | | | |
| | As a % of GDP | | | 0.9 | | | | -0.1 | | | | 0.3 | | | | -0.4 | | | | -0.3 | | | | -0.1 | | | | | |
| | | | | | | |
GDP at market prices | | | 1,580.2 | | | | 1,564.4 | | | | 1,564.4 | | | | 1,582.4 | | | | 1,629.1 | | | | 1,680.4 | | | | | |
Note: The expenditure and revenue levels do not consider the effects of the merger between the Autonomous Administration of State Monopolies and the Customs Office, the implementation decrees of the unification are being defined, subject to the neutrality of the effects on balances.
| | |
| | MINISTERODELL’ECONOMIAEDELLE FINANZE |
22 | | |
UPDATEOFTHE 2012 ECONOMICAND FINANCIAL DOCUMENT
| 4.5 | CONTENT OF THE DOMESTIC STABILITY AND CONVERGENCE PACTS |
Local authorities participate to the fiscal package with 4.2 billion euros in 2012 and 6.4 billion in 2013 and 201420.
In this regard, during 2012, the Constitutional Court declared Decree Law No. 98/2011 to be unconstitutional21 where it establishes22 that the measures provided should also be applied to the year 2014 and those following, instead of ‘until 2014’, thus blocking the effectiveness of the package adopted in 2011 up to 2014. The contribution of local authorities to the package was then set in the budget balance aims of the Domestic Stability Pact introduced by Law No. 183/201123.
In 201224, the participation of Regions and Local Authorities to the package is based on a virtuosity system measured according to the following parameters: a) respect of the Domestic Stability Pact; b) financial autonomy; c) balanced current account; d) ratio between collected and verified current account revenues.
The system provides for the division of authorities into two classes of virtuosity based on the above-mentioned criteria. Local Authorities25 placed in the most virtuous class must reach a mixed competence balance equal to zero, while the 2011 objective for regions in the most virtuous class is based on average final spending for 2007-2009, reduced by the established annual percentage. Local Authorities26 that fall into the remaining classes must participate by an amount such as to compensate for the reduction set in favour of virtuous authorities. The list of virtuous authorities and the objectives for the non-virtuous ones were indicated in the Minister of the Economy and Finance’s decree in concert with the Internal Minister, the Minister for Regional Affairs, Tourism and Sport and the Minister for Territorial Cohesion, in agreement with the Unified Conference27.
The introduction of the horizontal domestic pact28, analogous to the horizontal regional pact29, allows municipalities that foresee a negative differential with respect to the objective assigned, to inform the Ministry of the Economy and Finance as to their financial requirements, so as to allow the remodulation of objectives to allow payment on capital expenditure arrears. Municipalities that expect a positive differential can instead sell them. To facilitate these transfers a contribution is set, equal to the financing ceded, that is established on the whole as 200 million euros.
| 20 | Local Authorities’ contributions to the fiscal package for the three year period 2012-2014, implemented with the rules of the Domestic Stability Pact, as already indicated in the Economic and Financial Document, are disciplined by the norms in the following Decree Laws: No. 78/2010, article 14, paragraph 1; No. 98/2011 article 20, paragraph 5; and No. 138/2011, article 1, paragraphs 8 and 9. Decree Law No. 98/2011 also provides that, in 2012, the participation requested of local authorities in terms of requirement and net borrowing can be reduced on the whole by an amount equal to the increased return expected in the year from the increase of the IRES tax for businesses operating in the energy sector, estimated at 1.8 billion euros. The cut was distributed as follows: 760 million to the ordinary statute regions; 370 million to special statute Regions and to the Autonomous Provinces of Trento and Bolzano; 150 million to the provinces; and 520 million to municipalities with more than 5,000 inhabitants. |
| 21 | Ruling No. 193 of 17-19 July 2012. |
| 22 | Decree Law No. 98/2011, article 20, paragraph 5. |
| 23 | Law No. 183/2011, articles 31 and 32. |
| 24 | As per Decree Law No. 98/2011, article 20, paragraph 2. |
| 25 | Law No. 183/2011, article 31, paragraph 5. |
| 26 | Law No. 183/2011, article 31, paragraph 6. |
| 27 | Ministerial Decree No. 0048345 of 25 June 2012. |
| 28 | Decree Law No. 16/2012, article 4 ter, as amended by Decree Law No. 95/2012, article 16. |
| 29 | Law No. 220/2010, article 1, paragraph 140. |
| | |
| MINISTERODELL’ECONOMIAEDELLE FINANZE | | |
| | 23 |
UPDATEOFTHE 2012 ECONOMICAND FINANCIAL DOCUMENT
The provision of the vertical regional pact30, through which ordinary statute regions, Sicily and Sardinia can provide financing to the municipalities within their territory by consequently worsening their own objective and thus respecting public finance balances, follows the same logic of remodelling objectives according to real necessities. These regions must also inform the Ministry of the Economy and Finance within a deadline established by law.
The vertical pact instrument was boosted by the provision of an overall contribution of 800 million euros in favour of ordinary statute regions, Sicily and Sardinia31, in the amount of 83.33 per cent of financing ceded and assigned to municipalities within their own territory to encourage payments of capital expenditure arrears to creditors. The contribution is assigned by the regions to debt reduction.
To stimulate infrastructure investments, Decree Law No. 138/2011 contemplates the exclusion from the Domestic Stability Pact of capital account spending within the limit of the divestiture of shareholdings in companies offering local public services of economic importance, and, in any case, within the limit of 250 million euros in 2013 and 201432.
Finally, provision is made to extend the commitments of the Domestic Stability Pact to a wider range of entities, by subjecting in-house companies to the Pact and assigning to the local authorities that participate to their capital the task of controlling their fulfilment of the Pact33.
As of 2013, special firms and institutes will also be subject to the Domestic Stability Pact in ways to be established by inter-ministerial decree. Special firms and institutes that manage social welfare, educational and cultural services and pharmacies are excluded34.
Also beginning in 2013, provisions are made to subject municipalities with more than 1,000 inhabitants35 to the Pact and, as of 2014, also municipality unions of municipalities with less than 1,000 inhabitants36.
| 30 | Law No. 220/2010, article 1, paragraph 138. |
| 31 | Decree Law No. 95/2012, article 16, paragraphs 12 bis and following, converted by Law No. 135/2012. |
| 32 | Decree Law No. 138/2011, article 5, paragraph 1. |
| 33 | Decree Law No. 138/2011, article 3 bis, paragraph 5, introduced by article 25 of Decree Law No. 1/2012. |
| 34 | Decree Law No. 1/2012, article 25 amending article 114 of the Local Authorities Consolidated Act (TUEL). |
| 35 | . Decree Law No. 138/2011, article 16, paragraph 31. |
| 36 | Decree Law No. 138/2011, article 16, paragraph 3. |
| | |
| | MINISTERODELL’ECONOMIAEDELLE FINANZE |
24 | | |