UNITED STATES
SECURITIES AND EXCHANGE COMMISSION
Washington, D.C. 20549
FORM N-CSR
CERTIFIED SHAREHOLDER REPORT
OF
REGISTERED MANAGEMENT COMPANY
| Investment Company Act file number: | 811-1027 |
| Name of Registrant: | Vanguard World Funds |
| Address of Registrant: | P.O. Box 2600
Valley Forge, PA 19482 |
| Name and address of agent for service: | Heidi Stam, Esquire
P.O. Box 876
Valley Forge, PA 19482 |
Registrant’s telephone number, including area code: (610) 669-1000
| Date of fiscal year end: | August 31 |
| Date of reporting period: | September 1, 2005— August 31, 2006 |
| Item 1: | Reports to Shareholders |
Vanguard® U.S. Growth Fund |
| |
| |
| |
| |
| |
| |
> Annual Report | |
| |
| |
| |
| |
| |
August 31, 2006 | |
| |
| 
|
| |
| |
| |
| |
| |
| |
| |
| |
| |
| |
| |
| |
| |
| |
| |
| |
| |
| |
| |
| |
|
| |
| |
| |
> | Vanguard U.S. Growth Fund’s Investor Shares returned 1.9% and its Admiral |
| Shares returned 2.2% during the 2006 fiscal year. This performance was in |
| line with the return of the fund’s average peer, but below the return of the |
| benchmark index. |
| |
| |
> | In a generally weak market for large-capitalization growth stocks, the fund |
| produced a middling return for the period. |
| |
| |
> | Strong performances by several of the fund’s top-ten holdings were offset by |
| overall weak returns from health care and technology stocks. |
| | |
Contents | |
| |
Your Fund’s Total Returns | 1 |
Chairman’s Letter | 2 |
Advisors’ Report | 6 |
Fund Profile | 10 |
Performance Summary | 11 |
Financial Statements | 13 |
Your Fund’s After-Tax Returns | 24 |
About Your Fund’s Expenses | 25 |
Glossary | 27 |
Please note: The opinions expressed in this report are just that—informed opinions. They should not be considered promises or advice. Also, please keep in mind that the information and opinions cover the period through the date on the cover of this report. Of course, the risks of investing in your fund are spelled out in the prospectus.
Your Fund’s Total Returns
Fiscal Year Ended August 31, 2006 | |
| Total |
| Return |
Vanguard U.S. Growth Fund | |
Investor Shares | 1.9% |
Admiral™ Shares1 | 2.2 |
Russell 1000 Growth Index | 3.7 |
Average Large-Cap Growth Fund2 | 1.9 |
Dow Jones Wilshire 5000 Index | 8.8 |
Your Fund’s Performance at a Glance | | | |
August 31, 2005–August 31, 2006 | | | | |
| | | Distributions Per Share |
| Starting | Ending | Income | Capital |
| Share Price | Share Price | Dividends | Gains |
Vanguard U.S. Growth Fund | | | | |
Investor Shares | $16.77 | $17.06 | $0.035 | $0.000 |
Admiral Shares | 43.47 | 44.24 | 0.178 | 0.000 |
1 A lower-cost class of shares available to many longtime shareholders and to those with significant investments in the fund.
2 Derived from data provided by Lipper Inc.
1

Chairman’s Letter
Dear Shareholder,
The Investor Shares of Vanguard U.S. Growth Fund returned 1.9% during the fiscal year ended August 31, 2006. The fund’s Admiral Shares returned 2.2%. While the fund’s returns were in line with that of the average peer fund, the fund lagged its index benchmark during the period. This underperformance was due primarily to poor returns from the fund’s concentrated holdings in the health care and information technology sectors.
Stocks climbed for much of the year, then began to waver
During the fiscal year, stocks climbed steadily through the first three quarters, before becoming increasingly volatile amid concerns over higher oil prices and fears that the U.S. economy was stalling. Indeed, the marked slowdown in the housing market in recent months suggests that the economy may have shifted into a lower gear.
The broad U.S. stock market gained 8.8% for the year, with small-capitalization stocks slightly outperforming their large-cap counterparts. As has been the case for the past several years, returns from international equities continued to outshine domestic stocks. For U.S.-based investors, a weaker dollar further boosted these returns when international gains were converted back into U.S. dollars.
2
Rising interest rates dampened bond returns
At its August 8, 2006, meeting, the Federal Reserve Board left its target for the federal funds rate unchanged, at 5.25%. This brought at least a temporary halt to the Fed’s two-year inflation-fighting campaign, which had been marked by 17 consecutive rate hikes.
The broad market for taxable U.S. bonds finished the one-year period with a modest return of 1.7%. Municipal bonds fared somewhat better. The yield curve remained essentially flat, with a very small difference between the yields of 3-month and 30-year U.S. Treasury issues, although yields rose modestly at both ends of the maturity spectrum.
The technology and health care sectors hindered the fund’s performance
In a weak market for large-cap growth stocks, Vanguard U.S. Growth Fund produced a middling return during the 2006 fiscal year. The fund’s return was on par with that of the average large-cap growth fund, but lagged the Russell 1000 Growth Index by almost 2 percentage points.
The information technology and health care sectors have always been important to the fund because those sectors include a high number of growth-oriented large-cap stocks. Although top-ten holdings such as Apple Computer, Google, and Caremark Rx excelled during the year, their positive returns were offset by negative ones from other top-ten firms such as Genentech and QUALCOMM.
Market Barometer | | | |
| Average Annual Total Returns |
| Periods Ended August 31, 2006 |
| One Year | Three Years | Five Years |
Stocks | | | |
Russell 1000 Index (Large-caps) | 8.7% | 11.5% | 5.3% |
Russell 2000 Index (Small-caps) | 9.4 | 14.4 | 10.3 |
Dow Jones Wilshire 5000 Index (Entire market) | 8.8 | 12.0 | 6.1 |
MSCI All Country World Index ex USA (International) | 25.4 | 25.0 | 13.8 |
| | | |
| | | |
Bonds | | | |
Lehman Aggregate Bond Index (Broad taxable market) | 1.7% | 4.0% | 4.9% |
Lehman Municipal Bond Index | 3.0 | 5.1 | 5.0 |
Citigroup 3-Month Treasury Bill Index | 4.3 | 2.5 | 2.2 |
| | | |
| | | |
CPI | | | |
Consumer Price Index | 3.8% | 3.4% | 2.8% |
| | | | | |
3
The fund’s health care holdings were down –4% for the year, and its information technology stocks declined –2%. Since the fund overweighted these two sectors compared with its benchmark index, relative returns also suffered.
The portfolio also lacked some of the better-performing stocks in other market segments, particularly consumer staples and industrials. The fund’s underweighting of these sectors compared with its benchmark likewise hurt relative performance.
A bright spot for the fund was its significant exposure to the financials sector, which helped to offset losses elsewhere. The fund was weighted 15% in financials, compared with a 7% weighting for the benchmark sector; this paid off well, as the fund’s financial holdings returned 14% for the year.
The fund has been slow to recover from two punishing subpar years
Although the fund’s 2006 performance was fair, its long-term record remains subpar. The table below shows the fund’s average annual return for the ten years ended August 31, compared with the returns for the Russell 1000 Growth Index, the average large-cap growth fund, and the Dow Jones Wilshire 5000 Composite Index. In all cases, the fund’s results fell short by wide margins.
These disappointing returns are due principally to the fund’s disappointing results in fiscal years 2001 and 2002, especially among its tech stocks. With time and more consistent performance, we hope to close this gap. We remain confident in AllianceBernstein and William Blair & Company, the two investment advisory firms now charged with executing the fund’s strategy.
Total Returns | | |
| Ten Years Ended August 31, 2006 |
| Average | Final Value of a $10,000 |
| Annual Return | Initial Investment |
U.S. Growth Fund Investor Shares | 2.0% | $12,199 |
Russell 1000 Growth Index | 5.9 | 17,759 |
Average Large-Cap Growth Fund | 6.1 | 18,154 |
Dow Jones Wilshire 5000 Index | 8.9 | 23,550 |
| | | |
4
Ignoring today’s ups and downs can give you a long-term focus
Successful long-term investing doesn’t mean paying attention to today’s dramatic headlines, chasing yesterday’s performance, or trying to predict what tomorrow’s hot stocks will be. As we have counseled through the years, choosing and sticking with a carefully considered, balanced portfolio of stock, bond, and money market funds suited to your unique circumstances can be critical to your portfolio’s long-term success.
Despite a mediocre showing in 2006, U.S. Growth Fund has performed respectably since its struggles of several years ago. However, the fund’s subpar record in fiscal 2001 and 2002, on the heels of the stock market’s late-1990’s high-tech boom, has value as an object lesson: Even though you may think your portfolio is positioned to excel no matter what the financial markets may bring, good times can—and often will—come to an unpredictable halt. Broad diversification can help you manage the level of risk in your portfolio to suit your investment goals and time horizon.
Vanguard U.S. Growth Fund provides exposure to fast-growing, larger U.S. companies, but a prudent, well-diversified plan also incorporates investments in other parts of the broader equities market.
Thank you for investing with Vanguard.
Sincerely,

John J. Brennan
Chairman and Chief Executive Officer
September 14, 2006
Expense Ratios1 | | | |
Your fund compared with its peer group | | | |
| | | Average |
| Investor | Admiral | Large-Cap |
| Shares | Shares | Growth Fund |
U.S. Growth Fund | 0.58% | 0.34% | 1.46% |
1 Fund expense ratios reflect the 12 months ended August 31, 2006. Peer-group expense ratio is derived from data provided by Lipper Inc. and captures information through year-end 2005.
5
Advisors’ Report
During the fiscal year ended August 31, 2006, the Investor Shares of Vanguard U.S. Growth Fund returned 1.9% and the lower-cost Admiral Shares returned 2.2%. This performance reflects the combined efforts of your fund’s two independent advisors. The use of multiple advisors provides exposure to distinct, yet complementary, investment approaches, enhancing the fund’s diversification.
The advisors, the amount and percentage of fund assets each manages, and a brief description of their investment strategies are presented in the table below. Each advisor has also prepared a discussion of the investment environment that existed during the fiscal year and of how the portfolio’s positioning reflects this assessment.
AllianceBernstein L.P.
Portfolio Manager:
Alan Levi, Senior Vice President
The 12 months ended August 31, 2006, spanned a wide range of investor sentiment and contrasting equity market conditions. The period was characterized by volatile—though, on the whole, respectable—economic expansion. Commodity prices, most notably those for energy-related commodities, exhibited persistent strength. Nonetheless, measures of inflation, while rising, have remained at moderate levels, with recent measures of core CPI inflation rising 2.7% year-to-year, compared with increases of 2.2% for 2005 and 1.8% for 2004. Monetary policy was restrained throughout the period as the Federal Reserve Board extended to 17 the string
Vanguard U.S. Growth Fund Investment Advisors | | |
| | | |
| Fund Assets Managed | |
Investment Advisor | % | $ Million | | Investment Strategy |
AllianceBernstein L.P. | 68 | 3,902 | | Uses a fundamentally based, research-driven approach to large-cap growth investing The advisor seeks. to build a diversified portfolio of successful, well- managed companies with |
| | | | sustainable competitive advantages and |
| | | | superior prospects for growth not fully reflected |
| | | | in relative valuation. |
William Blair & Company, L.L.C. | 30 | 1,764 | | Uses a fundamental investment approach in pursuit of superior long-term investment results from growth- oriented companies with leadership positions and strong market presence. |
Cash Investments1 | 2 | 126 | | — |
Total | 100 | 5,792 | | — |
| | | | | |
1 These short-term reserves are invested by Vanguard in equity index products to simulate investment in stocks. Each advisor may also maintain a modest cash position.
6
of consecutive increases in the federal funds target rate that began in June 2004, for a total tightening of 425 basis points. Corporate profits have, if anything, exceeded expectations, with a number of companies continuing to exhibit impressive profit margins, cash flow, and overall balance sheet liquidity. To an extent, this has been reflected in rising dividend distributions and a record rate of share repurchase activity. Viewed in its totality, the past year has produced reasonable economic expansion and impressive corporate profits, yet investor sentiment has vacillated considerably over the period.
Following generally strong absolute and relative returns in 2005, we have been disappointed by the recent investment performance of a number of our holdings, particularly within the technology and health care sectors. In several instances this underperformance reflected disappointing company fundamentals and led us to eliminate the stock from the portfolio, but a number of holdings (including several of our largest commitments) underperformed despite continued robust earnings growth, favorable growth prospects, and upward revision of earnings estimates. In such cases we selectively increased our portfolio positions.
The ten largest holdings in our portion of the U.S. Growth Fund portfolio achieved average second-quarter earnings growth of 74%, with nine accelerating from first-quarter growth, and eight exceeding consensus estimates. Nonetheless, six of these stocks declined during the January 1 to June 30 period.
Starting from an extraordinarily inflated level six years ago, equity markets have since undergone a remarkable compression in valuation, often irrespective of the consistently strong earnings growth. With the pace of economic expansion likely to slow, we anticipate a deceleration in the rate of corporate profit growth. In this context, we anticipate that earnings growth, and its perceived sustainability, will likely become a stronger determinant of relative stock performance than has been the case over the past several years.
Although equity markets are at times volatile and inefficient, we believe that, over time, markets are efficient; stock prices ultimately reflect the fundamental success and earnings growth of underlying
7
companies. Accordingly, we seek companies that we believe have strong business franchises, sustainable competitive advantages, and superior growth prospects. Reflecting this, the current holdings in the Alliance-managed portion of Vanguard U.S. Growth Fund achieved 30% earnings growth in 2005, compared with 19% growth for the Russell 1000 Growth Index, the fund’s benchmark. While we have been disappointed with the investment performance in recent months, we are encouraged by the continued fundamental success of our portfolio companies.
William Blair & Company, L.L.C.
Portfolio Manager:
John F. Jostrand, CFA, Principal
For the one-year period ended August 31, 2006, domestic equity markets experienced gains across the board. Smaller-capitalization stocks continued their multiyear lead over their large-cap counterparts, but large-cap stocks began to close the gap in the spring. Value continues to outpace growth, as stocks in the energy and financials sectors generally achieved the strongest absolute returns during the year. These two sectors make up nearly 50% of the Russell 1000
Value Index, but represent just over 10% of the benchmark Russell 1000 Growth Index, which accounts for the primary return difference between the investment styles.
Our success during the one-year period largely reflected stock picking in the information technology and materials sectors. Stocks in the latter sector provided the strongest absolute returns for the period in both the benchmark index and the portfolio, with stock selection giving a relatively strong advantage to the portfolio.
Although information technology stocks were not among the strongest performers in the benchmark, the tech holdings in our portfolio did relatively well. Accenture, Taiwan Semiconductor Manufacturing, and Adobe Systems all contributed significantly to portfolio results. Energy continued to show strength during most of the year, and stock selection in the portfolio led to performance that again outpaced that of the index sector.
The market has experienced significant multiple compression over the last year. While many companies achieved their fundamental earnings targets during this period, stock prices fell as investors
8
indicated that valuations were too high. A few stocks in the portfolio suffered significant price depreciation due, in part, to revaluation. Examples include Dell and Bed Bath & Beyond.
Our fundamental approach continues to uncover quality growth opportunities regardless of sector or industry. That said, health care and information technology remain the most heavily weighted sectors in the portfolio. We have also found more growth opportunities in the financials sector during the year.
The sell-off of stocks in May and June repriced the market, bringing price/earnings multiples down. We think it likely that stocks will remain in the new valuation band for the next nine months to a year, until new or different information regarding market direction becomes apparent. The economic environment during the prior three calendar years provided an exceptional opportunity for strong earnings growth and historically high corporate profitability, resulting in little delineation between a mediocre company and a great one. But the market’s tenor is changing as growth rates decelerate and investors begin to adopt more conservative risk postures.
Given this environment, we believe conditions are favorable for high-quality growth investing to regain leadership in the stock market, and we continue to find investment ideas that fit within our quality growth framework. We remain overweighted in both the technology and health care sectors, largely at the expense of the consumer sectors, though we remain vigilant about continually assessing the risk–reward framework for individual companies within all sectors.
9
Fund Profile
As of August 31, 2006
Portfolio Characteristics | | |
| Comparative | | Broad |
| Fund | Index1 | Index2 |
Number of Stocks | 72 | 681 | 4,971 |
Median Market Cap | $47.4B | $33.7B | $27.2B |
Price/Earnings Ratio | 21.7x | 20.7x | 16.9x |
Price/Book Ratio | 3.6x | 3.9x | 2.6x |
Yield | | 1.2% | 1.7% |
Investor Shares | 0.6% | | |
Admiral Shares | 0.8% | | |
Return on Equity | 17.9% | 19.8% | 15.5% |
Earnings Growth Rate | 17.3% | 18.4% | 15.3% |
Foreign Holdings | 8.0% | 0.0% | 1.0% |
Turnover Rate | 48% | — | — |
Expense Ratio | | — | — |
Investor Shares | 0.58% | | |
Admiral Shares | 0.34% | | |
Short-Term Reserves | 3% | — | — |
Sector Diversification (% of portfolio) | |
| Comparative | Broad |
| Fund | Index1 | Index2 |
Consumer Discretionary | 8% | 13% | 12% |
Consumer Staples | 4 | 10 | 9 |
Energy | 5 | 4 | 10 |
Financials | 16 | 8 | 22 |
Health Care | 23 | 19 | 12 |
Industrials | 9 | 14 | 11 |
Information Technology | 30 | 26 | 15 |
Materials | 2 | 3 | 3 |
Telecommunication Services | 0 | 1 | 3 |
Utilities | 0 | 2 | 3 |
Short-Term Reserves | 3% | — | — |
| | | | |
Volatility Measures3 | |
| Fund Versus | Fund Versus |
| Comparative Index1 | Broad Index2 |
R-Squared | 0.92 | 0.85 |
Beta | 1.20 | 1.21 |
Ten Largest Holdings4(% of total net assets) | |
| | |
The Goldman Sachs Group, Inc. | investment banking and brokerage | 3.4% |
Schlumberger Ltd. | oil and gas equipment and services | 3.3 |
QUALCOMM Inc. | communications equipment | 3.2 |
Apple Computer, Inc. | computer hardware | 3.2 |
WellPoint Inc. | managed health care | 3.2 |
Google Inc. | internet software and services | 3.0 |
Genentech, Inc. | biotechnology | 3.0 |
Caremark Rx, Inc. | health care services | 3.0 |
Legg Mason Inc. | asset management and custody banks | 2.8 |
Danaher Corp. | industrial machinery | 2.7 |
Top Ten | | 30.8% |
| | | |
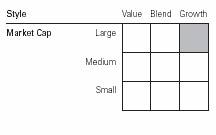
Investment Focus
1 Russell 1000 Growth Index.
2 Dow Jones Wilshire 5000 Index.
3 For an explanation of R-squared, beta, and other terms used here, see the Glossary on page 27.
4“Ten Largest Holdings” excludes any temporary cash investments and equity index products.
10
Performance Summary
All of the returns in this report represent past performance, which is not a guarantee of future results that may be achieved by the fund. (Current performance may be lower or higher than the performance data cited. For performance data current to the most recent month-end, visit our website at www.vanguard.com.) Note, too, that both investment returns and principal value can fluctuate widely, so an investor’s shares, when sold, could be worth more or less than their original cost. The returns shown do not reflect taxes that a shareholder would pay on fund distributions or on the sale of fund shares.
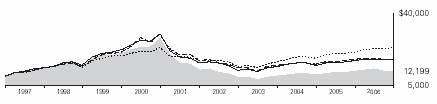
Cumulative Performance: August 31, 1996–August 31, 2006
Initial Investment of $10,000
| | | |
| | | |
| | Average Annual Total Returns | Final Value |
| | Periods Ended August 31, 2006 | of a $10,000 |
| One Year | Five Years | Ten Years | Investment |
U.S. Growth Fund Investor Shares | 1.93% | –0.81% | 2.01% | $12,199 |
Dow Jones Wilshire 5000 Index | 8.76 | 6.14 | 8.94 | 23,550 |
Russell 1000 Growth Index | 3.68 | 1.69 | 5.91 | 17,759 |
Average Large-Cap Growth Fund1 | 1.86 | 0.75 | 6.14 | 18,154 |
| | | | Final Value |
| | | Since | of a $100,000 |
| One Year | Five Years | Inception2 | Investment |
U.S. Growth Fund Admiral Shares | 2.16% | –0.61% | –1.98% | $90,374 |
Dow Jones Wilshire 5000 Index | 8.76 | 6.14 | 5.11 | 128,629 |
Russell 1000 Growth Index | 3.68 | 1.69 | 0.40 | 102,020 |
1 Derived from data provided by Lipper Inc.
2 August 13, 2001.
11
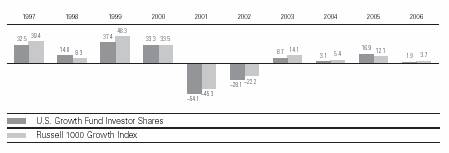
Fiscal-Year Total Returns (%): August 31, 1996–August 31, 2006
Average Annual Total Returns: Periods Ended June 30, 2006
This table presents average annual total returns through the latest calendar quarter—rather than through the end of the fiscal period. Securities and Exchange Commission rules require that we provide this information.
| Inception Date | One Year | Five Years | Ten Years |
Investor Shares | 1/6/1959 | 5.12% | –3.57% | 1.59% |
Admiral Shares | 8/13/2001 | 5.37 | –2.291 | — |
1 Return since inception.
Note: See Financial Highlights tables on pages 18 and 19 for dividend and capital gains information.
12
Financial Statements
Statement of Net Assets
As of August 31, 2006
The fund provides a complete list of its holdings four times in each fiscal year, at the quarter-ends. For the second and fourth fiscal quarters, the lists appear in the fund’s semiannual and annual reports to shareholders. For the first and third fiscal quarters, the fund files the lists with the Securities and Exchange Commission on Form N-Q. Shareholders can look up the fund’s Forms N-Q on the SEC’s website at www.sec.gov. Forms N-Q may also be reviewed and copied at the SEC’s Public Reference Room (see the back cover of this report for further information).
| | Market |
| | Value• |
| Shares | ($000) |
Common Stocks (94.7%)1 | | |
Consumer Discretionary (7.7%) | | |
* Kohl’s Corp. | 1,744,004 | 109,018 |
* Comcast Corp. Class A | 2,252,310 | 78,831 |
Lowe’s Cos., Inc. | 2,546,966 | 68,921 |
NIKE, Inc. Class B | 822,235 | 66,404 |
Marriott International,Inc. Class A | 1,561,454 | 58,804 |
Johnson Controls, Inc. | 481,165 | 34,610 |
Staples, Inc. | 1,182,010 | 26,666 |
| | 443,254 |
Consumer Staples (4.2%) | | |
The Procter & Gamble Co. | 1,847,780 | 114,378 |
PepsiCo, Inc. | 1,120,040 | 73,116 |
Walgreen Co. | 727,600 | 35,987 |
Whole Foods Market, Inc. | 334,400 | 17,931 |
| | 241,412 |
Energy (5.2%) | | |
Schlumberger Ltd. | 3,135,500 | 192,206 |
Baker Hughes, Inc. | 636,500 | 45,306 |
Suncor Energy, Inc. | 540,055 | 41,897 |
* Nabors Industries, Inc. | 640,300 | 21,053 |
| | 300,462 |
Financials (15.5%) | | |
The Goldman Sachs | | |
Group, Inc. | 1,317,650 | 195,869 |
Legg Mason Inc. | 1,751,860 | 159,875 |
American International Group, Inc. | 1,951,580 | 124,550 |
Citigroup, Inc. | 2,089,830 | 103,133 |
JPMorgan Chase & Co. | 2,123,650 | 96,966 |
Charles Schwab Corp. | 4,094,995 | 66,789 |
Merrill Lynch & Co., Inc. | 547,608 | 40,266 |
SLM Corp. | 819,624 | 39,776 |
Capital One Financial Corp. | 449,495 | 32,858 |
Franklin Resources Corp. | 207,470 | 20,417 |
State Street Corp. | 317,600 | 19,628 |
| | 900,127 |
| | Market |
| | Value• |
| Shares | ($000) |
Health Care (22.8%) | | |
Biotechnology (6.7%) | | |
* Genentech, Inc. | 2,114,060 | 174,452 |
* Gilead Sciences, Inc. | 2,043,350 | 129,548 |
* Amgen, Inc. | 941,185 | 63,935 |
* MedImmune Inc. | 677,235 | 18,719 |
| | |
Health Care Equipment & Supplies (2.6%) | |
* Alcon, Inc. | 769,820 | 90,677 |
Medtronic, Inc. | 840,256 | 39,408 |
C.R. Bard, Inc. | 251,790 | 18,930 |
| | |
Health Care Providers & Services (8.1%) | |
* WellPoint Inc. | 2,362,702 | 182,897 |
Caremark Rx, Inc. | 2,988,515 | 173,155 |
UnitedHealth Group Inc. | 2,198,421 | 114,208 |
| | |
Pharmaceuticals (5.4%) | | |
Teva Pharmaceutical | | |
Industries Ltd. | | |
Sponsored ADR | 4,172,500 | 145,036 |
Eli Lilly & Co. | 1,598,770 | 89,419 |
Merck & Co., Inc. | 1,395,500 | 56,588 |
Allergan, Inc. | 221,370 | 25,360 |
| | 1,322,332 |
Industrials (8.6%) | | |
Danaher Corp. | 2,388,451 | 158,330 |
The Boeing Co. | 1,244,500 | 93,213 |
General Electric Co. | 1,552,800 | 52,888 |
Rockwell Collins, Inc. | 971,730 | 50,948 |
United Technologies Corp. | 720,200 | 45,164 |
Emerson Electric Co. | 487,130 | 40,018 |
3M Co. | 453,230 | 32,497 |
Rockwell Automation, Inc. | 424,570 | 23,937 |
| | 496,995 |
13
| | Market |
| | Value• |
| Shares | ($000) |
Information Technology (28.8%) | |
Communications Equipment (6.1%) | |
QUALCOMM Inc. | 4,926,635 | 185,586 |
Motorola, Inc. | 2,919,730 | 68,263 |
* Cisco Systems, Inc. | 3,023,798 | 66,493 |
* Corning, Inc. | 1,573,665 | 34,998 |
| | |
Computers & Peripherals (5.5%) | |
* Apple Computer, Inc. | 2,708,810 | 183,793 |
* Network Appliance, Inc. | 2,325,230 | 79,616 |
* EMC Corp. | 3,482,550 | 40,572 |
* Sun Microsystems, Inc. | 3,429,100 | 17,111 |
Electronic Equipment & Instruments (0.5%) |
Jabil Circuit, Inc. | 1,073,440 | 28,800 |
| | |
Internet Software & Services (5.6%) | |
* Google Inc. | 462,075 | 174,909 |
* Yahoo! Inc. | 3,712,915 | 107,006 |
* eBay Inc. | 1,506,590 | 41,974 |
| | |
IT Services (2.5%) | | |
Infosys Technologies Ltd. ADR | 1,666,810 | 74,756 |
Paychex, Inc. | 1,936,056 | 69,524 |
| | |
Semiconductors & Semiconductor Equipment (6.8%) |
* Advanced Micro | | |
Devices, Inc. | 4,860,550 | 121,465 |
* Broadcom Corp. | 3,121,470 | 91,896 |
Taiwan Semiconductor Manufacturing Co.Ltd. ADR | 5,649,840 | 52,600 |
* NVIDIA Corp. | 1,651,800 | 48,084 |
Linear Technology Corp. | 1,156,506 | 39,333 |
* Marvell Technology Group Ltd. | 2,207,670 | 38,656 |
| | |
Software (1.8%) | | |
^SAP AG ADR | 1,190,200 | 56,820 |
* Adobe Systems, Inc. | 1,543,035 | 50,056 |
| | 1,672,311 |
Materials (1.9%) | | |
Praxair, Inc. | 1,216,420 | 69,835 |
Monsanto Co. | 853,480 | 40,489 |
| | 110,324 |
Exchange-Traded Fund (0.0%) | |
2 Vanguard Growth ETF | 3,100 | 166 |
| | |
| | |
Total Common Stocks | | |
(Cost $4,830,108) | | 5,487,383 |
| | Market |
| | Value• |
| Shares | ($000) |
Temporary Cash Investments (6.0%)1 | |
Money Market Fund (5.6%) | | |
3 Vanguard Market | | |
Liquidity Fund, 5.293% | 265,590,484 | 265,590 |
3 Vanguard Market | | |
Liquidity Fund, | | |
5.293%—Note G | 56,500,000 | 56,500 |
| | 322,090 |
| | |
| Face | |
| Amount | |
| ($000) | |
U.S. Agency Obligation (0.4%) | |
4 Federal Home Loan Bank | | |
5 5.382%, 9/29/06 | 23,900 | 23,806 |
Total Temporary Cash Investments | |
(Cost $345,892) | | 345,896 |
Total Investments (100.7%) | | |
(Cost $5,176,000) | | 5,833,279 |
Other Assets and Liabilities (–0.7%) | |
Other Assets—Note C | | 49,113 |
Liabilities—Note G | | (90,567) |
| | (41,454) |
Net Assets (100%) | | 5,791,825 |
14
At August 31, 2006, net assets consisted of:6 |
| Amount |
| ($000) |
Paid-in Capital | 12,009,277 |
Undistributed Net Investment Income | 3,794 |
Accumulated Net Realized Losses | (6,882,220) |
Unrealized Appreciation | |
Investment Securities | 657,279 |
Futures Contracts | 3,695 |
Net Assets | 5,791,825 |
| |
| |
Investor Shares—Net Assets | |
Applicable to 265,595,712 outstanding | |
$.001 par value shares of beneficial | |
interest (unlimited authorization) | 4,529,961 |
Net Asset Value Per Share— | |
Investor Shares | $17.06 |
| |
| |
Admiral Shares—Net Assets | |
Applicable to 28,522,584 outstanding | |
$.001 par value shares of beneficial | |
interest (unlimited authorization) | 1,261,864 |
Net Asset Value Per Share— | |
Admiral Shares | $44.24 |
• | See Note A in Notes to Financial Statements. |
* | Non-income-producing security. |
^ | Part of security position is on loan to broker-dealers. See Note G in Notes to Financial Statements. |
1 The fund invests a portion of its cash reserves in equity markets through the use of index futures contracts. After giving effect to futures investments, the fund’s effective common stock and temporary cash investment positions represent 97.0% and 3.7%, respectively, of net assets. See Note E in Notes to Financial Statements.
2 Considered an affiliated company of the fund as the issuer is another member of The Vanguard Group.
3 Affiliated money market fund available only to Vanguard funds and certain trusts and accounts managed by Vanguard. Rate shown is the 7-day yield.
4 The issuer operates under a congressional charter; its securities are neither issued nor guaranteed by the U.S. government. If needed, access to additional funding from the U.S. Treasury (beyond the issuer’s line of credit) would require congressional action.
5 Securities with a value of $23,806,000 have been segregated as initial margin for open futures contracts.
6 See Note E in Notes to Financial Statements for the tax-basis components of net assets.
ADR—American Depositary Receipt.
15
Statement of Operations
| Year Ended |
| August 31, 2006 |
| ($000) |
Investment Income | |
Income | |
Dividends1 | 42,288 |
Interest1 | 13,508 |
Security Lending | 17 |
Total Income | 55,813 |
Expenses | |
Investment Advisory Fees—Note B | |
Basic Fee | 9,093 |
Performance Adjustment | 1,180 |
The Vanguard Group—Note C | |
Management and Administrative—Investor Shares | 18,445 |
Management and Administrative—Admiral Shares | 1,815 |
Marketing and Distribution—Investor Shares | 1,128 |
Marketing and Distribution—Admiral Shares | 273 |
Custodian Fees | 71 |
Auditing Fees | 22 |
Shareholders’ Reports—Investor Shares | 182 |
Shareholders’ Reports—Admiral Shares | 3 |
Trustees’ Fees and Expenses | 9 |
Total Expenses | 32,221 |
Expenses Paid Indirectly—Note D | (604) |
Net Expenses | 31,617 |
Net Investment Income | 24,196 |
Realized Net Gain (Loss) | |
Investment Securities Sold1 | 285,797 |
Futures Contracts | 9,515 |
Realized Net Gain (Loss) | 295,312 |
Change in Unrealized Appreciation (Depreciation) | |
Investment Securities | (197,060) |
Futures Contracts | (3,327) |
Change in Unrealized Appreciation (Depreciation) | (200,387) |
Net Increase (Decrease) in Net Assets Resulting from Operations | 119,121 |
1 Dividend income, interest income and realized net gain (loss) from affiliated companies of the fund were $2,000, $12,394,000, and $0, respectively.
16
Statement of Changes in Net Assets
| Year Ended August 31, |
| 2006 | 2005 |
| ($000) | ($000) |
Increase (Decrease) In Net Assets | | |
Operations | | |
Net Investment Income | 24,196 | 20,242 |
Realized Net Gain (Loss) | 295,312 | 177,386 |
Change in Unrealized Appreciation (Depreciation) | (200,387) | 760,390 |
Net Increase (Decrease) in Net Assets Resulting from Operations | 119,121 | 958,018 |
Distributions | | |
Net Investment Income | | |
Investor Shares | (9,864) | (15,120) |
Admiral Shares | (4,703) | (4,423) |
Realized Capital Gain | | |
Investor Shares | — | — |
Admiral Shares | — | — |
Total Distributions | (14,567) | (19,543) |
Capital Share Transactions—Note H | | |
Investor Shares | (415,210) | (1,455,206) |
Admiral Shares | 242,974 | 49,555 |
Net Increase (Decrease) from Capital Share Transactions | (172,236) | (1,405,651) |
Total Increase (Decrease) | (67,682) | (467,176) |
Net Assets | | |
Beginning of Period | 5,859,507 | 6,326,683 |
End of Period1 | 5,791,825 | 5,859,507 |
1 Net Assets—End of Period includes undistributed (overdistributed) net investment income of $3,794,000 and ($5,835,000).
17
Financial Highlights
U.S. Growth Fund Investor Shares | | | | | |
| | | | | |
| | | |
For a Share Outstanding | | | Year Ended August 31, |
Throughout Each Period | 2006 | 2005 | 2004 | 2003 | 2002 |
Net Asset Value, Beginning of Period | $16.77 | $14.39 | $14.00 | $12.92 | $18.00 |
Investment Operations | | | | | |
Net Investment Income | .059 | .0401 | .028 | .040 | .031 |
Net Realized and Unrealized Gain (Loss) | | | | | |
on Investments | .266 | 2.385 | .409 | 1.082 | (5.075) |
Total from Investment Operations | .325 | 2.425 | .437 | 1.122 | (5.044) |
Distributions | | | | | |
Dividends from Net Investment Income | (.035) | (.045) | (.047) | (.042) | (.036) |
Distributions from Realized Capital Gains | — | — | — | — | — |
Total Distributions | (.035) | (.045) | (.047) | (.042) | (.036) |
Net Asset Value, End of Period | $17.06 | $16.77 | $14.39 | $14.00 | $12.92 |
| | | | | |
Total Return | 1.93% | 16.86% | 3.11% | 8.73% | –28.09% |
| | | | | |
Ratios/Supplemental Data | | | | | |
Net Assets, End of Period (Millions) | $4,530 | $4,848 | $5,503 | $5,892 | $5,472 |
Ratio of Total Expenses to | | | | | |
Average Net Assets2 | 0.58% | 0.55% | 0.53% | 0.55% | 0.50% |
Ratio of Net Investment Income to | | | | | |
Average Net Assets | 0.34% | 0.30%1 | 0.19% | 0.32% | 0.20% |
Portfolio Turnover Rate | 48% | 38% | 71% | 47% | 53% |
| | | | | | |
1 Net investment income per share and the ratio of net investment income to average net assets include $.017 and 0.11%, respectively, resulting from a special dividend from Microsoft Corp. in November 2004.
2 Includes performance-based investment advisory fee increases (decreases) of 0.02%, (0.02%), (0.03%), (0.02%), and 0.00%.
18
U.S. Growth Fund Admiral Shares | | | | | |
| | | | | |
| | | | |
For a Share Outstanding | | | Year Ended August 31, |
Throughout Each Period | 2006 | 2005 | 2004 | 2003 | 2002 |
Net Asset Value, Beginning of Period | $43.47 | $37.29 | $36.28 | $33.46 | $46.59 |
Investment Operations | | | | | |
Net Investment Income | .271 | .2261 | .147 | .164 | .168 |
Net Realized and Unrealized Gain (Loss) | | | | | |
on Investments | .677 | 6.163 | 1.052 | 2.811 | (13.167) |
Total from Investment Operations | .948 | 6.389 | 1.199 | 2.975 | (12.999) |
Distributions | | | | | |
Dividends from Net Investment Income | (.178) | (.209) | (.189) | (.155) | (.131) |
Distributions from Realized Capital Gains | — | — | — | — | — |
Total Distributions | (.178) | (.209) | (.189) | (.155) | (.131) |
Net Asset Value, End of Period | $44.24 | $43.47 | $37.29 | $36.28 | $33.46 |
| | | | | |
Total Return | 2.16% | 17.16% | 3.29% | 8.95% | –27.99% |
| | | | | |
Ratios/Supplemental Data | | | | | |
Net Assets, End of Period (Millions) | $1,262 | $1,012 | $824 | $1,071 | $1,069 |
Ratio of Total Expenses to | | | | | |
Average Net Assets2 | 0.34% | 0.32% | 0.32% | 0.37% | 0.36% |
Ratio of Net Investment Income to | | | | | |
Average Net Assets | 0.58% | 0.53%1 | 0.40% | 0.50% | 0.37% |
Portfolio Turnover Rate | 48% | 38% | 71% | 47% | 53% |
1 Net investment income per share and the ratio of net investment income to average net assets include $.045 and 0.11%, respectively, resulting from a special dividend from Microsoft Corp. in November 2004.
2 Includes performance-based investment advisory fee increases (decreases) of 0.02%, (0.02%), (0.03%), (0.02%), and 0.00%. See accompanying Notes, which are an integral part of the Financial Statements.
19
Notes to Financial Statements
Vanguard U.S. Growth Fund is registered under the Investment Company Act of 1940 as an open-end investment company, or mutual fund. The fund files reports with the SEC under the company name Vanguard World Funds. The fund offers two classes of shares, Investor Shares and Admiral Shares. Investor Shares are available to any investor who meets the fund’s minimum purchase requirements. Admiral Shares are designed for investors who meet certain administrative, servicing, tenure, and account-size criteria.
A. The following significant accounting policies conform to generally accepted accounting principles for U.S. mutual funds. The fund consistently follows such policies in preparing its financial statements.
1. Security Valuation: Securities are valued as of the close of trading on the New York Stock Exchange (generally 4:00 p.m. Eastern time) on the valuation date. Equity securities are valued at the latest quoted sales prices or official closing prices taken from the primary market in which each security trades; such securities not traded on the valuation date are valued at the mean of the latest quoted bid and asked prices. Securities for which market quotations are not readily available, or whose values have been materially affected by events occurring before the fund’s pricing time but after the close of the securities’ primary markets, are valued by methods deemed by the board of trustees to represent fair value. Investments in Vanguard Market Liquidity Fund are valued at that fund’s net asset value. Temporary cash investments acquired over 60 days to maturity are valued using the latest bid prices or using valuations based on a matrix system (which considers such factors as security prices, yields, maturities, and ratings), both as furnished by independent pricing services. Other temporary cash investments are valued at amortized cost, which approximates market value.
2. Futures Contracts: The fund uses index futures contracts to a limited extent, with the objective of maintaining full exposure to the stock market while maintaining liquidity. The fund may purchase or sell futures contracts to achieve a desired level of investment, whether to accommodate portfolio turnover or cash flows from capital share transactions. The primary risks associated with the use of futures contracts are imperfect correlation between changes in market values of stocks held by the fund and the prices of futures contracts, and the possibility of an illiquid market.
Futures contracts are valued at their quoted daily settlement prices. The aggregate principal amounts of the contracts are not recorded in the Statement of Net Assets. Fluctuations in the value of the contracts are recorded in the Statement of Net Assets as an asset (liability) and in the Statement of Operations as unrealized appreciation (depreciation) until the contracts are closed, when they are recorded as realized futures gains (losses).
3. Federal Income Taxes: The fund intends to continue to qualify as a regulated investment company and distribute all of its taxable income. Accordingly, no provision for federal income taxes is required in the financial statements.
4. Distributions: Distributions to shareholders are recorded on the ex-dividend date.
5. Security Lending: The fund may lend its securities to qualified institutional borrowers to earn additional income. Security loans are required to be secured at all times by collateral at least equal to the market value of securities loaned. The fund invests cash collateral received in Vanguard Market Liquidity Fund, and records a liability for the return of the collateral, during the period the securities are on loan. Security lending income represents the income earned on investing cash collateral, less expenses associated with the loan.
20
6. Other: Dividend income is recorded on the ex-dividend date. Interest income includes income distributions received from Vanguard Market Liquidity Fund and is accrued daily. Security transactions are accounted for on the date securities are bought or sold. Costs used to determine realized gains (losses) on the sale of investment securities are those of the specific securities sold.
Each class of shares has equal rights as to assets and earnings, except that each class separately bears certain class-specific expenses related to maintenance of shareholder accounts (included in Management and Administrative expenses) and shareholder reporting. Marketing and distribution expenses are allocated to each class of shares based on a method approved by the board of trustees. Income, other non-class-specific expenses, and gains and losses on investments are allocated to each class of shares based on its relative net assets.
B. AllianceBernstein L.P. and William Blair & Company, L.L.C., each provide investment advisory services to a portion of the fund for a fee calculated at an annual percentage rate of average net assets managed by the advisor. The basic fee for AllianceBernstein L.P. is subject to quarterly adjustments based on performance for the preceding three years relative to the Russell 1000 Growth Index. The basic fee for William Blair & Company is subject to quarterly adjustments based on performance since June 1, 2004, relative to the Russell 1000 Growth Index.
The Vanguard Group manages the cash reserves of the portfolio on an at-cost basis.
For the year ended August 31, 2006, the aggregate investment advisory fee represented an effective annual basic rate of 0.15% of the fund’s average net assets before an increase of $1,180,000 (0.02%) based on performance.
C. The Vanguard Group furnishes at cost corporate management, administrative, marketing, and distribution services. The costs of such services are allocated to the fund under methods approved by the board of trustees. The fund has committed to provide up to 0.40% of its net assets in capital contributions to Vanguard. At August 31, 2006, the fund had contributed capital of $610,000 to Vanguard (included in Other Assets), representing 0.01% of the fund’s net assets and 0.61% of Vanguard’s capitalization. The fund’s trustees and officers are also directors and officers of Vanguard.
D. The fund has asked its investment advisors to direct certain security trades, subject to obtaining the best price and execution, to brokers who have agreed to rebate to the fund part of the commissions generated. Such rebates are used solely to reduce the fund’s management and administrative expenses. For the year ended August 31, 2006, these arrangements reduced the fund’s expenses by $604,000 (an annual rate of 0.01% of average net assets).
E. Distributions are determined on a tax basis and may differ from net investment income and realized capital gains for financial reporting purposes. Differences may be permanent or temporary. Permanent differences are reclassified among capital accounts in the financial statements to reflect their tax character. Temporary differences arise when certain items of income, expense, gain, or loss are recognized in different periods for financial statement and tax purposes; these differences will reverse at some time in the future. Differences in classification may also result from the treatment of short-term gains as ordinary income for tax purposes.
For tax purposes, at August 31, 2006, the fund had $20,280,000 of ordinary income available for distribution. The fund had available realized losses of $6,877,842,000 to offset future net capital gains of $3,318,368,000 through August 31, 2010, $2,548,333,000 through August 31, 2011, $887,490,000 through August 31, 2012, and $123,651,000 through August 31, 2013.
21
At August 31, 2006, the cost of investment securities for tax purposes was $5,176,000,000. Net unrealized appreciation of investment securities for tax purposes was $657,279,000, consisting of unrealized gains of $816,088,000 on securities that had risen in value since their purchase and $158,809,000 in unrealized losses on securities that had fallen in value since their purchase.
At August 31, 2006, the aggregate settlement value of open futures contracts expiring through December 2006 and the related unrealized appreciation (depreciation) were:
| | | ($000) |
| | Aggregate | Unrealized |
| Number of | Settlement | Appreciation |
Futures Contracts | Long Contracts | Value | (Depreciation) |
S&P 500 Index | 293 | 95,771 | 3,519 |
E-mini NASDAQ 100 Index | 1,050 | 33,243 | 176 |
Unrealized appreciation (depreciation) on open futures contracts is required to be treated as realized gain (loss) for tax purposes.
F. During the year ended August 31, 2006, the fund purchased $2,798,630,000 of investment securities and sold $3,033,828,000 of investment securities other than temporary cash investments.
G. The market value of securities on loan to broker-dealers at August 31, 2006, was $53,946,000, for which the fund received cash collateral of $56,500,000.
H. Capital share transactions for each class of shares were:
| | | | Year Ended August 31, |
| | 2006 | | | 2005 |
| Amount | Shares | | Amount | Shares |
| ($000) | (000) | | ($000) | (000) |
Investor Shares | | | | | |
Issued | 766,902 | 43,413 | | 701,277 | 44,965 |
Issued in Lieu of Cash Distributions | 9,625 | 531 | | 14,787 | 918 |
Redeemed | (1,191,737) | (67,508) | | (2,171,270) | (139,231) |
Net Increase (Decrease)—Investor Shares | (415,210) | (23,564) | | (1,455,206) | (93,348) |
Admiral Shares | | | | | |
Issued | 451,855 | 9,832 | | 489,787 | 11,743 |
Issued in Lieu of Cash Distributions | 4,305 | 92 | | 4,233 | 102 |
Redeemed | (213,186) | (4,675) | | (444,465) | (10,662) |
Net Increase (Decrease)—Admiral Shares | 242,974 | 5,249 | | 49,555 | 1,183 |
I. In June 2006, the Financial Accounting Standards Board issued Interpretation No. 48 ("FIN 48"), "Accounting for Uncertainty in Income Taxes". FIN 48 establishes the minimum threshold for recognizing, and a system for measuring, the benefits of tax-return positions in financial statements. FIN 48 will be effective for the fund's fiscal year beginning September 1, 2007. Management is in the process of analyzing the fund's tax positions for purposes of implementing FIN 48; based on the analysis completed to date, management does not believe the adoption of FIN 48 will result in any material impact to the fund's financial statements.
22
Report of Independent Registered Public Accounting Firm
To the Trustees of Vanguard World Funds and the Shareholders of Vanguard U.S. Growth Fund:
In our opinion, the accompanying statement of net assets and the related statements of operations and of changes in net assets and the financial highlights present fairly, in all material respects, the financial position of Vanguard U.S. Growth Fund (the "Fund") at August 31, 2006, the results of its operations for the year then ended, the changes in its net assets for each of the two years in the period then ended and the financial highlights for each of the five years in the period then ended, in conformity with accounting principles generally accepted in the United States of America. These financial statements and financial highlights (hereafter referred to as "financial statements") are the responsibility of the Fund’s management; our responsibility is to express an opinion on these financial statements based on our audits. We conducted our audits of these financial statements in accordance with the standards of the Public Company Accounting Oversight Board (United States). Those standards require that we plan and perform the audit to obtain reasonable assurance about whether the financial statements are free of material misstatement. An audit includes examining, on a test basis, evidence supporting the amounts and disclosures in the financial statements, assessing the accounting principles used and significant estimates made by management, and evaluating the overall financial statement presentation. We believe that our audits, which included confirmation of securities at August 31, 2006 by correspondence with the custodian and broker and by agreement to the underlying ownership records for Vanguard Market Liquidity Fund, provide a reasonable basis for our opinion.
PricewaterhouseCoopers LLP
Philadelphia, Pennsylvania
October 12, 2006
Special 2006 tax information (unaudited) for Vanguard U.S. Growth Fund
This information for the fiscal year ended August 31, 2006, is included pursuant to provisions of the Internal Revenue Code.
The fund distributed $14,567,000 of qualified dividend income to shareholders during the fiscal year.
For corporate shareholders, 100% of investment income (dividend income plus short-term gains, if any) qualifies for the dividends-received deduction.
23
Your Fund’s After-Tax Returns
This table presents returns for your fund both before and after taxes. The after-tax returns are shown in two ways: (1) assuming that an investor owned the fund during the entire period and paid taxes on the fund’s distributions, and (2) assuming that an investor paid taxes on the fund’s distributions and sold all shares at the end of each period.
Calculations are based on the highest individual federal income tax and capital gains tax rates in effect at the times of the distributions and the hypothetical sales. State and local taxes were not considered. After-tax returns reflect any qualified dividend income, using actual prior year figures and estimates for 2006. (In the example, returns after the sale of fund shares may be higher than those assuming no sale. This occurs when the sale would have produced a capital loss. The calculation assumes that the investor received a tax deduction for the loss.)
The table shows returns for Investor Shares only; returns for other share classes will differ. Please note that your actual after-tax returns will depend on your tax situation and may differ from those shown. Also note that if you own the fund in a tax-deferred account, such as an individual retirement account or a 401(k) plan, this information does not apply to you. Such accounts are not subject to current taxes.
Finally, keep in mind that a fund’s performance—whether before or after taxes—does not guarantee future results.
Average Annual Total Returns: U.S. Growth Fund Investor Shares | | |
Periods Ended August 31, 2006 | | | |
| One | Five | Ten |
| Year | Years | Years |
Returns Before Taxes | 1.93% | –0.81% | 2.01% |
Returns After Taxes on Distributions | 1.90 | –0.87 | 0.91 |
Returns After Taxes on Distributions and Sale of Fund Shares | 1.29 | –0.71 | 1.58 |
24
About Your Fund’s Expenses
As a shareholder of the fund, you incur ongoing costs, which include costs for portfolio management, administrative services, and shareholder reports (like this one), among others. Operating expenses, which are deducted from a fund’s gross income, directly reduce the investment return of the fund.
A fund’s expenses are expressed as a percentage of its average net assets. This figure is known as the expense ratio. The following examples are intended to help you understand the ongoing costs (in dollars) of investing in your fund and to compare these costs with those of other mutual funds. The examples are based on an investment of $1,000 made at the beginning of the period shown and held for the entire period.
The table below illustrates your fund’s costs in two ways:
1. Based on actual fund return. This section helps you to estimate the actual expenses that you paid over the period. The “Ending Account Value” shown is derived from the fund’s actual return, and the third column shows the dollar amount that would have been paid by an investor who started with $1,000 in the fund. You may use the information here, together with the amount you invested, to estimate the expenses that you paid over the period.
To do so, simply divide your account value by $1,000 (for example, an $8,600 account value divided by $1,000 = 8.6), then multiply the result by the number given for your fund under the heading “Expenses Paid During Period.”
2. Based on hypothetical 5% yearly return. This section is intended to help you compare your fund’s costs with those of other mutual funds. It assumes that the fund had a yearly return of 5% before expenses, but that the expense ratio is unchanged. In this case—because the return used is not the fund’s actual return—the results do not apply to your investment. The example is useful in making comparisons because the Securities and Exchange Commission requires all mutual funds to calculate expenses based on a 5% return. You can assess your fund’s costs by comparing this hypothetical example with the hypothetical examples that appear in shareholder reports of other funds.
Six Months Ended August 31, 2006 | | | |
| Beginning | Ending | Expenses |
| Account Value | Account Value | Paid During |
U.S. Growth Fund | 2/28/2006 | 8/31/2006 | Period1 |
Based on Actual Fund Return | | | |
Investor Shares | $1,000.00 | $936.85 | $2.73 |
Admiral Shares | 1,000.00 | 937.69 | 1.56 |
Based on Hypothetical 5% Yearly Return | | | |
Investor Shares | $1,000.00 | $1,022.38 | $2.85 |
Admiral Shares | 1,000.00 | 1,023.59 | 1.63 |
1. | The calculations are based on expenses incurred in the most recent six-month period. The fund’s annualized six-month expense ratios for that period are 0.56% for Investor Shares and 0.32% for Admiral Shares. The dollar amounts shown as “Expenses Paid” are equal to the annualized expense ratio multiplied by the average account value over the period, multiplied by the number of days in the most recent six-month period, then divided by the number of days in the most recent 12-month period. |
25
Note that the expenses shown in the table are meant to highlight and help you compare ongoing costs only and do not reflect any transactional costs or account maintenance fees. They do not include your fund’s low-balance fee, which is described in the prospectus. If this fee were applied to your account, your costs would be higher. Your fund does not charge transaction fees, such as purchase or redemption fees, nor does it carry a “sales load.”
The calculations assume no shares were bought or sold during the period. Your actual costs may have been higher or lower, depending on the amount of your investment and the timing of any purchases or redemptions.
You can find more information about the fund’s expenses, including annual expense ratios, in the Financial Statements section of this report. For additional information on operating expenses and other shareholder costs, please refer to the current fund prospectus.
26
Glossary
Beta. A measure of the magnitude of a fund’s past share-price fluctuations in relation to the ups and downs of a given market index. The index is assigned a beta of 1.00. Compared with a given index, a fund with a beta of 1.20 typically would have seen its share price rise or fall by 12% when the index rose or fell by 10%. A fund’s beta should be reviewed in conjunction with its R-squared (see definition below). The lower the R-squared, the less correlation there is between the fund and the index, and the less reliable beta is as an indicator of volatility.
Earnings Growth Rate. The average annual rate of growth in earnings over the past five years for the stocks now in a fund.
Expense Ratio. The percentage of a fund’s average net assets used to pay its annual administrative and advisory expenses. These expenses directly reduce returns to investors.
Foreign Holdings. The percentage of a fund represented by stocks or depositary receipts of companies based outside the United States.
Median Market Cap. An indicator of the size of companies in which a fund invests; the midpoint of market capitalization (market price x shares outstanding) of a fund’s stocks, weighted by the proportion of the fund’s assets invested in each stock. Stocks representing half of the fund’s assets have market capitalizations above the median, and the rest are below it.
Price/Book Ratio. The share price of a stock divided by its net worth, or book value, per share. For a fund, the weighted average price/book ratio of the stocks it holds.
Price/Earnings Ratio. The ratio of a stock’s current price to its per-share earnings over the past year. For a fund, the weighted average P/E of the stocks it holds. P/E is an indicator of market expectations about corporate prospects; the higher the P/E, the greater the expectations for a company’s future growth.
R-Squared. A measure of how much of a fund’s past returns can be explained by the returns from the market in general, as measured by a given index. If a fund’s total returns were precisely synchronized with an index’s returns, its R-squared would be 1.00. If the fund’s returns bore no relationship to the index’s returns, its R-squared would be 0.
Return on Equity. The annual average rate of return generated by a company during the past five years for each dollar of shareholder’s equity (net income divided by shareholder’s equity). For a fund, the weighted average return on equity for the companies whose stocks it holds.
Short-Term Reserves. The percentage of a fund invested in highly liquid, short-term securities that can be readily converted to cash.
Turnover Rate. An indication of the fund’s trading activity. Funds with high turnover rates incur higher transaction costs and may be more likely to distribute capital gains (which may be taxable to investors). The turnover rate excludes in-kind transactions, which have minimal impact on costs.
Yield. A snapshot of a fund’s income from interest and dividends. The yield, expressed as a percentage of the fund’s net asset value, is based on income earned over the past 30 days and is annualized, or projected forward for the coming year. The index yield is based on the current annualized rate of income provided by securities in the index.
27
The People Who Govern Your Fund
The trustees of your mutual fund are there to see that the fund is operated and managed in your best interests since, as a shareholder, you are a part owner of the fund. Your fund’s trustees also serve on the board of directors of The Vanguard Group, Inc., which is owned by the Vanguard funds and provides services to them on an at-cost basis.
A majority of Vanguard’s board members are independent, meaning that they have no affiliation with Vanguard or the funds they oversee, apart from the sizable personal investments they have made as private individuals.
Our independent board members bring distinguished backgrounds in business, academia, and public service to their task of working with Vanguard officers to establish the policies and oversee the activities of the funds. Among board members’ responsibilities are selecting investment advisors for the funds; monitoring fund operations, performance, and costs; reviewing contracts; nominating and selecting new trustees/directors; and electing Vanguard officers.
Each trustee serves a fund until its termination; or until the trustee’s retirement, resignation, or death; or otherwise as specified in the fund’s organizational documents. Any trustee may be removed at a shareholders’ meeting by a vote representing two-thirds of the net asset value of all shares of the fund together with shares of other Vanguard funds organized within the same trust. The table on these two pages shows information for each trustee and executive officer of the fund. The mailing address of the trustees and officers is P.O. Box 876, Valley Forge, PA 19482.
Chairman of the Board, Chief Executive Officer, and Trustee |
| |
John J. Brennan1 | |
Born 1954 | Principal Occupation(s) During the Past Five Years: Chairman of the Board, Chief |
Trustee since May 1987; | Executive Officer, and Director/Trustee of The Vanguard Group, Inc., and of each |
Chairman of the Board and | of the investment companies served by The Vanguard Group. |
Chief Executive Officer | |
142 Vanguard Funds Overseen |
| |
Independent Trustees | |
| |
Charles D. Ellis | |
Born 1937 | Principal Occupation(s) During the Past Five Years: Applecore Partners (pro bono ventures |
Trustee since January 2001 | in education); Senior Advisor to Greenwich Associates (international business strategy |
142 Vanguard Funds Overseen | consulting); Successor Trustee of Yale University; Overseer of the Stern School of Business |
| at New York University; Trustee of the Whitehead Institute for Biomedical Research. |
| |
Rajiv L. Gupta | |
Born 1945 | Principal Occupation(s) During the Past Five Years: Chairman and Chief Executive Officer |
Trustee since December 20012 | of Rohm and Haas Co. (chemicals); Board Member of the American Chemistry Council; |
142 Vanguard Funds Overseen | Director of Tyco International, Ltd. (diversified manufacturing and services) (since 2005); |
| Trustee of Drexel University and of the Chemical Heritage Foundation. |
| |
Amy Gutmann | |
Born 1949 | Principal Occupation(s) During the Past Five Years: President of the University of |
Trustee since June 2006 | Pennsylvania since 2004; Professor in the School of Arts and Sciences, Annenberg School |
142 Vanguard Funds Overseen | for Communication, and Graduate School of Education of the University of Pennsylvania |
| since 2004; Provost (2001–2004) and Laurance S. Rockefeller Professor of Politics and the |
| University Center for Human Values (1990–2004), Princeton University; Director of Carnegie |
| Corporation of New York and of Philadelphia 2016 (since 2005) and of Schuylkill River |
| Development Corporation and Greater Philadelphia Chamber of Commerce (since 2004). |
JoAnn Heffernan Heisen | |
Born 1950 | Principal Occupation(s) During the Past Five Years: Corporate Vice President and Chief |
Trustee since July 1998 | Global Diversity Officer (since January 2006), Vice President and Chief Information |
142 Vanguard Funds Overseen | Officer (1997–2005), and Member of the Executive Committee of Johnson & Johnson |
| (pharmaceuticals/consumer products); Director of the University Medical Center at |
| Princeton and Women’s Research and Education Institute. |
| |
André F. Perold | |
Born 1952 | Principal Occupation(s) During the Past Five Years: George Gund Professor of Finance and |
Trustee since December 2004 | Banking, Harvard Business School (since 2000); Senior Associate Dean, Director of Faculty |
142 Vanguard Funds Overseen | Recruiting, and Chair of Finance Faculty, Harvard Business School; Director and Chairman |
| of UNX, Inc. (equities trading firm) (since 2003); Director of registered investment |
| companies advised by Merrill Lynch Investment Managers and affiliates (1985–2004), |
| Genbel Securities Limited (South African financial services firm) (1999–2003), Gensec |
| Bank (1999–2003), Sanlam, Ltd. (South African insurance company) (2001–2003), and |
| Stockback, Inc. (credit card firm) (2000–2002). |
| |
Alfred M. Rankin, Jr. | |
Born 1941 | Principal Occupation(s) During the Past Five Years: Chairman, President, Chief Executive |
Trustee since January 1993 | Officer, and Director of NACCO Industries, Inc. (forklift trucks/housewares/ lignite); |
142 Vanguard Funds Overseen | Director of Goodrich Corporation (industrial products/aircraft systems and services). |
| |
J. Lawrence Wilson | |
Born 1936 | Principal Occupation(s) During the Past Five Years: Retired Chairman and Chief Executive |
Trustee since April 1985 | Officer of Rohm and Haas Co. (chemicals); Director of Cummins Inc. (diesel engines), |
142 Vanguard Funds Overseen | MeadWestvaco Corp. (packaging products), and AmerisourceBergen Corp. (pharmaceutical |
| distribution); Trustee of Vanderbilt University and of Culver Educational Foundation. |
| |
Executive Officers1 | |
| |
Heidi Stam | |
Born 1956 | Principal Occupation(s) During the Past Five Years: Principal of The Vanguard Group, Inc., |
Secretary since July 2005 | since November 1997; General Counsel of The Vanguard Group since July 2005; |
142 Vanguard Funds Overseen | Secretary of The Vanguard Group and of each of the investment companies served |
| by The Vanguard Group since July 2005. |
| |
Thomas J. Higgins | |
Born 1957 | Principal Occupation(s) During the Past Five Years: Principal of The Vanguard Group, Inc.; |
Treasurer since July 1998 | Treasurer of each of the investment companies served by The Vanguard Group. |
142 Vanguard Funds Overseen | |
| |
Vanguard Senior Management Team |
| |
R. Gregory Barton | Kathleen C. Gubanich | Michael S. Miller |
Mortimer J. Buckley | Paul A. Heller | Ralph K. Packard |
James H. Gately | F. William McNabb, III | George U. Sauter |
| |
Founder | |
| |
John C. Bogle | |
Chairman and Chief Executive Officer, 1974–1996 |
1 Officers of the funds are “interested persons” as defined in the Investment Company Act of 1940.
2 December 2002 for Vanguard Equity Income Fund, Vanguard Growth Equity Fund, the Vanguard Municipal Bond Funds, and the Vanguard State Tax-Exempt Funds.
More information about the trustees is in the Statement of Additional Information, available from The Vanguard Group.
| 
|
| P.O. Box 2600 |
| Valley Forge, PA 19482-2600 |
Connect with Vanguard™ > www.vanguard.com
Fund Information > 800-662-7447 | Vanguard, Admiral, Connect with Vanguard, and the ship |
| logo are trademarks of The Vanguard Group, Inc. |
Direct Investor Account Services > 800-662-2739 | |
| |
Institutional Investor Services > 800-523-1036 | All other marks are the exclusive property of their |
| respective owners. |
Text Telephone > 800-952-3335 | |
| |
| All comparative mutual fund data are from Lipper Inc. |
| or Morningstar, Inc., unless otherwise noted. |
| |
| |
| You can obtain a free copy of Vanguard’s proxy voting |
This material may be used in conjunction | guidelines by visiting our website, www.vanguard.com, |
with the offering of shares of any Vanguard | and searching for “proxy voting guidelines,” or by calling |
fund only if preceded or accompanied by | Vanguard at 800-662-2739. They are also available from |
the fund’s current prospectus. | the SEC’s website, www.sec.gov. In addition, you may |
| obtain a free report on how your fund voted the proxies for |
| securities it owned during the 12 months ended June 30. |
| To get the report, visit either www.vanguard.com |
| or www.sec.gov. |
| |
| You can review and copy information about your fund |
| at the SEC’s Public Reference Room in Washington, D.C. |
| To find out more about this public service, call the SEC |
| at 202-551-8090. Information about your fund is also |
| available on the SEC’s website, and you can receive |
| copies of this information, for a fee, by sending a |
| request in either of two ways: via e-mail addressed to |
| publicinfo@sec.gov or via regular mail addressed to the |
| Public Reference Section, Securities and Exchange |
| Commission, Washington, DC 20549-0102. |
| |
| |
| |
| |
| © 2006 The Vanguard Group, Inc. |
| All rights reserved. |
| Vanguard Marketing Corporation, Distributor. |
| |
| Q230 102006 |
Vanguard® International Growth Fund |
| |
| |
> Annual Report | |
| |
| |
| |
| |
| |
August 31, 2006 | |
| |
| |
| |
| 
|
| |
| |
| |
| |
| |
| |
| |
| |
| |
| |
| |
| |
> Vanguard International Growth Fund’s Investor Shares posted a fiscal-year return of 24.8%. The fund’s result surpassed both that of its primary benchmark and the average return of its peers.
> The ongoing weakness of the dollar improved returns from foreign markets for U.S.-based investors.
> Strong stock selection, notably in financials and industrials, contributed to the fund’s success, as did its holdings in emerging markets.
Contents | |
| |
Your Fund’s Total Returns | 1 |
Chairman’s Letter | 2 |
Advisors’ Report | 7 |
Fund Profile | 10 |
Performance Summary | 12 |
Financial Statements | 14 |
Your Fund’s After-Tax Returns | 28 |
About Your Fund’s Expenses | 29 |
Glossary | 31 |
Please note: The opinions expressed in this report are just that—informed opinions. They should not be considered promises or advice. Also, please keep in mind that the information and opinions cover the period through the date on the cover of this report. Of course, the risks of investing in your fund are spelled out in the prospectus.
Your Fund’s Total Returns
Fiscal Year Ended August 31, 2006 | |
| Total |
| Return |
Vanguard International Growth Fund | |
Investor Shares | 24.8% |
Admiral™ Shares1 | 25.0 |
MSCI EAFE Index | 24.3 |
Average International Fund2 | 22.3 |
MSCI All Country World Index ex USA | 25.4 |
Your Fund’s Performance at a Glance
August 31, 2005–August 31, 2006 |
|---|
| Distributions Per Share
|
|---|
| Starting
Share Price | Ending
Share Price | Income
Dividends | Capital
Gains |
|---|
|
| Vanguard International Growth Fund | | | | |
|
| Investor Shares | $19.83 | $23.97 | $0.370 | $0.315 |
|
| Admiral Shares | 63.15 | 76.36 | 1.288 | 1.002 |
|
1 | A lower-cost class of shares available to many longtime shareholders and to those with significant investments in the fund. |
2 | Derived from data provided by Lipper Inc. |
1

Chairman’s Letter
Dear Shareholder,
The Investor Shares of Vanguard International Growth Fund posted a return of nearly 25% for the fiscal year ended August 31, 2006. The fund’s result surpassed that of its unmanaged benchmark index, the Morgan Stanley Capital International Europe, Australasia, Far East (MSCI EAFE) Index. It also surpassed the average return of its international-fund peers.
For those who invest in the fund through a taxable account, page 28 shows after-tax returns. We expect the fund to make year-end distributions from net capital gains totaling about $1.60 per Investor Share and $5.10 per Admiral Share.
Gains in U.S. stocks were trumped by advances in international stocks
The broad U.S. stock market gained 8.8% during the fiscal year, with small-capitalization stocks slightly outperforming their large-cap counterparts. As has been the case for the past several years, returns from international equities continued to outshine those of domestic stocks. The MSCI All Country World Index ex USA returned 25.4%. Stocks in Japan, a market that has endured difficulties for more than 15 years, provided particularly noteworthy results. A weak dollar boosted returns for U.S.-based investors when international gains were converted back into U.S. dollars.
Rising interest rates dampened bond returns
At its August 8, 2006, meeting, the Federal Reserve Board left its target for the federal funds rate unchanged, at
2
5.25%. This brought at least a temporary halt to the Fed’s two-year inflation-fighting campaign, which had been marked by 17 consecutive rate hikes.
The broad market for taxable U.S. bonds finished the one-year period with a modest return of 1.7%. Municipal bonds fared somewhat better. The yield curve remained essentially flat, with a very small difference between the yields of 3-month and 30-year U.S. Treasury issues, although yields rose modestly at both ends of the maturity spectrum.
Strong international markets yielded excellent results
Global economic growth over the fiscal year powered the International Growth Fund’s performance. The fund enjoyed solid double-digit returns from nine of the ten industry sectors in which it invested; the lone exception was its small position in telecommunication services, which produced a slight loss.
The fund’s financials and industrials holdings were the leading contributors to its success over the period. In financials, the advisors, Schroder Investment Management North America and Baillie Gifford Overseas, identified investment opportunities in numerous countries, among them France, Brazil, Germany, and Ireland. A top-performing holding was Germany’s Deutsche Bank. The fund’s industrials stocks also fared very well, owing to strong capital expenditures globally, including investments in machinery and commercial services. South Korea’s Daewoo Shipbuilding and East Japan Railway were leaders in this sector.
Market Barometer | | | |
| | Average Annual Total Returns |
| | Periods Ended August 31, 2006 |
| One Year | Three Years | Five Years |
Stocks | | | |
MSCI All Country World Index ex USA (International) | 25.4% | 25.0% | 13.8% |
Russell 1000 Index (Large-caps) | 8.7 | 11.5 | 5.3 |
Russell 2000 Index (Small-caps) | 9.4 | 14.4 | 10.3 |
Dow Jones Wilshire 5000 Index (Entire market) | 8.8 | 12.0 | 6.1 |
| | | |
| | | |
Bonds | | | |
Lehman Aggregate Bond Index (Broad taxable market) | 1.7% | 4.0% | 4.9% |
Lehman Municipal Bond Index | 3.0 | 5.1 | 5.0 |
Citigroup 3-Month Treasury Bill Index | 4.3 | 2.5 | 2.2 |
| | | |
| | | |
CPI | | | |
Consumer Price Index | 3.8% | 3.4% | 2.8% |
3
As has been the case over the past few years, energy-related stocks boosted the fund’s performance. The advisors overweighted the sector, and several of the fund’s holdings, including British company BG and Brazil’s Petróleo Brasileiro, provided outstanding returns.
Although the advisors are concerned primarily with individual stocks and sectors, some of their country and regional allocations proved beneficial, particularly their commitment to emerging markets. Among the several developing countries in which fund holdings performed very well were South Korea, Indonesia, and Brazil. The fund’s benchmark does not include emerging markets, which have been among the best-performing international segments in the past few years. To fund their positions in emerging markets, the advisors underweighted stocks in both Europe and the Pacific region.
For more on your fund’s performance and the factors that influenced its advisors over the course of the year, see the Advisors’ Report on page 7.
Long-term results are a credit to the advisors’ management skills
The strength of international markets—most notably emerging markets—has been even more noteworthy than the resurgence of the U.S. equity market over the past few years. This period stands in contrast to the late 1990s, when international markets provided returns that were respectable, but far less stellar than those of surging U.S. stocks.
Total Returns | | |
Ten Years Ended August 31, 2006 | | |
| Average | Final Value of a $10,000 |
| Annual Return | Initial Investment |
International Growth Fund Investor Shares | 7.7% | $20,993 |
MSCI EAFE Index | 7.1 | 19,824 |
Average International Fund | 7.0 | 19,626 |
MSCI All Country World Index ex USA | 7.9 | 21,332 |
4
The International Growth Fund’s ten-year performance has been very competitive when pitted against the results for its unmanaged benchmark and its peer group. The fund’s average annual gain of 7.7% over the decade ended August 31 was more than half a percentage point better than both. A hypothetical initial investment of $10,000 in the fund would have increased to $20,993 at the end of the ten years—more than double the original amount. That is $1,367 more than the $19,626 that would have resulted from an investment compounded at the peer group’s average return.
The fund’s solid results are a credit to the skills of the investment professionals who oversee it. Both Schroder Investment Management North America (which has been an advisor to the fund since its 1981 inception) and Baillie Gifford
Overseas (which joined as an advisor in 2003) have many years of experience in managing growth-oriented funds. Their time-tested investment techniques provide a diversity of thought that benefits you, the fund’s investors.
A cautionary note about the lure of international markets
The strong performance of international stocks, especially those from developing economies, has undoubtedly led many U.S. investors to send their money abroad in the past few years. Seeking diversification through an allocation to international equities makes sense, but a friendly reminder about the dangers of performance-chasing may be in order.
Investors need to resist the temptation to make short-term changes in their portfolio allocations, for international markets are
Expense Ratios1 | | | |
Your fund compared with its peer group | | | |
| | | Average |
| Investor | Admiral | International |
| Shares | Shares | Fund |
International Growth Fund | 0.55% | 0.35% | 1.65% |
1 | Fund expense ratios reflect the fiscal year ended August 31, 2006. Peer-group expense ratio is derived from data provided by Lipper Inc. and captures information through year-end 2005. |
5
prone to risks—currency, political, and geographic—that do not affect the U.S. market. Vanguard typically counsels that your commitment to international stocks represent no more than 20% of your total stock allocation. This allows you to benefit from the rewards of the international marketplace, while reducing the likelihood of being overexposed to risk. As part of your portfolio, the International Growth Fund can offer you a chance to take part in the innovation and progress of companies in nations around the world.
Thank you for your ongoing confidence in Vanguard.
Sincerely,

John J. Brennan
Chairman and Chief Executive Officer
September 14, 2006
6
Advisors’ Report
During the fiscal year ended
August 31, 2006, Vanguard International Growth Fund returned roughly 25%. This performance reflects the combined efforts of your fund’s two independent advisors. The use of more than one advisor provides exposure to distinct, yet complementary, investment approaches, enhancing the fund’s diversification. The advisors, the percentage of fund assets each manages, and a brief description of their investment strategies are presented in the table on page 8. Each advisor has also prepared a description of the investment environment that existed during the 2006 fiscal year and of the portfolio’s positioning.
Schroder Investment Management
North America
Portfolio Managers:
Virginie Maisonneuve, CFA,
Executive Director
Matthew Dobbs, Executive Director
International equity markets performed well in the fiscal year, although there was a marked shift in investor sentiment in May. Before then, markets were driven by strong optimism about global growth. They were buoyed by high corporate liquidity, relatively low real interest rates, strong growth in China, and the resilience of U.S. consumers in the face of high energy prices. The industrial cycle continued to be supported by the need for capital expenditure in formerly neglected sectors such as oil and mining, as well as by demand for infrastructure development in emerging markets.
The performance of cyclical sectors—including materials, industrials, and financials—and of Japan and emerging markets contributed to the expansion. Mergers and acquisitions also supported share prices in a range of sectors and across most regions, as companies sought alternative uses for cash that was accumulating on their balance sheets.
In May, however, signs that inflationary pressures might be building triggered a shift in risk appetite. Many investors began to fear that the Federal Reserve Board might raise interest rates higher than necessary and, in doing so, increase the probability of crimping economic growth in the United States, which would in turn threaten growth around the world. Share prices were sent lower, especially in segments of the market that are commonly associated with higher growth and in sectors most exposed to a slowdown in the economy. From this point, the market was led by defensive sectors such as utilities, consumer staples, and health care.
We believe that global economic growth will slow over the next 12 to 18 months but do not foresee a recession, and our positioning of the portfolio could best be described as cautiously optimistic. Looking forward, we expect growth in the world’s gross domestic product to be about 3% in calendar 2007, compared with 3.7% in 2006. This anticipated slowdown would be mostly the result of a drag from the United States, where consumers are feeling the effects of the Fed’s previously steady increases in interest rates, along with decreasing property values and high
7
oil prices. Further interest rate increases in Japan and Europe will provide additional headwinds to growth, while the potential for continued tension in the Middle East will add volatility.
Strong corporate cash flows around the world are a positive factor, especially as they have not led companies to massively expand their production capacity, but instead have facilitated merger-and-acquisition activity. In addition, in the United States, the economic impact of a slowing housing market might increase the possibility of rising unemployment and, as a result, lead to the end of interest rate increases and provide some additional relief. These factors should serve as tailwinds to the global economy.
Within this environment, we have maintained an overweight exposure to areas of growth through our holdings in emerging markets (such as China Resources Enterprise and Satyam Computer Services), industrials (including Schneider Electric and East Japan Railway), and energy (such as Petróleo Brasileiro, BG, and Suncor Energy). At the same time, we are maintaining an overweighting in the defensively biased U.K. market and in consumer staples stocks (including Tesco, Alliance Boots, Groupe Danone, and L’Oreal). Our emerging markets holdings are being funded primarily through underweightings in continental Europe and the Pacific region.
We believe market leadership has shifted to favor quality growth investing. Equity
Vanguard International Growth Fund Investment Advisors |
| | | | |
Fund Assets Managed | | |
Investment Advisor | % | $ Million | | Investment Strategy |
Schroder Investment | 65 | 9,138 | | Equity analysts in 11 countries and an |
Management North America Inc. | | | | international team of global sector and regional |
| | | | specialists help to identify reasonably priced |
| | | | companies with strong growth prospects and |
| | | | a sustainable competitive advantage. |
Baillie Gifford Overseas Ltd. | 33 | 4,584 | | The advisor seeks stocks that can |
| | | | generate above-average growth in earnings |
| | | | and cash flow, producing a bottom-up, stock- |
| | | | driven approach to country and asset allocation. |
| | | | An in-depth view on each company is |
| | | | measured against the consensus view, |
| | | | leading to discrepancies and potential |
| | | | opportunities to add value. |
Cash Investments1 | 2 | 250 | | — |
1 | These short-term reserves are invested by Vanguard in equity index products to simulate investment in stocks. Each advisor may also maintain a modest cash position. |
8
valuations are relatively attractive, and in this context, we continue to focus on finding attractively priced quality growth companies. We continue to seek price anomalies and compelling investment opportunities as the markets adjust to an environment of slower growth.
Baillie Gifford Overseas Ltd.
Portfolio Manager:
James K. Anderson, Deputy Chief
Investment Officer
The fund’s fiscal year was a joyous time for investors. World markets performed very well, and the benefits were fairly evenly spread; all of the major geographic regions produced returns above 20%. The only serious stumbling block was the telecommunications industry, where the ability of technology to vastly increase the amount of data and messages that can be transmitted had a painful effect on prices.
On the positive side, capital goods and raw materials stocks did especially well earlier in the period. However, steadier sectors such as real estate and utilities have caught up more recently, reflecting widespread profitability. This is something that merits careful attention: Things have rarely, if ever, gotten better than this. Our low exposure to financial businesses reflects our concern that returns in that industry are probably unsustainably high.
Our portfolio still has a heavy industrials bias; we are overweighted in capital goods, machinery, and semiconductors and software. At the same time, we are very underweighted in banks, insurance, utilities, telecommunications, and pharmaceuticals. Furthermore, we often prefer companies in emerging markets, especially in the energy sector.
These general characteristics have arisen from our analysis of individual companies and have not changed very much over the past 12 months. Our exposure to telecommunications stocks fell further, thanks to the sales of Vodafone and MTS, while our technology exposure grew with our purchases of Samsung, Taiwan Semiconductor, and Rakuten, and our addition to our SAP holdings. While these investments have yet to bear fruit, we think they were made at attractive valuations.
We have increased our exposure to emerging markets by making forays into India and Taiwan, and by adding to our investments in Russia and South Korea. Emerging markets now account for more than 19% of assets in our portfolio.
In recent months, investors have become concerned about inflation and growth. It seems misguided to worry about both, and we think their fears are probably excessive. The current high levels of corporate profitability do make us nervous, but we think that much of the improvement arises from changes in the global economy—the rapid development of some of the world’s largest countries, a huge supply of new labor, and the opening of new consumer markets. We believe this process has much further to go.
9
Fund Profile
As of August 31, 2006
Portfolio Characteristics | | |
| | Comparative | Broad |
| Fund | Index1 | Index2 |
Number of Stocks | 141 | 1,167 | 2,122 |
Turnover Rate | 45% | — | — |
Expense Ratio | | — | — |
Investor Shares | 0.55% | | |
Admiral Shares | 0.35% | | |
Short-Term Reserves | 2% | — | — |
Sector Diversification (% of portfolio) | |
| | Comparative | Broad |
| Fund | Index1 | Index2 |
Consumer Discretionary | 11% | 11% | 11% |
Consumer Staples | 11 | 8 | 8 |
Energy | 10 | 9 | 10 |
Financials | 26 | 27 | 27 |
Health Care | 7 | 9 | 9 |
Industrials | 15 | 10 | 10 |
Information Technology | 8 | 9 | 9 |
Materials | 4 | 7 | 7 |
Telecommunication | | | |
Services | 4 | 5 | 5 |
Utilities | 2 | 5 | 4 |
Short-Term Reserves | 2% | — | — |
Volatility Measures3 | |
| Fund Versus | Fund Versus |
| Comparative Index1 | Broad Index2 |
R-Squared | 0.97 | 0.97 |
Beta | 1.01 | 0.95 |
Ten Largest Holdings4 (% of total net assets) |
| | |
Royal Bank of | | |
Scotland Group PLC | diversified banks | 2.4% |
Petróleo Brasileiro ADR | integrated | |
| oil and gas | 2.1 |
Tesco PLC | food retail | 2.0 |
BG Group PLC | integrated | |
| oil and gas | 1.9 |
Rio Tinto PLC | diversified | |
| metals and mining | 1.8 |
Roche Holdings AG | pharmaceuticals | 1.8 |
SAP AG | application software | 1.7 |
Deutsche Bank AG | diversified | |
| capital markets | 1.7 |
Societe Generale Class A | diversified banks | 1.6 |
Mitsubishi UFJ | | |
Financial Group | diversified banks | 1.6 |
Top Ten | | 18.6% |
Allocation by Region (% of portfolio)
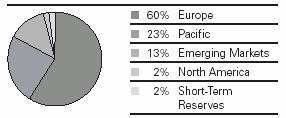
2 | MSCI All Country World Index ex USA. |
3 | For an explanation of R-squared, beta, and other terms used here, see the Glossary on page 31. |
4 “Ten Largest Holdings” excludes any temporary cash investments and equity index products.
10
Country Diversification (% of portfolio) | |
| | Comparative | Broad |
| Fund1 | Index2 | Index3 |
Europe | | | |
United Kingdom | 26% | 24% | 20% |
France | 11 | 10 | 8 |
Switzerland | 6 | 7 | 6 |
Germany | 6 | 7 | 6 |
Sweden | 3 | 2 | 2 |
Ireland | 2 | 1 | 1 |
Spain | 2 | 4 | 3 |
Netherlands | 1 | 3 | 3 |
Italy | 1 | 4 | 3 |
Belgium | 1 | 1 | 1 |
Greece | 1 | 1 | 1 |
Austria | 0 | 1 | 0 |
Denmark | 0 | 1 | 1 |
Finland | 0 | 1 | 1 |
Norway | 0 | 1 | 1 |
Subtotal | 60% | 68% | 57% |
Pacific | | | |
Japan | 19% | 24% | 19% |
Australia | 2 | 5 | 4 |
Singapore | 1 | 1 | 1 |
Hong Kong | 1 | 2 | 1 |
Subtotal | 23% | 32% | 25% |
Emerging Markets | | | |
Brazil | 4% | — | 2% |
South Korea | 4 | — | 2 |
India | 1 | — | 1 |
China | 1 | — | 1 |
Russia | 1 | — | 1 |
Taiwan | 1 | — | 2 |
Indonesia | 1 | — | 0 |
Mexico | 0 | — | 1 |
South Africa | 0 | — | 1 |
Subtotal | 13% | — | 11% |
North America | | | |
Canada | 2% | — | 7% |
Short-Term Reserves | 2% | — | — |
Total | 100% | 100% | 100% |
1 | Country percentages exclude currency contracts held by the fund. |
3 | MSCI All Country World Index ex USA. |
11
Performance Summary
All of the returns in this report represent past performance, which is not a guarantee of future results that may be achieved by the fund. (Current performance may be lower or higher than the performance data cited. For performance data current to the most recent month-end, visit our website at www.vanguard.com.) Note, too, that both investment returns and principal value can fluctuate widely, so an investor’s shares, when sold, could be worth more or less than their original cost. The returns shown do not reflect taxes that a shareholder would pay on fund distributions or on the sale of fund shares.
Cumulative Performance: August 31, 1996–August 31, 2006
Initial Investment of $10,000
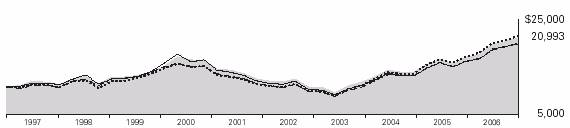
| | | |
| | | | |
| Average Annual Total Returns | Final Value |
| Periods Ended August 31, 2006 | of a $10,000 |
| One Year | Five Years | Ten Years | Investment |
International Growth Fund Investor Shares1 | 24.79% | 11.36% | 7.70% | $20,993 |
MSCI All Country World Index ex USA | 25.44 | 13.79 | 7.87 | 21,332 |
MSCI EAFE Index | 24.28 | 11.82 | 7.08 | 19,824 |
Average International Fund2 | 22.33 | 10.57 | 6.98 | 19,626 |
| One Year | Five Years | Since
Inception3 | Final Value
of a $100,000
Investment |
|---|
|
| International Growth Fund Admiral Shares1 | 25.03% | 11.56% | 11.01% | $169,431 |
|
| MSCI All Country World Index ex USA | 25.44 | 13.79 | 13.28 | 187,681 |
|
| MSCI EAFE Index | 24.28 | 11.82 | 11.35 | 172,113 |
|
1 | Total returns do not reflect the 2% fee assessed on redemptions of shares purchased on or after June 27, 2003, and held for less than two months. |
2 | Derived from data provided by Lipper Inc. |
Note: See Financial Highlights tables on pages 20 and 21 for dividend and capital gains information.
12
Fiscal-Year Total Returns (%): August 31, 1996–August 31, 2006
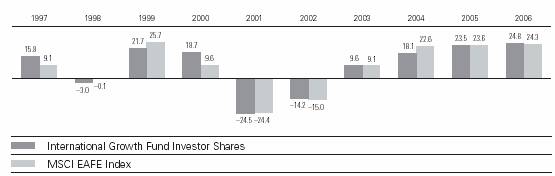
Average Annual Total Returns: Periods Ended June 30, 2006
This table presents average annual total returns through the latest calendar quarter—rather than through the end of the fiscal period. Securities and Exchange Commission rules require that we provide this information.
| Inception Date | One Year | Five Years | Ten Years |
Investor Shares1 | 9/30/1981 | 28.27% | 9.39% | 7.08% |
Admiral Shares1 | 8/13/2001 | 28.52 | 10.522 | — |
1 | Total returns do not reflect the 2% fee assessed on redemptions of shares purchased on or after June 27, 2003, and held for less than two months. |
13
Financial Statements
Statement of Net Assets
As of August 31, 2006
The fund provides a complete list of its holdings four times in each fiscal year, at the quarter-ends. For the second and fourth fiscal quarters, the lists appear in the fund’s semiannual and annual reports to shareholders. For the first and third fiscal quarters, the fund files the lists with the Securities and Exchange Commission on Form N-Q. Shareholders can look up the fund’s Forms N-Q on the SEC’s website at www.sec.gov. Forms N-Q may also be reviewed and copied at the SEC’s Public Reference Room (see the back cover of this report for further information).
| | Market |
| | Value• |
| Shares | ($000) |
Common Stocks (96.1%)1 | | |
Australia (2.4%) | | |
^Macquarie | | |
Infrastructure Group | 31,397,896 | 75,296 |
BHP Billiton Ltd. | 3,094,100 | 65,187 |
^Woolworths Ltd. | 3,912,800 | 61,775 |
^Woodside Petroleum Ltd. | 1,536,000 | 49,423 |
^Macquarie Bank Ltd. | 546,000 | 26,940 |
^Foster’s Group Ltd. | 5,900,000 | 26,789 |
^James Hardie | | |
Industries NV | 4,405,000 | 22,490 |
*^ Sydney Roads Group | 10,465,965 | 8,272 |
| | 336,172 |
Belgium (0.8%) | | |
KBC Bank & | | |
Verzekerings Holding | 1,000,000 | 107,609 |
| | |
Brazil (3.9%) | | |
Petróleo Brasileiro ADR | 1,947,000 | 174,568 |
Petróleo Brasileiro | | |
Series A ADR | 1,493,200 | 120,382 |
Unibanco-Uniao de | | |
Bancos Brasileiros SA | 13,570,000 | 98,893 |
Banco Itau Holding | | |
Financeira SA ADR | 3,108,600 | 94,626 |
Companhia Vale do Rio | | |
Doce ADR | 3,056,400 | 55,015 |
| | 543,484 |
Canada (1.4%) | | |
Suncor Energy, Inc. | 1,601,858 | 123,631 |
^Nova Chemicals Corp. | 2,368,000 | 75,217 |
| | 198,848 |
China (1.0%) | | |
^China Resources | | |
Enterprise Ltd. | 32,584,000 | 74,087 |
^CNOOC Ltd. | 44,035,000 | 38,401 |
^China Mobile | | |
(Hong Kong) Ltd. | 4,030,000 | 27,102 |
| | 139,590 |
France (10.5%) | | |
^Societe Generale Class A | 1,399,000 | 225,775 |
^Suez SA | 4,928,400 | 210,838 |
L’Oreal SA | 1,741,400 | 182,186 |
Total SA | 2,166,000 | 146,140 |
Essilor International SA | 1,250,000 | 129,315 |
Schneider Electric SA | 1,099,000 | 117,128 |
^Groupe Danone | 846,000 | 116,316 |
AXA | 2,772,222 | 103,021 |
^Sanofi-Aventis | 622,500 | 55,860 |
^Renault SA | 471,000 | 54,836 |
^Pernod Ricard SA | 220,850 | 48,139 |
^Imerys SA | 601,000 | 45,713 |
^Veolia Environnement | 470,000 | 26,341 |
| | 1,461,608 |
Germany (5.8%) | | |
SAP AG | 1,257,400 | 239,999 |
Deutsche Bank AG | 2,030,000 | 232,003 |
Siemens AG | 964,802 | 81,812 |
Porsche AG | 56,000 | 57,354 |
^Bayer AG | 1,123,213 | 55,696 |
^Celesio AG | 1,002,000 | 50,743 |
Bayerische Motoren | | |
Werke AG | 884,600 | 45,799 |
^Adidas AG | 822,840 | 39,209 |
| | 802,615 |
Greece (0.8%) | | |
National Bank of | | |
Greece SA | 2,556,335 | 105,501 |
| | |
Hong Kong (0.9%) | | |
Jardine Matheson | | |
Holdings Ltd. | 2,708,400 | 47,669 |
Esprit Holdings Ltd. | 5,500,000 | 45,669 |
^Hong Kong Exchanges & | | |
Clearing Ltd. | 4,790,000 | 32,480 |
| | 125,818 |
14
| | | Market |
| | | Value• |
| | Shares | ($000) |
India (1.3%) | | |
*2 | Satyam Computer | | |
| Services Ltd. | | |
| Warrants Exp. 10/13/10 | 3,956,000 | 69,535 |
| Infosys Technologies Ltd. | | |
| ADR | 1,392,000 | 62,431 |
*2 | State Bank of India | | |
| Warrants Exp. 1/28/09 | 2,711,000 | 54,833 |
| | | 186,799 |
Indonesia (0.5%) | | |
| PT Telekomunikasi | | |
| Indonesia Tbk | 40,746,000 | 35,492 |
| PT Indonesian | | |
| Satellite Corp. Tbk | 71,158,500 | 34,499 |
| | | 69,991 |
Ireland (2.4%) | | |
| Anglo Irish Bank Corp. | | |
| PLC | 9,124,000 | 150,718 |
| Allied Irish Banks PLC | | |
| (U.K. Shares) | 5,676,000 | 147,919 |
| Allied Irish Banks PLC | 1,311,160 | 34,210 |
| | | 332,847 |
Israel (0.3%) | | |
| Teva Pharmaceutical | | |
| Industries Ltd. | | |
| Sponsored ADR | 1,316,700 | 45,768 |
| | | |
Italy (1.3%) | | |
^San Paolo-IMI SpA | 8,401,000 | 175,934 |
| | | |
Japan (18.3%) | | |
| Mitsubishi UFJ | | |
| Financial Group | 16,273 | 220,964 |
| Orix Corp. | 714,000 | 188,684 |
| Sumitomo Mitsui | | |
| Financial Group, Inc. | 14,800 | 166,141 |
^Daikin Industries Ltd. | 5,102,300 | 155,900 |
| Mitsui & Co., Ltd. | 9,576,000 | 138,301 |
| East Japan Railway Co. | 18,648 | 137,540 |
| T & D Holdings, Inc. | 1,736,000 | 128,444 |
| Canon, Inc. | 2,346,300 | 116,670 |
^Toyota Motor Corp. | 1,871,000 | 101,207 |
| Mitsubishi Corp. | 4,514,000 | 91,462 |
* ^Jupiter Telecommunications | |
| Co., Ltd. | 122,000 | 90,449 |
| Ricoh Co. | 4,353,000 | 85,247 |
^Takashimaya Co. | 6,395,000 | 80,296 |
^ | Ebara Corp. | 19,283,000 | 76,987 |
| Hoya Corp. | 2,046,000 | 74,135 |
| Japan Tobacco, Inc. | 19,320 | 73,452 |
^Nissan Motor Co., Ltd. | 6,323,900 | 71,855 |
| Kao Corp. | 2,335,000 | 62,221 |
| Sumitomo Realty & | | |
| Development Co. | 1,862,000 | 54,634 |
^KDDI Corp. | 7,867 | 51,762 |
| ^Asahi Glass Co., Ltd. | 3,937,000 | 51,528 |
| Yamada Denki Co., Ltd. | 468,200 | 50,015 |
| Mitsui Sumitomo | | |
| Insurance Co. | 4,006,000 | 48,700 |
| Sumitomo Heavy | | |
| Industries Ltd. | 5,223,000 | 44,965 |
| SMC Corp. | 289,100 | 38,532 |
| ^Tokyu Corp. | 5,775,000 | 38,304 |
| ^Rakuten, Inc. | 79,355 | 34,250 |
| ^Nitto Denko Corp. | 431,000 | 30,882 |
| ^JTEKT Corp. | 1,547,000 | 30,732 |
| Promise Co., Ltd. | 571,000 | 25,504 |
| | | 2,559,763 |
Mexico (0.3%) | | |
| America Movil SA de | | |
| CV Series L ADR | 1,035,000 | 38,616 |
| | | |
Netherlands (1.4%) | | |
| Reed Elsevier NV | 5,292,000 | 84,960 |
| Heineken Holding NV | 1,471,074 | 58,940 |
| SBM Offshore NV | 1,912,039 | 52,331 |
| | | 196,231 |
Russia (0.8%) | | |
* | OAO Gazprom-Sponsored | | |
| ADR | 2,430,000 | 114,453 |
| | | |
Singapore (1.1%) | | |
| Singapore | | |
| Telecommunications Ltd. | 69,597,950 | 110,058 |
| Capitaland Ltd. | 14,530,000 | 43,903 |
| | | 153,961 |
South Africa (0.3%) | | |
| Sasol Ltd. | 1,213,037 | 42,164 |
| | | |
South Korea (3.5%) | | |
| Daewoo | | |
| Shipbuilding & Marine | | |
| Engineering Co., Ltd. | 5,551,120 | 171,074 |
2 | Samsung Electronics | | |
| Co., Ltd. GDR | 260,200 | 88,504 |
| Samsung Electronics | | |
| Co., Ltd. | 124,000 | 83,558 |
* | LG. Philips LCD Co., | | |
| Ltd. ADR | 3,696,000 | 73,440 |
| Hyundai Motor Co. Ltd. | 855,000 | 71,900 |
| | | 488,476 |
Spain (1.5%) | | |
| ^Iberdrola SA | 2,287,000 | 84,914 |
| ^Industria de Diseno | | |
| Textil SA | 1,744,984 | 78,573 |
| ^Banco Popular Espanol SA | 2,918,400 | 45,779 |
| | | 209,266 |
| | | | |
15
| | Market |
| | Value• |
| Shares | ($000) |
Sweden (3.4%) | | |
Atlas Copco AB A Shares | 5,994,390 | 154,931 |
^Skandinaviska Enskilda | | |
Banken AB A Shares | 5,698,086 | 147,732 |
Telefonaktiebolaget LM | | |
Ericsson AB Class B | 20,879,815 | 69,740 |
^Sandvik AB | 5,797,000 | 63,641 |
Svenska Handelsbanken | | |
AB A Shares | 1,693,670 | 44,269 |
| | 480,313 |
Switzerland (6.0%) | | |
Roche Holdings AG | 1,364,000 | 250,891 |
Novartis AG (Registered) | 3,341,708 | 190,313 |
Nestle SA (Registered) | 498,000 | 170,807 |
UBS AG | 1,950,436 | 110,069 |
Cie. Financiere | | |
Richemont AG | 1,476,000 | 70,031 |
Geberit AG | 43,418 | 50,432 |
| | 842,543 |
Taiwan (0.7%) | | |
Hon Hai Precision | | |
Industry Co., Ltd. | 10,134,000 | 56,988 |
Taiwan Semiconductor | | |
Manufacturing Co., Ltd. | 26,654,090 | 47,156 |
| | 104,144 |
United Kingdom (25.5%) | | |
Royal Bank of | | |
Scotland Group PLC | 9,754,400 | 330,539 |
Tesco PLC | 39,689,000 | 284,947 |
BG Group PLC | 19,827,000 | 258,991 |
Rio Tinto PLC | 5,034,000 | 253,710 |
Vodafone Group PLC | 87,753,750 | 189,991 |
Royal Dutch Shell PLC | | |
Class A | | |
(Amsterdam Shares) | 5,155,000 | 177,607 |
Barclays PLC | 12,843,000 | 160,748 |
AstraZeneca Group PLC | 2,271,516 | 147,260 |
Alliance Boots PLC | 9,903,000 | 145,239 |
Smith & Nephew PLC | 15,963,000 | 138,330 |
WPP Group PLC | 10,263,000 | 124,939 |
Signet Group PLC | 55,440,000 | 112,040 |
Standard Chartered PLC | 4,453,000 | 111,420 |
Rolls-Royce Group PLC | 13,225,000 | 109,776 |
SABMiller PLC | 5,268,561 | 103,687 |
Smiths Group PLC | 6,022,000 | 98,500 |
Burberry Group PLC | 10,742,000 | 97,791 |
Capita Group PLC | 9,186,400 | 95,608 |
Prudential PLC | 8,272,467 | 92,637 |
GUS PLC | 4,602,639 | 85,416 |
Reckitt Benckiser PLC | 1,880,000 | 77,981 |
Brambles Industries PLC | 8,283,000 | 72,526 |
Carnival PLC | 1,521,830 | 65,300 |
Wolseley PLC | 2,523,000 | 54,889 |
Diageo PLC | 3,042,334 | 54,180 |
Meggitt PLC | 8,072,000 | 48,228 |
| Imperial Tobacco | | |
| Group PLC | 1,360,000 | 46,835 |
* | Cairn Energy PLC | 756,558 | 30,664 |
| | | 3,569,779 |
Total Common Stocks | | |
(Cost $10,181,524) | | 13,432,293 |
Temporary Cash Investments (7.7%)1 | |
Money Market Fund (7.5%) | | |
3 | Vanguard Market | | |
| Liquidity Fund, 5.293% | 460,246,965 | 460,247 |
3 | Vanguard Market | | |
| Liquidity Fund, | | |
| 5.293%—Note G | 581,180,186 | 581,180 |
| | | 1,041,427 |
| | | |
| | Face | |
| | Amount | |
| | ($000) | |
U.S. Agency Obligations (0.2%) | |
4 | Federal Home Loan Bank | | |
5 | 5.393%, 9/29/06 | 12,600 | 12,551 |
4 | Federal Home Loan Bank | | |
5 | 5.377%, 9/29/06 | 12,400 | 12,351 |
| | | 24,902 |
Total Temporary Cash Investments | |
(Cost $1,066,324) | | 1,066,329 |
Total Investments (103.8%) | | |
(Cost $11,247,848) | | 14,498,622 |
Other Assets and Liabilities (–3.8%) | |
Other Assets—Note C | | 132,412 |
Security Lending Collateral | | |
| Payable to Brokers—Note G | (581,180) |
Other Liabilities | | (77,930) |
| | | (526,698) |
Net Assets (100%) | | 13,971,924 |
16
At August 31, 2006, net assets consisted of:6 |
| Amount |
| ($000) |
Paid-in Capital | 9,538,242 |
Undistributed Net Investment Income | 228,253 |
Accumulated Net Realized Gains | 937,816 |
Unrealized Appreciation | |
Investment Securities | 3,250,774 |
Futures Contracts | 16,353 |
Foreign Currencies and | |
Forward Currency Contracts | 486 |
Net Assets | 13,971,924 |
| |
| |
Investor Shares—Net Assets | |
Applicable to 436,567,510 outstanding $.001 |
par value shares of beneficial interest | |
(unlimited authorization) | 10,466,098 |
Net Asset Value Per Share— | |
Investor Shares | $23.97 |
| |
| |
Admiral Shares—Net Assets | |
Applicable to 45,911,203 outstanding $.001 |
par value shares of beneficial interest | |
(unlimited authorization) | 3,505,826 |
Net Asset Value Per Share— | |
Admiral Shares | $76.36 |
• | See Note A in Notes to Financial Statements. |
* Non-income-producing security.
^ Part of security position is on loan to broker-dealers. See Note G in Notes to Financial Statements.
1 | The fund invests a portion of its cash reserves in equity markets through the use of index futures contracts. After giving effect to futures investments, the fund’s effective common stock and temporary cash investment positions represent 98.0% and 5.8%, respectively, of net assets. See Note E in Notes to Financial Statements. |
2 | Security exempt from registration under Rule 144A of the Securities Act of 1933. Such securities may be sold in transactions exempt from registration, normally to qualified institutional buyers. At August 31, 2006, the aggregate value of these securities was $212,872,000, representing 1.5% of net assets. |
3 | Affiliated money market fund available only to Vanguard funds and certain trusts and accounts managed by Vanguard. Rate shown is the 7-day yield. |
4 | The issuer operates under a congressional charter; its securities are neither issued nor guaranteed by the U.S. government. If needed, access to additional funding from the U.S. Treasury (beyond the issuer’s line of credit) would require congressional action. |
5 | Securities with a value of $24,902,000 have been segregated as initial margin for open futures contracts. |
6 | See Note E in Notes to Financial Statements for the tax-basis components of net assets. ADR—American Depositary Receipt. |
GDR—Global Depositary Receipt.
17
Statement of Operations
| Year Ended |
| August 31, 2006 |
| ($000) |
Investment Income | |
Income | |
Dividends1 | 347,474 |
Interest2 | 20,894 |
Security Lending | 9,306 |
Total Income | 377,674 |
Expenses | |
Investment Advisory Fees—Note B | |
Basic Fee | 16,063 |
Performance Adjustment | (1,490) |
The Vanguard Group—Note C | |
Management and Administrative | |
Investor Shares | 35,548 |
Admiral Shares | 5,294 |
Marketing and Distribution | |
Investor Shares | 1,976 |
Admiral Shares | 572 |
Custodian Fees | 3,490 |
Auditing Fees | 31 |
Shareholders’ Reports | |
Investor Shares | 281 |
Admiral Shares | 5 |
Trustees’ Fees and Expenses | 15 |
Total Expenses | 61,785 |
Expenses Paid Indirectly—Note D | (1,118) |
Net Expenses | 60,667 |
Net Investment Income | 317,007 |
Realized Net Gain (Loss) | |
Investment Securities Sold | 1,138,696 |
Futures Contracts | 50,567 |
Foreign Currencies and Forward Currency Contracts | (7,876) |
Realized Net Gain (Loss) | 1,181,387 |
Change in Unrealized Appreciation (Depreciation) | |
Investment Securities | 1,134,259 |
Futures Contracts | (1,115) |
Foreign Currencies and Forward Currency Contracts | 4,311 |
Change in Unrealized Appreciation (Depreciation) | 1,137,455 |
Net Increase (Decrease) in Net Assets Resulting from Operations | 2,635,849 |
1 | Dividends are net of foreign withholding taxes of $7,316,000. |
2 | Interest income from an affiliated company of the fund was $18,740,000. |
18
Statement of Changes in Net Assets
| Year Ended August 31, |
| 2006 | 2005 |
| ($000) | ($000) |
Increase (Decrease) in Net Assets | | |
Operations | | |
Net Investment Income | 317,007 | 181,705 |
Realized Net Gain (Loss) | 1,181,387 | 835,460 |
Change in Unrealized Appreciation (Depreciation) | 1,137,455 | 918,909 |
Net Increase (Decrease) in Net Assets Resulting from Operations | 2,635,849 | 1,936,074 |
Distributions | | |
Net Investment Income | | |
Investor Shares | (151,413) | (132,990) |
Admiral Shares | (48,917) | (26,782) |
Realized Capital Gain1 | | |
Investor Shares | (128,906) | — |
Admiral Shares | (38,055) | — |
Total Distributions | (367,291) | (159,772) |
Capital Share Transactions—Note H | | |
Investor Shares | 544,778 | (91,001) |
Admiral Shares | 795,669 | 618,224 |
Net Increase (Decrease) from Capital Share Transactions | 1,340,447 | 527,223 |
Total Increase (Decrease) | 3,609,005 | 2,303,525 |
Net Assets | | |
Beginning of Period | 10,362,919 | 8,059,394 |
End of Period2 | 13,971,924 | 10,362,919 |
1 | Includes fiscal 2006 short-term gain distributions totaling $43,463,000. Short-term gain distributions are treated as ordinary income dividends for tax purposes. |
2 | Net Assets–End of Period includes undistributed net investment income of $228,253,000 and $132,587,000. |
19
Financial Highlights
International Growth Fund Investor Shares | | | | | |
| Year Ended August 31, |
For a Share Outstanding Throughout Each Period | 2006 | 2005 | 2004 | 2003 | 2002 |
Net Asset Value, Beginning of Period | $19.83 | $16.33 | $14.01 | $12.97 | $15.41 |
Investment Operations | | | | | |
Net Investment Income | .541 | .341 | .27 | .19 | .19 |
Net Realized and Unrealized Gain (Loss) | | | | | |
on Investments | 4.284 | 3.474 | 2.26 | 1.03 | (2.35) |
Total from Investment Operations | 4.825 | 3.815 | 2.53 | 1.22 | (2.16) |
Distributions | | | | | |
Dividends from Net Investment Income | (.370) | (.315) | (.21) | (.18) | (.24) |
Distributions from Realized Capital Gains | (.315) | — | — | — | (.04) |
Total Distributions | (.685) | (.315) | (.21) | (.18) | (.28) |
Net Asset Value, End of Period | $23.97 | $19.83 | $16.33 | $14.01 | $12.97 |
| | | | | |
| | | | | |
Total Return1 | 24.79% | 23.54% | 18.14% | 9.62% | –14.20% |
| | | | | |
| | | | | |
Ratios/Supplemental Data | | | | | |
Net Assets, End of Period (Millions) | $10,466 | $8,182 | $6,797 | $5,458 | $4,930 |
Ratio of Total Expenses to Average Net Assets2 | 0.55% | 0.60% | 0.63% | 0.69% | 0.67% |
Ratio of Net Investment Income to | | | | | |
Average Net Assets | 2.52% | 1.89% | 1.69% | 1.57% | 1.28% |
Portfolio Turnover Rate | 45% | 48% | 45% | 59% | 40% |
1 | Total returns do not reflect the 2% fee assessed on redemptions of shares purchased on or after June 27, 2003, and held for less than two months. |
2 | Includes performance-based investment advisory fee increases (decreases) of (0.01%), (0.01%), 0.00%, 0.01%, and 0.02%. |
20
International Growth Fund Admiral Shares | | | | | |
| Year Ended August 31, |
For a Share Outstanding Throughout Each Period | 2006 | 2005 | 2004 | 2003 | 2002 |
Net Asset Value, Beginning of Period | $63.15 | $51.96 | $44.57 | $41.27 | $49.02 |
Investment Operations | | | | | |
Net Investment Income | 1.861 | 1.222 | .93 | .681 | .677 |
Net Realized and Unrealized Gain (Loss) | | | | | |
on Investments | 13.639 | 11.063 | 7.21 | 3.264 | (7.502) |
Total from Investment Operations | 15.500 | 12.285 | 8.14 | 3.945 | (6.825) |
Distributions | | | | | |
Dividends from Net Investment Income | (1.288) | (1.095) | (.75) | (.645) | (.795) |
Distributions from Realized Capital Gains | (1.002) | — | — | — | (.130) |
Total Distributions | (2.290) | (1.095) | (.75) | (.645) | (.925) |
Net Asset Value, End of Period | $76.36 | $63.15 | $51.96 | $44.57 | $41.27 |
| | | | | |
| | | | | |
Total Return1 | 25.03% | 23.84% | 18.36% | 9.80% | –14.12% |
| | | | | |
| | | | | |
Ratios/Supplemental Data | | | | | |
Net Assets, End of Period (Millions) | $3,506 | $2,181 | $1,262 | $1,044 | $895 |
Ratio of Total Expenses to | | | | | |
Average Net Assets2 | 0.35% | 0.40% | 0.45% | 0.51% | 0.54% |
Ratio of Net Investment Income to | | | | | |
Average Net Assets | 2.72% | 2.07% | 1.86% | 1.76% | 1.53% |
Portfolio Turnover Rate | 45% | 48% | 45% | 59% | 40% |
1 | Total returns do not reflect the 2% fee assessed on redemptions of shares purchased on or after June 27, 2003, and held for less than two months. |
2 | Includes performance-based investment advisory fee increases (decreases) of (0.01%), (0.01%), 0.00%, 0.01%, and 0.02%. See accompanying Notes, which are an integral part of the Financial Statements. |
21
Notes to Financial Statements
Vanguard International Growth Fund is registered under the Investment Company Act of 1940 as an open-end investment company, or mutual fund. The fund files reports with the SEC under the company name Vanguard World Funds. The fund invests in securities of foreign issuers, which may subject it to investment risks not normally associated with investing in securities of United States corporations. The fund offers two classes of shares, Investor Shares and Admiral Shares. Investor Shares are available to any investor who meets the fund’s minimum purchase requirements. Admiral Shares are designed for investors who meet certain administrative, servicing, tenure, and account-size criteria.
A. The following significant accounting policies conform to generally accepted accounting principles for U.S. mutual funds. The fund consistently follows such policies in preparing its financial statements.
1. Security Valuation: Securities are valued as of the close of trading on the New York Stock Exchange (generally 4:00 p.m. Eastern time) on the valuation date. Equity securities are valued at the latest quoted sales prices or official closing prices taken from the primary market in which each security trades; such securities not traded on the valuation date are valued at the mean of the latest quoted bid and asked prices. Securities for which market quotations are not readily available, or whose values have been affected by events occurring before the fund’s pricing time but after the close of the securities’ primary markets, are valued at their fair values calculated according to procedures adopted by the board of trustees. These procedures include obtaining quotations from an independent pricing service, monitoring news to identify significant market- or security-specific events, and evaluating changes in the values of foreign market proxies (for example, ADRs, futures contracts, or exchange-traded funds), between the time the foreign markets close and the fund’s pricing time. When fair-value pricing is employed, the prices of securities used by a fund to calculate its net asset value may differ from quoted or published prices for the same securities. Investments in Vanguard Market Liquidity Fund are valued at that fund’s net asset value. Temporary cash investments acquired over 60 days to maturity are valued using the latest bid prices or using valuations based on a matrix system (which considers such factors as security prices, yields, maturities, and ratings), both as furnished by independent pricing services. Other temporary cash investments are valued at amortized cost, which approximates market value.
2. Foreign Currency: Securities and other assets and liabilities denominated in foreign currencies are translated into U.S. dollars at the exchange rates on the valuation date as employed by Morgan Stanley Capital International (MSCI) in the calculation of its indexes. As part of the fund’s fair value procedures, exchange rates may be adjusted if they change significantly before the fund’s pricing time but after the time at which the MSCI rates are determined (generally 11:00 a.m., Eastern time).
Realized gains (losses) and unrealized appreciation (depreciation) on investment securities include the effects of changes in exchange rates since the securities were purchased, combined with the effects of changes in security prices. Fluctuations in the value of other assets and liabilities resulting from changes in exchange rates are recorded as unrealized foreign currency gains (losses) until the asset or liability is settled in cash, when they are recorded as realized foreign currency gains (losses).
3. Futures and Forward Currency Contracts: The fund uses index futures contracts to a limited extent, with the objective of maintaining exposure to European and Pacific stock markets while maintaining liquidity. The fund may purchase or sell futures contracts to achieve a desired level of investment, whether to accommodate portfolio turnover or cash flows from capital share transactions. The primary risks associated with the use of futures contracts are imperfect correlation between changes in market values of stocks held by the portfolio and the prices of futures contracts, and the possibility of an illiquid market.
22
The fund also may enter into forward currency contracts to provide the appropriate currency exposure related to any open futures contracts. The fund’s risks in using these contracts include movement in the values of the foreign currencies relative to the U.S. dollar and the ability of the counterparties to fulfill their obligations under the contracts.
Futures and forward currency contracts are valued at their quoted daily settlement prices. The aggregate principal amounts of the contracts are not recorded in the Statement of Net Assets. Fluctuations in the value of the contracts are recorded in the Statement of Net Assets as an asset (liability) and in the Statement of Operations as unrealized appreciation (depreciation) until the contracts are closed, when they are recorded as realized gains (losses) on futures or forward currency contracts.
4. Federal Income Taxes: The fund intends to continue to qualify as a regulated investment company and distribute all of its taxable income. Accordingly, no provision for federal income taxes is required in the financial statements.
5. Distributions: Distributions to shareholders are recorded on the ex-dividend date.
6. Security Lending: The fund may lend its securities to qualified institutional borrowers to earn additional income. Security loans are required to be secured at all times by collateral at least equal to the market value of securities loaned. The fund invests cash collateral received in Vanguard Market Liquidity Fund, and records a liability for the return of the collateral, during the period the securities are on loan. Security lending income represents the income earned on investing cash collateral, less expenses associated with the loan.
7. Other: Dividend income is recorded on the ex-dividend date. Interest income includes income distributions received from Vanguard Market Liquidity Fund and is accrued daily. Security transactions are accounted for on the date securities are bought or sold. Costs used to determine realized gains (losses) on the sale of investment securities are those of the specific securities sold. Fees assessed on redemptions of capital shares are credited to paid-in capital.
Each class of shares has equal rights as to assets and earnings, except that each class separately bears certain class-specific expenses related to maintenance of shareholder accounts (included in Management and Administrative expenses) and shareholder reporting. Marketing and distribution expenses are allocated to each class of shares based on a method approved by the board of trustees. Income, other non-class-specific expenses, and gains and losses on investments are allocated to each class of shares based on its relative net assets.
B. Schroder Investment Management North America Inc. and Baillie Gifford Overseas Ltd. each provide investment advisory services to a portion of the fund for a fee calculated at an annual percentage rate of average net assets managed by the advisor. The basic fee of each advisor is subject to quarterly adjustments based on performance for the preceding three years relative to the Morgan Stanley Capital International Europe, Australasia, Far East Index.
The Vanguard Group manages the cash reserves of the fund on an at-cost basis.
For the year ended August 31, 2006, the aggregate investment advisory fee represented an effective annual basic rate of 0.13% of the fund’s average net assets, before a decrease of $1,490,000 (0.01%) based on performance.
23
C. The Vanguard Group furnishes at cost corporate management, administrative, marketing, and distribution services. The costs of such services are allocated to the fund under methods approved by the board of trustees. The fund has committed to provide up to 0.40% of its net assets in capital contributions to Vanguard. At August 31, 2006, the fund had contributed capital of $1,464,000 to Vanguard (included in Other Assets), representing 0.01% of the fund’s net assets and 1.46% of Vanguard’s capitalization. The fund’s trustees and officers are also directors and officers of Vanguard.
D. The fund has asked its investment advisors to direct certain security trades, subject to obtaining the best price and execution, to brokers who have agreed to rebate to the fund part of the commissions generated. Such rebates are used solely to reduce the fund’s management and administrative expenses. The fund’s custodian bank has also agreed to reduce its fees when the fund maintains cash on deposit in the non-interest-bearing custody account. For the year ended August 31, 2006, these arrangements reduced the fund’s management and administrative expenses by $1,116,000 and custodian fees by $2,000. The total expense reduction represented an effective annual rate of 0.01% of the fund’s average net assets.
E. Distributions are determined on a tax basis and may differ from net investment income and realized capital gains for financial reporting purposes. Differences may be permanent or temporary. Permanent differences are reclassified among capital accounts in the financial statements to reflect their tax character. Temporary differences arise when certain items of income, expense, gain, or loss are recognized in different periods for financial statement and tax purposes; these differences will reverse at some time in the future. Differences in classification may also result from the treatment of short-term gains as ordinary income for tax purposes.
During the year ended August 31, 2006, the fund realized net foreign currency losses of $2,967,000, which decreased distributable net income for tax purposes; accordingly, such losses have been reclassified from accumulated net realized gains to undistributed net investment income. Certain of the fund’s investments are in securities considered to be “passive foreign investment companies,” for which any unrealized appreciation and/or realized gains are required to be included in distributable net income for tax purposes. Unrealized appreciation on the fund’s passive foreign investment company holdings at August 31, 2006, was $22,301,000, of which $648,000 has been distributed and is reflected in the balance of undistributed net income.
The fund used a tax accounting practice to treat a portion of the price of capital shares redeemed during the year as distributions from net investment income and realized capital gains. Accordingly, the fund has reclassified $18,044,000 from undistributed net investment income, and $58,804,000 from accumulated net realized gains, to paid-in capital.
The fund used a capital loss carryforward of $25,164,000 to offset taxable capital gains realized during the year ended August 31, 2006, reducing the amount of capital gains that would otherwise be available to distribute to shareholders. For tax purposes, at August 31, 2006, the fund had $463,159,000 of ordinary income and $744,640,000 of long-term capital gains available for distribution.
At August 31, 2006, the cost of investment securities for tax purposes was $11,270,149,000. Net unrealized appreciation of investment securities for tax purposes was $3,228,473,000, consisting of unrealized gains of $3,335,690,000 on securities that had risen in value since their purchase and $107,217,000 in unrealized losses on securities that had fallen in value since their purchase.
24
At August 31, 2006, the aggregate settlement value of open futures contracts expiring in September 2006 and the related unrealized appreciation (depreciation) were:
| | ($000) |
| | Aggregate | Unrealized |
| Number of | Settlement | Appreciation |
Futures Contracts | Long Contracts | Value | (Depreciation) |
Dow Jones EURO STOXX 50 Index | 1,918 | 93,595 | 7,651 |
Topix Index | 514 | 71,574 | 4,572 |
FTSE 100 Index | 627 | 70,521 | 3,240 |
S&P ASX 200 Index | 216 | 21,035 | 890 |
At August 31, 2006, the fund had open forward currency contracts to receive and deliver currencies as follows:
| | | | | Unrealized |
| | | | | Appreciation |
| Contract Amount (000) | (Depreciation) |
Contract Settlement Date | | Receive | | Deliver | ($000) |
9/20/2006 | EUR | 65,557 | USD | 83,994 | 902 |
9/20/2006 | GBP | 34,632 | USD | 65,888 | 1,915 |
9/13/2006 | JPY | 7,512,114 | USD | 64,121 | (2,870) |
9/20/2006 | AUD | 26,228 | USD | 20,023 | 616 |
AUD—Australian dollar.
EUR—Euro.
GBP—British pound.
JPY—Japanese yen.
USD—U.S. dollar.
Unrealized appreciation (depreciation) on open forward currency contracts is treated as realized gain (loss) for tax purposes.
The fund had net unrealized foreign currency losses of $77,000 resulting from the translation of other assets and liabilities at August 31, 2006.
F. During the year ended August 31, 2006, the fund purchased $6,483,897,000 of investment securities and sold $5,321,869,000 of investment securities other than temporary cash investments.
G. The market value of securities on loan to broker-dealers at August 31, 2006, was $551,958,000, for which the fund received cash collateral of $581,180,000.
25
H. Capital share transactions for each class of shares were:
| Year Ended August 31, |
| | 2006 | | | 2005 |
| Amount | Shares | | Amount | Shares |
| ($000) | (000) | | ($000) | (000) |
Investor Shares | | | | | |
Issued | 2,259,984 | 101,241 | | 1,362,143 | 73,790 |
Issued in Lieu of Cash Distributions | 271,640 | 12,831 | | 127,164 | 7,006 |
Redeemed1 | (1,986,846) | (90,034) | | (1,580,308) | (84,616) |
Net Increase (Decrease)—Investor Shares | 544,778 | 24,038 | | (91,001) | (3,820) |
Admiral Shares | | | | | |
Issued | 1,212,240 | 17,312 | | 900,641 | 15,055 |
Issued in Lieu of Cash Distributions | 78,427 | 1,165 | | 23,476 | 407 |
Redeemed1 | (494,998) | (7,108) | | (305,893) | (5,213) |
Net Increase (Decrease)—Admiral Shares | 795,669 | 11,369 | | 618,224 | 10,249 |
I. In June 2006, the Financial Accounting Standards Board issued interpretation No. 48 (“FIN 48”), “Accounting for Uncertainty in Income Taxes.” FIN 48 establishes the minimum threshold for recognizing, and a system for measuring, the benefits of tax-return positions in financial statements. FIN 48 will be effective for the fund’s fiscal year beginning September 1, 2007. Management is in the process of analyzing the fund’s tax positions for purposes of implementing FIN 48; based on the analysis completed to date, management does not believe the adoption of FIN 48 will result in any material impact to the fund’s financial statements.
1 | Net of redemption fees of $1,093,000 and $140,000 (fund totals). |
26
Report of Independent Registered
Public Accounting Firm
To the Trustees of Vanguard World Funds and the Shareholders of Vanguard International Growth Fund:
In our opinion, the accompanying statement of net assets and the related statements of operations and of changes in net assets and the financial highlights present fairly, in all material respects, the financial position of Vanguard International Growth Fund (the “Fund”) at August 31, 2006, the results of its operations for the year then ended, the changes in its net assets for each of the two years in the period then ended and the financial highlights for each of the five years in the period then ended, in conformity with accounting principles generally accepted in the United States of America. These financial statements and financial highlights (hereafter referred to as “financial statements”) are the responsibility of the Fund’s management; our responsibility is to express an opinion on these financial statements based on our audits. We conducted our audits of these financial statements in accordance with the standards of the Public Company Accounting Oversight Board (United States). Those standards require that we plan and perform the audit to obtain reasonable assurance about whether the financial statements are free of material misstatement. An audit includes examining, on a test basis, evidence supporting the amounts and disclosures in the financial statements, assessing the accounting principles used and significant estimates made by management, and evaluating the overall financial statement presentation. We believe that our audits, which included confirmation of securities at August 31, 2006 by correspondence with the custodian and brokers and by agreement to the underlying ownership records for Vanguard Market Liquidity Fund, provide a reasonable basis for our opinion.
PricewaterhouseCoopers LLP
Philadelphia, Pennsylvania
October 12, 2006
Special 2006 tax information (unaudited) for Vanguard International Growth Fund
This information for the fiscal year ended August 31, 2006, is included pursuant to provisions of the Internal Revenue Code.
The fund distributed $170,307,000 as capital gain dividends (from net long-term capital gains) to shareholders during the fiscal year.
The fund distributed $142,475,000 of qualified dividend income to shareholders during the fiscal year.
The fund will pass through to shareholders foreign source income of $354,190,000 and foreign taxes paid of $6,716,000. The pass-through of foreign taxes paid will affect only shareholders on the dividend record date in December 2006. Shareholders will receive more detailed information along with their Form 1099-DIV in January 2007.
27
Your Fund’s After-Tax Returns
This table presents returns for your fund both before and after taxes. The after-tax returns are shown in two ways: (1) assuming that an investor owned the fund during the entire period and paid taxes on the fund’s distributions, and (2) assuming that an investor paid taxes on the fund’s distributions and sold all shares at the end of each period.
Calculations are based on the highest individual federal income tax and capital gains tax rates in effect at the times of the distributions and the hypothetical sales. State and local taxes were not considered. After-tax returns reflect any qualified dividend income, using actual prior year figures and estimates for 2006. (In the example, returns after the sale of fund shares may be higher than those assuming no sale. This occurs when the sale would have produced a capital loss. The calculation assumes that the investor received a tax deduction for the loss.)
The table shows returns for Investor Shares only; returns for other share classes will differ. Please note that your actual after-tax returns will depend on your tax situation and may differ from those shown. Also note that if you own the fund in a tax-deferred account, such as an individual retirement account or a 401(k) plan, this information does not apply to you. Such accounts are not subject to current taxes.
Finally, keep in mind that a fund’s performance—whether before or after taxes—does not guarantee future results.
Average Annual Total Returns: International Growth Fund Investor Shares1 |
Periods Ended August 31, 2006 | | | |
| One | Five | Ten |
| Year | Years | Years |
Returns Before Taxes | 24.79% | 11.36% | 7.70% |
Returns After Taxes on Distributions | 23.99 | 10.87 | 6.79 |
Returns After Taxes on Distributions and Sale of Fund Shares | 16.55 | 9.66 | 6.27 |
1 Total returns do not reflect the 2% fee assessed on redemptions of shares purchased on or after June 27, 2003, and held for less than two months.
28
About Your Fund’s Expenses
As a shareholder of the fund, you incur ongoing costs, which include costs for portfolio management, administrative services, and shareholder reports (like this one), among others. Operating expenses, which are deducted from a fund’s gross income, directly reduce the investment return of the fund.
A fund’s expenses are expressed as a percentage of its average net assets. This figure is known as the expense ratio. The following examples are intended to help you understand the ongoing costs (in dollars) of investing in your fund and to compare these costs with those of other mutual funds. The examples are based on an investment of $1,000 made at the beginning of the period shown and held for the entire period.
The table below illustrates your fund’s costs in two ways:
• Based on actual fund return. This section helps you to estimate the actual expenses that you paid over the period. The “Ending Account Value” shown is derived from the fund’s actual return, and the third column shows the dollar amount that would have been paid by an investor who started with $1,000 in the fund. You may use the information here, together with the amount you invested, to estimate the expenses that you paid over the period.
To do so, simply divide your account value by $1,000 (for example, an $8,600 account value divided by $1,000 = 8.6), then multiply the result by the number given for your fund under the heading “Expenses Paid During Period.”
• Based on hypothetical 5% yearly return. This section is intended to help you compare your fund’s costs with those of other mutual funds. It assumes that the fund had a yearly return of 5% before expenses, but that the expense ratio is unchanged. In this case—because the return used is not the fund’s actual return—the results do not apply to your investment. The example is useful in making comparisons because the Securities and Exchange Commission requires all mutual funds to calculate expenses based on a 5% return. You can assess your fund’s costs by comparing this hypothetical example with the hypothetical examples that appear in shareholder reports of other funds.
Six Months Ended August 31, 2006 |
| Beginning | Ending | Expenses |
| Account Value | Account Value | Paid During |
International Growth Fund | 2/28/2006 | 8/31/2006 | Period1 |
Based on Actual Fund Return |
Investor Shares | $1,000.00 | $1,071.52 | $2.82 |
Admiral Shares | 1,000.00 | 1,072.92 | 1.78 |
Based on Hypothetical 5% Yearly Return |
Investor Shares | $1,000.00 | $1,022.48 | $2.75 |
Admiral Shares | 1,000.00 | 1,023.49 | 1.73 |
1 | The calculations are based on expenses incurred in the most recent six-month period. The fund’s annualized six-month expense ratios for that period are 0.54% for Investor Shares and 0.34% for Admiral Shares. The dollar amounts shown as “Expenses Paid” are equal to the annualized expense ratio multiplied by the average account value over the period, multiplied by the number of days in the most recent six-month period, then divided by the number of days in the most recent 12-month period. |
29
Note that the expenses shown in the table on the previous page are meant to highlight and help you compare ongoing costs only; they do not include your fund’s low-balance fee or the 2% fee that applies to shares purchased on or after June 27, 2003, and held for less than two months. These fees are fully described in the prospectus. If the fees were applied to your account, your costs would be higher. Your fund does not carry a “sales load.”
The calculations assume no shares were bought or sold during the period. Your actual costs may have been higher or lower, depending on the amount of your investment and the timing of any purchases or redemptions.
You can find more information about the fund’s expenses, including annual expense ratios, in the Financial Statements section of this report. For additional information on operating expenses and other shareholder costs, please refer to the appropriate fund prospectus.
30
Glossary
Beta. A measure of the magnitude of a fund’s past share-price fluctuations in relation to the ups and downs of a given market index. The index is assigned a beta of 1.00. Compared with a given index, a fund with a beta of 1.20 typically would have seen its share price rise or fall by 12% when the index rose or fell by 10%. A fund’s beta should be reviewed in conjunction with its R-squared (see definition below). The lower the R-squared, the less correlation there is between the fund and the index, and the less reliable beta is as an indicator of volatility.
Expense Ratio. The percentage of a fund’s average net assets used to pay its annual administrative and advisory expenses. These expenses directly reduce returns to investors.
R-Squared. A measure of how much of a fund’s past returns can be explained by the returns from the market in general, as measured by a given index. If a fund’s total returns were precisely synchronized with an index’s returns, its R-squared would be 1.00. If the fund’s returns bore no relationship to the index’s returns, its R-squared would be 0.
Short-Term Reserves. The percentage of a fund invested in highly liquid, short-term securities that can be readily converted to cash.
Turnover Rate. An indication of the fund’s trading activity. Funds with high turnover rates incur higher transaction costs and may be more likely to distribute capital gains (which may be taxable to investors). The turnover rate excludes in-kind transactions, which have minimal impact on costs.
31
The People Who Govern Your Fund
The trustees of your mutual fund are there to see that the fund is operated and managed in your best interests since, as a shareholder, you are a part owner of the fund. Your fund's trustees also serve on the board of directors of The Vanguard Group, Inc., which is owned by the Vanguard funds and provides services to them on an at-cost basis.
A majority of Vanguard’s board members are independent, meaning that they have no affiliation with Vanguard or the funds they oversee, apart from the sizable personal investments they have made as private individuals.
Our independent board members bring distinguished backgrounds in business, academia, and public service to their task of working with Vanguard officers to establish the policies and oversee the activities of the funds. Among board members’ responsibilities are selecting investment advisors for the funds; monitoring fund operations, performance, and costs; reviewing contracts; nominating and selecting new trustees/directors; and electing Vanguard officers.
Each trustee serves a fund until its termination; or until the trustee’s retirement, resignation, or death; or otherwise as specified in the fund’s organizational documents. Any trustee may be removed at a shareholders’ meeting by a vote representing two-thirds of the net asset value of all shares of the fund together with shares of other Vanguard funds organized within the same trust. The table on these two pages shows information for each trustee and executive officer of the fund. The mailing address of the trustees and officers is P.O. Box 876, Valley Forge, PA 19482.
Chairman of the Board, Chief Executive Officer, and Trustee |
| |
John J. Brennan1 | |
Born 1954 | Principal Occupation(s) During the Past Five Years: Chairman of |
Trustee since May 1987; | the Board, Chief Executive Officer, and Director/Trustee of The |
Chairman of the Board and | Vanguard Group, Inc., and of each of the investment companies |
Chief Executive Officer | served by The Vanguard Group. |
142 Vanguard Funds Overseen | |
| |
Independent Trustees | |
| |
Charles D. Ellis | |
Born 1937 | Principal Occupation(s) During the Past Five Years: Applecore |
Trustee since January 2001 | Partners (pro bono ventures in education); Senior Advisor to |
142 Vanguard Funds Overseen | Greenwich Associates (international business strategy |
| consulting); Successor Trustee of Yale University; Overseer |
| of the Stern School of Business at New York University; |
| Trustee of the Whitehead Institute for Biomedical Research. |
| |
Rajiv L. Gupta | |
Born 1945 | Principal Occupation(s) During the Past Five Years: Chairman |
Trustee since December 20012 | and Chief Executive Officer of Rohm and Haas Co. (chemicals); |
142 Vanguard Funds Overseen | since 1999; Board Member of the American Chemistry Council; |
| Director of Tyco International, Ltd. (diversified manufac- |
| turing and services) (since 2005);Trustee of Drexel |
| University and of the Chemical Heritage Foundation. |
| |
Amy Gutmann | |
Born 1949 | Principal Occupation(s) During the Past Five Years: President of the |
Trustee since July 2006 | University of Pennsylvania since 2004; Professor in the School of Arts |
142 Vanguard Funds Overseen | and Sciences, Annenberg School for Communication, and Graduate |
| School of Education of the University of Pennsylvania since 2004; Provost |
| (2001-2004) and Laurance S. Rockefeller Professor of Politics and the |
| University Center for Human Values (1990-2004), Princeton University; |
| Director of Carnegie Corporation of New York since 2005 and of |
| Schuylkill River Development Corporation and Greater Philadelphia |
| Chamber of Commerce since 2004. |
JoAnn Heffernan Heisen | |
Born 1950 | Principal Occupation(s) During the Past Five Years: Corporate |
Trustee since July 1998 | Vice President and Chief Global Diversity Officer since 2006 |
142 Vanguard Funds Overseen | Vice President and Chief Information Officer (1997–2005), |
| and Member of the Executive Committee of Johnson & Johnson |
| (pharmaceuticals/consumer products); Director of the University |
| Medical Center at Princeton and Women’s Research and |
| Education Institute. |
| |
André F. Perold | |
Born 1952 | Principal Occupation(s) During the Past Five Years: |
Trustee since December 2004 | George Gund Professor of Finance and Banking, Harvard Business |
142 Vanguard Funds Overseen | School since 2000; Senior Associate Dean, Director of Faculty |
| Recruiting, and Chair of Finance Faculty, Harvard Business |
| School; Director and Chairman of UNX, Inc. (equities trading firm) |
| since 2003; Director of registered investment companies advised by |
| Merrill Lynch Investment Managers and affiliates (1985-2004), Genbel |
| Securities Limited (South African financial services firm) (1999-2003), |
| Gensec Bank (1999-2003), Sanlam, Ltd. (South African insurance company) |
| (2001-2003), and Stockback, Inc. (credit card firm) (2000-2002). |
| |
Alfred M. Rankin, Jr. | |
Born 1941 | Principal Occupation(s) During the Past Five Years: |
Trustee since January 1993 | Chairman, President, Chief Executive Officer, and Director of NACCO |
142 Vanguard Funds Overseen | Industries, Inc.(forklift trucks/housewares/lignite); Director of |
| Goodrich Corporation (industrialproducts/aircraft systems and services). |
| |
J. Lawrence Wilson | |
Born 1936 | Principal Occupation(s) During the Past Five Years: |
Trustee since April 1985 | Retired Chairman and Chief Executive Officer of Rohm and Haas Co. |
142 Vanguard Funds Overseen | (chemicals);Director of Cummins Inc. (diesel engines), MeadWestvaco |
| Corp. (packing products),and AmerisourceBergen Corp. (pharmaceutical |
| distribution); Trustee of Vanderbilt University and of Culver |
| Educational Foundation. |
| |
Executive Officers 1 | |
| |
Heidi Stam | |
Born 1956 | Principal Occupation(s) During the Past Five Years: |
Trustee since July 2005 | Managing Director since July 2006, General Counsel since July 2005, and |
142 Vanguard Funds Overseen | Secretary of Vanguard and of each of the investment companies served |
| by The Vanguard Group since July 2005; Principal of The Vanguard Group, Inc. |
| (1997-2006). |
| |
Thomas J. Higgins | |
Born 1957 | Principal Occupation(s) During the Past Five Years: |
Trustee since July 1998 | Principal of the Vanguard Group, Inc.; Treasurer of each of the investment |
142 Vanguard Funds Overseen | companies served by the Vanguard Group. |
| |
| |
| Vanguard Senior Management Team |
|---|
| | |
|---|
| R. Gregory Barton | Kathleen C. Gubanich | Michael S. Miller |
| Mortimer J. Buckley | Paul A. Heller | Ralph K. Packard |
| James H. Gately | F. William McNabb, III | George U. Sauter |
|
| Founder |
|---|
| | |
|---|
| John C. Bogle |
|
| Chairman and Chief Executive Officer, 1974-1996 |
1 Officers of the funds are “interested persons” as defined in the Investment Company Act of 1940.
2 December 2002 for Vanguard Equity Income Fund, Vanguard Growth Equity Fund, the Vanguard Municipal Bond Funds, and the Vanguard State
Tax-ExemptFunds.
More information about the trustees is in the Statement of Additional Information, available from The Vanguard Group.
|
|
| P.O. Box 2600 Valley Forge, PA 19482-2600 |
Connect with Vanguard™ > www.vanguard.com
| |
|---|
| Fund Information > 800-662-7447 | Vanguard, Admiral, Connect with Vanguard, and the ship |
| | logo are trademarks of The Vanguard Group, Inc. |
| Direct Investor Account Services > 800-662-2739 | |
| | All other marks are the exclusive property of their |
| Institutional Investor Services > 800-523-1036 | respective owners. |
| | |
| Text Telephone > 800-952-3335 | All comparative mutual fund data are from Lipper Inc. |
| | or Morningstar, Inc., unless otherwise noted. |
| | |
| | |
| | |
| | |
| | You can obtain a free copy of Vanguard’s proxy voting |
| This material may be used in conjunction | guidelines by visiting our website, www.vanguard.com, |
| with the offering of shares of any Vanguard | and searching for “proxy voting guidelines,” or by calling |
| fund only if preceded or accompanied by | Vanguard at 800-662-2739. They are also available from |
| the fund’s current prospectus. | the SEC’s website, www.sec.gov. In addition, you may |
| | obtain a free report on how your fund voted the proxies for |
| | securities it owned during the 12 months ended June 30. |
| | To get the report, visit either www.vanguard.com |
| | or www.sec.gov. |
| | |
| | You can review and copy information about your fund |
| | at the SEC’s Public Reference Room in Washington, D.C. |
| | To find out more about this public service, call the SEC |
| | at 202-551-8090. Information about your fund is also |
| | available on the SEC’s website, and you can receive |
| | copies of this information, for a fee, by sending a |
| | request in either of two ways: via e-mail addressed to |
| | publicinfo@sec.gov or via regular mail addressed to the |
| | Public Reference Section, Securities and Exchange |
| | Commission, Washington, DC 20549-0102. |
| | |
| | |
| | |
| | |
| | © 2006 The Vanguard Group, Inc. |
| | All rights reserved. |
| | Vanguard Marketing Corporation, Distributor. |
| | |
| | Q810 102006 |
|
Vanguard® FTSE Social Index Fund |
|
|
> Annual Report |
|
|
|
|
August 31, 2006 |
> | The Investor Shares of Vanguard FTSE Social Index Fund returned 7.2% during the 2006 fiscal year, while the Institutional Shares returned 7.4%. These results were in line with the return of the fund’s spliced target index and much stronger than the average return of its peer funds. |
> | The broad U.S. stock market returned about 9% for the 12 months ended August 31. The market climbed on positive economic news for the first three quarters of the period but then came under pressure from rising energy prices and inflationary concerns. |
> | The fund’s large allocation to financial stocks generated much of its gain. Its modest allocations to consumer staples, industrials, and telecommunication services stocks also proved beneficial. |
Contents | |
| |
Your Fund’s Total Returns | 1 |
Chairman’s Letter | 2 |
Fund Profile | 7 |
Performance Summary | 8 |
Financial Statements | 10 |
Your Fund’s After-Tax Returns | 24 |
About Your Fund’s Expenses | 25 |
Trustees Approve Advisory Arrangement | 27 |
Glossary | 28 |
Please note: The opinions expressed in this report are just that—informed opinions. They should not be considered promises or advice. Also, please keep in mind that the information and opinions cover the period through the date on the cover of this report. Of course, the risks of investing in your fund are spelled out in the prospectus.
Your Fund’s Total Returns
Fiscal Year Ended August 31, 2006 | |
| Total |
| Return |
Vanguard FTSE Social Index Fund | |
Investor Shares | 7.2% |
Institutional Shares1 | 7.4 |
Spliced Social Index2 | 7.4 |
Average Large-Cap Growth Fund3 | 1.9 |
Dow Jones Wilshire 5000 Index | 8.8 |
Your Fund’s Performance at a Glance | | | |
August 31, 2005–August 31, 2006 | | | |
| | | Distributions Per Share |
| Starting | Ending | Income | Capital |
| Share Price | Share Price | Dividends | Gains |
Vanguard FTSE Social Index Fund | | | | |
Investor Shares | $8.03 | $8.51 | $0.10 | $0.00 |
Institutional Shares | 8.04 | 8.52 | 0.11 | 0.00 |
1 This class of shares carries lower expenses and is available for a minimum initial investment of $5 million.
2 The Spliced Social Index captures the performance of the Calvert Social Index through December 16, 2005, and the FTSE4Good US Select Index thereafter.
3 Derived from data provided by Lipper Inc.
1

Chairman’s Letter
Dear Shareholder,
The Investor Shares of Vanguard FTSE Social Index Fund returned slightly more than 7% during the fiscal year ended August 31, 2006. The fund closely tracked the performance of its target, which for this period was a spliced benchmark consisting of the Calvert Social Index through December 16, 2005, and the FTSE4Good US Select Index thereafter. The fund’s result was much better than the average return of large-cap growth funds.
If you hold shares of the fund in a taxable account, you may wish to review the report on after-tax returns on page 24.
Stocks climbed for much of the year, then began to waver
Stocks climbed steadily through the first three quarters of the fiscal year before becoming increasingly volatile amid concerns over higher oil prices and fears that the U.S. economy was stalling. Indeed, the marked slowdown in the housing market in recent months suggests that the economy may have shifted into a lower gear.
The broad U.S. stock market gained 8.8% for the year, with small-capitalization stocks slightly outperforming their large-cap counterparts. As has been the case for the past several years, returns from international equities continued to outshine domestic stocks. For U.S.-based investors,
2
a weaker dollar further boosted these returns when international gains were converted back into U.S. dollars.
Rising interest rates dampened bond returns
At its August 8, 2006, meeting, the Federal Reserve Board left its target for the federal funds rate unchanged, at 5.25%. This brought at least a temporary halt to the Fed’s two-year inflation-fighting campaign, which had been marked by 17 consecutive rate hikes.
The broad market for taxable U.S. bonds finished the one-year period with a modest return of 1.7%. Municipal bonds fared somewhat better. The yield curve remained essentially flat, with a very small difference between the yields of 3-month and 30-year U.S. Treasury issues, although yields rose modestly at both ends of the maturity spectrum.
Financial holdings were a key to the fund’s performance
Although its performance fell somewhat short of that of the broad U.S. stock market, Vanguard FTSE Social Index Fund successfully captured almost all the return of its target benchmark, which for this period consisted of spliced returns from two indexes. As many readers will recall, in December the fund changed its target from the Calvert Social Index to the FTSE4Good US Select Index. This
Market Barometer | | | |
| | Average Annual Total Returns |
| | Periods Ended August 31, 2006 |
| One Year | Three Years | Five Years |
Stocks | | | |
Russell 1000 Index (Large-caps) | 8.7% | 11.5% | 5.3% |
Russell 2000 Index (Small-caps) | 9.4 | 14.4 | 10.3 |
Dow Jones Wilshire 5000 Index (Entire market) | 8.8 | 12.0 | 6.1 |
MSCI All Country World Index ex USA (International) | 25.4 | 25.0 | 13.8 |
| | | |
Bonds | | | |
Lehman Aggregate Bond Index (Broad taxable market) | 1.7% | 4.0% | 4.9% |
Lehman Municipal Bond Index | 3.0 | 5.1 | 5.0 |
Citigroup 3-Month Treasury Bill Index | 4.3 | 2.5 | 2.2 |
| | | |
CPI | | | |
Consumer Price Index | 3.8% | 3.4% | 2.8% |
3
change—and the subsequent renaming of the fund—did not alter the investment strategy or policy.
The FTSE4Good US Select Index is administered exclusively for Vanguard by the FTSE Group. The selection criteria for the index emphasize three main areas: preserving the environment, upholding and supporting human rights, and fostering a safe and healthy workplace. As of August 31, the index included more than 450 companies.
Because of its selection criteria, the index is apt to display a pronounced growth-stock orientation and have modest exposure to older manufacturing and materials industries, which often have difficulty complying with the index provider’s environmental mandates. The criteria also have led to sector weightings quite different from the proportions found in the broad U.S. stock market.
The financials sector typifies how the fund’s benchmark differs from the broad market in sector exposures. In the FTSE4Good US Select Index, the sector represented about 35% of overall capitalization at the end of the year. By contrast, in the broad market (as represented by the Dow Jones Wilshire 5000 Composite Index), the financials weighting checked in at 22 percent. For the fund, the higher weighting in financials was a boon in the fiscal period because of strong results from several subsectors—including investment banks (led by Goldman Sachs), commercial banks (Wells Fargo), and diversified financial services companies (JPMorgan Chase).
Smaller contributions to the overall result came from the consumer staples, industrials, and telecommunication services sectors. Among staples, Procter & Gamble and supermarket operator Kroger led the way. In industrials, Caterpillar and FedEx were the strongest contributors. In telecommunication services, merger partners AT&T and BellSouth turned in excellent results.
On the other hand, disappointing returns came from stocks in the consumer discretionary, health care, and information technology sectors, which together averaged more than 40% of the index’s capitalization. All three groups suffered overall declines, but fortunately these were relatively small. Consumer-related stocks were hurt by the performance of retailers and home builders, health care stocks by that of equipment makers and suppliers, and tech stocks by that of chipmakers.
4
The fund’s longer-term record reflects challenges of early years
Your fund began operation in May 2000, near the beginning of the three-year downturn that shook the U.S. stock market. That rocky start underlies the fund’s lifetime record: an average annual return of –1.7% over six-plus years. However, as you can see in the table below, the fund’s competitors suffered even more in the period.
As the table shows, the difference between the fund’s return and that of its spliced target has stayed quite small, which is a credit to the team of indexing experts in Vanguard’s Quantitative Equity Group. The team’s portfolio-construction and trading strategies have helped the fund closely track the performance of both its original benchmark and its new one, neither of which incurs the real-world expenses borne by the fund.
The fund’s longer-term record compares favorably with that of other large-cap growth mutual funds. A hypothetical initial investment of $10,000 in the fund would have been worth $8,986 on August 31, 2006; a similar investment that earned the average result for peer funds would have resulted in about $2,000 less.
Low costs are one of the key benefits of indexing. The fund’s low expense ratios allow it to pass along a larger share of its investment returns to you. You’ll find a closer look at your fund’s costs relative to those of its peer group below.
Expense Ratios1 | | | |
Your fund compared with its peer group | | | |
| | | Average |
| Investor | Institutional | Large-Cap |
| Shares | Shares | Growth Fund |
FTSE Social Index Fund | 0.25% | 0.12% | 1.46% |
Total Returns | | |
| May 31, 20002 through August 31, 2006 |
| Average | Final Value of a $10,000 |
| Annual Return | Initial Investment |
FTSE Social Index Fund Investor Shares | –1.7% | $8,986 |
Spliced Social Index3 | –1.6 | 9,064 |
Average Large-Cap Growth Fund | –5.6 | 6,957 |
Dow Jones Wilshire 5000 Index | 1.5 | 10,999 |
| | | |
1 Fund expense ratios reflect the 12 months ended August 31, 2006. Peer-group expense ratio is derived from data provided by Lipper Inc. and captures information through year-end 2005.
2 Fund inception. From May 8 until May 31, 2000, the fund conducted a subscription period during which its assets were held in money market instruments. Returns are measured from May 31, 2000, when the fund began to follow its investment strategy.
3 The Spliced Social Index captures the performance of the Calvert Social Index through December 16, 2005; the FTSE4Good US Select Index thereafter.
5
Indexing can help you keep your perspective
One of the most daunting elements of long-term investing is that no one can foresee the direction the financial markets will take. Our time-tested response to this uncertainty is to encourage investors to stick with a carefully considered, balanced portfolio of stock, bond, and money market funds suited to their unique circumstances. The temptation to change that mix can be great at times, but the danger is that you may jeopardize your long-term plan with a short-term reaction to market adversity.
Index funds can play an important role in helping to maintain your perspective no matter what happens with financial markets. With their consistent, diversified approach, these funds can help you capture much of the return of a relevant target index.
As Vanguard marks the 30th anniversary of the 500 Index Fund—which was launched on August 31, 1976, and was the first index fund offered to retail investors—we reaffirm our commitment to indexing as an investment strategy that can serve as the core of many investors’ portfolios. By enabling investors to earn a significant portion of a target benchmark’s return, index funds often fare considerably better than their actively managed counterparts.
For socially conscious investors seeking the benefits of a low-cost index portfolio, we believe the FTSE Social Index Fund is a sound choice.
Thank you for entrusting your assets to Vanguard.
Sincerely,

John J. Brennan
Chairman and Chief Executive Officer
September 14, 2006
6
Fund Profile
As of August 31, 2006
Portfolio Characteristics | | |
| | Target | Broad |
| Fund | Index1 | Index2 |
Number of Stocks | 454 | 453 | 4,971 |
Median Market Cap | $27.7B | $23.1B | $27.2B |
Price/Earnings Ratio | 17.9x | 18.3x | 16.9x |
Price/Book Ratio | 2.6x | 2.6x | 2.6x |
Yield | | 1.5% | 1.7% |
Investor Shares | 1.4% | | |
Institutional Shares | 1.6% | | |
Return on Equity | 17.8% | 18.3% | 15.5% |
Earnings Growth Rate | 13.8% | 14.3% | 15.3% |
Foreign Holdings | 0.4% | 0.4% | 1.0% |
Turnover Rate | 51% | — | — |
Expense Ratio | | — | — |
Investor Shares | 0.25% | | |
Institutional Shares | 0.12% | | |
Short-Term Reserves | 0% | — | — |
Sector Diversification (% of portfolio) | |
| | Target | Broad |
| Fund | Index1 | Index2 |
Consumer Discretionary | 14% | 15% | 12% |
Consumer Staples | 5 | 6 | 9 |
Energy | 3 | 3 | 10 |
Financials | 39 | 35 | 22 |
Health Care | 17 | 18 | 12 |
Industrials | 4 | 5 | 11 |
Information Technology | 12 | 13 | 15 |
Materials | 1 | 1 | 3 |
Telecommunication Services | 5 | 4 | 3 |
Utilities | 0 | 0 | 3 |
Volatility Measures3 | |
| Fund Versus | Fund Versus |
| Spliced Index4 | Broad Index2 |
R-Squared | 1.00 | 0.93 |
Beta | 1.00 | 1.01 |
Ten Largest Holdings5 (% of total net assets) |
| | |
Bank of America Corp. | diversified financial services | 3.6% |
American International Group, Inc. | multi-line insurance | 2.6 |
JPMorgan Chase & Co. | diversified financial services | 2.4 |
AT&T Inc. | integrated telecommunication services | 1.9 |
Wells Fargo & Co. | diversified banks | 1.8 |
Intel Corp. | semiconductors | 1.7 |
Merck & Co., Inc. | pharmaceuticals | 1.4 |
Wachovia Corp. | diversified banks | 1.4 |
Google Inc. | internet software and services | 1.3 |
Amgen, Inc. | pharmaceuticals | 1.2 |
Top Ten | | 19.3% |
Investment Focus
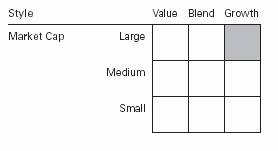
1 FTSE4Good US Select Index.
2 Dow Jones Wilshire 5000 Index.
3 For an explanation of R-squared, beta, and other terms used here, see the Glossary on page 28.
4 Calvert Social Index through December 16, 2005; FTSE4Good US Select Index thereafter.
5 “Ten Largest Holdings” excludes any temporary cash investments and equity index products.
7
Performance Summary
All of the returns in this report represent past performance, which is not a guarantee of future results that may be achieved by the fund. (Current performance may be lower or higher than the performance data cited. For performance data current to the most recent month-end, visit our website at www.vanguard.com.) Note, too, that both investment returns and principal value can fluctuate widely, so an investor’s shares, when sold, could be worth more or less than their original cost. The returns shown do not reflect taxes that a shareholder would pay on fund distributions or on the sale of fund shares.
Cumulative Performance: May 31, 2000–August 31, 2006
Initial Investment of $10,000
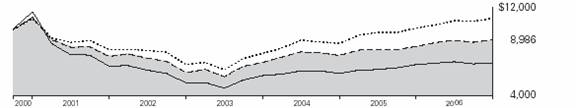
| Average Annual Total Returns | Final Value |
| Periods Ended August 31, 2006 | of a $10,000 |
| One Year | Five Years | Since Inception1 | Investment |
FTSE Social Index Fund Investor Shares2 | 7.25% | 3.46% | –1.70% | $8,986 |
Dow Jones Wilshire 5000 Index | 8.76 | 6.14 | 1.54 | 10,999 |
Spliced Social Index3 | 7.44 | 3.71 | –1.56 | 9,064 |
Average Large-Cap Growth Fund4 | 1.86 | 0.75 | –5.64 | 6,957 |
| | | Final Value of |
| | Since | a $5,000,000 |
| One Year | Inception1 | Investment |
FTSE Social Index Fund Institutional Shares | 7.37% | 10.26% | $7,125,044 |
Dow Jones Wilshire 5000 Index | 8.76 | 13.41 | 7,891,528 |
Spliced Social Index3 | 7.44 | 10.34 | 7,144,274 |
1 From May 8 until May 31, 2000, the fund conducted a subscription period during which its assets were held in money market instruments. Investor Shares returns are measured from May 31, 2000, when the fund began to follow its investment strategy. The inception date for Institutional Shares was January 14, 2003.
2 Total return figures do not reflect the $10 annual account maintenance fee applied on balances under $10,000.
3 Calvert Social Index through December 16, 2005; FTSE4Good US Select Index thereafter.
4 Derived from data provided by Lipper Inc.
Note: See Financial Highlights tables on pages 18 and 19 for dividend and capital gains information.
8
Fiscal-Year Total Returns (%): May 31, 2000–August 31, 2006
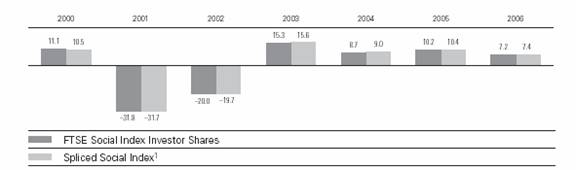
Average Annual Total Returns: Periods Ended June 30, 2006
This table presents average annual total returns through the latest calendar quarter—rather than through the end of the fiscal period. Securities and Exchange Commission rules require that we provide this information.
| Inception Date | One Year | Five Years | Since Inception |
Investor Shares2 | 5/31/20003 | 8.22% | 1.07% | –2.11% |
Institutional Shares | 1/14/2003 | 8.47 | 10.104 | — |
1 Calvert Social Index through December 16, 2005; FTSE4Good US Select Index thereafter.
2 Total return figures do not reflect the $10 annual account maintenance fee applied on balances under $10,000.
3 From May 8 until May 31, 2000, the fund conducted a subscription period during which its assets were held in money market instruments. Returns are measured from May 31, 2000, when the fund began to follow its investment strategy.
4 Return since inception.
9
Financial Statements
Statement of Net Assets
As of August 31, 2006
The fund provides a complete list of its holdings four times in each fiscal year, at the quarter-ends. For the second and fourth fiscal quarters, the lists appear in the fund’s semiannual and annual reports to shareholders. For the first and third fiscal quarters, the fund files the lists with the Securities and Exchange Commission on Form N-Q. Shareholders can look up the fund’s Forms N-Q on the SEC’s website at www.sec.gov. Forms N-Q may also be reviewed and copied at the SEC’s Public Reference Room (see the back cover of this report for further information).
| | | Market |
| | | Value• |
| | Shares | ($000) |
Common Stocks (99.9%) | | |
Consumer Discretionary (14.1%) | | |
* | Comcast Corp. Class A | 155,385 | 5,438 |
| Home Depot, Inc. | 156,319 | 5,360 |
| The Walt Disney Co. | 158,057 | 4,686 |
| McDonald’s Corp. | 94,215 | 3,382 |
| Lowe’s Cos., Inc. | 118,204 | 3,199 |
| Target Corp. | 65,871 | 3,188 |
| News Corp., Class A | 124,206 | 2,364 |
| Best Buy Co., Inc. | 36,878 | 1,733 |
* | Kohl’s Corp. | 25,930 | 1,621 |
| Federated Department Stores, Inc. | 41,666 | 1,582 |
| The McGraw-Hill Cos., Inc. | 27,051 | 1,512 |
| Carnival Corp. | 35,910 | 1,505 |
* | DIRECTV Group, Inc. | 72,271 | 1,358 |
* | Sears Holdings Corp. | 9,158 | 1,320 |
| Staples, Inc. | 54,937 | 1,239 |
| Clear Channel Communications, Inc. | 40,799 | 1,185 |
| Marriott International, Inc. Class A | 31,444 | 1,184 |
| News Corp., Class B | 59,347 | 1,179 |
| Gannett Co., Inc. | 18,122 | 1,030 |
| TJX Cos., Inc. | 34,777 | 930 |
* | Coach, Inc. | 29,030 | 876 |
| The Gap, Inc. | 48,341 | 813 |
* | Office Depot, Inc. | 21,657 | 798 |
| Limited Brands, Inc. | 29,790 | 767 |
| Nordstrom, Inc. | 20,457 | 764 |
| Hilton Hotels Corp. | 29,027 | 739 |
* | Amazon.com, Inc. | 23,595 | 727 |
* | IAC/InterActiveCorp | 25,502 | 726 |
* | Bed Bath & Beyond, Inc. | 21,293 | 718 |
| NTL Inc. | 24,386 | 646 |
| Pulte Homes, Inc. | 19,498 | 579 |
| Garmin Ltd. | 12,300 | 575 |
| H & R Block, Inc. | 24,801 | 522 |
| D. R. Horton, Inc. | 23,394 | 513 |
| Centex Corp. | 9,218 | 470 |
* | Univision Communications Inc. | 13,440 | 464 |
* | Wyndham Worldwide Corp. | 15,180 | 444 |
| Tribune Co. | 13,959 | 436 |
| Royal Caribbean Cruises, Ltd. | 11,891 | 434 |
| Lennar Corp. Class A | 9,640 | 432 |
| Michaels Stores, Inc. | 10,009 | 431 |
| Abercrombie & Fitch Co. | 6,574 | 424 |
*^ | Sirius Satellite Radio, Inc. | 100,015 | 409 |
* | Liberty Global, Inc. Class A | 17,103 | 404 |
* | Expedia, Inc. | 24,543 | 401 |
| Cablevision Systems NY Group Class A | 17,057 | 397 |
| Darden Restaurants Inc. | 11,209 | 397 |
* | AutoZone Inc. | 4,376 | 395 |
* | Mohawk Industries, Inc. | 5,110 | 362 |
| Autoliv, Inc. | 6,323 | 357 |
* | Lamar Advertising Co. Class A | 6,591 | 345 |
| Tiffany & Co. | 10,768 | 340 |
| American Eagle Outfitters, Inc. | 8,496 | 328 |
| E.W. Scripps Co. Class A | 7,180 | 326 |
| Circuit City Stores, Inc. | 13,457 | 318 |
| Family Dollar Stores, Inc. | 11,792 | 302 |
| KB Home | 7,038 | 301 |
* | Discovery Holding Co. Class A | 20,328 | 285 |
| Foot Locker, Inc. | 11,777 | 284 |
| PETsMART, Inc. | 10,673 | 268 |
| Ross Stores, Inc. | 10,815 | 265 |
| Williams-Sonoma, Inc. | 8,669 | 255 |
* | Chico’s FAS, Inc. | 13,628 | 251 |
| ServiceMaster Co. | 21,732 | 250 |
| Brinker International, Inc. | 6,432 | 247 |
| New York Times Co. Class A | 10,813 | 244 |
* | AutoNation, Inc. | 12,078 | 235 |
* | Toll Brothers, Inc. | 8,878 | 235 |
* | NVR, Inc. | 454 | 233 |
| Dollar General Corp. | 18,040 | 232 |
* | Dollar Tree Stores, Inc. | 7,974 | 229 |
| OfficeMax, Inc. | 5,283 | 219 |
10
| | | Market |
| | | Value• |
| | Shares | ($000) |
* | XM Satellite | | |
| Radio Holdings, Inc. | 15,243 | 198 |
| RadioShack Corp. | 10,126 | 183 |
| OSI Restaurant Partners, Inc. | 5,700 | 177 |
| Weight Watchers International, Inc. | 3,938 | 167 |
* | Getty Images, Inc. | 3,494 | 159 |
* | Urban Outfitters, Inc. | 9,321 | 146 |
* | Career Education Corp. | 7,317 | 140 |
| Washington Post Co. Class B | 174 | 134 |
| Dow Jones & Co., Inc. | 3,510 | 126 |
* | Comcast Corp. Special Class A | 2,976 | 104 |
* | Live Nation | 4,687 | 98 |
| Westwood One, Inc. | 4,505 | 33 |
| | | 69,072 |
Consumer Staples (4.7%) | | |
| Walgreen Co. | 76,391 | 3,778 |
| Colgate-Palmolive Co. | 39,199 | 2,346 |
| CVS Corp. | 61,819 | 2,074 |
| Costco Wholesale Corp. | 35,554 | 1,664 |
| General Mills, Inc. | 26,867 | 1,457 |
| The Kroger Co. | 55,144 | 1,313 |
| Kellogg Co. | 22,319 | 1,132 |
| Safeway, Inc. | 33,720 | 1,043 |
| Avon Products, Inc. | 34,006 | 976 |
| Sara Lee Corp. | 57,396 | 955 |
| Campbell Soup Co. | 23,432 | 880 |
| The Hershey Co. | 13,640 | 736 |
| Coca-Cola Enterprises, Inc. | 26,671 | 595 |
| Whole Foods Market, Inc. | 10,502 | 563 |
| Wm. Wrigley Jr. Co. | 10,965 | 509 |
| The Pepsi Bottling Group, Inc. | 13,347 | 467 |
| SuperValu Inc. | 15,200 | 434 |
* | Dean Foods Co. | 10,304 | 408 |
| McCormick & Co., Inc. | 9,014 | 328 |
* | Energizer Holdings, Inc. | 4,637 | 310 |
| Hormel Foods Corp. | 7,788 | 285 |
| Estee Lauder Cos. Class A | 7,134 | 263 |
| Alberto-Culver Co. Class B | 5,237 | 258 |
| PepsiAmericas, Inc. | 7,359 | 169 |
| Del Monte Foods Co. | 14,845 | 165 |
| Wm. Wrigley Jr. Co. Class B | 2,416 | 112 |
| | | 23,220 |
Energy (2.9%) | | |
| Schlumberger Ltd. | 89,006 | 5,456 |
| Apache Corp. | 24,825 | 1,621 |
| XTO Energy, Inc. | 27,262 | 1,248 |
| Peabody Energy Corp. | 19,996 | 881 |
* | Nabors Industries, Inc. | 23,456 | 771 |
| Sunoco, Inc. | 10,038 | 722 |
| Smith International, Inc. | 16,068 | 674 |
* | Ultra Petroleum Corp. | 11,708 | 581 |
| CONSOL Energy, Inc. | 14,030 | 512 |
* | Newfield Exploration Co. | 9,721 | 420 |
| Pioneer Natural Resources Co. | 9,714 | 405 |
| Patterson-UTI Energy, Inc. | 12,896 | 353 |
| Rowan Cos., Inc. | 8,241 | 282 |
| Pogo Producing Co. | 4,390 | 195 |
| Teekay Shipping Corp. | 4,189 | 185 |
| | | 14,306 |
Financials (38.7%) | | |
| Capital Markets (6.5%) | | |
| Morgan Stanley | 80,999 | 5,329 |
| Merrill Lynch & Co., Inc. | 67,405 | 4,956 |
| The Goldman Sachs Group, Inc. | 33,017 | 4,908 |
| Lehman Brothers Holdings, Inc. | 40,500 | 2,584 |
| The Bank of New York Co., Inc. | 57,603 | 1,944 |
| Charles Schwab Corp. | 97,304 | 1,587 |
| State Street Corp. | 25,335 | 1,566 |
| Franklin Resources Corp. | 14,608 | 1,438 |
| Bear Stearns Co., Inc. | 8,989 | 1,172 |
| Mellon Financial Corp. | 31,293 | 1,165 |
| Northern Trust Corp. | 16,645 | 932 |
| T. Rowe Price Group Inc. | 19,982 | 880 |
| Legg Mason Inc. | 9,377 | 856 |
* | E*TRADE Financial Corp. | 32,247 | 761 |
| TD Ameritrade Holding Corp. | 23,078 | 404 |
| Allied Capital Corp. | 10,467 | 320 |
| A.G. Edwards & Sons, Inc. | 5,763 | 304 |
| SEI Investments Co. | 5,644 | 288 |
| Janus Capital Group Inc. | 15,987 | 284 |
| Investors Financial Services Corp. | 4,972 | 230 |
| | | |
| Commercial Banks (8.1%) | | |
| Wells Fargo & Co. | 252,868 | 8,787 |
| Wachovia Corp. | 121,581 | 6,642 |
| U.S. Bancorp | 134,815 | 4,324 |
| SunTrust Banks, Inc. | 27,259 | 2,083 |
| BB&T Corp. | 41,302 | 1,768 |
| Fifth Third Bancorp | 41,794 | 1,644 |
| PNC Financial Services Group | 22,326 | 1,580 |
| Regions Financial Corp. | 34,507 | 1,242 |
| KeyCorp | 30,532 | 1,123 |
| M & T Bank Corp. | 8,523 | 1,044 |
| North Fork Bancorp, Inc. | 35,323 | 969 |
| Marshall & Ilsley Corp. | 19,107 | 891 |
| AmSouth Bancorp | 26,345 | 755 |
| Synovus Financial Corp. | 24,311 | 707 |
| Comerica, Inc. | 12,306 | 705 |
| Zions Bancorp | 7,976 | 630 |
| Compass Bancshares Inc. | 9,802 | 569 |
| Commerce Bancorp, Inc. | 13,945 | 465 |
| Huntington Bancshares Inc. | 18,536 | 443 |
| Popular, Inc. | 20,895 | 398 |
| First Horizon National Corp. | 9,338 | 357 |
| Mercantile Bankshares Corp. | 9,304 | 344 |
| Associated Banc-Corp. | 10,058 | 317 |
| Colonial BancGroup, Inc. | 11,599 | 284 |
11
| | | Market |
| | | Value• |
| | Shares | ($000) |
| UnionBanCal Corp. | 4,378 | 262 |
| TCF Financial Corp. | 9,899 | 258 |
| TD Banknorth, Inc. | 8,551 | 253 |
| Commerce Bancshares, Inc. | 5,048 | 253 |
| City National Corp. | 3,738 | 246 |
| Valley National Bancorp | 8,743 | 224 |
| Fulton Financial Corp. | 12,976 | 217 |
| | | |
| Consumer Finance (1.7%) | | |
| American Express Co. | 93,729 | 4,925 |
| Capital One Financial Corp. | 22,935 | 1,677 |
| SLM Corp. | 31,184 | 1,513 |
* | AmeriCredit Corp. | 9,936 | 233 |
| The First Marblehead Corp. | 2,361 | 124 |
| Student Loan Corp. | 374 | 69 |
| | | |
| Diversified Financial Services (6.6%) | | |
| Bank of America Corp. | 345,015 | 17,758 |
| JPMorgan Chase & Co. | 262,698 | 11,995 |
| Moody’s Corp. | 21,952 | 1,343 |
| CIT Group Inc. | 15,085 | 680 |
| The Chicago Mercantile Exchange | 782 | 344 |
| | | |
| Insurance (9.4%) | | |
| American International Group, Inc. | 198,030 | 12,638 |
| MetLife, Inc. | 57,054 | 3,140 |
| The Allstate Corp. | 47,959 | 2,779 |
| Prudential Financial, Inc. | 37,153 | 2,727 |
| The St. Paul Travelers, Cos. Inc. | 52,353 | 2,298 |
| The Hartford Financial Services Group Inc. | 22,734 | 1,952 |
| AFLAC Inc. | 37,859 | 1,706 |
| The Chubb Corp. | 31,380 | 1,574 |
| Progressive Corp. of Ohio | 59,584 | 1,465 |
| ACE Ltd. | 24,426 | 1,316 |
| Lincoln National Corp. | 21,551 | 1,308 |
| Genworth Financial Inc. | 34,411 | 1,185 |
| The Principal Financial Group, Inc. | 21,179 | 1,128 |
| Marsh & McLennan Cos., Inc. | 41,164 | 1,077 |
| XL Capital Ltd. Class A | 13,595 | 892 |
| Ambac Financial Group, Inc. | 7,969 | 690 |
| MBIA, Inc. | 10,227 | 630 |
| Cincinnati Financial Corp. | 13,105 | 611 |
| Fidelity National Financial, Inc. | 13,182 | 530 |
| Safeco Corp. | 9,031 | 521 |
| W.R. Berkley Corp. | 14,464 | 506 |
| Assurant, Inc. | 9,806 | 505 |
| UnumProvident Corp. | 25,998 | 493 |
| Torchmark Corp. | 7,549 | 470 |
| Everest Re Group, Ltd. | 4,844 | 455 |
| White Mountains Insurance Group Inc. | 815 | 431 |
| Axis Capital Holdings Ltd. | 11,549 | 375 |
| Old Republic International Corp. | 17,242 | 360 |
| Willis Group Holdings Ltd. | 8,945 | 324 |
| Brown & Brown, Inc. | 10,376 | 311 |
| First American Corp. | 7,217 | 293 |
| RenaissanceRe Holdings Ltd. | 5,394 | 278 |
| PartnerRe Ltd. | 4,298 | 276 |
* | Markel Corp. | 737 | 268 |
| Protective Life Corp. | 5,214 | 240 |
| Unitrin, Inc. | 3,872 | 170 |
| Transatlantic Holdings, Inc. | 1,950 | 120 |
| Mercury General Corp. | 2,021 | 102 |
| Erie Indemnity Co. Class A | 1,816 | 93 |
| Wesco Financial Corp. | 101 | 42 |
| | | |
| Real Estate (2.8%) | | |
| Simon Property Group, Inc.REIT | 16,651 | 1,412 |
| Vornado Realty Trust REIT | 10,607 | 1,123 |
| Equity Residential REIT | 21,987 | 1,096 |
| Equity Office Properties Trust REIT | 27,661 | 1,026 |
| Host Marriott Corp. REIT | 39,067 | 881 |
| Boston Properties, Inc. REIT | 8,540 | 868 |
| Archstone-Smith Trust REIT | 16,052 | 854 |
| General Growth Properties Inc. REIT | 18,193 | 825 |
| Public Storage, Inc. REIT | 9,430 | 817 |
| Kimco Realty Corp. REIT | 18,185 | 756 |
| Avalonbay Communities, Inc.REIT | 5,666 | 686 |
| Developers Diversified Realty Corp. REIT | 8,159 | 441 |
| The Macerich Co. REIT | 5,384 | 402 |
| Duke Realty Corp. REIT | 10,122 | 384 |
| AMB Property Corp. REIT | 6,404 | 358 |
| Regency Centers Corp. REIT | 5,207 | 350 |
| Liberty Property Trust REIT | 6,700 | 321 |
| Health Care Properties Investors REIT | 10,222 | 308 |
| Weingarten Realty Investors REIT | 6,728 | 285 |
| iStar Financial Inc. REIT | 6,364 | 267 |
| Hospitality Properties Trust REIT | 5,463 | 253 |
| Friedman, Billings, Ramsey Group, Inc. REIT | 12,093 | 100 |
| Mills Corp. REIT | 4,134 | 74 |
| | | |
| Real Estate Management & Development (0.2%) | |
* | Realogy Corp. | 18,900 | 404 |
| Forest City Enterprise Class A | 5,737 | 309 |
^ | The St. Joe Co. | 5,661 | 288 |
12
| | | Market |
| | | Value• |
| | Shares | ($000) |
| Thrifts & Mortgage Finance (3.4%) | | |
| Fannie Mae | 73,342 | 3,861 |
| Freddie Mac | 52,015 | 3,308 |
| Washington Mutual, Inc. | 72,383 | 3,032 |
| Golden West Financial Corp. | 23,298 | 1,759 |
| Countrywide Financial Corp. | 45,842 | 1,549 |
| Sovereign Bancorp, Inc. | 35,720 | 744 |
| Hudson City Bancorp, Inc. | 43,942 | 574 |
| MGIC Investment Corp. | 6,818 | 395 |
| Radian Group, Inc. | 6,283 | 376 |
| New York Community Bancorp, Inc. | 22,280 | 366 |
| The PMI Group Inc. | 6,805 | 294 |
| Astoria Financial Corp. | 7,753 | 238 |
| People’s Bank | 5,323 | 192 |
| | | 190,208 |
Health Care (16.8%) | | |
| Merck & Co., Inc. | 168,002 | 6,812 |
* | Amgen, Inc. | 89,210 | 6,060 |
| Abbott Laboratories | 115,449 | 5,622 |
| UnitedHealth Group Inc. | 103,075 | 5,355 |
| Eli Lilly & Co. | 85,471 | 4,780 |
| Medtronic, Inc. | 87,300 | 4,094 |
* | WellPoint Inc. | 48,279 | 3,737 |
* | Genentech, Inc. | 31,742 | 2,619 |
| Schering-Plough Corp. | 111,956 | 2,345 |
| Baxter International, Inc. | 49,788 | 2,210 |
* | Gilead Sciences, Inc. | 34,086 | 2,161 |
| Cardinal Health, Inc. | 31,561 | 2,128 |
| Caremark Rx, Inc. | 33,413 | 1,936 |
* | Boston Scientific Corp. | 105,043 | 1,832 |
| Aetna Inc. | 43,198 | 1,610 |
| HCA Inc. | 32,547 | 1,605 |
* | Medco Health Solutions, Inc. | 22,816 | 1,446 |
| Allergan, Inc. | 11,414 | 1,308 |
* | Genzyme Corp. | 19,640 | 1,301 |
* | Zimmer Holdings, Inc. | 18,722 | 1,273 |
* | Forest Laboratories, Inc. | 24,609 | 1,230 |
| McKesson Corp. | 22,939 | 1,165 |
* | Biogen Idec Inc. | 25,558 | 1,128 |
| Stryker Corp. | 22,838 | 1,097 |
* | Celgene Corp. | 26,026 | 1,059 |
| CIGNA Corp. | 9,057 | 1,024 |
* | St. Jude Medical, Inc. | 27,265 | 993 |
* | Express Scripts Inc. | 11,249 | 946 |
* | Alcon, Inc. | 6,974 | 821 |
* | Humana Inc. | 12,407 | 756 |
| Quest Diagnostics, Inc. | 11,181 | 719 |
| AmerisourceBergen Corp. | 15,736 | 695 |
* | Coventry Health Care Inc. | 12,137 | 658 |
* | Laboratory Corp. of America Holdings | 9,406 | 644 |
| Biomet, Inc. | 18,708 | 612 |
* | MedImmune Inc. | 18,676 | 516 |
* | DaVita, Inc. | 7,779 | 454 |
* | Hospira, Inc. | 11,819 | 433 |
| Applera Corp.–Applied Biosystems Group | 13,933 | 427 |
| Omnicare, Inc. | 9,100 | 412 |
* | Sepracor Inc. | 8,168 | 384 |
| Health Management Associates Class A | 18,198 | 381 |
* | Health Net Inc. | 8,672 | 363 |
* | Barr Pharmaceuticals Inc. | 5,978 | 338 |
* | Henry Schein, Inc. | 6,701 | 334 |
* | Waters Corp. | 7,791 | 332 |
| Mylan Laboratories, Inc. | 15,963 | 324 |
* | Patterson Cos. | 10,432 | 322 |
| Manor Care, Inc. | 6,021 | 314 |
* | King Pharmaceuticals, Inc. | 18,277 | 296 |
* | Triad Hospitals, Inc. | 6,661 | 293 |
* | Community Health Systems, Inc. | 7,359 | 285 |
* | Tenet Healthcare Corp. | 35,453 | 279 |
* | Lincare Holdings, Inc. | 7,220 | 267 |
* | Millipore Corp. | 4,058 | 260 |
* | Millennium Pharmaceuticals, Inc. | 23,828 | 259 |
* | Cephalon, Inc. | 4,383 | 250 |
* | Emdeon Corp. | 20,838 | 247 |
* | Invitrogen Corp. | 4,040 | 246 |
| Universal Health Services Class B | 3,842 | 218 |
* | Watson Pharmaceuticals, Inc. | 8,291 | 213 |
| Bausch & Lomb, Inc. | 3,973 | 192 |
* | ImClone Systems, Inc. | 4,681 | 140 |
* | Kinetic Concepts, Inc. | 3,945 | 125 |
| | | 82,685 |
Industrials (3.8%) | | |
| Caterpillar, Inc. | 50,630 | 3,359 |
| Burlington Northern Santa Fe Corp. | 27,496 | 1,841 |
| Union Pacific Corp. | 20,238 | 1,626 |
| Deere & Co. | 17,848 | 1,394 |
| Norfolk Southern Corp. | 31,153 | 1,331 |
| Southwest Airlines Co. | 60,560 | 1,049 |
| PACCAR, Inc. | 18,868 | 1,032 |
| Masco Corp. | 29,974 | 822 |
| Rockwell Automation, Inc. | 13,367 | 754 |
| Pitney Bowes, Inc. | 16,759 | 731 |
| C.H. Robinson Worldwide Inc. | 13,136 | 602 |
| W.W. Grainger, Inc. | 6,687 | 447 |
| Fastenal Co. | 11,416 | 419 |
| Robert Half International, Inc. | 13,031 | 403 |
| Republic Services, Inc. Class A | 10,303 | 400 |
| Manpower Inc. | 6,594 | 390 |
* | Monster Worldwide Inc. | 9,325 | 380 |
| Cintas Corp. | 9,490 | 351 |
| Equifax, Inc. | 9,738 | 310 |
| American Power Conversion Corp. | 14,549 | 256 |
13
| | | Market |
| | | Value• |
| | Shares | ($000) |
* | ChoicePoint Inc. | 6,525 | 236 |
| Ryder System, Inc. | 4,567 | 226 |
| J.B. Hunt Transport Services, Inc. | 8,661 | 170 |
| Cendant Corp. | 74,401 | 144 |
| Deluxe Corp. | 3,785 | 68 |
| | | 18,741 |
Information Technology (12.4%) | | |
| Intel Corp. | 439,746 | 8,593 |
* | Google Inc. | 17,320 | 6,556 |
* | Apple Computer, Inc. | 64,230 | 4,358 |
| First Data Corp. | 57,643 | 2,477 |
* | Yahoo! Inc. | 79,730 | 2,298 |
* | eBay Inc. | 78,479 | 2,186 |
| Automatic Data Processing, Inc. | 43,601 | 2,058 |
* | Adobe Systems, Inc. | 45,671 | 1,482 |
* | Symantec Corp. | 78,932 | 1,471 |
| Accenture Ltd. | 43,340 | 1,285 |
* | Electronic Arts Inc. | 22,976 | 1,171 |
* | Broadcom Corp. | 35,466 | 1,044 |
| Seagate Technology | 44,043 | 980 |
* | Network Appliance, Inc. | 28,362 | 971 |
| Electronic Data Systems Corp. | 39,419 | 939 |
* | Advanced Micro Devices, Inc. | 36,666 | 916 |
* | Micron Technology, Inc. | 51,096 | 883 |
* | SanDisk Corp. | 14,767 | 870 |
| Analog Devices, Inc. | 27,303 | 837 |
* | Intuit, Inc. | 26,810 | 810 |
| CA, Inc. | 32,943 | 776 |
* | Cognizant Technology Solutions Corp. | 10,599 | 741 |
| Maxim Integrated Products, Inc. | 24,290 | 707 |
| KLA-Tencor Corp. | 15,062 | 661 |
* | Juniper Networks, Inc. | 42,397 | 622 |
* | Autodesk, Inc. | 17,363 | 604 |
* | Freescale Semiconductor, Inc. Class B | 19,506 | 603 |
| Xilinx, Inc. | 26,060 | 596 |
* | Fiserv, Inc. | 13,287 | 587 |
* | Marvell Technology Group Ltd. | 33,144 | 580 |
* | Amdocs Ltd. | 15,197 | 577 |
* | Altera Corp. | 27,186 | 550 |
| Microchip Technology, Inc. | 16,099 | 550 |
* | Flextronics International Ltd. | 43,735 | 516 |
* | LAM Research Corp. | 10,572 | 452 |
* | BMC Software, Inc. | 16,094 | 428 |
| Jabil Circuit, Inc. | 15,896 | 426 |
* | Citrix Systems, Inc. | 13,776 | 423 |
* | Iron Mountain, Inc. | 9,875 | 405 |
* | BEA Systems, Inc. | 29,304 | 402 |
* | VeriSign, Inc. | 18,593 | 376 |
* | DST Systems, Inc. | 6,275 | 370 |
* | Avaya Inc. | 34,923 | 365 |
* | Cadence Design Systems, Inc. | 21,455 | 352 |
* | Tellabs, Inc. | 33,580 | 342 |
* | Comverse Technology, Inc. | 15,242 | 319 |
* | Freescale Semiconductor, Inc. Class A | 10,335 | 317 |
* | JDS Uniphase Corp. | 125,887 | 286 |
* | McAfee Inc. | 11,946 | 272 |
* | Check Point Software Technologies Ltd. | 14,603 | 271 |
| Fidelity National Information Services, Inc. | 7,324 | 268 |
* | Novellus Systems, Inc. | 9,598 | 268 |
* | Ceridian Corp. | 11,164 | 266 |
* | LSI Logic Corp. | 30,048 | 242 |
* | Alliance Data Systems Corp. | 4,632 | 234 |
| Symbol Technologies, Inc. | 19,225 | 231 |
* | QLogic Corp. | 12,170 | 224 |
* | Convergys Corp. | 10,585 | 221 |
* | Compuware Corp. | 28,955 | 220 |
| Sabre Holdings Corp. | 9,933 | 218 |
* | Avnet, Inc. | 11,033 | 216 |
| Diebold, Inc. | 5,145 | 216 |
| MoneyGram International, Inc. | 6,533 | 205 |
* | Agere Systems Inc. | 12,673 | 193 |
* | NAVTEQ Corp. | 7,093 | 188 |
* | Zebra Technologies Corp. Class A | 5,336 | 181 |
| Fair Isaac, Inc. | 4,879 | 171 |
| Molex, Inc. Class A | 4,717 | 148 |
* | Unisys Corp. | 25,584 | 137 |
| Total System Services, Inc. | 2,901 | 65 |
| | | 60,773 |
Materials (1.4%) | | |
| Monsanto Co. | 40,534 | 1,923 |
| Air Products & Chemicals, Inc. | 16,809 | 1,114 |
| Freeport-McMoRan Copper & Gold, Inc. Class B | 14,279 | 831 |
| Vulcan Materials Co. | 7,579 | 596 |
| Temple-Inland Inc. | 8,402 | 374 |
| Sigma-Aldrich Corp. | 5,106 | 371 |
| Ashland, Inc. | 5,409 | 342 |
| Eastman Chemical Co. | 6,171 | 324 |
| Sealed Air Corp. | 6,125 | 318 |
* | Pactiv Corp. | 10,892 | 291 |
| Bemis Co., Inc. | 7,881 | 255 |
| Louisiana-Pacific Corp. | 8,012 | 157 |
| | | 6,896 |
Telecommunication Services (4.7%) | | |
| AT&T Inc. | 293,919 | 9,150 |
| BellSouth Corp. | 136,769 | 5,569 |
| Sprint Nextel Corp. | 216,367 | 3,661 |
* | Qwest Communications International Inc. | 142,324 | 1,254 |
* | American Tower Corp. Class A | 31,727 | 1,138 |
* | NII Holdings Inc. | 11,454 | 611 |
14
| | | Market |
| | | Value• |
| | Shares | ($000) |
* | Crown Castle International Corp. | 16,207 | 557 |
* | Level 3 Communications, Inc. | 86,398 | 383 |
| CenturyTel, Inc. | 8,715 | 347 |
| Citizens Communications Co. | 24,533 | 338 |
| Telephone & Data Systems, Inc. | 3,873 | 164 |
| Telephone &Data Systems, Inc. – Special Common Shares | 3,774 | 155 |
| | | 23,327 |
Utilities (0.4%) | | |
| Questar Corp. | 6,396 | 554 |
| NiSource, Inc. | 20,442 | 433 |
| Pepco Holdings, Inc. | 14,180 | 360 |
| Equitable Resources, Inc. | 9,200 | 339 |
| Puget Energy, Inc. | 8,674 | 196 |
| | | 1,882 |
Total Common Stocks | | |
(Cost $444,117) | | 491,110 |
Temporary Cash Investment (0.1%) | | |
1 | Vanguard Market Liquidity | | |
| Fund, 5.293%—Note E | | |
| (Cost $616) | 615,600 | 616 |
Total Investments (100.0%) | | |
(Cost $444,733) | | 491,726 |
Other Assets and Liabilities (0.0%) | | |
Other Assets—Note B | | 1,843 |
Liabilities—Note E | | (2,081) |
| | | (238) |
Net Assets (100%) | | 491,488 |
At August 31, 2006, net assets consisted of:2 | |
| Amount |
| ($000) |
Paid-in Capital | 454,534 |
Undistributed Net Investment Income | 3,871 |
Accumulated Net Realized Losses | (13,910) |
Unrealized Appreciation | 46,993 |
Net Assets | 491,488 |
| |
Investor Shares—Net Assets | |
Applicable to 47,604,490 outstanding $.001 | |
par value shares of beneficial interest | |
(unlimited authorization) | 404,919 |
Net Asset Value Per Share— | |
Investor Shares | $8.51 |
| |
Institutional Shares—Net Assets | |
Applicable to 10,159,713 outstanding $.001 | |
par value shares of beneficial interest | |
(unlimited authorization) | 86,569 |
Net Asset Value Per Share— | |
Institutional Shares | $8.52 |
• | See Note A in Notes to Financial Statements. |
* | Non-income-producing security. |
^ | Part of security position is on loan to broker-dealers. See Note E in Notes to Financial Statements. |
1 Affiliated money market fund available only to Vanguard funds and certain trusts and accounts managed by Vanguard. Rate shown is the 7-day yield.
2 See Note C in Notes to Financial Statements for the tax-basis components of net assets.
REIT—Real Estate Investment Trust.
15
Statement of Operations
| Year Ended |
| August 31, 2006 |
| ($000) |
Investment Income | |
Income | |
Dividends | 7,165 |
Interest1 | 39 |
Security Lending | 20 |
Total Income | 7,224 |
Expenses | |
The Vanguard Group—Note B | |
Investment Advisory Services | 40 |
Management and Administrative | |
Investor Shares | 734 |
Institutional Shares | 34 |
Marketing and Distribution | |
Investor Shares | 116 |
Institutional Shares | 9 |
Custodian Fees | 63 |
Auditing Fees | 20 |
Shareholders’ Reports | |
Investor Shares | 13 |
Institutional Shares | — |
Trustees’ Fees and Expenses | 1 |
Total Expenses | 1,030 |
Net Investment Income | 6,194 |
Realized Net Gain (Loss) on Investment Securities Sold | 2,537 |
Change in Unrealized Appreciation (Depreciation) of Investment Securities | 21,293 |
Net Increase (Decrease) in Net Assets Resulting from Operations | 30,024 |
1 Interest income from an affiliated company of the fund was $39,000.
16
Statement of Changes in Net Assets
| Year Ended August 31, |
| 2006 | 2005 |
| ($000) | ($000) |
Increase (Decrease) in Net Assets | | |
Operations | | |
Net Investment Income | 6,194 | 6,011 |
Realized Net Gain (Loss) | 2,537 | (3,593) |
Change in Unrealized Appreciation (Depreciation) | 21,293 | 29,703 |
Net Increase (Decrease) in Net Assets Resulting from Operations | 30,024 | 32,121 |
Distributions | | |
Net Investment Income | | |
Investor Shares | (4,630) | (4,823) |
Institutional Shares | (363) | (221) |
Realized Capital Gain | | |
Investor Shares | — | — |
Institutional Shares | — | — |
Total Distributions | (4,993) | (5,044) |
Capital Share Transactions—Note F | | |
Investor Shares | 21,636 | 61,863 |
Institutional Shares | 56,187 | 12,803 |
Net Increase (Decrease) from Capital Share Transactions | 77,823 | 74,666 |
Total Increase (Decrease) | 102,854 | 101,743 |
Net Assets | | |
Beginning of Period | 388,634 | 286,891 |
End of Period1 | 491,488 | 388,634 |
1 Net Assets—End of Period includes undistributed net investment income of $3,871,000 and $2,670,000.
17
Financial Highlights
FTSE Social Index Fund Investor Shares
| Year Ended August 31, |
For a Share Outstanding Throughout Each Period | 2006 | 2005 | 2004 | 2003 | 2002 |
Net Asset Value, Beginning of Period | $8.03 | $7.40 | $6.87 | $6.02 | $7.57 |
Investment Operations | | | | | |
Net Investment Income | .11 | .131 | .08 | .07 | .05 |
Net Realized and Unrealized | | | | | |
Gain (Loss) on Investments | .47 | .62 | .52 | .84 | (1.55) |
Total from Investment Operations | .58 | .75 | .60 | .91 | (1.50) |
Distributions | | | | | |
Dividends from Net Investment Income | (.10) | (.12) | (.07) | (.06) | (.05) |
Distributions from Realized Capital Gains | — | — | — | — | — |
Total Distributions | (.10) | (.12) | (.07) | (.06) | (.05) |
Net Asset Value, End of Period | $8.51 | $8.03 | $7.40 | $6.87 | $6.02 |
| | | | | |
Total Return2 | 7.25% | 10.16% | 8.75% | 15.28% | –19.96% |
| | | | | |
Ratios/Supplemental Data | | | | | |
Net Assets, End of Period (Millions) | $405 | $361 | $274 | $150 | $94 |
Ratio of Total Expenses to | | | | | |
Average Net Assets | 0.25% | 0.25% | 0.25% | 0.25% | 0.25% |
Ratio of Net Investment Income | | | | | |
to Average Net Assets | 1.41% | 1.74%1 | 1.17% | 1.18% | 0.82% |
Portfolio Turnover Rate | 51%3 | 12% | 8% | 14% | 18% |
1 Net investment income per share and the ratio of net investment income to average net assets include $0.04 and 0.43%, respectively, resulting from a special dividend from Microsoft Corp. in November 2004.
2 Total returns do not reflect the $10 annual account maintenance fee applied on balances under $10,000.
3 Includes activity related to a change in the fund’s target index.
18
FTSE Social Index Fund Institutional Shares
| | | | Jan. 141 to |
| Year Ended August 31, | Aug. 31, |
For a Share Outstanding Throughout Each Period | 2006 | 2005 | 2004 | 2003 |
Net Asset Value, Beginning of Period | $8.04 | $7.41 | $6.88 | $6.22 |
Investment Operations | | | | |
Net Investment Income | .12 | .1382 | .084 | .05 |
Net Realized and Unrealized Gain (Loss) on Investments | .47 | .620 | .522 | .61 |
Total from Investment Operations | .59 | .758 | .606 | .66 |
Distributions | | | | |
Dividends from Net Investment Income | (.11) | (.128) | (.076) | — |
Distributions from Realized Capital Gains | — | — | — | — |
Total Distributions | (.11) | (.128) | (.076) | — |
Net Asset Value, End of Period | $8.52 | $8.04 | $7.41 | $6.88 |
| | | | |
Total Return | 7.37% | 10.26% | 8.83% | 10.61% |
| | | | |
Ratios/Supplemental Data | | | | |
Net Assets, End of Period (Millions) | $87 | $27 | $13 | $12 |
Ratio of Total Expenses to Average Net Assets | 0.12% | 0.12% | 0.12% | 0.12%3 |
Ratio of Net Investment Income to Average Net Assets | 1.54% | 1.83%2 | 1.30% | 1.32%3 |
Portfolio Turnover Rate | 51%4 | 12% | 8% | 14% |
1 Inception.
2 Net investment income per share and the ratio of net investment income to average net assets include $0.036 and 0.43%, respectively, resulting from a special dividend from Microsoft Corp. in November 2004.
3 Annualized.
4 Includes activity related to a change in the fund’s target index.
See accompanying Notes, which are an integral part of the Financial Statements.
19
Notes to Financial Statements
Vanguard FTSE Social Index Fund (formerly known as Vanguard Calvert Social Index Fund) is registered under the Investment Company Act of 1940 as an open-end investment company, or mutual fund. The fund files reports with the SEC under the company name Vanguard World Funds. The fund offers two classes of shares, Investor Shares and Institutional Shares. Investor Shares are available to any investor who meets the fund’s minimum purchase requirements. Institutional Shares are designed for investors who meet certain administrative and servicing criteria and invest a minimum of $5 million.
A. The following significant accounting policies conform to generally accepted accounting principles for U.S. mutual funds. The fund consistently follows such policies in preparing its financial statements.
1. Security Valuation: Securities are valued as of the close of trading on the New York Stock Exchange (generally 4:00 p.m. Eastern time) on the valuation date. Equity securities are valued at the latest quoted sales prices or official closing prices taken from the primary market in which each security trades; such securities not traded on the valuation date are valued at the mean of the latest quoted bid and asked prices. Securities for which market quotations are not readily available, or whose values have been materially affected by events occurring before the fund’s pricing time but after the close of the securities’ primary markets, are valued by methods deemed by the board of trustees to represent fair value. Investments in Vanguard Market Liquidity Fund are valued at that fund's net asset value.
2. Federal Income Taxes: The fund intends to continue to qualify as a regulated investment company and distribute all of its taxable income. Accordingly, no provision for federal income taxes is required in the financial statements.
3. Distributions: Distributions to shareholders are recorded on the ex-dividend date.
4. Security Lending: The fund may lend its securities to qualified institutional borrowers to earn additional income. Security loans are required to be secured at all times by collateral at least equal to the market value of securities loaned. The fund invests cash collateral received in Vanguard Market Liquidity Fund, and records a liability for the return of the collateral, during the period the securities are on loan. Security lending income represents the income earned on investing cash collateral, less expenses associated with the loan.
5. Other: Dividend income is recorded on the ex-dividend date. Interest income includes income distributions received from Vanguard Market Liquidity Fund and is accrued daily. Security transactions are accounted for on the date securities are bought or sold. Costs used to determine realized gains (losses) on the sale of investment securities are those of the specific securities sold.
Each class of shares has equal rights as to assets and earnings, except that each class separately bears certain class-specific expenses related to maintenance of shareholder accounts (included in Management and Administrative expenses) and shareholder reporting. Marketing and distribution expenses are allocated to each class of shares based on a method approved by the board of trustees. Income, other non-class-specific expenses, and gains and losses on investments are allocated to each class of shares based on its relative net assets.
B. The Vanguard Group furnishes at cost investment advisory, corporate management, administrative, marketing, and distribution services. The costs of such services are allocated to the fund under methods approved by the board of trustees. The fund has committed to provide up to 0.40% of its net assets in capital contributions to Vanguard. At August 31, 2006, the fund had contributed capital of
20
$52,000 to Vanguard (included in Other Assets), representing 0.01% of the fund’s net assets and 0.05% of Vanguard’s capitalization. The fund’s trustees and officers are also directors and officers of Vanguard.
C. Distributions are determined on a tax basis and may differ from net investment income and realized capital gains for financial reporting purposes. Differences may be permanent or temporary. Permanent differences are reclassified among capital accounts in the financial statements to reflect their tax character. Temporary differences arise when certain items of income, expense, gain, or loss are recognized in different periods for financial statement and tax purposes; these differences will reverse at some time in the future. Differences in classification may also result from the treatment of short-term gains as ordinary income for tax purposes.
For tax purposes, at August 31, 2006, the fund had $4,398,000 of ordinary income available for distribution. The fund had available realized losses of $13,625,000 to offset future net capital gains of $56,000 through August 31, 2009, $3,511,000 through August 31, 2010, $5,506,000 through August 31, 2011, $3,200,000 through August 31, 2012, $985,000 through August 31, 2013, and $367,000 through August 31, 2014.
At August 31, 2006, the cost of investment securities for tax purposes was $444,998,000. Net unrealized appreciation of investment securities for tax purposes was $46,728,000, consisting of unrealized gains of $67,268,000 on securities that had risen in value since their purchase and $20,540,000 in unrealized losses on securities that had fallen in value since their purchase.
D. During the year ended August 31, 2006, the fund purchased $300,992,000 of investment securities and sold $222,473,000 of investment securities other than temporary cash investments.
E. The market value of securities on loan to broker-dealers at August 31, 2006, was $532,000, for which the fund received cash collateral of $616,000.
F. Capital share transactions for each class of shares were:
| | | | Year Ended August 31, |
| | 2006 | | | 2005 |
| Amount | Shares | | Amount | Shares |
| ($000) | (000) | | ($000) | (000) |
Investor Shares | | | | | |
Issued | 111,874 | 13,456 | | 133,415 | 17,210 |
Issued in Lieu of Cash Distributions | 4,249 | 509 | | 4,403 | 558 |
Redeemed | (94,487) | (11,368) | | (75,955) | (9,751) |
Net Increase (Decrease)—Investor Shares | 21,636 | 2,597 | | 61,863 | 8,017 |
Institutional Shares | | | | | |
Issued | 60,218 | 7,250 | | 16,099 | 2,046 |
Issued in Lieu of Cash Distributions | 363 | 44 | | 221 | 28 |
Redeemed | (4,394) | (530) | | (3,517) | (452) |
Net Increase (Decrease)—Institutional Shares | 56,187 | 6,764 | | 12,803 | 1,622 |
21
G. In June 2006, the Financial Accounting Standards Board issued Interpretation No. 48 (“FIN 48”), “Accounting for Uncertainty in Income Taxes.” FIN 48 establishes the minimum threshold for recognizing, and a system for measuring, the benefits of tax-return positions in financial statements. FIN 48 will be effective for the fund’s fiscal year beginning September 1, 2007. Management is in the process of analyzing the fund’s tax positions for purposes of implementing FIN 48; based on the analysis completed to date, management does not believe the adoption of FIN 48 will result in any material impact to the fund’s financial statements.
22
Report of Independent Registered Public Accounting Firm
To the Trustees of Vanguard World Funds and the Shareholders of Vanguard FTSE Social Index Fund:
In our opinion, the accompanying statement of net assets and the related statements of operations and of changes in net assets and the financial highlights present fairly, in all material respects, the financial position of Vanguard FTSE Social Index Fund (the “Fund”) at August 31, 2006, the results of its operations for the year then ended, the changes in its net assets for each of the two years in the period then ended and the financial highlights for each of the periods indicated, in conformity with accounting principles generally accepted in the United States of America. These financial statements and financial highlights (hereafter referred to as “financial statements”) are the responsibility of the Fund's management; our responsibility is to express an opinion on these financial statements based on our audits. We conducted our audits of these financial statements in accordance with the standards of the Public Company Accounting Oversight Board (United States). Those standards require that we plan and perform the audit to obtain reasonable assurance about whether the financial statements are free of material misstatement. An audit includes examining, on a test basis, evidence supporting the amounts and disclosures in the financial statements, assessing the accounting principles used and significant estimates made by management, and evaluating the overall financial statement presentation. We believe that our audits, which included confirmation of securities at August 31, 2006 by correspondence with the custodian and by agreement to the underlying ownership records for Vanguard Market Liquidity Fund, provide a reasonable basis for our opinion.
PricewaterhouseCoopers LLP
Philadelphia, Pennsylvania
October 12, 2006
Special 2006 tax information (unaudited) for Vanguard FTSE Social Index Fund
This information for the fiscal year ended August 31, 2006, is included pursuant to provisions of the Internal Revenue Code.
The fund distributed $4,993,000 of qualified dividend income to shareholders during the fiscal year.
For corporate shareholders, 100% of investment income (dividend income plus short-term gains, if any) qualifies for the dividends-received deduction.
23
Your Fund’s After-Tax Returns
This table presents returns for your fund both before and after taxes. The after-tax returns are shown in two ways: (1) assuming that an investor owned the fund during the entire period and paid taxes on the fund’s distributions, and (2) assuming that an investor paid taxes on the fund’s distributions and sold all shares at the end of each period.
Calculations are based on the highest individual federal income tax and capital gains tax rates in effect at the times of the distributions and the hypothetical sales. State and local taxes were not considered. After-tax returns reflect any qualified dividend income, using actual prior-year figures and estimates for 2006. (In the example, returns after the sale of fund shares may be higher than those assuming no sale. This occurs when the sale would have produced a capital loss. The calculation assumes that the investor received a tax deduction for the loss.)
The table shows returns for Investor Shares only; returns for other share classes will differ. Please note that your actual after-tax returns will depend on your tax situation and may differ from those shown. Also note that if you own the fund in a tax-deferred account, such as an individual retirement account or a 401(k) plan, this information does not apply to you. Such accounts are not subject to current taxes.
Finally, keep in mind that a fund’s performance—whether before or after taxes—does not guarantee future results.
Average Annual Total Returns: FTSE Social Index Investor Shares1 |
Periods Ended August 31, 2006 | | | |
| One | Five | Since |
| Year | Years | Inception2 |
Returns Before Taxes | 7.25% | 3.46% | –1.70% |
Returns After Taxes on Distributions | 7.06 | 3.22 | –1.91 |
Returns After Taxes on Distributions and Sale of Fund Shares | 4.96 | 2.87 | –1.52 |
1 Total return figures do not reflect the $10 annual account maintenance fee applied on balances under $10,000.
2 From May 8 until May 31, 2000, the fund conducted a subscription period during which its assets were held in money market instruments. Returns are measured from May 31, 2000, when the fund began to follow its investment strategy.
24
About Your Fund’s Expenses
As a shareholder of the fund, you incur ongoing costs, which include costs for portfolio management, administrative services, and shareholder reports (like this one), among others. Operating expenses, which are deducted from a fund’s gross income, directly reduce the investment return of the fund.
A fund’s expenses are expressed as a percentage of its average net assets. This figure is known as the expense ratio. The following examples are intended to help you understand the ongoing costs (in dollars) of investing in your fund and to compare these costs with those of other mutual funds. The examples are based on an investment of $1,000 made at the beginning of the period shown and held for the entire period.
The table below illustrates your fund’s costs in two ways:
• Based on actual fund return. This section helps you to estimate the actual expenses that you paid over the period. The “Ending Account Value” shown is derived from the fund’s actual return, and the third column shows the dollar amount that would have been paid by an investor who started with $1,000 in the fund. You may use the information here, together with the amount you invested, to estimate the expenses that you paid over the period.
To do so, simply divide your account value by $1,000 (for example, an $8,600 account value divided by $1,000 = 8.6), then multiply the result by the number given for your fund under the heading “Expenses Paid During Period.”
• Based on hypothetical 5% yearly return. This section is intended to help you compare your fund’s costs with those of other mutual funds. It assumes that the fund had a yearly return of 5% before expenses, but that the expense ratio is unchanged. In this case—because the return used is not the fund’s actual return—the results do not apply to your investment. The example is useful in making comparisons because the Securities and Exchange Commission requires all mutual funds to calculate expenses based on a 5% return. You can assess your fund’s costs by comparing this hypothetical example with the hypothetical examples that appear in shareholder reports of other funds.
Six Months Ended August 31, 2006 | | | |
| Beginning | Ending | Expenses |
| Account Value | Account Value | Paid During |
FTSE Social Index Fund | 2/28/2006 | 8/31/2006 | Period1 |
Based on Actual Fund Return | | | |
Investor Shares | $1,000.00 | $1,003.54 | $1.26 |
Institutional Shares | 1,000.00 | 1,003.53 | 0.61 |
Based on Hypothetical 5% Yearly Return | | | |
Investor Shares | $1,000.00 | $1,023.95 | $1.28 |
Institutional Shares | 1,000.00 | 1,024.60 | 0.61 |
1 These calculations are based on expenses incurred in the most recent six-month period. The fund’s annualized six-month expense ratios for that period are 0.25% for Investor Shares and 0.12% for Institutional Shares. The dollar amounts shown as “Expenses Paid” are equal to the annualized expense ratio multiplied by the average account value over the period, multiplied by the number of days in the most recent six-month period, then divided by the number of days in the most recent 12-month period.
25
Note that the expenses shown in the table are meant to highlight and help you compare ongoing costs only and do not reflect any transactional costs or account maintenance fees. They do not include your fund’s low-balance fee, which is described in the prospectus. If this fee were applied to your account, your costs would be higher. Your fund does not charge transaction fees, such as purchase or redemption fees, nor does it carry a “sales load.”
The calculations assume no shares were bought or sold during the period. Your actual costs may have been higher or lower, depending on the amount of your investment and the timing of any purchases or redemptions.
You can find more information about the fund’s expenses, including annual expense ratios, in the Financial Statements section of this report. For additional information on operating expenses and other shareholder costs, please refer to the appropriate fund prospectus.
26
Trustees Approve Advisory Arrangement
The board of trustees of Vanguard FTSE Social Index Fund has approved the fund’s investment advisory arrangement with The Vanguard Group, Inc. Vanguard—through its Quantitative Equity Group—serves as the investment advisor for the fund. The board determined that continuing the fund’s internalized management structure was in the best interests of the fund and its shareholders.
The board based its decision upon its most recent evaluation of the advisor’s investment staff, portfolio management process, and performance. The trustees considered the factors discussed below, among others. However, no single factor determined whether the board approved the arrangement. Rather, it was the totality of the circumstances that drove the board’s decision.
Nature, extent, and quality of services
The board considered the quality of the fund’s investment management over both short- and long-term periods, and took into account the organizational depth and stability of the advisor. Vanguard has been managing investments for more than two decades. George U. Sauter, Vanguard managing director and chief investment officer, has been in the investment management business since 1985 and has led the Quantitative Equity Group since 1987. The Quantitative Equity Group adheres to a sound, disciplined investment management process; the team has considerable experience, stability, and depth.
The board concluded that Vanguard’s experience, stability, depth, and performance, among other factors, warranted continuation of the advisory arrangement.
Investment performance
The board considered the short- and long-term performance of the fund, including any periods of outperformance or underperformance of its benchmark and peer group. The board noted that the fund has performed in line with expectations and that its results have been consistent with its investment strategy. Information about the fund’s performance, including some of the data considered by the board, can be found in the Performance Summary section of this report.
Cost
The fund’s expense ratio was far below the average expense ratio charged by funds in its peer group. The fund’s advisory expense ratio was also well below its peer-group average. Information about the fund’s expense ratio appears in the About Your Fund’s Expenses section of this report as well as in the Financial Statements section.
The board does not conduct a profitability analysis of Vanguard because of Vanguard’s unique “at-cost” structure. Unlike most other mutual fund management companies, Vanguard is owned by the funds it oversees, and produces “profits” only in the form of reduced expenses for fund shareholders.
The benefit of economies of scale
The board of trustees concluded that the fund’s low-cost arrangement with Vanguard ensures that the fund will realize economies of scale as it grows, with the cost to shareholders declining as fund assets increase.
The board will consider whether to renew the advisory arrangement again after a one-year period.
27
Glossary
Beta. A measure of the magnitude of a fund’s past share-price fluctuations in relation to the ups and downs of a given market index. The index is assigned a beta of 1.00. Compared with a given index, a fund with a beta of 1.20 typically would have seen its share price rise or fall by 12% when the index rose or fell by 10%. A fund’s beta should be reviewed in conjunction with its R-squared (see definition below). The lower the R-squared, the less correlation there is between the fund and the index, and the less reliable beta is as an indicator of volatility.
Earnings Growth Rate. The average annual rate of growth in earnings over the past five years for the stocks now in a fund.
Expense Ratio. The percentage of a fund’s average net assets used to pay its annual administrative and advisory expenses. These expenses directly reduce returns to investors.
Foreign Holdings. The percentage of a fund represented by stocks or depositary receipts of companies based outside the United States.
Median Market Cap. An indicator of the size of companies in which a fund invests; the midpoint of market capitalization (market price x shares outstanding) of a fund’s stocks, weighted by the proportion of the fund’s assets invested in each stock. Stocks representing half of the fund’s assets have market capitalizations above the median, and the rest are below it.
Price/Book Ratio. The share price of a stock divided by its net worth, or book value, per share. For a fund, the weighted average price/book ratio of the stocks it holds.
Price/Earnings Ratio. The ratio of a stock’s current price to its per-share earnings over the past year. For a fund, the weighted average P/E of the stocks it holds. P/E is an indicator of market expectations about corporate prospects; the higher the P/E, the greater the expectations for a company’s future growth.
R-Squared. A measure of how much of a fund’s past returns can be explained by the returns from the market in general, as measured by a given index. If a fund’s total returns were precisely synchronized with an index’s returns, its R-squared would be 1.00. If the fund’s returns bore no relationship to the index’s returns, its R-squared would be 0.
Return on Equity. The annual average rate of return generated by a company during the past five years for each dollar of shareholder’s equity (net income divided by shareholder’s equity). For a fund, the weighted average return on equity for the companies whose stocks it holds.
Short-Term Reserves. The percentage of a fund invested in highly liquid, short-term securities that can be readily converted to cash.
Turnover Rate. An indication of the fund’s trading activity. Funds with high turnover rates incur higher transaction costs and may be more likely to distribute capital gains (which may be taxable to investors). The turnover rate excludes in-kind transactions, which have minimal impact on costs.
Yield. A snapshot of a fund’s income from interest and dividends. The yield, expressed as a percentage of the fund’s net asset value, is based on income earned over the past 30 days and is annualized, or projected forward for the coming year. The index yield is based on the current annualized rate of income provided by securities in the index.
28
This page intentionally left blank.
This page intentionally left blank.
This page intentionally left blank.
The People Who Govern Your Fund
The trustees of your mutual fund are there to see that the fund is operated and managed in your best interests since, as a shareholder, you are a part owner of the fund. Your fund’s trustees also serve on the board of directors of The Vanguard Group, Inc., which is owned by the Vanguard funds and provides services to them on an at-cost basis.
A majority of Vanguard’s board members are independent, meaning that they have no affiliation with Vanguard or the funds they oversee, apart from the sizable personal investments they have made as private individuals.
Our independent board members bring distinguished backgrounds in business, academia, and public service to their task of working with Vanguard officers to establish the policies and oversee the activities of the funds. Among board members’ responsibilities are selecting investment advisors for the funds; monitoring fund operations, performance, and costs; reviewing contracts; nominating and selecting new trustees/directors; and electing Vanguard officers.
Each trustee serves a fund until its termination; or until the trustee’s retirement, resignation, or death; or otherwise as specified in the fund’s organizational documents. Any trustee may be removed at a shareholders’ meeting by a vote representing two-thirds of the net asset value of all shares of the fund together with shares of other Vanguard funds organized within the same trust. The table on these two pages shows information for each trustee and executive officer of the fund. The mailing address of the trustees and officers is P.O. Box 876, Valley Forge, PA 19482.
Chairman of the Board, Chief Executive Officer, and Trustee |
| |
John J. Brennan1 | |
Born 1954 | Principal Occupation(s) During the Past Five Years: Chairman of the Board, Chief |
Trustee since May 1987; | Executive Officer, and Director/Trustee of The Vanguard Group, Inc., and of each |
Chairman of the Board and | of the investment companies served by The Vanguard Group. |
Chief Executive Officer | |
142 Vanguard Funds Overseen |
| |
Independent Trustees | |
| |
Charles D. Ellis | |
Born 1937 | Principal Occupation(s) During the Past Five Years: Applecore Partners (pro bono ventures |
Trustee since January 2001 | in education); Senior Advisor to Greenwich Associates (international business strategy |
142 Vanguard Funds Overseen | consulting); Successor Trustee of Yale University; Overseer of the Stern School of Business |
| at New York University; Trustee of the Whitehead Institute for Biomedical Research. |
| |
Rajiv L. Gupta | |
Born 1945 | Principal Occupation(s) During the Past Five Years: Chairman and Chief Executive Officer |
Trustee since December 20012 | of Rohm and Haas Co. (chemicals); Board Member of the American Chemistry Council; |
142 Vanguard Funds Overseen | Director of Tyco International, Ltd. (diversified manufacturing and services) (since 2005); |
| Trustee of Drexel University and of the Chemical Heritage Foundation. |
| |
Amy Gutmann | |
Born 1949 | Principal Occupation(s) During the Past Five Years: President of the University of |
Trustee since June 2006 | Pennsylvania since 2004; Professor in the School of Arts and Sciences, Annenberg School |
142 Vanguard Funds Overseen | for Communication, and Graduate School of Education of the University of Pennsylvania |
| since 2004; Provost (2001–2004) and Laurance S. Rockefeller Professor of Politics and the |
| University Center for Human Values (1990–2004), Princeton University; Director of Carnegie |
| Corporation of New York and of Philadelphia 2016 (since 2005) and of Schuylkill River |
| Development Corporation and Greater Philadelphia Chamber of Commerce (since 2004). |
JoAnn Heffernan Heisen | |
Born 1950 | Principal Occupation(s) During the Past Five Years: Corporate Vice President and Chief |
Trustee since July 1998 | Global Diversity Officer (since January 2006), Vice President and Chief Information |
142 Vanguard Funds Overseen | Officer (1997–2005), and Member of the Executive Committee of Johnson & Johnson |
| (pharmaceuticals/consumer products); Director of the University Medical Center at |
| Princeton and Women’s Research and Education Institute. |
| |
André F. Perold | |
Born 1952 | Principal Occupation(s) During the Past Five Years: George Gund Professor of Finance and |
Trustee since December 2004 | Banking, Harvard Business School (since 2000); Senior Associate Dean, Director of Faculty |
142 Vanguard Funds Overseen | Recruiting, and Chair of Finance Faculty, Harvard Business School; Director and Chairman |
| of UNX, Inc. (equities trading firm) (since 2003); Director of registered investment |
| companies advised by Merrill Lynch Investment Managers and affiliates (1985–2004), |
| Genbel Securities Limited (South African financial services firm) (1999–2003), Gensec |
| Bank (1999–2003), Sanlam, Ltd. (South African insurance company) (2001–2003), and |
| Stockback, Inc. (credit card firm) (2000–2002). |
| |
Alfred M. Rankin, Jr. | |
Born 1941 | Principal Occupation(s) During the Past Five Years: Chairman, President, Chief Executive |
Trustee since January 1993 | Officer, and Director of NACCO Industries, Inc. (forklift trucks/housewares/ lignite); |
142 Vanguard Funds Overseen | Director of Goodrich Corporation (industrial products/aircraft systems and services). |
| |
J. Lawrence Wilson | |
Born 1936 | Principal Occupation(s) During the Past Five Years: Retired Chairman and Chief Executive |
Trustee since April 1985 | Officer of Rohm and Haas Co. (chemicals); Director of Cummins Inc. (diesel engines), |
142 Vanguard Funds Overseen | MeadWestvaco Corp. (packaging products), and AmerisourceBergen Corp. (pharmaceutical |
| distribution); Trustee of Vanderbilt University and of Culver Educational Foundation. |
| |
Executive Officers1 | |
| |
Heidi Stam | |
Born 1956 | Principal Occupation(s) During the Past Five Years: Principal of The Vanguard Group, Inc., |
Secretary since July 2005 | since November 1997; General Counsel of The Vanguard Group since July 2005; |
142 Vanguard Funds Overseen | Secretary of The Vanguard Group and of each of the investment companies served |
| by The Vanguard Group since July 2005. |
| |
Thomas J. Higgins | |
Born 1957 | Principal Occupation(s) During the Past Five Years: Principal of The Vanguard Group, Inc.; |
Treasurer since July 1998 | Treasurer of each of the investment companies served by The Vanguard Group. |
142 Vanguard Funds Overseen | |
| |
Vanguard Senior Management Team |
| |
R. Gregory Barton | Kathleen C. Gubanich | Michael S. Miller |
Mortimer J. Buckley | Paul A. Heller | Ralph K. Packard |
James H. Gately | F. William McNabb, III | George U. Sauter |
| |
Founder | |
| |
John C. Bogle | |
Chairman and Chief Executive Officer, 1974–1996 |
1 Officers of the funds are “interested persons” as defined in the Investment Company Act of 1940.
2 December 2002 for Vanguard Equity Income Fund, Vanguard Growth Equity Fund, the Vanguard Municipal Bond Funds, and the Vanguard State Tax-Exempt Funds.
More information about the trustees is in the Statement of Additional Information, available from The Vanguard Group.
| 
|
| P.O. Box 2600 |
| Valley Forge, PA 19482-2600 |
Connect with Vanguard™ > www.vanguard.com
Fund Information > 800-662-7447 | All other marks are the exclusive property of their |
| respective owners. |
Direct Investor Account Services > 800-662-2739 | |
| |
Institutional Investor Services > 800-523-1036 | All comparative mutual fund data are from Lipper Inc. |
| or Morningstar, Inc., unless otherwise noted. |
Text Telephone > 800-952-3335 | |
| You can obtain a free copy of Vanguard’s proxy voting |
| guidelines by visiting our website, www.vanguard.com, |
| and searching for “proxy voting guidelines,” or by calling |
This material may be used in conjunction | Vanguard at 800-662-2739. They are also available from |
with the offering of shares of any Vanguard | the SEC’s website, www.sec.gov. In addition, you may |
fund only if preceded or accompanied by | obtain a free report on how your fund voted the proxies for |
the fund’s current prospectus. | securities it owned during the 12 months ended June 30. |
| |
| To get the report, visit either www.vanguard.com |
Vanguard, Connect with Vanguard, and the ship logo | or www.sec.gov. |
are trademarks of The Vanguard Group, Inc. | |
| You can review and copy information about your fund |
“FTSE®” and “FTSE4Good™” are trademarks jointly | at the SEC’s Public Reference Room in Washington, D.C. |
owned by the London Stock Exchange plc and The | To find out more about this public service, call the SEC |
Financial Times Limited and are used by FTSE | at 202-551-8090. Information about your fund is also |
International Limited under license. The FTSE4Good | available on the SEC’s website, and you can receive |
US Select Index is calculated by FTSE International | copies of this information, for a fee, by sending a |
Limited. FTSE International Limited does not sponsor, | request in either of two ways: via e-mail addressed to |
endorse, or promote the fund; is not in any way | publicinfo@sec.gov or via regular mail addressed to the |
connected to it; and does not accept any liability in | Public Reference Section, Securities and Exchange |
relation to its issue, operation, and trading. | Commission, Washington, DC 20549-0102. |
| |
| |
| |
| |
| |
| © 2006 The Vanguard Group, Inc. |
| All rights reserved. |
| Vanguard Marketing Corporation, Distributor. |
| |
| Q2130 102006 |
Vanguard® U.S. Sector Index Funds |
| |
| |
> Annual Report | |
| |
| |
| |
| |
August 31, 2006 | |
| |
| |
| |
| |
| |
| |
| 
|
| |
| |
| |
| |
Vanguard Consumer Discretionary Index Fund | |
| |
Vanguard Consumer Staples Index Fund | |
| |
Vanguard Energy Index Fund | |
| |
Vanguard Financials Index Fund | |
| |
Vanguard Health Care Index Fund | |
| |
Vanguard Industrials Index Fund | |
| |
Vanguard Information Technology Index Fund | |
| |
Vanguard Materials Index Fund | |
| |
Vanguard Telecommunication Services Index Fund |
| |
Vanguard Utilities Index Fund | |
> During the fiscal year ended August 31, 2006, the broad U.S. stock market returned nearly 9%, climbing through much of the period, then fluctuating considerably over the last several months.
> The Vanguard U.S. Sector Index Funds posted a wide range of returns. More than 20 percentage points separated the returns of the best- and worst-performing sectors.
> The telecommunication services, materials, and financials market sectors recorded the highest 12-month results. The results of the consumer discretionary, information technology, and health care groups trailed the broad market’s return for the period.
Contents | |
| |
Your Fund’s Total Returns | 1 |
Chairman’s Letter | 2 |
Consumer Discretionary Index Fund | 7 |
Consumer Staples Index Fund | 15 |
Energy Index Fund | 21 |
Financials Index Fund | 28 |
Health Care Index Fund | 37 |
Industrials Index Fund | 44 |
Information Technology Index Fund | 52 |
Materials Index Fund | 60 |
Telecommunication Services Index Fund | 67 |
Utilities Index Fund | 73 |
Your Fund’s After-Tax Returns | 80 |
About Your Fund’s Expenses | 81 |
Trustees Approve Advisory Arrangement | 82 |
Glossary | 83 |

Please note: The opinions expressed in this report are just that—informed opinions. They should not be considered promises or advice. Also, please keep in mind that the information and opinions cover the period through the date on the cover of this report. Of course, the risks of investing in your fund are spelled out in the prospectus.
Your Fund’s Total Returns
Fiscal Year Ended August 31, 2006
Admiral™ Shares1 | |
| |
Vanguard Consumer Discretionary | |
Index Fund | –2.0% |
MSCI® US IMI/Consumer Discretionary | –1.8 |
| |
| |
Vanguard Consumer Staples Index Fund | 11.9% |
MSCI US IMI/Consumer Staples | 12.3 |
| |
| |
Vanguard Energy Index Fund | 12.3% |
MSCI US IMI/Energy | 12.4 |
| |
| |
Vanguard Financials Index Fund | 15.8% |
MSCI US IMI/Financials | 16.0 |
| |
| |
Vanguard Health Care Index Fund | 4.7% |
MSCI US IMI/Health Care | 4.9 |
| |
| |
Vanguard Industrials Index Fund | –9.9%2 |
MSCI US IMI/Industrials | –9.8 2 |
MSCI US IMI/2500 | –2.1 2 |
| |
| |
Vanguard Information Technology Index Fund | 2.1% |
MSCI US IMI/Information Technology | 2.4 |
| |
| |
Vanguard Materials Index Fund | 16.1% |
MSCI US IMI/Materials | 16.4 |
| |
| |
Vanguard Telecommunication Services | |
Index Fund | 21.5% |
MSCI US IMI/Telecommunication Services | 20.8 |
| |
| |
Vanguard Utilities Index Fund | 10.5% |
MSCI US IMI/Utilities | 10.7 |
| |
| |
MSCI US IMI/2500 | 8.9% |
ETF Shares3 | |
| |
Vanguard Consumer Discretionary ETF | |
Market Price | –1.5% |
Net Asset Value | –2.0 |
MSCI US IMI/Consumer Discretionary | –1.8 |
| |
| |
Vanguard Consumer Staples ETF | |
Market Price | 12.1% |
Net Asset Value | 11.9 |
MSCI US IMI/Consumer Staples | 12.3 |
| |
| |
Vanguard Energy ETF | |
Market Price | 12.5% |
Net Asset Value | 12.3 |
MSCI US IMI/Energy | 12.4 |
| |
| |
Vanguard Financials ETF | |
Market Price | 16.5% |
Net Asset Value | 15.8 |
MSCI US IMI/Financials | 16.0 |
| |
| |
Vanguard Health Care ETF | |
Market Price | 4.9% |
Net Asset Value | 4.7 |
MSCI US IMI/Health Care | 4.9 |
| |
| |
Vanguard Industrials ETF | |
Market Price | 11.2% |
Net Asset Value | 11.1 |
MSCI US IMI/Industrials | 10.7 |
| |
| |
Vanguard Information Technology ETF | |
Market Price | 2.5% |
Net Asset Value | 2.1 |
MSCI US IMI/Information Technology | 2.4 |
| |
| |
Vanguard Materials ETF | |
Market Price | 16.3% |
Net Asset Value | 16.1 |
MSCI US IMI/Materials | 16.4 |
| |
| |
Vanguard Telecommunication Services ETF | |
Market Price | 22.1% |
Net Asset Value | 21.5 |
MSCI US IMI/Telecommunication Services | 20.8 |
| |
| |
Vanguard Utilities ETF | |
Market Price | 10.5% |
Net Asset Value | 10.5 |
MSCI US IMI/Utilities | 10.7 |
| |
| |
MSCI US IMI/2500 | 8.9% |
1 A lower-cost class of shares available to many longtime shareholders and to those with significant investments in the fund. Returns do not reflect the 2% redemption fee assessed on redemptions of shares held for less than one year.
2 Return since Admiral Shares’ inception, May 8, 2006.
3 Vanguard ETF™ Shares are traded on the American Stock Exchange and are available only through brokers. The table shows the ETF returns based on both the AMEX market price and the net asset value for a share. U.S. Pat. No. 6,879,964 B2.
Note: MSCI US IMI/2500 is the Morgan Stanley Capital International US Investable Market 2500 Index.
1

Chairman’s Letter
Dear Shareholder,
The broad U.S. stock market returned nearly 9% for the fiscal year ended August 31, 2006. Some of the gains made during the first portion of the year were later surrendered during a rather choppy last few months of the reporting period.
The Vanguard U.S. Sector Index Funds posted generally respectable returns. Seven of the ten sectors outperformed the results of the broad market for the 12 months, with telecommunication services, materials, and financials leading the way. Meanwhile, consumer discretionary, information technology, and health care—three of the market’s larger sectors—each registered returns that trailed the broad market’s return for the period. (Note that the Industrials Index Fund Admiral Shares, introduced in May, posted a negative return for their first few months of operation.)
We also remind shareholders that on July 6, 2006, Vanguard changed the name of its VIPER® Shares to Vanguard ETF™ Shares. The ticker symbols for the shares are unchanged.
Stocks climbed for much of the year, then began to waver
During the fiscal year, stocks climbed steadily through the first three quarters, before becoming increasingly volatile amid concerns over higher oil prices and fears that the U.S. economy was stalling. Indeed, the marked slowdown in the housing market in recent months suggests that the economy may have shifted into a lower gear.
The broad U.S. stock market gained 8.8% for the year, with small-capitalization stocks slightly outperforming their large-cap counterparts. As has been the case for the past several years, returns from international equities continued to outshine domestic stocks. For U.S.-based investors, a weaker dollar further boosted these returns when international gains were converted back into U.S. dollars.
Market Barometer | | | |
| Average Annual Total Returns |
| Periods Ended August 31, 2006 |
| One Year | Three Years | Five Years |
Stocks | | | |
Russell 1000 Index (Large-caps) | 8.7% | 11.5% | 5.3% |
Russell 2000 Index (Small-caps) | 9.4 | 14.4 | 10.3 |
Dow Jones Wilshire 5000 Index (Entire market) | 8.8 | 12.0 | 6.1 |
MSCI All Country World Index ex USA (International)
| 25.4 | 25.0 | 13.8 |
Bonds | | | |
Lehman Aggregate Bond Index (Broad taxable market) | 1.7% | 4.0% | 4.9% |
Lehman Municipal Bond Index | 3.0 | 5.1 | 5.0 |
Citigroup 3-Month Treasury Bill Index
| 4.3 | 2.5 | 2.2 |
CPI | | | |
Consumer Price Index | 3.8% | 3.4% | 2.8% |
2
Rising interest rates dampened bond returns
At its August 8, 2006, meeting, the Federal Reserve Board left its target for the federal funds rate unchanged, at 5.25%. This brought at least a temporary halt to the Fed’s two-year inflation-fighting campaign, which had been marked by 17 consecutive rate hikes.
The broad market for taxable U.S. bonds finished the one-year period with a modest return of 1.7%. Municipal bonds fared somewhat better. The yield curve remained essentially flat, with a very small difference between the yields of 3-month and 30-year U.S. Treasury issues, although yields rose modestly at both ends of the maturity spectrum.
Telecom, materials, and financials posted strong returns in an up market
As a group, the Vanguard U.S. Sector Index Funds recorded solid results, though, as should be expected, the difference between the best and worst performers was large. The market’s smallest segments—telecommunication services and materials—produced the largest returns. Telecom services, one of the market’s poorer performers over the past decade, led the way with a 21.5% return, as investors reacted favorably to consolidation in the sector. The materials sector returned 16.1%, benefiting from rising prices for some of the economy’s basic building blocks. In particular, metals and mining stocks climbed over 40% during the period. Meanwhile, the sizable financials sector returned 15.8%, keying off strong performances from some of the nation’s largest banks and real estate investment trusts.
The energy and consumer staples sectors both posted returns near 12%, though they traveled distinct paths to achieve that result. The energy sector was marked by large monthly swings in performance, while consumer staples posted more consistent, less flashy month-to-month results. The industrials and utilities sectors also outperformed the nearly 9% return of the overall stock market for the fiscal year.
Consumer discretionary stocks, which returned –2%, were the only sector with a negative return for the one-year period. The sector’s homebuilding stocks created a large drag on performance, as they faced the dual headwinds of rising mortgage interest rates and rising prices for raw materials. The large information technology and health care sectors posted positive, though underwhelming, fiscal-year returns.
The U.S. Sector Index Funds generally met their objectives of tightly tracking their target indexes, thanks in large part to the discipline and expertise of the funds’ advisor, Vanguard Quantitative Equity Group. The low expense ratios provided to ETF and Admiral Share class investors helped make the advisor’s task of tracking the indexes easier.
Recent market volatility reminds investors to stay diversified
The stock market volatility that we all experienced starting in late spring served as a reminder that diversification plays a critical part in any investment strategy. The more we diversify across and within asset classes, the more cushioning we have to absorb the market’s inevitable jolts.
As a stand-alone investment, any one of the U.S. Sector Index Funds would be a risky and volatile experience. Instead, these funds are designed to be implemented as part of a portfolio diversified among many market segments. We believe the U.S. Sector Index Funds are versatile tools that can help you fine-tune your portfolio to achieve your targeted sector allocations.
Thank you for entrusting your assets with Vanguard.

Sincerely,
John J. Brennan
Chairman and Chief Executive Officer
September 14, 2006
3
Your Fund’s Performance at a Glance |
August 31, 2005–August 31, 2006 |
| | | | |
| | | Distributions Per Share |
| Starting | Ending | Income | Capital |
| Share Price | Share Price | Dividends | Gains |
Consumer Discretionary Index Fund | | | | |
Admiral Shares | $27.75 | $27.03 | $0.157 | $0.000 |
ETF Shares | 53.65 | 52.28 | 0.308 | 0.000 |
Consumer Staples Index Fund | | | | |
Admiral Shares | $27.64 | $30.56 | $0.343 | $0.000 |
ETF Shares | 56.03 | 61.94 | 0.703 | 0.000 |
Energy Index Fund | | | | |
Admiral Shares | $36.29 | $40.36 | $0.350 | $0.000 |
ETF Shares | 72.72 | 80.90 | 0.701 | 0.000 |
Financials Index Fund | | | | |
Admiral Shares | $26.36 | $29.86 | $0.608 | $0.000 |
ETF Shares | 52.57 | 59.57 | 1.230 | 0.000 |
Health Care Index Fund | | | | |
Admiral Shares | $26.92 | $27.99 | $0.185 | $0.000 |
ETF Shares | 53.85 | 55.99 | 0.387 | 0.000 |
Industrials Index Fund | | | | |
Admiral Shares | $34.101 | $30.72 | $0.000 | $0.000 |
ETF Shares | 54.30 | 59.85 | 0.452 | 0.000 |
Information Technology Index Fund | | | | |
Admiral Shares | $23.93 | $24.40 | $0.038 | $0.000 |
ETF Shares | 46.76 | 47.66 | 0.091 | 0.000 |
Materials Index Fund | | | | |
Admiral Shares | $28.34 | $32.37 | $0.495 | $0.000 |
ETF Shares | 55.70 | 63.65 | 0.968 | 0.000 |
Telecommunication Services Index Fund | | | | |
Admiral Shares | $28.18 | $33.29 | $0.792 | $0.000 |
ETF Shares | 55.35 | 65.40 | 1.557 | 0.000 |
Utilities Index Fund | | | | |
Admiral Shares | $34.03 | $36.47 | $1.018 | $0.000 |
ETF Shares | 67.80 | 72.68 | 2.038 | 0.000 |
1 | Inception date for the Industrials Index Fund Admiral Shares, May 8, 2006. |
4
ETF Premium/Discount Record
The extent to which the funds’ ETF Shares have traded at a premium or a discount to NAV since inception.
Market prices for ETF Shares, and for exchange-traded funds in general, can deviate from the net asset value (NAV) of the underlying securities.
| | Market Price | | | |
| | Above or Equal to | | | Market Price Below |
| | Net Asset Value | | | Net Asset Value |
| Basis Point | Number | Percentage of | | Number | Percentage of |
| Differential2 | of Days | Total Days | | of Days | Total Days |
January 26, 20041– August 31, 2006 | | | | | | |
Consumer Discretionary ETF | 0–24.9 | 348 | 52.98% | | 271 | 41.25% |
| 25–49.9 | 28 | 4.26 | | 3 | 0.46 |
| 50–74.9 | 1 | 0.15 | | 2 | 0.30 |
| 75–100.0 | 0 | 0.00 | | 0 | 0.00 |
| >100.0 | 2 | 0.30 | | 2 | 0.30 |
| Total | 379 | 57.69% | | 278 | 42.31% |
January 26, 20041– August 31, 2006 | | | | | | |
Consumer Staples ETF | 0–24.9 | 396 | 60.27% | | 249 | 37.91% |
| 25–49.9 | 8 | 1.22 | | 2 | 0.30 |
| 50–74.9 | 0 | 0.00 | | 0 | 0.00 |
| 75–100.0 | 0 | 0.00 | | 2 | 0.30 |
| >100.0 | 0 | 0.00 | | 0 | 0.00 |
| Total | 404 | 61.49% | | 253 | 38.51% |
September 23, 20041– August 31, 2006 | | | | | | |
Energy ETF | 0–24.9 | 259 | 52.85% | | 226 | 46.13% |
| 25–49.9 | 4 | 0.82 | | 1 | 0.20 |
| 50–74.9 | 0 | 0.00 | | 0 | 0.00 |
| 75–100.0 | 0 | 0.00 | | 0 | 0.00 |
| >100.0 | 0 | 0.00 | | 0 | 0.00 |
| Total | 263 | 53.67% | | 227 | 46.33% |
January 26, 20041– August 31, 2006 | | | | | | |
Financials ETF | 0–24.9 | 361 | 54.96% | | 257 | 39.12% |
| 25–49.9 | 29 | 4.41 | | 1 | 0.15 |
| 50–74.9 | 1 | 0.15 | | 1 | 0.15 |
| 75–100.0 | 2 | 0.30 | | 1 | 0.15 |
| >100.0 | 1 | 0.15 | | 3 | 0.46 |
| Total | 394 | 59.97% | | 263 | 40.03% |
January 26, 20041– August 31, 2006 | | | | | | |
Health Care ETF | 0–24.9 | 407 | 61.95% | | 245 | 37.29% |
| 25– 49.9 | 4 | 0.61 | | 1 | 0.15 |
| 50–74.9 | 0 | 0.00 | | 0 | 0.00 |
| 75–100.0 | 0 | 0.00 | | 0 | 0.00 |
| >100.0 | 0 | 0.00 | | 0 | 0.00 |
| Total | 411 | 62.56% | | 246 | 37.44% |
September 23, 20041– August 31, 2006 | | | | | | |
Industrials ETF | 0–24.9 | 258 | 52.66% | | 191 | 38.98% |
| 25–49.9 | 33 | 6.73 | | 2 | 0.41 |
| 50–74.9 | 1 | 0.20 | | 0 | 0.00 |
| 75–100.0 | 2 | 0.41 | | 1 | 0.20 |
| >100.0 | 0 | 0.00 | | 2 | 0.41 |
| Total | 294 | 60.00% | | 196 | 40.00% |
2 | One basis point equals 1/100 of a percentage point. |
5
ETF Premium/Discount Record (continued) |
| | | | | | |
| | Market Price | | | |
| | Above or Equal to | | Market Price Below |
| | Net Asset Value | | Net Asset Value |
| Basis Point | Number | Percentage of | | Number | Percentage of |
| Differential2 | of Days | Total Days | | of Days | Total Days |
January 26, 20041– August 31, 2006 | | | | | | |
Information Technology ETF | 0–24.9 | 380 | 57.84% | | 251 | 38.20% |
| 25–49.9 | 7 | 1.07 | | 4 | 0.61 |
| 50–74.9 | 1 | 0.15 | | 1 | 0.15 |
| 75–100.0 | 0 | 0.00 | | 1 | 0.15 |
| >100.0 | 5 | 0.76 | | 7 | 1.07 |
| Total | 393 | 59.82% | | 264 | 40.18% |
January 26, 20041– August 31, 2006 | | | | | | |
Materials ETF | 0–24.9 | 338 | 51.45% | | 308 | 46.89% |
| 25–49.9 | 1 | 0.15 | | 1 | 0.15 |
| 50–74.9 | 1 | 0.15 | | 6 | 0.91 |
| 75–100.0 | 0 | 0.00 | | 1 | 0.15 |
| >100.0 | 1 | 0.15 | | 0 | 0.00 |
| Total | 341 | 51.90% | | 316 | 48.10% |
September 23, 20041– August 31, 2006 | | | | | | |
Telecommunication Services ETF | 0–24.9 | 206 | 42.04% | | 235 | 47.96% |
| 25–49.9 | 31 | 6.33 | | 2 | 0.41 |
| 50–74.9 | 1 | 0.20 | | 2 | 0.41 |
| 75–100.0 | 2 | 0.41 | | 1 | 0.20 |
| >100.0 | 3 | 0.61 | | 7 | 1.43 |
| Total | 243 | 49.59% | | 247 | 50.41% |
January 26, 20041– August 31, 2006 | | | | | | |
Utilities ETF | 0–24.9 | 332 | 50.53% | | 315 | 47.95% |
| 25–49.9 | 4 | 0.61 | | 3 | 0.46 |
| 50–74.9 | 0 | 0.00 | | 1 | 0.15 |
| 75–100.0 | 0 | 0.00 | | 1 | 0.15 |
| >100.0 | 0 | 0.00 | | 1 | 0.15 |
| Total | 336 | 51.14% | | 321 | 48.86% |
| | | | | | |
2 | One basis point equals 1/100 of a percentage point. |
6
Consumer Discretionary Index Fund
Fund Profile
As of August 31, 2006
Portfolio Characteristics | | |
| | Target | Broad |
| Fund | Index1 | Index2 |
Number of Stocks | 435 | 435 | 2,477 |
Median Market Cap | $14.1B | $14.1B | $30.8B |
Price/Earnings Ratio | 19.1x | 19.1x | 17.4x |
Price/Book Ratio | 2.4x | 2.4x | 2.7x |
Yield | | 1.1% | 1.8% |
Admiral Shares | 0.8% | | |
ETF Shares | 0.8% | | |
Return on Equity | 14.5% | 14.5% | 17.8% |
Earnings Growth Rate | 17.9% | 17.9% | 16.7% |
Foreign Holdings | 0.0% | 0.0% | 0.0% |
Turnover Rate | 10% | — | — |
Expense Ratio | | — | — |
Admiral Shares | 0.28% | | |
ETF Shares | 0.25% | | |
Short-Term Reserves | 0% | — | — |
Industry Diversification (% of portfolio) |
| |
Advertising | 2% |
Apparel Retail | 5 |
Apparel, Accessories & Luxury Goods | 3 |
Auto Parts & Equipment | 2 |
Automobile Manufacturers | 2 |
Automotive Retail | 2 |
Broadcasting & Cable TV | 12 |
Casinos & Gaming | 4 |
Catalog Retail | 1 |
Computer & Electronics Retail | 2 |
Consumer Electronics | 1 |
Department Stores | 5 |
Distributors | 1 |
Education Services | 1 |
Footwear | 1 |
General Merchandise Stores | 3 |
Home Furnishings | 1 |
Home Improvement Retail | 7 |
Homebuilding | 3 |
Homefurnishing Retail | 1 |
Hotels, Resorts & Cruise Lines | 4 |
Household Appliances | 1 |
Housewares & Specialties | 2 |
Internet Retail | 2 |
Leisure Products | 1 |
Motorcycle Manufacturers | 1 |
Movies & Entertainment | 13 |
Publishing | 4 |
Restaurants | 8 |
Specialized Consumer Services | 1 |
Specialty Stores | 4 |
Ten Largest Holdings3 (% of total net assets) |
| |
Comcast Corp. | 4.5% |
Home Depot, Inc. | 4.5 |
Time Warner, Inc. | 4.4 |
The Walt Disney Co. | 3.9 |
News Corp. | 2.9 |
McDonald’s Corp. | 2.8 |
Lowe’s Cos., Inc. | 2.5 |
Target Corp. | 2.5 |
Starbucks Corp. | 1.5 |
Viacom Inc. | 1.4 |
Top Ten | 30.9% |
1 | MSCI US IMI/Consumer Discretionary. |
3 | “Ten Largest Holdings” excludes any temporary cash investments and equity index products. |
7
Consumer Discretionary Index Fund
Performance Summary
All of the returns in this report represent past performance, which is not a guarantee of future results that may be achieved by the fund. (Current performance may be lower or higher than the performance data cited. For performance data current to the most recent month-end, visit our website at www.vanguard.com.) Note, too, that both investment returns and principal value can fluctuate widely, so an investor’s shares, when sold, could be worth more or less than their original cost. The returns shown do not reflect taxes that a shareholder would pay on fund distributions or on the sale of fund shares.
Cumulative Performance: January 26, 2004–August 31, 2006
Initial Investment of $10,000
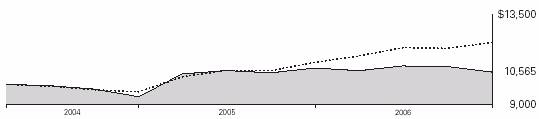
| | |
| | | |
| Average Annual Total Returns | Final Value |
| Periods Ended August 31, 2006 | of a $10,000 |
| One Year | Since Inception1 | Investment |
Consumer Discretionary Index Fund ETF | | | |
Shares Net Asset Value | –1.99% | 2.14% | $10,565 |
Consumer Discretionary Index Fund ETF | | | |
Shares Market Price | –1.52 | 2.33 | 10,617 |
MSCI US IMI/2500 | 8.91 | 7.62 | 12,098 |
MSCI US IMI/Consumer Discretionary | –1.79 | 2.34 | 10,619 |
| | | Final Value |
| | | of a $100,000 |
| One Year | Since Inception1 | Investment |
Consumer Discretionary Index Fund Admiral Shares2 | –2.03% | –3.46% | $ 96,095 |
MSCI US IMI/2500 | 8.91 | 7.90 | 108,980 |
MSCI US IMI/Consumer Discretionary | –1.79 | –3.25 | 96,331 |
Fiscal-Year Total Returns (%): January 26, 2004–August 31, 2006
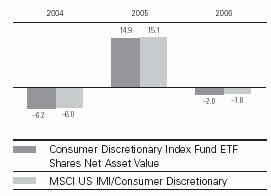
Cumulative Returns: ETF Shares, January 26, 2004–August 31, 2006 |
| | Cumulative |
| | Since |
| One Year | Inception |
Consumer Discretionary Index Fund ETF Shares Market Price | –1.52% | 6.17% |
Consumer Discretionary Index Fund ETF Shares Net Asset Value | –1.99 | 5.65 |
MSCI US IMI/Consumer Discretionary | –1.79 | 6.19 |
Average Annual Total Returns: Periods Ended June 30, 2006
This table presents average annual total returns through the latest calendar quarter—rather than through the end of the fiscal period. Securities and Exchange Commission rules require that we provide this information.
| | | Since |
| Inception Date | One Year | Inception |
ETF Shares | 1/26/2004 | | |
Market Price | | 1.06% | 3.08% |
Net Asset Value | | 0.94 | 3.04 |
Admiral Shares2 | 7/14/2005 | — | –2.20 |
1 | Inception dates are: for ETF Shares, January 26, 2004; for Admiral Shares, July 14, 2005. |
2 | Total returns do not reflect the 2% fee assessed on redemptions of shares held less than one year. Note: See Financial Highlights tables on page 13 for dividend and capital gains information. |
8
Consumer Discretionary Index Fund
Financial Statements
Statement of Net Assets
As of August 31, 2006
The fund provides a complete list of its holdings four times in each fiscal year, at the quarter-ends. For the second and fourth fiscal quarters, the lists appear in the fund’s semiannual and annual reports to shareholders. For the first and third fiscal quarters, the fund files the lists with the Securities and Exchange Commission on Form N-Q. Shareholders can look up the fund’s Forms N-Q on the SEC’s website at www.sec.gov. Forms N-Q may also be reviewed and copied at the SEC’s Public Reference Room (see the back cover of this report for further information).
| | | Market |
| | | Value• |
| | Shares | ($000) |
Common Stocks (99.5%) | | |
Auto Components (2.0%) | | |
| Johnson Controls, Inc. | 5,870 | 422 |
| BorgWarner, Inc. | 1,715 | 97 |
* | The Goodyear Tire & | | |
| Rubber Co. | 4,740 | 64 |
| Gentex Corp. | 4,316 | 63 |
| Lear Corp. | 1,991 | 41 |
* | Visteon Corp. | 3,908 | 33 |
* | Tenneco Automotive, Inc. | 1,423 | 32 |
* | LKQ Corp. | 1,451 | 30 |
| ArvinMeritor, Inc. | 1,878 | 28 |
* | TRW Automotive | | |
| Holdings Corp. | 1,052 | 26 |
| Modine Manufacturing Co. | 950 | 22 |
| American Axle & | | |
| Manufacturing Holdings, Inc. | 1,247 | 21 |
| Cooper Tire & Rubber Co. | 1,646 | 16 |
* | Drew Industries, Inc. | 487 | 13 |
* | Aftermarket Technology Corp. | 604 | 12 |
| Superior Industries | | |
| International, Inc. | 643 | 11 |
| Sauer-Danfoss, Inc. | 337 | 8 |
| Bandag, Inc. | 189 | 7 |
| Bandag, Inc. Class A | 149 | 5 |
| | | 951 |
Automobiles (3.0%) | | |
| Harley-Davidson, Inc. | 8,120 | 475 |
| Ford Motor Co. | 54,345 | 455 |
| General Motors Corp. | 13,621 | 397 |
| Thor Industries, Inc. | 1,088 | 46 |
| Winnebago Industries, Inc. | 925 | 27 |
* | Fleetwood Enterprises, Inc. | 1,928 | 14 |
| Monaco Coach Corp. | 875 | 9 |
| | | 1,423 |
Distributors (0.6%) | | |
| Genuine Parts Co. | 5,200 | 215 |
| Building Materials | | |
| Holding Corp. | 834 | 22 |
* | Source Interlink Cos., Inc. | 1,482 | 16 |
* | Keystone Automotive | | |
| Industries, Inc. | 473 | 16 |
* | Audiovox Corp. | 530 | 8 |
* | Core-Mark Holding Co., Inc. | 161 | 5 |
| | | 282 |
Diversified Consumer Services (2.7%) | |
* | Apollo Group, Inc. Class A | 4,407 | 221 |
| H & R Block, Inc. | 9,403 | 198 |
| ServiceMaster Co. | 8,835 | 102 |
* | ITT Educational Services, Inc. | 1,372 | 91 |
| Service Corp. International | 8,918 | 75 |
* | Laureate Education Inc. | 1,468 | 70 |
| Weight Watchers | | |
| International, Inc. | 1,523 | 65 |
* | Career Education Corp. | 2,901 | 55 |
| Regis Corp. | 1,372 | 50 |
| Strayer Education, Inc. | 410 | 43 |
| Sotheby’s | 1,547 | 43 |
* | DeVry, Inc. | 1,783 | 40 |
| Matthews International Corp. | 956 | 34 |
| Jackson Hewitt Tax Service Inc. | 1,055 | 33 |
* | Bright Horizons Family | | |
| Solutions, Inc. | 817 | 32 |
* | Corinthian Colleges, Inc. | 2,541 | 31 |
* | Alderwoods Group, Inc. | 1,237 | 24 |
* | Steiner Leisure Ltd. | 501 | 19 |
| Stewart Enterprises, Inc. | | |
| Class A | 2,832 | 16 |
* | Universal Technical | | |
| Institute Inc. | 656 | 12 |
* | Vertrue Inc. | 255 | 11 |
| Pre-Paid Legal Services, Inc. | 282 | 11 |
* | Educate, Inc. | 541 | 4 |
* | Escala Group, Inc. | 209 | 1 |
| | | 1,281 |
Hotels, Restaurants & Leisure (16.1%) | |
| McDonald’s Corp. | 37,474 | 1,345 |
* | Starbucks Corp. | 23,107 | 716 |
| Carnival Corp. | 13,461 | 564 |
| Yum! Brands, Inc. | 8,194 | 400 |
| Marriott International, Inc. | | |
| Class A | 10,510 | 396 |
| International Game Technology | 10,209 | 395 |
| Starwood Hotels & | | |
| Resorts Worldwide, Inc. | 6,540 | 348 |
| Harrah’s Entertainment, Inc. | 5,284 | 330 |
| Hilton Hotels Corp. | 11,001 | 280 |
| Wendy’s International, Inc. | 3,511 | 224 |
* | Las Vegas Sands Corp. | 3,187 | 222 |
* | Wyndham Worldwide Corp. | 6,071 | 178 |
| Darden Restaurants Inc. | 4,319 | 153 |
| Royal Caribbean Cruises, Ltd. | 3,831 | 140 |
* | MGM Mirage, Inc. | 3,835 | 137 |
* | Wynn Resorts Ltd. | 1,501 | 116 |
| Brinker International, Inc. | 2,577 | 99 |
| Station Casinos, Inc. | 1,623 | 95 |
* | Penn National Gaming, Inc. | 2,170 | 72 |
| OSI Restaurant Partners, Inc. | 2,000 | 62 |
| Boyd Gaming Corp. | 1,663 | 60 |
* | Scientific Games Corp. | 2,024 | 59 |
* | Sonic Corp. | 2,656 | 58 |
* | Aztar Corp. | 1,059 | 55 |
* | The Cheesecake Factory Inc. | 2,226 | 55 |
* | Gaylord Entertainment Co. | 1,210 | 53 |
* | Jack in the Box Inc. | 1,063 | 51 |
| Applebee’s International, Inc. | 2,250 | 47 |
* | Panera Bread Co. | 888 | 46 |
| Ruby Tuesday, Inc. | 1,739 | 45 |
| International Speedway Corp. | 903 | 44 |
| Orient-Express Hotel Ltd. | 1,265 | 42 |
| Choice Hotel International, Inc. | 1,084 | 41 |
* | Pinnacle Entertainment, Inc. | 1,443 | 37 |
| CBRL Group, Inc. | 919 | 35 |
* | Life Time Fitness, Inc. | 750 | 34 |
* | CEC Entertainment Inc. | 1,013 | 32 |
| Bob Evans Farms, Inc. | 1,079 | 30 |
| Domino’s Pizza, Inc. | 1,212 | 30 |
* | Shuffle Master, Inc. | 1,005 | 28 |
* | Vail Resorts Inc. | 738 | 28 |
* | Rare Hospitality | | |
| International Inc. | 969 | 28 |
* | P.F. Chang’s China Bistro, Inc. | 761 | 27 |
* | Papa John’s International, Inc. | 763 | 26 |
| CKE Restaurants Inc. | 1,605 | 25 |
| IHOP Corp. | 505 | 23 |
* | Bally Technologies Inc. | 1,393 | 22 |
* | WMS Industries, Inc. | 809 | 22 |
* | Ryan’s Restaurant Group, Inc. | 1,271 | 20 |
* | Red Robin Gourmet | | |
| Burgers, Inc. | 417 | 18 |
* | Texas Roadhouse, Inc. | 1,427 | 17 |
| Speedway Motorsports, Inc. | 430 | 16 |
| Ameristar Casinos, Inc. | 707 | 15 |
* | California Pizza Kitchen, Inc. | 523 | 15 |
| Lone Star Steakhouse & | | |
| Saloon, Inc. | 538 | 15 |
| The Marcus Corp. | 663 | 14 |
| Ambassadors Group, Inc. | 483 | 14 |
* | Six Flags, Inc. | 2,626 | 14 |
| Landry’s Restaurants, Inc. | 521 | 14 |
* | AFC Enterprises, Inc. | 907 | 13 |
* | Steak n Shake Co. | 824 | 13 |
* | Krispy Kreme Doughnuts, Inc. | 1,598 | 13 |
* | O’Charley’s Inc. | 684 | 13 |
| Triarc Cos., Inc. Class B | 736 | 11 |
* | Trump Entertainment | | |
| Resorts, Inc. | 580 | 10 |
* | Isle of Capri Casinos, Inc. | 509 | 10 |
| Churchill Downs, Inc. | 256 | 10 |
* | Ruth’s Chris Steak House | 517 | 10 |
* | Multimedia Games Inc. | 814 | 8 |
* | Great Wolf Resorts, Inc. | 647 | 8 |
* | BJ’s Restaurants Inc. | 440 | 8 |
| Triarc Cos., Inc. Class A | 494 | 8 |
* | Denny’s Corp. | 2,330 | 8 |
* | Bluegreen Corp. | 636 | 7 |
* | MTR Gaming Group Inc. | 795 | 6 |
| Dover Downs Gaming & | | |
| Entertainment, Inc. | 403 | 5 |
* | Magna Entertainment Corp. | | |
| Class A | 1,179 | 5 |
| | | 7,693 |
Household Durables (7.0%) | | |
| Fortune Brands, Inc. | 4,415 | 320 |
| Newell Rubbermaid, Inc. | 8,334 | 225 |
| Pulte Homes, Inc. | 6,570 | 195 |
| Whirlpool Corp. | 2,329 | 188 |
| Centex Corp. | 3,676 | 187 |
| D. R. Horton, Inc. | 8,472 | 186 |
| Lennar Corp. Class A | 3,837 | 172 |
| Black & Decker Corp. | 2,318 | 171 |
| Garmin Ltd. | 3,568 | 167 |
| Harman International | | |
| Industries, Inc. | 1,914 | 155 |
9
Consumer Discretionary Index Fund
| | | Market |
| | | Value• |
| | Shares | ($000) |
| Leggett & Platt, Inc. | 5,455 | 126 |
* | Mohawk Industries, Inc. | 1,620 | 115 |
| The Stanley Works | 2,230 | 105 |
| KB Home | 2,360 | 101 |
* | Toll Brothers, Inc. | 3,440 | 91 |
* | NVR, Inc. | 151 | 78 |
| Snap-On Inc. | 1,639 | 72 |
| Ryland Group, Inc. | 1,373 | 59 |
| Beazer Homes USA, Inc. | 1,246 | 50 |
| Standard Pacific Corp. | 2,020 | 48 |
| MDC Holdings, Inc. | 1,004 | 43 |
| American Greetings Corp. | | |
| Class A | 1,771 | 43 |
* | Jarden Corp. | 1,430 | 42 |
| The Yankee Candle Co., Inc. | 1,271 | 33 |
| Ethan Allen Interiors, Inc. | 918 | 31 |
* | Meritage Corp. | 698 | 29 |
| Tupperware Corp. | 1,610 | 29 |
| Furniture Brands | | |
| International Inc. | 1,449 | 28 |
* | Hovnanian Enterprises Inc. | | |
| Class A | 1,056 | 28 |
| La-Z-Boy Inc. | 1,543 | 22 |
* | Tempur-Pedic International Inc. | 1,057 | 17 |
| Blyth, Inc. | 769 | 16 |
* | WCI Communities, Inc. | 1,031 | 16 |
* | Champion Enterprises, Inc. | 2,264 | 15 |
* | Helen of Troy Ltd. | 872 | 15 |
* | Interface, Inc. | 1,104 | 14 |
| Kimball International, Inc. | | |
| Class B | 747 | 13 |
| M/I Homes, Inc. | 369 | 12 |
* | Blount International, Inc. | 1,096 | 10 |
| Brookfield Homes Corp. | 381 | 9 |
* | Avatar Holding, Inc. | 156 | 9 |
| Skyline Corp. | 207 | 8 |
| Technical Olympic USA, Inc. | 642 | 8 |
| CSS Industries, Inc. | 283 | 8 |
* | Directed Electronics Inc. | 406 | 6 |
| Levitt Corp. Class A | 476 | 6 |
* | Russ Berrie and Co., Inc. | 415 | 6 |
* | Palm Harbor Homes, Inc. | 321 | 5 |
* | iRobot Corp. | 280 | 5 |
| | | 3,337 |
Internet & Catalog Retail (2.5%) | | |
* | Liberty Media-Interactive A | 20,189 | 385 |
* | Amazon.com, Inc. | 9,436 | 291 |
* | IAC/InterActiveCorp | 6,598 | 188 |
* | Expedia, Inc. | 7,245 | 118 |
* | Nutri/System Inc. | 922 | 46 |
* | Coldwater Creek Inc. | 1,627 | 45 |
* | Netflix.com, Inc. | 1,295 | 26 |
* | priceline.com, Inc. | 775 | 26 |
* | VistaPrint Ltd. | 838 | 21 |
* | Blue Nile Inc. | 459 | 16 |
* | Stamps.com Inc. | 612 | 12 |
* | ValueVision Media, Inc. | 778 | 9 |
* | GSI Commerce, Inc. | 586 | 8 |
* | FTD Group, Inc. | 421 | 7 |
* | Overstock.com, Inc. | 345 | 7 |
* | 1-800-FLOWERS.COM, Inc. | 824 | 4 |
* | Audible, Inc. | 465 | 4 |
| | | 1,213 |
Leisure Equipment & Products (1.8%) | |
| Mattel, Inc. | 11,643 | 219 |
| Eastman Kodak Co. | 8,612 | 183 |
| Hasbro, Inc. | 4,757 | 97 |
| Brunswick Corp. | 2,841 | 81 |
| SCP Pool Corp. | 1,591 | 61 |
| Polaris Industries, Inc. | 1,235 | 47 |
* | Marvel Entertainment, Inc. | 1,913 | 41 |
| Callaway Golf Co. | 2,219 | 30 |
* | RC2 Corp. | 534 | 18 |
* | K2 Inc. | 1,447 | 17 |
* | JAKKS Pacific, Inc. | 780 | 13 |
| Oakley, Inc. | 774 | 13 |
* | MarineMax, Inc. | 551 | 13 |
| Nautilus Inc. | 948 | 12 |
* | Leapfrog Enterprises, Inc. | 840 | 6 |
| Arctic Cat, Inc. | 342 | 6 |
| Marine Products Corp. | 482 | 4 |
| | | 861 |
Media (31.1%) | | |
| Time Warner, Inc. | 126,128 | 2,096 |
| The Walt Disney Co. | 62,774 | 1,861 |
* | Comcast Corp. Class A | 38,624 | 1,352 |
| News Corp., Class A | 55,525 | 1,057 |
* | Comcast Corp. Special | | |
| Class A | 22,837 | 797 |
* | Viacom Inc. Class B | 18,784 | 682 |
| The McGraw-Hill Cos., Inc. | 10,749 | 601 |
| CBS Corp. | 20,260 | 578 |
| Omnicom Group Inc. | 5,149 | 450 |
| Clear Channel | | |
| Communications, Inc. | 14,523 | 422 |
| Gannett Co., Inc. | 7,160 | 407 |
* | DIRECTV Group, Inc. | 21,220 | 399 |
* | Liberty Media Capital A | 4,038 | 349 |
| News Corp., Class B | 16,539 | 329 |
* | Univision | | |
| Communications Inc. | 6,382 | 220 |
| NTL Inc. | 8,209 | 217 |
* | EchoStar | | |
| Communications Corp. | | |
| Class A | 6,161 | 196 |
| Tribune Co. | 5,046 | 157 |
* | Sirius Satellite Radio, Inc. | 38,047 | 156 |
* | Liberty Global, Inc. Class A | 6,509 | 154 |
| Cablevision Systems | | |
| NY Group Class A | 6,412 | 149 |
* | Liberty Global, Inc. Series C | 6,176 | 142 |
* | Lamar Advertising Co. | | |
| Class A | 2,572 | 135 |
| Washington Post Co. | | |
| Class B | 167 | 128 |
* | Interpublic Group of Cos., Inc. | 13,144 | 121 |
| E.W. Scripps Co. Class A | 2,646 | 120 |
* | Discovery Holding Co. | | |
| Class A | 7,673 | 108 |
* | XM Satellite Radio | | |
| Holdings, Inc. | 7,680 | 100 |
| New York Times Co. Class A | 4,063 | 92 |
* | R.H. Donnelley Corp. | 1,544 | 84 |
* | Getty Images, Inc. | 1,590 | 72 |
| The McClatchy Co. Class A | 1,652 | 67 |
| Dow Jones & Co., Inc. | 1,607 | 58 |
| Meredith Corp. | 1,135 | 54 |
| Belo Corp. Class A | 2,703 | 44 |
| Harte-Hanks, Inc. | 1,541 | 41 |
| John Wiley & Sons Class A | 1,133 | 39 |
| Catalina Marketing Corp. | 1,347 | 38 |
| Arbitron Inc. | 939 | 35 |
| Reader’s Digest | | |
| Association, Inc. | 2,706 | 35 |
* | Live Nation | 1,624 | 34 |
| Regal Entertainment Group | | |
| Class A | 1,550 | 31 |
* | RCN Corp. | 1,126 | 29 |
* | Scholastic Corp. | 955 | 29 |
* | Valassis Communications, Inc. | 1,442 | 28 |
| Warner Music Group Corp. | 1,112 | 28 |
| Lee Enterprises, Inc. | 1,135 | 28 |
| ADVO, Inc. | 956 | 27 |
* | DreamWorks Animation | | |
| SKG, Inc. | 1,254 | 26 |
| Entercom Communications Corp. | 992 | 25 |
| Media General, Inc. Class A | 633 | 25 |
* | Gemstar-TV Guide | | |
| International, Inc. | 7,397 | 24 |
* | Interactive Data Corp. | 1,050 | 20 |
| Hearst-Argyle Television Inc. | 848 | 19 |
* | TiVo Inc. | 2,170 | 18 |
* | Charter Communications, Inc. | 12,048 | 17 |
| Sun-Times Media Group, Inc. | 2,253 | 17 |
* | Cox Radio, Inc. | 1,032 | 16 |
| Westwood One, Inc. | 2,081 | 15 |
| Journal Communications, Inc. | 1,312 | 14 |
| Martha Stewart Living | | |
| Omnimedia, Inc. | 754 | 14 |
* | Radio One, Inc. Class D | 2,104 | 13 |
* | Mediacom | | |
| Communications Corp. | 1,806 | 12 |
* | Entravision | | |
| Communications Corp. | 1,544 | 11 |
| Sinclair Broadcast Group, Inc. | 1,461 | 11 |
* | Emmis Communications, Inc. | 890 | 11 |
* | Morningstar, Inc. | 290 | 11 |
| Courier Corp. | 286 | 11 |
* | CKX, Inc. | 1,024 | 10 |
* | Cumulus Media Inc. | 954 | 10 |
* | Harris Interactive Inc. | 1,548 | 9 |
| Citadel Broadcasting Corp. | 995 | 9 |
| World Wrestling | | |
| Entertainment, Inc. | 531 | 9 |
* | ProQuest Co. | 677 | 9 |
| Journal Register Co. | 1,223 | 9 |
* | Fisher Communications, Inc. | 178 | 8 |
| Gray Television, Inc. | 1,175 | 8 |
* | Playboy Enterprises, Inc. | | |
| Class B | 692 | 7 |
* | Lin TV Corp. | 876 | 6 |
| Salem Communications Corp. | 395 | 5 |
* | Spanish Broadcasting | | |
| System, Inc. | 1,053 | 5 |
* | PRIMEDIA Inc. | 3,036 | 5 |
* | Radio One, Inc. | 360 | 2 |
| Beasley Broadcast Group, Inc. | 150 | 1 |
| | | 14,818 |
Multiline Retail (8.4%) | | |
| Target Corp. | 24,762 | 1,198 |
| Federated Department | | |
| Stores, Inc. | 16,540 | 628 |
* | Kohl’s Corp. | 9,271 | 579 |
| J.C. Penney Co., Inc. | | |
| (Holding Co.) | 7,063 | 445 |
* | Sears Holdings Corp. | 2,633 | 379 |
| Nordstrom, Inc. | 6,421 | 240 |
| Dollar General Corp. | 8,960 | 115 |
| Family Dollar Stores, Inc. | 4,432 | 113 |
* | Dollar Tree Stores, Inc. | 3,033 | 87 |
* | Big Lots Inc. | 3,376 | 62 |
| Dillard’s Inc. | 1,877 | 59 |
| Saks Inc. | 3,606 | 52 |
10
Consumer Discretionary Index Fund
| | | Market |
| | | Value• |
| | Shares | ($000) |
* | 99 Cents Only Stores | 1,428 | 16 |
| Fred’s, Inc. | 1,098 | 14 |
* | Retail Ventures, Inc. | 812 | 12 |
| Tuesday Morning Corp. | 914 | 12 |
* | Conn’s, Inc. | 147 | 3 |
| | | 4,014 |
Specialty Retail (20.4%) | | |
| Home Depot, Inc. | 62,229 | 2,134 |
| Lowe’s Cos., Inc. | 44,421 | 1,202 |
| Best Buy Co., Inc. | 12,482 | 587 |
| Staples, Inc. | 21,921 | 495 |
| TJX Cos., Inc. | 13,739 | 367 |
* | Office Depot, Inc. | 8,810 | 324 |
| The Gap, Inc. | 17,889 | 301 |
* | Bed Bath & Beyond, Inc. | 8,478 | 286 |
| Limited Brands, Inc. | 10,725 | 276 |
| Sherwin-Williams Co. | 3,459 | 179 |
| Abercrombie & Fitch Co. | 2,649 | 171 |
| Michaels Stores, Inc. | 3,803 | 164 |
| American Eagle Outfitters, Inc. | 4,068 | 157 |
* | AutoZone Inc. | 1,727 | 156 |
| Tiffany & Co. | 4,289 | 136 |
| Circuit City Stores, Inc. | 5,302 | 125 |
* | CarMax, Inc. | 3,152 | 119 |
| Foot Locker, Inc. | 4,640 | 112 |
| Ross Stores, Inc. | 4,335 | 106 |
| PETsMART, Inc. | 4,232 | 106 |
* | Chico’s FAS, Inc. | 5,427 | 100 |
| Advance Auto Parts, Inc. | 3,225 | 97 |
| OfficeMax, Inc. | 2,109 | 88 |
* | AutoNation, Inc. | 4,481 | 87 |
* | AnnTaylor Stores Corp. | 2,175 | 86 |
| Williams-Sonoma, Inc. | 2,908 | 86 |
* | O’Reilly Automotive, Inc. | 2,862 | 85 |
| Claire’s Stores, Inc. | 2,677 | 73 |
| RadioShack Corp. | 3,819 | 69 |
* | GameStop Corp. Class B | 1,537 | 62 |
| Barnes & Noble, Inc. | 1,664 | 60 |
* | Rent-A-Center, Inc. | 2,107 | 57 |
| Men’s Wearhouse, Inc. | 1,427 | 51 |
* | Payless ShoeSource, Inc. | 2,053 | 48 |
* | Charming Shoppes, Inc. | 3,619 | 48 |
* | Urban Outfitters, Inc. | 2,985 | 47 |
* | PETCO Animal Supplies, Inc. | 1,644 | 46 |
* | Dick’s Sporting Goods, Inc. | 1,079 | 44 |
* | Tractor Supply Co. | 1,001 | 43 |
* | Aeropostale, Inc. | 1,636 | 41 |
* | The Children’s Place | | |
| Retail Stores, Inc. | 693 | 40 |
* | Zale Corp. | 1,485 | 40 |
| Borders Group, Inc. | 2,028 | 39 |
* | Tween Brands, Inc. | 997 | 34 |
* | The Gymboree Corp. | 983 | 33 |
* | Select Comfort Corp. | 1,624 | 32 |
* | The Pantry, Inc. | 642 | 30 |
* | Pacific Sunwear of | | |
| California, Inc. | 2,175 | 29 |
| Group 1 Automotive, Inc. | 651 | 29 |
| Aaron Rents, Inc. Class B | 1,238 | 29 |
* | Guitar Center, Inc. | 761 | 29 |
| Christopher & Banks Corp. | 1,086 | 26 |
| United Auto Group, Inc. | 1,290 | 26 |
* | Hibbett Sporting Goods, Inc. | 1,078 | 26 |
* | The Dress Barn, Inc. | 1,388 | 25 |
* | Guess ?, Inc. | 541 | 22 |
| Stage Stores, Inc. | 827 | 22 |
* | Cabela’s Inc. | 1,031 | 21 |
| Cato Corp. Class A | 864 | 20 |
| The Pep Boys | | |
| (Manny, Moe & Jack) | 1,585 | 20 |
* | Genesco, Inc. | 704 | 19 |
| Sonic Automotive, Inc. | 894 | 19 |
| bebe stores, inc. | 819 | 18 |
| Pier 1 Imports Inc. | 2,590 | 17 |
* | CSK Auto Corp. | 1,357 | 15 |
| Talbots Inc. | 696 | 15 |
| Finish Line, Inc. | 1,328 | 15 |
* | GameStop Corp. Class A | 314 | 14 |
* | Jos. A. Bank Clothiers, Inc. | 525 | 13 |
| Lithia Motors, Inc. | 508 | 13 |
* | Blockbuster Inc. Class A | 3,172 | 13 |
* | Hot Topic, Inc. | 1,248 | 12 |
* | DSW Inc. Class A | 431 | 12 |
* | Charlotte Russe Holding Inc. | 435 | 12 |
| Big 5 Sporting Goods Corp. | 593 | 12 |
| Monro Muffler Brake, Inc. | 353 | 11 |
* | Zumiez Inc. | 451 | 10 |
| Stein Mart, Inc. | 822 | 10 |
* | Build-A-Bear-Workshop, Inc. | 462 | 10 |
* | Jo-Ann Stores, Inc. | 661 | 10 |
| The Buckle, Inc. | 239 | 8 |
| Asbury Automotive Group, Inc. | 373 | 8 |
| Haverty Furniture Cos., Inc. | 588 | 8 |
* | A.C. Moore Arts & Crafts, Inc. | 454 | 8 |
* | New York & Co., Inc. | 617 | 7 |
* | Citi Trends Inc. | 209 | 7 |
* | Cost Plus, Inc. | 639 | 7 |
* | Blockbuster Inc. Class B | 2,014 | 7 |
* | West Marine, Inc. | 500 | 7 |
| Deb Shops, Inc. | 137 | 3 |
| | | 9,733 |
Textiles, Apparel & Luxury Goods (3.9%) | |
| NIKE, Inc. Class B | 5,569 | 450 |
* | Coach, Inc. | 11,590 | 350 |
| VF Corp. | 2,657 | 186 |
| Liz Claiborne, Inc. | 3,140 | 117 |
| Polo Ralph Lauren Corp. | 1,849 | 109 |
| Jones Apparel Group, Inc. | 3,420 | 107 |
| Phillips-Van Heusen Corp. | 1,665 | 64 |
* | Quiksilver, Inc. | 3,688 | 52 |
* | Timberland Co. | 1,535 | 44 |
| Wolverine World Wide, Inc. | 1,552 | 39 |
* | Under Armour, Inc. | 906 | 31 |
* | Carter’s, Inc. | 1,288 | 30 |
* | The Warnaco Group, Inc. | 1,430 | 29 |
* | Fossil, Inc. | 1,474 | 28 |
| Brown Shoe Co., Inc. | 790 | 25 |
| Steven Madden, Ltd. | 591 | 22 |
Kellwood Co. | 768 | 21 |
* Columbia Sportswear Co. | 428 | 21 |
K-Swiss, Inc. | 730 | 20 |
Oxford Industries, Inc. | 461 | 19 |
* Skechers U.S.A., Inc. | 762 | 17 |
The Stride Rite Corp. | 1,021 | 14 |
Movado Group, Inc. | 572 | 13 |
UniFirst Corp. | 401 | 12 |
* True Religion Apparel, Inc. | 405 | 8 |
* Volcom, Inc. | 341 | 8 |
Kenneth Cole Productions, Inc. | 322 | 8 |
Xerium Technologies Inc. | 401 | 4 |
| | 1,848 |
Total Common Stocks | | |
(Cost $50,053) | | 47,454 |
Temporary Cash Investment (0.5%) | | |
1 Vanguard Market | | |
Liquidity Fund 5.293% | | |
(Cost $246) | 246,271 | 246 |
Total Investments (100.0%) | | |
(Cost $50,299) | | 47,700 |
Other Assets and Liabilities (0.0%) | | |
Other Assets—Note B | | 268 |
Liabilities | | (291) |
| | (23) |
Net Assets (100%) | | 47,677 |
At August 31, 2006, net assets consisted of:2 |
| Amount | |
| ($000) | |
Paid-in Capital | 50,348 | |
Undistributed Net Investment Income | 269 |
Accumulated Net Realized Losses | (341) | |
Unrealized Depreciation | (2,599) | |
Net Assets | 47,677 | |
| | |
| | |
Admiral Shares—Net Assets | | |
Applicable to 23,172 outstanding | | |
$.001 par value shares of beneficial | |
interest (unlimited authorization) | 626 | |
Net Asset Value Per Share— | | |
Admiral Shares | $27.03 | |
| | |
| | |
ETF Shares—Net Assets | | |
Applicable to 900,000 outstanding | | |
$.001 par value shares of beneficial | |
interest (unlimited authorization) | 47,051 | |
Net Asset Value Per Share— | | |
ETF Shares | $52.28 | |
• | See Note A in Notes to Financial Statements. |
* | Non-income-producing security. |
1 | Affiliated money market fund available only to Vanguard funds and certain trusts and accounts managed by Vanguard. Rate shown is the 7-day yield. |
2 | See Note C in Notes to Financial Statements for the tax-basis components of net assets. |
11
Consumer Discretionary Index Fund
Statement of Operations
| Year Ended |
| August 31, 2006 |
| ($000) |
Investment Income | |
Income | |
Dividends | 476 |
Interest1 | 3 |
Total Income | 479 |
Expenses | |
The Vanguard Group—Note B | |
Investment Advisory Services | 8 |
Management and Administrative | |
Admiral Shares | 1 |
ETF Shares | 32 |
Marketing and Distribution | |
Admiral Shares | — |
ETF Shares | 11 |
Custodian Fees | 28 |
Auditing Fees | 20 |
Shareholders’ Reports | |
Admiral Shares | — |
ETF Shares | 2 |
Total Expenses | 102 |
Net Investment Income | 377 |
Realized Net Gain (Loss) on | |
Investment Securities Sold | 1,273 |
Change in Unrealized Appreciation | |
(Depreciation) of Investment Securities | (2,542) |
Net Increase (Decrease) in Net Assets | |
Resulting from Operations | (892) |
Statement of Changes in Net Assets
| Year Ended August 31, |
| 2006 | 2005 |
| ($000) | ($000) |
Increase (Decrease) In Net Assets | | |
Operations | | |
Net Investment Income | 377 | 136 |
Realized Net Gain (Loss) | 1,273 | 1,483 |
Change in Unrealized Appreciation (Depreciation) | (2,542) | 1,242 |
Net Increase (Decrease) in Net Assets Resulting from Operations | (892) | 2,861 |
Distributions | | |
Net Investment Income | | |
Admiral Shares | (2) | — |
ETF Shares | (216) | (105) |
Realized Capital Gain | | |
Admiral Shares | — | — |
ETF Shares | — | — |
Total Distributions | (218) | (105) |
Capital Share Transactions—Note F | | |
Admiral Shares | 550 | 100 |
ETF Shares | 15,947 | 10,639 |
Net Increase (Decrease) from Capital Share Transactions | 16,497 | 10,739 |
Total Increase (Decrease) | 15,387 | 13,495 |
Net Assets | | |
Beginning of Period | 32,290 | 18,795 |
End of Period2 | 47,677 | 32,290 |
1 | Interest income from an affiliated company of the fund was $3,000. |
2 | Net Assets—End of Period includes undistributed net investment income of $269,000 and $110,000. |
Consumer Discretionary Index Fund
12
Consumer Discretionary Index Fund
Financial Highlights
Admiral Shares | | |
| Year | |
| Ended | July 141 to |
| Aug. 31, | Aug. 31, |
For a Share Outstanding Throughout Each Period | 2006 | 2005 |
Net Asset Value, Beginning of Period | $27.75 | $28.29 |
Investment Operations | | |
Net Investment Income | .2452 | .162 |
Net Realized and Unrealized Gain (Loss) on Investments | (.808) | (.70) |
Total from Investment Operations | (.563) | (.54) |
Distributions | | |
Dividends from Net Investment Income | (.157) | — |
Distributions from Realized Capital Gains | — | — |
Total Distributions | (.157) | — |
Net Asset Value, End of Period | $27.03 | $27.75 |
| | |
| | |
Total Return3 | –2.03% | –1.91% |
| | |
| | |
Ratios/Supplemental Data | | |
Net Assets, End of Period (Millions) | $0.6 | $0.1 |
Ratio of Total Expenses to Average Net Assets | 0.28% | 0.28%4 |
Ratio of Net Investment Income to Average Net Assets | 0.89% | 0.67%4 |
Portfolio Turnover Rate5 | 10% | 13% |
ETF Shares | | | |
| | | |
| | | |
| Year Ended | Jan. 261 to |
| August 31, | Aug. 31, |
For a Share Outstanding Throughout Each Period | 2006 | 2005 | 2004 |
Net Asset Value, Beginning of Period | $53.65 | $46.99 | $50.09 |
Investment Operations | | | |
Net Investment Income | .4942 | .352 | .20 |
Net Realized and Unrealized Gain (Loss) on Investments | (1.556) | 6.66 | (3.30) |
Total from Investment Operations | (1.062) | 7.01 | (3.10) |
Distributions | | | |
Dividends from Net Investment Income | (.308) | (.35) | — |
Distributions from Realized Capital Gains | — | — | — |
Total Distributions | (.308) | (.35) | — |
Net Asset Value, End of Period | $52.28 | $53.65 | $46.99 |
| | | |
| | | |
Total Return | –1.99% | 14.91% | –6.19% |
| | | |
| | | |
Ratios/Supplemental Data | | | |
Net Assets, End of Period (Millions) | $47 | $32 | $19 |
Ratio of Total Expenses to Average Net Assets | 0.25% | 0.26% | 0.28%4 |
Ratio of Net Investment Income to Average Net Assets | 0.92% | 0.69% | 0.68%4 |
Portfolio Turnover Rate5 | 10% | 13% | 11% |
2 | Calculated based on average shares outstanding. |
3 | Total returns do not reflect the 2% fee assessed on redemptions of shares held for less than one year. |
5 | Excludes the value of portfolio securities received or delivered as a result of in-kind purchases or redemptions of the fund’s capital shares, including ETF Creation Units. See accompanying Notes, which are an integral part of the Financial Statements. |
13
Consumer Discretionary Index Fund
Notes to Financial Statements
Vanguard Consumer Discretionary Index Fund is registered under the Investment Company Act of 1940 as an open-end investment company, or mutual fund. The fund files reports with the SEC under the company name Vanguard World Funds. The fund offers two classes of shares, Admiral Shares and ETF Shares (formerly known as VIPER Shares). Admiral Shares are available to any investor who meets the fund’s minimum purchase requirements. ETF Shares are listed for trading on the American Stock Exchange; they can be purchased and sold through a broker.
A. The following significant accounting policies conform to generally accepted accounting principles for U.S. mutual funds. The fund consistently follows such policies in preparing its financial statements.
1. Security Valuation: Securities are valued as of the close of trading on the New York Stock Exchange (generally 4:00 p.m. Eastern time) on the valuation date. Equity securities are valued at the latest quoted sales prices or official closing prices taken from the primary market in which each security trades; such securities not traded on the valuation date are valued at the mean of the latest quoted bid and asked prices. Securities for which market quotations are not readily available, or whose values have been materially affected by events occurring before the fund’s pricing time but after the close of the securities’ primary markets, are valued by methods deemed by the board of trustees to represent fair value. Investments in Vanguard Market Liquidity Fund are valued at that fund’s net asset value.
2. Federal Income Taxes: The fund intends to continue to qualify as a regulated investment company and distribute all of its taxable income. Accordingly, no provision for federal income taxes is required in the financial statements.
3. Distributions: Distributions to shareholders are recorded on the ex-dividend date.
4. Other: Dividend income is recorded on the ex-dividend date. Interest income includes income distributions received from Vanguard Market Liquidity Fund and is accrued daily. Security transactions are accounted for on the date securities are bought or sold. Costs used to determine realized gains (losses) on the sale of investment securities are those of the specific securities sold. Fees assessed on redemptions of Admiral Shares are credited to paid-in capital.
Each class of shares has equal rights as to assets and earnings, except that each class separately bears certain class-specific expenses related to maintenance of shareholder accounts (included in Management and Administrative expenses) and shareholder reporting. Marketing and distribution expenses are allocated to each class of shares based on a method approved by the board of trustees. Income, other non-class-specific expenses, and gains and losses on investments are allocated to each class of shares based on its relative net assets.
B. The Vanguard Group furnishes at cost investment advisory, corporate management, administrative, marketing, and distribution services. The costs of such services are allocated to the fund under methods approved by the board of trustees. The fund has committed to provide up to 0.40% of its net assets in capital contributions to Vanguard. At August 31, 2006, the fund had contributed capital of $4,000 to Vanguard (included in Other Assets), representing 0.01% of the fund’s net assets and 0.004% of Vanguard’s capitalization. The fund’s trustees and officers are also directors and officers of Vanguard.
C. Distributions are determined on a tax basis and may differ from net investment income and realized capital gains for financial reporting purposes. Differences may be permanent or temporary. Permanent differences are reclassified among capital accounts in the financial statements to reflect their tax character. Temporary differences arise when certain items of income, expense, gain, or loss are recognized in different periods for financial statement and tax purposes; these differences will reverse at some time in the future. Differences in classification may also result from the treatment of short-term gains as ordinary income for tax purposes.
During the year ended August 31, 2006, the fund realized $1,546,000 of net capital gains resulting from in-kind redemptions—in which shareholders exchanged fund shares for securities held by the fund rather than for cash. Because such gains are not taxable to the fund, and are not distributed to shareholders, they have been reclassified from accumulated net realized losses to paid-in capital.
For tax purposes, at August 31, 2006, the fund had $289,000 of ordinary income available for distribution. The fund had available realized losses of $339,000 to offset future net capital gains of $36,000 through August 31, 2013, $86,000 through August 31, 2014, and $217,000 through August 31, 2015.
At August 31, 2006, the cost of investment securities for tax purposes was $50,301,000. Net unrealized depreciation of investment securities for tax purposes was $2,601,000, consisting of unrealized gains of $2,247,000 on securities that had risen in value since their purchase and $4,848,000 in unrealized losses on securities that had fallen in value since their purchase.
D. During the year ended August 31, 2006, the fund purchased $56,434,000 of investment securities and sold $39,762,000 of investment securities, other than temporary cash investments.
E. In June 2006, the Financial Accounting Standards Board issued Interpretation No. 48 (“FIN 48”), “Accounting for Uncertainty in Income Taxes.” FIN 48 establishes the minimum threshold for recognizing, and a system for measuring, the benefits of tax-return positions in financial statements. FIN 48 will be effective for the fund’s fiscal year beginning September 1, 2007. Management is in the process of analyzing the fund’s tax positions for purposes of implementing FIN 48; based on the analysis completed to date, management does not believe the adoption of FIN 48 will result in any material impact to the fund's financial statements.
F. Capital share transactions for each class of shares were (see table below):
| Year Ended August 31, |
| 2006 | | 2005 |
| Amount | Shares | | Amount | Shares |
| ($000) | (000) | | ($000) | (000) |
Admiral Shares | | | | | |
Issued | 737 | 27 | | 100 | 4 |
Issued in Lieu of Cash Distributions | 1 | — | | — | — |
Redeemed1 | (188) | (7) | | — | — |
Net Increase (Decrease)—Admiral Shares | 550 | 20 | | 100 | 4 |
ETF Shares | | | | | |
Issued | 51,989 | 1,000 | | 31,226 | 600 |
Issued in Lieu of Cash Distributions | — | — | | — | — |
Redeemed | (36,042) | (700) | | (20,587) | (400) |
Net Increase (Decrease)—ETF Shares | 15,947 | 300 | | 10,639 | 200 |
1 | Net of redemption fees of $2,000 and $0 (fund totals). |
14
Consumer Staples Index Fund
Fund Profile
As of August 31, 2006
Portfolio Characteristics | | |
| | Target | Broad |
| Fund | Index1 | Index2 |
Number of Stocks | 105 | 104 | 2,477 |
Median Market Cap | $38.2B | $105.6B | $30.8B |
Price/Earnings Ratio | 20.5x | 20.2x | 17.4x |
Price/Book Ratio | 3.7x | 4.0x | 2.7x |
Yield | | 2.2% | 1.8% |
Admiral Shares | 1.8% | | |
ETF Shares | 1.8% | | |
Return on Equity | 27.4% | 29.3% | 17.8% |
Earnings Growth Rate | 11.1% | 11.4% | 16.7% |
Foreign Holdings | 0.9% | 0.9% | 0.0% |
Turnover Rate | 14% | — | — |
Expense Ratio | | — | — |
Admiral Shares | 0.28% | | |
ETF Shares | 0.25% | | |
Short-Term Reserves | 0% | — | — |
Industry Diversification (% of portfolio) |
| |
Agricultural Products | 3% |
Brewers | 4 |
Distillers & Vintners | 1 |
Drug Retail | 7 |
Food Distributors | 3 |
Food Retail | 5 |
Household Products | 21 |
Hypermarkets & Super Centers | 9 |
Packaged Foods & Meats | 15 |
Personal Products | 4 |
Soft Drinks | 13 |
Tobacco | 15 |
Ten Largest Holdings3 (% of total net assets) |
| |
The Procter & Gamble Co. | 14.2% |
Altria Group, Inc. | 11.9 |
Wal-Mart Stores, Inc. | 6.8 |
PepsiCo, Inc. | 6.5 |
The Coca-Cola Co. | 5.5 |
Walgreen Co. | 4.1 |
Anheuser-Busch Cos., Inc. | 3.2 |
Colgate-Palmolive Co. | 2.6 |
Kimberly-Clark Corp. | 2.5 |
CVS Corp. | 2.3 |
Top Ten | 59.6% |
1 | MSCI US IMI/Consumer Staples. |
3 | “Ten Largest Holdings” excludes any temporary cash investments and equity index products. |
15
Consumer Staples Index Fund
Performance Summary
All of the returns in this report represent past performance, which is not a guarantee of future results that may be achieved by the fund. (Current performance may be lower or higher than the performance data cited. For performance data current to the most recent month-end, visit our website at www.vanguard.com.) Note, too, that both investment returns and principal value can fluctuate widely, so an investor’s shares, when sold, could be worth more or less than their original cost. The returns shown do not reflect taxes that a shareholder would pay on fund distributions or on the sale of fund shares.
Cumulative Performance: January 26, 2004–August 31, 2006
Initial Investment of $10,000

| Average Annual Total Returns | Final Value |
| Periods Ended August 31, 2006 | of a $10,000 |
| One Year | Since Inception1 | Investment |
Consumer Staples Index Fund ETF Shares | | | |
Net Asset Value | 11.91% | 9.26% | $12,582 |
Consumer Staples Index Fund ETF Shares | | | |
Market Price | 12.14 | 9.30 | 12,596 |
MSCI US IMI/2500 | 8.91 | 7.62 | 12,098 |
MSCI US IMI/Consumer Staples | 12.34 | 9.10 | 12,535 |
| | | Final Value |
| | | of a $100,000 |
| One Year | Since Inception1 | Investment |
Consumer Staples Index Fund Admiral Shares2 | 11.92% | 9.47% | $126,328 |
MSCI US IMI/2500 | 8.91 | 8.56 | 123,656 |
MSCI US IMI/Consumer Staples | 12.34 | 9.32 | 125,897 |
Fiscal-Year Total Returns (%):
January 26, 2004–August 31, 2006
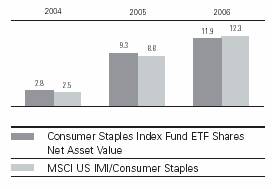
Cumulative Returns: ETF Shares, January 26, 2004–August 31, 2006 |
| | Cumulative |
| | Since |
| One Year | Inception |
Consumer Staples Index Fund ETF Shares Market Price | 12.14% | 25.96% |
Consumer Staples Index Fund ETF Shares Net Asset Value | 11.91 | 25.82 |
MSCI US IMI/Consumer Staples | 12.34 | 25.35 |
Average Annual Total Returns: Periods Ended June 30, 2006
This table presents average annual total returns through the latest calendar quarter—rather than through the end of the fiscal period. Securities and Exchange Commission rules require that we provide this information.
| | | Since |
| Inception Date | One Year | Inception |
ETF Shares | 1/26/2004 | | |
Market Price | | 8.13% | 7.72% |
Net Asset Value | | 7.86 | 7.59 |
Admiral Shares2 | 1/30/2004 | 7.84 | 7.80 |
1 | Inception dates are: for ETF Shares, January 26, 2004; for Admiral Shares, January 30, 2004. |
2 | Total returns do not reflect the 2% fee assessed on redemptions of shares held less than one year. Note: See Financial Highlights tables on page 19 for dividend and capital gains information. |
Consumer Staples Index Fund
16
Financial Statements
Statement of Net Assets
As of August 31, 2006
The fund provides a complete list of its holdings four times in each fiscal year, at the quarter-ends. For the second and fourth fiscal quarters, the lists appear in the fund’s semiannual and annual reports to shareholders. For the first and third fiscal quarters, the fund files the lists with the Securities and Exchange Commission on Form N-Q. Shareholders can look up the fund’s Forms N-Q on the SEC’s website at www.sec.gov. Forms N-Q may also be reviewed and copied at the SEC’s Public Reference Room (see the back cover of this report for further information).
| | | Market |
| | | Value• |
| | Shares | ($000) |
Common Stocks (100.0%) | | |
Beverages (18.4%) | | |
| PepsiCo, Inc. | 215,726 | 14,083 |
| The Coca-Cola Co. | 264,041 | 11,832 |
| Anheuser-Busch Cos., Inc. | 139,198 | 6,874 |
| Coca-Cola Enterprises, Inc. | 56,105 | 1,251 |
* | Constellation Brands, Inc. | | |
| Class A | 43,569 | 1,189 |
| Molson Coors Brewing Co. | | |
| Class B | 15,672 | 1,102 |
| The Pepsi Bottling Group, Inc. | 31,442 | 1,101 |
| Brown-Forman Corp. Class B | 11,183 | 861 |
* | Hansen Natural Corp. | 19,390 | 534 |
| PepsiAmericas, Inc. | 21,676 | 498 |
* | Boston Beer Co., Inc. | | |
| Class A | 9,065 | 291 |
| Coca-Cola Bottling Co. | 4,788 | 281 |
| | | 39,897 |
Food & Staples Retailing (23.6%) | |
| Wal-Mart Stores, Inc. | 329,390 | 14,730 |
| Walgreen Co. | 180,622 | 8,934 |
| CVS Corp. | 149,384 | 5,012 |
| Costco Wholesale Corp. | 87,082 | 4,075 |
| Sysco Corp. | 115,166 | 3,615 |
| The Kroger Co. | 129,438 | 3,082 |
| Safeway, Inc. | 85,915 | 2,657 |
| Whole Foods Market, Inc. | 28,843 | 1,547 |
| SuperValu Inc. | 44,322 | 1,266 |
* | Rite Aid Corp. | 136,553 | 593 |
* | BJ’s Wholesale Club, Inc. | 20,990 | 553 |
| Longs Drug Stores, Inc. | 10,140 | 461 |
* | United Natural Foods, Inc. | 14,989 | 435 |
| Casey’s General Stores, Inc. | 17,850 | 422 |
| Ruddick Corp. | 15,420 | 398 |
* | Performance Food Group Co. | 15,516 | 382 |
| Andersons, Inc. | 8,480 | 348 |
* | Central European | | |
| Distribution Corp. | 14,048 | 324 |
* | Wild Oats Markets Inc. | 19,484 | 318 |
| The Great Atlantic & | | |
| Pacific Tea Co., Inc. | 13,709 | 314 |
| Weis Markets, Inc. | 7,907 | 312 |
| Ingles Markets, Inc. | 11,523 | 295 |
| The Topps Co., Inc. | 33,434 | 292 |
| Nash-Finch Co. | 12,671 | 290 |
* | Smart & Final Inc. | 16,825 | 279 |
| | | 50,934 |
Food Products (18.2%) | | |
| Archer-Daniels-Midland Co. | 108,293 | 4,458 |
| General Mills, Inc. | 63,294 | 3,432 |
| H.J. Heinz Co. | 63,955 | 2,676 |
| Kellogg Co. | 49,102 | 2,489 |
| Sara Lee Corp. | 146,541 | 2,437 |
| ConAgra Foods, Inc. | 100,405 | 2,390 |
| The Hershey Co. | 33,541 | 1,810 |
| Campbell Soup Co. | 45,567 | 1,712 |
| Kraft Foods Inc. | 44,615 | 1,513 |
| Bunge Ltd. | 25,109 | 1,415 |
| Wm. Wrigley Jr. Co. | 27,496 | 1,276 |
* | Dean Foods Co. | 29,809 | 1,181 |
| McCormick & Co., Inc. | 27,212 | 991 |
| Tyson Foods, Inc. | 58,499 | 862 |
* | Smithfield Foods, Inc. | 25,471 | 765 |
| Hormel Foods Corp. | 19,724 | 723 |
| J.M. Smucker Co. | 14,513 | 706 |
| Corn Products | | |
| International, Inc. | 19,773 | 682 |
| Del Monte Foods Co. | 56,819 | 631 |
| Flowers Foods, Inc. | 18,446 | 501 |
| Delta & Pine Land Co. | 12,000 | 485 |
* | Ralcorp Holdings, Inc. | 9,425 | 466 |
| Lancaster Colony Corp. | 9,862 | 435 |
| Pilgrim’s Pride Corp. | 17,283 | 421 |
* | Gold Kist Inc. | 20,606 | 415 |
* | Hain Celestial Group, Inc. | 16,429 | 387 |
* | TreeHouse Foods Inc. | 14,558 | 371 |
| Chiquita Brands | | |
| International, Inc. | 21,465 | 363 |
| Tootsie Roll Industries, Inc. | 12,028 | 349 |
| Sanderson Farms, Inc. | 10,995 | 344 |
| Seaboard Corp. | 243 | 340 |
| Lance, Inc. | 14,070 | 321 |
| Reddy Ice Holdings, Inc. | 13,357 | 317 |
| J & J Snack Foods Corp. | 9,835 | 311 |
| Premium Standard Farms Inc. | 18,190 | 308 |
* | Peet’s Coffee & Tea Inc. | 11,990 | 302 |
| Alico, Inc. | 4,775 | 281 |
| Farmer Brothers, Inc. | 12,589 | 266 |
| Wm. Wrigley Jr. Co. Class B | 3,993 | 184 |
| | | 39,316 |
Household Products (21.3%) | | |
| The Procter & Gamble Co. | 494,528 | 30,611 |
| Colgate-Palmolive Co. | 93,527 | 5,599 |
| Kimberly-Clark Corp. | 83,844 | 5,324 |
| The Clorox Co. | 30,279 | 1,811 |
* | Energizer Holdings, Inc. | 13,737 | 918 |
| Church & Dwight, Inc. | 17,567 | 676 |
* | Central Garden and Pet Co. | 9,337 | 409 |
| WD-40 Co. | 9,590 | 333 |
* | Spectrum Brands Inc. | 37,768 | 301 |
| | | 45,982 |
Personal Products (3.7%) | | |
| Avon Products, Inc. | 86,783 | 2,492 |
| Estee Lauder Cos. Class A | 27,441 | 1,011 |
Alberto-Culver Co. Class B | 19,215 | 946 |
* NBTY, Inc. | 17,694 | 564 |
* Herbalife Ltd. | 13,965 | 456 |
Nu Skin Enterprises, Inc. | 24,296 | 421 |
* Chattem, Inc. | 9,836 | 341 |
* Playtex Products, Inc. | 25,730 | 338 |
* USANA Health Sciences, Inc. | 7,248 | 324 |
* Elizabeth Arden, Inc. | 21,252 | 309 |
* Prestige Brands Holdings Inc. | 30,559 | 306 |
Mannatech, Inc. | 19,448 | 282 |
* Revlon, Inc. Class A | 214,633 | 279 |
| | 8,069 |
Tobacco (14.8%) | | |
Altria Group, Inc. | 307,487 | 25,684 |
Reynolds American Inc. | 34,534 | 2,247 |
UST, Inc. | 32,555 | 1,721 |
Carolina Group | 22,902 | 1,311 |
Universal Corp. (VA) | 10,713 | 414 |
Vector Group Ltd. | 18,323 | 316 |
Alliance One | | |
International, Inc. | 73,162 | 295 |
| | 31,988 |
Total Investments (100.0%) | | |
(Cost $198,972) | | 216,186 |
Other Assets and Liabilities (0.0%) | |
Other Assets—Note B | | 2,222 |
Liabilities | | (2,185) |
| | 37 |
Net Assets (100%) | | 216,223 |
| | |
| | |
At August 31, 2006, net assets consisted of:1 |
| Amount |
| ($000) |
Paid-in Capital | 198,556 |
Undistributed Net Investment Income | 1,534 |
Accumulated Net Realized Losses | (1,081) |
Unrealized Appreciation | 17,214 |
Net Assets | 216,223 |
| |
| |
Admiral Shares—Net Assets | |
Applicable to 183,829 outstanding | |
$.001 par value shares of beneficial | |
interest (unlimited authorization) | 5,617 |
Net Asset Value Per Share— | |
Admiral Shares | $30.56 |
| |
| |
ETF Shares—Net Assets | |
Applicable to 3,400,000 outstanding | |
$.001 par value shares of beneficial | |
interest (unlimited authorization) | 210,606 |
Net Asset Value Per Share— | |
ETF Shares | $61.94 |
• | See Note A in Notes to Financial Statements. |
* | Non-income-producing security. |
1 | See Note C in Notes to Financial Statements for the tax-basis components of net assets. |
17
Consumer Staples Index Fund
Statement of Operations
| Year Ended |
| August 31, 2006 |
| ($000) |
Investment Income | |
Income | |
Dividends | 2,427 |
Interest1 | 2 |
Total Income | 2,429 |
Expenses | |
The Vanguard Group—Note B | |
Investment Advisory Services | 18 |
Management and Administrative | |
Admiral Shares | 7 |
ETF Shares | 194 |
Marketing and Distribution | |
Admiral Shares | 2 |
ETF Shares | 27 |
Custodian Fees | 4 |
Auditing Fees | 20 |
Shareholder’s Reports | |
Admiral Shares | 2 |
ETF Shares | 6 |
Total Expenses | 280 |
Net Investment Income | 2,149 |
Realized Net Gain (Loss) on | |
Investment Securities Sold | (1,072) |
Change in Unrealized Appreciation | |
(Depreciation) of Investment Securities | 15,111 |
Net Increse (Decrease) in Net Assets | |
Resulting from Operations | 16,188 |
Statement of Changes in Net Assets | | |
| | |
| Year Ended August 31, |
| 2006 | 2005 |
| ($000) | ($000) |
Increase (Decrease in Net Assets | | |
Operations | | |
Net Investment Income | 2,149 | 652 |
Realized Net Gain (Loss) | (1,072) | (10) |
Unrealized Appreciation (Depreciation) | 15,111 | 1,835 |
Net Increase (Decrease) in Net Assets Resulting from Operations | 16,188 | 2,477 |
Distributions | | |
Net Investment Income | | |
Admiral Shares | (51) | (16) |
ETF Shares | (1,054) | (341) |
Realized Capital Gain2 | | |
Admiral Shares | — | (4) |
ETF Shares | — | (96) |
Total Distributions | (1,105) | (457) |
Capital Share Transactions—Note F | | |
Admiral Shares | 1,104 | 3,109 |
ETF Shares | 123,168 | 49,996 |
Net Increase (Decrease) from Capital Share Transactions | 124,272 | 53,105 |
Total Increase (Decrease) | 139,355 | 55,125 |
Net Assets | | |
Beginning of Period | 76,868 | 21,743 |
End of Period3 | 216,223 | 76,868 |
1 | Interest income from an affiliated company of the fund was $2,000. |
2 | Includes fiscal 2006 and 2005 short-term gain distributions totaling $0 and $100,000. Short-term gain distributions are treated as ordinary income dividends for tax purposes. |
3 | Net Assets—End of Period includes undistributed net investment income of $1,534,000 and $490,000. |
Consumer Staples Index Fund
18
Consumer Staples Index Fund
Financial Highlights
Admiral Shares | | | | |
| | | | |
| | | | |
| Year Ended | | Jan. 301 to |
| August 31, | | Aug. 31, |
For a Share Outstanding Throughout Each Period | 2006 | 2005 | | 2004 |
Net Asset Value, Beginning of Period | $27.64 | $25.82 | | $25.00 |
Investment Operations | | | | |
Net Investment Income | .5472 | .4272 | | .24 |
Net Realized and Unrealized Gain (Loss) on Investments | 2.716 | 1.952 | | .58 |
Total from Investment Operations | 3.263 | 2.379 | | .82 |
Distributions | | | | |
Dividends from Net Investment Income | (.343) | (.440) | | — |
Distributions from Realized Capital Gains | — | (.119) | | — |
Total Distributions | (.343) | (.559) | | — |
Net Asset Value, End of Period | $30.56 | $27.64 | | $25.82 |
| | | | |
| | | | |
Total Return3 | 11.92% | 9.29% | | 3.28% |
| | | | |
| | | | |
Ratios/Supplemental Data | | | | |
Net Assets, End of Period (Millions) | $6 | $4 | | $1 |
Ratio of Total Expenses to Average Net Assets | 0.28% | 0.28% | | 0.28%4 |
Ratio of Net Investment Income to Average Net Assets | 1.90% | 1.69% | | 1.51%4 |
Portfolio Turnover Rate5 | 14% | 7% | | 20% |
ETF Shares | | | | |
| | | | |
| Year Ended | | Jan. 261 to |
| August 31, | | Aug. 31, |
For a Share Outstanding Throughout Each Period | 2006 | 2005 | | 2004 |
Net Asset Value, Beginning of Period | $56.03 | $52.28 | | $50.84 |
Investment Operations | | | | |
Net Investment Income | 1.0902 | .9502 | | .47 |
Net Realized and Unrealized Gain (Loss) on Investments | 5.523 | 3.894 | | .97 |
Total from Investment Operations | 6.613 | 4.844 | | 1.44 |
Distributions | | | | |
Dividends from Net Investment Income | (.703) | (.853) | | — |
Distributions from Realized Capital Gains | — | (.241) | | — |
Total Distributions | (.703) | (1.094) | | — |
Net Asset Value, End of Period | $61.94 | $56.03 | | $52.28 |
| | | | |
| | | | |
Total Return | 11.91% | 9.33% | | 2.83% |
| | | | |
| | | | |
Ratios/Supplemental Data | | | | |
Net Assets, End of Period (Millions) | $211 | $73 | | $21 |
Ratio of Total Expenses to Average Net Assets | 0.25% | 0.26% | | 0.28%4 |
Ratio of Net Investment Income to Average Net Assets | 1.93% | 1.71% | | 1.51%4 |
Portfolio Turnover Rate5 | 14% | 7% | | 20% |
2 | Calculated based on average shares outstanding. |
3 | Total returns do not reflect the 2% fee assessed on redemptions of shares held for less than one year. |
5 | Excludes the value of portfolio securities received or delivered as a result of in-kind purchases or redemptions of the fund’s capital shares, including ETF Creation Units. See accompanying Notes, which are an integral part of the Financial Statements. |
19
Consumer Staples Index Fund
Notes to Financial Statements
Vanguard Consumer Staples Index Fund is registered under the Investment Company Act of 1940 as an open-end investment company, or mutual fund. The fund files reports with the SEC under the company name Vanguard World Funds. The fund offers two classes of shares, Admiral Shares and ETF Shares (formerly known as VIPER Shares). Admiral Shares are available to any investor who meets the fund’s minimum purchase requirements. ETF Shares are listed for trading on the American Stock Exchange; they can be purchased and sold through a broker.
A. The following significant accounting policies conform to generally accepted accounting principles for U.S. mutual funds. The fund consistently follows such policies in preparing its financial statements.
1. Security Valuation: Securities are valued as of the close of trading on the New York Stock Exchange (generally 4:00 p.m. Eastern time) on the valuation date. Equity securities are valued at the latest quoted sales prices or official closing prices taken from the primary market in which each security trades; such securities not traded on the valuation date are valued at the mean of the latest quoted bid and asked prices. Securities for which market quotations are not readily available, or whose values have been materially affected by events occurring before the fund’s pricing time but after the close of the securities’ primary markets, are valued by methods deemed by the board of trustees to represent fair value. Investments in Vanguard Market Liquidity Fund are valued at that fund’s net asset value.
2. Federal Income Taxes: The fund intends to continue to qualify as a regulated investment company and distribute all of its taxable income. Accordingly, no provision for federal income taxes is required in the financial statements.
3. Distributions: Distributions to shareholders are recorded on the ex-dividend date.
4. Other: Dividend income is recorded on the ex-dividend date. Interest income includes income distributions received from Vanguard Market Liquidity Fund and is accrued daily. Security transactions are accounted for on the date securities are bought or sold. Costs used to determine realized gains (losses) on the sale of investment securities are those of the specific securities sold. Fees assessed on redemptions of Admiral Shares are credited to paid-in capital.
Each class of shares has equal rights as to assets and earnings, except that each class separately bears certain class-specific expenses related to maintenance of shareholder accounts (included in Management and Administrative expenses) and shareholder reporting. Marketing and distribution expenses are allocated to each class of shares based on a method approved by the board of trustees. Income, other non-class-specific expenses, and gains and losses on investments are allocated to each class of shares based on its relative net assets.
B. The Vanguard Group furnishes at cost investment advisory, corporate management, administrative, marketing, and distribution services. The costs of such services are allocated to the fund under methods approved by the board of trustees. The fund has committed to provide up to 0.40% of its net assets in capital contributions to Vanguard. At August 31, 2006, the fund had contributed capital of $18,000 to Vanguard (included in Other Assets), representing 0.01% of the fund’s net assets and 0.02% of Vanguard’s capitalization. The fund’s trustees and officers are also directors and officers of Vanguard.
C. Distributions are determined on a tax basis and may differ from net investment income and realized capital gains for financial reporting purposes. Differences may be permanent or temporary. Permanent differences are reclassified among capital accounts in the financial statements to reflect their tax character. Temporary differences arise when certain items of income, expense, gain, or loss are recognized in different periods for financial statement and tax purposes; these differences will reverse at some time in the future. Differences in classification may also result from the treatment of short-term gains as ordinary income for tax purposes.
For tax purposes, at August 31, 2006, the fund had $1,592,000 of ordinary income available for distribution. The fund had available realized losses of $1,078,000 to offset future net capital gains of $276,000 through August 31, 2014, and $802,000 through August 31, 2015.
At August 31, 2006, the cost of investment securities for tax purposes was $198,983,000. Net unrealized
appreciation of investment securities for tax purposes was $17,203,000, consisting of unrealized gains of $19,441,000 on securities that had risen in value since their purchase and $2,238,000 in unrealized losses on securities that had fallen in value since their purchase.
D. During the year ended August 31, 2006, the fund purchased $141,856,000 of investment securities and sold $16,536,000 of investment securities, other than temporary cash investments.
E. In June 2006, the Financial Accounting Standards Board issued Interpretation No. 48 (“FIN 48”), “Accounting for Uncertainty in Income Taxes.” FIN 48 establishes the minimum threshold for recognizing, and a system for measuring, the benefits of tax-return positions in financial statements. FIN 48 will be effective for the fund’s fiscal year beginning September 1, 2007. Management is in the process of analyzing the fund’s tax positions for purposes of implementing FIN 48; based on the analysis completed to date, management does not believe the adoption of FIN 48 will result in any material impact to the fund's financial statements.
F. Capital share transactions for each class of shares were (see table below):
| Year Ended August 31, |
| | 2006 | | | 2005 |
| Amount | Shares | | Amount | Shares |
| ($000) | (000) | | ($000) | (000) |
Admiral Shares | | | | | |
Issued | 1,868 | 65 | | 3,792 | 140 |
Issued in Lieu of Cash Distributions | 50 | 2 | | 12 | — |
Redeemed1 | (814) | (29) | | (695) | (26) |
Net Increase (Decrease)—Admiral Shares | 1,104 | 38 | | 3,109 | 114 |
ETF Shares | | | | | |
Issued | 123,168 | 2,100 | | 49,996 | 900 |
Issued in Lieu of Cash Distributions | — | — | | — | — |
Redeemed | — | — | | — | — |
Net Increase (Decrease)—ETF Shares | 123,168 | 2,100 | | 49,996 | 900 |
1 | Net of redemption fees of $4,000 and $7,000. |
20
Energy Index Fund
Fund Profile
As of August 31, 2006
Portfolio Characteristics | | |
| | Target | Broad |
| Fund | Index1 | Index2 |
Number of Stocks | 147 | 147 | 2,477 |
Median Market Cap | $43.7B | $72.6B | $30.8B |
Price/Earnings Ratio | 10.7x | 10.6x | 17.4x |
Price/Book Ratio | 2.6x | 2.7x | 2.7x |
Yield | | 1.4% | 1.8% |
Admiral Shares | 1.2% | | |
ETF Shares | 1.2% | | |
Return on Equity | 20.0% | 20.8% | 17.8% |
Earnings Growth Rate | 33.3% | 32.7% | 16.7% |
Foreign Holdings | 0.3% | 0.3% | 0.0% |
Turnover Rate | 21% | — | — |
Expense Ratio | | — | — |
Admiral Shares | 0.28% | | |
ETF Shares | 0.25% | | |
Short-Term Reserves | 0% | — | — |
Industry Diversification (% of portfolio) |
| |
Coal & Consumable Fuels | 2% |
Integrated Oil & Gas | 49 |
Oil & Gas Drilling | 7 |
Oil & Gas Equipment & Services | 19 |
Oil & Gas Exploration & Production | 16 |
Oil & Gas Refining & Marketing | 4 |
Oil & Gas Storage & Transportation | 3 |
Ten Largest Holdings3 (% of total net assets) |
| |
ExxonMobil Corp. | 22.2% |
Chevron Corp. | 11.4 |
ConocoPhillips Co. | 8.1 |
Schlumberger Ltd. | 6.3 |
Occidental Petroleum Corp. | 3.2 |
Valero Energy Corp. | 2.6 |
Halliburton Co. | 2.5 |
Marathon Oil Corp. | 2.2 |
Devon Energy Corp. | 1.9 |
Baker Hughes, Inc. | 1.8 |
Top Ten | 62.2% |
3 | “Ten Largest Holdings” excludes any temporary cash investments and equity index products. |
21
Energy Index Fund
Performance Summary
All of the returns in this report represent past performance, which is not a guarantee of future results that may be achieved by the fund. (Current performance may be lower or higher than the performance data cited. For performance data current to the most recent month-end, visit our website at www.vanguard.com.) Note, too, that both investment returns and principal value can fluctuate widely, so an investor’s shares, when sold, could be worth more or less than their original cost. The returns shown do not reflect taxes that a shareholder would pay on fund distributions or on the sale of fund shares.
Cumulative Performance: September 23, 2004–August 31, 2006
Initial Investment of $10,000.
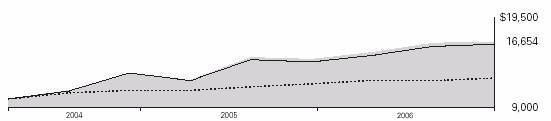
| | | |
| Average Annual Total Returns | | Final Value |
| Periods Ended August 31, 2006 | | of a $10,000 |
| One Year | Since Inception1 | | Investment |
Energy Index Fund ETF Shares Net Asset Value | 12.31% | 30.14% | | $16,654 |
Energy Index Fund ETF Shares Market Price | 12.53 | 30.19 | | 16,666 |
MSCI US IMI/2500 | 8.91 | 12.04 | | 12,462 |
MSCI US IMI/Energy | 12.44 | 29.08 | | 16,394 |
| | | Final Value |
| | | of a $100,000 |
| One Year | Since Inception1 | Investment |
Energy Index Fund Admiral Shares2 | 12.27% | 27.03% | $157,483 |
MSCI US IMI/2500 | 8.91 | 11.04 | 121,999 |
MSCI US IMI/Energy | 12.44 | 25.80 | 154,603 |
Fiscal-Year Total Returns (%):
September 23, 2004–August 31, 2006
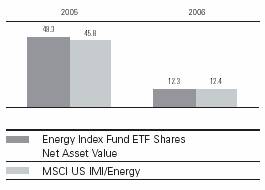
Cumulative Returns: ETF Shares, September 23, 2004–August 31, 2006 |
| | Cumulative |
| | Since |
| One Year | Inception |
Energy Index Fund ETF Shares Market Price | 12.53% | 66.66% |
Energy Index Fund ETF Shares Net Asset Value | 12.31 | 66.54 |
MSCI US IMI/Energy | 12.44 | 63.94 |
Average Annual Total Returns: Periods Ended June 30, 2006
This table presents average annual total returns through the latest calendar quarter—rather than through the end of the fiscal period. Securities and Exchange Commission rules require that we provide this information.
| | | Since |
| Inception Date | One Year | Inception |
ETF Shares | 9/23/2004 | | |
Market Price | | 29.91% | 34.50% |
Net Asset Value | | 29.79 | 34.46 |
Admiral Shares2 | 10/7/2004 | 29.77 | 31.04 |
1 | Inception dates are: for ETF Shares, September 23, 2004; for Admiral Shares, October 7, 2004. |
2 | Total returns do not reflect the 2% fee assessed on redemptions of shares held less than one year. Note: See Financial Highlights tables on page 26 for dividend and capital gains information. |
22
Energy Index Fund
Financial Statements
Statement of Net Assets
As of August 31, 2006
The fund provides a complete list of its holdings four times in each fiscal year, at the quarter-ends. For the second and fourth fiscal quarters, the lists appear in the fund’s semiannual and annual reports to shareholders. For the first and third fiscal quarters, the fund files the lists with the Securities and Exchange Commission on Form N-Q. Shareholders can look up the fund’s Forms N-Q on the SEC’s website at www.sec.gov. Forms N-Q may also be reviewed and copied at the SEC’s Public Reference Room (see the back cover of this report for further information).
| | | Market |
| | | Value• |
| | Shares | ($000) |
Common Stocks (100.1%) | | |
Energy Equipment & Services (25.6%) | | |
| Oil & Gas Drilling (6.9%) | | |
* | Transocean Inc. | 101,353 | 6,765 |
| GlobalSantaFe Corp. | 75,410 | 3,712 |
* | Nabors Industries, Inc. | 97,514 | 3,206 |
| Noble Corp. | 42,499 | 2,779 |
| ENSCO International, Inc. | 49,265 | 2,202 |
| Patterson-UTI Energy, Inc. | 57,249 | 1,569 |
| Diamond Offshore | | |
| Drilling, Inc. | 21,420 | 1,553 |
* | Pride International, Inc. | 54,589 | 1,415 |
| Rowan Cos., Inc. | 36,879 | 1,261 |
| Helmerich & Payne, Inc. | 36,167 | 887 |
* | Unit Corp. | 14,756 | 778 |
* | Todco Class A | 20,690 | 766 |
* | Grey Wolf, Inc. | 81,163 | 593 |
* | Atwood Oceanics, Inc. | 10,981 | 472 |
* | Parker Drilling Co. | 58,169 | 413 |
* | Pioneer Drilling Co. | 27,206 | 383 |
* | Hercules Offshore, Inc. | 8,405 | 268 |
* | Bronco Drilling Co., Inc. | 10,251 | 199 |
| | | |
| Oil & Gas Equipment & Services (18.7%) | |
| Schlumberger Ltd. | 435,517 | 26,697 |
| Halliburton Co. | 318,053 | 10,375 |
| Baker Hughes, Inc. | 106,187 | 7,558 |
* | Weatherford International Ltd. | 109,716 | 4,718 |
* | National Oilwell Varco Inc. | 54,009 | 3,527 |
| BJ Services Co. | 100,221 | 3,439 |
| Smith International, Inc. | 66,822 | 2,805 |
* | Cameron International Corp. | 37,728 | 1,808 |
* | Grant Prideco, Inc. | 42,646 | 1,771 |
* | FMC Technologies Inc. | 22,037 | 1,296 |
* | Maverick Tube Corp. | 15,178 | 975 |
* | Superior Energy Services, Inc. | 28,961 | 925 |
| Tidewater Inc. | 19,149 | 912 |
| | | | | |
* | Veritas DGC Inc. | 13,025 | 776 |
* | Core Laboratories NV | 10,373 | 761 |
* | Oceaneering | | |
| International, Inc. | 19,761 | 711 |
* | TETRA Technologies, Inc. | 24,739 | 688 |
* | Hanover Compressor Co. | 33,409 | 629 |
* | SEACOR Holdings Inc. | 6,920 | 602 |
* | Universal Compression | | |
| Holdings, Inc. | 11,049 | 601 |
* | W-H Energy Services, Inc. | 11,451 | 578 |
* | Global Industries Ltd. | 31,509 | 565 |
* | Hydrill Co. | 7,840 | 513 |
* | Oil States International, Inc. | 15,376 | 491 |
* | Lone Star Technologies, Inc. | 10,705 | 485 |
* | Dresser Rand Group, Inc. | 21,620 | 442 |
* | NS Group Inc. | 9,259 | 421 |
* | Bristow Group, Inc. | 10,393 | 388 |
| Lufkin Industries, Inc. | 5,811 | 366 |
* | Input/Output, Inc. | 34,948 | 348 |
* | Hornbeck Offshore | | |
| Services, Inc. | 10,228 | 344 |
* | Dril-Quip, Inc. | 4,444 | 341 |
| CARBO Ceramics Inc. | 8,514 | 340 |
* | Trico Marine Services, Inc. | 9,086 | 326 |
* | Newpark Resources, Inc. | 56,693 | 314 |
* | Willbros Group, Inc. | 16,905 | 302 |
* | Basic Energy Services Inc. | 9,755 | 279 |
* | Gulfmark Offshore, Inc. | 8,214 | 249 |
| RPC Inc. | 12,134 | 248 |
* | Superior Well Services, Inc. | 5,235 | 113 |
* | SulphCo, Inc. | 10,545 | 70 |
| | | 108,318 |
Oil—Crude Producers (74.5%) | | |
| Coal & Consumable Fuels (2.3%) | |
| Peabody Energy Corp. | 81,549 | 3,594 |
| CONSOL Energy, Inc. | 58,876 | 2,147 |
| Arch Coal, Inc. | 41,684 | 1,365 |
| Massey Energy Co. | 27,251 | 688 |
* | KFX, Inc. | 34,088 | 546 |
| Foundation Coal | | |
| Holdings, Inc. | 14,056 | 505 |
* | Alpha Natural Resources, Inc. | 20,902 | 379 |
| USEC Inc. | 37,440 | 379 |
* | James River Coal Co. | 12,591 | 185 |
* | International Coal Group, Inc. | 21,084 | 132 |
| | | |
| Integrated Oil & Gas (48.6%) | | |
| ExxonMobil Corp. | 1,385,224 | 93,738 |
| Chevron Corp. | 746,603 | 48,081 |
| ConocoPhillips Co. | 542,544 | 34,414 |
| Occidental Petroleum Corp. | 263,462 | 13,434 |
| Marathon Oil Corp. | 112,820 | 9,420 |
| Hess Corp. | 77,546 | 3,550 |
| Murphy Oil Corp. | 52,904 | 2,588 |
* | CNX Gas Corp. | 12,828 | 331 |
| | | |
| Oil & Gas Exploration & Production (15.9%) |
| Devon Energy Corp. | 130,476 | 8,153 |
| Apache Corp. | 102,835 | 6,713 |
| Anadarko Petroleum Corp. | 139,028 | 6,522 |
| XTO Energy, Inc. | 105,346 | 4,822 |
| EOG Resources, Inc. | 73,849 | 4,787 |
| Chesapeake Energy Corp. | 122,947 | 3,881 |
| Noble Energy, Inc. | 55,912 | 2,763 |
* | Ultra Petroleum Corp. | 48,847 | 2,425 |
* | Southwestern Energy Co. | 54,262 | 1,864 |
* | Newfield Exploration Co. | 41,598 | 1,799 |
| Pioneer Natural Resources Co. | 41,741 | 1,741 |
* | Denbury Resources, Inc. | 40,190 | 1,246 |
| Range Resources Corp. | 43,621 | 1,221 |
* | Plains Exploration & | | |
| Production Co. | 26,948 | 1,186 |
* | Helix Energy Solutions | | |
| Group, Inc. | 30,069 | 1,156 |
| Cimarex Energy Co. | 27,519 | 1,054 |
| Pogo Producing Co. | 20,602 | 915 |
| Cabot Oil & Gas Corp. | 17,668 | 902 |
| St. Mary Land & | | |
| Exploration Co. | 20,593 | 840 |
* | Forest Oil Corp. | 21,871 | 741 |
* | Houston Exploration Co. | 10,991 | 705 |
* | Cheniere Energy, Inc. | 20,469 | 673 |
* | Quicksilver Resources, Inc. | 17,305 | 651 |
* | Whiting Petroleum Corp. | 14,180 | 638 |
* | Petrohawk Energy Corp. | 56,555 | 631 |
| Penn Virginia Corp. | 7,423 | 527 |
* | Swift Energy Co. | 11,758 | 515 |
* | Encore Acquisition Co. | 18,104 | 490 |
* | Comstock Resources, Inc. | 16,667 | 479 |
* | Delta Petroleum Corp. | 22,765 | 476 |
* | Parallel Petroleum Corp. | 19,059 | 457 |
| Berry Petroleum Class A | 14,594 | 456 |
| W&T Offshore, Inc. | 14,163 | 454 |
* | Stone Energy Corp. | 10,130 | 447 |
* | Energy Partners, Ltd. | 16,724 | 417 |
* | Atlas America, Inc. | 8,565 | 394 |
* | Petroleum Development Corp. | 8,981 | 383 |
* | ATP Oil & Gas Corp. | 9,132 | 357 |
* | Bill Barrett Corp. | 12,181 | 352 |
* | Warren Resources Inc. | 20,953 | 303 |
* | Carrizo Oil & Gas, Inc. | 10,629 | 296 |
* | Mariner Energy Inc. | 14,583 | 276 |
* | Harvest Natural | | |
| Resources, Inc. | 20,731 | 265 |
* | PetroQuest Energy, Inc. | 21,908 | 264 |
* | Goodrich Petroleum Corp. | 8,097 | 257 |
| | | | |
* | McMoRan Exploration Co. | 11,771 | 219 |
* | Endeavor International Corp. | 69,353 | 203 |
* | The Meridian Resource Corp. | 45,617 | 153 |
* | Brigham Exploration Co. | 19,368 | 136 |
* | GeoGlobal Resources Inc. | 24,263 | 131 |
* | Pacific Ethanol, Inc. | 5,399 | 100 |
* | Bois d’Arc Energy, Inc. | 5,532 | 91 |
| | | |
| Oil & Gas Refining & Marketing (4.4%) | |
| Valero Energy Corp. | 190,264 | 10,921 |
| Sunoco, Inc. | 41,409 | 2,978 |
| Tesoro Petroleum Corp. | 22,644 | 1,463 |
| Frontier Oil Corp. | 36,386 | 1,190 |
| Holly Corp. | 13,958 | 640 |
* | Giant Industries, Inc. | 5,840 | 477 |
| World Fuel Services Corp. | 10,725 | 387 |
| Alon USA Energy, Inc. | 7,444 | 261 |
* | Syntroleum Corp. | 22,574 | 109 |
| | | |
| Oil & Gas Storage & Transportation (3.3%) |
| Williams Cos., Inc. | 175,979 | 4,334 |
| Kinder Morgan, Inc. | 34,721 | 3,623 |
| El Paso Corp. | 216,799 | 3,148 |
* | Kinder Morgan | | |
| Management, LLC | 17,503 | 739 |
23
Energy Index Fund
| | | Market |
| | | Value• |
| | Shares | ($000) |
| Overseas Shipholding | | |
| Group Inc. | 11,039 | 736 |
| OMI Corp. | 25,033 | 564 |
| General Maritime Corp. | 8,489 | 319 |
| Crosstex Energy, Inc. | 3,052 | 281 |
* | Enbridge Energy | | |
| Management LLC | 5,693 | 267 |
| | | 314,840 |
Total Investments (100.1%) | | |
(Cost $370,403) | | 423,158 |
Other Assets and Liabilities (–0.1%) | | |
Other Assets—Note B | | 1,334 |
Liabilities | | (1,548) |
| | | (214) |
Net Assets (100%) | | 422,944 |
At August 31, 2006, net assets consisted of: 1 |
| Amount |
| ($000) |
Paid in Capital | 368,086 |
Undistributed Net Investment Income | 3,485 |
Accumulated Net Realized Losses | (1,382) |
Unrealized Appreciation | 52,755 |
Net Assets | 422,944 |
| |
| |
Admiral Shares—Net Assets | |
Applicable to 2,053,170 outstanding | |
$.001 par value shares of beneficial | |
interest (unlimited authorization) | 82,865 |
Net Asset Value Per Share— | |
Admiral Shares | $40.36 |
| |
| |
ETF Shares—Net Assets | |
Applicable to 4,203,632 outstanding | |
$.001 par value shares of beneficial | |
interest (unlimited authorization) | 340,079 |
Net Asset Value Per Share— | |
ETF Shares | $80.90 |
• | See Note A in Notes to Financial Statements. |
* | Non-income-producing security. |
1 | See Note C in Notes to Financial Statements for the tax-basis components of net assets. |
24
Energy Index Fund
Statement of Operations |
| |
| Year Ended |
| August 31, 2006 |
| ($000) |
Investment Income | |
Income | |
Dividends | 5,103 |
Interest1 | 19 |
Total Income | 5,122 |
Expenses | |
The Vanguard Group—Note B | |
Investment Advisory Services | 38 |
Management and Administrative | |
Admiral Shares | 142 |
ETF Shares | 567 |
Marketing and Distribution | |
Admiral Shares | 20 |
ETF Shares | 35 |
Custodian Fees | 19 |
Auditing Fees | 21 |
Shareholders’ Reports | |
Admiral Shares | 29 |
ETF Shares | 18 |
Total Expenses | 889 |
Net Investment Income | 4,233 |
Realized Net Gain (Loss) on | |
Investment Securities Sold | 16,291 |
Change in Unrealized Appreciation | |
(Depreciation) of Investment Securities | 11,499 |
Net Increase (Decrease) in Net Assets | |
Resulting from Operations | 32,023 |
Statement of Changes in Net Assets | | |
| | |
| | Sept. 23, |
| Year Ended | 20042 to |
| Aug. 31, | Aug. 31, |
| 2006 | 2005 |
| ($000) | ($000) |
Increase (Decrease) In Net Assets | | |
Operations | | |
Net Investment Income | 4,233 | 2,036 |
Realized Net Gain (Loss) | 16,291 | 2,416 |
Change in Unrealized Appreciation (Depreciation) | 11,499 | 41,256 |
Net Increase (Decrease) in Net Assets Resulting from Operations | 32,023 | 45,708 |
Distributions | | |
Net Investment Income | | |
Admiral Shares | (618) | (2) |
ETF Shares | (2,034) | (130) |
Realized Capital Gain | | |
Admiral Shares | — | — |
ETF Shares | — | — |
Total Distributions | (2,652) | (132) |
Capital Share Transactions—Note F | | |
Admiral Shares | 15,324 | 51,140 |
ETF Shares | 135,972 | 145,561 |
Net Increase (Decrease) from Capital Share Transactions | 151,296 | 196,701 |
Total Increase (Decrease) | 180,667 | 242,277 |
Net Assets | | |
Beginning of Period | 242,277 | — |
End of Period3 | 422,944 | 242,277 |
1 | Interest income from an affiliated company of the fund was $19,000. |
3 | Net Assets—End of Period includes undistributed net investment income of $3,485,000 and $1,904,000. |
25
Energy Index Fund
Financial Highlights
Admiral Shares | | |
| Year | Oct. 7, |
| Ended | 20041 to |
| Aug. 31, | Aug. 31, |
For a Share Outstanding Throughout Each Period | 2006 | 2005 |
Net Asset Value, Beginning of Period | $36.29 | $25.98 |
Investment Operations | | |
Net Investment Income | .462 | .5882,3 |
Net Realized and Unrealized Gain (Loss) on Investments | 3.96 | 9.833 |
Total from Investment Operations | 4.42 | 10.421 |
Distributions | | |
Dividends from Net Investment Income | (.35) | (.111) |
Distributions from Realized Capital Gains | — | — |
Total Distributions | (.35) | (.111) |
Net Asset Value, End of Period | $40.36 | $36.29 |
| | |
| | |
Total Return4 | 12.27% | 40.27% |
| | |
| | |
Ratios/Supplemental Data | | |
Net Assets, End of Period (Millions) | $83 | $60 |
Ratio of Total Expenses to Average Net Assets | 0.28% | 0.28%5 |
Ratio of Net Investment Income to Average Net Assets | 1.20% | 1.95%3,5 |
Portfolio Turnover Rate6 | 21% | 16% |
ETF Shares | | |
| Year | Sept. 23, |
| Ended | 20041 to |
| Aug. 31, | Aug. 31, |
For a Share Outstanding Throughout Each Period | 2006 | 2005 |
Net Asset Value, Beginning of Period | $72.72 | $49.24 |
Investment Operations | | |
Net Investment Income | .9662 | 1.1692,7 |
Net Realized and Unrealized Gain (Loss) on Investments | 7.915 | 22.527 |
Total from Investment Operations | 8.881 | 23.696 |
Distributions | | |
Dividends from Net Investment Income | (.701) | (.216) |
Distributions from Realized Capital Gains | — | — |
Total Distributions | (.701) | (.216) |
Net Asset Value, End of Period | $80.90 | $72.72 |
| | |
| | |
Total Return | 12.31% | 48.29% |
| | |
| | |
Ratios/Supplemental Data | | |
Net Assets, End of Period (Millions) | $340 | $182 |
Ratio of Total Expenses to Average Net Assets | 0.25% | 0.26%5 |
Ratio of Net Investment Income to Average Net Assets | 1.23% | 1.97%5,7 |
Portfolio Turnover Rate6 | 21% | 16% |
1 Inception.
2 | Calculated based on average shares outstanding. |
3 | Net investment income per share and the ratio of net investment income to average net assets include $.163 and 0.52%, respectively, resulting from a cash payment received in connection with the merger of Chevron Corp. and Unocal Corp. in August 2005. |
4 | Total returns do not reflect the 2% fee assessed on redemptions of shares held for less than one year. |
6 | Excludes the value of portfolio securities received or delivered as a result of in-kind purchases or redemptions of the fund’s capital shares, including ETF Creation Units. |
7 | Net investment income per share and the ratio of net investment income to average net assets include $.324 and 0.52%, respectively, resulting from a cash payment received in connection with the merger of Chevron Corp. and Unocal Corp. in August 2005. |
See accompanying Notes, which are an integral part of the Financial Statements.
26
Energy Index Fund
Notes to Financial Statements
Vanguard Energy Index Fund is registered under the Investment Company Act of 1940 as an open-end investment company, or mutual fund. The fund files reports with the SEC under the company name Vanguard World Funds. The fund offers two classes of shares, Admiral Shares and ETF Shares (formerly known as VIPER Shares). Admiral Shares are available to any investor who meets the fund’s minimum purchase requirements. ETF Shares are listed for trading on the American Stock Exchange; they can be purchased and sold through a broker.
A. The following significant accounting policies conform to generally accepted accounting principles for U.S. mutual funds. The fund consistently follows such policies in preparing its financial statements.
1. Security Valuation: Securities are valued as of the close of trading on the New York Stock Exchange (generally 4:00 p.m. Eastern time) on the valuation date. Equity securities are valued at the latest quoted sales prices or official closing prices taken from the primary market in which each security trades; such securities not traded on the valuation date are valued at the mean of the latest quoted bid and asked prices. Securities for which market quotations are not readily available, or whose values have been materially affected by events occurring before the fund’s pricing time but after the close of the securities’ primary markets, are valued by methods deemed by the board of trustees to represent fair value. Investments in Vanguard Market Liquidity Fund are valued at that fund’s net asset value.
2. Federal Income Taxes: The fund intends to continue to qualify as a regulated investment company and distribute all of its taxable income. Accordingly, no provision for federal income taxes is required in the financial statements.
3. Distributions: Distributions to shareholders are recorded on the ex-dividend date.
4. Other: Dividend income is recorded on the ex-dividend date. Interest income includes income distributions received from Vanguard Market Liquidity Fund and is accrued daily. Security transactions are accounted for on the date securities are bought or sold. Costs used to determine realized gains (losses) on the sale of investment securities are those of the specific securities sold. Fees assessed on redemptions of Admiral Shares are credited to paid-in capital.
Each class of shares has equal rights as to assets and earnings, except that each class separately bears certain class-specific expenses related to maintenance of shareholder accounts (included in Management and Administrative expenses) and shareholder reporting. Marketing and distribution expenses are allocated to each class of shares based on a method approved by the board of trustees. Income, other non-class-specific expenses, and gains and losses on investments are allocated to each class of shares based on its relative net assets.
B. The Vanguard Group furnishes at cost investment advisory, corporate management, administrative, marketing, and distribution services. The costs of such services are allocated to the fund under methods approved by the board of trustees. The fund has committed to provide up to 0.40% of its net assets in capital contributions to Vanguard. At August 31, 2006, the fund had contributed capital of $47,000 to Vanguard (included in Other Assets), representing 0.01% of the fund’s net assets and 0.05% of Vanguard’s capitalization. The fund’s trustees and officers are also directors and officers of Vanguard.
C. Distributions are determined on a tax basis and may differ from net investment income and realized capital gains for financial reporting purposes. Differences may be permanent or temporary. Permanent differences are reclassified among capital accounts in the financial statements to reflect their tax character. Temporary differences arise when certain items of income, expense, gain, or loss are recognized in different periods for financial statement and tax purposes; these differences will reverse at some time in the future. Differences in classification may also result from the treatment of short-term gains as ordinary income for tax purposes.
During the year ended August 31, 2006, the fund realized $17,637,000 of net capital gains resulting from in-kind redemptions—in which shareholders exchanged fund shares for securities held by the fund rather than for cash. Because such gains are not taxable to the fund, and are not distributed to shareholders, they have been reclassified from accumulated net realized gains to paid-in capital.
For tax purposes, at August 31, 2006, the fund had $3,630,000 of ordinary income available for distribution. The
fund had available realized losses of $1,240,000 to offset future net capital gains of $5,000 through August 31, 2013, $789,000 through August 31, 2014, and $446,000 through August 31, 2015.
At August 31, 2006, the cost of investment securities for tax purposes was $370,545,000. Net unrealized appreciation of investment securities for tax purposes was $52,613,000, consisting of unrealized gains of $55,108,000 on securities that had risen in value since their purchase and $2,495,000 in unrealized losses on securities that had fallen in value since their purchase.
D. During the year ended August 31, 2006, the fund purchased $284,806,000 of investment securities and sold $131,256,000 of investment securities, other than temporary cash investments.
E. In June 2006, the Financial Accounting Standards Board issued Interpretation No. 48 (“FIN 48”), “Accounting for Uncertainty in Income Taxes.” FIN 48 establishes the minimum threshold for recognizing, and a system for measuring, the benefits of tax-return positions in financial statements. FIN 48 will be effective for the fund’s fiscal year beginning September 1, 2007. Management is in the process of analyzing the fund’s tax positions for purposes of implementing FIN 48; based on the analysis completed to date, management does not believe the adoption of FIN 48 will result in any material impact to the fund's financial statements.
F. Capital share transactions for each class of shares were (see table below):
| Year Ended | | September 23, 20041 |
| August 31, 2006 | | to August 31, 2005 |
| Amount | Shares | | Amount | Shares |
| ($000) | (000) | | ($000) | (000) |
Admiral Shares | | | | | |
Issued | 31,354 | 808 | | 53,398 | 1,741 |
Issued in Lieu of Cash Distributions | 548 | 15 | | 2 | — |
Redeemed2 | (16,578) | (436) | | (2,260) | (74) |
Net Increase (Decrease)—Admiral Shares | 15,324 | 387 | | 51,140 | 1,667 |
ETF Shares | | | | | |
Issued | 203,625 | 2,604 | | 162,797 | 2,800 |
Issued in Lieu of Cash Distributions | — | — | | — | — |
Redeemed | (67,653) | (900) | | (17,236) | (300) |
Net Increase (Decrease)—ETF Shares | 135,972 | 1,704 | | 145,561 | 2,500 |
2 | Net of redemption fees of $112,000 and $46,000. |
27
Financials Index Fund
Fund Profile
As of August 31, 2006
Portfolio Characteristics | | |
| | Target | Broad |
| Fund | Index1 | Index2 |
Number of Stocks | 548 | 548 | 2,477 |
Median Market Cap | $30.6B | $30.6B | $30.8B |
Price/Earnings Ratio | 14.9x | 14.9x | 17.4x |
Price/Book Ratio | 2.0x | 2.0x | 2.7x |
Yield | | 2.7% | 1.8% |
Admiral Shares | 2.5% | | |
ETF Shares | 2.6% | | |
Return on Equity | 15.8% | 15.9% | 17.8% |
Earnings Growth Rate | 14.4% | 14.4% | 16.7% |
Foreign Holdings | 0.1% | 0.1% | 0.0% |
Turnover Rate | 6% | — | — |
Expense Ratio | | — | — |
Admiral Shares | 0.28% | | |
ETF Shares | 0.25% | | |
Short-Term Reserves | 0% | — | — |
Industry Diversification (% of portfolio) | |
| |
Asset Management & Custody Banks | 5% |
Consumer Finance | 3 |
Diversified Banks | 8 |
Diversified REITs | 1 |
Industrial REITs | 1 |
Insurance Brokers | 1 |
Investment Banking & Brokerage | 9 |
Life & Health Insurance | 5 |
Mortgage REITs | 1 |
Multiline Insurance | 6 |
Office REITs | 2 |
Other Diversified Financial Services | 20 |
Property & Casualty Insurance | 8 |
Real Estate Management & Development | 1 |
Regional Banks | 11 |
Reinsurance | 1 |
Residential REITs | 2 |
Retail REITs | 3 |
Specialized Finance | 2 |
Specialized REITs | 2 |
Thrifts & Mortgage Finance | 8 |
Ten Largest Holdings3 (% of total net assets) |
| |
Citigroup, Inc. | 7.7% |
Bank of America Corp. | 7.4 |
JPMorgan Chase & Co. | 4.9 |
American International Group, Inc. | 4.2 |
Wells Fargo & Co. | 3.5 |
Wachovia Corp. | 2.8 |
Merrill Lynch & Co., Inc. | 2.0 |
Morgan Stanley | 2.0 |
The Goldman Sachs Group, Inc. | 1.8 |
American Express Co. | 1.8 |
Top Ten | 38.1% |
3 | “Ten Largest Holdings” excludes any temporary cash investments and equity index products. |
28
Financials Index Fund
Performance Summary
All of the returns in this report represent past performance, which is not a guarantee of future results that may be achieved by the fund. (Current performance may be lower or higher than the performance data cited. For performance data current to the most recent month-end, visit our website at www.vanguard.com.) Note, too, that both investment returns and principal value can fluctuate widely, so an investor’s shares, when sold, could be worth more or less than their original cost. The returns shown do not reflect taxes that a shareholder would pay on fund distributions or on the sale of fund shares.
Cumulative Performance: January 26, 2004–August 31, 2006
Initial Investment of $10,000
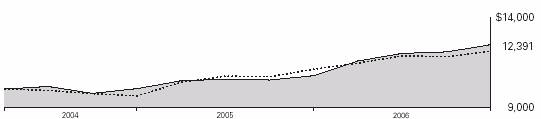
| Average Annual Total Returns | | Final Value |
| Periods Ended August 31, 2006 | | of a $10,000 |
| One Year | Since Inception1 | | Investment |
Financials Index Fund ETF Shares Net Asset Value | 15.82% | 8.61% | | $12,391 |
Financials Index Fund ETF Shares Market Price | 16.47 | 8.76 | | 12,433 |
MSCI US IMI/2500 | 8.91 | 7.62 | | 12,098 |
MSCI US IMI/Financials | 16.05 | 8.83 | | 12,456 |
| | | Final Value |
| | | of a $100,000 |
| One Year | Since Inception1 | Investment |
Financials Index Fund Admiral Shares2 | 15.76% | 9.39% | $125,957 |
MSCI US IMI/2500 | 8.91 | 8.89 | 124,475 |
MSCI US IMI/Financials | 16.05 | 9.63 | 126,662 |
Fiscal-Year Total Returns (%):
January 26, 2004–August 31, 2006
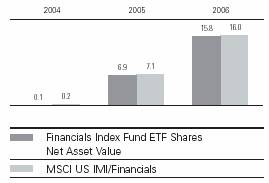
Cumulative Returns: ETF Shares, January 26, 2004–August 31, 2006 |
| | Cumulative |
| | Since |
| One Year | Inception |
Financials Index Fund ETF Shares Market Price | 16.47% | 24.33% |
Financials Index Fund ETF Shares Net Asset Value | 15.82 | 23.91 |
MSCI US IMI/Financials | 16.05 | 24.56 |
Average Annual Total Returns: Periods Ended June 30, 2006
This table presents average annual total returns through the latest calendar quarter—rather than through the end of the fiscal period. Securities and Exchange Commission rules require that we provide this information.
| | | Since |
| Inception Date | One Year | Inception |
ETF Shares | 1/26/2004 | | |
Market Price | | 12.17% | 7.78% |
Net Asset Value | | 12.13 | 7.77 |
Admiral Shares2 | 2/4/2004 | 12.08 | 8.59 |
1 | Inception dates are: for ETF Shares, January 26, 2004; for Admiral Shares, February 4, 2004. |
2 | Total returns do not reflect the 2% fee assessed on redemptions of shares held less than one year. Note: See Financial Highlights tables on page 35 for dividend and capital gains information. |
29
Financials Index Fund
Financial Statements
Statement of Net Assets
As of August 31, 2006
The fund provides a complete list of its holdings four times in each fiscal year, at the quarter-ends. For the second and fourth fiscal quarters, the lists appear in the fund’s semiannual and annual reports to shareholders. For the first and third fiscal quarters, the fund files the lists with the Securities and Exchange Commission on Form N-Q. Shareholders can look up the fund’s Forms N-Q on the SEC’s website at www.sec.gov. Forms N-Q may also be reviewed and copied at the SEC’s Public Reference Room (see the back cover of this report for further information).
| | | Market |
| | | Value• |
| | Shares | ($000) |
Common Stocks (100.0%) | | |
Capital Markets (13.9%) | | |
| Merrill Lynch & Co., Inc. | 36,935 | 2,716 |
| Morgan Stanley | 39,814 | 2,619 |
| The Goldman Sachs | | |
| Group, Inc. | 16,298 | 2,423 |
| Lehman Brothers | | |
| Holdings, Inc. | 18,921 | 1,207 |
| The Bank of | | |
| New York Co., Inc. | 31,688 | 1,069 |
| State Street Corp. | 13,854 | 856 |
| Charles Schwab Corp. | 45,182 | 737 |
| Franklin Resources Corp. | 7,446 | 733 |
| Mellon Financial Corp. | 17,081 | 636 |
| Bear Stearns Co., Inc. | 4,663 | 608 |
| Legg Mason Inc. | 4,987 | 455 |
| T. Rowe Price Group Inc. | 10,310 | 454 |
| Northern Trust Corp. | 7,620 | 427 |
| Ameriprise Financial, Inc. | 9,247 | 423 |
* | E*TRADE Financial Corp. | 15,531 | 366 |
| American Capital | | |
| Strategies, Ltd. | 5,700 | 221 |
| TD Ameritrade Holding Corp. | 12,447 | 218 |
| Allied Capital Corp. | 5,926 | 181 |
| A.G. Edwards & Sons, Inc. | 3,133 | 165 |
| Janus Capital Group Inc. | 8,923 | 159 |
| Nuveen Investments, Inc. | | |
| Class A | 3,242 | 155 |
| SEI Investments Co. | 2,655 | 136 |
| Eaton Vance Corp. | 5,095 | 135 |
* | Affiliated Managers Group, Inc. | 1,390 | 129 |
| Investors Financial | | |
| Services Corp. | 2,681 | 124 |
| Federated Investors, Inc. | 3,545 | 119 |
| Raymond James Financial, Inc. | 3,759 | 104 |
| Jefferies Group, Inc. | 4,147 | 103 |
| Waddell & Reed Financial, Inc. | 3,513 | 82 |
* | Investment Technology | | |
| Group, Inc. | 1,754 | 81 |
| BlackRock, Inc. | 609 | 79 |
* | Knight Capital Group, Inc. | | |
| Class A | 4,227 | 74 |
| Apollo Investment Corp. | 3,384 | 68 |
* | Piper Jaffray Cos., Inc. | 851 | 50 |
| MCG Capital Corp. | 2,121 | 34 |
| Ares Capital Corp. | 1,956 | 33 |
| Greenhill & Co., Inc. | 597 | 33 |
* | GFI Group Inc. | 634 | 29 |
| optionsXpress Holdings Inc. | 1,083 | 28 |
| Calamos Asset | | |
| Management, Inc. | 993 | 26 |
* | LaBranche & Co. Inc. | 2,265 | 19 |
| SWS Group, Inc. | 681 | 17 |
* | Tradestation Group Inc. | 904 | 13 |
| Capital Southwest Corp. | 114 | 12 |
| Cohen & Steers, Inc. | 433 | 12 |
| Gamco Investors Inc. Class A | 253 | 10 |
* | MarketAxess Holdings, Inc. | 1,050 | 10 |
| | | 18,388 |
Commercial Banks (19.6%) | | |
| Wells Fargo & Co. | 132,634 | 4,609 |
| Wachovia Corp. | 67,063 | 3,664 |
| U.S. Bancorp | 74,104 | 2,377 |
| SunTrust Banks, Inc. | 14,155 | 1,081 |
| BB&T Corp. | 22,712 | 972 |
| National City Corp. | 25,333 | 876 |
| PNC Financial Services Group | 12,122 | 858 |
| Fifth Third Bancorp | 19,487 | 767 |
| Regions Financial Corp. | 18,763 | 675 |
| KeyCorp | 16,688 | 614 |
| North Fork Bancorp, Inc. | 19,404 | 532 |
| Marshall & Ilsley Corp. | 9,223 | 430 |
| AmSouth Bancorp | 14,256 | 408 |
| Comerica, Inc. | 6,738 | 386 |
| M & T Bank Corp. | 2,759 | 338 |
| Zions Bancorp | 4,198 | 332 |
| Synovus Financial Corp. | 10,292 | 299 |
| Compass Bancshares Inc. | 4,859 | 282 |
| Huntington Bancshares Inc. | 9,886 | 236 |
| Commerce Bancorp, Inc. | 6,793 | 226 |
| Popular, Inc. | 10,766 | 205 |
| Mercantile Bankshares Corp. | 5,134 | 190 |
| First Horizon National Corp. | 4,952 | 189 |
| Associated Banc-Corp. | 5,039 | 159 |
| UnionBanCal Corp. | 2,383 | 143 |
| TD Banknorth, Inc. | 4,807 | 142 |
| Colonial BancGroup, Inc. | 5,744 | 141 |
| TCF Financial Corp. | 5,011 | 131 |
| Fulton Financial Corp. | 7,209 | 120 |
| Commerce Bancshares, Inc. | 2,396 | 120 |
| Cullen/Frost Bankers, Inc. | 2,001 | 118 |
| Valley National Bancorp | 4,581 | 118 |
| Wilmington Trust Corp. | 2,650 | 117 |
| City National Corp. | 1,751 | 115 |
| Bank of Hawaii Corp. | 2,112 | 103 |
| Sky Financial Group, Inc. | 4,091 | 101 |
| Whitney Holdings Corp. | 2,603 | 92 |
| East West Bancorp, Inc. | 2,244 | 91 |
| BancorpSouth, Inc. | 2,928 | 82 |
| The South Financial Group, Inc. | 2,949 | 80 |
| FirstMerit Corp. | 3,363 | 77 |
| First Midwest Bancorp, Inc. | 2,053 | 77 |
| Texas Regional | | |
| Bancshares, Inc. | 1,919 | 73 |
| UCBH Holdings, Inc. | 3,959 | 72 |
| Cathay General Bancorp | 1,924 | 72 |
* | SVB Financial Group | 1,446 | 65 |
| Westamerica Bancorporation | 1,340 | 64 |
| Umpqua Holdings Corp. | 2,237 | 61 |
| Trustmark Corp. | 1,937 | 61 |
| Greater Bay Bancorp | 2,044 | 58 |
| United Bankshares, Inc. | 1,509 | 56 |
| Chittenden Corp. | 1,893 | 55 |
| Hancock Holding Co. | 1,002 | 52 |
| International Bancshares Corp. | 1,817 | 52 |
| Provident Bankshares Corp. | 1,363 | 51 |
| Pacific Capital Bancorp | 1,826 | 51 |
| Old National Bancorp | 2,720 | 51 |
| BOK Financial Corp. | 975 | 51 |
| Park National Corp. | 476 | 49 |
| Wintrust Financial Corp. | 959 | 48 |
| Sterling Financial Corp. | 1,439 | 48 |
| Susquehanna Bancshares, Inc. | 1,925 | 47 |
| Frontier Financial Corp. | 1,127 | 46 |
| First Community Bancorp | 853 | 46 |
| United Community Banks, Inc. | 1,444 | 45 |
| MB Financial, Inc. | 1,224 | 45 |
| UMB Financial Corp. | 1,272 | 44 |
| First Citizens BancShares | | |
| Class A | 219 | 43 |
| First Republic Bank | 994 | 42 |
| Glacier Bancorp, Inc. | 1,287 | 42 |
| Alabama National | | |
| BanCorporation | 609 | 41 |
| Central Pacific Financial Co. | 1,128 | 41 |
| Citizens Banking Corp. | 1,587 | 40 |
| F.N.B. Corp. | 2,361 | 39 |
| Republic Bancorp, Inc. | 2,971 | 38 |
* | Signature Bank | 1,167 | 38 |
| Sterling Bancshares, Inc. | 1,804 | 37 |
| Prosperity Bancshares, Inc. | 1,054 | 37 |
| CVB Financial Corp. | 2,433 | 36 |
| National Penn Bancshares Inc. | 1,698 | 35 |
* | Investors Bancorp, Inc. | 2,367 | 34 |
| PrivateBancorp, Inc. | 746 | 33 |
| Hanmi Financial Corp. | 1,667 | 33 |
| Boston Private Financial | | |
| Holdings, Inc. | 1,294 | 32 |
| First Commonwealth | | |
| Financial Corp. | 2,439 | 31 |
| First Charter Corp. | 1,254 | 30 |
| NBT Bancorp, Inc. | 1,288 | 30 |
| S & T Bancorp, Inc. | 958 | 30 |
| Amcore Financial, Inc. | 986 | 30 |
| First BanCorp Puerto Rico | 3,171 | 29 |
| Chemical Financial Corp. | 947 | 28 |
| City Holding Co. | 709 | 28 |
| Community Bank System, Inc. | 1,169 | 26 |
| Westbanco Inc. | 839 | 25 |
* | Centennial Bank Holdings Inc. | 2,549 | 25 |
| Community Banks, Inc. | 967 | 25 |
| Mid-State Bancshares | 927 | 25 |
| First Financial Bankshares, Inc. | 635 | 25 |
| Cascade Bancorp | 688 | 24 |
| Harleysville National Corp. | 1,125 | 23 |
| Capitol Bancorp Ltd. | 545 | 23 |
| Sterling Financial Corp. (PA) | 1,021 | 23 |
| Sandy Spring Bancorp, Inc. | 624 | 23 |
| First Financial Bancorp | 1,410 | 22 |
| Independent Bank Corp. (MI) | 864 | 22 |
| Community Trust Bancorp Inc. | 554 | 21 |
| IBERIABANK Corp. | 363 | 21 |
| Columbia Banking System, Inc. | 676 | 21 |
* | Western Alliance Bancorp | 559 | 21 |
30
Financials Index Fund
| | | Market |
| | | Value• |
| | Shares | ($000) |
| Independent Bank Corp. (MA) | 604 | 21 |
* | Texas Capital Bancshares, Inc. | 1,015 | 20 |
| West Coast Bancorp | 648 | 20 |
| Capital City Bank Group, Inc. | 588 | 19 |
| Banner Corp. | 449 | 19 |
| BankFinancial Corp. | 1,050 | 18 |
| Integra Bank Corp. | 703 | 18 |
| Seacoast Banking Corp. | | |
| of Florida | 576 | 18 |
| Renasant Corp. | 571 | 17 |
| Midwest Banc Holdings, Inc. | 726 | 17 |
| Nara Bancorp, Inc. | 936 | 17 |
| Placer Sierra Bancshares | 718 | 17 |
| Bank of the Ozarks, Inc. | 533 | 17 |
| Interchange Financial | | |
| Services Corp. | 740 | 17 |
| First Merchants Corp. | 685 | 17 |
| First Community | | |
| Bancshares, Inc. | 484 | 16 |
| Suffolk Bancorp | 471 | 16 |
| First Source Corp. | 546 | 16 |
| Univest Corp. of Pennsylvania | 538 | 16 |
| Washington Trust Bancorp, Inc. | 606 | 16 |
| CoBiz Inc. | 694 | 16 |
| S.Y. Bancorp, Inc. | 560 | 16 |
| Union Bankshares Corp. | 372 | 16 |
| Irwin Financial Corp. | 826 | 16 |
| Sterling Bancorp | 806 | 16 |
| Old Second Bancorp, Inc. | 491 | 15 |
| Omega Financial Corp. | 475 | 15 |
| First Indiana Corp. | 571 | 14 |
| First Financial Corp. (IN) | 415 | 14 |
| U.S.B. Holding Co., Inc. | 603 | 13 |
| Tompkins Trustco, Inc. | 296 | 13 |
| Simmons First National Corp. | 456 | 13 |
| Wilshire Bancorp Inc. | 673 | 13 |
| Yardville National Bancorp | 357 | 13 |
| Peoples Bancorp, Inc. | 424 | 13 |
| BancFirst Corp. | 267 | 13 |
| TriCo Bancshares | 513 | 13 |
| Heartland Financial USA, Inc. | 469 | 13 |
| Oriental Financial Group Inc. | 1,018 | 12 |
* | Virginia Commerce | | |
| Bancorp, Inc. | 557 | 12 |
| Center Financial Corp. | 470 | 11 |
| First Bancorp (NC) | 551 | 11 |
| Arrow Financial Corp. | 417 | 11 |
| Great Southern Bancorp, Inc. | 395 | 11 |
| R & G Financial Corp. Class B | 1,333 | 10 |
| Lakeland Bancorp, Inc. | 618 | 9 |
| Republic Bancorp, Inc. Class A | 397 | 9 |
| Royal Bancshares of | | |
| Pennsylvania, Inc. | 235 | 6 |
| | | 26,017 |
Consumer Finance (3.4%) | | |
| American Express Co. | 45,997 | 2,417 |
| Capital One Financial Corp. | 11,475 | 839 |
| SLM Corp. | 15,566 | 755 |
* | AmeriCredit Corp. | 5,530 | 130 |
| The First Marblehead Corp. | 1,340 | 70 |
| Student Loan Corp. | 262 | 48 |
| Cash America International Inc. | 1,245 | 46 |
| Advance America Cash | | |
| Advance Centers Inc. | 1,852 | 29 |
* | World Acceptance Corp. | 692 | 28 |
| Advanta Corp. Class B | 708 | 24 |
* | First Cash Financial | | |
| Services, Inc. | 1,108 | 23 |
* | Nelnet, Inc. | 762 | 23 |
* | CompuCredit Corp. | 639 | 19 |
| Advanta Corp. Class A | 253 | 8 |
* | United PanAm Financial Corp. | 422 | 7 |
| | | 4,466 |
Diversified Financial Services (21.8%) | |
| Citigroup, Inc. | 205,902 | 10,161 |
| Bank of America Corp. | 191,438 | 9,853 |
| JPMorgan Chase & Co. | 143,833 | 6,567 |
| The Chicago | | |
| Mercantile Exchange | 1,430 | 629 |
| Moody’s Corp. | 10,258 | 628 |
| CIT Group Inc. | 8,188 | 369 |
| Leucadia National Corp. | 6,683 | 172 |
* | NYSE Group Inc. | 2,244 | 133 |
* | Nasdaq Stock Market Inc. | 3,893 | 111 |
* | CBOT Holdings, Inc. Class A | 878 | 103 |
* | IntercontinentalExchange Inc. | 1,487 | 94 |
| International Securities | | |
| Exchange, Inc. | 1,536 | 65 |
| Financial Federal Corp. | 1,068 | 28 |
* | Portfolio Recovery | | |
| Associates, Inc. | 646 | 26 |
| Resource America, Inc. | 675 | 14 |
* | Asset Acceptance | | |
| Capital Corp. | 871 | 13 |
* | Primus Guaranty, Ltd. | 643 | 7 |
* | Encore Capital Group, Inc. | 558 | 7 |
| | | 28,980 |
Insurance (21.4%) | | |
| American International | | |
| Group, Inc. | 87,711 | 5,598 |
| MetLife, Inc. | 31,247 | 1,720 |
| Prudential Financial, Inc. | 20,442 | 1,501 |
| The Allstate Corp. | 25,212 | 1,461 |
| The St. Paul | | |
| Travelers, Cos. Inc. | 28,699 | 1,260 |
* | Berkshire Hathaway Inc. | | |
| Class B | 347 | 1,112 |
| The Hartford Financial | | |
| Services Group Inc. | 12,429 | 1,067 |
| AFLAC Inc. | 20,488 | 923 |
| The Chubb Corp. | 17,048 | 855 |
| Progressive Corp. of Ohio | 30,771 | 757 |
| ACE Ltd. | 13,317 | 717 |
| Lincoln National Corp. | 11,685 | 709 |
| Genworth Financial Inc. | 18,752 | 646 |
| Loews Corp. | 16,037 | 617 |
| The Principal Financial | | |
| Group, Inc. | 11,532 | 614 |
| Marsh & McLennan Cos., Inc. | 18,716 | 490 |
| XL Capital Ltd. Class A | 7,310 | 480 |
| Aon Corp. | 11,989 | 414 |
| Ambac Financial Group, Inc. | 4,342 | 376 |
| MBIA, Inc. | 5,522 | 340 |
| Cincinnati Financial Corp. | 6,788 | 317 |
| Safeco Corp. | 5,070 | 293 |
| Fidelity National Financial, Inc. | 7,119 | 286 |
| Torchmark Corp. | 4,254 | 265 |
| Everest Re Group, Ltd. | 2,756 | 259 |
| W.R. Berkley Corp. | 6,987 | 245 |
| UnumProvident Corp. | 12,335 | 234 |
| Assurant, Inc. | 4,540 | 234 |
| Old Republic | | |
| International Corp. | 9,010 | 188 |
* | Arch Capital Group Ltd. | 2,864 | 171 |
| White Mountains Insurance | | |
| Group Inc. | 310 | 164 |
| PartnerRe Ltd. | 2,332 | 150 |
| Axis Capital Holdings Ltd. | 4,595 | 149 |
| HCC Insurance Holdings, Inc. | 4,566 | 148 |
| Brown & Brown, Inc. | 4,903 | 147 |
| RenaissanceRe Holdings Ltd. | 2,787 | 144 |
* | Markel Corp. | 377 | 137 |
| First American Corp. | 3,340 | 136 |
* | Conseco, Inc. | 6,265 | 130 |
| Protective Life Corp. | 2,708 | 125 |
| AmerUs Group Co. | 1,679 | 114 |
| Nationwide Financial | | |
| Services, Inc. | 2,351 | 114 |
| Arthur J. Gallagher & Co. | 3,988 | 107 |
| StanCorp Financial Group, Inc. | 2,277 | 106 |
| Hanover Insurance Group Inc. | 2,210 | 98 |
* | Philadelphia Consolidated | | |
| Holding Corp. | 2,440 | 88 |
| Unitrin, Inc. | 1,985 | 87 |
| American Financial Group, Inc. | 1,796 | 84 |
| Mercury General Corp. | 1,572 | 79 |
| Endurance Specialty | | |
| Holdings Ltd. | 2,338 | 75 |
| Platinum Underwriters | | |
| Holdings, Ltd. | 2,441 | 73 |
| Delphi Financial Group, Inc. | 1,801 | 70 |
| Ohio Casualty Corp. | 2,647 | 69 |
| Reinsurance Group of | | |
| America, Inc. | 1,298 | 67 |
* | ProAssurance Corp. | 1,310 | 66 |
| Transatlantic Holdings, Inc. | 1,080 | 66 |
| Aspen Insurance Holdings Ltd. | 2,572 | 64 |
| Commerce Group, Inc. | 2,082 | 62 |
* | Alleghany Corp. | 216 | 61 |
| Selective Insurance Group | 1,164 | 61 |
| Montpelier Re Holdings Ltd. | 3,371 | 61 |
| IPC Holdings Ltd. | 2,149 | 60 |
| Hilb, Rogal and Hamilton Co. | 1,359 | 59 |
| Assured Guaranty Ltd. | 2,183 | 58 |
| Erie Indemnity Co. Class A | 1,135 | 58 |
| The Phoenix Cos., Inc. | 3,801 | 56 |
| Zenith National Insurance Corp. | 1,378 | 52 |
| National Financial | | |
| Partners Corp. | 1,356 | 50 |
| LandAmerica Financial | | |
| Group, Inc. | 698 | 44 |
| R.L.I. Corp. | 900 | 44 |
* | Argonaut Group, Inc. | 1,334 | 41 |
| Max Re Capital Ltd. | 1,739 | 40 |
| Horace Mann Educators Corp. | 1,757 | 32 |
| Infinity Property & | | |
| Casualty Corp. | 851 | 32 |
* | USI Holdings Corp. | 2,105 | 28 |
| Alfa Corp. | 1,529 | 26 |
| Fidelity National Title | | |
| Group, Inc. Class A | 1,264 | 25 |
| Safety Insurance Group, Inc. | 489 | 25 |
* | Navigators Group, Inc. | 538 | 25 |
| American Equity Investment | | |
| Life Holding Co. | 2,100 | 24 |
| Stewart Information | | |
| Services Corp. | 711 | 24 |
| United Fire & Casualty Co. | 831 | 23 |
* | Universal American | | |
| Financial Corp. | 1,419 | 22 |
| National Western Life | | |
| Insurance Co. Class A | 94 | 22 |
| Harleysville Group, Inc. | 575 | 21 |
| Presidential Life Corp. | 850 | 20 |
31
Financials Index Fund
| | | Market |
| | | Value• |
| | Shares | ($000) |
| Midland Co. | 479 | 20 |
| FBL Financial Group, Inc. | | |
| Class A | 551 | 18 |
| State Auto Financial Corp. | 581 | 18 |
* | United America Indemnity, Ltd. | 840 | 18 |
| 21st Century Insurance Group | 1,161 | 17 |
| Odyssey Re Holdings Corp. | 571 | 17 |
* | CNA Surety Corp. | 802 | 16 |
| Scottish Re Group Ltd. | 1,677 | 15 |
| Bristol West Holdings, Inc. | 760 | 11 |
| PXRE Group Ltd. | 2,425 | 10 |
* | James River Group Inc. | 310 | 9 |
| Direct General Corp. | 622 | 8 |
* | First Acceptance Corp. | 683 | 8 |
| Baldwin & Lyons, Inc. Class B | 330 | 8 |
| National Interstate Corp. | 232 | 6 |
| Crawford & Co. Class B | 448 | 4 |
| | | 28,365 |
Real Estate Investment Trusts (11.5%) | |
| Simon Property Group, Inc. | | |
| REIT | 9,255 | 785 |
| Equity Residential REIT | 11,979 | 597 |
| Equity Office Properties Trust | | |
| REIT | 15,658 | 581 |
| ProLogis REIT | 10,133 | 572 |
| Vornado Realty Trust REIT | 5,318 | 563 |
| Boston Properties, Inc. REIT | 4,571 | 465 |
| Archstone-Smith Trust REIT | 8,730 | 464 |
| Public Storage, Inc. REIT | 5,095 | 441 |
| Host Marriott Corp. REIT | 19,108 | 431 |
| General Growth Properties Inc. | | |
| REIT | 9,209 | 417 |
| Kimco Realty Corp. REIT | 8,918 | 371 |
| Avalonbay Communities, Inc. | | |
| REIT | 3,028 | 366 |
| Plum Creek Timber Co. Inc. | | |
| REIT | 7,653 | 267 |
| Developers Diversified | | |
| Realty Corp. REIT | 4,493 | 243 |
| The Macerich Co. REIT | 2,877 | 215 |
| Duke Realty Corp. REIT | 5,599 | 213 |
| AMB Property Corp. REIT | 3,691 | 206 |
| Apartment Investment & | | |
| Management Co. | | |
| Class A REIT | 3,984 | 204 |
| SL Green Realty Corp. REIT | 1,821 | 203 |
| iStar Financial Inc. REIT | 4,679 | 196 |
| Regency Centers Corp. REIT | 2,882 | 194 |
| Camden Property Trust REIT | 2,299 | 178 |
| Liberty Property Trust REIT | 3,643 | 174 |
| Health Care Properties | | |
| Investors REIT | 5,680 | 171 |
| United Dominion Realty | | |
| Trust REIT | 5,575 | 170 |
| Federal Realty Investment | | |
| Trust REIT | 2,189 | 162 |
| Ventas, Inc. REIT | 3,845 | 154 |
| Reckson Associates | | |
| Realty Corp. REIT | 3,418 | 146 |
| Weingarten Realty Investors | | |
| REIT | 3,432 | 146 |
| Hospitality Properties Trust | | |
| REIT | 3,064 | 142 |
| Mack-Cali Realty Corp. REIT | 2,562 | 136 |
| BRE Properties Inc. | | |
| Class A REIT | 2,131 | 126 |
| Rayonier Inc. REIT | 3,143 | 124 |
| Trizec Properties, Inc. REIT | 4,228 | 122 |
| Brandywine Realty Trust REIT | 3,733 | 122 |
| New Plan Excel Realty Trust | | |
| REIT | 4,280 | 118 |
| Pan Pacific Retail | | |
| Properties, Inc. REIT | 1,686 | 118 |
| Essex Property Trust, Inc. REIT | 897 | 113 |
| CapitalSource Inc. REIT | 4,601 | 112 |
| Kilroy Realty Corp. REIT | 1,401 | 111 |
| Alexandria Real Estate | | |
| Equities, Inc. REIT | 1,086 | 106 |
| Annaly Mortgage | | |
| Management Inc. REIT | 8,260 | 103 |
| CBL & Associates | | |
| Properties, Inc. REIT | 2,516 | 102 |
| Health Care Inc. REIT | 2,547 | 102 |
| Thornburg Mortgage, Inc. REIT | 4,392 | 101 |
| HRPT Properties Trust REIT | 8,596 | 100 |
| Realty Income Corp. REIT | 3,691 | 91 |
| Crescent Real Estate, Inc. REIT | 4,026 | 87 |
| Colonial Properties Trust REIT | 1,751 | 87 |
| Taubman Co. REIT | 2,137 | 86 |
| Post Properties, Inc. REIT | 1,697 | 82 |
| KKR Financial Corp. REIT | 3,350 | 80 |
| New Century Financial Corp. | | |
| REIT | 2,062 | 80 |
| Home Properties, Inc. REIT | 1,413 | 80 |
| First Industrial Realty Trust | | |
| REIT | 1,817 | 79 |
| Corporate Office Properties | | |
| Trust, Inc. REIT | 1,669 | 78 |
| BioMed Realty Trust, Inc. REIT | 2,515 | 78 |
| Nationwide Health | | |
| Properties, Inc. REIT | 3,012 | 78 |
| Washington REIT | 1,841 | 75 |
Maguire Properties, Inc. REIT | 1,881 | 75 |
Highwood Properties, Inc. REIT | 1,925 | 73 |
LaSalle Hotel Properties REIT | 1,616 | 71 |
Healthcare Realty Trust Inc. | | |
REIT | 1,957 | 71 |
Sunstone Hotel Investors, Inc. | | |
REIT | 2,365 | 71 |
Strategic Hotels and | | |
Resorts, Inc. REIT | 3,188 | 65 |
Pennsylvania REIT | 1,477 | 63 |
American Home Mortgage | | |
Investment Corp. REIT | 1,954 | 62 |
American Financial Realty | | |
Trust REIT | 5,285 | 61 |
Senior Housing Properties | | |
Trust REIT | 3,018 | 61 |
Potlatch Corp. REIT | 1,601 | 61 |
Mid-America Apartment | | |
Communities, Inc. REIT | 923 | 56 |
Cousins Properties, Inc. REIT | 1,587 | 55 |
Friedman, Billings, Ramsey | | |
Group, Inc. REIT | 6,586 | 54 |
Longview Fibre Co. REIT | 2,605 | 54 |
Entertainment Properties | | |
Trust REIT | 1,082 | 54 |
Newcastle Investment Corp. | | |
REIT | 1,834 | 50 |
National Retail Properties REIT | 2,236 | 50 |
Redwood Trust, Inc. REIT | 981 | 48 |
EastGroup Properties, Inc. | | |
REIT | 927 | 47 |
Tanger Factory Outlet | | |
Centers, Inc. REIT | 1,306 | 47 |
Lexington Corporate | | |
Properties Trust REIT | 2,190 | 46 |
DiamondRock Hospitality Co. | | |
REIT | 2,750 | 46 |
Spirit Finance Corp. REIT | 3,967 | 45 |
FelCor Lodging Trust, Inc. REIT | 2,102 | 45 |
Digital Realty Trust, Inc. REIT | 1,481 | 44 |
Equity One, Inc. REIT | 1,708 | 43 |
Inland Real Estate Corp. REIT | 2,647 | 43 |
Equity Lifestyle | | |
Properties, Inc. REIT | 935 | 42 |
Heritage Property Investment | | |
Trust REIT | 1,161 | 42 |
Mills Corp. REIT | 2,337 | 42 |
Franklin Street Properties Corp. | | |
REIT | 2,162 | 41 |
U-Store-It Trust REIT | 2,050 | 41 |
PS Business Parks, Inc. REIT | 660 | 40 |
Sovran Self Storage, Inc. REIT | 737 | 40 |
Global Signal, Inc. REIT | 804 | 39 |
Novastar Financial, Inc. REIT | 1,293 | 38 |
Glimcher Realty Trust REIT | 1,537 | 37 |
Omega Healthcare | | |
Investors, Inc. REIT | 2,443 | 36 |
Glenborough Realty Trust, Inc. | | |
REIT | 1,344 | 35 |
Extra Space Storage Inc. REIT | 2,028 | 35 |
Equity Inns, Inc. REIT | 2,258 | 35 |
Highland Hospitality Corp. | | |
REIT | 2,520 | 35 |
First Potomac REIT | 1,049 | 33 |
RAIT Investment Trust REIT | 1,161 | 32 |
Trustreet Properties, Inc. REIT | 2,631 | 32 |
Ashford Hospitality Trust REIT | 2,599 | 31 |
Innkeepers USA Trust REIT | 1,854 | 31 |
Anthracite Capital Inc. REIT | 2,363 | 30 |
Parkway Properties Inc. REIT | 603 | 30 |
Saxon Inc. REIT | 2,064 | 29 |
Impac Mortgage Holdings, Inc. | | |
REIT | 3,108 | 28 |
National Health Investors REIT | 1,015 | 28 |
Acadia Realty Trust REIT | 1,059 | 26 |
Deerfield Triarc Capital Corp. | | |
REIT | 1,914 | 25 |
MFA Mortgage | | |
Investments, Inc. REIT | 3,474 | 24 |
Ramco-Gershenson Properties | | |
Trust REIT | 720 | 23 |
Gramercy Capital Corp. REIT | 819 | 22 |
GMH Communities Trust REIT | 1,731 | 22 |
Sun Communities, Inc. REIT | 677 | 22 |
Getty Realty Holding Corp. | | |
REIT | 722 | 22 |
Medical Properties Trust Inc. | | |
REIT | 1,608 | 22 |
Capital Trust Class A REIT | 528 | 21 |
Saul Centers, Inc. REIT | 443 | 19 |
LTC Properties, Inc. REIT | 810 | 19 |
Luminent Mortgage | | |
Capital, Inc. REIT | 1,769 | 18 |
Arbor Realty Trust, Inc. REIT | 707 | 18 |
MortgageIT Holdings Inc. REIT | 1,221 | 18 |
Universal Health Realty Income | | |
REIT | 502 | 18 |
Investors Real Estate Trust | | |
REIT | 1,822 | 17 |
Capital Lease Funding, Inc. | | |
REIT | 1,476 | 17 |
32
Financials Index Fund
| | | Market |
| | | Value• |
| | Shares | ($000) |
| Fieldstone Investment Corp. | | |
| REIT | 2,031 | 17 |
| JER Investors Trust Inc. REIT | 994 | 17 |
| Urstadt Biddle Properties | | |
| Class A REIT | 914 | 16 |
| Anworth Mortgage Asset Corp. | | |
| REIT | 1,928 | 15 |
| Education Realty Trust, Inc. | | |
| REIT | 1,087 | 15 |
| HomeBanc Corp. REIT | 2,062 | 14 |
| Aames Investment Corp. REIT | 2,047 | 8 |
| Urstadt Biddle Properties REIT | 162 | 3 |
| | | 15,235 |
Real Estate Management & Development (0.7%) |
* | Realogy Corp. | 10,365 | 222 |
* | CB Richard Ellis Group, Inc. | 7,751 | 178 |
| The St. Joe Co. | 3,013 | 154 |
| Forest City Enterprise Class A | 2,610 | 140 |
| Jones Lang LaSalle Inc. | 1,448 | 121 |
* | Trammell Crow Co. | 1,506 | 52 |
* | MOVE, INC. | 5,772 | 26 |
* | Tejon Ranch Co. | 500 | 22 |
* | Affordable Residential | | |
| Communities REIT | 1,078 | 11 |
| | | 926 |
Thrifts & Mortgage Finance (7.7%) | |
| Fannie Mae | 38,969 | 2,052 |
| Freddie Mac | 27,736 | 1,764 |
| Washington Mutual, Inc. | 40,847 | 1,711 |
| Countrywide Financial Corp. | 24,780 | 838 |
| Golden West Financial Corp. | 10,759 | 812 |
| Sovereign Bancorp, Inc. | 15,457 | 322 |
| Hudson City Bancorp, Inc. | 23,163 | 303 |
| MGIC Investment Corp. | 3,710 | 215 |
| Radian Group, Inc. | 3,424 | 205 |
| New York Community | | |
| Bancorp, Inc. | 10,910 | 179 |
| The PMI Group Inc. | 3,663 | 158 |
| Astoria Financial Corp. | 3,924 | 120 |
| Webster Financial Corp. | 2,298 | 109 |
| IndyMac Bancorp, Inc. | 2,739 | 107 |
| People’s Bank | 2,345 | 85 |
| Washington Federal Inc. | 3,623 | 80 |
| NewAlliance Bancshares, Inc. | 4,618 | 67 |
| First Niagara Financial | | |
| Group, Inc. | 4,313 | 64 |
| Downey Financial Corp. | 866 | 53 |
| MAF Bancorp, Inc. | 1,217 | 50 |
| Provident Financial | | |
| Services Inc. | 2,624 | 49 |
| Harbor Florida Bancshares, Inc. | 872 | 39 |
| Fremont General Corp. | 2,696 | 39 |
* | First Federal Financial Corp. | 695 | 35 |
| TrustCo Bank NY | 3,195 | 35 |
| Capitol Federal Financial | 1,005 | 34 |
| Fidelity Bankshares, Inc. | 895 | 34 |
| BankUnited Financial Corp. | 1,315 | 34 |
| Brookline Bancorp, Inc. | 2,537 | 34 |
| PFF Bancorp, Inc. | 899 | 32 |
| Commercial Capital | | |
| Bancorp, Inc. | 1,999 | 32 |
| Bank Mutual Corp. | 2,525 | 31 |
| Corus Bankshares Inc. | 1,381 | 30 |
| BankAtlantic Bancorp, Inc. | | |
| Class A | 1,973 | 28 |
| W Holding Co., Inc. | 4,914 | 25 |
* | Ocwen Financial Corp. | 1,644 | 24 |
| Northwest Bancorp, Inc. | 897 | 24 |
| Provident New York | | |
| Bancorp, Inc. | 1,670 | 23 |
| Flagstar Bancorp, Inc. | 1,556 | 23 |
| TierOne Corp. | 663 | 23 |
| Anchor Bancorp Wisconsin Inc. | 760 | 22 |
| Partners Trust Financial | | |
| Group, Inc. | 2,009 | 22 |
* | Accredited Home Lenders | | |
| Holding Co. | 689 | 22 |
* | Triad Guaranty, Inc. | 417 | 21 |
| City Bank Lynnwood (WA) | 379 | 19 |
| Doral Financial Corp. | 3,823 | 19 |
* | Franklin Bank Corp. | 945 | 19 |
| First Financial Holdings, Inc. | 538 | 19 |
| KNBT Bancorp Inc. | 1,142 | 19 |
| Dime Community Bancshares | 1,186 | 17 |
| First Place Financial Corp. | 694 | 16 |
| WSFS Financial Corp. | 238 | 15 |
| United Community | | |
| Financial Corp. | 1,071 | 14 |
| Flushing Financial Corp. | 766 | 13 |
| Kearny Financial Corp. | 874 | 13 |
| NetBank, Inc. | 2,116 | 13 |
| First Busey Corp. | 601 | 13 |
| ITLA Capital Corp. | 227 | 12 |
* | Wauwatosa Holdings, Inc. | 473 | 8 |
| Charter Financial Corp. | 200 | 8 |
| OceanFirst Financial Corp. | 358 | 8 |
| Clifton Savings Bancorp, Inc. | 638 | 7 |
| | | 10,261 |
Total Common Stocks | | |
(Cost $124,251) | | 132,638 |
Temporary Cash Investment (0.0%) | |
1 Vanguard Market | | |
| Liquidity Fund, 5.293% | | |
| (Cost $53) | 53,137 | 53 |
Total Investments (100.0%) | | |
| | | | |
(Cost $124,304) | | 132,691 |
Other Assets and Liabilities (0.0%) | |
Other Assets—Note B | | 490 |
Liabilities | | (498) |
| | | (8) |
Net Assets (100%) | | 132,683 |
| | | |
At August 31, 2006, net assets consisted of:2 |
| Amount |
| ($000) |
Paid-in Capital | 123,709 |
Undistributed Net Investment Income | 686 |
Accumulated Net Realized Losses | (99) |
Unrealized Appreciation | 8,387 |
Net Assets | 132,683 |
| |
| |
Admiral Shares—Net Assets | |
Applicable to 254,066 outstanding | |
$.001 par value shares of beneficial | |
interest (unlimited authorization) | 7,587 |
Net Asset Value Per Share— | |
Admiral Shares | $29.86 |
| |
| |
ETF Shares—Net Assets | |
Applicable to 2,100,000 outstanding | |
$.001 par value shares of beneficial | |
interest (unlimited authorization) | 125,096 |
Net Asset Value Per Share— | |
ETF Shares | $59.57 |
• | See Note A in Notes to Financial Statements. |
* | Non-income-producing security. |
1 | Affiliated money market fund available only to Vanguard funds and certain trusts and accounts managed by Vanguard. Rate shown is the 7-day yield. |
2 | See Note C in Notes to Financial Statements for the tax-basis components of net assets. REIT—Real Estate Investment Trust. |
33
Financials Index Fund
Statement of Operations
| Year Ended |
| August 31, 2006 |
| ($000) |
Investment Income | |
Income | |
Dividends | 2,477 |
Interest1 | 3 |
Total Income | 2,480 |
Expenses | |
The Vanguard Group—Note B | |
Investment Advisory Services | 15 |
Management and Administrative | |
Admiral Shares | 7 |
ETF Shares | 114 |
Marketing and Distribution | |
Admiral Shares | — |
ETF Shares | 20 |
Custodian Fees | 42 |
Auditing Fees | 20 |
Shareholders’ Reports | |
Admiral Shares | 2 |
ETF Shares | 5 |
Total Expenses | 225 |
Net Investment Income | 2,255 |
Realized Net Gain (Loss) on | |
Investment Securities Sold | 1,259 |
Change in Unrealized Appreciation | |
(Depreciation) of Investment Securities | 8,095 |
Net Increase (Decrease) in Net Assets | |
Resulting from Operations | 11,609 |
Statement of Changes in Net Assets
| Year Ended August 31, |
| 2006 | 2005 |
| ($000) | ($000) |
Increase (Decrease) In Net Assets | | |
Operations | | |
Net Investment Income | 2,255 | 749 |
Realized Net Gain (Loss) | 1,259 | (71) |
Change in Unrealized Appreciation (Depreciation) | 8,095 | 565 |
Net Increase (Decrease) in Net Assets Resulting from Operations | 11,609 | 1,243 |
Distributions | | |
Net Investment Income | | |
Admiral Shares | (98) | (31) |
ETF Shares | (1,715) | (764) |
Realized Capital Gain | | |
Admiral Shares | — | — |
ETF Shares | — | — |
Total Distributions | (1,813) | (795) |
Capital Share Transactions—Note F | | |
Admiral Shares | 3,796 | 2,331 |
ETF Shares | 63,343 | 31,975 |
Net Increase (Decrease) from Capital Share Transactions | 67,139 | 34,306 |
Total Increase (Decrease) | 76,935 | 34,754 |
Net Assets | | |
Beginning of Period | 55,748 | 20,994 |
End of Period2 | 132,683 | 55,748 |
1 | Interest income from an affiliated company of the fund was $3,000. |
2 | Net Assets—End of Period includes undistributed net investment income of $686,000 and $244,000. |
34
Financial Highlights
Admiral Shares | | | | |
| | | | |
| | | | Feb. 41 to |
| Year Ended | | |
| August 31, | | Aug. 31, |
For a Share Outstanding Throughout Each Period | 2006 | 2005 | | 2004 |
Net Asset Value, Beginning of Period | $26.36 | $25.35 | | $24.90 |
Investment Operations | | | | |
Net Investment Income | .7162 | .6602 | | .31 |
Net Realized and Unrealized Gain (Loss) on Investments | 3.392 | 1.086 | | .14 |
Total from Investment Operations | 4.108 | 1.746 | | .45 |
Distributions | | | | |
Dividends from Net Investment Income | (.608) | (.736) | | — |
Distributions from Realized Capital Gains | — | — | | — |
Total Distributions | (.608) | (.736) | | — |
Net Asset Value, End of Period | $29.86 | $26.36 | | $25.35 |
| | | | |
| | | | |
Total Return3 | 15.76% | 6.88% | | 1.81% |
| | | | |
| | | | |
Ratios/Supplemental Data | | | | |
Net Assets, End of Period (Millions) | $8 | $3 | | $1 |
Ratio of Total Expenses to Average Net Assets | 0.28% | 0.28% | | 0.28%4 |
Ratio of Net Investment Income to Average Net Assets | 2.49% | 2.59% | | 2.38%4 |
Portfolio Turnover Rate5 | 6% | 6% | | 9% |
ETF Shares | | | | |
| Year Ended | | Jan. 261 to |
| August 31, | | Aug. 31, |
For a Share Outstanding Throughout Each Period | 2006 | 2005 | | 2004 |
Net Asset Value, Beginning of Period | $52.57 | $50.57 | | $50.51 |
Investment Operations | | | | |
Net Investment Income | 1.432 | 1.3162 | | .70 |
Net Realized and Unrealized Gain (Loss) on Investments | 6.80 | 2.160 | | (.64) |
Total from Investment Operations | 8.23 | 3.476 | | .06 |
Distributions | | | | |
Dividends from Net Investment Income | (1.23) | (1.476) | | — |
Distributions from Realized Capital Gains | — | — | | — |
Total Distributions | (1.23) | (1.476) | | — |
Net Asset Value, End of Period | $59.57 | $52.57 | | $50.57 |
| | | | |
| | | | |
Total Return | 15.82% | 6.85% | | 0.12% |
| | | | |
| | | | |
Ratios/Supplemental Data | | | | |
Net Assets, End of Period (Millions) | $125 | $53 | | $20 |
Ratio of Total Expenses to Average Net Assets | 0.25% | 0.26% | | 0.28%4 |
Ratio of Net Investment Income to Average Net Assets | 2.52% | 2.61% | | 2.38%4 |
Portfolio Turnover Rate5 | 6% | 6% | | 9% |
2 | Calculated based on average shares outstanding. |
3 | Total returns do not reflect the 2% fee assessed on redemptions of shares held for less than one year. |
5 | Excludes the value of portfolio securities received or delivered as a result of in-kind purchases or redemptions of the fund’s capital shares, including ETF Creation Units. See accompanying Notes, which are an integral part of the Financial Statements. |
35
Financials Index Fund
Notes to Financial Statements
Vanguard Financials Index Fund is registered under the Investment Company Act of 1940 as an open-end investment company, or mutual fund. The fund files reports with the SEC under the company name Vanguard World Funds. The fund offers two classes of shares, Admiral Shares and ETF Shares (formerly known as VIPER Shares). Admiral Shares are available to any investor who meets the fund’s minimum purchase requirements. ETF Shares are listed for trading on the American Stock Exchange; they can be purchased and sold through a broker.
A. The following significant accounting policies conform to generally accepted accounting principles for U.S. mutual funds. The fund consistently follows such policies in preparing its financial statements.
1. Security Valuation: Securities are valued as of the close of trading on the New York Stock Exchange (generally 4:00 p.m. Eastern time) on the valuation date. Equity securities are valued at the latest quoted sales prices or official closing prices taken from the primary market in which each security trades; such securities not traded on the valuation date are valued at the mean of the latest quoted bid and asked prices. Securities for which market quotations are not readily available, or whose values have been materially affected by events occurring before the fund’s pricing time but after the close of the securities’ primary markets, are valued by methods deemed by the board of trustees to represent fair value. Investments in Vanguard Market Liquidity Fund are valued at that fund’s net asset value.
2. Federal Income Taxes: The fund intends to continue to qualify as a regulated investment company and distribute all of its taxable income. Accordingly, no provision for federal income taxes is required in the financial statements.
3. Distributions: Distributions to shareholders are recorded on the ex-dividend date.
4. Other: Dividend income is recorded on the ex-dividend date. Interest income includes income distributions received from Vanguard Market Liquidity Fund and is accrued daily. Security transactions are accounted for on the date securities are bought or sold. Costs used to determine realized gains (losses) on the sale of investment securities are those of the specific securities sold. Fees assessed on redemptions of Admiral Shares are credited to paid-in capital.
Each class of shares has equal rights as to assets and earnings, except that each class separately bears certain class-specific expenses related to maintenance of shareholder accounts (included in Management and Administrative expenses) and shareholder reporting. Marketing and distribution expenses are allocated to each class of shares based on a method approved by the board of trustees. Income, other non-class-specific expenses, and gains and losses on investments are allocated to each class of shares based on its relative net assets.
B. The Vanguard Group furnishes at cost investment advisory, corporate management, administrative, marketing, and distribution services. The costs of such services are allocated to the fund under methods approved by the board of trustees. The fund has committed to provide up to 0.40% of its net assets in capital contributions to Vanguard. At August 31, 2006, the fund had contributed capital of $14,000 to Vanguard (included in Other Assets), representing 0.01% of the fund’s net assets and 0.01% of Vanguard’s capitalization. The fund’s trustees and officers are also directors and officers of Vanguard.
C. Distributions are determined on a tax basis and may differ from net investment income and realized capital gains for financial reporting purposes. Differences may be permanent or temporary. Permanent differences are reclassified among capital accounts in the financial statements to reflect their tax character. Temporary differences arise when certain items of income, expense, gain, or loss are recognized in different periods for financial statement and tax purposes; these differences will reverse at some time in the future. Differences in classification may also result from the treatment of short-term gains as ordinary income for tax purposes.
During the year ended August 31, 2006, the fund realized $1,292,000 of net capital gains resulting from in-kind redemptions—in which shareholders exchanged fund shares for securities held by the fund rather than for cash. Because such gains are not taxable to the fund, and are not distributed to shareholders, they have been reclassified from accumulated net realized losses to paid-in capital.
For tax purposes, at August 31, 2006, the fund had $752,000 of ordinary income available for distribution. The fund had available realized losses of $126,000 to offset future net capital gains of $86,000 through August 31, 2014, and $40,000 through August 31, 2015.
At August 31, 2006, the cost of investment securities for tax purposes was $124,304,000. Net unrealized appreciation of investment securities for tax purposes was $8,387,000, consisting of unrealized gains of $10,109,000 on securities that had risen in value since their purchase and $1,722,000 in unrealized losses on securities that had fallen in value since their purchase.
D. During the year ended August 31, 2006, the fund purchased $78,570,000 of investment securities and sold $10,845,000 of investment securities, other than temporary cash investments.
E. In June 2006, the Financial Accounting Standards Board issued Interpretation No. 48 (“FIN 48”), “Accounting for Uncertainty in Income Taxes.” FIN 48 establishes the minimum threshold for recognizing, and a system for measuring, the benefits of tax-return positions in financial statements. FIN 48 will be effective for the fund’s fiscal year beginning September 1, 2007. Management is in the process of analyzing the fund’s tax positions for purposes of implementing FIN 48; based on the analysis completed to date, management does not believe the adoption of FIN 48 will result in any material impact to the fund's financial statements.
F. Capital share transactions for each class of shares were (see table below):
| Year Ended August 31, |
| 2006 | | 2005 |
| Amount | Shares | | Amount | Shares |
| ($000) | (000) | | ($000) | (000) |
Admiral Shares | | | | | |
Issued | 5,301 | 188 | | 2,636 | 102 |
Issued in Lieu of Cash Distributions | 96 | 3 | | 31 | 1 |
Redeemed1 | (1,601) | (57) | | (336) | (13) |
Net Increase (Decrease)—Admiral Shares | 3,796 | 134 | | 2,331 | 90 |
ETF Shares | | | | | |
Issued | 69,220 | 1,200 | | 31,975 | 600 |
Issued in Lieu of Cash Distributions | — | — | | — | — |
Redeemed | (5,877) | (100) | | — | — |
Net Increase (Decrease)—ETF Shares | 63,343 | 1,100 | | 31,975 | 600 |
1 | Net of redemption fees of $25,000 and $0. |
36
Health Care Index Fund
Fund Profile
As of August 31, 2006
Portfolio Characteristics | | |
| | Target | Broad |
| Fund | Index1 | Index2 |
Number of Stocks | 276 | 276 | 2,477 |
Median Market Cap | $56.6B | $56.6B | $30.8B |
Price/Earnings Ratio | 22.5x | 22.5x | 17.4x |
Price/Book Ratio | 3.8x | 3.8x | 2.7x |
Yield | | 1.4% | 1.8% |
Admiral Shares | 1.1% | | |
ETF Shares | 1.1% | | |
Return on Equity | 22.1% | 22.1% | 17.8% |
Earnings Growth Rate | 16.9% | 16.9% | 16.7% |
Foreign Holdings | 0.0% | 0.0% | 0.0% |
Turnover Rate | 11% | — | — |
Expense Ratio | | — | — |
Admiral Shares | 0.28% | | |
ETF Shares | 0.25% | | |
Short-Term Reserves | 0% | — | — |
Industry Diversification (% of portfolio) |
| |
Biotechnology | 14% |
Health Care Distributors | 3 |
Health Care Equipment | 14 |
Health Care Facilities | 3 |
Health Care Services | 6 |
Health Care Supplies | 1 |
Health Care Technology | 1 |
Life Sciences Tools & Services | 3 |
Managed Health Care | 10 |
Pharmaceuticals | 45 |
Ten Largest Holdings3 (% of total net assets) |
| |
Pfizer Inc. | 11.0% |
Johnson & Johnson | 10.4 |
Merck & Co., Inc. | 4.8 |
Amgen, Inc. | 4.3 |
Abbott Laboratories | 4.1 |
UnitedHealth Group Inc. | 3.8 |
Wyeth | 3.6 |
Eli Lilly & Co. | 3.1 |
Medtronic, Inc. | 3.1 |
WellPoint Inc. | 2.8 |
Top Ten | 51.0% |
1 | MSCI US IMI/Health Care. |
3 | “Ten Largest Holdings” excludes any temporary cash investments and equity index products. |
37
Health Care Index Fund
Performance Summary
All of the returns in this report represent past performance, which is not a guarantee of future results that may be achieved by the fund. (Current performance may be lower or higher than the performance data cited. For performance data current to the most recent month-end, visit our website at www.vanguard.com.) Note, too, that both investment returns and principal value can fluctuate widely, so an investor’s shares, when sold, could be worth more or less than their original cost. The returns shown do not reflect taxes that a shareholder would pay on fund distributions or on the sale of fund shares.
Cumulative Performance: January 26, 2004–August 31, 2006
Initial Investment of $10,000
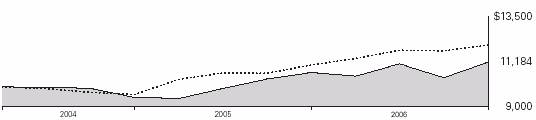
| | | |
| | | | |
| Average Annual Total Returns | | Final Value |
| Periods Ended August 31, 2006 | | of a $10,000 |
| One Year | Since Inception1 | | Investment |
Health Care Index Fund ETF Shares Net Asset Value | 4.71% | 4.41% | | $11,184 |
Health Care Index Fund ETF Shares Market Price | 4.86 | 4.43 | | 11,189 |
MSCI US IMI/2500 | 8.91 | 7.62 | | 12,098 |
MSCI US IMI/Health Care | 4.91 | 4.64 | | 11,250 |
| | | Final Value |
| | | of a $100,000 |
| One Year | Since Inception1 | Investment |
Health Care Index Fund Admiral Shares2 | 4.68% | 4.38% | $111,639 |
MSCI US IMI/2500 | 8.91 | 8.81 | 124,201 |
MSCI US IMI/Health Care | 4.91 | 4.65 | 112,380 |
Fiscal-Year Total Returns (%):
January 26, 2004–August 31, 2006
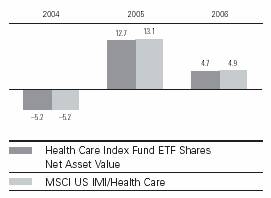
Cumulative Returns: ETF Shares, January 26, 2004–August 31, 2006 |
| | Cumulative |
| | Since |
| One Year | Inception |
Health Care Index Fund ETF Shares Market Price | 4.86% | 11.89% |
Health Care Index Fund ETF Shares Net Asset Value | 4.71 | 11.84 |
MSCI US IMI/Health Care | 4.91 | 12.50 |
Average Annual Total Returns: Periods Ended June 30, 2006
This table presents average annual total returns through the latest calendar quarter—rather than through the end of the fiscal period. Securities and Exchange Commission rules require that we provide this information.
| | | Since |
| Inception Date | One Year | Inception |
ETF Shares | 1/26/2004 | | |
Market Price | | 0.61% | 1.84% |
Net Asset Value | | 0.55 | 1.81 |
Admiral Shares2 | 2/5/2004 | 0.53 | 1.76 |
1 | Inception dates are: for ETF Shares, January 26, 2004; for Admiral Shares, February 5, 2004. |
2 | Total returns do not reflect the 2% fee assessed on redemptions of shares held less than one year. Note: See Financial Highlights tables on page 42 for dividend and capital gains information. |
38
Health Care Index Fund
Financial Statements
Statement of Net Assets
As of August 31, 2006
The fund provides a complete list of its holdings four times in each fiscal year, at the quarter-ends. For the second and fourth fiscal quarters, the lists appear in the fund’s semiannual and annual reports to shareholders. For the first and third fiscal quarters, the fund files the lists with the Securities and Exchange Commission on Form N-Q. Shareholders can look up the fund’s Forms N-Q on the SEC’s website at www.sec.gov. Forms N-Q may also be reviewed and copied at the SEC’s Public Reference Room (see the back cover of this report for further information).
| Shares | Market
Value•
($000) |
|---|
|
| Common Stocks (100.0%) | | |
|
| Biotechnology (13.8%) |
| * Amgen, Inc. | 301,948 | 20,511 |
| * Genentech, Inc. | 121,136 | 9,996 |
| * Gilead Sciences, Inc. | 118,258 | 7,497 |
| * Genzyme Corp. | 66,413 | 4,398 |
| * Biogen Idec Inc. | 87,979 | 3,883 |
| * Celgene Corp. | 89,011 | 3,622 |
| * MedImmune Inc. | 65,284 | 1,804 |
| * Amylin Pharmaceuticals, Inc. | 26,501 | 1,201 |
| * Vertex Pharmaceuticals, Inc. | 28,066 | 967 |
| * Cephalon, Inc. | 15,462 | 882 |
| * Millennium |
| Pharmaceuticals, Inc. | 79,889 | 868 |
| * PDL BioPharma Inc. | 27,830 | 548 |
| * OSI Pharmaceuticals, Inc. | 14,603 | 544 |
| * ImClone Systems, Inc. | 17,155 | 513 |
| * ICOS Corp. | 15,905 | 391 |
| * Alkermes, Inc. | 23,473 | 384 |
| * BioMarin Pharmaceutical Inc. | 21,456 | 357 |
| * Human Genome Sciences, Inc. | 30,427 | 342 |
| * Cubist Pharmaceuticals, Inc. | 13,842 | 325 |
| * Medarex, Inc. | 29,832 | 320 |
| * United Therapeutics Corp. | 5,722 | 312 |
| * Alexion Pharmaceuticals, Inc. | 7,989 | 300 |
| * Nuvelo, Inc. | 13,398 | 277 |
| * Theravance, Inc. | 10,308 | 274 |
| * Applera Corp.— |
| Celera Genomics Group | 19,420 | 270 |
| * Myriad Genetics, Inc. | 10,034 | 254 |
| * Martek Biosciences Corp. | 8,245 | 248 |
| * Myogen, Inc. | 7,096 | 247 |
| * Telik, Inc. | 13,512 | 241 |
| * Digene Corp. | 5,239 | 218 |
| * Regeneron |
| Pharmaceuticals, Inc. | 12,612 | 200 |
| * Zymogenetics, Inc. | 8,530 | 165 |
| * CV Therapeutics, Inc. | 14,311 | 161 |
| * Onyx Pharmaceuticals, Inc. | 10,597 | 160 |
| * Isis Pharmaceuticals, Inc. | 18,011 | 138 |
| * MannKind Corp. | 7,185 | 132 |
| * Arena Pharmaceuticals, Inc. | 10,679 | 131 |
| * Progenics Pharmaceuticals, Inc. | 5,551 | 126 |
| * Pharmion Corp. | 6,601 | 123 |
| * InterMune Inc. | 7,076 | 122 |
| * Geron Corp. | 16,783 | 118 |
| * Keryx Biopharmaceuticals, Inc. | 8,312 | 114 |
| * Tanox, Inc. | 7,046 | 106 |
| * Incyte Corp. | 19,187 | 98 |
| * Enzon Pharmaceuticals, Inc. | 11,303 | 92 |
| * Nabi Biopharmaceuticals | 15,384 | 91 |
| * Dendreon Corp. | 18,380 | 89 |
| * ARIAD Pharmaceuticals, Inc. | 16,318 | 77 |
| * Momenta |
| Pharmaceuticals, Inc. | 4,827 | 77 |
| * deCODE genetics, Inc. | 13,152 | 74 |
| * Encysive Pharmaceuticals, Inc. | 15,452 | 68 |
| * Panacos Pharmaceuticals Inc. | 11,380 | 64 |
| * Cell Genesys, Inc. | 12,225 | 61 |
| * Rigel Pharmaceuticals, Inc. | 6,135 | 61 |
| * Idenix Pharmaceuticals Inc. | 5,933 | 60 |
| * NPS Pharmaceuticals Inc. | 12,287 | 55 |
| * Lexicon Genetics Inc. | 12,636 | 53 |
| * Maxygen Inc. | 6,208 | 51 |
| * Neurocrine Biosciences, Inc. | 4,051 | 47 |
| * Coley Pharmaceutical Group | 3,792 | 39 |
| * GTx, Inc. | 3,265 | 31 |
| * Threshold |
| Pharmaceuticals, Inc. | 1,894 | 4 |
|
|
| | | 64,982 |
| Health Care Equipment & Supplies (14.7%) |
| Medtronic, Inc. | 308,990 | 14,492 |
| Baxter International, Inc. | 168,168 | 7,463 |
| * Boston Scientific Corp. | 267,874 | 4,672 |
| Becton, Dickinson & Co. | 63,263 | 4,409 |
| * Zimmer Holdings, Inc. | 57,026 | 3,878 |
| Stryker Corp. | 72,632 | 3,489 |
| * St. Jude Medical, Inc. | 93,704 | 3,412 |
| C.R. Bard, Inc. | 26,600 | 2,000 |
| Biomet, Inc. | 60,140 | 1,967 |
| * Varian Medical Systems, Inc. | 33,790 | 1,801 |
| * Hospira, Inc. | 39,379 | 1,442 |
| DENTSPLY International Inc. | 38,373 | 1,250 |
| Beckman Coulter, Inc. | 16,170 | 886 |
| * Intuitive Surgical, Inc. | 8,943 | 844 |
| * Advanced Medical Optics, Inc. | 17,411 | 838 |
| Dade Behring Holdings Inc. | 20,293 | 822 |
| Hillenbrand Industries, Inc. | 14,182 | 809 |
| * ResMed Inc. | 19,415 | 790 |
| * IDEXX Laboratories Corp. | 8,217 | 756 |
| * Edwards Lifesciences Corp. | 15,177 | 709 |
| * Cytyc Corp. | 29,531 | 706 |
| * Respironics, Inc. | 18,619 | 687 |
| Bausch & Lomb, Inc. | 13,734 | 665 |
| * Gen-Probe Inc. | 13,121 | 638 |
| Cooper Cos., Inc. | 10,837 | 542 |
| * Hologic, Inc. | 11,692 | 505 |
| Mentor Corp. | 10,152 | 493 |
| STERIS Corp. | 17,387 | 413 |
| * Kinetic Concepts, Inc. | 12,683 | 401 |
| * Immucor Inc. | 17,196 | 357 |
| West Pharmaceutical |
| Services, Inc. | 8,110 | 324 |
| * Haemonetics Corp. | 6,885 | 321 |
| * American Medical Systems |
| Holdings, Inc. | 18,008 | 316 |
| * ArthroCare Corp. | 6,560 | 299 |
| * Intermagnetics General Corp. | 10,856 | 296 |
| * Kyphon Inc. | 7,417 | 269 |
| * LifeCell Corp. | 8,542 | 258 |
| * Inverness Medical |
| Innovations, Inc. | 7,408 | 250 |
| PolyMedica Corp. | 5,926 | 241 |
| * Viasys Healthcare Inc. | 8,336 | 221 |
| * DJ Orthopedics Inc. | 5,739 | 221 |
| * Conor Medsystems, Inc. | 8,070 | 218 |
| Analogic Corp. | 3,579 | 203 |
| * Biosite Inc. | 4,284 | 189 |
| * Integra LifeSciences Holdings | 4,766 | 183 |
| * Wright Medical Group, Inc. | 7,929 | 181 |
| Invacare Corp. | 7,545 | 175 |
| * Palomar Medical |
| Technologies, Inc. | 4,236 | 168 |
| * Thoratec Corp. | 10,735 | 157 |
| * Foxhollow Technologies Inc. | 4,850 | 152 |
| * CONMED Corp. | 7,218 | 148 |
| Arrow International, Inc. | 4,587 | 148 |
| * Orthofix International NV | 3,717 | 146 |
| * ICU Medical, Inc. | 3,292 | 145 |
| * Greatbatch, Inc. | 5,658 | 138 |
| Meridian Bioscience Inc. | 5,727 | 137 |
| * SurModics, Inc. | 3,858 | 135 |
| * SonoSite, Inc. | 4,160 | 132 |
| * Conceptus, Inc. | 7,573 | 131 |
| Vital Signs, Inc. | 2,093 | 114 |
| Datascope Corp. | 3,275 | 108 |
| * Zoll Medical Corp. | 2,503 | 95 |
| * Merit Medical Systems, Inc. | 6,686 | 94 |
| * IntraLase Corp. | 4,861 | 91 |
| * Align Technology, Inc. | 13,744 | 86 |
| Sirona Dental Systems Inc. | 2,809 | 85 |
| * Cyberonics, Inc. | 5,165 | 84 |
| * OraSure Technologies, Inc. | 12,030 | 83 |
| * Aspect Medical Systems, Inc. | 4,037 | 78 |
| * Kensey Nash Corp. | 2,877 | 78 |
| * Symmetry Medical Inc. | 5,529 | 77 |
| * ev3 Inc. | 4,536 | 69 |
| Young Innovations, Inc. | 1,538 | 56 |
|
|
| | | 69,236 |
| Health Care Providers & Services (22.2%) |
| UnitedHealth Group Inc. | 346,433 | 17,997 |
| * WellPoint Inc. | 167,862 | 12,994 |
| Cardinal Health, Inc. | 107,839 | 7,270 |
| Caremark Rx, Inc. | 113,104 | 6,553 |
| Aetna Inc. | 144,997 | 5,404 |
| * Medco Health Solutions, Inc. | 77,787 | 4,929 |
| HCA Inc. | 93,891 | 4,631 |
| McKesson Corp. | 74,361 | 3,778 |
| CIGNA Corp. | 30,998 | 3,505 |
| Quest Diagnostics, Inc. | 43,090 | 2,770 |
| * Express Scripts Inc. | 31,829 | 2,676 |
| * Humana Inc. | 42,020 | 2,560 |
| AmerisourceBergen Corp. | 53,420 | 2,359 |
| * Coventry Health Care Inc. | 41,002 | 2,224 |
| * Laboratory Corp. of |
| America Holdings | 32,012 | 2,190 |
| * DaVita, Inc. | 26,464 | 1,544 |
| Omnicare, Inc. | 30,910 | 1,401 |
| Health Management |
| Associates Class A | 61,480 | 1,286 |
| * Health Net Inc. | 29,410 | 1,230 |
| * Henry Schein, Inc. | 22,258 | 1,110 |
| Manor Care, Inc. | 20,116 | 1,050 |
| * Triad Hospitals, Inc. | 22,307 | 983 |
39
Health Care Index Fund
| Shares | Market
Value•
($000) |
|---|
|
| * Community Health | | |
| Systems, Inc. | 24,994 | 969 |
| * Tenet Healthcare Corp. | 120,279 | 948 |
| * Lincare Holdings, Inc. | 24,472 | 906 |
| * Patterson Cos | 28,296 | 872 |
| * VCA Antech, Inc. | 21,225 | 752 |
| Universal Health Services |
| Class B | 12,923 | 732 |
| * Sierra Health Services, Inc. | 13,408 | 575 |
| * Pediatrix Medical Group, Inc. | 12,415 | 569 |
| * WellCare Health Plans Inc. | 8,228 | 461 |
| * Magellan Health Services, Inc. | 9,478 | 456 |
| * LifePoint Hospitals, Inc. | 13,174 | 449 |
| * Healthways, Inc. | 8,372 | 432 |
| * AMERIGROUP Corp. | 13,285 | 419 |
| * Psychiatric Solutions, Inc. | 12,795 | 410 |
| Brookdale Senior Living Inc. | 8,527 | 408 |
| * Sunrise Senior Living, Inc. | 11,631 | 343 |
| * PSS World Medical, Inc. | 17,161 | 333 |
| Owens & Minor, Inc. |
| Holding Co. | 10,300 | 331 |
| * United Surgical Partners |
| International, Inc. | 11,381 | 321 |
| * Kindred Healthcare, Inc. | 10,004 | 312 |
| Chemed Corp. | 6,744 | 266 |
| * HealthExtras, Inc. | 7,702 | 237 |
| * inVentiv Health, Inc. | 7,338 | 228 |
| * Genesis Healthcare Corp. | 4,962 | 226 |
| LCA-Vision Inc. | 5,115 | 225 |
| * Apria Healthcare Group Inc. | 10,967 | 224 |
| * AmSurg Corp. | 7,617 | 183 |
| * Centene Corp. | 11,153 | 172 |
| * AMN Healthcare Services, Inc. | 7,031 | 169 |
| * Amedisys Inc. | 4,126 | 167 |
| * Matria Healthcare, Inc. | 5,411 | 146 |
| * Odyssey Healthcare, Inc. | 8,973 | 144 |
| * Molina Healthcare Inc. | 3,610 | 134 |
| Landauer, Inc. | 2,401 | 115 |
| * Gentiva Health Services, Inc. | 6,324 | 114 |
| * Symbion, Inc. | 4,744 | 110 |
| * Cross Country Healthcare, Inc. | 6,609 | 108 |
| National Healthcare Corp. | 1,835 | 90 |
| * Radiation Therapy |
| Services, Inc. | 3,041 | 88 |
| * RehabCare Group, Inc. | 4,543 | 67 |
| * VistaCare, Inc. | 4,264 | 56 |
| * Alliance Imaging, Inc. | 3,964 | 26 |
|
|
| | | 104,737 |
| Heath Care Technology (0.8%) |
| IMS Health, Inc. | 50,915 | 1,389 |
| * Emdeon Corp. | 70,352 | 834 |
| * Cerner Corp. | 16,114 | 742 |
| * Allscripts Healthcare |
| Solutions, Inc. | 11,997 | 244 |
| * Per-Se Technologies, Inc. | 8,543 | 195 |
| * Eclipsys Corp. | 10,989 | 188 |
| * The TriZetto Group, Inc. | 10,466 | 144 |
| * Dendrite International, Inc. | 10,746 | 108 |
| * Merge Technologies, Inc. | 5,699 | 42 |
|
|
| | | 3,886 |
| Life Sciences Tools & Services (3.4%) |
| * Fisher Scientific |
| International Inc. | 31,605 | 2,472 |
| * Thermo Electron Corp. | 41,630 | 1,632 |
| Applera Corp.— |
| Applied Biosystems Group | 46,871 | 1,437 |
| * Waters Corp. | 26,634 | 1,136 |
| Pharmaceutical Product |
| Development, Inc. | 26,792 | 1,021 |
| * Covance, Inc. | 16,158 | 1,016 |
| * Millipore Corp. | 13,671 | 877 |
| * Invitrogen Corp. | 13,654 | 831 |
| * Charles River Laboratories, Inc. | 18,546 | 754 |
| PerkinElmer, Inc. | 32,499 | 599 |
| * Techne Corp. | 9,579 | 488 |
| * Nektar Therapeutics | 22,571 | 395 |
| * Ventana Medical |
| Systems, Inc. | 8,438 | 394 |
| * Varian, Inc. | 8,035 | 375 |
| * Affymetrix, Inc. | 17,317 | 369 |
| * Illumina, Inc. | 10,405 | 350 |
| * Bio-Rad Laboratories, Inc. |
| Class A | 4,672 | 343 |
| * Dionex Corp. | 5,195 | 262 |
| * PAREXEL International Corp. | 6,820 | 226 |
| * Exelixis, Inc. | 20,386 | 198 |
| Cambrex Corp. | 6,835 | 154 |
| * PRA International | 4,483 | 116 |
| * eResearch Technology, Inc. | 12,011 | 105 |
| * Molecular Devices Corp. | 4,130 | 99 |
| * Pharmanet Development |
| Group, Inc. | 4,670 | 91 |
| * Enzo Biochem, Inc. | 7,149 | 91 |
| * Diversa Corp. | 7,235 | 66 |
| * Albany Molecular |
| Research, Inc. | 5,888 | 58 |
| * Bruker BioSciences Corp. | 8,033 | 57 |
|
|
| | | 16,012 |
| Pharmaceuticals (45.1%) |
| Pfizer Inc. | 1,878,981 | 51,785 |
| Johnson & Johnson | 760,031 | 49,144 |
| Merck & Co., Inc. | 558,584 | 22,651 |
| Abbott Laboratories | 393,001 | 19,139 |
| Wyeth | 344,726 | 16,788 |
| Eli Lilly & Co. | 260,440 | 14,566 |
| Bristol-Myers Squibb Co. | 501,542 | 10,908 |
| Schering-Plough Corp. | 379,266 | 7,946 |
| Allergan, Inc. | 39,153 | 4,485 |
| * Forest Laboratories, Inc. | 83,262 | 4,161 |
| * Barr Pharmaceuticals Inc. | 25,707 | 1,452 |
| * Sepracor Inc. | 27,319 | 1,284 |
| Mylan Laboratories, Inc. | 53,849 | 1,094 |
| * Endo Pharmaceuticals |
| Holdings, Inc. | 32,300 | 1,067 |
| * King Pharmaceuticals, Inc. | 61,918 | 1,004 |
| * Watson Pharmaceuticals, Inc. | 24,689 | 633 |
| Valeant Pharmaceuticals |
| International | 23,843 | 469 |
| * Andrx Group | 18,920 | 451 |
| Medicis Pharmaceutical Corp. | 13,966 | 409 |
| Perrigo Co. | 20,426 | 330 |
| * MGI Pharma, Inc. | 19,994 | 303 |
| * Kos Pharmaceuticals, Inc. | 6,050 | 296 |
| * The Medicines Co. | 12,142 | 274 |
| * Adolor Corp. | 10,450 | 261 |
| Alpharma, Inc. Class A | 10,876 | 228 |
| * Adams Respiratory |
| Therapeutics, Inc. | 5,273 | 215 |
| * ViroPharma Inc. | 16,955 | 212 |
| * K-V Pharmaceutical Co. |
| Class A | 8,493 | 190 |
| * Par Pharmaceutical Cos. Inc. | 9,147 | 164 |
| * Salix Pharmaceuticals, Ltd. | 11,925 | 160 |
| * Noven Pharmaceuticals, Inc. | 6,191 | 155 |
| * Abraxis Bioscience, Inc. | 6,099 | 152 |
| * AtheroGenics, Inc. | 10,253 | 143 |
| * Sciele Pharma, Inc. | 7,381 | 129 |
| * Connetics Corp. | 8,940 | 97 |
| * New River |
| Pharmaceuticals Inc. | 3,383 | 88 |
| * K-V Pharmaceutical Co. |
| Class B | 1,395 | 31 |
| * Discovery Laboratories, Inc. | 15,978 | 27 |
| * NitroMed, Inc. | 1,758 | 5 |
|
|
| | | 212,896 |
|
| Total Investments (100.0%) |
| (Cost $443,297) | | 471,749 |
|
| Other Assets and Liabilities (0.0%) |
|
| Other Assets—Note B | | 1,206 |
| Liabilities | | (1,010) |
| | | 196 |
|
| Net Assets (100%) | | 471,945 |
|
At August 31, 2006, net assets consisted of:1 |
| Amount |
| ($000) |
Paid-in Capital | 440,343 |
Undistributed Net Investment Income | 3,371 |
Accumulated Net Realized Losses | (221) |
Unrealized Appreciation | 28,452 |
Net Assets | 471,945 |
| |
| |
Admiral Shares—Net Assets | |
Applicable to 3,854,921 outstanding | |
$.001 par value shares of beneficial | |
interest (unlimited authorization) | 107,895 |
Net Asset Value Per Share— | |
Admiral Shares | $27.99 |
| |
| |
ETF Shares—Net Assets | |
Applicable to 6,501,943 outstanding | |
$.001 par value shares of beneficial | |
interest (unlimited authorization) | 364,050 |
Net Asset Value Per Share— | |
ETF Shares | $55.99 |
• | See Note A in Notes to Financial Statements. |
* | Non-income-producing security. |
1 | See Note C in Notes to Financial Statements for the tax-basis components of net assets. |
40
Health Care Index Fund
Statement of Operations
| Year Ended |
| August 31, 2006 |
| ($000) |
Investment Income | |
Income | |
Dividends | 5,272 |
Interest1 | 12 |
Security Lending | 1 |
Total Income | 5,285 |
Expenses | |
The Vanguard Group—Note B | |
Investment Advisory Services | 39 |
Management and Administrative | |
Admiral Shares | 197 |
ETF Shares | 526 |
Marketing and Distribution | |
Admiral Shares | 26 |
ETF Shares | 73 |
Custodian Fees | 51 |
Auditing Fees | 20 |
Shareholders’ Reports | |
Admiral Shares | 22 |
ETF Shares | 17 |
Total Expenses | 971 |
Net Investment Income | 4,314 |
Realized Net Gain (Loss) on | |
Investment Securities Sold | 2,987 |
Change in Unrealized Appreciation | |
(Depreciation) of Investment Securities | 12,648 |
Net Increase (Decrease) in Net Assets | |
Resulting from Operations | 19,949 |
Statement of Changes in Net Assets
| Year Ended August 31, |
| 2006 | 2005 |
| ($000) | ($000) |
Increase (Decrease) In Net Assets | | |
Operations | | |
Net Investment Income | 4,314 | 1,592 |
Realized Net Gain (Loss) | 2,987 | (28) |
Change in Unrealized Appreciation (Depreciation) | 12,648 | 16,982 |
Net Increase (Decrease) in Net Assets Resulting from Operations | 19,949 | 18,546 |
Distributions | | |
Net Investment Income | | |
Admiral Shares | (671) | (182) |
ETF Shares | (1,702) | (133) |
Realized Capital Gain | | |
Admiral Shares | — | — |
ETF Shares | — | — |
Total Distributions | (2,373) | (315) |
Capital Share Transactions—Note F | | |
Admiral Shares | 30,610 | 55,950 |
ETF Shares | 146,248 | 172,885 |
Net Increase (Decrease) from Capital Share Transactions | 176,858 | 228,835 |
Total Increase (Decrease) | 194,434 | 247,066 |
Net Assets | | |
Beginning of Period | 277,511 | 30,445 |
End of Period2 | 471,945 | 277,511 |
1 | Interest income from an affiliated company of the fund was $12,000. |
2 | Net Assets—End of Period includes undistributed net investment income of $3,371,000 and $1,430,000. |
41
Health Care Index Fund
Financial Highlights
Admiral Shares | | | | |
| | | | |
| | | | |
| Year Ended | | Feb. 51 to |
| August 31, | | Aug. 31, |
For a Share Outstanding Throughout Each Period | 2006 | 2005 | | 2004 |
Net Asset Value, Beginning of Period | $26.92 | $23.97 | | $25.33 |
Investment Operations | | | | |
Net Investment Income | .3042 | .2742 | | .13 |
Net Realized and Unrealized Gain (Loss) on Investments | .951 | 2.762 | | (1.49) |
Total from Investment Operations | 1.255 | 3.036 | | (1.36) |
Distributions | | | | |
Dividends from Net Investment Income | (.185) | (.086) | | — |
Distributions from Realized Capital Gains | — | — | | — |
Total Distributions | (.185) | (.086) | | — |
Net Asset Value, End of Period | $27.99 | $26.92 | | $23.97 |
| | | | |
| | | | |
Total Return3 | 4.68% | 12.70% | | –5.37% |
| | | | |
| | | | |
Ratios/Supplemental Data | | | | |
Net Assets, End of Period (Millions) | $108 | $73 | | $11 |
Ratio of Total Expenses to Average Net Assets | 0.28% | 0.28% | | 0.28%4 |
Ratio of Net Investment Income to Average Net Assets | 1.12% | 1.11% | | 1.09%4 |
Portfolio Turnover Rate5 | 11% | 9% | | 8% |
ETF Shares | | | | |
| | | | |
| | | | |
| Year Ended | | Jan. 261 to |
| August 31, | | Aug. 31, |
For a Share Outstanding Throughout Each Period | 2006 | 2005 | | 2004 |
Net Asset Value, Beginning of Period | $53.85 | $47.90 | | $50.55 |
Investment Operations | | | | |
Net Investment Income | .6222 | .5972 | | .23 |
Net Realized and Unrealized Gain (Loss) on Investments | 1.905 | 5.486 | | (2.88) |
Total from Investment Operations | 2.527 | 6.083 | | (2.65) |
Distributions | | | | |
Dividends from Net Investment Income | (.387) | (.133) | | — |
Distributions from Realized Capital Gains | — | — | | — |
Total Distributions | (.387) | (.133) | | — |
Net Asset Value, End of Period | $55.99 | $53.85 | | $47.90 |
| | | | |
| | | | |
Total Return | 4.71% | 12.72% | | –5.24% |
| | | | |
| | | | |
Ratios/Supplemental Data | | | | |
Net Assets, End of Period (Millions) | $364 | $205 | | $19 |
Ratio of Total Expenses to Average Net Assets | 0.25% | 0.26% | | 0.28%4 |
Ratio of Net Investment Income to Average Net Assets | 1.15% | 1.13% | | 1.09%4 |
Portfolio Turnover Rate5 | 11% | 9% | | 8% |
2 | Calculated based on average shares outstanding. |
3 | Total returns do not reflect the 2% fee assessed on redemptions of shares held for less than one year. |
5 | Excludes the value of portfolio securities received or delivered as a result of in-kind purchases or redemptions of the fund’s capital shares, including ETF Creation Units. See accompanying Notes, which are an integral part of the Financial Statements. |
42
Health Care Index Fund
Notes to Financial Statements
Vanguard Health Care Index Fund is registered under the Investment Company Act of 1940 as an open-end investment company, or mutual fund. The fund files reports with the SEC under the company name Vanguard World Funds. The fund offers two classes of shares, Admiral Shares and ETF Shares (formerly known as VIPER Shares). Admiral Shares are available to any investor who meets the fund’s minimum purchase requirements. ETF Shares are listed for trading on the American Stock Exchange; they can be purchased and sold through a broker.
A. The following significant accounting policies conform to generally accepted accounting principles for U.S. mutual funds. The fund consistently follows such policies in preparing its financial statements.
1. Security Valuation: Securities are valued as of the close of trading on the New York Stock Exchange (generally 4:00 p.m. Eastern time) on the valuation date. Equity securities are valued at the latest quoted sales prices or official closing prices taken from the primary market in which each security trades; such securities not traded on the valuation date are valued at the mean of the latest quoted bid and asked prices. Securities for which market quotations are not readily available, or whose values have been materially affected by events occurring before the fund’s pricing time but after the close of the securities’ primary markets, are valued by methods deemed by the board of trustees to represent fair value. Investments in Vanguard Market Liquidity Fund are valued at that fund’s net asset value.
2. Federal Income Taxes: The fund intends to continue to qualify as a regulated investment company and distribute all of its taxable income. Accordingly, no provision for federal income taxes is required in the financial statements.
3. Distributions: Distributions to shareholders are recorded on the ex-dividend date.
4. Security Lending: The fund may lend its securities to qualified institutional borrowers to earn additional income. Security loans are required to be secured at all times by collateral at least equal to the market value of securities loaned. The fund invests cash collateral received in Vanguard Market Liquidity Fund, and records a liability for the return of the collateral, during the period the securities are on loan. Security lending income represents the income earned on investing cash collateral, less expenses associated with the loan.
5. Other: Dividend income is recorded on the ex-dividend date. Interest income includes income distributions received from Vanguard Market Liquidity Fund and is accrued daily. Security transactions are accounted for on the date securities are bought or sold. Costs used to determine realized gains (losses) on the sale of investment securities are those of the specific securities sold. Fees assessed on redemptions of Admiral Shares are credited to paid-in capital.
Each class of shares has equal rights as to assets and earnings, except that each class separately bears certain class-specific expenses related to maintenance of shareholder accounts (included in Management and Administrative expenses) and shareholder reporting. Marketing and distribution expenses are allocated to each class of shares based on a method approved by the board of trustees. Income, other non-class-specific expenses, and gains and losses on investments are allocated to each class of shares based on its relative net assets.
B. The Vanguard Group furnishes at cost investment advisory, corporate management, administrative, marketing, and distribution services. The costs of such services are allocated to the fund under methods approved by the board of trustees. The fund has committed to provide up to 0.40% of its net assets in capital contributions to Vanguard. At August 31, 2006, the fund had contributed capital of $47,000 to Vanguard (included in Other Assets), representing 0.01% of the fund’s net assets and 0.05% of Vanguard’s capitalization. The fund’s trustees and officers are also directors and officers of Vanguard.
C. Distributions are determined on a tax basis and may differ from net investment income and realized capital gains for financial reporting purposes. Differences may be permanent or temporary. Permanent differences are reclassified among capital accounts in the financial statements to reflect their tax character. Temporary differences arise when certain items of income, expense, gain, or loss are recognized in different periods for financial statement and tax purposes; these differences will reverse at some time in the future. Differences in classification may also result from the treatment of short-term gains as ordinary income for tax purposes.
During the year ended August 31, 2006, the fund realized $3,173,000 of net capital gains resulting from in-kind
redemptions—in which shareholders exchanged fund shares for securities held by the fund rather than for cash. Because such gains are not taxable to the fund, and are not distributed to shareholders, they have been reclassified from accumulated net realized gains to paid-in capital.
For tax purposes, at August 31, 2006, the fund had $3,647,000 of ordinary income available for distribution. The fund had available realized losses of $311,000 to offset future net capital gains of $207,000 through August 31, 2014, and $104,000 through August 31, 2015.
At August 31, 2006, the cost of investment securities for tax purposes was $443,314,000. Net unrealized appreciation of investment securities for tax purposes was $28,435,000, consisting of unrealized gains of $40,641,000 on securities that had risen in value since their purchase and $12,206,000 in unrealized losses on securities that had fallen in value since their purchase.
D. During the year ended August 31, 2006, the fund purchased $230,467,000 of investment securities and sold $52,483,000 of investment securities, other than temporary cash investments.
E. In June 2006, the Financial Accounting Standards Board issued Interpretation No. 48 (“FIN 48”), “Accounting for Uncertainty in Income Taxes.” FIN 48 establishes the minimum threshold for recognizing, and a system for measuring, the benefits of tax-return positions in financial statements. FIN 48 will be effective for the fund’s fiscal year beginning September 1, 2007. Management is in the process of analyzing the fund’s tax positions for purposes of implementing FIN 48; based on the analysis completed to date, management does not believe the adoption of FIN 48 will result in any material impact to the fund's financial statements.
F. Capital share transactions for each class of shares were (see table below):
| | | | Year Ended August 31, |
| 2006 | | 2005 |
| Amount | Shares | | Amount | Shares |
| ($000) | (000) | | ($000) | (000) |
Admiral Shares | | | | | |
Issued | 44,720 | 1,672 | | 58,293 | 2,329 |
Issued in Lieu of Cash Distributions | 236 | 9 | | 40 | 2 |
Redeemed1 | (14,346) | (534) | | (2,383) | (94) |
Net Increase (Decrease)—Admiral Shares | 30,610 | 1,147 | | 55,950 | 2,237 |
ETF Shares | | | | | |
Issued | 162,547 | 3,002 | | 172,885 | 3,400 |
Issued in Lieu of Cash Distributions | — | — | | — | — |
Redeemed | (16,299) | (300) | | — | — |
Net Increase (Decrease)—ETF Shares | 146,248 | 2,702 | | 172,885 | 3,400 |
1 | Net of redemption fees of $69,000 and $0. |
43
Industrials Index Fund
Fund Profile
As of August 31, 2006
Portfolio Characteristics | | |
| | Target | Broad |
| Fund | Index1 | Index2 |
Number of Stocks | 320 | 320 | 2,477 |
Median Market Cap | $24.9B | $30.8B | $30.8B |
Price/Earnings Ratio | 17.7x | 17.7x | 17.4x |
Price/Book Ratio | 2.9x | 2.9x | 2.7x |
Yield | | 1.8% | 1.8% |
Admiral Shares | 1.5% | | |
ETF Shares | 1.5% | | |
Return on Equity | 17.8% | 18.1% | 17.8% |
Earnings Growth Rate | 15.8% | 15.4% | 16.7% |
Foreign Holdings | 0.0% | 0.0% | 0.0% |
Turnover Rate | 9% | — | — |
Expense Ratio | | — | — |
Admiral Shares | 0.28%3 | | |
ETF Shares | 0.25% | | |
Short-Term Reserves | 0% | — | — |
Industry Diversification (% of portfolio) |
| |
Aerospace & Defense | 19% |
Air Freight & Logistics | 6 |
Airlines | 2 |
Building Products | 2 |
Commercial Printing | 1 |
Construction & Engineering | 2 |
Construction & Farm Machinery & Heavy Trucks | 7 |
Diversified Commercial & Professional Services | 4 |
Electrical Components & Equipment | 5 |
Environmental & Facilities Services | 2 |
Human Resource & Employment Services | 2 |
Industrial Conglomerates | 28 |
Industrial Machinery | 9 |
Office Services & Supplies | 2 |
Railroads | 5 |
Trading Companies & Distributors | 2 |
Trucking | 2 |
Ten Largest Holdings4 (% of total net assets) |
| |
General Electric Co. | 19.8% |
United Technologies Corp. | 3.8 |
The Boeing Co. | 3.6 |
Tyco International Ltd. | 3.4 |
3M Co. | 3.2 |
United Parcel Service, Inc. | 2.9 |
Caterpillar, Inc. | 2.8 |
Emerson Electric Co. | 2.1 |
Honeywell International Inc. | 1.9 |
Lockheed Martin Corp. | 1.9 |
Top Ten | 45.4% |
1 | MSCI US IMI/Industrials. |
4 | “Ten Largest Holdings” excludes any temporary cash investments and equity index products. |
44
Industrials Index Fund
Performance Summary
All of the returns in this report represent past performance, which is not a guarantee of future results that may be achieved by the fund. (Current performance may be lower or higher than the performance data cited. For performance data current to the most recent month-end, visit our website at www.vanguard.com.) Note, too, that both investment returns and principal value can fluctuate widely, so an investor’s shares, when sold, could be worth more or less than their original cost. The returns shown do not reflect taxes that a shareholder would pay on fund distributions or on the sale of fund shares.
Cumulative Performance: September 23, 2004–August 31, 2006
Initial Investment of $10,000
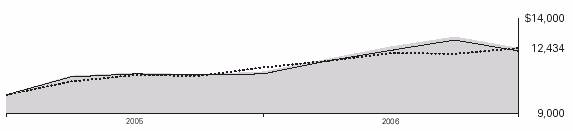
| Average Annual Total Returns | | Final Value |
| Periods Ended August 31, 2006 | | of a $10,000 |
| One Year | Since Inception1 | | Investment |
Industrials Index Fund ETF Shares Net Asset Value | 11.08% | 11.91% | | $12,434 |
Industrials Index Fund ETF Shares Market Price | 11.19 | 11.93 | | 12,440 |
MSCI US IMI/2500 | 8.91 | 12.04 | | 12,462 |
MSCI US IMI/Industrials | 10.75 | 11.25 | | 12,293 |
| | | | | |
| | Final Value |
| | of a $100,000 |
| Since Inception1 | Investment |
Industrials Index Fund Admiral Shares2 | –11.71% | $88,286 |
MSCI US IMI/2500 | –2.07 | 97,933 |
MSCI US IMI/Industrials | –9.77 | 90,226 |
Fiscal-Year Total Returns (%):
September 23, 2004–August 31, 2006
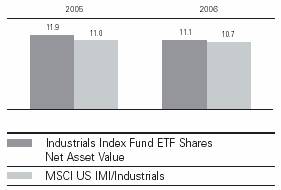
Cumulative Returns: ETF Shares, September 23, 2004–August 31, 2006 |
| | Cumulative |
| | Since |
| One Year | Inception |
Industrials Index Fund ETF Shares Market Price | 11.19% | 24.40% |
Industrials Index Fund ETF Shares Net Asset Value | 11.08 | 24.34 |
MSCI US IMI/Industrials | 10.75 | 22.93 |
Average Annual Total Returns: Periods Ended June 30, 2006
This table presents average annual total returns through the latest calendar quarter—rather than through the end of the fiscal period. Securities and Exchange Commission rules require that we provide this information.
| | | Since |
| Inception Date | One Year | Inception |
ETF Shares | 9/23/2004 | | |
Market Price | | 19.53% | 16.05% |
Net Asset Value | | 19.49 | 16.09 |
Admiral Shares | 5/8/2006 | — | –5.69 |
Fee-Adjusted Return2 | | — | –7.58 |
1 | Inception dates are: for ETF Shares, September 23, 2004; for Admiral Shares, May 8, 2006. |
2 | Reflective of the 2% fee assessed on redemptions of shares held for less than one year. Note: See Financial Highlights tables on page 50 for dividend and capital gains information. |
45
Industrials Index Fund
Financial Statements
Statement of Net Assets
As of August 31, 2006
The fund provides a complete list of its holdings four times in each fiscal year, at the quarter-ends. For the second and fourth fiscal quarters, the lists appear in the fund’s semiannual and annual reports to shareholders. For the first and third fiscal quarters, the fund files the lists with the Securities and Exchange Commission on Form N-Q. Shareholders can look up the fund’s Forms N-Q on the SEC’s website at www.sec.gov. Forms N-Q may also be reviewed and copied at the SEC’s Public Reference Room (see the back cover of this report for further information).
| | | Market |
| | | Value• |
| | Shares | ($000) |
Common Stocks (99.8%) | | |
Aerospace & Defense (19.0%) | | |
| United Technologies Corp. | 72,706 | 4,559 |
| The Boeing Co. | 57,609 | 4,315 |
| Honeywell International Inc. | 59,866 | 2,318 |
| Lockheed Martin Corp. | 27,847 | 2,300 |
| General Dynamics Corp. | 26,063 | 1,761 |
| Northrop Grumman Corp. | 24,816 | 1,658 |
| Raytheon Co. | 33,888 | 1,600 |
| Rockwell Collins, Inc. | 13,139 | 689 |
| L-3 Communications | | |
| Holdings, Inc. | 8,828 | 666 |
| Precision Castparts Corp. | 10,360 | 605 |
| Goodrich Corp. | 9,130 | 356 |
* | Alliant Techsystems, Inc. | 2,888 | 221 |
* | BE Aerospace, Inc. | 6,277 | 150 |
* | Armor Holdings, Inc. | 2,649 | 140 |
| DRS Technologies, Inc. | 3,238 | 134 |
* | Aviall, Inc. | 2,396 | 114 |
* | Hexcel Corp. | 7,453 | 112 |
* | Teledyne Technologies, Inc. | 2,706 | 104 |
| Curtiss-Wright Corp. | 3,291 | 102 |
* | Moog Inc. | 2,983 | 97 |
* | Ceradyne, Inc. | 2,146 | 95 |
* | Orbital Sciences Corp. | 4,591 | 83 |
* | Esterline Technologies Corp. | 2,188 | 77 |
* | AAR Corp. | 3,190 | 71 |
| Triumph Group, Inc. | 1,422 | 63 |
* | GenCorp, Inc. | 4,461 | 61 |
* | K&F Industries Holdings | 2,758 | 52 |
| United Industrial Corp. | 823 | 44 |
* | Taser International Inc. | 5,244 | 41 |
| EDO Corp. | 1,645 | 38 |
* | Argon ST, Inc. | 1,378 | 35 |
| Cubic Corp. | 1,700 | 34 |
| HEICO Corp. Class A | 1,021 | 28 |
* | MTC Technologies, Inc. | 1,233 | 26 |
* | Ionatron Inc. | 3,700 | 23 |
| HEICO Corp. | 469 | 16 |
| | | 22,788 |
Air Freight & Logistics (6.2%) | | |
| United Parcel Service, Inc. | 49,586 | 3,474 |
| FedEx Corp. | 21,994 | 2,222 |
| Expeditors International of | | |
| Washington, Inc. | 16,255 | 648 |
| C.H. Robinson Worldwide Inc. | 12,677 | 581 |
| UTI Worldwide, Inc. | 4,774 | 110 |
| Pacer International, Inc. | 3,191 | 88 |
* | EGL, Inc. | 2,765 | 85 |
| Forward Air Corp. | 2,560 | 82 |
* | Hub Group, Inc. | 3,122 | 73 |
* | ABX Air, Inc. | 6,138 | 34 |
| | | 7,397 |
Airlines (1.9%) | | |
| Southwest Airlines Co. | 61,036 | 1,057 |
* | AMR Corp. | 15,614 | 322 |
* | Continental Airlines, Inc. | | |
| Class B | 6,996 | 176 |
* | US Airways Group Inc. | 3,819 | 161 |
* | JetBlue Airways Corp. | 12,079 | 124 |
| Skywest, Inc. | 4,954 | 120 |
* | Alaska Air Group, Inc. | 2,784 | 105 |
* | AirTran Holdings, Inc. | 7,676 | 88 |
* | Republic Airways Holdings Inc. | 2,818 | 45 |
* | ExpressJet Holdings, Inc. | 4,924 | 34 |
* | Frontier Airlines Holdings, Inc. | 4,159 | 29 |
| | | 2,261 |
Building Products (2.0%) | | |
| Masco Corp. | 30,345 | 832 |
| American Standard Cos., Inc. | 14,097 | 589 |
* | USG Corp. | 5,198 | 265 |
| Lennox International Inc. | 5,017 | 118 |
* | NCI Building Systems, Inc. | 1,739 | 95 |
| Simpson Manufacturing Co. | 3,296 | 87 |
| Universal Forest Products, Inc. | 1,462 | 71 |
* | Jacuzzi Brands, Inc. | 6,752 | 67 |
| Ameron International Corp. | 763 | 54 |
* | Griffon Corp. | 2,236 | 53 |
| ElkCorp | 1,707 | 48 |
| Apogee Enterprises, Inc. | 2,522 | 38 |
* | Trex Co., Inc. | 1,256 | 34 |
| American Woodmark Corp. | 1,042 | 33 |
* | Builders FirstSource, Inc. | 1,550 | 24 |
| | | 2,408 |
Commercial Services & Supplies (10.3%) | |
| Waste Management, Inc. | 41,509 | 1,423 |
| Pitney Bowes, Inc. | 16,992 | 741 |
| R.R. Donnelley & Sons Co. | 16,636 | 539 |
| Avery Dennison Corp. | 7,207 | 446 |
| Republic Services, Inc. | | |
| Class A | 10,546 | 409 |
| Cintas Corp. | 10,969 | 406 |
| Manpower Inc. | 6,720 | 397 |
| Robert Half International, Inc. | 12,622 | 391 |
* | Monster Worldwide Inc. | 9,107 | 371 |
* | The Dun & Bradstreet Corp. | 5,152 | 362 |
| Equifax, Inc. | 9,955 | 316 |
| Aramark Corp. Class B | 9,445 | 310 |
| The Corporate Executive | | |
| Board Co. | 3,130 | 274 |
* | ChoicePoint Inc. | 6,692 | 242 |
| The Brink’s Co. | 3,818 | 218 |
* | Stericycle, Inc. | 3,261 | 217 |
* | Allied Waste Industries, Inc. | 20,305 | 210 |
* | Corrections Corp. of America | 3,179 | 200 |
* | Covanta Holding Corp. | 9,361 | 193 |
* | Copart, Inc. | 5,699 | 160 |
| Adesa, Inc. | 7,224 | 160 |
| Cendant Corp. | 80,831 | 156 |
| HNI Corp. | 3,759 | 150 |
| Herman Miller, Inc. | 5,268 | 149 |
| IKON Office Solutions, Inc. | 10,331 | 147 |
| Brady Corp. Class A | 3,796 | 145 |
* | Waste Connections, Inc. | 3,555 | 131 |
* | West Corp. | 2,594 | 125 |
* | United Stationers, Inc. | 2,593 | 119 |
* | PHH Corp. | 4,393 | 110 |
| Watson Wyatt & Co. Holdings | 2,736 | 108 |
* | IHS Inc.-Class A | 3,345 | 100 |
| Banta Corp. | 2,000 | 94 |
* | Resources Connection, Inc. | 3,817 | 93 |
| Mine Safety Appliances Co. | 2,479 | 88 |
* | Navigant Consulting, Inc. | 4,439 | 87 |
* | Cenveo Inc. | 4,074 | 86 |
| John H. Harland Co. | 2,237 | 84 |
* | Tetra Tech, Inc. | 4,917 | 82 |
* | Mobile Mini, Inc. | 3,015 | 81 |
* | Labor Ready, Inc. | 4,678 | 80 |
* | The Advisory Board Co. | 1,522 | 77 |
| Deluxe Corp. | 4,213 | 76 |
* | Acco Brands Corp. | 3,512 | 76 |
* | FTI Consulting, Inc. | 3,374 | 75 |
* | Korn/Ferry International | 3,671 | 75 |
| Steelcase Inc. | 5,056 | 73 |
| Administaff, Inc. | 2,071 | 72 |
* | School Specialty, Inc. | 2,000 | 71 |
* | American Reprographics Co. | 2,322 | 71 |
* | NCO Group, Inc. | 2,683 | 70 |
| ABM Industries Inc. | 3,700 | 67 |
* | Consolidated Graphics, Inc. | 1,050 | 65 |
* | CoStar Group, Inc. | 1,565 | 63 |
| Viad Corp. | 1,771 | 63 |
| G & K Services, Inc. Class A | 1,818 | 60 |
| Knoll, Inc. | 3,340 | 60 |
* | Coinstar, Inc. | 2,254 | 59 |
* | Global Cash Access, Inc. | 3,812 | 59 |
| Rollins, Inc. | 2,781 | 59 |
* | Heidrick & Struggles | | |
| International, Inc. | 1,602 | 57 |
| Healthcare Services Group, Inc. | 2,377 | 54 |
* | Teletech Holdings Inc. | 3,420 | 52 |
* | Clean Harbors Inc. | 1,189 | 50 |
| Kelly Services, Inc. Class A | 1,824 | 50 |
* | Huron Consulting Group Inc. | 1,273 | 48 |
| McGrath RentCorp | 2,024 | 46 |
| Bowne & Co., Inc. | 2,851 | 44 |
* | CRA International Inc. | 986 | 44 |
* | CBIZ Inc. | 5,548 | 43 |
* | Spherion Corp. | 5,621 | 42 |
* | Kforce Inc. | 3,349 | 41 |
* | Kenexa Corp. | 1,537 | 39 |
* | Volt Information Sciences Inc. | 857 | 37 |
| Ennis, Inc. | 1,717 | 35 |
* | Pike Electric Corp. | 1,913 | 34 |
| Central Parking Corp. | 1,777 | 30 |
| CDI Corp. | 1,446 | 30 |
| Schawk, Inc. | 1,506 | 29 |
* | LECG Corp. | 1,659 | 28 |
46
Industrials Index Fund
| | | Market |
| | | Value• |
| | Shares | ($000) |
* | Diamond Management | | |
| and Technology | 2,933 | 27 |
* | Hudson Highland Group, Inc. | 2,448 | 25 |
* | Sirva Inc. | 7,065 | 21 |
| The Standard Register Co. | 1,285 | 16 |
| | | 12,413 |
Construction & Engineering (1.9%) | |
| Fluor Corp. | 6,720 | 581 |
* | Jacobs Engineering Group Inc. | 4,533 | 395 |
* | Foster Wheeler Ltd. | 5,363 | 233 |
* | URS Corp. | 4,103 | 166 |
* | Shaw Group, Inc. | 6,460 | 163 |
* | Quanta Services, Inc. | 8,407 | 149 |
| Granite Construction Co. | 2,645 | 142 |
* | EMCOR Group, Inc. | 2,551 | 141 |
| Washington Group | | |
| International, Inc. | 2,349 | 139 |
* | Infrasource Services Inc. | 3,296 | 57 |
* | Insituform Technologies Inc. | | |
| Class A | 2,474 | 57 |
* | Perini Corp. | 1,736 | 42 |
| | | 2,265 |
Electrical Equipment (5.5%) | | |
| Emerson Electric Co. | 31,182 | 2,562 |
| Rockwell Automation, Inc. | 12,895 | 727 |
| Cooper Industries, Inc. | | |
| Class A | 7,091 | 581 |
| Roper Industries Inc. | 6,758 | 313 |
| American Power | | |
| Conversion Corp. | 13,694 | 241 |
| Ametek, Inc. | 5,573 | 239 |
* | Thomas & Betts Corp. | 4,863 | 220 |
| Hubbell Inc. Class B | 4,129 | 192 |
* | General Cable Corp. | 4,073 | 157 |
| Acuity Brands, Inc. | 3,612 | 154 |
* | Genlyte Group, Inc. | 2,057 | 135 |
| Belden CDT Inc. | 3,472 | 124 |
* | Energy Conversion | | |
| Devices, Inc. | 3,245 | 114 |
| Regal-Beloit Corp. | 2,428 | 105 |
| Woodward Governor Co. | 2,550 | 86 |
| Franklin Electric, Inc. | 1,482 | 71 |
| A.O. Smith Corp. | 1,740 | 70 |
| Baldor Electric Co. | 2,317 | 69 |
* | Encore Wire Corp. | 1,461 | 55 |
* | Evergreen Solar, Inc. | 5,254 | 53 |
* | GrafTech International Ltd. | 9,185 | 50 |
* | II-VI, Inc. | 2,338 | 49 |
* | Power-One, Inc. | 6,318 | 43 |
* | Medis Technology Ltd. | 2,037 | 41 |
* | FuelCell Energy, Inc. | 3,957 | 39 |
* | EnerSys | 2,121 | 38 |
* | Plug Power, Inc. | 6,566 | 31 |
| Vicor Corp. | 2,131 | 27 |
| | | 6,586 |
Industrial Conglomerates (28.0%) | |
| General Electric Co. | 698,613 | 23,795 |
| Tyco International Ltd. | 154,225 | 4,033 |
| 3M Co. | 54,315 | 3,894 |
| Textron, Inc. | 8,928 | 749 |
* | McDermott International, Inc. | 7,507 | 362 |
| Carlisle Co., Inc. | 2,438 | 208 |
| Walter Industries, Inc. | 3,459 | 190 |
| Teleflex Inc. | 2,907 | 162 |
* | Sequa Corp. Class A | 496 | 46 |
| Raven Industries, Inc. | 1,573 | 44 |
| Tredegar Corp. | 2,633 | 43 |
| Standex International Corp. | 1,121 | 33 |
| | | 33,559 |
Machinery (16.3%) | | |
| Caterpillar, Inc. | 50,458 | 3,348 |
| Illinois Tool Works, Inc. | 36,239 | 1,591 |
| Deere & Co. | 17,879 | 1,396 |
| Danaher Corp. | 18,638 | 1,236 |
| PACCAR, Inc. | 18,303 | 1,001 |
| Ingersoll-Rand Co. | 25,081 | 954 |
| Dover Corp. | 15,584 | 758 |
| Eaton Corp. | 10,925 | 727 |
| Parker Hannifin Corp. | 9,209 | 682 |
| ITT Industries, Inc. | 13,386 | 655 |
| Joy Global Inc. | 9,595 | 418 |
| Cummins Inc. | 3,564 | 409 |
* | Terex Corp. | 7,812 | 343 |
| Oshkosh Truck Corp. | 5,706 | 295 |
| Pall Corp. | 9,650 | 263 |
| Harsco Corp. | 3,249 | 258 |
| SPX Corp. | 4,779 | 252 |
* | Flowserve Corp. | 4,456 | 228 |
| Pentair, Inc. | 7,497 | 224 |
| The Manitowoc Co., Inc. | 4,846 | 214 |
| Trinity Industries, Inc. | 6,255 | 209 |
| Graco, Inc. | 5,416 | 205 |
| Donaldson Co., Inc. | 6,095 | 203 |
| The Timken Co. | 5,948 | 191 |
| IDEX Corp. | 4,258 | 179 |
* | AGCO Corp. | 7,107 | 177 |
| Kennametal, Inc. | 3,171 | 167 |
| Lincoln Electric Holdings, Inc. | 2,897 | 159 |
| Crane Co. | 3,860 | 154 |
| JLG Industries, Inc. | 8,598 | 150 |
* | Gardner Denver Inc. | 4,107 | 148 |
| Bucyrus International, Inc. | 2,590 | 134 |
| The Toro Co. | 3,298 | 132 |
| CLARCOR Inc. | 4,133 | 124 |
| Briggs & Stratton Corp. | 4,152 | 117 |
* | Navistar International Corp. | 5,051 | 116 |
| Mueller Industries Inc. | 3,026 | 116 |
* | ESCO Technologies Inc. | 2,133 | 109 |
| Wabtec Corp. | 3,701 | 104 |
| Actuant Corp. | 2,272 | 102 |
| Nordson Corp. | 2,406 | 96 |
| Kaydon Corp. | 2,285 | 87 |
| Valmont Industries, Inc. | 1,528 | 80 |
| Albany International Corp. | 2,280 | 80 |
| Watts Water Technologies, Inc. | 2,213 | 69 |
| NACCO Industries, Inc. | | |
| Class A | 498 | 67 |
| Federal Signal Corp. | 4,257 | 66 |
| Freightcar America Inc. | 1,063 | 62 |
* | EnPro Industries, Inc. | 1,807 | 57 |
| Barnes Group, Inc. | 3,307 | 54 |
* | The Middleby Corp. | 599 | 47 |
| Wabash National Corp. | 3,031 | 42 |
| Tennant Co. | 1,553 | 42 |
* | Astec Industries, Inc. | 1,714 | 40 |
| CIRCOR International, Inc. | 1,385 | 40 |
* | RBC Bearings Inc. | 1,845 | 39 |
| Cascade Corp. | 1,011 | 38 |
* | Commercial Vehicle Group Inc. | 1,926 | 38 |
* | American Science & | | |
| Engineering, Inc. | 827 | 38 |
| The Greenbrier Cos., Inc. | 1,308 | 36 |
| Robbins & Myers, Inc. | 1,224 | 35 |
* | A.S.V., Inc. | 1,964 | 30 |
* | Accuride Corp. | 2,556 | 28 |
* | Tecumseh Products Co. | | |
| Class A | 1,581 | 23 |
* | TurboChef Technologies, Inc. | 2,038 | 21 |
* | Tecumseh Products Co. | | |
| Class B | 238 | 3 |
| | | 19,506 |
Marine (0.4%) | | | |
| Alexander & Baldwin, Inc. | 3,398 | 149 |
* | American Commercial | | |
| Lines Inc. | 2,495 | 131 |
* | Kirby Corp. | 3,510 | 103 |
| Eagle Bulk Shipping Inc. | 2,100 | 33 |
| Genco Shipping and | | |
| Trading Ltd. | 1,402 | 31 |
| Horizon Lines Inc. | 1,901 | 30 |
| | | 477 |
Road & Rail (6.7%) | | | |
| Burlington Northern | | |
| Santa Fe Corp. | 27,692 | 1,854 |
| Union Pacific Corp. | 19,420 | 1,560 |
| Norfolk Southern Corp. | 31,552 | 1,348 |
| CSX Corp. | 33,799 | 1,021 |
| Ryder System, Inc. | 4,796 | 237 |
| Landstar System, Inc. | 4,600 | 196 |
| Con-way, Inc. | 4,103 | 196 |
| J.B. Hunt Transport | | |
| Services, Inc. | 9,178 | 180 |
| Laidlaw International Inc. | 6,560 | 177 |
* | YRC Worldwide, Inc. | 4,596 | 169 |
* | Kansas City Southern | 5,197 | 137 |
| Florida East Coast | | |
| Industries, Inc. Class A | 2,441 | 133 |
| Arkansas Best Corp. | 2,027 | 89 |
* | Dollar Thrifty Automotive | | |
| Group, Inc. | 2,068 | 88 |
* | Swift Transportation Co., Inc. | 3,802 | 88 |
| Werner Enterprises, Inc. | 4,669 | 87 |
| Heartland Express, Inc. | 5,252 | 84 |
| Knight Transportation, Inc. | 4,737 | 81 |
* | Genesee & Wyoming Inc. | | |
| Class A | 3,226 | 80 |
* | Old Dominion Freight Line, Inc. | 2,481 | 79 |
* | Amerco, Inc. | 940 | 67 |
* | RailAmerica, Inc. | 3,890 | 39 |
| | | 7,990 |
Trading Companies & Distributors (1.6%) | |
| W.W. Grainger, Inc. | 5,863 | 392 |
| Fastenal Co. | 9,877 | 362 |
* | Wesco International, Inc. | 3,816 | 223 |
| GATX Corp. | 4,102 | 152 |
| MSC Industrial Direct Co., Inc. | | |
| Class A | 3,809 | 150 |
* | United Rentals, Inc. | 5,857 | 127 |
| Watsco, Inc. | 1,964 | 86 |
| Applied Industrial | | |
| Technology, Inc. | 3,457 | 78 |
| UAP Holding Corp. | 3,730 | 78 |
* | Beacon Roofing Supply, Inc. | 3,668 | 67 |
* | Interline Brands, Inc. | 2,209 | 55 |
* | Williams Scotsman | | |
| International Inc. | 2,383 | 50 |
* | TAL International Group, Inc. | 1,665 | 39 |
| Kaman Corp. Class A | 2,168 | 39 |
| Bluelinx Holdings Inc. | 3,042 | 32 |
47
Industrials Index Fund
| | | Market |
| | | Value• |
| | Shares | ($000) |
* | Electro Rent Corp. | 1,818 | 29 |
| Lawson Products, Inc. | 561 | 22 |
| | | 1,981 |
Transportation Infrastructure (0.0%) | |
* | Sea Containers Ltd. Class A | 6,215 | 14 |
Total Investments (99.8%) | | |
(Cost $120,573) | | 119,645 |
Other Assets and Liabilities (0.2%) | |
Other Assets—Note B | | 1,915 |
Liabilities | | (1,679) |
| | | 236 |
Net Assets (100%) | | 119,881 |
At August 31, 2006, net assets consisted of:1 |
| Amount |
| ($000) |
Paid-in Capital | 120,335 |
Undistributed Net Investment Income | 824 |
Accumulated Net Realized Losses | (350) |
Unrealized Depreciation | (928) |
Net Assets | 119,881 |
| |
| |
Admiral Shares—Net Assets | |
Applicable to 6,065 outstanding | |
$.001 par value shares of beneficial | |
interest (unlimited authorization) | 186 |
Net Asset Value Per Share— | |
Admiral Shares | $30.72 |
| |
| |
ETF Shares—Net Assets | |
Applicable to 2,000,000 outstanding | |
$.001 par value shares of beneficial | |
interest (unlimited authorization) | 119,695 |
Net Asset Value Per Share— | |
ETF Shares | $59.85 |
• | See Note A in Notes to Financial Statements. |
* | Non-income-producing security. |
1 | See Note C in Notes to Financial Statements for the tax-basis components of net assets. |
48
Industrials Index Fund
Statement of Operations
| Year Ended |
| August 31, 2006 |
| ($000) |
Investment Income | |
Income | |
Dividends | 1,125 |
Total Income | 1,125 |
Expenses | |
The Vanguard Group—Note B | |
Investment Advisory Services | 11 |
Management and Administrative | |
Admiral Shares | — |
ETF Shares | 101 |
Marketing and Distribution | |
Admiral Shares | — |
ETF Shares | 8 |
Custodian Fees | 28 |
Auditing Fees | 21 |
Shareholders’ Reports | |
Admiral Shares | — |
ETF Shares | 4 |
Total Expenses | 173 |
Net Investment Income | 952 |
Realized Net Gain (Loss) on | |
Investment Securities Sold | 774 |
Change in Unrealized Appreciation | |
(Depreciation) of Investment Securities | (1,279) |
Net Increase (Decrease) in Net Assets | |
Resulting from Operations | 447 |
Statement of Changes in Net Assets
| | Sept. 23, |
| Year Ended | 20041 to |
| Aug. 31, | Aug. 31, |
| 2006 | 2005 |
| ($000) | ($000) |
Increase (Decrease) In Net Assets | | |
Operations | | |
Net Investment Income | 952 | 162 |
Realized Net Gain (Loss) | 774 | 1,632 |
Change in Unrealized Appreciation (Depreciation) | (1,279) | 351 |
Net Increase (Decrease) in Net Assets Resulting from Operations | 447 | 2,145 |
Distributions | | |
Net Investment Income | | |
Admiral Shares | — | — |
ETF Shares | (226) | (64) |
Realized Capital Gain | | |
Admiral Shares | — | — |
ETF Shares | — | — |
Total Distributions | (226) | (64) |
Capital Share Transactions—Note F | | |
Admiral Shares | 197 | — |
ETF Shares | 103,172 | 14,210 |
Net Increase (Decrease) from Capital Share Transactions | 103,369 | 14,210 |
Total Increase (Decrease) | 103,590 | 16,291 |
Net Assets | | |
Beginning of Period | 16,291 | — |
End of Period2 | 119,881 | 16,291 |
2 | Net Assets—End of Period includes undistributed net investment income of $824,000 and $98,000. |
49
Industrials Index Fund
Financial Highlights
Admiral Shares | |
| May 81 to |
| Aug. 31, |
For a Share Outstanding Throughout the Period | 2006 |
Net Asset Value, Beginning of Period | $34.10 |
Investment Operations | |
Net Investment Income | .1642 |
Net Realized and Unrealized Gain (Loss) on Investments2 | (3.544) |
Total from Investment Operations | (3.380) |
Distributions | |
Dividends from Net Investment Income | — |
Distributions from Realized Capital Gains | — |
Total Distributions | — |
Net Asset Value, End of Period | $30.72 |
| |
| |
Total Return3 | –9.91% |
| |
| |
Ratios/Supplemental Data | |
Net Assets, End of Period (Millions) | $.2 |
Ratio of Total Expenses to Average Net Assets | 0.28%4 |
Ratio of Net Investment Income to Average Net Assets | 1.35%4 |
Portfolio Turnover Rate5 | 9% |
ETF Shares | | |
| Year | Sept. 23, |
| Ended | 20041 to |
| Aug. 31, | Aug. 31, |
For a Share Outstanding Throughout Each Period | 2006 | 2005 |
Net Asset Value, Beginning of Period | $54.30 | $48.79 |
Investment Operations | | |
Net Investment Income | .8422 | .65 |
Net Realized and Unrealized Gain (Loss) on Investments | 5.160 | 5.18 |
Total from Investment Operations | 6.002 | 5.83 |
Distributions | | |
Dividends from Net Investment Income | (.452) | (.32) |
Distributions from Realized Capital Gains | — | — |
Total Distributions | (.452) | (.32) |
Net Asset Value, End of Period | $59.85 | $54.30 |
| | |
| | |
Total Return | 11.08% | 11.94% |
| | |
| | |
Ratios/Supplemental Data | | |
Net Assets, End of Period (Millions) | $120 | $16 |
Ratio of Total Expenses to Average Net Assets | 0.25% | 0.26%4 |
Ratio of Net Investment Income to Average Net Assets | 1.38% | 1.30%4 |
Portfolio Turnover Rate5 | 9% | 11% |
2 | Calculated based on average shares outstanding. |
3 | Total returns do not reflect the 2% fee assessed on redemptions of shares held for less than one year. |
5 | Excludes the value of portfolio securities received or delivered as a result of in-kind purchases or redemptions of the fund’s capital shares, including ETF Creation Units. See accompanying Notes, which are an integral part of the Financial Statements. |
50
Industrials Index Fund
Notes to Financial Statements
Vanguard Industrials Index Fund is registered under the Investment Company Act of 1940 as an open-end investment company, or mutual fund. The fund files reports with the SEC under the company name Vanguard World Funds. The fund offers two classes of shares, Admiral Shares and ETF Shares (formerly known as VIPER Shares). Admiral Shares are available to any investor who meets the fund’s minimum purchase requirements. Admiral Shares were first issued on May 8, 2006. ETF Shares are listed for trading on the American Stock Exchange; they can be purchased and sold through a broker.
A. The following significant accounting policies conform to generally accepted accounting principles for U.S. mutual funds. The fund consistently follows such policies in preparing its financial statements.
1. Security Valuation: Securities are valued as of the close of trading on the New York Stock Exchange (generally 4:00 p.m. Eastern time) on the valuation date. Equity securities are valued at the latest quoted sales prices or official closing prices taken from the primary market in which each security trades; such securities not traded on the valuation date are valued at the mean of the latest quoted bid and asked prices. Securities for which market quotations are not readily available, or whose values have been materially affected by events occurring before the fund’s pricing time but after the close of the securities’ primary markets, are valued by methods deemed by the board of trustees to represent fair value.
2. Federal Income Taxes: The fund intends to continue to qualify as a regulated investment company and distribute all of its taxable income. Accordingly, no provision for federal income taxes is required in the financial statements.
3. Distributions: Distributions to shareholders are recorded on the ex-dividend date.
4. Other: Dividend income is recorded on the ex-dividend date. Security transactions are accounted for on the date securities are bought or sold. Costs used to determine realized gains (losses) on the sale of investment securities are those of the specific securities sold.
B. The Vanguard Group furnishes at cost investment advisory, corporate management, administrative, marketing, and distribution services. The costs of such services are allocated to the fund under methods approved by the board of trustees. The fund has committed to provide up to 0.40% of its net assets in capital contributions to Vanguard. At August 31, 2006, the fund had contributed capital of $13,000 to Vanguard (included in Other Assets), representing 0.01% of the fund’s net assets and 0.01% of Vanguard’s capitalization. The fund’s trustees and officers are also directors and officers of Vanguard.
C. Distributions are determined on a tax basis and may differ from net investment income and realized capital gains for financial reporting purposes. Differences may be permanent or temporary. Permanent differences are reclassified among capital accounts in the financial statements to reflect their tax character. Temporary differences arise when certain items of income, expense, gain, or loss are recognized in different periods for financial statement and tax purposes; these differences will reverse at some time in the future. Differences in classification may also result from the treatment of short-term gains as ordinary income for tax purposes.
During the year ended August 31, 2006, the fund realized $1,127,000 of net capital gains resulting from in-kind redemptions—in which shareholders exchanged fund shares for securities held by the fund rather than for cash. Because such gains are not taxable to the fund, and are not distributed to shareholders, they have been reclassified from accumulated net realized losses to paid-in capital.
For tax purposes, at August 31, 2006, the fund had $851,000 of ordinary income available for distribution. The fund had available realized losses of $339,000 to offset future net capital gains of $18,000 through August 31, 2014, and $321,000 through August 31, 2015.
At August 31, 2006, the cost of investment securities for tax purposes was $120,587,000. Net unrealized depreciation of investment securities for tax purposes was $942,000, consisting of unrealized gains of $3,504,000 on securities that had risen in value since their purchase and $4,446,000 in unrealized losses on securities that had fallen in value since their purchase.
D. During the year ended August 31, 2006, the fund purchased $116,302,000 of investment securities and sold $12,448,000 of investment securities, other than temporary cash investments.
E. In June 2006, the Financial Accounting Standards Board issued Interpretation No. 48 (“FIN 48”), “Accounting for Uncertainty in Income Taxes.” FIN 48 establishes the minimum threshold for recognizing, and a system for
measuring, the benefits of tax-return positions in financial statements. FIN 48 will be effective for the fund’s fiscal year beginning September 1, 2007. Management is in the process of analyzing the fund’s tax positions for purposes of implementing FIN 48; based on the analysis completed to date, management does not believe the adoption of FIN 48 will result in any material impact to the fund's financial statements.
F. Capital share transactions for each class of shares were (see table below):
| Year Ended | | September 23, 20041 |
| August 31, 2006 | | to August 31, 2005 |
| Amount | Shares | | Amount | Shares |
| ($000) | (000) | | ($000) | (000) |
Admiral Shares | | | | | |
Issued | 197 | 6 | | — | — |
Issued in Lieu of Cash Distributions | — | — | | — | — |
Redeemed | — | — | | — | — |
Net Increase (Decrease)—Admiral Shares | 197 | 6 | | — | — |
ETF Shares | | | | | |
Issued | 109,102 | 1,800 | | 30,466 | 600 |
Issued in Lieu of Cash Distributions | — | — | | — | — |
Redeemed | (5,930) | (100) | | (16,256) | (300) |
Net Increase (Decrease)—ETF Shares | 103,172 | 1,700 | | 14,210 | 300 |
51
Information Technology Index Fund
Fund Profile
As of August 31, 2006
Portfolio Characteristics | | |
| | Target | Broad |
| Fund | Index1 | Index2 |
Number of Stocks | 396 | 395 | 2,477 |
Median Market Cap | $50.8B | $50.8B | $30.8B |
Price/Earnings Ratio | 23.8x | 23.7x | 17.4x |
Price/Book Ratio | 3.6x | 3.6x | 2.7x |
Yield | | 0.6% | 1.8% |
Admiral Shares | 0.3% | | |
ETF Shares | 0.4% | | |
Return on Equity | 13.7% | 13.7% | 17.8% |
Earnings Growth Rate | 20.1% | 20.1% | 16.7% |
Foreign Holdings | 0.0% | 0.0% | 0.0% |
Turnover Rate | 8% | — | — |
Expense Ratio | | — | — |
Admiral Shares | 0.28% | | |
ETF Shares | 0.25% | | |
Short-Term Reserves | 0% | — | — |
Industry Diversification (% of portfolio) |
| |
Application Software | 5% |
Communications Equipment | 17 |
Computer Hardware | 16 |
Computer Storage & Peripherals | 4 |
Data Processing & Outsourced Services | 7 |
Electronic Equipment Manufacturers | 2 |
Electronic Manufacturing Services | 1 |
Home Entertainment Software | 1 |
Internet Software & Services | 8 |
IT Consulting & Other Services | 2 |
Office Electronics | 1 |
Semiconductor Equipment | 3 |
Semiconductors | 16 |
Systems Software | 16 |
Technology Distributors | 1 |
Ten Largest Holdings3 (% of total net assets) |
| |
Microsoft Corp. | 10.3% |
Cisco Systems, Inc. | 6.1 |
International Business Machines Corp. | 5.7 |
Intel Corp. | 5.2 |
Hewlett-Packard Co. | 4.6 |
Google Inc. | 3.7 |
Oracle Corp. | 3.0 |
QUALCOMM Inc. | 2.9 |
Motorola, Inc. | 2.6 |
Apple Computer, Inc. | 2.6 |
Top Ten | 46.7% |
1 | MSCI US IMI/Information Technology. |
3 | “Ten Largest Holdings” excludes any temporary cash investments and equity index products. |
52
Information Technology Index Fund
Performance Summary
All of the returns in this report represent past performance, which is not a guarantee of future results that may be achieved by the fund. (Current performance may be lower or higher than the performance data cited. For performance data current to the most recent month-end, visit our website at www.vanguard.com.) Note, too, that both investment returns and principal value can fluctuate widely, so an investor’s shares, when sold, could be worth more or less than their original cost. The returns shown do not reflect taxes that a shareholder would pay on fund distributions or on the sale of fund shares.
Cumulative Performance: January 26, 2004–August 31, 2006
Initial Investment of $10,000
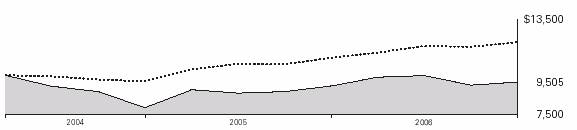
| | | | |
| Average Annual Total Returns | | Final Value |
| Periods Ended August 31, 2006 | | of a $10,000 |
| One Year | Since Inception1 | | Investment |
Information Technology Index Fund | | | | |
ETF Shares Net Asset Value | 2.11% | –1.94% | | $9,505 |
Information Technology Index Fund | | | | |
ETF Shares Market Price | 2.46 | –1.84 | | 9,530 |
MSCI US IMI/2500 | 8.91 | 7.62 | | 12,098 |
MSCI US IMI/Information Technology | 2.37 | –1.74 | | 9,556 |
| | | Final Value |
| | | of a $100,000 |
| One Year | Since Inception1 | Investment |
Information Technology Index Fund Admiral Shares2 | 2.12% | 2.36% | $105,843 |
MSCI US IMI/2500 | 8.91 | 9.81 | 125,571 |
MSCI US IMI/Information Technology | 2.37 | 2.57 | 106,375 |
Fiscal-Year Total Returns (%):
January 26, 2004–August 31, 2006
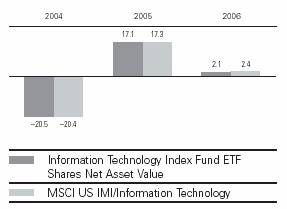
Cumulative Returns: ETF Shares, January 26, 2004–August 31, 2006 |
| | Cumulative |
| | Since |
| One Year | Inception |
Information Technology Index Fund ETF Shares Market Price | 2.46% | –4.70% |
Information Technology Index Fund ETF Shares Net Asset Value | 2.11 | –4.9 |
MSCI US IMI/Information Technology | 2.37 | –4.44 |
Average Annual Total Returns: Periods Ended June 30, 2006
This table presents average annual total returns through the latest calendar quarter—rather than through the end of the fiscal period. Securities and Exchange Commission rules require that we provide this information.
| | | Since |
| Inception Date | One Year | Inception |
ETF Shares | 1/26/2004 | | |
Market Price | | 4.18% | –3.35% |
Net Asset Value | | 4.28 | –3.40 |
Admiral Shares2 | 3/25/2004 | 4.26 | 1.04 |
1 | Inception dates are: for ETF Shares, January 26, 2004; for Admiral Shares, March 25, 2004. |
2 | Total returns do not reflect the 2% fee assessed on redemptions of shares held less than one year. Note: See Financial Highlights tables on page 58 for dividend and capital gains information. |
53
Information Technology Index Fund
Financial Statements
Statement of Net Assets
As of August 31, 2006
The fund provides a complete list of its holdings four times in each fiscal year, at the quarter-ends. For the second and fourth fiscal quarters, the lists appear in the fund’s semiannual and annual reports to shareholders. For the first and third fiscal quarters, the fund files the lists with the Securities and Exchange Commission on Form N-Q. Shareholders can look up the fund’s Forms N-Q on the SEC’s website at www.sec.gov. Forms N-Q may also be reviewed and copied at the SEC’s Public Reference Room (see the back cover of this report for further information).
| | | Market |
| | | Value• |
| | Shares | ($000) |
Common Stocks (99.9%) | | |
Communications Equipment (16.6%) | | |
* | Cisco Systems, Inc. | 489,491 | 10,764 |
| QUALCOMM Inc. | 134,262 | 5,058 |
| Motorola, Inc. | 198,027 | 4,630 |
* | Corning, Inc. | 124,791 | 2,775 |
* | Lucent Technologies, Inc. | 357,321 | 833 |
* | Juniper Networks, Inc. | 40,540 | 595 |
| Harris Corp. | 10,725 | 471 |
* | Avaya Inc. | 33,766 | 353 |
* | Tellabs, Inc. | 34,226 | 349 |
* | Comverse Technology, Inc. | 16,150 | 338 |
* | JDS Uniphase Corp. | 134,612 | 306 |
* | Ciena Corp. | 46,757 | 185 |
* | Polycom, Inc. | 6,974 | 166 |
* | F5 Networks, Inc. | 3,185 | 160 |
* | Interdigital | | |
| Communications Corp. | 4,401 | 146 |
* | 3Com Corp. | 31,040 | 138 |
| ADTRAN Inc. | 5,497 | 137 |
* | CommScope, Inc. | 4,526 | 132 |
* | Foundry Networks, Inc. | 10,830 | 132 |
* | ADC Telecommunications, Inc. | 9,302 | 127 |
* | Avocent Corp. | 3,915 | 118 |
* | Andrew Corp. | 12,688 | 117 |
* | Arris Group Inc. | 8,515 | 98 |
* | Sonus Networks, Inc. | 18,993 | 92 |
* | Redback Networks Inc. | 4,320 | 81 |
* | UTStarcom, Inc. | 8,344 | 69 |
| Plantronics, Inc. | 3,793 | 68 |
* | Finisar Corp. | 17,691 | 66 |
* | Dycom Industries, Inc. | 3,199 | 65 |
* | Tekelec | 4,809 | 64 |
* | Powerwave Technologies, Inc. | 7,954 | 60 |
* | Comtech | | |
| Telecommunications Corp. | 1,817 | 59 |
* | Sycamore Networks, Inc. | 15,552 | 57 |
| Black Box Corp. | 1,406 | 54 |
* | NETGEAR, Inc. | 2,663 | 52 |
* | ViaSat, Inc. | 1,887 | 51 |
* | Mastec Inc. | 3,278 | 38 |
* | SafeNet, Inc. | 1,990 | 37 |
* | Harmonic, Inc. | 5,765 | 36 |
| Inter-Tel, Inc. | 1,620 | 36 |
* | Extreme Networks, Inc. | 9,458 | 35 |
* | Ixia | 2,928 | 29 |
* | Packeteer, Inc. | 2,667 | 27 |
| Bel Fuse, Inc. Class B | 650 | 24 |
* | Ditech Networks Inc. | 2,534 | 22 |
* | Blue Coat Systems, Inc. | 969 | 17 |
* | Westell Technologies, Inc. | 4,630 | 13 |
| Bel Fuse, Inc. Class A | 184 | 6 |
| | | 29,286 |
Computers & Peripherals (20.6%) | | |
| International Business | | |
| Machines Corp. | 124,339 | 10,068 |
| Hewlett-Packard Co. | 223,755 | 8,180 |
* | Apple Computer, Inc. | 68,162 | 4,625 |
* | Dell Inc. | 175,482 | 3,957 |
* | EMC Corp. | 189,609 | 2,209 |
* | Sun Microsystems, Inc. | 280,190 | 1,398 |
* | Network Appliance, Inc. | 29,810 | 1,021 |
| Seagate Technology | 42,535 | 946 |
* | SanDisk Corp. | 15,522 | 915 |
* | NCR Corp. | 14,536 | 506 |
* | Lexmark International, Inc. | 8,454 | 474 |
* | Western Digital Corp. | 17,589 | 322 |
* | QLogic Corp. | 12,929 | 238 |
| Diebold, Inc. | 5,535 | 232 |
* | Brocade Communications | | |
| Systems, Inc. | 21,986 | 136 |
* | Avid Technology, Inc. | 3,218 | 128 |
* | Intermec, Inc. | 4,068 | 122 |
* | Emulex Corp. | 6,747 | 117 |
| Imation Corp. | 2,791 | 111 |
* | Palm, Inc. | 7,398 | 108 |
* | Electronics for Imaging, Inc. | 4,558 | 105 |
* | Komag, Inc. | 2,261 | 81 |
* | Rackable Systems Inc. | 2,099 | 58 |
* | Synaptics Inc. | 1,873 | 47 |
* | Hutchinson Technology, Inc. | 2,069 | 43 |
* | McDATA Corp. Class A | 9,364 | 40 |
* | Adaptec, Inc. | 9,132 | 38 |
* | Gateway, Inc. | 17,502 | 35 |
* | Quantum Corp. | 14,974 | 33 |
* | Novatel Wireless, Inc. | 2,272 | 25 |
* | Presstek, Inc. | 2,584 | 21 |
* | McDATA Corp. Class B | 2,974 | 12 |
| | | 36,351 |
Electronic Equipment & Instruments (4.4%) | | |
* | Agilent Technologies, Inc. | 34,171 | 1,099 |
* | Flextronics International Ltd. | 46,174 | 545 |
| Amphenol Corp. | 7,110 | 409 |
| Jabil Circuit, Inc. | 13,968 | 375 |
| CDW Corp. | 5,148 | 300 |
* | Arrow Electronics, Inc. | 9,646 | 269 |
| Symbol Technologies, Inc. | 20,289 | 244 |
* | Solectron Corp. | 72,993 | 229 |
* | Trimble Navigation Ltd. | 4,344 | 213 |
* | Avnet, Inc. | 10,583 | 207 |
| Molex, Inc. Class A | 6,519 | 205 |
* | Mettler-Toledo | | |
| International Inc. | 3,313 | 202 |
* | Ingram Micro, Inc. Class A | 11,063 | 199 |
* | Vishay Intertechnology, Inc. | 13,545 | 190 |
| Tektronix, Inc. | 6,495 | 184 |
| Molex, Inc. | 4,771 | 174 |
* | Tech Data Corp. | 4,595 | 160 |
* | FLIR Systems, Inc. | 5,227 | 145 |
* | Sanmina-SCI Corp. | 42,858 | 145 |
| Anixter International Inc. | 2,632 | 143 |
* | Benchmark Electronics, Inc. | 5,022 | 125 |
| National Instruments Corp. | 4,403 | 122 |
* | Itron, Inc. | 1,982 | 111 |
* | Coherent, Inc. | 2,474 | 90 |
| Technitrol, Inc. | 3,105 | 88 |
| Cognex Corp. | 3,409 | 87 |
* | Global Imaging Systems, Inc. | 3,750 | 82 |
| AVX Corp. | 4,873 | 81 |
* | Rogers Corp. | 1,313 | 76 |
* | Plexus Corp. | 3,597 | 71 |
* | Insight Enterprises, Inc. | 3,803 | 68 |
* | Brightpoint, Inc. | 4,055 | 67 |
* | Rofin-Sinar Technologies Inc. | 1,202 | 66 |
* | Littelfuse, Inc. | 1,788 | 65 |
* | ScanSource, Inc. | 2,053 | 64 |
* | Aeroflex, Inc. | 5,943 | 62 |
* | Dolby Laboratories Inc. | 2,793 | 61 |
* | Paxar Corp. | 2,952 | 57 |
* | KEMET Corp. | 6,959 | 57 |
* | Checkpoint Systems, Inc. | 3,048 | 55 |
* | Newport Corp. | 3,098 | 55 |
| Daktronics, Inc. | 2,498 | 52 |
| MTS Systems Corp. | 1,548 | 52 |
* | L-1 Identity Solutions Inc. | 3,319 | 50 |
* | Cogent Inc. | 3,309 | 47 |
* | Electro Scientific | | |
| Industries, Inc. | 2,314 | 46 |
* | TTM Technologies, Inc. | 3,307 | 43 |
| Park Electrochemical Corp. | 1,549 | 40 |
| CTS Corp. | 2,734 | 40 |
| Agilysys, Inc. | 2,360 | 32 |
* | Excel Technology, Inc. | 935 | 27 |
* | DTS Inc. | 1,380 | 25 |
| Methode Electronics, Inc. | | |
| Class A | 3,059 | 24 |
* | SYNNEX Corp. | 1,030 | 23 |
* | Echelon Corp. | 2,469 | 22 |
* | Universal Display Corp. | 2,024 | 21 |
* | Mercury Computer | | |
| Systems, Inc. | 1,704 | 21 |
* | Photon Dynamics, Inc. | 1,317 | 18 |
* | Multi-Fineline Electronix, Inc. | 777 | 18 |
* | Metrologic Instruments, Inc. | 947 | 15 |
| | | 7,863 |
Internet Software & Services (8.2%) | | |
* | Google Inc. | 17,218 | 6,518 |
* | Yahoo! Inc. | 101,660 | 2,930 |
* | eBay Inc. | 84,476 | 2,354 |
* | Akamai Technologies, Inc. | 10,392 | 407 |
* | VeriSign, Inc. | 19,701 | 399 |
* | Digital River, Inc. | 3,159 | 153 |
* | aQuantive, Inc. | 5,068 | 126 |
* | ValueClick, Inc. | 6,828 | 121 |
* | CNET Networks, Inc. | 11,503 | 108 |
* | WebEx Communications, Inc. | 2,983 | 106 |
* | Equinix, Inc. | 1,809 | 104 |
* | RealNetworks, Inc. | 9,258 | 102 |
* | j2 Global | | |
| Communications, Inc. | 3,755 | 94 |
54
Information Technology Index Fund
| | | Market |
| | | Value• |
| | Shares | ($000) |
* | Websense, Inc. | 3,874 | 80 |
* | EarthLink, Inc. | 10,506 | 77 |
* | Digital Insight Corp. | 2,766 | 72 |
* | Digitas Inc. | 7,093 | 63 |
* | Openwave Systems Inc. | 7,433 | 60 |
| United Online, Inc. | 5,104 | 59 |
* | InfoSpace, Inc. | 2,476 | 55 |
* | Ariba, Inc. | 5,825 | 48 |
* | SonicWALL, Inc. | 4,326 | 44 |
* | CMGI Inc. | 34,957 | 39 |
* | DealerTrack Holdings Inc. | 1,724 | 38 |
* | Interwoven Inc. | 3,307 | 36 |
* | webMethods, Inc. | 4,220 | 33 |
* | Vignette Corp. | 2,370 | 33 |
* | Marchex, Inc. | 1,904 | 31 |
* | Bankrate, Inc. | 1,009 | 29 |
* | S1 Corp. | 5,274 | 27 |
* | iPass Inc. | 4,302 | 20 |
* | NetRatings, Inc. | 1,261 | 19 |
* | Jupitermedia Corp. | 1,587 | 11 |
| | | 14,396 |
IT Services (9.0%) | | |
| First Data Corp. | 61,422 | 2,639 |
| Automatic Data | | |
| Processing, Inc. | 46,405 | 2,190 |
| Accenture Ltd. | 46,626 | 1,383 |
| Paychex, Inc. | 27,372 | 983 |
| Electronic Data Systems Corp. | 41,222 | 982 |
* | Cognizant Technology | | |
| Solutions Corp. | 11,204 | 783 |
* | Computer Sciences Corp. | 14,911 | 706 |
* | Fiserv, Inc. | 14,310 | 632 |
* | Affiliated Computer | | |
| Services, Inc. Class A | 8,872 | 456 |
* | Iron Mountain, Inc. | 8,472 | 347 |
* | MasterCard, Inc. Class A | 5,102 | 285 |
* | Ceridian Corp. | 11,741 | 280 |
* | Alliance Data Systems Corp. | 5,484 | 277 |
* | DST Systems, Inc. | 4,419 | 261 |
* | Convergys Corp. | 11,184 | 233 |
| Sabre Holdings Corp. | 10,557 | 231 |
* | CheckFree Corp. | 6,219 | 223 |
| MoneyGram International, Inc. | 6,822 | 214 |
| Global Payments Inc. | 5,365 | 204 |
| Fidelity National Information | | |
| Services, Inc. | 5,370 | 197 |
| Acxiom Corp. | 6,587 | 160 |
* | Unisys Corp. | 27,263 | 146 |
* | CACI International, Inc. | 2,405 | 128 |
* | BearingPoint, Inc. | 14,432 | 121 |
* | MPS Group, Inc. | 8,380 | 118 |
* | Hewitt Associates, Inc. | 4,999 | 112 |
* | Perot Systems Corp. | 7,052 | 101 |
* | BISYS Group, Inc. | 9,704 | 100 |
* | CSG Systems | | |
| International, Inc. | 3,671 | 99 |
* | Wright Express Corp. | 3,243 | 87 |
* | SRA International, Inc. | 3,107 | 87 |
* | eFunds Corp. | 3,666 | 85 |
* | Gartner, Inc. Class A | 5,475 | 85 |
* | VeriFone Holdings, Inc. | 3,313 | 77 |
| Total System Services, Inc. | 3,156 | 70 |
* | Euronet Worldwide, Inc. | 2,525 | 61 |
* | Keane, Inc. | 3,956 | 61 |
| Talx Corp. | 2,398 | 59 |
| Gevity HR, Inc. | 2,049 | 53 |
* | Sykes Enterprises, Inc. | 2,206 | 44 |
* | ManTech International Corp. | 1,434 | 44 |
| Heartland Payment | | |
| Systems, Inc. | 1,526 | 41 |
| MAXIMUS, Inc. | 1,513 | 40 |
* | Sapient Corp. | 7,109 | 35 |
* | Tyler Technologies, Inc. | 2,581 | 34 |
* | Lionbridge Technologies, Inc. | 4,644 | 33 |
* | Forrester Research, Inc. | 1,096 | 32 |
* | Kanbay International Inc. | 1,692 | 31 |
* | Ciber, Inc. | 4,432 | 29 |
* | TNS Inc. | 1,740 | 28 |
* | Covansys Corp. | 1,646 | 28 |
| infoUSA Inc. | 2,839 | 23 |
* | Ness Technologies Inc. | 1,648 | 19 |
* | RightNow Technologies Inc. | 1,065 | 16 |
| Syntel, Inc. | 626 | 14 |
| | | 15,807 |
Office Electronics (0.7%) | | |
* | Xerox Corp. | 73,657 | 1,091 |
* | Zebra Technologies Corp. | | |
| Class A | 5,389 | 182 |
| | | 1,273 |
Semiconductors & | | |
Semiconductor Equipment (18.9%) | |
| Intel Corp. | 466,525 | 9,116 |
| Texas Instruments, Inc. | 125,003 | 4,074 |
| Applied Materials, Inc. | 125,437 | 2,117 |
* | Broadcom Corp. | 37,481 | 1,103 |
* | Micron Technology, Inc. | 58,222 | 1,006 |
* | Advanced Micro Devices, Inc. | 38,529 | 963 |
| Analog Devices, Inc. | 28,968 | 888 |
| Linear Technology Corp. | 24,442 | 831 |
* | NVIDIA Corp. | 26,801 | 780 |
| Maxim Integrated | | |
| Products, Inc. | 25,634 | 746 |
| KLA-Tencor Corp. | 15,953 | 701 |
* | Freescale Semiconductor, Inc. | | |
| Class B | 21,626 | 668 |
* | Marvell Technology Group Ltd. | 37,435 | 655 |
| National Semiconductor Corp. | 26,983 | 655 |
| Xilinx, Inc. | 27,565 | 630 |
| Microchip Technology, Inc. | 17,034 | 582 |
* | Altera Corp. | 28,726 | 581 |
* | MEMC Electronic | | |
| Materials, Inc. | 14,064 | 544 |
* | LAM Research Corp. | 11,170 | 478 |
* | Freescale Semiconductor, Inc. | | |
| Class A | 10,904 | 335 |
| Intersil Corp. | 11,296 | 286 |
* | Novellus Systems, Inc. | 10,222 | 285 |
* | Integrated Device | | |
| Technology Inc. | 16,061 | 277 |
* | LSI Logic Corp. | 31,637 | 255 |
* | Teradyne, Inc. | 15,846 | 222 |
* | Agere Systems Inc. | 13,642 | 208 |
* | Atmel Corp. | 35,131 | 203 |
* | International Rectifier Corp. | 5,694 | 201 |
* | Fairchild Semiconductor | | |
| International, Inc. | 9,742 | 176 |
* | Cypress Semiconductor Corp. | 10,973 | 172 |
* | FormFactor Inc. | 3,432 | 166 |
* | Varian Semiconductor | | |
| Equipment Associates, Inc. | 4,590 | 162 |
* | Microsemi Corp. | 5,269 | 146 |
* | Silicon Laboratories Inc. | 3,777 | 133 |
* | Cymer, Inc. | 3,017 | 124 |
* | Tessera Technologies, Inc. | 3,663 | 121 |
* | Cree, Inc. | 6,065 | 113 |
* | PMC Sierra Inc. | 16,406 | 112 |
* | Rambus Inc. | 6,827 | 108 |
* | SiRF Technology | | |
| Holdings, Inc. | 3,871 | 102 |
* | RF Micro Devices, Inc. | 15,170 | 100 |
* | Entegris Inc. | 8,694 | 94 |
* | ON Semiconductor Corp. | 15,526 | 93 |
* | ATMI, Inc. | 3,009 | 87 |
* | Conexant Systems, Inc. | 38,155 | 79 |
* | Brooks Automation, Inc. | 5,594 | 78 |
* | Trident Microsystems, Inc. | 3,723 | 77 |
* | Semtech Corp. | 5,857 | 77 |
* | Silicon Image, Inc. | 6,488 | 75 |
* | OmniVision Technologies, Inc. | 4,182 | 69 |
* | Spansion Inc. Class A | 3,926 | 67 |
* | Zoran Corp. | 3,727 | 66 |
* | Applied Micro Circuits Corp. | 23,963 | 65 |
* | Lattice Semiconductor Corp. | 8,936 | 65 |
* | Cabot Microelectronics Corp. | 1,931 | 61 |
* | Diodes Inc. | 1,630 | 61 |
* | MKS Instruments, Inc. | 2,849 | 60 |
* | DSP Group Inc. | 2,411 | 59 |
* | Skyworks Solutions, Inc. | 12,571 | 58 |
* | TriQuint Semiconductor, Inc. | 11,305 | 56 |
* | Veeco Instruments, Inc. | 2,200 | 54 |
* | Axcelis Technologies, Inc. | 8,200 | 52 |
* | Micrel, Inc. | 5,156 | 52 |
* | Amkor Technology, Inc. | 8,410 | 48 |
* | Photronics Inc. | 3,130 | 45 |
* | Cirrus Logic, Inc. | 6,211 | 45 |
* | Hittite Microwave Corp. | 995 | 45 |
* | FEI Co. | 2,059 | 43 |
* | Standard Microsystem Corp. | 1,521 | 43 |
* | Exar Corp. | 2,879 | 40 |
* | Atheros Communications | 2,469 | 40 |
* | Advanced Energy | | |
| Industries, Inc. | 2,665 | 38 |
* | Genesis Microchip Inc. | 2,824 | 36 |
* | Netlogic Microsystems Inc. | 1,181 | 35 |
* | Actel Corp. | 2,112 | 33 |
* | Kulicke & Soffa Industries, Inc. | 4,120 | 32 |
* | Silicon Storage | | |
| Technology, Inc. | 7,493 | 31 |
* | AMIS Holdings Inc. | 3,412 | 31 |
| Cohu, Inc. | 1,731 | 29 |
* | Asyst Technologies, Inc. | 3,803 | 29 |
* | Advanced Analogic | | |
| Technologies, Inc. | 2,933 | 28 |
* | Ultratech, Inc. | 1,865 | 27 |
* | Mattson Technology, Inc. | 3,441 | 27 |
* | LTX Corp. | 4,781 | 24 |
* | PDF Solutions, Inc. | 1,590 | 21 |
* | Kopin Corp. | 5,403 | 20 |
* | IXYS Corp. | 2,135 | 19 |
* | Ikanos Communications, Inc. | 1,468 | 19 |
* | Credence Systems Corp. | 6,704 | 17 |
* | PortalPlayer Inc. | 1,320 | 16 |
* | SigmaTel Inc. | 2,916 | 14 |
| | | 33,505 |
Software (21.5%) | | |
| Microsoft Corp. | 710,479 | 18,252 |
* | Oracle Corp. | 341,939 | 5,351 |
* | Adobe Systems, Inc. | 48,146 | 1,562 |
* | Symantec Corp. | 83,536 | 1,557 |
* | Electronic Arts Inc. | 24,330 | 1,240 |
| CA, Inc. | 37,026 | 873 |
55
Information Technology Index Fund
| | | Market |
| | | Value• |
| | Shares | ($000) |
* | Intuit, Inc. | 26,536 | 802 |
* | Autodesk, Inc. | 18,450 | 641 |
* | BMC Software, Inc. | 17,018 | 453 |
* | Citrix Systems, Inc. | 14,291 | 438 |
* | BEA Systems, Inc. | 30,051 | 413 |
* | Cadence Design Systems, Inc. | 22,717 | 373 |
* | Red Hat, Inc. | 13,982 | 325 |
* | McAfee Inc. | 12,814 | 292 |
* | Activision, Inc. | 22,111 | 285 |
* | Compuware Corp. | 30,865 | 235 |
* | Synopsys, Inc. | 11,466 | 217 |
* | salesforce.com, Inc. | 6,261 | 216 |
* | Novell, Inc. | 31,031 | 207 |
| Reynolds & Reynolds Class A | 4,974 | 191 |
| Fair Isaac, Inc. | 5,219 | 183 |
* | NAVTEQ Corp. | 6,664 | 177 |
* | Sybase, Inc. | 7,200 | 166 |
* | RSA Security Inc. | 5,809 | 162 |
* | Hyperion Solutions Corp. | 4,759 | 158 |
* | MICROS Systems, Inc. | 3,128 | 150 |
* | Parametric Technology Corp. | 8,911 | 144 |
* | THQ Inc. | 5,116 | 132 |
* | ANSYS, Inc. | 2,600 | 122 |
* | TIBCO Software Inc. | 15,355 | 121 |
| Jack Henry & Associates Inc. | 6,199 | 119 |
* | FileNet Corp. | 3,351 | 117 |
| FactSet Research Systems Inc. | 2,524 | 111 |
* | Transaction Systems | | |
| Architects, Inc. | 3,001 | 100 |
* | Informatica Corp. | 6,676 | 98 |
* | Macrovision Corp. | 4,103 | 96 |
* | Mentor Graphics Corp. | 6,409 | 93 |
* | Internet Security Systems, Inc. | 3,253 | 90 |
* | Nuance Communications, Inc. | 10,545 | 83 |
* | Progress Software Corp. | 3,263 | 83 |
* | Intergraph Corp. | 2,113 | 79 |
* | Quest Software, Inc. | 5,607 | 78 |
* | MicroStrategy Inc. | 850 | 78 |
* | Kronos, Inc. | 2,521 | 77 |
* | Take-Two Interactive | | |
| Software, Inc. | 5,667 | 69 |
* | Lawson Softward, Inc. | 10,061 | 67 |
* | Wind River Systems Inc. | 6,089 | 62 |
* | Advent Software, Inc. | 1,863 | 61 |
| Blackbaud, Inc. | 2,454 | 57 |
| Quality Systems, Inc. | 1,377 | 55 |
* | Blackboard Inc. | 1,971 | 53 |
* | Manhattan Associates, Inc. | 2,164 | 50 |
* | Epicor Software Corp. | 3,941 | 49 |
* | Open Solutions Inc. | 1,637 | 48 |
* | Opsware, Inc. | 6,639 | 47 |
* | MRO Software Inc. | 1,794 | 46 |
* | Altiris, Inc. | 1,958 | 44 |
* | Witness Systems, Inc. | 2,674 | 43 |
* | The Ultimate Software | | |
| Group, Inc. | 1,709 | 39 |
* | Verint Systems Inc. | 1,158 | 38 |
* | JDA Software Group, Inc. | 2,267 | 38 |
* | SPSS, Inc. | 1,454 | 37 |
* | Borland Software Corp. | 6,196 | 36 |
* | Concur Technologies, Inc. | 2,271 | 32 |
* | Sonic Solutions, Inc. | 1,925 | 29 |
* | Agile Software Corp. | 4,418 | 26 |
* | Secure Computing Corp. | 3,602 | 23 |
* | OpenTV Corp. | 7,303 | 22 |
* | InterVoice, Inc. | 3,105 | 22 |
* | Magma Design | | |
| Automation, Inc. | 2,680 | 20 |
* | eSPEED, Inc. Class A | 2,204 | 19 |
* | EPIQ Systems, Inc. | 1,183 | 18 |
* | FalconStor Software, Inc. | 1,840 | 13 |
* | Ulticom, Inc. | 995 | 11 |
| Renaissance Learning, Inc. | 738 | 10 |
| | | 37,924 |
Total Investments (99.9%) | | |
(Cost $182,459) | | 176,405 |
Other Assets and Liabilities (0.1%) | |
Other Assets—Note B | | 863 |
Liabilities | | (673) |
| | | 190 |
Net Assets (100%) | | 176,595 |
At August 31, 2006, net assets consisted of:1 |
| Amount |
| ($000) |
Paid-in Capital | 183,782 |
Undistributed Net Investment Income | 365 |
Accumulated Net Realized Losses | (1,498) |
Unrealized Depreciation | (6,054) |
Net Assets | 176,595 |
| |
| |
Admiral Shares—Net Assets | |
Applicable to 196,266 outstanding | |
$.001 par value shares of beneficial | |
interest (unlimited authorization) | 4,788 |
Net Asset Value Per Share— | |
Admiral Shares | $24.40 |
| |
| |
ETF Shares—Net Assets | |
Applicable to 3,604,506 outstanding | |
$.001 par value shares of beneficial | |
interest (unlimited authorization) | 171,807 |
Net Asset Value Per Share— | |
ETF Shares | $47.66 |
• | See Note A in Notes to Financial Statements. |
* | Non-income-producing security. |
1 | See Note C in Notes to Financial Statements for the tax-basis components of net assets. |
56
Information Technology Index Fund
Statement of Operations
| Year Ended |
| August 31, 2006 |
| ($000) |
Investment Income | |
Income | |
Dividends | 785 |
Interest1 | 2 |
Total Income | 787 |
Expenses | |
The Vanguard Group—Note B | |
Investment Advisory Services | 20 |
Management and Administrative | |
Admiral Shares | 5 |
ETF Shares | 201 |
Marketing and Distribution | |
Admiral Shares | 1 |
ETF Shares | 27 |
Custodian Fees | 39 |
Auditing Fees | 20 |
Shareholders’ Reports | |
Admiral Shares | 3 |
ETF Shares | 7 |
Total Expenses | 323 |
Net Investment Income | 464 |
Realized Net Gain (Loss) on | |
Investment Securities Sold | 2,551 |
Change in Unrealized Appreciation | |
(Depreciation) of Investment Securities | (6,138) |
Net Increase (Decrease) in Net Assets | |
Resulting from Operations | (3,123) |
Statement of Changes in Net Assets
| Year Ended August 31, |
| 2006 | 2005 |
| ($000) | ($000) |
Increase (Decrease) In Net Assets | | |
Operations | | |
Net Investment Income | 464 | 343 |
Realized Net Gain (Loss) | 2,551 | (150) |
Change in Unrealized Appreciation (Depreciation) | (6,138) | 4,225 |
Net Increase (Decrease) in Net Assets Resulting from Operations | (3,123) | 4,418 |
Distributions | | |
Net Investment Income | | |
Admiral Shares | (4) | (6) |
ETF Shares | (200) | (244) |
Realized Capital Gain | | |
Admiral Shares | — | — |
ETF Shares | — | — |
Total Distributions | (204) | (250) |
Capital Share Transactions—Note F | | |
Admiral Shares | 2,900 | 1,721 |
ETF Shares | 123,535 | 31,193 |
Net Increase (Decrease) from Capital Share Transactions | 126,435 | 32,914 |
Total Increase (Decrease) | 123,108 | 37,082 |
Net Assets | | |
Beginning of Period | 53,487 | 16,405 |
End of Period2 | 176,595 | 53,487 |
1 | Interest income from an affiliated company of the fund was $2,000. |
2 | Net Assets—End of Period includes undistributed net investment income of $365,000 and $105,000. |
57
Information Technology Index Fund
Financial Highlights
Admiral Shares | | | |
| | | |
| | | |
| | Year Ended | Mar. 251 to |
| | August 31, | Aug. 31, |
For a Share Outstanding Throughout Each Period | 2006 | 2005 | 2004 |
Net Asset Value, Beginning of Period | $23.93 | $20.72 | $23.40 |
Investment Operations | | | |
Net Investment Income | .0842 | .3513 | .01 |
Net Realized and Unrealized Gain (Loss) on Investments | .424 | 3.182 | (2.69) |
Total from Investment Operations | .508 | 3.533 | (2.68) |
Distributions | | | |
Dividends from Net Investment Income | (.038) | (.323) | — |
Distributions from Realized Capital Gains | — | — | — |
Total Distributions | (.038) | (.323) | — |
Net Asset Value, End of Period | $24.40 | $23.93 | $20.72 |
| | | |
| | | |
Total Return4 | 2.12% | 17.05% | –11.45% |
| | | |
| | | |
Ratios/Supplemental Data | | | |
Net Assets, End of Period (Millions) | $5 | $2 | $0.2 |
Ratio of Total Expenses to Average Net Assets | 0.28% | 0.28% | 0.28%5 |
Ratio of Net Investment Income to Average Net Assets | 0.33% | 1.26%3 | 0.12%5 |
Portfolio Turnover Rate6 | 8% | 7% | 9% |
ETF Shares | | | |
| | | |
| | | |
| | Year Ended | Jan. 261 to |
| | August 31, | Aug. 31, |
For a Share Outstanding Throughout Each Period | 2006 | 2005 | 2004 |
Net Asset Value, Beginning of Period | $46.76 | $40.46 | $50.89 |
Investment Operations | | | |
Net Investment Income | .1752 | .6707 | .03 |
Net Realized and Unrealized Gain (Loss) on Investments | .816 | 6.239 | (10.46) |
Total from Investment Operations | .991 | 6.909 | (10.43) |
Distributions | | | |
Dividends from Net Investment Income | (.091) | (.609) | — |
Distributions from Realized Capital Gains | — | — | — |
Total Distributions | (.091) | (.609) | — |
Net Asset Value, End of Period | $47.66 | $46.76 | $40.46 |
| | | |
| | | |
Total Return | 2.11% | 17.07% | –20.50% |
| | | |
| | | |
Ratios/Supplemental Data | | | |
Net Assets, End of Period (Millions) | $172 | $51 | $16 |
Ratio of Total Expenses to Average Net Assets | 0.25% | 0.26% | 0.28%5 |
Ratio of Net Investment Income to Average Net Assets | 0.36% | 1.28%7 | 0.12%5 |
Portfolio Turnover Rate6 | 8% | 7% | 9% |
2 | Calculated based on average shares outstanding. |
3 | Net investment income per share and the ratio of net investment income to average net assets include $.284 and 1.00%, respectively, resulting from a special dividend from Microsoft Corp. in November 2004. |
4 | Total returns do not reflect the 2% fee assessed on redemptions of shares held for less than one year. |
6 | Excludes the value of portfolio securities received or delivered as a result of in-kind purchases or redemptions of the fund’s capital shares, including ETF Creation Units. |
7 | Net investment income per share and the ratio of net investment income to average net assets include $.553 and 1.00%, respectively, resulting from a special dividend from Microsoft Corp. in November 2004. See accompanying Notes, which are an integral part of the Financial Statements. |
58
Information Technology Index Fund
Notes to Financial Statements
Vanguard Information Technology Index Fund is registered under the Investment Company Act of 1940 as an open-end investment company, or mutual fund. The fund files reports with the SEC under the company name Vanguard World Funds. The fund offers two classes of shares, Admiral Shares and ETF Shares (formerly known as VIPER Shares). Admiral Shares are available to any investor who meets the fund’s minimum purchase requirements. ETF Shares are listed for trading on the American Stock Exchange; they can be purchased and sold through a broker.
A. The following significant accounting policies conform to generally accepted accounting principles for U.S. mutual funds. The fund consistently follows such policies in preparing its financial statements.
1. Security Valuation: Securities are valued as of the close of trading on the New York Stock Exchange (generally 4:00 p.m. Eastern time) on the valuation date. Equity securities are valued at the latest quoted sales prices or official closing prices taken from the primary market in which each security trades; such securities not traded on the valuation date are valued at the mean of the latest quoted bid and asked prices. Securities for which market quotations are not readily available, or whose values have been materially affected by events occurring before the fund’s pricing time but after the close of the securities’ primary markets, are valued by methods deemed by the board of trustees to represent fair value. Investments in Vanguard Market Liquidity Fund are valued at that fund’s net asset value.
2. Federal Income Taxes: The fund intends to continue to qualify as a regulated investment company and distribute all of its taxable income. Accordingly, no provision for federal income taxes is required in the financial statements.
3. Distributions: Distributions to shareholders are recorded on the ex-dividend date.
4. Other: Dividend income is recorded on the ex-dividend date. Interest income includes income distributions received from Vanguard Market Liquidity Fund and is accrued daily. Security transactions are accounted for on the date securities are bought or sold. Costs used to determine realized gains (losses) on the sale of investment securities are those of the specific securities sold. Fees assessed on redemptions of Admiral Shares are credited to paid-in capital.
Each class of shares has equal rights as to assets and earnings, except that each class separately bears certain class-specific expenses related to maintenance of shareholder accounts (included in Management and Administrative expenses) and shareholder reporting. Marketing and distribution expenses are allocated to each class of shares based on a method approved by the board of trustees. Income, other non-class-specific expenses, and gains and losses on investments are allocated to each class of shares based on its relative net assets.
B. The Vanguard Group furnishes at cost investment advisory, corporate management, administrative, marketing, and distribution services. The costs of such services are allocated to the fund under methods approved by the board of trustees. The fund has committed to provide up to 0.40% of its net assets in capital contributions to Vanguard. At August 31, 2006, the fund had contributed capital of $17,000 to Vanguard (included in Other Assets), representing 0.01% of the fund’s net assets and 0.02% of Vanguard’s capitalization. The fund’s trustees and officers are also directors and officers of Vanguard.
C. Distributions are determined on a tax basis and may differ from net investment income and realized capital gains for financial reporting purposes. Differences may be permanent or temporary. Permanent differences are reclassified among capital accounts in the financial statements to reflect their tax character. Temporary differences arise when certain items of income, expense, gain, or loss are recognized in different periods for financial statement and tax purposes; these differences will reverse at some time in the future. Differences in classification may also result from the treatment of short-term gains as ordinary income for tax purposes.
During the year ended August 31, 2006, the fund realized $3,827,000 of net capital gains resulting from in-kind redemptions—in which shareholders exchanged fund shares for securities held by the fund rather than for cash. Because such gains are not taxable to the fund, and are not distributed to shareholders, they have been reclassified from accumulated net realized gains to paid-in capital.
For tax purposes, at August 31, 2006, the fund had $415,000 of ordinary income available for distribution. The fund had available realized losses of $1,400,000 to offset future net capital gains of $63,000 through August 31, 2013, $188,000 through August 31, 2014, and $1,149,000 through August 31, 2015.
At August 31, 2006, the cost of investment securities for tax purposes was $182,558,000. At August 31, 2006, net unrealized depreciation of investment securities for tax purposes was $6,153,000, consisting of unrealized gains of $7,749,000 on securities that had risen in value since their purchase and $13,902,000 in unrealized losses on securities that had fallen in value since their purchase.
D. During the year ended August 31, 2006, the fund purchased $160,197,000 of investment securities and sold $33,588,000 of investment securities, other than temporary cash investments.
E. In June 2006, the Financial Accounting Standards Board issued Interpretation No. 48 (“FIN 48”), “Accounting for Uncertainty in Income Taxes.” FIN 48 establishes the minimum threshold for recognizing, and a system for measuring, the benefits of tax-return positions in financial statements. FIN 48 will be effective for the fund’s fiscal year beginning September 1, 2007. Management is in the process of analyzing the fund’s tax positions for purposes of implementing FIN 48; based on the analysis completed to date, management does not believe the adoption of FIN 48 will result in any material impact to the fund's financial statements.
F. Capital share transactions for each class of shares were (see table below):
| Year Ended August 31, |
| 2006 | | 2005 | |
| Amount | Shares | | Amount | Shares | |
| ($000) | (000) | | ($000) | (000) | |
Admiral Shares | | | | | | |
Issued | 4,501 | 179 | | 1,729 | 76 | |
Issued in Lieu of Cash Distributions | 4 | — | | 6 | — | |
Redeemed1 | (1,605) | (68) | | (14) | (1) | |
Net Increase (Decrease)—Admiral Shares | 2,900 | 111 | | 1,721 | 75 | |
ETF Shares | | | | | | |
Issued | 146,601 | 3,005 | | 31,193 | 700 | |
Issued in Lieu of Cash Distributions | — | — | | — | — | |
Redeemed | (23,066) | (500) | | — | — | |
Net Increase (Decrease)—ETF Shares | 123,535 | 2,505 | | 31,193 | 700 | |
1 | Net of redemption fees of $9,000 and $0. |
59
Materials Index Fund
Fund Profile
As of August 31, 2006
Portfolio Characteristics | | |
| | Target | Broad |
| Fund | Index1 | Index2 |
Number of Stocks | 119 | 119 | 2,477 |
Median Market Cap | $14.9B | $14.9B | $30.8B |
Price/Earnings Ratio | 17.3x | 17.3x | 17.4x |
Price/Book Ratio | 2.6x | 2.6x | 2.7x |
Yield | | 2.0% | 1.8% |
Admiral Shares | 1.7% | | |
ETF Shares | 1.8% | | |
Return on Equity | 14.3% | 14.3% | 17.8% |
Earnings Growth Rate | 17.7% | 17.7% | 16.7% |
Foreign Holdings | 0.0% | 0.0% | 0.0% |
Turnover Rate | 13% | — | — |
Expense Ratio | | — | — |
Admiral Shares | 0.28% | | |
ETF Shares | 0.25% | | |
Short-Term Reserves | 0% | — | — |
Industry Diversification (% of portfolio) |
| |
Aluminum | 6% |
Commodity Chemicals | 2 |
Construction Materials | 4 |
Diversified Chemicals | 22 |
Diversified Metals & Mining | 7 |
Fertilizers & Agricultural Chemicals | 7 |
Forest Products | 4 |
Gold | 5 |
Industrial Gases | 8 |
Metal & Glass Containers | 4 |
Paper Packaging | 5 |
Paper Products | 5 |
Precious Metals & Minerals | 1 |
Specialty Chemicals | 10 |
Steel | 10 |
Ten Largest Holdings3 (% of total net assets) |
| |
Dow Chemical Co. | 8.0% |
E.I. du Pont de Nemours & Co. | 8.0 |
Monsanto Co. | 5.5 |
Alcoa Inc. | 5.4 |
Newmont Mining Corp. (Holding Co.) | 5.0 |
Praxair, Inc. | 4.0 |
Phelps Dodge Corp. | 4.0 |
International Paper Co. | 3.5 |
Nucor Corp. | 3.3 |
Weyerhaeuser Co. | 3.3 |
Top Ten | 50.0% |
3 | “Ten Largest Holdings” excludes any temporary cash investments and equity index products. |
60
Materials Index Fund
Performance Summary
All of the returns in this report represent past performance, which is not a guarantee of future results that may be achieved by the fund. (Current performance may be lower or higher than the performance data cited. For performance data current to the most recent month-end, visit our website at www.vanguard.com.) Note, too, that both investment returns and principal value can fluctuate widely, so an investor’s shares, when sold, could be worth more or less than their original cost. The returns shown do not reflect taxes that a shareholder would pay on fund distributions or on the sale of fund shares.
Cumulative Performance: January 26, 2004–August 31, 2006
Initial Investment of $10,000
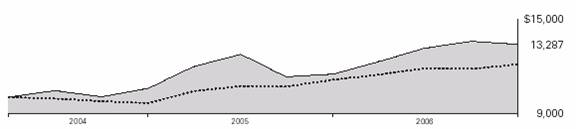
| | | | |
| | | | |
| Average Annual Total Returns | | Final Value |
| Periods Ended August 31, 2006 | | of a $10,000 |
| One Year | Since Inception1 | | Investment |
Materials Index Fund ETF Shares Net Asset Value | 16.11% | 11.58% | | $13,287 |
Materials Index Fund ETF Shares Market Price | 16.32 | 11.62 | | 13,301 |
MSCI US IMI/2500 | 8.91 | 7.62 | | 12,098 |
MSCI US IMI/Materials | 16.45 | 11.84 | | 13,367 |
| | | Final Value |
| | | of a $100,000 |
| One Year | Since Inception1 | Investment |
Materials Index Fund Admiral Shares2 | 16.08% | 10.14% | $127,953 |
MSCI US IMI/2500 | 8.91 | 7.65 | 120,693 |
MSCI US IMI/Materials | 16.45 | 10.42 | 128,757 |
Fiscal-Year Total Returns (%):
January 26, 2004–August 31, 2006
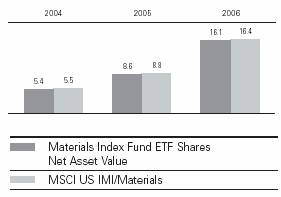
Cumulative Returns: ETF Shares, January 26, 2004–August 31, 2006 |
| | Cumulative |
| | Since |
| One Year | Inception |
Materials Index Fund ETF Shares Market Price | 16.32% | 33.01% |
Materials Index Fund ETF Shares Net Asset Value | 16.11 | 32.87 |
MSCI US IMI/Materials | 16.45 | 33.67 |
Average Annual Total Returns: Periods Ended June 30, 2006
This table presents average annual total returns through the latest calendar quarter—rather than through the end of the fiscal period. Securities and Exchange Commission rules require that we provide this information.
| | | Since |
| Inception Date | One Year | Inception |
ETF Shares | 1/26/2004 | | |
Market Price | | 20.49% | 13.02% |
Net Asset Value | | 20.44 | 13.03 |
Admiral Shares2 | 2/11/2004 | 20.43 | 11.51 |
1 | Inception dates are: for ETF Shares, January 26, 2004; for Admiral Shares, February 11, 2004. |
2 | Total returns do not reflect the 2% fee assessed on redemptions of shares held less than one year. Note: See Financial Highlights tables on page 65 for dividend and capital gains information. |
61
Materials Index Fund
Financial Statements
Statement of Net Assets
As of August 31, 2006
The fund provides a complete list of its holdings four times in each fiscal year, at the quarter-ends. For the second and fourth fiscal quarters, the lists appear in the fund’s semiannual and annual reports to shareholders. For the first and third fiscal quarters, the fund files the lists with the Securities and Exchange Commission on Form N-Q. Shareholders can look up the fund’s Forms N-Q on the SEC’s website at www.sec.gov. Forms N-Q may also be reviewed and copied at the SEC’s Public Reference Room (see the back cover of this report for further information).
| | | Market |
| | | Value• |
| | Shares | ($000) |
Common Stocks (100.1%) | | |
Chemicals (49.6%) | | |
| Dow Chemical Co. | 225,755 | 8,608 |
| E.I. du Pont | | |
| de Nemours & Co. | 214,695 | 8,581 |
| Monsanto Co. | 125,686 | 5,963 |
| Praxair, Inc. | 75,347 | 4,326 |
| Air Products & Chemicals, Inc. | 51,918 | 3,442 |
| PPG Industries, Inc. | 38,593 | 2,445 |
| Ecolab, Inc. | 44,325 | 1,976 |
| Rohm & Haas Co. | 33,804 | 1,491 |
| Lyondell Chemical Co. | 51,902 | 1,348 |
| Sigma-Aldrich Corp. | 15,752 | 1,144 |
| Eastman Chemical Co. | 19,071 | 1,000 |
| Ashland, Inc. | 14,945 | 944 |
| International Flavors & | | |
| Fragrances, Inc. | 17,965 | 715 |
| Lubrizol Corp. | 15,878 | 691 |
| Valspar Corp. | 22,340 | 594 |
| Airgas, Inc. | 16,343 | 585 |
| FMC Corp. | 8,613 | 526 |
| RPM International, Inc. | 27,485 | 517 |
| Albemarle Corp. | 9,387 | 515 |
* | The Mosaic Co. | 31,208 | 507 |
| Cytec Industries, Inc. | 9,180 | 490 |
| Chemtura Corp. | 55,730 | 484 |
| Celanese Corp. Series A | 25,818 | 477 |
| Scotts Miracle-Gro Co. | 11,114 | 477 |
| Cabot Corp. | 14,025 | 466 |
* | Nalco Holding Co. | 24,904 | 464 |
* | Huntsman Corp. | 23,252 | 420 |
* | Hercules, Inc. | 24,960 | 389 |
* | OM Group, Inc. | 6,837 | 274 |
| H.B. Fuller Co. | 13,636 | 262 |
| Olin Corp. | 16,626 | 250 |
| Minerals Technologies, Inc. | 4,634 | 241 |
| Sensient Technologies Corp. | 10,264 | 207 |
| Georgia Gulf Corp. | 7,542 | 200 |
| NewMarket Corp. | 3,231 | 200 |
* | PolyOne Corp. | 20,355 | 177 |
* | Symyx Technologies, Inc. | 7,658 | 175 |
| MacDermid, Inc. | 6,000 | 172 |
| Spartech Corp. | 7,495 | 169 |
| Ferro Corp. | 9,603 | 164 |
* | Terra Industries, Inc. | 22,024 | 162 |
| CF Industries Holdings, Inc. | 10,091 | 160 |
| Arch Chemicals, Inc. | 5,440 | 151 |
* | W.R. Grace & Co. | 14,632 | 149 |
| A. Schulman Inc. | 6,060 | 143 |
| Westlake Chemical Corp. | 4,537 | 136 |
* | Rockwood Holdings, Inc. | 6,084 | 128 |
| Tronox Inc. Class B | 5,229 | 67 |
| Tronox Inc. | 4,232 | 54 |
| American Vanguard Corp. | 3,584 | 54 |
* | Calgon Carbon Corp. | 8,464 | 40 |
| NL Industries, Inc. | 2,286 | 24 |
| | | 53,344 |
Construction Materials (3.7%) | | |
| Vulcan Materials Co. | 23,441 | 1,843 |
| Martin Marietta Materials, Inc. | 10,714 | 882 |
| Florida Rock Industries, Inc. | 11,481 | 427 |
| Eagle Materials, Inc. | 11,670 | 418 |
| Texas Industries, Inc. | 5,399 | 253 |
* | Headwaters Inc. | 9,865 | 218 |
| | | 4,041 |
Containers & Packaging (8.5%) | | |
| Temple-Inland Inc. | 25,853 | 1,151 |
| Sealed Air Corp. | 18,963 | 984 |
| Ball Corp. | 23,154 | 934 |
* | Pactiv Corp. | 33,199 | 887 |
| Bemis Co., Inc. | 24,466 | 790 |
| Sonoco Products Co. | 21,946 | 735 |
* | Crown Holdings, Inc. | 38,985 | 717 |
* | Smurfit-Stone Container Corp. | 59,160 | 674 |
* | Owens-Illinois, Inc. | 35,742 | 542 |
| Packaging Corp. of America | 19,354 | 448 |
| AptarGroup Inc. | 8,214 | 423 |
| Silgan Holdings, Inc. | 5,701 | 202 |
| Greif Inc. Class A | 2,658 | 188 |
| Rock-Tenn Co. | 7,690 | 149 |
| Myers Industries, Inc. | 6,141 | 101 |
* | Graphic Packaging Corp. | 22,954 | 89 |
| Chesapeake Corp. of Virginia | 4,283 | 62 |
* | Caraustar Industries, Inc. | 6,636 | 50 |
| | | 9,126 |
Metals & Mining (29.2%) | | |
| Alcoa Inc. | 203,399 | 5,815 |
| Newmont Mining Corp. | | |
| (Holding Co.) | 104,668 | 5,364 |
| Phelps Dodge Corp. | 47,568 | 4,257 |
| Nucor Corp. | 72,690 | 3,552 |
| Freeport-McMoRan Copper & | | |
| Gold, Inc. Class B | 43,574 | 2,536 |
| United States Steel Corp. | 25,380 | 1,476 |
| Allegheny Technologies Inc. | 19,738 | 1,132 |
| Carpenter Technology Corp. | 5,647 | 541 |
| Steel Dynamics, Inc. | 10,205 | 539 |
| Commercial Metals Co. | 23,201 | 501 |
* | Titanium Metals Corp. | 18,950 | 489 |
| Reliance Steel & | | |
| Aluminum Co. | 14,112 | 462 |
* | Oregon Steel Mills, Inc. | 8,361 | 403 |
* | Chaparral Steel Co. | 5,305 | 379 |
| Cleveland-Cliffs Inc. | 10,151 | 370 |
* | Aleris International Inc. | 6,916 | 355 |
* | Coeur d’Alene Mines Corp. | 63,871 | 347 |
* | AK Steel Corp. | 25,446 | 321 |
| Worthington Industries, Inc. | 16,425 | 314 |
| Quanex Corp. | 8,740 | 300 |
* | RTI International Metals, Inc. | 5,413 | 235 |
* | Apex Silver Mines Ltd. | 12,487 | 208 |
| Compass Minerals | | |
| International | 7,474 | 200 |
* | Century Aluminum Co. | 5,309 | 184 |
* | Hecla Mining Co. | 27,410 | 178 |
| Schnitzer Steel Industries, Inc. | | |
| Class A | 5,210 | 165 |
| Metal Management, Inc. | 5,663 | 145 |
| Gibraltar Industries Inc. | 5,859 | 142 |
| Royal Gold, Inc. | 4,626 | 138 |
| Ryerson Tull, Inc. | 5,958 | 126 |
| AMCOL International Corp. | 5,276 | 123 |
* | Stillwater Mining Co. | 9,546 | 90 |
| | | 31,387 |
Paper & Forest Products (9.1%) | | |
| International Paper Co. | 109,249 | 3,799 |
| Weyerhaeuser Co. | 56,781 | 3,520 |
| MeadWestvaco Corp. | 42,231 | 1,079 |
| Louisiana-Pacific Corp. | 24,725 | 484 |
| Bowater Inc. | 12,951 | 294 |
| Wausau Paper Corp. | 10,565 | 144 |
| Glatfelter | 9,127 | 131 |
| Deltic Timber Corp. | 2,449 | 116 |
| Neenah Paper Inc. | 3,431 | 115 |
* | Buckeye Technology, Inc. | 7,868 | 64 |
| Schweitzer-Mauduit | | |
| International, Inc. | 3,297 | 63 |
| | | 9,809 |
Total Investments (100.1%) | | |
(Cost $106,371) | | 107,707 |
Other Assets and Liabilities (–0.1%) | |
Other Assets—Note B | | 250 |
Liabilities | | (317) |
| | | (67) |
Net Assets (100%) | | 107,640 |
| | | |
62
Materials Index Fund
At August 31, 2006, net assets consisted of:1 |
| Amount |
| ($000) |
Paid-in Capital | 105,701 |
Undistributed Net Investment Income | 1,285 |
Accumulated Net Realized Losses | (682) |
Unrealized Appreciation | 1,336 |
Net Assets | 107,640 |
| |
| |
Admiral Shares—Net Assets | |
Applicable to 375,731 outstanding | |
$.001 par value shares of beneficial | |
interest (unlimited authorization) | 12,162 |
Net Asset Value Per Share— | |
Admiral Shares | $32.37 |
| |
| |
ETF Shares—Net Assets | |
Applicable to 1,500,000 outstanding | |
$.001 par value shares of beneficial | |
interest (unlimited authorization) | 95,478 |
Net Asset Value Per Share— | |
ETF Shares | $63.65 |
• | See Note A in Notes to Financial Statements. |
* | Non-income-producing security. |
1 | See Note C in Notes to Financial Statements for the tax-basis components of net assets. |
63
Materials Index Fund
Statement of Operations
| Year Ended
August 31, 2006 |
|---|
| ($000) |
|---|
|
| Investment Income | |
|
| Income |
|
| Dividends | 1,966 |
|
| Interest1 | 2 |
|
| Total Income | 1,968 |
|
| Expenses |
|
| The Vanguard Group—Note B |
|
| Investment Advisory Services | 15 |
|
| Management and Administrative |
|
| Admiral Shares | 16 |
|
| ETF Shares | 121 |
|
| Marketing and Distribution |
|
| Admiral Shares | 2 |
|
| ETF Shares | 18 |
|
| Custodian Fees | 8 |
|
| Auditing Fees | 20 |
|
| Shareholders’ Reports |
|
| Admiral Shares | 3 |
|
| ETF Shares | 4 |
|
| Total Expenses | 207 |
|
| Net Investment Income | 1,761 |
|
| Realized Net Gain (Loss) on |
| Investment Securities Sold | 362 |
|
| Change in Unrealized Appreciation |
| (Depreciation) of Investment Securities | 5,554 |
|
| Net Increase (Decrease) in Net Assets |
| Resulting from Operations | 7,677 |
|
Statement of Changes in Net Assets
| Year Ended August 31, |
| 2006 | 2005 |
| ($000) | ($000) |
Increase (Decrease) in Net Assets | | |
Operations | | |
Net Investment Income | 1,761 | 694 |
Realized Net Gain (Loss) | 362 | 4,347 |
Change in Unrealized Appreciation (Depreciation) | 5,554 | (5,049) |
Net Increase (Decrease) in Net Assets Resulting from Operations | 7,677 | (8) |
Distributions | | |
Net Investment Income | | |
Admiral Shares | (135) | (11) |
ETF Shares | (871) | (390) |
Realized Capital Gain | | |
Admiral Shares | — | — |
ETF Shares | — | — |
Total Distributions | (1,006) | (401) |
Capital Share Transactions—Note F | | |
Admiral Shares | 4,402 | 6,678 |
ETF Shares | 39,604 | 29,307 |
Net Increase (Decrease) from Capital Share Transactions | 44,006 | 35,985 |
Total Increase (Decrease) | 50,677 | 35,576 |
Net Assets | | |
Beginning of Period | 56,963 | 21,387 |
End of Period2 | 107,640 | 56,963 |
1 | Interest income from an affiliated company of the fund was $2,000. |
2 | Net Assets—End of Period includes undistributed net investment income of $1,285,000 and $530,000. |
64
Materials Index Fund
Financial Highlights
Admiral Shares | | | | |
| | | |
| | | | |
| Year Ended | | Feb. 111 to |
| August 31, | | Aug. 31, |
For a Share Outstanding Throughout Each Period | 2006 | 2005 | | 2004 |
Net Asset Value, Beginning of Period | $28.34 | $26.53 | | $26.14 |
Investment Operations | | | | |
Net Investment Income | .6722 | .48 | | .24 |
Net Realized and Unrealized Gain (Loss) on Investments | 3.853 | 1.83 | | .15 |
Total from Investment Operations | 4.525 | 2.31 | | .39 |
Distributions | | | | |
Dividends from Net Investment Income | (.495) | (.50) | | — |
Distributions from Realized Capital Gains | — | — | | — |
Total Distributions | (.495) | (.50) | | — |
Net Asset Value, End of Period | $32.37 | $28.34 | | $26.53 |
| | | | |
| | | | |
Total Return3 | 16.08% | 8.61% | | 1.49% |
| | | | |
| | | | |
Ratios/Supplemental Data | | | | |
Net Assets, End of Period (Millions) | $12 | $7 | | $1 |
Ratio of Total Expenses to Average Net Assets | 0.28% | 0.28% | | 0.28%4 |
Ratio of Net Investment Income to Average Net Assets | 2.13% | 1.81% | | 1.93%4 |
Portfolio Turnover Rate5 | 13% | 12% | | 8% |
ETF Shares | | | | |
| | | |
| | | | |
| Year Ended | | Jan. 261 to |
| August 31, | | Aug. 31, |
For a Share Outstanding Throughout Each Period | 2006 | 2005 | | 2004 |
Net Asset Value, Beginning of Period | $55.70 | $52.13 | | $49.48 |
Investment Operations | | | | |
Net Investment Income | 1.3362 | .915 | | .58 |
Net Realized and Unrealized Gain (Loss) on Investments | 7.582 | 3.630 | | 2.07 |
Total from Investment Operations | 8.918 | 4.545 | | 2.65 |
Distributions | | | | |
Dividends from Net Investment Income | (.968) | (.975) | | — |
Distributions from Realized Capital Gains | — | — | | — |
Total Distributions | (.968) | (.975) | | — |
Net Asset Value, End of Period | $63.65 | $55.70 | | $52.13 |
| | | | |
| | | | |
Total Return | 16.11% | 8.62% | | 5.36% |
| | | | |
| | | | |
Ratios/Supplemental Data | | | | |
Net Assets, End of Period (Millions) | $95 | $50 | | $21 |
Ratio of Total Expenses to Average Net Assets | 0.25% | 0.26% | | 0.28%4 |
Ratio of Net Investment Income to Average Net Assets | 2.16% | 1.83% | | 1.93%4 |
Portfolio Turnover Rate5 | 13% | 12% | | 8% |
2 | Calculated based on average shares outstanding. |
3 | Total returns do not reflect the 2% fee assessed on redemptions of shares held for less than one year. |
5 | Excludes the value of portfolio securities received or delivered as a result of in-kind purchases or redemptions of the fund’s capital shares, including ETF Creation Units. See accompanying Notes, which are an integral part of the Financial Statements. |
65
Materials Index Fund
Notes to Financial Statements
Vanguard Materials Index Fund is registered under the Investment Company Act of 1940 as an open-end investment company, or mutual fund. The fund files reports with the SEC under the company name Vanguard World Funds. The fund offers two classes of shares, Admiral Shares and ETF Shares (formerly known as VIPER Shares). Admiral Shares are available to any investor who meets the fund’s minimum purchase requirements. ETF Shares are listed for trading on the American Stock Exchange; they can be purchased and sold through a broker.
A. The following significant accounting policies conform to generally accepted accounting principles for U.S. mutual funds. The fund consistently follows such policies in preparing its financial statements.
1. Security Valuation: Securities are valued as of the close of trading on the New York Stock Exchange (generally 4:00 p.m. Eastern time) on the valuation date. Equity securities are valued at the latest quoted sales prices or official closing prices taken from the primary market in which each security trades; such securities not traded on the valuation date are valued at the mean of the latest quoted bid and asked prices. Securities for which market quotations are not readily available, or whose values have been materially affected by events occurring before the fund’s pricing time but after the close of the securities’ primary markets, are valued by methods deemed by the board of trustees to represent fair value. Investments in Vanguard Market Liquidity Fund are valued at that fund’s net asset value.
2. Federal Income Taxes: The fund intends to continue to qualify as a regulated investment company and distribute all of its taxable income. Accordingly, no provision for federal income taxes is required in the financial statements.
3. Distributions: Distributions to shareholders are recorded on the ex-dividend date.
4. Other: Dividend income is recorded on the ex-dividend date. Interest income includes income distributions received from Vanguard Market Liquidity Fund and is accrued daily. Security transactions are accounted for on the date securities are bought or sold. Costs used to determine realized gains (losses) on the sale of investment securities are those of the specific securities sold. Fees assessed on redemptions of Admiral Shares are credited to paid-in capital.
Each class of shares has equal rights as to assets and earnings, except that each class separately bears certain class-specific expenses related to maintenance of shareholder accounts (included in Management and Administrative expenses) and shareholder reporting. Marketing and distribution expenses are allocated to each class of shares based on a method approved by the board of trustees. Income, other non-class-specific expenses, and gains and losses on investments are allocated to each class of shares based on its relative net assets.
B. The Vanguard Group furnishes at cost investment advisory, corporate management, administrative, marketing, and distribution services. The costs of such services are allocated to the fund under methods approved by the board of trustees. The fund has committed to provide up to 0.40% of its net assets in capital contributions to Vanguard. At August 31, 2006, the fund had contributed capital of $11,000 to Vanguard (included in Other Assets), representing 0.01% of the fund’s net assets and 0.01% of Vanguard’s capitalization. The fund’s trustees and officers are also directors and officers of Vanguard.
C. Distributions are determined on a tax basis and may differ from net investment income and realized capital gains for financial reporting purposes. Differences may be permanent or temporary. Permanent differences are reclassified among capital accounts in the financial statements to reflect their tax character. Temporary differences arise when certain items of income, expense, gain, or loss are recognized in different periods for financial statement and tax purposes; these differences will reverse at some time in the future. Differences in classification may also result from the treatment of short-term gains as ordinary income for tax purposes.
During the year ended August 31, 2006, the fund realized $1,041,000 of net capital gains resulting from in-kind redemptions—in which shareholders exchanged fund shares for securities held by the fund rather than for cash. Because such gains are not taxable to the fund, and are not distributed to shareholders, they have been reclassified from accumulated net realized losses to paid-in capital.
For tax purposes, at August 31, 2006, the fund had $1,325,000 of ordinary income available for distribution. The
fund had available realized losses of $656,000 to offset future net capital gains of $6,000 through August 31, 2014, and $650,000 through August 31, 2015.
At August 31, 2006, the cost of investment securities for tax purposes was $106,397,000. Net unrealized appreciation of investment securities for tax purposes was $1,310,000, consisting of unrealized gains of $7,655,000 on securities that had risen in value since their purchase and $6,345,000 in unrealized losses on securities that had fallen in value since their purchase.
D. During the year ended August 31, 2006, the fund purchased $63,045,000 of investment securities and sold $18,240,000 of investment securities, other than temporary cash investments.
E. In June 2006, the Financial Accounting Standards Board issued Interpretation No. 48 (“FIN 48”), “Accounting for Uncertainty in Income Taxes.” FIN 48 establishes the minimum threshold for recognizing, and a system for measuring, the benefits of tax-return positions in financial statements. FIN 48 will be effective for the fund’s fiscal year beginning September 1, 2007. Management is in the process of analyzing the fund’s tax positions for purposes of implementing FIN 48; based on the analysis completed to date, management does not believe the adoption of FIN 48 will result in any material impact to the fund's financial statements.
F. Capital share transactions for each class of shares were (see table below):
| Year Ended August 31, |
| 2006 | | 2005 |
| Amount | Shares | | Amount | Shares |
| ($000) | (000) | | ($000) | (000) |
Admiral Shares | | | | | |
Issued | 6,115 | 188 | | 6,863 | 228 |
Issued in Lieu of Cash Distributions | 125 | 4 | | 11 | — |
Redeemed1 | (1,838) | (58) | | (196) | (7) |
Net Increase (Decrease)—Admiral Shares | 4,402 | 134 | | 6,678 | 221 |
ETF Shares | | | | | |
Issued | 51,474 | 800 | | 63,127 | 1,100 |
Issued in Lieu of Cash Distributions | — | — | | — | — |
Redeemed | (11,870) | (200) | | (33,820) | (600) |
Net Increase (Decrease)—ETF Shares | 39,604 | 600 | | 29,307 | 500 |
1 | Net of redemption fees of $5,000 and $4,000. |
66
Telecommunication Services Index Fund
Fund Profile
As of August 31, 2006
Portfolio Characteristics | | |
| | Target | Broad |
| Fund | Index1 | Index2 |
Number of Stocks | 45 | 44 | 2,477 |
Median Market Cap | $21.1B | $73.7B | $30.8B |
Price/Earnings Ratio | 27.4x | 22.4x | 17.4x |
Price/Book Ratio | 2.6x | 2.2x | 2.7x |
Yield | | 3.1% | 1.8% |
Admiral Shares | 2.6% | | |
ETF Shares | 2.6% | | |
Return on Equity | 9.6% | 11.8% | 17.8% |
Earnings Growth Rate | 2.5% | 2.6% | 16.7% |
Foreign Holdings | 0.0% | 0.0% | 0.0% |
Turnover Rate | 32% | — | — |
Expense Ratio | | — | — |
Admiral Shares | 0.28% | | |
ETF Shares | 0.25% | | |
Short-Term Reserves | 0% | — | — |
Industry Diversification (% of portfolio) |
| |
Alternative Carriers | 7% |
Integrated Telecommunication Services | 64 |
Wireless Telecommunication Services | 29 |
Ten Largest Holdings3 (% of total net assets) |
| |
AT&T Inc. | 18.8% |
Verizon Communications Inc. | 14.0 |
BellSouth Corp. | 8.5 |
Sprint Nextel Corp. | 5.4 |
Alltel Corp. | 4.3 |
American Tower Corp. Class A | 3.9 |
Qwest Communications International Inc. | 3.7 |
Windstream Corp. | 3.5 |
Crown Castle International Corp. | 2.3 |
NII Holdings Inc. | 2.3 |
Top Ten | 66.7% |
1 | MSCI US IMI/Telecommunication Services. |
3 | “Ten Largest Holdings” excludes any temporary cash investments and equity index products. |
67
Telecommunication Services Index Fund
Performance Summary
All of the returns in this report represent past performance, which is not a guarantee of future results that may be achieved by the fund. (Current performance may be lower or higher than the performance data cited. For performance data current to the most recent month-end, visit our website at www.vanguard.com.) Note, too, that both investment returns and principal value can fluctuate widely, so an investor’s shares, when sold, could be worth more or less than their original cost. The returns shown do not reflect taxes that a shareholder would pay on fund distributions or on the sale of fund shares.
Cumulative Performance: September 23, 2004–August 31, 2006
Initial Investment of $10,000
| | | |
| | | | |
| Average Annual Total Returns | | Final Value |
| Periods Ended August 31, 2006 | | of a $10,000 |
| One Year | Since Inception1 | | Investment |
Telecommunication Services Index Fund | | | | |
ETF Shares Net Asset Value | 21.49% | 17.59% | | $13,686 |
Telecommunication Services Index Fund | | | | |
ETF Shares Market Price | 22.11 | 17.76 | | 13,724 |
MSCI US IMI/2500 | 8.91 | 12.04 | | 12,462 |
MSCI US IMI/Telecommunication Services | 20.81 | 14.05 | | 12,900 |
| | | Final Value |
| | | of a $100,000 |
| One Year | Since Inception1 | Investment |
Telecommunication Services Index Fund Admiral Shares2 | 21.47% | 18.21% | $127,965 |
MSCI US IMI/2500 | 8.91 | 8.76 | 113,170 |
MSCI US IMI/Telecommunication Services | 20.81 | 16.01 | 124,472 |
Fiscal-Year Total Returns (%):
September 23, 2004–August 31, 2006
Cumulative Returns: ETF Shares, September 23, 2004–August 31, 2006 |
| | Cumulative |
| | Since |
| One Year | Inception |
Telecommunication Services Index Fund ETF Shares Market Price | 22.11% | 37.24% |
Telecommunication Services Index Fund ETF Shares Net Asset Value | 21.49 | 36.86 |
MSCI US IMI/Telecommunication Services | 20.81 | 29.00 |
Average Annual Total Returns: Periods Ended June 30, 2006
This table presents average annual total returns through the latest calendar quarter—rather than through the end of the fiscal period. Securities and Exchange Commission rules require that we provide this information.
| | | Since |
| Inception Date | One Year | Inception |
ETF Shares | 9/23/2004 | | |
Market Price | | 18.60% | 15.87% |
Net Asset Value | | 18.67 | 15.95 |
Admiral Shares2 | 3/11/2005 | 18.67 | 16.08 |
1 | Inception dates are: for ETF Shares, September 23, 2004; for Admiral Shares, March 11, 2005. |
2 | Total returns do not reflect the 2% fee assessed on redemptions of shares held less than one year. Note: See Financial Highlights tables on page 71 for dividend and capital gains information. |
68
Telecommunication Services Index Fund
Financial Statements
Statement of Net Assets
As of August 31, 2006
The fund provides a complete list of its holdings four times in each fiscal year, at the quarter-ends. For the second and fourth fiscal quarters, the lists appear in the fund’s semiannual and annual reports to shareholders. For the first and third fiscal quarters, the fund files the lists with the Securities and Exchange Commission on Form N-Q. Shareholders can look up the fund’s Forms N-Q on the SEC’s website at www.sec.gov. Forms N-Q may also be reviewed and copied at the SEC’s Public Reference Room (see the back cover of this report for further information).
| | | Market |
| | | Value• |
| | Shares | ($000) |
Common Stocks (99.1%) | | |
Diversified Telecommunication Services (70.1%) |
| Alternative Carriers (6.3%) | | |
* | Level 3 Communications, Inc. | 304,692 | 1,350 |
* | Time Warner Telecom Inc. | 49,748 | 894 |
* | Broadwing Corp. | 67,891 | 777 |
* | Cogent Communications | | |
| Group, Inc. | 73,763 | 684 |
* | Premiere Global Services, Inc. | 80,001 | 624 |
* | Covad Communications | | |
| Group, Inc. | 386,919 | 588 |
| | | |
| Integrated Telecommunication Services (63.8%) |
| AT&T Inc. | 469,134 | 14,604 |
| Verizon Communications Inc. | 307,728 | 10,826 |
| BellSouth Corp. | 161,834 | 6,590 |
* | Qwest Communications | | |
| International Inc. | 326,495 | 2,876 |
| Windstream Corp. | 204,223 | 2,696 |
* | Embarq Corp. | 36,074 | 1,701 |
| CenturyTel, Inc. | 35,024 | 1,395 |
| Citizens Communications Co. | 96,853 | 1,336 |
* | Cincinnati Bell Inc. | 171,289 | 865 |
* | NeuStar, Inc. Class A | 27,722 | 782 |
* | Cbeyond, Inc. | 30,312 | 720 |
| Commonwealth Telephone | | |
| Enterprises, Inc. | 20,100 | 709 |
| FairPoint | | |
| Communications, Inc. | 41,987 | 686 |
| Iowa Telecommunications | | |
| Services Inc. | 33,462 | 650 |
| North Pittsburgh Systems, Inc. | 25,597 | 639 |
* | General Communication, Inc. | 49,797 | 633 |
| Consolidated Communications | | |
| Holdings, Inc. | 33,726 | 578 |
* | IDT Corp. Class B | 38,025 | 543 |
| Surewest Communications | 23,654 | 449 |
* | IDT Corp. | 11,010 | 152 |
| | | 54,347 |
Wireless Telecommunication Services (29.0%) |
| Sprint Nextel Corp. | 249,591 | 4,223 |
| Alltel Corp. | 60,955 | 3,304 |
* | American Tower Corp. | | |
| Class A | 85,268 | 3,058 |
* | Crown Castle | | |
| International Corp. | 52,995 | 1,821 |
* | NII Holdings Inc. | 34,002 | 1,814 |
* | SBA Communications Corp. | 37,988 | 978 |
* | Leap Wireless | | |
| International, Inc. | 20,228 | 936 |
| USA Mobility, Inc. | 35,036 | 801 |
* | Dobson | | |
| Communications Corp. | 114,138 | 784 |
* | U.S. Cellular Corp. | 11,226 | 673 |
* | Syniverse Holdings Inc. | 39,876 | 668 |
* | InPhonic, Inc. | 93,498 | 662 |
* | @ Road, Inc. | 139,757 | 661 |
| Telephone & | | |
| Data Systems, Inc. | 14,231 | 603 |
| Telephone & | | |
| Data Systems, Inc.— | | |
| Special Common Shares | 14,281 | 585 |
| Centennial | | |
| Communications Corp. | | |
| Class A | 65,001 | 305 |
* | Wireless Facilities, Inc. | 131,295 | 288 |
* | Fibertower Corp. | 29,820 | 232 |
* | Price Communications Corp. | 6,297 | 115 |
| | | 22,511 |
Total Common Stocks | | |
(Cost $75,653) | | 76,858 |
Temporary Cash Investment (0.8%) | |
1 Vanguard Market Liquidity | | |
| Fund, 5.293% | | |
| (Cost $556) | 555,995 | 556 |
Total Investments (99.9%) | | |
(Cost $76,209) | | 77,414 |
Other Assets and Liabilities (0.1%) | |
Other Assets—Note B | | 140 |
Liabilities | | (28) |
| | | 112 |
Net Assets (100%) | | 77,526 |
At August 31, 2006, net assets consisted of:2 |
| Amount |
| ($000) |
Paid-in Capital | 75,927 |
Undistributed Net Investment Income | 1,250 |
Accumulated Net Realized Losses | (856) |
Unrealized Appreciation | 1,205 |
Net Assets | 77,526 |
| |
| |
Admiral Shares—Net Assets | |
Applicable to 167,707 outstanding | |
$.001 par value shares of beneficial | |
interest (unlimited authorization) | 5,584 |
Net Asset Value Per Share— | |
Admiral Shares | $33.29 |
| |
| |
ETF Shares—Net Assets | |
Applicable to 1,100,000 outstanding | |
$.001 par value shares of beneficial | |
interest (unlimited authorization) | 71,942 |
Net Asset Value Per Share— | |
ETF Shares | $65.40 |
• | See Note A in Notes to Financial Statements. |
* | Non-income-producing security. |
1 | Affiliated money market fund available only to Vanguard funds and certain trusts and accounts managed by Vanguard. Rate shown is the 7-day yield. |
2 | See Note C in Notes to Financial Statements for the tax-basis components of net assets. |
69
Telecommunication Services Index Fund
Statement of Operations
| Year Ended |
| August 31, 2006 |
| ($000) |
Investment Income | |
Income | |
Dividends | 1,637 |
Interest1 | 6 |
Total Income | 1,643 |
Expenses | |
The Vanguard Group—Note B | |
Investment Advisory Services | 7 |
Management and Administrative | |
Admiral Shares | 4 |
ETF Shares | 74 |
Marketing and Distribution | |
Admiral Shares | — |
ETF Shares | 5 |
Custodian Fees | 2 |
Auditing Fees | 21 |
Shareholders’ Reports | |
Admiral Shares | — |
ETF Shares | 2 |
Total Expenses | 115 |
Net Investment Income | 1,528 |
Realized Net Gain (Loss) on | |
Investment Securities Sold | 6,462 |
Change in Unrealized Appreciation | |
(Depreciation) of Investment Seurities | 739 |
Net Increase (Decrease) in Net Assets | |
Resulting from Operations | 8,729 |
Statement of Changes in Net Assets
| | Sept. 23, |
| Year Ended | 20042 to |
| Aug. 31, | Aug. 31, |
| 2006 | 2005 |
| ($000) | ($000) |
Increase (Decrease) In Net Assets | | |
Operations | | |
Net Investment Income | 1,528 | 496 |
Realized Net Gain (Loss) | 6,462 | 2,602 |
Change in Unrealized Appreciation (Depreciation) | 739 | 466 |
Net Increase (Decrease) in Net Assets Resulting from Operations | 8,729 | 3,564 |
Distributions | | |
Net Investment Income | | |
Admiral Shares | (28) | — |
ETF Shares | (623) | (123) |
Realized Capital Gain | | |
Admiral Shares | — | — |
ETF Shares | — | — |
Total Distributions | (651) | (123) |
Capital Share Transactions—Note F | | |
Admiral Shares | 4,372 | 783 |
ETF Shares | 47,662 | 13,190 |
Net Increase (Decrease) from Capital Share Transactions | 52,034 | 13,973 |
Total Increase (Decrease) | 60,112 | 17,414 |
Net Assets | | |
Beginning of Period | 17,414 | — |
End of Period3 | 77,526 | 17,414 |
1 | Interest income from an affiliated company of the fund was $6,000. |
3 | Net Assets—End of Period includes undistributed net investment income of $1,250,000 and $373,000. |
70
Telecommunication Services Index Fund
Financial Highlights
Admiral Shares | | |
| Year | |
| Ended | Mar. 111 to |
| Aug. 31, | Aug. 31, |
For a Share Outstanding Throughout Each Period | 2006 | 2005 |
Net Asset Value, Beginning of Period | $28.18 | $26.75 |
Investment Operations | | |
Net Investment Income | .8612,3 | .342 |
Net Realized and Unrealized Gain (Loss) on Investments | 5.041 | 1.09 |
Total from Investment Operations | 5.902 | 1.43 |
Distributions | | |
Dividends from Net Investment Income | (.792) | — |
Distributions from Realized Capital Gains | — | — |
Total Distributions | (.792) | — |
Net Asset Value, End of Period | $33.29 | $28.18 |
| | |
| | |
Total Return4 | 21.47% | 5.35% |
| | |
| | |
Ratios/Supplemental Data | | |
Net Assets, End of Period (Millions) | $6 | $1 |
Ratio of Total Expenses to Average Net Assets | 0.28% | 0.28%5 |
Ratio of Net Investment Income to Average Net Assets | 3.28%3 | 2.70%5 |
Portfolio Turnover Rate6 | 32% | 41% |
ETF Shares | | |
| Year | Sept. 23, |
| Ended | 20041 to |
| Aug. 31, | Aug. 31, |
For a Share Outstanding Throughout Each Period | 2006 | 2005 |
Net Asset Value, Beginning of Period | $55.35 | $49.50 |
Investment Operations | | |
Net Investment Income | 2.0402,7 | 1.302 |
Net Realized and Unrealized Gain (Loss) on Investments | 9.567 | 4.96 |
Total from Investment Operations | 11.607 | 6.26 |
Distributions | | |
Dividends from Net Investment Income | (1.557) | (.41) |
Distributions from Realized Capital Gains | — | — |
Total Distributions | (1.557) | (.41) |
Net Asset Value, End of Period | $65.40 | $55.35 |
| | |
| | |
Total Return | 21.49% | 12.65% |
| | |
| | |
Ratios/Supplemental Data | | |
Net Assets, End of Period (Millions) | $72 | $17 |
Ratio of Total Expenses to Average Net Assets | 0.25% | 0.26%5 |
Ratio of Net Investment Income to Average Net Assets | 3.31%7 | 2.72%5 |
Portfolio Turnover Rate6 | 32% | 41% |
2 | Calculated based on average shares outstanding. |
3 | Net investment income per share and the ratio of net investment income to average net assets include $0.112 and 0.38%, respectively, resulting from a special dividend from MCI in December 2005. |
4 | Total returns do not reflect the 2% fee assessed on redemptions of shares held for less than one year. |
6 | Excludes the value of portfolio securities received or delivered as a result of in-kind purchases or redemptions of the fund’s capital shares, including ETF Creation Units. |
7 | Net investment income per share and the ratio of net investment income to average net assets include $0.219 and 0.38%, respectively, resulting from a special dividend from MCI in December 2005. |
See accompanying Notes, which are an integral part of the Financial Statements.
71
Telecommunication Services Index Fund
Notes to Financial Statements
Vanguard Telecommunication Services Index Fund is registered under the Investment Company Act of 1940 as an open-end investment company, or mutual fund. The fund files reports with the SEC under the company name Vanguard World Funds. The fund offers two classes of shares, Admiral Shares and ETF Shares (formerly known as VIPER Shares). Admiral Shares are available to any investor who meets the fund’s minimum purchase requirements. ETF Shares are listed for trading on the American Stock Exchange; they can be purchased and sold through a broker.
A. The following significant accounting policies conform to generally accepted accounting principles for U.S. mutual funds. The fund consistently follows such policies in preparing its financial statements.
1. Security Valuation: Securities are valued as of the close of trading on the New York Stock Exchange (generally 4:00 p.m. Eastern time) on the valuation date. Equity securities are valued at the latest quoted sales prices or official closing prices taken from the primary market in which each security trades; such securities not traded on the valuation date are valued at the mean of the latest quoted bid and asked prices. Securities for which market quotations are not readily available, or whose values have been materially affected by events occurring before the fund’s pricing time but after the close of the securities’ primary markets, are valued by methods deemed by the board of trustees to represent fair value. Investments in Vanguard Market Liquidity Fund are valued at that fund’s net asset value.
2. Federal Income Taxes: The fund intends to continue to qualify as a regulated investment company and distribute all of its taxable income. Accordingly, no provision for federal income taxes is required in the financial statements.
3. Distributions: Distributions to shareholders are recorded on the ex-dividend date.
4. Other: Dividend income is recorded on the ex-dividend date. Interest income includes income distributions received from Vanguard Market Liquidity Fund and is accrued daily. Security transactions are accounted for on the date securities are bought or sold. Costs used to determine realized gains (losses) on the sale of investment securities are those of the specific securities sold. Fees assessed on redemptions of Admiral Shares are credited to paid-in capital.
Each class of shares has equal rights as to assets and earnings, except that each class separately bears certain class-specific expenses related to maintenance of shareholder accounts
(included in Management and Administrative expenses) and shareholder reporting. Marketing and distribution expenses are allocated to each class of shares based on a method approved by the board of trustees. Income, other non-class-specific expenses, and gains and losses on investments are allocated to each class of shares based on its relative net assets.
B. The Vanguard Group furnishes at cost investment advisory, corporate management, administrative, marketing, and distribution services. The costs of such services are allocated to the fund under methods approved by the board of trustees. The fund has committed to provide up to 0.40% of its net assets in capital contributions to Vanguard. At August 31, 2006, the fund had contributed capital of $12,000 to Vanguard (included in Other Assets), representing 0.02% of the fund’s net assets and 0.01% of Vanguard’s capitalization. The fund’s trustees and officers are also directors and officers of Vanguard.
C. Distributions are determined on a tax basis and may differ from net investment income and realized capital gains for financial reporting purposes. Differences may be permanent or temporary. Permanent differences are reclassified among capital accounts in the financial statements to reflect their tax character. Temporary differences arise when certain items of income, expense, gain, or loss are recognized in different periods for financial statement and tax purposes; these differences will reverse at some time in the future. Differences in classification may also result from the treatment of short-term gains as ordinary income for tax purposes.
During the year ended August 31, 2006, the fund realized $7,295,000 of net capital gains resulting from in-kind redemptions—in which shareholders exchanged fund shares for securities held by the fund rather than for cash.
Because such gains are not taxable to the fund, and are not distributed to shareholders, they have been
reclassified from accumulated net realized gains to paid-in capital.
For tax purposes, at August 31, 2006, the fund had $1,270,000 of ordinary income available for distribution. The fund had available realized losses of $856,000 to offset future net capital gains of $29,000 through August 31, 2014, and $827,000 through August 31, 2015.
At August 31, 2006, the cost of investment securities for tax purposes was $76,209,000. Net unrealized appreciation of investment securities for tax purposes was $1,205,000, consisting of unrealized gains of $3,669,000 on securities that had risen in value since their purchase and $2,464,000 in unrealized losses on securities that had fallen in value since their purchase.
D. During the year ended August, 31, 2006, the fund purchased $159,185,000 of investment securities and sold $106,558,000 of investment securities, other than temporary cash investments.
E. In June 2006, the Financial Accounting Standards Board issued Interpretation No. 48 (“FIN 48”), “Accounting for Uncertainty in Income Taxes.” FIN 48 establishes the minimum threshold for recognizing, and a system for measuring, the benefits of tax-return positions in financial statements. FIN 48 will be effective for the fund’s fiscal year beginning September 1, 2007. Management is in the process of analyzing the fund’s tax positions for purposes of implementing FIN 48; based on the analysis completed to date, management does not believe the adoption of FIN 48 will result in any material impact to the fund's financial statements.
F. Capital share transactions for each class of shares were (see table below):
| Year Ended | | September 23, 20041 |
| August 31, 2006 | | to August 31, 2005 |
| Amount | Shares | | Amount | Shares |
| ($000) | (000) | | ($000) | (000) |
Admiral Shares | | | | | |
Issued | 4,536 | 144 | | 783 | 29 |
Issued in Lieu of Cash Distributions | 28 | 1 | | — | — |
Redeemed2 | (192) | (6) | | — | — |
Net Increase (Decrease)—Admiral Shares | 4,372 | 139 | | 783 | 29 |
ETF Shares | | | | | |
Issued | 139,818 | 2,300 | | 40,420 | 800 |
Issued in Lieu of Cash Distributions | — | — | | — | — |
Redeemed | (92,156) | (1,500) | | (27,230) | (500) |
Net Increase (Decrease)—ETF Shares | 47,662 | 800 | | 13,190 | 300 |
2 | Net of redemption fees of $2,000 and $0. |
72
Utilities Index Fund
Fund Profile
As of August 31, 2006
Portfolio Characteristics | | |
| | Target | Broad |
| Fund | Index1 | Index2 |
Number of Stocks | 89 | 89 | 2,477 |
Median Market Cap | $14.0B | $14.0B | $30.8B |
Price/Earnings Ratio | 17.9x | 17.9x | 17.4x |
Price/Book Ratio | 2.1x | 2.1x | 2.7x |
Yield | | 3.2% | 1.8% |
Admiral Shares | 2.8% | | |
ETF Shares | 2.9% | | |
Return on Equity | 14.1% | 14.1% | 17.8% |
Earnings Growth Rate | 5.4% | 5.4% | 16.7% |
Foreign Holdings | 0.0% | 0.0% | 0.0% |
Turnover Rate | 9% | — | — |
Expense Ratio | | — | — |
Admiral Shares | 0.28% | | |
ETF Shares | 0.25% | | |
Short-Term Reserves | 0% | — | — |
Industry Diversification (% of portfolio) |
| |
Electric Utilities | 40% |
Gas Utilities | 8 |
Independent Power Producers & Energy Traders | 13 |
Multi-Utilities | 38 |
Water Utilities | 1 |
Ten Largest Holdings3 (% of total net assets) |
| |
Exelon Corp. | 7.4% |
Duke Energy Corp. | 6.7 |
TXU Corp. | 5.2 |
Dominion Resources, Inc. | 5.0 |
Southern Co. | 4.6 |
FirstEnergy Corp. | 3.4 |
Public Service Enterprise Group, Inc. | 3.2 |
FPL Group, Inc. | 3.1 |
Entergy Corp. | 2.9 |
PG&E Corp. | 2.7 |
Top Ten | 44.2% |
3 | “Ten Largest Holdings” excludes any temporary cash investments and equity index products. |
73
Utilities Index Fund
Performance Summary
All of the returns in this report represent past performance, which is not a guarantee of future results that may be achieved by the fund. (Current performance may be lower or higher than the performance data cited. For performance data current to the most recent month-end, visit our website at www.vanguard.com.) Note, too, that both investment returns and principal value can fluctuate widely, so an investor’s shares, when sold, could be worth more or less than their original cost. The returns shown do not reflect taxes that a shareholder would pay on fund distributions or on the sale of fund shares.
Cumulative Performance: January 26, 2004–August 31, 2006
Initial Investment of $10,000
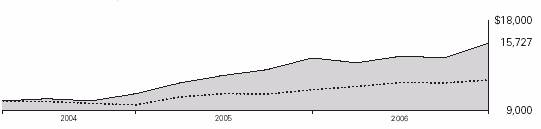
| | | |
| | | | |
| Average Annual Total Returns | | Final Value |
| Periods Ended August 31, 2006 | | of a $10,000 |
| One Year | Since Inception1 | | Investment |
Utilities Index Fund ETF Shares Net Asset Value | 10.52% | 19.07% | | $15,727 |
Utilities Index Fund ETF Shares Market Price | 10.53 | 19.08 | | 15,731 |
MSCI US IMI/2500 | 8.91 | 7.62 | | 12,098 |
MSCI US IMI/Utilities | 10.65 | 19.30 | | 15,808 |
| | | Final Value |
| | | of a $100,000 |
| One Year | Since Inception1 | Investment |
Utilities Index Fund Admiral Shares2 | 10.48% | 21.12% | $156,593 |
MSCI US IMI/2500 | 8.91 | 9.66 | 124,092 |
MSCI US IMI/Utilities | 10.65 | 21.38 | 157,397 |
Fiscal-Year Total Returns (%):
January 26, 2004–August 31, 2006

Cumulative Returns: ETF Shares, January 26, 2004–August 31, 2006 |
| | Cumulative |
| | Since |
| One Year | Inception |
Utilities Index Fund ETF Shares Market Price | 10.53% | 57.31% |
Utilities Index Fund ETF Shares Net Asset Value | 10.52 | 57.27 |
MSCI US IMI/Utilities | 10.65 | 58.08 |
Average Annual Total Returns: Periods Ended June 30, 2006
This table presents average annual total returns through the latest calendar quarter—rather than through the end of the fiscal period. Securities and Exchange Commission rules require that we provide this information.
| | | Since |
| Inception Date | One Year | Inception |
ETF Shares | 1/26/2004 | | |
Market Price | | 5.74% | 16.88% |
Net Asset Value | | 5.76 | 16.90 |
Admiral Shares2 | 4/28/2004 | 5.74 | 18.83 |
1 | Inception dates are: for ETF Shares, January 26, 2004; for Admiral Shares, April 28, 2004. |
2 | Total returns do not reflect the 2% fee assessed on redemptions of shares held less than one year. Note: See Financial Highlights tables on page 77 for dividend and capital gains information. |
74
Utilities Index Fund
Financial Statements
Statement of Net Assets
As of August 31, 2006
The fund provides a complete list of its holdings four times in each fiscal year, at the quarter-ends. For the second and fourth fiscal quarters, the lists appear in the fund’s semiannual and annual reports to shareholders. For the first and third fiscal quarters, the fund files the lists with the Securities and Exchange Commission on Form N-Q. Shareholders can look up the fund’s Forms N-Q on the SEC’s website at www.sec.gov. Forms N-Q may also be reviewed and copied at the SEC’s Public Reference Room (see the back cover of this report for further information).
| | | Market |
| | | Value• |
| | Shares | ($000) |
Common Stocks (99.9%) | | |
Electric Utilities (39.6%) | | |
| Exelon Corp. | 283,973 | 17,317 |
| Southern Co. | 315,310 | 10,806 |
| FirstEnergy Corp. | 140,155 | 7,997 |
| FPL Group, Inc. | 163,189 | 7,254 |
| Entergy Corp. | 88,359 | 6,861 |
| American Electric | | |
| Power Co., Inc. | 167,385 | 6,106 |
| Edison International | 131,523 | 5,740 |
| PPL Corp. | 161,683 | 5,654 |
| Progress Energy, Inc. | 102,121 | 4,527 |
* | Allegheny Energy, Inc. | 69,411 | 2,897 |
| Pepco Holdings, Inc. | 80,916 | 2,054 |
| Pinnacle West Capital Corp. | 42,123 | 1,935 |
* | Reliant Energy, Inc. | 130,213 | 1,753 |
| Northeast Utilities | 65,211 | 1,487 |
| DPL Inc. | 51,632 | 1,435 |
* | Sierra Pacific Resources | 93,888 | 1,385 |
| Great Plains Energy, Inc. | 33,777 | 1,031 |
| Hawaiian Electric | | |
| Industries Inc. | 34,451 | 945 |
| Westar Energy, Inc. | 37,002 | 903 |
| IDACORP, Inc. | 18,176 | 698 |
| Duquesne Light Holdings, Inc. | 33,284 | 655 |
| Cleco Corp. | 24,372 | 608 |
| UniSource Energy Corp. | 14,896 | 514 |
| ALLETE, Inc. | 10,914 | 501 |
* | El Paso Electric Co. | 20,563 | 492 |
| UIL Holdings Corp. | 9,889 | 361 |
| Otter Tail Corp. | 11,873 | 358 |
| MGE Energy, Inc. | 8,684 | 292 |
| Empire District Electric Co. | 12,503 | 283 |
| ITC Holdings Corp. | 5,627 | 192 |
| | | 93,041 |
| Gas Utilities (8.1%) | | |
| Questar Corp. | 36,355 | 3,146 |
| ONEOK, Inc. | 47,358 | 1,812 |
| Equitable Resources, Inc. | 48,641 | 1,793 |
| National Fuel Gas Co. | 34,069 | 1,300 |
| Energen Corp. | 29,666 | 1,295 |
| AGL Resources Inc. | 33,095 | 1,204 |
| Southern Union Co. | 40,379 | 1,116 |
| UGI Corp. Holding Co. | 44,723 | 1,109 |
| Atmos Energy Corp. | 34,495 | 993 |
| Piedmont Natural Gas, Inc. | 32,479 | 847 |
| Nicor Inc. | 18,873 | 824 |
| Peoples Energy Corp. | 16,326 | 692 |
| WGL Holdings Inc. | 20,691 | 643 |
| New Jersey Resources Corp. | 11,891 | 591 |
| Southwest Gas Corp. | 16,993 | 573 |
| Northwest Natural Gas Co. | 11,739 | 449 |
| South Jersey Industries, Inc. | 12,390 | 359 |
| The Laclede Group, Inc. | 8,583 | 280 |
| | | 19,026 |
Independent Power Producers & | |
Energy Traders (12.8%) | | |
| TXU Corp. | 184,371 | 12,207 |
* | AES Corp. | 279,737 | 5,942 |
| Constellation Energy | | |
| Group, Inc. | 76,041 | 4,569 |
* | Mirant Corp. | 101,249 | 2,933 |
* | NRG Energy, Inc. | 55,313 | 2,801 |
* | Dynegy, Inc. | 167,973 | 1,041 |
| Black Hills Corp. | 14,117 | 491 |
| Ormat Technologies Inc. | 5,295 | 193 |
| | | 30,177 |
Multi-Utilities (38.5%) | | |
| Duke Energy Corp. | 526,847 | 15,805 |
| Dominion Resources, Inc. | 147,660 | 11,797 |
| Public Service Enterprise | | |
| Group, Inc. | 106,855 | 7,482 |
| PG&E Corp. | 150,101 | 6,294 |
| Sempra Energy | 99,084 | 4,926 |
| Consolidated Edison Inc. | 104,438 | 4,825 |
| Ameren Corp. | 87,258 | 4,673 |
| Xcel Energy, Inc. | 172,305 | 3,584 |
| DTE Energy Co. | 75,542 | 3,153 |
| KeySpan Corp. | 74,348 | 3,048 |
| NiSource, Inc. | 115,876 | 2,453 |
| Wisconsin Energy Corp. | 49,714 | 2,138 |
| SCANA Corp. | 46,635 | 1,928 |
| Alliant Energy Corp. | 49,912 | 1,826 |
| CenterPoint Energy Inc. | 119,001 | 1,720 |
| MDU Resources Group, Inc. | 68,819 | 1,686 |
| Energy East Corp. | 62,712 | 1,521 |
| NSTAR | 45,391 | 1,495 |
| OGE Energy Corp. | 38,547 | 1,436 |
| TECO Energy, Inc. | 88,652 | 1,398 |
* | CMS Energy Corp. | 93,984 | 1,376 |
| Puget Energy, Inc. | 49,275 | 1,115 |
| Vectren Corp. | 32,382 | 892 |
| WPS Resources Corp. | 17,138 | 881 |
| PNM Resources Inc. | 27,768 | 796 |
* | Aquila, Inc. | 158,951 | 728 |
| NorthWestern Corp. | 15,106 | 526 |
| Avista Corp. | 20,751 | 503 |
| CH Energy Group, Inc. | 6,696 | 329 |
| | | 90,334 |
Water Utilities (0.9%) | | |
Aqua America, Inc. | 56,078 | 1,329 |
California Water | | |
Service Group | 7,436 | 283 |
American States Water Co. | 7,149 | 275 |
SJW Corp. | 5,837 | 177 |
| | 2,064 |
Total Investments | | |
(Cost $214,140) | | 234,642 |
Other Assets and Liabilities (0.1%) | |
Other Assets—Note B | | 1,392 |
Liabilities | | (1,174) |
| | 218 |
Net Assets (100%) | | 234,860 |
| | |
| | |
| | |
At August 31, 2006, net assets consisted of:1 |
| Amount |
| ($000) |
Paid-in Capital | 214,451 |
Undistributed Net Investment Income | 1,189 |
Accumulated Net Realized Losses | (1,282) |
Unrealized Appreciation | 20,502 |
Net Assets | 234,860 |
| |
| |
Admiral Shares—Net Assets | |
Applicable to 1,425,895 outstanding | |
$.001 par value shares of beneficial | |
interest (unlimited authorization) | 52,007 |
Net Asset Value Per Share— | |
Admiral Shares | $36.47 |
| |
| |
ETF Shares—Net Assets | |
Applicable to 2,516,005 outstanding | |
$.001 par value shares of beneficial | |
interest (unlimited authorization) | 182,853 |
Net Asset Value Per Share— | |
ETF Shares | $72.68 |
• | See Note A in Notes to Financial Statements. |
* | Non-income-producing security. |
1 | See Note C in Notes to Financial Statements for the tax-basis components of net assets. |
75
Utilities Index Fund
Statement of Operations
| Year Ended |
| August 31, 2006 |
| ($000) |
Investment Income | |
Income | |
Dividends | 5,526 |
Interest1 | 12 |
Security Lending | 5 |
Total Income | 5,543 |
Expenses | |
The Vanguard Group—Note B | |
Investment Advisory Services | 25 |
Management and Administrative | |
Admiral Shares | 52 |
ETF Shares | 159 |
Marketing and Distribution | |
Admiral Shares | 7 |
ETF Shares | 29 |
Custodian Fees | 72 |
Auditing Fees | 21 |
Shareholders’ Reports | |
Admiral Shares | 30 |
ETF Shares | 10 |
Total Expenses | 405 |
Net Investment Income | 5,138 |
Realized Net Gain (Loss) on | |
Investment Securities Sold | 1,881 |
Change in Unrealized Appreciation | |
(Depreciation) of Investment Securities | 8,794 |
Net Increase (Decrease) in Net Assets | |
Resulting from Operations | 15,813 |
Statement of Changes in Net Assets
| Year Ended August 31, |
| 2006 | 2005 |
| ($000) | ($000) |
Increase (Decrease) In Net Assets | | |
Operations | | |
Net Investment Income | 5,138 | 2,117 |
Realized Net Gain (Loss) | 1,881 | 4,948 |
Change in Unrealized Appreciation (Depreciation) | 8,794 | 9,476 |
Net Increase (Decrease) in Net Assets Resulting from Operations | 15,813 | 16,541 |
Distributions | | |
Net Investment Income | | |
Admiral Shares | (1,331) | (121) |
ETF Shares | (3,232) | (2,283) |
Realized Capital Gain | | |
Admiral Shares | — | — |
ETF Shares | — | — |
Total Distributions | (4,563) | (2,404) |
Capital Share Transactions—Note F | | |
Admiral Shares | 19,104 | 27,773 |
ETF Shares | 79,989 | 39,518 |
Net Increase (Decrease) from Capital Share Transactions | 99,093 | 67,291 |
Total Increase (Decrease) | 110,343 | 81,428 |
Net Assets | | |
Beginning of Period | 124,517 | 43,089 |
End of Period2 | 234,860 | 124,517 |
1 | Interest income from an affiliated company of the fund was $12,000. |
2 | Net Assets—End of Period includes undistributed net investment income of $1,189,000 and $614,000. |
76
Utilities Index Fund
Financial Highlights
Admiral Shares | | | | |
| | | | |
| | | | |
| Year Ended | | Apr. 281 to |
| August 31, | | Aug. 31, |
For a Share Outstanding Throughout Each Period | 2006 | 2005 | | 2004 |
Net Asset Value, Beginning of Period | $34.03 | $26.70 | | $25.03 |
Investment Operations | | | | |
Net Investment Income | 1.0802 | .9722 | | .36 |
Net Realized and Unrealized Gain (Loss) on Investments3 | 2.378 | 7.623 | | 1.31 |
Total from Investment Operations | 3.458 | 8.595 | | 1.67 |
Distributions | | | | |
Dividends from Net Investment Income | (1.018) | (1.265) | | — |
Distributions from Realized Capital Gains | — | — | | — |
Total Distributions | (1.018) | (1.265) | | — |
Net Asset Value, End of Period | $36.47 | $34.03 | | $26.70 |
| | | | |
| | | | |
Total Return4 | 10.48% | 32.87% | | 6.67% |
| | | | |
| | | | |
Ratios/Supplemental Data | | | | |
Net Assets, End of Period (Millions) | $52 | $30 | | $1 |
Ratio of Total Expenses to Average Net Assets | 0.28% | 0.28% | | 0.28%5 |
Ratio of Net Investment Income to Average Net Assets | 3.26% | 3.34% | | 3.82%5 |
Portfolio Turnover Rate6 | 9% | 7% | | 7% |
ETF Shares | | | | |
| | | | |
| | | | |
| Year Ended | | Jan. 261 to |
| August 31, | | Aug. 31, |
For a Share Outstanding Throughout Each Period | 2006 | 2005 | | 2004 |
Net Asset Value, Beginning of Period | $67.80 | $53.14 | | $49.64 |
Investment Operations | | | | |
Net Investment Income | 2.2142 | 2.0362 | | 1.11 |
Net Realized and Unrealized Gain (Loss) on Investments7 | 4.704 | 15.115 | | 2.39 |
Total from Investment Operations | 6.918 | 17.151 | | 3.50 |
Distributions | | | | |
Dividends from Net Investment Income | (2.038) | (2.491) | | — |
Distributions from Realized Capital Gains | — | — | | — |
Total Distributions | (2.038) | (2.491) | | — |
Net Asset Value, End of Period | $72.68 | $67.80 | | $53.14 |
| | | | |
| | | | |
Total Return | 10.52% | 32.93% | | 7.05% |
| | | | |
| | | | |
Ratios/Supplemental Data | | | | |
Net Assets, End of Period (Millions) | $183 | $95 | | $43 |
Ratio of Total Expenses to Average Net Assets | 0.25% | 0.26% | | 0.28%5 |
Ratio of Net Investment Income to Average Net Assets | 3.29% | 3.36% | | 3.82%5 |
Portfolio Turnover Rate6 | 9% | 7% | | 7% |
2 | Calculated based on average shares outstanding. |
3 | Includes increases from redemption fees of $.04, $.00, and $.00. |
4 | Total returns do not reflect the 2% fee assessed on redemptions of shares held for less than one year. |
6 | Excludes the value of portfolio securities received or delivered as a result of in-kind purchases or redemptions of the fund’s capital shares, including ETF Creation Units. |
7 | Includes increases from redemption fees of $.06, $.01, and $.00. |
See accompanying Notes, which are an integral part of the Financial Statements.
77
Utilities Index Fund
Notes to Financial Statements
Vanguard Utilities Index Fund is registered under the Investment Company Act of 1940 as an open-end investment company, or mutual fund. The fund files reports with the SEC under the company name Vanguard World Funds. The fund offers two classes of shares, Admiral Shares and ETF Shares (formerly known as VIPER Shares). Admiral Shares are available to any investor who meets the fund’s minimum purchase requirements. ETF Shares are listed for trading on the American Stock Exchange; they can be purchased and sold through a broker.
A. The following significant accounting policies conform to generally accepted accounting principles for U.S. mutual funds. The fund consistently follows such policies in preparing its financial statements.
1. Security Valuation: Securities are valued as of the close of trading on the New York Stock Exchange (generally 4:00 p.m. Eastern time) on the valuation date. Equity securities are valued at the latest quoted sales prices or official closing prices taken from the primary market in which each security trades; such securities not traded on the valuation date are valued at the mean of the latest quoted bid and asked prices. Securities for which market quotations are not readily available, or whose values have been materially affected by events occurring before the fund’s pricing time but after the close of the securities’ primary markets, are valued by methods deemed by the board of trustees to represent fair value. Investments in Vanguard Market Liquidity Fund are valued at that fund’s net asset value.
2. Federal Income Taxes: The fund intends to continue to qualify as a regulated investment company and distribute all of its taxable income. Accordingly, no provision for federal income taxes is required in the financial statements.
3. Distributions: Distributions to shareholders are recorded on the ex-dividend date.
4. Security Lending: The fund may lend its securities to qualified institutional borrowers to earn additional income. Security loans are required to be secured at all times by collateral at least equal to the market value of securities loaned. The fund invests cash collateral received in Vanguard Market Liquidity Fund, and records a liability for the return of the collateral, during the period the securities are on loan. Security lending income represents the income earned on investing cash collateral, less expenses associated with the loan.
5. Other: Dividend income is recorded on the ex-dividend date. Interest income includes income distributions received from Vanguard Market Liquidity Fund and is accrued daily. Security transactions are accounted for on the date securities are bought or sold. Costs used to determine realized gains (losses) on the sale of investment securities are those of the specific securities sold. Fees assessed on redemptions of Admiral Shares are credited to paid-in capital.
Each class of shares has equal rights as to assets and earnings, except that each class separately bears certain class-specific expenses related to maintenance of shareholder accounts (included in Management and Administrative expenses) and shareholder reporting. Marketing and distribution expenses are allocated to each class of shares based on a method approved by the board of trustees. Income, other non-class-specific expenses, and gains and losses on investments are allocated to each class of shares based on its relative net assets.
B. The Vanguard Group furnishes at cost investment advisory, corporate management, administrative, marketing, and distribution services. The costs of such services are allocated to the fund under methods approved by the board of trustees. The fund has committed to provide up to 0.40% of its net assets in capital contributions to Vanguard. At August 31, 2006, the fund had contributed capital of $18,000 to Vanguard (included in Other Assets), representing 0.01% of the fund’s net assets and 0.02% of Vanguard’s capitalization. The fund’s trustees and officers are also directors and officers of Vanguard.
C. Distributions are determined on a tax basis and may differ from net investment income and realized capital gains for financial reporting purposes. Differences may be permanent or temporary. Permanent differences are reclassified among capital accounts in the financial statements to reflect their tax character. Temporary differences arise when certain items of income, expense, gain, or loss are recognized in different periods for financial statement and tax purposes; these differences will reverse at some time in the future. Differences in classification may also result from the treatment of short-term gains as ordinary income for tax purposes.
During the year ended August 31, 2006, the fund realized $3,073,000 of net capital gains resulting from in-kind redemptions—in which shareholders exchanged fund shares for securities held by the fund rather than for cash. Because such gains are not taxable to the fund, and are not distributed to shareholders, they have been reclassified from accumulated net realized losses to paid-in capital.
For tax purposes, at August 31, 2006, the fund had $1,266,000 of ordinary income available for distribution. The fund had available realized losses of $1,243,000 to offset future net capital gains of $62,000 through August 31, 2013, $62,000 through August 31, 2014, and $1,119,000 through August 31, 2015.
At August 31, 2006, the cost of investment securities for tax purposes was $214,178,000. Net unrealized appreciation of investment securities for tax purposes was $20,464,000, consisting of unrealized gains of $21,214,000 on securities that had risen in value since their purchase and $750,000 in unrealized losses on securities that had fallen in value since their purchase.
D. During the year ended August 31, 2006, the fund purchased $126,511,000 of investment securities and sold $26,687,000 of investment securities, other than temporary cash investments.
E. In June 2006, the Financial Accounting Standards Board issued Interpretation No. 48 (“FIN 48”), “Accounting for Uncertainty in Income Taxes.” FIN 48 establishes the minimum threshold for recognizing, and a system for measuring, the benefits of tax-return positions in financial statements. FIN 48 will be effective for the fund’s fiscal year beginning September 1, 2007. Management is in the process of analyzing the fund’s tax positions for purposes of implementing FIN 48; based on the analysis completed to date, management does not believe the adoption of FIN 48 will result in any material impact to the fund's financial statements.
F. Capital share transactions for each class of shares were (see table below):
| Year Ended August 31, |
| | 2006 | | | 2005 |
| Amount | Shares | | Amount | Shares |
| ($000) | (000) | | ($000) | (000) |
Admiral Shares | | | | | |
Issued | 31,057 | 924 | | 28,295 | 864 |
Issued in Lieu of Cash Distributions | 1,186 | 36 | | 112 | 4 |
Redeemed1 | (13,139) | (404) | | (634) | (20) |
Net Increase (Decrease)—Admiral Shares | 19,104 | 556 | | 27,773 | 848 |
ETF Shares | | | | | |
Issued | 93,087 | 1,316 | | 64,154 | 1,000 |
Issued in Lieu of Cash Distributions | — | — | | — | — |
Redeemed | (13,098) | (200) | | (24,636) | (400) |
Net Increase (Decrease)—ETF Shares | 79,989 | 1,116 | | 39,518 | 600 |
1 | Net of redemption fees of $200,000 and $12,000. |
78
Report of Independent Registered
Public Accounting Firm
To the Trustees of Vanguard World Funds and the Shareholders of Vanguard Consumer Discretionary Index Fund, Vanguard Consumer Staples Index Fund, Vanguard Energy Index Fund, Vanguard Financials Index Fund, Vanguard Health Care Index Fund, Vanguard Industrials Index Fund, Vanguard Information Technology Index Fund, Vanguard Materials Index Fund, Vanguard Telecommunication Services Index Fund and Vanguard Utilities Index Fund:
In our opinion, the accompanying statements of net assets and the related statements of operations and of changes in net assets and the financial highlights present fairly, in all material respects, the financial position of Vanguard Consumer Discretionary Index Fund, Vanguard Consumer Staples Index Fund, Vanguard Energy Index Fund, Vanguard Financials Index Fund, Vanguard Health Care Index Fund, Vanguard Industrials Index Fund, Vanguard Information Technology Index Fund, Vanguard Materials Index Fund, Vanguard Telecommunication Services Index Fund and Vanguard Utilities Index Fund (the "Funds") at August 31, 2006, and the results of each of their operations for the year then ended, and the changes in each of their net assets and the financial highlights for each of the periods indicated, in conformity with accounting principles generally accepted in the United States of America. These financial statements and financial highlights (hereafter referred to as "financial statements") are the responsibility of the Funds’ management; our responsibility is to express an opinion on these financial statements based on our audits. We conducted our audits of these financial statements in accordance with the standards of the Public Company Accounting Oversight Board (United States). Those standards require that we plan and perform the audit to obtain reasonable assurance about whether the financial statements are free of material misstatement. An audit includes examining, on a test basis, evidence supporting the amounts and disclosures in the financial statements, assessing the accounting principles used and significant estimates made by management, and evaluating the overall financial statement presentation. We believe that our audits, which included confirmation of securities at August 31, 2006 by correspondence with the custodian and by agreement to the underlying ownership records for Vanguard Market Liquidity Fund, provide a reasonable basis for our opinion.
PricewaterhouseCoopers LLP
Philadelphia, Pennsylvania
October 12, 2006
Special 2006 tax information (unaudited) for Vanguard U.S. Sector Index Funds
This information for the fiscal year ended August 31, 2006, is included pursuant to provisions of the Internal Revenue Code.
The funds distributed qualified dividend income to shareholders during the fiscal year as follows:
| Qualified Dividend |
Index Fund | Income ($000) |
Consumer Discretionary | 218 |
Consumer Staples | 1,105 |
Energy | 2,652 |
Financials | 1,639 |
Health Care | 2,373 |
Industrials | 226 |
Information Technology | 204 |
Materials | 1,006 |
Telecommunication Services | 651 |
Utilities | 4,563 |
For corporate shareholders, the percentage of investment income (dividend income plus short-term gains, if any) that qualifies for the dividends-received deduction is as follows:
Index Fund | Percentage |
Consumer Discretionary | 100.0% |
Consumer Staples | 100.0 |
Energy | 100.0 |
Financials | 89.1 |
Health Care | 100.0 |
Industrials | 100.0 |
Information Technology | 100.0 |
Materials | 100.0 |
Telecommunication Services | 100.0 |
Utilities | 100.0 |
Your Fund’s After-Tax Returns
This table presents returns for your fund both before and after taxes. The after-tax returns are shown in two ways: (1) assuming that an investor owned the fund during the entire period and paid taxes on the fund’s distributions, and (2) assuming that an investor paid taxes on the fund’s distributions and sold all shares at the end of each period.
Calculations are based on the highest individual federal income tax and capital gains tax rates in effect at the times of the distributions and the hypothetical sales. State and local taxes were not considered. After-tax returns reflect any qualified dividend income, using actual prior-year figures and estimates for 2006. (In the example, returns after the sale of fund shares may be higher than those assuming no sale. This occurs when the sale would have produced a capital loss. The calculation assumes that the investor received a tax deduction for the loss.)
The table shows returns, based on the net asset value, for ETF Shares only; returns for other share classes will differ. Please note that your actual after-tax returns will depend on your tax situation and may differ from those shown. Also note that if you own the fund in a tax-deferred account, such as an individual retirement account or a 401(k) plan, this information does not apply to you. Such accounts are not subject to current taxes.
Finally, keep in mind that a fund’s performance—whether before or after taxes—does not guarantee future results.
Average Annual Total Returns: U.S. Sector Index Funds | | |
Periods Ended August 31, 2006 | | |
| One | Since |
| Year | Inception1 |
Consumer Discretionary ETF | | |
Returns Before Taxes | –1.99% | 2.14% |
Returns After Taxes on Distributions | –2.07 | 2.07 |
Returns After Taxes on Distributions and Sale of Fund Shares | –1.18 | 1.83 |
| | |
Consumer Staples ETF | | |
Returns Before Taxes | 11.91% | 9.26% |
Returns After Taxes on Distributions | 11.71 | 9.02 |
Returns After Taxes on Distributions and Sale of Fund Shares | 7.98 | 7.88 |
| | |
Energy ETF | | |
Returns Before Taxes | 12.31% | 30.14% |
Returns After Taxes on Distributions | 12.15 | 30.00 |
Returns After Taxes on Distributions and Sale of Fund Shares | 8.18 | 26.02 |
| | |
Financials ETF | | |
Returns Before Taxes | 15.82% | 8.61% |
Returns After Taxes on Distributions | 15.39 | 8.25 |
Returns After Taxes on Distributions and Sale of Fund Shares | 10.69 | 7.30 |
| | |
Health Care ETF | | |
Returns Before Taxes | 4.71% | 4.41% |
Returns After Taxes on Distributions | 4.60 | 4.35 |
Returns After Taxes on Distributions and Sale of Fund Shares | 3.20 | 3.76 |
| | |
Industrials ETF | | |
Returns Before Taxes | 11.08% | 11.91% |
Returns After Taxes on Distributions | 10.95 | 11.79 |
Returns After Taxes on Distributions and Sale of Fund Shares | 7.37 | 10.19 |
| | |
Information Technology ETF | | |
Returns Before Taxes | 2.11% | –1.94% |
Returns After Taxes on Distributions | 2.08 | –2.02 |
Returns After Taxes on Distributions and Sale of Fund Shares | 1.41 | –1.64 |
| | |
Materials ETF | | |
Returns Before Taxes | 16.11% | 11.58% |
Returns After Taxes on Distributions | 15.83 | 11.37 |
Returns After Taxes on Distributions and Sale of Fund Shares | 10.81 | 9.94 |
| | |
Telecommunication Services ETF | | |
Returns Before Taxes | 21.49% | 17.59% |
Returns After Taxes on Distributions | 20.99 | 17.28 |
Returns After Taxes on Distributions and Sale of Fund Shares | 14.48 | 15.03 |
| | |
Utilities ETF | | |
Returns Before Taxes | 10.52% | 19.07% |
Returns After Taxes on Distributions | 10.02 | 18.58 |
Returns After Taxes on Distributions and Sale of Fund Shares | 7.41 | 16.43 |
1 | For Consumer Discretionary, Consumer Staples, Financials, Health Care, Information Technology, Materials and Utilities, January 26, 2004; for Energy, Industrials and Telecommunication Services, September 23, 2004. |
80
About Your Fund’s Expenses
As a shareholder of the fund, you incur ongoing costs, which include costs for portfolio management, administrative services, and shareholder reports (like this one), among others. Operating expenses, which are deducted from a fund’s gross income, directly reduce the investment return of the fund.
A fund’s expenses are expressed as a percentage of its average net assets. This figure is known as the expense ratio. The examples on this page are intended to help you understand the ongoing costs (in dollars) of investing in your fund and to compare these costs with those of other mutual funds. The examples are based on an investment of $1,000 made at the beginning of the period shown and held for the entire period.
The adjacent table illustrates your fund’s costs in two ways:
• Based on actual fund return. This section helps you to estimate the actual expenses that you paid over the period. The “Ending Account Value” shown is derived from the fund’s actual return, and the third column shows the dollar amount that would have been paid by an investor who started with $1,000 in the fund. You may use the information here, together with the amount you invested, to estimate the expenses that you paid over the period.
To do so, simply divide your account value by $1,000 (for example, an $8,600 account value divided by $1,000 = 8.6), then multiply the result by the number given for your fund under the heading “Expenses Paid During Period.”
• Based on hypothetical 5% yearly return. This section is intended to help you compare your fund’s costs with those of other mutual funds. It assumes that the fund had a yearly return of 5% before expenses, but that the expense ratio is unchanged. In this case—because the return used is not the fund’s actual return—the results do not apply to your investment. The example is useful in making comparisons because the Securities and Exchange Commission requires all mutual funds to calculate expenses based on a 5% return. You can assess your fund’s costs by comparing this hypothetical example with the hypothetical examples that appear in shareholder reports of other funds.
Note that the expenses shown in the table are meant to highlight and help you compare ongoing costs only; they do not include the 2% fee assessed on redemptions of Admiral Shares held for less than one year. If the fee were applied to your account, your costs would be higher. The funds do not carry a “sales load.”
The calculations assume no shares were bought or sold during the period. Your actual costs may have been higher or lower, depending on the amount of your investment and the timing of any purchases or redemptions.
You can find more information about the fund’s expenses in the Financial Statements section of this report. For additional information on operating expenses and other shareholder costs, please refer to the appropriate fund prospectus.
Based on actual fund return | | | | |
Six months ended August 31, 20061 |
| | Beginning | Ending | Expenses |
| | Account Value | Account Value | Paid During |
Index Fund | Share Class | 2/28/2006 | 8/31/2006 | Period2 |
Consumer Discretionary | Admiral | $1,000.00 | $971.25 | $1.39 |
| ETF | 1,000.00 | 971.57 | 1.24 |
Consumer Staples | Admiral | $1,000.00 | $1,090.26 | $1.48 |
| ETF | 1,000.00 | 1,090.11 | 1.32 |
Energy | Admiral | $1,000.00 | $1,079.14 | $1.47 |
| ETF | 1,000.00 | 1,079.10 | 1.31 |
Financials | Admiral | $1,000.00 | $1,037.90 | $1.44 |
| ETF | 1,000.00 | 1,038.24 | 1.28 |
Health Care | Admiral | $1,000.00 | $1,007.20 | $1.42 |
| ETF | 1,000.00 | 1,007.20 | 1.26 |
Industrials | ETF | $1,000.00 | $993.69 | $1.26 |
Information Technology | Admiral | $1,000.00 | $957.24 | $1.38 |
| ETF | 1,000.00 | 957.22 | 1.23 |
Materials | Admiral | $1,000.00 | $1,016.97 | $1.42 |
| ETF | 1,000.00 | 1,016.94 | 1.27 |
Telecommunication Services | Admiral | $1,000.00 | $1,095.79 | $1.48 |
| ETF | 1,000.00 | 1,096.03 | 1.32 |
Utilities | Admiral | $1,000.00 | $1,093.03 | $1.48 |
| ETF | 1,000.00 | 1,093.32 | 1.32 |
Based on hypothetical 5% yearly return | | | |
Six months ended August 31, 20061 |
| | Beginning | Ending | Expenses |
| | Account Value | Account Value | Paid During |
Index Fund | Share Class | 2/28/2006 | 8/31/2006 | Period2 |
Consumer Discretionary | Admiral | $1,000.00 | $1,023.79 | $1.43 |
| ETF | 1,000.00 | 1,023.95 | 1.28 |
Consumer Staples | Admiral | $1,000.00 | $1,023.79 | $1.43 |
| ETF | 1,000.00 | 1,023.95 | 1.28 |
Energy | Admiral | $1,000.00 | $1,023.79 | $1.43 |
| ETF | 1,000.00 | 1,023.95 | 1.28 |
Financials | Admiral | $1,000.00 | $1,023.79 | $1.43 |
| ETF | 1,000.00 | 1,023.95 | 1.28 |
Health Care | Admiral | $1,000.00 | $1,023.79 | $1.43 |
| ETF | 1,000.00 | 1,023.95 | 1.28 |
Industrials | ETF | $1,000.00 | $1,023.95 | $1.28 |
Information Technology | Admiral | $1,000.00 | $1,023.79 | $1.43 |
| ETF | 1,000.00 | 1,023.95 | 1.28 |
Materials | Admiral | $1,000.00 | $1,023.79 | $1.43 |
| ETF | 1,000.00 | 1,023.95 | 1.28 |
Telecommunication Services | Admiral | $1,000.00 | $1,023.79 | $1.43 |
| ETF | 1,000.00 | 1,023.95 | 1.28 |
Utilities | Admiral | $1,000.00 | $1,023.79 | $1.43 |
| ETF | 1,000.00 | 1,023.95 | 1.28 |
1 | This table does not include data for funds or share classes of funds with fewer than six months of history. |
2 | The calculations are based on expenses incurred in the most recent six-month period. The fund’s annualized six-month expense ratios for that period are 0.28% for the Consumer Discretionary Index Fund Admiral Shares and 0.25% for the ETF Shares; 0.28% for the Consumer Staples Index Fund Admiral Shares and 0.25% for the ETF Shares; 0.28% for the Energy Index Fund Admiral Shares and 0.25% for the ETF Shares; 0.28% for the Financials Index Fund Admiral Shares and 0.25% for the ETF Shares; 0.28% for the Health Care Index Fund Admiral Shares and 0.25% for the ETF Shares; 0.25% for the Industrials Index ETF Shares; 0.28% for the Information Technology Index Fund Admiral Shares and 0.25% for the ETF Shares; 0.28% for the Materials Index Fund Admiral Shares and 0.25% for the ETF Shares; 0.28% for the Telecommunication Services Index Fund Admiral Shares and 0.25% for the ETF Shares; 0.28% for the Utilities Index Fund Admiral Shares and 0.25% for the ETF Shares. The dollar amounts shown as "Expenses Paid" are equal to the annualized expense ratio multiplied by the average account value over the period, multiplied by the number of days in the most recent six-month period, then divided by the number of days in the most recent 12-month period. |
81
81
Trustees Approve Advisory Arrangement
The board of trustees of the Vanguard U.S. Sector Index Funds has approved the funds’ investment advisory arrangement with The Vanguard Group, Inc. Vanguard—through its Quantitative Equity Group—serves as the investment advisor for the funds. The board determined that continuing the funds’ internalized management structure was in the best interests of the funds and their shareholders.
The board based its decision upon its most recent evaluation of the advisor’s investment staff, portfolio management process, and performance. The trustees considered the factors discussed below, among others. However, no single factor determined whether the board approved the agreement. Rather, it was the totality of the circumstances that drove the board’s decision.
Nature, extent, and quality of services
The board considered the quality of the funds’ investment management over both short- and long-term periods and took into account the organizational depth and stability of the advisor. Vanguard has been managing investments for more than two decades. George U. Sauter, Vanguard managing director and chief investment officer, has been in the investment management business since 1985 and has led the Quantitative Equity Group since 1987. The Quantitative Equity Group adheres to a sound, disciplined investment management process; the team has considerable experience, stability, and depth.
The board concluded that Vanguard’s experience, stability, depth, and performance, among other factors, warranted continuation of the advisory arrangement.
Investment performance
The board considered the short- and long-term performance of the funds, including any periods of outperformance or underperformance of their benchmarks and peer groups. The board noted that the funds have performed in line with expectations, and that their results have been consistent with their investment strategies. Information about the funds’ performance, including some of the data considered by the board, can be found in the Performance Summary pages of this report.
Cost
The funds’ expense ratios were far below the average expense ratios charged by funds in their respective peer groups. The funds’ advisory expense ratios were also well below their peer-group averages. Information about the funds’ expense ratios appears in the About Your Fund’s Expenses section of this report as well as in the
Financial Statements sections.
The board does not conduct a profitability analysis of Vanguard because of Vanguard’s unique “at-cost” structure. Unlike most other mutual fund management companies, Vanguard is owned by the funds it oversees, and produces “profits” only in the form of reduced expenses for fund shareholders.
The benefit of economies of scale
The board of trustees concluded that the funds’ low-cost arrangement with Vanguard ensures that the funds will realize economies of scale as they grow, with the cost to shareholders declining as fund assets increase.
The board will consider whether to renew the advisory arrangement again after a one-year period.
82
Glossary
Earnings Growth Rate. The average annual rate of growth in earnings over the past five years for the stocks now in a fund.
Expense Ratio. The percentage of a fund’s average net assets used to pay its annual administrative and advisory expenses. These expenses directly reduce returns to investors.
Foreign Holdings. The percentage of a fund represented by stocks or depositary receipts of companies based outside the United States.
Median Market Cap. An indicator of the size of companies in which a fund invests; the midpoint of market capitalization (market price x shares outstanding) of a fund’s stocks, weighted by the proportion of the fund’s assets invested in each stock. Stocks representing half of the fund’s assets have market capitalizations above the median, and the rest are below it.
Price/Book Ratio. The share price of a stock divided by its net worth, or book value, per share. For a fund, the weighted average price/book ratio of the stocks it holds.
Price/Earnings Ratio. The ratio of a stock’s current price to its per-share earnings over the past year. For a fund, the weighted average P/E of the stocks it holds. P/E is an indicator of market expectations about corporate prospects; the higher the P/E, the greater the expectations for a company’s future growth.
Return on Equity. The annual average rate of return generated by a company during the past five years for each dollar of shareholder’s equity (net income divided by shareholder’s equity). For a fund, the weighted average return on equity for the companies whose stocks it holds.
Short-Term Reserves. The percentage of a fund invested in highly liquid, short-term securities that can be readily converted to cash.
Turnover Rate. An indication of the fund’s trading activity. Funds with high turnover rates incur higher transaction costs and may be more likely to distribute capital gains (which may be taxable to investors). The turnover rate excludes in-kind transactions, which have minimal impact on costs.
Yield. A snapshot of a fund’s income from interest and dividends. The yield, expressed as a percentage of the fund’s net asset value, is based on income earned over the past 30 days and is annualized, or projected forward for the coming year. The index yield is based on the current annualized rate of income provided by securities in the index.
83
The People Who Govern Your Fund
The trustees of your mutual fund are there to see that the fund is operated and managed in your best interests since, as a shareholder, you are a part owner of the fund. Your fund's trustees also serve on the board of directors of The Vanguard Group, Inc., which is owned by the Vanguard funds and provides services to them on an at-cost basis.
A majority of Vanguard’s board members are independent, meaning that they have no affiliation with Vanguard or the funds they oversee, apart from the sizable personal investments they have made as private individuals.
Our independent board members bring distinguished backgrounds in business, academia, and public service to their task of working with Vanguard officers to establish the policies and oversee the activities of the funds. Among board members’ responsibilities are selecting investment advisors for the funds; monitoring fund operations, performance, and costs; reviewing contracts; nominating and selecting new trustees/directors; and electing Vanguard officers.
Each trustee serves a fund until its termination; or until the trustee’s retirement, resignation, or death; or otherwise as specified in the fund’s organizational documents. Any trustee may be removed at a shareholders’ meeting by a vote representing two-thirds of the net asset value of all shares of the fund together with shares of other Vanguard funds organized within the same trust. The table on these two pages shows information for each trustee and executive officer of the fund. The mailing address of the trustees and officers is P.O. Box 876, Valley Forge, PA 19482.
Chairman of the Board, Chief Executive Officer, and Trustee |
| |
John J. Brennan1 | |
Born 1954 | Principal Occupation(s) During the Past Five Years: Chairman of |
Trustee since May 1987; | the Board, Chief Executive Officer, and Director/Trustee of The |
Chairman of the Board and | Vanguard Group, Inc., and of each of the investment companies |
Chief Executive Officer | served by The Vanguard Group. |
142 Vanguard Funds Overseen | |
| |
Independent Trustees | |
| |
Charles D. Ellis | |
Born 1937 | Principal Occupation(s) During the Past Five Years: Applecore |
Trustee since January 2001 | Partners (pro bono ventures in education); Senior Advisor to |
142 Vanguard Funds Overseen | Greenwich Associates (international business strategy |
| consulting); Successor Trustee of Yale University; Overseer |
| of the Stern School of Business at New York University; |
| Trustee of the Whitehead Institute for Biomedical Research. |
| |
Rajiv L. Gupta | |
Born 1945 | Principal Occupation(s) During the Past Five Years: Chairman |
Trustee since December 20012 | and Chief Executive Officer of Rohm and Haas Co. (chemicals); |
142 Vanguard Funds Overseen | Board Member of the American Chemistry Council; |
| Director of Tyco International, Ltd. (diversified manufac- |
| turing and services) since 2005;Trustee of Drexel |
| University and of the Chemical Heritage Foundation. |
| |
Amy Gutmann | |
Born 1949 | Principal Occupation(s) During the Past Five Years: President of the |
Trustee since July 2006 | University of Pennsylvania since 2004; Professor in the School of Arts |
142 Vanguard Funds Overseen | and Sciences, Annenberg School for Communication, and Graduate |
| School of Education of the University of Pennsylvania since 2004; Provost |
| (2001-2004) and Laurance S. Rockefeller Professor of Politics and the |
| University Center for Human Values (1990-2004), Princeton University; |
| Director of Carnegie Corporation of New York since 2005 and of |
| Schuylkill River Development Corporation and Greater Philadelphia |
| Chamber of Commerce since 2004. |
JoAnn Heffernan Heisen | |
Born 1950 | Principal Occupation(s) During the Past Five Years: Corporate |
Trustee since July 1998 | Vice President and Chief Global Diversity Officer since 2006 |
142 Vanguard Funds Overseen | Vice President and Chief Information Officer (1997–2005), |
| and Member of the Executive Committee of Johnson & Johnson |
| (pharmaceuticals/consumer products); Director of the University |
| Medical Center at Princeton and Women’s Research and |
| Education Institute. |
| |
André F. Perold | |
Born 1952 | Principal Occupation(s) During the Past Five Years: |
Trustee since December 2004 | George Gund Professor of Finance and Banking, Harvard Business |
142 Vanguard Funds Overseen | School since 2000; Senior Associate Dean, Director of Faculty |
| Recruiting, and Chair of Finance Faculty, Harvard Business |
| School; Director and Chairman of UNX, Inc. (equities trading firm) |
| since 2003; Director of registered investment companies advised by |
| Merrill Lynch Investment Managers and affiliates (1985-2004), Genbel |
| Securities Limited (South African financial services firm) (1999-2003), |
| Gensec Bank (1999-2003), Sanlam, Ltd. (South African insurance company) |
| (2001-2003), and Stockback, Inc. (credit card firm) (2000-2002). |
| |
Alfred M. Rankin, Jr. | |
Born 1941 | Principal Occupation(s) During the Past Five Years: |
Trustee since January 1993 | Chairman, President, Chief Executive Officer, and Director of NACCO |
142 Vanguard Funds Overseen | Industries, Inc.(forklift trucks/housewares/lignite); Director of |
| Goodrich Corporation (industrialproducts/aircraft systems and services). |
| |
J. Lawrence Wilson | |
Born 1936 | Principal Occupation(s) During the Past Five Years: |
Trustee since April 1985 | Retired Chairman and Chief Executive Officer of Rohm and Haas Co. |
142 Vanguard Funds Overseen | (chemicals);Director of Cummins Inc. (diesel engines), MeadWestvaco |
| Corp. (packing products),and AmerisourceBergen Corp. (pharmaceutical |
| distribution); Trustee of Vanderbilt University and of Culver |
| Educational Foundation. |
| |
Executive Officers 1 | |
| |
Heidi Stam | |
Born 1956 | Principal Occupation(s) During the Past Five Years: |
Trustee since July 2005 | Managing Director since July 2006, General Counsel since July 2005, and |
142 Vanguard Funds Overseen | Secretary of Vanguard and of each of the investment companies served |
| by The Vanguard Group since July 2005; Principal of The Vanguard Group, Inc. |
| (1997-2006). |
| |
Thomas J. Higgins | |
Born 1957 | Principal Occupation(s) During the Past Five Years: |
Trustee since July 1998 | Principal of the Vanguard Group, Inc.; Treasurer of each of the investment |
142 Vanguard Funds Overseen | companies served by the Vanguard Group. |
| |
| |
| Vanguard Senior Management Team |
|---|
| | |
|---|
| R. Gregory Barton | Kathleen C. Gubanich | Michael S. Miller |
| Mortimer J. Buckley | Paul A. Heller | Ralph K. Packard |
| James H. Gately | F. William McNabb, III | George U. Sauter |
|
| Founder |
|---|
| | |
|---|
| John C. Bogle |
|
| Chairman and Chief Executive Officer, 1974-1996 |
1 Officers of the funds are “interested persons” as defined in the Investment Company Act of 1940.
2 December 2002 for Vanguard Equity Income Fund, Vanguard Growth Equity Fund, the Vanguard Municipal Bond Funds, and the Vanguard State
Tax-ExemptFunds.
More information about the trustees is in the Statement of Additional Information, available from The Vanguard Group.
This page intentionally left blank.
| 
|
| P.O. Box 2600 Valley Forge, PA 19482-2600 |
Connect with Vanguard™ > www.vanguard.com
| |
|---|
| Fund Information > 800-662-7447 | Vanguard, Admiral, Connect with Vanguard, Vanguard ETF |
| | and the ship logo are trademarks of The Vanguard Group, Inc. |
| Direct Investor Account Services > 800-662-2739 | |
| | The funds or securities referred to herein that are offered |
| Institutional Investor Services > 800-523-1036 | by The Vanguard Group and track an MSCI index are not
sponsored, endorsed, or promoted by MSCI, and MSCI bears no
liability with respect to any such funds or securities. For
such funds or securities, the prospectus or the Statement
of Additional Information contains a more detailed
description of the limited relationship MSCI has with
The Vanguard Group. |
| | |
| Text Telephone > 800-952-3335 | All comparative mutual fund data are from Lipper Inc. |
| | or Morningstar, Inc., unless otherwise noted. |
| | |
| | |
| | |
| | |
| | You can obtain a free copy of Vanguard’s proxy voting |
| This material may be used in conjunction | guidelines by visiting our website, www.vanguard.com, |
| with the offering of shares of any Vanguard | and searching for “proxy voting guidelines,” or by calling |
| fund only if preceded or accompanied by | Vanguard at 800-662-2739. They are also available from |
| the fund’s current prospectus. | the SEC’s website, www.sec.gov. In addition, you may |
| | obtain a free report on how your fund voted the proxies for |
| | securities it owned during the 12 months ended June 30. |
| | To get the report, visit either www.vanguard.com |
| | or www.sec.gov. |
| | |
| | You can review and copy information about your fund |
| | at the SEC’s Public Reference Room in Washington, D.C. |
| | To find out more about this public service, call the SEC |
| | at 202-551-8090. Information about your fund is also |
| | available on the SEC’s website, and you can receive |
| | copies of this information, for a fee, by sending a |
| | request in either of two ways: via e-mail addressed to |
| | publicinfo@sec.gov or via regular mail addressed to the |
| | Public Reference Section, Securities and Exchange |
| | Commission, Washington, DC 20549-0102. |
| | |
| | |
| | |
| | |
| | © 2006 The Vanguard Group, Inc. |
| | All rights reserved. |
| | Vanguard Marketing Corporation, Distributor. |
| | |
| | Q4830 102006 |
Item 2: Code of Ethics. The Registrant has adopted a code of ethics that applies to the Registrant's principal executive officer, principal financial officer, principal accounting officer or controller or persons performing similar functions. The Code of Ethics was amended during the reporting period covered by this report to make certain technical, non-material changes.
Item 3: Audit Committee Financial Expert. The following members of the Audit Committee have been determined by the Registrant’s Board of Trustees to be Audit Committee Financial Experts serving on its Audit Committee, and to be independent: Charles D. Ellis, Rajiv L. Gupta, JoAnn Heffernan Heisen, André F. Perold, Alfred M. Rankin, Jr., and J. Lawrence Wilson.
Item 4: Principal Accountant Fees and Services.
(a) Audit Fees.
Audit Fees of the Registrant
Fiscal Year Ended August 31, 2006: $272,000
Fiscal Year Ended August 31, 2005: $245,000
Aggregate Audit Fees of Registered Investment Companies in the Vanguard Group
Fiscal Year Ended August 31, 2006: $2,347,620
Fiscal Year Ended August 31, 2005: $2,152,740
(b) Audit-Related Fees.
Fiscal Year Ended August 31, 2006: $530,000
Fiscal Year Ended August 31, 2005: $382,200
Includes fees billed in connection with assurance and related services provided to the Registrant, The Vanguard Group, Inc., Vanguard Marketing Corporation, and other registered investment companies in the Vanguard Group.
(c) Tax Fees.
Fiscal Year Ended August 31, 2006: $101,300
Fiscal Year Ended August 31, 2005: $98,400
Includes fees billed in connection with tax compliance, planning and advice services provided to the Registrant, The Vanguard Group, Inc., Vanguard Marketing Corporation, and other registered investment companies in the Vanguard Group and related to income and excise taxes.
(d) All Other Fees.
Fiscal Year Ended August 31, 2006: $0
Fiscal Year Ended August 31, 2005: $0
Includes fees billed for services related to risk management and privacy matters. Services were provided to the Registrant, The Vanguard Group, Inc., Vanguard Marketing Corporation, and other registered investment companies in the Vanguard Group.
(e) (1) Pre-Approval Policies. The policy of the Registrant’s Audit Committee is to consider and, if appropriate, approve before the principal accountant is engaged for such services, all specific audit and non-audit services provided to: (1) the Registrant; (2) The Vanguard Group, Inc.; (3) other entities controlled by The Vanguard Group, Inc. that provide ongoing services to the Registrant; and (4) other registered investment companies in the Vanguard Group. In making a determination, the Audit Committee considers whether the services are consistent with maintaining the principal accountant’s independence.
In the event of a contingency situation in which the principal accountant is needed to provide services in between scheduled Audit Committee meetings, the Chairman of the Audit Committee would be called on to consider and, if appropriate, pre-approve audit or permitted non-audit services in an amount sufficient to complete services through the next Audit Committee meeting, and to determine if such services would be consistent with maintaining the accountant’s independence. At the next scheduled Audit Committee meeting, services and fees would be presented to the Audit Committee for formal consideration, and, if appropriate, approval by the entire Audit Committee. The Audit Committee would again consider whether such services and fees are consistent with maintaining the principal accountant’s independence.
The Registrant’s Audit Committee is informed at least annually of all audit and non-audit services provided by the principal accountant to the Vanguard complex, whether such services are provided to: (1) the Registrant; (2) The Vanguard Group, Inc.; (3) other entities controlled by The Vanguard Group, Inc. that provide ongoing services to the Registrant; or other registered investment companies in the Vanguard Group.
(2) No percentage of the principal accountant’s fees or services were approved pursuant to the waiver provision of paragraph (c)(7)(i)(C) of Rule 2-01 of Regulation S-X.
(f) For the most recent fiscal year, over 50% of the hours worked under the principal accountant’s engagement were not performed by persons other than full-time, permanent employees of the principal accountant.
(g) Aggregate Non-Audit Fees.
Fiscal Year Ended August 31, 2006: $101,300
Fiscal Year Ended August 31, 2005: $98,400
Includes fees billed for non-audit services provided to the Registrant, The Vanguard Group, Inc., Vanguard Marketing Corporation, and other registered investment companies in the Vanguard Group.
(h) For the most recent fiscal year, the Audit Committee has determined that the provision of all non-audit services was consistent with maintaining the principal accountant’s independence.
Item 5: Audit Committee of Listed Registrants. The Registrant is a listed issuer as defined in Rule 10A-3 under the Securities Exchange Act of 1934 ("Exchange Act"). The Registrant has a separately-designated standing audit committee established in accordance with Section 3(a)(58)(A) of the Exchange Act. The Registrant's audit committee members are: Charles D. Ellis, Rajiv L. Gupta, Amy Gutmann, JoAnn Heffernan Heisen, André F. Perold, Alfred M. Rankin, Jr., and J. Lawrence Wilson.
Item 6: Not applicable.
Item 7: Not applicable.
Item 8: Not applicable.
Item 9: Not applicable.
Item 10: Not applicable
Item 11: Controls and Procedures.
(a) Disclosure Controls and Procedures. The Principal Executive and Financial Officers concluded that the Registrant’s Disclosure Controls and Procedures are effective based on their evaluation of the Disclosure Controls and Procedures as of a date within 90 days of the filing date of this report.
(b) Internal Control Over Financial Reporting. There were no significant changes in Registrant’s internal control over financial reporting or in other factors that could significantly affect this control subsequent to the date of the evaluation, including any corrective actions with regard to significant deficiencies and material weaknesses.
Item 12: Exhibits.
(a) Code of Ethics.
(b) Certifications.
Pursuant to the requirements of the Securities Exchange Act of 1934 and the Investment Company Act of 1940, the registrant has duly caused this report to be signed on its behalf by the undersigned, thereunto duly authorized.
| VANGUARD WORLD FUNDS
|
| BY: | (signature)
|
| (HEIDI STAM)
JOHN J. BRENNAN*
CHIEF EXECUTIVE OFFICER |
Pursuant to the requirements of the Securities Exchange Act of 1934 and the Investment Company Act of 1940, this report has been signed below by the following persons on behalf of the registrant and in the capacities and on the dates indicated.
| VANGUARD WORLD FUNDS
|
| BY: | (signature)
|
| (HEIDI STAM)
JOHN J. BRENNAN*
CHIEF EXECUTIVE OFFICER |
| VANGUARD WORLD FUNDS
|
| BY: | (signature)
|
| (HEIDI STAM)
THOMAS J. HIGGINS*
TREASURER |
* By Power of Attorney. See File Number 002-65955-99, filed on July 27, 2006. Incorporated by Reference.