UNITED STATES
SECURITIES AND EXCHANGE COMMISSION
Washington, D.C. 20549
FORM N-CSR
CERTIFIED SHAREHOLDER REPORT
OF
REGISTERED MANAGEMENT INVESTMENT COMPANIES
Investment Company Act file number: 811-1027
Name of Registrant: Vanguard World Funds
Address of Registrant:
P.O. Box 2600
Valley Forge, PA 19482
Name and address of agent for service:
Heidi Stam, Esquire
P.O. Box 876
Valley Forge, PA 19482
Registrant’s telephone number, including area code: (610) 669-1000
Date of fiscal year end: August 31
Date of reporting period: September 1, 2007–August 31, 2008
Item 1: Reports to Shareholders

> Vanguard U.S. Growth Fund’s Investor Shares returned a disappointing –7.4% (Admiral Shares, –7.3%) for the fiscal year ended August 31, 2008, a few steps behind the return of the fund’s benchmark but nearly on par with the peer-group average.
> Large-capitalization growth stocks outperformed their value-oriented counterparts for the year.
> Information technology and financial stocks, which bore the brunt of the slowing economy and credit-market turmoil, accounted for most of the fund’s retreat.
Contents | |
| |
Your Fund’s Total Returns | 1 |
President’s Letter | 2 |
Advisors’ Report | 7 |
Fund Profile | 10 |
Performance Summary | 11 |
Financial Statements | 13 |
Your Fund’s After-Tax Returns | 25 |
About Your Fund’s Expenses | 26 |
Glossary | 28 |
Please note: The opinions expressed in this report are just that—informed opinions. They should not be considered promises or advice. Also, please keep in mind that the information and opinions cover the period through the date on the front of this report. Of course, the risks of investing in your fund are spelled out in the prospectus.
Your Fund’s Total Returns
Fiscal Year Ended August 31, 2008 | | |
| Ticker | Total |
| Symbol | Returns |
Vanguard U.S. Growth Fund | | |
Investor Shares | VWUSX | –7.4% |
Admiral™ Shares1 | VWUAX | –7.3 |
Russell 1000 Growth Index | | –6.8 |
Average Large-Cap Growth Fund2 | | –7.2 |
Your Fund’s Performance at a Glance |
August 31, 2007–August 31, 2008 | | | | |
| | | Distributions Per Share |
| Starting | Ending | Income | Capital |
| Share Price | Share Price | Dividends | Gains |
Vanguard U.S. Growth Fund | | | | |
Investor Shares | $19.44 | $17.89 | $0.116 | $0.000 |
Admiral Shares | 50.42 | 46.37 | 0.425 | 0.000 |
1 A lower-cost class of shares available to many longtime shareholders and to those with significant investments in the fund.
2 Derived from data provided by Lipper Inc.
1

President’s Letter
Dear Shareholder,
Vanguard U.S. Growth Fund’s Investor Shares returned a disappointing –7.4% for the fiscal year ended August 31, 2008. The lower-cost Admiral Shares returned –7.3%. After a subpar first half, the fund’s performance versus its peers significantly improved in the second half—with gains that brought it in line with the peer group but left it behind the benchmark Russell 1000 Growth Index for the 12 months.
If you hold shares of the U.S. Growth Fund in a taxable account, you may wish to refer to our report on after-tax performance on page 25.
Stocks performed poorly as volatility returned
Stocks lost ground as credit-market turmoil spread throughout the global economy. Over the full 12 months, the broad U.S. stock market lost about –10% of its value. International markets followed a similar path, returning about –12% for the year.
The descent was bumpy. After years of relative calm, the U.S. market routinely rose or fell by more than a percentage point in a day’s trading. The volatility reflected a seemingly endless series of unnerving developments: persistently high energy prices, further deterioration in the housing market, several bank failures, and the broad economy’s deceleration.
2
Risk-aversion increased, and Treasuries outperformed
The collapse in subprime mortgage-backed securities and the aftershocks prompted a flight to safety. Short-term U.S. Treasury securities were among the fixed income market’s best performers. Over the 12 months, the broad taxable bond market returned a respectable 5.9%, largely reflecting the Treasury bond rally.
As risk-aversion increased, the difference between the yields of Treasury bonds and those of all other securities increased, depressing the price of corporate debt. (As you know, yield and price move in opposite directions.) Even as corporate bonds grew cheaper, the prices of most goods and services rose quickly, powered by escalating energy prices.
The combination of higher inflation, financial market volatility, and economic weakness put the U.S. Federal Reserve Board in an uncomfortable position. The Fed decided that it was imperative to respond to the financial crisis with a dramatic easing of monetary policy through interest rate cuts, even as it recognized that the result might be even higher inflation. Over the full 12 months, the Fed reduced its target for the federal funds rate from 5.25% to 2.00%.
Stock selection delivered mixed results for the fund
Stocks began the fiscal year with a flourish: Most markets reached record highs in October 2007. But as anxious investors grappled with trouble in the credit markets and heightened economic
Market Barometer | | | |
| Average Annual Total Returns |
| Periods Ended August 31, 2008 |
| One Year | Three Years | Five Years |
Stocks | | | |
Russell 1000 Index (Large-caps) | –10.6% | 3.9% | 7.4% |
Russell 2000 Index (Small-caps) | –5.5 | 4.8 | 9.6 |
Dow Jones Wilshire 5000 Index (Entire market) | –9.9 | 4.2 | 7.9 |
MSCI All Country World Index ex USA (International) | –12.2 | 10.7 | 16.1 |
| | | |
| | | |
Bonds | | | |
Lehman U.S. Aggregate Bond Index (Broad taxable market) | 5.9% | 4.3% | 4.6% |
Lehman Municipal Bond Index | 4.5 | 3.3 | 4.4 |
Citigroup 3-Month Treasury Bill Index | 2.8 | 4.0 | 3.1 |
| | | |
| | | |
CPI | | | |
Consumer Price Index | 5.4% | 3.7% | 3.5% |
3
uncertainty, equities finished the 12 months broadly lower. All but three of the ten industry sectors in the U.S. Growth Fund’s benchmark index declined in value, creating more hurdles for the fund.
The fund’s concentrated portfolio faced a tough test in this unsettled environment. Top-ten holdings represented about one-third of the fund’s average value, magnifying the impact of individual stocks. This was a plus in health care—the leading contributor to return and the fund’s second-largest sector, on average—where the advisors’ outsized commitment to biotechnology proved rewarding. Gilead Sciences, Genentech, and Celgene contributed a total of more than 2 percentage points to the fund’s return.
The materials sector was the best performer in both the market and the fund. However, it represented a small slice of the portfolio. And although oil prices dominated the year’s headlines—soaring to record highs before retreating in July and August—energy stocks made almost no contribution to performance for the year, in contrast to earlier robust returns.
On the downside, information technology and financial stocks collectively trimmed more than 7 percentage points from the fund’s return. The tech sector represented almost one-third of the portfolio’s average value (slightly more than in the benchmark), and suffered from budget curtailments in the face of growing concerns about a global economic slowdown. Semiconductor-product companies were hit especially
Total Returns | |
Ten Years Ended August 31, 2008 | |
| Average |
| Annual Return |
U.S. Growth Fund Investor Shares | –1.5% |
Russell 1000 Growth Index | 2.6 |
Average Large-Cap Growth Fund1 | 3.1 |
The figures shown represent past performance, which is not a guarantee of future results. (Current performance may be lower or higher than the performance data cited. For performance data current to the most recent month-end, visit our website at www.vanguard.com/performance.) Note, too, that both investment returns and principal value can fluctuate widely, so an investor’s shares, when sold, could be worth more or less than their original cost.
1 Derived from data provided by Lipper Inc.
4
hard, including Broadcom, Intel, and NVIDIA. Among other notable detractors were two top-ten holdings: Google and Cisco Systems.
Financial services companies continued to be buffeted by asset write-downs and other challenges posed by the subprime-mortgage crisis that emerged more than a year ago. Amid widespread weakness, the fund’s leading detractors included investment bank Lehman Brothers Holdings, CME Group (the Chicago Mercantile Exchange), and multiline insurer American International Group (AIG). Bucking this trend was brokerage firm Charles Schwab, an outsized position that posted a double-digit gain.
Relative to the benchmark, the advisors’ overweighting of health care stocks added almost 3 percentage points to return. However, this performance advantage was more than offset by the commitments to the weakly performing information technology and financial stocks. Consumer staples stocks, often viewed as somewhat recession-proof, performed well in the benchmark, but the fund’s holdings turned in a generally weak performance.
For more details about the fund’s positioning and performance during the period, please see the Advisors’ Report, which begins on page 7. Also, please note that in July, two portfolio managers from AllianceBernstein—an advisor to the fund since 2001—were named to replace Alan Levi, who plans to retire.
Expense Ratios1 | | | |
Your Fund Compared With Its Peer Group | | | |
| | | Average |
| Investor | Admiral | Large-Cap |
| Shares | Shares | Growth Fund |
U.S. Growth Fund | 0.50% | 0.27% | 1.36% |
1 Fund expense ratios shown are from the prospectus dated December 10, 2007. The expense ratios for the fiscal year ended August 31, 2008, were 0.43% for Investor Shares and 0.24% for Admiral Shares. Peer-group expense ratio is derived from data provided by Lipper Inc. and captures information through year-end 2007.
5
A long-term view and quality focus are key
Overall, the last ten years have been challenging for growth-stock investors. After lagging for several years—notably during the bear market of 2000–2002—growth stocks reclaimed the lead from their value-oriented counterparts in mid-2007. But your advisors’ focus on high-quality companies has not been rewarded consistently. For the ten years ended August 31, the –1.5% annual return of U.S. Growth trailed that of its comparative standards, as shown in the table on page 4. Although these results have clearly been a disappointment, we remain confident that the advisors’ approach to large-cap growth investing has the potential to produce competitive long-term returns.
Although we can’t predict whether growth will lead value, or whether large-cap stocks will outperform small-caps, one thing is certain: The markets will continue to deliver surprises. That’s why we believe the key to investment success is to determine a diversified mix of stock, bond, and money market funds that is consistent with your goals, time horizon, and risk tolerance. Once you have established your asset allocation plan, try to stick with it. And always pay attention to costs.
The advisors of the U.S. Growth Fund make sizable commitments to a relatively small number of stocks (about 70–80), grounded in the advisors’ fundamental analysis and extensive research. That is why it’s appropriate to consider this fund for a complementary, rather than a cornerstone, role within a balanced portfolio.
Thank you for entrusting your assets to Vanguard.
Sincerely,

F. William McNabb III
President and Chief Executive Officer
September 11, 2008
6
Advisors’ Report
For the fiscal year ended August 31, 2008, the Investor Shares of Vanguard U.S. Growth Fund returned –7.4%, and the lower-cost Admiral Shares returned –7.3%. This performance reflects the combined efforts of your fund’s two independent advisors. The use of multiple advisors provides exposure to distinct, yet complementary, investment approaches, enhancing the fund’s diversification.
The advisors, the amount and percentage of fund assets each manages, and brief descriptions of their investment strategies are presented in the table below. Each advisor has also prepared a discussion of the investment environment that existed during the fiscal year and of how the portfolio’s positioning reflects this assessment. These comments were prepared on September 12, 2008.
AllianceBernstein L.P.
Portfolio Managers:
James G. Reilly,
Executive Vice President
P. Scott Wallace, CFA,
Senior Vice President
Equity markets were volatile throughout the 12 months as credit-market turmoil intensified, U.S. economic momentum slowed (and prospects deteriorated), and uncertainties increased on several fronts. Although overall U.S. economic growth
Vanguard U.S. Growth Fund Investment Advisors | |
| | | |
| Fund Assets Managed | |
Investment Advisor | % | $ Million | Investment Strategy |
AllianceBernstein L.P. | 67 | 3,189 | Uses a fundamentally based, research-driven approach |
| | | to large-cap growth investing. The advisor seeks to |
| | | build a diversified portfolio of successful, well-managed |
| | | companies with sustainable competitive advantages |
| | | and superior prospects for growth not fully reflected in |
| | | relative valuation. |
William Blair & Company, L.L.C. | 31 | 1,453 | Uses a fundamental investment approach in pursuit |
| | | of superior long-term investment results from growth- |
| | | oriented companies with leadership positions and |
| | | strong market presence. |
Cash Investments1 | 2 | 111 | — |
1 These short-term reserves are invested by Vanguard in equity index products to simulate investment in stocks. Each advisor may also maintain a modest cash position.
7
and corporate profits proved satisfactory, if not better than expected, this masked significant and widening divergences. Escalating energy and commodity prices, exacerbated by a weakened U.S. dollar combined with stagnating employment growth, imposed an increasing burden on already stressed American consumers. The erosion of disposable personal income, consumption, and consumer confidence was compounded by protracted weakness in housing markets and equity values. Reflecting this environment, equity markets have become increasingly risk-averse.
In contrast to the U.S. economy’s moderating and subdued growth, a number of overseas economies experienced comparatively robust expansion, particularly those of several populous emerging markets. The combination of healthy growth in foreign demand and the weak U.S. dollar led to a resurgence of U.S. export growth and manufacturing, providing an important counterbalance to the weakness in domestic consumption. Reflecting this, overall U.S. exports increased 18% through the first six months of 2008, expanding 50% faster than China’s export sector. This environment has benefited a number of the holdings in our portion of the portfolio, given our focus on companies with leading, in some cases dominant, industry positions; many of these companies also enjoy a strong and increasing global presence.
Our performance was adversely affected by disappointing stock selection among a number of financial service and technology holdings, magnified by an overweighted exposure to financials early in the year. This was largely offset by strong stock selection among a number of the portfolio’s health care and industrials holdings, combined with our significant absolute and overweighted exposure to health care.
Our holdings generally continued to exhibit the fundamental strength we seek, with upward earnings revisions remaining more prevalent than among benchmark constituents. Although stocks of such companies failed to enjoy their historical rewards over this period, we believe that this anomaly is unlikely to persist. In particular, in a global economic and earnings slowdown, which we appear to be in, investors tend to more carefully distinguish among companies and favor those best-positioned to sustain their earnings growth. We would expect that this tendency will once again reward the kind of superior earnings potential that we emphasize.
William Blair & Company, L.L.C.
Portfolio Manager:
John F. Jostrand, CFA, Principal
U.S. equity markets were very difficult and volatile over the fiscal year, owing to economic uncertainty. Markets declined in response to the continued credit crisis;
8
deleveraging; and weakened consumers in the face of rising gas and food costs, increasing unemployment, tightening lending standards, and elevated levels of credit and mortgage delinquencies.
Investors’ concerns shifted from slowing U.S. economic growth to rising inflation, especially in commodity and food prices. Most notably, the price of oil surged to record levels as demand remained high, especially from emerging-market countries. Also, supply issues surfaced and investor speculation in oil rose as many looked to it as an inflationary hedge or an alternative to U.S. dollar investments or the risky credit markets. However, by the end of August, the price of oil retreated, which was a relief to the equity markets, as demand destruction occurred modestly and some weakness in global growth appeared.
Our portion of the portfolio benefited from our bias toward quality growth stocks, which typically do better when growth becomes harder to find. Health care was the highest-performing sector, with good stock selection in the biotechnology industry. The information technology sector was the largest detractor due to our slight overweighting in a weaker benchmark group, as well as our stock selection in the computer and peripherals industry.
Going forward, it’s difficult to predict what additional downside risks remain or when investor sentiment will turn. We believe that economic growth will continue to be subdued into 2009, as the financial system and consumers likely have a long workout period ahead.
In this environment, we have not adopted a particularly defensive posture. Instead, we continue to rely on our quality growth investment philosophy and process, seeking stocks with attractive long-term earnings growth prospects, strong financial positions, and competitive and sustainable business models that we believe will outperform over time. This approach generally leads us to companies that have somewhat more defensive characteristics during market conditions like those experienced recently, primarily because of the firms’ more stable business models with better balance sheets. In our view, quality growth opportunities remain readily available, and we are taking advantage of increasingly attractive valuation levels to buy stocks that we believe will produce superior long-term returns. Whether the markets experience elevated levels of volatility or a slow-growth environment, investors will continue to seek strong, quality companies, which become scarce, and thus more valuable, in a challenging period.
9
Fund Profile
As of August 31, 2008
Portfolio Characteristics | | |
| | Comparative | Broad |
| Fund | Index1 | Index2 |
Number of Stocks | 75 | 650 | 4,692 |
Median Market Cap | $50.9B | $36.5B | $31.5B |
Price/Earnings Ratio | 22.1x | 18.2x | 16.9x |
Price/Book Ratio | 4.3x | 3.9x | 2.4x |
Yield3 | | 1.3% | 2.1% |
Investor Shares | 0.5% | | |
Admiral Shares | 0.7% | | |
Return on Equity | 23.1% | 23.2% | 19.9% |
Earnings Growth Rate | 32.9% | 23.4% | 18.2% |
Foreign Holdings | 8.8% | 0.0% | 0.0% |
Turnover Rate | 107% | — | — |
Expense Ratio (8/31/2007)4 | | — | — |
Investor Shares | 0.50% | | |
Admiral Shares | 0.27% | | |
Short-Term Reserves | 1.9% | — | — |
Sector Diversification (% of equity exposure) |
| | Comparative | Broad |
| Fund | Index1 | Index2 |
Consumer Discretionary | 4.3% | 9.3% | 9.1% |
Consumer Staples | 9.4 | 12.3 | 9.7 |
Energy | 9.7 | 11.2 | 13.3 |
Financials | 7.1 | 4.2 | 16.0 |
Health Care | 21.5 | 13.3 | 12.6 |
Industrials | 9.6 | 13.6 | 11.9 |
Information Technology | 31.6 | 28.9 | 16.5 |
Materials | 5.5 | 4.4 | 4.1 |
Telecommunication | | | |
Services | 1.2 | 0.8 | 2.9 |
Utilities | 0.1 | 2.0 | 3.9 |
Volatility Measures5 | | |
Fund Versus | | Fund Versus |
Comparative Index1 | | Broad Index2 |
R-Squared | 0.90 | 0.82 |
Beta | 1.03 | 1.01 |
Ten Largest Holdings6 (% of total net assets) |
| | |
Apple Inc. | computer hardware | 5.9% |
Google Inc. | internet software | |
| and services | 5.5 |
Cisco Systems, Inc. | communications | |
| equipment | 3.8 |
Hewlett-Packard Co. | computer hardware | 3.8 |
Schlumberger Ltd. | oil and gas | |
| equipment | |
| and services | 3.7 |
Gilead Sciences, Inc. | biotechnology | 3.6 |
Monsanto Co. | fertilizers and | |
| agricultural chemicals | 3.4 |
QUALCOMM Inc. | communications | |
| equipment | 3.0 |
Celgene Corp. | biotechnology | 2.9 |
Abbott Laboratories | pharmaceuticals | 2.7 |
Top Ten | | 38.3% |
Investment Focus
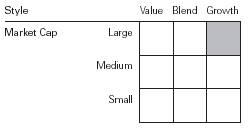
1 Russell 1000 Growth Index.
2 Dow Jones Wilshire 5000 Index.
3 30-day SEC yield for the fund; annualized dividend yield for the indexes. See the Glossary.
4 Expense ratios are shown from the prospectus dated December 10, 2007. The expense ratios for the fiscal year ended August 31, 2008, were 0.43% for Investor Shares and 0.24% for Admiral Shares.
5 For an explanation of R-squared, beta, and other terms used here, see the Glossary.
6 The holdings listed exclude any temporary cash investments and equity index products.
10
Performance Summary
All of the returns in this report represent past performance, which is not a guarantee of future results that may be achieved by the fund. (Current performance may be lower or higher than the performance data cited. For performance data current to the most recent month-end, visit our website at www.vanguard.com/performance.) Note, too, that both investment returns and principal value can fluctuate widely, so an investor’s shares, when sold, could be worth more or less than their original cost. The returns shown do not reflect taxes that a shareholder would pay on fund distributions or on the sale of fund shares.
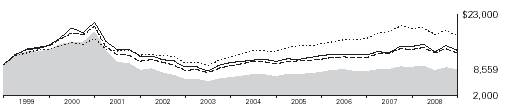
Cumulative Performance: August 31, 1998–August 31, 2008
Initial Investment of $10,000
| | | |
| | | | |
| Average Annual Total Returns | Final Value |
| Periods Ended August 31, 2008 | of a $10,000 |
| One Year | Five Years | Ten Years | Investment |
U.S. Growth Fund Investor Shares1 | –7.44% | 5.41% | –1.54% | $8,559 |
Dow Jones Wilshire 5000 Index | –9.92 | 7.90 | 5.69 | 17,396 |
Russell 1000 Growth Index | –6.78 | 6.09 | 2.59 | 12,917 |
Average Large-Cap Growth Fund2 | –7.15 | 5.30 | 3.11 | 13,586 |
| | | | Final Value |
| | | Since | of a $100,000 |
| One Year | Five Years | Inception3 | Investment |
U.S. Growth Fund Admiral Shares | –7.27% | 5.64% | –0.55% | $96,199 |
Dow Jones Wilshire 5000 Index | –9.92 | 7.90 | 4.23 | 133,922 |
Russell 1000 Growth Index | –6.78 | 6.09 | 1.61 | 111,955 |
1 Total returns do not include the account service fee that may be applicable to certain accounts with balances below $10,000.
2 Derived from data provided by Lipper Inc.
3 Performance for the fund’s Admiral Shares and comparative standards is calculated since the Admiral Shares’ inception: August 13, 2001.
11
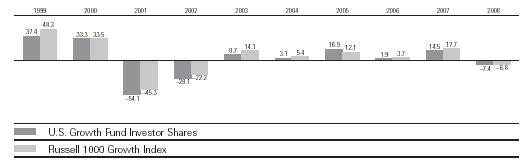
Fiscal-Year Total Returns (%): August 31, 1998–August 31, 2008
Average Annual Total Returns: Periods Ended June 30, 2008
This table presents average annual total returns through the latest calendar quarter—rather than through the end of the fiscal period. Securities and Exchange Commission rules require that we provide this information.
| Inception Date | One Year | Five Years | Ten Years |
Investor Shares1 | 1/6/1959 | –7.21% | 6.47% | –3.09% |
Admiral Shares | 8/13/2001 | –7.05 | 6.71 | –0.572 |
1 Total returns do not include the account service fee that may be applicable to certain accounts with balances below $10,000.
2 Since inception.
Note: See Financial Highlights tables for dividend and capital gains information.
12
Financial Statements
Statement of Net Assets
As of August 31, 2008
The fund provides a complete list of its holdings four times in each fiscal year, at the quarter-ends. For the second and fourth fiscal quarters, the lists appear in the fund’s semiannual and annual reports to shareholders. For the first and third fiscal quarters, the fund files the lists with the Securities and Exchange Commission on Form N-Q. Shareholders can look up the fund’s Forms N-Q on the SEC’s website at www.sec.gov. Forms N-Q may also be reviewed and copied at the SEC’s Public Reference Room (see the back cover of this report for further information).
| | | Market |
| | | Value• |
| | Shares | ($000) |
Common Stocks (96.2%)1 | | |
Consumer Discretionary (4.0%) | | |
* | Kohl’s Corp. | 1,852,534 | 91,089 |
| McDonald’s Corp. | 738,100 | 45,799 |
| Omnicom Group Inc. | 610,420 | 25,876 |
| NIKE, Inc. Class B | 254,410 | 15,420 |
* | Starbucks Corp. | 724,800 | 11,278 |
| | | 189,462 |
Consumer Staples (9.1%) | | |
| Wal-Mart Stores, Inc. | 1,691,550 | 99,920 |
| The Coca-Cola Co. | 977,250 | 50,885 |
| Colgate-Palmolive Co. | 606,800 | 46,135 |
| The Procter & Gamble Co. | 657,920 | 45,903 |
| Philip Morris International Inc. | 852,900 | 45,801 |
| Avon Products, Inc. | 765,855 | 32,802 |
| PepsiCo, Inc. | 459,100 | 31,439 |
| Wm. Wrigley Jr. Co. | 351,500 | 27,937 |
| Costco Wholesale Corp. | 375,900 | 25,208 |
| Wal-Mart de Mexico | | |
| SA de Cv ADR | 474,800 | 17,330 |
| Kellogg Co. | 135,500 | 7,377 |
| | | 430,737 |
Energy (9.3%) | | |
| Schlumberger Ltd. | 1,873,930 | 176,562 |
| EOG Resources, Inc. | 805,400 | 84,100 |
| Apache Corp. | 387,570 | 44,330 |
* | National Oilwell Varco Inc. | 533,400 | 39,328 |
* | Weatherford | | |
| International Ltd. | 829,050 | 31,985 |
* | Cameron International Corp. | 608,740 | 28,361 |
| Suncor Energy, Inc. | 408,080 | 23,195 |
* | Transocean, Inc. | 104,300 | 13,267 |
| | | 441,128 |
Exchange-Traded Fund (0.0%) | | |
2 | Vanguard Growth ETF | 3,100 | 183 |
| | | |
Financials (6.6%) | | |
| CME Group, Inc. | 338,770 | 113,617 |
| Franklin Resources Corp. | 681,500 | 71,217 |
| Charles Schwab Corp. | 2,018,965 | 48,435 |
| The Goldman Sachs | | |
| Group, Inc. | 230,245 | 37,753 |
| Merrill Lynch & Co., Inc. | 1,084,000 | 30,731 |
| NYSE Euronext | 283,900 | 11,524 |
| | | 313,277 |
Health Care (20.8%) | | |
| Biotechnology (8.4%) | | |
* | Gilead Sciences, Inc. | 3,285,650 | 173,088 |
* | Celgene Corp. | 1,977,240 | 137,023 |
* | Genentech, Inc. | 900,095 | 88,884 |
| | | |
| Health Care Equipment & Supplies (4.4%) | |
| Alcon, Inc. | 495,440 | 84,368 |
| Becton, Dickinson & Co. | 594,910 | 51,983 |
| Baxter International, Inc. | 613,200 | 41,550 |
* | St. Jude Medical, Inc. | 703,980 | 32,263 |
| | | |
| Health Care Providers & Services (1.6%) | | |
* | Medco Health | | |
| Solutions, Inc. | 1,634,700 | 76,586 |
| | | |
| Life Science Tools & Services (0.7%) | | |
* | Thermo Fisher | | |
| Scientific, Inc. | 556,720 | 33,715 |
| | | |
| Pharmaceuticals (5.7%) | | |
| Abbott Laboratories | 2,219,910 | 127,489 |
| Teva Pharmaceutical | | |
| Industries Ltd. | | |
| Sponsored ADR | 2,188,760 | 103,616 |
| Allergan, Inc. | 733,625 | 40,988 |
| | | 991,553 |
Industrials (9.2%) | | |
| Honeywell International Inc. | 1,434,900 | 71,989 |
| Danaher Corp. | 594,255 | 48,473 |
| Deere & Co. | 644,500 | 45,482 |
| Fluor Corp. | 513,800 | 41,171 |
| Roper Industries Inc. | 551,190 | 32,564 |
| Fastenal Co. | 593,820 | 30,837 |
| ABB Ltd. ADR | 1,243,195 | 30,545 |
| Joy Global Inc. | 359,990 | 25,574 |
13
| | | Market |
| | | Value• |
| | Shares | ($000) |
| Union Pacific Corp. | 287,700 | 24,138 |
| Rockwell Automation, Inc. | 448,390 | 21,169 |
| Expeditors International of | | |
| Washington, Inc. | 512,220 | 18,486 |
| Emerson Electric Co. | 319,970 | 14,975 |
| J.B. Hunt Transport | | |
| Services, Inc. | 378,470 | 13,795 |
| Lockheed Martin Corp. | 101,100 | 11,772 |
* | Foster Wheeler Ltd. | 101,000 | 5,019 |
| | | 435,989 |
Information Technology (30.7%) | | |
| Communications Equipment (9.4%) | | |
* | Cisco Systems, Inc. | 7,526,653 | 181,016 |
| QUALCOMM Inc. | 2,670,695 | 140,612 |
* | Research In Motion Ltd. | 844,694 | 102,715 |
| Corning, Inc. | 1,082,965 | 22,244 |
| | | |
| Computers & Peripherals (9.7%) | | |
* | Apple Inc. | 1,654,276 | 280,449 |
| Hewlett-Packard Co. | 3,841,300 | 180,234 |
| | | |
| Electronic Equipment & Instruments (0.4%) | |
* | FLIR Systems, Inc. | 568,270 | 20,287 |
| | | |
| Internet Software & Services (5.5%) | | |
* | Google Inc. | 559,550 | 259,234 |
| | | |
| Semiconductors & Semiconductor Equipment (1.4%) | |
* | MEMC Electronic | | |
| Materials, Inc. | 945,000 | 46,390 |
| Intel Corp. | 869,810 | 19,893 |
| | | |
| Software (4.3%) | | |
* | Electronic Arts Inc. | 1,328,060 | 64,823 |
| Microsoft Corp. | 2,181,055 | 59,521 |
* | Adobe Systems, Inc. | 1,167,665 | 50,011 |
* | salesforce.com, inc. | 576,970 | 32,322 |
| | | 1,459,751 |
Materials (5.3%) | | |
| Monsanto Co. | 1,403,075 | 160,301 |
| Praxair, Inc. | 591,600 | 53,149 |
| Air Products & | | |
| Chemicals, Inc. | 422,100 | 38,770 |
| | | 252,220 |
Telecommunication Services (1.2%) | | |
| America Movil SA de | | |
| CV Series L ADR | 1,091,300 | 56,071 |
Total Common Stocks | | |
(Cost $4,304,209) | | 4,570,371 |
Temporary Cash Investments (4.2%)1 | | |
Money Market Fund (3.8%) | | |
3 | Vanguard Market Liquidity | | |
| Fund, 2.389% | 183,341,427 | 183,341 |
| Face | Market |
| Amount | Value• |
| ($000) | ($000) |
U.S. Agency Obligation (0.4%) | | |
4 Federal Home Loan Bank | | |
5 2.433%, 11/6/08 | 18,000 | 17,917 |
Total Temporary Cash Investments | |
(Cost $201,262) | | 201,258 |
Total Investments (100.4%) | | |
(Cost $4,505,471) | | 4,771,629 |
Other Assets and Liabilities (–0.4%) | |
Other Assets | | 17,266 |
Liabilities | | (36,085) |
| | (18,819) |
Net Assets (100%) | | 4,752,810 |
14
At August 31, 2008, net assets consisted of: |
| Amount |
| ($000) |
Paid-in Capital | 10,627,711 |
Undistributed Net Investment Income | 2,111 |
Accumulated Net Realized Losses | (6,136,457) |
Unrealized Appreciation (Depreciation) | |
Investment Securities | 266,158 |
Futures Contracts | (6,713) |
Net Assets | 4,752,810 |
| |
| |
Investor Shares—Net Assets | |
Applicable to 203,296,172 outstanding | |
$.001 par value shares of beneficial | |
interest (unlimited authorization) | 3,637,061 |
Net Asset Value Per Share— | |
Investor Shares | $17.89 |
| |
| |
Admiral Shares—Net Assets | |
Applicable to 24,059,364 outstanding | |
$.001 par value shares of beneficial | |
interest (unlimited authorization) | 1,115,749 |
Net Asset Value Per Share— | |
Admiral Shares | $46.37 |
• See Note A in Notes to Financial Statements.
* Non-income-producing security.
1 The fund invests a portion of its cash reserves in equity markets through the use of index futures contracts. After giving effect to futures investments, the fund’s effective common stock and temporary cash investment positions represent 98.5% and 1.9%, respectively, of net assets.
2 Considered an affiliated company of the fund as the issuer is another member of The Vanguard Group.
3 Affiliated money market fund available only to Vanguard funds and certain trusts and accounts managed by Vanguard. Rate shown is the 7-day yield.
4 The issuer operates under a congressional charter; its securities are neither issued nor guaranteed by the U.S. government.
5 Securities with a value of $17,917,000 have been segregated as initial margin for open futures contracts. ADR—American Depositary Receipt.
See accompanying Notes, which are an integral part of the Financial Statements.
15
Statement of Operations
| Year Ended |
| August 31, 2008 |
| ($000) |
Investment Income | |
Income | |
Dividends1 | 37,196 |
Interest1 | 8,826 |
Security Lending | 1,146 |
Total Income | 47,168 |
Expenses | |
Investment Advisory Fees—Note B | |
Basic Fee | 7,929 |
Performance Adjustment | (1,572) |
The Vanguard Group—Note C | |
Management and Administrative—Investor Shares | 11,320 |
Management and Administrative—Admiral Shares | 1,152 |
Marketing and Distribution—Investor Shares | 807 |
Marketing and Distribution—Admiral Shares | 236 |
Custodian Fees | 47 |
Auditing Fees | 24 |
Shareholders’ Reports—Investor Shares | 125 |
Shareholders’ Reports—Admiral Shares | 35 |
Trustees’ Fees and Expenses | 9 |
Total Expenses | 20,112 |
Expenses Paid Indirectly | (263) |
Net Expenses | 19,849 |
Net Investment Income | 27,319 |
Realized Net Gain (Loss) | |
Investment Securities Sold1 | 157,712 |
Futures Contracts | (19,541) |
Realized Net Gain (Loss) | 138,171 |
Change in Unrealized Appreciation (Depreciation) | |
Investment Securities | (547,609) |
Futures Contracts | (4,147) |
Change in Unrealized Appreciation (Depreciation) | (551,756) |
Net Increase (Decrease) in Net Assets Resulting from Operations | (386,266) |
1 Dividend income, interest income, and realized net gain (loss) from affiliated companies of the fund were $2,000, $8,213,000, and $0, respectively.
See accompanying Notes, which are an integral part of the Financial Statements.
16
Statement of Changes in Net Assets
| Year Ended August 31, |
| 2008 | 2007 |
| ($000) | ($000) |
Increase (Decrease) in Net Assets | | |
Operations | | |
Net Investment Income | 27,319 | 38,382 |
Realized Net Gain (Loss) | 138,171 | 607,592 |
Change in Unrealized Appreciation (Depreciation) | (551,756) | 150,227 |
Net Increase (Decrease) in Net Assets Resulting from Operations | (386,266) | 796,201 |
Distributions | | |
Net Investment Income | | |
Investor Shares | (25,051) | (21,929) |
Admiral Shares | (11,166) | (9,238) |
Realized Capital Gain | | |
Investor Shares | — | — |
Admiral Shares | — | — |
Total Distributions | (36,217) | (31,167) |
Capital Share Transactions | | |
Investor Shares | (351,798) | (818,275) |
Admiral Shares | (106,170) | (105,323) |
Net Increase (Decrease) from Capital Share Transactions | (457,968) | (923,598) |
Total Increase (Decrease) | (880,451) | (158,564) |
Net Assets | | |
Beginning of Period | 5,633,261 | 5,791,825 |
End of Period1 | 4,752,810 | 5,633,261 |
1 Net Assets—End of Period includes undistributed net investment income of $2,111,000 and $11,009,000. See accompanying Notes, which are an integral part of the Financial Statements.
17
Financial Highlights
Investor Shares | | | | | |
| | | | | |
| | | | | |
| | | |
For a Share Outstanding | Year Ended August 31, |
Throughout Each Period | 2008 | 2007 | 2006 | 2005 | 2004 |
Net Asset Value, Beginning of Period | $19.44 | $17.06 | $16.77 | $14.39 | $14.00 |
Investment Operations | | | | | |
Net Investment Income | .089 | .113 | .059 | .0401 | .028 |
Net Realized and Unrealized Gain (Loss) | | | | | |
on Investments | (1.523) | 2.354 | .266 | 2.385 | .409 |
Total from Investment Operations | (1.434) | 2.467 | .325 | 2.425 | .437 |
Distributions | | | | | |
Dividends from Net Investment Income | (.116) | (.087) | (.035) | (.045) | (.047) |
Distributions from Realized Capital Gains | — | — | — | — | — |
Total Distributions | (.116) | (.087) | (.035) | (.045) | (.047) |
Net Asset Value, End of Period | $17.89 | $19.44 | $17.06 | $16.77 | $14.39 |
| | | | | |
| | | | | |
Total Return2 | –7.44% | 14.50% | 1.93% | 16.86% | 3.11% |
| | | | | |
| | | | | |
Ratios/Supplemental Data | | | | | |
Net Assets, End of Period (Millions) | $3,637 | $4,308 | $4,530 | $4,848 | $5,503 |
Ratio of Total Expenses to | | | | | |
Average Net Assets3 | 0.43% | 0.50% | 0.58% | 0.55% | 0.53% |
Ratio of Net Investment Income to | | | | | |
Average Net Assets | 0.47% | 0.60% | 0.34% | 0.30%1 | 0.19% |
Portfolio Turnover Rate | 107% | 51% | 48% | 38% | 71% |
1 Net investment income per share and the ratio of net investment income to average net assets include $.017 and 0.11%, respectively, resulting from a special dividend from Microsoft Corp. in November 2004.
2 Total returns do not include the account service fee that may be applicable to certain accounts with balances below $10,000.
3 Includes performance-based investment advisory fee increases (decreases) of (0.03%), (0.01%), 0.02%, (0.02%), and (0.03%). See accompanying Notes, which are an integral part of the Financial Statements.
18
Admiral Shares | | | | | |
| | | | | |
| | | | | |
| | | |
For a Share Outstanding | Year Ended August 31, |
Throughout Each Period | 2008 | 2007 | 2006 | 2005 | 2004 |
Net Asset Value, Beginning of Period | $50.42 | $44.24 | $43.47 | $37.29 | $36.28 |
Investment Operations | | | | | |
Net Investment Income | .325 | .416 | .271 | .2261 | .147 |
Net Realized and Unrealized Gain (Loss) | | | | | |
on Investments | (3.950) | 6.107 | .677 | 6.163 | 1.052 |
Total from Investment Operations | (3.625) | 6.523 | .948 | 6.389 | 1.199 |
Distributions | | | | | |
Dividends from Net Investment Income | (.425) | (.343) | (.178) | (.209) | (.189) |
Distributions from Realized Capital Gains | — | — | — | — | — |
Total Distributions | (.425) | (.343) | (.178) | (.209) | (.189) |
Net Asset Value, End of Period | $46.37 | $50.42 | $44.24 | $43.47 | $37.29 |
| | | | | |
| | | | | |
Total Return | –7.28% | 14.80% | 2.16% | 17.16% | 3.29% |
| | | | | |
| | | | | |
Ratios/Supplemental Data | | | | | |
Net Assets, End of Period (Millions) | $1,116 | $1,325 | $1,262 | $1,012 | $824 |
Ratio of Total Expenses to | | | | | |
Average Net Assets2 | 0.24% | 0.27% | 0.34% | 0.32% | 0.32% |
Ratio of Net Investment Income to | | | | | |
Average Net Assets | 0.66% | 0.83% | 0.58% | 0.53%1 | 0.40% |
Portfolio Turnover Rate | 107% | 51% | 48% | 38% | 71% |
1 Net investment income per share and the ratio of net investment income to average net assets include $.045 and 0.11%, respectively, resulting from a special dividend from Microsoft Corp. in November 2004.
2 Includes performance-based investment advisory fee increases (decreases) of (0.03%), (0.01%), 0.02%, (0.02%), and (0.03%). See accompanying Notes, which are an integral part of the Financial Statements.
19
Notes to Financial Statements
Vanguard U.S. Growth Fund is registered under the Investment Company Act of 1940 as an open-end investment company, or mutual fund. The fund offers two classes of shares, Investor Shares and Admiral Shares. Investor Shares are available to any investor who meets the fund’s minimum purchase requirements. Admiral Shares are designed for investors who meet certain administrative, service, tenure, and account-size criteria.
A. The following significant accounting policies conform to generally accepted accounting principles for U.S. mutual funds. The fund consistently follows such policies in preparing its financial statements.
1. Security Valuation: Securities are valued as of the close of trading on the New York Stock Exchange (generally 4 p.m., Eastern time) on the valuation date. Equity securities are valued at the latest quoted sales prices or official closing prices taken from the primary market in which each security trades; such securities not traded on the valuation date are valued at the mean of the latest quoted bid and asked prices. Securities for which market quotations are not readily available, or whose values have been materially affected by events occurring before the fund’s pricing time but after the close of the securities’ primary markets, are valued by methods deemed by the board of trustees to represent fair value. Investments in Vanguard Market Liquidity Fund are valued at that fund’s net asset value. Temporary cash investments acquired over 60 days to maturity are valued using the latest bid prices or using valuations based on a matrix system (which considers such factors as security prices, yields, maturities, and ratings), both as furnished by independent pricing services. Other temporary cash investments are valued at amortized cost, which approximates market value.
2. Futures Contracts: The fund uses index futures contracts to a limited extent, with the objective of maintaining full exposure to the stock market while maintaining liquidity. The fund may purchase or sell futures contracts to achieve a desired level of investment, whether to accommodate portfolio turnover or cash flows from capital share transactions. The primary risks associated with the use of futures contracts are imperfect correlation between changes in market values of stocks held by the fund and the prices of futures contracts, and the possibility of an illiquid market.
Futures contracts are valued at their quoted daily settlement prices. The aggregate principal amounts of the contracts are not recorded in the Statement of Net Assets. Fluctuations in the value of the contracts are recorded in the Statement of Net Assets as an asset (liability) and in the Statement of Operations as unrealized appreciation (depreciation) until the contracts are closed, when they are recorded as realized futures gains (losses).
3. Federal Income Taxes: The fund intends to continue to qualify as a regulated investment company and distribute all of its taxable income. Management has analyzed the fund’s tax positions taken on federal income tax returns for all open tax years (tax years ended August 31, 2005–2008), and has concluded that no provision for federal income tax is required in the fund’s financial statements.
4. Distributions: Distributions to shareholders are recorded on the ex-dividend date.
5. Security Lending: The fund may lend its securities to qualified institutional borrowers to earn additional income. Security loans are required to be secured at all times by collateral at least equal to the market value of securities loaned. The fund invests cash collateral received in Vanguard Market Liquidity Fund, and records a liability for the return of the collateral, during the period the securities are on loan. Security lending income represents the income earned on investing cash collateral, less expenses associated with the loan.
20
6. Other: Dividend income is recorded on the ex-dividend date. Interest income includes income distributions received from Vanguard Market Liquidity Fund and is accrued daily. Security transactions are accounted for on the date securities are bought or sold. Costs used to determine realized gains (losses) on the sale of investment securities are those of the specific securities sold.
Each class of shares has equal rights as to assets and earnings, except that each class separately bears certain class-specific expenses related to maintenance of shareholder accounts (included in Management and Administrative expenses) and shareholder reporting. Marketing and distribution expenses are allocated to each class of shares based on a method approved by the board of trustees. Income, other non-class-specific expenses, and gains and losses on investments are allocated to each class of shares based on its relative net assets.
B. AllianceBernstein L.P. and William Blair & Company, L.L.C., each provide investment advisory services to a portion of the fund for a fee calculated at an annual percentage rate of average net assets managed by the advisor. The basic fee for AllianceBernstein L.P. is subject to quarterly adjustments based on performance for the preceding three years relative to the Russell 1000 Growth Index. The basic fee for William Blair & Company, L.L.C., is subject to quarterly adjustments based on performance since June 1, 2004, relative to the Russell 1000 Growth Index.
The Vanguard Group manages the cash reserves of the portfolio on an at-cost basis.
For the year ended August 31, 2008, the aggregate investment advisory fee represented an effective annual basic rate of 0.15% of the fund’s average net assets before a decrease of $1,572,000 (0.03%) based on performance.
C. The Vanguard Group furnishes at cost corporate management, administrative, marketing, and distribution services. The costs of such services are allocated to the fund under methods approved by the board of trustees. The fund has committed to provide up to 0.40% of its net assets in capital contributions to Vanguard. At August 31, 2008, the fund had contributed capital of $407,000 to Vanguard (included in Other Assets), representing 0.01% of the fund’s net assets and 0.41% of Vanguard’s capitalization. The fund’s trustees and officers are also directors and officers of Vanguard.
D. The fund has asked its investment advisors to direct certain security trades, subject to obtaining the best price and execution, to brokers who have agreed to rebate to the fund part of the commissions generated. Such rebates are used solely to reduce the fund’s management and administrative expenses. The fund’s custodian bank has also agreed to reduce its fees when the fund maintains cash on deposit in the non-interest-bearing custody account. For the year ended August 31, 2008, these arrangements reduced the fund’s management and administrative expenses by $259,000 and custodian fees by $4,000. The total expense reduction represented an effective annual rate of 0.01% of the fund’s average net assets.
E. Distributions are determined on a tax basis and may differ from net investment income and realized capital gains for financial reporting purposes. Differences may be permanent or temporary. Permanent differences are reclassified among capital accounts in the financial statements to reflect their tax character. Temporary differences arise when certain items of income, expense, gain, or loss are recognized in different periods for financial statement and tax purposes; these differences will reverse at some time in the future. Differences in classification may also result from the treatment of short-term gains as ordinary income for tax purposes.
21
For tax purposes, at August 31, 2008, the fund had $19,079,000 of ordinary income available for distribution. The fund had available realized losses of $6,142,272,000 to offset future net capital gains of $2,582,798,000 through August 31, 2010, $2,548,333,000 through August 31, 2011, $887,490,000 through August 31, 2012, and $123,651,000 through August 31, 2013.
At August 31, 2008, the cost of investment securities for tax purposes was $4,505,687,000. Net unrealized appreciation of investment securities for tax purposes was $265,942,000, consisting of unrealized gains of $436,726,000 on securities that had risen in value since their purchase and $170,784,000 in unrealized losses on securities that had fallen in value since their purchase.
At August 31, 2008, the aggregate settlement value of open futures contracts expiring in September 2008 and the related unrealized appreciation (depreciation) were:
| | | ($000) |
| Number of | Aggregate | Unrealized |
| Long (Short) | Settlement | Appreciation |
Futures Contracts | Contracts | Value | (Depreciation) |
S&P 500 Index | 198 | 63,489 | (3,612) |
S&P Mid-Cap 400 Index | 108 | 44,064 | (3,123) |
E-mini S&P 500 Index | 20 | 1,283 | 7 |
E-mini S&P Mid-Cap 400 Index | 6 | 489 | 15 |
Unrealized appreciation (depreciation) on open futures contracts is required to be treated as realized gain (loss) for tax purposes.
F. During the year ended August 31, 2008, the fund purchased $5,357,366,000 of investment securities and sold $5,842,699,000 of investment securities other than temporary cash investments.
G. Capital share transactions for each class of shares were:
Year Ended August 31, |
| | 2008 | | | 2007 |
| Amount | Shares | | Amount | Shares |
| ($000) | (000) | | ($000) | (000) |
Investor Shares | | | | | |
Issued | 488,406 | 26,158 | | 407,021 | 21,765 |
Issued in Lieu of Cash Distributions | 24,561 | 1,226 | | 21,402 | 1,180 |
Redeemed | (864,765) | (45,681) | | (1,246,698) | (66,948) |
Net Increase (Decrease)—Investor Shares | (351,798) | (18,297) | | (818,275) | (44,003) |
Admiral Shares | | | | | |
Issued | 207,633 | 4,245 | | 232,243 | 4,793 |
Issued in Lieu of Cash Distributions | 10,509 | 203 | | 8,540 | 182 |
Redeemed | (324,312) | (6,673) | | (346,106) | (7,213) |
Net Increase (Decrease)—Admiral Shares | (106,170) | (2,225) | | (105,323) | (2,238) |
22
H. In September 2006, the Financial Accounting Standards Board issued Statement of Financial Accounting Standards No. 157 (“FAS 157”), “Fair Value Measurements.” FAS 157 establishes a framework for measuring fair value and expands disclosures about fair value measurements in financial statements.
The various inputs that may be used to determine the value of the fund’s investments are summarized in three broad levels. The inputs or methodologies used for valuing securities are not necessarily an indication of the risk associated with investing in those securities.
Level 1—Quoted prices in active markets for identical securities.
Level 2—Other significant observable inputs (including quoted prices for similar securities, interest rates, prepayment speeds, credit risk, etc.).
Level 3—Significant unobservable inputs (including the fund’s own assumptions used to determine the fair value of investments).
The following table summarizes the fund’s investments as of August 31, 2008, based on the inputs used to value them:
��
| Investments | Futures |
| in Securities | Contracts |
Valuation Inputs | ($000) | ($000) |
Level 1—Quoted prices | 4,753,712 | (6,713) |
Level 2—Other significant observable inputs | 17,917 | — |
Level 3—Significant unobservable inputs | — | — |
Total | 4,771,629 | (6,713) |
23
Report of Independent Registered
Public Accounting Firm
To the Trustees of Vanguard World Funds and the Shareholders of Vanguard U.S. Growth Fund:
In our opinion, the accompanying statement of net assets and the related statements of operations and of changes in net assets and the financial highlights present fairly, in all material respects, the financial position of Vanguard U.S. Growth Fund (the “Fund”) at August 31, 2008, the results of its operations for the year then ended, the changes in its net assets for each of the two years in the period then ended and the financial highlights for each of the five years in the period then ended, in conformity with accounting principles generally accepted in the United States of America. These financial statements and financial highlights (hereafter referred to as “financial statements”) are the responsibility of the Fund’s management; our responsibility is to express an opinion on these financial statements based on our audits. We conducted our audits of these financial statements in accordance with the standards of the Public Company Accounting Oversight Board (United States). Those standards require that we plan and perform the audit to obtain reasonable assurance about whether the financial statements are free of material misstatement. An audit includes examining, on a test basis, evidence supporting the amounts and disclosures in the financial statements, assessing the accounting principles used and significant estimates made by management, and evaluating the overall financial statement presentation. We believe that our audits, which included confirmation of securities at August 31, 2008 by correspondence with the custodian and broker and by agreement to the underlying ownership records for Vanguard Market Liquidity Fund, provide a reasonable basis for our opinion.
PricewaterhouseCoopers LLP
Philadelphia, Pennsylvania
October 14, 2008
Special 2008 tax information (unaudited) for Vanguard U.S. Growth Fund
This information for the fiscal year ended August 31, 2008, is included pursuant to provisions of the Internal Revenue Code.
The fund distributed $36,217,000 of qualified dividend income to shareholders during the fiscal year.
For corporate shareholders, 100% of investment income (dividend income plus short-term gains, if any) qualifies for the dividends-received deduction.
24
Your Fund’s After-Tax Returns
This table presents returns for your fund both before and after taxes. The after-tax returns are shown in two ways: (1) assuming that an investor owned the fund during the entire period and paid taxes on the fund’s distributions, and (2) assuming that an investor paid taxes on the fund’s distributions and sold all shares at the end of each period.
Calculations are based on the highest individual federal income tax and capital gains tax rates in effect at the times of the distributions and the hypothetical sales. State and local taxes were not considered. After-tax returns reflect any qualified dividend income, using actual prior-year figures and estimates for 2008. (In the example, returns after the sale of fund shares may be higher than those assuming no sale. This occurs when the sale would have produced a capital loss. The calculation assumes that the investor received a tax deduction for the loss.)
The table shows returns for Investor Shares only; returns for other share classes will differ. Please note that your actual after-tax returns will depend on your tax situation and may differ from those shown. Also note that if you own the fund in a tax-deferred account, such as an individual retirement account or a 401(k) plan, this information does not apply to you. Such accounts are not subject to current taxes.
Finally, keep in mind that a fund’s performance—whether before or after taxes—does not guarantee future results.
Average Annual Total Returns: U.S. Growth Fund Investor Shares1 |
Periods Ended August 31, 2008 | | | |
| One | Five | Ten |
| Year | Years | Years |
Returns Before Taxes | –7.44% | 5.41% | –1.54% |
Returns After Taxes on Distributions | –7.52 | 5.36 | –2.28 |
Returns After Taxes on Distributions and Sale of Fund Shares | –4.71 | 4.67 | –1.29 |
1 Total returns do not include the account service fee that may be applicable to certain accounts with balances below $10,000.
25
About Your Fund’s Expenses
As a shareholder of the fund, you incur ongoing costs, which include costs for portfolio management, administrative services, and shareholder reports (like this one), among others. Operating expenses, which are deducted from a fund’s gross income, directly reduce the investment return of the fund.
A fund’s expenses are expressed as a percentage of its average net assets. This figure is known as the expense ratio. The following examples are intended to help you understand the ongoing costs (in dollars) of investing in your fund and to compare these costs with those of other mutual funds. The examples are based on an investment of $1,000 made at the beginning of the period shown and held for the entire period.
The accompanying table illustrates your fund’s costs in two ways:
• Based on actual fund return. This section helps you to estimate the actual expenses that you paid over the period. The “Ending Account Value” shown is derived from the fund’s actual return, and the third column shows the dollar amount that would have been paid by an investor who started with $1,000 in the fund. You may use the information here, together with the amount you invested, to estimate the expenses that you paid over the period.
To do so, simply divide your account value by $1,000 (for example, an $8,600 account value divided by $1,000 = 8.6), then multiply the result by the number given for your fund under the heading “Expenses Paid During Period.”
• Based on hypothetical 5% yearly return. This section is intended to help you compare your fund’s costs with those of other mutual funds. It assumes that the fund had a yearly return of 5% before expenses, but that the expense ratio is unchanged. In this case—because the return used is not the fund’s actual return—the results do not apply to your investment. The example is useful in making comparisons because the Securities and Exchange Commission requires all mutual funds to calculate expenses based on a 5% return. You can assess your fund’s costs by comparing this hypothetical example with the hypothetical examples that appear in shareholder reports of other funds.
Six Months Ended August 31, 2008 | | | |
| Beginning | Ending | Expenses |
| Account Value | Account Value | Paid During |
U.S. Growth Fund | 2/29/2008 | 8/31/2008 | Period1 |
Based on Actual Fund Return | | | |
Investor Shares | $1,000.00 | $1,026.39 | $2.04 |
Admiral Shares | 1,000.00 | 1,027.25 | 1.23 |
Based on Hypothetical 5% Yearly Return | | | |
Investor Shares | $1,000.00 | $1,023.19 | $2.04 |
Admiral Shares | 1,000.00 | 1,024.00 | 1.22 |
1 The calculations are based on expenses incurred in the most recent six-month period. The fund’s annualized six-month expense ratios for that period are 0.40% for Investor Shares and 0.24% for Admiral Shares. The dollar amounts shown as “Expenses Paid” are equal to the annualized expense ratio multiplied by the average account value over the period, multiplied by the number of days in the most recent six-month period, then divided by the number of days in the most recent 12-month period.
26
Note that the expenses shown in the table are meant to highlight and help you compare ongoing costs only and do not reflect transaction costs incurred by the fund for buying and selling securities. Further, the expenses do not include the account service fee described in the prospectus. If such a fee were applied to your account, your costs would be higher. Your fund does not charge transaction fees, such as purchase or redemption fees, nor does it carry a “sales load.”
The calculations assume no shares were bought or sold during the period. Your actual costs may have been higher or lower, depending on the amount of your investment and the timing of any purchases or redemptions.
You can find more information about the fund’s expenses, including annual expense ratios, in the Financial Statements section of this report. For additional information on operating expenses and other shareholder costs, please refer to your fund’s current prospectus.
27
Glossary
Beta. A measure of the magnitude of a fund’s past share-price fluctuations in relation to the ups and downs of a given market index. The index is assigned a beta of 1.00. Compared with a given index, a fund with a beta of 1.20 typically would have seen its share price rise or fall by 12% when the index rose or fell by 10%. For this report, beta is based on returns over the past 36 months for both the fund and the index. Note that a fund’s beta should be reviewed in conjunction with its R-squared. The lower the R-squared, the less correlation there is between the fund and the index, and the less reliable beta is as an indicator of volatility.
Earnings Growth Rate. The average annual rate of growth in earnings over the past five years for the stocks now in a fund.
Equity Exposure. A measure that reflects a fund’s investments in stocks and stock futures. Any holdings in short-term reserves are excluded.
Expense Ratio. The percentage of a fund’s average net assets used to pay its annual administrative and advisory expenses. These expenses directly reduce returns to investors.
Foreign Holdings. The percentage of a fund represented by stocks or depositary receipts of companies based outside the United States.
Inception Date. The date on which the assets of a fund (or one of its share classes) are first invested in accordance with the fund’s investment objective. For funds with a subscription period, the inception date is the day after that period ends. Investment performance is measured from the inception date.
Median Market Cap. An indicator of the size of companies in which a fund invests; the midpoint of market capitalization (market price x shares outstanding) of a fund’s stocks, weighted by the proportion of the fund’s assets invested in each stock. Stocks representing half of the fund’s assets have market capitalizations above the median, and the rest are below it.
Price/Book Ratio. The share price of a stock divided by its net worth, or book value, per share. For a fund, the weighted average price/book ratio of the stocks it holds.
Price/Earnings Ratio. The ratio of a stock’s current price to its per-share earnings over the past year. For a fund, the weighted average P/E of the stocks it holds. P/E is an indicator of market expectations about corporate prospects; the higher the P/E, the greater the expectations for a company’s future growth.
R-Squared. A measure of how much of a fund’s past returns can be explained by the returns from the market in general, as measured by a given index. If a fund’s total returns were precisely synchronized with an index’s returns, its R-squared would be 1.00. If the fund’s returns bore no relationship to the index’s returns, its R-squared would be 0. For this report, R-squared is based on returns over the past 36 months for both the fund and the index.
Return on Equity. The annual average rate of return generated by a company during the past five years for each dollar of shareholder’s equity (net income divided by shareholder’s equity). For a fund, the weighted average return on equity for the companies whose stocks it holds.
Short-Term Reserves. The percentage of a fund invested in highly liquid, short-term securities that can be readily converted to cash.
Turnover Rate. An indication of the fund’s trading activity. Funds with high turnover rates incur higher transaction costs and may be more likely to distribute capital gains (which may be taxable to investors). The turnover rate excludes in-kind transactions, which have minimal impact on costs.
28
Yield. A fund’s 30-day SEC yield is derived using a formula specified by the U.S. Securities and Exchange Commission. Under the formula, data related to the fund’s security holdings in the previous 30 days are used to calculate the fund’s hypothetical net income for that period, which is then annualized and divided by the fund’s estimated average net assets over the calculation period. For the purposes of this calculation, a security’s income is based on its current market yield to maturity (in the case of bonds) or its projected dividend yield (for stocks). Because the SEC yield represents hypothetical annualized income, it will differ—at times significantly—from the fund’s actual experience. As a result, the fund’s income distributions may be higher or lower than implied by the SEC yield.
29
This page intentionally left blank.
This page intentionally left blank.
The People Who Govern Your Fund
The trustees of your mutual fund are there to see that the fund is operated and managed in your best interests since, as a shareholder, you are a part owner of the fund. Your fund’s trustees also serve on the board of directors of The Vanguard Group, Inc., which is owned by the Vanguard funds and provides services to them on an at-cost basis.
A majority of Vanguard’s board members are independent, meaning that they have no affiliation with Vanguard or the funds they oversee, apart from the sizable personal investments they have made as private individuals.
Our independent board members bring distinguished backgrounds in business, academia, and public service to their task of working with Vanguard officers to establish the policies and oversee the activities of the funds. Among board members’ responsibilities are selecting investment advisors for the funds; monitoring fund operations, performance, and costs; reviewing contracts; nominating and selecting new trustees/directors; and electing Vanguard officers.
Each trustee serves a fund until its termination; or until the trustee’s retirement, resignation, or death; or otherwise as specified in the fund’s organizational documents. Any trustee may be removed at a shareholders’ meeting by a vote representing two-thirds of the net asset value of all shares of the fund together with shares of other Vanguard funds organized within the same trust. The table on these two pages shows information for each trustee and executive officer of the fund. The mailing address of the trustees and officers is P.O. Box 876, Valley Forge, PA 19482.
Chairman of the Board and Trustee
John J. Brennan1
Born 1954 Principal Occupation(s) During the Past Five Years: Chairman of the Board and Director/ Trustee Since May 1987; Trustee of The Vanguard Group, Inc., and of each of the investment companies served Chairman of the Board by The Vanguard Group; Director of Vanguard Marketing Corporation; President and Chief 156 Vanguard Funds Overseen Executive Officer of The Vanguard Group and of each of the investment companies served by The Vanguard Group (1996–2008).
Independent Trustees
Charles D. Ellis
Born 1937 Principal Occupation(s) During the Past Five Years: Applecore Partners (pro bono ventures Trustee Since January 2001 in education); Senior Advisor to Greenwich Associates (international business strategy 156 Vanguard Funds Overseen consulting); Successor Trustee of Yale University; Overseer of the Stern School of Business at New York University; Trustee of the Whitehead Institute for Biomedical Research.
Emerson U. Fullwood
Born 1948 Principal Occupation(s) During the Past Five Years: Executive Chief Staff and Marketing Trustee Since January 2008 Officer for North America since 2004 and Corporate Vice President of Xerox Corporation 156 Vanguard Funds Overseen (photocopiers and printers); Director of SPX Corporation (multi-industry manufacturing), of the United Way of Rochester, and of the Boy Scouts of America.
Rajiv L. Gupta
Born 1945 Principal Occupation(s) During the Past Five Years: Chairman, President, and Trustee Since December 20012 Chief Executive Officer of Rohm and Haas Co. (chemicals); Board Member of 156 Vanguard Funds Overseen the American Chemistry Council; Director of Tyco International, Ltd. (diversified manufacturing and services) since 2005.
Amy Gutmann
Born 1949 Principal Occupation(s) During the Past Five Years: President of the University of
Trustee Since June 2006 Pennsylvania since 2004; Professor in the School of Arts and Sciences, Annenberg School 156 Vanguard Funds Overseen for Communication, and Graduate School of Education of the University of Pennsylvania since 2004; Provost (2001–2004) and Laurance S. Rockefeller Professor of Politics and the University Center for Human Values (1990–2004), Princeton University; Director of Carnegie Corporation of New York since 2005 and of Schuylkill River Development Corporation and Greater Philadelphia Chamber of Commerce since 2004; Trustee of the National Constitution Center since 2007.
JoAnn Heffernan Heisen
Born 1950 Principal Occupation(s) During the Past Five Years: Corporate Vice President and Trustee Since July 1998 Chief Global Diversity Officer since 2006, Vice President and Chief Information 156 Vanguard Funds Overseen Officer (1997–2005), and Member of the Executive Committee of Johnson & Johnson (pharmaceuticals/consumer products); Director of the University Medical Center at Princeton and Women’s Research and Education Institute.
André F. Perold
Born 1952 Principal Occupation(s) During the Past Five Years: George Gund Professor of Finance Trustee Since December 2004 and Banking, Harvard Business School; Senior Associate Dean and Director of Faculty 156 Vanguard Funds Overseen Recruiting, Harvard Business School; Director and Chairman of UNX, Inc. (equities trading firm); Chair of the Investment Committee of HighVista Strategies LLC (private investment firm) since 2005.
Alfred M. Rankin, Jr.
Born 1941 Principal Occupation(s) During the Past Five Years: Chairman, President, Chief Executive Trustee Since January 1993 Officer, and Director of NACCO Industries, Inc. (forklift trucks/housewares/lignite); Director 156 Vanguard Funds Overseen of Goodrich Corporation (industrial products/aircraft systems and services).
J. Lawrence Wilson
Born 1936 Principal Occupation(s) During the Past Five Years: Retired Chairman and Chief Executive Trustee Since April 1985 Officer of Rohm and Haas Co. (chemicals); Director of Cummins Inc. (diesel engines) and 156 Vanguard Funds Overseen AmerisourceBergen Corp. (pharmaceutical distribution); Trustee of Vanderbilt University and of Culver Educational Foundation.
Executive Officers1
Thomas J. Higgins
Born 1957 Principal Occupation(s) During the Past Five Years: Principal of The Vanguard Group, Inc.; Treasurer Since July 1998 Treasurer of each of the investment companies served by The Vanguard Group. 156 Vanguard Funds Overseen
F. William McNabb III
Born 1957 Principal Occupation(s) During the Past Five Years: Chief Executive Officer, Director, Chief Executive Officer and President of The Vanguard Group, Inc., since 2008; Chief Executive Officer and Since August 31, 2008 President of each of the investment companies served by The Vanguard Group since President Since March 2008 2008; Director of Vanguard Marketing Corporation; Managing Director of The Vanguard 156 Vanguard Funds Overseen Group (1995–2008).
Heidi Stam
Born 1956 Principal Occupation(s) During the Past Five Years: Managing Director of The Vanguard Secretary Since July 2005 Group, Inc., since 2006; General Counsel of The Vanguard Group since 2005; Secretary of 156 Vanguard Funds Overseen The Vanguard Group and of each of the investment companies served by The Vanguard Group, since 2005; Director and Senior Vice President of Vanguard Marketing Corporation since 2005; Principal of The Vanguard Group (1997–2006).
Vanguard Senior Management Team | | |
| | | |
R. Gregory Barton | Kathleen C. Gubanich | Michael S. Miller | Glenn W. Reed |
Mortimer J. Buckley | Paul A. Heller | Ralph K. Packard | George U. Sauter |
Founder
John C. Bogle
Chairman and Chief Executive Officer, 1974–1996
1 These individuals are “interested persons” as defined in the Investment Company Act of 1940.
2 December 2002 for Vanguard Equity Income Fund, Vanguard Growth Equity Fund, the Vanguard Municipal Bond Funds, and the Vanguard State Tax-Exempt Funds.
More information about the trustees is in the Statement of Additional Information, available from The Vanguard Group.

P.O. Box 2600
Valley Forge, PA 19482-2600
Connect with Vanguard® > www.vanguard.com
Fund Information > 800-662-7447 | All comparative mutual fund data are from Lipper Inc. |
| or Morningstar, Inc., unless otherwise noted. |
Direct Investor Account Services > 800-662-2739 | |
| You can obtain a free copy of Vanguard’s proxy voting |
Institutional Investor Services > 800-523-1036 | guidelines by visiting our website, www.vanguard.com, |
| and searching for “proxy voting guidelines,” or by |
Text Telephone for People | calling Vanguard at 800-662-2739. The guidelines are |
With Hearing Impairment > 800-952-3335 | also available from the SEC’s website, www.sec.gov. |
| In addition, you may obtain a free report on how your |
| fund voted the proxies for securities it owned during |
| the 12 months ended June 30. To get the report, visit |
This material may be used in conjunction | either www.vanguard.com or www.sec.gov. |
with the offering of shares of any Vanguard | |
fund only if preceded or accompanied by | |
the fund’s current prospectus. | |
| |
| You can review and copy information about your fund |
| at the SEC’s Public Reference Room in Washington, D.C. |
| To find out more about this public service, call the SEC |
The funds or securities referred to herein are not | at 202-551-8090. Information about your fund is also |
sponsored, endorsed, or promoted by MSCI, and MSCI | available on the SEC’s website, and you can receive |
bears no liability with respect to any such funds or | copies of this information, for a fee, by sending a |
securities. For any such funds or securities, the | request in either of two ways: via e-mail addressed to |
prospectus or the Statement of Additional Information | publicinfo@sec.gov or via regular mail addressed to the |
contains a more detailed description of the limited | Public Reference Section, Securities and Exchange |
relationship MSCI has with The Vanguard Group and | Commission, Washington, DC 20549-0102. |
any related funds. | |
| |
Russell is a trademark of The Frank Russell Company. | |
| |
CFA is a trademark owned by CFA Institute. | |
© 2008 The Vanguard Group, Inc., All rights reserved.
Vanguard Marketing Corporation, Distributor.
Q230 102008

> Vanguard International Growth Fund returned –12.8% for Investor Shares (–12.7% for Admiral Shares) in the fiscal year ended August 31, 2008, a disappointing result that nevertheless exceeded the returns of its comparative standards.
> Most developed markets lost value in the period, while most emerging-market regions notched gains.
> As the repercussions of credit-market turmoil and the economic slowdown in the United States spread across the globe, three sectors accounted for most of the fund’s decline: consumer discretionary, industrials, and financials.
Contents | |
| |
Your Fund’s Total Returns | 1 |
President’s Letter | 2 |
Advisors’ Report | 7 |
Fund Profile | 12 |
Performance Summary | 14 |
Financial Statements | 16 |
Your Fund’s After-Tax Returns | 31 |
About Your Fund’s Expenses | 32 |
Glossary | 34 |
Please note: The opinions expressed in this report are just that—informed opinions. They should not be considered promises or advice. Also, please keep in mind that the information and opinions cover the period through the date on the front of this report. Of course, the risks of investing in your fund are spelled out in the prospectus.
Your Fund’s Total Returns
Fiscal Year Ended August 31, 2008 | | |
| Ticker | Total |
| Symbol | Returns |
Vanguard International Growth Fund | | |
Investor Shares | VWIGX | –12.8% |
Admiral™ Shares1 | VWILX | –12.7 |
MSCI EAFE Index | | –14.4 |
Average International Fund2 | | –14.8 |
Your Fund’s Performance at a Glance | | | | |
August 31, 2007–August 31, 2008 | | | | |
| | | Distributions Per Share |
| Starting | Ending | Income | Capital |
| Share Price | Share Price | Dividends | Gains |
Vanguard International Growth Fund | | | | |
Investor Shares | $26.13 | $20.43 | $0.528 | $2.214 |
Admiral Shares | 83.26 | 65.09 | 1.845 | 7.045 |
1 A lower-cost class of shares available to many longtime shareholders and to those with significant investments in the fund.
2 Derived from data provided by Lipper Inc.
1

President’s Letter
Dear Shareholder,
In a tumultuous year, Investor Shares of Vanguard International Growth Fund returned a disappointing –12.8% (the lower-cost Admiral Shares returned –12.7%). Nevertheless, the fund outperformed both its benchmark index and the average result of peer funds by about 2 percentage points.
Many stock markets around the globe enjoyed a rousing start to the fiscal year, notching record highs. However, resilience soon gave way to weakness, driving many markets into—or near—bear market territory near the end of the period. Your fund benefited from the advisors’ stock selection in virtually all regions, especially Europe and Latin America. The relative weakness of the U.S. dollar compared with the euro and the yen (but not the British pound) also provided some support for dollar-based investors’ returns, as some foreign holdings became worth more when converted into U.S. dollars.
If you invest in the fund through a taxable account, page 30 shows after-tax returns for investors in the highest tax bracket.
Stocks performed poorly as volatility returned
Stocks lost ground as credit-market turmoil spread throughout the global economy. Over the full 12 months, the broad U.S. stock market lost about 10% of its value. International markets followed a similar path, returning –12.2% for the year.
2
The descent was bumpy. After years of relative calm, global stock markets routinely rose or fell by more than a percentage point in a day’s trading. The volatility reflected a seemingly endless series of unnerving developments: higher energy prices, further deterioration in the U.S. housing market, several bank failures, and deceleration in the globe’s major economic engines.
Risk-aversion increased, and Treasuries outperformed
The collapse in subprime mortgage-backed securities and the aftershocks prompted a flight to safety. Short-term U.S. Treasury securities were among the fixed income market’s best performers. Over the 12 months, the broad taxable bond market returned a respectable 5.9%, largely reflecting the Treasury bond rally.
As risk-aversion increased, the difference between the yields of Treasury bonds and those of all other securities increased, depressing the price of corporate debt. (Yield and price move in opposite directions.) Even as corporate bonds grew cheaper, the prices of most goods and services rose quickly, powered by escalating energy prices.
The combination of higher inflation, financial market volatility, and economic weakness put the U.S. Federal Reserve Board in an uncomfortable position. The Fed decided that it was imperative to respond to the financial crisis with a
Market Barometer | | | |
| Average Annual Total Returns |
| Periods Ended August 31, 2008 |
| One Year | Three Years | Five Years |
Stocks | | | |
MSCI All Country World Index ex USA (International) | –12.2% | 10.7% | 16.1% |
Russell 1000 Index (Large-caps) | –10.6 | 3.9 | 7.4 |
Russell 2000 Index (Small-caps) | –5.5 | 4.8 | 9.6 |
Dow Jones Wilshire 5000 Index (Entire market) | –9.9 | 4.2 | 7.9 |
| | | |
| | | |
Bonds | | | |
Lehman U.S. Aggregate Bond Index (Broad taxable market) | 5.9% | 4.3% | 4.6% |
Lehman Municipal Bond Index | 4.5 | 3.3 | 4.4 |
Citigroup 3-Month Treasury Bill Index | 2.8 | 4.0 | 3.1 |
| | | |
| | | |
CPI | | | |
Consumer Price Index | 5.4% | 3.7% | 3.5% |
3
dramatic easing of monetary policy through interest rate cuts, even as it recognized that the result might be higher inflation. Over the full 12 months, the Fed reduced its target for the federal funds rate from 5.25% to 2.00%.
As developed markets stumbled, emerging markets cushioned the fall
At the start of the fiscal year, it appeared that fallout from the subprime-mortgage debacle would largely be contained in the United States. In short order, however, the global extent of the credit problems became apparent as foreign banks disclosed significant holdings of U.S. mortgage-related securities. Slower growth coupled with rising inflation crossed the Atlantic from the United States to markets in Europe and beyond, creating stiff headwinds.
Companies based in Europe’s developed countries anchored International Growth’s portfolio. They accounted for about 60% of both the fund’s average value and total return for the period. Even though the fund’s exposure to financial stocks was less than that of its benchmark, the asset write-downs by many overseas banks weighed on the fund’s performance. Among the leading detractors were Anglo Irish Bank, UniCredit (a top-ten holding and one of Europe’s largest banks), UBS, Barclays, and Royal Bank of Scotland.
Expense Ratios1 | | | |
Your Fund Compared With Its Peer Group | | | |
| | | Average |
| Investor | Admiral | International |
| Shares | Shares | Fund |
International Growth Fund | 0.51% | 0.31% | 1.48% |
Total Returns | |
Ten Years Ended August 31, 2008 | |
| Average |
| Annual Return |
International Growth Fund Investor Shares | 7.0% |
MSCI EAFE Index | 6.3 |
Average International Fund2 | 5.9 |
The figures shown represent past performance, which is not a guarantee of future results. (Current performance may be lower or higher than the performance data cited. For performance data current to the most recent month-end, visit our website at www.vanguard.com/performance.) Note, too, that both investment returns and principal value can fluctuate widely, so an investor’s shares, when sold, could be worth more or less than their original cost.
1 Fund expense ratios shown are from the prospectus dated April 29, 2008. Expense ratios for the fiscal year ended August 31, 2008, were 0.47% for Investor Shares and 0.28% for Admiral Shares. Peer-group expense ratio is derived from data provided by Lipper Inc. and captures information through year-end 2007.
2 Derived from data provided by Lipper Inc.
4
Consumer discretionary companies in Europe, including automakers BMW and Rolls-Royce Group, also struggled as soaring oil prices and slower growth made customers more budget-conscious. In consumer staples, British retailing giant Tesco, a top-ten holding, also slipped.
Outside of Europe, the fund’s largest position was in Japan, where the long-awaited economic rebound stalled. In midsummer, Japan’s exports fell for the first time in almost five years, depriving many multinational companies and the Japanese economy of an important growth engine. In this environment, the fund benefited from its below-benchmark investment in the country. Among the detractors were Sony, Sumitomo Heavy Industries, and Toray Industries (a chemicals and textile maker).
The fund’s long-standing commitment to emerging markets continued to prove rewarding. All regions except Asia posted gains, led by Latin America (up 17% for the year). In 2007, top-ten holding Petróleo Brasileiro (Petrobras) announced the discovery of an oil field off the coast of Brazil that is potentially one of the world’s largest finds in recent years. Brazilian mining giant Companhia Vale do Rio Doce was boosted by soaring prices for iron ore and other commodities. In Asia, reversing course from last year, many electronics and industrial giants (especially in South Korea) lost ground amid slower demand.
For more about the advisors’ strategies and the fund’s positioning during the year, see the Advisors’ Report—including our first report from M&G Investment Management Limited—which begins on page 7. As discussed in the fund’s semiannual report, M&G (based in London, England) joined the fund’s management team in late February.
The fund’s long-term record remains impressive
For the ten years ended August 31—a period that included intermittent gains and setbacks for international markets—the International Growth Fund bested its comparative standards. This is a tribute to the experience, discipline, and skill of its advisors, who scour the globe—including developing countries—to identify companies with seemingly attractive long-term growth prospects. In addition, the fund’s low expenses help investors keep more of the fund’s return, an advantage that compounds over time.
Diversification is key to long-term success
Not long ago, it appeared that international markets might be moving toward “decoupling,” or becoming more insulated from economic developments in the United States. This view has not been borne out over the last 12 months. But even though foreign markets may experience some of the same ups and downs as those in the United States, they don’t march in lockstep—not with
5
each other and not with their U.S. counterparts. This divergent performance underscores the potentially significant diversification benefits of investing abroad.
The past year has also provided a valuable reminder of how quickly market trends can reverse. Oil prices are a case in point: After what seemed like an inexorable climb, they abruptly reversed course. Prices of many other commodities followed a similar path. Investors who make frequent portfolio shifts to try to benefit from such trends often end up frustrated, and they can incur additional costs.
Instead, we encourage you to take the long view—to establish a balanced and diversified mix of stocks, bonds, and money market funds that is consistent with your goals, time horizon, and risk tolerance. Then try to stick with your asset allocation plan. As part of your equity portfolio, Vanguard International Growth Fund can help you to capture opportunities that may not be available within U.S. borders.
Thank you for your entrusting your assets
to Vanguard.
Sincerely,

F. William McNabb III
President and Chief Executive Officer
September 12, 2008
6
Advisors’ Report
For the fiscal year ended August 31, 2008, Vanguard International Growth Fund’s Investor Shares returned –12.8% (Admiral Shares returned –12.7%). This performance reflects the combined efforts of your fund’s three independent advisors. The use of more than one advisor provides exposure to distinct, yet complementary, investment approaches, enhancing the fund’s diversification.
The advisors, the percentage and amount of fund assets each manages, and brief descriptions of their investment strategies are presented in the table below. The advisors have also prepared a discussion of the investment environment that existed during the fiscal year and of how their portfolio positioning reflects this assessment. These comments were prepared on September 11, 2008.
Schroder Investment Management
North America Inc.
Portfolio Managers:
Virginie Maisonneuve, CFA
Head of Global and International Equities
Matthew Dobbs
Head of Global Small Companies
For the past 12 months, international markets (represented by the MSCI EAFE Index) returned –14.4% in U.S. dollars. We witnessed a global economic slowdown and the deleveraging of the global banking system. In this context, financial and consumer discretionary stocks performed the worst, while utilities, energy, and consumer staples did best. Currencies showed strong volatility, with the U.S. dollar rebounding sharply toward the end of the fiscal year after prolonged weakness.
Vanguard International Growth Fund Investment Advisors |
| | | |
| Fund Assets Managed | |
Investment Advisor | % | $ Million | Investment Strategy |
Schroder Investment Management | 50 | 8,461 | Equity analysts in 11 countries and an international |
North America Inc. | | | team of global sector and regional specialists help |
| | | to identify reasonably priced companies with strong |
| | | growth prospects and a sustainable competitive |
| | | advantage. |
Baillie Gifford Overseas Ltd. | 40 | 6,766 | The advisor seeks stocks that can generate above- |
| | | average growth in earnings and cash flow, producing |
| | | a bottom-up, stock-driven approach to country and |
| | | asset allocation. An in-depth view on each company |
| | | is measured against the consensus view, leading to |
| | | discrepancies and potential opportunities to add value. |
M&G Investment Management Limited | 7 | 1,107 | The advisor constructs a portfolio using a long-term, |
| | | bottom-up investment approach focusing on |
| | | identifying underappreciated companies—particularly |
| | | those with scarce assets—with the ability to deliver |
| | | high returns and growth potential. |
Cash Investments1 | 3 | 480 | — |
1 These short-term reserves are invested by Vanguard in equity index products to simulate investment in stocks. Each advisor may also maintain a modest cash position.
7
The year was punctuated by several shifts in investors’ main concerns. After initially focusing on the immediate fallout from the U.S. subprime-mortgage crisis, investors began to fear the onset of “stagflation.” Expectations of a sharp economic slowdown were combined with worries about increased inflation, driven by steep increases in oil and commodity prices that reflected strength in emerging-market economies. Most recently, inflationary pressures have receded, as we expected, with the deceleration in global growth; this has led to weaker commodities prices, while wage pressures have been mild.
The framework in which businesses operate globally has been marked by pockets of difficulty during the fiscal year, especially for companies that rely on external financing, as most banks have found it difficult to keep up with their past lending activities. In Europe, the interbank market is still tight, and the European Central Bank recently restrained its emergency-lending procedures.
While the markets in peripheral Europe have been weak for a while, those in core Europe decelerated notably during the summer, after being relatively resilient. In the United Kingdom in particular, consumer confidence came under severe pressure as property prices adjusted sharply lower. European banks have been raising capital as deleveraging and asset destruction have intensified. In Switzerland, regulators stepped in to tighten the operating framework, and we expect similar trends throughout Europe in the coming year.
The pace of growth in emerging-market economies also slowed in the fiscal period, but was still healthy compared with the rest of the world. Trading within the region became increasingly important, offsetting the impact of weaker demand for exports (especially to the United States and Europe). Consumers and companies within developing countries also faced increased inflation. While emerging-market equities had been fairly resilient, they have sharply corrected in 2008 as the impact of the global slowdown has intensified. We continue to believe that growth in emerging markets is on a strong secular trend, although there are clear signs of a cyclical slowdown. We believe that this will provide attractive opportunities to further raise our emerging-markets position.
During the period, some of the strongest contributors in our portion of the portfolio included Rio Tinto (a mining company headquartered in the United Kingdom), Syngenta (a Swiss agribusiness firm specializing in crop protection), Unibanco-União de Bancos Brasileiros (Brazilian bank), ArcelorMittal (one of the world’s largest steelmakers, headquartered in Luxembourg), and Honda Motor (Japanese auto company). For the most part, these companies have benefited from strong structural growth linked to climate change, demographics, and emerging-market demand. Although holdings such as Daewoo Shipbuilding & Marine Engineering, a South Korean company, have disappointed, we believe market sentiment has been overly pessimistic, and we expect demand for energy-related shipping vessels to remain buoyant. The market has also
8
been concerned about companies in Asia, such as hotel group Shangri-La Asia, which was affected by the Sichuan earthquake, and Singapore property company Keppel Land.
Although economic adjustments by consumers and financial deleveraging will continue over the next 12 months, it is important to point out that some countries are now, or soon will be, operating in a negative real interest rate environment, which historically has been beneficial to equities. In addition, valuations are becoming increasingly attractive. In this environment, we continue to strive to identify quality growth companies trading at a reasonable price with sustainable earnings growth.
Baillie Gifford Overseas Ltd.
Portfolio Manager:
James K. Anderson,
Chief Investment Officer and
Head of Global Equities
The fiscal year ended August 31 has been a painful one for equity investors. Media watchers will have amassed ample reasons for gloom, if not despair. The best antidote is to listen to the companies in the portfolio. Some of them are telling us that their short-term outlook has deteriorated. Universally, however, the companies in our portfolio are robustly optimistic about their long-term prospects.
Several firms have reminded us that some parts of the world, China in particular, are still growing strongly. Perhaps even the United States is more resilient than many suppose.
In our view, we are already partway through what might be called “The Big Adjustment.” The largest of the world’s imbalances, the U.S. current account deficit, is shrinking rapidly as currency markets begin to impose a more sustainable pattern on world trade. And the debt-inflated housing markets on both sides of the Atlantic are subsiding to more sensible levels as consumers relearn the attractions of saving. The corporate sector has made good progress in reorienting its sales effort toward the developing world, and banks have begun the painful process of deleveraging, though not all can be expected to survive.
Looking forward, we expect that growth will be slower than before and that credit will be tight. This will create a big problem for the weaker “also ran” companies, especially in the financial sector, so we are starting to look for banks that will benefit from their competitors’ difficulties. The developing world is still the site of most of the economic growth, so we are keeping our big exposure to the emerging markets. Their weak share prices have made us more enthusiastic. We have always liked traditional growth stocks too, and many are now trading at low valuations.
9
High finance has crash-landed, but the real economy is not in such bad shape. We think our companies can battle through the current crisis and will still be standing when it is over.
M&G Investment Management Limited
Portfolio Managers:
Graham E. French, Portfolio Manager
Greg Aldridge, Portfolio Manager
Since our appointment as an advisor to the International Growth Fund in late February, our strategy has been directed by our firm belief that a long-term investment horizon supported by bottom-up analysis of company fundamentals is the most effective way to achieve superior returns for investors. Our analysis seeks to identify businesses that have a number of scarce assets that are hard for competitors to replicate, enabling those businesses to achieve high and sustainable returns on capital and to reinvest profitably—thereby increasing the firms’ value and share prices over time.
The ability of these companies to generate sustainable returns also makes them attractive to investors in uncertain times. As such, we believe our portion of the portfolio is well-positioned to deal with the current difficult market environment and, more important, the future.
Our holdings are well-diversified: About 60% of the portfolio is invested in Europe, about 25% is in Asia, and the remainder in Canada, Central and South America, and South Africa. While this geographical positioning is a product of bottom-up company analysis rather than any top-down views on individual countries, it is worth mentioning that we invest directly in some of the world’s developing markets, where we can find quality companies supported by higher-than-average levels of economic growth. From a sector perspective, the portfolio’s main relative exposures have been an overweighting to health care and an underweighting to financials—again, positions that result from the merits of the underlying companies, rather than a view on the sectors as a whole.
Our overweighted position in health care proved beneficial amid strong performances by large, defensive pharmaceutical businesses such as Switzerland’s Novartis and the United Kingdom’s GlaxoSmithKline, following an extended period of underperformance. During a volatile period for financials, our stock selection in this area was a positive. Solid contributions to performance came from U.K.-listed HSBC Holdings, the high-quality global bank with emerging-market exposure, and Dutch financials giant ING Groep, whose product and geographical diversification should help it to sustain superior returns.
10
In contrast, the main detractors in our portfolio included Canadian nickel and coal producer Sherritt International, which was hurt by declines in commodities prices; Swiss cement business Holcim, which faced fears over challenging end markets; and Austrian building-products maker Wienerberger, which suffered from negative sentiment toward the construction industry.
We will continue to focus on a broad range of differentiated businesses whose scarce assets should enable them to generate high returns and to grow over the long term. We believe this approach will enable the fund to ride out periods of volatility, such as those currently affecting financial markets, and will thereby provide superior returns for investors in the long run.
11
Fund Profile
As of August 31, 2008
Portfolio Characteristics | | |
| | Comparative | Broad |
| Fund | Index1 | Index2 |
Number of Stocks | 168 | 1,022 | 1,900 |
Turnover Rate | 55% | — | — |
Expense Ratio (8/31/2007)3 | | — | — |
Investor Shares | 0.51% | | |
Admiral Shares | 0.31% | | |
Short-Term Reserves | 1.2% | — | — |
Sector Diversification (% of equity exposure) |
| | Comparative | Broad |
| Fund | Index1 | Index2 |
Consumer Discretionary | 11.0% | 9.1% | 8.6% |
Consumer Staples | 10.1 | 8.8 | 8.3 |
Energy | 10.2 | 11.4 | 12.4 |
Financials | 19.3 | 22.3 | 22.7 |
Health Care | 5.7 | 8.7 | 8.0 |
Industrials | 15.6 | 11.2 | 10.8 |
Information Technology | 8.5 | 9.3 | 9.2 |
Materials | 10.9 | 8.8 | 9.5 |
Telecommunication | | | |
Services | 6.7 | 5.2 | 5.6 |
Utilities | 2.0 | 5.2 | 4.9 |
Volatility Measures4 | |
| Fund Versus | Fund Versus |
| Comparative Index1 | Broad Index2 |
R-Squared | 0.98 | 0.97 |
Beta | 1.06 | 0.95 |
Ten Largest Holdings5 | (% of total net assets) |
| | |
Tesco PLC | food retail | 2.5% |
Nestlé SA (Registered) | packaged foods | |
| and meats | 2.0 |
Roche Holdings AG | pharmaceuticals | 1.8 |
Syngenta AG | fertilizers and | |
| agricultural chemicals | 1.7 |
Vodafone Group PLC | wireless | |
| telecommunication | |
| services | 1.7 |
Petróleo Brasileiro SA | integrated oil | |
| and gas | 1.7 |
Siemens AG | industrial | |
| conglomerates | 1.7 |
Standard Chartered PLC | diversified banks | 1.5 |
Swire Pacific Ltd. A Shares | real estate | |
| management and | |
| development | 1.5 |
UniCredit SpA | diversified banks | 1.5 |
Top Ten | | 17.6% |
Allocation by Region (% of equity exposure)
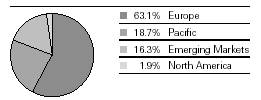
1 MSCI EAFE Index.
2 MSCI All Country World Index ex USA.
3 Fund expense ratios shown are from the prospectus dated April 29, 2008. Expense ratios for the fiscal year ended August 31, 2008 were 0.47% for Investor Shares and 0.28% for Admiral shares.
4 For an explanation of R-squared, beta, and other terms used here, see the Glossary.
5 The holdings listed exclude any temporary cash investments and equity index products.
12
Market Diversification (% of equity exposure) |
| | Comparative | Broad |
| Fund1 | Index2 | Index3 |
Europe | | | |
United Kingdom | 18.2% | 21.6% | 15.5% |
Germany | 9.0 | 9.1 | 6.7 |
Switzerland | 8.9 | 7.5 | 5.5 |
France | 7.6 | 11.0 | 8.1 |
Netherlands | 4.0 | 2.7 | 2.0 |
Spain | 3.5 | 4.1 | 3.0 |
Sweden | 3.3 | 2.2 | 1.7 |
Denmark | 3.1 | 1.0 | 0.8 |
Italy | 2.1 | 3.8 | 2.8 |
Norway | 1.2 | 1.0 | 0.8 |
Other European | | | |
Markets | 2.2 | 4.7 | 3.5 |
Subtotal | 63.1% | 68.7% | 50.4% |
Pacific | | | |
Japan | 10.7% | 21.4% | 15.8% |
Hong Kong | 4.4 | 2.1 | 1.6 |
Australia | 2.7 | 6.5 | 4.8 |
Other Pacific Markets | 0.9 | 1.3 | 1.0 |
Subtotal | 18.7% | 31.3% | 23.2% |
Emerging Markets | | | |
Brazil | 4.9% | — | 3.1% |
South Korea | 1.7 | — | 2.2 |
China | 3.5 | — | 2.9 |
Israel | 1.9 | — | 0.5 |
India | 1.2 | | 1.3 |
Taiwan | 1.0 | — | 2.0 |
Other Emerging | | | |
Markets | 2.1 | — | 7.0 |
Subtotal | 16.3% | — | 19.0% |
North America | | | |
Canada | 1.9% | — | 7.4% |
1 Market percentages exclude currency contracts held by the fund.
2 MSCI EAFE Index.
3 MSCI All Country World Index ex USA.
13
Performance Summary
All of the returns in this report represent past performance, which is not a guarantee of future results that may be achieved by the fund. (Current performance may be lower or higher than the performance data cited. For performance data current to the most recent month-end, visit our website at www.vanguard.com/performance.) Note, too, that both investment returns and principal value can fluctuate widely, so an investor’s shares, when sold, could be worth more or less than their original cost. The returns shown do not reflect taxes that a shareholder would pay on fund distributions or on the sale of fund shares.
Cumulative Performance: August 31, 1998–August 31, 2008
Initial Investment of $10,000
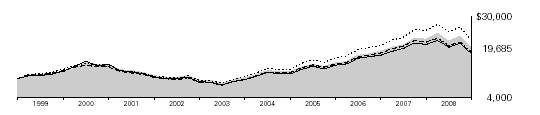
| Average Annual Total Returns | Final Value |
| Periods Ended August 31, 2008 | of a $10,000 |
| One Year | Five Years | Ten Years | Investment |
International Growth Fund Investor Shares1 | –12.83% | 13.93% | 7.01% | $19,685 |
MSCI All Country World Index ex USA | –12.17 | 16.13 | 8.37 | 22,333 |
MSCI EAFE Index | –14.41 | 13.86 | 6.34 | 18,496 |
Average International Fund2 | –14.84 | 12.92 | 5.93 | 17,792 |
| | | | Final Value |
| | | Since | of a $100,000 |
| One Year | Five Years | Inception3 | Investment |
International Growth Fund Admiral Shares1 | –12.67% | 14.15% | 8.63% | $179,213 |
MSCI All Country World Index ex USA | –12.17 | 16.13 | 10.49 | 202,032 |
MSCI EAFE Index | –14.41 | 13.86 | 8.25 | 174,871 |
1 Total returns do not reflect the 2% fee assessed on redemptions of shares purchased on or after June 27, 2003, and held for less than two months, nor for the Investor Shares do they include the account service fee that may be applicable to certain accounts with balances below $10,000.
2 Derived from data provided by Lipper Inc.
3 Performance for the fund’s Admiral Shares and comparative standards is calculated since the Admiral Shares’ inception: August 13, 2001.
14
Fiscal Year Total Returns (%): August 31, 1998–August 31, 2008
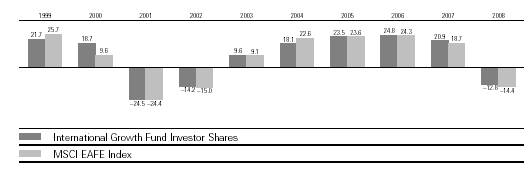
Average Annual Total Returns: Periods Ended June 30, 2008
This table presents average annual total returns through the latest calendar quarter—rather than through the end of the fiscal period. Securities and Exchange Commission rules require that we provide this information.
| Inception Date | One Year | Five Years | Ten Years |
Investor Shares1 | 9/30/1981 | –7.41% | 17.12% | 6.63% |
Admiral Shares1 | 8/13/2001 | –7.23 | 17.35 | 10.162 |
1 Total returns do not reflect the 2% fee assessed on redemptions of shares purchased on or after June 27, 2003, and held for less than two months, nor for the Investor Shares do they include the account service fee that may be applicable to certain accounts with balances below $10,000.
2 Return since inception.
15
Financial Statements
Statement of Net Assets
As of August 31, 2008
The fund provides a complete list of its holdings four times in each fiscal year, at the quarter-ends. For the second and fourth fiscal quarters, the lists appear in the fund’s semiannual and annual reports to shareholders. For the first and third fiscal quarters, the fund files the lists with the Securities and Exchange Commission on Form N-Q. Shareholders can look up the fund’s Forms N-Q on the SEC’s website at www.sec.gov. Forms N-Q may also be reviewed and copied at the SEC’s Public Reference Room (see the back cover of this report for further information).
| | Market |
| | Value• |
| Shares | ($000) |
Common Stocks (95.6%)1 | | |
Australia (2.4%) | | |
Woodside Petroleum Ltd. | 2,777,000 | 149,161 |
Woolworths Ltd. | 3,995,600 | 96,464 |
Brambles Ltd. | 9,423,900 | 61,834 |
Orica Ltd. | 1,593,000 | 33,738 |
^James Hardie | | |
Industries NV | 7,105,000 | 28,168 |
Sims Group Ltd. | 655,000 | 19,201 |
Amcor Ltd. | 3,900,000 | 18,304 |
| | 406,870 |
Austria (0.1%) | | |
^Wienerberger AG | 860,000 | 22,568 |
| | |
Belgium (0.1%) | | |
^Barco NV | 315,000 | 14,709 |
| | |
Brazil (4.8%) | | |
Petroleo Brasileiro | | |
SA Series A ADR | 6,142,200 | 263,930 |
Banco Itau Holding | | |
Financeira SA ADR | 7,811,250 | 148,414 |
Unibanco-Uniao de | | |
Bancos Brasileiros SA | 8,635,000 | 103,567 |
Redecard SA | 5,648,705 | 102,647 |
Companhia Vale do Rio | | |
Doce Sponsored ADR | 3,641,900 | 86,568 |
Companhia Vale do Rio | | |
Doce Pfd. Class A | 1,789,000 | 41,806 |
Petroleo Brasileiro SA Pfd. | 980,000 | 21,097 |
Banco do Brasil SA | 1,085,000 | 15,796 |
Votorantim Celulose | | |
e Papel SA Pfd. | 700,000 | 14,762 |
BM&F BOVESPA SA | 803,781 | 6,154 |
| | 804,741 |
Canada (1.9%) | | |
Niko Resources Ltd. | 2,026,489 | 147,149 |
Cameco Corp. | 4,669,000 | 140,448 |
Sherritt International Corp. | 1,750,000 | 15,740 |
| Harry Winston Diamond Corp. | 545,714 | 10,690 |
2 | Harry Winston Diamond Corp. | | |
| Private Placement | 166,286 | 3,095 |
| | | 317,122 |
China (3.5%) | | |
| China Mobile | | |
| (Hong Kong) Ltd. | 11,372,500 | 129,101 |
| China Unicom Ltd. | 71,390,000 | 112,939 |
| Ctrip.com | | |
| International Ltd. ADR | 2,028,000 | 101,968 |
| China Resources | | |
| Enterprise Ltd. | 31,410,000 | 85,002 |
| CNOOC Ltd. | 44,035,000 | 68,466 |
| Denway Motors Ltd. | 171,826,000 | 61,217 |
| Chaoda Modern | | |
| Agriculture Holdings Ltd. | 14,400,000 | 15,293 |
| Dongfang Electrical | | |
| Corp Ltd. | 3,215,600 | 9,963 |
| | | 583,949 |
Denmark (3.0%) | | |
* | Vestas Wind Systems A/S | 1,485,736 | 201,605 |
| Danske Bank A/S | 4,039,000 | 113,656 |
| Novo Nordisk | | |
| A/S B Shares | 1,940,000 | 108,294 |
| ^Novozymes A/S | 634,400 | 63,708 |
| AP Moller-Maersk | | |
| A/S B Shares | 2,250 | 25,172 |
| | | 512,435 |
France (7.1%) | | |
| L’Oreal SA | 2,361,336 | 234,385 |
| Total SA | 2,779,169 | 199,645 |
| AXA | 6,252,000 | 199,485 |
| Groupe Danone | 2,136,000 | 148,893 |
| STMicroelectronics NV | 10,802,000 | 141,091 |
| Essilor International SA | 2,333,000 | 124,110 |
| Gaz de France | 1,638,190 | 94,306 |
| Societe Generale Class A | 300,000 | 28,939 |
| Publicis Groupe SA | 700,000 | 23,462 |
| | | 1,194,316 |
16
| | Market |
| | Value• |
| Shares | ($000) |
Germany (8.6%) | | |
Siemens AG | 2,615,000 | 283,852 |
SAP AG | 3,923,500 | 219,832 |
E.On AG | 3,495,000 | 204,107 |
Porsche AG | 994,400 | 139,587 |
*,^Q-Cells AG | 986,500 | 99,370 |
ThyssenKrupp AG | 1,864,000 | 92,996 |
Adidas AG | 1,580,410 | 92,521 |
Linde AG | 542,985 | 68,299 |
Bayerische Motoren | | |
Werke AG | 1,457,300 | 59,619 |
Celesio AG | 1,522,800 | 58,252 |
^Solarworld AG | 1,093,498 | 56,687 |
K+S AG | 376,800 | 45,475 |
Symrise AG | 1,200,000 | 20,673 |
| | 1,441,270 |
Greece (0.4%) | | |
EFG Eurobank Ergasias | 3,625,699 | 72,937 |
| | |
Hong Kong (4.4%) | | |
Swire Pacific Ltd. | | |
A Shares | 25,149,000 | 251,205 |
Jardine Matheson | | |
Holdings Ltd. | 3,663,200 | 105,458 |
Esprit Holdings Ltd. | 10,600,400 | 87,509 |
Industrial and | | |
Commercial Bank | | |
of China Ltd. Class H | 118,246,000 | 80,965 |
Shangri-La Asia Ltd. | 42,062,000 | 80,767 |
^Hong Kong Exchanges & | | |
Clearing Ltd. | 6,214,500 | 80,276 |
Li & Fung Ltd. | 10,292,000 | 31,296 |
^Techtronic Industries | | |
Co., Ltd. | 20,499,943 | 19,085 |
| | 736,561 |
India (1.1%) | | |
*,2 Bharti Airtel Ltd. Warrants | | |
Exp. 8/10/10 | 4,459,000 | 85,445 |
2 State Bank of India | | |
Warrants Exp. 01/28/09 | 1,964,800 | 63,738 |
Reliance Capital Ltd. | 1,454,500 | 45,043 |
| | 194,226 |
Ireland (0.7%) | | |
Allied Irish Banks PLC | 3,997,260 | 50,375 |
Anglo Irish Bank | | |
Corp. PLC | 5,162,496 | 44,719 |
Kerry Group PLC A Shares | 825,000 | 22,373 |
| | 117,467 |
Israel (1.9%) | | |
Teva Pharmaceutical | | |
Industries Ltd. | | |
Sponsored ADR | 5,179,800 | 245,212 |
Makhteshim-Agan | | |
Industries Ltd. | 10,576,000 | 71,407 |
| | 316,619 |
Italy (1.9%) | | |
| UniCredit SpA | 45,858,553 | 246,749 |
| Intesa Sanpaolo SpA | 14,327,662 | 76,909 |
| | | 323,658 |
Japan (9.8%) | | |
| Canon, Inc. | 3,654,600 | 163,886 |
| Mitsubishi Corp. | 5,022,000 | 137,950 |
| Honda Motor Co., Ltd. | 4,169,000 | 135,399 |
| Nintendo Co. | 251,600 | 118,116 |
| Square Enix Co., Ltd. | 3,494,300 | 115,187 |
* | Mitsui Sumitomo Insurance | | |
| Group Holdings, Inc. | 3,434,100 | 112,635 |
| SMC Corp. | 1,055,800 | 108,550 |
| Sekisui Chemical Co. | 16,661,000 | 103,190 |
| Central Japan Railway Co. | 9,839 | 102,206 |
| Komatsu Ltd. | 4,398,800 | 92,065 |
| Sumitomo Mitsui Financial | | |
| Group, Inc. | 14,800 | 89,602 |
| Rakuten, Inc. | 156,452 | 87,142 |
| Japan Tobacco, Inc. | 12,639 | 59,984 |
| Hoya Corp. | 2,310,700 | 47,104 |
| Yamada Denki Co., Ltd. | 596,500 | 42,853 |
| Asahi Glass Co., Ltd. | 3,937,000 | 41,795 |
| Toyota Motor Corp. | 600,000 | 26,771 |
| Astellas Pharma Inc. | 580,000 | 26,124 |
| Sumitomo Heavy | | |
| Industries Ltd. | 5,223,000 | 25,397 |
| Yamaha Motor Co., Ltd. | 1,275,000 | 19,642 |
| | | 1,655,598 |
Luxembourg (0.9%) | | |
| ArcelorMittal | 1,833,000 | 143,788 |
| | | |
Mexico (0.7%) | | |
| America Movil SA de | | |
| CV Series L ADR | 1,403,500 | 72,112 |
| Wal-Mart de Mexico SA | 8,200,000 | 29,928 |
| Consorcio ARA SA de CV | 18,000,000 | 14,197 |
| | | 116,237 |
Netherlands (3.8%) | | |
3 | SBM Offshore NV | 7,344,750 | 177,698 |
| Unilever NV | 4,638,000 | 127,976 |
| ^ING Groep NV | 2,816,501 | 87,746 |
| Koninklijke (Royal) Philips | | |
| Electronics NV | 2,561,000 | 83,207 |
| Heineken Holding NV | 1,471,074 | 65,249 |
| ASML Holding NV | 2,200,231 | 51,887 |
| ^European Aeronautic | | |
| Defence and Space Co. | 1,150,000 | 25,744 |
| TNT NV | 640,000 | 23,873 |
| | | 643,380 |
Norway (1.2%) | | |
| Telenor ASA | 10,926,000 | 171,722 |
| StatoilHydro ASA | 779,000 | 23,896 |
| | | 195,618 |
17
| | Market |
| | Value• |
| Shares | ($000) |
Russia (0.6%) | | |
OAO Gazprom | | |
Sponsored ADR | 2,634,100 | 102,495 |
| | |
Singapore (0.8%) | | |
^Keppel Land Ltd. | 35,212,000 | 95,646 |
^Singapore Exchange Ltd. | 6,541,000 | 28,884 |
DBS Group Holdings Ltd. | 1,300,000 | 16,438 |
| | 140,968 |
South Africa (0.4%) | | |
Impala Platinum | | |
Holdings Ltd. | 1,778,600 | 50,184 |
MTN Group Ltd. | 1,100,000 | 16,912 |
| | 67,096 |
South Korea (1.7%) | | |
Daewoo Shipbuilding & | | |
Marine Engineering | | |
Co., Ltd. | 5,826,000 | 184,309 |
Samsung Fire & Marine | | |
Insurance Co. | 186,900 | 33,943 |
Shinsegae Co., Ltd. | 51,800 | 25,722 |
Samsung Electronics | | |
Co., Ltd. | 38,000 | 17,825 |
Hankook Tire Co. Ltd. | 1,200,000 | 17,527 |
| | 279,326 |
Spain (3.3%) | | |
Telefonica SA | 8,163,000 | 201,696 |
Repsol YPF SA | 4,432,000 | 137,084 |
^Industria de Diseno | | |
Textil SA | 2,605,085 | 121,154 |
Banco Santander Central | | |
Hispano SA | 5,636,600 | 95,819 |
| | 555,753 |
Sweden (3.2%) | | |
^Atlas Copco AB A Shares | 15,095,533 | 210,714 |
Sandvik AB | 11,859,363 | 146,976 |
Telefonaktiebolaget LM | | |
Ericsson AB Class B | 10,264,034 | 117,167 |
^Svenska Handelsbanken | | |
AB A Shares | 1,471,406 | 35,404 |
Oriflame Cosmetics SA | 575,000 | 33,240 |
| | 543,501 |
Switzerland (8.8%) | | |
Nestle SA (Registered) | 7,548,000 | 332,562 |
Roche Holdings AG | 1,784,007 | 300,210 |
Syngenta AG | 1,078,100 | 289,265 |
Cie. Financiere | | |
Richemont AG | 3,236,100 | 188,292 |
* UBS AG | 5,142,591 | 111,780 |
| Credit Suisse Group | | |
| (Registered) | 2,185,000 | 101,346 |
| Geberit AG | 494,180 | 71,929 |
| Novartis AG (Registered) | 510,000 | 28,411 |
| Holcim Ltd. (Registered) | 350,000 | 25,165 |
| Adecco SA (Registered) | 505,797 | 23,733 |
| | | 1,472,693 |
Taiwan (0.9%) | | |
| Taiwan Semiconductor | | |
| Manufacturing Co., Ltd. | 41,916,826 | 77,204 |
| Hon Hai Precision | | |
| Industry Co., Ltd. | 13,053,200 | 65,482 |
| Compal Electronics Inc. | 17,487,000 | 15,687 |
| | | 158,373 |
Turkey (0.4%) | | |
* | Turkiye Garanti | | |
| Bankasi A.S. | 20,354,000 | 60,258 |
| | | |
United Kingdom (17.2%) | | |
| Tesco PLC | 59,487,000 | 412,327 |
| Vodafone Group PLC | 112,345,000 | 287,103 |
| Standard Chartered PLC | 9,610,800 | 259,912 |
| Rio Tinto PLC | 2,403,000 | 228,114 |
| WPP Group PLC | 22,549,000 | 219,479 |
| Rolls-Royce Group PLC | 30,409,616 | 219,477 |
| BG Group PLC | 9,327,000 | 206,886 |
| BHP Billiton PLC | 6,362,600 | 198,169 |
| Rexam PLC | 22,174,343 | 163,655 |
| Admiral Group PLC | 7,920,000 | 139,857 |
| The Sage Group PLC | 28,445,162 | 108,456 |
| Barclays PLC | 12,464,000 | 79,756 |
| Royal Bank of Scotland | | |
| Group PLC | 15,462,000 | 65,761 |
| Meggitt PLC | 14,917,500 | 62,368 |
| Capita Group PLC | 3,551,612 | 45,696 |
| Bunzl PLC | 2,828,500 | 36,766 |
| GlaxoSmithKline PLC | 1,250,000 | 29,414 |
| HSBC Holdings PLC | 1,729,688 | 27,216 |
| Unilever PLC | 1,000,000 | 26,822 |
| Ultra Electronics | | |
| Holdings PLC | 1,010,000 | 25,381 |
| Victrex PLC | 1,618,557 | 23,995 |
| Inchcape PLC | 4,250,000 | 19,952 |
| | | 2,886,562 |
Total Common Stocks | | |
(Cost $15,910,215) | | 16,081,094 |
Temporary Cash Investments (5.3%)1 | | |
Money Market Fund (4.9%) | | |
4,5 | Vanguard Market Liquidity | | |
| Fund, 2.389% | 819,781,219 | 819,781 |
18
| | Market |
| Face | Value• |
| Amount | ($000) |
U.S. Agency Obligations (0.4%) | | |
6 Federal National Mortgage Assn. | | |
2.464%, 11/5/08 | 10,000 | 9,955 |
7 2.585%, 11/17/08 | 54,800 | 54,505 |
| | 64,460 |
Total Temporary Cash Investments | | |
(Cost $884,236) | | 884,241 |
Total Investments (100.9%) | | |
(Cost $16,794,451) | | 16,965,335 |
Other Assets and Liabilities (–0.9%) | | |
Other Assets | | 48,851 |
Liabilities5 | | (200,300) |
| | (151,449) |
Net Assets (100%) | | 16,813,886 |
At August 31, 2008, net assets consisted of: |
| Amount |
| ($000) |
Paid-in Capital | 15,664,063 |
Undistributed Net Investment Income | 303,101 |
Accumulated Net Realized Gains | 686,919 |
Unrealized Appreciation (Depreciation) | |
Investment Securities | 170,884 |
Futures Contracts | (31,617) |
Foreign Currencies and | |
Forward Currency Contracts | 20,536 |
Net Assets | 16,813,886 |
| |
| |
Investor Shares—Net Assets | |
Applicable to 585,823,221 outstanding | |
$.001 par value shares of beneficial | |
interest (unlimited authorization) | 11,969,013 |
Net Asset Value Per Share— | |
Investor Shares | $20.43 |
| |
| |
Admiral Shares—Net Assets | |
Applicable to 74,435,122 outstanding | |
$.001 par value shares of beneficial | |
interest (unlimited authorization) | 4,844,873 |
Net Asset Value Per Share— | |
Admiral Shares | $65.09 |
• See Note A in Notes to Financial Statements.
* Non-income-producing security.
^ Part of security position is on loan to broker-dealers. The total value of securities on loan is $182,539,000.
1 The fund invests a portion of its cash reserves in equity markets through the use of index futures contracts. After giving effect to futures investments, the fund’s effective common stock and temporary cash investment positions represent 98.5% and 2.4%, respectively, of net assets.
2 Security exempt from registration under Rule 144A of the Securities Act of 1933. Such securities may be sold in transactions exempt from registration, normally to qualified institutional buyers. At August 31, 2008, the aggregate value of these securities was $152,278,000, representing 0.9% of net assets.
3 Considered an affiliated company of the fund as the fund owns more than 5% of the outstanding voting securities of such company.
4 Affiliated money market fund available only to Vanguard funds and certain trusts and accounts managed by
Vanguard. Rate shown is the 7-day yield.
5 Includes $191,858,000 of collateral received for securities on loan.
6 The issuer operates under a congressional charter; its securities are neither issued nor guaranteed by the U.S. government.
7 Securities with a value of $39,785,000 have been segregated as initial margin for open futures contracts. ADR—American Depositary Receipt.
See accompanying Notes, which are an integral part of the Financial Statements.
19
Statement of Operations
| Year Ended |
| August 31, 2008 |
| ($000) |
Investment Income | |
Income | |
Dividends1,2 | 429,488 |
Interest2 | 37,076 |
Security Lending | 13,253 |
Total Income | 479,817 |
Expenses | |
Investment Advisory Fees—Note B | |
Basic Fee | 22,808 |
Performance Adjustment | 3,220 |
The Vanguard Group—Note C | |
Management and Administrative—Investor Shares | 37,093 |
Management and Administrative—Admiral Shares | 4,666 |
Marketing and Distribution—Investor Shares | 2,788 |
Marketing and Distribution—Admiral Shares | 1,059 |
Custodian Fees | 5,842 |
Auditing Fees | 35 |
Shareholders’ Reports—Investor Shares | 386 |
Shareholders’ Reports—Admiral Shares | 36 |
Trustees’ Fees and Expenses | 30 |
Total Expenses | 77,963 |
Expenses Paid Indirectly | (289) |
Net Expenses | 77,674 |
Net Investment Income | 402,143 |
Realized Net Gain (Loss) | |
Investment Securities Sold2 | 1,322,139 |
Futures Contracts | (201,556) |
Foreign Currencies and Forward Currency Contracts | 43,649 |
Realized Net Gain (Loss) | 1,164,232 |
Change in Unrealized Appreciation (Depreciation) | |
Investment Securities | (4,107,320) |
Futures Contracts | (14,382) |
Foreign Currencies and Forward Currency Contracts | 16,714 |
Change in Unrealized Appreciation (Depreciation) | (4,104,988) |
Net Increase (Decrease) in Net Assets Resulting from Operations | (2,538,613) |
1 Dividends are net of foreign withholding taxes of $26,841,000.
2 Dividend income, interest income, and realized net gain (loss) from affiliated companies of the fund were $4,328,000, $34,952,000, and ($517,000), respectively.
See accompanying Notes, which are an integral part of the Financial Statements.
20
Statement of Changes in Net Assets
| Year Ended August 31, |
| 2008 | 2007 |
| ($000) | ($000) |
Increase (Decrease) in Net Assets | | |
Operations | | |
Net Investment Income | 402,143 | 417,169 |
Realized Net Gain (Loss) | 1,164,232 | 1,604,165 |
Change in Unrealized Appreciation (Depreciation) | (4,104,988) | 997,178 |
Net Increase (Decrease) in Net Assets Resulting from Operations | (2,538,613) | 3,018,512 |
Distributions | | |
Net Investment Income | | |
Investor Shares | (273,198) | (236,800) |
Admiral Shares | (119,608) | (88,348) |
Realized Capital Gain1 | | |
Investor Shares | (1,145,568) | (909,670) |
Admiral Shares | (456,714) | (312,400) |
Total Distributions | (1,995,088) | (1,547,218) |
Capital Share Transactions | | |
Investor Shares | 1,975,823 | 1,670,489 |
Admiral Shares | 1,092,739 | 1,165,318 |
Net Increase (Decrease) from Capital Share Transactions | 3,068,562 | 2,835,807 |
Total Increase (Decrease) | (1,465,139) | 4,307,101 |
Net Assets | | |
Beginning of Period | 18,279,025 | 13,971,924 |
End of Period2 | 16,813,886 | 18,279,025 |
1 Includes fiscal 2008 and 2007 short-term gain distributions totaling $364,747,000 and $280,908,000, respectively. Short-term gain distributions are treated as ordinary income dividends for tax purposes.
2 Net Assets—End of Period includes undistributed net investment income of $303,101,000 and $316,265,000. See accompanying Notes, which are an integral part of the Financial Statements.
21
Financial Highlights
Investor Shares | | | | | |
| | | | | |
| | | | | |
| | | Year Ended August 31, |
For a Share Outstanding Throughout Each Period | 2008 | 2007 | 2006 | 2005 | 2004 |
Net Asset Value, Beginning of Period | $26.13 | $23.97 | $19.83 | $16.33 | $14.01 |
Investment Operations | | | | | |
Net Investment Income | .473 | .594 | .541 | .341 | .27 |
Net Realized and Unrealized Gain (Loss) | | | | | |
on Investments | (3.431) | 4.132 | 4.284 | 3.474 | 2.26 |
Total from Investment Operations | (2.958) | 4.726 | 4.825 | 3.815 | 2.53 |
Distributions | | | | | |
Dividends from Net Investment Income | (.528) | (.530) | (.370) | (.315) | (.21) |
Distributions from Realized Capital Gains | (2.214) | (2.036) | (.315) | — | — |
Total Distributions | (2.742) | (2.566) | (.685) | (.315) | (.21) |
Net Asset Value, End of Period | $20.43 | $26.13 | $23.97 | $19.83 | $16.33 |
| | | | | |
| | | | | |
Total Return1 | –12.83% | 20.87% | 24.79% | 23.54% | 18.14% |
| | | | | |
| | | | | |
Ratios/Supplemental Data | | | | | |
Net Assets, End of Period (Millions) | $11,969 | $13,219 | $10,466 | $8,182 | $6,797 |
Ratio of Total Expenses to | | | | | |
Average Net Assets2 | 0.47% | 0.51% | 0.55% | 0.60% | 0.63% |
Ratio of Net Investment Income to | | | | | |
Average Net Assets | 2.07% | 2.47% | 2.52% | 1.89% | 1.69% |
Portfolio Turnover Rate | 55% | 41% | 45% | 48% | 45% |
1 Total returns do not reflect the 2% fee assessed on redemptions of shares purchased on or after June 27, 2003, and held for less than two months or the account service fee that may be applicable to certain accounts with balances below $10,000.
2 Includes performance-based investment advisory fee increases (decreases) of 0.02%, 0.01%, (0.01%), (0.01%), and 0.00%. See accompanying Notes, which are an integral part of the Financial Statements.
22
Admiral Shares | | | | | |
| Year Ended August 31, |
For a Share Outstanding Throughout Each Period | 2008 | 2007 | 2006 | 2005 | 2004 |
Net Asset Value, Beginning of Period | $83.26 | $76.36 | $63.15 | $51.96 | $44.57 |
Investment Operations | | | | | |
Net Investment Income | 1.649 | 2.051 | 1.861 | 1.222 | .93 |
Net Realized and Unrealized Gain (Loss) | | | | | |
on Investments | (10.929) | 13.159 | 13.639 | 11.063 | 7.21 |
Total from Investment Operations | (9.280) | 15.210 | 15.500 | 12.285 | 8.14 |
Distributions | | | | | |
Dividends from Net Investment Income | (1.845) | (1.832) | (1.288) | (1.095) | (.75) |
Distributions from Realized Capital Gains | (7.045) | (6.478) | (1.002) | — | — |
Total Distributions | (8.890) | (8.310) | (2.290) | (1.095) | (.75) |
Net Asset Value, End of Period | $65.09 | $83.26 | $76.36 | $63.15 | $51.96 |
| | | | | |
| | | | | |
Total Return1 | –12.67% | 21.11% | 25.03% | 23.84% | 18.36% |
| | | | | |
| | | | | |
Ratios/Supplemental Data | | | | | |
Net Assets, End of Period (Millions) | $4,845 | $5,060 | $3,506 | $2,181 | $1,262 |
Ratio of Total Expenses to | | | | | |
Average Net Assets2 | 0.28% | 0.31% | 0.35% | 0.40% | 0.45% |
Ratio of Net Investment Income to | | | | | |
Average Net Assets | 2.26% | 2.67% | 2.72% | 2.07% | 1.86% |
Portfolio Turnover Rate | 55% | 41% | 45% | 48% | 45% |
1 Total returns do not reflect the 2% fee assessed on redemptions of shares purchased on or after June 27, 2003, and held for less than two months.
2 Includes performance-based investment advisory fee increases (decreases) of 0.02%, 0.01%, (0.01%), (0.01%), and 0.00%. See accompanying Notes, which are an integral part of the Financial Statements.
23
Notes to Financial Statements
Vanguard International Growth Fund is registered under the Investment Company Act of 1940 as an open-end investment company, or mutual fund. The fund invests in securities of foreign issuers, which may subject it to investment risks not normally associated with investing in securities of United States corporations. The fund offers two classes of shares, Investor Shares and Admiral Shares. Investor Shares are available to any investor who meets the fund’s minimum purchase requirements. Admiral Shares are designed for investors who meet certain administrative, service, tenure, and account-size criteria.
A. The following significant accounting policies conform to generally accepted accounting principles for U.S. mutual funds. The fund consistently follows such policies in preparing its financial statements.
1. Security Valuation: Securities are valued as of the close of trading on the New York Stock Exchange (generally 4 p.m., Eastern time) on the valuation date. Equity securities are valued at the latest quoted sales prices or official closing prices taken from the primary market in which each security trades; such securities not traded on the valuation date are valued at the mean of the latest quoted bid and asked prices. Securities for which market quotations are not readily available, or whose values have been affected by events occurring before the fund’s pricing time but after the close of the securities’ primary markets, are valued at their fair values calculated according to procedures adopted by the board of trustees. These procedures include obtaining quotations from an independent pricing service, monitoring news to identify significant market- or security-specific events, and evaluating changes in the values of foreign market proxies (for example, ADRs, futures contracts, or exchange-traded funds), between the time the foreign markets close and the fund’s pricing time. When fair-value pricing is employed, the prices of securities used by a fund to calculate its net asset value may differ from quoted or published prices for the same securities. Investments in Vanguard Market Liquidity Fund are valued at that fund’s net asset value. Temporary cash investments acquired over 60 days to maturity are valued using the latest bid prices or using valuations based on a matrix system (which considers such factors as security prices, yields, maturities, and ratings), both as furnished by independent pricing services. Other temporary cash investments are valued at amortized cost, which approximates market value.
2. Foreign Currency: Securities and other assets and liabilities denominated in foreign currencies are translated into U.S. dollars using exchange rates obtained from an independent third party as of the fund’s pricing time on the valuation date. Realized gains (losses) and unrealized appreciation (depreciation) on investment securities include the effects of changes in exchange rates since the securities were purchased, combined with the effects of changes in security prices. Fluctuations in the value of other assets and liabilities resulting from changes in exchange rates are recorded as unrealized foreign currency gains (losses) until the assets or liabilities are settled in cash, at which time they are recorded as realized foreign currency gains (losses).
3. Futures and Forward Currency Contracts: The fund uses index futures contracts to a limited extent, with the objective of maintaining full exposure to the European and Pacific stock markets while maintaining liquidity. The fund may purchase or sell futures contracts to achieve a desired level of investment, whether to accommodate portfolio turnover or cash flows from capital share transactions. The primary risks associated with the use of futures contracts are imperfect correlation between changes in market values of stocks held by the fund and the prices of futures contracts, and the possibility of an illiquid market.
24
The fund may also enter into forward currency contracts to provide the appropriate currency exposure related to any open futures contracts or to protect the value of securities and related receivables and payables against changes in foreign exchange rates. The primary risk associated with the fund’s use of these contracts is that a counterparty will fail to fulfill its obligation to pay gains due to the fund under the contracts.
Futures and forward currency contracts are valued at their quoted daily settlement prices. The aggregate principal amounts of the contracts are not recorded in the Statement of Net Assets. Fluctuations in the value of the contracts are recorded in the Statement of Net Assets as an asset (liability) and in the Statement of Operations as unrealized appreciation (depreciation) until the contracts are closed, when they are recorded as realized gains (losses) on futures or forward currency contracts.
4. Federal Income Taxes: The fund intends to continue to qualify as a regulated investment company and distribute all of its taxable income. Management has analyzed the fund’s tax positions taken on federal income tax returns for all open tax years (tax years ended August 31, 2005–2008), and has concluded that no provision for federal income tax is required in the fund’s financial statements.
5. Distributions: Distributions to shareholders are recorded on the ex-dividend date.
6. Security Lending: The fund may lend its securities to qualified institutional borrowers to earn additional income. Security loans are required to be secured at all times by collateral at least equal to the market value of securities loaned. The fund invests cash collateral received in Vanguard Market Liquidity Fund, and records a liability for the return of the collateral, during the period the securities are on loan. Security lending income represents the income earned on investing cash collateral, less expenses associated with the loan.
7. Other: Dividend income is recorded on the ex-dividend date. Interest income includes income distributions received from Vanguard Market Liquidity Fund and is accrued daily. Security transactions are accounted for on the date securities are bought or sold. Costs used to determine realized gains (losses) on the sale of investment securities are those of the specific securities sold. Fees assessed on redemptions of capital shares are credited to paid-in capital.
Each class of shares has equal rights as to assets and earnings, except that each class separately bears certain class-specific expenses related to maintenance of shareholder accounts (included in Management and Administrative expenses) and shareholder reporting. Marketing and distribution expenses are allocated to each class of shares based on a method approved by the board of trustees. Income, other non-class-specific expenses, and gains and losses on investments are allocated to each class of shares based on its relative net assets.
B. Schroder Investment Management North America Inc., Baillie Gifford Overseas Ltd., and M&G Investment Management Ltd. each provide investment advisory services to a portion of the fund for a fee calculated at an annual percentage rate of average net assets managed by the advisor. The basic fees of Schroder Investment Management North America Inc. and Baillie Gifford Overseas Ltd. are subject to quarterly adjustments based on performance for the preceding three years relative to the Morgan Stanley Capital International Europe, Australasia, Far East Index. In accordance with the advisory contract entered into with M&G Investment Management Ltd. in February 2008, beginning December 1, 2008, the investment advisory fee will be subject to quarterly adjustments based on performance since February 29, 2008, relative to the MSCI All Country World Index excluding USA.
25
The Vanguard Group manages the cash reserves of the fund on an at-cost basis.
For the year ended August 31, 2008, the aggregate investment advisory fee represented an effective annual basic rate of 0.12% of the fund’s average net assets before an increase of $3,220,000 (0.02%) based on performance.
C. The Vanguard Group furnishes at cost corporate management, administrative, marketing, and distribution services. The costs of such services are allocated to the fund under methods approved by the board of trustees. The fund has committed to provide up to 0.40% of its net assets in capital contributions to Vanguard. At August 31, 2008, the fund had contributed capital of $1,515,000 to Vanguard (included in Other Assets), representing 0.01% of the fund’s net assets and 1.51% of Vanguard’s capitalization. The fund’s trustees and officers are also directors and officers of Vanguard.
D. The fund has asked its investment advisors to direct certain security trades, subject to obtaining the best price and execution, to brokers who have agreed to rebate to the fund part of the commissions generated. Such rebates are used solely to reduce the fund’s management and administrative expenses. The fund’s custodian bank has also agreed to reduce its fees when the fund maintains cash on deposit in the non-interest-bearing custody account. For the year ended August 31, 2008, these arrangements reduced the fund’s management and administrative expenses by $270,000 and custodian fees by $19,000. The total expense reduction represented an effective annual rate of 0.00% of average net assets.
E. Distributions are determined on a tax basis and may differ from net investment income and realized capital gains for financial reporting purposes. Differences may be permanent or temporary. Permanent differences are reclassified among capital accounts in the financial statements to reflect their tax character. Temporary differences arise when certain items of income, expense, gain, or loss are recognized in different periods for financial statement and tax purposes; these differences will reverse at some time in the future. Differences in classification may also result from the treatment of short-term gains as ordinary income for tax purposes.
During the year ended August 31, 2008, the fund realized net foreign currency gains of $6,477,000, which increased distributable net income for tax purposes; accordingly, such gains have been reclassified from accumulated net realized gains to undistributed net investment income. The fund used a tax accounting practice to treat a portion of the price of capital shares redeemed during the year as distributions from net investment income and realized capital gains. Accordingly, the fund has reclassified $28,978,000 from undistributed net investment income, and $79,910,000 from accumulated net realized gains, to paid-in capital.
For tax purposes, at August 31, 2008, the fund had $324,563,000 of ordinary income and $725,620,000 of long-term capital gains available for distribution.
At August 31, 2008, the cost of investment securities for tax purposes was $16,804,351,000. Net unrealized appreciation of investment securities for tax purposes was $160,984,000, consisting of unrealized gains of $2,124,090,000 on securities that had risen in value since their purchase and $1,963,106,000 in unrealized losses on securities that had fallen in value since their purchase.
26
At August 31, 2008, the aggregate settlement value of open futures contracts expiring in September 2008 and the related unrealized appreciation (depreciation) were:
| | | ($000) |
| Number of | Aggregate | Unrealized |
| Long (Short) | Settlement | Appreciation |
Futures Contracts | Contracts | Value | (Depreciation) |
Dow Jones EURO STOXX 50 Index | 3,962 | 196,749 | (9,781) |
Topix Index | 1,053 | 121,819 | (13,783) |
FTSE 100 Index | 1,181 | 121,673 | (6,220) |
S&P ASX 200 Index | 398 | 44,079 | (1,833) |
At August 31, 2008, the fund had open forward currency contracts to receive and deliver currencies as follows:
| | | | | Unrealized |
| | | | | Appreciation |
| | | Contract Amount (000) | (Depreciation) |
Contract Settlement Date | | Receive | | Deliver | ($000) |
10/9/08 | USD | 606,744 | GBP | 308,900 | 44,941 |
9/24/08 | EUR | 129,681 | USD | 200,516 | (9,965) |
9/24/08 | GBP | 63,032 | USD | 122,212 | (7,458) |
9/17/08 | JPY | 12,889,600 | USD | 121,072 | (2,333) |
9/24/08 | AUD | 48,450 | USD | 45,157 | (3,579) |
AUD—Australian dollar. | | | | | |
EUR—Euro. | | | | | |
GBP—British pound. | | | | | |
JPY—Japanese yen. | | | | | |
USD—U.S. dollar. | | | | | |
Unrealized appreciation (depreciation) on open forward currency contracts is treated as realized gain (loss) for tax purposes.
The fund had net unrealized foreign currency losses of $1,070,000 resulting from the translation of other assets and liabilities at August 31, 2008.
F. During the year ended August 31, 2008, the fund purchased $11,009,060,000 of investment securities and sold $9,837,589,000 of investment securities other than temporary cash investments.
27
G. Capital share transactions for each class of shares were:
| | | Year Ended August 31 |
| | 2008 | | | 2007 |
| Amount | Shares | | Amount | Shares |
| ($000) | (000) | | ($000) | (000) |
Investor Shares | | | | | |
Issued | 2,869,056 | 117,748 | | 2,549,115 | 101,410 |
Issued in Lieu of Cash Distributions | 1,393,855 | 58,443 | | 1,123,137 | 47,631 |
Redeemed1 | (2,287,088) | (96,226) | | (2,001,763) | (79,750) |
Net Increase (Decrease)—Investor Shares | 1,975,823 | 79,965 | | 1,670,489 | 69,291 |
Admiral Shares | | | | | |
Issued | 1,350,456 | 17,226 | | 1,325,389 | 16,528 |
Issued in Lieu of Cash Distributions | 534,007 | 7,037 | | 373,586 | 4,979 |
Redeemed1 | (791,724) | (10,598) | | (533,657) | (6,648) |
Net Increase (Decrease)—Admiral Shares | 1,092,739 | 13,665 | | 1,165,318 | 14,859 |
H. The fund has invested in a company that is considered to be an affiliated company of the fund because the fund owns more than 5% of the outstanding voting securities of the company. Transactions during the period in securities of this company were as follows:
| | | Current Period Transactions | |
| Aug. 31, 2007 | | Proceeds from | | Aug. 31, 2008 |
| Market | Purchases | Securities | Dividend | Market |
| Value | at Cost | Sold | Income | Value |
| ($000) | ($000) | ($000) | ($000) | ($000) |
SBM Offshore NV | NA2 | 270,103 | 39,398 | 4,328 | 177,698 |
I. In September 2006, the Financial Accounting Standards Board issued Statement of Financial Accounting Standards No. 157 (“FAS 157”), “Fair Value Measurements.” FAS 157 establishes a framework for measuring fair value and expands disclosures about fair value measurements in financial statements.
The various inputs that may be used to determine the value of the fund’s investments are summarized in three broad levels. The inputs or methodologies used for valuing securities are not necessarily an indication of the risk associated with investing in those securities.
Level 1—Quoted prices in active markets for identical securities.
Level 2—Other significant observable inputs (including quoted prices for similar securities, interest rates, prepayment speeds, credit risk, etc.).
Level 3—Significant unobservable inputs (including the fund’s own assumptions used to determine the fair value of investments).
1 Net of redemption fees of $1,294,000 and $692,000 (fund totals).
2 At August 31, 2007, the issuer was not an affiliated company of the fund.
28
The following table summarizes the fund’s investments as of August 31, 2008, based on the inputs used to value them:
| | | Forward |
| Investments | Futures | Currency |
| in Securities | Contracts | Contracts |
Valuation Inputs | ($000) | ($000) | ($000) |
Level 1—Quoted prices | 2,401,965 | (31,617) | 21,606 |
Level 2—Other significant observable inputs | 14,560,275 | — | — |
Level 3—Significant unobservable inputs | 3,095 | — | — |
Total | 16,965,335 | (31,617) | 21,606 |
The following table summarizes changes in investments valued based on Level 3 inputs during the year ended August 31, 2008:
| Investments |
| in Securities |
Amount valued based on Level 3 inputs | ($000) |
Balance as of September 1, 2007 | — |
Net Purchases (Sales) | 4,212 |
Change in Unrealized Appreciation (Depreciation) | (1,117) |
Balance as of August 31, 2008 | 3,095 |
29
Report of Independent Registered
Public Accounting Firm
To the Trustees of Vanguard World Funds and the Shareholders of Vanguard International Growth Fund:
In our opinion, the accompanying statement of net assets and the related statements of operations and of changes in net assets and the financial highlights present fairly, in all material respects, the financial position of Vanguard International Growth Fund (the “Fund”) at August 31, 2008, the results of its operations for the year then ended, the changes in its net assets for each of the two years in the period then ended and the financial highlights for each of the five years in the period then ended, in conformity with accounting principles generally accepted in the United States of America. These financial statements and financial highlights (hereafter referred to as “financial statements”) are the responsibility of the Fund’s management; our responsibility is to express an opinion on these financial statements based on our audits. We conducted our audits of these financial statements in accordance with the standards of the Public Company Accounting Oversight Board (United States). Those standards require that we plan and perform the audit to obtain reasonable assurance about whether the financial statements are free of material misstatement. An audit includes examining, on a test basis, evidence supporting the amounts and disclosures in the financial statements, assessing the accounting principles used and significant estimates made by management, and evaluating the overall financial statement presentation. We believe that our audits, which included confirmation of securities at August 31, 2008 by correspondence with the custodian and brokers and by agreement to the underlying ownership records for Vanguard Market Liquidity Fund, provide a reasonable basis for our opinion.
PricewaterhouseCoopers LLP
Philadelphia, Pennsylvania
October 14, 2008
Special 2008 tax information (unaudited) for Vanguard International Growth Fund
This information for the fiscal year ended August 31, 2008, is included pursuant to provisions of the Internal Revenue Code.
The fund distributed $1,311,110,000 as capital gain dividends (from net long-term capital gains) to shareholders during the fiscal year.
The fund distributed $291,580,000 of qualified dividend income to shareholders during the fiscal year.
The fund will pass through to shareholders foreign source income of $456,482,000 and foreign taxes paid of $26,994,000. The pass-through of foreign taxes paid will affect only shareholders on the dividend record date in December 2008. Shareholders will receive more detailed information along with their Form 1099-DIV in January 2009.
30
Your Fund’s After-Tax Returns
This table presents returns for your fund both before and after taxes. The after-tax returns are shown in two ways: (1) assuming that an investor owned the fund during the entire period and paid taxes on the fund’s distributions, and (2) assuming that an investor paid taxes on the fund’s distributions and sold all shares at the end of each period.
Calculations are based on the highest individual federal income tax and capital gains tax rates in effect at the times of the distributions and the hypothetical sales. State and local taxes were not considered. After-tax returns reflect any qualified dividend income, using actual prior-year figures and estimates for 2008. (In the example, returns after the sale of fund shares may be higher than those assuming no sale. This occurs when the sale would have produced a capital loss. The calculation assumes that the investor received a tax deduction for the loss.)
The table shows returns for Investor Shares only; returns for other share classes will differ. Please note that your actual after-tax returns will depend on your tax situation and may differ from those shown. Also note that if you own the fund in a tax-deferred account, such as an individual retirement account or a 401(k) plan, this information does not apply to you. Such accounts are not subject to current taxes.
Finally, keep in mind that a fund’s performance—whether before or after taxes—does not guarantee future results.
Average Annual Total Returns: International Growth Fund Investor Shares1 | | |
Periods Ended August 31, 2008 | | | |
| One | Five | Ten |
| Year | Years | Years |
Returns Before Taxes | –12.83% | 13.93% | 7.01% |
Returns After Taxes on Distributions | –14.54 | 12.78 | 5.95 |
Returns After Taxes on Distributions and Sale of Fund Shares | –6.48 | 11.99 | 5.76 |
1 Total returns do not reflect the 2% fee assessed on redemptions of shares purchased on or after June 27, 2003, and held for less than two months, nor do they include the account service fee that may be applicable to certain accounts with balances below $10,000.
31
About Your Fund’s Expenses
As a shareholder of the fund, you incur ongoing costs, which include costs for portfolio management, administrative services, and shareholder reports (like this one), among others. Operating expenses, which are deducted from a fund’s gross income, directly reduce the investment return of the fund.
A fund’s expenses are expressed as a percentage of its average net assets. This figure is known as the expense ratio. The following examples are intended to help you understand the ongoing costs (in dollars) of investing in your fund and to compare these costs with those of other mutual funds. The examples are based on an investment of $1,000 made at the beginning of the period shown and held for the entire period.
The table below illustrates your fund’s costs in two ways:
• Based on actual fund return. This section helps you to estimate the actual expenses that you paid over the period. The “Ending Account Value” shown is derived from the fund’s actual return, and the third column shows the dollar amount that would have been paid by an investor who started with $1,000 in the fund. You may use the information here, together with the amount you invested, to estimate the expenses that you paid over the period.
To do so, simply divide your account value by $1,000 (for example, an $8,600 account value divided by $1,000 = 8.6), then multiply the result by the number given for your fund under the heading “Expenses Paid During Period.”
• Based on hypothetical 5% yearly return. This section is intended to help you compare your fund’s costs with those of other mutual funds. It assumes that the fund had a yearly return of 5% before expenses, but that the expense ratio is unchanged. In this case—because the return used is not the fund’s actual return—the results do not apply to your investment. The example is useful in making comparisons because the Securities and Exchange Commission requires all mutual funds to calculate expenses based on a 5% return. You can assess your fund’s costs by comparing this hypothetical example with the hypothetical examples that appear in shareholder reports of other funds.
Six Months Ended August 31, 2008 | | | |
| Beginning | Ending | Expenses |
| Account Value | Account Value | Paid During |
International Growth Fund | 2/29/2008 | 8/31/2008 | Period1 |
Based on Actual Fund Return | | | |
Investor Shares | $1,000.00 | $896.45 | $2.10 |
Admiral Shares | 1,000.00 | 897.30 | 1.24 |
Based on Hypothetical 5% Yearly Return | | | |
Investor Shares | $1,000.00 | $1,022.99 | $2.24 |
Admiral Shares | 1,000.00 | 1,023.89 | 1.33 |
1 The calculations are based on expenses incurred in the most recent six-month period. The fund’s annualized six-month expense ratios for that period are 0.44% for Investor Shares and 0.26% for Admiral Shares. The dollar amounts shown as “Expenses Paid” are equal to the annualized expense ratio multiplied by the average account value over the period, multiplied by the number of days in the most recent six-month period, then divided by the number of days in the most recent 12-month period.
32
Note that the expenses shown in the table on the previous page are meant to highlight and help you compare ongoing costs only and do not reflect transaction costs incurred by the fund for buying and selling securities. Further, the expenses do not include the 2% fee that applies to shares purchased on or after June 27, 2003, and held for less than two months, nor do they include the account service fee described in the prospectus. If such fees were applied to your account, your costs would be higher. Your fund does not carry a “sales load.”
The calculations assume no shares were bought or sold during the period. Your actual costs may have been higher or lower, depending on the amount of your investment and the timing of any purchases or redemptions.
You can find more information about the fund’s expenses, including annual expense ratios, in the Financial Statements section of this report. For additional information on operating expenses and other shareholder costs, please refer to your fund’s current prospectus.
33
Glossary
Beta. A measure of the magnitude of a fund’s past share-price fluctuations in relation to the ups and downs of a given market index. The index is assigned a beta of 1.00. Compared with a given index, a fund with a beta of 1.20 typically would have seen its share price rise or fall by 12% when the index rose or fell by 10%. For this report, beta is based on returns over the past 36 months for both the fund and the index. Note that a fund’s beta should be reviewed in conjunction with its R-squared (see definition below). The lower the R-squared, the less correlation there is between the fund and the index, and the less reliable beta is as an indicator of volatility.
Equity Exposure. A measure that reflects a fund’s investments in stocks and stock futures. Any holdings in short-term reserves are excluded.
Expense Ratio. The percentage of a fund’s average net assets used to pay its annual administrative and advisory expenses. These expenses directly reduce returns to investors.
Inception Date. The date on which the assets of a fund (or one of its share classes) are first invested in accordance with the fund’s investment objective. For funds with a subscription period, the inception date is the day after that period ends. Investment performance is measured from the inception date.
R-Squared. A measure of how much of a fund’s past returns can be explained by the returns from the market in general, as measured by a given index. If a fund’s total returns were precisely synchronized with an index’s returns, its R-squared would be 1.00. If the fund’s returns bore no relationship to the index’s returns, its R-squared would be 0. For this report, R-squared is based on returns over the past 36 months for both the fund and the index.
Short-Term Reserves. The percentage of a fund invested in highly liquid, short-term securities that can be readily converted to cash.
Turnover Rate. An indication of the fund’s trading activity. Funds with high turnover rates incur higher transaction costs and may be more likely to distribute capital gains (which may be taxable to investors). The turnover rate excludes in-kind transactions, which have minimal impact on costs.
34
This page intentionally left blank.
The People Who Govern Your Fund
The trustees of your mutual fund are there to see that the fund is operated and managed in your best interests since, as a shareholder, you are a part owner of the fund. Your fund’s trustees also serve on the board of directors of The Vanguard Group, Inc., which is owned by the Vanguard funds and provides services to them on an at-cost basis.
A majority of Vanguard’s board members are independent, meaning that they have no affiliation with Vanguard or the funds they oversee, apart from the sizable personal investments they have made as private individuals.
Our independent board members bring distinguished backgrounds in business, academia, and public service to their task of working with Vanguard officers to establish the policies and oversee the activities of the funds. Among board members’ responsibilities are selecting investment advisors for the funds; monitoring fund operations, performance, and costs; reviewing contracts; nominating and selecting new trustees/directors; and electing Vanguard officers.
Each trustee serves a fund until its termination; or until the trustee’s retirement, resignation, or death; or otherwise as specified in the fund’s organizational documents. Any trustee may be removed at a shareholders’ meeting by a vote representing two-thirds of the net asset value of all shares of the fund together with shares of other Vanguard funds organized within the same trust. The table on these two pages shows information for each trustee and executive officer of the fund. The mailing address of the trustees and officers is P.O. Box 876, Valley Forge, PA 19482.
Chairman of the Board and Trustee
John J. Brennan1
Born 1954 Principal Occupation(s) During the Past Five Years: Chairman of the Board and Director/ Trustee Since May 1987; Trustee of The Vanguard Group, Inc., and of each of the investment companies served Chairman of the Board by The Vanguard Group; Director of Vanguard Marketing Corporation; President and Chief 156 Vanguard Funds Overseen Executive Officer of The Vanguard Group and of each of the investment companies served by The Vanguard Group (1996–2008).
Independent Trustees
Charles D. Ellis
Born 1937 Principal Occupation(s) During the Past Five Years: Applecore Partners (pro bono ventures Trustee Since January 2001 in education); Senior Advisor to Greenwich Associates (international business strategy 156 Vanguard Funds Overseen consulting); Successor Trustee of Yale University; Overseer of the Stern School of Business at New York University; Trustee of the Whitehead Institute for Biomedical Research.
Emerson U. Fullwood
Born 1948 Principal Occupation(s) During the Past Five Years: Executive Chief Staff and Marketing Trustee Since January 2008 Officer for North America since 2004 and Corporate Vice President of Xerox Corporation 156 Vanguard Funds Overseen (photocopiers and printers); Director of SPX Corporation (multi-industry manufacturing), of the United Way of Rochester, and of the Boy Scouts of America.
Rajiv L. Gupta
Born 1945 Principal Occupation(s) During the Past Five Years: Chairman, President, and Trustee Since December 20012 Chief Executive Officer of Rohm and Haas Co. (chemicals); Board Member of 156 Vanguard Funds Overseen the American Chemistry Council; Director of Tyco International, Ltd. (diversified manufacturing and services) since 2005.
Amy Gutmann
Born 1949 Principal Occupation(s) During the Past Five Years: President of the University of
Trustee Since June 2006 Pennsylvania since 2004; Professor in the School of Arts and Sciences, Annenberg School 156 Vanguard Funds Overseen for Communication, and Graduate School of Education of the University of Pennsylvania since 2004; Provost (2001–2004) and Laurance S. Rockefeller Professor of Politics and the University Center for Human Values (1990–2004), Princeton University; Director of Carnegie Corporation of New York since 2005 and of Schuylkill River Development Corporation and Greater Philadelphia Chamber of Commerce since 2004; Trustee of the National Constitution Center since 2007.
JoAnn Heffernan Heisen
Born 1950 Principal Occupation(s) During the Past Five Years: Corporate Vice President and Trustee Since July 1998 Chief Global Diversity Officer since 2006, Vice President and Chief Information 156 Vanguard Funds Overseen Officer (1997–2005), and Member of the Executive Committee of Johnson & Johnson (pharmaceuticals/consumer products); Director of the University Medical Center at Princeton and Women’s Research and Education Institute.
André F. Perold
Born 1952 Principal Occupation(s) During the Past Five Years: George Gund Professor of Finance Trustee Since December 2004 and Banking, Harvard Business School; Senior Associate Dean and Director of Faculty 156 Vanguard Funds Overseen Recruiting, Harvard Business School; Director and Chairman of UNX, Inc. (equities trading firm); Chair of the Investment Committee of HighVista Strategies LLC (private investment firm) since 2005.
Alfred M. Rankin, Jr.
Born 1941 Principal Occupation(s) During the Past Five Years: Chairman, President, Chief Executive Trustee Since January 1993 Officer, and Director of NACCO Industries, Inc. (forklift trucks/housewares/lignite); Director 156 Vanguard Funds Overseen of Goodrich Corporation (industrial products/aircraft systems and services).
J. Lawrence Wilson
Born 1936 Principal Occupation(s) During the Past Five Years: Retired Chairman and Chief Executive Trustee Since April 1985 Officer of Rohm and Haas Co. (chemicals); Director of Cummins Inc. (diesel engines) and 156 Vanguard Funds Overseen AmerisourceBergen Corp. (pharmaceutical distribution); Trustee of Vanderbilt University and of Culver Educational Foundation.
Executive Officers1
Thomas J. Higgins
Born 1957 Principal Occupation(s) During the Past Five Years: Principal of The Vanguard Group, Inc.; Treasurer Since July 1998 Treasurer of each of the investment companies served by The Vanguard Group. 156 Vanguard Funds Overseen
F. William McNabb III
Born 1957 Principal Occupation(s) During the Past Five Years: Chief Executive Officer, Director, Chief Executive Officer and President of The Vanguard Group, Inc., since 2008; Chief Executive Officer and Since August 31, 2008 President of each of the investment companies served by The Vanguard Group since President Since March 2008 2008; Director of Vanguard Marketing Corporation; Managing Director of The Vanguard 156 Vanguard Funds Overseen Group (1995–2008).
Heidi Stam
Born 1956 Principal Occupation(s) During the Past Five Years: Managing Director of The Vanguard Secretary Since July 2005 Group, Inc., since 2006; General Counsel of The Vanguard Group since 2005; Secretary of 156 Vanguard Funds Overseen The Vanguard Group and of each of the investment companies served by The Vanguard Group, since 2005; Director and Senior Vice President of Vanguard Marketing Corporation since 2005; Principal of The Vanguard Group (1997–2006).
Vanguard Senior Management Team | | |
| | | |
R. Gregory Barton | Kathleen C. Gubanich | Michael S. Miller | Glenn W. Reed |
Mortimer J. Buckley | Paul A. Heller | Ralph K. Packard | George U. Sauter |
Founder
John C. Bogle
Chairman and Chief Executive Officer, 1974–1996
1 These individuals are “interested persons” as defined in the Investment Company Act of 1940.
2 December 2002 for Vanguard Equity Income Fund, Vanguard Growth Equity Fund, the Vanguard Municipal Bond Funds, and the Vanguard State Tax-Exempt Funds.
More information about the trustees is in the Statement of Additional Information, available from The Vanguard Group.

P.O. Box 2600
Valley Forge, PA 19482-2600
Connect with Vanguard® > www.vanguard.com
Fund Information > 800-662-7447 | All comparative mutual fund data are from Lipper Inc. |
| or Morningstar, Inc., unless otherwise noted. |
Direct Investor Account Services > 800-662-2739 | |
| You can obtain a free copy of Vanguard’s proxy voting |
Institutional Investor Services > 800-523-1036 | guidelines by visiting our website, www.vanguard.com, |
| and searching for “proxy voting guidelines,” or by |
Text Telephone for People | calling Vanguard at 800-662-2739. The guidelines are |
With Hearing Impairment > 800-952-3335 | also available from the SEC’s website, www.sec.gov. |
| In addition, you may obtain a free report on how your |
| fund voted the proxies for securities it owned during |
| the 12 months ended June 30. To get the report, visit |
This material may be used in conjunction | either www.vanguard.com or www.sec.gov. |
with the offering of shares of any Vanguard | |
fund only if preceded or accompanied by | |
the fund’s current prospectus. | |
| |
| You can review and copy information about your fund |
| at the SEC’s Public Reference Room in Washington, D.C. |
| To find out more about this public service, call the SEC |
The funds or securities referred to herein are not | at 202-551-8090. Information about your fund is also |
sponsored, endorsed, or promoted by MSCI, and MSCI | available on the SEC’s website, and you can receive |
bears no liability with respect to any such funds or | copies of this information, for a fee, by sending a |
securities. For any such funds or securities, the | request in either of two ways: via e-mail addressed to |
prospectus or the Statement of Additional Information | publicinfo@sec.gov or via regular mail addressed to the |
contains a more detailed description of the limited | Public Reference Section, Securities and Exchange |
relationship MSCI has with The Vanguard Group and | Commission, Washington, DC 20549-0102. |
any related funds. | |
| |
Russell is a trademark of The Frank Russell Company. | |
| |
CFA® is a trademark owned by CFA Institute. | |
| |
| |
| |
| |
| |
| |
| |
| |
| © 2008 The Vanguard Group, Inc. All rights reserved. |
| Vanguard Marketing Corporation, Distributor. |
| |
| Q810 102008 |

> For the fiscal year ended August 31, 2008, Vanguard FTSE Social Index Fund returned –15.3% for Investor Shares.
> The fund closely tracked its target index over the 12-month period. Both fund and index lagged the average return of large-capitalization growth funds.
> Significant holdings in the financial sector—which continued to suffer during the period—weighed on the fund and on the rest of the broad U.S. stock market.
Contents | |
| |
Your Fund’s Total Returns | 1 |
President’s Letter | 2 |
Fund Profile | 7 |
Performance Summary | 8 |
Financial Statements | 10 |
Your Fund’s After-Tax Returns | 23 |
About Your Fund’s Expenses | 24 |
Trustees Approve Advisory Arrangement | 26 |
Glossary | 27 |
Please note: The opinions expressed in this report are just that—informed opinions. They should not be considered promises or advice. Also, please keep in mind that the information and opinions cover the period through the date on the front of this report. Of course, the risks of investing in your fund are spelled out in the prospectus.
Your Fund’s Total Returns
Fiscal Year Ended August 31, 2008 | | |
| Ticker | Total |
| Symbol | Returns |
Vanguard FTSE Social Index Fund | | |
Investor Shares | VFTSX | –15.3% |
Institutional Shares1 | VFTNX | –15.2 |
FTSE4Good US Select Index | | –15.1 |
Average Large-Cap Growth Fund2 | | –7.2 |
Your Fund’s Performance at a Glance | | | | |
August 31, 2007–August 31, 2008 | | | | |
| | | Distributions Per Share |
| Starting | Ending | Income | Capital |
| Share Price | Share Price | Dividends | Gains |
Vanguard FTSE Social Index Fund | | | | |
Investor Shares | $9.30 | $7.76 | $0.140 | $0.000 |
Institutional Shares | 9.32 | 7.77 | 0.152 | 0.000 |
1 This class of shares carries lower expenses and is available for a minimum initial investment of $5 million.
2 Derived from data provided by Lipper Inc.
1

President’s Letter
Dear Shareholder,
Over the 12 months ended August 31, Vanguard FTSE Social Index Fund’s performance reflected the troubles plaguing the U.S. stock market. The fund’s Investor Shares returned –15.3% for the 2008 fiscal year and its Institutional Shares –15.2%. The fund achieved its primary goal of closely tracking its target, the FTSE4Good US Select Index, which closed the period with a return of –15.1%.
The persistent upheaval in the financial industry didn’t bode well for the index, given its heavy weighting in the sector. At the other end of the spectrum, the index’s top performers were energy and materials stocks.
If you hold shares of the fund in a taxable account, you may wish to review our report on after-tax returns on page 23.
As market volatility intensified, stocks declined worldwide
Stocks lost ground as credit-market turmoil spread throughout the global economy. Over the full 12 months, the broad U.S. stock market lost about 10% of its value. International markets followed a similar path, returning –12.2% for the year.
The descent was bumpy. After years of relative calm, the U.S. market routinely rose or fell by more than a percentage point in a day’s trading. The volatility reflected a seemingly endless series of
2
unnerving developments: the persistent rise in energy prices, further deterioration in the housing market, several bank failures, and the broad economy’s deceleration.
Risk-aversion increased, and Treasuries outperformed
The collapse in subprime mortgage-backed securities and the aftershocks prompted a flight to safety. Short-term U.S. Treasury securities were among the fixed income market’s best performers. Over the 12 months, the broad taxable bond market returned a respectable 5.9%, largely reflecting the Treasury bond rally.
As risk-aversion increased, the difference between the yields of Treasury bonds and those of all other securities increased, depressing the price of corporate debt. (As you know, yield and price move in opposite directions.) Even as corporate bonds grew cheaper, the prices of most goods and services rose quickly, powered by escalating energy prices.
The combination of higher inflation, financial market volatility, and economic weakness put the U.S. Federal Reserve Board in an uncomfortable position. The Fed decided that it was imperative to respond to the financial crisis with a dramatic easing of monetary policy through interest rate cuts, even as it recognized that the result might be higher inflation. Over the full 12 months, the Fed reduced its target for the federal funds rate from 5.25% to 2.00%.
Market Barometer | | | |
| Average Annual Total Returns |
| Periods Ended August 31, 2008 |
| One Year | Three Years | Five Years |
Stocks | | | |
Russell 1000 Index (Large-caps) | –10.6% | 3.9% | 7.4% |
Russell 2000 Index (Small-caps) | –5.5 | 4.8 | 9.6 |
Dow Jones Wilshire 5000 Index (Entire market) | –9.9 | 4.2 | 7.9 |
MSCI All Country World Index ex USA (International) | –12.2 | 10.7 | 16.1 |
| | | |
| | | |
Bonds | | | |
Lehman U.S. Aggregate Bond Index (Broad taxable market) | 5.9% | 4.3% | 4.6% |
Lehman Municipal Bond Index | 4.5 | 3.3 | 4.4 |
Citigroup 3-Month Treasury Bill Index | 2.8 | 4.0 | 3.1 |
| | | |
| | | |
CPI | | | |
Consumer Price Index | 5.4% | 3.7% | 3.5% |
3
Holdings in financials proved burdensome
Over the fiscal year ended August 31, the performance of Vanguard FTSE Social Index Fund closely tracked that of the FTSE4Good US Select Index, the fund’s target benchmark. The index’s socially conscious mandate—which favors companies that work to protect the environment, maintain fair hiring and promotion practices for women and minorities, and institute safe and healthy workplace habits—sets it apart from the average large-cap growth fund.
The index provider’s screening criteria generally lead to a portfolio heavily weighted in the financial, consumer discretionary, and health care sectors. The index typically has limited exposure to stocks in the energy, materials, and utilities groups. This stock mix can work well in some market environments, but not so well in others. The past 12 months provided an example of the latter: The energy and materials sectors were among the top contributors in the broad market, while financial stocks were among the worst performers.
The index’s large allocation to the financial sector, which fell more than 30% for the period, was a major factor in its disappointing performance. As the credit crisis intensified, banks, brokerages, insurers, and other financial-service providers booked substantial credit-related losses.
Information technology companies were also big detractors. Internet companies such as Google and Yahoo! saw their
Expense Ratios1 | | | |
Your Fund Compared With Its Peer Group | | | |
| | | Average |
| Investor | Institutional | Large-Cap |
| Shares | Shares | Growth Fund |
FTSE Social Index Fund | 0.24% | 0.11% | 1.36% |
1 Fund expense ratios shown are from the prospectus dated December 10, 2007. The expense ratios for the fiscal year ended August 31, 2008, were 0.24% for Investor Shares and 0.11% for Institutional Shares. Peer-group expense ratio is derived from data provided by Lipper Inc. and captures information through year-end 2007.
4
stocks decline as online advertising sales hit a rough patch. Semiconductor companies were hurt by slower growth in demand for computer chips. Consumer discretionary stocks felt the effects of the broad economic slowdown as Americans had less money to spend on shopping and eating out.
Throughout the 12-month period, energy stocks were the shining stars of the index. As oil prices rose, coal and exploration companies turned in exceptional performances. Continued economic expansion in emerging markets heightened the demand for commodities, giving materials stocks a boost.
The fund’s long-term results are on track with its benchmark
Since the FTSE Social Index Fund’s inception in May 2000, two significant stock market downturns (2000–2002 and the current one) have hurt the fund’s long-term performance, resulting in an average annual return of –2.0%. Although negative, the fund’s average return is higher than that of the average large-cap growth fund and is closely aligned with that of its benchmark index.
For the five-year period ended August 31, 2008, the fund’s Investor Shares returned an average of 3.8% a year, again closely tracking the benchmark’s average annual return of 4.0% for the same period.
Total Returns | |
May 31, 2000,1 Through August 31, 2008 | |
| Average |
| Annual Return |
FTSE Social Index Fund Investor Shares | –2.0% |
Spliced Social Index2 | –1.9 |
Average Large-Cap Growth Fund3 | –3.5 |
The figures shown represent past performance, which is not a guarantee of future results. (Current performance may be lower or higher than the performance data cited. For performance data current to the most recent month-end, visit our website at www.vanguard.com/performance.) Note, too, that both investment returns and principal value can fluctuate widely, so an investor's shares, when sold, could be worth more or less than their original cost.
1 Fund inception.
2 Calvert Social Index through December 16, 2005, and the FTSE4Good US Select Index thereafter.
3 Derived from data provided by Lipper Inc.
5
As this record shows, the fund’s advisor, Vanguard Quantitative Equity Group, has done an exceptional job of tracking the fund's target index. The advisor’s accuracy is supported by the fund’s expense ratio, which is much lower than the average cost of peer funds.
A long-term perspective is key during turbulent times
As trouble continued in the U.S. economy, the markets have seen sometimes startling volatility. Over the past 12 months, Vanguard FTSE Social Index Fund experienced its share of the ups and downs. Such volatility is a good reminder of why we urge shareholders to avoid reacting to short-term market “noise.” Instead, Vanguard suggests that you maintain both a well-balanced portfolio and a long-term perspective.
A well-balanced portfolio includes stock funds, bond funds, and short-term reserves in proportions that fit your goals and risk tolerance. Such a carefully planned investment program can help to cushion the stock market’s occasionally sharp declines while allowing you to participate in its long-term potential for growth.
For socially conscious investors, Vanguard FTSE Social Index Fund offers a low-cost option that can play an important role in this kind of long-term investment plan.
Thank you for investing with Vanguard.
Sincerely,

F. William McNabb III
President and Chief Executive Officer
September 11, 2008
6
Fund Profile
As of August 31, 2008
Portfolio Characteristics | | |
| | Target | Broad |
| Fund | Index1 | Index2 |
Number of Stocks | 391 | 390 | 4,692 |
Median Market Cap | $24.3B | $23.7B | $31.5B |
Price/Earnings Ratio | 18.6x | 18.5x | 16.9x |
Price/Book Ratio | 2.3x | 2.3x | 2.4x |
Yield3 | | 1.8% | 2.1% |
Investor Shares | 1.6% | | |
Institutional Shares | 1.7% | | |
Return on Equity | 18.5% | 18.5% | 19.9% |
Earnings Growth Rate | 20.5% | 20.3% | 18.2% |
Foreign Holdings | 0.0% | 0.0% | 0.0% |
Turnover Rate | 41% | — | — |
Expense Ratio (8/31/2007)4 | | — | — |
Investor Shares | 0.24% | | |
Institutional Shares | 0.11% | | |
Short-Term Reserves | 0.0% | — | — |
Sector Diversification (% of portfolio) | |
| | Target | Broad |
| Fund | Index1 | Index2 |
Consumer Discretionary | 13.4% | 13.7% | 9.1% |
Consumer Staples | 5.8 | 5.8 | 9.7 |
Energy | 4.9 | 4.9 | 13.3 |
Financials | 28.5 | 28.0 | 16.0 |
Health Care | 17.2 | 17.3 | 12.6 |
Industrials | 4.0 | 4.0 | 11.9 |
Information Technology | 22.6 | 22.6 | 16.5 |
Materials | 0.7 | 0.7 | 4.1 |
Telecommunication | | | |
Services | 1.6 | 1.6 | 2.9 |
Utilities | 1.3 | 1.4 | 3.9 |
Volatility Measures5 | |
| Fund Versus | Fund Versus |
| Spliced Index6 | Broad Index2 |
R-Squared | 1.00 | 0.91 |
Beta | 0.99 | 1.07 |
Ten Largest Holdings7 (% of total net assets) |
| | |
Apple Inc. | computer hardware | 3.4% |
Bank of America Corp. | diversified | |
| financial services | 3.2 |
Intel Corp. | semiconductors | 2.9 |
JPMorgan Chase & Co. | diversified | |
| financial services | 2.9 |
Google Inc. | Internet software | |
| and services | 2.4 |
QUALCOMM Inc. | communications | |
| equipment | 1.9 |
McDonald’s Corp. | restaurants | 1.6 |
Amgen, Inc. | biotechnology | 1.5 |
The Walt Disney Co. | movies and | |
| entertainment | 1.4 |
Medtronic, Inc. | health care | |
| equipment | 1.4 |
Top Ten | | 22.6% |
Investment Focus

1 FTSE4Good US Select Index.
2 Dow Jones Wilshire 5000 Index.
3 30-day SEC yield for the fund; annualized dividend yield for the indexes. See the Glossary.
4 Expense ratios shown are from the prospectus dated December 10, 2007. The expense ratios for the fiscal year ended August 31, 2008, were 0.24% for Investor Shares and 0.11% for Institutional Shares.
5 For an explanation of R-squared, beta, and other terms used here, see the Glossary.
6 Calvert Social Index through December 16, 2005; FTSE4Good US Select Index thereafter.
7 The holdings listed exclude any temporary cash investments and equity index products.
7
Performance Summary
All of the returns in this report represent past performance, which is not a guarantee of future results that may be achieved by the fund. (Current performance may be lower or higher than the performance data cited. For performance data current to the most recent month-end, visit our website at www.vanguard.com/performance.) Note, too, that both investment returns and principal value can fluctuate widely, so an investor’s shares, when sold, could be worth more or less than their original cost. The returns shown do not reflect taxes that a shareholder would pay on fund distributions or on the sale of fund shares.
Cumulative Performance: May 31, 2000–August 31, 2008
Initial Investment of $10,000
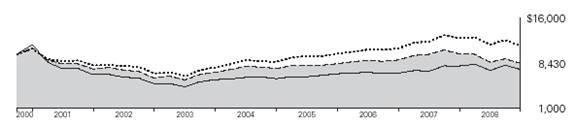
| | |
| Average Annual Total Returns | |
| Periods Ended August 31, 2008 | Final Value |
| One | Five | Since | of a $10,000 |
| Year | Years | Inception1 | Investment |
FTSE Social Index Fund Investor Shares2 | –15.26% | 3.80% | –2.05% | $8,430 |
Dow Jones Wilshire 5000 Index | –9.92 | 7.91 | 1.66 | 11,452 |
Spliced Social Index3 | –15.15 | 4.01 | –1.90 | 8,537 |
Average Large-Cap Growth Fund4 | –7.15 | 5.30 | –3.46 | 7,479 |
| | | | Final Value |
| One | Five | Since | of a $5,000,000 |
| Year | Years | Inception1 | Investment |
FTSE Social Index Fund Institutional Shares | –15.22% | 3.92% | 5.34% | $6,701,749 |
Dow Jones Wilshire 5000 Index | –9.92 | 7.91 | 9.23 | 8,216,278 |
Spliced Social Index3 | –15.15 | 4.01 | 5.42 | 6,729,422 |
1 Performance for the fund and its comparative standards is calculated since the fund’s inception: May 31, 2000, for Investor Shares and January 14, 2003, for Institutional Shares.
2 Total returns do not include the account service fee that may be applicable to certain accounts with balances below $10,000.
3 Calvert Social Index through December 16, 2005; FTSE4Good US Select Index thereafter.
4 Derived from data provided by Lipper Inc.
8
Fiscal-Year Total Returns (%): May 31, 2000–August 31, 2008
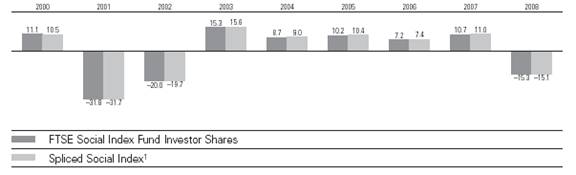
Average Annual Total Returns: Periods Ended June 30, 2008
This table presents average annual total returns through the latest calendar quarter—rather than through the end of the fiscal period. Securities and Exchange Commission rules require that we provide this information.
| Inception | One | Five | Since |
| Date | Year | Years | Inception |
Investor Shares2 | 5/31/2000 | –20.57% | 4.07% | –2.44% |
Institutional Shares | 1/14/2003 | –20.52 | 4.18 | 4.96 |
1 Calvert Social Index through December 16, 2005; FTSE4Good US Select Index thereafter.
2 Total returns do not include the account service fee that may be applicable to certain accounts with balances below $10,000. Note: See Financial Highlights tables for dividend and capital gains information.
9
Financial Statements
Statement of Net Assets
As of August 31, 2008
The fund provides a complete list of its holdings four times in each fiscal year, at the quarter-ends. For the second and fourth fiscal quarters, the lists appear in the fund’s semiannual and annual reports to shareholders. For the first and third fiscal quarters, the fund files the lists with the Securities and Exchange Commission on Form N-Q. Shareholders can look up the fund’s Forms N-Q on the SEC’s website at www.sec.gov. Forms N-Q may also be reviewed and copied at the SEC’s Public Reference Room (see the back cover of this report for further information).
| | | Market |
| | | Value• |
| | Shares | ($000) |
Common Stocks (99.9%) | | |
Consumer Discretionary (13.4%) | | |
| McDonald’s Corp. | 135,618 | 8,415 |
| The Walt Disney Co. | 228,057 | 7,378 |
| Target Corp. | 97,171 | 5,152 |
| Lowe’s Cos., Inc. | 174,841 | 4,308 |
* | Amazon.com, Inc. | 37,295 | 3,014 |
* | DIRECTV Group, Inc. | 102,671 | 2,896 |
| Best Buy Co., Inc. | 49,378 | 2,211 |
| Carnival Corp. | 55,710 | 2,065 |
| Staples, Inc. | 84,837 | 2,053 |
| TJX Cos., Inc. | 50,977 | 1,847 |
* | Kohl’s Corp. | 37,030 | 1,821 |
* | Liberty Media Corp. | 59,072 | 1,642 |
| The Gap, Inc. | 66,241 | 1,288 |
* | Apollo Group, Inc. Class A | 19,954 | 1,271 |
* | Coach, Inc. | 40,730 | 1,181 |
| Harley-Davidson, Inc. | 28,445 | 1,132 |
| Macy’s Inc. | 50,466 | 1,051 |
| H & R Block, Inc. | 38,701 | 988 |
* | Bed Bath & Beyond, Inc. | 30,793 | 944 |
* | Liberty Media Corp.– | | |
| Interactive Series A | 67,520 | 918 |
| Cablevision Systems | | |
| NY Group Class A | 27,757 | 896 |
* | GameStop Corp. Class A | 19,395 | 851 |
| Limited Brands, Inc. | 40,790 | 848 |
| Genuine Parts Co. | 19,613 | 832 |
| Nordstrom, Inc. | 25,957 | 807 |
* | AutoZone Inc. | 5,676 | 779 |
* | Liberty Global, Inc. Class A | 19,541 | 687 |
| ^Garmin Ltd. | 19,500 | 678 |
| Tiffany & Co. | 15,298 | 676 |
* | Discovery Holding Co. | | |
| Class A | 32,021 | 648 |
| Ross Stores, Inc. | 15,915 | 640 |
* | Liberty Global, Inc. Series C | 19,136 | 636 |
* | Mohawk Industries, Inc. | 8,210 | 567 |
* | Expedia, Inc. | 30,872 | 545 |
* | Urban Outfitters, Inc. | 14,921 | 531 |
| Royal Caribbean Cruises, Ltd. | 19,291 | 524 |
| Gannett Co., Inc. | 27,522 | 490 |
* | Sirius XM Radio Inc. | 358,792 | 477 |
| Scripps Networks Interactive | 11,480 | 477 |
| D. R. Horton, Inc. | 37,894 | 472 |
| Virgin Media Inc. | 39,386 | 449 |
| Pulte Homes, Inc. | 30,798 | 447 |
| PetSmart, Inc. | 15,573 | 420 |
* | Dollar Tree, Inc. | 10,874 | 417 |
| Wyndham Worldwide Corp. | 20,682 | 399 |
* | NVR, Inc. | 624 | 373 |
* | Toll Brothers, Inc. | 14,178 | 353 |
* | Lamar Advertising Co. | | |
| Class A | 9,291 | 345 |
| Foot Locker, Inc. | 18,977 | 309 |
| RadioShack Corp. | 15,426 | 293 |
| Gentex Corp. | 17,371 | 277 |
| American Eagle | | |
| Outfitters, Inc. | 18,194 | 274 |
* | Office Depot, Inc. | 33,057 | 233 |
| Williams-Sonoma, Inc. | 13,069 | 231 |
| New York Times Co. Class A | 17,713 | 230 |
| KB Home | 10,538 | 219 |
* | Liberty Media Corp.– | | |
| Capital Series A | 12,593 | 205 |
| Lennar Corp. Class A | 15,340 | 202 |
* | Career Education Corp. | 10,717 | 201 |
| Weight Watchers | | |
| International, Inc. | 4,738 | 188 |
* | Ticketmaster | 6,080 | 130 |
* | Chico’s FAS, Inc. | 21,079 | 121 |
* | Sally Beauty Co. Inc. | 10,700 | 91 |
* | HSN, Inc. | 6,080 | 89 |
* | Interval Leisure Group, Inc. | 6,080 | 79 |
| Circuit City Stores, Inc. | 20,166 | 36 |
| Idearc Inc. | 17,428 | 29 |
| E.W. Scripps Co. Class A | 3,893 | 28 |
| The McClatchy Co. Class A | 6,801 | 25 |
* | R.H. Donnelley Corp. | 1,400 | 5 |
| | | 71,334 |
10
| | | Market |
| | | Value• |
| | Shares | ($000) |
Consumer Staples (5.8%) | | |
| CVS/Caremark Corp. | 170,946 | 6,257 |
| Walgreen Co. | 119,291 | 4,346 |
| Costco Wholesale Corp. | 52,354 | 3,511 |
| General Mills, Inc. | 40,067 | 2,652 |
| Sysco Corp. | 72,018 | 2,292 |
| Kellogg Co. | 33,919 | 1,847 |
| Safeway, Inc. | 52,920 | 1,394 |
| Wm. Wrigley Jr. Co. | 16,965 | 1,348 |
| Bunge Ltd. | 14,485 | 1,294 |
| Campbell Soup Co. | 34,032 | 1,253 |
| The Hershey Co. | 20,240 | 730 |
| The Estee Lauder Cos. Inc. | | |
| Class A | 13,834 | 689 |
| The Pepsi Bottling Group, Inc. | 19,647 | 581 |
| McCormick & Co., Inc. | 13,814 | 559 |
* | Dean Foods Co. | 18,304 | 461 |
| Hormel Foods Corp. | 12,388 | 442 |
| Alberto-Culver Co. | 12,137 | 318 |
| PepsiAmericas, Inc. | 11,459 | 268 |
| Whole Foods Market, Inc. | 11,902 | 218 |
| Del Monte Foods Co. | 23,778 | 203 |
| Wm. Wrigley Jr. Co. Class B | 2,416 | 191 |
| | | 30,854 |
Energy (4.9%) | | |
| Apache Corp. | 39,825 | 4,555 |
* | National Oilwell Varco Inc. | 49,321 | 3,636 |
| XTO Energy, Inc. | 65,677 | 3,311 |
| Williams Cos., Inc. | 69,942 | 2,161 |
| Peabody Energy Corp. | 32,496 | 2,046 |
| Spectra Energy Corp. | 75,100 | 1,987 |
| Smith International, Inc. | 23,768 | 1,657 |
| CONSOL Energy, Inc. | 21,730 | 1,471 |
* | Ultra Petroleum Corp. | 18,108 | 1,234 |
| Pioneer Natural Resources Co. | 14,214 | 898 |
* | Newfield Exploration Co. | 15,621 | 706 |
* | Plains Exploration & | | |
| Production Co. | 12,962 | 699 |
* | Patriot Coal Corp. | 9,218 | 553 |
| Patterson-UTI Energy, Inc. | 18,496 | 526 |
| Rowan Cos., Inc. | 13,641 | 504 |
| Teekay Shipping Corp. | 6,589 | 234 |
| | | 26,178 |
Financial Services (28.4%) | | |
| Bank of America Corp. | 546,276 | 17,011 |
| JPMorgan Chase & Co. | 405,075 | 15,591 |
| U.S. Bancorp | 208,315 | 6,637 |
| American Express Co. | 139,729 | 5,544 |
| MetLife, Inc. | 84,754 | 4,594 |
| Merrill Lynch & Co., Inc. | 154,605 | 4,383 |
| Wachovia Corp. | 258,220 | 4,103 |
| State Street Corp. | 50,961 | 3,449 |
| Charles Schwab Corp. | 137,604 | 3,301 |
| AFLAC Inc. | 56,759 | 3,218 |
| PNC Financial Services Group | 41,290 | 2,971 |
| The Allstate Corp. | 65,759 | 2,968 |
| CME Group, Inc. | 7,986 | 2,678 |
| Simon Property | | |
| Group, Inc. REIT | 26,651 | 2,529 |
| The Hartford Financial | | |
| Services Group Inc. | 37,934 | 2,393 |
| Franklin Resources Corp. | 21,308 | 2,227 |
| Northern Trust Corp. | 26,354 | 2,119 |
| The Chubb Corp. | 43,580 | 2,092 |
* | Ace Ltd. | 39,726 | 2,090 |
| BB&T Corp. | 66,202 | 1,986 |
| T. Rowe Price Group Inc. | 30,982 | 1,839 |
| Vornado Realty Trust REIT | 18,307 | 1,821 |
| SunTrust Banks, Inc. | 41,859 | 1,753 |
| Lincoln National Corp. | 30,951 | 1,571 |
| Progressive Corp. of Ohio | 81,284 | 1,501 |
| The Principal Financial | | |
| Group, Inc. | 31,379 | 1,437 |
| Equity Residential REIT | 32,187 | 1,358 |
| Public Storage, Inc. REIT | 15,330 | 1,354 |
| Lehman Brothers | | |
| Holdings, Inc. | 83,600 | 1,345 |
| NYSE Euronext | 31,531 | 1,280 |
| Ameriprise Financial, Inc. | 26,475 | 1,190 |
| Moody’s Corp. | 29,152 | 1,185 |
| Hudson City Bancorp, Inc. | 62,042 | 1,144 |
| Kimco Realty Corp. REIT | 30,185 | 1,121 |
| Unum Group | 41,398 | 1,052 |
| Discover Financial Services | 63,149 | 1,039 |
| Plum Creek Timber | | |
| Co. Inc. REIT | 20,702 | 1,027 |
| HCP, Inc. REIT | 28,022 | 1,015 |
| Leucadia National Corp. | 20,752 | 961 |
| M & T Bank Corp. | 13,123 | 936 |
* | SLM Corp. | 55,784 | 921 |
| Avalonbay Communities, Inc. | | |
| REIT | 9,166 | 917 |
| Host Hotels & | | |
| Resorts Inc. REIT | 62,567 | 895 |
| Fannie Mae | 126,942 | 868 |
| General Growth | | |
| Properties Inc. REIT | 32,093 | 832 |
| Genworth Financial Inc. | 51,611 | 828 |
| Assurant, Inc. | 14,106 | 824 |
| Washington Mutual, Inc. | 203,483 | 824 |
| Regions Financial Corp. | 83,072 | 770 |
| XL Capital Ltd. Class A | 37,295 | 750 |
| People’s United Financial Inc. | 41,413 | 742 |
| Sovereign Bancorp, Inc. | 76,120 | 735 |
| Safeco Corp. | 10,831 | 732 |
* | TD Ameritrade Holding Corp. | 35,278 | 721 |
| Legg Mason Inc. | 15,977 | 711 |
| KeyCorp | 58,132 | 698 |
| New York Community | | |
| Bancorp, Inc. | 40,880 | 674 |
| Torchmark Corp. | 10,749 | 642 |
| Everest Re Group, Ltd. | 7,344 | 603 |
11
| | | Market |
| | | Value• |
| | Shares | ($000) |
| White Mountains | | |
| Insurance Group Inc. | 1,275 | 603 |
| Axis Capital Holdings Ltd. | 17,849 | 597 |
| Cincinnati Financial Corp. | 19,505 | 578 |
| The Macerich Co. REIT | 8,984 | 556 |
| * IntercontinentalExchange Inc. | 6,230 | 548 |
| AMB Property Corp. REIT | 11,804 | 536 |
| ^MBIA, Inc. | 32,627 | 529 |
| Janus Capital Group Inc. | 19,487 | 526 |
| Regency Centers Corp. REIT | 8,407 | 521 |
| Comerica, Inc. | 18,006 | 506 |
| Developers Diversified | | |
| Realty Corp. REIT | 14,459 | 485 |
| Marshall & Ilsley Corp. | 31,207 | 481 |
| W.R. Berkley Corp. | 20,364 | 480 |
| PartnerRe Ltd. | 6,498 | 448 |
| * Markel Corp. | 1,207 | 447 |
| Willis Group Holdings Ltd. | 12,845 | 442 |
| Duke Realty Corp. REIT | 17,622 | 441 |
| Liberty Property Trust REIT | 11,100 | 419 |
| SEI Investments Co. | 17,488 | 413 |
| The St. Joe Co. | 11,061 | 412 |
| RenaissanceRe Holdings Ltd. | 7,794 | 395 |
| Commerce Bancshares, Inc. | 8,585 | 386 |
| Apartment Investment & | | |
| Management Co. | | |
| Class A REIT | 10,874 | 385 |
| Synovus Financial Corp. | 39,911 | 367 |
| CIT Group Inc. | 34,385 | 355 |
| Freddie Mac | 77,315 | 349 |
| Zions Bancorp | 12,976 | 348 |
| Brown & Brown, Inc. | 16,976 | 344 |
| Weingarten Realty | | |
| Investors REIT | 10,228 | 338 |
| Huntington Bancshares Inc. | 43,636 | 319 |
| Allied Capital Corp. | 21,167 | 312 |
| Valley National Bancorp | 15,416 | 308 |
| Protective Life Corp. | 8,414 | 305 |
| Old Republic | | |
| International Corp. | 27,842 | 304 |
| City National Corp. | 5,738 | 284 |
| First American Corp. | 11,217 | 283 |
| Popular, Inc. | 34,015 | 277 |
| Forest City Enterprise Class A | 9,437 | 271 |
| Associated Banc-Corp. | 15,358 | 269 |
| Hospitality Properties | | |
| Trust REIT | 11,463 | 260 |
| Astoria Financial Corp. | 11,753 | 257 |
| First Horizon National Corp. | 21,938 | 246 |
| ^Ambac Financial Group, Inc. | 34,269 | 245 |
| TCF Financial Corp. | 14,999 | 236 |
| Fulton Financial Corp. | 20,376 | 217 |
| * E*TRADE Financial Corp. | 64,347 | 206 |
| Transatlantic Holdings, Inc. | 3,250 | 195 |
| Mercury General Corp. | 3,221 | 164 |
| ^Colonial BancGroup, Inc. | 23,999 | 152 |
| Unitrin, Inc. | 5,772 | 147 |
* | AmeriCredit Corp. | 13,536 | 143 |
| | | |
| MGIC Investment Corp. | 15,218 | 128 |
| Erie Indemnity Co. Class A | 2,616 | 121 |
| iStar Financial Inc. REIT | 16,264 | 91 |
| Wesco Financial Corp. | 161 | 60 |
| Student Loan Corp. | 494 | 58 |
| Radian Group, Inc. | 9,654 | 37 |
| The First Marblehead Corp. | 4,941 | 20 |
| The PMI Group Inc. | 1,005 | 4 |
| | | 151,654 |
Health Care (17.2%) | | |
* | Amgen, Inc. | 130,010 | 8,171 |
| Medtronic, Inc. | 134,400 | 7,338 |
| Eli Lilly & Co. | 135,171 | 6,306 |
* | Gilead Sciences, Inc. | 111,272 | 5,862 |
| Baxter International, Inc. | 75,088 | 5,088 |
| UnitedHealth Group Inc. | 146,875 | 4,472 |
* | Celgene Corp. | 52,126 | 3,612 |
* | WellPoint Inc. | 62,879 | 3,319 |
| Covidien Ltd. | 59,026 | 3,192 |
* | Medco Health Solutions, Inc. | 60,522 | 2,835 |
* | Genzyme Corp. | 31,940 | 2,501 |
| Aetna Inc. | 57,898 | 2,498 |
| Stryker Corp. | 36,538 | 2,455 |
| Cardinal Health, Inc. | 42,761 | 2,351 |
* | Boston Scientific Corp. | 178,743 | 2,245 |
* | Express Scripts Inc. | 30,098 | 2,209 |
| Allergan, Inc. | 36,728 | 2,052 |
* | Zimmer Holdings, Inc. | 27,622 | 2,000 |
* | St. Jude Medical, Inc. | 40,665 | 1,864 |
| Alcon, Inc. | 10,674 | 1,818 |
* | Biogen Idec Inc. | 35,138 | 1,790 |
| CIGNA Corp. | 33,271 | 1,393 |
* | Intuitive Surgical, Inc. | 4,641 | 1,370 |
* | Forest Laboratories, Inc. | 37,209 | 1,328 |
| Quest Diagnostics, Inc. | 17,569 | 950 |
* | Humana Inc. | 20,207 | 938 |
* | Waters Corp. | 11,991 | 818 |
| AmerisourceBergen Corp. | 19,536 | 801 |
* | Hospira, Inc. | 19,119 | 772 |
| Applied Biosystems Inc. | 20,233 | 738 |
* | DaVita, Inc. | 12,679 | 728 |
* | Barr Pharmaceuticals Inc. | 9,578 | 647 |
* | Coventry Health Care Inc. | 18,237 | 639 |
* | Henry Schein, Inc. | 10,701 | 626 |
* | Cephalon, Inc. | 8,083 | 619 |
| Beckman Coulter, Inc. | 7,410 | 547 |
* | Patterson Cos. | 15,632 | 509 |
* | Millipore Corp. | 6,558 | 492 |
* | Mylan Inc. | 36,363 | 469 |
| Omnicare, Inc. | 14,300 | 461 |
* | Community Health | | |
| Systems, Inc. | 11,559 | 399 |
* | Health Net Inc. | 12,672 | 350 |
* | Tenet Healthcare Corp. | 57,638 | 348 |
| Universal Health | | |
| Services Class B | 5,542 | 342 |
12
| | | Market |
| | | Value• |
| | Shares | ($000) |
* | King Pharmaceuticals, Inc. | 29,677 | 340 |
* | Lincare Holdings, Inc. | 8,720 | 288 |
* | HLTH Corp. | 22,090 | 275 |
* | Sepracor Inc. | 13,068 | 240 |
* | Kinetic Concepts, Inc. | 6,645 | 234 |
* | Health Management | | |
| Associates Class A | 29,881 | 174 |
| | | 91,813 |
Industrials (4.0%) | | |
| Deere & Co. | 52,394 | 3,697 |
| Norfolk Southern Corp. | 45,153 | 3,320 |
| PACCAR, Inc. | 43,552 | 1,875 |
| Southwest Airlines Co. | 88,060 | 1,341 |
* | First Solar, Inc. | 4,782 | 1,323 |
| C.H. Robinson Worldwide Inc. | 20,536 | 1,070 |
* | Jacobs Engineering Group Inc. | 14,394 | 1,063 |
| Fastenal Co. | 18,016 | 936 |
| Pitney Bowes, Inc. | 24,759 | 846 |
| W.W. Grainger, Inc. | 9,117 | 821 |
| Republic Services, Inc. | | |
| Class A | 21,904 | 720 |
* | Iron Mountain, Inc. | 23,962 | 693 |
* | Terex Corp. | 11,959 | 601 |
| Equifax, Inc. | 15,538 | 549 |
| Robert Half International, Inc. | 19,031 | 487 |
| Manpower Inc. | 9,594 | 461 |
| Cintas Corp. | 13,990 | 431 |
| J.B. Hunt Transport | | |
| Services, Inc. | 11,261 | 410 |
* | ChoicePoint Inc. | 8,125 | 395 |
* | Monster Worldwide Inc. | 14,325 | 280 |
| | | 21,319 |
Information Technology (22.6%) | | |
* | Apple Inc. | 105,530 | 17,891 |
| Intel Corp. | 685,046 | 15,667 |
* | Google Inc. | 28,200 | 13,065 |
| QUALCOMM Inc. | 192,814 | 10,152 |
* | Dell Inc. | 241,701 | 5,252 |
* | eBay Inc. | 117,979 | 2,941 |
| Applied Materials, Inc. | 161,683 | 2,897 |
| MasterCard, Inc. Class A | 11,741 | 2,848 |
| Automatic Data | | |
| Processing, Inc. | 62,401 | 2,769 |
| Western Union Co. | 88,343 | 2,440 |
* | Yahoo! Inc. | 123,730 | 2,398 |
* | Symantec Corp. | 101,032 | 2,254 |
| Tyco Electronics Ltd. | 57,326 | 1,887 |
* | Electronic Arts Inc. | 37,976 | 1,854 |
* | Juniper Networks, Inc. | 62,597 | 1,609 |
* | Agilent Technologies, Inc. | 43,190 | 1,501 |
* | Broadcom Corp. | 53,566 | 1,289 |
* | Intuit, Inc. | 39,110 | 1,176 |
| CA, Inc. | 46,143 | 1,103 |
* | NetApp, Inc. | 41,162 | 1,049 |
* | Fiserv, Inc. | 19,787 | 1,026 |
* | Cognizant Technology | | |
| Solutions Corp. | 34,798 | 1,020 |
* | MEMC Electronic | | |
| Materials, Inc. | 20,388 | 1,001 |
* | Autodesk, Inc. | 27,863 | 990 |
| Analog Devices, Inc. | 34,603 | 968 |
| Xilinx, Inc. | 34,360 | 893 |
* | Flextronics International Ltd. | 99,035 | 883 |
| Linear Technology Corp. | 26,514 | 865 |
| Seagate Technology | 57,743 | 861 |
* | Computer Sciences Corp. | 17,985 | 846 |
* | NVIDIA Corp. | 66,710 | 843 |
| Altera Corp. | 35,886 | 812 |
* | Marvell Technology Group Ltd. | 53,844 | 760 |
* | Amdocs Ltd. | 25,097 | 758 |
| KLA-Tencor Corp. | 20,362 | 755 |
* | McAfee Inc. | 19,046 | 753 |
* | VeriSign, Inc. | 23,293 | 745 |
* | BMC Software, Inc. | 22,894 | 745 |
| Microchip Technology, Inc. | 22,599 | 723 |
* | Citrix Systems, Inc. | 22,076 | 668 |
* | Check Point Software | | |
| Technologies Ltd. | 26,703 | 654 |
| National Semiconductor Corp. | 29,132 | 624 |
* | Affiliated Computer | | |
| Services, Inc. Class A | 10,631 | 566 |
* | LAM Research Corp. | 14,872 | 547 |
* | Teradata Corp. | 21,737 | 534 |
* | Avnet, Inc. | 18,033 | 529 |
* | LSI Corp. | 76,445 | 508 |
* | Arrow Electronics, Inc. | 14,813 | 492 |
| Total System Services, Inc. | 23,605 | 470 |
* | Akamai Technologies, Inc. | 20,304 | 465 |
* | Advanced Micro Devices, Inc. | 73,166 | 460 |
| Jabil Circuit, Inc. | 24,896 | 420 |
* | DST Systems, Inc. | 6,575 | 406 |
* | SanDisk Corp. | 27,067 | 391 |
* | Alliance Data Systems Corp. | 6,032 | 388 |
* | Micron Technology, Inc. | 89,796 | 381 |
* | Compuware Corp. | 33,355 | 381 |
* | Synopsys, Inc. | 16,863 | 363 |
| Broadridge Financial | | |
| Solutions LLC | 16,850 | 337 |
* | QLogic Corp. | 16,070 | 300 |
* | JDS Uniphase Corp. | 27,287 | 277 |
* | Novellus Systems, Inc. | 12,098 | 274 |
* | Metavante Technologies | 10,854 | 257 |
* | Tellabs, Inc. | 49,080 | 256 |
* | IAC/InterActiveCorp | 15,201 | 252 |
* | Cadence Design Systems, Inc. | 30,555 | 244 |
* | Zebra Technologies | | |
| Corp. Class A | 7,736 | 242 |
* | Convergys Corp. | 14,585 | 215 |
* | Teradyne, Inc. | 20,627 | 192 |
* | Sanmina-SCI Corp. | 64,764 | 152 |
| Fair Isaac, Inc. | 5,879 | 136 |
| | | 120,670 |
13
| | | Market |
| | | Value• |
| | Shares | ($000) |
Materials (0.7%) | | |
| Vulcan Materials Co. | 13,079 | 979 |
| Sigma-Aldrich Corp. | 15,512 | 880 |
| Southern Peru Copper Corp. | | |
| (U.S. Shares) | 31,805 | 812 |
| Sealed Air Corp. | 19,050 | 462 |
* | Pactiv Corp. | 15,792 | 424 |
| Louisiana-Pacific Corp. | 12,612 | 123 |
| | | 3,680 |
Telecommunication Services (1.6%) | | |
| Sprint Nextel Corp. | 331,067 | 2,887 |
* | NII Holdings Inc. | 19,954 | 1,048 |
* | Crown Castle | | |
| International Corp. | 25,507 | 954 |
| Embarq Corp. | 17,726 | 836 |
| Qwest Communications | | |
| International Inc. | 209,124 | 790 |
*,^ | Level 3 Communications, Inc. | 185,388 | 636 |
| CenturyTel, Inc. | 12,715 | 491 |
* | Frontier Communications Corp. | 38,833 | 488 |
| Telephone & Data | | |
| Systems, Inc.– | | |
| Special Common Shares | 7,074 | 264 |
| Telephone & Data | | |
| Systems, Inc. | 6,173 | 237 |
| | | 8,631 |
Utilities (1.3%) | | |
* | AES Corp. | 80,586 | 1,230 |
| Questar Corp. | 20,792 | 1,079 |
* | NRG Energy, Inc. | 28,149 | 1,060 |
| Allegheny Energy, Inc. | 20,030 | 908 |
| Equitable Resources, Inc. | 15,500 | 774 |
* | Mirant Corp. | 22,186 | 656 |
| Pepco Holdings, Inc. | 23,880 | 605 |
| TECO Energy, Inc. | 25,124 | 448 |
| Puget Energy, Inc. | 15,474 | 432 |
| | | 7,192 |
Total Common Stocks | | |
(Cost $554,191) | | 533,325 |
Temporary Cash Investment (0.3%) | | |
1,2 | Vanguard Market Liquidity | | |
| Fund, 2.389% | | |
| (Cost $1,707) | 1,706,500 | 1,707 |
Total Investments (100.2%) | | |
(Cost $555,898) | | 535,032 |
| Market |
| Value• |
| ($000) |
Other Assets and Liabilities (–0.2%) | |
Other Assets | 4,005 |
Liabilities2 | (5,049) |
| (1,044) |
Net Assets (100%) | 533,988 |
| |
| |
| |
At August 31, 2008, net assets consisted of: |
| Amount |
| ($000) |
Paid-in Capital | 558,932 |
Undistributed Net Investment Income | 4,494 |
Accumulated Net Realized Losses | (8,572) |
Unrealized Appreciation (Depreciation) | (20,866) |
Net Assets | 533,988 |
| |
| |
Investor Shares—Net Assets | |
Applicable to 50,847,650 outstanding | |
$.001 par value shares of beneficial | |
interest (unlimited authorization) | 394,630 |
Net Asset Value Per Share— | |
Investor Shares | $7.76 |
| |
| |
Institutional Shares—Net Assets | |
Applicable to 17,923,961 outstanding | |
$.001 par value shares of beneficial | |
interest (unlimited authorization) | 139,358 |
Net Asset Value Per Share— | |
Institutional Shares | $7.77 |
• See Note A in Notes to Financial Statements.
* Non-income-producing security.
^ Part of security position is on loan to broker-dealers. The total value of securities on loan is $1,559,000.
1 Affiliated money market fund available only to Vanguard funds and certain trusts and accounts managed by Vanguard. Rate shown is the 7-day yield.
2 Includes $1,707,000 of collateral received for securities on loan.
REIT—Real Estate Investment Trust.
See accompanying Notes, which are an integral part of the Financial Statements.
14
Statement of Operations
| Year Ended |
| August 31, 2008 |
| ($000) |
Investment Income | |
Income | |
Dividends | 9,965 |
Interest1 | 31 |
Security Lending | 70 |
Total Income | 10,066 |
Expenses | |
The Vanguard Group—Note B | |
Investment Advisory Services | 51 |
Management and Administrative—Investor Shares | 832 |
Management and Administrative—Institutional Shares | 77 |
Marketing and Distribution—Investor Shares | 124 |
Marketing and Distribution—Institutional Shares | 33 |
Custodian Fees | 60 |
Auditing Fees | 22 |
Shareholders’ Reports—Investor Shares | 21 |
Shareholders’ Reports—Institutional Shares | — |
Trustees’ Fees and Expenses | 1 |
Total Expenses | 1,221 |
Net Investment Income | 8,845 |
Realized Net Gain (Loss) on Investment Securities Sold | (6,921) |
Change in Unrealized Appreciation (Depreciation) of Investment Securities | (99,890) |
Net Increase (Decrease) in Net Assets Resulting from Operations | (97,966) |
1 Interest income from an affiliated company of the fund was $20,000.
See accompanying Notes, which are an integral part of the Financial Statements.
15
Statement of Changes in Net Assets
| Year Ended August 31, |
| 2008 | 2007 |
| ($000) | ($000) |
Increase (Decrease) In Net Assets | | |
Operations | | |
Net Investment Income | 8,845 | 9,095 |
Realized Net Gain (Loss) | (6,921) | 12,259 |
Change in Unrealized Appreciation (Depreciation) | (99,890) | 32,031 |
Net Increase (Decrease) in Net Assets Resulting from Operations | (97,966) | 53,385 |
Distributions | | |
Net Investment Income | | |
Investor Shares | (7,812) | (6,055) |
Institutional Shares | (2,061) | (1,389) |
Realized Capital Gain | | |
Investor Shares | — | — |
Institutional Shares | — | — |
Total Distributions | (9,873) | (7,444) |
Capital Share Transactions | | |
Investor Shares | (60,224) | 97,215 |
Institutional Shares | 51,023 | 16,384 |
Net Increase (Decrease) from Capital Share Transactions | (9,201) | 113,599 |
Total Increase (Decrease) | (117,040) | 159,540 |
Net Assets | | |
Beginning of Period | 651,028 | 491,488 |
End of Period1 | 533,988 | 651,028 |
1 Net Assets—End of Period includes undistributed net investment income of $4,494,000 and $5,522,000.
See accompanying Notes, which are an integral part of the Financial Statements.
16
Financial Highlights
Investor Shares | | | | | |
| | | | | |
| | | | | |
| | | | |
For a Share Outstanding | Year Ended August 31, |
Throughout Each Period | 2008 | 2007 | 2006 | 2005 | 2004 |
Net Asset Value, Beginning of Period | $9.30 | $8.51 | $8.03 | $7.40 | $6.87 |
Investment Operations | | | | | |
Net Investment Income | .125 | .13 | .11 | .131 | .08 |
Net Realized and Unrealized Gain (Loss) | | | | | |
on Investments | (1.525) | .78 | .47 | .62 | .52 |
Total from Investment Operations | (1.400) | .91 | .58 | .75 | .60 |
Distributions | | | | | |
Dividends from Net Investment Income | (.140) | (.12) | (.10) | (.12) | (.07) |
Distributions from Realized Capital Gains | — | — | — | — | — |
Total Distributions | (.140) | (.12) | (.10) | (.12) | (.07) |
Net Asset Value, End of Period | $7.76 | $9.30 | $8.51 | $8.03 | $7.40 |
| | | | | |
| | | | | |
Total Return2 | –15.26% | 10.70% | 7.25% | 10.16% | 8.75% |
| | | | | |
| | | | | |
Ratios/Supplemental Data | | | | | |
Net Assets, End of Period (Millions) | $395 | $540 | $405 | $361 | $274 |
Ratio of Total Expenses to | | | | | |
Average Net Assets | 0.24% | 0.24% | 0.25% | 0.25% | 0.25% |
Ratio of Net Investment Income to | | | | | |
Average Net Assets | 1.48% | 1.48% | 1.41% | 1.74%1 | 1.17% |
Portfolio Turnover Rate | 41% | 20% | 51%3 | 12% | 8% |
1 Net investment income per share and the ratio of net investment income to average net assets include $0.04 and 0.43%, respectively, resulting from a special dividend from Microsoft Corp. in November 2004.
2 Total returns do not include the account service fee that may be applicable to certain accounts with balances below $10,000.
3 Includes activity related to a change in the fund’s target index.
See accompanying Notes, which are an integral part of the Financial Statements.
17
Institutional Shares | | | | | |
| | | | | |
| | | | | |
| | | | |
For a Share Outstanding | Year Ended August 31, |
Throughout Each Period | 2008 | 2007 | 2006 | 2005 | 2004 |
Net Asset Value, Beginning of Period | $9.32 | $8.52 | $8.04 | $7.41 | $6.88 |
Investment Operations | | | | | |
Net Investment Income | .137 | .152 | .12 | .1381 | .084 |
Net Realized and Unrealized Gain (Loss) | | | | | |
on Investments | (1.535) | .780 | .47 | .620 | .522 |
Total from Investment Operations | (1.398) | .932 | .59 | .758 | .606 |
Distributions | | | | | |
Dividends from Net Investment Income | (.152) | (.132) | (.11) | (.128) | (.076) |
Distributions from Realized Capital Gains | — | — | — | — | — |
Total Distributions | (.152) | (.132) | (.11) | (.128) | (.076) |
Net Asset Value, End of Period | $7.77 | $9.32 | $8.52 | $8.04 | $7.41 |
| | | | | |
| | | | | |
Total Return | –15.22% | 10.95% | 7.37% | 10.26% | 8.83% |
| | | | | |
| | | | | |
Ratios/Supplemental Data | | | | | |
Net Assets, End of Period (Millions) | $139 | $111 | $87 | $27 | $13 |
Ratio of Total Expenses to Average Net Assets | 0.11% | 0.11% | 0.12% | 0.12% | 0.12% |
Ratio of Net Investment Income to | | | | | |
Average Net Assets | 1.61% | 1.61% | 1.54% | 1.83%1 | 1.30% |
Portfolio Turnover Rate | 41% | 20% | 51%2 | 12% | 8% |
1 Net investment income per share and the ratio of net investment income to average net assets include $0.036 and 0.43%, respectively, resulting from a special dividend from Microsoft Corp. in November 2004.
2 Includes activity related to a change in the fund’s target index.
See accompanying Notes, which are an integral part of the Financial Statements.
18
Notes to Financial Statements
Vanguard FTSE Social Index Fund is registered under the Investment Company Act of 1940 as an open-end investment company, or mutual fund. The fund offers two classes of shares, Investor Shares and Institutional Shares. Investor Shares are available to any investor who meets the fund’s minimum purchase requirements. Institutional Shares are designed for investors who meet certain administrative and service criteria and invest a minimum of $5 million.
A. The following significant accounting policies conform to generally accepted accounting principles for U.S. mutual funds. The fund consistently follows such policies in preparing its financial statements.
1. Security Valuation: Securities are valued as of the close of trading on the New York Stock Exchange (generally 4 p.m., Eastern time) on the valuation date. Equity securities are valued at the latest quoted sales prices or official closing prices taken from the primary market in which each security trades; such securities not traded on the valuation date are valued at the mean of the latest quoted bid and asked prices. Securities for which market quotations are not readily available, or whose values have been materially affected by events occurring before the fund’s pricing time but after the close of the securities’ primary markets, are valued by methods deemed by the board of trustees to represent fair value. Investments in Vanguard Market Liquidity Fund are valued at that fund’s net asset value.
2. Federal Income Taxes: The fund intends to continue to qualify as a regulated investment company and distribute all of its taxable income. Management has analyzed the fund’s tax positions taken on federal income tax returns for all open tax years (tax years ended August 31, 2005–2008), and has concluded that no provision for federal income tax is required in the fund’s financial statements.
3. Distributions: Distributions to shareholders are recorded on the ex-dividend date.
4. Security Lending: The fund may lend its securities to qualified institutional borrowers to earn additional income. Security loans are required to be secured at all times by collateral at least equal to the market value of securities loaned. The fund invests cash collateral received in Vanguard Market Liquidity Fund, and records a liability for the return of the collateral, during the period the securities are on loan. Security lending income represents the income earned on investing cash collateral, less expenses associated with the loan.
5. Other: Dividend income is recorded on the ex-dividend date. Interest income includes income distributions received from Vanguard Market Liquidity Fund and is accrued daily. Security transactions are accounted for on the date securities are bought or sold. Costs used to determine realized gains (losses) on the sale of investment securities are those of the specific securities sold.
Each class of shares has equal rights as to assets and earnings, except that each class separately bears certain class-specific expenses related to maintenance of shareholder accounts (included in Management and Administrative expenses) and shareholder reporting. Marketing and distribution expenses are allocated to each class of shares based on a method approved by the board of trustees. Income, other non-class-specific expenses, and gains and losses on investments are allocated to each class of shares based on its relative net assets.
B. The Vanguard Group furnishes at cost investment advisory, corporate management, administrative, marketing, and distribution services. The costs of such services are allocated to the fund under methods approved by the board of trustees. The fund has committed to provide up to 0.40% of its net assets in capital contributions to Vanguard. At August 31, 2008, the fund had contributed capital of $45,000 to Vanguard (included in Other Assets), representing 0.01% of the fund’s net assets and 0.04% of Vanguard’s capitalization. The fund’s trustees and officers are also directors and officers of Vanguard.
19
C. Distributions are determined on a tax basis and may differ from net investment income and realized capital gains for financial reporting purposes. Differences may be permanent or temporary. Permanent differences are reclassified among capital accounts in the financial statements to reflect their tax character. Temporary differences arise when certain items of income, expense, gain, or loss are recognized in different periods for financial statement and tax purposes; these differences will reverse at some time in the future. Differences in classification may also result from the treatment of short-term gains as ordinary income for tax purposes.
For tax purposes, at August 31, 2008, the fund had $5,302,000 of ordinary income available for distribution. The fund had available realized losses of $4,064,000 to offset future net capital gains of $79,000 through August 31, 2012, $985,000 through August 31, 2013, $367,000 through August 31, 2014, $2,136,000 through August 31, 2016, and $497,000 through August 31, 2017.
At August 31, 2008, the cost of investment securities for tax purposes was $560,321,000. Net unrealized depreciation of investment securities for tax purposes was $25,289,000, consisting of unrealized gains of $68,988,000 on securities that had risen in value since their purchase and $94,277,000 in unrealized losses on securities that had fallen in value since their purchase.
D. During the year ended August 31, 2008, the fund purchased $240,752,000 of investment securities and sold $251,503,000 of investment securities other than temporary cash investments.
E. Capital share transactions for each class of shares were:
| | | Year Ended August 31, | |
| | 2008 | | | 2007 |
| Amount | Shares | | Amount | Shares |
| ($000) | (000) | | ($000) | (000) |
Investor Shares | | | | | |
Issued | 89,674 | 10,639 | | 167,494 | 17,947 |
Issued in Lieu of Cash Distributions | 7,393 | 821 | | 5,638 | 610 |
Redeemed | (157,291) | (18,620) | | (75,917) | (8,154) |
Net Increase (Decrease)—Investor Shares | (60,224) | (7,160) | | 97,215 | 10,403 |
Institutional Shares | | | | | |
Issued | 75,608 | 8,817 | | 41,949 | 4,428 |
Issued in Lieu of Cash Distributions | 1,715 | 190 | | 1,389 | 150 |
Redeemed | (26,300) | (3,027) | | (26,954) | (2,794) |
Net Increase (Decrease)—Institutional Shares | 51,023 | 5,980 | | 16,384 | 1,784 |
| | | | | | |
F. In September 2006, the Financial Accounting Standards Board issued Statement of Financial Accounting Standards No. 157 (“FAS 157”), “Fair Value Measurements.” FAS 157 establishes a framework for measuring fair value and expands disclosures about fair value measurements in financial statements.
The various inputs that may be used to determine the value of the fund’s investments are summarized in three broad levels. The inputs or methodologies used for valuing securities are not necessarily an indication of the risk associated with investing in those securities.
20
Level 1—Quoted prices in active markets for identical securities.
Level 2—Other significant observable inputs (including quoted prices for similar securities, interest rates, prepayment speeds, credit risk, etc.).
Level 3—Significant unobservable inputs (including the fund’s own assumptions used to determine the fair value of investments).
At August 31, 2008, 100% of the fund’s investments were valued based on Level 1 inputs.
21
Report of Independent Registered
Public Accounting Firm
To the Trustees of Vanguard World Funds and the Shareholders of Vanguard FTSE Social Index Fund:
In our opinion, the accompanying statement of net assets and the related statements of operations and of changes in net assets and the financial highlights present fairly, in all material respects, the financial position of Vanguard FTSE Social Index Fund (the “Fund”) at August 31, 2008, the results of its operations for the year then ended, the changes in its net assets for each of the two years in the period then ended and the financial highlights for each of the five years in the period then ended, in conformity with accounting principles generally accepted in the United States of America. These financial statements and financial highlights (hereafter referred to as “financial statements”) are the responsibility of the Fund’s management; our responsibility is to express an opinion on these financial statements based on our audits. We conducted our audits of these financial statements in accordance with the standards of the Public Company Accounting Oversight Board (United States). Those standards require that we plan and perform the audit to obtain reasonable assurance about whether the financial statements are free of material misstatement. An audit includes examining, on a test basis, evidence supporting the amounts and disclosures in the financial statements, assessing the accounting principles used and significant estimates made by management, and evaluating the overall financial statement presentation. We believe that our audits, which included confirmation of securities at August 31, 2008 by correspondence with the custodian and by agreement to the underlying ownership records for Vanguard Market Liquidity Fund, provide a reasonable basis for our opinion.
PricewaterhouseCoopers LLP
Philadelphia, Pennsylvania
October 14, 2008
Special 2008 tax information (unaudited) for Vanguard FTSE Social Index Fund
This information for the fiscal year ended August 31, 2008, is included pursuant to provisions of the Internal Revenue Code.
The fund distributed $9,873,000 of qualified dividend income to shareholders during the fiscal year.
For corporate shareholders, 100% of investment income (dividend income plus short-term gains, if any) qualifies for the dividends-received deduction.
22
Your Fund’s After-Tax Returns
This table presents returns for your fund both before and after taxes. The after-tax returns are shown in two ways: (1) assuming that an investor owned the fund during the entire period and paid taxes on the fund’s distributions, and (2) assuming that an investor paid taxes on the fund’s distributions and sold all shares at the end of each period.
Calculations are based on the highest individual federal income tax and capital gains tax rates in effect at the times of the distributions and the hypothetical sales. State and local taxes were not considered. After-tax returns reflect any qualified dividend income, using actual prior-year figures and estimates for 2008. (In the example, returns after the sale of fund shares may be higher than those assuming no sale. This occurs when the sale would have produced a capital loss. The calculation assumes that the investor received a tax deduction for the loss.)
The table shows returns for Investor Shares only; returns for other share classes will differ. Please note that your actual after-tax returns will depend on your tax situation and may differ from those shown. Also note that if you own the fund in a tax-deferred account, such as an individual retirement account or a 401(k) plan, this information does not apply to you. Such accounts are not subject to current taxes.
Finally, keep in mind that a fund’s performance—whether before or after taxes—does not guarantee future results.
Average Annual Total Returns: FTSE Social Index Fund Investor Shares1 |
Periods Ended August 31, 2008 | | | |
| One | Five | Since |
| Year | Years | Inception2 |
Returns Before Taxes | –15.26% | 3.80% | –2.05% |
Returns After Taxes on Distributions | –15.46 | 3.60 | –2.26 |
Returns After Taxes on Distributions and Sale of Fund Shares | –9.60 | 3.28 | –1.77 |
1 Total return figures do not include the account service fee that may be applicable to certain accounts with balances below $10,000.
2 Inception date for Investor Shares is May 31, 2000.
23
About Your Fund’s Expenses
As a shareholder of the fund, you incur ongoing costs, which include costs for portfolio management, administrative services, and shareholder reports (like this one), among others. Operating expenses, which are deducted from a fund’s gross income, directly reduce the investment return of the fund.
A fund’s expenses are expressed as a percentage of its average net assets. This figure is known as the expense ratio. The following examples are intended to help you understand the ongoing costs (in dollars) of investing in your fund and to compare these costs with those of other mutual funds. The examples are based on an investment of $1,000 made at the beginning of the period shown and held for the entire period.
The accompanying table illustrates your fund’s costs in two ways:
• Based on actual fund return. This section helps you to estimate the actual expenses that you paid over the period. The “Ending Account Value” shown is derived from the fund’s actual return, and the third column shows the dollar amount that would have been paid by an investor who started with $1,000 in the fund. You may use the information here, together with the amount you invested, to estimate the expenses that you paid over the period.
To do so, simply divide your account value by $1,000 (for example, an $8,600 account value divided by $1,000 = 8.6), then multiply the result by the number given for your fund under the heading “Expenses Paid During Period.”
• Based on hypothetical 5% yearly return. This section is intended to help you compare your fund’s costs with those of other mutual funds. It assumes that the fund had a yearly return of 5% before expenses, but that the expense ratio is unchanged. In this case—because the return used is not the fund’s actual return—the results do not apply to your investment. The example is useful in making comparisons because the Securities and Exchange Commission requires all mutual funds to calculate expenses based on a 5% return. You can assess your fund’s costs by comparing this hypothetical example with the hypothetical examples that appear in shareholder reports of other funds.
Six Months Ended August 31, 2008 | | | |
| Beginning | Ending | Expenses |
| Account Value | Account Value | Paid During |
FTSE Social Index Fund | 2/29/2008 | 8/31/2008 | Period1 |
Based on Actual Fund Return | | | |
Investor Shares | $1,000.00 | $978.56 | $1.15 |
Institutional Shares | 1,000.00 | 978.59 | 0.50 |
Based on Hypothetical 5% Yearly Return | | | |
Investor Shares | $1,000.00 | $1,024.05 | $1.17 |
Institutional Shares | 1,000.00 | 1,024.70 | 0.51 |
1 The calculations are based on expenses incurred in the most recent six-month period. The fund’s annualized six-month expense ratios for that period are 0.23% for Investor Shares and 0.10% for Institutional Shares. The dollar amounts shown as “Expenses Paid” are equal to the annualized expense ratio multiplied by the average account value over the period, multiplied by the number of days in the most recent six-month period, then divided by the number of days in the most recent 12-month period.
24
Note that the expenses shown in the table are meant to highlight and help you compare ongoing costs only and do not reflect transaction costs incurred by the fund for buying and selling securities. Further, the expenses do not include the account service fee described in the prospectus. If such a fee were applied to your account, your costs would be higher. Your fund does not charge transaction fees, such as purchase or redemption fees, nor does it carry a “sales load.”
The calculations assume no shares were bought or sold during the period. Your actual costs may have been higher or lower, depending on the amount of your investment and the timing of any purchases or redemptions.
You can find more information about the fund’s expenses, including annual expense ratios, in the Financial Statements section of this report. For additional information on operating expenses and other shareholder costs, please refer to your fund’s current prospectus.
25
Trustees Approve Advisory Arrangement
The board of trustees of Vanguard FTSE Social Index Fund has renewed the fund’s investment advisory arrangement with The Vanguard Group, Inc. Vanguard—through its Quantitative Equity Group (QEG)—serves as the investment advisor for the fund. The board determined that continuing the fund’s internalized management structure was in the best interests of the fund and its shareholders.
The board based its decision upon an evaluation of the advisor’s investment staff, portfolio management process, and performance. The trustees considered the factors discussed below, among others. However, no single factor determined whether the board approved the arrangement. Rather, it was the totality of the circumstances that drove the board’s decision.
Nature, extent, and quality of services
The board considered the quality of the fund’s investment management over both the short and long term, and took into account the organizational depth and stability of the advisor. The board noted that Vanguard has been managing investments for more than 25 years. George U. Sauter, Vanguard managing director and chief investment officer, has been in the investment management business since 1985. Mr. Sauter has led QEG since 1987. QEG adheres to a sound, disciplined investment management process; the team has considerable experience, stability, and depth.
The board concluded that Vanguard’s experience, stability, depth, and performance, among other factors, warranted continuation of the advisory arrangement.
Investment performance
The board considered the short- and long-term performance of the fund, including any periods of outperformance or underperformance of its target benchmark and peer group. The board concluded that the fund has performed in line with expectations and that its results have been consistent with its investment strategy. Information about the fund’s most recent performance can be found in the Performance Summary section of this report.
Cost
The board concluded that the fund’s expense ratio was far below the average expense ratio charged by funds in its peer group. The board noted that the fund’s advisory expense ratio was also well below its peer-group average. Information about the fund’s expense ratio appears in the About Your Fund’s Expenses section of this report as well as in the Financial Statements section.
The board does not conduct a profitability analysis of Vanguard because of Vanguard’s unique “at-cost” structure. Unlike most other mutual fund management companies, Vanguard is owned by the funds it oversees, and produces “profits” only in the form of reduced expenses for fund shareholders.
The benefit of economies of scale
The board concluded that the fund’s low-cost arrangement with Vanguard ensures that the fund will realize economies of scale as it grows, with the cost to shareholders declining as the fund’s assets increase.
The board will consider whether to renew the advisory arrangement again after a one-year period.
26
Glossary
Beta. A measure of the magnitude of a fund’s past share-price fluctuations in relation to the ups and downs of a given market index. The index is assigned a beta of 1.00. Compared with a given index, a fund with a beta of 1.20 typically would have seen its share price rise or fall by 12% when the index rose or fell by 10%. For this report, beta is based on returns over the past 36 months for both the fund and the index. Note that a fund’s beta should be reviewed in conjunction with its R-squared (see definition below). The lower the R-squared, the less correlation there is between the fund and the index, and the less reliable beta is as an indicator of volatility.
Earnings Growth Rate. The average annual rate of growth in earnings over the past five years for the stocks now in a fund.
Equity Exposure. A measure that reflects a fund’s investments in stocks and stock futures. Any holdings in short-term reserves are excluded.
Expense Ratio. The percentage of a fund’s average net assets used to pay its annual administrative and advisory expenses. These expenses directly reduce returns to investors.
Foreign Holdings. The percentage of a fund represented by stocks or depositary receipts of companies based outside the United States.
Inception Date. The date on which the assets of a fund (or one of its share classes) are first invested in accordance with the fund’s investment objective. For funds with a subscription period, the inception date is the day after that period ends. Investment performance is measured from the inception date.
Median Market Cap. An indicator of the size of companies in which a fund invests; the midpoint of market capitalization (market price x shares outstanding) of a fund’s stocks, weighted by the proportion of the fund’s assets invested in each stock. Stocks representing half of the fund’s assets have market capitalizations above the median, and the rest are below it.
Price/Book Ratio. The share price of a stock divided by its net worth, or book value, per share. For a fund, the weighted average price/book ratio of the stocks it holds.
Price/Earnings Ratio. The ratio of a stock’s current price to its per-share earnings over the past year. For a fund, the weighted average P/E of the stocks it holds. P/E is an indicator of market expectations about corporate prospects; the higher the P/E, the greater the expectations for a company’s future growth.
R-Squared. A measure of how much of a fund’s past returns can be explained by the returns from the market in general, as measured by a given index. If a fund’s total returns were precisely synchronized with an index’s returns, its R-squared would be 1.00. If the fund’s returns bore no relationship to the index’s returns, its R-squared would be 0. For this report, R-squared is based on returns over the past 36 months for both the fund and the index.
Return on Equity. The annual average rate of return generated by a company during the past five years for each dollar of shareholder’s equity (net income divided by shareholder’s equity). For a fund, the weighted average return on equity for the companies whose stocks it holds.
Short-Term Reserves. The percentage of a fund invested in highly liquid, short-term securities that can be readily converted to cash.
27
Turnover Rate. An indication of the fund’s trading activity. Funds with high turnover rates incur higher transaction costs and may be more likely to distribute capital gains (which may be taxable to investors). The turnover rate excludes in-kind transactions, which have minimal impact on costs.
Yield. A fund’s 30-day SEC yield is derived using a formula specified by the U.S. Securities and Exchange Commission. Under the formula, data related to the fund’s security holdings in the previous 30 days are used to calculate the fund’s hypothetical net income for that period, which is then annualized and divided by the fund’s estimated average net assets over the calculation period. For the purposes of this calculation, a security’s income is based on its current market yield to maturity (in the case of bonds) or its projected dividend yield (for stocks). Because the SEC yield represents hypothetical annualized income, it will differ—at times significantly—from the fund’s actual experience. As a result, the fund’s income distributions may be higher or lower than implied by the SEC yield.
28
This page intentionally left blank.
This page intentionally left blank.
This page intentionally left blank.
The People Who Govern Your Fund
The trustees of your mutual fund are there to see that the fund is operated and managed in your best interests since, as a shareholder, you are a part owner of the fund. Your fund’s trustees also serve on the board of directors of The Vanguard Group, Inc., which is owned by the Vanguard funds and provides services to them on an at-cost basis.
A majority of Vanguard’s board members are independent, meaning that they have no affiliation with Vanguard or the funds they oversee, apart from the sizable personal investments they have made as private individuals.
Our independent board members bring distinguished backgrounds in business, academia, and public service to their task of working with Vanguard officers to establish the policies and oversee the activities of the funds. Among board members’ responsibilities are selecting investment advisors for the funds; monitoring fund operations, performance, and costs; reviewing contracts; nominating and selecting new trustees/directors; and electing Vanguard officers.
Each trustee serves a fund until its termination; or until the trustee’s retirement, resignation, or death; or otherwise as specified in the fund’s organizational documents. Any trustee may be removed at a shareholders’ meeting by a vote representing two-thirds of the net asset value of all shares of the fund together with shares of other Vanguard funds organized within the same trust. The table on these two pages shows information for each trustee and executive officer of the fund. The mailing address of the trustees and officers is P.O. Box 876, Valley Forge, PA 19482.
Chairman of the Board and Trustee
John J. Brennan1
Born 1954 Principal Occupation(s) During the Past Five Years: Chairman of the Board and Director/ Trustee Since May 1987; Trustee of The Vanguard Group, Inc., and of each of the investment companies served Chairman of the Board by The Vanguard Group; Director of Vanguard Marketing Corporation; President and Chief 156 Vanguard Funds Overseen Executive Officer of The Vanguard Group and of each of the investment companies served by The Vanguard Group (1996–2008).
Independent Trustees
Charles D. Ellis
Born 1937 Principal Occupation(s) During the Past Five Years: Applecore Partners (pro bono ventures Trustee Since January 2001 in education); Senior Advisor to Greenwich Associates (international business strategy 156 Vanguard Funds Overseen consulting); Successor Trustee of Yale University; Overseer of the Stern School of Business at New York University; Trustee of the Whitehead Institute for Biomedical Research.
Emerson U. Fullwood
Born 1948 Principal Occupation(s) During the Past Five Years: Executive Chief Staff and Marketing Trustee Since January 2008 Officer for North America since 2004 and Corporate Vice President of Xerox Corporation 156 Vanguard Funds Overseen (photocopiers and printers); Director of SPX Corporation (multi-industry manufacturing), of the United Way of Rochester, and of the Boy Scouts of America.
Rajiv L. Gupta
Born 1945 Principal Occupation(s) During the Past Five Years: Chairman, President, and Trustee Since December 20012 Chief Executive Officer of Rohm and Haas Co. (chemicals); Board Member of 156 Vanguard Funds Overseen the American Chemistry Council; Director of Tyco International, Ltd. (diversified manufacturing and services) since 2005.
Amy Gutmann
Born 1949 Principal Occupation(s) During the Past Five Years: President of the University of
Trustee Since June 2006 Pennsylvania since 2004; Professor in the School of Arts and Sciences, Annenberg School 156 Vanguard Funds Overseen for Communication, and Graduate School of Education of the University of Pennsylvania since 2004; Provost (2001–2004) and Laurance S. Rockefeller Professor of Politics and the University Center for Human Values (1990–2004), Princeton University; Director of Carnegie Corporation of New York since 2005 and of Schuylkill River Development Corporation and Greater Philadelphia Chamber of Commerce since 2004; Trustee of the National Constitution Center since 2007.
JoAnn Heffernan Heisen
Born 1950 Principal Occupation(s) During the Past Five Years: Corporate Vice President and Trustee Since July 1998 Chief Global Diversity Officer since 2006, Vice President and Chief Information 156 Vanguard Funds Overseen Officer (1997–2005), and Member of the Executive Committee of Johnson & Johnson (pharmaceuticals/consumer products); Director of the University Medical Center at Princeton and Women’s Research and Education Institute.
André F. Perold
Born 1952 Principal Occupation(s) During the Past Five Years: George Gund Professor of Finance Trustee Since December 2004 and Banking, Harvard Business School; Senior Associate Dean and Director of Faculty 156 Vanguard Funds Overseen Recruiting, Harvard Business School; Director and Chairman of UNX, Inc. (equities trading firm); Chair of the Investment Committee of HighVista Strategies LLC (private investment firm) since 2005.
Alfred M. Rankin, Jr.
Born 1941 Principal Occupation(s) During the Past Five Years: Chairman, President, Chief Executive Trustee Since January 1993 Officer, and Director of NACCO Industries, Inc. (forklift trucks/housewares/lignite); Director 156 Vanguard Funds Overseen of Goodrich Corporation (industrial products/aircraft systems and services).
J. Lawrence Wilson
Born 1936 Principal Occupation(s) During the Past Five Years: Retired Chairman and Chief Executive Trustee Since April 1985 Officer of Rohm and Haas Co. (chemicals); Director of Cummins Inc. (diesel engines) and 156 Vanguard Funds Overseen AmerisourceBergen Corp. (pharmaceutical distribution); Trustee of Vanderbilt University and of Culver Educational Foundation.
Executive Officers1
Thomas J. Higgins
Born 1957 Principal Occupation(s) During the Past Five Years: Principal of The Vanguard Group, Inc.; Treasurer Since July 1998 Treasurer of each of the investment companies served by The Vanguard Group. 156 Vanguard Funds Overseen
F. William McNabb III
Born 1957 Principal Occupation(s) During the Past Five Years: Chief Executive Officer, Director, Chief Executive Officer and President of The Vanguard Group, Inc., since 2008; Chief Executive Officer and Since August 31, 2008 President of each of the investment companies served by The Vanguard Group since President Since March 2008 2008; Director of Vanguard Marketing Corporation; Managing Director of The Vanguard 156 Vanguard Funds Overseen Group (1995–2008).
Heidi Stam
Born 1956 Principal Occupation(s) During the Past Five Years: Managing Director of The Vanguard Secretary Since July 2005 Group, Inc., since 2006; General Counsel of The Vanguard Group since 2005; Secretary of 156 Vanguard Funds Overseen The Vanguard Group and of each of the investment companies served by The Vanguard Group, since 2005; Director and Senior Vice President of Vanguard Marketing Corporation since 2005; Principal of The Vanguard Group (1997–2006).
Vanguard Senior Management Team | | |
| | | |
R. Gregory Barton | Kathleen C. Gubanich | Michael S. Miller | Glenn W. Reed |
Mortimer J. Buckley | Paul A. Heller | Ralph K. Packard | George U. Sauter |
Founder
John C. Bogle
Chairman and Chief Executive Officer, 1974–1996
1 These individuals are “interested persons” as defined in the Investment Company Act of 1940.
2 December 2002 for Vanguard Equity Income Fund, Vanguard Growth Equity Fund, the Vanguard Municipal Bond Funds, and the Vanguard State Tax-Exempt Funds.
More information about the trustees is in the Statement of Additional Information, available from The Vanguard Group.

P.O. Box 2600
Valley Forge, PA 19482-2600
Connect with Vanguard® > www.vanguard.com
Fund Information > 800-662-7447 | Russell is a trademark of The Frank Russell Company. |
| |
Direct Investor Account Services > 800-662-2739 | All comparative mutual fund data are from Lipper Inc. |
| or Morningstar, Inc., unless otherwise noted. |
Institutional Investor Services > 800-523-1036 | |
| You can obtain a free copy of Vanguard’s proxy voting |
Text Telephone for People | guidelines by visiting our website, www.vanguard.com, |
With Hearing Impairment > 800-952-3335 | and searching for “proxy voting guidelines,” or by |
| calling Vanguard at 800-662-2739. The guidelines are |
| also available from the SEC’s website, www.sec.gov. |
This material may be used in conjunction | In addition, you may obtain a free report on how your |
with the offering of shares of any Vanguard | fund voted the proxies for securities it owned during |
fund only if preceded or accompanied by | the 12 months ended June 30. To get the report, visit |
the fund’s current prospectus. | either www.vanguard.com or www.sec.gov. |
| |
| |
“FTSE®” and “FTSE4Good™” are trademarks jointly | |
owned by the London Stock Exchange plc and The | You can review and copy information about your fund |
Financial Times Limited and are used by FTSE | at the SEC’s Public Reference Room in Washington, D.C. |
International Limited under license. The FTSE4Good | To find out more about this public service, call the SEC |
US Select Index is calculated by FTSE International | at 202-551-8090. Information about your fund is also |
Limited. FTSE International Limited does not sponsor, | available on the SEC’s website, and you can receive |
endorse, or promote the fund; is not in any way | copies of this information, for a fee, by sending a |
connected to it; and does not accept any liability | request in either of two ways: via e-mail addressed to |
in relation to its issue, operation, and trading. | publicinfo@sec.gov or via regular mail addressed to the |
| Public Reference Section, Securities and Exchange |
The funds or securities referred to herein are not | Commission, Washington, DC 20549-0102. |
sponsored, endorsed, or promoted by MSCI, and MSCI | |
bears no liability with respect to any such funds or | |
securities. For any such funds or securities, the | |
prospectus or the Statement of Additional Information | |
contains a more detailed description of the limited | |
relationship MSCI has with The Vanguard Group and | |
any related funds. | |
| |
| |
| |
| © 2008 The Vanguard Group, Inc. |
| All rights reserved. |
| Vanguard Marketing Corporation, Distributor. |
| |
| Q2130 102008 |
> The broad U.S. stock market returned –9.9% for the fiscal year ended August 31, 2008, as worries about inflation, recession, and the widening impact of the subprime-mortgage crisis weighed on the economy.
> For the 12 months, the Vanguard U.S. Sector Index Funds’ returns varied widely, from about –30% for financial stocks to more than 9% for energy stocks.
> Returns for the Financials, Telecommunication Services, and Consumer Discretionary Index Funds trailed the 12-month return of the broad market. Among the seven sector funds that outpaced the market, only the Energy, Materials, and Consumer Staples Index Funds turned in positive results.
Contents | |
| |
Your Fund’s Total Returns | 1 |
President’s Letter | 2 |
Consumer Discretionary Index Fund | 7 |
Consumer Staples Index Fund | 17 |
Energy Index Fund | 26 |
Financials Index Fund | 35 |
Health Care Index Fund | 46 |
Industrials Index Fund | 55 |
Information Technology Index Fund | 65 |
Materials Index Fund | 75 |
Telecommunication Services Index Fund | 84 |
Utilities Index Fund | 92 |
Your Fund’s After-Tax Returns | 101 |
About Your Fund’s Expenses | 102 |
Trustees Approve Advisory Arrangement | 104 |
Glossary | 105 |

Please note: The opinions expressed in this report are just that—informed opinions. They should not be considered promises or advice. Also, please keep in mind that the information and opinions cover the period through the date on the front of this report. Of course, the risks of investing in your fund are spelled out in the prospectus.
Your Fund’s Total Returns
Fiscal Year Ended August 31, 2008
Admiral™ Shares1 and ETF Shares2 | |
| | |
| Ticker | Total |
| Symbol | Returns |
Vanguard Consumer | | |
Discretionary Index Fund | VCDAX | –18.7% |
Vanguard Consumer | | |
Discretionary ETF | VCR | |
Market Price | | –18.5 |
Net Asset Value | | –18.7 |
MSCI® US IMI/Consumer Discretionary | | –18.7 |
| | |
| | |
Vanguard Consumer Staples | | |
Index Fund | VCSAX | 4.1% |
Vanguard Consumer Staples ETF | VDC | |
Market Price | | 4.3 |
Net Asset Value | | 4.2 |
MSCI US IMI/Consumer Staples | | 5.6 |
| | |
| | |
Vanguard Energy Index Fund | VENAX | 9.4% |
Vanguard Energy ETF | VDE | |
Market Price | | 9.7 |
Net Asset Value | | 9.5 |
MSCI US IMI/Energy | | 8.2 |
| | |
| | |
Vanguard Financials Index Fund | VFAIX | –30.4% |
Vanguard Financials ETF | VFH | |
Market Price | | –30.2 |
Net Asset Value | | –30.3 |
MSCI US IMI/Financials | | –30.3 |
| | |
| | |
Vanguard Health Care Index Fund | VHCIX | –2.6% |
Vanguard Health Care ETF | VHT | |
Market Price | | –2.4 |
Net Asset Value | | –2.6 |
MSCI US IMI/Health Care | | –2.3 |
| Ticker | Total |
| Symbol | Returns |
Vanguard Industrials Index Fund | VINAX | –8.7% |
Vanguard Industrials ETF | VIS | |
Market Price | | –8.5 |
Net Asset Value | | –8.7 |
MSCI US IMI/Industrials | | –8.5 |
| | |
| | |
Vanguard Information | | |
Technology Index Fund | VITAX | –8.7% |
Vanguard Information | | |
Technology ETF | VGT | |
Market Price | | –8.6 |
Net Asset Value | | –8.6 |
MSCI US IMI/Information Technology | –8.5 |
| | |
| | |
Vanguard Materials Index Fund | VMIAX | 4.1% |
Vanguard Materials ETF | VAW | |
Market Price | | 4.2 |
Net Asset Value | | 4.1 |
MSCI US IMI/Materials | | 4.1 |
| | |
| | |
Vanguard Telecommunication | | |
Services Index Fund | VTCAX | –21.0% |
Vanguard Telecommunication | | |
Services ETF | VOX | |
Market Price | | –20.9 |
Net Asset Value | | –20.9 |
MSCI US IMI/Telecommunication Services | –20.1 |
| | |
| | |
Vanguard Utilities Index Fund | VUIAX | –0.7% |
Vanguard Utilities ETF | VPU | |
Market Price | | –0.4 |
Net Asset Value | | –0.7 |
MSCI US IMI/Utilities | | –0.4 |
| | |
| | |
MSCI US IMI/2500 | | –9.9% |
1 A lower-cost class of shares available to many longtime shareholders and to those with significant investments in the fund.
2 Vanguard ETF™ Shares are traded on the NYSE Arca exchange and are available only through brokers. The table shows the ETF returns based on both the NYSE Arca market price and the net asset value for a share. U.S. Pat. No. 6,879,964 B2; 7,337,138.
Note: MSCI US IMI/2500 is the Morgan Stanley Capital International® US Investable Market 2500 Index.
1

President’s Letter
Dear Shareholder,
The Vanguard U.S. Sector Index Funds faced stiff headwinds during the latest fiscal year. The overall stock market declined, the economy slowed as energy-led inflation rose, and concern about the impact of the subprime-mortgage crisis continued to swell.
As you would expect, the continuing credit-market distress stemming from widespread mortgage defaults undercut financial sector stocks, which posted the worst returns of all the sectors. At the other extreme, energy sector stocks (with exceptions) were bolstered by rising oil prices and turned in the best performance as a group.
Seven of the sector funds outpaced the –9.9% return of the broad stock market for the year, but only the Energy, Materials, and Consumer Staples Index Funds had positive returns. The Financials, Telecommunication Services, and Consumer Discretionary Index Funds underperformed the market, posting double-digit declines.
As market volatility intensified, stocks sagged worldwide
Stocks in many markets lost ground as credit-market turmoil spread throughout the global economy. Over the full 12 months, the broad U.S. stock market lost about –10% of its value. International markets followed a similar path, returning –12.2% for the year.
The descent was bumpy. After years of relative calm, the U.S. market routinely rose or fell by more than a percentage point in a day’s trading. The volatility reflected a seemingly endless series of unnerving developments: the persistent rise in energy prices, further deterioration in the housing market, a string of bank failures, and the broad economy’s deceleration.
Risk-aversion increased, and Treasuries outperformed
The collapse in subprime mortgage-backed securities and the aftershocks prompted a flight to safety. Short-term U.S. Treasury securities were among the fixed income market’s best performers. Over the 12 months, the broad taxable bond market returned a respectable 5.9%, largely reflecting the Treasury bond rally.
As risk-aversion increased, the difference between the yields of Treasury bonds and those of all other securities increased, depressing the price of corporate debt. (As you know, yield and price move in opposite directions.) Even as corporate bonds grew cheaper, the prices of most goods and services rose quickly, powered by escalating energy prices.
Market Barometer | | | |
| Average Annual Total Returns |
| Periods Ended August 31, 2008 |
| One Year | Three Years | Five Years |
Stocks | | | |
Russell 1000 Index (Large-caps) | –10.6% | 3.9% | 7.4% |
Russell 2000 Index (Small-caps) | –5.5 | 4.8 | 9.6 |
Dow Jones Wilshire 5000 Index (Entire market) | –9.9 | 4.2 | 7.9 |
MSCI All Country World Index ex USA (International) | –12.2 | 10.7 | 16.1 |
| | | |
| | | |
Bonds | | | |
Lehman U.S. Aggregate Bond Index (Broad taxable market) | 5.9% | 4.3% | 4.6% |
Lehman Municipal Bond Index | 4.5 | 3.3 | 4.4 |
Citigroup 3-Month Treasury Bill Index | 2.8 | 4.0 | 3.1 |
| | | |
| | | |
CPI | | | |
Consumer Price Index | 5.4% | 3.7% | 3.5% |
2
The combination of higher inflation, financial market volatility, and economic weakness put the U.S. Federal Reserve Board in an uncomfortable position. The Fed decided that it was imperative to respond to the financial crisis with a dramatic easing of monetary policy through interest rate cuts, even as it recognized that the result might be higher inflation. Over the full 12 months, the Fed reduced its target for the federal funds rate from 5.25% to 2.00%.
Energy and financial sectors traveled very separate paths
Even as the U.S. economy was decelerating, worldwide demand for commodities such as oil and grains remained strong for much of the year. The share prices of exploration and production companies and coal companies climbed strongly in this climate of high and rising energy prices, although the impact on giant integrated oil companies was mixed. The net result was a 9.4% gain for the Energy Index Fund, the top-performing sector fund.
In the materials sector, agricultural chemical companies Monsanto and Mosaic benefited from strong worldwide demand for products to improve crop yields. These two companies were the primary drivers behind the Materials Index Fund’s 4.1% return.
As is typical during economic slowdowns, consumers continued to spend on basic products and services. Reflecting this, the Consumer Staples Index Fund returned 4.1% for the year. In sharp contrast, the Consumer Discretionary Index Fund returned –18.7% as Americans cut back on postponable spending, another true-to-form characteristic of the economic cycle. Especially hard hit were the stocks of movie, publishing, broadcasting, and cable television businesses; leisure-activity companies; and retailers (although the giant retailer Wal-Mart Stores—a consumer staples company—was a strong exception to this trend).
The Utilities Index Fund had a nearly flat return (–0.7%). The Health Care Index Fund returned –2.6%, pulled down by its holdings in managed health care companies and a number of pharmaceutical firms.
The Industrials and Information Technology Index Funds produced identical returns of –8.7%. Tech stocks suffered as both consumers and businesses—which count the ailing financial sector as a major customer—slowed spending on technology. Leading the decline in industrials was General Electric.
The Telecommunication Services Index Fund, which includes companies such as AT&T, Sprint Nextel, and Verizon that compete fiercely for market share, returned –21.0%. The Financials Index Fund was the worst performer for the year, returning –30.4% as investors increasingly lost confidence in the balance sheets of many financial firms.
The funds’ advisor, Vanguard Quantitative Equity Group, generally succeeded in capturing the returns of the target indexes. The exceptions to this pattern were the Energy Index, Consumer Staples Index, and Telecommunication Services Index Funds. Regulatory limits on holdings of individual securities precluded these funds from completely replicating the characteristics of their respective indexes.
Diversification and low cost were never more important
The varied performances of the Vanguard Sector Index Funds during the past fiscal year underscore a fundamental principle of sound investing: the need for diversification. The value of this principle has become especially clear during the past few months, as the crisis that started with subprime mortgages rippled through the financial markets.
No one knows for sure what will happen in the markets from day to day or year to year. A diversified portfolio can do much to help dampen the risk that comes with both normal and heightened degrees of investing uncertainty.
The Vanguard U.S. Sector Index Funds are an efficient way to round out your portfolio. Even better, they’re a low-cost alternative to competing funds. This is important because low costs allow you to keep more of what you earn—yet another foundational principle of smart investing. (Please note that the expense ratios shown in the following Profile pages are those of the 2007 annual report. For the funds’ expense ratios in the most recent reporting period, please see the Financial Highlights tables.)
Thank you for investing with Vanguard.
Sincerely,

F. William McNabb III
President and Chief Executive Officer
September 16, 2008
3
Your Fund’s Performance at a Glance | | | | |
August 31, 2007–August 31, 2008 | | | | |
| | | | |
| | | Distributions Per Share |
| Starting | Ending | Income | Capital |
| Share Price | Share Price | Dividends | Gains |
Consumer Discretionary Index Fund | | | | |
Admiral Shares | $31.02 | $25.03 | $0.200 | $0.000 |
ETF Shares | 60.02 | 48.38 | 0.460 | 0.000 |
Consumer Staples Index Fund | | | | |
Admiral Shares | $33.22 | $34.06 | $0.560 | $0.000 |
ETF Shares | 67.35 | 69.04 | 1.159 | 0.000 |
Energy Index Fund | | | | |
Admiral Shares | $50.36 | $54.66 | $0.450 | $0.000 |
ETF Shares | 100.92 | 109.54 | 0.940 | 0.000 |
Financials Index Fund | | | | |
Admiral Shares | $30.10 | $20.38 | $0.721 | $0.000 |
ETF Shares | 60.04 | 40.66 | 1.461 | 0.000 |
Health Care Index Fund | | | | |
Admiral Shares | $29.82 | $28.68 | $0.395 | $0.000 |
ETF Shares | 59.65 | 57.36 | 0.820 | 0.000 |
Industrials Index Fund | | | | |
Admiral Shares | $37.94 | $34.20 | $0.500 | $0.000 |
ETF Shares | 73.94 | 66.65 | 0.981 | 0.000 |
Information Technology Index Fund | | | | |
Admiral Shares | $29.95 | $27.28 | $0.085 | $0.000 |
ETF Shares | 58.52 | 53.32 | 0.175 | 0.000 |
Materials Index Fund | | | | |
Admiral Shares | $41.75 | $42.85 | $0.640 | $0.000 |
ETF Shares | 82.10 | 84.27 | 1.277 | 0.000 |
Telecommunication Services Index Fund | | | | |
Admiral Shares | $41.01 | $31.58 | $1.000 | $0.000 |
ETF Shares | 80.60 | 62.05 | 1.998 | 0.000 |
Utilities Index Fund | | | | |
Admiral Shares | $40.60 | $39.26 | $1.126 | $0.000 |
ETF Shares | 80.92 | 78.22 | 2.290 | 0.000 |
4
ETF Premium/Discount Record
The extent to which the funds’ ETF Shares have traded at a premium or a discount to net asset value (NAV) since inception. Market prices for ETF Shares, and for exchange-traded funds in general, can deviate from the NAV of the underlying securities.
| | | Market Price | | | |
| | | Above or Equal to | | | Market Price Below |
| | | Net Asset Value | | | Net Asset Value |
| Basis Point | Number | Percentage of | | Number | Percentage of |
| Differential2 | of Days | Total Days | | of Days | Total Days |
January 26, 20041–August 31, 2008 | | | | | | |
Consumer Discretionary ETF | 0–24.9 | 601 | 51.81% | | 512 | 44.14% |
| 25–49.9 | 31 | 2.67 | | 6 | 0.52 |
| 50–74.9 | 1 | 0.09 | | 2 | 0.17 |
| 75–100.0 | 1 | 0.09 | | 0 | 0.00 |
| >100.0 | 2 | 0.17 | | 4 | 0.34 |
| Total | 636 | 54.83% | | 524 | 45.17% |
January 26, 20041–August 31, 2008 | | | | | | |
Consumer Staples ETF | 0–24.9 | 622 | 53.62% | | 520 | 44.83% |
| 25–49.9 | 11 | 0.95 | | 5 | 0.43 |
| 50–74.9 | 0 | 0.00 | | 0 | 0.00 |
| 75–100.0 | 0 | 0.00 | | 2 | 0.17 |
| >100.0 | 0 | 0.00 | | 0 | 0.00 |
| Total | 633 | 54.57% | | 527 | 45.43% |
September 23, 20041–August 31, 2008 | | | | | | |
Energy ETF | 0–24.9 | 505 | 50.86% | | 469 | 47.23% |
| 25–49.9 | 13 | 1.31 | | 4 | 0.40 |
| 50–74.9 | 1 | 0.10 | | 1 | 0.10 |
| 75–100.0 | 0 | 0.00 | | 0 | 0.00 |
| >100.0 | 0 | 0.00 | | 0 | 0.00 |
| Total | 519 | 52.27% | | 474 | 47.73% |
January 26, 20041–August 31, 2008 | | | | | | |
Financials ETF | 0–24.9 | 641 | 55.26% | | 461 | 39.74% |
| 25–49.9 | 39 | 3.36 | | 8 | 0.69 |
| 50–74.9 | 1 | 0.09 | | 2 | 0.17 |
| 75–100.0 | 2 | 0.17 | | 2 | 0.17 |
| >100.0 | 1 | 0.09 | | 3 | 0.26 |
| Total | 684 | 58.97% | | 476 | 41.03% |
January 26, 20041–August 31, 2008 | | | | | | |
Health Care ETF | 0–24.9 | 686 | 59.14% | | 462 | 39.83% |
| 25–49.9 | 7 | 0.60 | | 5 | 0.43 |
| 50–74.9 | 0 | 0.00 | | 0 | 0.00 |
| 75–100.0 | 0 | 0.00 | | 0 | 0.00 |
| >100.0 | 0 | 0.00 | | 0 | 0.00 |
| Total | 693 | 59.74% | | 467 | 40.26% |
September 23, 20041–August 31, 2008 | | | | | | |
Industrials ETF | 0–24.9 | 487 | 49.05% | | 460 | 46.33% |
| 25–49.9 | 34 | 3.42 | | 5 | 0.50 |
| 50–74.9 | 1 | 0.10 | | 0 | 0.00 |
| 75–100.0 | 2 | 0.20 | | 1 | 0.10 |
| >100.0 | 1 | 0.10 | | 2 | 0.20 |
| Total | 525 | 52.87% | | 468 | 47.13% |
1 Inception.
2 One basis point equals 1/100 of a percentage point.
5
ETF Premium/Discount Record (continued) |
| | | | | | |
| | | Market Price | | | |
| | | Above or Equal to | | | Market Price Below |
| | | Net Asset Value | | | Net Asset Value |
| Basis Point | Number | Percentage of | | Number | Percentage of |
| Differential2 | of Days | Total Days | | of Days | Total Days |
January 26, 20041–August 31, 2008 | | | | | | |
Information Technology ETF | 0–24.9 | 653 | 56.29% | | 466 | 40.18% |
| 25–49.9 | 14 | 1.21 | | 10 | 0.86 |
| 50–74.9 | 1 | 0.09 | | 2 | 0.17 |
| 75–100.0 | 0 | 0.00 | | 2 | 0.17 |
| >100.0 | 5 | 0.43 | | 7 | 0.60 |
| Total | 673 | 58.02% | | 487 | 41.98% |
January 26, 20041–August 31, 2008 | | | | | | |
Materials ETF | 0–24.9 | 550 | 47.40% | | 597 | 51.47% |
| 25–49.9 | 1 | 0.09 | | 2 | 0.17 |
| 50–74.9 | 1 | 0.09 | | 7 | 0.60 |
| 75–100.0 | 0 | 0.00 | | 1 | 0.09 |
| >100.0 | 1 | 0.09 | | 0 | 0.00 |
| Total | 553 | 47.67% | | 607 | 52.33% |
September 23, 20041–August 31, 2008 | | | | | | |
Telecommunication Services ETF | 0–24.9 | 446 | 44.92% | | 484 | 48.75% |
| 25–49.9 | 35 | 3.52 | | 9 | 0.91 |
| 50–74.9 | 1 | 0.10 | | 3 | 0.30 |
| 75–100.0 | 2 | 0.20 | | 2 | 0.20 |
| >100.0 | 4 | 0.40 | | 7 | 0.70 |
| Total | 488 | 49.14% | | 505 | 50.86% |
January 26, 20041–August 31, 2008 | | | | | | |
Utilities ETF | 0–24.9 | 577 | 49.74% | | 565 | 48.70% |
| 25–49.9 | 5 | 0.43 | | 8 | 0.69 |
| 50–74.9 | 0 | 0.00 | | 1 | 0.09 |
| 75–100.0 | 0 | 0.00 | | 1 | 0.09 |
| >100.0 | 0 | 0.00 | | 3 | 0.26 |
| Total | 582 | 50.17% | | 578 | 49.83% |
1 Inception.
2 One basis point equals 1/100 of a percentage point.
6
Consumer Discretionary Index Fund
Fund Profile
As of August 31, 2008
Portfolio Characteristics | | |
| | Target | Broad |
| Fund | Index1 | Index2 |
Number of Stocks | 393 | 408 | 2,481 |
Median Market Cap | $13.8B | $13.8B | $32.1B |
Price/Earnings Ratio | 16.0x | 16.0x | 16.8x |
Price/Book Ratio | 2.2x | 2.2x | 2.4x |
Yield3 | | 1.4% | 2.0% |
Admiral Shares | 1.4% | | |
ETF Shares | 1.4% | | |
Return on Equity | 17.1% | 17.1% | 20.1% |
Earnings Growth Rate | 17.5% | 17.5% | 18.4% |
Foreign Holdings | 0.0% | 0.0% | 0.0% |
Turnover Rate | 12% | — | — |
Expense Ratio (8/31/2007)4 | — | — |
Admiral Shares | 0.27% | | |
ETF Shares | 0.22% | | |
Short-Term Reserves | 0.0% | — | — |
Volatility Measures5 | |
| Fund Versus | Fund Versus |
| Target Index1 | Broad Index2 |
R-Squared | 1.00 | 0.70 |
Beta | 1.00 | 1.10 |
Industry Diversification (% of equity exposure) |
| |
Advertising | 1.8% |
Apparel Retail | 5.7 |
Apparel, Accessories & Luxury Goods | 3.0 |
Auto Parts & Equipment | 3.0 |
Automobile Manufacturers | 1.1 |
Automotive Retail | 1.7 |
Broadcasting & Cable TV | 11.9 |
Casinos & Gaming | 2.5 |
Computer & Electronics Retail | 2.0 |
Department Stores | 3.6 |
Education Services | 1.9 |
Footwear | 2.2 |
General Merchandise Stores | 3.9 |
Home Improvement Retail | 6.8 |
Homebuilding | 1.8 |
Home Furnishing Retail | 1.0 |
Hotels, Resorts & Cruise Lines | 3.4 |
Household Appliances | 1.4 |
Housewares & Specialties | 1.6 |
Internet Retail | 2.9 |
Leisure Products | 1.4 |
Movies & Entertainment | 13.4 |
Publishing | 2.5 |
Restaurants | 10.2 |
Specialized Consumer Services | 1.7 |
Specialty Stores | 3.0 |
Other Consumer Discretionary | 4.6 |
Ten Largest Holdings6 (% of total net assets) |
| |
McDonald’s Corp. | 5.5% |
Comcast Corp. | 4.7 |
Time Warner, Inc. | 4.6 |
The Walt Disney Co. | 4.6 |
Home Depot, Inc. | 3.6 |
Target Corp. | 3.1 |
Lowe’s Cos., Inc. | 2.8 |
News Corp. | 2.5 |
Amazon.com, Inc. | 2.0 |
Liberty Media Corp. | 1.8 |
Top Ten | 35.2% |
1 MSCI US IMI/Consumer Discretionary.
2 MSCI US IMI/2500.
3 30-day SEC yield for the fund; annualized dividend yield for the indexes. See the Glossary.
4 Expense ratios shown are from the prospectus dated December 10, 2007. Expense ratios for the fiscal year ended August 31, 2008, were 0.25% for Admiral Shares and 0.20% for ETF Shares.
5 For an explanation of R-squared, beta, and other terms used here, see the Glossary.
6 The holdings listed exclude any temporary cash investments and equity index products.
7
Consumer Discretionary Index Fund
Performance Summary
All of the returns in this report represent past performance, which is not a guarantee of future results that may be achieved by the fund. (Current performance may be lower or higher than the performance data cited. For performance data current to the most recent month-end, visit our website at www.vanguard.com/performance.) Note, too, that both investment returns and principal value can fluctuate widely, so an investor’s shares, when sold, could be worth more or less than their original cost. The returns shown do not reflect taxes that a shareholder would pay on fund distributions or on the sale of fund shares.
Cumulative Performance: January 26, 2004–August 31, 2008
Initial Investment of $10,000
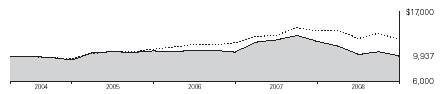
| Average Annual Total Returns | Final Value |
| Periods Ended August 31, 2008 | of a $10,000 |
| One Year | Since Inception1 | Investment |
Consumer Discretionary Index Fund ETF Shares | | | |
Net Asset Value | –18.70% | –0.14% | $9,937 |
Consumer Discretionary Index Fund ETF Shares | | | |
Market Price | –18.52 | –0.14 | 9,935 |
MSCI US IMI/2500 | –9.90 | 5.15 | 12,594 |
MSCI US IMI/Consumer Discretionary | –18.68 | 0.02 | 10,007 |
| | | Final Value |
| | | of a $100,000 |
| One Year | Since Inception1 | Investment |
Consumer Discretionary Index Fund Admiral Shares2 | –18.74% | –3.20% | $90,303 |
MSCI US IMI/2500 | –9.90 | 4.11 | 113,455 |
MSCI US IMI/Consumer Discretionary | –18.68 | –3.04 | 90,783 |
1 Performance for the fund and its comparative standards is calculated since the following inception dates: January 26, 2004, for ETF Shares; July 14, 2005, for Admiral Shares.
2 Total returns do not reflect the 2% fee assessed on redemptions of shares held for less than one year.
Consumer Discretionary Index Fund
8
Consumer Discretionary Index Fund
Fiscal-Year Total Returns (%): January 26, 2004–August 31, 2008
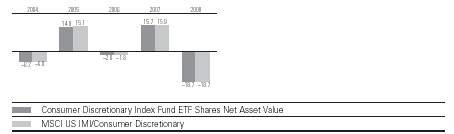
Cumulative Returns: ETF Shares, January 26, 2004–August 31, 2008 |
| | Cumulative |
| | Since |
| One Year | Inception |
Consumer Discretionary Index Fund ETF Shares Market Price | –18.52% | –0.65% |
Consumer Discretionary Index Fund ETF Shares Net Asset Value | –18.70 | –0.63 |
MSCI US IMI/Consumer Discretionary | –18.68 | 0.07 |
Average Annual Total Returns: Periods Ended June 30, 2008
This table presents average annual total returns through the latest calendar quarter—rather than through the end of the fiscal period. Securities and Exchange Commission rules require that we provide this information.
| | | Since |
| Inception Date | One Year | Inception |
ETF Shares | 1/26/2004 | | |
Market Price | | –28.35% | –1.74% |
Net Asset Value | | –28.35 | –1.73 |
Admiral Shares1 | 7/14/2005 | –28.41 | –5.68 |
1 Total returns do not reflect the 2% fee assessed on redemptions of shares held for less than one year. Note: See Financial Highlights tables for dividend and capital gains information.
9
Consumer Discretionary Index Fund
Financial Statements
Statement of Net Assets
As of August 31, 2008
The fund provides a complete list of its holdings four times in each fiscal year, at the quarter-ends. For the second and fourth fiscal quarters, the lists appear in the fund’s semiannual and annual reports to shareholders. For the first and third fiscal quarters, the fund files the lists with the Securities and Exchange Commission on Form N-Q. Shareholders can look up the fund’s Forms N-Q on the SEC’s website at www.sec.gov. Forms N-Q may also be reviewed and copied at the SEC’s Public Reference Room (see the back cover of this report for further information).
| | | Market |
| | | Value• |
| | Shares | ($000) |
Common Stocks (100.0%) | | |
Auto Components (3.4%) | | |
| Johnson Controls, Inc. | 118,669 | 3,669 |
| BorgWarner, Inc. | 23,197 | 959 |
* | The Goodyear Tire & | | |
| Rubber Co. | 45,659 | 895 |
| Autoliv, Inc. | 14,575 | 560 |
| WABCO Holdings Inc. | 11,793 | 517 |
| Gentex Corp. | 28,535 | 455 |
* | TRW Automotive | | |
| Holdings Corp. | 11,110 | 213 |
| ArvinMeritor, Inc. | 13,998 | 210 |
* | Exide Technologies | 15,062 | 186 |
* | Lear Corp. | 13,158 | 165 |
* | Tenneco Automotive, Inc. | 9,227 | 135 |
| Cooper Tire & Rubber Co. | 11,367 | 109 |
* | ATC Technology Corp. | 4,462 | 108 |
| Modine Manufacturing Co. | 6,152 | 97 |
* | Visteon Corp. | 26,163 | 84 |
| Superior Industries | | |
| International, Inc. | 4,551 | 80 |
* | Drew Industries, Inc. | 3,949 | 63 |
* | Raser Technologies, Inc. | 6,650 | 57 |
| American Axle & | | |
| Manufacturing Holdings, Inc. | 9,211 | 45 |
| Spartan Motors, Inc. | 5,992 | 28 |
| | | 8,635 |
Automobiles (1.8%) | | |
| Harley-Davidson, Inc. | 47,306 | 1,882 |
* | Ford Motor Co. | 347,017 | 1,547 |
| General Motors Corp. | 90,489 | 905 |
| Thor Industries, Inc. | 7,193 | 165 |
| Winnebago Industries, Inc. | 5,539 | 63 |
* | Fleetwood Enterprises, Inc. | 14,826 | 32 |
| Monaco Coach Corp. | 5,512 | 13 |
| | | 4,607 |
Distributors (0.7%) | | |
| Genuine Parts Co. | 32,728 | 1,389 |
* | LKQ Corp. | 24,358 | 456 |
* | Core-Mark Holding Co., Inc. | 1,898 | 56 |
| | | 1,901 |
Diversified Consumer Services (3.5%) | | |
* | Apollo Group, Inc. Class A | 28,527 | 1,817 |
| H & R Block, Inc. | 65,085 | 1,662 |
* | ITT Educational Services, Inc. | 7,757 | 690 |
| DeVry, Inc. | 12,837 | 662 |
| Strayer Education, Inc. | 2,860 | 600 |
| Service Corp. International | 53,024 | 541 |
| Sotheby’s | 13,468 | 363 |
* | Career Education Corp. | 18,041 | 338 |
| Matthews International Corp. | 6,237 | 314 |
| Hillenbrand Inc. | 12,485 | 297 |
| Weight Watchers | | |
| International, Inc. | 7,080 | 280 |
* | Corinthian Colleges, Inc. | 17,028 | 226 |
| Regis Corp. | 8,171 | 225 |
* | Coinstar, Inc. | 5,599 | 184 |
| Stewart Enterprises, Inc. | | |
| Class A | 17,377 | 163 |
* | Capella Education Co. | 2,580 | 128 |
* | thinkorswim Group, Inc. | 11,350 | 114 |
* | Steiner Leisure Ltd. | 3,089 | 109 |
| Jackson Hewitt Tax Service Inc. | 5,899 | 101 |
* | Pre-Paid Legal Services, Inc. | 1,820 | 81 |
* | Universal Technical Institute Inc. | 4,538 | 78 |
* | American Public Education, Inc. | 1,604 | 72 |
* | K12 Inc. | 1,951 | 46 |
| | | 9,091 |
Hotels, Restaurants & Leisure (16.4%) | | |
| McDonald’s Corp. | 226,676 | 14,065 |
| Yum! Brands, Inc. | 94,734 | 3,380 |
| Carnival Corp. | 87,343 | 3,237 |
* | Starbucks Corp. | 145,582 | 2,265 |
| Marriott International, Inc. | | |
| Class A | 56,507 | 1,594 |
| Starwood Hotels & | | |
| Resorts Worldwide, Inc. | 37,302 | 1,352 |
| International Game Technology | 61,970 | 1,328 |
^ | Wynn Resorts Ltd. | 12,306 | 1,174 |
| Tim Hortons, Inc. | 36,937 | 1,162 |
*, | ^Las Vegas Sands Corp. | 21,303 | 1,010 |
| Darden Restaurants Inc. | 26,471 | 775 |
| Royal Caribbean Cruises, Ltd. | 27,721 | 753 |
*, | ^MGM Mirage, Inc. | 19,492 | 686 |
| Wyndham Worldwide Corp. | 35,371 | 682 |
* | Penn National Gaming, Inc. | 14,778 | 500 |
| Burger King Holdings Inc. | 18,871 | 468 |
| Wendy’s International, Inc. | 17,528 | 425 |
* | Scientific Games Corp. | 13,891 | 418 |
| Brinker International, Inc. | 20,248 | 383 |
* | WMS Industries, Inc. | 10,168 | 342 |
* | Bally Technologies Inc. | 9,846 | 337 |
* | Panera Bread Co. | 5,783 | 311 |
| Orient-Express Hotel Ltd. | 8,493 | 305 |
* | Gaylord Entertainment Co. | 8,166 | 283 |
* | Jack in the Box Inc. | 11,802 | 280 |
* | Vail Resorts Inc. | 5,420 | 238 |
* | Life Time Fitness, Inc. | 6,719 | 238 |
| International Speedway Corp. | 5,921 | 235 |
* | Chipotle Mexican Grill, Inc. | | |
| Class B | 3,517 | 229 |
* | Chipotle Mexican Grill, Inc. | 2,914 | 202 |
* | The Cheesecake Factory Inc. | 12,729 | 196 |
| Choice Hotels International, Inc. | 6,852 | 185 |
| Bob Evans Farms, Inc. | 6,192 | 174 |
* | Sonic Corp. | 11,682 | 169 |
* | CEC Entertainment Inc. | 4,909 | 168 |
| Boyd Gaming Corp. | 11,336 | 138 |
* | Pinnacle Entertainment, Inc. | 12,032 | 133 |
* | Papa John’s International, Inc. | 4,572 | 128 |
* | P.F. Chang’s China Bistro, Inc. | 4,838 | 126 |
| CKE Restaurants Inc. | 9,416 | 120 |
* | Domino’s Pizza, Inc. | 8,928 | 120 |
* | Buffalo Wild Wings Inc. | 3,207 | 116 |
| CBRL Group, Inc. | 4,432 | 115 |
* | Morgans Hotel Group | 5,980 | 102 |
* | Interval Leisure Group, Inc. | 7,780 | 101 |
* | Texas Roadhouse, Inc. | 11,065 | 99 |
* | Red Robin Gourmet | | |
| Burgers, Inc. | 3,199 | 85 |
| Ameristar Casinos, Inc. | 5,123 | 85 |
| Churchill Downs, Inc. | 1,891 | 84 |
* | Peet’s Coffee & Tea Inc. | 2,748 | 72 |
| The Marcus Corp. | 4,191 | 72 |
* | Ruby Tuesday, Inc. | 10,297 | 72 |
* | California Pizza Kitchen, Inc. | 4,808 | 69 |
| Speedway Motorsports, Inc. | 3,015 | 67 |
| DineEquity, Inc. | 3,068 | 61 |
| Ambassadors Group, Inc. | 3,233 | 55 |
| Triarc Cos., Inc. Class B | 9,396 | 55 |
* | Denny’s Corp. | 18,994 | 53 |
* | Shuffle Master, Inc. | 10,340 | 52 |
* | AFC Enterprises, Inc. | 5,436 | 49 |
* | Krispy Kreme Doughnuts, Inc. | 11,144 | 47 |
| Landry’s Restaurants, Inc. | 2,320 | 45 |
| O’Charley’s Inc. | 4,399 | 44 |
* | Steak n Shake Co. | 5,192 | 40 |
* | BJ’s Restaurants Inc. | 3,443 | 40 |
* | Bluegreen Corp. | 2,779 | 32 |
* | Great Wolf Resorts, Inc. | 5,921 | 31 |
* | Monarch Casino & Resort, Inc. | 2,302 | 31 |
* | Town Sports International | | |
| Holdings, Inc. | 2,276 | 24 |
| Dover Downs Gaming & | | |
| Entertainment, Inc. | 2,929 | 24 |
* | Isle of Capri Casinos, Inc. | 3,214 | 23 |
| Triarc Cos., Inc. Class A | 3,750 | 22 |
* | MTR Gaming Group Inc. | 4,528 | 19 |
* | Six Flags, Inc. | 18,175 | 18 |
* | Ruth’s Hospitality Group Inc. | 3,883 | 18 |
| | | 42,236 |
Household Durables (6.0%) | | |
| Fortune Brands, Inc. | 30,740 | 1,808 |
| Whirlpool Corp. | 15,024 | 1,222 |
| Newell Rubbermaid, Inc. | 55,333 | 1,002 |
^ | Garmin Ltd. | 23,720 | 825 |
* | Mohawk Industries, Inc. | 11,617 | 802 |
| Black & Decker Corp. | 12,214 | 773 |
| Leggett & Platt, Inc. | 33,206 | 741 |
| D. R. Horton, Inc. | 56,797 | 708 |
| The Stanley Works | 14,095 | 676 |
* | Toll Brothers, Inc. | 26,921 | 670 |
| Snap-On Inc. | 11,529 | 657 |
| Pulte Homes, Inc. | 43,749 | 635 |
* | NVR, Inc. | 794 | 475 |
| Tupperware Brands Corp. | 12,384 | 442 |
| Centex Corp. | 24,679 | 400 |
| Harman International | | |
| Industries, Inc. | 11,042 | 376 |
* | Jarden Corp. | 13,852 | 356 |
| Lennar Corp. Class A | 25,893 | 340 |
| KB Home | 15,226 | 317 |
| MDC Holdings, Inc. | 6,769 | 281 |
| Ryland Group, Inc. | 8,474 | 196 |
| Tempur-Pedic International Inc. | 14,142 | 160 |
| Ethan Allen Interiors, Inc. | 5,460 | 148 |
| American Greetings Corp. | | |
| Class A | 9,058 | 146 |
* | Helen of Troy Ltd. | 5,782 | 139 |
* | Meritage Corp. | 5,537 | 130 |
| Furniture Brands | | |
| International Inc. | 9,136 | 82 |
10
Consumer Discretionary Index Fund
| | | Market |
| | | Value• |
| | Shares | ($000) |
| Blyth, Inc. | 5,151 | 81 |
* | Standard Pacific Corp. | 24,792 | 79 |
| La-Z-Boy Inc. | 10,186 | 77 |
* | Champion Enterprises, Inc. | 15,475 | 76 |
* | Universal Electronics, Inc. | 2,871 | 75 |
* | Hovnanian Enterprises Inc. | | |
| Class A | 10,497 | 75 |
| National Presto Industries, Inc. | 892 | 69 |
| Sealy Corp. | 8,995 | 60 |
| Beazer Homes USA, Inc. | 7,395 | 51 |
| M/I Homes, Inc. | 2,494 | 45 |
* | iRobot Corp. | 3,097 | 43 |
| CSS Industries, Inc. | 1,481 | 39 |
| Brookfield Homes Corp. | 2,519 | 32 |
| | | 15,309 |
Internet & Catalog Retail (3.5%) | | |
* | Amazon.com, Inc. | 62,644 | 5,062 |
* | Liberty Media Corp.– | | |
| Interactive Series A | 112,751 | 1,532 |
* | Expedia, Inc. | 39,057 | 690 |
* | Priceline.com, Inc. | 7,311 | 680 |
* | Netflix.com, Inc. | 9,869 | 304 |
* | Ticketmaster | 7,772 | 167 |
^ | NutriSystem, Inc. | 5,797 | 115 |
* | HSN,Inc. | 7,780 | 114 |
* | Blue Nile Inc. | 2,698 | 112 |
* | Overstock.com, Inc. | 3,250 | 69 |
* | Stamps.com Inc. | 3,368 | 46 |
* | Orbitz Worldwide, Inc. | 7,311 | 45 |
* | Gaiam, Inc. | 3,260 | 42 |
* | 1-800-FLOWERS.COM, Inc. | 5,375 | 33 |
* | Shutterfly, Inc. | 3,144 | 29 |
* | ValueVision Media, Inc. | 6,006 | 14 |
| | | 9,054 |
Internet Software & Services (0.1%) | |
* | IAC/InterActiveCorp | 18,987 | 315 |
| | | |
Leisure Equipment & Products (1.8%) | |
| Mattel, Inc. | 72,308 | 1,398 |
| Hasbro, Inc. | 24,928 | 932 |
| Eastman Kodak Co. | 57,582 | 932 |
| Polaris Industries, Inc. | 6,583 | 297 |
| Brunswick Corp. | 17,515 | 241 |
| Pool Corp. | 9,562 | 232 |
| Callaway Golf Co. | 12,621 | 171 |
* | JAKKS Pacific, Inc. | 5,336 | 133 |
* | RC2 Corp. | 3,575 | 90 |
* | Leapfrog Enterprises, Inc. | 6,692 | 57 |
* | Smith & Wesson Holding Corp. | 7,877 | 45 |
| Marine Products Corp. | 2,530 | 21 |
| | | 4,549 |
Media (30.0%) | | |
| Time Warner, Inc. | 715,575 | 11,714 |
| The Walt Disney Co. | 361,938 | 11,709 |
| Comcast Corp. Class A | 375,051 | 7,944 |
| News Corp., Class A | 363,651 | 5,149 |
| Comcast Corp. Special | | |
| Class A | 194,811 | 4,118 |
* | DIRECTV Group, Inc. | 137,484 | 3,878 |
* | Viacom Inc. Class B | 109,314 | 3,223 |
| The McGraw-Hill Cos., Inc. | 64,252 | 2,753 |
* | Liberty Media Corp. | 98,575 | 2,739 |
| Omnicom Group Inc. | 64,052 | 2,715 |
| CBS Corp. | 118,260 | 1,914 |
| Cablevision Systems NY | | |
| Group Class A | 46,647 | 1,505 |
| News Corp., Class B | 87,745 | 1,260 |
* | DISH Network Corp. | 42,120 | 1,188 |
* | Liberty Global, Inc. Class A | 32,411 | 1,140 |
* | Discovery Holding Co. Class A | 53,612 | 1,085 |
* | Liberty Global, Inc. Series C | 31,815 | 1,057 |
* | Time Warner Cable, Inc. | 36,040 | 964 |
* | Interpublic Group of Cos., Inc. | 94,290 | 886 |
| Gannett Co., Inc. | 45,732 | 814 |
| Washington Post Co. Class B | 1,234 | 736 |
| Scripps Networks Interactive | 17,667 | 734 |
* | Sirius XM Radio Inc. | 535,369 | 712 |
| Virgin Media Inc. | 55,718 | 635 |
* | Lamar Advertising Co. Class A | 14,747 | 548 |
* | DreamWorks Animation | | |
| SKG, Inc. | 13,517 | 431 |
| John Wiley & Sons Class A | 8,729 | 415 |
* | Liberty Media Corp.– | | |
| Capital Series A | 24,643 | 401 |
| New York Times Co. Class A | 27,158 | 353 |
* | Marvel Entertainment, Inc. | 10,232 | 347 |
| Arbitron Inc. | 5,449 | 261 |
| Regal Entertainment Group | | |
| Class A | 15,571 | 261 |
* | Lions Gate | | |
| Entertainment Corp. | 23,738 | 239 |
* | Live Nation, Inc. | 14,395 | 231 |
| Interactive Data Corp. | 7,531 | 227 |
| Meredith Corp. | 7,510 | 213 |
* | Morningstar, Inc. | 3,197 | 209 |
* | CTC Media, Inc. | 9,137 | 177 |
| Scholastic Corp. | 6,564 | 171 |
* | Clear Channel Outdoor | | |
| Holdings, Inc. Class A | 8,154 | 137 |
| Belo Corp. Class A | 17,433 | 128 |
| Hearst-Argyle Television Inc. | 5,221 | 103 |
* | RCN Corp. | 7,452 | 103 |
| Harte-Hanks, Inc. | 8,203 | 101 |
| Cinemark Holdings Inc. | 6,462 | 95 |
| National CineMedia Inc. | 8,333 | 93 |
* | Valassis Communications, Inc. | 9,608 | 90 |
* | Charter Communications, Inc. | 77,478 | 81 |
| Sinclair Broadcast Group, Inc. | 10,462 | 74 |
| World Wrestling | | |
| Entertainment, Inc. | 4,417 | 72 |
| CKX, Inc. | 8,771 | 70 |
* | Mediacom | | |
| Communications Corp. | 8,157 | 69 |
| Warner Music Group Corp. | 7,702 | 66 |
* | Knology, Inc. | 6,002 | 61 |
* | Cox Radio, Inc. | 5,172 | 58 |
* | R.H. Donnelley Corp. | 13,657 | 51 |
| Fisher Communications, Inc. | 1,471 | 51 |
^ | Media General, Inc. Class A | 4,053 | 50 |
| Idearc Inc. | 29,775 | 49 |
* | Dolan Media Co. | 3,175 | 48 |
| Journal Communications, Inc. | 9,061 | 46 |
| E.W. Scripps Co. Class A | 5,743 | 42 |
^ | The McClatchy Co. Class A | 11,473 | 42 |
* | Martha Stewart Living | | |
| Omnimedia, Inc. | 5,009 | 41 |
* | Entravision | | |
| Communications Corp. | 11,554 | 37 |
| Entercom | | |
| Communications Corp. | 5,993 | 37 |
| Citadel Broadcasting Corp. | 35,440 | 35 |
* | Lin TV Corp. | 5,529 | 34 |
* | Cumulus Media Inc. | 6,297 | 30 |
| Lee Enterprises, Inc. | 7,846 | 29 |
| Gray Television, Inc. | 8,209 | 20 |
* | Playboy Enterprises, Inc. | | |
| Class B | 3,942 | 17 |
| AH Belo Corp. | 3,390 | 16 |
* | Crown Media Holdings, Inc. | 2,882 | 15 |
* | Westwood One, Inc. | 14,257 | 12 |
| PRIMEDIA Inc. | 3,248 | 9 |
| GateHouse Media, Inc. | 6,778 | 4 |
| | | 77,172 |
Multiline Retail (7.4%) | | |
| Target Corp. | 149,815 | 7,943 |
* | Kohl’s Corp. | 58,688 | 2,886 |
| Macy’s Inc. | 84,280 | 1,755 |
| J.C. Penney Co., Inc. | | |
| (Holding Co.) | 42,153 | 1,643 |
*, | ^Sears Holdings Corp. | 14,506 | 1,334 |
| Nordstrom, Inc. | 32,838 | 1,021 |
* | Dollar Tree, Inc. | 17,978 | 689 |
| Family Dollar Stores, Inc. | 26,539 | 661 |
* | Big Lots Inc. | 16,257 | 481 |
* | Saks Inc. | 27,402 | 312 |
^ | Dillard’s Inc. | 12,142 | 155 |
| Fred’s, Inc. | 7,590 | 106 |
* | 99 Cents Only Stores | 9,717 | 83 |
* | Retail Ventures, Inc. | 5,705 | 27 |
* | Tuesday Morning Corp. | 6,099 | 26 |
| | | 19,122 |
Specialty Retail (20.1%) | | |
| Home Depot, Inc. | 337,964 | 9,166 |
| Lowe’s Cos., Inc. | 292,362 | 7,204 |
| Staples, Inc. | 140,406 | 3,398 |
| Best Buy Co., Inc. | 69,997 | 3,134 |
| TJX Cos., Inc. | 84,930 | 3,078 |
| The Gap, Inc. | 102,788 | 1,999 |
* | Bed Bath & Beyond, Inc. | 51,892 | 1,591 |
* | GameStop Corp. Class A | 30,988 | 1,359 |
| Limited Brands, Inc. | 61,264 | 1,274 |
* | AutoZone Inc. | 8,849 | 1,214 |
| Sherwin-Williams Co. | 20,224 | 1,184 |
| Tiffany & Co. | 25,168 | 1,112 |
| Ross Stores, Inc. | 26,628 | 1,071 |
| Abercrombie & Fitch Co. | 17,271 | 906 |
* | Urban Outfitters, Inc. | 23,351 | 832 |
| Advance Auto Parts, Inc. | 19,037 | 819 |
* | O’Reilly Automotive, Inc. | 25,549 | 744 |
| PetSmart, Inc. | 25,486 | 687 |
* | CarMax, Inc. | 43,691 | 647 |
| American Eagle Outfitters, Inc. | 37,004 | 557 |
| Foot Locker, Inc. | 30,923 | 504 |
| RadioShack Corp. | 24,924 | 474 |
* | Aeropostale, Inc. | 13,375 | 466 |
| Guess ?, Inc. | 11,386 | 424 |
* | Dick’s Sporting Goods, Inc. | 17,020 | 390 |
* | Office Depot, Inc. | 54,614 | 384 |
| Williams-Sonoma, Inc. | 17,956 | 318 |
* | AutoNation, Inc. | 26,681 | 303 |
* | Rent-A-Center, Inc. | 13,343 | 302 |
* | Tractor Supply Co. | 6,723 | 287 |
* | AnnTaylor Stores Corp. | 11,794 | 286 |
| Aaron Rents, Inc. | 8,531 | 244 |
* | The Gymboree Corp. | 5,680 | 223 |
| Men’s Wearhouse, Inc. | 9,788 | 214 |
* | J. Crew Group, Inc. | 8,087 | 214 |
* | The Children’s Place | | |
| Retail Stores, Inc. | 4,975 | 209 |
* | Zale Corp. | 7,502 | 205 |
* | Chico’s FAS, Inc. | 35,284 | 203 |
| Barnes & Noble, Inc. | 7,665 | 190 |
* | Collective Brands, Inc. | 12,977 | 188 |
| OfficeMax, Inc. | 15,204 | 186 |
| Genesco, Inc. | 4,634 | 170 |
| The Buckle, Inc. | 3,063 | 159 |
* | The Dress Barn, Inc. | 9,664 | 157 |
* | Sally Beauty Co. Inc. | 16,376 | 140 |
11
Consumer Discretionary Index Fund
| | | Market |
| | | Value• |
| | Shares | ($000) |
* | Hibbett Sports Inc. | 5,674 | 136 |
* | Charming Shoppes, Inc. | 23,563 | 127 |
| Brown Shoe Co., Inc. | 8,325 | 127 |
| Stage Stores, Inc. | 7,655 | 122 |
* | Jo-Ann Stores, Inc. | 4,817 | 120 |
| Finish Line, Inc. | 9,864 | 119 |
| Penske Automotive Group Inc. | 8,470 | 112 |
* | Cabela’s Inc. | 8,517 | 104 |
| Group 1 Automotive, Inc. | 4,637 | 98 |
| Cato Corp. Class A | 5,523 | 97 |
* | Jos. A. Bank Clothiers, Inc. | 3,637 | 94 |
* | Coldwater Creek Inc. | 12,580 | 92 |
| The Pep Boys | | |
| (Manny, Moe & Jack) | 10,257 | 90 |
* | Pacific Sunwear of | | |
| California, Inc. | 14,014 | 89 |
| Borders Group, Inc. | 12,098 | 85 |
* | Pier 1 Imports Inc. | 17,585 | 78 |
| Asbury Automotive Group, Inc. | 6,321 | 77 |
| Monro Muffler Brake, Inc. | 3,465 | 72 |
| Christopher & Banks Corp. | 7,078 | 68 |
| Talbots Inc. | 4,916 | 67 |
| Sonic Automotive, Inc. | 5,736 | 62 |
* | New York & Co., Inc. | 5,225 | 62 |
| Circuit City Stores, Inc. | 33,848 | 61 |
* | Zumiez Inc. | 3,812 | 55 |
* | Hot Topic, Inc. | 8,753 | 54 |
* | Blockbuster Inc. Class A | 22,545 | 54 |
* | Tween Brands, Inc. | 4,977 | 54 |
| bebe stores, inc. | 5,278 | 51 |
* | Ulta Salon, Cosmetics & | | |
| Fragrance, Inc. | 4,555 | 50 |
* | Charlotte Russe Holding Inc. | 4,047 | 48 |
| Systemax Inc. | 2,938 | 45 |
* | Citi Trends Inc. | 2,007 | 41 |
* | Conn’s, Inc. | 2,096 | 40 |
* | DSW Inc. Class A | 2,750 | 40 |
| Big 5 Sporting Goods Corp. | 4,010 | 36 |
* | hhgregg, Inc. | 3,136 | 31 |
* | MarineMax, Inc. | 3,448 | 27 |
* | Lumber Liquidators, Inc. | 2,087 | 27 |
* | Build-A-Bear-Workshop, Inc. | 3,365 | 25 |
* | Blockbuster Inc. Class B | 13,004 | 24 |
* | Select Comfort Corp. | 8,827 | 21 |
| Stein Mart, Inc. | 5,184 | 20 |
| Lithia Motors, Inc. | 2,927 | 14 |
* | Nexcen Brands, Inc. | 9,162 | 3 |
| | | 51,735 |
Textiles, Apparel & Luxury Goods (5.3%) | | |
| NIKE, Inc. Class B | 73,655 | 4,464 |
* | Coach, Inc. | 68,256 | 1,979 |
| VF Corp. | 17,443 | 1,382 |
| Polo Ralph Lauren Corp. | 11,215 | 851 |
* | The Warnaco Group, Inc. | 9,092 | 469 |
* | Hanesbrands Inc. | 18,868 | 450 |
| Phillips-Van Heusen Corp. | 10,281 | 391 |
| Jones Apparel Group, Inc. | 17,317 | 344 |
| Liz Claiborne, Inc. | 18,936 | 307 |
* | Fossil, Inc. | 9,668 | 289 |
* | Deckers Outdoor Corp. | 2,477 | 282 |
| Wolverine World Wide, Inc. | 10,067 | 265 |
* | Carter’s, Inc. | 11,426 | 210 |
*,^Under Armour, Inc. | 5,832 | 197 |
* | Quiksilver, Inc. | 25,011 | 193 |
* | Timberland Co. | 9,726 | 164 |
* | Iconix Brand Group Inc. | 10,377 | 134 |
* | Skechers U.S.A., Inc. | 6,624 | 127 |
| UniFirst Corp. | 2,730 | 117 |
* | True Religion Apparel, Inc. | 4,305 | 117 |
| Columbia Sportswear Co. | 2,766 | 112 |
*,^Lululemon Athletica, Inc. | 5,454 | 106 |
| K-Swiss, Inc. | 5,309 | 91 |
| Movado Group, Inc. | 3,610 | 84 |
* | Steven Madden, Ltd. | 3,137 | 79 |
| Oxford Industries, Inc. | 3,030 | 69 |
* | Crocs, Inc. | 15,608 | 65 |
* | American Apparel, Inc. | 6,397 | 57 |
* | Volcom, Inc. | 3,111 | 55 |
| Kenneth Cole Productions, Inc. | 2,230 | 36 |
| | | 13,486 |
Thrifts & Mortgage Finance (0.0%) | | |
* | Tree.com, Inc. | 133 | 1 |
Total Common Stocks | | |
(Cost $293,219) | | 257,213 |
Temporary Cash Investment (1.1%) | | |
1,2 | Vanguard Market Liquidity | | |
| Fund, 2.389% | | |
| (Cost $2,760) | 2,760,170 | 2,760 |
Total Investments (101.1%) | | |
(Cost $295,980) | | 259,973 |
Other Assets and Liabilities (–1.1%) | | |
Other Assets | | 1,906 |
Liabilities2 | | (4,673) |
| | | (2,767) |
Net Assets (100%) | | 257,206 |
At August 31, 2008, net assets consisted of: |
| Amount |
| ($000) |
Paid-in Capital | 298,245 |
Undistributed Net Investment Income | 1,291 |
Accumulated Net Realized Losses | (6,323) |
Unrealized Appreciation (Depreciation) | (36,007) |
Net Assets | 257,206 |
| |
| |
Admiral Shares—Net Assets | |
Applicable to 28,082 outstanding $.001 | |
par value shares of beneficial interest | |
(unlimited authorization) | 703 |
Net Asset Value Per Share— | |
Admiral Shares | $25.03 |
| |
| |
ETF Shares—Net Assets | |
Applicable to 5,302,208 outstanding | |
$.001 par value shares of beneficial | |
interest (unlimited authorization) | 256,503 |
Net Asset Value Per Share— | |
ETF Shares | $48.38 |
• See Note A in Notes to Financial Statements.
* Non-income-producing security.
^ Part of security position is on loan to broker-dealers. The total value of securities on loan is $2,662,000.
1 Affiliated money market fund available only to Vanguard funds and certain trusts and accounts managed by Vanguard. Rate shown is the 7-day yield.
2 Includes $2,718,000 of collateral received for securities on loan.
See accompanying Notes, which are an integral part of the Financial Statements.
12
Consumer Discretionary Index Fund
Statement of Operations
| Year Ended |
| August 31, 2008 |
| ($000) |
Investment Income | |
Income | |
Dividends | 2,257 |
Interest1 | 6 |
Security Lending | 30 |
Total Income | 2,293 |
Expenses | |
The Vanguard Group—Note B | |
Investment Advisory Services | 24 |
Management and Administrative | |
Admiral Shares | 2 |
ETF Shares | 215 |
Marketing and Distribution | |
Admiral Shares | — |
ETF Shares | 37 |
Custodian Fees | 19 |
Auditing Fees | 23 |
Shareholders’ Reports | |
Admiral Shares | — |
ETF Shares | 11 |
Total Expenses | 331 |
Net Investment Income | 1,962 |
Realized Net Gain (Loss) on | |
Investment Securities Sold | 2,340 |
Change in Unrealized Appreciation | |
(Depreciation) of Investment Securities | (33,599) |
Net Increase (Decrease) in Net Assets | |
Resulting from Operations | (29,297) |
13
Statement of Changes in Net Assets
| Year Ended August 31, |
| 2008 | 2007 |
| ($000) | ($000) |
Increase (Decrease) in Net Assets | | |
Operations | | |
Net Investment Income | 1,962 | 833 |
Realized Net Gain (Loss) | 2,340 | 8,674 |
Change in Unrealized Appreciation (Depreciation) | (33,599) | 191 |
Net Increase (Decrease) in Net Assets Resulting from Operations | (29,297) | 9,698 |
Distributions | | |
Net Investment Income | | |
Admiral Shares | (4) | (8) |
ETF Shares | (1,197) | (564) |
Realized Capital Gain | | |
Admiral Shares | — | — |
ETF Shares | — | — |
Total Distributions | (1,201) | (572) |
Capital Share Transactions | | |
Admiral Shares | (123) | 268 |
ETF Shares | 172,810 | 57,946 |
Net Increase (Decrease) from Capital Share Transactions | 172,687 | 58,214 |
Total Increase (Decrease) | 142,189 | 67,340 |
Net Assets | | |
Beginning of Period | 115,017 | 47,677 |
End of Period2 | 257,206 | 115,017 |
1 Interest income from an affiliated company of the fund was $6,000.
2 Net Assets—End of Period includes undistributed net investment income of $1,291,000 and $530,000.
See accompanying Notes, which are an integral part of the Financial Statements.
14
Consumer Discretionary Index Fund
Financial Highlights
Admiral Shares | | | | |
| | | | |
| | | | July 14, |
| | 20051 to |
| Year Ended August 31, | Aug. 31, |
For a Share Outstanding Throughout Each Period | 2008 | 2007 | 2006 | 2005 |
Net Asset Value, Beginning of Period | $31.02 | $27.03 | $27.75 | $28.29 |
Investment Operations | | | | |
Net Investment Income | .2852 | .217 | .2452 | .1602 |
Net Realized and Unrealized Gain (Loss) on Investments | (6.075) | 4.015 | (.808) | (.700) |
Total from Investment Operations | (5.790) | 4.232 | (.563) | (.540) |
Distributions | | | | |
Dividends from Net Investment Income | (.200) | (.242) | (.157) | — |
Distributions from Realized Capital Gains | — | — | — | — |
Total Distributions | (.200) | (.242) | (.157) | — |
Net Asset Value, End of Period | $25.03 | $31.02 | $27.03 | $27.75 |
| | | | |
| | | | |
Total Return3 | –18.74% | 15.64% | –2.03% | –1.91% |
| | | | |
| | | | |
Ratios/Supplemental Data | | | | |
Net Assets, End of Period (Millions) | $0.7 | $1.0 | $0.6 | $0.1 |
Ratio of Total Expenses to Average Net Assets | 0.25% | 0.27% | 0.28% | 0.28%4 |
Ratio of Net Investment Income to Average Net Assets | 1.11% | 0.84% | 0.89% | 0.67%4 |
Portfolio Turnover Rate5 | 12% | 8% | 10% | 13% |
ETF Shares | | | | | |
| | | | | |
| | | | | Jan. 26, |
| | | 20041 to |
| Year Ended August 31, | Aug. 31, |
For a Share Outstanding Throughout Each Period | 2008 | 2007 | 2006 | 2005 | 2004 |
Net Asset Value, Beginning of Period | $60.02 | $52.28 | $53.65 | $46.99 | $50.09 |
Investment Operations | | | | | |
Net Investment Income | .5922 | .450 | .4942 | .3502 | .200 |
Net Realized and Unrealized Gain | | | | | |
(Loss) on Investments | (11.772) | 7.760 | (1.556) | 6.660 | (3.300) |
Total from Investment Operations | (11.180) | 8.210 | (1.062) | 7.010 | (3.100) |
Distributions | | | | | |
Dividends from Net Investment Income | (.460) | (.470) | (.308) | (.350) | — |
Distributions from Realized Capital Gains | — | — | — | — | — |
Total Distributions | (.460) | (.470) | (.308) | (.350) | — |
Net Asset Value, End of Period | $48.38 | $60.02 | $52.28 | $53.65 | $46.99 |
| | | | | |
| | | | | |
Total Return | –18.70% | 15.69% | –1.99% | 14.91% | –6.19% |
| | | | | |
| | | | | |
Ratios/Supplemental Data | | | | | |
Net Assets, End of Period (Millions) | $257 | $114 | $47 | $32 | $19 |
Ratio of Total Expenses to Average Net Assets | 0.20% | 0.22% | 0.25% | 0.26% | 0.28%4 |
Ratio of Net Investment Income to | | | | | |
Average Net Assets | 1.16% | 0.89% | 0.92% | 0.69% | 0.68%4 |
Portfolio Turnover Rate5 | 12% | 8% | 10% | 13% | 11% |
1 Inception.
2 Calculated based on average shares outstanding.
3 Total returns do not reflect the 2% fee assessed on redemptions of shares held for less than one year.
4 Annualized.
5 Excludes the value of portfolio securities received or delivered as a result of in-kind purchases or redemptions of the fund’s capital shares, including ETF Creation Units. See accompanying Notes, which are an integral part of the Financial Statements.
15
Consumer Discretionary Index Fund
Notes to Financial Statements
Vanguard Consumer Discretionary Index Fund is registered under the Investment Company Act of 1940 as an open-end investment company, or mutual fund. The fund offers two classes of shares, Admiral Shares and ETF Shares. Admiral Shares are available to any investor who meets the fund’s minimum purchase requirements. ETF Shares were listed for trading on the American Stock Exchange through September 18, 2008, and on the NYSE Arca, Inc., thereafter; they can be purchased and sold through a broker.
A. The following significant accounting policies conform to generally accepted accounting principles for U.S. mutual funds. The fund consistently follows such policies in preparing its financial statements.
1. Security Valuation: Securities are valued as of the close of trading on the New York Stock Exchange (generally 4 p.m., Eastern time) on the valuation date. Equity securities are valued at the latest quoted sales prices or official closing prices taken from the primary market in which each security trades; such securities not traded on the valuation date are valued at the mean of the latest quoted bid and asked prices. Securities for which market quotations are not readily available, or whose values have been materially affected by events occurring before the fund’s pricing time but after the close of the securities’ primary markets, are valued by methods deemed by the board of trustees to represent fair value. Investments in Vanguard Market Liquidity Fund are valued at that fund’s net asset value.
2. Federal Income Taxes: The fund intends to continue to qualify as a regulated investment company and distribute all of its taxable income. Management has analyzed the fund’s tax positions taken on federal income tax returns for all open tax years (tax years ended August 31, 2005–2008), and has concluded that no provision for federal income tax is required in the fund’s financial statements.
3. Distributions: Distributions to shareholders are recorded on the ex-dividend date.
4. Security Lending: The fund may lend its securities to qualified institutional borrowers to earn additional income. Security loans are required to be secured at all times by collateral at least equal to the market value of securities loaned. The fund invests cash collateral received in Vanguard Market Liquidity Fund, and records a liability for the return of the collateral, during the period the securities are on loan. Security lending income represents the income earned on investing cash collateral, less expenses associated with the loan.
5. Other: Dividend income is recorded on the ex-dividend date. Interest income includes income distributions received from Vanguard Market Liquidity Fund and is accrued daily. Security transactions are accounted for on the date securities are bought or sold. Costs used to determine realized gains (losses) on the sale of investment securities are those of the specific securities sold. Fees assessed on redemptions of Admiral Shares are credited to paid-in capital.
Each class of shares has equal rights as to assets and earnings, except that each class separately bears certain class-specific expenses related to maintenance of shareholder accounts (included in Management and Administrative expenses) and shareholder reporting. Marketing and distribution expenses are allocated to each class of shares based on a method approved by the board of trustees. Income, other non-class-specific expenses, and gains and losses on investments are allocated to each class of shares based on its relative net assets.
B. The Vanguard Group furnishes at cost investment advisory, corporate management, administrative, marketing, and distribution services. The costs of such services are allocated to the fund under methods approved by the board of trustees. The fund has committed to provide up to 0.40% of its net assets in capital contributions to Vanguard. At August 31, 2008, the fund had contributed capital of $19,000 to Vanguard (included in Other Assets), representing 0.01% of the fund’s net assets and 0.02% of Vanguard’s capitalization. The fund’s trustees and officers are also directors and officers of Vanguard.
C. Distributions are determined on a tax basis and may differ from net investment income and realized capital gains for financial reporting purposes. Differences may be permanent or temporary. Permanent differences are reclassified among capital accounts in the financial statements to reflect their tax character. Temporary differences arise when certain items of income, expense, gain, or loss are recognized in different periods for financial statement and tax purposes; these differences will reverse at some time in the
future. Differences in classification may also result from the treatment of short-term gains as ordinary income for tax purposes.
16
Consumer Discretionary Index Fund
During the year ended August 31, 2008, the fund realized $7,765,000 of net capital gains resulting from in-kind redemptions—in which shareholders exchanged fund shares for securities held by the fund rather than for cash. Because such gains are not taxable to the fund, and are not distributed to shareholders, they have been reclassified from accumulated net realized losses to paid-in capital.
For tax purposes, at August 31, 2008, the fund had $1,380,000 of ordinary income available for distribution. The fund had available realized losses of $6,213,000 to offset future net capital gains of $36,000 through August 31, 2013, $86,000 through August 31, 2014, $178,000 through August 31, 2015, $1,527,000 through August 31, 2016, and $4,386,000 through August 31, 2017.
At August 31, 2008, the cost of investment securities for tax purposes was $296,090,000. Net unrealized depreciation of investment securities for tax purposes was $36,117,000, consisting of unrealized gains of $4,282,000 on securities that had risen in value since their purchase and $40,399,000 in unrealized losses on securities that had fallen in value since their purchase.
D. During the year ended August 31, 2008, the fund purchased $272,919,000 of investment securities and sold $99,065,000 of investment securities, other than temporary cash investments.
E. Capital share transactions for each class of shares were:
| | | Year Ended August 31, |
| | 2008 | | | 2007 |
| Amount | Shares | | Amount | Shares |
| ($000) | (000) | | ($000) | (000) |
Admiral Shares | | | | | |
Issued | 414 | 16 | | 884 | 28 |
Issued in Lieu of Cash Distributions | 4 | — | | 7 | — |
Redeemed1 | (541) | (19) | | (623) | (20) |
Net Increase (Decrease)—Admiral Shares | (123) | (3) | | 268 | 8 |
ETF Shares | | | | | |
Issued | 252,012 | 5,002 | | 134,154 | 2,300 |
Issued in Lieu of Cash Distributions | — | — | | — | — |
Redeemed1 | (79,202) | (1,600) | | (76,208) | (1,300) |
Net Increase (Decrease)—ETF Shares | 172,810 | 3,402 | | 57,946 | 1,000 |
F. In September 2006, the Financial Accounting Standards Board issued Statement of Financial Accounting Standards No. 157 (“FAS 157”), “Fair Value Measurements.” FAS 157 establishes a framework for measuring fair value and expands disclosures about fair value measurements in financial statements.
The various inputs that may be used to determine the value of the fund’s investments are summarized in three broad levels. The inputs or methodologies used for valuing securities are not necessarily an indication of the risk associated with investing in those securities.
Level 1—Quoted prices in active markets for identical securities.
Level 2—Other significant observable inputs (including quoted prices for similar securities, interest rates, prepayment speeds, credit risk, etc.).
Level 3—Significant unobservable inputs (including the fund’s own assumptions used to determine the fair value of investments).
At August 31, 2008, 100% of the fund’s investments were valued based on Level 1 inputs.
1 Net of redemption fees of $7,000 and $8,000 (fund totals).
17
Consumer Staples Index Fund
Fund Profile
As of August 31, 2008
Portfolio Characteristics | | |
| | Target | Broad |
| Fund | Index1 | Index2 |
Number of Stocks | 110 | 109 | 2,481 |
Median Market Cap | $48.4B | $108.6B | $32.1B |
Price/Earnings Ratio | 16.6x | 16.6x | 16.8x |
Price/Book Ratio | 3.4x | 3.6x | 2.4x |
Yield3 | | 2.5% | 2.0% |
Admiral Shares | 2.2% | | |
ETF Shares | 2.2% | | |
Return on Equity | 24.9% | 25.6% | 20.1% |
Earnings Growth Rate | 10.1% | 10.1% | 18.4% |
Foreign Holdings | 0.0% | 0.0% | 0.0% |
Turnover Rate | 13% | — | — |
Expense Ratio (8/31/2007)4 | — | — |
Admiral Shares | 0.26% | | |
ETF Shares | 0.22% | | |
Short-Term Reserves | 0.0% | — | — |
Volatility Measures5 | |
| Fund Versus | Fund Versus |
| Target Index1 | Broad Index2 |
R-Squared | 0.99 | 0.47 |
Beta | 0.99 | 0.53 |
Industry Diversification (% of equity exposure) |
| |
Agricultural Products | 2.5% |
Brewers | 4.2 |
Drug Retail | 6.9 |
Food Distributors | 1.8 |
Food Retail | 3.6 |
Household Products | 21.1 |
Hypermarkets & Super Centers | 11.7 |
Packaged Foods & Meats | 15.2 |
Personal Products | 3.3 |
Soft Drinks | 15.6 |
Tobacco | 13.2 |
Other Consumer Staples | 0.9 |
Ten Largest Holdings6 (% of total net assets) |
| |
The Procter & Gamble Co. | 14.6% |
Wal-Mart Stores, Inc. | 9.2 |
Philip Morris International Inc. | 7.2 |
The Coca-Cola Co. | 6.9 |
PepsiCo, Inc. | 6.9 |
CVS/Caremark Corp. | 3.9 |
Anheuser-Busch Cos., Inc. | 3.6 |
Kraft Foods Inc. | 3.4 |
Altria Group, Inc. | 3.3 |
Colgate-Palmolive Co. | 2.9 |
Top Ten | 61.9% |
1 MSCI US IMI/Consumer Staples.
2 MSCI US IMI/2500.
3 30-day SEC yield for the fund; annualized dividend yield for the indexes. See the Glossary.
4 Expense ratios shown are from the prospectus dated December 10, 2007. Expense ratios for the fiscal year ended August 31, 2008, were 0.25% for Admiral Shares and 0.20% for ETF Shares.
5 For an explanation of R-squared, beta, and other terms used here, see the Glossary.
6 The holdings listed exclude any temporary cash investments and equity index products.
18
Consumer Staples Index Fund
Performance Summary
All of the returns in this report represent past performance, which is not a guarantee of future results that may be achieved by the fund. (Current performance may be lower or higher than the performance data cited. For performance data current to the most recent month-end, visit our website at www.vanguard.com/performance.) Note, too, that both investment returns and principal value can fluctuate widely, so an investor’s shares, when sold, could be worth more or less than their original cost. The returns shown do not reflect taxes that a shareholder would pay on fund distributions or on the sale of fund shares.
Cumulative Performance: January 26, 2004–August 31, 2008
Initial Investment of $10,000
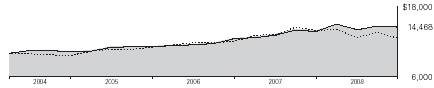
| | |
| | | |
| Average Annual Total Returns | Final Value |
| Periods Ended August 31, 2008 | of a $10,000 |
| One Year | Since Inception1 | Investment |
Consumer Staples Index Fund ETF Shares | | | |
Net Asset Value | 4.18% | 8.37% | $14,468 |
Consumer Staples Index Fund ETF Shares | | | |
Market Price | 4.33 | 8.36 | 14,466 |
MSCI US IMI/2500 | –9.90 | 5.15 | 12,594 |
MSCI US IMI/Consumer Staples | 5.59 | 8.48 | 14,539 |
| | | Final Value |
| | | of a $100,000 |
| One Year | Since Inception1 | Investment |
Consumer Staples Index Fund Admiral Shares2 | 4.15% | 8.46% | $145,118 |
MSCI US IMI/2500 | –9.90 | 5.66 | 128,733 |
MSCI US IMI/Consumer Staples | 5.59 | 8.61 | 146,021 |
1 Performance for the fund and its comparative standards is calculated since the following Inception dates: January 26, 2004, for ETF Shares; January 30, 2004, for Admiral Shares.
2 Total returns do not reflect the 2% fee assessed on redemptions of shares held for less than one year.
19
Consumer Staples Index Fund
Fiscal-Year Total Returns (%): January 26, 2004–August 31, 2008
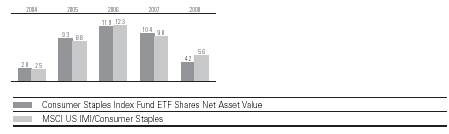
Cumulative Returns: ETF Shares, January 26, 2004–August 31, 2008 |
| | Cumulative |
| | Since |
| One Year | Inception |
Consumer Staples Index Fund ETF Shares Market Price | 4.33% | 44.66% |
Consumer Staples Index Fund ETF Shares Net Asset Value | 4.18 | 44.68 |
MSCI US IMI/Consumer Staples | 5.59 | 45.39 |
Average Annual Total Returns: Periods Ended June 30, 2008
This table presents average annual total returns through the latest calendar quarter—rather than through the end of the fiscal period. Securities and Exchange Commission rules require that we provide this information.
| | | Since |
| Inception Date | One Year | Inception |
ETF Shares | 1/26/2004 | | |
Market Price | | –1.80% | 7.28% |
Net Asset Value | | –1.84 | 7.29 |
Admiral Shares1 | 1/30/2004 | –1.90 | 7.38 |
1 Total returns do not reflect the 2% fee assessed on redemptions of shares held for less than one year. Note: See Financial Highlights tables for dividend and capital gains information.
20
Consumer Staples Index Fund
Financial Statements
Statement of Net Assets
As of August 31, 2008
The fund provides a complete list of its holdings four times in each fiscal year, at the quarter-ends. For the second and fourth fiscal quarters, the lists appear in the fund’s semiannual and annual reports to shareholders. For the first and third fiscal quarters, the fund files the lists with the Securities and Exchange Commission on Form N-Q. Shareholders can look up the fund’s Forms N-Q on the SEC’s website at www.sec.gov. Forms N-Q may also be reviewed and copied at the SEC’s Public Reference Room (see the back cover of this report for further information).
| | | Market |
| | | Value• |
| | Shares | ($000) |
Common Stocks (99.9%) | | |
Beverages (20.7%) | | |
| The Coca-Cola Co. | 714,309 | 37,194 |
| PepsiCo, Inc. | 540,975 | 37,046 |
| Anheuser-Busch Cos., Inc. | 284,450 | 19,303 |
* | Dr. Pepper Snapple | | |
| Group, Inc. | 110,679 | 2,735 |
| Molson Coors | | |
| Brewing Co. Class B | 54,065 | 2,576 |
| Coca-Cola Enterprises, Inc. | 131,208 | 2,240 |
| The Pepsi Bottling Group, Inc. | 65,120 | 1,926 |
* | Constellation Brands, Inc. | | |
| Class A | 88,979 | 1,878 |
| Brown-Forman Corp. Class B | 25,017 | 1,801 |
* | Central European | | |
| Distribution Corp. | 21,006 | 1,212 |
*, | ^Hansen Natural Corp. | 39,649 | 1,090 |
| PepsiAmericas, Inc. | 36,771 | 861 |
* | Boston Beer Co., Inc. Class A | 9,945 | 447 |
| Coca-Cola Bottling Co. | 8,368 | 340 |
* | National Beverage Corp. | 34,501 | 315 |
| | | 110,964 |
Food & Staples Retailing (24.1%) | | |
| Wal-Mart Stores, Inc. | 836,942 | 49,438 |
| CVS/Caremark Corp. | 569,694 | 20,851 |
| Walgreen Co. | 397,193 | 14,470 |
| Costco Wholesale Corp. | 174,493 | 11,702 |
| Sysco Corp. | 244,904 | 7,795 |
| The Kroger Co. | 256,715 | 7,090 |
| Safeway, Inc. | 182,885 | 4,817 |
| SuperValu Inc. | 95,653 | 2,218 |
| Whole Foods Market, Inc. | 70,394 | 1,289 |
* | BJ’s Wholesale Club, Inc. | 30,779 | 1,171 |
| Longs Drug Stores, Inc. | 15,702 | 1,125 |
| Casey’s General Stores, Inc. | 28,462 | 825 |
| Ruddick Corp. | 23,825 | 759 |
* | Winn-Dixie Stores, Inc. | 41,498 | 586 |
* | United Natural Foods, Inc. | 30,296 | 582 |
*, | ^Rite Aid Corp. | 460,629 | 557 |
| The Andersons, Inc. | 12,069 | 543 |
* | The Great Atlantic & | | |
| Pacific Tea Co., Inc. | 29,892 | 488 |
| Nash-Finch Co. | 11,948 | 487 |
| Spartan Stores, Inc. | 20,528 | 467 |
* | The Pantry, Inc. | 24,064 | 441 |
| Weis Markets, Inc. | 11,558 | 437 |
| Ingles Markets, Inc. | 16,052 | 397 |
| PriceSmart, Inc. | 17,609 | 374 |
| | | 128,909 |
Food Products (17.6%) | | |
| Kraft Foods Inc. | 580,877 | 18,303 |
| General Mills, Inc. | 135,974 | 8,999 |
| H.J. Heinz Co. | 129,389 | 6,511 |
| Wm. Wrigley Jr. Co. | 80,270 | 6,380 |
| Archer-Daniels-Midland Co. | 238,687 | 6,077 |
| Kellogg Co. | 109,251 | 5,948 |
| Bunge Ltd. | 50,920 | 4,550 |
| ConAgra Foods, Inc. | 204,715 | 4,354 |
| Sara Lee Corp. | 297,909 | 4,022 |
| Campbell Soup Co. | 97,100 | 3,574 |
| The Hershey Co. | 69,810 | 2,519 |
| McCormick & Co., Inc. | 52,209 | 2,112 |
| Tyson Foods, Inc. | 125,128 | 1,817 |
* | Dean Foods Co. | 70,594 | 1,777 |
* | Ralcorp Holdings, Inc. | 26,686 | 1,639 |
| Corn Products | | |
| International, Inc. | 35,276 | 1,580 |
| J.M. Smucker Co. | 25,842 | 1,401 |
| Hormel Foods Corp. | 37,110 | 1,323 |
* | Smithfield Foods, Inc. | 61,035 | 1,227 |
| Flowers Foods, Inc. | 43,354 | 1,146 |
| Del Monte Foods Co. | 109,977 | 937 |
* | Darling International, Inc. | 52,110 | 716 |
* | Hain Celestial Group, Inc. | 26,493 | 689 |
* | TreeHouse Foods Inc. | 22,321 | 620 |
| Lancaster Colony Corp. | 16,171 | 562 |
* | Chiquita Brands | | |
| International, Inc. | 35,457 | 521 |
* | Green Mountain | | |
| Coffee Roasters, Inc. | 14,231 | 519 |
| Tootsie Roll Industries, Inc. | 18,056 | 514 |
| Sanderson Farms, Inc. | 14,932 | 512 |
| Pilgrim’s Pride Corp. | 39,843 | 512 |
| Lance, Inc. | 23,457 | 481 |
| J & J Snack Foods Corp. | 13,668 | 461 |
| Cal-Maine Foods, Inc. | 11,558 | 456 |
| B&G Foods Inc. | 48,777 | 393 |
| Farmer Brothers, Inc. | 13,448 | 351 |
| Reddy Ice Holdings, Inc. | 39,939 | 336 |
| Alico, Inc. | 7,784 | 336 |
| Wm. Wrigley Jr. Co. Class B | 3,993 | 316 |
| | | 94,491 |
Household Products (21.0%) | | |
| The Procter & Gamble Co. | 1,119,987 | 78,141 |
| Colgate-Palmolive Co. | 203,351 | 15,461 |
| Kimberly-Clark Corp. | 169,045 | 10,427 |
| The Clorox Co. | 58,935 | 3,483 |
* | Energizer Holdings, Inc. | 24,760 | 2,103 |
| Church & Dwight, Inc. | 30,660 | 1,916 |
| WD-40 Co. | 13,936 | 486 |
* | Spectrum Brands Inc. | 182,008 | 309 |
* | Central Garden & Pet Co. | | |
| Class A | 54,080 | 287 |
* | Central Garden and Pet Co. | 25,978 | 146 |
| | | 112,759 |
Personal Products (3.3%) | | |
| Avon Products, Inc. | 174,293 | 7,465 |
| The Estee Lauder Cos. Inc. | | |
| Class A | 46,484 | 2,314 |
| Alberto-Culver Co. | 46,091 | 1,206 |
| Herbalife Ltd. | 25,134 | 1,184 |
* | NBTY, Inc. | 29,794 | 990 |
* | Chattem, Inc. | 10,516 | 737 |
| Nu Skin Enterprises, Inc. | 36,419 | 610 |
* | Bare Escentuals, Inc. | 43,188 | 537 |
* | Elizabeth Arden, Inc. | 23,365 | 478 |
* | American Oriental | | |
| Bioengineering, Inc. | 57,669 | 478 |
* | Prestige Brands Holdings Inc. | 42,843 | 407 |
*,^USANA Health Sciences, Inc. | 10,708 | 405 |
* | Revlon, Inc. Class A | 266,146 | 370 |
| Inter Parfums, Inc. | 25,752 | 365 |
| Mannatech, Inc. | 66,714 | 296 |
| | | 17,842 |
Tobacco (13.2%) | | |
| Philip Morris | | |
| International Inc. | 723,297 | 38,841 |
| Altria Group, Inc. | 836,852 | 17,599 |
| Lorillard, Inc. | 72,200 | 5,216 |
| Reynolds American Inc. | 74,919 | 3,969 |
| UST, Inc. | 63,285 | 3,391 |
| Universal Corp. (VA) | 16,021 | 832 |
| Vector Group Ltd. | 31,566 | 583 |
* | Alliance One | | |
| International, Inc. | 102,536 | 412 |
| | | 70,843 |
Total Common Stocks | | |
(Cost $524,824) | | 535,808 |
Temporary Cash Investment (0.2%) | | |
1,2 | Vanguard Market Liquidity | | |
| Fund, 2.389% | | |
| (Cost $991) | 991,301 | 991 |
Total Investments (100.1%) | | |
(Cost $525,815) | | 536,799 |
Other Assets and Liabilities (–0.1%) | | |
Other Assets | | 4,967 |
Liabilities2 | | (5,699) |
| | | (732) |
Net Assets (100%) | | 536,067 |
21
Consumer Staples Index Fund
At August 31, 2008, net assets consisted of: |
| Amount |
| ($000) |
Paid-in Capital | 525,752 |
Undistributed Net Investment Income | 5,872 |
Accumulated Net Realized Losses | (6,541) |
Unrealized Appreciation (Depreciation) | 10,984 |
Net Assets | 536,067 |
| |
| |
Admiral Shares—Net Assets | |
Applicable to 536,458 outstanding | |
$.001 par value shares of beneficial | |
interest (unlimited authorization) | 18,269 |
Net Asset Value Per Share— | |
Admiral Shares | $34.06 |
| |
| |
ETF Shares—Net Assets | |
Applicable to 7,500,000 outstanding | |
$.001 par value shares of beneficial | |
interest (unlimited authorization) | 517,798 |
Net Asset Value Per Share— | |
ETF Shares | $69.04 |
• See Note A in Notes to Financial Statements.
* Non-income-producing security.
^ Part of security position is on loan to broker-dealers. The total value of securities on loan is $822,000.
1 Affiliated money market fund available only to Vanguard funds and certain trusts and accounts managed by Vanguard. Rate shown is the 7-day yield.
2 Includes $991,000 of collateral received for securities on loan.
See accompanying Notes, which are an integral part of the Financial Statements.
22
Consumer Staples Index Fund
Statement of Operations
| Year Ended |
| August 31, 2008 |
| ($000) |
Investment Income | |
Income | |
Dividends | 9,148 |
Interest1 | 6 |
Security Lending | 16 |
Total Income | 9,170 |
Expenses | |
The Vanguard Group—Note B | |
Investment Advisory Services | 45 |
Management and Administrative | |
Admiral Shares | 17 |
ETF Shares | 624 |
Marketing and Distribution | |
Admiral Shares | 3 |
ETF Shares | 103 |
Custodian Fees | 17 |
Auditing Fees | 23 |
Shareholders’ Reports | |
Admiral Shares | 13 |
ETF Shares | 13 |
Total Expenses | 858 |
Net Investment Income | 8,312 |
Realized Net Gain (Loss) on Investment | |
Securities Sold | 21,737 |
Change in Unrealized Appreciation | |
(Depreciation) of Investment Securities | (19,968) |
Net Increase (Decrease) in Net Assets | |
Resulting from Operations | 10,081 |
Statement of Changes in Net Assets
| Year Ended August 31, |
| 2008 | 2007 |
| ($000) | ($000) |
Increase (Decrease) in Net Assets | | |
Operations | | |
Net Investment Income | 8,312 | 6,405 |
Realized Net Gain (Loss) | 21,737 | 6,817 |
Change in Unrealized Appreciation (Depreciation) | (19,968) | 13,738 |
Net Increase (Decrease) in Net Assets Resulting from Operations | 10,081 | 26,960 |
Distributions | | |
Net Investment Income | | |
Admiral Shares | (184) | (96) |
ETF Shares | (6,259) | (3,840) |
Realized Capital Gain | | |
Admiral Shares | — | — |
ETF Shares | — | — |
Total Distributions | (6,443) | (3,936) |
Capital Share Transactions | | |
Admiral Shares | 9,079 | 2,899 |
ETF Shares | 204,450 | 76,754 |
Net Increase (Decrease) from Capital Share Transactions | 213,529 | 79,653 |
Total Increase (Decrease) | 217,167 | 102,677 |
Net Assets | | |
Beginning of Period | 318,900 | 216,223 |
End of Period2 | 536,067 | 318,900 |
1 Interest income from an affiliated company of the fund was $6,000.
2 Net Assets—End of Period includes undistributed net investment income of $5,872,000 and $4,003,000. See accompanying Notes, which are an integral part of the Financial Statements.
23
Consumer Staples Index Fund
Financial Highlights
Admiral Shares | | | | | |
| | | | | |
| | | | | Jan. 30, |
| | | 20041 to |
| Year Ended August 31, | Aug. 31, |
For a Share Outstanding Throughout Each Period | 2008 | 2007 | 2006 | 2005 | 2004 |
Net Asset Value, Beginning of Period | $33.22 | $30.56 | $27.64 | $25.82 | $25.00 |
Investment Operations | | | | | |
Net Investment Income | .6342 | .662 | .5472 | .4272 | .240 |
Net Realized and Unrealized Gain | | | | | |
(Loss) on Investments | .766 | 2.460 | 2.716 | 1.952 | .580 |
Total from Investment Operations | 1.400 | 3.122 | 3.263 | 2.379 | .820 |
Distributions | | | | | |
Dividends from Net Investment Income | (.560) | (.462) | (.343) | (.440) | — |
Distributions from Realized Capital Gains | — | — | — | (.119) | — |
Total Distributions | (.560) | (.462) | (.343) | (.559) | — |
Net Asset Value, End of Period | $34.06 | $33.22 | $30.56 | $27.64 | $25.82 |
| | | | | |
| | | | | |
Total Return3 | 4.15% | 10.30% | 11.92% | 9.29% | 3.28% |
| | | | | |
| | | | | |
Ratios/Supplemental Data | | | | | |
Net Assets, End of Period (Millions) | $18 | $9 | $6 | $4 | $1 |
Ratio of Total Expenses to Average Net Assets | 0.25% | 0.26% | 0.28% | 0.28% | 0.28%4 |
Ratio of Net Investment Income to | | | | | |
Average Net Assets | 1.88% | 2.16% | 1.90% | 1.69% | 1.51%4 |
Portfolio Turnover Rate5 | 13% | 12% | 14% | 7% | 20% |
| | | | | |
ETF Shares | | | | | |
| | | | | |
| | | | | Jan. 26, |
| | | 20041 to |
| Year Ended August 31, | Aug. 31, |
For a Share Outstanding Throughout Each Period | 2008 | 2007 | 2006 | 2005 | 2004 |
Net Asset Value, Beginning of Period | $67.35 | $61.94 | $56.03 | $52.28 | $50.84 |
Investment Operations | | | | | |
Net Investment Income | 1.3272 | 1.370 | 1.0902 | .9502 | .470 |
Net Realized and Unrealized Gain | | | | | |
(Loss) on Investments | 1.522 | 5.000 | 5.523 | 3.894 | .970 |
Total from Investment Operations | 2.849 | 6.370 | 6.613 | 4.844 | 1.440 |
Distributions | | | | | |
Dividends from Net Investment Income | (1.159) | (.960) | (.703) | (.853) | — |
Distributions from Realized Capital Gains | — | — | — | (.241) | — |
Total Distributions | (1.159) | (.960) | (.703) | (1.094) | — |
Net Asset Value, End of Period | $69.04 | $67.35 | $61.94 | $56.03 | $52.28 |
| | | | | |
| | | | | |
Total Return | 4.18% | 10.38% | 11.91% | 9.33% | 2.83% |
| | | | | |
| | | | | |
Ratios/Supplemental Data | | | | | |
Net Assets, End of Period (Millions) | $518 | $310 | $211 | $73 | $21 |
Ratio of Total Expenses to Average Net Assets | 0.20% | 0.22% | 0.25% | 0.26% | 0.28%4 |
Ratio of Net Investment Income to | | | | | |
Average Net Assets | 1.93% | 2.20% | 1.93% | 1.71% | 1.51%4 |
Portfolio Turnover Rate5 | 13% | 12% | 14% | 7% | 20% |
1 Inception.
2 Calculated based on average shares outstanding.
3 Total returns do not reflect the 2% fee assessed on redemptions of shares held for less than one year.
4 Annualized.
5 Excludes the value of portfolio securities received or delivered as a result of in-kind purchases or redemptions of the fund’s capital shares, including ETF Creation Units. See accompanying Notes, which are an integral part of the Financial Statements.
24
Consumer Staples Index Fund
Notes to Financial Statements
Vanguard Consumer Staples Index Fund is registered under the Investment Company Act of 1940 as an open-end investment company, or mutual fund. The fund offers two classes of shares, Admiral Shares and ETF Shares. Admiral Shares are available to any investor who meets the fund’s minimum purchase requirements. ETF Shares were listed for trading on the American Stock Exchange through September 18, 2008, and on the NYSE Arca, Inc., thereafter; they can be purchased and sold through a broker.
A. The following significant accounting policies conform to generally accepted accounting principles for U.S. mutual funds. The fund consistently follows such policies in preparing its financial statements.
1. Security Valuation: Securities are valued as of the close of trading on the New York Stock Exchange (generally 4 p.m., Eastern time) on the valuation date. Equity securities are valued at the latest quoted sales prices or official closing prices taken from the primary market in which each security trades; such securities not traded on the valuation date are valued at the mean of the latest quoted bid and asked prices. Securities for which market quotations are not readily available, or whose values have been materially affected by events occurring before the fund’s pricing time but after the close of the securities’ primary markets, are valued by methods deemed by the board of trustees to represent fair value. Investments in Vanguard Market Liquidity Fund are valued at that fund’s net asset value.
2. Federal Income Taxes: The fund intends to continue to qualify as a regulated investment company and distribute all of its taxable income. Management has analyzed the fund’s tax positions taken on federal income tax returns for all open tax years (tax years ended August 31, 2005–2008), and has concluded that no provision for federal income tax is required in the fund’s financial statements.
3. Distributions: Distributions to shareholders are recorded on the ex-dividend date.
4. Security Lending: The fund may lend its securities to qualified institutional borrowers to earn additional income. Security loans are required to be secured at all times by collateral at least equal to the market value of securities loaned. The fund invests cash collateral received in Vanguard Market Liquidity Fund, and records a liability for the return of the collateral, during the period the securities are on loan. Security lending income represents the income earned on investing cash collateral, less expenses associated with the loan.
5. Other: Dividend income is recorded on the ex-dividend date. Interest income includes income distributions received from Vanguard Market Liquidity Fund and is accrued daily. Security transactions are accounted for on the date securities are bought or sold. Costs used to determine realized gains (losses) on the sale of investment securities are those of the specific securities sold. Fees assessed on redemptions of Admiral Shares are credited to paid-in capital.
Each class of shares has equal rights as to assets and earnings, except that each class separately bears certain class-specific expenses related to maintenance of shareholder accounts (included in Management and Administrative expenses) and shareholder reporting. Marketing and distribution expenses are allocated to each class of shares based on a method approved by the board of trustees. Income, other non-class-specific expenses, and gains and losses on investments are allocated to each class of shares based on its relative net assets.
B. The Vanguard Group furnishes at cost investment advisory, corporate management, administrative, marketing, and distribution services. The costs of such services are allocated to the fund under methods approved by the board of trustees. The fund has committed to provide up to 0.40% of its net assets in capital contributions to Vanguard. At August 31, 2008, the fund had contributed capital of $39,000 to Vanguard (included in Other Assets), representing 0.01% of the fund’s net assets and 0.04% of Vanguard’s capitalization. The fund’s trustees and officers are also directors and officers of Vanguard.
C. Distributions are determined on a tax basis and may differ from net investment income and realized capital gains for financial reporting purposes. Differences may be permanent or temporary. Permanent differences are reclassified among capital accounts in the financial statements to reflect their tax character. Temporary differences arise when certain items of income, expense, gain, or loss are recognized in different periods for financial statement and tax purposes; these differences will reverse at some time in the future. Differences in classification may also result from the treatment of short-term gains as ordinary income for tax purposes.
25
Consumer Staples Index Fund
During the year ended August 31, 2008, the fund realized $24,902,000 of net capital gains resulting from in-kind redemptions—in which shareholders exchanged fund shares for securities held by the fund rather than for cash. Because such gains are not taxable to the fund, and are not distributed to shareholders, they have been reclassified from accumulated net realized losses to paid-in capital.
For tax purposes, at August 31, 2008, the fund had $6,116,000 of ordinary income available for distribution. The fund had available realized losses of $6,539,000 to offset future net capital gains of $276,000 through August 31, 2014, $773,000 through August 31, 2015, $2,261,000 through August 31, 2016, and $3,229,000 through August 31, 2017.
At August 31, 2008, the cost of investment securities for tax purposes was $525,825,000. Net unrealized appreciation of investment securities for tax purposes was $10,974,000, consisting of unrealized gains of $28,728,000 on securities that had risen in value since their purchase and $17,754,000 in unrealized losses on securities that had fallen in value since their purchase.
D. During the year ended August 31, 2008, the fund purchased $392,283,000 of investment securities and sold $177,090,000 of investment securities, other than temporary cash investments.
E. Capital share transactions for each class of shares were:
| | | Year Ended August 31, |
| | 2008 | | | 2007 |
| Amount | Shares | | Amount | Shares |
| ($000) | (000) | | ($000) | (000) |
Admiral Shares | | | | | |
Issued | 12,663 | 371 | | 4,493 | 139 |
Issued in Lieu of Cash Distributions | 172 | 5 | | 92 | 3 |
Redeemed1 | (3,756) | (113) | | (1,686) | (53) |
Net Increase (Decrease)—Admiral Shares | 9,079 | 263 | | 2,899 | 89 |
ETF Shares | | | | | |
Issued | 327,325 | 4,700 | | 109,926 | 1,700 |
Issued in Lieu of Cash Distributions | — | — | | — | — |
Redeemed1 | (122,875) | (1,800) | | (33,172) | (500) |
Net Increase (Decrease)—ETF Shares | 204,450 | 2,900 | | 76,754 | 1,200 |
F. In September 2006, the Financial Accounting Standards Board issued Statement of Financial Accounting Standards No. 157 (“FAS 157”), “Fair Value Measurements.” FAS 157 establishes a framework for measuring fair value and expands disclosures about fair value measurements in financial statements.
The various inputs that may be used to determine the value of the fund’s investments are summarized in three broad levels. The inputs or methodologies used for valuing securities are not necessarily an indication of the risk associated with investing in those securities.
Level 1—Quoted prices in active markets for identical securities.
Level 2—Other significant observable inputs (including quoted prices for similar securities, interest rates, prepayment speeds, credit risk, etc.).
Level 3—Significant unobservable inputs (including the fund’s own assumptions used to determine the fair value of investments).
At August 31, 2008, 100% of the fund’s investments were valued based on Level 1 inputs.
1 Net of redemption fees of $35,000 and $9,000 (fund totals).
26
Energy Index Fund
Fund Profile
As of August 31, 2008
Portfolio Characteristics | | |
| | Target | Broad |
| Fund | Index1 | Index2 |
Number of Stocks | 168 | 167 | 2,481 |
Median Market Cap | $45.5B | $65.1B | $32.1B |
Price/Earnings Ratio | 12.3x | 12.1x | 16.8x |
Price/Book Ratio | 2.6x | 2.6x | 2.4x |
Yield3 | | 1.4% | 2.0% |
Admiral Shares | 1.1% | | |
ETF Shares | 1.2% | | |
Return on Equity | 27.0% | 27.3% | 20.1% |
Earnings Growth Rate | 34.0% | 33.7% | 18.4% |
Foreign Holdings | 0.0% | 0.0% | 0.0% |
Turnover Rate | 11% | — | — |
Expense Ratio (8/31/2007)4 | — | — |
Admiral Shares | 0.26% | | |
ETF Shares | 0.22% | | |
Short-Term Reserves | 0.0% | — | — |
Volatility Measures5 | |
| Fund Versus | Fund Versus |
| Target Index1 | Broad Index2 |
R-Squared | 1.00 | 0.20 |
Beta | 1.01 | 0.94 |
Industry Diversification (% of equity exposure) |
| |
Coal & Consumable Fuels | 3.7% |
Integrated Oil & Gas | 46.2 |
Oil & Gas Drilling | 6.6 |
Oil & Gas Equipment & Services | 19.3 |
Oil & Gas Exploration & Production | 19.4 |
Oil & Gas Refining & Marketing | 1.5 |
Oil & Gas Storage & Transportation | 3.3 |
Ten Largest Holdings6 (% of total net assets) |
| |
ExxonMobil Corp. | 19.9% |
Chevron Corp. | 10.6 |
ConocoPhillips Co. | 7.4 |
Schlumberger Ltd. | 6.9 |
Occidental Petroleum Corp. | 3.6 |
Devon Energy Corp. | 2.4 |
Transocean, Inc. | 2.3 |
Halliburton Co. | 2.1 |
Apache Corp. | 2.1 |
Marathon Oil Corp. | 1.8 |
Top Ten | 59.1% |
1 MSCI US IMI/Energy.
2 MSCI US IMI/2500.
3 30-day SEC yield for the fund; annualized dividend yield for the indexes. See the Glossary.
4 Expense ratios shown are from the prospectus dated December 10, 2007. Expense ratios for the fiscal year ended August 31, 2008, were 0.25% for Admiral Shares and 0.20% for ETF Shares.
5 For an explanation of R-squared, beta, and other terms used here, see the Glossary.
6 The holdings listed exclude any temporary cash investments and equity index products.
27
Energy Index Fund
Performance Summary
All of the returns in this report represent past performance, which is not a guarantee of future results that may be achieved by the fund. (Current performance may be lower or higher than the performance data cited. For performance data current to the most recent month-end, visit our website at www.vanguard.com/performance.) Note, too, that both investment returns and principal value can fluctuate widely, so an investor’s shares, when sold, could be worth more or less than their original cost. The returns shown do not reflect taxes that a shareholder would pay on fund distributions or on the sale of fund shares.
Cumulative Performance: September 23, 2004–August 31, 2008
Initial Investment of $10,000

| | |
| | | |
| Average Annual Total Returns | Final Value |
| Periods Ended August 31, 2008 | of a $10,000 |
| One Year | Since Inception1 | Investment |
Energy Index Fund ETF Shares Net Asset Value | 9.47% | 23.55% | $22,990 |
Energy Index Fund ETF Shares Market Price | 9.65 | 23.57 | 23,005 |
MSCI US IMI/2500 | –9.90 | 6.84 | 12,973 |
MSCI US IMI/Energy | 8.25 | 22.88 | 22,508 |
| | | Final Value |
| | | of a $100,000 |
| One Year | Since Inception1 | Investment |
Energy Index Fund Admiral Shares2 | 9.42% | 22.01% | $217,174 |
MSCI US IMI/2500 | –9.90 | 6.32 | 127,008 |
MSCI US IMI/Energy | 8.25 | 21.29 | 212,267 |
1 Performance for the fund and its comparative standards is calculated since the following inception dates: September 23, 2004, for ETF Shares; October 7, 2004, for Admiral Shares.
2 Total returns do not reflect the 2% fee assessed on redemptions of shares held for less than one year.
28
Energy Index Fund
Fiscal-Year Total Returns (%): September 23, 2004–August 31, 2008
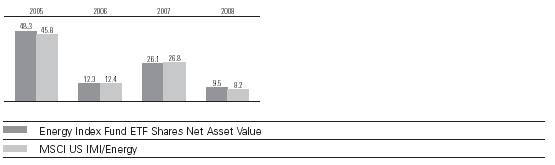
Cumulative Returns: ETF Shares, September 23, 2004–August 31, 2008 |
| | Cumulative |
| | Since |
| One Year | Inception |
Energy Index Fund ETF Shares Market Price | 9.65% | 130.05% |
Energy Index Fund ETF Shares Net Asset Value | 9.47 | 129.90 |
MSCI US IMI/Energy | 8.25 | 125.08 |
Average Annual Total Returns: Periods Ended June 30, 2008
This table presents average annual total returns through the latest calendar quarter—rather than through the end of the fiscal period. Securities and Exchange Commission rules require that we provide this information.
| | | Since |
| Inception Date | One Year | Inception |
ETF Shares | 9/23/2004 | | |
Market Price | | 29.62% | 30.46% |
Net Asset Value | | 29.54 | 30.47 |
Admiral Shares1 | 10/7/2004 | 29.49 | 28.86 |
1 Total returns do not reflect the 2% fee assessed on redemptions of shares held for less than one year. Note: See Financial Highlights tables for dividend and capital gains information.
29
Energy Index Fund
Financial Statements
Statement of Net Assets
As of August 31, 2008
The fund provides a complete list of its holdings four times in each fiscal year, at the quarter-ends. For the second and fourth fiscal quarters, the lists appear in the fund’s semiannual and annual reports to shareholders. For the first and third fiscal quarters, the fund files the lists with the Securities and Exchange Commission on Form N-Q. Shareholders can look up the fund’s Forms N-Q on the SEC’s website at www.sec.gov. Forms N-Q may also be reviewed and copied at the SEC’s Public Reference Room (see the back cover of this report for further information).
| | | Market |
| | | Value• |
| | Shares | ($000) |
Common Stocks (99.3%) | | |
Energy Equipment & Services (25.7%) | | |
| Oil & Gas Drilling (6.5%) | | |
* | Transocean, Inc. | 177,547 | 22,584 |
| Noble Corp. | 151,019 | 7,595 |
* | Nabors Industries, Inc. | 158,892 | 5,657 |
| ENSCO International, Inc. | 81,522 | 5,526 |
| Diamond Offshore Drilling, Inc. | 39,474 | 4,339 |
* | Pride International, Inc. | 95,616 | 3,673 |
| Helmerich & Payne, Inc. | 59,598 | 3,404 |
| Patterson-UTI Energy, Inc. | 89,211 | 2,535 |
| Rowan Cos., Inc. | 65,144 | 2,406 |
* | Unit Corp. | 27,663 | 1,874 |
* | Atwood Oceanics, Inc. | 34,459 | 1,401 |
* | Hercules Offshore, Inc. | 53,857 | 1,189 |
* | Grey Wolf, Inc. | 110,609 | 963 |
* | Parker Drilling Co. | 73,573 | 682 |
* | Pioneer Drilling Co. | 33,716 | 565 |
* | Bronco Drilling Co., Inc. | 21,106 | 335 |
| | | |
| Oil & Gas Equipment & Services (19.2%) | | |
| Schlumberger Ltd. | 729,082 | 68,694 |
| Halliburton Co. | 485,647 | 21,339 |
* | National Oilwell Varco Inc. | 231,483 | 17,067 |
* | Weatherford | | |
| International Ltd. | 378,689 | 14,610 |
| Baker Hughes, Inc. | 171,865 | 13,751 |
| Smith International, Inc. | 122,618 | 8,546 |
* | Cameron International Corp. | 122,390 | 5,702 |
| BJ Services Co. | 166,672 | 4,475 |
* | FMC Technologies Inc. | 72,927 | 3,906 |
* | Superior Energy Services, Inc. | 46,939 | 2,208 |
* | Dresser Rand Group, Inc. | 50,309 | 2,041 |
* | Oceaneering International, Inc. | 32,228 | 2,011 |
| Tidewater Inc. | 29,253 | 1,775 |
* | Exterran Holdings, Inc. | 36,776 | 1,681 |
* | Oil States International, Inc. | 29,335 | 1,632 |
| Core Laboratories N.V. | 12,945 | 1,607 |
* | Helix Energy Solutions | | |
| Group, Inc. | 51,598 | 1,588 |
* | IHS Inc. Class A | 21,786 | 1,398 |
* | SEACOR Holdings Inc. | 12,793 | 1,128 |
* | Dril-Quip, Inc. | 18,916 | 1,041 |
* | TETRA Technologies, Inc. | 46,035 | 1,019 |
* | Willbros Group, Inc. | 24,041 | 996 |
* | Complete Production | | |
| Services, Inc. | 30,162 | 891 |
| Lufkin Industries, Inc. | 9,326 | 865 |
* | ION Geophysical Corp. | 53,263 | 859 |
| CARBO Ceramics Inc. | 13,303 | 799 |
* | Bristow Group, Inc. | 17,284 | 705 |
* | Hornbeck Offshore | | |
| Services, Inc. | 15,308 | 674 |
* | NATCO Group Inc. | 12,584 | 638 |
* | Global Industries Ltd. | 65,523 | 634 |
* | Gulfmark Offshore, Inc. | 12,339 | 618 |
* | Newpark Resources, Inc. | 61,572 | 528 |
* | Matrix Service Co. | 18,361 | 483 |
* | Basic Energy Services Inc. | 16,140 | 472 |
* | T-3 Energy Services, Inc. | 8,363 | 467 |
| RPC Inc. | 24,720 | 451 |
* | Cal Dive International, Inc. | 35,487 | 410 |
| Gulf Island Fabrication, Inc. | 9,091 | 392 |
* | PHI Inc. Non-Voting Shares | 9,541 | 366 |
* | Superior Well Services, Inc. | 11,012 | 363 |
* | Dawson Geophysical Co. | 5,717 | 359 |
* | Allis-Chalmers Energy Inc. | 18,806 | 272 |
* | Trico Marine Services, Inc. | 11,050 | 262 |
* | OYO Geospace Corp. | 4,532 | 222 |
* | SulphCo, Inc. | 71,850 | 210 |
| | | 254,883 |
Oil, Gas & Consumable Fuels (73.6%) | | |
| Coal & Consumable Fuels (3.6%) | | |
| Peabody Energy Corp. | 152,060 | 9,572 |
| CONSOL Energy, Inc. | 102,832 | 6,963 |
| Arch Coal, Inc. | 81,764 | 4,435 |
* | Alpha Natural Resources, Inc. | 40,086 | 3,973 |
| Massey Energy Co. | 46,225 | 3,049 |
| Walter Industries, Inc. | 31,704 | 2,974 |
* | Patriot Coal Corp. | 31,332 | 1,879 |
| Foundation Coal Holdings, Inc. | 26,845 | 1,588 |
* | International Coal Group, Inc. | 82,056 | 839 |
* | James River Coal Co. | 16,646 | 702 |
* | USEC Inc. | 22,517 | 130 |
* | Evergreen Energy, Inc. | 32,352 | 58 |
* | Uranium Resources Inc. | 5,816 | 13 |
| | | |
| Integrated Oil & Gas (45.9%) | | |
| ExxonMobil Corp. | 2,475,461 | 198,062 |
| Chevron Corp. | 1,221,460 | 105,436 |
| ConocoPhillips Co. | 890,803 | 73,500 |
| Occidental Petroleum Corp. | 455,994 | 36,188 |
| Marathon Oil Corp. | 394,381 | 17,775 |
| Hess Corp. | 162,052 | 16,968 |
| Murphy Oil Corp. | 101,338 | 7,958 |
| | | |
| Oil & Gas Exploration & Production (19.3%) | |
| Devon Energy Corp. | 235,943 | 24,078 |
| Apache Corp. | 185,783 | 21,250 |
| Anadarko Petroleum Corp. | 261,037 | 16,114 |
| XTO Energy, Inc. | 306,355 | 15,443 |
| Chesapeake Energy Corp. | 286,544 | 13,869 |
| EOG Resources, Inc. | 128,579 | 13,426 |
* | Southwestern Energy Co. | 192,200 | 7,375 |
| Noble Energy, Inc. | 96,908 | 6,951 |
* | Ultra Petroleum Corp. | 86,191 | 5,874 |
* | Petrohawk Energy Corp. | 139,872 | 4,841 |
| Pioneer Natural | | |
| Resources Co. | 67,888 | 4,288 |
| Range Resources Corp. | 87,800 | 4,076 |
* | Denbury Resources, Inc. | 140,438 | 3,495 |
* | Newfield Exploration Co. | 75,288 | 3,405 |
* | Plains Exploration & | | |
| Production Co. | 61,387 | 3,309 |
* | Forest Oil Corp. | 48,492 | 2,760 |
| Cimarex Energy Co. | 47,828 | 2,656 |
| Cabot Oil & Gas Corp. | 56,603 | 2,515 |
* | Whiting Petroleum Corp. | 24,571 | 2,365 |
* | Comstock Resources, Inc. | 26,849 | 1,744 |
| Penn Virginia Corp. | 24,574 | 1,626 |
* | Encore Acquisition Co. | 30,065 | 1,550 |
| St. Mary Land & | | |
| Exploration Co. | 36,568 | 1,544 |
* | SandRidge Energy, Inc. | 43,393 | 1,519 |
* | Continental Resources, Inc. | 30,154 | 1,513 |
* | Quicksilver Resources, Inc. | 61,311 | 1,483 |
* | EXCO Resources, Inc. | 53,254 | 1,410 |
* | Mariner Energy Inc. | 47,260 | 1,375 |
* | Concho Resources, Inc. | 30,483 | 996 |
* | Arena Resources, Inc. | 22,017 | 983 |
| Berry Petroleum Class A | 22,589 | 940 |
* | Stone Energy Corp. | 19,392 | 924 |
* | Swift Energy Co. | 19,170 | 895 |
* | Carrizo Oil & Gas, Inc. | 17,439 | 866 |
| Atlas America, Inc. | 22,942 | 860 |
* | Goodrich Petroleum Corp. | 16,432 | 836 |
* | Bill Barrett Corp. | 20,061 | 790 |
* | McMoRan Exploration Co. | 28,411 | 777 |
* | Rosetta Resources, Inc. | 32,979 | 767 |
* | Delta Petroleum Corp. | 42,638 | 766 |
| W&T Offshore, Inc. | 19,809 | 696 |
* | Contango Oil & Gas Co. | 9,238 | 657 |
* | BPZ Energy, Inc. | 33,302 | 656 |
* | GMX Resources Inc. | 9,392 | 637 |
* | CNX Gas Corp. | 20,147 | 611 |
* | Petroleum Development Corp. | 9,895 | 602 |
* | Oilsands Quest, Inc. | 142,522 | 591 |
* | PetroQuest Energy, Inc. | 29,494 | 545 |
* | Warren Resources Inc. | 39,745 | 449 |
* | Clayton Williams Energy, Inc. | 5,376 | 435 |
* | Brigham Exploration Co. | 31,903 | 433 |
* | Parallel Petroleum Corp. | 29,467 | 390 |
* | TXCO Resources Inc. | 26,223 | 318 |
* | Harvest Natural | | |
| Resources, Inc. | 27,897 | 309 |
* | Gulfport Energy Corp. | 22,794 | 304 |
* | Energy Partners, Ltd. | 25,479 | 303 |
* | Veneco Inc. | 17,230 | 290 |
| APCO Argentina Inc. | 9,323 | 270 |
* | GeoGlobal Resources Inc. | 49,701 | 198 |
* | Approach Resources Inc. | 11,852 | 166 |
* | ATP Oil & Gas Corp. | 2,089 | 54 |
| | | |
| Oil & Gas Refining & Marketing (1.5%) | | |
| Valero Energy Corp. | 279,818 | 9,726 |
| Sunoco, Inc. | 44,392 | 1,970 |
| Holly Corp. | 26,953 | 862 |
| World Fuel Services Corp. | 18,692 | 538 |
| Frontier Oil Corp. | 22,861 | 443 |
* | Rentech, Inc. | 130,595 | 308 |
*, | ^Clean Energy Fuels Corp. | 14,770 | 255 |
* | Aventine Renewable | | |
| Energy Holdings, Inc. | 33,856 | 217 |
| Tesoro Corp. | 4,482 | 83 |
* | VeraSun Energy Corp. | 10,952 | 63 |
* | CVR Energy, Inc. | 2,298 | 32 |
| ^Western Refining, Inc. | 2,665 | 24 |
*, | ^Verenium Corp. | 6,349 | 14 |
| Alon USA Energy, Inc. | 1,143 | 14 |
* | Pacific Ethanol, Inc. | 5,392 | 11 |
| Delek US Holdings, Inc. | 1,348 | 11 |
30
Energy Index Fund
| | | Market |
| | | Value• |
| | Shares | ($000) |
| Oil & Gas Storage & Transportation (3.3%) | |
| Williams Cos., Inc. | 327,153 | 10,106 |
| Spectra Energy Corp. | 354,649 | 9,384 |
| El Paso Corp. | 395,264 | 6,625 |
* | Kinder Morgan | | |
| Management, LLC | 39,307 | 2,182 |
| Southern Union Co. | 61,836 | 1,611 |
| Overseas Shipholding | | |
| Group Inc. | 17,653 | 1,266 |
| Crosstex Energy, Inc. | 24,948 | 813 |
| General Maritime Corp. | 19,842 | 490 |
* | Enbridge Energy | | |
| Management LLC | 8,870 | 448 |
*,^Cheniere Energy, Inc. | 4,040 | 15 |
| | | 730,741 |
Total Common Stocks | | |
(Cost $805,311) | | 985,624 |
Temporary Cash Investment (0.0%) | | |
1,2 | Vanguard Market Liquidity | | |
| Fund, 2.389% | | |
| (Cost $141) | 140,900 | 141 |
Total Investments (99.3%) | | |
(Cost $805,452) | | 985,765 |
Other Assets and Liabilities (0.7%) | | |
Other Assets | | 18,900 |
Liabilities2 | | (11,548) |
| | | 7,352 |
Net Assets (100%) | | 993,117 |
At August 31, 2008, net assets consisted of: |
| Amount |
| ($000) |
Paid-in Capital | 818,899 |
Undistributed Net Investment Income | 7,020 |
Accumulated Net Realized Losses | (13,115) |
Unrealized Appreciation (Depreciation) | 180,313 |
Net Assets | 993,117 |
| |
| |
Admiral Shares—Net Assets | |
Applicable to 2,709,374 outstanding | |
$.001 par value shares of beneficial | |
interest (unlimited authorization) | 148,104 |
Net Asset Value Per Share— | |
Admiral Shares | $54.66 |
| |
| |
ETF Shares—Net Assets | |
Applicable to 7,714,140 outstanding | |
$.001 par value shares of beneficial | |
interest (unlimited authorization) | 845,013 |
Net Asset Value Per Share— | |
ETF Shares | $109.54 |
• See Note A in Notes to Financial Statements.
* Non-income-producing security.
^ Part of security position is on loan to broker-dealers. The total value of securities on loan is $133,000.
1 Affiliated money market fund available only to Vanguard funds and certain trusts and accounts managed by Vanguard. Rate shown is the 7-day yield.
2 Includes $141,000 of collateral received for securities on loan.
See accompanying Notes, which are an integral part of the Financial Statements.
31
Energy Index Fund
Statement of Operations
| Year Ended |
| August 31, 2008 |
| ($000) |
Investment Income | |
Income | |
Dividends | 11,310 |
Interest1 | 15 |
Security Lending | 7 |
Total Income | 11,332 |
Expenses | |
The Vanguard Group—Note B | |
Investment Advisory Services | 54 |
Management and Administrative | |
Admiral Shares | 315 |
ETF Shares | 1,186 |
Marketing and Distribution | |
Admiral Shares | 27 |
ETF Shares | 191 |
Custodian Fees | 22 |
Auditing Fees | 23 |
Shareholders’ Reports | |
Admiral Shares | 1 |
ETF Shares | 56 |
Trustees’ Fees and Expenses | 1 |
Total Expenses | 1,876 |
Net Investment Income | 9,456 |
Realized Net Gain (Loss) on | |
Investment Securities Sold | 52,425 |
Change in Unrealized Appreciation | |
(Depreciation) of Investment Securities | 11,906 |
Net Increase (Decrease) in Net Assets | |
Resulting from Operations | 73,787 |
Statement of Changes in Net Assets
| Year Ended August 31, |
| 2008 | 2007 |
| ($000) | ($000) |
Increase (Decrease) in Net Assets | | |
Operations | | |
Net Investment Income | 9,456 | 6,565 |
Realized Net Gain (Loss) | 52,425 | 3,965 |
Change in Unrealized Appreciation (Depreciation) | 11,906 | 115,652 |
Net Increase (Decrease) in Net Assets Resulting from Operations | 73,787 | 126,182 |
Distributions | | |
Net Investment Income | | |
Admiral Shares | (1,147) | (852) |
ETF Shares | (6,303) | (4,184) |
Realized Capital Gain | | |
Admiral Shares | — | — |
ETF Shares | — | — |
Total Distributions | (7,450) | (5,036) |
Capital Share Transactions | | |
Admiral Shares | 24,896 | 13,336 |
ETF Shares | 130,701 | 213,757 |
Net Increase (Decrease) from Capital Share Transactions | 155,597 | 227,093 |
Total Increase (Decrease) | 221,934 | 348,239 |
Net Assets | | |
Beginning of Period | 771,183 | 422,944 |
End of Period2 | 993,117 | 771,183 |
1 Interest income from an affiliated company of the fund was $15,000.
2 Net Assets—End of Period includes undistributed net investment income of $7,020,000 and $5,014,000. See accompanying Notes, which are an integral part of the Financial Statements.
32
Energy Index Fund
Financial Highlights
Admiral Shares | | | | |
| | | | |
| | | | Oct. 7, |
| | 20041 to |
| Year Ended August 31, | Aug. 31, |
For a Share Outstanding Throughout Each Period | 2008 | 2007 | 2006 | 2005 |
Net Asset Value, Beginning of Period | $50.36 | $40.36 | $36.29 | $25.98 |
Investment Operations | | | | |
Net Investment Income | .504 | .5012 | .462 | .5882,3 |
Net Realized and Unrealized Gain (Loss) on Investments | 4.246 | 9.944 | 3.96 | 9.833 |
Total from Investment Operations | 4.750 | 10.445 | 4.42 | 10.421 |
Distributions | | | | |
Dividends from Net Investment Income | (.450) | (.445) | (.35) | (.111) |
Distributions from Realized Capital Gains | — | — | — | — |
Total Distributions | (.450) | (.445) | (.35) | (.111) |
Net Asset Value, End of Period | $54.66 | $50.36 | $40.36 | $36.29 |
| | | | |
| | | | |
Total Return4 | 9.42% | 26.03% | 12.27% | 40.27% |
| | | | |
| | | | |
Ratios/Supplemental Data | | | | |
Net Assets, End of Period (Millions) | $148 | $115 | $83 | $60 |
Ratio of Total Expenses to Average Net Assets | 0.25% | 0.26% | 0.28% | 0.28%* |
Ratio of Net Investment Income to Average Net Assets | 0.99% | 1.16% | 1.20% | 1.95%3,* |
Portfolio Turnover Rate5 | 11% | 15% | 21% | 16% |
ETF Shares | | | | |
| | | | |
| | | | Sept. 23, |
| | 20041 to |
| Year Ended August 31, | Aug. 31, |
For a Share Outstanding Throughout Each Period | 2008 | 2007 | 2006 | 2005 |
Net Asset Value, Beginning of Period | $100.92 | $80.90 | $72.72 | $49.24 |
Investment Operations | | | | |
Net Investment Income | 1.059 | 1.0802 | .9662 | 1.1692,6 |
Net Realized and Unrealized Gain (Loss) on Investments | 8.501 | 19.869 | 7.915 | 22.527 |
Total from Investment Operations | 9.560 | 20.949 | 8.881 | 23.696 |
Distributions | | | | |
Dividends from Net Investment Income | (.940) | (.929) | (.701) | (.216) |
Distributions from Realized Capital Gains | — | — | — | — |
Total Distributions | (.940) | (.929) | (.701) | (.216) |
Net Asset Value, End of Period | $109.54 | $100.92 | $80.90 | $72.72 |
| | | | |
| | | | |
Total Return | 9.47% | 26.09% | 12.31% | 48.29% |
| | | | |
| | | | |
Ratios/Supplemental Data | | | | |
Net Assets, End of Period (Millions) | $845 | $656 | $340 | $182 |
Ratio of Total Expenses to Average Net Assets | 0.20% | 0.22% | 0.25% | 0.26%* |
Ratio of Net Investment Income to Average Net Assets | 1.04% | 1.20% | 1.23% | 1.97%6,* |
Portfolio Turnover Rate5 | 11% | 15% | 21% | 16% |
1 Inception.
2 Calculated based on average shares outstanding.
3 Net investment income per share and the ratio of net investment income to average net assets include $.163 and 0.52%, respectively, resulting from a cash payment received in connection with the merger of Chevron Corp. and Unocal Corp. in August 2005.
4 Total returns do not reflect the 2% fee assessed on redemptions of shares held for less than one year.
5 Excludes the value of portfolio securities received or delivered as a result of in-kind purchases or redemptions of the fund’s capital shares, including ETF Creation Units.
6 Net investment income per share and the ratio of net investment income to average net assets include $.324 and 0.52%, respectively, resulting from a cash payment received in connection with the merger of Chevron Corp. and Unocal Corp. in August 2005.
* Annualized.
See accompanying Notes, which are an integral part of the Financial Statements.
33
Energy Index Fund
Notes to Financial Statements
Vanguard Energy Index Fund is registered under the Investment Company Act of 1940 as an open-end investment company, or mutual fund. The fund offers two classes of shares, Admiral Shares and ETF Shares. Admiral Shares are available to any investor who meets the fund’s minimum purchase requirements. ETF Shares were listed for trading on the American Stock Exchange through September 18, 2008, and on the NYSE Arca, Inc., thereafter; they can be purchased and sold through a broker.
A. The following significant accounting policies conform to generally accepted accounting principles for U.S. mutual funds. The fund consistently follows such policies in preparing its financial statements.
1. Security Valuation: Securities are valued as of the close of trading on the New York Stock Exchange (generally 4 p.m., Eastern time) on the valuation date. Equity securities are valued at the latest quoted sales prices or official closing prices taken from the primary market in which each security trades; such securities not traded on the valuation date are valued at the mean of the latest quoted bid and asked prices. Securities for which market quotations are not readily available, or whose values have been materially affected by events occurring before the fund’s pricing time but after the close of the securities’ primary markets, are valued by methods deemed by the board of trustees to represent fair value. Investments in Vanguard Market Liquidity Fund are valued at that fund’s net asset value.
2. Federal Income Taxes: The fund intends to continue to qualify as a regulated investment company and distribute all of its taxable income. Management has analyzed the fund’s tax positions taken on federal income tax returns for all open tax years (tax years ended August 31, 2005–2008), and has concluded that no provision for federal income tax is required in the fund’s financial statements.
3. Distributions: Distributions to shareholders are recorded on the ex-dividend date.
4. Security Lending: The fund may lend its securities to qualified institutional borrowers to earn additional income. Security loans are required to be secured at all times by collateral at least equal to the market value of securities loaned. The fund invests cash collateral received in Vanguard Market Liquidity Fund, and records a liability for the return of the collateral, during the period the securities are on loan. Security lending income represents the income earned on investing cash collateral, less expenses associated with the loan.
5. Other: Dividend income is recorded on the ex-dividend date. Interest income includes income distributions received from Vanguard Market Liquidity Fund and is accrued daily. Security transactions are accounted for on the date securities are bought or sold. Costs used to determine realized gains (losses) on the sale of investment securities are those of the specific securities sold. Fees assessed on redemptions of Admiral Shares are credited to paid-in capital.
Each class of shares has equal rights as to assets and earnings, except that each class separately bears certain class-specific expenses related to maintenance of shareholder accounts (included in Management and Administrative expenses) and shareholder reporting. Marketing and distribution expenses are allocated to each class of shares based on a method approved by the board of trustees. Income, other non-class-specific expenses, and gains and losses on investments are allocated to each class of shares based on its relative net assets.
B. The Vanguard Group furnishes at cost investment advisory, corporate management, administrative, marketing, and distribution services. The costs of such services are allocated to the fund under methods approved by the board of trustees. The fund has committed to provide up to 0.40% of its net assets in capital contributions to Vanguard. At August 31, 2008, the fund had contributed capital of $82,000 to Vanguard (included in Other Assets), representing 0.01% of the fund’s net assets and 0.08% of Vanguard’s capitalization. The fund’s trustees and officers are also directors and officers of Vanguard.
C. Distributions are determined on a tax basis and may differ from net investment income and realized capital gains for financial reporting purposes. Differences may be permanent or temporary. Permanent differences are reclassified among capital accounts in the financial statements to reflect their tax character. Temporary differences arise when certain items of income, expense, gain, or loss are recognized in different periods for financial statement and tax purposes; these differences will reverse at some time in the future. Differences in classification may also result from the treatment of short-term gains as ordinary income for tax purposes.
During the year ended August 31, 2008, the fund realized $62,294,000 of net capital gains resulting from in-kind redemptions—in which shareholders exchanged fund shares for securities held by the fund rather than for cash. Because such gains are not taxable to the fund, and are not distributed to shareholders, they have been reclassified from accumulated net realized losses to paid-in capital.
34
Energy Index Fund
For tax purposes, at August 31, 2008, the fund had $7,538,000 of ordinary income available for distribution. The fund had available realized losses of $12,978,000 to offset future net capital gains of $5,000 through August 31, 2013, $789,000 through August 31, 2014, $461,000 through August 31, 2015, $1,694,000 through August 31, 2016, and $10,029,000 through August 31, 2017.
At August 31, 2008, the cost of investment securities for tax purposes was $805,589,000. Net unrealized appreciation of investment securities for tax purposes was $180,176,000, consisting of unrealized gains of $189,507,000 on securities that had risen in value since their purchase and $9,331,000 in unrealized losses on securities that had fallen in value since their purchase.
D. During the year ended August 31, 2008, the fund purchased $381,785,000 of investment securities and sold $230,272,000 of investment securities, other than temporary cash investments.
E. Capital share transactions for each class of shares were:
| | | Year Ended August 31, |
| | 2008 | | | 2007 |
| Amount | Shares | | Amount | Shares |
| ($000) | (000) | | ($000) | (000) |
Admiral Shares | | | | | |
Issued | 58,522 | 1,041 | | 43,071 | 931 |
Issued in Lieu of Cash Distributions | 1,022 | 18 | | 749 | 17 |
Redeemed1 | (34,648) | (630) | | (30,484) | (721) |
Net Increase (Decrease)—Admiral Shares | 24,896 | 429 | | 13,336 | 227 |
ETF Shares | | | | | |
Issued | 261,143 | 2,311 | | 247,713 | 2,700 |
Issued in Lieu of Cash Distributions | — | — | | — | — |
Redeemed1 | (130,442) | (1,100) | | (33,956) | (400) |
Net Increase (Decrease)—ETF Shares | 130,701 | 1,211 | | 213,757 | 2,300 |
F. In September 2006, the Financial Accounting Standards Board issued Statement of Financial Accounting Standards No. 157 (“FAS 157”), “Fair Value Measurements.” FAS 157 establishes a framework for measuring fair value and expands disclosures about fair value measurements in financial statements.
The various inputs that may be used to determine the value of the fund’s investments are summarized in three broad levels. The inputs or methodologies used for valuing securities are not necessarily an indication of the risk associated with investing in those securities.
Level 1—Quoted prices in active markets for identical securities.
Level 2—Other significant observable inputs (including quoted prices for similar securities, interest rates, prepayment speeds, credit risk, etc.).
Level 3—Significant unobservable inputs (including the fund’s own assumptions used to determine the fair value of investments).
At August 31, 2008, 100% of the fund’s investments were valued based on Level 1 inputs.
1 Net of redemption fees of $241,000 and $96,000 (fund totals).
35
Financials Index Fund
Fund Profile
As of August 31, 2008
Portfolio Characteristics | | |
| | Target | Broad |
| Fund | Index1 | Index2 |
Number of Stocks | 493 | 500 | 2,481 |
Median Market Cap | $24.7B | $24.7B | $32.1B |
Price/Earnings Ratio | 19.0x | 18.9x | 16.8x |
Price/Book Ratio | 1.3x | 1.3x | 2.4x |
Yield3 | | 3.8% | 2.0% |
Admiral Shares | 3.6% | | |
ETF Shares | 3.6% | | |
Return on Equity | 14.9% | 14.9% | 20.1% |
Earnings Growth Rate | 8.7% | 8.9% | 18.4% |
Foreign Holdings | 0.0% | 0.0% | 0.0% |
Turnover Rate | 10% | — | — |
Expense Ratio (8/31/2007)4 | | — | — |
Admiral Shares | 0.26% | | |
ETF Shares | 0.22% | | |
Short-Term Reserves | 0.0% | — | — |
Volatility Measures5 | |
| Fund Versus | Fund Versus |
| Target Index1 | Broad Index2 |
R-Squared | 1.00 | 0.55 |
Beta | 1.00 | 1.18 |
Industry Diversification (% of equity exposure) |
| |
Asset Management & Custody Banks | 8.2% |
Consumer Finance | 3.7 |
Diversified Banks | 8.7 |
Diversified REITs | 1.1 |
Insurance Brokers | 1.9 |
Investment Banking & Brokerage | 9.2 |
Life & Health Insurance | 6.9 |
Multiline Insurance | 4.9 |
Office REITs | 2.1 |
Other Diversified Financial Services | 17.1 |
Property & Casualty Insurance | 9.8 |
Regional Banks | 8.5 |
Reinsurance | 1.4 |
Residential REITs | 1.9 |
Retail REITs | 3.3 |
Specialized Finance | 2.5 |
Specialized REITs | 3.4 |
Thrifts & Mortgage Finance | 2.7 |
Other Financials | 2.7 |
Ten Largest Holdings6 (% of total net assets) |
| |
Bank of America Corp. | 6.6% |
JPMorgan Chase & Co. | 6.1 |
Citigroup, Inc. | 4.6 |
Wells Fargo & Co. | 4.4 |
The Goldman Sachs Group, Inc. | 2.7 |
U.S. Bancorp | 2.6 |
American International Group, Inc. | 2.4 |
Merrill Lynch & Co., Inc. | 2.0 |
American Express Co. | 1.9 |
Morgan Stanley | 1.9 |
Top Ten | 35.2% |
1 MSCI US IMI/Financials.
2 MSCI US IMI/2500.
3 30-day SEC yield for the fund; annualized dividend yield for the indexes. See the Glossary.
4 Expense ratios shown are from the prospectus dated December 10, 2007. Expense ratios for the fiscal year ended August 31, 2008, were 0.25% for Admiral Shares and 0.20% for ETF Shares.
5 For an explanation of R-squared, beta, and other terms used here, see the Glossary.
6 The holdings listed exclude any temporary cash investments and equity index products.
36
Financials Index Fund
Performance Summary
All of the returns in this report represent past performance, which is not a guarantee of future results that may be achieved by the fund. (Current performance may be lower or higher than the performance data cited. For performance data current to the most recent month-end, visit our website at www.vanguard.com/performance.) Note, too, that both investment returns and principal value can fluctuate widely, so an investor’s shares, when sold, could be worth more or less than their original cost. The returns shown do not reflect taxes that a shareholder would pay on fund distributions or on the sale of fund shares.
Cumulative Performance: January 26, 2004–August 31, 2008
Initial Investment of $10,000
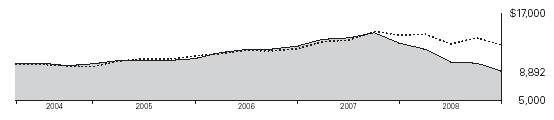
| | |
| | | |
| Average Annual Total Returns | Final Value |
| Periods Ended August 31, 2008 | of a $10,000 |
| One Year | Since Inception1 | Investment |
Financials Index Fund ETF Shares Net Asset Value | –30.30% | –2.52% | $8,892 |
Financials Index Fund ETF Shares Market Price | –30.19 | –2.55 | 8,880 |
MSCI US IMI/2500 | –9.90 | 5.15 | 12,594 |
MSCI US IMI/Financials | –30.30 | –2.37 | 8,956 |
| | | Final Value |
| | | of a $100,000 |
| One Year | Since Inception1 | Investment |
Financials Index Fund Admiral Shares2 | –30.36% | –2.21% | $90,304 |
MSCI US IMI/2500 | –9.90 | 5.83 | 129,586 |
MSCI US IMI/Financials | –30.30 | –2.02 | 91,073 |
1 Performance for the fund and its comparative standards is calculated since the following inception dates: January 26, 2004, for ETF Shares; February 4, 2004, for Admiral Shares.
2 Total returns do not reflect the 2% fee assessed on redemptions of shares held for less than one year.
37
Financials Index Fund
Fiscal-Year Total Returns (%): January 26, 2004–August 31, 2008
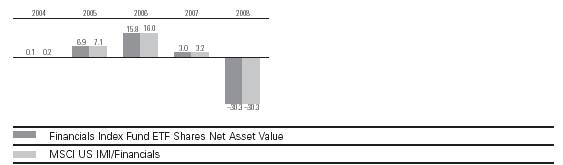
Cumulative Returns: ETF Shares, January 26, 2004–August 31, 2008 |
| | Cumulative |
| | Since |
| One Year | Inception |
Financials Index Fund ETF Shares Market Price | –30.19% | –11.20% |
Financials Index Fund ETF Shares Net Asset Value | –30.30 | –11.08 |
MSCI US IMI/Financials | –30.30 | –10.44 |
Average Annual Total Returns: Periods Ended June 30, 2008
This table presents average annual total returns through the latest calendar quarter—rather than through the end of the fiscal period. Securities and Exchange Commission rules require that we provide this information.
| | | Since |
| Inception Date | One Year | Inception |
ETF Shares | 1/26/2004 | | |
Market Price | | –38.72% | –4.08% |
Net Asset Value | | –38.79 | –4.08 |
Admiral Shares1 | 2/4/2004 | –38.85 | –3.77 |
1 Total returns do not reflect the 2% fee assessed on redemptions of shares held for less than one year. Note: See Financial Highlights tables for dividend and capital gains information.
38
Financials Index Fund
Financial Statements
Statement of Net Assets
As of August 31, 2008
The fund provides a complete list of its holdings four times in each fiscal year, at the quarter-ends. For the second and fourth fiscal quarters, the lists appear in the fund’s semiannual and annual reports to shareholders. For the first and third fiscal quarters, the fund files the lists with the Securities and Exchange Commission on Form N-Q. Shareholders can look up the fund’s Forms N-Q on the SEC’s website at www.sec.gov. Forms N-Q may also be reviewed and copied at the SEC’s Public Reference Room (see the back cover of this report for further information).
| | | Market |
| | | Value• |
| | Shares | ($000) |
Common Stocks (99.9%) | | |
Capital Markets (17.3%) | | |
| The Goldman | | |
| Sachs Group, Inc. | 120,008 | 19,678 |
| Merrill Lynch & Co., Inc. | 526,947 | 14,939 |
| Morgan Stanley | 337,412 | 13,777 |
| Bank of New York | | |
| Mellon Corp. | 387,239 | 13,402 |
| State Street Corp. | 144,390 | 9,771 |
| Charles Schwab Corp. | 329,861 | 7,913 |
| Franklin Resources Corp. | 55,959 | 5,848 |
| Northern Trust Corp. | 67,194 | 5,402 |
| T. Rowe Price Group Inc. | 83,463 | 4,954 |
| Ameriprise Financial, Inc. | 75,199 | 3,380 |
| Invesco, Ltd. | 131,192 | 3,362 |
| Lehman Brothers | | |
| Holdings, Inc. | 200,159 | 3,221 |
| Legg Mason Inc. | 47,108 | 2,098 |
* | TD Ameritrade Holding Corp. | 80,552 | 1,646 |
| Janus Capital Group Inc. | 55,528 | 1,498 |
* | American Capital Ltd. | 68,767 | 1,495 |
| Eaton Vance Corp. | 37,180 | 1,328 |
* | Affiliated Managers | | |
| Group, Inc. | 13,878 | 1,321 |
| SEI Investments Co. | 46,023 | 1,087 |
| Federated Investors, Inc. | 30,910 | 1,034 |
| Raymond James Financial, Inc. | 32,271 | 995 |
| Waddell & Reed Financial, Inc. | 27,815 | 896 |
| Allied Capital Corp. | 60,500 | 892 |
| Apollo Investment Corp. | 47,800 | 846 |
| Jefferies Group, Inc. | 37,663 | 724 |
* | E*TRADE Financial Corp. | 176,017 | 563 |
* | Knight Capital Group, Inc. | | |
| Class A | 30,165 | 520 |
* | Investment Technology | | |
| Group, Inc. | 14,727 | 471 |
| Ares Capital Corp. | 32,804 | 397 |
| Greenhill & Co., Inc. | 5,453 | 360 |
| optionsXpress Holdings Inc. | 14,198 | 328 |
| GFI Group Inc. | 23,876 | 277 |
* | Stifel Financial Corp. | 6,764 | 276 |
*, | ^KBW Inc. | 9,020 | 266 |
* | MF Global Ltd. | 34,482 | 254 |
* | Piper Jaffray Cos., Inc. | 6,375 | 242 |
| SWS Group, Inc. | 8,777 | 177 |
* | FCStone Group, Inc. | 8,387 | 175 |
| Calamos Asset | | |
| Management, Inc. | 7,208 | 154 |
| Capital Southwest Corp. | 1,034 | 139 |
| Cohen & Steers, Inc. | 4,713 | 137 |
* | LaBranche & Co. Inc. | 18,476 | 119 |
* | TradeStation Group, Inc. | 10,305 | 103 |
* | BGC Partners, Inc. | 14,423 | 95 |
| BlackRock Kelso Capital Corp. | 8,361 | 94 |
| Gamco Investors Inc. Class A | 1,896 | 90 |
| MCG Capital Corp. | 24,919 | 87 |
* | Penson Worldwide, Inc. | 4,662 | 79 |
* | FBR Capital Markets Corp. | 8,489 | 41 |
* | Thomas Weisel | | |
| Partners Group, Inc. | 2,857 | 17 |
| | | 126,968 |
Commercial Banks (17.2%) | | |
| Wells Fargo & Co. | 1,062,071 | 32,149 |
| U.S. Bancorp | 589,242 | 18,773 |
| Wachovia Corp. | 731,076 | 11,617 |
| PNC Financial | | |
| Services Group | 117,142 | 8,428 |
| BB&T Corp. | 184,753 | 5,543 |
| SunTrust Banks, Inc. | 112,848 | 4,727 |
| Fifth Third Bancorp | 174,884 | 2,760 |
| Regions Financial Corp. | 234,431 | 2,173 |
| KeyCorp | 164,119 | 1,971 |
| M & T Bank Corp. | 24,169 | 1,724 |
| Comerica, Inc. | 50,849 | 1,428 |
| National City Corp. | 244,569 | 1,233 |
| Marshall & Ilsley Corp. | 78,946 | 1,216 |
| UnionBanCal Corp. | 16,328 | 1,203 |
| Cullen/Frost Bankers, Inc. | 17,849 | 994 |
| Commerce Bancshares, Inc. | 20,636 | 929 |
| Zions Bancorp | 34,367 | 922 |
| Synovus Financial Corp. | 94,767 | 872 |
| Valley National Bancorp | 43,212 | 865 |
| Bank of Hawaii Corp. | 16,332 | 864 |
| Huntington Bancshares Inc. | 117,550 | 860 |
^ | Popular, Inc. | 89,717 | 731 |
| Associated Banc-Corp. | 40,877 | 715 |
| First Horizon National Corp. | 63,088 | 708 |
| City National Corp. | 13,822 | 684 |
| Fulton Financial Corp. | 58,593 | 625 |
* | SVB Financial Group | 11,045 | 619 |
| TCF Financial Corp. | 38,353 | 604 |
| BancorpSouth, Inc. | 25,087 | 577 |
| FirstMerit Corp. | 27,166 | 550 |
| Wilmington Trust Corp. | 22,848 | 536 |
| UMB Financial Corp. | 9,765 | 508 |
| Westamerica Bancorporation | 9,758 | 500 |
| International Bancshares Corp. | 18,531 | 479 |
| Whitney Holdings Corp. | 21,654 | 469 |
�� | Susquehanna Bancshares, Inc. | 28,716 | 459 |
| Prosperity Bancshares, Inc. | 13,418 | 429 |
| Colonial BancGroup, Inc. | 64,978 | 411 |
| Hancock Holding Co. | 7,968 | 391 |
| Old National Bancorp | 22,349 | 389 |
| Webster Financial Corp. | 17,729 | 378 |
| Glacier Bancorp, Inc. | 17,207 | 367 |
| First Midwest Bancorp, Inc. | 16,340 | 366 |
| United Bankshares, Inc. | 13,910 | 358 |
| BOK Financial Corp. | 7,953 | 346 |
| National Penn Bancshares Inc. | 24,084 | 344 |
| F.N.B. Corp. | 29,070 | 340 |
| Trustmark Corp. | 16,407 | 315 |
^ | PrivateBancorp, Inc. | 9,893 | 303 |
* | Signature Bank | 10,035 | 297 |
^ | Umpqua Holdings Corp. | 20,223 | 282 |
^ | Cathay General Bancorp | 14,126 | 273 |
| S & T Bancorp, Inc. | 7,916 | 266 |
| East West Bancorp, Inc. | 21,251 | 265 |
| NBT Bancorp, Inc. | 10,359 | 260 |
| First Financial Bankshares, Inc. | 5,284 | 259 |
| First Commonwealth | | |
| Financial Corp. | 22,136 | 253 |
| First BanCorp Puerto Rico | 26,544 | 251 |
| MB Financial, Inc. | 8,942 | 249 |
| Sterling Bancshares, Inc. | 24,591 | 242 |
* | Investors Bancorp, Inc. | 16,391 | 240 |
| First Citizens BancShares | | |
| Class A | 1,563 | 232 |
| City Holding Co. | 5,539 | 232 |
| Park National Corp. | 3,775 | 231 |
| CVB Financial Corp. | 21,090 | 227 |
| Pacific Capital Bancorp | 14,752 | 217 |
| Community Bank System, Inc. | 9,517 | 215 |
| Chemical Financial Corp. | 7,272 | 210 |
| UCBH Holdings, Inc. | 35,199 | 206 |
| PacWest Bancorp | 8,927 | 202 |
| IBERIABANK Corp. | 3,670 | 199 |
| WesBanco, Inc. | 7,589 | 188 |
| Wintrust Financial Corp. | 7,879 | 183 |
| Sterling Financial Corp. | 17,437 | 178 |
| The South Financial | | |
| Group, Inc. | 24,573 | 167 |
| Boston Private Financial | | |
| Holdings, Inc. | 18,308 | 164 |
^ | Frontier Financial Corp. | 14,137 | 158 |
| Community Trust Bancorp Inc. | 4,554 | 153 |
| United Community Banks, Inc. | 12,890 | 152 |
| Harleysville National Corp. | 10,031 | 147 |
| Independent Bank Corp. (MA) | 5,235 | 145 |
| First Financial Corp. (IN) | 3,377 | 140 |
| First Financial Bancorp | 10,601 | 138 |
* | Texas Capital Bancshares, Inc. | 8,584 | 134 |
| TowneBank | 6,846 | 134 |
^ | First Busey Corp. | 9,093 | 129 |
| Renasant Corp. | 6,764 | 128 |
| Oriental Financial Group Inc. | 7,270 | 126 |
* | Pinnacle Financial | | |
| Partners, Inc. | 4,926 | 125 |
| Citizens Banking Corp. | 31,827 | 117 |
| Central Pacific Financial Co. | 9,659 | 115 |
| S.Y. Bancorp, Inc. | 3,940 | 111 |
| Simmons First National Corp. | 3,795 | 108 |
| Univest Corp. of Pennsylvania | 3,700 | 107 |
| First Merchants Corp. | 5,448 | 105 |
| First Community | | |
| Bancshares, Inc. | 3,222 | 103 |
| BancFirst Corp. | 2,116 | 102 |
| Tompkins Trustco, Inc. | 2,229 | 101 |
* | Guaranty Bancorp | 17,821 | 100 |
| Union Bankshares Corp. | 4,333 | 98 |
| Sandy Spring Bancorp, Inc. | 5,458 | 98 |
| First Source Corp. | 4,490 | 97 |
| Bank of the Ozarks, Inc. | 4,287 | 96 |
| Washington Trust Bancorp, Inc. | 3,805 | 93 |
| Republic Bancorp, Inc. Class A | 3,015 | 89 |
| Nara Bancorp, Inc. | 7,810 | 85 |
*, | ^Western Alliance Bancorp | 6,541 | 85 |
39
Financials Index Fund
| | | Market |
| | | Value• |
| | Shares | ($000) |
^ | Capital City Bank Group, Inc. | 3,499 | 85 |
| Columbia Banking System, Inc. | 6,003 | 84 |
| Heartland Financial USA, Inc. | 3,864 | 83 |
* | Northfield Bancorp, Inc. | 6,849 | 83 |
^ | Provident Bankshares Corp. | 10,513 | 81 |
| Wilshire Bancorp Inc. | 5,873 | 80 |
| Capitol Bancorp Ltd. | 4,899 | 75 |
| TriCo Bancshares | 4,578 | 75 |
| CoBiz Inc. | 6,203 | 66 |
| Hanmi Financial Corp. | 12,909 | 66 |
| Amcore Financial, Inc. | 6,995 | 62 |
| Old Second Bancorp, Inc. | 3,611 | 61 |
| Cascade Bancorp | 7,474 | 60 |
| City Bank Lynnwood (WA) | 4,515 | 55 |
| West Coast Bancorp | 4,883 | 54 |
| Independent Bank Corp. (MI) | 6,842 | 51 |
^ | Seacoast Banking | | |
| Corp. of Florida | 4,768 | 42 |
| Integra Bank Corp. | 6,433 | 41 |
| Banner Corp. | 3,679 | 39 |
| Midwest Banc Holdings, Inc. | 6,854 | 38 |
| First State Bancorporation | 6,621 | 38 |
* | Virginia Commerce | | |
| Bancorp, Inc. | 6,726 | 35 |
| Great Southern Bancorp, Inc. | 2,861 | 30 |
| W Holding Co., Inc. | 38,341 | 24 |
| Taylor Capital Group, Inc. | 1,947 | 21 |
| | | 125,988 |
Consumer Finance (3.7%) | | |
| American Express Co. | 352,991 | 14,007 |
| Capital One Financial Corp. | 127,069 | 5,609 |
* | SLM Corp. | 157,691 | 2,604 |
| Discover Financial Services | 145,913 | 2,400 |
| Cash America | | |
| International Inc. | 9,884 | 409 |
*, | ^AmeriCredit Corp. | 38,637 | 409 |
* | World Acceptance Corp. | 5,186 | 202 |
* | EZCORP, Inc. | 11,562 | 180 |
* | First Cash Financial | | |
| Services, Inc. | 9,308 | 173 |
| Student Loan Corp. | 1,352 | 159 |
* | Dollar Financial Corp. | 8,108 | 148 |
| Nelnet, Inc. | 6,482 | 102 |
| The First Marblehead Corp. | 21,456 | 88 |
| Advance America, Cash | | |
| Advance Centers, Inc. | 15,414 | 76 |
| Advanta Corp. Class B | 9,601 | 73 |
* | Credit Acceptance Corp. | 3,525 | 59 |
* | Cardtronics Inc. | 4,485 | 35 |
* | CompuCredit Corp. | 5,341 | 28 |
| Advanta Corp. Class A | 2,726 | 18 |
| | | 26,779 |
Diversified Financial Services (20.2%) | |
| Bank of America Corp. | 1,543,381 | 48,061 |
| JPMorgan Chase & Co. | 1,169,041 | 44,996 |
| Citigroup, Inc. | 1,777,246 | 33,750 |
| CME Group, Inc. | 20,514 | 6,880 | |
| Leucadia National Corp. | 63,064 | 2,919 | |
| Moody’s Corp. | 70,402 | 2,863 | |
| NYSE Euronext | 44,766 | 1,817 | |
* | IntercontinentalExchange Inc. | 19,056 | 1,677 | |
* | Nasdaq Stock Market Inc. | 47,373 | 1,549 | |
| CIT Group Inc. | 95,492 | 985 | |
* | MSCI, Inc.-Class A Shares | 23,710 | 708 | |
* | Interactive Brokers Group, Inc. | 13,932 | 380 | |
* | PHH Corp. | 18,257 | 278 | |
* | PICO Holdings, Inc. | 5,761 | 274 | |
* | Portfolio Recovery | | |
| Associates, Inc. | 5,155 | 219 |
| Financial Federal Corp. | 8,283 | 207 |
* | NewStar Financial, Inc. | 11,658 | 103 |
* | MarketAxess Holdings, Inc. | 9,888 | 99 |
| Compass Diversified Trust | 7,381 | 95 |
| Resource America, Inc. | 5,331 | 66 |
| Life Partners Holdings | 1,981 | 57 |
* | Asset Acceptance Capital Corp. | 5,031 | 55 | |
* | Primus Guaranty, Ltd. | 8,369 | 42 |
| ASTA Funding, Inc. | 3,418 | 28 |
| | | 148,108 |
Insurance (24.8%) | | |
| American International | | |
| Group, Inc. | 811,407 | 17,437 |
| MetLife, Inc. | 240,482 | 13,034 |
* | Berkshire Hathaway Inc. | | |
| Class B | 3,339 | 13,029 |
| Prudential Financial, Inc. | 146,899 | 10,828 |
| AFLAC Inc. | 160,902 | 9,123 |
| The Travelers Cos., Inc. | 204,649 | 9,037 |
| The Allstate Corp. | 177,104 | 7,993 |
| The Hartford Financial | | |
| Services Group Inc. | 106,545 | 6,721 |
| The Chubb Corp. | 123,679 | 5,938 |
* | Ace Ltd. | 112,723 | 5,930 |
| Marsh & McLennan Cos., Inc. | 173,096 | 5,527 |
| Loews Corp. | 110,714 | 4,808 |
| Lincoln National Corp. | 87,688 | 4,451 |
| Aon Corp. | 90,946 | 4,319 |
| Progressive Corp. of Ohio | 218,041 | 4,027 |
| The Principal Financial | | |
| Group, Inc. | 87,394 | 4,002 |
| Unum Group | 117,430 | 2,984 |
| Genworth Financial Inc. | 146,390 | 2,350 |
| XL Capital Ltd. Class A | 102,779 | 2,066 |
| Safeco Corp. | 30,369 | 2,053 |
| Assurant, Inc. | 33,899 | 1,981 |
| Torchmark Corp. | 30,345 | 1,813 |
| Everest Re Group, Ltd. | 20,963 | 1,722 |
| Willis Group Holdings Ltd. | 47,718 | 1,642 |
| Axis Capital Holdings Ltd. | 47,803 | 1,598 |
| Cincinnati Financial Corp. | 52,396 | 1,553 |
| White Mountains | | |
| Insurance Group Inc. | 2,754 | 1,302 |
| PartnerRe Ltd. | 18,294 | 1,261 |
* | Philadelphia Consolidated | | |
| Holding Corp. | 20,721 | 1,238 |
| | | | | |
| W.R. Berkley Corp. | 51,649 | 1,217 |
* | Markel Corp. | 3,198 | 1,183 |
^ | MBIA, Inc. | 68,162 | 1,106 |
* | Arch Capital Group Ltd. | 15,105 | 1,054 |
| RenaissanceRe Holdings Ltd. | 20,684 | 1,049 |
| HCC Insurance Holdings, Inc. | 38,833 | 978 |
| Fidelity National | | |
| Financial, Inc. Class A | 69,318 | 972 |
| The Hanover Insurance | | |
| Group Inc. | 17,544 | 829 |
| Arthur J. Gallagher & Co. | 31,098 | 823 |
| Brown & Brown, Inc. | 40,369 | 819 |
| Protective Life Corp. | 22,528 | 817 |
| StanCorp Financial Group, Inc. | 16,567 | 812 |
| Old Republic | | |
| International Corp. | 74,029 | 809 |
| Nationwide Financial | | |
| Services, Inc. | 15,554 | 800 |
| Aspen Insurance | | |
| Holdings Ltd. | 28,254 | 766 |
| American Financial Group, Inc. | 24,974 | 712 | |
| First American Corp. | 26,338 | 666 | |
^ | Ambac Financial Group, Inc. | 91,943 | 658 | |
| Platinum Underwriters | | | |
| Holdings, Ltd. | 16,629 | 601 | |
* | Alleghany Corp. | 1,829 | 585 | |
| IPC Holdings Ltd. | 18,095 | 573 | |
| Endurance Specialty | | | |
| Holdings Ltd. | 17,324 | 565 | |
* | Conseco, Inc. | 62,819 | 563 | |
* | ProAssurance Corp. | 10,375 | 559 | |
| Transatlantic Holdings, Inc. | 9,009 | 541 | |
| Hilb, Rogal and Hamilton Co. | 11,848 | 540 | |
| Erie Indemnity Co. Class A | 11,606 | 537 | |
| Allied World Assurance | | | |
| Holdings, Ltd. | 13,223 | 511 | |
| Reinsurance Group of | | | |
| America, Inc. | 10,539 | 508 | |
| Montpelier Re Holdings Ltd. | 31,145 | 504 | |
| Zenith National | | | |
| Insurance Corp. | 12,511 | 478 | |
| Mercury General Corp. | 9,222 | 470 | |
| The Phoenix Cos., Inc. | 36,655 | 437 | |
| Selective Insurance Group | 17,955 | 433 | |
| Unitrin, Inc. | 16,341 | 417 | |
| Max Re Capital Ltd. | 15,342 | 399 | |
* | Argo Group International | | | |
| Holdings | 10,327 | 388 | |
| Odyssey Re Holdings Corp. | 10,068 | 380 | |
| Delphi Financial Group, Inc. | 14,018 | 376 | |
| Assured Guaranty Ltd. | 23,069 | 375 | |
| R.L.I. Corp. | 6,317 | 353 | |
* | Enstar Group Ltd. | 2,719 | 319 | |
| Employers Holdings, Inc. | 16,774 | 291 | |
| Infinity Property & | | | |
| Casualty Corp. | 5,508 | 256 | |
| National Financial | | | |
| Partners Corp. | 12,605 | 254 | |
* | Navigators Group, Inc. | 4,574 | 240 | |
| United Fire & Casualty Co. | 7,289 | 217 |
| Horace Mann Educators Corp. | 13,619 | 203 |
| Safety Insurance Group, Inc. | 4,645 | 200 |
| National Western Life | | |
| Insurance Co. Class A | 813 | 195 |
| Harleysville Group, Inc. | 5,150 | 187 |
| OneBeacon Insurance | | |
| Group Ltd. | 8,093 | 173 |
* | Hilltop Holdings Inc. | 15,099 | 157 |
| American Equity Investment | | |
| Life Holding Co. | 16,827 | 155 |
* | FPIC Insurance Group, Inc. | 2,949 | 152 |
| State Auto Financial Corp. | 4,784 | 148 |
| Tower Group, Inc. | 6,999 | 147 |
| Flagstone Reinsurance | | |
| Holdings Ltd. | 11,432 | 141 |
| Presidential Life Corp. | 7,571 | 136 |
* | Greenlight Capital Re. Ltd. | 6,561 | 134 |
| Castlepoint Holdings Ltd. | 11,656 | 132 |
| American Physicians | | |
| Capital, Inc. | 3,105 | 131 |
| Amtrust Financial Services Inc. | 8,995 | 126 |
| FBL Financial Group, Inc. | | |
| Class A | 4,894 | 112 |
* | United America | | |
| Indemnity, Ltd. | 7,224 | 110 |
| Stewart Information | | |
| Services Corp. | 5,645 | 106 |
* | CNA Surety Corp. | 5,873 | 94 |
40
Financials Index Fund
| | | Market |
| | | Value• |
| | Shares | ($000) |
| LandAmerica Financial | | |
| Group, Inc. | 5,061 | 87 |
| Kansas City Life Insurance Co. | 1,651 | 79 |
* | Darwin Professional | | |
| Underwriters, Inc. | 2,331 | 74 |
* | eHealth, Inc. | 4,944 | 73 |
| Donegal Group Inc. Class A | 4,035 | 73 |
| Baldwin & Lyons, Inc. Class B | 2,602 | 55 |
| National Interstate Corp. | 1,883 | 37 |
* | First Acceptance Corp. | 6,025 | 20 |
| | | 181,944 |
Real Estate Investment Trusts (REITs) (13.5%) | |
| Simon Property | | |
| Group, Inc. REIT | 76,090 | 7,219 |
| Vornado Realty Trust REIT | 46,748 | 4,650 |
| Boston Properties, Inc. REIT | 40,462 | 4,146 |
| Equity Residential REIT | 91,257 | 3,851 |
| ProLogis REIT | 88,749 | 3,822 |
| Public Storage, Inc. REIT | 42,855 | 3,785 |
| HCP, Inc. REIT | 84,108 | 3,046 |
| Plum Creek Timber Co. Inc. | | |
| REIT | 57,857 | 2,871 |
| Kimco Realty Corp. REIT | 77,016 | 2,860 |
| Annaly Mortgage | | |
| Management Inc. REIT | 178,753 | 2,674 |
| Avalonbay | | |
| Communities, Inc. REIT | 26,192 | 2,619 |
| Host Hotels & | | |
| Resorts Inc. REIT | 168,129 | 2,404 |
| Ventas, Inc. REIT | 46,768 | 2,124 |
| General Growth | | |
| Properties Inc. REIT | 81,577 | 2,115 |
| SL Green Realty Corp. REIT | 19,730 | 1,697 |
| Health Care Inc. REIT | 30,431 | 1,579 |
| The Macerich Co. REIT | 24,447 | 1,514 |
| Federal Realty | | |
| Investment Trust REIT | 19,898 | 1,510 |
| AMB Property Corp. REIT | 33,118 | 1,503 |
| Regency Centers Corp. REIT | 23,581 | 1,461 |
| Developers Diversified | | |
| Realty Corp. REIT | 40,392 | 1,354 |
| Duke Realty Corp. REIT | 49,444 | 1,238 |
| Rayonier Inc. REIT | 26,549 | 1,194 |
| Liberty Property Trust REIT | 31,437 | 1,187 |
| Alexandria Real Estate | | |
| Equities, Inc. REIT | 10,887 | 1,173 |
| Nationwide Health | | |
| Properties, Inc. REIT | 32,707 | 1,126 |
| UDR, Inc. REIT | 44,273 | 1,097 |
| Apartment Investment & | | |
| Management Co. | | |
| Class A REIT | 30,292 | 1,074 |
| Digital Realty Trust, Inc. REIT | 22,887 | 1,050 |
| Essex Property Trust, Inc. REIT | 8,700 | 1,021 |
| Mack-Cali Realty Corp. REIT | 22,167 | 896 |
^ | Realty Income Corp. REIT | 34,277 | 880 |
| Camden Property Trust REIT | 17,828 | 870 |
| Taubman Co. REIT | 17,793 | 864 |
| Weingarten Realty | | |
| Investors REIT | 25,480 | 842 |
| BRE Properties Inc. | | |
| Class A REIT | 17,293 | 834 |
| Senior Housing | | |
| Properties Trust REIT | 37,806 | 820 |
| CapitalSource Inc. REIT | 62,908 | 791 |
| Douglas Emmett, Inc. REIT | 32,452 | 768 |
| Hospitality Properties | | |
| Trust REIT | 31,677 | 718 |
| Highwood Properties, | | |
| Inc. REIT | 19,297 | 700 |
| BioMed Realty Trust, Inc. REIT | 24,134 | 646 |
| Corporate Office Properties | | |
| Trust, Inc. REIT | 16,036 | 627 |
| Potlatch Corp. REIT | 13,306 | 621 |
| Entertainment Properties | | |
| Trust REIT | 11,115 | 603 |
| Washington REIT | 16,673 | 589 |
| HRPT Properties Trust REIT | 76,119 | 577 |
| Home Properties, Inc. REIT | 10,685 | 564 |
| National Retail | | |
| Properties REIT | 24,512 | 556 |
| Kilroy Realty Corp. REIT | 11,102 | 556 |
| Brandywine Realty Trust REIT | 29,381 | 511 |
| Healthcare Realty | | |
| Trust Inc. REIT | 17,162 | 492 |
| Post Properties, Inc. REIT | 14,816 | 466 |
| CBL & Associates | | |
| Properties, Inc. REIT | 21,068 | 457 |
| Mid-America Apartment | | |
| Communities, Inc. REIT | 8,700 | 436 |
| Tanger Factory Outlet | | |
| Centers, Inc. REIT | 10,623 | 426 |
| DCT Industrial Trust Inc. REIT | 56,843 | 424 |
| Omega Healthcare | | |
| Investors, Inc. REIT | 23,280 | 415 |
| American Campus | | |
| Communities, Inc. REIT | 13,472 | 409 |
| Extra Space | | |
| Storage Inc. REIT | 25,449 | 401 |
| Equity Lifestyle | | |
| Properties, Inc. REIT | 7,872 | 391 |
| MFA Mortgage | | |
| Investments, Inc. REIT | 57,307 | 390 |
| EastGroup | | |
| Properties, Inc. REIT | 8,398 | 373 |
| Cousins Properties, Inc. REIT | 14,925 | 373 |
| LaSalle Hotel Properties REIT | 13,591 | 354 |
^ | First Industrial | | |
| Realty Trust REIT | 14,720 | 347 |
| Lexington Realty Trust REIT | 21,212 | 316 |
| Inland Real Estate Corp. REIT | 19,935 | 300 |
| DiamondRock | | |
| Hospitality Co. REIT | 32,110 | 296 |
| Colonial Properties Trust REIT | 15,190 | 287 |
| Equity One, Inc. REIT | 13,669 | 287 |
| Sovran Self Storage, Inc. REIT | 7,347 | 283 |
| PS Business Parks, Inc. REIT | 5,235 | 282 |
| National Health Investors REIT | 8,459 | 277 |
| Pennsylvania REIT | 13,260 | 263 |
* | Alexander’s, Inc. REIT | 679 | 261 |
| Franklin Street | | |
| Properties Corp. REIT | 20,200 | 257 |
| iStar Financial Inc. REIT | 44,957 | 251 |
| Acadia Realty Trust REIT | 10,340 | 246 |
| Sunstone Hotel | | |
| Investors, Inc. REIT | 17,278 | 245 |
| Medical Properties | | |
| Trust Inc. REIT | 21,713 | 240 |
| Strategic Hotels and | | |
| Resorts, Inc. REIT | 25,219 | 233 |
| Saul Centers, Inc. REIT | 4,851 | 222 |
| Capstead Mortgage | | |
| Corp. REIT | 18,179 | 213 |
| DuPont Fabros | | |
| Technology Inc. | 12,014 | 211 |
| U-Store-It Trust REIT | 16,585 | 207 |
| Investors Real Estate | | |
| Trust REIT | 19,105 | 197 |
| Cedar Shopping | | |
| Centers, Inc. REIT | 14,874 | 195 |
| Parkway Properties Inc. REIT | 5,109 | 184 |
| Anworth Mortgage | | |
| Asset Corp. REIT | 27,681 | 181 |
| LTC Properties, Inc. REIT | 6,578 | 177 |
| Ashford Hospitality Trust REIT | 38,519 | 175 |
| FelCor Lodging | | |
| Trust, Inc. REIT | 21,141 | 169 |
^ | Redwood Trust, Inc. REIT | 8,682 | 163 |
| Maguire Properties, Inc. REIT | 12,770 | 145 |
| Ramco-Gershenson | | |
| Properties Trust REIT | 6,225 | 144 |
| NorthStar Realty | | |
| Finance Corp. REIT | 19,877 | 142 |
| Universal Health | | |
| Realty Income REIT | 3,763 | 138 |
| First Potomac REIT | 8,188 | 136 |
| Getty Realty | | |
| Holding Corp. REIT | 6,194 | 130 |
| Glimcher Realty Trust REIT | 12,594 | 127 |
| Newcastle Investment | | |
| Corp. REIT | 17,953 | 125 |
| Anthracite Capital Inc. REIT | 21,387 | 120 |
| CapLease, Inc. REIT | 14,300 | 118 |
| RAIT Financial Trust REIT | 19,436 | 115 |
| Kite Realty Group Trust REIT | 9,294 | 113 |
| Sun Communities, Inc. REIT | 5,613 | 108 |
| Education Realty | | |
| Trust, Inc. REIT | 9,445 | 104 |
| Gramercy Capital Corp. REIT | 14,567 | 98 |
| Urstadt Biddle Properties | | |
| Class A REIT | 5,675 | 97 |
| Friedman, Billings, | | |
| Ramsey Group, Inc. REIT | 46,337 | 85 |
| Chimera Investment Corp. | 11,543 | 73 |
^ | Arbor Realty Trust, Inc. REIT | 6,537 | 58 |
| Capital Trust Class A REIT | 4,633 | 56 |
| JER Investors Trust Inc. REIT | 8,054 | 46 |
^ | Thornburg Mortgage, | | |
| Inc. REIT | 73,604 | 32 |
| Urstadt Biddle Properties REIT | 1,078 | 19 |
| Crystal River Capital Inc. REIT | 8,025 | 19 |
| | | 98,917 |
Real Estate Management & Development (0.5%) | |
^ | The St. Joe Co. | 31,019 | 1,156 |
* | CB Richard Ellis Group, Inc. | 61,466 | 803 |
| Forest City Enterprise Class A | 21,125 | 608 |
| Jones Lang LaSalle Inc. | 10,764 | 536 |
* | Forestar Real | | |
| Estate Group, Inc. | 11,937 | 241 |
* | Tejon Ranch Co. | 4,309 | 147 |
* | Avatar Holding, Inc. | 1,830 | 58 |
| Grubb & Ellis Co. | 13,765 | 48 |
* | Meruelo Maddux | | |
| Properties Inc. | 13,853 | 19 |
* | FX Real Estate and | | |
| Entertainment Inc. | 3,139 | 4 |
| | | 3,620 |
Thrifts & Mortgage Finance (2.7%) | |
| Hudson City Bancorp, Inc. | 157,750 | 2,909 |
| Fannie Mae | 364,539 | 2,493 |
| People’s United | | |
| Financial Inc. | 116,502 | 2,088 |
| New York Community | | |
| Bancorp, Inc. | 109,670 | 1,808 |
41
Financials Index Fund
| | | Market |
| | | Value• |
| | Shares | ($000) |
| Sovereign Bancorp, Inc. | 183,586 | 1,773 |
^ | Washington Mutual, Inc. | 304,404 | 1,233 |
| Freddie Mac | 218,001 | 983 |
| Astoria Financial Corp. | 27,440 | 600 |
| First Niagara Financial | | |
| Group, Inc. | 35,373 | 529 |
| Washington Federal Inc. | 29,496 | 508 |
| TFS Financial Corp. | 39,310 | 480 |
| NewAlliance Bancshares, Inc. | 32,963 | 452 |
| MGIC Investment Corp. | 42,425 | 357 |
| Capitol Federal Financial | 7,522 | 329 |
| Provident Financial | | |
| Services Inc. | 18,051 | 275 |
| TrustCo Bank NY | 25,516 | 250 |
| Brookline Bancorp, Inc. | 19,662 | 202 |
| Bank Mutual Corp. | 16,015 | 193 |
| Northwest Bancorp, Inc. | 6,517 | 181 |
| Provident New York | | |
| Bancorp, Inc. | 12,126 | 168 |
| Dime Community Bancshares | 8,002 | 131 |
* | Beneficial Mutual | | |
| Bancorp, Inc. | 11,149 | 129 |
| WSFS Financial Corp. | 2,111 | 113 |
| Radian Group, Inc. | 26,706 | 102 |
| BankFinancial Corp. | 6,701 | 100 |
| Kearny Financial Corp. | 7,147 | 99 |
| The PMI Group Inc. | 27,010 | 97 |
* | Ocwen Financial Corp. | 12,546 | 87 |
| First Financial Holdings, Inc. | 3,731 | 82 |
* | Oritani Financial Corp. | 4,742 | 80 |
* | First Federal Financial Corp. | 4,654 | 73 |
| ViewPoint Financial Group | 3,791 | 62 |
* | Guaranty Financial Group, Inc. | 11,731 | 56 |
| Flagstar Bancorp, Inc. | 11,897 | 53 |
| First Place Financial Corp. | 4,800 | 49 |
| Roma Financial Corp. | 3,172 | 48 |
| Anchor Bancorp | | |
| Wisconsin Inc. | 5,921 | 45 |
^ | Corus Bankshares Inc. | 10,834 | 43 |
* | Waterstone Financial, Inc. | 3,114 | 31 |
| United Community | | |
| Financial Corp. | 8,245 | 30 |
| TierOne Corp. | 4,952 | 28 |
| BankAtlantic Bancorp, Inc. | | |
| Class A | 14,309 | 27 |
^ | Downey Financial Corp. | 6,751 | 15 |
| | | 19,391 |
Total Common Stocks | | |
(Cost $926,833) | | 731,715 |
Temporary Cash Investment (0.5%) | |
1,2 | Vanguard Market Liquidity | | |
| Fund, 2.389% | | |
| (Cost $3,726) | 3,725,903 | 3,726 |
Total Investments (100.4%) | | |
(Cost $930,559) | | 735,441 |
Other Assets and Liabilities (–0.4%) | |
Other Assets | | 12,987 |
Liabilities2 | | (15,716) |
| | | (2,729) |
Net Assets (100%) | | 732,712 |
| | |
| | |
| | |
| | |
At August 31, 2008, net assets consisted of: |
| Amount |
| ($000) |
Paid-in Capital | 937,849 |
Undistributed Net Investment Income | 3,901 |
Accumulated Net Realized Losses | (13,920) |
Unrealized Appreciation (Depreciation) | (195,118) |
Net Assets | 732,712 |
| |
| |
Admiral Shares—Net Assets | |
Applicable to 3,994,625 outstanding | |
$.001 par value shares of beneficial | |
interest (unlimited authorization) | 81,427 |
Net Asset Value Per Share— | |
Admiral Shares | $20.38 |
| |
| |
ETF Shares—Net Assets | |
Applicable to 16,015,863 outstanding | |
$.001 par value shares of beneficial | |
interest (unlimited authorization) | 651,285 |
Net Asset Value Per Share— | |
ETF Shares | $40.66 |
• See Note A in Notes to Financial Statements.
* Non-income-producing security.
^ Part of security position is on loan to broker-dealers. The total value of securities on loan is $3,558,000.
1 Affiliated money market fund available only to Vanguard funds and certain trusts and accounts managed by Vanguard. Rate shown is the 7-day yield.
2 Includes $3,726,000 of collateral received for securities on loan. REIT—Real Estate Investment Trust.
See accompanying Notes, which are an integral part of the Financial Statements.
42
Financials Index Fund
Statement of Operations
| Year Ended |
| August 31, 2008 |
| ($000) |
Investment Income | |
Income | |
Dividends | 16,726 |
Interest1 | 16 |
Security Lending | 11 |
Total Income | 16,753 |
Expenses | |
The Vanguard Group—Note B | |
Investment Advisory Services | 44 |
Management and Administrative | |
Admiral Shares | 85 |
ETF Shares | 627 |
Marketing and Distribution | |
Admiral Shares | 9 |
ETF Shares | 108 |
Custodian Fees | 97 |
Auditing Fees | 24 |
Shareholders’ Reports | |
Admiral Shares | 1 |
ETF Shares | 23 |
Trustees’ Fees and Expenses | 1 |
Total Expenses | 1,019 |
Net Investment Income | 15,734 |
Realized Net Gain (Loss) on | |
Investment Securities Sold | (5,892) |
Change in Unrealized Appreciation | |
(Depreciation) of Investment Securities | (183,247) |
Net Increase (Decrease) in Net Assets | |
Resulting from Operations | (173,405) |
Statement of Changes in Net Assets
| Year Ended August 31, |
| 2008 | 2007 |
| ($000) | ($000) |
Increase (Decrease) in Net Assets | | |
Operations | | |
Net Investment Income | 15,734 | 6,347 |
Realized Net Gain (Loss) | (5,892) | 7,622 |
Change in Unrealized Appreciation (Depreciation) | (183,247) | (20,258) |
Net Increase (Decrease) in Net Assets Resulting from Operations | (173,405) | (6,289) |
Distributions | | |
Net Investment Income | | |
Admiral Shares | (1,097) | (272) |
ETF Shares | (12,437) | (5,087) |
Realized Capital Gain | | |
Admiral Shares | — | — |
ETF Shares | — | — |
Total Distributions | (13,534) | (5,359) |
Capital Share Transactions | | |
Admiral Shares | 78,669 | 11,614 |
ETF Shares | 540,089 | 168,244 |
Net Increase (Decrease) from Capital Share Transactions | 618,758 | 179,858 |
Total Increase (Decrease) | 431,819 | 168,210 |
Net Assets | | |
Beginning of Period | 300,893 | 132,683 |
End of Period2 | 732,712 | 300,893 |
1 Interest income from an affiliated company of the fund was $16,000.
2 Net Assets—End of Period includes undistributed net investment income of $3,901,000 and $1,701,000. See accompanying Notes, which are an integral part of the Financial Statements.
43
Financials Index Fund
Financial Highlights
Admiral Shares | | | | | |
| | | | | |
| | | | | Feb. 4, |
| | | 20041 to |
| Year Ended August 31, | Aug. 31, |
For a Share Outstanding Throughout Each Period | 2008 | 2007 | 2006 | 2005 | 2004 |
Net Asset Value, Beginning of Period | $30.10 | $29.86 | $26.36 | $25.35 | $24.90 |
Investment Operations | | | | | |
Net Investment Income | .7002 | .7702 | .7162 | .6602 | .310 |
Net Realized and Unrealized Gain | | | | | |
(Loss) on Investments | (9.699) | .145 | 3.392 | 1.086 | .140 |
Total from Investment Operations | (8.999) | .915 | 4.108 | 1.746 | .450 |
Distributions | | | | | |
Dividends from Net Investment Income | (.721) | (.675) | (.608) | (.736) | — |
Distributions from Realized Capital Gains | — | — | — | — | — |
Total Distributions | (.721) | (.675) | (.608) | (.736) | — |
Net Asset Value, End of Period | $20.38 | $30.10 | $29.86 | $26.36 | $25.35 |
| | | | | |
| | | | | |
Total Return3 | –30.36% | 2.95% | 15.76% | 6.88% | 1.81% |
| | | | | |
| | | | | |
Ratios/Supplemental Data | | | | | |
Net Assets, End of Period (Millions) | $81 | $19 | $8 | $3 | $1 |
Ratio of Total Expenses to Average Net Assets | 0.25% | 0.26% | 0.28% | 0.28% | 0.28%4 |
Ratio of Net Investment Income to | | | | | |
Average Net Assets | 3.06% | 2.37% | 2.49% | 2.59% | 2.38%4 |
Portfolio Turnover Rate5 | 10% | 12% | 6% | 6% | 9% |
ETF Shares | | | | | |
| | | | | |
| | | | | Jan. 26, |
| | | 20041 to |
| Year Ended August 31, | Aug. 31, |
For a Share Outstanding Throughout Each Period | 2008 | 2007 | 2006 | 2005 | 2004 |
Net Asset Value, Beginning of Period | $60.04 | $59.57 | $52.57 | $50.57 | $50.51 |
Investment Operations | | | | | |
Net Investment Income | 1.4492 | 1.5572 | 1.4302 | 1.3162 | .700 |
Net Realized and Unrealized Gain | | | | | |
(Loss) on Investments | (19.368) | .282 | 6.800 | 2.160 | (.640) |
Total from Investment Operations | (17.919) | 1.839 | 8.230 | 3.476 | .060 |
Distributions | | | | | |
Dividends from Net Investment Income | (1.461) | (1.369) | (1.230) | (1.476) | — |
Distributions from Realized Capital Gains | — | — | — | — | — |
Total Distributions | (1.461) | (1.369) | (1.230) | (1.476) | — |
Net Asset Value, End of Period | $40.66 | $60.04 | $59.57 | $52.57 | $50.57 |
| | | | | |
| | | | | |
Total Return | –30.30% | 2.97% | 15.82% | 6.85% | 0.12% |
| | | | | |
| | | | | |
Ratios/Supplemental Data | | | | | |
Net Assets, End of Period (Millions) | $651 | $282 | $125 | $53 | $20 |
Ratio of Total Expenses to Average Net Assets | 0.20% | 0.22% | 0.25% | 0.26% | 0.28%4 |
Ratio of Net Investment Income to | | | | | |
Average Net Assets | 3.11% | 2.41% | 2.52% | 2.61% | 2.38%4 |
Portfolio Turnover Rate5 | 10% | 12% | 6% | 6% | 9% |
1 Inception.
2 Calculated based on average shares outstanding.
3 Total returns do not reflect the 2% fee assessed on redemptions of shares held for less than one year.
4 Annualized.
5 Excludes the value of portfolio securities received or delivered as a result of in-kind purchases or redemptions of the fund’s capital shares, including ETF Creation Units. See accompanying Notes, which are an integral part of the Financial Statements.
44
Financials Index Fund
Notes to Financial Statements
Vanguard Financials Index Fund is registered under the Investment Company Act of 1940 as an open-end investment company, or mutual fund. The fund offers two classes of shares: Admiral Shares and ETF Shares. Admiral Shares are available to any investor who meets the fund’s minimum purchase requirements. ETF Shares were listed for trading on the American Stock Exchange through September 18, 2008, and on the NYSE Arca, Inc., thereafter; they can be purchased and sold through a broker.
A. The following significant accounting policies conform to generally accepted accounting principles for U.S. mutual funds. The fund consistently follows such policies in preparing its financial statements.
1. Security Valuation: Securities are valued as of the close of trading on the New York Stock Exchange (generally 4 p.m., Eastern time) on the valuation date. Equity securities are valued at the latest quoted sales prices or official closing prices taken from the primary market in which each security trades; such securities not traded on the valuation date are valued at the mean of the latest quoted bid and asked prices. Securities for which market quotations are not readily available, or whose values have been materially affected by events occurring before the fund’s pricing time but after the close of the securities’ primary markets, are valued by methods deemed by the board of trustees to represent fair value. Investments in Vanguard Market Liquidity Fund are valued at that fund’s net asset value.
2. Federal Income Taxes: The fund intends to continue to qualify as a regulated investment company and distribute all of its taxable income. Management has analyzed the fund’s tax positions taken on federal income tax returns for all open tax years (tax years ended August 31, 2005–2008), and has concluded that no provision for federal income tax is required in the fund’s financial statements.
3. Distributions: Distributions to shareholders are recorded on the ex-dividend date.
4. Security Lending: The fund may lend its securities to qualified institutional borrowers to earn additional income. Security loans are required to be secured at all times by collateral at least equal to the market value of securities loaned. The fund invests cash collateral received in Vanguard Market Liquidity Fund, and records a liability for the return of the collateral, during the period the securities are on loan. Security lending income represents the income earned on investing cash collateral, less expenses associated with the loan.
5. Other: Dividend income is recorded on the ex-dividend date. Interest income includes income distributions received from Vanguard Market Liquidity Fund and is accrued daily. Security transactions are accounted for on the date securities are bought or sold. Costs used to determine realized gains (losses) on the sale of investment securities are those of the specific securities sold. Fees assessed on redemptions of Admiral Shares are credited to paid-in capital.
Each class of shares has equal rights as to assets and earnings, except that each class separately bears certain class-specific expenses related to maintenance of shareholder accounts (included in Management and Administrative expenses) and shareholder reporting. Marketing and distribution expenses are allocated to each class of shares based on a method approved by the board of trustees. Income, other non-class-specific expenses, and gains and losses on investments are allocated to each class of shares based on its relative net assets.
B. The Vanguard Group furnishes at cost investment advisory, corporate management, administrative, marketing, and distribution services. The costs of such services are allocated to the fund under methods approved by the board of trustees. The fund has committed to provide up to 0.40% of its net assets in capital contributions to Vanguard. At August 31, 2008, the fund had contributed capital of $59,000 to Vanguard (included in Other Assets), representing 0.01% of the fund’s net assets and 0.06% of Vanguard’s capitalization. The fund’s trustees and officers are also directors and officers of Vanguard.
C. Distributions are determined on a tax basis and may differ from net investment income and realized capital gains for financial reporting purposes. Differences may be permanent or temporary. Permanent differences are reclassified among capital accounts in the financial statements to reflect their tax character. Temporary differences arise when certain items of income, expense, gain, or loss are recognized in different periods for financial statement and tax purposes; these differences will reverse at some time in the future. Differences in classification may also result from the treatment of short-term gains as ordinary income for tax purposes.
45
Financials Index Fund
During the year ended August 31, 2008, the fund realized $7,014,000 of net capital gains resulting from in-kind redemptions—in which shareholders exchanged fund shares for securities held by the fund rather than for cash. Because such gains are not taxable to the fund, and are not distributed to shareholders, they have been reclassified from accumulated net realized losses to paid-in capital.
For tax purposes, at August 31, 2008, the fund had $4,144,000 of ordinary income available for distribution. The fund had available realized losses of $9,066,000 to offset future net capital gains of $85,000 through August 31, 2014, $11,000 through August 31, 2015, $1,312,000 through August 31, 2016, and $7,658,000 through August 31, 2017.
At August 31, 2008, the cost of investment securities for tax purposes was $935,413,000. Net unrealized depreciation of investment securities for tax purposes was $199,972,000, consisting of unrealized gains of $9,827,000 on securities that had risen in value since their purchase and $209,799,000 in unrealized losses on securities that had fallen in value since their purchase.
D. During the year ended August 31, 2008, the fund purchased $724,470,000 of investment securities and sold $104,319,000 of investment securities, other than temporary cash investments.
E. Capital share transactions for each class of shares were:
| | | Year Ended August 31, |
| | 2008 | | | 2007 |
| Amount | Shares | | Amount | Shares |
| ($000) | (000) | | ($000) | (000) |
Admiral Shares | | | | | |
Issued | 96,727 | 4,152 | | 17,304 | 546 |
Issued in Lieu of Cash Distributions | 889 | 39 | | 234 | 7 |
Redeemed1 | (18,947) | (817) | | (5,924) | (186) |
Net Increase (Decrease)—Admiral Shares | 78,669 | 3,374 | | 11,614 | 367 |
ETF Shares | | | | | |
Issued | 592,724 | 12,516 | | 213,622 | 3,300 |
Issued in Lieu of Cash Distributions | — | — | | — | — |
Redeemed1 | (52,635) | (1,200) | | (45,378) | (700) |
Net Increase (Decrease)—ETF Shares | 540,089 | 11,316 | | 168,244 | 2,600 |
F. In September 2006, the Financial Accounting Standards Board issued Statement of Financial Accounting Standards No. 157 (“FAS 157”), “Fair Value Measurements.” FAS 157 establishes a framework for measuring fair value and expands disclosures about fair value measurements in financial statements.
The various inputs that may be used to determine the value of the fund’s investments are summarized in three broad levels. The inputs or methodologies used for valuing securities are not necessarily an indication of the risk associated with investing in those securities.
Level 1—Quoted prices in active markets for identical securities.
Level 2—Other significant observable inputs (including quoted prices for similar securities, interest rates, prepayment speeds, credit risk, etc.).
Level 3—Significant unobservable inputs (including the fund’s own assumptions used to determine the fair value of investments).
At August 31, 2008, 100% of the fund’s investments were valued based on Level 1 inputs.
1 Net of redemption fees of $200,000 and $53,000 (fund totals).
46
Health Care Index Fund
Fund Profile
As of August 31, 2008
Portfolio Characteristics | | |
| | Target | Broad |
| Fund | Index1 | Index2 |
Number of Stocks | 284 | 284 | 2,481 |
Median Market Cap | $42.2B | $42.2B | $32.1B |
Price/Earnings Ratio | 21.9x | 21.9x | 16.8x |
Price/Book Ratio | 3.3x | 3.3x | 2.4x |
Yield3 | | 1.7% | 2.0% |
Admiral Shares | 1.4% | | |
ETF Shares | 1.5% | | |
Return on Equity | 20.6% | 20.6% | 20.1% |
Earnings Growth Rate | 16.4% | 16.4% | 18.4% |
Foreign Holdings | 0.0% | 0.0% | 0.0% |
Turnover Rate | 8% | — | — |
Expense Ratio (8/31/2007)4 | | — | — |
Admiral Shares | 0.26% | | |
ETF Shares | 0.22% | | |
Short-Term Reserves | 0.0% | — | — |
Volatility Measures5 | |
| Fund Versus | Fund Versus |
| Target Index1 | Broad Index2 |
R-Squared | 1.00 | 0.43 |
Beta | 1.00 | 0.64 |
Industry Diversification (% of equity exposure) |
| |
Biotechnology | 16.7% |
Health Care Distributors | 3.2 |
Health Care Equipment | 17.8 |
Health Care Facilities | 1.4 |
Health Care Services | 4.8 |
Health Care Supplies | 1.0 |
Life Sciences Tools & Services | 5.0 |
Managed Health Care | 7.0 |
Pharmaceuticals | 42.3 |
Other Health Care | 0.8 |
Ten Largest Holdings6 (% of total net assets) |
| |
Johnson & Johnson | 11.4% |
Pfizer Inc. | 7.4 |
Abbott Laboratories | 5.1 |
Merck & Co., Inc. | 4.4 |
Amgen, Inc. | 3.9 |
Medtronic, Inc. | 3.5 |
Wyeth | 3.3 |
Gilead Sciences, Inc. | 2.8 |
Eli Lilly & Co. | 2.7 |
Genentech, Inc. | 2.7 |
Top Ten | 47.2% |
1 MSCI US IMI/Health Care.
2 MSCI US IMI/2500.
3 30-day SEC yield for the fund; annualized dividend yield for the indexes. See the Glossary.
4 Expense ratios shown are from the prospectus dated December 10, 2007. Expense ratios for the fiscal year ended August 31, 2008, were 0.25% for Admiral Shares and 0.20% for ETF Shares.
5 For an explanation of R-squared, beta, and other terms used here, see the Glossary.
6 The holdings listed exclude any temporary cash investments and equity index products.
47
Health Care Index Fund
Performance Summary
All of the returns in this report represent past performance, which is not a guarantee of future results that may be achieved by the fund. (Current performance may be lower or higher than the performance data cited. For performance data current to the most recent month-end, visit our website at www.vanguard.com/performance.) Note, too, that both investment returns and principal value can fluctuate widely, so an investor’s shares, when sold, could be worth more or less than their original cost. The returns shown do not reflect taxes that a shareholder would pay on fund distributions or on the sale of fund shares.
Cumulative Performance: January 26, 2004–August 31, 2008
Initial Investment of $10,000
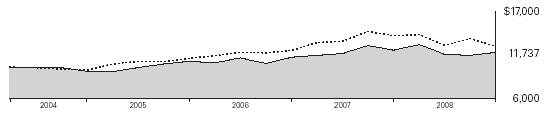
| | |
| | | |
| Average Annual Total Returns | Final Value |
| Periods Ended August 31, 2008 | of a $10,000 |
| One Year | Since Inception1 | Investment |
Health Care Index Fund ETF Shares Net Asset Value | –2.55% | 3.55% | $11,737 |
Health Care Index Fund ETF Shares Market Price | –2.40 | 3.54 | 11,735 |
MSCI US IMI/2500 | –9.90 | 5.15 | 12,594 |
MSCI US IMI/Health Care | –2.34 | 3.78 | 11,857 |
| | | Final Value |
| | | of a $100,000 |
| One Year | Since Inception1 | Investment |
Health Care Index Fund Admiral Shares2 | –2.59% | 3.51% | $117,066 |
MSCI US IMI/2500 | –9.90 | 5.79 | 129,301 |
MSCI US IMI/Health Care | –2.34 | 3.77 | 118,443 |
1 Performance for the fund and its comparative standards is calculated since the following inception dates: January 26, 2004, for ETF Shares; February 5, 2004, for Admiral Shares.
2 Total returns do not reflect the 2% fee assessed on redemptions of shares held for less than one year.
48
Health Care Index Fund
Fiscal-Year Total Returns (%): January 26, 2004–August 31, 2008
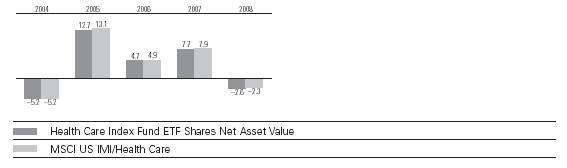
Cumulative Returns: ETF Shares, January 26, 2004–August 31, 2008 | | |
| | Cumulative |
| | Since |
| One Year | Inception |
Health Care Index Fund ETF Shares Market Price | –2.40% | 17.35% |
Health Care Index Fund ETF Shares Net Asset Value | –2.55 | 17.37 |
MSCI US IMI/Health Care | –2.34 | 18.57 |
Average Annual Total Returns: Periods Ended June 30, 2008
This table presents average annual total returns through the latest calendar quarter—rather than through the end of the fiscal period. Securities and Exchange Commission rules require that we provide this information.
| | | Since |
| Inception Date | One Year | Inception |
ETF Shares | 1/26/2004 | | |
Market Price | | –10.88% | 1.88% |
Net Asset Value | | –10.88 | 1.88 |
Admiral Shares1 | 2/5/2004 | –10.94 | 1.84 |
1 Total returns do not reflect the 2% fee assessed on redemptions of shares held for less than one year.
Note: See Financial Highlights tables for dividend and capital gains information.
49
Health Care Index Fund
Financial Statements
Statement of Net Assets
As of August 31, 2008
The fund provides a complete list of its holdings four times in each fiscal year, at the quarter-ends. For the second and fourth fiscal quarters, the lists appear in the fund’s semiannual and annual reports to shareholders. For the first and third fiscal quarters, the fund files the lists with the Securities and Exchange Commission on Form N-Q. Shareholders can look up the fund’s Forms N-Q on the SEC’s website at www.sec.gov. Forms N-Q may also be reviewed and copied at the SEC’s Public Reference Room (see the back cover of this report for further information).
| | | Market |
| | | Value• |
| | Shares | ($000) |
Common Stocks (99.8%) | | |
Biotechnology (16.6%) | | |
* | Amgen, Inc. | 467,803 | 29,401 |
* | Gilead Sciences, Inc. | 396,342 | 20,879 |
* | Genentech, Inc. | 203,210 | 20,067 |
* | Celgene Corp. | 187,326 | 12,982 |
* | Genzyme Corp. | 114,911 | 8,998 |
* | Biogen Idec Inc. | 124,667 | 6,349 |
* | Cephalon, Inc. | 28,988 | 2,221 |
* | ImClone Systems, Inc. | 25,908 | 1,668 |
* | Vertex Pharmaceuticals, Inc. | 60,439 | 1,623 |
* | Alexion Pharmaceuticals, Inc. | 31,437 | 1,417 |
* | Myriad Genetics, Inc. | 19,206 | 1,310 |
* | Amylin Pharmaceuticals, Inc. | 58,957 | 1,296 |
* | BioMarin Pharmaceutical Inc. | 42,384 | 1,277 |
* | OSI Pharmaceuticals, Inc. | 24,936 | 1,259 |
* | United Therapeutics Corp. | 9,726 | 1,032 |
* | Onyx Pharmaceuticals, Inc. | 23,681 | 968 |
* | Isis Pharmaceuticals, Inc. | 41,055 | 726 |
* | Regeneron | | |
| Pharmaceuticals, Inc. | 26,301 | 571 |
* | Alkermes, Inc. | 42,698 | 571 |
* | Cubist Pharmaceuticals, Inc. | 24,038 | 530 |
* | Savient Pharmaceuticals Inc. | 22,948 | 522 |
* | Celera Corp. | 34,119 | 478 |
* | Martek Biosciences Corp. | 14,091 | 471 |
| PDL BioPharma Inc. | 38,381 | 463 |
* | Cepheid, Inc. | 23,809 | 443 |
* | Acorda Therapeutics Inc. | 15,098 | 425 |
* | Alnylam Pharmaceuticals Inc. | 14,006 | 415 |
* | Human Genome Sciences, Inc. | 55,117 | 408 |
* | Medarex, Inc. | 51,957 | 383 |
* | Incyte Corp. | 36,902 | 378 |
* | Rigel Pharmaceuticals, Inc. | 15,460 | 366 |
* | CV Therapeutics, Inc. | 26,123 | 300 |
* | Seattle Genetics, Inc. | 26,587 | 296 |
* | Theravance, Inc. | 19,978 | 272 |
*, | ^InterMune Inc. | 13,383 | 254 |
* | Abraxis BioScience | 3,452 | 254 |
* | Cougar Biotechnology Inc. | 7,116 | 245 |
*, | ^Dendreon Corp. | 40,126 | 236 |
* | Allos Therapeutics Inc. | 23,852 | 223 |
* | Halozyme Therapeutics Inc. | 28,499 | 222 |
* | Arena Pharmaceuticals, Inc. | 31,036 | 188 |
* | Progenics | | |
| Pharmaceuticals, Inc. | 11,478 | 158 |
* | Array BioPharma Inc. | 19,278 | 158 |
* | Momenta | | |
| Pharmaceuticals, Inc. | 10,922 | 157 |
* | Sangamo BioSciences, Inc. | 15,455 | 154 |
* | Geron Corp. | 32,763 | 150 |
* | Nabi Biopharmaceuticals | 25,713 | 148 |
* | Zymogenetics, Inc. | 17,599 | 147 |
* | Omrix Biopharmaceuticals, Inc. | 6,178 | 142 |
* | Genomic Health, Inc. | 6,185 | 138 |
* | Ligand Pharmaceuticals Inc. | | |
| Class B | 38,503 | 130 |
* | GTx, Inc. | 6,753 | 120 |
* | XOMA Ltd. | 56,637 | 117 |
*, | ^Osiris Therapeutics, Inc. | 6,436 | 99 |
* | Neurocrine Biosciences, Inc. | 16,646 | 86 |
* | Affymax Inc. | 4,576 | 86 |
* | Orexigen Therapeutics Inc. | 7,356 | 86 |
*, | ^Opko Health, Inc. | 34,453 | 72 |
* | Lexicon Pharmaceuticals Inc. | 32,311 | 60 |
* | Senomyx, Inc. | 13,263 | 56 |
* | Amicus Therapeutics, Inc. | 3,394 | 47 |
* | Emergent BioSolutions Inc. | 2,700 | 37 |
* | MannKind Corp. | 4,156 | 14 |
* | Indevus Pharmaceuticals, Inc. | 4,500 | 10 |
* | Acadia Pharmaceuticals Inc. | 2,238 | 6 |
| | | 124,765 |
Health Care Equipment & Supplies (18.8%) | |
| Medtronic, Inc. | 482,489 | 26,344 |
| Baxter International, Inc. | 269,504 | 18,262 |
| Covidien Ltd. | 212,985 | 11,516 |
| Becton, Dickinson & Co. | 104,950 | 9,170 |
| Stryker Corp. | 123,919 | 8,326 |
* | Boston Scientific Corp. | 578,581 | 7,267 |
* | Zimmer Holdings, Inc. | 99,461 | 7,200 |
* | St. Jude Medical, Inc. | 145,531 | 6,670 |
* | Intuitive Surgical, Inc. | 16,632 | 4,911 |
| C.R. Bard, Inc. | 42,922 | 4,011 |
* | Varian Medical Systems, Inc. | 53,757 | 3,395 |
* | Hospira, Inc. | 68,353 | 2,759 |
| DENTSPLY International Inc. | 61,407 | 2,407 |
* | Hologic, Inc. | 109,395 | 2,321 |
| Beckman Coulter, Inc. | 26,927 | 1,988 |
* | ResMed Inc. | 33,250 | 1,556 |
* | IDEXX Laboratories Corp. | 26,085 | 1,469 |
* | Edwards Lifesciences Corp. | 23,577 | 1,396 |
* | Gen-Probe Inc. | 23,137 | 1,382 |
* | Inverness Medical | | |
| Innovations, Inc. | 31,539 | 1,120 |
* | Immucor Inc. | 29,988 | 966 |
| STERIS Corp. | 25,632 | 942 |
* | Masimo Corp. | 20,480 | 819 |
* | Kinetic Concepts, Inc. | 23,213 | 816 |
| Hill-Rom Holdings, Inc. | 25,324 | 758 |
* | Nuvasive, Inc. | 15,153 | 722 |
* | Haemonetics Corp. | 10,922 | 685 |
| West Pharmaceutical | | |
| Services, Inc. | 13,908 | 679 |
* | Thoratec Corp. | 23,145 | 617 |
| Cooper Cos., Inc. | 15,704 | 578 |
* | Advanced Medical Optics, Inc. | 26,017 | 563 |
* | American Medical Systems | | |
| Holdings, Inc. | 31,171 | 555 |
| Meridian Bioscience Inc. | 17,226 | 490 |
* | Wright Medical Group, Inc. | 15,687 | 483 |
* | Integra LifeSciences Holdings | 8,554 | 415 |
* | CONMED Corp. | 12,262 | 392 |
| Analogic Corp. | 5,755 | 390 |
| Vital Signs, Inc. | 4,906 | 362 |
^ | Mentor Corp. | 14,524 | 358 |
* | Align Technology, Inc. | 25,341 | 330 |
* | Zoll Medical Corp. | 8,899 | 309 |
* | ArthroCare Corp. | 12,047 | 309 |
* | ev3 Inc. | 24,779 | 303 |
| Datascope Corp. | 5,626 | 281 |
* | Natus Medical Inc. | 11,021 | 271 |
* | Symmetry Medical Inc. | 15,227 | 262 |
* | SurModics, Inc. | 6,668 | 260 |
* | Cyberonics, Inc. | 11,738 | 252 |
* | Quidel Corp. | 12,671 | 248 |
* | SonoSite, Inc. | 7,238 | 245 |
* | ABIOMED, Inc. | 13,219 | 238 |
* | Greatbatch, Inc. | 9,702 | 237 |
* | Sirona Dental Systems Inc. | 8,248 | 227 |
* | Volcano Corp. | 12,096 | 222 |
* | Merit Medical Systems, Inc. | 11,184 | 216 |
* | Conceptus, Inc. | 12,688 | 214 |
* | Abaxis, Inc. | 9,339 | 186 |
* | RTI Biologics, Inc. | 19,684 | 185 |
* | ICU Medical, Inc. | 5,518 | 168 |
| Invacare Corp. | 6,529 | 166 |
* | Orthofix International N.V. | 6,552 | 159 |
* | Accuray Inc. | 17,920 | 148 |
* | Palomar Medical | | |
| Technologies, Inc. | 7,615 | 110 |
* | Insulet Corp. | 7,417 | 106 |
* | Cynosure Inc. | 3,630 | 90 |
* | Clinical Data, Inc. | 4,993 | 83 |
* | Hansen Medical Inc. | 5,411 | 68 |
* | TomoTherapy, Inc. | 9,600 | 59 |
* | OraSure Technologies, Inc. | 3,246 | 16 |
* | Stereotaxis Inc. | 1,985 | 14 |
| | | 141,042 |
Health Care Providers & Services (16.3%) | | |
| UnitedHealth Group Inc. | 528,009 | 16,078 |
* | WellPoint Inc. | 226,071 | 11,934 |
* | Medco Health Solutions, Inc. | 217,742 | 10,201 |
| Aetna Inc. | 208,323 | 8,987 |
| Cardinal Health, Inc. | 153,321 | 8,430 |
| McKesson Corp. | 119,164 | 6,885 |
* | Express Scripts Inc. | 91,957 | 6,751 |
| CIGNA Corp. | 120,699 | 5,055 |
| Quest Diagnostics, Inc. | 71,226 | 3,850 |
* | Laboratory Corp. of | | |
| America Holdings | 47,811 | 3,497 |
* | Humana Inc. | 72,788 | 3,377 |
| AmerisourceBergen Corp. | 69,640 | 2,856 |
* | DaVita, Inc. | 44,945 | 2,579 |
* | Coventry Health Care Inc. | 65,175 | 2,282 |
* | Henry Schein, Inc. | 38,785 | 2,268 |
| Omnicare, Inc. | 52,109 | 1,681 |
* | Patterson Cos. | 45,252 | 1,472 |
* | Community Health | | |
| Systems, Inc. | 41,003 | 1,415 |
| Universal Health Services | | |
| Class B | 20,679 | 1,278 |
* | Tenet Healthcare Corp. | 205,889 | 1,242 |
* | Pediatrix Medical Group, Inc. | 20,793 | 1,184 |
* | Health Net Inc. | 42,621 | 1,178 |
* | VCA Antech, Inc. | 36,172 | 1,112 |
* | Lincare Holdings, Inc. | 31,394 | 1,036 |
* | Psychiatric Solutions, Inc. | 23,630 | 892 |
| Owens & Minor, Inc. | | |
| Holding Co. | 17,565 | 810 |
* | WellCare Health Plans Inc. | 17,931 | 749 |
50
Health Care Index Fund
| | | Market |
| | | Value• |
| | Shares | ($000) |
* | Magellan Health Services, Inc. | 17,096 | 745 |
* | LifePoint Hospitals, Inc. | 22,067 | 745 |
* | HealthSouth Corp. | 37,724 | 679 |
* | Health Management | | |
| Associates Class A | 104,042 | 604 |
* | Amedisys Inc. | 11,350 | 604 |
* | AMERIGROUP Corp. | 22,879 | 592 |
* | PSS World Medical, Inc. | 27,699 | 506 |
* | HealthExtras, Inc. | 14,605 | 476 |
| Chemed Corp. | 10,391 | 454 |
* | Healthspring, Inc. | 21,858 | 434 |
* | Centene Corp. | 18,761 | 424 |
* | Kindred Healthcare, Inc. | 13,163 | 407 |
* | Apria Healthcare Group Inc. | 18,855 | 373 |
* | AmSurg Corp. | 13,433 | 364 |
* | Gentiva Health Services, Inc. | 11,428 | 318 |
* | PharMerica Corp. | 13,026 | 308 |
* | inVentiv Health, Inc. | 13,834 | 305 |
* | Healthways, Inc. | 15,403 | 293 |
* | Sun Healthcare Group Inc. | 16,725 | 288 |
* | AMN Healthcare Services, Inc. | 14,752 | 280 |
| Landauer, Inc. | 3,976 | 259 |
* | Sunrise Senior Living, Inc. | 12,724 | 259 |
* | Universal American Corp. | 19,177 | 253 |
* | HMS Holdings Corp. | 9,970 | 247 |
* | AthenaHealth Inc. | 7,651 | 247 |
* | Emeritus Corp. | 9,265 | 206 |
* | Res-Care, Inc. | 10,664 | 205 |
* | Cross Country Healthcare, Inc. | 12,989 | 204 |
* | Molina Healthcare Inc. | 6,112 | 192 |
* | LHC Group Inc. | 6,573 | 191 |
* | MWI Veterinary Supply Inc. | 4,702 | 185 |
* | Assisted Living Concepts Inc. | 24,986 | 177 |
| Brookdale Senior Living Inc. | 7,722 | 170 |
* | MedCath Corp. | 7,926 | 169 |
| National Healthcare Corp. | 2,773 | 139 |
* | Odyssey Healthcare, Inc. | 14,082 | 137 |
* | Genoptix, Inc. | 3,912 | 137 |
* | Air Methods Corp. | 4,708 | 136 |
* | Skilled Healthcare Group Inc. | 8,293 | 132 |
* | Alliance Imaging, Inc. | 10,961 | 127 |
* | Triple-S Management Corp. | 6,945 | 121 |
* | CorVel Corp. | 3,591 | 105 |
* | Chindex International, Inc. | 4,523 | 53 |
* | Virtual Radiologic Corp. | 3,160 | 41 |
* | Nighthawk Radiology | | |
| Holdings, Inc. | 1,399 | 12 |
| LCA-Vision Inc. | 1,359 | 8 |
| | | 122,390 |
Health Care Technology (0.8%) | | |
| IMS Health, Inc. | 78,443 | 1,743 |
* | Cerner Corp. | 29,292 | 1,349 |
* | HLTH Corp. | 74,138 | 923 |
* | Eclipsys Corp. | 20,775 | 463 |
* | Allscripts Healthcare | | |
| Solutions, Inc. | 24,429 | 350 |
* | Phase Forward Inc. | 17,271 | 334 |
* | Omnicell, Inc. | 14,901 | 229 |
* | MedAssets, Inc. | 10,499 | 187 |
* | Vital Images, Inc. | 7,153 | 112 |
| | | 5,690 |
Life Sciences Tools & Services (4.9%) | | |
* | Thermo Fisher Scientific, Inc. | 179,692 | 10,882 |
* | Waters Corp. | 43,030 | 2,937 |
| Applied Biosystems Inc. | 72,479 | 2,645 |
* | Covance, Inc. | 27,007 | 2,548 |
* | Illumina, Inc. | 25,955 | 2,235 |
* | Charles River | | |
| Laboratories, Inc. | 29,215 | 1,917 |
| Pharmaceutical Product | | |
| Development, Inc. | 46,020 | 1,878 |
* | Millipore Corp. | 23,667 | 1,775 |
* | Invitrogen Corp. | 40,038 | 1,700 |
| PerkinElmer, Inc. | 50,836 | 1,444 |
* | Techne Corp. | 15,869 | 1,225 |
* | Bio-Rad Laboratories, Inc. | | |
| Class A | 8,035 | 865 |
* | PAREXEL International Corp. | 24,120 | 766 |
* | Varian, Inc. | 13,112 | 652 |
* | Dionex Corp. | 8,038 | 524 |
* | Luminex Corp. | 16,609 | 423 |
* | Bruker BioSciences Corp. | 24,466 | 378 |
* | AMAG Pharmaceuticals, Inc. | 7,339 | 284 |
* | Kendle International Inc. | 5,648 | 279 |
*, | ^Medivation Inc. | 10,524 | 261 |
* | Exelixis, Inc. | 45,083 | 256 |
* | Affymetrix, Inc. | 29,668 | 255 |
* | eResearch Technology, Inc. | 17,392 | 235 |
* | Pharmanet Development | | |
| Group, Inc. | 8,167 | 213 |
* | Albany Molecular | | |
| Research, Inc. | 10,677 | 186 |
* | Enzo Biochem, Inc. | 14,282 | 185 |
* | Cambrex Corp. | 12,649 | 82 |
* | Nektar Therapeutics | 10,868 | 43 |
| | | 37,073 |
Pharmaceuticals (42.4%) | | |
| Johnson & Johnson | 1,210,737 | 85,272 |
| Pfizer Inc. | 2,906,784 | 55,549 |
| Abbott Laboratories | 663,036 | 38,078 |
| Merck & Co., Inc. | 922,238 | 32,896 |
| Wyeth | 572,837 | 24,792 |
| Eli Lilly & Co. | 439,654 | 20,510 |
| Bristol-Myers Squibb Co. | 850,500 | 18,150 |
| Schering-Plough Corp. | 696,618 | 13,514 |
| Allergan, Inc. | 130,933 | 7,315 |
* | Forest Laboratories, Inc. | 130,897 | 4,672 |
* | Barr Pharmaceuticals Inc. | 44,154 | 2,982 |
* | Mylan Inc. | 130,235 | 1,679 |
* | Watson Pharmaceuticals, Inc. | 42,248 | 1,281 |
* | King Pharmaceuticals, Inc. | 104,723 | 1,198 |
| Perrigo Co. | 34,080 | 1,192 |
* | Endo Pharmaceuticals | | |
| Holdings, Inc. | 51,743 | 1,176 |
* | Sepracor Inc. | 42,084 | 774 |
* | Valeant Pharmaceuticals | | | |
| International | 39,066 | 715 | |
* | Warner Chilcott Ltd. | 42,956 | 687 | |
* | Alpharma, Inc. Class A | 18,978 | 678 | |
* | Auxilium Pharmaceuticals, Inc. | 16,445 | 646 | |
* | The Medicines Co. | 22,176 | 540 | |
| Medicis Pharmaceutical Corp. | 24,101 | 499 | |
* | Xenoport Inc. | 9,679 | 473 | |
* | ViroPharma Inc. | 29,974 | 439 | |
* | APP Pharmaceuticals, Inc. | 17,127 | 405 | |
* | K-V Pharmaceutical Co. | | | |
| Class A | 14,281 | 322 | |
| Sciele Pharma, Inc. | 14,557 | 281 | |
* | Par Pharmaceutical Cos. Inc. | 14,611 | 208 | |
* | Salix Pharmaceuticals, Ltd. | 20,489 | 139 | |
* | Noven Pharmaceuticals, Inc. | 10,666 | 132 | |
* | Questcor Pharmaceuticals, Inc. | 20,755 | 113 | |
* | Akorn, Inc. | 22,809 | 111 | |
* | Cypress Bioscience, Inc. | 16,041 | 110 | |
* | Cadence Pharmaceuticals, Inc. | 8,945 | 89 | |
* | Caraco Pharmaceutical | | | |
| Laboratories, Ltd. | 4,042 | 65 | |
* | BioForm Medical, Inc. | 8,663 | 35 | |
* | MAP Pharmaceuticals Inc. | 3,125 | 31 | |
* | Sucampo Pharmaceuticals Inc. | 3,043 | 29 | |
| | | 317,777 | |
Total Common Stocks | | | |
(Cost $767,366) | | 748,737 | |
Temporary Cash Investment (0.1%) | | | |
1,2 | Vanguard Market Liquidity | | | |
| Fund, 2.389% | | | |
| (Cost $596) | 595,502 | 596 | |
Total Investments (99.9%) | | | |
(Cost $767,962) | | 749,333 | |
Other Assets and Liabilities (0.1%) | | | |
Other Assets | | 4,904 | |
Liabilities2 | | (3,893) | |
| | | 1,011 | |
Net Assets (100%) | | 750,344 |
| | | | | |
At August 31, 2008, net assets consisted of: |
| Amount |
| ($000) |
Paid-in Capital | 773,178 |
Undistributed Net Investment Income | 6,454 |
Accumulated Net Realized Losses | (10,659) |
Unrealized Appreciation (Depreciation) | (18,629) |
Net Assets | 750,344 |
| |
| |
Admiral Shares—Net Assets | |
Applicable to 4,756,163 outstanding | |
$.001 par value shares of beneficial | |
interest (unlimited authorization) | 136,388 |
Net Asset Value Per Share— | |
Admiral Shares | $28.68 |
| |
| |
ETF Shares—Net Assets | |
Applicable to 10,702,626 outstanding | |
$.001 par value shares of beneficial | |
interest (unlimited authorization) | 613,956 |
Net Asset Value Per Share— | |
ETF Shares | $57.36 |
• See Note A in Notes to Financial Statements.
* Non-income-producing security.
^ Part of security position is on loan to broker-dealers. The total value of securities on loan is $576,000.
1 Affiliated money market fund available only to Vanguard funds and certain trusts and accounts managed by Vanguard. Rate shown is the 7-day yield.
2 Includes $596,000 of collateral received for securities on loan.
See accompanying Notes, which are an integral part of the Financial Statements.
51
Health Care Index Fund
Statement of Operations
| Year Ended |
| August 31, 2008 |
| ($000) |
Investment Income | |
Income | |
Dividends | 10,433 |
Interest1 | 9 |
Security Lending | 4 |
Total Income | 10,446 |
Expenses | |
The Vanguard Group—Note B | |
Investment Advisory Services | 50 |
Management and Administrative | |
Admiral Shares | 279 |
ETF Shares | 734 |
Marketing and Distribution | |
Admiral Shares | 23 |
ETF Shares | 131 |
Custodian Fees | 64 |
Auditing Fees | 23 |
Shareholders’ Reports | |
Admiral Shares | 1 |
ETF Shares | 42 |
Trustees’ Fees and Expenses | 1 |
Total Expenses | 1,348 |
Net Investment Income | 9,098 |
Realized Net Gain (Loss) on | |
Investment Securities Sold | 3,694 |
Change in Unrealized Appreciation | |
(Depreciation) of Investment Securities | (35,268) |
Net Increase (Decrease) in Net Assets | |
Resulting from Operations | (22,476) |
Statement of Changes in Net Assets
| Year Ended August 31, |
| 2008 | 2007 |
| ($000) | ($000) |
Increase (Decrease) in Net Assets | | |
Operations | | |
Net Investment Income | 9,098 | 7,712 |
Realized Net Gain (Loss) | 3,694 | 40,442 |
Change in Unrealized Appreciation (Depreciation) | (35,268) | (11,813) |
Net Increase (Decrease) in Net Assets Resulting from Operations | (22,476) | 36,341 |
Distributions | | |
Net Investment Income | | |
Admiral Shares | (1,807) | (1,154) |
ETF Shares | (6,890) | (3,876) |
Realized Capital Gain | | |
Admiral Shares | — | — |
ETF Shares | — | — |
Total Distributions | (8,697) | (5,030) |
Capital Share Transactions | | |
Admiral Shares | 10,131 | 17,034 |
ETF Shares | 162,011 | 89,085 |
Net Increase (Decrease) from Capital Share Transactions | 172,142 | 106,119 |
Total Increase (Decrease) | 140,969 | 137,430 |
Net Assets | | |
Beginning of Period | 609,375 | 471,945 |
End of Period2 | 750,344 | 609,375 |
1 Interest income from an affiliated company of the fund was $9,000.
2 Net Assets—End of Period includes undistributed net investment income of $6,454,000 and $6,053,000. See accompanying Notes, which are an integral part of the Financial Statements.
52
Health Care Index Fund
Financial Highlights
Admiral Shares | | | | | |
| | | | | |
| | | | | Feb. 5, |
| | | 20041 to |
| Year Ended August 31, | Aug. 31, |
For a Share Outstanding Throughout Each Period | 2008 | 2007 | 2006 | 2005 | 2004 |
Net Asset Value, Beginning of Period | $29.82 | $27.99 | $26.92 | $23.97 | $25.33 |
Investment Operations | | | | | |
Net Investment Income | .345 | .392 | .3042 | .2742 | .130 |
Net Realized and Unrealized Gain | | | | | |
(Loss) on Investments | (1.090) | 1.736 | .951 | 2.762 | (1.490) |
Total from Investment Operations | (.745) | 2.128 | 1.255 | 3.036 | (1.360) |
Distributions | | | | | |
Dividends from Net Investment Income | (.395) | (.298) | (.185) | (.086) | — |
Distributions from Realized Capital Gains | — | — | — | — | — |
Total Distributions | (.395) | (.298) | (.185) | (.086) | — |
Net Asset Value, End of Period | $28.68 | $29.82 | $27.99 | $26.92 | $23.97 |
| | | | | |
| | | | | |
Total Return3 | –2.59% | 7.65% | 4.68% | 12.70% | –5.37% |
| | | | | |
| | | | | |
Ratios/Supplemental Data | | | | | |
Net Assets, End of Period (Millions) | $136 | $132 | $108 | $73 | $11 |
Ratio of Total Expenses to Average Net Assets | 0.25% | 0.26% | 0.28% | 0.28% | 0.28%4 |
Ratio of Net Investment Income to | | | | | |
Average Net Assets | 1.36% | 1.42% | 1.12% | 1.11% | 1.09%4 |
Portfolio Turnover Rate5 | 8% | 10% | 11% | 9% | 8% |
ETF Shares | | | | | |
| | | | | |
| | | | | Jan. 26, |
| | | 20041 to |
| Year Ended August 31, | Aug. 31, |
For a Share Outstanding Throughout Each Period | 2008 | 2007 | 2006 | 2005 | 2004 |
Net Asset Value, Beginning of Period | $59.65 | $55.99 | $53.85 | $47.90 | $50.55 |
Investment Operations | | | | | |
Net Investment Income | .720 | .809 | .6222 | .5972 | .230 |
Net Realized and Unrealized Gain | | | | | |
(Loss) on Investments | (2.190) | 3.466 | 1.905 | 5.486 | (2.880) |
Total from Investment Operations | (1.470) | 4.275 | 2.527 | 6.083 | (2.650) |
Distributions | | | | | |
Dividends from Net Investment Income | (.820) | (.615) | (.387) | (.133) | — |
Distributions from Realized Capital Gains | — | — | — | — | — |
Total Distributions | (.820) | (.615) | (.387) | (.133) | — |
Net Asset Value, End of Period | $57.36 | $59.65 | $55.99 | $53.85 | $47.90 |
| | | | | |
| | | | | |
Total Return | –2.55% | 7.69% | 4.71% | 12.72% | –5.24% |
| | | | | |
| | | | | |
Ratios/Supplemental Data | | | | | |
Net Assets, End of Period (Millions) | $614 | $477 | $364 | $205 | $19 |
Ratio of Total Expenses to Average Net Assets | 0.20% | 0.22% | 0.25% | 0.26% | 0.28%4 |
Ratio of Net Investment Income to | | | | | |
Average Net Assets | 1.41% | 1.46% | 1.15% | 1.13% | 1.09%4 |
Portfolio Turnover Rate5 | 8% | 10% | 11% | 9% | 8% |
1 Inception.
2 Calculated based on average shares outstanding.
3 Total returns do not reflect the 2% fee assessed on redemptions of shares held for less than one year.
4 Annualized.
5 Excludes the value of portfolio securities received or delivered as a result of in-kind purchases or redemptions of the fund’s capital shares, including ETF Creation Units. See accompanying Notes, which are an integral part of the Financial Statements.
53
Health Care Index Fund
Notes to Financial Statements
Vanguard Health Care Index Fund is registered under the Investment Company Act of 1940 as an open-end investment company, or mutual fund. The fund offers two classes of shares, Admiral Shares and ETF Shares. Admiral Shares are available to any investor who meets the fund’s minimum purchase requirements. ETF Shares were listed for trading on the American Stock Exchange through September 18, 2008, and on the NYSE Arca, Inc., thereafter; they can be purchased and sold through a broker.
A. The following significant accounting policies conform to generally accepted accounting principles for U.S. mutual funds. The fund consistently follows such policies in preparing its financial statements.
1. Security Valuation: Securities are valued as of the close of trading on the New York Stock Exchange (generally 4 p.m., Eastern time) on the valuation date. Equity securities are valued at the latest quoted sales prices or official closing prices taken from the primary market in which each security trades; such securities not traded on the valuation date are valued at the mean of the latest quoted bid and asked prices. Securities for which market quotations are not readily available, or whose values have been materially affected by events occurring before the fund’s pricing time but after the close of the securities’ primary markets, are valued by methods deemed by the board of trustees to represent fair value. Investments in Vanguard Market Liquidity Fund are valued at that fund’s net asset value.
2. Federal Income Taxes: The fund intends to continue to qualify as a regulated investment company and distribute all of its taxable income. Management has analyzed the fund’s tax positions taken on federal income tax returns for all open tax years (tax years ended August 31, 2005–2008), and has concluded that no provision for federal income tax is required in the fund’s financial statements.
3. Distributions: Distributions to shareholders are recorded on the ex-dividend date.
4. Security Lending: The fund may lend its securities to qualified institutional borrowers to earn additional income. Security loans are required to be secured at all times by collateral at least equal to the market value of securities loaned. The fund invests cash collateral received in Vanguard Market Liquidity Fund, and records a liability for the return of the collateral, during the period the securities are on loan. Security lending income represents the income earned on investing cash collateral, less expenses associated with the loan.
5. Other: Dividend income is recorded on the ex-dividend date. Interest income includes income distributions received from Vanguard Market Liquidity Fund and is accrued daily. Security transactions are accounted for on the date securities are bought or sold. Costs used to determine realized gains (losses) on the sale of investment securities are those of the specific securities sold. Fees assessed on redemptions of Admiral Shares are credited to paid-in capital.
Each class of shares has equal rights as to assets and earnings, except that each class separately bears certain class-specific expenses related to maintenance of shareholder accounts (included in Management and Administrative expenses) and shareholder reporting. Marketing and distribution expenses are allocated to each class of shares based on a method approved by the board of trustees. Income, other non-class-specific expenses, and gains and losses on investments are allocated to each class of shares based on its relative net assets.
B. The Vanguard Group furnishes at cost investment advisory, corporate management, administrative, marketing, and distribution services. The costs of such services are allocated to the fund under methods approved by the board of trustees. The fund has committed to provide up to 0.40% of its net assets in capital contributions to Vanguard. At August 31, 2008, the fund had contributed capital of $56,000 to Vanguard (included in Other Assets), representing 0.01% of the fund’s net assets and 0.06% of Vanguard’s capitalization. The fund’s trustees and officers are also directors and officers of Vanguard.
C. Distributions are determined on a tax basis and may differ from net investment income and realized capital gains for financial reporting purposes. Differences may be permanent or temporary. Permanent differences are reclassified among capital accounts in the financial statements to reflect their tax character. Temporary differences arise when certain items of income, expense, gain, or loss are recognized in different periods for financial statement and tax purposes; these differences will reverse at some time in the future. Differences in classification may also result from the treatment of short-term gains as ordinary income for tax purposes.
54
Health Care Index Fund
During the year ended August 31, 2008, the fund realized $9,780,000 of net capital gains resulting from in-kind redemptions—in which shareholders exchanged fund shares for securities held by the fund rather than for cash. Because such gains are not taxable to the fund, and are not distributed to shareholders, they have been reclassified from accumulated net realized losses to paid-in capital.
For tax purposes, at August 31, 2008, the fund had $7,011,000 of ordinary income available for distribution. The fund had available realized losses of $10,277,000 to offset future net capital gains of $207,000 through August 31, 2014, $343,000 through August 31, 2015, $3,126,000 through August 31, 2016, and $6,601,000 through August 31, 2017.
At August 31, 2008, the cost of investment securities for tax purposes was $768,452,000. Net unrealized depreciation of investment securities for tax purposes was $19,119,000, consisting of unrealized gains of $59,099,000 on securities that had risen in value since their purchase and $78,218,000 in unrealized losses on securities that had fallen in value since their purchase.
D. During the year ended August 31, 2008, the fund purchased $282,902,000 of investment securities and sold $109,465,000 of investment securities, other than temporary cash investments.
E. Capital share transactions for each class of shares were:
| | | Year Ended August 31, |
| | 2008 | | | 2007 |
| Amount | Shares | | Amount | Shares |
| ($000) | (000) | | ($000) | (000) |
Admiral Shares | | | | | |
Issued | 26,987 | 923 | | 29,033 | 979 |
Issued in Lieu of Cash Distributions | 847 | 28 | | 449 | 16 |
Redeemed1 | (17,703) | (622) | | (12,448) | (423) |
Net Increase (Decrease)—Admiral Shares | 10,131 | 329 | | 17,034 | 572 |
ETF Shares | | | | | |
Issued | 222,891 | 3,800 | | 290,709 | 4,901 |
Issued in Lieu of Cash Distributions | — | — | | — | — |
Redeemed1 | (60,880) | (1,100) | | (201,624) | (3,400) |
Net Increase (Decrease)—ETF Shares | 162,011 | 2,700 | | 89,085 | 1,501 |
F. In September 2006, the Financial Accounting Standards Board issued Statement of Financial Accounting Standards No. 157 (“FAS 157”), “Fair Value Measurements.” FAS 157 establishes a framework for measuring fair value and expands disclosures about fair value measurements in financial statements.
The various inputs that may be used to determine the value of the fund’s investments are summarized in three broad levels. The inputs or methodologies used for valuing securities are not necessarily an indication of the risk associated with investing in those securities.
Level 1—Quoted prices in active markets for identical securities.
Level 2—Other significant observable inputs (including quoted prices for similar securities, interest rates, prepayment speeds, credit risk, etc.).
Level 3—Significant unobservable inputs (including the fund’s own assumptions used to determine the fair value of investments).
At August 31, 2008, 100% of the fund’s investments were valued based on Level 1 inputs.
1 Net of redemption fees of $106,000 and $52,000 (fund totals).
55
Industrials Index Fund
Fund Profile
As of August 31, 2008
Portfolio Characteristics | | |
| | Target | Broad |
| Fund | Index1 | Index2 |
Number of Stocks | 357 | 357 | 2,481 |
Median Market Cap | $26.0B | $26.0B | $32.1B |
Price/Earnings Ratio | 15.8x | 15.8x | 16.8x |
Price/Book Ratio | 2.7x | 2.7x | 2.4x |
Yield3 | | 2.0% | 2.0% |
Admiral Shares | 1.7% | | |
ETF Shares | 1.8% | | |
Return on Equity | 20.0% | 20.0% | 20.1% |
Earnings Growth Rate | 19.8% | 19.8% | 18.4% |
Foreign Holdings | 0.0% | 0.0% | 0.0% |
Turnover Rate | 7% | — | — |
Expense Ratio (8/31/2007)4 | — | — |
Admiral Shares | 0.26% | | |
ETF Shares | 0.22% | | |
Short-Term Reserves | 0.0% | — | — |
Volatility Measures5 | |
| Fund Versus | Fund Versus |
| Target Index1 | Broad Index2 |
R-Squared | 1.00 | 0.73 |
Beta | 1.00 | 0.98 |
Industry Diversification (% of equity exposure) |
| |
Aerospace & Defense | 20.1% |
Air Freight & Logistics | 5.5 |
Airlines | 1.3 |
Building Products | 1.2 |
Commercial Services & Supplies | 4.2 |
Construction & Engineering | 3.5 |
Construction & Farm Machinery & Heavy Trucks | 8.6 |
Electrical Components & Equipment | 6.5 |
Environmental & Facilities Services | 2.9 |
Industrial Conglomerates | 22.3 |
Industrial Machinery | 10.3 |
Office Services & Supplies | 1.3 |
Railroads | 8.3 |
Trading Companies & Distributors | 1.6 |
Trucking | 1.2 |
Other Industrial | 1.2 |
Ten Largest Holdings6 (% of total net assets) |
| |
General Electric Co. | 16.8% |
United Technologies Corp. | 3.6 |
3M Co. | 2.9 |
The Boeing Co. | 2.8 |
United Parcel Service, Inc. | 2.6 |
Caterpillar, Inc. | 2.6 |
Union Pacific Corp. | 2.5 |
Lockheed Martin Corp. | 2.4 |
Burlington Northern Santa Fe Corp. | 2.2 |
Emerson Electric Co. | 2.2 |
Top Ten | 40.6% |
1 MSCI US IMI/Industrials.
2 MSCI US IMI/2500.
3 30-day SEC yield for the fund; annualized dividend yield for the indexes. See the Glossary.
4 Expense ratios shown are from the prospectus dated December 10, 2007. Expense ratios for the fiscal year ended August 31, 2008, were 0.25% for Admiral Shares and 0.20% for ETF Shares.
5 For an explanation of R-squared, beta, and other terms used here, see the Glossary.
6 The holdings listed exclude any temporary cash investments and equity index products.
56
Industrials Index Fund
Performance Summary
All of the returns in this report represent past performance, which is not a guarantee of future results that may be achieved by the fund. (Current performance may be lower or higher than the performance data cited. For performance data current to the most recent month-end, visit our website at www.vanguard.com/performance.) Note, too, that both investment returns and principal value can fluctuate widely, so an investor’s shares, when sold, could be worth more or less than their original cost. The returns shown do not reflect taxes that a shareholder would pay on fund distributions or on the sale of fund shares.
Cumulative Performance: September 23, 2004–August 31, 2008
Initial Investment of $10,000
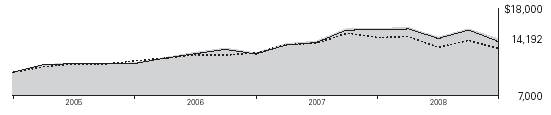
| Average Annual Total Returns | Final Value |
| Periods Ended August 31, 2008 | of a $10,000 |
| One Year | Since Inception1 | Investment |
Industrials Index Fund ETF Shares Net Asset Value | –8.65% | 9.30% | $14,192 |
Industrials Index Fund ETF Shares Market Price | –8.46 | 9.30 | 14,193 |
MSCI US IMI/2500 | –9.90 | 6.84 | 12,973 |
MSCI US IMI/Industrials | –8.54 | 9.02 | 14,049 |
| | | Final Value |
| | | of a $100,000 |
| One Year | Since Inception1 | Investment |
Industrials Index Fund Admiral Shares2 | –8.67% | 1.18% | $102,759 |
MSCI US IMI/2500 | –9.90 | 0.84 | 101,954 |
MSCI US IMI/Industrials | –8.54 | 1.34 | 103,120 |
1 Performance for the fund and its comparative standards is calculated since the following inception dates: September 23, 2004, for ETF Shares; May 8, 2006, for Admiral Shares.
2 Total returns do not reflect the 2% fee assessed on redemptions of shares held for less than one year.
57
Industrials Index Fund
Fiscal-Year Total Returns (%): September 23, 2004–August 31, 2008
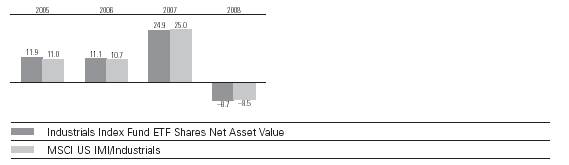
Cumulative Returns: ETF Shares, September 23, 2004–August 31, 2008 |
| | Cumulative |
| | Since |
| One Year | Inception |
Industrials Index Fund ETF Shares Market Price | –8.46% | 41.93% |
Industrials Index Fund ETF Shares Net Asset Value | –8.65 | 41.92 |
MSCI US IMI/Industrials | –8.54 | 40.49 |
Average Annual Total Returns: Periods Ended June 30, 2008
This table presents average annual total returns through the latest calendar quarter—rather than through the end of the fiscal period. Securities and Exchange Commission rules require that we provide this information.
| | | Since |
| Inception Date | One Year | Inception |
ETF Shares | 9/23/2004 | | |
Market Price | | –11.51% | 8.76% |
Net Asset Value | | –11.54 | 8.78 |
Admiral Shares1 | 5/8/2006 | –11.59 | –0.27 |
1 Total returns do not reflect the 2% fee assessed on redemptions of shares held for less than one year. Note: See Financial Highlights tables for dividend and capital gains information.
58
Industrials Index Fund
Financial Statements
Statement of Net Assets
As of August 31, 2008
The fund provides a complete list of its holdings four times in each fiscal year, at the quarter-ends. For the second and fourth fiscal quarters, the lists appear in the fund’s semiannual and annual reports to shareholders. For the first and third fiscal quarters, the fund files the lists with the Securities and Exchange Commission on Form N-Q. Shareholders can look up the fund’s Forms N-Q on the SEC’s website at www.sec.gov. Forms N-Q may also be reviewed and copied at the SEC’s Public Reference Room (see the back cover of this report for further information).
| | | Market |
| | | Value• |
| | Shares | ($000) |
Common Stocks (100.0%) | | |
Aerospace & Defense (20.1%) | | |
| United Technologies Corp. | 198,201 | 13,000 |
| The Boeing Co. | 153,040 | 10,033 |
| Lockheed Martin Corp. | 73,795 | 8,593 |
| Honeywell International Inc. | 151,018 | 7,577 |
| General Dynamics Corp. | 72,614 | 6,702 |
| Raytheon Co. | 90,683 | 5,440 |
| Northrop Grumman Corp. | 69,663 | 4,796 |
| Precision Castparts Corp. | 29,863 | 3,084 |
| L-3 Communications | | |
| Holdings, Inc. | 26,296 | 2,733 |
| Rockwell Collins, Inc. | 34,460 | 1,812 |
| Goodrich Corp. | 26,814 | 1,374 |
* | Alliant Techsystems, Inc. | 7,058 | 743 |
| DRS Technologies, Inc. | 8,880 | 707 |
| Curtiss-Wright Corp. | 9,593 | 517 |
* | Spirit Aerosystems | | |
| Holdings Inc. | 22,041 | 503 |
* | BE Aerospace, Inc. | 19,954 | 478 |
* | Teledyne Technologies, Inc. | 7,218 | 450 |
* | Hexcel Corp. | 20,567 | 427 |
* | Moog Inc. | 8,266 | 392 |
* | Esterline Technologies Corp. | 6,320 | 357 |
* | Orbital Sciences Corp. | 12,562 | 332 |
* | Ceradyne, Inc. | 5,399 | 243 |
* | TransDigm Group, Inc. | 5,646 | 212 |
| Triumph Group, Inc. | 3,587 | 196 |
* | Axsys Technologies, Inc. | 2,001 | 136 |
| American Science & | | |
| Engineering, Inc. | 2,010 | 134 |
* | AAR Corp. | 8,305 | 132 |
| Cubic Corp. | 3,459 | 96 |
* | DynCorp International Inc. | | |
| Class A | 5,700 | 90 |
* | Aerovironment Inc. | 2,644 | 88 |
* | Ladish Co., Inc. | 3,184 | 85 |
| HEICO Corp. Class A | 2,922 | 84 |
* | GenCorp, Inc. | 10,639 | 83 |
* | Stanley Inc. | 2,230 | 76 |
* | Argon ST, Inc. | 2,866 | 72 |
| HEICO Corp. | 1,178 | 42 |
* | Taser International Inc. | 3,681 | 24 |
* | Applied Energetics, Inc. | 11,713 | 17 |
| | | 71,860 |
Air Freight & Logistics (5.5%) | | |
| United Parcel Service, Inc. | 147,031 | 9,428 |
| FedEx Corp. | 63,148 | 5,230 |
| C.H. Robinson Worldwide Inc. | 36,561 | 1,905 |
| Expeditors International of | | |
| Washington, Inc. | 45,726 | 1,650 |
| UTI Worldwide, Inc. | 19,201 | 386 |
* | Hub Group, Inc. | 7,951 | 318 |
| Forward Air Corp. | 6,220 | 219 |
* | Atlas Air Worldwide | | |
| Holdings, Inc. | 3,052 | 176 |
| Pacer International, Inc. | 7,443 | 157 |
* | Air Transport Services | | |
| Group Inc. | 14,503 | 14 |
| | | 19,483 |
Airlines (1.3%) | | |
| Southwest Airlines Co. | 156,911 | 2,390 |
* | Delta Air Lines Inc. | 62,994 | 512 |
* | AMR Corp. | 42,254 | 437 |
* | Continental Airlines, Inc. | | |
| Class B | 23,628 | 384 |
| Skywest, Inc. | 12,606 | 215 |
* | JetBlue Airways Corp. | 33,931 | 206 |
* | Alaska Air Group, Inc. | 7,796 | 164 |
| UAL Corp. | 13,891 | 154 |
* | Allegiant Travel Co. | 2,669 | 83 |
* | AirTran Holdings, Inc. | 25,372 | 61 |
* | Republic Airways Holdings Inc. | 6,958 | 60 |
* | US Airways Group Inc. | 5,475 | 46 |
| | | 4,712 |
Building Products (1.2%) | | |
| Masco Corp. | 79,063 | 1,507 |
* | USG Corp. | 15,929 | 442 |
* | Owens Corning Inc. | 16,944 | 410 |
| Lennox International Inc. | 10,354 | 383 |
| Simpson Manufacturing Co. | 8,342 | 232 |
| Ameron International Corp. | 1,888 | 220 |
* | NCI Building Systems, Inc. | 4,277 | 164 |
| Armstrong Worldwide | | |
| Industries, Inc. | 4,298 | 160 |
| Quanex Building | | |
| Products Corp. | 8,070 | 133 |
| Apogee Enterprises, Inc. | 6,305 | 126 |
| Universal Forest Products, Inc. | 3,615 | 119 |
| Gibraltar Industries Inc. | 5,190 | 112 |
* | Griffon Corp. | 5,773 | 71 |
| American Woodmark Corp. | 2,200 | 52 |
* | China Architectural | | |
| Engineering Inc. | 3,533 | 29 |
* | Builders FirstSource, Inc. | 4,153 | 21 |
| | | 4,181 |
Commercial Services & Supplies (8.9%) | | |
| Waste Management, Inc. | 105,190 | 3,701 |
| Pitney Bowes, Inc. | 44,500 | 1,520 |
| Republic Services, Inc. | | |
| Class A | 39,148 | 1,287 |
| R.R. Donnelley & Sons Co. | 45,519 | 1,269 |
* | Iron Mountain, Inc. | 40,954 | 1,184 |
* | Allied Waste Industries, Inc. | 83,306 | 1,120 |
| The Dun & Bradstreet Corp. | 11,969 | 1,101 |
* | Stericycle, Inc. | 18,489 | 1,096 |
| Avery Dennison Corp. | 20,545 | 991 |
| Equifax, Inc. | 27,767 | 981 |
| Cintas Corp. | 29,652 | 913 |
| Robert Half International, Inc. | 32,356 | 828 |
| Manpower Inc. | 17,040 | 819 |
* | FTI Consulting, Inc. | 10,764 | 790 |
* | Covanta Holding Corp. | 26,453 | 736 |
* | ChoicePoint Inc. | 14,704 | 715 |
* | Corrections Corp. of America | 26,803 | 713 |
* | Copart, Inc. | 16,146 | 711 |
| The Brink’s Co. | 9,667 | 675 |
| Watson Wyatt & Co. Holdings | 9,168 | 537 |
* | Waste Connections, Inc. | 14,271 | 518 |
* | Monster Worldwide Inc. | 22,359 | 437 |
* | Clean Harbors Inc. | 4,501 | 365 |
* | Tetra Tech, Inc. | 12,648 | 361 |
| IKON Office Solutions, Inc. | 20,110 | 348 |
| Herman Miller, Inc. | 12,090 | 340 |
| EnergySolutions | 15,190 | 281 |
| The Corporate Executive | | |
| Board Co. | 7,354 | 268 |
| ABM Industries Inc. | 9,726 | 256 |
* | Huron Consulting Group Inc. | 3,911 | 252 |
* | United Stationers, Inc. | 5,083 | 252 |
* | Geo Group Inc. | 10,981 | 243 |
| Mine Safety Appliances Co. | 6,535 | 237 |
* | MPS Group, Inc. | 20,372 | 235 |
* | Resources Connection, Inc. | 9,459 | 229 |
* | CoStar Group, Inc. | 3,978 | 210 |
| Deluxe Corp. | 11,108 | 183 |
* | Navigant Consulting, Inc. | 10,371 | 180 |
* | Korn/Ferry International | 10,041 | 179 |
| Knoll, Inc. | 10,735 | 177 |
| Rollins, Inc. | 9,853 | 175 |
| Healthcare Services | | |
| Group, Inc. | 8,840 | 172 |
* | Mobile Mini, Inc. | 7,690 | 164 |
* | TrueBlue, Inc. | 9,513 | 158 |
| G & K Services, Inc. Class A | 4,389 | 151 |
* | Team, Inc. | 3,773 | 144 |
* | Sykes Enterprises, Inc. | 7,118 | 143 |
| Interface, Inc. | 10,852 | 143 |
| Steelcase Inc. | 12,821 | 142 |
| McGrath RentCorp | 4,952 | 141 |
* | American Reprographics Co. | 7,929 | 140 |
| Administaff, Inc. | 5,102 | 140 |
| Comfort Systems USA, Inc. | 9,001 | 137 |
| Viad Corp. | 4,340 | 136 |
* | M&F Worldwide Corp. | 3,005 | 132 |
* | School Specialty, Inc. | 4,307 | 131 |
* | The Advisory Board Co. | 3,891 | 120 |
| Heidrick & Struggles | | |
| International, Inc. | 3,859 | 117 |
| American Ecology Corp. | 3,562 | 116 |
* | Cenveo Inc. | 11,114 | 115 |
| Kelly Services, Inc. Class A | 5,443 | 105 |
* | Hill International Inc. | 5,326 | 103 |
| HNI Corp. | 4,413 | 102 |
* | Acco Brands Corp. | 11,779 | 100 |
* | Exponent, Inc. | 3,174 | 98 |
* | CRA International Inc. | 2,407 | 96 |
| Ennis, Inc. | 5,607 | 93 |
* | GeoEye Inc. | 3,665 | 91 |
* | Consolidated Graphics, Inc. | 2,265 | 88 |
* | CBIZ Inc. | 10,268 | 87 |
* | Kforce Inc. | 7,840 | 84 |
* | Innerworkings, Inc. | 6,847 | 81 |
| CDI Corp. | 3,228 | 81 |
| Bowne & Co., Inc. | 5,902 | 71 |
* | Fuel-Tech N.V. | 3,856 | 71 |
* | Spherion Corp. | 12,567 | 65 |
59
Industrials Index Fund
| | | Market |
| | | Value• |
| | Shares | ($000) |
* | Metalico, Inc. | 4,623 | 60 |
| Kimball International, Inc. | | |
| Class B | 5,217 | 55 |
| Schawk, Inc. | 3,455 | 54 |
* | Hudson Highland Group, Inc. | 5,849 | 54 |
| Courier Corp. | 2,326 | 50 |
* | Duff & Phelps Corp. | 2,297 | 47 |
* | EnerNOC Inc. | 2,962 | 46 |
* | Volt Information Sciences Inc. | 3,251 | 46 |
* | LECG Corp. | 5,394 | 44 |
* | First Advantage Corp. Class A | 2,323 | 39 |
| The Standard Register Co. | 2,230 | 25 |
| | | 31,991 |
Construction & Engineering (3.5%) | |
| Fluor Corp. | 38,032 | 3,047 |
* | Jacobs Engineering Group Inc. | 26,113 | 1,928 |
* | Foster Wheeler Ltd. | 30,902 | 1,536 |
* | Quanta Services, Inc. | 36,802 | 1,175 |
| KBR Inc. | 36,399 | 894 |
* | Shaw Group, Inc. | 17,792 | 881 |
* | URS Corp. | 18,113 | 869 |
* | EMCOR Group, Inc. | 14,585 | 497 |
* | Aecom Technology Corp. | 14,108 | 451 |
| Granite Construction Co. | 7,089 | 260 |
* | Layne Christensen Co. | 4,135 | 227 |
* | Perini Corp. | 5,594 | 149 |
* | Mastec Inc. | 10,170 | 144 |
* | Dycom Industries, Inc. | 8,766 | 141 |
* | Insituform Technologies Inc. | | |
| Class A | 5,962 | 109 |
* | Pike Electric Corp. | 4,202 | 79 |
| Great Lakes Dredge & | | |
| Dock Co. | 8,811 | 66 |
| | | 12,453 |
Electrical Equipment (6.5%) | | |
| Emerson Electric Co. | 167,379 | 7,833 |
* | First Solar, Inc. | 8,549 | 2,365 |
| Cooper Industries, Inc. | | |
| Class A | 37,305 | 1,777 |
| Rockwell Automation, Inc. | 29,886 | 1,411 |
| Roper Industries Inc. | 19,174 | 1,133 |
| Ametek, Inc. | 22,899 | 1,112 |
* | SunPower Corp. Class A | 8,183 | 798 |
* | Energy Conversion | | |
| Devices, Inc. | 8,683 | 653 |
| Woodward Governor Co. | 12,999 | 602 |
* | Thomas & Betts Corp. | 12,464 | 574 |
* | General Cable Corp. | 11,308 | 557 |
| Hubbell Inc. Class B | 10,483 | 456 |
* | GrafTech International Ltd. | 22,128 | 450 |
| Brady Corp. Class A | 10,856 | 399 |
| Acuity Brands, Inc. | 8,759 | 381 |
| Belden Inc. | 9,419 | 346 |
| Regal-Beloit Corp. | 6,896 | 324 |
| Baldor Electric Co. | 8,898 | 317 |
* | II-VI, Inc. | 5,473 | 240 |
* | EnerSys | 7,992 | 225 |
* | American | | |
| Superconductor Corp. | 8,554 | 210 |
* | Evergreen Solar, Inc. | 22,207 | 209 |
| A.O. Smith Corp. | 4,328 | 178 |
| Franklin Electric, Inc. | 3,948 | 171 |
* | Polypore International Inc. | 5,226 | 143 |
* | FuelCell Energy, Inc. | 14,018 | 97 |
* | Powell Industries, Inc. | 1,724 | 76 |
| Encore Wire Corp. | 3,967 | 76 |
| Vicor Corp. | 4,354 | 44 |
* | Plug Power, Inc. | 16,170 | 44 |
* | Power-One, Inc. | 15,204 | 34 |
* | Fushi Copperweld, Inc. | 2,647 | 30 |
* | Orion Energy Systems Inc. | 4,038 | 24 |
* | Medis Technology Ltd. | 5,921 | 19 |
| | | 23,308 |
Industrial Conglomerates (22.5%) | | |
| General Electric Co. | 2,136,779 | 60,043 |
| 3M Co. | 143,434 | 10,270 |
| Tyco International, Ltd. | 106,249 | 4,556 |
| Textron, Inc. | 53,432 | 2,196 |
* | McDermott International, Inc. | 48,549 | 1,686 |
| Teleflex Inc. | 8,490 | 548 |
| Carlisle Co., Inc. | 13,240 | 429 |
| Otter Tail Corp. | 6,122 | 243 |
| Raven Industries, Inc. | 3,575 | 162 |
| Tredegar Corp. | 5,685 | 113 |
| Seaboard Corp. | 80 | 104 |
| | | 80,350 |
Machinery (18.9%) | | |
| Caterpillar, Inc. | 131,871 | 9,327 |
| Deere & Co. | 92,386 | 6,520 |
| Danaher Corp. | 54,612 | 4,455 |
| Illinois Tool Works, Inc. | 89,658 | 4,448 |
| PACCAR, Inc. | 74,366 | 3,202 |
| Cummins Inc. | 41,367 | 2,695 |
| Ingersoll-Rand Co. | 68,200 | 2,519 |
| Eaton Corp. | 33,523 | 2,453 |
| ITT Industries, Inc. | 37,002 | 2,359 |
| Parker Hannifin Corp. | 35,969 | 2,305 |
| Dover Corp. | 40,598 | 2,005 |
| Joy Global Inc. | 23,140 | 1,644 |
| Flowserve Corp. | 12,351 | 1,632 |
| SPX Corp. | 11,451 | 1,365 |
* | AGCO Corp. | 19,665 | 1,212 |
| Bucyrus International, Inc. | 16,042 | 1,121 |
* | Terex Corp. | 21,676 | 1,090 |
| Pall Corp. | 26,296 | 1,068 |
| Harsco Corp. | 18,064 | 951 |
| Pentair, Inc. | 20,181 | 742 |
| Lincoln Electric Holdings, Inc. | 9,165 | 740 |
| The Manitowoc Co., Inc. | 27,872 | 702 |
| Donaldson Co., Inc. | 15,053 | 661 |
| IDEX Corp. | 17,677 | 655 |
| Trinity Industries, Inc. | 17,366 | 625 |
| Wabtec Corp. | 9,884 | 584 |
| Kennametal, Inc. | 16,523 | 582 |
| The Timken Co. | 17,501 | 566 |
* | Gardner Denver Inc. | 11,280 | 509 |
| Graco, Inc. | 13,042 | 498 |
| Valmont Industries, Inc. | 3,912 | 418 |
| CLARCOR Inc. | 10,361 | 414 |
| Crane Co. | 10,320 | 379 |
| Actuant Corp. | 11,976 | 378 |
| Nordson Corp. | 6,500 | 349 |
| The Toro Co. | 8,176 | 334 |
| Kaydon Corp. | 5,975 | 333 |
| Robbins & Myers, Inc. | 6,320 | 283 |
* | Chart Industries, Inc. | 6,071 | 280 |
* | ESCO Technologies Inc. | 5,571 | 265 |
| Barnes Group, Inc. | 9,913 | 239 |
| Mueller Industries Inc. | 7,998 | 224 |
| Oshkosh Truck Corp. | 14,521 | 224 |
| CIRCOR International, Inc. | 3,433 | 207 |
^ | Lindsay Manufacturing Co. | 2,427 | 199 |
| Mueller Water Products, Inc. | 18,543 | 192 |
* | RBC Bearings Inc. | 4,711 | 188 |
| Titan International, Inc. | 7,030 | 188 |
* | The Middleby Corp. | 3,468 | 185 |
* | EnPro Industries, Inc. | 4,373 | 184 |
| Watts Water Technologies, Inc. | 6,349 | 180 |
| Albany International Corp. | 5,691 | 175 |
| Federal Signal Corp. | 10,362 | 166 |
| Briggs & Stratton Corp. | 10,760 | 161 |
| NACCO Industries, Inc. | | |
| Class A | 1,223 | 144 |
* | Astec Industries, Inc. | 3,867 | 133 |
| Gorman-Rupp Co. | 3,232 | 130 |
| Badger Meter, Inc. | 2,677 | 123 |
| Tennant Co. | 3,693 | 115 |
* | Columbus McKinnon Corp. | 4,023 | 110 |
* | Blount International, Inc. | 8,652 | 109 |
| Freightcar America Inc. | 2,542 | 94 |
| Cascade Corp. | 1,775 | 92 |
* | L.B. Foster Co. Class A | 2,366 | 91 |
| Sun Hydraulics Corp. | 2,693 | 89 |
| Sauer-Danfoss, Inc. | 2,636 | 86 |
| Dynamic Materials Corp. | 2,702 | 83 |
| Ampco-Pittsburgh Corp. | 1,897 | 82 |
* | John Bean Technologies Corp. | 6,140 | 80 |
* | Tecumseh Products Co. | | |
| Class A | 2,943 | 78 |
* | Titan Machinery, Inc. | 2,796 | 73 |
| The Greenbrier Cos., Inc. | 3,493 | 70 |
| Mueller Water Products, Inc. | | |
| Class A | 6,124 | 67 |
* | Force Protection, Inc. | 14,660 | 58 |
| Wabash National Corp. | 6,647 | 58 |
* | Commercial Vehicle Group Inc. | 4,618 | 47 |
* | 3D Systems Corp. | 3,727 | 46 |
| American Railcar | | |
| Industries, Inc. | 2,403 | 39 |
* | TriMas Corp. | 3,602 | 28 |
* | TurboChef Technologies, Inc. | 4,371 | 27 |
* | Tecumseh Products Co. | | |
| Class B | 725 | 18 |
* | Accuride Corp. | 6,294 | 9 |
| | | 67,559 |
Marine (0.5%) | | |
* | Kirby Corp. | 10,985 | 503 |
| Alexander & Baldwin, Inc. | 8,886 | 398 |
| Genco Shipping and | | |
| Trading Ltd. | 5,792 | 363 |
| Eagle Bulk Shipping Inc. | 10,060 | 266 |
* | American Commercial | | |
| Lines Inc. | 8,739 | 108 |
| Horizon Lines Inc. | 6,424 | 83 |
* | TBS International Ltd. | 2,870 | 83 |
| Paragon Shipping, Inc. | 4,336 | 66 |
| | | 1,870 |
Road & Rail (9.4%) | | |
| Union Pacific Corp. | 106,188 | 8,909 |
| Burlington Northern | | |
| Santa Fe Corp. | 73,945 | 7,942 |
| Norfolk Southern Corp. | 80,554 | 5,923 |
| CSX Corp. | 86,759 | 5,612 |
* | Kansas City Southern | 16,697 | 859 |
| Ryder System, Inc. | 12,394 | 800 |
| J.B. Hunt Transport | | |
| Services, Inc. | 17,380 | 633 |
| Landstar System, Inc. | 11,306 | 554 |
| Con-way, Inc. | 9,775 | 480 |
* | Genesee & Wyoming Inc. | | |
| Class A | 6,785 | 292 |
| Knight Transportation, Inc. | 12,943 | 232 |
| Werner Enterprises, Inc. | 9,892 | 226 |
| Heartland Express, Inc. | 13,650 | 225 |
60
Industrials Index Fund
| | | Market |
| | | Value• |
| | Shares | ($000) |
* | YRC Worldwide, Inc. | 12,240 | 221 |
* | Old Dominion Freight Line, Inc. | 6,070 | 202 |
* | Hertz Global Holdings Inc. | 19,173 | 182 |
| Arkansas Best Corp. | 5,160 | 179 |
* | Avis Budget Group, Inc. | 19,325 | 147 |
* | Amerco, Inc. | 1,506 | 63 |
* | Universal Truckload | | |
| Services, Inc. | 1,437 | 35 |
* | Dollar Thrifty Automotive | | |
| Group, Inc. | 4,973 | 23 |
| | | 33,739 |
Trading Companies & Distributors (1.6%) | | |
| Fastenal Co. | 27,173 | 1,411 |
| W.W. Grainger, Inc. | 13,944 | 1,255 |
| MSC Industrial Direct Co., Inc. | | |
| Class A | 9,638 | 491 |
| GATX Corp. | 9,870 | 433 |
* | WESCO International, Inc. | 9,070 | 349 |
| Watsco, Inc. | 5,245 | 268 |
| Applied Industrial | | |
| Technology, Inc. | 8,255 | 240 |
* | United Rentals, Inc. | 10,286 | 166 |
| Kaman Corp. Class A | 5,435 | 164 |
* | Beacon Roofing Supply, Inc. | 9,579 | 156 |
| Aircastle Ltd. | 10,249 | 136 |
* | RSC Holdings Inc. | 12,175 | 124 |
* | Interline Brands, Inc. | 6,358 | 102 |
| TAL International Group, Inc. | 3,770 | 93 |
* | Rush Enterprises, Inc. Class A | 5,750 | 76 |
* | H&E Equipment Services, Inc. | 4,879 | 69 |
| Houston Wire & Cable Co. | 3,396 | 57 |
| Textainer Group Holdings Ltd. | 2,565 | 46 |
| Lawson Products, Inc. | 927 | 28 |
* | Rush Enterprises, Inc. Class B | 1,984 | 26 |
| | | 5,690 |
Transportation Infrastructure (0.1%) | | |
| Macquarie Infrastructure | | |
| Co. LLC | 9,239 | 192 |
Total Common Stocks | | |
(Cost $378,827) | | 357,388 |
Temporary Cash Investment (0.0%) | |
1,2 | Vanguard Market Liquidity | | |
| Fund, 2.389% | | |
| (Cost $78) | 78,302 | 78 |
Total Investments (100.0%) | | |
(Cost $378,905) | | 357,466 |
Other Assets and Liabilities (0.0%) | |
Other Assets | | 2,294 |
Liabilities2 | | (2,239) |
| | | 55 |
Net Assets (100%) | | 357,521 |
At August 31, 2008, net assets consisted of: |
| Amount |
| ($000) |
Paid-in Capital | 380,202 |
Undistributed Net Investment Income | 2,797 |
Accumulated Net Realized Losses | (4,039) |
Unrealized Appreciation (Depreciation) | (21,439) |
Net Assets | 357,521 |
| |
| |
Admiral Shares—Net Assets | |
Applicable to 316,878 outstanding | |
$.001 par value shares of beneficial | |
interest (unlimited authorization) | 10,836 |
Net Asset Value Per Share— | |
Admiral Shares | $34.20 |
| |
| |
ETF Shares—Net Assets | |
Applicable to 5,201,305 outstanding | |
$.001 par value shares of beneficial | |
interest (unlimited authorization) | 346,685 |
Net Asset Value Per Share— | |
ETF Shares | $66.65 |
• See Note A in Notes to Financial Statements.
* Non-income-producing security.
^ Part of security position is on loan to broker-dealers. The total value of securities on loan is $74,000.
1 Affiliated money market fund available only to Vanguard funds and certain trusts and accounts managed by Vanguard. Rate shown is the 7-day yield.
2 Includes $78,000 of collateral received for securities on loan.
See accompanying Notes, which are an integral part of the Financial Statements.
61
Industrials Index Fund
Statement of Operations
| Year Ended |
| August 31, 2008 |
| ($000) |
Investment Income | |
Income | |
Dividends | 4,929 |
Interest1 | 4 |
Total Income | 4,933 |
Expenses | |
The Vanguard Group—Note B | |
Investment Advisory Services | 36 |
Management and Administrative | |
Admiral Shares | 15 |
ETF Shares | 339 |
Marketing and Distribution | |
Admiral Shares | 1 |
ETF Shares | 64 |
Custodian Fees | 28 |
Auditing Fees | 23 |
Shareholders’ Reports—Admiral Shares | — |
Shareholders’ Reports—ETF Shares | 16 |
Total Expenses | 522 |
Net Investment Income | 4,411 |
Realized Net Gain (Loss) on | |
Investment Securities Sold | 18,166 |
Change in Unrealized Appreciation | |
(Depreciation) of Investment Securities | (46,076) |
Net Increase (Decrease) in Net Assets | |
Resulting from Operations | (23,499) |
Statement of Changes in Net Assets
| Year Ended August 31, |
| 2008 | 2007 |
| ($000) | ($000) |
Increase (Decrease) in Net Assets | | |
Operations | | |
Net Investment Income | 4,411 | 2,607 |
Realized Net Gain (Loss) | 18,166 | 7,876 |
Change in Unrealized Appreciation (Depreciation) | (46,076) | 25,565 |
Net Increase (Decrease) in Net Assets Resulting from Operations | (23,499) | 36,048 |
Distributions | | |
Net Investment Income | | |
Admiral Shares | (67) | (4) |
ETF Shares | (3,337) | (1,637) |
Realized Capital Gain | | |
Admiral Shares | — | — |
ETF Shares | — | — |
Total Distributions | (3,404) | (1,641) |
Capital Share Transactions | | |
Admiral Shares | 7,721 | 3,509 |
ETF Shares | 143,649 | 75,257 |
Net Increase (Decrease) from Capital Share Transactions | 151,370 | 78,766 |
Total Increase (Decrease) | 124,467 | 113,173 |
Net Assets | | |
Beginning of Period | 233,054 | 119,881 |
End of Period2 | 357,521 | 233,054 |
1 Interest income from an affiliated company of the fund was $4,000.
2 Net Assets—End of Period includes undistributed net investment income of $2,797,000 and $1,790,000. See accompanying Notes, which are an integral part of the Financial Statements.
62
Industrials Index Fund
Financial Highlights
Admiral Shares | | | |
| | | |
| | | May 8, |
| Year Ended | 20061 to |
| August 31, | Aug. 31, |
For a Share Outstanding Throughout Each Period | 2008 | 2007 | 2006 |
Net Asset Value, Beginning of Period | $37.94 | $30.72 | $34.10 |
Investment Operations | | | |
Net Investment Income | .5762 | .5102 | .1642 |
Net Realized and Unrealized Gain (Loss) on Investments | (3.816) | 7.090 | (3.544) |
Total from Investment Operations | (3.240) | 7.600 | (3.380) |
Distributions | | | |
Dividends from Net Investment Income | (.500) | (.380) | — |
Distributions from Realized Capital Gains | — | — | — |
Total Distributions | (.500) | (.380) | — |
Net Asset Value, End of Period | $34.20 | $37.94 | $30.72 |
| | | |
| | | |
Total Return3 | –8.67% | 24.90% | –9.91% |
| | | |
| | | |
Ratios/Supplemental Data | | | |
Net Assets, End of Period (Millions) | $11 | $4 | $0.2 |
Ratio of Total Expenses to Average Net Assets | 0.25% | 0.26% | 0.28%4 |
Ratio of Net Investment Income to Average Net Assets | 1.63% | 1.46% | 1.35%4 |
Portfolio Turnover Rate5 | 7% | 13% | 9% |
ETF Shares | | | | |
| | | | |
| | | | Sept. 23, |
| | 20041 to |
| Year Ended August 31, | Aug. 31, |
For a Share Outstanding Throughout Each Period | 2008 | 2007 | 2006 | 2005 |
Net Asset Value, Beginning of Period | $73.94 | $59.85 | $54.30 | $48.79 |
Investment Operations | | | | |
Net Investment Income | 1.1572 | 1.0262 | .8422 | .650 |
Net Realized and Unrealized Gain (Loss) on Investments | (7.466) | 13.808 | 5.160 | 5.180 |
Total from Investment Operations | (6.309) | 14.834 | 6.002 | 5.830 |
Distributions | | | | |
Dividends from Net Investment Income | (.981) | (.744) | (.452) | (.320) |
Distributions from Realized Capital Gains | — | — | — | — |
Total Distributions | (.981) | (.744) | (.452) | (.320) |
Net Asset Value, End of Period | $66.65 | $73.94 | $59.85 | $54.30 |
| | | | |
| | | | |
Total Return | –8.65% | 24.95% | 11.08% | 11.94% |
| | | | |
| | | | |
Ratios/Supplemental Data | | | | |
Net Assets, End of Period (Millions) | $347 | $229 | $120 | $16 |
Ratio of Total Expenses to Average Net Assets | 0.20% | 0.22% | 0.25% | 0.26%4 |
Ratio of Net Investment Income to Average Net Assets | 1.68% | 1.50% | 1.38% | 1.30%4 |
Portfolio Turnover Rate5 | 7% | 13% | 9% | 11% |
1 Inception.
2 Calculated based on average shares outstanding.
3 Total returns do not reflect the 2% fee assessed on redemptions of shares held for less than one year.
4 Annualized.
5 Excludes the value of portfolio securities received or delivered as a result of in-kind purchases or redemptions of the fund’s capital shares, including ETF Creation Units. See accompanying Notes, which are an integral part of the Financial Statements.
63
Industrials Index Fund
Notes to Financial Statements
Vanguard Industrials Index Fund is registered under the Investment Company Act of 1940 as an open-end investment company, or mutual fund. The fund offers two classes of shares, Admiral Shares and ETF Shares. Admiral Shares are available to any investor who meets the fund’s minimum purchase requirements. ETF Shares were listed for trading on the American Stock Exchange through September 18, 2008, and on the NYSE Arca, Inc., thereafter; they can be purchased and sold through a broker.
A. The following significant accounting policies conform to generally accepted accounting principles for U.S. mutual funds. The fund consistently follows such policies in preparing its financial statements.
1. Security Valuation: Securities are valued as of the close of trading on the New York Stock Exchange (generally 4 p.m., Eastern time) on the valuation date. Equity securities are valued at the latest quoted sales prices or official closing prices taken from the primary market in which each security trades; such securities not traded on the valuation date are valued at the mean of the latest quoted bid and asked prices. Securities for which market quotations are not readily available, or whose values have been materially affected by events occurring before the fund’s pricing time but after the close of the securities’ primary markets, are valued by methods deemed by the board of trustees to represent fair value. Investments in Vanguard Market Liquidity Fund are valued at that fund’s net asset value.
2. Federal Income Taxes: The fund intends to continue to qualify as a regulated investment company and distribute all of its taxable income. Management has analyzed the fund’s tax positions taken on federal income tax returns for all open tax years (tax years ended August 31, 2005–2008), and has concluded that no provision for federal income tax is required in the fund’s financial statements.
3. Distributions: Distributions to shareholders are recorded on the ex-dividend date.
4. Security Lending: The fund may lend its securities to qualified institutional borrowers to earn additional income. Security loans are required to be secured at all times by collateral at least equal to the market value of securities loaned. The fund invests cash collateral received in Vanguard Market Liquidity Fund, and records a liability for the return of the collateral, during the period the securities are on loan. Security lending income represents the income earned on investing cash collateral, less expenses associated with the loan.
5. Other: Dividend income is recorded on the ex-dividend date. Interest income includes income distributions received from Vanguard Market Liquidity Fund and is accrued daily. Security transactions are accounted for on the date securities are bought or sold. Costs used to determine realized gains (losses) on the sale of investment securities are those of the specific securities sold. Fees assessed on redemptions of Admiral Shares are credited to paid-in capital.
Each class of shares has equal rights as to assets and earnings, except that each class separately bears certain class-specific expenses related to maintenance of shareholder accounts (included in Management and Administrative expenses) and shareholder reporting. Marketing and distribution expenses are allocated to each class of shares based on a method approved by the board of trustees. Income, other non-class-specific expenses, and gains and losses on investments are allocated to each class of shares based on its relative net assets.
B. The Vanguard Group furnishes at cost investment advisory, corporate management, administrative, marketing, and distribution services. The costs of such services are allocated to the fund under methods approved by the board of trustees. The fund has committed to provide up to 0.40% of its net assets in capital contributions to Vanguard. At August 31, 2008, the fund had contributed capital of $25,000 to Vanguard (included in Other Assets), representing 0.01% of the fund’s net assets and 0.02% of Vanguard’s capitalization. The fund’s trustees and officers are also directors and officers of Vanguard.
C. Distributions are determined on a tax basis and may differ from net investment income and realized capital gains for financial reporting purposes. Differences may be permanent or temporary. Permanent differences are reclassified among capital accounts in the financial statements to reflect their tax character. Temporary differences arise when certain items of income, expense, gain, or loss are recognized in different periods for financial statement and tax purposes; these differences will reverse at some time in the future. Differences in classification may also result from the treatment of short-term gains as ordinary income for tax purposes.
During the year ended August 31, 2008, the fund realized $21,887,000 of net capital gains resulting from in-kind redemptions—in which shareholders exchanged fund shares for securities held by the fund rather than for cash. Because such gains are not taxable to the fund, and are not distributed to shareholders, they have been reclassified from accumulated net realized losses to paid-in capital.
64
Industrials Index Fund
For tax purposes, at August 31, 2008, the fund had $2,936,000 of ordinary income available for distribution. The fund had available realized losses of $3,935,000 to offset future net capital gains of $18,000 through August 31, 2014, $283,000 through August 31, 2015, $552,000 through August 31, 2016, and $3,082,000 through August 31, 2017.
At August 31, 2008, the cost of investment securities for tax purposes was $379,011,000. Net unrealized depreciation of investment securities for tax purposes was $21,545,000, consisting of unrealized gains of $14,420,000 on securities that had risen in value since their purchase and $35,965,000 in unrealized losses on securities that had fallen in value since their purchase.
D. During the year ended August 31, 2008, the fund purchased $280,279,000 of investment securities and sold $126,497,000 of investment securities, other than temporary cash investments.
E. Capital share transactions for each class of shares were:
| | | Year Ended August 31, |
| | 2008 | | | 2007 |
| Amount | Shares | | Amount | Shares |
| ($000) | (000) | | ($000) | (000) |
Admiral Shares | | | | | |
Issued | 9,334 | 262 | | 3,732 | 102 |
Issued in Lieu of Cash Distributions | 56 | 2 | | 2 | — |
Redeemed1 | (1,669) | (48) | | (225) | (7) |
Net Increase (Decrease)—Admiral Shares | 7,721 | 216 | | 3,509 | 95 |
ETF Shares | | | | | |
Issued | 250,498 | 3,601 | | 104,732 | 1,500 |
Issued in Lieu of Cash Distributions | — | — | | — | — |
Redeemed1 | (106,849) | (1,500) | | (29,475) | (400) |
Net Increase (Decrease)—ETF Shares | 143,649 | 2,101 | | 75,257 | 1,100 |
F. In September 2006, the Financial Accounting Standards Board issued Statement of Financial Accounting Standards No. 157 (“FAS 157”), “Fair Value Measurements.” FAS 157 establishes a framework for measuring fair value and expands disclosures about fair value measurements in financial statements.
The various inputs that may be used to determine the value of the fund’s investments are summarized in three broad levels. The inputs or methodologies used for valuing securities are not necessarily an indication of the risk associated with investing in those securities.
Level 1—Quoted prices in active markets for identical securities.
Level 2—Other significant observable inputs (including quoted prices for similar securities, interest rates, prepayment speeds, credit risk, etc.).
Level 3—Significant unobservable inputs (including the fund’s own assumptions used to determine the fair value of investments).
At August 31, 2008, 100% of the fund’s investments were valued based on Level 1 inputs.
1 Net of redemption fees of $25,000 and $4,000 (fund totals).
65
Information Technology Index Fund
Fund Profile
As of August 31, 2008
Portfolio Characteristics | | |
| | Target | Broad |
| Fund | Index1 | Index2 |
Number of Stocks | 398 | 406 | 2,481 |
Median Market Cap | $85.2B | $85.2B | $32.1B |
Price/Earnings Ratio | 19.6x | 19.6x | 16.8x |
Price/Book Ratio | 3.5x | 3.5x | 2.4x |
Yield3 | | 0.8% | 2.0% |
Admiral Shares | 0.5% | | |
ETF Shares | 0.6% | | |
Return on Equity | 20.9% | 20.9% | 20.1% |
Earnings Growth Rate | 26.8% | 26.7% | 18.4% |
Foreign Holdings | 0.0% | 0.0% | 0.0% |
Turnover Rate | 11% | — | — |
Expense Ratio (8/31/2007)4 | | — | — |
Admiral Shares | 0.26% | | |
ETF Shares | 0.22% | | |
Short-Term Reserves | 0.0% | — | — |
Volatility Measures5 | |
| Fund Versus | Fund Versus |
| Target Index1 | Broad Index2 |
R-Squared | 1.00 | 0.80 |
Beta | 1.00 | 1.41 |
Industry Diversification (% of equity exposure) |
| |
Application Software | 4.2% |
Communications Equipment | 15.0 |
Computer Hardware | 21.3 |
Computer Storage & Peripherals | 3.0 |
Data Processing & Outsourced Services | 7.4 |
Electronic Equipment Manufacturers | 1.5 |
Electronic Manufacturing Services | 1.8 |
Home Entertainment Software | 1.2 |
Internet Software & Services | 8.8 |
IT Consulting & Other Services | 2.2 |
Semiconductor Equipment | 2.8 |
Semiconductors | 12.3 |
Systems Software | 16.4 |
Other Information Technology | 2.1 |
Ten Largest Holdings6 (% of total net assets) |
| |
Microsoft Corp. | 9.9% |
International Business Machines Corp. | 7.2 |
Apple Inc. | 6.5 |
Cisco Systems, Inc. | 6.2 |
Intel Corp. | 5.7 |
Hewlett-Packard Co. | 5.0 |
Google Inc. | 4.8 |
Oracle Corp. | 3.9 |
QUALCOMM Inc. | 3.7 |
Dell Inc. | 1.7 |
Top Ten | 54.6% |
1 MSCI US IMI/Information Technology.
2 MSCI US IMI/2500.
3 30-day SEC yield for the fund; annualized dividend yield for the indexes. See the Glossary.
4 Expense ratios shown are from the prospectus dated December 10, 2007. Expense ratios for the fiscal year ended August 31, 2008, were 0.25% for Admiral Shares and 0.20% for ETF Shares.
5 For an explanation of R-squared, beta, and other terms used here, see the Glossary.
6 The holdings listed exclude any temporary cash investments and equity index products.
66
Information Technology Index Fund
Performance Summary
All of the returns in this report represent past performance, which is not a guarantee of future results that may be achieved by the fund. (Current performance may be lower or higher than the performance data cited. For performance data current to the most recent month-end, visit our website at www.vanguard.com/performance.) Note, too, that both investment returns and principal value can fluctuate widely, so an investor’s shares, when sold, could be worth more or less than their original cost. The returns shown do not reflect taxes that a shareholder would pay on fund distributions or on the sale of fund shares.
Cumulative Performance: January 26, 2004–August 31, 2008
Initial Investment of $10,000
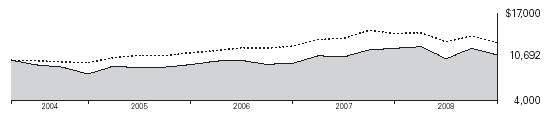
| Average Annual Total Returns | Final Value |
| Periods Ended August 31, 2008 | of a $10,000 |
| One Year | Since Inception1 | Investment |
Information Technology Index Fund ETF Shares | | | |
Net Asset Value | –8.62% | 1.47% | $10,692 |
Information Technology Index Fund ETF Shares | | | |
Market Price | –8.56 | 1.48 | 10,698 |
MSCI US IMI/2500 | –9.90 | 5.15 | 12,594 |
MSCI US IMI/Information Technology | –8.51 | 1.65 | 10,784 |
| | | Final Value |
| | | of a $100,000 |
| One Year | Since Inception1 | Investment |
Information Technology Index Fund Admiral Shares2 | –8.67% | 3.98% | $118,920 |
MSCI US IMI/2500 | –9.90 | 6.23 | 130,726 |
MSCI US IMI/Information Technology | –8.51 | 4.21 | 120,044 |
1 Performance for the fund and its comparative standards is calculated since the following inception dates: January 26, 2004, for ETF Shares; March 25, 2004, for Admiral Shares.
2 Total returns do not reflect the 2% fee assessed on redemptions of shares held for less than one year.
67
Information Technology Index Fund
Fiscal-Year Total Returns (%): January 26, 2004–August 31, 2008
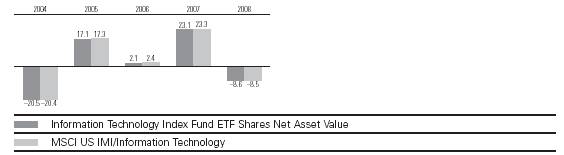
Cumulative Returns: ETF Shares, January 26, 2004–August 31, 2008 |
| | Cumulative |
| | Since |
| One Year | Inception |
Information Technology Index Fund ETF Shares Market Price | –8.56% | 6.98% |
Information Technology Index Fund ETF Shares Net Asset Value | –8.62 | 6.92 |
MSCI US IMI/Information Technology | –8.51 | 7.84 |
Average Annual Total Returns: Periods Ended June 30, 2008
This table presents average annual total returns through the latest calendar quarter—rather than through the end of the fiscal period. Securities and Exchange Commission rules require that we provide this information.
| | | Since |
| Inception Date | One Year | Inception |
ETF Shares | 1/26/2004 | | |
Market Price | | –8.09% | 1.27% |
Net Asset Value | | –8.17 | 1.27 |
Admiral Shares1 | 3/25/2004 | –8.23 | 3.88 |
1 Total returns do not reflect the 2% fee assessed on redemptions of shares held for less than one year. Note: See Financial Highlights tables for dividend and capital gains information.
68
Information Technology Index Fund
Financial Statements
Statement of Net Assets
As of August 31, 2008
The fund provides a complete list of its holdings four times in each fiscal year, at the quarter-ends. For the second and fourth fiscal quarters, the lists appear in the fund’s semiannual and annual reports to shareholders. For the first and third fiscal quarters, the fund files the lists with the Securities and Exchange Commission on Form N-Q. Shareholders can look up the fund’s Forms N-Q on the SEC’s website at www.sec.gov. Forms N-Q may also be reviewed and copied at the SEC’s Public Reference Room (see the back cover of this report for further information).
| | | Market |
| | | Value• |
| | Shares | ($000) |
Common Stocks (100.1%) | | |
Communications Equipment (15.0%) | | |
* | Cisco Systems, Inc. | 1,337,643 | 32,170 |
| QUALCOMM Inc. | 366,442 | 19,293 |
| Corning, Inc. | 356,530 | 7,323 |
| Motorola, Inc. | 510,542 | 4,809 |
* | Juniper Networks, Inc. | 118,840 | 3,054 |
| Harris Corp. | 30,653 | 1,605 |
* | CommScope, Inc. | 15,812 | 774 |
* | F5 Networks, Inc. | 18,541 | 632 |
* | Brocade Communications | | |
| Systems, Inc. | 84,545 | 627 |
* | Foundry Networks, Inc. | 32,005 | 589 |
* | Polycom, Inc. | 19,788 | 555 |
* | JDS Uniphase Corp. | 50,855 | 517 |
* | Tellabs, Inc. | 88,270 | 460 |
* | Ciena Corp. | 19,551 | 340 |
| ADTRAN Inc. | 13,411 | 306 |
* | EchoStar Corp. | 9,438 | 296 |
* | InterDigital, Inc. | 10,690 | 284 |
| Plantronics, Inc. | 10,971 | 283 |
* | ADC Telecommunications, Inc. | 26,409 | 271 |
* | Arris Group Inc. | 27,747 | 262 |
* | Emulex Corp. | 18,901 | 254 |
* | Comtech | | |
| Telecommunications Corp. | 5,397 | 247 |
* | Avocent Corp. | 10,241 | 240 |
* | Tekelec | 13,607 | 223 |
* | Riverbed Technology, Inc. | 11,953 | 203 |
* | Sonus Networks, Inc. | 60,035 | 203 |
* | 3Com Corp. | 90,035 | 191 |
* | Harmonic, Inc. | 21,032 | 185 |
* | Infinera Corp. | 16,476 | 182 |
* | ViaSat, Inc. | 6,170 | 162 |
* | Blue Coat Systems, Inc. | 8,512 | 158 |
* | Sycamore Networks, Inc. | 44,247 | 155 |
* | Powerwave Technologies, Inc. | 29,640 | 150 |
| Black Box Corp. | 3,948 | 141 |
* | NETGEAR, Inc. | 7,881 | 133 |
* | Hughes Communications Inc. | 2,173 | 96 |
* | Finisar Corp. | 62,441 | 90 |
* | Extreme Networks, Inc. | 24,846 | 87 |
* | Starent Networks Corp. | 6,234 | 86 |
* | EMS Technologies, Inc. | 3,482 | 82 |
��
* | Neutral Tandem, Inc. | 3,958 | 81 |
* | Ixia | 9,282 | 81 |
* | UTStarcom, Inc. | 22,945 | 75 |
* | Aruba Networks, Inc. | 11,547 | 73 |
* | Harris Stratex Networks, Inc. | | |
| Class A | 5,823 | 54 |
| Bel Fuse, Inc. Class B | 1,881 | 52 |
* | Loral Space and | | |
| Communications Ltd. | 2,767 | 51 |
* | MRV Communications Inc. | 35,853 | 49 |
* | Acme Packet, Inc. | 5,330 | 34 |
* | Cogo Group, Inc. | 6,007 | 33 |
* | OpNext, Inc. | 5,210 | 33 |
* | Orbcomm, Inc. | 5,592 | 32 |
* | Optium Corp. | 3,111 | 28 |
* | Airvana, Inc. | 4,921 | 25 |
| Bel Fuse, Inc. Class A | 529 | 16 |
* | BigBand Networks Inc. | 4,196 | 15 |
* | Nextwave Wireless Inc. | 11,450 | 11 |
| | | 78,461 |
Computers & Peripherals (24.4%) | | |
| International Business | | |
| Machines Corp. | 311,056 | 37,865 |
* | Apple Inc. | 199,640 | 33,845 |
| Hewlett-Packard Co. | 558,255 | 26,193 |
* | Dell Inc. | 411,755 | 8,947 |
* | EMC Corp. | 467,984 | 7,151 |
* | NetApp, Inc. | 77,790 | 1,982 |
| Seagate Technology | 109,724 | 1,636 |
* | Sun Microsystems, Inc. | 178,022 | 1,602 |
* | Western Digital Corp. | 50,135 | 1,367 |
* | NCR Corp. | 37,918 | 1,003 |
* | Teradata Corp. | 40,646 | 999 |
* | Lexmark International, Inc. | 21,558 | 775 |
* | SanDisk Corp. | 50,892 | 736 |
| Diebold, Inc. | 14,775 | 586 |
* | QLogic Corp. | 30,166 | 563 |
* | Synaptics Inc. | 5,133 | 269 |
* | Intermec, Inc. | 10,928 | 220 |
* | Electronics for Imaging, Inc. | 12,748 | 211 |
* | Avid Technology, Inc. | 8,486 | 197 |
* | Palm, Inc. | 22,833 | 194 |
| Imation Corp. | 7,463 | 159 |
* | Data Domain, Inc. | 5,744 | 132 |
* | Adaptec, Inc. | 27,399 | 104 |
* | Netezza Corp. | 6,489 | 88 |
* | Hutchinson Technology, Inc. | 5,931 | 86 |
* | Quantum Corp. | 45,900 | 81 |
* | Stratasys, Inc. | 4,438 | 74 |
* | Rackable Systems Inc. | 6,578 | 68 |
* | 3PAR, Inc. | 6,051 | 67 |
* | Novatel Wireless, Inc. | 7,194 | 45 |
* | Compellent Technologies, Inc. | 2,040 | 26 |
* | Isilon Systems Inc. | 4,816 | 24 |
| | | 127,295 |
Electronic Equipment & Instruments (4.7%) | |
| Tyco Electronics Ltd. | 112,608 | 3,706 |
* | Agilent Technologies, Inc. | 82,638 | 2,873 |
| Amphenol Corp. | 39,762 | 1,889 |
* | Flextronics International Ltd. | 189,390 | 1,689 |
* | FLIR Systems, Inc. | 29,540 | 1,055 |
* | Avnet, Inc. | 34,057 | 1,000 |
* | Trimble Navigation Ltd. | 27,481 | 930 |
* | Arrow Electronics, Inc. | 27,614 | 917 |
* | Mettler-Toledo International Inc. | 7,924 | 834 |
* | Itron, Inc. | 7,677 | 795 |
| Jabil Circuit, Inc. | 40,261 | 679 |
* | Ingram Micro, Inc. Class A | 34,254 | 648 |
* | Anixter International Inc. | 6,784 | 501 |
* | Dolby Laboratories Inc. | 11,524 | 469 |
| National Instruments Corp. | 13,454 | 434 |
* | Tech Data Corp. | 12,454 | 425 |
| Molex, Inc. Class A | 17,383 | 401 |
| Molex, Inc. | 14,422 | 348 |
* | Vishay Intertechnology, Inc. | 38,621 | 343 |
* | Sanmina-SCI Corp. | 119,210 | 280 |
* | Plexus Corp. | 9,672 | 271 |
* | Rofin-Sinar Technologies Inc. | 6,648 | 269 |
* | Benchmark Electronics, Inc. | 16,096 | 265 |
* | L-1 Identity Solutions Inc. | 14,934 | 246 |
* | Checkpoint Systems, Inc. | 8,935 | 190 |
| Cognex Corp. | 9,253 | 187 |
* | Insight Enterprises, Inc. | 10,879 | 181 |
* | Littelfuse, Inc. | 5,070 | 180 |
* | ScanSource, Inc. | 5,855 | 176 |
* | Rogers Corp. | 4,010 | 160 |
| MTS Systems Corp. | 3,574 | 148 |
| Technitrol, Inc. | 8,750 | 138 |
| Daktronics, Inc. | 7,644 | 134 |
| AVX Corp. | 11,592 | 133 |
* | DTS Inc. | 3,978 | 128 |
| Park Electrochemical Corp. | 4,373 | 123 |
* | Cogent Inc. | 10,662 | 117 |
* | TTM Technologies, Inc. | 9,482 | 114 |
* | Brightpoint, Inc. | 11,767 | 101 |
* | Universal Display Corp. | 7,103 | 101 |
| CTS Corp. | 7,534 | 100 |
| Methode Electronics, Inc. | | |
| Class A | 8,513 | 94 |
* | SYNNEX Corp. | 3,932 | 90 |
* | Electro Scientific | | |
| Industries, Inc. | 6,231 | 89 |
* | FARO Technologies, Inc. | 3,587 | 85 |
* | Echelon Corp. | 6,360 | 83 |
* | IPG Photonics Corp. | 3,498 | 71 |
* | Newport Corp. | 7,477 | 70 |
| Agilysys, Inc. | 5,338 | 69 |
| Electro Rent Corp. | 4,301 | 59 |
* | GSI Group, Inc. | 8,584 | 43 |
* | Multi-Fineline Electronix, Inc. | 2,269 | 39 |
* | KEMET Corp. | 18,625 | 30 |
* | Smart Modular | | |
| Technologies Inc. | 8,119 | 25 |
* | Comverge Inc. | 3,180 | 21 |
| | | 24,546 |
Internet Software & Services (8.8%) | | |
* | Google Inc. | 54,021 | 25,027 |
* | eBay Inc. | 253,286 | 6,314 |
* | Yahoo! Inc. | 296,375 | 5,744 |
* | VeriSign, Inc. | 44,871 | 1,435 |
* | Akamai Technologies, Inc. | 38,098 | 872 |
* | Equinix, Inc. | 7,513 | 605 |
* | SINA.com | 11,673 | 498 |
* | Sohu.com Inc. | 5,934 | 447 |
* | Digital River, Inc. | 8,403 | 368 |
*, | ^VistaPrint Ltd. | 9,385 | 312 |
* | ValueClick, Inc. | 22,104 | 285 |
* | Ariba, Inc. | 19,008 | 280 |
* | j2 Global Communications, Inc. | 10,052 | 248 |
* | Websense, Inc. | 10,203 | 231 |
* | EarthLink, Inc. | 24,635 | 230 |
69
Information Technology Index Fund
| | | Market |
| | | Value• |
| | Shares | ($000) |
* | Omniture, Inc. | 12,206 | 218 |
* | Mercadolibre Inc. | 6,423 | 198 |
| United Online, Inc. | 17,235 | 182 |
* | RealNetworks, Inc. | 22,696 | 151 |
* | Interwoven Inc. | 10,187 | 150 |
* | Vocus, Inc. | 3,968 | 141 |
* | DealerTrack Holdings Inc. | 7,620 | 140 |
* | CMGI, Inc. | 10,474 | 124 |
* | Art Technology Group, Inc. | 29,136 | 119 |
* | SAVVIS, Inc. | 6,484 | 103 |
* | S1 Corp. | 12,768 | 97 |
* | Bankrate, Inc. | 2,966 | 96 |
* | SonicWALL, Inc. | 14,087 | 92 |
| InfoSpace, Inc. | 7,688 | 90 |
* | Move, Inc. | 32,721 | 88 |
* | AsiaInfo Holdings, Inc. | 6,606 | 87 |
* | Vignette Corp. | 5,959 | 81 |
* | ComScore Inc. | 3,794 | 77 |
* | GSI Commerce, Inc. | 4,692 | 75 |
* | Internet Capital Group Inc. | 8,613 | 73 |
* | LoopNet, Inc. | 6,460 | 69 |
| Marchex, Inc. | 5,876 | 66 |
| NIC Inc. | 8,921 | 62 |
* | WebMD Health Corp. Class A | 1,930 | 61 |
* | Switch and Data Inc. | 4,124 | 60 |
* | The Knot, Inc. | 6,284 | 57 |
* | Perficient, Inc. | 6,480 | 51 |
* | Internet Brands Inc. | 6,453 | 45 |
* | Chordiant Software, Inc. | 7,385 | 44 |
* | Dice Holdings Inc. | 4,807 | 43 |
* | Constant Contact, Inc. | 2,443 | 42 |
* | DivX, Inc. | 4,229 | 39 |
* | Liquidity Services, Inc. | 3,410 | 37 |
* | Internap Network | | |
| Services Corp. | 10,847 | 34 |
* | Limelight Networks Inc. | 8,207 | 31 |
* | Openwave Systems Inc. | 19,063 | 27 |
* | TechTarget | 2,238 | 16 |
| | | 46,062 |
IT Services (9.6%) | | |
| Visa Inc. | 100,731 | 7,645 |
| Accenture Ltd. | 134,343 | 5,556 |
| Automatic Data | | |
| Processing, Inc. | 117,387 | 5,210 |
| Western Union Co. | 167,516 | 4,627 |
| MasterCard, Inc. Class A | 16,641 | 4,036 |
| Paychex, Inc. | 73,499 | 2,505 |
* | Fiserv, Inc. | 37,123 | 1,925 |
* | Cognizant Technology | | |
| Solutions Corp. | 65,203 | 1,912 |
* | Computer Sciences Corp. | 34,215 | 1,609 |
* | Alliance Data Systems Corp. | 17,956 | 1,153 |
* | Affiliated Computer | | |
| Services, Inc. Class A | 20,333 | 1,082 |
| Fidelity National Information | | |
| Services, Inc. | 44,184 | 965 |
| Global Payments Inc. | 18,014 | 868 |
* | SAIC, Inc. | 41,738 | 837 |
* | Hewitt Associates, Inc. | 19,843 | 798 |
| Total System Services, Inc. | 38,147 | 760 |
* | Lender Processing | | |
| Services, Inc. | 21,778 | 725 |
| Broadridge Financial | | |
| Solutions LLC | 31,439 | 628 |
* | DST Systems, Inc. | 9,256 | 572 |
* | Metavante Technologies | 20,306 | 480 |
* | NeuStar, Inc. Class A | 17,562 | 422 |
* | Convergys Corp. | 28,464 | 420 |
* | Gartner, Inc. Class A | 15,510 | 410 |
* | Perot Systems Corp. | 20,265 | 361 |
* | CACI International, Inc. | 6,765 | 343 |
* | Unisys Corp. | 80,672 | 330 |
* | VeriFone Holdings, Inc. | 15,012 | 303 |
* | ManTech International Corp. | 4,662 | 275 |
* | Wright Express Corp. | 8,796 | 262 |
* | CyberSource Corp. | 14,595 | 251 |
| Acxiom Corp. | 16,494 | 238 |
* | Genpact, Ltd. | 16,572 | 234 |
* | SRA International, Inc. | 9,879 | 232 |
| Syntel, Inc. | 5,562 | 184 |
* | Euronet Worldwide, Inc. | 9,251 | 174 |
* | Sapient Corp. | 18,198 | 169 |
| MAXIMUS, Inc. | 4,145 | 153 |
* | TeleTech Holdings, Inc. | 9,385 | 145 |
* | CSG Systems International, Inc. | 7,628 | 144 |
* | Forrester Research, Inc. | 3,654 | 126 |
| Heartland Payment | | |
| Systems, Inc. | 5,087 | 115 |
* | TNS Inc. | 4,926 | 113 |
* | Ness Technologies Inc. | 7,980 | 99 |
* | Ciber, Inc. | 12,413 | 97 |
* | RightNow Technologies Inc. | 4,452 | 67 |
* | Global Cash Access, Inc. | 11,055 | 66 |
* | BearingPoint, Inc. | 48,234 | 55 |
* | iGATE Corp. | 4,878 | 55 |
* | infoGROUP, Inc. | 7,608 | 50 |
| Gevity HR, Inc. | 5,156 | 42 |
* | Lionbridge Technologies, Inc. | 12,951 | 41 |
* | ExlService Holdings, Inc. | 3,274 | 36 |
| | | 49,905 |
Office Electronics (0.6%) | | |
| Xerox Corp. | 203,546 | 2,835 |
* | Zebra Technologies Corp. | | |
| Class A | 15,299 | 478 |
| | | 3,313 |
Semiconductors & | | |
Semiconductor Equipment (15.1%) | | |
| Intel Corp. | 1,297,078 | 29,664 |
| Texas Instruments, Inc. | 299,444 | 7,339 |
| Applied Materials, Inc. | 306,434 | 5,491 |
* | MEMC Electronic | | |
| Materials, Inc. | 51,449 | 2,526 |
* | Broadcom Corp. | 101,056 | 2,431 |
| Analog Devices, Inc. | 66,005 | 1,845 |
| Xilinx, Inc. | 63,220 | 1,642 |
| Linear Technology Corp. | 50,226 | 1,639 |
* | Marvell Technology | | |
| Group Ltd. | 115,660 | 1,632 |
| Altera Corp. | 67,867 | 1,537 |
* | NVIDIA Corp. | 119,336 | 1,508 |
| KLA-Tencor Corp. | 38,498 | 1,427 |
| Microchip Technology, Inc. | 42,397 | 1,357 |
| National Semiconductor Corp. | 54,900 | 1,177 |
* | Cypress Semiconductor Corp. | 34,084 | 1,105 |
* | LAM Research Corp. | 28,226 | 1,038 |
* | LSI Corp. | 144,306 | 960 |
* | Advanced Micro Devices, Inc. | 137,361 | 864 |
* | ON Semiconductor Corp. | 85,331 | 808 |
* | Micron Technology, Inc. | 170,737 | 724 |
| Intersil Corp. | 28,454 | 667 |
* | Varian Semiconductor | | |
| Equipment Associates, Inc. | 16,931 | 547 |
* | Novellus Systems, Inc. | 22,898 | 519 |
* | Microsemi Corp. | 17,560 | 483 |
* | PMC Sierra Inc. | 49,039 | 441 |
* | Atheros Communications, Inc. | 13,431 | 438 |
* | Cree, Inc. | 18,270 | 426 |
* | Integrated Device | | |
| Technology Inc. | 38,776 | 411 |
* | Atmel Corp. | 95,807 | 401 |
* | Rambus Inc. | 21,164 | 372 |
* | Teradyne, Inc. | 39,150 | 365 |
* | Skyworks Solutions, Inc. | 36,470 | 354 |
* | Silicon Laboratories Inc. | 10,475 | 353 |
* | Fairchild Semiconductor | | |
| International, Inc. | 28,000 | 351 |
* | International Rectifier Corp. | 16,303 | 341 |
* | Tessera Technologies, Inc. | 10,747 | 250 |
* | Verigy Ltd. | 13,439 | 248 |
* | FEI Co. | 8,167 | 221 |
* | RF Micro Devices, Inc. | 56,573 | 220 |
* | MKS Instruments, Inc. | 9,587 | 216 |
* | Semtech Corp. | 14,422 | 213 |
* | Cabot Microelectronics Corp. | 5,300 | 205 |
* | Cymer, Inc. | 6,814 | 204 |
* | TriQuint Semiconductor, Inc. | 31,666 | 199 |
* | FormFactor Inc. | 10,379 | 199 |
* | Amkor Technology, Inc. | 26,434 | 199 |
* | ATMI, Inc. | 7,475 | 182 |
* | Diodes Inc. | 6,784 | 161 |
* | Entegris Inc. | 25,959 | 160 |
* | Standard Microsystem Corp. | 5,227 | 153 |
* | OmniVision Technologies, Inc. | 12,473 | 146 |
* | Brooks Automation, Inc. | 14,810 | 142 |
* | Hittite Microwave Corp. | 3,835 | 136 |
* | Advanced Energy | | |
| Industries, Inc. | 8,190 | 132 |
* | Netlogic Microsystems Inc. | 3,803 | 132 |
* | Silicon Image, Inc. | 18,893 | 131 |
* | Monolithic Power Systems | 5,227 | 127 |
* | Applied Micro Circuits Corp. | 14,498 | 115 |
* | Veeco Instruments, Inc. | 6,821 | 115 |
* | Sigma Designs, Inc. | 6,678 | 114 |
| Micrel, Inc. | 11,991 | 110 |
* | Axcelis Technologies, Inc. | 22,823 | 108 |
* | Zoran Corp. | 11,434 | 102 |
* | Cirrus Logic, Inc. | 15,519 | 96 |
* | Cavium Networks, Inc. | 5,355 | 92 |
* | Actel Corp. | 5,997 | 83 |
| Cohu, Inc. | 4,888 | 82 |
* | Supertex, Inc. | 2,629 | 78 |
* | Silicon Storage | | |
| Technology, Inc. | 20,870 | 68 |
* | Exar Corp. | 8,754 | 68 |
* | Conexant Systems, Inc. | 10,948 | 64 |
* | Kulicke & Soffa Industries, Inc. | 12,206 | 63 |
* | Spansion Inc. Class A | 26,723 | 60 |
* | Lattice Semiconductor Corp. | 25,626 | 60 |
* | DSP Group Inc. | 7,261 | 56 |
* | Mattson Technology, Inc. | 11,023 | 56 |
* | Rudolph Technologies, Inc. | 6,456 | 54 |
* | ANADIGICS, Inc. | 13,868 | 47 |
* | Trident Microsystems, Inc. | 13,235 | 42 |
* | Eagle Test Systems, Inc. | 2,813 | 40 |
* | Advanced Analogic | | |
| Technologies, Inc. | 8,701 | 40 |
* | Rubicon Technology, Inc. | 2,849 | 35 |
* | PDF Solutions, Inc. | 5,455 | 35 |
* | Photronics, Inc. | 8,814 | 29 |
* | SiRF Technology Holdings, Inc. | 12,726 | 24 |
| | | 79,095 |
Software (21.9%) | | |
| Microsoft Corp. | 1,898,055 | 51,798 |
* | Oracle Corp. | 932,970 | 20,460 |
* | Adobe Systems, Inc. | 120,395 | 5,157 |
* | Symantec Corp. | 190,071 | 4,241 |
70
Information Technology Index Fund
| | | Market |
| | | Value• |
| | Shares | ($000) |
* | Electronic Arts Inc. | 72,085 | 3,518 |
| CA, Inc. | 93,065 | 2,225 |
* | Activision Blizzard, Inc. | 66,767 | 2,191 |
* | Intuit, Inc. | 69,036 | 2,076 |
* | Autodesk, Inc. | 50,581 | 1,797 |
* | McAfee Inc. | 36,446 | 1,442 |
* | BMC Software, Inc. | 43,145 | 1,405 |
* | salesforce.com, inc. | 23,122 | 1,295 |
* | Citrix Systems, Inc. | 41,608 | 1,260 |
* | Red Hat, Inc. | 43,656 | 917 |
* | ANSYS, Inc. | 19,067 | 846 |
* | Synopsys, Inc. | 32,261 | 695 |
* | Compuware Corp. | 59,233 | 677 |
| FactSet Research Systems Inc. | 10,290 | 645 |
* | Sybase, Inc. | 17,952 | 618 |
* | Nuance Communications, Inc. | 38,315 | 605 |
* | MICROS Systems, Inc. | 18,412 | 567 |
* | Parametric Technology Corp. | 26,046 | 523 |
* | Novell, Inc. | 79,032 | 508 |
* | Cadence Design Systems, Inc. | 58,373 | 466 |
* | Take-Two Interactive | | |
| Software, Inc. | 17,406 | 436 |
* | Solera Holdings, Inc. | 13,827 | 426 |
* | Concur Technologies, Inc. | 9,464 | 416 |
* | VMware Inc. | 9,514 | 378 |
* | Macrovision Solutions Corp. | 22,999 | 357 |
| Jack Henry & Associates Inc. | 17,668 | 354 |
* | TIBCO Software Inc. | 42,006 | 344 |
* | Informatica Corp. | 19,705 | 332 |
* | Progress Software Corp. | 9,480 | 277 |
* | Blackboard Inc. | 6,655 | 266 |
| Fair Isaac, Inc. | 10,957 | 253 |
* | Mentor Graphics Corp. | 20,062 | 245 |
* | Lawson Software, Inc. | 29,873 | 242 |
* | THQ Inc. | 14,952 | 229 |
* | Quest Software, Inc. | 15,098 | 223 |
* | Net 1 UEPS Technologies, Inc. | 8,256 | 221 |
| Blackbaud, Inc. | 9,937 | 201 |
* | Wind River Systems Inc. | 17,659 | 195 |
* | Advent Software, Inc. | 4,119 | 191 |
* | TiVo Inc. | 21,153 | 179 |
| Quality Systems, Inc. | 3,999 | 171 |
* | Commvault Systems, Inc. | 9,363 | 158 |
* | The Ultimate Software | | |
| Group, Inc. | 5,514 | 155 |
* | ACI Worldwide, Inc. | 8,112 | 147 |
* | Manhattan Associates, Inc. | 5,491 | 135 |
* | MicroStrategy Inc. | 2,080 | 133 |
* | MSC Software Corp. | 10,062 | 131 |
* | Tyler Technologies, Inc. | 8,047 | 130 |
* | SPSS, Inc. | 3,995 | 126 |
* | JDA Software Group, Inc. | 6,420 | 117 |
* | Taleo Corp. Class A | 4,818 | 117 |
* | Kenexa Corp. | 4,746 | 110 |
* | Epicor Software Corp. | 11,858 | 101 |
* | VASCO Data Security | | |
| International, Inc. | 6,615 | 91 |
* | Symyx Technologies, Inc. | 7,079 | 78 |
* | EPIQ Systems, Inc. | 6,815 | 77 |
* | SuccessFactors Inc. | 6,693 | 74 |
* | Intervoice, Inc. | 8,573 | 70 |
* | Synchronoss Technologies, Inc. | 4,713 | 60 |
* | NetSuite Inc. | 3,296 | 55 |
* | Secure Computing Corp. | 12,628 | 54 |
* | Monotype Imaging | | |
| Holdings Inc. | 4,181 | 52 |
* | Radiant Systems, Inc. | 5,727 | 52 |
* | FalconStor Software, Inc. | 6,713 | 51 |
* | Magma Design | | |
| Automation, Inc. | 8,319 | 42 |
* | Sonic Solutions, Inc. | 5,723 | 27 |
| Renaissance Learning, Inc. | 1,746 | 22 |
* | Deltek, Inc. | 2,317 | 19 |
| | | 114,252 |
Total Common Stocks | | |
(Cost $574,148) | | 522,929 |
Temporary Cash Investment (0.0%) | | |
1,2 | Vanguard Market Liquidity | | |
| Fund, 2.389% | | |
| (Cost $151) | 150,505 | 151 |
Total Investments (100.1%) | | |
(Cost $574,299) | | 523,080 |
Other Assets and Liabilities (–0.1%) | | |
Other Assets | | 4,648 |
Liabilities2 | | (5,005) |
| | | (357) |
Net Assets (100%) | | 522,723 |
At August 31, 2008, net assets consisted of: |
| Amount |
| ($000) |
Paid-in Capital | 581,846 |
Undistributed Net Investment Income | 1,954 |
Accumulated Net Realized Losses | (9,858) |
Unrealized Appreciation (Depreciation) | (51,219) |
Net Assets | 522,723 |
| |
| |
Admiral Shares—Net Assets | |
Applicable to 956,598 outstanding | |
$.001 par value shares of beneficial | |
interest (unlimited authorization) | 26,095 |
Net Asset Value Per Share— | |
Admiral Shares | $27.28 |
| |
| |
ETF Shares—Net Assets | |
Applicable to 9,314,517 outstanding | |
$.001 par value shares of beneficial | |
interest (unlimited authorization) | 496,628 |
Net Asset Value Per Share— | |
ETF Shares | $53.32 |
• See Note A in Notes to Financial Statements.
* Non-income-producing security.
^ Part of security position is on loan to broker-dealers. The total value of securities on loan is $143,000.
1 Affiliated money market fund available only to Vanguard funds and certain trusts and accounts managed by Vanguard. Rate shown is the 7-day yield.
2 Includes $151,000 of collateral received for securities on loan.
See accompanying Notes, which are an integral part of the Financial Statements.
71
Information Technology Index Fund
Statement of Operations
| Year Ended |
| August 31, 2008 |
| ($000) |
Investment Income | |
Income | |
Dividends | 3,757 |
Interest1 | 12 |
Total Income | 3,769 |
Expenses | |
The Vanguard Group—Note B | |
Investment Advisory Services | 47 |
Management and Administrative | |
Admiral Shares | 44 |
ETF Shares | 738 |
Marketing and Distribution | |
Admiral Shares | 4 |
ETF Shares | 131 |
Custodian Fees | 33 |
Auditing Fees | 22 |
Shareholders’ Reports | |
Admiral Shares | — |
ETF Shares | 38 |
Trustees’ Fees and Expenses | 1 |
Total Expenses | 1,058 |
Net Investment Income | 2,711 |
Realized Net Gain (Loss) on | |
Investment Securities Sold | 32,592 |
Change in Unrealized Appreciation | |
(Depreciation) of Investment Securities | (98,555) |
Net Increase (Decrease) in Net Assets | |
Resulting from Operations | (63,252) |
Statement of Changes in Net Assets
| Year Ended August 31, |
| 2008 | 2007 |
| ($000) | ($000) |
Increase (Decrease) in Net Assets | | |
Operations | | |
Net Investment Income | 2,711 | 1,259 |
Realized Net Gain (Loss) | 32,592 | 295 |
Change in Unrealized Appreciation (Depreciation) | (98,555) | 53,390 |
Net Increase (Decrease) in Net Assets Resulting from Operations | (63,252) | 54,944 |
Distributions | | |
Net Investment Income | | |
Admiral Shares | (64) | (14) |
ETF Shares | (1,663) | (640) |
Realized Capital Gain | | |
Admiral Shares | — | — |
ETF Shares | — | — |
Total Distributions | (1,727) | (654) |
Capital Share Transactions | | |
Admiral Shares | 16,473 | 6,136 |
ETF Shares | 119,838 | 214,370 |
Net Increase (Decrease) from Capital Share Transactions | 136,311 | 220,506 |
Total Increase (Decrease) | 71,332 | 274,796 |
Net Assets | | |
Beginning of Period | 451,391 | 176,595 |
End of Period2 | 522,723 | 451,391 |
1 Interest income from an affiliated company of the fund was $12,000.
2 Net Assets—End of Period includes undistributed net investment income of $1,954,000 and $970,000. See accompanying Notes, which are an integral part of the Financial Statements.
72
Information Technology Index Fund
Financial Highlights
Admiral Shares | | | | | |
| | | | | |
| | | | | Mar. 25, |
| | | 20041 to |
| Year Ended August 31, | Aug. 31, |
For a Share Outstanding Throughout Each Period | 2008 | 2007 | 2006 | 2005 | 2004 |
Net Asset Value, Beginning of Period | $29.95 | $24.40 | $23.93 | $20.72 | $23.40 |
Investment Operations | | | | | |
Net Investment Income | .121 | .1102 | .0842 | .3513 | .010 |
Net Realized and Unrealized Gain | | | | | |
(Loss) on Investments | (2.706) | 5.500 | .424 | 3.182 | (2.690) |
Total from Investment Operations | (2.585) | 5.610 | .508 | 3.533 | (2.680) |
Distributions | | | | | |
Dividends from Net Investment Income | (.085) | (.060) | (.038) | (.323) | — |
Distributions from Realized Capital Gains | — | — | — | — | — |
Total Distributions | (.085) | (.060) | (.038) | (.323) | — |
Net Asset Value, End of Period | $27.28 | $29.95 | $24.40 | $23.93 | $20.72 |
| | | | | |
| | | | | |
Total Return4 | –8.67% | 23.02% | 2.12% | 17.05% | –11.45% |
| | | | | |
| | | | | |
Ratios/Supplemental Data | | | | | |
Net Assets, End of Period (Millions) | $26 | $12 | $5 | $2 | $0.2 |
Ratio of Total Expenses to Average Net Assets | 0.25% | 0.26% | 0.28% | 0.28% | 0.28%5 |
Ratio of Net Investment Income to | | | | | |
Average Net Assets | 0.46% | 0.38% | 0.33% | 1.26%3 | 0.12%5 |
Portfolio Turnover Rate6 | 11% | 8% | 8% | 7% | 9% |
ETF Shares | | | | | |
| | | | | |
| | | | | Jan. 26, |
| | | 20041 to |
| Year Ended August 31, | Aug. 31, |
For a Share Outstanding Throughout Each Period | 2008 | 2007 | 2006 | 2005 | 2004 |
Net Asset Value, Beginning of Period | $58.52 | $47.66 | $46.76 | $40.46 | $50.89 |
Investment Operations | | | | | |
Net Investment Income | .249 | .2312 | .1752 | .6707 | .030 |
Net Realized and Unrealized Gain | | | | | |
(Loss) on Investments | (5.274) | 10.765 | .816 | 6.239 | (10.460) |
Total from Investment Operations | (5.025) | 10.996 | .991 | 6.909 | (10.430) |
Distributions | | | | | |
Dividends from Net Investment Income | (.175) | (.136) | (.091) | (.609) | — |
Distributions from Realized Capital Gains | — | — | — | — | — |
Total Distributions | (.175) | (.136) | (.091) | (.609) | — |
Net Asset Value, End of Period | $53.32 | $58.52 | $47.66 | $46.76 | $40.46 |
| | | | | |
| | | | | |
Total Return | –8.62% | 23.10% | 2.11% | 17.07% | –20.50% |
| | | | | |
| | | | | |
Ratios/Supplemental Data | | | | | |
Net Assets, End of Period (Millions) | $497 | $439 | $172 | $51 | $16 |
Ratio of Total Expenses to Average Net Assets | 0.20% | 0.22% | 0.25% | 0.26% | 0.28%5 |
Ratio of Net Investment Income to | | | | | |
Average Net Assets | 0.51% | 0.42% | 0.36% | 1.28%7 | 0.12%5 |
Portfolio Turnover Rate6 | 11% | 8% | 8% | 7% | 9% |
1 Inception.
2 Calculated based on average shares outstanding.
3 Net investment income per share and the ratio of net investment income to average net assets include $.284 and 1.00%, respectively, resulting from a special dividend from Microsoft Corp. in November 2004.
4 Total returns do not reflect the 2% fee assessed on redemptions of shares held for less than one year.
5 Annualized.
6 Excludes the value of portfolio securities received or delivered as a result of in-kind purchases or redemptions of the fund’s capital shares, including ETF Creation Units.
7 Net investment income per share and the ratio of net investment income to average net assets include $.553 and 1.00%, respectively, resulting from a special dividend from Microsoft Corp. in November 2004. See accompanying Notes, which are an integral part of the Financial Statements.
73
Information Technology Index Fund
Notes to Financial Statements
Vanguard Information Technology Index Fund is registered under the Investment Company Act of 1940 as an open-end investment company, or mutual fund. The fund offers two classes of shares, Admiral Shares and ETF Shares. Admiral Shares are available to any investor who meets the fund’s minimum purchase requirements. ETF Shares were listed for trading on the American Stock Exchange through September 18, 2008, and on the NYSE Arca, Inc., thereafter; they can be purchased and sold through a broker.
A. The following significant accounting policies conform to generally accepted accounting principles for U.S. mutual funds. The fund consistently follows such policies in preparing its financial statements.
1. Security Valuation: Securities are valued as of the close of trading on the New York Stock Exchange (generally 4 p.m., Eastern time) on the valuation date. Equity securities are valued at the latest quoted sales prices or official closing prices taken from the primary market in which each security trades; such securities not traded on the valuation date are valued at the mean of the latest quoted bid and asked prices. Securities for which market quotations are not readily available, or whose values have been materially affected by events occurring before the fund’s pricing time but after the close of the securities’ primary markets, are valued by methods deemed by the board of trustees to represent fair value. Investments in Vanguard Market Liquidity Fund are valued at that fund’s net asset value.
2. Federal Income Taxes: The fund intends to continue to qualify as a regulated investment company and distribute all of its taxable income. Management has analyzed the fund’s tax positions taken on federal income tax returns for all open tax years (tax years ended August 31, 2005–2008), and has concluded that no provision for federal income tax is required in the fund’s financial statements.
3. Distributions: Distributions to shareholders are recorded on the ex-dividend date.
4. Security Lending: The fund may lend its securities to qualified institutional borrowers to earn additional income. Security loans are required to be secured at all times by collateral at least equal to the market value of securities loaned. The fund invests cash collateral received in Vanguard Market Liquidity Fund, and records a liability for the return of the collateral, during the period the securities are on loan. Security lending income represents the income earned on investing cash collateral, less expenses associated with the loan.
5. Other: Dividend income is recorded on the ex-dividend date. Interest income includes income distributions received from Vanguard Market Liquidity Fund and is accrued daily. Security transactions are accounted for on the date securities are bought or sold. Costs used to determine realized gains (losses) on the sale of investment securities are those of the specific securities sold. Fees assessed on redemptions of Admiral Shares are credited to paid-in capital.
Each class of shares has equal rights as to assets and earnings, except that each class separately bears certain class-specific expenses related to maintenance of shareholder accounts (included in Management and Administrative expenses) and shareholder reporting. Marketing and distribution expenses are allocated to each class of shares based on a method approved by the board of trustees. Income, other non-class-specific expenses, and gains and losses on investments are allocated to each class of shares based on its relative net assets.
B. The Vanguard Group furnishes at cost investment advisory, corporate management, administrative, marketing, and distribution services. The costs of such services are allocated to the fund under methods approved by the board of trustees. The fund has committed to provide up to 0.40% of its net assets in capital contributions to Vanguard. At August 31, 2008, the fund had contributed capital of $42,000 to Vanguard (included in Other Assets), representing 0.01% of the fund’s net assets and 0.04% of Vanguard’s capitalization. The fund’s trustees and officers are also directors and officers of Vanguard.
C. Distributions are determined on a tax basis and may differ from net investment income and realized capital gains for financial reporting purposes. Differences may be permanent or temporary. Permanent differences are reclassified among capital accounts in the financial statements to reflect their tax character. Temporary differences arise when certain items of income, expense, gain, or loss are recognized in different periods for financial statement and tax purposes; these differences will reverse at some time in the future. Differences in classification may also result from the treatment of short-term gains as ordinary income for tax purposes.
74
Information Technology Index Fund
During the year ended August 31, 2008, the fund realized $41,247,000 of net capital gains resulting from in-kind redemptions—in which shareholders exchanged fund shares for securities held by the fund rather than for cash. Because such gains are not taxable to the fund, and are not distributed to shareholders, they have been reclassified from accumulated net realized losses to paid-in capital.
For tax purposes, at August 31, 2008, the fund had $2,217,000 of ordinary income available for distribution. The fund had available realized losses of $9,645,000 to offset future net capital gains of $63,000 through August 31, 2013, $188,000 through August 31, 2014, $612,000 through August 31, 2015, $218,000 through August 31, 2016, and $8,564,000 through August 31, 2017.
At August 31, 2008, the cost of investment securities for tax purposes was $574,512,000. Net unrealized depreciation of investment securities for tax purposes was $51,432,000, consisting of unrealized gains of $17,173,000 on securities that had risen in value since their purchase and $68,605,000 in unrealized losses on securities that had fallen in value since their purchase.
D. During the year ended August 31, 2008, the fund purchased $420,580,000 of investment securities and sold $282,704,000 of investment securities, other than temporary cash investments.
E. Capital share transactions for each class of shares were:
| | | Year Ended August 31, | |
| | 2008 | | | 2007 |
| Amount | Shares | | Amount | Shares |
| ($000) | (000) | | ($000) | (000) |
Admiral Shares | | | | | |
Issued | 22,099 | 752 | | 9,143 | 320 |
Issued in Lieu of Cash Distributions | 58 | 2 | | 12 | — |
Redeemed1 | (5,684) | (206) | | (3,019) | (108) |
Net Increase (Decrease)—Admiral Shares | 16,473 | 548 | | 6,136 | 212 |
ETF Shares | | | | | |
Issued | 344,646 | 6,010 | | 214,370 | 3,900 |
Issued in Lieu of Cash Distributions | — | — | | — | — |
Redeemed1 | (224,808) | (4,200) | | — | — |
Net Increase (Decrease)—ETF Shares | 119,838 | 1,810 | | 214,370 | 3,900 |
| | | | | | |
F. In September 2006, the Financial Accounting Standards Board issued Statement of Financial Accounting Standards No. 157 (“FAS 157”), “Fair Value Measurements.” FAS 157 establishes a framework for measuring fair value and expands disclosures about fair value measurements in financial statements.
The various inputs that may be used to determine the value of the fund’s investments are summarized in three broad levels. The inputs or methodologies used for valuing securities are not necessarily an indication of the risk associated with investing in those securities.
Level 1—Quoted prices in active markets for identical securities.
Level 2—Other significant observable inputs (including quoted prices for similar securities, interest rates, prepayment speeds, credit risk, etc.).
Level 3—Significant unobservable inputs (including the fund’s own assumptions used to determine the fair value of investments).
At August 31, 2008, 100% of the fund’s investments were valued based on Level 1 inputs.
1 Net of redemption fees of $70,000 and $19,000 (fund totals).
75
Materials Index Fund
Fund Profile
As of August 31, 2008
Portfolio Characteristics | | |
| | Target | Broad |
| Fund | Index1 | Index2 |
Number of Stocks | 118 | 118 | 2,481 |
Median Market Cap | $16.6B | $16.6B | $32.1B |
Price/Earnings Ratio | 16.6x | 16.6x | 16.8x |
Price/Book Ratio | 2.5x | 2.5x | 2.4x |
Yield3 | | 1.9% | 2.0% |
Admiral Shares | 1.7% | | |
ETF Shares | 1.8% | | |
Return on Equity | 18.6% | 18.6% | 20.1% |
Earnings Growth Rate | 28.6% | 28.6% | 18.4% |
Foreign Holdings | 0.0% | 0.0% | 0.0% |
Turnover Rate | 10% | — | — |
Expense Ratio (8/31/2007)4 | | — | — |
Admiral Shares | 0.26% | | |
ETF Shares | 0.22% | | |
Short-Term Reserves | 0.0% | — | — |
Volatility Measures5 | |
| Fund Versus | Fund Versus |
| Target Index1 | Broad Index2 |
R-Squared | 1.00 | 0.62 |
Beta | 1.00 | 1.01 |
Industry Diversification (% of equity exposure) |
| |
Aluminum | 5.0% |
Commodity Chemicals | 1.5 |
Construction Materials | 2.8 |
Diversified Chemicals | 17.9 |
Diversified Metals & Mining | 7.1 |
Fertilizers & Agricultural Chemicals | 16.3 |
Forest Products | 2.3 |
Gold | 3.6 |
Industrial Gases | 9.1 |
Metal & Glass Containers | 4.5 |
Paper Packaging | 3.1 |
Paper Products | 3.7 |
Specialty Chemicals | 10.7 |
Steel | 12.0 |
Other Materials | 0.4 |
Ten Largest Holdings6 (% of total net assets) |
| |
Monsanto Co. | 11.0% |
E.I. du Pont de Nemours & Co. | 7.0 |
Freeport-McMoRan Copper & Gold, Inc. | |
Class B | 6.0 |
Dow Chemical Co. | 5.5 |
Praxair, Inc. | 4.9 |
Alcoa Inc. | 4.6 |
Newmont Mining Corp. (Holding Co.) | 3.4 |
Air Products & Chemicals, Inc. | 3.4 |
The Mosaic Co. | 2.9 |
Nucor Corp. | 2.9 |
Top Ten | 51.6% |
1 MSCI US IMI/Materials.
2 MSCI US IMI/2500.
3 30-day SEC yield for the fund; annualized dividend yield for the indexes. See the Glossary.
4 Expense ratios shown are from the prospectus dated December 10, 2007. Expense ratios for the fiscal year ended August 31, 2008, were 0.25% for Admiral Shares and 0.20% for ETF Shares.
5 For an explanation of R-squared, beta, and other terms used here, see the Glossary.
6 The holdings listed exclude any temporary cash investments and equity index products.
76
Materials Index Fund
Performance Summary
All of the returns in this report represent past performance, which is not a guarantee of future results that may be achieved by the fund. (Current performance may be lower or higher than the performance data cited. For performance data current to the most recent month-end, visit our website at www.vanguard.com/performance.) Note, too, that both investment returns and principal value can fluctuate widely, so an investor’s shares, when sold, could be worth more or less than their original cost. The returns shown do not reflect taxes that a shareholder would pay on fund distributions or on the sale of fund shares.
Cumulative Performance: January 26, 2004–August 31, 2008
Initial Investment of $10,000
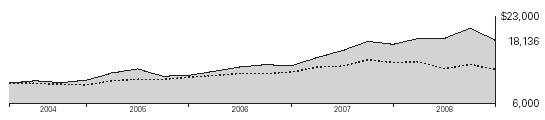
| Average Annual Total Returns | Final Value |
| Periods Ended August 31, 2008 | of a $10,000 |
| One Year | Since Inception1 | Investment |
Materials Index Fund ETF Shares Net Asset Value | 4.15% | 13.83% | $18,136 |
Materials Index Fund ETF Shares Market Price | 4.25% | 13.83% | 18,138 |
MSCI US IMI/2500 | –9.90 | 5.15 | 12,594 |
MSCI US IMI/Materials | 4.15 | 14.00 | 18,264 |
| | | Final Value |
| | | of a $100,000 |
| One Year | Since Inception1 | Investment |
Materials Index Fund Admiral Shares2 | 4.09% | 13.01% | $174,471 |
MSCI US IMI/2500 | –9.90 | 5.14 | 125,648 |
MSCI US IMI/Materials | 4.15 | 13.21 | 175,924 |
1 Performance for the fund and its comparative standards is calculated since the following inception dates: January 26, 2004, for ETF Shares; February 11, 2004, for Admiral Shares.
2 Total returns do not reflect the 2% fee assessed on redemptions of shares held for less than one year.
77
Materials Index Fund
Fiscal-Year Total Returns (%): January 26, 2004–August 31, 2008
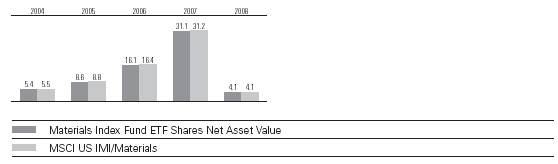
Cumulative Returns: ETF Shares, January 26, 2004–August 31, 2008 |
| | Cumulative |
| | Since |
| One Year | Inception |
Materials Index Fund ETF Shares Market Price | 4.25% | 81.38% |
Materials Index Fund ETF Shares Net Asset Value | 4.15 | 81.36 |
MSCI US IMI/Materials | 4.15 | 82.64 |
Average Annual Total Returns: Periods Ended June 30, 2008
This table presents average annual total returns through the latest calendar quarter—rather than through the end of the fiscal period. Securities and Exchange Commission rules require that we provide this information.
| | | Since |
| Inception Date | One Year | Inception |
ETF Shares | 1/26/2004 | | |
Market Price | | 8.06% | 16.09% |
Net Asset Value | | 7.95 | 16.09 |
Admiral Shares1 | 2/11/2004 | 7.91 | 15.24 |
1 Total returns do not reflect the 2% fee assessed on redemptions of shares held for less than one year. Note: See Financial Highlights tables for dividend and capital gains information.
78
Materials Index Fund
Financial Statements
Statement of Net Assets
As of August 31, 2008
The fund provides a complete list of its holdings four times in each fiscal year, at the quarter-ends. For the second and fourth fiscal quarters, the lists appear in the fund’s semiannual and annual reports to shareholders. For the first and third fiscal quarters, the fund files the lists with the Securities and Exchange Commission on Form N-Q. Shareholders can look up the fund’s Forms N-Q on the SEC’s website at www.sec.gov. Forms N-Q may also be reviewed and copied at the SEC’s Public Reference Room (see the back cover of this report for further information).
| | | Market |
| | | Value• |
| | Shares | ($000) |
Common Stocks (100.0%) | | |
Chemicals (55.5%) | | |
| Monsanto Co. | 452,476 | 51,695 |
| E.I. du Pont de | | |
| Nemours & Co. | 742,548 | 32,999 |
| Dow Chemical Co. | 766,968 | 26,177 |
| Praxair, Inc. | 258,149 | 23,192 |
| Air Products & | | |
| Chemicals, Inc. | 173,585 | 15,944 |
| The Mosaic Co. | 128,094 | 13,673 |
| PPG Industries, Inc. | 135,539 | 8,520 |
| Rohm & Haas Co. | 105,324 | 7,904 |
| Ecolab, Inc. | 153,246 | 7,009 |
| CF Industries Holdings, Inc. | 44,254 | 6,744 |
| Sigma-Aldrich Corp. | 106,945 | 6,070 |
| Celanese Corp. Series A | 125,165 | 4,826 |
| FMC Corp. | 59,165 | 4,351 |
| Eastman Chemical Co. | 62,830 | 3,790 |
| Terra Industries, Inc. | 75,265 | 3,774 |
| Airgas, Inc. | 61,554 | 3,646 |
| Lubrizol Corp. | 56,712 | 3,005 |
| Nalco Holding Co. | 116,922 | 2,674 |
| International Flavors & | | |
| Fragrances, Inc. | 60,500 | 2,433 |
| Albemarle Corp. | 60,266 | 2,395 |
| RPM International, Inc. | 101,186 | 2,186 |
| Ashland, Inc. | 47,099 | 1,928 |
| Hercules, Inc. | 89,157 | 1,921 |
| Cytec Industries, Inc. | 37,599 | 1,910 |
| Valspar Corp. | 78,684 | 1,862 |
| Huntsman Corp. | 136,270 | 1,778 |
| Olin Corp. | 61,971 | 1,668 |
* | W.R. Grace & Co. | 58,310 | 1,533 |
| Cabot Corp. | 54,154 | 1,498 |
* | Rockwood Holdings, Inc. | 36,919 | 1,397 |
| Chemtura Corp. | 200,126 | 1,319 |
| H.B. Fuller Co. | 43,559 | 1,136 |
| Sensient Technologies Corp. | 37,247 | 1,088 |
| Minerals Technologies, Inc. | 15,820 | 1,039 |
* | OM Group, Inc. | 25,056 | 930 |
| Ferro Corp. | 36,128 | 796 |
| Arch Chemicals, Inc. | 20,973 | 770 |
| NewMarket Corp. | 11,171 | 759 |
| Koppers Holdings, Inc. | 14,647 | 671 |
* | Calgon Carbon Corp. | 30,241 | 645 |
* | PolyOne Corp. | 73,127 | 600 |
| Scotts Miracle-Gro Co. | 21,989 | 588 |
| A. Schulman Inc. | 21,464 | 520 |
| Innophos Holdings Inc. | 12,189 | 457 |
* | Zoltek Cos., Inc. | 22,475 | 383 |
| Innospec, Inc. | 20,417 | 320 |
| Westlake Chemical Corp. | 16,339 | 310 |
| American Vanguard Corp. | 19,260 | 286 |
| Spartech Corp. | 25,637 | 270 |
* | Flotek Industries, Inc. | 15,871 | 267 |
| NL Industries, Inc. | 8,340 | 88 |
| Georgia Gulf Corp. | 1,559 | 5 |
| Tronox Inc. | 1,273 | 1 |
| Tronox Inc. Class B | 1,344 | 1 |
| | | 261,751 |
Construction Materials (2.8%) | | |
^ | Vulcan Materials Co. | 90,317 | 6,759 |
| Martin Marietta Materials, Inc. | 34,117 | 3,852 |
| Eagle Materials, Inc. | 36,248 | 1,106 |
| Texas Industries, Inc. | 19,285 | 1,016 |
* | Headwaters Inc. | 36,194 | 557 |
| | | 13,290 |
Containers & Packaging (7.6%) | | |
* | Owens-Illinois, Inc. | 136,838 | 6,103 |
* | Crown Holdings, Inc. | 132,788 | 3,683 |
| Ball Corp. | 76,847 | 3,529 |
| Sealed Air Corp. | 133,920 | 3,245 |
* | Pactiv Corp. | 108,347 | 2,911 |
| Sonoco Products Co. | 82,520 | 2,852 |
| Bemis Co., Inc. | 83,157 | 2,322 |
| AptarGroup Inc. | 56,746 | 2,292 |
| Packaging Corp. of America | 86,859 | 2,237 |
| Temple-Inland Inc. | 87,894 | 1,469 |
| Greif Inc. Class A | 19,856 | 1,372 |
| Silgan Holdings, Inc. | 22,015 | 1,152 |
| Rock-Tenn Co. | 30,343 | 1,113 |
* | Smurfit-Stone | | |
| Container Corp. | 210,961 | 1,065 |
* | Graphic Packaging | | |
| Holding Co. | 92,542 | 264 |
| Myers Industries, Inc. | 2,797 | 37 |
| | | 35,646 |
Metals & Mining (28.1%) | | |
| Freeport-McMoRan Copper | | |
| & Gold, Inc. Class B | 315,957 | 28,221 |
| Alcoa Inc. | 671,001 | 21,559 |
| Newmont Mining Corp. | | |
| (Holding Co.) | 359,170 | 16,199 |
| Nucor Corp. | 259,057 | 13,601 |
| United States Steel Corp. | 97,169 | 12,930 |
| Cleveland-Cliffs Inc. | 74,718 | 7,563 |
| AK Steel Holding Corp. | 92,594 | 4,871 |
| Allegheny Technologies Inc. | 75,315 | 3,690 |
| Steel Dynamics, Inc. | 132,688 | 3,295 |
| Reliance Steel & | | |
| Aluminum Co. | 55,784 | 3,180 |
| Commercial Metals Co. | 96,637 | 2,515 |
| Compass Minerals | | |
| International, Inc. | 26,774 | 1,855 |
* | Century Aluminum Co. | 31,816 | 1,551 |
| Carpenter Technology Corp. | 38,125 | 1,480 |
| Schnitzer Steel | | |
| Industries, Inc. Class A | 17,958 | 1,229 |
| Titanium Metals Corp. | 78,594 | 1,133 |
| Worthington Industries, Inc. | 56,411 | 993 |
| Royal Gold, Inc. | 25,240 | 876 |
* | Coeur d’Alene Mines Corp. | 410,386 | 735 |
*,^Hecla Mining Co. | 101,613 | 713 |
| Kaiser Aluminum Corp. | 12,942 | 700 |
| AMCOL International Corp. | 19,016 | 693 |
* | Haynes International, Inc. | 10,138 | 593 |
* | Brush Engineered | | |
| Materials Inc. | 16,992 | 498 |
* | RTI International Metals, Inc. | 12,134 | 410 |
| Olympic Steel, Inc. | 7,612 | 362 |
* | General Moly, Inc. | 43,871 | 299 |
* | Stillwater Mining Co. | 39,779 | 296 |
| A.M. Castle & Co. | 13,838 | 278 |
* | Horsehead Holding Corp. | 30,455 | 253 |
* | Apex Silver Mines Ltd. | 43,744 | 129 |
| | | 132,700 |
Paper & Forest Products (6.0%) | | |
| Weyerhaeuser Co. | 174,093 | 9,660 |
| International Paper Co. | 335,285 | 9,070 |
| MeadWestvaco Corp. | 144,049 | 3,814 |
* | Domtar Corp. | 440,619 | 2,516 |
| Louisiana-Pacific Corp. | 86,586 | 843 |
| Glatfelter | 38,511 | 565 |
| Deltic Timber Corp. | 9,074 | 557 |
| Wausau Paper Corp. | 41,646 | 359 |
* | Buckeye Technology, Inc. | 34,289 | 316 |
*,^AbitibiBowater, Inc. | 41,709 | 274 |
| Schweitzer-Mauduit | | |
| International, Inc. | 13,275 | 252 |
| Neenah Paper Inc. | 12,462 | 242 |
| | | 28,468 |
Total Common Stocks | | |
(Cost $483,403) | | 471,855 |
Temporary Cash Investment (0.9%) | | |
1,2 | Vanguard Market Liquidity | | |
| Fund, 2.389% | | |
| (Cost $4,202) | 4,201,501 | 4,202 |
Total Investments (100.9%) | | |
(Cost $487,605) | | 476,057 |
Other Assets and Liabilities (–0.9%) | |
Other Assets | | 2,189 |
Liabilities2 | | (6,563) |
| | | (4,374) |
Net Assets (100%) | | 471,683 |
79
Materials Index Fund
At August 31, 2008, net assets consisted of: |
| Amount |
| ($000) |
Paid-in Capital | 486,177 |
Undistributed Net Investment Income | 4,789 |
Accumulated Net Realized Losses | (7,735) |
Unrealized Appreciation (Depreciation) | (11,548) |
Net Assets | 471,683 |
| |
| |
Admiral Shares—Net Assets | |
Applicable to 2,497,907 outstanding | |
$.001 par value shares of beneficial | |
interest (unlimited authorization) | 107,040 |
Net Asset Value Per Share— | |
Admiral Shares | $42.85 |
| |
| |
ETF Shares—Net Assets | |
Applicable to 4,326,918 outstanding | |
$.001 par value shares of beneficial | |
interest (unlimited authorization) | 364,643 |
Net Asset Value Per Share— | |
ETF Shares | $84.27 |
• See Note A in Notes to Financial Statements.
* Non-income-producing security.
^ Part of security position is on loan to broker-dealers. The total value of securities on loan is $3,951,000.
1 Affiliated money market fund available only to Vanguard funds and certain trusts and accounts managed by Vanguard. Rate shown is the 7-day yield.
2 Includes $4,202,000 of collateral received for securities on loan.
See accompanying Notes, which are an integral part of the Financial Statements.
80
Materials Index Fund
Statement of Operations
| Year Ended |
| August 31, 2008 |
| ($000) |
Investment Income | |
Income | |
Dividends | 8,872 |
Interest1 | 17 |
Security Lending | 7 |
Total Income | 8,896 |
Expenses | |
The Vanguard Group—Note B | |
Investment Advisory Services | 45 |
Management and Administrative | |
Admiral Shares | 186 |
ETF Shares | 517 |
Marketing and Distribution | |
Admiral Shares | 16 |
ETF Shares | 90 |
Custodian Fees | 18 |
Auditing Fees | 23 |
Shareholders’ Reports | |
Admiral Shares | 1 |
ETF Shares | 30 |
Total Expenses | 926 |
Net Investment Income | 7,970 |
Realized Net Gain (Loss) on | |
Investment Securities Sold | 34,834 |
Change in Unrealized Appreciation | |
(Depreciation) of Investment Securities | (35,820) |
Net Increase (Decrease) in Net Assets | |
Resulting from Operations | 6,984 |
Statement of Changes in Net Assets
| Year Ended August 31, |
| 2008 | 2007 |
| ($000) | ($000) |
Increase (Decrease) in Net Assets | | |
Operations | | |
Net Investment Income | 7,970 | 4,022 |
Realized Net Gain (Loss) | 34,834 | 12,404 |
Change in Unrealized Appreciation (Depreciation) | (35,820) | 22,936 |
Net Increase (Decrease) in Net Assets Resulting from Operations | 6,984 | 39,362 |
Distributions | | |
Net Investment Income | | |
Admiral Shares | (1,057) | (270) |
ETF Shares | (5,116) | (2,045) |
Realized Capital Gain | | |
Admiral Shares | — | — |
ETF Shares | — | — |
Total Distributions | (6,173) | (2,315) |
Capital Share Transactions | | |
Admiral Shares | 52,003 | 40,346 |
ETF Shares | 49,893 | 183,943 |
Net Increase (Decrease) from Capital Share Transactions | 101,896 | 224,289 |
Total Increase (Decrease) | 102,707 | 261,336 |
Net Assets | | |
Beginning of Period | 368,976 | 107,640 |
End of Period2 | 471,683 | 368,976 |
1 Interest income from an affiliated company of the fund was $17,000.
2 Net Assets—End of Period includes undistributed net investment income of $4,789,000 and $2,992,000. See accompanying Notes, which are an integral part of the Financial Statements.
81
Materials Index Fund
Financial Highlights
Admiral Shares | | | | | |
| | | | | |
| | | | | Feb. 11, |
| | | 20041 to |
| Year Ended August 31, | Aug. 31, |
For a Share Outstanding Throughout Each Period | 2008 | 2007 | 2006 | 2005 | 2004 |
Net Asset Value, Beginning of Period | $41.75 | $32.37 | $28.34 | $26.53 | $26.14 |
Investment Operations | | | | | |
Net Investment Income | .732 | .7002 | .6722 | .480 | .240 |
Net Realized and Unrealized Gain | | | | | |
(Loss) on Investments3 | 1.008 | 9.250 | 3.853 | 1.830 | .150 |
Total from Investment Operations | 1.740 | 9.950 | 4.525 | 2.310 | .390 |
Distributions | | | | | |
Dividends from Net Investment Income | (.640) | (.570) | (.495) | (.500) | — |
Distributions from Realized Capital Gains | — | — | — | — | — |
Total Distributions | (.640) | (.570) | (.495) | (.500) | — |
Net Asset Value, End of Period | $42.85 | $41.75 | $32.37 | $28.34 | $26.53 |
| | | | | |
| | | | | |
Total Return4 | 4.09% | 31.00% | 16.08% | 8.61% | 1.49% |
| | | | | |
| | | | | |
Ratios/Supplemental Data | | | | | |
Net Assets, End of Period (Millions) | $107 | $57 | $12 | $7 | $1 |
Ratio of Total Expenses to Average Net Assets | 0.25% | 0.26% | 0.28% | 0.28% | 0.28%5 |
Ratio of Net Investment Income to | | | | | |
Average Net Assets | 1.74% | 1.80% | 2.13% | 1.81% | 1.93%5 |
Portfolio Turnover Rate6 | 10% | 6% | 13% | 12% | 8% |
ETF Shares | | | | | |
| | | | | |
| | | | | Jan. 26, |
| | | 20041 to |
| Year Ended August 31, | Aug. 31, |
For a Share Outstanding Throughout Each Period | 2008 | 2007 | 2006 | 2005 | 2004 |
Net Asset Value, Beginning of Period | $82.10 | $63.65 | $55.70 | $52.13 | $49.48 |
Investment Operations | | | | | |
Net Investment Income | 1.470 | 1.4182 | 1.3362 | .915 | .580 |
Net Realized and Unrealized Gain | | | | | |
(Loss) on Investments7 | 1.977 | 18.168 | 7.582 | 3.630 | 2.070 |
Total from Investment Operations | 3.447 | 19.586 | 8.918 | 4.545 | 2.650 |
Distributions | | | | | |
Dividends from Net Investment Income | (1.277) | (1.136) | (.968) | (.975) | — |
Distributions from Realized Capital Gains | — | — | — | — | — |
Total Distributions | (1.277) | (1.136) | (.968) | (.975) | — |
Net Asset Value, End of Period | $84.27 | $82.10 | $63.65 | $55.70 | $52.13 |
| | | | | |
| | | | | |
Total Return | 4.15% | 31.06% | 16.11% | 8.62% | 5.36% |
| | | | | |
| | | | | |
Ratios/Supplemental Data | | | | | |
Net Assets, End of Period (Millions) | $365 | $312 | $95 | $50 | $21 |
Ratio of Total Expenses to Average Net Assets | 0.20% | 0.22% | 0.25% | 0.26% | 0.28%5 |
Ratio of Net Investment Income to | | | | | |
Average Net Assets | 1.79% | 1.84% | 2.16% | 1.83% | 1.93%5 |
Portfolio Turnover Rate6 | 10% | 6% | 13% | 12% | 8% |
1 Inception.
2 Calculated based on average shares outstanding.
3 Includes increases from redemption fees of $.02, $.01, $.00, $.00, and $.01.
4 Total returns do not reflect the 2% fee assessed on redemptions of shares held for less than one year.
5 Annualized.
6 Excludes the value of portfolio securities received or delivered as a result of in-kind purchases or redemptions of the fund’s capital shares, including ETF Creation Units.
7 Includes increases from redemption fees of $.04, $.02, $.00, $.00, and $.02. See accompanying Notes, which are an integral part of the Financial Statements.
82
Materials Index Fund
Notes to Financial Statements
Vanguard Materials Index Fund is registered under the Investment Company Act of 1940 as an open-end investment company, or mutual fund. The fund offers two classes of shares: Admiral Shares and ETF Shares. Admiral Shares are available to any investor who meets the fund’s minimum purchase requirements. ETF Shares were listed for trading on the American Stock Exchange through September 18, 2008, and on the NYSE Arca, Inc., thereafter; they can be purchased and sold through a broker.
A. The following significant accounting policies conform to generally accepted accounting principles for U.S. mutual funds. The fund consistently follows such policies in preparing its financial statements.
1. Security Valuation: Securities are valued as of the close of trading on the New York Stock Exchange (generally 4 p.m., Eastern time) on the valuation date. Equity securities are valued at the latest quoted sales prices or official closing prices taken from the primary market in which each security trades; such securities not traded on the valuation date are valued at the mean of the latest quoted bid and asked prices. Securities for which market quotations are not readily available, or whose values have been materially affected by events occurring before the fund’s pricing time but after the close of the securities’ primary markets, are valued by methods deemed by the board of trustees to represent fair value. Investments in Vanguard Market Liquidity Fund are valued at that fund’s net asset value.
2. Federal Income Taxes: The fund intends to continue to qualify as a regulated investment company and distribute all of its taxable income. Management has analyzed the fund’s tax positions taken on federal income tax returns for all open tax years (tax years ended August 31, 2005–2008), and has concluded that no provision for federal income tax is required in the fund’s financial statements.
3. Distributions: Distributions to shareholders are recorded on the ex-dividend date.
4. Security Lending: The fund may lend its securities to qualified institutional borrowers to earn additional income. Security loans are required to be secured at all times by collateral at least equal to the market value of securities loaned. The fund invests cash collateral received in Vanguard Market Liquidity Fund, and records a liability for the return of the collateral, during the period the securities are on loan. Security lending income represents the income earned on investing cash collateral, less expenses associated with the loan.
5. Other: Dividend income is recorded on the ex-dividend date. Interest income includes income distributions received from Vanguard Market Liquidity Fund and is accrued daily. Security transactions are accounted for on the date securities are bought or sold. Costs used to determine realized gains (losses) on the sale of investment securities are those of the specific securities sold. Fees assessed on redemptions of Admiral Shares are credited to paid-in capital.
Each class of shares has equal rights as to assets and earnings, except that each class separately bears certain class-specific expenses related to maintenance of shareholder accounts (included in Management and Administrative expenses) and shareholder reporting. Marketing and distribution expenses are allocated to each class of shares based on a method approved by the board of trustees. Income, other non-class-specific expenses, and gains and losses on investments are allocated to each class of shares based on its relative net assets.
B. The Vanguard Group furnishes at cost investment advisory, corporate management, administrative, marketing, and distribution services. The costs of such services are allocated to the fund under methods approved by the board of trustees. The fund has committed to provide up to 0.40% of its net assets in capital contributions to Vanguard. At August 31, 2008, the fund had contributed capital of $44,000 to Vanguard (included in Other Assets), representing 0.01% of the fund’s net assets and 0.04% of Vanguard’s capitalization. The fund’s trustees and officers are also directors and officers of Vanguard.
C. Distributions are determined on a tax basis and may differ from net investment income and realized capital gains for financial reporting purposes. Differences may be permanent or temporary. Permanent differences are reclassified among capital accounts in the financial statements to reflect their tax character. Temporary differences arise when certain items of income, expense, gain, or loss are recognized in different periods for financial statement and tax purposes; these differences will reverse at some time in the future. Differences in classification may also result from the treatment of short-term gains as ordinary income for tax purposes.
During the year ended August 31, 2008, the fund realized $40,528,000 of net capital gains resulting from in-kind redemptions—in which shareholders exchanged fund shares for securities held by the fund rather than for cash. Because such gains are not taxable to the fund, and are not distributed to shareholders, they have been reclassified from accumulated net realized losses to paid-in capital.
83
Materials Index Fund
For tax purposes, at August 31, 2008, the fund had $5,003,000 of ordinary income available for distribution. The fund had available realized losses of $7,506,000 to offset future net capital gains of $6,000 through August 31, 2014, $698,000 through August 31, 2015, $1,458,000 through August 31, 2016, and $5,344,000 through August 31, 2017.
At August 31, 2008, the cost of investment securities for tax purposes was $487,834,000. Net unrealized depreciation of investment securities for tax purposes was $11,777,000, consisting of unrealized gains of $36,802,000 on securities that had risen in value since their purchase and $48,579,000 in unrealized losses on securities that had fallen in value since their purchase.
D. During the year ended August 31, 2008, the fund purchased $292,915,000 of investment securities and sold $188,871,000 of investment securities, other than temporary cash investments.
E. Capital share transactions for each class of shares were:
| | | Year Ended August 31, |
| | 2008 | | | 2007 |
| Amount | Shares | | Amount | Shares |
| ($000) | (000) | | ($000) | (000) |
Admiral Shares | | | | | |
Issued | 72,955 | 1,626 | | 46,752 | 1,145 |
Issued in Lieu of Cash Distributions | 987 | 22 | | 251 | 7 |
Redeemed1 | (21,939) | (507) | | (6,657) | (171) |
Net Increase (Decrease)—Admiral Shares | 52,003 | 1,141 | | 40,346 | 981 |
ETF Shares | | | | | |
Issued | 200,303 | 2,323 | | 224,099 | 2,804 |
Issued in Lieu of Cash Distributions | — | — | | — | — |
Redeemed1 | (150,410) | (1,800) | | (40,156) | (500) |
Net Increase (Decrease)—ETF Shares | 49,893 | 523 | | 183,943 | 2,304 |
F. In September 2006, the Financial Accounting Standards Board issued Statement of Financial Accounting Standards No. 157 (“FAS 157”), “Fair Value Measurements.” FAS 157 establishes a framework for measuring fair value and expands disclosures about fair value measurements in financial statements.
The various inputs that may be used to determine the value of the fund’s investments are summarized in three broad levels. The inputs or methodologies used for valuing securities are not necessarily an indication of the risk associated with investing in those securities.
Level 1—Quoted prices in active markets for identical securities.
Level 2—Other significant observable inputs (including quoted prices for similar securities, interest rates, prepayment speeds, credit risk, etc.).
Level 3—Significant unobservable inputs (including the fund’s own assumptions used to determine the fair value of investments).
At August 31, 2008, 100% of the fund’s investments were valued based on Level 1 inputs.
1 Net of redemption fees of $237,000 and $68,000 (fund totals).
84
Telecommunication Services Index Fund
Fund Profile
As of August 31, 2008
Portfolio Characteristics | | |
| | Target | Broad |
| Fund | Index1 | Index2 |
Number of Stocks | 46 | 46 | 2,481 |
Median Market Cap | $10.6B | $100.1B | $32.1B |
Price/Earnings Ratio | 22.5x | 17.2x | 16.8x |
Price/Book Ratio | 2.3x | 2.0x | 2.4x |
Yield3 | | 4.1% | 2.0% |
Admiral Shares | 3.3% | | |
ETF Shares | 3.4% | | |
Return on Equity | 9.3% | 11.0% | 20.1% |
Earnings Growth Rate | 1.8% | 0.4% | 18.4% |
Foreign Holdings | 0.0% | 0.0% | 0.0% |
Turnover Rate | 28% | — | — |
Expense Ratio (8/31/2007)4 | | — | — |
Admiral Shares | 0.27% | | |
ETF Shares | 0.23% | | |
Short-Term Reserves | 0.0% | — | — |
Volatility Measures5 | |
| Fund Versus | Fund Versus |
| Target Index1 | Broad Index2 |
R-Squared | 0.94 | 0.76 |
Beta | 0.92 | 1.34 |
Industry Diversification (% of equity exposure) |
| |
Alternative Carriers | 8.8% |
Integrated Telecommunication Services | 61.2 |
Wireless Telecommunication Services | 30.0 |
Ten Largest Holdings6 (% of total net assets) |
| |
AT&T Inc. | 20.1% |
Verizon Communications Inc. | 20.1 |
Sprint Nextel Corp. | 4.9 |
American Tower Corp. Class A | 4.5 |
Crown Castle International Corp. | 3.2 |
NII Holdings Inc. | 2.9 |
Embarq Corp. | 2.6 |
Qwest Communications International Inc. | 2.2 |
Windstream Corp. | 2.2 |
Level 3 Communications, Inc. | 2.1 |
Top Ten | 64.8% |
1 MSCI US IMI/Telecommunication Services.
2 MSCI US IMI/2500.
3 30-day SEC yield for the fund; annualized dividend yield for the indexes. See the Glossary.
4 Expense ratios shown are from the prospectus dated December 10, 2007. Expense ratios for the fiscal year ended August 31, 2008, were 0.25% for Admiral Shares and 0.20% for ETF Shares.
5 For an explanation of R-squared, beta, and other terms used here, see the Glossary.
6 The holdings listed exclude any temporary cash investments and equity index products.
85
Telecommunication Services Index Fund
Performance Summary
All of the returns in this report represent past performance, which is not a guarantee of future results that may be achieved by the fund. (Current performance may be lower or higher than the performance data cited. For performance data current to the most recent month-end, visit our website at www.vanguard.com/performance.) Note, too, that both investment returns and principal value can fluctuate widely, so an investor’s shares, when sold, could be worth more or less than their original cost. The returns shown do not reflect taxes that a shareholder would pay on fund distributions or on the sale of fund shares.
Cumulative Performance: September 23, 2004–August 31, 2008
Initial Investment of $10,000
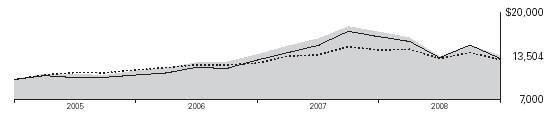
| Average Annual Total Returns | Final Value |
| Periods Ended August 31, 2008 | of a $10,000 |
| One Year | Since Inception1 | Investment |
Telecommunication Services Index Fund ETF Shares | | | |
Net Asset Value | –20.94% | 7.93% | $13,504 |
Telecommunication Services Index Fund ETF Shares | | | |
Market Price | –20.94 | 7.90 | 13,489 |
MSCI US IMI/2500 | –9.90 | 6.84 | 12,973 |
MSCI US IMI/Telecommunication Services | –20.07 | 7.11 | 13,107 |
| | | Final Value |
| | | of a $100,000 |
| One Year | Since Inception1 | Investment |
Telecommunication Services Index Fund Admiral Shares2 | –20.98% | 6.91% | $126,154 |
MSCI US IMI/2500 | –9.90 | 4.83 | 117,817 |
MSCI US IMI/Telecommunication Services | –20.07 | 6.99 | 126,475 |
1 Performance for the fund and its comparative standards is calculated since the following inception dates: September 23, 2004, for ETF Shares; March 11, 2005, for Admiral Shares.
2 Total returns do not reflect the 2% fee assessed on redemptions of shares held for less than one year.
86
Telecommunication Services Index Fund
Fiscal-Year Total Returns (%): September 23, 2004–August 31, 2008
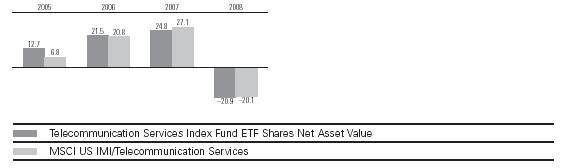
Cumulative Returns: ETF Shares, September 23, 2004–August 31, 2008 |
| | Cumulative |
| | Since |
| One Year | Inception |
Telecommunication Services Index Fund ETF Shares Market Price | –20.94% | 34.89% |
Telecommunication Services Index Fund ETF Shares Net Asset Value | –20.94 | 35.04 |
MSCI US IMI/Telecommunication Services | –20.07 �� | 31.07 |
Average Annual Total Returns: Periods Ended June 30, 2008
This table presents average annual total returns through the latest calendar quarter—rather than through the end of the fiscal period. Securities and Exchange Commission rules require that we provide this information.
| | | Since |
| Inception Date | One Year | Inception |
ETF Shares | 9/23/2004 | | |
Market Price | | –22.68% | 8.38% |
Net Asset Value | | –22.69 | 8.40 |
Admiral Shares1 | 3/11/2005 | –22.74 | 7.39 |
1 Total returns do not reflect the 2% fee assessed on redemptions of shares held for less than one year.
Note: See Financial Highlights tables for dividend and capital gains information.
87
Telecommunication Services Index Fund
Financial Statements
Statement of Net Assets
As of August 31, 2008
The fund provides a complete list of its holdings four times in each fiscal year, at the quarter-ends. For the second and fourth fiscal quarters, the lists appear in the fund’s semiannual and annual reports to shareholders. For the first and third fiscal quarters, the fund files the lists with the Securities and Exchange Commission on Form N-Q. Shareholders can look up the fund’s Forms N-Q on the SEC’s website at www.sec.gov. Forms N-Q may also be reviewed and copied at the SEC’s Public Reference Room (see the back cover of this report for further information).
| | | Market |
| | | Value• |
| | Shares | ($000) |
Common Stocks (100.7%) | | |
Diversified Telecommunication Services (70.5%) | |
| Alternative Carriers (8.8%) | | |
* | Level 3 Communications, Inc. | 990,172 | 3,396 |
* | tw telecom inc. | 137,378 | 2,107 |
* | Premiere Global | | |
| Services, Inc. | 105,811 | 1,600 |
* | Vonage Holdings Corp. | 1,052,071 | 1,557 |
* | Global Crossing Ltd. | 80,180 | 1,464 |
* | Cogent Communications | | |
| Group, Inc. | 154,599 | 1,424 |
* | Globalstar, Inc. | 441,941 | 1,370 |
* | PAETEC Holding Corp. | 402,903 | 1,330 |
| | | |
| Integrated Telecommunication Services (61.7%) | |
| AT&T Inc. | 1,015,575 | 32,488 |
| Verizon Communications Inc. | 923,139 | 32,421 |
| Embarq Corp. | 87,434 | 4,123 |
| Qwest Communications | | |
| International Inc. | 961,167 | 3,633 |
| Windstream Corp. | 286,261 | 3,555 |
* | Frontier | | |
| Communications Corp. | 230,952 | 2,903 |
| CenturyTel, Inc. | 73,220 | 2,829 |
* | Cincinnati Bell Inc. | 418,607 | 1,633 |
| FairPoint | | |
| Communications, Inc. | 181,823 | 1,609 |
| Iowa Telecommunications | | |
| Services Inc. | 87,373 | 1,607 |
* | General Communication, Inc. | 153,676 | 1,558 |
* | Cbeyond Inc. | 89,481 | 1,515 |
| NTELOS Holdings Corp. | 49,471 | 1,472 |
| Shenandoah | | |
| Telecommunications Co. | 84,528 | 1,461 |
| Alaska Communications | | |
| Systems Holdings, Inc. | 137,832 | 1,450 |
| SureWest Communications | 118,878 | 1,413 |
| Consolidated Communications | | |
| Holdings, Inc. | 92,826 | 1,403 |
| Atlantic Tele-Network, Inc. | 41,630 | 1,393 |
* | IDT Corp. Class B | 724,858 | 1,124 |
* | IDT Corp. | 67,059 | 104 |
| | | 113,942 |
Wireless Telecommunication Services (30.2%) | |
| Sprint Nextel Corp. | 909,108 | 7,927 |
* | American Tower Corp. | | |
| Class A | 175,965 | 7,273 |
* | Crown Castle | | �� |
| International Corp. | 140,154 | 5,242 |
* | NII Holdings Inc. | 90,696 | 4,763 |
* | MetroPCS | | |
| Communications Inc. | 156,592 | 2,642 |
* | SBA Communications Corp. | 75,620 | 2,641 |
* | Leap Wireless | | |
| International, Inc. | 50,157 | 2,240 |
* | U.S. Cellular Corp. | 32,369 | 1,693 |
| USA Mobility, Inc. | 144,283 | 1,626 |
* | Syniverse Holdings Inc. | 95,457 | 1,584 |
* | Centennial Communications | | |
| Corp. Class A | 199,306 | 1,519 |
* | Clearwire Corp. | 153,742 | 1,514 |
* | ICO Global Communications | | |
| (Holdings) Ltd. | 491,174 | 1,439 |
* | iPCS, Inc. | 69,844 | 1,397 |
| Telephone & Data | | |
| Systems, Inc. | 35,656 | 1,369 |
| Telephone & Data | | |
| Systems, Inc.— | | |
| Special Common Shares | 35,508 | 1,326 |
* | Fibertower Corp. | 971,493 | 1,263 |
* | TerreStar Corp. | 453,908 | 1,262 |
| | | 48,720 |
Total Investments (100.7%) | | |
(Cost $204,119) | | 162,662 |
Other Assets and Liabilities (–0.7%) | | |
Other Assets | | 4,042 |
Liabilities | | (5,218) |
| | | (1,176) |
Net Assets (100%) | | 161,486 |
At August 31, 2008, net assets consisted of: |
| Amount |
| ($000) |
Paid-in Capital | 222,740 |
Undistributed Net Investment Income | 3,214 |
Accumulated Net Realized Losses | (23,011) |
Unrealized Appreciation (Depreciation) | (41,457) |
Net Assets | 161,486 |
| |
| |
Admiral Shares—Net Assets | |
Applicable to 594,292 outstanding | |
$.001 par value shares of beneficial | |
interest (unlimited authorization) | 18,769 |
Net Asset Value Per Share— | |
Admiral Shares | $31.58 |
| |
| |
ETF Shares—Net Assets | |
Applicable to 2,300,000 outstanding | |
$.001 par value shares of beneficial | |
interest (unlimited authorization) | 142,717 |
Net Asset Value Per Share— | |
ETF Shares | $62.05 |
• See Note A in Notes to Financial Statements.
* Non-income-producing security.
See accompanying Notes, which are an integral part of the Financial Statements.
88
Telecommunication Services Index Fund
Statement of Operations
| Year Ended |
| August 31, 2008 |
| ($000) |
Investment Income | |
Income | |
Dividends | 5,966 |
Interest1 | 15 |
Security Lending | 3 |
Total Income | 5,984 |
Expenses | |
The Vanguard Group—Note B | |
Investment Advisory Services | 36 |
Management and Administrative | |
Admiral Shares | 54 |
ETF Shares | 236 |
Marketing and Distribution | |
Admiral Shares | 14 |
ETF Shares | 55 |
Custodian Fees | 20 |
Auditing Fees | 23 |
Shareholders’ Reports | |
Admiral Shares | — |
ETF Shares | 15 |
Total Expenses | 453 |
Expenses Paid Indirectly | (4) |
Net Expenses | 449 |
Net Investment Income | 5,535 |
Realized Net Gain (Loss) on | |
Investment Securities Sold | (7,019) |
Change in Unrealized Appreciation | |
(Depreciation) of Investment Securities | (51,454) |
Net Increase (Decrease) in Net Assets | |
Resulting from Operations | (52,938) |
Statement of Changes in Net Assets
| Year Ended August 31, |
| 2008 | 2007 |
| ($000) | ($000) |
Increase (Decrease) in Net Assets | | |
Operations | | |
Net Investment Income | 5,535 | 5,124 |
Realized Net Gain (Loss) | (7,019) | 21,123 |
Change in Unrealized Appreciation (Depreciation) | (51,454) | 8,792 |
Net Increase (Decrease) in Net Assets Resulting from Operations | (52,938) | 35,039 |
Distributions | | |
Net Investment Income | | |
Admiral Shares | (1,069) | (271) |
ETF Shares | (5,594) | (1,761) |
Realized Capital Gain | | |
Admiral Shares | — | — |
ETF Shares | — | — |
Total Distributions | (6,663) | (2,032) |
Capital Share Transactions | | |
Admiral Shares | (22,656) | 40,952 |
ETF Shares | (73,150) | 165,408 |
Net Increase (Decrease) from Capital Share Transactions | (95,806) | 206,360 |
Total Increase (Decrease) | (155,407) | 239,367 |
Net Assets | | |
Beginning of Period | 316,893 | 77,526 |
End of Period2 | 161,486 | 316,893 |
1 Interest income from an affiliated company of the fund was $15,000.
2 Net Assets—End of Period includes undistributed net investment income of $3,214,000 and $4,342,000. See accompanying Notes, which are an integral part of the Financial Statements.
89
Telecommunication Services Index Fund
Financial Highlights
Admiral Shares | | | | |
| | | | |
| | | | Mar. 11, |
| | 20051 to |
| Year Ended August 31, | Aug. 31, |
For a Share Outstanding Throughout Each Period | 2008 | 2007 | 2006 | 2005 |
Net Asset Value, Beginning of Period | $41.01 | $33.29 | $28.18 | $26.75 |
Investment Operations | | | | |
Net Investment Income | .9082 | .8882 | .8612,3 | .3402 |
Net Realized and Unrealized Gain (Loss) on Investments4 | (9.338) | 7.308 | 5.041 | 1.090 |
Total from Investment Operations | (8.430) | 8.196 | 5.902 | 1.430 |
Distributions | | | | |
Dividends from Net Investment Income | (1.000) | (.476) | (.792) | — |
Distributions from Realized Capital Gains | — | — | — | — |
Total Distributions | (1.000) | (.476) | (.792) | — |
Net Asset Value, End of Period | $31.58 | $41.01 | $33.29 | $28.18 |
| | | | |
| | | | |
Total Return5 | –20.98% | 24.77% | 21.47% | 5.35% |
| | | | |
| | | | |
Ratios/Supplemental Data | | | | |
Net Assets, End of Period (Millions) | $19 | $51 | $6 | $1 |
Ratio of Total Expenses to Average Net Assets | 0.25% | 0.27% | 0.28% | 0.28%6 |
Ratio of Net Investment Income to Average Net Assets | 2.50% | 2.17% | 3.28%3 | 2.70%6 |
Portfolio Turnover Rate7 | 28% | 17% | 32% | 41% |
ETF Shares | | | | |
| | | | |
| | | | Sept. 23, |
| | 20041 to |
| Year Ended August 31, | Aug. 31, |
For a Share Outstanding Throughout Each Period | 2008 | 2007 | 2006 | 2005 |
Net Asset Value, Beginning of Period | $80.60 | $65.40 | $55.35 | $49.50 |
Investment Operations | | | | |
Net Investment Income | 1.7642 | 1.7412 | 2.0402,8 1.3002 |
Net Realized and Unrealized Gain (Loss) on Investments9 | (18.316) | 14.386 | 9.567 | 4.960 |
Total from Investment Operations | (16.552) | 16.127 | 11.607 | 6.260 |
Distributions | | | | |
Dividends from Net Investment Income | (1.998) | (.927) | (1.557) | (.410) |
Distributions from Realized Capital Gains | — | — | — | — |
Total Distributions | (1.998) | (.927) | (1.557) | (.410) |
Net Asset Value, End of Period | $62.05 | $80.60 | $65.40 | $55.35 |
| | | | |
| | | | |
Total Return | –20.94% | 24.81% | 21.49% | 12.65% |
| | | | |
| | | | |
Ratios/Supplemental Data | | | | |
Net Assets, End of Period (Millions) | $143 | $266 | $72 | $17 |
Ratio of Total Expenses to Average Net Assets | 0.20% | 0.23% | 0.25% | 0.26%6 |
Ratio of Net Investment Income to Average Net Assets | 2.55% | 2.21% | 3.31%8 | 2.72%6 |
Portfolio Turnover Rate7 | 28% | 17% | 32% | 41% |
1 Inception.
2 Calculated based on average shares outstanding.
3 Net investment income per share and the ratio of net investment income to average net assets include $0.112 and 0.38%, respectively, resulting from a special dividend from MCI in December 2005.
4 Includes increases from redemption fees of $.05, $.01, $.00, and $.00.
5 Total returns do not reflect the 2% fee assessed on redemptions of shares held for less than one year.
6 Annualized.
7 Excludes the value of portfolio securities received or delivered as a result of in-kind purchases or redemptions of the fund’s capital shares, including ETF Creation Units.
8 Net investment income per share and the ratio of net investment income to average net assets include $0.219 and 0.38%, respectively, resulting from a special dividend from MCI in December 2005.
9 Includes increases from redemption fees of $.08, $.03, $.00, and $.00.
See accompanying Notes, which are an integral part of the Financial Statements.
90
Telecommunication Services Index Fund
Notes to Financial Statements
Vanguard Telecommunication Services Index Fund is registered under the Investment Company Act of 1940 as an open-end investment company, or mutual fund. The fund offers two classes of shares, Admiral Shares and ETF Shares. Admiral Shares are available to any investor who meets the fund’s minimum purchase requirements. ETF Shares were listed for trading on the American Stock Exchange through September 18, 2008, and on the NYSE Arca, Inc., thereafter; they can be purchased and sold through a broker.
A. The following significant accounting policies conform to generally accepted accounting principles for U.S. mutual funds. The fund consistently follows such policies in preparing its financial statements.
1. Security Valuation: Securities are valued as of the close of trading on the New York Stock Exchange (generally 4 p.m., Eastern time) on the valuation date. Equity securities are valued at the latest quoted sales prices or official closing prices taken from the primary market in which each security trades; such securities not traded on the valuation date are valued at the mean of the latest quoted bid and asked prices. Securities for which market quotations are not readily available, or whose values have been materially affected by events occurring before the fund’s pricing time but after the close of the securities’ primary markets, are valued by methods deemed by the board of trustees to represent fair value. Investments in Vanguard Market Liquidity Fund are valued at that fund’s net asset value.
2. Federal Income Taxes: The fund intends to continue to qualify as a regulated investment company and distribute all of its taxable income. Management has analyzed the fund’s tax positions taken on federal income tax returns for all open tax years (tax years ended August 31, 2005–2008), and has concluded that no provision for federal income tax is required in the fund’s financial statements.
3. Distributions: Distributions to shareholders are recorded on the ex-dividend date.
4. Other: Dividend income is recorded on the ex-dividend date. Interest income includes income distributions received from Vanguard Market Liquidity Fund and is accrued daily. Security transactions are accounted for on the date securities are bought or sold. Costs used to determine realized gains (losses) on the sale of investment securities are those of the specific securities sold. Fees assessed on redemptions of Admiral Shares are credited to paid-in capital.
Each class of shares has equal rights as to assets and earnings, except that each class separately bears certain class-specific expenses related to maintenance of shareholder accounts (included in Management and Administrative expenses) and shareholder reporting. Marketing and distribution expenses are allocated to each class of shares based on a method approved by the board of trustees. Income, other non-class-specific expenses, and gains and losses on investments are allocated to each class of shares based on its relative net assets.
B. The Vanguard Group furnishes at cost investment advisory, corporate management, administrative, marketing, and distribution services. The costs of such services are allocated to the fund under methods approved by the board of trustees. The fund has committed to provide up to 0.40% of its net assets in capital contributions to Vanguard. At August 31, 2008, the fund had contributed capital of $14,000 to Vanguard (included in Other Assets), representing 0.01% of the fund’s net assets and 0.01% of Vanguard’s capitalization. The fund’s trustees and officers are also directors and officers of Vanguard.
C. The fund’s custodian bank has agreed to reduce its fees when the fund maintains cash on deposit in the non-interest-bearing custody account. For the year ended August 31, 2008, custodian fee offset arrangements reduced the fund’s expenses by $4,000 (an annual rate of 0.00% of average net assets).
D. Distributions are determined on a tax basis and may differ from net investment income and realized capital gains for financial reporting purposes. Differences may be permanent or temporary. Permanent differences are reclassified among capital accounts in the financial statements to reflect their tax character. Temporary differences arise when certain items of income, expense, gain, or loss are recognized in different periods for financial statement and tax purposes; these differences will reverse at some time in the future. Differences in classification may also result from the treatment of short-term gains as ordinary income for tax purposes.
During the year ended August 31, 2008, the fund realized $10,786,000 of net capital gains resulting from in-kind redemptions—in which shareholders exchanged fund shares for securities held by the fund rather than for cash. Because such gains are not taxable to the fund, and are not distributed to shareholders, they have been reclassified from accumulated net realized losses to paid-in capital.
91
Telecommunication Services Index Fund
For tax purposes, at August 31, 2008, the fund had $3,351,000 of ordinary income available for distribution. The fund had available realized losses of $23,011,000 to offset future net capital gains of $29,000 through August 31, 2014, $819,000 through August 31, 2015, $4,154,000 through August 31, 2016, and $18,009,000 through August 31, 2017.
At August 31, 2008, the cost of investment securities for tax purposes was $204,119,000. Net unrealized depreciation of investment securities for tax purposes was $41,457,000, consisting of unrealized gains of $1,155,000 on securities that had risen in value since their purchase and $42,612,000 in unrealized losses on securities that had fallen in value since their purchase.
E. During the year ended August 31, 2008, the fund purchased $156,069,000 of investment securities and sold $250,490,000 of investment securities, other than temporary cash investments.
F. Capital share transactions for each class of shares were:
| | | Year Ended August 31, |
| | 2008 | | | 2007 |
| Amount | Shares | | Amount | Shares |
| ($000) | (000) | | ($000) | (000) |
Admiral Shares | | | | | |
Issued | 4,265 | 123 | | 47,055 | 1,227 |
Issued in Lieu of Cash Distributions | 1,014 | 26 | | 257 | 7 |
Redeemed1 | (27,935) | (796) | | (6,360) | (161) |
Net Increase (Decrease)—Admiral Sharess | (22,656) | (647) | | 40,952 | 1,073 |
ETF Shares | | | | | |
Issued | 93,859 | 1,400 | | 285,319 | 3,700 |
Issued in Lieu of Cash Distributions | — | — | | — | — |
Redeemed1 | (167,009) | (2,400) | | (119,911) | (1,500) |
Net Increase (Decrease)—ETF Sharess | (73,150) | (1,000) | | 165,408 | 2,200 |
G. In September 2006, the Financial Accounting Standards Board issued Statement of Financial Accounting Standards No. 157 (“FAS 157”), “Fair Value Measurements.” FAS 157 establishes a framework for measuring fair value and expands disclosures about fair value measurements in financial statements.
The various inputs that may be used to determine the value of the fund’s investments are summarized in three broad levels. The inputs or methodologies used for valuing securities are not necessarily an indication of the risk associated with investing in those securities.
Level 1—Quoted prices in active markets for identical securities.
Level 2—Other significant observable inputs (including quoted prices for similar securities, interest rates, prepayment speeds, credit risk, etc.).
Level 3—Significant unobservable inputs (including the fund’s own assumptions used to determine the fair value of investments).
At August 31, 2008, 100% of the fund’s investments were valued based on Level 1 inputs.
1 Net of redemption fees of $220,000 and $110,000 (fund totals).
92
Utilities Index Fund
Fund Profile
As of August 31, 2008
Portfolio Characteristics | | |
| | Target | Broad |
| Fund | Index1 | Index2 |
Number of Stocks | 85 | 86 | 2,481 |
Median Market Cap | $14.8B | $14.8B | $32.1B |
Price/Earnings Ratio | 14.7x | 14.7x | 16.8x |
Price/Book Ratio | 1.9x | 1.9x | 2.4x |
Yield3 | | 3.4% | 2.0% |
Admiral Shares | 3.1% | | |
ETF Shares | 3.2% | | |
Return on Equity | 14.2% | 14.2% | 20.1% |
Earnings Growth Rate | 9.9% | 10.0% | 18.4% |
Foreign Holdings | 0.0% | 0.0% | 0.0% |
Turnover Rate | 18% | — | — |
Expense Ratio (8/31/2007)4 | | — | — |
Admiral Shares | 0.26% | | |
ETF Shares | 0.22% | | |
Short-Term Reserves | 0.0% | — | — |
Volatility Measures5 | |
| Fund Versus | Fund Versus |
| Target Index1 | Broad Index2 |
R-Squared | 1.00 | 0.31 |
Beta | 1.00 | 0.68 |
Industry Diversification (% of equity exposure) |
| |
Electric Utilities | 49.9% |
Gas Utilities | 8.7 |
Independent Power Producers & | |
Energy Traders | 8.7 |
Multi-Utilities | 31.9 |
Other Utilities | 0.8 |
Ten Largest Holdings6 (% of total net assets) |
| |
Exelon Corp. | 9.2% |
Southern Co. | 5.3 |
Dominion Resources, Inc. | 4.7 |
FPL Group, Inc. | 4.3 |
FirstEnergy Corp. | 4.1 |
Duke Energy Corp. | 4.1 |
Public Service Enterprise Group, Inc. | 3.8 |
Entergy Corp. | 3.7 |
PPL Corp. | 3.0 |
American Electric Power Co., Inc. | 2.9 |
Top Ten | 45.1% |
1 MSCI US IMI/Utilities.
2 MSCI US IMI/2500.
3 30-day SEC yield for the fund; annualized dividend yield for the indexes. See the Glossary.
4 Expense ratios shown are from the prospectus dated December 10, 2007. Expense ratios for the fiscal year ended August 31, 2008, were 0.25% for Admiral Shares and 0.20% for ETF Shares.
5 For an explanation of R-squared, beta, and other terms used here, see the Glossary.
6 The holdings listed exclude any temporary cash investments and equity index products.
93
Utilities Index Fund
Performance Summary
All of the returns in this report represent past performance, which is not a guarantee of future results that may be achieved by the fund. (Current performance may be lower or higher than the performance data cited. For performance data current to the most recent month-end, visit our website at www.vanguard.com/performance.) Note, too, that both investment returns and principal value can fluctuate widely, so an investor’s shares, when sold, could be worth more or less than their original cost. The returns shown do not reflect taxes that a shareholder would pay on fund distributions or on the sale of fund shares.
Cumulative Performance: January 26, 2004–August 31, 2008
Initial Investment of $10,000
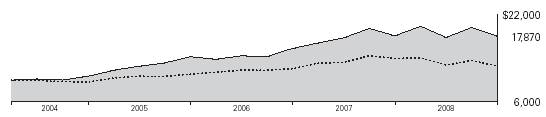
| Average Annual Total Returns | Final Value |
| Periods Ended August 31, 2008 | of a $10,000 |
| One Year | Since Inception1 | Investment |
Utilities Index Fund ETF Shares Net Asset Value | –0.66% | 13.46% | $17,870 |
Utilities Index Fund ETF Shares Market Price | –0.42 | 13.46 | 17,867 |
MSCI US IMI/2500 | –9.90 | 5.15 | 12,594 |
MSCI US IMI/Utilities | –0.38 | 13.71 | 18,046 |
| | | Final Value |
| | | of a $100,000 |
| One Year | Since Inception1 | Investment |
Utilities Index Fund Admiral Shares2 | –0.69% | 14.18% | $177,807 |
MSCI US IMI/2500 | –9.90 | 6.08 | 129,187 |
MSCI US IMI/Utilities | –0.38 | 14.45 | 179,675 |
1 Performance for the fund and its comparative standards is calculated since the following inception dates: January 26, 2004, for ETF Shares; April 28, 2004, for Admiral Shares.
2 Total returns do not reflect the 2% fee assessed on redemptions of shares held for less than one year.
94
Utilities Index Fund
Fiscal-Year Total Returns (%): January 26, 2004–August 31, 2008
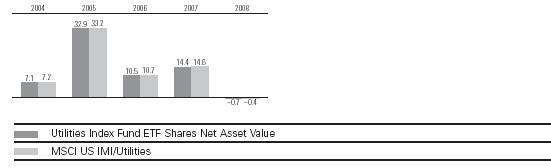
Cumulative Returns: ETF Shares, January 26, 2004–August 31, 2008 |
| | Cumulative |
| | Since |
| One Year | Inception |
Utilities Index Fund ETF Shares Market Price | –0.42% | 78.67% |
Utilities Index Fund ETF Shares Net Asset Value | –0.66 | 78.70 |
MSCI US IMI/Utilities | –0.38 | 80.46 |
Average Annual Total Returns: Periods Ended June 30, 2008
This table presents average annual total returns through the latest calendar quarter—rather than through the end of the fiscal period. Securities and Exchange Commission rules require that we provide this information.
| | | Since |
| Inception Date | One Year | Inception |
ETF Shares | 1/26/2004 | | |
Market Price | | 4.54% | 15.84% |
Net Asset Value | | 4.55 | 15.85 |
Admiral Shares1 | 4/28/2004 | 4.49 | 16.76 |
1 Total returns do not reflect the 2% fee assessed on redemptions of shares held for less than one year. Note: See Financial Highlights tables for dividend and capital gains information.
95
Utilities Index Fund
Financial Statements
Statement of Net Assets
As of August 31, 2008
The fund provides a complete list of its holdings four times in each fiscal year, at the quarter-ends. For the second and fourth fiscal quarters, the lists appear in the fund’s semiannual and annual reports to shareholders. For the first and third fiscal quarters, the fund files the lists with the Securities and Exchange Commission on Form N-Q. Shareholders can look up the fund’s Forms N-Q on the SEC’s website at www.sec.gov. Forms N-Q may also be reviewed and copied at the SEC’s Public Reference Room (see the back cover of this report for further information).
| | | Market |
| | | Value• |
| | Shares | ($000) |
Common Stocks (99.9%) | | |
Electric Utilities (49.9%) | | |
| Exelon Corp. | 583,730 | 44,340 |
| Southern Co. | 682,688 | 25,608 |
| FPL Group, Inc. | 345,000 | 20,721 |
| FirstEnergy Corp. | 271,252 | 19,704 |
| Duke Energy Corp. | 1,125,292 | 19,625 |
| Entergy Corp. | 170,405 | 17,618 |
| PPL Corp. | 331,940 | 14,529 |
| American Electric | | |
| Power Co., Inc. | 357,348 | 13,951 |
| Edison International | 275,421 | 12,647 |
| Progress Energy, Inc. | 220,905 | 9,649 |
| Allegheny Energy, Inc. | 149,519 | 6,778 |
| Pepco Holdings, Inc. | 179,209 | 4,543 |
| Northeast Utilities | 138,316 | 3,719 |
| Pinnacle West Capital Corp. | 89,548 | 3,151 |
| DPL Inc. | 101,093 | 2,509 |
| Great Plains Energy, Inc. | 105,491 | 2,474 |
| ITC Holdings Corp. | 43,626 | 2,443 |
| Sierra Pacific Resources | 208,170 | 2,340 |
| Westar Energy, Inc. | 93,285 | 2,113 |
| Hawaiian Electric | | |
| Industries Inc. | 74,816 | 1,979 |
| Portland General Electric Co. | 55,643 | 1,426 |
| Cleco Corp. | 53,564 | 1,350 |
| IDACORP, Inc. | 40,253 | 1,199 |
| UniSource Energy Corp. | 30,629 | 984 |
| ALLETE, Inc. | 23,242 | 981 |
* | El Paso Electric Co. | 39,915 | 850 |
| UIL Holdings Corp. | 21,315 | 695 |
| MGE Energy, Inc. | 19,651 | 666 |
| Empire District Electric Co. | 30,030 | 634 |
| | | 239,226 |
Gas Utilities (8.7%) | | |
| Questar Corp. | 154,198 | 8,001 |
| Equitable Resources, Inc. | 109,680 | 5,474 |
| ONEOK, Inc. | 88,148 | 3,853 |
| Energen Corp. | 60,607 | 3,384 |
| National Fuel Gas Co. | 65,064 | 3,078 |
| UGI Corp. Holding Co. | 95,143 | 2,617 |
| AGL Resources Inc. | 68,100 | 2,251 |
| Atmos Energy Corp. | 80,253 | 2,210 |
| Piedmont Natural Gas, Inc. | 65,321 | 1,885 |
| Nicor Inc. | 40,167 | 1,843 |
| WGL Holdings Inc. | 44,018 | 1,417 |
| New Jersey Resources Corp. | 37,308 | 1,350 |
| Southwest Gas Corp. | 38,510 | 1,169 |
| Northwest Natural Gas Co. | 23,505 | 1,146 |
| South Jersey Industries, Inc. | 26,454 | 944 |
| The Laclede Group, Inc. | 18,347 | 824 |
| EnergySouth, Inc. | 6,451 | 395 |
| | | 41,841 |
Independent Power Producers & | |
Energy Traders (8.7%) | | |
| Constellation Energy | | |
| Group, Inc. | 158,729 | 10,589 |
* | AES Corp. | 597,798 | 9,122 |
* | NRG Energy, Inc. | 199,434 | 7,507 |
* | Mirant Corp. | 184,243 | 5,450 |
* | Reliant Energy, Inc. | 307,917 | 5,244 |
* | Dynegy, Inc. | 446,796 | 2,663 |
| Ormat Technologies Inc. | 18,149 | 910 |
* | Synthesis Energy | | |
| Systems, Inc. | 28,841 | 194 |
| | | 41,679 |
Multi-Utilities (31.8%) | | |
| Dominion Resources, Inc. | 514,318 | 22,388 |
| Public Service Enterprise | | |
| Group, Inc. | 452,483 | 18,448 |
| PG&E Corp. | 322,856 | 13,344 |
| Sempra Energy | 211,623 | 12,257 |
| Consolidated Edison Inc. | 242,599 | 9,922 |
| Xcel Energy, Inc. | 383,390 | 7,863 |
| Ameren Corp. | 186,398 | 7,803 |
| DTE Energy Co. | 145,175 | 6,121 |
| MDU Resources Group, Inc. | 154,587 | 5,108 |
| Wisconsin Energy Corp. | 104,046 | 4,866 |
| CenterPoint Energy Inc. | 277,496 | 4,407 |
| NiSource, Inc. | 243,998 | 4,021 |
| SCANA Corp. | 98,622 | 3,866 |
| Energy East Corp. | 140,860 | 3,831 |
| Integrys Energy Group, Inc. | 68,005 | 3,555 |
| Alliant Energy Corp. | 98,269 | 3,434 |
| TECO Energy, Inc. | 187,537 | 3,346 |
| Puget Energy, Inc. | 115,392 | 3,219 |
| NSTAR | 95,041 | 3,216 |
| OGE Energy Corp. | 81,842 | 2,758 |
| CMS Energy Corp. | 200,464 | 2,720 |
| Vectren Corp. | 67,945 | 1,885 |
| Black Hills Corp. | 34,174 | 1,155 |
| Avista Corp. | 47,207 | 1,053 |
| NorthWestern Corp. | 34,535 | 908 |
| PNM Resources Inc. | 68,179 | 804 |
| CH Energy Group, Inc. | 13,966 | 556 |
| | | 152,854 |
Water Utilities (0.8%) | | |
| Aqua America, Inc. | 118,908 | 2,175 |
| California Water | | |
| Service Group | 17,423 | 684 |
| American States Water Co. | 15,227 | 602 |
| SJW Corp. | 12,199 | 340 |
| | | 3,801 |
Total Investments | | |
(Cost $502,530) | | 479,401 |
| Market |
| Value• |
| ($000) |
Other Assets and Liabilities (0.1%) | |
Other Assets | 5,710 |
Liabilities | (5,305) |
| 405 |
Net Assets (100%) | 479,806 |
| |
| |
| |
At August 31, 2008, net assets consisted of: |
| Amount |
| ($000) |
Paid-in Capital | 503,772 |
Undistributed Net Investment Income | 2,745 |
Accumulated Net Realized Losses | (3,582) |
Unrealized Appreciation (Depreciation) | (23,129) |
Net Assets | 479,806 |
| |
| |
Admiral Shares—Net Assets | |
Applicable to 2,783,731 outstanding | |
$.001 par value shares of beneficial | |
interest (unlimited authorization) | 109,281 |
Net Asset Value Per Share— | |
Admiral Shares | $39.26 |
| |
| |
ETF Shares—Net Assets | |
Applicable to 4,736,942 outstanding | |
$.001 par value shares of beneficial | |
interest (unlimited authorization) | 370,525 |
Net Asset Value Per Share— | |
ETF Shares | $78.22 |
• See Note A in Notes to Financial Statements.
* Non-income-producing security.
See accompanying Notes, which are an integral part of the Financial Statements.
96
Utilities Index Fund
Statement of Operations
| Year Ended |
| August 31, 2008 |
| ($000) |
Investment Income | |
Income | |
Dividends | 13,690 |
Interest1 | 11 |
Total Income | 13,701 |
Expenses | |
The Vanguard Group—Note B | |
Investment Advisory Services | 46 |
Management and Administrative | |
Admiral Shares | 235 |
ETF Shares | 463 |
Marketing and Distribution | |
Admiral Shares | 22 |
ETF Shares | 85 |
Custodian Fees | 53 |
Auditing Fees | 23 |
Shareholders’ Reports | |
Admiral Shares | 1 |
ETF Shares | 32 |
Trustees’ Fees and Expenses | 1 |
Total Expenses | 961 |
Net Investment Income | 12,740 |
Realized Net Gain (Loss) on | |
Investment Securities Sold | 3,952 |
Change in Unrealized Appreciation | |
(Depreciation) of Investment Securities | (26,543) |
Net Increase (Decrease) in Net Assets | |
Resulting from Operations | (9,851) |
Statement of Changes in Net Assets
| Year Ended August 31, |
| 2008 | 2007 |
| ($000) | ($000) |
Increase (Decrease) in Net Assets | | |
Operations | | |
Net Investment Income | 12,740 | 8,540 |
Realized Net Gain (Loss) | 3,952 | 29,429 |
Change in Unrealized Appreciation (Depreciation) | (26,543) | (17,088) |
Net Increase (Decrease) in Net Assets Resulting from Operations | (9,851) | 20,881 |
Distributions | | |
Net Investment Income | | |
Admiral Shares | (3,122) | (2,008) |
ETF Shares | (9,062) | (5,532) |
Realized Capital Gain | | |
Admiral Shares | — | — |
ETF Shares | — | — |
Total Distributions | (12,184) | (7,540) |
Capital Share Transactions | | |
Admiral Shares | 6,878 | 50,850 |
ETF Shares | 102,404 | 93,508 |
Net Increase (Decrease) from Capital Share Transactions | 109,282 | 144,358 |
Total Increase (Decrease) | 87,247 | 157,699 |
Net Assets | | |
Beginning of Period | 392,559 | 234,860 |
End of Period2 | 479,806 | 392,559 |
1 Interest income from an affiliated company of the fund was $11,000.
2 Net Assets—End of Period includes undistributed net investment income of $2,745,000 and $2,189,000. See accompanying Notes, which are an integral part of the Financial Statements.
97
Utilities Index Fund
Financial Highlights
Admiral Shares | | | | | |
| | | | | |
| | | | | Apr. 28, |
| | | 20041 to |
| Year Ended August 31, | Aug. 31, |
For a Share Outstanding Throughout Each Period | 2008 | 2007 | 2006 | 2005 | 2004 |
Net Asset Value, Beginning of Period | $40.60 | $36.47 | $34.03 | $26.70 | $25.03 |
Investment Operations | | | | | |
Net Investment Income | 1.126 | 1.080 | 1.0802 | .9722 | .360 |
Net Realized and Unrealized Gain | | | | | |
(Loss) on Investments3 | (1.340) | 4.089 | 2.378 | 7.623 | 1.310 |
Total from Investment Operations | (.214) | 5.169 | 3.458 | 8.595 | 1.670 |
Distributions | | | | | |
Dividends from Net Investment Income | (1.126) | (1.039) | (1.018) | (1.265) | — |
Distributions from Realized Capital Gains | — | — | — | — | — |
Total Distributions | (1.126) | (1.039) | (1.018) | (1.265) | — |
Net Asset Value, End of Period | $39.26 | $40.60 | $36.47 | $34.03 | $26.70 |
| | | | | |
| | | | | |
Total Return4 | –0.69% | 14.33% | 10.48% | 32.87% | 6.67% |
| | | | | |
| | | | | |
Ratios/Supplemental Data | | | | | |
Net Assets, End of Period (Millions) | $109 | $108 | $52 | $30 | $1 |
Ratio of Total Expenses to Average Net Assets | 0.25% | 0.26% | 0.28% | 0.28% | 0.28%5 |
Ratio of Net Investment Income to | | | | | |
Average Net Assets | 2.75% | 2.70% | 3.26% | 3.34% | 3.82%5 |
Portfolio Turnover Rate6 | 18% | 12% | 9% | 7% | 7% |
ETF Shares | | | | | |
| | | | | |
| | | | | Jan. 26, |
| | | 20041 to |
| Year Ended August 31, | Aug. 31, |
For a Share Outstanding Throughout Each Period | 2008 | 2007 | 2006 | 2005 | 2004 |
Net Asset Value, Beginning of Period | $80.92 | $72.68 | $67.80 | $53.14 | $49.64 |
Investment Operations | | | | | |
Net Investment Income | 2.285 | 2.180 | 2.2142 | 2.0362 | 1.110 |
Net Realized and Unrealized Gain | | | | | |
(Loss) on Investments7 | (2.695) | 8.156 | 4.704 | 15.115 | 2.390 |
Total from Investment Operations | (.410) | 10.336 | 6.918 | 17.151 | 3.500 |
Distributions | | | | | |
Dividends from Net Investment Income | (2.290) | (2.096) | (2.038) | (2.491) | — |
Distributions from Realized Capital Gains | — | — | — | — | — |
Total Distributions | (2.290) | (2.096) | (2.038) | (2.491) | — |
Net Asset Value, End of Period | $78.22 | $80.92 | $72.68 | $67.80 | $53.14 |
| | | | | |
| | | | | |
Total Return | –0.66% | 14.37% | 10.52% | 32.93% | 7.05% |
| | | | | |
| | | | | |
Ratios/Supplemental Data | | | | | |
Net Assets, End of Period (Millions) | $371 | $285 | $183 | $95 | $43 |
Ratio of Total Expenses to Average Net Assets | 0.20% | 0.22% | 0.25% | 0.26% | 0.28%5 |
Ratio of Net Investment Income to | | | | | |
Average Net Assets | 2.80% | 2.74% | 3.29% | 3.36% | 3.82%5 |
Portfolio Turnover Rate6 | 18% | 12% | 9% | 7% | 7% |
1 Inception.
2 Calculated based on average shares outstanding.
3 Includes increases from redemption fees of $.02, $.02, $.04, $.00, and $.00.
4 Total returns do not reflect the 2% fee assessed on redemptions of shares held for less than one year.
5 Annualized.
6 Excludes the value of portfolio securities received or delivered as a result of in-kind purchases or redemptions of the fund’s capital shares, including ETF Creation Units.
7 Includes increases from redemption fees of $.04, $.03, $.06, $.01, and $.00. See accompanying Notes, which are an integral part of the Financial Statements.
98
Utilities Index Fund
Notes to Financial Statements
Vanguard Utilities Index Fund is registered under the Investment Company Act of 1940 as an open-end investment company, or mutual fund. The fund offers two classes of shares: Admiral Shares and ETF Shares. Admiral Shares are available to any investor who meets the fund’s minimum purchase requirements. ETF Shares were listed for trading on the American Stock Exchange through September 18, 2008, and on the NYSE Arca, Inc., thereafter; they can be purchased and sold through a broker.
A. The following significant accounting policies conform to generally accepted accounting principles for U.S. mutual funds. The fund consistently follows such policies in preparing its financial statements.
1. Security Valuation: Securities are valued as of the close of trading on the New York Stock Exchange (generally 4 p.m., Eastern time) on the valuation date. Equity securities are valued at the latest quoted sales prices or official closing prices taken from the primary market in which each security trades; such securities not traded on the valuation date are valued at the mean of the latest quoted bid and asked prices. Securities for which market quotations are not readily available, or whose values have been materially affected by events occurring before the fund’s pricing time but after the close of the securities’ primary markets, are valued by methods deemed by the board of trustees to represent fair value. Investments in Vanguard Market Liquidity Fund are valued at that fund’s net asset value.
2. Federal Income Taxes: The fund intends to continue to qualify as a regulated investment company and distribute all of its taxable income. Management has analyzed the fund’s tax positions taken on federal income tax returns for all open tax years (tax years ended August 31, 2005–2008), and has concluded that no provision for federal income tax is required in the fund’s financial statements.
3. Distributions: Distributions to shareholders are recorded on the ex-dividend date.
4. Other: Dividend income is recorded on the ex-dividend date. Interest income includes income distributions received from Vanguard Market Liquidity Fund and is accrued daily. Security transactions are accounted for on the date securities are bought or sold. Costs used to determine realized gains (losses) on the sale of investment securities are those of the specific securities sold. Fees assessed on redemptions of Admiral Shares are credited to paid-in capital.
Each class of shares has equal rights as to assets and earnings, except that each class separately bears certain class-specific expenses related to maintenance of shareholder accounts (included in Management and Administrative expenses) and shareholder reporting. Marketing and distribution expenses are allocated to each class of shares based on a method approved by the board of trustees. Income, other non-class-specific expenses, and gains and losses on investments are allocated to each class of shares based on its relative net assets.
B. The Vanguard Group furnishes at cost investment advisory, corporate management, administrative, marketing, and distribution services. The costs of such services are allocated to the fund under methods approved by the board of trustees. The fund has committed to provide up to 0.40% of its net assets in capital contributions to Vanguard. At August 31, 2008, the fund had contributed capital of $41,000 to Vanguard (included in Other Assets), representing 0.01% of the fund’s net assets and 0.04% of Vanguard’s capitalization. The fund’s trustees and officers are also directors and officers of Vanguard.
C. Distributions are determined on a tax basis and may differ from net investment income and realized capital gains for financial reporting purposes. Differences may be permanent or temporary. Permanent differences are reclassified among capital accounts in the financial statements to reflect their tax character. Temporary differences arise when certain items of income, expense, gain, or loss are recognized in different periods for financial statement and tax purposes; these differences will reverse at some time in the future. Differences in classification may also result from the treatment of short-term gains as ordinary income for tax purposes.
During the year ended August 31, 2008, the fund realized $5,120,000 of net capital gains resulting from in-kind redemptions—in which shareholders exchanged fund shares for securities held by the fund rather than for cash. Because such gains are not taxable to the fund, and are not distributed to shareholders, they have been reclassified from accumulated net realized losses to paid-in capital.
For tax purposes, at August 31, 2008, the fund had $3,018,000 of ordinary income available for distribution. The fund had available realized losses of $2,410,000 to offset future net capital gains of $515,000 through August 31, 2015, and $1,895,000 through August 31, 2017.
99
Utilities Index Fund
At August 31, 2008, the cost of investment securities for tax purposes was $503,703,000. Net unrealized depreciation of investment securities for tax purposes was $24,302,000, consisting of unrealized gains of $9,748,000 on securities that had risen in value since their purchase and $34,050,000 in unrealized losses on securities that had fallen in value since their purchase.
D. During the year ended August 31, 2008, the fund purchased $216,561,000 of investment securities and sold $106,108,000 of investment securities, other than temporary cash investments.
E. Capital share transactions for each class of shares were:
| | | Year Ended August 31, |
| | 2008 | | | 2007 |
| Amount | Shares | | Amount | Shares |
| ($000) | (000) | | ($000) | (000) |
Admiral Shares | | | | | |
Issued | 42,121 | 996 | | 70,180 | 1,711 |
Issued in Lieu of Cash Distributions | 2,849 | 68 | | 1,829 | 47 |
Redeemed1 | (38,092) | (935) | | (21,159) | (529) |
Net Increase (Decrease)—Admiral Shares | 6,878 | 129 | | 50,850 | 1,229 |
ETF Shares | | | | | |
Issued | 127,421 | 1,518 | | 250,373 | 3,003 |
Issued in Lieu of Cash Distributions | — | — | | — | — |
Redeemed1 | (25,017) | (300) | | (156,865) | (2,000) |
Net Increase (Decrease)—ETF Shares | 102,404 | 1,218 | | 93,508 | 1,003 |
F. In September 2006, the Financial Accounting Standards Board issued Statement of Financial Accounting Standards No. 157 (“FAS 157”), “Fair Value Measurements.” FAS 157 establishes a framework for measuring fair value and expands disclosures about fair value measurements in financial statements.
The various inputs that may be used to determine the value of the fund’s investments are summarized in three broad levels. The inputs or methodologies used for valuing securities are not necessarily an indication of the risk associated with investing in those securities.
Level 1—Quoted prices in active markets for identical securities.
Level 2—Other significant observable inputs (including quoted prices for similar securities, interest rates, prepayment speeds, credit risk, etc.).
Level 3—Significant unobservable inputs (including the fund’s own assumptions used to determine the fair value of investments).
At August 31, 2008, 100% of the fund’s investments were valued based on Level 1 inputs.
1 Net of redemption fees of $228,000 and $155,000 (fund totals).
100
Report of Independent Registered
Public Accounting Firm
To the Trustees of Vanguard World Funds and the Shareholders of Vanguard Consumer Discretionary Index Fund, Vanguard Consumer Staples Index Fund, Vanguard Energy Index Fund, Vanguard Financials Index Fund, Vanguard Health Care Index Fund, Vanguard Industrials Index Fund, Vanguard Information Technology Index Fund, Vanguard Materials Index Fund, Vanguard Telecommunication Services Index Fund and Vanguard Utilities Index Fund:
In our opinion, the accompanying statements of net assets, and the related statements of operations and of changes in net assets and the financial highlights present fairly, in all material respects, the financial position of Vanguard Consumer Discretionary Index Fund, Vanguard Consumer Staples Index Fund, Vanguard Energy Index Fund, Vanguard Financials Index Fund, Vanguard Health Care Index Fund, Vanguard Industrials Index Fund, Vanguard Information Technology Index Fund, Vanguard Materials Index Fund, Vanguard Telecommunication Services Index Fund and Vanguard Utilities Index Fund (the “Funds”) at August 31, 2008, and the results of each of their operations for the year then ended, the changes in each of their net assets for each of the two years in the period then ended and the financial highlights for each of the periods indicated, in conformity with accounting principles generally accepted in the United States of America. These financial statements and financial highlights (hereafter referred to as “financial statements”) are the responsibility of the Funds’ management; our responsibility is to express an opinion on these financial statements based on our audits. We conducted our audits of these financial statements in accordance with the standards of the Public Company Accounting Oversight Board (United States). Those standards require that we plan and perform the audit to obtain reasonable assurance about whether the financial statements are free of material misstatement. An audit includes examining, on a test basis, evidence supporting the amounts and disclosures in the financial statements, assessing the accounting principles used and significant estimates made by management, and evaluating the overall financial statement presentation. We believe that our audits, which included confirmation of securities at August 31, 2008 by correspondence with the custodian and by agreement to the underlying ownership records for Vanguard Market Liquidity Fund, provide a reasonable basis for our opinion.
PricewaterhouseCoopers LLP
Philadelphia, Pennsylvania
October 14, 2008
Special 2008 tax information (unaudited) for Vanguard U.S. Sector Index Funds
This information for the fiscal year ended August 31, 2008, is included pursuant to provisions of the Internal Revenue Code.
The funds distributed qualified dividend income to shareholders during the fiscal year as follows:
| Qualified Dividend |
Index Fund | Income ($000) |
Consumer Discretionary | 1,201 |
Consumer Staples | 6,443 |
Energy | 7,450 |
Financials | 11,876 |
Health Care | 8,697 |
Industrials | 3,404 |
Information Technology | 1,727 |
Materials | 6,173 |
Telecommunication Services | 6,663 |
Utilities | 12,184 |
For corporate shareholders, the percentage of investment income (dividend income plus short-term gains, if any) that qualifies for the dividends-received deduction is as follows:
Index Fund | Percentage |
Consumer Discretionary | 100.0% |
Consumer Staples | 100.0 |
Energy | 100.0 |
Financials | 85.9 |
Health Care | 100.0 |
Industrials | 100.0 |
Information Technology | 100.0 |
Materials | 100.0 |
Telecommunication Services | 100.0 |
Utilities | 100.0 |
101
Your Fund’s After-Tax Returns
This table presents returns for your fund both before and after taxes. The after-tax returns are shown in two ways: (1) assuming that an investor owned the fund during the entire period and paid taxes on the fund’s distributions, and (2) assuming that an investor paid taxes on the fund’s distributions and sold all shares at the end of each period.
Calculations are based on the highest individual federal income tax and capital gains tax rates in effect at the times of the distributions and the hypothetical sales. State and local taxes were not considered. After-tax returns reflect any qualified dividend income, using actual prior-year figures and estimates for 2008. (In the example, returns after the sale of fund shares may be higher than those assuming no sale. This occurs when the sale would have produced a capital loss. The calculation assumes that the investor received a tax deduction for the loss.)
The table shows returns, based on the net asset value, for ETF Shares only; returns for other share classes will differ. Please note that your actual after-tax returns will depend on your tax situation and may differ from those shown. Also note that if you own the fund in a tax-deferred account, such as an individual retirement account or a 401(k) plan, this information does not apply to you. Such accounts are not subject to current taxes.
Finally, keep in mind that a fund’s performance—whether before or after taxes—does not guarantee future results.
Average Annual Total Returns: U.S. Sector Index Funds | | |
Periods Ended August 31, 2008 | | |
| One | Since |
| Year | Inception1 |
Consumer Discretionary ETF | | |
Returns Before Taxes | –18.70% | –0.14% |
Returns After Taxes on Distributions | –18.81 | –0.23 |
Returns After Taxes on Distributions and Sale of Fund Shares | –12.00 | –0.10 |
| | |
| | |
Consumer Staples ETF | | |
Returns Before Taxes | 4.18% | 8.37% |
Returns After Taxes on Distributions | 3.93 | 8.13 |
Returns After Taxes on Distributions and Sale of Fund Shares | 3.06 | 7.21 |
| | |
| | |
Energy ETF | | |
Returns Before Taxes | 9.47% | 23.55% |
Returns After Taxes on Distributions | 9.33 | 23.39 |
Returns After Taxes on Distributions and Sale of Fund Shares | 6.34 | 20.76 |
| | |
| | |
Financials ETF | | |
Returns Before Taxes | –30.30% | –2.52% |
Returns After Taxes on Distributions | –30.65 | –2.89 |
Returns After Taxes on Distributions and Sale of Fund Shares | –19.21 | –2.08 |
| | |
| | |
Health Care ETF | | |
Returns Before Taxes | –2.55% | 3.55% |
Returns After Taxes on Distributions | –2.74 | 3.43 |
Returns After Taxes on Distributions and Sale of Fund Shares | –1.37 | 3.04 |
| | |
| | |
Industrials ETF | | |
Returns Before Taxes | –8.65% | 9.30% |
Returns After Taxes on Distributions | –8.83 | 9.14 |
Returns After Taxes on Distributions and Sale of Fund Shares | –5.35 | 8.04 |
| | |
| | |
Information Technology ETF | | |
Returns Before Taxes | –8.62% | 1.47% |
Returns After Taxes on Distributions | –8.66 | 1.40 |
Returns After Taxes on Distributions and Sale of Fund Shares | –5.54 | 1.25 |
| | |
| | |
Materials ETF | | |
Returns Before Taxes | 4.15% | 13.83% |
Returns After Taxes on Distributions | 3.92 | 13.60 |
Returns After Taxes on Distributions and Sale of Fund Shares | 3.01 | 12.08 |
| | |
| | |
Telecommunication Services ETF | | |
Returns Before Taxes | –20.94% | 7.93% |
Returns After Taxes on Distributions | –21.25 | 7.63 |
Returns After Taxes on Distributions and Sale of Fund Shares | –13.08 | 6.85 |
| | |
| | |
Utilities ETF | | |
Returns Before Taxes | –0.66% | 13.46% |
Returns After Taxes on Distributions | –1.06 | 13.00 |
Returns After Taxes on Distributions and Sale of Fund Shares | 0.16 | 11.73 |
1 For the Consumer Discretionary, Consumer Staples, Financials, Health Care, Information Technology, Materials, and Utilities ETFs, January 26, 2004; for the Energy, Industrials, and Telecommunication Services ETFs, September 23, 2004.
102
About Your Fund’s Expenses
As a shareholder of the fund, you incur ongoing costs, which include costs for portfolio management, administrative services, and shareholder reports (like this one), among others. Operating expenses, which are deducted from a fund’s gross income, directly reduce the investment return of the fund.
A fund’s expenses are expressed as a percentage of its average net assets. This figure is known as the expense ratio. The examples on this page are intended to help you understand the ongoing costs (in dollars) of investing in your fund and to compare these costs with those of other mutual funds. The examples are based on an investment of $1,000 made at the beginning of the period shown and held for the entire period.
The acompanying table illustrates your fund’s costs in two ways:
• Based on actual fund return. This section helps you to estimate the actual expenses that you paid over the period. The “Ending Account Value” shown is derived from the fund’s actual return, and the third column shows the dollar amount that would have been paid by an investor who started with $1,000 in the fund. You may use the information here, together with the amount you invested, to estimate the expenses that you paid over the period.
To do so, simply divide your account value by $1,000 (for example, an $8,600 account value divided by $1,000 = 8.6), then multiply the result by the number given for your fund under the heading “Expenses Paid During Period.”
• Based on hypothetical 5% yearly return. This section is intended to help you compare your fund’s costs with those of other mutual funds. It assumes that the fund had a yearly return of 5% before expenses, but that the expense ratio is unchanged. In this case—because the return used is not the fund’s actual return—the results do not apply to your investment. The example is useful in making comparisons because the Securities and Exchange Commission requires all mutual funds to calculate expenses based on a 5% return. You can assess your fund’s costs by comparing this hypothetical example with the hypothetical examples that appear in shareholder reports of other funds.
Note that the expenses shown in the table are meant to highlight and help you compare ongoing costs only and do not reflect transaction costs incurred by the fund for buying and selling securities. Further, the expenses do not include the 2% fee on redemptions of shares held for less than one year. If this fee were applied to your account, your costs would be higher. Your fund does not carry a “sales load.”
The calculations assume no shares were bought or sold during the period. Your actual costs may have been higher or lower, depending on the amount of your investment and the timing of any purchases or redemptions.
You can find more information about the fund’s expenses in the Financial Statements section of this report. For additional information on operating expenses and other shareholder costs, please refer to your fund’s current prospectus.
Six Months Ended August 31, 2008 | | | | |
| | | | |
| | Beginning | Ending | Expenses |
| | Account Value | Account Value | Paid During |
Index Fund | Share Class | 2/29/2008 | 8/31/2008 | Period1 |
Based on Actual Fund Return | | | | |
Consumer Discretionary | Admiral | $1,000.00 | $976.21 | $1.25 |
| ETF | 1,000.00 | 976.39 | 0.95 |
Consumer Staples | Admiral | $1,000.00 | $1,029.94 | $1.23 |
| ETF | 1,000.00 | 1,030.14 | 0.97 |
Energy | Admiral | $1,000.00 | $1,000.00 | $1.26 |
| ETF | 1,000.00 | 1,000.27 | 1.01 |
Financials | Admiral | $1,000.00 | $874.11 | $1.13 |
| ETF | 1,000.00 | 874.31 | 0.90 |
Health Care | Admiral | $1,000.00 | $1,021.73 | $1.22 |
| ETF | 1,000.00 | 1,021.55 | 0.97 |
Industrials | Admiral | $1,000.00 | $983.89 | $1.20 |
| ETF | 1,000.00 | 983.76 | 0.95 |
Information Technology | Admiral | $1,000.00 | $1,052.47 | $1.24 |
| ETF | 1,000.00 | 1,052.71 | 0.98 |
Materials | Admiral | $1,000.00 | $976.08 | $1.20 |
| ETF | 1,000.00 | 976.25 | 0.95 |
Telecommunication Services | Admiral | $1,000.00 | $1,008.95 | $1.27 |
| ETF | 1,000.00 | 1,009.44 | 1.01 |
Utilities | Admiral | $1,000.00 | $1,012.97 | $1.27 |
| ETF | 1,000.00 | 1,013.17 | 0.96 |
Based on Hypothetical 5% Yearly Return |
Consumer Discretionary | Admiral | $1,000.00 | $1,023.95 | $1.28 |
| ETF | 1,000.00 | 1,024.25 | 0.97 |
Consumer Staples | Admiral | $1,000.00 | $1,024.00 | $1.22 |
| ETF | 1,000.00 | 1,024.25 | 0.97 |
Energy | Admiral | $1,000.00 | $1,023.95 | $1.28 |
| ETF | 1,000.00 | 1,024.20 | 1.02 |
Financials | Admiral | $1,000.00 | $1,024.00 | $1.22 |
| ETF | 1,000.00 | 1,024.25 | 0.97 |
Health Care | Admiral | $1,000.00 | $1,024.00 | $1.22 |
| ETF | 1,000.00 | 1,024.25 | 0.97 |
Industrials | Admiral | $1,000.00 | $1,024.00 | $1.22 |
| ETF | 1,000.00 | 1,024.25 | 0.97 |
Information Technology | Admiral | $1,000.00 | $1,024.00 | $1.22 |
| ETF | 1,000.00 | 1,024.25 | 0.97 |
Materials | Admiral | $1,000.00 | $1,024.00 | $1.22 |
| ETF | 1,000.00 | 1,024.25 | 0.97 |
Telecommunication Services | Admiral | $1,000.00 | $1,023.95 | $1.28 |
| ETF | 1,000.00 | 1,024.20 | 1.02 |
Utilities | Admiral | $1,000.00 | $1,023.95 | $1.28 |
| ETF | 1,000.00 | 1,024.25 | 0.97 |
1 The calculations are based on expenses incurred in the most recent six-month period. The funds’ annualized six-month expense ratios for that period are 0.25% for the Consumer Discretionary Index Fund Admiral Shares and 0.19% for the ETF Shares; 0.24% for the Consumer Staples Index Fund Admiral Shares and 0.19% for the ETF Shares; 0.25% for the Energy Index Fund Admiral Shares and 0.20% for the ETF Shares; 0.24% for the Financials Index Fund Admiral Shares and 0.19% for the ETF Shares; 0.24% for the Health Care Index Fund Admiral Shares and 0.19% for the ETF Shares; 0.24% for the Industrials Index Fund Admiral Shares and 0.19% for the ETF Shares; 0.24% for the Information Technology Index Fund Admiral Shares and 0.19% for the ETF Shares; 0.24% for the Materials Index Fund Admiral Shares and 0.19% for the ETF Shares; 0.25% for the Telecommunication Services Index Fund Admiral Shares and 0.20% for the ETF Shares; 0.25% for the Utilities Index Fund Admiral Shares and 0.19% for the ETF Shares. The dollar amounts shown as “Expenses Paid” are equal to the annualized expense ratio multiplied by the average account value over the period, multiplied by the number of days in the most recent six-month period, then divided by the number of days in the most recent 12-month period.
103
Trustees Approve Advisory Arrangement
The board of trustees of the Vanguard U.S. Sector Index Funds has renewed the funds’ investment advisory arrangement with The Vanguard Group, Inc. Vanguard—through its Quantitative Equity Group (QEG)—serves as the investment advisor for the funds. The board determined that continuing the funds’ internalized management structure was in the best interests of the funds and their shareholders.
The board based its decision upon an evaluation of the advisor’s investment staff, portfolio management process, and performance. The trustees considered the factors discussed below, among others. However, no single factor determined whether the board approved the arrangement. Rather, it was the totality of the circumstances that drove the board’s decision.
Nature, extent, and quality of services
The board considered the quality of the funds’ investment management over both the short and long term, and took into account the organizational depth and stability of the advisor. The board noted that Vanguard has been managing investments for more than 25 years. George U. Sauter, Vanguard managing director and chief investment officer, has been in the investment management business since 1985 and has led QEG since 1987. QEG adheres to a sound, disciplined investment management process; the team has considerable experience, stability, and depth.
The board concluded that Vanguard’s experience, stability, depth, and performance, among other factors, warranted continuation of the advisory arrangement.
Investment performance
The board considered the short- and long-term performance of the funds, including any periods of outperformance or underperformance of their target benchmarks and peer groups. The board noted that the funds have performed in line with expectations, and that their results have been consistent with their investment strategies. Information about the funds’ most recent performance can be found in the Performance Summary sections of this report.
Cost
The board concluded that the funds’ expense ratios were far below the average expense ratios charged by funds in their respective peer groups. The board noted that the funds’ advisory expense ratios were also well below their peer-group averages. Information about the funds’ expense ratios appears in the About Your Fund’s Expenses section of this report as well as in the Financial Statements sections.
The board does not conduct a profitability analysis of Vanguard because of Vanguard’s unique “at-cost” structure. Unlike most other mutual fund management companies, Vanguard is owned by the funds it oversees, and produces “profits” only in the form of reduced expenses for fund shareholders.
The benefit of economies of scale
The board concluded that the funds’ low-cost arrangement with Vanguard ensures that each fund will realize economies of scale as it grows, with the cost to shareholders declining as fund assets increase.
The board will consider whether to renew the advisory arrangement again after a one-year period.
104
Glossary
Beta. A measure of the magnitude of a fund’s past share-price fluctuations in relation to the ups and downs of a given market index. The index is assigned a beta of 1.00. Compared with a given index, a fund with a beta of 1.20 typically would have seen its share price rise or fall by 12% when the index rose or fell by 10%. For this report, beta is based on returns over the past 36 months for both the fund and the index. Note that a fund’s beta should be reviewed in conjunction with its R-squared (see definition below). The lower the R-squared, the less correlation there is between the fund and the index, and the less reliable beta is as an indicator of volatility.
Earnings Growth Rate. The average annual rate of growth in earnings over the past five years for the stocks now in a fund.
Equity Exposure. A measure that reflects a fund’s investments in stocks and stock futures. Any holdings in short-term reserves are excluded.
Expense Ratio. The percentage of a fund’s average net assets used to pay its annual administrative and advisory expenses. These expenses directly reduce returns to investors.
Foreign Holdings. The percentage of a fund represented by stocks or depositary receipts of companies based outside the United States.
Inception Date. The date on which the assets of a fund (or one of its share classes) are first invested in accordance with the fund’s investment objective. For funds with a subscription period, the inception date is the day after that period ends. Investment performance is measured from the inception date.
Median Market Cap. An indicator of the size of companies in which a fund invests; the midpoint of market capitalization (market price x shares outstanding) of a fund’s stocks, weighted by the proportion of the fund’s assets invested in each stock. Stocks representing half of the fund’s assets have market capitalizations above the median, and the rest are below it.
Price/Book Ratio. The share price of a stock divided by its net worth, or book value, per share. For a fund, the weighted average price/book ratio of the stocks it holds.
Price/Earnings Ratio. The ratio of a stock’s current price to its per-share earnings over the past year. For a fund, the weighted average P/E of the stocks it holds. P/E is an indicator of market expectations about corporate prospects; the higher the P/E, the greater the expectations for a company’s future growth.
R-Squared. A measure of how much of a fund’s past returns can be explained by the returns from the market in general, as measured by a given index. If a fund’s total returns were precisely synchronized with an index’s returns, its R-squared would be 1.00. If the fund’s returns bore no relationship to the index’s returns, its R-squared would be 0. For this report, R-squared is based on returns over the past 36 months for both the fund and the index.
Return on Equity. The annual average rate of return generated by a company during the past five years for each dollar of shareholder’s equity (net income divided by shareholder’s equity). For a fund, the weighted average return on equity for the companies whose stocks it holds.
Short-Term Reserves. The percentage of a fund invested in highly liquid, short-term securities that can be readily converted to cash.
Turnover Rate. An indication of the fund’s trading activity. Funds with high turnover rates incur higher transaction costs and may be more likely to distribute capital gains (which may be taxable to investors). The turnover rate excludes in-kind transactions, which have minimal impact on costs.
Yield. A fund’s 30-day SEC yield is derived using a formula specified by the U.S. Securities and Exchange Commission. Under the formula, data related to the fund’s security holdings in the previous 30 days are used to calculate the fund’s hypothetical net income for that period, which is then annualized and divided by the fund’s estimated average net assets over the calculation period. For the purposes of this calculation, a security’s income is based on its current market yield to maturity (in the case of bonds) or its projected dividend yield (for stocks). Because the SEC yield represents hypothetical annualized income, it will differ—at times significantly—from the fund’s actual experience. As a result, the fund’s income distributions may be higher or lower than implied by the SEC yield.
105
This page intentionally left blank.
This page intentionally left blank.
This page intentionally left blank.
The People Who Govern Your Fund
The trustees of your mutual fund are there to see that the fund is operated and managed in your best interests since, as a shareholder, you are a part owner of the fund. Your fund trustees also serve on the board of directors of The Vanguard Group, Inc., which is owned by the Vanguard funds and provides services to them on an at-cost basis.
A majority of Vanguard’s board members are independent, meaning that they have no affiliation with Vanguard or the funds they oversee, apart from the sizable personal investments they have made as private individuals.
Each trustee serves a fund until its termination; or until the trustee’s retirement, resignation, or death; or otherwise as specified in the fund’s organizational documents. Any trustee may be removed at a shareholders’ meeting by a vote representing two-thirds of the net asset value of all shares of the fund together with shares of other Vanguard funds organized within the same trust. The table below shows information for each trustee and executive officer of the fund. The mailing address of the trustees and officers is P.O. Box 876, Valley Forge, PA 19482.
Chairman of the Board and Trustee |
| |
John J. Brennan1 | |
Born 1954 | Principal Occupation(s) During the Past Five Years: |
Trustee Since May 1987; | Chairman of the Board and Director/Trustee of |
Chairman of the Board | The Vanguard Group, Inc., and of each of the |
156 Vanguard Funds Overseen | investment companies served by The Vanguard |
| Group; Director of Vanguard Marketing Corporation; |
| President and Chief Executive Officer of The |
| Vanguard Group and each of the investment |
| companies served by The Vanguard Group |
| (1996–2008). |
| |
Independent Trustees | |
| |
Charles D. Ellis | |
Born 1937 | Principal Occupation(s) During the Past Five Years: |
Trustee Since January 2001 | Applecore Partners (pro bono ventures in education); |
156 Vanguard Funds Overseen | Senior Advisor to Greenwich Associates (international |
| business strategy consulting); Successor Trustee |
| of Yale University; Overseer of the Stern School of |
| Business at New York University; Trustee of the |
| Whitehead Institute for Biomedical Research. |
| |
Emerson U. Fullwood | |
Born 1948 | Principal Occupation(s) During the Past Five Years: |
Trustee Since January 2008 | Executive Chief Staff and Marketing Officer for |
156 Vanguard Funds Overseen | North America since 2004 and Corporate Vice |
| President of Xerox Corporation (photocopiers and |
| printers); Director of SPX Corporation (multi- |
| industry manufacturing), of the United Way of |
| Rochester, and of the Boy Scouts of America. |
| |
Rajiv L. Gupta | |
Born 1945 | Principal Occupation(s) During the Past Five Years: |
Trustee Since December 20012 | Chairman, President, and Chief Executive Officer |
156 Vanguard Funds Overseen | of Rohm and Haas Co. (chemicals); Board Member |
| of the American Chemistry Council; Director of |
| Tyco International, Ltd. (diversified manufacturing |
| and services) since 2005. |
| |
Amy Gutmann | |
Born 1949 | Principal Occupation(s) During the Past Five Years: |
Trustee Since June 2006 | President of the University of Pennsylvania since |
156 Vanguard Funds Overseen | 2004; Professor in the School of Arts and Sciences, |
| Annenberg School for Communication, and |
| Graduate School of Education of the University |
| of Pennsylvania since 2004; Provost (2001–2004) |
| and Laurance S. Rockefeller Professor of Politics |
| and the University Center for Human Values |
| (1990–2004), Princeton University; Director of |
| Carnegie Corporation of New York since 2005 |
| and of Schuylkill River Development Corporation |
| and Greater Philadelphia Chamber of Commerce |
| since 2004; Trustee of the National Constitution |
| Center since 2007. |
| |
JoAnn Heffernan Heisen | |
Born 1950 | Principal Occupation(s) During the Past Five Years: |
Trustee Since July 1998 | Corporate Vice President and Chief Global Diversity |
156 Vanguard Funds Overseen | Officer since 2006, Vice President and Chief |
| Information Officer (1997–2005), and Member of |
| the Executive Committee of Johnson & Johnson |
| (pharmaceuticals/consumer products); Director of |
| the University Medical Center at Princeton and |
| Women’s Research and Education Institute. |
André F. Perold | |
Born 1952 | Principal Occupation(s) During the Past Five Years: |
Trustee Since December 2004 | George Gund Professor of Finance and Banking, |
156 Vanguard Funds Overseen | Harvard Business School; Senior Associate Dean |
| and Director of Faculty Recruiting, Harvard |
| Business School; Director and Chairman of UNX, |
| Inc. (equities trading firm); Chair of the Investment |
| Committee of HighVista Strategies LLC (private |
| investment firm) since 2005. |
| |
Alfred M. Rankin, Jr. | |
Born 1941 | Principal Occupation(s) During the Past Five Years: |
Trustee Since January 1993 | Chairman, President, Chief Executive Officer, |
156 Vanguard Funds Overseen | and Director of NACCO Industries, Inc. (forklift |
| trucks/housewares/lignite); Director of Goodrich |
| Corporation (industrial products/aircraft systems |
| and services). |
| |
J. Lawrence Wilson | |
Born 1936 | Principal Occupation(s) During the Past Five Years: |
Trustee Since April 1985 | Retired Chairman and Chief Executive Officer |
156 Vanguard Funds Overseen | of Rohm and Haas Co. (chemicals); Director |
| of Cummins Inc. (diesel engines) and |
| AmerisourceBergen Corp. (pharmaceutical |
| distribution); Trustee of Vanderbilt University |
| and of Culver Educational Foundation. |
| |
Executive Officers1 | |
| |
Thomas J. Higgins | |
Born 1957 | Principal Occupation(s) During the Past Five Years: |
Treasurer Since July 1998 | Principal of The Vanguard Group, Inc.; Treasurer |
156 Vanguard Funds Overseen | of each of the investment companies served by |
| The Vanguard Group. |
| |
F. William McNabb III | |
Born 1957 | Principal Occupation(s) During the Past Five Years: |
Chief Executive Officer | Chief Executive Officer, Director, and President of |
Since August 31, 2008 | The Vanguard Group, Inc., since 2008; Chief |
President Since March 2008 | Executive Officer and President of each of the |
156 Vanguard Funds Overseen | investment companies served by The Vanguard |
| Group since 2008; Director of Vanguard Marketing |
| Corporation; Managing Director of The Vanguard |
| Group (1995–2008). |
| |
Heidi Stam | |
Born 1956 | Principal Occupation(s) During the Past Five Years: |
Secretary Since July 2005 | Managing Director of The Vanguard Group, Inc., |
156 Vanguard Funds Overseen | since 2006; General Counsel of The Vanguard |
| Group since 2005; Secretary of The Vanguard |
| Group, and of each of the investment companies |
| served by The Vanguard Group, since 2005; |
| Director and Senior Vice President of Vanguard |
| Marketing Corporation since 2005; Principal of |
| The Vanguard Group (1997–2006). |
| |
| |
Vanguard Senior Management Team |
R. Gregory Barton | Paul A. Heller | Glenn W. Reed |
Mortimer J. Buckley | Michael S. Miller | George U. Sauter |
Kathleen C. Gubanich | Ralph K. Packard |
| |
Founder | |
John C. Bogle | |
Chairman and Chief Executive Officer, 1974–1996 |
1 These individuals are “interested persons” as defined in the Investment Company Act of 1940.
2 December 2002 for Vanguard Equity Income Fund, Vanguard Growth Equity Fund, the Vanguard Municipal Bond Funds, and the Vanguard State Tax-Exempt Funds. More information about the trustees is in the Statement of Additional Information, available from The Vanguard Group.

P. O. Box 2600
Valley Forge, PA 19482-26003
Connect with Vanguard® > www.vanguard.com
Fund Information > 800-662-7447 | The funds or securities referred to herein are not sponsored, |
| endorsed, or promoted by MSCI, and MSCI bears no liability |
Direct Investor Account Services > 800-662-2739 | with respect to any such funds or securities. For any such funds |
| or securities, the prospectus or the Statement of Additional |
Institutional Investor Services > 800-523-1036 | Information contains a more detailed description of the limited |
| relationship MSCI has with The Vanguard Group and any |
Text Telephone for People | related funds. |
With Hearing Impairment > 800-952-3335 | |
| |
| Russell is a trademark of The Frank Russell Company. |
| |
This material may be used in conjunction with | All comparative mutual fund data are from Lipper Inc. or |
the offering of shares of any Vanguard fund | Morningstar, Inc., unless otherwise noted. |
only if preceded or accompanied by the fund’s | You can obtain a free copy of Vanguard’s proxy voting guidelines |
current prospectus. | by visiting our website, www.vanguard.com, and searching for |
| “proxy voting guidelines,” or by calling Vanguard at 800-662-2739. |
| The guidelines are also available from the SEC’s website, |
| www.sec.gov. In addition, you may obtain a free report on how your |
| fund voted the proxies for securities it owned during the 12 months |
| ended June 30. To get the report, visit either www.vanguard.com |
| or www.sec.gov. |
| |
| You can review and copy information about your fund at the SEC’s |
| Public Reference Room in Washington, D.C. To find out more about |
| this public service, call the SEC at 202-551-8090. Information about |
| your fund is also available on the SEC’s website, and you can |
| receive copies of this information, for a fee, by sending a request in |
| either of two ways: via e-mail addressed to publicinfo@sec.gov or |
| via regular mail addressed to the Public Reference Section, |
| Securities and Exchange Commission, Washington, DC 20549-0102. |
| |
| |
| |
| |
| |
| |
| |
| |
| |
| |
| |
| |
| |
| |
| |
| |
| |
| |
| |
| |
| © 2008 The Vanguard Group, Inc. |
| All rights reserved. |
| Vanguard Marketing Corporation, Distributor. |
| |
| Q4830 102008 |

> Vanguard Extended Duration Treasury Index Fund Institutional Shares returned 0.4% for the fiscal period ended August 31, 2008.
> The fund’s return slightly trailed that of its benchmark index, the Lehman U.S. Treasury STRIPS 20–30 Year Equal Par Bond Index.
> Long-term bond yields remained relatively stable during the period compared with their short-term and intermediate-term counterparts.
Contents | |
| |
Your Fund’s Total Returns | 1 |
President’s Letter | 2 |
Fund Profile | 7 |
Performance Summary | 8 |
Financial Statements | 10 |
About Your Fund’s Expenses | 20 |
Trustees Approve Advisory Arrangement | 22 |
Glossary | 23 |
Please note: The opinions expressed in this report are just that—informed opinions. They should not be considered promises or advice. Also, please keep in mind that the information and opinions cover the period through the date on the front of this report. Of course, the risks of investing in your fund are spelled out in the prospectus.
Your Fund’s Total Returns
Inception Through August 31, 2008 | | |
| | Total |
| | Returns Since |
| Ticker | Share-Class |
| Symbol | Inception |
Vanguard Extended Duration Treasury Index Fund | | |
Institutional Shares1 (Inception: November 28, 2007) | VEDTX | 0.4% |
Lehman U.S. Treasury STRIPS 20–30 Year Equal Par Bond Index | | 0.8 |
| | |
| | |
Vanguard Extended Duration Treasury Index Fund | | |
ETF Shares2 (Inception: December 6, 2007) | EDV | |
Market Price | | 2.6% |
Net Asset Value | | 2.3 |
Lehman U.S. Treasury STRIPS 20–30 Year Equal Par Bond Index | | 3.2 |
Your Fund’s Performance at a Glance | | | | |
Inception Through August 31, 2008 | | | | |
| | | Distributions Per Share |
| Starting | Ending | Income | Capital |
| Share Price | Share Price | Dividends | Gains |
Vanguard Extended Duration Treasury | | | | |
Index Fund | | | | |
Institutional Shares | $30.003 | $29.52 | $0.575 | $0.000 |
ETF Shares | 97.784 | 98.11 | 1.853 | 0.000 |
1 This class of shares carries low expenses and is available for a minimum initial investment of $5 million.
2 These Vanguard ETF™ Shares are traded on the NYSE Arca exchange and are available only through brokers. The table shows ETF returns based on both the NYSE Arca market price and the net asset value for a share. U.S. Pat. No. 6,879,964 B2; 7,337,138
3 Share price at inception: November 28, 2007.
4 Share price at inception: December 6, 2007.

President’s Letter
Dear Shareholder,
I am pleased to present the first “annual report” for Vanguard Extended Duration Treasury Index Fund. This bond fund, which was launched November 28, 2007, is designed especially for institutional investors, including pension funds and endowments, that manage portfolios with very long time horizons.
For the fiscal period ended August 31, 2008, the fund’s Institutional Shares returned 0.4%, slightly short of the return of the fund’s target index, the Lehman U.S. Treasury STRIPS 20–30 Year Equal Par Bond Index. The fund’s ETF Shares, which were first offered on December 6, 2007, returned 2.3% based on their net asset value.
Risk-aversion increased, and Treasuries outperformed
During the fiscal period, the collapse in subprime mortgage-backed securities and the aftershocks prompted a “flight to safety” among investors. Short-term U.S. Treasury securities were among the fixed income market’s best performers. Over the 12 months, the broad taxable bond market returned a respectable 5.9%, largely reflecting the Treasury bond rally.
As risk-aversion increased, the difference between the yields of Treasury bonds and those of all other securities increased, depressing the price of corporate debt. (As you know, yield and price move in opposite directions.) Even as corporate bonds grew cheaper, the prices of most goods and services rose quickly, powered by escalating energy prices.
2
The combination of higher inflation, financial market volatility, and economic weakness put the U.S. Federal Reserve Board in an uncomfortable position. The Fed decided that it was imperative to respond to the financial crisis with a dramatic easing of monetary policy through interest rate cuts, even as it recognized that the result might be higher inflation. Over the full 12 months, the Fed reduced its target for the federal funds rate from 5.25% to 2.00%.
Stocks performed poorly as volatility returned
Stocks lost ground as credit-market turmoil spread throughout the global economy. The broad U.S. stock market lost about 10% of its value. International markets followed a similar path, returning –12.2% for the year.
The descent was bumpy. After years of relative calm, the U.S. market routinely rose or fell by more than a percentage point in a day’s trading. The volatility reflected a seemingly endless series of unnerving developments: the persistent rise in energy prices, further deterioration in the housing market, a string of bank failures, and the broad economy’s deceleration.
Your extended bond fund held steady despite Treasury yield fluctuations
The Extended Duration Treasury Index Fund invests in zero-coupon Treasury securities with maturities ranging from 20 to 30 years. The fund’s manager, Vanguard Fixed Income Group, aims to provide institutional and other investors with a tool to moderate changes in the ratio of their long-term assets and obligations.
Market Barometer | | | |
| Average Annual Total Returns |
| Periods Ended August 31, 2008 |
| One Year | Three Years | Five Years |
Bonds | | | |
Lehman U.S. Aggregate Bond Index (Broad taxable market) | 5.9% | 4.3% | 4.6% |
Lehman Municipal Bond Index | 4.5 | 3.3 | 4.4 |
Citigroup 3-Month Treasury Bill Index | 2.8 | 4.0 | 3.1 |
| | | |
| | | |
Stocks | | | |
Russell 1000 Index (Large-caps) | –10.6% | 3.9% | 7.4% |
Russell 2000 Index (Small-caps) | –5.5 | 4.8 | 9.6 |
Dow Jones Wilshire 5000 Index (Entire market) | –9.9 | 4.2 | 7.9 |
MSCI All Country World Index ex USA (International) | –12.2 | 10.7 | 16.1 |
| | | |
| | | |
CPI | | | |
Consumer Price Index | 5.4% | 3.7% | 3.5% |
3
The fund’s usefulness in managing this longer-term risk comes, paradoxically, with the potential for high levels of short-term volatility in total return. The Extended Duration Treasury Index Fund consists almost entirely of long-term bonds, making its short-term returns highly sensitive to changes in interest rates.
During the fund’s fiscal period, U.S. Treasury yields fluctuated, moving higher across the board toward the end of the period. The impact on the fund was nevertheless limited, as much of the interest-rate volatility took place among short-term and intermediate-term securities.
The long-term bonds held by the Extended Duration Treasury Index Fund experienced only slight increases in yields and consequent declines in prices. The fund’s total return of 0.4% reflected approximately 2.0% in income return and a capital change of –1.6%. These returns were slightly less than those of the fund’s target benchmark index, which incurs no operating expenses.
For a young fund, an experienced advisor
While it is too early to discuss the long-term performance of the Extended Duration Treasury Index Fund, investors can be confident that Vanguard Fixed Income Group has years of experience in managing index funds.
The Fixed Income Group uses sophisticated trading strategies and sampling techniques to seek to create a portfolio that closely matches its benchmark index.
Expense Ratios1 | | |
| | |
| Institutional | ETF |
| Shares | Shares |
Extended Duration Treasury Index Fund | 0.11% | 0.14% |
1 Fund expense ratios shown are from the prospectus dated September 10, 2007 and were based on estimated expenses. The annualized expense ratios for the fiscal period ended August 31, 2008, were 0.11% for Institutional Shares and 0.14% for ETF Shares.
4
And Vanguard’s commitment to low costs allows investors to keep a greater portion of their fund’s returns.
The fund offers diversification for long-term institutional portfolios
Heightened volatility in the markets can be worrisome for both novice investors and experienced managers of institutional portfolios.
While periodic market fluctuations are bound to take place, a diversified portfolio focused on the long term can help moderate short-term volatility in total returns. The Extended Duration Treasury Index Fund can also provide special benefits to institutions and other investors with long time horizons and obligations that extend well into the future. Its low-cost exposure to long-term Treasury securities offers both diversification opportunities and the potential to better manage long-term liabilities.
Thank you for investing with Vanguard.
Sincerely,

F. William McNabb III
President and Chief Executive Officer
September 11, 2008
5
Vanguard Extended Duration Treasury ETF | | | | |
Premium/Discount: December 6, 20071–August 31, 2008 | |
| | | | | |
| Market Price Above or | | Market Price Below | |
| Equal to Net Asset Value | | Net Asset Value | |
| Number | Percentage | | Number | Percentage |
Basis Point Differential2 | of Days | of Total Days | | of Days | of Total Days |
0–24.9 | 35 | 18.93% | | 36 | 19.45% |
25–49.9 | 20 | 10.81 | | 21 | 11.35 |
50–74.9 | 3 | 1.62 | | 13 | 7.03 |
75–100.0 | 3 | 1.62 | | 13 | 7.03 |
>100.0 | 6 | 3.24 | | 35 | 18.92 |
Total | 67 | 36.22% | | 118 | 63.78% |
| | | | | | | |
1 Inception.
2 One basis point equals 1/100 of a percentage point.
6
Fund Profile
As of August 31, 2008
Financial Attributes | | |
| | Target |
| Fund | Index1 |
Number of Issues | 47 | 48 |
Yield2 | | 4.6% |
Institutional Shares | 4.5% | |
ETF Shares | 4.5% | |
Yield to Maturity | 4.6%3 | 4.6% |
Average Coupon | 0.0% | 0.0% |
Average Effective Maturity | 24.5 years | 24.1 years |
Average Quality4 | Aaa | Aaa |
Average Duration | 24.7 years | 24.4 years |
Expense Ratio (9/10/2007)5 | | — |
Institutional Shares | 0.11% | |
ETF Shares | 0.14% | |
Short-Term Reserves | 0.0% | — |
Sector Diversification (% of portfolio) | |
| |
Treasury/Agency | 100.0% |
Distribution by Maturity (% of portfolio) | |
| |
20–30 Years | 100.0% |
Distribution by Credit Quality4 (% of portfolio) |
| |
Aaa | 100.0% |
Investment Focus
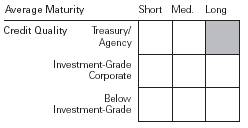
1 Lehman U.S. Treasury STRIPS 20–30 Year Equal Par Bond Index.
2 30-day SEC yield for the fund; index yield assumes that all bonds are called or prepaid at the earliest possible date. See the Glossary.
3 Before expenses.
4 Moody’s Investors Service.
5 Fund expense ratios shown are from the prospectus dated September 10, 2007 and were based on estimated expenses. The annualized expense ratios for the fiscal period ended August 31, 2008, were 0.11% for Institutional Shares and 0.14% for ETF Shares.
7
Performance Summary
All of the returns in this report represent past performance, which is not a guarantee of future results that may be achieved by the fund. (Current performance may be lower or higher than the performance data cited. For performance data current to the most recent month-end, visit our website at www.vanguard.com/performance.) Note, too, that both investment returns and principal value can fluctuate widely, so an investor’s shares, when sold, could be worth more or less than their original cost. The returns shown do not reflect taxes that a shareholder would pay on fund distributions or on the sale of fund shares.
Cumulative Performance: November 28, 2007–August 31, 2008
Initial Investment of $5,000,000
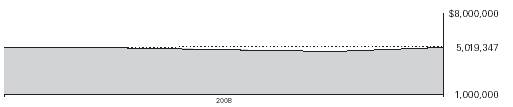
| Total Returns | |
| Periods Ended August 31, 2008 | |
| | Final Value |
| Since | of a $5,000,000 |
| Inception1 | Investment |
Extended Duration Treasury Index Fund Institutional Shares | 0.39% | $5,019,347 |
Lehman U.S. Aggregate Bond Index | 2.56 | 5,127,914 |
Lehman US Treasury Strips 20–30 Year Equal Par Bond Index | 0.81 | 5,040,517 |
| | Final Value |
| Since | of a $10,000 |
| Inception1 | Investment |
Extended Duration Treasury Index Fund ETF Shares Net Asset Value | 2.29% | $10,229 |
Lehman US Treasury Strips 20–30 Year Equal Par Bond Index | 3.16 | 10,316 |
1 Performance for the fund and its comparative standards is calculated since the fund's inception: November 28, 2007, for Institutional Shares and December 6, 2007 for the ETF Shares.
8
Cumulative Performance: ETF Shares, December 6, 2007–August 31, 2008 | |
| Since |
| Inception1 |
Extended Duration Treasury Index Fund ETF Shares Market Price | 2.64% |
Extended Duration Treasury Index Fund ETF Shares Net Asset Value | 2.29 |
Lehman US Treasury Strips 20–30 Year Equal Par Bond Index | 3.16 |
Total Returns (%): November 28, 2007–August 31, 2008 |
| | | |
| Institutional Shares | Lehman2 |
Fiscal | Capital | Income | Total | Total |
Year | Return | Return | Return | Returns |
20083 | –1.6% | 2.0% | 0.4% | 0.8% |
Total Returns: Periods Ended June 30, 2008 |
| | | Since Inception |
| Inception Date | Capital | Income | Total |
Institutional Shares | 11/28/2007 | –3.93% | 1.94% | –1.99% |
ETF Shares | 12/6/2007 | | | |
Market Price | | — | — | –0.49 |
Net Asset Value | | –2.04 | 1.91 | –0.13 |
1 Performance for the fund and its comparative standards is calculated since the ETF Shares’ inception on December 6, 2007.
2 Lehman US Treasury Strips 20–30 Year Equal Par Bond Index.
3 Since the Institutional Shares’ inception on November 28, 2007.
Note: See Financial Highlights tables for dividend and capital gains information.
9
Financial Statements
Statement of Net Assets
As of August 31, 2008
The fund provides a complete list of its holdings four times in each fiscal year, at the quarter-ends. For the second and fourth fiscal quarters, the lists appear in the fund’s semiannual and annual reports to shareholders. For the first and third fiscal quarters, the fund files the lists with the Securities and Exchange Commission on Form N-Q. Shareholders can look up the fund’s Forms N-Q on the SEC’s website at www.sec.gov. Forms N-Q may also be reviewed and copied at the SEC’s Public Reference Room (see the back cover of this report for further information).
| | | Face | Market |
| | Maturity | Amount | Value• |
| Coupon | Date | ($000) | ($000) |
U.S. Government Securities (100.1%) | | | | |
U.S. Treasury STRIPS | 0.000% | 11/15/28 | 19,100 | 7,524 |
U.S. Treasury STRIPS | 0.000% | 11/15/28 | 17,850 | 6,989 |
U.S. Treasury STRIPS | 0.000% | 2/15/29 | 14,000 | 5,445 |
U.S. Treasury STRIPS | 0.000% | 2/15/29 | 16,600 | 6,412 |
U.S. Treasury STRIPS | 0.000% | 5/15/29 | 16,500 | 6,311 |
U.S. Treasury STRIPS | 0.000% | 8/15/29 | 12,000 | 4,560 |
U.S. Treasury STRIPS | 0.000% | 8/15/29 | 25,550 | 9,645 |
U.S. Treasury STRIPS | 0.000% | 11/15/29 | 19,000 | 7,107 |
U.S. Treasury STRIPS | 0.000% | 2/15/30 | 12,350 | 4,575 |
U.S. Treasury STRIPS | 0.000% | 5/15/30 | 17,650 | 6,511 |
U.S. Treasury STRIPS | 0.000% | 5/15/30 | 17,100 | 6,266 |
U.S. Treasury STRIPS | 0.000% | 8/15/30 | 20,100 | 7,299 |
U.S. Treasury STRIPS | 0.000% | 11/15/30 | 13,425 | 4,829 |
U.S. Treasury STRIPS | 0.000% | 2/15/31 | 15,800 | 5,656 |
U.S. Treasury STRIPS | 0.000% | 2/15/31 | 17,850 | 6,351 |
U.S. Treasury STRIPS | 0.000% | 5/15/31 | 14,950 | 5,263 |
U.S. Treasury STRIPS | 0.000% | 8/15/31 | 20,750 | 7,220 |
U.S. Treasury STRIPS | 0.000% | 11/15/31 | 13,200 | 4,556 |
U.S. Treasury STRIPS | 0.000% | 2/15/32 | 16,750 | 5,721 |
U.S. Treasury STRIPS | 0.000% | 5/15/32 | 16,155 | 5,472 |
U.S. Treasury STRIPS | 0.000% | 8/15/32 | 17,350 | 5,810 |
U.S. Treasury STRIPS | 0.000% | 11/15/32 | 15,000 | 4,974 |
U.S. Treasury STRIPS | 0.000% | 2/15/33 | 15,400 | 5,039 |
U.S. Treasury STRIPS | 0.000% | 5/15/33 | 17,900 | 5,795 |
U.S. Treasury STRIPS | 0.000% | 8/15/33 | 18,100 | 5,798 |
U.S. Treasury STRIPS | 0.000% | 11/15/33 | 19,550 | 6,189 |
U.S. Treasury STRIPS | 0.000% | 2/15/34 | 13,000 | 4,083 |
U.S. Treasury STRIPS | 0.000% | 5/15/34 | 21,300 | 6,593 |
U.S. Treasury STRIPS | 0.000% | 8/15/34 | 14,250 | 4,377 |
U.S. Treasury STRIPS | 0.000% | 11/15/34 | 13,725 | 4,180 |
U.S. Treasury STRIPS | 0.000% | 2/15/35 | 18,800 | 5,649 |
U.S. Treasury STRIPS | 0.000% | 5/15/35 | 15,675 | 4,680 |
U.S. Treasury STRIPS | 0.000% | 8/15/35 | 15,250 | 4,484 |
U.S. Treasury STRIPS | 0.000% | 11/15/35 | 14,750 | 4,314 |
U.S. Treasury STRIPS | 0.000% | 2/15/36 | 16,450 | 4,824 |
U.S. Treasury STRIPS | 0.000% | 2/15/36 | 16,150 | 4,689 |
U.S. Treasury STRIPS | 0.000% | 5/15/36 | 20,100 | 5,776 |
U.S. Treasury STRIPS | 0.000% | 8/15/36 | 16,550 | 4,701 |
U.S. Treasury STRIPS | 0.000% | 11/15/36 | 18,150 | 5,099 |
U.S. Treasury STRIPS | 0.000% | 2/15/37 | 14,900 | 4,188 |
10
| | | Face | Market |
| | Maturity | Amount | Value• |
| Coupon | Date | ($000) | ($000) |
U.S. Treasury STRIPS | 0.000% | 2/15/37 | 20,700 | 5,760 |
U.S. Treasury STRIPS | 0.000% | 5/15/37 | 28,550 | 7,945 |
U.S. Treasury STRIPS | 0.000% | 5/15/37 | 17,100 | 4,727 |
U.S. Treasury STRIPS | 0.000% | 2/15/38 | 25,950 | 7,051 |
U.S. Treasury STRIPS | 0.000% | 2/15/38 | 12,650 | 3,408 |
U.S. Treasury STRIPS | 0.000% | 5/15/38 | 27,900 | 7,494 |
U.S. Treasury STRIPS | 0.000% | 5/15/38 | 7,050 | 1,894 |
Total U.S. Government Securities (Cost $263,009) | | | | 263,233 |
| | | | |
| | | | |
| | | Shares | |
Temporary Cash Investment (0.0%) | | | | |
1 Vanguard Market Liquidity Fund (Cost $6) | 2.389% | | 5,691 | 6 |
Total Investments (100.1%) (Cost $263,015) | | | | 263,239 |
Other Assets and Liabilities (–0.1%) | | | | |
Other Assets | | | | 11,180 |
Liabilities | | | | (11,402) |
| | | | (222) |
Net Assets (100%) | | | | 263,017 |
At August 31, 2008, net assets consisted of: | |
| Amount |
| ($000) |
Paid-in Capital | 261,402 |
Undistributed Net Investment Income | 1,839 |
Accumulated Net Realized Losses | (448) |
Unrealized Appreciation (Depreciation) | 224 |
Net Assets | 263,017 |
| |
| |
Institutional Shares—Net Assets | |
Applicable to 8,742,956 outstanding $.001 par value shares of | |
beneficial interest (unlimited authorization) | 258,112 |
Net Asset Value Per Share—Institutional Shares | $29.52 |
| |
| |
ETF Shares—Net Assets | |
Applicable to 50,000 outstanding $.001 par value shares of | |
beneficial interest (unlimited authorization) | 4,905 |
Net Asset Value Per Share—ETF Shares | $98.11 |
• See Note A in Notes to Financial Statements.
1 Affiliated money market fund available only to Vanguard funds and certain trusts and accounts managed by Vanguard. Rate shown is the 7-day yield.
See accompanying Notes, which are an integral part of the Financial Statements.
11
Statement of Operations
| November 28, 20071 to |
| August 31, 2008 |
| ($000) |
Investment Income | |
Income | |
Interest2 | 4,417 |
Total Income | 4,417 |
Expenses | |
The Vanguard Group—Note B | |
Investment Advisory Services | 6 |
Management and Administrative—Institutional Shares | 20 |
Management and Administrative—ETF Shares | 1 |
Marketing and Distribution—Institutional Shares | 12 |
Marketing and Distribution—ETF Shares | 1 |
Custodian Fees | 36 |
Auditing Fees | 25 |
Shareholders’ Reports—Institutional Shares | — |
Shareholders’ Reports—ETF Shares | 3 |
Total Expenses | 104 |
Net Investment Income | 4,313 |
Realized Net Gain (Loss) on Investment Securities Sold | (927) |
Unrealized Appreciation (Depreciation) of Investment Securities | 224 |
Net Increase (Decrease) in Net Assets Resulting from Operations | 3,610 |
1 Inception.
2 Interest income from an affiliated company of the fund was $2,000.
See accompanying Notes, which are an integral part of the Financial Statements.
12
Statement of Changes in Net Assets
| November 28, 20071 to |
| August 31, 2008 |
| ($000) |
Increase (Decrease) in Net Assets | |
Operations | |
Net Investment Income | 4,313 |
Realized Net Gain (Loss) | (927) |
Unrealized Appreciation (Depreciation) | 224 |
Net Increase (Decrease) in Net Assets Resulting from Operations | 3,610 |
Distributions | |
Net Investment Income | |
Institutional Shares | (2,278) |
ETF Shares | (196) |
Realized Capital Gain | |
Institutional Shares | — |
ETF Shares | — |
Total Distributions | (2,474) |
Capital Share Transactions | |
Institutional Shares | 256,542 |
ETF Shares | 5,339 |
Net Increase (Decrease) from Capital Shares Transactions | 261,881 |
Total Increase (Decrease) | 263,017 |
Net Assets | |
Beginning of Period | — |
End of Period2 | 263,017 |
1 Inception.
2 Net Assets—End of Period includes undistributed net investment income of $1,839,000. See accompanying Notes, which are an integral part of the Financial Statements.
13
Financial Highlights
Institutional Shares | |
| November 28, 20071 to |
For a Share Outstanding Throughout the Period | August 31, 2008 |
Net Asset Value, Beginning of Period | $30.00 |
Investment Operations | |
Net Investment Income | 1.0232 |
Net Realized and Unrealized Gain (Loss) on Investments3 | (.928) |
Total from Investment Operations | .095 |
Distributions | |
Dividends from Net Investment Income | (.575) |
Distributions from Realized Capital Gains | — |
Total Distributions | (.575) |
Net Asset Value, End of Period | $29.52 |
| |
| |
Total Return4 | 0.39% |
| |
| |
Ratios/Supplemental Data | |
Net Assets, End of Period (Millions) | $258 |
Ratio of Total Expenses to Average Net Assets | 0.11%* |
Ratio of Net Investment Income to Average Net Assets | 4.55%* |
Portfolio Turnover Rate5 | 36% |
1 Inception.
2 Calculated based on average shares outstanding.
3 Includes increase from purchase fees of $.03.
4 Total returns do not include a portfolio transaction fee that may apply to aggregate purchases of more than $20 million by a single investor.
5 Excludes the value of portfolio securities received or delivered as a result of in-kind purchases or redemptions of the fund’s capital shares, including ETF Creation Units.
* Annualized.
See accompanying Notes, which are an integral part of the Financial Statements.
14
ETF Shares | |
| December 6, 20071 to |
For a Share Outstanding Throughout the Period | August 31, 2008 |
Net Asset Value, Beginning of Period | $97.78 |
Investment Operations | |
Net Investment Income | 3.1662 |
Net Realized and Unrealized Gain (Loss) on Investments3 | (.983) |
Total from Investment Operations | 2.183 |
Distributions | |
Dividends from Net Investment Income | (1.853) |
Distributions from Realized Capital Gains | — |
Total Distributions | (1.853) |
Net Asset Value, End of Period | $98.11 |
| |
| |
Total Return | 2.29% |
| |
| |
Ratios/Supplemental Data | |
Net Assets, End of Period (Millions) | $5 |
Ratio of Total Expenses to Average Net Assets | 0.14%* |
Ratio of Net Investment Income to Average Net Assets | 4.52%* |
Portfolio Turnover Rate4 | 36% |
1 Inception.
2 Calculated based on average shares outstanding.
3 Includes increase from purchase fees of $ .11.
4 Excludes the value of portfolio securities received or delivered as a result of in-kind purchases or redemptions of the fund’s capital shares, including ETF Creation Units.
* Annualized.
See accompanying Notes, which are an integral part of the Financial Statements.
15
Notes to Financial Statements
Vanguard Extended Duration Treasury Index Fund is registered under the Investment Company Act of 1940 as an open-end investment company, or mutual fund. The fund offers three classes of shares: Institutional Shares, Institutional Plus Shares, and ETF Shares. Institutional Shares were first issued on November 28, 2007, and are designed for investors who meet certain administrative and service criteria and invest a minimum of $5 million. Institutional Plus Shares are available to investors who invest a minimum of $100 million. The fund had not issued any Institutional Plus Shares through August 31, 2008. ETF Shares were first issued on December 6, 2007, and first offered to the public on December 10, 2007. ETF Shares were listed for trading on the American Stock Exchange through September 18, 2008, and on NYSE Arca, Inc. thereafter; they can be purchased and sold through a broker.
A. The following significant accounting policies conform to generally accepted accounting principles for U.S. mutual funds. The fund consistently follows such policies in preparing its financial statements.
1. Security Valuation: Bonds, and temporary cash investments acquired over 60 days to maturity, are valued using the latest bid prices or using valuations based on a matrix system (which considers such factors as security prices, yields, maturities, and ratings), both as furnished by independent pricing services. Investments in Vanguard Market Liquidity Fund are valued at that fund’s net asset value. Securities for which market quotations are not readily available, or whose values have been materially affected by events occurring before the fund’s pricing time but after the close of the securities’ primary markets, are valued by methods deemed by the board of trustees to represent fair value.
2. Federal Income Taxes: The fund intends to qualify as a regulated investment company and distribute all of its taxable income. Management has analyzed the fund’s tax positions taken for the period from inception to August 31, 2008, and has concluded that no provision for federal income tax is required in the fund’s financial statements.
3. Distributions: Distributions to shareholders are recorded on the ex-dividend date.
4. Other: Interest income includes income distributions received from Vanguard Market Liquidity Fund and is accrued daily. Premiums and discounts on debt securities purchased are amortized and accreted, respectively, to interest income over the lives of the respective securities. Security transactions are accounted for on the date securities are bought or sold. Costs used to determine realized gains (losses) on the sale of investment securities are those of the specific securities sold. Fees, if any, assessed on purchases of Institutional Shares are credited to paid-in capital.
Each class of shares has equal rights as to assets and earnings, except that each class separately bears certain class-specific expenses related to maintenance of shareholder accounts (included in Management and Administrative expenses) and shareholder reporting. Marketing and distribution expenses are allocated to each class of shares based on a method approved by the board of trustees. Income, other non-class-specific expenses, and gains and losses on investments are allocated to each class of shares based on its relative net assets.
B. The Vanguard Group furnishes at cost investment advisory, corporate management, administrative, marketing, and distribution services. The costs of such services are allocated to the fund under methods approved by the board of trustees. The fund has committed to provide up to 0.40% of its net assets in capital contributions to Vanguard. At August 31, 2008, the fund had contributed capital of $17,000 to Vanguard (included in Other Assets), representing 0.01% of the fund’s net assets and 0.02% of Vanguard’s capitalization. The fund’s trustees and officers are also directors and officers of Vanguard.
16
C. Distributions are determined on a tax basis and may differ from net investment income and realized capital gains for financial reporting purposes. Differences may be permanent or temporary. Permanent differences are reclassified among capital accounts in the financial statements to reflect their tax character. Temporary differences arise when certain items of income, expense, gain, or loss are recognized in different periods for financial statement and tax purposes; these differences will reverse at some time in the future. Differences in classification may also result from the treatment of short-term gains as ordinary income for tax purposes.
During the period ended August 31, 2008, the fund realized $479,000 of net capital losses resulting from in-kind redemptions—in which shareholders exchanged fund shares for securities held by the fund rather than for cash. Because such losses are not taxable to the fund, and are not distributed to shareholders, they have been reclassified from accumulated net realized losses to paid-in capital.
For tax purposes, at August 31, 2008, the fund had $1,865,000 of ordinary income available for distribution. The fund had available realized losses of $435,000 to offset future net capital gains through August 31, 2017.
At August 31, 2008, the cost of investment securities for tax purposes was $263,028,000. Net unrealized appreciation of investment securities for tax purposes was $211,000, consisting of unrealized gains of $1,191,000 on securities that had risen in value since their purchase and $980,000 in unrealized losses on securities that had fallen in value since their purchase.
D. During the period ended August 31, 2008, the fund purchased $315,646,000 of investment securities and sold $56,119,000 of investment securities other than temporary cash investments.
E. Capital share transactions for each class of shares were:
| Inception1 to |
| August 31, 2008 |
| Amount | Shares |
| ($000) | (000) |
Institutional Shares | | |
Issued2 | 256,993 | 8,769 |
Issued in Lieu of Cash Distributions | 2,278 | 80 |
Redeemed | (2,729) | (106) |
Net Increase (Decrease)—Institutional Shares | 256,542 | 8,743 |
ETF Shares | | |
Issued2 | 14,691 | 150 |
Issued in Lieu of Cash Distributions | — | — |
Redeemed | (9,352) | (100) |
Net Increase (Decrease)—ETF Shares | 5,339 | 50 |
1 Inception was November 28, 2007, for Institutional Shares and December 6, 2007, for ETF Shares.
2 Includes purchase fees of $289,000 (fund total).
17
F. In September 2006, the Financial Accounting Standards Board issued Statement of Financial Accounting Standards No. 157 (“FAS 157”), “Fair Value Measurements.” FAS 157 establishes a framework for measuring fair value and expands disclosures about fair value measurements in financial statements, effective for the fund’s current fiscal year.
The various inputs that may be used to determine the value of the fund’s investments are summarized in three broad levels. The inputs or methodologies used for valuing securities are not necessarily an indication of the risk associated with investing in those securities.
Level 1—Quoted prices in active markets for identical securities.
Level 2—Other significant observable inputs (including quoted prices for similar securities, interest rates, prepayment speeds, credit risk, etc.).
Level 3—Significant unobservable inputs (including the fund’s own assumptions used to determine the fair value of investments).
The following table summarizes the fund’s investments as of August 31, 2008, based on the inputs used to value them:
| Investments |
| in Securities |
Valuation Inputs | ($000) |
Level 1—Quoted prices | 6 |
Level 2—Other significant observable inputs | 263,233 |
Level 3—Significant unobservable inputs | — |
Total | 263,239 |
18
Report of Independent Registered
Public Accounting Firm
To the Trustees of Vanguard World Funds and the Shareholders of Vanguard Extended Duration Treasury Index Fund:
In our opinion, the accompanying statement of net assets, and the related statements of operations and of changes in net assets and the financial highlights present fairly, in all material respects, the financial position of Vanguard Extended Duration Treasury Index Fund (the “Fund”) at August 31, 2008, the results of its operations, the changes in its net assets and the financial highlights for the period November 28, 2007 (commencement of operations) through August 31, 2008, in conformity with accounting principles generally accepted in the United States of America. These financial statements and financial highlights (hereafter referred to as “financial statements”) are the responsibility of the Fund’s management; our responsibility is to express an opinion on these financial statements based on our audit. We conducted our audit of these financial statements in accordance with the standards of the Public Company Accounting Oversight Board (United States). Those standards require that we plan and perform the audit to obtain reasonable assurance about whether the financial statements are free of material misstatement. An audit includes examining, on a test basis, evidence supporting the amounts and disclosures in the financial statements, assessing the accounting principles used and significant estimates made by management, and evaluating the overall financial statement presentation. We believe that our audit, which included confirmation of securities at August 31, 2008 by correspondence with the custodian and by agreement to the underlying ownership records for Vanguard Market Liquidity Fund, provide a reasonable basis for our opinion.
PricewaterhouseCoopers LLP
Philadelphia, Pennsylvania
October 14, 2008
Special 2008 tax information (unaudited) for Vanguard Extended Duration Treasury Index Fund
This information for the fiscal year ended August 31, 2008, is included pursuant to provisions of the Internal Revenue Code.
For non-resident alien shareholders, 99.9% of income dividends are interest-related dividends.
19
About Your Fund’s Expenses
As a shareholder of the fund, you incur ongoing costs, which include costs for portfolio management, administrative services, and shareholder reports (like this one), among others. Operating expenses, which are deducted from a fund’s gross income, directly reduce the investment return of the fund.
A fund’s expenses are expressed as a percentage of its average net assets. This figure is known as the expense ratio. The following examples are intended to help you understand the ongoing costs (in dollars) of investing in your fund and to compare these costs with those of other mutual funds. The examples are based on an investment of $1,000 made at the beginning of the period shown and held for the entire period.
The table below illustrates your fund’s costs in two ways:
• Based on actual fund return. This section helps you to estimate the actual expenses that you paid over the period. The “Ending Account Value” shown is derived from the fund’s actual return, and the third column shows the dollar amount that would have been paid by an investor who started with $1,000 in the fund. You may use the information here, together with the amount you invested, to estimate the expenses that you paid over the period.
To do so, simply divide your account value by $1,000 (for example, an $8,600 account value divided by $1,000 = 8.6), then multiply the result by the number given for your fund under the heading “Expenses Paid During Period.”
• Based on hypothetical 5% yearly return. This section is intended to help you compare your fund’s costs with those of other mutual funds. It assumes that the fund had a yearly return of 5% before expenses, but that the expense ratio is unchanged. In this case—because the return used is not the fund’s actual return—the results do not apply to your investment. The example is useful in making comparisons because the Securities and Exchange Commission requires all mutual funds to calculate expenses based on a 5% return. You can assess your fund’s costs by comparing this hypothetical example with the hypothetical examples that appear in shareholder reports of other funds.
Six Months Ended August 31, 2008 | | | |
| Beginning | Ending | Expenses |
| Account Value | Account Value | Paid During |
Extended Duration Treasury Index Fund | 2/29/2008 | 8/31/2008 | Period1 |
Based on Actual Fund Return | | | |
Institutional Shares | $1,000.00 | $1,032.57 | $0.56 |
ETF Shares | 1,000.00 | 1032.46 | 0.72 |
Based on Hypothetical 5% Yearly Return | | | |
Institutional Shares | $1,000.00 | $1,024.65 | $0.56 |
ETF Shares | 1,000.00 | 1024.50 | 0.71 |
1 The calculations are based on expenses incurred in the most recent six-month period. The fund’s annualized six-month expense ratios for that period are 0.11% for Institutional Shares and 0.14% for ETF Shares. The dollar amounts shown as “Expenses Paid” are equal to the annualized expense ratio multiplied by the average account value over the period, multiplied by the number of days in the most recent six-month period, then divided by the number of days in the most recent 12-month period.
20
Note that the expenses shown in the table are meant to highlight and help you compare ongoing costs only and do not reflect transaction costs incurred by the fund for buying and selling securities. Your fund does not carry a “sales load.”
The calculations assume no shares were bought or sold during the period. Your actual costs may have been higher or lower, depending on the amount of your investment and the timing of any purchases or redemptions.
You can find more information about the fund’s expenses, including annual expense ratios, in the Financial Statements section of this report. For additional information on operating expenses and other shareholder costs, please refer to your fund’s current prospectus.
21
Trustees Approve Advisory Arrangement
The board of trustees of Vanguard Extended Duration Treasury Index Fund has renewed the investment advisory arrangement with The Vanguard Group, Inc. Vanguard—through its Fixed Income Group (FIG)—serves as the investment advisor for the fund. The board determined that continuing the fund’s internalized management structure was in the best interests of the fund and its shareholders.
The board based its decision upon an evaluation of the advisor’s investment staff, portfolio management process, and performance. The trustees considered the factors discussed below, among others. However, no single factor determined whether the board approved the arrangement. Rather, it was the totality of the circumstances that drove the board’s decision.
Nature, extent, and quality of services
The board considered the quality of the fund’s investment management services provided by FIG since the fund’s inception in 2007, and took into account the organizational depth and stability of the advisor. The board noted that Vanguard has been managing investments for more than 25 years. George U. Sauter, Vanguard managing director and chief investment officer, has been in the investment management business since 1985. Robert F. Auwaerter, head of Fixed Income Portfolio Management and principal of Vanguard, has been in the investment management business since 1978. FIG adheres to a sound, disciplined investment management process; the team has considerable experience, stability, and depth.
The board concluded that Vanguard’s experience, stability, depth, and performance, among other factors, warranted continuation of the advisory arrangement.
Investment performance
The board considered the fund’s performance since inception, including any periods of outperformance or underperformance of its target benchmark and peer group. The board concluded that the fund has performed in line with expectations, and that the results have been consistent with the fund’s investment strategy. Information about the fund’s performance can be found in the Performance Summary section of this report.
Cost
The board concluded that the fund’s expense ratio was far below the average expense ratio charged by funds in its peer group. The board noted that the fund’s advisory expense ratio was also well below its peer-group average. Information about the fund’s expense ratio appears in the About Your Fund’s Expenses section of this report as well as in the Financial Statements section.
The board does not conduct a profitability analysis of Vanguard because of Vanguard’s unique “at-cost” structure. Unlike most other mutual fund management companies, Vanguard is owned by the funds it oversees, and produces “profits” only in the form of reduced expenses for fund shareholders.
The benefit of economies of scale
The board concluded that the fund’s low-cost arrangement with Vanguard ensures that the fund will realize economies of scale as it grows, with the cost to shareholders declining as the fund’s assets increase.
The board will consider whether to renew the advisory arrangement again after a one-year period.
22
Glossary
Average Coupon. The average interest rate paid on the fixed income securities held by a fund. It is expressed as a percentage of face value.
Average Duration. An estimate of how much the value of the bonds held by a fund will fluctuate in response to a change in interest rates. To see how the value could change, multiply the average duration by the change in rates. If interest rates rise by 1 percentage point, the value of the bonds in a fund with an average duration of five years would decline by about 5%. If rates decrease by a percentage point, the value would rise by 5%.
Average Effective Maturity. The average length of time until fixed income securities held by a fund reach maturity and are repaid, taking into consideration the possibility that the issuer may call the bond before its maturity date. The figure reflects the proportion of fund assets represented by each security; it also reflects any futures contracts held. In general, the longer the average effective maturity, the more a fund’s share price will fluctuate in response to changes in market interest rates.
Average Quality. An indicator of credit risk, this figure is the average of the ratings assigned to a fund’s fixed income holdings by credit-rating agencies. The agencies make their judgment after appraising an issuer’s ability to meet its obligations. Quality is graded on a scale, with Aaa or AAA indicating the most creditworthy bond issuers. U.S. Treasury securities are considered to have the highest credit quality.
Distribution by Coupon. A breakdown of the securities in a fund according to coupon rate—the interest rate that an issuer promises to pay, expressed as an annual percentage of face value. Securities with unusually high coupon rates may be subject to call risk, the possibility that they will be redeemed (or “called”) early by the issuer.
Expense Ratio. The percentage of a fund’s average net assets used to pay its annual administrative and advisory expenses. These expenses directly reduce returns to investors.
Inception Date. The date on which the assets of a fund (or one of its share classes) are first invested in accordance with the fund’s investment objective. For funds with a subscription period, the inception date is the day after that period ends. Investment performance is measured from the inception date.
Short-Term Reserves. The percentage of a fund invested in highly liquid, short-term securities that can be readily converted to cash.
Yield. A fund’s 30-day SEC yield is derived using a formula specified by the U.S. Securities and Exchange Commission. Under the formula, data related to the fund’s security holdings in the previous 30 days are used to calculate the fund’s hypothetical net income for that period, which is then annualized and divided by the fund’s estimated average net assets over the calculation period. For the purposes of this calculation, a security’s income is based on its current market yield to maturity (in the case of bonds) or its projected dividend yield (for stocks). Because the SEC yield represents hypothetical annualized income, it will differ—at times significantly—from the fund’s actual experience. As a result, the fund’s income distributions may be higher or lower than implied by the SEC yield.
Yield to Maturity. The rate of return an investor would receive if the fixed income securities held by a fund were held to their maturity dates.
23
The People Who Govern Your Fund
The trustees of your mutual fund are there to see that the fund is operated and managed in your best interests since, as a shareholder, you are a part owner of the fund. Your fund’s trustees also serve on the board of directors of The Vanguard Group, Inc., which is owned by the Vanguard funds and provides services to them on an at-cost basis.
A majority of Vanguard’s board members are independent, meaning that they have no affiliation with Vanguard or the funds they oversee, apart from the sizable personal investments they have made as private individuals.
Our independent board members bring distinguished backgrounds in business, academia, and public service to their task of working with Vanguard officers to establish the policies and oversee the activities of the funds. Among board members’ responsibilities are selecting investment advisors for the funds; monitoring fund operations, performance, and costs; reviewing contracts; nominating and selecting new trustees/directors; and electing Vanguard officers.
Each trustee serves a fund until its termination; or until the trustee’s retirement, resignation, or death; or otherwise as specified in the fund’s organizational documents. Any trustee may be removed at a shareholders’ meeting by a vote representing two-thirds of the net asset value of all shares of the fund together with shares of other Vanguard funds organized within the same trust. The table on these two pages shows information for each trustee and executive officer of the fund. The mailing address of the trustees and officers is P.O. Box 876, Valley Forge, PA 19482.
Chairman of the Board and Trustee
John J. Brennan1
Born 1954 Principal Occupation(s) During the Past Five Years: Chairman of the Board and Director/ Trustee Since May 1987; Trustee of The Vanguard Group, Inc., and of each of the investment companies served Chairman of the Board by The Vanguard Group; Director of Vanguard Marketing Corporation; President and Chief 156 Vanguard Funds Overseen Executive Officer of The Vanguard Group and of each of the investment companies served by The Vanguard Group (1996–2008).
Independent Trustees
Charles D. Ellis
Born 1937 Principal Occupation(s) During the Past Five Years: Applecore Partners (pro bono ventures Trustee Since January 2001 in education); Senior Advisor to Greenwich Associates (international business strategy 156 Vanguard Funds Overseen consulting); Successor Trustee of Yale University; Overseer of the Stern School of Business at New York University; Trustee of the Whitehead Institute for Biomedical Research.
Emerson U. Fullwood
Born 1948 Principal Occupation(s) During the Past Five Years: Executive Chief Staff and Marketing Trustee Since January 2008 Officer for North America since 2004 and Corporate Vice President of Xerox Corporation 156 Vanguard Funds Overseen (photocopiers and printers); Director of SPX Corporation (multi-industry manufacturing), of the United Way of Rochester, and of the Boy Scouts of America.
Rajiv L. Gupta
Born 1945 Principal Occupation(s) During the Past Five Years: Chairman, President, and Trustee Since December 20012 Chief Executive Officer of Rohm and Haas Co. (chemicals); Board Member of 156 Vanguard Funds Overseen the American Chemistry Council; Director of Tyco International, Ltd. (diversified manufacturing and services) since 2005.
Amy Gutmann
Born 1949 Principal Occupation(s) During the Past Five Years: President of the University of
Trustee Since June 2006 Pennsylvania since 2004; Professor in the School of Arts and Sciences, Annenberg School 156 Vanguard Funds Overseen for Communication, and Graduate School of Education of the University of Pennsylvania since 2004; Provost (2001–2004) and Laurance S. Rockefeller Professor of Politics and the University Center for Human Values (1990–2004), Princeton University; Director of Carnegie Corporation of New York since 2005 and of Schuylkill River Development Corporation and Greater Philadelphia Chamber of Commerce since 2004; Trustee of the National Constitution Center since 2007.
JoAnn Heffernan Heisen
Born 1950 Principal Occupation(s) During the Past Five Years: Corporate Vice President and Trustee Since July 1998 Chief Global Diversity Officer since 2006, Vice President and Chief Information 156 Vanguard Funds Overseen Officer (1997–2005), and Member of the Executive Committee of Johnson & Johnson (pharmaceuticals/consumer products); Director of the University Medical Center at Princeton and Women’s Research and Education Institute.
André F. Perold
Born 1952 Principal Occupation(s) During the Past Five Years: George Gund Professor of Finance Trustee Since December 2004 and Banking, Harvard Business School; Senior Associate Dean and Director of Faculty 156 Vanguard Funds Overseen Recruiting, Harvard Business School; Director and Chairman of UNX, Inc. (equities trading firm); Chair of the Investment Committee of HighVista Strategies LLC (private investment firm) since 2005.
Alfred M. Rankin, Jr.
Born 1941 Principal Occupation(s) During the Past Five Years: Chairman, President, Chief Executive Trustee Since January 1993 Officer, and Director of NACCO Industries, Inc. (forklift trucks/housewares/lignite); Director 156 Vanguard Funds Overseen of Goodrich Corporation (industrial products/aircraft systems and services).
J. Lawrence Wilson
Born 1936 Principal Occupation(s) During the Past Five Years: Retired Chairman and Chief Executive Trustee Since April 1985 Officer of Rohm and Haas Co. (chemicals); Director of Cummins Inc. (diesel engines) and 156 Vanguard Funds Overseen AmerisourceBergen Corp. (pharmaceutical distribution); Trustee of Vanderbilt University and of Culver Educational Foundation.
Executive Officers1
Thomas J. Higgins
Born 1957 Principal Occupation(s) During the Past Five Years: Principal of The Vanguard Group, Inc.; Treasurer Since July 1998 Treasurer of each of the investment companies served by The Vanguard Group. 156 Vanguard Funds Overseen
F. William McNabb III
Born 1957 Principal Occupation(s) During the Past Five Years: Chief Executive Officer, Director, Chief Executive Officer and President of The Vanguard Group, Inc., since 2008; Chief Executive Officer and Since August 31, 2008 President of each of the investment companies served by The Vanguard Group since President Since March 2008 2008; Director of Vanguard Marketing Corporation; Managing Director of The Vanguard 156 Vanguard Funds Overseen Group (1995–2008).
Heidi Stam
Born 1956 Principal Occupation(s) During the Past Five Years: Managing Director of The Vanguard Secretary Since July 2005 Group, Inc., since 2006; General Counsel of The Vanguard Group since 2005; Secretary of 156 Vanguard Funds Overseen The Vanguard Group and of each of the investment companies served by The Vanguard Group, since 2005; Director and Senior Vice President of Vanguard Marketing Corporation since 2005; Principal of The Vanguard Group (1997–2006).
Vanguard Senior Management Team | | |
| | | |
R. Gregory Barton | Kathleen C. Gubanich | Michael S. Miller | Glenn W. Reed |
Mortimer J. Buckley | Paul A. Heller | Ralph K. Packard | George U. Sauter |
Founder
John C. Bogle
Chairman and Chief Executive Officer, 1974–1996
1 These individuals are “interested persons” as defined in the Investment Company Act of 1940.
2 December 2002 for Vanguard Equity Income Fund, Vanguard Growth Equity Fund, the Vanguard Municipal Bond Funds, and the Vanguard State Tax-Exempt Funds.
More information about the trustees is in the Statement of Additional Information, available from The Vanguard Group.

P.O. Box 2600
Valley Forge, PA 19482-2600
Connect with Vanguard® > www.vanguard.com
Fund Information > 800-662-7447 | All comparative mutual fund data are from Lipper Inc. |
| or Morningstar, Inc., unless otherwise noted. |
Direct Investor Account Services > 800-662-2739 | |
| You can obtain a free copy of Vanguard’s proxy voting |
Institutional Investor Services > 800-523-1036 | guidelines by visiting our website, www.vanguard.com, |
| and searching for “proxy voting guidelines,” or by |
Text Telephone for People | calling Vanguard at 800-662-2739. The guidelines are |
With Hearing Impairment > 800-952-3335 | also available from the SEC’s website, www.sec.gov. |
| In addition, you may obtain a free report on how your |
| fund voted the proxies for securities it owned during |
| the 12 months ended June 30. To get the report, visit |
This material may be used in conjunction | either www.vanguard.com or www.sec.gov. |
with the offering of shares of any Vanguard | |
fund only if preceded or accompanied by | |
the fund’s current prospectus. | |
| |
| You can review and copy information about your fund |
| at the SEC’s Public Reference Room in Washington, D.C. |
| To find out more about this public service, call the SEC |
The funds or securities referred to herein are not | at 202-551-8090. Information about your fund is also |
sponsored, endorsed, or promoted by MSCI, and MSCI | available on the SEC’s website, and you can receive |
bears no liability with respect to any such funds or | copies of this information, for a fee, by sending a |
securities. For any such funds or securities, the | request in either of two ways: via e-mail addressed to |
prospectus or the Statement of Additional Information | publicinfo@sec.gov or via regular mail addressed to the |
contains a more detailed description of the limited | Public Reference Section, Securities and Exchange |
relationship MSCI has with The Vanguard Group and | Commission, Washington, DC 20549-0102. |
any related funds. | |
| |
Russell is a trademark of The Frank Russell Company. | |
| |
| |
| |
| |
| |
| |
| |
| |
| |
| |
| © 2008 The Vanguard Group, Inc. |
| All rights reserved. |
| Vanguard Marketing Corporation, Distributor. |
| |
| Q12750 102008 |
> | From inception on December 17, 2007, through August 31, 2008, Vanguard’s Mega Cap 300 Index Funds posted returns ranging from –5.9% to –13.6% for their ETF Shares, as determined by the net asset value per share. All three of the funds closely tracked their target indexes. |
> | The Mega Cap 300 Growth Index Fund turned in the best performance of the group during the period, while the Mega Cap 300 Value Index Fund posted the weakest results and reported losses in all 10 sectors. |
> | Financial stocks were among the top detractors in all three funds, as the crisis in the U.S. credit markets continued. |
Contents | |
| |
Your Fund’s Total Returns | 1 |
President’s Letter | 4 |
Mega Cap 300 Index Fund | 10 |
Mega Cap 300 Growth Index Fund | 25 |
Mega Cap 300 Value Index Fund | 38 |
About Your Fund’s Expenses | 53 |
Trustees Approve Advisory Arrangement | 55 |
Glossary | 56 |

Mega Cap 300 Index Fund
Mega Cap 300 Growth Index Fund
Mega Cap 300 Value Index Fund
Please note: The opinions expressed in this report are just that��informed opinions. They should not be considered promises or advice. Also, please keep in mind that the information and opinions cover the period through the date on the front of this report. Of course, the risks of investing in your fund are spelled out in the prospectus.
Your Fund’s Total Returns
Periods Ended August 31, 2008 | | |
| | Returns Since |
| Ticker | Share-Class |
| Symbol | Inception |
Vanguard Mega Cap 300 Index Fund | | |
Institutional Shares1 (Inception: February 22, 2008) | VMCTX | –3.7% |
MSCI® US Large Cap 300 Index | | –3.7 |
Average Large-Cap Core Fund2 | | –4.1 |
| | |
Vanguard Mega Cap 300 Index Fund | | |
ETF Shares3 (Inception: December 17, 2007) | MGC | |
Market Price | | –9.6% |
Net Asset Value | | –9.6 |
MSCI US Large Cap 300 Index | | –9.6 |
Average Large-Cap Core Fund2 | | –10.0 |
| | |
Vanguard Mega Cap 300 Growth Index Fund | | |
Institutional Shares1 (Inception: April 3, 2008) | VMGAX | –1.0% |
MSCI US Large Cap Growth Index | | –1.0 |
Average Large-Cap Growth Fund2 | | –3.5 |
| | |
Vanguard Mega Cap 300 Growth Index Fund | | |
ETF Shares3 (Inception: December 17, 2007) | MGK | |
Market Price | | –5.8% |
Net Asset Value | | –5.9 |
MSCI US Large Cap Growth Index | | –5.9 |
Average Large-Cap Growth Fund2 | | –10.2 |
1 This class of shares carries low expenses and is available for a minimum investment of $5 million.
2 Derived from data provided by Lipper Inc.
3 These Vanguard ETF™ Shares are traded on the NYSE Arca exchange and are available only through brokers. The table shows ETF returns based on both the NYSE Arca market price and the net asset value for a share. U.S. Pat. No. 6,879,964 B2; 7,337,138.
1
Your Fund’s Total Returns
Periods Ended August 31, 2008 | | |
| | Returns Since |
| Ticker | Share-Class |
| Symbol | Inception |
Vanguard Mega Cap 300 Value Index Fund | | |
Institutional Shares1 (Inception: March 5, 2008) | VMVLX | –6.0% |
MSCI US Large Cap Value Index | | –6.0 |
Average Large-Cap Value Fund2 | | –3.9 |
| | |
Vanguard Mega Cap 300 Value Index Fund | | |
ETF Shares3 (Inception: December 17, 2007) | MGV | |
Market Price | | –13.5% |
Net Asset Value | | –13.6 |
MSCI US Large Cap Value Index | | –13.5 |
Average Large-Cap Value Fund2 | | –12.0 |
1 This class of shares carries low expenses and is available for a minimum investment of $5 million.
2 Derived from data provided by Lipper Inc.
3 These Vanguard ETF Shares are traded on the NYSE Arca exchange and are available only through brokers. The table shows ETF returns based on both the NYSE Arca market price and the net asset value for a share. U.S. Pat. No. 6,879,964 B2; 7,337,138.
2
Your Fund’s Performance at a Glance
Inception Through August 31, 2008 | | | | |
| | | Distributions Per Share |
| Starting | Ending | Income | Capital |
| Share Price | Share Price | Dividends | Gains |
Mega Cap 300 Index Fund | | | | |
Institutional Shares | $91.071 | $87.14 | $0.587 | $0.000 |
ETF Shares | 49.242 | 44.21 | 0.292 | 0.000 |
Mega Cap 300 Growth Index Fund | | | | |
Institutional Shares | $92.211 | $91.10 | $0.203 | $0.000 |
ETF Shares | 49.102 | 46.04 | 0.158 | 0.000 |
Mega Cap 300 Value Index Fund | | | | |
Institutional Shares | $90.011 | $83.69 | $1.000 | $0.000 |
ETF Shares | 49.382 | 42.21 | 0.496 | 0.000 |
1 At inception: For the Mega Cap 300 Index Fund, February 22, 2008; for the Mega Cap 300 Growth Index Fund, April 3, 2008; and for the Mega Cap 300 Value Index Fund, March 5, 2008.
2 At inception: December 17, 2007.
3

President’s Letter
Dear Shareholder,
Vanguard Mega Cap 300 Index Fund, Mega Cap 300 Value Index Fund, and Mega Cap 300 Growth Index Fund—which launched ETF Shares on December 17, 2007—are designed to capture the performance of the largest stocks in the U.S. market. The funds track the MSCI US Large Cap Indexes and allow you to invest in the market segment as a whole or directly in its growth or value components.
The funds were introduced during a turbulent time in the U.S. markets, and have endured difficult times since the very beginning. From inception through August 31, the Mega Cap 300 Growth Index Fund was the top performer of the group, with its ETF Shares returning –5.9% for the period, as determined by the net asset value per share. The Mega Cap 300 Index ETF was next in line, returning –9.6% for the period, while the Mega Cap 300 Value Index ETF returned –13.6%.
Despite the unsettled investment environment, the fund’s advisor, Vanguard Quantitative Equity Group, has managed to closely track the funds’ target indexes. The advisor is helped in this task by the funds’ expense ratios, which are much lower than the average costs of peer funds.
4
The Mega Cap 300 Index Funds also offer Institutional Shares, which are available for a minimum initial investment of $5,000,000. The table on pages 1 and 2 shows the returns for the funds and their target indexes and the average returns for their peer groups for the period.
As market volatility intensified, stocks declined worldwide
Although the funds began operations after the start of their fiscal year, we provide a review of the investment environment during the full 12 months.
Stocks lost ground as credit-market turmoil spread throughout the global economy. Over the 12 months, the broad U.S. stock market lost about 10% of its value. International markets followed a similar path, returning –12.2% for the year.
The descent was bumpy. After years of relative calm, the U.S. market routinely rose or fell by more than a percentage point in a day’s trading. The volatility reflected a seemingly endless series of unnerving developments: the persistent rise in energy prices, further deterioration in the housing market, a string of bank failures, and the broad economy’s deceleration.
Market Barometer | | | |
| Average Annual Total Returns |
| Periods Ended August 31, 2008 |
| One Year | Three Years | Five Years |
Stocks | | | |
Russell 1000 Index (Large-caps) | –10.6% | 3.9% | 7.4% |
Russell 2000 Index (Small-caps) | –5.5 | 4.8 | 9.6 |
Dow Jones Wilshire 5000 Index (Entire market) | –9.9 | 4.2 | 7.9 |
MSCI All Country World Index ex USA (International) | –12.2 | 10.7 | 16.1 |
| | | |
Bonds | | | |
Lehman U.S. Aggregate Bond Index (Broad taxable market) | 5.9% | 4.3% | 4.6% |
Lehman Municipal Bond Index | 4.5 | 3.3 | 4.4 |
Citigroup 3-Month Treasury Bill Index | 2.8 | 4.0 | 3.1 |
| | | |
CPI | | | |
Consumer Price Index | 5.4% | 3.7% | 3.5% |
5
Risk aversion increased, and Treasuries outperformed
The collapse in subprime mortgage-backed securities and the aftershocks prompted a flight to safety. Short-term U.S. Treasury securities were among the fixed income market’s best performers. Over the 12 months, the broad taxable bond market returned a respectable 5.9%, largely reflecting the Treasury bond rally.
As risk aversion increased, the difference between the yields of Treasury bonds and those of all other securities increased, depressing the price of corporate debt. (As you know, yield and price move in opposite directions.) Even as corporate bonds grew cheaper, the prices of most goods and services rose quickly, powered by escalating energy prices.
The combination of higher inflation, financial market volatility, and economic weakness put the U.S. Federal Reserve Board in an uncomfortable position. The Fed decided that it was imperative to respond to the financial crisis with a dramatic easing of monetary policy through interest rate cuts, even as it recognized that the result might be higher inflation. Over the full 12 months, the Fed reduced its target for the federal funds rate from 5.25% to 2.00%.
Expense Ratios1 | | | |
Your Fund Compared With Its Peer Group | | | |
| Institutional | ETF | Peer |
| Shares | Shares | Group |
Mega Cap 300 Index Fund | 0.08% | 0.13% | 1.29% |
Mega Cap 300 Growth Index Fund | 0.08 | 0.13 | 1.36 |
Mega Cap 300 Value Index Fund | 0.08 | 0.13 | 1.28 |
1 Fund expense ratios shown are from the prospectus dated December 10, 2007, and were based on estimated expenses. Annualized expense ratios for the fiscal period ended August 31, 2008, were 0.08% for Mega Cap 300 Index Institutional Shares and 0.13% for ETF Shares, 0.08% for Mega Cap 300 Growth Index Institutional Shares and 0.13% for ETF Shares, 0.08% for Mega Cap 300 Value Index Institutional Shares and 0.13% for ETF Shares. Peer groups are: for the Mega Cap 300 Index Institutional Shares, the Average Large-Cap Core Fund; for the Mega Cap 300 Growth Index Institutional Shares, the Average Large-Cap Growth Fund; for the Mega Cap 300 Value Index Institutional Shares, the Average Large-Cap Value Fund. Peer-group expense ratios are derived from data provided by Lipper Inc. and capture information through year-end 2007.
6
Trouble in financials hindered index returns
As the turmoil in the U.S. markets continued, all three Mega Cap 300 Index Funds reported negative returns for the period ended August 31, 2008. The persistent upheaval in the financial industry didn’t bode well for the Mega Cap 300 Value Index Fund in particular, given its heavy weighting in the sector. The Mega Cap 300 Growth Index Fund—which significantly outperformed its peers—fared relatively well, mostly because of its more modest allocation to financial stocks and positive results from the consumer staples and materials sectors.
The Mega Cap 300 Value Index’s large allocation to the financial sector was a major factor in its disappointing performance. As the credit crisis endured, mortgage giants Freddie Mac and Fannie Mae were thrown into turmoil. Investment banks and insurers also suffered from credit-related losses.
Information technology companies were the biggest detractors for the Mega Cap 300 Growth Index Fund, as software and hardware makers negotiated a slowdown in key markets. Industrial stocks also performed weakly.
In the health care sector, pharmaceutical and managed health care stocks struggled, hindering the performance of all three indexes. Consumer discretionary stocks felt the effects of the broad economic slowdown as Americans had less money to spend on the nonessentials.
While the value index reported losses in all market sectors for the period, the growth index saw a couple of bright spots. In the consumer staples sector, jumbo retailer Wal-Mart Stores was up 25% for the period. Fertilizer companies and mining companies contributed to the positive performance of the materials sector.
A long-term perspective is key despite market conditions
Amid continued trouble in the U.S. economy, the financial markets have seen sometimes startling volatility. Since their inception in December of 2007, the Vanguard Mega Cap 300 Index Funds have already experienced their fair share of ups and downs. Such volatility is a good reminder of why we urge shareholders to avoid reacting to short-term market “noise.” Instead, Vanguard suggests that you maintain both a well-balanced portfolio and a long-term perspective.
7
A well-balanced portfolio includes stock funds, bond funds, and short-term reserves in proportions that fit your goals and risk tolerance. Such a carefully planned investment program can help to cushion the stock market’s occasionally sharp declines while allowing you to participate in its long-term potential for growth.
The lineup of Vanguard Mega Cap 300 Index Funds offers shareholders a low-cost way to invest in the large-cap area of the market as a whole, or solely in the growth or value segments. Whatever your preference, these funds can play an important role in your long-term investment plan.
Thank you for investing with Vanguard.
Sincerely,

F. William McNabb III
President and Chief Executive Officer
September 19, 2008
Vanguard Mega Cap 300 ETF |
Premium/Discount: December 17, 20071–August 31, 2008 |
| | | | |
| Market Price Above or | Market Price Below |
| Equal to Net Asset Value | | Net Asset Value |
| Number | Percentage | Number | Percentage |
Basis Point Differential2 | of Days | of Total Days | of Days | of Total Days |
0–24.9 | 93 | 52.25% | 81 | 45.51% |
25–49.9 | 1 | 0.56 | 1 | 0.56 |
50–74.9 | 1 | 0.56 | 0 | 0.00 |
75–100.0 | 0 | 0.00 | 0 | 0.00 |
>100.0 | 1 | 0.56 | 0 | 0.00 |
Total | 96 | 53.93% | 82 | 46.07% |
1 Inception.
2 One basis point equals 1/100 of a percentage point.
8
Vanguard Mega Cap 300 Growth ETF |
Premium/Discount: December 17, 20071–August 31, 2008 |
| | | | |
| Market Price Above or | Market Price Below |
| Equal to Net Asset Value | | Net Asset Value |
| Number | Percentage | Number | Percentage |
Basis Point Differential2 | of Days | of Total Days | of Days | of Total Days |
0–24.9 | 85 | 47.76% | 88 | 49.44% |
25–49.9 | 1 | 0.56 | 0 | 0.00 |
50–74.9 | 0 | 0.00 | 0 | 0.00 |
75–100.0 | 0 | 0.00 | 0 | 0.00 |
>100.0 | 2 | 1.12 | 2 | 1.12 |
Total | 88 | 49.44% | 90 | 50.56% |
Vanguard Mega Cap 300 Value ETF |
Premium/Discount: December 17, 20071–August 31, 2008 |
| | | | |
| Market Price Above or | Market Price Below |
| Equal to Net Asset Value | | Net Asset Value |
| Number | Percentage | Number | Percentage |
Basis Point Differential2 | of Days | of Total Days | of Days | of Total Days |
0–24.9 | 105 | 58.99% | 67 | 37.64% |
25–49.9 | 3 | 1.69 | 1 | 0.56 |
50–74.9 | 1 | 0.56 | 0 | 0.00 |
75–100.0 | 0 | 0.00 | 0 | 0.00 |
>100.0 | 1 | 0.56 | 0 | 0.00 |
Total | 110 | 61.80% | 68 | 38.20% |
1 Inception.
2 One basis point equals 1/100 of a percentage point.
9
Mega Cap 300 Index Fund
Fund Profile
As of August 31, 2008
Portfolio Characteristics | | |
| | Target | Broad |
| Fund | Index1 | Index2 |
Number of Stocks | 301 | 302 | 4,692 |
Median Market Cap | $57.7B | $57.7B | $31.5B |
Price/Earnings Ratio | 16.0x | 16.0x | 16.9x |
Price/Book Ratio | 2.5x | 2.5x | 2.4x |
Yield3 | | 2.2% | 2.1% |
Institutional Shares | 2.2% | | |
ETF Shares | 2.1% | | |
Return on Equity | 21.4% | 21.4% | 19.9% |
Earnings Growth Rate | 18.3% | 18.2% | 18.2% |
Foreign Holdings | 0.0% | 0.0% | 0.0% |
Turnover Rate | 30% | — | — |
Expense Ratio4 | | | |
(12/10/2007) | | — | — |
Institutional Shares | 0.08% | | |
ETF Shares | 0.13% | | |
Short-Term Reserves | 0.0% | — | — |
Sector Diversification (% of equity exposure) |
| | Target | Broad |
| Fund | Index1 | Index2 |
Consumer Discretionary | 7.9% | 8.0% | 9.1% |
Consumer Staples | 11.9 | 11.9 | 9.7 |
Energy | 13.7 | 13.6 | 13.3 |
Financials | 15.1 | 15.1 | 16.0 |
Health Care | 13.2 | 13.2 | 12.6 |
Industrials | 10.5 | 10.5 | 11.9 |
Information Technology | 17.6 | 17.6 | 16.5 |
Materials | 3.5 | 3.5 | 4.1 |
Telecommunication | | | |
Services | 3.3 | 3.3 | 2.9 |
Utilities | 3.3 | 3.3 | 3.9 |
Ten Largest Holdings5 (% of total net assets) |
| | |
ExxonMobil Corp. | integrated oil | |
| and gas | 4.1% |
General Electric Co. | industrial | |
| conglomerates | 2.7 |
Microsoft Corp. | systems software | 2.2 |
The Procter & Gamble Co. | household products | 2.1 |
Johnson & Johnson | pharmaceuticals | 1.9 |
AT&T Inc. | integrated | |
| telecommunication | |
| services | 1.9 |
Chevron Corp. | integrated oil | |
| and gas | 1.7 |
International Business | | |
Machines Corp. | computer hardware | 1.6 |
Apple Inc. | computer hardware | 1.5 |
Bank of America Corp. | diversified financial | |
| services | 1.4 |
Top Ten | | 21.1% |
Investment Focus
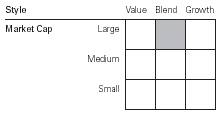
1 MSCI US Large Cap 300 Index.
2 Dow Jones Wilshire 5000 Index.
3 30-day SEC yield for the fund; annualized dividend yield for the indexes. See the Glossary.
4 Fund expense ratios shown are from the prospectus dated December 10, 2007, and were based on estimated expenses. The annualized expense ratios for the fiscal period ended August 31, 2008, were 0.08% for Institutional Shares and 0.13% for ETF Shares.
5 The holdings listed exclude any temporary cash investments and equity index products.
10
Mega Cap 300 Index Fund
Performance Summary
All of the returns in this report represent past performance, which is not a guarantee of future results that may be achieved by the fund. (Current performance may be lower or higher than the performance data cited. For performance data current to the most recent month-end, visit our website at www.vanguard.com/performance.) Note, too, that both investment returns and principal value can fluctuate widely, so an investor’s shares, when sold, could be worth more or less than their original cost. The returns shown do not reflect taxes that a shareholder would pay on fund distributions or on the sale of fund shares.
Cumulative Performance: December 17, 2007–August 31, 2008
Initial Investment of $10,000
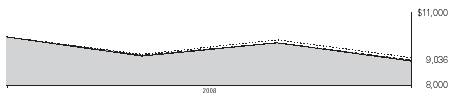
| Total Returns | |
| Periods Ended August 31, 2008 | Final Value |
| Since | of a $10,000 |
| Inception1 | Investment |
Mega Cap 300 Index Fund ETF Shares Net Asset Value | –9.64% | $9,036 |
Mega Cap 300 Index Fund ETF Shares Market Price | –9.62 | 9,038 |
Dow Jones Wilshire 5000 Index | –8.60 | 9,140 |
MSCI US Large Cap 300 Index | –9.62 | 9,038 |
Average Large-Cap Core Fund2 | –10.04 | 8,996 |
| | Final Value of |
| Since | a $5,000,000 |
| Inception1 | Investment |
Mega Cap 300 Index Fund Institutional Shares | –3.69% | $4,815,608 |
Dow Jones Wilshire 5000 Index | –2.98 | 4,850,943 |
MSCI US Large Cap 300 Index | –3.72 | 4,814,125 |
1 Performance for the fund and its comparative standards is calculated since the following inception dates: December 17, 2007, for ETF Shares and February 22, 2008, for Institutional Shares.
2 Derived from data provided by Lipper Inc.
11
Mega Cap 300 Index Fund
Cumulative Returns of ETF Shares: December 17, 2007–August 31, 2008 | |
| |
| Cumulative |
| Since Inception1 |
Mega Cap 300 Index Fund ETF Shares Market Price | –9.62% |
Mega Cap 300 Index Fund ETF Shares Net Asset Value | –9.64 |
MSCI US Large Cap 300 Index | –9.62 |
Fiscal-Period Total Returns (%): December 17, 2007–August 31, 2008
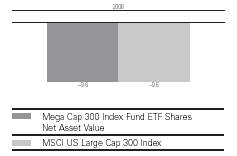
Total Returns: Periods Ended June 30, 2008
This table presents average annual total returns through the latest calendar quarter—rather than through the end of the fiscal period. Securities and Exchange Commission rules require that we provide this information.
| | Since |
| Inception Date | Inception |
ETF Shares | 12/17/2007 | |
Market Price | | –10.45% |
Net Asset Value | | –10.41 |
Institutional Shares | 2/22/2008 | –4.53 |
1 Performance for the fund’s ETF Shares and comparative standards is calculated since the ETF Shares’ inception: December 17, 2007.
Note: See Financial Highlights tables for dividend and capital gains information.
12
Mega Cap 300 Index Fund
Financial Statements
Statement of Net Assets
As of August 31, 2008
The fund provides a complete list of its holdings four times in each fiscal year, at the quarter-ends. For the second and fourth fiscal quarters, the lists appear in the fund’s semiannual and annual reports to shareholders. For the first and third fiscal quarters, the fund files the lists with the Securities and Exchange Commission on Form N-Q. Shareholders can look up the fund’s Forms N-Q on the SEC’s website at www.sec.gov. Forms N-Q may also be reviewed and copied at the SEC’s Public Reference Room (see the back cover of this report for further information).
| | | Market |
| | | Value• |
| | Shares | ($000) |
Common Stocks (100.0%) | | |
Consumer Discretionary (7.9%) | | |
| McDonald’s Corp. | 15,644 | 971 |
| The Walt Disney Co. | 25,064 | 811 |
| Time Warner, Inc. | 49,180 | 805 |
| Home Depot, Inc. | 23,206 | 629 |
| Comcast Corp. Class A | 26,833 | 568 |
| Target Corp. | 10,311 | 547 |
| Lowe’s Cos., Inc. | 20,048 | 494 |
| News Corp., Class A | 24,979 | 354 |
* | Amazon.com, Inc. | 4,300 | 348 |
| NIKE, Inc. Class B | 5,120 | 310 |
* | DIRECTV Group, Inc. | 9,484 | 268 |
| Comcast Corp. Special | | |
| Class A | 12,603 | 266 |
| Johnson Controls, Inc. | 8,167 | 253 |
| Staples, Inc. | 9,720 | 235 |
| Yum! Brands, Inc. | 6,540 | 233 |
* | Viacom Inc. Class B | 7,625 | 225 |
| Carnival Corp. | 6,004 | 223 |
| Best Buy Co., Inc. | 4,899 | 219 |
| TJX Cos., Inc. | 6,010 | 218 |
* | Kohl’s Corp. | 4,098 | 201 |
| The McGraw-Hill Cos., Inc. | 4,525 | 194 |
* | Liberty Media Corp. | 6,774 | 188 |
| Omnicom Group Inc. | 4,409 | 187 |
* | Starbucks Corp. | 9,972 | 155 |
| The Gap, Inc. | 7,227 | 141 |
* | Coach, Inc. | 4,835 | 140 |
| CBS Corp. | 8,173 | 132 |
| Harley-Davidson, Inc. | 3,281 | 131 |
| Fortune Brands, Inc. | 2,116 | 124 |
| Macy’s Inc. | 5,773 | 120 |
| J.C. Penney Co., Inc. | | |
| (Holding Co.) | 2,897 | 113 |
* | Bed Bath & Beyond, Inc. | 3,603 | 110 |
| Marriott International, Inc. | | |
| Class A | 3,894 | 110 |
| | | Market |
| | | Value• |
| | Shares | ($000) |
* | Liberty Media Corp.– | | |
| Interactive Series A | 7,953 | 108 |
* | Ford Motor Co. | 23,870 | 106 |
* | Sears Holdings Corp. | 1,039 | 96 |
| Starwood Hotels & | | |
| Resorts Worldwide, Inc. | 2,589 | 94 |
| International Game Technology | 4,344 | 93 |
| News Corp., Class B | 6,217 | 89 |
* | Liberty Global, Inc. Class A | 2,422 | 85 |
* | DISH Network Corp. | 2,846 | 80 |
* | Liberty Global, Inc. Series C | 2,253 | 75 |
* | Las Vegas Sands Corp. | 1,469 | 70 |
* | Time Warner Cable, Inc. | 2,461 | 66 |
| General Motors Corp. | 6,169 | 62 |
^ | Garmin Ltd. | 1,620 | 56 |
* | MGM Mirage, Inc. | 1,330 | 47 |
| | | 11,150 |
Consumer Staples (11.9%) | | |
| The Procter & Gamble Co. | 42,175 | 2,943 |
| Wal-Mart Stores, Inc. | 32,739 | 1,934 |
| Philip Morris International Inc. | 29,176 | 1,567 |
| PepsiCo, Inc. | 22,026 | 1,508 |
| The Coca-Cola Co. | 28,908 | 1,505 |
| CVS/Caremark Corp. | 19,689 | 721 |
| Anheuser-Busch Cos., Inc. | 9,825 | 667 |
| Kraft Foods Inc. | 20,238 | 638 |
| Altria Group, Inc. | 28,992 | 610 |
| Colgate-Palmolive Co. | 7,007 | 533 |
| Walgreen Co. | 13,636 | 497 |
| Costco Wholesale Corp. | 5,979 | 401 |
| Kimberly-Clark Corp. | 5,780 | 357 |
| General Mills, Inc. | 4,640 | 307 |
| Sysco Corp. | 8,302 | 264 |
| Avon Products, Inc. | 5,870 | 251 |
| The Kroger Co. | 8,826 | 244 |
| Wm. Wrigley Jr. Co. | 2,842 | 226 |
| H.J. Heinz Co. | 4,335 | 218 |
| Kellogg Co. | 3,744 | 204 |
| Archer-Daniels-Midland Co. | 7,962 | 203 |
13
Mega Cap 300 Index Fund
| | | Market |
| | | Value• |
| | Shares | ($000) |
| Lorillard, Inc. | 2,392 | 173 |
| Safeway, Inc. | 6,049 | 159 |
| ConAgra Foods, Inc. | 6,706 | 143 |
| Sara Lee Corp. | 9,790 | 132 |
| Reynolds American Inc. | 2,434 | 129 |
| Campbell Soup Co. | 3,165 | 117 |
| The Hershey Co. | 2,268 | 82 |
| | | 16,733 |
Energy (13.8%) | | |
| ExxonMobil Corp. | 72,951 | 5,837 |
| Chevron Corp. | 28,559 | 2,465 |
| ConocoPhillips Co. | 20,232 | 1,669 |
| Schlumberger Ltd. | 16,468 | 1,552 |
| Occidental Petroleum Corp. | 11,313 | 898 |
| Devon Energy Corp. | 5,864 | 598 |
* | Transocean, Inc. | 4,412 | 561 |
| Halliburton Co. | 12,106 | 532 |
| Apache Corp. | 4,578 | 524 |
| Marathon Oil Corp. | 9,769 | 440 |
| Hess Corp. | 4,025 | 421 |
* | National Oilwell Varco Inc. | 5,694 | 420 |
| Anadarko Petroleum Corp. | 6,414 | 396 |
| XTO Energy, Inc. | 7,550 | 381 |
* | Weatherford International Ltd. | 9,331 | 360 |
| EOG Resources, Inc. | 3,396 | 355 |
| Chesapeake Energy Corp. | 7,144 | 346 |
| Baker Hughes, Inc. | 4,255 | 340 |
| Valero Energy Corp. | 7,271 | 253 |
| Williams Cos., Inc. | 8,046 | 249 |
| Smith International, Inc. | 3,403 | 237 |
| Peabody Energy Corp. | 3,763 | 237 |
| Spectra Energy Corp. | 8,696 | 230 |
| Diamond Offshore Drilling, Inc. | 954 | 105 |
| | | 19,406 |
Financials (15.1%) | | |
| Bank of America Corp. | 63,047 | 1,963 |
| JPMorgan Chase & Co. | 47,751 | 1,838 |
| Citigroup, Inc. | 72,673 | 1,380 |
| Wells Fargo & Co. | 43,301 | 1,311 |
| The Goldman Sachs | | |
| Group, Inc. | 4,900 | 803 |
| U.S. Bancorp | 24,090 | 768 |
| American International | | |
| Group, Inc. | 32,962 | 708 |
| Merrill Lynch & Co., Inc. | 21,421 | 607 |
| American Express Co. | 14,311 | 568 |
| Morgan Stanley | 13,674 | 558 |
| Bank of New York | | |
| Mellon Corp. | 15,693 | 543 |
* | Berkshire Hathaway Inc. | | |
| Class B | 138 | 538 |
| MetLife, Inc. | 9,749 | 528 |
| | | Market |
| | | Value• |
| | Shares | ($000) |
| Wachovia Corp. | 29,903 | 475 |
| Prudential Financial, Inc. | 6,106 | 450 |
| State Street Corp. | 5,868 | 397 |
| AFLAC Inc. | 6,686 | 379 |
| The Travelers Cos., Inc. | 8,532 | 377 |
| PNC Financial Services Group | 4,750 | 342 |
| The Allstate Corp. | 7,322 | 330 |
| Charles Schwab Corp. | 13,551 | 325 |
| Simon Property Group, Inc. | | |
| REIT | 3,067 | 291 |
| CME Group, Inc. | 832 | 279 |
| The Hartford Financial | | |
| Services Group Inc. | 4,318 | 272 |
| The Chubb Corp. | 5,087 | 244 |
| Franklin Resources Corp. | 2,294 | 240 |
* | Ace Ltd. | 4,533 | 238 |
| Marsh & McLennan Cos., Inc. | 7,154 | 228 |
| Capital One Financial Corp. | 5,130 | 226 |
| BB&T Corp. | 7,509 | 225 |
| Northern Trust Corp. | 2,725 | 219 |
| T. Rowe Price Group Inc. | 3,446 | 205 |
| Loews Corp. | 4,500 | 195 |
| SunTrust Banks, Inc. | 4,612 | 193 |
| Vornado Realty Trust REIT | 1,897 | 189 |
| Lincoln National Corp. | 3,703 | 188 |
| Aon Corp. | 3,781 | 180 |
| Boston Properties, Inc. REIT | 1,642 | 168 |
| Progressive Corp. of Ohio | 8,859 | 164 |
| The Principal Financial | | |
| Group, Inc. | 3,553 | 163 |
| Equity Residential REIT | 3,708 | 156 |
| Public Storage, Inc. REIT | 1,759 | 155 |
| ProLogis REIT | 3,551 | 153 |
| Ameriprise Financial, Inc. | 3,131 | 141 |
| Invesco, Ltd. | 5,305 | 136 |
| Lehman Brothers | | |
| Holdings, Inc. | 8,144 | 131 |
| Moody’s Corp. | 3,021 | 123 |
| Fifth Third Bancorp | 7,107 | 112 |
* | SLM Corp. | 6,417 | 106 |
| Fannie Mae | 14,584 | 100 |
| Discover Financial Services | 5,930 | 98 |
| Genworth Financial Inc. | 6,016 | 97 |
| Regions Financial Corp. | 9,651 | 89 |
| General Growth Properties Inc. | | |
| REIT | 3,365 | 87 |
| Legg Mason Inc. | 1,937 | 86 |
| KeyCorp | 6,677 | 80 |
| NYSE Euronext | 1,821 | 74 |
| M & T Bank Corp. | 974 | 69 |
| Freddie Mac | 9,149 | 41 |
| | | 21,329 |
14
Mega Cap 300 Index Fund
| | | Market |
| | | Value• |
| | Shares | ($000) |
Health Care (13.2%) | | |
| Johnson & Johnson | 38,955 | 2,744 |
| Pfizer Inc. | 93,443 | 1,786 |
| Abbott Laboratories | 21,255 | 1,221 |
| Merck & Co., Inc. | 29,777 | 1,062 |
* | Amgen, Inc. | 15,056 | 946 |
| Medtronic, Inc. | 15,551 | 849 |
| Wyeth | 18,413 | 797 |
* | Gilead Sciences, Inc. | 12,776 | 673 |
| Eli Lilly & Co. | 14,154 | 660 |
* | Genentech, Inc. | 6,518 | 644 |
| Baxter International, Inc. | 8,725 | 591 |
| Bristol-Myers Squibb Co. | 27,220 | 581 |
| UnitedHealth Group Inc. | 17,212 | 524 |
| Schering-Plough Corp. | 22,273 | 432 |
* | Celgene Corp. | 5,983 | 415 |
* | WellPoint Inc. | 7,251 | 383 |
| Covidien Ltd. | 6,812 | 368 |
* | Thermo Fisher Scientific, Inc. | 5,778 | 350 |
* | Medco Health Solutions, Inc. | 6,975 | 327 |
| Aetna Inc. | 6,877 | 297 |
| Becton, Dickinson & Co. | 3,356 | 293 |
* | Genzyme Corp. | 3,653 | 286 |
| Cardinal Health, Inc. | 4,899 | 269 |
| Stryker Corp. | 3,959 | 266 |
| Allergan, Inc. | 4,208 | 235 |
* | Zimmer Holdings, Inc. | 3,228 | 234 |
* | Boston Scientific Corp. | 18,468 | 232 |
| McKesson Corp. | 3,816 | 220 |
* | St. Jude Medical, Inc. | 4,731 | 217 |
* | Express Scripts Inc. | 2,950 | 217 |
* | Biogen Idec Inc. | 4,094 | 209 |
| CIGNA Corp. | 3,839 | 161 |
* | Forest Laboratories, Inc. | 4,282 | 153 |
| | | 18,642 |
Industrials (10.5%) | | |
| General Electric Co. | 137,804 | 3,872 |
| United Technologies Corp. | 12,807 | 840 |
| 3M Co. | 9,241 | 662 |
| The Boeing Co. | 9,850 | 646 |
| United Parcel Service, Inc. | 9,513 | 610 |
| Caterpillar, Inc. | 8,583 | 607 |
| Union Pacific Corp. | 6,812 | 572 |
| Lockheed Martin Corp. | 4,749 | 553 |
| Burlington Northern | | |
| Santa Fe Corp. | 4,789 | 514 |
| Emerson Electric Co. | 10,805 | 506 |
| Honeywell International Inc. | 9,721 | 488 |
| General Dynamics Corp. | 4,702 | 434 |
| Deere & Co. | 5,997 | 423 |
| Norfolk Southern Corp. | 5,176 | 381 |
| CSX Corp. | 5,548 | 359 |
| | | Market |
| | | Value• |
| | Shares | ($000) |
| Raytheon Co. | 5,865 | 352 |
| FedEx Corp. | 4,044 | 335 |
| Northrop Grumman Corp. | 4,502 | 310 |
| Tyco International, Ltd. | 6,812 | 292 |
| Illinois Tool Works, Inc. | 5,792 | 287 |
| Danaher Corp. | 3,503 | 286 |
| Waste Management, Inc. | 6,812 | 240 |
| PACCAR, Inc. | 4,791 | 206 |
| Precision Castparts Corp. | 1,911 | 197 |
| Ingersoll-Rand Co. | 4,375 | 162 |
| Eaton Corp. | 2,150 | 157 |
| Southwest Airlines Co. | 10,119 | 154 |
* | First Solar, Inc. | 541 | 150 |
| Textron, Inc. | 3,420 | 141 |
| Masco Corp. | 5,063 | 97 |
| | | 14,833 |
Information Technology (17.5%) | | |
| Microsoft Corp. | 115,924 | 3,164 |
| International Business | | |
| Machines Corp. | 18,972 | 2,309 |
* | Apple Inc. | 12,195 | 2,067 |
* | Cisco Systems, Inc. | 81,595 | 1,962 |
| Intel Corp. | 79,109 | 1,809 |
| Hewlett-Packard Co. | 33,936 | 1,592 |
* | Google Inc. | 3,303 | 1,530 |
* | Oracle Corp. | 57,013 | 1,250 |
| QUALCOMM Inc. | 22,394 | 1,179 |
* | Dell Inc. | 24,618 | 535 |
| Visa Inc. | 6,222 | 472 |
| Texas Instruments, Inc. | 18,242 | 447 |
| Corning, Inc. | 21,658 | 445 |
* | EMC Corp. | 28,854 | 441 |
* | eBay Inc. | 15,537 | 387 |
* | Yahoo! Inc. | 18,289 | 354 |
| Accenture Ltd. | 8,223 | 340 |
| Applied Materials, Inc. | 18,650 | 334 |
| Automatic Data | | |
| Processing, Inc. | 7,189 | 319 |
* | Adobe Systems, Inc. | 7,322 | 314 |
| Motorola, Inc. | 31,007 | 292 |
| Western Union Co. | 10,311 | 285 |
* | Symantec Corp. | 11,637 | 260 |
| MasterCard, Inc. Class A | 1,019 | 247 |
| Tyco Electronics Ltd. | 6,841 | 225 |
* | Electronic Arts Inc. | 4,356 | 213 |
* | Juniper Networks, Inc. | 7,169 | 184 |
* | Agilent Technologies, Inc. | 5,098 | 177 |
| Xerox Corp. | 12,620 | 176 |
* | Broadcom Corp. | 6,449 | 155 |
* | MEMC Electronic | | |
| Materials, Inc. | 3,152 | 155 |
| Paychex, Inc. | 4,502 | 153 |
15
Mega Cap 300 Index Fund
| | | Market |
| | | Value• |
| | Shares | ($000) |
| CA, Inc. | 5,649 | 135 |
* | Activision Blizzard, Inc. | 4,055 | 133 |
* | Intuit, Inc. | 4,347 | 131 |
* | NetApp, Inc. | 4,733 | 121 |
| Analog Devices, Inc. | 4,037 | 113 |
| Seagate Technology | 6,629 | 99 |
* | Sun Microsystems, Inc. | 10,899 | 98 |
* | NVIDIA Corp. | 7,371 | 93 |
* | VMware Inc. | 566 | 22 |
| | | 24,717 |
Materials (3.5%) | | |
| Monsanto Co. | 7,591 | 867 |
| E.I. du Pont de | | |
| Nemours & Co. | 12,369 | 550 |
| Freeport-McMoRan | | |
| Copper & Gold, Inc. | | |
| Class B | 5,248 | 469 |
| Dow Chemical Co. | 12,918 | 441 |
| Praxair, Inc. | 4,308 | 387 |
| Alcoa Inc. | 11,195 | 360 |
| Air Products & Chemicals, Inc. | 2,948 | 271 |
| Newmont Mining Corp. | | |
| (Holding Co.) | 5,995 | 270 |
| The Mosaic Co. | 2,133 | 228 |
| Nucor Corp. | 4,312 | 226 |
| United States Steel Corp. | 1,620 | 216 |
| Weyerhaeuser Co. | 2,995 | 166 |
| International Paper Co. | 5,594 | 151 |
| PPG Industries, Inc. | 2,254 | 142 |
| Rohm & Haas Co. | 1,751 | 131 |
| Ecolab, Inc. | 2,550 | 117 |
| | | 4,992 |
Telecommunication Services (3.3%) | | |
| AT&T Inc. | 81,993 | 2,623 |
| Verizon Communications Inc. | 39,565 | 1,390 |
| Sprint Nextel Corp. | 38,084 | 332 |
* | American Tower Corp. | | |
| Class A | 5,566 | 230 |
| Qwest Communications | | |
| International Inc. | 22,303 | 84 |
| | | 4,659 |
Utilities (3.3%) | | |
| Exelon Corp. | 9,095 | 691 |
| Southern Co. | 10,517 | 394 |
| Dominion Resources, Inc. | 7,901 | 344 |
| FPL Group, Inc. | 5,323 | 320 |
| | | Market |
| | | Value• |
| | Shares | ($000) |
| FirstEnergy Corp. | 4,192 | 305 |
| Duke Energy Corp. | 17,344 | 302 |
| Public Service Enterprise | | |
| Group, Inc. | 6,993 | 285 |
| Entergy Corp. | 2,655 | 274 |
| PPL Corp. | 5,118 | 224 |
| American Electric | | |
| Power Co., Inc. | 5,502 | 215 |
| PG&E Corp. | 4,971 | 205 |
| Sempra Energy | 3,414 | 198 |
| Edison International | 4,256 | 195 |
| Constellation Energy | | |
| Group, Inc. | 2,448 | 163 |
| Consolidated Edison Inc. | 3,742 | 153 |
| Progress Energy, Inc. | 3,386 | 148 |
* | AES Corp. | 9,204 | 140 |
| Ameren Corp. | 2,865 | 120 |
| | | 4,676 |
Total Common Stocks | | |
(Cost $147,951) | | 141,137 |
Temporary Cash Investment (0.0%) | | |
1,2 | Vanguard Market Liquidity | | |
| Fund, 2.389% (Cost $44) | 44,400 | 44 |
Total Investments (100.0%) | | |
(Cost $147,995) | | 141,181 |
Other Assets and Liabilities (0.0%) | | |
Other Assets | | 895 |
Liabilities2 | | (826) |
| | | 69 |
Net Assets (100%) | | 141,250 |
16
Mega Cap 300 Index Fund
At August 31, 2008, net assets consisted of: |
| Amount |
| ($000) |
Paid-in Capital | 149,422 |
Undistributed Net Investment Income | 481 |
Accumulated Net Realized Losses | (1,839) |
Unrealized Appreciation (Depreciation) | (6,814) |
Net Assets | 141,250 |
| |
Institutional Shares—Net Assets | |
Applicable to 606,355 outstanding | |
$.001 par value shares of beneficial | |
interest (unlimited authorization) | 52,837 |
Net Asset Value Per Share— | |
Institutional Shares | $87.14 |
| |
ETF Shares—Net Assets | |
Applicable to 2,000,000 outstanding | |
$.001 par value shares of beneficial | |
interest (unlimited authorization) | 88,413 |
Net Asset Value Per Share— | |
ETF Shares | $44.21 |
• | See Note A in Notes to Financial Statements. |
* | Non-income-producing security. |
^ | Part of security position is on loan to broker-dealers. The total value of securities on loan is $42,000. |
1 Affiliated money market fund available only to Vanguard funds and certain trusts and accounts managed by Vanguard. Rate shown is the 7-day yield.
2 Includes $44,000 of collateral received for securities on loan.
REIT—Real Estate Investment Trust.
See accompanying Notes, which are an integral part of the Financial Statements.
17
Mega Cap 300 Index Fund
Statement of Operations
| December 17, 20071 to |
| August 31, 2008 |
| ($000) |
Investment Income | |
Income | |
Dividends | 1,045 |
Interest2 | 10 |
Security Lending | 1 |
Total Income | 1,056 |
Expenses | |
The Vanguard Group—Note B | |
Investment Advisory Services | 7 |
Management and Administrative—Institutional Shares | — |
Management and Administrative—ETF Shares | 8 |
Marketing and Distribution—Institutional Shares | 2 |
Marketing and Distribution—ETF Shares | 2 |
Custodian Fees | 7 |
Auditing Fees | 23 |
Shareholders’ Reports—Institutional Shares | — |
Shareholders’ Reports—ETF Shares | 3 |
Total Expenses | 52 |
Net Investment Income | 1,004 |
Realized Net Gain (Loss) on Investment Securities Sold | 416 |
Change in Unrealized Appreciation (Depreciation) of Investment Securities | (6,814) |
Net Increase (Decrease) in Net Assets Resulting from Operations | (5,394) |
1 Inception.
2 Interest income from an affiliated company of the fund was $10,000.
See accompanying Notes, which are an integral part of the Financial Statements.
18
Mega Cap 300 Index Fund
Statement of Changes in Net Assets
| December 17, 20071 to |
| August 31, 2008 |
| ($000) |
Increase (Decrease) in Net Assets | |
Operations | |
Net Investment Income | 1,004 |
Realized Net Gain (Loss) | 416 |
Change in Unrealized Appreciation (Depreciation) | (6,814) |
Net Increase (Decrease) in Net Assets Resulting from Operations | (5,394) |
Distributions | |
Net Investment Income | |
Institutional Shares | (216) |
ETF Shares | (307) |
Realized Capital Gain | |
Institutional Shares | — |
ETF Shares | — |
Total Distributions | (523) |
Capital Share Transactions | |
Institutional Shares | 56,057 |
ETF Shares | 91,110 |
Net Increase (Decrease) from Capital Share Transactions | 147,167 |
Total Increase (Decrease) | 141,250 |
Net Assets | |
Beginning of Period | — |
End of Period2 | 141,250 |
1 Inception.
2 Net Assets—End of Period includes undistributed net investment income of $481,000.
See accompanying Notes, which are an integral part of the Financial Statements.
19
Mega Cap 300 Index Fund
Financial Highlights
Institutional Shares | |
| February 22, 20081 to |
For a Share Outstanding Throughout the Period | August 31, 2008 |
Net Asset Value, Beginning of Period | $91.07 |
Investment Operations | |
Net Investment Income | .685 |
Net Realized and Unrealized Gain (Loss) on Investments | (4.028) |
Total from Investment Operations | (3.343) |
Distributions | |
Dividends from Net Investment Income | (.587) |
Distributions from Realized Capital Gains | — |
Total Distributions | (.587) |
Net Asset Value, End of Period | $87.14 |
| |
Total Return | –3.69% |
| |
Ratios/Supplemental Data | |
Net Assets, End of Period (Millions) | $53 |
Ratio of Total Expenses to Average Net Assets | 0.08%* |
Ratio of Net Investment Income to Average Net Assets | 2.14%* |
Portfolio Turnover Rate2 | 30% |
1 Inception.
2 Excludes the value of portfolio securities received or delivered as a result of in-kind purchases or redemptions of the fund’s capital shares, including ETF Creation Units.
See accompanying Notes, which are an integral part of the Financial Statements.
20
Mega Cap 300 Index Fund
ETF Shares | |
| December 17, 20071 to |
For a Share Outstanding Throughout the Period | August 31, 2008 |
Net Asset Value, Beginning of Period | $49.24 |
Investment Operations | |
Net Investment Income | .441 |
Net Realized and Unrealized Gain (Loss) on Investments | (5.179) |
Total from Investment Operations | (4.738) |
Distributions | |
Dividends from Net Investment Income | (.292) |
Distributions from Realized Capital Gains | — |
Total Distributions | (.292) |
Net Asset Value, End of Period | $44.21 |
| |
Total Return | –9.64% |
| |
Ratios/Supplemental Data | |
Net Assets, End of Period (Millions) | $88 |
Ratio of Total Expenses to Average Net Assets | 0.13%* |
Ratio of Net Investment Income to Average Net Assets | 2.09%* |
Portfolio Turnover Rate2 | 30% |
1 Inception.
2 Excludes the value of portfolio securities received or delivered as a result of in-kind purchases or redemptions of the fund’s capital shares, including ETF Creation Units.
See accompanying Notes, which are an integral part of the Financial Statements.
21
Mega Cap 300 Index Fund
Notes to Financial Statements
Vanguard Mega Cap 300 Index Fund is registered under the Investment Company Act of 1940 as an open-end investment company, or mutual fund. The fund offers two classes of shares: Institutional Shares and ETF Shares. Institutional Shares were first issued on February 22, 2008, and are designed for investors who meet certain administrative and service criteria and invest a minimum of $5 million. ETF Shares were first issued on December 17, 2007, and first offered to the public on December 21, 2007. ETF Shares are listed for trading on the NYSE Arca, Inc.; they can be purchased and sold through a broker.
A. The following significant accounting policies conform to generally accepted accounting principles for U.S. mutual funds. The fund consistently follows such policies in preparing its financial statements.
1. Security Valuation: Securities are valued as of the close of trading on the New York Stock Exchange (generally 4 p.m., Eastern time) on the valuation date. Equity securities are valued at the latest quoted sales prices or official closing prices taken from the primary market in which each security trades; such securities not traded on the valuation date are valued at the mean of the latest quoted bid and asked prices. Securities for which market quotations are not readily available, or whose values have been materially affected by events occurring before the fund’s pricing time but after the close of the securities’ primary markets, are valued by methods deemed by the board of trustees to represent fair value. Investments in Vanguard Market Liquidity Fund are valued at that fund’s net asset value.
2. Federal Income Taxes: The fund intends to qualify as a regulated investment company and distribute all of its taxable income. Management has analyzed the fund’s tax positions taken for the period from inception to August 31, 2008, and has concluded that no provision for federal income tax is required in the fund’s financial statements.
3. Distributions: Distributions to shareholders are recorded on the ex-dividend date.
4. Security Lending: The fund may lend its securities to qualified institutional borrowers to earn additional income. Security loans are required to be secured at all times by collateral at least equal to the market value of securities loaned. The fund invests cash collateral received in Vanguard Market Liquidity Fund, and records a liability for the return of the collateral, during the period the securities are on loan. Security lending income represents the income earned on investing cash collateral, less expenses associated with the loan.
5. Other: Dividend income is recorded on the ex-dividend date. Interest income includes income distributions received from Vanguard Market Liquidity Fund and is accrued daily. Security transactions are accounted for on the date securities are bought or sold. Costs used to determine realized gains (losses) on the sale of investment securities are those of the specific securities sold.
Each class of shares has equal rights as to assets and earnings, except that each class separately bears certain class-specific expenses related to maintenance of shareholder accounts (included in Management and Administrative expenses) and shareholder reporting. Marketing and distribution expenses are allocated to each class of shares based on a method approved by the board of trustees. Income, other non-class-specific expenses, and gains and losses on investments are allocated to each class of shares based on its relative net assets.
B. The Vanguard Group furnishes at cost investment advisory, corporate management, administrative, marketing, and distribution services. The costs of such services are allocated to the fund under methods approved by the board of trustees. The fund has committed to provide up to 0.40% of its net assets
22
Mega Cap 300 Index Fund
in capital contributions to Vanguard. At August 31, 2008, the fund had contributed capital of $11,000 to Vanguard (included in Other Assets), representing 0.01% of the fund’s net assets and 0.01% of Vanguard’s capitalization. The fund’s trustees and officers are also directors and officers of Vanguard.
C. Distributions are determined on a tax basis and may differ from net investment income and realized capital gains for financial reporting purposes. Differences may be permanent or temporary. Permanent differences are reclassified among capital accounts in the financial statements to reflect their tax character. Temporary differences arise when certain items of income, expense, gain, or loss are recognized in different periods for financial statement and tax purposes; these differences will reverse at some time in the future. Differences in classification may also result from the treatment of short-term gains as ordinary income for tax purposes.
During the period ended August 31, 2008, the fund realized $2,255,000 of net capital gains resulting from in-kind redemptions—in which shareholders exchanged fund shares for securities held by the fund rather than for cash. Because such gains are not taxable to the fund, and are not distributed to shareholders, they have been reclassified from accumulated net realized losses to paid-in capital.
For tax purposes, at August 31, 2008, the fund had $490,000 of ordinary income available for distribution. The fund had available realized losses of $673,000 to offset future net capital gains through August 31, 2017.
At August 31, 2008, the cost of investment securities for tax purposes was $149,161,000. Net unrealized depreciation of investment securities for tax purposes was $7,980,000, consisting of unrealized gains of $2,002,000 on securities that had risen in value since their purchase and $9,982,000 in unrealized losses on securities that had fallen in value since their purchase.
D. During the period ended August 31, 2008, the fund purchased $195,778,000 of investment securities and sold $48,251,000 of investment securities, other than temporary cash investments.
E. Capital share transactions for each class of shares were:
| Inception1 to |
| August 31, 2008 |
| Amount | Shares |
| ($000) | (000) |
Institutional Shares | | |
Issued | 62,041 | 673 |
Issued in Lieu of Cash Distributions | 216 | 2 |
Redeemed | (6,200) | (69) |
Net Increase (Decrease) in Institutional Shares | 56,057 | 606 |
ETF Shares | | |
Issued | 117,638 | 2,600 |
Issued in Lieu of Cash Distributions | — | — |
Redeemed | (26,528) | (600) |
Net Increase (Decrease) in ETF Shares | 91,110 | 2,000 |
1 Inception dates are February 22, 2008, for the Institutional Shares and December 17, 2007, for the ETF Shares.
23
Mega Cap 300 Index Fund
F. In September 2006, the Financial Accounting Standards Board issued Statement of Financial Accounting Standards No. 157 (“FAS 157”), “Fair Value Measurements.” FAS 157 establishes a framework for measuring fair value and expands disclosures about fair value measurements in financial statements, effective for the fund’s current fiscal period.
The various inputs that may be used to determine the value of the fund’s investments are summarized in three broad levels. The inputs or methodologies used for valuing securities are not necessarily an indication of the risk associated with investing in those securities.
Level 1—Quoted prices in active markets for identical securities.
Level 2—Other significant observable inputs (including quoted prices for similar securities, interest rates, prepayment speeds, credit risk, etc.).
Level 3—Significant unobservable inputs (including the fund’s own assumptions used to determine the fair value of investments).
At August 31, 2008, 100% of the fund’s investments were valued based on Level 1 inputs.
24
Mega Cap 300 Growth Index Fund
Fund Profile
As of August 31, 2008
Portfolio Characteristics | | |
| | Target | Broad |
| Fund | Index1 | Index2 |
Number of Stocks | 180 | 179 | 4,692 |
Median Market Cap | $46.0B | $47.2B | $31.5B |
Price/Earnings Ratio | 18.1x | 18.1x | 16.9x |
Price/Book Ratio | 3.6x | 3.6x | 2.4x |
Yield3 | | 1.2% | 2.1% |
Institutional Shares | 1.1% | | |
ETF Shares | 1.1% | | |
Return on Equity | 23.1% | 23.1% | 19.9% |
Earnings Growth Rate | 24.3% | 24.2% | 18.2% |
Foreign Holdings | 0.0% | 0.0% | 0.0% |
Turnover Rate | 9% | — | — |
Expense Ratio4 | | | |
(12/10/2007) | | — | — |
Institutional Shares | 0.08% | | |
ETF Shares | 0.13% | | |
Short-Term Reserves | 0.0% | — | — |
Sector Diversification (% of equity exposure) |
| | Target | Broad |
| Fund | Index1 | Index2 |
Consumer Discretionary | 9.9% | 10.0% | 9.1% |
Consumer Staples | 14.0 | 14.0 | 9.7 |
Energy | 9.6 | 9.3 | 13.3 |
Financials | 5.8 | 5.8 | 16.0 |
Health Care | 12.0 | 12.1 | 12.6 |
Industrials | 11.4 | 11.4 | 11.9 |
Information Technology | 32.6 | 32.7 | 16.5 |
Materials | 3.5 | 3.5 | 4.1 |
Telecommunication | | | |
Services | 0.3 | 0.3 | 2.9 |
Utilities | 0.9 | 0.9 | 3.9 |
Ten Largest Holdings5 (% of total net assets) |
| | |
Microsoft Corp. | systems software | 4.3% |
International Business | | |
Machines Corp. | computer hardware | 3.1 |
Apple Inc. | computer hardware | 2.8 |
Cisco Systems, Inc. | communication | |
| equipment | 2.7 |
Wal-Mart Stores, Inc. | hypermarkets and | |
| super centers | 2.6 |
The Procter & Gamble Co. | household products | 2.6 |
Intel Corp. | semiconductors | 2.5 |
Hewlett-Packard Co. | computer hardware | 2.2 |
Schlumberger Ltd. | oil and gas | |
| equipment | |
| and services | 2.1 |
Google Inc. | internet software | |
| and services | 2.1 |
Top Ten | | 27.0% |
Investment Focus
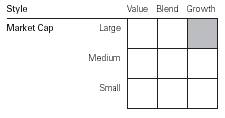
1 MSCI US Large Cap Growth Index.
2 Dow Jones Wilshire 5000 Index.
3 30-day SEC yield for the fund; annualized dividend yield for the indexes. See the Glossary.
4 Fund expense ratios shown are from the prospectus dated December 10, 2007, and were based on estimated expenses. Annualized expense ratios for the fiscal period ended August 31, 2008, were 0.08% for Institutional Shares and 0.13% for ETF Shares.
5 The holdings listed exclude any temporary cash investments and equity index products.
25
Mega Cap 300 Growth Index Fund
Performance Summary
All of the returns in this report represent past performance, which is not a guarantee of future results that may be achieved by the fund. (Current performance may be lower or higher than the performance data cited. For performance data current to the most recent month-end, visit our website at www.vanguard.com/performance.) Note, too, that both investment returns and principal value can fluctuate widely, so an investor’s shares, when sold, could be worth more or less than their original cost. The returns shown do not reflect taxes that a shareholder would pay on fund distributions or on the sale of fund shares.
Cumulative Performance: December 17, 2007–August 31, 2008
Initial Investment of $10,000
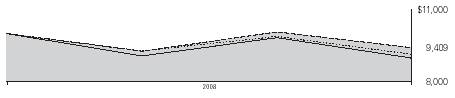
| Total Returns | |
| Periods Ended August 31, 2008 | Final Value |
| Since | of a $10,000 |
| Inception1 | Investment |
Mega Cap 300 Growth Index Fund ETF Shares | | |
Net Asset Value | –5.91% | $9,409 |
Mega Cap 300 Growth Index Fund ETF Shares | | |
Market Price | –5.84 | 9,416 |
Dow Jones Wilshire 5000 Index | –8.60 | 9,140 |
MSCI US Large Cap Growth Index | –5.86 | 9,414 |
Average Large-Cap Growth Fund2 | –10.19 | 8,981 |
| | Final Value of |
| Since | a $5,000,000 |
| Inception1 | Investment |
Mega Cap 300 Growth Index Fund Institutional Shares | –0.99% | $4,950,533 |
Dow Jones Wilshire 5000 Index | –4.16 | 4,792,065 |
MSCI US Large Cap Growth Index | –0.97 | 4,951,385 |
1 Performance for the fund and its comparative standards is calculated since the following inception dates: December 17, 2007, for ETF Shares and April 3, 2008, for Institutional Shares.
2 Derived from data provided by Lipper Inc.
26
Mega Cap 300 Growth Index Fund
Cumulative Returns of ETF Shares: December 17, 2007–August 31, 2008 | |
| |
| Cumulative |
| Since Inception1 |
Mega Cap 300 Growth Index Fund ETF Shares Market Price | –5.84% |
Mega Cap 300 Growth Index Fund ETF Shares Net Asset Value | –5.91 |
MSCI US Large Cap Growth Index | –5.86 |
Fiscal-Period Total Returns (%): December 17, 2007–August 31, 2008
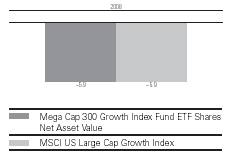
Total Returns: Periods Ended June 30, 2008
This table presents average annual total returns through the latest calendar quarter—rather than through the end of the fiscal period. Securities and Exchange Commission rules require that we provide this information.
| | Since |
| Inception Date | Inception |
ETF Shares | 12/17/2007 | |
Market Price | | –6.39% |
Net Asset Value | | –6.40 |
Institutional Shares | 4/3/2008 | –1.50 |
1 Performance for the fund’s ETF Shares and comparative standards is calculated since the ETF Shares’ inception: December 17, 2007.
Note: See Financial Highlights tables for dividend and capital gains information.
27
Mega Cap 300 Growth Index Fund
Financial Statements
Statement of Net Assets
As of August 31, 2008
The fund provides a complete list of its holdings four times in each fiscal year, at the quarter-ends. For the second and fourth fiscal quarters, the lists appear in the fund’s semiannual and annual reports to shareholders. For the first and third fiscal quarters, the fund files the lists with the Securities and Exchange Commission on Form N-Q. Shareholders can look up the fund’s Forms N-Q on the SEC’s website at www.sec.gov. Forms N-Q may also be reviewed and copied at the SEC’s Public Reference Room (see the back cover of this report for further information).
| | | Market |
| | | Value• |
| | Shares | ($000) |
Common Stocks (99.9%) | | |
Consumer Discretionary (9.9%) | | |
| Comcast Corp. Class A | 93,748 | 1,986 |
| Target Corp. | 36,309 | 1,925 |
| Lowe’s Cos., Inc. | 70,858 | 1,746 |
| McDonald’s Corp. | 27,468 | 1,704 |
| News Corp., Class A | 87,837 | 1,244 |
* | Amazon.com, Inc. | 15,126 | 1,222 |
| NIKE, Inc. Class B | 17,850 | 1,082 |
* | DIRECTV Group, Inc. | 33,397 | 942 |
| Comcast Corp. Special | | |
| Class A | 44,364 | 938 |
| Johnson Controls, Inc. | 28,605 | 884 |
| Staples, Inc. | 34,061 | 824 |
| Yum! Brands, Inc. | 22,904 | 817 |
* | Viacom Inc. Class B | 26,493 | 781 |
| Best Buy Co., Inc. | 16,964 | 759 |
| TJX Cos., Inc. | 20,583 | 746 |
* | Kohl’s Corp. | 14,223 | 699 |
| The McGraw-Hill Cos., Inc. | 15,572 | 667 |
* | Liberty Media Corp. | 23,826 | 662 |
| Omnicom Group Inc. | 15,445 | 655 |
* | Starbucks Corp. | 35,284 | 549 |
* | Coach, Inc. | 16,541 | 480 |
* | Bed Bath & Beyond, Inc. | 12,618 | 387 |
| Marriott International, Inc. | | |
| Class A | 13,642 | 385 |
* | Liberty Media Corp.– | | |
| Interactive Series A | 27,352 | 372 |
| Starwood Hotels & | | |
| Resorts Worldwide, Inc. | 9,072 | 329 |
| International Game | | |
| Technology | 15,068 | 323 |
| News Corp., Class B | 21,156 | 304 |
* | DISH Network Corp. | 10,121 | 286 |
* | Liberty Global, Inc. Class A | 7,862 | 277 |
* | Liberty Global, Inc. Series C | 7,718 | 256 |
*^ | Las Vegas Sands Corp. | 5,133 | 243 |
| | | | |
| | | Market |
| | | Value• |
| | Shares | ($000) |
* | Time Warner Cable, Inc. | 8,691 | 232 |
^ | Garmin Ltd. | 5,750 | 200 |
* | Ford Motor Co. | 41,835 | 187 |
* | MGM Mirage, Inc. | 4,809 | 169 |
*^ | Sears Holdings Corp. | 1,759 | 162 |
| General Motors Corp. | 10,906 | 109 |
| | | 25,533 |
Consumer Staples (14.0%) | | |
| Wal-Mart Stores, Inc. | 114,930 | 6,789 |
| The Procter & Gamble Co. | 96,177 | 6,710 |
| PepsiCo, Inc. | 76,871 | 5,264 |
| The Coca-Cola Co. | 65,858 | 3,429 |
| CVS/Caremark Corp. | 69,277 | 2,536 |
| Colgate-Palmolive Co. | 24,626 | 1,872 |
| Walgreen Co. | 47,861 | 1,744 |
| Anheuser-Busch Cos., Inc. | 22,463 | 1,524 |
| Costco Wholesale Corp. | 21,021 | 1,410 |
| Sysco Corp. | 29,075 | 925 |
| Avon Products, Inc. | 20,667 | 885 |
| Wm. Wrigley Jr. Co. | 9,952 | 791 |
| Archer-Daniels-Midland Co. | 27,902 | 710 |
| Kellogg Co. | 8,353 | 455 |
| The Kroger Co. | 15,205 | 420 |
| Lorillard, Inc. | 4,189 | 303 |
| Campbell Soup Co. | 3,882 | 143 |
| The Hershey Co. | 2,668 | 96 |
| | | 36,006 |
Energy (9.6%) | | |
| Schlumberger Ltd. | 57,820 | 5,448 |
| Occidental Petroleum Corp. | 39,721 | 3,152 |
* | Transocean, Inc. | 15,455 | 1,966 |
| Halliburton Co. | 42,280 | 1,858 |
* | National Oilwell Varco Inc. | 20,122 | 1,484 |
| Hess Corp. | 14,088 | 1,475 |
| XTO Energy, Inc. | 26,566 | 1,339 |
* | Weatherford International Ltd. | 32,815 | 1,266 |
| EOG Resources, Inc. | 12,035 | 1,257 |
| Chesapeake Energy Corp. | 24,882 | 1,204 |
28
Mega Cap 300 Growth Index Fund
| | | Market |
| | | Value• |
| | Shares | ($000) |
| Baker Hughes, Inc. | 14,965 | 1,197 |
| Williams Cos., Inc. | 28,181 | 871 |
| Peabody Energy Corp. | 13,160 | 828 |
| Smith International, Inc. | 10,605 | 739 |
| Diamond Offshore Drilling, Inc. | 3,346 | 368 |
| Valero Energy Corp. | 8,965 | 312 |
| | | 24,764 |
Financials (5.8%) | | |
| American Express Co. | 50,530 | 2,005 |
| Bank of New York | | |
| Mellon Corp. | 55,437 | 1,919 |
* | Berkshire Hathaway Inc. | | |
| Class B | 477 | 1,861 |
| AFLAC Inc. | 23,037 | 1,306 |
| Charles Schwab Corp. | 47,229 | 1,133 |
| CME Group, Inc. | 2,934 | 984 |
| State Street Corp. | 13,425 | 908 |
| Franklin Resources Corp. | 8,035 | 840 |
| T. Rowe Price Group Inc. | 11,957 | 710 |
| Simon Property Group, Inc. | | |
| REIT | 7,081 | 672 |
| ProLogis REIT | 12,706 | 547 |
| Public Storage, Inc. REIT | 6,160 | 544 |
| Northern Trust Corp. | 6,213 | 499 |
| Moody’s Corp. | 10,080 | 410 |
| Boston Properties, Inc. REIT | 3,742 | 383 |
| NYSE Euronext | 6,377 | 259 |
| | | 14,980 |
Health Care (12.0%) | | |
* | Amgen, Inc. | 52,765 | 3,316 |
| Medtronic, Inc. | 54,428 | 2,972 |
* | Gilead Sciences, Inc. | 44,708 | 2,355 |
* | Genentech, Inc. | 22,881 | 2,259 |
| Baxter International, Inc. | 30,406 | 2,060 |
| UnitedHealth Group Inc. | 59,550 | 1,813 |
| Schering-Plough Corp. | 78,584 | 1,525 |
| Abbott Laboratories | 26,150 | 1,502 |
* | Celgene Corp. | 21,125 | 1,464 |
* | Thermo Fisher Scientific, Inc. | 20,319 | 1,231 |
* | Medco Health Solutions, Inc. | 24,555 | 1,150 |
| Becton, Dickinson & Co. | 11,817 | 1,033 |
* | Genzyme Corp. | 12,956 | 1,014 |
| Aetna Inc. | 23,496 | 1,014 |
| Stryker Corp. | 13,941 | 937 |
| Allergan, Inc. | 14,734 | 823 |
* | Zimmer Holdings, Inc. | 11,219 | 812 |
| McKesson Corp. | 13,438 | 776 |
* | Express Scripts Inc. | 10,347 | 760 |
* | St. Jude Medical, Inc. | 16,423 | 753 |
* | Biogen Idec Inc. | 14,069 | 717 |
* | WellPoint Inc. | 8,925 | 471 |
* | Forest Laboratories, Inc. | 7,498 | 268 |
| | | 31,025 |
| | | Market |
| | | Value• |
| | Shares | ($000) |
Industrials (11.4%) | | |
| United Technologies Corp. | 44,808 | 2,939 |
| 3M Co. | 32,457 | 2,324 |
| The Boeing Co. | 34,598 | 2,268 |
| Caterpillar, Inc. | 29,813 | 2,109 |
| Lockheed Martin Corp. | 16,683 | 1,943 |
| Burlington Northern | | |
| Santa Fe Corp. | 16,717 | 1,795 |
| Emerson Electric Co. | 37,840 | 1,771 |
| Honeywell International Inc. | 34,163 | 1,714 |
| General Dynamics Corp. | 16,416 | 1,515 |
| Deere & Co. | 20,886 | 1,474 |
| CSX Corp. | 19,615 | 1,269 |
| Raytheon Co. | 20,501 | 1,230 |
| FedEx Corp. | 14,227 | 1,178 |
| Tyco International, Ltd. | 23,988 | 1,029 |
| Danaher Corp. | 12,329 | 1,006 |
| United Parcel Service, Inc. | 11,661 | 748 |
| PACCAR, Inc. | 16,881 | 727 |
| Precision Castparts Corp. | 6,752 | 697 |
| Southwest Airlines Co. | 35,438 | 540 |
* | First Solar, Inc. | 1,933 | 535 |
| Textron, Inc. | 11,982 | 492 |
| | | 29,303 |
Information Technology (32.5%) | | |
| Microsoft Corp. | 406,240 | 11,086 |
| International Business | | |
| Machines Corp. | 66,566 | 8,103 |
* | Apple Inc. | 42,729 | 7,244 |
* | Cisco Systems, Inc. | 286,294 | 6,885 |
| Intel Corp. | 277,612 | 6,349 |
| Hewlett-Packard Co. | 119,483 | 5,606 |
* | Google Inc. | 11,564 | 5,357 |
* | Oracle Corp. | 199,739 | 4,380 |
| QUALCOMM Inc. | 78,452 | 4,130 |
* | Dell Inc. | 88,152 | 1,916 |
| Visa Inc. | 21,573 | 1,637 |
| Texas Instruments, Inc. | 64,095 | 1,571 |
| Corning, Inc. | 76,100 | 1,563 |
* | EMC Corp. | 100,190 | 1,531 |
* | eBay Inc. | 54,226 | 1,352 |
* | Yahoo! Inc. | 63,451 | 1,230 |
| Accenture Ltd. | 28,670 | 1,186 |
| Applied Materials, Inc. | 65,604 | 1,176 |
| Automatic Data | | |
| Processing, Inc. | 25,125 | 1,115 |
* | Adobe Systems, Inc. | 25,775 | 1,104 |
| Western Union Co. | 35,863 | 991 |
* | Symantec Corp. | 40,717 | 908 |
| MasterCard, Inc. Class A | 3,545 | 860 |
* | Electronic Arts Inc. | 15,433 | 753 |
* | Juniper Networks, Inc. | 25,443 | 654 |
* | Agilent Technologies, Inc. | 17,692 | 615 |
29
Mega Cap 300 Growth Index Fund
| | | Market |
| | | Value• |
| | Shares | ($000) |
* | MEMC Electronic | | |
| Materials, Inc. | 11,038 | 542 |
| Paychex, Inc. | 15,768 | 537 |
* | Broadcom Corp. | 21,635 | 521 |
| CA, Inc. | 19,786 | 473 |
* | Activision Blizzard, Inc. | 14,205 | 466 |
* | Intuit, Inc. | 14,780 | 444 |
* | NetApp, Inc. | 16,580 | 422 |
| Analog Devices, Inc. | 14,161 | 396 |
* | Sun Microsystems, Inc. | 38,188 | 344 |
* | NVIDIA Corp. | 25,425 | 321 |
* | VMware Inc. | 2,003 | 80 |
| | | 83,848 |
Materials (3.5%) | | |
| Monsanto Co. | 26,597 | 3,039 |
| Praxair, Inc. | 15,142 | 1,360 |
| Newmont Mining Corp. | | |
| (Holding Co.) | 21,099 | 952 |
| Air Products & | | |
| Chemicals, Inc. | 10,209 | 938 |
| The Mosaic Co. | 7,526 | 803 |
| Nucor Corp. | 15,105 | 793 |
| United States Steel Corp. | 5,676 | 755 |
| Ecolab, Inc. | 8,931 | 409 |
| | | 9,049 |
Telecommunication Services (0.3%) | | |
* | American Tower Corp. | | |
| Class A | 19,220 | 794 |
| | | |
Utilities (0.9%) | | |
| Exelon Corp. | 15,896 | 1,207 |
| Constellation Energy Group, Inc. 8,572 | | 572 |
* | AES Corp. | 32,239 | 492 |
| | | 2,271 |
Total Common Stocks | | |
(Cost $258,903) | | 257,573 |
| | Market |
| | Value• |
| Shares | ($000) |
Temporary Cash Investment (0.2%) | | |
1,2 Vanguard Market Liquidity | | |
Fund, 2.389% (Cost $410) | 410,000 | 410 |
Total Investments (100.1%) | | |
(Cost $259,313) | | 257,983 |
Other Assets and Liabilities (–0.1%) | | |
Other Assets | | 2,197 |
Liabilities2 | | (2,504) |
| | (307) |
Net Assets (100%) | | 257,676 |
At August 31, 2008, net assets consisted of: |
| Amount |
| ($000) |
Paid-in Capital | 259,376 |
Undistributed Net Investment Income | 448 |
Accumulated Net Realized Losses | (818) |
Unrealized Appreciation (Depreciation) | (1,330) |
Net Assets | 257,676 |
| |
Institutional Shares—Net Assets | |
Applicable to 1,059,836 outstanding | |
$.001 par value shares of beneficial | |
interest (unlimited authorization) | 96,550 |
Net Asset Value Per Share— | |
Institutional Shares | $91.10 |
| |
ETF Shares—Net Assets | |
Applicable to 3,500,000 outstanding | |
$.001 par value shares of beneficial | |
interest (unlimited authorization) | 161,126 |
Net Asset Value Per Share— | |
ETF Shares | $46.04 |
• | See Note A in Notes to Financial Statements. |
* | Non-income-producing security. |
^ | Part of security position is on loan to broker-dealers. The total value of securities on loan is $405,000. |
1 Affiliated money market fund available only to Vanguard funds and certain trusts and accounts managed by Vanguard. Rate shown is the 7-day yield.
2 Includes $410,000 of collateral received for securities on loan.
REIT—Real Estate Investment Trust.
See accompanying Notes, which are an integral part of the Financial Statements.
30
Mega Cap 300 Growth Index Fund
Statement of Operations
| December 17, 20071 to |
| August 31, 2008 |
| ($000) |
Investment Income | |
Income | |
Dividends | 889 |
Interest2 | 25 |
Security Lending | 3 |
Total Income | 917 |
Expenses | |
The Vanguard Group—Note B | |
Investment Advisory Services | 5 |
Management and Administrative—Institutional Shares | 4 |
Management and Administrative—ETF Shares | 36 |
Marketing and Distribution—Institutional Shares | 2 |
Marketing and Distribution—ETF Shares | 6 |
Custodian Fees | 6 |
Auditing Fees | 23 |
Shareholders’ Reports—Institutional Shares | — |
Shareholders’ Reports—ETF Shares | 2 |
Total Expenses | 84 |
Net Investment Income | 833 |
Realized Net Gain (Loss) on Investment Securities Sold | (334) |
Change in Unrealized Appreciation (Depreciation) of Investment Securities | (1,330) |
Net Increase (Decrease) in Net Assets Resulting from Operations | (831) |
1 Inception.
2 Interest income from an affiliated company of the fund was $25,000.
See accompanying Notes, which are an integral part of the Financial Statements.
31
Mega Cap 300 Growth Index Fund
Statement of Changes in Net Assets
| December 17, 20071 to |
| August 31, 2008 |
| ($000) |
Increase (Decrease) in Net Assets | |
Operations | |
Net Investment Income | 833 |
Realized Net Gain (Loss) | (334) |
Change in Unrealized Appreciation (Depreciation) | (1,330) |
Net Increase (Decrease) in Net Assets Resulting from Operations | (831) |
Distributions | |
Net Investment Income | |
Institutional Shares | (84) |
ETF Shares | (301) |
Realized Capital Gain | |
Institutional Shares | — |
ETF Shares | — |
Total Distributions | (385) |
Capital Share Transactions | |
Institutional Shares | 96,712 |
ETF Shares | 162,180 |
Net Increase (Decrease) from Capital Share Transactions | 258,892 |
Total Increase (Decrease) | 257,676 |
Net Assets | |
Beginning of Period | — |
End of Period2 | 257,676 |
1 Inception
2 Net Assets—End of Period includes undistributed net investment income of $448,000.
See accompanying Notes, which are an integral part of the Financial Statements.
32
Mega Cap 300 Growth Index Fund
Financial Highlights
Institutional Shares | |
| April 3, 20081 to |
For a Share Outstanding Throughout the Period | August 31, 2008 |
Net Asset Value, Beginning of Period | $92.21 |
Investment Operations | |
Net Investment Income | .343 |
Net Realized and Unrealized Gain (Loss) on Investments | (1.250) |
Total from Investment Operations | (.907) |
Distributions | |
Dividends from Net Investment Income | (.203) |
Distributions from Realized Capital Gains | — |
Total Distributions | (.203) |
Net Asset Value, End of Period | $91.10 |
| |
Total Return | –0.99% |
| |
Ratios/Supplemental Data | |
Net Assets, End of Period (Millions) | $97 |
Ratio of Total Expenses to Average Net Assets | 0.08%* |
Ratio of Net Investment Income to Average Net Assets | 1.16%* |
Portfolio Turnover Rate2 | 9% |
1 Inception.
2 Excludes the value of portfolio securities received or delivered as a result of in-kind purchases or redemptions of the fund’s capital shares, including ETF Creation Units.
See accompanying Notes, which are an integral part of the Financial Statements.
33
Mega Cap 300 Growth Index Fund
ETF Shares | |
| December 17, 20071 to |
For a Share Outstanding Throughout the Period | August 31, 2008 |
Net Asset Value, Beginning of Period | $49.10 |
Investment Operations | |
Net Investment Income | .237 |
Net Realized and Unrealized Gain (Loss) on Investments | (3.139) |
Total from Investment Operations | (2.902) |
Distributions | |
Dividends from Net Investment Income | (.158) |
Distributions from Realized Capital Gains | — |
Total Distributions | (.158) |
Net Asset Value, End of Period | $46.04 |
| |
Total Return | –5.91% |
| |
Ratios/Supplemental Data | |
Net Assets, End of Period (Millions) | $161 |
Ratio of Total Expenses to Average Net Assets | 0.13%* |
Ratio of Net Investment Income to Average Net Assets | 1.11%* |
Portfolio Turnover Rate2 | 9% |
1 Inception.
2 Excludes the value of portfolio securities received or delivered as a result of in-kind purchases or redemptions of the fund’s capital shares, including ETF Creation Units.
See accompanying Notes, which are an integral part of the Financial Statements.
34
Mega Cap 300 Growth Index Fund
Notes to Financial Statements
Vanguard Mega Cap 300 Growth Index Fund is registered under the Investment Company Act of 1940 as an open-end investment company, or mutual fund. The fund offers two classes of shares: Institutional Shares and ETF Shares. Institutional Shares were first issued on April 3, 2008, and are designed for investors who meet certain administrative and service criteria and invest a minimum of $5 million. ETF Shares were first issued on December 17, 2007, and first offered to the public on December 21, 2007. ETF Shares are listed for trading on the NYSE Arca, Inc.; they can be purchased and sold through a broker.
A. The following significant accounting policies conform to generally accepted accounting principles for U.S. mutual funds. The fund consistently follows such policies in preparing its financial statements.
1. Security Valuation: Securities are valued as of the close of trading on the New York Stock Exchange (generally 4 p.m., Eastern time) on the valuation date. Equity securities are valued at the latest quoted sales prices or official closing prices taken from the primary market in which each security trades; such securities not traded on the valuation date are valued at the mean of the latest quoted bid and asked prices. Securities for which market quotations are not readily available, or whose values have been materially affected by events occurring before the fund’s pricing time but after the close of the securities’ primary markets, are valued by methods deemed by the board of trustees to represent fair value. Investments in Vanguard Market Liquidity Fund are valued at that fund’s net asset value.
2. Federal Income Taxes: The fund intends to qualify as a regulated investment company and distribute all of its taxable income. Management has analyzed the fund’s tax positions taken for the period from inception to August 31, 2008, and has concluded that no provision for federal income tax is required in the fund’s financial statements.
3. Distributions: Distributions to shareholders are recorded on the ex-dividend date.
4. Security Lending: The fund may lend its securities to qualified institutional borrowers to earn additional income. Security loans are required to be secured at all times by collateral at least equal to the market value of securities loaned. The fund invests cash collateral received in Vanguard Market Liquidity Fund, and records a liability for the return of the collateral, during the period the securities are on loan. Security lending income represents the income earned on investing cash collateral, less expenses associated with the loan.
5. Other: Dividend income is recorded on the ex-dividend date. Interest income includes income distributions received from Vanguard Market Liquidity Fund and is accrued daily. Security transactions are accounted for on the date securities are bought or sold. Costs used to determine realized gains (losses) on the sale of investment securities are those of the specific securities sold.
Each class of shares has equal rights as to assets and earnings, except that each class separately bears certain class-specific expenses related to maintenance of shareholder accounts (included in Management and Administrative expenses) and shareholder reporting. Marketing and distribution expenses are allocated to each class of shares based on a method approved by the board of trustees. Income, other non-class-specific expenses, and gains and losses on investments are allocated to each class of shares based on its relative net assets.
B. The Vanguard Group furnishes at cost investment advisory, corporate management, administrative, marketing, and distribution services. The costs of such services are allocated to the fund under methods approved by the board of trustees. The fund has committed to provide up to 0.40% of its net assets in
35
Mega Cap 300 Growth Index Fund
capital contributions to Vanguard. At August 31, 2008, the fund had contributed capital of $20,000 to Vanguard (included in Other Assets), representing 0.01% of the fund’s net assets and 0.02% of Vanguard’s capitalization. The fund’s trustees and officers are also directors and officers of Vanguard.
C. Distributions are determined on a tax basis and may differ from net investment income and realized capital gains for financial reporting purposes. Differences may be permanent or temporary. Permanent differences are reclassified among capital accounts in the financial statements to reflect their tax character. Temporary differences arise when certain items of income, expense, gain, or loss are recognized in different periods for financial statement and tax purposes; these differences will reverse at some time in the future. Differences in classification may also result from the treatment of short-term gains as ordinary income for tax purposes.
During the period ended August 31, 2008, the fund realized $484,000 of net capital gains resulting from in-kind redemptions—in which shareholders exchanged fund shares for securities held by the fund rather than for cash. Because such gains are not taxable to the fund, and are not distributed to shareholders, they have been reclassified from accumulated net realized losses to paid-in capital.
For tax purposes, at August 31, 2008, the fund had $464,000 of ordinary income available for distribution. The fund had available realized losses of $551,000 to offset future net capital gains through August 31, 2017.
At August 31, 2008, the cost of investment securities for tax purposes was $259,580,000. Net unrealized depreciation of investment securities for tax purposes was $1,597,000, consisting of unrealized gains of $7,670,000 on securities that had risen in value since their purchase and $9,267,000 in unrealized losses on securities that had fallen in value since their purchase.
D. During the period ended August 31, 2008, the fund purchased $274,486,000 of investment securities and sold $15,249,000 of investment securities, other than temporary cash investments.
E. Capital share transactions for each class of shares were:
| Inception1 to |
| August 31, 2008 |
| Amount | Shares |
| ($000) | (000) |
Institutional Shares | | |
Issued | 96,628 | 1,059 |
Issued in Lieu of Cash Distributions | 84 | 1 |
Redeemed | — | — |
Net Increase (Decrease) in Institutional Shares | 96,712 | 1,060 |
ETF Shares | | |
Issued | 167,115 | 3,600 |
Issued in Lieu of Cash Distributions | — | — |
Redeemed | (4,935) | (100) |
Net Increase (Decrease) in ETF Shares | 162,180 | 3,500 |
1 Inception dates are April 3, 2008, for the Institutional Shares and December 17, 2007, for the ETF Shares.
36
Mega Cap 300 Growth Index Fund
F. In September 2006, the Financial Accounting Standards Board issued Statement of Financial Accounting Standards No. 157 (“FAS 157”), “Fair Value Measurements.” FAS 157 establishes a framework for measuring fair value and expands disclosures about fair value measurements in financial statements, effective for the fund’s current fiscal period.
The various inputs that may be used to determine the value of the fund’s investments are summarized in three broad levels. The inputs or methodologies used for valuing securities are not necessarily an indication of the risk associated with investing in those securities.
Level 1—Quoted prices in active markets for identical securities.
Level 2—Other significant observable inputs (including quoted prices for similar securities, interest rates, prepayment speeds, credit risk, etc.).
Level 3—Significant unobservable inputs (including the fund’s own assumptions used to determine the fair value of investments).
At August 31, 2008, 100% of the fund’s investments were valued based on Level 1 inputs.
Mega Cap 300 Value Index Fund
37
Fund Profile
As of August 31, 2008
Portfolio Characteristics | | |
| | Target | Broad |
| Fund | Index1 | Index2 |
Number of Stocks | 143 | 145 | 4,692 |
Median Market Cap | $76.6B | $76.6B | $31.5B |
Price/Earnings Ratio | 14.1x | 14.1x | 16.9x |
Price/Book Ratio | 1.9x | 1.9x | 2.4x |
Yield3 | | 3.4% | 2.1% |
Institutional Shares | 3.3% | | |
ETF Shares | 3.2% | | |
Return on Equity | 19.7% | 19.7% | 19.9% |
Earnings Growth Rate | 12.4% | 12.4% | 18.2% |
Foreign Holdings | 0.0% | 0.0% | 0.0% |
Turnover Rate | 12% | — | — |
Expense Ratio4 | | | |
(12/10/2007) | | — | — |
Institutional Shares | 0.08% | | |
ETF Shares | 0.13% | | |
Short-Term Reserves | 0.0% | — | — |
Sector Diversification (% of equity exposure) |
| | Target | Broad |
| Fund | Index1 | Index2 |
Consumer Discretionary | 5.7% | 5.8% | 9.1% |
Consumer Staples | 9.5 | 9.5 | 9.7 |
Energy | 18.3 | 18.3 | 13.3 |
Financials | 25.1 | 25.0 | 16.0 |
Health Care | 14.5 | 14.5 | 12.6 |
Industrials | 9.6 | 9.5 | 11.9 |
Information Technology | 1.2 | 1.2 | 16.5 |
Materials | 3.6 | 3.6 | 4.1 |
Telecommunication | | | |
Services | 6.5 | 6.6 | 2.9 |
Utilities | 6.0 | 6.0 | 3.9 |
Ten Largest Holdings5 (% of total net assets) |
| | |
ExxonMobil Corp. | integrated oil | |
| and gas | 8.6% |
General Electric Co. | industrial | |
| conglomerates | 5.7 |
Johnson & Johnson | pharmaceuticals | 4.0 |
AT&T Inc. | integrated | |
| telecommunication | |
| services | 3.9 |
Chevron Corp. | integrated oil | |
| and gas | 3.6 |
Bank of America Corp. | diversified financial | |
| services | 2.9 |
JPMorgan Chase & Co. | diversified financial | |
| services | 2.7 |
Pfizer Inc. | pharmaceuticals | 2.6 |
ConocoPhillips Co. | integrated oil | |
| and gas | 2.5 |
Philip Morris | | |
International Inc. | tobacco | 2.3 |
Top Ten | | 38.8% |
Investment Focus
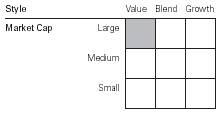
1 MSCI US Large Cap Value Index.
2 Dow Jones Wilshire 5000 Index.
3 30-day SEC yield for the fund; annualized dividend yield for the indexes. See the Glossary.
4 Fund expense ratios shown are from the prospectus dated December 10, 2007, and were based on estimated expenses. Annualized expense ratios for the fiscal period ended August 31, 2008, were 0.08% for Institutional Shares and 0.13% for ETF Shares.
5 The holdings listed exclude any temporary cash investments and equity index products.
38
Mega Cap 300 Value Index Fund
Performance Summary
All of the returns in this report represent past performance, which is not a guarantee of future results that may be achieved by the fund. (Current performance may be lower or higher than the performance data cited. For performance data current to the most recent month-end, visit our website at www.vanguard.com/performance.) Note, too, that both investment returns and principal value can fluctuate widely, so an investor’s shares, when sold, could be worth more or less than their original cost. The returns shown do not reflect taxes that a shareholder would pay on fund distributions or on the sale of fund shares.
Cumulative Performance: December 17, 2007–August 31, 2008
Initial Investment of $10,000
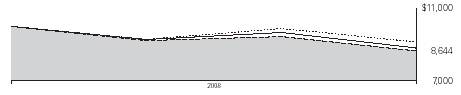
| Total Returns | |
| Periods Ended August 31, 2008 | Final Value |
| Since | of a $10,000 |
| Inception1 | Investment |
Mega Cap 300 Value Index Fund ETF Shares | | |
Net Asset Value | –13.56% | $8,644 |
Mega Cap 300 Value Index Fund ETF Shares | | |
Market Price | –13.54 | 8,646 |
Dow Jones Wilshire 5000 Index | –8.60 | 9,140 |
MSCI US Large Cap Value Index | –13.54 | 8,646 |
Average Large-Cap Value Fund2 | –11.96 | 8,804 |
| | Final Value of |
| Since | a $5,000,000 |
| Inception1 | Investment |
Mega Cap 300 Value Index Fund Institutional Shares | –5.96% | $4,701,908 |
Dow Jones Wilshire 5000 Index | –1.69 | 4,915,410 |
MSCI US Large Cap Value Index | –5.99 | 4,700,329 |
1 Performance for the fund and its comparative standards is calculated since the following inception dates: December 17, 2007, for ETF Shares and March 5, 2008, for Institutional Shares.
2 | Derived from data provided by Lipper Inc. |
39
Mega Cap 300 Value Index Fund
Cumulative Returns of ETF Shares: December 17, 2007–August 31, 2008 | |
| |
| Cumulative |
| Since Inception1 |
Mega Cap 300 Value Index Fund ETF Shares Market Price | –13.54% |
Mega Cap 300 Value Index Fund ETF Shares Net Asset Value | –13.56 |
MSCI US Large Cap Value Index | –13.54 |
Fiscal-Period Total Returns (%): December 17, 2007–August 31, 2008
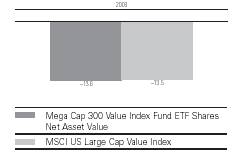
Total Returns: Periods Ended June 30, 2008
This table presents average annual total returns through the latest calendar quarter—rather than through the end of the fiscal period. Securities and Exchange Commission rules require that we provide this information.
| | Since |
| Inception Date | Inception |
ETF Shares | 12/17/2007 | |
Market Price | | –14.74% |
Net Asset Value | | –14.63 |
Institutional Shares | 3/5/2008 | –7.13 |
1 Performance for the fund’s ETF Shares and comparative standards is calculated since the ETF Shares’ inception: December 17, 2007.
Note: See Financial Highlights tables for dividend and capital gains information.
40
Mega Cap 300 Value Index Fund
Financial Statements
Statement of Net Assets
As of August 31, 2008
The fund provides a complete list of its holdings four times in each fiscal year, at the quarter-ends. For the second and fourth fiscal quarters, the lists appear in the fund’s semiannual and annual reports to shareholders. For the first and third fiscal quarters, the fund files the lists with the Securities and Exchange Commission on Form N-Q. Shareholders can look up the fund’s Forms N-Q on the SEC’s website at www.sec.gov. Forms N-Q may also be reviewed and copied at the SEC’s Public Reference Room (see the back cover of this report for further information).
| | | Market |
| | | Value• |
| | Shares | ($000) |
Common Stocks (99.8%) | | |
Consumer Discretionary (5.7%) | | |
| Time Warner, Inc. | 109,713 | 1,796 |
| The Walt Disney Co. | 55,493 | 1,795 |
| Home Depot, Inc. | 51,817 | 1,405 |
| McDonald’s Corp. | 17,377 | 1,078 |
| Carnival Corp. | 13,392 | 496 |
| The Gap, Inc. | 15,758 | 306 |
| CBS Corp. | 18,038 | 292 |
| Harley-Davidson, Inc. | 7,220 | 287 |
| Fortune Brands, Inc. | 4,663 | 274 |
| Macy’s Inc. | 12,919 | 269 |
| J.C. Penney Co., Inc. | | |
| (Holding Co.) | 6,400 | 249 |
* | Ford Motor Co. | 26,175 | 117 |
*^ | Sears Holdings Corp. | 1,113 | 102 |
| General Motors Corp. | 6,793 | 68 |
| | | 8,534 |
Consumer Staples (9.5%) | | |
| Philip Morris | | |
| International Inc. | 64,672 | 3,473 |
| The Procter & Gamble Co. | 32,761 | 2,286 |
| Kraft Foods Inc. | 44,617 | 1,406 |
| Altria Group, Inc. | 64,226 | 1,351 |
| The Coca-Cola Co. | 22,434 | 1,168 |
| Kimberly-Clark Corp. | 12,866 | 794 |
| General Mills, Inc. | 10,291 | 681 |
| Anheuser-Busch Cos., Inc. | 7,652 | 519 |
| H.J. Heinz Co. | 9,622 | 484 |
| Safeway, Inc. | 13,424 | 354 |
| ConAgra Foods, Inc. | 14,898 | 317 |
| Sara Lee Corp. | 21,629 | 292 |
| Reynolds American Inc. | 5,451 | 289 |
| The Kroger Co. | 9,717 | 268 |
| Lorillard, Inc. | 2,678 | 193 |
| Campbell Soup Co. | 4,504 | 166 |
| Kellogg Co. | 2,876 | 157 |
| The Hershey Co. | 3,101 | 112 |
| | | 14,310 |
| | | Market |
| | | Value• |
| | Shares | ($000) |
Energy (18.2%) | | |
| ExxonMobil Corp. | 161,998 | 12,961 |
| Chevron Corp. | 63,418 | 5,474 |
| ConocoPhillips Co. | 44,927 | 3,707 |
| Devon Energy Corp. | 12,996 | 1,326 |
| Apache Corp. | 10,228 | 1,170 |
| Marathon Oil Corp. | 21,684 | 977 |
| Anadarko Petroleum Corp. | 14,353 | 886 |
| Spectra Energy Corp. | 19,407 | 514 |
| Valero Energy Corp. | 10,532 | 366 |
| | | 27,381 |
Financials (25.1%) | | |
| Bank of America Corp. | 139,782 | 4,353 |
| JPMorgan Chase & Co. | 105,873 | 4,075 |
| Citigroup, Inc. | 160,961 | 3,057 |
| Wells Fargo & Co. | 96,196 | 2,912 |
| The Goldman Sachs | | |
| Group, Inc. | 10,884 | 1,785 |
| U.S. Bancorp | 53,367 | 1,700 |
| American International | | |
| Group, Inc. | 73,487 | 1,579 |
| Merrill Lynch & Co., Inc. | 47,763 | 1,354 |
| Morgan Stanley | 30,552 | 1,247 |
| MetLife, Inc. | 21,779 | 1,180 |
| Wachovia Corp. | 66,215 | 1,052 |
| Prudential Financial, Inc. | 13,306 | 981 |
| The Travelers Cos., Inc. | 18,540 | 819 |
| PNC Financial Services Group | 10,580 | 761 |
| The Allstate Corp. | 16,042 | 724 |
| The Hartford Financial | | |
| Services Group Inc. | 9,650 | 609 |
| The Chubb Corp. | 11,264 | 541 |
* | Ace Ltd. | 10,210 | 537 |
| Capital One Financial Corp. | 11,504 | 508 |
| BB&T Corp. | 16,767 | 503 |
| Marsh & McLennan Cos., Inc. | 15,685 | 501 |
| Loews Corp. | 10,009 | 435 |
| SunTrust Banks, Inc. | 10,269 | 430 |
| Vornado Realty Trust REIT | 4,239 | 422 |
41
Mega Cap 300 Value Index Fund
| | | Market |
| | | Value• |
| | Shares | ($000) |
| Lincoln National Corp. | 7,950 | 404 |
| Aon Corp. | 8,243 | 391 |
| Progressive Corp. of Ohio | 19,580 | 362 |
| The Principal Financial | | |
| Group, Inc. | 7,882 | 361 |
| Equity Residential REIT | 8,294 | 350 |
| State Street Corp. | 4,580 | 310 |
| Ameriprise Financial, Inc. | 6,811 | 306 |
| Invesco, Ltd. | 11,887 | 305 |
| Lehman Brothers | | |
| Holdings, Inc. | 18,086 | 291 |
| Fifth Third Bancorp | 15,778 | 249 |
* | SLM Corp. | 14,188 | 234 |
| Simon Property Group, Inc. | | |
| REIT | 2,388 | 227 |
| Fannie Mae | 33,010 | 226 |
| Discover Financial Services | 13,227 | 218 |
| Genworth Financial Inc. | 13,272 | 213 |
| Regions Financial Corp. | 21,303 | 197 |
| General Growth | | |
| Properties Inc. REIT | 7,382 | 191 |
| Legg Mason Inc. | 4,267 | 190 |
| KeyCorp | 14,887 | 179 |
| Northern Trust Corp. | 2,093 | 168 |
| M & T Bank Corp. | 2,157 | 154 |
| Boston Properties, Inc. REIT | 1,274 | 131 |
| Freddie Mac | 19,316 | 87 |
| | | 37,809 |
Health Care (14.4%) | | |
| Johnson & Johnson | 86,407 | 6,086 |
| Pfizer Inc. | 207,422 | 3,964 |
| Merck & Co., Inc. | 65,812 | 2,348 |
| Wyeth | 40,881 | 1,769 |
| Abbott Laboratories | 30,757 | 1,766 |
| Eli Lilly & Co. | 31,374 | 1,464 |
| Bristol-Myers Squibb Co. | 60,695 | 1,295 |
| Covidien Ltd. | 15,153 | 819 |
| Cardinal Health, Inc. | 10,929 | 601 |
* | WellPoint Inc. | 10,486 | 554 |
* | Boston Scientific Corp. | 41,288 | 519 |
| CIGNA Corp. | 8,610 | 361 |
* | Forest Laboratories, Inc. | 4,671 | 167 |
| | | 21,713 |
Industrials (9.6%) | | |
| General Electric Co. | 305,603 | 8,587 |
| Union Pacific Corp. | 15,187 | 1,274 |
| United Parcel Service, Inc. | 13,668 | 876 |
| Norfolk Southern Corp. | 11,522 | 847 |
| Northrop Grumman Corp. | 9,964 | 686 |
| Illinois Tool Works, Inc. | 12,822 | 636 |
| Waste Management, Inc. | 15,044 | 529 |
| Ingersoll-Rand Co. | 9,754 | 360 |
| | Market |
| | Value• |
| Shares | ($000) |
Eaton Corp. | 4,774 | 349 |
Masco Corp. | 11,161 | 213 |
| | 14,357 |
Information Technology (1.2%) | | |
Motorola, Inc. | 69,146 | 651 |
Tyco Electronics Ltd. | 15,252 | 502 |
Xerox Corp. | 27,567 | 384 |
Seagate Technology | 14,860 | 222 |
| | 1,759 |
Materials (3.6%) | | |
E.I. du Pont de | | |
Nemours & Co. | 27,616 | 1,227 |
Freeport-McMoRan | | |
Copper & Gold, Inc. | | |
Class B | 11,750 | 1,050 |
Dow Chemical Co. | 28,526 | 974 |
Alcoa Inc. | 24,991 | 803 |
Weyerhaeuser Co. | 6,477 | 359 |
International Paper Co. | 12,354 | 334 |
PPG Industries, Inc. | 5,026 | 316 |
Rohm & Haas Co. | 3,918 | 294 |
| | 5,357 |
Telecommunication Services (6.5%) | | |
AT&T Inc. | 182,151 | 5,827 |
Verizon Communications Inc. | 87,400 | 3,069 |
Sprint Nextel Corp. | 85,118 | 742 |
Qwest Communications | | |
International Inc. | 48,126 | 182 |
| | 9,820 |
Utilities (6.0%) | | |
Southern Co. | 23,523 | 882 |
Dominion Resources, Inc. | 17,722 | 771 |
Exelon Corp. | 10,056 | 764 |
FPL Group, Inc. | 11,888 | 714 |
FirstEnergy Corp. | 9,313 | 677 |
Duke Energy Corp. | 38,774 | 676 |
Public Service Enterprise | | |
Group, Inc. | 15,591 | 636 |
Entergy Corp. | 5,873 | 607 |
PPL Corp. | 11,438 | 501 |
American Electric | | |
Power Co., Inc. | 12,313 | 481 |
PG&E Corp. | 11,060 | 457 |
Edison International | 9,490 | 436 |
Sempra Energy | 7,291 | 422 |
Consolidated Edison Inc. | 8,360 | 342 |
Progress Energy, Inc. | 7,612 | 332 |
Ameren Corp. | 6,423 | 269 |
| | 8,967 |
Total Common Stocks | | |
(Cost $156,350) | | 150,007 |
42
Mega Cap 300 Value Index Fund
| | Market |
| | Value• |
| Shares | ($000) |
Temporary Cash Investment (0.0%) | | |
1,2 Vanguard Market Liquidity | | |
Fund, 2.389% (Cost $62) | 62,113 | 62 |
Total Investments (99.8%) | | |
(Cost $156,412) | | 150,069 |
Other Assets and Liabilities (0.2%) | | |
Other Assets | | 1,339 |
Liabilities2 | | (1,074) |
| | 265 |
Net Assets (100%) | | 150,334 |
At August 31, 2008, net assets consisted of: |
| Amount |
| ($000) |
Paid-in Capital | 156,356 |
Undistributed Net Investment Income | 661 |
Accumulated Net Realized Losses | (340) |
Unrealized Appreciation (Depreciation) | (6,343) |
Net Assets | 150,334 |
| |
Institutional Shares—Net Assets | |
Applicable to 636,293 outstanding | |
$.001 par value shares of beneficial | |
interest (unlimited authorization) | 53,254 |
Net Asset Value Per Share— | |
Institutional Shares | $83.69 |
| |
ETF Shares—Net Assets | |
Applicable to 2,300,000 outstanding | |
$.001 par value shares of beneficial | |
interest (unlimited authorization) | 97,080 |
Net Asset Value Per Share— | |
ETF Shares | $42.21 |
• | See Note A in Notes to Financial Statements. |
* | Non-income-producing security. |
^ | Part of security position is on loan to broker-dealers. The total value of securities on loan is $55,000. |
1 Affiliated money market fund available only to Vanguard funds and certain trusts and accounts managed by Vanguard. Rate shown is the 7-day yield.
2 Includes $56,000 of collateral received for securities on loan.
REIT—Real Estate Investment Trust.
See accompanying Notes, which are an integral part of the Financial Statements.
43
Mega Cap 300 Value Index Fund
Statement of Operations
| December 17, 20071 to |
| August 31, 2008 |
| ($000) |
Investment Income | |
Income | |
Dividends | 1,300 |
Interest2 | 29 |
Security Lending | 1 |
Total Income | 1,330 |
Expenses | |
The Vanguard Group—Note B | |
Investment Advisory Services | 6 |
Management and Administrative—Institutional Shares | 3 |
Management and Administrative—ETF Shares | 8 |
Marketing and Distribution—Institutional Shares | — |
Marketing and Distribution—ETF Shares | 3 |
Custodian Fees | 3 |
Auditing Fees | 23 |
Shareholders’ Reports—Institutional Shares | — |
Shareholders’ Reports—ETF Shares | 1 |
Total Expenses | 47 |
Net Investment Income | 1,283 |
Realized Net Gain (Loss) on Investment Securities Sold | (340) |
Change in Unrealized Appreciation (Depreciation) of Investment Securities | (6,343) |
Net Increase (Decrease) in Net Assets Resulting from Operations | (5,400) |
1 Inception.
2 Interest income from an affiliated company of the fund was $11,000.
See accompanying Notes, which are an integral part of the Financial Statements.
44
Mega Cap 300 Value Index Fund
Statement of Changes in Net Assets
| December 17, 20071 to |
| August 31, 2008 |
| ($000) |
Increase (Decrease) in Net Assets | |
Operations | |
Net Investment Income | 1,283 |
Realized Net Gain (Loss) | (340) |
Change in Unrealized Appreciation (Depreciation) | (6,343) |
Net Increase (Decrease) in Net Assets Resulting from Operations | (5,400) |
Distributions | |
Net Investment Income | |
Institutional Shares | (127) |
ETF Shares | (495) |
Realized Capital Gain | |
Institutional Shares | — |
ETF Shares | — |
Total Distributions | (622) |
Capital Share Transactions | |
Institutional Shares | 53,693 |
ETF Shares | 102,663 |
Net Increase (Decrease) from Capital Share Transactions | 156,356 |
Total Increase (Decrease) | 150,334 |
Net Assets | |
Beginning of Period | — |
End of Period2 | 150,334 |
1 Inception.
2 Net Assets—End of Period includes undistributed net investment income of $661,000.
See accompanying Notes, which are an integral part of the Financial Statements.
45
Mega Cap 300 Value Index Fund
Financial Highlights
Institutional Shares | |
| March 5, 20081 to |
For a Share Outstanding Throughout the Period | August 31, 2008 |
Net Asset Value, Beginning of Period | $90.01 |
Investment Operations | |
Net Investment Income | 1.1242 |
Net Realized and Unrealized Gain (Loss) on Investments | (6.444) |
Total from Investment Operations | (5.320) |
Distributions | |
Dividends from Net Investment Income | (1.000) |
Distributions from Realized Capital Gains | — |
Total Distributions | (1.000) |
Net Asset Value, End of Period | $83.69 |
| |
Total Return | –5.96% |
| |
Ratios/Supplemental Data | |
Net Assets, End of Period (Millions) | $53 |
Ratio of Total Expenses to Average Net Assets | 0.08%* |
Ratio of Net Investment Income to Average Net Assets | 3.19%* |
Portfolio Turnover Rate3 | 12% |
1 Inception.
2 Calculated based on average shares outstanding.
3 Excludes the value of portfolio securities received or delivered as a result of in-kind purchases or redemptions of the fund’s capital shares, including ETF Creation Units.
See accompanying Notes, which are an integral part of the Financial Statements.
46
Mega Cap 300 Value Index Fund
ETF Shares | |
| December 17, 20071 to |
For a Share Outstanding Throughout the Period | August 31, 2008 |
Net Asset Value, Beginning of Period | $49.38 |
Investment Operations | |
Net Investment Income | .8862 |
Net Realized and Unrealized Gain (Loss) on Investments | (7.560) |
Total from Investment Operations | (6.674) |
Distributions | |
Dividends from Net Investment Income | (.496) |
Distributions from Realized Capital Gains | — |
Total Distributions | (.496) |
Net Asset Value, End of Period | $42.21 |
| |
Total Return | –13.56% |
| |
Ratios/Supplemental Data | |
Net Assets, End of Period (Millions) | $97 |
Ratio of Total Expenses to Average Net Assets | 0.13%* |
Ratio of Net Investment Income to Average Net Assets | 3.14%* |
Portfolio Turnover Rate3 | 12% |
1 Inception.
2 Calculated based on average shares outstanding.
3 Excludes the value of portfolio securities received or delivered as a result of in-kind purchases or redemptions of the fund’s capital shares, including ETF Creation Units.
See accompanying Notes, which are an integral part of the Financial Statements.
47
Mega Cap 300 Value Index Fund
Notes to Financial Statements
Vanguard Mega Cap 300 Value Index Fund is registered under the Investment Company Act of 1940 as an open-end investment company, or mutual fund. The fund offers two classes of shares: Institutional Shares and ETF Shares. Institutional Shares were first issued on March 5, 2008, and are designed for investors who meet certain administrative and service criteria and invest a minimum of $5 million. ETF Shares were first issued on December 17, 2007, and first offered to the public on December 21, 2007. ETF Shares are listed for trading on the NYSE Arca, Inc.; they can be purchased and sold through a broker.
A. The following significant accounting policies conform to generally accepted accounting principles for U.S. mutual funds. The fund consistently follows such policies in preparing its financial statements.
1. Security Valuation: Securities are valued as of the close of trading on the New York Stock Exchange (generally 4 p.m., Eastern time) on the valuation date. Equity securities are valued at the latest quoted sales prices or official closing prices taken from the primary market in which each security trades; such securities not traded on the valuation date are valued at the mean of the latest quoted bid and asked prices. Securities for which market quotations are not readily available, or whose values have been materially affected by events occurring before the fund’s pricing time but after the close of the securities’ primary markets, are valued by methods deemed by the board of trustees to represent fair value. Investments in Vanguard Market Liquidity Fund are valued at that fund’s net asset value.
2. Federal Income Taxes: The fund intends to qualify as a regulated investment company and distribute all of its taxable income. Management has analyzed the fund’s tax positions taken for the period from inception to August 31, 2008, and has concluded that no provision for federal income tax is required in the fund’s financial statements.
3. Distributions: Distributions to shareholders are recorded on the ex-dividend date.
4. Security Lending: The fund may lend its securities to qualified institutional borrowers to earn additional income. Security loans are required to be secured at all times by collateral at least equal to the market value of securities loaned. The fund invests cash collateral received in Vanguard Market Liquidity Fund, and records a liability for the return of the collateral, during the period the securities are on loan. Security lending income represents the income earned on investing cash collateral, less expenses associated with the loan.
5. Other: Dividend income is recorded on the ex-dividend date. Interest income includes income distributions received from Vanguard Market Liquidity Fund and is accrued daily. Security transactions are accounted for on the date securities are bought or sold. Costs used to determine realized gains (losses) on the sale of investment securities are those of the specific securities sold.
Each class of shares has equal rights as to assets and earnings, except that each class separately bears certain class-specific expenses related to maintenance of shareholder accounts (included in Management and Administrative expenses) and shareholder reporting. Marketing and distribution expenses are allocated to each class of shares based on a method approved by the board of trustees. Income, other non-class-specific expenses, and gains and losses on investments are allocated to each class of shares based on its relative net assets.
48
Mega Cap 300 Value Index Fund
B. The Vanguard Group furnishes at cost investment advisory, corporate management, administrative, marketing, and distribution services. The costs of such services are allocated to the fund under methods approved by the board of trustees. The fund has committed to provide up to 0.40% of its net assets in capital contributions to Vanguard. At August 31, 2008, the fund had contributed capital of $10,000 to Vanguard (included in Other Assets), representing 0.01% of the fund’s net assets and 0.01% of Vanguard’s capitalization. The fund’s trustees and officers are also directors and officers of Vanguard.
C. Distributions are determined on a tax basis and may differ from net investment income and realized capital gains for financial reporting purposes. Differences may be permanent or temporary. Permanent differences are reclassified among capital accounts in the financial statements to reflect their tax character. Temporary differences arise when certain items of income, expense, gain, or loss are recognized in different periods for financial statement and tax purposes; these differences will reverse at some time in the future. Differences in classification may also result from the treatment of short-term gains as ordinary income for tax purposes.
For tax purposes, at August 31, 2008, the fund had $669,000 of ordinary income available for distribution. The fund had available realized losses of $220,000 to offset future net capital gains through August 21, 2017.
At August 31, 2008, the cost of investment securities for tax purposes was $156,532,000. Net unrealized depreciation of investment securities for tax purposes was $6,463,000, consisting of unrealized gains of $2,326,000 on securities that had risen in value since their purchase and $8,789,000 in unrealized losses on securities that had fallen in value since their purchase.
D. During the period ended August 31, 2008, the fund purchased $164,256,000 of investment securities and sold $7,560,000 of investment securities, other than temporary cash investments.
E. Capital share transactions for each class of shares were:
| Inception1 to |
| August 31, 2008 |
| Amount | Shares |
| ($000) | (000) |
Institutional Shares | | |
Issued | 53,949 | 639 |
Issued in Lieu of Cash Distributions | 127 | 1 |
Redeemed | (383) | (4) |
Net Increase (Decrease) in Institutional Shares | 53,693 | 636 |
ETF Shares | | |
Issued | 102,663 | 2,300 |
Issued in Lieu of Cash Distributions | — | — |
Redeemed | — | — |
Net Increase (Decrease) in ETF Shares | 102,663 | 2,300 |
1 Inception dates are March 5, 2008, for the Institutional Shares and December 17, 2007, for the ETF Shares.
49
Mega Cap 300 Value Index Fund
F. In September 2006, the Financial Accounting Standards Board issued Statement of Financial Accounting Standards No. 157 (“FAS 157”), “Fair Value Measurements.” FAS 157 establishes a framework for measuring fair value and expands disclosures about fair value measurements in financial statements, effective for the fund’s current fiscal period.
The various inputs that may be used to determine the value of the fund’s investments are summarized in three broad levels. The inputs or methodologies used for valuing securities are not necessarily an indication of the risk associated with investing in those securities.
Level 1—Quoted prices in active markets for identical securities.
Level 2—Other significant observable inputs (including quoted prices for similar securities, interest rates, prepayment speeds, credit risk, etc.).
Level 3—Significant unobservable inputs (including the fund’s own assumptions used to determine the fair value of investments).
At August 31, 2008, 100% of the fund’s investments were valued based on Level 1 inputs.
50
Report of Independent Registered Public Accounting Firm
To the Trustees of Vanguard World Funds and the Shareholders of Vanguard Mega Cap 300 Index Fund, Vanguard Mega Cap 300 Growth Index Fund and Vanguard Mega Cap 300 Value Index Fund:
In our opinion, the accompanying statements of net assets, and the related statements of operations and of changes in net assets and the financial highlights present fairly, in all material respects, the financial position of Vanguard Mega Cap 300 Index Fund, Vanguard Mega Cap 300 Growth Index Fund and Vanguard Mega Cap 300 Value Index Fund (the “Funds”) at August 31, 2008, the results of each of their operations, the changes in each of their net assets and the financial highlights for the period December 17, 2007 (commencement of operations) through August 31, 2008, in conformity with accounting principles generally accepted in the United States of America. These financial statements and financial highlights (hereafter referred to as “financial statements”) are the responsibility of the Funds’ management; our responsibility is to express an opinion on these financial statements based on our audit. We conducted our audit of these financial statements in accordance with the standards of the Public Company Accounting Oversight Board (United States). Those standards require that we plan and perform the audit to obtain reasonable assurance about whether the financial statements are free of material misstatement. An audit includes examining, on a test basis, evidence supporting the amounts and disclosures in the financial statements, assessing the accounting principles used and significant estimates made by management, and evaluating the overall financial statement presentation. We believe that our audit, which included confirmation of securities at August 31, 2008 by correspondence with the custodian and by agreement to the underlying ownership records for Vanguard Market Liquidity Fund, provide a reasonable basis for our opinion.
PricewaterhouseCoopers LLP
Philadelphia, Pennsylvania
October 14, 2008
51
Special 2008 tax information (unaudited) for Vanguard Mega Cap 300 Index Funds |
This information for the fiscal year ended August 31, 2008, is included pursuant to provisions of the Internal Revenue Code.
The funds distributed qualified dividend income to shareholders during the fiscal year as follows:
| Qualified Dividend Income |
Index Fund | ($000) |
Mega Cap 300 | 523 |
Mega Cap 300 Growth | 385 |
Mega Cap 300 Value | 622 |
For corporate shareholders, the percentage of investment income (dividend income plus short-term gains, if any) that qualifies for the dividends-received deduction is as follows:
Index Fund | Percentage |
Mega Cap 300 | 100.0% |
Mega Cap 300 Growth | 100.0 |
Mega Cap 300 Value | 99.1 |
52
About Your Fund’s Expenses
As a shareholder of the fund, you incur ongoing costs, which include costs for portfolio management, administrative services, and shareholder reports (like this one), among others. Operating expenses, which are deducted from a fund’s gross income, directly reduce the investment return of the fund.
A fund’s expenses are expressed as a percentage of its average net assets. This figure is known as the expense ratio. The following examples are intended to help you understand the ongoing costs (in dollars) of investing in your fund and to compare these costs with those of other mutual funds. The examples are based on an investment of $1,000 made at the beginning of the period shown and held for the entire period.
The accompanying table illustrates your fund’s costs in two ways:
• Based on actual fund return. This section helps you to estimate the actual expenses that you paid over the period. The “Ending Account Value” shown is derived from the fund’s actual return, and the third column shows the dollar amount that would have been paid by an investor who started with $1,000 in the fund. You may use the information here, together with the amount you invested, to estimate the expenses that you paid over the period.
To do so, simply divide your account value by $1,000 (for example, an $8,600 account value divided by $1,000 = 8.6), then multiply the result by the number given for your fund under the heading “Expenses Paid During Period.”
• Based on hypothetical 5% yearly return. This section is intended to help you compare your fund’s costs with those of other mutual funds. It assumes that the fund had a yearly return of 5% before expenses, but that the expense ratio is unchanged. In this case—because the return used is not the fund’s actual return—the results do not apply to your investment. The example is useful in making comparisons because the Securities and Exchange Commission requires all mutual funds to calculate expenses based on a 5% return. You can assess your fund’s costs by comparing this hypothetical example with the hypothetical examples that appear in shareholder reports of other funds.
Note that the expenses shown in the table are meant to highlight and help you compare ongoing costs only and do not reflect transaction costs incurred by the fund for buying and selling securities. Your fund does not charge transaction fees, such as purchase or redemption fees, nor does it carry a “sales load.”
The calculations assume no shares were bought or sold during the period. Your actual costs may have been higher or lower, depending on the amount of your investment and the timing of any purchases or redemptions.
You can find more information about the fund’s expenses, including annual expense ratios, in the Financial Statements section of this report. For additional information on operating expenses and other shareholder costs, please refer to your fund’s current prospectus.
53
Six Months Ended August 31, 20081 | | | |
| Beginning | Ending | Expenses |
| Account Value | Account Value | Paid During |
Index Fund | 2/29/2008 | 8/31/2008 | Period2 |
Based on Actual Fund Return | | | |
Mega Cap 300 | | | |
Institutional Shares | $1,000.00 | $978.05 | $0.40 |
ETF Shares | 1,000.00 | 977.90 | 0.65 |
Mega Cap 300 Growth | | | |
ETF Shares | $1,000.00 | $1,015.30 | $0.66 |
Mega Cap 300 Value | | | |
ETF Shares | $1,000.00 | $938.29 | $0.64 |
Based on Hypothetical 5% Yearly Return | | | |
Mega Cap 300 | | | |
Institutional Shares | $1,000.00 | $1,024.80 | $0.41 |
ETF Shares | 1,000.00 | 1,024.55 | 0.66 |
Mega Cap 300 Growth | | | |
ETF Shares | $1,000.00 | $1,024.55 | $0.66 |
Mega Cap 300 Value | | | |
ETF Shares | $1,000.00 | $1,024.55 | $0.66 |
1 The table does not include data for fund share classes with less than six months of history.
2 The calculations are based on expenses incurred in the most recent six-month period. The funds’ annualized six-month expense ratios for that period are: 0.08% for the Mega Cap 300 Index Fund Institutional Shares and 0.13% for the ETF Shares; 0.13% for the Mega Cap 300 Growth Index Fund ETF Shares; and 0.13% for the Mega Cap 300 Value Index Fund ETF Shares. The dollar amounts shown as “Expenses Paid” are equal to the annualized expense ratio multiplied by the average account value over the period, multiplied by the number of days in the most recent six-month period, then divided by the number of days in the most recent 12-month period.
54
Trustees Approve Advisory Arrangement
The board of trustees of Vanguard Mega Cap 300 Index Fund, Mega Cap 300 Growth Index Fund, and Mega Cap 300 Value Index Fund has renewed the funds’ investment advisory arrangement with The Vanguard Group, Inc. Vanguard—through its Quantitative Equity Group (QEG)—serves as investment advisor for the funds. The board determined that continuing the funds’ internalized management structure was in the best interests of the funds and their shareholders.
The board based its decision upon an evaluation of the advisor’s investment staff, portfolio management process, and performance. The trustees considered the factors discussed below, among others. However, no single factor determined whether the board approved the arrangement. Rather, it was the totality of the circumstances that drove the board’s decision.
Nature, extent, and quality of services
The board considered the quality of the funds’ investment management services provided by QEG since the funds’ inceptions in 2007, and took into account the organizational depth and stability of the advisor. The board noted that Vanguard has been managing investments for more than 25 years. George U. Sauter, Vanguard managing director and chief investment officer, has been in the investment management business since 1985. Mr. Sauter has led QEG since 1987. QEG adheres to a sound, disciplined investment management process; the team has considerable experience, stability, and depth.
The board concluded that Vanguard’s experience, stability, depth, and performance, among other factors, warranted approval of the advisory arrangement.
Investment performance
The board considered the funds’ performance since inception, including any periods of outperformance and underperformance of their target benchmarks and peer groups. The board concluded that the funds have performed in line with expectations, and that their results have been consistent with their investment strategies. Information about the funds’ performance can be found in the Performance Summary pages of this report.
Cost
The board concluded that the funds’ expense ratios were far below the average expense ratios charged by funds in their respective peer groups. The board noted that the funds’ advisory expense ratios were also well below their peer-group averages. Information about the funds’ expense ratios appears in the About Your Fund’s Expenses section of this report as well as in the Financial Statements sections.
The board does not conduct a profitability analysis of Vanguard, because of Vanguard’s unique “at-cost” structure. Unlike most other mutual fund management companies, Vanguard is owned by the funds it oversees, and produces “profits” only in the form of reduced expenses for fund shareholders.
The benefit of economies of scale
The board concluded that the funds’ low-cost arrangement with Vanguard ensures that each fund will realize economies of scale as it grows, with the cost to shareholders declining as fund assets increase.
The board will consider whether to renew the advisory arrangement again after a one-year period.
55
Glossary
Earnings Growth Rate. The average annual rate of growth in earnings over the past five years for the stocks now in a fund.
Equity Exposure. A measure that reflects a fund’s investments in stocks and stock futures. Any holdings in short-term reserves are excluded.
Expense Ratio. The percentage of a fund’s average net assets used to pay its annual administrative and advisory expenses. These expenses directly reduce returns to investors.
Foreign Holdings. The percentage of a fund represented by stocks or depositary receipts of companies based outside the United States.
Inception Date. The date on which the assets of a fund (or one of its share classes) are first invested in accordance with the fund’s investment objective. For funds with a subscription period, the inception date is the day after that period ends. Investment performance is measured from the inception date.
Median Market Cap. An indicator of the size of companies in which a fund invests; the midpoint of market capitalization (market price x shares outstanding) of a fund’s stocks, weighted by the proportion of the fund’s assets invested in each stock. Stocks representing half of the fund’s assets have market capitalizations above the median, and the rest are below it.
Price/Book Ratio. The share price of a stock divided by its net worth, or book value, per share. For a fund, the weighted average price/book ratio of the stocks it holds.
Price/Earnings Ratio. The ratio of a stock’s current price to its per-share earnings over the past year. For a fund, the weighted average P/E of the stocks it holds. P/E is an indicator of market expectations about corporate prospects; the higher the P/E, the greater the expectations for a company’s future growth.
Return on Equity. The annual average rate of return generated by a company during the past five years for each dollar of shareholder’s equity (net income divided by shareholder’s equity). For a fund, the weighted average return on equity for the companies whose stocks it holds.
Short-Term Reserves. The percentage of a fund invested in highly liquid, short-term securities that can be readily converted to cash.
Turnover Rate. An indication of the fund’s trading activity. Funds with high turnover rates incur higher transaction costs and may be more likely to distribute capital gains (which may be taxable to investors). The turnover rate excludes in-kind transactions, which have minimal impact on costs.
Yield. A fund’s 30-day SEC yield is derived using a formula specified by the U.S. Securities and Exchange Commission. Under the formula, data related to the fund’s security holdings in the previous 30 days are used to calculate the fund’s hypothetical net income for that period, which is then annualized and divided by the fund’s estimated average net assets over the calculation period. For the purposes of this calculation, a security’s income is based on its current market yield to maturity (in the case of bonds) or its projected dividend yield (for stocks). Because the SEC yield represents hypothetical annualized income, it will differ—at times significantly—from the fund’s actual experience. As a result, the fund’s income distributions may be higher or lower than implied by the SEC yield.
56
This page intentionally left blank.
This page intentionally left blank.
This page intentionally left blank.
The People Who Govern Your Fund
The trustees of your mutual fund are there to see that the fund is operated and managed in your best interests since, as a shareholder, you are a part owner of the fund. Your fund’s trustees also serve on the board of directors of The Vanguard Group, Inc., which is owned by the Vanguard funds and provides services to them on an at-cost basis.
A majority of Vanguard’s board members are independent, meaning that they have no affiliation with Vanguard or the funds they oversee, apart from the sizable personal investments they have made as private individuals.
Our independent board members bring distinguished backgrounds in business, academia, and public service to their task of working with Vanguard officers to establish the policies and oversee the activities of the funds. Among board members’ responsibilities are selecting investment advisors for the funds; monitoring fund operations, performance, and costs; reviewing contracts; nominating and selecting new trustees/directors; and electing Vanguard officers.
Each trustee serves a fund until its termination; or until the trustee’s retirement, resignation, or death; or otherwise as specified in the fund’s organizational documents. Any trustee may be removed at a shareholders’ meeting by a vote representing two-thirds of the net asset value of all shares of the fund together with shares of other Vanguard funds organized within the same trust. The table on these two pages shows information for each trustee and executive officer of the fund. The mailing address of the trustees and officers is P.O. Box 876, Valley Forge, PA 19482.
Chairman of the Board and Trustee |
| |
John J. Brennan1 | |
Born 1954 | Principal Occupation(s) During the Past Five Years: Chairman of the Board and Director/ |
Trustee Since May 1987; | Trustee of The Vanguard Group, Inc., and of each of the investment companies served |
Chairman of the Board | by The Vanguard Group; Director of Vanguard Marketing Corporation; President and Chief |
156 Vanguard Funds Overseen | Executive Officer of The Vanguard Group and of each of the investment companies |
| served by The Vanguard Group (1996–2008). |
| |
Independent Trustees | |
| |
Charles D. Ellis | |
Born 1937 | Principal Occupation(s) During the Past Five Years: Applecore Partners (pro bono ventures |
Trustee Since January 2001 | in education); Senior Advisor to Greenwich Associates (international business strategy |
156 Vanguard Funds Overseen | consulting); Successor Trustee of Yale University; Overseer of the Stern School of Business |
| at New York University; Trustee of the Whitehead Institute for Biomedical Research. |
| |
Emerson U. Fullwood | |
Born 1948 | Principal Occupation(s) During the Past Five Years: Executive Chief Staff and Marketing |
Trustee Since January 2008 | Officer for North America since 2004 and Corporate Vice President of Xerox Corporation |
156 Vanguard Funds Overseen | (photocopiers and printers); Director of SPX Corporation (multi-industry manufacturing), |
| of the United Way of Rochester, and of the Boy Scouts of America. |
| |
Rajiv L. Gupta | |
Born 1945 | Principal Occupation(s) During the Past Five Years: Chairman, President, and |
Trustee Since December 20012 | Chief Executive Officer of Rohm and Haas Co. (chemicals); Board Member of |
156 Vanguard Funds Overseen | the American Chemistry Council; Director of Tyco International, Ltd. (diversified |
| manufacturing and services) since 2005. |
| |
Amy Gutmann | |
Born 1949 | Principal Occupation(s) During the Past Five Years: President of the University of |
Trustee Since June 2006 | Pennsylvania since 2004; Professor in the School of Arts and Sciences, Annenberg School |
156 Vanguard Funds Overseen | for Communication, and Graduate School of Education of the University of Pennsylvania |
| since 2004; Provost (2001–2004) and Laurance S. Rockefeller Professor of Politics and |
| the University Center for Human Values (1990–2004), Princeton University; Director of |
| Carnegie Corporation of New York since 2005 and of Schuylkill River Development |
| Corporation and Greater Philadelphia Chamber of Commerce since 2004; Trustee of |
| the National Constitution Center since 2007. |
JoAnn Heffernan Heisen | |
Born 1950 | Principal Occupation(s) During the Past Five Years: Corporate Vice President and |
Trustee Since July 1998 | Chief Global Diversity Officer since 2006, Vice President and Chief Information |
156 Vanguard Funds Overseen | Officer (1997–2005), and Member of the Executive Committee of Johnson & |
| Johnson (pharmaceuticals/consumer products); Director of the University Medical |
| Center at Princeton and Women’s Research and Education Institute. |
| |
André F. Perold | |
Born 1952 | Principal Occupation(s) During the Past Five Years: George Gund Professor of Finance |
Trustee Since December 2004 | and Banking, Harvard Business School; Senior Associate Dean and Director of Faculty |
156 Vanguard Funds Overseen | Recruiting, Harvard Business School; Director and Chairman of UNX, Inc. (equities |
| trading firm); Chair of the Investment Committee of HighVista Strategies LLC (private |
| investment firm) since 2005. |
| |
Alfred M. Rankin, Jr. | |
Born 1941 | Principal Occupation(s) During the Past Five Years: Chairman, President, Chief Executive |
Trustee Since January 1993 | Officer, and Director of NACCO Industries, Inc. (forklift trucks/housewares/lignite); Director |
156 Vanguard Funds Overseen | of Goodrich Corporation (industrial products/aircraft systems and services). |
| |
| |
J. Lawrence Wilson | |
Born 1936 | Principal Occupation(s) During the Past Five Years: Retired Chairman and Chief Executive |
Trustee Since April 1985 | Officer of Rohm and Haas Co. (chemicals); Director of Cummins Inc. (diesel engines) and |
156 Vanguard Funds Overseen | AmerisourceBergen Corp. (pharmaceutical distribution); Trustee of Vanderbilt University |
| and of Culver Educational Foundation. |
| |
Executive Officers1 | |
| |
Thomas J. Higgins | |
Born 1957 | Principal Occupation(s) During the Past Five Years: Principal of The Vanguard Group, Inc.; |
Treasurer Since July 1998 | Treasurer of each of the investment companies served by The Vanguard Group. |
156 Vanguard Funds Overseen | |
| |
| |
F. William McNabb III | |
Born 1957 | Principal Occupation(s) During the Past Five Years: Chief Executive Officer, Director, |
Chief Executive Officer | and President of The Vanguard Group, Inc., since 2008; Chief Executive Officer and |
Since August 31, 2008 | President of each of the investment companies served by The Vanguard Group since |
President Since March 2008 | 2008; Director of Vanguard Marketing Corporation; Managing Director of The Vanguard |
156 Vanguard Funds Overseen | Group (1995–2008). |
| |
| |
Heidi Stam | |
Born 1956 | Principal Occupation(s) During the Past Five Years: Managing Director of The Vanguard |
Secretary Since July 2005 | Group, Inc., since 2006; General Counsel of The Vanguard Group since 2005; Secretary of |
156 Vanguard Funds Overseen | The Vanguard Group and of each of the investment companies served by The Vanguard |
| Group, since 2005; Director and Senior Vice President of Vanguard Marketing Corporation |
| since 2005; Principal of The Vanguard Group (1997–2006). |
Vanguard Senior Management Team | | |
| | | |
R. Gregory Barton | Kathleen C. Gubanich | Michael S. Miller | Glenn W. Reed |
Mortimer J. Buckley | Paul A. Heller | Ralph K. Packard | George U. Sauter |
Founder |
|
John C. Bogle |
Chairman and Chief Executive Officer, 1974–1996 |
1 These individuals are “interested persons” as defined in the Investment Company Act of 1940.
2 December 2002 for Vanguard Equity Income Fund, Vanguard Growth Equity Fund, the Vanguard Municipal Bond Funds, and the Vanguard State Tax-Exempt Funds.
More information about the trustees is in the Statement of Additional Information, available from The Vanguard Group.
| 
|
| P.O. Box 2600 |
| Valley Forge, PA 19482-2600 |
Connect with Vanguard® > www.vanguard.com
Fund Information > 800-662-7447 | All comparative mutual fund data are from Lipper Inc. |
| or Morningstar, Inc., unless otherwise noted. |
Direct Investor Account Services > 800-662-2739 | |
| |
Institutional Investor Services > 800-523-1036 | You can obtain a free copy of Vanguard’s proxy voting |
| guidelines by visiting our website, www.vanguard.com, |
Text Telephone for People | and searching for “proxy voting guidelines,” or by |
With Hearing Impairment > 800-952-3335 | calling Vanguard at 800-662-2739. The guidelines are |
| also available from the SEC’s website, www.sec.gov. |
| In addition, you may obtain a free report on how your |
This material may be used in conjunction | fund voted the proxies for securities it owned during |
with the offering of shares of any Vanguard | the 12 months ended June 30. To get the report, visit |
fund only if preceded or accompanied by | either www.vanguard.com or www.sec.gov. |
the fund’s current prospectus. | |
| |
| You can review and copy information about your fund |
| at the SEC’s Public Reference Room in Washington, D.C. |
The funds or securities referred to herein are not | To find out more about this public service, call the SEC |
sponsored, endorsed, or promoted by MSCI, and MSCI | at 202-551-8090. Information about your fund is also |
bears no liability with respect to any such funds or | available on the SEC’s website, and you can receive |
securities. For any such funds or securities, the | copies of this information, for a fee, by sending a |
prospectus or the Statement of Additional Information | request in either of two ways: via e-mail addressed to |
contains a more detailed description of the limited | publicinfo@sec.gov or via regular mail addressed to the |
relationship MSCI has with The Vanguard Group and | Public Reference Section, Securities and Exchange |
any related funds. | Commission, Washington, DC 20549-0102. |
| |
Russell is a trademark of The Frank Russell Company. | |
| |
| |
| |
| |
| |
| |
| |
| |
| |
| © 2008 The Vanguard Group, Inc. |
| All rights reserved. |
| Vanguard Marketing Corporation, Distributor. |
| |
| Q8280 102008 |
Item 2: Code of Ethics. The Registrant has adopted a code of ethics that applies to the Registrant’s principal executive officer, principal financial officer, principal accounting officer or controller or persons performing similar functions. The Code of Ethics was amended during the reporting period covered by this report to make certain technical, non-material changes.
Item 3: Audit Committee Financial Expert. The following members of the Audit Committee have been determined by the Registrant’s Board of Trustees to be Audit Committee Financial Experts serving on its Audit Committee, and to be independent: Charles D. Ellis, Rajiv L. Gupta, JoAnn Heffernan Heisen, André F. Perold, Alfred M. Rankin, Jr., and J. Lawrence Wilson.
Item 4: Principal Accountant Fees and Services.
(a) Audit Fees.
Audit Fees of the Registrant
Fiscal Year Ended August 31, 2008: $405,000
Fiscal Year Ended August 31, 2007: $300,000
Aggregate Audit Fees of Registered Investment Companies in the Vanguard Group.
Fiscal Year Ended August 31, 2008: $3,055,590
Fiscal Year Ended August 31, 2007: $2,835,320
(b) Audit-Related Fees.
Fiscal Year Ended August 31, 2008: $626,240
Fiscal Year Ended August 31, 2007: $630,400
Includes fees billed in connection with assurance and related services provided to the Registrant, The Vanguard Group, Inc., Vanguard Marketing Corporation, and other registered investment companies in the Vanguard Group.
(c) Tax Fees.
Fiscal Year Ended August 31, 2008: $230,400
Fiscal Year Ended August 31, 2007: $215,900
Includes fees billed in connection with tax compliance, planning and advice services provided to the Registrant, The Vanguard Group, Inc., Vanguard Marketing Corporation, and other registered investment companies in the Vanguard Group and related to income and excise taxes.
(d) All Other Fees.
Fiscal Year Ended August 31, 2008: $0
Fiscal Year Ended August 31, 2007: $0
Includes fees billed for services related to risk management and privacy matters. Services were provided to the Registrant, The Vanguard Group, Inc., Vanguard Marketing Corporation, and other registered investment companies in the Vanguard Group.
(e) (1) Pre-Approval Policies. The policy of the Registrant’s Audit Committee is to consider and, if appropriate, approve before the principal accountant is engaged for such services, all specific audit and non-audit services provided to: (1) the Registrant; (2) The Vanguard Group, Inc.; (3) other entities controlled by The Vanguard Group, Inc. that provide ongoing services to the Registrant; and (4) other registered investment companies in the Vanguard Group. In making a determination, the Audit Committee considers whether the services are consistent with maintaining the principal accountant’s independence.
In the event of a contingency situation in which the principal accountant is needed to provide services in between scheduled Audit Committee meetings, the Chairman of the Audit Committee would be called on to consider and, if appropriate, pre-approve audit or permitted non-audit services in an amount sufficient to complete services through the next Audit Committee meeting, and to determine if such services would be consistent with maintaining the accountant’s independence. At the next scheduled Audit Committee meeting, services and fees would be presented to the Audit Committee for formal consideration, and, if appropriate, approval by the entire Audit Committee. The Audit Committee would again consider whether such services and fees are consistent with maintaining the principal accountant’s independence.
The Registrant’s Audit Committee is informed at least annually of all audit and non-audit services provided by the principal accountant to the Vanguard complex, whether such services are provided to: (1) the Registrant; (2) The Vanguard Group, Inc.; (3) other entities controlled by The Vanguard Group, Inc. that provide ongoing services to the Registrant; or (4) other registered investment companies in the Vanguard Group.
(2) No percentage of the principal accountant’s fees or services were approved pursuant to the waiver provision of paragraph (c)(7)(i)(C) of Rule 2-01 of Regulation S-X.
(f) For the most recent fiscal year, over 50% of the hours worked under the principal accountant’s engagement were not performed by persons other than full-time, permanent employees of the principal accountant.
(g) Aggregate Non-Audit Fees.
Fiscal Year Ended August 31, 2008: $230,400
Fiscal Year Ended August 31, 2007: $215,900
Includes fees billed for non-audit services provided to the Registrant, The Vanguard Group, Inc., Vanguard Marketing Corporation, and other registered investment companies in the Vanguard Group.
(h) For the most recent fiscal year, the Audit Committee has determined that the provision of all non-audit services was consistent with maintaining the principal accountant’s independence.
Item 5: The Registrant is a listed issuer as defined in Rule 10A-3 under the Securities Exchange Act of 1934 (“Exchange Act”). The Registrant has a separately-designated standing audit committee established in accordance with Section 3(a)(58)(A) of the Exchange Act. The Registrant’s audit committee members are: Charles D. Ellis, Rajiv L. Gupta, Amy Gutmann, JoAnn Heffernan Heisen, André F. Perold, Alfred M. Rankin, Jr., and J. Lawrence Wilson.
Item 6: Not Applicable.
Item 7: Not Applicable.
Item 8: Not Applicable.
Item 9: Not Applicable.
Item 10: Not Applicable.
Item 11: Controls and Procedures.
(a) Disclosure Controls and Procedures. The Principal Executive and Financial Officers concluded that the Registrant's Disclosure Controls and Procedures are effective based on their evaluation of the Disclosure Controls and Procedures as of a date within 90 days of the filing date of this report.
(b) Internal Control Over Financial Reporting. There were no significant changes in Registrant’s Internal Control Over Financial Reporting or in other factors that could significantly affect this control subsequent to the date of the evaluation, including any corrective actions with regard to significant deficiencies and material weaknesses.
Item 12: Exhibits.
(a) Code of Ethics.
(b) Certifications.
Pursuant to the requirements of the Securities Exchange Act of 1934 and the Investment Company Act of 1940, the registrant has duly caused this report to be signed on its behalf by the undersigned, thereunto duly authorized.
| VANGUARD WORLD FUNDS |
| /s/ HEIDI STAM |
BY: | (HEIDI STAM) |
| F WILLIAM MCNABB III* |
| CHIEF EXECUTIVE OFFICER |
Date: October 14, 2008
Pursuant to the requirements of the Securities Exchange Act of 1934 and the Investment Company Act of 1940, this report has been signed below by the following persons on behalf of the registrant and in the capacities and on the dates indicated.
| VANGUARD WORLD FUNDS |
| /s/ HEIDI STAM |
BY: | (HEIDI STAM) |
| F WILLIAM MCNABB III* |
| CHIEF EXECUTIVE OFFICER |
Date: October 14, 2008
| VANGUARD WORLD FUNDS |
| /s/ HEIDI STAM |
BY: | (HEIDI STAM) |
| THOMAS J. HIGGINS * |
| TREASURER |
Date: October 14, 2008
*Heidi Stam, pursuant to a Power of Attorney filed on January 18, 2008, see file Number 2-29601, Incorporated by Reference; and pursuant to a Power of Attorney filed on September 26, 2008, see File Number 2-47371, Incorporated by Reference.