UNITED STATES
SECURITIES AND EXCHANGE COMMISSION
Washington, D.C. 20549
FORM N-CSR
CERTIFIED SHAREHOLDER REPORT
OF
REGISTERED MANAGEMENT INVESTMENT COMPANIES
Investment Company Act file number: 811-1027
Name of Registrant: Vanguard World Fund
Address of Registrant:
P.O. Box 2600
Valley Forge, PA 19482
Name and address of agent for service:
Heidi Stam, Esquire
P.O. Box 876
Valley Forge, PA 19482
Registrant’s telephone number, including area code: (610) 669-1000
Date of fiscal year end: August 31
Date of reporting period: September 1, 2009 – August 31, 2010
Item 1: Reports to Shareholders
 |
| Vanguard U.S. Growth Fund |
| Annual Report |
|
| August 31, 2010 |
 |
> For the 12 months ended August 31, 2010, Vanguard U.S. Growth Fund had a disappointing near-zero return, behind the results of its comparative standards.
> After solid first-half gains, equities broadly declined in the second half of the fiscal year but generally finished in positive territory.
> The fund’s financial and health care holdings were largely responsible for its underperformance. Information technology and industrials were relative strengths.
|
| See a Notice to Shareholders concerning the fund’s investment advisors. |
| |
| Contents | |
| Your Fund’s Total Returns. | 1 |
| Chairman’s Letter. | 2 |
| Advisors’ Report. | 7 |
| Fund Profile. | 10 |
| Performance Summary. | 11 |
| Financial Statements. | 13 |
| Your Fund’s After-Tax Returns. | 25 |
| About Your Fund’s Expenses. | 26 |
| Notice to Shareholders. | 28 |
| Glossary. | 33 |
Please note: The opinions expressed in this report are just that—informed opinions. They should not be considered promises or advice. Also, please keep in mind that the information and opinions cover the period through the date on the front of this report. Of course, the risks of investing in your fund are spelled out in the prospectus.
See the Glossary for definitions of investment terms used in this report.
Cover photograph: Jean Maher.
Your Fund’s Total Returns
| |
| Fiscal Year Ended August 31, 2010 | |
| | Total |
| | Returns |
| Vanguard U.S. Growth Fund | |
| Investor Shares | -0.02% |
| Admiral™ Shares | 0.13 |
| Russell 1000 Growth Index | 6.14 |
| Large-Cap Growth Funds Average | 4.04 |
Large-Cap Growth Funds Average: Derived from data provided by Lipper Inc.
Admiral Shares carry lower expenses and are available to investors who meet certain account-balance requirements.
Your Fund’s Performance at a Glance
August 31, 2009, Through August 31, 2010
| | | | | |
| | | | |
| | | | | Distributions Per Share |
| | Starting | Ending | Income | Capital |
| | Share Price | Share Price | Dividends | Gains |
| Vanguard U.S. Growth Fund | | | | |
| Investor Shares | $14.83 | $14.75 | $0.086 | $0.000 |
| Admiral Shares | 38.41 | 38.20 | 0.292 | 0.000 |
1

Chairman’s Letter
Dear Shareholder,
When the dramatic stock market rally that began in March 2009 faltered in the spring of 2010, the favorable tailwinds that had boosted large-company growth stocks turned into headwinds. Investors became more risk averse amid concerns about slower economic growth in the United States and abroad—especially China—and European sovereign debt issues.
In this environment, Vanguard U.S. Growth Fund had a disappointing return of –0.02% for Investor Shares and 0.13% for Admiral Shares for the fiscal year ended August 31, lagging the 4.04% average return of peer funds and the 6.14% return of the benchmark Russell 1000 Growth Index. Subpar selection among financial and health care stocks was primarily responsible for the fund’s weak performance. The advisors’ orientation toward higher-quality stocks also held back results, as lower-quality, riskier stocks led the way during the rally. Still, there were bright spots, especially in the industrial and information technology sectors.
A ragged 12-month climb in global stock markets
At the start of the 12-month period, stock markets moved higher as global economies continued to pull out of a deep downturn. Within a few months, however, optimism began to fade. Europe’s sovereign debt crisis fueled fears of another global financial shock, while persistently high unemployment
2
and downward revisions to U.S. economic indicators suggested that the powerful rebound in corporate earnings could be at risk.
This alternating pattern of hope and fear persisted through the period’s final months. The net result for the fiscal year was mid-single-digit gains in the broad U.S. stock market. International stocks returned about 3%, as modest declines in developed markets in Europe and the Pacific region were offset by a strong rally in emerging markets.
Bonds produced strong returns as prices rose and yields declined
The economic uncertainty and high stock market volatility over the fiscal period created a favorable environment for fixed income investments. The broad taxable bond market returned more than 9%, as investors sought shelter in U.S. Treasury and corporate bonds. The municipal bond market returned a bit more. In both markets, much of the total return came from rising bond prices. The flip side of rising prices, of course, is shrinking yields, which can set the stage for lower future returns.
As it has since December 2008, the Federal Reserve kept its target for short-term interest rates between 0% and 0.25%, in an effort to bolster the economy. This policy has kept a tight lid on the returns available from Treasury bills, commercial paper, and other money market instruments. Near-zero short-term
| | | |
| Market Barometer | | | |
| |
| | | Average Annual Total Returns |
| | | Periods Ended August 31, 2010 |
| | One | Three | Five |
| | Year | Years | Years |
| Stocks | | | |
| Russell 1000 Index (Large-caps) | 5.55% | -8.34% | -0.71% |
| Russell 2000 Index (Small-caps) | 6.60 | -7.44 | -0.69 |
| Dow Jones U.S. Total Stock Market Index | 6.15 | -7.83 | -0.31 |
| MSCI All Country World Index ex USA (International) | 3.27 | -7.93 | 3.78 |
| |
| Bonds | | | |
| Barclays Capital U.S. Aggregate Bond Index (Broad | | | |
| taxable market) | 9.18% | 7.65% | 5.96% |
| Barclays Capital Municipal Bond Index (Broad | | | |
| tax-exempt market) | 9.78 | 6.62 | 5.02 |
| Citigroup Three-Month U.S. Treasury Bill Index | 0.12 | 1.13 | 2.53 |
| |
| CPI | | | |
| Consumer Price Index | 1.15% | 1.64% | 2.14% |
3
yields also were a factor nudging investors to shift to bonds in search of income, despite the risks such a shift entails.
Financial and health care stocks weighed on the fund’s return
Equity returns for fiscal-year 2010 may look “boring” in contrast to recent years. Once again, however, the period’s two halves were marked by notably divergent results for both the broad market and the fund. In fiscal 2009, dismal first-half losses were tempered by robust second-half gains. This year, instead of gaining traction from a strong start, stocks downshifted in the closing six months, in some cases erasing first-half gains. Within the fund, the positive 12-month returns posted by five sectors were counterbalanced by losses in five declining sectors.
Financial stocks were the fund’s weakest performers, both in absolute returns and relative to the benchmark index. Prospects for financial regulatory reform, ultimately passed by Congress in July, unsettled JPMorgan Chase and Wells Fargo, while Goldman Sachs dealt with civil fraud charges by the Securities and Exchange Commission. The fund’s financial stocks returned about –20% for the fiscal year, trimming about 2 percentage points from its return. Financial stocks in the index, by contrast, sustained less damage.
Mixed performance among the fund’s health care stocks subtracted about 1 percentage point from its absolute and relative returns. It is tempting, and perhaps convenient, to cite health care reform as the culprit, as uncertainty about whether
Expense Ratios
Your Fund Compared With Its Peer Group
| | | |
| | Investor | Admiral | Peer Group |
| | Shares | Shares | Average |
| U.S. Growth Fund | 0.49% | 0.30% | 1.37% |
The fund expense ratios shown are from the prospectus dated December 28, 2009, and represent estimated costs for the current fiscal year. For the fiscal year ended August 31, 2010, the fund’s expense ratios were 0.45% for Investor Shares and 0.29% for Admiral Shares. The peer-group expense ratio is derived from data provided by Lipper Inc. and captures information through year-end 2009.
Peer group: Large-Cap Growth Funds.
4
Congress would reach an agreement gave way to questions about what the new legislation might mean for companies and consumers. However, there were also company-specific reasons for success and setbacks in this sector.
On the plus side, Alcon—an eye-care company and one of the fund’s largest holdings—benefited from a bid by Novartis to eventually acquire 100% of the company. But more than offsetting Alcon’s uplift was the decline in biotechnology holding Gilead Sciences, one of the world’s largest makers of AIDS drugs, which lowered its revenue outlook for 2010.
The fund’s sizable industrial and information technology holdings deserve an honorable mention. Both sectors posted positive returns for the fiscal year. Danaher, a maker of industrial and consumer products, bolstered the industrial sector. In the technology sector, Apple, the fund’s largest holding, returned more than 40% for the year as it overtook Microsoft, also a fund holding, as the largest tech company in terms of U.S. market capitalization.
New advisors join U.S. Growth Fund
Whether short-term performance proves rewarding or not, Vanguard counsels investors to take the long-term view. Our expectation is that, over time, our funds’ interim ups and downs will add up to highly competitive long-term performance, the
Total Returns
Ten Years Ended August 31, 2010
| |
| | Average |
| | Annual Return |
| U.S. Growth Fund Investor Shares | -8.96% |
| Russell 1000 Growth Index | -5.36 |
| Large-Cap Growth Funds Average | -6.00 |
| Large-Cap Growth Funds Average: Derived from data provided by Lipper Inc. | |
The figures shown represent past performance, which is not a guarantee of future results. (Current performance may be lower or higher than the performance data cited. For performance data current to the most recent month-end, visit our website at vanguard.com/performance.) Note, too, that both investment returns and principal value can fluctuate widely, so an investor’s shares, when sold, could be worth more or less than their original cost.
5
product of skilled investment management and costs that are well below industry averages.
Such has not been the case for Vanguard U.S. Growth Fund. During an unusually tough decade for large-cap growth stocks, the fund has significantly trailed the returns of its target index and its peer group. It has produced an average annual return of about –9%, as its periods of strength have been unable to compensate for its stretches of weakness.
After the close of the period, Vanguard added two new advisory firms to Vanguard U.S. Growth Fund, a change that we hope will restore the fund’s luster. The fund’s investment objective and policies remain unchanged. The new advisors are longtime Vanguard partner Wellington Management Company, llp, and Delaware Investments, a long-established advisory firm with a distinguished team of growth-stock investment professionals.
The new advisors replace AllianceBernstein L.P., which has managed the fund since 2001. We thank AllianceBernstein for its years of service to the fund. The new advisors join William Blair & Company, L.L.C., which is adding two new portfolio managers to its portion of Vanguard U.S. Growth Fund. James Golan, CFA, and Tracy McCormick join current manager John Jostrand, CFA, who is expected to assume new responsibilities at Blair at the end of 2010.
Diversification paves the way for a smoother ride
Growth stocks, like their value-oriented counterparts, move in and out of favor depending on investors’ confidence in the economic outlook and a host of other factors. Similarly, large-company stocks often trade places in the performance rankings with their smaller brethren. But one thing that seldom goes out of fashion is diversification. As part of an investment portfolio that is balanced both among and within stock, bond, and money market funds, Vanguard U.S. Growth Fund can play a role in providing you with exposure to some of the largest engines of the U.S. economy.
Thank you for entrusting your assets to Vanguard.
Sincerely,

F. William McNabb III
Chairman and Chief Executive Officer
October 6, 2010
6
Advisors’ Report
For the 12 months ended August 31, 2010, Vanguard U.S. Growth Fund had a near-zero return, lagging the returns of its comparative standards. During the past 12 months, your fund was managed by two independent advisors. After the close of the period, Vanguard named two new advisory firms to replace Alliance Bernstein L.P., as explained on page 5.
The table below presents the advisors, the percentage and amount of fund assets that each managed, and brief descriptions of their investment strategies. Each advisor has also prepared a discussion of the investment environment during the fiscal year and of how the portfolio’s positioning reflected this assessment. These reports were prepared on September 10, 2010.
AllianceBernstein L.P.
Portfolio Manager:
P. Scott Wallace, CFA, Senior Vice President
For the fiscal year, the broad U.S. stock market advanced but wavered between positive and negative territory, posting positive returns for only seven of the past 12 months. The market’s strength at the end of 2009 and in early 2010 has waned. Even though some indicators suggest the economic recovery remains on track, several concerns have troubled the markets so far in 2010: European sovereign debt issues; whether stimulus programs in the developed world can sustain growth; the magnitude of debt burdens in countries like the United States
| | | | |
| Vanguard U.S. Growth Fund Investment Advisors | |
| |
| | | Fund Assets Managed | |
| Investment Advisor | % | $ Million | Investment Strategy |
| AllianceBernstein L.P. | 65 | 2,282 | Uses a fundamentally based, research-driven approach |
| | | | to large-capitalization growth investing. The advisor |
| | | | seeks to build a diversified portfolio of successful, |
| | | | well-managed companies with sustainable competitive |
| | | | advantages and superior prospects for growth not fully |
| | | | reflected in relative valuation. |
| William Blair & Company, L.L.C. | 33 | 1,176 | Uses a fundamental investment approach in pursuit of |
| | | | superior long-term investment results from |
| | | | growth-oriented companies with leadership positions |
| | | | and strong market presence. |
| Cash Investments | 2 | 76 | These short-term reserves are invested by Vanguard in |
| | | | equity index products to simulate investment in stocks. |
| | | | Each advisor may also maintain a modest cash |
| | | | position. |
7
and United Kingdom; and whether China can maintain its pace of expansion and continue keeping global growth afloat. In this environment, among large-capitalization companies, the growth style outperformed the value style for the year.
Weakness in our portion of the portfolio during the period was primarily the result of stock selection, particularly within the financial and health care sectors. Among the largest detractors were Goldman Sachs and Gilead Sciences.
Despite strong fundamentals, Goldman Sachs declined because of uncertainty surrounding the SEC’s fraud lawsuit. As a result of this uncertainty we exited the position during the second quarter of 2010. Subsequent to the firm’s settlement with the SEC, we reinitiated our position, as our original thesis remains strong. Goldman is well-positioned to benefit in a newly configured financial landscape, it has strong fundamentals, and we believe it can continue to beat expectations.
Gilead Sciences, a leader in HIV/AIDS treatment, underperformed because of uncertainty surrounding health care reform in Washington—even though such treatment is generally not a target of reform. We remain confident in Gilead’s ability to deliver strong earnings growth and to continue to gain market share.
Despite recent challenges, U.S. companies rank among the most competitive in the world in areas such as productivity and financial strength. Their return on equity (ROE) has significant upside potential based on historical data, and they have strong incremental margins, meaning a large percentage of recovering revenues will help their bottom line.
William Blair & Company, L.L.C.
Portfolio Manager:
John F. Jostrand, CFA, Principal
U.S. equity markets generally gained ground during the fiscal year, but volatility increased as uncertainty returned in the latter months. The Russell 1000 Growth Index returned 6.1% for the period. Stocks rose through April as the U.S. economy continued to strengthen, and company earnings reports were better than expected—notably, on stronger sales growth and not expense control alone. By May, investors began to question the sustainability of global economic growth. Equity markets reacted poorly to mixed economic data, sovereign debt issues, and the potential for fiscal austerity in Europe.
In this environment, our portion of the portfolio had strong results from industrial stocks such as United Parcel Service and Rockwell Automation; both had better-than-anticipated earnings because of increased demand and global economic improvement. Discovery Communications, a media and entertainment company, was also a significant contributor, with strong international and U.S. advertising growth as a result of attractive programming.
The health care sector was a challenge for us. Baxter International, a more defensive position, disappointed; facing competitive
8
pricing pressures, the company lowered 2010 earnings guidance. We sold the stock because of these issues amid lower confidence in management. Some technology stocks also lagged. QUALCOMM disappointed in its estimated average selling price for handsets. In our view, the long-term growth case for the firm remains intact as the shift from 2G to 3G technologies continues.
In the near term, we believe the U.S. economy should continue to see growth, though at a slower pace. The low interest rate environment mandated by the Federal Reserve will continue to assist businesses and housing. Also, corporations may provide additional fuel as they have decreased expenditures over the last several years and have a positive bias for capital spending. In the longer term, we remain concerned about growth prospects in the face of a slowdown in the global economic recovery as fiscal stimulus begins to wear off, continued consumer deleveraging, the government deficit, the effects of Chinese interest rate tightening, and any significant European government fiscal austerity or weakness in banking. However, we believe a double-dip economic recession is unlikely unless China has a hard landing or European sovereign debt contagion spreads.
In our view, a slow growth environment should benefit our quality growth investment discipline. Corporations with attractive earnings growth, superior financials, and strong management teams should rise above peers. As always, our focus will remain on rigorous fundamental research and adherence to our investment process, which we believe will benefit investors over the long term.
9
U.S. Growth Fund
Fund Profile
As of August 31, 2010
| | | |
| Share-Class Characteristics | | |
| | Investor | | Admiral |
| | Shares | | Shares |
| Ticker Symbol | VWUSX | | VWUAX |
| Expense Ratio1 | 0.49% | | 0.30% |
| 30-Day SEC Yield | 0.57% | | 0.74% |
| |
| Portfolio Characteristics | | |
| | | Russell | DJ |
| | | 1000 | U.S. Total |
| | | Growth | Market |
| | Fund | Index | Index |
| Number of Stocks | 78 | 628 | 4,100 |
| Median Market Cap $37.5B | $33.8B | $26.3B |
| Price/Earnings Ratio | 16.2x | 16.3x | 15.7x |
| Price/Book Ratio | 2.5x | 3.2x | 1.9x |
| Return on Equity | 22.3% | 24.7% | 19.0% |
| Earnings Growth Rate 12.2% | 11.6% | 6.2% |
| Dividend Yield | 1.2% | 1.7% | 2.0% |
| Foreign Holdings | 2.2% | 0.0% | 0.0% |
| Turnover Rate | 74% | — | — |
| Short-Term Reserves | 1.7% | — | — |
| | | |
| Sector Diversification (% of equity exposure) |
| | | Russell | DJ |
| | | 1000 | U.S. Total |
| | | Growth | Market |
| | Fund | Index | Index |
| Consumer | | | |
| Discretionary | 16.2% | 14.3% | 11.5% |
| Consumer Staples | 6.1 | 10.5 | 10.6 |
| Energy | 9.2 | 10.2 | 9.6 |
| Financials | 9.9 | 4.7 | 17.1 |
| Health Care | 12.8 | 10.3 | 11.3 |
| Industrials | 14.8 | 13.0 | 10.7 |
| Information | | | |
| Technology | 26.4 | 30.9 | 18.3 |
| Materials | 4.5 | 5.1 | 4.3 |
| Telecommunication | | | |
| Services | 0.0 | 0.9 | 2.9 |
| Utilities | 0.1 | 0.1 | 3.7 |
| | |
| Volatility Measures | | |
| | | DJ |
| | | U.S. Total |
| | Russell 1000 | Market |
| | Growth Index | Index |
| R-Squared | 0.98 | 0.94 |
| Beta | 0.98 | 0.94 |
These measures show the degree and timing of the fund’s fluctuations compared with the indexes over 36 months.
| | |
| Ten Largest Holdings (% of total net assets) |
| Apple Inc. | Computer | |
| | Hardware | 6.1% |
| Google Inc. Class A | Internet Software & | |
| | Services | 4.4 |
| Alcon Inc. | Health Care | |
| | Supplies | 3.6 |
| Schlumberger Ltd. | Oil & Gas | |
| | Equipment & | |
| | Services | 3.4 |
| JPMorgan Chase & Co. | Diversified Financial | |
| | Services | 3.2 |
| EMC Corp. | Computer Storage | |
| | & Peripherals | 3.0 |
| PepsiCo Inc. | Soft Drinks | 2.8 |
| Microsoft Corp. | Systems Software | 2.4 |
| Danaher Corp. | Industrial | |
| | Machinery | 2.3 |
| Gilead Sciences Inc. | Biotechnology | 2.1 |
| Top Ten | | 33.3% |
The holdings listed exclude any temporary cash investments and equity index products.
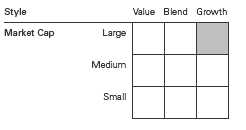
Investment Focus
1 The expense ratios shown are from the prospectus dated December 28, 2009, and represent estimated costs for the current fiscal year. For the fiscal year ended August 31, 2010, the expense ratios were 0.45% for Investor Shares and 0.29% for Admiral Shares.
10
U.S. Growth Fund
Performance Summary
All of the returns in this report represent past performance, which is not a guarantee of future results that may be achieved by the fund. (Current performance may be lower or higher than the performance data cited. For performance data current to the most recent month-end, visit our website at vanguard.com/performance.) Note, too, that both investment returns and principal value can fluctuate widely, so an investor’s shares, when sold, could be worth more or less than their original cost. The returns shown do not reflect taxes that a shareholder would pay on fund distributions or on the sale of fund shares.
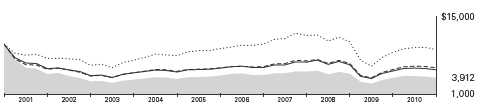
Cumulative Performance: August 31, 2000, Through August 31, 2010
Initial Investment of $10,000
| | | | |
| | Average Annual Total Returns | |
| | Periods Ended August 31, 2010 | |
| | | | | Final Value |
| | One | Five | Ten | of a $10,000 |
| | Year | Years | Years | Investment |
| U.S. Growth Fund Investor Shares | -0.02% | -2.00% | -8.96% | $3,912 |
| Dow Jones U.S. Total Stock Market | | | | |
| Index | 6.15 | -0.31 | -0.97 | 9,075 |
| Russell 1000 Growth Index | 6.14 | 0.10 | -5.36 | 5,765 |
| Large-Cap Growth Funds Average | 4.04 | -1.06 | -6.00 | 5,384 |
Large-Cap Growth Funds Average: Derived from data provided by Lipper Inc.
| | | | |
| | | | Since | Final Value |
| | One | Five | Inception | of a $100,000 |
| | Year | Years | (8/13/2001) | Investment |
| U.S. Growth Fund Admiral Shares | 0.13% | -1.80% | -2.33% | $80,770 |
| Dow Jones U.S. Total Stock Market | | | | |
| Index | 6.15 | -0.31 | 1.70 | 116,430 |
| Russell 1000 Growth Index | 6.14 | 0.10 | -0.12 | 98,917 |
"Since Inception" performance is calculated from the Admiral Shares’ inception date for both the fund and its comparative standards.
See Financial Highlights for dividend and capital gains information.
11
U.S. Growth Fund
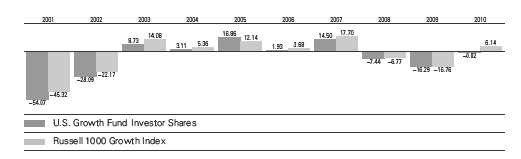
Fiscal-Year Total Returns (%): August 31, 2000, Through August 31, 2010
Average Annual Total Returns: Periods Ended June 30, 2010
This table presents average annual total returns through the latest calendar quarter—rather than through the end of the fiscal period. Securities and Exchange Commission rules require that we provide this information.
| | | | | |
| | Inception | One | Five | Ten | |
| | Date | Year | Years | Years | |
| Investor Shares | 1/6/1959 | 9.46% | -1.24% | -8.34% | |
| Admiral Shares | 8/13/2001 | 9.68 | -1.04 | -2.42 | 1 |
| 1 Return since inception. | | | | | |
12
U.S. Growth Fund
Financial Statements
Statement of Net Assets
As of August 31, 2010
The fund reports a complete list of its holdings in regulatory filings four times in each fiscal year, at the quarter-ends. For the second and fourth fiscal quarters, the lists appear in the fund’s semiannual and annual reports to shareholders. For the first and third fiscal quarters, the fund files the lists with the Securities and Exchange Commission on Form N-Q. Shareholders can look up the fund’s Forms N-Q on the SEC’s website at sec.gov. Forms N-Q may also be reviewed and copied at the SEC’s Public Reference Room (see the back cover of this report for further information).
| | | |
| | | | Market |
| | | | Value |
| | | Shares | ($000) |
| Common Stocks (96.5%)1 | | |
| Consumer Discretionary (15.7%) | |
| | Johnson Controls Inc. | 2,654,200 | 70,416 |
| * | Kohl’s Corp. | 1,353,663 | 63,595 |
| | Comcast Corp. Class A | 2,894,300 | 49,550 |
| | Target Corp. | 942,200 | 48,203 |
| * | Ford Motor Co. | 3,825,400 | 43,189 |
| | Walt Disney Co. | 1,300,000 | 42,367 |
| | McDonald’s Corp. | 521,315 | 38,087 |
| | News Corp. Class A | 2,696,400 | 33,894 |
| | Lowe’s Cos. Inc. | 1,600,300 | 32,486 |
| | Yum! Brands Inc. | 714,600 | 29,799 |
| * | O’Reilly Automotive Inc. | 575,400 | 27,199 |
| * | Discovery | | |
| | Communications Inc. | | |
| | Class A | 714,000 | 26,954 |
| * | Amazon.com Inc. | 195,100 | 24,354 |
| | Polo Ralph Lauren Corp. | | |
| | Class A | 218,600 | 16,557 |
| * | Hyatt Hotels Corp. Class A | 215,600 | 8,119 |
| | | | 554,769 |
| Consumer Staples (5.8%) | | |
| | PepsiCo Inc. | 1,535,300 | 98,535 |
| | Costco Wholesale Corp. | 717,500 | 40,575 |
| | Colgate-Palmolive Co. | 527,800 | 38,973 |
| | Mead Johnson Nutrition Co. | 538,400 | 28,099 |
| | | | 206,182 |
| Energy (8.8%) | | |
| | Schlumberger Ltd. | 2,275,870 | 121,372 |
| | Occidental Petroleum Corp. | 683,800 | 49,972 |
| | Noble Energy Inc. | 704,000 | 49,125 |
| | EOG Resources Inc. | 431,140 | 37,453 |
| | Suncor Energy Inc. | 738,300 | 22,341 |
| * | Cameron International Corp. | 516,940 | 19,013 |
| | Apache Corp. | 153,550 | 13,797 |
| | | | 313,073 |
| Exchange-Traded Fund (0.0%) | | |
| 2 | Vanguard Growth ETF | 3,100 | 154 |
| | | |
| | | | Market |
| | | | Value |
| | | Shares | ($000) |
| Financials (9.4%) | | |
| | JPMorgan Chase & Co. | 3,099,700 | 112,705 |
| | Goldman Sachs Group Inc. | 419,300 | 57,419 |
| | CMEGroup Inc. | 217,350 | 53,920 |
| | Franklin Resources Inc. | 314,200 | 30,324 |
| | American Express Co. | 706,000 | 28,148 |
| | Wells Fargo & Co. | 1,167,300 | 27,490 |
| | Ameriprise Financial Inc. | 475,900 | 20,740 |
| | | | 330,746 |
| Health Care (12.4%) | | |
| | Alcon Inc. | 788,180 | 127,843 |
| * | GileadSciences Inc. | 2,373,440 | 75,618 |
| * | Celgene Corp. | 1,367,060 | 70,431 |
| | Teva Pharmaceutical | | |
| | Industries Ltd. ADR | 1,021,660 | 51,675 |
| * | Vertex Pharmaceuticals Inc. | 841,500 | 28,056 |
| | Allergan Inc. | 408,035 | 25,061 |
| * | Express Scripts Inc. | 548,500 | 23,366 |
| * | Illumina Inc. | 413,700 | 17,744 |
| | Covidien PLC | 488,500 | 17,263 |
| | | | 437,057 |
| Industrials (14.4%) | | |
| | Danaher Corp. | 2,202,930 | 80,032 |
| | United Parcel Service Inc. | | |
| | Class B | 1,090,700 | 69,587 |
| | Goodrich Corp. | 796,100 | 54,517 |
| | Illinois Tool Works Inc. | 1,226,100 | 50,589 |
| | Cooper Industries PLC | 1,021,000 | 42,974 |
| | Dover Corp. | 688,900 | 30,835 |
| | Rockwell Automation Inc. | 564,800 | 28,884 |
| | WW Grainger Inc. | 262,400 | 27,759 |
| * | Stericycle Inc. | 373,300 | 24,451 |
| | Honeywell International Inc. | 537,100 | 20,995 |
| | Manpower Inc. | 457,800 | 19,457 |
| | Roper Industries Inc. | 300,190 | 17,435 |
| | JBHunt Transport | | |
| | Services Inc. | 504,390 | 16,514 |
13
U.S. Growth Fund
| | | |
| | | | Market |
| | | | Value |
| | | Shares | ($000) |
| | CH Robinson | | |
| | Worldwide Inc. | 202,100 | 13,134 |
| | FedEx Corp. | 143,300 | 11,185 |
| | | | 508,348 |
| Information Technology (25.6%) | |
| * | Apple Inc. | 881,506 | 214,532 |
| * | Google Inc. Class A | 343,245 | 154,467 |
| * | EMCCorp. | 5,724,800 | 104,420 |
| | Microsoft Corp. | 3,665,325 | 86,062 |
| | Hewlett-Packard Co. | 1,548,700 | 59,594 |
| * | CiscoSystems Inc. | 2,908,180 | 58,309 |
| * | eBayInc. | 1,940,900 | 45,107 |
| | Broadcom Corp. Class A | 1,454,300 | 43,585 |
| | Intel Corp. | 1,369,678 | 24,271 |
| * | Agilent Technologies Inc. | 745,300 | 20,101 |
| | QUALCOMM Inc. | 523,285 | 20,047 |
| * | McAfee Inc. | 383,300 | 18,034 |
| | VisaInc. Class A | 251,000 | 17,314 |
| | KLA-TencorCorp. | 594,100 | 16,641 |
| * | Juniper Networks Inc. | 425,700 | 11,579 |
| * | NVIDIA Corp. | 1,191,300 | 11,115 |
| | | | 905,178 |
| Materials (4.4%) | | |
| | Dow Chemical Co. | 1,914,800 | 46,664 |
| | Monsanto Co. | 815,510 | 42,936 |
| | Praxair Inc. | 402,240 | 34,605 |
| | Freeport-McMoRan | | |
| | Copper & Gold Inc. | 355,375 | 25,580 |
| ^ | ArcelorMittal | 156,000 | 4,513 |
| | | | 154,298 |
| Total Common Stocks | | |
| (Cost $3,609,155) | | 3,409,805 |
| | |
| | | Market |
| | | Value |
| | Shares | ($000) |
| Temporary Cash Investments (3.9%)1 | |
| Money Market Fund (3.4%) | |
| 3,4 Vanguard Market | | |
| Liquidity Fund, | | |
| 0.288% | 120,049,125 | 120,049 |
| |
| | Face | |
| | Amount | |
| | ($000) | |
| U.S. Government and Agency Obligations (0.5%) |
| 5,6 Freddie Mac | | |
| Discount Notes, | | |
| 0.245%, 9/21/10 | 18,000 | 17,998 |
| Total Temporary Cash Investments | |
| (Cost $138,047) | | 138,047 |
| Total Investments (100.4%) | |
| (Cost $3,747,202) | | 3,547,852 |
| Other Assets and Liabilities (-0.4%) | |
| Other Assets | | 39,177 |
| Liabilities4 | | (53,104) |
| | | (13,927) |
| Net Assets (100%) | | 3,533,925 |
14
U.S. Growth Fund
| |
| At August 31, 2010, net assets consisted of: |
| | Amount |
| | ($000) |
| Paid-in Capital | 7,638,384 |
| Undistributed Net Investment Income | 3,406 |
| Accumulated Net Realized Losses | (3,906,756) |
| Unrealized Appreciation (Depreciation) | |
| Investment Securities | (199,350) |
| Futures Contracts | (1,759) |
| Net Assets | 3,533,925 |
| |
| |
| Investor Shares—Net Assets | |
| Applicable to 189,640,574 outstanding | |
| $.001 par value shares of beneficial | |
| interest (unlimited authorization) | 2,796,494 |
| Net Asset Value Per Share— | |
| Investor Shares | $14.75 |
| |
| |
| Admiral Shares—Net Assets | |
| Applicable to 19,303,303 outstanding | |
| $.001 par value shares of beneficial | |
| interest (unlimited authorization) | 737,431 |
| Net Asset Value Per Share— | |
| Admiral Shares | $38.20 |
See Note A in Notes to Financial Statements.
* Non-income-producing security.
^ Part of security position is on loan to broker-dealers. The total value of securities on loan is $4,282,000.
1 The fund invests a portion of its cash reserves in equity markets through the use of index futures contracts. After giving effect to futures investments, the fund’s effective common stock and temporary cash investment positions represent 98.6% and 1.8%, respectively, of net assets.
2 Considered an affiliated company of the fund as the issuer is another member of The Vanguard Group.
3 Affiliated money market fund available only to Vanguard funds and certain trusts and accounts managed by Vanguard. Rate shown is the 7-day yield.
4 Includes $4,440,000 of collateral received for securities on loan.
5 The issuer operates under a congressional charter; its securities are not backed by the full faith and credit of the U.S. government.
6 Securities with a value of $17,998,000 have been segregated as initial margin for open futures contracts.
ADR—American Depositary Receipt.
See accompanying Notes, which are an integral part of the Financial Statements.
15
U.S. Growth Fund
Statement of Operations
| | |
| |
| | Year Ended |
| | | August 31, 2010 |
| | ($000) |
| Investment Income | |
| Income | |
| Dividends1 | 42,877 |
| Interest1 | 306 |
| Security Lending | 277 |
| Total Income | 43,460 |
| Expenses | |
| Investment Advisory Fees—Note B | |
| Basic Fee | 6,368 |
| Performance Adjustment | (1,075) |
| The Vanguard Group—Note C | |
| Management and Administrative—Investor Shares | 9,028 |
| Management and Administrative—Admiral Shares | 1,131 |
| Marketing and Distribution—Investor Shares | 599 |
| Marketing and Distribution—Admiral Shares | 164 |
| Custodian Fees | 60 |
| Auditing Fees | 28 |
| Shareholders’ Reports—Investor Shares | 77 |
| Shareholders’ Reports—Admiral Shares | 18 |
| Trustees’ Fees and Expenses | 9 |
| Total Expenses | 16,407 |
| Expenses Paid Indirectly | (225) |
| Net Expenses | 16,182 |
| Net Investment Income | 27,278 |
| Realized Net Gain (Loss) | |
| Investment Securities Sold1 | 214,584 |
| Futures Contracts | 19,830 |
| Realized Net Gain (Loss) | 234,414 |
| Change in Unrealized Appreciation (Depreciation) | |
| Investment Securities | (225,014) |
| Futures Contracts | (9,452) |
| Change in Unrealized Appreciation (Depreciation) | (234,466) |
| Net Increase (Decrease) in Net Assets Resulting from Operations | 27,226 |
1 Dividend income, interest income, and realized net gain (loss) from affiliated companies of the fund were $2,000, $260,000, and $0, respectively.
See accompanying Notes, which are an integral part of the Financial Statements.
16
U.S. Growth Fund
Statement of Changes in Net Assets
| | |
| | Year Ended August 31, |
| | 2010 | 2009 |
| | ($000) | ($000) |
| Increase (Decrease) in Net Assets | | |
| Operations | | |
| Net Investment Income | 27,278 | 28,907 |
| Realized Net Gain (Loss) | 234,414 | (587,511) |
| Change in Unrealized Appreciation (Depreciation) | (234,466) | (226,088) |
| Net Increase (Decrease) in Net Assets Resulting from Operations | 27,226 | (784,692) |
| Distributions | | |
| Net Investment Income | | |
| Investor Shares | (16,650) | (23,339) |
| Admiral Shares | (6,066) | (8,835) |
| Realized Capital Gain | | |
| Investor Shares | — | — |
| Admiral Shares | — | — |
| Total Distributions | (22,716) | (32,174) |
| Capital Share Transactions | | |
| Investor Shares | (159,838) | (65,408) |
| Admiral Shares | (104,130) | (77,153) |
| Net Increase (Decrease) from Capital Share Transactions | (263,968) | (142,561) |
| Total Increase (Decrease) | (259,458) | (959,427) |
| Net Assets | | |
| Beginning of Period | 3,793,383 | 4,752,810 |
| End of Period1 | 3,533,925 | 3,793,383 |
1 Net Assets—End of Period includes undistributed (overdistributed) net investment income of $3,406,000 and ($1,156,000).
See accompanying Notes, which are an integral part of the Financial Statements.
17
U.S. Growth Fund
Financial Highlights
| | | | | |
| Investor Shares | | | | | |
| |
| For a Share Outstanding | | | | Year Ended August 31, |
| Throughout Each Period | 2010 | 2009 | 2008 | 2007 | 2006 |
| Net Asset Value, Beginning of Period | $14.83 | $17.89 | $19.44 | $17.06 | $16.77 |
| Investment Operations | | | | | |
| Net Investment Income | .105 | .105 | .089 | .113 | .059 |
| Net Realized and Unrealized Gain (Loss) | | | | | |
| on Investments | (.099) | (3.049) | (1.523) | 2.354 | .266 |
| Total from Investment Operations | .006 | (2.944) | (1.434) | 2.467 | .325 |
| Distributions | | | | | |
| Dividends from Net Investment Income | (.086) | (.116) | (.116) | (.087) | (.035) |
| Distributions from Realized Capital Gains | — | — | — | — | — |
| Total Distributions | (.086) | (.116) | (.116) | (.087) | (.035) |
| Net Asset Value, End of Period | $14.75 | $14.83 | $17.89 | $19.44 | $17.06 |
| |
| Total Return1 | -0.02% | -16.29% | -7.44% | 14.50% | 1.93% |
| |
| Ratios/Supplemental Data | | | | | |
| Net Assets, End of Period (Millions) | $2,796 | $2,956 | $3,637 | $4,308 | $4,530 |
| Ratio of Total Expenses to | | | | | |
| Average Net Assets2 | 0.45% | 0.49% | 0.43% | 0.50% | 0.58% |
| Ratio of Net Investment Income to | | | | | |
| Average Net Assets | 0.66% | 0.79% | 0.47% | 0.60% | 0.34% |
| Portfolio Turnover Rate | 74% | 101% | 107% | 51% | 48% |
1 Total returns do not include account service fees that may have applied in the periods shown. Fund prospectuses provide information about any applicable account service fees.
2 Includes performance-based investment advisory fee increases (decreases) of (0.03%), (0.03%), (0.03%), (0.01%), and 0.02%.
See accompanying Notes, which are an integral part of the Financial Statements.
18
U.S. Growth Fund
Financial Highlights
| | | | | |
| Admiral Shares | | | | | |
| |
| For a Share Outstanding | | | | Year Ended August 31, |
| Throughout Each Period | 2010 | 2009 | 2008 | 2007 | 2006 |
| Net Asset Value, Beginning of Period | $38.41 | $46.37 | $50.42 | $44.24 | $43.47 |
| Investment Operations | | | | | |
| Net Investment Income | .338 | .335 | .325 | .416 | .271 |
| Net Realized and Unrealized Gain (Loss) | | | | | |
| on Investments | (.256) | (7.919) | (3.950) | 6.107 | .677 |
| Total from Investment Operations | .082 | (7.584) | (3.625) | 6.523 | .948 |
| Distributions | | | | | |
| Dividends from Net Investment Income | (.292) | (.376) | (.425) | (.343) | (.178) |
| Distributions from Realized Capital Gains | — | — | — | — | — |
| Total Distributions | (.292) | (.376) | (.425) | (.343) | (.178) |
| Net Asset Value, End of Period | $38.20 | $38.41 | $46.37 | $50.42 | $44.24 |
| |
| Total Return | 0.13% | -16.15% | -7.28% | 14.80% | 2.16% |
| |
| Ratios/Supplemental Data | | | | | |
| Net Assets, End of Period (Millions) | $737 | $838 | $1,116 | $1,325 | $1,262 |
| Ratio of Total Expenses to | | | | | |
| Average Net Assets1 | 0.29% | 0.30% | 0.24% | 0.27% | 0.34% |
| Ratio of Net Investment Income to | | | | | |
| Average Net Assets | 0.82% | 0.98% | 0.66% | 0.83% | 0.58% |
| Portfolio Turnover Rate | 74% | 101% | 107% | 51% | 48% |
1 Includes performance-based investment advisory fee increases (decreases) of (0.03%), (0.03%), (0.03%), (0.01%), and 0.02%.
See accompanying Notes, which are an integral part of the Financial Statements.
19
U.S. Growth Fund
Notes to Financial Statements
Vanguard U.S. Growth Fund is registered under the Investment Company Act of 1940 as an open-end investment company, or mutual fund. The fund offers two classes of shares: Investor Shares and Admiral Shares. Investor Shares are available to any investor who meets the fund’s minimum purchase requirements. Admiral Shares are designed for investors who meet certain administrative, service, and account-size criteria.
A. The following significant accounting policies conform to generally accepted accounting principles for U.S. mutual funds. The fund consistently follows such policies in preparing its financial statements.
1. Security Valuation: Securities are valued as of the close of trading on the New York Stock Exchange (generally 4 p.m., Eastern time) on the valuation date. Equity securities are valued at the latest quoted sales prices or official closing prices taken from the primary market in which each security trades; such securities not traded on the valuation date are valued at the mean of the latest quoted bid and asked prices. Securities for which market quotations are not readily available, or whose values have been materially affected by events occurring before the fund’s pricing time but after the close of the securities ’ primary markets, are valued by methods deemed by the board of trustees to represent fair value. Investments in Vanguard Market Liquidity Fund are valued at that fund’s net asset value. Temporary cash investments acquired over 60 days to maturity are valued using the latest bid prices or using valuations based on a matrix system (which considers such factors as security prices, yields, maturities, and ratings), both as furnished by independent pricing services. Other temporary cash investments are valued at amortized cost, which approximates market value.
2. Futures Contracts: The fund uses index futures contracts to a limited extent, with the objective of maintaining full exposure to the stock market while maintaining liquidity. The fund may purchase or sell futures contracts to achieve a desired level of investment, whether to accommodate portfolio turnover or cash flows from capital share transactions. The primary risks associated with the use of futures contracts are imperfect correlation between changes in market values of stocks held by the fund and the prices of futures contracts, and the possibility of an illiquid market.
Futures contracts are valued at their quoted daily settlement prices. The aggregate principal amounts of the contracts are not recorded in the Statement of Net Assets. Fluctuations in the value of the contracts are recorded in the Statement of Net Assets as an asset (liability) and in the Statement of Operations as unrealized appreciation (depreciation) until the contracts are closed, when they are recorded as realized futures gains (losses).
3. Federal Income Taxes: The fund intends to continue to qualify as a regulated investment company and distribute all of its taxable income. Management has analyzed the fund’s tax positions taken for all open federal income tax years (August 31, 2007–2010), and has concluded that no provision for federal income tax is required in the fund’s financial statements.
4. Distributions: Distributions to shareholders are recorded on the ex-dividend date.
5. Security Lending: The fund may lend its securities to qualified institutional borrowers to earn additional income. Security loans are required to be secured at all times by collateral at least equal to the market value of securities loaned. The fund invests cash collateral received in Vanguard Market Liquidity Fund, and records a liability for the return of the collateral, during the period the securities are on loan. Security lending income represents the income earned on investing cash collateral, less expenses associated with the loan.
20
U.S. Growth Fund
6. Other: Dividend income is recorded on the ex-dividend date. Interest income includes income distributions received from Vanguard Market Liquidity Fund and is accrued daily. Security transactions are accounted for on the date securities are bought or sold. Costs used to determine realized gains (losses) on the sale of investment securities are those of the specific securities sold.
Each class of shares has equal rights as to assets and earnings, except that each class separately bears certain class-specific expenses related to maintenance of shareholder accounts (included in Management and Administrative expenses) and shareholder reporting. Marketing and distribution expenses are allocated to each class of shares based on a method approved by the board of trustees. Income, other non-class-specific expenses, and gains and losses on investments are allocated to each class of shares based on its relative net assets.
B. AllianceBernstein L.P. and William Blair & Company, L.L.C., each provide investment advisory services to a portion of the fund for a fee calculated at an annual percentage rate of average net assets managed by the advisor. The basic fees are subject to quarterly adjustments based on performance relative to the Russell 1000 Growth Index over the preceding three years for AllianceBernstein and over the preceding five years for William Blair & Company.
The Vanguard Group manages the cash reserves of the fund on an at-cost basis.
For the year ended August 31, 2010, the aggregate investment advisory fee represented an effective annual basic rate of 0.16% of the fund’s average net assets, before a decrease of $1,075,000 (0.03%) based on performance.
After the close of the fiscal year, the board of trustees restructured the advisory arrangement for the fund. Wellington Management Company, LLP, and Delaware Investments have replaced AllianceBernstein L.P. as advisors to the fund beginning in October 2010.
C. The Vanguard Group furnishes at cost corporate management, administrative, marketing, and distribution services. The costs of such services are allocated to the fund under methods approved by the board of trustees. The fund has committed to provide up to 0.40% of its net assets in capital contributions to Vanguard. At August 31, 2010, the fund had contributed capital of $701,000 to Vanguard (included in Other Assets), representing 0.02% of the fund’s net assets and 0.28% of Vanguard’s capitalization. The fund’s trustees and officers are also directors and officers of Vanguard.
D. The fund has asked its investment advisors to direct certain security trades, subject to obtaining the best price and execution, to brokers who have agreed to rebate to the fund part of the commissions generated. Such rebates are used solely to reduce the fund’s management and administrative expenses. For the year ended August 31, 2010, these arrangements reduced the fund’s expenses by $225,000 (an annual rate of 0.01% of average net assets).
E. Various inputs may be used to determine the value of the fund’s investments. These inputs are summarized in three broad levels for financial statement purposes. The inputs or methodologies used to value securities are not necessarily an indication of the risk associated with investing in those securities.
Level 1—Quoted prices in active markets for identical securities.
Level 2—Other significant observable inputs (including quoted prices for similar securities, interest rates, prepayment speeds, credit risk, etc.).
Level 3—Significant unobservable inputs (including the fund’s own assumptions used to determine the fair value of investments).
21
U.S. Growth Fund
The following table summarizes the fund’s investments as of August 31, 2010, based on the inputs used to value them:
| | | |
| | Level 1 | Level 2 | Level 3 |
| Investments | ($000) | ($000) | ($000) |
| Common Stocks | 3,409,805 | — | — |
| Temporary Cash Investments | 120,049 | 17,998 | — |
| Futures Contracts—Assets1 | 192 | — | — |
| Futures Contracts—Liabilities1 | (10) | — | — |
| Total | 3,530,036 | 17,998 | — |
| 1 Represents variation margin on the last day of the reporting period. | | | |
F. At August 31, 2010, the aggregate settlement value of open futures contracts and the related unrealized appreciation (depreciation) were:
| | | | | |
| | | | |
| | | | | | ($000) |
| | | | Aggregate | |
| | | Number of | Settlement | Unrealized |
| | | Long (Short) | Value | Appreciation |
| Futures Contracts | Expiration | Contracts | Long (Short) | (Depreciation) |
| S&P 500 Index | September 2010 | 98 | 25,683 | (162) |
| S&P Mid-Cap 400 Index | September 2010 | 80 | 28,844 | (1,384) |
| E-mini S&P 500 Index | September 2010 | 385 | 20,180 | (213) |
Unrealized appreciation (depreciation) on open futures contracts is required to be treated as realized gain (loss) for tax purposes.
G. Distributions are determined on a tax basis and may differ from net investment income and realized capital gains for financi al reporting purposes. Differences may be permanent or temporary. Permanent differences are reclassified among capital accounts in the financial statements to reflect their tax character. Temporary differences arise when certain items of income, expense, gain, or loss are recognized in different periods for financial statement and tax purposes; these differences will reverse at some time in the future. Differences in classification may also result from the treatment of short-term gains as ordinary income for tax purposes.
For tax purposes, at August 31, 2010, the fund had $12,855,000 of ordinary income available for distribution. The fund had available capital loss carryforwards totaling $3,907,607,000 to offset future net capital gains of $2,548,333,000 through August 31, 2011, $887,490,000 through August 31, 2012, $123,651,000 through August 31, 2013, $256,306,000 through August 31, 2017, and $91,827,000 through August 31, 2018. Capital loss carryforwards of $2,582,798,000 expired on August 31, 2010; accordingly, such losses have been reclassified from accumulated net realized losses to paid-in capital.
At August 31, 2010, the cost of investment securities for tax purposes was $3,747,428,000. Net unrealized depreciation of investment securities for tax purposes was $199,576,000, consisting of unrealized gains of $186,799,000 on securities that had risen in value since their purchase and $386,375,000 in unrealized losses on securities that had fallen in value since their purchase.
H. During the year ended August 31, 2010, the fund purchased $2,761,487,000 of investment securities and sold $3,035,029,000 of investment securities, other than temporary cash investments.
22
U.S. Growth Fund
I. Capital share transactions for each class of shares were:
| | | | | |
| | | | Year Ended August 31, |
| | | 2010 | | | 2009 |
| | Amount | Shares | Amount | Shares |
| | ($000) | (000) | ($000) | (000) |
| Investor Shares | | | | |
| Issued | 287,660 | 18,248 | 397,147 | 30,584 |
| Issued in Lieu of Cash Distributions | 16,387 | 988 | 22,922 | 1,941 |
| Redeemed | (463,885) | (28,939) | (485,477) | (36,477) |
| Net Increase (Decrease)—Investor Shares | (159,838) | (9,703) | (65,408) | (3,952) |
| Admiral Shares | | | | |
| Issued | 114,435 | 2,754 | 135,668 | 4,030 |
| Issued in Lieu of Cash Distributions | 5,753 | 134 | 8,303 | 272 |
| Redeemed | (224,318) | (5,395) | (221,124) | (6,551) |
| Net Increase (Decrease)—Admiral Shares | (104,130) | (2,507) | (77,153) | (2,249) |
J. In preparing the financial statements as of August 31, 2010, management considered the impact of subsequent events for potential recognition or disclosure in these financial statements.
23
Report of Independent Registered Public Accounting Firm
To the Trustees of Vanguard World Fund and the Shareholders of Vanguard U.S. Growth Fund:
In our opinion, the accompanying statement of net assets and the related statements of operations and of changes in net assets and the financial highlights present fairly, in all material respects, the financial position of Vanguard U.S. Growth Fund (constituting a separate portfolio of Vanguard World Fund, hereafter referred to as the “Fund”) at August 31, 2010, the results of its operations for the year then ended, the changes in its net assets for each of the two years in the period then ended and the financial highlights for each of the five years in the period then ended, in conformity with accounting principles generally accepted in the United States of America. These financial statements and financial highlights (hereafter referred to as “financial statements”) are the responsib ility of the Fund’s management; our responsibility is to express an opinion on these financial statements based on our audits. We conducted our audits of these financial statements in accordance with the standards of the Public Company Accounting Oversight Board (United States). Those standards require that we plan and perform the audit to obtain reasonable assurance about whether the financial statements are free of material misstatement. An audit includes examining, on a test basis, evidence supporting the amounts and disclosures in the financial statements, assessing the acc ounting principles used and significant estimates made by management, and evaluating the overall financial statement presentation. We believe that our audits, which included confirmation of securities at August 31, 2010 by correspondence with the custodian and broker and by agreement to the underlying ownership records of Vanguard Market Liquidity Fund, provide a reasonable basis for our opinion.
PricewaterhouseCoopers LLP
Philadelphia, Pennsylvania
October 11, 2010

Special 2010 tax information (unaudited) for Vanguard U.S. Growth FundThis information for the fiscal year ended August 31, 2010, is included pursuant to provisions of the Internal Revenue Code.
The fund distributed $22,716,000 of qualified dividend income to shareholders during the fiscal year.
For corporate shareholders, 100% of investment income (dividend income plus short-term gains, if any) qualifies for the dividends-received deduction.
24
Your Fund’s After-Tax Returns
This table presents returns for your fund both before and after taxes. The after-tax returns are shown in two ways: (1) assuming that an investor owned the fund during the entire period and paid taxes on the fund’s distributions, and (2) assuming that an investor paid taxes on the fund’s distributions and sold all shares at the end of each period.
Calculations are based on the highest individual federal income tax and capital gains tax rates in effect at the times of the distributions and the hypothetical sales. State and local taxes were not considered. After-tax returns reflect any qualified dividend income , using actual prior-year figures and estimates for 2010. (In the example, returns after the sale of fund shares may be higher than those assuming no sale. This occurs when the sale would have produced a capital loss. The calculation assumes that the investor received a tax deduction for the loss.)
The table shows returns for Investor Shares only; returns for other share classes will differ. Please note that your actual after-tax returns will depend on your tax situation and may differ from those shown. Also note that if you own the fund in a tax-deferred account, such as an individual retirement account or a 401(k) plan, this information does not apply to you. Such accounts are not subject to current taxes.
Finally, keep in mind that a fund’s performance—whether before or after taxes—does not guarantee future results.
Average Annual Total Returns: U.S. Growth Fund Investor Shares
Periods Ended August 31, 2010
| | | |
| | One | Five | Ten |
| | Year | Years | Years |
| Returns Before Taxes | -0.02% | -2.00% | -8.96% |
| Returns After Taxes on Distributions | -0.10 | -2.08 | -9.40 |
| Returns After Taxes on Distributions and Sale of Fund Shares | 0.11 | -1.68 | -6.95 |
25
About Your Fund’s Expenses
As a shareholder of the fund, you incur ongoing costs, which include costs for portfolio management, administrative services, and shareholder reports (like this one), among others. Operating expenses, which are deducted from a fund’s gross income, directly reduce the investment return of the fund.
A fund’s expenses are expressed as a percentage of its average net assets. This figure is known as the expense ratio. The following examples are intended to help you understand the ongoing costs (in dollars) of investing in your fund and to compare these costs with those of other mutual funds. The examples are based on an investment of $1,000 made at the beginning of the period shown and held for the entire period.
The accompanying table illustrates your fund’s costs in two ways:
• Based on actual fund return. This section helps you to estimate the actual expenses that you paid over the period. The ”Ending Account Value“ shown is derived from the fund‘s actual return, and the third column shows the dollar amount that would have been paid by an investor who started with $1,000 in the fund. You may use the information here, together with the amount you invested, to estimate the expenses that you paid over the period.
To do so, simply divide your account value by $1,000 (for example, an $8,600 account value divided by $1,000 = 8.6), then multiply the result by the number given for your fund under the heading ”Expenses Paid During Period.“
• Based on hypothetical 5% yearly return. This section is intended to help you compare your fund‘s costs with those of other mutual funds. It assumes that the fund had a yearly return of 5% before expenses, but that the expense ratio is unchanged. In this case—because the return used is not the fund’s actual return—the results do not apply to your investment. The example is useful in making comparisons because the Securities and Exchange Commission requires all mutual funds to calculate expenses based on a 5% return. You can assess your fund’s costs by comparing this hypothetical example with the hypothetical examples that appear in shareholder reports of other funds.
Note that the expenses shown in the table are meant to highlight and help you compare ongoing costs only and do not reflect transaction costs incurred by the fund for buying and selling securities. Further, the expenses do not include the account service fee described in the prospectus. If such a fee were applied to your account, your costs would be higher. Your fund does not charge transaction fees, such as purchase or redemption fees, nor does it carry a “sales load.”
The calculations assume no shares were bought or sold during the period. Your actual costs may have been higher or lower, depending on the amount of your investment and the timing of any purchases or redemptions.
You can find more information about the fund’s expenses, including annual expense ratios, in the Financial Statements section of this report. For additional information on operating expenses and other shareholder costs, please refer to your fund’s current prospectus.
26
| | | |
| Six Months Ended August 31, 2010 | | | |
| | Beginning | Ending | Expenses |
| | Account Value | Account Value | Paid During |
| U.S. Growth Fund | 2/28/2010 | 8/31/2010 | Period |
| Based on Actual Fund Return | | | |
| Investor Shares | $1,000.00 | $922.45 | $2.04 |
| Admiral Shares | 1,000.00 | 922.93 | 1.45 |
| Based on Hypothetical 5% Yearly Return | | | |
| Investor Shares | $1,000.00 | $1,023.09 | $2.14 |
| Admiral Shares | 1,000.00 | 1,023.69 | 1.53 |
The calculations are based on expenses incurred in the most recent six-month period. The fund’s annualized six-month expense ratios for that period are 0.42% for Investor Shares and 0.30% for Admiral Shares. The dollar amounts shown as “Expenses Paid” are equal to the annualized expense ratio multiplied by the average account value over the period, multiplied by the number of days in the most recent six-month period, then divided by the number of days in the most recent 12-month period.
27
Notice to Shareholders
U.S. Growth Fund Realigns Investment Advisory Team
The board of trustees of Vanguard U.S. Growth Fund has announced the restructuring of the fund’s investment advisory team by adding Wellington Management Company, LLP (Wellington Management), and Delaware Management Company (Delaware Investments) as investment advisors and removing AllianceBernstein L.P. (AllianceBernstein). Wellington Management, Delaware Investments, and the fund’s continuing investment advisor—William Blair & Company, L.L.C. (William Blair & Company)—each independently select and maintain a portfolio of common stocks for the fund. The assets from the portion of the fund formerly managed by AllianceBernstein, which accounted for approximately 65% of the fund as of August 31, 2010, have been divided equally between Wellington Management and Delaware Investm ents.
Delaware Investments, an indirect subsidiary of Australia-based Macquarie Group, is a Philadelphia-based investment management firm with more than $135 billion in assets under management as of June 30, 2010. Delaware Investments’ eight-member investment team averages 18 years of investment experience and 10 years with the team.
Founded in 1928, Wellington Management is an investment counseling firm with assets under management of approximately $567 billion as of August 31, 2010. Andrew J. Shilling, portfolio manager for the Wellington Management portion of the fund, leads a three-person investment team that averages 13 years of experience. This team is supported by the 47 global industry analysts at Wellington Management.
The restructuring of the fund’s investment advisory team is expected to result in an increase in the estimated expense ratio for the fund’s Investor Shares to 0.53% from 0.49% of the fund’s average net assets; the estimated expense ratio for the fund’s Admiral Shares is expected to increase to 0.34% from 0.30% of the fund’s average net assets. These expenses remain at a substantial discount to the 1.37% average expense ratio for large-cap growth funds (derived from data provided by Lipper Inc.). In addition, the fund’s investment objective, primary investment strategies, and primary risks will not change.
The table and examples on the next page show the fund’s actual expenses and cost of investing for its most recent fiscal year compared with the “pro forma” expenses and cost of investing that would have applied if the new advisory realignment had been in effect for that period. The examples are intended to help you compare the cost of investing in the fund’s Investor Shares or Admiral Shares with the cost of investing in other mutual funds. They illustrate the hypothetical expenses that you would incur over various periods if you invest $10,000 in the fund’s shares. These examples assume that the shares provide a return of 5% a year and that operating expenses remain as stated or match our estimates, as applicable. The results apply whether or not yo u redeem your investment at the end of the given period.
28
Annual Fund Operating Expenses
(Expenses deducted from the fund’s assets)
| | | | |
| | | Actual | | Pro Forma |
| | Investor Shares | Admiral Shares | Investor Shares | Admiral Shares |
| Management Expenses | 0.45% | 0.27% | 0.49% | 0.31% |
| 12b-1 Distribution Fee | None | None | None | None |
| Other Expenses | 0.04% | 0.03% | 0.04% | 0.03% |
| Total Annual Fund Operating Expenses | 0.49% | 0.30% | 0.53% | 0.34% |
| |
| |
| Examples | | | | |
| |
| Actual | 1 Year | 3 Years | 5 Years | 10 Years |
| Investor Shares | $50 | $157 | $274 | $616 |
| Admiral Shares | 31 | 97 | 169 | 381 |
| |
| Pro Forma | 1 Year | 3 Years | 5 Years | 10 Years |
| Investor Shares | $54 | $170 | $296 | $665 |
| Admiral Shares | 35 | 109 | 191 | 431 |
Additional Information
Vanguard U.S. Growth Fund has entered into new investment advisory agreements with Wellington
Management and Delaware Investments. These additions will not affect the fund’s investment objective, policies, or strategies. The fee schedule for the advisory services provided by William Blair & Company has not changed.
Under the terms of the fund’s agreements with Wellington Management and Delaware Investments, the fund will pay Wellington Management and Delaware Investments a fee at the end of each fiscal quarter. The fee is calculated by applying an annual percentage rate to the average daily net assets of the portions of the fund managed by Wellington Management and Delaware Investments, respectively, during the quarter. In addition, the quarterly payments to Wellington Management and Delaware Investments may be increased or decreased by applying a performance adjustment. The adjustment is based on the cumulative total return of the portions of the fund managed by Wellington Management and Delaware Investments, respectively, over a trailing 36-month period relative to the total return of the Russell 1000 Growth Index over the same period. Transition rules apply to the fee calculation during the initial 36-month period.
For the fiscal year ended August 31, 2010, the fund paid approximately $6.4 million in base investment advisory fees to its advisors, or 0.16% of the fund’s average net assets. Note that these figures do not reflect any actual or potential adjustments based on the performance of assets managed by any advisor.
Vanguard U.S. Growth Fund receives corporate, management, administrative, and distribution services on an at-cost basis from The Vanguard Group, Inc., P.O. Box 1110, Valley Forge, PA 19482.
29
With respect to its portion of the U.S. Growth Fund, each advisor is responsible for managing the investment and reinvestment of a portion of the fund’s assets and for continuously revi ewing, supervising, and administering the fund’s investment program. Each advisor is subject to supervision and oversight by Vanguard’s Portfolio Review Department and the officers and trustees of the fund. The fund’s board of trustees designates the proportion of fund assets to be managed by each advisor and may change these proportions at any time.
Board Approval of the Investment Advisory Agreement with Wellington Management Company, LLP
The U.S. Growth Fund’s board of trustees retained Wellington Management under the terms of a new investment advisory agreement. The board’s decision to hire Wellington Management as part of the fund’s multimanager structure was based upon the board’s most recent evaluation of the fund’s current investment staff, portfolio management process, and investment advisory arrangements. In considering whether to approve the agreement, the board engaged in arm’s-length discussions with Wellington Management and considered the following factors, among others:
• The board considered the benefits to shareholders of adding Wellington Management as a new advisor to the fund, particularly in light of the nature, extent, and quality of services to be provided by Wellington Management. The board noted that Wellington Management employs a traditional, bottom-up, fundamental research investment approach that identifies companies that have demonstrated above-average growth at attractive valuations. The board concluded that it is in the best interests of the fund and its shareholders to add a high-quality manager with a track record of success such as Wellington Management. The board noted that adding Wellington Management as an advisor would allow the fund to retain its character as a diversified large-cap growth equity offering with a mix of differentiated active managers, who each have the opportunity to generate superior returns. The combination provi des an attractive blend of proven managers, and should benefit fund shareholders over the long term.
• The board analyzed the performance of other funds and portfolios managed by Wellington Management. The board concluded that Wellington Management’s large-cap growth strategy had strong investment returns, has posted competitive results over the short term, and has outperformed relevant benchmarks and competitors over the long term.
• The board considered the advisory fee schedule and estimated expense ratio of the fund and compared them with the average advisory fee and expense ratio of the fund’s peer group. The board concluded that the addition of Wellington Management would result in a modest increase in the fund’s aggregate investment advisory fees, but that the fund’s advisory fee rate and expense ratio would remain significantly below those of the fund’s peers.
• The board considered the extent to which economies of scale would be realized as the fund grows, including a consideration of appropriate breakpoints in Wellington Management’s advisory fee schedule. By including asset-based breakpoints in the fee schedule, the fund’s trustees ensure that, if the portion of the fund managed by Wellington Management continues to grow, investors will capture economies of scale in the form of a lower advisory fee rate.
• Based on its informed business judgment, the board concluded that the course of action in the best interests of the fund and its shareholders was to approve the agreement to hire Wellington Management.
The new agreement will continue for two years from its effective date and is renewable after that for successive one-year periods. The agreement will be reviewed annually by the fund’s board of trustees, a majority of whom are not “interested persons” of either the fund or its advisors as defined in federal securities laws. The board may, at any time, reallocate the fund’s assets among the fund’s advisors, or allocate assets of the fund to other investment advisors, without terminating or revising the new agreement with Wellington Management.
Board Approval of the Investment Advisory Agreement with Delaware Investments
The U.S. Growth Fund’s board of trustees retained Delaware Investments under the terms of a new investment advisory agreement. The board’s decision to hire Delaware Investments as part of the fund’s multimanager structure was based upon the board’s most recent evaluation of the fund’s current investment staff, portfolio management process, and investment advisory arrangements. In considering whether to approve the agreement, the board engaged in arm’s-length discussions with Delaware Investments and considered the following factors, among others:
• The board considered the benefits to shareholders of adding Delaware Investments as a new advisor to the fund, particularly in light of the nature, extent, and quality of services to be provided by Delaware Investments. The board noted that Delaware Investments uses deep, bottom-up fundamental research to identify the most attractive long-term investments. The board concluded that it is in the best interests of the fund and its shareholders to add a high-quality manager with a track record of success. The board noted that adding Delaware Investments as an advisor would allow the fund to retain its character as a diversified large-cap growth equity offering with a mix of differentiated active managers, who each have the opportunity to generate superior returns. The combination provides an attractive blend of proven managers, and should benefit fund shareholders over the long term.
• The board analyzed the performance of other funds and portfolios managed by Delaware Investments. The board concluded that Delaware Investments’ large-cap growth strategy has provided strong investment returns, has posted competitive results over the short term, and has outperformed relevant benchmarks and competitors over the long term.
• The board considered the advisory fee schedule and estimated expense ratio of the fund and compared them with the average advisory fee and expense ratio of the fund’s peer group. The board concluded that the addition of Delaware Investments would result in a modest increase in the fund’s aggregate investment advisory fees, but that the fund’s advisory fee rate and expense ratio would remain significantly below those of the fund’s peers.
• The board considered the extent to which economies of scale would be realized as the fund grows, including a consideration of appropriate breakpoints in Delaware Investments’ advisory fee schedule. By including asset-based breakpoints in the fee schedule, the fund’s trustees ensure that, if the portion of the fund managed by Delaware Investments continues to grow, investors will capture economies of scale in the form of a lower advisory fee rate.
• Based on its informed business judgment, the board concluded that the course of action in the best interests of the fund and its shareholders was to approve the agreement to hire Delaware Investments.31
The new agreement will continue for two years from its effective date and is renewable after that for successive one-year periods. The agreement will be reviewed annually by the fund’s board of trustees, a majority of whom are not “interested persons” of either the fund or its advisors as defined in federal securities laws. The board may, at any time, reallocate the fund’s assets between the fund’s advisors, or allocate assets of the fund to other investment advisors, without terminating or revising the new agreement with Delaware Investments.
Background Information on Wellington Management Company, LLP
Wellington Management Company, LLP, 75 State Street, Boston, MA 02109, is an investment counseling firm founded in 1928. As of August 31, 2010, Wellington Management had assets under management that totaled approximately $567 billion. The manager primarily responsible for overseeing Wellington Management’s portion of Vanguard U.S. Growth Fund is:
Andrew J. Shilling, CFA, Senior Vice President and Equity Portfolio Manager of Wellington Management. He has worked in investment management for Wellington Management since 1994; has managed investment portfolios since 2000; and has managed a portion of the fund since October 2010. Education: B.A., Amherst College; M.B.A., Tuck School of Business, Dartmouth College.
Background Information on Delaware Investments
Delaware Investments, 2005 Market Street, Philadelphia, PA 19103, is an investment management firm founded in 1929. As of June 30, 2010, Delaware Investments had assets under management that totaled more than $135 billion. The managers primarily responsible for overseeing Delaware Investments’ portion of Vanguard U.S. Growth Fund are:
Christopher J. Bonavico, CFA, Vice President, Senior Portfolio Manager, and Equity Analyst at Delaware Investments. He has worked in investment management since 1988; has mana ged investment portfolios since joining Delaware in 2005; and has co-managed a portion of the fund since October 2010. Education: B.S., University of Delaware.
Christopher M. Ericksen, CFA, Vice President, Portfolio Manager, and Equity Analyst at Delaware Investments. He has worked in investment management since 1994; h as managed investment portfolios since 2004; has been with Delaware since 2005; and has co-managed a portion of the fund since October 2010. Education: B.S., Carnegie Mellon University.
Daniel J. Prislin, CFA, Vice President, Senior Portfolio Manager, and Equity Analyst at Delaware Investments. He has worked in investment management since 1994; has managed investment portfolios since 1996; has been with Delaware since 2005; and has co-managed a portion of the fund since October 2010. Education: B.S. and M.B.A., University of California at Berkeley.
Jeffrey S. Van Harte, CFA, Senior Vice President, Chief Investment Officer—Focus Growth Equity at Delaware Investments. He has worked in investment management since 1980; has managed investment portfolios since 1984; has been with Delaware since 2005; and has co-managed a portion of the fund since October 2010. Education: B.A., California State University at Fullerton.
32
Glossary
30-Day SEC Yield. A fund’s 30-day SEC yield is derived using a formula specified by the U.S. Securities and Exchange Commission. Under the formula, data related to the fund’s security holdings in the previous 30 days are used to calculate the fund’s hypothetical net income for that period, which is then annualized and divided by the fund’s estimated average net assets over the calculation period. For the purposes of this calculation, a security’s income is based on its current market yield to maturity (in the case of bonds) or its projected dividend yield (for stocks). Because the SEC yield represents hypothetical annualized income, it will differ—at times significantly—from the fund’s actual experience. As a result, the fund’s income distributions may be higher or lower than implied by the SEC yield.
Beta. A measure of the magnitude of a fund’s past share-price fluctuations in relation to the ups and downs of a given market index. The index is assigned a beta of 1.00. Compared with a given index, a fund with a beta of 1.20 typically would have seen its share price rise or fall by 12% when the index rose or fell by 10%. For this report, beta is based on returns over the past 36 months for both the fund and the index. Note that a fund’s beta should be reviewed in conjunction with its R-squared (see definition). The lower the R-squared, the less correlation there is between the fund and the index, and the less reliable beta is as an indicator of volatility.
Dividend Yield. Dividend income earned by stocks, expressed as a percentage of the aggregate market value (or of net asset value, for a fund). The yield is determined by dividing the amount of the annual dividends by the aggregate value (or net asset value) at the end of the period. For a fund, the dividend yield is based solely on stock holdings and does not include any income produced by other investments.
Earnings Growth Rate. The average annual rate of growth in earnings over the past five years for the stocks now in a fund.
Equity Exposure. A measure that reflects a fund’s investments in stocks and stock futures. Any holdings in short-term reserves are excluded.
Expense Ratio. The percentage of a fund’s average net assets used to pay its annual administrative and advisory expenses. These expenses directly reduce returns to investors.
Foreign Holdings. The percentage of a fund represented by stocks or depositary receipts of companies based outside the United States.
Inception Date. The date on which the assets of a fund (or one of its share classes) are first invested in accordance with the fund’s investment objective. For funds with a subscription period, the inception date is the day after that period ends. Investment performance is measured from the inception date.
Median Market Cap. An indicator of the size of companies in which a fund invests; the midpoint of market capitalization (market price x shares outstanding) of a fund’s stocks, weighted by the proportion of the fund’s assets invested in each stock. Stocks representing half of the fund’s assets have market capitalizations above the median, and the rest are below it.
Price/Book Ratio. The share price of a stock divided by its net worth, or book value, per share. For a fund, the weighted average price/book ratio of the stocks it holds.
33
Price/Earnings Ratio. The ratio of a stock’s current price to its per-share earnings over the past year. For a fund, the weighted average P/E of the stocks it holds. P/E is an indicator of market expectations about corporate prospects; the higher the P/E, the greater the expectations for a company’s future growth.
R-Squared. A measure of how much of a fund’s past returns can be explained by the returns from the market in general, as measured by a given index. If a fund’s total returns were precisely synchronized with an index’s returns, its R-squared would be 1.00. If the fund’s returns bore no relationship to the index’s returns, its R-squared would be 0. For this report, R-squared is based on returns over the past 36 months for both the fund and the index.
Return on Equity. The annual average rate of return generated by a company during the past five years for each dollar of shareholder’s equity (net income divided by shareholder’s equity). For a fund, the weighted average return on equity for the companies whose stocks it holds.
Short-Term Reserves. The percentage of a fund invested in highly liquid, short-term securities that can be readily converted to cash.
Turnover Rate. An indication of the fund’s trading activity. Funds with high turnover rates incur higher transaction costs and may be more likely to distribute capital gains (which may be taxable to investors). The turnover rate excludes in-kind transactions, which have minimal impact on costs.
34
This page intentionally left blank.
The People Who Govern Your Fund
The trustees of your mutual fund are there to see that the fund is operated and managed in your best interests since, as a shareholder, you are a part owner of the fund. Your fund’s trustees also serve on the board of directors of The Vanguard Group, Inc., which is owned by the Vanguard funds and provides services to them on an at-cost basis.
A majority of Vanguard’s board members are independent, meaning that they have no affiliation with Vanguard or the funds they oversee, apart from the sizable personal investments they have made as private individuals. The independent board members have distinguished backgrounds in business, academia, and public service. Each of the trustees and executive officers oversees 163 Vanguard funds.
The following table provides information for each trustee and executive officer of the fund. More information about the trustees is in the Statement of Additional Information, which can be obtained, without charge, by contacting Vanguard at 800-662-7447, or online at vanguard.com.
| |
| Interested Trustee1 | Amy Gutmann |
| | Born 1949. Trustee Since June 2006. Principal |
| F. William McNabb III | Occupation(s) During the Past Five Years: President |
| Born 1957. Trustee Since July 2009. Chairman of the | of the University of Pennsylvania; Christopher H. |
| Board. Principal Occupation(s) During the Past Five | Browne Distinguished Professor of Political Science |
| Years: Chairman of the Board of The Vanguard Group, | in the School of Arts and Sciences with secondary |
| Inc., and of each of the investment companies served | appointments at the Annenberg School for Commu- |
| by The Vanguard Group, since January 2010; Director | nication and the Graduate School of Education |
| of The Vanguard Group since 2008; Chief Executive | of the University of Pennsylvania; Director of |
| Officer and President of The Vanguard Group and of | Carnegie Corporation of New York, Schuylkill River |
| each of the investment companies served by The | Development Corporation, and Greater Philadelphia |
| Vanguard Group since 2008; Director of Vanguard | Chamber of Commerce; Trustee of the National |
| Marketing Corporation; Managing Director of The | Constitution Center; Chair of the Presidential |
| Vanguard Group (1995–2008). | Commission for the Study of Bioethical Issues. |
| |
| | JoAnn Heffernan Heisen |
| Independent Trustees | Born 1950. Trustee Since July 1998. Principal |
| | Occupation(s) During the Past Five Years: Corporate |
| Emerson U. Fullwood | Vice President and Chief Global Diversity Officer |
| Born 1948. Trustee Since January 2008. Principal | since 2006 (retired 2008) and Member of the |
| Occupation(s) During the Past Five Years: Executive | Executive Committee (retired 2008) of Johnson & |
| Chief Staff and Marketing Officer for North America | Johnson (pharmaceuticals/consumer products); Vice |
| and Corporate Vice President (retired 2008) of Xerox | President and Chief Information Officer of Johnson & |
| Corporation (document management products and | Johnson (1997–2005); Director of the University |
| services); Director of SPX Corporation (multi-industry | Medical Center at Princeton and Women’s Research |
| manufacturing), the United Way of Rochester, | and Education Institute; Member of the Advisory |
| Amerigroup Corporation (managed health care), | Board of the Maxwell School of Citizenship and Public |
| the University of Rochester Medical Center, and | Affairs at Syracuse University. |
| Monroe Community College Foundation. | |
| | F. Joseph Loughrey |
| Rajiv L. Gupta | Born 1949. Trustee Since October 2009. Principal |
| Born 1945. Trustee Since December 2001.2 | Occupation(s) During the Past Five Years: President |
| Principal Occupation(s) During the Past Five Years: | and Chief Operating Officer since 2005 (retired 2009) |
| Chairman and Chief Executive Officer (retired 2009) | and Vice Chairman of the Board (2008–2009) of |
| and President (2006–2008) of Rohm and Haas Co. | Cummins Inc. (industrial machinery); Director of |
| (chemicals); Director of Tyco International, Ltd. | SKF AB (industrial machinery), Hillenbrand, Inc. |
| (diversified manufacturing and services) and Hewlett- | (specialized consumer services), Sauer-Danfoss Inc. |
| Packard Co. (electronic computer manufacturing); | (machinery), the Lumina Foundation for Education, |
| Trustee of The Conference Board; Member of the | and Oxfam America; Chairman of the Advisory |
| Board of Managers of Delphi Automotive LLP | Council for the College of Arts and Letters at the |
| (automotive components) . | University of Notre Dame. |
| | |
| André F. Perold | Kathryn J. Hyatt | |
| Born 1952. Trustee Since December 2004. Principal | Born 1955. Treasurer Since November 2008. Principal |
| Occupation(s) During the Past Five Years: George | Occupation(s) During the Past Five Years: Principal |
| Gund Professor of Finance and Banking at the Harvard | of The Vanguard Group, Inc.; Treasurer of each of |
| Business School; Chair of the Investment Committee | the investment companies served by The Vanguard |
| of HighVista Strategies LLC (private investment firm) . | Group since 2008; Assistant Treasurer of each of the |
| | investment companies served by The Vanguard Group |
| Alfred M. Rankin, Jr. | (1988–2008). | |
| Born 1941. Trustee Since January 1993. Principal | | |
| Occupation(s) During the Past Five Years: Chairman, | Heidi Stam | |
| President, and Chief Executive Officer of NACCO | Born 1956. Secretary Since July 2005. Principal |
| Industries, Inc. (forklift trucks/housewares/lignite); | Occupation(s) During the Past Five Years: Managing |
| Director of Goodrich Corporation (industrial products/ | Director of The Vanguard Group, Inc., since 2006; |
| aircraft systems and services); Chairman of the | General Counsel of The Vanguard Group since 2005; |
| Federal Reserve Bank of Cleveland; Trustee of The | Secretary of The Vanguard Group and of each of the |
| Cleveland Museum of Art. | investment companies served by The Vanguard Group |
| | since 2005; Director and Senior Vice President of |
| Peter F. Volanakis | Vanguard Marketing Corporation since 2005; |
| Born 1955. Trustee Since July 2009. Principal | Principal of The Vanguard Group (1997–2006). |
| Occupation(s) During the Past Five Years: President | | |
| since 2007 and Chief Operating Officer since 2005 | | |
| of Corning Incorporated (communications equipment); | Vanguard Senior Management Team |
| President of Corning Technologies (2001–2005); | | |
| Director of Corning Incorporated and Dow Corning; | R. Gregory Barton | Michael S. Miller |
| Trustee of the Corning Incorporated Foundation and | Mortimer J. Buckley | James M. Norris |
| the Corning Museum of Glass; Overseer of the | Kathleen C. Gubanich | Glenn W. Reed |
| Amos Tuck School of Business Administration at | Paul A. Heller | George U. Sauter |
| Dartmouth College. | | |
| |
| | Chairman Emeritus and Senior Advisor |
| Executive Officers | | |
| | John J. Brennan | |
| Glenn Booraem | Chairman, 1996–2009 | |
| Born 1967. Controller Since July 2010. Principal | Chief Executive Officer and President, 1996–2008 |
| Occupation(s) During the Past Five Years: Principal | | |
| of The Vanguard Group, Inc.; Controller of each of | | |
| the investment companies served by The Vanguard | Founder | |
| Group since 2010; Assistant Controller of each of | | |
| the investment companies served by The Vanguard | John C. Bogle | |
| Group (2001–2010) . | Chairman and Chief Executive Officer, 1974–1996 |
| |
| Thomas J. Higgins | | |
| Born 1957. Chief Financial Officer Since September | | |
| 2008. Principal Occupation(s) During the Past Five | | |
| Years: Principal of The Vanguard Group, Inc.; Chief | | |
| Financial Officer of each of the investment companies | | |
| served by The Vanguard Group since 2008; Treasurer | | |
| of each of the investment companies served by The | | |
| Vanguard Group (1998–2008). | | |
1 Mr. McNabb is considered an “interested person,” as defined in the Investment Company Act of 1940, because he is an officer of the Vanguard funds.
2 December 2002 for Vanguard Equity Income Fund, Vanguard Growth Equity Fund, the Vanguard Municipal Bond Funds, and the Vanguard State Tax-Exempt Funds.
|  |
| P.O. Box 2600 |
| Valley Forge, PA 19482-2600 |
|
| Connect with Vanguard® > Vanguard.com |
| |
| Fund Information > 800-662-7447 | CFA® is a trademark owned by CFA Institute. |
| Direct Investor Account Services > 800-662-2739 | |
| Institutional Investor Services > 800-523-1036 | |
| Text Telephone for People | |
| With Hearing Impairment > 800-749-7273 | |
| |
| This material may be used in conjunction | |
| with the offering of shares of any Vanguard | |
| fund only if preceded or accompanied by | |
| the fund’s current prospectus. | |
| |
| All comparative mutual fund data are from Lipper Inc. or | |
| Morningstar, Inc., unless otherwise noted. | |
| |
| You can obtain a free copy of Vanguard’s proxy voting | |
| guidelines by visiting vanguard.com/proxyreporting or by | |
| calling Vanguard at 800-662-2739. The guidelines are | |
| also available from the SEC’s website, sec.gov. In | |
| addition, you may obtain a free report on how your fund | |
| voted the proxies for securities it owned during the 12 | |
| months ended June 30. To get the report, visit either | |
| vanguard.com/proxyreporting or sec.gov. | |
| |
| You can review and copy information about your fund at | |
| the SEC’s Public Reference Room in Washington, D.C. To | |
| find out more about this public service, call the SEC at | |
| 202-551-8090. Information about your fund is also | |
| available on the SEC’s website, and you can receive | |
| copies of this information, for a fee, by sending a | |
| request in either of two ways: via e-mail addressed to | |
| publicinfo@sec.gov or via regular mail addressed to the | |
| Public Reference Section, Securities and Exchange | |
| Commission, Washington, DC 20549-1520. | |
| © 2010 The Vanguard Group, Inc. |
| All rights reserved. |
| Vanguard Marketing Corporation, Distributor. |
| |
| Q230 102010 |
 |
| Vanguard International Growth Fund |
| Annual Report |
|
| August 31, 2010 |
 |
> Vanguard International Growth Fund returned about 5% for the fiscal year ended August 31, 2010, exceeding the returns of its comparative benchmarks.
> Emerging markets outperformed their developed market counterparts during the period.
> The fund’s holdings in emerging markets and strong stock selection in the consumer staples, information technology, and materials sectors—contributed most to its performance.
| |
| Contents | |
| Your Fund’s Total Returns. | 1 |
| Chairman’s Letter. | 2 |
| Advisors’ Report. | 7 |
| Fund Profile. | 12 |
| Performance Summary. | 14 |
| Financial Statements. | 16 |
| Your Fund’s After-Tax Returns. | 32 |
| About Your Fund’s Expenses. | 33 |
| Glossary. | 35 |
Please note: The opinions expressed in this report are just that—informed opinions. They should not be considered promises or advice. Also, please keep in mind that the information and opinions cover the period through the date on the front of this report. Of course, the risks of investing in your fund are spelled out in the prospectus.
See the Glossary for definitions of investment terms used in this report.
Cover photograph: Jean Maher.
Your Fund’s Total Returns
| |
| Fiscal Year Ended August 31, 2010 | |
| | Total |
| | Returns |
| Vanguard International Growth Fund | |
| Investor Shares | 5.19% |
| Admiral™ Shares | 5.36 |
| Spliced International Index | -2.67 |
| International Funds Average | 1.05 |
Spliced International Index: MSCI EAFE Index through May 31, 2010; MSCI All Country World Index ex USA thereafter.
International Funds Average: Derived from data provided by Lipper Inc.
Admiral Shares carry lower expenses and are available to investors who meet certain account-balance requirements.
Your Fund’s Performance at a Glance
August 31, 2009, Through August 31, 2010
| | | | | |
| | | | |
| | | | | Distributions Per Share |
| | Starting | Ending | Income | Capital |
| | Share Price | Share Price | Dividends | Gains |
| Vanguard International Growth Fund | | | | |
| Investor Shares | $15.73 | $16.27 | $0.286 | $0.000 |
| Admiral Shares | 50.08 | 51.81 | 0.987 | 0.000 |
1

Chairman’s Letter
Dear Shareholder,
Vanguard International Growth Fund returned about 5% for the fiscal year ended August 31, besting both the average return of its peer international funds and its spliced benchmark index, which recorded a negative return. It was International Growth’s first positive fiscal-year return since the global credit-market turmoil began in 2007.
Despite sharp declines in global stock markets in the spring, at the height of Europe’s sovereign debt crisis, the fund’s investments in all regions contributed positively to its result. Emerging market stocks, which notched double-digit gains, were notably strong performers.
Please note that on June 1, the International Growth Fund’s primary benchmark changed from the Morgan Stanley Capital International Europe, Australasia, Far East (MSCI EAFE) Index to the MSCI All Country World Index ex USA, which is designed to measure the equity performance of developed and emerging markets outside the United States. The new index is more consistent with the fund’s investment objective and its longstanding practice of investing in both developed and emerging markets. The Spliced International Index referred to on page 1 and elsewhere in this report combines the old and new benchmarks.
If you invest in the fund through a taxable account, page 32 shows after-tax returns for investors in the highest tax bracket.
2
A ragged 12-month climb in global stock markets
At the start of the 12-month period, stock markets moved higher as global economies continued to pull out of a deep downturn. Within a few months, however, optimism began to fade. Europe’s sovereign debt crisis fueled fears of another global financial shock, while persistently high unemployment and downward revisions to economic indicators in the U.S. suggested that the powerful rebound in corporate earnings could be at risk.
This alternating pattern of hope and fear persisted through the period’s final months. Broad-based international stocks returned about 3% for the fiscal year, as modest declines in developed markets in Europe and the Pacific region were offset by a strong rally in emerging markets. The net result for the fiscal year was mid-single-digit gains in the broad U.S. stock market.
Bonds produced strong returns as prices rose and yields declined
The economic uncertainty and high stock market volatility over the fiscal period created a favorable environment for fixed income investments. The broad taxable bond market returned more than 9%, as investors sought shelter in U.S. Treasury and corporate bonds. The municipal bond market returned a bit more. In both markets, much of the total return came from rising bond prices. The flip side of rising prices, of course, is shrinking yields, which can set the stage for lower future returns.
| | | |
| Market Barometer | | | |
| |
| | | Average Annual Total Returns |
| | | Periods Ended August 31, 2010 |
| | One | Three | Five |
| | Year | Years | Years |
| Stocks | | | |
| Russell 1000 Index (Large-caps) | 5.55% | -8.34% | -0.71% |
| Russell 2000 Index (Small-caps) | 6.60 | -7.44 | -0.69 |
| Dow Jones U.S. Total Stock Market Index | 6.15 | -7.83 | -0.31 |
| MSCI All Country World Index ex USA (International) | 3.27 | -7.93 | 3.78 |
| |
| Bonds | | | |
| Barclays Capital U.S. Aggregate Bond Index (Broad | | | |
| taxable market) | 9.18% | 7.65% | 5.96% |
| Barclays Capital Municipal Bond Index (Broad | | | |
| tax-exempt market) | 9.78 | 6.62 | 5.02 |
| Citigroup Three-Month U.S. Treasury Bill Index | 0.12 | 1.13 | 2.53 |
| |
| CPI | | | |
| Consumer Price Index | 1.15% | 1.64% | 2.14% |
3
As it has since December 2008, the Federal Reserve kept its target for short-term interest rates between 0% and 0.25%, in an effort to bolster the economy. This policy has kept a tight lid on the returns available from Treasury bills, commercial paper, and other money market instruments. Near-zero short-term yields also were a factor nudging investors to shift to bonds in search of income, despite the risks such a shift entails.
Emerging markets bolstered the fund’s performance
Vanguard International Growth Fund’s performance fluctuated throughout the fiscal year, particularly in the second half, as fears of government debt problems in Europe sent world markets reeling.
With more than half of its assets, on average, in Europe, the fund could not escape the ripple effects of Greece’s debt crisis as it spread to other countries, including Spain, Portugal, Italy, and Ireland. The fund returned –10% in May—at the peak of the crisis—but quickly recovered by July, when it jumped nearly 10%, thanks in part to investors’ confidence in policymakers’ swift and forceful response to the upheaval.
Astute stock selection in Europe helped the fund’s advisors sidestep some of the potholes that plagued the index’s performance. For example, the fund had no exposure to the hard-hit Greek and Portuguese stock markets—which returned –47% and –11%, respectively,
Expense Ratios
Your Fund Compared With Its Peer Group
| | | |
| | Investor | Admiral | Peer Group |
| | Shares | Shares | Average |
| International Growth Fund | 0.53% | 0.34% | 1.44% |
The fund expense ratios shown are from the prospectus dated December 28, 2009, and represent estimated costs for the current fiscal year. For the fiscal year ended August 31, 2010, the fund’s expense ratios were 0.49% for Investor Shares and 0.33% for Admiral Shares. The peer-group expense ratio is derived from data provided by Lipper Inc. and captures information through year-end 2009.
Peer group: International Funds.
4
in the benchmark—and, on average, held a smaller proportion of assets in the other fiscally shaky countries than the index weighting. Also key to the fund’s strong performance in the region were its holdings in the United Kingdom, which contributed more than 1 percentage point toward the overall result. The fund’s advisors made wise choices in the materials, consumer staples, and industrials sectors. Relative to comparable market indexes, the fund also benefited from its decision to avoid BP, the British oil giant whose stock tumbled as a result of the company’s massive oil spill in the Gulf of Mexico—the largest environmental disaster of its kind in U.S. history.
Emerging markets, which represented, on average, about one-fifth of the fund’s assets, made the strongest contribution (+5 percentage points) to the 12-month return. Of the fund’s 12 emerging market countries, more than half posted double-digit returns for the period, including China (+48%) and Brazil (+18%). In China, holdings such as Baidu (+138%), the country’s largest internet search engine, and consumer-related stocks enhanced performance. In Brazil, companies within the financials, materials, and consumer staples sectors performed best.
Developed markets in the Pacific region, with more than one-fifth of the fund’s assets, on average, contributed little to the fund’s outcome for the fiscal year. Japan, the largest country exposure in the region, struggled in several sectors, including financials, materials, and health care. Hong Kong, the third-largest market
Total Returns
Ten Years Ended August 31, 2010
| |
| | Average |
| | Annual Return |
| International Growth Fund Investor Shares | 2.15% |
| Spliced International Index | 1.07 |
| International Funds Average | 0.28 |
Spliced International Index: MSCI EAFE Index through May 31, 2010; MSCI All Country World Index ex USA thereafter.
International Funds Average: Derived from data provided by Lipper Inc.
The figures shown represent past performance, which is not a guarantee of future results. (Current performance may be lower or higher than the performance data cited. For performance data current to the most recent month-end, visit our website at vanguard.com/performance.) Note, too, that both investment returns and principal value can fluctuate widely, so an investor’s shares, when sold, could be worth more or less than their original cost.
5
in the region after Australia, contributed the most, with strong performance in its industrial, consumer discretionary, and financial sectors.
For more about the advisors’ strategies and the fund’s positioning during the 12 months, see the Advisors’ Report that follows this letter.
Impressive ten-year record surpasses benchmark, peers
Over the past ten years, a period marked by extreme volatility in the financial markets, Vanguard International Growth Fund has exceeded the returns of both its unmanaged benchmark index and its peer group. The fund’s average annual return of about 2% is modest, but it was achieved during a very weak period in global stock markets. Over a full decade, the fund’s average annual return was nearly 2-percentage-points higher than the average for peer funds—representing a significant difference in wealth accumulation.
This performance edge is a tribute to the expertise of your fund’s three investment advisors: Baillie Gifford Overseas, Schroder Investment Management North America, and M&G Investment Management. Also, the fund’s low expenses help you keep more of its return, an advantage that compounds over time.
International stocks can diversify a balanced portfolio
The past year has been tumultuous for investors in international markets, particularly in Europe. Although such periods can be frustrating, the markets’ ups and downs are an integral part of investing.
Vanguard International Growth Fund will no doubt undergo fluctuations in the future, too, but we believe that including international stocks in a long-term portfolio can provide useful diversification to help temper overall volatility. Indeed, Vanguard research indicates that the benefits of including international holdings in an investment program usually become more apparent in the long run, as the economic and financial performances of various countries diverge.
As always, we encourage investors to develop a portfolio that includes stock, bond, and cash investments in proportions consistent with individual goals and risk tolerance. Such a balanced portfolio can help buffer your assets from the markets’ worst outcomes while giving you the opportunity to participate in the best.
Thank you for investing with Vanguard.
Sincerely,

F. William McNabb III
Chairman and Chief Executive Officer
September 10, 2010
6
Advisors’ Report
For the fiscal year ended August 31, 2010, Vanguard International Growth Fund returned about 5%. Your fund is managed by three independent advisors, a strategy that enhances the fund’s diversification by providing exposure to distinct, yet complementary, investment approaches. It is not uncommon for different advisors to have different views about individual securities or the broader investment
environment. The advisors, the amount and percentage of fund assets each manages, and brief descriptions of their investment strategies are presented in the table below. The advisors have also prepared a discussion of the investment environment that existed during the fiscal year and of how their portfolio positioning reflects this assessment. These comments were prepared on September 17, 2010.
Vanguard International Growth Fund Investment Advisors
| | | |
| | Fund Assets Managed | |
| Investment Advisor | % | $ Million | Investment Strategy |
| Baillie Gifford Overseas Ltd. | 45 | 6,700 | The advisor seeks stocks that can generate |
| | | | above-average growth in earnings and cash flow, |
| | | | producing a bottom-up, stock-driven approach to |
| | | | country and asset allocation. An in-depth view on each |
| | | | company is measured against the consensus view, |
| | | | leading to discrepancies and potential opportunities to |
| | | | add value. |
| Schroder Investment | 43 | 6,446 | Equity analysts in 11 countries and an international |
| Management North America, Inc. | | | team of global sector and regional specialists help to |
| | | | identify reasonably priced companies with strong |
| | | | growth prospects and a sustainable competitive |
| | | | advantage. |
| M&G Investment Management | 10 | 1,429 | The advisor constructs a portfolio using a long-term, |
| Limited | | | bottom-up investment approach focusing on identifying |
| | | | underappreciated companies—particularly those with |
| | | | scarce assets—with the ability to deliver high returns |
| | | | and growth potential. |
| Cash Investments | 2 | 271 | These short-term reserves are invested by Vanguard in |
| | | | equity index products to simulate investment in stocks. |
| | | | Each advisor may also maintain a modest cash |
| | | | position. |
7
Baillie Gifford Overseas Ltd.
Portfolio Manager:
James K. Anderson
Chief Investment Officer and Head of Global Equities
It is increasingly difficult to characterize the world economy as a whole. Some areas—including China, Brazil, Korea, and Germany—are doing very well. Others, however, such as the United States and southern Europe, remain sluggish. The main differentiating factor is debt: Some countries need very low interest rates to sustain their debt burdens and avert a slide into deflation, whereas others don’t need such stimulus and actually are finding current rates too low.
We are especially impressed with Germany’s performance, which has been helped by a combination of factors: strong exports, a competitive currency weakened by the debt problems facing the peripheral nations in Europe, and the lack of significant debt. A long-awaited revival in consumption has produced stunning corporate results. Germany’s exports to China have been projected to rise nearly 60% by year-end 2010. Also, BMW’s sales to China doubled over the fiscal period, and its sales throughout Europe rebounded.
We do not believe in the so-called double-dip theory—that the U.S. economy will plunge into another recession. Plenty of evidence points to financial healing as banks and consumers slowly rebuild their reserves. America’s problems are disappointing, but the global economy no longer relies on the U.S. consumer as it once did. Today’s world is multipolar, led, for the time being, by China.
Share prices of companies in international markets have been influenced more by America’s housing problems than by developments in home countries, so most stock markets have been dull, despite strong rises in profits. This has provided investors with opportunities, and there are signs that companies are beginning to respond by using their immense cash piles to acquire one another. The hunt for yield has left bonds looking extraordinarily expensive, while non-U.S. equity markets, with values of about ten times current earnings and yields of 3%, look fairly cheap. Buying opportunities don’t occur in times of general jollity, so we find the current gloom encouraging.
Our portfolio has benefited from our optimism about the developing world and skepticism about demand in the mature economies and the banks that depend on them. We have added more technology companies to our roster, but our general approach is still patient, rather than busy.
8
Schroder Investment Management North America Inc.
Portfolio Managers:
Virginie Maisonneuve, CFA
Head of Global and International Equities
Simon Webber, CFA
Portfolio Manager
Most countries recovered from their recessions by the end of 2009, but concerns about European sovereign debt and potential contagion later disrupted many financial markets. European leaders agreed on a 750 billion euro stabilization scheme, and individual countries unveiled sweeping austerity packages. During the period, Basel III and new U.S., European Union, and U.K. rules helped to bring clarity to a new financial regulatory framework. In Asia, Japan continued to struggle with a strong yen and slow growth. After impressive gross domestic product growth for first-quarter 2010, China ended the stimulus measures it had put into place during the financial crisis, in order to rein in some of the impacts of excessive liquidity, such as property price increases.
Currencies remained volatile during the period. Most noticeably, the yen and the Brazilian real appreciated nearly 10% and 7%, respectively, versus the dollar, while the euro and the British pound depreciated 11% and about 5%, respectively.
Turning to performance, on a pure stock-selection basis our top contributors during the period were China Resources Enterprise, Jardine Matheson Holdings, Niko Resources, and Swire Pacific. Most regions contributed positively to performance, with emerging markets and Japan being the strongest contributors. North American and Pacific ex-Japan holdings also added value, while from a sector perspective, financials, energy, and consumer discretionary holdings led.
Within financials, the continued cautious approach to developed market stocks (such as Sony Financial and DnB NOR), combined with a targeted exposure to holdings benefiting from earnings growth in Asia and emerging markets (including Swire Pacific, Itau Unibanco Holding, and Australia & New Zealand Banking Group), rewarded.
In energy, holdings such as Niko Resources, which is benefiting from strong cash flow from its Indian assets, and U.K.-based AMEC, which we recently acquired, were strong contributors.
Throughout our portion of the portfolio, our conviction in companies benefiting from exposure to emerging markets’ growth in consumption remained supported by long-term demographic trends and the economic concept of
9
the “supercycle,” which concerns the impact of emerging market growth on the rest of the world. Examples of such holdings in emerging or developed markets include, in China, Baidu, China Resources, and Ctrip.com International, along with Jardine Matheson Holdings (in Hong Kong), Unicharm (in Japan), and Fresenius Medical Care (in Germany).
Looking forward, the global economic environment remains volatile. The developed economies’ adjustment to slower growth will progress as the deleveraging process unfolds. While companies in the developed world are for the most part in good shape as a result of the cost adjustments they made during the crisis, it is unclear whether a gradual normalization of the environment will lead to strong employment. Recently, Europe has seen improving economic results in Germany, which has benefited from substantial exports to emerging markets and China, in particular. Although tensions in southern Europe have receded for the time being, the situation there remains fragile. In addition, European fiscal constraints and budget cuts to come will put renewed pressure on public employment particularly, at a time when private-sector employment has yet to show signs of robust improvement.
The international corporate sector, however, is in very good health, with solid margins and strong balance sheets. We expect to see more merger-and-acquisition activity as companies look to deploy capital.
We continue to find attractively priced growth companies with quality names and a strong competitive advantage. As the globe adjusts to the “new normal”—a world in which economic growth is fueled by the large emerging economies, developed market consumers deleverage, and the financial system settles in to function under new rules—we believe competitive companies with solid balance sheets will find attractive growth opportunities.
M&G Investment Management Limited
Portfolio Managers:
Graham E. French, Portfolio Manager
Greg Aldridge, Portfolio Manager
The fund generated a positive return for investors during a fiscal period characterized by high stock market volatility. Early on, investors’ optimism about the economic recovery led to healthy gains for global equities, especially in emerging market and commodities-related stocks. However, this rally ground to a halt in April, as investor sentiment was dented by factors including growing concern about the government debt crisis in peripheral Europe.
10
Against this backdrop, strong contributions to performance came from a range of good-quality businesses, particularly those in Europe, including Symrise, a German supplier of flavors and fragrances; Irish food and ingredients manufacturer Kerry Group; and highly cash-generative Swiss food giant Nestlé. French advertising and media specialist Publicis and Brazilian miner Vale, the world’s largest producer of iron ore, were among the more economically sensitive stocks in the portfolio that also performed well.
At a time when banks’ potential exposure to sovereign bonds from heavily indebted, peripheral European countries was under close scrutiny, the fund’s relatively small holding in financials, and European banks in particular, was beneficial.
By contrast, weak contributions came from those companies in the portfolio that were negatively affected by concerns over a slowdown in economic growth, particularly related to construction and discretionary consumer spending. For example, Austrian brick manufacturer Wienerberger was a leading detractor as the company suffered from continuing fragility in the European and U.S. construction markets. A number of holdings reliant on consumer expenditure disappointed, including Hong Kong power-tool manufacturer Techtronic Industries, U.K. automobile distributor Inchcape, and Japanese car manufacturer Toyota Motor, the last of these succumbing to negative sentiment related to quality issues.
During a period of consistently high stock market volatility, we remained committed to our investment strategy of selecting quality, value-creating companies with scarce assets that provide a sustainable competitive advantage from both cyclical and defensive areas of the stock market. Transatlantic cruise operator Carnival, Japanese clinical diagnostic devices supplier Sysmex, and German cash machines and payment systems provider Wincor-Nixdorf were among the companies we added to the portfolio. Investors have yet to recognize these businesses’ ability to deliver sustainable returns and their potential for profitable growth over the long term.
We took profits from the holdings in some of the portfolio’s strongest performers during the review period, including Taiwanese electronics manufacturer Compal Electronics and globally diversified testing services business Intertek. Following reasonably strong performance for the fund, our position in Australian packaging firm Amcor was closed as we saw opportunities to reinvest the proceeds in higher-quality businesses elsewhere.
11
International Growth Fund
Fund Profile
As of August 31, 2010
| | |
| Share-Class Characteristics | |
| | Investor | Admiral |
| | Shares | Shares |
| Ticker Symbol | VWIGX | VWILX |
| Expense Ratio1 | 0.53% | 0.34% |
| |
| Portfolio Characteristics | |
| | | MSCI AC |
| | | World Index |
| | Fund | ex USA |
| Number of Stocks | 182 | 1,813 |
| Median Market Cap | $30.4B | $25.9B |
| Price/Earnings Ratio | 17.6x | 15.5x |
| Price/Book Ratio | 1.9x | 1.6x |
| Return on Equity | 20.8% | 18.1% |
| Earnings Growth Rate | 6.5% | 4.6% |
| Dividend Yield | 2.1% | 3.0% |
| Turnover Rate | 44% | — |
| Short-Term Reserves | 0.8% | — |
| | |
| Sector Diversification (% of equity exposure) |
| | | MSCI AC |
| | | World Index |
| | Fund | ex USA |
| Consumer Discretionary | 13.1% | 8.8% |
| Consumer Staples | 10.6 | 9.1 |
| Energy | 8.3 | 10.2 |
| Financials | 22.9 | 25.8 |
| Health Care | 7.1 | 6.3 |
| Industrials | 14.4 | 10.4 |
| Information Technology | 11.3 | 6.4 |
| Materials | 9.5 | 11.9 |
| Telecommunication | | |
| Services | 1.7 | 6.3 |
| Utilities | 1.1 | 4.8 |
| | |
| Volatility Measures | | |
| | Spliced | MSCI AC |
| | International | World Index |
| | Index | ex USA |
| R-Squared | 0.97 | 0.98 |
| Beta | 1.06 | 1.00 |
These measures show the degree and timing of the fund’s fluctuations compared with the indexes over 36 months.
| | |
| Ten Largest Holdings (% of total net assets) |
| Itau Unibanco Holding | Diversified Banks | |
| SA | | 2.4% |
| Baidu Inc. ADR | Internet Software & | |
| | Services | 2.1 |
| Novartis AG | Pharmaceuticals | 2.1 |
| BG Group PLC | Integrated Oil & | |
| | Gas | 2.1 |
| Canon Inc. | Office Electronics | 1.8 |
| Petroleo Brasileiro SA | Integrated Oil & | |
| | Gas | 1.7 |
| Atlas Copco AB Class A | Industrial | |
| | Machinery | 1.5 |
| Tesco PLC | Food Retail | 1.5 |
| Banco Santander SA | Diversified Banks | 1.5 |
| Standard Chartered PLC | Diversified Banks | 1.5 |
| Top Ten | | 18.2% |
The holdings listed exclude any temporary cash investments and equity index products.
Allocation by Region (% of equity exposure)
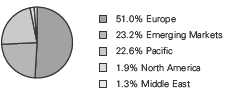
1 The expense ratios shown are from the prospectus dated December 28, 2009, and represent estimated costs for the current fiscal year. For the fiscal year ended August 31, 2010, the expense ratios were 0.49% for Investor Shares and 0.33% for Admiral Shares.
12
International Growth Fund
| | |
| Market Diversification (% of equity exposure) |
| | | MSCI AC |
| | | World |
| | | Index |
| | Fund | ex USA |
| Europe | | |
| United Kingdom | 18.6% | 15.0% |
| France | 7.3 | 6.7 |
| Switzerland | 6.8 | 5.6 |
| Germany | 5.9 | 5.2 |
| Sweden | 3.7 | 2.0 |
| Spain | 2.6 | 2.6 |
| Netherlands | 2.3 | 1.8 |
| Denmark | 1.8 | 0.7 |
| Other | 2.0 | 4.6 |
| Subtotal | 51.0% | 44.2% |
| Pacific | | |
| Japan | 13.9% | 15.4% |
| Australia | 4.7 | 5.7 |
| Hong Kong | 3.6 | 1.8 |
| Other | 0.4 | 1.3 |
| Subtotal | 22.6% | 24.2% |
| Emerging Markets | | |
| China | 7.8% | 4.3% |
| Brazil | 7.2 | 3.7 |
| South Korea | 1.8 | 3.1 |
| India | 1.7 | 1.8 |
| Turkey | 1.2 | 0.4 |
| Taiwan | 1.0 | 2.5 |
| Other | 2.5 | 7.4 |
| Subtotal | 23.2% | 23.2% |
| Middle East | | |
| Israel | 1.3% | 0.6% |
| North America | | |
| Canada | 1.9% | 7.8% |
13
International Growth Fund
Performance Summary
All of the returns in this report represent past performance, which is not a guarantee of future results that may be achieved by the fund. (Current performance may be lower or higher than the performance data cited. For performance data current to the most recent month-end, visit our website at vanguard.com/performance.) Note, too, that both investment returns and principal value can fluctuate widely, so an investor’s shares, when sold, could be worth more or less than their original cost. The returns shown do not reflect taxes that a shareholder would pay on fund distributions or on the sale of fund shares.
Cumulative Performance: August 31, 2000, Through August 31, 2010
Initial Investment of $10,000
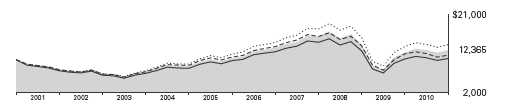
| | | | |
| | Average Annual Total Returns | |
| | Periods Ended August 31, 2010 | |
| | | | | Final Value |
| | One | Five | Ten | of a $10,000 |
| | Year | Years | Years | Investment |
| International Growth Fund Investor | | | | |
| Shares | 5.19% | 3.59% | 2.15% | $12,365 |
| MSCI All Country World Index ex USA | 3.27 | 3.78 | 3.18 | 13,680 |
| Spliced International Index | -2.67 | 0.89 | 1.07 | 11,120 |
| International Funds Average | 1.05 | 1.04 | 0.28 | 10,286 |
Spliced International Index: MSCI EAFE Index through May 31, 2010; MSCI All Country World Index ex USA thereafter.
International Funds Average: Derived from data provided by Lipper Inc.
Vanguard fund returns do not reflect the 2% fee on redemptions of shares held for less than two months.
See Financial Highlights for dividend and capital gains information.
14
International Growth Fund
| | | | |
| | | Average Annual Total Returns | |
| | | Periods Ended August 31, 2010 | |
| | | | Since | Final Value |
| | One | Five | Inception | of a $100,000 |
| | Year | Years | (8/13/2001) | Investment |
| International Growth Fund Admiral | | | | |
| Shares | 5.36% | 3.79% | 5.56% | $163,202 |
| MSCI All Country World Index ex | | | | |
| USA | 3.27 | 3.78 | 6.68 | 179,516 |
| Spliced International Index | -2.67 | 0.89 | 4.17 | 144,756 |
| "Since Inception" performance is calculated from the Admiral Shares’ inception date for both the fund and its comparative standards. |
Fiscal-Year Total Returns (%): August 31, 2000, Through August 31, 2010
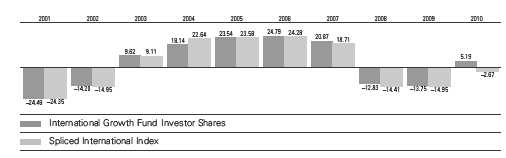
Average Annual Total Returns: Periods Ended June 30, 2010
This table presents average annual total returns through the latest calendar quarter—rather than through the end of the fiscal period. Securities and Exchange Commission rules require that we provide this information.
| | | | |
| | Inception | One | Five | Ten |
| | Date | Year | Years | Years |
| Investor Shares | 9/30/1981 | 11.86% | 3.69% | 1.14% |
| Admiral Shares | 8/13/2001 | 12.01 | 3.88 | 4.931 |
| 1 Return since inception. | | | | |
Vanguard fund returns do not reflect the 2% fee on redemptions of shares held for less than two months.
15
International Growth Fund
Financial Statements
Statement of Net Assets
As of August 31, 2010
The fund reports a complete list of its holdings in regulatory filings four times in each fiscal year, at the quarter-ends. For the second and fourth fiscal quarters, the lists appear in the fund’s semiannual and annual reports to shareholders. For the first and third fiscal quarters, the fund files the lists with the Securities and Exchange Commission on Form N-Q. Shareholders can look up the fund’s Forms N-Q on the SEC’s website at sec.gov. Forms N-Q may also be reviewed and copied at the SEC’s Public Reference Room (see the back cover of this report for further information).
| | | |
| | | | Market |
| | | | Value |
| | | Shares | ($000) |
| Common Stocks (97.4%)1 | | |
| Australia (4.4%) | | |
| | Australia & New Zealand | | |
| | Banking Group Ltd. | 8,562,878 | 173,220 |
| | Woolworths Ltd. | 5,214,600 | 128,691 |
| | Woodside Petroleum Ltd. | 2,777,000 | 103,734 |
| | Brambles Ltd. | 14,934,900 | 78,053 |
| ^ | Newcrest Mining Ltd. | 2,246,000 | 74,528 |
| ^,* | Fortescue Metals | | |
| | Group Ltd. | 13,582,674 | 57,327 |
| * | James Hardie Industries | | |
| | SE | 6,196,069 | 29,517 |
| ^ | Sims Metal | | |
| | Management Ltd. | 1,004,886 | 14,853 |
| | | | 659,923 |
| Austria (0.1%) | | |
| | Wienerberger AG | 1,720,000 | 22,174 |
| |
| Belgium (0.6%) | | |
| | Anheuser-Busch InBev | | |
| | NV | 1,730,000 | 89,873 |
| | Barco NV | 24,400 | 1,122 |
| | | | 90,995 |
| Brazil (7.1%) | | |
| | Petroleo Brasileiro | | |
| | SA ADR Type A | 7,733,400 | 228,599 |
| | Itau Unibanco Holding | | |
| | SA ADR | 8,592,375 | 185,338 |
| | Itau Unibanco Holding | | |
| | SA Prior Pfd. | 8,226,490 | 175,936 |
| | BM&FBovespa SA | 17,436,600 | 126,586 |
| | Vale SA Class B Pfd. | | |
| | ADR | 3,641,900 | 86,022 |
| * | OGX Petroleo e | | |
| | Gas Participacoes SA | 7,117,200 | 84,859 |
| | | |
| | | | Market |
| | | | Value |
| | | Shares | ($000) |
| | Cia Brasileira de | | |
| | Distribuicao Grupo Pao | | |
| | de Acucar ADR | 636,426 | 44,817 |
| | Banco do Brasil SA | 1,522,467 | 24,602 |
| | Vale SA Prior Pfd. | 1,035,000 | 24,298 |
| | Redecard SA | 1,679,000 | 23,145 |
| | Petroleo Brasileiro SA | | |
| | Prior Pfd. | 1,515,000 | 22,342 |
| | B2W Cia Global | | |
| | Do Varejo | 1,063,000 | 16,972 |
| | Fibria Celulose SA | 716,170 | 10,961 |
| | | | 1,054,477 |
| Canada (1.9%) | | |
| | Suncor Energy Inc. | 3,827,000 | 115,957 |
| | Niko Resources Ltd. | 799,600 | 78,921 |
| | Teck Resources Ltd. | | |
| | Class B | 1,938,000 | 64,827 |
| | Sherritt | | |
| | International Corp. | 2,300,000 | 14,775 |
| | Harry Winston | | |
| | Diamond Corp. | 732,000 | 7,366 |
| | | | 281,846 |
| China (7.7%) | | |
| * | Baidu Inc. ADR | 4,050,000 | 317,642 |
| | China Resources | | |
| | Enterprise Ltd. | 28,546,000 | 119,247 |
| | Ping An Insurance | | |
| | Group Co. of China Ltd. | 13,269,500 | 109,772 |
| | Tencent Holdings Ltd. | 5,691,000 | 104,357 |
| * | Ctrip.com | | |
| | International Ltd. ADR | 2,177,400 | 88,163 |
| | China | | |
| | Merchants Holdings | | |
| | International Co. Ltd. | 25,280,029 | 85,387 |
| | CNOOC Ltd. | 44,035,000 | 74,987 |
| * | Agricultural Bank of | | |
| | China Ltd. | 155,679,000 | 70,447 |
16
International Growth Fund
| | | |
| | | Market |
| | | Value |
| | Shares | ($000) |
| ^ | Dongfang | | |
| Electric Corp. Ltd. | 17,496,400 | 63,771 |
| China Merchants | | |
| Bank Co. Ltd. | 18,899,500 | 48,952 |
| Beijing Enterprises | | |
| Holdings Ltd. | 4,379,500 | 30,912 |
| ^ | Chaoda | | |
| Modern Agriculture | | |
| Holdings Ltd. | 23,000,719 | 17,152 |
| Ports Design Ltd. | 4,958,000 | 12,169 |
| | | 1,142,958 |
| Denmark (1.8%) | | |
| Novo Nordisk A/S | | |
| Class B | 1,135,200 | 97,288 |
| Novozymes A/S | 634,400 | 74,330 |
| * | Vestas Wind Systems A/S | 1,653,736 | 61,389 |
| AP Moller - Maersk A/S | | |
| Class B | 3,750 | 28,151 |
| | | 261,158 |
| France (7.0%) | | |
| Cie Generale d’Optique | | |
| Essilor International SA | 3,107,800 | 188,340 |
| PPR | 1,142,265 | 148,207 |
| GDF Suez | 3,926,000 | 121,123 |
| L’Oreal SA | 901,231 | 89,413 |
| BNP Paribas | 1,415,000 | 88,017 |
| Schneider Electric SA | 764,000 | 80,672 |
| ArcelorMittal | 2,678,000 | 77,753 |
| Vallourec SA | 785,750 | 67,188 |
| European Aeronautic | | |
| Defence and | | |
| Space Co. NV | 1,720,000 | 37,755 |
| Publicis Groupe SA | 865,000 | 36,138 |
| Total SA | 620,000 | 28,870 |
| Danone | 492,000 | 26,374 |
| Societe Generale | 500,000 | 25,285 |
| CFAO SA | 728,105 | 22,075 |
| | | 1,037,210 |
| Germany (5.7%) | | |
| SAP AG | 3,435,400 | 149,454 |
| Adidas AG | 2,307,810 | 117,133 |
| Siemens AG | 1,235,000 | 112,013 |
| Fresenius Medical Care | | |
| AG & Co. KGaA | 1,756,000 | 99,156 |
| Linde AG | 713,000 | 79,921 |
| Porsche Automobil | | |
| Holding SE Prior Pfd. | 994,400 | 46,156 |
| ThyssenKrupp AG | 1,688,000 | 45,848 |
| GEA Group AG | 2,097,000 | 43,435 |
| Symrise AG | 1,495,000 | 36,844 |
| ^,* | TUI AG | 3,575,300 | 35,929 |
| Wincor Nixdorf AG | 573,283 | 33,264 |
| E.ON AG | 800,000 | 22,401 |
| | | |
| | | | Market |
| | | | Value |
| | | Shares | ($000) |
| | Celesio AG | 856,571 | 17,326 |
| ^,* | Q-Cells SE | 986,500 | 6,348 |
| | | | 845,228 |
| Hong Kong (3.6%) | | |
| | Swire Pacific Ltd. | 12,636,000 | 152,480 |
| | Jardine Matheson | | |
| | Holdings Ltd. | 3,111,600 | 135,258 |
| | Sun Hung Kai | | |
| | Properties Ltd. | 5,331,000 | 75,152 |
| | Hong Kong Exchanges | | |
| | and Clearing Ltd. | 4,514,200 | 70,995 |
| | Li & Fung Ltd. | 10,292,000 | 52,311 |
| ^ | Techtronic Industries Co. | 25,499,943 | 22,163 |
| | Esprit Holdings Ltd. | 3,519,605 | 19,891 |
| | | | 528,250 |
| India (1.7%) | | |
| | Housing Development | | |
| | Finance Corp. | 7,063,700 | 94,343 |
| | Tata Motors Ltd. | 3,981,000 | 85,383 |
| | HDFC Bank Ltd. | 1,036,000 | 46,980 |
| * | Reliance Capital Ltd. | 1,454,500 | 23,509 |
| | | | 250,215 |
| Indonesia (0.4%) | | |
| | Telekomunikasi Indonesia | | |
| | Tbk PT | 64,030,000 | 61,247 |
| |
| Ireland (0.2%) | | |
| | Kerry Group PLC Class A | 925,000 | 30,345 |
| |
| Israel (1.3%) | | |
| | Teva Pharmaceutical | | |
| | Industries Ltd. ADR | 3,712,900 | 187,798 |
| |
| Italy (0.4%) | | |
| | Intesa Sanpaolo SPA | | |
| | (Registered) | 18,981,662 | 52,898 |
| |
| Japan (13.3%) | | |
| | Canon Inc. | 6,407,100 | 261,823 |
| | Honda Motor Co. Ltd. | 6,216,500 | 204,916 |
| | Mitsubishi Corp. | 9,482,800 | 203,940 |
| | Nintendo Co. Ltd. | 570,100 | 158,202 |
| | Rakuten Inc. | 199,916 | 151,517 |
| | Unicharm Corp. | 972,000 | 118,435 |
| | Bridgestone Corp. | 6,451,000 | 111,721 |
| | SMC Corp. | 756,400 | 93,027 |
| * | Yamaha Motor Co. Ltd. | 5,710,000 | 76,908 |
| | Sekisui Chemical Co. Ltd. | 12,557,000 | 73,786 |
| | Japan Tobacco Inc. | 23,355 | 72,439 |
| | Yamada Denki Co. Ltd. | 1,023,570 | 63,692 |
| | Sony Corp. | 2,081,200 | 58,251 |
| | Sony Financial | | |
| | Holdings Inc. | 17,589 | 57,729 |
17
International Growth Fund
| | | |
| | | | Market |
| | | | Value |
| | | Shares | ($000) |
| | Hoya Corp. | 2,310,700 | 50,902 |
| | THK Co. Ltd. | 2,809,900 | 46,161 |
| | Rohm Co. Ltd. | 589,500 | 35,484 |
| | Sysmex Corp. | 540,000 | 34,204 |
| | Toyota Motor Corp. | 890,000 | 30,203 |
| | Kyocera Corp. | 347,900 | 29,476 |
| | Astellas Pharma Inc. | 810,000 | 27,944 |
| | Trend Micro Inc. | 695,000 | 18,803 |
| | | | 1,979,563 |
| Luxembourg (0.1%) | | |
| * | Reinet Investments SCA | 542,339 | 7,904 |
| |
| Mexico (0.4%) | | |
| | Wal-Mart de Mexico SAB | | |
| | de CV | 16,400,000 | 36,666 |
| | Consorcio ARA SAB | | |
| | de CV | 30,500,000 | 17,584 |
| | | | 54,250 |
| Netherlands (2.2%) | | |
| * | ING Groep NV | 17,936,000 | 158,578 |
| | Unilever NV | 5,485,000 | 146,542 |
| ^ | TNT NV | 1,173,613 | 29,664 |
| | | | 334,784 |
| Norway (0.5%) | | |
| | DnB NOR ASA | 4,178,776 | 45,966 |
| | Statoil ASA | 1,225,000 | 22,932 |
| | | | 68,898 |
| Peru (0.4%) | | |
| | Credicorp Ltd. | 585,600 | 61,634 |
| |
| Russia (0.2%) | | |
| | Gazprom OAO ADR | 1,613,100 | 33,166 |
| |
| Singapore (0.4%) | | |
| | Singapore Exchange Ltd. | 6,541,000 | 36,368 |
| | DBS Group Holdings Ltd. | 2,502,686 | 25,721 |
| | | | 62,089 |
| South Africa (0.6%) | | |
| | Impala Platinum | | |
| | Holdings Ltd. | 1,778,600 | 41,841 |
| | Sasol Ltd. | 620,000 | 23,552 |
| | MTN Group Ltd. | 1,330,000 | 21,677 |
| | | | 87,070 |
| South Korea (1.8%) | | |
| | Samsung | | |
| | Electronics Co. Ltd. | 276,000 | 174,511 |
| | Shinhan Financial | | |
| | Group Co. Ltd. | 2,047,000 | 78,231 |
| | Hankook Tire Co. Ltd. | 880,000 | 19,167 |
| | | | 271,909 |
| | | |
| | | Market |
| | | Value |
| | Shares | ($000) |
| Spain (2.5%) | | |
| Banco Santander SA | 18,877,667 | 220,632 |
| Inditex SA | 2,217,885 | 147,639 |
| | | 368,271 |
| Sweden (3.6%) | | |
| Atlas Copco AB Class A | 15,095,533 | 228,624 |
| Sandvik AB | 10,514,363 | 124,125 |
| Svenska Handelsbanken | | |
| AB Class A | 3,672,206 | 95,573 |
| Telefonaktiebolaget LM | | |
| Ericsson Class B | 3,700,000 | 35,800 |
| Oriflame Cosmetics SA | 575,000 | 30,038 |
| Alfa Laval AB | 1,840,254 | 26,780 |
| | | 540,940 |
| Switzerland (6.8%) | | |
| Novartis AG | 5,830,000 | 305,794 |
| Cie Financiere Richemont | | |
| SA | 3,635,300 | 140,856 |
| Credit Suisse Group AG | 2,647,000 | 115,652 |
| Syngenta AG | 399,100 | 91,924 |
| Geberit AG | 494,180 | 79,468 |
| GAM Holding Ltd. | 5,635,087 | 70,064 |
| ABB Ltd. | 2,863,100 | 55,243 |
| Nestle SA | 780,000 | 40,339 |
| Roche Holding AG | 275,000 | 37,356 |
| Zurich Financial Services | | |
| AG | 154,000 | 34,300 |
| Holcim Ltd. | 535,000 | 32,056 |
| | | 1,003,052 |
| Taiwan (1.0%) | | |
| Taiwan Semiconductor | | |
| Manufacturing Co. Ltd. | 37,122,508 | 68,053 |
| AU Optronics Corp. ADR | 7,662,095 | 65,970 |
| Compal Electronics Inc. | 18,353,304 | 20,596 |
| | | 154,619 |
| Thailand (0.5%) | | |
| Kasikornbank PCL | 19,719,000 | 68,461 |
| Kasikornbank PCL | | |
| (Foreign) | 1,762,100 | 6,428 |
| | | 74,889 |
| Turkey (1.2%) | | |
| Turkiye Garanti Bankasi | | |
| AS | 35,984,000 | 173,254 |
| |
| United Kingdom (18.0%) | | |
| BG Group PLC | 18,904,213 | 304,543 |
| Tesco PLC | 36,405,778 | 227,348 |
| Standard Chartered PLC | 8,080,300 | 215,593 |
| Rio Tinto PLC | 4,153,000 | 209,524 |
| BHP Billiton PLC | 6,822,700 | 190,907 |
18
International Growth Fund
| | | |
| | | | Market |
| | | | Value |
| | | Shares | ($000) |
| | British American Tobacco | |
| | PLC | 4,963,464 | 168,785 |
| * | Lloyds Banking Group | | |
| | PLC | 143,770,785 | 153,516 |
| | Vodafone Group PLC | 63,449,665 | 153,239 |
| | Rolls-Royce Group PLC | 13,797,616 | 116,955 |
| | SABMiller PLC | 3,960,000 | 112,899 |
| | Kingfisher PLC | 32,849,000 | 102,722 |
| | Prudential PLC | 10,627,000 | 92,348 |
| | Eurasian Natural | | |
| | Resources Corp. PLC | 5,739,000 | 74,340 |
| | AMEC PLC | 5,048,764 | 70,716 |
| | Sage Group PLC | 16,690,000 | 62,735 |
| | Meggitt PLC | 14,917,500 | 60,685 |
| * | Signet Jewelers Ltd. | 1,356,000 | 35,781 |
| * | Autonomy Corp. PLC | 1,423,100 | 33,949 |
| | GlaxoSmithKline PLC | 1,810,000 | 33,915 |
| | G4S PLC | 8,600,000 | 33,311 |
| | Ultra Electronics | | |
| | Holdings PLC | 1,280,000 | 32,698 |
| | HSBC Holdings PLC | 3,229,512 | 31,818 |
| | Unilever PLC | 1,190,000 | 31,449 |
| | Carnival PLC | 920,000 | 29,784 |
| | Victrex PLC | 1,706,167 | 28,104 |
| | Intertek Group PLC | 1,047,522 | 26,988 |
| | Inchcape PLC | 6,480,000 | 25,334 |
| | BAE Systems PLC | 3,162,777 | 14,304 |
| | | | 2,674,290 |
| Total Common Stocks | | |
| (Cost $13,420,186) | | 14,457,304 |
| Temporary Cash Investments (3.3%)1 | |
| Money Market Fund (3.0%) | | |
| 2,3 | Vanguard Market | | |
| | Liquidity Fund, | | |
| | 0.288% | 450,667,752 | 450,668 |
| | | |
| | | Face | Market |
| | | Amount | Value |
| | | ($000) | ($000) |
| U.S. Government and Agency Obligations (0.3%) |
| 4,5 | Fannie Mae | | |
| | Discount Notes, | | |
| | 0.280%, 12/15/10 | 5,000 | 4,997 |
| 4,5 | Fannie Mae | | |
| | Discount Notes, | | |
| | 0.320%, 12/20/10 | 10,000 | 9,993 |
| 4,5 | Fannie Mae | | |
| | Discount Notes, | | |
| | 0.240%, 2/16/11 | 5,000 | 4,995 |
| 4,5 | Fannie Mae | | |
| | Discount Notes, | | |
| | 0.320%, 3/1/11 | 1,000 | 999 |
| 4 | Federal Home Loan Bank | | |
| | Discount Notes, 0.300%, | | |
| | 11/19/10 | 2,000 | 1,999 |
| 4 | Freddie Mac | | |
| | Discount Notes, | | |
| | 0.320%, 9/7/10 | 1,500 | 1,500 |
| 4 | Freddie Mac | | |
| | Discount Notes, | | |
| | 0.320%, 12/15/10 | 3,000 | 2,998 |
| 4 | Freddie Mac | | |
| | Discount Notes, | | |
| | 0.340%, 12/17/10 | 2,500 | 2,498 |
| 4,5 | Freddie Mac | | |
| | Discount Notes, | | |
| | 0.280%, 2/1/11 | 5,000 | 4,995 |
| 4,5 | Freddie Mac | | |
| | Discount Notes, | | |
| | 0.295%, 3/31/11 | 5,000 | 4,993 |
| | | | 39,967 |
| Total Temporary Cash Investments | |
| (Cost $490,626) | | 490,635 |
| Total Investments (100.7%) | | |
| (Cost $13,910,812) | | 14,947,939 |
| Other Assets and Liabilities (-0.7%) | |
| Other Assets | | 100,342 |
| Liabilities3 | | (202,262) |
| | | | (101,920) |
| Net Assets (100%) | | 14,846,019 |
19
International Growth Fund
| |
| At August 31, 2010, net assets consisted of: |
| | Amount |
| | ($000) |
| Paid-in Capital | 16,843,340 |
| Undistributed Net Investment Income | 181,439 |
| Accumulated Net Realized Losses | (3,224,734) |
| Unrealized Appreciation (Depreciation) | |
| Investment Securities | 1,037,127 |
| Futures Contracts | (1,178) |
| Foreign Currencies and | |
| Forward Currency Contracts | 10,025 |
| Net Assets | 14,846,019 |
| |
| |
| Investor Shares—Net Assets | |
| Applicable to 644,798,883 outstanding | |
| $.001 par value shares of beneficial | |
| interest (unlimited authorization) | 10,493,324 |
| Net Asset Value Per Share— | |
| Investor Shares | $16.27 |
| |
| |
| Admiral Shares—Net Assets | |
| Applicable to 84,020,366 outstanding | |
| $.001 par value shares of beneficial | |
| interest (unlimited authorization) | 4,352,695 |
| Net Asset Value Per Share— | |
| Admiral Shares | $51.81 |
See Note A in Notes to Financial Statements.
^ Part of security position is on loan to broker-dealers. The total value of securities on loan is $81,436,000.
* Non-income-producing security.
1 The fund invests a portion of its cash reserves in equity markets through the use of index futures contracts. After giving effect to futures investments, the fund’s effective common stock and temporary cash investment positions represent 99.4% and 1.3%, respectively, of net assets.
2 Affiliated money market fund available only to Vanguard funds and certain trusts and accounts managed by Vanguard. Rate shown is the 7-day yield.
3 Includes $86,453,000 of collateral received for securities on loan.
4 The issuer operates under a congressional charter; its securities are not backed by the full faith and credit of the U.S. government.
5 Securities with a value of $22,478,000 have been segregated as initial margin for open futures contracts.
ADR—American Depositary Receipt.
See accompanying Notes, which are an integral part of the Financial Statements.
20
| | |
| International Growth Fund | |
| |
| |
| Statement of Operations | |
| |
| | Year Ended |
| | | August 31, 2010 |
| | ($000) |
| Investment Income | |
| Income | |
| Dividends1 | 331,614 |
| Interest2 | 1,331 |
| Security Lending | 8,818 |
| Total Income | 341,763 |
| Expenses | |
| Investment Advisory Fees—Note B | |
| Basic Fee | 19,219 |
| Performance Adjustment | 4,340 |
| The Vanguard Group—Note C | |
| Management and Administrative—Investor Shares | 32,370 |
| Management and Administrative—Admiral Shares | 6,140 |
| Marketing and Distribution—Investor Shares | 2,451 |
| Marketing and Distribution—Admiral Shares | 912 |
| Custodian Fees | 2,599 |
| Auditing Fees | 38 |
| Shareholders’ Reports—Investor Shares | 362 |
| Shareholders’ Reports—Admiral Shares | 45 |
| Trustees’ Fees and Expenses | 33 |
| Total Expenses | 68,509 |
| Expenses Paid Indirectly | (175) |
| Net Expenses | 68,334 |
| Net Investment Income | 273,429 |
| Realized Net Gain (Loss) | |
| Investment Securities Sold | (43,612) |
| Futures Contracts | 54,532 |
| Foreign Currencies and Forward Currency Contracts | (10,958) |
| Realized Net Gain (Loss) | (38) |
| Change in Unrealized Appreciation (Depreciation) | |
| Investment Securities | 507,861 |
| Futures Contracts | (61,485) |
| Foreign Currencies and Forward Currency Contracts | (4,800) |
| Change in Unrealized Appreciation (Depreciation) | 441,576 |
| Net Increase (Decrease) in Net Assets Resulting from Operations | 714,967 |
1 Dividends are net of foreign withholding taxes of $19,697,000.
2 Interest income from an affiliated company of the fund was $1,194,000.
See accompanying Notes, which are an integral part of the Financial Statements.
21
| | |
| International Growth Fund | | |
| |
| |
| Statement of Changes in Net Assets | | |
| |
| | Year Ended August 31, |
| | 2010 | 2009 |
| | ($000) | ($000) |
| Increase (Decrease) in Net Assets | | |
| Operations | | |
| Net Investment Income | 273,429 | 331,879 |
| Realized Net Gain (Loss) | (38) | (3,200,301) |
| Change in Unrealized Appreciation (Depreciation) | 441,576 | 444,595 |
| Net Increase (Decrease) in Net Assets Resulting from Operations | 714,967 | (2,423,827) |
| Distributions | | |
| Net Investment Income | | |
| Investor Shares | (186,646) | (320,390) |
| Admiral Shares | (79,427) | (134,624) |
| Realized Capital Gain | | |
| Investor Shares | — | (514,799) |
| Admiral Shares | — | (202,398) |
| Total Distributions | (266,073) | (1,172,211) |
| Capital Share Transactions | | |
| Investor Shares | (55,225) | 792,137 |
| Admiral Shares | 291,731 | 150,634 |
| Net Increase (Decrease) from Capital Share Transactions | 236,506 | 942,771 |
| Total Increase (Decrease) | 685,400 | (2,653,267) |
| Net Assets | | |
| Beginning of Period | 14,160,619 | 16,813,886 |
| End of Period1 | 14,846,019 | 14,160,619 |
| 1 Net Assets—End of Period includes undistributed net investment income of $181,439,000 and $179,384,000. | |
See accompanying Notes, which are an integral part of the Financial Statements.
22
| | | | | |
| International Growth Fund | | | | | |
| |
| |
| Financial Highlights | | | | | |
| |
| Investor Shares | | | | | |
| |
| For a Share Outstanding | | | | Year Ended August 31, |
| Throughout Each Period | 2010 | 2009 | 2008 | 2007 | 2006 |
| Net Asset Value, Beginning of Period | $15.73 | $20.43 | $26.13 | $23.97 | $19.83 |
| Investment Operations | | | | | |
| Net Investment Income | .291 | .3981 | .473 | .594 | .541 |
| Net Realized and Unrealized Gain (Loss) | | | | | |
| on Investments | .535 | (3.633) | (3.431) | 4.132 | 4.284 |
| Total from Investment Operations | .826 | (3.235) | (2.958) | 4.726 | 4.825 |
| Distributions | | | | | |
| Dividends from Net Investment Income | (.286) | (.562) | (.528) | (.530) | (.370) |
| Distributions from Realized Capital Gains | — | (.903) | (2.214) | (2.036) | (.315) |
| Total Distributions | (.286) | (1.465) | (2.742) | (2.566) | (.685) |
| Net Asset Value, End of Period | $16.27 | $15.73 | $20.43 | $26.13 | $23.97 |
| |
| Total Return2 | 5.19% | -13.75% | -12.83% | 20.87% | 24.79% |
| |
| Ratios/Supplemental Data | | | | | |
| Net Assets, End of Period (Millions) | $10,493 | $10,226 | $11,969 | $13,219 | $10,466 |
| Ratio of Total Expenses to | | | | | |
| Average Net Assets3 | 0.49% | 0.53% | 0.47% | 0.51% | 0.55% |
| Ratio of Net Investment Income to | | | | | |
| Average Net Assets | 1.74% | 2.84%1 | 2.07% | 2.47% | 2.52% |
| Portfolio Turnover Rate | 44% | 51% | 55% | 41% | 45% |
1 Net investment income per share and the ratio of net investment income to average net assets include $0.061 and 0.48%, respectively, resulting from income accrued in connection with a spinoff in October 2008 by Reinet Investments SA of British American Tobacco PLC.
2 Total returns do not include transaction or account service fees that may have applied in the periods shown. Fund prospectuses provide information about any applicable transaction and account service fees.
3 Includes performance-based investment advisory fee increases (decreases) of 0.03%, 0.03%, 0.02%, 0.01%, and (0.01%).
See accompanying Notes, which are an integral part of the Financial Statements.
23
| | | | | |
| International Growth Fund | | | | | |
| |
| |
| Financial Highlights | | | | | |
| |
| Admiral Shares | | | | | |
| |
| For a Share Outstanding | | | | Year Ended August 31, |
| Throughout Each Period | 2010 | 2009 | 2008 | 2007 | 2006 |
| Net Asset Value, Beginning of Period | $50.08 | $65.09 | $83.26 | $76.36 | $63.15 |
| Investment Operations | | | | | |
| Net Investment Income | 1.009 | 1.3401 | 1.649 | 2.051 | 1.861 |
| Net Realized and Unrealized Gain (Loss) | | | | | |
| on Investments | 1.708 | (11.571) | (10.929) | 13.159 | 13.639 |
| Total from Investment Operations | 2.717 | (10.231) | (9.280) | 15.210 | 15.500 |
| Distributions | | | | | |
| Dividends from Net Investment Income | (.987) | (1.909) | (1.845) | (1.832) | (1.288) |
| Distributions from Realized Capital Gains | — | (2.870) | (7.045) | (6.478) | (1.002) |
| Total Distributions | (.987) | (4.779) | (8.890) | (8.310) | (2.290) |
| Net Asset Value, End of Period | $51.81 | $50.08 | $65.09 | $83.26 | $76.36 |
| |
| Total Return2 | 5.36% | -13.57% | -12.67% | 21.11% | 25.03% |
| |
| Ratios/Supplemental Data | | | | | |
| Net Assets, End of Period (Millions) | $4,353 | $3,934 | $4,845 | $5,060 | $3,506 |
| Ratio of Total Expenses to | | | | | |
| Average Net Assets3 | 0.33% | 0.34% | 0.28% | 0.31% | 0.35% |
| Ratio of Net Investment Income to | | | | | |
| Average Net Assets | 1.90% | 3.03%1 | 2.26% | 2.67% | 2.72% |
| Portfolio Turnover Rate | 44% | 51% | 55% | 41% | 45% |
1 Net investment income per share and the ratio of net investment income to average net assets include $0.194 and 0.48%, respectively, resulting from income accrued in connection with a spinoff in October 2008 by Reinet Investments SA of British American Tobacco PLC.
2 Total returns do not include transaction fees that may have applied in the periods shown. Fund prospectuses provide information about any applicable transaction fees.
3 Includes performance-based investment advisory fee increases (decreases) of 0.03%, 0.03%, 0.02%, 0.01%, and (0.01%).
See accompanying Notes, which are an integral part of the Financial Statements.
24
International Growth Fund
Notes to Financial Statements
Vanguard International Growth Fund is registered under the Investment Company Act of 1940 as an open-end investment company, or mutual fund. The fund invests in securities of foreign issuers, which may subject it to investment risks not normally associated with investing in securities of U.S. corporations. The fund offers two classes of shares: Investor Shares and Admiral Shares. Investor Shares are available to any investor who meets the fund’s minimum purchase requirements. Admiral Shares are designed for investors who meet certain administrative, service, and account-size criteria.
A. The following significant accounting policies conform to generally accepted accounting principles for U.S. mutual funds. The fund consistently follows such policies in preparing its financial statements.
1. Security Valuation: Securities are valued as of the close of trading on the New York Stock Exchange (generally 4 p.m., Eastern time) on the valuation date. Equity securities are valued at the latest quoted sales prices or official closing prices taken from the primary market in which each security trades; such securities not traded on the valuation date are valued at the mean of the latest quoted bid and asked prices. Securities for which market quotations are not readily available, or whose values have been affected by events occurring before the fund’s pricing time but after the close of the securities’ primary markets, are valued at their fair values calculated according to procedures adopted by the board of trustees. These procedures include obtaining quotations from an independent pricing service, monitoring news to identify significant market- or security-specific events, and evaluating changes in the values of foreign market proxies (for example, ADRs, futures contracts, or exchange-traded funds), between the time the foreign markets close and the fund’s pricing time. When fair-value pricing is employed, the prices of securities used by a fund to calculate its net asset value may differ from quoted or published prices for the same securities. Investments in Vanguard Market Liquidity Fund are valued at that fund’s net asset value. Temporary cash investments acquired over 60 days to maturity are valued using the latest bid prices or using valuations based on a matrix system (which considers such factors as security prices, yields, maturities, and ratings), both as furnished by independent pricing services. Other temporary cash investments are valued at amortized cost, which approximates market value.
2. Foreign Currency: Securities and other assets and liabilities denominated in foreign currencies are translated into U.S. dollars using exchange rates obtained from an independent third party as of the fund’s pricing time on the valuation date. Realized gains (losses) and unrealized appreciation (depreciation) on investment securities include the effects of changes in exchange rates since the securities were purchased, combined with the effects of changes in security prices. Fluctuations in the value of other assets and liabilities resulting from changes in exchange rates are recorded as unrealized foreign currency gains (losses) until the assets or liabilities are settled in cash, at which time they are recorded as realized foreign currency gains (losses).
3. Futures and Forward Currency Contracts: The fund uses index futures contracts to a limited extent, with the objective of maintaining full exposure to the stock market while maintaining liquidity. The fund may purchase or sell futures contracts to achieve a desired level of investment, whether to accommodate portfolio turnover or cash flows from capital share transactions. The primary risks associated with the use of futures contracts are imperfect correlation between changes in market values of stocks held by the fund and the prices of futures contracts, and the possibility of an illiquid market.
The fund may also enter into forward currency contracts to provide the appropriate currency exposure related to any open futures contracts or to protect the value of securities and related receivables and payables against changes in foreign exchange rates. The primary risk associated with the fund’s use
25
International Growth Fund
of these contracts is that a counterparty will fail to fulfill its obligation to pay gains due to the fund under the contracts. Counterparty risk is mitigated by entering into forward currency contracts only with highly rated counterparties, by a master netting arrangement between the fund and the counterparty, and by the posting of collateral by the counterparty. The forward currency contracts contain provisions whereby a counterparty may terminate open contracts if the fund’s net assets decline below a certain level, triggering a payment by the fund if the fund is in a net liability position at the time of the termination. The payment amount would be reduced by any collateral the fund has posted. Any securities posted as collateral for open contracts are noted in the Statement of Net Assets.
Futures and forward currency contracts are valued at their quoted daily settlement prices. The aggregate principal amounts of the contracts are not recorded in the Statement of Net Assets. Fluctuations in the value of the contracts are recorded in the Statement of Net Assets as an asset (liability) and in the Statement of Operations as unrealized appreciation (depreciation) until the contracts are closed, when they are recorded as realized gains (losses) on futures or forward currency contracts.
4. Federal Income Taxes: The fund intends to continue to qualify as a regulated investment company and distribute all of its taxable income. Management has analyzed the fund’s tax positions taken for all open federal income tax years (August 31, 2007–2010), and has concluded that no provision for federal income tax is required in the fund’s financial statements.
5. Distributions: Distributions to shareholders are recorded on the ex-dividend date.
6. Security Lending: The fund may lend its securities to qualified institutional borrowers to earn additional income. Security loans are required to be secured at all times by collateral at least equal to the market value of securities loaned. The fund invests cash collateral received in Vanguard Market Liquidity Fund, and records a liability for the return of the collateral, during the period the securities are on loan. Security lending income represents the income earned on investing cash collateral, less expenses associated with the loan.
7. Other: Dividend income is recorded on the ex-dividend date. Interest income includes income distributions received from Vanguard Market Liquidity Fund and is accrued daily. Security transactions are accounted for on the date securities are bought or sold. Costs used to determine realized gains (losses) on the sale of investment securities are those of the specific securities sold. Fees assessed on redemptions of capital shares are credited to paid-in capital.
Each class of shares has equal rights as to assets and earnings, except that each class separately bears certain class-specific expenses related to maintenance of shareholder accounts (included in Management and Administrative expenses) and shareholder reporting. Marketing and distribution expenses are allocated to each class of shares based on a method approved by the board of trustees. Income, other non-class-specific expenses, and gains and losses on investments are allocated to each class of shares based on its relative net assets.
B. Schroder Investment Management North America Inc., Baillie Gifford Overseas Ltd., and M&G Investment Management Ltd. each provide investment advisory services to a portion of the fund for a fee calculated at an annual percentage rate of average net assets managed by the advisor. The basic fees of Schroder Investment Management North America Inc. and Baillie Gifford Overseas Ltd. are
26
International Growth Fund
subject to quarterly adjustments based on performance for the preceding three years relative to the Morgan Stanley Capital International Europe, Australasia, Far East Index. The basic fee of M&G Investment Management Ltd. is subject to quarterly adjustments based on the fund’s performance since February 29, 2008, relative to the MSCI All Country World Index excluding USA.
The Vanguard Group manages the cash reserves of the fund on an at-cost basis.
For the year ended August 31, 2010, the aggregate investment advisory fee represented an effective annual basic rate of 0.13% of the fund’s average net assets, before an increase of $4,340,000 (0.03%) based on performance.
C. The Vanguard Group furnishes at cost corporate management, administrative, marketing, and distribution services. The costs of such services are allocated to the fund under methods approved by the board of trustees. The fund has committed to provide up to 0.40% of its net assets in capital contributions to Vanguard. At August 31, 2010, the fund had contributed capital of $2,880,000 to Vanguard (included in Other Assets), representing 0.02% of the fund’s net assets and 1.15% of Vanguard’s capitalization. The fund’s trustees and officers are also directors and officers of Vanguard.
D. The fund has asked its investment advisors to direct certain security trades, subject to obtaining the best price and execution, to brokers who have agreed to rebate to the fund part of the commissions generated. Such rebates are used solely to reduce the fund’s management and administrative expenses. For the year ended August 31, 2010, these arrangements reduced the fund’s expenses by $175,000 (an annual rate of 0.00% of average net assets).
E. Various inputs may be used to determine the value of the fund’s investments. These inputs are summarized in three broad levels for financial statement purposes. The inputs or methodologies used to value securities are not necessarily an indication of the risk associated with investing in those securities.
Level 1—Quoted prices in active markets for identical securities.
Level 2—Other significant observable inputs (including quoted prices for similar securities, interest rates, prepayment speeds, credit risk, etc.).
Level 3—Significant unobservable inputs (including the fund’s own assumptions used to determine the fair value of investments).
The following table summarizes the fund’s investments as of August 31, 2010, based on the inputs used to value them:
| | | |
| | Level 1 | Level 2 | Level 3 |
| Investments | ($000) | ($000) | ($000) |
| Common Stocks—North and South America | 1,452,207 | — | — |
| Common Stocks----Other | 659,574 | 12,345,523 | — |
| Temporary Cash Investments | 450,668 | 39,967 | — |
| Futures Contracts—Liabilities1 | (3,255) | — | — |
| Forward Currency Contracts—Assets | — | 10,095 | — |
| Total | 2,559,194 | 12,395,585 | — |
| 1 Represents variation margin on the last day of the reporting period. | | | |
27
International Growth Fund
F. At August 31, 2010, the fair values of derivatives were reflected in the Statement of Net Assets as follows:
| | | |
| | | Foreign | |
| | Equity | Exchange | |
| | Contracts1 | Contracts | Total |
| Statement of Net Assets Caption | ($000) | ($000) | ($000) |
| Other Assets | — | 10,095 | 10,095 |
| Liabilities | (3,255) | — | (3,255) |
| 1 Represents variation margin on the last day of the reporting period. | | | |
Realized net gain (loss) and the change in unrealized appreciation (depreciation) on derivatives for the year ended August 31, 2010, were:
| | | |
| | | Foreign | |
| | Equity | Exchange | |
| | Contracts | Contracts | Total |
| Realized Net Gain (Loss) on Derivatives | ($000) | ($000) | ($000) |
| Futures Contracts | 54,532 | — | 54,532 |
| Forward Currency Contracts | — | (5,656) | (5,656) |
| Realized Net Gain (Loss) on Derivatives | 54,532 | (5,656) | 48,876 |
| |
| Change in Unrealized Appreciation (Depreciation) on Derivatives | | | |
| Futures Contracts | (61,485) | — | (61,485) |
| Forward Currency Contracts | — | (4,317) | (4,317) |
| Change in Unrealized Appreciation (Depreciation) on Derivatives | (61,485) | (4,317) | (65,802) |
At August 31, 2010, the aggregate settlement value of open futures contracts and the related unrealized appreciation (depreciation) were:
| | | | |
| | | | | ($000) |
| | | | Aggregate | |
| | | Number of | Settlement | Unrealized |
| | | Long (Short) | Value | Appreciation |
| Futures Contracts | Expiration | Contracts | Long (Short) | (Depreciation) |
| Dow Jones EURO STOXX 50 Index | September 2010 | 3,172 | 105,423 | 135 |
| FTSE 100 Index | September 2010 | 942 | 75,305 | 2,558 |
| Topix Index | September 2010 | 731 | 69,687 | (3,991) |
| S&P ASX 200 Index | September 2010 | 412 | 40,218 | 120 |
Unrealized appreciation (depreciation) on open FTSE 100 Index futures contracts is required to be treated as realized gain (loss) for tax purposes.
28
International Growth Fund
At August 31, 2010, the fund had open forward currency contracts to receive and deliver currencies as follows. Unrealized appreciation (depreciation) on open forward currency contracts is treated as realized gain (loss) for tax purposes.
| | | | | | |
| | Contract | | | | | Appreciation |
| | Settlement | | | Contract Amount (000) | (Depreciation) |
| Counterparty | Date | | Receive | | Deliver | ($000) |
| Brown Brothers Harriman & Co. | 9/22/10 | EUR | 82,864 | USD | 105,232 | 1,905 |
| Brown Brothers Harriman & Co. | 9/15/10 | JPY | 6,186,811 | USD | 73,673 | 4,605 |
| Brown Brothers Harriman & Co. | 9/22/10 | GBP | 47,700 | USD | 73,257 | 1,848 |
| Brown Brothers Harriman & Co. | 9/22/10 | AUD | 45,911 | USD | 40,742 | 1,737 |
AUD—Australian dollar.
EUR—Euro.
GBP—British pound.
JPY—Japanese yen.
USD—U.S. dollar.
At August 31, 2010, the counterparty had deposited in a segregated account cash with a value sufficient to cover substantially all amounts due to the fund in connection with open forward currency contracts.
The fund had net unrealized foreign currency losses of $70,000 resulting from the translation of other assets and liabilities at August 31, 2010.
G. Distributions are determined on a tax basis and may differ from net investment income and realized capital gains for financial reporting purposes. Differences may be permanent or temporary. Permanent differences are reclassified among capital accounts in the financial statements to reflect their tax character. Temporary differences arise when certain items of income, expense, gain, or loss are recognized in different periods for financial statement and tax purposes; these differences will reverse at some time in the future. Differences in classification may also result from the treatment of short-term gains as ordinary income for tax purposes.
During the year ended August 31, 2010, the fund realized net foreign currency losses of $5,301,000, which decreased distributable net income for tax purposes; accordingly, such losses have been reclassified from accumulated net realized losses to undistributed net investment income. Certain of the fund’s investments are in securities considered to be “passive foreign investment companies,” for which any unrealized appreciation and/or realized gains are required to be included in distributable net investment income for tax purposes. Unrealized appreciation on passive foreign investment company holdings at August 31, 2010, was $22,163,000, of which $547,000 has been distributed and is reflected in the balance of undistributed net investment income.
For tax purposes, at August 31, 2010, the fund had $240,398,000 of ordinary income available for distribution. The fund had available capital loss carryforwards totaling $3,074,326,000 to offset future net capital gains of $1,198,712,000 through August 31, 2017, and $1,875,614,000 through August 31, 2018. In addition, the fund realized losses of $139,102,000 during the period from November 1, 2009, through August 31, 2010, which are deferred and will be treated as realized for tax purposes in fiscal 2011.
29
International Growth Fund
At August 31, 2010, the cost of investment securities for tax purposes was $13,932,975,000. Net unrealized appreciation of investment securities for tax purposes was $1,014,964,000, consisting of unrealized gains of $2,209,038,000 on securities that had risen in value since their purchase and $1,194,074,000 in unrealized losses on securities that had fallen in value since their purchase.
H. During the year ended August 31, 2010, the fund purchased $6,957,171,000 of investment securities and sold $6,331,251,000 of investment securities, other than temporary cash investments.
| | | | | |
| | | | |
| I. Capital share transactions for each class of shares were: | | | |
| | | | Year Ended August 31, |
| | | 2010 | | | 2009 |
| | Amount | Shares | Amount | Shares |
| | ($000) | (000) | ($000) | (000) |
| Investor Shares | | | | |
| Issued | 1,854,437 | 110,882 | 1,791,374 | 133,321 |
| Issued in Lieu of Cash Distributions | 182,857 | 10,852 | 819,473 | 67,224 |
| Redeemed1 | (2,092,519) | (126,909) | (1,818,710) | (136,394) |
| Net Increase (Decrease)—Investor Shares | (55,225) | (5,175) | 792,137 | 64,151 |
| Admiral Shares | | | | |
| Issued | 953,163 | 17,988 | 676,458 | 16,117 |
| Issued in Lieu of Cash Distributions | 72,968 | 1,361 | 312,461 | 8,068 |
| Redeemed1 | (734,400) | (13,893) | (838,285) | (20,055) |
| Net Increase (Decrease)—Admiral Shares | 291,731 | 5,456 | 150,634 | 4,130 |
| 1 Net of redemption fees for fiscal 2010 and 2009 of $801,000 and $888,000, respectively (fund totals). | | |
J. In preparing the financial statements as of August 31, 2010, management considered the impact of subsequent events for potential recognition or disclosure in these financial statements.
30
Report of Independent Registered Public Accounting Firm
To the Trustees of Vanguard World Fund and the Shareholders of Vanguard International Growth Fund:
In our opinion, the accompanying statement of net assets and the related statements of operations and of changes in net assets and the financial highlights present fairly, in all material respects, the financial position of Vanguard International Growth Fund (constituting a separate portfolio of Vanguard World Fund, hereafter referred to as the “Fund”) at August 31, 2010, the results of its operations for the year then ended, the changes in its net assets for each of the two years in the period then ended and the financial highlights for each of the five years in the period then ended, in conformity with accounting principles generally accepted in the United States of America. These financial statements and financial highlights (hereafter referred to as “financial statements”) are the responsibility of the Fund’s management; our responsibility is to express an opinion on these financial statements based on our audits. We conducted o ur audits of these financial statements in accordance with the standards of the Public Company Accounting Oversight Board (United States). Those standards require that we plan and perform the audit to obtain reasonable assurance about whether the financial statements are free of material misstatement. An audit includes examining, on a test basis, evidence supporting the amounts and disclosures in the financial statements, assessing the accounting principles used and significant estimates made by management, and evaluating the overall financial statement presentation. We believe that our audits, which included confirmation of securities at August 31, 2010 by correspondence with the custodian and brokers and by agreement to the underlying ownership records of Vanguard Market Liquidity Fund, provide a reasonable basis for our opinion.
PricewaterhouseCoopers LLP
Philadelphia, Pennsylvania
October 11, 2010

Special 2010 tax information (unaudited) for Vanguard International Growth Fund
This information for the fiscal year ended August 31, 2010, is included pursuant to provisions of the Internal Revenue Code.
The fund distributed $204,184,000 of qualified dividend income to shareholders during the fiscal year.
The fund designates to shareholders foreign source income of $351,229,000 and foreign taxes paid of $19,605,000. Shareholders will receive more detailed information with their Form 1099-DIV in January 2011 to determine the calendar year amounts to be included on their 2010 tax returns.
31
Your Fund’s After-Tax Returns
This table presents returns for your fund both before and after taxes. The after-tax returns are shown in two ways: (1) assuming that an investor owned the fund during the entire period and paid taxes on the fund’s distributions, and (2) assuming that an investor paid taxes on the fund’s distributions and sold all shares at the end of each period.
Calculations are based on the highest individual federal income tax and capital gains tax rates in effect at the times of the distributions and the hypothetical sales. State and local taxes were not considered. After-tax returns reflect any qualified dividend income , using actual prior-year figures and estimates for 2010. (In the example, returns after the sale of fund shares may be higher than those assuming no sale. This occurs when the sale would have produced a capital loss. The calculation assumes that the investor received a tax deduction for the loss.)
The table shows returns for Investor Shares only; returns for other share classes will differ. Please note that your actual after-tax returns will depend on your tax situation and may differ from those shown. Also note that if you own the fund in a tax-deferred account, such as an individual retirement account or a 401(k) plan, this information does not apply to you. Such accounts are not subject to current taxes.
Finally, keep in mind that a fund’s performance—whether before or after taxes—does not guarantee future results.
Average Annual Total Returns: International Growth Fund Investor Shares
Periods Ended August 31, 2010
| | | |
| | One | Five | Ten |
| | Year | Years | Years |
| Returns Before Taxes | 5.19% | 3.59% | 2.15% |
| Returns After Taxes on Distributions | 4.93 | 2.26 | 1.12 |
| Returns After Taxes on Distributions and Sale of Fund Shares | 3.74 | 2.89 | 1.56 |
Returns do not reflect the 2% fee on redemptions of shares held for less than two months.
32
About Your Fund’s Expenses
As a shareholder of the fund, you incur ongoing costs, which include costs for portfolio management, administrative services, and shareholder reports (like this one), among others. Operating expenses, which are deducted from a fund’s gross income, directly reduce the investment return of the fund.
A fund’s expenses are expressed as a percentage of its average net assets. This figure is known as the expense ratio. The following examples are intended to help you understand the ongoing costs (in dollars) of investing in your fund and to compare these costs with those of other mutual funds. The examples are based on an investment of $1,000 made at the beginning of the period shown and held for the entire period.
The accompanying table illustrates your fund’s costs in two ways:
• Based on actual fund return. This section helps you to estimate the actual expenses that you paid over the period. The ”Ending Account Value“ shown is derived from the fund‘s actual return, and the third column shows the dollar amount that would have been paid by an investor who started with $1,000 in the fund. You may use the information here, together with the amount you invested, to estimate the expenses that you paid over the period.
To do so, simply divide your account value by $1,000 (for example, an $8,600 account value divided by $1,000 = 8.6), then multiply the result by the number given for your fund under the heading ”Expenses Paid During Period.“
• Based on hypothetical 5% yearly return. This section is intended to help you compare your fund‘s costs with those of other mutual funds. It assumes that the fund had a yearly return of 5% before expenses, but that the expense ratio is unchanged. In this case—because the return used is not the fund’s actual return—the results do not apply to your investment. The example is useful in making comparisons because the Securities and Exchange Commission requires all mutual funds to calculate expenses based on a 5% return. You can assess your fund’s costs by comparing this hypothetical example with the hypothetical examples that appear in shareholder reports of other funds.
Note that the expenses shown in the table are meant to highlight and help you compare ongoing costs only and do not reflect transaction costs incurred by the fund for buying and selling securities. Further, the expenses do not include the 2% fee on redemptions of shares held for less than two months, nor do they include the account service fee described in the prospectus. If such fees were applied to your account, your costs would be higher. Your fund does not carry a “sales load.”
The calculations assume no shares were bought or sold during the period. Your actual costs may have been higher or lower, depending on the amount of your investment and the timing of any purchases or redemptions.
You can find more information about the fund’s expenses, including annual expense ratios, in the Financial Statements section of this report. For additional information on operating expenses and other shareholder costs, please refer to your fund’s current prospectus.
33
| | | |
| Six Months Ended August 31, 2010 | | | |
| | Beginning | Ending | Expenses |
| | Account Value | Account Value | Paid During |
| International Growth Fund | 2/28/2010 | 8/31/2010 | Period |
| Based on Actual Fund Return | | | |
| Investor Shares | $1,000.00 | $1,001.23 | $2.32 |
| Admiral Shares | 1,000.00 | 1,001.93 | 1.72 |
| Based on Hypothetical 5% Yearly Return | | | |
| Investor Shares | $1,000.00 | $1,022.89 | $2.35 |
| Admiral Shares | 1,000.00 | 1,023.49 | 1.73 |
The calculations are based on expenses incurred in the most recent six-month period. The fund’s annualized six-month expense ratios for that period are 0.46% for Investor Shares and 0.34% for Admiral Shares. The dollar amounts shown as “Expenses Paid” are equal to the annualized expense ratio multiplied by the average account value over the period, multiplied by the number of days in the most recent six-month period, then divided by the number of days in the most recent 12-month period.
34
Glossary
Beta. A measure of the magnitude of a fund’s past share-price fluctuations in relation to the ups and downs of a given market index. The index is assigned a beta of 1.00. Compared with a given index, a fund with a beta of 1.20 typically would have seen its share price rise or fall by 12% when the index rose or fell by 10%. For this report, beta is based on returns over the past 36 months for both the fund and the index. Note that a fund’s beta should be reviewed in conjunction with its R-squared (see definition). The lower the R-squared, the less correlation there is between the fund and the index, and the less reliable beta is as an indicator of volatility.
Dividend Yield. Dividend income earned by stocks, expressed as a percentage of the aggregate market value (or of net asset value, for a fund). The yield is determined by dividing the amount of the annual dividends by the aggregate value (or net asset value) at the end of the period. For a fund, the dividend yield is based solely on stock holdings and does not include any income produced by other investments.
Earnings Growth Rate. The average annual rate of growth in earnings over the past five years for the stocks now in a fund.
Equity Exposure. A measure that reflects a fund’s investments in stocks and stock futures. Any holdings in short-term reserves are excluded.
Expense Ratio. The percentage of a fund’s average net assets used to pay its annual administrative and advisory expenses. These expenses directly reduce returns to investors.
Inception Date. The date on which the assets of a fund (or one of its share classes) are first invested in accordance with the fund’s investment objective. For funds with a subscription period, the inception date is the day after that period ends. Investment performance is measured from the inception date.
Median Market Cap. An indicator of the size of companies in which a fund invests; the midpoint of market capitalization (market price x shares outstanding) of a fund’s stocks, weighted by the proportion of the fund’s assets invested in each stock. Stocks representing half of the fund’s assets have market capitalizations above the median, and the rest are below it.
Price/Book Ratio. The share price of a stock divided by its net worth, or book value, per share. For a fund, the weighted average price/book ratio of the stocks it holds.
Price/Earnings Ratio. The ratio of a stock’s current price to its per-share earnings over the past year. For a fund, the weighted average P/E of the stocks it holds. P/E is an indicator of market expectations about corporate prospects; the higher the P/E, the greater the expectations for a company’s future growth.
R-Squared. A measure of how much of a fund’s past returns can be explained by the returns from the market in general, as measured by a given index. If a fund’s total returns were precisely synchronized with an index’s returns, its R-squared would be 1.00. If the fund’s returns bore no relationship to the index’s returns, its R-squared would be 0. For this report, R-squared is based on returns over the past 36 months for both the fund and the index.
Return on Equity. The annual average rate of return generated by a company during the past five years for each dollar of shareholder’s equity (net income divided by shareholder’s equity). For a fund, the weighted average return on equity for the companies whose stocks it holds.
35
Short-Term Reserves. The percentage of a fund invested in highly liquid, short-term securities that can be readily converted to cash.
Turnover Rate. An indication of the fund’s trading activity. Funds with high turnover rates incur higher transaction costs and may be more likely to distribute capital gains (which may be taxable to investors). The turnover rate excludes in-kind transactions, which have minimal impact on costs.
36
This page intentionally left blank.
This page intentionally left blank.
This page intentionally left blank.
The People Who Govern Your Fund
The trustees of your mutual fund are there to see that the fund is operated and managed in your best interests since, as a shareholder, you are a part owner of the fund. Your fund’s trustees also serve on the board of directors of The Vanguard Group, Inc., which is owned by the Vanguard funds and provides services to them on an at-cost basis.
A majority of Vanguard’s board members are independent, meaning that they have no affiliation with Vanguard or the funds they oversee, apart from the sizable personal investments they have made as private individuals. The independent board members have distinguished backgrounds in business, academia, and public service. Each of the trustees and executive officers oversees 163 Vanguard funds.
The following table provides information for each trustee and executive officer of the fund. More information about the trustees is in the Statement of Additional Information, which can be obtained, without charge, by contacting Vanguard at 800-662-7447, or online at vanguard.com.
| |
| Interested Trustee1 | Amy Gutmann |
| | Born 1949. Trustee Since June 2006. Principal |
| F. William McNabb III | Occupation(s) During the Past Five Years: President |
| Born 1957. Trustee Since July 2009. Chairman of the | of the University of Pennsylvania; Christopher H. |
| Board. Principal Occupation(s) During the Past Five | Browne Distinguished Professor of Political Science |
| Years: Chairman of the Board of The Vanguard Group, | in the School of Arts and Sciences with secondary |
| Inc., and of each of the investment companies served | appointments at the Annenberg School for Commu- |
| by The Vanguard Group, since January 2010; Director | nication and the Graduate School of Education |
| of The Vanguard Group since 2008; Chief Executive | of the University of Pennsylvania; Director of |
| Officer and President of The Vanguard Group and of | Carnegie Corporation of New York, Schuylkill River |
| each of the investment companies served by The | Development Corporation, and Greater Philadelphia |
| Vanguard Group since 2008; Director of Vanguard | Chamber of Commerce; Trustee of the National |
| Marketing Corporation; Managing Director of The | Constitution Center; Chair of the Presidential |
| Vanguard Group (1995–2008) . | Commission for the Study of Bioethical Issues. |
| |
| | JoAnn Heffernan Heisen |
| Independent Trustees | Born 1950. Trustee Since July 1998. Principal |
| | Occupation(s) During the Past Five Years: Corporate |
| Emerson U. Fullwood | Vice President and Chief Global Diversity Officer |
| Born 1948. Trustee Since January 2008. Principal | since 2006 (retired 2008) and Member of the |
| Occupation(s) During the Past Five Years: Executive | Executive Committee (retired 2008) of Johnson & |
| Chief Staff and Marketing Officer for North America | Johnson (pharmaceuticals/consumer products); Vice |
| and Corporate Vice President (retired 2008) of Xerox | President and Chief Information Officer of Johnson & |
| Corporation (document management products and | Johnson (1997–2005); Director of the University |
| services); Director of SPX Corporation (multi-industry | Medical Center at Princeton and Women’s Research |
| manufacturing), the United Way of Rochester, | and Education Institute; Member of the Advisory |
| Amerigroup Corporation (managed health care), | Board of the Maxwell School of Citizenship and Public |
| the University of Rochester Medical Center, and | Affairs at Syracuse University. |
| Monroe Community College Foundation. | |
| | F. Joseph Loughrey |
| Rajiv L. Gupta | Born 1949. Trustee Since October 2009. Principal |
| Born 1945. Trustee Since December 2001.2 | Occupation(s) During the Past Five Years: President |
| Principal Occupation(s) During the Past Five Years: | and Chief Operating Officer since 2005 (retired 2009) |
| Chairman and Chief Executive Officer (retired 2009) | and Vice Chairman of the Board (2008–2009) of |
| and President (2006–2008) of Rohm and Haas Co. | Cummins Inc. (industrial machinery); Director of |
| (chemicals); Director of Tyco International, Ltd. | SKF AB (industrial machinery), Hillenbrand, Inc. |
| (diversified manufacturing and services) and Hewlett- | (specialized consumer services), Sauer-Danfoss Inc. |
| Packard Co. (electronic computer manufacturing); | (machinery), the Lumina Foundation for Education, |
| Trustee of The Conference Board; Member of the | and Oxfam America; Chairman of the Advisory |
| Board of Managers of Delphi Automotive LLP | Council for the College of Arts and Letters at the |
| (automotive components) . | University of Notre Dame. |
| | |
| André F. Perold | Kathryn J. Hyatt | |
| Born 1952. Trustee Since December 2004. Principal | Born 1955. Treasurer Since November 2008. Principal |
| Occupation(s) During the Past Five Years: George | Occupation(s) During the Past Five Years: Principal |
| Gund Professor of Finance and Banking at the Harvard | of The Vanguard Group, Inc.; Treasurer of each of |
| Business School; Chair of the Investment Committee | the investment companies served by The Vanguard |
| of HighVista Strategies LLC (private investment firm) . | Group since 2008; Assistant Treasurer of each of the |
| | investment companies served by The Vanguard Group |
| Alfred M. Rankin, Jr. | (1988–2008) . | |
| Born 1941. Trustee Since January 1993. Principal | | |
| Occupation(s) During the Past Five Years: Chairman, | Heidi Stam | |
| President, and Chief Executive Officer of NACCO | Born 1956. Secretary Since July 2005. Principal |
| Industries, Inc. (forklift trucks/housewares/lignite); | Occupation(s) During the Past Five Years: Managing |
| Director of Goodrich Corporation (industrial products/ | Director of The Vanguard Group, Inc., since 2006; |
| aircraft systems and services); Chairman of the | General Counsel of The Vanguard Group since 2005; |
| Federal Reserve Bank of Cleveland; Trustee of The | Secretary of The Vanguard Group and of each of the |
| Cleveland Museum of Art. | investment companies served by The Vanguard Group |
| | since 2005; Director and Senior Vice President of |
| Peter F. Volanakis | Vanguard Marketing Corporation since 2005; |
| Born 1955. Trustee Since July 2009. Principal | Principal of The Vanguard Group (1997–2006). |
| Occupation(s) During the Past Five Years: President | | |
| since 2007 and Chief Operating Officer since 2005 | | |
| of Corning Incorporated (communications equipment); | Vanguard Senior Management Team |
| President of Corning Technologies (2001–2005); | | |
| Director of Corning Incorporated and Dow Corning; | R. Gregory Barton | Michael S. Miller |
| Trustee of the Corning Incorporated Foundation and | Mortimer J. Buckley | James M. Norris |
| the Corning Museum of Glass; Overseer of the | Kathleen C. Gubanich | Glenn W. Reed |
| Amos Tuck School of Business Administration at | Paul A. Heller | George U. Sauter |
| Dartmouth College. | | |
| |
| | Chairman Emeritus and Senior Advisor |
| Executive Officers | | |
| | John J. Brennan | |
| Glenn Booraem | Chairman, 1996–2009 | |
| Born 1967. Controller Since July 2010. Principal | Chief Executive Officer and President, 1996–2008 |
| Occupation(s) During the Past Five Years: Principal | | |
| of The Vanguard Group, Inc.; Controller of each of | | |
| the investment companies served by The Vanguard | Founder | |
| Group since 2010; Assistant Controller of each of | | |
| the investment companies served by The Vanguard | John C. Bogle | |
| Group (2001–2010) . | Chairman and Chief Executive Officer, 1974–1996 |
| |
| Thomas J. Higgins | | |
| Born 1957. Chief Financial Officer Since September | | |
| 2008. Principal Occupation(s) During the Past Five | | |
| Years: Principal of The Vanguard Group, Inc.; Chief | | |
| Financial Officer of each of the investment companies | | |
| served by The Vanguard Group since 2008; Treasurer | | |
| of each of the investment companies served by The | | |
| Vanguard Group (1998–2008) . | | |
1 Mr. McNabb is considered an “interested person,” as defined in the Investment Company Act of 1940, because he is an officer of the Vanguard funds.
2 December 2002 for Vanguard Equity Income Fund, Vanguard Growth Equity Fund, the Vanguard Municipal Bond Funds, and the Vanguard State Tax-Exempt Funds.
|  |
| P.O. Box 2600 |
| Valley Forge, PA 19482-2600 |
Connect with Vanguard® > Vanguard.com
| |
| Fund Information > 800-662-7447 | CFA® is a trademark owned by CFA Institute. |
| Direct Investor Account Services > 800-662-2739 | |
| Institutional Investor Services > 800-523-1036 | |
| Text Telephone for People | |
| With Hearing Impairment > 800-749-7273 | |
| |
| This material may be used in conjunction | |
| with the offering of shares of any Vanguard | |
| fund only if preceded or accompanied by | |
| the fund’s current prospectus. | |
| |
| All comparative mutual fund data are from Lipper Inc. or | |
| Morningstar, Inc., unless otherwise noted. | |
| |
| You can obtain a free copy of Vanguard’s proxy voting | |
| guidelines by visiting vanguard.com/proxyreporting or by | |
| calling Vanguard at 800-662-2739. The guidelines are | |
| also available from the SEC’s website, sec.gov. In | |
| addition, you may obtain a free report on how your fund | |
| voted the proxies for securities it owned during the 12 | |
| months ended June 30. To get the report, visit either | |
| vanguard.com/proxyreporting or sec.gov. | |
| |
| You can review and copy information about your fund at | |
| the SEC’s Public Reference Room in Washington, D.C. To | |
| find out more about this public service, call the SEC at | |
| 202-551-8090. Information about your fund is also | |
| available on the SEC’s website, and you can receive | |
| copies of this information, for a fee, by sending a | |
| request in either of two ways: via e-mail addressed to | |
| publicinfo@sec.gov or via regular mail addressed to the | |
| Public Reference Section, Securities and Exchange | |
| Commission, Washington, DC 20549-1520. | |
| |
| |
| | © 2010 The Vanguard Group, Inc. |
| | All rights reserved. |
| | Vanguard Marketing Corporation, Distributor. |
| |
| | Q810 102010 |
 |
| Vanguard FTSE Social Index Fund |
| Annual Report |
|
| August 31, 2010 |
 |
> Vanguard FTSE Social Index Fund returned about 2% for the fiscal year ended August 31, 2010.
> The fund closely tracked its target index, but trailed its peers among large-capitalization growth funds.
> The fund’s substantial holdings in financial stocks weighed on performance.
| |
| Contents | |
| Your Fund’s Total Returns. | 1 |
| Chairman’s Letter. | 2 |
| Fund Profile. | 7 |
| Performance Summary. | 8 |
| Financial Statements. | 10 |
| Your Fund’s After-Tax Returns. | 23 |
| About Your Fund’s Expenses. | 24 |
| Trustees Approve Advisory Arrangement. | 26 |
| Glossary. | 27 |
Please note: The opinions expressed in this report are just that—informed opinions. They should not be considered promises or advice. Also, please keep in mind that the information and opinions cover the period through the date on the front of this report. Of course, the risks of investing in your fund are spelled out in the prospectus.
See the Glossary for definitions of investment terms used in this report.
Cover photograph: Jean Maher.
Your Fund’s Total Returns
| |
| Fiscal Year Ended August 31, 2010 | |
| | Total |
| | Returns |
| Vanguard FTSE Social Index Fund | |
| Investor Shares | 2.18% |
| Institutional Shares | 2.29 |
| FTSE4Good US Select Index | 2.38 |
| Large-Cap Growth Funds Average | 4.04 |
| Large-Cap Growth Funds Average: Derived from data provided by Lipper Inc. | |
Institutional Shares are available to certain institutional investors who meet specific administrative, service, and account-size criteria.
Your Fund’s Performance at a Glance
August 31, 2009, Through August 31, 2010
| | | | |
| | | | Distributions Per Share |
| | Starting | Ending | Income | Capital |
| | Share Price | Share Price | Dividends | Gains |
| Vanguard FTSE Social Index Fund | | | | |
| Investor Shares | $6.20 | $6.27 | $0.068 | $0.000 |
| Institutional Shares | 6.20 | 6.27 | 0.075 | 0.000 |
1

Chairman’s Letter
Dear Shareholder,
For the 12 months ended August 31, 2010, Vanguard FTSE Social Index Fund returned about 2% and achieved its primary objective of closely tracking its target index, the FTSE4Good US Select Index. While returns were solid for much of the year, the fund’s performance suffered during the stock market’s turbulent spring and summer.
The index’s social and environmental screening process results in relatively large holdings in the financial sector, which restricted results. For the full fiscal year, the fund and its index trailed the return of the broad stock market and the average return of large-cap growth funds.
If you hold shares of the fund in a taxable account, you may wish to review information on the fund’s after-tax returns that appears later in this report.
A ragged 12-month climb in global stock markets
At the start of the 12-month period, stock markets moved higher as global economies continued to pull out of a deep downturn. Within a few months, however, optimism began to fade. Europe’s sovereign debt crisis fueled fears of another global financial shock, while persistently high unemployment and downward revisions to U.S. economic indicators suggested that the powerful rebound in corporate earnings could be at risk.
2
This alternating pattern of hope and fear persisted through the period’s final months. The net result for the fiscal year was mid-single-digit gains in the broad U.S. stock market. International stocks returned about 3%, as modest declines in developed markets in Europe and the Pacific region were offset by a strong rally in emerging markets.
Bonds produced strong returns as prices rose and yields declined
The economic uncertainty and high stock market volatility over the fiscal period created a favorable environment for fixed income investments. The broad taxable bond market returned more than 9%, as investors sought shelter in U.S. Treasury and corporate bonds. The municipal bond market returned a bit more. In both markets, much of the total return came from rising bond prices. The flip side of rising prices, of course, is shrinking yields, which can set the stage for lower future returns.
As it has since December 2008, the Federal Reserve kept its target for short-term interest rates between 0% and 0.25%, in an effort to bolster the economy. This policy has kept a tight lid on the returns available from Treasury bills, commercial paper, and other money market instruments. Near-zero short-term yields also were a factor nudging investors to shift to bonds in search of income, despite the risk such a shift entails.
| | | |
| Market Barometer | | | |
| |
| | | Average Annual Total Returns |
| | | Periods Ended August 31, 2010 |
| | One | Three | Five |
| | Year | Years | Years |
| Stocks | | | |
| Russell 1000 Index (Large-caps) | 5.55% | -8.34% | -0.71% |
| Russell 2000 Index (Small-caps) | 6.60 | -7.44 | -0.69 |
| Dow Jones U.S. Total Stock Market Index | 6.15 | -7.83 | -0.31 |
| MSCI All Country World Index ex USA (International) | 3.27 | -7.93 | 3.78 |
| |
| Bonds | | | |
| Barclays Capital U.S. Aggregate Bond Index (Broad | | | |
| taxable market) | 9.18% | 7.65% | 5.96% |
| Barclays Capital Municipal Bond Index (Broad | | | |
| tax-exempt market) | 9.78 | 6.62 | 5.02 |
| Citigroup Three-Month U.S. Treasury Bill Index | 0.12 | 1.13 | 2.53 |
| |
| CPI | | | |
| Consumer Price Index | 1.15% | 1.64% | 2.14% |
3
Financial holdings limited fund’s returns
Vanguard FTSE Social Index Fund returned about 2% and closely tracked its target index, the FTSE4Good US Select Index, during the fiscal year. The index’s screening process seeks companies that work to protect the environment, maintain fair hiring and promotion practices for women and minorities, and have safe and healthy workplace conditions.
Compared with the overall stock market, as measured by the Dow Jones U.S. Total Stock Market Index, the fund’s benchmark has greater exposure to the financial, health care, and information technology sectors and smaller allocations to industrials, energy, and consumer staples. While this combination of stocks can thrive in some market environments, it wasn’t ideal over the recent fiscal year.
Financial stocks, which make up nearly 30% of assets in the index and the fund, performed the worst. The debt crisis in Europe and concerns over regulatory reform and the strength of their balance sheets hurt the returns of major investment and commercial banks. Overall, the financial sector retreated more than 5%.
Health care was the only other group that failed to register a positive return for the period. Uncertainty regarding the implications of health care reform was no doubt a factor, as was weakness among select health care equipment companies and biotechnology firms.
Expense Ratios
Your Fund Compared With Its Peer Group
| | | |
| | Investor | Institutional | Peer Group |
| | Shares | Shares | Average |
| FTSE Social Index Fund | 0.29% | 0.16% | 1.37% |
The fund expense ratios shown are from the prospectus dated December 28, 2009, and represent estimated costs for the current fiscal year. For the fiscal year ended August 31, 2010, the fund’s expense ratios were 0.29% for Investor Shares and 0.16% for Institutional Shares. The peer-group expense ratio is derived from data provided by Lipper Inc. and captures information through year-end 2009.
Peer group: Large-Cap Growth Funds.
4
Consumer discretionary stocks contributed the most to the fund’s return. Although consumers continued to spend less, and the economy’s growth has been slow, certain restaurants and internet retailers have thrived by catering to the bargain conscious. While the returns of technology stocks were mixed overall, a return of almost 45% for Apple—the largest stock in the index, with an average weighting of nearly 5%—drove performance.
The fund missed out on some of the top performers in energy, industrials, and utilities, because they do not meet the index’s criteria for environmental protection.
The fund has successfully tracked its benchmark
The FTSE Social Index Fund’s inception in May 2000 came shortly after a peak in the stock market. In the past decade, the fund has recorded an average annual return of about –4% while suffering through two severe bear markets and two recessions. The result closely matches that of the fund’s spliced target index for the same period and surpasses the average return of –6% for large-cap growth funds. Of course, beating our peer group by registering a smaller decline is not a “victory” that makes us cheer.
Total Returns
Ten Years Ended August 31, 2010
| |
| | Average |
| | Annual Return |
| FTSE Social Index Fund Investor Shares | -4.44% |
| Spliced Social Index | -4.25 |
| Large-Cap Growth Funds Average | -6.00 |
Spliced Social Index: Calvert Social Index though December 16, 2005; FTSE4Good US Select Index thereafter.
Large-Cap Growth Funds Average: Derived from data provided by Lipper Inc.
The figures shown represent past performance, which is not a guarantee of future results. (Current performance may be lower or higher than the performance data cited. For performance data current to the most recent month-end, visit our website at vanguard.com/performance.) Note, too, that both investment returns and principal value can fluctuate widely, so an investor’s shares, when sold, could be worth more or less than their original cost.
5
While the return of an index fund is directly related to the performance of its benchmark, the fund’s investment advisor, Vanguard Quantitative Equity Group, has done an outstanding job of tracking the fund’s target index. The advisor’s skill and accuracy is helped by the fund’s expense ratio, which is significantly lower than the average for its peers.
A long-term focus is crucial
As we continually note, the financial markets are unpredictable, and so is the performance of the underlying sectors that flourish and fade over both long and short periods. In its decade-plus of existence, the FTSE Social Index Fund has both benefited and suffered because of this dynamic. For example, the fund’s heavy weighting in financial stocks often served it well in past years, but held it back during this fiscal year.
Nobody knows which direction the stock market is headed, or which sectors will lead the way or lag behind. Because of this, we encourage you to build a well-balanced and diversified portfolio that includes stock funds, bond funds, and short-term reserves in proportions that fit your goals, risk tolerance, and time horizon, and to maintain it with a long-term perspective. As part of such a plan, the FTSE Social Index Fund can provide a low-cost portfolio for investors who pay attention to expenses and seek an investment that meets the index’s strict environmental and social standards.
Thank you for investing with Vanguard.
Sincerely,

F. William McNabb III
Chairman and Chief Executive Officer
September 10, 2010
6
FTSE Social Index Fund
Fund Profile
As of August 31, 2010
| | |
| Share-Class Characteristics | |
| | Investor | Institutional |
| | Shares | Shares |
| Ticker Symbol | VFTSX | VFTNX |
| Expense Ratio1 | 0.29% | 0.16% |
| 30-Day SEC Yield | 0.92% | 1.05% |
| | | |
| Portfolio Characteristics | | |
| | | FTSE | DJ |
| | | 4Good | U.S. Total |
| | | US Select | Market |
| | Fund | Index | Index |
| Number of Stocks | 306 | 305 | 4,100 |
| Median Market Cap $26.3B | $26.3B | $26.3B |
| Price/Earnings Ratio | 16.1x | 16.1x | 15.7x |
| Price/Book Ratio | 1.8x | 1.8x | 1.9x |
| Return on Equity | 18.7% | 18.7% | 19.0% |
| Earnings Growth Rate | 8.3% | 8.4% | 6.2% |
| Dividend Yield | 1.3% | 1.3% | 2.0% |
| Foreign Holdings | 0.0% | 0.0% | 0.0% |
| Turnover Rate | 35% | — | — |
| Short-Term Reserves | 0.1% | — | — |
| | | |
| Sector Diversification (% of equity exposure) |
| | | FTSE | DJ |
| | | 4Good | U.S. Total |
| | | US Select | Market |
| | Fund | Index | Index |
| Consumer | | | |
| Discretionary | 9.8% | 9.8% | 11.5% |
| Consumer Staples | 9.2 | 9.3 | 10.6 |
| Energy | 1.5 | 1.4 | 9.6 |
| Financials | 29.2 | 29.1 | 17.1 |
| Health Care | 13.4 | 13.4 | 11.3 |
| Industrials | 2.6 | 2.6 | 10.7 |
| Information | | | |
| Technology | 30.6 | 30.7 | 18.3 |
| Materials | 1.3 | 1.3 | 4.3 |
| Telecommunication | | | |
| Services | 2.2 | 2.2 | 2.9 |
| Utilities | 0.2 | 0.2 | 3.7 |
| | |
| Volatility Measures | | |
| | FTSE | DJ |
| | 4Good | U.S. Total |
| | US Select | Market |
| | Index | Index |
| R-Squared | 1.00 | 0.97 |
| Beta | 1.00 | 1.12 |
These measures show the degree and timing of the fund’s fluctuations compared with the indexes over 36 months.
| | |
| Ten Largest Holdings (% of total net assets) |
| Apple Inc. | Computer | |
| | Hardware | 5.5% |
| Procter & Gamble Co. | Household | |
| | Products | 4.2 |
| JPMorgan Chase & Co. | Diversified Financial | |
| | Services | 3.6 |
| Bank of America Corp. | Diversified Financial | |
| | Servies | 3.1 |
| Wells Fargo & Co. | Diversified Banks | 3.0 |
| Cisco Systems Inc. | Communications | |
| | Equipment | 2.8 |
| Oracle Corp. | Systems Software | 2.7 |
| Google Inc. Class A | Internet Software & | |
| | Services | 2.6 |
| Intel Corp. | Semiconductors | 2.4 |
| McDonald's Corp. | Restaurants | 1.9 |
| Top Ten | | 31.8% |
The holdings listed exclude any temporary cash investments and equity index products.
Investment Focus
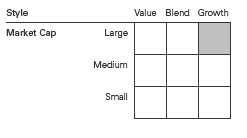
1 The expense ratios shown are from the prospectus dated December 28, 2009, and represent estimated costs for the current fiscal year. For the fiscal year ended August 31, 2010, the expense ratios were 0.29% for Investor Shares and 0.16% for Institutional Shares.
7
FTSE Social Index Fund
Performance Summary
All of the returns in this report represent past performance, which is not a guarantee of future results that may be achieved by the fund. (Current performance may be lower or higher than the performance data cited. For performance data current to the most recent month-end, visit our website at vanguard.com/performance.) Note, too, that both investment returns and principal value can fluctuate widely, so an investor’s shares, when sold, could be worth more or less than their original cost. The returns shown do not reflect taxes that a shareholder would pay on fund distributions or on the sale of fund shares.
Cumulative Performance: August 31, 2000, Through August 31, 2010
Initial Investment of $10,000
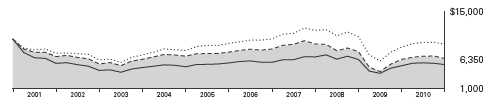
| | | | |
| | Average Annual Total Returns | |
| | Periods Ended August 31, 2010 | |
| | | | | Final Value |
| | One | Five | Ten | of a $10,000 |
| | Year | Years | Years | Investment |
| FTSE Social Index Fund Investor | | | | |
| Shares | 2.18% | -3.39% | -4.44% | $6,350 |
| Dow Jones U.S. Total Stock Market | | | | |
| Index | 6.15 | -0.31 | -0.97 | 9,075 |
| Spliced Social Index | 2.38 | -3.23 | -4.25 | 6,475 |
| Large-Cap Growth Funds Average | 4.04 | -1.06 | -6.00 | 5,384 |
Spliced Social Index: Calvert Social Index though December 16, 2005; FTSE4Good US Select Index thereafter.
Large-Cap Growth Funds Average: Derived from data provided by Lipper Inc.
| | | | |
| | | | Since | Final Value |
| | One | Five | Inception | of a $5,000,000 |
| | Year | Years | (1/14/2003) | Investment |
| FTSE Social Index Fund Institutional | | | | |
| Shares | 2.29% | -3.27% | 1.54% | $5,618,763 |
| Dow Jones U.S. Total Stock Market | | | | |
| Index | 6.15 | -0.31 | 4.79 | 7,143,097 |
| Spliced Social Index | 2.38 | -3.23 | 1.60 | 5,641,839 |
"Since Inception" performance is calculated from the Institutional Shares’ inception date for both the fund and its comparative standards.
See Financial Highlights for dividend and capital gains information.
8
FTSE Social Index Fund
Fiscal-Year Total Returns (%): August 31, 2000, Through August 31, 2010

Average Annual Total Returns: Periods Ended June 30, 2010
This table presents average annual total returns through the latest calendar quarter—rather than through the end of the fiscal period. Securities and Exchange Commission rules require that we provide this information.
| | | | |
| | Inception | One | Five | Ten |
| | Date | Year | Years | Years |
| Investor Shares | 5/31/2000 | 18.32% | -2.68% | -3.93% |
| Institutional Shares | 1/14/2003 | 18.44 | -2.57 | 1.641 |
| 1 Return since inception. | | | | |
9
FTSE Social Index Fund
Financial Statements
Statement of Net Assets
As of August 31, 2010
The fund reports a complete list of its holdings in regulatory filings four times in each fiscal year, at the quarter-ends. For the second and fourth fiscal quarters, the lists appear in the fund’s semiannual and annual reports to shareholders. For the first and third fiscal quarters, the fund files the lists with the Securities and Exchange Commission on Form N-Q. Shareholders can look up the fund’s Forms N-Q on the SEC’s website at sec.gov. Forms N-Q may also be reviewed and copied at the SEC’s Public Reference Room (see the back cover of this report for further information).
| | | |
| | | | Market |
| | | | Value |
| | | Shares | ($000) |
| Common Stocks (100.0%) | | |
| Consumer Discretionary (9.8%) | | |
| | McDonald’s Corp. | 115,426 | 8,433 |
| * | Amazon.com Inc. | 35,549 | 4,438 |
| * | DIRECTV Class A | 94,964 | 3,601 |
| | Lowe’s Cos. Inc. | 153,243 | 3,111 |
| * | Kohl’s Corp. | 32,647 | 1,534 |
| | Staples Inc. | 77,877 | 1,384 |
| | Coach Inc. | 32,812 | 1,176 |
| * | Bed Bath & Beyond Inc. | 27,903 | 1,004 |
| | Starwood Hotels & Resorts | | |
| | Worldwide Inc. | 20,163 | 942 |
| | McGraw-Hill Cos. Inc. | 33,835 | 935 |
| | Gap Inc. | 53,689 | 907 |
| | Macy’s Inc. | 44,872 | 872 |
| | Mattel Inc. | 38,961 | 818 |
| | Ltd Brands Inc. | 34,580 | 816 |
| | Genuine Parts Co. | 17,031 | 714 |
| * | Apollo Group Inc. Class A | 16,152 | 686 |
| | Nordstrom Inc. | 23,299 | 674 |
| | Cablevision Systems Corp. | | |
| | Class A | 26,827 | 673 |
| | Ross Stores Inc. | 13,161 | 653 |
| * | Dollar Tree Inc. | 14,061 | 637 |
| | Hasbro Inc. | 15,516 | 626 |
| | Darden Restaurants Inc. | 15,041 | 621 |
| | Harley-Davidson Inc. | 25,175 | 612 |
| | Tiffany & Co. | 13,565 | 538 |
| | H&R Block Inc. | 34,907 | 449 |
| * | Interpublic Group of Cos. Inc. | 52,045 | 444 |
| | Wyndham Worldwide Corp. | 19,102 | 443 |
| * | Royal Caribbean Cruises Ltd. | 16,991 | 417 |
| | Scripps Networks | | |
| | Interactive Inc. Class A | 10,380 | 417 |
| | PetSmart Inc. | 12,563 | 401 |
| * | Sirius XM Radio Inc. | 410,124 | 392 |
| * | Mohawk Industries Inc. | 7,370 | 327 |
| | Gannett Co. Inc. | 25,322 | 306 |
| * | GameStop Corp. Class A | 16,235 | 291 |
| | | |
| | | | Market |
| | | | Value |
| | | Shares | ($000) |
| | American Eagle | | |
| | Outfitters Inc. | 22,294 | 282 |
| | Gentex Corp. | 14,921 | 262 |
| | RadioShack Corp. | 13,276 | 245 |
| * | Toll Brothers Inc. | 13,497 | 233 |
| * | Harman International | | |
| | Industries Inc. | 7,411 | 231 |
| | Lennar Corp. Class A | 16,740 | 220 |
| * | Lamar Advertising Co. | | |
| | Class A | 8,291 | 217 |
| | Foot Locker Inc. | 16,577 | 195 |
| | Wendy’s/Arby’s | | |
| | Group Inc. Class A | 45,713 | 178 |
| * | Madison Square Garden Inc. | | |
| | Class A | 6,631 | 130 |
| | Weight Watchers | | |
| | International Inc. | 4,238 | 121 |
| * | Krispy Kreme Doughnuts Inc. | | |
| | Warrants Exp. 03/02/2012 | 179 | — |
| | | | 42,606 |
| Consumer Staples (9.2%) | | |
| | Procter & Gamble Co. | 303,727 | 18,123 |
| | CVS Caremark Corp. | 145,730 | 3,935 |
| | Costco Wholesale Corp. | 47,102 | 2,664 |
| | General Mills Inc. | 71,098 | 2,571 |
| | Sysco Corp. | 62,953 | 1,730 |
| | HJ Heinz Co. | 33,585 | 1,553 |
| | Kellogg Co. | 30,516 | 1,516 |
| | Avon Products Inc. | 45,784 | 1,332 |
| | Campbell Soup Co. | 27,449 | 1,023 |
| | Dr Pepper Snapple | | |
| | Group Inc. | 26,390 | 972 |
| | Hershey Co. | 17,853 | 830 |
| | Safeway Inc. | 41,898 | 788 |
| | Estee Lauder Cos. Inc. | | |
| | Class A | 12,914 | 724 |
| * | Whole Foods Market Inc. | 18,212 | 634 |
| | McCormick & Co. Inc. | 12,944 | 516 |
| | Hormel Foods Corp. | 10,804 | 466 |
10
FTSE Social Index Fund
| | | |
| | | Market |
| | | Value |
| | Shares | ($000) |
| Alberto-Culver Co. Class B | 10,537 | 327 |
| * | Dean Foods Co. | 19,564 | 200 |
| | | 39,904 |
| Energy (1.4%) | | |
| Apache Corp. | 38,879 | 3,493 |
| Noble Corp. | 27,581 | 858 |
| * | Newfield Exploration Co. | 14,251 | 684 |
| QEP Resources Inc. | 18,718 | 544 |
| EQT Corp. | 15,530 | 506 |
| Patterson-UTI Energy Inc. | 16,751 | 247 |
| | | 6,332 |
| Financials (29.2%) | | |
| JPMorgan Chase & Co. | 425,129 | 15,458 |
| Bank of America Corp. | 1,064,256 | 13,250 |
| Wells Fargo & Co. | 554,353 | 13,055 |
| American Express Co. | 128,472 | 5,122 |
| US Bancorp | 204,985 | 4,264 |
| MetLife Inc. | 96,905 | 3,644 |
| Bank of New York | | |
| Mellon Corp. | 131,523 | 3,192 |
| PNC Financial Services | | |
| Group Inc. | 56,298 | 2,869 |
| Simon Property Group Inc. | 31,000 | 2,804 |
| Travelers Cos. Inc. | 53,037 | 2,598 |
| Prudential Financial Inc. | 49,258 | 2,491 |
| Aflac Inc. | 49,857 | 2,356 |
| Chubb Corp. | 35,117 | 1,936 |
| ACE Ltd. | 35,938 | 1,922 |
| State Street Corp. | 53,632 | 1,881 |
| Capital One Financial Corp. | 48,726 | 1,845 |
| Franklin Resources Inc. | 18,380 | 1,774 |
| CME Group Inc. | 7,009 | 1,739 |
| BB&T Corp. | 73,756 | 1,631 |
| Charles Schwab Corp. | 126,954 | 1,620 |
| Loews Corp. | 45,177 | 1,587 |
| Progressive Corp. | 71,955 | 1,425 |
| Equity Residential | 30,302 | 1,389 |
| T Rowe Price Group Inc. | 27,837 | 1,219 |
| Boston Properties Inc. | 14,748 | 1,200 |
| SunTrust Banks Inc. | 53,167 | 1,196 |
| Ameriprise Financial Inc. | 27,319 | 1,191 |
| Northern Trust Corp. | 25,634 | 1,183 |
| HCP Inc. | 31,402 | 1,106 |
| M&T Bank Corp. | 12,557 | 1,075 |
| Hartford Financial Services | | |
| Group Inc. | 47,704 | 962 |
| AvalonBay Communities Inc. | 8,937 | 940 |
| Host Hotels & Resorts Inc. | 70,330 | 923 |
| Ventas Inc. | 16,784 | 848 |
| Discover Financial Services | 58,409 | 847 |
| Regions Financial Corp. | 127,752 | 821 |
| Principal Financial Group Inc. | 34,149 | 787 |
| NYSE Euronext | 27,783 | 771 |
| Lincoln National Corp. | 32,415 | 757 |
| * | IntercontinentalExchange Inc. 7,889 | 754 |
| | | |
| | | | Market |
| | | | Value |
| | | Shares | ($000) |
| | New York Community | | |
| | Bancorp Inc. | 46,350 | 736 |
| | Unum Group | 35,589 | 714 |
| | KeyCorp | 93,592 | 690 |
| | XL Group PLC Class A | 36,551 | 655 |
| | Hudson City Bancorp Inc. | 56,392 | 650 |
| | Comerica Inc. | 18,823 | 648 |
| | PartnerRe Ltd. | 8,258 | 615 |
| | Plum Creek Timber Co. Inc. | 17,342 | 598 |
| * | SLM Corp. | 51,776 | 572 |
| * | Genworth Financial Inc. | | |
| | Class A | 52,391 | 567 |
| | Macerich Co. | 13,653 | 565 |
| | ProLogis | 50,397 | 547 |
| | Moody’s Corp. | 25,090 | 530 |
| | Willis Group Holdings PLC | 18,045 | 525 |
| | People’s United | | |
| | Financial Inc. | 40,023 | 509 |
| * | American International | | |
| | Group Inc. | 14,399 | 489 |
| | Cincinnati Financial Corp. | 17,365 | 463 |
| | Legg Mason Inc. | 17,617 | 446 |
| | Torchmark Corp. | 8,850 | 437 |
| | Assurant Inc. | 11,886 | 434 |
| | WR Berkley Corp. | 16,214 | 427 |
| | AMB Property Corp. | 17,804 | 423 |
| | Axis Capital Holdings Ltd. | 13,446 | 415 |
| | Huntington Bancshares Inc. | 76,276 | 403 |
| | Marshall & Ilsley Corp. | 56,967 | 373 |
| | Liberty Property Trust | 12,120 | 368 |
| | RenaissanceRe Holdings Ltd. | 6,258 | 355 |
| * | Markel Corp. | 1,067 | 350 |
| | Old Republic | | |
| | International Corp. | 26,062 | 333 |
| | Transatlantic Holdings Inc. | 6,766 | 322 |
| | Regency Centers Corp. | 8,737 | 318 |
| | Zions Bancorporation | 17,076 | 315 |
| | Commerce Bancshares Inc. | 8,781 | 314 |
| | Duke Realty Corp. | 26,766 | 300 |
| | Brown & Brown Inc. | 15,476 | 295 |
| * | Popular Inc. | 110,815 | 284 |
| | White Mountains | | |
| | Insurance Group Ltd. | 925 | 281 |
| | Arthur J Gallagher & Co. | 11,141 | 277 |
| | SEI Investments Co. | 15,580 | 276 |
| | City National Corp. | 5,538 | 268 |
| * | St. Joe Co. | 10,101 | 243 |
| * | First Horizon National Corp. | 24,129 | 243 |
| | Valley National Bancorp | 18,039 | 235 |
| | Erie Indemnity Co. Class A | 4,176 | 219 |
| | Janus Capital Group Inc. | 19,413 | 176 |
| | Protective Life Corp. | 9,214 | 172 |
| * | Forest City Enterprises Inc. | | |
| | Class A | 14,437 | 163 |
| | First American Financial Corp. | 10,557 | 157 |
11
FTSE Social Index Fund
| | | |
| | | | Market |
| | | | Value |
| | | Shares | ($000) |
| | Mercury General Corp. | 2,976 | 117 |
| * | CNA Financial Corp. | 2,490 | 65 |
| | Wesco Financial Corp. | 141 | 51 |
| | | | 126,360 |
| Health Care (13.4%) | | |
| * | Amgen Inc. | 102,437 | 5,228 |
| | UnitedHealth Group Inc. | 121,637 | 3,858 |
| | Medtronic Inc. | 118,618 | 3,734 |
| * | Gilead Sciences Inc. | 95,283 | 3,036 |
| * | Express Scripts Inc. | 62,216 | 2,650 |
| * | Celgene Corp. | 49,274 | 2,539 |
| * | WellPoint Inc. | 45,719 | 2,271 |
| * | Medco Health Solutions Inc. | 48,807 | 2,122 |
| | Allergan Inc. | 32,897 | 2,021 |
| * | Genzyme Corp. | 28,490 | 1,997 |
| | Covidien PLC | 53,614 | 1,895 |
| | Becton Dickinson and Co. | 24,873 | 1,696 |
| | Alcon Inc. | 9,604 | 1,558 |
| * | Biogen Idec Inc. | 28,801 | 1,550 |
| | Stryker Corp. | 31,882 | 1,377 |
| | Aetna Inc. | 45,578 | 1,218 |
| * | St. Jude Medical Inc. | 34,947 | 1,208 |
| | Cardinal Health Inc. | 38,597 | 1,156 |
| * | Zimmer Holdings Inc. | 21,767 | 1,027 |
| | CIGNA Corp. | 29,460 | 949 |
| * | Hospira Inc. | 17,812 | 915 |
| * | Forest Laboratories Inc. | 32,279 | 881 |
| * | Humana Inc. | 18,255 | 872 |
| * | Boston Scientific Corp. | 161,563 | 839 |
| | Quest Diagnostics Inc. | 19,095 | 831 |
| * | Life Technologies Corp. | 19,313 | 826 |
| | AmerisourceBergen Corp. | | |
| | Class A | 30,056 | 820 |
| * | Laboratory Corp. of | | |
| | America Holdings | 11,166 | 811 |
| | CR Bard Inc. | 10,059 | 773 |
| * | DaVita Inc. | 11,075 | 716 |
| * | Varian Medical Systems Inc. | 13,304 | 708 |
| * | Waters Corp. | 9,971 | 603 |
| * | Mylan Inc. | 33,099 | 568 |
| * | Henry Schein Inc. | 9,681 | 511 |
| * | CareFusion Corp. | 23,648 | 510 |
| * | Watson Pharmaceuticals Inc. | 11,222 | 483 |
| * | Cephalon Inc. | 7,967 | 451 |
| | DENTSPLY International Inc. | 15,827 | 440 |
| | Beckman Coulter Inc. | 7,634 | 348 |
| | Patterson Cos. Inc. | 13,082 | 331 |
| * | Coventry Health Care Inc. | 15,677 | 303 |
| | Universal Health Services Inc. | |
| | Class B | 9,484 | 298 |
| * | Community Health | | |
| | Systems Inc. | 10,125 | 264 |
| | Omnicare Inc. | 12,840 | 247 |
| * | Kinetic Concepts Inc. | 7,545 | 241 |
| * | King Pharmaceuticals Inc. | 27,049 | 236 |
| | | | 57,916 |
| | | |
| | | | Market |
| | | | Value |
| | | Shares | ($000) |
| Industrials (2.6%) | | |
| | Deere & Co. | 45,322 | 2,867 |
| | PACCAR Inc. | 38,928 | 1,596 |
| | Southwest Airlines Co. | 79,610 | 880 |
| | WW Grainger Inc. | 7,781 | 823 |
| | Rockwell Automation Inc. | 15,151 | 775 |
| | Fastenal Co. | 15,766 | 714 |
| | Iron Mountain Inc. | 21,890 | 444 |
| | Pitney Bowes Inc. | 21,939 | 422 |
| | Equifax Inc. | 13,558 | 400 |
| | Manpower Inc. | 8,710 | 370 |
| | Dun & Bradstreet Corp. | 5,308 | 350 |
| | Robert Half International Inc. | 16,058 | 346 |
| | JB Hunt Transport | | |
| | Services Inc. | 10,271 | 336 |
| | Pentair Inc. | 10,673 | 321 |
| * | Foster Wheeler AG | 13,311 | 284 |
| * | Terex Corp. | 11,359 | 207 |
| | | | 11,135 |
| Information Technology (30.7%) | |
| * | Apple Inc. | 97,376 | 23,698 |
| * | Cisco Systems Inc. | 612,694 | 12,285 |
| | Oracle Corp. | 533,286 | 11,668 |
| * | Google Inc. Class A | 25,514 | 11,482 |
| | Intel Corp. | 595,143 | 10,546 |
| | QUALCOMM Inc. | 175,454 | 6,722 |
| * | EMC Corp. | 218,124 | 3,979 |
| | Visa Inc. Class A | 52,923 | 3,651 |
| * | eBay Inc. | 139,640 | 3,245 |
| * | Dell Inc. | 209,821 | 2,470 |
| | Mastercard Inc. Class A | 11,874 | 2,355 |
| | Automatic Data | | |
| | Processing Inc. | 53,589 | 2,069 |
| * | Cognizant Technology | | |
| | Solutions Corp. Class A | 32,120 | 1,850 |
| * | Adobe Systems Inc. | 56,241 | 1,561 |
| * | Juniper Networks Inc. | 56,708 | 1,542 |
| | Applied Materials Inc. | 144,134 | 1,498 |
| * | NetApp Inc. | 37,018 | 1,497 |
| * | Intuit Inc. | 34,022 | 1,456 |
| | Broadcom Corp. Class A | 46,969 | 1,408 |
| | Tyco Electronics Ltd. | 49,134 | 1,205 |
| * | Symantec Corp. | 85,831 | 1,170 |
| * | Citrix Systems Inc. | 19,932 | 1,155 |
| | Western Union Co. | 72,092 | 1,130 |
| * | Marvell Technology | | |
| | Group Ltd. | 69,140 | 1,102 |
| * | Agilent Technologies Inc. | 37,160 | 1,002 |
| | Paychex Inc. | 39,140 | 974 |
| | Analog Devices Inc. | 31,829 | 887 |
| * | First Solar Inc. | 6,770 | 866 |
| * | Akamai Technologies Inc. | 18,604 | 857 |
| * | Fiserv Inc. | 16,422 | 822 |
| * | SanDisk Corp. | 24,567 | 817 |
| | Altera Corp. | 32,246 | 795 |
| * | McAfee Inc. | 16,862 | 793 |
12
FTSE Social Index Fund
| | | |
| | | | Market |
| | | | Value |
| | | Shares | ($000) |
| * | Check Point Software | | |
| | Technologies Ltd. | 22,463 | 784 |
| | CA Inc. | 41,529 | 748 |
| | Xilinx Inc. | 29,562 | 714 |
| | Activision Blizzard Inc. | 66,128 | 707 |
| * | BMC Software Inc. | 19,520 | 704 |
| * | Micron Technology Inc. | 106,800 | 690 |
| * | Autodesk Inc. | 24,795 | 688 |
| | Linear Technology Corp. | 23,764 | 681 |
| * | Teradata Corp. | 17,847 | 584 |
| * | VeriSign Inc. | 19,625 | 572 |
| * | NVIDIA Corp. | 60,806 | 567 |
| | Microchip Technology Inc. | 19,649 | 544 |
| * | Seagate Technology PLC | 52,577 | 533 |
| * | Electronic Arts Inc. | 34,840 | 531 |
| | KLA-Tencor Corp. | 18,112 | 507 |
| * | Lam Research Corp. | 13,512 | 488 |
| * | Flextronics International Ltd. | 85,935 | 424 |
| * | Advanced Micro Devices Inc. | 70,766 | 398 |
| * | Avnet Inc. | 16,127 | 369 |
| * | Synopsys Inc. | 15,813 | 362 |
| | National | | |
| | Semiconductor Corp. | 25,372 | 320 |
| | Broadridge Financial | | |
| | Solutions Inc. | 14,500 | 310 |
| | Total System Services Inc. | 21,245 | 302 |
| * | Arrow Electronics Inc. | 12,603 | 288 |
| * | LSI Corp. | 69,945 | 281 |
| * | IAC/InterActiveCorp | 10,421 | 258 |
| * | Novellus Systems Inc. | 10,258 | 239 |
| | Jabil Circuit Inc. | 23,156 | 237 |
| | DST Systems Inc. | 4,905 | 200 |
| | CoreLogic Inc. | 11,057 | 191 |
| | Diebold Inc. | 7,019 | 182 |
| * | Compuware Corp. | 24,655 | 177 |
| | | | 133,137 |
| Materials (1.3%) | | |
| | Praxair Inc. | 32,988 | 2,838 |
| | Sigma-Aldrich Corp. | 13,058 | 694 |
| | Ball Corp. | 9,960 | 559 |
| | Vulcan Materials Co. | 13,627 | 501 |
| * | Pactiv Corp. | 14,230 | 456 |
| | International Flavors & | | |
| | Fragrances Inc. | 8,524 | 389 |
| | Sealed Air Corp. | 17,150 | 352 |
| | | | 5,789 |
| Telecommunication Services (2.2%) | |
| * | American Tower Corp. | | |
| | Class A | 42,837 | 2,007 |
| * | Crown Castle | | |
| | International Corp. | 31,485 | 1,295 |
| * | Sprint Nextel Corp. | 315,594 | 1,288 |
| | | |
| | | Market |
| | | Value |
| | Shares | ($000) |
| CenturyLink Inc. | 32,319 | 1,169 |
| Millicom International | | |
| Cellular SA | 11,477 | 1,057 |
| Qwest Communications | | |
| International Inc. | 185,243 | 1,046 |
| Frontier | | |
| Communications Corp. | 106,123 | 820 |
| * NII Holdings Inc. | 17,704 | 642 |
| Telephone & Data | | |
| Systems Inc. | 5,373 | 155 |
| | | 9,479 |
| Utilities (0.2%) | | |
| TECO Energy Inc. | 22,874 | 386 |
| Questar Corp. | 19,018 | 310 |
| | | 696 |
| Total Common Stocks | | |
| (Cost $441,519) | | 433,354 |
| Temporary Cash Investment (0.1%) | |
| Money Market Fund (0.1%) | | |
| 1 Vanguard Market | | |
| Liquidity Fund, 0.288% | | |
| (Cost $507) | 506,887 | 507 |
| Total Investments (100.1%) | | |
| (Cost $442,026) | | 433,861 |
| Other Assets and Liabilities (-0.1%) | |
| Other Assets | | 1,081 |
| Liabilities | | (1,661) |
| | | (580) |
| Net Assets (100%) | | 433,281 |
13
FTSE Social Index Fund
| |
| At August 31, 2010, net assets consisted of: |
| | Amount |
| | ($000) |
| Paid-in Capital | 566,691 |
| Undistributed Net Investment Income | 1,355 |
| Accumulated Net Realized Losses | (126,600) |
| Unrealized Appreciation (Depreciation) | (8,165) |
| Net Assets | 433,281 |
| |
| |
| Investor Shares—Net Assets | |
| Applicable to 48,788,592 outstanding | |
| $.001 par value shares of beneficial | |
| interest (unlimited authorization) | 305,711 |
| Net Asset Value Per Share— | |
| Investor Shares | $6.27 |
| |
| |
| Institutional Shares—Net Assets | |
| Applicable to 20,337,016 outstanding | |
| $.001 par value shares of beneficial | |
| interest (unlimited authorization) | 127,570 |
| Net Asset Value Per Share— | |
| Institutional Shares | $6.27 |
See Note A in Notes to Financial Statements.
* Non-income-producing security.
1 Affiliated money market fund available only to Vanguard funds and certain trusts and accounts managed by Vanguard. Rate shown is the 7-day yield.
See accompanying Notes, which are an integral part of the Financial Statements.
14
FTSE Social Index Fund
Statement of Operations
| |
| | Year Ended |
| | August 31, 2010 |
| | ($000) |
| Investment Income | |
| Income | |
| Dividends | 5,348 |
| Interest1 | 2 |
| Security Lending | 15 |
| Total Income | 5,365 |
| Expenses | |
| The Vanguard Group—Note B | |
| Investment Advisory Services | 66 |
| Management and Administrative—Investor Shares | 756 |
| Management and Administrative—Institutional Shares | 123 |
| Marketing and Distribution—Investor Shares | 81 |
| Marketing and Distribution—Institutional Shares | 33 |
| Custodian Fees | 27 |
| Auditing Fees | 26 |
| Shareholders’ Reports—Investor Shares | 20 |
| Shareholders’ Reports—Institutional Shares | 4 |
| Trustees’ Fees and Expenses | 1 |
| Total Expenses | 1,137 |
| Net Investment Income | 4,228 |
| Realized Net Gain (Loss) on Investment Securities Sold | (33,928) |
| Change in Unrealized Appreciation (Depreciation) of Investment Securities | 36,338 |
| Net Increase (Decrease) in Net Assets Resulting from Operations | 6,638 |
| 1 Interest income from an affiliated company of the fund was $2,000. | |
See accompanying Notes, which are an integral part of the Financial Statements.
15
FTSE Social Index Fund
Statement of Changes in Net Assets
| | |
| | Year Ended August 31, |
| | 2010 | 2009 |
| | ($000) | ($000) |
| Increase (Decrease) in Net Assets | | |
| Operations | | |
| Net Investment Income | 4,228 | 5,479 |
| Realized Net Gain (Loss) | (33,928) | (84,100) |
| Change in Unrealized Appreciation (Depreciation) | 36,338 | (23,637) |
| Net Increase (Decrease) in Net Assets Resulting from Operations | 6,638 | (102,258) |
| Distributions | | |
| Net Investment Income | | |
| Investor Shares | (3,306) | (5,643) |
| Institutional Shares | (1,275) | (2,622) |
| Realized Capital Gain | | |
| Investor Shares | — | — |
| Institutional Shares | — | — |
| Total Distributions | (4,581) | (8,265) |
| Capital Share Transactions | | |
| Investor Shares | (1,269) | (12,691) |
| Institutional Shares | 23,724 | (2,005) |
| Net Increase (Decrease) from Capital Share Transactions | 22,455 | (14,696) |
| Total Increase (Decrease) | 24,512 | (125,219) |
| Net Assets | | |
| Beginning of Period | 408,769 | 533,988 |
| End of Period1 | 433,281 | 408,769 |
| 1 Net Assets—End of Period includes undistributed net investment income of $1,355,000 and $1,708,000. | | |
See accompanying Notes, which are an integral part of the Financial Statements.
16
FTSE Social Index Fund
Financial Highlights
| | | | | |
| Investor Shares | | | | | |
| |
| For a Share Outstanding | | | | Year Ended August 31, |
| Throughout Each Period | 2010 | 2009 | 2008 | 2007 | 2006 |
| Net Asset Value, Beginning of Period | $6.20 | $7.76 | $9.30 | $8.51 | $8.03 |
| Investment Operations | | | | | |
| Net Investment Income | .061 | .080 | .125 | .130 | .110 |
| Net Realized and Unrealized Gain | | | | | |
| (Loss) on Investments | .077 | (1.522) | (1.525) | .780 | .470 |
| Total from Investment Operations | .138 | (1.442) | (1.400) | .910 | .580 |
| Distributions | | | | | |
| Dividends from Net Investment Income | (.068) | (.118) | (.140) | (.120) | (.100) |
| Distributions from Realized Capital Gains | — | — | — | — | — |
| Total Distributions | (.068) | (.118) | (.140) | (.120) | (.100) |
| Net Asset Value, End of Period | $6.27 | $6.20 | $7.76 | $9.30 | $8.51 |
| |
| Total Return1 | 2.18% | -18.11% | -15.26% | 10.70% | 7.25% |
| |
| Ratios/Supplemental Data | | | | | |
| Net Assets, End of Period (Millions) | $306 | $304 | $395 | $540 | $405 |
| Ratio of Total Expenses to Average Net Assets | 0.29% | 0.29% | 0.24% | 0.24% | 0.25% |
| Ratio of Net Investment Income to | | | | | |
| Average Net Assets | 0.91% | 1.50% | 1.48% | 1.48% | 1.41% |
| Portfolio Turnover Rate | 35% | 30% | 41% | 20% | 51%2 |
1 Total returns do not include account service fees that may have applied in the periods shown. Fund prospectuses provide information about any applicable account service fees.
2 Includes activity related to a change in the fund’s target index.
See accompanying Notes, which are an integral part of the Financial Statements.
17
FTSE Social Index Fund
Financial Highlights
| | | | | |
| Institutional Shares | | | | | |
| |
| For a Share Outstanding | | | | Year Ended August 31, |
| Throughout Each Period | 2010 | 2009 | 2008 | 2007 | 2006 |
| Net Asset Value, Beginning of Period | $6.20 | $7.77 | $9.32 | $8.52 | $8.04 |
| Investment Operations | | | | | |
| Net Investment Income | .070 | .087 | .137 | .152 | .120 |
| Net Realized and Unrealized Gain | | | | | |
| (Loss) on Investments | .075 | (1.528) | (1.535) | .780 | .470 |
| Total from Investment Operations | .145 | (1.441) | (1.398) | .932 | .590 |
| Distributions | | | | | |
| Dividends from Net Investment Income | (.075) | (.129) | (.152) | (.132) | (.110) |
| Distributions from Realized Capital Gains | — | — | — | — | — |
| Total Distributions | (.075) | (.129) | (.152) | (.132) | (.110) |
| Net Asset Value, End of Period | $6.27 | $6.20 | $7.77 | $9.32 | $8.52 |
| |
| Total Return | 2.29% | -18.03% | -15.22% | 10.95% | 7.37% |
| |
| Ratios/Supplemental Data | | | | | |
| Net Assets, End of Period (Millions) | $128 | $104 | $139 | $111 | $87 |
| Ratio of Total Expenses to Average Net Assets | 0.16% | 0.16% | 0.11% | 0.11% | 0.12% |
| Ratio of Net Investment Income to | | | | | |
| Average Net Assets | 1.04% | 1.63% | 1.61% | 1.61% | 1.54% |
| Portfolio Turnover Rate | 35% | 30% | 41% | 20% | 51%1 |
1 Includes activity related to a change in the fund’s target index.
See accompanying Notes, which are an integral part of the Financial Statements.
18
FTSE Social Index Fund
Notes to Financial Statements
Vanguard FTSE Social Index Fund is registered under the Investment Company Act of 1940 as an open-end investment company, or mutual fund. The fund offers two classes of shares: Investor Shares and Institutional Shares. Investor Shares are available to any investor who meets the fund’s minimum purchase requirements. Institutional Shares are designed for investors who meet certain administrative, service, and account-size criteria.
A. The following significant accounting policies conform to generally accepted accounting principles for U.S. mutual funds. The fund consistently follows such policies in preparing its financial statements.
1. Security Valuation: Securities are valued as of the close of trading on the New York Stock Exchange (generally 4 p.m., Eastern time) on the valuation date. Equity securities are valued at the latest quoted sales prices or official closing prices taken from the primary market in which each security trades; such securities not traded on the valuation date are valued at the mean of the latest quoted bid and asked prices. Securities for which market quotations are not readily available, or whose values have been materially affected by events occurring before the fund’s pricing time but after the close of the securities’ primary markets, are valued by methods deemed by the board of trustees to represent fair value. Investments in Vanguard Market Liquidity Fund are valued at that fund’s net asset value.
2. Federal Income Taxes: The fund intends to continue to qualify as a regulated investment company and distribute all of its taxable income. Management has analyzed the fund’s tax positions taken for all open federal income tax years (August 31, 2007–2010), and has concluded that no provision for federal income tax is required in the fund’s financial statements.
3. Distributions: Distributions to shareholders are recorded on the ex-dividend date.
4. Security Lending: The fund may lend its securities to qualified institutional borrowers to earn additional income. Security loans are required to be secured at all times by collateral at least equal to the market value of securities loaned. The fund invests cash collateral received in Vanguard Market Liquidity Fund, and records a liability for the return of the collateral, during the period the securities are on loan. Security lending income represents the income earned on investing cash collateral, less expenses associated with the loan.
5. Other: Dividend income is recorded on the ex-dividend date. Interest income includes income distributions received from Vanguard Market Liquidity Fund and is accrued daily. Security transactions are accounted for on the date securities are bought or sold. Costs used to determine realized gains (losses) on the sale of investment securities are those of the specific securities sold.
Each class of shares has equal rights as to assets and earnings, except that each class separately bears certain class-specific expenses related to maintenance of shareholder accounts (included in Management and Administrative expenses) and shareholder reporting. Marketing and distribution expenses are allocated to each class of shares based on a method approved by the board of trustees. Income, other non-class-specific expenses, and gains and losses on investments are allocated to each class of shares based on its relative net assets.
B. The Vanguard Group furnishes at cost investment advisory, corporate management, administrative, marketing, and distribution services. The costs of such services are allocated to the fund under methods approved by the board of trustees. The fund has committed to provide up to 0.40% of its net assets in capital contributions to Vanguard. At August 31, 2010, the fund had contributed capital of $87,000 to Vanguard (included in Other Assets), representing 0.02% of the fund’s net assets and 0.03% of Vanguard’s capitalization. The fund’s trustees and officers are also directors and officers of Vanguard.
19
FTSE Social Index Fund
C. Various inputs may be used to determine the value of the fund’s investments. These inputs are summarized in three broad levels for financial statement purposes. The inputs or methodologies used to value securities are not necessarily an indication of the risk associated with investing in those securities.
Level 1—Quoted prices in active markets for identical securities.
Level 2—Other significant observable inputs (including quoted prices for similar securities, interest rates, prepayment speeds, credit risk, etc.).
Level 3—Significant unobservable inputs (including the fund’s own assumptions used to determine the fair value of investments).
At August 31, 2010, 100% of the fund’s investments were valued based on Level 1 inputs.
D. Distributions are determined on a tax basis and may differ from net investment income and realized capital gains for financial reporting purposes. Differences may be permanent or temporary. Permanent differences are reclassified among capital accounts in the financial statements to reflect their tax character. Temporary differences arise when certain items of income, expense, gain, or loss are recognized in different periods for financial statement and tax purposes; these differences will reverse at some time in the future. Differences in classification may also result from the treatment of short-term gains as ordinary income for tax purposes.
For tax purposes, at August 31, 2010, the fund had $2,422,000 of ordinary income available for distribution. The fund had available capital loss carryforwards totaling $90,831,000 to offset future net capital gains of $79,000 through August 31, 2012, $985,000 through August 31, 2013, $367,000 through August 31, 2014, $2,136,000 through August 31, 2016, $22,335,000 through August 31, 2017, and $64,929,000 through August 31, 2018. In addition, the fund realized losses of $35,005,000 during the period from November 1, 2009, through August 31, 2010, which are deferred and will be treated as realized for tax purposes in fiscal 2011.
At August 31, 2010, the cost of investment securities for tax purposes was $442,769,000. Net unrealized depreciation of investment securities for tax purposes was $8,908,000, consisting of unrealized gains of $57,734,000 on securities that had risen in value since their purchase and $66,642,000 in unrealized losses on securities that had fallen in value since their purchase.
E. During the year ended August 31, 2010, the fund purchased $178,715,000 of investment securities and sold $155,860,000 of investment securities, other than temporary cash investments.
20
FTSE Social Index Fund
F. Capital share transactions for each class of shares were:
| | | | | |
| | | | Year Ended August 31, |
| | | 2010 | | | 2009 |
| | Amount | Shares | Amount | Shares |
| | ($000) | (000) | ($000) | (000) |
| Investor Shares | | | | |
| Issued | 76,759 | 11,344 | 69,845 | 13,553 |
| Issued in Lieu of Cash Distributions | 3,123 | 477 | 5,331 | 1,125 |
| Redeemed | (81,151) | (12,168) | (87,867) | (16,390) |
| Net Increase (Decrease)—Investor Shares | (1,269) | (347) | (12,691) | (1,712) |
| Institutional Shares | | | | |
| Issued | 48,750 | 7,280 | 34,054 | 6,299 |
| Issued in Lieu of Cash Distributions | 925 | 141 | 2,022 | 427 |
| Redeemed | (25,951) | (3,896) | (38,081) | (7,838) |
| Net Increase (Decrease)—Institutional Shares | 23,724 | 3,525 | (2,005) | (1,112) |
G. In preparing the financial statements as of August 31, 2010, management considered the impact of subsequent events for potential recognition or disclosure in these financial statements.
21
Report of Independent Registered Public Accounting Firm
To the Trustees of Vanguard World Fund and the Shareholders of Vanguard FTSE Social Index Fund:
In our opinion, the accompanying statement of net assets and the related statements of operations and of changes in net assets and the financial highlights present fairly, in all material respects, the financial position of Vanguard FTSE Social Index Fund (constituting a separate portfolio of Vanguard World Fund, hereafter referred to as the “Fund”) at August 31, 2010, the results of its operations for the year then ended, the changes in its net assets for each of the two years in the period then ended and the financial highlights for each of the five years in the period then ended, in conformity with accounting principles generally accepted in the United States of America. These financial statements and financial highlights (hereafter referred to as “financial statements”) are the responsibility of the Fund’s management; our responsibility is to express an opinion on these financial statements based on our audits. We conducted our audits of these financial statements in accordance with the standards of the Public Company Accounting Oversight Board (United States). Those standards require that we plan and perform the audit to obtain reasonable assurance about whether the financial statements are free of material misstatement. An audit includes examining, on a test basis, evidence supporting the amounts and disclosures in the financial statements, assessing the accounting principles used and significant estimates made by management, and evaluating the overall financial statement presentation. We believe that our audits, which included confirmation of securities at August 31, 2010 by correspondence with the custodian and by agreement to the underlying ownership records of Vanguard Market Liquidity Fund, provide a reasonable basis for our opinion.
PricewaterhouseCoopers LLP
Philadelphia, Pennsylvania
October 11, 2010

Special 2010 tax information (unaudited) for Vanguard FTSE Social Index Fund
This information for the fiscal year ended August 31, 2010, is included pursuant to provisions of the Internal Revenue Code.
The fund distributed $4,581,000 of qualified dividend income to shareholders during the fiscal year.
For corporate shareholders, 100% of investment income (dividend income plus short-term gains, if any) qualifies for the dividends-received deduction.
22
Your Fund’s After-Tax Returns
This table presents returns for your fund both before and after taxes. The after-tax returns are shown in two ways: (1) assuming that an investor owned the fund during the entire period and paid taxes on the fund’s distributions, and (2) assuming that an investor paid taxes on the fund’s distributions and sold all shares at the end of each period.
Calculations are based on the highest individual federal income tax and capital gains tax rates in effect at the times of the distributions and the hypothetical sales. State and local taxes were not considered. After-tax returns reflect any qualified dividend income , using actual prior-year figures and estimates for 2010. (In the example, returns after the sale of fund shares may be higher than those assuming no sale. This occurs when the sale would have produced a capital loss. The calculation assumes that the investor received a tax deduction for the loss.)
The table shows returns for Investor Shares only; returns for other share classes will differ. Please note that your actual after-tax returns will depend on your tax situation and may differ from those shown. Also note that if you own the fund in a tax-deferred account, such as an individual retirement account or a 401(k) plan, this information does not apply to you. Such accounts are not subject to current taxes.
Finally, keep in mind that a fund’s performance—whether before or after taxes—does not guarantee future results.
Average Annual Total Returns: FTSE Social Index Fund Investor Shares
Periods Ended August 31, 2010
| | | |
| | One | Five | Ten |
| | Year | Years | Years |
| Returns Before Taxes | 2.18% | -3.39% | -4.44% |
| Returns After Taxes on Distributions | 2.02 | -3.60 | -4.66 |
| Returns After Taxes on Distributions and Sale of Fund Shares | 1.64 | -2.83 | -3.68 |
23
About Your Fund’s Expenses
As a shareholder of the fund, you incur ongoing costs, which include costs for portfolio management, administrative services, and shareholder reports (like this one), among others. Operating expenses, which are deducted from a fund’s gross income, directly reduce the investment return of the fund.
A fund’s expenses are expressed as a percentage of its average net assets. This figure is known as the expense ratio. The following examples are intended to help you understand the ongoing costs (in dollars) of investing in your fund and to compare these costs with those of other mutual funds. The examples are based on an investment of $1,000 made at the beginning of the period shown and held for the entire period.
The accompanying table illustrates your fund’s costs in two ways:
• Based on actual fund return. This section helps you to estimate the actual expenses that you paid over the period. The ”Ending Account Value“ shown is derived from the fund‘s actual return, and the third column shows the dollar amount that would have been paid by an investor who started with $1,000 in the fund. You may use the information here, together with the amount you invested, to estimate the expenses that you paid over the period.
To do so, simply divide your account value by $1,000 (for example, an $8,600 account value divided by $1,000 = 8.6), then multiply the result by the number given for your fund under the heading ”Expenses Paid During Period.“
• Based on hypothetical 5% yearly return. This section is intended to help you compare your fund‘s costs with those of other mutual funds. It assumes that the fund had a yearly return of 5% before expenses, but that the expense ratio is unchanged. In this case—because the return used is not the fund’s actual return—the results do not apply to your investment. The example is useful in making comparisons because the Securities and Exchange Commission requires all mutual funds to calculate expenses based on a 5% return. You can assess your fund’s costs by comparing this hypothetical example with the hypothetical examples that appear in shareholder reports of other funds.
Note that the expenses shown in the table are meant to highlight and help you compare ongoing costs only and do not reflect transaction costs incurred by the fund for buying and selling securities. Further, the expenses do not include the account service fee described in the prospectus. If such a fee were applied to your account, your costs would be higher. Your fund does not charge transaction fees, such as purchase or redemption fees, nor does it carry a “sales load.”
The calculations assume no shares were bought or sold during the period. Your actual costs may have been higher or lower, depending on the amount of your investment and the timing of any purchases or redemptions.
You can find more information about the fund’s expenses, including annual expense ratios, in the Financial Statements section of this report. For additional information on operating expenses and other shareholder costs, please refer to your fund’s current prospectus.
24
| | | |
| Six Months Ended August 31, 2010 | | | |
| | Beginning | Ending | Expenses |
| | Account Value | Account Value | Paid During |
| FTSE Social Index Fund | 2/28/2010 | 8/31/2010 | Period |
| Based on Actual Fund Return | | | |
| Investor Shares | $1,000.00 | $937.22 | $1.42 |
| Institutional Shares | 1,000.00 | 937.22 | 0.78 |
| Based on Hypothetical 5% Yearly Return | | | |
| Investor Shares | $1,000.00 | $1,023.74 | $1.48 |
| Institutional Shares | 1,000.00 | 1,024.40 | 0.82 |
The calculations are based on expenses incurred in the most recent six-month period. The fund’s annualized six-month expense ratios for that period are 0.29% for Investor Shares and 0.16% for Institutional Shares. The dollar amounts shown as “Expenses Paid” are equal to the annualized expense ratio multiplied by the average account value over the period, multiplied by the number of days in the most recent six-month period, then divided by the number of days in the most recent 12-month period.
25
Trustees Approve Advisory Arrangement
The board of trustees of Vanguard FTSE Social Index Fund has renewed the fund’s investment advisory arrangement with The Vanguard Group, Inc. Vanguard—through its Quantitative Equity Group—serves as the investment advisor to the fund. The board determined that continuing the fund’s internalized management structure was in the best interests of the fund and its shareholders.
The board based its decision upon an evaluation of the advisor’s investment staff, portfolio management process, and performance. The trustees considered the factors discussed below, among others. However, no single factor determined whether the board approved the arrangement. Rather, it was the totality of the circumstances that drove the board’s decision.
Nature, extent, and quality of services
The board considered the quality of the fund’s investment management over both the short and long term, and took into account the organizational depth and stability of the advisor. The board noted that Vanguard has been managing investments for more than three decades. The Quantitative Equity Group adheres to a sound, disciplined investment management process; the team has considerable experience, stability, and depth.
The board concluded that Vanguard’s experience, stability, depth, and performance, among other factors, warranted continuation of the advisory arrangement.
Investment performance
The board considered the short- and long-term performance of the fund, including any periods of outperformance or underperformance of its target index and peer group. The board concluded that the fund has performed in line with expectations, and that the results have been consistent with the fund’s investment strategies. Information about the fund’s most recent performance can be found in the Performance Summary section of this report.
Cost
The board concluded that the fund’s expense ratio was well below the average expense ratio charged by funds in its peer group and that the fund’s advisory expense ratio was also well below its peer-group average. Information about the fund’s expense ratio appears in the About Your Fund’s Expenses section of this report.
The board does not conduct a profitability analysis of Vanguard, because of Vanguard’s unique “at-cost” structure. Unlike most other mutual fund management companies, Vanguard is owned by the funds it oversees, and produces “profits” only in the form of reduced expenses for fund shareholders.
The benefit of economies of scale
The board concluded that the fund’s low-cost arrangement with Vanguard ensures that the fund will realize economies of scale as it grows, with the cost to shareholders declining as fund assets increase.
The board will consider whether to renew the advisory arrangement again after a one-year period.
26
Glossary
30-Day SEC Yield. A fund’s 30-day SEC yield is derived using a formula specified by the U.S. Securities and Exchange Commission. Under the formula, data related to the fund’s security holdings in the previous 30 days are used to calculate the fund’s hypothetical net income for that period, which is then annualized and divided by the fund’s estimated average net assets over the calculation period. For the purposes of this calculation, a security’s income is based on its current market yield to maturity (in the case of bonds) or its projected dividend yield (for stocks). Because the SEC yield represents hypothetical annualized income, it will differ—at times significantly—from the fund’s actual experience. As a result, the fund’s income distributions may be higher or lower than implied by the SEC yield.
Beta. A measure of the magnitude of a fund’s past share-price fluctuations in relation to the ups and downs of a given market index. The index is assigned a beta of 1.00. Compared with a given index, a fund with a beta of 1.20 typically would have seen its share price rise or fall by 12% when the index rose or fell by 10%. For this report, beta is based on returns over the past 36 months for both the fund and the index. Note that a fund’s beta should be reviewed in conjunction with its R-squared (see definition). The lower the R-squared, the less correlation there is between the fund and the index, and the less reliable beta is as an indicator of volatility.
Dividend Yield. Dividend income earned by stocks, expressed as a percentage of the aggregate market value (or of net asset value, for a fund). The yield is determined by dividing the amount of the annual dividends by the aggregate value (or net asset value) at the end of the period. For a fund, the dividend yield is based solely on stock holdings and does not include any income produced by other investments.
Earnings Growth Rate. The average annual rate of growth in earnings over the past five years for the stocks now in a fund.
Equity Exposure. A measure that reflects a fund’s investments in stocks and stock futures. Any holdings in short-term reserves are excluded.
Expense Ratio. The percentage of a fund’s average net assets used to pay its annual administrative and advisory expenses. These expenses directly reduce returns to investors.
Foreign Holdings. The percentage of a fund represented by stocks or depositary receipts of companies based outside the United States.
Inception Date. The date on which the assets of a fund (or one of its share classes) are first invested in accordance with the fund’s investment objective. For funds with a subscription period, the inception date is the day after that period ends. Investment performance is measured from the inception date.
Median Market Cap. An indicator of the size of companies in which a fund invests; the midpoint of market capitalization (market price x shares outstanding) of a fund’s stocks, weighted by the proportion of the fund’s assets invested in each stock. Stocks representing half of the fund’s assets have market capitalizations above the median, and the rest are below it.
Price/Book Ratio. The share price of a stock divided by its net worth, or book value, per share. For a fund, the weighted average price/book ratio of the stocks it holds.
27
Price/Earnings Ratio. The ratio of a stock’s current price to its per-share earnings over the past year. For a fund, the weighted average P/E of the stocks it holds. P/E is an indicator of market expectations about corporate prospects; the higher the P/E, the greater the expectations for a company’s future growth.
R-Squared. A measure of how much of a fund’s past returns can be explained by the returns from the market in general, as measured by a given index. If a fund’s total returns were precisely synchronized with an index’s returns, its R-squared would be 1.00. If the fund’s returns bore no relationship to the index’s returns, its R-squared would be 0. For this report, R-squared is based on returns over the past 36 months for both the fund and the index.
Return on Equity. The annual average rate of return generated by a company during the past five years for each dollar of shareholder’s equity (net income divided by shareholder’s equity). For a fund, the weighted average return on equity for the companies whose stocks it holds.
Short-Term Reserves. The percentage of a fund invested in highly liquid, short-term securities that can be readily converted to cash.
Turnover Rate. An indication of the fund’s trading activity. Funds with high turnover rates incur higher transaction costs and may be more likely to distribute capital gains (which may be taxable to investors). The turnover rate excludes in-kind transactions, which have minimal impact on costs.
28
This page intentionally left blank.
This page intentionally left blank.
This page intentionally left blank.
The People Who Govern Your Fund
The trustees of your mutual fund are there to see that the fund is operated and managed in your best interests since, as a shareholder, you are a part owner of the fund. Your fund’s trustees also serve on the board of directors of The Vanguard Group, Inc., which is owned by the Vanguard funds and provides services to them on an at-cost basis.
A majority of Vanguard’s board members are independent, meaning that they have no affiliation with Vanguard or the funds they oversee, apart from the sizable personal investments they have made as private individuals. The independent board members have distinguished backgrounds in business, academia, and public service. Each of the trustees and executive officers oversees 163 Vanguard funds.
The following table provides information for each trustee and executive officer of the fund. More information about the trustees is in the Statement of Additional Information, which can be obtained, without charge, by contacting Vanguard at 800-662-7447, or online at vanguard.com.
| |
| Interested Trustee1 | Amy Gutmann |
| | Born 1949. Trustee Since June 2006. Principal |
| F. William McNabb III | Occupation(s) During the Past Five Years: President |
| Born 1957. Trustee Since July 2009. Chairman of the | of the University of Pennsylvania; Christopher H. |
| Board. Principal Occupation(s) During the Past Five | Browne Distinguished Professor of Political Science |
| Years: Chairman of the Board of The Vanguard Group, | in the School of Arts and Sciences with secondary |
| Inc., and of each of the investment companies served | appointments at the Annenberg School for Commu- |
| by The Vanguard Group, since January 2010; Director | nication and the Graduate School of Education |
| of The Vanguard Group since 2008; Chief Executive | of the University of Pennsylvania; Director of |
| Officer and President of The Vanguard Group and of | Carnegie Corporation of New York, Schuylkill River |
| each of the investment companies served by The | Development Corporation, and Greater Philadelphia |
| Vanguard Group since 2008; Director of Vanguard | Chamber of Commerce; Trustee of the National |
| Marketing Corporation; Managing Director of The | Constitution Center; Chair of the Presidential |
| Vanguard Group (1995–2008) . | Commission for the Study of Bioethical Issues. |
| |
| | JoAnn Heffernan Heisen |
| Independent Trustees | Born 1950. Trustee Since July 1998. Principal |
| | Occupation(s) During the Past Five Years: Corporate |
| Emerson U. Fullwood | Vice President and Chief Global Diversity Officer |
| Born 1948. Trustee Since January 2008. Principal | since 2006 (retired 2008) and Member of the |
| Occupation(s) During the Past Five Years: Executive | Executive Committee (retired 2008) of Johnson & |
| Chief Staff and Marketing Officer for North America | Johnson (pharmaceuticals/consumer products); Vice |
| and Corporate Vice President (retired 2008) of Xerox | President and Chief Information Officer of Johnson & |
| Corporation (document management products and | Johnson (1997–2005); Director of the University |
| services); Director of SPX Corporation (multi-industry | Medical Center at Princeton and Women’s Research |
| manufacturing), the United Way of Rochester, | and Education Institute; Member of the Advisory |
| Amerigroup Corporation (managed health care), | Board of the Maxwell School of Citizenship and Public |
| the University of Rochester Medical Center, and | Affairs at Syracuse University. |
| Monroe Community College Foundation. | |
| | F. Joseph Loughrey |
| Rajiv L. Gupta | Born 1949. Trustee Since October 2009. Principal |
| Born 1945. Trustee Since December 2001.2 | Occupation(s) During the Past Five Years: President |
| Principal Occupation(s) During the Past Five Years: | and Chief Operating Officer since 2005 (retired 2009) |
| Chairman and Chief Executive Officer (retired 2009) | and Vice Chairman of the Board (2008–2009) of |
| and President (2006–2008) of Rohm and Haas Co. | Cummins Inc. (industrial machinery); Director of |
| (chemicals); Director of Tyco International, Ltd. | SKF AB (industrial machinery), Hillenbrand, Inc. |
| (diversified manufacturing and services) and Hewlett- | (specialized consumer services), Sauer-Danfoss Inc. |
| Packard Co. (electronic computer manufacturing); | (machinery), the Lumina Foundation for Education, |
| Trustee of The Conference Board; Member of the | and Oxfam America; Chairman of the Advisory |
| Board of Managers of Delphi Automotive LLP | Council for the College of Arts and Letters at the |
| (automotive components) . | University of Notre Dame. |
| | |
| André F. Perold | Kathryn J. Hyatt | |
| Born 1952. Trustee Since December 2004. Principal | Born 1955. Treasurer Since November 2008. Principal |
| Occupation(s) During the Past Five Years: George | Occupation(s) During the Past Five Years: Principal |
| Gund Professor of Finance and Banking at the Harvard | of The Vanguard Group, Inc.; Treasurer of each of |
| Business School; Chair of the Investment Committee | the investment companies served by The Vanguard |
| of HighVista Strategies LLC (private investment firm) . | Group since 2008; Assistant Treasurer of each of the |
| | investment companies served by The Vanguard Group |
| Alfred M. Rankin, Jr. | (1988–2008) . | |
| Born 1941. Trustee Since January 1993. Principal | | |
| Occupation(s) During the Past Five Years: Chairman, | Heidi Stam | |
| President, and Chief Executive Officer of NACCO | Born 1956. Secretary Since July 2005. Principal |
| Industries, Inc. (forklift trucks/housewares/lignite); | Occupation(s) During the Past Five Years: Managing |
| Director of Goodrich Corporation (industrial products/ | Director of The Vanguard Group, Inc., since 2006; |
| aircraft systems and services); Chairman of the | General Counsel of The Vanguard Group since 2005; |
| Federal Reserve Bank of Cleveland; Trustee of The | Secretary of The Vanguard Group and of each of the |
| Cleveland Museum of Art. | investment companies served by The Vanguard Group |
| | since 2005; Director and Senior Vice President of |
| Peter F. Volanakis | Vanguard Marketing Corporation since 2005; |
| Born 1955. Trustee Since July 2009. Principal | Principal of The Vanguard Group (1997–2006). |
| Occupation(s) During the Past Five Years: President | | |
| since 2007 and Chief Operating Officer since 2005 | | |
| of Corning Incorporated (communications equipment); | Vanguard Senior Management Team |
| President of Corning Technologies (2001–2005); | | |
| Director of Corning Incorporated and Dow Corning; | R. Gregory Barton | Michael S. Miller |
| Trustee of the Corning Incorporated Foundation and | Mortimer J. Buckley | James M. Norris |
| the Corning Museum of Glass; Overseer of the | Kathleen C. Gubanich | Glenn W. Reed |
| Amos Tuck School of Business Administration at | Paul A. Heller | George U. Sauter |
| Dartmouth College. | | |
| |
| | Chairman Emeritus and Senior Advisor |
| Executive Officers | | |
| | John J. Brennan | |
| Glenn Booraem | Chairman, 1996–2009 | |
| Born 1967. Controller Since July 2010. Principal | Chief Executive Officer and President, 1996–2008 |
| Occupation(s) During the Past Five Years: Principal | | |
| of The Vanguard Group, Inc.; Controller of each of | | |
| the investment companies served by The Vanguard | Founder | |
| Group since 2010; Assistant Controller of each of | | |
| the investment companies served by The Vanguard | John C. Bogle | |
| Group (2001–2010) . | Chairman and Chief Executive Officer, 1974–1996 |
| |
| Thomas J. Higgins | | |
| Born 1957. Chief Financial Officer Since September | | |
| 2008. Principal Occupation(s) During the Past Five | | |
| Years: Principal of The Vanguard Group, Inc.; Chief | | |
| Financial Officer of each of the investment companies | | |
| served by The Vanguard Group since 2008; Treasurer | | |
| of each of the investment companies served by The | | |
| Vanguard Group (1998–2008) . | | |
1 Mr. McNabb is considered an “interested person,” as defined in the Investment Company Act of 1940, because he is an officer of the Vanguard funds.
2 December 2002 for Vanguard Equity Income Fund, Vanguard Growth Equity Fund, the Vanguard Municipal Bond Funds, and the Vanguard State Tax-Exempt Funds.
|  |
| P.O. Box 2600 |
| Valley Forge, PA 19482-2600 |
Connect with Vanguard® > Vanguard.com
| |
| Fund Information > 800-662-7447 | “FTSE®” and “FTSE4Good™” are trademarks jointly |
| Direct Investor Account Services > 800-662-2739 | owned by the London Stock Exchange plc and The |
| Institutional Investor Services > 800-523-1036 | International Limited under license. The FTSE4Good US |
| Text Telephone for People | Select Index is calculated by FTSE International |
| With Hearing Impairment > 800-749-7273 | Limited. FTSE International Limited does not sponsor, |
| | endorse, or promote the fund; is not in any way |
| This material may be used in conjunction | connected to it; and does not accept any liability in |
| with the offering of shares of any Vanguard | relation to its issue, operation, and trading. |
| fund only if preceded or accompanied by | |
| the fund’s current prospectus. | |
| |
| All comparative mutual fund data are from Lipper Inc. or | |
| Morningstar, Inc., unless otherwise noted. | |
| |
| You can obtain a free copy of Vanguard’s proxy voting | |
| guidelines by visiting vanguard.com/proxyreporting or by | |
| calling Vanguard at 800-662-2739. The guidelines are | |
| also available from the SEC’s website, sec.gov. In | |
| addition, you may obtain a free report on how your fund | |
| voted the proxies for securities it owned during the 12 | |
| months ended June 30. To get the report, visit either | |
| vanguard.com/proxyreporting or sec.gov. | |
| |
| You can review and copy information about your fund at | |
| the SEC’s Public Reference Room in Washington, D.C. To | |
| find out more about this public service, call the SEC at | |
| 202-551-8090. Information about your fund is also | |
| available on the SEC’s website, and you can receive | |
| copies of this information, for a fee, by sending a | |
| request in either of two ways: via e-mail addressed to | |
| publicinfo@sec.gov or via regular mail addressed to the | |
| Public Reference Section, Securities and Exchange | |
| Commission, Washington, DC 20549-1520. | |
| |
| |
| | © 2010 The Vanguard Group, Inc. |
| | All rights reserved. |
| | Vanguard Marketing Corporation, Distributor. |
| |
| | Q2130 102010 |
| |
| Vanguard U.S. Sector Index Funds |
| Annual Report |
|
| August 31, 2010 |
 |
| |
| |
| Vanguard Consumer Discretionary | Vanguard Industrials Index Fund |
| Index Fund | Vanguard Information Technology |
| Vanguard Consumer Staples Index Fund | Index Fund |
| Vanguard Energy Index Fund | Vanguard Materials Index Fund |
| Vanguard Financials Index Fund | Vanguard Telecommunication Services |
| Vanguard Health Care Index Fund | Index Fund |
| | Vanguard Utilities Index Fund |
> Returns were volatile through the spring and summer as the broad U.S. stock market gained about 6% for the 12 months ended August 31, 2010.
> The Vanguard U.S. Sector Index Funds recorded fiscal-year returns ranging from about –4% for financial stocks to more than 16% for consumer discretionary stocks.
> Of the ten sector funds, only the Financials Index Fund had a negative return for the period; six of the funds outpaced the overall U.S. stock market, some substantially, and four trailed.
| |
| Contents | |
| |
| Your Fund’s Total Returns | 1 |
| Chairman’s Letter | 2 |
| Consumer Discretionary Index Fund | 5 |
| Consumer Staples Index Fund | 15 |
| Energy Index Fund | 24 |
| Financials Index Fund | 33 |
| Health Care Index Fund | 44 |
| Industrials Index Fund | 54 |
| Information Technology Index Fund | 64 |
| Materials Index Fund | 74 |
| Telecommunication Services Index Fund | 84 |
| Utilities Index Fund | 93 |
| Your Fund’s After-Tax Returns | 103 |
| About Your Fund’s Expenses | 105 |
| Trustees Approve Advisory Arrangement | 107 |
| Glossary | 108 |

Please note: The opinions expressed in this report are just that—informed opinions. They should not be considered promises or advice. Also, please keep in mind that the information and opinions cover the period through the date on the front of this report. Of course, the risks of investing in your fund are spelled out in the prospectus.
Cover photograph: Jean Maher.
Your Fund’s Total Returns
Fiscal Year Ended August 31, 2010
| | |
| Admiral™ Shares1 and ETF Shares2 | |
| |
| | Ticker | Total |
| | Symbol | Returns |
| Vanguard Consumer | | |
| Discretionary Index Fund | VCDAX | 16.62% |
| Vanguard Consumer | | |
| Discretionary ETF | VCR | |
| Market Price | | 16.44 |
| Net Asset Value | | 16.62 |
| Spliced MSCI US | | |
| IMI/Consumer Discretionary 25/503 | | 16.88 |
| |
| Vanguard Consumer Staples | | |
| Index Fund | VCSAX | 10.34% |
| Vanguard Consumer Staples ETF | VDC | |
| Market Price | | 10.18 |
| Net Asset Value | | 10.33 |
| Spliced MSCI US | | |
| IMI/Consumer Staples 25/503 | | 10.49 |
| |
| Vanguard Energy Index Fund | VENAX | 2.05% |
| Vanguard Energy ETF | VDE | |
| Market Price | | 1.81 |
| Net Asset Value | | 2.05 |
| Spliced MSCI US IMI/Energy 25/503 | | 0.63 |
| |
| Vanguard Financials Index Fund | VFAIX | –3.52% |
| Vanguard Financials ETF | VFH | |
| Market Price | | –3.70 |
| Net Asset Value | | –3.51 |
| Spliced MSCI US IMI/Financials 25/503 | –3.41 |
| |
| Vanguard Health Care Index Fund | VHCIX | 1.41% |
| Vanguard Health Care ETF | VHT | |
| Market Price | | 1.29 |
| Net Asset Value | | 1.40 |
| Spliced MSCI US IMI/Health Care 25/503 | 1.55 |
| |
| Vanguard Industrials Index Fund | VINAX | 12.85% |
| Vanguard Industrials ETF | VIS | |
| Market Price | | 12.72 |
| Net Asset Value | | 12.85 |
| Spliced MSCI US IMI/Industrials 25/503 | 13.13 |
| | |
| | Ticker | Total |
| | Symbol | Returns |
| Vanguard Information Technology | | |
| Index Fund | VITAX | 4.17% |
| Vanguard Information | | |
| Technology ETF | VGT | |
| Market Price | | 3.98 |
| Net Asset Value | | 4.17 |
| Spliced MSCI US | | |
| IMI/Information Technology 25/503 | | 4.41 |
| |
| Vanguard Materials Index Fund | VMIAX | 10.07% |
| Vanguard Materials ETF | VAW | |
| Market Price | | 9.96 |
| Net Asset Value | | 10.07 |
| Spliced MSCI US IMI/Materials 25/503 | 10.31 |
| |
| Vanguard Telecommunication | | |
| Services Index Fund | VTCAX | 16.40% |
| Vanguard Telecommunication | | |
| Services ETF | VOX | |
| Market Price | | 16.37 |
| Net Asset Value | | 16.39 |
| Spliced MSCI US | | |
| IMI/Telecommunication Services 25/503 | 12.26 |
| |
| Vanguard Utilities Index Fund | VUIAX | 10.20% |
| Vanguard Utilities ETF | VPU | |
| Market Price | | 10.07 |
| Net Asset Value | | 10.18 |
| Spliced MSCI US IMI/Utilities 25/503 | | 10.41 |
| |
| MSCI US IMI/2500 | | 5.81% |
1 Admiral Shares carry lower expenses and are available to investors who meet certain account-balance requirements.
2 The Vanguard ETF® Shares shown are traded on the NYSE Arca exchange and are available only through brokers. The table shows the ETF returns based on both the NYSE Arca market price and the net asset value for a share. U.S. Pat. No. 6,879,964 B2; 7,337,138.
3 Spliced MSCI US IMI/Consumer Discretionary 25/50: MSCI US IMI/Consumer Discretionary through February 26, 2010; MSCI US IMI/Consumer Discretionary 25/50 thereafter. Spliced MSCI US IMI/Consumer Staples 25/50: MSCI US IMI/Consumer Staples through February 26, 2010; MSCI US IMI/Consumer Staples 25/50 thereafter. Spliced MSCI US IMI/Energy 25/50: MSCI US IMI/Energy through February 26, 2010; MSCI US IMI/Energy 25/50 thereafter. Spliced MSCI US IMI/Financials 25/50: MSCI US IMI/Financials through February 26, 2010; MSCI US IMI/Financials 25/50 thereafter. Spliced MSCI US IMI/Health Care 25/50: MSCI US IMI/Health Care through February 26, 2010; MSCI US IMI/Health Care 25/50 thereafter. Spliced MSCI US IMI/Industrials 25/50: MSCI US IMI/Industrials through February 26, 2010; MSCI US IMI/Industrials 25/50 thereafter. Spliced MSCI US IMI/Information Technology 25/50: M SCI US IMI/Information Technology through February 26, 2010; MSCI US IMI/Information Technology 25/50 thereafter. Spliced MSCI US IMI/ Materials 25/50: MSCI US IMI/Materials through February 26, 2010; MSCI US IMI/Materials 25/50 thereafter. Spliced MSCI US IMI/Telecommunication Services 25/50: MSCI US IMI/Telecommunication Services through February 26, 2010; MSCI US IMI/Telecommunication Services 25/50 thereafter. Spliced MSCI US IMI/Utilities 25/50: MSCI US IMI/Utilities through February 26, 2010; MSCI US IMI/Utilities 25/50 thereafter.
Note: MSCI US IMI/2500 is the Morgan Stanley Capital International® US Investable Market 2500 Index.
1

Chairman’s Letter
Dear Shareholder,
For the fiscal year ended August 31, 2010, the broad U.S. stock market returned about 6%. Stocks advanced about 10% for the first half of the fiscal year, continuing the rally that began in March 2009. The recovery lost steam over the second half of the period; stocks retreated as doubts about the U.S. economy’s health surfaced and the debt crisis in Europe flared.
Reflecting the business dynamics unique to each sector, the Vanguard U.S. Sector Index Funds responded to the economic and market environment in different ways For the 12 months, six of the ten sector funds outperformed the broad stock market’s return. Overall, the funds recorded fiscal-year returns ranging from about –4% for financial stocks to more than 16% for consumer discretionary stocks.
Consumer discretionary, telecommunication services, industrials, consumer staples, materials, and utilities all registered double-digit gains. Although financials was the only sector with a negative return, the information technology, health care, and energy sectors lagged the broad market for the 12 months.
If you hold shares in a taxable account, you may wish to review the table and discussion on after-tax returns for the fiscal year, based on the highest tax bracket, later in this report.
On another matter, at the close of business on February 26, 2010, Vanguard changed the target benchmarks for all ten U.S. Sector Index Funds to address the gaps between the sector indexes’ composition and what Internal Revenue Code regulations allow a real-world fund to hold. The change––to the MSCI 25/50 Indexes––will provide shareholders with a more reasonable standard for evaluating their funds’ index-tracking success, while ensuring that the funds remain compliant with SEC and IRS regulations for favorable tax treatment.
A ragged 12-month climb in global stock markets
At the start of the 12-month period, stock markets moved higher as global economies continued to pull out of a deep downturn. Within a few months, however, optimism began to fade. Europe’s sovereign debt crisis fueled fears of another global financial shock, while persistently high unemployment and downward revisions to U.S. economic indicators suggested that the powerful rebound in corporate earnings could be at risk.
| | | | |
| | | |
| Market Barometer | | | |
| | | Average Annual Total Returns |
| | | | Periods Ended August 31, 2010 |
| | One Year | Three Years | Five Years |
| Stocks | | | |
| Russell 1000 Index (Large-caps) | 5.55% | –8.34% | –0.71% |
| Russell 2000 Index (Small-caps) | 6.60 | –7.44 | –0.69 |
| Dow Jones U.S. Total Stock Market Index | 6.15 | –7.83 | –0.31 |
| MSCI All Country World Index ex USA (International) | 3.27 | –7.93 | 3.78 |
| |
| Bonds | | | |
| Barclays Capital U.S. Aggregate Bond Index | | | |
| (Broad taxable market) | 9.18% | 7.65% | 5.96% |
| Barclays Capital Municipal Bond Index | | | |
| (Broad tax-exempt market) | 9.78 | 6.62 | 5.02 |
| Citigroup 3-Month Treasury Bill Index | 0.12 | 1.13 | 2.53 |
| |
| CPI | | | |
| Consumer Price Index | 1.15% | 1.64% | 2.14% |
2
This alternating pattern of hope and fear persisted through the period’s final months. The net result for the fiscal year was mid-single-digit gains for the broad U.S. stock market. International stocks returned about 3%, as modest declines in developed markets in Europe and the Pacific region were offset by a strong rally in emerging markets.
Bonds produced strong returns as prices rose and yields declined
The economic uncertainty and high stock market volatility over the fiscal period created a favorable environment for fixed income investments. The broad, taxable bond market returned more than 9%, as investors sought shelter in U.S. Treasury and corporate bonds. The municipal bond market returned a bit more. In both markets, much of the total return came from rising bond prices. The flip side of rising prices, of course, is shrinking yields, which can set the stage for lower future returns.
As it has since December 2008, the Federal Reserve kept its target for short-term interest rates between 0% and 0.25%, in an effort to bolster the economy. This policy has kept a tight lid on the returns available from Treasury bills, commercial paper, and other money market instruments. Near-zero short-term yields also were a factor nudging investors to shift to banks in search of income, despite the risks such a shift entails.
Sectors out of sync in all market conditions
As the overall U.S. stock market’s recovery lurched ahead for much of the fiscal year, the various underlying sectors moved at varying paces and in different directions. In tallying the final results, however, the difference between the best and worst performers wasn’t as wide as it has been in other time periods.
The Consumer Discretionary Index Fund was the top-performing sector index fund, returning more than 16%. While consumers still kept an eye on price tags and their purse strings, innovative and opportunistic companies from a variety of industries found ways to reach savvy and bargain-conscious shoppers. Media companies, restaurants, internet retailers, and carmakers delivered strong returns.
Sidestepping investors’ concerns about the U.S. economic recovery, the Industrials Index Fund forged ahead nearly 13% for the period. Standout industrial conglomerates as well as machinery, aerospace, and railroad companies benefited from a boost in consumer and commercial demand. Manufacturers and farms expanded capacity, and orders for service, equipment, and goods increased.
The Consumer Staples Index Fund returned about 10% as consumers continued to spend on products and services that are essential to their everyday lives. Corporations that produce soft drinks, tobacco, and household goods enjoyed the most success.
Double-digit returns were also delivered by the Materials and Utilities Index Funds (about +10% each) and the Telecommunication Services Fund (about +16%), which all represent the smallest slices of the broad market. Investors’ search for yield in the low-interest-rate environment lifted high-dividend telecom services and utilities stocks. The gradual economic recovery helped materials companies. As concerns about inflation grew and gold became a more popular investment option, precious metals stocks rose.
Returns for the Information Technology Fund (about +4%) faded as the fiscal year progressed. After advancing nearly 11% for the first six months of the year as consumers and companies renewed spending, anticipation of an economic slowdown led to returns for the sector of about –6% over the second six months.
The Financials Index Fund’s poor performance (about –4%) was partly owed to the sovereign debt crisis, which affected fixed income, currency, and commodity trading, while concerns over regulatory reform hurt the returns of major banks.
The Energy Index Fund returned about 2%. Although BP, the global energy giant tied to the Gulf Coast disaster, is not a fund holding, the industry felt the effects of the oil spill as well as concerns about legislation on offshore drilling. The Health Care Index Fund gained about 1% as uncertainty regarding the implications for national health care reform stymied returns.
Sector funds provide diversification options
To say the least, the stock market has traveled a rocky road over the past few years. As the recovery that began in March 2009 extended past a year, volatility returned to the market. Nobody really knows the market’s next move, but there are ways to cope with the turbulence.
Investors can mitigate market risk by building a portfolio that is diversified across stocks, bonds, and money market mutual funds, and among the different stock market segments, a bedrock principle of successful long-term investing. Each U.S. Sector Index Fund is a potentially risky and volatile investment by itself. But the funds also provide a way to further diversify and fill in a portfolio’s “holes.”
Indexing and low costs––two other Vanguard hallmarks––are also at the core of the U.S. Sector Index Funds. Vanguard Quantitative Equity Group, a proven global leader in index fund management, has expertly overseen the company’s index-tracking results for more than 30 years. The funds’ low costs also ensure that you keep more of the funds’ returns.
Thank you for entrusting your assets to Vanguard.
Sincerely,

F. William McNabb III
Chairman and Chief Executive Officer
September 13, 2010
3
Your Fund’s Performance at a Glance
August 31, 2009–August 31, 2010
| | | | | |
| | | | Distributions Per Share |
| | Starting | Ending | Income | Capital |
| | Share Price | Share Price | Dividends | Gains |
| Consumer Discretionary Index Fund | | | | |
| Admiral Shares | $21.43 | $24.76 | $0.228 | $0.000 |
| ETF Shares | 41.37 | 47.80 | 0.437 | 0.000 |
| Consumer Staples Index Fund | | | | |
| Admiral Shares | $30.62 | $32.92 | $0.850 | $0.000 |
| ETF Shares | 62.07 | 66.72 | 1.738 | 0.000 |
| Energy Index Fund | | | | |
| Admiral Shares | $37.34 | $37.58 | $0.580 | $0.000 |
| ETF Shares | 74.74 | 75.20 | 1.193 | 0.000 |
| Financials Index Fund | | | | |
| Admiral Shares | $14.72 | $13.99 | $0.224 | $0.000 |
| ETF Shares | 29.38 | 27.92 | 0.452 | 0.000 |
| Health Care Index Fund | | | | |
| Admiral Shares | $25.19 | $24.87 | $0.737 | $0.000 |
| ETF Shares | 50.37 | 49.72 | 1.487 | 0.000 |
| Industrials Index Fund | | | | |
| Admiral Shares | $23.85 | $26.57 | $0.345 | $0.000 |
| ETF Shares | 46.45 | 51.71 | 0.715 | 0.000 |
| Information Technology Index Fund | | | | |
| Admiral Shares | $24.39 | $25.30 | $0.118 | $0.000 |
| ETF Shares | 47.64 | 49.40 | 0.250 | 0.000 |
| Materials Index Fund | | | | |
| Admiral Shares | $30.68 | $33.32 | $0.459 | $0.000 |
| ETF Shares | 60.23 | 65.40 | 0.923 | 0.000 |
| Telecommunication Services Index Fund | | | | |
| Admiral Shares | $25.77 | $29.22 | $0.757 | $0.000 |
| ETF Shares | 50.58 | 57.34 | 1.511 | 0.000 |
| Utilities Index Fund | | | | |
| Admiral Shares | $30.73 | $32.60 | $1.205 | $0.000 |
| ETF Shares | 61.24 | 64.93 | 2.414 | 0.000 |
4
Consumer Discretionary Index Fund
Fund Profile
As of August 31, 2010
| | | |
| Portfolio Characteristics | | |
| | | Target | Broad |
| | Fund | Index1 | Index2 |
| Number of Stocks | 374 | 375 | 2,478 |
| Median Market Cap | $14.4B | $14.4B | $26.3B |
| Price/Earnings Ratio | 16.5x | 16.5x | 15.4x |
| Price/Book Ratio | 2.3x | 2.3x | 1.9x |
| Yield3 | | 1.5% | 2.1% |
| Admiral Shares | 0.9% | | |
| ETF Shares | 0.9% | | |
| Return on Equity | 16.2% | 16.2% | 19.2% |
| Earnings Growth Rate | 4.5% | 4.5% | 6.3% |
| Foreign Holdings | 0.0% | 0.0% | 0.0% |
| Turnover Rate | 7% | — | — |
| Expense Ratio4 | | — | — |
| Admiral Shares | 0.28% | | |
| ETF Shares | 0.25% | | |
| Short-Term Reserves | 0.1% | — | — |
| | |
| Volatility Measures5 | | |
| | Fund Versus | Fund Versus |
| | Spliced Index6 | Broad Index2 |
| R-Squared | 1.00 | 0.87 |
| Beta | 1.00 | 1.20 |
| |
Subindustry Diversification
(% of equity exposure) | |
| |
| |
| Advertising | 1.5% |
| Apparel Retail | 5.5 |
| Apparel, Accessories & Luxury Goods | 3.2 |
| Auto Parts & Equipment | 3.4 |
| Automobile Manufacturers | 2.7 |
| Automotive Retail | 2.1 |
| Broadcasting | 2.6 |
| Cable & Satellite | 10.0 |
| Casinos & Gaming | 2.5 |
| Computer & Electronics Retail | 1.4 |
| Department Stores | 2.9 |
| Education Services | 1.4 |
| Footwear | 2.7 |
| General Merchandise Stores | 4.2 |
| Home Improvement Retail | 6.1 |
| Homebuilding | 1.4 |
| Homefurnishing Retail | 1.1 |
| Hotels, Resorts & Cruise Lines | 3.6 |
| Household Appliances | 1.2 |
| Housewares & Specialties | 1.4 |
| Internet Retail | 5.6 |
| Leisure Products | 1.5 |
| Movies & Entertainment | 11.9 |
| Publishing | 1.7 |
| Restaurants | 11.5 |
| Specialized Consumer Services | 1.2 |
| Specialty Stores | 2.8 |
| Other Consumer Discretionary | 2.9 |
| |
| Ten Largest Holdings7 (% of total net assets) |
| |
| McDonald’s Corp. | 6.2% |
| Walt Disney Co. | 4.8 |
| Comcast Corp. | 3.7 |
| Home Depot Inc. | 3.7 |
| Amazon.com Inc. | 3.5 |
| Target Corp. | 2.8 |
| Time Warner Inc. | 2.7 |
| DIRECTV Class A | 2.7 |
| Ford Motor Co. | 2.6 |
| Lowe’s Cos. Inc. | 2.3 |
| Top Ten | 35.0% |
1 MSCI US IMI/Consumer Discretionary 25/50.
2 MSCI US IMI/2500.
3 30-day SEC yield for the fund; annualized dividend yield for the indexes. See the Glossary.
4 The expense ratios shown are from the prospectus dated December 28, 2009, and represent estimated costs for the current fiscal year. For the fiscal year ended August 31, 2010, the expense ratios were 0.24% for the Admiral Shares and 0.24% for the ETF Shares.
5 For an explanation of R-squared, beta, and other terms used here, see the Glossary.
6 Spliced MSCI US IMI/Consumer Discretionary 25/50: MSCI US IMI/Consumer Discretionary through February 26, 2010; MSCI US IMI/Consumer Discretionary 25/50 thereafter.
7 The holdings listed exclude any temporary cash investments and equity index products.
5
Consumer Discretionary Index Fund
Performance Summary
All of the returns in this report represent past performance, which is not a guarantee of future results that may be achieved by the fund. (Current performance may be lower or higher than the performance data cited. For performance data current to the most recent month-end, visit our website at vanguard.com/performance.) Note, too, that both investment returns and principal value can fluctuate widely, so an investor’s shares, when sold, could be worth more or less than their original cost. The returns shown do not reflect taxes that a shareholder would pay on fund distributions or on the sale of fund shares.
Cumulative Performance: January 26, 2004–August 31, 2010
Initial Investment of $10,000
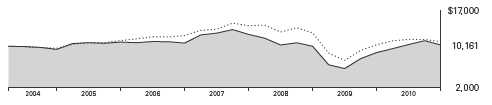
| | | | | |
| | | | |
| | | Average Annual Total Returns | |
| | | | Periods Ended August 31, 2010 | Final Value |
| | | | Since | of a $10,000 |
| | One Year | Five Years | Inception1 | Investment |
| Consumer Discretionary Index Fund | | | | |
| ETF Shares Net Asset Value2 | 16.62% | –1.18% | 0.24% | $10,161 |
| Consumer Discretionary Index Fund | | | | |
| ETF Shares Market Price | 16.44 | –1.20 | 0.22 | 10,147 |
| MSCI US IMI/2500 | 5.81 | –0.39 | 1.31 | 10,893 |
| Spliced MSCI US IMI/Consumer | | | | |
| Discretionary 25/503 | 16.88 | –1.05 | 0.39 | 10,258 |
| | | | |
| | | | | Final Value |
| | | | Since | of a $100,000 |
| | One Year | Five Years | Inception1 | Investment |
| Consumer Discretionary Index Fund | | | | |
| Admiral Shares4 | 16.62% | –1.20% | –1.54% | $92,324 |
| MSCI US IMI/2500 | 5.81 | –0.39 | –0.37 | 98,130 |
| Spliced MSCI US IMI/Consumer Discretionary 25/503 | 16.88 | –1.05 | –1.39 | 93,059 |
1 Performance for the fund and its comparative standards is calculated since the following inception dates: January 26, 2004, for ETF Shares; July 14, 2005, for Admiral Shares.
2 For more information about how the ETF Shares’ market prices have compared with their net asset value, visit Vanguard.com, select your ETF, and then select the Performance tab. The Premium/Discount table there shows the percentages of days on which the ETF Shares’ market price was above or below the NAV.
3 Spliced MSCI US IMI/Consumer Discretionary 25/50: MSCI US IMI/Consumer Discretionary through February 26, 2010; MSCI US IMI/Consumer Discretionary 25/50 thereafter.
4 Total returns do not reflect the 2% fee assessed on redemptions of shares held for less than one year.
See Financial Highlights for dividend and capital gains information.
6
Consumer Discretionary Index Fund
Fiscal-Year Total Returns (%): January 26, 2004–August 31, 2010
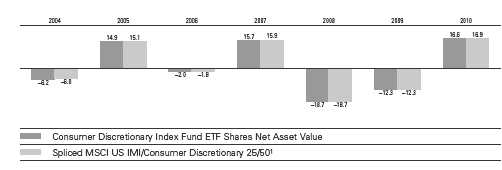
| | | |
| Cumulative Returns: ETF Shares, January 26, 2004–August 31, 2010 | | |
| | | | Cumulative |
| | | | Since |
| | One Year | Five Years | Inception |
| Consumer Discretionary Index Fund ETF Shares Market Price | 16.44% | –5.88% | 1.47% |
| Consumer Discretionary Index Fund ETF Shares Net Asset Value | 16.62 | –5.74 | 1.61 |
| Spliced MSCI US IMI/Consumer Discretionary 25/501 | 16.88 | –5.13 | 2.58 |
Average Annual Total Returns: Periods Ended June 30, 2010
This table presents average annual total returns through the latest calendar quarter—rather than through the end of the fiscal period. Securities and Exchange Commission rules require that we provide this information.
| | | | |
| | | | | Since |
| | Inception Date | One Year | Five Years | Inception |
| ETF Shares | 1/26/2004 | | | |
| Market Price | | 29.73% | –1.50% | –0.20% |
| Net Asset Value | | 29.85 | –1.50 | –0.19 |
| Admiral Shares2 | 7/14/2005 | 29.86 | — | –2.16 |
1 Spliced MSCI US IMI/Consumer Discretionary 25/50: MSCI US IMI/Consumer Discretionary through February 26, 2010; MSCI US IMI/Consumer Discretionary 25/50 thereafter.
2 Total returns do not reflect the 2% fee assessed on redemptions of shares held for less than one year.
7
Consumer Discretionary Index Fund
Financial Statements
Statement of Net Assets
As of August 31, 2010
The fund reports a complete list of its holdings in regulatory filings four times in each fiscal year, at the quarter-ends. For the second and fourth fiscal quarters, the lists appear in the fund’s semiannual and annual reports to shareholders. For the first and third fiscal quarters, the fund files the lists with the Securities and Exchange Commission on Form N-Q. Shareholders can look up the fund’s Forms N-Q on the SEC’s website at sec.gov. Forms N-Q may also be reviewed and copied at the SEC’s Public Reference Room (see the back cover of this report for further information).
| | | |
| | | | Market |
| | | | Value• |
| | | Shares | ($000) |
| Common Stocks (100.0%) | | |
| Auto Components (3.6%) | | |
| | Johnson Controls Inc. | 127,153 | 3,373 |
| * | BorgWarner Inc. | 22,265 | 972 |
| | Autoliv Inc. | 16,143 | 874 |
| * | Lear Corp. | 8,812 | 649 |
| * | TRW Automotive | | |
| | Holdings Corp. | 15,761 | 548 |
| | Gentex Corp. | 26,363�� | 463 |
| * | Goodyear Tire & Rubber Co. | 43,543 | 402 |
| * | Tenneco Inc. | 11,300 | 279 |
| * | Dana Holding Corp. | 26,510 | 272 |
| | Cooper Tire & Rubber Co. | 10,417 | 169 |
| * | American Axle & | | |
| | Manufacturing Holdings Inc. | 12,079 | 101 |
| * | Fuel Systems Solutions Inc. | 2,806 | 91 |
| * | Federal-Mogul Corp. | 5,558 | 85 |
| * | Modine Manufacturing Co. | 8,228 | 82 |
| * | Drew Industries Inc. | 3,692 | 71 |
| | Superior Industries | | |
| | International Inc. | 4,219 | 62 |
| * | Exide Technologies | 14,154 | 59 |
| * | Dorman Products Inc. | 2,489 | 58 |
| * | Wonder Auto Technology Inc. | 3,625 | 28 |
| | Spartan Motors Inc. | 5,801 | 23 |
| * | China Automotive | | |
| | Systems Inc. | 1,294 | 18 |
| | | | 8,679 |
| Automobiles (3.2%) | | |
| * | Ford Motor Co. | 560,942 | 6,333 |
| | Harley-Davidson Inc. | 44,520 | 1,083 |
| | Thor Industries Inc. | 6,798 | 159 |
| * | Winnebago Industries Inc. | 5,418 | 46 |
| | | | 7,621 |
| Distributors (0.7%) | | |
| | Genuine Parts Co. | 30,015 | 1,259 |
| * | LKQ Corp. | 25,649 | 477 |
| * | Core-Mark Holding Co. Inc. | 1,823 | 47 |
| | | | 1,783 |
| Diversified Consumer Services (2.5%) | |
| * | Apollo Group Inc. Class A | 25,716 | 1,092 |
| | H&R Block Inc. | 62,286 | 800 |
| | DeVry Inc. | 12,119 | 462 |
| | Strayer Education Inc. | 2,627 | 380 |
| | Service Corp. International | 48,167 | 370 |
| * | ITT Educational Services Inc. | 6,518 | 347 |
| | Sotheby’s | 12,634 | 336 |
| * | Career Education Corp. | 15,441 | 271 |
| * | Coinstar Inc. | 5,687 | 247 |
| | Hillenbrand Inc. | 11,748 | 224 |
| | Weight Watchers | | |
| | International Inc. | 6,576 | 188 |
| | Regis Corp. | 10,857 | 182 |
| | Matthews International Corp. | | |
| | Class A | 5,710 | 180 |
| * | Capella Education Co. | 2,839 | 178 |
| * | K12 Inc. | 4,283 | 99 |
| | | |
| | | | Market |
| | | | Value• |
| | | Shares | ($000) |
| * | Steiner Leisure Ltd. | 2,664 | 95 |
| * | American Public | | |
| | Education Inc. | 3,460 | 86 |
| * | Corinthian Colleges Inc. | 16,552 | 81 |
| | Stewart Enterprises Inc. | | |
| | Class A | 15,968 | 76 |
| * | Pre-Paid Legal Services Inc. | 1,332 | 73 |
| * | Education Management Corp. | 8,165 | 66 |
| * | Grand Canyon Education Inc. | 3,834 | 66 |
| | Universal Technical | | |
| | Institute Inc. | 3,915 | 60 |
| * | Bridgepoint Education Inc. | 3,654 | 47 |
| * | Lincoln Educational | | |
| | Services Corp. | 3,417 | 37 |
| | | | 6,043 |
| Hotels, Restaurants & Leisure (17.8%) | |
| | McDonald’s Corp. | 203,345 | 14,856 |
| | Yum! Brands Inc. | 88,355 | 3,684 |
| | Starbucks Corp. | 140,837 | 3,238 |
| | Carnival Corp. | 87,685 | 2,734 |
| * | Las Vegas Sands Corp. | 62,408 | 1,768 |
| | Marriott International Inc. | | |
| | Class A | 54,639 | 1,749 |
| | Starwood Hotels & | | |
| | Resorts Worldwide Inc. | 35,819 | 1,674 |
| | Wynn Resorts Ltd. | 15,151 | 1,221 |
| | Darden Restaurants Inc. | 25,257 | 1,042 |
| * | Chipotle Mexican Grill Inc. | | |
| | Class A | 5,951 | 898 |
| | International Game | | |
| | Technology | 56,395 | 823 |
| | Wyndham Worldwide Corp. | 34,056 | 790 |
| * | Royal Caribbean Cruises Ltd. | 26,410 | 649 |
| * | Panera Bread Co. Class A | 5,779 | 462 |
| * | MGM Resorts International | 50,061 | 451 |
| * | WMS Industries Inc. | 11,018 | 389 |
| * | Penn National Gaming Inc. | 12,902 | 364 |
| * | Bally Technologies Inc. | 10,443 | 328 |
| * | Hyatt Hotels Corp. Class A | 8,280 | 312 |
| | Brinker International Inc. | 19,432 | 306 |
| | Burger King Holdings Inc. | 18,196 | 299 |
| | Wendy’s/Arby’s Group Inc. | | |
| | Class A | 64,943 | 253 |
| * | Cheesecake Factory Inc. | 10,858 | 243 |
| * | Life Time Fitness Inc. | 7,103 | 241 |
| * | Jack in the Box Inc. | 10,401 | 210 |
| | Cracker Barrel Old | | |
| | Country Store Inc. | 4,497 | 201 |
| | PF Chang’s China Bistro Inc. | 4,378 | 187 |
| | Choice Hotels | | |
| | International Inc. | 5,619 | 185 |
| * | Vail Resorts Inc. | 5,494 | 182 |
| * | Gaylord Entertainment Co. | 6,254 | 164 |
| * | Orient-Express Hotels Ltd. | | |
| | Class A | 17,130 | 148 |
| | Bob Evans Farms Inc. | 5,791 | 148 |
| * | Scientific Games Corp. | | |
| | Class A | 13,387 | 137 |
| | | |
| | | | Market |
| | | | Value• |
| | | Shares | ($000) |
| * | Buffalo Wild Wings Inc. | 3,260 | 136 |
| * | Texas Roadhouse Inc. | | |
| | Class A | 10,124 | 134 |
| * | CEC Entertainment Inc. | 4,158 | 130 |
| | International Speedway Corp. | | |
| | Class A | 5,251 | 120 |
| * | Pinnacle Entertainment Inc. | 11,487 | 113 |
| * | Domino’s Pizza Inc. | 7,818 | 100 |
| * | Ruby Tuesday Inc. | 10,867 | 100 |
| * | BJ’s Restaurants Inc. | 4,109 | 98 |
| * | Papa John’s International Inc. | 4,071 | 97 |
| * | Interval Leisure Group Inc. | 7,571 | 95 |
| * | DineEquity Inc. | 2,880 | 92 |
| * | Peet’s Coffee & Tea Inc. | 2,536 | 87 |
| * | Sonic Corp. | 10,900 | 84 |
| | Ameristar Casinos Inc. | 4,912 | 81 |
| * | Shuffle Master Inc. | 10,012 | 80 |
| | Churchill Downs Inc. | 2,269 | 78 |
| * | Boyd Gaming Corp. | 10,528 | 73 |
| * | California Pizza Kitchen Inc. | 4,445 | 68 |
| * | Biglari Holdings Inc. | 227 | 66 |
| * | AFC Enterprises Inc. | 4,923 | 53 |
| * | Red Robin Gourmet | | |
| | Burgers Inc. | 2,776 | 51 |
| * | Krispy Kreme | | |
| | Doughnuts Inc. | 11,388 | 45 |
| * | Denny’s Corp. | 18,871 | 45 |
| | Marcus Corp. | 3,876 | 43 |
| | Ambassadors Group Inc. | 3,387 | 37 |
| | Speedway Motorsports Inc. | 2,789 | 37 |
| * | Landry’s Restaurants Inc. | 1,346 | 33 |
| * | Isle of Capri Casinos Inc. | 3,009 | 21 |
| * | Monarch Casino & Resort Inc. | 1,768 | 17 |
| * | Krispy Kreme Doughnuts Inc. | | |
| | Warrants Exp. 3/2/2012 | 45 | — |
| | | | 42,550 |
| Household Durables (5.0%) | | |
| | Stanley Black & Decker Inc. | 28,802 | 1,545 |
| | Fortune Brands Inc. | 28,794 | 1,290 |
| | Whirlpool Corp. | 14,204 | 1,053 |
| | Newell Rubbermaid Inc. | 52,585 | 790 |
| * | NVR Inc. | 1,099 | 664 |
| ^ | Garmin Ltd. | 22,615 | 602 |
| | DR Horton Inc. | 54,131 | 555 |
| | Leggett & Platt Inc. | 28,061 | 538 |
| * | Pulte Group Inc. | 65,085 | 522 |
| * | Mohawk Industries Inc. | 11,018 | 488 |
| | Tupperware Brands Corp. | 11,945 | 470 |
| | Jarden Corp. | 17,443 | 470 |
| * | Toll Brothers Inc. | 26,502 | 458 |
| * | Harman International | | |
| | Industries Inc. | 13,142 | 410 |
| | Lennar Corp. Class A | 29,040 | 382 |
| * | Tempur-Pedic | | |
| | International Inc. | 13,166 | 353 |
| | MDC Holdings Inc. | 7,090 | 189 |
| | KB Home | 14,875 | 153 |
| | Ryland Group Inc. | 8,374 | 135 |
| | American Greetings Corp. | | |
| | Class A | 6,894 | 133 |
| * | Helen of Troy Ltd. | 5,488 | 122 |
| * | Meritage Homes Corp. | 5,472 | 98 |
| | National Presto Industries Inc. | 902 | 90 |
| * | Standard Pacific Corp. | 20,257 | 71 |
| * | iRobot Corp. | 4,008 | 66 |
| | Ethan Allen Interiors Inc. | 4,889 | 66 |
| * | La-Z-Boy Inc. | 9,742 | 65 |
| * | Universal Electronics Inc. | 2,546 | 49 |
| * | Beazer Homes USA Inc. | 14,071 | 49 |
8
Consumer Discretionary Index Fund
| | | |
| | | | Market |
| | | | Value• |
| | | Shares | ($000) |
| | Blyth Inc. | 1,081 | 41 |
| * | Hovnanian Enterprises Inc. | | |
| | Class A | 9,914 | 34 |
| * | Furniture Brands | | |
| | International Inc. | 7,272 | 34 |
| * | M/I Homes Inc. | 3,480 | 33 |
| * | Deer Consumer Products Inc. | 3,394 | 27 |
| | CSS Industries Inc. | 1,426 | 22 |
| * | Sealy Corp. | 9,003 | 21 |
| * | Brookfield Homes Corp. | 2,185 | 14 |
| | | | 12,102 |
| Internet & Catalog Retail (5.7%) | |
| * | Amazon.com Inc. | 67,392 | 8,413 |
| * | priceline.com Inc. | 8,616 | 2,511 |
| * | NetFlix Inc. | 8,397 | 1,054 |
| | Expedia Inc. | 39,108 | 894 |
| * | HSN Inc. | 7,590 | 199 |
| * | Blue Nile Inc. | 2,725 | 112 |
| * | Shutterfly Inc. | 4,569 | 102 |
| | NutriSystem Inc. | 5,341 | 94 |
| | PetMed Express Inc. | 4,296 | 66 |
| * | Overstock.com Inc. | 2,987 | 42 |
| * | Orbitz Worldwide Inc. | 3,719 | 19 |
| * | Vitacost.com Inc. | 3,154 | 18 |
| | Gaiam Inc. Class A | 2,864 | 15 |
| * | 1-800-Flowers.com Inc. | | |
| | Class A | 5,000 | 8 |
| | | | 13,547 |
| Leisure Equipment & Products (1.5%) | |
| | Mattel Inc. | 68,943 | 1,447 |
| | Hasbro Inc. | 24,757 | 999 |
| | Polaris Industries Inc. | 5,947 | 317 |
| | Brunswick Corp. | 16,703 | 212 |
| * | Eastman Kodak Co. | 50,941 | 178 |
| | Pool Corp. | 9,364 | 173 |
| * | Jakks Pacific Inc. | 5,261 | 78 |
| | Callaway Golf Co. | 12,121 | 76 |
| * | RC2 Corp. | 4,114 | 76 |
| | Sturm Ruger & Co. Inc. | 3,553 | 46 |
| * | Smith & Wesson | | |
| | Holding Corp. | 11,219 | 42 |
| * | Leapfrog Enterprises Inc. | 6,740 | 32 |
| * | Marine Products Corp. | 2,210 | 11 |
| | | | 3,687 |
| Media (27.9%) | | |
| | Walt Disney Co. | 351,692 | 11,462 |
| | Time Warner Inc. | 215,426 | 6,458 |
| * | DIRECTV Class A | 167,657 | 6,358 |
| | Comcast Corp. Class A | 354,861 | 6,075 |
| | News Corp. Class A | 373,242 | 4,692 |
| | Time Warner Cable Inc. | 67,005 | 3,458 |
| | Viacom Inc. Class B | 104,910 | 3,296 |
| | Comcast Corp. | 180,315 | 2,898 |
| | Omnicom Group Inc. | 58,020 | 2,031 |
| | McGraw-Hill Cos. Inc. | 59,635 | 1,649 |
| | CBS Corp. Class B | 118,817 | 1,642 |
| | Virgin Media Inc. | 59,405 | 1,236 |
| | Cablevision Systems Corp. | | |
| | Class A | 47,526 | 1,192 |
| * | Liberty Media Corp. - | | |
| | Interactive | 107,359 | 1,133 |
| * | Discovery | | |
| | Communications Inc. | | |
| | Class A | 25,714 | 971 |
| * | Discovery | | |
| | Communications Inc. | 26,787 | 905 |
| * | Interpublic Group of | | |
| | Cos. Inc. | 92,586 | 790 |
| | News Corp. Class B | 54,197 | 764 |
| | | |
| | | | Market |
| | | | Value• |
| | | Shares | ($000) |
| * | Liberty Media Corp. - Capital | 15,816 | 713 |
| | DISH Network Corp. | | |
| | Class A | 39,582 | 710 |
| * | Sirius XM Radio Inc. | 734,453 | 702 |
| | Scripps Networks | | |
| | Interactive Inc. Class A | 17,169 | 690 |
| * | Liberty Global Inc. Class A | 24,718 | 680 |
| * | Liberty Global Inc. | 21,787 | 600 |
| * | Liberty Media Corp. - Starz | 9,229 | 551 |
| | Gannett Co. Inc. | 45,019 | 544 |
| * | DreamWorks Animation | | |
| | SKG Inc. Class A | 13,735 | 407 |
| | Washington Post Co. Class B | 1,124 | 405 |
| | John Wiley & Sons Inc. | | |
| | Class A | 8,463 | 301 |
| * | Lamar Advertising Co. | | |
| | Class A | 10,954 | 287 |
| * | Valassis Communications Inc. | 9,405 | 276 |
| * | Madison Square Garden Inc. | | |
| | Class A | 11,770 | 231 |
| * | Live Nation | | |
| | Entertainment Inc. | 26,098 | 225 |
| | Meredith Corp. | 6,869 | 201 |
| | Regal Entertainment Group | | |
| | Class A | 16,044 | 198 |
| | CTC Media Inc. | 10,312 | 185 |
| * | New York Times Co. Class A | 24,496 | 176 |
| * | Morningstar Inc. | 4,214 | 170 |
| | National CineMedia Inc. | 9,984 | 159 |
| | Cinemark Holdings Inc. | 10,610 | 155 |
| | Scholastic Corp. | 6,245 | 146 |
| | Arbitron Inc. | 5,000 | 127 |
| * | Lions Gate | | |
| | Entertainment Corp. | 14,260 | 102 |
| * | Belo Corp. Class A | 17,392 | 91 |
| * | Clear Channel Outdoor | | |
| | Holdings Inc. Class A | 7,791 | 78 |
| | Harte-Hanks Inc. | 7,137 | 73 |
| * | Knology Inc. | 5,932 | 70 |
| * | Ascent Media Corp. Class A | 2,582 | 69 |
| | World Wrestling | | |
| | Entertainment Inc. Class A | 4,345 | 61 |
| * | Sinclair Broadcast Group Inc. | | |
| | Class A | 8,791 | 53 |
| * | Mediacom Communications | | |
| | Corp. Class A | 7,811 | 45 |
| * | Warner Music Group Corp. | 10,171 | 43 |
| * | CKX Inc. | 8,739 | 41 |
| * | EW Scripps Co. Class A | 5,954 | 40 |
| * | Journal Communications Inc. | | |
| | Class A | 8,207 | 32 |
| * | Martha Stewart Living | | |
| | Omnimedia Class A | 5,242 | 23 |
| * | LIN TV Corp. Class A | 5,539 | 22 |
| * | SuperMedia Inc. | 2,401 | 22 |
| * | China MediaExpress | | |
| | Holdings Inc. | 1,846 | 16 |
| * | Outdoor Channel | | |
| | Holdings Inc. | 2,438 | 13 |
| | | | 66,743 |
| Multiline Retail (7.1%) | | |
| | Target Corp. | 132,246 | 6,766 |
| * | Kohl’s Corp. | 55,123 | 2,590 |
| | Macy’s Inc. | 79,785 | 1,551 |
| * | Dollar Tree Inc. | 25,025 | 1,134 |
| | Family Dollar Stores Inc. | 24,264 | 1,038 |
| | Nordstrom Inc. | 32,968 | 953 |
| | JC Penney Co. Inc. | 40,199 | 804 |
| *,^ | Sears Holdings Corp. | 8,685 | 538 |
| | | |
| | | | Market |
| | | | Value• |
| | | Shares | ($000) |
| * | Big Lots Inc. | 15,303 | 478 |
| * | Dollar General Corp. | 16,080 | 439 |
| | Dillard’s Inc. Class A | 9,450 | 207 |
| * | Saks Inc. | 25,857 | 204 |
| * | 99 Cents Only Stores | 9,214 | 161 |
| | Fred’s Inc. Class A | 7,133 | 79 |
| * | Retail Ventures Inc. | 4,567 | 39 |
| | | | 16,981 |
| Specialty Retail (19.1%) | | |
| | Home Depot Inc. | 320,071 | 8,901 |
| | Lowe’s Cos. Inc. | 272,752 | 5,537 |
| | TJX Cos. Inc. | 77,116 | 3,061 |
| | Staples Inc. | 137,968 | 2,452 |
| | Best Buy Co. Inc. | 67,795 | 2,128 |
| * | Bed Bath & Beyond Inc. | 49,901 | 1,795 |
| | Gap Inc. | 88,308 | 1,492 |
| * | O’Reilly Automotive Inc. | 26,111 | 1,234 |
| | Ltd Brands Inc. | 51,967 | 1,226 |
| | Ross Stores Inc. | 23,135 | 1,148 |
| * | AutoZone Inc. | 5,405 | 1,134 |
| | Tiffany & Co. | 24,049 | 953 |
| | Advance Auto Parts Inc. | 16,535 | 901 |
| * | CarMax Inc. | 42,273 | 842 |
| * | Urban Outfitters Inc. | 25,640 | 777 |
| | PetSmart Inc. | 23,384 | 746 |
| | Abercrombie & Fitch Co. | 16,671 | 577 |
| * | GameStop Corp. Class A | 27,405 | 491 |
| | Williams-Sonoma Inc. | 18,333 | 476 |
| | American Eagle | | |
| | Outfitters Inc. | 37,592 | 475 |
| | Tractor Supply Co. | 6,870 | 467 |
| | RadioShack Corp. | 23,713 | 438 |
| * | Signet Jewelers Ltd. | 16,166 | 427 |
| * | Dick’s Sporting Goods Inc. | 17,124 | 419 |
| * | Aeropostale Inc. | 17,879 | 381 |
| | Guess? Inc. | 11,466 | 370 |
| * | J Crew Group Inc. | 11,462 | 349 |
| | Foot Locker Inc. | 29,524 | 347 |
| | Chico’s FAS Inc. | 33,848 | 279 |
| * | AutoNation Inc. | 12,194 | 275 |
| * | Dress Barn Inc. | 12,017 | 251 |
| | Rent-A-Center Inc. | 12,388 | 249 |
| | Aaron’s Inc. | 13,182 | 215 |
| * | Gymboree Corp. | 5,626 | 212 |
| * | Childrens Place Retail | | |
| | Stores Inc. | 4,720 | 206 |
| * | Jo-Ann Stores Inc. | 4,915 | 200 |
| * | JOS A Bank Clothiers Inc. | 5,205 | 190 |
| | Men’s Wearhouse Inc. | 9,476 | 183 |
| * | Office Depot Inc. | 52,111 | 178 |
| * | AnnTaylor Stores Corp. | 11,176 | 171 |
| * | Sally Beauty Holdings Inc. | 18,970 | 164 |
| * | Collective Brands Inc. | 12,246 | 158 |
| * | OfficeMax Inc. | 16,074 | 157 |
| | Monro Muffler Brake Inc. | 3,578 | 150 |
| * | Ulta Salon Cosmetics & | | |
| | Fragrance Inc. | 6,051 | 137 |
| * | Pier 1 Imports Inc. | 22,105 | 135 |
| | Finish Line Inc. Class A | 9,943 | 131 |
| | Buckle Inc. | 5,300 | 127 |
| * | Hibbett Sports Inc. | 5,461 | 127 |
| | Cato Corp. Class A | 5,256 | 121 |
| * | Cabela’s Inc. | 7,695 | 120 |
| * | Group 1 Automotive Inc. | 4,630 | 117 |
| * | Genesco Inc. | 4,559 | 115 |
| | Barnes & Noble Inc. | 7,117 | 108 |
| * | Penske Automotive Group Inc. | 8,637 | 104 |
| | PEP Boys-Manny Moe | | |
| | & Jack | 10,013 | 90 |
9
Consumer Discretionary Index Fund
| | | |
| | | | Market |
| | | | Value• |
| | | Shares | ($000) |
| | Brown Shoe Co. Inc. | 8,272 | 87 |
| * | Lumber Liquidators | | |
| | Holdings Inc. | 4,122 | 83 |
| | Stage Stores Inc. | 7,337 | 82 |
| * | Vitamin Shoppe Inc. | 3,286 | 80 |
| * | Charming Shoppes Inc. | 21,711 | 73 |
| * | Talbots Inc. | 7,287 | 73 |
| * | hhgregg Inc. | 3,696 | 70 |
| * | Asbury Automotive Group Inc. | 5,601 | 67 |
| * | DSW Inc. Class A | 2,770 | 66 |
| * | Citi Trends Inc. | 2,770 | 63 |
| * | Sonic Automotive Inc. Class A | 6,979 | 61 |
| * | Zumiez Inc. | 4,097 | 61 |
| * | Wet Seal Inc. Class A | 19,219 | 58 |
| * | Select Comfort Corp. | 10,267 | 55 |
| * | Rue21 Inc. | 2,520 | 53 |
| * | Coldwater Creek Inc. | 12,096 | 52 |
| * | America’s Car-Mart Inc. | 1,981 | 50 |
| | Big 5 Sporting Goods Corp. | 3,979 | 47 |
| * | Pacific Sunwear Of California | 12,304 | 46 |
| | Christopher & Banks Corp. | 6,714 | 43 |
| | HOT Topic Inc. | 8,267 | 43 |
| * | Stein Mart Inc. | 5,026 | 36 |
| | Bebe Stores Inc. | 5,669 | 32 |
| | Haverty Furniture Cos. Inc. | 2,945 | 28 |
| | Systemax Inc. | 2,062 | 24 |
| * | Build-A-Bear Workshop Inc. | 2,968 | 15 |
| * | Borders Group Inc. | 11,173 | 12 |
| * | New York & Co. Inc. | 5,119 | 9 |
| * | Conn’s Inc. | 1,771 | 8 |
| | | | 45,691 |
| Textiles, Apparel & Luxury Goods (5.9%) | |
| | NIKE Inc. Class B | 71,057 | 4,974 |
| | Coach Inc. | 57,671 | 2,067 |
| | VF Corp. | 16,652 | 1,176 |
| | Polo Ralph Lauren Corp. | | |
| | Class A | 12,019 | 910 |
| | Phillips-Van Heusen Corp. | 10,935 | 499 |
| * | Fossil Inc. | 10,173 | 483 |
| * | Hanesbrands Inc. | 18,069 | 433 |
| * | Warnaco Group Inc. | 8,381 | 351 |
| * | Deckers Outdoor Corp. | 7,325 | 318 |
| * | Lululemon Athletica Inc. | 8,599 | 284 |
| | | |
| | | | Market |
| | | | Value• |
| | | Shares | ($000) |
| | Jones Apparel Group Inc. | 16,424 | 253 |
| * | Carter’s Inc. | 11,212 | 250 |
| * | Under Armour Inc. Class A | 6,859 | 246 |
| | Wolverine World Wide Inc. | 9,367 | 237 |
| * | Iconix Brand Group Inc. | 13,645 | 208 |
| * | CROCS Inc. | 16,296 | 204 |
| * | Skechers U.S.A. Inc. Class A | 6,751 | 172 |
| * | Steven Madden Ltd. | 4,693 | 162 |
| * | Timberland Co. Class A | 8,157 | 131 |
| * | Maidenform Brands Inc. | 4,332 | 116 |
| | Columbia Sportswear Co. | 2,254 | 105 |
| * | Quiksilver Inc. | 24,682 | 89 |
| * | True Religion Apparel Inc. | 4,515 | 79 |
| * | Liz Claiborne Inc. | 17,769 | 75 |
| * | G-III Apparel Group Ltd. | 3,070 | 74 |
| * | K-Swiss Inc. Class A | 5,042 | 57 |
| | Oxford Industries Inc. | 2,641 | 52 |
| * | Volcom Inc. | 3,206 | 50 |
| * | Unifi Inc. | 8,479 | 35 |
| * | Movado Group Inc. | 3,313 | 34 |
| | Weyco Group Inc. | 1,380 | 32 |
| * | Kenneth Cole Productions Inc. | |
| | Class A | 1,868 | 23 |
| * | Fuqi International Inc. | 3,055 | 18 |
| * | American Apparel Inc. | 7,062 | 5 |
| | | | 14,202 |
| Total Common Stocks | | |
| (Cost $266,869) | | 239,629 |
| Temporary Cash Investment (0.3%) | |
| Money Market Fund (0.3%) | | |
| 1,2 | Vanguard Market | | |
| | Liquidity Fund, 0.288% | | |
| | (Cost $747) | 746,502 | 747 |
| Total Investments (100.3%) | | |
| (Cost $267,616) | | 240,376 |
| Other Assets and Liabilities (–0.3%) | |
| Other Assets | | 1,554 |
| Liabilities2 | | (2,336) |
| | | | (782) |
| Net Assets (100%) | | 239,594 |
| |
| At August 31, 2010, net assets consisted of: |
| | Amount |
| | ($000) |
| Paid-in Capital | 280,223 |
| Undistributed Net Investment Income | 1,830 |
| Accumulated Net Realized Losses | (15,219) |
| Unrealized Appreciation (Depreciation) | (27,240) |
| Net Assets | 239,594 |
| |
| |
| Admiral Shares—Net Assets | |
| Applicable to 212,700 outstanding | |
| $.001 par value shares of beneficial | |
| interest (unlimited authorization) | 5,266 |
| Net Asset Value Per Share— | |
| Admiral Shares | $24.76 |
| |
| |
| ETF Shares—Net Assets | |
| Applicable to 4,902,208 outstanding | |
| $.001 par value shares of beneficial | |
| interest (unlimited authorization) | 234,328 |
| Net Asset Value Per Share— | |
| ETF Shares | $47.80 |
• See Note A in Notes to Financial Statements.
* Non-income-producing security.
^ Part of security position is on loan to broker-dealers. The total value of securities on loan is $565,000.
1 Affiliated money market fund available only to Vanguard funds and certain trusts and accounts managed by Vanguard. Rate shown is the 7-day yield.
2 Includes $585,000 of collateral received for securities on loan.
See accompanying Notes, which are an integral part of the Financial Statements.
10
Consumer Discretionary Index Fund
| |
| Statement of Operations |
| |
| | Year Ended |
| | August 31, 2010 |
| | ($000) |
| Investment Income | |
| Income | |
| Dividends | 3,329 |
| Security Lending | 39 |
| Total Income | 3,368 |
| Expenses | |
| The Vanguard Group—Note B | |
| Investment Advisory Services | 29 |
| Management and Administrative— | |
| Admiral Shares | 9 |
| Management and Administrative— | |
| ETF Shares | 372 |
| Marketing and Distribution— | |
| Admiral Shares | — |
| Marketing and Distribution— | |
| ETF Shares | 56 |
| Custodian Fees | 16 |
| Auditing Fees | 26 |
| Shareholders’ Reports—Admiral Shares | — |
| Shareholders’ Reports—ETF Shares | 20 |
| Total Expenses | 528 |
| Net Investment Income | 2,840 |
| Realized Net Gain (Loss) on | |
| Investment Securities Sold | 10,984 |
| Change in Unrealized Appreciation | |
| (Depreciation) of Investment Securities | 7,411 |
| Net Increase (Decrease) in Net Assets | |
| Resulting from Operations | 21,235 |
| | | |
| | |
| Statement of Changes in Net Assets | | |
| |
| | | Year Ended August 31, |
| | 2010 | 2009 |
| | ($000) | ($000) |
| Increase (Decrease) in Net Assets | | |
| Operations | | |
| Net Investment Income | 2,840 | 1,838 |
| Realized Net Gain (Loss) | 10,984 | (63,452) |
| Change in Unrealized Appreciation (Depreciation) | 7,411 | 1,356 |
| Net Increase (Decrease) in Net Assets Resulting from Operations | 21,235 | (60,258) |
| Distributions | | |
| Net Investment Income | | |
| Admiral Shares | (19) | (11) |
| ETF Shares | (1,749) | (2,360) |
| Realized Capital Gain | | |
| Admiral Shares | — | — |
| ETF Shares | — | — |
| Total Distributions | (1,768) | (2,371) |
| Capital Share Transactions | | |
| Admiral Shares | 4,050 | 597 |
| ETF Shares | 74,041 | (53,138) |
| Net Increase (Decrease) from Capital Share Transactions | 78,091 | (52,541) |
| Total Increase (Decrease) | 97,558 | (115,170) |
| Net Assets | | |
| Beginning of Period | 142,036 | 257,206 |
| End of Period1 | 239,594 | 142,036 |
1 Net Assets—End of Period includes undistributed net investment income of $1,830,000 and $758,000.
See accompanying Notes, which are an integral part of the Financial Statements.
11
Consumer Discretionary Index Fund
Financial Highlights
| | | | | | |
| | | | | |
| Admiral Shares | | | | | |
| |
| For a Share Outstanding | | | | Year Ended August 31, |
| Throughout Each Period | 2010 | 2009 | 2008 | 2007 | 2006 |
| Net Asset Value, Beginning of Period | $21.43 | $25.03 | $31.02 | $27.03 | $27.75 |
| Investment Operations | | | | | |
| Net Investment Income | .307 | .398 | .2851 | .217 | .2451 |
| Net Realized and Unrealized Gain (Loss) | | | | | |
| on Investments | 3.251 | (3.603) | (6.075) | 4.015 | (.808) |
| Total from Investment Operations | 3.558 | (3.205) | (5.790) | 4.232 | (.563) |
| Distributions | | | | | |
| Dividends from Net Investment Income | (.228) | (.395) | (.200) | (.242) | (.157) |
| Distributions from Realized Capital Gains | — | — | — | — | — |
| Total Distributions | (.228) | (.395) | (.200) | (.242) | (.157) |
| Net Asset Value, End of Period | $24.76 | $21.43 | $25.03 | $31.02 | $27.03 |
| |
| Total Return2 | 16.62% | –12.34% | –18.74% | 15.64% | –2.03% |
| |
| Ratios/Supplemental Data | | | | | |
| Net Assets, End of Period (Millions) | $5.3 | $1.3 | $0.7 | $1.0 | $0.6 |
| Ratio of Total Expenses to | | | | | |
| Average Net Assets | 0.24% | 0.28% | 0.25% | 0.27% | 0.28% |
| Ratio of Net Investment Income to | | | | | |
| Average Net Assets | 1.28% | 1.58% | 1.11% | 0.84% | 0.89% |
| Portfolio Turnover Rate3 | 7% | 5% | 12% | 8% | 10% |
1 Calculated based on average shares outstanding.
2 Total returns do not include transaction fees that may have applied in the periods shown. Fund prospectuses provide information about any applicable transaction fees.
3 Excludes the value of portfolio securities received or delivered as a result of in-kind purchases or redemptions of the fund’s capital shares, including ETF Creation Units.
| | | | | | |
| | | | | |
| ETF Shares | | | | | |
| |
| For a Share Outstanding | | | | Year Ended August 31, |
| Throughout Each Period | 2010 | 2009 | 2008 | 2007 | 2006 |
| Net Asset Value, Beginning of Period | $41.37 | $48.38 | $60.02 | $52.28 | $53.65 |
| Investment Operations | | | | | |
| Net Investment Income | .581 | .764 | .5921 | .450 | .4941 |
| Net Realized and Unrealized Gain (Loss) | | | | | |
| on Investments | 6.286 | (6.988) | (11.772) | 7.760 | (1.556) |
| Total from Investment Operations | 6.867 | (6.224) | (11.180) | 8.210 | (1.062) |
| Distributions | | | | | |
| Dividends from Net Investment Income | (.437) | (.786) | (.460) | (.470) | (.308) |
| Distributions from Realized Capital Gains | — | — | — | — | — |
| Total Distributions | (.437) | (.786) | (.460) | (.470) | (.308) |
| Net Asset Value, End of Period | $47.80 | $41.37 | $48.38 | $60.02 | $52.28 |
| |
| Total Return | 16.62% | –12.32% | –18.70% | 15.69% | –1.99% |
| |
| Ratios/Supplemental Data | | | | | |
| Net Assets, End of Period (Millions) | $234 | $141 | $257 | $114 | $47 |
| Ratio of Total Expenses to | | | | | |
| Average Net Assets | 0.24% | 0.25% | 0.20% | 0.22% | 0.25% |
| Ratio of Net Investment Income to | | | | | |
| Average Net Assets | 1.28% | 1.61% | 1.16% | 0.89% | 0.92% |
| Portfolio Turnover Rate2 | 7% | 5% | 12% | 8% | 10% |
1 Calculated based on average shares outstanding.
2 Excludes the value of portfolio securities received or delivered as a result of in-kind purchases or redemptions of the fund’s capital shares, including ETF Creation Units.
See accompanying Notes, which are an integral part of the Financial Statements.
12
Consumer Discretionary Index Fund
Notes to Financial Statements
Vanguard Consumer Discretionary Index Fund is registered under the Investment Company Act of 1940 as an open-end investment company, or mutual fund. The fund offers two classes of shares: Admiral Shares and ETF Shares. Admiral Shares are designed for investors who meet certain administrative, service, and account-size criteria. ETF Shares are listed for trading on the NYSE Arca, Inc.; they can be purchased and sold through a broker.
A. The following significant accounting policies conform to generally accepted accounting principles for U.S. mutual funds. The fund consistently follows such policies in preparing its financial statements.
1. Security Valuation: Securities are valued as of the close of trading on the New York Stock Exchange (generally 4 p.m., Eastern time) on the valuation date. Equity securities are valued at the latest quoted sales prices or official closing prices taken from the primary market in which each security trades; such securities not traded on the valuation date are valued at the mean of the latest quoted bid and asked prices. Securities for which market quotations are not readily available, or whose values have been materially affected by events occurring before the fund’s pricing time but after the close of the securities’ primary markets, are valued by methods deemed by the board of trustees to represent fair value. Investments in Vanguard Market Liquidity Fund are valued at that fund’s net asset value.
2. Federal Income Taxes: The fund intends to continue to qualify as a regulated investment company and distribute all of its taxable income. Management has analyzed the fund’s tax positions taken for all open federal income tax years (August 31, 2007–2010), and has concluded that no provision for federal income tax is required in the fund’s financial statements.
3. Distributions: Distributions to shareholders are recorded on the ex-dividend date.
4. Security Lending: The fund may lend its securities to qualified institutional borrowers to earn additional income. Security loans are required to be secured at all times by collateral at least equal to the market value of securities loaned. The fund invests cash collateral received in Vanguard Market Liquidity Fund, and records a liability for the return of the collateral, during the period the securities are on loan. Security lending income represents the income earned on investing cash collateral, less expenses associated with the loan.
5. Other: Dividend income is recorded on the ex-dividend date. Interest income includes income distributions received from Vanguard Market Liquidity Fund and is accrued daily. Security transactions are accounted for on the date securities are bought or sold. Costs used to determine realized gains (losses) on the sale of investment securities are those of the specific securities sold. Fees assessed on redemptions of capital shares are credited to paid-in capital.
Each class of shares has equal rights as to assets and earnings, except that each class separately bears certain class-specific expenses related to maintenance of shareholder accounts (included in Management and Administrative expenses) and shareholder reporting. Marketing and distribution expenses are allocated to each class of shares based on a method approved by the board of trustees. Income, other non-class-specific expenses, and gains and losses on investments are allocated to each class of shares based on its relative net assets.
B. The Vanguard Group furnishes at cost investment advisory, corporate management, administrative, marketing, and distribution services. The costs of such services are allocated to the fund under methods approved by the board of trustees. The fund has committed to provide up to 0.40% of its net assets in capital contributions to Vanguard. At August 31, 2010, the fund had contributed capital of $47,000 to Vanguard (included in Other Assets), representing 0.02% of the fund’s net assets and 0.02% of Vanguard’s capitalization. The fund’s trustees and officers are also directors and officers of Vanguard.
C. Various inputs may be used to determine the value of the fund’s investments. These inputs are summarized in three broad levels for financial statement purposes. The inputs or methodologies used to value securities are not necessarily an indication of the risk associated with investing in those securities.
Level 1—Quoted prices in active markets for identical securities.
Level 2—Other significant observable inputs (including quoted prices for similar securities, interest rates, prepayment speeds, credit risk, etc.).
Level 3—Significant unobservable inputs (including the fund’s own assumptions used to determine the fair value of investments).
At August 31, 2010, 100% of the fund’s investments were valued based on Level 1 inputs.
13
Consumer Discretionary Index Fund
D. Distributions are determined on a tax basis and may differ from net investment income and realized capital gains for financial reporting purposes. Differences may be permanent or temporary. Permanent differences are reclassified among capital accounts in the financial statements to reflect their tax character. Temporary differences arise when certain items of income, expense, gain, or loss are recognized in different periods for financial statement and tax purposes; these differences will reverse at some time in the future. Differences in classification may also result from the treatment of short-term gains as ordinary income for tax purposes.
During the year ended August 31, 2010, the fund realized $12,664,000 of net capital gains resulting from in-kind redemptions—in which shareholders exchanged fund shares for securities held by the fund rather than for cash. Because such gains are not taxable to the fund, and are not distributed to shareholders, they have been reclassified from accumulated net realized losses to paid-in capital.
For tax purposes, at August 31, 2010, the fund had $2,010,000 of ordinary income available for distribution. The fund had available capital loss carryforwards totaling $13,657,000 to offset future net capital gains of $36,000 through August 31, 2013, $86,000 through August 31, 2014, $178,000 through August 31, 2015, $1,526,000 through August 31, 2016, $4,557,000 through August 31, 2017, and $7,274,000 through August 31, 2018. In addition, the fund realized losses of $1,506,000 during the period from November 1, 2009, through August 31, 2010, which are deferred and will be treated as realized for tax purposes in fiscal 2011.
At August 31, 2010, the cost of investment securities for tax purposes was $267,672,000. Net unrealized depreciation of investment securities for tax purposes was $27,296,000, consisting of unrealized gains of $13,145,000 on securities that had risen in value since their purchase and $40,441,000 in unrealized losses on securities that had fallen in value since their purchase.
E. During the year ended August 31, 2010, the fund purchased $134,345,000 of investment securities and sold $55,133,000 of investment securities, other than temporary cash investments.
F. Capital share transactions for each class of shares were:
| | | | | | |
| | | | |
| | | | | Year Ended August 31, |
| | | | 2010 | | | 2009 |
| | Amount | Shares | Amount | Shares |
| | ($000) | (000) | ($000) | (000) |
| Admiral Shares | | | | |
| Issued | 4,546 | 173 | 659 | 34 |
| Issued in Lieu of Cash Distributions | 16 | 1 | 10 | 1 |
| Redeemed1 | (512) | (21) | (72) | (4) |
| Net Increase (Decrease)—Admiral Shares | 4,050 | 153 | 597 | 31 |
| ETF Shares | | | | |
| Issued | 113,968 | 2,300 | 100,999 | 2,600 |
| Issued in Lieu of Cash Distributions | — | — | — | — |
| Redeemed1 | (39,927) | (800) | (154,137) | (4,500) |
| Net Increase (Decrease)—ETF Shares | 74,041 | 1,500 | (53,138) | (1,900) |
1 Net of redemption fees for fiscal 2010 and 2009 of $8,000 and $0, respectively (fund totals).
G. In preparing the financial statements as of August 31, 2010, management considered the impact of subsequent events for potential recognition or disclosure in these financial statements.
14
Consumer Staples Index Fund
Fund Profile
As of August 31, 2010
| | | |
| Portfolio Characteristics | | |
| | | Target | Broad |
| | Fund | Index1 | Index2 |
| Number of Stocks | 113 | 113 | 2,478 |
| Median Market Cap | $46.5B | $52.2B | $26.3B |
| Price/Earnings Ratio | 15.3x | 15.3x | 15.4x |
| Price/Book Ratio | 2.9x | 3.0x | 1.9x |
| Yield3 | | 3.0% | 2.1% |
| Admiral Shares | 2.6% | | |
| ETF Shares | 2.5% | | |
| Return on Equity | 24.3% | 24.3% | 19.2% |
| Earnings Growth Rate | 6.0% | 6.1% | 6.3% |
| Foreign Holdings | 0.0% | 0.0% | 0.0% |
| Turnover Rate | 7% | — | — |
| Expense Ratio4 | | — | — |
| Admiral Shares | 0.28% | | |
| ETF Shares | 0.25% | | |
| Short-Term Reserves | 0.0% | — | — |
| | |
| Volatility Measures5 | | |
| | Fund Versus | Fund Versus |
| | Spliced Index6 | Broad Index2 |
| R-Squared | 0.99 | 0.81 |
| Beta | 1.01 | 0.60 |
| |
Subindustry Diversification
(% of equity exposure) | |
| |
| |
| Agricultural Products | 2.9% |
| Drug Retail | 5.5 |
| Food Distributors | 1.9 |
| Food Retail | 3.3 |
| Household Products | 21.0 |
| Hypermarkets & Supercenters | 10.4 |
| Packaged Foods & Meats | 18.1 |
| Personal Products | 3.3 |
| Soft Drinks | 18.7 |
| Tobacco | 13.2 |
| Other Consumer Staples | 1.7 |
| |
| Ten Largest Holdings7 (% of total net assets) |
| |
| Procter & Gamble Co. | 13.6% |
| Coca-Cola Co. | 8.7 |
| Wal-Mart Stores Inc. | 7.9 |
| PepsiCo Inc. | 7.8 |
| Philip Morris International Inc. | 7.1 |
| Kraft Foods Inc. | 4.5 |
| Altria Group Inc. | 4.0 |
| CVS Caremark Corp. | 3.2 |
| Colgate-Palmolive Co. | 3.1 |
| Kimberly-Clark Corp. | 2.3 |
| Top Ten | 62.2% |
1 MSCI US IMI/Consumer Staples 25/50.
2 MSCI US IMI/2500.
3 30-day SEC yield for the fund; annualized dividend yield for the indexes. See the Glossary.
4 The expense ratios shown are from the prospectus dated December 28, 2009, and represent estimated costs for the current fiscal year. For the fiscal year ended August 31, 2010, the expense ratios were 0.24% for the Admiral Shares and 0.24% for the ETF Shares.
5 For an explanation of R-squared, beta, and other terms used here, see the Glossary.
6 Spliced MSCI US IMI/Consumer Staples 25/50: MSCI US IMI/Consumer Staples through February 26, 2010; MSCI US IMI/Consumer Staples 25/50 thereafter.
7 The holdings listed exclude any temporary cash investments and equity index products.
15
Consumer Staples Index Fund
Performance Summary
All of the returns in this report represent past performance, which is not a guarantee of future results that may be achieved by the fund. (Current performance may be lower or higher than the performance data cited. For performance data current to the most recent month-end, visit our website at vanguard.com/performance.) Note, too, that both investment returns and principal value can fluctuate widely, so an investor’s shares, when sold, could be worth more or less than their original cost. The returns shown do not reflect taxes that a shareholder would pay on fund distributions or on the sale of fund shares.
Cumulative Performance: January 26, 2004–August 31, 2010
Initial Investment of $10,000
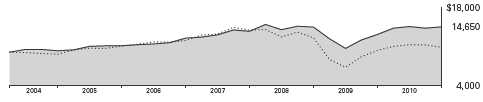
| | | | | |
| | | | |
| | | Average Annual Total Returns | |
| | | | Periods Ended August 31, 2010 | Final Value |
| | | | Since | of a $10,000 |
| | One Year | Five Years | Inception1 | Investment |
| Consumer Staples Index Fund | | | | |
| ETF Shares Net Asset Value2 | 10.33% | 5.44% | 5.96% | $14,650 |
| Consumer Staples Index Fund | | | | |
| ETF Shares Market Price | 10.18 | 5.44 | 5.95 | 14,636 |
| MSCI US IMI/2500 | 5.81 | –0.39 | 1.31 | 10,893 |
| Spliced MSCI US | | | | |
| IMI/Consumer Staples 25/503 | 10.49 | 5.50 | 5.89 | 14,583 |
| | | | |
| | | | | Final Value |
| | | | Since | of a $100,000 |
| | One Year | Five Years | Inception1 | Investment |
| Consumer Staples Index Fund Admiral Shares4 | 10.34% | 5.41% | 6.02% | $146,899 |
| MSCI US IMI/2500 | 5.81 | –0.39 | 1.65 | 111,344 |
| Spliced MSCI US IMI/Consumer Staples 25/503 | 10.49 | 5.50 | 5.97 | 146,466 |
1 Performance for the fund and its comparative standards is calculated since the following inception dates: January 26, 2004, for ETF Shares; January 30, 2004, for Admiral Shares.
2 For more information about how the ETF Shares’ market prices have compared with their net asset value, visit Vanguard.com, select your ETF, and then select the Performance tab. The Premium/Discount table there shows the percentages of days on which the ETF Shares’ market price was above or below the NAV.
3 Spliced MSCI US IMI/Consumer Staples 25/50: MSCI US IMI/Consumer Staples through February 26, 2010; MSCI US IMI/Consumer Staples 25/50 thereafter.
4 Total returns do not reflect the 2% fee assessed on redemptions of shares held for less than one year.
See Financial Highlights for dividend and capital gains information.
16
Consumer Staples Index Fund
Fiscal-Year Total Returns (%): January 26, 2004–August 31, 2010
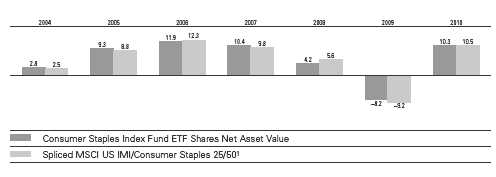
| | | |
| Cumulative Returns: ETF Shares, January 26, 2004–August 31, 2010 | | |
| | | | Cumulative |
| | | | Since |
| | One Year | Five Years | Inception |
| Consumer Staples Index Fund ETF Shares Market Price | 10.18% | 30.30% | 46.36% |
| Consumer Staples Index Fund ETF Shares Net Asset Value | 10.33 | 30.31 | 46.50 |
| Spliced MSCI US IMI/Consumer Staples 25/501 | 10.49 | 30.70 | 45.83 |
Average Annual Total Returns: Periods Ended June 30, 2010
This table presents average annual total returns through the latest calendar quarter—rather than through the end of the fiscal period. Securities and Exchange Commission rules require that we provide this information.
| | | | |
| | | | | Since |
| | Inception Date | One Year | Five Years | Inception |
| ETF Shares | 1/26/2004 | | | |
| Market Price | | 13.76% | 4.84% | 5.41% |
| Net Asset Value | | 13.75 | 4.86 | 5.42 |
| Admiral Shares2 | 1/30/2004 | 13.74 | 4.83 | 5.47 |
1 Spliced MSCI US IMI/Consumer Staples 25/50: MSCI US IMI/Consumer Staples through February 26, 2010; MSCI US IMI/Consumer Staples 25/50 thereafter.
2 Total returns do not reflect the 2% fee assessed on redemptions of shares held for less than one year.
17
Consumer Staples Index Fund
Financial Statements
Statement of Net Assets
As of August 31, 2010
The fund reports a complete list of its holdings in regulatory filings four times in each fiscal year, at the quarter-ends. For the second and fourth fiscal quarters, the lists appear in the fund’s semiannual and annual reports to shareholders. For the first and third fiscal quarters, the fund files the lists with the Securities and Exchange Commission on Form N-Q. Shareholders can look up the fund’s Forms N-Q on the SEC’s website at sec.gov. Forms N-Q may also be reviewed and copied at the SEC’s Public Reference Room (see the back cover of this report for further information).
| | | |
| | | | Market |
| | | | Value• |
| | | Shares | ($000) |
| Common Stocks (100.1%) | | |
| Beverages (20.4%) | | |
| | Coca-Cola Co. | 899,047 | 50,275 |
| | PepsiCo Inc. | 702,835 | 45,108 |
| | Dr Pepper Snapple | | |
| | Group Inc. | 132,088 | 4,863 |
| | Coca-Cola Enterprises Inc. | 155,810 | 4,434 |
| | Molson Coors Brewing Co. | | |
| | Class B | 83,907 | 3,655 |
| | Brown-Forman Corp. | | |
| | Class B | 43,177 | 2,646 |
| * | Hansen Natural Corp. | 43,730 | 1,970 |
| * | Constellation Brands Inc. | | |
| | Class A | 113,359 | 1,888 |
| * | Central European | | |
| | Distribution Corp. | 41,495 | 949 |
| * | Boston Beer Co. Inc. | | |
| | Class A | 10,359 | 681 |
| | National Beverage Corp. | 30,865 | 443 |
| * | Heckmann Corp. | 99,195 | 397 |
| | Coca-Cola Bottling Co. | | |
| | Consolidated | 7,836 | 390 |
| | | | 117,699 |
| Food & Staples Retailing (21.2%) | |
| | Wal-Mart Stores Inc. | 912,931 | 45,774 |
| | CVS Caremark Corp. | 684,491 | 18,481 |
| | Walgreen Co. | 487,701 | 13,109 |
| | Costco Wholesale Corp. | 219,723 | 12,425 |
| | Sysco Corp. | 297,454 | 8,177 |
| | Kroger Co. | 310,510 | 6,126 |
| | Safeway Inc. | 202,526 | 3,808 |
| * | Whole Foods Market Inc. | 78,497 | 2,731 |
| * | BJ’s Wholesale Club Inc. | 34,923 | 1,465 |
| ^ | Casey’s General Stores Inc. | 33,668 | 1,267 |
| | SUPERVALU Inc. | 123,599 | 1,201 |
| * | United Natural Foods Inc. | 29,879 | 1,038 |
| | Ruddick Corp. | 29,711 | 962 |
| | Andersons Inc. | 17,492 | 627 |
| * | Pantry Inc. | 32,175 | 606 |
| | Nash Finch Co. | 14,515 | 570 |
| | Pricesmart Inc. | 21,113 | 545 |
| | Weis Markets Inc. | 14,237 | 501 |
| * | Rite Aid Corp. | 542,129 | 473 |
| * | Susser Holdings Corp. | 34,115 | 396 |
| | Spartan Stores Inc. | 30,201 | 395 |
| | Ingles Markets Inc. Class A | 25,770 | 381 |
| | Village Super Market Inc. | | |
| | Class A | 13,237 | 343 |
| * | Winn-Dixie Stores Inc. | 52,250 | 343 |
| | Arden Group Inc. | 3,743 | 327 |
| *,^ | Great Atlantic & | | |
| | Pacific Tea Co. | 80,419 | 244 |
| | | | 122,315 |
| Food Products (21.0%) | | |
| | Kraft Foods Inc. | 862,871 | 25,843 |
| | General Mills Inc. | 331,444 | 11,985 |
| | Archer-Daniels-Midland Co. | 322,317 | 9,921 |
| | HJ Heinz Co. | 159,558 | 7,378 |
| | | |
| | | | Market |
| | | | Value• |
| | | Shares | ($000) |
| | Kellogg Co. | 134,825 | 6,698 |
| | Mead Johnson Nutrition Co. | 105,014 | 5,481 |
| | Sara Lee Corp. | 341,033 | 4,924 |
| | ConAgra Foods Inc. | 227,909 | 4,921 |
| | Campbell Soup Co. | 108,796 | 4,054 |
| | Hershey Co. | 83,902 | 3,899 |
| | Bunge Ltd. | 70,963 | 3,761 |
| | JM Smucker Co. | 62,221 | 3,639 |
| | McCormick & Co. Inc. | 65,005 | 2,592 |
| | Tyson Foods Inc. Class A | 158,070 | 2,589 |
| * | Ralcorp Holdings Inc. | 31,711 | 1,892 |
| * | Green Mountain Coffee | | |
| | Roasters Inc. | 61,159 | 1,885 |
| | Hormel Foods Corp. | 42,565 | 1,837 |
| | Del Monte Foods Co. | 118,230 | 1,542 |
| | Corn Products | | |
| | International Inc. | 44,905 | 1,533 |
| * | Smithfield Foods Inc. | 89,077 | 1,437 |
| | Flowers Foods Inc. | 51,138 | 1,321 |
| * | Dean Foods Co. | 108,458 | 1,110 |
| * | TreeHouse Foods Inc. | 23,667 | 982 |
| * | Fresh Del Monte | | |
| | Produce Inc. | 35,873 | 788 |
| * | Hain Celestial Group Inc. | 34,839 | 778 |
| | Diamond Foods Inc. | 18,103 | 764 |
| | Sanderson Farms Inc. | 16,465 | 708 |
| | Lancaster Colony Corp. | 14,466 | 659 |
| * | Zhongpin Inc. | 36,188 | 579 |
| | B&G Foods Inc. Class A | 53,009 | 566 |
| * | Darling International Inc. | 75,172 | 565 |
| | Lance Inc. | 25,269 | 544 |
| | J&J Snack Foods Corp. | 13,785 | 520 |
| | Tootsie Roll Industries Inc. | 21,686 | 512 |
| * | Chiquita Brands | | |
| | International Inc. | 39,143 | 492 |
| | Cal-Maine Foods Inc. | 15,116 | 449 |
| | Calavo Growers Inc. | 21,416 | 420 |
| * | Pilgrim’s Pride Corp. | 57,994 | 363 |
| * | Dole Food Co. Inc. | 40,227 | 348 |
| * | Smart Balance Inc. | 83,369 | 303 |
| | Farmer Bros Co. | 19,405 | 276 |
| | Alico Inc. | 12,684 | 261 |
| *,^ | American Dairy Inc. | 30,961 | 252 |
| * | AgFeed Industries Inc. | 90,352 | 203 |
| | | | 121,574 |
| Household Products (20.9%) | | |
| | Procter & Gamble Co. | 1,319,715 | 78,748 |
| | Colgate-Palmolive Co. | 243,479 | 17,979 |
| | Kimberly-Clark Corp. | 206,325 | 13,287 |
| | Clorox Co. | 72,140 | 4,676 |
| | Church & Dwight Co. Inc. | 38,313 | 2,346 |
| * | Energizer Holdings Inc. | 37,051 | 2,336 |
| | WD-40 Co. | 16,686 | 587 |
| * | Central Garden and Pet Co. | | |
| | Class A | 53,235 | 497 |
| * | Central Garden and Pet Co. | 37,230 | 344 |
| | | | 120,800 |
| | | |
| | | | Market |
| | | | Value• |
| | | Shares | ($000) |
| Personal Products (3.3%) | | |
| | Avon Products Inc. | 217,073 | 6,317 |
| | Estee Lauder Cos. Inc. | | |
| | Class A | 60,040 | 3,366 |
| | Herbalife Ltd. | 36,550 | 2,031 |
| * | NBTY Inc. | 33,218 | 1,810 |
| | Alberto-Culver Co. Class B | 52,989 | 1,645 |
| | Nu Skin Enterprises Inc. | | |
| | Class A | 39,626 | 1,013 |
| * | USANA Health Sciences Inc. | 12,868 | 547 |
| | Inter Parfums Inc. | 27,811 | 457 |
| * | Elizabeth Arden Inc. | 27,280 | 447 |
| * | Prestige Brands Holdings Inc. | 54,912 | 406 |
| *,^ | China-Biotics Inc. | 25,292 | 327 |
| * | American Oriental | | |
| | Bioengineering Inc. | 116,618 | 265 |
| * | Revlon Inc. Class A | 23,854 | 259 |
| * | China Sky One Medical Inc. | 25,024 | 239 |
| | | | 19,129 |
| Tobacco (13.3%) | | |
| | Philip Morris | | |
| | International Inc. | 795,491 | 40,920 |
| | Altria Group Inc. | 1,031,406 | 23,021 |
| | Lorillard Inc. | 79,350 | 6,031 |
| | Reynolds American Inc. | 89,976 | 4,907 |
| | Vector Group Ltd. | 39,215 | 747 |
| | Universal Corp. | 17,273 | 616 |
| * | Alliance One | | |
| | International Inc. | 99,059 | 347 |
| | | | 76,589 |
| Total Common Stocks | | |
| (Cost $603,326) | | 578,106 |
| Temporary Cash Investment (0.2%) | |
| Money Market Fund (0.2%) | | |
| 1,2 | Vanguard Market | | |
| | Liquidity Fund, 0.288% | | |
| | (Cost $949) | 949,102 | 949 |
| Total Investments (100.3%) | | |
| (Cost $604,275) | | 579,055 |
| Other Assets and Liabilities (–0.3%) | |
| Other Assets | | 5,991 |
| Liabilities2 | | (7,445) |
| | | | (1,454) |
| Net Assets (100%) | | 577,601 |
18
Consumer Staples Index Fund
| |
| At August 31, 2010, net assets consisted of: |
| | Amount |
| | ($000) |
| Paid-in Capital | 611,655 |
| Undistributed Net Investment Income | 9,486 |
| Accumulated Net Realized Losses | (18,320) |
| Unrealized Appreciation (Depreciation) | (25,220) |
| Net Assets | 577,601 |
| |
| |
| Admiral Shares—Net Assets | |
| Applicable to 922,328 outstanding | |
| $.001 par value shares of beneficial | |
| interest (unlimited authorization) | 30,362 |
| Net Asset Value Per Share— | |
| Admiral Shares | $32.92 |
| |
| |
| ETF Shares—Net Assets | |
| Applicable to 8,201,572 outstanding | |
| $.001 par value shares of beneficial | |
| interest (unlimited authorization) | 547,239 |
| Net Asset Value Per Share— | |
| ETF Shares | $66.72 |
• See Note A in Notes to Financial Statements.
* Non-income-producing security.
^ Part of security position is on loan to broker-dealers. The total value of securities on loan is $906,000.
1 Affiliated money market fund available only to Vanguard funds and certain trusts and accounts managed by Vanguard. Rate shown is the 7-day yield.
2 Includes $949,000 of collateral received for securities on loan.
See accompanying Notes, which are an integral part of the Financial Statements.
19
Consumer Staples Index Fund
| |
| Statement of Operations |
| |
| | Year Ended |
| August 31, 2010 |
| | ($000) |
| Investment Income | |
| Income | |
| Dividends | 17,508 |
| Interest1 | 1 |
| Security Lending | 61 |
| Total Income | 17,570 |
| Expenses | |
| The Vanguard Group—Note B | |
| Investment Advisory Services | 90 |
| Management and Administrative— | |
| Admiral Shares | 60 |
| Management and Administrative— | |
| ETF Shares | 1,030 |
| Marketing and Distribution— | |
| Admiral Shares | 6 |
| Marketing and Distribution— | |
| ETF Shares | 172 |
| Custodian Fees | 6 |
| Auditing Fees | 26 |
| Shareholders’ Reports—Admiral Shares | — |
| Shareholders’ Reports—ETF Shares | 72 |
| Trustees’ Fees and Expenses | 1 |
| Total Expenses | 1,463 |
| Net Investment Income | 16,107 |
| Realized Net Gain (Loss) on | |
| Investment Securities Sold | 18,127 |
| Change in Unrealized Appreciation | |
| (Depreciation) of Investment Securities | 23,452 |
| Net Increase (Decrease) in | |
| Net Assets Resulting from Operations | 57,686 |
| | | |
| | |
| Statement of Changes in Net Assets | | |
| |
| | | Year Ended August 31, |
| | 2010 | 2009 |
| | ($000) | ($000) |
| Increase (Decrease) in Net Assets | | |
| Operations | | |
| Net Investment Income | 16,107 | 15,458 |
| Realized Net Gain (Loss) | 18,127 | 2,903 |
| Change in Unrealized Appreciation (Depreciation) | 23,452 | (59,656) |
| Net Increase (Decrease) in Net Assets Resulting from Operations | 57,686 | (41,295) |
| Distributions | | |
| Net Investment Income | | |
| Admiral Shares | (745) | (425) |
| ETF Shares | (15,294) | (11,495) |
| Realized Capital Gain | | |
| Admiral Shares | — | — |
| ETF Shares | — | — |
| Total Distributions | (16,039) | (11,920) |
| Capital Share Transactions | | |
| Admiral Shares | (302) | 11,397 |
| ETF Shares | (44,794) | 86,801 |
| Net Increase (Decrease) from Capital Share Transactions | (45,096) | 98,198 |
| Total Increase (Decrease) | (3,449) | 44,983 |
| Net Assets | | |
| Beginning of Period | 581,050 | 536,067 |
| End of Period2 | 577,601 | 581,050 |
1 Interest income from an affiliated company of the fund was $1,000.
2 Net Assets—End of Period includes undistributed net investment income of $9,486,000 and $9,418,000.
See accompanying Notes, which are an integral part of the Financial Statements.
20
Consumer Staples Index Fund
Financial Highlights
| | | | | | |
| | | | | |
| Admiral Shares | | | | | |
| |
| For a Share Outstanding | | | | Year Ended August 31, |
| Throughout Each Period | 2010 | 2009 | 2008 | 2007 | 2006 |
| Net Asset Value, Beginning of Period | $30.62 | $34.06 | $33.22 | $30.56 | $27.64 |
| Investment Operations | | | | | |
| Net Investment Income | .8601 | .7771 | .6341 | .662 | .5471 |
| Net Realized and Unrealized Gain (Loss) | | | | | |
| on Investments | 2.290 | (3.648) | .766 | 2.460 | 2.716 |
| Total from Investment Operations | 3.150 | (2.871) | 1.400 | 3.122 | 3.263 |
| Distributions | | | | | |
| Dividends from Net Investment Income | (.850) | (.569) | (.560) | (.462) | (.343) |
| Distributions from Realized Capital Gains | — | — | — | — | — |
| Total Distributions | (.850) | (.569) | (.560) | (.462) | (.343) |
| Net Asset Value, End of Period | $32.92 | $30.62 | $34.06 | $33.22 | $30.56 |
| |
| Total Return2 | 10.34% | –8.26% | 4.15% | 10.30% | 11.92% |
| |
| Ratios/Supplemental Data | | | | | |
| Net Assets, End of Period (Millions) | $30 | $29 | $18 | $9 | $6 |
| Ratio of Total Expenses to | | | | | |
| Average Net Assets | 0.24% | 0.28% | 0.25% | 0.26% | 0.28% |
| Ratio of Net Investment Income to | | | | | |
| Average Net Assets | 2.61% | 2.77% | 1.88% | 2.16% | 1.90% |
| Portfolio Turnover Rate3 | 7% | 17% | 13% | 12% | 14% |
1 Calculated based on average shares outstanding.
2 Total returns do not include transaction fees that may have applied in the periods shown. Fund prospectuses provide information about any applicable transaction fees.
3 Excludes the value of portfolio securities received or delivered as a result of in-kind purchases or redemptions of the fund’s capital shares, including ETF Creation Units.
| | | | | | |
| | | | | |
| ETF Shares | | | | | |
| |
| For a Share Outstanding | | | | Year Ended August 31, |
| Throughout Each Period | 2010 | 2009 | 2008 | 2007 | 2006 |
| Net Asset Value, Beginning of Period | $62.07 | $69.04 | $67.35 | $61.94 | $56.03 |
| Investment Operations | | | | | |
| Net Investment Income | 1.7531 | 1.6161 | 1.3271 | 1.370 | 1.0901 |
| Net Realized and Unrealized Gain (Loss) | | | | | |
| on Investments | 4.635 | (7.413) | 1.522 | 5.000 | 5.523 |
| Total from Investment Operations | 6.388 | (5.797) | 2.849 | 6.370 | 6.613 |
| Distributions | | | | | |
| Dividends from Net Investment Income | (1.738) | (1.173) | (1.159) | (.960) | (.703) |
| Distributions from Realized Capital Gains | — | — | — | — | — |
| Total Distributions | (1.738) | (1.173) | (1.159) | (.960) | (.703) |
| Net Asset Value, End of Period | $66.72 | $62.07 | $69.04 | $67.35 | $61.94 |
| |
| Total Return | 10.33% | –8.22% | 4.18% | 10.38% | 11.91% |
| |
| Ratios/Supplemental Data | | | | | |
| Net Assets, End of Period (Millions) | $547 | $552 | $518 | $310 | $211 |
| Ratio of Total Expenses to | | | | | |
| Average Net Assets | 0.24% | 0.25% | 0.20% | 0.22% | 0.25% |
| Ratio of Net Investment Income to | | | | | |
| Average Net Assets | 2.61% | 2.80% | 1.93% | 2.20% | 1.93% |
| Portfolio Turnover Rate2 | 7% | 17% | 13% | 12% | 14% |
1 Calculated based on average shares outstanding.
2 Excludes the value of portfolio securities received or delivered as a result of in-kind purchases or redemptions of the fund’s capital shares, including ETF Creation Units.
See accompanying Notes, which are an integral part of the Financial Statements.
21
Consumer Staples Index Fund
Notes to Financial Statements
Vanguard Consumer Staples Index Fund is registered under the Investment Company Act of 1940 as an open-end investment company, or mutual fund. The fund offers two classes of shares: Admiral Shares and ETF Shares. Admiral Shares are designed for investors who meet certain administrative, service, and account-size criteria. ETF Shares are listed for trading on the NYSE Arca, Inc.; they can be purchased and sold through a broker.
A. The following significant accounting policies conform to generally accepted accounting principles for U.S. mutual funds. The fund consistently follows such policies in preparing its financial statements.
1. Security Valuation: Securities are valued as of the close of trading on the New York Stock Exchange (generally 4 p.m., Eastern time) on the valuation date. Equity securities are valued at the latest quoted sales prices or official closing prices taken from the primary market in which each security trades; such securities not traded on the valuation date are valued at the mean of the latest quoted bid and asked prices. Securities for which market quotations are not readily available, or whose values have been materially affected by events occurring before the fund’s pricing time but after the close of the securities’ primary markets, are valued by methods deemed by the board of trustees to represent fair value. Investments in Vanguard Market Liquidity Fund are valued at that fund’s net asset value.
2. Federal Income Taxes: The fund intends to continue to qualify as a regulated investment company and distribute all of its taxable income. Management has analyzed the fund’s tax positions taken for all open federal income tax years (August 31, 2007–2010), and has concluded that no provision for federal income tax is required in the fund’s financial statements.
3. Distributions: Distributions to shareholders are recorded on the ex-dividend date.
4. Security Lending: The fund may lend its securities to qualified institutional borrowers to earn additional income. Security loans are required to be secured at all times by collateral at least equal to the market value of securities loaned. The fund invests cash collateral received in Vanguard Market Liquidity Fund, and records a liability for the return of the collateral, during the period the securities are on loan. Security lending income represents the income earned on investing cash collateral, less expenses associated with the loan.
5. Other: Dividend income is recorded on the ex-dividend date. Interest income includes income distributions received from Vanguard Market Liquidity Fund and is accrued daily. Security transactions are accounted for on the date securities are bought or sold. Costs used to determine realized gains (losses) on the sale of investment securities are those of the specific securities sold. Fees assessed on redemptions of capital shares are credited to paid-in capital.
Each class of shares has equal rights as to assets and earnings, except that each class separately bears certain class-specific expenses related to maintenance of shareholder accounts (included in Management and Administrative expenses) and shareholder reporting. Marketing and distribution expenses are allocated to each class of shares based on a method approved by the board of trustees. Income, other non-class-specific expenses, and gains and losses on investments are allocated to each class of shares based on its relative net assets.
B. The Vanguard Group furnishes at cost investment advisory, corporate management, administrative, marketing, and distribution services. The costs of such services are allocated to the fund under methods approved by the board of trustees. The fund has committed to provide up to 0.40% of its net assets in capital contributions to Vanguard. At August 31, 2010, the fund had contributed capital of $117,000 to Vanguard (included in Other Assets), representing 0.02% of the fund’s net assets and 0.05% of Vanguard’s capitalization. The fund’s trustees and officers are also directors and officers of Vanguard.
C. Various inputs may be used to determine the value of the fund’s investments. These inputs are summarized in three broad levels for financial statement purposes. The inputs or methodologies used to value securities are not necessarily an indication of the risk associated with investing in those securities.
Level 1—Quoted prices in active markets for identical securities.
Level 2—Other significant observable inputs (including quoted prices for similar securities, interest rates, prepayment speeds, credit risk, etc.).
Level 3—Significant unobservable inputs (including the fund’s own assumptions used to determine the fair value of investments).
At August 31, 2010, 100% of the fund’s investments were valued based on Level 1 inputs.
22
Consumer Staples Index Fund
D. Distributions are determined on a tax basis and may differ from net investment income and realized capital gains for financial reporting purposes. Differences may be permanent or temporary. Permanent differences are reclassified among capital accounts in the financial statements to reflect their tax character. Temporary differences arise when certain items of income, expense, gain, or loss are recognized in different periods for financial statement and tax purposes; these differences will reverse at some time in the future. Differences in classification may also result from the treatment of short-term gains as ordinary income for tax purposes.
During the year ended August 31, 2010, the fund realized $20,087,000 of net capital gains resulting from in-kind redemptions—in which shareholders exchanged fund shares for securities held by the fund rather than for cash. Because such gains are not taxable to the fund, and are not distributed to shareholders, they have been reclassified from accumulated net realized losses to paid-in capital.
For tax purposes, at August 31, 2010, the fund had $10,107,000 of ordinary income available for distribution. The fund had available capital loss carryforwards totaling $16,360,000 to offset future net capital gains of $276,000 through August 31, 2014, $773,000 through August 31, 2015, $2,261,000 through August 31, 2016, $2,671,000 through August 31, 2017, and $10,379,000 through August 31, 2018. In addition, the fund realized losses of $1,689,000 during the period from November 1, 2009, through August 31, 2010, which are deferred and will be treated as realized for tax purposes in fiscal 2011.
At August 31, 2010, the cost of investment securities for tax purposes was $604,546,000. Net unrealized depreciation of investment securities for tax purposes was $25,491,000, consisting of unrealized gains of $23,440,000 on securities that had risen in value since their purchase and $48,931,000 in unrealized losses on securities that had fallen in value since their purchase.
E. During the year ended August 31, 2010, the fund purchased $153,100,000 of investment securities and sold $197,502,000 of investment securities, other than temporary cash investments.
F. Capital share transactions for each class of shares were:
| | | | | | |
| | | | |
| | | | | Year Ended August 31, |
| | | | 2010 | | | 2009 |
| | Amount | Shares | Amount | Shares |
| | ($000) | (000) | ($000) | (000) |
| Admiral Shares | | | | |
| Issued | 8,871 | 267 | 17,568 | 619 |
| Issued in Lieu of Cash Distributions | 690 | 21 | 400 | 14 |
| Redeemed1 | (9,863) | (300) | (6,571) | (236) |
| Net Increase (Decrease)—Admiral Shares | (302) | (12) | 11,397 | 397 |
| ETF Shares | | | | |
| Issued | 108,286 | 1,602 | 258,009 | 4,400 |
| Issued in Lieu of Cash Distributions | — | — | — | — |
| Redeemed1 | (153,080) | (2,300) | (171,208) | (3,000) |
| Net Increase (Decrease)—ETF Shares | (44,794) | (698) | 86,801 | 1,400 |
1 Net of redemption fees for fiscal 2010 and 2009 of $18,000 and $49,000, respectively (fund totals).
G. In preparing the financial statements as of August 31, 2010, management considered the impact of subsequent events for potential recognition or disclosure in these financial statements.
23
Energy Index Fund
Fund Profile
As of August 31, 2010
| | | |
| Portfolio Characteristics | | |
| | | Target | Broad |
| | Fund | Index1 | Index2 |
| Number of Stocks | 162 | 160 | 2,478 |
| Median Market Cap | $32.7B | $59.4B | $26.3B |
| Price/Earnings Ratio | 13.4x | 13.4x | 15.4x |
| Price/Book Ratio | 1.6x | 1.6x | 1.9x |
| Yield3 | | 2.0% | 2.1% |
| Admiral Shares | 1.6% | | |
| ETF Shares | 1.6% | | |
| Return on Equity | 23.0% | 23.3% | 19.2% |
| Earnings Growth Rate | 3.8% | 4.0% | 6.3% |
| Foreign Holdings | 0.0% | 0.0% | 0.0% |
| Turnover Rate | 16% | — | — |
| Expense Ratio4 | | — | — |
| Admiral Shares | 0.28% | | |
| ETF Shares | 0.25% | | |
| Short-Term Reserves | 0.0% | — | — |
| | |
| Volatility Measures5 | | |
| | Fund Versus | Fund Versus |
| | Spliced Index6 | Broad Index2 |
| R-Squared | 0.99 | 0.57 |
| Beta | 1.05 | 0.95 |
| |
Subindustry Diversification
(% of equity exposure) | |
| |
| |
| Coal & Consumable Fuels | 3.4% |
| Integrated Oil & Gas | 49.4 |
| Oil & Gas Drilling | 4.5 |
| Oil & Gas Equipment & Services | 15.6 |
| Oil & Gas Exploration & Production | 21.4 |
| Oil & Gas Refining & Marketing | 2.0 |
| Oil & Gas Storage & Transportation | 3.7 |
| |
| Ten Largest Holdings7 (% of total net assets) |
| |
| ExxonMobil Corp. | 22.6% |
| Chevron Corp. | 12.4 |
| ConocoPhillips Co. | 6.2 |
| Occidental Petroleum Corp. | 4.5 |
| Schlumberger Ltd. | 4.4 |
| Apache Corp. | 2.7 |
| Devon Energy Corp. | 2.2 |
| Halliburton Co. | 2.2 |
| Anadarko Petroleum Corp. | 1.9 |
| EOG Resources Inc. | 1.9 |
| Top Ten | 61.0% |
1 MSCI US IMI/Energy 25/50.
2 MSCI US IMI/2500.
3 30-day SEC yield for the fund; annualized dividend yield for the indexes. See the Glossary.
4 The expense ratios shown are from the prospectus dated December 28, 2009, and represent estimated costs for the current fiscal year. For the fiscal year ended August 31, 2010, the expense ratios were 0.24% for the Admiral Shares and 0.24% for the ETF Shares.
5 For an explanation of R-squared, beta, and other terms used here, see the Glossary.
6 Spliced MSCI US IMI/Energy 25/50: MSCI US IMI/Energy through February 26, 2010; MSCI US IMI/Energy 25/50 thereafter.
7 The holdings listed exclude any temporary cash investments and equity index products.
24
Energy Index Fund
Performance Summary
All of the returns in this report represent past performance, which is not a guarantee of future results that may be achieved by the fund. (Current performance may be lower or higher than the performance data cited. For performance data current to the most recent month-end, visit our website at vanguard.com/performance.) Note, too, that both investment returns and principal value can fluctuate widely, so an investor’s shares, when sold, could be worth more or less than their original cost. The returns shown do not reflect taxes that a shareholder would pay on fund distributions or on the sale of fund shares.
Cumulative Performance: September 23, 2004–August 31, 2010
Initial Investment of $10,000
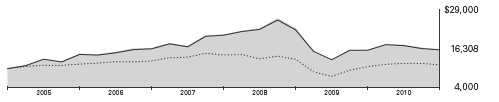
| | | | | |
| | | | |
| | | Average Annual Total Returns | |
| | | | Periods Ended August 31, 2010 | Final Value |
| | | | Since | of a $10,000 |
| | One Year | Five Years | Inception1 | Investment |
| Energy Index Fund ETF Shares | | | | |
| Net Asset Value2 | 2.05% | 1.92% | 8.59% | $16,308 |
| Energy Index Fund ETF Shares Market Price | 1.81 | 1.92 | 8.57 | 16,289 |
| MSCI US IMI/2500 | 5.81 | –0.39 | 1.96 | 11,221 |
| Spliced MSCI US IMI/Energy 25/503 | 0.63 | 1.93 | 8.29 | 16,041 |
| | | | |
| | | | | Final Value |
| | | | Since | of a $100,000 |
| | One Year | Five Years | Inception1 | Investment |
| Energy Index Fund Admiral Shares4 | 2.05% | 1.89% | 7.60% | $154,012 |
| MSCI US IMI/2500 | 5.81 | –0.39 | 1.61 | 109,852 |
| Spliced MSCI US IMI/Energy 25/503 | 0.63 | 1.93 | 7.27 | 151,280 |
1 Performance for the fund and its comparative standards is calculated since the following inception dates: September 23, 2004, for ETF Shares; October 7, 2004, for Admiral Shares.
2 For more information about how the ETF Shares’ market prices have compared with their net asset value, visit Vanguard.com, select your ETF, and then select the Performance tab. The Premium/Discount table there shows the percentages of days on which the ETF Shares’ market price was above or below the NAV.
3 Spliced MSCI US IMI/Energy 25/50: MSCI US IMI/Energy through February 26, 2010; MSCI US IMI/Energy 25/50 thereafter.
4 Total returns do not reflect the 2% fee assessed on redemptions of shares held for less than one year.
See Financial Highlights for dividend and capital gains information.
25
Energy Index Fund
Fiscal-Year Total Returns (%): September 23, 2004–August 31, 2010
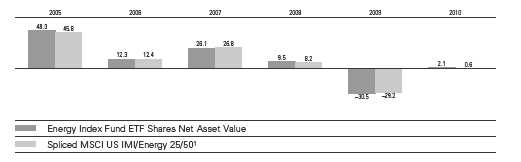
| | | |
| Cumulative Returns: ETF Shares, September 23, 2004–August 31, 2010 | | |
| | | | Cumulative |
| | | | Since |
| | One Year | Five Years | Inception |
| Energy Index Fund ETF Shares Market Price | 1.81% | 9.98% | 62.89% |
| Energy Index Fund ETF Shares Net Asset Value | 2.05 | 9.97 | 63.08 |
| Spliced MSCI US IMI/Energy 25/501 | 0.63 | 10.02 | 60.41 |
Average Annual Total Returns: Periods Ended June 30, 2010
This table presents average annual total returns through the latest calendar quarter—rather than through the end of the fiscal period. Securities and Exchange Commission rules require that we provide this information.
| | | | |
| | | | | Since |
| | Inception Date | One Year | Five Years | Inception |
| ETF Shares | 9/23/2004 | | | |
| Market Price | | 5.62% | 3.97% | 8.23% |
| Net Asset Value | | 5.61 | 3.96 | 8.24 |
| Admiral Shares2 | 10/7/2004 | 5.58 | 3.92 | 7.22 |
1 Spliced MSCI US IMI/Energy 25/50: MSCI US IMI/Energy through February 26, 2010; MSCI US IMI/Energy 25/50 thereafter.
2 Total returns do not reflect the 2% fee assessed on redemptions of shares held for less than one year.
26
Energy Index Fund
Financial Statements
Statement of Net Assets
As of August 31, 2010
The fund reports a complete list of its holdings in regulatory filings four times in each fiscal year, at the quarter-ends. For the second and fourth fiscal quarters, the lists appear in the fund’s semiannual and annual reports to shareholders. For the first and third fiscal quarters, the fund files the lists with the Securities and Exchange Commission on Form N-Q. Shareholders can look up the fund’s Forms N-Q on the SEC’s website at sec.gov. Forms N-Q may also be reviewed and copied at the SEC’s Public Reference Room (see the back cover of this report for further information).
| | | |
| | | | Market |
| | | | Value• |
| | | Shares | ($000) |
| Common Stocks (100.0%) | | |
| Energy Equipment & Services (20.1%) | |
| | Oil & Gas Drilling (4.5%) | | |
| * | Transocean Ltd. | 319,492 | 16,262 |
| | Noble Corp. | 261,996 | 8,153 |
| * | Nabors Industries Ltd. | 294,780 | 4,622 |
| * | Pride International Inc. | 183,443 | 4,320 |
| ^ | Diamond Offshore | | |
| | Drilling Inc. | 72,297 | 4,206 |
| | Helmerich & Payne Inc. | 110,252 | 4,084 |
| * | Rowan Cos. Inc. | 122,659 | 3,154 |
| | Patterson-UTI Energy Inc. | 169,983 | 2,509 |
| * | Atwood Oceanics Inc. | 68,205 | 1,711 |
| * | Unit Corp. | 48,819 | 1,663 |
| * | Parker Drilling Co. | 191,269 | 694 |
| * | Pioneer Drilling Co. | 107,154 | 583 |
| * | Hercules Offshore Inc. | 249,498 | 534 |
| * | Bronco Drilling Co. Inc. | 95,487 | 376 |
| * | Seahawk Drilling Inc. | 51,609 | 372 |
| |
| | Oil & Gas Equipment & Services (15.6%) |
| | Schlumberger Ltd. | 963,011 | 51,357 |
| | Halliburton Co. | 894,941 | 25,246 |
| | Baker Hughes Inc. | 430,803 | 16,190 |
| | National Oilwell Varco Inc. | 416,383 | 15,652 |
| * | Weatherford | | |
| | International Ltd. | 739,287 | 11,023 |
| * | Cameron International Corp. | 246,075 | 9,051 |
| * | FMC Technologies Inc. | 124,164 | 7,680 |
| | Core Laboratories NV | 46,871 | 3,700 |
| * | McDermott | | |
| | International Inc. | 246,983 | 3,166 |
| * | Dresser-Rand Group Inc. | 88,773 | 3,153 |
| * | Oceaneering | | |
| | International Inc. | 59,198 | 2,961 |
| | Tidewater Inc. | 57,828 | 2,318 |
| * | Oil States International Inc. | 55,946 | 2,307 |
| * | Superior Energy Services Inc. | 90,452 | 1,945 |
| * | Dril-Quip Inc. | 36,683 | 1,939 |
| * | SEACOR Holdings Inc. | 24,611 | 1,936 |
| | CARBO Ceramics Inc. | 22,842 | 1,730 |
| * | Exterran Holdings Inc. | 72,543 | 1,605 |
| | Lufkin Industries Inc. | 36,820 | 1,423 |
| * | Complete Production | | |
| | Services Inc. | 78,696 | 1,388 |
| * | Bristow Group Inc. | 41,991 | 1,386 |
| * | Key Energy Services Inc. | 158,080 | 1,266 |
| * | Helix Energy Solutions | | |
| | Group Inc. | 130,251 | 1,185 |
| * | Newpark Resources Inc. | 129,825 | 1,133 |
| * | Gulfmark Offshore Inc. | 34,221 | 923 |
| * | Tetra Technologies Inc. | 109,288 | 917 |
| * | Superior Well Services Inc. | 38,753 | 858 |
| | RPC Inc. | 49,258 | 803 |
| * | Global Industries Ltd. | 164,048 | 749 |
| * | Cal Dive International Inc. | 153,181 | 700 |
| | | |
| | | | Market |
| | | | Value• |
| | | Shares | ($000) |
| * | Hornbeck Offshore | | |
| | Services Inc. | 40,591 | 641 |
| * | ION Geophysical Corp. | 184,837 | 632 |
| * | Willbros Group Inc. | 79,679 | 624 |
| * | Allis-Chalmers Energy Inc. | 158,776 | 614 |
| * | T-3 Energy Services Inc. | 26,455 | 584 |
| * | Tesco Corp. | 58,266 | 578 |
| * | OYO Geospace Corp. | 10,991 | 541 |
| * | Matrix Service Co. | 62,224 | 530 |
| | Gulf Island Fabrication Inc. | 32,843 | 489 |
| * | Dawson Geophysical Co. | 19,824 | 479 |
| * | PHI Inc. | 32,474 | 471 |
| * | Basic Energy Services Inc. | 62,311 | 447 |
| | | | 235,563 |
| Oil, Gas & Consumable Fuels (79.9%) | |
| | Coal & Consumable Fuels (3.4%) | |
| | Peabody Energy Corp. | 269,463 | 11,533 |
| | Consol Energy Inc. | 227,826 | 7,336 |
| * | Alpha Natural | | |
| | Resources Inc. | 125,396 | 4,656 |
| | EQT Corp. | 141,369 | 4,609 |
| | Arch Coal Inc. | 170,941 | 3,848 |
| | Massey Energy Co. | 104,989 | 3,019 |
| * | Patriot Coal Corp. | 103,033 | 1,059 |
| * | International Coal Group Inc. | 190,177 | 869 |
| * | USEC Inc. | 172,341 | 810 |
| * | Cloud Peak Energy Inc. | 49,565 | 784 |
| * | James River Coal Co. | 45,949 | 727 |
| * | Uranium Energy Corp. | 178,362 | 453 |
| |
| | Integrated Oil & Gas (49.5%) | |
| | Exxon Mobil Corp. | 4,470,219 | 264,458 |
| | Chevron Corp. | 1,955,735 | 145,037 |
| | ConocoPhillips | 1,375,451 | 72,115 |
| | Occidental | | |
| | Petroleum Corp. | 722,550 | 52,804 |
| | Marathon Oil Corp. | 700,659 | 21,363 |
| | Hess Corp. | 292,802 | 14,713 |
| | Murphy Oil Corp. | 182,345 | 9,767 |
| |
| | Oil & Gas Exploration & Production (21.4%) |
| | Apache Corp. | 356,156 | 32,001 |
| | Devon Energy Corp. | 419,362 | 25,279 |
| | Anadarko Petroleum Corp. | 488,029 | 22,444 |
| | EOG Resources Inc. | 249,722 | 21,693 |
| | Chesapeake Energy Corp. | 645,305 | 13,345 |
| | Noble Energy Inc. | 174,772 | 12,196 |
| * | Southwestern Energy Co. | 345,010 | 11,289 |
| | Pioneer Natural | | |
| | Resources Co. | 117,729 | 6,807 |
| * | Newfield Exploration Co. | 135,549 | 6,508 |
| * | Ultra Petroleum Corp. | 155,071 | 6,049 |
| * | Denbury Resources Inc. | 397,205 | 5,855 |
| | Cimarex Energy Co. | 85,722 | 5,608 |
| | Range Resources Corp. | 163,450 | 5,526 |
| | QEP Resources Inc. | 178,353 | 5,178 |
| * | Petrohawk Energy Corp. | 312,672 | 4,728 |
| | | |
| | | | Market |
| | | | Value• |
| | | Shares | ($000) |
| * | Concho Resources Inc. | 80,535 | 4,705 |
| * | Whiting Petroleum Corp. | 53,398 | 4,530 |
| * | Plains Exploration & | | |
| | Production Co. | 148,809 | 3,554 |
| | Cabot Oil & Gas Corp. | 111,272 | 3,098 |
| * | Forest Oil Corp. | 115,256 | 3,010 |
| | EXCO Resources Inc. | 196,414 | 2,642 |
| | SM Energy Co. | 69,343 | 2,634 |
| * | Mariner Energy Inc. | 114,840 | 2,629 |
| * | Atlas Energy Inc. | 87,074 | 2,368 |
| * | Brigham Exploration Co. | 131,495 | 2,014 |
| * | Gran Tierra Energy Inc. | 295,439 | 1,861 |
| * | SandRidge Energy Inc. | 430,304 | 1,738 |
| * | Quicksilver Resources Inc. | 141,719 | 1,729 |
| * | Continental Resources Inc. | 40,425 | 1,638 |
| | Berry Petroleum Co. Class A | 57,641 | 1,565 |
| * | Bill Barrett Corp. | 46,914 | 1,528 |
| * | McMoRan Exploration Co. | 98,584 | 1,399 |
| * | Comstock Resources Inc. | 60,090 | 1,308 |
| * | Rosetta Resources Inc. | 66,235 | 1,305 |
| * | Swift Energy Co. | 48,253 | 1,300 |
| * | Energy XXI Bermuda Ltd. | 57,953 | 1,158 |
| * | Carrizo Oil & Gas Inc. | 47,606 | 998 |
| * | Cobalt International | | |
| | Energy Inc. | 119,474 | 975 |
| * | Northern Oil and Gas Inc. | 65,194 | 915 |
| | Penn Virginia Corp. | 65,403 | 912 |
| * | Contango Oil & Gas Co. | 19,133 | 839 |
| * | Petroleum | | |
| | Development Corp. | 30,659 | 825 |
| * | ATP Oil & Gas Corp. | 69,249 | 790 |
| * | Stone Energy Corp. | 68,873 | 779 |
| * | Venoco Inc. | 41,762 | 739 |
| * | Rex Energy Corp. | 65,292 | 738 |
| * | Resolute Energy Corp. | 66,829 | 714 |
| * | Energy Partners Ltd. | 61,025 | 667 |
| * | Clayton Williams Energy Inc. | 14,405 | 659 |
| * | Goodrich Petroleum Corp. | 49,066 | 652 |
| * | Petroquest Energy Inc. | 107,773 | 644 |
| * | Vaalco Energy Inc. | 111,941 | 637 |
| * | Gulfport Energy Corp. | 55,657 | 633 |
| * | BPZ Resources Inc. | 151,623 | 599 |
| | W&T Offshore Inc. | 66,138 | 598 |
| * | Harvest Natural | | |
| | Resources Inc. | 76,281 | 535 |
| * | Warren Resources Inc. | 162,015 | 499 |
| * | Magnum Hunter | | |
| | Resources Corp. | 121,707 | 470 |
| * | Endeavour | | |
| | International Corp. | 385,199 | 455 |
| * | Delta Petroleum Corp. | 610,822 | 421 |
| * | Gastar Exploration Ltd. | 139,312 | 418 |
| * | Approach Resources Inc. | 47,716 | 415 |
| * | GMX Resources Inc. | 97,134 | 413 |
| * | Oilsands Quest Inc. | 729,186 | 357 |
27
Energy Index Fund
| | | |
| | | | Market |
| | | | Value• |
| | | Shares | ($000) |
| | Oil & Gas Refining & Marketing (1.9%) |
| | Valero Energy Corp. | 566,045 | 8,927 |
| | Sunoco Inc. | 125,525 | 4,228 |
| | Tesoro Corp. | 163,829 | 1,840 |
| | World Fuel Services Corp. | 65,330 | 1,669 |
| | Holly Corp. | 62,949 | 1,637 |
| | Frontier Oil Corp. | 128,102 | 1,500 |
| * | Clean Energy Fuels Corp. | 59,051 | 853 |
| * | CVR Energy Inc. | 79,289 | 565 |
| * | Western Refining Inc. | 124,103 | 541 |
| | Delek US Holdings Inc. | 58,752 | 394 |
| * | China Integrated Energy Inc. 48,059 | 368 |
| | Alon USA Energy Inc. | 63,183 | 342 |
| |
| | Oil & Gas Storage & Transportation (3.7%) |
| | Spectra Energy Corp. | 645,663 | 13,133 |
| | Williams Cos. Inc. | 583,714 | 10,583 |
| | El Paso Corp. | 709,373 | 8,080 |
| * | Kinder Morgan | | |
| | Management LLC | 82,533 | 4,875 |
| | Southern Union Co. | 120,897 | 2,720 |
| | Overseas Shipholding | | |
| | Group Inc. | 37,229 | 1,199 |
| * | Enbridge Energy | | |
| | Management LLC | 19,523 | 1,036 |
| | General Maritime Corp. | 151,371 | 677 |
| * | Crosstex Energy Inc. | 84,054 | 624 |
| * | Cheniere Energy Inc. | 175,790 | 425 |
| | | | 936,691 |
| Total Common Stocks | | |
| (Cost $1,237,885) | | 1,172,254 |
| Temporary Cash Investment (0.2%) | |
| Money Market Fund (0.2%) | | |
| 1,2 | Vanguard Market | | |
| | Liquidity Fund, 0.288% | | |
| | (Cost $2,202) | 2,202,102 | 2,202 |
| Total Investments (100.2%) | | |
| (Cost $1,240,087) | | 1,174,456 |
| Other Assets and Liabilities (–0.2%) | |
| Other Assets | | 17,855 |
| Liabilities2 | | (19,881) |
| | | | (2,026) |
| Net Assets (100%) | | 1,172,430 |
| |
| At August 31, 2010, net assets consisted of: |
| | Amount |
| | ($000) |
| Paid-in Capital | 1,349,551 |
| Undistributed Net Investment Income | 14,159 |
| Accumulated Net Realized Losses | (125,649) |
| Unrealized Appreciation (Depreciation) | (65,631) |
| Net Assets | 1,172,430 |
| |
| |
| Admiral Shares—Net Assets | |
| Applicable to 3,497,253 outstanding | |
| $.001 par value shares of beneficial | |
| interest (unlimited authorization) | 131,421 |
| Net Asset Value Per Share— | |
| Admiral Shares | $37.58 |
| |
| |
| ETF Shares—Net Assets | |
| Applicable to 13,843,489 outstanding | |
| $.001 par value shares of beneficial | |
| interest (unlimited authorization) | 1,041,009 |
| Net Asset Value Per Share— | |
| ETF Shares | $75.20 |
• See Note A in Notes to Financial Statements.
* Non-income-producing security.
^ Part of security position is on loan to broker-dealers. The total value of securities on loan is $2,100,000.
1 Affiliated money market fund available only to Vanguard funds and certain trusts and accounts managed by Vanguard. Rate shown is the 7-day yield.
2 Includes $2,202,000 of collateral received for securities on loan.
See accompanying Notes, which are an integral part of the Financial Statements.
28
Energy Index Fund
| |
| Statement of Operations |
| |
| | Year Ended |
| August 31, 2010 |
| | ($000) |
| Investment Income | |
| Income | |
| Dividends | 23,203 |
| Interest1 | 3 |
| Security Lending | 22 |
| Total Income | 23,228 |
| Expenses | |
| The Vanguard Group—Note B | |
| Investment Advisory Services | 144 |
| Management and Administrative— | |
| Admiral Shares | 263 |
| Management and Administrative— | |
| ETF Shares | 1,965 |
| Marketing and Distribution— | |
| Admiral Shares | 22 |
| Marketing and Distribution— | |
| ETF Shares | 291 |
| Custodian Fees | 9 |
| Auditing Fees | 26 |
| Shareholders’ Reports—Admiral Shares | — |
| Shareholders’ Reports—ETF Shares | 109 |
| Trustees’ Fees and Expenses | 2 |
| Total Expenses | 2,831 |
| Net Investment Income | 20,397 |
| Realized Net Gain (Loss) on | |
| Investment Securities Sold | (9,773) |
| Change in Unrealized Appreciation | |
| (Depreciation) of Investment Securities | (10,417) |
| Net Increase (Decrease) in Net Assets | |
| Resulting from Operations | 207 |
| | | |
| Statement of Changes in Net Assets | | |
| |
| | | Year Ended August 31, |
| | 2010 | 2009 |
| | ($000) | ($000) |
| Increase (Decrease) in Net Assets | | |
| Operations | | |
| Net Investment Income | 20,397 | 13,882 |
| Realized Net Gain (Loss) | (9,773) | (45,410) |
| Change in Unrealized Appreciation (Depreciation) | (10,417) | (235,527) |
| Net Increase (Decrease) in Net Assets Resulting from Operations | 207 | (267,055) |
| Distributions | | |
| Net Investment Income | | |
| Admiral Shares | (1,675) | (1,381) |
| ETF Shares | (14,832) | (9,252) |
| Realized Capital Gain | | |
| Admiral Shares | — | — |
| ETF Shares | — | — |
| Total Distributions | (16,507) | (10,633) |
| Capital Share Transactions | | |
| Admiral Shares | 27,810 | 4,816 |
| ETF Shares | 183,909 | 256,766 |
| Net Increase (Decrease) from Capital Share Transactions | 211,719 | 261,582 |
| Total Increase (Decrease) | 195,419 | (16,106) |
| Net Assets | | |
| Beginning of Period | 977,011 | 993,117 |
| End of Period2 | 1,172,430 | 977,011 |
1 Interest income from an affiliated company of the fund was $3,000.
2 Net Assets—End of Period includes undistributed net investment income of $14,159,000 and $10,269,000.
See accompanying Notes, which are an integral part of the Financial Statements.
29
Energy Index Fund
Financial Highlights
| | | | | | |
| Admiral Shares | | | | | |
| |
| For a Share Outstanding | | | | | Year Ended August 31, |
| Throughout Each Period | 2010 | 2009 | 2008 | 2007 | 2006 |
| Net Asset Value, Beginning of Period | $37.34 | $54.66 | $50.36 | $40.36 | $36.29 |
| Investment Operations | | | | | |
| Net Investment Income | .654 | .578 | .504 | .5011 | .4601 |
| Net Realized and Unrealized Gain (Loss) | | | | | |
| on Investments | .166 | (17.335) | 4.246 | 9.944 | 3.960 |
| Total from Investment Operations | .820 | (16.757) | 4.750 | 10.445 | 4.420 |
| Distributions | | | | | |
| Dividends from Net Investment Income | (.580) | (.563) | (.450) | (.445) | (.350) |
| Distributions from Realized Capital Gains | — | — | — | — | — |
| Total Distributions | (.580) | (.563) | (.450) | (.445) | (.350) |
| Net Asset Value, End of Period | $37.58 | $37.34 | $54.66 | $50.36 | $40.36 |
| |
| Total Return2 | 2.05% | –30.51% | 9.42% | 26.03% | 12.27% |
| |
| Ratios/Supplemental Data | | | | | |
| Net Assets, End of Period (Millions) | $131 | $108 | $148 | $115 | $83 |
| Ratio of Total Expenses to | | | | | |
| Average Net Assets | 0.24% | 0.28% | 0.25% | 0.26% | 0.28% |
| Ratio of Net Investment Income to | | | | | |
| Average Net Assets | 1.71% | 1.81% | 0.99% | 1.16% | 1.20% |
| Portfolio Turnover Rate3 | 16% | 25% | 11% | 15% | 21% |
1 Calculated based on average shares outstanding.
2 Total returns do not include transaction fees that may have applied in the periods shown. Fund prospectuses provide information about any applicable transaction fees.
3 Excludes the value of portfolio securities received or delivered as a result of in-kind purchases or redemptions of the fund’s capital shares, including ETF Creation Units.
| | | | | | |
| ETF Shares | | | | | |
| |
| For a Share Outstanding | | | | | Year Ended August 31, |
| Throughout Each Period | 2010 | 2009 | 2008 | 2007 | 2006 |
| Net Asset Value, Beginning of Period | $74.74 | $109.54 | $100.92 | $80.90 | $72.72 |
| Investment Operations | | | | | |
| Net Investment Income | 1.312 | 1.191 | 1.059 | 1.0801 | .9661 |
| Net Realized and Unrealized Gain (Loss) | | | | | |
| on Investments | .341 | (34.808) | 8.501 | 19.869 | 7.915 |
| Total from Investment Operations | 1.653 | (33.617) | 9.560 | 20.949 | 8.881 |
| Distributions | | | | | |
| Dividends from Net Investment Income | (1.193) | (1.183) | (.940) | (.929) | (.701) |
| Distributions from Realized Capital Gains | — | — | — | — | — |
| Total Distributions | (1.193) | (1.183) | (.940) | (.929) | (.701) |
| Net Asset Value, End of Period | $75.20 | $74.74 | $109.54 | $100.92 | $80.90 |
| |
| Total Return | 2.05% | –30.49% | 9.47% | 26.09% | 12.31% |
| |
| Ratios/Supplemental Data | | | | | |
| Net Assets, End of Period (Millions) | $1,041 | $869 | $845 | $656 | $340 |
| Ratio of Total Expenses to | | | | | |
| Average Net Assets | 0.24% | 0.25% | 0.20% | 0.22% | 0.25% |
| Ratio of Net Investment Income to | | | | | |
| Average Net Assets | 1.71% | 1.84% | 1.04% | 1.20% | 1.23% |
| Portfolio Turnover Rate2 | 16% | 25% | 11% | 15% | 21% |
1 Calculated based on average shares outstanding.
2 Excludes the value of portfolio securities received or delivered as a result of in-kind purchases or redemptions of the fund’s capital shares, including ETF Creation Units.
See accompanying Notes, which are an integral part of the Financial Statements.
30
Energy Index Fund
Notes to Financial Statements
Vanguard Energy Index Fund is registered under the Investment Company Act of 1940 as an open-end investment company, or mutual fund. The fund offers two classes of shares: Admiral Shares and ETF Shares. Admiral Shares are designed for investors who meet certain administrative, service, and account-size criteria. ETF Shares are listed for trading on the NYSE Arca, Inc.; they can be purchased and sold through a broker.
A. The following significant accounting policies conform to generally accepted accounting principles for U.S. mutual funds. The fund consistently follows such policies in preparing its financial statements.
1. Security Valuation: Securities are valued as of the close of trading on the New York Stock Exchange (generally 4 p.m., Eastern time) on the valuation date. Equity securities are valued at the latest quoted sales prices or official closing prices taken from the primary market in which each security trades; such securities not traded on the valuation date are valued at the mean of the latest quoted bid and asked prices. Securities for which market quotations are not readily available, or whose values have been materially affected by events occurring before the fund’s pricing time but after the close of the securities’ primary markets, are valued by methods deemed by the board of trustees to represent fair value. Investments in Vanguard Market Liquidity Fund are valued at that fund’s net asset value.
2. Federal Income Taxes: The fund intends to continue to qualify as a regulated investment company and distribute all of its taxable income. Management has analyzed the fund’s tax positions taken for all open federal income tax years (August 31, 2007–2010), and has concluded that no provision for federal income tax is required in the fund’s financial statements.
3. Distributions: Distributions to shareholders are recorded on the ex-dividend date.
4. Security Lending: The fund may lend its securities to qualified institutional borrowers to earn additional income. Security loans are required to be secured at all times by collateral at least equal to the market value of securities loaned. The fund invests cash collateral received in Vanguard Market Liquidity Fund, and records a liability for the return of the collateral, during the period the securities are on loan. Security lending income represents the income earned on investing cash collateral, less expenses associated with the loan.
5. Other: Dividend income is recorded on the ex-dividend date. Interest income includes income distributions received from Vanguard Market Liquidity Fund and is accrued daily. Security transactions are accounted for on the date securities are bought or sold. Costs used to determine realized gains (losses) on the sale of investment securities are those of the specific securities sold. Fees assessed on redemptions of capital shares are credited to paid-in capital.
Each class of shares has equal rights as to assets and earnings, except that each class separately bears certain class-specific expenses related to maintenance of shareholder accounts (included in Management and Administrative expenses) and shareholder reporting. Marketing and distribution expenses are allocated to each class of shares based on a method approved by the board of trustees. Income, other non-class-specific expenses, and gains and losses on investments are allocated to each class of shares based on its relative net assets.
B. The Vanguard Group furnishes at cost investment advisory, corporate management, administrative, marketing, and distribution services. The costs of such services are allocated to the fund under methods approved by the board of trustees. The fund has committed to provide up to 0.40% of its net assets in capital contributions to Vanguard. At August 31, 2010, the fund had contributed capital of $237,000 to Vanguard (included in Other Assets), representing 0.02% of the fund’s net assets and 0.09% of Vanguard’s capitalization. The fund’s trustees and officers are also directors and officers of Vanguard.
C. Various inputs may be used to determine the value of the fund’s investments. These inputs are summarized in three broad levels for financial statement purposes. The inputs or methodologies used to value securities are not necessarily an indication of the risk associated with investing in those securities.
Level 1—Quoted prices in active markets for identical securities.
Level 2—Other significant observable inputs (including quoted prices for similar securities, interest rates, prepayment speeds, credit risk, etc.).
Level 3—Significant unobservable inputs (including the fund’s own assumptions used to determine the fair value of investments).
At August 31, 2010, 100% of the fund’s investments were valued based on Level 1 inputs.
31
Energy Index Fund
D. Distributions are determined on a tax basis and may differ from net investment income and realized capital gains for financial reporting purposes. Differences may be permanent or temporary. Permanent differences are reclassified among capital accounts in the financial statements to reflect their tax character. Temporary differences arise when certain items of income, expense, gain, or loss are recognized in different periods for financial statement and tax purposes; these differences will reverse at some time in the future. Differences in classification may also result from the treatment of short-term gains as ordinary income for tax purposes.
During the year ended August 31, 2010, the fund realized $29,099,000 of net capital gains resulting from in-kind redemptions—in which shareholders exchanged fund shares for securities held by the fund rather than for cash. Because such gains are not taxable to the fund, and are not distributed to shareholders, they have been reclassified from accumulated net realized losses to paid-in capital.
For tax purposes, at August 31, 2010, the fund had $15,281,000 of ordinary income available for distribution. The fund had available capital loss carryforwards totaling $91,138,000 to offset future net capital gains of $5,000 through August 31, 2013, $789,000 through August 31, 2014, $461,000 through August 31, 2015, $1,694,000 through August 31, 2016, $21,266,000 through August 31, 2017, and $66,923,000 through August 31, 2018. In addition, the fund realized losses of $32,690,000 during the period from November 1, 2009, through August 31, 2010, which are deferred and will be treated as realized for tax purposes in fiscal 2011.
At August 31, 2010, the cost of investment securities for tax purposes was $1,241,907,000. Net unrealized depreciation of investment securities for tax purposes was $67,451,000, consisting of unrealized gains of $65,728,000 on securities that had risen in value since their purchase and $133,179,000 in unrealized losses on securities that had fallen in value since their purchase.
E. During the year ended August 31, 2010, the fund purchased $497,991,000 of investment securities and sold $282,492,000 of investment securities, other than temporary cash investments.
F. Capital share transactions for each class of shares were:
| | | | | | |
| | | | | Year Ended August 31, |
| | | | 2010 | | | 2009 |
| | Amount | Shares | Amount | Shares |
| | ($000) | (000) | ($000) | (000) |
| Admiral Shares | | | | |
| Issued | 57,079 | 1,339 | 40,669 | 1,162 |
| Issued in Lieu of Cash Distributions | 1,465 | 35 | 1,181 | 36 |
| Redeemed1 | (30,734) | (762) | (37,034) | (1,022) |
| Net Increase (Decrease)—Admiral Shares | 27,810 | 612 | 4,816 | 176 |
| ETF Shares | | | | |
| Issued | 274,072 | 3,313 | 350,914 | 5,017 |
| Issued in Lieu of Cash Distributions | — | — | — | — |
| Redeemed1 | (90,163) | (1,100) | (94,148) | (1,100) |
| Net Increase (Decrease)—ETF Shares | 183,909 | 2,213 | 256,766 | 3,917 |
1 Net of redemption fees for fiscal 2010 and 2009 of $83,000 and $243,000, respectively (fund totals).
G. In preparing the financial statements as of August 31, 2010, management considered the impact of subsequent events for potential recognition or disclosure in these financial statements.
32
Financials Index Fund
Fund Profile
As of August 31, 2010
| | | |
| Portfolio Characteristics | | |
| | | Target | Broad |
| | Fund | Index1 | Index2 |
| Number of Stocks | 490 | 489 | 2,478 |
| Median Market Cap | $18.1B | $18.0B | $26.3B |
| Price/Earnings Ratio | 16.2x | 16.2x | 15.4x |
| Price/Book Ratio | 1.0x | 1.0x | 1.9x |
| Yield3 | | 1.9% | 2.1% |
| Admiral Shares | 1.6% | | |
| ETF Shares | 1.5% | | |
| Return on Equity | 11.2% | 11.3% | 19.2% |
| Earnings Growth Rate | –6.9% | –6.9% | 6.3% |
| Foreign Holdings | 0.0% | 0.0% | 0.0% |
| Turnover Rate | 11% | — | — |
| Expense Ratio4 | | — | — |
| Admiral Shares | 0.28% | | |
| ETF Shares | 0.25% | | |
| Short-Term Reserves | 0.1% | — | — |
| | |
| Volatility Measures5 | | |
| | Fund Versus | Fund Versus |
| | Spliced Index6 | Broad Index2 |
| R-Squared | 1.00 | 0.78 |
| Beta | 1.00 | 1.37 |
| |
Subindustry Diversification
(% of equity exposure) | |
| |
| |
| Asset Management & Custody Banks | 7.3% |
| Consumer Finance | 4.4 |
| Diversified Banks | 8.6 |
| Diversified REITs | 1.2 |
| Insurance Brokers | 1.7 |
| Investment Banking & Brokerage | 7.0 |
| Life & Health Insurance | 5.9 |
| Mortgage REITs | 1.3 |
| Multi-line Insurance | 2.2 |
| Office REITs | 2.4 |
| Other Diversified Financial Services | 19.4 |
| Property & Casualty Insurance | 11.1 |
| Regional Banks | 9.5 |
| Reinsurance | 1.8 |
| Residential REITs | 2.4 |
| Retail REITs | 3.6 |
| Specialized Finance | 2.3 |
| Specialized REITs | 4.5 |
| Thrifts & Mortgage Finance | 1.8 |
| Other Financials | 1.6 |
| |
| Ten Largest Holdings7 (% of total net assets) |
| |
| JPMorgan Chase & Co. | 7.8% |
| Bank of America Corp. | 6.7 |
| Wells Fargo & Co. | 6.2 |
| Citigroup Inc. | 4.9 |
| Goldman Sachs Group Inc. | 3.6 |
| Berkshire Hathaway Inc. Class B | 3.4 |
| American Express Co. | 2.3 |
| US Bancorp | 2.1 |
| MetLife Inc. | 1.8 |
| Morgan Stanley | 1.7 |
| Top Ten | 40.5% |
1 MSCI US IMI/Financials 25/50.
2 MSCI US IMI/2500.
3 30-day SEC yield for the fund; annualized dividend yield for the indexes. See the Glossary.
4 The expense ratios shown are from the prospectus dated December 28, 2009, and represent estimated costs for the current fiscal year. For the fiscal year ended August 31, 2010, the expense ratios were 0.24% for the Admiral Shares and 0.24% for the ETF Shares.
5 For an explanation of R-squared, beta, and other terms used here, see the Glossary.
6 Spliced MSCI US IMI/Financials 25/50: MSCI US IMI/Financials through February 26, 2010; MSCI US IMI/Financials 25/50 thereafter.
7 The holdings listed exclude any temporary cash investments and equity index products.
33
Financials Index Fund
Performance Summary
All of the returns in this report represent past performance, which is not a guarantee of future results that may be achieved by the fund. (Current performance may be lower or higher than the performance data cited. For performance data current to the most recent month-end, visit our website at vanguard.com/performance.) Note, too, that both investment returns and principal value can fluctuate widely, so an investor’s shares, when sold, could be worth more or less than their original cost. The returns shown do not reflect taxes that a shareholder would pay on fund distributions or on the sale of fund shares.
Cumulative Performance: January 26, 2004–August 31, 2010
Initial Investment of $10,000
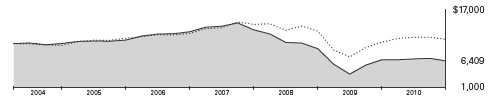
| | | | | |
| | | | |
| | | | Average Annual Total Returns | |
| | Periods Ended August 31, 2010 | Final Value |
| | | | Since | of a $10,000 |
| | One Year | Five Years | Inception1 | Investment |
| Financials Index Fund ETF Shares | | | | |
| Net Asset Value2 | –3.51% | –9.74% | –6.52% | $6,409 |
| Financials Index Fund ETF Shares | | | | |
| Market Price | –3.70 | –9.73 | –6.54 | 6,399 |
| MSCI US IMI/2500 | 5.81 | –0.39 | 1.31 | 10,893 |
| Spliced MSCI US IMI/Financials 25/503 | –3.41 | –9.74 | –6.48 | 6,431 |
| | | | |
| | | | | Final Value |
| | | | Since | of a $100,000 |
| | One Year | Five Years | Inception1 | Investment |
| Financials Index Fund Admiral Shares4 | –3.52% | –9.78% | –6.34% | $65,039 |
| MSCI US IMI/2500 | 5.81 | –0.39 | 1.75 | 112,082 |
| Spliced MSCI US IMI/Financials 25/503 | –3.41 | –9.74 | –6.26 | 65,390 |
1 Performance for the fund and its comparative standards is calculated since the following inception dates: January 26, 2004, for ETF Shares; February 4, 2004, for Admiral Shares.
2 For more information about how the ETF Shares’ market prices have compared with their net asset value, visit Vanguard.com, select your ETF, and then select the Performance tab. The Premium/Discount table there shows the percentages of days on which the ETF Shares’ market price was above or below the NAV.
3 Spliced MSCI US IMI/Financials 25/50: MSCI US IMI/Financials through February 26, 2010; MSCI US IMI/Financials 25/50 thereafter.
4 Total returns do not reflect the 2% fee assessed on redemptions of shares held for less than one year.
See Financial Highlights for dividend and capital gains information.
34
Financials Index Fund
Fiscal-Year Total Returns (%): January 26, 2004–August 31, 2010
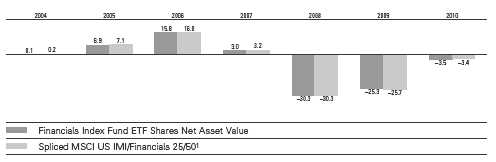
| | | |
| Cumulative Returns: ETF Shares, January 26, 2004–August 31, 2010 | | |
| | | | Cumulative |
| | | | Since |
| | One Year | Five Years | Inception |
| Financials Index Fund ETF Shares Market Price | –3.70% | –40.05% | –36.01% |
| Financials Index Fund ETF Shares Net Asset Value | –3.51 | –40.10 | –35.91 |
| Spliced MSCI US IMI/Financials 25/501 | –3.41 | –40.09 | –35.69 |
Average Annual Total Returns: Periods Ended June 30, 2010
This table presents average annual total returns through the latest calendar quarter—rather than through the end of the fiscal period. Securities and Exchange Commission rules require that we provide this information.
| | | | |
| | | | | Since |
| | Inception Date | One Year | Five Years | Inception |
| ETF Shares | 1/26/2004 | | | |
| Market Price | | 19.02% | –9.55% | –6.54% |
| Net Asset Value | | 18.96 | –9.55 | –6.55 |
| Admiral Shares2 | 2/4/2004 | 18.84 | –9.59 | –6.35 |
1 Spliced MSCI US IMI/Financials 25/50: MSCI US IMI/Financials through February 26, 2010; MSCI US IMI/Financials 25/50 thereafter.
2 Total returns do not reflect the 2% fee assessed on redemptions of shares held for less than one year.
35
Financials Index Fund
Financial Statements
Statement of Net Assets
As of August 31, 2010
The fund reports a complete list of its holdings in regulatory filings four times in each fiscal year, at the quarter-ends. For the second and fourth fiscal quarters, the lists appear in the fund’s semiannual and annual reports to shareholders. For the first and third fiscal quarters, the fund files the lists with the Securities and Exchange Commission on Form N-Q. Shareholders can look up the fund’s Forms N-Q on the SEC’s website at sec.gov. Forms N-Q may also be reviewed and copied at the SEC’s Public Reference Room (see the back cover of this report for further information).
| | | |
| | | | Market |
| | | | Value• |
| | | Shares | ($000) |
| Common Stocks (101.0%) | | |
| Capital Markets (14.5%) | | |
| | Goldman Sachs Group Inc. | 138,733 | 18,998 |
| | Morgan Stanley | 356,940 | 8,813 |
| | Bank of New York | | |
| | Mellon Corp. | 344,132 | 8,352 |
| | State Street Corp. | 142,460 | 4,998 |
| | Franklin Resources Inc. | 45,128 | 4,355 |
| | Charles Schwab Corp. | 287,847 | 3,673 |
| | T Rowe Price Group Inc. | 73,593 | 3,222 |
| | Ameriprise Financial Inc. | 73,164 | 3,188 |
| | Northern Trust Corp. | 61,740 | 2,849 |
| | Invesco Ltd. | 123,748 | 2,240 |
| | BlackRock Inc. | 10,070 | 1,429 |
| | Legg Mason Inc. | 46,419 | 1,176 |
| * | TD Ameritrade Holding Corp. | 66,956 | 978 |
| | Eaton Vance Corp. | 33,645 | 874 |
| | Ares Capital Corp. | 54,975 | 821 |
| * | E*Trade Financial Corp. | 62,512 | 776 |
| * | Affiliated Managers | | |
| | Group Inc. | 12,080 | 776 |
| | Jefferies Group Inc. | 32,061 | 722 |
| | SEI Investments Co. | 37,980 | 672 |
| | Raymond James | | |
| | Financial Inc. | 28,482 | 657 |
| | Waddell & Reed | | |
| | Financial Inc. | 24,620 | 567 |
| | Federated Investors Inc. | | |
| | Class B | 26,639 | 555 |
| | Apollo Investment Corp. | 54,803 | 524 |
| | Greenhill & Co. Inc. | 7,173 | 505 |
| * | American Capital Ltd. | 96,403 | 489 |
| | Janus Capital Group Inc. | 52,648 | 478 |
| * | Stifel Financial Corp. | 9,233 | 400 |
| * | Knight Capital Group Inc. | | |
| | Class A | 25,715 | 305 |
| * | MF Global Holdings Ltd. | 39,587 | 261 |
| * | KBW Inc. | 9,773 | 215 |
| | BlackRock Kelso Capital Corp. | 17,583 | 190 |
| * | optionsXpress Holdings Inc. | 12,558 | 179 |
| * | GLG Partners Inc. | 39,895 | 178 |
| | Prospect Capital Corp. | 18,176 | 167 |
| * | Investment Technology | | |
| | Group Inc. | 12,459 | 166 |
| * | Piper Jaffray Cos. | 5,674 | 157 |
| | Fifth Street Finance Corp. | 15,419 | 152 |
| | Artio Global Investors Inc. | | |
| | Class A | 9,215 | 128 |
| | Cohen & Steers Inc. | 5,378 | 115 |
| | Evercore Partners Inc. | | |
| | Class A | 4,383 | 107 |
| | Hercules Technology | | |
| | Growth Capital Inc. | 10,473 | 96 |
| | GFI Group Inc. | 20,683 | 93 |
| | MVC Capital Inc. | 6,464 | 83 |
| | BGC Partners Inc. Class A | 14,482 | 75 |
| | Capital Southwest Corp. | 829 | 72 |
| | | |
| | | | Market |
| | | | Value• |
| | | Shares | ($000) |
| | Oppenheimer Holdings Inc. | | |
| | Class A | 2,912 | 68 |
| * | TradeStation Group Inc. | 10,781 | 63 |
| * | International Assets | | |
| | Holding Corp. | 3,823 | 63 |
| | SWS Group Inc. | 8,449 | 61 |
| * | FBR Capital Markets Corp. | 16,973 | 58 |
| | Duff & Phelps Corp. Class A | 5,810 | 58 |
| | Calamos Asset | | |
| | Management Inc. Class A | 5,842 | 55 |
| | Westwood Holdings | | |
| | Group Inc. | 1,683 | 52 |
| | NGP Capital Resources Co. | 6,357 | 51 |
| | GAMCO Investors Inc. | 1,326 | 47 |
| * | LaBranche & Co. Inc. | 9,611 | 37 |
| * | Gleacher & Co. Inc. | 21,631 | 36 |
| * | Penson Worldwide Inc. | 5,187 | 24 |
| | | | 76,499 |
| Commercial Banks (18.3%) | | |
| | Wells Fargo & Co. | 1,404,500 | 33,076 |
| | US Bancorp | 543,895 | 11,313 |
| | PNC Financial Services | | |
| | Group Inc. | 149,345 | 7,611 |
| | BB&T Corp. | 196,306 | 4,342 |
| | SunTrust Banks Inc. | 141,780 | 3,189 |
| | Fifth Third Bancorp | 225,521 | 2,492 |
| | Regions Financial Corp. | 338,386 | 2,176 |
| | M&T Bank Corp. | 23,521 | 2,014 |
| * | CIT Group Inc. | 53,921 | 1,978 |
| | KeyCorp | 249,458 | 1,838 |
| | Comerica Inc. | 49,977 | 1,720 |
| | Huntington Bancshares Inc. | 203,286 | 1,075 |
| | Marshall & Ilsley Corp. | 143,468 | 940 |
| | Zions Bancorporation | 45,480 | 838 |
| | Cullen/Frost Bankers Inc. | 15,537 | 796 |
| | Commerce Bancshares Inc. | 20,289 | 725 |
| | City National Corp. | 13,349 | 647 |
| * | First Horizon National Corp. | 64,056 | 646 |
| | Bank of Hawaii Corp. | 13,777 | 615 |
| | Valley National Bancorp | 43,919 | 572 |
| | Associated Banc-Corp | 47,123 | 568 |
| | East West Bancorp Inc. | 38,589 | 564 |
| | FirstMerit Corp. | 30,786 | 533 |
| | TCF Financial Corp. | 36,370 | 519 |
| | Fulton Financial Corp. | 57,167 | 473 |
| * | Popular Inc. | 184,495 | 472 |
| * | SVB Financial Group | 11,872 | 441 |
| * | Signature Bank | 11,681 | 427 |
| | Westamerica Bancorporation | 8,365 | 424 |
| | Synovus Financial Corp. | 204,149 | 420 |
| | CapitalSource Inc. | 74,345 | 375 |
| | Iberiabank Corp. | 7,640 | 372 |
| | Prosperity Bancshares Inc. | 12,656 | 360 |
| | BOK Financial Corp. | 7,781 | 346 |
| | Webster Financial Corp. | 21,214 | 341 |
| | Umpqua Holdings Corp. | 32,580 | 339 |
| | Trustmark Corp. | 17,478 | 333 |
| | UMB Financial Corp. | 9,237 | 294 |
| | | |
| | | | Market |
| | | | Value• |
| | | Shares | ($000) |
| | Susquehanna | | |
| | Bancshares Inc. | 35,875 | 284 |
| | Glacier Bancorp Inc. | 20,192 | 279 |
| | BancorpSouth Inc. | 21,654 | 276 |
| | United Bankshares Inc. | 11,948 | 275 |
| | First Financial Bancorp | 16,278 | 260 |
| | FNB Corp. | 32,949 | 256 |
| | Wintrust Financial Corp. | 8,672 | 249 |
| | International | | |
| | Bancshares Corp. | 15,769 | 246 |
| | First Citizens | | |
| | BancShares Inc. Class A | 1,410 | 237 |
| | Old National Bancorp | 25,251 | 233 |
| | Hancock Holding Co. | 8,405 | 229 |
| | First Midwest Bancorp Inc. | 20,414 | 224 |
| | Wilmington Trust Corp. | 25,419 | 224 |
| | First Financial Bankshares Inc. | 4,765 | 213 |
| | National Penn | | |
| | Bancshares Inc. | 36,303 | 211 |
| | Community Bank System Inc. | 9,337 | 211 |
| | MB Financial Inc. | 13,901 | 208 |
| | Whitney Holding Corp. | 27,729 | 206 |
| | NBT Bancorp Inc. | 9,978 | 204 |
| | Cathay General Bancorp | 20,813 | 200 |
| | Park National Corp. | 3,215 | 193 |
| | Columbia Banking | | |
| | System Inc. | 10,807 | 192 |
| | PrivateBancorp Inc. Class A | 17,335 | 181 |
| | CVB Financial Corp. | 24,429 | 167 |
| * | Investors Bancorp Inc. | 14,982 | 159 |
| | Chemical Financial Corp. | 7,918 | 153 |
| * | Texas Capital Bancshares Inc. | 9,965 | 152 |
| | First Commonwealth | | |
| | Financial Corp. | 29,456 | 146 |
| | Bank of the Ozarks Inc. | 3,913 | 144 |
| | Home Bancshares Inc. | 6,588 | 142 |
| | PacWest Bancorp | 8,274 | 141 |
| | Sterling Bancshares Inc. | 27,028 | 134 |
| | S&T Bancorp Inc. | 7,690 | 130 |
| | City Holding Co. | 4,469 | 128 |
| | Boston Private | | |
| | Financial Holdings Inc. | 19,288 | 121 |
| * | Western Alliance Bancorp | 19,653 | 120 |
| | Oriental Financial Group Inc. | 9,067 | 120 |
| | Independent Bank Corp. | 5,626 | 118 |
| | Simmons First National Corp. | | |
| | Class A | 4,187 | 106 |
| | WesBanco Inc. | 6,937 | 106 |
| | SCBT Financial Corp. | 3,667 | 105 |
| | Community Trust Bancorp Inc. | 3,795 | 100 |
| | TowneBank | 6,898 | 99 |
| | Sandy Spring Bancorp Inc. | 6,590 | 96 |
| | Tompkins Financial Corp. | 2,499 | 92 |
| | Danvers Bancorp Inc. | 6,082 | 92 |
| | SY Bancorp Inc. | 3,799 | 90 |
| * | Citizens Republic | | |
| | Bancorp Inc. | 113,760 | 89 |
| | First Financial Corp. | 2,917 | 84 |
| | Lakeland Financial Corp. | 4,460 | 83 |
| * | Pinnacle Financial | | |
| | Partners Inc. | 9,018 | 77 |
| | Renasant Corp. | 5,647 | 76 |
| | Bancfirst Corp. | 2,026 | 75 |
| | First Busey Corp. | 17,304 | 74 |
| | Cardinal Financial Corp. | 8,059 | 74 |
| | Univest Corp. of Pennsylvania | 4,570 | 73 |
| | Southside Bancshares Inc. | 3,945 | 72 |
| | Washington Trust | | |
| | Bancorp Inc. | 3,877 | 70 |
36
Financials Index Fund
| | | |
| | | | Market |
| | | | Value• |
| | | Shares | ($000) |
| | 1st Source Corp. | 4,238 | 69 |
| | Suffolk Bancorp | 2,839 | 67 |
| | StellarOne Corp. | 6,414 | 66 |
| | Camden National Corp. | 2,155 | 66 |
| | Arrow Financial Corp. | 2,881 | 66 |
| * | United Community | | |
| | Banks Inc. | 26,201 | 65 |
| | Sterling Bancorp | 7,192 | 63 |
| | Southwest Bancorp Inc. | 5,209 | 62 |
| * | Nara Bancorp Inc. | 10,147 | 61 |
| | Union First Market | | |
| | Bankshares Corp. | 5,142 | 60 |
| | First Community | | |
| | Bancshares Inc. | 4,607 | 59 |
| | Northfield Bancorp Inc. | 5,393 | 59 |
| | Republic Bancorp Inc. | | |
| | Class A | 3,017 | 59 |
| | First Merchants Corp. | 7,336 | 57 |
| | First Bancorp | 4,450 | 54 |
| | Trico Bancshares | 3,876 | 54 |
| | Lakeland Bancorp Inc. | 6,405 | 51 |
| | CoBiz Financial Inc. | 9,134 | 49 |
| | Heartland Financial USA Inc. | 3,406 | 48 |
| | Great Southern Bancorp Inc. | 2,269 | 46 |
| | Citizens & Northern Corp. | 3,596 | 38 |
| | Wilshire Bancorp Inc. | 5,703 | 35 |
| | MainSource Financial | | |
| | Group Inc. | 5,751 | 35 |
| | Ames National Corp. | 2,015 | 34 |
| | Capital City Bank Group Inc. | 3,005 | 33 |
| * | South Financial Group Inc. | 63,813 | 18 |
| * | First BanCorp | 23,386 | 8 |
| | | | 96,685 |
| Consumer Finance (4.4%) | | |
| | American Express Co. | 306,736 | 12,230 |
| | Capital One Financial Corp. | 129,489 | 4,902 |
| | Discover Financial Services | 154,273 | 2,238 |
| * | SLM Corp. | 137,824 | 1,523 |
| * | AmeriCredit Corp. | 38,344 | 928 |
| | Cash America | | |
| | International Inc. | 8,484 | 260 |
| * | Ezcorp Inc. Class A | 12,424 | 223 |
| | Nelnet Inc. Class A | 8,911 | 195 |
| * | World Acceptance Corp. | 4,689 | 191 |
| * | First Cash Financial | | |
| | Services Inc. | 7,212 | 172 |
| * | Credit Acceptance Corp. | 2,696 | 153 |
| * | Dollar Financial Corp. | 7,075 | 137 |
| * | Cardtronics Inc. | 9,740 | 135 |
| | Advance America Cash | | |
| | Advance Centers Inc. | 12,492 | 42 |
| * | First Marblehead Corp. | 19,028 | 39 |
| | Student Loan Corp. | 1,177 | 22 |
| | CompuCredit Holdings Corp. | 3,445 | 15 |
| | | | 23,405 |
| Diversified Financial Services (22.0%) | |
| | JPMorgan Chase & Co. | 1,128,956 | 41,049 |
| | Bank of America Corp. | 2,847,035 | 35,445 |
| * | Citigroup Inc. | 6,990,263 | 26,004 |
| | CME Group Inc. | 18,631 | 4,622 |
| | NYSE Euronext | 74,059 | 2,054 |
| * | IntercontinentalExchange Inc. | 17,923 | 1,713 |
| | Moody’s Corp. | 57,134 | 1,208 |
| * | Leucadia National Corp. | 55,223 | 1,179 |
| * | MSCI Inc. Class A | 31,661 | 947 |
| * | NASDAQ OMX Group Inc. | 38,394 | 688 |
| * | Portfolio Recovery | | |
| | Associates Inc. | 4,798 | 306 |
| * | PHH Corp. | 15,730 | 291 |
| | | |
| | | | Market |
| | | | Value• |
| | | Shares | ($000) |
| * | Interactive Brokers | | |
| | Group Inc. | 10,764 | 174 |
| * | Pico Holdings Inc. | 5,767 | 161 |
| | Compass Diversified | | |
| | Holdings | 10,138 | 144 |
| | MarketAxess Holdings Inc. | 8,381 | 128 |
| * | CBOE Holdings Inc. | 3,385 | 71 |
| * | NewStar Financial Inc. | 8,647 | 58 |
| | Life Partners Holdings Inc. | 2,192 | 32 |
| * | Asset Acceptance | | |
| | Capital Corp. | 4,516 | 17 |
| | | | 116,291 |
| Insurance (23.0%) | | |
| * | Berkshire Hathaway Inc. | | |
| | Class B | 230,994 | 18,198 |
| | MetLife Inc. | 254,055 | 9,552 |
| | Travelers Cos. Inc. | 140,472 | 6,880 |
| | Prudential Financial Inc. | 131,620 | 6,656 |
| | Aflac Inc. | 133,184 | 6,293 |
| | ACE Ltd. | 96,017 | 5,134 |
| | Chubb Corp. | 92,692 | 5,109 |
| | Allstate Corp. | 144,996 | 4,002 |
| | Marsh & McLennan | | |
| | Cos. Inc. | 153,492 | 3,641 |
| | Progressive Corp. | 180,683 | 3,578 |
| | Loews Corp. | 94,921 | 3,336 |
| | AON Corp. | 68,836 | 2,495 |
| | Hartford Financial Services | | |
| | Group Inc. | 119,753 | 2,414 |
| | Principal Financial Group Inc. | 90,646 | 2,089 |
| | Lincoln National Corp. | 85,799 | 2,004 |
| | Unum Group | 94,384 | 1,892 |
| | XL Group PLC Class A | 97,006 | 1,737 |
| | PartnerRe Ltd. | 21,124 | 1,573 |
| * | Genworth Financial Inc. | | |
| | Class A | 138,695 | 1,502 |
| | Willis Group Holdings PLC | 48,053 | 1,397 |
| | Everest Re Group Ltd. | 16,639 | 1,317 |
| | Assurant Inc. | 33,008 | 1,207 |
| * | Arch Capital Group Ltd. | 14,828 | 1,183 |
| | Cincinnati Financial Corp. | 43,902 | 1,171 |
| * | American International | | |
| | Group Inc. | 34,368 | 1,166 |
| | Torchmark Corp. | 23,360 | 1,153 |
| | Axis Capital Holdings Ltd. | 34,097 | 1,053 |
| | WR Berkley Corp. | 39,003 | 1,028 |
| | RenaissanceRe Holdings Ltd. | 16,947 | 962 |
| | Reinsurance Group of | | |
| | America Inc. Class A | 20,946 | 916 |
| | Fidelity National Financial Inc. | |
| | Class A | 61,918 | 898 |
| | Transatlantic Holdings Inc. | 18,437 | 879 |
| * | Markel Corp. | 2,634 | 863 |
| | Old Republic | | |
| | International Corp. | 65,630 | 839 |
| | HCC Insurance Holdings Inc. | 32,656 | 824 |
| | Arthur J Gallagher & Co. | 29,458 | 732 |
| | Assured Guaranty Ltd. | 44,964 | 695 |
| | White Mountains Insurance | | |
| | Group Ltd. | 2,225 | 675 |
| | Brown & Brown Inc. | 34,758 | 662 |
| | American Financial | | |
| | Group Inc. | 22,061 | 635 |
| | Aspen Insurance | | |
| | Holdings Ltd. | 21,906 | 622 |
| | Allied World Assurance Co. | | |
| | Holdings Ltd. | 12,104 | 610 |
| | Hanover Insurance | | |
| | Group Inc. | 12,703 | 551 |
| | | |
| | | | Market |
| | | | Value• |
| | | Shares | ($000) |
| * | Alleghany Corp. | 1,817 | 541 |
| | Validus Holdings Ltd. | 20,804 | 530 |
| | Platinum Underwriters | | |
| | Holdings Ltd. | 12,756 | 513 |
| | Endurance Specialty | | |
| | Holdings Ltd. | 13,735 | 506 |
| | StanCorp Financial | | |
| | Group Inc. | 13,569 | 483 |
| * | ProAssurance Corp. | 8,854 | 469 |
| | Protective Life Corp. | 24,618 | 460 |
| | Erie Indemnity Co. Class A | 8,606 | 452 |
| | Alterra Capital Holdings Ltd. | 23,965 | 444 |
| * | MBIA Inc. | 46,950 | 439 |
| | First American | | |
| | Financial Corp. | 26,759 | 397 |
| | Unitrin Inc. | 14,392 | 343 |
| * | CNO Financial Group Inc. | 68,484 | 324 |
| | Montpelier Re Holdings Ltd. | 20,414 | 323 |
| | Mercury General Corp. | 7,922 | 311 |
| | Delphi Financial Group Inc. | 13,794 | 308 |
| | Argo Group International | | |
| | Holdings Ltd. | 8,851 | 270 |
| | Tower Group Inc. | 12,085 | 259 |
| | RLI Corp. | 4,882 | 256 |
| | Selective Insurance | | |
| | Group Inc. | 15,268 | 227 |
| | American National | | |
| | Insurance Co. | 2,679 | 205 |
| * | Greenlight Capital Re Ltd. | | |
| | Class A | 8,678 | 201 |
| | Horace Mann | | |
| | Educators Corp. | 11,368 | 186 |
| | Infinity Property & | | |
| | Casualty Corp. | 3,896 | 181 |
| | Employers Holdings Inc. | 12,219 | 179 |
| * | Navigators Group Inc. | 4,101 | 172 |
| | Safety Insurance Group Inc. | 3,685 | 150 |
| | American Equity Investment | | |
| | Life Holding Co. | 15,651 | 149 |
| * | Enstar Group Ltd. | 2,133 | 148 |
| | Flagstone Reinsurance | | |
| | Holdings SA | 14,406 | 145 |
| | Meadowbrook Insurance | | |
| | Group Inc. | 15,491 | 133 |
| | United Fire & Casualty Co. | 6,476 | 131 |
| * | National Financial | | |
| | Partners Corp. | 12,000 | 128 |
| * | Hilltop Holdings Inc. | 12,191 | 120 |
| | American Physicians | | |
| | Capital Inc. | 2,901 | 120 |
| | Harleysville Group Inc. | 3,579 | 114 |
| | Maiden Holdings Ltd. | 15,168 | 111 |
| | Amtrust Financial | | |
| | Services Inc. | 7,765 | 106 |
| | FBL Financial Group Inc. | | |
| | Class A | 4,236 | 97 |
| * | AMERISAFE Inc. | 5,401 | 95 |
| * | FPIC Insurance Group Inc. | 2,895 | 88 |
| | OneBeacon Insurance | | |
| | Group Ltd. Class A | 6,683 | 87 |
| * | CNA Surety Corp. | 5,063 | 85 |
| * | Citizens Inc. | 12,566 | 85 |
| | National Western | | |
| | Life Insurance Co. Class A | 617 | 79 |
| * | Global Indemnity PLC | 4,332 | 72 |
| * | eHealth Inc. | 6,437 | 65 |
| | State Auto Financial Corp. | 4,654 | 65 |
| * | Phoenix Cos. Inc. | 32,808 | 58 |
37
Financials Index Fund
| | | |
| | | | Market |
| | | | Value• |
| | | Shares | ($000) |
| | Stewart Information | | |
| | Services Corp. | 5,026 | 52 |
| | Presidential Life Corp. | 5,925 | 51 |
| | Baldwin & Lyons Inc. | 2,300 | 51 |
| | SeaBright Holdings Inc. | 6,442 | 46 |
| * | Ambac Financial Group Inc. | 82,312 | 45 |
| | Kansas City Life Insurance Co. | 1,303 | 40 |
| | First Mercury Financial Corp. | 4,339 | 40 |
| | National Interstate Corp. | 2,005 | 38 |
| | EMC Insurance Group Inc. | 1,539 | 32 |
| | Donegal Group Inc. Class A | 2,765 | 30 |
| | Universal Insurance | | |
| | Holdings Inc. | 5,293 | 22 |
| * | Crawford & Co. Class B | 3,751 | 10 |
| * | Crawford & Co. Class A | 4,231 | 9 |
| | | | 121,999 |
| |
| Real Estate Investment Trusts (16.2%) | |
| | Simon Property Group Inc. | 83,090 | 7,516 |
| | Public Storage | 40,912 | 4,010 |
| | Vornado Realty Trust | 46,401 | 3,761 |
| | Equity Residential | 80,269 | 3,679 |
| | Boston Properties Inc. | 39,433 | 3,210 |
| | Annaly Capital | | |
| | Management Inc. | 175,801 | 3,055 |
| | HCP Inc. | 83,348 | 2,936 |
| | AvalonBay Communities Inc. | 23,587 | 2,482 |
| | Host Hotels & Resorts Inc. | 179,004 | 2,350 |
| | Ventas Inc. | 44,419 | 2,244 |
| | Kimco Realty Corp. | 115,103 | 1,716 |
| | Health Care REIT Inc. | 35,204 | 1,617 |
| | Plum Creek Timber Co. Inc. | 46,234 | 1,594 |
| | Macerich Co. | 36,937 | 1,530 |
| | ProLogis | 135,924 | 1,475 |
| | Digital Realty Trust Inc. | 23,999 | 1,422 |
| | Federal Realty | | |
| | Investment Trust | 17,375 | 1,378 |
| | SL Green Realty Corp. | 22,070 | 1,330 |
| | Nationwide Health | | |
| | Properties Inc. | 33,316 | 1,282 |
| | AMB Property Corp. | 47,628 | 1,133 |
| | Rayonier Inc. | 22,902 | 1,083 |
| | Liberty Property Trust | 32,267 | 980 |
| | Realty Income Corp. | 29,843 | 973 |
| | Chimera Investment Corp. | 234,014 | 920 |
| | Essex Property Trust Inc. | 8,631 | 913 |
| | UDR Inc. | 44,207 | 910 |
| | Alexandria Real Estate | | |
| | Equities Inc. | 12,529 | 869 |
| | Senior Housing | | |
| | Properties Trust | 36,507 | 858 |
| | Camden Property Trust | 18,564 | 850 |
| | Regency Centers Corp. | 23,123 | 843 |
| | Duke Realty Corp. | 70,360 | 789 |
| | BRE Properties Inc. | 17,978 | 735 |
| | Mack-Cali Realty Corp. | 22,732 | 701 |
| | Hospitality Properties Trust | 34,932 | 683 |
| | Apartment Investment & | | |
| | Management Co. | 33,074 | 676 |
| | Weingarten Realty Investors | 32,324 | 652 |
| | Taubman Centers Inc. | 15,585 | 647 |
| | Highwoods Properties Inc. | 20,475 | 640 |
| | Developers Diversified | | |
| | Realty Corp. | 61,020 | 632 |
| | Corporate Office Properties | | |
| | Trust | 16,826 | 607 |
| | MFA Financial Inc. | 80,378 | 592 |
| | National Retail | | |
| | Properties Inc. | 23,781 | 579 |
| | | |
| | | | Market |
| | | | Value• |
| | | Shares | ($000) |
| | Omega Healthcare | | |
| | Investors Inc. | 26,453 | 567 |
| | Entertainment | | |
| | Properties Trust | 13,096 | 564 |
| | American Campus | | |
| | Communities Inc. | 18,657 | 556 |
| | BioMed Realty Trust Inc. | 31,940 | 546 |
| | Tanger Factory | | |
| | Outlet Centers | 11,602 | 536 |
| | Washington Real Estate | | |
| | Investment Trust | 17,238 | 528 |
| | Home Properties Inc. | 10,399 | 525 |
| | Douglas Emmett Inc. | 31,436 | 507 |
| | Mid-America Apartment | | |
| | Communities Inc. | 8,606 | 486 |
| | CBL & Associates | | |
| | Properties Inc. | 37,788 | 461 |
| | Kilroy Realty Corp. | 14,730 | 458 |
| | CommonWealth REIT | 18,317 | 442 |
| | Equity Lifestyle | | |
| | Properties Inc. | 8,291 | 429 |
| | LaSalle Hotel Properties | 19,805 | 417 |
| | Healthcare Realty Trust Inc. | 17,725 | 415 |
| | DuPont Fabros | | |
| | Technology Inc. | 16,483 | 407 |
| | Brandywine Realty Trust | 37,057 | 407 |
| | Potlatch Corp. | 11,459 | 384 |
| | DiamondRock | | |
| | Hospitality Co. | 43,670 | 383 |
| | Extra Space Storage Inc. | 23,670 | 362 |
| | Post Properties Inc. | 13,969 | 355 |
| | PS Business Parks Inc. | 5,628 | 317 |
| | Medical Properties Trust Inc. | 30,859 | 304 |
| | Hatteras Financial Corp. | 10,354 | 300 |
| | Colonial Properties Trust | 18,908 | 300 |
| | National Health Investors Inc. | 7,118 | 298 |
| | Sovran Self Storage Inc. | 7,855 | 297 |
| | Redwood Trust Inc. | 21,197 | 293 |
| | DCT Industrial Trust Inc. | 59,679 | 276 |
| | EastGroup Properties Inc. | 7,639 | 269 |
| | Starwood Property Trust Inc. | 13,621 | 259 |
| * | Sunstone Hotel | | |
| | Investors Inc. | 28,399 | 243 |
| | American Capital | | |
| | Agency Corp. | 8,928 | 243 |
| | Franklin Street | | |
| | Properties Corp. | 20,616 | 242 |
| | Capstead Mortgage Corp. | 19,905 | 231 |
| | Anworth Mortgage | | |
| | Asset Corp. | 33,767 | 230 |
| | Government Properties | | |
| | Income Trust | 8,360 | 215 |
| | Lexington Realty Trust | 32,012 | 214 |
| | Acadia Realty Trust | 11,531 | 207 |
| | Alexander’s Inc. | 659 | 201 |
| | Equity One Inc. | 11,970 | 191 |
| | U-Store-It Trust | 23,873 | 191 |
| * | Pebblebrook Hotel Trust | 10,309 | 183 |
| | Cousins Properties Inc. | 26,223 | 172 |
| | Hersha Hospitality Trust | 36,308 | 172 |
| | Investors Real Estate Trust | 20,913 | 172 |
| | Inland Real Estate Corp. | 22,181 | 171 |
| | Saul Centers Inc. | 3,876 | 160 |
| | LTC Properties Inc. | 6,447 | 159 |
| | Getty Realty Corp. | 6,218 | 154 |
| | First Potomac Realty Trust | 10,352 | 154 |
| | Pennsylvania Real Estate | | |
| | Investment Trust | 14,674 | 154 |
| | | |
| | | | Market |
| | | | Value• |
| | | Shares | ($000) |
| * | Strategic Hotels & | | |
| | Resorts Inc. | 40,531 | 145 |
| | Glimcher Realty Trust | 23,995 | 143 |
| | Sun Communities Inc. | 4,858 | 139 |
| | Walter Investment | | |
| | Management Corp. | 7,407 | 120 |
| | Retail Opportunity | | |
| | Investments Corp. | 12,067 | 114 |
| | Education Realty Trust Inc. | 16,043 | 110 |
| | Cypress Sharpridge | | |
| | Investments Inc. | 8,116 | 109 |
| * | FelCor Lodging Trust Inc. | 26,868 | 107 |
| | Universal Health Realty | | |
| | Income Trust | 3,337 | 106 |
| * | Ashford Hospitality Trust Inc. | 13,107 | 105 |
| | Ramco-Gershenson | | |
| | Properties Trust | 10,059 | 105 |
| * | iStar Financial Inc. | 27,097 | 95 |
| | Urstadt Biddle Properties Inc. | |
| | Class A | 5,086 | 93 |
| | Parkway Properties Inc. | 6,248 | 91 |
| | Cedar Shopping Centers Inc. | 16,000 | 88 |
| | Pennymac Mortgage | | |
| | Investment Trust | 4,871 | 85 |
| | CapLease Inc. | 15,030 | 77 |
| | Colony Financial Inc. | 4,308 | 76 |
| | Kite Realty Group Trust | 18,236 | 76 |
| | Winthrop Realty Trust | 5,046 | 69 |
| * | First Industrial Realty | | |
| | Trust Inc. | 16,089 | 68 |
| | NorthStar Realty | | |
| | Finance Corp. | 20,929 | 67 |
| | CreXus Investment Corp. | 4,017 | 48 |
| * | RAIT Financial Trust | 20,484 | 28 |
| | | | 85,823 |
| Real Estate Management & Development (0.7%) |
| * | CB Richard Ellis Group Inc. | | |
| | Class A | 81,752 | 1,342 |
| | Jones Lang LaSalle Inc. | 12,023 | 908 |
| * | St. Joe Co. | 26,506 | 638 |
| * | Forest City Enterprises Inc. | | |
| | Class A | 34,659 | 391 |
| * | Forestar Group Inc. | 9,962 | 148 |
| * | Altisource Portfolio | | |
| | Solutions SA | 4,791 | 127 |
| * | Tejon Ranch Co. | 3,924 | 83 |
| | Consolidated-Tomoka | | |
| | Land Co. | 1,619 | 44 |
| * | Avatar Holdings Inc. | 2,332 | 41 |
| | | | 3,722 |
| Thrifts & Mortgage Finance (1.9%) | |
| | New York Community | | |
| | Bancorp Inc. | 117,948 | 1,874 |
| | Hudson City Bancorp Inc. | 134,446 | 1,550 |
| | People’s United | | |
| | Financial Inc. | 106,260 | 1,352 |
| | First Niagara Financial | | |
| | Group Inc. | 60,067 | 678 |
| | Washington Federal Inc. | 32,400 | 462 |
| * | MGIC Investment Corp. | 51,233 | 370 |
| | Northwest Bancshares Inc. | 31,998 | 344 |
| | NewAlliance Bancshares Inc. | 27,401 | 335 |
| | Astoria Financial Corp. | 25,500 | 308 |
| | TFS Financial Corp. | 26,763 | 246 |
| | Radian Group Inc. | 38,231 | 242 |
| * | Ocwen Financial Corp. | 21,559 | 196 |
| | Provident Financial | | |
| | Services Inc. | 15,446 | 177 |
| ^ | Capitol Federal Financial | 6,442 | 165 |
38
Financials Index Fund
| | | |
| | | | Market |
| | | | Value• |
| | | Shares | ($000) |
| | Brookline Bancorp Inc. | 17,056 | 160 |
| * | PMI Group Inc. | 44,471 | 137 |
| | Trustco Bank Corp. NY | 21,879 | 116 |
| | Dime Community Bancshares | 8,486 | 106 |
| | Flushing Financial Corp. | 8,619 | 93 |
| | ViewPoint Financial Group | 9,492 | 85 |
| | Provident New York Bancorp | 9,990 | 81 |
| * | Beneficial Mutual Bancorp Inc. | 9,597 | 80 |
| | Berkshire Hills Bancorp Inc. | 3,928 | 70 |
| | WSFS Financial Corp. | 1,890 | 68 |
| | Bank Mutual Corp. | 12,860 | 65 |
| | Westfield Financial Inc. | 8,009 | 61 |
| | United Financial Bancorp Inc. | 4,320 | 58 |
| | Territorial Bancorp Inc. | 3,372 | 57 |
| | Home Federal Bancorp Inc. | 4,206 | 52 |
| | Abington Bancorp Inc. | 5,057 | 51 |
| | BankFinancial Corp. | 5,437 | 49 |
| | First Financial Holdings Inc. | 4,684 | 42 |
| | ESSA Bancorp Inc. | 3,301 | 37 |
| * | Meridian Interstate | | |
| | Bancorp Inc. | 2,998 | 32 |
| | Rockville Financial Inc. | 2,654 | 31 |
| * | Flagstar Bancorp Inc. | 13,172 | 30 |
| | Roma Financial Corp. | 2,252 | 23 |
| | First Financial Northwest Inc. | 5,076 | 21 |
| | NASB Financial Inc. | 933 | 13 |
| * | Doral Financial Corp. | 3,564 | 5 |
| | | | 9,922 |
| Total Common Stocks | | |
| (Cost $774,540) | | 534,346 |
| Temporary Cash Investment (0.1%) | |
| Money Market Fund (0.1%) | | |
| 1,2 | Vanguard Market | | |
| | Liquidity Fund, 0.288% | | |
| | (Cost $631) | 630,671 | 631 |
| Total Investments (101.1%) | | |
| (Cost $775,171) | | 534,977 |
| Other Assets and Liabilities (–1.1%) | |
| Other Assets | | 4,379 |
| Liabilities2 | | (10,090) |
| | | | (5,711) |
| Net Assets (100%) | | 529,266 |
| |
| At August 31, 2010, net assets consisted of: |
| | Amount |
| | ($000) |
| Paid-in Capital | 988,551 |
| Undistributed Net Investment Income | 1,003 |
| Accumulated Net Realized Losses | (220,094) |
| Unrealized Appreciation (Depreciation) | (240,194) |
| Net Assets | 529,266 |
| |
| |
| Admiral Shares—Net Assets | |
| Applicable to 4,633,106 outstanding | |
| $.001 par value shares of beneficial | |
| interest (unlimited authorization) | 64,836 |
| Net Asset Value Per Share— | |
| Admiral Shares | $13.99 |
| |
| |
| ETF Shares—Net Assets | |
| Applicable to 16,636,225 outstanding | |
| $.001 par value shares of beneficial | |
| interest (unlimited authorization) | 464,430 |
| Net Asset Value Per Share— | |
| ETF Shares | $27.92 |
• See Note A in Notes to Financial Statements.
* Non-income-producing security.
^ Part of security position is on loan to broker-dealers. The total value of securities on loan is $82,000.
1 Affiliated money market fund available only to Vanguard funds and certain trusts and accounts managed by Vanguard. Rate shown is the 7-day yield.
2 Includes $86,000 of collateral received for securities on loan.
REIT—Real Estate Investment Trust.
See accompanying Notes, which are an integral part of the Financial Statements.
39
Financials Index Fund
| |
| Statement of Operations |
| |
| | Year Ended |
| | August 31, 2010 |
| | ($000) |
| Investment Income | |
| Income | |
| Dividends | 9,477 |
| Security Lending | 136 |
| Total Income | 9,613 |
| Expenses | |
| The Vanguard Group—Note B | |
| Investment Advisory Services | 91 |
| Management and Administrative— | |
| Admiral Shares | 137 |
| Management and Administrative— | |
| ETF Shares | 886 |
| Marketing and Distribution— | |
| Admiral Shares | 16 |
| Marketing and Distribution— | |
| ETF Shares | 161 |
| Custodian Fees | 40 |
| Auditing Fees | 27 |
| Shareholders’ Reports—Admiral Shares | — |
| Shareholders’ Reports—ETF Shares | 72 |
| Trustees’ Fees and Expenses | 1 |
| Total Expenses | 1,431 |
| Net Investment Income | 8,182 |
| Realized Net Gain (Loss) on | |
| Investment Securities Sold | (35,200) |
| Change in Unrealized Appreciation | |
| (Depreciation) of Investment Securities | 1,899 |
| Net Increase (Decrease) in Net Assets | |
| Resulting from Operations | (25,119) |
| | | |
| Statement of Changes in Net Assets | | |
| |
| | | Year Ended August 31, |
| | 2010 | 2009 |
| | ($000) | ($000) |
| Increase (Decrease) in Net Assets | | |
| Operations | | |
| Net Investment Income | 8,182 | 14,751 |
| Realized Net Gain (Loss) | (35,200) | (140,463) |
| Change in Unrealized Appreciation (Depreciation) | 1,899 | (46,975) |
| Net Increase (Decrease) in Net Assets Resulting from Operations | (25,119) | (172,687) |
| Distributions | | |
| Net Investment Income | | |
| Admiral Shares | (1,074) | (1,971) |
| ETF Shares | (8,041) | (14,745) |
| Realized Capital Gain | | |
| Admiral Shares | — | — |
| ETF Shares | — | — |
| Total Distributions | (9,115) | (16,716) |
| Capital Share Transactions | | |
| Admiral Shares | (5,323) | 13,533 |
| ETF Shares | (84,711) | 96,692 |
| Net Increase (Decrease) from Capital Share Transactions | (90,034) | 110,225 |
| Total Increase (Decrease) | (124,268) | (79,178) |
| Net Assets | | |
| Beginning of Period | 653,534 | 732,712 |
| End of Period1 | 529,266 | 653,534 |
1 Net Assets—End of Period includes undistributed net investment income of $1,003,000 and $1,936,000.
See accompanying Notes, which are an integral part of the Financial Statements.
40
Financials Index Fund
Financial Highlights
| | | | | | |
| | | | | |
| Admiral Shares | | | | | |
| |
| For a Share Outstanding | | | | Year Ended August 31, |
| Throughout Each Period | 2010 | 2009 | 2008 | 2007 | 2006 |
| Net Asset Value, Beginning of Period | $14.72 | $20.38 | $30.10 | $29.86 | $26.36 |
| Investment Operations | | | | | |
| Net Investment Income | .209 | .389 | .7001 | .7701 | .7161 |
| Net Realized and Unrealized Gain (Loss) | | | | | |
| on Investments2 | (.715) | (5.596) | (9.699) | .145 | 3.392 |
| Total from Investment Operations | (.506) | (5.207) | (8.999) | .915 | 4.108 |
| Distributions | | | | | |
| Dividends from Net Investment Income | (.224) | (.453) | (.721) | (.675) | (.608) |
| Distributions from Realized Capital Gains | — | — | — | — | — |
| Total Distributions | (.224) | (.453) | (.721) | (.675) | (.608) |
| Net Asset Value, End of Period | $13.99 | $14.72 | $20.38 | $30.10 | $29.86 |
| |
| Total Return3 | –3.52% | –25.35% | –30.36% | 2.95% | 15.76% |
| |
| Ratios/Supplemental Data | | | | | |
| Net Assets, End of Period (Millions) | $65 | $74 | $81 | $19 | $8 |
| Ratio of Total Expenses to | | | | | |
| Average Net Assets | 0.24% | 0.28% | 0.25% | 0.26% | 0.28% |
| Ratio of Net Investment Income to | | | | | |
| Average Net Assets | 1.36% | 2.97% | 3.06% | 2.37% | 2.49% |
| Portfolio Turnover Rate4 | 11% | 17% | 10% | 12% | 6% |
1 Calculated based on average shares outstanding.
2 Includes increases from redemption fees of $.00, $.01, $.00, $.00, and $.01.
3 Total returns do not include transaction fees that may have applied in the periods shown. Fund prospectuses provide information about any applicable transaction fees.
4 Excludes the value of portfolio securities received or delivered as a result of in-kind purchases or redemptions of the fund’s capital shares, including ETF Creation Units.
| | | | | | |
| | | | | |
| ETF Shares | | | | | |
| |
| For a Share Outstanding | | | | Year Ended August 31, |
| Throughout Each Period | 2010 | 2009 | 2008 | 2007 | 2006 |
| Net Asset Value, Beginning of Period | $29.38 | $40.66 | $60.04 | $59.57 | $52.57 |
| Investment Operations | | | | | |
| Net Investment Income | .417 | .784 | 1.4491 | 1.5571 | 1.4301 |
| Net Realized and Unrealized Gain (Loss) | | | | | |
| on Investments2 | (1.425) | (11.150) | (19.368) | .282 | 6.800 |
| Total from Investment Operations | (1.008) | (10.366) | (17.919) | 1.839 | 8.230 |
| Distributions | | | | | |
| Dividends from Net Investment Income | (.452) | (.914) | (1.461) | (1.369) | (1.230) |
| Distributions from Realized Capital Gains | — | — | — | — | — |
| Total Distributions | (.452) | (.914) | (1.461) | (1.369) | (1.230) |
| Net Asset Value, End of Period | $27.92 | $29.38 | $40.66 | $60.04 | $59.57 |
| |
| Total Return | –3.51% | –25.31% | –30.30% | 2.97% | 15.82% |
| |
| Ratios/Supplemental Data | | | | | |
| Net Assets, End of Period (Millions) | $464 | $580 | $651 | $282 | $125 |
| Ratio of Total Expenses to | | | | | |
| Average Net Assets | 0.24% | 0.25% | 0.20% | 0.22% | 0.25% |
| Ratio of Net Investment Income to | | | | | |
| Average Net Assets | 1.36% | 3.00% | 3.11% | 2.41% | 2.52% |
| Portfolio Turnover Rate3 | 11% | 17% | 10% | 12% | 6% |
1 Calculated based on average shares outstanding.
2 Includes increases from redemption fees of $.01, $.02, $.01, $.01, and $.01.
3 Excludes the value of portfolio securities received or delivered as a result of in-kind purchases or redemptions of the fund’s capital shares, including ETF Creation Units.
See accompanying Notes, which are an integral part of the Financial Statements.
41
Financials Index Fund
Notes to Financial Statements
Vanguard Financials Index Fund is registered under the Investment Company Act of 1940 as an open-end investment company, or mutual fund. The fund offers two classes of shares: Admiral Shares and ETF Shares. Admiral Shares are designed for investors who meet certain administrative, service, and account-size criteria. ETF Shares are listed for trading on the NYSE Arca, Inc.; they can be purchased and sold through a broker.
A. The following significant accounting policies conform to generally accepted accounting principles for U.S. mutual funds. The fund consistently follows such policies in preparing its financial statements.
1. Security Valuation: Securities are valued as of the close of trading on the New York Stock Exchange (generally 4 p.m., Eastern time) on the valuation date. Equity securities are valued at the latest quoted sales prices or official closing prices taken from the primary market in which each security trades; such securities not traded on the valuation date are valued at the mean of the latest quoted bid and asked prices. Securities for which market quotations are not readily available, or whose values have been materially affected by events occurring before the fund’s pricing time but after the close of the securities’ primary markets, are valued by methods deemed by the board of trustees to represent fair value. Investments in Vanguard Market Liquidity Fund are valued at that fund’s net asset value.
2. Federal Income Taxes: The fund intends to continue to qualify as a regulated investment company and distribute all of its taxable income. Management has analyzed the fund’s tax positions taken for all open federal income tax years (August 31, 2007–2010), and has concluded that no provision for federal income tax is required in the fund’s financial statements.
3. Distributions: Distributions to shareholders are recorded on the ex-dividend date.
4. Security Lending: The fund may lend its securities to qualified institutional borrowers to earn additional income. Security loans are required to be secured at all times by collateral at least equal to the market value of securities loaned. The fund invests cash collateral received in Vanguard Market Liquidity Fund, and records a liability for the return of the collateral, during the period the securities are on loan. Security lending income represents the income earned on investing cash collateral, less expenses associated with the loan.
5. Other: Dividend income is recorded on the ex-dividend date. Interest income includes income distributions received from Vanguard Market Liquidity Fund and is accrued daily. Security transactions are accounted for on the date securities are bought or sold. Costs used to determine realized gains (losses) on the sale of investment securities are those of the specific securities sold. Fees assessed on redemptions of capital shares are credited to paid-in capital.
Each class of shares has equal rights as to assets and earnings, except that each class separately bears certain class-specific expenses related to maintenance of shareholder accounts (included in Management and Administrative expenses) and shareholder reporting. Marketing and distribution expenses are allocated to each class of shares based on a method approved by the board of trustees. Income, other non-class-specific expenses, and gains and losses on investments are allocated to each class of shares based on its relative net assets.
B. The Vanguard Group furnishes at cost investment advisory, corporate management, administrative, marketing, and distribution services. The costs of such services are allocated to the fund under methods approved by the board of trustees. The fund has committed to provide up to 0.40% of its net assets in capital contributions to Vanguard. At August 31, 2010, the fund had contributed capital of $108,000 to Vanguard (included in Other Assets), representing 0.02% of the fund’s net assets and 0.04% of Vanguard’s capitalization. The fund’s trustees and officers are also directors and officers of Vanguard.
C. Various inputs may be used to determine the value of the fund’s investments. These inputs are summarized in three broad levels for financial statement purposes. The inputs or methodologies used to value securities are not necessarily an indication of the risk associated with investing in those securities.
Level 1—Quoted prices in active markets for identical securities.
Level 2—Other significant observable inputs (including quoted prices for similar securities, interest rates, prepayment speeds, credit risk, etc.).
Level 3—Significant unobservable inputs (including the fund’s own assumptions used to determine the fair value of investments).
At August 31, 2010, 100% of the fund’s investments were valued based on Level 1 inputs.
42
Financials Index Fund
D. Distributions are determined on a tax basis and may differ from net investment income and realized capital gains for financial reporting purposes. Differences may be permanent or temporary. Permanent differences are reclassified among capital accounts in the financial statements to reflect their tax character. Temporary differences arise when certain items of income, expense, gain, or loss are recognized in different periods for financial statement and tax purposes; these differences will reverse at some time in the future. Differences in classification may also result from the treatment of short-term gains as ordinary income for tax purposes.
During the year ended August 31, 2010, the fund realized $34,449,000 of net capital gains resulting from in-kind redemptions—in which shareholders exchanged fund shares for securities held by the fund rather than for cash. Because such gains are not taxable to the fund, and are not distributed to shareholders, they have been reclassified from accumulated net realized losses to paid-in capital.
For tax purposes, at August 31, 2010, the fund had $1,644,000 of ordinary income available for distribution. The fund had available capital loss carryforwards totaling $159,472,000 to offset future net capital gains of $85,000 through August 31, 2014, $11,000 through August 31, 2015, $1,313,000 through August 31, 2016, $28,618,000 through August 31, 2017, and $129,445,000 through August 31, 2018. In addition, the fund realized losses of $59,815,000 during the period from November 1, 2009, through August 31, 2010, which are deferred and will be treated as realized for tax purposes in fiscal 2011.
At August 31, 2010, the cost of investment securities for tax purposes was $775,977,000. Net unrealized depreciation of investment securities for tax purposes was $241,000,000, consisting of unrealized gains of $6,084,000 on securities that had risen in value since their purchase and $247,084,000 in unrealized losses on securities that had fallen in value since their purchase.
E. During the year ended August 31, 2010, the fund purchased $167,519,000 of investment securities and sold $252,354,000 of investment securities, other than temporary cash investments.
F. Capital share transactions for each class of shares were:
| | | | | | |
| | | | | |
| | | | | Year Ended August 31, |
| | | | 2010 | | | 2009 |
| | Amount | Shares | Amount | Shares |
| | ($000) | (000) | ($000) | (000) |
| Admiral Shares | | | | |
| Issued | 15,750 | 1,024 | 39,058 | 3,069 |
| Issued in Lieu of Cash Distributions | 972 | 65 | 1,834 | 135 |
| Redeemed1 | (22,045) | (1,476) | (27,359) | (2,179) |
| Net Increase (Decrease)—Admiral Shares | (5,323) | (387) | 13,533 | 1,025 |
| ETF Shares | | | | |
| Issued | 100,712 | 3,207 | 342,606 | 13,213 |
| Issued in Lieu of Cash Distributions | — | — | — | — |
| Redeemed1 | (185,423) | (6,300) | (245,914) | (9,500) |
| Net Increase (Decrease)—ETF Shares | (84,711) | (3,093) | 96,692 | 3,713 |
1 Net of redemption fees for fiscal 2010 and 2009 of $144,000 and $383,000, respectively (fund totals).
G. In preparing the financial statements as of August 31, 2010, management considered the impact of subsequent events for potential recognition or disclosure in these financial statements.
43
Health Care Index Fund
Fund Profile
As of August 31, 2010
| | | |
| Portfolio Characteristics | | |
| | | Target | Broad |
| | Fund | Index1 | Index2 |
| Number of Stocks | 296 | 300 | 2,478 |
| Median Market Cap | $28.4B | $28.4B | $26.3B |
| Price/Earnings Ratio | 13.3x | 13.3x | 15.4x |
| Price/Book Ratio | 2.2x | 2.2x | 1.9x |
| Yield3 | | 2.0% | 2.1% |
| Admiral Shares | 1.3% | | |
| ETF Shares | 1.3% | | |
| Return on Equity | 19.7% | 19.7% | 19.2% |
| Earnings Growth Rate | 11.9% | 11.9% | 6.3% |
| Foreign Holdings | 0.0% | 0.0% | 0.0% |
| Turnover Rate | 10% | — | — |
| Expense Ratio4 | | — | — |
| Admiral Shares | 0.28% | | |
| ETF Shares | 0.25% | | |
| Short-Term Reserves | 0.0% | — | — |
| | |
| Volatility Measures5 | | |
| | Fund Versus | Fund Versus |
| | Spliced Index6 | Broad Index2 |
| R-Squared | 1.00 | 0.66 |
| Beta | 1.00 | 0.65 |
| |
Subindustry Diversification
(% of equity exposure) | |
| |
| |
| Biotechnology | 14.4% |
| Health Care Distributors | 3.3 |
| Health Care Equipment | 16.4 |
| Health Care Facilities | 1.5 |
| Health Care Services | 5.9 |
| Health Care Supplies | 1.1 |
| Life Sciences Tools & Services | 4.2 |
| Managed Health Care | 7.2 |
| Pharmaceuticals | 45.1 |
| Other Health Care | 0.9 |
| |
| Ten Largest Holdings7 (% of total net assets) |
| |
| Johnson & Johnson | 11.4% |
| Pfizer Inc. | 9.3 |
| Merck & Co., Inc. | 8.0 |
| Abbott Laboratories | 5.5 |
| Amgen Inc. | 3.5 |
| Bristol-Myers Squibb Co. | 3.3 |
| UnitedHealth Group Inc. | 2.6 |
| Eli Lilly & Co. | 2.5 |
| Medtronic Inc. | 2.5 |
| Gilead Sciences Inc. | 2.1 |
| Top Ten | 50.7% |
1 MSCI US IMI/Health Care 25/50.
2 MSCI US IMI/2500.
3 30-day SEC yield for the fund; annualized dividend yield for the indexes. See the Glossary.
4 The expense ratios shown are from the prospectus dated December 28, 2009, and represent estimated costs for the current fiscal year. For the fiscal year ended August 31, 2010, the expense ratios were 0.24% for the Admiral Shares and 0.24% for the ETF Shares.
5 For an explanation of R-squared, beta, and other terms used here, see the Glossary.
6 Spliced MSCI US IMI/Health Care 25/50: MSCI US IMI/Health Care through February 26, 2010; MSCI US IMI/Health Care 25/50 thereafter.
7 The holdings listed exclude any temporary cash investments and equity index products.
44
Health Care Index Fund
Performance Summary
All of the returns in this report represent past performance, which is not a guarantee of future results that may be achieved by the fund. (Current performance may be lower or higher than the performance data cited. For performance data current to the most recent month-end, visit our website at vanguard.com/performance.) Note, too, that both investment returns and principal value can fluctuate widely, so an investor’s shares, when sold, could be worth more or less than their original cost. The returns shown do not reflect taxes that a shareholder would pay on fund distributions or on the sale of fund shares.
Cumulative Performance: January 26, 2004–August 31, 2010
Initial Investment of $10,000
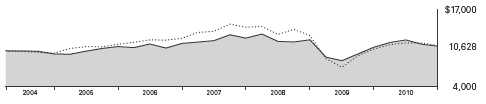
| | | | | |
| | | | |
| | | Average Annual Total Returns | |
| | | | Periods Ended August 31, 2010 | Final Value |
| | | | Since | of a $10,000 |
| | One Year | Five Years | Inception1 | Investment |
| Health Care Index Fund ETF Shares | | | | |
| Net Asset Value2 | 1.40% | –0.10% | 0.93% | $10,628 |
| Health Care Index Fund ETF Shares | | | | |
| Market Price | 1.29 | –0.10 | 0.91 | 10,617 |
| MSCI US IMI/2500 | 5.81 | –0.39 | 1.31 | 10,893 |
| Spliced MSCI US IMI/Health Care 25/503 | 1.55 | 0.09 | 1.14 | 10,774 |
| | | | |
| | | | | Final Value |
| | | | Since | of a $100,000 |
| | One Year | Five Years | Inception1 | Investment |
| Health Care Index Fund Admiral Shares4 | 1.41% | –0.13% | 0.89% | $105,964 |
| MSCI US IMI/2500 | 5.81 | –0.39 | 1.72 | 111,835 |
| Spliced MSCI US IMI/Health Care 25/503 | 1.55 | 0.09 | 1.13 | 107,627 |
1 Performance for the fund and its comparative standards is calculated since the following inception dates: January 26, 2004, for ETF Shares; February 5, 2004, for Admiral Shares.
2 For more information about how the ETF Shares’ market prices have compared with their net asset value, visit Vanguard.com, select your ETF, and then select the Performance tab. The Premium/Discount table there shows the percentages of days on which the ETF Shares’ market price was above or below the NAV.
3 Spliced MSCI US IMI/Health Care 25/50: MSCI US IMI/Health Care through February 26, 2010; MSCI US IMI/Health Care 25/50 thereafter.
4 Total returns do not reflect the 2% fee assessed on redemptions of shares held for less than one year.
See Financial Highlights for dividend and capital gains information.
45
Health Care Index Fund
Fiscal-Year Total Returns (%): January 26, 2004–August 31, 2010
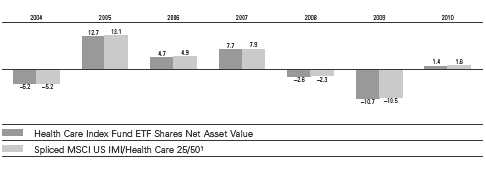
| | | |
| Cumulative Returns: ETF Shares, January 26, 2004–August 31, 2010 | | |
| | | | Cumulative |
| | | | Since |
| | One Year | Five Years | Inception |
| Health Care Index Fund ETF Shares Market Price | 1.29% | –0.50% | 6.17% |
| Health Care Index Fund ETF Shares Net Asset Value | 1.40 | –0.50 | 6.28 |
| Spliced MSCI US IMI/Health Care 25/501 | 1.55 | 0.47 | 7.74 |
Average Annual Total Returns: Periods Ended June 30, 2010
This table presents average annual total returns through the latest calendar quarter—rather than through the end of the fiscal period. Securities and Exchange Commission rules require that we provide this information.
| | | | |
| | | | | Since |
| | Inception Date | One Year | Five Years | Inception |
| ETF Shares | 1/26/2004 | | | |
| Market Price | | 10.63% | 0.65% | 1.10% |
| Net Asset Value | | 10.66 | 0.64 | 1.10 |
| Admiral Shares2 | 2/5/2004 | 10.69 | 0.61 | 1.05 |
1 Spliced MSCI US IMI/Health Care 25/50: MSCI US IMI/Health Care through February 26, 2010; MSCI US IMI/Health Care 25/50 thereafter.
2 Total returns do not reflect the 2% fee assessed on redemptions of shares held for less than one year.
46
Health Care Index Fund
Financial Statements
Statement of Net Assets
As of August 31, 2010
The fund reports a complete list of its holdings in regulatory filings four times in each fiscal year, at the quarter-ends. For the second and fourth fiscal quarters, the lists appear in the fund’s semiannual and annual reports to shareholders. For the first and third fiscal quarters, the fund files the lists with the Securities and Exchange Commission on Form N-Q. Shareholders can look up the fund’s Forms N-Q on the SEC’s website at sec.gov. Forms N-Q may also be reviewed and copied at the SEC’s Public Reference Room (see the back cover of this report for further information).
| | | |
| | | | Market |
| | | | Value• |
| | | Shares | ($000) |
| Common Stocks (99.8%) | | |
| Biotechnology (14.4%) | | |
| * | Amgen Inc. | 425,074 | 21,696 |
| * | Gilead Sciences Inc. | 394,961 | 12,583 |
| * | Celgene Corp. | 204,615 | 10,542 |
| * | Genzyme Corp. | 118,542 | 8,311 |
| * | Biogen Idec Inc. | 118,453 | 6,373 |
| * | Vertex Pharmaceuticals Inc. | 89,278 | 2,976 |
| * | Human Genome | | |
| | Sciences Inc. | 83,472 | 2,428 |
| * | Alexion Pharmaceuticals Inc. | 39,683 | 2,241 |
| * | Dendreon Corp. | 59,728 | 2,141 |
| * | Cephalon Inc. | 33,351 | 1,888 |
| * | Amylin Pharmaceuticals Inc. | 63,649 | 1,307 |
| * | United Therapeutics Corp. | 23,555 | 1,089 |
| * | BioMarin Pharmaceutical Inc. | 44,938 | 912 |
| * | Myriad Genetics Inc. | 42,967 | 673 |
| * | Onyx Pharmaceuticals Inc. | 27,776 | 669 |
| * | Incyte Corp. Ltd. | 52,627 | 659 |
| * | Talecris Biotherapeutics | | |
| | Holdings Corp. | 27,294 | 599 |
| * | Regeneron | | |
| | Pharmaceuticals Inc. | 26,475 | 582 |
| * | Cubist Pharmaceuticals Inc. | 25,835 | 569 |
| * | Alkermes Inc. | 41,927 | 556 |
| * | Acorda Therapeutics Inc. | 17,007 | 512 |
| * | Seattle Genetics Inc. | 37,969 | 435 |
| * | Savient Pharmaceuticals Inc. | 29,598 | 427 |
| * | Cepheid Inc. | 26,232 | 386 |
| * | Pharmasset Inc. | 14,200 | 345 |
| * | Theravance Inc. | 26,811 | 324 |
| * | Isis Pharmaceuticals Inc. | 41,342 | 324 |
| * | Martek Biosciences Corp. | 14,740 | 322 |
| | PDL BioPharma Inc. | 53,017 | 300 |
| * | Arena Pharmaceuticals Inc. | 44,937 | 293 |
| * | Abraxis BioScience Inc. | 3,598 | 264 |
| * | Halozyme Therapeutics Inc. | 32,614 | 249 |
| * | Momenta | | |
| | Pharmaceuticals Inc. | 16,744 | 242 |
| * | Celera Corp. | 36,291 | 239 |
| * | AMAG Pharmaceuticals Inc. | 9,299 | 234 |
| * | InterMune Inc. | 21,974 | 229 |
| * | Alnylam | | |
| | Pharmaceuticals Inc. | 15,718 | 215 |
| * | Enzon Pharmaceuticals Inc. | 20,232 | 208 |
| * | Geron Corp. | 42,945 | 198 |
| * | MannKind Corp. | 35,603 | 198 |
| * | Rigel Pharmaceuticals Inc. | 23,031 | 180 |
| * | Targacept Inc. | 8,560 | 178 |
| * | NPS Pharmaceuticals Inc. | 25,567 | 166 |
| * | Micromet Inc. | 26,382 | 162 |
| * | Emergent Biosolutions Inc. | 8,799 | 160 |
| * | Immunogen Inc. | 29,462 | 158 |
| * | Protalix BioTherapeutics Inc. | 19,795 | 153 |
| * | Exelixis Inc. | 47,513 | 141 |
| * | Medivation Inc. | 14,090 | 134 |
| * | Lexicon Pharmaceuticals Inc. | 92,876 | 133 |
| | | |
| | | | Market |
| | | | Value• |
| | | Shares | ($000) |
| * | Clinical Data Inc. | 8,456 | 126 |
| * | Allos Therapeutics Inc. | 34,513 | 126 |
| * | Metabolix Inc. | 10,867 | 123 |
| * | Zymogenetics Inc. | 23,869 | 119 |
| * | SIGA Technologies Inc. | 15,303 | 115 |
| * | Nabi Biopharmaceuticals | 22,568 | 109 |
| * | Cell Therapeutics Inc. | 271,943 | 101 |
| * | Arqule Inc. | 18,885 | 99 |
| * | Idenix Pharmaceuticals Inc. | 16,257 | 98 |
| * | Opko Health Inc. | 44,677 | 92 |
| * | Dyax Corp. | 40,181 | 92 |
| * | Genomic Health Inc. | 6,300 | 91 |
| * | Orexigen Therapeutics Inc. | 15,544 | 68 |
| * | Ligand Pharmaceuticals Inc. | | |
| | Class B | 46,658 | 68 |
| * | Maxygen Inc. | 12,131 | 67 |
| * | Progenics | | |
| | Pharmaceuticals Inc. | 14,021 | 57 |
| * | Sangamo Biosciences Inc. | 17,871 | 53 |
| * | Biospecifics | | |
| | Technologies Corp. | 1,972 | 52 |
| * | Osiris Therapeutics Inc. | 7,180 | 47 |
| * | Affymax Inc. | 8,216 | 46 |
| * | China Biologic Products Inc. | 4,129 | 43 |
| * | Biotime Inc. | 8,016 | 34 |
| | | | 88,129 |
| Health Care Equipment & Supplies (17.5%) | |
| | Medtronic Inc. | 488,844 | 15,389 |
| | Baxter International Inc. | 266,013 | 11,321 |
| | Covidien PLC | 222,724 | 7,871 |
| | Becton Dickinson and Co. | 103,468 | 7,055 |
| | Stryker Corp. | 132,039 | 5,703 |
| * | St. Jude Medical Inc. | 148,341 | 5,128 |
| * | Intuitive Surgical Inc. | 17,388 | 4,608 |
| * | Zimmer Holdings Inc. | 90,263 | 4,258 |
| * | Hospira Inc. | 73,657 | 3,783 |
| * | Boston Scientific Corp. | 672,775 | 3,492 |
| | CR Bard Inc. | 42,109 | 3,235 |
| * | ResMed Inc. | 100,752 | 3,037 |
| * | Varian Medical Systems Inc. | 54,749 | 2,915 |
| * | Edwards Lifesciences Corp. | 50,375 | 2,900 |
| * | CareFusion Corp. | 83,910 | 1,811 |
| | DENTSPLY International Inc. | 61,666 | 1,716 |
| * | Hologic Inc. | 115,129 | 1,634 |
| | Beckman Coulter Inc. | 31,077 | 1,418 |
| * | IDEXX Laboratories Inc. | 25,569 | 1,413 |
| * | Gen-Probe Inc. | 22,038 | 992 |
| * | Alere Inc. | 35,148 | 983 |
| * | Kinetic Concepts Inc. | 28,585 | 912 |
| | Hill-Rom Holdings Inc. | 28,001 | 899 |
| | Teleflex Inc. | 17,691 | 850 |
| | Cooper Cos. Inc. | 20,399 | 823 |
| * | Thoratec Corp. | 24,167 | 778 |
| | STERIS Corp. | 26,266 | 756 |
| * | American Medical | | |
| | Systems Holdings Inc. | 33,105 | 603 |
| * | Haemonetics Corp. | 11,179 | 582 |
| * | Sirona Dental Systems Inc. | 18,411 | 580 |
| | | |
| | | | Market |
| | | | Value• |
| | | Shares | ($000) |
| * | Immucor Inc. | 31,017 | 546 |
| | Masimo Corp. | 23,294 | 530 |
| * | NuVasive Inc. | 17,333 | 509 |
| | West Pharmaceutical | | |
| | Services Inc. | 14,752 | 496 |
| * | Volcano Corp. | 19,544 | 432 |
| * | Align Technology Inc. | 25,188 | 404 |
| * | Integra LifeSciences | | |
| | Holdings Corp. | 9,641 | 335 |
| | Meridian Bioscience Inc. | 18,098 | 331 |
| | Invacare Corp. | 13,209 | 302 |
| * | DexCom Inc. | 23,915 | 293 |
| * | Neogen Corp. | 9,445 | 276 |
| * | Cyberonics Inc. | 12,316 | 264 |
| * | Zoll Medical Corp. | 9,515 | 251 |
| * | Conmed Corp. | 12,878 | 238 |
| | Analogic Corp. | 5,684 | 236 |
| * | Wright Medical Group Inc. | 17,182 | 228 |
| * | Greatbatch Inc. | 10,326 | 227 |
| * | Orthofix International NV | 7,597 | 203 |
| * | ICU Medical Inc. | 5,584 | 199 |
| * | Insulet Corp. | 14,676 | 194 |
| * | SonoSite Inc. | 6,478 | 189 |
| * | Merit Medical Systems Inc. | 11,817 | 186 |
| * | NxStage Medical Inc. | 11,336 | 179 |
| * | Conceptus Inc. | 12,922 | 178 |
| * | Abaxis Inc. | 9,738 | 176 |
| * | Angiodynamics Inc. | 10,882 | 166 |
| * | Natus Medical Inc. | 12,628 | 152 |
| * | Accuray Inc. | 21,696 | 143 |
| * | Symmetry Medical Inc. | 15,864 | 143 |
| * | Quidel Corp. | 10,897 | 132 |
| * | ABIOMED Inc. | 14,097 | 128 |
| * | Kensey Nash Corp. | 4,344 | 115 |
| | Atrion Corp. | 751 | 105 |
| * | AGA Medical Holdings Inc. | 6,604 | 90 |
| | Cantel Medical Corp. | 6,273 | 90 |
| * | MAKO Surgical Corp. | 8,203 | 86 |
| * | SurModics Inc. | 6,966 | 84 |
| * | MELA Sciences Inc. | 10,363 | 71 |
| * | Synovis Life | | |
| | Technologies Inc. | 5,031 | 70 |
| * | OraSure Technologies Inc. | 20,273 | 69 |
| * | Palomar Medical | | |
| | Technologies Inc. | 7,566 | 67 |
| * | CryoLife Inc. | 11,920 | 62 |
| * | IRIS International Inc. | 7,937 | 61 |
| * | TomoTherapy Inc. | 19,019 | 59 |
| * | Stereotaxis Inc. | 17,757 | 56 |
| * | Exactech Inc. | 3,745 | 54 |
| * | RTI Biologics Inc. | 24,112 | 51 |
| * | Orthovita Inc. | 30,497 | 50 |
| * | Cynosure Inc. Class A | 4,236 | 40 |
| | | | 106,991 |
| Health Care Providers & Services (17.9%) | |
| | UnitedHealth Group Inc. | 504,497 | 16,003 |
| * | Express Scripts Inc. | 231,717 | 9,871 |
| * | WellPoint Inc. | 196,969 | 9,785 |
47
Health Care Index Fund
| | | |
| | | | Market |
| | | | Value• |
| | | Shares | ($000) |
| * | Medco Health | | |
| | Solutions Inc. | 202,680 | 8,813 |
| | McKesson Corp. | 120,504 | 6,995 |
| | Aetna Inc. | 188,577 | 5,039 |
| | Cardinal Health Inc. | 160,897 | 4,821 |
| | CIGNA Corp. | 122,415 | 3,944 |
| * | Humana Inc. | 75,799 | 3,622 |
| | AmerisourceBergen Corp. | | |
| | Class A | 125,749 | 3,430 |
| * | Laboratory Corp. of | | |
| | America Holdings | 46,312 | 3,363 |
| * | DaVita Inc. | 45,966 | 2,970 |
| | Quest Diagnostics Inc. | 67,687 | 2,944 |
| * | Henry Schein Inc. | 40,656 | 2,147 |
| * | Coventry Health Care Inc. | 65,878 | 1,275 |
| | Universal Health Services Inc. | |
| | Class B | 39,850 | 1,251 |
| * | Community Health | | |
| | Systems Inc. | 42,172 | 1,099 |
| * | Health Net Inc. | 44,651 | 1,066 |
| | Patterson Cos. Inc. | 40,816 | 1,032 |
| | Omnicare Inc. | 53,482 | 1,027 |
| | Lincare Holdings Inc. | 43,854 | 1,010 |
| * | Mednax Inc. | 20,897 | 968 |
| * | Tenet Healthcare Corp. | 213,958 | 839 |
| * | AMERIGROUP Corp. | 22,694 | 837 |
| * | Psychiatric Solutions Inc. | 23,781 | 793 |
| | Owens & Minor Inc. | 28,021 | 747 |
| * | LifePoint Hospitals Inc. | 24,415 | 743 |
| * | VCA Antech Inc. | 36,290 | 717 |
| * | Health Management | | |
| | Associates Inc. Class A | 110,981 | 694 |
| * | Healthsouth Corp. | 41,501 | 675 |
| * | Catalyst Health Solutions Inc. | 16,754 | 672 |
| * | Magellan Health Services Inc. | 14,781 | 648 |
| * | Emergency Medical | | |
| | Services Corp. Class A | 13,160 | 632 |
| * | HMS Holdings Corp. | 12,043 | 628 |
| | Chemed Corp. | 10,147 | 506 |
| * | Brookdale Senior Living Inc. | 37,178 | 498 |
| * | WellCare Health Plans Inc. | 18,858 | 468 |
| * | PSS World Medical Inc. | 25,311 | 465 |
| * | Centene Corp. | 22,871 | 462 |
| * | Healthspring Inc. | 21,762 | 452 |
| * | Amedisys Inc. | 12,522 | 290 |
| * | MWI Veterinary Supply Inc. | 5,141 | 273 |
| * | Gentiva Health Services Inc. | 12,436 | 256 |
| * | Sun Healthcare Group Inc. | 31,495 | 255 |
| | Landauer Inc. | 4,180 | 235 |
| * | Amsurg Corp. Class A | 13,679 | 228 |
| * | Bio-Reference Labs Inc. | 11,088 | 220 |
| | Universal American Corp. | 15,228 | 210 |
| * | Kindred Healthcare Inc. | 17,328 | 204 |
| * | Healthways Inc. | 15,043 | 188 |
| * | Air Methods Corp. | 5,059 | 185 |
| * | RehabCare Group Inc. | 10,947 | 181 |
| * | Select Medical | | |
| | Holdings Corp. | 24,594 | 176 |
| * | Molina Healthcare Inc. | 6,653 | 169 |
| * | IPC The Hospitalist Co. Inc. | 7,160 | 167 |
| * | Emeritus Corp. | 10,443 | 161 |
| * | Hanger Orthopedic | | |
| | Group Inc. | 11,933 | 156 |
| * | Res-Care Inc. | 11,850 | 147 |
| * | Emdeon Inc. Class A | 14,015 | 144 |
| * | Triple-S Management Corp. | | |
| | Class B | 9,016 | 144 |
| * | LHC Group Inc. | 6,965 | 139 |
| * | Genoptix Inc. | 7,678 | 132 |
| | | |
| | | | Market |
| | | | Value• |
| | | Shares | ($000) |
| * | Corvel Corp. | 3,203 | 118 |
| | National Healthcare Corp. | 3,376 | 117 |
| * | Assisted Living Concepts Inc. | |
| | Class A | 4,264 | 116 |
| * | PharMerica Corp. | 13,592 | 105 |
| * | Almost Family Inc. | 3,617 | 91 |
| * | Cross Country | | |
| | Healthcare Inc. | 12,334 | 91 |
| | Ensign Group Inc. | 4,934 | 82 |
| * | Clarient Inc. | 22,278 | 74 |
| * | Medcath Corp. | 8,080 | 65 |
| * | AMN Healthcare | | |
| | Services Inc. | 14,457 | 64 |
| * | Alliance HealthCare | | |
| | Services Inc. | 12,783 | 54 |
| * | Sunrise Senior Living Inc. | 22,335 | 49 |
| * | CardioNet Inc. | 10,058 | 44 |
| * | Skilled Healthcare Group Inc. | 8,997 | 30 |
| | | | 109,311 |
| Health Care Technology (0.9%) | |
| * | Cerner Corp. | 31,009 | 2,259 |
| * | Allscripts Healthcare | | |
| | Solutions Inc. | 74,681 | 1,248 |
| | Quality Systems Inc. | 8,921 | 500 |
| * | athenahealth Inc. | 14,254 | 384 |
| * | MedAssets Inc. | 18,970 | 376 |
| | Computer Programs & | | |
| | Systems Inc. | 4,350 | 178 |
| * | Omnicell Inc. | 14,240 | 159 |
| * | Medidata Solutions Inc. | 7,542 | 129 |
| * | Vital Images Inc. | 5,980 | 75 |
| | | | 5,308 |
| Life Sciences Tools & Services (4.2%) | |
| * | Thermo Fisher | | |
| | Scientific Inc. | 182,284 | 7,678 |
| * | Life Technologies Corp. | 81,115 | 3,469 |
| * | Waters Corp. | 41,186 | 2,493 |
| * | Illumina Inc. | 54,060 | 2,319 |
| * | Mettler-Toledo | | |
| | International Inc. | 14,870 | 1,644 |
| | Pharmaceutical Product | | |
| | Development Inc. | 50,015 | 1,149 |
| | PerkinElmer Inc. | 51,965 | 1,092 |
| * | Covance Inc. | 28,512 | 1,081 |
| | Techne Corp. | 15,763 | 910 |
| * | Charles River Laboratories | | |
| | International Inc. | 29,299 | 828 |
| * | Bio-Rad Laboratories Inc. | | |
| | Class A | 8,537 | 704 |
| * | Dionex Corp. | 7,887 | 572 |
| * | Parexel International Corp. | 25,799 | 513 |
| * | Bruker Corp. | 29,067 | 346 |
| * | Luminex Corp. | 16,748 | 240 |
| * | Sequenom Inc. | 33,189 | 203 |
| * | eResearchTechnology Inc. | 21,325 | 158 |
| * | Accelrys Inc. | 24,244 | 147 |
| * | Affymetrix Inc. | 31,627 | 130 |
| * | Albany Molecular | | |
| | Research Inc. | 9,754 | 59 |
| * | Enzo Biochem Inc. | 15,138 | 54 |
| * | Kendle International Inc. | 6,169 | 48 |
| | | | 25,837 |
| Pharmaceuticals (44.9%) | | |
| | Johnson & Johnson | 1,224,049 | 69,795 |
| | Pfizer Inc. | 3,579,987 | 57,029 |
| | Merck & Co., Inc. | 1,384,090 | 48,665 |
| | Abbott Laboratories | 685,041 | 33,800 |
| | Bristol-Myers Squibb Co. | 762,925 | 19,897 |
| | | |
| | | | Market |
| | | | Value• |
| | | Shares | ($000) |
| | Eli Lilly & Co. | 460,542 | 15,456 |
| | Allergan Inc. | 136,567 | 8,388 |
| * | Forest Laboratories Inc. | 134,664 | 3,675 |
| * | Mylan Inc. | 136,509 | 2,342 |
| * | Watson | | |
| | Pharmaceuticals Inc. | 49,813 | 2,145 |
| | Perrigo Co. | 36,548 | 2,083 |
| * | Valeant Pharmaceuticals | | |
| | International | 26,849 | 1,549 |
| * | Warner Chilcott PLC | | |
| | Class A | 50,440 | 1,433 |
| * | Endo Pharmaceuticals | | |
| | Holdings Inc. | 51,533 | 1,400 |
| * | King Pharmaceuticals Inc. | 110,537 | 963 |
| * | Salix Pharmaceuticals Ltd. | 25,304 | 958 |
| | Medicis | | |
| | Pharmaceutical Corp. | | |
| | Class A | 26,422 | 727 |
| * | Auxilium | | |
| | Pharmaceuticals Inc. | 20,966 | 543 |
| * | Nektar Therapeutics | 41,425 | 531 |
| * | Viropharma Inc. | 34,493 | 433 |
| * | Par Pharmaceutical Cos. Inc. | 15,554 | 410 |
| * | Impax Laboratories Inc. | 23,647 | 371 |
| * | Medicines Co. | 23,543 | 271 |
| * | Questcor | | |
| | Pharmaceuticals Inc. | 27,031 | 262 |
| * | Vivus Inc. | 35,471 | 200 |
| * | Ardea Biosciences Inc. | 8,329 | 168 |
| * | Inspire Pharmaceuticals Inc. | 27,324 | 132 |
| * | Cadence | | |
| | Pharmaceuticals Inc. | 12,250 | 97 |
| * | Pain Therapeutics Inc. | 15,837 | 90 |
| * | Akorn Inc. | 24,015 | 82 |
| * | Durect Corp. | 34,584 | 72 |
| * | Obagi Medical Products Inc. | 6,797 | 71 |
| * | Pozen Inc. | 10,530 | 71 |
| * | XenoPort Inc. | 12,138 | 70 |
| * | MAP Pharmaceuticals Inc. | 6,418 | 69 |
| * | Cypress Bioscience Inc. | 16,953 | 55 |
| * | Caraco Pharmaceutical | | |
| | Laboratories Ltd. | 5,031 | 28 |
| * | Sucampo | | |
| | Pharmaceuticals Inc. | | |
| | Class A | 3,658 | 12 |
| | | | 274,343 |
| Total Common Stocks | | |
| (Cost $724,058) | | 609,919 |
| Temporary Cash Investment (0.0%) | |
| Money Market Fund (0.0%) | | |
| 1 | Vanguard Market | | |
| | Liquidity Fund, 0.288% | | |
| | (Cost $13) | 13,000 | 13 |
| Total Investments (99.8%) | | |
| (Cost $724,071) | | 609,932 |
| Other Assets and Liabilities (0.2%) | |
| Other Assets | | 5,406 |
| Liabilities | | (4,072) |
| | | | 1,334 |
| Net Assets (100%) | | 611,266 |
48
Health Care Index Fund
| |
| At August 31, 2010, net assets consisted of: |
| | Amount |
| | ($000) |
| Paid-in Capital | 763,546 |
| Undistributed Net Investment Income | 6,715 |
| Accumulated Net Realized Losses | (44,856) |
| Unrealized Appreciation (Depreciation) | (114,139) |
| Net Assets | 611,266 |
| |
| |
| Admiral Shares—Net Assets | |
| Applicable to 2,159,075 outstanding | |
| $.001 par value shares of beneficial | |
| interest (unlimited authorization) | 53,694 |
| Net Asset Value Per Share— | |
| Admiral Shares | $24.87 |
| |
| |
| ETF Shares—Net Assets | |
| Applicable to 11,214,919 outstanding | |
| $.001 par value shares of beneficial | |
| interest (unlimited authorization) | 557,572 |
| Net Asset Value Per Share— | |
| ETF Shares | $49.72 |
• See Note A in Notes to Financial Statements.
* Non-income-producing security.
1 Affiliated money market fund available only to Vanguard funds and certain trusts and accounts managed by Vanguard. Rate shown is the 7-day yield.
See accompanying Notes, which are an integral part of the Financial Statements.
49
Health Care Index Fund
| |
| Statement of Operations |
| |
| | Year Ended |
| August 31, 2010 |
| | ($000) |
| Investment Income | |
| Income | |
| Dividends | 20,496 |
| Interest1 | 3 |
| Security Lending | 8 |
| Total Income | 20,507 |
| Expenses | |
| The Vanguard Group—Note B | |
| Investment Advisory Services | 101 |
| Management and Administrative— | |
| Admiral Shares | 194 |
| Management and Administrative— | |
| ETF Shares | 1,046 |
| Marketing and Distribution— | |
| Admiral Shares | 18 |
| Marketing and Distribution— | |
| ETF Shares | 169 |
| Custodian Fees | 18 |
| Auditing Fees | 26 |
| Shareholders’ Reports—Admiral Shares | — |
| Shareholders’ Reports—ETF Shares | 61 |
| Trustees’ Fees and Expenses | 1 |
| Total Expenses | 1,634 |
| Net Investment Income | 18,873 |
| Realized Net Gain (Loss) on | |
| Investment Securities Sold | (11,505) |
| Change in Unrealized Appreciation | |
| (Depreciation) of Investment Securities | 5,094 |
| Net Increase (Decrease) in Net Assets | |
| Resulting from Operations | 12,462 |
| | | |
| Statement of Changes in Net Assets | | |
| |
| | | Year Ended August 31, |
| | 2010 | 2009 |
| | ($000) | ($000) |
| Increase (Decrease) in Net Assets | | |
| Operations | | |
| Net Investment Income | 18,873 | 11,142 |
| Realized Net Gain (Loss) | (11,505) | 7,908 |
| Change in Unrealized Appreciation (Depreciation) | 5,094 | (100,604) |
| Net Increase (Decrease) in Net Assets Resulting from Operations | 12,462 | (81,554) |
| Distributions | | |
| Net Investment Income | | |
| Admiral Shares | (3,211) | (1,658) |
| ETF Shares | (16,212) | (8,673) |
| Realized Capital Gain | | |
| Admiral Shares | — | — |
| ETF Shares | — | — |
| Total Distributions | (19,423) | (10,331) |
| Capital Share Transactions | | |
| Admiral Shares | (60,866) | (7,704) |
| ETF Shares | 14,020 | 14,318 |
| Net Increase (Decrease) from Capital Share Transactions | (46,846) | 6,614 |
| Total Increase (Decrease) | (53,807) | (85,271) |
| Net Assets | | |
| Beginning of Period | 665,073 | 750,344 |
| End of Period2 | 611,266 | 665,073 |
1 Interest income from an affiliated company of the fund was $3,000.
2 Net Assets—End of Period includes undistributed net investment income of $6,715,000 and $7,265,000.
See accompanying Notes, which are an integral part of the Financial Statements.
50
Health Care Index Fund
| | | | | | |
| | | | | |
| Financial Highlights | | | | | |
| |
| Admiral Shares | | | | | |
| |
| For a Share Outstanding | | | | | Year Ended August 31, |
| Throughout Each Period | 2010 | 2009 | 2008 | 2007 | 2006 |
| Net Asset Value, Beginning of Period | $25.19 | $28.68 | $29.82 | $27.99 | $26.92 |
| Investment Operations | | | | | |
| Net Investment Income | .7291 | .398 | .345 | .392 | .3042 |
| Net Realized and Unrealized Gain (Loss) | | | | | |
| on Investments | (.312) | (3.524) | (1.090) | 1.736 | .951 |
| Total from Investment Operations | .417 | (3.126) | (.745) | 2.128 | 1.255 |
| Distributions | | | | | |
| Dividends from Net Investment Income | (.737) | (.364) | (.395) | (.298) | (.185) |
| Distributions from Realized Capital Gains | — | — | — | — | — |
| Total Distributions | (.737) | (.364) | (.395) | (.298) | (.185) |
| Net Asset Value, End of Period | $24.87 | $25.19 | $28.68 | $29.82 | $27.99 |
| |
| Total Return3 | 1.41% | –10.74% | –2.59% | 7.65% | 4.68% |
| |
| Ratios/Supplemental Data | | | | | |
| Net Assets, End of Period (Millions) | $54 | $111 | $136 | $132 | $108 |
| Ratio of Total Expenses to | | | | | |
| Average Net Assets | 0.24% | 0.28% | 0.25% | 0.26% | 0.28% |
| Ratio of Net Investment Income to | | | | | |
| Average Net Assets | 2.74%1 | 1.75% | 1.36% | 1.42% | 1.12% |
| Portfolio Turnover Rate4 | 10% | 6% | 8% | 10% | 11% |
1 Net investment income per share and the ratio of net investment income to average net assets include $.30 and 1.17%, respectively, resulting from a cash payment received in connection with the merger of Schering-Plough Corp. and Merck & Co., Inc. in November 2009.
2 Calculated based on average shares outstanding.
3 Total returns do not include transaction fees that may have applied in the periods shown. Fund prospectuses provide information about any applicable transaction fees.
4 Excludes the value of portfolio securities received or delivered as a result of in-kind purchases or redemptions of the fund’s capital shares, including ETF Creation Units.
| | | | | | |
| | | | | |
| ETF Shares | | | | | |
| |
| For a Share Outstanding | | | | | Year Ended August 31, |
| Throughout Each Period | 2010 | 2009 | 2008 | 2007 | 2006 |
| Net Asset Value, Beginning of Period | $50.37 | $57.36 | $59.65 | $55.99 | $53.85 |
| Investment Operations | | | | | |
| Net Investment Income | 1.4831 | .809 | .720 | .809 | .6222 |
| Net Realized and Unrealized Gain (Loss) | | | | | |
| on Investments | (.646) | (7.045) | (2.190) | 3.466 | 1.905 |
| Total from Investment Operations | .837 | (6.236) | (1.470) | 4.275 | 2.527 |
| Distributions | | | | | |
| Dividends from Net Investment Income | (1.487) | (.754) | (.820) | (.615) | (.387) |
| Distributions from Realized Capital Gains | — | — | — | — | — |
| Total Distributions | (1.487) | (.754) | (.820) | (.615) | (.387) |
| Net Asset Value, End of Period | $49.72 | $50.37 | $57.36 | $59.65 | $55.99 |
| |
| Total Return | 1.40% | –10.70% | –2.55% | 7.69% | 4.71% |
| |
| Ratios/Supplemental Data | | | | | |
| Net Assets, End of Period (Millions) | $558 | $554 | $614 | $477 | $364 |
| Ratio of Total Expenses to | | | | | |
| Average Net Assets | 0.24% | 0.25% | 0.20% | 0.22% | 0.25% |
| Ratio of Net Investment Income to | | | | | |
| Average Net Assets | 2.74%1 | 1.78% | 1.41% | 1.46% | 1.15% |
| Portfolio Turnover Rate3 | 10% | 6% | 8% | 10% | 11% |
1 Net investment income per share and the ratio of net investment income to average net assets include $.62 and 1.17%, respectively, resulting from a cash payment received in connection with the merger of Schering-Plough Corp. and Merck & Co., Inc. in November 2009.
2 Calculated based on average shares outstanding.
3 Excludes the value of portfolio securities received or delivered as a result of in-kind purchases or redemptions of the fund’s capital shares, including ETF Creation Units.
See accompanying Notes, which are an integral part of the Financial Statements.
51
Health Care Index Fund
Notes to Financial Statements
Vanguard Health Care Index Fund is registered under the Investment Company Act of 1940 as an open-end investment company, or mutual fund. The fund offers two classes of shares: Admiral Shares and ETF Shares. Admiral Shares are designed for investors who meet certain administrative, service, and account-size criteria. ETF Shares are listed for trading on the NYSE Arca, Inc.; they can be purchased and sold through a broker.
A. The following significant accounting policies conform to generally accepted accounting principles for U.S. mutual funds. The fund consistently follows such policies in preparing its financial statements.
1. Security Valuation: Securities are valued as of the close of trading on the New York Stock Exchange (generally 4 p.m., Eastern time) on the valuation date. Equity securities are valued at the latest quoted sales prices or official closing prices taken from the primary market in which each security trades; such securities not traded on the valuation date are valued at the mean of the latest quoted bid and asked prices. Securities for which market quotations are not readily available, or whose values have been materially affected by events occurring before the fund’s pricing time but after the close of the securities’ primary markets, are valued by methods deemed by the board of trustees to represent fair value. Investments in Vanguard Market Liquidity Fund are valued at that fund’s net asset value.
2. Federal Income Taxes: The fund intends to continue to qualify as a regulated investment company and distribute all of its taxable income. Management has analyzed the fund’s tax positions taken for all open federal income tax years (August 31, 2007–2010), and has concluded that no provision for federal income tax is required in the fund’s financial statements.
3. Distributions: Distributions to shareholders are recorded on the ex-dividend date.
4. Security Lending: The fund may lend its securities to qualified institutional borrowers to earn additional income. Security loans are required to be secured at all times by collateral at least equal to the market value of securities loaned. The fund invests cash collateral received in Vanguard Market Liquidity Fund, and records a liability for the return of the collateral, during the period the securities are on loan. Security lending income represents the income earned on investing cash collateral, less expenses associated with the loan.
5. Other: Dividend income is recorded on the ex-dividend date. Interest income includes income distributions received from Vanguard Market Liquidity Fund and is accrued daily. Security transactions are accounted for on the date securities are bought or sold. Costs used to determine realized gains (losses) on the sale of investment securities are those of the specific securities sold. Fees assessed on redemptions of capital shares are credited to paid-in capital.
Each class of shares has equal rights as to assets and earnings, except that each class separately bears certain class-specific expenses related to maintenance of shareholder accounts (included in Management and Administrative expenses) and shareholder reporting. Marketing and distribution expenses are allocated to each class of shares based on a method approved by the board of trustees. Income, other non-class-specific expenses, and gains and losses on investments are allocated to each class of shares based on its relative net assets.
B. The Vanguard Group furnishes at cost investment advisory, corporate management, administrative, marketing, and distribution services. The costs of such services are allocated to the fund under methods approved by the board of trustees. The fund has committed to provide up to 0.40% of its net assets in capital contributions to Vanguard. At August 31, 2010, the fund had contributed capital of $118,000 to Vanguard (included in Other Assets), representing 0.02% of the fund’s net assets and 0.05% of Vanguard’s capitalization. The fund’s trustees and officers are also directors and officers of Vanguard.
C. Various inputs may be used to determine the value of the fund’s investments. These inputs are summarized in three broad levels for financial statement purposes. The inputs or methodologies used to value securities are not necessarily an indication of the risk associated with investing in those securities.
Level 1—Quoted prices in active markets for identical securities.
Level 2—Other significant observable inputs (including quoted prices for similar securities, interest rates, prepayment speeds, credit risk, etc.).
Level 3—Significant unobservable inputs (including the fund’s own assumptions used to determine the fair value of investments).
At August 31, 2010, 100% of the fund’s investments were valued based on Level 1 inputs.
52
Health Care Index Fund
D. Distributions are determined on a tax basis and may differ from net investment income and realized capital gains for financial reporting purposes. Differences may be permanent or temporary. Permanent differences are reclassified among capital accounts in the financial statements to reflect their tax character. Temporary differences arise when certain items of income, expense, gain, or loss are recognized in different periods for financial statement and tax purposes; these differences will reverse at some time in the future. Differences in classification may also result from the treatment of short-term gains as ordinary income for tax purposes.
During the year ended August 31, 2010, the fund realized $12,010,000 of net capital gains resulting from in-kind redemptions—in which shareholders exchanged fund shares for securities held by the fund rather than for cash. Because such gains are not taxable to the fund, and are not distributed to shareholders, they have been reclassified from accumulated net realized losses to paid-in capital.
For tax purposes, at August 31, 2010, the fund had $7,659,000 of ordinary income available for distribution. The fund had available capital loss carryforwards totaling $20,852,000 to offset future net capital gains of $207,000 through August 31, 2014, $343,000 through August 31, 2015, $3,126,000 through August 31, 2016, $7,261,000 through August 31, 2017, and $9,915,000 through August 31, 2018. In addition, the fund realized losses of $23,043,000 during the period from November 1, 2009, through August 31, 2010, which are deferred and will be treated as realized for tax purposes in fiscal 2011.
At August 31, 2010, the cost of investment securities for tax purposes was $725,139,000. Net unrealized depreciation of investment securities for tax purposes was $115,207,000, consisting of unrealized gains of $23,771,000 on securities that had risen in value since their purchase and $138,978,000 in unrealized losses on securities that had fallen in value since their purchase.
E. During the year ended August 31, 2010, the fund purchased $161,159,000 of investment securities and sold $209,189,000 of investment securities, other than temporary cash investments.
F. Capital share transactions for each class of shares were:
| | | | | | |
| | | | | |
| | | | | Year Ended August 31, |
| | | | 2010 | | | 2009 |
| | Amount | Shares | Amount | Shares |
| | ($000) | (000) | ($000) | (000) |
| Admiral Shares | | | | |
| Issued | 13,125 | 486 | 9,782 | 428 |
| Issued in Lieu of Cash Distributions | 1,377 | 51 | 758 | 34 |
| Redeemed1 | (75,368) | (2,777) | (18,244) | (819) |
| Net Increase (Decrease)—Admiral Shares | (60,866) | (2,240) | (7,704) | (357) |
| ETF Shares | | | | |
| Issued | 92,508 | 1,712 | 189,315 | 4,100 |
| Issued in Lieu of Cash Distributions | — | — | — | — |
| Redeemed1 | (78,488) | (1,500) | (174,997) | (3,800) |
| Net Increase (Decrease)—ETF Shares | 14,020 | 212 | 14,318 | 300 |
1 Net of redemption fees for fiscal 2010 and 2009 of $22,000 and $72,000, respectively (fund totals).
G. In preparing the financial statements as of August 31, 2010, management considered the impact of subsequent events for potential recognition or disclosure in these financial statements.
53
Industrials Index Fund
Fund Profile
As of August 31, 2010
| | | |
| Portfolio Characteristics | | |
| | | Target | Broad |
| | Fund | Index1 | Index2 |
| Number of Stocks | 369 | 372 | 2,478 |
| Median Market Cap | $19.9B | $19.9B | $26.3B |
| Price/Earnings Ratio | 17.5x | 17.5x | 15.4x |
| Price/Book Ratio | 2.2x | 2.2x | 1.9x |
| Yield3 | | 2.1% | 2.1% |
| Admiral Shares | 1.6% | | |
| ETF Shares | 1.6% | | |
| Return on Equity | 19.1% | 19.1% | 19.2% |
| Earnings Growth Rate | 3.1% | 3.1% | 6.3% |
| Foreign Holdings | 0.0% | 0.0% | 0.0% |
| Turnover Rate | 10% | — | — |
| Expense Ratio4 | | — | — |
| Admiral Shares | 0.28% | | |
| ETF Shares | 0.25% | | |
| Short-Term Reserves | 0.0% | — | — |
| | |
| Volatility Measures5 | | |
| | Fund Versus | Fund Versus |
| | Spliced Index6 | Broad Index2 |
| R-Squared | 1.00 | 0.94 |
| Beta | 1.00 | 1.26 |
| |
Subindustry Diversification
(% of equity exposure) | |
| |
| |
| Aerospace & Defense | 21.1% |
| Air Freight & Logistics | 7.3 |
| Airlines | 2.5 |
| Building Products | 1.3 |
| Construction & Engineering | 2.9 |
| Construction & Farm Machinery & | |
| Heavy Trucks | 10.1 |
| Diversified Support Services | 1.1 |
| Electrical Components & Equipment | 6.5 |
| Environmental & Facilities Services | 3.3 |
| Industrial Conglomerates | 18.4 |
| Industrial Machinery | 10.6 |
| Office Services & Supplies | 1.1 |
| Railroads | 6.4 |
| Research & Consulting Services | 1.5 |
| Trading Companies & Distributors | 1.9 |
| Trucking | 1.5 |
| Other Industrial | 2.5 |
| |
| Ten Largest Holdings7 (% of total net assets) |
| |
| General Electric Co. | 12.1% |
| United Technologies Corp. | 4.5 |
| 3M Co. | 4.2 |
| United Parcel Service, Inc. Class B | 3.6 |
| The Boeing Co. | 3.3 |
| Caterpillar, Inc. | 3.2 |
| Union Pacific Corp. | 2.9 |
| Emerson Electric Co. | 2.7 |
| Honeywell International Inc. | 2.2 |
| Deere & Co. | 2.1 |
| Top Ten | 40.8% |
1 MSCI US IMI/Industrials 25/50.
2 MSCI US IMI/2500.
3 30-day SEC yield for the fund; annualized dividend yield for the indexes. See the Glossary.
4 The expense ratios shown are from the prospectus dated December 28, 2009, and represent estimated costs for the current fiscal year. For the fiscal year ended August 31, 2010, the expense ratios were 0.24% for the Admiral Shares and 0.24% for the ETF Shares.
5 For an explanation of R-squared, beta, and other terms used here, see the Glossary.
6 Spliced MSCI US IMI/Industrials 25/50: MSCI US IMI/Industrials through February 26, 2010; MSCI US IMI/Industrials 25/50 thereafter.
7 The holdings listed exclude any temporary cash investments and equity index products.
54
Industrials Index Fund
Performance Summary
All of the returns in this report represent past performance, which is not a guarantee of future results that may be achieved by the fund. (Current performance may be lower or higher than the performance data cited. For performance data current to the most recent month-end, visit our website at vanguard.com/performance.) Note, too, that both investment returns and principal value can fluctuate widely, so an investor’s shares, when sold, could be worth more or less than their original cost. The returns shown do not reflect taxes that a shareholder would pay on fund distributions or on the sale of fund shares.
Cumulative Performance: September 23, 2004–August 31, 2010
Initial Investment of $10,000

| | | | | |
| | | | |
| | | Average Annual Total Returns | |
| | | | Periods Ended August 31, 2010 | Final Value |
| | | | Since | of a $10,000 |
| | One Year | Five Years | Inception1 | Investment |
| Industrials Index Fund ETF Shares | | | | |
| Net Asset Value2 | 12.85% | 0.48% | 2.33% | $11,466 |
| Industrials Index Fund ETF Shares | | | | |
| Market Price | 12.72 | 0.47 | 2.31 | 11,455 |
| MSCI US IMI/2500 | 5.81 | –0.39 | 1.96 | 11,221 |
| Spliced MSCI US IMI/Industrials 25/503 | 13.13 | 0.51 | 2.21 | 11,384 |
| | | |
| | | | Final Value |
| | | Since | of a $100,000 |
| | One Year | Inception1 | Investment |
| Industrials Index Fund Admiral Shares4 | 12.85% | –4.23% | $82,979 |
| MSCI US IMI/2500 | 5.81 | –2.87 | 88,183 |
| Spliced MSCI US IMI/Industrials 25/503 | 13.13 | –4.08 | 83,555 |
1 Performance for the fund and its comparative standards is calculated since the following inception dates: September 23, 2004, for ETF Shares; May 8, 2006, for Admiral Shares.
2 For more information about how the ETF Shares’ market prices have compared with their net asset value, visit Vanguard.com, select your ETF, and then select the Performance tab. The Premium/Discount table there shows the percentages of days on which the ETF Shares’ market price was above or below the NAV.
3 Spliced MSCI US IMI/Industrials 25/50: MSCI US IMI/Industrials through February 26, 2010; MSCI US IMI/Industrials 25/50 thereafter.
4 Total returns do not reflect the 2% fee assessed on redemptions of shares held for less than one year.
See Financial Highlights for dividend and capital gains information.
55
Industrials Index Fund
Fiscal-Year Total Returns (%): September 23, 2004–August 31, 2010
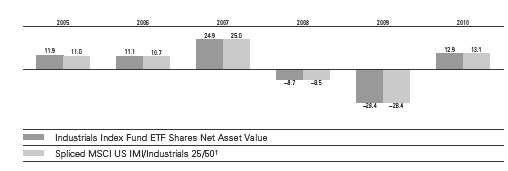
| | | |
| Cumulative Returns: ETF Shares, September 23, 2004–August 31, 2010 | | |
| | | | Cumulative |
| | | | Since |
| | One Year | Five Years | Inception |
| Industrials Index Fund ETF Shares Market Price | 12.72% | 2.39% | 14.55% |
| Industrials Index Fund ETF Shares Net Asset Value | 12.85 | 2.43 | 14.66 |
| Spliced MSCI US IMI/Industrials 25/501 | 13.13 | 2.56 | 13.84 |
Average Annual Total Returns: Periods Ended June 30, 2010
This table presents average annual total returns through the latest calendar quarter—rather than through the end of the fiscal period. Securities and Exchange Commission rules require that we provide this information.
| | | | |
| | | | | Since |
| | Inception Date | One Year | Five Years | Inception |
| ETF Shares | 9/23/2004 | | | |
| Market Price | | 26.14% | 0.71% | 2.10% |
| Net Asset Value | | 26.24 | 0.70 | 2.11 |
| Admiral Shares2 | 5/8/2006 | 26.21 | — | –4.78 |
1 Spliced MSCI US IMI/Industrials 25/50: MSCI US IMI/Industrials through February 26, 2010; MSCI US IMI/Industrials 25/50 thereafter.
2 Total returns do not reflect the 2% fee assessed on redemptions of shares held for less than one year.
56
Industrials Index Fund
Financial Statements
Statement of Net Assets
As of August 31, 2010
The fund reports a complete list of its holdings in regulatory filings four times in each fiscal year, at the quarter-ends. For the second and fourth fiscal quarters, the lists appear in the fund’s semiannual and annual reports to shareholders. For the first and third fiscal quarters, the fund files the lists with the Securities and Exchange Commission on Form N-Q. Shareholders can look up the fund’s Forms N-Q on the SEC’s website at sec.gov. Forms N-Q may also be reviewed and copied at the SEC’s Public Reference Room (see the back cover of this report for further information).
| | | |
| | | | Market |
| | | | Value• |
| | | Shares | ($000) |
| Common Stocks (100.0%) | | |
| Aerospace & Defense (21.4%) | | |
| | United Technologies Corp. | 208,737 | 13,612 |
| | Boeing Co. | 160,866 | 9,834 |
| | Honeywell International Inc. | 171,310 | 6,697 |
| | Lockheed Martin Corp. | 74,813 | 5,201 |
| | General Dynamics Corp. | 77,207 | 4,314 |
| | Raytheon Co. | 89,734 | 3,941 |
| | Precision Castparts Corp. | 33,485 | 3,790 |
| | Northrop Grumman Corp. | 67,732 | 3,666 |
| | Goodrich Corp. | 29,527 | 2,022 |
| | Rockwell Collins Inc. | 37,089 | 2,000 |
| | L-3 Communications | | |
| | Holdings Inc. | 27,271 | 1,816 |
| | ITT Corp. | 40,952 | 1,740 |
| | TransDigm Group Inc. | 10,972 | 635 |
| * | BE Aerospace Inc. | 22,875 | 616 |
| * | Alliant Techsystems Inc. | 7,778 | 513 |
| * | Spirit Aerosystems | | |
| | Holdings Inc. Class A | 24,765 | 479 |
| * | Hexcel Corp. | 22,841 | 390 |
| * | Esterline Technologies Corp. | 7,026 | 323 |
| * | Teledyne Technologies Inc. | 8,497 | 307 |
| * | Moog Inc. Class A | 9,247 | 289 |
| | Curtiss-Wright Corp. | 10,810 | 287 |
| | Triumph Group Inc. | 3,937 | 261 |
| * | DigitalGlobe Inc. | 6,398 | 196 |
| * | GeoEye Inc. | 5,197 | 189 |
| * | Orbital Sciences Corp. | 13,403 | 174 |
| | American Science & | | |
| | Engineering Inc. | 2,116 | 150 |
| | Cubic Corp. | 3,773 | 144 |
| * | AAR Corp. | 9,160 | 141 |
| | HEICO Corp. Class A | 4,167 | 128 |
| * | Ceradyne Inc. | 5,677 | 124 |
| * | Ladish Co. Inc. | 3,580 | 89 |
| | HEICO Corp. | 2,019 | 84 |
| * | Aerovironment Inc. | 3,593 | 81 |
| | Applied Signal | | |
| | Technology Inc. | 2,947 | 58 |
| * | GenCorp Inc. | 11,621 | 51 |
| * | Taser International Inc. | 13,666 | 50 |
| | Ducommun Inc. | 2,395 | 46 |
| | | | 64,438 |
| Air Freight & Logistics (7.3%) | | |
| | United Parcel Service Inc. | | |
| | Class B | 169,627 | 10,822 |
| | FedEx Corp. | 70,114 | 5,472 |
| | CH Robinson Worldwide Inc. | 40,988 | 2,664 |
| | Expeditors International | | |
| | of Washington Inc. | 50,041 | 1,981 |
| | UTi Worldwide Inc. | 23,694 | 332 |
| * | Atlas Air Worldwide | | |
| | Holdings Inc. | 6,062 | 263 |
| * | HUB Group Inc. Class A | 8,841 | 235 |
| | Forward Air Corp. | 6,878 | 164 |
| * | Pacer International Inc. | 8,153 | 42 |
| | | | 21,975 |
| | | |
| | | | Market |
| | | | Value• |
| | | Shares | ($000) |
| Airlines (2.5%) | | |
| * | Delta Air Lines Inc. | 185,988 | 1,945 |
| | Southwest Airlines Co. | 175,351 | 1,938 |
| * | UAL Corp. | 39,464 | 836 |
| * | Continental Airlines Inc. | | |
| | Class B | 32,762 | 732 |
| * | AMR Corp. | 78,349 | 479 |
| * | Alaska Air Group Inc. | 8,398 | 372 |
| * | US Airways Group Inc. | 37,971 | 343 |
| * | JetBlue Airways Corp. | 58,455 | 334 |
| | Skywest Inc. | 13,198 | 168 |
| * | AirTran Holdings Inc. | 30,367 | 137 |
| | Allegiant Travel Co. Class A | 3,272 | 123 |
| * | Hawaiian Holdings Inc. | 11,981 | 59 |
| * | Republic Airways | | |
| | Holdings Inc. | 7,856 | 55 |
| | | | 7,521 |
| Building Products (1.2%) | | |
| | Masco Corp. | 84,965 | 891 |
| * | Owens Corning | 27,101 | 737 |
| | Lennox International Inc. | 11,273 | 478 |
| | AO Smith Corp. | 5,941 | 305 |
| | Simpson | | |
| | Manufacturing Co. Inc. | 9,348 | 206 |
| * | USG Corp. | 16,335 | 199 |
| * | Armstrong World | | |
| | Industries Inc. | 4,724 | 186 |
| * | Griffon Corp. | 13,310 | 142 |
| | Quanex Building | | |
| | Products Corp. | 8,871 | 140 |
| | Ameron International Corp. | 2,063 | 116 |
| | Universal Forest Products Inc. | 4,098 | 106 |
| | AAON Inc. | 3,023 | 67 |
| * | Trex Co. Inc. | 3,042 | 61 |
| | Apogee Enterprises Inc. | 6,668 | 60 |
| * | Gibraltar Industries Inc. | 6,326 | 48 |
| | American Woodmark Corp. | 2,180 | 34 |
| | | | 3,776 |
| Commercial Services & Supplies (6.4%) | |
| | Waste Management Inc. | 108,055 | 3,576 |
| | Republic Services Inc. | | |
| | Class A | 89,859 | 2,645 |
| * | Stericycle Inc. | 19,000 | 1,244 |
| | Pitney Bowes Inc. | 48,891 | 941 |
| | Iron Mountain Inc. | 43,188 | 876 |
| | Cintas Corp. | 32,489 | 828 |
| | Avery Dennison Corp. | 23,406 | 761 |
| | RR Donnelley & Sons Co. | 48,535 | 735 |
| * | Waste Connections Inc. | 17,366 | 656 |
| * | Corrections Corp. of America | 27,321 | 610 |
| * | Copart Inc. | 16,849 | 557 |
| | Covanta Holding Corp. | 31,022 | 447 |
| * | Geo Group Inc. | 16,086 | 355 |
| * | Clean Harbors Inc. | 5,567 | 337 |
| * | Tetra Tech Inc. | 14,565 | 264 |
| * | United Stationers Inc. | 5,672 | 255 |
| | HNI Corp. | 10,655 | 249 |
| | Rollins Inc. | 10,580 | 217 |
| | | |
| | | | Market |
| | | | Value• |
| | | Shares | ($000) |
| | Brink’s Co. | 11,319 | 214 |
| | Herman Miller Inc. | 12,577 | 206 |
| | Healthcare Services | | |
| | Group Inc. | 9,794 | 203 |
| | ABM Industries Inc. | 10,361 | 203 |
| | Deluxe Corp. | 12,142 | 203 |
| | Mine Safety Appliances Co. | 8,035 | 183 |
| | Knoll Inc. | 11,051 | 148 |
| | Interface Inc. Class A | 11,299 | 145 |
| | Unifirst Corp. | 3,396 | 133 |
| * | EnerNOC Inc. | 3,955 | 129 |
| * | Mobile Mini Inc. | 8,541 | 122 |
| | Steelcase Inc. Class A | 18,769 | 117 |
| * | SYKES Enterprises Inc. | 9,487 | 113 |
| * | ATC Technology Corp. | 4,697 | 113 |
| | McGrath Rentcorp | 5,316 | 107 |
| | Bowne & Co. Inc. | 9,427 | 104 |
| * | Consolidated Graphics Inc. | 2,505 | 99 |
| | Ennis Inc. | 6,129 | 94 |
| | G&K Services Inc. Class A | 4,383 | 88 |
| | EnergySolutions Inc. | 17,854 | 82 |
| * | KAR Auction Services Inc. | 6,422 | 78 |
| | Viad Corp. | 4,881 | 77 |
| * | ACCO Brands Corp. | 13,000 | 76 |
| * | Cenveo Inc. | 13,125 | 72 |
| * | M&F Worldwide Corp. | 2,763 | 64 |
| * | Team Inc. | 4,307 | 63 |
| * | American Reprographics Co. | 8,654 | 57 |
| | US Ecology Inc. | 4,054 | 55 |
| | Schawk Inc. Class A | 3,601 | 55 |
| * | Standard Parking Corp. | 3,246 | 51 |
| * | Innerworkings Inc. | 6,517 | 35 |
| * | APAC Customer Services Inc. | 6,309 | 32 |
| | Courier Corp. | 2,419 | 32 |
| | Kimball International Inc. | | |
| | Class B | 6,036 | 31 |
| * | RINO International Corp. | 1,994 | 29 |
| * | Metalico Inc. | 9,174 | 29 |
| * | Fuel Tech Inc. | 3,852 | 21 |
| | Standard Register Co. | 2,547 | 7 |
| | | | 19,223 |
| Construction & Engineering (2.9%) | |
| | Fluor Corp. | 42,183 | 1,884 |
| * | Jacobs Engineering | | |
| | Group Inc. | 29,361 | 1,018 |
| * | Quanta Services Inc. | 49,296 | 884 |
| | KBR Inc. | 37,886 | 879 |
| * | URS Corp. | 19,501 | 696 |
| * | Shaw Group Inc. | 19,858 | 644 |
| * | Foster Wheeler AG | 30,028 | 641 |
| * | Aecom Technology Corp. | 21,477 | 483 |
| * | EMCOR Group Inc. | 15,602 | 355 |
| * | Insituform Technologies Inc. | | |
| | Class A | 9,190 | 187 |
| | Granite Construction Inc. | 8,180 | 180 |
| * | Tutor Perini Corp. | 6,308 | 125 |
| * | Layne Christensen Co. | 4,608 | 115 |
| * | MasTec Inc. | 10,737 | 104 |
| | Comfort Systems USA Inc. | 9,102 | 95 |
| * | Dycom Industries Inc. | 9,245 | 74 |
| * | Orion Marine Group Inc. | 6,264 | 70 |
| * | MYR Group Inc. | 4,748 | 66 |
| | Great Lakes Dredge & | | |
| | Dock Corp. | 12,931 | 65 |
| * | Michael Baker Corp. | 1,909 | 63 |
| * | Sterling Construction Co. Inc. | 3,500 | 38 |
| * | Furmanite Corp. | 8,185 | 35 |
| * | Pike Electric Corp. | 4,238 | 34 |
| * | Northwest Pipe Co. | 2,146 | 32 |
| * | Argan Inc. | 1,738 | 14 |
| | | | 8,781 |
57
Industrials Index Fund
| | | |
| | | | Market |
| | | | Value• |
| | | Shares | ($000) |
| Electrical Equipment (6.8%) | | |
| | Emerson Electric Co. | 177,357 | 8,274 |
| | Rockwell Automation Inc. | 33,578 | 1,717 |
| | Cooper Industries PLC | 39,445 | 1,660 |
| | Roper Industries Inc. | 22,093 | 1,283 |
| | AMETEK Inc. | 25,043 | 1,077 |
| * | Babcock & Wilcox Co. | 27,115 | 607 |
| | Hubbell Inc. Class B | 12,386 | 557 |
| | Regal-Beloit Corp. | 9,067 | 502 |
| * | Thomas & Betts Corp. | 12,394 | 458 |
| * | GrafTech International Ltd. | 29,312 | 412 |
| | Acuity Brands Inc. | 10,231 | 396 |
| | Baldor Electric Co. | 10,434 | 366 |
| | Woodward Governor Co. | 13,701 | 358 |
| | Brady Corp. Class A | 11,533 | 297 |
| * | General Cable Corp. | 12,285 | 273 |
| * | American | | |
| | Superconductor Corp. | 10,051 | 270 |
| | Belden Inc. | 11,035 | 242 |
| * | EnerSys | 10,849 | 239 |
| * | II-VI Inc. | 6,187 | 213 |
| * | Polypore International Inc. | 5,743 | 155 |
| | Franklin Electric Co. Inc. | 4,624 | 147 |
| * | Sensata Technologies | | |
| | Holding NV | 8,063 | 136 |
| | AZZ Inc. | 2,936 | 117 |
| * | A123 Systems Inc. | 15,862 | 104 |
| | Encore Wire Corp. | 4,406 | 81 |
| * | Harbin Electric Inc. | 4,695 | 79 |
| | Vicor Corp. | 5,018 | 68 |
| * | Powell Industries Inc. | 1,926 | 55 |
| * | Fushi Copperweld Inc. | 6,098 | 50 |
| *,^ | Ener1 Inc. | 11,404 | 36 |
| * | Capstone Turbine Corp. | 54,686 | 35 |
| * | Lihua International Inc. | 3,655 | 29 |
| * | FuelCell Energy Inc. | 25,487 | 29 |
| * | Broadwind Energy Inc. | 12,385 | 21 |
| | Preformed Line Products Co. | 586 | 19 |
| * | Valence Technology Inc. | 14,465 | 11 |
| | | | 20,373 |
| Industrial Conglomerates (18.4%) | |
| | General Electric Co. | 2,514,127 | 36,404 |
| | 3M Co. | 159,475 | 12,527 |
| | Tyco International Ltd. | 121,146 | 4,516 |
| | Textron Inc. | 64,318 | 1,098 |
| | Carlisle Cos. Inc. | 14,175 | 398 |
| | Seaboard Corp. | 88 | 142 |
| | Raven Industries Inc. | 3,819 | 129 |
| | Tredegar Corp. | 6,039 | 99 |
| | Standex International Corp. | 2,967 | 70 |
| | | | 55,383 |
| Machinery (20.6%) | | |
| | Caterpillar Inc. | 147,927 | 9,639 |
| | Deere & Co. | 100,042 | 6,330 |
| | Danaher Corp. | 129,963 | 4,722 |
| | Illinois Tool Works Inc. | 100,577 | 4,150 |
| | Cummins Inc. | 44,871 | 3,339 |
| | PACCAR Inc. | 77,309 | 3,169 |
| | Eaton Corp. | 37,494 | 2,605 |
| | Ingersoll-Rand PLC | 75,729 | 2,463 |
| | Parker Hannifin Corp. | 37,930 | 2,244 |
| | Dover Corp. | 43,978 | 1,968 |
| | Joy Global Inc. | 24,256 | 1,376 |
| | Flowserve Corp. | 13,203 | 1,180 |
| | Bucyrus International Inc. | | |
| | Class A | 18,121 | 1,042 |
| | Pall Corp. | 27,659 | 946 |
| | Donaldson Co. Inc. | 17,262 | 723 |
| * | AGCO Corp. | 21,838 | 722 |
| | | |
| | | | Market |
| | | | Value• |
| | | Shares | ($000) |
| | Pentair Inc. | 23,241 | 700 |
| | SPX Corp. | 11,734 | 658 |
| | Timken Co. | 19,462 | 637 |
| * | Navistar International Corp. | 15,019 | 629 |
| | Gardner Denver Inc. | 12,296 | 587 |
| | IDEX Corp. | 19,039 | 567 |
| | Snap-On Inc. | 13,610 | 561 |
| * | WABCO Holdings Inc. | 15,096 | 532 |
| * | Oshkosh Corp. | 21,096 | 525 |
| | Lincoln Electric Holdings Inc. | 10,044 | 498 |
| | Kennametal Inc. | 19,209 | 484 |
| | Wabtec Corp. | 11,218 | 477 |
| * | Terex Corp. | 25,510 | 465 |
| | Nordson Corp. | 7,176 | 460 |
| | CLARCOR Inc. | 11,883 | 400 |
| | Crane Co. | 11,728 | 398 |
| | Toro Co. | 7,918 | 395 |
| | Graco Inc. | 14,153 | 395 |
| | Harsco Corp. | 18,966 | 378 |
| | Valmont Industries Inc. | 4,959 | 332 |
| | Trinity Industries Inc. | 18,674 | 320 |
| | Actuant Corp. Class A | 16,013 | 317 |
| | Manitowoc Co. Inc. | 30,858 | 283 |
| * | ArvinMeritor Inc. | 21,045 | 275 |
| | Kaydon Corp. | 7,914 | 256 |
| * | Middleby Corp. | 4,173 | 229 |
| | Briggs & Stratton Corp. | 11,752 | 213 |
| | Watts Water | | |
| | Technologies Inc. Class A | 6,992 | 210 |
| | Mueller Industries Inc. | 8,884 | 209 |
| | ESCO Technologies Inc. | 6,259 | 195 |
| | Barnes Group Inc. | 10,992 | 167 |
| | Robbins & Myers Inc. | 6,588 | 156 |
| * | RBC Bearings Inc. | 5,105 | 150 |
| * | EnPro Industries Inc. | 4,689 | 128 |
| | Badger Meter Inc. | 3,348 | 125 |
| | Tennant Co. | 3,970 | 124 |
| * | Astec Industries Inc. | 4,514 | 116 |
| | Albany International Corp. | 6,511 | 116 |
| | CIRCOR International Inc. | 4,011 | 112 |
| * | Blount International Inc. | 9,522 | 110 |
| | Lindsay Corp. | 2,964 | 109 |
| * | Chart Industries Inc. | 6,721 | 107 |
| | John Bean | | |
| | Technologies Corp. | 6,521 | 97 |
| | NACCO Industries Inc. | | |
| | Class A | 1,185 | 92 |
| | Gorman-Rupp Co. | 3,556 | 91 |
| | Mueller Water Products Inc. | | |
| | Class A | 36,296 | 86 |
| | Titan International Inc. | 7,980 | 81 |
| | Federal Signal Corp. | 14,120 | 74 |
| * | Colfax Corp. | 5,681 | 71 |
| | Cascade Corp. | 2,219 | 69 |
| | FreightCar America Inc. | 2,849 | 66 |
| | Sun Hydraulics Corp. | 2,957 | 66 |
| * | Force Protection Inc. | 16,759 | 65 |
| * | LB Foster Co. Class A | 2,440 | 63 |
| * | 3D Systems Corp. | 4,644 | 58 |
| * | Columbus McKinnon Corp. | 4,265 | 55 |
| * | Greenbrier Cos. Inc. | 4,556 | 53 |
| * | Kadant Inc. | 2,855 | 49 |
| * | Sauer-Danfoss Inc. | 2,922 | 48 |
| | Ampco-Pittsburgh Corp. | 2,038 | 44 |
| | Dynamic Materials Corp. | 3,049 | 42 |
| * | Tecumseh Products Co. | | |
| | Class A | 3,113 | 36 |
| * | SmartHeat Inc. | 4,612 | 27 |
| | | |
| | | | Market |
| | | | Value• |
| | | Shares | ($000) |
| * | American Railcar | | |
| | Industries Inc. | 2,237 | 26 |
| * | Energy Recovery Inc. | 7,327 | 23 |
| * | China Fire & Security | | |
| | Group Inc. | 1,936 | 14 |
| * | Duoyuan Printing Inc. | 1,776 | 13 |
| * | Tecumseh Products Co. | | |
| | Class B | 786 | 9 |
| | | | 62,141 |
| Marine (0.4%) | | |
| * | Kirby Corp. | 12,087 | 445 |
| | Alexander & Baldwin Inc. | 9,686 | 328 |
| * | Genco Shipping & | | |
| | Trading Ltd. | 7,531 | 113 |
| * | Eagle Bulk Shipping Inc. | 14,803 | 69 |
| * | American | | |
| | Commercial Lines Inc. | 2,253 | 63 |
| | Horizon Lines Inc. Class A | 6,650 | 27 |
| * | TBS International PLC | | |
| | Class A | 3,260 | 18 |
| | | | 1,063 |
| Professional Services (2.4%) | | |
| | Equifax Inc. | 29,835 | 879 |
| | Manpower Inc. | 19,280 | 819 |
| | Dun & Bradstreet Corp. | 11,865 | 782 |
| | Robert Half International Inc. | 33,563 | 724 |
| * | Verisk Analytics Inc. Class A | 23,711 | 660 |
| * | IHS Inc. Class A | 9,781 | 604 |
| | Towers Watson & Co. | | |
| | Class A | 11,052 | 496 |
| * | FTI Consulting Inc. | 10,955 | 359 |
| | Corporate Executive | | |
| | Board Co. | 8,091 | 227 |
| * | CoStar Group Inc. | 4,618 | 191 |
| * | Advisory Board Co. | 3,647 | 148 |
| * | Korn/Ferry International | 10,764 | 140 |
| | Resources Connection Inc. | 10,906 | 121 |
| | Administaff Inc. | 5,508 | 119 |
| * | Navigant Consulting Inc. | 11,782 | 117 |
| * | TrueBlue Inc. | 10,364 | 112 |
| * | Exponent Inc. | 3,203 | 99 |
| * | Huron Consulting Group Inc. | 4,893 | 90 |
| * | ICF International Inc. | 4,017 | 85 |
| * | Kforce Inc. | 7,777 | 82 |
| | Heidrick & Struggles | | |
| | International Inc. | 4,028 | 70 |
| * | SFN Group Inc. | 12,227 | 67 |
| * | Kelly Services Inc. Class A | 6,364 | 66 |
| * | CBIZ Inc. | 11,159 | 66 |
| * | Dolan Co. | 6,912 | 63 |
| * | School Specialty Inc. | 4,485 | 58 |
| * | CRA International Inc. | 2,550 | 41 |
| | CDI Corp. | 3,153 | 35 |
| * | Mistras Group Inc. | 2,791 | 30 |
| * | Hill International Inc. | 5,970 | 23 |
| * | Volt Information Sciences Inc. | 3,439 | 22 |
| | | | 7,395 |
| Road & Rail (7.8%) | | |
| | Union Pacific Corp. | 119,176 | 8,693 |
| | Norfolk Southern Corp. | 87,187 | 4,680 |
| | CSX Corp. | 91,655 | 4,573 |
| * | Kansas City Southern | 24,024 | 806 |
| | JB Hunt Transport | | |
| | Services Inc. | 22,549 | 738 |
| | Ryder System Inc. | 12,582 | 483 |
| * | Hertz Global Holdings Inc. | 53,203 | 453 |
| | Landstar System Inc. | 11,837 | 426 |
| * | Genesee & Wyoming Inc. | | |
| | Class A | 9,086 | 353 |
58
Industrials Index Fund
| | | |
| | | | Market |
| | | | Value• |
| | | Shares | ($000) |
| | Con-way Inc. | 12,682 | 332 |
| * | Dollar Thrifty Automotive | | |
| | Group Inc. | 6,071 | 285 |
| | Knight Transportation Inc. | 14,748 | 278 |
| * | Old Dominion Freight | | |
| | Line Inc. | 9,912 | 231 |
| | Werner Enterprises Inc. | 11,094 | 221 |
| * | Avis Budget Group Inc. | 24,140 | 220 |
| | Heartland Express Inc. | 12,901 | 188 |
| * | Amerco Inc. | 1,607 | 130 |
| | Arkansas Best Corp. | 5,666 | 117 |
| | Marten Transport Ltd. | 3,902 | 77 |
| * | YRC Worldwide Inc. | 242,264 | 60 |
| * | Celadon Group Inc. | 4,890 | 57 |
| * | RailAmerica Inc. | 5,685 | 57 |
| * | Saia Inc. | 3,689 | 43 |
| * | Patriot Transportation | | |
| | Holding Inc. | 426 | 32 |
| * | Universal Truckload | | |
| | Services Inc. | 1,457 | 20 |
| | | | 23,553 |
| Trading Companies & Distributors (1.9%) | |
| | WW Grainger Inc. | 14,591 | 1,544 |
| | Fastenal Co. | 31,280 | 1,416 |
| | MSC Industrial Direct Co. | | |
| | Class A | 10,558 | 471 |
| * | WESCO International Inc. | 10,000 | 323 |
| | Watsco Inc. | 5,944 | 305 |
| | GATX Corp. | 10,886 | 297 |
| | Applied Industrial | | |
| | Technologies Inc. | 9,017 | 242 |
| * | United Rentals Inc. | 14,164 | 159 |
| * | Beacon Roofing Supply Inc. | 10,674 | 149 |
| | | |
| | | | Market |
| | | | Value• |
| | | Shares | ($000) |
| | Kaman Corp. | 6,041 | 129 |
| * | Interline Brands Inc. | 7,666 | 124 |
| | Aircastle Ltd. | 13,121 | 102 |
| * | Rush Enterprises Inc. Class A | 6,194 | 79 |
| | TAL International Group Inc. | 3,582 | 76 |
| * | RSC Holdings Inc. | 12,261 | 73 |
| * | Titan Machinery Inc. | 3,176 | 47 |
| * | H&E Equipment Services Inc. | 6,493 | 44 |
| | Houston Wire & Cable Co. | 3,960 | 36 |
| | Aceto Corp. | 5,801 | 33 |
| * | Rush Enterprises Inc. Class B | 1,649 | 19 |
| | | | 5,668 |
| Transportation Infrastructure (0.0%) | |
| * | Macquarie Infrastructure | | |
| | Co. LLC | 10,207 | 139 |
| | | | 139 |
| Total Common Stocks | | |
| (Cost $385,329) | | 301,429 |
| Temporary Cash Investment (0.0%) | |
| Money Market Fund (0.0%) | | |
| 1,2 | Vanguard Market | | |
| | Liquidity Fund, 0.288% | | |
| | (Cost $23) | 22,802 | 23 |
| Total Investments (100.0%) | | |
| (Cost $385,352) | | 301,452 |
| Other Assets and Liabilities (0.0%) | |
| Other Assets | | 1,400 |
| Liabilities2 | | (1,279) |
| | | | 121 |
| Net Assets (100%) | | 301,573 |
| |
| At August 31, 2010, net assets consisted of: |
| | Amount |
| | ($000) |
| Paid-in Capital | 406,507 |
| Undistributed Net Investment Income | 3,238 |
| Accumulated Net Realized Losses | (24,272) |
| Unrealized Appreciation (Depreciation) | (83,900) |
| Net Assets | 301,573 |
| |
| |
| Admiral Shares—Net Assets | |
| Applicable to 249,040 outstanding | |
| $.001 par value shares of beneficial | |
| interest (unlimited authorization) | 6,618 |
| Net Asset Value Per Share— | |
| Admiral Shares | $26.57 |
| |
| |
| ETF Shares—Net Assets | |
| Applicable to 5,703,483 outstanding | |
| $.001 par value shares of beneficial | |
| interest (unlimited authorization) | 294,955 |
| Net Asset Value Per Share— | |
| ETF Shares | $51.71 |
• See Note A in Notes to Financial Statements.
* Non-income-producing security.
^ Part of security position is on loan to broker-dealers. The total value of securities on loan is $18,000.
1 Affiliated money market fund available only to Vanguard funds and certain trusts and accounts managed by Vanguard. Rate shown is the 7-day yield.
2 Includes $23,000 of collateral received for securities on loan.
See accompanying Notes, which are an integral part of the Financial Statements.
59
Industrials Index Fund
| |
| Statement of Operations |
| |
| | Year Ended |
| | August 31, 2010 |
| | ($000) |
| Investment Income | |
| Income | |
| Dividends | 5,952 |
| Interest1 | 1 |
| Security Lending | 8 |
| Total Income | 5,961 |
| Expenses | |
| The Vanguard Group—Note B | |
| Investment Advisory Services | 46 |
| Management and Administrative— | |
| Admiral Shares | 14 |
| Management and Administrative— | |
| ETF Shares | 513 |
| Marketing and Distribution— | |
| Admiral Shares | — |
| Marketing and Distribution— | |
| ETF Shares | 80 |
| Custodian Fees | 30 |
| Auditing Fees | 26 |
| Shareholders’ Reports—Admiral Shares | — |
| Shareholders’ Reports—ETF Shares | 28 |
| Trustees’ Fees and Expenses | 1 |
| Total Expenses | 738 |
| Net Investment Income | 5,223 |
| Realized Net Gain (Loss) on | |
| Investment Securities Sold | 4,360 |
| Change in Unrealized Appreciation | |
| (Depreciation) of Investment Securities | 19,208 |
| Net Increase (Decrease) in Net Assets | |
| Resulting from Operations | 28,791 |
| | | |
| | |
| Statement of Changes in Net Assets | | |
| |
| | | Year Ended August 31, |
| | 2010 | 2009 |
| | ($000) | ($000) |
| Increase (Decrease) in Net Assets | | |
| Operations | | |
| Net Investment Income | 5,223 | 5,213 |
| Realized Net Gain (Loss) | 4,360 | (28,412) |
| Change in Unrealized Appreciation (Depreciation) | 19,208 | (81,669) |
| Net Increase (Decrease) in Net Assets Resulting from Operations | 28,791 | (104,868) |
| Distributions | | |
| Net Investment Income | | |
| Admiral Shares | (80) | (158) |
| ETF Shares | (4,648) | (5,112) |
| Realized Capital Gain | | |
| Admiral Shares | — | — |
| ETF Shares | — | — |
| Total Distributions | (4,728) | (5,270) |
| Capital Share Transactions | | |
| Admiral Shares | 102 | (1,396) |
| ETF Shares | 85,531 | (54,110) |
| Net Increase (Decrease) from Capital Share Transactions | 85,633 | (55,506) |
| Total Increase (Decrease) | 109,696 | (165,644) |
| Net Assets | | |
| Beginning of Period | 191,877 | 357,521 |
| End of Period2 | 301,573 | 191,877 |
1 Interest income from an affiliated company of the fund was $1,000.
2 Net Assets—End of Period includes undistributed net investment income of $3,238,000 and $2,743,000.
See accompanying Notes, which are an integral part of the Financial Statements.
60
Industrials Index Fund
| | | | | | |
| | | | | |
| Financial Highlights | | | | | |
| |
| Admiral Shares | | | | | |
| | | | | | May 8, |
| | | | | | 20061 to |
| For a Share Outstanding | | | | Year Ended August 31, | Aug. 31, |
| Throughout Each Period | 2010 | 2009 | 2008 | 2007 | 2006 |
| Net Asset Value, Beginning of Period | $23.85 | $34.20 | $37.94 | $30.72 | $34.10 |
| Investment Operations | | | | | |
| Net Investment Income | .4462 | .635 | .5762 | .5102 | .1642 |
| Net Realized and Unrealized Gain (Loss) | | | | | |
| on Investments | 2.619 | (10.428) | (3.816) | 7.090 | (3.544) |
| Total from Investment Operations | 3.065 | (9.793) | (3.240) | 7.600 | (3.380) |
| Distributions | | | | | |
| Dividends from Net Investment Income | (.345) | (.557) | (.500) | (.380) | — |
| Distributions from Realized Capital Gains | — | — | — | — | — |
| Total Distributions | (.345) | (.557) | (.500) | (.380) | — |
| Net Asset Value, End of Period | $26.57 | $23.85 | $34.20 | $37.94 | $30.72 |
| |
| Total Return3 | 12.85% | –28.44% | –8.67% | 24.90% | –9.91% |
| |
| Ratios/Supplemental Data | | | | | |
| Net Assets, End of Period (Millions) | $7 | $6 | $11 | $4 | $0.2 |
| Ratio of Total Expenses to | | | | | |
| Average Net Assets | 0.24% | 0.28% | 0.25% | 0.26% | 0.28%4 |
| Ratio of Net Investment Income to | | | | | |
| Average Net Assets | 1.69% | 2.71% | 1.63% | 1.46% | 1.35%4 |
| Portfolio Turnover Rate5 | 10% | 8% | 7% | 13% | 9% |
1 Inception.
2 Calculated based on average shares outstanding.
3 Total returns do not include transaction fees that may have applied in the periods shown. Fund prospectuses provide information about any applicable transaction fees.
4 Annualized.
5 Excludes the value of portfolio securities received or delivered as a result of in-kind purchases or redemptions of the fund’s capital shares, including ETF Creation Units.
| | | | | | |
| | | | | |
| ETF Shares | | | | | |
| |
| For a Share Outstanding | | | | Year Ended August 31, |
| Throughout Each Period | 2010 | 2009 | 2008 | 2007 | 2006 |
| Net Asset Value, Beginning of Period | $46.45 | $66.65 | $73.94 | $59.85 | $54.30 |
| Investment Operations | | | | | |
| Net Investment Income | .9101 | 1.253 | 1.1571 | 1.0261 | .8421 |
| Net Realized and Unrealized Gain (Loss) | | | | | |
| on Investments | 5.065 | (20.342) | (7.466) | 13.808 | 5.160 |
| Total from Investment Operations | 5.975 | (19.089) | (6.309) | 14.834 | 6.002 |
| Distributions | | | | | |
| Dividends from Net Investment Income | (.715) | (1.111) | (.981) | (.744) | (.452) |
| Distributions from Realized Capital Gains | — | — | — | — | — |
| Total Distributions | (.715) | (1.111) | (.981) | (.744) | (.452) |
| Net Asset Value, End of Period | $51.71 | $46.45 | $66.65 | $73.94 | $59.85 |
| |
| Total Return | 12.85% | –28.41% | –8.65% | 24.95% | 11.08% |
| |
| Ratios/Supplemental Data | | | | | |
| Net Assets, End of Period (Millions) | $295 | $186 | $347 | $229 | $120 |
| Ratio of Total Expenses to | | | | | |
| Average Net Assets | 0.24% | 0.25% | 0.20% | 0.22% | 0.25% |
| Ratio of Net Investment Income to | | | | | |
| Average Net Assets | 1.69% | 2.74% | 1.68% | 1.50% | 1.38% |
| Portfolio Turnover Rate2 | 10% | 8% | 7% | 13% | 9% |
1 Calculated based on average shares outstanding.
2 Excludes the value of portfolio securities received or delivered as a result of in-kind purchases or redemptions of the fund’s capital shares, including ETF Creation Units.
See accompanying Notes, which are an integral part of the Financial Statements.
61
Industrials Index Fund
Notes to Financial Statements
Vanguard Industrials Index Fund is registered under the Investment Company Act of 1940 as an open-end investment company, or mutual fund. The fund offers two classes of shares: Admiral Shares and ETF Shares. Admiral Shares are designed for investors who meet certain administrative, service, and account-size criteria. ETF Shares are listed for trading on the NYSE Arca, Inc.; they can be purchased and sold through a broker.
A. The following significant accounting policies conform to generally accepted accounting principles for U.S. mutual funds. The fund consistently follows such policies in preparing its financial statements.
1. Security Valuation: Securities are valued as of the close of trading on the New York Stock Exchange (generally 4 p.m., Eastern time) on the valuation date. Equity securities are valued at the latest quoted sales prices or official closing prices taken from the primary market in which each security trades; such securities not traded on the valuation date are valued at the mean of the latest quoted bid and asked prices. Securities for which market quotations are not readily available, or whose values have been materially affected by events occurring before the fund’s pricing time but after the close of the securities’ primary markets, are valued by methods deemed by the board of trustees to represent fair value. Investments in Vanguard Market Liquidity Fund are valued at that fund’s net asset value.
2. Federal Income Taxes: The fund intends to continue to qualify as a regulated investment company and distribute all of its taxable income. Management has analyzed the fund’s tax positions taken for all open federal income tax years (August 31, 2007–2010), and has concluded that no provision for federal income tax is required in the fund’s financial statements.
3. Distributions: Distributions to shareholders are recorded on the ex-dividend date.
4. Security Lending: The fund may lend its securities to qualified institutional borrowers to earn additional income. Security loans are required to be secured at all times by collateral at least equal to the market value of securities loaned. The fund invests cash collateral received in Vanguard Market Liquidity Fund, and records a liability for the return of the collateral, during the period the securities are on loan. Security lending income represents the income earned on investing cash collateral, less expenses associated with the loan.
5. Other: Dividend income is recorded on the ex-dividend date. Interest income includes income distributions received from Vanguard Market Liquidity Fund and is accrued daily. Security transactions are accounted for on the date securities are bought or sold. Costs used to determine realized gains (losses) on the sale of investment securities are those of the specific securities sold. Fees assessed on redemptions of capital shares are credited to paid-in capital.
Each class of shares has equal rights as to assets and earnings, except that each class separately bears certain class-specific expenses related to maintenance of shareholder accounts (included in Management and Administrative expenses) and shareholder reporting. Marketing and distribution expenses are allocated to each class of shares based on a method approved by the board of trustees. Income, other non-class-specific expenses, and gains and losses on investments are allocated to each class of shares based on its relative net assets.
B. The Vanguard Group furnishes at cost investment advisory, corporate management, administrative, marketing, and distribution services. The costs of such services are allocated to the fund under methods approved by the board of trustees. The fund has committed to provide up to 0.40% of its net assets in capital contributions to Vanguard. At August 31, 2010, the fund had contributed capital of $62,000 to Vanguard (included in Other Assets), representing 0.02% of the fund’s net assets and 0.02% of Vanguard’s capitalization. The fund’s trustees and officers are also directors and officers of Vanguard.
C. Various inputs may be used to determine the value of the fund’s investments. These inputs are summarized in three broad levels for financial statement purposes. The inputs or methodologies used to value securities are not necessarily an indication of the risk associated with investing in those securities.
Level 1—Quoted prices in active markets for identical securities.
Level 2—Other significant observable inputs (including quoted prices for similar securities, interest rates, prepayment speeds, credit risk, etc.).
Level 3—Significant unobservable inputs (including the fund’s own assumptions used to determine the fair value of investments).
At August 31, 2010, 100% of the fund’s investments were valued based on Level 1 inputs.
62
Industrials Index Fund
D. Distributions are determined on a tax basis and may differ from net investment income and realized capital gains for financial reporting purposes. Differences may be permanent or temporary. Permanent differences are reclassified among capital accounts in the financial statements to reflect their tax character. Temporary differences arise when certain items of income, expense, gain, or loss are recognized in different periods for financial statement and tax purposes; these differences will reverse at some time in the future. Differences in classification may also result from the treatment of short-term gains as ordinary income for tax purposes.
During the year ended August 31, 2010, the fund realized $11,157,000 of net capital gains resulting from in-kind redemptions—in which shareholders exchanged fund shares for securities held by the fund rather than for cash. Because such gains are not taxable to the fund, and are not distributed to shareholders, they have been reclassified from accumulated net realized losses to paid-in capital.
For tax purposes, at August 31, 2010, the fund had $3,535,000 of ordinary income available for distribution. The fund had available capital loss carryforwards totaling $18,693,000 to offset future net capital gains of $18,000 through August 31, 2014, $283,000 through August 31, 2015, $552,000 through August 31, 2016, $4,696,000 through August 31, 2017, and $13,144,000 through August 31, 2018. In addition, the fund realized losses of $5,174,000 during the period from November 1, 2009, through August 31, 2010, which are deferred and will be treated as realized for tax purposes in fiscal 2011.
At August 31, 2010, the cost of investment securities for tax purposes was $385,756,000. Net unrealized depreciation of investment securities for tax purposes was $84,304,000, consisting of unrealized gains of $4,062,000 on securities that had risen in value since their purchase and $88,366,000 in unrealized losses on securities that had fallen in value since their purchase.
E. During the year ended August 31, 2010, the fund purchased $217,689,000 of investment securities and sold $131,678,000 of investment securities, other than temporary cash investments.
F. Capital share transactions for each class of shares were:
| | | | | | |
| | | | | |
| | | | | Year Ended August 31, |
| | | | 2010 | | | 2009 |
| | Amount | Shares | Amount | Shares |
| | ($000) | (000) | ($000) | (000) |
| Admiral Shares | | | | |
| Issued | 2,823 | 97 | 3,309 | 160 |
| Issued in Lieu of Cash Distributions | 54 | 2 | 128 | 6 |
| Redeemed1 | (2,775) | (102) | (4,833) | (231) |
| Net Increase (Decrease)—Admiral Shares | 102 | (3) | (1,396) | (65) |
| ETF Shares | | | | |
| Issued | 187,471 | 3,602 | 77,709 | 1,900 |
| Issued in Lieu of Cash Distributions | — | — | — | — |
| Redeemed1 | (101,940) | (1,900) | (131,819) | (3,100) |
| Net Increase (Decrease)—ETF Shares | 85,531 | 1,702 | (54,110) | (1,200) |
1 Net of redemption fees for fiscal 2010 and 2009 of $22,000 and $42,000, respectively (fund totals).
G. In preparing the financial statements as of August 31, 2010, management considered the impact of subsequent events for potential recognition or disclosure in these financial statements.
63
Information Technology Index Fund
Fund Profile
As of August 31, 2010
| | | |
| Portfolio Characteristics | | |
| | | Target | Broad |
| | Fund | Index1 | Index2 |
| Number of Stocks | 418 | 419 | 2,478 |
| Median Market Cap | $90.2B | $62.8B | $26.3B |
| Price/Earnings Ratio | 15.5x | 15.7x | 15.4x |
| Price/Book Ratio | 2.9x | 2.9x | 1.9x |
| Yield3 | | 1.0% | 2.1% |
| Admiral Shares | 0.6% | | |
| ETF Shares | 0.6% | | |
| Return on Equity | 25.4% | 25.0% | 19.2% |
| Earnings Growth Rate | 18.1% | 17.6% | 6.3% |
| Foreign Holdings | 0.0% | 0.0% | 0.0% |
| Turnover Rate | 9% | — | — |
| Expense Ratio4 | | — | — |
| Admiral Shares | 0.28% | | |
| ETF Shares | 0.25% | | |
| Short-Term Reserves | 0.0% | — | — |
| | |
| Volatility Measures5 | | |
| | Fund Versus | Fund Versus |
| | Spliced Index6 | Broad Index2 |
| R-Squared | 1.00 | 0.87 |
| Beta | 1.00 | 1.11 |
| |
Subindustry Diversification
(% of equity exposure) | |
| |
| |
| Application Software | 5.1% |
| Communications Equipment | 12.2 |
| Computer Hardware | 15.9 |
| Computer Storage & Peripherals | 3.7 |
| Data Processing & Outsourced Services | 6.9 |
| Electronic Components | 1.9 |
| Electronic Equipment & Instruments | 1.1 |
| Electronic Manufacturing Services | 1.3 |
| Internet Software & Services | 9.5 |
| IT Consulting & Other Services | 10.4 |
| Semiconductor Equipment | 2.0 |
| Semiconductors | 12.3 |
| Systems Software | 15.8 |
| Other Information Technology | 1.9 |
| |
| Ten Largest Holdings7 (% of total net assets) |
| |
| Apple Inc. | 10.4% |
| Microsoft Corp. | 8.7 |
| International Business Machines Corp. | 7.4 |
| Cisco Systems Inc. | 5.4 |
| Google Inc. Class A | 5.2 |
| Intel Corp. | 4.6 |
| Hewlett-Packard Co. | 4.2 |
| Oracle Corp. | 4.1 |
| QUALCOMM Inc. | 3.0 |
| EMC Corp. | 1.8 |
| Top Ten | 54.8% |
1 MSCI US IMI/Information Technology 25/50.
2 MSCI US IMI/2500.
3 30-day SEC yield for the fund; annualized dividend yield for the indexes. See the Glossary.
4 The expense ratios shown are from the prospectus dated December 28, 2009, and represent estimated costs for the current fiscal year. For the fiscal year ended August 31, 2010, the expense ratios were 0.24% for the Admiral Shares and 0.24% for the ETF Shares.
5 For an explanation of R-squared, beta, and other terms used here, see the Glossary.
6 Spliced MSCI US IMI/Information Technology 25/50: MSCI US IMI/Information Technology through February 26, 2010; MSCI US IMI/Information Technology 25/50 thereafter.
7 The holdings listed exclude any temporary cash investments and equity index products.
64
Information Technology Index Fund
Performance Summary
All of the returns in this report represent past performance, which is not a guarantee of future results that may be achieved by the fund. (Current performance may be lower or higher than the performance data cited. For performance data current to the most recent month-end, visit our website at vanguard.com/performance.) Note, too, that both investment returns and principal value can fluctuate widely, so an investor’s shares, when sold, could be worth more or less than their original cost. The returns shown do not reflect taxes that a shareholder would pay on fund distributions or on the sale of fund shares.
Cumulative Performance: January 26, 2004–August 31, 2010
Initial Investment of $10,000
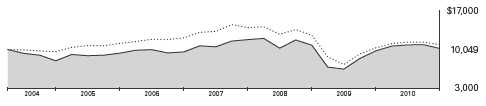
| | | | | |
| | | | |
| | | Average Annual Total Returns | |
| | | | Periods Ended August 31, 2010 | Final Value |
| | | | Since | of a $10,000 |
| | One Year | Five Years | Inception1 | Investment |
| Information Technology Index Fund | | | | |
| ETF Shares Net Asset Value2 | 4.17% | 1.54% | 0.07% | $10,049 |
| Information Technology Index Fund | | | | |
| ETF Shares Market Price | 3.98 | 1.54 | 0.06 | 10,040 |
| MSCI US IMI/2500 | 5.81 | –0.39 | 1.31 | 10,893 |
| Spliced MSCI US | | | | |
| IMI/Information Technology 25/503 | 4.41 | 1.74 | 0.26 | 10,176 |
| | | | |
| | | | | Final Value |
| | | | Since | of a $100,000 |
| | One Year | Five Years | Inception1 | Investment |
| Information Technology Index Fund Admiral Shares4 | 4.17% | 1.52% | 1.74% | $111,750 |
| MSCI US IMI/2500 | 5.81 | –0.39 | 1.93 | 113,068 |
| Spliced MSCI US IMI/Information Technology 25/503 | 4.41 | 1.74 | 1.96 | 113,281 |
1 Performance for the fund and its comparative standards is calculated since the following inception dates: January 26, 2004, for ETF Shares; March 25, 2004, for Admiral Shares.
2 For more information about how the ETF Shares’ market prices have compared with their net asset value, visit Vanguard.com, select your ETF, and then select the Performance tab. The Premium/Discount table there shows the percentages of days on which the ETF Shares’ market price was above or below the NAV.
3 Spliced MSCI US IMI/Information Technology 25/50: MSCI US IMI/Information Technology through February 26, 2010; MSCI US IMI/Information Technology 25/50 thereafter.
4 Total returns do not reflect the 2% fee assessed on redemptions of shares held for less than one year.
See Financial Highlights for dividend and capital gains information.
65
Information Technology Index Fund
Fiscal-Year Total Returns (%): January 26, 2004–August 31, 2010
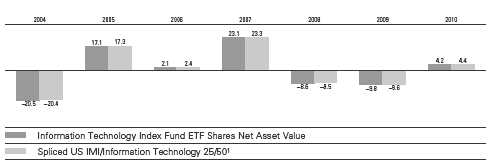
| | | |
| Cumulative Returns: ETF Shares, January 26, 2004–August 31, 2010 | | |
| | | | Cumulative |
| | | | Since |
| | One Year | Five Years | Inception |
| Information Technology Index Fund ETF Shares Market Price | 3.98% | 7.94% | 0.40% |
| Information Technology Index Fund ETF Shares Net Asset Value | 4.17 | 7.96 | 0.49 |
| Spliced MSCI US IMI/Information Technology 25/501 | 4.41 | 9.01 | 1.76 |
Average Annual Total Returns: Periods Ended June 30, 2010
This table presents average annual total returns through the latest calendar quarter—rather than through the end of the fiscal period. Securities and Exchange Commission rules require that we provide this information.
| | | | |
| | | | | Since |
| | Inception Date | One Year | Five Years | Inception |
| ETF Shares | 1/26/2004 | | | |
| Market Price | | 16.79% | 2.63% | 0.10% |
| Net Asset Value | | 16.83 | 2.68 | 0.10 |
| Admiral Shares2 | 3/25/2004 | 16.80 | 2.65 | 1.81 |
1 Spliced MSCI US IMI/Information Technology 25/50: MSCI US IMI/Information Technology through February 26, 2010; MSCI US IMI/Information Technology 25/50 thereafter.
2 Total returns do not reflect the 2% fee assessed on redemptions of shares held for less than one year.
66
Information Technology Index Fund
Financial Statements
Statement of Net Assets
As of August 31, 2010
The fund reports a complete list of its holdings in regulatory filings four times in each fiscal year, at the quarter-ends. For the second and fourth fiscal quarters, the lists appear in the fund’s semiannual and annual reports to shareholders. For the first and third fiscal quarters, the fund files the lists with the Securities and Exchange Commission on Form N-Q. Shareholders can look up the fund’s Forms N-Q on the SEC’s website at sec.gov. Forms N-Q may also be reviewed and copied at the SEC’s Public Reference Room (see the back cover of this report for further information).
| | | |
| | | | Market |
| | | | Value• |
| | | Shares | ($000) |
| Common Stocks (100.1%) | | |
| Communications Equipment (12.2%) | |
| * | Cisco Systems Inc. | 3,182,340 | 63,806 |
| | QUALCOMM Inc. | 914,040 | 35,017 |
| * | Motorola Inc. | 1,230,264 | 9,264 |
| * | Juniper Networks Inc. | 293,172 | 7,974 |
| * | F5 Networks Inc. | 44,659 | 3,904 |
| | Harris Corp. | 72,346 | 3,044 |
| | Tellabs Inc. | 203,944 | 1,448 |
| * | Polycom Inc. | 47,478 | 1,352 |
| * | Riverbed Technology Inc. | 33,871 | 1,299 |
| * | Brocade Communications | | |
| | Systems Inc. | 245,646 | 1,233 |
| * | JDS Uniphase Corp. | 122,703 | 1,128 |
| * | CommScope Inc. | 52,630 | 987 |
| | ADTRAN Inc. | 31,170 | 980 |
| * | Aruba Networks Inc. | 40,928 | 752 |
| | Plantronics Inc. | 27,230 | 744 |
| * | Viasat Inc. | 20,004 | 699 |
| * | ADC | | |
| | Telecommunications Inc. | 54,043 | 685 |
| * | Ciena Corp. | 51,581 | 643 |
| * | InterDigital Inc. | 24,467 | 605 |
| * | Arris Group Inc. | 70,662 | 577 |
| * | Acme Packet Inc. | 16,916 | 568 |
| * | Finisar Corp. | 37,178 | 475 |
| * | Blue Coat Systems Inc. | 23,186 | 437 |
| * | Emulex Corp. | 45,197 | 431 |
| * | Netgear Inc. | 19,616 | 414 |
| * | Infinera Corp. | 49,043 | 414 |
| * | Tekelec | 34,261 | 375 |
| * | EchoStar Corp. Class A | 18,748 | 350 |
| * | Sonus Networks Inc. | 114,928 | 340 |
| * | Loral Space & | | |
| | Communications Inc. | 6,248 | 334 |
| * | Comtech | | |
| | Telecommunications Corp. | 15,890 | 324 |
| * | Harmonic Inc. | 54,005 | 314 |
| * | Oclaro Inc. | 27,006 | 277 |
| | Black Box Corp. | 9,778 | 276 |
| | Sycamore Networks Inc. | 11,089 | 243 |
| * | DG FastChannel Inc. | 14,242 | 226 |
| * | Ixia | 19,676 | 222 |
| * | Oplink Communications Inc. | 11,693 | 184 |
| * | Aviat Networks Inc. | 33,254 | 131 |
| * | Extreme Networks | 47,640 | 130 |
| * | Hughes Communications Inc. | 5,423 | 126 |
| * | Powerwave | | |
| | Technologies Inc. | 73,958 | 126 |
| * | Symmetricom Inc. | 24,444 | 124 |
| * | EMS Technologies Inc. | 8,529 | 124 |
| * | Seachange International Inc. | 15,582 | 121 |
| * | UTStarcom Inc. | 62,288 | 118 |
| * | ShoreTel Inc. | 25,082 | 116 |
| * | Anaren Inc. | 7,779 | 106 |
| * | Digi International Inc. | 13,195 | 100 |
| | Bel Fuse Inc. Class B | 4,746 | 88 |
| | | |
| | | | Market |
| | | | Value• |
| | | Shares | ($000) |
| * | Cogo Group Inc. | 13,994 | 85 |
| | Bel Fuse Inc. Class A | 3,893 | 72 |
| * | BigBand Networks Inc. | 24,494 | 66 |
| * | Opnext Inc. | 30,567 | 42 |
| | | | 144,020 |
| Computers & Peripherals (19.7%) | |
| * | Apple Inc. | 507,032 | 123,396 |
| | Hewlett-Packard Co. | 1,306,722 | 50,283 |
| * | EMC Corp. | 1,145,415 | 20,892 |
| * | Dell Inc. | 981,979 | 11,558 |
| * | NetApp Inc. | 192,040 | 7,766 |
| * | SanDisk Corp. | 128,148 | 4,260 |
| * | Western Digital Corp. | 128,150 | 3,095 |
| * | Seagate Technology PLC | 271,607 | 2,751 |
| * | Lexmark International Inc. | | |
| | Class A | 43,742 | 1,530 |
| * | NCR Corp. | 89,321 | 1,148 |
| | Diebold Inc. | 36,746 | 953 |
| * | QLogic Corp. | 62,146 | 926 |
| * | Netezza Corp. | 27,400 | 533 |
| * | 3PAR Inc. | 15,564 | 500 |
| * | Synaptics Inc. | 18,875 | 499 |
| * | Isilon Systems Inc. | 14,531 | 290 |
| * | Intermec Inc. | 27,538 | 289 |
| * | Electronics for Imaging Inc. | 25,229 | 269 |
| * | Stratasys Inc. | 10,857 | 247 |
| * | Avid Technology Inc. | 21,193 | 235 |
| * | STEC Inc. | 18,371 | 205 |
| * | Compellent | | |
| | Technologies Inc. | 12,381 | 189 |
| * | Quantum Corp. | 113,440 | 163 |
| * | Imation Corp. | 17,015 | 146 |
| * | Super Micro Computer Inc. | 14,284 | 129 |
| * | Intevac Inc. | 12,412 | 117 |
| * | Novatel Wireless Inc. | 17,416 | 101 |
| * | Silicon Graphics | | |
| | International Corp. | 16,237 | 96 |
| | | | 232,566 |
| Electronic Equipment, Instruments & | |
| Components (5.0%) | | |
| | Corning Inc. | 869,679 | 13,637 |
| | Tyco Electronics Ltd. | 252,727 | 6,197 |
| * | Agilent Technologies Inc. | 193,992 | 5,232 |
| | Amphenol Corp. Class A | 96,705 | 3,938 |
| * | Flextronics International Ltd. | 453,920 | 2,238 |
| * | FLIR Systems Inc. | 85,443 | 2,146 |
| * | Avnet Inc. | 84,599 | 1,937 |
| * | Trimble Navigation Ltd. | 67,590 | 1,901 |
| * | Dolby Laboratories Inc. | | |
| | Class A | 29,625 | 1,642 |
| * | Arrow Electronics Inc. | 67,659 | 1,548 |
| * | Ingram Micro Inc. | 92,161 | 1,388 |
| * | Itron Inc. | 22,456 | 1,213 |
| | Jabil Circuit Inc. | 106,989 | 1,097 |
| * | Tech Data Corp. | 28,714 | 1,039 |
| | National Instruments Corp. | 32,397 | 934 |
| * | Vishay Intertechnology Inc. | 96,002 | 738 |
| | | |
| | | | Market |
| | | | Value• |
| | | Shares | ($000) |
| * | Anixter International Inc. | 15,950 | 732 |
| | Molex Inc. Class A | 41,487 | 626 |
| | Molex Inc. | 34,610 | 611 |
| * | Coherent Inc. | 14,080 | 523 |
| * | Plexus Corp. | 22,488 | 518 |
| * | Benchmark Electronics Inc. | 35,127 | 493 |
| * | Littelfuse Inc. | 12,213 | 455 |
| * | L-1 Identity Solutions Inc. | 46,573 | 419 |
| | Cognex Corp. | 20,998 | 409 |
| * | Checkpoint Systems Inc. | 21,998 | 403 |
| * | Power-One Inc. | 39,406 | 401 |
| * | Sanmina-SCI Corp. | 44,299 | 400 |
| * | Scansource Inc. | 14,960 | 373 |
| * | Rofin-Sinar Technologies Inc. | 17,803 | 363 |
| | AVX Corp. | 28,439 | 353 |
| * | Universal Display Corp. | 17,830 | 351 |
| * | DTS Inc. | 9,689 | 340 |
| * | Insight Enterprises Inc. | 25,757 | 338 |
| * | IPG Photonics Corp. | 14,162 | 307 |
| * | Cogent Inc. | 27,457 | 302 |
| * | SYNNEX Corp. | 12,563 | 290 |
| * | TTM Technologies Inc. | 33,032 | 273 |
| * | OSI Systems Inc. | 9,150 | 271 |
| | Park Electrochemical Corp. | 10,887 | 260 |
| | MTS Systems Corp. | 9,107 | 243 |
| * | Rogers Corp. | 8,792 | 236 |
| * | Brightpoint Inc. | 35,327 | 211 |
| * | China Security & | | |
| | Surveillance | | |
| | Technology Inc. | 37,473 | 202 |
| * | Newport Corp. | 20,418 | 193 |
| | Methode Electronics Inc. | 20,746 | 185 |
| | Daktronics Inc. | 19,448 | 179 |
| * | Electro Scientific | | |
| | Industries Inc. | 15,415 | 167 |
| * | FARO Technologies Inc. | 8,540 | 157 |
| | CTS Corp. | 18,934 | 152 |
| * | Maxwell Technologies Inc. | 13,247 | 149 |
| * | Echelon Corp. | 17,252 | 131 |
| * | SMART Modular | | |
| | Technologies WWH Inc. | 26,081 | 122 |
| * | Multi-Fineline Electronix Inc. | 5,688 | 119 |
| | Electro Rent Corp. | 9,340 | 110 |
| * | Comverge Inc. | 13,308 | 88 |
| | Technitrol Inc. | 21,831 | 81 |
| * | CPI International Inc. | 4,198 | 59 |
| * | Agilysys Inc. | 12,869 | 56 |
| * | ICx Technologies Inc. | 6,805 | 52 |
| | | | 59,528 |
| Internet Software & Services (9.5%) | |
| * | Google Inc. Class A | 136,853 | 61,587 |
| * | eBay Inc. | 655,808 | 15,241 |
| * | Yahoo! Inc. | 733,189 | 9,590 |
| * | Akamai Technologies Inc. | 95,907 | 4,419 |
| * | VeriSign Inc. | 102,219 | 2,978 |
| * | Equinix Inc. | 24,361 | 2,222 |
| * | WebMD Health Corp. | 29,832 | 1,520 |
| * | IAC/InterActiveCorp | 55,564 | 1,377 |
| * | AOL Inc. | 59,466 | 1,321 |
| * | Rackspace Hosting Inc. | 51,973 | 1,023 |
| * | MercadoLibre Inc. | 14,752 | 973 |
| * | Sohu.com Inc. | 16,857 | 818 |
| * | VistaPrint NV | 24,250 | 744 |
| * | Monster Worldwide Inc. | 66,762 | 736 |
| * | GSI Commerce Inc. | 31,149 | 709 |
| * | Digital River Inc. | 22,077 | 582 |
| * | j2 Global | | |
| | Communications Inc. | 25,172 | 543 |
| | Earthlink Inc. | 60,133 | 515 |
67
Information Technology Index Fund
| | | |
| | | | Market |
| | | | Value• |
| | | Shares | ($000) |
| * | ValueClick Inc. | 45,315 | 494 |
| * | OpenTable Inc. | 7,604 | 405 |
| * | SAVVIS Inc. | 19,881 | 348 |
| * | DealerTrack Holdings Inc. | 21,335 | 315 |
| * | Art Technology Group Inc. | 87,490 | 305 |
| * | Constant Contact Inc. | 15,965 | 283 |
| * | LogMeIn Inc. | 7,686 | 252 |
| | United Online Inc. | 48,552 | 239 |
| * | comScore Inc. | 12,093 | 220 |
| | NIC Inc. | 30,050 | 218 |
| * | Terremark Worldwide Inc. | 23,545 | 197 |
| * | LoopNet Inc. | 16,302 | 172 |
| * | Internet Capital Group Inc. | 20,306 | 171 |
| * | Move Inc. | 86,892 | 163 |
| * | Vocus Inc. | 10,258 | 152 |
| * | Internet Brands Inc. Class A | 14,409 | 149 |
| * | ModusLink Global | | |
| | Solutions Inc. | 24,681 | 143 |
| * | Perficient Inc. | 16,216 | 141 |
| * | Infospace Inc. | 19,970 | 140 |
| * | DivX Inc. | 17,410 | 134 |
| * | RealNetworks Inc. | 48,986 | 132 |
| * | Knot Inc. | 15,991 | 113 |
| * | Internap Network | | |
| | Services Corp. | 25,985 | 107 |
| * | Liquidity Services Inc. | 8,276 | 107 |
| * | Limelight Networks Inc. | 24,588 | 97 |
| * | Stamps.com Inc. | 5,971 | 68 |
| * | Dice Holdings Inc. | 10,487 | 66 |
| | Marchex Inc. Class B | 10,189 | 41 |
| * | TechTarget Inc. | 8,281 | 37 |
| * | Archipelago Learning Inc. | 1,535 | 16 |
| | | | 112,323 |
| IT Services (17.3%) | | |
| | International Business | | |
| | Machines Corp. | 714,544 | 88,053 |
| | Visa Inc. Class A | 275,819 | 19,026 |
| | Accenture PLC Class A | 354,955 | 12,991 |
| | Mastercard Inc. Class A | 55,580 | 11,025 |
| | Automatic Data | | |
| | Processing Inc. | 280,272 | 10,821 |
| * | Cognizant Technology | | |
| | Solutions Corp. Class A | 166,886 | 9,613 |
| | Western Union Co. | 374,529 | 5,873 |
| | Paychex Inc. | 181,250 | 4,511 |
| * | Fiserv Inc. | 85,036 | 4,254 |
| | Fidelity National Information | | |
| | Services Inc. | 138,737 | 3,585 |
| | Computer Sciences Corp. | 85,944 | 3,421 |
| * | SAIC Inc. | 215,462 | 3,206 |
| * | Teradata Corp. | 92,999 | 3,045 |
| * | Hewitt Associates Inc. | | |
| | Class A | 49,198 | 2,375 |
| | Global Payments Inc. | 45,472 | 1,711 |
| * | Alliance Data Systems Corp. | 29,727 | 1,670 |
| | Broadridge Financial | | |
| | Solutions Inc. | 75,884 | 1,620 |
| | Lender Processing | | |
| | Services Inc. | 52,834 | 1,550 |
| | Total System Services Inc. | 93,495 | 1,328 |
| * | Gartner Inc. | 42,877 | 1,230 |
| * | VeriFone Systems Inc. | 46,659 | 1,128 |
| * | NeuStar Inc. Class A | 41,776 | 925 |
| | CoreLogic Inc. | 51,796 | 895 |
| | DST Systems Inc. | 20,824 | 848 |
| * | Genpact Ltd. | 54,870 | 768 |
| * | Convergys Corp. | 68,909 | 698 |
| * | CACI International Inc. | | |
| | Class A | 16,847 | 688 |
| | | |
| | | | Market |
| | | | Value• |
| | | Shares | ($000) |
| * | Wright Express Corp. | 20,533 | 659 |
| | Sapient Corp. | 59,818 | 624 |
| | Syntel Inc. | 13,885 | 535 |
| * | Unisys Corp. | 23,563 | 527 |
| * | Acxiom Corp. | 42,181 | 523 |
| | MAXIMUS Inc. | 9,731 | 523 |
| * | SRA International Inc. | | |
| | Class A | 24,432 | 470 |
| * | Mantech International Corp. | | |
| | Class A | 12,763 | 452 |
| * | Euronet Worldwide Inc. | 25,532 | 360 |
| * | CSG Systems | | |
| | International Inc. | 18,975 | 347 |
| | Heartland Payment | | |
| | Systems Inc. | 21,081 | 298 |
| * | Forrester Research Inc. | 8,792 | 270 |
| | iGate Corp. | 16,943 | 266 |
| * | RightNow Technologies Inc. | 13,367 | 224 |
| * | TNS Inc. | 14,523 | 218 |
| * | TeleTech Holdings Inc. | 17,131 | 217 |
| | Cass Information | | |
| | Systems Inc. | 5,650 | 185 |
| * | ExlService Holdings Inc. | 8,126 | 135 |
| * | Global Cash Access | | |
| | Holdings Inc. | 29,345 | 106 |
| * | Ciber Inc. | 36,631 | 100 |
| * | Ness Technologies Inc. | 21,320 | 91 |
| * | China Information | | |
| | Technology Inc. | 17,320 | 88 |
| * | NCI Inc. Class A | 4,222 | 81 |
| * | Echo Global Logistics Inc. | 6,076 | 76 |
| * | Integral Systems Inc. | 9,755 | 66 |
| | | | 204,299 |
| Office Electronics (0.6%) | | |
| | Xerox Corp. | 768,422 | 6,485 |
| * | Zebra Technologies Corp. | 32,168 | 921 |
| | | | 7,406 |
| Semiconductors & Semiconductor | |
| Equipment (14.3%) | | |
| | Intel Corp. | 3,100,345 | 54,938 |
| | Texas Instruments Inc. | 681,042 | 15,684 |
| | Applied Materials Inc. | 748,490 | 7,777 |
| | Broadcom Corp. Class A | 245,564 | 7,360 |
| * | Marvell Technology | | |
| | Group Ltd. | 305,253 | 4,866 |
| | Analog Devices Inc. | 166,249 | 4,635 |
| | Altera Corp. | 168,904 | 4,167 |
| * | First Solar Inc. | 30,892 | 3,950 |
| | Xilinx Inc. | 152,597 | 3,685 |
| | Linear Technology Corp. | 124,893 | 3,578 |
| * | Micron Technology Inc. | 498,394 | 3,222 |
| * | Cree Inc. | 56,898 | 3,046 |
| * | NVIDIA Corp. | 318,839 | 2,975 |
| | Microchip Technology Inc. | 102,658 | 2,843 |
| | Maxim Integrated | | |
| | Products Inc. | 168,474 | 2,674 |
| | KLA-Tencor Corp. | 94,723 | 2,653 |
| * | Lam Research Corp. | 70,506 | 2,546 |
| * | Advanced Micro | | |
| | Devices Inc. | 318,927 | 1,792 |
| * | Skyworks Solutions Inc. | 98,511 | 1,759 |
| | National | | |
| | Semiconductor Corp. | 132,651 | 1,673 |
| * | Atmel Corp. | 257,191 | 1,492 |
| * | ON Semiconductor Corp. | 239,437 | 1,480 |
| * | LSI Corp. | 364,204 | 1,464 |
| * | MEMC Electronic | | |
| | Materials Inc. | 126,719 | 1,304 |
| * | Novellus Systems Inc. | 53,520 | 1,247 |
| | | |
| | | | Market |
| | | | Value• |
| | | Shares | ($000) |
| * | Avago Technologies Ltd. | 60,003 | 1,209 |
| * | Rambus Inc. | 63,813 | 1,138 |
| * | Varian Semiconductor | | |
| | Equipment Associates Inc. | 41,563 | 1,032 |
| * | Atheros | | |
| | Communications Inc. | 39,388 | 971 |
| * | Silicon Laboratories Inc. | 24,354 | 929 |
| * | Cypress | | |
| | Semiconductor Corp. | 86,785 | 919 |
| * | Teradyne Inc. | 100,432 | 902 |
| * | PMC - Sierra Inc. | 127,781 | 884 |
| * | Netlogic Microsystems Inc. | 31,403 | 758 |
| * | Veeco Instruments Inc. | 22,436 | 746 |
| * | International Rectifier Corp. | 39,378 | 723 |
| * | RF Micro Devices Inc. | 142,084 | 693 |
| | Intersil Corp. Class A | 68,924 | 689 |
| * | Microsemi Corp. | 46,253 | 648 |
| * | TriQuint Semiconductor Inc. | 86,482 | 601 |
| * | Omnivision Technologies Inc. | 29,016 | 595 |
| * | Hittite Microwave Corp. | 13,576 | 578 |
| * | Semtech Corp. | 34,598 | 574 |
| * | Fairchild Semiconductor | | |
| | International Inc. Class A | 69,990 | 541 |
| * | Cirrus Logic Inc. | 35,555 | 538 |
| * | Cavium Networks Inc. | 19,775 | 477 |
| * | Cymer Inc. | 15,926 | 469 |
| * | Integrated Device | | |
| | Technology Inc. | 90,505 | 463 |
| * | MKS Instruments Inc. | 26,518 | 458 |
| | Power Integrations Inc. | 15,594 | 427 |
| * | Tessera Technologies Inc. | 27,977 | 425 |
| * | Cabot Microelectronics Corp. | 13,169 | 394 |
| * | Applied Micro Circuits Corp. | 36,475 | 393 |
| * | FEI Co. | 21,170 | 353 |
| * | Monolithic Power | | |
| | Systems Inc. | 20,230 | 332 |
| * | Volterra Semiconductor Corp. | 16,037 | 322 |
| * | Amkor Technology Inc. | 61,426 | 311 |
| * | SunPower Corp. Class A | 28,460 | 308 |
| * | Advanced Energy | | |
| | Industries Inc. | 20,448 | 288 |
| * | Diodes Inc. | 19,551 | 288 |
| * | Entegris Inc. | 72,844 | 280 |
| * | GT Solar International Inc. | 36,062 | 279 |
| * | Verigy Ltd. | 33,081 | 277 |
| * | Lattice Semiconductor Corp. | 64,605 | 268 |
| * | Brooks Automation Inc. | 36,215 | 245 |
| *,^ | Rubicon Technology Inc. | 9,876 | 242 |
| * | Zoran Corp. | 28,555 | 231 |
| * | Standard Microsystems Corp. | 12,490 | 226 |
| * | SunPower Corp. Class B | 21,720 | 225 |
| * | ATMI Inc. | 17,546 | 224 |
| | Micrel Inc. | 24,366 | 215 |
| * | Kulicke & Soffa | | |
| | Industries Inc. | 37,119 | 213 |
| * | Ultratech Inc. | 12,672 | 210 |
| * | Actel Corp. | 14,623 | 209 |
| * | FormFactor Inc. | 26,469 | 186 |
| * | Silicon Image Inc. | 42,700 | 155 |
| * | Anadigics Inc. | 36,340 | 146 |
| | Cohu Inc. | 12,472 | 143 |
| * | Sigma Designs Inc. | 14,733 | 140 |
| * | Supertex Inc. | 6,127 | 135 |
| * | Rudolph Technologies Inc. | 16,509 | 130 |
| * | IXYS Corp. | 13,093 | 124 |
| * | Pericom | | |
| | Semiconductor Corp. | 14,125 | 119 |
| * | Energy Conversion | | |
| | Devices Inc. | 25,500 | 115 |
68
Information Technology Index Fund
| | | |
| | | | Market |
| | | | Value• |
| | | Shares | ($000) |
| * | Exar Corp. | 20,764 | 113 |
| * | Kopin Corp. | 37,112 | 104 |
| * | DSP Group Inc. | 12,897 | 87 |
| * | Evergreen Solar Inc. | 110,130 | 74 |
| * | Advanced Analogic | | |
| | Technologies Inc. | 22,763 | 74 |
| * | Conexant Systems Inc. | 45,238 | 67 |
| * | Trident Microsystems Inc. | 39,257 | 60 |
| * | Mattson Technology Inc. | 27,877 | 58 |
| | | | 169,560 |
| Software (21.5%) | | |
| | Microsoft Corp. | 4,395,009 | 103,195 |
| | Oracle Corp. | 2,237,370 | 48,954 |
| * | Adobe Systems Inc. | 293,330 | 8,143 |
| * | Intuit Inc. | 166,279 | 7,117 |
| * | Salesforce.com Inc. | 64,543 | 7,092 |
| * | Symantec Corp. | 445,152 | 6,067 |
| * | Citrix Systems Inc. | 103,501 | 5,997 |
| | CA Inc. | 229,408 | 4,132 |
| * | McAfee Inc. | 86,935 | 4,090 |
| * | BMC Software Inc. | 101,147 | 3,647 |
| * | Red Hat Inc. | 105,115 | 3,632 |
| * | Autodesk Inc. | 127,820 | 3,547 |
| | Activision Blizzard Inc. | 311,905 | 3,334 |
| * | VMware Inc. Class A | 39,217 | 3,081 |
| * | Electronic Arts Inc. | 183,700 | 2,800 |
| * | Rovi Corp. | 56,867 | 2,474 |
| * | ANSYS Inc. | 50,432 | 1,956 |
| * | Synopsys Inc. | 83,471 | 1,911 |
| * | Nuance | | |
| | Communications Inc. | 129,819 | 1,906 |
| | Factset Research | | |
| | Systems Inc. | 24,691 | 1,816 |
| * | MICROS Systems Inc. | 44,746 | 1,705 |
| * | Informatica Corp. | 51,171 | 1,646 |
| | Solera Holdings Inc. | 39,285 | 1,559 |
| * | TIBCO Software Inc. | 92,575 | 1,341 |
| * | Concur Technologies Inc. | 23,623 | 1,105 |
| * | Parametric | | |
| | Technology Corp. | 64,683 | 1,103 |
| * | Novell Inc. | 194,104 | 1,091 |
| | Jack Henry & | | |
| | Associates Inc. | 45,169 | 1,063 |
| * | Cadence Design | | |
| | Systems Inc. | 150,607 | 1,024 |
| * | Compuware Corp. | 125,387 | 900 |
| * | Ariba Inc. | 50,085 | 775 |
| * | Quest Software Inc. | 34,895 | 748 |
| * | Progress Software Corp. | 23,498 | 628 |
| * | Blackboard Inc. | 18,071 | 598 |
| * | Lawson Software Inc. | 76,591 | 582 |
| | Fair Isaac Corp. | 25,442 | 570 |
| * | CommVault Systems Inc. | 22,850 | 561 |
| * | SuccessFactors Inc. | 26,223 | 553 |
| * | ArcSight Inc. | 14,197 | 545 |
| * | Mentor Graphics Corp. | 59,449 | 540 |
| * | AsiaInfo-Linkage Inc. | 29,669 | 530 |
| | Blackbaud Inc. | 24,969 | 520 |
| * | Taleo Corp. Class A | 19,939 | 511 |
| * | JDA Software Group Inc. | 22,062 | 507 |
| * | TiVo Inc. | 64,342 | 506 |
| * | Websense Inc. | 24,072 | 468 |
| | | |
| | | | Market |
| | | | Value• |
| | | Shares | ($000) |
| * | Advent Software Inc. | 9,334 | 464 |
| * | Ultimate Software Group Inc. | 13,194 | 434 |
| * | Fortinet Inc. | 20,671 | 421 |
| * | MicroStrategy Inc. Class A | 5,063 | 394 |
| * | Take-Two Interactive | | |
| | Software Inc. | 47,113 | 392 |
| * | Sourcefire Inc. | 14,544 | 369 |
| * | Ebix Inc. | 19,525 | 364 |
| * | ACI Worldwide Inc. | 18,950 | 360 |
| * | Manhattan Associates Inc. | 12,652 | 329 |
| * | Radiant Systems Inc. | 16,087 | 288 |
| * | Tyler Technologies Inc. | 16,581 | 287 |
| * | Netscout Systems Inc. | 16,315 | 258 |
| * | Net 1 UEPS | | |
| | Technologies Inc. | 21,492 | 247 |
| * | SolarWinds Inc. | 17,045 | 246 |
| * | Bottomline Technologies Inc. | 16,672 | 234 |
| | EPIQ Systems Inc. | 17,346 | 216 |
| * | Epicor Software Corp. | 31,657 | 215 |
| | Pegasystems Inc. | 9,283 | 203 |
| * | NetSuite Inc. | 10,585 | 201 |
| * | Synchronoss | | |
| | Technologies Inc. | 11,332 | 175 |
| * | S1 Corp. | 28,852 | 140 |
| * | THQ Inc. | 37,651 | 134 |
| * | Smith Micro Software Inc. | 17,190 | 131 |
| * | DemandTec Inc. | 16,691 | 124 |
| * | Kenexa Corp. | 10,701 | 119 |
| | Opnet Technologies Inc. | 7,530 | 119 |
| * | Interactive Intelligence Inc. | 7,290 | 109 |
| * | Rosetta Stone Inc. | 6,230 | 106 |
| * | TeleCommunication | | |
| | Systems Inc. Class A | 33,510 | 103 |
| * | VASCO Data Security | | |
| | International Inc. | 16,772 | 100 |
| * | Monotype Imaging | | |
| | Holdings Inc. | 12,661 | 94 |
| * | PROS Holdings Inc. | 10,873 | 86 |
| * | Deltek Inc. | 9,385 | 67 |
| * | FalconStor Software Inc. | 19,007 | 60 |
| | Renaissance Learning Inc. | 5,717 | 46 |
| * | China TransInfo | | |
| | Technology Corp. | 5,626 | 35 |
| | | | 254,240 |
| Total Common Stocks | | |
| (Cost $1,267,078) | | 1,183,942 |
| Temporary Cash Investment (0.0%) | |
| Money Market Fund (0.0%) | | |
| 1,2 | Vanguard Market | | |
| | Liquidity Fund, 0.288% | | |
| | (Cost $39) | 39,001 | 39 |
| Total Investments (100.1%) | | |
| (Cost $1,267,117) | | 1,183,981 |
| Other Assets and Liabilities (–0.1%) | |
| Other Assets | | 33,099 |
| Liabilities2 | | (33,830) |
| | | | (731) |
| Net Assets (100%) | | 1,183,250 |
| |
| At August 31, 2010, net assets consisted of: |
| | Amount |
| | ($000) |
| Paid-in Capital | 1,318,705 |
| Undistributed Net Investment Income | 5,176 |
| Accumulated Net Realized Losses | (57,495) |
| Unrealized Appreciation (Depreciation) | (83,136) |
| Net Assets | 1,183,250 |
| |
| |
| Admiral Shares—Net Assets | |
| Applicable to 1,828,166 outstanding | |
| $.001 par value shares of beneficial | |
| interest (unlimited authorization) | 46,244 |
| Net Asset Value Per Share— | |
| Admiral Shares | $25.30 |
| |
| |
| ETF Shares—Net Assets | |
| Applicable to 23,016,155 outstanding | |
| $.001 par value shares of beneficial | |
| interest (unlimited authorization) | 1,137,006 |
| Net Asset Value Per Share— | |
| ETF Shares | $49.40 |
• See Note A in Notes to Financial Statements.
* Non-income-producing security.
^ Part of security position is on loan to broker-dealers. The total value of securities on loan is $37,000.
1 Affiliated money market fund available only to Vanguard funds and certain trusts and accounts managed by Vanguard. Rate shown is the 7-day yield.
2 Includes $39,000 of collateral received for securities on loan.
See accompanying Notes, which are an integral part of the Financial Statements.
69
Information Technology Index Fund
| |
| Statement of Operations |
| |
| | |
| Year Ended |
| August 31, 2010 |
| | ($000) |
| Investment Income | |
| Income | |
| Dividends | 9,751 |
| Interest1 | 1 |
| Security Lending | 5 |
| Total Income | 9,757 |
| Expenses | |
| The Vanguard Group—Note B | |
| Investment Advisory Services | 124 |
| Management and Administrative— | |
| Admiral Shares | 90 |
| Management and Administrative— | |
| ETF Shares | 1,895 |
| Marketing and Distribution— | |
| Admiral Shares | 8 |
| Marketing and Distribution— | |
| ETF Shares | 259 |
| Custodian Fees | 44 |
| Auditing Fees | 26 |
| Shareholders’ Reports—Admiral Shares | — |
| Shareholders’ Reports—ETF Shares | 58 |
| Trustees’ Fees and Expenses | 2 |
| Total Expenses | 2,506 |
| Net Investment Income | 7,251 |
| Realized Net Gain (Loss) on | |
| Investment Securities Sold | 15,125 |
| Change in Unrealized Appreciation | |
| (Depreciation) of Investment Securities | (37,393) |
| Net Increase (Decrease) in Net Assets | |
| Resulting from Operations | (15,017) |
| | | |
| Statement of Changes in Net Assets | | |
| |
| | |
| | Year Ended August 31, |
| | 2010 | 2009 |
| | ($000) | ($000) |
| Increase (Decrease) in Net Assets | | |
| Operations | | |
| Net Investment Income | 7,251 | 3,610 |
| Realized Net Gain (Loss) | 15,125 | (27,908) |
| Change in Unrealized Appreciation (Depreciation) | (37,393) | 5,476 |
| Net Increase (Decrease) in Net Assets Resulting from Operations | (15,017) | (18,822) |
| Distributions | | |
| Net Investment Income | | |
| Admiral Shares | (165) | (133) |
| ETF Shares | (4,304) | (3,037) |
| Realized Capital Gain | | |
| Admiral Shares | — | — |
| ETF Shares | — | — |
| Total Distributions | (4,469) | (3,170) |
| Capital Share Transactions | | |
| Admiral Shares | 13,740 | 7,447 |
| ETF Shares | 517,008 | 163,810 |
| Net Increase (Decrease) from Capital Share Transactions | 530,748 | 171,257 |
| Total Increase (Decrease) | 511,262 | 149,265 |
| Net Assets | | |
| Beginning of Period | 671,988 | 522,723 |
| End of Period2 | 1,183,250 | 671,988 |
1 Interest income from an affiliated company of the fund was $1,000.
2 Net Assets—End of Period includes undistributed net investment income of $5,176,000 and $2,394,000.
See accompanying Notes, which are an integral part of the Financial Statements.
70
Information Technology Index Fund
| | | | | | |
| Financial Highlights | | | | | |
| |
| Admiral Shares | | | | | |
| |
| For a Share Outstanding | | | | | Year Ended August 31, |
| Throughout Each Period | 2010 | 2009 | 2008 | 2007 | 2006 |
| Net Asset Value, Beginning of Period | $24.39 | $27.28 | $29.95 | $24.40 | $23.93 |
| Investment Operations | | | | | |
| Net Investment Income | .146 | .1631 | .121 | .1101 | .0841 |
| Net Realized and Unrealized Gain (Loss) | | | | | |
| on Investments | .882 | (2.897) | (2.706) | 5.500 | .424 |
| Total from Investment Operations | 1.028 | (2.734) | (2.585) | 5.610 | .508 |
| Distributions | | | | | |
| Dividends from Net Investment Income | (.118) | (.156) | (.085) | (.060) | (.038) |
| Distributions from Realized Capital Gains | — | — | — | — | — |
| Total Distributions | (.118) | (.156) | (.085) | (.060) | (.038) |
| Net Asset Value, End of Period | $25.30 | $24.39 | $27.28 | $29.95 | $24.40 |
| |
| Total Return2 | 4.17% | –9.79% | –8.67% | 23.02% | 2.12% |
| |
| Ratios/Supplemental Data | | | | | |
| Net Assets, End of Period (Millions) | $46 | $33 | $26 | $12 | $5 |
| Ratio of Total Expenses to | | | | | |
| Average Net Assets | 0.24% | 0.28% | 0.25% | 0.26% | 0.28% |
| Ratio of Net Investment Income to | | | | | |
| Average Net Assets | 0.69% | 0.82% | 0.46% | 0.38% | 0.33% |
| Portfolio Turnover Rate3 | 9% | 12% | 11% | 8% | 8% |
1 Calculated based on average shares outstanding.
2 Total returns do not include transaction fees that may have applied in the periods shown. Fund prospectuses provide information about any applicable transaction fees.
3 Excludes the value of portfolio securities received or delivered as a result of in-kind purchases or redemptions of the fund’s capital shares, including ETF Creation Units.
| | | | | | |
| ETF Shares | | | | | |
| |
| For a Share Outstanding | | | | | Year Ended August 31, |
| Throughout Each Period | 2010 | 2009 | 2008 | 2007 | 2006 |
| Net Asset Value, Beginning of Period | $47.64 | $53.32 | $58.52 | $47.66 | $46.76 |
| Investment Operations | | | | | |
| Net Investment Income | .296 | .3311 | .249 | .2311 | .1751 |
| Net Realized and Unrealized Gain (Loss) | | | | | |
| on Investments | 1.714 | (5.685) | (5.274) | 10.765 | .816 |
| Total from Investment Operations | 2.010 | (5.354) | (5.025) | 10.996 | .991 |
| Distributions | | | | | |
| Dividends from Net Investment Income | (.250) | (.326) | (.175) | (.136) | (.091) |
| Distributions from Realized Capital Gains | — | — | — | — | — |
| Total Distributions | (.250) | (.326) | (.175) | (.136) | (.091) |
| Net Asset Value, End of Period | $49.40 | $47.64 | $53.32 | $58.52 | $47.66 |
| |
| Total Return | 4.17% | –9.78% | –8.62% | 23.10% | 2.11% |
| |
| Ratios/Supplemental Data | | | | | |
| Net Assets, End of Period (Millions) | $1,137 | $639 | $497 | $439 | $172 |
| Ratio of Total Expenses to | | | | | |
| Average Net Assets | 0.24% | 0.25% | 0.20% | 0.22% | 0.25% |
| Ratio of Net Investment Income to | | | | | |
| Average Net Assets | 0.69% | 0.85% | 0.51% | 0.42% | 0.36% |
| Portfolio Turnover Rate2 | 9% | 12% | 11% | 8% | 8% |
1 Calculated based on average shares outstanding.
2 Excludes the value of portfolio securities received or delivered as a result of in-kind purchases or redemptions of the fund’s capital shares, including ETF Creation Units.
See accompanying Notes, which are an integral part of the Financial Statements.
71
Information Technology Index Fund
Notes to Financial Statements
Vanguard Information Technology Index Fund is registered under the Investment Company Act of 1940 as an open-end investment company, or mutual fund. The fund offers two classes of shares: Admiral Shares and ETF Shares. Admiral Shares are designed for investors who meet certain administrative, service, and account-size criteria. ETF Shares are listed for trading on the NYSE Arca, Inc.; they can be purchased and sold through a broker.
A. The following significant accounting policies conform to generally accepted accounting principles for U.S. mutual funds. The fund consistently follows such policies in preparing its financial statements.
1. Security Valuation: Securities are valued as of the close of trading on the New York Stock Exchange (generally 4 p.m., Eastern time) on the valuation date. Equity securities are valued at the latest quoted sales prices or official closing prices taken from the primary market in which each security trades; such securities not traded on the valuation date are valued at the mean of the latest quoted bid and asked prices. Securities for which market quotations are not readily available, or whose values have been materially affected by events occurring before the fund’s pricing time but after the close of the securities’ primary markets, are valued by methods deemed by the board of trustees to represent fair value. Investments in Vanguard Market Liquidity Fund are valued at that fund’s net asset value.
2. Federal Income Taxes: The fund intends to continue to qualify as a regulated investment company and distribute all of its taxable income. Management has analyzed the fund’s tax positions taken for all open federal income tax years (August 31, 2007–2010), and has concluded that no provision for federal income tax is required in the fund’s financial statements.
3. Distributions: Distributions to shareholders are recorded on the ex-dividend date.
4. Security Lending: The fund may lend its securities to qualified institutional borrowers to earn additional income. Security loans are required to be secured at all times by collateral at least equal to the market value of securities loaned. The fund invests cash collateral received in Vanguard Market Liquidity Fund, and records a liability for the return of the collateral, during the period the securities are on loan. Security lending income represents the income earned on investing cash collateral, less expenses associated with the loan.
5. Other: Dividend income is recorded on the ex-dividend date. Interest income includes income distributions received from Vanguard Market Liquidity Fund and is accrued daily. Security transactions are accounted for on the date securities are bought or sold. Costs used to determine realized gains (losses) on the sale of investment securities are those of the specific securities sold. Fees assessed on redemptions of capital shares are credited to paid-in capital.
Each class of shares has equal rights as to assets and earnings, except that each class separately bears certain class-specific expenses related to maintenance of shareholder accounts (included in Management and Administrative expenses) and shareholder reporting. Marketing and distribution expenses are allocated to each class of shares based on a method approved by the board of trustees. Income, other non-class-specific expenses, and gains and losses on investments are allocated to each class of shares based on its relative net assets.
B. The Vanguard Group furnishes at cost investment advisory, corporate management, administrative, marketing, and distribution services. The costs of such services are allocated to the fund under methods approved by the board of trustees. The fund has committed to provide up to 0.40% of its net assets in capital contributions to Vanguard. At August 31, 2010, the fund had contributed capital of $230,000 to Vanguard (included in Other Assets), representing 0.02% of the fund’s net assets and 0.09% of Vanguard’s capitalization. The fund’s trustees and officers are also directors and officers of Vanguard.
C. Various inputs may be used to determine the value of the fund’s investments. These inputs are summarized in three broad levels for financial statement purposes. The inputs or methodologies used to value securities are not necessarily an indication of the risk associated with investing in those securities.
Level 1—Quoted prices in active markets for identical securities.
Level 2—Other significant observable inputs (including quoted prices for similar securities, interest rates, prepayment speeds, credit risk, etc.).
Level 3—Significant unobservable inputs (including the fund’s own assumptions used to determine the fair value of investments).
At August 31, 2010, 100% of the fund’s investments were valued based on Level 1 inputs.
72
Information Technology Index Fund
D. Distributions are determined on a tax basis and may differ from net investment income and realized capital gains for financial reporting purposes. Differences may be permanent or temporary. Permanent differences are reclassified among capital accounts in the financial statements to reflect their tax character. Temporary differences arise when certain items of income, expense, gain, or loss are recognized in different periods for financial statement and tax purposes; these differences will reverse at some time in the future. Differences in classification may also result from the treatment of short-term gains as ordinary income for tax purposes.
During the year ended August 31, 2010, the fund realized $36,387,000 of net capital gains resulting from in-kind redemptions—in which shareholders exchanged fund shares for securities held by the fund rather than for cash. Because such gains are not taxable to the fund, and are not distributed to shareholders, they have been reclassified from accumulated net realized losses to paid-in capital.
For tax purposes, at August 31, 2010, the fund had $5,867,000 of ordinary income available for distribution. The fund had available capital loss carryforwards totaling $35,142,000 to offset future net capital gains of $63,000 through August 31, 2013, $188,000 through August 31, 2014, $612,000 through August 31, 2015, $218,000 through August 31, 2016, $14,013,000 through August 31, 2017, and $20,048,000 through August 31, 2018. In addition, the fund realized losses of $21,593,000 during the period from November 1, 2009, through August 31, 2010, which are deferred and will be treated as realized for tax purposes in fiscal 2011.
At August 31, 2010, the cost of investment securities for tax purposes was $1,267,877,000. Net unrealized depreciation of investment securities for tax purposes was $83,896,000, consisting of unrealized gains of $67,518,000 on securities that had risen in value since their purchase and $151,414,000 in unrealized losses on securities that had fallen in value since their purchase.
E. During the year ended August 31, 2010, the fund purchased $731,928,000 of investment securities and sold $197,791,000 of investment securities, other than temporary cash investments.
F. Capital share transactions for each class of shares were:
| | | | | | |
| | Year Ended August 31, |
| | | 2010 | | | 2009 |
| | Amount | Shares | Amount | Shares |
| | ($000) | (000) | ($000) | (000) |
| Admiral Shares | | | | |
| Issued | 21,910 | 790 | 14,130 | 714 |
| Issued in Lieu of Cash Distributions | 152 | 5 | 116 | 7 |
| Redeemed1 | (8,322) | (312) | (6,799) | (333) |
| Net Increase (Decrease)—Admiral Shares | 13,740 | 483 | 7,447 | 388 |
| ETF Shares | | | | |
| Issued | 625,414 | 11,700 | 264,940 | 6,802 |
| Issued in Lieu of Cash Distributions | — | — | — | — |
| Redeemed1 | (108,406) | (2,100) | (101,130) | (2,700) |
| Net Increase (Decrease)—ETF Shares | 517,008 | 9,600 | 163,810 | 4,102 |
1 Net of redemption fees for fiscal 2010 and 2009 of $51,000 and $74,000, respectively (fund totals).
G. In preparing the financial statements as of August 31, 2010, management considered the impact of subsequent events for potential recognition or disclosure in these financial statements.
73
Materials Index Fund
Fund Profile
As of August 31, 2010
| | | |
| Portfolio Characteristics | | |
| | | Target | Broad |
| | Fund | Index1 | Index2 |
| Number of Stocks | 130 | 130 | 2,478 |
| Median Market Cap | $10.9B | $10.9B | $26.3B |
| Price/Earnings Ratio | 17.8x | 17.9x | 15.4x |
| Price/Book Ratio | 2.3x | 2.3x | 1.9x |
| Yield3 | | 1.9% | 2.1% |
| Admiral Shares | 1.4% | | |
| ETF Shares | 1.4% | | |
| Return on Equity | 19.0% | 19.0% | 19.2% |
| Earnings Growth Rate | 10.3% | 10.2% | 6.3% |
| Foreign Holdings | 0.0% | 0.0% | 0.0% |
| Turnover Rate | 10% | — | — |
| Expense Ratio4 | | — | — |
| Admiral Shares | 0.28% | | |
| ETF Shares | 0.25% | | |
| Short-Term Reserves | 0.8% | — | — |
| | |
| Volatility Measures5 | | |
| | Fund Versus | Fund Versus |
| | Spliced Index6 | Broad Index2 |
| R-Squared | 1.00 | 0.88 |
| Beta | 1.00 | 1.32 |
| |
Subindustry Diversification
(% of equity exposure) | |
| |
| |
| Aluminum | 2.4% |
| Commodity Chemicals | 1.4 |
| Construction Materials | 2.1 |
| Diversified Chemicals | 20.3 |
| Diversified Metals & Mining | 8.8 |
| Fertilizers & Agricultural Chemicals | 10.2 |
| Forest Products | 2.1 |
| Gold | 7.3 |
| Industrial Gases | 10.0 |
| Metal & Glass Containers | 5.0 |
| Paper Packaging | 3.4 |
| Paper Products | 3.9 |
| Specialty Chemicals | 13.3 |
| Steel | 8.9 |
| Other Materials | 0.9 |
| |
| Ten Largest Holdings7 (% of total net assets) |
| |
| EI du Pont de Nemours & Co. | 7.8% |
| Freeport-McMoRan Copper & Gold Inc. | 6.6 |
| Newmont Mining Corp. | 6.4 |
| Monsanto Co. | 6.1 |
| Dow Chemical Co. | 6.0 |
| Praxair Inc. | 5.6 |
| Air Products & Chemicals Inc. | 3.3 |
| Nucor Corp. | 2.5 |
| Ecolab Inc. | 2.3 |
| PPG Industries Inc. | 2.3 |
| Top Ten | 48.9% |
1 MSCI US IMI/Materials 25/50.
2 MSCI US IMI/2500.
3 30-day SEC yield for the fund; annualized dividend yield for the indexes. See the Glossary.
4 The expense ratios shown are from the prospectus dated December 28, 2009, and represent estimated costs for the current fiscal year. For the fiscal year ended August 31, 2010, the expense ratios were 0.24% for the Admiral Shares and 0.24% for the ETF Shares.
5 For an explanation of R-squared, beta, and other terms used here, see the Glossary.
6 Spliced MSCI US IMI/Materials 25/50: MSCI US IMI/Materials through February 26, 2010; MSCI US IMI/Materials 25/50 thereafter.
7 The holdings listed exclude any temporary cash investments and equity index products.
74
Materials Index Fund
Performance Summary
All of the returns in this report represent past performance, which is not a guarantee of future results that may be achieved by the fund. (Current performance may be lower or higher than the performance data cited. For performance data current to the most recent month-end, visit our website at vanguard.com/performance.) Note, too, that both investment returns and principal value can fluctuate widely, so an investor’s shares, when sold, could be worth more or less than their original cost. The returns shown do not reflect taxes that a shareholder would pay on fund distributions or on the sale of fund shares.
Cumulative Performance: January 26, 2004–August 31, 2010
Initial Investment of $10,000
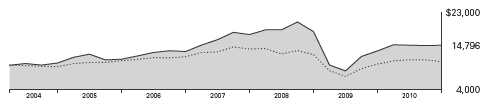
| | | | | |
| | | Average Annual Total Returns | |
| | | | Periods Ended August 31, 2010 | Final Value |
| | | | Since | of a $10,000 |
| One Year | Five Years | Inception1 | Investment |
| Materials Index Fund ETF Shares | | | | |
| Net Asset Value2 | 10.07% | 5.27% | 6.12% | $14,796 |
| Materials Index Fund ETF Shares Market Price | 9.96 | 5.28 | 6.12 | 14,791 |
| MSCI US IMI/2500 | 5.81 | –0.39 | 1.31 | 10,893 |
| Spliced MSCI US IMI/Materials 25/503 | 10.31 | 5.37 | 6.24 | 14,908 |
| | | | |
| | | | | Final Value |
| | | | Since | of a $100,000 |
| | One Year | Five Years | Inception1 | Investment |
| Materials Index Fund Admiral Shares4 | 10.07% | 5.24% | 5.53% | $142,280 |
| MSCI US IMI/2500 | 5.81 | –0.39 | 1.28 | 108,676 |
| Spliced MSCI US IMI/Materials 25/503 | 10.31 | 5.37 | 5.68 | 143,600 |
1 Performance for the fund and its comparative standards is calculated since the following inception dates: January 26, 2004, for ETF Shares; February 11, 2004, for Admiral Shares.
2 For more information about how the ETF Shares’ market prices have compared with their net asset value, visit Vanguard.com, select your ETF, and then select the Performance tab. The Premium/Discount table there shows the percentages of days on which the ETF Shares’ market price was above or below the NAV.
3 Spliced MSCI US IMI/Materials 25/50: MSCI US IMI/IMaterials through February 26, 2010; MSCI US IMI/Materials 25/50 thereafter.
4 Total returns do not reflect the 2% fee assessed on redemptions of shares held for less than one year.
See Financial Highlights for dividend and capital gains information.
75
Materials Index Fund
Fiscal-Year Total Returns (%): January 26, 2004–August 31, 2010
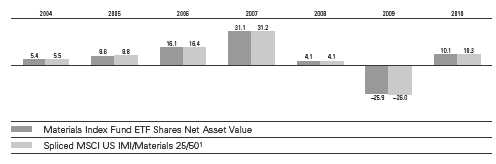
| | | |
| Cumulative Returns: ETF Shares, January 26, 2004–August 31, 2010 | | |
| | | | Cumulative |
| | | | Since |
| | One Year | Five Years | Inception |
| Materials Index Fund ETF Shares Market Price | 9.96% | 29.36% | 47.91% |
| Materials Index Fund ETF Shares Net Asset Value | 10.07 | 29.29 | 47.96 |
| Spliced MSCI US IMI/Materials 25/501 | 10.31 | 29.87 | 49.08 |
Average Annual Total Returns: Periods Ended June 30, 2010
This table presents average annual total returns through the latest calendar quarter—rather than through the endn of the fiscal period. Securities and Exchange Commission rules require that we provide this information.
| | | | |
| | | | | Since |
| | Inception Date | One Year | Five Years | Inception |
| ETF Shares | 1/26/2004 | | | |
| Market Price | | 17.11% | 3.99% | 4.88% |
| Net Asset Value | | 17.14 | 3.98 | 4.88 |
| Admiral Shares2 | 2/11/2004 | 17.12 | 3.95 | 4.28 |
1 Spliced MSCI US IMI/Materials 25/50: MSCI US IMI/IMaterials through February 26, 2010; MSCI US IMI/Materials 25/50 thereafter.
2 Total returns do not reflect the 2% fee assessed on redemptions of shares held for less than one year.
76
Materials Index Fund
Financial Statements
Statement of Net Assets
As of August 31, 2010
The fund reports a complete list of its holdings in regulatory filings four times in each fiscal year, at the quarter-ends. For the second and fourth fiscal quarters, the lists appear in the fund’s semiannual and annual reports to shareholders. For the first and third fiscal quarters, the fund files the lists with the Securities and Exchange Commission on Form N-Q. Shareholders can look up the fund’s Forms N-Q on the SEC’s website at sec.gov. Forms N-Q may also be reviewed and copied at the SEC’s Public Reference Room (see the back cover of this report for further information).
| | | |
| | | | Market |
| | | | Value• |
| | | Shares | ($000) |
| Common Stocks (100.0%) ) | | |
| Chemicals (55.2%) | | |
| | EI du Pont de | | |
| | Nemours & Co. | 981,537 | 40,017 |
| | Monsanto Co. | 591,050 | 31,119 |
| | Dow Chemical Co. | 1,250,375 | 30,472 |
| | Praxair Inc. | 331,509 | 28,520 |
| | Air Products & | | |
| | Chemicals Inc. | 229,839 | 17,015 |
| | Ecolab Inc. | 252,543 | 11,971 |
| | PPG Industries Inc. | 180,316 | 11,870 |
| | Mosaic Co. | 168,644 | 9,893 |
| | CF Industries Holdings Inc. | 76,982 | 7,121 |
| | Sherwin-Williams Co. | 100,866 | 7,099 |
| | Sigma-Aldrich Corp. | 131,390 | 6,986 |
| | Lubrizol Corp. | 73,811 | 6,887 |
| | Airgas Inc. | 85,877 | 5,651 |
| | Eastman Chemical Co. | 78,305 | 4,820 |
| | FMC Corp. | 74,927 | 4,666 |
| | Celanese Corp. Class A | 169,501 | 4,526 |
| | International Flavors & | | |
| | Fragrances Inc. | 86,176 | 3,937 |
| | Ashland Inc. | 80,612 | 3,745 |
| | Albemarle Corp. | 89,376 | 3,583 |
| | Nalco Holding Co. | 150,389 | 3,417 |
| | Valspar Corp. | 102,737 | 3,094 |
| | Cytec Industries Inc. | 53,125 | 2,520 |
| | Scotts Miracle-Gro Co. | | |
| | Class A | 50,734 | 2,396 |
| | RPM International Inc. | 140,825 | 2,380 |
| * | WR Grace & Co. | 78,031 | 1,974 |
| | Cabot Corp. | 67,691 | 1,924 |
| | Huntsman Corp. | 205,369 | 1,871 |
| * | Solutia Inc. | 131,052 | 1,774 |
| | Olin Corp. | 84,763 | 1,518 |
| | Sensient Technologies Corp. | 53,380 | 1,480 |
| * | Rockwood Holdings Inc. | 56,084 | 1,450 |
| | NewMarket Corp. | 13,807 | 1,388 |
| | Minerals Technologies Inc. | 20,417 | 1,094 |
| * | Intrepid Potash Inc. | 48,273 | 1,084 |
| | HB Fuller Co. | 53,169 | 1,010 |
| * | Ferro Corp. | 93,249 | 998 |
| * | PolyOne Corp. | 98,986 | 965 |
| * | OM Group Inc. | 33,292 | 852 |
| | Arch Chemicals Inc. | 27,387 | 841 |
| * | Calgon Carbon Corp. | 61,301 | 765 |
| | Balchem Corp. | 30,497 | 746 |
| | Innophos Holdings Inc. | 23,204 | 677 |
| | A Schulman Inc. | 34,054 | 619 |
| * | STR Holdings Inc. | 27,136 | 561 |
| | Westlake Chemical Corp. | 21,609 | 560 |
| | Stepan Co. | 8,735 | 484 |
| * | Georgia Gulf Corp. | 36,757 | 478 |
| | | |
| | | | Market |
| | | | Value• |
| | | Shares | ($000) |
| | Koppers Holdings Inc. | 22,276 | 445 |
| | Zep Inc. | 23,241 | 402 |
| * | Kraton Performance | | |
| | Polymers Inc. | 12,870 | 348 |
| * | LSB Industries Inc. | 18,852 | 313 |
| * | Yongye International Inc. | 39,459 | 312 |
| * | Innospec Inc. | 24,736 | 307 |
| | Hawkins Inc. | 9,595 | 292 |
| * | Spartech Corp. | 32,555 | 291 |
| * | Zoltek Cos. Inc. | 31,952 | 272 |
| | American Vanguard Corp. | 23,837 | 158 |
| *,^ | China Green Agriculture Inc. | 16,068 | 154 |
| * | Landec Corp. | 27,508 | 151 |
| * | ShengdaTech Inc. | 30,485 | 135 |
| *,^ | China Agritech Inc. | 8,473 | 129 |
| | | | 282,527 |
| Construction Materials (2.1%) | | |
| | Vulcan Materials Co. | 138,259 | 5,082 |
| | Martin Marietta | | |
| | Materials Inc. | 49,359 | 3,613 |
| | Eagle Materials Inc. | 45,287 | 1,039 |
| | Texas Industries Inc. | 25,709 | 778 |
| * | Headwaters Inc. | 67,640 | 208 |
| * | United States Lime & | | |
| | Minerals Inc. | 2,400 | 92 |
| | | | 10,812 |
| Containers & Packaging (8.4%) | | |
| | Ball Corp. | 94,860 | 5,320 |
| * | Crown Holdings Inc. | 175,575 | 4,892 |
| * | Pactiv Corp. | 143,873 | 4,615 |
| * | Owens-Illinois Inc. | 178,500 | 4,473 |
| | Sealed Air Corp. | 172,849 | 3,545 |
| | Sonoco Products Co. | 108,980 | 3,427 |
| | Bemis Co. Inc. | 117,652 | 3,397 |
| | Aptargroup Inc. | 73,826 | 3,075 |
| | Packaging Corp. of America | 112,057 | 2,498 |
| | Rock-Tenn Co. Class A | 40,180 | 1,936 |
| | Temple-Inland Inc. | 110,194 | 1,755 |
| | Silgan Holdings Inc. | 57,666 | 1,724 |
| | Greif Inc. Class A | 26,831 | 1,525 |
| * | Boise Inc. | 64,447 | 443 |
| * | Graphic Packaging | | |
| | Holding Co. | 95,363 | 291 |
| | Myers Industries Inc. | 32,668 | 208 |
| | | | 43,124 |
| Metals & Mining (28.3%) | | |
| | Freeport-McMoRan | | |
| | Copper & Gold Inc. | 468,727 | 33,739 |
| | Newmont Mining Corp. | 532,281 | 32,639 |
| | Nucor Corp. | 341,059 | 12,544 |
| | Alcoa Inc. | 1,105,172 | 11,284 |
| | Cliffs Natural | | |
| | Resources Inc. | 146,566 | 8,968 |
| | | |
| | | | Market |
| | | | Value• |
| | | Shares | ($000) |
| | United States Steel Corp. | 155,170 | 6,596 |
| | Walter Energy Inc. | 58,278 | 4,198 |
| | Allegheny Technologies Inc. | 96,088 | 3,913 |
| | Steel Dynamics Inc. | 223,450 | 3,061 |
| | Reliance Steel & | | |
| | Aluminum Co. | 76,242 | 2,840 |
| | Royal Gold Inc. | 54,562 | 2,677 |
| | Compass Minerals | | |
| | International Inc. | 35,507 | 2,548 |
| * | Allied Nevada Gold Corp. | 82,201 | 1,928 |
| * | Titanium Metals Corp. | 97,934 | 1,775 |
| | Commercial Metals Co. | 123,618 | 1,611 |
| | AK Steel Holding Corp. | 118,245 | 1,506 |
| * | Coeur d’Alene Mines Corp. | 87,731 | 1,505 |
| * | Hecla Mining Co. | 260,144 | 1,488 |
| | Carpenter Technology Corp. | 47,958 | 1,487 |
| | Schnitzer Steel | | |
| | Industries Inc. | 24,604 | 1,089 |
| | Worthington Industries Inc. | 69,112 | 983 |
| * | RTI International Metals Inc. | 32,741 | 904 |
| * | Globe Specialty Metals Inc. | 68,618 | 750 |
| * | Stillwater Mining Co. | 52,975 | 726 |
| * | Century Aluminum Co. | 65,677 | 657 |
| | AMCOL International Corp. | 23,362 | 610 |
| | Kaiser Aluminum Corp. | 15,543 | 574 |
| * | Brush Engineered | | |
| | Materials Inc. | 22,016 | 530 |
| | Haynes International Inc. | 13,165 | 385 |
| * | Horsehead Holding Corp. | 47,405 | 375 |
| * | AM Castle & Co. | 18,996 | 265 |
| | Olympic Steel Inc. | 10,278 | 227 |
| * | General Moly Inc. | 67,208 | 202 |
| * | Gulf Resources Inc. | 21,488 | 187 |
| | | | 144,771 |
| Paper & Forest Products (6.0%) | | |
| | International Paper Co. | 448,811 | 9,183 |
| | Weyerhaeuser Co. | 581,144 | 9,124 |
| | MeadWestvaco Corp. | 184,860 | 4,022 |
| | Domtar Corp. | 46,920 | 2,816 |
| | Schweitzer-Mauduit | | |
| | International Inc. | 19,953 | 1,074 |
| * | Louisiana-Pacific Corp. | 136,042 | 906 |
| * | Clearwater Paper Corp. | 12,432 | 845 |
| | PH Glatfelter Co. | 49,795 | 509 |
| | Deltic Timber Corp. | 12,301 | 502 |
| | Buckeye Technologies Inc. | 42,260 | 502 |
| * | KapStone Paper and | | |
| | Packaging Corp. | 36,148 | 412 |
| * | Wausau Paper Corp. | 50,678 | 321 |
| | Neenah Paper Inc. | 16,345 | 241 |
| | | | 30,457 |
| Total Common Stocks | | |
| (Cost $591,177) | | 511,691 |
77
Materials Index Fund
| | |
| | | Market |
| | | Value• |
| | Shares | ($000) |
| Temporary Cash Investment (0.8%) | |
| Money Market Fund (0.8%) | |
| 1,2 Vanguard Market | | |
| Liquidity Fund, 0.288% | |
| (Cost $4,073) | 4,073,276 | 4,073 |
| Total Investments (100.8%) | |
| (Cost $595,250) | | 515,764 |
| Other Assets and Liabilities (–0.8%) | |
| Other Assets | | 8,921 |
| Liabilities2 | | (13,134) |
| | | (4,213) |
| Net Assets (100%) | | 511,551 |
| |
| At August 31, 2010, net assets consisted of: |
| | Amount |
| | ($000) |
| Paid-in Capital | 633,633 |
| Undistributed Net Investment Income | 11,661 |
| Accumulated Net Realized Losses | (54,257) |
| Unrealized Appreciation (Depreciation) | (79,486) |
| Net Assets | 511,551 |
| |
| |
| Admiral Shares—Net Assets | |
| Applicable to 2,904,424 outstanding | |
| $.001 par value shares of beneficial | |
| interest (unlimited authorization) | 96,786 |
| Net Asset Value Per Share— | |
| Admiral Shares | $33.32 |
| |
| |
| ETF Shares—Net Assets | |
| Applicable to 6,341,859 outstanding | |
| $.001 par value shares of beneficial | |
| interest (unlimited authorization) | 414,765 |
| Net Asset Value Per Share— | |
| ETF Shares | $65.40 |
• See Note A in Notes to Financial Statements.
* Non-income-producing security.
^ Part of security position is on loan to broker-dealers. The total value of securities on loan is $128,000.
1 Affiliated money market fund available only to Vanguard funds and certain trusts and accounts managed by Vanguard. Rate shown is the 7-day yield.
2 Includes $145,000 of collateral received for securities on loan.
See accompanying Notes, which are an integral part of the Financial Statements.
78
Materials Index Fund
| |
| Statement of Operations |
| |
| Year Ended |
| | August 31, 2010 |
| | ($000) |
| Investment Income | |
| Income | |
| Dividends | 17,183 |
| Security Lending | 9 |
| Total Income | 17,192 |
| Expenses | |
| The Vanguard Group—Note B | |
| Investment Advisory Services | 83 |
| Management and Administrative— | |
| Admiral Shares | 205 |
| Management and Administrative— | |
| ETF Shares | 811 |
| Marketing and Distribution— | |
| Admiral Shares | 21 |
| Marketing and Distribution—ETF Shares | 129 |
| Custodian Fees | 1 |
| Auditing Fees | 26 |
| Shareholders’ Reports—Admiral Shares | — |
| Shareholders’ Reports—ETF Shares | 64 |
| Trustees’ Fees and Expenses | 1 |
| Total Expenses | 1,341 |
| Net Investment Income | 15,851 |
| Realized Net Gain (Loss) on | |
| Investment Securities Sold | 17,399 |
| Change in Unrealized Appreciation | |
| (Depreciation) of Investment Securities | 12,576 |
| Net Increase (Decrease) in Net Assets | |
| Resulting from Operations | 45,826 |
| | | |
| | |
| Statement of Changes in Net Assets | | |
| |
| | | Year Ended August 31, |
| | 2010 | 2009 |
| | ($000) | ($000) |
| Increase (Decrease) in Net Assets | | |
| Operations | | |
| Net Investment Income | 15,851 | 6,646 |
| Realized Net Gain (Loss) | 17,399 | (21,222) |
| Change in Unrealized Appreciation (Depreciation) | 12,576 | (80,514) |
| Net Increase (Decrease) in Net Assets Resulting from Operations | 45,826 | (95,090) |
| Distributions | | |
| Net Investment Income | | |
| Admiral Shares | (1,398) | (1,751) |
| ETF Shares | (6,674) | (5,802) |
| Realized Capital Gain | | |
| Admiral Shares | — | — |
| ETF Shares | — | — |
| Total Distributions | (8,072) | (7,553) |
| Capital Share Transactions | | |
| Admiral Shares | (521) | 10,896 |
| ETF Shares | 9,040 | 85,342 |
| Net Increase (Decrease) from Capital Share Transactions | 8,519 | 96,238 |
| Total Increase (Decrease) | 46,273 | (6,405) |
| Net Assets | | |
| Beginning of Period | 465,278 | 471,683 |
| End of Period1 | 511,551 | 465,278 |
1 Net Assets—End of Period includes undistributed net investment income of $11,661,000 and $3,882,000.
See accompanying Notes, which are an integral part of the Financial Statements.
79
Materials Index Fund
| | | | | | |
| | | | | |
| Financial Highlights | | | | | |
| |
| Admiral Shares | | | | | |
| |
| For a Share Outstanding | | | | | Year Ended August 31, |
| Throughout Each Period | 2010 | 2009 | 2008 | 2007 | 2006 |
| Net Asset Value, Beginning of Period | $30.68 | $42.85 | $41.75 | $32.37 | $28.34 |
| Investment Operations | | | | | |
| Net Investment Income | .9711 | .622 | .732 | .7002 | .6722 |
| Net Realized and Unrealized Gain (Loss) | | | | | |
| on Investments3 | 2.128 | (11.996) | 1.008 | 9.250 | 3.853 |
| Total from Investment Operations | 3.099 | (11.374) | 1.740 | 9.950 | 4.525 |
| Distributions | | | | | |
| Dividends from Net Investment Income | (.459) | (.796) | (.640) | (.570) | (.495) |
| Distributions from Realized Capital Gains | — | — | — | — | — |
| Total Distributions | (.459) | (.796) | (.640) | (.570) | (.495) |
| Net Asset Value, End of Period | $33.32 | $30.68 | $42.85 | $41.75 | $32.37 |
| |
| Total Return4 | 10.07% | –25.91% | 4.09% | 31.00% | 16.08% |
| |
| Ratios/Supplemental Data | | | | | |
| Net Assets, End of Period (Millions) | $97 | $90 | $107 | $57 | $12 |
| Ratio of Total Expenses to | | | | | |
| Average Net Assets | 0.24% | 0.28% | 0.25% | 0.26% | 0.28% |
| Ratio of Net Investment Income to | | | | | |
| Average Net Assets | 2.81%1 | 2.23% | 1.74% | 1.80% | 2.13% |
| Portfolio Turnover Rate5 | 10% | 12% | 10% | 6% | 13% |
1 Net investment income per share and the ratio of net investment income to average net assets include $.417 and 1.14%, respectively, resulting from a special dividend from Weyerhaeuser Co. in July 2010.
2 Calculated based on average shares outstanding.
3 Includes increases from redemption fees of $.01, $.02, $.02, $.01, and $.00.
4 Total returns do not include transaction fees that may have applied in the periods shown. Fund prospectuses provide information about any applicable transaction fees.
5 Excludes the value of portfolio securities received or delivered as a result of in-kind purchases or redemptions of the fund’s capital shares, including ETF Creation Units.
See accompanying Notes, which are an integral part of the Financial Statements.
80
Materials Index Fund
| | | | | | |
| | | | | |
| Financial Highlights | | | | | |
| |
| ETF Shares | | | | | |
| |
| For a Share Outstanding | | | | | Year Ended August 31, |
| Throughout Each Period | 2010 | 2009 | 2008 | 2007 | 2006 |
| Net Asset Value, Beginning of Period | $60.23 | $84.27 | $82.10 | $63.65 | $55.70 |
| Investment Operations | | | | | |
| Net Investment Income | 1.9071 | 1.242 | 1.470 | 1.4182 | 1.3362 |
| Net Realized and Unrealized Gain (Loss) | | | | | |
| on Investments3 | 4.186 | (23.683) | 1.977 | 18.168 | 7.582 |
| Total from Investment Operations | 6.093 | (22.441) | 3.447 | 19.586 | 8.918 |
| Distributions | | | | | |
| Dividends from Net Investment Income | (.923) | (1.599) | (1.277) | (1.136) | (.968) |
| Distributions from Realized Capital Gains | — | — | — | — | — |
| Total Distributions | (.923) | (1.599) | (1.277) | (1.136) | (.968) |
| Net Asset Value, End of Period | $65.40 | $60.23 | $84.27 | $82.10 | $63.65 |
| |
| Total Return | 10.07% | –25.88% | 4.15% | 31.06% | 16.11% |
| |
| Ratios/Supplemental Data | | | | | |
| Net Assets, End of Period (Millions) | $415 | $375 | $365 | $312 | $95 |
| Ratio of Total Expenses to | | | | | |
| Average Net Assets | 0.24% | 0.25% | 0.20% | 0.22% | 0.25% |
| Ratio of Net Investment Income to | | | | | |
| Average Net Assets | 2.81%1 | 2.26% | 1.79% | 1.84% | 2.16% |
| Portfolio Turnover Rate4 | 10% | 12% | 10% | 6% | 13% |
1 Net investment income per share and the ratio of net investment income to average net assets include $.819 and 1.14%, respectively, resulting from a special dividend from Weyerhaeuser Co. in July 2010.
2 Calculated based on average shares outstanding.
3 Includes increases from redemption fees of $.01, $.03, $.04, $.02 and $.00.
4 Excludes the value of portfolio securities received or delivered as a result of in-kind purchases or redemptions of the fund’s capital shares, including ETF Creation Units.
See accompanying Notes, which are an integral part of the Financial Statements.
81
Materials Index Fund
Notes to Financial Statements
Vanguard Materials Index Fund is registered under the Investment Company Act of 1940 as an open-end investment company, or mutual fund. The fund offers two classes of shares: Admiral Shares and ETF Shares. Admiral Shares are designed for investors who meet certain administrative, service, and account-size criteria. ETF Shares are listed for trading on the NYSE Arca, Inc.; they can be purchased and sold through a broker.
A. The following significant accounting policies conform to generally accepted accounting principles for U.S. mutual funds. The fund consistently follows such policies in preparing its financial statements.
1. Security Valuation: Securities are valued as of the close of trading on the New York Stock Exchange (generally 4 p.m., Eastern time) on the valuation date. Equity securities are valued at the latest quoted sales prices or official closing prices taken from the primary market in which each security trades; such securities not traded on the valuation date are valued at the mean of the latest quoted bid and asked prices. Securities for which market quotations are not readily available, or whose values have been materially affected by events occurring before the fund’s pricing time but after the close of the securities’ primary markets, are valued by methods deemed by the board of trustees to represent fair value. Investments in Vanguard Market Liquidity Fund are valued at that fund’s net asset value.
2. Federal Income Taxes: The fund intends to continue to qualify as a regulated investment company and distribute all of its taxable income. Management has analyzed the fund’s tax positions taken for all open federal income tax years (August 31, 2007–2010), and has concluded that no provision for federal income tax is required in the fund’s financial statements.
3. Distributions: Distributions to shareholders are recorded on the ex-dividend date.
4. Security Lending: The fund may lend its securities to qualified institutional borrowers to earn additional income. Security loans are required to be secured at all times by collateral at least equal to the market value of securities loaned. The fund invests cash collateral received in Vanguard Market Liquidity Fund, and records a liability for the return of the collateral, during the period the securities are on loan. Security lending income represents the income earned on investing cash collateral, less expenses associated with the loan.
5. Other: Dividend income is recorded on the ex-dividend date. Security transactions are accounted for on the date securities are bought or sold. Costs used to determine realized gains (losses) on the sale of investment securities are those of the specific securities sold. Fees assessed on redemptions of capital shares are credited to paid-in capital.
Each class of shares has equal rights as to assets and earnings, except that each class separately bears certain class-specific expenses related to maintenance of shareholder accounts (included in Management and Administrative expenses) and shareholder reporting. Marketing and distribution expenses are allocated to each class of shares based on a method approved by the board of trustees. Income, other non-class-specific expenses, and gains and losses on investments are allocated to each class of shares based on its relative net assets.
B. The Vanguard Group furnishes at cost investment advisory, corporate management, administrative, marketing, and distribution services. The costs of such services are allocated to the fund under methods approved by the board of trustees. The fund has committed to provide up to 0.40% of its net assets in capital contributions to Vanguard. At August 31, 2010, the fund had contributed capital of $104,000 to Vanguard (included in Other Assets), representing 0.02% of the fund’s net assets and 0.04% of Vanguard’s capitalization. The fund’s trustees and officers are also directors and officers of Vanguard.
C. Various inputs may be used to determine the value of the fund’s investments. These inputs are summarized in three broad levels for financial statement purposes. The inputs or methodologies used to value securities are not necessarily an indication of the risk associated with investing in those securities.
Level 1—Quoted prices in active markets for identical securities.
Level 2—Other significant observable inputs (including quoted prices for similar securities, interest rates, prepayment speeds, credit risk, etc.).
Level 3—Significant unobservable inputs (including the fund’s own assumptions used to determine the fair value of investments).
At August 31, 2010, 100% of the fund’s investments were valued based on Level 1 inputs.
82
Materials Index Fund
D. Distributions are determined on a tax basis and may differ from net investment income and realized capital gains for financial reporting purposes. Differences may be permanent or temporary. Permanent differences are reclassified among capital accounts in the financial statements to reflect their tax character. Temporary differences arise when certain items of income, expense, gain, or loss are recognized in different periods for financial statement and tax purposes; these differences are primarily attributed to tax deferral of losses on wash sales and will reverse at some time in the future. Differences in classification may also result from the treatment of short-term gains as ordinary income for tax purposes.
During the year ended August 31, 2010, the fund realized $35,361,000 of net capital gains resulting from in-kind redemptions—in which shareholders exchanged fund shares for securities held by the fund rather than for cash. Because such gains are not taxable to the fund, and are not distributed to shareholders, they have been reclassified from accumulated net realized losses to paid-in capital.
For tax purposes, at August 31, 2010, the fund had $12,168,000 of ordinary income available for distribution. The fund had available capital loss carryforwards totaling $35,358,000 to offset future net capital gains of $6,000 through August 31, 2014, $698,000 through August 31, 2015, $1,458,000 through August 31, 2016, $12,836,000 though August 31, 2017, and $20,360,000 through August 31, 2018. In addition, the fund realized losses of $15,447,000 during the period from November 1, 2009, through August 31, 2010, which are deferred and will be treated as realized for tax purposes in fiscal 2011.
At August 31, 2010, the cost of investment securities for tax purposes was $598,702,000. Net unrealized depreciation of investment securities for tax purposes was $82,938,000, consisting of unrealized gains of $31,103,000 on securities that had risen in value since their purchase and $114,041,000 in unrealized losses on securities that had fallen in value since their purchase.
E. During the year ended August 31, 2010, the fund purchased $181,613,000 of investment securities and sold $170,580,000 of investment securities, other than temporary cash investments.
F. Capital share transactions for each class of shares were:
| | | | | | |
| | | | | |
| | | | | Year Ended August 31, |
| | | | 2010 | | | 2009 |
| | Amount | Shares | Amount | Shares |
| | ($000) | (000) | ($000) | (000) |
| Admiral Shares | | | | |
| Issued | 22,219 | 654 | 36,435 | 1,409 |
| Issued in Lieu of Cash Distributions | 1,301 | 38 | 1,643 | 72 |
| Redeemed1 | (24,041) | (720) | (27,182) | (1,046) |
| Net Increase (Decrease)—Admiral Shares | (521) | (28) | 10,896 | 435 |
| ETF Shares | | | | |
| Issued | 127,810 | 1,911 | 160,431 | 3,104 |
| Issued in Lieu of Cash Distributions | — | — | — | — |
| Redeemed1 | (118,770) | (1,800) | (75,089) | (1,200) |
| Net Increase (Decrease)—ETF Shares | 9,040 | 111 | 85,342 | 1,904 |
1 Net of redemption fees for fiscal 2010 and 2009 of $92,000 and $263,000, respectively (fund totals).
G. In preparing the financial statements as of August 31, 2010, management considered the impact of subsequent events for potential recognition or disclosure in these financial statements.
83
Telecommunication Services Index Fund
Fund Profile
As of August 31, 2010
| | | |
| Portfolio Characteristics | | |
| | | Target | Broad |
| | Fund | Index1 | Index2 |
| Number of Stocks | 38 | 38 | 2,478 |
| Median Market Cap | $12.2B | $12.2B | $26.3B |
| Price/Earnings Ratio | 25.6x | 25.7x | 15.4x |
| Price/Book Ratio | 2.1x | 2.1x | 1.9x |
| Yield3 | | 4.3% | 2.1% |
| Admiral Shares | 4.2% | | |
| ETF Shares | 4.2% | | |
| Return on Equity | 9.6% | 9.7% | 19.2% |
| Earnings Growth Rate | –6.3% | –6.0% | 6.3% |
| Foreign Holdings | 0.0% | 0.0% | 0.0% |
| Turnover Rate | 23% | — | — |
| Expense Ratio4 | | — | — |
| Admiral Shares | 0.28% | | |
| ETF Shares | 0.25% | | |
| Short-Term Reserves | 0.1% | — | — |
| | |
| Volatility Measures5 | | |
| | Fund Versus | Fund Versus |
| | Spliced Index6 | Broad Index2 |
| R-Squared | 0.90 | 0.71 |
| Beta | 1.02 | 0.86 |
| |
Subindustry Diversification
(% of equity exposure) | |
| |
| |
| Alternative Carriers | 8.7% |
| Integrated Telecommunication Services | 63.5 |
| Wireless Telecommunication Services | 27.8 |
| |
| Ten Largest Holdings7 (% of total net assets) |
| |
| AT&T Inc. | 22.6% |
| Verizon Communications Inc. | 22.3 |
| American Tower Corp. Class A | 4.5 |
| Crown Castle International Corp. | 4.3 |
| Sprint Nextel Corp. | 4.0 |
| CenturyLink Inc. | 3.8 |
| Qwest Communications International Inc. | 3.5 |
| Frontier Communications Corp. | 3.4 |
| Windstream Corp. | 2.9 |
| NII Holdings Inc. | 2.5 |
| Top Ten | 73.8% |
1 MSCI US IMI/Telecommunication Services 25/50.
2 MSCI US IMI/2500.
3 30-day SEC yield for the fund; annualized dividend yield for the indexes. See the Glossary.
4 The expense ratios shown are from the prospectus dated December 28, 2009, and represent estimated costs for the current fiscal year. For the fiscal year ended August 31, 2010, the expense ratios were 0.24% for the Admiral Shares and 0.24% for the ETF Shares.
5 For an explanation of R-squared, beta, and other terms used here, see the Glossary.
6 Spliced MSCI US IMI/Telecommunication Services 25/50: MSCI US IMI/Telecommunication Services through February 26, 2010; MSCI US IMI/Telecommunication Services 25/50 thereafter.
7 The holdings listed exclude any temporary cash investments and equity index products.
84
Telecommunication Services Index Fund
Performance Summary
All of the returns in this report represent past performance, which is not a guarantee of future results that may be achieved by the fund. (Current performance may be lower or higher than the performance data cited. For performance data current to the most recent month-end, visit our website at vanguard.com/performance.) Note, too, that both investment returns and principal value can fluctuate widely, so an investor’s shares, when sold, could be worth more or less than their original cost. The returns shown do not reflect taxes that a shareholder would pay on fund distributions or on the sale of fund shares.
Cumulative Performance: September 23, 2004–August 31, 2010
Initial Investment of $10,000
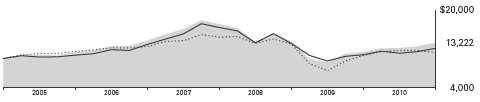
| | | | | |
| | | | |
| | | Average Annual Total Returns | |
| | | | Periods Ended August 31, 2010 | Final Value |
| | | | Since | of a $10,000 |
| | One Year | Five Years | Inception1 | Investment |
| Telecommunication Services Index Fund | | | | |
| ETF Shares Net Asset Value2 | 16.39% | 3.26% | 4.82% | $13,222 |
| Telecommunication Services Index Fund | | | | |
| ETF Shares Market Price | 16.37 | 3.29 | 4.81 | 13,213 |
| MSCI US IMI/2500 | 5.81 | –0.39 | 1.96 | 11,221 |
| Spliced MSCI US IMI/ | | | | |
| Telecommunication Services 25/503 | 12.26 | 2.51 | 3.24 | 12,086 |
| | | | |
| | | | | Final Value |
| | | | Since | of a $100,000 |
| | One Year | Five Years | Inception1 | Investment |
| Telecommunication Services Index Fund | | | | |
| Admiral Shares4 | 16.40% | 3.23% | 3.93% | $123,493 |
| MSCI US IMI/2500 | 5.81 | –0.39 | 0.34 | 101,902 |
| Spliced MSCI US IMI/ | | | | |
| Telecommunication Services 25/503 | 12.26 | 2.51 | 2.85 | 116,623 |
1 Performance for the fund and its comparative standards is calculated since the following inception dates: September 23, 2004, for ETF Shares; March 11, 2005, for Admiral Shares.
2 For more information about how the ETF Shares’ market prices have compared with their net asset value, visit Vanguard.com, select your ETF, and then select the Performance tab. The Premium/Discount table there shows the percentages of days on which the ETF Shares’ market price was above or below the NAV.
3 Spliced MSCI US IMI/Telecommunication Services 25/50: MSCI US IMI/ITelecommunication Services through February 26, 2010; MSCI US IMI/Telecommunication Services 25/50 thereafter.
4 Total returns do not reflect the 2% fee assessed on redemptions of shares held for less than one year.
See Financial Highlights for dividend and capital gains information.
85
Telecommunication Services Index Fund
Fiscal-Year Total Returns (%): September 23, 2004–August 31, 2010
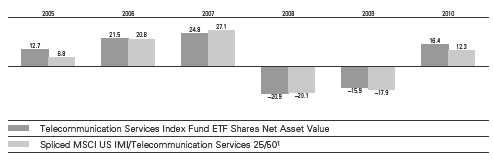
| | | |
| Cumulative Returns: ETF Shares, September 23, 2004–August 31, 2010 | | |
| | | | Cumulative |
| | | | Since |
| | One Year | Five Years | Inception |
| Telecommunication Services Index Fund ETF Shares Market Price | 16.37% | 17.57% | 32.13% |
| Telecommunication Services Index Fund ETF Shares Net Asset Value | 16.39 | 17.37 | 32.22 |
| Spliced MSCI US IMI/Telecommunication Services 25/501 | 12.26 | 13.20 | 12.09 |
Average Annual Total Returns: Periods Ended June 30, 2010
This table presents average annual total returns through the latest calendar quarter—rather than through the end of the fiscal period. Securities and Exchange Commission rules require that we provide this information.
| | | | |
| | | | | Since |
| | Inception Date | One Year | Five Years | Inception |
| ETF Shares | 9/23/2004 | | | |
| Market Price | | 9.68% | 2.26% | 3.56% |
| Net Asset Value | | 9.79 | 2.26 | 3.57 |
| Admiral Shares2 | 3/11/2005 | 9.76 | 2.23 | 2.55 |
1 Spliced MSCI US IMI/Telecommunication Services 25/50: MSCI US IMI/ITelecommunication Services through February 26, 2010; MSCI US IMI/Telecommunication Services 25/50 thereafter.
2 Total returns do not reflect the 2% fee assessed on redemptions of shares held for less than one year.
86
Telecommunication Services Index Fund
Financial Statements
Statement of Net Assets
As of August 31, 2010
The fund reports a complete list of its holdings in regulatory filings four times in each fiscal year, at the quarter-ends. For the second and fourth fiscal quarters, the lists appear in the fund’s semiannual and annual reports to shareholders. For the first and third fiscal quarters, the fund files the lists with the Securities and Exchange Commission on Form N-Q. Shareholders can look up the fund’s Forms N-Q on the SEC’s website at sec.gov. Forms N-Q may also be reviewed and copied at the SEC’s Public Reference Room (see the back cover of this report for further information).
| | | |
| | | | Market |
| | | | Value• |
| | | Shares | ($000) |
| Common Stocks (99.9%) | | |
| Diversified Telecommunication Services (72.1%) |
| | Alternative Carriers (8.7%) | |
| * | tw telecom inc Class A | 237,322 | 4,161 |
| * | Level 3 | | |
| | Communications Inc. | 2,587,593 | 2,665 |
| * | PAETEC Holding Corp. | 620,346 | 2,543 |
| * | Global Crossing Ltd. | 169,359 | 2,083 |
| * | AboveNet Inc. | 39,982 | 2,064 |
| * | Vonage Holdings Corp. | 951,368 | 2,055 |
| * | Cogent Communications | | |
| | Group Inc. | 207,529 | 1,810 |
| * | Iridium | | |
| | Communications Inc. | 188,035 | 1,630 |
| * | Neutral Tandem Inc. | 144,144 | 1,629 |
| * | Premiere Global | | |
| | Services Inc. | 313,046 | 1,553 |
| |
| Integrated Telecommunication Services (63.4%) |
| | AT&T Inc. | 2,130,522 | 57,588 |
| | Verizon | | |
| | Communications Inc. | 1,931,543 | 57,000 |
| | CenturyLink Inc. | 268,600 | 9,713 |
| | Qwest Communications | | |
| | International Inc. | 1,585,504 | 8,958 |
| | Frontier | | |
| | Communications Corp. | 1,128,899 | 8,726 |
| | Windstream Corp. | 630,857 | 7,277 |
| * | General | | |
| | Communication Inc. | | |
| | Class A | 277,753 | 2,503 |
| | Consolidated | | |
| | Communications | | |
| | Holdings Inc. | 141,441 | 2,453 |
| | Alaska Communications | | |
| | Systems Group Inc. | 251,119 | 2,426 |
| | Atlantic Tele-Network Inc. | 44,491 | 1,897 |
| * | Cincinnati Bell Inc. | 740,493 | 1,740 |
| * | Cbeyond Inc. | 136,933 | 1,636 |
| | | | 184,110 |
| Wireless Telecommunication Services (27.8%) |
| * | American Tower Corp. | | |
| | Class A | 242,951 | 11,385 |
| * | Crown Castle | | |
| | International Corp. | 269,014 | 11,062 |
| | | |
| | | | Market |
| | | | Value• |
| | | Shares | ($000) |
| * | Sprint Nextel Corp. | 2,518,203 | 10,274 |
| * | NII Holdings Inc. | 176,905 | 6,413 |
| * | SBA | | |
| | Communications Corp. | | |
| | Class A | 138,215 | 4,948 |
| * | MetroPCS | | |
| | Communications Inc. | 391,128 | 3,497 |
| * | Syniverse Holdings Inc. | 146,144 | 3,006 |
| | Telephone & Data | | |
| | Systems Inc. | 102,206 | 2,953 |
| | Telephone & Data | | |
| | Systems Inc.—Special | | |
| | Common Shares | 105,265 | 2,661 |
| * | United States Cellular Corp. | 63,335 | 2,655 |
| | NTELOS Holdings Corp. | 135,761 | 2,197 |
| | USA Mobility Inc. | 152,850 | 2,195 |
| * | ICO Global | | |
| | Communications | | |
| | Holdings Ltd. | 1,501,800 | 2,012 |
| | Shenandoah | | |
| | Telecommunications Co. | 115,652 | 1,953 |
| * | Clearwire Corp. Class A | 296,663 | 1,901 |
| * | Leap Wireless | | |
| | International Inc. | 168,645 | 1,749 |
| | | | 70,861 |
| Total Common Stocks | | |
| (Cost $257,712) | | 254,971 |
| Temporary Cash Investment (0.1%) | |
| Money Market Fund (0.1%) | | |
| 1 | Vanguard Market | | |
| | Liquidity Fund, 0.288% | | |
| | (Cost $319) | 318,787 | 319 |
| Total Investments (100.0%) | | |
| (Cost $258,031) | | 255,290 |
| Other Assets and Liabilities (0.0%) | |
| Other Assets | | 5,267 |
| Liabilities | | (5,358) |
| | | | (91) |
| Net Assets (100%) | | 255,199 |
| |
| At August 31, 2010, net assets consisted of: |
| | Amount |
| | ($000) |
| Paid-in Capital | 322,263 |
| Undistributed Net Investment Income | 5,294 |
| Accumulated Net Realized Losses | (69,617) |
| Unrealized Appreciation (Depreciation) | (2,741) |
| Net Assets | 255,199 |
| |
| |
| Admiral Shares—Net Assets | |
| Applicable to 487,719 outstanding | |
| $.001 par value shares of beneficial | |
| interest (unlimited authorization) | 14,249 |
| Net Asset Value Per Share— | |
| Admiral Shares | $29.22 |
| |
| |
| ETF Shares—Net Assets | |
| Applicable to 4,202,158 outstanding | |
| $.001 par value shares of beneficial | |
| interest (unlimited authorization) | 240,950 |
| Net Asset Value Per Share— | |
| ETF Shares | $57.34 |
• See Note A in Notes to Financial Statements.
* Non-income-producing security.
1 Affiliated money market fund available only to Vanguard funds and certain trusts and accounts managed by Vanguard. Rate shown is the 7-day yield.
See accompanying Notes, which are an integral part of the Financial Statements.
87
Telecommunication Services Index Fund
| |
| Statement of Operations |
| |
| | Year Ended |
| | August 31, 2010 |
| | ($000) |
| Investment Income | |
| Income | |
| Dividends | 8,118 |
| Interest1 | 1 |
| Security Lending | 10 |
| Total Income | 8,129 |
| Expenses | |
| The Vanguard Group—Note B | |
| Investment Advisory Services | 30 |
| Management and Administrative— | |
| Admiral Shares | 25 |
| Management and Administrative— | |
| ETF Shares | 328 |
| Marketing and Distribution— | |
| Admiral Shares | 3 |
| Marketing and Distribution— | |
| ETF Shares | 54 |
| Auditing Fees | 26 |
| Shareholders’ Reports—Admiral Shares | — |
| Shareholders’ Reports—ETF Shares | 39 |
| Total Expenses | 505 |
| Net Investment Income | 7,624 |
| Realized Net Gain (Loss) on | |
| Investment Securities Sold | (20,124) |
| Change in Unrealized Appreciation | |
| (Depreciation) of Investment Securities | 42,804 |
| Net Increase (Decrease) in Net Assets | |
| Resulting from Operations | 30,304 |
| | | |
| | |
| Statement of Changes in Net Assets | | |
| |
| | | Year Ended August 31, |
| | 2010 | 2009 |
| | ($000) | ($000) |
| Increase (Decrease) in Net Assets | | |
| Operations | | |
| Net Investment Income | 7,624 | 4,803 |
| Realized Net Gain (Loss) | (20,124) | (15,383) |
| Change in Unrealized Appreciation (Depreciation) | 42,804 | (4,088) |
| Net Increase (Decrease) in Net Assets Resulting from Operations | 30,304 | (14,668) |
| Distributions | | |
| Net Investment Income | | |
| Admiral Shares | (346) | (326) |
| ETF Shares | (5,141) | (4,534) |
| Realized Capital Gain | | |
| Admiral Shares | — | — |
| ETF Shares | — | — |
| Total Distributions | (5,487) | (4,860) |
| Capital Share Transactions | | |
| Admiral Shares | 673 | (2,971) |
| ETF Shares | 70,937 | 19,785 |
| Net Increase (Decrease) from Capital Share Transactions | 71,610 | 16,814 |
| Total Increase (Decrease) | 96,427 | (2,714) |
| Net Assets | | |
| Beginning of Period | 158,772 | 161,486 |
| End of Period2 | 255,199 | 158,772 |
1 Interest income from an affiliated company of the fund was $1,000.
2 Net Assets—End of Period includes undistributed net investment income of $5,294,000 and $3,157,000.
See accompanying Notes, which are an integral part of the Financial Statements.
88
Telecommunication Services Index Fund
Financial Highlights
| | | | | | |
| Admiral Shares | | | | | |
| |
| For a Share Outstanding | | | | Year Ended August 31, |
| Throughout Each Period | 2010 | 2009 | 2008 | 2007 | 2006 |
| Net Asset Value, Beginning of Period | $25.77 | $31.58 | $41.01 | $33.29 | $28.18 |
| Investment Operations | | | | | |
| Net Investment Income | 1.0241 | .8401 | .9081 | .8881 | .8611,2 |
| Net Realized and Unrealized Gain (Loss) | | | | | |
| on Investments3 | 3.183 | (5.977) | (9.338) | 7.308 | 5.041 |
| Total from Investment Operations | 4.207 | (5.137) | (8.430) | 8.196 | 5.902 |
| Distributions | | | | | |
| Dividends from Net Investment Income | (.757) | (.673) | (1.000) | (.476) | (.792) |
| Distributions from Realized Capital Gains | — | — | — | — | — |
| Total Distributions | (.757) | (.673) | (1.000) | (.476) | (.792) |
| Net Asset Value, End of Period | $29.22 | $25.77 | $31.58 | $41.01 | $33.29 |
| |
| Total Return4 | 16.40% | –15.90% | –20.98% | 24.77% | 21.47% |
| |
| Ratios/Supplemental Data | | | | | |
| Net Assets, End of Period (Millions) | $14 | $12 | $19 | $51 | $6 |
| Ratio of Total Expenses to | | | | | |
| Average Net Assets | 0.24% | 0.28% | 0.25% | 0.27% | 0.28% |
| Ratio of Net Investment Income to | | | | | |
| Average Net Assets | 3.60% | 3.39% | 2.50% | 2.17% | 3.28%2 |
| Portfolio Turnover Rate5 | 23% | 25% | 28% | 17% | 32% |
1 Calculated based on average shares outstanding.
2 Net investment income per share and the ratio of net investment income to average net assets include $.112 and 0.38%, respectively, resulting from a special dividend from MCI in December 2005.
3 Includes increases from redemption fees of $.00, $.00, $.05, $.01, and $.00.
4 Total returns do not include transaction fees that may have applied in the periods shown. Fund prospectuses provide information about any applicable transaction fees.
5 Excludes the value of portfolio securities received or delivered as a result of in-kind purchases or redemptions of the fund’s capital shares, including ETF Creation Units.
See accompanying Notes, which are an integral part of the Financial Statements.
89
Telecommunication Services Index Fund
Financial Highlights
| | | | | | |
| ETF Shares | | | | | |
| |
| For a Share Outstanding | | | | Year Ended August 31, |
| Throughout Each Period | 2010 | 2009 | 2008 | 2007 | 2006 |
| Net Asset Value, Beginning of Period | $50.58 | $62.05 | $80.60 | $65.40 | $55.35 |
| Investment Operations | | | | | |
| Net Investment Income | 1.9811 | 1.6021 | 1.7641 | 1.7411 | 2.0401,2 |
| Net Realized and Unrealized Gain (Loss) | | | | | |
| on Investments3 | 6.290 | (11.699) | (18.316) | 14.386 | 9.567 |
| Total from Investment Operations | 8.271 | (10.097) | (16.552) | 16.127 | 11.607 |
| Distributions | | | | | |
| Dividends from Net Investment Income | (1.511) | (1.373) | (1.998) | (.927) | (1.557) |
| Distributions from Realized Capital Gains | — | — | — | — | — |
| Total Distributions | (1.511) | (1.373) | (1.998) | (.927) | (1.557) |
| Net Asset Value, End of Period | $57.34 | $50.58 | $62.05 | $80.60 | $65.40 |
| |
| Total Return | 16.39% | –15.88% | –20.94% | 24.81% | 21.49% |
| |
| Ratios/Supplemental Data | | | | | |
| Net Assets, End of Period (Millions) | $241 | $147 | $143 | $266 | $72 |
| Ratio of Total Expenses to | | | | | |
| Average Net Assets | 0.24% | 0.25% | 0.20% | 0.23% | 0.25% |
| Ratio of Net Investment Income to | | | | | |
| Average Net Assets | 3.60% | 3.42% | 2.55% | 2.21% | 3.31%2 |
| Portfolio Turnover Rate4 | 23% | 25% | 28% | 17% | 32% |
1 Calculated based on average shares outstanding.
2 Net investment income per share and the ratio of net investment income to average net assets include $.219 and 0.38%, respectively, resulting from a special dividend from MCI in December 2005.
3 Includes increases from redemption fees of $.00, $.00, $.08, $.03 and $.00.
4 Excludes the value of portfolio securities received or delivered as a result of in-kind purchases or redemptions of the fund’s capital shares, including ETF Creation Units.
See accompanying Notes, which are an integral part of the Financial Statements.
90
Telecommunication Services Index Fund
Notes to Financial Statements
Vanguard Telecommunication Services Index Fund is registered under the Investment Company Act of 1940 as an open-end investment company, or mutual fund. The fund offers two classes of shares: Admiral Shares and ETF Shares. Admiral Shares are designed for investors who meet certain administrative, service, and account-size criteria. ETF Shares are listed for trading on the NYSE Arca, Inc.; they can be purchased and sold through a broker.
A. The following significant accounting policies conform to generally accepted accounting principles for U.S. mutual funds. The fund consistently follows such policies in preparing its financial statements.
1. Security Valuation: Securities are valued as of the close of trading on the New York Stock Exchange (generally 4 p.m., Eastern time) on the valuation date. Equity securities are valued at the latest quoted sales prices or official closing prices taken from the primary market in which each security trades; such securities not traded on the valuation date are valued at the mean of the latest quoted bid and asked prices. Securities for which market quotations are not readily available, or whose values have been materially affected by events occurring before the fund’s pricing time but after the close of the securities’ primary markets, are valued by methods deemed by the board of trustees to represent fair value. Investments in Vanguard Market Liquidity Fund are valued at that fund’s net asset value.
2. Federal Income Taxes: The fund intends to continue to qualify as a regulated investment company and distribute all of its taxable income. Management has analyzed the fund’s tax positions taken for all open federal income tax years (August 31, 2007–2010), and has concluded that no provision for federal income tax is required in the fund’s financial statements.
3. Distributions: Distributions to shareholders are recorded on the ex-dividend date.
4. Security Lending: The fund may lend its securities to qualified institutional borrowers to earn additional income. Security loans are required to be secured at all times by collateral at least equal to the market value of securities loaned. The fund invests cash collateral received in Vanguard Market Liquidity Fund, and records a liability for the return of the collateral, during the period the securities are on loan. Security lending income represents the income earned on investing cash collateral, less expenses associated with the loan.
5. Other: Dividend income is recorded on the ex-dividend date. Interest income includes income distributions received from Vanguard Market Liquidity Fund and is accrued daily. Security transactions are accounted for on the date securities are bought or sold. Costs used to determine realized gains (losses) on the sale of investment securities are those of the specific securities sold. Fees assessed on redemptions of capital shares are credited to paid-in capital.
Each class of shares has equal rights as to assets and earnings, except that each class separately bears certain class-specific expenses related to maintenance of shareholder accounts (included in Management and Administrative expenses) and shareholder reporting. Marketing and distribution expenses are allocated to each class of shares based on a method approved by the board of trustees. Income, other non-class-specific expenses, and gains and losses on investments are allocated to each class of shares based on its relative net assets.
B. The Vanguard Group furnishes at cost investment advisory, corporate management, administrative, marketing, and distribution services. The costs of such services are allocated to the fund under methods approved by the board of trustees. The fund has committed to provide up to 0.40% of its net assets in capital contributions to Vanguard. At August 31, 2010, the fund had contributed capital of $47,000 to Vanguard (included in Other Assets), representing 0.02% of the fund’s net assets and 0.02% of Vanguard’s capitalization. The fund’s trustees and officers are also directors and officers of Vanguard.
C. Various inputs may be used to determine the value of the fund’s investments. These inputs are summarized in three broad levels for financial statement purposes. The inputs or methodologies used to value securities are not necessarily an indication of the risk associated with investing in those securities.
Level 1—Quoted prices in active markets for identical securities.
Level 2—Other significant observable inputs (including quoted prices for similar securities, interest rates, prepayment speeds, credit risk, etc.).
Level 3—Significant unobservable inputs (including the fund’s own assumptions used to determine the fair value of investments).
At August 31, 2010, 100% of the fund’s investments were valued based on Level 1 inputs.
91
Telecommunication Services Index Fund
D. Distributions are determined on a tax basis and may differ from net investment income and realized capital gains for financial reporting purposes. Differences may be permanent or temporary. Permanent differences are reclassified among capital accounts in the financial statements to reflect their tax character. Temporary differences arise when certain items of income, expense, gain, or loss are recognized in different periods for financial statement and tax purposes; these differences will reverse at some time in the future. Differences in classification may also result from the treatment of short-term gains as ordinary income for tax purposes.
During the year ended August 31, 2010, the fund realized $3,197,000 of net capital gains resulting from in-kind redemptions—in which shareholders exchanged fund shares for securities held by the fund rather than for cash. Because such gains are not taxable to the fund, and are not distributed to shareholders, they have been reclassified from accumulated net realized losses to paid-in capital.
For tax purposes, at August 31, 2010, the fund had $5,530,000 of ordinary income available for distribution. The fund had available capital loss carryforwards totaling $50,032,000 to offset future net capital gains of $29,000 through August 31, 2014, $818,000 through August 31, 2015, $4,154,000 through August 31, 2016, $18,696,000 through August 31, 2017, and $26,335,000 through August 31, 2018. In addition, the fund realized losses of $19,425,000 during the period from November 1, 2009, through August 31, 2010, which are deferred and will be treated as realized for tax purposes in fiscal 2011.
At August 31, 2010, the cost of investment securities for tax purposes was $258,190,000. Net unrealized depreciation of investment securities for tax purposes was $2,900,000, consisting of unrealized gains of $14,899,000 on securities that had risen in value since their purchase and $17,799,000 in unrealized losses on securities that had fallen in value since their purchase.
E. During the year ended August 31, 2010, the fund purchased $138,255,000 of investment securities and sold $64,169,000 of investment securities, other than temporary cash investments.
F. Capital share transactions for each class of shares were:
| | | | | | |
| | | | | |
| | | | | Year Ended August 31, |
| | | | 2010 | | | 2009 |
| | Amount | Shares | Amount | Shares |
| | ($000) | (000) | ($000) | (000) |
| Admiral Shares | | | | |
| Issued | 3,194 | 112 | 1,801 | 74 |
| Issued in Lieu of Cash Distributions | 304 | 11 | 299 | 14 |
| Redeemed1 | (2,825) | (100) | (5,071) | (217) |
| Net Increase (Decrease)—Admiral Shares | 673 | 23 | (2,971) | (129) |
| ETF Shares | | | | |
| Issued | 86,865 | 1,600 | 117,888 | 2,702 |
| Issued in Lieu of Cash Distributions | — | — | — | — |
| Redeemed1 | (15,928) | (300) | (98,103) | (2,100) |
| Net Increase (Decrease)—ETF Shares | 70,937 | 1,300 | 19,785 | 602 |
| 1 Net of redemption fees for fiscal 2010 and 2009 of $3,000 and $7,000, respectively (fund totals). | | |
G. In preparing the financial statements as of August 31, 2010, management considered the impact of subsequent events for potential recognition or disclosure in these financial statements.
92
Utilities Index Fund
Fund Profile
As of August 31, 2010
| | | |
| Portfolio Characteristics | | |
| | | Target | Broad |
| | Fund | Index1 | Index2 |
| Number of Stocks | 89 | 89 | 2,478 |
| Median Market Cap | $12.6B | $12.3B | $26.3B |
| Price/Earnings Ratio | 13.8x | 13.8x | 15.4x |
| Price/Book Ratio | 1.4x | 1.4x | 1.9x |
| Yield3 | | 4.3% | 2.1% |
| Admiral Shares | 3.7% | | |
| ETF Shares | 3.7% | | |
| Return on Equity | 13.3% | 13.4% | 19.2% |
| Earnings Growth Rate | 5.7% | 5.6% | 6.3% |
| Foreign Holdings | 0.0% | 0.0% | 0.0% |
| Turnover Rate | 8% | — | — |
| Expense Ratio4 | | — | — |
| Admiral Shares | 0.28% | | |
| ETF Shares | 0.25% | | |
| Short-Term Reserves | 0.0% | — | — |
| | |
| Volatility Measures5 | | |
| Fund Versus | Fund Versus |
| Spliced Index6 | Broad Index2 |
| R-Squared | 1.00 | 0.55 |
| Beta | 1.00 | 0.60 |
| |
| |
Subindustry Diversification
(% of equity exposure) | | |
| | |
| |
| Electric Utilities | | 49.3% |
| Gas Utilities | | 7.4 |
| Independent Power Producers & | | |
| Energy Traders | | 5.7 |
| Multi-Utilities | | 35.7 |
| Water Utilities | | 1.9 |
| |
| Ten Largest Holdings7 (% of total net assets) |
| |
| Southern Co. | 6.6% |
| Exelon Corp. | 5.9 |
| Dominion Resources Inc. | 5.6 |
| Duke Energy Corp. | 4.9 |
| NextEra Energy Inc. | 4.6 |
| PG&E Corp. | 3.8 |
| American Electric Power Co. Inc. | 3.7 |
| Public Service Enterprise Group Inc. | 3.5 |
| Entergy Corp. | 3.3 |
| Consolidated Edison Inc. | 2.9 |
| Top Ten | 44.8% |
1 MSCI US IMI/Utilities 25/50.
2 MSCI US IMI/2500.
3 30-day SEC yield for the fund; annualized dividend yield for the indexes. See the Glossary.
4 The expense ratios shown are from the prospectus dated December 28, 2009, and represent estimated costs for the current fiscal year. For the fiscal year ended August 31, 2010, the expense ratios were 0.24% for the Admiral Shares and 0.24% for the ETF Shares.
5 For an explanation of R-squared, beta, and other terms used here, see the Glossary.
6 Spliced MSCI US IMI/Utilities 25/50: MSCI US IMI/Utilities through February 26, 2010; MSCI US IMI/Utilities 25/50 thereafter.
7 The holdings listed exclude any temporary cash investments and equity index products.
93
Utilities Index Fund
Performance Summary
All of the returns in this report represent past performance, which is not a guarantee of future results that may be achieved by the fund. (Current performance may be lower or higher than the performance data cited. For performance data current to the most recent month-end, visit our website at vanguard.com/performance.) Note, too, that both investment returns and principal value can fluctuate widely, so an investor’s shares, when sold, could be worth more or less than their original cost. The returns shown do not reflect taxes that a shareholder would pay on fund distributions or on the sale of fund shares.
Cumulative Performance: January 26, 2004–August 31, 2010
Initial Investment of $10,000
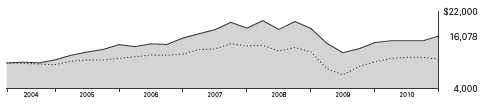
| | | | | |
| | | | |
| | | Average Annual Total Returns | |
| | | | Periods Ended August 31, 2010 | Final Value |
| | | | Since | of a $10,000 |
| | One Year | Five Years | Inception1 | Investment |
| Utilities Index Fund ETF Shares | | | | |
| Net Asset Value2 | 10.18% | 2.47% | 7.47% | $16,078 |
| Utilities Index Fund ETF Shares Market Price | 10.07 | 2.46 | 7.46 | 16,073 |
| MSCI US IMI/2500 | 5.81 | –0.39 | 1.31 | 10,893 |
| Spliced MSCI US IMI/Utilities 25/503 | 10.41 | 2.67 | 7.69 | 16,296 |
| | | | |
| | | | | Final Value |
| | | | Since | of a $100,000 |
| | One Year | Five Years | Inception1 | Investment |
| Utilities Index Fund Admiral Shares4 | 10.20% | 2.44% | 7.69% | $159,915 |
| MSCI US IMI/2500 | 5.81 | –0.39 | 1.77 | 111,737 |
| Spliced MSCI US IMI/Utilities 25/503 | 10.41 | 2.67 | 7.93 | 162,256 |
1 Performance for the fund and its comparative standards is calculated since the following inception dates: January 26, 2004, for ETF Shares; April 28, 2004, for Admiral Shares.
2 For more information about how the ETF Shares’ market prices have compared with their net asset value, visit Vanguard.com, select your ETF, and then select the Performance tab. The Premium/Discount table there shows the percentages of days on which the ETF Shares’ market price was above or below the NAV.
3 Spliced MSCI US IMI/Utilities 25/50: MSCI US IMI/IUtilities through February 26, 2010; MSCI US IMI/Utilities 25/50 thereafter.
4 Total returns do not reflect the 2% fee assessed on redemptions of shares held for less than one year.
See Financial Highlights for dividend and capital gains information.
94
Utilities Index Fund
Fiscal-Year Total Returns (%): January 26, 2004–August 31, 2010
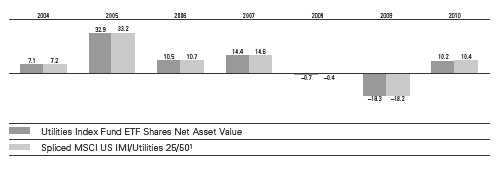
| | | |
| Cumulative Returns: ETF Shares, January 26, 2004–August 31, 2010 | | |
| | | | Cumulative |
| | | | Since |
| | One Year | Five Years | Inception |
| Utilities Index Fund ETF Shares Market Price | 10.07% | 12.93% | 60.73% |
| Utilities Index Fund ETF Shares Net Asset Value | 10.18 | 12.99 | 60.78 |
| Spliced MSCI US IMI/Utilities 25/501 | 10.41 | 14.07 | 62.96 |
Average Annual Total Returns: Periods Ended June 30, 2010
This table presents average annual total returns through the latest calendar quarter—rather than through the end of the fiscal period. Securities and Exchange Commission rules require that we provide this information.
| | | | |
| | | | | Since |
| | Inception Date | One Year | Five Years | Inception |
| ETF Shares | 1/26/2004 | | | |
| Market Price | | 6.51% | 1.45% | 6.33% |
| Net Asset Value | | 6.62 | 1.44 | 6.33 |
| Admiral Shares2 | 4/28/2004 | 6.61 | 1.40 | 6.50 |
1 Spliced MSCI US IMI/Utilities 25/50: MSCI US IMI/IUtilities through February 26, 2010; MSCI US IMI/Utilities 25/50 thereafter.
2 Total returns do not reflect the 2% fee assessed on redemptions of shares held for less than one year.
95
Utilities Index Fund
Financial Statements
Statement of Net Assets
As of August 31, 2010
The fund reports a complete list of its holdings in regulatory filings four times in each fiscal year, at the quarter-ends. For the second and fourth fiscal quarters, the lists appear in the fund’s semiannual and annual reports to shareholders. For the first and third fiscal quarters, the fund files the lists with the Securities and Exchange Commission on Form N-Q. Shareholders can look up the fund’s Forms N-Q on the SEC’s website at sec.gov. Forms N-Q may also be reviewed and copied at the SEC’s Public Reference Room (see the back cover of this report for further information).
| | | |
| | | | Market |
| | | | Value• |
| | | Shares | ($000) |
| Common Stocks (100.0%) | | |
| Electric Utilities (49.3%) | | |
| | Southern Co. | 1,322,889 | 48,537 |
| | Exelon Corp. | 1,059,836 | 43,157 |
| | Duke Energy Corp. | 2,106,800 | 36,216 |
| | NextEra Energy Inc. | 632,038 | 33,959 |
| | American Electric | | |
| | Power Co. Inc. | 768,308 | 27,206 |
| | Entergy Corp. | 303,719 | 23,945 |
| | PPL Corp. | 751,819 | 20,419 |
| | Progress Energy Inc. | 460,740 | 19,770 |
| | FirstEnergy Corp. | 489,079 | 17,866 |
| | Edison International | 496,595 | 16,760 |
| | Northeast Utilities | 282,369 | 8,180 |
| | Pinnacle West Capital Corp. | 173,993 | 6,934 |
| | Pepco Holdings Inc. | 358,119 | 6,428 |
| | Allegheny Energy Inc. | 272,074 | 6,135 |
| | DPL Inc. | 190,831 | 4,832 |
| | NV Energy Inc. | 376,938 | 4,825 |
| | ITC Holdings Corp. | 80,447 | 4,663 |
| | Westar Energy Inc. | 177,483 | 4,254 |
| | Great Plains Energy Inc. | 217,463 | 4,021 |
| | Hawaiian Electric | | |
| | Industries Inc. | 149,491 | 3,591 |
| | Cleco Corp. | 97,365 | 2,758 |
| | IDACORP Inc. | 77,169 | 2,706 |
| | Portland General | | |
| | Electric Co. | 120,773 | 2,413 |
| | Unisource Energy Corp. | 57,881 | 1,883 |
| | Allete Inc. | 51,191 | 1,821 |
| * | El Paso Electric Co. | 70,212 | 1,611 |
| | PNM Resources Inc. | 139,059 | 1,591 |
| | MGE Energy Inc. | 37,085 | 1,384 |
| | UIL Holdings Corp. | 48,106 | 1,274 |
| | Empire District Electric Co. | 61,451 | 1,206 |
| | Otter Tail Corp. | 57,650 | 1,068 |
| | Central Vermont Public | | |
| | Service Corp. | 18,259 | 362 |
| | | | 361,775 |
| Gas Utilities (7.4%) | | |
| | Oneok Inc. | 162,013 | 6,952 |
| | UGI Corp. | 175,168 | 4,835 |
| | National Fuel Gas Co. | 111,720 | 4,802 |
| | Energen Corp. | 109,562 | 4,676 |
| | AGL Resources Inc. | 124,902 | 4,584 |
| | Questar Corp. | 280,922 | 4,573 |
| | Atmos Energy Corp. | 149,446 | 4,229 |
| | Piedmont Natural | | |
| | Gas Co. Inc. | 115,101 | 3,140 |
| | | |
| | | | Market |
| | | | Value• |
| | | Shares | ($000) |
| | Nicor Inc. | 72,634 | 3,072 |
| | WGL Holdings Inc. | 81,257 | 2,866 |
| | New Jersey Resources Corp. | 66,256 | 2,465 |
| | Southwest Gas Corp. | 72,794 | 2,289 |
| | South Jersey Industries Inc. | 47,929 | 2,252 |
| | Northwest Natural Gas Co. | 42,620 | 1,937 |
| | Laclede Group Inc. | 33,960 | 1,131 |
| | Chesapeake Utilities Corp. | 14,417 | 497 |
| *,^ | China Natural Gas Inc. | 21,758 | 111 |
| | | | 54,411 |
| Independent Power Producers & | |
| Energy Traders (5.7%) | | |
| * | AES Corp. | 1,084,693 | 11,107 |
| | Constellation Energy | | |
| | Group Inc. | 307,400 | 9,016 |
| * | NRG Energy Inc. | 409,625 | 8,324 |
| * | Calpine Corp. | 570,186 | 7,253 |
| * | Mirant Corp. | 233,374 | 2,264 |
| * | RRI Energy Inc. | 567,018 | 1,967 |
| | Ormat Technologies Inc. | 32,801 | 904 |
| * | Dynegy Inc. Class A | 163,988 | 808 |
| | | | 41,643 |
| Multi-Utilities (35.7%) | | |
| | Dominion Resources Inc. | 956,294 | 40,891 |
| | PG&E Corp. | 597,394 | 27,934 |
| | Public Service Enterprise | | |
| | Group Inc. | 811,752 | 25,944 |
| | Consolidated Edison Inc. | 452,396 | 21,502 |
| | Sempra Energy | 377,296 | 19,212 |
| | Xcel Energy Inc. | 737,329 | 16,450 |
| | DTE Energy Co. | 270,198 | 12,659 |
| | Ameren Corp. | 382,307 | 10,731 |
| | Wisconsin Energy Corp. | 187,557 | 10,454 |
| | CenterPoint Energy Inc. | 636,166 | 9,409 |
| | NiSource Inc. | 444,623 | 7,710 |
| | SCANA Corp. | 189,056 | 7,379 |
| | NSTAR | 171,364 | 6,517 |
| | CMS Energy Corp. | 368,848 | 6,455 |
| | Alliant Energy Corp. | 177,722 | 6,224 |
| | OGE Energy Corp. | 155,957 | 6,090 |
| | Integrys Energy Group Inc. | 123,567 | 5,987 |
| | TECO Energy Inc. | 326,051 | 5,504 |
| | MDU Resources Group Inc. | 286,746 | 5,394 |
| | Vectren Corp. | 123,752 | 3,037 |
| | Avista Corp. | 88,073 | 1,838 |
| | Black Hills Corp. | 59,710 | 1,817 |
| | NorthWestern Corp. | 57,769 | 1,624 |
| | CH Energy Group Inc. | 25,370 | 1,069 |
| | | | 261,831 |
| | |
| | | Market |
| | | Value• |
| | Shares | ($000) |
| Water Utilities (1.9%) | | |
| American Water | | |
| Works Co. Inc. | 280,295 | 6,329 |
| Aqua America Inc. | 219,732 | 4,368 |
| California Water | | |
| Service Group | 31,710 | 1,104 |
| American States Water Co. | 29,793 | 993 |
| SJW Corp. | 22,133 | 511 |
| Middlesex Water Co. | 24,355 | 400 |
| Connecticut Water | | |
| Service Inc. | 13,644 | 309 |
| Consolidated Water Co. Ltd. | 21,940 | 202 |
| | | 14,216 |
| Total Common Stocks | | |
| (Cost $816,509) | | 733,876 |
| Temporary Cash Investment (0.0%) | |
| Money Market Fund (0.0%) | | |
| 1,2 Vanguard Market | | |
| Liquidity Fund, 0.288% | | |
| (Cost $63) | 63,002 | 63 |
| Total Investments (100.0%) | | |
| (Cost $816,572) | | 733,939 |
| Other Assets and Liabilities (0.0%) | |
| Other Assets | | 11,876 |
| Liabilities2 | | (11,928) |
| | | (52) |
| Net Assets (100%) | | 733,887 |
| |
| At August 31, 2010, net assets consisted of: |
| | Amount |
| | ($000) |
| Paid-in Capital | 833,069 |
| Undistributed Net Investment Income | 5,246 |
| Accumulated Net Realized Losses | (21,795) |
| Unrealized Appreciation (Depreciation) | (82,633) |
| Net Assets | 733,887 |
| |
| |
| Admiral Shares—Net Assets | |
| Applicable to 4,689,110 outstanding | |
| $.001 par value shares of beneficial | |
| interest (unlimited authorization) | 152,853 |
| Net Asset Value Per Share— | |
| Admiral Shares | $32.60 |
| |
| |
| ETF Shares—Net Assets | |
| Applicable to 8,948,860 outstanding | |
| $.001 par value shares of beneficial | |
| interest (unlimited authorization) | 581,034 |
| Net Asset Value Per Share— | |
| ETF Shares | $64.93 |
• See Note A in Notes to Financial Statements.
* Non-income-producing security.
^ Part of security position is on loan to broker-dealers. The total value of securities on loan is $54,000.
1 Affiliated money market fund available only to Vanguard funds and certain trusts and accounts managed by Vanguard. Rate shown is the 7-day yield.
2 Includes $63,000 of collateral received for securities on loan.
See accompanying Notes, which are an integral part of the Financial Statements.
96
Utilities Index Fund
| |
| Statement of Operations |
| |
| | Year Ended |
| | August 31, 2010 |
| | ($000) |
| Investment Income | |
| Income | |
| Dividends | 25,234 |
| Interest1 | 2 |
| Security Lending | 3 |
| Total Income | 25,239 |
| Expenses | |
| The Vanguard Group—Note B | |
| Investment Advisory Services | 78 |
| Management and Administrative— | |
| Admiral Shares | 223 |
| Management and Administrative— | |
| ETF Shares | 854 |
| Marketing and Distribution— | |
| Admiral Shares | 20 |
| Marketing and Distribution— | |
| ETF Shares | 127 |
| Custodian Fees | 19 |
| Auditing Fees | 26 |
| Shareholders’ Reports—Admiral Shares | — |
| Shareholders’ Reports—ETF Shares | 47 |
| Trustees’ Fees and Expenses | 1 |
| Total Expenses | 1,395 |
| Net Investment Income | 23,844 |
| Realized Net Gain (Loss) on | |
| Investment Securities Sold | 4,109 |
| Change in Unrealized Appreciation | |
| (Depreciation) of Investment Securities | 23,581 |
| Net Increase (Decrease) in Net Assets | |
| Resulting from Operations | 51,534 |
| | | |
| | |
| Statement of Changes in Net Assets | | |
| |
| | | Year Ended August 31, |
| | 2010 | 2009 |
| | ($000) | ($000) |
| Increase (Decrease) in Net Assets | | |
| Operations | | |
| Net Investment Income | 23,844 | 16,574 |
| Realized Net Gain (Loss) | 4,109 | (17,489) |
| Change in Unrealized Appreciation (Depreciation) | 23,581 | (83,085) |
| Net Increase (Decrease) in Net Assets Resulting from Operations | 51,534 | (84,000) |
| Distributions | | |
| Net Investment Income | | |
| Admiral Shares | (4,081) | (3,297) |
| ETF Shares | (17,757) | (12,782) |
| Realized Capital Gain | | |
| Admiral Shares | — | — |
| ETF Shares | — | — |
| Total Distributions | (21,838) | (16,079) |
| Capital Share Transactions | | |
| Admiral Shares | 66,315 | (4,742) |
| ETF Shares | 193,359 | 69,532 |
| Net Increase (Decrease) from Capital Share Transactions | 259,674 | 64,790 |
| Total Increase (Decrease) | 289,370 | (35,289) |
| Net Assets | | |
| Beginning of Period | 444,517 | 479,806 |
| End of Period2 | 733,887 | 444,517 |
1 Interest income from an affiliated company of the fund was $2,000.
2 Net Assets—End of Period includes undistributed net investment income of $5,246,000 and $3,240,000.
See accompanying Notes, which are an integral part of the Financial Statements.
97
Utilities Index Fund
Financial Highlights
| | | | | | |
| | | | | |
| Admiral Shares | | | | | |
| |
| For a Share Outstanding | | | | | Year Ended August 31, |
| Throughout Each Period | 2010 | 2009 | 2008 | 2007 | 2006 |
| Net Asset Value, Beginning of Period | $30.73 | $39.26 | $40.60 | $36.47 | $34.03 |
| Investment Operations | | | | | |
| Net Investment Income | 1.2931 | 1.251 | 1.126 | 1.080 | 1.0801 |
| Net Realized and Unrealized Gain (Loss) | | | | | |
| on Investments2 | 1.782 | (8.530) | (1.340) | 4.089 | 2.378 |
| Total from Investment Operations | 3.075 | (7.279) | (.214) | 5.169 | 3.458 |
| Distributions | | | | | |
| Dividends from Net Investment Income | (1.205) | (1.251) | (1.126) | (1.039) | (1.018) |
| Distributions from Realized Capital Gains | — | — | — | — | — |
| Total Distributions | (1.205) | (1.251) | (1.126) | (1.039) | (1.018) |
| Net Asset Value, End of Period | $32.60 | $30.73 | $39.26 | $40.60 | $36.47 |
| |
| Total Return3 | 10.20% | –18.39% | –0.69% | 14.33% | 10.48% |
| |
| Ratios/Supplemental Data | | | | | |
| Net Assets, End of Period (Millions) | $153 | $81 | $109 | $108 | $52 |
| Ratio of Total Expenses to | | | | | |
| Average Net Assets | 0.24% | 0.28% | 0.25% | 0.26% | 0.28% |
| Ratio of Net Investment Income to | | | | | |
| Average Net Assets | 4.07% | 4.28% | 2.75% | 2.70% | 3.26% |
| Portfolio Turnover Rate4 | 8% | 10% | 18% | 12% | 9% |
1 Calculated based on average shares outstanding.
2 Includes increases from redemption fees of $.00, $.01, $.02, $.02, and $.04.
3 Total returns do not include transaction fees that may have applied in the periods shown. Fund prospectuses provide information about any applicable transaction fees.
4 Excludes the value of portfolio securities received or delivered as a result of in-kind purchases or redemptions of the fund’s capital shares, including ETF Creation Units.
See accompanying Notes, which are an integral part of the Financial Statements.
98
Utilities Index Fund
Financial Highlights
| | | | | | |
| | | | | |
| ETF Shares | | | | | |
| |
| For a Share Outstanding | | | | | Year Ended August 31, |
| Throughout Each Period | 2010 | 2009 | 2008 | 2007 | 2006 |
| Net Asset Value, Beginning of Period | $61.24 | $78.22 | $80.92 | $72.68 | $67.80 |
| Investment Operations | | | | | |
| Net Investment Income | 2.5541 | 2.512 | 2.285 | 2.180 | 2.2141 |
| Net Realized and Unrealized Gain (Loss) | | | | | |
| on Investments2 | 3.550 | (16.978) | (2.695) | 8.156 | 4.704 |
| Total from Investment Operations | 6.104 | (14.466) | (.410) | 10.336 | 6.918 |
| Distributions | | | | | |
| Dividends from Net Investment Income | (2.414) | (2.514) | (2.290) | (2.096) | (2.038) |
| Distributions from Realized Capital Gains | — | — | — | — | — |
| Total Distributions | (2.414) | (2.514) | (2.290) | (2.096) | (2.038) |
| Net Asset Value, End of Period | $64.93 | $61.24 | $78.22 | $80.92 | $72.68 |
| |
| Total Return | 10.18% | –18.34% | –0.66% | 14.37% | 10.52% |
| |
| Ratios/Supplemental Data | | | | | |
| Net Assets, End of Period (Millions) | $581 | $364 | $371 | $285 | $183 |
| Ratio of Total Expenses to | | | | | |
| Average Net Assets | 0.24% | 0.25% | 0.20% | 0.22% | 0.25% |
| Ratio of Net Investment Income to | | | | | |
| Average Net Assets | 4.07% | 4.31% | 2.80% | 2.74% | 3.29% |
| Portfolio Turnover Rate3 | 8% | 10% | 18% | 12% | 9% |
1 Calculated based on average shares outstanding.
2 Includes increases from redemption fees of $.01, $.02, $.04, $.03, and $.06.
3 Excludes the value of portfolio securities received or delivered as a result of in-kind purchases or redemptions of the fund’s capital shares, including ETF Creation Units.
See accompanying Notes, which are an integral part of the Financial Statements.
99
Utilities Index Fund
Notes to Financial Statements
Vanguard Utilities Index Fund is registered under the Investment Company Act of 1940 as an open-end investment company, or mutual fund. The fund offers two classes of shares: Admiral Shares and ETF Shares. Admiral Shares are designed for investors who meet certain administrative, service, and account-size criteria. ETF Shares are listed for trading on the NYSE Arca, Inc.; they can be purchased and sold through a broker.
A. The following significant accounting policies conform to generally accepted accounting principles for U.S. mutual funds. The fund consistently follows such policies in preparing its financial statements.
1. Security Valuation: Securities are valued as of the close of trading on the New York Stock Exchange (generally 4 p.m., Eastern time) on the valuation date. Equity securities are valued at the latest quoted sales prices or official closing prices taken from the primary market in which each security trades; such securities not traded on the valuation date are valued at the mean of the latest quoted bid and asked prices. Securities for which market quotations are not readily available, or whose values have been materially affected by events occurring before the fund’s pricing time but after the close of the securities’ primary markets, are valued by methods deemed by the board of trustees to represent fair value. Investments in Vanguard Market Liquidity Fund are valued at that fund’s net asset value.
2. Federal Income Taxes: The fund intends to continue to qualify as a regulated investment company and distribute all of its taxable income. Management has analyzed the fund’s tax positions taken for all open federal income tax years (August 31, 2007–2010), and has concluded that no provision for federal income tax is required in the fund’s financial statements.
3. Distributions: Distributions to shareholders are recorded on the ex-dividend date.
4. Security Lending: The fund may lend its securities to qualified institutional borrowers to earn additional income. Security loans are required to be secured at all times by collateral at least equal to the market value of securities loaned. The fund invests cash collateral received in Vanguard Market Liquidity Fund, and records a liability for the return of the collateral, during the period the securities are on loan. Security lending income represents the income earned on investing cash collateral, less expenses associated with the loan.
5. Other: Dividend income is recorded on the ex-dividend date. Interest income includes income distributions received from Vanguard Market Liquidity Fund and is accrued daily. Security transactions are accounted for on the date securities are bought or sold. Costs used to determine realized gains (losses) on the sale of investment securities are those of the specific securities sold. Fees assessed on redemptions of capital shares are credited to paid-in capital.
Each class of shares has equal rights as to assets and earnings, except that each class separately bears certain class-specific expenses related to maintenance of shareholder accounts (included in Management and Administrative expenses) and shareholder reporting. Marketing and distribution expenses are allocated to each class of shares based on a method approved by the board of trustees. Income, other non-class-specific expenses, and gains and losses on investments are allocated to each class of shares based on its relative net assets.
B. The Vanguard Group furnishes at cost investment advisory, corporate management, administrative, marketing, and distribution services. The costs of such services are allocated to the fund under methods approved by the board of trustees. The fund has committed to provide up to 0.40% of its net assets in capital contributions to Vanguard. At August 31, 2010, the fund had contributed capital of $132,000 to Vanguard (included in Other Assets), representing 0.02% of the fund’s net assets and 0.05% of Vanguard’s capitalization. The fund’s trustees and officers are also directors and officers of Vanguard.
C. Various inputs may be used to determine the value of the fund’s investments. These inputs are summarized in three broad levels for financial statement purposes. The inputs or methodologies used to value securities are not necessarily an indication of the risk associated with investing in those securities.
Level 1—Quoted prices in active markets for identical securities.
Level 2—Other significant observable inputs (including quoted prices for similar securities, interest rates, prepayment speeds, credit risk, etc.).
Level 3—Significant unobservable inputs (including the fund’s own assumptions used to determine the fair value of investments).
At August 31, 2010, 100% of the fund’s investments were valued based on Level 1 inputs.
100
Utilities Index Fund
D. Distributions are determined on a tax basis and may differ from net investment income and realized capital gains for financial reporting purposes. Differences may be permanent or temporary. Permanent differences are reclassified among capital accounts in the financial statements to reflect their tax character. Temporary differences arise when certain items of income, expense, gain, or loss are recognized in different periods for financial statement and tax purposes; these differences will reverse at some time in the future. Differences in classification may also result from the treatment of short-term gains as ordinary income for tax purposes.
During the year ended August 31, 2010, the fund realized $7,228,000 of net capital gains resulting from in-kind redemptions—in which shareholders exchanged fund shares for securities held by the fund rather than for cash. Because such gains are not taxable to the fund, and are not distributed to shareholders, they have been reclassified from accumulated net realized losses to paid-in capital.
For tax purposes, at August 31, 2010, the fund had $5,815,000 of ordinary income available for distribution. The fund had available capital loss carryforwards totaling $18,385,000 to offset future net capital gains of $515,000 through August 31, 2015, $2,910,000 through August 31, 2017, and $14,960,000 through August 31, 2018. In addition, the fund realized losses of $3,314,000 during the period from November 1, 2009, through August 31, 2010, which are deferred and will be treated as realized for tax purposes in fiscal 2011.
At August 31, 2010, the cost of investment securities for tax purposes was $816,668,000. Net unrealized depreciation of investment securities for tax purposes was $82,729,000, consisting of unrealized gains of $14,276,000 on securities that had risen in value since their purchase and $97,005,000 in unrealized losses on securities that had fallen in value since their purchase.
E. During the year ended August 31, 2010, the fund purchased $359,585,000 of investment securities and sold $97,812,000 of investment securities, other than temporary cash investments.
F. Capital share transactions for each class of shares were:
| | | | | | |
| | | | | |
| | | | | Year Ended August 31, |
| | | | 2010 | | | 2009 |
| | Amount | Shares | Amount | Shares |
| | ($000) | (000) | ($000) | (000) |
| Admiral Shares | | | | |
| Issued | 88,042 | 2,749 | 20,497 | 698 |
| Issued in Lieu of Cash Distributions | 3,417 | 109 | 2,918 | 98 |
| Redeemed1 | (25,144) | (800) | (28,157) | (949) |
| Net Increase (Decrease)—Admiral Shares | 66,315 | 2,058 | (4,742) | (153) |
| ETF Shares | | | | |
| Issued | 243,210 | 3,810 | 153,405 | 2,602 |
| Issued in Lieu of Cash Distributions | — | — | — | — |
| Redeemed1 | (49,851) | (800) | (83,873) | (1,400) |
| Net Increase (Decrease)—ETF Shares | 193,359 | 3,010 | 69,532 | 1,202 |
| 1 Net of redemption fees for fiscal 2010 and 2009 of $70,000 and $113,000, respectively (fund totals). | | |
G. In preparing the financial statements as of August 31, 2010, management considered the impact of subsequent events for potential recognition or disclosure in these financial statements.
101
Report of Independent Registered Public Accounting Firm
To the Trustees of Vanguard World Fund and the Shareholders of Vanguard Consumer Discretionary Index Fund, Vanguard Consumer Staples Index Fund, Vanguard Energy Index Fund, Vanguard Financials Index Fund, Vanguard Health Care Index Fund, Vanguard Industrials Index Fund, Vanguard Information Technology Index Fund, Vanguard Materials Index Fund, Vanguard Telecommunication Services Index Fund and Vanguard Utilities Index Fund: In our opinion, the accompanying statements of net assets and the related statements of operations and of changes in net assets and the financial highlights present fairly, in all material respects, the financial position of Vanguard Consumer Discretionary Index Fund, Vanguard Consumer Staples Index Fund, Vanguard Energy Index Fund, Vanguard Financials Index Fund, Vanguard Health Care Index Fund, Vanguard Industrials Index Fund, Vanguard Information Technology Index Fund, Vanguard Materials Index Fund, Vanguard Telecommunication Services Index Fund and Vanguard Utilities Index Fund (constituting separate portfolios of Vanguard World Fund, hereafter referred to as the “Funds”) at August 31, 2010, the results of each of their operations for the year then ended, the changes in each of their net assets for each of the two years in the period then ended and the financial highlights for each of the periods indicated, in conformity with accounting principles generally accepted in the United States of America. These financial statements and financial highlights (hereafter referred to as “financial statements”) are the responsibility of the Funds’ management; our responsibility is to express an opinion on these financial statements based on our audits. We conducted our audits of these financial statements in accordance with the standards of the Public Company Accounting Oversight Board (United States). Those standards require that we plan and perform the audit to obtain reasonable assurance about whether the financial statem ents are free of material misstatement. An audit includes examining, on a test basis, evidence supporting the amounts and disclosures in the financial statements, assessing the accounting principles used and significant estimates made by management, and evaluating the overall financial statement presentation. We believe that our audits, which included confirmation of securities at August 31, 2010 by correspondence with the custodian and by agreement to the underlying ownership records of Vanguard Market Liquidity Fund, provide a reasonable basis for our opinion.
PricewaterhouseCoopers LLP
Philadelphia, Pennsylvania
October 11, 2010

Special 2010 tax information (unaudited) for Vanguard U.S. Sector Index Funds
This information for the fiscal year ended August 31, 2010, is included pursuant to provisions of the Internal Revenue Code.
The funds distributed qualified dividend income to shareholders during the fiscal year as follows:
| |
| | Qualified Dividend |
| Index Fund | Income ($000) |
| Consumer Discretionary | 1,768 |
| Consumer Staples | 16,039 |
| Energy | 16,507 |
| Financials | 6,793 |
| Health Care | 19,423 |
| Industrials | 4,728 |
| Information Technology | 4,469 |
| Materials | 8,072 |
| Telecommunication Services | 5,487 |
| Utilities | 21,838 |
For corporate shareholders, the percentage of investment income (dividend income plus short-term gains, if any) that qualifies for the dividends-received deduction is as follows:
| |
| Index Fund | Percentage |
| Consumer Discretionary | 100.0% |
| Consumer Staples | 100.0 |
| Energy | 100.0 |
| Financials | 66.2 |
| Health Care | 100.0 |
| Industrials | 100.0 |
| Information Technology | 100.0 |
| Materials | 66.6 |
| Telecommunication Services | 100.0 |
| Utilities | 100.0 |
102
Your Fund’s After-Tax Returns
This table presents returns for your fund both before and after taxes. The after-tax returns are shown in two ways: (1) assuming that an investor owned the fund during the entire period and paid taxes on the fund’s distributions, and (2) assuming that an investor paid taxes on the fund’s distributions and sold all shares at the end of each period.
Calculations are based on the highest individual federal income tax and capital gains tax rates in effect at the times of the distributions and the hypothetical sales. State and local taxes were not considered. After-tax returns reflect any qualified dividend income, using actual prior-year figures and estimates for 2010. (In the example, returns after the sale of fund shares may be higher than those assuming no sale. This occurs when the sale would have produced a capital loss. The calculation assumes that the investor received a tax deduction for the loss.)
The table shows returns, based on the net asset value, for ETF Shares only; returns for other share classes will differ. Please note that your actual after-tax returns will depend on your tax situation and may differ from those shown. Also note that if you own the fund in a tax-deferred account, such as an individual retirement account or a 401(k) plan, this information does not apply to you. Such accounts are not subject to current taxes.
Finally, keep in mind that a fund’s performance—whether before or after taxes—does not guarantee future results.
103
Average Annual Total Returns: U.S. Sector Index Funds
Periods Ended August 31, 2010
| | | |
| | One | Five | Since |
| | Year | Years | Inception1 |
| Consumer Discretionary ETF | | | |
| Returns Before Taxes | 16.62% | –1.18% | 0.24% |
| Returns After Taxes on Distributions | 16.46 | –1.34 | 0.10 |
| Returns After Taxes on Distributions and Sale of Fund Shares | 11.01 | –1.01 | 0.19 |
| |
| Consumer Staples ETF | | | |
| Returns Before Taxes | 10.33% | 5.44% | 5.96% |
| Returns After Taxes on Distributions | 9.90 | 5.15 | 5.68 |
| Returns After Taxes on Distributions and Sale of Fund Shares | 7.27 | 4.67 | 5.14 |
| |
| Energy ETF | | | |
| Returns Before Taxes | 2.05% | 1.92% | 8.59% |
| Returns After Taxes on Distributions | 1.84 | 1.73 | 8.41 |
| Returns After Taxes on Distributions and Sale of Fund Shares | 1.67 | 1.65 | 7.50 |
| |
| Financials ETF | | | |
| Returns Before Taxes | –3.51% | –9.74% | –6.52% |
| Returns After Taxes on Distributions | –3.80 | –10.14 | –6.90 |
| Returns After Taxes on Distributions and Sale of Fund Shares | –2.04 | –7.94 | –5.31 |
| |
| Health Care ETF | | | |
| Returns Before Taxes | 1.40% | –0.10% | 0.93% |
| Returns After Taxes on Distributions | 0.99 | –0.32 | 0.75 |
| Returns After Taxes on Distributions and Sale of Fund Shares | 1.52 | –0.07 | 0.81 |
| |
| Industrials ETF | | | |
| Returns Before Taxes | 12.85% | 0.48% | 2.33% |
| Returns After Taxes on Distributions | 12.62 | 0.26 | 2.13 |
| Returns After Taxes on Distributions and Sale of Fund Shares | 8.66 | 0.41 | 2.00 |
| |
| Information Technology ETF | | | |
| Returns Before Taxes | 4.17% | 1.54% | 0.07% |
| Returns After Taxes on Distributions | 4.10 | 1.48 | 0.00 |
| Returns After Taxes on Distributions and Sale of Fund Shares | 2.82 | 1.31 | 0.06 |
| |
| Materials ETF | | | |
| Returns Before Taxes | 10.07% | 5.27% | 6.12% |
| Returns After Taxes on Distributions | 9.85 | 4.97 | 5.85 |
| Returns After Taxes on Distributions and Sale of Fund Shares | 6.86 | 4.52 | 5.29 |
| |
| Telecommunication Services ETF | | | |
| Returns Before Taxes | 16.39% | 3.26% | 4.82% |
| Returns After Taxes on Distributions | 15.94 | 2.87 | 4.47 |
| Returns After Taxes on Distributions and Sale of Fund Shares | 11.25 | 2.78 | 4.15 |
| |
| Utilities ETF | | | |
| Returns Before Taxes | 10.18% | 2.47% | 7.47% |
| Returns After Taxes on Distributions | 9.55 | 1.97 | 6.97 |
| Returns After Taxes on Distributions and Sale of Fund Shares | 7.39 | 2.10 | 6.49 |
1 For the Consumer Discretionary, Consumer Staples, Financials, Health Care, Information Technology, Materials, and Utilities ETFs, January 26, 2004; for the Energy, Industrials, and Telecommunication Services ETFs, September 23, 2004.
104
About Your Fund’s Expenses
As a shareholder of the fund, you incur ongoing costs, which include costs for portfolio management, administrative services, and shareholder reports (like this one), among others. Operating expenses, which are deducted from a fund’s gross income, directly reduce the investment return of the fund.
A fund’s expenses are expressed as a percentage of its average net assets. This figure is known as the expense ratio. The examples on this page are intended to help you understand the ongoing costs (in dollars) of investing in your fund and to compare these costs with those of other mutual funds. The examples are based on an investment of $1,000 made at the beginning of the period shown and held for the entire period.
The acompanying table illustrates your fund’s costs in two ways:
• Based on actual fund return. This section helps you to estimate the actual expenses that you paid over the period. The “Ending Account Value” shown is derived from the fund’s actual return, and the third column shows the dollar amount that would have been paid by an investor who started with $1,000 in the fund. You may use the information here, together with the amount you invested, to estimate the expenses that you paid over the period.
To do so, simply divide your account value by $1,000 (for example, an $8,600 account value divided by $1,000 = 8.6), then multiply the result by the number given for your fund under the heading “Expenses Paid During Period.”
• Based on hypothetical 5% yearly return. This section is intended to help you compare your fund’s costs with those of other mutual funds. It assumes that the fund had a yearly return of 5% before expenses, but that the expense ratio is unchanged. In this case—because the return used is not the fund’s actual return—the results do not apply to your investment. The example is useful in making comparisons because the Securities and Exchange Commission requires all mutual funds to calculate expenses based on a 5% return. You can assess your fund’s costs by comparing this hypothetical example with the hypothetical examples that appear in shareholder reports of other funds.
Note that the expenses shown in the table are meant to highlight and help you compare ongoing costs only and do not reflect transaction costs incurred by the fund for buying and selling securities. Further, the expenses do not include the 2% fee on redemptions of Admiral Shares held for less than one year. If this fee were applied to your account, your costs would be higher. Your fund does not carry a “sales load.”
The calculations assume no shares were bought or sold during the period. Your actual costs may have been higher or lower, depending on the amount of your investment and the timing of any purchases or redemptions.
You can find more information about the fund’s expenses in the Financial Statements section of this report. For additional information on operating expenses and other shareholder costs, please refer to your fund’s current prospectus.
105
| | | | |
| Six Months Ended August 31, 2010 | | | | |
| | | Beginning | Ending | Expenses |
| | | Account Value | Account Value | Paid During |
| Index Fund | Share Class | 2/28/2010 | 8/31/2010 | Period1 |
| Based on Actual Fund Return | | | | |
| Consumer Discretionary | Admiral | $1,000.00 | $990.80 | $1.15 |
| | ETF | 1,000.00 | 990.67 | 1.20 |
| Consumer Staples | Admiral | $1,000.00 | $995.77 | $1.06 |
| | ETF | 1,000.00 | 995.67 | 1.21 |
| Energy | Admiral | $1,000.00 | $919.95 | $1.06 |
| | ETF | 1,000.00 | 919.77 | 1.16 |
| Financials | Admiral | $1,000.00 | $940.55 | $1.03 |
| | ETF | 1,000.00 | 940.55 | 1.17 |
| Health Care | Admiral | $1,000.00 | $909.99 | $0.96 |
| | ETF | 1,000.00 | 909.62 | 1.16 |
| Industrials | Admiral | $1,000.00 | $976.84 | $1.05 |
| | ETF | 1,000.00 | 976.77 | 1.20 |
| Information Technology | Admiral | $1,000.00 | $939.12 | $1.08 |
| | ETF | 1,000.00 | 938.81 | 1.17 |
| Materials | Admiral | $1,000.00 | $997.90 | $1.06 |
| | ETF | 1,000.00 | 998.02 | 1.21 |
| Telecommunication Services | Admiral | $1,000.00 | $1,090.30 | $1.16 |
| | ETF | 1,000.00 | 1,089.91 | 1.26 |
| Utilities | Admiral | $1,000.00 | $1,074.64 | $1.15 |
| | ETF | 1,000.00 | 1,074.50 | 1.25 |
| Based on Hypothetical 5% Yearly Return | | | |
| Consumer Discretionary | Admiral | $1,000.00 | $1,024.05 | $1.17 |
| | ETF | 1,000.00 | 1,024.00 | 1.22 |
| Consumer Staples | Admiral | $1,000.00 | $1,024.15 | $1.07 |
| | ETF | 1,000.00 | 1,024.00 | 1.22 |
| Energy | Admiral | $1,000.00 | $1,024.10 | $1.12 |
| | ETF | 1,000.00 | 1,024.00 | 1.22 |
| Financials | Admiral | $1,000.00 | $1,024.15 | $1.07 |
| | ETF | 1,000.00 | 1,024.00 | 1.22 |
| Health Care | Admiral | $1,000.00 | $1,024.20 | $1.02 |
| | ETF | 1,000.00 | 1,024.00 | 1.22 |
| Industrials | Admiral | $1,000.00 | $1,024.15 | $1.07 |
| | ETF | 1,000.00 | 1,024.00 | 1.22 |
| Information Technology | Admiral | $1,000.00 | $1,024.10 | $1.12 |
| | ETF | 1,000.00 | 1,024.00 | 1.22 |
| Materials | Admiral | $1,000.00 | $1,024.15 | $1.07 |
| | ETF | 1,000.00 | 1,024.00 | 1.22 |
| Telecommunication Services | Admiral | $1,000.00 | $1,024.10 | $1.12 |
| | ETF | 1,000.00 | 1,024.00 | 1.22 |
| Utilities | Admiral | $1,000.00 | $1,024.10 | $1.12 |
| | ETF | 1,000.00 | 1,024.00 | 1.22 |
1 The calculations are based on expenses incurred in the most recent six-month period.The funds’ annualized six-month expense ratios for that period are 0.23% for the Consumer Discretionary Index Fund Admiral Shares and 0.24% for the ETF Shares; 0.21% for the Consumer Staples Index Fund Admiral Shares and 0.24% for the ETF Shares; 0.22% for the Energy Index Fund Admiral Shares and 0.24% for the ETF Shares; 0.21% for the Financials Index Fund Admiral Shares and 0.24% for the ETF Shares; 0.20% for the Health Care Index Fund Admiral Shares and 0.24% for the ETF Shares; 0.21% for the Industrials Index Fund Admiral Shares and 0.24% for the ETF Shares; 0.22% for the Information Technology Index Fund Admiral Shares and 0.24% for the ETF Shares; 0.21% for the Materials Index Fund Admiral Shares and 0.24% for the ETF Shares; 0.22% for the Telecommunication Services Index Fund Admiral Shares and 0.24% for the ETF Shares; 0.22% for the Utilities Index Fund Admiral Shares and 0.24% for the ETF Shares. The dollar amounts shown as “Expenses Paid” are equal to the annualized expense ratio multiplied by the average account value over the period, multiplied by the number of days in the most recent six-month period, then divided by the number of days in the most recent 12-month period.
106
Trustees Approve Advisory Arrangement
The board of trustees of Vanguard Consumer Discretionary Index Fund, Consumer Staples Index Fund, Energy Index Fund, Financials Index Fund, Health Care Index Fund, Industrials Index Fund, Information Technology Index Fund, Materials Index Fund, Telecommunication Services Index Fund, and Utilities Index Fund has renewed the funds’ investment advisory arrangement with The Vanguard Group, Inc. Vanguard—through its Quantitative Equity Group—serves as the investment advisor to the funds. The board determined that continuing the funds’ internalized management structure was in the best interests of the funds and their shareholders.
The board based its decision upon an evaluation of the advisor’s investment staff, portfolio management process, and performance. The trustees considered the factors discussed below, among others. However, no single factor determined whether the board approved the arrangement. Rather, it was the totality of the circumstances that drove the board’s decision.
Nature, extent, and quality of services
The board considered the quality of the funds’ investment management over both the short and long term, and took into account the organizational depth and stability of the advisor. The board noted that Vanguard has been managing investments for more than three decades. The Quantitative Equity Group adheres to a sound, disciplined investment management process; the team has considerable experience, stability, and depth.
The board concluded that Vanguard’s experience, stability, depth, and performance, among other factors, warranted continuation of the advisory arrangements.
Investment performance
The board considered the short- and long-term performance of the funds, including any periods of outperformance or underperformance of their target indexes and peer groups. The board concluded that the funds have performed in line with expectations, and that their results have been consistent with their investment strategies. Information about each fund’s most recent performance can be found on the Performance Summary pages of this report.
Cost
The board concluded that the funds’ expense ratios were well below the average expense ratios charged by funds in their respective peer groups and that the funds’ advisory expense ratios were also well below their peer-group averages. Information about the funds’ expense ratios appears in the About Your Fund’s Expenses section of this report.
The board does not conduct a profitability analysis of Vanguard, because of Vanguard’s unique “at-cost” structure. Unlike most other mutual fund management companies, Vanguard is owned by the funds it oversees, and produces “profits” only in the form of reduced expenses for fund shareholders.
The benefit of economies of scale
The board concluded that the funds’ low-cost arrangement with Vanguard ensures that the funds will realize economies of scale as they grow, with the cost to shareholders declining as fund assets increase.
The board will consider whether to renew the advisory arrangement again after a one-year period.
107
Glossary
Beta. A measure of the magnitude of a fund’s past share-price fluctuations in relation to the ups and downs of a given market index. The index is assigned a beta of 1.00. Compared with a given index, a fund with a beta of 1.20 typically would have seen its share price rise or fall by 12% when the index rose or fell by 10%. For this report, beta is based on returns over the past 36 months for both the fund and the index. Note that a fund’s beta should be reviewed in conjunction with its R-squared (see definition below). The lower the R-squared, the less correlation there is between the fund and the index, and the less reliable beta is as an indicator of volatility.
Earnings Growth Rate. The average annual rate of growth in earnings over the past five years for the stocks now in a fund.
Equity Exposure. A measure that reflects a fund’s investments in stocks and stock futures. Any holdings in short-term reserves are excluded.
Expense Ratio. The percentage of a fund’s average net assets used to pay its annual administrative and advisory expenses. These expenses directly reduce returns to investors.
Foreign Holdings. The percentage of a fund represented by stocks or depositary receipts of companies based outside the United States.
Inception Date. The date on which the assets of a fund (or one of its share classes) are first invested in accordance with the fund’s investment objective. For funds with a subscription period, the inception date is the day after that period ends. Investment performance is measured from the inception date.
Median Market Cap. An indicator of the size of companies in which a fund invests; the midpoint of market capitalization (market price x shares outstanding) of a fund’s stocks, weighted by the proportion of the fund’s assets invested in each stock. Stocks representing half of the fund’s assets have market capitalizations above the median, and the rest are below it.
Price/Book Ratio. The share price of a stock divided by its net worth, or book value, per share. For a fund, the weighted average price/book ratio of the stocks it holds.
Price/Earnings Ratio. The ratio of a stock’s current price to its per-share earnings over the past year. For a fund, the weighted average P/E of the stocks it holds. P/E is an indicator of market expectations about corporate prospects; the higher the P/E, the greater the expectations for a company’s future growth.
R-Squared. A measure of how much of a fund’s past returns can be explained by the returns from the market in general, as measured by a given index. If a fund’s total returns were precisely synchronized with an index’s returns, its R-squared would be 1.00. If the fund’s returns bore no relationship to the index’s returns, its R-squared would be 0. For this report, R-squared is based on returns over the past 36 months for both the fund and the index.
Return on Equity. The annual average rate of return generated by a company during the past five years for each dollar of shareholder’s equity (net income divided by shareholder’s equity). For a fund, the weighted average return on equity for the companies whose stocks it holds.
Short-Term Reserves. The percentage of a fund invested in highly liquid, short-term securities that can be readily converted to cash.
Turnover Rate. An indication of the fund’s trading activity. Funds with high turnover rates incur higher transaction costs and may be more likely to distribute capital gains (which may be taxable to investors). The turnover rate excludes in-kind transactions, which have minimal impact on costs.
Yield. A fund’s 30-day SEC yield is derived using a formula specified by the U.S. Securities and Exchange Commission. Under the formula, data related to the fund’s security holdings in the previous 30 days are used to calculate the fund’s hypothetical net income for that period, which is then annualized and divided by the fund’s estimated average net assets over the calculation period. For the purposes of this calculation, a security’s income is based on its current market yield to maturity (in the case of bonds) or its projected dividend yield (for stocks). Because the SEC yield represents hypothetical annualized income, it will differ—at times significantly—from the fund’s actual experience. As a result, the fund’s income distributions may be higher or lower than implied by the SEC yield.
108
The People Who Govern Your Fund
The trustees of your mutual fund are there to see that the fund is operated and managed in your best interests since, as a shareholder, you are a part owner of the fund. Your fund’s trustees also serve on the board of directors of The Vanguard Group, Inc., which is owned by the Vanguard funds and provides services to them on an at-cost basis.
A majority of Vanguard’s board members are independent, meaning that they have no affiliation with Vanguard or the funds they oversee, apart from the sizable personal investments they have made as private individuals.
The independent board members have distinguished backgrounds in business, academia, and public service. Each of the trustees and executive officers oversees 163 Vanguard funds.
The following table provides information for each trustee and executive officer of the fund. More information about the trustees is in the Statement of Additional Information, which can be obtained, without charge, by contacting Vanguard at 800-662-7447, or online at vanguard.com.
| |
| Interested Trustee1 | JoAnn Heffernan Heisen |
| | Born 1950. Trustee Since July 1998. Principal |
| F. William McNabb III | Occupation(s) During the Past Five Years: Corporate |
| Born 1957. Trustee Since July 2009. Chairman of the | Vice President and Chief Global Diversity Officer since |
| Board. Principal Occupation(s) During the Past Five | 2006 (retired 2008) and Member of the Executive |
| Years: Chairman of the Board of The Vanguard Group, | Committee (retired 2008) of Johnson & Johnson |
| Inc., and of each of the investment companies served | (pharmaceuticals/consumer products); Vice President |
| by The Vanguard Group, since January 2010; Director | and Chief Information Officer of Johnson & Johnson |
| of The Vanguard Group since 2008; Chief Executive | (1997–2005); Director of the University Medical |
| Officer and President of The Vanguard Group and of | Center at Princeton and Women’s Research and |
| each of the investment companies served by The | Education Institute; Member of the Advisory Board of |
| Vanguard Group since 2008; Director of Vanguard | the Maxwell School of Citizenship and Public Affairs |
| Marketing Corporation; Managing Director of The | at Syracuse University. |
| Vanguard Group (1995–2008). | |
| | F. Joseph Loughrey |
| | Born 1949. Trustee Since October 2009. Principal |
| Independent Trustees | Occupation(s) During the Past Five Years: President |
| | and Chief Operating Officer since 2005 (retired 2009) |
| Emerson U. Fullwood | and Vice Chairman of the Board (2008–2009) of |
| Born 1948. Trustee Since January 2008. Principal | Cummins Inc. (industrial machinery); Director of |
| Occupation(s) During the Past Five Years: Executive | SKF AB (industrial machinery), Hillenbrand, Inc. |
| Chief Staff and Marketing Officer for North America | (specialized consumer services), Sauer-Danfoss Inc. |
| and Corporate Vice President (retired 2008) of Xerox | (machinery), the Lumina Foundation for Education, |
| Corporation (document management products and | and Oxfam America; Chairman of the Advisory |
| services); Director of SPX Corporation (multi-industry | Council for the College of Arts and Letters at the |
| manufacturing), the United Way of Rochester, | University of Notre Dame. |
| Amerigroup Corporation (managed health care), | |
| the University of Rochester Medical Center, and | André F. Perold |
| Monroe Community College Foundation. | Born 1952. Trustee Since December 2004. Principal |
| | Occupation(s) During the Past Five Years: George |
| Rajiv L. Gupta | Gund Professor of Finance and Banking at the Harvard |
| Born 1945. Trustee Since December 2001.2 | Business School; Chair of the Investment Committee |
| Principal Occupation(s) During the Past Five Years: | of HighVista Strategies LLC (private investment firm). |
| Chairman and Chief Executive Officer (retired 2009) | |
| and President (2006–2008) of Rohm and Haas Co. | Alfred M. Rankin, Jr. |
| (chemicals); Director of Tyco International, Ltd. | Born 1941. Trustee Since January 1993. Principal |
| (diversified manufacturing and services) and Hewlett- | Occupation(s) During the Past Five Years: Chairman, |
| Packard Co. (electronic computer manufacturing); | President, and Chief Executive Officer of NACCO |
| Trustee of The Conference Board; Member of the | Industries, Inc. (forklift trucks/housewares/lignite); |
| Board of Managers of Delphi Automotive LLP | Director of Goodrich Corporation (industrial products/ |
| (automotive components). | aircraft systems and services); Chairman of the |
| | Federal Reserve Bank of Cleveland; Trustee of The |
| Amy Gutmann | Cleveland Museum of Art. |
| Born 1949. Trustee Since June 2006. Principal | |
| Occupation(s) During the Past Five Years: President | Peter F. Volanakis |
| of the University of Pennsylvania; Christopher H. | Born 1955. Trustee Since July 2009. Principal |
| Browne Distinguished Professor of Political Science | Occupation(s) During the Past Five Years: President |
| in the School of Arts and Sciences with secondary | since 2007 and Chief Operating Officer since 2005 |
| appointments at the Annenberg School for Commu- | of Corning Incorporated (communications equipment); |
| nication and the Graduate School of Education of | President of Corning Technologies (2001–2005); |
| the University of Pennsylvania; Director of Carnegie | Director of Corning Incorporated and Dow Corning; |
| Corporation of New York, Schuylkill River | Trustee of the Corning Incorporated Foundation and |
| Development Corporation, and Greater Philadelphia | the Corning Museum of Glass; Overseer of the |
| Chamber of Commerce; Trustee of the National | Amos Tuck School of Business Administration at |
| Constitution Center; Chair of the Presidential | Dartmouth College. |
| Commission for the Study of Bioethical Issues. | |
| |
| Executive Officers | |
| |
| Glenn Booraem | |
| Born 1967. Controller Since July 2010. Principal |
| Occupation(s) During the Past Five Years: Principal |
| of The Vanguard Group, Inc.; Controller of each of |
| the investment companies served by The Vanguard |
| Group since 2010; Assistant Controller of each of |
| the investment companies served by The Vanguard |
| Group (2001–2010). | |
| |
| Thomas J. Higgins | |
| Born 1957. Chief Financial Officer Since September |
| 2008. Principal Occupation(s) During the Past Five |
| Years: Principal of The Vanguard Group, Inc.; Chief |
| Financial Officer of each of the investment companies |
| served by The Vanguard Group since 2008; Treasurer |
| of each of the investment companies served by The |
| Vanguard Group (1998–2008). |
| |
| Kathryn J. Hyatt | |
| Born 1955. Treasurer Since November 2008. Principal |
| Occupation(s) During the Past Five Years: Principal |
| of The Vanguard Group, Inc.; Treasurer of each of |
| the investment companies served by The Vanguard |
| Group since 2008; Assistant Treasurer of each of the |
| investment companies served by The Vanguard Group |
| (1988–2008). | |
| |
| Heidi Stam | |
| Born 1956. Secretary Since July 2005. Principal |
| Occupation(s) During the Past Five Years: Managing |
| Director of The Vanguard Group, Inc., since 2006; |
| General Counsel of The Vanguard Group since 2005; |
| Secretary of The Vanguard Group and of each of the |
| investment companies served by The Vanguard Group |
| since 2005; Director and Senior Vice President of |
| Vanguard Marketing Corporation since 2005; |
| Principal of The Vanguard Group (1997–2006). |
| |
| Vanguard Senior Management Team |
| |
| R. Gregory Barton Michael S. Miller |
| Mortimer J. Buckley James M. Norris |
| Kathleen C. Gubanich Glenn W. Reed |
| Paul A. Heller George U. Sauter |
| |
| Chairman Emeritus and Senior Advisor |
| |
| John J. Brennan | |
| Chairman, 1996–2009 | |
| Chief Executive Officer and President, 1996–2008 |
| |
| Founder | |
| |
| John C. Bogle | |
| Chairman and Chief Executive Officer, 1974–1996 |
1 Mr. McNabb is considered an “interested person,” as defined in the Investment Company Act of 1940, because he is an officer of the Vanguard funds.
2 December 2002 for Vanguard Equity Income Fund, Vanguard Growth Equity Fund, the Vanguard Municipal Bond Funds, and the Vanguard State Tax-Exempt Funds.
|  |
| P.O. Box 2600 |
| Valley Forge, PA 19482-2600 |
Connect with Vanguard® > Vanguard.com
| |
| Fund Information > 800-662-7447 | All comparative mutual fund data are from Lipper Inc. |
| Direct Investor Account Services > 800-662-2739 | or Morningstar, Inc., unless otherwise noted. |
| Institutional Investor Services > 800-523-1036 | |
| Text Telephone for People | You can obtain a free copy of Vanguard’s proxy voting |
| With Hearing Impairment > 800-749-7273 | guidelines by visiting vanguard.com/proxyreporting or |
| | by calling Vanguard at 800-662-2739. The guidelines |
| are also available from the SEC’s website, sec.gov. |
| In addition, you may obtain a free report on how your |
| | fund voted the proxies for securities it owned during |
| | the 12 months ended June 30. To get the report, visit |
| This material may be used in conjunction | either vanguard.com/proxyreporting or sec.gov. |
| with the offering of shares of any Vanguard | |
| fund only if preceded or accompanied by the | |
| fund’s current prospectus. | You can review and copy information about your fund |
| at the SEC’s Public Reference Room in Washington, D.C. |
| | To find out more about this public service, call the SEC |
| The funds or securities referred to herein are not | at 202-551-8090. Information about your fund is also |
| sponsored, endorsed, or promoted by MSCI, and | available on the SEC’s website, and you can receive |
| MSCI bears no liability with respect to any such funds or | copies of this information, for a fee, by sending a |
| securities. For any such funds or securities, the prospectus | request in either of two ways: via e-mail addressed to |
| or the Statement of Additional Information contains a more | publicinfo@sec.gov or via regular mail addressed to the |
| detailed description of the limited relationship MSCI has | Public Reference Section, Securities and Exchange |
| with The Vanguard Group and any related funds. | Commission, Washington, DC 20549-1520. |
| |
| |
| |
| | © 2010 The Vanguard Group, Inc. |
| All rights reserved. |
| Vanguard Marketing Corporation, Distributor. |
| Q4830 102010 |
 |
| Vanguard Extended Duration Treasury |
| Index Fund Annual Report |
|
| August 31, 2010 |
 |
> For the fiscal year ended August 31, 2010, Vanguard Extended Duration Treasury Index Fund’s Institutional Shares returned nearly 21%, with the Fund’s ETF Shares, as measured by their net asset value, following close behind.
> U.S. Treasury securities were in strong demand during the second half of the fiscal year as investors flocked to Treasuries because of a confluence of economic worries.
> The fund’s return trailed the 21.48% result of its benchmark, the Barclays Capital U.S. Treasury STRIPS 20–30 Year Equal Par Bond Index.
| |
| Contents | |
| Your Fund’s Total Returns. | 1 |
| Chairman’s Letter. | 2 |
| Fund Profile. | 7 |
| Performance Summary. | 8 |
| Financial Statements. | 10 |
| About Your Fund’s Expenses. | 20 |
| Trustees Approve Advisory Arrangement. | 22 |
| Glossary. | 23 |
Please note: The opinions expressed in this report are just that—informed opinions. They should not be considered promises or advice. Also, please keep in mind that the information and opinions cover the period through the date on the front of this report. Of course, the risks of investing in your fund are spelled out in the prospectus.
See the Glossary for definitions of investment terms used in this report.
Cover photograph: Jean Maher.
Your Fund’s Total Returns
| | | | |
| Fiscal Year Ended August 31, 2010 | | | | |
| |
| | 30-Day SEC | Income | Capital | Total |
| | Yields | Returns | Returns | Returns |
| Vanguard Extended Duration Treasury Index Fund | | | | |
| Institutional Shares | 3.71% | 4.78% | 16.06% | 20.84% |
| ETF Shares | 3.69 | | | |
| Market Price | | | | 19.06 |
| Net Asset Value | | | | 20.80 |
| Barclays Capital U.S. Treasury STRIPS 20–30 | | | | 21.48 |
| Year Equal Par Bond Index | | | | |
Institutional Shares are available to certain institutional investors who meet specific administrative, service, and account-size criteria. The Vanguard ETF® Shares shown are traded on the NYSE Arca exchange and are available only through brokers. The table provides ETF returns based on both the NYSE Arca market price and the net asset value for a share. U.S. Pat. No. 6,879,964 B2; 7,337,138.
Your Fund’s Performance at a Glance
August 31, 2009, Through August 31, 2010
| | | | | |
| | | | |
| | | | | Distributions Per Share |
| | Starting | Ending | Income | Capital |
| | Share Price | Share Price | Dividends | Gains |
| Vanguard Extended Duration Treasury Index | | | | |
| Fund | | | | |
| Institutional Shares | $30.69 | $31.18 | $1.134 | $3.345 |
| ETF Shares | 101.91 | 103.39 | 3.752 | 11.108 |
1

Chairman’s Letter
Dear Shareholder,
Vanguard Extended Duration Treasury Index Fund returned about 21% for the fiscal year ended August 31, 2010. The fund’s return reflected strong demand during the second half of the period for assets perceived as safe—U.S. Treasuries topped the list—as investors reacted to fears of default by smaller European countries, signs that an already fragile U.S. recovery might be slowing, and the potential for deflation.
The rush toward Treasuries pushed prices up and yields down substantially. As of August 31, 2010, the f und’s SEC yield stood at 3.7%, down from 4.3% a year earlier. Bond yields, of course, move inversely to bond price changes, and the fluctuation can be particularly sharp with long-duration funds, such as this one. (The fund’s duration, a measure of interest rate sensitivity, was about 27 years as of August 31.)
The fund’s return differed slightly from that of its benchmark, a not-unusual short-term deviation arising from the fund’s sampling technique and slight differences in the timing of end-of-day pricing between the fund and its index.
A ragged 12-month climb in global stock markets
At the start of the 12-month period, stock markets moved higher as global economies continued to pull out of a deep downturn. Within a few months, however, optimism began to fade.
2
Europe’s sovereign debt crisis fueled fears of another global financial shock, while persistently high unemployment and downward revisions to U.S. economic indicators suggested that the powerful rebound in corporate earnings could be at risk.
This alternating pattern of hope and fear persisted through the period&# 146;s final months. The net result for the fiscal year was mid-single-digit gains in the broad U.S. stock market. International stocks returned about 3%, as modest declines in developed markets in Europe and the Pacific region were offset by a strong rally in emerging markets.
Bonds produced strong returns as prices rose and yields declined
The economic uncertainty and high stock market volatility over the fiscal period created a favorable environment for fixed income investments. The broad, taxable bond market returned more than 9%, as investors sought shelter in Treasury and corporate bonds. The municipal bond market returned a bit more. In both markets, much of the total return came from rising bond prices. The flip side of rising prices, of course, is shrinking yields, which can set the stage for lower future returns.
| | | |
| Market Barometer | | | |
| | | Average Annual Total Returns |
| | | Periods Ended August 31, 2010 |
| | One | Three | Five |
| | Year | Years | Years |
| Bonds | | | |
| Barclays Capital U.S. Aggregate Bond Index (Broad | | | |
| taxable market) | 9.18% | 7.65% | 5.96% |
| Barclays Capital Municipal Bond Index (Broad tax-exempt | | | |
| market) | 9.78 | 6.62 | 5.02 |
| Citigroup Three-Month U.S. Treasury Bill Index | 0.12 | 1.13 | 2.53 |
| |
| Stocks | | | |
| Russell 1000 Index (Large-caps) | 5.55% | -8.34% | -0.71% |
| Russell 2000 Index (Small-caps) | 6.60 | -7.44 | -0.69 |
| Dow Jones U.S. Total Stock Market Index | 6.15 | -7.83 | -0.31 |
| MSCI All Country World Index ex USA (International) | 3.27 | -7.93 | 3.78 |
| |
| CPI | | | |
| Consumer Price Index | 1.15% | 1.64% | 2.14% |
3
As it has since December 2008, the Federal Reserve kept its target for short-term interest rates between 0% and 0.25%, in an effort to bolster the economy.
This policy has kept a tight lid on the returns available from Treasury bills, commercial paper, and other money market instruments. Near-zero short-term yields also were a factor nudging investors to shift to bonds in s earch of income, despite the risks such a shift entails.
The fiscal year as a whole had two very different halves
Because of the high sensitivity of the Extended Duration Treasury Index Fund to even modest fluctuations in interest rates and changes in demand during stressful periods, the fund’s return can be volatile. You can see this in the fund’s fiscal 2010 experience.
By the end of the first six months of the period, the fund had returned about –8%. This was primarily because investors’ long-term expectation for inflation had risen in light of the global economy’s apparent emergence from its severe slump. The ten-year market-consensus inflation gauge—the “br eak-even inflation rate”—was ratcheted up from 1.65% a year as of August 2009 to 2.16% as of February 2010. (The estimate compares the expected yield of traditional Treasury bonds with that of Treasury inflation-protected securities.)
| | |
| Expense Ratios | | |
| |
| | Institutional | ETF |
| | Shares | Shares |
| Extended Duration Treasury Index Fund | 0.11% | 0.14% |
The fund expense ratios shown are from the prospectus dated December 28, 2009, and represent estimated costs for the current fiscal year. For the fiscal year ended August 31, 2010, the fund’s expense ratios were 0.11% for Institutional Shares and 0.13% for ETF Shares.
4
By the end of your fund’s fiscal year—August 31, 2010—the ten-year expected U.S. inflation rate had dropped to 1.55% a year. Talk of deflation now fil led the air, as the economy’s slow progress seemed to stumble and worries surfaced that the economy would slip back into recession. Moreover, the glob al economy seemed to lurch toward another financial crisis as Greece appeared to be on the ve rge of defaulting on its bonds. At the same time, investors raised concerns about generally widening budget deficits in the United States and abroad.
Although Greece is a small economy, the episode triggered anxiety about the fiscal soundness of other European countries and even whether the Eurozone’s common currency could hold together over the long
Long duration means acute sensitivity to changing yields: August 2009–August 2010
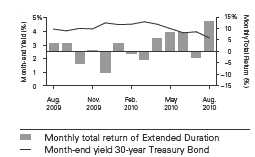
Sources: Bloomberg L.P., Vanguard.
term, given the tensions between stronger and weaker members. A variety of policy actions by individual European nations, the European Union as a whole, the International Monetary Fund, and European bank regulators seemed to quell immediate concerns (although caution still reigned after the fiscal year ended). Over the longer term, the United States and European members of the Group of 20 agreed to halve budget deficits by 2013 and stabilize their debt loads by 2016.
During the period of rampant uncertainty, demand for Treasuries surged and pushed down yields—as you can see in the chart below, showing the steady decline in the yields of 30-year Treasuries during the fiscal second half. For that period alone, yields of 30-year Treasuries dropped from 4.5% to 3.5%, and the fund returned about 32%.
The fund can be an excellent liability-driven investment tool
To be sure, concern over the level of government debt in the United States and abroad lingers. If this is translated into higher inflationary expectations and, therefore, higher yields, fund returns could decline.
For managers of defined benefit pension plans—the fund’s primary investor base—the fund’s total return is less important than the tendency of the fund’s assets to fluctuate in value in the same direction as a firm’s long-term pension-plan liabilities, both of which react similarly to interest rate changes.
5
Your fund’s approach, which uses securities of the highest credit q uality in a low-cost strategy, can be a major help in managing changes in the ratio of a plan’s assets to its liabilities.
As always, thank you for entrusting your assets to Vanguard.
Sincerely,

F. William McNabb III
Chairman and Chief Executive Officer
September 13, 2010
6
Extended Duration Treasury Index Fund
Fund Profile
As of August 31, 2010
| | |
| Share-Class Characteristics | |
| |
| | Institutional | ETF |
| | Shares | Shares |
| Ticker Symbol | VEDTX | EDV |
| Expense Ratio1 | 0.11% | 0.14% |
| 30-Day SEC Yield | 3.71% | 3.69% |
| | |
| Financial Attributes | | |
| |
| | | Barclays |
| | | Treasury |
| | | STRIPS |
| | | 20–30 Year |
| | Fund | Index |
| |
| Number of Bonds | 52 | 52 |
| |
| Yield to Maturity | | |
| (before expenses) | 3.8% | 3.8% |
| |
| Average Coupon | 0.0% | 0.0% |
| |
| Average Duration | 27.3 years | 26.9 years |
| |
| Average Effective | | |
| Maturity | 25.3 years | 25.0 years |
| |
| Short-Term | | |
| Reserves | 0.0% | — |
| |
| Sector Diversification (% of portfolio) | |
| Treasury/Agency | 100.0% |
| Short-Term Reserves | 0.0 |
The agency and mortgage-backed securities sectors may include issues from government-sponsored enterprises; such issues are not backed by the full faith and credit of the U.S. government.
| |
| Distribution by Maturity (% of portfolio) | |
| 20 - 30 Years | 100.0% |
| Distribution by Credit Quality (% of portfolio) |
| Aaa | 100.0% |
For information about these ratings, see the Glossary entry for Credit Quality.
Investment Focus
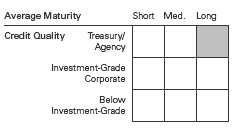
1 The expense ratios shown are from the prospectus dated December 28, 2009, and represent estimated costs for the current fiscal year. For the fiscal year ended August 31, 2010, the expense ratios were 0.11% for Institutional Shares and 0.13% for ETF Shares.
7
Extended Duration Treasury Index Fund
Performance Summary
All of the returns in this report represent past performance, which is not a guarantee of future results that may be achieved by the fund. (Current performance may be lower or higher than the performance data cited. For performance data current to the most recent month-end, visit our website at vanguard.com/performance.) Note, too, that both investment returns and principal value can fluctuate widely, so an investor’s shares, when sold, could be worth more or less than their original cost. The returns shown do not reflect taxes that a shareholder would pay on fund distributions or on the sale of fund shares.
Cumulative Performance: December 6, 2007, Through August 31, 2010
Initial Investment of $10,000
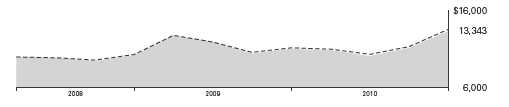
| | | |
| | Average Annual Total Returns | |
| | Periods Ended August 31, 2010 | |
| | | Since | Final Value |
| | One | Inception | of a $10,000 |
| | Year | (12/6/2007) | Investment |
| Extended Duration Treasury Index | | | |
| Fund ETF Shares Net Asset Value | 20.80% | 11.12% | $13,343 |
| Extended Duration Treasury Index | | | |
| Fund ETF Shares Market Price | 19.06 | 11.30 | 13,402 |
| Barclays Capital U.S. Treasury STRIPS | | | |
| 20–30 Year Equal Par Bond Index | 21.48 | 11.85 | 13,583 |
"Since Inception" performance is calculated from the ETF Shares’ inception date for both the fund and its comparative standards.
| | | |
| | | Since | Final Value |
| | One | Inception | of a $5,000,000 |
| | Year | (11/28/2007) | Investment |
| Extended Duration Treasury Index | | | |
| Fund Institutional Shares | 20.54% | 10.21% | $6,537,134 |
| Barclays Capital U.S. Treasury | | | |
| STRIPS 20–30 Year Equal Par Bond | | | |
| Index | 21.48 | 10.82 | 6,636,882 |
"Since Inception" performance is calculated from the Institutional Shares’ inception date for both the fund and its comparative standards.
Except for the ETF Shares, Vanguard fund returns are adjusted to reflect the 0.25% fee on purchases of fund shares. The fee does not apply to the ETF Shares.
See Financial Highlights for dividend and capital gains information.
8
Extended Duration Treasury Index Fund
| | |
| Cumulative Returns of ETF Shares: December 6, 2007, Through August 31, 2010 | |
| |
| | | Since |
| | One | Inception |
| | Year | (12/6/2007) |
| Extended Duration Treasury Index Fund | | |
| ETF Shares Market Price | 19.06% | 34.02% |
| Extended Duration Treasury Index Fund | | |
| ETF Shares Net Asset Value | 20.80 | 33.43 |
| Barclays Capital U.S. Treasury STRIPS | | |
| 20–30 Year Equal Par Bond Index | 21.48 | 35.83 |
"Since Inception" performance is calculated from the ETF Shares’ inception date for both the fund and its comparative standards.
For more information about how the ETF Shares' market prices have compared with their net asset value, visit vanguard.com, select your ETF, and then select the Performance tab. The Premium/Discount table there shows the percentages of days on which the ETF Shares' market price was above or below the NAV.
| | |
| Fiscal-Year Total Returns (%): December 6, 2007, Through August 31, 2010 | |
| | | Barclays |
| | | Treasury |
| | | STRIPS |
| | ETF Shares Net Asset | 20–30 Year |
| | Value | Index |
| Fiscal Year | Total Returns | Total Returns |
| 2008 | 2.29% | 3.16% |
| 2009 | 7.98 | 8.39 |
| 2010 | 20.80 | 21.48 |
Average Annual Total Returns: Periods Ended June 30, 2010
This table presents average annual total returns through the latest calendar quarter—rather than through the end of the fiscal period. Securities and Exchange Commission rules require that we provide this information.
| | | |
| | Inception Date | One Year | Since Inception |
| Institutional Shares | 11/28/2007 | 13.86% | 6.87% |
| ETF Shares | 12/6/2007 | | |
| Market Price | | 12.56 | 7.79 |
| Net Asset Value | | 13.86 | 7.68 |
9
Extended Duration Treasury Index Fund
Financial Statements
Statement of Net Assets
As of August 31, 2010
The fund reports a complete list of its holdings in regulatory filings four times in each fiscal year, at the quarter-ends. For the second and fourth fiscal quarters, the lists appear in the fund’s semiannual and annual reports to shareholders. For the first and third fiscal quarters, the fund files the lists with the Securities and Exchange Commission on Form N-Q. Shareholders can look up the fund ’s Forms N-Q on the SEC’s website at sec.gov. Forms N-Q may also be reviewed and copied at the SEC’s Public Reference Room (see the back cover of this report for further information).
| | | | |
| | | | Face | Market |
| | | Maturity | Amount | Value |
| | Coupon | Date | ($000) | ($000) |
| U.S. Government and Agency Obligations (100.0%) | | | | |
| U.S. Government Securities (100.0%) | | | | |
| United States Treasury Strip Coupon | 0.000% | 11/15/30 | 22,480 | 10,815 |
| United States Treasury Strip Coupon | 0.000% | 2/15/31 | 26,545 | 12,615 |
| United States Treasury Strip Coupon | 0.000% | 5/15/31 | 23,455 | 10,987 |
| United States Treasury Strip Coupon | 0.000% | 8/15/31 | 22,700 | 10,515 |
| United States Treasury Strip Coupon | 0.000% | 11/15/31 | 21,305 | 9,764 |
| United States Treasury Strip Coupon | 0.000% | 2/15/32 | 22,085 | 9,995 |
| United States Treasury Strip Coupon | 0.000% | 5/15/32 | 26,045 | 11,672 |
| United States Treasury Strip Coupon | 0.000% | 8/15/32 | 22,030 | 9,755 |
| United States Treasury Strip Coupon | 0.000% | 11/15/32 | 21,495 | 9,433 |
| United States Treasury Strip Coupon | 0.000% | 2/15/33 | 24,060 | 10,429 |
| United States Treasury Strip Coupon | 0.000% | 5/15/33 | 23,500 | 10,101 |
| United States Treasury Strip Coupon | 0.000% | 8/15/33 | 23,425 | 9,939 |
| United States Treasury Strip Coupon | 0.000% | 11/15/33 | 22,415 | 9,416 |
| United States Treasury Strip Coupon | 0.000% | 2/15/34 | 20,885 | 8,659 |
| United States Treasury Strip Coupon | 0.000% | 5/15/34 | 24,990 | 10,275 |
| United States Treasury Strip Coupon | 0.000% | 8/15/34 | 23,210 | 9,424 |
| United States Treasury Strip Coupon | 0.000% | 11/15/34 | 22,240 | 8,952 |
| United States Treasury Strip Coupon | 0.000% | 2/15/35 | 21,400 | 8,488 |
| United States Treasury Strip Coupon | 0.000% | 5/15/35 | 24,040 | 9,468 |
| United States Treasury Strip Coupon | 0.000% | 8/15/35 | 23,085 | 8,981 |
| United States Treasury Strip Coupon | 0.000% | 11/15/35 | 23,235 | 8,949 |
| United States Treasury Strip Coupon | 0.000% | 2/15/36 | 26,125 | 9,952 |
| United States Treasury Strip Coupon | 0.000% | 5/15/36 | 24,220 | 9,122 |
| United States Treasury Strip Coupon | 0.000% | 8/15/36 | 20,050 | 7,481 |
| United States Treasury Strip Coupon | 0.000% | 11/15/36 | 23,920 | 8,824 |
| United States Treasury Strip Coupon | 0.000% | 2/15/37 | 32,275 | 11,828 |
| United States Treasury Strip Coupon | 0.000% | 5/15/37 | 17,000 | 6,181 |
| United States Treasury Strip Coupon | 0.000% | 8/15/37 | 22,925 | 8,228 |
| United States Treasury Strip Coupon | 0.000% | 11/15/37 | 22,575 | 8,014 |
| United States Treasury Strip Coupon | 0.000% | 2/15/38 | 23,195 | 8,140 |
| United States Treasury Strip Coupon | 0.000% | 5/15/38 | 32,780 | 11,404 |
| United States Treasury Strip Coupon | 0.000% | 8/15/38 | 25,745 | 8,840 |
| United States Treasury Strip Coupon | 0.000% | 11/15/38 | 18,600 | 6,321 |
| United States Treasury Strip Coupon | 0.000% | 2/15/39 | 21,000 | 7,050 |
| United States Treasury Strip Coupon | 0.000% | 5/15/39 | 11,300 | 3,759 |
| United States Treasury Strip Coupon | 0.000% | 8/15/39 | 15,800 | 5,200 |
| United States Treasury Strip Coupon | 0.000% | 11/15/39 | 28,705 | 9,385 |
| United States Treasury Strip Coupon | 0.000% | 2/15/40 | 4,000 | 1,295 |
10
| | | | |
| Extended Duration Treasury Index Fund | | | | |
| |
| |
| |
| | | | Face | Market |
| | | Maturity | Amount | Value |
| | Coupon | Date | ($000) | ($000) |
| United States Treasury Strip Coupon | 0.000% | 5/15/40 | 4,695 | 1,507 |
| United States Treasury Strip Principal | 0.000% | 2/15/31 | 18,000 | 8,730 |
| United States Treasury Strip Principal | 0.000% | 2/15/36 | 18,900 | 7,439 |
| United States Treasury Strip Principal | 0.000% | 2/15/37 | 13,600 | 5,164 |
| United States Treasury Strip Principal | 0.000% | 5/15/37 | 27,575 | 10,399 |
| United States Treasury Strip Principal | 0.000% | 2/15/38 | 19,700 | 7,097 |
| United States Treasury Strip Principal | 0.000% | 5/15/38 | 14,495 | 5,176 |
| United States Treasury Strip Principal | 0.000% | 2/15/39 | 24,515 | 8,446 |
| United States Treasury Strip Principal | 0.000% | 5/15/39 | 32,075 | 10,800 |
| United States Treasury Strip Principal | 0.000% | 8/15/39 | 29,210 | 9,742 |
| United States Treasury Strip Principal | 0.000% | 11/15/39 | 20,100 | 6,617 |
| United States Treasury Strip Principal | 0.000% | 2/15/40 | 41,125 | 13,430 |
| United States Treasury Strip Principal | 0.000% | 5/15/40 | 41,400 | 13,407 |
| United States Treasury Strip Principal | 0.000% | 8/15/40 | 44,500 | 14,462 |
| Total U.S. Government and Agency Obligat ions (Cost $386,830) | | | 462,072 |
| |
| | | | Shares | |
| Temporary Cash Investment (0.1%) | | | | |
| Money Market Fund (0.1%) | | | | |
| 1 Vanguard Market Liquidity Fund (Cost $460) | 0.288% | | 459,964 | 460 |
| Total Investments (100.1%) (Cost $387,290) | | | | 462,532 |
| Other Assets and Liabilities (-0.1%) | | | | |
| Other Assets | | | | 11,510 |
| Liabilities | | | | (12,030) |
| | | | | (520) |
| Net Assets (100%) | | | | 462,012 |
| |
| |
| At August 31, 2010, net assets consisted of: | | | | |
| | | | | Amount |
| | | | | ($000) |
| Paid-in Capital | | | | 382,813 |
| Undistributed Net Investment Income | | | | 2,949 |
| Accumulated Net Realized Gains | | | | 1,008 |
| Unrealized Appreciation (Depreciation) | | | | 75,242 |
| Net Assets | | | | 462,012 |
| |
| |
| Institutional Shares—Net Assets | | | | |
| Applicable to 9,181,845 outstanding $.001 par value shares of | | | |
| beneficial interest (unlimited authorization) | | | | 286,256 |
| Net Asset Value Per Share—Institutional Shares | | | | $31.18 |
| |
| |
| ETF Shares—Net Assets | | | | |
| Applicable to 1,700,000 outstanding $.001 par value shares of | | | |
| beneficial interest (unlimited authorization) | | | | 175,756 |
| Net Asset Value Per Share—ETF Shares | | | | $103.39 |
s See Note A in Notes to Financial Statements11
Extended Duration Treasury Index Fund
Statement of Operations
| |
| | Year Ended |
| | August 31, 2010 |
| | ($000) |
| Investment Income | |
| Income | |
| Interest1 | 13,183 |
| Total Income | 13,183 |
| Expenses | |
| The Vanguard Group—Note B | |
| Investment Advisory Services | 35 |
| Management and Administrative—Institutional Shares | 112 |
| Management and Administrative—ETF Shares | 67 |
| Marketing and Distribution—Institutional Shares | 52 |
| Marketing and Distribution—ETF Shares | 22 |
| Custodian Fees | 15 |
| Auditing Fees | 29 |
| Shareholders’ Reports and Proxies—Institutional Shares | — |
| Shareholders’ Reports and Proxies—ETF Shares | 7 |
| Total Expenses | 339 |
| Net Investment Income | 12,844 |
| Realized Net Gain (Loss) on Investment Securities Sold | 2,320 |
| Change in Unrealized Appreciation (Depreciation) of Investment Securities | 69,415 |
| Net Increase (Decrease) in Net Assets Resulting from Operations | 84,579 |
1 Interest income from an affiliated company of the fund was $1,000.
See accompanying Notes, which are an integral part of the Financial Statements.
12
Extended Duration Treasury Index Fund
Statement of Changes in Net Assets
| | | |
| | | Year Ended August 31, |
| | 2010 | 2009 |
| | ($000) | ($000) |
| Increase (Decrease) in Net Assets | | |
| Operations | | |
| Net Investment Income | 12,844 | 8,763 |
| Realized Net Gain (Loss) | 2,320 | 42,012 |
| Change in Unrealized Appreciation (Depreciation) | 69,415 | 5,603 |
| Net Increase (Decrease) in Net Assets Resulting from Operations | 84,579 | 56,378 |
| Distributions | | |
| Net Investment Income | | |
| Institutional Shares | (7,703) | (7,647) |
| ETF Shares | (3,636) | (1,511) |
| Realized Capital Gain1 | | |
| Institutional Shares | (18,983) | — |
| ETF Shares | (9,997) | — |
| Total Distributions | (40,319) | (9,158) |
| Capital Share Transactions | | |
| Institutional Shares | 105,367 | (154,948) |
| ETF Shares | 115,593 | 41,503 |
| Net Increase (Decrease) from Capital Share Transactions | 220,960 | (113,445) |
| Total Increase (Decrease) | 265,220 | (66,225) |
| Net Assets | | |
| Beginning of Period | 196,792 | 263,017 |
| End of Period2 | 462,012 | 196,792 |
1 Includes fiscal 2010 short-term gain distributions totaling $28,980.000. Short-term gain distributions are treated as ordinary income dividends for tax purposes.
2 Net Assets - End of Period includes undistributed net investment income of $2,949,000 and $1,444,000.
See accompanying Notes, which are an integral part of the Finanacial Statements.
13
Extended Duration Treasury Index Fund
Financial Highlights
| | | | |
| Institutional Shares | | | |
| | | | Nov. 28, |
| | Year Ended | 20071 to |
| | | August 31, | Aug. 31, |
| For a Share Outstanding Throughout Each Period | 2010 | 2009 | 2008 |
| Net Asset Value, Beginning of Period | $30.69 | $29.52 | $30.00 |
| Investment Operations | | | |
| Net Investment Income | 1.1732 | 1.2732 | 1.0232 |
| Net Realized and Unrealized Gain (Loss) on Investments3 | 3.796 | 1.221 | (.928) |
| Total from Investment Operations | 4.969 | 2.494 | .095 |
| Distributions | | | |
| Dividends from Net Investment Income | (1.134) | (1.324) | (.575) |
| Distributions from Realized Capital Gains | (3.345) | — | — |
| Total Distributions | (4.479) | (1.324) | (.575) |
| Net Asset Value, End of Period | $31.18 | $30.69 | $29.52 |
| |
| Total Return4 | 20.84% | 8.05% | 0.39% |
| |
| Ratios/Supplemental Data | | | |
| Net Assets, End of Period (Millions) | $286 | $151 | $258 |
| Ratio of Total Expenses to Average Net Assets | 0.11% | 0.11% | 0.11%5 |
| Ratio of Net Investment Income to Average Net Assets | 4.41% | 3.93% | 4.55%5 |
| Portfolio Turnover Rate6 | 24% | 39% | 36% |
1 Inception.
2 Calculated based on average shares outstanding.
3 Includes increases from purchase fees of $.00, $.01, and $.03.
4 Total returns do not include transation fees that may have applied in the periods shown. Fund prospectuses provide information about any applicable transaction fees.
5 Annualized.
6 Excludes the value of portfolio securities received or delivered as a result of in-kind purchases or redemptions of the fund's capital shares, including ETF Creation Units.
See accompanying Notes, which are an integral part of the Financial Statements.
14
Extended Duration Treasury Index Fund
Financial Highlights
| | | | |
| ETF Shares | | | |
| | | | Dec. 6, |
| | Year Ended | 20071 to |
| | | August 31, | Aug. 31, |
| For a Share Outstanding Throughout Each Period | 2010 | 2009 | 2008 |
| Net Asset Value, Beginning of Period | $101.91 | $98.11 | $97.78 |
| Investment Operations | | | |
| Net Investment Income | 3.9212 | 4.3172 | 3.1662 |
| Net Realized and Unrealized Gain (Loss) on Investments3 | 12.419 | 3.880 | (.983) |
| Total from Investment Operations | 16.340 | 8.197 | 2.183 |
| Distributions | | | |
| Dividends from Net Investment Income | (3.752) | (4.397) | (1.853) |
| Distributions from Realized Capital Gains | (11.108) | — | — |
| Total Distributions | (14.860) | (4.397) | (1.853) |
| Net Asset Value, End of Period | $103.39 | $101.91 | $98.11 |
| |
| Total Return | 20.80% | 7.98% | 2.29% |
| |
| Ratios/Supplemental Data | | | |
| Net Assets, End of Period (Millions) | $176 | $46 | $5 |
| Ratio of Total Expenses to Average Net Assets | 0.13% | 0.14% | 0.14%4 |
| Ratio of Net Investment Income to Average Net Assets | 4.39% | 3.90% | 4.52%4 |
| Portfolio Turnover Rate5 | 24% | 39% | 36% |
1 Inception.
2 Calculated based on average shares outstanding.
3 Includes increases from purchase fees of $.01, $.02, and $.11.
4 Annualized.
5 Excludes the value of portfolio securities received or delivered as a result of in-kind purchases or redemptions of the fund's capital shares, including ETF Creation Units.
See accompanying Notes, which are an integral part of the Financial Statements.
15
Extended Duration Treasury Index Fund
Notes to Financial Statements
Vanguard Extended Duration Treasury Index Fund is registered under the Investment Company Act of 1940 as an open-end investment company, or mutual fund. The fund offers three classes of shares: Institutional Shares, Institutional Plus Shares, and ETF Shares. Institutional Shares and Institutional Plus Shares are designed for investors who meet certain administrative, service, and account size criteria. The fund has not issued any Institutional Plus Shares through August 31, 2010. ETF Shares are listed for trading on the NYSE Arca, Inc.; they can be purchased and sold through a broker.
A. The following significant accounting policies conform to generally accepted accounting principles for U.S. mutual funds. The fund consistently follows such policies in preparing its financial statements.
1. Security Valuation: Bonds, and temporary cash investments acquired over 60 days to maturity, are valued using the latest bid prices or using valuations based on a matrix system (which considers such factors as security prices, yields, maturities, and ratings), both as furnished by independent pricing services. Investments in Vanguard Market Liquidity Fund are valued at that fund’s net asset value. Securities for which market quotati ons are not readily available, or whose values have been affected by events occurring before the fund’s pricing time but after the close of the securities’ primary markets, are valued by methods deemed by the board of trustees to represent fair value.
2. Federal Income Taxes: The fund intends to continue to qualify as a regulated investment company and distribute all of its taxable income. Management has analyzed the fund’s tax positions taken for all open federal income tax years (August 31, 2008–2010), and has concluded that no provision for federal income tax is required in the fund’s financial statements.
3. Distributions: Distributions to shareholders are recorded on the ex-dividend date.
4. Other: Interest income includes income distributions received from Vanguard Market Liquidity Fund and is accrued daily. Premiums and discounts on debt securities purchased are amortized and accreted, respectively, to interest income over the lives of the respective securities. Security transactions are accounted for on the date securities are bought or sold. Costs used to determine realized gains (losses) on the sale of investment securities are those of the specific securities sold. Fees assessed on purchases of Institutional Shares are credited to paid-in capital.
Each class of shares has equal rights as to assets and earnings, except that each class separately bears certain class-specific expenses related to maintenance of sh areholder accounts (included in Management and Administrative expenses), shareholder reporting, and proxies. Marketing and distribution expenses are allocated to each class of shares based on a method approved by the board of trustees. Income, other non-class-specific expenses, and gains and losses on investm ents are allocated to each class of shares based on its relative net assets.
B. The Vanguard Group furnishes at cost investment advisory, corporate management, administrative, marketing, and distri bution services. The costs of such services are allocated to the fund under methods approved by the board of trustees. The fund has committed to provide up to 0.40% of its net assets in capital contributions to Vanguard. At August 31, 2010, the fund had contributed capital of $74,000 to Vanguard (included in Other Assets), representing 0.02% of the fund’s net assets and 0.03% of Vanguard’s capitalization. The fund’s trustees and officers are also directors and officers of Vanguard.
16
Extended Duration Treasury Index Fund
C. Various inputs may be used to determine the value of the fund’s investments. These inputs are summarized in three broad levels for financial statement purposes. The inputs or methodologies used to value securities are not necessarily an indication of the risk associated wit h investing in those securities.
Level 1—Quoted prices in active markets for identical securities.
Level 2—Other significant observable inputs (including quoted prices for similar securities, interest rates, prepayment speeds, credit risk, etc.).
Level 3—Significant unobservable inputs (including the fund’s own assumptions used to determine the fair value of investments).
The following table summarizes the fund’s investments as of August 31, 2010, based on th e inputs used to value them:
| | | |
| | Level 1 | Level 2 | Level 3 |
| Investments | ($000) | ($000) | ($000) |
| U.S. Government and Agency Obligations | — | 462,072 | — |
| Temporary Cash Investments | 460 | — | — |
| Total | 460 | 462,072 | — |
D. Distributions are determined on a tax basis and may differ from net investment income and realized capital gains for financial reporting purposes. Differences may be permanent or temporary. Permanent differences are reclassified among capital accounts in the financial statements to reflect their tax character. Temporary differences arise when certain items of income, expense, gain, or loss are recognized in different periods for financial statement and tax purposes; these differences will reverse at some time in the future. Differences in classification may also result from the treatment of short-term gains as ordinary income for tax purposes.
During the year ended August 31, 2010, the fund realized $1,140,000 of net capital gains resulting from in-kind redemptions—in which shareholders exchanged fund shares for securities held by the fund rather than for cash. Because such gains are not taxable to the fund, and are not distributed to shareholders, they have been reclassified from ac cumulated net realized gains to paid-in capital.
The fund used a tax accounting practice to treat a portion of the price of capital shares redeemed during the year as distributions from realized capital gains. Accordingly, the fund has reclassified $123,000 from accumulated net realized gains to paid-in capital.
For tax purposes, at August 31, 2010, the fund had $3,216,000 of ordinary income and $906,000 of long-term capital gains available for distribution.
At August 31, 2010, the cost of investment securities for tax purposes was $387,290,000. Net unrealized appreciation of investment securities for tax purposes was $75,242,000, consisting of unrealized gains of $75,248,000 on securities that had risen in value since their purchase and $6,000 in unrealized losses on securities that had fallen in value since their purchase.
E. During the year ended August 31, 2010, the fund purchased $259,564,000 of investment securities and sold $79,074,000 of investment securities, other than temporary cash investments.
17
Extended Duration Treasury Index Fund
F. Capital share transactions for each class of shares were:
| | | | | | |
| | | Year Ended August 31, |
| | | 2010 | | | 2009 |
| | Amount | Shares | Amount | Shares |
| | ($000) | (000) | ($000) | (000) |
| Institutional Shares | | | | |
| Issued1 | 94,827 | 3,768 | 40,704 | 1,396 |
| Issued in Lieu of Cash Distributions | 25,988 | 1,069 | 7,647 | 222 |
| Redeemed | (15,448) | (573) | (203,299) | (5,443) |
| Net Increase (Decrease)—Institutional Shares | 105,367 | 4,264 | (154,948) | (3,825) |
| ETF Shares | | | | |
| Issued1 | 124,631 | 1,350 | 60,981 | 550 |
| Issued in Lieu of Cash Distributions | — | — | — | — |
| Redeemed | (9,038) | (100) | (19,478) | (150) |
| Net Increase (Decrease)—ETF Shares | 115,593 | 1,250 | 41,503 | 400 |
| 1 Includes purchase fees of of $55,000 and $42,000 (fund totals). | | | | |
G. In preparing the financial statements as of August 31, 2010, management considered the impact of subsequent events for potential recognition or disclosure in these financial statements.
18
Report of Independent Registered Public Accounti ng Firm
To the Trustees of Vanguard World Fund and the Shareholders of Vanguard Extended Duration Treasury Index Fund:
In our opinion, the accompanying statement of net assets and the related statements of operations and of changes in net assets and the financial highlights present fairly, in all material respects, the financial position of Vanguard Extended Duration Treasury Index Fund (constituting a separate portfolio of Vanguard World Fund, hereafter referred to as the “Fund”) at August 31, 2010, the results of its operations for the year then ended, the changes in its net assets for each of the two years in the period then ended and the financial highlights for each of the periods indicated, in conformity with accounting principles generally accepted in the United States of America. These financial statements and financial highlights (hereafter referred to as “financial statements”) are the responsibility of the Fund’s management; our responsibility is to express an opinion on these financial statements based on our audits. We conducted our audits of these financial statements in accordance with the standards of the Public Company Accounting Oversight Board (United States). Those standards require that we plan and perform the audit to obtain reasonable assurance about whether the financial statements are free of material misstatement. An audit includes examining, on a test basis, evidence supporting the amounts and disclosures in the financial statements, assessing the accounting principles used and significant estimates made by management, and evaluating the o verall financial statement presentation. We believe that our audits, which included confirmation of securities at August 31, 2010 by correspondence with the custodian, provide a reasonable basis for our opinion.
PricewaterhouseCoopers LLP
Philadelphia, Pennsylvania
October 11, 2010

Special 2010 tax information (unaudited) for Vanguard Extended Duration Treasury Index Fund
This information for the fiscal year ended August 31, 2010, is included pursuant to provisions of the Internal Revenue Code.
The fund distributed $105,000 as capital gain dividends (from net long-term capital gains) to shareholders during the fiscal year.
For nonresident alien shareholders, 100.0% of income dividends are interest-related dividends.
19
About Your Fund’s Expenses
As a shareholder of the fund, you incur ongoing costs, which include costs for portfolio management, administrative services, and shareholder reports (like this one), among others. Operating expenses, which are deducted from a fund’s gross income, directly reduce the investment return of the fund.
A fund’s expenses are expressed as a percentage of its average net assets. This figure is known as the expense ratio. The following examples are intended to help you understand the ongoing costs (in dollars) of investing in your fund and to compare these costs with those of other mutual funds. The examples are based on an investment of $1,000 made at the beginning of the period shown and held for the entire period.
The accompanying table illustrates your fund’s costs in two ways:
• Based on actual fund return. This section helps you to estimate the actual expenses that you paid over the period. The ”Ending Account Value“ shown is derived from the fund‘s actual return, and the third column shows the dollar amount that would have been paid by an investor who started with $1,000 in the fund. You may use the information here, together with the amount you invested, to estimate the expenses that you paid over the period.
To do so, simply divide your account value by $1,000 (for example, an $8,600 account value divided by $1,000 = 8.6), then multiply the result by the number given for your fund under the heading ”Expenses Paid During Period.“
• Based on hypothetical 5% yearly return. This section is intended to help you compare your fund‘s costs with those of other mutual funds. It assumes that the fund had a yearly return of 5% before expenses, but that the expense ratio is unchanged. In this case—because the return used is not the fund’s actual return—the results do not apply to your investment. The example is useful in making comparisons because the Securities and Exchange Commission requires all mutual funds to calculate expenses based on a 5% return. You can assess your fund’s costs by comparing this hypothetical example with the hypothetical examples that appear in shareholder reports of other funds.
Note that the expenses shown in the table are meant to highlight and help you compare ongoing costs only and do not reflect transaction costs incurred by the fund for buying and selling securities. Further, the expenses do not include the transaction fees described in the prospectus. If such fees were applied to your account, your costs would be higher. Your fund does not carry a “sales load.”
The calculations assume no shares were bought or sold during the period. Your actual costs may have been higher or lower, depending on the amount of your investment and the timing of any purchases or redemptions.
You can find more information about the fund’s expenses, including annual expense ratios, in the Financial Statements section of this report. For additional information on operating expenses and other shareholder costs, please refer to your fund’s current prospectus.
20
| | | |
| Six Months Ended August 31, 2010 | | | |
| | Beginning | Ending | Expenses |
| | Account Value | Account Value | Paid During |
| Extended Duration Treasury Index Fund | 2/28/2010 | 8/31/2010 | Period |
| Based on Actual Fund Return | | | |
| Institutional Shares | $1,000.00 | $1,319.50 | $0.64 |
| ETF Shares | 1,000.00 | 1,319.16 | 0.76 |
| Based on Hypothetical 5% Yearly Return | | | |
| Institutional Shares | $1,000.00 | $1,024.65 | $0.56 |
| ETF Shares | 1,000.00 | 1,024.55 | 0.66 |
The calculations are based on expenses incurred in the most recent six-month period. The fund’s annualized six-month expense ratios for that period are 0.11% for Institutional Shares and 0.13% for ETF Shares. The dollar amounts shown as “Expenses Paid” are equal to the annualized expense ratio multiplied by the average account value over the period, multiplied by the number of days in the most recent six-month period, then divided by the number of days in the most recent 12-month period.
21
Trustees Approve Advisory Arrangement
The board of trustees of Vanguard Extended Duration Treasury Index Fund has renewed the fund’s investment advisory arrangement with The Vanguard Group, Inc. Vanguard—through its Fixed Income Group—serves as the investment advisor to the fund. The board determined that continuing the fund’s internalized management structure was in the best interests of the fund and its shareholders.
The board based its decision upon an evaluation of the advisor’s investment staff, portfolio management process, and performance. The trustees considered the factors discussed below, among others. However, no single factor determined whether the board approved the arrangement. Rather, it was the totality of the circumstances that drove the board’s decision.
Nature, extent, and quality of services
The board considered the quality of the investment management services provided to the fund since it s inception in 2007, and took into account the organizational depth and stability of the advisor. The board noted that Vanguard has been managing in vestments for more than three decades. The Fixed Income Group adheres to a sound, disciplined investment management process; the team has considerable experience, stability, and depth.
The board concluded that Vanguard’s experience, stability, depth, and performance, among other factors, warranted continuation of the advisory arrangement.
Investment performance
The board considered the fund’s performance since its inception in 2007, including any periods of outperformance or underperformance of its target index and peer group. The board concluded that the fund has performed in line with expectations, and that the results have been consistent with the fund’s investment strategies. Information about the fund’s most recen t performance can be found in the Performance Summary section of this report.
Cost
The board concluded that the fund’s expense ratio was well below the average expense ratio charged by funds in its peer group and that the fund’s advisory expense ratio was also well below its peer-group average. Information about the fund’s expense ratio appears in the About Your Fund’s Expenses section of this report.
The board does not conduct a profitability analysis of Vanguard, because of Vanguard’s unique “at-cost” structure. Unlike most other mutual fund management companies, Vanguard is owned by the funds it oversees, and produces “profits” only in the form of reduced expenses for fund shareholders.
The benefit of economies of scale
The board concluded that the fund’s low-cost arrangement with Vanguard ensures that the fund will realize economies of scale as it grows, with the cost to shareholders declining as fund assets increase.
The board will consider whether to renew the advisory arrangement again after a one-year period.
22
Glossary
30-Day SEC Yield. A fund’s 30-day SEC yield is derived using a formula specified by the U.S. Securities and Exchange Commission. Under the formula, data related to the fund’s security holdings in the previous 30 days are used to calculate the fund’s hypothetical net income for that period, which is then annualized and divided by the fund’s estimated average net assets over the calculation period. For the purposes of this calculation, a security’s income is based on its current market yield to maturity (in the case of bonds) or its projected dividend yield (for stocks). Because the SEC yield represents hypothetical annualized income, it will differ—at times significantly—from the fund’s actual experience. As a result, the fund’s income distributions may be higher or lower than implied by the SEC yield.
Average Coupon. The average interest rate paid on the fixed income securities held by a fund. It is expressed as a percentage of face value.
Average Duration. An estimate of how much the value of the bonds held by a fund will fluctuate in response to a change in interest rates. To see how the value could change, multiply the average duration by the change in rates. If interest rates rise by 1 percentage point, the value of the bonds in a fund with an average duration of five years would decline by about 5%. If rates decrease by a percentage point, the value would rise by 5%.
Average Effective Maturity. The average length of time until fixed income securities held by a fund reach maturity and are repaid, taking into consideration the possibility that the issuer may call the bond before its maturity date. The figure reflects the proportion of fund assets represented by each security; it also reflects any futures contracts held. In general, the longer the average effective maturity, the more a fund’s share price will fluctuate in response to changes in market interest rates.
Credit Quality. The credit ratings assigned to fixed income securities are an indicator of risk. They represent a rating agency’s assessment of the issuer’s ability to meet its obligations. For this report, credit-quality ratings for each issue are obtained from Barclays Capital using ratings derived from Moody’s Investors Service, Fitch Ratings, and Standard & Poor’s. When ratings from all three agencies are available, the median rating is used; when ratings are available from two of the agencies, the lower rating is used; and when one rating is available, that rating is used.
Distribution by Coupon. A breakdown of the securities in a fund according to coupon rate—the interest rate that an issuer promises to pay, expressed as an annual percentage of face value. Securities with unusually high coupon rates may be subject to call risk, the possibility that they will be redeemed (or “called”) early by the issuer.
Expense Ratio. The percentage of a fund’s average net assets used to pay its annual administrative and advisory expenses. These expenses directly reduce returns to investors.
Inception Date. The date on which the assets of a fund (or one of its share classes) are first invested in accordance with the fund’s investment objective. For funds with a subscription period, the inception date is the day after that period ends. Investment performance is measured from the inception date.
Short-Term Reserves. The percentage of a fund invested in highly liquid, short-term securities that can be readily converted to cash.
23
Yield to Maturity. The rate of return an investor would receive if the fixed income securities held by a fund were held to their maturity dates.
24
This page intentionally left blank.
This page intentionally left blank.
This page intentionally left blank.
The People Who Govern Your Fund
The trustees of your mutual fund are there to see that the fund is operated and managed in your best interests since, as a shareholder, you are a part owner o f the fund. Your fund’s trustees also serve on the board of directors of The Vanguard Group, Inc., which is owned by the Vanguard funds and provides services to them on an at-cost basis.
A majority of Vanguard’s board members are independent, meaning that they have no affiliation with Vanguard or the funds they oversee, apart from the sizable personal investments they have ma de as private individuals. The independent board members have distinguished backgrounds in business, academia, and public service. Each of the trustees and executive officers oversees 163 Vanguard funds.
The following table provides information for each trustee and executive officer of the fund. More information about the trustees is in the Statement of Additional Information, which can be obtained, without charge, by contacting Vanguard at 800-662-7447, or online at vanguard.com.
| |
| Interested Trustee1 | Amy Gutmann |
| | Born 1949. Trustee Since June 2006. Principal |
| F. William McNabb III | Occupation(s) During the Past Five Years: President |
| Born 1957. Trustee Since July 2009. Chairman of the | of the University of Pennsylvania; Christopher H. |
| Board. Principal Occupation(s) During the Past Five | Browne Distinguished Professor of Political Science |
| Years: Chairman of the Board of The Vanguard Group, | in the School of Arts and Sciences with secondary |
| Inc., and of each of the investment companies served | appointments at the Annenberg School for Commu- |
| by The Vanguard Group, since January 2010; Director | nication and the Graduate School of Education |
| of The Vanguard Group since 2008; Chief Executive | of the University of Pennsylvania; Director of |
| Officer and President of The Vanguard Group and of | Carnegie Corporation of New York, Schuylkill River |
| each of the investment companies served by The | Development Corporation, and Greater Philadelphia |
| Vanguard Group since 2008; Director of Vanguard | Chamber of Commerce; Trustee of the National |
| Marketing Corporation; Managing Director of The | Constitution Center; Chair of the Presidential |
| Vanguard Group (1995–2008) . | Commission for the Study of Bioethical Issues. |
| |
| | JoAnn Heffernan Heisen |
| Independent Trustees | Born 1950. Trustee Since July 1998. Principal |
| | Occupation(s) During the Past Five Years: Corporate |
| Emerson U. Fullwood | Vice President and Chief Global Diversity Officer |
| Born 1948. Trustee Since January 2008. Principal | since 2006 (retired 2008) and Member of the |
| Occupation(s) During the Past Five Years: Executive | Executive Committee (retired 2008) of Johnson & |
| Chief Staff and Marketing Officer for North America | Johnson (pharmaceuticals/consumer products) ; Vice |
| and Corporate Vice President (retired 2008) of Xerox | President and Chief Information Officer of Johnson & |
| Corporation (document management products and | Johnson (1997–2005) ; Director of the University |
| services) ; Director of SPX Corporation (multi-industry | Medical Center at Princeton and Women’s Research |
| manufacturing), the United Way of Rochester, | and Education Institute; Member of the Advisory |
| Amerigroup Corporation (managed health care) , | Board of the Maxwell School of Citizenship and Public |
| the University of Rochester Medical Center, and | Affairs at Syracuse University. |
| Monroe Community College Foundation. | |
| | F. Joseph Loughrey |
| Rajiv L. Gupta | Born 1949. Trustee Since October 2009. Principal |
| Born 1945. Trustee Since December 2001. 2 | Occupation(s) During the Past Five Years: President |
| Principal Occupation(s) During the Past Five Years: | and Chief Operating Officer since 2005 (retired 2009) |
| Chairman and Chief Executive Officer (retired 2009) | and Vice Chairman of the Board (2008–2009) of |
| and President (2006–2008) of Rohm and Haas Co. | Cummins Inc. (industrial machinery); Director of |
| (chemicals); Director of Tyco International, Ltd. | SKF AB (industrial machinery), Hillenbrand, Inc. |
| (diversified manufacturing and services) and Hewlett- | (specialized consumer services) , Sauer-Danfoss Inc. |
| Packard Co. (electronic computer manufacturing); | (machinery), the Lumina Foundation for Education, |
| Trustee of The Conference Board; Member of the | and Oxfam America; Chairman of the Advisory |
| Board of Managers of Delphi Automotive LLP | Council for the College of Arts and Letters at the |
| (automotive components). | University of Notre Dame. |
| | |
| André F. Perold | Kathryn J. Hyatt | |
| Born 1952. Trustee Since December 2004. Principal | Born 1955. Treasurer Since November 2008. Principal |
| Occupation(s) During the Past Five Years: George | Occupation(s) During the Past Five Years: Principal |
| Gund Professor of Finance and Banking at the Harvard | of The Vanguard Group, Inc.; Treasurer of each of |
| Business School; Chair of the Investment Committee | the investment companies served by The Vanguard |
| of HighVista Strategies LLC (private investment firm). | Group since 2008; Assistant Treasurer of each of the |
| | investment companies served by The Vanguard Group |
| Alfred M. Rankin, Jr. | (1988–2008) . | |
| Born 1941. Trustee Since January 1993. Principal | | |
| Occupation(s) During the Past Five Years: Chairman, | Heidi Stam | |
| President, and Chief Executive Officer of NACCO | Born 1956. Secretary Since July 2005. Principal |
| Industries, Inc. (forklift trucks/housewares/lignite) ; | Occupation(s) During the Past Five Years: Managing |
| Director of Goodrich Corporation (industrial products/ | Director of The Vanguard Group, Inc., since 2006; |
| aircraft systems and services) ; Chairman of the | General Counsel of The Vanguard Group since 2005; |
| Federal Reserve Bank of Cleveland; Trustee of The | Secretary of The Vanguard Group and of each of the |
| Cleveland Museum of Art. | investment companies served by The Vanguard Group |
| | since 2005; Director and Senior Vice President of |
| Peter F. Volanakis | Vanguard Marketing Corporation since 2005; |
| Born 1955. Trustee Since July 2009. Principal | Principal of The Vanguard Group (1997–2006) . |
| Occupation(s) During the Past Five Years: President | | |
| since 2007 and Chief Operating Officer since 2005 | | |
| of Corning Incorporated (communications equipment) ; | Vanguard Senior Management Team |
| President of Corning Technologies (2001–2005); | | |
| Director of Corning Incorporated and Dow Corning; | R. Gregory Barton | Michael S. Miller |
| Trustee of the Corning Incorporated Foundation and | Mortimer J. Buckley | JamesM. Norris |
| the Corning Museum of Glass; Overseer of the | Kathleen C. Gubanich | GlennW. Reed |
| Amos Tuck School of Business Administration at | Paul A. Heller | George U. Sauter |
| Dartmouth College. | | |
| |
| | Chairman Emeritus and Senior Advisor |
| Executive Officers | | |
| | John J. Brennan | |
| Glenn Booraem | Chairman, 1996–2009 | |
| Born 1967. Controller Since July 2010. Principal | Chief Executive Officer and President, 1996–2008 |
| Occupation(s) During the Past Five Years: Principal | | |
| of The Vanguard Group, Inc.; Controller of each of | | |
| the investment companies served by The Vanguard | Founder | |
| Group since 2010; Assistant Controller of each of | | |
| the investment companies served by The Vanguard | John C. Bogle | |
| Group (2001–2010). | Chairman and Chief Executive Officer, 1974–1996 |
| |
| Thomas J. Higgins | | |
| Born 1957. Chief Financial Officer Since September | | |
| 2008. Principal Occupation(s) During the Past Five | | |
| Years: Principal of The Vanguard Group, Inc.; Chief | | |
| Financial Officer of each of the investment companies | | |
| served by The Vanguard Group since 2008; Treasurer | | |
| of each of the investment companies served by The | | |
| Vanguard Group (1998–2008) . | | |
1 Mr. McNabb is considered an “interested person,” as defined in the Investment Company Act of 1940, because he is an officer of the Vanguard funds.
2 December 2002 for Vanguard Equity Income Fund, Vanguard Growth Equity Fund, the Vanguard Municipal Bond Funds, and the Vanguard State Tax-Exempt Funds.
| 
|
| P.O. Box 2600 |
| Valley Forge, PA 19482-2600 |
Connect with Vanguard® > Vanguard.com
| |
| Fund Information > 800-662-7447 | Vanguard Extended Duration Treasury ETF is not |
| Direct Investor Account Services > 800-662-2739 | sponsored, endorsed, sold, or promoted by Barclays |
| Institutional Investor Services > 800-523-1036 | Capital. Barclays Capital makes no representation or |
| Text Telephone for People | warranty, express or implied, to the owners of |
| With Hearing Impairment > 800-749-7273 | Vanguard Extended Duration Treasury ETF or any |
| member of the public regarding the advisability of |
| | investing in securities generally or in Vanguard |
| This material may be used in conjunction | Extended Duration Treasury ETF particularly or the |
| with the offering of shares of any Vanguard | ability of the Barclays Capital Index to track general |
| fund only if preceded or accompanied by | bond market performance. Barclays Capital hereby |
| the fund’s current prospectus. | expressly disclaims all warranties of merchantability |
| and fitness for a particular purpose with respect to the |
| All comparative mutual fund data are from Lipper Inc. or | Barclays Capital Index and any data included therein. |
| Morningstar, Inc., unless otherwise noted. | Barclays Capital’s only relationship to Vanguard and |
| | Vanguard Extended Duration Treasury ETF is the |
| You can obtain a free copy of Vanguard’s proxy voting | licensing of the Barclays Capital Index, which is |
| guidelines by visiting vanguard.com/proxyreporting or by | determined, composed, and calculated by Barclays |
| calling Vanguard at 800-662-2739. The guidelines are | Capital without regard to Vanguard or Vanguard |
| also available from the SEC’s website, sec.gov. In | Extended Duration Treasury ETF. Barclays Capital is not |
| addition, you may obtain a free report on how your fund | responsible for, and has not participated in, the |
| voted the proxies for securities it owned during the 12 | determination of the timing of, prices of, or quantities |
| months ended June 30. To get the report, visit either | of Vanguard Extended Duration Treasury ETF to be |
| vanguard.com/proxyreporting or sec.gov. | issued. |
| |
| You can review and copy information about your fund at | |
| the SEC’s Public Reference Room in Washington, D.C. To | |
| find out more about this public service, call the SEC at | |
| 202-551-8090. Information about your fund is also | |
| available on the SEC’s website, and you can receive | |
| copies of this information, for a fee, by sending a | |
| request in either of two ways: via e-mail addressed to | |
| publicinfo@sec.gov or via regular mail addressed to the | |
| Public Reference Section, Securities and Exchange | |
| Commission, Washington, DC 20549-1520. | |
| |
| |
| | © 2010 The Vanguard Group, Inc. |
| | All rights reserved. |
| | Vanguard Marketing Corporation, Distributor. |
| |
| | Q12750 102010 |

|
| Vanguard Mega Cap 300 Index Funds |
| Annual Report |
|
| August 31, 2010 |
 |
| |
| Vanguard Mega Cap 300 Index Fund |
| Vanguard Mega Cap 300 Growth Index Fund |
| Vanguard Mega Cap 300 Value Index Fund |
> For the 12-month period ended August 31, 2010, Vanguard’s Mega Cap 300 Index Funds posted returns ranging from 2.68% to 4.82% for their ETF Shares, as determined by the net asset value per share. Returns for the funds’ Institutional Shares were slightly higher.
> All three funds closely tracked their target indexes; their returns outpaced the average returns for their respective peer groups.
> Stocks in the consumer discretionary, industrial, and consumer staples sectors were leading contributors to performance in all three funds.
| |
| Contents | |
| Your Fund’s Total Returns. | 1 |
| Chairman’s Letter. | 2 |
| Mega Cap 300 Index Fund. | 7 |
| Mega Cap 300 Growth Index Fund. | 21 |
| Mega Cap 300 Value Index Fund. | 34 |
| Your Fund’s After-Tax Returns. | 49 |
| About Your Fund’s Expenses. | 50 |
| Trustees Approve Advisory Arrangement. | 52 |
| Glossary. | 53 |

Mega Cap 300 Index Fund
Mega Cap 300 Growth Index Fund
Mega Cap 300 Value Index Fund
Please note: The opinions expressed in this report are just that—informed opinions. They should not be considered promises or advice. Also, please keep in mind that the information and opinions cover the period through the date on the front of this report. Of course, the risks of investing in your fund are spelled out in the prospectus.
See the Glossary for definitions of investment terms used in this report.
Cover photograph: Jean Maher.
Your Fund’s Total Returns
| |
| Fiscal Year Ended August 31, 2010 | |
| | Total |
| | Returns |
| Vanguard Mega Cap 300 Index Fund | |
| Institutional Shares | 3.74% |
| ETF Shares | |
| Market Price | 3.54 |
| Net Asset Value | 3.71 |
| MSCI US Large Cap 300 Index | 3.84 |
| Large-Cap Core Funds Average | 2.58 |
| Large-Cap Core Funds Average: Derived from data provided by Lipper Inc. | |
| Vanguard Mega Cap 300 Growth Index Fund | |
| Institutional Shares | 4.84% |
| ETF Shares | |
| Market Price | 4.63 |
| Net Asset Value | 4.82 |
| MSCI US Large Cap Growth Index | 4.95 |
| Large-Cap Growth Funds Average | 4.04 |
| Large-Cap Growth Funds Average: Derived from data provided by Lipper Inc. | |
| Vanguard Mega Cap 300 Value Index Fund | |
| Institutional Shares | 2.69% |
| ETF Shares | |
| Market Price | 2.51 |
| Net Asset Value | 2.68 |
| MSCI US Large Cap Value Index | 2.79 |
| Large-Cap Value Funds Average | 2.13 |
| Large-Cap Value Funds Average: Derived from data provided by Lipper Inc. | |
Institutional Shares are available to certain institutional investors who meet specific administrative, service, and account-size criteria. The Vanguard ETF® Shares shown are traded on the NYSE Arca exchange and are available only through brokers. The table provides ETF returns based on both the NYSE Arca market price and the net asset value for a share. U.S. Pat. No. 6,879,964 B2; 7,337,138.
1

Chairman’s Letter
Dear Shareholder,
Vanguard’s Mega Cap 300 Index Funds represent the largest companies in the U.S. stock market. The three Mega Cap 300 funds, each of which tracks a different MSCI large-cap index, allow shareholders to invest in the large-cap segment as a whole through the Mega Cap 300 Index Fund, or directly in either the growth or value segments through one of the two other funds.
Each fund met its objective by closely tracking its target index for the 12 months ended August 31, 2010. The Mega Cap 300 Growth Index Fund had the best return among the three funds, at 4.82% for its ETF Shares, as measured by their net asset value. The Mega Cap 300 Value Index Fund returned 2.68%, and the Mega Cap 300 Index Fund fell in between, with a return of 3.71%.
A ragged 12-month climb in global stock markets
At the start of the 12-month period, stock markets moved higher as global economies continued to pull out of a deep downturn. Within a few months, however, optimism began to fade. Europe’s sovereign debt crisis fueled fears of another global financial shock, while persistently high unemployment and downward revisions to U.S. economic indicators suggested that the powerful rebound in corporate earnings could be at risk.
2
This alternating pattern of hope and fear persisted through the period’s final months. The net result for the fiscal year was mid-single-digit gains in U.S. stocks. International stocks returned about 3%, as modest declines in developed markets in Europe and the Pacific region were offset by a strong rally in emerging markets.
Bonds produced strong returns as prices rose and yields declined
The economic uncertainty and high stock market volatility over the fiscal period created a favorable environment for fixed income investments. The broad, taxable bond market returned more than 9%, as investors sought shelter in U.S. Treasury and corporate bonds. The municipal bond market returned a bit more. In both markets, much of the total return came from rising bond prices. The flip side of rising prices, of course, is shrinking yields, which can set the stage for lower future returns.
As it has since December 2008, the Federal Reserve kept its target for short-term interest rates between 0% and 0.25%, in an effort to bolster the economy. This policy has kept a tight lid on the returns available from Treasury bills, commercial paper, and other money market instruments.
Mega-cap growth companies outpaced their value counterparts
The broad U.S. stock market was up modestly for the 12-month period, amid mounting concerns about Europe’s sovereign debt crisis, slowing growth
| | | |
| Market Barometer | | | |
| |
| | | Average Annual Total Returns |
| | | Periods Ended August 31, 2010 |
| | One | Three | Five |
| | Year | Years | Years |
| Stocks | | | |
| Russell 1000 Index (Large-caps) | 5.55% | -8.34% | -0.71% |
| Russell 2000 Index (Small-caps) | 6.60 | -7.44 | -0.69 |
| Dow Jones U.S. Total Stock Market Index | 6.15 | -7.83 | -0.31 |
| MSCI All Country World Index ex USA (International) | 3.27 | -7.93 | 3.78 |
| |
| Bonds | | | |
| Barclays Capital U.S. Aggregate Bond Index (Broad | | | |
| taxable market) | 9.18% | 7.65% | 5.96% |
| Barclays Capital Municipal Bond Index (Broad | | | |
| tax-exempt market) | 9.78 | 6.62 | 5.02 |
| Citigroup Three-Month U.S. Treasury Bill Index | 0.12 | 1.13 | 2.53 |
| |
| CPI | | | |
| Consumer Price Index | 1.15% | 1.64% | 2.14% |
3
in China, and—last but certainly not least—the sustainability of the global economic recovery. In this challenging stock market environment, the big-company stocks that make up the Mega Cap 300 Index Funds underperformed the broad market, which includes both the biggest stocks and the stocks of small and mid-sized companies, which held up somewhat better.
In the large-cap segment of the market, growth stocks outperformed their value counterparts, and the Mega Cap 300 Growth Index Fund, in turn, had the best performance among the three Vanguard funds for the period. Results for Mega Cap 300 Index Fund—which invests in both growth and value stocks—fell in the middle of the pack, while the Mega Cap 300 Value Index Fund brought up the rear.
Despite the differences in their market segments—growth, value, or both—all three funds generally saw similar results on a sector level. Stocks in the consumer discretionary, industrial, and consumer staples areas of the market contributed most positively to returns for each of the funds.
In the consumer-oriented sectors, restaurants, hotels, and even some retailers got back on track amid the uneven recovery, and industrial conglomerates and machinery, aerospace, and railroad companies benefited from a boost in consumer and commercial demand.
Expense Ratios
Your Fund Compared With Its Peer Group
| | | |
| | Institutional | ETF | Peer Group |
| | Shares | Shares | Average |
| Mega Cap 300 Index Fund | 0.11% | 0.13% | 1.27% |
| Mega Cap 300 Growth Index Fund | 0.11 | 0.13 | 1.37 |
| Mega Cap 300 Value Index Fund | 0.11 | 0.13 | 1.28 |
The fund expense ratios shown are from the prospectus dated December 28, 2009, and represent estimated costs for the current fiscal year. For the fiscal year ended August 31, 2010, the funds’ expense ratios were: for the Mega Cap 300 Index Fund, 0.11% for Institutional Shares and 0.13% for ETF Shares; for the Mega Cap 300 Growth Index Fund, 0.11% for Institutional Shares and 0.13% for ETF Shares; and for the Mega Cap 300 Value Index Fund, 0.11% for Institutional Shares and 0.13% for ETF Shares. Peer-group expense ratios are derived from data provided by Lipper Inc. and capture information through year-end 2009.
Peer groups: For the Mega Cap 300 Index Fund, Large-Cap Core Funds; for the Mega Cap 300 Growth Index Fund, Large-Cap Growth Funds; and for the Mega Cap 300 Value Index Fund, Large-Cap Value Funds.
4
Meanwhile, holdings in the financial sector took a significant toll on the funds’ results for the period. Stocks of many large financial institutions, including investment banks and diversified financial services companies, suffered as concerns over regulatory reform and the strength of the institutions’ balance sheets influenced investors.
Health care stocks also subtracted from performance in the Mega Cap Index Fund and Mega Cap Growth Index Fund. The Mega Cap Value Index Fund was weighed down by holdings in the information technology sector.
Funds continue to track their benchmarks
Since the inception of Vanguard’s Mega Cap 300 Index Funds in December 2007, the U.S. stock market has experienced extreme volatility, including one of the worst bear markets in history. During this period, all three Mega Cap 300 Index Funds have successfully achieved their primary objective of tracking their benchmark indexes.
The funds’ advisor, Vanguard Quantitative Equity Group, deserves credit for the funds’ successful tracking record. The advisor is helped in this task by the funds’ low expense ratios, which are far below the industry average.
Focus on your goals rather than the market’s moves
The stock market’s ups and downs seem to be occurring with alarming frequency these days. This can be unsettling, but it’s generally unwise to let the market’s unpredictable movements unduly influence your investment strategy.
While nobody can predict what’s going to happen next in the financial markets, we can position our investment portfolios to make sure that they’re in line with our investment goals. Vanguard encourages you to create a long-term plan that includes a mix of stocks, bonds, and short-term investments that is appropriate for your goals and risk tolerance. Such a well-balanced investment portfolio can help provide some cushion from the stock market’s downward swings while allowing you to participate in its long-term potential for growth.
Vanguard’s Mega Cap 300 Index Funds can play an important role in your long-term investment plan by providing low-cost exposure to the stock market’s biggest companies, whether you choose to invest broadly in this segment or focus specifically on its growth or value sectors.
As always, thank you for entrusting your assets to Vanguard.
Sincerely,

F. William McNabb III
Chairman and Chief Executive Officer
September 13, 2010
5
Your Fund’s Performance at a Glance
August 31, 2009, Through August 31, 2010
| | | | | |
| | | | |
| | | | | Distributions Per Share |
| | Starting | Ending | Income | Capital |
| | Share Price | Share Price | Dividends | Gains |
| Vanguard Mega Cap 300 Index Fund | | | | |
| Institutional Shares | $69.95 | $71.03 | $1.610 | $0.000 |
| ETF Shares | 35.49 | 36.03 | 0.811 | 0.000 |
| Vanguard Mega Cap 300 Growth Index Fund | | | | |
| Institutional Shares | $74.21 | $76.74 | $1.115 | $0.000 |
| ETF Shares | 37.50 | 38.78 | 0.554 | 0.000 |
| Vanguard Mega Cap 300 Value Index Fund | | | | |
| Institutional Shares | $66.02 | $65.97 | $1.907 | $0.000 |
| ETF Shares | 33.29 | 33.26 | 0.957 | 0.000 |
6
Mega Cap 300 Index Fund
Fund Profile
As of August 31, 2010
| | |
| Share-Class Characteristics | |
| |
| | Institutional | ETF |
| | Shares | Shares |
| Ticker Symbol | VMCTX | MGC |
| Expense Ratio1 | 0.11% | 0.13% |
| 30-Day SEC Yield | 1.89% | 1.87% |
| | | |
| Portfolio Characteristics | | |
| | | | DJ |
| | | MSCI US | U.S. Total |
| | | Large Cap | Market |
| | Fund | 300 Index | Index |
| Number of Stocks | 298 | 300 | 4,100 |
| Median Market Cap $52.2B | $52.2B | $26.3B |
| Price/Earnings Ratio | 14.2x | 14.2x | 15.7x |
| Price/Book Ratio | 2.0x | 2.0x | 1.9x |
| Return on Equity | 21.3% | 21.2% | 19.0% |
| Earnings Growth Rate | 6.3% | 6.3% | 6.2% |
| Dividend Yield | 2.3% | 2.3% | 2.0% |
| Foreign Holdings | 0.0% | 0.0% | 0.0% |
| Turnover Rate | 7% | — | — |
| Short-Term Reserves | 0.0% | — | — |
| | | |
| Sector Diversification (% of equity exposure) |
| | | | DJ |
| | | MSCI US | U.S. Total |
| | | Large Cap | Market |
| | Fund 300 Index | Index |
| Consumer | | | |
| Discretionary | 9.3% | 9.4% | 11.5% |
| Consumer Staples | 12.4 | 12.5 | 10.6 |
| Energy | 11.6 | 11.7 | 9.6 |
| Financials | 15.0 | 14.6 | 17.1 |
| Health Care | 12.3 | 12.3 | 11.3 |
| Industrials | 10.2 | 10.2 | 10.7 |
| Information | | | |
| Technology | 19.0 | 19.1 | 18.3 |
| Materials | 3.2 | 3.2 | 4.3 |
| Telecommunication | | | |
| Services | 3.6 | 3.6 | 2.9 |
| Utilities | 3.4 | 3.4 | 3.7 |
| | |
| Ten Largest Holdings (% of total net assets) |
| Exxon Mobil Corp. | Integrated Oil & | |
| | Gas | 3.6% |
| Apple Inc. | Computer | |
| | Hardware | 2.6 |
| Microsoft Corp. | Systems Software | 2.2 |
| Procter & Gamble Co. | Household | |
| | Products | 2.0 |
| AT&T Inc. | Integrated | |
| | Telecommunication | |
| | Services | 1.9 |
| International Business | IT Consulting & | |
| Machines Corp. | Other Services | 1.9 |
| Johnson & Johnson | Pharmaceuticals | 1.9 |
| General Electric Co. | Industrial | |
| | Conglomerates | 1.8 |
| Chevron Corp. | Integrated Oil & | |
| | Gas | 1.8 |
| JPMorgan Chase & Co. | Diversified Financial | |
| | Services | 1.7 |
| Top Ten | | 21.4% |
The holdings listed exclude any temporary cash investments and equity index products.
Investment Focus
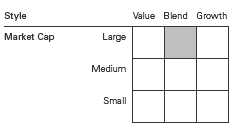
1 The expense ratios shown are from the prospectus dated December 28, 2009, and represent estimated costs for the current fiscal year. For the fiscal year ended August 31, 2010, the expense ratios were 0.11% for Institutional Shares and 0.13% for ETF Shares.
7
Mega Cap 300 Index Fund
Performance Summary
All of the returns in this report represent past performance, which is not a guarantee of future results that may be achieved by the fund. (Current performance may be lower or higher than the performance data cited. For performance data current to the most recent month-end, visit our website at vanguard.com/performance.) Note, too, that both investment returns and principal value can fluctuate widely, so an investor’s shares, when sold, could be worth more or less than their original cost. The returns shown do not reflect taxes that a shareholder would pay on fund distributions or on the sale of fund shares.
Cumulative Performance: December 17, 2007, Through August 31, 2010
Initial Investment of $10,000
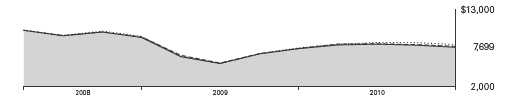
| | | |
| | Average Annual Total Returns | |
| | Periods Ended August 31, 2010 | |
| | | Since | Final Value |
| | One | Inception | of a $10,000 |
| | Year | (12/17/2007) | Investment |
| Mega Cap 300 Index Fund ETF Shares | | | |
| Net Asset Value | 3.71% | -9.22% | $7,699 |
| Mega Cap 300 Index Fund ETF Shares | | | |
| Market Price | 3.54 | -9.25 | 7,691 |
| Dow Jones U.S. Total Stock Market | | | |
| Index | 6.15 | -8.15 | 7,946 |
| MSCI US Large Cap 300 Index | 3.84 | -9.16 | 7,711 |
| Large-Cap Core Funds Average | 2.58 | -9.77 | 7,573 |
Large-Cap Core Funds Average: Derived from data provided by Lipper Inc.
"Since Inception" performance is calculated from the ETF Shares’ inception date for both the fund and its comparative standards.
| | | |
| | | Since | Final Value |
| | One | Inception | of a $5,000,000 |
| | Year | (2/22/2008) | Investment |
| Mega Cap 300 Index Fund | | | |
| Institutional Shares | 3.74% | -7.53% | $4,104,620 |
| Dow Jones U.S. Total Stock Market | | | |
| Index | 6.15 | -6.53 | 4,217,329 |
| MSCI US Large Cap 300 Index | 3.84 | -7.50 | 4,107,456 |
"Since Inception" performance is calculated from the Institutional Shares’ inception date for both the fund and its comparative standards.
See Financial Highlights for dividend and capital gains information.
8
Mega Cap 300 Index Fund
| | |
| Cumulative Returns of ETF Shares: December 17, 2007, Through August 31, 2010 | |
| |
| | | Since |
| | One | Inception |
| | Year | (12/17/2007) |
| Mega Cap 300 Index Fund | | |
| ETF Shares Market Price | 3.54% | -23.09% |
| Mega Cap 300 Index Fund | | |
| ETF Shares Net Asset Value | 3.71 | -23.01 |
| MSCI US Large Cap 300 Index | 3.84 | -22.89 |
"Since Inception" performance is calculated from the ETF Shares’ inception date for both the fund and its comparative standards.
For more information about how the ETF Shares' market prices have compared with their net asset value, visit vanguard.com, select your ETF, and then select the Performance tab. The Premium/Discount table there shows the percentages of days on which the ETF Shares' market price was above or below the NAV.
Fiscal-Year Total Returns (%): December 17, 2007, Through August 31, 2010
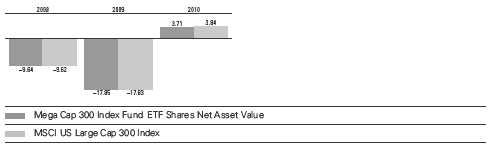
Average Annual Total Returns: Periods Ended June 30, 2010
This table presents average annual total returns through the latest calendar quarter—rather than through the end of
the fiscal period. Securities and Exchange Commission rules require that we provide this information.
| | | |
| | Inception | One | Since |
| | Date | Year | Inception |
| Institutional Shares | 2/22/2008 | 12.51% | -8.90% |
| ETF Shares | 12/17/2007 | | |
| Market Price | | 12.36 | -10.60 |
| Net Asset Value | | 12.50 | -10.58 |
9
Mega Cap 300 Index Fund
Financial Statements
Statement of Net Assets
As of August 31, 2010
The fund reports a complete list of its holdings in regulatory filings four times in each fiscal year, at the quarter-ends. For the second and fourth fiscal quarters, the lists appear in the fund’s semiannual and annual reports to shareholders. For the first and third fiscal quarters, the fund files the lists with the Securities and Exchange Commission on Form N-Q. Shareholders can look up the fund’s Forms N-Q on the SEC’s website at sec.gov. Forms N-Q may also be reviewed and copied at the SEC’s Public Reference Room (see the back cover of this report for further information).
| | | |
| | | | Market |
| | | | Value |
| | | Shares | ($000) |
| Common Stocks (100.1%) | | |
| Consumer Discretionary (9.3%) | | |
| | McDonald’s Corp. | 40,363 | 2,949 |
| | Walt Disney Co. | 69,897 | 2,278 |
| | Home Depot Inc. | 63,730 | 1,772 |
| * | Amazon.com Inc. | 13,393 | 1,672 |
| | Target Corp. | 26,276 | 1,344 |
| | Time Warner Inc. | 42,805 | 1,283 |
| * | DIRECTV Class A | 33,305 | 1,263 |
| * | Ford Motor Co. | 111,339 | 1,257 |
| | Comcast Corp. Class A | 70,479 | 1,207 |
| | Lowe’s Cos. Inc. | 54,194 | 1,100 |
| | NIKE Inc. Class B | 14,156 | 991 |
| | News Corp. Class A | 76,583 | 963 |
| | Yum! Brands Inc. | 17,582 | 733 |
| | Time Warner Cable Inc. | 13,316 | 687 |
| | Johnson Controls Inc. | 25,192 | 668 |
| | Viacom Inc. Class B | 20,801 | 654 |
| | Starbucks Corp. | 28,026 | 644 |
| | TJX Cos. Inc. | 15,319 | 608 |
| | Comcast Corp. | 35,874 | 577 |
| | Carnival Corp. | 17,431 | 544 |
| * | Kohl’s Corp. | 10,893 | 512 |
| | Staples Inc. | 27,420 | 487 |
| | Best Buy Co. Inc. | 13,474 | 423 |
| | Coach Inc. | 11,456 | 411 |
| | Omnicom Group Inc. | 11,590 | 406 |
| * | Bed Bath & Beyond Inc. | 9,899 | 356 |
| * | Las Vegas Sands Corp. | 12,392 | 351 |
| | Marriott International Inc. | | |
| | Class A | 10,866 | 348 |
| | McGraw-Hill Cos. Inc. | 11,857 | 328 |
| | CBS Corp. Class B | 23,485 | 325 |
| | Macy’s Inc. | 15,865 | 308 |
| | Stanley Black & Decker Inc. | 5,690 | 305 |
| | Gap Inc. | 17,541 | 296 |
| | Fortune Brands Inc. | 5,725 | 256 |
| | VF Corp. | 3,341 | 236 |
| * | AutoZone Inc. | 1,072 | 225 |
| * | Apollo Group Inc. Class A | 5,107 | 217 |
| | | |
| | | | Market |
| | | | Value |
| | | Shares | ($000) |
| | JC Penney Co. Inc. | 8,006 | 160 |
| | DISH Network Corp. Class A | 7,907 | 142 |
| | Garmin Ltd. | 4,523 | 120 |
| | News Corp. Class B | 8,429 | 119 |
| *,^ | Sears Holdings Corp. | 1,711 | 106 |
| * | Dollar General Corp. | 3,226 | 88 |
| | | | 29,719 |
| Consumer Staples (12.4%) | | |
| | Procter & Gamble Co. | 108,163 | 6,454 |
| | Coca-Cola Co. | 77,993 | 4,361 |
| | PepsiCo Inc. | 60,569 | 3,887 |
| | Wal-Mart Stores Inc. | 76,533 | 3,837 |
| | Philip Morris | | |
| | International Inc. | 69,547 | 3,577 |
| | Kraft Foods Inc. | 65,534 | 1,963 |
| | Altria Group Inc. | 78,226 | 1,746 |
| | CVS Caremark Corp. | 51,104 | 1,380 |
| | Colgate-Palmolive Co. | 18,420 | 1,360 |
| | Kimberly-Clark Corp. | 15,604 | 1,005 |
| | Walgreen Co. | 36,748 | 988 |
| | Costco Wholesale Corp. | 16,560 | 936 |
| | General Mills Inc. | 24,926 | 901 |
| | Archer-Daniels-Midland Co. | 24,182 | 744 |
| | Sysco Corp. | 22,211 | 611 |
| | HJ Heinz Co. | 11,827 | 547 |
| | Kellogg Co. | 10,048 | 499 |
| | Avon Products Inc. | 16,039 | 467 |
| | Kroger Co. | 23,207 | 458 |
| | Lorillard Inc. | 5,794 | 440 |
| | ConAgra Foods Inc. | 16,745 | 362 |
| | Reynolds American Inc. | 6,579 | 359 |
| | Sara Lee Corp. | 23,582 | 341 |
| | Clorox Co. | 5,243 | 340 |
| | Coca-Cola Enterprises Inc. | 11,165 | 318 |
| | Campbell Soup Co. | 7,736 | 288 |
| | Safeway Inc. | 14,692 | 276 |
| | Hershey Co. | 5,943 | 276 |
| | Molson Coors Brewing Co. | | |
| | Class B | 6,039 | 263 |
10
Mega Cap 300 Index Fund
| | | |
| | | | Market |
| | | | Value |
| | | Shares | ($000) |
| | Estee Lauder Cos. Inc. | | |
| | Class A | 4,273 | 240 |
| | Brown-Forman Corp. Class B | 3,094 | 190 |
| | | | 39,414 |
| Energy (11.7%) | | |
| | Exxon Mobil Corp. | 191,437 | 11,325 |
| | Chevron Corp. | 75,449 | 5,595 |
| | ConocoPhillips | 53,110 | 2,785 |
| | Schlumberger Ltd. | 51,344 | 2,738 |
| | Occidental Petroleum Corp. | 30,472 | 2,227 |
| | Apache Corp. | 13,520 | 1,215 |
| | Devon Energy Corp. | 15,915 | 959 |
| | Halliburton Co. | 33,909 | 957 |
| | Anadarko Petroleum Corp. | 18,585 | 855 |
| | EOG Resources Inc. | 9,527 | 828 |
| | Marathon Oil Corp. | 26,546 | 809 |
| * | Transocean Ltd. | 12,055 | 614 |
| | Baker Hughes Inc. | 16,100 | 605 |
| | National Oilwell Varco Inc. | 15,651 | 588 |
| | Hess Corp. | 11,128 | 559 |
| | Chesapeake Energy Corp. | 24,356 | 504 |
| | Spectra Energy Corp. | 24,414 | 497 |
| | Noble Energy Inc. | 6,539 | 456 |
| | Peabody Energy Corp. | 10,074 | 431 |
| * | Southwestern Energy Co. | 13,004 | 425 |
| * | Weatherford International Ltd. | 27,738 | 414 |
| | Williams Cos. Inc. | 21,853 | 396 |
| | Murphy Oil Corp. | 6,825 | 366 |
| | Valero Energy Corp. | 21,115 | 333 |
| | Noble Corp. | 9,652 | 300 |
| * | Ultra Petroleum Corp. | 5,681 | 222 |
| | Diamond Offshore Drilling Inc. | 2,656 | 154 |
| | | | 37,157 |
| Financials (15.0%) | | |
| | JPMorgan Chase & Co. | 149,450 | 5,434 |
| | Bank of America Corp. | 376,856 | 4,692 |
| | Wells Fargo & Co. | 185,929 | 4,379 |
| * | Citigroup Inc. | 926,645 | 3,447 |
| | Goldman Sachs Group Inc. | 18,371 | 2,516 |
| * | Berkshire Hathaway Inc. | | |
| | Class B | 30,540 | 2,406 |
| | American Express Co. | 40,612 | 1,619 |
| | US Bancorp | 72,004 | 1,498 |
| | MetLife Inc. | 33,541 | 1,261 |
| | Morgan Stanley | 47,129 | 1,164 |
| | Bank of New York | | |
| | Mellon Corp. | 45,562 | 1,106 |
| | PNC Financial | | |
| | Services Group Inc. | 19,764 | 1,007 |
| | Simon Property Group Inc. | 10,997 | 995 |
| | Travelers Cos. Inc. | 18,598 | 911 |
| | Prudential Financial Inc. | 17,360 | 878 |
| | Aflac Inc. | 17,586 | 831 |
| | ACE Ltd. | 12,722 | 680 |
| | Chubb Corp. | 12,316 | 679 |
| | | |
| | | | Market |
| | | | Value |
| | | Shares | ($000) |
| | State Street Corp. | 18,849 | 661 |
| | Capital One Financial Corp. | 17,099 | 647 |
| | CME Group Inc. | 2,467 | 612 |
| | Franklin Resources Inc. | 5,979 | 577 |
| | BB&T Corp. | 25,874 | 572 |
| | Public Storage | 5,403 | 530 |
| | Allstate Corp. | 19,115 | 528 |
| | Vornado Realty Trust | 6,113 | 496 |
| | Equity Residential | 10,586 | 485 |
| | Charles Schwab Corp. | 37,921 | 484 |
| | Marsh & McLennan Cos. Inc. | 20,318 | 482 |
| | Progressive Corp. | 23,875 | 473 |
| | Loews Corp. | 12,707 | 447 |
| | T Rowe Price Group Inc. | 9,759 | 427 |
| | Boston Properties Inc. | 5,227 | 426 |
| | SunTrust Banks Inc. | 18,665 | 420 |
| | Ameriprise Financial Inc. | 9,611 | 419 |
| | Annaly Capital | | |
| | Management Inc. | 23,205 | 403 |
| | Northern Trust Corp. | 8,220 | 379 |
| | Fifth Third Bancorp | 29,805 | 329 |
| | AON Corp. | 9,080 | 329 |
| | Hartford Financial | | |
| | Services Group Inc. | 15,845 | 319 |
| | Invesco Ltd. | 16,476 | 298 |
| | Principal Financial Group Inc. | 11,988 | 276 |
| | NYSE Euronext | 9,748 | 270 |
| | M&T Bank Corp. | 3,151 | 270 |
| | Hudson City Bancorp Inc. | 17,819 | 205 |
| | BlackRock Inc. | 1,317 | 187 |
| | Moody’s Corp. | 7,528 | 159 |
| * | TD Ameritrade Holding Corp. | 8,928 | 130 |
| | | | 47,743 |
| Health Care (12.3%) | | |
| | Johnson & Johnson | 103,598 | 5,907 |
| | Pfizer Inc. | 303,019 | 4,827 |
| | Merck & Co. Inc. | 117,155 | 4,119 |
| | Abbott Laboratories | 57,975 | 2,860 |
| * | Amgen Inc. | 35,966 | 1,836 |
| | Bristol-Myers Squibb Co. | 64,597 | 1,685 |
| | UnitedHealth Group Inc. | 42,687 | 1,354 |
| | Eli Lilly & Co. | 38,917 | 1,306 |
| | Medtronic Inc. | 41,387 | 1,303 |
| * | Gilead Sciences Inc. | 33,422 | 1,065 |
| | Baxter International Inc. | 22,623 | 963 |
| * | Celgene Corp. | 17,335 | 893 |
| * | Express Scripts Inc. | 19,613 | 835 |
| * | WellPoint Inc. | 16,647 | 827 |
| * | Medco Health Solutions Inc. | 17,157 | 746 |
| | Allergan Inc. | 11,553 | 710 |
| * | Genzyme Corp. | 10,025 | 703 |
| | Covidien PLC | 18,862 | 667 |
| * | Thermo Fisher Scientific Inc. | 15,366 | 647 |
| | Becton Dickinson and Co. | 8,830 | 602 |
| | McKesson Corp. | 10,196 | 592 |
11
Mega Cap 300 Index Fund
| | | |
| | | | Market |
| | | | Value |
| | | Shares | ($000) |
| * | Biogen Idec Inc. | 10,103 | 544 |
| | Stryker Corp. | 11,188 | 483 |
| * | St. Jude Medical Inc. | 12,530 | 433 |
| | Aetna Inc. | 15,957 | 426 |
| | Cardinal Health Inc. | 13,559 | 406 |
| * | Intuitive Surgical Inc. | 1,472 | 390 |
| * | Zimmer Holdings Inc. | 7,585 | 358 |
| | CIGNA Corp. | 10,429 | 336 |
| * | Forest Laboratories Inc. | 11,418 | 312 |
| * | Boston Scientific Corp. | 56,749 | 294 |
| * | Laboratory Corp. of | | |
| | America Holdings | 3,955 | 287 |
| | CR Bard Inc. | 3,603 | 277 |
| | Quest Diagnostics Inc. | 5,744 | 250 |
| | | | 39,243 |
| Industrials (10.2%) | | |
| | General Electric Co. | 401,032 | 5,807 |
| | United Technologies Corp. | 33,293 | 2,171 |
| | 3M Co. | 25,454 | 1,999 |
| | United Parcel Service Inc. | | |
| | Class B | 27,060 | 1,726 |
| | Boeing Co. | 25,661 | 1,569 |
| | Caterpillar Inc. | 23,598 | 1,538 |
| | Union Pacific Corp. | 19,013 | 1,387 |
| | Emerson Electric Co. | 28,220 | 1,316 |
| | Honeywell International Inc. | 27,360 | 1,069 |
| | Deere & Co. | 15,959 | 1,010 |
| | FedEx Corp. | 11,143 | 870 |
| | Lockheed Martin Corp. | 11,965 | 832 |
| | Danaher Corp. | 20,753 | 754 |
| | Norfolk Southern Corp. | 13,845 | 743 |
| | CSX Corp. | 14,617 | 729 |
| | Tyco International Ltd. | 19,282 | 719 |
| | General Dynamics Corp. | 12,290 | 687 |
| | Illinois Tool Works Inc. | 16,002 | 660 |
| | Raytheon Co. | 14,327 | 629 |
| | Precision Castparts Corp. | 5,354 | 606 |
| | Northrop Grumman Corp. | 10,782 | 584 |
| | Waste Management Inc. | 17,299 | 572 |
| | Cummins Inc. | 7,153 | 532 |
| | PACCAR Inc. | 12,286 | 504 |
| | CH Robinson Worldwide Inc. | 6,541 | 425 |
| | Republic Services Inc. | | |
| | Class A | 14,283 | 420 |
| | Eaton Corp. | 5,997 | 417 |
| | Ingersoll-Rand PLC | 12,067 | 393 |
| | Parker Hannifin Corp. | 6,046 | 358 |
| | Expeditors International | | |
| | of Washington Inc. | 7,969 | 315 |
| | Southwest Airlines Co. | 27,914 | 308 |
| | Fluor Corp. | 6,761 | 302 |
| | L-3 Communications | | |
| | Holdings Inc. | 4,332 | 289 |
| | ITT Corp. | 6,514 | 277 |
| | | | 32,517 |
| | | |
| | | | Market |
| | | | Value |
| | | Shares | ($000) |
| Information Technology (19.0%) | |
| * | Apple Inc. | 34,181 | 8,319 |
| | Microsoft Corp. | 296,276 | 6,957 |
| | International Business | | |
| | Machines Corp. | 48,160 | 5,935 |
| * | Cisco Systems Inc. | 214,514 | 4,301 |
| * | Google Inc. Class A | 9,227 | 4,152 |
| | Intel Corp. | 209,011 | 3,704 |
| | Hewlett-Packard Co. | 88,081 | 3,389 |
| | Oracle Corp. | 150,824 | 3,300 |
| | QUALCOMM Inc. | 61,598 | 2,360 |
| * | EMC Corp. | 77,229 | 1,409 |
| | Visa Inc. Class A | 18,604 | 1,283 |
| | Texas Instruments Inc. | 45,900 | 1,057 |
| * | eBay Inc. | 44,187 | 1,027 |
| | Corning Inc. | 58,566 | 918 |
| | Accenture PLC Class A | 23,930 | 876 |
| * | Dell Inc. | 65,918 | 776 |
| | Mastercard Inc. Class A | 3,750 | 744 |
| | Automatic Data | | |
| | Processing Inc. | 18,903 | 730 |
| * | Yahoo! Inc. | 49,418 | 646 |
| * | Cognizant Technology | | |
| | Solutions Corp. Class A | 11,206 | 645 |
| * | Motorola Inc. | 82,886 | 624 |
| * | Adobe Systems Inc. | 19,801 | 550 |
| * | Juniper Networks Inc. | 19,765 | 538 |
| * | NetApp Inc. | 12,948 | 524 |
| | Applied Materials Inc. | 50,252 | 522 |
| | Broadcom Corp. Class A | 16,453 | 493 |
| * | Intuit Inc. | 11,309 | 484 |
| | Xerox Corp. | 51,825 | 437 |
| | Tyco Electronics Ltd. | 17,160 | 421 |
| * | Symantec Corp. | 30,004 | 409 |
| | Western Union Co. | 25,242 | 396 |
| * | Agilent Technologies Inc. | 13,066 | 352 |
| * | Marvell Technology | | |
| | Group Ltd. | 20,585 | 328 |
| | Analog Devices Inc. | 11,144 | 311 |
| | Paychex Inc. | 12,236 | 304 |
| | CA Inc. | 15,574 | 280 |
| * | First Solar Inc. | 2,085 | 267 |
| | Fidelity National Information | | |
| | Services Inc. | 9,332 | 241 |
| | Activision Blizzard Inc. | 21,379 | 228 |
| * | VMware Inc. Class A | 2,646 | 208 |
| * | NVIDIA Corp. | 21,501 | 201 |
| | | | 60,646 |
| Materials (3.2%) | | |
| | EI du Pont de | | |
| | Nemours & Co. | 34,034 | 1,388 |
| | Freeport-McMoRan | | |
| | Copper & Gold Inc. | 16,252 | 1,170 |
| | Newmont Mining Corp. | 18,458 | 1,132 |
| | Monsanto Co. | 20,457 | 1,077 |
| | Dow Chemical Co. | 43,383 | 1,057 |
12
Mega Cap 300 Index Fund
| | | |
| | | | Market |
| | | | Value |
| | | Shares | ($000) |
| | Praxair Inc. | 11,485 | 988 |
| | Air Products & Chemicals Inc. | 7,939 | 588 |
| | Nucor Corp. | 11,773 | 433 |
| | Ecolab Inc. | 8,764 | 415 |
| | PPG Industries Inc. | 6,263 | 412 |
| | Alcoa Inc. | 38,085 | 389 |
| | Mosaic Co. | 5,835 | 342 |
| | International Paper Co. | 15,508 | 317 |
| | Weyerhaeuser Co. | 20,144 | 316 |
| | Sherwin-Williams Co. | 3,519 | 248 |
| | | | 10,272 |
| Telecommunication Services (3.6%) | |
| | AT&T Inc. | 221,955 | 5,999 |
| | Verizon Communications Inc. | 106,173 | 3,133 |
| * | American Tower Corp. | | |
| | Class A | 15,108 | 708 |
| * | Crown Castle | | |
| | International Corp. | 10,978 | 451 |
| * | Sprint Nextel Corp. | 110,455 | 451 |
| | CenturyLink Inc. | 11,301 | 409 |
| | Qwest Communications | | |
| | International Inc. | 58,919 | 333 |
| | | | 11,484 |
| Utilities (3.4%) | | |
| | Southern Co. | 30,973 | 1,136 |
| | Exelon Corp. | 24,741 | 1,007 |
| | Dominion Resources Inc. | 22,497 | 962 |
| | Duke Energy Corp. | 49,325 | 848 |
| | NextEra Energy Inc. | 14,805 | 795 |
| | PG&E Corp. | 14,007 | 655 |
| | American Electric | | |
| | Power Co. Inc. | 18,004 | 638 |
| | Public Service | | |
| | Enterprise Group Inc. | 18,964 | 606 |
| | Entergy Corp. | 7,091 | 559 |
| | Consolidated Edison Inc. | 10,619 | 505 |
| | PPL Corp. | 17,569 | 477 |
| | Progress Energy Inc. | 10,793 | 463 |
| | Sempra Energy | 8,802 | 448 |
| | FirstEnergy Corp. | 11,458 | 419 |
| | Edison International | 11,613 | 392 |
| | Xcel Energy Inc. | 17,212 | 384 |
| * | AES Corp. | 25,448 | 261 |
| | Ameren Corp. | 8,915 | 250 |
| | | | 10,805 |
| Total Common Stocks | | |
| (Cost $348,765) | | 319,000 |
| | |
| | Market |
| | Value |
| Shares | ($000) |
| Temporary Cash Investment (0.1%) | |
| Money Market Fund (0.1%) | |
| 1,2 Vanguard Market Liquidity | |
| Fund, 0.288% (Cost $101) | 100,801 | 101 |
| Total Investments (100.2%) | |
| (Cost $348,866) | 319,101 |
| Other Assets and Liabilities (-0.2%) | |
| Other Assets | 2,602 |
| Liabilities1 | (3,111) |
| | (509) |
| Net Assets (100%) | 318,592 |
| |
| At August 31, 2010, net assets consisted of: |
| | Amount |
| | ($000) |
| Paid-in Capital | 367,471 |
| Undistributed Net Investment Income | 1,419 |
| Accumulated Net Realized Losses | (20,533) |
| Unrealized Appreciation (Depreciation) | (29,765) |
| Net Assets | 318,592 |
| |
| |
| Institutional Shares—Net Assets | |
| Applicable to 1,289,596 outstanding | |
| $.001 par value shares of beneficial | |
| interest (unlimited authorization) | 91,604 |
| Net Asset Value Per Share— | |
| Institutional Shares | $71.03 |
| |
| |
| ETF Shares—Net Assets | |
| Applicable to 6,300,000 outstanding | |
| $.001 par value shares of beneficial | |
| interest (unlimited authorization) | 226,988 |
| Net Asset Value Per Share— | |
| ETF Shares | $36.03 |
See Note A in Notes to Financial Statements.
* Non-income-producing security.
^ Part of security position is on loan to broker-dealers. The total value of securities on loan is $99,000.
1 Includes $101,000 of collateral received for securities on loan.
2 Affiliated money market fund available only to Vanguard funds and certain trusts and accounts managed by Vanguard. Rate shown is the 7-day yield.
See accompanying Notes, which are an integral part of the Financial Statements.
13
Mega Cap 300 Index Fund
Statement of Operations
| |
| | Year Ended |
| | August 31, 2010 |
| | ($000) |
| Investment Income | |
| Income | |
| Dividends | 7,565 |
| Interest1 | 1 |
| Security Lending | 10 |
| Total Income | 7,576 |
| Expenses | |
| The Vanguard Group—Note B | |
| Investment Advisory Services | 48 |
| Management and Administrative—Institutional Shares | 54 |
| Management and Administrative—ETF Shares | 145 |
| Marketing and Distribution—Institutional Shares | 30 |
| Marketing and Distribution—ETF Shares | 62 |
| Custodian Fees | 15 |
| Auditing Fees | 26 |
| Shareholders’ Reports—Institutional Shares | — |
| Shareholders’ Reports—ETF Shares | 18 |
| Total Expenses | 398 |
| Net Investment Income | 7,178 |
| Realized Net Gain (Loss) on Investment Securities Sold | 4,896 |
| Change in Unrealized Appreciation (Depreciation) of Investment Securities | (3,219) |
| Net Increase (Decrease) in Net Assets Resulting from Operations | 8,855 |
| 1 Interest income from an affiliated company of the fund was $1,000. | |
See accompanying Notes, which are an integral part of the Financial Statements.
14
Mega Cap 300 Index Fund
Statement of Changes in Net Assets
| | |
| | Year Ended August 31, |
| | 2010 | 2009 |
| | ($000) | ($000) |
| Increase (Decrease) in Net Assets | | |
| Operations | | |
| Net Investment Income | 7,178 | 5,734 |
| Realized Net Gain (Loss) | 4,896 | (9,366) |
| Change in Unrealized Appreciation (Depreciation) | (3,219) | (19,732) |
| Net Increase (Decrease) in Net Assets Resulting from Operations | 8,855 | (23,364) |
| Distributions | | |
| Net Investment Income | | |
| Institutional Shares | (2,266) | (2,078) |
| ETF Shares | (4,660) | (2,970) |
| Realized Capital Gain | | |
| Institutional Shares | — | — |
| ETF Shares | — | — |
| Total Distributions | (6,926) | (5,048) |
| Capital Share Transactions | | |
| Institutional Shares | (13,221) | 69,994 |
| ETF Shares | 28,699 | 118,353 |
| Net Increase (Decrease) from Capital Share Transactions | 15,478 | 188,347 |
| Total Increase (Decrease) | 17,407 | 159,935 |
| Net Assets | | |
| Beginning of Period | 301,185 | 141,250 |
| End of Period1 | 318,592 | 301,185 |
| 1 Net Assets—End of Period includes undistributed net investment income of $1,419,000 and $1,167,000. | | |
See accompanying Notes, which are an integral part of the Financial Statements.
15
Mega Cap 300 Index Fund
Financial Highlights
| | | | |
| | | |
| Institutional Shares | | | |
| | | | Feb. 22, |
| | Year Ended | 20081 to |
| | | August 31, | Aug. 31, |
| For a Share Outstanding Throughout Each Period | 2010 | 2009 | 2008 |
| Net Asset Value, Beginning of Period | $69.95 | $87.14 | $91.07 |
| Investment Operations | | | |
| Net Investment Income | 1.657 | 1.6812 | .685 |
| Net Realized and Unrealized Gain (Loss) on Investments | 1.033 | (17.409) | (4.028) |
| Total from Investment Operations | 2.690 | (15.728) | (3.343) |
| Distributions | | | |
| Dividends from Net Investment Income | (1.610) | (1.462) | (.587) |
| Distributions from Realized Capital Gains | — | — | — |
| Total Distributions | (1.610) | (1.462) | (.587) |
| Net Asset Value, End of Period | $71.03 | $69.95 | $87.14 |
| |
| Total Return | 3.74% | -17.84% | -3.69% |
| |
| Ratios/Supplemental Data | | | |
| Net Assets, End of Period (Millions) | $92 | $102 | $53 |
| Ratio of Total Expenses to Average Net Assets | 0.11% | 0.11% | 0.08%3 |
| Ratio of Net Investment Income to Average Net Assets | 2.24% | 2.59% | 2.14%3 |
| Portfolio Turnover Rate4 | 7% | 10% | 30% |
1 Inception.
2 Calculated based on average shares outstanding.
3 Annualized.
4 Excludes the value of portfolio securities received or delivered as a result of in-kind purchases or redemptions of the fund’s capital shares, including ETF Creation Units.
See accompanying Notes, which are an integral part of the Financial Statements.
16
Mega Cap 300 Index Fund
Financial Highlights
| | | | |
| ETF Shares | | | |
| | | | |
| | | Dec. 17, |
| | Year Ended | 20071 to |
| | August 31, | Aug. 31, |
| For a Share Outstanding Throughout Each Period | 2010 | 2009 | 2008 |
| Net Asset Value, Beginning of Period | $35.49 | $44.21 | $49.24 |
| Investment Operations | | | |
| Net Investment Income | .834 | .8222 | .441 |
| Net Realized and Unrealized Gain (Loss) on Investments | .517 | (8.808) | (5.179) |
| Total from Investment Operations | 1.351 | (7.986) | (4.738) |
| Distributions | | | |
| Dividends from Net Investment Income | (.811) | (.734) | (.292) |
| Distributions from Realized Capital Gains | — | — | — |
| Total Distributions | (.811) | (.734) | (.292) |
| Net Asset Value, End of Period | $36.03 | $35.49 | $44.21 |
| |
| Total Return | 3.71% | -17.85% | -9.64% |
| |
| Ratios/Supplemental Data | | | |
| Net Assets, End of Period (Millions) | $227 | $199 | $88 |
| Ratio of Total Expenses to Average Net Assets | 0.13% | 0.13% | 0.13%3 |
| Ratio of Net Investment Income to Average Net Assets | 2.22% | 2.57% | 2.09%3 |
| Portfolio Turnover Rate4 | 7% | 10% | 30% |
1 Inception.
2 Calculated based on average shares outstanding.
3 Annualized.
4 Excludes the value of portfolio securities received or delivered as a result of in-kind purchases or redemptions of the fund’s capital shares, including ETF Creation Units.
See accompanying Notes, which are an integral part of the Financial Statements.
17
Mega Cap 300 Index Fund
Notes to Financial Statements
Vanguard Mega Cap 300 Index Fund is registered under the Investment Company Act of 1940 as an open-end investment company, or mutual fund. The fund offers two classes of shares: Institutional Shares and ETF Shares. Institutional Shares are designed for investors who meet certain administrative, service, and account-size criteria. ETF Shares are listed for trading on the NYSE Arca, Inc.; they can be purchased and sold through a broker.
A. The following significant accounting policies conform to generally accepted accounting principles for U.S. mutual funds. The fund consistently follows such policies in preparing its financial statements.
1. Security Valuation: Securities are valued as of the close of trading on the New York Stock Exchange (generally 4 p.m., Eastern time) on the valuation date. Equity securities are valued at the latest quoted sales prices or official closing prices taken from the primary market in which each security trades; such securities not traded on the valuation date are valued at the mean of the latest quoted bid and asked prices. Securities for which market quotations are not readily available, or whose values have been materially affected by events occurring before the fund’s pricing time but after the close of the securities’ primary markets, are valued by methods deemed by the board of trustees to represent fair value. Investments in Vanguard Market Liquidity Fund are valued at that fund’s net asset value.
2. Federal Income Taxes: The fund intends to continue to qualify as a regulated investment company and distribute all of its taxable income. Management has analyzed the fund’s tax positions taken for all open federal income tax years (August 31, 2008–2010), and has concluded that no provision for federal income tax is required in the fund’s financial statements.
3. Distributions: Distributions to shareholders are recorded on the ex-dividend date.
4. Security Lending: The fund may lend its securities to qualified institutional borrowers to earn additional income. Security loans are required to be secured at all times by collateral at least equal to the market value of securities loaned. The fund invests cash collateral received in Vanguard Market Liquidity Fund, and records a liability for the return of the collateral, during the period the securities are on loan. Security lending income represents the income earned on investing cash collateral, less expenses associated with the loan.
5. Other: Dividend income is recorded on the ex-dividend date. Interest income includes income distributions received from Vanguard Market Liquidity Fund and is accrued daily. Security transactions are accounted for on the date securities are bought or sold. Costs used to determine realized gains (losses) on the sale of investment securities are those of the specific securities sold.
Each class of shares has equal rights as to assets and earnings, except that each class separately bears certain class-specific expenses related to maintenance of shareholder accounts (included in Management and Administrative expenses) and shareholder reporting. Marketing and distribution expenses are allocated to each class of shares based on a method approved by the board of trustees. Income, other non-class-specific expenses, and gains and losses on investments are allocated to each class of shares based on its relative net assets.
18
Mega Cap 300 Index Fund
B. The Vanguard Group furnishes at cost investment advisory, corporate management, administrative, marketing, and distribution services. The costs of such services are allocated to the fund under methods approved by the board of trustees. The fund has committed to provide up to 0.40% of its net assets in capital contributions to Vanguard. At August 31, 2010, the fund had contributed capital of $61,000 to Vanguard (included in Other Assets), representing 0.02% of the fund’s net assets and 0.02% of Vanguard’s capitalization. The fund’s trustees and officers are also directors and officers of Vanguard.
C. Various inputs may be used to determine the value of the fund’s investments. These inputs are summarized in three broad levels for financial statement purposes. The inputs or methodologies used to value securities are not necessarily an indication of the risk associated with investing in those securities.
Level 1—Quoted prices in active markets for identical securities.
Level 2—Other significant observable inputs (including quoted prices for similar securities, interest rates, prepayment speeds, credit risk, etc.).
Level 3—Significant unobservable inputs (including the fund’s own assumptions used to determine the fair value of investments).
At August 31, 2010, 100% of the fund’s investments were valued based on Level 1 inputs.
D. Distributions are determined on a tax basis and may differ from net investment income and realized capital gains for financial reporting purposes. Differences may be permanent or temporary. Permanent differences are reclassified among capital accounts in the financial statements to reflect their tax character. Temporary differences arise when certain items of income, expense, gain, or loss are recognized in different periods for financial statement and tax purposes; these differences will reverse at some time in the future. Differences in classification may also result from the treatment of short-term gains as ordinary income for tax purposes.
During the year ended August 31, 2010, the fund realized $10,989,000 of net capital gains resulting from in-kind redemptions—in which shareholders exchanged fund shares for securities held by the fund rather than for cash. Because such gains are not taxable to the fund, and are not distributed to shareholders, they have been reclassified from accumulated net realized losses to paid-in capital.
For tax purposes, at August 31, 2010, the fund had $1,599,000 of ordinary income available for distribution. The fund had available capital loss carryforwards totaling $14,505,000 to offset future net capital gains of $948,000 through August 31, 2017, and $13,557,000 through August 31, 2018. In addition, the fund realized losses of $6,014,000 during the period from November 1, 2009, through August 31, 2010, which are deferred and will be treated as realized for tax purposes in fiscal 2011.
At August 31, 2010, the cost of investment securities for tax purposes was $348,879,000. Net unrealized depreciation of investment securities for tax purposes was $29,778,000, consisting of unrealized gains of $13,077,000 on securities that had risen in value since their purchase and $42,855,000 in unrealized losses on securities that had fallen in value since their purchase.
19
Mega Cap 300 Index Fund
E. During the year ended August 31, 2010, the fund purchased $103,417,000 of investment securities and sold $87,338,000 of investment securities, other than temporary cash investments.
F. Capital share transactions for each class of shares were:
| | | | | |
| | | | |
| | | | Year Ended August 31, |
| | | 2010 | | | 2009 |
| | Amount | Shares | Amount | Shares |
| | ($000) | (000) | ($000) | (000) |
| Institutional Shares | | | | |
| Issued | 5,107 | 68 | 69,116 | 847 |
| Issued in Lieu of Cash Distributions | 2,266 | 30 | 2,078 | 33 |
| Redeemed | (20,594) | (273) | (1,200) | (21) |
| Net Increase (Decrease)—Institutional Shares | (13,221) | (175) | 69,994 | 859 |
| ETF Shares | | | | |
| Issued | 80,172 | 2,100 | 299,108 | 8,500 |
| Issued in Lieu of Cash Distributions | — | — | — | — |
| Redeemed | (51,473) | (1,400) | (180,755) | (4,900) |
| Net Increase (Decrease)—ETF Shares | 28,699 | 700 | 118,353 | 3,600 |
The amount of Institutional Shares issued during the year ended August 31, 2009, includes $58,176,000 in purchases that were processed late and should have been recorded in the prior fiscal period. Vanguard, as transfer agent for the fund, offset any impact to the fund resulting from late processing of shareholder transactions. Accordingly, the purchases had no impact to the fund’s net asset value per share or total returns.
G. In preparing the financial statements as of August 31, 2010, management considered the impact of subsequent events for potential recognition or disclosure in these financial statements.
20
Mega Cap 300 Growth Index Fund
Fund Profile
As of August 31, 2010
| | | |
| Share-Class Characteristics | | |
| |
| | Institutional | ETF |
| | Shares | Shares |
| Ticker Symbol | VMGAX | MGK |
| Expense Ratio1 | 0.11% | 0.13% |
| 30-Day SEC Yield | 1.30% | 1.28% |
| |
| Portfolio Characteristics | | |
| | | MSCI US | DJ |
| | | Large Cap | U.S. Total |
| | | Growth | Market |
| | Fund | Index | Index |
| Number of Stocks | 177 | 178 | 4,100 |
| Median Market Cap $40.9B | $40.9B | $26.3B |
| Price/Earnings Ratio | 15.6x | 15.7x | 15.7x |
| Price/Book Ratio | 3.1x | 3.1x | 1.9x |
| Return on Equity | 25.8% | 25.5% | 19.0% |
| Earnings Growth Rate 13.9% | 13.9% | 6.2% |
| Dividend Yield | 1.6% | 1.6% | 2.0% |
| Foreign Holdings | 0.0% | 0.0% | 0.0% |
| Turnover Rate | 21% | — | — |
| Short-Term Reserves | 0.0% | — | — |
| | | |
| Sector Diversification (% of equity exposure) |
| | | MSCI US | DJ |
| | | Large Cap | U.S. Total |
| | | Growth | Market |
| | Fund | Index | Index |
| Consumer | | | |
| Discretionary | 12.7% | 12.7% | 11.5% |
| Consumer Staples | 15.0 | 15.3 | 10.6 |
| Energy | 7.7 | 7.7 | 9.6 |
| Financials | 5.0 | 4.9 | 17.1 |
| Health Care | 9.3 | 9.3 | 11.3 |
| Industrials | 9.5 | 9.4 | 10.7 |
| Information | | | |
| Technology | 35.6 | 35.5 | 18.3 |
| Materials | 4.3 | 4.3 | 4.3 |
| Telecommunication | | | |
| Services | 0.7 | 0.7 | 2.9 |
| Utilities | 0.2 | 0.2 | 3.7 |
| | |
| Ten Largest Holdings (% of total net assets) |
| Apple Inc. | Computer | |
| | Hardware | 5.3% |
| Microsoft Corp. | Systems Software | 4.4 |
| International Business | IT Consulting & | |
| Machines Corp. | Other Services | 3.8 |
| Coca-Cola Co. | Soft Drinks | 2.8 |
| Cisco Systems Inc. | Communications | |
| | Equipment | 2.7 |
| Google Inc. Class A | Internet Software & | |
| | Services | 2.6 |
| Exxon Mobil Corp. | Integrated Oil & | |
| | Gas | 2.5 |
| PepsiCo Inc. | Soft Drinks | 2.5 |
| Wal-Mart Stores Inc. | Hypermarkets & | |
| | Super Centers | 2.4 |
| Philip Morris | Tobacco | |
| International Inc. | | 2.3 |
| Top Ten | | 31.3% |
The holdings listed exclude any temporary cash investments and equity index products.
Investment Focus
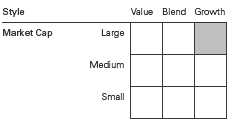
1 The expense ratios shown are from the prospectus dated December 28, 2009, and represent estimated costs for the current fiscal year. For the fiscal year ended August 31, 2010, the expense ratios were 0.11% for Institutional Shares and 0.13% for ETF Shares.
21
Mega Cap 300 Growth Index Fund
Performance Summary
All of the returns in this report represent past performance, which is not a guarantee of future results that may be achieved by the fund. (Current performance may be lower or higher than the performance data cited. For performance data current to the most recent month-end, visit our website at vanguard.com/performance.) Note, too, that both investment returns and principal value can fluctuate widely, so an investor’s shares, when sold, could be worth more or less than their original cost. The returns shown do not reflect taxes that a shareholder would pay on fund distributions or on the sale of fund shares.
Cumulative Performance: December 17, 2007, Through August 31, 2010
Initial Investment of $10,000
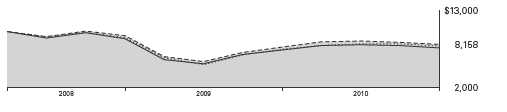
| | | |
| | Average Annual Total Returns | |
| | Periods Ended August 31, 2010 | |
| | | Since | Final Value |
| | One | Inception | of a $10,000 |
| | Year | (12/17/2007) | Investment |
| Mega Cap 300 Growth Index Fund | | | |
| ETF Shares Net Asset Value | 4.82% | -7.25% | $8,158 |
| Mega Cap 300 Growth Index Fund ETF | | | |
| Shares Market Price | 4.63 | -7.29 | 8,150 |
| Dow Jones U.S. Total Stock Market | | | |
| Index | 6.15 | -8.15 | 7,946 |
| MSCI US Large Cap Growth Index | 4.95 | -7.17 | 8,178 |
| Large-Cap Growth Funds Average | 4.04 | -9.32 | 7,676 |
Large-Cap Growth Funds Average: Derived from data provided by Lipper Inc.
"Since Inception" performance is calculated from the ETF Shares’ inception date for both the fund and its comparative standards.
| | | |
| | | Since | Final Value |
| | One | Inception | of a $5,000,000 |
| | Year | (4/3/2008) | Investment |
| Mega Cap 300 Growth Index Fund | | | |
| Institutional Shares | 4.84% | -6.12% | $4,294,486 |
| Dow Jones U.S. Total Stock Market | | | |
| Index | 6.15 | -7.29 | 4,166,142 |
| MSCI US Large Cap Growth Index | 4.95 | -6.06 | 4,301,087 |
"Since Inception" performance is calculated from the Institutional Shares’ inception date for both the fund and its comparative standards.
See Financial Highlights for dividend and capital gains information.
22
Mega Cap 300 Growth Index Fund
| | |
| Cumulative Returns of ETF Shares: December 17, 2007, Through August 31, 2010 | |
| |
| | | Since |
| | One | Inception |
| | Year | (12/17/2007) |
| Mega Cap 300 Growth Index Fund | | |
| ETF Shares Market Price | 4.63% | -18.50% |
| Mega Cap 300 Growth Index Fund | | |
| ETF Shares Net Asset Value | 4.82 | -18.42 |
| MSCI US Large Cap Growth Index | 4.95 | -18.22 |
"Since Inception" performance is calculated from the ETF Shares’ inception date for both the fund and its comparative standards.
For more information about how the ETF Shares' market prices have compared with their net asset value, visit vanguard.com, select your ETF, and then select the Performance tab. The Premium/Discount table there shows the percentages of days on which the ETF Shares' market price was above or below the NAV.
Fiscal-Year Total Returns (%): December 17, 2007, Through August 31, 2010
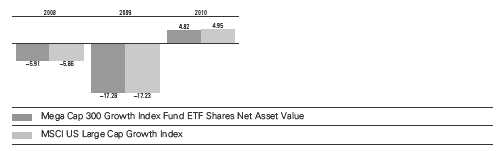
Average Annual Total Returns: Periods Ended June 30, 2010
This table presents average annual total returns through the latest calendar quarter—rather than through the end of
the fiscal period. Securities and Exchange Commission rules require that we provide this information.
| | | |
| | Inception | One | Since |
| | Date | Year | Inception |
| Institutional Shares | 4/3/2008 | 11.71% | -7.49% |
| ETF Shares | 12/17/2007 | | |
| Market Price | | 11.62 | -8.53 |
| Net Asset Value | | 11.70 | -8.52 |
23
Mega Cap 300 Growth Index Fund
Financial Statements
Statement of Net Assets
As of August 31, 2010
The fund reports a complete list of its holdings in regulatory filings four times in each fiscal year, at the quarter-ends. For the second and fourth fiscal quarters, the lists appear in the fund’s semiannual and annual reports to shareholders. For the first and third fiscal quarters, the fund files the lists with the Securities and Exchange Commission on Form N-Q. Shareholders can look up the fund’s Forms N-Q on the SEC’s website at sec.gov. Forms N-Q may also be reviewed and copied at the SEC’s Public Reference Room (see the back cover of this report for further information).
| | | |
| | | | Market |
| | | | Value |
| | | Shares | ($000) |
| Common Stocks (99.9%) | | |
| Consumer Discretionary (12.7%) | |
| | McDonald’s Corp. | 96,657 | 7,062 |
| * | Amazon.com Inc. | 32,034 | 3,999 |
| | Target Corp. | 62,860 | 3,216 |
| * | DIRECTV Class A | 79,692 | 3,022 |
| * | Ford Motor Co. | 266,635 | 3,010 |
| | Lowe’s Cos. Inc. | 129,648 | 2,632 |
| | NIKE Inc. Class B | 33,802 | 2,366 |
| | Walt Disney Co. | 58,510 | 1,907 |
| | Yum! Brands Inc. | 42,025 | 1,752 |
| | Johnson Controls Inc. | 60,440 | 1,604 |
| | Starbucks Corp. | 66,945 | 1,539 |
| | Home Depot Inc. | 53,333 | 1,483 |
| | TJX Cos. Inc. | 36,655 | 1,455 |
| * | Kohl’s Corp. | 26,012 | 1,222 |
| | Staples Inc. | 65,581 | 1,165 |
| | Best Buy Co. Inc. | 32,226 | 1,012 |
| | Coach Inc. | 27,412 | 983 |
| | Omnicom Group Inc. | 27,722 | 971 |
| * | Bed Bath & Beyond Inc. | 23,720 | 853 |
| * | Las Vegas Sands Corp. | 29,483 | 835 |
| | Marriott International Inc. | | |
| | Class A | 25,972 | 831 |
| | McGraw-Hill Cos. Inc. | 28,370 | 784 |
| | News Corp. Class B | 39,583 | 558 |
| | Viacom Inc. Class B | 17,508 | 550 |
| * | AutoZone Inc. | 2,568 | 539 |
| * | Apollo Group Inc. Class A | 12,410 | 527 |
| | Comcast Corp. | 24,223 | 389 |
| | Gap Inc. | 21,566 | 364 |
| | Garmin Ltd. | 10,809 | 288 |
| | DISH Network Corp. Class A | 12,174 | 219 |
| * | Dollar General Corp. | 7,669 | 209 |
| | JC Penney Co. Inc. | 9,470 | 189 |
| *,^ | Sears Holdings Corp. | 2,697 | 167 |
| | | | 47,702 |
| | | |
| | | | Market |
| | | | Value |
| | | Shares | ($000) |
| Consumer Staples (15.0%) | | |
| | Coca-Cola Co. | 186,552 | 10,432 |
| | PepsiCo Inc. | 144,896 | 9,299 |
| | Wal-Mart Stores Inc. | 183,314 | 9,191 |
| | Philip Morris | | |
| | International Inc. | 166,384 | 8,559 |
| | Colgate-Palmolive Co. | 44,147 | 3,260 |
| | Walgreen Co. | 88,008 | 2,366 |
| | Costco Wholesale Corp. | 39,578 | 2,238 |
| | General Mills Inc. | 59,618 | 2,156 |
| | CVS Caremark Corp. | 61,135 | 1,650 |
| | Kellogg Co. | 23,789 | 1,182 |
| | Avon Products Inc. | 38,174 | 1,111 |
| | Kroger Co. | 55,133 | 1,088 |
| | Clorox Co. | 12,524 | 812 |
| | Coca-Cola Enterprises Inc. | 26,977 | 768 |
| | HJ Heinz Co. | 14,228 | 658 |
| | Estee Lauder Cos. Inc. | | |
| | Class A | 10,359 | 581 |
| | Campbell Soup Co. | 11,943 | 445 |
| | Hershey Co. | 9,221 | 428 |
| | Brown-Forman Corp. Class B | 4,826 | 296 |
| | | | 56,520 |
| Energy (7.7%) | | |
| | Exxon Mobil Corp. | 160,268 | 9,482 |
| | Schlumberger Ltd. | 122,765 | 6,547 |
| | Anadarko Petroleum Corp. | 44,451 | 2,044 |
| | EOG Resources Inc. | 22,745 | 1,976 |
| | Halliburton Co. | 52,531 | 1,482 |
| | Baker Hughes Inc. | 38,343 | 1,441 |
| | Peabody Energy Corp. | 24,000 | 1,027 |
| * | Southwestern Energy Co. | 30,907 | 1,011 |
| * | Weatherford | | |
| | International Ltd. | 65,896 | 983 |
| * | Transocean Ltd. | 14,361 | 731 |
| | National Oilwell Varco Inc. | 18,683 | 702 |
| * | Ultra Petroleum Corp. | 13,710 | 535 |
| | Noble Energy Inc. | 5,462 | 381 |
24
Mega Cap 300 Growth Index Fund
| | | |
| | | | Market |
| | | | Value |
| | | Shares | ($000) |
| | Diamond Offshore | | |
| | Drilling Inc. | 6,208 | 361 |
| | Noble Corp. | 11,517 | 358 |
| | | | 29,061 |
| Financials (4.9%) | | |
| | American Express Co. | 97,136 | 3,873 |
| | State Street Corp. | 45,078 | 1,581 |
| | Capital One Financial Corp. | 41,018 | 1,553 |
| | CME Group Inc. | 5,901 | 1,464 |
| | Franklin Resources Inc. | 14,320 | 1,382 |
| | Aflac Inc. | 27,230 | 1,287 |
| | Public Storage | 12,875 | 1,262 |
| | Simon Property Group Inc. | 13,150 | 1,189 |
| | Charles Schwab Corp. | 90,493 | 1,155 |
| | T Rowe Price Group Inc. | 23,128 | 1,012 |
| | Northern Trust Corp. | 19,434 | 897 |
| | Progressive Corp. | 19,941 | 395 |
| | Moody’s Corp. | 18,005 | 381 |
| | SunTrust Banks Inc. | 15,831 | 356 |
| | Boston Properties Inc. | 4,355 | 354 |
| * | TD Ameritrade Holding Corp. | 21,402 | 313 |
| | Hudson City Bancorp Inc. | 15,062 | 173 |
| | | | 18,627 |
| Health Care (9.3%) | | |
| * | Amgen Inc. | 86,067 | 4,393 |
| | Medtronic Inc. | 98,753 | 3,109 |
| * | Gilead Sciences Inc. | 79,955 | 2,547 |
| | Abbott Laboratories | 48,525 | 2,394 |
| | Baxter International Inc. | 53,916 | 2,295 |
| * | Celgene Corp. | 41,407 | 2,133 |
| * | Express Scripts Inc. | 46,717 | 1,990 |
| * | Medco Health Solutions Inc. | 41,046 | 1,785 |
| | Allergan Inc. | 27,629 | 1,697 |
| * | Genzyme Corp. | 23,978 | 1,681 |
| | Becton Dickinson and Co. | 21,048 | 1,435 |
| | McKesson Corp. | 24,384 | 1,415 |
| * | Biogen Idec Inc. | 24,076 | 1,295 |
| | Stryker Corp. | 26,778 | 1,157 |
| * | St. Jude Medical Inc. | 29,848 | 1,032 |
| | Cardinal Health Inc. | 32,277 | 967 |
| * | Intuitive Surgical Inc. | 3,519 | 933 |
| * | Zimmer Holdings Inc. | 18,109 | 854 |
| * | Laboratory Corp. of | | |
| | America Holdings | 9,350 | 679 |
| | CR Bard Inc. | 8,543 | 656 |
| | Quest Diagnostics Inc. | 13,581 | 591 |
| | | | 35,038 |
| Industrials (9.5%) | | |
| | United Parcel Service Inc. | | |
| | Class B | 64,720 | 4,129 |
| | Boeing Co. | 61,377 | 3,752 |
| | Caterpillar Inc. | 56,441 | 3,678 |
| | Union Pacific Corp. | 45,454 | 3,315 |
| | Emerson Electric Co. | 67,670 | 3,157 |
| | | |
| | | | Market |
| | | | Value |
| | | Shares | ($000) |
| | Deere & Co. | 38,171 | 2,415 |
| | FedEx Corp. | 26,733 | 2,087 |
| | Danaher Corp. | 49,587 | 1,802 |
| | Norfolk Southern Corp. | 33,249 | 1,785 |
| | Precision Castparts Corp. | 12,776 | 1,446 |
| | Cummins Inc. | 17,152 | 1,276 |
| | PACCAR Inc. | 29,269 | 1,200 |
| | CH Robinson Worldwide Inc. | 15,639 | 1,016 |
| | Honeywell International Inc. | 22,701 | 887 |
| | Expeditors International | | |
| | of Washington Inc. | 18,943 | 750 |
| | Fluor Corp. | 16,079 | 718 |
| | Lockheed Martin Corp. | 9,974 | 693 |
| | ITT Corp. | 15,501 | 659 |
| | Southwest Airlines Co. | 43,605 | 482 |
| | Parker Hannifin Corp. | 7,264 | 430 |
| | | | 35,677 |
| Information Technology (35.5%) | |
| * | Apple Inc. | 81,776 | 19,902 |
| | Microsoft Corp. | 708,869 | 16,644 |
| | International Business | | |
| | Machines Corp. | 115,255 | 14,203 |
| * | Cisco Systems Inc. | 513,126 | 10,288 |
| * | Google Inc. Class A | 22,067 | 9,931 |
| | Hewlett-Packard Co. | 210,698 | 8,108 |
| | Oracle Corp. | 360,758 | 7,893 |
| | QUALCOMM Inc. | 147,381 | 5,646 |
| * | EMC Corp. | 184,689 | 3,369 |
| | Intel Corp. | 174,967 | 3,100 |
| | Visa Inc. Class A | 44,474 | 3,068 |
| | Texas Instruments Inc. | 109,812 | 2,529 |
| * | eBay Inc. | 105,684 | 2,456 |
| | Accenture PLC Class A | 57,234 | 2,095 |
| * | Dell Inc. | 158,337 | 1,864 |
| | Mastercard Inc. Class A | 8,962 | 1,778 |
| | Automatic Data | | |
| | Processing Inc. | 45,207 | 1,745 |
| * | Yahoo! Inc. | 118,806 | 1,554 |
| * | Cognizant Technology | | |
| | Solutions Corp. Class A | 26,902 | 1,550 |
| * | Adobe Systems Inc. | 47,298 | 1,313 |
| * | Juniper Networks Inc. | 47,272 | 1,286 |
| * | NetApp Inc. | 30,965 | 1,252 |
| | Broadcom Corp. Class A | 39,596 | 1,187 |
| * | Intuit Inc. | 26,872 | 1,150 |
| | Corning Inc. | 69,603 | 1,091 |
| * | Symantec Corp. | 71,995 | 981 |
| | Western Union Co. | 60,971 | 956 |
| * | Agilent Technologies Inc. | 31,337 | 845 |
| * | Marvell Technology | | |
| | Group Ltd. | 49,220 | 784 |
| * | Motorola Inc. | 99,184 | 747 |
| | Paychex Inc. | 29,245 | 728 |
| | CA Inc. | 37,151 | 669 |
| * | First Solar Inc. | 4,988 | 638 |
25
Mega Cap 300 Growth Index Fund
| | | |
| | | | Market |
| | | | Value |
| | | Shares | ($000) |
| | Activision Blizzard Inc. | 50,968 | 545 |
| * | VMware Inc. Class A | 6,324 | 497 |
| | Analog Devices Inc. | 17,453 | 486 |
| * | NVIDIA Corp. | 51,411 | 480 |
| | Tyco Electronics Ltd. | 14,349 | 352 |
| | | | 133,710 |
| Materials (4.4%) | | |
| | Freeport-McMoRan | | |
| | Copper & Gold Inc. | 38,872 | 2,798 |
| | Newmont Mining Corp. | 44,142 | 2,707 |
| | Monsanto Co. | 49,017 | 2,581 |
| | Praxair Inc. | 27,489 | 2,365 |
| | Air Products & | | |
| | Chemicals Inc. | 18,946 | 1,403 |
| | Ecolab Inc. | 21,098 | 1,000 |
| | Alcoa Inc. | 91,108 | 930 |
| | Mosaic Co. | 13,914 | 816 |
| | International Paper Co. | 37,001 | 757 |
| | Sherwin-Williams Co. | 8,390 | 590 |
| | Weyerhaeuser Co. | 31,328 | 492 |
| | | | 16,439 |
| Telecommunication Services (0.7%) | |
| * | American Tower Corp. | | |
| | Class A | 36,247 | 1,699 |
| * | Crown Castle | | |
| | International Corp. | 26,155 | 1,075 |
| | | | 2,774 |
| Utilities (0.2%) | | |
| * | AES Corp. | 60,854 | 623 |
| Total Common Stocks | | |
| (Cost $383,453) | | 376,171 |
| Temporary Cash Investment (0.1%) | |
| Money Market Fund (0.1%) | | |
| 1,2 | Vanguard Market Liquidity | | |
| | Fund, 0.288% (Cost $158) | 157,501 | 158 |
| Total Investments (100.0%) | | |
| (Cost $383,611) | | 376,329 |
| Other Assets and Liabilities (0.0%) | |
| Other Assets | | 3,365 |
| Liabilities2 | | (3,234) |
| | | | 131 |
| Net Assets (100%) | | 376,460 |
| |
| At August 31, 2010, net assets consisted of: |
| | Amount |
| | ($000) |
| Paid-in Capital | 420,894 |
| Undistributed Net Investment Income | 1,157 |
| Accumulated Net Realized Losses | (38,309) |
| Unrealized Appreciation (Depreciation) | (7,282) |
| Net Assets | 376,460 |
| |
| |
| Institutional Shares—Net Assets | |
| Applicable to 1,166,550 outstanding | |
| $.001 par value shares of beneficial | |
| interest (unlimited authorization) | 89,518 |
| Net Asset Value Per Share— | |
| Institutional Shares | $76.74 |
| |
| |
| ETF Shares—Net Assets | |
| Applicable to 7,400,000 outstanding | |
| $.001 par value shares of beneficial | |
| interest (unlimited authorization) | 286,942 |
| Net Asset Value Per Share— | |
| ETF Shares | $38.78 |
See Note A in Notes to Financial Statements.
* Non-income-producing security.
^ Part of security position is on loan to broker-dealers. The total value of securities on loan is $155,000.
1 Affiliated money market fund available only to Vanguard funds and certain trusts and accounts managed by Vanguard. Rate shown is the 7-day yield.
2 Includes $158,000 of collateral received for securities on loan.
See accompanying Notes, which are an integral part of the Financial Statements.
26
Mega Cap 300 Growth Index Fund
Statement of Operations
| |
| | Year Ended |
| | August 31, 2010 |
| | ($000) |
| Investment Income | |
| Income | |
| Dividends | 5,951 |
| Interest1 | 2 |
| Security Lending | 11 |
| Total Income | 5,964 |
| Expenses | |
| The Vanguard Group—Note B | |
| Investment Advisory Services | 60 |
| Management and Administrative—Institutional Shares | 44 |
| Management and Administrative—ETF Shares | 218 |
| Marketing and Distribution—Institutional Shares | 20 |
| Marketing and Distribution—ETF Shares | 108 |
| Custodian Fees | 13 |
| Auditing Fees | 26 |
| Shareholders’ Reports—Institutional Shares | — |
| Shareholders’ Reports—ETF Shares | 12 |
| Trustees’ Fees and Expenses | 1 |
| Total Expenses | 502 |
| Net Investment Income | 5,462 |
| Realized Net Gain (Loss) on Investment Securities Sold | 52,781 |
| Change in Unrealized Appreciation (Depreciation) of Investment Securities | (28,108) |
| Net Increase (Decrease) in Net Assets Resulting from Operations | 30,135 |
| 1 Interest income from an affiliated company of the fund was $2,000. | |
See accompanying Notes, which are an integral part of the Financial Statements.
27
Mega Cap 300 Growth Index Fund
Statement of Changes in Net Assets
| | |
| | Year Ended August 31, |
| | 2010 | 2009 |
| | ($000) | ($000) |
| Increase (Decrease) in Net Assets | | |
| Operations | | |
| Net Investment Income | 5,462 | 4,621 |
| Realized Net Gain (Loss) | 52,781 | (47,518) |
| Change in Unrealized Appreciation (Depreciation) | (28,108) | 22,156 |
| Net Increase (Decrease) in Net Assets Resulting from Operations | 30,135 | (20,741) |
| Distributions | | |
| Net Investment Income | | |
| Institutional Shares | (1,017) | (753) |
| ETF Shares | (4,676) | (2,928) |
| Realized Capital Gain | | |
| Institutional Shares | — | — |
| ETF Shares | — | — |
| Total Distributions | (5,693) | (3,681) |
| Capital Share Transactions | | |
| Institutional Shares | 26,091 | (32,148) |
| ETF Shares | (272,394) | 397,215 |
| Net Increase (Decrease) from Capital Share Transactions | (246,303) | 365,067 |
| Total Increase (Decrease) | (221,861) | 340,645 |
| Net Assets | | |
| Beginning of Period | 598,321 | 257,676 |
| End of Period1 | 376,460 | 598,321 |
| 1 Net Assets—End of Period includes undistributed net investment income of $1,157,000 and $1,388,000. | | |
See accompanying Notes, which are an integral part of the Financial Statements.
28
Mega Cap 300 Growth Index Fund
Financial Highlights
| | | |
| Institutional Shares | | | |
| | | | Apr. 3, |
| | Year Ended | 20081 to |
| | August 31, | Aug. 31, |
| For a Share Outstanding Throughout Each Period | 2010 | 2009 | 2008 |
| Net Asset Value, Beginning of Period | $74.21 | $91.10 | $92.21 |
| Investment Operations | | | |
| Net Investment Income | 1.180 | 1.053 | .343 |
| Net Realized and Unrealized Gain (Loss) on Investments | 2.465 | (16.900) | (1.250) |
| Total from Investment Operations | 3.645 | (15.847) | (.907) |
| Distributions | | | |
| Dividends from Net Investment Income | (1.115) | (1.043) | (.203) |
| Distributions from Realized Capital Gains | — | — | — |
| Total Distributions | (1.115) | (1.043) | (.203) |
| Net Asset Value, End of Period | $76.74 | $74.21 | $91.10 |
| |
| Total Return | 4.84% | -17.25% | -0.99% |
| |
| Ratios/Supplemental Data | | | |
| Net Assets, End of Period (Millions) | $90 | $62 | $97 |
| Ratio of Total Expenses to Average Net Assets | 0.11% | 0.11% | 0.08%2 |
| Ratio of Net Investment Income to Average Net Assets | 1.39% | 1.59% | 1.16%2 |
| Portfolio Turnover Rate3 | 21% | 31% | 9% |
1 Inception.
2 Annualized.
3 Excludes the value of portfolio securities received or delivered as a result of in-kind purchases or redemptions of the fund’s capital shares, including ETF Creation Units.
See accompanying Notes, which are an integral part of the Financial Statements.
29
Mega Cap 300 Growth Index Fund
Financial Highlights
| | | |
| ETF Shares | | | |
| | | | Dec. 17, |
| | Year Ended | 20071 to |
| | August 31, | Aug. 31, |
| For a Share Outstanding Throughout Each Period | 2010 | 2009 | 2008 |
| Net Asset Value, Beginning of Period | $37.50 | $46.04 | $49.10 |
| Investment Operations | | | |
| Net Investment Income | .586 | .528 | .237 |
| Net Realized and Unrealized Gain (Loss) on Investments | 1.248 | (8.548) | (3.139) |
| Total from Investment Operations | 1.834 | (8.020) | (2.902) |
| Distributions | | | |
| Dividends from Net Investment Income | (.554) | (.520) | (.158) |
| Distributions from Realized Capital Gains | — | — | — |
| Total Distributions | (.554) | (.520) | (.158) |
| Net Asset Value, End of Period | $38.78 | $37.50 | $46.04 |
| |
| Total Return | 4.82% | -17.28% | -5.91% |
| |
| Ratios/Supplemental Data | | | |
| Net Assets, End of Period (Millions) | $287 | $536 | $161 |
| Ratio of Total Expenses to Average Net Assets | 0.13% | 0.13% | 0.13%2 |
| Ratio of Net Investment Income to Average Net Assets | 1.37% | 1.57% | 1.11%2 |
| Portfolio Turnover Rate3 | 21% | 31% | 9% |
1 Inception.
2 Annualized.
3 Excludes the value of portfolio securities received or delivered as a result of in-kind purchases or redemptions of the fund’s capital shares, including ETF Creation Units.
See accompanying Notes, which are an integral part of the Financial Statements.
30
Mega Cap 300 Growth Index Fund
Notes to Financial Statements
Vanguard Mega Cap 300 Growth Index Fund is registered under the Investment Company Act of 1940 as an open-end investment company, or mutual fund. The fund offers two classes of shares: Institutional Shares and ETF Shares. Institutional Shares are designed for investors who meet certain administrative, service, and account-size criteria. ETF Shares are listed for trading on the NYSE Arca, Inc.; they can be purchased and sold through a broker.
A. The following significant accounting policies conform to generally accepted accounting principles for U.S. mutual funds. The fund consistently follows such policies in preparing its financial statements.
1. Security Valuation: Securities are valued as of the close of trading on the New York Stock Exchange (generally 4 p.m., Eastern time) on the valuation date. Equity securities are valued at the latest quoted sales prices or official closing prices taken from the primary market in which each security trades; such securities not traded on the valuation date are valued at the mean of the latest quoted bid and asked prices. Securities for which market quotations are not readily available, or whose values have been materially affected by events occurring before the fund’s pricing time but after the close of the securities’ primary markets, are valued by methods deemed by the board of trustees to represent fair value. Investments in Vanguard Market Liquidity Fund are valued at that fund’s net asset value.
2. Federal Income Taxes: The fund intends to continue to qualify as a regulated investment company and distribute all of its taxable income. Management has analyzed the fund’s tax positions taken for all open federal income tax years (August 31, 2008–2010), and has concluded that no provision for federal income tax is required in the fund’s financial statements.
3. Distributions: Distributions to shareholders are recorded on the ex-dividend date.
4. Security Lending: The fund may lend its securities to qualified institutional borrowers to earn additional income. Security loans are required to be secured at all times by collateral at least equal to the market value of securities loaned. The fund invests cash collateral received in Vanguard Market Liquidity Fund, and records a liability for the return of the collateral, during the period the securities are on loan. Security lending income represents the income earned on investing cash collateral, less expenses associated with the loan.
5. Other: Dividend income is recorded on the ex-dividend date. Interest income includes income distributions received from Vanguard Market Liquidity Fund and is accrued daily. Security transactions are accounted for on the date securities are bought or sold. Costs used to determine realized gains (losses) on the sale of investment securities are those of the specific securities sold.
Each class of shares has equal rights as to assets and earnings, except that each class separately bears certain class-specific expenses related to maintenance of shareholder accounts (included in Management and Administrative expenses) and shareholder reporting. Marketing and distribution expenses are allocated to each class of shares based on a method approved by the board of trustees. Income, other non-class-specific expenses, and gains and losses on investments are allocated to each class of shares based on its relative net assets.
31
Mega Cap 300 Growth Index Fund
B. The Vanguard Group furnishes at cost investment advisory, corporate management, administrative, marketing, and distribution services. The costs of such services are allocated to the fund under methods approved by the board of trustees. The fund has committed to provide up to 0.40% of its net assets in capital contributions to Vanguard. At August 31, 2010, the fund had contributed capital of $74,000 to Vanguard (included in Other Assets), representing 0.02% of the fund’s net assets and 0.03% of Vanguard’s capitalization. The fund’s trustees and officers are also directors and officers of Vanguard.
C. Various inputs may be used to determine the value of the fund’s investments. These inputs are summarized in three broad levels for financial statement purposes. The inputs or methodologies used to value securities are not necessarily an indication of the risk associated with investing in those securities.
Level 1—Quoted prices in active markets for identical securities.
Level 2—Other significant observable inputs (including quoted prices for similar securities, interest rates, prepayment speeds, credit risk, etc.).
Level 3—Significant unobservable inputs (including the fund’s own assumptions used to determine the fair value of investments).
At August 31, 2010, 100% of the fund’s investments were valued based on Level 1 inputs.
D. Distributions are determined on a tax basis and may differ from net investment income and realized capital gains for financial reporting purposes. Differences may be permanent or temporary. Permanent differences are reclassified among capital accounts in the financial statements to reflect their tax character. Temporary differences arise when certain items of income, expense, gain, or loss are recognized in different periods for financial statement and tax purposes; these differences will reverse at some time in the future. Differences in classification may also result from the treatment of short-term gains as ordinary income for tax purposes.
During the year ended August 31, 2010, the fund realized $58,147,000 of net capital gains resulting from in-kind redemptions—in which shareholders exchanged fund shares for securities held by the fund rather than for cash. Because such gains are not taxable to the fund, and are not distributed to shareholders, they have been reclassified from accumulated net realized losses to paid-in capital.
For tax purposes, at August 31, 2010, the fund had $1,429,000 of ordinary income available for distribution. The fund had available capital loss carryforwards totaling $33,005,000 to offset future net capital gains of $7,258,000 through August 31, 2017, and $25,747,000 through August 31, 2018. In addition, the fund realized losses of $5,267,000 during the period from November 1, 2009, through August 31, 2010, which are deferred and will be treated as realized for tax purposes in fiscal 2011.
At August 31, 2010, the cost of investment securities for tax purposes was $383,649,000. Net unrealized depreciation of investment securities for tax purposes was $7,320,000, consisting of unrealized gains of $24,695,000 on securities that had risen in value since their purchase and $32,015,000 in unrealized losses on securities that had fallen in value since their purchase.
32
Mega Cap 300 Growth Index Fund
E. During the year ended August 31, 2010, the fund purchased $202,161,000 of investment securities and sold $449,225,000 of investment securities, other than temporary cash investments.
F. Capital share transactions for each class of shares were:
| | | | | |
| | | | |
| | | | Year Ended August 31, |
| | | 2010 | | | 2009 |
| | Amount | Shares | Amount | Shares |
| | ($000) | (000) | ($000) | (000) |
| Institutional Shares | | | | |
| Issued | 25,101 | 317 | (32,901) | (235) |
| Issued in Lieu of Cash Distributions | 1,017 | 13 | 753 | 12 |
| Redeemed | (27) | — | — | — |
| Net Increase (Decrease)—Institutional Shares | 26,091 | 330 | (32,148) | (223) |
| ETF Shares | | | | |
| Issued | 93,521 | 2,300 | 773,526 | 23,100 |
| Issued in Lieu of Cash Distributions | — | — | — | — |
| Redeemed | (365,915) | (9,200) | (376,311) | (12,300) |
| Net Increase (Decrease)—ETF Shares | (272,394) | (6,900) | 397,215 | 10,800 |
The amounts of Institutional Shares issued during the year ended August 31, 2009, are negative because they reflect the cancellation of $58,176,000 of purchases recorded during the prior fiscal period that were determined to have been processed incorrectly. Vanguard, as a transfer agent for the fund, offset any impact to the fund resulting from incorrectly processed shareholder transactions. Accordingly, the cancelled purchases had no impact to the fund’s net asset values per share or total returns.
G. In preparing the financial statements as of August 31, 2010, management considered the impact of subsequent events for potential recognition or disclosure in these financial statements.
33
Mega Cap 300 Value Index Fund
Fund Profile
As of August 31, 2010
| | | |
| Share-Class Characteristics | | |
| |
| | Institutional | ETF |
| | Shares | Shares |
| Ticker Symbol | VMVLX | MGV |
| Expense Ratio1 | 0.11% | 0.13% |
| 30-Day SEC Yield | 2.50% | 2.48% |
| |
| Portfolio Characteristics | | |
| | | MSCI US | DJ |
| | | Large Cap | U.S. Total |
| | | Value | Market |
| | Fund | Index | Index |
| Number of Stocks | 158 | 158 | 4,100 |
| Median Market Cap $60.8B | $60.8B | $26.3B |
| Price/Earnings Ratio | 13.0x | 13.0x | 15.7x |
| Price/Book Ratio | 1.4x | 1.4x | 1.9x |
| Return on Equity | 17.2% | 17.3% | 19.0% |
| Earnings Growth Rate | -1.3% | -1.3% | 6.2% |
| Dividend Yield | 3.0% | 3.0% | 2.0% |
| Foreign Holdings | 0.0% | 0.0% | 0.0% |
| Turnover Rate | 26% | — | — |
| Short-Term Reserves | 0.0% | — | — |
| | | |
| Sector Diversification (% of equity exposure) |
| | | MSCI US | DJ |
| | | Large Cap | U.S. Total |
| | | Value | Market |
| | Fund | Index | Index |
| Consumer | | | |
| Discretionary | 6.0% | 6.1% | 11.5% |
| Consumer Staples | 9.8 | 9.8 | 10.6 |
| Energy | 15.5 | 15.6 | 9.6 |
| Financials | 24.7 | 24.2 | 17.1 |
| Health Care | 15.2 | 15.3 | 11.3 |
| Industrials | 10.9 | 11.0 | 10.7 |
| Information | | | |
| Technology | 2.9 | 2.9 | 18.3 |
| Materials | 2.1 | 2.1 | 4.3 |
| Telecommunication | | | |
| Services | 6.4 | 6.4 | 2.9 |
| Utilities | 6.5 | 6.6 | 3.7 |
| | |
| Ten Largest Holdings (% of total net assets) |
| Exxon Mobil Corp. | Integrated Oil & | |
| | Gas | 4.6% |
| Procter & Gamble Co. | Household | |
| | Products | 4.0 |
| AT&T Inc. | Integrated | |
| | Telecommunication | |
| | Services | 3.7 |
| Johnson & Johnson | Pharmaceuticals | 3.7 |
| General Electric Co. | Industrial | |
| | Conglomerates | 3.6 |
| Chevron Corp. | Integrated Oil & | |
| | Gas | 3.5 |
| JPMorgan Chase & Co. | Diversified Financial | |
| | Services | 3.4 |
| Pfizer Inc. | Pharmaceuticals | 3.0 |
| Bank of America Corp. | Diversified Financial | |
| | Services | 2.9 |
| Wells Fargo & Co. | Diversified Banks | 2.7 |
| Top Ten | | 35.1% |
The holdings listed exclude any temporary cash investments and equity index products.
Investment Focus
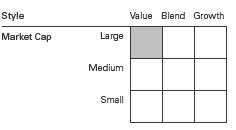
1 The expense ratios shown are from the prospectus dated December 28, 2009, and represent estimated costs for the current fiscal year. For the fiscal year ended August 31, 2010, the expense ratios were 0.11% for Institutional Shares and 0.13% for ETF Shares.
34
Mega Cap 300 Value Index Fund
Performance Summary
All of the returns in this report represent past performance, which is not a guarantee of future results that may be achieved by the fund. (Current performance may be lower or higher than the performance data cited. For performance data current to the most recent month-end, visit our website at vanguard.com/performance.) Note, too, that both investment returns and principal value can fluctuate widely, so an investor’s shares, when sold, could be worth more or less than their original cost. The returns shown do not reflect taxes that a shareholder would pay on fund distributions or on the sale of fund shares.
Cumulative Performance: December 17, 2007, Through August 31, 2010
Initial Investment of $10,000
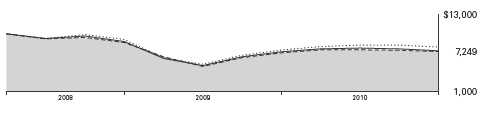
| | | |
| | Average Annual Total Returns | |
| | Periods Ended August 31, 2010 | |
| | | Since | Final Value |
| | One | Inception | of a $10,000 |
| | Year | (12/17/2007) | Investment |
| Mega Cap 300 Value Index Fund ETF | | | |
| Shares Net Asset Value | 2.68% | -11.22% | $7,249 |
| Mega Cap 300 Value Index Fund ETF | | | |
| Shares Market Price | 2.51 | -11.24 | 7,243 |
| Dow Jones U.S. Total Stock Market | | | |
| Index | 6.15 | -8.15 | 7,946 |
| MSCI US Large Cap Value Index | 2.79 | -11.22 | 7,248 |
| Large-Cap Value Funds Average | 2.13 | -10.67 | 7,371 |
Large-Cap Value Funds Average: Derived from data provided by Lipper Inc.
"Since Inception" performance is calculated from the ETF Shares’ inception date for both the fund and its comparative standards.
| | | |
| | | Since | Final Value |
| | One | Inception | of a $5,000,000 |
| | Year | (3/5/2008) | Investment |
| Mega Cap 300 Value Index Fund | | | |
| Institutional Shares | 2.69% | -9.08% | $3,945,448 |
| Dow Jones U.S. Total Stock Market | | | |
| Index | 6.15 | -6.12 | 4,273,376 |
| MSCI US Large Cap Value Index | 2.79 | -9.13 | 3,940,126 |
"Since Inception" performance is calculated from the Institutional Shares’ inception date for both the fund and its comparative standards.
See Financial Highlights for dividend and capital gains information.
35
Mega Cap 300 Value Index Fund
| | |
| Cumulative Returns of ETF Shares: December 17, 2007, Through August 31, 2010 | |
| |
| | | Since |
| | One | Inception |
| | Year | (12/17/2007) |
| Mega Cap 300 Value Index Fund | | |
| ETF Shares Market Price | 2.51% | -27.57% |
| Mega Cap 300 Value Index Fund | | |
| ETF Shares Net Asset Value | 2.68 | -27.51 |
| MSCI US Large Cap Value Index | 2.79 | -27.52 |
"Since Inception" performance is calculated from the ETF Shares’ inception date for both the fund and its comparative standards.
For more information about how the ETF Shares' market prices have compared with their net asset value, visit vanguard.com, select your ETF, and then select the Performance tab. The Premium/Discount table there shows the percentages of days on which the ETF Shares' market price was above or below the NAV.
Fiscal-Year Total Returns (%): December 17, 2007, Through August 31, 2010
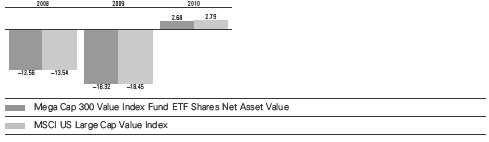
Average Annual Total Returns: Periods Ended June 30, 2010
This table presents average annual total returns through the latest calendar quarter—rather than through the end of the fiscal period. Securities and Exchange Commission rules require that we provide this information.
| | | |
| | Inception | One | Since |
| | Date | Year | Inception |
| Institutional Shares | 3/5/2008 | 13.34% | -10.55% |
| ETF Shares | 12/17/2007 | | |
| Market Price | | 13.19 | -12.68 |
| Net Asset Value | | 13.28 | -12.67 |
36
Mega Cap 300 Value Index Fund
Financial Statements
Statement of Net Assets
As of August 31, 2010
The fund reports a complete list of its holdings in regulatory filings four times in each fiscal year, at the quarter-ends. For the second and fourth fiscal quarters, the lists appear in the fund’s semiannual and annual reports to shareholders. For the first and third fiscal quarters, the fund files the lists with the Securities and Exchange Commission on Form N-Q. Shareholders can look up the fund’s Forms N-Q on the SEC’s website at sec.gov. Forms N-Q may also be reviewed and copied at the SEC’s Public Reference Room (see the back cover of this report for further information).
| | | |
| | | | Market |
| | | | Value |
| | | Shares | ($000) |
| Common Stocks (100.1%) | | |
| Consumer Discretionary (6.1%) | | |
| | Walt Disney Co. | 84,847 | 2,765 |
| | Time Warner Inc. | 79,957 | 2,397 |
| | Home Depot Inc. | 77,218 | 2,147 |
| | Comcast Corp. Class A | 95,689 | 1,638 |
| | News Corp. Class A | 116,037 | 1,459 |
| | Comcast Corp. | 84,162 | 1,352 |
| | Time Warner Cable Inc. | 24,907 | 1,285 |
| | Carnival Corp. | 32,539 | 1,015 |
| | Viacom Inc. Class B | 25,288 | 795 |
| | CBS Corp. Class B | 44,047 | 609 |
| | Stanley Black & Decker Inc. | 10,733 | 576 |
| | Macy’s Inc. | 29,611 | 576 |
| | Fortune Brands Inc. | 10,681 | 478 |
| | VF Corp. | 6,172 | 436 |
| | Gap Inc. | 16,449 | 278 |
| | News Corp. Class B | 11,798 | 166 |
| | JC Penney Co. Inc. | 7,464 | 149 |
| | DISH Network Corp. Class A | 5,129 | 92 |
| ^,* | Sears Holdings Corp. | 1,130 | 70 |
| | | | 18,283 |
| Consumer Staples (9.8%) | | |
| | Procter & Gamble Co. | 202,044 | 12,056 |
| | Kraft Foods Inc. | 122,316 | 3,663 |
| | Altria Group Inc. | 146,104 | 3,261 |
| | Kimberly-Clark Corp. | 29,042 | 1,870 |
| | Archer-Daniels-Midland Co. | 45,113 | 1,389 |
| | CVS Caremark Corp. | 47,731 | 1,289 |
| | Sysco Corp. | 41,502 | 1,141 |
| | Lorillard Inc. | 10,697 | 813 |
| | ConAgra Foods Inc. | 31,189 | 673 |
| | Reynolds American Inc. | 12,267 | 669 |
| | Sara Lee Corp. | 44,236 | 639 |
| | HJ Heinz Co. | 11,092 | 513 |
| | Safeway Inc. | 27,261 | 513 |
| | Molson Coors Brewing Co. | | |
| | Class B | 11,392 | 496 |
| | | |
| | | | Market |
| | | | Value |
| | | Shares | ($000) |
| | Campbell Soup Co. | 5,057 | 188 |
| | Hershey Co. | 3,903 | 181 |
| | Brown-Forman Corp. Class B | 2,035 | 125 |
| | | | 29,479 |
| Energy (15.5%) | | |
| | Exxon Mobil Corp. | 232,412 | 13,749 |
| | Chevron Corp. | 140,919 | 10,451 |
| | ConocoPhillips | 99,194 | 5,201 |
| | Occidental Petroleum Corp. | 56,978 | 4,164 |
| | Apache Corp. | 25,312 | 2,274 |
| | Devon Energy Corp. | 29,784 | 1,795 |
| | Marathon Oil Corp. | 49,775 | 1,518 |
| | Hess Corp. | 20,778 | 1,044 |
| | Chesapeake Energy Corp. | 45,736 | 946 |
| | Spectra Energy Corp. | 45,459 | 925 |
| | Williams Cos. Inc. | 40,903 | 742 |
| | Murphy Oil Corp. | 12,761 | 683 |
| | Halliburton Co. | 22,227 | 627 |
| | Valero Energy Corp. | 39,670 | 626 |
| * | Transocean Ltd. | 11,264 | 573 |
| | Noble Energy Inc. | 7,962 | 556 |
| | National Oilwell Varco Inc. | 14,712 | 553 |
| | Noble Corp. | 9,045 | 281 |
| | | | 46,708 |
| Financials (24.7%) | | |
| | JPMorgan Chase & Co. | 279,131 | 10,149 |
| | Bank of America Corp. | 703,876 | 8,763 |
| | Wells Fargo & Co. | 347,249 | 8,178 |
| * | Citigroup Inc. | 1,728,154 | 6,429 |
| | Goldman Sachs Group Inc. | 34,309 | 4,698 |
| * | Berkshire Hathaway Inc. | | |
| | Class B | 56,878 | 4,481 |
| | US Bancorp | 134,481 | 2,797 |
| | MetLife Inc. | 62,817 | 2,362 |
| | Morgan Stanley | 88,258 | 2,179 |
| | Bank of New York | | |
| | Mellon Corp. | 85,094 | 2,065 |
37
Mega Cap 300 Value Index Fund
| | | |
| | | | Market |
| | | | Value |
| | | Shares | ($000) |
| | PNC Financial Services | | |
| | Group Inc. | 36,905 | 1,881 |
| | Travelers Cos. Inc. | 34,750 | 1,702 |
| | Prudential Financial Inc. | 32,552 | 1,646 |
| | ACE Ltd. | 23,754 | 1,270 |
| | Chubb Corp. | 22,918 | 1,263 |
| | BB&T Corp. | 48,554 | 1,074 |
| | Allstate Corp. | 35,790 | 988 |
| | Vornado Realty Trust | 11,502 | 932 |
| | Simon Property Group Inc. | 10,251 | 927 |
| | Equity Residential | 19,878 | 911 |
| | Marsh & McLennan Cos. Inc. | 37,871 | 898 |
| | Loews Corp. | 23,432 | 823 |
| | Ameriprise Financial Inc. | 18,096 | 789 |
| | Annaly Capital | | |
| | Management Inc. | 43,390 | 754 |
| | AON Corp. | 17,075 | 619 |
| | Fifth Third Bancorp | 55,758 | 616 |
| | Hartford Financial | | |
| | Services Group Inc. | 29,698 | 599 |
| | Progressive Corp. | 29,151 | 577 |
| | Invesco Ltd. | 30,629 | 554 |
| | Aflac Inc. | 11,546 | 546 |
| | Principal Financial Group Inc. | 22,457 | 518 |
| | Boston Properties Inc. | 6,339 | 516 |
| | SunTrust Banks Inc. | 22,794 | 513 |
| | NYSE Euronext | 18,276 | 507 |
| | M&T Bank Corp. | 5,853 | 501 |
| | BlackRock Inc. | 2,492 | 354 |
| | Hudson City Bancorp Inc. | 21,671 | 250 |
| | | | 74,629 |
| Health Care (15.2%) | | |
| | Johnson & Johnson | 193,496 | 11,033 |
| | Pfizer Inc. | 565,891 | 9,015 |
| | Merck & Co. Inc. | 218,765 | 7,692 |
| | Abbott Laboratories | 70,388 | 3,473 |
| | Bristol-Myers Squibb Co. | 120,645 | 3,146 |
| | UnitedHealth Group Inc. | 79,744 | 2,530 |
| | Eli Lilly & Co. | 72,809 | 2,443 |
| * | WellPoint Inc. | 31,144 | 1,547 |
| | Covidien PLC | 35,166 | 1,243 |
| * | Thermo Fisher Scientific Inc. | 28,792 | 1,213 |
| | Aetna Inc. | 29,733 | 794 |
| | CIGNA Corp. | 19,345 | 623 |
| * | Forest Laboratories Inc. | 21,213 | 579 |
| * | Boston Scientific Corp. | 106,177 | 551 |
| | | | 45,882 |
| Industrials (10.9%) | | |
| | General Electric Co. | 749,027 | 10,846 |
| | United Technologies Corp. | 62,188 | 4,055 |
| | 3M Co. | 47,524 | 3,733 |
| | CSX Corp. | 27,306 | 1,362 |
| | Tyco International Ltd. | 36,092 | 1,346 |
| | | |
| | | | Market |
| | | | Value |
| | | Shares | ($000) |
| | Honeywell International Inc. | 33,191 | 1,298 |
| | General Dynamics Corp. | 23,001 | 1,285 |
| | Illinois Tool Works Inc. | 29,964 | 1,236 |
| | Raytheon Co. | 26,684 | 1,172 |
| | Northrop Grumman Corp. | 20,178 | 1,092 |
| | Waste Management Inc. | 32,162 | 1,064 |
| | Lockheed Martin Corp. | 14,469 | 1,006 |
| | Republic Services Inc. | | |
| | Class A | 26,871 | 791 |
| | Eaton Corp. | 11,150 | 775 |
| | Ingersoll-Rand PLC | 22,649 | 737 |
| | L-3 Communications | | |
| | Holdings Inc. | 8,119 | 541 |
| | Parker Hannifin Corp. | 5,653 | 334 |
| | Southwest Airlines Co. | 18,285 | 202 |
| | | | 32,875 |
| Information Technology (2.9%) | | |
| | Intel Corp. | 253,727 | 4,496 |
| | Applied Materials Inc. | 94,226 | 979 |
| | Corning Inc. | 54,629 | 857 |
| | Xerox Corp. | 96,517 | 815 |
| * | Motorola Inc. | 77,736 | 585 |
| | Tyco Electronics Ltd. | 20,759 | 509 |
| | Fidelity National Information | | |
| | Services Inc. | 17,532 | 453 |
| | Analog Devices Inc. | 7,317 | 204 |
| | | | 8,898 |
| Materials (2.1%) | | |
| | EI du Pont de | | |
| | Nemours & Co. | 63,564 | 2,591 |
| | Dow Chemical Co. | 81,022 | 1,975 |
| | Nucor Corp. | 22,072 | 812 |
| | PPG Industries Inc. | 11,704 | 770 |
| | Weyerhaeuser Co. | 12,809 | 201 |
| | | | 6,349 |
| Telecommunication Services (6.4%) | |
| | AT&T Inc. | 414,554 | 11,205 |
| | Verizon Communications Inc. | 198,313 | 5,852 |
| * | Sprint Nextel Corp. | 207,390 | 846 |
| | CenturyLink Inc. | 21,066 | 762 |
| | Qwest Communications | | |
| | International Inc. | 109,456 | 619 |
| | | | 19,284 |
| Utilities (6.5%) | | |
| | Southern Co. | 57,844 | 2,122 |
| | Exelon Corp. | 46,343 | 1,887 |
| | Dominion Resources Inc. | 41,816 | 1,788 |
| | Duke Energy Corp. | 92,123 | 1,583 |
| | NextEra Energy Inc. | 27,636 | 1,485 |
| | PG&E Corp. | 26,084 | 1,220 |
| | American Electric | | |
| | Power Co. Inc. | 33,570 | 1,189 |
38
Mega Cap 300 Value Index Fund
| | |
| | | Market |
| | | Value |
| | Shares | ($000) |
| Public Service Enterprise | | |
| Group Inc. | 35,494 | 1,134 |
| Entergy Corp. | 13,280 | 1,047 |
| Consolidated Edison Inc. | 19,838 | 943 |
| PPL Corp. | 32,874 | 893 |
| Progress Energy Inc. | 20,105 | 863 |
| Sempra Energy | 16,455 | 838 |
| FirstEnergy Corp. | 21,371 | 781 |
| Edison International | 21,714 | 733 |
| Xcel Energy Inc. | 32,234 | 719 |
| Ameren Corp. | 16,700 | 469 |
| | | 19,694 |
| Total Common Stocks | | |
| (Cost $315,769) | | 302,081 |
| Temporary Cash Investment (0.0%) | |
| Money Market Fund (0.0%) | | |
| 1,2 Vanguard Market Liquidity | | |
| Fund, 0.288% (Cost $63) | 63,001 | 63 |
| Total Investments (100.1%) | | |
| (Cost $315,832) | | 302,144 |
| Other Assets and Liabilities (-0.1%) | |
| Other Assets | | 3,658 |
| Liabilities2 | | (3,896) |
| | | (238) |
| Net Assets (100%) | | 301,906 |
| |
| At August 31, 2010, net assets consisted of: |
| | Amount |
| | ($000) |
| Paid-in Capital | 344,130 |
| Undistributed Net Investment Income | 1,745 |
| Accumulated Net Realized Losses | (30,281) |
| Unrealized Appreciation (Depreciation) | (13,688) |
| Net Assets | 301,906 |
| |
| |
| Institutional Shares—Net Assets | |
| Applicable to 1,147,678 outstanding | |
| $.001 par value shares of beneficial | |
| interest (unlimited authorization) | 75,715 |
| Net Asset Value Per Share— | |
| Institutional Shares | $65.97 |
| |
| |
| ETF Shares—Net Assets | |
| Applicable to 6,800,000 outstanding | |
| $.001 par value shares of beneficial | |
| interest (unlimited authorization) | 226,191 |
| Net Asset Value Per Share— | |
| ETF Shares | $33.26 |
See Note A in Notes to Financial Statements.
^ Part of security position is on loan to broker-dealers. The total value of securities on loan is $62,000.
* Non-income-producing security.
1 Affiliated money market fund available only to Vanguard funds and certain trusts and accounts managed by Vanguard. Rate shown is the 7-day yield.
2 Includes $63,000 of collateral received for securities on loan.
See accompanying Notes, which are an integral part of the Financial Statements.
39
Mega Cap 300 Value Index Fund
Statement of Operations
| |
| | Year Ended |
| | August 31, 2010 |
| | ($000) |
| Investment Income | |
| Income | |
| Dividends | 8,427 |
| Security Lending | 15 |
| Total Income | 8,442 |
| Expenses | |
| The Vanguard Group—Note B | |
| Investment Advisory Services | 40 |
| Management and Administrative—Institutional Shares | 36 |
| Management and Administrative—ETF Shares | 142 |
| Marketing and Distribution—Institutional Shares | 22 |
| Marketing and Distribution—ETF Shares | 56 |
| Custodian Fees | 19 |
| Auditing Fees | 26 |
| Shareholders’ Reports—Institutional Shares | 3 |
| Shareholders’ Reports—ETF Shares | 8 |
| Total Expenses | 352 |
| Net Investment Income | 8,090 |
| Realized Net Gain (Loss) on Investment Securities Sold | 779 |
| Change in Unrealized Appreciation (Depreciation) of Investment Securities | (5,528) |
| Net Increase (Decrease) in Net Assets Resulting from Operations | 3,341 |
See accompanying Notes, which are an integral part of the Financial Statements.
40
Mega Cap 300 Value Index Fund
Statement of Changes in Net Assets
| | |
| | Year Ended August 31, |
| | 2010 | 2009 |
| | ($000) | ($000) |
| Increase (Decrease) in Net Assets | | |
| Operations | | |
| Net Investment Income | 8,090 | 6,197 |
| Realized Net Gain (Loss) | 779 | (16,911) |
| Change in Unrealized Appreciation (Depreciation) | (5,528) | (1,817) |
| Net Increase (Decrease) in Net Assets Resulting from Operations | 3,341 | (12,531) |
| Distributions | | |
| Net Investment Income | | |
| Institutional Shares | (2,101) | (1,849) |
| ETF Shares | (5,508) | (3,745) |
| Realized Capital Gain | | |
| Institutional Shares | — | — |
| ETF Shares | — | — |
| Total Distributions | (7,609) | (5,594) |
| Capital Share Transactions | | |
| Institutional Shares | 6,114 | 26,850 |
| ETF Shares | 66,952 | 74,049 |
| Net Increase (Decrease) from Capital Share Transactions | 73,066 | 100,899 |
| Total Increase (Decrease) | 68,798 | 82,774 |
| Net Assets | | |
| Beginning of Period | 233,108 | 150,334 |
| End of Period1 | 301,906 | 233,108 |
| 1 Net Assets—End of Period includes undistributed net investment income of $1,745,000 and $1,264,000. | | |
See accompanying Notes, which are an integral part of the Financial Statements.
41
Mega Cap 300 Value Index Fund
Financial Highlights
| | | |
| Institutional Shares | | | |
| | | | Mar. 5, |
| | Year Ended | 20081 to |
| | August 31, | Aug. 31, |
| For a Share Outstanding Throughout Each Period | 2010 | 2009 | 2008 |
| Net Asset Value, Beginning of Period | $66.02 | $83.69 | $90.01 |
| Investment Operations | | | |
| Net Investment Income | 1.932 | 2.135 | 1.1242 |
| Net Realized and Unrealized Gain (Loss) on Investments | (.075) | (17.658) | (6.444) |
| Total from Investment Operations | 1.857 | (15.523) | (5.320) |
| Distributions | | | |
| Dividends from Net Investment Income | (1.907) | (2.147) | (1.000) |
| Distributions from Realized Capital Gains | — | — | — |
| Total Distributions | (1.907) | (2.147) | (1.000) |
| Net Asset Value, End of Period | $65.97 | $66.02 | $83.69 |
| |
| Total Return | 2.69% | -18.29% | -5.96% |
| |
| Ratios/Supplemental Data | | | |
| Net Assets, End of Period (Millions) | $76 | $70 | $53 |
| Ratio of Total Expenses to Average Net Assets | 0.11% | 0.11% | 0.08%3 |
| Ratio of Net Investment Income to Average Net Assets | 2.88% | 3.66% | 3.19%3 |
| Portfolio Turnover Rate4 | 26% | 31% | 12% |
1 Inception.
2 Calculated based on average shares outstanding.
3 Annualized.
4 Excludes the value of portfolio securities received or delivered as a result of in-kind purchases or redemptions of the fund’s capital shares, including ETF Creation Units.
See accompanying Notes, which are an integral part of the Financial Statements.
42
Mega Cap 300 Value Index Fund
Financial Highlights
| | | |
| ETF Shares | | | |
| | | | Dec. 17, |
| | Year Ended | 20071 to |
| | August 31, | Aug. 31, |
| For a Share Outstanding Throughout Each Period | 2010 | 2009 | 2008 |
| Net Asset Value, Beginning of Period | $33.29 | $42.21 | $49.38 |
| Investment Operations | | | |
| Net Investment Income | .969 | 1.070 | .8862 |
| Net Realized and Unrealized Gain (Loss) on Investments | (.042) | (8.915) | (7.560) |
| Total from Investment Operations | .927 | (7.845) | (6.674) |
| Distributions | | | |
| Dividends from Net Investment Income | (.957) | (1.075) | (.496) |
| Distributions from Realized Capital Gains | — | — | — |
| Total Distributions | (.957) | (1.075) | (.496) |
| Net Asset Value, End of Period | $33.26 | $33.29 | $42.21 |
| |
| Total Return | 2.68% | -18.32% | -13.56% |
| |
| Ratios/Supplemental Data | | | |
| Net Assets, End of Period (Millions) | $226 | $163 | $97 |
| Ratio of Total Expenses to Average Net Assets | 0.13% | 0.13% | 0.13%3 |
| Ratio of Net Investment Income to Average Net Assets | 2.86% | 3.64% | 3.14%3 |
| Portfolio Turnover Rate4 | 26% | 31% | 12% |
1 Inception.
2 Calculated based on average shares outstanding.
3 Annualized.
4 Excludes the value of portfolio securities received or delivered as a result of in-kind purchases or redemptions of the fund’s capital shares, including ETF Creation Units.
See accompanying Notes, which are an integral part of the Financial Statements.
43
Mega Cap 300 Value Index Fund
Notes to Financial Statements
Vanguard Mega Cap 300 Value Index Fund is registered under the Investment Company Act of 1940 as an open-end investment company, or mutual fund. The fund offers two classes of shares: Institutional Shares and ETF Shares. Institutional Shares are designed for investors who meet certain administrative, service, and account-size criteria. ETF Shares are listed for trading on the NYSE Arca, Inc.; they can be purchased and sold through a broker.
A. The following significant accounting policies conform to generally accepted accounting principles for U.S. mutual funds. The fund consistently follows such policies in preparing its financial statements.
1. Security Valuation: Securities are valued as of the close of trading on the New York Stock Exchange (generally 4 p.m., Eastern time) on the valuation date. Equity securities are valued at the latest quoted sales prices or official closing prices taken from the primary market in which each security trades; such securities not traded on the valuation date are valued at the mean of the latest quoted bid and asked prices. Securities for which market quotations are not readily available, or whose values have been materially affected by events occurring before the fund’s pricing time but after the close of the securities’ primary markets, are valued by methods deemed by the board of trustees to represent fair value. Investments in Vanguard Market Liquidity Fund are valued at that fund’s net asset value.
2. Federal Income Taxes: The fund intends to continue to qualify as a regulated investment company and distribute all of its taxable income. Management has analyzed the fund’s tax positions taken for all open federal income tax years (August 31, 2008-2010), and has concluded that no provision for federal income tax is required in the fund’s financial statements.
3. Distributions: Distributions to shareholders are recorded on the ex-dividend date.
4. Security Lending: The fund may lend its securities to qualified institutional borrowers to earn additional income. Security loans are required to be secured at all times by collateral at least equal to the market value of securities loaned. The fund invests cash collateral received in Vanguard Market Liquidity Fund, and records a liability for the return of the collateral, during the period the securities are on loan. Security lending income represents the income earned on investing cash collateral, less expenses associated with the loan.
5. Other: Dividend income is recorded on the ex-dividend date. Security transactions are accounted for on the date securities are bought or sold. Costs used to determine realized gains (losses) on the sale of investment securities are those of the specific securities sold.
Each class of shares has equal rights as to assets and earnings, except that each class separately bears certain class-specific expenses related to maintenance of shareholder accounts (included in Management and Administrative expenses) and shareholder reporting. Marketing and distribution expenses are allocated to each class of shares based on a method approved by the board of trustees. Income, other non-class-specific expenses, and gains and losses on investments are allocated to each class of shares based on its relative net assets.
44
Mega Cap 300 Value Index Fund
B. The Vanguard Group furnishes at cost investment advisory, corporate management, administrative, marketing, and distribution services. The costs of such services are allocated to the fund under methods approved by the board of trustees. The fund has committed to provide up to 0.40% of its net assets in capital contributions to Vanguard. At August 31, 2010, the fund had contributed capital of $60,000 to Vanguard (included in Other Assets), representing 0.02% of the fund’s net assets and 0.02% of Vanguard’s capitalization. The fund’s trustees and officers are also directors and officers of Vanguard.
C. Various inputs may be used to determine the value of the fund’s investments. These inputs are summarized in three broad levels for financial statement purposes. The inputs or methodologies used to value securities are not necessarily an indication of the risk associated with investing in those securities.
Level 1—Quoted prices in active markets for identical securities.
Level 2—Other significant observable inputs (including quoted prices for similar securities, interest rates, prepayment speeds, credit risk, etc.).
Level 3—Significant unobservable inputs (including the fund’s own assumptions used to determine the fair value of investments).
At August 31, 2010, 100% of the fund’s investments were valued based on Level 1 inputs.
D. Distributions are determined on a tax basis and may differ from net investment income and realized capital gains for financial reporting purposes. Differences may be permanent or temporary. Permanent differences are reclassified among capital accounts in the financial statements to reflect their tax character. Temporary differences arise when certain items of income, expense, gain, or loss are recognized in different periods for financial statement and tax purposes; these differences will reverse at some time in the future. Differences in classification may also result from the treatment of short-term gains as ordinary income for tax purposes.
During the year ended August 31, 2010, the fund realized $10,413,000 of net capital gains resulting from in-kind redemptions—in which shareholders exchanged fund shares for securities held by the fund rather than for cash. Because such gains are not taxable to the fund, and are not distributed to shareholders, they have been reclassified from accumulated net realized losses to paid-in capital.
For tax purposes, at August 31, 2010, the fund had $1,895,000 of ordinary income available for distribution. The fund had available capital loss carryforwards totaling $19,395,000 to offset future net capital gains of $851,000 through August 31, 2017, and $18,544,000 through August 31, 2018. In addition, the fund realized losses of $9,749,000 during the period from November 1, 2009, through August 31, 2010, which are deferred and will be treated as realized for tax purposes in fiscal 2011.
At August 31, 2010, the cost of investment securities for tax purposes was $316,968,000. Net unrealized depreciation of investment securities for tax purposes was $14,824,000, consisting of unrealized gains of $12,526,000 on securities that had risen in value since their purchase and $27,350,000 in unrealized losses on securities that had fallen in value since their purchase.
45
Mega Cap 300 Value Index Fund
E. During the year ended August 31, 2010, the fund purchased $188,299,000 of investment securities and sold $114,677,000 of investment securities, other than temporary cash investments.
F. Capital share transactions for each class of shares were:
| | | | | |
| | | | |
| | | | Year Ended August 31, |
| | | 2010 | | | 2009 |
| | Amount | Shares | Amount | Shares |
| | ($000) | (000) | ($000) | (000) |
| Institutional Shares | | | | |
| Issued | 14,527 | 210 | 32,907 | 536 |
| Issued in Lieu of Cash Distributions | 2,101 | 30 | 1,849 | 31 |
| Redeemed | (10,514) | (152) | (7,906) | (143) |
| Net Increase (Decrease)—Institutional Shares | 6,114 | 88 | 26,850 | 424 |
| ETF Shares | | | | |
| Issued | 111,531 | 3,200 | 123,860 | 4,200 |
| Issued in Lieu of Cash Distributions | — | — | — | — |
| Redeemed | (44,579) | (1,300) | (49,811) | (1,600) |
| Net Increase (Decrease)—ETF Shares | 66,952 | 1,900 | 74,049 | 2,600 |
G. In preparing the financial statements as of August 31, 2010, management considered the impact of subsequent events for potential recognition or disclosure in these financial statements.
46
Report of Independent Registered Public Accounting Firm
To the Trustees of Vanguard World Fund and the Shareholders of Vanguard Mega Cap 300 Index Fund, Vanguard Mega Cap 300 Growth Index Fund and Vanguard Mega Cap 300 Value Index Fund:
In our opinion, the accompanying statements of net assets and the related statements of operations and of changes in net assets and the financial highlights present fairly, in all material respects, the financial position of Vanguard Mega Cap 300 Index Fund, Vanguard Mega Cap 300 Growth Index Fund and Vanguard Mega Cap 300 Value Index Fund (constituting separate portfolios of Vanguard World Fund, hereafter referred to as the “Funds”) at August 31, 2010, the results of each of their operations for the year then ended, the changes in each of their net assets for each of the two years in the period then ended and the financial highlights for each of the periods indicated, in conformity with accounting principles generally accepted in the United States of America. These financial statements and financial highlights (hereafter referred to as “financial statements”) are the responsibility of the Funds’ management; our responsibility is to express an opinion on these financial statements based on our audits. We conducted our audits of these financial statements in accordance with the standards of the Public Company Accounting Oversight Board (United States). Those standards require that we plan and perform the audit to obtain reasonable assurance about whether the financial statements are free of material misstatement. An audit includes examining, on a test basis, evidence supporting the amounts and disclosures in the financial statements, assessing the accounting principles used and significant estimates made by management, and evaluating the overall financial statement presentation. We believe that our audits, which included confirmation of securities at August 31, 2010 by correspondence with the custodian and by agreement to the underlying ownership records of Vanguard Market Liquidity Fund, provide a reasonable basis for our opinion.
PricewaterhouseCoopers LLP
Philadelphia, Pennsylvania
October 11, 2010
47

Special 2010 tax information (unaudited) for Vanguard Mega Cap 300 Index Funds
This information for the fiscal period ended August 31, 2010, is included pursuant to provisions of the Internal Revenue Code.
The funds distributed qualified dividend income to shareholders during the fiscal year as follows:
| |
| | Qualified Dividend Income |
| Index Fund | ($000) |
| Mega Cap 300 | 6,926 |
| Mega Cap 300 Growth | 5,693 |
| Mega Cap 300 Value | 7,609 |
For corporate shareholders, the percentage of investment income (dividend income plus short-term gains, if any) that qualifies for the dividends-received deduction is as follows:
| |
| Index Fund | Percentage |
| Mega Cap 300 | 97.0% |
| Mega Cap 300 Growth | 94.7 |
| Mega Cap 300 Value | 97.3 |
48
Your Fund’s After-Tax Returns
This table presents returns for your fund both before and after taxes. The after-tax returns are shown in two ways: (1) assuming that an investor owned the fund during the entire period and paid taxes on the fund’s distributions, and (2) assuming that an investor paid taxes on the fund’s distributions and sold all shares at the end of each period.
Calculations are based on the highest individual federal income tax and capital gains tax rates in effect at the times of the distributions and the hypothetical sales. State and local taxes were not considered. After-tax returns reflect any qualified dividend income , using actual prior-year figures and estimates for 2010. (In the example, returns after the sale of fund shares may be higher than those assuming no sale. This occurs when the sale would have produced a capital loss. The calculation assumes that the investor received a tax deduction for the loss.)
The table shows returns for ETF Shares only; returns for other share classes will differ. Please note that your actual after-tax returns will depend on your tax situation and may differ from those shown. Also note that if you own the fund in a tax-deferred account, such as an individual retirement account or a 401(k) plan, this information does not apply to you. Such accounts are not subject to current taxes.
Finally, keep in mind that a fund’s performance—whether before or after taxes—does not guarantee future results.
Average Annual Total Returns: Mega Cap 300 Index Funds
Periods Ended August 31, 2010
| | |
| | | Since |
| | One | Inception |
| | Year | (12/17/2007) |
| Mega Cap 300 Index Fund ETF Shares | | |
| Returns Before Taxes | 3.71% | -9.22% |
| Returns After Taxes on Distributions | 3.38 | -9.47 |
| Returns After Taxes on Distributions and Sale of Fund Shares | 2.88 | -7.73 |
| |
| | | Since |
| | One | Inception |
| | Year | (12/17/2007) |
| Mega Cap 300 Growth Index Fund ETF Shares | | |
| Returns Before Taxes | 4.82% | -7.25% |
| Returns After Taxes on Distributions | 4.61 | -7.42 |
| Returns After Taxes on Distributions and Sale of Fund Shares | 3.44 | -6.11 |
| |
| | | Since |
| | One | Inception |
| | Year | (12/17/2007) |
| Mega Cap 300 Value Index Fund ETF Shares | | |
| Returns Before Taxes | 2.68% | -11.22% |
| Returns After Taxes on Distributions | 2.26 | -11.58 |
| Returns After Taxes on Distributions and Sale of Fund Shares | 2.33 | -9.37 |
49
About Your Fund’s Expenses
As a shareholder of the fund, you incur ongoing costs, which include costs for portfolio management, administrative services, and shareholder reports (like this one), among others. Operating expenses, which are deducted from a fund’s gross income, directly reduce the investment return of the fund.
A fund’s expenses are expressed as a percentage of its average net assets. This figure is known as the expense ratio. The following examples are intended to help you understand the ongoing costs (in dollars) of investing in your fund and to compare these costs with those of other mutual funds. The examples are based on an investment of $1,000 made at the beginning of the period shown and held for the entire period.
The accompanying table illustrates your fund’s costs in two ways:
• Based on actual fund return. This section helps you to estimate the actual expenses that you paid over the period. The ”Ending Account Value“ shown is derived from the fund‘s actual return, and the third column shows the dollar amount that would have been paid by an investor who started with $1,000 in the fund. You may use the information here, together with the amount you invested, to estimate the expenses that you paid over the period.
To do so, simply divide your account value by $1,000 (for example, an $8,600 account value divided by $1,000 = 8.6), then multiply the result by the number given for your fund under the heading ”Expenses Paid During Period.“
• Based on hypothetical 5% yearly return. This section is intended to help you compare your fund‘s costs with those of other mutual funds. It assumes that the fund had a yearly return of 5% before expenses, but that the expense ratio is unchanged. In this case—because the return used is not the fund’s actual return—the results do not apply to your investment. The example is useful in making comparisons because the Securities and Exchange Commission requires all mutual funds to calculate expenses based on a 5% return. You can assess your fund’s costs by comparing this hypothetical example with the hypothetical examples that appear in shareholder reports of other funds.
Note that the expenses shown in the table are meant to highlight and help you compare ongoing costs only and do not reflect transaction costs incurred by the fund for buying and selling securities. Your fund does not charge transaction fees, such as purchase or redemption fees, nor does it carry a “sales load.”
The calculations assume no shares were bought or sold during the period. Your actual costs may have been higher or lower, depending on the amount of your investment and the timing of any purchases or redemptions.
You can find more information about the fund’s expenses, including annual expense ratios, in the Financial Statements section of this report. For additional information on operating expenses and other shareholder costs, please refer to your fund’s current prospectus.
50
| | | |
| Six Months Ended August 31, 2010 | | | |
| | Beginning | Ending | Expenses |
| | Account Value | Account Value | Paid During |
| | 2/28/2010 | 8/31/2010 | Period |
| Based on Actual Fund Return | | | |
| Mega Cap 300 Index Fund | | | |
| Institutional Shares | $1,000.00 | $953.62 | $0.54 |
| ETF Shares | 1,000.00 | 953.64 | 0.64 |
| Mega Cap 300 Growth Index Fund | | | |
| Institutional Shares | $1,000.00 | $944.36 | $0.54 |
| ETF Shares | 1,000.00 | 944.21 | 0.64 |
| Mega Cap 300 Value Index Fund | | | |
| Institutional Shares | $1,000.00 | $962.59 | $0.54 |
| ETF Shares | 1,000.00 | 962.46 | 0.64 |
| Based on Hypothetical 5% Yearly Return | | | |
| Mega Cap 300 Index Fund | | | |
| Institutional Shares | $1,000.00 | $1,024.65 | $0.56 |
| ETF Shares | 1,000.00 | 1,024.55 | 0.66 |
| Mega Cap 300 Growth Index Fund | | | |
| Institutional Shares | $1,000.00 | $1,024.65 | $0.56 |
| ETF Shares | 1,000.00 | 1,024.55 | 0.66 |
| Mega Cap 300 Value Index Fund | | | |
| Institutional Shares | $1,000.00 | $1,024.65 | $0.56 |
| ETF Shares | 1,000.00 | 1,024.55 | 0.66 |
The calculations are based on expenses incurred in the most recent six-month period. The funds’ annualized six-month expense ratios for that period are: for the Mega Cap 300 Index Fund, 0.11% for Institutional Shares and 0.13% for ETF Shares; for the Mega Cap 300 Growth Index Fund, 0.11% for Institutional Shares and 0.13% for ETF Shares; and for the Mega Cap 300 Value Index Fund, 0.11% for Institutional Shares and 0.13% for ETF Shares. The dollar amounts shown as “Expenses Paid” are equal to the annualized expense ratio multiplied by the average account value over the period, multiplied by the number of days in the most recent six-month period, then divided by the number of days in the most recent 12-month period.
51
Trustees Approve Advisory Arrangement
The board of trustees of Vanguard Mega Cap 300 Index Fund, Mega Cap 300 Growth Index Fund, and Mega Cap 300 Value Index Fund has renewed the funds’ investment advisory arrangement with The Vanguard Group, Inc. Vanguard—through its Quantitative Equity Group—serves as investment advisor to the funds. The board determined that continuing the funds’ internalized management structure was in the best interests of the funds and their shareholders.
The board based its decision upon an evaluation of the advisor’s investment staff, portfolio management process, and performance. The trustees considered the factors discussed below, among others. However, no single factor determined whether the board approved the arrangement. Rather, it was the totality of the circumstances that drove the board’s decision.
Nature, extent, and quality of services
The board considered the quality of the funds’ investment management since their inception in 2007 and took into account the organizational depth and stability of the advisor. The board noted that Vanguard has been managing investments for more than three decades. The Quantitative Equity Group adheres to a sound, disciplined investment management process; the team has considerable experience, stability, and depth.
The board concluded that Vanguard’s experience, stability, depth, and performance, among other factors, warranted continuation of the advisory arrangement.
Investment performance
The board considered the funds’ performance since their inception, including any periods of outper- formance and underperformance of their target indexes and peer groups.
The board concluded that the funds have performed in line with expectations, and that their results have been consistent with their investment strategies. Information about each fund’s most recent performance can be found on the Performance Summary pages of this report.
Cost
The board concluded that the funds’ expense ratios were well below the average expense ratios charged by funds in their respective peer groups and that the funds’ advisory expense ratios were also well below their peer-group averages. Information about the funds’ expense ratios appears in the About Your Fund’s Expenses section of this report.
The board does not conduct a profitability analysis of Vanguard, because of Vanguard’s unique “at-cost” structure. Unlike most other mutual fund management companies, Vanguard is owned by the funds it oversees, and produces “profits” only in the form of reduced expenses for fund shareholders.
The benefit of economies of scale
The board concluded that the funds’ low-cost arrangement with Vanguard ensures that the funds will realize economies of scale as they grow, with the cost to shareholders declining as fund assets increase.
The board will consider whether to renew the advisory arrangement again after a one-year period.
52
Glossary
30-Day SEC Yield. A fund’s 30-day SEC yield is derived using a formula specified by the U.S. Securities and Exchange Commission. Under the formula, data related to the fund’s security holdings in the previous 30 days are used to calculate the fund’s hypothetical net income for that period, which is then annualized and divided by the fund’s estimated average net assets over the calculation period. For the purposes of this calculation, a security’s income is based on its current market yield to maturity (in the case of bonds) or its projected dividend yield (for stocks). Because the SEC yield represents hypothetical annualized income, it will differ—at times significantly—from the fund’s actual experience. As a result, the fund’s income distributions may be higher or lower than implied by the SEC yield.
Dividend Yield. Dividend income earned by stocks, expressed as a percentage of the aggregate market value (or of net asset value, for a fund). The yield is determined by dividing the amount of the annual dividends by the aggregate value (or net asset value) at the end of the period. For a fund, the dividend yield is based solely on stock holdings and does not include any income produced by other investments.
Earnings Growth Rate. The average annual rate of growth in earnings over the past five years for the stocks now in a fund.
Equity Exposure. A measure that reflects a fund’s investments in stocks and stock futures. Any holdings in short-term reserves are excluded.
Expense Ratio. The percentage of a fund’s average net assets used to pay its annual administrative and advisory expenses. These expenses directly reduce returns to investors.
Foreign Holdings. The percentage of a fund represented by stocks or depositary receipts of companies based outside the United States.
Inception Date. The date on which the assets of a fund (or one of its share classes) are first invested in accordance with the fund’s investment objective. For funds with a subscription period, the inception date is the day after that period ends. Investment performance is measured from the inception date.
Median Market Cap. An indicator of the size of companies in which a fund invests; the midpoint of market capitalization (market price x shares outstanding) of a fund’s stocks, weighted by the proportion of the fund’s assets invested in each stock. Stocks representing half of the fund’s assets have market capitalizations above the median, and the rest are below it.
Price/Book Ratio. The share price of a stock divided by its net worth, or book value, per share. For a fund, the weighted average price/book ratio of the stocks it holds.
Price/Earnings Ratio. The ratio of a stock’s current price to its per-share earnings over the past year. For a fund, the weighted average P/E of the stocks it holds. P/E is an indicator of market expectations about corporate prospects; the higher the P/E, the greater the expectations for a company’s future growth.
Return on Equity. The annual average rate of return generated by a company during the past five years for each dollar of shareholder’s equity (net income divided by shareholder’s equity). For a fund, the weighted average return on equity for the companies whose stocks it holds.
53
Short-Term Reserves. The percentage of a fund invested in highly liquid, short-term securities that can be readily converted to cash.
Turnover Rate. An indication of the fund’s trading activity. Funds with high turnover rates incur higher transaction costs and may be more likely to distribute capital gains (which may be taxable to investors). The turnover rate excludes in-kind transactions, which have minimal impact on costs.
54
This page intentionally left blank.
The People Who Govern Your Fund
The trustees of your mutual fund are there to see that the fund is operated and managed in your best interests since, as a shareholder, you are a part owner of the fund. Your fund’s trustees also serve on the board of directors of The Vanguard Group, Inc., which is owned by the Vanguard funds and provides services to them on an at-cost basis.
A majority of Vanguard’s board members are independent, meaning that they have no affiliation with Vanguard or the funds they oversee, apart from the sizable personal investments they have made as private individuals. The independent board members have distinguished backgrounds in business, academia, and public service. Each of the trustees and executive officers oversees 163 Vanguard funds.
The following table provides information for each trustee and executive officer of the fund. More information about the trustees is in the Statement of Additional Information, which can be obtained, without charge, by contacting Vanguard at 800-662-7447, or online at vanguard.com.
| |
| Interested Trustee1 | Amy Gutmann |
| | Born 1949. Trustee Since June 2006. Principal |
| F. William McNabb III | Occupation(s) During the Past Five Years: President |
| Born 1957. Trustee Since July 2009. Chairman of the | of the University of Pennsylvania; Christopher H. |
| Board. Principal Occupation(s) During the Past Five | Browne Distinguished Professor of Political Science |
| Years: Chairman of the Board of The Vanguard Group, | in the School of Arts and Sciences with secondary |
| Inc., and of each of the investment companies served | appointments at the Annenberg School for Commu- |
| by The Vanguard Group, since January 2010; Director | nication and the Graduate School of Education |
| of The Vanguard Group since 2008; Chief Executive | of the University of Pennsylvania; Director of |
| Officer and President of The Vanguard Group and of | Carnegie Corporation of New York, Schuylkill River |
| each of the investment companies served by The | Development Corporation, and Greater Philadelphia |
| Vanguard Group since 2008; Director of Vanguard | Chamber of Commerce; Trustee of the National |
| Marketing Corporation; Managing Director of The | Constitution Center; Chair of the Presidential |
| Vanguard Group (1995–2008) . | Commission for the Study of Bioethical Issues. |
| |
| | JoAnn Heffernan Heisen |
| Independent Trustees | Born 1950. Trustee Since July 1998. Principal |
| | Occupation(s) During the Past Five Years: Corporate |
| Emerson U. Fullwood | Vice President and Chief Global Diversity Officer |
| Born 1948. Trustee Since January 2008. Principal | since 2006 (retired 2008) and Member of the |
| Occupation(s) During the Past Five Years: Executive | Executive Committee (retired 2008) of Johnson & |
| Chief Staff and Marketing Officer for North America | Johnson (pharmaceuticals/consumer products); Vice |
| and Corporate Vice President (retired 2008) of Xerox | President and Chief Information Officer of Johnson & |
| Corporation (document management products and | Johnson (1997–2005); Director of the University |
| services); Director of SPX Corporation (multi-industry | Medical Center at Princeton and Women’s Research |
| manufacturing), the United Way of Rochester, | and Education Institute; Member of the Advisory |
| Amerigroup Corporation (managed health care), | Board of the Maxwell School of Citizenship and Public |
| the University of Rochester Medical Center, and | Affairs at Syracuse University. |
| Monroe Community College Foundation. | |
| | F. Joseph Loughrey |
| Rajiv L. Gupta | Born 1949. Trustee Since October 2009. Principal |
| Born 1945. Trustee Since December 2001.2 | Occupation(s) During the Past Five Years: President |
| Principal Occupation(s) During the Past Five Years: | and Chief Operating Officer since 2005 (retired 2009) |
| Chairman and Chief Executive Officer (retired 2009) | and Vice Chairman of the Board (2008–2009) of |
| and President (2006–2008) of Rohm and Haas Co. | Cummins Inc. (industrial machinery); Director of |
| (chemicals); Director of Tyco International, Ltd. | SKF AB (industrial machinery), Hillenbrand, Inc. |
| (diversified manufacturing and services) and Hewlett- | (specialized consumer services), Sauer-Danfoss Inc. |
| Packard Co. (electronic computer manufacturing); | (machinery), the Lumina Foundation for Education, |
| Trustee of The Conference Board; Member of the | and Oxfam America; Chairman of the Advisory |
| Board of Managers of Delphi Automotive LLP | Council for the College of Arts and Letters at the |
| (automotive components) . | University of Notre Dame. |
| | |
| André F. Perold | Kathryn J. Hyatt | |
| Born 1952. Trustee Since December 2004. Principal | Born 1955. Treasurer Since November 2008. Principal |
| Occupation(s) During the Past Five Years: George | Occupation(s) During the Past Five Years: Principal |
| Gund Professor of Finance and Banking at the Harvard | of The Vanguard Group, Inc.; Treasurer of each of |
| Business School; Chair of the Investment Committee | the investment companies served by The Vanguard |
| of HighVista Strategies LLC (private investment firm) . | Group since 2008; Assistant Treasurer of each of the |
| | investment companies served by The Vanguard Group |
| Alfred M. Rankin, Jr. | (1988–2008) . | |
| Born 1941. Trustee Since January 1993. Principal | | |
| Occupation(s) During the Past Five Years: Chairman, | Heidi Stam | |
| President, and Chief Executive Officer of NACCO | Born 1956. Secretary Since July 2005. Principal |
| Industries, Inc. (forklift trucks/housewares/lignite); | Occupation(s) During the Past Five Years: Managing |
| Director of Goodrich Corporation (industrial products/ | Director of The Vanguard Group, Inc., since 2006; |
| aircraft systems and services); Chairman of the | General Counsel of The Vanguard Group since 2005; |
| Federal Reserve Bank of Cleveland; Trustee of The | Secretary of The Vanguard Group and of each of the |
| Cleveland Museum of Art. | investment companies served by The Vanguard Group |
| | since 2005; Director and Senior Vice President of |
| Peter F. Volanakis | Vanguard Marketing Corporation since 2005; |
| Born 1955. Trustee Since July 2009. Principal | Principal of The Vanguard Group (1997–2006). |
| Occupation(s) During the Past Five Years: President | | |
| since 2007 and Chief Operating Officer since 2005 | | |
| of Corning Incorporated (communications equipment); | Vanguard Senior Management Team |
| President of Corning Technologies (2001–2005); | | |
| Director of Corning Incorporated and Dow Corning; | R. Gregory Barton | Michael S. Miller |
| Trustee of the Corning Incorporated Foundation and | Mortimer J. Buckley | James M. Norris |
| the Corning Museum of Glass; Overseer of the | Kathleen C. Gubanich | Glenn W. Reed |
| Amos Tuck School of Business Administration at | Paul A. Heller | George U. Sauter |
| Dartmouth College. | | |
| |
| | Chairman Emeritus and Senior Advisor |
| Executive Officers | | |
| | John J. Brennan | |
| Glenn Booraem | Chairman, 1996–2009 | |
| Born 1967. Controller Since July 2010. Principal | Chief Executive Officer and President, 1996–2008 |
| Occupation(s) During the Past Five Years: Principal | | |
| of The Vanguard Group, Inc.; Controller of each of | | |
| the investment companies served by The Vanguard | Founder | |
| Group since 2010; Assistant Controller of each of | | |
| the investment companies served by The Vanguard | John C. Bogle | |
| Group (2001–2010) . | Chairman and Chief Executive Officer, 1974–1996 |
| |
| Thomas J. Higgins | | |
| Born 1957. Chief Financial Officer Since September | | |
| 2008. Principal Occupation(s) During the Past Five | | |
| Years: Principal of The Vanguard Group, Inc.; Chief | | |
| Financial Officer of each of the investment companies | | |
| served by The Vanguard Group since 2008; Treasurer | | |
| of each of the investment companies served by The | | |
| Vanguard Group (1998–2008) . | | |
1 Mr. McNabb is considered an “interested person,” as defined in the Investment Company Act of 1940, because he is an officer of the Vanguard funds.
2 December 2002 for Vanguard Equity Income Fund, Vanguard Growth Equity Fund, the Vanguard Municipal Bond Funds, and the Vanguard State Tax-Exempt Funds.
|  |
| P.O. Box 2600 |
| Valley Forge, PA 19482-2600 |
Connect with Vanguard® > Vanguard.com
| |
| Fund Information > 800-662-7447 | The funds or securities referred to herein are not |
| Direct Investor Account Services > 800-662-2739 | sponsored, endorsed, or promoted by MSCI, and MSCI |
| Institutional Investor Services > 800-523-1036 | bears no liability with respect to any such funds or |
| Text Telephone for People | securities. For any such funds or securities, the |
| With Hearing Impairment > 800-749-7273 | prospectus or the Statement of Additional Information |
| contains a more detailed description of the limited |
| | relationship MSCI has with The Vanguard Group and |
| This material may be used in conjunction | any related funds. |
| with the offering of shares of any Vanguard | |
| fund only if preceded or accompanied by | |
| the fund’s current prospectus. | |
| |
| All comparative mutual fund data are from Lipper Inc. or | |
| Morningstar, Inc., unless otherwise noted. | |
| |
| You can obtain a free copy of Vanguard’s proxy voting | |
| guidelines by visiting vanguard.com/proxyreporting or by | |
| calling Vanguard at 800-662-2739. The guidelines are | |
| also available from the SEC’s website, sec.gov. In | |
| addition, you may obtain a free report on how your fund | |
| voted the proxies for securities it owned during the 12 | |
| months ended June 30. To get the report, visit either | |
| vanguard.com/proxyreporting or sec.gov. | |
| |
| You can review and copy information about your fund at | |
| the SEC’s Public Reference Room in Washington, D.C. To | |
| find out more about this public service, call the SEC at | |
| 202-551-8090. Information about your fund is also | |
| available on the SEC’s website, and you can receive | |
| copies of this information, for a fee, by sending a | |
| request in either of two ways: via e-mail addressed to | |
| publicinfo@sec.gov or via regular mail addressed to the | |
| Public Reference Section, Securities and Exchange | |
| Commission, Washington, DC 20549-1520. | |
| |
| |
| | © 2010 The Vanguard Group, Inc. |
| | All rights reserved. |
| | Vanguard Marketing Corporation, Distributor. |
| |
| | Q8280 102010 |
Item 2: Code of Ethics. The Registrant has adopted a code of ethics that applies to the Registrant’s principal executive officer, principal financial officer, principal accounting officer or controller or persons performing similar functions. The Code of Ethics was amended during the reporting period covered by this report to make certain technical, non-material changes.
Item 3: Audit Committee Financial Expert. The following members of the Audit Committee have been determined by the Registrant’s Board of Trustees to be Audit Committee Financial Experts serving on its Audit Committee, and to be independent: Charles D. Ellis, Rajiv L. Gupta, JoAnn Heffernan Heisen, André F. Perold, and Alfred M. Rankin, Jr.
Item 4: Principal Accountant Fees and Services.
(a) Audit Fees.
Audit Fees of the Registrant
Fiscal Year Ended August 31, 2010: $460,000
Fiscal Year Ended August 31, 2009: $423,000
Aggregate Audit Fees of Registered Investment Companies in the Vanguard Group.
Fiscal Year Ended August 31, 2010: $3,607,060
Fiscal Year Ended August 31, 2009: $3,354,640
(b) Audit-Related Fees.
Fiscal Year Ended August 31, 2010: $791,350
Fiscal Year Ended August 31, 2009: $876,210
Includes fees billed in connection with assurance and related services provided to the Registrant, The Vanguard Group, Inc., Vanguard Marketing Corporation, and other registered investment companies in the Vanguard Group.
(c) Tax Fees.
Fiscal Year Ended August 31, 2010: $336,090
Fiscal Year Ended August 31, 2009: $423,070
Includes fees billed in connection with tax compliance, planning and advice services provided to the Registrant, The Vanguard Group, Inc., Vanguard Marketing Corporation, and other registered investment companies in the Vanguard Group and related to income and excise taxes.
(d) All Other Fees.
Fiscal Year Ended August 31, 2010: $16,000
Fiscal Year Ended August 31, 2009: $0
Includes fees billed for services related to risk management and privacy matters. Services were provided to the Registrant, The Vanguard Group, Inc., Vanguard Marketing Corporation, and other registered investment companies in the Vanguard Group.
(e) (1) Pre-Approval Policies. The policy of the Registrant’s Audit Committee is to consider and, if appropriate, approve before the principal accountant is engaged for such services, all specific audit and non-audit services provided to: (1) the Registrant; (2) The Vanguard Group, Inc.; (3) other entities controlled by The Vanguard Group, Inc. that provide ongoing services to the Registrant; and (4) other registered investment companies in the Vanguard Group. In making a determination, the Audit Committee considers whether the services are consistent with maintaining the principal accountant’s independence.
In the event of a contingency situation in which the principal accountant is needed to provide services in between scheduled Audit Committee meetings, the Chairman of the Audit Committee would be called on to consider and, if appropriate, pre-approve audit or permitted non-audit services in an amount sufficient to complete services through the next Audit Committee meeting, and to determine if such services would be consistent with maintaining the accountant’s independence. At the next scheduled Audit Committee meeting, services and fees would be presented to the Audit Committee for formal consideration, and, if appropriate, approval by the entire Audit Committee. The Audit Committee would again consider whether such services and fees are consistent with maintaining the principal accountant’s independence.
The Registrant’s Audit Committee is informed at least annually of all audit and non-audit services provided by the principal accountant to the Vanguard complex, whether such services are provided to: (1) the Registrant; (2) The Vanguard Group, Inc.; (3) other entities controlled by The Vanguard Group, Inc. that provide ongoing services to the Registrant; or (4) other registered investment companies in the Vanguard Group.
(2) No percentage of the principal accountant’s fees or services were approved pursuant to the waiver provision of paragraph (c)(7)(i)(C) of Rule 2-01 of Regulation S-X.
(f) For the most recent fiscal year, over 50% of the hours worked under the principal accountant’s engagement were not performed by persons other than full-time, permanent employees of the principal accountant.
(g) Aggregate Non-Audit Fees.
Fiscal Year Ended August 31, 2010: $352,090
Fiscal Year Ended August 31, 2009: $423,070
Includes fees billed for non-audit services provided to the Registrant, The Vanguard Group, Inc., Vanguard Marketing Corporation, and other registered investment companies in the Vanguard Group.
(h) For the most recent fiscal year, the Audit Committee has determined that the provision of all non-audit services was consistent with maintaining the principal accountant’s independence.
Item 5: Audit Committee of Listed Registrants. The Registrant is a listed issuer as defined in Rule 10A-3 under the Securities Exchange Act of 1934 (“Exchange Act”). The Registrant has separately-designated standing audit committee established in accordance with Section 3(a)(58)(A) of the Exchange Act. The Registrant’s audit committee members are: Emerson U. Fullwood, Rajiv L. Gupta, Amy Gutmann, JoAnn Heffernan Heisen, F. Joseph Loughrey, André F. Perold, Alfred M. Rankin, Jr., and Peter F. Volanakis.
Item 6: Investments.
Not Applicable.
Item 7: Disclosure of Proxy Voting Policies and Procedures for Closed-End Management Investment Companies.
Not Applicable.
Item 8: Portfolio Managers of Closed-End Management Investment Companies.
Not Applicable.
Item 9: Purchase of Equity Securities by Closed-End Management Investment Company and Affiliated Purchasers.
Not Applicable.
Item 10: Submission of Matters to a Vote of Security Holders.
Not Applicable.
Item 11: Controls and Procedures.
(a) Disclosure Controls and Procedures. The Principal Executive and Financial Officers concluded that the Registrant's Disclosure Controls and Procedures are effective based on their evaluation of the Disclosure Controls and Procedures as of a date within 90 days of the filing date of this report.
(b) Internal Control Over Financial Reporting. There were no significant changes in Registrant’s Internal Control Over Financial Reporting or in other factors that could significantly affect this control subsequent to the date of the evaluation, including any corrective actions with regard to significant deficiencies and material weaknesses.
Item 12: Exhibits.
(a) Code of Ethics.
(b) Certifications.
Pursuant to the requirements of the Securities Exchange Act of 1934 and the Investment Company Act of 1940, the registrant has duly caused this report to be signed on its behalf by the undersigned, thereunto duly authorized.
| |
| | VANGUARD WORLD FUND |
| |
| By: | /s/ F. WILLIAM MCNABB III* |
| | F. WILLIAM MCNABB III |
| | CHIEF EXECUTIVE OFFICER |
| |
| Date: October 21, 2010 |
Pursuant to the requirements of the Securities Exchange Act of 1934 and the Investment Company Act of 1940, this report has been signed below by the following persons on behalf of the registrant and in the capacities and on the dates indicated.
| |
| | VANGUARD WORLD FUND |
| |
| By: | /s/ F. WILLIAM MCNABB III* |
| | F. WILLIAM MCNABB III |
| | CHIEF EXECUTIVE OFFICER |
| |
| Date: October 21, 2010 |
| |
| | VANGUARD WORLD FUND |
| |
| By: | /s/ THOMAS J. HIGGINS* |
| | THOMAS J. HIGGINS |
| | CHIEF FINANCIAL OFFICER |
| |
| Date: October 21, 2010 |
* By: /s/ Heidi Stam
Heidi Stam, pursuant to a Power of Attorney filed on April 26, 2010, see file Number
33-53683, Incorporated by Reference.