UNITED STATES
SECURITIES AND EXCHANGE COMMISSION
Washington, D.C. 20549
CERTIFIED SHAREHOLDER REPORT
OF
REGISTERED MANAGEMENT INVESTMENT COMPANIES
| |
| Investment Company Act file number: 811-1027 |
| Name of Registrant: Vanguard World Funds |
| Address of Registrant: P.O. Box 2600 | |
| Valley Forge, PA 19482 |
| Name and address of agent for service: | Heidi Stam, Esquire |
| | P.O. Box 876 |
| | Valley Forge, PA 19482 |
| Registrant’s telephone number, including area code: (610) 669-1000 |
| Date of fiscal year end: August 31 | |
| Date of reporting period: September 1, 2008 – August 31, 2009 |
Item 1: Reports to Shareholders

| Vanguard U.S. Growth Fund |
| Annual Report |
| August 31, 2009 |

> Vanguard U.S. Growth Fund returned about –16% for the fiscal year ended
August 31, 2009.
> The fund’s disappointing return was nevertheless better than the return of its
benchmark index (about –17%) and the average return of competing funds
(about –18%).
> The fund’s result for the fiscal year encompassed two very different market
environments—a first half during which the fund returned about –39% and a
second half during which it returned about 37%.
| |
| Contents | |
| Your Fund’s Total Returns. | 1 |
| President’s Letter. | 2 |
| Advisors’ Report. | 7 |
| Results of Proxy Voting. | 10 |
| Fund Profile. | 11 |
| Performance Summary. | 13 |
| Financial Statements. | 15 |
| Your Fund’s After-Tax Returns. | 27 |
| About Your Fund’s Expenses. | 28 |
| Glossary. | 30 |
Please note: The opinions expressed in this report are just that—informed opinions. They should not be considered promises or advice.
Also, please keep in mind that the information and opinions cover the period through the date on the front of this report. Of course, the
risks of investing in your fund are spelled out in the prospectus.
See the Glossary for definitions of investment terms used in this report.
Cover photograph: Veronica Coia.
Your Fund’s Total Returns
| |
| Fiscal Year Ended August 31, 2009 | |
| | Total |
| | Returns |
| Vanguard U.S. Growth Fund | |
| Investor Shares | -16.29% |
| Admiral™ Shares | -16.15 |
| Russell 1000 Growth Index | -16.76 |
| Large-Cap Growth Funds Average | -17.84 |
| Large-Cap Growth Funds Average: Derived from data provided by Lipper Inc. | |
Admiral Shares are a lower-cost class of shares available to many longtime shareholders and to those with significant investments in the fund.
Your Fund’s Performance at a Glance
August 31, 2008, Through August 31, 2009
| | | | |
| | | | Distributions Per Share |
| | Starting | Ending | Income | Capital |
| | Share Price | Share Price | Dividends | Gains |
| Vanguard U.S. Growth Fund | | | | |
| Investor Shares | $17.89 | $14.83 | $0.116 | $0.000 |
| Admiral Shares | 46.37 | 38.41 | 0.376 | 0.000 |
1

President’s Letter
Dear Shareholder,
Vanguard U.S. Growth Fund returned about –16% for the fiscal year ended August 31, its second annual loss in a row. However, the results mask a dramatic turnaround in market sentiment and fund performance that began about midway through U.S. Growth’s fiscal year.
Investor confidence abruptly returned in March as turmoil in the credit markets began to subside and economic reports began to suggest that the economy was on the mend. The corporate bond market and the stock market rebounded, helping turn the second half of the fund’s fiscal year into a mirror image of the first.
U.S. Growth returned about 37% for the second half of the fiscal year, compared with a return of almost –39% for its opening six months. Because of the sometimes confounding mathematics of percentages, these more or less inverse returns netted to the 12-month loss of about –16%. U.S. Growth outdid its benchmark index and the average return of peer-group funds for the year as a whole. On a relative basis, at least, the fund’s performance marks a positive change from its struggles in recent years.
2
Stocks sank, then soared as credit and economy stabilized
The fiscal year began with the September collapse of a major investment bank and the government-engineered rescue of several giant financial institutions. Stocks sank as the ensuing crisis spread from Wall Street to Main Street and around the globe. Stricken by seized-up credit markets and a near-total lack of confidence, businesses and consumers put the brakes on economic growth.
Governments in the United States and abroad responded with unprecedented stimulus and other programs. Over the past six months, these efforts started to take hold. Credit-market conditions improved, and the outlook for the U.S.
economy brightened. From their early-March lows, stocks took off on an almost-unbroken winning streak.
Even so, the broad U.S. stock market ended the 12 months in negative territory, with a return of about –18%. International markets performed somewhat better, as major European economies emerged from recession; the MSCI All Country World Index ex USA returned about –14%.
Despite the robust second-half rally, it may be premature to sound the all-clear signal. As the fiscal year came to a close, home foreclosures and the unemployment rate were rising, and the federal government’s list of problem banks had climbed above 400—the most since June 1994. There is
| | | |
| Market Barometer | | | |
| |
| | Average Annual Total Returns |
| | Periods Ended August 31, 2009 |
| | One | Three | Five |
| | Year | Years | Years |
| Stocks | | | |
| Russell 1000 Index (Large-caps) | -18.39% | -5.61% | 0.94% |
| Russell 2000 Index (Small-caps) | -21.29 | -6.08 | 2.21 |
| Dow Jones U.S. Total Stock Market Index | -18.10 | -5.17 | 1.45 |
| MSCI All Country World Index ex USA (International) | -13.96 | -2.41 | 8.18 |
| |
| Bonds | | | |
| Barclays Capital U.S. Aggregate Bond Index (Broad | | | |
| taxable market) | 7.94% | 6.35% | 4.96% |
| Barclays Capital Municipal Bond Index | 5.67 | 4.14 | 4.15 |
| Citigroup Three-Month U.S. Treasury Bill Index | 0.51 | 2.77 | 2.98 |
| |
| CPI | | | |
| Consumer Price Index | -1.48% | 1.91% | 2.64% |
3
considerable historical evidence that recovery from a recession caused by a financial crisis tends to take longer than average.
Among bond investors, safety and yield traded places
The U.S. bond market also performed a U-turn during the year. Early on, as credit markets deteriorated, investors rushed to the relative safety and liquidity of U.S. Treasury securities, driving their prices up and yields down. Investors were so risk-averse that short-term Treasury yields briefly turned negative. November and December were among the ten best months ever for Treasury returns (adjusted for inflation). Corporate bonds, especially those of lower credit quality, struggled,
and their yield spreads above comparable Treasuries widened to near-historic levels during the first six months.
Several moves by the Treasury and the Federal Reserve Board—which slashed its target level for short-term interest rates to a range of 0%–0.25% in December—helped credit markets to attain some stability by the spring. In a dramatic reversal, investors regained their appetite for risk, favoring corporate bonds over Treasuries.
After all the ups and downs, Treasuries and high-yield corporate bonds produced similar 12-month returns of about 6%–7%. Overall, the broad U.S. taxable bond market returned about 8%. Tax-exempt municipal bonds, after a flat first half, returned more than 5% for the fiscal year.
Expense Ratios
Your Fund Compared With Its Peer Group
| | | |
| | | | Large-Cap |
| | Investor | Admiral | Growth Funds |
| | Shares | Shares | Average |
| U.S. Growth Fund | 0.50% | 0.31% | 1.34% |
The fund expense ratios shown are from the prospectus dated December 29, 2008, and represent estimated costs for the current fiscal year based on the fund’s net assets as of the prospectus date. For the fiscal year ended August 31, 2009, the expense ratios were 0.49% for the Investor Shares and 0.30% for the Admiral Shares. The peer-group expense ratio is derived from data provided by Lipper Inc. and captures information through year-end 2008.
4
Health care and energy stocks drove the fund’s return
During the market’s free fall in the fiscal year’s first half, every sector in which the fund invested posted negative results. By contrast, each of these sectors contributed a solid positive return during the second half.
The fund’s holdings in health care and energy had the most significant impact on its full-year performance; they were responsible for about half of the fund’s negative return. The fund’s consumer staples and industrial stocks also took a large chunk from its fiscal-year result.
The negative impact of other sectors, such as financials and materials, was less severe, in part because of stocks
that swam against the general market tide, including those of bankers Goldman Sachs and JPMorgan Chase and copper-miner Freeport-McMoRan.
The fund’s substantial holdings in information technology stocks—which represented about a third of its assets at the end of the period—held up relatively well, as a powerful second-half rally offset most of the sector’s decline in the first half. Over the full 12 months, the fund’s tech stocks trimmed about 1 percentage point from its return.
The only sector holdings that made a positive contribution to the fiscal-year return were—despite the economic
| |
| Total Returns | |
| Ten Years Ended August 31, 2009 | |
| | Average |
| | Annual Return |
| U.S. Growth Fund Investor Shares | -6.30% |
| Russell 1000 Growth Index | -3.17 |
| Large-Cap Growth Funds Average | -3.34 |
| Large-Cap Growth Funds Average: Derived from data provided by Lipper Inc. | |
The figures shown represent past performance, which is not a guarantee of future results. (Current performance may be lower or higher than the performance data cited. For performance data current to the most recent month-end, visit our website at www.vanguard.com/performance.) Note, too, that both investment returns and principal value can fluctuate widely, so an investor’s shares, when sold, could be worth more or less than their original cost.
5
slump—consumer discretionary stocks, which got a significant boost from Kohl’s, the department store chain.
Although it was difficult to find bright spots in the year’s disappointing results, the advisors’ stock selections helped the fund stay a few steps ahead of its comparative standards. Of course, we can’t forget that such “better” performance during market downturns is a relative concept.
A word on expenses
The fund’s expense ratio has risen over the past fiscal year. The explanation is twofold.
First, as the value of the fund assets has declined, the fund’s fixed expenses have accounted for a modestly higher percentage of fund assets. Second, the Vanguard funds’ contracts with external advisors typically include breakpoint pricing. As assets rise above a breakpoint threshold, advisory fees are paid at a lower rate. When assets fall, as they have during fiscal 2009, a smaller portion of assets is subject to the lower rate, causing the overall rate to increase.
A turn for the better after a tough stretch
U.S. Growth ended fiscal 2009 on a welcome note. The fund performed well compared with its benchmark index and peer funds during a very difficult time. The funds’ advisors—AllianceBernstein and William Blair & Company—deserve much credit for that performance.
Of course, a single year’s result is only a part of a long-term record. And, in truth, the fund’s performance in recent years has not consistently matched that of its
benchmark. Over the past decade, for example, the fund produced an average annual return of about –6%, compared with about –3% for its benchmark index.
Going forward, we have confidence in our advisors and their approach to large-cap growth investing, and we believe that the fund has the potential to produce competitive returns over the long term.
Keep in mind that the fund’s long-term results are likely to be composed of widely differing yearly returns, as you can see in the Performance Summary later in this report. That reflects a variety of factors, from changing economic circumstances to the changing fortunes of the fast-growing, dynamic companies in which the fund invests.
That is why we urge investors to maintain a portfolio that is balanced among stocks, bonds, and cash reserves and diversified within these asset classes—a portfolio that holds both growth and value stocks, for example. The exact mix of assets should be based on your unique objective, time horizon, and risk tolerance. U.S. Growth can serve as an element in such a diversified portfolio.
Thank you for entrusting your assets to Vanguard.
Sincerely,

F. William McNabb III
President and Chief Executive Officer
September 12, 2009
6
Advisors’ Report
For the 12 months ended August 31, 2009, Vanguard U.S. Growth Fund returned about –16%. Your fund is managed by two independent advisors, a strategy that enhances the fund’s diversification by providing exposure to distinct, yet complementary, investment approaches. It is not uncommon for different advisors to have different views about individual securities or the broader investment environment.
The table below presents the advisors, the percentage and amount of fund assets that each manages, and brief descriptions of their investment strategies. Each advisor has also prepared a discussion of the investment environment during the fiscal year and of how the portfolio’s
positioning reflects this assessment. These reports were prepared on September 10, 2009.
AllianceBernstein L.P.
Portfolio Managers:
James G. Reilly,
Executive Vice President
P. Scott Wallace, CFA,
Senior Vice President
After extending 2008’s sharp losses in January and February, U.S. equities rallied, with the S&P 500 gaining about 41% from March to August 2009 amid thawing credit markets, signs of economic recovery, and better-than-expected corporate profits.
| | | |
| Vanguard U.S. Growth Fund Investment Advisors | |
| |
| | Fund Assets Managed | |
| Investment Advisor | % | $ Million | Investment Strategy |
| AllianceBernstein L.P. | 68 | 2,565 | Uses a fundamentally based, research-driven approach |
| | | | to large-capitalization growth investing. The advisor |
| | | | seeks to build a diversified portfolio of successful, |
| | | | well-managed companies with sustainable competitive |
| | | | advantages and superior prospects for growth not fully |
| | | | reflected in relative valuation. |
| William Blair & Company, L.L.C. | 30 | 1,146 | Uses a fundamental investment approach in pursuit of |
| | | | superior long-term investment results from |
| | | | growth-oriented companies with leadership positions |
| | | | and strong market presence. |
| Cash Investments | 2 | 82 | These short-term reserves are invested by Vanguard in |
| | | | equity index products to simulate investment in stocks. |
| | | | Each advisor may also maintain a modest cash |
| | | | position. |
7
Still, the S&P 500 finished the 12 months ended August 31, 2009, down about 18%. The growth investment style outperformed value during the period, with the Russell 1000 Growth Index returning about –17% and the Russell 1000 Value Index returning about –20%. For the 12 months, the fund outperformed its Russell 1000 Growth benchmark.
In the portion of the portfolio that we manage, our stock selection and overweighting in health care helped overall returns, as investors gravitated toward sectors perceived as defensive during the market turmoil. Our financial holdings, led by Goldman Sachs and JPMorgan Chase, also outperformed, reflecting emerging indications of these companies’ ability to take advantage of weakened competition and gain share in capital-markets segments. Our technology holdings, hurt by concerns about cutbacks in global tech spending, were the largest source of underperformance.
The market’s recent strength has provided a clear indication that fears about end-of-the-world scenarios have been put to rest, although investors are now questioning the sustainability of a rebound because of weak consumer spending. But it wasn’t the consumer segment that drove the economy down in the latest recession, and consumer spending often doesn’t lead the way out, as a wait-and-see attitude among employers causes rehiring to lag recovery.
With fears of financial Armageddon behind them, investors are returning their focus to earnings. Recent earnings reports showed a spike in earnings surprises relative to disappointments, suggesting that analysts were caught off guard by the moderation in declines. Meanwhile, earnings for growth companies have held up better this year and look more promising for 2010. Growth stocks are now priced on parity with value stocks, a seemingly counterintuitive occurrence. We expect investors to become more discerning as an economic recovery takes shape, and to gravitate toward companies that provide greater confidence in earnings stability and expansion; that should, in our view, favor the growth style.
William Blair & Company, L.L.C.
Portfolio Manager:
John F. Jostrand, CFA, Principal
The last year was an extremely difficult period for U.S. equity investors. The portfolio’s benchmark, the Russell 1000 Growth Index, returned about –17%. The period began with severe declines as the global financial crisis deepened, and record levels of volatility and indiscriminate selling occurred. Losses continued into early 2009 as investors reacted negatively to deteriorating economic and equity market fundamentals. As risk aversion increased, investors flocked to defensive groups such as consumer staples, health care, and larger-cap stocks.
8
After March 9, U.S. equity markets recorded an impressive positive performance. Stocks rallied as investors anticipated an economic recovery based on improved global economic data resulting from aggressive fiscal and monetary policy, both here and abroad. In general, over the last six months, riskier assets surpassed more conservative ones, emerging markets outperformed developed markets, and smaller-capitalization stocks surpassed large-caps.
Early in the period, our portion of the portfolio held up relatively well owing to our quality growth focus, although stock selection and an underweighted position in consumer staples weighed on results. The consumer staples sector was a strong performer as investors sought safety, but our exposure to it was substantially less than that of the index because we believe there are better opportunities for earnings growth in other groups. Campbell Soup, our weakest holding in consumer staples, came under pressure because of product-price discounting concerns, and we eliminated it.
Conversely, the consumer discretionary sector was the greatest contributor to our portion of the portfolio because of strong stock selection and an overweighting in a relatively good performer: Johnson Controls rallied as the economy and outlook for the automotive industry looked less dire.
In our view, we are probably past the worst of the recessionary declines, and economic recovery has begun. Signs of stabilization and improvement in the U.S. and other economies continue to appear. Global stimulus programs will continue to help as more of their components take effect. Additionally, in the near term, we should see an uptick in production as restocking occurs after the rapid reduction in inventory between October and March. Overall, our outlook for U.S. economic growth remains at subdued levels.
Many stocks—especially small-caps and those of lower quality—reacted positively and quickly to early signs of a recovery, even though there had been only slight improvement from the lows. Moving into 2010, investors are likely to focus on a company’s ability to sustain its recent advance, as demonstrated by a revival in sales combined with expense control. In this environment, we believe our portfolio will continue to benefit from our quality growth philosophy and our research-intensive investment process, which will help us to identify industry-leading companies with competitive business models that have compelling and sustainable earnings growth profiles and strong financial positions.
9
Results of Proxy Voting
At a special meeting of shareholders on July 2, 2009, fund shareholders approved the following two proposals:
Proposal 1—Elect trustees for each fund.*
The individuals listed in the table below were elected as trustees for each fund. All trustees with the exception of Messrs. McNabb and Volanakis (both of whom already served as directors of The Vanguard Group, Inc.) served as trustees to the funds prior to the shareholder meeting.
| | | |
| | | | Percentage |
| Trustee | For | Withheld | For |
| John J. Brennan | 816,325,661 | 25,839,114 | 96.9% |
| Charles D. Ellis | 811,618,878 | 30,545,897 | 96.4% |
| Emerson U. Fullwood | 816,960,560 | 25,204,215 | 97.0% |
| Rajiv L. Gupta | 815,607,429 | 26,557,346 | 96.8% |
| Amy Gutmann | 818,039,387 | 24,125,388 | 97.1% |
| JoAnn Heffernan Heisen | 815,771,400 | 26,393,375 | 96.9% |
| F. William McNabb III | 817,559,701 | 24,605,074 | 97.1% |
| André F. Perold | 814,833,250 | 27,331,525 | 96.8% |
| Alfred M. Rankin, Jr. | 815,942,907 | 26,221,868 | 96.9% |
| Peter F. Volanakis | 817,780,699 | 24,384,076 | 97.1% |
| * Results are for all funds within the same trust. | | | |
Proposal 2—Update and standardize the funds’ fundamental policies regarding:
(a) Purchasing and selling real estate.
(b) Issuing senior securities.
(c) Borrowing money.
(d) Making loans.
(e) Purchasing and selling commodities.
(f) Concentrating investments in a particular industry or group of industries.
(g) Eliminating outdated fundamental investment policies not required by law.
The revised fundamental policies are clearly stated and simple, yet comprehensive, making oversight and compliance more efficient than under the former policies. The revised fundamental policies will allow the funds to respond more quickly to regulatory and market changes, while avoiding the costs and delays associated with successive shareholder meetings.
| | | | | |
| | | | | Broker | Percentage |
| Vanguard Fund | For | Abstain | Against | Non-Votes | For |
| U.S. Growth Fund | | | | | |
| 2a | 165,876,100 | 4,890,892 | 4,356,102 | 4,561,467 | 92.3% |
| 2b | 165,333,362 | 5,207,115 | 4,582,614 | 4,561,469 | 92.0% |
| 2c | 164,407,000 | 5,129,930 | 5,586,162 | 4,561,469 | 91.5% |
| 2d | 164,607,338 | 5,140,619 | 5,375,135 | 4,561,468 | 91.6% |
| 2e | 165,078,411 | 5,040,748 | 5,003,934 | 4,561,468 | 91.9% |
| 2f | 165,249,329 | 5,178,086 | 4,695,676 | 4,561,469 | 92.0% |
| 2g | 166,305,489 | 5,073,329 | 3,744,272 | 4,561,470 | 92.6% |
10
U.S. Growth Fund
Fund Profile
As of August 31, 2009
| | |
| Share-Class Characteristics | |
| | Investor | Admiral |
| | Shares | Shares |
| Ticker Symbol | VWUSX | VWUAX |
| Expense Ratio1 | 0.50% | 0.31% |
| 30-Day SEC Yield | 0.58% | 0.81% |
| | | |
| Portfolio Characteristics | | |
| | | Russell | DJ |
| | | 1000 | U.S. Total |
| | | Growth | Market |
| | Fund | Index | Index |
| Number of Stocks | 86 | 627 | 4,345 |
| Median Market Cap | $53.2B | $35.3B | $27.3B |
| Price/Earnings Ratio | 24.2x | 20.6x | 26.0x |
| Price/Book Ratio | 2.6x | 3.4x | 2.1x |
| Return on Equity | 29.5% | 23.6% | 19.2% |
| Earnings Growth Rate | 21.8% | 16.6% | 9.7% |
| Dividend Yield | 1.1% | 1.7% | 2.0% |
| Foreign Holdings | 8.0% | 0.0% | 0.0% |
| Turnover Rate | 101% | — | — |
| Short-Term Reserves | 0.7% | — | — |
| | |
| Volatility Measures | | |
| | | DJ |
| | U.S. Total |
| | Russell 1000 | Market |
| | Growth Index | Index |
| R-Squared | 0.97 | 0.93 |
| Beta | 0.95 | 0.91 |
| These measures show the degree and timing of the fund’s fluctuations compared with the indexes over 36 months. | |
| | |
| Ten Largest Holdings (% of total net assets) |
| Apple Inc. | Computer | |
| | Hardware | 6.0% |
| Google Inc. | Internet Software & | |
| | Services | 5.5 |
| The Goldman Sachs | Investment Banking | |
| Group, Inc. | & Brokerage | 4.2 |
| QUALCOMM Inc. | Communications | |
| | Equipment | 4.0 |
| Hewlett-Packard Co. | Computer | |
| | Hardware | 4.0 |
| JPMorgan Chase & Co. | Diversified Financial | |
| | Services | 3.9 |
| Schlumberger Ltd. | Oil & Gas | |
| | Equipment & | |
| | Services | 3.4 |
| Gilead Sciences, Inc. | Biotechnology | 3.4 |
| Intel Corp. | Semiconductors | 2.7 |
| Kohl's Corp. | Department Stores | 2.6 |
| Top Ten | | 39.7% |
| The holdings listed exclude any temporary cash investments and equity index products. |
Investment Focus
1 The expense ratios shown are from the prospectus dated December 29, 2008, and represent estimated costs for the current fiscal year based
on the fund’s net assets as of the prospectus date. For the fiscal year ended August 31, 2009, the expense ratios were 0.49% for the Investor
Shares and 0.30% for the Admiral Shares.
11
U.S. Growth Fund
Sector Diversification (% of equity exposure)
| | | Russell | DJ |
| | | 1000 | U.S. Total |
| | | Growth | Market |
| | Fund | Index | Index |
| Consumer | | | |
| Discretionary | 9.9% | 10.4% | 10.0% |
| Consumer Staples | 7.0 | 16.0 | 10.0 |
| Energy | 8.5 | 4.1 | 11.2 |
| Financials | 13.8 | 5.3 | 16.5 |
| Health Care | 14.2 | 16.8 | 13.2 |
| Industrials | 9.0 | 10.1 | 10.3 |
| Information | | | |
| Technology | 32.2 | 31.8 | 18.2 |
| Materials | 5.3 | 4.0 | 3.8 |
| Telecommunication | | | |
| Services | 0.0 | 0.5 | 2.9 |
| Utilities | 0.1 | 1.0 | 3.9 |
12
U.S. Growth Fund
Performance Summary
All of the returns in this report represent past performance, which is not a guarantee of future results that may be achieved by the fund. (Current performance may be lower or higher than the performance data cited. For performance data current to the most recent month-end, visit our website at www.vanguard.com/performance.) Note, too, that both investment returns and principal value can fluctuate widely, so an investor’s shares, when sold, could be worth more or less than their original cost. The returns shown do not reflect taxes that a shareholder would pay on fund distributions or on the sale of fund shares.
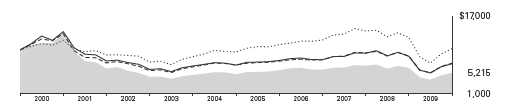
Cumulative Performance: August 31, 1999, Through August 31, 2009
Initial Investment of $10,000
| | | | | |
| | | | Average Annual Total Returns | |
| | | Periods Ended August 31, 2009 | |
| | | | | | Final Value |
| | | One | Five | Ten | of a $10,000 |
| | | Year | Years | Years | Investment |
| | U.S. Growth Fund Investor Shares | -16.29% | 1.11% | -6.30% | $5,215 |
| •••••••• | Dow Jones U.S. Total Stock Market | | | | |
| | Index | -18.10 | 1.45 | 0.26 | 10,259 |
| |
| |
| – – – – | Large-Cap Russell 1000 Growth Growth Funds Index Average | -17.84 -16.76 | 0.74 1.21 | -3.34 -3.17 | 7,119 7,249 |
Large-Cap Growth Funds Average: Derived from data provided by Lipper Inc.
| | | | |
| | | | Since | Final Value |
| | | | Inception | of a $100,000 |
| | One Year | Five Years | (8/13/2001) | Investment |
| U.S. Growth Fund Admiral Shares | -16.15% | 1.33% | -2.63% | $80,665 |
| Dow Jones U.S. Total Stock Market | | | | |
| Index | -18.10 | 1.45 | 1.15 | 109,681 |
| Russell 1000 Growth Index | -16.76 | 1.21 | -0.87 | 93,192 |
| Performance for the fund’s Admiral Shares and comparative standards is calculated since the Admiral Shares’ inception. | |
Vanguard fund total returns do not include the account service fee that may be applicable to certain accounts with balances below $10,000.
See Financial Highlights for dividend and capital gains information.
13
U.S. Growth Fund
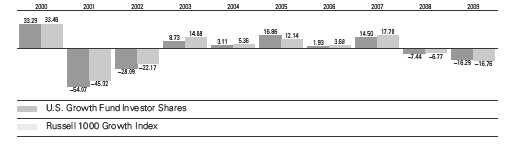
Fiscal-Year Total Returns (%): August 31, 1999, Through August 31, 2009
Average Annual Total Returns: Periods Ended June 30, 2009
This table presents average annual total returns through the latest calendar quarter—rather than through the end of
the fiscal period. Securities and Exchange Commission rules require that we provide this information.
| | | | |
| | Inception Date | One Year | Five Years | Ten Years |
| Investor Shares | 1/6/1959 | -23.81% | -2.46% | -7.46% |
| Admiral Shares | 8/13/2001 | -23.70 | -2.26 | -3.861 |
| 1 Return since inception. | | | | |
Vanguard fund total returns do not include the account service fee that may be applicable to certain accounts with balances below $10,000.
See Financial Highlights for dividend and capital gains information.
14
U.S. Growth Fund
Financial Statements
Statement of Net Assets
As of August 31, 2009
The fund provides a complete list of its holdings four times in each fiscal year, at the quarter-ends.
For the second and fourth fiscal quarters, the lists appear in the fund’s semiannual and annual reports to shareholders. For the first and third fiscal quarters, the fund files the lists with the Securities and
Exchange Commission on Form N-Q. Shareholders can look up the fund’s Forms N-Q on the SEC’s website at www.sec.gov. Forms N-Q may also be reviewed and copied at the SEC’s Public Reference Room (see the back cover of this report for further information).
| | | |
| | | | Market |
| | | | Value• |
| | | Shares | ($000) |
| Common Stocks (97.6%)1 | | |
| Consumer Discretionary (9.6%) | |
| * | Kohl’s Corp. | 1,897,191 | 97,876 |
| | Johnson Controls, Inc. | 1,662,400 | 41,178 |
| | Target Corp. | 871,600 | 40,965 |
| | McDonald’s Corp. | 688,790 | 38,737 |
| | Lowe’s Cos., Inc. | 1,752,600 | 37,681 |
| * | Discovery | | |
| | Communications Inc. | | |
| | Class A | 1,077,600 | 27,931 |
| * | O’Reilly Automotive, Inc. | 437,100 | 16,732 |
| | Omnicom Group Inc. | 372,630 | 13,534 |
| | Yum! Brands, Inc. | 393,600 | 13,481 |
| * | Amazon.com, Inc. | 160,600 | 13,039 |
| | The Walt Disney Co. | 446,800 | 11,635 |
| | Toyota Motor Corp. ADR | 134,500 | 11,458 |
| | | | 364,247 |
| Consumer Staples (6.8%) | | |
| | PepsiCo, Inc. | 1,334,600 | 75,632 |
| | Wal-Mart Stores, Inc. | 1,132,650 | 57,618 |
| | Costco Wholesale Corp. | 962,200 | 49,053 |
| | CVS Caremark Corp. | 810,840 | 30,422 |
| | Colgate-Palmolive Co. | 405,200 | 29,458 |
| | General Mills, Inc. | 174,800 | 10,441 |
| | Mead Johnson Nutrition Co. | 155,800 | 6,179 |
| | | | 258,803 |
| Energy (8.3%) | | |
| | Schlumberger Ltd. | 2,301,070 | 129,320 |
| | Occidental | | |
| | Petroleum Corp. | 737,900 | 53,941 |
| | Apache Corp. | 379,950 | 32,277 |
| * | Cameron | | |
| | International Corp. | 890,640 | 31,805 |
| | | |
| | | | Market |
| | | | Value• |
| | | Shares | ($000) |
| * | Suncor Energy, Inc. | | |
| | (New York Shares) | 586,000 | 17,955 |
| | Petroleo Brasileiro SA ADR | 376,800 | 14,936 |
| * | National Oilwell Varco Inc. | 366,100 | 13,308 |
| | EOG Resources, Inc. | 166,340 | 11,976 |
| | Petroleo Brasileiro SA | | |
| | Series A ADR | 236,200 | 7,842 |
| | | | 313,360 |
| Exchange-Traded Fund (0.0%) | | |
| ^,2 | Vanguard Growth ETF | 3,100 | 147 |
| |
| Financials (13.4%) | | |
| | The Goldman Sachs | | |
| | Group, Inc. | 952,537 | 157,607 |
| | JPMorgan Chase & Co. | 3,415,300 | 148,429 |
| | CME Group, Inc. | 196,455 | 57,176 |
| * | Credit Suisse Group | | |
| | AG ADR | 831,200 | 42,300 |
| | Invesco, Ltd. | 985,300 | 20,445 |
| | Franklin Resources, Inc. | 215,700 | 20,131 |
| | Bank of America Corp. | 984,300 | 17,314 |
| | Charles Schwab Corp. | 931,785 | 16,828 |
| | The Principal | | |
| | Financial Group, Inc. | 504,900 | 14,339 |
| | Janus Capital Group Inc. | 1,010,200 | 12,850 |
| | | | 507,419 |
| Health Care (13.9%) | | |
| * | Gilead Sciences, Inc. | 2,826,460 | 127,360 |
| | Teva Pharmaceutical | | |
| | Industries Ltd. | | |
| | Sponsored ADR | 1,465,060 | 75,451 |
| * | Celgene Corp. | 1,397,360 | 72,900 |
| | Baxter International, Inc. | 1,178,900 | 67,103 |
15
U.S. Growth Fund
| | | |
| | | | Market |
| | | | Value• |
| | | Shares | ($000) |
| | Alcon, Inc. | 516,140 | 66,825 |
| * | Medco Health | | |
| | Solutions, Inc. | 967,600 | 53,431 |
| * | Thermo Fisher | | |
| | Scientific, Inc. | 653,120 | 29,527 |
| | Allergan, Inc. | 332,435 | 18,590 |
| | UnitedHealth Group Inc. | 555,700 | 15,560 |
| | | | 526,747 |
| Industrials (8.7%) | | |
| | Danaher Corp. | 1,118,615 | 67,911 |
| | Illinois Tool Works, Inc. | 1,061,100 | 44,375 |
| | United Parcel Service, Inc. | 614,200 | 32,835 |
| * | Vestas Wind Systems A/S | 1,335,100 | 31,942 |
| | Union Pacific Corp. | 461,100 | 27,579 |
| | FedEx Corp. | 328,200 | 22,551 |
| | W.W. Grainger, Inc. | 215,300 | 18,832 |
| | J.B. Hunt Transport | | |
| | Services, Inc. | 632,210 | 17,721 |
| | Roper Industries Inc. | 367,690 | 17,421 |
| | Rockwell Automation, Inc. | 404,100 | 16,912 |
| | United Technologies Corp. | 267,300 | 15,867 |
| * | Quanta Services, Inc. | 574,600 | 12,710 |
| | Emerson Electric Co. | 144,270 | 5,319 |
| | | | 331,975 |
| Information Technology (31.7%) | |
| * | Apple Inc. | 1,346,306 | 226,462 |
| * | Google Inc. | 454,750 | 209,944 |
| | QUALCOMM Inc. | 3,236,995 | 150,261 |
| | Hewlett-Packard Co. | 3,338,000 | 149,843 |
| | Intel Corp. | 5,021,910 | 102,045 |
| | Microsoft Corp. | 2,585,595 | 63,735 |
| * | Cisco Systems, Inc. | 2,471,080 | 53,375 |
| * | EMC Corp. | 2,053,500 | 32,651 |
| | Visa Inc. | 443,000 | 31,497 |
| | Taiwan Semiconductor | | |
| | Manufacturing Co., | | |
| | Ltd. ADR | 2,558,939 | 27,381 |
| | Altera Corp. | 1,335,700 | 25,659 |
| * | Broadcom Corp. | 767,000 | 21,821 |
| * | Juniper Networks, Inc. | 831,000 | 19,171 |
| * | Cognizant Technology | | |
| | Solutions Corp. | 492,800 | 17,189 |
| | Amphenol Corp. Class A | 472,700 | 16,526 |
| * | McAfee Inc. | 394,400 | 15,689 |
| * | Activision Blizzard, Inc. | 1,320,800 | 15,335 |
| * | Adobe Systems, Inc. | 420,539 | 13,213 |
| * | Research In Motion Ltd. | 169,500 | 12,384 |
| | | | 1,204,181 |
| | |
| | | Market |
| | | Value• |
| | Shares | ($000) |
| Materials (5.2%) | | |
| Freeport-McMoRan | | |
| Copper & Gold, Inc. | | |
| Class B | 683,200 | 43,028 |
| Arcelor Mittal Class A | | |
| New York | | |
| Registered Shares | 1,051,500 | 37,465 |
| Praxair, Inc. | 411,640 | 31,540 |
| Rio Tinto PLC ADR | 167,000 | 25,912 |
| Air Products & | | |
| Chemicals, Inc. | 320,730 | 24,064 |
| Ecolab, Inc. | 420,320 | 17,775 |
| Monsanto Co. | 187,255 | 15,707 |
| | | 195,491 |
| Total Common Stocks | | |
| (Cost $3,676,708) | | 3,702,370 |
| Temporary Cash Investments (2.9%)1 | |
| Money Market Fund (2.4%) | | |
| 3,4 Vanguard Market | | |
| Liquidity Fund, | | |
| 0.277% | 90,274,855 | 90,275 |
| |
| | Face | |
| | Amount | |
| | ($000) | |
| U.S. Government and Agency Obligations (0.5%) |
| 5,6 Federal Home Loan | | |
| Bank, 0.275%, 2/19/10 | 18,000 | 17,978 |
| Total Temporary Cash Investments | |
| (Cost $108,251) | | 108,253 |
| Total Investments (100.5%) | | |
| (Cost $3,784,959) | | 3,810,623 |
| Other Assets and Liabilities (-0.5%) | |
| Other Assets | | 28,778 |
| Liabilities4 | | (46,018) |
| | | (17,240) |
| Net Assets (100%) | | 3,793,383 |
16
U.S. Growth Fund
| |
| At August 31, 2009, net assets consisted of: |
| | Amount |
| | ($000) |
| Paid-in Capital | 10,485,150 |
| Overdistributed Net Investment Income | (1,156) |
| Accumulated Net Realized Losses | (6,723,968) |
| Unrealized Appreciation (Depreciation) | |
| Investment Securities | 25,664 |
| Futures Contracts | 7,693 |
| Net Assets | 3,793,383 |
| |
| |
| Investor Shares—Net Assets | |
| Applicable to 199,343,891 outstanding | |
| $.001 par value shares of beneficial | |
| interest (unlimited authorization) | 2,955,597 |
| Net Asset Value Per Share— | |
| Investor Shares | $14.83 |
| |
| |
| Admiral Shares—Net Assets | |
| Applicable to 21,810,598 outstanding | |
| $.001 par value shares of beneficial | |
| interest (unlimited authorization) | 837,786 |
| Net Asset Value Per Share— | |
| Admiral Shares | $38.41 |
• See Note A in Notes to Financial Statements.
* Non-income-producing security.
^ Part of security position is on loan to broker-dealers. The total
value of securities on loan is $95,000.
1 The fund invests a portion of its cash reserves in equity markets
through the use of index futures contracts. After giving effect to
futures investments, the fund’s effective common stock and
temporary cash investment positions represent 99.8% and 0.7%,
respectively, of net assets.
2 Considered an affiliated company of the fund as the issuer is
another member of The Vanguard Group.
3 Affiliated money market fund available only to Vanguard funds
and certain trusts and accounts managed by Vanguard. Rate
shown is the 7-day yield.
4 Includes $98,000 of collateral received for securities on loan.
5 The issuer operates under a congressional charter; its securities
are not backed by the full faith and credit of the U.S.
government.
6 Securities with a value of $17,978,000 have been segregated as
initial margin for open futures contracts.
ADR—American Depositary Receipt.
See accompanying Notes, which are an integral part of the Financial Statements.
17
U.S. Growth Fund
Statement of Operations
| |
| | Year Ended |
| | August 31, 2009 |
| | ($000) |
| Investment Income | |
| Income | |
| Dividends1 | 41,434 |
| Interest1 | 2,154 |
| Security Lending | 295 |
| Total Income | 43,883 |
| Expenses | |
| Investment Advisory Fees—Note B&n bsp; | |
| Basic Fee | 5,688 |
| Performance Adjustment | (1,163) |
| The Vanguard Group—Note C | |
| Management and Administrative—Investor Shares | 8,366 |
| Management and Administrative—Admiral Shares | 1,046 |
| Marketing and Distribution—Investor Shares | 717 |
| Marketing and Distribution—Admiral Shares | 209 |
| Custodian Fees | 54 |
| Auditing Fees | 25 |
| Shareholders’ Reports and Proxies—Investor Shares | 310 |
| Shareholders’ Reports and Proxies—Admiral Shares | 32 |
| Trustees’ Fees and Expenses | 8 |
| Total Expenses | 15,292 |
| Expenses Paid Indirectly | (316) |
| Net Expenses | 14,976 |
| Net Investment Income | 28,907 |
| Realized Net Gain (Loss) | |
| Investment Securities Sold1 | (533,789) |
| Futures Contracts | (53,722) |
| Realized Net Gain (Loss) | (587,511) |
| Change in Unrealized Appreciation (Depreciation) | |
| Investment Securities | (240,494) |
| Futures Contracts | 14,406 |
| Change in Unrealized Appreciation (Depreciation) | (226,088) |
| Net Increase (Decrease) in Net Assets Resulting from Operations | (784,692) |
1 Dividend income, interest income, and realized net gain (loss) from affiliated companies of the fund were $2,000, $1,952,000, and
$0, respectively.
See accompanying Notes, which are an integral part of the Financial Statements.
18
U.S. Growth Fund
Statement of Changes in Net Assets
| | |
| | Year Ended August 31, |
| | 2009 | 2008 |
| | ($000) | ($000) |
| Increase (Decrease) in Net Assets | | |
| Operations | | |
| Net Investment Income | 28,907 | 27,319 |
| Realized Net Gain (Loss) | (587,511) | 138,171 |
| Change in Unrealized Appreciation (Depreciation) | (226,088) | (551,756) |
| Net Increase (Decrease) in Net Assets Resulting from Operations | (784,692) | (386,266) |
| Distributions | | |
| Net Investment Income | | |
| Investor Shares | (23,339) | (25,051) |
| Admiral Shares | (8,835) | (11,166) |
| Realized Capital Gain | | |
| Investor Shares | — | — |
| Admiral Shares | — | — |
| Total Distributions | (32,174) | (36,217) |
| Capital Share Transactions | | |
| Investor Shares | (65,408) | (351,798) |
| Admiral Shares | (77,153) | (106,170) |
| Net Increase (Decrease) from Capital Share Transactions | (142,561) | (457,968) |
| Total Increase (Decrease) | (959,427) | (880,451) |
| Net Assets | | |
| Beginning of Period | 4,752,810 | 5,633,261 |
| End of Period1 | 3,793,383 | 4,752,810 |
1 Net Assets—End of Period includes undistributed (overdistributed) net investment income of ($1,156,000) and $2,111,000.
See accompanying Notes, which are an integral part of the Financial Statements.
19
U.S. Growth Fund
Financial Highlights
| | | | | |
| Investor Shares | | | | | |
| |
| For a Share Outstanding | Year Ended August 31, |
| Throughout Each Period | 2009 | 2008 | 2007 | 2006 | 2005 |
| Net Asset Value, Beginning of Period | $17.89 | $19.44 | $17.06 | $16.77 | $14.39 |
| Investment Operations | | | | | |
| Net Investment Income | .105 | .089 | .113 | .059 | .040 |
| Net Realized and Unrealized Gain (Loss) | | | | | |
| on Investments | (3.049) | (1.523) | 2.354 | .266 | 2.385 |
| Total from Investment Operations | (2.944) | (1.434) | 2.467 | .325 | 2.425 |
| Distributions | | | | | |
| Dividends from Net Investment Income | (.116) | (.116) | (.087) | (.035) | (.045) |
| Distributions from Realized Capital Gains | — | — | — | — | — |
| Total Distributions | (.116) | (.116) | (.087) | (.035) | (.045) |
| Net Asset Value, End of Period | $14.83 | $17.89 | $19.44 | $17.06 | $16.77 |
| |
| Total Return1 | -16.29% | -7.44% | 14.50% | 1.93% | 16.86% |
| |
| Ratios/Supplemental Data | | | | | |
| Net Assets, End of Period (Millions) | $2,956 | $3,637 | $4,308 | $4,530 | $4,848 |
| Ratio of Total Expenses to | | | | | |
| Average Net Assets2 | 0.49% | 0.43% | 0.50% | 0.58% | 0.55% |
| Ratio of Net Investment Income to | | | | | |
| Average Net Assets | 0.79% | 0.47% | 0.60% | 0.34% | 0.30% |
| Portfolio Turnover Rate | 101% | 107% | 51% | 48% | 38% |
1 Total returns do not include the account service fee that may be applicable to certain accounts with balances below $10,000.
2 Includes performance-based investment advisory fee increases (decreases) of (0.03%), (0.03%), (0.01%), 0.02%, and (0.02%).
See accompanying Notes, which are an integral part of the Financial Statements.
20
U.S. Growth Fund
Financial Highlights
| | | | | |
| Admiral Shares | | | | | |
| |
| For a Share Outstanding | Year Ended August 31, |
| Throughout Each Period | 2009 | 2008 | 2007 | 2006 | 2005 |
| Net Asset Value, Beginning of Period | $46.37 | $50.42 | $44.24 | $43.47 | $37.29 |
| Investment Operations | | | | | |
| Net Investment Income | .335 | .325 | .416 | .271 | .226 |
| Net Realized and Unrealized Gain (Loss) | | | | | |
| on Investments | (7.919) | (3.950) | 6.107 | .677 | 6.163 |
| Total from Investment Operations | (7.584) | (3.625) | 6.523 | .948 | 6.389 |
| Distributions | | | | | |
| Dividends from Net Investment Income | (.376) | (.425) | (.343) | (.178) | (.209) |
| Distributions from Realized Capital Gains | — | — | — | — | — |
| Total Distributions | (.376) | (.425) | (.343) | (.178) | (.209) |
| Net Asset Value, End of Period | $38.41 | $46.37 | $50.42 | $44.24 | $43.47 |
| |
| Total Return | -16.15% | -7.28% | 14.80% | 2.16% | 17.16% |
| |
| Ratios/Supplemental Data | | | | | |
| Net Assets, End of Period (Millions) | $838 | $1,116 | $1,325 | $1,262 | $1,012 |
| Ratio of Total Expenses to | | | | | |
| Average Net Assets1 | 0.30% | 0.24% | 0.27% | 0.34% | 0.32% |
| Ratio of Net Investment Income to | | | | | |
| Average Net Assets | 0.98% | 0.66% | 0.83% | 0.58% | 0.53% |
| Portfolio Turnover Rate | 101% | 107% | 51% | 48% | 38% |
1 Includes performance-based investment advisory fee increases (decreases) of (0.03%), (0.03%), (0.01%), 0.02%, and (0.02%).
See accompanying Notes, which are an integral part of the Financial Statements.

U.S. Growth Fund
Notes to Financial Statements
Vanguard U.S. Growth Fund is registered under the Investment Company Act of 1940 as an open-end investment company, or mutual fund. The fund offers two classes of shares, Investor Shares and
Admiral Shares. Investor Shares are available to any investor who meets the fund’s minimum purchase requirements. Admiral Shares are designed for investors who meet certain administrative, service, tenure, and account-size criteria.
A. The following significant accounting policies conform to generally accepted accounting principles for
U.S. mutual funds. The fund consistently follows such policies in preparing its financial statements.
1. Security Valuation: Securities are valued as of the close of trading on the New York Stock Exchange (generally 4 p.m., Eastern time) on the valuation date. Equity securities are valued at the latest quoted sales prices or official closing prices taken from the primary market in which each security trades; such securities not traded on the valuation date are valued at the mean of the latest quoted bid and asked prices. Securities f or which market quotations are not readily available, or whose values have been materially affected by events occurring before the fund’s pricing time but after the close of the securities’ primary markets, are valued by methods deemed by the board of trustees to represent fair value. Investments in Vanguard Market Liquidity Fund are valued at that fund’s net asset value.
Temporary cash investments acquired over 60 days to maturity are valued using the latest bid prices or using valuations based on a matrix system (which considers such factors as security prices, yields, maturities, and ratings), both as furnished by independent pricing services. Other temporary cash investments are valued at amortized cost, which approximates market value.
2. Futures Contracts: The fund uses index futures contracts to a limited extent, with the objective of maintaining full exposure to the stock market while maintaining liquidity. Th e fund may purchase or sell futur es contracts to achieve a desired level of investment, whether to accommodate portfolio turnover or cash flows from capital share transactions. The primary risks associated with the use of futures contracts are imperfect correlation between changes in market values of stocks held by the fund and the prices of futures contracts, and the possibility of an illiquid market.
Futures contracts are valued at their quoted daily settlement prices. The aggregate principal amounts of the contracts are not recorded in the Statement of Net Assets. Fluctuations in the value of the contracts are recorded in the Statement of Net Assets as an asset (liability) and in the Statement of Operations as unrealized appreciation (depreciation) until the contracts are closed, when they are recorded as realized futures gains (losses).
3. Federal Income Taxes: The fund intends to continue to qualify as a regulated investment company and distribute all of its taxable income. Management has analyzed the fund’s tax positions taken for all open federal income tax years (August 31, 2006–2009), and has concluded that no provision for federal income tax is required in the fund’s financial statements.
4. Distributions: Distributions to shareholders are recorded on the ex-dividend date.
5. Security Lending: The fund may lend its securities to qualified institutional borrowers to earn additional income. Security loans are required to be secured at all times by collateral at least equal to the market value of securities loaned. The fund invests cash collateral received in Vanguard Market Liquidity Fund, and r ecords a liability for the return of the collateral, during the period the securities are on loan. Security lending income represents the income earned on investing cash collateral, less expenses associated with the loan.
22
U.S. Growth Fund
6. Other: Dividend income is recorded on the ex-dividend date. Interest income includes income distributions received from Vanguard Market Liquidity Fund and is accrued daily. Security transactions are accounted for on the date securities are bought or sold. Costs used to determine realized gains (losses) on the sale of investment securities are those of the specific securities sold.
Each class of shares has equal rights as to assets and earnings, except that each class separately bears certain class-specific expenses related to maintenance of shareholder accounts (included in Management and Administrative expenses), share holder reporting, and proxies. Marketing and distribution expenses are allocated to each class of s hares based on a method approved by the board of trustees. Income, other non-class-specific expenses, and gains and losses on investments are allocated to each class of shares based on its relative net assets.
B. AllianceBernstein L.P. and William Blair & Company, L.L.C., each provide investment advisory services to a portion of the fund for a fee calculated at an annual percentage rate of average net assets managed by the advisor. The basic fee for AllianceBernstein L.P. is subject to quarterly adjustments based on performance for the preceding three years relative to the Russell 1000 Growth Index. The basic fee for William Blair & Company, L.L.C., is subject to quarterly adjustments based on performance since June 1, 2004, relative to the Russell 1000 Growth Index.
The Vanguard Group manages the cash reserves of the fund on an at-cost basis.
For the year ended August 31, 2009, the aggregate investment advisory fee represented an effective annual basic rate of 0.17% of the fund’s average net assets, before a decrease of $1,163,000 (0.03%) based on performance.
C. The Vanguard Group furnishes at cost corporate management, administrative, marketing, and distribution services. The costs of such services are allocated to the fund under methods approved by the board of trustees. The fund has committed to provide up to 0.40% of its net assets in capital contributions to Vanguard. At August 31, 2009, the fund had contributed ca pital of $827,000 to Vanguard (included in Other Assets), representing 0.02% of the fund’s net assets and 0.33% of
Vanguard’s capitalization. The fund’s trustees and officers are also directors and officers of Vanguard.
D. The fund has asked its investment advisors to direct certain security trades, subject to obtaining the best price and execution, to brokers who have agreed to rebate to the fund part of the commissions generated. Such rebates are used solely to reduce the fund’s management and administrative expenses. For the year ended August 31, 2009, these arrangements reduced the fund’s expenses by $316,000 (an annual rate of 0.01% of average net assets).
E. Various inputs may be used to determine the value of the fund’s investments. These inputs are summarized in three broad levels for financial statement purposes. The inputs or methodologies used to value securities are not necessarily an indication of the risk associated with investing in those securities.
Level 1—Quoted prices in active markets for identical securities.
Level 2—Other significant observable inputs (including quo ted prices for similar securities, interest
rates, prepayment speeds, credit risk, etc.).
Level 3—Significant unobservable inputs (including the fund’s own assumptions used to determine
the fair value of investments).
23
U.S. Growth Fund
The following table summarizes the fund’s investments as of August 31, 2009, based on the inputs used to value them:
| | | |
| | Level 1 | Level 2 | Level 3 |
| Investments | ($000) | ($000) | ($000) |
| Common Stocks | 3,702,370 | — | — |
| Temporary Cash Investments | 90,275 | 17,978 | — |
| Futures Contracts—Assets1 | 24 | — | — |
| Futures Contracts—Liabilities1 | (819) | — | — |
| Total | 3,791,850 | 17,978 | — |
1 Represents variation margin on the last day of the reporting period.
F. At August 31, 2009, the aggregate settlement value of open futures contracts and the related unrealized appreciation (depreciation) were:
| | | | |
| | | | | ($000) |
| | | Number of | Aggregate | Unrealized |
| | | Long (Short) | Settlement | Appreciation |
| Futures Contracts | Expiration | Contracts | Value | (Depreciation) |
| S&P 500 Index | September 2009 | 177 | 45,122 | 4,436 |
| S&P Mid-Cap 400 Index | September 2009 | 100 | 32,700 | 3,287 |
| E-mini S&P 500 Index | September 2009 | 75 | 3,824 | (30) |
Unrealized appreciation (depreciation) on open futures contracts is required t o be treated as realized gain (loss) for tax purposes.
G. Distributions are determined on a tax basis and may differ from net investment income and realized capital gains for financial reporting purposes. Differences may be permanent or temporary. Permanent differences are reclassified among capital accounts in the financial statements to reflect their tax character. Temporary differences arise when certain items of income, expense, gain, or loss are recognized in different periods for financial statement and tax purposes; these differences will reverse at some time in the future. Differences in classification may also result from the treatment of shor t-term gains as ordinary income for tax purposes.
For tax purposes, at August 31, 2009, the fund had $14,725,000 of ordinary income available for distribution. The fund had available capital loss carryforwards totaling $6,398,578,000 to offset future net capital gains of $2,582,798,000 through August 31, 2010, $2,548,333,000 through August 31, 2011, $887,490,000 through August 31, 2012, $123,651,000 through August 31, 2013, and $256,306,000 through August 31, 2017. In addition, the fund realized losses of $316,709,000 during the period from November 1, 2008, through August 31, 2009, which are deferred and will be treated as realized for tax purposes in fiscal 2010.
At August 31, 2009, the cost of investment securities for tax purposes was $3,785,265,000. Net unrealized appreciation of investment securities for tax purposes was $25,358,000, consisting of unrealized gains of $266,479,000 on securities that had risen in value since their purchase and $241,121,000 in unrealized losses on securities that had fallen in value since their purchase.
24
U.S. Growth Fund
H. During the year ended August 31, 2009, the fund purchased $3,386,073,000 of investment securities and sold $3,454,896,000 of investment securities, other than temporary cash investments.
I. Capital share transactions for each class of shares were:
| | | | |
| | Year Ended August 31, |
| | 2009 | 2008 |
| | Amount | Shares | Amount | Shares |
| | ($000) | (000) | ($000) | (000) |
| Investor Shares | | | | |
| Issued | 397,147 | 30,584 | 488,406 | 26,158 |
| Issued in Lieu of Cash Distributions | 22,922 | 1,941 | 24,561 | 1,226 |
| Redeemed | (485,477) | (36,477) | (864,765) | (45,681) |
| Net Increase (Decrease)—Investor Shares | (65,408) | (3,952) | (351,798) | (18,297) |
| Admiral Shares | | | | |
| Issued | 135,668 | 4,030 | 207,633 | 4,245 |
| Issued in Lieu of Cash Distributions | 8,303 | 272 | 10,509 | 203 |
| Redeemed | (221,124) | (6,551) | (324,312) | (6,673) |
| Net Increase (Decrease)—Admiral Shares | (77,153) | (2,249) | (106,170) | (2,225) |
J. In preparing the financial statements as of August 31, 2009, management considered the impact of subsequent events occurring through October 15, 2009, for potential recognition or disclosure in these financial statements.
25
Report of Independent Registered
Public Accounting Firm
To the Trustees of Vanguard World Fund and the Shareholders of Vanguard U.S. Growth Fund:
In our opinion, the accompanying statement of net assets and the related statements of operations and of changes in net assets and the financial highlights present fairly, in all material respects, the financial position of Vanguard U.S. Growth Fund (the “Fund”) at August 31, 2009, the results of its operations for the year then e nded, the changes in its net assets for each of the two years in the period then ended and the financial highlights for each of the five years in the period then ended, in conformity with accounting principles generally accepted in the United States of America. Th ese financial statements and financial highlights (hereafter referred to as “financial statements”) are the responsibility of the Fund’s management; our responsibility is to express an opinion on these financial statements based on our audits. We conducted our audits of these financial statements in accordance with the standards of the Public Company Accounting Oversight Board (United States). Those standards require that we plan and perform t he audit to obtain reasonable ass urance about whether the financial statements are free of material misstatement. An audit includes examining, on a test basis, evidence supporting the amounts and disclosures in the financial statements, assessing the accounting principles used and significant estimates made by management, and evaluating the overall financial statement presentation. We believe that our audits, which included confirmation of securities at August 31, 2009 by correspondence with the custodian and broker and by agreement to the underlying ownership records for Vanguard Market Liquidity Fund, provide a reasonable basis for our opinion.
PricewaterhouseCoopers LLP
Philadelphia, Pennsylvania
October 15, 2009

Special 2009 tax information (unaudited) for Vanguard U.S. Growth Fund
This information for the fiscal year ended August 31, 2009, is included pursuant to provisions of the
Internal Revenue Code.
The fund distributed $32,174,000 of qualified dividend income to shareholders during the fiscal year.
For corporate shareholders, 100% of investment income (dividend income plus short-term gains, if any)
qualifies for the dividends-received deduction.
26
Your Fund’s After-Tax Returns
This table presents returns for your fund both before and after taxes. The after-tax returns are shown in two ways: (1) assuming that an investor owned the fund during the entire period and paid taxes on the fund’s distributions, and (2) assuming that an investor paid taxes on the fund’s distributions and sold all shares at the end of each period.
Calculations are based on the highest individual federal income tax and capital gains tax rates in effect at the times of the distributions and the hypothetical sales. State and local taxes were not considered. After-tax returns reflect any qualified dividend income, using actual prior-year figures and estimates for 2009. (In the example, returns after the sale of fund shares may be higher than those assuming no sale. This occurs when the sale would have produced a capital loss. The calculation assumes that the investor received a tax deduction for the loss.) The table shows returns for Investor Shares only; returns for other share classes will differ. Please note that your actual after-tax returns will depend on your tax situation and may differ from those shown. Also note that if you own the fund in a tax-deferred account, such as an individual retirement account or a 401(k) plan, this information does not apply to you. Such accounts are not subject to current taxes.
Finally, keep in mind that a fund’s performance—whether before or after taxes—does not guarantee future results.
| | | |
| Average Annual Total Returns: U.S. Growth Fund Investor Shares | | |
| Periods Ended August 31, 2009 | | | |
| | One | Five | Ten |
| | Year | Years | Years |
| Returns Before Taxes | -16.29% | 1.11% | -6.30% |
| Returns After Taxes on Distributions | -16.41 | 1.03 | -6.86 |
| Returns After Taxes on Distributions and Sale of Fund Shares | -10.48 | 0.94 | -4.97 |
Vanguard fund total returns do not include the account service fee that may be applicable to certain accounts with balances below $10,000.
27
About Your Fund’s Expenses
As a shareholder of the fund, you incur ongoing costs, which include costs for portfolio management, administrative services, and shareholder reports (like this one), among others. Operating expenses, which are deducted from a fund’s gross income, directly reduce the investment return of the fund.
A fund’s expenses are expressed as a percentage of its average net assets. This figure is known as the expense ratio. The following examples are intended to help you understand the ongoing costs (in dollars) of investing in your fund and to compare these costs with those of other mutual funds. The examples are based on an investment of $1,000 made at the beginning of the period shown and held for the entire period.
The accompanying table illustrates your fund’s costs in two ways:
• Based on actual fund return. This section helps you to estimate the actual expenses that you paid over the period. The ”Ending Account Value“ shown is derived from the fund‘s actual return, and the third column shows the dollar amount that would have been paid by an investor who started with $1,000 in the fund. You may use the information here, together with the amount you invested, to estimate the expenses that you paid over the period.
To do so, simply divide your account value by $1,000 (for example, an $8,600 account value divided by $1,000 = 8.6), then multiply the result by the number given for your fund under the heading ”Expenses Paid During Period.“
• Based on hypothetical 5% yearly return. This section is intended to help you compare your fund‘s costs with those of other mutual funds. It assumes that the fund had a yearly return of 5% before expenses, but that the expense ratio is unchanged. In this case—because the return used is not the fund’s actual return—the results do not apply to your investment. The example is useful in making comparisons because the Securities and Exchange Commission requires all mutual funds to calculate expenses based on a 5% return. You can assess your fund’s costs by comparing this hypothetical example with the hypothetical examples that appear in shareholder reports of other funds.
Note that the expenses shown in the table are meant to highlight and help you compare ongoing costs only and do not reflect transaction costs incurred by the fund for buying and selling securities. Further, the expenses do not include the account service fee described in the prospectus. If such a fee were applied to your account, your costs would be higher. Your fund does not charge transaction fees, such as purchase or redemption fees, nor does it carry a “sales load.” The calculations assume no shares were bought or sold during the period. Your actual costs may have been higher or lower, depending on the amount of your investment and the timing of any purchases or redemptions.
You can find more information about the fund’s expenses, including annual expense ratios, in the Financial Statements section of this report. For additional information on operating expenses and other shareholder costs, please refer to your fund’s current prospectus.
28
| | | |
| Six Months Ended August 31, 2009 | | | |
| | Beginning | Ending | Expenses |
| | Account Value | Account Value | Paid During |
| U.S. Growth Fund | 2/28/2009 | 8/31/2009 | Period |
| Based on Actual Fund Return | | | |
| Investor Shares | $1,000.00 | $1,369.34 | $3.11 |
| Admiral Shares | 1,000.00 | 1,370.81 | 1.79 |
| |
| Based on Hypothetical 5% Yearly Return | | | |
| Investor Shares | $1,000.00 | $1,022.58 | $2.65 |
| Admiral Shares | 1,000.00 | 1,023.69 | 1.53 |
The calculations are based on expenses incurred in the most recent six-month period. The fund’s annualized six-month expense ratios for that period are 0.52% for the Investor Shares and 0.30% for the Admiral Shares. The dollar amounts shown as “Expenses Paid” are equal to the annualized expense ratio multiplied by the average account value over the period, multiplied by the number of days in the most recent six-month period, then divided by the number of days in the most recent 12-month period.
29
Glossary
30-Day SEC Yield. A fund’s 30-day SEC yield is derived using a formula specified by the U.S. Securities and Exchange Commission. Under the formula, data related to the fund’s security holdings in the previous 30 days are used to calculate the fund’s hypothetical net income for that period, which is then annualized and divided by the fund’s estimated average net assets over the calculation period. For the purposes of this calculation, a security’s income is based on its current market yield to maturity (in the case of bonds) or its projected dividend yield (for stocks). Because the SEC yield represents hypothetical annualized income, it will differ—at times significantly—from the fund’s actual experience. As a result, the fund’s income distributions may be higher or lower than implied by the SEC yield.
Beta. A measure of the magnitude of a fund’s past share-price fluctuations in relation to the ups and downs of a given market index. The index is assigned a beta of 1.00. Compared with a given index, a fund with a beta of 1.20 typically would have seen its share price rise or fall by 12% when the index rose or fell by 10%. For this report, beta is based on returns over the past 36 months for both the fund and the index. Note that a fund’s beta should be reviewed in conjunction with its R-squared (see definition). The lower the R-squared, the less correlation there is between the fund and the index, and the less reliable beta is as an indicator of volatility.
Dividend Yield. Dividend income earned by stocks, expressed as a percentage of the aggregate market value (or of net asset value, for a fund). The yield is determined by dividing the amount of the annual dividends by the aggregate value (or net asset value) at the end of the period. For a fund, the dividend yield is based solely on stock holdings and does not include any income produced by other investments.
Earnings Growth Rate. The average annual rate of growth in earnings over the past five years for the stocks now in a fund.
Equity Exposure. A measure that reflects a fund’s investments in stocks and stock futures. Any holdings in short-term reserves are excluded.
Expense Ratio. The percentage of a fund’s average net assets used to pay its annual administrative and advisory expenses. These expenses directly reduce returns to investors.
Foreign Holdings. The percentage of a fund represented by stocks or depositary receipts of companies based outside the United States.
Inception Date. The date on which the assets of a fund (or one of its share classes) are first invested in accordance with the fund’s investment objective. For funds with a subscription period, the inception date is the day after that period ends. Investment performance is measured from the inception date.
Median Market Cap. An indicator of the size of companies in which a fund invests; the midpoint of market capitalization (market price x shares outstanding) of a fund’s stocks, weighted by the proportion of the fund’s assets invested in each stock. Stocks representing half of the fund’s assets have market capitalizations above the median, and the rest are below it.
Price/Book Ratio. The share price of a stock divided by its net worth, or book value, per share. For a fund, the weighted average price/book ratio of the stocks it holds.
30
Price/Earnings Ratio. The ratio of a stock’s current price to its per-share earnings over the past year. For a fund, the weighted average P/E of the stocks it holds. P/E is an indicator of market expectations about corporate prospects; the higher the P/E, the greater the expectations for a company’s future growth.
R-Squared. A measure of how much of a fund’s past returns can be explained by the returns from the market in general, as measured by a given index. If a fund’s total returns were precisely synchronized with an index’s returns, its R-squared would be 1.00. If the fund’s returns bore no relationship to the index’s returns, its R-squared would be 0. For this report, R-squared is based on returns over the past 36 months for both the fund and the index.
Return on Equity. The annual average rate of return generated by a company during the past five years for each dollar of shareholder’s equity (net income divided by shareholder’s equity). For a fund, the weighted average return on equity for the companies whose stocks it holds.
Short-Term Reserves. The percentage of a fund invested in highly liquid, short-term securities that can be readily converted to cash.
Turnover Rate. An indication of the fund’s trading activity. Funds with high turnover rates incur higher transaction costs and may be more likely to distribute capital gains (which may be taxable to investors). The turnover rate excludes in-kind transactions, which have minimal impact on costs.
31
The People Who Govern Your Fund
The trustees of your mutual fund are there to see that the fund is operated and managed in your best interests since, as a shareholder, you are a part owner of the fund. Your fund’s trustees also serve on the board of directors of The Vanguard Group, Inc., which is owned by the Vanguard funds and provides services to them on an at-cost basis.
A majority of Vanguard’s board members are independent, meaning that they have no affiliation with Vanguard or the funds they oversee, apart from the sizable personal investments they have made as private individuals. The independent board members have distinguished backgrounds in business, academia, and public service. Each of the trustees and executive officers oversees 157 Vanguard funds.
The following table provides information for each trustee and executive officer of the fund. More information about the trustees is in the Statement of Additional Informatio n, which can be obtained, wit hout charge, by contacting Vanguard at 800-662-7447, or online at www.vanguard.com.
| |
| Interested Trustees | Emerson U. Fullwood |
| | Born 1948. Trustee Since January 2008. Principal |
| John J. Brennan1 | Occupation(s) During the Past Five Years: Retired |
| Born 1954. Trustee Since May 1987. Chairman of | Executive Chief Staff and Marketing Officer for North |
| the Board. Principal Occupation(s) During the Past | America and Corporate Vice President of Xerox |
| Five Years: Chairman of the Board and Director/Trustee | Corporation (photocopiers and printers); Director of |
| of The Vanguard Group, Inc., and of each of the | SPX Corporation (multi-industry manufacturing), the |
| investment companies served by The Vanguard Group; | United Way of Rochester, the Boy Scouts of America, |
| Chief Executive Officer and President of The Vanguard | Amerigroup Corporation (direct health and medical |
| Group and of each of the investment companies served | insurance carriers), and Monroe Community College |
| by The Vanguard Group (1996–2008); Chairman of | Foundation. |
| the Financial Accounting Foundation; Governor of | |
| the Financial Industry Regulatory Authority (FINRA); | Rajiv L. Gupta |
| Director of United Way of Southeastern Pennsylvania. | Born 1945. Trustee Since December 2001.2 Principal |
| | Occupation(s) During the Past Five Years: Retired |
| F. William McNabb III1 | Chairman and Chief Executive Officer of Rohm and |
| Born 1957. Trustee Since July 2009. Principal | Haas Co. (chemicals); President of Rohm and Haas Co. |
| Occupation(s) During the Past Five Years: Director of | (2006–2008); Board Member of American Chemistry |
| The Vanguard Group, Inc., since 2008; Chief Executive | Council; Director of Tyco International, Ltd. (diversified |
| Officer and President of The Vanguard Group and of | manufacturing and services) and Hewlett-Packard Co. |
| each of the investment companies served by The | (electronic computer manufacturing); Trustee of The |
| Vanguard Group since 2008; Director of Vanguard | Conference Board. |
| Marketing Corporation; Managing Director of The | |
| Vanguard Group (1995–2008). | Amy Gutmann |
| | Born 1949. Trustee Since June 2006. Principal |
| | Occupation(s) During the Past Five Years: President of |
| Independent Trustees | the University of Pennsylvania; Christopher H. Browne |
| | Distinguished Professor of Political Science in the School |
| Charles D. Ellis | of Arts and Sciences with Secondary Appointments |
| Born 1937. Trustee Since January 2001. Principal | at the Annenberg School for Communication and the |
| Occupation(s) During the Past Five Years: Applecore | Graduate School of Education of the University of |
| Partners (pro bono ventures in education); Senior | Pennsylvania; Director of Carnegie Corporation of |
| Advisor to Greenwich Associates (international business | New York, Schuylkill River Development Corporation, |
| strategy consulting); Successor Trustee of Yale University; | and Greater Philadelphia Chamber of Commerce; |
| Overseer of the Stern School of Business at New York | Trustee of the National Constitution Center. |
| University; Trustee of the Whitehead Institute for | |
| Biomedical Research. | |
| | |
| JoAnn Heffernan Heisen | Executive Officers | |
| Born 1950. Trustee Since July 1998. Principal | | |
| Occupation(s) During the Past Five Years: Retired | Thomas J. Higgins1 | |
| Corporate Vice President, Chief Global Diversity Officer, | Born 1957. Chief Financial Officer Since September |
| and Member of the Executive Committee of Johnson | 2008. Principal Occupation(s) During the Past Five |
| & Johnson (pharmaceuticals/consumer products); | Years: Principal of The Vanguard Group, Inc.; Chief |
| Vice President and Chief Information Officer of Johnson | Financial Officer of each of the investment companies |
| & Johnson (1997 –2005); Director of the University | served by The Vanguard Group since 2008; Treasurer |
| Medical Center at Princeton and Women’s Research | of each of the investment companies served by The |
| and Education Instit ute. | Vanguard Group (1998–2008). |
| |
| André F. Perold | Kathryn J. Hyatt1 | |
| Born 1952. Trustee Since December 2004. Principal | Born 1955. Treasurer Since November 2008. Principal |
| Occupation(s) During the Past Five Years: George Gund | Occupation(s) During the Past Five Years: Principal of |
| Professor of Finance and Banking, Harvard Business | The Vanguard Group, Inc.; Treasurer of each of the |
| School; Director and Chairman of UNX, Inc. (equities | investment companies served by The Vanguard |
| trading firm); Chair of the Investment Committee of | Group since 2008; Assistant Treasurer of each of the |
| HighVista Strategies LLC (private investment firm). | investment companies served by The Vanguard Group |
| | (1988–2008). | |
| Alfred M. Rankin, Jr. | | |
| Born 1941. Trustee Since January 1993. Principal | Heidi Stam1 | |
| Occupation(s) During the Past Five Years: Chairman, | Born 1956. Secretary Since July 2005. Principal |
| President, Chief Executive Officer, and Director of | Occupation(s) During the Past Five Years: Managing |
| NACCO Industries, Inc. (forklift trucks/housewares/ | Director of The Vanguard Group, Inc., since 2006; |
| lignite); Director of Goodrich Corporation (industrial | General Counsel of The Vanguard Group since 2005; |
| products/aircraft systems and services). | Secretary of The Vanguard Group and of each of the |
| | investment companies served by The Vanguard Group |
| Peter F. Volanakis | since 2005; Director and Senior Vice President of |
| Born 1955. Trustee Since July 2009. Principal | Vanguard Marketing Corporation since 2005; Principal |
| Occupation(s) During the Past Five Years: President | of The Vanguard Group (1997–2006). |
| since 2007 and Chief Operating Officer since 2005 | | |
| of Corning Incorporated (communications equipment); | | |
| President of Corning Technologies (2001–2005); Director | Vanguard Senior Management Team |
| of Corning Incorporated and Dow Corning; Trustee of | | |
| the Corning Incorporated Foundation and the Corning | R. Gregory Barton | Michael S. Miller |
| Museum of Glass; Overseer of the Amos Tuck School | Mortimer J. Buckley | James M. Norris |
| of Business Administration at Dartmouth College. | Kathleen C. Gubanich | Glenn W. Reed |
| | Paul A. Heller | George U. Sauter |
| |
| |
| | Founder | |
| | John C. Bogle | |
| | Chairman and Chief Executive Officer, 1974–1996 |
1 These individuals are “interested persons” as defined in the Investment Company Act of 1940.
2 December 2002 for Vanguard Equity Income Fund, Vanguard Growth Equity Fund, the Vanguard Municipal Bond Funds, and the Vanguard
State Tax-Exempt Funds.

P.O. Box 2600
Valley Forge, PA 19482-2600
Connect with Vanguard® > www.vanguard.com
| |
| Fund Information > 800-662-7447 | CFA® is a trademark owned by CFA Institute. |
| |
| Direct Investor Account Services > 800-662-2739 | |
| |
| Institutional Investor Services > 800-523-1036 | |
| |
| Text Telephone for People | |
| With Hearing Impairment > 800-952-3335 | |
| |
| This material may be used in conjunction | |
| with the offering of shares of any Vanguard | |
| fund only if preceded or accompanied by | |
| the fund’s current prospectus. | |
| |
| All comparative mutual fund data are from Lipper Inc. or | |
| Morningstar, Inc., unless otherwise noted. | |
| |
| You can obtain a free copy of Vanguard’s proxy voting | |
| guidelines by visiting our website, www.vanguard.com, | |
| and searching for “proxy voting guidelines,” or by calling | |
| Vanguard at 800-662-2739. The guidelines are also | |
| available from the SEC’s website, www.sec.gov. In | |
| addition, you may obtain a free report on how your fund | |
| voted the proxies for securities it owned during the 12 | |
| months ended June 30. To get the report, visit either | |
| www.vanguard.com or www.sec.gov. | |
| |
| You can review and copy information about your fund at | |
| the SEC’s Public Reference Room in Washington, D.C. To | |
| find out more about this public service, call the SEC at | |
| 202-551-8090. Information about your fund is also | |
| available on the SEC’s website, and you can receive | |
| copies of this information, for a fee, by sending a | |
| request in either of two ways: via e-mail addressed to | |
| publicinfo@sec.gov or via regular mail addressed to the | |
| Public Reference Section, Securities and Exchange | © 2009 The Vanguard Group, Inc. |
| Commission, Washington, DC 20549-0102. | All rights reserved. |
| Vanguard Marketing Corporation, Distributor. |
| |
| | Q230 102009 |

| Vanguard International Growth Fund |
| Annual Report |

> For the fiscal year ended August 31, 2009, Vanguard International Growth Fund
returned about –14%.
> The fund’s disappointing performance nevertheless exceeded the return of its
benchmark index and the average return of peer funds.
> Both developed and emerging markets posted losses; the developed European
market detracted the most from overall performance.
| |
| Contents | |
| |
| Your Fund’s Total Returns | 1 |
| President’s Letter | 2 |
| Advisors’ Report | 8 |
| Results of Proxy Voting | 13 |
| Fund Profile | 14 |
| Performance Summary | 16 |
| Financial Statements | 18 |
| Your Fund’s After-Tax Returns | 35 |
| About Your Fund’s Expenses | 36 |
| Glossary | 38 |
Please note: The opinions expressed in this report are just that—informed opinions. They should not be considered promises or advice.
Also, please keep in mind that the information and opinions cover the period through the date on the front of this report. Of course, the
risks of investing in your fund are spelled out in the prospectus.
Cover photograph: Veronica Coia.
Your Fund’s Total Returns
| | |
| Fiscal Year Ended August 31, 2009 | | |
| | Ticker | Total |
| | Symbol | Returns |
| Vanguard International Growth Fund | | |
| Investor Shares | VWIGX | –13.75% |
| Admiral™ Shares1 | VWILX | –13.57 |
| MSCI EAFE Index | | –14.95 |
| International Funds Average2 | | –16.32 |
| Your Fund’s Performance at a Glance | | | | |
| August 31, 2008–August 31, 2009 | | | | |
| | | | Distributions Per Share |
| | Starting | Ending | Income | Capital |
| | Share Price | Share Price | Dividends | Gains |
| Vanguard International Growth Fund | | | | |
| Investor Shares | $20.43 | $15.73 | $0.562 | $0.903 |
| Admiral Shares | 65.09 | 50.08 | 1.909 | 2.870 |
1 A lower-cost class of shares available to many longtime shareholders and to those with significant investments in the fund.
2 Derived from data provided by Lipper Inc.
1

President’s Letter
Dear Shareholder:
In an extremely volatile period in the global stock markets, Vanguard International Growth Fund returned about –14% for the fiscal year ended August 31, 2009. This performance, although disappointing, compared favorably with that of the fund’s market benchmark, the Morgan Stanley Capital International Europe, Australasia, Far East (MSCI EAFE) Index, and the average return of international peer funds.
The first six months of the fiscal year were a time of severe gloom in global stock markets as credit markets froze and economic contraction was widespread. Foreign governments’ stimulus programs gained traction during the second half of the fiscal year, and global stock markets advanced strongly.
All ten of the fund’s sectors recorded declines for the year, and results were negative across all regions. Relative to the benchmark, however, the fund benefited from the advisors’ limited exposure to, and strong stock selection in, the financial sector, and from holdings in emerging markets. Emerging markets—which are not included in the index—outperformed developed markets.
If you invest in the fund through a taxable account, page 35 shows after-tax returns for investors in the highest tax bracket.
2
Stocks sank, then soared as credit and economy stabilized
The 12 months ended August 31 spanned two strikingly different half-years. The period began with the September collapse of a major investment bank and the government-engineered rescue of several giant financial institutions. Stocks sank as the ensuing crisis spread from Wall Street to Main Street and around the globe. Stricken by seized-up credit markets and a near-total lack of confidence, businesses and consumers put the brakes on economic growth.
Governments in the United States and abroad responded with unprecedented stimulus and other programs. Over the past six months, these efforts started to take hold. Credit-market conditions
improved, and the outlook for the U.S. economy brightened. From their early-March lows, stocks took off on an almost unbroken winning streak.
Even so, the broad U.S. stock market ended the 12 months in negative territory, with a return of about –18%. International markets performed somewhat better, as major European economies emerged from recession; the MSCI All Country World Index ex USA returned about –14%.
Despite the robust second-half rally, it may be premature to sound the all-clear signal. As the fiscal year came to a close, home foreclosures and the unemployment rate were rising, and the federal government’s list of problem banks had climbed above 400—the most since June 1994. There is
| Market Barometer | | | |
| | Average Annual Total Returns |
| | Periods Ended August 31, 2009 |
| | One Year | Three Years | Five Years |
| Stocks | | | |
| MSCI All Country World Index ex USA (International) | –13.96% | –2.41% | 8.18% |
| Russell 1000 Index (Large-caps) | –18.39 | –5.61 | 0.94 |
| Russell 2000 Index (Small-caps) | –21.29 | –6.08 | 2.21 |
| Dow Jones U.S. Total Stock Market Index | –18.10 | –5.17 | 1.45 |
| |
| Bonds | | | |
| Barclays Capital U.S. Aggregate Bond Index | | | |
| (Broad taxable market) | 7.94% | 6.35% | 4.96% |
| Barclays Capital Municipal Bond Index | 5.67 | 4.14 | 4.15 |
| Citigroup 3-Month Treasury Bill Index | 0.51 | 2.77 | 2.98 |
| |
| CPI | | | |
| Consumer Price Index | –1.48% | 1.91% | 2.64% |
3
considerable historical evidence that recovery from a recession caused by a financial crisis tends to take longer than average.
Among bond investors, safety and yield traded places
The U.S. bond market also performed a U-turn during the year. Early on, as credit markets deteriorated, investors rushed to the relative safety and liquidity of U.S. Treasury securities, driving their prices up and yields down. Investors were so risk-averse that short-term Treasury yields briefly turned negative. November and December were among the ten best months ever for Treasury returns (adjusted for inflation). Corporate bonds, especially those of lower credit quality, struggled,
and their yield spreads above comparable Treasuries widened to near-historic levels during the first six months.
Several moves by the Treasury and the Federal Reserve Board—which slashed its target level for short-term interest rates to a range of 0%–0.25% in December—helped credit markets to attain some stability by the spring. In a dramatic reversal, investors regained their appetite for risk, favoring corporate bonds over Treasuries.
After all the ups and downs, Treasuries and high-yield corporate bonds produced similar 12-month returns of about 6%–7%. Overall, the broad U.S. taxable bond market returned about 8%. Tax-exempt municipal bonds, after a flat first half, returned more than 5% for the fiscal year.
| Expense Ratios1 | | | |
| Your Fund Compared With Its Peer Group | | | |
| | | | International |
| | Investor | Admiral | Funds |
| | Shares | Shares | Average |
| International Growth Fund | 0.54% | 0.35% | 1.44% |
1 The fund expense ratios shown are from the prospectus dated December 29, 2008, and represent estimated costs for the current fiscal
year based on the fund’s net assets as of the prospectus date. The expense ratios for the fiscal year ended August 31, 2009, were 0.53%
for Investor Shares and 0.34% for Admiral Shares. The peer-group expense ratio is derived from data provided by Lipper Inc. and captures
information through year-end 2008.
4
Second-half rally could not offset losses
Global stock markets opened the fiscal year plagued by the credit crisis that began in the United States and the economic slowdown that followed. While the markets staged a solid rally over the year’s second half, the gains weren’t enough to offset the steep losses incurred earlier in the period.
Emerging-market stocks, while still down for the fiscal year, made an impressive comeback over the last six months, and your fund’s advisors reaped the benefits of opportunistically building up their allocation to emerging markets during the year. Leading the rally was China, where investors cheered the government’s stimulus program. Financial, consumer
discretionary, and industrial stocks contributed the most to China’s return. The advisors’ selection of financial stocks also had a positive effect on the fund.
More than half of International Growth Fund’s holdings were in the developed markets of Europe, and the fund’s losses were heavily influenced by this large stake. Holdings in the developed markets of the Pacific region also dragged down the fund’s return. Japan made up more than half of the fund’s stocks in the region, and its industrial and financial holdings especially weakened performance.
The region’s best performer was Hong Kong, which received a lift from several financial stocks.
| Total Returns | |
| Ten Years Ended August 31, 2009 | |
| | Average |
| | Annual Return |
| International Growth Fund Investor Shares | 3.39% |
| MSCI EAFE Index | 2.27 |
| International Funds Average1 | 1.82 |
The figures shown represent past performance, which is not a guarantee of future results. (Current performance may be lower or higher than the performance data cited. For performance data current to the most recent month-end, visit our website at www.vanguard.com/performance.) Note, too, that both investment returns and principal value can fluctuate widely, so an investor’s shares, when sold, could be worth more or less than their original cost.
1 Derived from data provided by Lipper Inc.
5
On a sector basis, although financial companies faltered during the year, the fund’s advisors avoided some of the hardest-hit stocks and shared in the gains of those that improved. The fund was helped by avoiding troubled banks that suffered during the credit freeze that began last fall and continued into the first months of 2009.
The beaten-down industrial sector, particularly machinery, electrical equipment, and alternative energy companies, detracted the most from the fund’s return Industrial stocks are particularly sensitive in recessionary times, as many projects are halted or postponed. Also weighing on the fund’s performance was the telecommunication services sector.
For more about the advisors’ strategies and the fund’s positioning during the year, see the Advisors’ Report that follows this letter.
Ten-year record tops benchmark, peers
In a decade marked by historic volatility and two severe bear markets, Vanguard International Growth Fund has outperformed its unmanaged benchmark index and its peer group. The fund’s average annual return of about 3% during the past 10 years was more than 1 percentage point better than that of its benchmark and its peer-group average.
This performance is a credit to the skills, knowledge, and experience of the investment professionals who advise your fund. Schroder Investment Management North America has managed the fund since its 1981 inception, Baillie Gifford Overseas joined as an advisor in 2003, and M&G Investment Management came aboard in 2008. All three firms have many years of experience in managing growth-oriented funds.
As a shareholder, you have also benefited from the fund’s low costs, which allow you to keep more of its return.
A word on expenses
As detailed in the table and footnote on page 4, the fund’s expense ratios have risen over the past fiscal year. The explanation is threefold.
First, as the value of fund assets has declined, the fund’s fixed expenses have accounted for a modestly higher percentage of fund assets. Second, in fiscal 2008, the fund’s board of directors approved an increase in the advisory fee that took effect during fiscal 2009.
Third, many of the Vanguard funds’ advisory contracts include a performance incentive-fee/penalty provision. If the advisor outperforms its benchmark, the firm's fee increases; if it underperforms, the fee declines. The incentive fee
6
structure helps ensure that the interests of the advisors and the funds’ shareholders remain aligned. During the past year, the fund’s strong performance resulted in an increase in the performance adjustment. The fund’s financial statements include more information about the incentive fee.
Foreign stocks have a role in a diversified portfolio
After several years of superior returns, international markets suffered even more than U.S. stocks during the global financial crisis. The results led some investors to question the value of international investing and enlivened the debate about whether international stocks truly serve to diversify a portfolio.
As long as two asset classes do not move perfectly in tandem, there is potential for diversification to add value, and Vanguard’s research suggests that international equities can, in fact, help diversify your portfolio over the long run. The International Growth Fund can give you access to international companies with the potential for above-average growth, and can play a valuable role in your efforts to allocate your resources among and within the major asset classes in a way that fits your unique circumstances.
The past year’s extreme turbulence has no doubt been frustrating for investors, but it’s crucial not to let short-term volatility prevent you from considering the long-term merits of both international equities and the broader stock market. As international stocks rode a rollercoaster to frightening depths last year, an impulsive retreat from the markets would have kept an investor from participating in the strong rally and partial recovery at the end of the period.
Thank you for investing in Vanguard.
Sincerely,

F. William McNabb III
President and Chief Executive Officer
September 12, 2009
7
Advisors’ Report
For the fiscal year ended August 31, 2009, Vanguard International Growth Fund returned about –14%. Your fund is managed by three independent advisors, a strategy that enhances the fund’s diversification by providing exposure to distinct, yet complementary, investment approaches. It is not uncommon for different advisors to have different views about individual securities or the broader investment environment.
The advisors, the amount and percentage of fund assets each manages, and brief descriptions of their investment strategies are presented in the table below. The advisors have also prepared a discussion of the investment environment that existed during the fiscal year and of how their portfolio positioning reflects this assessment. These comments were prepared on September 15, 2009.
Vanguard International Growth Fund Investment Advisors
| | | |
| | Fund Assets Managed | |
| Investment Advisor | % | $ Million | Investment Strategy |
| Schroder Investment | 45 | 6,460 | Equity analysts in 11 countries and an international team of |
| Management North America Inc. | | | global sector and regional specialists help to identify |
| | | | reasonably priced companies with strong growth prospects |
| | | | and a sustainable competitive advantage. |
| Baillie Gifford Overseas Ltd. | 42 | 5,963 | The advisor seeks stocks that can generate above- |
| | | | average growth in earnings and cash flow, producing |
| | | | a bottom-up, stock-driven approach to country and |
| | | | asset allocation. An in-depth view on each company |
| | | | is measured against the consensus view, leading to |
| | | | discrepancies and potential opportunities to add value. |
| M&G Investment | 8 | 1,099 | The advisor constructs a portfolio using a long-term, |
| Management Limited | | | bottom-up investment approach focusing on |
| | | | identifying underappreciated companies—particularly |
| | | | those with scarce assets—with the ability to deliver |
| | | | high returns and growth potential. |
| Cash Investments | 5 | 639 | These short-term reserves are invested by Vanguard |
| | | | in equity index products to simulate investment in |
| | | | stocks. Each advisor may also maintain a modest |
| | | | cash position. |
8
Schroder Investment Management
North America Inc.
Portfolio Managers:
Virginie Maisonneuve, CFA
Head of Global and International Equities
Matthew Dobbs
Head of Global Small Companies
International equity markets declined by about 15% (measured in U.S. dollars) over the 12 months ended August 31, 2009, with a strong rally in the second half of the period wiping out some of the large losses the market experienced in the first half. The primary catalysts for the dramatic turn of events were the concerted efforts by governments to support the banking system and provide liquidity to markets, which helped underpin investors’ confidence that the worst of the crisis might have passed.
We had believed for some time that emerging markets—China and Brazil in particular—would be most capable of boosting their economies in this downturn. They entered the crisis in much better shape than the developed world and had underlying support from their growing middle classes and, in the case of Brazil, from resources. As markets collapsed, we added quality growth names in these regions, especially those benefiting from domestic consumption and infrastructure spending—areas in which we see strong long-term earnings support. Attractively priced examples in the portfolio include China-based auto company Denway
Motors, online travel agency ctrip.com, and conglomerate Swire Pacific, as well as banking group Itau Unibanco in Brazil and commodities companies such as CVRD (Companhia Vale do Rio Doce).
In Europe, we were cautious about banks throughout 2008 and kept our exposure in “safer” names, such as insurance companies (Admiral) and the better-capitalized banks. As valuations became increasingly depressed in the early part of 2009, we added holdings such as HSBC and BNP Paribas, as well as Nomura Holdings in Japan.
We also took advantage of poor market sentiment in the first quarter to add globally competitive companies with strong brand names and long-term earnings power, such as BMW and Nokia.
Although we successfully added to Honda on weakness, as the strong yen and bearish sentiment on the global car industry affected the share price, we have limited exposure to Japan, as we continue to find better-valued growth companies elsewhere.
On the downside, our exposure to industrials and materials hurt most early in the period, with steel producer ArcelorMittal and mining company Rio Tinto detracting from performance as commodity prices fell. This was due to companies drastically reducing inventory levels toward the end of 2008 amid falling global demand. We believed the sell-off
9
in some stocks had been overdone, and we added to some of the positions in which we had the greatest conviction. Indeed, companies began rebuilding stock in 2009 as the outlook improved, and many of our positions rebounded accordingly.
Looking forward, we believe the markets will continue to be volatile as investors shift their focus between different time horizons. On the one hand, equity markets are benefiting from the improving sequential macroeconomic data and the massive liquidity injected by governments globally. On the other hand, the long-term realities of deleveraging and the uncertain impact of the emergency measures put in place are still weighing on the markets. In this environment, we continue to focus on finding attractively priced globally competitive companies that demonstrate long-term earnings growth with strong structural drivers underpinning their growth.
Baillie Gifford Overseas Ltd.
Portfolio Manager:
James K. Anderson, Chief Investment
Officer and Head of Global Equities
It is surprising that our portfolio, which reflects our conviction in our investment ideas, performed roughly in line with its benchmark during 12 months of extreme volatility. What we lost, relatively speaking, in the first half of the period, when investors were panicking, we made back in the second half as confidence returned. It all feels like an expensive and nerve-racking round trip. The most important
thing for us was not to lose faith in our long-term policy. By sticking to our guns, we have benefited from the strong bounce in markets this year.
This implies that there was very little change in the makeup of the portfolio during the period, which is true. We still like the developing world (Brazil represents our most significant overweighting among countries), and we are heavily exposed to the industrial and technology sectors. Economic crises have not increased the appeal of pharmaceutical companies or utilities, in our opinion, and we have very little invested in them. The only change of note was a gradual tilt toward more technology businesses and retailers, and away from some of the industrials that have served us so well.
Our successes and failures balanced each other out during the period. The most surprising aspect of our performance was the strong contribution from retail stocks. We are overweighted in the sector; Inditex (Industria de Diseno Textil) and Woolworths Holdings were especially helpful. The main reasons for the shopkeepers’ resilience were relief that demand did not collapse, vigorous cost cutting, and hopes of feebler competition in the future. The main disappointment in the portfolio was our exposure to alternative energy (solar and wind power). The companies’ shares were dumped indiscriminately by other investors. Our positive long-term view is largely unchanged.
10
At the moment, the market’s verdict is that what we are going through is more a case of “back to the future” than a “brave new world.” This is probably correct. Countries with a heavy debt overhang, such as the United States and United Kingdom, may take longer to revive, but much of the global economy seems to be recovering more sharply than most people expected. Governments are determined not to risk a double dip, and the emerging world has come through the crisis in good shape. It is hard not to feel fairly optimistic.
M&G Investment
Management Limited
Portfolio Managers:
Graham E. French, Portfolio Manager
Greg Aldridge, Portfolio Manager
Following dramatic declines in the fourth quarter of 2008, when financial markets anticipated the possibility of another Great Depression, global equities rallied strongly from March 2009 onward as these fears subsided and investors focused on the prospects for recovery in the global economy. The first part of the period was characterized by the outperformance of defensive sectors such as health care and consumer staples; in the second, investors’ appetite for risk grew substantially, prompting a particularly strong recovery in emerging markets and, among industries, in more volatile financial and natural resources stocks.
In terms of performance, our exposure to technology stocks proved particularly beneficial, especially Samsung Electronics, the Korean consumer electronics business (a position we exited during the period); Compal Electronics, the Taiwanese computer manufacturer; and Ericsson, the Swedish mobile communications equipment maker.
The portfolio’s positions in emerging markets benefited from the resurgence in risk appetite as financial concerns eased and as the relative strength of many of these economies became more apparent. Positive contributions came from MTN, the South African mobile phone business with strong positions in a number of under-penetrated markets across Africa and the Middle East; Petrobras, the Brazilian oil and gas producer with exciting growth prospects; and Hankook Tire, the Korean tire manufacturer.
Elsewhere, strong returns came from the advertising agency Publicis and from the testing services company Intertek, a new holding during the year whose share price rebounded from levels that reflected overly pessimistic fears of a cyclical slowdown.
By contrast, the weakest performers were those whose sharp declines earlier in the period outweighed the subsequent rebound in their share prices. Inchcape, the international car distribution business, suffered as households constrained their discretionary spending; diamond miner and retailer Harry Winston was hurt by falling
11
diamond prices; and Dutch financial group ING succumbed to the pressures affecting much of the industry. Health care companies Astellas Pharma, Novartis, and GlaxoSmithKline, meanwhile, which had held up well in the first half of the period, didn’t participate in the second-half rally and also ended the year as net detractors from performance.
We established new positions in holdings with high-returning business models and scarce assets, such as G4S (Group 4 Securicor), a global security services business based in the United Kingdom, and South African energy producer Sasol. G4S has strong market positions around the world and benefits from the trend towards security outsourcing globally, while Sasol is a clearly differentiated energy producer with proven experience and know-how in converting coal and gas into liquid oil products.
During the period, we sold food producer Danone and, as we mentioned above, Samsung, with the proceeds being used to fund more compelling valuation opportunities elsewhere.
It has been an extraordinary year for investors in global equities. Following the dramatic fall and subsequent rally in share prices over the 12 months, we believe it is right to retain our focus on high-quality, value-creating businesses whose scarce assets differentiate them from their competitors and should enable them to generate high returns and grow over the long term.
12
Results of Proxy Voting
At a special meeting of shareholders on July 2, 2009, fund shareholders approved the following two proposals:
Proposal 1—Elect trustees for each fund.*
The individuals listed in the table below were elected as trustees for each fund. All trustees with the exception of Messrs. McNabb and Volanakis (both of whom already served as directors of The Vanguard Group, Inc.) served as trustees to the funds prior to the shareholder meeting.
| | | |
| | | | Percentage |
| Trustee | For | Withheld | For |
| John J. Brennan | 816,325,661 | 25,839,114 | 96.9% |
| Charles D. Ellis | 811,618,878 | 30,545,897 | 96.4% |
| Emerson U. Fullwood | 816,960,560 | 25,204,215 | 97.0% |
| Rajiv L. Gupta | 815,607,429 | 26,557,346 | 96.8% |
| Amy Gutmann | 818,039,387 | 24,125,388 | 97.1% |
| JoAnn Heffernan Heisen | 815,771,400 | 26,393,375 | 96.9% |
| F. William McNabb III | 817,559,701 | 24,605,074 | 97.1% |
| André F. Perold | 814,833,250 | 27,331,525 | 96.8% |
| Alfred M. Rankin, Jr. | 815,942,907 | 26,221,868 | 96.9% |
| Peter F. Volanakis | 817,780,699 | 24,384,076 | 97.1% |
| * Results are for all funds within the same trust. | | | |
Proposal 2—Update and standardize the funds’ fundamental policies regarding:
(a) Purchasing and selling real estate.
(b) Issuing senior securities.
(c) Borrowing money.
(d) Making loans.
(e) Purchasing and selling commodities.
(f) Concentrating investments in a particular industry or group of industries.
(g) Eliminating outdated fundamental investment policies not required by law.
The revised fundamental policies are clearly stated and simple, yet comprehensive, making oversight and compliance more efficient than under the former policies. The revised fundamental policies will allow the funds to respond more quickly to regulatory and market changes, while avoiding the costs and delays associated with successive shareholder meetings.
| | | | | |
| | | | | Broker | Percentage |
| Vanguard Fund | For | Abstain | Against | Non-Votes | For |
| International Growth Fund | | | | | |
| 2a | 487,872,988 | 9,212,832 | 10,770,095 | 30,667,450 | 90.6% |
| 2b | 486,960,724 | 9,833,833 | 11,061,361 | 30,667,448 | 90.4% |
| 2c | 463,170,280 | 9,854,477 | 34,831,160 | 30,667,449 | 86.0% |
| 2d | 470,743,410 | 9,952,062 | 27,160,443 | 30,667,450 | 87.4% |
| 2e | 479,258,089 | 9,484,466 | 19,113,358 | 30,667,452 | 89.0% |
| 2f | 486,442,002 | 9,611,529 | 11,802,385 | 30,667,449 | 90.3% |
| 2g | 491,503,528 | 9,499,079 | 6,853,310 | 30,667,449 | 91.3% |
13
International Growth Fund
Fund Profile
As of August 31, 2009
| | | |
| Portfolio Characteristics | | |
| | | Comparative | Broad |
| | Fund | Index1 | Index2 |
| Number of Stocks | 177 | 959 | 1,794 |
| Median Market Cap | $34.7B | $32.3B | $27.5B |
| Price/Earnings Ratio | 21.4x | 34.1x | 27.3x |
| Price/Book Ratio | 2.0x | 1.5x | 1.6x |
| Return on Equity | 21.3% | 17.9% | 18.8% |
| Earnings Growth Rate | 16.1% | 11.1% | 13.5% |
| Dividend Yield | 2.6% | 3.5% | 3.2% |
| Turnover Rate | 51% | — | — |
| Expense Ratio3 | | — | — |
Investor Shares | 0.54% | | |
Admiral Shares | 0.35% | | |
| Short-Term Reserves | 1.1% | — | — |
Sector Diversification (% of equity exposure)
| | | |
| | Comparative | Broad |
| | Fund | Index1 | Index2 |
| Consumer Discretionary 12.5% | | 9.9% | 8.5% |
| Consumer Staples | 12.5 | 9.7 | 8.3 |
| Energy | 8.7 | 8.1 | 10.7 |
| Financials | 22.7 | 26.3 | 26.8 |
| Health Care | 7.2 | 8.2 | 6.4 |
| Industrials | 11.9 | 11.3 | 10.0 |
| Information Technology | 8.9 | 5.0 | 6.6 |
| Materials | 9.0 | 9.4 | 10.9 |
| Telecommunication | | | |
| Services | 4.8 | 5.9 | 6.5 |
| Utilities | 1.8 | 6.2 | 5.3 |
| | |
| Volatility Measures4 | |
| | Fund Versus | Fund Versus |
| | Comparative Index1 | Broad Index2 |
| R-Squared | 0.97 | 0.98 |
| Beta | 1.06 | 0.99 |
Ten Largest Holdings5 (% of total net assets)
| SAP AG | application software | 2.1% |
| Tesco PLC | food retail | 2.1 |
| Petroleo Brasileiro SA | integrated oil and gas | 2.0 |
| Teva Pharmaceutical Industries Ltd. Sponsored ADR | pharmaceuticals | 1.8 |
| Canon, Inc. | office electronics | 1.7 |
| HSBC Holdings PLC | diversified banks | 1.6 |
| BG Group PLC | integrated oil and gas | 1.6 |
| Nestle SA (Registered) | packaged foods and meats | 1.5 |
| Syngenta AG | fertilizers and agricultural chemicals | 1.4 |
| L’Oreal SA | personal products | 1.4 |
| Top Ten | | 17.2% |
Allocation by Region (% of equity exposure)
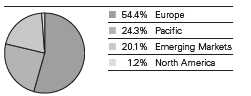
1 MSCI EAFE Index.
2 MSCI All Country World Index ex USA.
3 The expense ratios shown are from the prospectus dated December 29, 2008, and represent estimated costs for the current fiscal year
based on the fund’s net assets as of the prospectus date. The expense ratios for the fiscal year ended August 31, 2009, were 0.53% for
the Investor Shares and 0.34% for the Admiral Shares.
4 For an explanation of R-squared, beta, and other terms used here, see the Glossary.
5 The holdings listed exclude any temporary cash investments and equity index products.
14
.
International Growth Fund
Market Diversification (% of equity exposure)
| | | |
| | Comparative | | Broad |
| | Fund1 | Index2 | Index3 |
| Europe | | | |
| United Kingdom | 17.2% | 21.0% | 15.3% |
| France | 10.0 | 10.7 | 7.8 |
| Switzerland | 8.4 | 7.7 | 5.6 |
| Germany | 6.9 | 7.9 | 5.7 |
| Spain | 3.5 | 4.7 | 3.4 |
| Sweden | 2.8 | 2.6 | 1.9 |
| Netherlands | 2.3 | 2.4 | 1.8 |
| Denmark | 1.8 | 0.9 | 0.7 |
| Other European | | | |
| Markets | 1.5 | 8.0 | 5.8 |
| Subtotal | 54.4% | 65.9% | 48.0% |
| Pacific | | | |
| Japan | 15.4% | 22.9% | 16.6% |
| Hong Kong | 4.2 | 2.2 | 1.6 |
| Australia | 3.4 | 7.6 | 5.5 |
| Singapore | 1.3 | 1.3 | 0.9 |
| Other Pacific | | | |
| Markets | 0.0 | 0.1 | 0.1 |
| Subtotal | 24.3% | 34.1% | 24.7% |
| Emerging Markets | | | |
| Brazil | 6.4% | — | 3.0% |
| China | 5.4 | — | 3.7 |
| Israel | 2.3 | — | 0.6 |
| Mexico | 1.2 | | 0.9 |
| South Africa | 1.1 | | 1.5 |
| Other Emerging | | | |
| Markets | 3.7 | — | 10.6 |
| Subtotal | 20.1% | — | 20.3% |
| North America | | | |
| Canada | 1.2% | — | 7.0% |
1 Market percentages exclude currency contracts held by the fund.
2 MSCI EAFE Index.
3 MSCI All Country World Index ex USA.
15
International Growth Fund
Performance Summary
All of the returns in this report represent past performance, which is not a guarantee of future results that may be achieved by the fund. (Current performance may be lower or higher than the performance data cited. For performance data current to the most recent month-end, visit our website at www.vanguard.com/performance.) Note, too, that both investment returns and principal value can fluctuate widely, so an investor’s shares, when sold, could be worth more or less than their original cost. The returns shown do not reflect taxes that a shareholder would pay on fund distributions or on the sale of fund shares.
Cumulative Performance: August 31, 1999–August 31, 2009
Initial Investment of $10,000
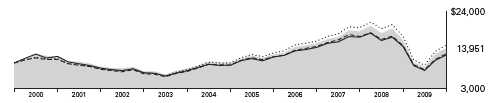
| | | | |
| | | Average Annual Total Returns | Final Value |
| | | Periods Ended August 31, 2009 | of a $10,000 |
| | One Year | Five Years | Ten Years | Investment |
| International Growth Fund Investor Shares1 | –13.75% | 6.98% | 3.39% | $13,951 |
| MSCI All Country World Index ex USA | –13.96 | 8.18 | 4.01 | 14,813 |
| MSCI EAFE Index | –14.95 | 5.82 | 2.27 | 12,517 |
| International Funds Average2 | –16.32 | 5.28 | 1.82 | 11,974 |
| | | | |
| | | | | Final Value |
| | | | Since | of a $100,000 |
| | One Year | Five Years | Inception3 | Investment |
| International Growth Fund Admiral Shares1 | –13.57% | 7.20% | 5.59% | $154,900 |
| MSCI All Country World Index ex USA | –13.96 | 8.18 | 7.11 | 173,830 |
| MSCI EAFE Index | –14.95 | 5.82 | 5.06 | 148,729 |
1 Total returns do not reflect the 2% fee assessed on redemptions of shares purchased on or after June 27, 2003, and held for less than
two months, nor for the Investor Shares do they include the account service fee that may be applicable to certain accounts with balances
below $10,000.
2 Derived from data provided by Lipper Inc.
3 Performance for the fund’s Admiral Shares and comparative standards is calculated since the share class inception: August 13, 2001.
Note: See Financial Highlights tables for dividend and capital gains information.
16
International Growth Fund
Fiscal-Year Total Returns (%): August 31, 1999–August 31, 2009
Average Annual Total Returns: Periods Ended June 30, 2009
This table presents average annual total returns through the latest calendar quarter—rather than through the end
of the fiscal period. Securities and Exchange Commission rules require that we provide this information.
| | | | |
| | Inception Date | One Year | Five Years | Ten Years |
| Investor Shares1 | 9/30/1981 | –29.78% | 3.85% | 2.26% |
| Admiral Shares1 | 8/13/2001 | –29.63 | 4.05 | 4.072 |
1 Total returns do not reflect the 2% fee assessed on redemptions of shares purchased on or after June 27, 2003, and held for less than
two months, nor for the Investor Shares do they include the account service fee that may be applicable to certain accounts with balances
below $10,000.
2 Return since inception.
Note: See Financial Highlights tables for dividend and capital gains information.
17
International Growth Fund
Financial Statements
Statement of Net Assets
As of August 31, 2009
The fund provides a complete list of its holdings four times in each fiscal year, at the quarter-ends. For the second and fourth fiscal quarters, the lists appear in the fund’s semiannual and annual reports to shareholders. For the first and third fiscal quarters, the fund files the lists with the Securities and Exchange Commission on Form N-Q. Shareholders can look up the fund’s Forms N-Q on the SEC’s website at www.sec.gov. Forms N-Q may also be reviewed and copied at the SEC’s Public Reference Room (see the back cover of this report for further information).
| | | |
| | | | Market |
| | | | Value• |
| | | Shares | ($000) |
| Common Stocks (94.4%)1 | | |
| Australia (3.0%) | | |
| | Woolworths Ltd. | 5,583,900 | 132,016 |
| | Woodside Petroleum Ltd. | 2,777,000 | 115,227 |
| | Brambles Ltd. | 14,934,900 | 93,806 |
| * | James Hardie Industries | | |
| | NV | 6,196,069 | 36,441 |
| | Amcor Ltd. | 6,333,889 | 30,821 |
| | Sims Metal | | |
| | Management Ltd. | 750,000 | 14,502 |
| | | | 422,813 |
| Austria (0.2%) | | |
| ^ | Wienerberger AG | 967,000 | 22,105 |
| |
| Belgium (0.1%) | | |
| | Barco NV | 355,000 | 17,334 |
| |
| Brazil (6.3%) | | |
| | Petroleo Brasileiro SA | | |
| | Series A ADR | 7,733,400 | 256,749 |
| | Itau Unibanco Banco | | |
| | Multiplo SA | 8,592,375 | 143,922 |
| | Redecard SA | 7,504,952 | 102,219 |
| | Banco Itau Holding | | |
| | Financeira SA | 5,404,490 | 90,529 |
| | Companhia Vale do | | |
| | Rio Doce Pfd. Class A | 4,149,000 | 71,788 |
| | BM&F BOVESPA SA | 11,085,000 | 68,462 |
| * | Vale SA Preferred ADR | 3,641,900 | 62,677 |
| | Companhia Brasileira de | | |
| | Distribuicao Grupo Pao | | |
| | de Acucar ADR | 795,000 | 38,772 |
| | Petroleo Brasileiro | | |
| | SA Pfd. | 1,515,000 | 25,160 |
| | Banco do Brasil SA | 1,220,000 | 17,044 |
| | Votorantim Celulose e | | |
| | Papel SA | 716,170 | 11,240 |
| | | | 888,562 |
| | | |
| | | | Market |
| | | | Value• |
| | | Shares | ($000) |
| Canada (1.2%) | | |
| | Niko Resources Ltd. | 1,417,600 | 91,938 |
| | Canadian Pacific | | |
| | Railway Ltd. | 1,264,000 | 60,524 |
| | Sherritt | | |
| | International Corp. | 1,965,000 | 12,098 |
| | Harry Winston | | |
| | Diamond Corp. | 732,000 | 4,293 |
| | | | 168,853 |
| China (5.3%) | | |
| | China | | |
| | Construction Bank | 147,450,000 | 111,312 |
| | China Mobile | | |
| | (Hong Kong) Ltd. | 10,364,500 | 101,769 |
| | China Resources | | |
| | Enterprise Ltd. | 24,730,000 | 58,042 |
| | CNOOC Ltd. | 44,035,000 | 57,648 |
| | Ping An Insurance | | |
| | (Group) Co. of | | |
| | China Ltd. | 7,695,000 | 57,548 |
| ^ | Dongfang | | |
| | Electrical Corp Ltd. | 10,506,200 | 51,266 |
| | Denway Motors Ltd. | 112,074,000 | 49,898 |
| ^ | Want Want China | | |
| | Holdings Ltd. | 89,703,000 | 47,673 |
| * | Ctrip.com | | |
| | International Ltd. ADR | 941,700 | 46,087 |
| | China Unicom Ltd. | 29,408,000 | 41,119 |
| * | Baidu.com, Inc. | 115,400 | 38,089 |
| ^ | China Overseas Land & | | |
| | Investment Ltd. | 16,430,800 | 33,406 |
| ^ | Tencent Holdings Ltd. | 1,888,000 | 28,096 |
| ^ | China Merchants | | |
| | Bank Co., Ltd. Class H | 9,496,500 | 20,679 |
| | Chaoda Modern | | |
| | Agriculture | | |
| | Holdings Ltd. | 20,000,719 | 11,874 |
| | | | 754,506 |
18
| | | |
| International Growth Fund | | |
| |
| |
| |
| | | | Market |
| | | | Value• |
| | | Shares | ($000) |
| Denmark (1.8%) | | |
| * | Vestas Wind Systems | | |
| | A/S | 1,485,736 | 106,619 |
| | Novo Nordisk A/S | | |
| | B Shares | 1,135,200 | 69,257 |
| | Novozymes A/S | 634,400 | 54,469 |
| | AP Moller-Maersk A/S | | |
| | B Shares | 2,525 | 18,171 |
| | | | 248,516 |
| France (9.3%) | | |
| | L’Oreal SA | 2,013,495 | 198,768 |
| | Axa | 8,336,250 | 190,405 |
| | Essilor International SA | 3,380,100 | 182,873 |
| | Total SA | 2,859,000 | 164,050 |
| | Groupe Danone | 2,210,000 | 120,494 |
| | BNP Paribas SA | 1,354,000 | 109,176 |
| | GDF Suez | 2,349,012 | 99,289 |
| | ArcelorMittal | | |
| | (Amsterdam Shares) | 2,609,425 | 93,325 |
| | PPR | 605,000 | 70,431 |
| ^ | Publicis Groupe SA | 785,000 | 28,933 |
| | Societe Generale Class A | 347,000 | 28,048 |
| | European Aeronautic | | |
| | Defence and Space Co. | 1,300,000 | 27,038 |
| | | | 1,312,830 |
| Germany (6.4%) | | |
| | SAP AG | 6,219,400 | 303,681 |
| | E.On AG | 2,700,133 | 114,410 |
| | Adidas AG | 2,142,810 | 101,064 |
| | Linde AG | 861,000 | 86,657 |
| | Fresenius Medical Care | | |
| | AG | 1,756,000 | 78,792 |
| | Porsche AG | 994,400 | 73,414 |
| | ThyssenKrupp AG | 1,219,000 | 41,574 |
| | Celesio AG | 1,522,800 | 41,495 |
| | Siemens AG | 283,000 | 24,586 |
| | Symrise AG | 1,345,000 | 22,262 |
| *,^ | Q-Cells AG | 986,500 | 15,147 |
| | | | 903,082 |
| Hong Kong (4.1%) | | |
| | Swire Pacific Ltd. | | |
| | A Shares | 18,217,500 | 190,129 |
| ^ | Hong Kong Exchanges & | | |
| | Clearing Ltd. | 6,214,500 | 108,194 |
| | Esprit Holdings Ltd. | 17,380,500 | 105,752 |
| | Sun Hung Kai | | |
| | Properties Ltd. | 5,294,000 | 71,703 |
| | Shangri-La Asia Ltd. | 26,390,000 | 38,830 |
| | Li & Fung Ltd. | 10,292,000 | 34,215 |
| ^ | Techtronic | | |
| | Industries Co., Ltd. | 22,999,943 | 22,598 |
| * | Ports Design Limited | 4,958,000 | 11,348 |
| | | | 582,769 |
| | |
| | | Market |
| | | Value• |
| | Shares | ($000) |
| India (0.3%) | | |
| Reliance Capital Ltd. | 1,454,500 | 25,990 |
| Housing Development | | |
| Finance Corp. Ltd. | 425,800 | 21,574 |
| | | 47,564 |
| Indonesia (0.5%) | | |
| PT Telekomunikasi | | |
| Indonesia Tbk | 81,778,500 | 67,706 |
| |
| Ireland (0.2%) | | |
| Kerry Group PLC | | |
| A Shares | 850,000 | 22,236 |
| Kerry Group PLC | 75,000 | 1,967 |
| | | 24,203 |
| Israel (2.2%) | | |
| Teva Pharmaceutical | | |
| Industries Ltd. | | |
| Sponsored ADR | 4,969,100 | 255,909 |
| Makhteshim-Agan | | |
| Industries Ltd. | 13,061,243 | 59,943 |
| | | 315,852 |
| Italy (0.6%) | | |
| * Intesa Sanpaolo SpA | 18,981,662 | 82,481 |
| |
| Japan (14.0%) | | |
| Canon, Inc. | 6,385,100 | 244,081 |
| Honda Motor Co., Ltd. | 6,170,100 | 193,467 |
| Toyota Motor Corp. | 2,843,900 | 121,248 |
| Mitsubishi Corp. | 5,978,000 | 120,845 |
| Nintendo Co. | 420,900 | 114,074 |
| Uni-Charm Corp. | 1,105,000 | 99,002 |
| Mitsui Sumitomo | | |
| Insurance Group | | |
| Holdings, Inc. | 3,434,100 | 96,592 |
| Nippon Telegraph and | | |
| Telephone Corp. | 1,929,000 | 85,875 |
| Mitsubishi UFJ | | |
| Financial Group | 12,839,400 | 81,623 |
| Nomura Holdings Inc. | 9,194,200 | 81,472 |
| Bridgestone Corp. | 4,414,500 | 80,562 |
| Sekisui Chemical Co. | 12,557,000 | 80,086 |
| SMC Corp. | 643,300 | 74,807 |
| Rakuten, Inc. | 116,652 | 70,465 |
| Yamada Denki Co., Ltd. | 1,023,570 | 69,592 |
| Japan Tobacco, Inc. | 23,355 | 67,717 |
| THK Co., Inc. | 3,095,300 | 57,937 |
| JFE Holdings, Inc. | 1,623,000 | 56,642 |
| Hoya Corp. | 2,310,700 | 52,065 |
| Rohm Co., Ltd. | 589,500 | 39,789 |
| Kyocera Corp. | 347,900 | 28,913 |
| Trend Micro Inc. | 695,000 | 27,279 |
| Astellas Pharma Inc. | 585,000 | 23,382 |
| Yamaha Motor Co., Ltd. | 1,600,000 | 18,871 |
| | | 1,986,386 |
19
| | |
| International Growth Fund | | |
| |
| |
| |
| | | Market |
| | | Value• |
| | Shares | ($000) |
| Luxembourg (0.1%) | | |
| Reinet Investments SA | 542,339 | 7,508 |
| |
| Mexico (1.2%) | | |
| Grupo Televisa SA ADR | 3,880,000 | 67,823 |
| America Movil SA de | | |
| CV Series L ADR | 1,403,500 | 63,368 |
| Wal-Mart de Mexico SA | 8,200,000 | 29,062 |
| Consorcio ARA SA | | |
| de CV | 20,250,000 | 11,646 |
| | | 171,899 |
| Netherlands (2.2%) | | |
| Unilever NV | 5,054,000 | 141,603 |
| SBM Offshore NV | 4,091,246 | 85,226 |
| Reed Elsevier NV | 4,998,000 | 53,103 |
| ^ TNT NV | 747,911 | 18,521 |
| ING Groep NV | 900,000 | 13,570 |
| | | 312,023 |
| Norway (0.1%) | | |
| StatoilHydro ASA | 875,000 | 19,138 |
| |
| Russia (0.7%) | | |
| OAO Gazprom-Sponsored | | |
| ADR (London Shares) | 4,851,000 | 101,799 |
| |
| Singapore (1.3%) | | |
| Jardine Matheson | | |
| Holdings Ltd. | 4,516,400 | 130,881 |
| Singapore Exchange Ltd. | 6,541,000 | 37,960 |
| DBS Group Holdings Ltd. | 2,190,000 | 19,232 |
| | | 188,073 |
| South Africa (1.1%) | | |
| MTN Group Ltd. | 6,307,372 | 103,416 |
| Impala Platinum | | |
| Holdings Ltd. | 1,778,600 | 41,574 |
| Sasol Ltd. | 406,000 | 15,309 |
| | | 160,299 |
| South Korea (0.9%) | | |
| Samsung | | |
| Electronics Co., Ltd. | 116,000 | 71,528 |
| Samsung Fire & | | |
| Marine Insurance Co. | 186,900 | 33,486 |
| Hankook Tire Co. Ltd. | 1,080,000 | 19,177 |
| | | 124,191 |
| Spain (3.2%) | | |
| Banco Santander SA | 11,409,450 | 175,651 |
| Industria de Diseno Textil | | |
| SA | 2,217,885 | 120,957 |
| | | |
| | | | Market |
| | | | Value• |
| | | Shares | ($000) |
| | Banco Bilbao Vizcaya | | |
| | Argentaria SA | 4,703,000 | 83,617 |
| | Gamesa Corporacion | | |
| | Tecnologica SA | 3,390,418 | 74,425 |
| | | | 454,650 |
| Sweden (2.8%) | | |
| | Atlas Copco AB A Shares | 15,095,533 | 190,637 |
| | Sandvik AB | 10,514,363 | 106,285 |
| | Svenska Handelsbanken | | |
| | AB A Shares | 1,703,706 | 44,774 |
| ^ | Oriflame Cosmetics SA | 575,000 | 28,045 |
| | Telefonaktiebolaget LM | | |
| | Ericsson AB Class B | 2,725,000 | 26,148 |
| | | | 395,889 |
| Switzerland (8.3%) | | |
| | Nestle SA (Registered) | 5,000,000 | 208,165 |
| | Syngenta AG | 849,814 | 199,744 |
| | Credit Suisse Group | | |
| | (Registered) | 3,245,000 | 165,557 |
| | Roche Holdings AG | 1,008,684 | 160,659 |
| * | UBS AG | 8,367,391 | 154,039 |
| * | Compagnie Financiere | | |
| | Richemont SA | 3,236,100 | 88,338 |
| | Geberit AG | 494,180 | 76,194 |
| | ABB Ltd. | 2,331,300 | 44,898 |
| | Holcim Ltd. (Registered) | 486,000 | 32,856 |
| | Novartis AG (Registered) | 575,000 | 26,710 |
| | Zurich Financial Services | | |
| | AG | 50,000 | 11,019 |
| | Julius Baer Holding, Ltd. | 198,745 | 10,135 |
| | | | 1,178,314 |
| Taiwan (0.8%) | | |
| | Taiwan Semiconductor | | |
| | Manufacturing Co., Ltd. | 37,122,508 | 66,703 |
| | Chinatrust Financial | | |
| | Holding | 43,888,000 | 24,364 |
| | Compal Electronics Inc. | 19,738,200 | 19,872 |
| | | | 110,939 |
| Turkey (0.5%) | | |
| * | Turkiye Garanti | | |
| | Bankasi A.S. | 20,354,000 | 75,334 |
| |
| United Kingdom (15.7%) | | |
| | Tesco PLC | 49,634,300 | 302,136 |
| | HSBC Holdings PLC | 20,850,854 | 225,367 |
| | BG Group PLC | 13,691,213 | 224,633 |
| | Standard Chartered PLC | 7,532,300 | 170,015 |
| | Vodafone Group PLC | 75,739,324 | 163,886 |
20
International Growth Fund
| | | |
| | | | Market |
| | | | Value• |
| | | Shares | ($000) |
| | BHP Billiton PLC | 5,536,700 | 144,220 |
| | British American | | |
| | Tobacco PLC | 4,554,464 | 138,389 |
| | Rolls-Royce Group PLC | 13,797,616 | 101,047 |
| | AstraZeneca Group PLC | 2,164,000 | 100,420 |
| | Rio Tinto PLC | 2,574,200 | 99,721 |
| | Admiral Group PLC | 4,712,000 | 81,677 |
| | SABMiller PLC | 2,480,000 | 57,192 |
| | Meggitt PLC | 14,917,500 | 51,701 |
| | Capita Group PLC | 3,551,612 | 39,248 |
| | The Sage Group PLC | 9,902,000 | 35,406 |
| * | Signet Jewelers Ltd. | 1,356,000 | 32,076 |
| | Lloyds Banking Group | | |
| | PLC | 16,799,464 | 30,081 |
| | Intertek Testing Services | | |
| | PLC | 1,460,000 | 28,607 |
| | GlaxoSmithKline PLC | 1,410,000 | 27,534 |
| | Bunzl PLC | 2,828,500 | 26,932 |
| | Unilever PLC | 985,000 | 26,916 |
| | Ultra Electronics Holdings | |
| | PLC | 1,130,000 | 23,082 |
| | Morrison Supermarkets | | |
| | PLC | 5,020,000 | 22,508 |
| | Inchcape PLC | 47,815,000 | 21,451 |
| | Group 4 Securicor PLC | 5,650,000 | 20,424 |
| | Victrex PLC | 1,706,167 | 19,597 |
| | | | 2,214,266 |
| Total Common Stocks | | |
| (Cost $12,830,628) | | 13,359,884 |
| Temporary Cash Investments (6.1%)1 | |
| Money Market Fund (5.7%) | | |
| 2,3 | Vanguard Market Liquidity | |
| | Fund, 0.277% | 804,503,971 | 804,504 |
| | | |
| | | Face | Market |
| | | Amount | Value• |
| | | ($000) | ($000) |
| U.S. Government and Agency Obligations (0.4%) |
| 4,5 | Federal Home Loan Bank, | | |
| | 0.275%, 2/19/10 | 12,000 | 11,986 |
| 4,5 | Federal Home Loan | | |
| | Mortgage Corp., | | |
| | 0.210%, 9/28/09 | 6,000 | 5,999 |
| 4,5 | Federal National | | |
| | Mortgage Assn., | | |
| | 0.426%, 9/23/09 | 43,000 | 42,997 |
| | | | 60,982 |
| Total Temporary Cash Investments | |
| (Cost $865,476) | | 865,486 |
| Total Investments (100.5%) | | |
| (Cost $13,696,104) | | 14,225,370 |
| Other Assets and Liabilites (–0.5%) | |
| Other Assets | | 101,284 |
| Liabilities3 | | (166,035) |
| | | | (64,751) |
| Net Assets (100%) | | 14,160,619 |
21
International Growth Fund
At August 31, 2009, net assets consisted of:
| |
| | Amount |
| | ($000) |
| Paid-in Capital | 16,606,834 |
| Undistributed Net Investment Income | 179,384 |
| Accumulated Net Realized Losses | (3,229,997) |
| Unrealized Appreciation (Depreciation) | |
| Investment Securities | 529,266 |
| Futures Contracts | 60,307 |
| Foreign Currencies and | |
| Forward Currency Contracts | 14,825 |
| Net Assets | 14,160,619 |
| |
| |
| Investor Shares—Net Assets | |
| Applicable to 649,974,274 outstanding | |
| $.001 par value shares of beneficial | |
| interest (unlimited authorization) | 10,226,306 |
| Net Asset Value Per Share— | |
| Investor Shares | $15.73 |
| |
| |
| Admiral Shares—Net Assets | |
| Applicable to 78,564,662 outstanding | |
| $.001 par value shares of beneficial | |
| interest (unlimited authorization) | 3,934,313 |
| Net Asset Value Per Share— | |
| Admiral Shares | $50.08 |
• See Note A in Notes to Financial Statements.
* Non-income-producing security.
^ Part of security position is on loan to broker-dealers. The total value of securities on loan is $79,970,000.
1 The fund invests a portion of its cash reserves in equity markets through the use of index futures contracts. After giving effect to futures
investments, the fund’s effective common stock and temporary cash investment positions represent 98.8% and 1.7%, respectively, of
net assets.
2 Affiliated money market fund available only to Vanguard funds and certain trusts and accounts managed by Vanguard. Rate shown is the
7-day yield.
3 Includes $85,118,000 of collateral received for securities on loan.
4 The issuer operates under a congressional charter; its securities are not backed by the full faith and credit of the U.S. government.
5 Securities with a value of $60,982,000 have been segregated as initial margin for open futures contracts.
ADR—American Depositary Receipt.
See accompanying Notes, which are an integral part of the Financial Statements.
22
International Growth Fund
Statement of Operations
| |
| | Year Ended |
| | August 31, 2009 |
| | ($000) |
| Investment Income | |
| Income | |
| Dividends1,2 | 370,511 |
| Interest2 | 6,015 |
| Security Lending | 9,573 |
| Total Income | 386,099 |
| Expenses | |
| Investment Advisory Fees—Note B | |
| Basic Fee | 14,568 |
| Performance Adjustment | 2,906 |
| The Vanguard Group—Note C | |
| Management and Administrative—Investor Shares | 26,336 |
| Management and Administrative—Admiral Shares | 4,379 |
| Marketing and Distribution—Investor Shares | 2,496 |
| Marketing and Distribution—Admiral Shares | 955 |
| Custodian Fees | 2,177 |
| Auditing Fees | 35 |
| Shareholders’ Reports and Proxies—Investor Shares | 570 |
| Shareholders’ Reports and Proxies—Admiral Shares | 39 |
| Trustees’ Fees and Expenses | 26 |
| Total Expenses | 54,487 |
| Expenses Paid Indirectly | (267) |
| Net Expenses | 54,220 |
| Net Investment Income | 331,879 |
| Realized Net Gain (Loss) | |
| Investment Securities Sold2 | (3,109,339) |
| Futures Contracts | (129,779) |
| Foreign Currencies and Forward Currency Contracts | 38,817 |
| Realized Net Gain (Loss) | (3,200,301) |
| Change in Unrealized Appreciation (Depreciation) | |
| Investment Securities | 358,382 |
| Futures Contracts | 91,924 |
| Foreign Currencies and Forward Currency Contracts | (5,711) |
| Change in Unrealized Appreciation (Depreciation) | 444,595 |
| Net Increase (Decrease) in Net Assets Resulting from Operations | (2,423,827) |
1 Dividends are net of foreign withholding taxes of $19,340,000.
2 Dividend income, interest income, and realized net gain (loss) from affiliated companies of the fund were $0, $4,920,000, and
($82,634,000), respectively.
See accompanying Notes, which are an integral part of the Financial Statements.
23
International Growth Fund
Statement of Changes in Net Assets
| | |
| | Year Ended August 31, |
| | 2009 | 2008 |
| | ($000) | ($000) |
| Increase (Decrease) in Net Assets | | |
| Operations | | |
| Net Investment Income | 331,879 | 402,143 |
| Realized Net Gain (Loss) | (3,200,301) | 1,164,232 |
| Change in Unrealized Appreciation (Depreciation) | 444,595 | (4,104,988) |
| Net Increase (Decrease) in Net Assets Resulting from Operations | (2,423,827) | (2,538,613) |
| Distributions | | |
| Net Investment Income | | |
| Investor Shares | (320,390) | (273,198) |
| Admiral Shares | (134,624) | (119,608) |
| Realized Capital Gain1 | | |
| Investor Shares | (514,799) | (1,145,568) |
| Admiral Shares | (202,398) | (456,714) |
| Total Distributions | (1,172,211) | (1,995,088) |
| Capital Share Transactions | | |
| Investor Shares | 792,137 | 1,975,823 |
| Admiral Shares | 150,634 | 1,092,739 |
| Net Increase (Decrease) from Capital Share Transactions | 942,771 | 3,068,562 |
| Total Increase (Decrease) | (2,653,267) | (1,465,139) |
| Net Assets | | |
| Beginning of Period | 16,813,886 | 18,279,025 |
| End of Period2 | 14,160,619 | 16,813,886 |
1 Includes fiscal 2009 and 2008 short-term gain distributions totaling $0 and $364,747,000, respectively. Short-term gain distributions
are treated as ordinary income dividends for tax purposes.
2 Net Assets—End of Period includes undistributed net investment income of $179,384,000 and $303,101,000.
See accompanying Notes, which are an integral part of the Financial Statements.
24
International Growth Fund
Financial Highlights
| | | | | |
| Investor Shares | | | | | |
| |
| For a Share Outstanding | Year Ended August 31, |
| Throughout Each Period | 2009 | 2008 | 2007 | 2006 | 2005 |
| Net Asset Value, Beginning of Period | $20.43 | $26.13 | $23.97 | $19.83 | $16.33 |
| Investment Operations | | | | | |
| Net Investment Income | .3981 | .473 | .594 | .541 | .341 |
| Net Realized and Unrealized Gain (Loss) | | | | | |
| on Investments | (3.633) | (3.431) | 4.132 | 4.284 | 3.474 |
| Total from Investment Operations | (3.235) | (2.958) | 4.726 | 4.825 | 3.815 |
| Distributions | | | | | |
| Dividends from Net Investment Income | (.562) | (.528) | (.530) | (.370) | (.315) |
| Distributions from Realized Capital Gains | (.903) | (2.214) | (2.036) | (.315) | — |
| Total Distributions | (1.465) | (2.742) | (2.566) | (.685) | (.315) |
| Net Asset Value, End of Period | $15.73 | $20.43 | $26.13 | $23.97 | $19.83 |
| |
| Total Return2 | –13.75% | –12.83% | 20.87% | 24.79% | 23.54% |
| |
| Ratios/Supplemental Data | | | | | |
| Net Assets, End of Period (Millions) | $10,226 | $11,969 | $13,219 | $10,466 | $8,182 |
| Ratio of Total Expenses to | | | | | |
| Average Net Assets3 | 0.53% | 0.47% | 0.51% | 0.55% | 0.60% |
| Ratio of Net Investment Income to | | | | | |
| Average Net Assets | 2.84%1 | 2.07% | 2.47% | 2.52% | 1.89% |
| Portfolio Turnover Rate | 51% | 55% | 41% | 45% | 48% |
1 Net investment income per share and the ratio of net investment income to average net assets include $0.061 and 0.48%, respectively,
resulting from income accrued in connection with a spinoff in October 2008 by Reinet Investments SA of British American Tobacco PLC.
2 Total returns do not reflect the 2% fee assessed on redemptions of shares held for less than two months or the account service fee that
may be applicable to certain accounts with balances below $10,000.
3 Includes performance-based investment advisory fee increases (decreases) of 0.03%, 0.02%, 0.01%, (0.01%), and (0.01%).
See accompanying Notes, which are an integral part of the Financial Statements.
25
International Growth Fund
Financial Highlights
| | | | | |
| Admiral Shares | | | | | |
| |
| For a Share Outstanding | Year Ended August 31, |
| Throughout Each Period | 2009 | 2008 | 2007 | 2006 | 2005 |
| Net Asset Value, Beginning of Period | $65.09 | $83.26 | $76.36 | $63.15 | $51.96 |
| Investment Operations | | | | | |
| Net Investment Income | 1.3401 | 1.649 | 2.051 | 1.861 | 1.222 |
| Net Realized and Unrealized Gain (Loss) | | | | | |
| on Investments | (11.571) | (10.929) | 13.159 | 13.639 | 11.063 |
| Total from Investment Operations | (10.231) | (9.280) | 15.210 | 15.500 | 12.285 |
| Distributions | | | | | |
| Dividends from Net Investment Income | (1.909) | (1.845) | (1.832) | (1.288) | (1.095) |
| Distributions from Realized Capital Gains | (2.870) | (7.045) | (6.478) | (1.002) | — |
| Total Distributions | (4.779) | (8.890) | (8.310) | (2.290) | (1.095) |
| Net Asset Value, End of Period | $50.08 | $65.09 | $83.26 | $76.36 | $63.15 |
| |
| Total Return2 | –13.57% | –12.67% | 21.11% | 25.03% | 23.84% |
| |
| Ratios/Supplemental Data | | | | | |
| Net Assets, End of Period (Millions) | $3,934 | $4,845 | $5,060 | $3,506 | $2,181 |
| Ratio of Total Expenses to | | | | | |
| Average Net Assets3 | 0.34% | 0.28% | 0.31% | 0.35% | 0.40% |
| Ratio of Net Investment Income to | | | | | |
| Average Net Assets | 3.03%1 | 2.26% | 2.67% | 2.72% | 2.07% |
| Portfolio Turnover Rate | 51% | 55% | 41% | 45% | 48% |
1 Net investment income per share and the ratio of net investment income to average net assets include $0.194 and 0.48%, respectively,
resulting from income accrued in connection with a spinoff in October 2008 by Reinet Investments SA of British American Tobacco PLC.
2 Total returns do not reflect the 2% fee assessed on redemptions of shares held for less than two months.
3 Includes performance-based investment advisory fee increases (decreases) of 0.03%, 0.02%, 0.01%, (0.01%), and (0.01%).
See accompanying Notes, which are an integral part of the Financial Statements.
26
International Growth Fund
Notes to Financial Statements
Vanguard International Growth Fund is registered under the Investment Company Act of 1940 as an open-end investment company, or mutual fund. The fund invests in securities of foreign issuers, which may subject it to investment risks not normally associated with investing in securities of U.S. corporations. The fund offers two classes of shares: Investor Shares and Admiral Shares. Investor Shares are available to any investor who meets the fund’s minimum purchase requirements. Admiral Shares are designed for investors who meet certain administrative, service, tenure, and account-size criteria.
A. The following significant accounting policies conform to generally accepted accounting principles for U.S. mutual funds. The fund consistently follows such policies in preparing its financial statements.
1. Security Valuation: Securities are valued as of the close of trading on the New York Stock Exchange (generally 4 p.m., Eastern time) on the valuation date. Equity securities are valued at the latest quoted sales prices or official closing prices taken from the primary market in which each security trades; such securities not traded on the valuation date are valued at the mean of the latest quoted bid and asked prices. Securities for which market quotations are not readily available, or whose values have been affected by events occurring before the fund’s pricing time but after the close of the securities’ primary markets, are valued at their fair values calculated according to procedures adopted by the board of trustees. These procedures include obtaining quotations from an independent pricing service, monitoring news to identify significant market- or security-specific events, and evaluat ing changes in the values of foreign market proxies (for example, ADRs, futures contracts, or exchange-traded funds), between the time the foreign markets close and the fund’s pricing time. When fair-value pricing is employed, the prices of securities used by a fund to calculate its net asset value may differ from quoted or published prices for the same securities. Investments in Vanguard Market Liquidity Fund are valued at that fund’s net asset value. Temporary cash investments acquired over 60 days to maturity are valued using the latest bid prices or using valuations based on a matrix system (which considers such factors as security prices, yields, maturities, and ratings), both as furnished by independent pricing services. Other temporary cash investments are valued at amortized cost, which approximates market value.
2. Foreign Currency: Securities and other assets and liabilities denominated in foreign currencies are translated into U.S. dollars using exchange rates obtained from an independent third party as of the fund’s pricing time on the valuation date. Realized gains (losses) and unrealized appreciation (depreciation) on investment securities include the effects of changes in exchange rates since the securities were purchased, combined with the effects of changes in security prices. Fluctuations in the value of other assets and liabilities resulting from changes in exchange rates are recorded as unrealized foreign currency gains (losses) until the assets or liabilities are settled in cash, at which time they are recorded as realized foreign currency gains (losses).
3. Futures and Forward Currency Contracts: The fund uses index futures contracts to a limited extent, with the objective of maintaining full exposure to the stock market while maintaining liquidity. The fund may purchase or sell futures contracts to achieve a desired level of investment, whether to accommodate portfolio turnover or cash flows from capital share transactions. The primary risks associated with the use of futures contracts are imperfect correlation between changes in market values of stocks held by the fund and the prices of futures contracts, and the possibility of an illiquid market.
27
International Growth Fund
The fund may also enter into forward currency contracts to provide the appropriate currency exposure related to any open futures contracts or to protect the value of securities and related receivables and payables against changes in foreign exchange rates. The primary risk associated with the fund’s use of these contracts is that a counterparty will fail to fulfill its obligation to pay gains due to the fund under the contracts. Counterparty risk is mitigated by entering into forward currency contracts only with highly rated counterparties, by a master netting arrangement between the fund and the counterparty, and by the posting of collateral by the counterparty. The forward currency contracts contain provisions whereby a counterparty may terminate open contracts if the fund’s net assets decline below a certain level, triggering a payment by the fund if the fund is in a net liability position at the time of the termination. The payment amount would be reduced by any collateral the fund has posted. Any securities posted as collateral for open contracts are noted in the Statement of Net Assets.
Futures and forward currency contracts are valued at their quoted daily settlement prices. The aggregate principal amounts of the contracts are not recorded in the Statement of Net Assets. Fluctuations in the value of the contracts are recorded in the Statement of Net Assets as an asset (liability) and in the Statement of Operations as unrealized appreciation (depreciation) until the contracts are closed, when they are recorded as realized gains (losses) on futures or forward currency contracts.
4. Federal Income Taxes: The fund intends to continue to qualify as a regulated investment company and distribute all of its taxable income. Management has analyzed the fund’s tax positions taken for all open federal income tax years (August 31, 2006–2009), and has concluded that no provision for federal income tax is required in the fund’s financial statements.
5. Distributions: Distributions to shareholders are recorded on the ex-dividend date.
6. Security Lending: The fund may lend its securities to qualified institutional borrowers to earn additional income. Security loans are required to be secured at all times by collateral at least equal to the market value of securities loaned. The fund invests cash collateral received in Vanguard Market Liquidity Fund, and records a liability for the return of the collateral, during the period the securities are on loan. Security lending income represents the income earned on investing cash collateral, less expenses associated with the loan.
7. Other: Dividend income is recorded on the ex-dividend date. Interest income includes income distributions received from Vanguard Market Liquidity Fund and is accrued daily. Security transactions are accounted for on the date securities are bought or sold. Costs used to determine realized gains (losses) on the sale of investment securities are those of the specific securities sold. Fees assessed on redemptions of capital shares are credited to paid-in capital.
Each class of shares has equal rights as to assets and earnings, except that each class separately bears certain class-specific expenses related to maintenance of shareholder accounts (included in Management and Administrative expenses), shareholder reporting, and proxies. Marketing and distribution expenses are allocated to each class of shares based on a method approved by the board of trustees. Income, other non-class-specific expenses, and gains and losses on investments are allocated to each class of shares based on its relative net assets.
B. Schroder Investment Management North America Inc., Baillie Gifford Overseas Ltd., and M&G Investment Management Ltd. each provide investment advisory services to a portion of the fund for a fee calculated at an annual percentage rate of average net assets managed by the advisor. The basic fees of Schroder Investment Management North America Inc. and Baillie Gifford Overseas Ltd. are
28
International Growth Fund
subject to quarterly adjustments based on performance for the preceding three years relative to the Morgan Stanley Capital International Europe, Australasia, Far East Index. The basic fee of M&G Investment Management Ltd. is subject to quarterly adjustments based on the fund’s performance since February 29, 2008, relative to the MSCI All Country World Index excluding USA.
The Vanguard Group manages the cash reserves of the fund on an at-cost basis.
For the year ended August 31, 2009, the aggregate investment advisory fee represented an effective annual basic rate of 0.13% of the fund’s average net assets before an increase of $2,906,000 (0.03%) based on performance.
C. The Vanguard Group furnishes at cost corporate management, administrative, marketing, and distribution services. The costs of such services are allocated to the fund under methods approved by the board of trustees. The fund has committed to provide up to 0.40% of its net assets in capital contributions to Vanguard. At August 31, 2009, the fund had contributed capital of $3,031,000 to Vanguard (included in Other Assets), representing 0.02% of the fund’s net assets and 1.21% of Vanguard’s capitalization. The fund’s trustees and officers are also directors and officers of Vanguard.
D. The fund has asked its investment advisors to direct certain security trades, subject to obtaining the best price and execution, to brokers who have agreed to rebate to the fund part of the commissions generated. Such rebates are used solely to reduce the fund’s management and administrative expenses. The fund’s custodian bank has also agreed to reduce its fees when the fund maintains cash on deposit in the non-interest-bearing custody account. For the year ended August 31, 2009, these arrangements reduced the fund’s management and administrative expenses by $263,000 and custodian fees by $4,000. The total expense reduction represented an effective annual rate of 0.00% of the fund’s average net assets.
E. Various inputs may be used to determine the value of the fund’s investments. These inputs are summarized in three broad levels for financial statement purposes. The inputs or methodologies used to value securities are not necessarily an indication of the risk associated with investing in those securities.
Level 1—Quoted prices in active markets for identical securities.
Level 2—Other significant observable inputs (including quoted prices for similar securities, interest
rates, prepayment speeds, credit risk, etc.).
Level 3—Significant unobservable inputs (including the fund’s own assumptions used to determine
the fair value of investments).
The following table summarizes the fund’s investments as of August 31, 2009, based on the inputs used to value them:
| | | |
| | Level 1 | Level 2 | Level 3 |
| Investments | ($000) | ($000) | ($000) |
| Common Stocks | 1,569,398 | 11,790,486 | — |
| Temporary Cash Investments | 804,504 | 60,982 | — |
| Futures Contracts—Liabilities1 | (3,728) | — | — |
| Forward Currency Contracts—Assets | 15,133 | — | — |
| Forward Currency Contracts—Liabilities | (720) | — | — |
| Total | 2,384,587 | 11,851,468 | — |
1 Represents variation margin on the last day of the reporting period.
29
International Growth Fund
The following table summarizes changes in investments valued based on Level 3 inputs during the year ended August 31, 2009:
| |
| | Investments in |
| | Common Stocks |
| Amount Valued Based on Level 3 Inputs | ($000) |
| Balance as of August 31, 2008 | 3,095 |
| Change in Unrealized Appreciation (Depreciation) | (2,212) |
| Transfers out of Level 3 | (883) |
| Balance as of August 31, 2009 | — |
F. At August 31, 2009, the fair values of derivatives were reflected in the Statement of Net Assets as follows:
| | | |
| | | Foreign | |
| | Equity | Exchange | |
| | Contracts1 | Contracts | Total |
| Statement of Net Assets Caption | ($000) | ($000) | ($000) |
| Other Assets | — | 15,133 | 15,133 |
| Liabilities | (3,728) | (720) | (4,448) |
| 1 Represents variation margin on the last day of the reporting period. | | | |
Realized net gain (loss) and the change in unrealized appreciation (depreciation) on derivatives for the year ended August 31, 2009, were:
| | | |
| | | Foreign | |
| | Equity | Exchange | |
| | Contracts | Contracts | Total |
| Realized Net Gain (Loss) on Derivatives | ($000) | ($000) | ($000) |
| Futures Contracts | (129,779) | — | (129,779) |
| Forward Currency Contracts | — | 39,399 | 39,399 |
| Realized Net Gain (Loss) on Derivatives | (129,779) | 39,399 | (90,380) |
| |
| Change in Unrealized Appreciation (Depreciation) | | | |
| on Derivatives | | | |
| Futures Contracts | 91,924 | — | 91,924 |
| Forward Currency Contracts | — | (7,193) | (7,193) |
| Change in Unrealized Appreciation (Depreciation) | | | |
| on Derivatives | 91,924 | (7,193) | 84,731 |
30
International Growth Fund
At August 31, 2009, the aggregate settlement value of open futures contracts and the related unrealized appreciation (depreciation) were:
| | | | |
| | | | | ($000) |
| | | Number of | Aggregate | Unrealized |
| | | Long (Short) | Settlement | Appreciation |
| Futures Contracts | Expiration | Contracts | Value | (Depreciation) |
| Dow Jones EURO STOXX 50 Index | September 2009 | 6,093 | 242,639 | 27,999 |
| Topix Index | September 2009 | 1,567 | 162,502 | 6,998 |
| FTSE 100 Index | September 2009 | 2,000 | 160,323 | 18,407 |
| S&P ASX 200 Index | September 2009 | 635 | 59,837 | 6,903 |
At August 31, 2009, the fund had open forward currency contracts to receive and deliver currencies as follows. Unrealized appreciation (depreciation) on open forward currency contracts is treated as realized gain (loss) for tax purposes.
| | | | |
| | | | | Unrealized |
| | | | | Appreciation |
| | Contract Amount (000) | (Depreciation) |
| Contract Settlement Date | | Receive | Deliver | ($000) |
| 9/23/2009 | EUR | 165,648 | USD 237,663 | 6,023 |
| 9/16/2009 | JPY | 15,191,541 | USD 163,548 | 5,866 |
| 9/23/2009 | GBP | 95,177 | USD 155,072 | (672) |
| 9/23/2009 | AUD | 70,585 | USD 59,436 | 3,196 |
AUD—Australian dollar.
EUR—Euro.
GBP—British pound.
JPY—Japanese yen.
USD—U.S. dollar.
At August 31, 2009, counterparties had deposited in segregated accounts cash with a value sufficient to cover substantially all amounts due to the fund in connection with open forward currency contracts.
The fund had net unrealized foreign currency gains of $412,000 resulting from the translation of other assets and liabilities at August 31, 2009.
G. Distributions are determined on a tax basis and may differ from net investment income and realized capital gains for financial reporting purposes. Differences may be permanent or temporary. Permanent differences are reclassified among capital accounts in the financial statements to reflect their tax character. Temporary differences arise when certain items of income, expense, gain, or loss are recognized in different periods for financial statement and tax purposes; these differences will reverse at some time in the future. Differences in classification may also result from the treatment of short-term gains as ordinary income for tax purposes.
31
International Growth Fund
During the year ended August 31, 2009, the fund realized net foreign currency losses of $582,000, which decreased distributable net income for tax purposes; accordingly, such losses have been reclassified from accumulated net realized losses to undistributed net investment income.
For tax purposes, at August 31, 2009, the fund had $209,690,000 of ordinary income available for distribution. The fund had available capital loss carryforwards totaling $1,198,712,000 to offset future net capital gains through August 31, 2017. In addition, the fund realized losses of $2,008,606,000 during the period from November 1, 2008, through August 31, 2009, which are deferred and will be treated as realized for tax purposes in fiscal 2010.
At August 31, 2009, the cost of investment securities for tax purposes was $13,705,719,000. Net unrealized appreciation of investment securities for tax purposes was $519,651,000, consisting of unrealized gains of $1,991,582,000 on securities that had risen in value since their purchase and $1,471,931,000 in unrealized losses on securities that had fallen in value since their purchase.
H. During the year ended August 31, 2009, the fund purchased $5,792,126,000 of investment securities and sold $5,814,994,000 of investment securities, other than temporary cash investments.
I. Capital share transactions for each class of shares were:
| | | | |
| | Year Ended August 31 |
| | 2009 | 2008 |
| | Amount | Shares | Amount | Shares |
| | ($000) | (000) | ($000) | (000) |
| Investor Shares | | | | |
| Issued | 1,791,374 | 133,321 | 2,869,056 | 117,748 |
| Issued in Lieu of Cash Distributions | 819,473 | 67,224 | 1,393,855 | 58,443 |
| Redeemed1 | (1,818,710) | (136,394) | (2,287,088) | (96,226) |
| Net Increase (Decrease)—Investor Shares | 792,137 | 64,151 | 1,975,823 | 79,965 |
| Admiral Shares | | | | |
| Issued | 676,458 | 16,117 | 1,350,456 | 17,226 |
| Issued in Lieu of Cash Distributions | 312,461 | 8,068 | 534,007 | 7,037 |
| Redeemed1 | (838,285) | (20,055) | (791,724) | (10,598) |
| Net Increase (Decrease)—Admiral Shares | 150,634 | 4,130 | 1,092,739 | 13,665 |
1 Net of redemption fees of $888,000 and $1,294,000 (fund totals).
32
International Growth Fund
J. The fund had invested in a company that was considered to be an affiliated company of the fund because the fund owned more than 5% of the outstanding voting securities of the company. Transactions during the period in securities of this company were as follows:
| | | | | |
| | | Current Period Transactions | |
| | Aug. 31, 2008 | | Proceeds from | | Aug. 31, 2009 |
| | Market | Purchases | Securities | Dividend | Market |
| | Value | at Cost | Sold | Income | Value |
| | ($000) | ($000) | ($000) | ($000) | ($000) |
| SBM Offshore NV | 177,698 | 4,251 | 50,772 | — | NA1 |
1 At August 31, 2009, the security was still held but the issuer was no longer an affiliated company of the fund.
K. In preparing the financial statements as of August 31, 2009, management considered the impact of subsequent events occurring through October 15, 2009, for potential recognition or disclosure in these financial statements.
33
Report of Independent Registered
Public Accounting Firm
To the Trustees of Vanguard World Fund and the Shareholders of Vanguard International Growth Fund:
In our opinion, the accompanying statement of net assets and the related statements of operations and of changes in net assets and the financial highlights present fairly, in all material respects, the financial position of Vanguard International Growth Fund (the “Fund”) at August 31, 2009, the results of its operations for the year then ended, the changes in its net assets for each of the two years in the period then ended and the financial highlights for each of the five years in the period then ended, in conformity with accounting principles generally accepted in the United States of America. These financial statements and financial highlights (hereafter referred to as “financial statements”) are the responsibility of the Fund’s management; our responsibility is to express an opinion on these financial statements based on our audits. We conducted our audits of these financial state ments in accordance with the standards of the Public Company Accounting Oversight Board (United States). Those standards require that we plan and perform the audit to obtain reasonable assurance about whether the financial statements are free of material misstatement. An audit includes examining, on a test basis, evidence supporting the amounts and disclosures in the financial statements, assessing the accounting principles used and significant estimates made by management, and evaluating the overall financial statement presentation. We believe that our audits, which included confirmation of securities at August 31, 2009 by correspondence with the custodian and brokers and by agreement to the underlying ownership records for Vanguard Market Liquidity Fund, provide a reasonable basis for our opinion.
PricewaterhouseCoopers LLP
Philadelphia, Pennsylvania
October 15, 2009
Special 2009 tax information (unaudited) for Vanguard International Growth FundThis information for the fiscal year ended August 31, 2009, is included pursuant to provisions ofthe Internal Revenue Code.The fund distributed $725,737,000 as capital gain dividends (from net long-term capital gains) toshareholders during the fiscal year.The fund distributed $340,487,000 of qualified dividend income to shareholders during thefiscal year.The fund will pass through foreign source income of $389,426,000 and foreign taxes paid of$18,915,000 to shareholders. The pass-through of foreign taxes paid will affect only shareholderson the fund’s dividend record date in December 2009. Shareholders will receive more detailedinformation along with their Form 1099-DIV in January 2010.34
Your Fund’s After-Tax Returns
This table presents returns for your fund both before and after taxes. The after-tax returns are shown in two ways: (1) assuming that an investor owned the fund during the entire period and paid taxes on the fund’s distributions, and (2) assuming that an investor paid taxes on the fund’s distributions and sold all shares at the end of each period.
Calculations are based on the highest individual federal income tax and capital gains tax rates in effect at the times of the distributions and the hypothetical sales. State and local taxes were not considered. After-tax returns reflect any qualified dividend income, using actual prior-year figures and estimates for 2009. (In the example, returns after the sale of fund shares may be higher than those assuming no sale. This occurs when the sale would have produced a capital loss. The calculation assumes that the investor received a tax deduction for the loss.)
The table shows returns for Investor Shares only; returns for other share classes will differ. Please note that your actual after-tax returns will depend on your tax situation and may differ from those shown. Also note that if you own the fund in a tax-deferred account, such as an individual retirement account or a 401(k) plan, this information does not apply to you. Such accounts are not subject to current taxes.
Finally, keep in mind that a fund’s performance—whether before or after taxes—does not guarantee future results.
Average Annual Total Returns: International Growth Fund Investor Shares1
Periods Ended August 31, 2009
| | | |
| | One | Five | Ten |
| | Year | Years | Years |
| Returns Before Taxes | –13.75% | 6.98% | 3.39% |
| Returns After Taxes on Distributions | –15.18 | 5.58 | 2.25 |
| Returns After Taxes on Distributions and Sale of Fund Shares | –7.74 | 5.86 | 2.61 |
1 Total returns do not reflect the 2% fee assessed on redemptions of shares purchased on or after June 27, 2003, and held for less than
two months, nor do they include the account service fee that may be applicable to certain accounts with balances below $10,000.
35
About Your Fund’s Expenses
As a shareholder of the fund, you incur ongoing costs, which include costs for portfolio management, administrative services, and shareholder reports (like this one), among others. Operating expenses, which are deducted from a fund’s gross income, directly reduce the investment return of the fund.
A fund’s expenses are expressed as a percentage of its average net assets. This figure is known as the expense ratio. The following examples are intended to help you understand the ongoing costs (in dollars) of investing in your fund and to compare these costs with those of other mutual funds. The examples are based on an investment of $1,000 made at the beginning of the period shown and held for the entire period.
The accompanying table illustrates your fund’s costs in two ways:
• Based on actual fund return. This section helps you to estimate the actual expenses that you paid over the period. The “Ending Account Value” shown is derived from the fund’s actual return, and the third column shows the dollar amount that would have been paid by an investor who started with $1,000 in the fund. You may use the information here, together with the amount you invested, to estimate the expenses that you paid over the period.
To do so, simply divide your account value by $1,000 (for example, an $8,600 account value divided by $1,000 = 8.6), then multiply the result by the number given for your fund under the heading “Expenses Paid During Period.”
• Based on hypothetical 5% yearly return. This section is intended to help you compare your fund’s costs with those of other mutual funds. It assumes that the fund had a yearly return of 5% before expenses, but that the expense ratio is unchanged. In this case—because the return used is not the fund’s actual return—the results do not apply to your investment. The example is useful in making comparisons because the Securities and Exchange Commission requires all mutual funds to calculate expenses based on a 5% return. You can assess your fund’s costs by comparing this hypothetical example with the hypothetical examples that appear in shareholder reports of other funds.
Note that the expenses shown in the table are meant to highlight and help you compare ongoing costs only and do not reflect transaction costs incurred by the fund for buying and selling securities. Further, the expenses do not include the 2% fee on redemptions of shares held for less than two months, nor do they include the account service fee described in the prospectus. If such fees were applied to your account, your costs would be higher. Your fund does not carry a “sales load.”
The calculations assume no shares were bought or sold during the period. Your actual costs may have been higher or lower, depending on the amount of your investment and the timing of any purchases or redemptions.
You can find more information about the fund’s expenses, including annual expense ratios, in the Financial Statements section of this report. For additional information on operating expenses and other shareholder costs, please refer to your fund’s current prospectus.
36
| | | |
| Six Months Ended August 31, 2009 | | | |
| | Beginning | Ending | Expenses |
| | Account Value | Account Value | Paid During |
| International Growth Fund | 2/28/2009 | 8/31/2009 | Period1 |
| Based on Actual Fund Return | | | |
| Investor Shares | $1,000.00 | $1,563.62 | $3.49 |
| Admiral Shares | 1,000.00 | 1,565.49 | 2.26 |
| Based on Hypothetical 5% Yearly Return | | | |
| Investor Shares | $1,000.00 | $1,022.48 | $2.75 |
| Admiral Shares | 1,000.00 | 1,023.44 | 1.79 |
1 The calculations are based on expenses incurred in the most recent six-month period. The fund’s annualized six-month expense ratios
that period are 0.54% for Investor Shares and 0.35% for Admiral Shares. The dollar amounts shown as “Expenses Paid” are equal to
annualized expense ratio multiplied by the average account value over the period, multiplied by the number of days in the most recent
six-month period, then divided by the number of days in the most recent 12-month period.
37
Glossary
Beta. A measure of the magnitude of a fund’s past share-price fluctuations in relation to the ups and downs of a given market index. The index is assigned a beta of 1.00. Compared with a given index, a fund with a beta of 1.20 typically would have seen its share price rise or fall by 12% when the index rose or fell by 10%. For this report, beta is based on returns over the past 36 months for both the fund and the index. Note that a fund’s beta should be reviewed in conjunction with its R-squared (see definition). The lower the R-squared, the less correlation there is between the fund and the index, and the less reliable beta is as an indicator of volatility.
Dividend Yield. Dividend income earned by stocks, expressed as a percentage of the aggregate market value (or of net asset value, for a fund). The yield is determined by dividing the amount of the annual dividends by the aggregate value (or net asset value) at the end of the period. For a fund, the dividend yield is based solely on stock holdings and does not include any income produced by other investments.
Earnings Growth Rate. The average annual rate of growth in earnings over the past five years for the stocks now in a fund.
Equity Exposure. A measure that reflects a fund’s investments in stocks and stock futures. Any holdings in short-term reserves are excluded.
Expense Ratio. The percentage of a fund’s average net assets used to pay its annual administrative and advisory expenses. These expenses directly reduce returns to investors.
Inception Date. The date on which the assets of a fund (or one of its share classes) are first invested in accordance with the fund’s investment objective. For funds with a subscription period, the inception date is the day after that period ends. Investment performance is measured from the inception date.
Median Market Cap. An indicator of the size of companies in which a fund invests; the midpoint of market capitalization (market price x shares outstanding) of a fund’s stocks, weighted by the proportion of the fund’s assets invested in each stock. Stocks representing half of the fund’s assets have market capitalizations above the median, and the rest are below it.
Price/Book Ratio. The share price of a stock divided by its net worth, or book value, per share. For a fund, the weighted average price/book ratio of the stocks it holds.
Price/Earnings Ratio. The ratio of a stock’s current price to its per-share earnings over the past year. For a fund, the weighted average P/E of the stocks it holds. P/E is an indicator of market expectations about corporate prospects; the higher the P/E, the greater the expectations for a company’s future growth.
R-Squared. A measure of how much of a fund’s past returns can be explained by the returns from the market in general, as measured by a given index. If a fund’s total returns were precisely synchronized with an index’s returns, its R-squared would be 1.00. If the fund’s returns bore no relationship to the index’s returns, its R-squared would be 0. For this report, R-squared is based on returns over the past 36 months for both the fund and the index.
Return on Equity. The annual average rate of return generated by a company during the past five years for each dollar of shareholder’s equity (net income divided by shareholder’s equity). For a fund, the weighted average return on equity for the companies whose stocks it holds.
38
Short-Term Reserves. The percentage of a fund invested in highly liquid, short-term securities that can be readily converted to cash.
Turnover Rate. An indication of the fund’s trading activity. Funds with high turnover rates incur higher transaction costs and may be more likely to distribute capital gains (which may be taxable to investors). The turnover rate excludes in-kind transactions, which have minimal impact on costs.
39
The People Who Govern Your Fund
The trustees of your mutual fund are there to see that the fund is operated and managed in your best interests since, as a shareholder, you are a part owner of the fund. Your fund’s trustees also serve on the board of directors of The Vanguard Group, Inc., which is owned by the Vanguard funds and provides services to them on an at-cost basis.
A majority of Vanguard’s board members are independent, meaning that they have no affiliation with Vanguard or the funds they oversee, apart from the sizable personal investments they have made as private individuals. The independent board members have distinguished backgrounds in business, academia, and public service. Each of the trustees and executive officers oversees 157 Vanguard funds.
The following table provides information for each trustee and executive officer of the fund. More information about the trustees is in the Statement of Additional Information, which can be obtained, without charge, by contacting Vanguard at 800-662-7447, or online at www.vanguard.com.
| |
| Interested Trustees | Emerson U. Fullwood |
| | Born 1948. Trustee Since January 2008. Principal |
| John J. Brennan1 | Occupation(s) During the Past Five Years: Retired |
| Born 1954. Trustee Since May 1987. Chairman of | Executive Chief Staff and Marketing Officer for North |
| the Board. Principal Occupation(s) During the Past | America and Corporate Vice President of Xerox |
| Five Years: Chairman of the Board and Director/Trustee | Corporation (photocopiers and printers); Director of |
| of The Vanguard Group, Inc., and of each of the | SPX Corporation (multi-industry manufacturing), the |
| investment companies served by The Vanguard Group; | United Way of Rochester, the Boy Scouts of America, |
| Chief Executive Officer and President of The Vanguard | Amerigroup Corporation (direct health and medical |
| Group and of each of the investment companies served | insurance carriers), and Monroe Community College |
| by The Vanguard Group (1996–2008); Chairman of | Foundation. |
| the Financial Accounting Foundation; Governor of | |
| the Financial Industry Regulatory Authority (FINRA); | Rajiv L. Gupta |
| Director of United Way of Southeastern Pennsylvania. | Born 1945. Trustee Since December 2001.2 Principal |
| | Occupation(s) During the Past Five Years: Retired |
| F. William McNabb III1 | Chairman and Chief Executive Officer of Rohm and |
| Born 1957. Trustee Since July 2009. Principal | Haas Co. (chemicals); President of Rohm and Haas Co. |
| Occupation(s) During the Past Five Years: Director of | (2006–2008); Board Member of American Chemistry |
| The Vanguard Group, Inc., since 2008; Chief Executive | Council; Director of Tyco International, Ltd. (diversified |
| Officer and President of The Vanguard Group and of | manufacturing and services) and Hewlett-Packard Co. |
| each of the investment companies served by The | (electronic computer manufacturing); Trustee of The |
| Vanguard Group since 2008; Director of Vanguard | Conference Board. |
| Marketing Corporation; Managing Director of The | |
| Vanguard Group (1995–2008). | Amy Gutmann |
| | Born 1949. Trustee Since June 2006. Principal |
| | Occupation(s) During the Past Five Years: President of |
| Independent Trustees | the University of Pennsylvania; Christopher H. Browne |
| | Distinguished Professor of Political Science in the School |
| Charles D. Ellis | of Arts and Sciences with Secondary Appointments |
| Born 1937. Trustee Since January 2001. Principal | at the Annenberg School for Communication and the |
| Occupation(s) During the Past Five Years: Applecore | Graduate School of Education of the University of |
| Partners (pro bono ventures in education); Senior | Pennsylvania; Director of Carnegie Corporation of |
| Advisor to Greenwich Associates (international business | New York, Schuylkill River Development Corporation, |
| strategy consulting); Successor Trustee of Yale University; | and Greater Philadelphia Chamber of Commerce; |
| Overseer of the Stern School of Business at New York | Trustee of the National Constitution Center. |
| University; Trustee of the Whitehead Institute for | |
| Biomedical Research. | |
| | |
| JoAnn Heffernan Heisen | Executive Officers | |
| Born 1950. Trustee Since July 1998. Principal | | |
| Occupation(s) During the Past Five Years: Retired | Thomas J. Higgins1 | |
| Corporate Vice President, Chief Global Diversity Officer, | Born 1957. Chief Financial Officer Since September |
| and Member of the Executive Committee of Johnson | 2008. Principal Occupation(s) During the Past Five |
| & Johnson (pharmaceuticals/consumer products); | Years: Principal of The Vanguard Group, Inc.; Chief |
| Vice President and Chief Information Officer of Johnson | Financial Officer of each of the investment companies |
| & Johnson (1997–2005); Director of the University | served by The Vanguard Group since 2008; Treasurer |
| Medical Center at Princeton and Women’s Research | of each of the investment companies served by The |
| and Education Institute. | Vanguard Group (1998–2008). |
| |
| André F. Perold | Kathryn J. Hyatt1 | |
| Born 1952. Trustee Since December 2004. Principal | Born 1955. Treasurer Since November 2008. Principal |
| Occupation(s) During the Past Five Years: George Gund | Occupation(s) During the Past Five Years: Principal of |
| Professor of Finance and Banking, Harvard Business | The Vanguard Group, Inc.; Treasurer of each of the |
| School; Director and Chairman of UNX, Inc. (equities | investment companies served by The Vanguard |
| trading firm); Chair of the Investment Committee of | Group since 2008; Assistant Treasurer of each of the |
| HighVista Strategies LLC (private investment firm). | investment companies served by The Vanguard Group |
| | (1988–2008). | |
| Alfred M. Rankin, Jr. | | |
| Born 1941. Trustee Since January 1993. Principal | Heidi Stam1 | |
| Occupation(s) During the Past Five Years: Chairman, | Born 1956. Secretary Since July 2005. Principal |
| President, Chief Executive Officer, and Director of | Occupation(s) During the Past Five Years: Managing |
| NACCO Industries, Inc. (forklift trucks/housewares/ | Director of The Vanguard Group, Inc., since 2006; |
| lignite); Director of Goodrich Corporation (industrial | General Counsel of The Vanguard Group since 2005; |
| products/aircraft systems and services). | Secretary of The Vanguard Group and of each of the |
| | investment companies served by The Vanguard Group |
| Peter F. Volanakis | since 2005; Director and Senior Vice President of |
| Born 1955. Trustee Since July 2009. Principal | Vanguard Marketing Corporation since 2005; Principal |
| Occupation(s) During the Past Five Years: President | of The Vanguard Group (1997–2006). |
| since 2007 and Chief Operating Officer since 2005 | | |
| of Corning Incorporated (communications equipment); | | |
| President of Corning Technologies (2001–2005); Director | Vanguard Senior Management Team |
| of Corning Incorporated and Dow Corning; Trustee of | | |
| the Corning Incorporated Foundation and the Corning | R. Gregory Barton | Michael S. Miller |
| Museum of Glass; Overseer of the Amos Tuck School | Mortimer J. Buckley | James M. Norris |
| of Business Administration at Dartmouth College. | Kathleen C. Gubanich | Glenn W. Reed |
| | Paul A. Heller | George U. Sauter |
| |
| |
| | Founder | |
| | John C. Bogle | |
| | Chairman and Chief Executive Officer, 1974–1996 |
1 These individuals are “interested persons” as defined in the Investment Company Act of 1940.
2 December 2002 for Vanguard Equity Income Fund, Vanguard Growth Equity Fund, the Vanguard Municipal Bond Funds, and the Vanguard
State Tax-Exempt Funds.

P.O. Box 2600
Valley Forge, PA 19482-2600
Connect with Vanguard® > www.vanguard.com
| |
| Fund Information > 800-662-7447 | All comparative mutual fund data are from Lipper Inc. or Morningstar, Inc., unless otherwise |
| | noted. You can obtain a free copy of Vanguard’s proxy voting guidelines by visiting our website, |
| Direct Investor Account Services > 800-662-2739 | www.vanguard.com, and searching for “proxy voting guidelines,” or by calling Vanguard |
| | at 800-662-2739. The guidelines are also available from the SEC’s website, www.sec.gov. |
| Institutional Investor Services > 800-523-1036 | In addition, you may obtain a free report on how your fund voted the proxies for securities it |
| | owned during the 12 months ended June 30. To get the report, visit either www.vanguard.com or www.sec.gov. |
| Text Telephone for People | |
| With Hearing Impairment > 800-952-3335 | |
| | You can review and copy information about your fund at the SEC’s Public Reference Room in |
| This material may be used in conjunction | Washington, D.C. To find out more about this public service, call the SEC at 202-551-8090. |
| with the offering of shares of any | Information about your fund is also available on the SEC’s website, and you can receive |
| Vanguard fund only if preceded or | copies of this information, for a fee, by sending a request in either of two ways: |
| accompanied by the fund’s | via e-mail addressed to publicinfo@sec.gov or via regular mail addressed to the Public |
| current prospectus. | Reference Section, Securities and Exchange Commission, Washington, DC 20549-0102. |
| |
| | |
| CFA® is a trademark owned by CFA Institute. | |
| |
| | © 2009 The Vanguard Group, Inc. |
| | All rights reserved. |
| | Vanguard Marketing Corporation, Distributor. |
| | Q810 102009 |

| Vanguard FTSE Social Index Fund |
| Annual Report |

> For the fiscal year ended August 31, 2009, Vanguard FTSE Social Index Fund
returned about –18%.
> The fund’s result for the period was in line with that of its target index but
lagged the average return of large-capitalization growth funds.
> The fund’s significant holdings in the battered financial sector weighed heavily
on its performance.
| |
| Contents | |
| |
| Your Fund’s Total Returns | 1 |
| President’s Letter | 2 |
| Results of Proxy Voting | 8 |
| Fund Profile | 9 |
| Performance Summary | 10 |
| Financial Statements | 12 |
| Your Fund’s After-Tax Returns | 24 |
| About Your Fund’s Expenses | 25 |
| Trustees Approve Advisory Arrangement | 27 |
| Glossary | 28 |
Please note: The opinions expressed in this report are just that—informed opinions. They should not be considered promises or advice.
Also, please keep in mind that the information and opinions cover the period through the date on the front of this report. Of course, the
risks of investing in your fund are spelled out in the prospectus.
Cover photograph: Veronica Coia.
Your Fund’s Total Returns
| | | | |
| Fiscal Year Ended August 31, 2009 | | | | |
| | | | Ticker | Total |
| | | | Symbol | Returns |
| Vanguard FTSE Social Index Fund | | | | |
| Investor Shares | | | VFTSX | –18.11% |
| Institutional Shares1 | | | VFTNX | –18.03 |
| FTSE4Good US Select Index | | | | –18.11 |
| Large-Cap Growth Funds Average2 | | | | –17.84 |
| |
| |
| Your Fund’s Performance at a Glance | | | | |
| August 31, 2008–August 31, 2009 | | | | |
| | | | Distributions Per Share |
| | Starting | Ending | Income | Capital |
| | Share Price | Share Price | Dividends | Gains |
| FTSE Social Index Fund | | | | |
| Investor Shares | $7.76 | $6.20 | $0.118 | $0.000 |
| Institutional Shares | 7.77 | 6.20 | 0.129 | 0.000 |
1 This class of shares carries lower expenses and is available for a minimum initial investment of $5 million.
2 Derived from data provided by Lipper Inc.
1

President’s Letter
Dear Shareholder,
For the 12 months ended August 31, Vanguard FTSE Social Index Fund’s performance reflected the weakness in the broader U.S. stock market. The fund returned –18.11% for Investor Shares and –18.03% for Institutional Shares.
Although these results are of course disappointing, the fund did meet its goal of closely tracking its benchmark, the FTSE4Good US Select Index, which closed the period with a return of –18.11%. The fund’s return was slightly behind the –17.84% average return of large-cap growth funds.
Your fund’s large stake in the U.S. financial sector—which neared collapse during the first half of the fiscal period—hurt its performance the most. An uptick for information technology stocks in the second half of the period helped a bit, but was not enough to offset losses in all sectors.
If you hold shares of the fund in a taxable account, you may wish to review the fund’s after-tax returns, which appear later in this report.
Stocks sank, then soared as credit and economy stabilized
The 12 months ended August 31 spanned two strikingly different half-years. The period began with the September collapse
2
of a major investment bank and the government-engineered rescue of several giant financial institutions. Stocks sank as the ensuing crisis spread from Wall Street to Main Street and around the globe. Stricken by seized-up credit markets and a near-total lack of confidence, businesses and consumers put the brakes on economic growth.
Governments in the United States and abroad responded with unprecedented stimulus and other programs. Over the past six months, these efforts started to take hold. Credit-market conditions improved, and the outlook for the U.S. economy brightened. From their early-March lows, stocks took off on an almost-unbroken winning streak.
Even so, the broad U.S. stock market ended the 12 months in negative territory, with a return of about –18%. International markets performed somewhat better, as major European economies emerged from recession; the MSCI All Country World Index ex USA returned about –14%.
Despite the robust second-half rally, it may be premature to sound the all-clear signal. As the fiscal year came to a close, home foreclosures and the unemployment rate were rising, and the federal government’s list of problem banks had climbed above 400—the most since June 1994. There is considerable historical evidence that recovery from a recession caused by a financial crisis tends to take longer than average.
| | | |
| Market Barometer | | | |
| | | Average Annual Total Returns |
| | | Periods Ended August 31, 2009 |
| | One Year | Three Years | Five Years |
| Stocks | | | |
| Russell 1000 Index (Large-caps) | –18.39% | –5.61% | 0.94% |
| Russell 2000 Index (Small-caps) | –21.29 | –6.08 | 2.21 |
| Dow Jones U.S. Total Stock Market Index | –18.10 | –5.17 | 1.45 |
| MSCI All Country World Index ex USA (International) | –13.96 | –2.41 | 8.18 |
| |
| Bonds | | | |
| Barclays Capital U.S. Aggregate Bond Index | | | |
| (Broad taxable market) | 7.94% | 6.35% | 4.96% |
| Barclays Capital Municipal Bond Index | 5.67 | 4.14 | 4.15 |
| Citigroup 3-Month Treasury Bill Index | 0.51 | 2.77 | 2.98 |
| |
| CPI | | | |
| Consumer Price Index | –1.48% | 1.91% | 2.64% |
3
Among bond investors, safety and yield traded places
The U.S. bond market also performed a U-turn during the year. Early on, as credit markets deteriorated, investors rushed to the relative safety and liquidity of U.S. Treasury securities, driving their prices up and yields down. Investors were so risk-averse that short-term Treasury yields briefly turned negative. November and December were among the ten best months ever for Treasury returns (adjusted for inflation). Corporate bonds, especially those of lower credit quality, struggled, and their yield spreads above comparable Treasuries widened to near-historic levels during the first six months.
Several moves by the Treasury and the Federal Reserve Board—which slashed its target level for short-term interest rates to a range of 0%–0.25% in December—helped credit markets to attain some stability by the spring. In a dramatic reversal, investors regained their appetite for risk, favoring corporate bonds over Treasuries.
After all the ups and downs, Treasuries and high-yield corporate bonds produced similar 12-month returns of about 6%–7%. Overall, the broad U.S. taxable bond market returned about 8%. Tax-exempt municipal bonds, after a flat first half, returned more than 5% for the fiscal year.
| | | |
| Expense Ratios1 | | | |
| Your Fund Compared With Its Peer Group | | |
| | | | Large-Cap |
| | Investor | Institutional | Growth Funds |
| | Shares | Shares | Average |
| FTSE Social Index Fund | 0.31% | 0.18% | 1.34% |
1 The fund expense ratios shown are from the prospectuses dated December 29, 2008, and represent estimated costs for the current fiscal
year based on the fund’s net assets as of the prospectus date. For the fiscal year ended August 31, 2009, the expense ratios were 0.29%
for Investor Shares and 0.16% for Institutional Shares. The peer-group expense ratio is derived from data provided by Lipper Inc. and
captures information through year-end 2008.
4
In a tough period, financials delivered the hardest blow
During the fiscal year ended August 31, Vanguard FTSE Social Index Fund mirrored its socially conscious target index by investing in companies that work to protect the environment, maintain fair hiring and promotion practices for women and minorities, and institute safe and healthy workplace habits.
The index’s criteria for selecting stocks differentiate the fund from most other large-cap growth funds. FTSE’s screening process typically leads the index, and thus the fund, to focus on a few sectors: financials, information technology, health care, and consumer discretionary.
Financials, the fund’s largest sector with about 30% of assets as of August 31, had the most influence on its performance. The fiscal period began with the collapse of Lehman Brothers in September 2008, an omen for a year plagued by a global recession and credit crisis. As commercial banks, diversified financial services firms, and insurance companies suffered major losses, the financial sector dragged down the fund’s overall performance by nearly 11 percentage points.
The information technology sector, the fund’s second-largest, benefited slightly from a late-period rally in tech stocks, primarily those of software developers and companies that manufacture computer
| |
| Total Returns | |
| May 31, 2000,1 Through August 31, 2009 | |
| | Average |
| | Annual Return |
| FTSE Social Index Fund Investor Shares | –3.93% |
| Spliced Social Index2 | –3.80 |
| Large-Cap Growth Funds Average3 | –5.45 |
The performance data shown represent past performance, which is not a guarantee of future results. (Current performance may be lower or higher than the performance data cited. For performance data current to the most recent month-end, visit our website at www.vanguard.com/performance.) Note, too, that both investment returns and principal value can fluctuate widely, so an investor’s shares, when sold, could be worth more or less than their original cost.
1 Fund inception.
2 Calvert Social Index through December 16, 2005; FTSE4Good US Select Index thereafter.
3 Derived from data provided by Lipper Inc.
5
hardware and semiconductor equipment. But those gains were too small to nudge the IT sector’s overall result into positive territory.
The consumer discretionary and health care sectors also struggled during the fiscal year. Traditionally defensive health care stocks drifted lower in a punishing stock market, while consumer discretionary companies—retailers, restaurants, and entertainment purveyors—struggled with Americans’ sudden, and dramatic, retreat from the malls.
Returns for the fund’s six smaller sectors, which together represented about 16% of its assets at the end of the period, also weakened its performance. Their returns ranged from about –43% for the energy sector to about –8% for the consumer staples sector.
The fund has a record of closely tracking its target
The FTSE Social Index Fund was launched in May 2000, at the height of the stock market’s tech boom. Since its inception, the fund has endured two recessions and
two of the worst bear markets on record, resulting in an average annual return of –3.93%. This is higher than the average return of large-cap growth funds (–5.45%) and is close to that of the fund’s spliced target index (–3.80%).
As the fund’s long-term record shows, the investment advisor, Vanguard Quantitative Equity Group, has done a fine job of tracking the index. In doing so, the group has been supported by the fund’s expense ratio, which is much lower than the average cost of peer funds.
Focus on the long term regardless of market conditions
During the past 12 months, Vanguard FTSE Social Index Fund has experienced one of the toughest economic periods since the 1930s. Although at this point the stock market has recovered from some of its losses, the only certainty about its near-term direction is continued uncertainty.
At Vanguard, we encourage you to focus on the long term and avoid making hasty investment decisions based on the markets’ short-term volatility. One of
6
the best ways to do that is to develop a well-balanced and diversified portfolio that is consistent with your long-term goals, time horizon, and risk tolerance—and then plan to stick with it. Such a portfolio should include a stable, cost-efficient mix of stocks, bonds, and short-term reserves.
A carefully planned investment program can help to cushion the stock market’s occasional sharp decline while allowing you to participate in its long-term potential for growth. For socially conscious investors who are also mindful of expenses, Vanguard FTSE Social Index Fund offers a low-cost option that can play an important role in this kind of long-term investment plan.
Thank you for investing with Vanguard.
Sincerely,

F. William McNabb III
President and Chief Executive Officer September 11, 2009
7
Results of Proxy Voting
At a special meeting of shareholders on July 2, 2009, fund shareholders approved the following two proposals:
Proposal 1—Elect trustees for each fund.*
The individuals listed in the table below were elected as trustees for each fund. All trustees with the exception of Messrs. McNabb and Volanakis (both of whom already served as directors of The Vanguard Group, Inc.) served as trustees to the funds prior to the shareholder meeting.
| | | |
| | | | Percentage |
| Trustee | For | Withheld | For |
| John J. Brennan | 816,325,661 | 25,839,114 | 96.9% |
| Charles D. Ellis | 811,618,878 | 30,545,897 | 96.4% |
| Emerson U. Fullwood | 816,960,560 | 25,204,215 | 97.0% |
| Rajiv L. Gupta | 815,607,429 | 26,557,346 | 96.8% |
| Amy Gutmann | 818,039,387 | 24,125,388 | 97.1% |
| JoAnn Heffernan Heisen | 815,771,400 | 26,393,375 | 96.9% |
| F. William McNabb III | 817,559,701 | 24,605,074 | 97.1% |
| André F. Perold | 814,833,250 | 27,331,525 | 96.8% |
| Alfred M. Rankin, Jr. | 815,942,907 | 26,221,868 | 96.9% |
| Peter F. Volanakis | 817,780,699 | 24,384,076 | 97.1% |
| * Results are for all funds within the same trust. | | | |
Proposal 2—Update and standardize the funds’ fundamental policies regarding:
(a) Purchasing and selling real estate.
(b) Issuing senior securities.
(c) Borrowing money.
(d) Making loans.
(e) Purchasing and selling commodities.
(f) Concentrating investments in a particular industry or group of industries.
(g) Eliminating outdated fundamental investment policies not required by law.
The revised fundamental policies are clearly stated and simple, yet comprehensive, making oversight and compliance more efficient than under the former policies. The revised fundamental policies will allow the funds to respond more quickly to regulatory and market changes, while avoiding the costs and delays associated with successive shareholder meetings.
| | | | | |
| | | | | Broker | Percentage |
| | For | Abstain | Against | Non-Votes | For |
| FTSE Social Index Fund | | | | | |
| 2a | 40,646,105 | 991,797 | 889,152 | 5,551,084 | 84.5% |
| 2b | 40,466,332 | 1,165,376 | 895,345 | 5,551,085 | 84.2% |
| 2c | 40,130,972 | 1,048,084 | 1,347,995 | 5,551,087 | 83.5% |
| 2d | 40,107,519 | 1,074,962 | 1,344,572 | 5,551,086 | 83.4% |
| 2e | 40,224,995 | 1,120,682 | 1,181,376 | 5,551,086 | 83.7% |
| 2f | 40,403,409 | 1,253,173 | 870,474 | 5,551,083 | 84.0% |
| 2g | 40,360,433 | 1,130,780 | 1,035,840 | 5,551,086 | 83.9% |
8
FTSE Social Index Fund
Fund Profile
As of August 31, 2009
| | | |
| Portfolio Characteristics | | |
| | | Target | Broad |
| | Fund | Index1 | Index2 |
| Number of Stocks | 299 | 298 | 4,345 |
| Median Market Cap | $22.1B | $22.1B | $27.3B |
| Price/Earnings Ratio | 40.9x | 40.8x | 26.0x |
| Price/Book Ratio | 1.9x | 1.9x | 2.1x |
| Yield3 | | 1.2% | 2.0% |
| Investor Shares | 1.0% | | |
| Institutional Shares | 1.1% | | |
| Return on Equity | 17.9% | 17.9% | 19.2% |
| Earnings Growth Rate | 9.1% | 9.1% | 9.7% |
| Foreign Holdings | 0.0% | 0.0% | 0.0% |
| Turnover Rate | 30% | — | — |
| Expense Ratio4 | | — | — |
| Investor Shares | 0.31% | | |
| Institutional Shares | 0.18% | | |
| Short-Term Reserves | 0.0% | — | — |
Sector Diversification (% of equity exposure)
| | | |
| | | Target | Broad |
| | Fund | Index1 | Index2 |
| Consumer Discretionary 11.5% | 11.5% | 10.0% |
| Consumer Staples | 6.3 | 6.3 | 10.0 |
| Energy | 3.4 | 3.4 | 11.2 |
| Financials | 30.6 | 30.5 | 16.5 |
| Health Care | 15.5 | 15.5 | 13.2 |
| Industrials | 3.6 | 3.6 | 10.3 |
| Information Technology | 26.3 | 26.3 | 18.2 |
| Materials | 0.8 | 0.8 | 3.8 |
| Telecommunication | | | |
| Services | 1.3 | 1.3 | 2.9 |
| Utilities | 0.7 | 0.8 | 3.9 |
| | |
| Volatility Measures5 | |
| | Fund Versus | Fund Versus |
| | Target Index1 | Broad Index2 |
| R-Squared | 1.00 | 0.97 |
| Beta | 1.00 | 1.15 |
Ten Largest Holdings6 (% of total net assets)
| JPMorgan Chase & Co. | diversified financial services | 5.3% |
| Bank of America Corp. | diversified financial services | 4.7 |
| Apple Inc. | computer hardware | 4.7 |
| Intel Corp. | semiconductors | 3.5 |
| Google Inc. | Internet and software services | 3.4 |
| QUALCOMM Inc. | communications equipment | 2.4 |
| McDonald’s Corp. | restaurants | 1.9 |
| Amgen Inc. | biotechnology | 1.9 |
| CVS Caremark Corp. | drug retail | 1.7 |
| Medtronic, Inc. | health care equipment | 1.3 |
| Top Ten | | 30.8% |
Investment Focus
1 FTSE4Good US Select Index.
2 Dow Jones U.S. Total Stock Market Index.
3 30-day SEC yield for the fund; annualized dividend yield for the indexes. See the Glossary.
4 The fund expense ratios shown are from the prospectuses dated December 29, 2008, and represent estimated costs for the current fiscal
year based on the fund’s net assets as of the prospectus date. For the fiscal year ended August 31, 2009, the expense ratios were 0.29%
for Investor Shares and 0.16% for Institutional Shares.
5 For an explanation of R-squared, beta, and other terms used here, see the Glossary.
6 The holdings listed exclude any temporary cash investments and equity index products.
9
FTSE Social Index Fund
Performance Summary
All of the returns in this report represent past performance, which is not a guarantee of future results that may be achieved by the fund. (Current performance may be lower or higher than the performance data cited. For performance data current to the most recent month-end, visit our website at www.vanguard.com/performance.) Note, too, that both investment returns and principal value can fluctuate widely, so an investor’s shares, when sold, could be worth more or less than their original cost. The returns shown do not reflect taxes that a shareholder would pay on fund distributions or on the sale of fund shares.
Cumulative Performance May 31, 2000–August 31, 2009
Initial Investment of $10,000
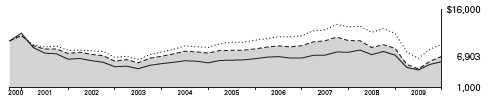
| | | | |
| | | Average Annual Total Returns | |
| | | Periods Ended August 31, 2009 | Final Value of |
| | | | Since | a $10,000 |
| | One Year | Five Years | Inception1 | Investment |
| FTSE Social Index Fund Investor Shares2 | –18.11% | –1.92% | –3.93% | $6,903 |
| Dow Jones U.S. Total Stock Market Index | –18.10 | 1.45 | –0.69 | 9,379 |
| Spliced Social Index3 | –18.11 | –1.76 | –3.80 | 6,991 |
| Large-Cap Growth Funds Average4 | –17.84 | 0.74 | –5.45 | 5,952 |
| | | | |
| | | | | Final Value of |
| | | | Since | a $5,000,000 |
| | One Year | Five Years | Inception1 | Investment |
| FTSE Social Index Fund Institutional Shares | –18.03% | –1.81% | 1.43% | $5,493,135 |
| Dow Jones U.S. Total Stock Market Index | –18.10 | 1.45 | 4.58 | 6,729,032 |
| Spliced Social Index3 | –18.11 | –1.76 | 1.48 | 5,510,796 |
1 Performance for the fund and its comparative standards is calculated since the fund’s inception: May 31, 2000, for Investor Shares and
January 14, 2003, for Institutional Shares.
2 Total returns do not include the account service fee that may be applicable to certain accounts with balances below $10,000.
3 Calvert Social Index through December 16, 2005; FTSE4Good US Select Index thereafter.
4 Derived from data provided by Lipper Inc.
10
FTSE Social Index Fund
Fiscal-Year Total Returns (%) May 31, 2000–August 31, 2009
Average Annual Total Returns: Periods Ended June 30, 2009
This table presents average annual total returns through the latest calendar quarter—rather than through the end of the fiscal period. Securities and Exchange Commission rules require that we provide this information.
| | | | |
| | | | | Since |
| | Inception Date | One Year | Five Years | Inception |
| Investor Shares2 | 5/31/2000 | –26.87% | –5.52% | –5.49% |
| Institutional Shares | 1/14/2003 | –26.80 | –5.39 | –0.74 |
1 Calvert Social Index through December 16, 2005; FTSE4Good US Select Index thereafter.
2 Total returns do not include the account service fee that may be applicable to certain accounts with balances below $10,000.
Note: See Financial Highlights tables for dividend and capital gains information.
11
FTSE Social Index Fund
Financial Statements
Statement of Net Assets
As of August 31, 2009
The fund provides a complete list of its holdings four times in each fiscal year, at the quarter-ends. For the second and fourth fiscal quarters, the lists appear in the fund’s semiannual and annual reports to shareholders. For the first and third fiscal quarters, the fund files the lists with the Securities and Exchange Commission on Form N-Q. Shareholders can look up the fund’s Forms N-Q on the SEC’s website at www.sec.gov. Forms N-Q may also be reviewed and copied at the SEC’s Public Reference Room (see the back cover of this report for further information).
| | | |
| | | | Market |
| | | | Value• |
| | | Shares | ($000) |
| Common Stocks (100.0%) | | |
| Consumer Discretionary (11.5%) | |
| | McDonald’s Corp. | 140,104 | 7,879 |
| | Target Corp. | 95,929 | 4,509 |
| | Lowe’s Cos., Inc. | 186,033 | 4,000 |
| * | Amazon.com, Inc. | 40,557 | 3,293 |
| * | Kohl’s Corp. | 38,647 | 1,994 |
| | Staples, Inc. | 91,077 | 1,968 |
| | Best Buy Co., Inc. | 52,776 | 1,915 |
| | TJX Cos., Inc. | 52,341 | 1,882 |
| | Carnival Corp. | 59,140 | 1,730 |
| * | Apollo Group, Inc. Class A | 20,432 | 1,324 |
| | The Gap, Inc. | 66,489 | 1,306 |
| * | Bed Bath & Beyond, Inc. | 33,003 | 1,204 |
| | Coach, Inc. | 40,412 | 1,143 |
| | Macy’s Inc. | 53,472 | 830 |
| * | AutoZone Inc. | 5,258 | 774 |
| | Nordstrom, Inc. | 27,599 | 774 |
| | Genuine Parts Co. | 20,331 | 753 |
| | H & R Block, Inc. | 43,107 | 745 |
| | Ross Stores, Inc. | 15,961 | 744 |
| | Harley-Davidson, Inc. | 29,575 | 709 |
| | Pulte Homes, Inc. | 48,498 | 620 |
| | Limited Brands, Inc. | 40,880 | 610 |
| * | Dollar Tree, Inc. | 11,274 | 563 |
| * | GameStop Corp. Class A | 20,735 | 493 |
| * | Mohawk Industries, Inc. | 8,740 | 438 |
| | Scripps Networks Interactive | 12,280 | 399 |
| | Royal Caribbean Cruises, Ltd. | 20,191 | 385 |
| | Wyndham Worldwide Corp. | 22,452 | 340 |
| | PetSmart, Inc. | 16,223 | 339 |
| * | Chico’s FAS, Inc. | 22,479 | 286 |
| | Lennar Corp. Class A | 18,340 | 278 |
| | American Eagle Outfitters, Inc. | 19,894 | 269 |
| * | Career Education Corp. | 11,117 | 264 |
| | Gannett Co., Inc. | 29,622 | 256 |
| | RadioShack Corp. | 15,926 | 241 |
| * | Lamar Advertising Co. | | |
| | Class A | 9,791 | 224 |
| * | Liberty Media Corp.– | | |
| | Capital Series A | 11,593 | 221 |
| | | |
| | | | Market |
| | | | Value• |
| | | Shares | ($000) |
| | Foot Locker, Inc. | 19,977 | 213 |
| | KB Home | 11,438 | 208 |
| * | Office Depot, Inc. | 35,457 | 185 |
| | WABCO Holdings Inc. | 8,313 | 159 |
| | Hillenbrand Inc. | 7,884 | 158 |
| | New York Times Co. Class A | 18,113 | 138 |
| | Weight Watchers | | |
| | International, Inc. | 4,838 | 133 |
| * | Ticketmaster | | |
| | Entertainment Inc. | 7,680 | 75 |
| * | HSN, Inc. | 6,980 | 73 |
| * | Interval Leisure Group, Inc. | 6,880 | 72 |
| * | Ascent Media Corp. | 1,751 | 45 |
| | | | 47,161 |
| Consumer Staples (6.3%) | | |
| | CVS Caremark Corp. | 185,102 | 6,945 |
| | Walgreen Co. | 125,455 | 4,250 |
| | Costco Wholesale Corp. | 54,800 | 2,794 |
| | General Mills, Inc. | 41,679 | 2,490 |
| | Sysco Corp. | 75,053 | 1,913 |
| | Kellogg Co. | 36,216 | 1,705 |
| | Safeway, Inc. | 54,598 | 1,040 |
| * | Dr. Pepper | | |
| | Snapple Group, Inc. | 32,090 | 849 |
| | The Hershey Co. | 21,453 | 842 |
| | The Estee Lauder Cos. Inc. | | |
| | Class A | 15,014 | 538 |
| * | Whole Foods Market, Inc. | 17,712 | 515 |
| | McCormick & Co., Inc. | 14,714 | 479 |
| | Hormel Foods Corp. | 12,704 | 469 |
| * | Dean Foods Co. | 23,204 | 421 |
| | PepsiAmericas, Inc. | 11,959 | 335 |
| | Alberto-Culver Co. | 12,237 | 323 |
| | | | 25,908 |
| Energy (3.4%) | | |
| | Apache Corp. | 42,387 | 3,601 |
| | Devon Energy Corp. | 56,495 | 3,468 |
| | Spectra Energy Corp. | 81,953 | 1,542 |
| | Williams Cos., Inc. | 73,420 | 1,207 |
| | Peabody Energy Corp. | 33,926 | 1,109 |
| * | Ultra Petroleum Corp. | 19,306 | 896 |
12
| | | | |
| FTSE Social Index Fund | | | |
| |
| |
| |
| | | | | Market |
| | | | | Value• |
| | | | Shares | ($000) |
| | CONSOL Energy, Inc. | | 22,966 | 859 |
| * | Newfield Exploration Co. | 16,651 | 644 |
| | Pioneer Natural | | | |
| | Resources Co. | | 14,634 | 424 |
| | Teekay Shipping Corp. | | 6,789 | 122 |
| | | | | 13,872 |
| Financials (30.5%) | | | |
| | JPMorgan Chase & Co. | 495,987 | 21,556 |
| | Bank of America Corp. | 1,099,922 | 19,348 |
| | U.S. Bancorp | | 241,325 | 5,459 |
| | American Express Co. | | 151,044 | 5,108 |
| | MetLife, Inc. | | 104,115 | 3,931 |
| | The Travelers Cos., Inc. | 74,297 | 3,746 |
| | State Street Corp. | | 62,794 | 3,295 |
| | Prudential Financial, Inc. | 58,438 | 2,956 |
| | Charles Schwab Corp. | | 146,354 | 2,643 |
| | PNC Financial | | | |
| | Services Group | | 58,378 | 2,486 |
| | CME Group, Inc. | | 8,489 | 2,471 |
| | AFLAC Inc. | | 59,127 | 2,402 |
| | BB&T Corp. | | 82,056 | 2,293 |
| | Simon Property | | | |
| | Group, Inc. REIT | | 35,826 | 2,279 |
| | Ace Ltd. | | 42,600 | 2,223 |
| | The Chubb Corp. | | 44,617 | 2,204 |
| | Franklin Resources, Inc. | 22,184 | 2,070 |
| | Northern Trust Corp. | | 30,534 | 1,785 |
| | T. Rowe Price Group Inc. | 32,637 | 1,479 |
| | SunTrust Banks, Inc. | | 61,267 | 1,432 |
| * | Progressive Corp. of Ohio | 85,955 | 1,420 |
| | The Principal Financial | | | |
| | Group, Inc. | | 39,549 | 1,123 |
| | HCP, Inc. REIT | | 34,702 | 988 |
| | The Hartford Financial | | | |
| | Services Group Inc. | | 41,404 | 982 |
| | Ameriprise Financial, Inc. | 32,519 | 977 |
| | Lincoln National Corp. | | 38,515 | 972 |
| | Unum Group | | 42,189 | 951 |
| | Discover Financial Services | 68,409 | 941 |
| | NYSE Euronext | | 33,083 | 938 |
| | M & T Bank Corp. | | 14,757 | 911 |
| | Hudson City Bancorp, Inc. | 66,292 | 870 |
| | Regions Financial Corp. | 146,952 | 861 |
| | Moody’s Corp. | | 29,790 | 811 |
| | Host Hotels & | | | |
| | Resorts Inc. REIT | | 76,611 | 764 |
| | XL Capital Ltd. Class A | | 43,251 | 750 |
| | KeyCorp | | 112,092 | 747 |
| | People’s United Financial Inc. | 43,923 | 705 |
| * | Intercontinental Exchange Inc. | 6,889 | 646 |
| | Plum Creek | | | |
| | Timber Co. Inc. REIT | | 20,642 | 625 |
| | ProLogis REIT | | 55,797 | 620 |
| | Kimco Realty Corp. REIT | 47,785 | 600 |
| | Legg Mason Inc. | | 20,617 | 593 |
| | Genworth Financial Inc. | 54,591 | 577 |
| | | |
| | | | Market |
| | | | Value• |
| | | Shares | ($000) |
| * | Leucadia National Corp. | 22,502 | 560 |
| | Willis Group Holdings Ltd. | 21,395 | 552 |
| | Cincinnati Financial Corp. | 20,665 | 532 |
| | PartnerRe Ltd. | 7,158 | 529 |
| * | SLM Corp. | 58,876 | 524 |
| | W.R. Berkley Corp. | 20,164 | 515 |
| | New York Community | | |
| | Bancorp, Inc. | 43,380 | 462 |
| | Assurant, Inc. | 15,046 | 451 |
| | Liberty Property Trust REIT | 13,180 | 432 |
| | RenaissanceRe Holdings Ltd. | 7,838 | 427 |
| | AMB Property Corp. REIT | 18,404 | 420 |
| * | Markel Corp. | 1,237 | 407 |
| * | The St. Joe Co. | 11,701 | 384 |
| | First American Corp. | 11,817 | 372 |
| * | First Horizon National Corp. | 26,985 | 361 |
| | Old Republic | | |
| | International Corp. | 30,262 | 360 |
| | Brown & Brown, Inc. | 17,976 | 357 |
| | Commerce Bancshares, Inc. | 9,644 | 354 |
| | White Mountains | | |
| | Insurance Group Inc. | 1,125 | 351 |
| | Regency Centers Corp. REIT | 10,307 | 346 |
| | SEI Investments Co. | 17,920 | 330 |
| | Marshall & Ilsley Corp. | 45,907 | 327 |
| | Duke Realty Corp. REIT | 28,086 | 324 |
| | Huntington Bancshares Inc. | 70,136 | 320 |
| | Janus Capital Group Inc. | 23,243 | 296 |
| | The Macerich Co. REIT | 10,122 | 290 |
| | Zions Bancorp | 14,676 | 259 |
| | Federated Investors, Inc. | 9,806 | 257 |
| | City National Corp. | 6,338 | 250 |
| * | E*TRADE Financial Corp. | 135,947 | 239 |
| | Protective Life Corp. | 10,814 | 233 |
| | TCF Financial Corp. | 16,199 | 223 |
| | Valley National Bancorp | 18,377 | 214 |
| * | MBIA, Inc. | 26,727 | 180 |
| | Popular, Inc. | 81,415 | 175 |
| | Associated Banc-Corp. | 16,558 | 172 |
| | Fulton Financial Corp. | 22,076 | 162 |
| | Synovus Financial Corp. | 42,411 | 157 |
| | Forest City Enterprise | | |
| | Class A | 16,437 | 152 |
| | Unitrin, Inc. | 5,672 | 107 |
| | Erie Indemnity Co. Class A | 2,676 | 104 |
| | CIT Group Inc. | 51,185 | 89 |
| * | Forestar Real Estate | | |
| | Group, Inc. | 4,848 | 70 |
| | Allied Capital Corp. | 21,767 | 65 |
| | Ambac Financial Group, Inc. | 34,269 | 60 |
| | Wesco Financial Corp. | 181 | 55 |
| | The PMI Group Inc. | 9,714 | 32 |
| * | iStar Financial Inc. REIT | 13,964 | 29 |
| | Student Loan Corp. | 494 | 24 |
| | | | 124,429 |
13
| | | |
| FTSE Social Index Fund | | |
| |
| |
| |
| | | | Market |
| | | | Value• |
| | | Shares | ($000) |
| Health Care (15.5%) | | |
| * | Amgen Inc. | 129,829 | 7,756 |
| | Medtronic, Inc. | 142,800 | 5,469 |
| * | Gilead Sciences, Inc. | 115,865 | 5,221 |
| | UnitedHealth Group Inc. | 151,309 | 4,237 |
| * | Medco Health Solutions, Inc. | 61,305 | 3,385 |
| * | WellPoint Inc. | 61,617 | 3,257 |
| * | Celgene Corp. | 58,372 | 3,045 |
| | Covidien PLC | 63,674 | 2,520 |
| * | Express Scripts Inc. | 34,358 | 2,481 |
| * | Boston Scientific Corp. | 191,063 | 2,245 |
| | Allergan, Inc. | 39,105 | 2,187 |
| * | Genzyme Corp. | 34,390 | 1,916 |
| * | Biogen Idec Inc. | 36,809 | 1,848 |
| * | St. Jude Medical, Inc. | 43,847 | 1,690 |
| | Cardinal Health, Inc. | 45,897 | 1,587 |
| | Stryker Corp. | 37,890 | 1,571 |
| | Alcon, Inc. | 11,358 | 1,471 |
| | CIGNA Corp. | 34,560 | 1,017 |
| | Quest Diagnostics, Inc. | 17,695 | 955 |
| | AmerisourceBergen Corp. | 38,756 | 826 |
| * | Hospira, Inc. | 20,212 | 790 |
| * | Humana Inc. | 21,455 | 766 |
| * | DaVita, Inc. | 13,275 | 686 |
| * | Waters Corp. | 12,271 | 617 |
| * | Henry Schein, Inc. | 11,381 | 603 |
| | Beckman Coulter, Inc. | 8,614 | 583 |
| * | Mylan Inc. | 38,399 | 563 |
| * | Cephalon, Inc. | 9,367 | 533 |
| * | Millipore Corp. | 7,078 | 469 |
| * | Watson Pharmaceuticals, Inc. | 13,222 | 467 |
| * | Patterson Companies, Inc. | 15,282 | 416 |
| * | Coventry Health Care Inc. | 18,737 | 409 |
| | Omnicare, Inc. | 15,200 | 348 |
| | Universal Health | | |
| | Services Class B | 5,842 | 343 |
| * | King Pharmaceuticals, Inc. | 30,969 | 321 |
| * | Sepracor Inc. | 13,568 | 246 |
| * | Kinetic Concepts, Inc. | 6,745 | 216 |
| * | Health Net Inc. | 12,972 | 199 |
| | | | 63,259 |
| Industrials (3.6%) | | |
| | Deere & Co. | 53,620 | 2,338 |
| | Norfolk Southern Corp. | 46,707 | 2,142 |
| | PACCAR, Inc. | 46,528 | 1,683 |
| | Republic Services, Inc. | | |
| | Class A | 48,202 | 1,234 |
| | C.H. Robinson Worldwide Inc. | 21,470 | 1,208 |
| | W.W. Grainger, Inc. | 9,381 | 821 |
| | Southwest Airlines Co. | 93,510 | 765 |
| * | Iron Mountain, Inc. | 25,590 | 750 |
| | Fastenal Co. | 19,166 | 694 |
| * | Jacobs Engineering Group Inc. | 15,555 | 684 |
| | Pitney Bowes, Inc. | 26,339 | 589 |
| | Manpower Inc. | 10,010 | 517 |
| | Equifax, Inc. | 16,018 | 443 |
| | | |
| | | | Market |
| | | | Value• |
| | | Shares | ($000) |
| | Cintas Corp. | 14,740 | 404 |
| | J.B. Hunt Transport | | |
| | Services, Inc. | 11,941 | 335 |
| * | Terex Corp. | 13,659 | 225 |
| | | | 14,832 |
| Information Technology (26.3%) | |
| * | Apple Inc. | 113,265 | 19,052 |
| | Intel Corp. | 707,119 | 14,369 |
| * | Google Inc. | 29,990 | 13,845 |
| | QUALCOMM Inc. | 208,730 | 9,689 |
| * | Dell Inc. | 249,071 | 3,943 |
| | MasterCard, Inc. Class A | 13,946 | 2,826 |
| * | eBay Inc. | 121,630 | 2,693 |
| | Automatic Data | | |
| | Processing, Inc. | 63,651 | 2,441 |
| | Applied Materials, Inc. | 168,634 | 2,223 |
| * | Adobe Systems, Inc. | 66,441 | 2,087 |
| | Western Union Co. | 89,392 | 1,613 |
| * | Symantec Corp. | 104,631 | 1,582 |
| * | Juniper Networks, Inc. | 67,308 | 1,553 |
| * | Broadcom Corp. | 54,269 | 1,544 |
| * | Tyco Electronics Ltd. | 58,334 | 1,331 |
| | Paychex, Inc. | 46,340 | 1,311 |
| * | Cognizant Technology | | |
| | Solutions Corp. | 36,820 | 1,284 |
| * | Intuit, Inc. | 40,922 | 1,136 |
| | CA, Inc. | 49,229 | 1,097 |
| * | NVIDIA Corp. | 69,406 | 1,008 |
| * | NetApp, Inc. | 42,018 | 956 |
| * | Fiserv, Inc. | 19,622 | 947 |
| * | Marvell Technology | | |
| | Group Ltd. | 58,940 | 899 |
| | Seagate Technology | 62,577 | 867 |
| * | BMC Software, Inc. | 23,520 | 838 |
| * | Citrix Systems, Inc. | 23,132 | 825 |
| * | Micron Technology, Inc. | 107,900 | 795 |
| * | McAfee Inc. | 19,762 | 786 |
| | Xilinx, Inc. | 35,162 | 782 |
| * | Check Point Software | | |
| | Technologies Ltd. | 26,963 | 751 |
| | Linear Technology Corp. | 27,964 | 743 |
| | Altera Corp. | 37,046 | 712 |
| * | Autodesk, Inc. | 28,795 | 675 |
| | KLA-Tencor Corp. | 21,612 | 674 |
| | Microchip Technology, Inc. | 23,249 | 617 |
| * | Teradata Corp. | 22,847 | 615 |
| * | Flextronics International Ltd. | 102,335 | 607 |
| * | VeriSign, Inc. | 24,425 | 517 |
| * | SanDisk Corp. | 28,867 | 511 |
| * | LAM Research Corp. | 16,112 | 495 |
| | National Semiconductor Corp. | 29,402 | 446 |
| * | LSI Corp. | 82,545 | 430 |
| * | Arrow Electronics, Inc. | 15,263 | 422 |
| | Lender Processing | | |
| | Services, Inc. | 11,983 | 411 |
| * | Synopsys, Inc. | 18,163 | 386 |
14
| | | |
| FTSE Social Index Fund | | |
| |
| |
| |
| | | | Market |
| | | | Value• |
| | | Shares | ($000) |
| | Total System Services, Inc. | 25,175 | 384 |
| * | Akamai Technologies, Inc. | 21,704 | 383 |
| | Broadridge Financial | | |
| | Solutions LLC | 18,150 | 378 |
| * | Advanced Micro Devices, Inc. | 85,766 | 374 |
| * | Metavante Technologies | 11,268 | 355 |
| * | IAC/InterActiveCorp | 16,071 | 298 |
| | Jabil Circuit, Inc. | 27,096 | 297 |
| * | DST Systems, Inc. | 6,305 | 289 |
| | Diebold, Inc. | 8,419 | 254 |
| * | Novellus Systems, Inc. | 12,358 | 237 |
| * | Compuware Corp. | 32,055 | 231 |
| * | Cadence Design Systems, Inc. 33,055 | 207 |
| * | JDS Uniphase Corp. | 26,787 | 184 |
| * | Teradyne, Inc. | 21,727 | 179 |
| * | Convergys Corp. | 15,385 | 167 |
| * | EchoStar Corp. | 4,940 | 92 |
| | | | 107,643 |
| Materials (0.8%) | | |
| | Southern Copper Corp. | | |
| | (U.S. Shares) | 32,473 | 918 |
| | Vulcan Materials Co. | 15,727 | 787 |
| | Sigma-Aldrich Corp. | 15,458 | 785 |
| * | Pactiv Corp. | 16,680 | 415 |
| | Sealed Air Corp. | 19,800 | 374 |
| | | | 3,279 |
| Telecommunication Services (1.3%) | |
| * | Sprint Nextel Corp. | 353,194 | 1,293 |
| | CenturyTel, Inc. | 37,619 | 1,213 |
| * | Millicom International | | |
| | Cellular SA | 13,777 | 972 |
| * | Crown Castle | | |
| | International Corp. | 27,585 | 741 |
| * | NII Holdings Inc. | 20,804 | 493 |
| | Frontier Communications | | |
| | Corp. | 39,583 | 281 |
| | Telephone & Data | | |
| | Systems, Inc. | 6,573 | 173 |
| | | | 5,166 |
| Utilities (0.8%) | | |
| * | NRG Energy, Inc. | 33,779 | 907 |
| | Questar Corp. | 22,018 | 743 |
| | EQT Corp. | 16,330 | 648 |
| | Pepco Holdings, Inc. | 27,780 | 398 |
| | TECO Energy, Inc. | 27,204 | 362 |
| | | | 3,058 |
| Total Common Stocks | | |
| (Cost $453,110) | | 408,607 |
| | |
| | | Market |
| | | Value• |
| | Shares | ($000) |
| Temporary Cash Investment (0.0%) | |
| Money Market Fund (0.0%) | | |
| 1 Vanguard Market Liquidity | | |
| Fund, 0.277% | | |
| (Cost $91) | 90,895 | 91 |
| Total Investments (100.0%) | | |
| (Cost $453,201) | | 408,698 |
| Other Assets and Liabilities (0.0%) | |
| Other Assets | | 1,668 |
| Liabilities | | (1,597) |
| | | 71 |
| Net Assets (100%) | | 408,769 |
At August 31, 2009, net assets consisted of:
| Amount |
| | ($000) |
| Paid-in Capital | 544,236 |
| Undistributed Net Investment Income | 1,708 |
| Accumulated Net Realized Losses | (92,672) |
| Unrealized Appreciation (Depreciation) | (44,503) |
| Net Assets | 408,769 |
| |
| Investor Shares—Net Assets | |
| Applicable to 49,135,703 outstanding | |
| $.001 par value shares of beneficial | |
| interest (unlimited authorization) | 304,498 |
| Net Asset Value Per Share— | |
| Investor Shares | $6.20 |
| |
| Institutional Shares—Net Assets | |
| Applicable to 16,811,932 outstanding | |
| $.001 par value shares of beneficial | |
| interest (unlimited authorization) | 104,271 |
| Net Asset Value Per Share— | |
| Institutional Shares | $6.20 |
• See Note A in Notes to Financial Statements.
* Non-income-producing security.
1 Affiliated money market fund available only to Vanguard funds and certain trusts and accounts managed by Vanguard. Rate shown is
the 7-day yield.
REIT—Real Estate Investment Trust.
See accompanying Notes, which are an integral part of the Financial Statements.
15
FTSE Social Index Fund
Statement of Operations
| |
| | Year Ended |
| | August 31, 2009 |
| | ($000) |
| Investment Income | |
| Income | |
| Dividends | 6,293 |
| Interest1 | 5 |
| Security Lending | 79 |
| Total Income | 6,377 |
| Expenses | |
| The Vanguard Group—Note B | |
| Investment Advisory Services | 53 |
| Management and Administrative—Investor Shares | 554 |
| Management and Administrative—Institutional Shares | 84 |
| Marketing and Distribution—Investor Shares | 87 |
| Marketing and Distribution—Institutional Shares | 33 |
| Custodian Fees | 36 |
| Auditing Fees | 23 |
| Shareholders’ Reports and Proxies—Investor Shares | 25 |
| Shareholders’ Reports and Proxies—Institutional Shares | 2 |
| Trustees’ Fees and Expenses | 1 |
| Total Expenses | 898 |
| Net Investment Income | 5,479 |
| Realized Net Gain (Loss) on Investment Securities Sold | (84,100) |
| Change in Unrealized Appreciation (Depreciation) of Investment Securities | (23,637) |
| Net Increase (Decrease) in Net Assets Resulting from Operations | (102,258) |
1 Interest income from an affiliated company of the fund was $5,000.
See accompanying Notes, which are an integral part of the Financial Statements.
16
FTSE Social Index Fund
Statement of Changes in Net Assets
| | |
| | Year Ended August 31, |
| | 2009 | 2008 |
| | ($000) | ($000) |
| Increase (Decrease) in Net Assets | | |
| Operations | | |
| Net Investment Income | 5,479 | 8,845 |
| Realized Net Gain (Loss) | (84,100) | (6,921) |
| Change in Unrealized Appreciation (Depreciation) | (23,637) | (99,890) |
| Net Increase (Decrease) in Net Assets Resulting from Operations | (102,258) | (97,966) |
| Distributions | | |
| Net Investment Income | | |
| Investor Shares | (5,643) | (7,812) |
| Institutional Shares | (2,622) | (2,061) |
| Realized Capital Gain | | |
| Investor Shares | — | — |
| Institutional Shares | — | — |
| Total Distributions | (8,265) | (9,873) |
| Capital Share Transactions | | |
| Investor Shares | (12,691) | (60,224) |
| Institutional Shares | (2,005) | 51,023 |
| Net Increase (Decrease) from Capital Share Transactions | (14,696) | (9,201) |
| Total Increase (Decrease) | (125,219) | (117,040) |
| Net Assets | | |
| Beginning of Period | 533,988 | 651,028 |
| End of Period1 | 408,769 | 533,988 |
1 Net Assets—End of Period includes undistributed net investment income of $1,708,000 and $4,494,000.
See accompanying Notes, which are an integral part of the Financial Statements.
17
| | | | | |
| FTSE Social Index Fund | | | | | |
| |
| |
| Financial Highlights | | | | | |
| |
| |
| Investor Shares | | | | | |
| |
| For a Share Outstanding | Year Ended August 31, |
| Throughout Each Period | 2009 | 2008 | 2007 | 2006 | 2005 |
| Net Asset Value, Beginning of Period | $7.76 | $9.30 | $8.51 | $8.03 | $7.40 |
| Investment Operations | | | | | |
| Net Investment Income | .080 | .125 | .130 | .110 | .130 |
| Net Realized and Unrealized Gain (Loss) | | | | | |
| on Investments | (1.522) | (1.525) | .780 | .470 | .620 |
| Total from Investment Operations | (1.442) | (1.400) | .910 | .580 | .750 |
| Distributions | | | | | |
| Dividends from Net Investment Income | (.118) | (.140) | (.120) | (.100) | (.120) |
| Distributions from Realized Capital Gains | — | — | — | — | — |
| Total Distributions | (.118) | (.140) | (.120) | (.100) | (.120) |
| Net Asset Value, End of Period | $6.20 | $7.76 | $9.30 | $8.51 | $8.03 |
| |
| Total Return1 | –18.11% | –15.26% | 10.70% | 7.25% | 10.16% |
| |
| Ratios/Supplemental Data | | | | | |
| Net Assets, End of Period (Millions) | $304 | $395 | $540 | $405 | $361 |
| Ratio of Total Expenses to | | | | | |
| Average Net Assets | 0.29% | 0.24% | 0.24% | 0.25% | 0.25% |
| Ratio of Net Investment Income to | | | | | |
| Average Net Assets | 1.50% | 1.48% | 1.48% | 1.41% | 1.74% |
| Portfolio Turnover Rate | 30% | 41% | 20% | 51%2 | 12% |
1 Total returns do not include the account service fee that may be applicable to certain accounts with balances below $10,000.
2 Includes activity related to a change in the fund’s target index.
See accompanying Notes, which are an integral part of the Financial Statements.
18
| | | | | |
| FTSE Social Index Fund | | | | | |
| |
| |
| Financial Highlights | | | | | |
| |
| |
| Institutional Shares | | | | | |
| |
| For a Share Outstanding | Year Ended August 31, |
| Throughout Each Period | 2009 | 2008 | 2007 | 2006 | 2005 |
| Net Asset Value, Beginning of Period | $7.77 | $9.32 | $8.52 | $8.04 | $7.41 |
| Investment Operations | | | | | |
| Net Investment Income | .087 | .137 | .152 | .120 | .138 |
| Net Realized and Unrealized Gain (Loss) | | | | | |
| on Investments | (1.528) | (1.535) | .780 | .470 | .620 |
| Total from Investment Operations | (1.441) | (1.398) | .932 | .590 | .758 |
| Distributions | | | | | |
| Dividends from Net Investment Income | (.129) | (.152) | (.132) | (.110) | (.128) |
| Distributions from Realized Capital Gains | — | — | — | — | — |
| Total Distributions | (.129) | (.152) | (.132) | (.110) | (.128) |
| Net Asset Value, End of Period | $6.20 | $7.77 | $9.32 | $8.52 | $8.04 |
| |
| Total Return | –18.03% | –15.22% | 10.95% | 7.37% | 10.26% |
| |
| Ratios/Supplemental Data | | | | | |
| Net Assets, End of Period (Millions) | $104 | $139 | $111 | $87 | $27 |
| Ratio of Total Expenses to | | | | | |
| Average Net Assets | 0.16% | 0.11% | 0.11% | 0.12% | 0.12% |
| Ratio of Net Investment Income to | | | | | |
| Average Net Assets | 1.63% | 1.61% | 1.61% | 1.54% | 1.83% |
| Portfolio Turnover Rate | 30% | 41% | 20% | 51%1 | 12% |
1 Includes activity related to a change in the fund’s target index.
See accompanying Notes, which are an integral part of the Financial Statements.
19
FTSE Social Index Fund
Notes to Financial Statements
Vanguard FTSE Social Index Fund is registered under the Investment Company Act of 1940 as an open-end investment company, or mutual fund. The fund offers two classes of shares: Investor Shares and Institutional Shares. Investor Shares are available to any investor who meets the fund’s minimum purchase requirements. Institutional Shares are designed for investors who meet certain administrative and service criteria and invest a minimum of $5 million.
A. The following significant accounting policies conform to generally accepted accounting principles for U.S. mutual funds. The fund consistently follows such policies in preparing its financial statements.
1. Security Valuation: Securities are valued as of the close of trading on the New York Stock Exchange (generally 4 p.m., Eastern time) on the valuation date. Equity securities are valued at the latest quoted sales prices or official closing prices taken from the primary market in which each security trades; such securities not traded on the valuation date are valued at the mean of the latest quoted bid and asked prices. Securities for which market quotations are not readily available, or whose values have been materially affected by events occurring before the fund’s pricing time but after the close of the securities’ primary markets, are valued by methods deemed by the board of trustees to represent fair value. Investments in Vanguard Market Liquidity Fund are valued at that fund’s net asset value.
2. Federal Income Taxes: The fund intends to continue to qualify as a regulated investment company and distribute all of its taxable income. Management has analyzed the fund’s tax positions taken for all open federal income tax years (August 31, 2006–2009), and has concluded that no provision for federal income tax is required in the fund’s financial statements.
3. Distributions: Distributions to shareholders are recorded on the ex-dividend date.
4. Security Lending: The fund may lend its securities to qualified institutional borrowers to earn additional income. Security loans are required to be secured at all times by collateral at least equal to the market value of securities loaned. The fund invests cash collateral received in Vanguard Market Liquidity Fund, and records a liability for the return of the collateral, during the period the securities are on loan. Security lending income represents the income earned on investing cash collateral, less expenses associated with the loan.
5. Other: Dividend income is recorded on the ex-dividend date. Interest income includes income distributions received from Vanguard Market Liquidity Fund and is accrued daily. Security transactions are accounted for on the date securities are bought or sold. Costs used to determine realized gains (losses) on the sale of investment securities are those of the specific securities sold.
Each class of shares has equal rights as to assets and earnings, except that each class separately bears certain class-specific expenses related to maintenance of shareholder accounts (included in Management and Administrative expenses), shareholder reporting, and proxies. Marketing and distribution expenses are allocated to each class of shares based on a method approved by the board of trustees. Income, other non-class-specific expenses, and gains and losses on investments are allocated to each class of shares based on its relative net assets.
20
FTSE Social Index Fund
B. The Vanguard Group furnishes at cost investment advisory, corporate management, administrative, marketing, and distribution services. The costs of such services are allocated to the fund under methods approved by the board of trustees. The fund has committed to provide up to 0.40% of its net assets in capital contributions to Vanguard. At August 31, 2009, the fund had contributed capital of $86,000 to Vanguard (included in Other Assets), representing 0.02% of the fund’s net assets and 0.03% of Vanguard’s capitalization. The fund’s trustees and officers are also directors and officers of Vanguard.
C. Various inputs may be used to determine the value of the fund’s investments. These inputs are summarized in three broad levels for financial statement purposes. The inputs or methodologies used to value securities are not necessarily an indication of the risk associated with investing in those securities.
Level 1—Quoted prices in active markets for identical securities.
Level 2—Other significant observable inputs (including quoted prices for similar securities, interest
rates, prepayment speeds, credit risk, etc.).
Level 3—Significant unobservable inputs (including the fund’s own assumptions used to determine
the fair value of investments).
At August 31, 2009, 100% of the fund’s investments were valued based on Level 1 inputs.
D. Distributions are determined on a tax basis and may differ from net investment income and realized capital gains for financial reporting purposes. Differences may be permanent or temporary. Permanent differences are reclassified among capital accounts in the financial statements to reflect their tax character. Temporary differences arise when certain items of income, expense, gain, or loss are recognized in different periods for financial statement and tax purposes; these differences will reverse at some time in the future. Differences in classification may also result from the treatment of short-term gains as ordinary income for tax purposes.
For tax purposes, at August 31, 2009, the fund had $2,587,000 of ordinary income available for distribution. The fund had available capital loss carryforwards totaling $25,902,000 to offset future net capital gains of $79,000 through August 31, 2012, $985,000 through August 31, 2013, $367,000 through August 31, 2014, $2,136,000 through August 31, 2016, and $22,335,000 through August 31, 2017.
In addition, the fund realized losses of $66,197,000 during the period from November 1, 2008, through August 31, 2009, which are deferred and will be treated as realized for tax purposes in fiscal 2010.
At August 31, 2009, the cost of investment securities for tax purposes was $453,753,000. Net unrealized depreciation of investment securities for tax purposes was $45,055,000, consisting of unrealized gains of $45,564,000 on securities that had risen in value since their purchase and $90,619,000 in unrealized losses on securities that had fallen in value since their purchase.
21
FTSE Social Index Fund
E. During the year ended August 31, 2009, the fund purchased $109,377,000 of investment securities and sold $125,659,000 of investment securities, other than temporary cash investments.
| | | | |
| F. Capital share transactions for each class of shares were: | | | |
| | Year Ended August 31, |
| | 2009 | 2008 |
| | Amount | Shares | Amount | Shares |
| | ($000) | (000) | ($000) | (000) |
| Investor Shares | | | | |
| Issued | 69,845 | 13,553 | 89,674 | 10,639 |
| Issued in Lieu of Cash Distributions | 5,331 | 1,125 | 7,393 | 821 |
| Redeemed | (87,867) | (16,390) | (157,291) | (18,620) |
| Net Increase (Decrease)—Investor Shares | (12,691) | (1,712) | (60,224) | (7,160) |
| Institutional Shares | | | | |
| Issued | 34,054 | 6,299 | 75,608 | 8,817 |
| Issued in Lieu of Cash Distributions | 2,022 | 427 | 1,715 | 190 |
| Redeemed | (38,081) | (7,838) | (26,300) | (3,027) |
| Net Increase (Decrease)—Institutional Shares | (2,005) | (1,112) | 51,023 | 5,980 |
G. In preparing the financial statements as of August 31, 2009, management considered the impact of subsequent events occurring through October 15, 2009, for potential recognition or disclosure in these financial statements.
22
Report of Independent Registered
Public Accounting Firm
To the Trustees of Vanguard World Fund and the Shareholders of Vanguard FTSE Social Index Fund:
In our opinion, the accompanying statement of net assets and the related statements of operations and of changes in net assets and the financial highlights present fairly, in all material respects, the financial position of Vanguard FTSE Social Index Fund (the “Fund”) at August 31, 2009, the results of its operations for the year then ended, the changes in its net assets for each of the two years in the period then ended and the financial highlights for each of the five years in the period then ended, in conformity with accounting principles generally accepted in the United States of America. These financial statements and financial highlights (hereafter referred to as “financial statements”) are the responsibility of the Fund’s management; our responsibility is to express an opinion on these financial statements based on our audits. We conducted our audits of these financial statemen ts in accordance with the standards of the Public Company Accounting Oversight Board (United States). Those standards require that we plan and perform the audit to obtain reasonable assurance about whether the financial statements are free of material misstatement. An audit includes examining, on a test basis, evidence supporting the amounts and disclosures in the financial statements, assessing the accounting principles used and significant estimates made by management, and evaluating the overall financial statement presentation. We believe that our audits, which included confirmation of securities at August 31, 2009 by correspondence with the custodian and by agreement to the underlying ownership records for Vanguard Market Liquidity Fund, provide a reasonable basis for our opinion.
PricewaterhouseCoopers LLP
Philadelphia, Pennsylvania
October 15, 2009
Special 2009 tax information (unaudited) for Vanguard FTSE Social Index FundThis information for the fiscal year ended August 31, 2009, is included pursuant to provisions of theInternal Revenue Code.The fund distributed $8,265,000 of qualified dividend income to shareholders during the fiscal year.For corporate shareholders, 100% of investment income (dividend income plus short-term gains, if any)qualifies for the dividends-received deduction.23
Your Fund’s After-Tax Returns
This table presents returns for your fund both before and after taxes. The after-tax returns are shown in two ways: (1) assuming that an investor owned the fund during the entire period and paid taxes on the fund’s distributions, and (2) assuming that an investor paid taxes on the fund’s distributions and sold all shares at the end of each period.
Calculations are based on the highest individual federal income tax and capital gains tax rates in effect at the times of the distributions and the hypothetical sales. State and local taxes were not considered. After-tax returns reflect any qualified dividend income, using actual prior-year figures and estimates for 2009. (In the example, returns after the sale of fund shares may be higher than those assuming no sale. This occurs when the sale would have produced a capital loss. The calculation assumes that the investor received a tax deduction for the loss.)
The table shows returns for Investor Shares only; returns for other share classes will differ. Please note that your actual after-tax returns will depend on your tax situation and may differ from those shown. Also note that if you own the fund in a tax-deferred account, such as an individual retirement account or a 401(k) plan, this information does not apply to you. Such accounts are not subject to current taxes.
Finally, keep in mind that a fund’s performance—whether before or after taxes—does not guarantee future results.
| | | |
| Average Annual Total Returns: FTSE Social Index Fund Investor Shares1 | | |
| Periods Ended August 31, 2009 | | | |
| | One | Five | Since |
| | Year | Years | Inception2 |
| Returns Before Taxes | –18.11% | –1.92% | –3.93% |
| Returns After Taxes on Distributions | –18.41 | –2.15 | –4.15 |
| Returns After Taxes on Distributions and Sale of Fund Shares | –11.52 | –1.59 | –3.28 |
1 Total returns do not include the account service fee that may be applicable to certain accounts with balances below $10,000.
2 Inception date for Investor Shares is May 31, 2000.
24
About Your Fund’s Expenses
As a shareholder of the fund, you incur ongoing costs, which include costs for portfolio management, administrative services, and shareholder reports (like this one), among others. Operating expenses, which are deducted from a fund’s gross income, directly reduce the investment return of the fund.
A fund’s expenses are expressed as a percentage of its average net assets. This figure is known as the expense ratio. The following examples are intended to help you understand the ongoing costs (in dollars) of investing in your fund and to compare these costs with those of other mutual funds. The examples are based on an investment of $1,000 made at the beginning of the period shown and held for the entire period.
The accompanying table illustrates your fund’s costs in two ways:
• Based on actual fund return. This section helps you to estimate the actual expenses that you paid over the period. The “Ending Account Value” shown is derived from the fund’s actual return, and the third column shows the dollar amount that would have been paid by an investor who started with $1,000 in the fund. You may use the information here, together with the amount you invested, to estimate the expenses that you paid over the period.
To do so, simply divide your account value by $1,000 (for example, an $8,600 account value divided by $1,000 = 8.6), then multiply the result by the number given for your fund under the heading “Expenses Paid During Period.”
• Based on hypothetical 5% yearly return. This section is intended to help you compare your fund’s costs with those of other mutual funds. It assumes that the fund had a yearly return of 5% before expenses, but that the expense ratio is unchanged. In this case—because the return used is not the fund’s actual return—the results do not apply to your investment. The example is useful in making comparisons because the Securities and Exchange Commission requires all mutual funds to calculate expenses based on a 5% return. You can assess your fund’s costs by comparing this hypothetical example with the hypothetical examples that appear in shareholder reports of other funds.
| | | |
| Six Months Ended August 31, 2009 | | | |
| | Beginning | Ending | Expenses |
| | Account Value | Account Value | Paid During |
| FTSE Social Index Fund | 2/28/2009 | 8/31/2009 | Period1 |
| Based on Actual Fund Return | | | |
| Investor Shares | $1,000.00 | $1,534.65 | $1.85 |
| Institutional Shares | 1,000.00 | 1,534.65 | 1.02 |
| Based on Hypothetical 5% Yearly Return | | | |
| Investor Shares | $1,000.00 | $1,023.74 | $1.48 |
| Institutional Shares | 1,000.00 | 1,024.40 | 0.82 |
1 The calculations are based on expenses incurred in the most recent six-month period. The fund’s annualized six-month expense ratios for
that period are 0.29% for Investor Shares and 0.16% for Institutional Shares. The dollar amounts shown as “Expenses Paid” are equal to
the annualized expense ratio multiplied by the average account value over the period, multiplied by the number of days in the most recent
six-month period, then divided by the number of days in the most recent 12-month period.
25
Note that the expenses shown in the table are meant to highlight and help you compare ongoing costs only and do not reflect transaction costs incurred by the fund for buying and selling securities. Further, the expenses do not include the account service fee described in the prospectus. If such a fee were applied to your account, your costs would be higher. Your fund does not charge transaction fees, such as purchase or redemption fees, nor does it carry a “sales load.”
The calculations assume no shares were bought or sold during the period. Your actual costs may have been higher or lower, depending on the amount of your investment and the timing of any purchases or redemptions.
You can find more information about the fund’s expenses, including annual expense ratios, in the Financial Statements section of this report. For additional information on operating expenses and other shareholder costs, please refer to your fund’s current prospectus.
26
Trustees Approve Advisory Arrangement
The board of trustees of Vanguard FTSE Social Index Fund has renewed the fund’s investment advisory
arrangement with The Vanguard Group, Inc. Vanguard—through its Quantitative Equity Group—serves
as the investment advisor to the fund. The board determined that continuing the fund’s internalized
management structure was in the best interests of the fund and its shareholders.
The board based its decision upon an evaluation of the advisor’s investment staff, portfolio manage-
ment process, and performance. The trustees considered the factors discussed below, among others.
However, no single factor determined whether the board approved the arrangement. Rather, it was the
totality of the circumstances that drove the board’s decision.
Nature, extent, and quality of services
The board considered the quality of the fund’s investment management over both the short and long
term, and took into account the organizational depth and stability of the advisor. The board noted that
Vanguard has been managing investments for more than three decades. The Quantitative Equity Group
adheres to a sound, disciplined investment management process; the team has considerable
experience, stability, and depth.
The board concluded that Vanguard’s experience, stability, depth, and performance, among other
factors, warranted continuation of the advisory arrangement.
Investment performance
The board considered the short- and long-term performance of the fund, including any periods of
outperformance or underperformance of its target index and peer group. The board concluded that
the fund has performed in line with expectations, and that the results have been consistent with the
fund’s investment strategies. Information about the fund’s most recent performance can be found
in the Performance Summary section of this report.
Cost
The board concluded that the fund’s expense ratio was well below the average expense ratio charged
by funds in its peer group and that the fund’s advisory expense ratio was also well below its peer-
group average. Information about the fund’s expense ratio appears in the About Your Fund’s Expenses
section of this report.
The board does not conduct a profitability analysis of Vanguard, because of Vanguard’s unique “at-cost”
structure. Unlike most other mutual fund management companies, Vanguard is owned by the funds it
oversees, and produces “profits” only in the form of reduced expenses for fund shareholders.
The benefit of economies of scale
The board concluded that the fund’s low-cost arrangement with Vanguard ensures that the fund will
realize economies of scale as it grows, with the cost to shareholders declining as fund assets increase.
The board will consider whether to renew the advisory arrangement again after a one-year period.
27
Glossary
Beta. A measure of the magnitude of a fund’s past share-price fluctuations in relation to the ups and downs of a given market index. The index is assigned a beta of 1.00. Compared with a given index, a fund with a beta of 1.20 typically would have seen its share price rise or fall by 12% when the index rose or fell by 10%. For this report, beta is based on returns over the past 36 months for both the fund and the index. Note that a fund’s beta should be reviewed in conjunction with its R-squared (see definition). The lower the R-squared, the less correlation there is between the fund and the index, and the less reliable beta is as an indicator of volatility.
Earnings Growth Rate. The average annual rate of growth in earnings over the past five years for the stocks now in a fund.
Equity Exposure. A measure that reflects a fund’s investments in stocks and stock futures. Any holdings in short-term reserves are excluded.
Expense Ratio. The percentage of a fund’s average net assets used to pay its annual administrative and advisory expenses. These expenses directly reduce returns to investors.
Foreign Holdings. The percentage of a fund represented by stocks or depositary receipts of companies based outside the United States.
Inception Date. The date on which the assets of a fund (or one of its share classes) are first invested in accordance with the fund’s investment objective. For funds with a subscription period, the inception date is the day after that period ends. Investment performance is measured from the inception date.
Median Market Cap. An indicator of the size of companies in which a fund invests; the midpoint of market capitalization (market price x shares outstanding) of a fund’s stocks, weighted by the proportion of the fund’s assets invested in each stock. Stocks representing half of the fund’s assets have market capitalizations above the median, and the rest are below it.
Price/Book Ratio. The share price of a stock divided by its net worth, or book value, per share. For a fund, the weighted average price/book ratio of the stocks it holds.
Price/Earnings Ratio. The ratio of a stock’s current price to its per-share earnings over the past year. For a fund, the weighted average P/E of the stocks it holds. P/E is an indicator of market expectations about corporate prospects; the higher the P/E, the greater the expectations for a company’s future growth.
R-Squared. A measure of how much of a fund’s past returns can be explained by the returns from the market in general, as measured by a given index. If a fund’s total returns were precisely synchronized with an index’s returns, its R-squared would be 1.00. If the fund’s returns bore no relationship to the index’s returns, its R-squared would be 0. For this report, R-squared is based on returns over the past 36 months for both the fund and the index.
Return on Equity. The annual average rate of return generated by a company during the past five years for each dollar of shareholder’s equity (net income divided by shareholder’s equity). For a fund, the weighted average return on equity for the companies whose stocks it holds.
Short-Term Reserves. The percentage of a fund invested in highly liquid, short-term securities that can be readily converted to cash.
28
Turnover Rate. An indication of the fund’s trading activity. Funds with high turnover rates incur higher transaction costs and may be more likely to distribute capital gains (which may be taxable to investors). The turnover rate excludes in-kind transactions, which have minimal impact on costs.
Yield. A fund’s 30-day SEC yield is derived using a formula specified by the U.S. Securities and Exchange Commission. Under the formula, data related to the fund’s security holdings in the previous 30 days are used to calculate the fund’s hypothetical net income for that period, which is then annualized and divided by the fund’s estimated average net assets over the calculation period. For the purposes of this calculation, a security’s income is based on its current market yield to maturity (in the case of bonds) or its projected dividend yield (for stocks). Because the SEC yield represents hypothetical annualized income, it will differ—at times significantly—from the fund’s actual experience. As a result, the fund’s income distributions may be higher or lower than implied by the SEC y ield.
29
This page intentionally left blank.
This page intentionally left blank.
The People Who Govern Your Fund
The trustees of your mutual fund are there to see that the fund is operated and managed in your best interests since, as a shareholder, you are a part owner of the fund. Your fund’s trustees also serve on the board of directors of The Vanguard Group, Inc., which is owned by the Vanguard funds and provides services to them on an at-cost basis.
A majority of Vanguard’s board members are independent, meaning that they have no affiliation with Vanguard or the funds they oversee, apart from the sizable personal investments they have made as private individuals. The independent board members have distinguished backgrounds in business, academia, and public service. Each of the trustees and executive officers oversees 157 Vanguard funds.
The following table provides information for each trustee and executive officer of the fund. More information about the trustees is in the Statement of Additional Information, which can be obtained, without charge, by contacting Vanguard at 800-662-7447, or online at www.vanguard.com.
| |
| Interested Trustees | Emerson U. Fullwood |
| | Born 1948. Trustee Since January 2008. Principal |
| John J. Brennan1 | Occupation(s) During the Past Five Years: Retired |
| Born 1954. Trustee Since May 1987. Chairman of | Executive Chief Staff and Marketing Officer for North |
| the Board. Principal Occupation(s) During the Past | America and Corporate Vice President of Xerox |
| Five Years: Chairman of the Board and Director/Trustee | Corporation (photocopiers and printers); Director of |
| of The Vanguard Group, Inc., and of each of the | SPX Corporation (multi-industry manufacturing), the |
| investment companies served by The Vanguard Group; | United Way of Rochester, the Boy Scouts of America, |
| Chief Executive Officer and President of The Vanguard | Amerigroup Corporation (direct health and medical |
| Group and of each of the investment companies served | insurance carriers), and Monroe Community College |
| by The Vanguard Group (1996–2008); Chairman of | Foundation. |
| the Financial Accounting Foundation; Governor of | |
| the Financial Industry Regulatory Authority (FINRA); | Rajiv L. Gupta |
| Director of United Way of Southeastern Pennsylvania. | Born 1945. Trustee Since December 2001.2 Principal |
| | Occupation(s) During the Past Five Years: Retired |
| F. William McNabb III1 | Chairman and Chief Executive Officer of Rohm and |
| Born 1957. Trustee Since July 2009. Principal | Haas Co. (chemicals); President of Rohm and Haas Co. |
| Occupation(s) During the Past Five Years: Director of | (2006–2008); Board Member of American Chemistry |
| The Vanguard Group, Inc., since 2008; Chief Executive | Council; Director of Tyco International, Ltd. (diversified |
| Officer and President of The Vanguard Group and of | manufacturing and services) and Hewlett-Packard Co. |
| each of the investment companies served by The | (electronic computer manufacturing); Trustee of The |
| Vanguard Group since 2008; Director of Vanguard | Conference Board. |
| Marketing Corporation; Managing Director of The | |
| Vanguard Group (1995–2008). | Amy Gutmann |
| | Born 1949. Trustee Since June 2006. Principal |
| | Occupation(s) During the Past Five Years: President of |
| Independent Trustees | the University of Pennsylvania; Christopher H. Browne |
| | Distinguished Professor of Political Science in the School |
| Charles D. Ellis | of Arts and Sciences with Secondary Appointments |
| Born 1937. Trustee Since January 2001. Principal | at the Annenberg School for Communication and the |
| Occupation(s) During the Past Five Years: Applecore | Graduate School of Education of the University of |
| Partners (pro bono ventures in education); Senior | Pennsylvania; Director of Carnegie Corporation of |
| Advisor to Greenwich Associates (international business | New York, Schuylkill River Development Corporation, |
| strategy consulting); Successor Trustee of Yale University; | and Greater Philadelphia Chamber of Commerce; |
| Overseer of the Stern School of Business at New York | Trustee of the National Constitution Center. |
| University; Trustee of the Whitehead Institute for | |
| Biomedical Research. | |
| | |
| JoAnn Heffernan Heisen | Executive Officers | |
| Born 1950. Trustee Since July 1998. Principal | | |
| Occupation(s) During the Past Five Years: Retired | Thomas J. Higgins1 | |
| Corporate Vice President, Chief Global Diversity Officer, | Born 1957. Chief Financial Officer Since September |
| and Member of the Executive Committee of Johnson | 2008. Principal Occupation(s) During the Past Five |
| & Johnson (pharmaceuticals/consumer products); | Years: Principal of The Vanguard Group, Inc.; Chief |
| Vice President and Chief Information Officer of Johnson | Financial Officer of each of the investment companies |
| & Johnson (1997–2005); Director of the University | served by The Vanguard Group since 2008; Treasurer |
| Medical Center at Princeton and Women’s Research | of each of the investment companies served by The |
| and Education Institute. | Vanguard Group (1998–2008). |
| |
| André F. Perold | Kathryn J. Hyatt1 | |
| Born 1952. Trustee Since December 2004. Principal | Born 1955. Treasurer Since November 2008. Principal |
| Occupation(s) During the Past Five Years: George Gund | Occupation(s) During the Past Five Years: Principal of |
| Professor of Finance and Banking, Harvard Business | The Vanguard Group, Inc.; Treasurer of each of the |
| School; Director and Chairman of UNX, Inc. (equities | investment companies served by The Vanguard |
| trading firm); Chair of the Investment Committee of | Group since 2008; Assistant Treasurer of each of the |
| HighVista Strategies LLC (private investment firm). | investment companies served by The Vanguard Group |
| | (1988–2008). | |
| Alfred M. Rankin, Jr. | | |
| Born 1941. Trustee Since January 1993. Principal | Heidi Stam1 | |
| Occupation(s) During the Past Five Years: Chairman, | Born 1956. Secretary Since July 2005. Principal |
| President, Chief Executive Officer, and Director of | Occupation(s) During the Past Five Years: Managing |
| NACCO Industries, Inc. (forklift trucks/housewares/ | Director of The Vanguard Group, Inc., since 2006; |
| lignite); Director of Goodrich Corporation (industrial | General Counsel of The Vanguard Group since 2005; |
| products/aircraft systems and services). | Secretary of The Vanguard Group and of each of the |
| | investment companies served by The Vanguard Group |
| Peter F. Volanakis | since 2005; Director and Senior Vice President of |
| Born 1955. Trustee Since July 2009. Principal | Vanguard Marketing Corporation since 2005; Principal |
| Occupation(s) During the Past Five Years: President | of The Vanguard Group (1997–2006). |
| since 2007 and Chief Operating Officer since 2005 | | |
| of Corning Incorporated (communications equipment); | | |
| President of Corning Technologies (2001–2005); Director | Vanguard Senior Management Team |
| of Corning Incorporated and Dow Corning; Trustee of | | |
| the Corning Incorporated Foundation and the Corning | R. Gregory Barton | Michael S. Miller |
| Museum of Glass; Overseer of the Amos Tuck School | Mortimer J. Buckley | James M. Norris |
| of Business Administration at Dartmouth College. | Kathleen C. Gubanich | Glenn W. Reed |
| | Paul A. Heller | George U. Sauter |
| |
| |
| | Founder | |
| | John C. Bogle | |
| | Chairman and Chief Executive Officer, 1974–1996 |
1 These individuals are “interested persons” as defined in the Investment Company Act of 1940.
2 December 2002 for Vanguard Equity Income Fund, Vanguard Growth Equity Fund, the Vanguard Municipal Bond Funds, and the Vanguard
State Tax-Exempt Funds.

P.O. Box 2600
Valley Forge, PA 19482-2600
Connect with Vanguard® > www.vanguard.com
| Fund Information > 800-662-7447 | All comparative mutual fund data are from Lipper Inc. |
| | or Morningstar, Inc., unless otherwise noted. |
| Direct Investor Account Services > 800-662-2739 | |
| | You can obtain a free copy of Vanguard’s proxy voting |
| Institutional Investor Services > 800-523-1036 | guidelines by visiting our website, www.vanguard.com, |
| | and searching for “proxy voting guidelines,” or by |
| Text Telephone for People | calling Vanguard at 800-662-2739. The guidelines are |
| With Hearing Impairment > 800-952-3335 | also available from the SEC’s website, www.sec.gov. |
| | In addition, you may obtain a free report on how your |
| This material may be used in conjunction | fund voted the proxies for securities it owned during |
| with the offering of shares of any Vanguard | the 12 months ended June 30. To get the report, visit |
| fund only if preceded or accompanied by | either www.vanguard.com or www.sec.gov. |
| the fund’s current prospectus. | |
| You can review and copy information about your fund |
| | at the SEC’s Public Reference Room in Washington, D.C. |
| “FTSE®” and “FTSE4Good™” are trademarks jointly owned | To find out more about this public service, call the SEC |
| by the London Stock Exchange plc and The Financial Times | at 202-551-8090. Information about your fund is also |
| Limited and are used by FTSE International Limited under | available on the SEC’s website, and you can receive |
| license. The FTSE4Good US Select Index is calculated by | copies of this information, for a fee, by sending a |
| FTSE International Limited. FTSE International Limited does | request in either of two ways: via e-mail addressed to |
| not sponsor, endorse, or promote the fund; is not in any | publicinfo@sec.gov or via regular mail addressed to the |
| way connected to it; and does not accept any liability in | Public Reference Section, Securities and Exchange |
| relation to its issue, operation, and trading. | Commission, Washington, DC 20549-0102. |
| |
| |
| | © 2009 The Vanguard Group, Inc. |
| | All rights reserved. |
| | Vanguard Marketing Corporation, Distributor. |
| | Q2130 102009 |

|
| Vanguard U.S. Sector Index Funds |
| Annual Report |
| August 31, 2009 |

| Vanguard Consumer Discretionary Index Fund | Vanguard Industrials Index Fund |
| Vanguard Consumer Staples Index Fund | Vanguard Information Technology Index Fund |
| Vanguard Energy Index Fund | Vanguard Materials Index Fund |
| Vanguard Financials Index Fund | Vanguard Telecommunication Services Index Fund |
| Vanguard Health Care Index Fund | Vanguard Utilities Index Fund |
> After a dismal first half of the fiscal year, stocks rebounded dramatically on
encouraging economic news. Still, for the 12 months ended August 31, 2009,
the broad U.S. stock market returned about –18%.
> Unable to fully recover from their first-half losses, the Vanguard U.S. Sector
Index Funds produced fiscal-year returns ranging from about –8% for consumer
staples stocks to about –31% for energy stocks.
> Five of the U.S. Sector Index Funds returned considerably more than the broad
U.S. market, one returned about the same, and four returned considerably less.
| |
| Contents | |
| |
| Your Fund’s Total Returns | 1 |
| President’s Letter | 2 |
| Results of Proxy Voting | 5 |
| Consumer Discretionary Index Fund | 8 |
| Consumer Staples Index Fund | 19 |
| Energy Index Fund | 28 |
| Financials Index Fund | 38 |
| Health Care Index Fund | 49 |
| Industrials Index Fund | 59 |
| Information Technology Index Fund | 70 |
| Materials Index Fund | 80 |
| Telecommunication Services Index Fund | 89 |
| Utilities Index Fund | 98 |
| Your Fund’s After-Tax Returns | 107 |
| About Your Fund’s Expenses | 108 |
| Trustees Approve Advisory Arrangement | 110 |
| Glossary | 111 |

Please note: The opinions expressed in this report are just that—informed opinions. They should not be considered promises or advice. Also, please keep in mind that the information and opinions cover the
period through the date on the front of this report. Of course, the risks of investing in your fund are spelled out in the prospectus.
Cover photograph: Veronica Coia.
Your Fund’s Total Returns
Fiscal Year Ended August 31, 2009
| | |
| Admiral™ Shares1 and ETF Shares2 | |
| |
| | Ticker | Total |
| | Symbol | Return |
| Vanguard Consumer | | |
| Discretionary Index Fund | VCDAX | –12.34% |
| Vanguard Consumer | | |
| Discretionary ETF | VCR | |
| Market Price | | –12.29 |
| Net Asset Value | | –12.32 |
| MSCI® US IMI/Consumer Discretionary | | –12.30 |
| |
| Vanguard Consumer Staples | | |
| Index Fund | VCSAX | –8.26% |
| Vanguard Consumer Staples ETF | VDC | |
| Market Price | | –8.17 |
| Net Asset Value | | –8.22 |
| MSCI US IMI/Consumer Staples | | –9.22 |
| |
| Vanguard Energy Index Fund | VENAX | –30.51% |
| Vanguard Energy ETF | VDE | |
| Market Price | | –30.45 |
| Net Asset Value | | –30.49 |
| MSCI US IMI/Energy | | –29.18 |
| |
| Vanguard Financials Index Fund | VFAIX | –25.35% |
| Vanguard Financials ETF | VFH | |
| Market Price | | –25.16 |
| Net Asset Value | | –25.31 |
| MSCI US IMI/Financials | | –25.67 |
| |
| Vanguard Health Care Index Fund | VHCIX | –10.74% |
| Vanguard Health Care ETF | VHT | |
| Market Price | | –10.68 |
| Net Asset Value | | –10.70 |
| MSCI US IMI/Health Care | | –10.52 |
| | |
| | Ticker | Total |
| | Symbol | Return |
| Vanguard Industrials Index Fund | VINAX | –28.44% |
| Vanguard Industrials ETF | VIS | |
| Market Price | | –28.40 |
| Net Asset Value | | –28.41 |
| MSCI US IMI/Industrials | | –28.38 |
| |
| Vanguard Information | | |
| Technology Index Fund | VITAX | –9.79% |
| Vanguard Information | | |
| Technology ETF | VGT | |
| Market Price | | –9.73 |
| Net Asset Value | | –9.78 |
| MSCI US IMI/Information Technology | –9.62 |
| |
| Vanguard Materials Index Fund | VMIAX | –25.91% |
| Vanguard Materials ETF | VAW | |
| Market Price | | –25.84 |
| Net Asset Value | | –25.88 |
| MSCI US IMI/Materials | | –26.00 |
| |
| Vanguard Telecommunication | | |
| Services Index Fund | VTCAX | –15.90% |
| Vanguard Telecommunication | | |
| Services ETF | VOX | |
| Market Price | | –15.82 |
| Net Asset Value | | –15.88 |
| MSCI US IMI/Telecommunication Services | –17.86 |
| |
| Vanguard Utilities Index Fund | VUIAX | –18.39% |
| Vanguard Utilities ETF | VPU | |
| Market Price | | –18.28 |
| Net Asset Value | | –18.34 |
| MSCI US IMI/Utilities | | –18.21 |
| |
| MSCI US IMI/2500 | | –18.26% |
1 A lower-cost class of shares available to many longtime shareholders and to those with significant investments in the fund.
2 Vanguard ETF™ Shares are traded on the NYSE Arca exchange and are available only through brokers. The table shows the ETF returns based on both the NYSE Arca market price and the net asset value for a
share. U.S. Pat. No. 6,879,964 B2; 7,337,138.
Note: MSCI US IMI/2500 is the Morgan Stanley Capital International US Investable Market 2500 Index.
1

President’s Letter
Dear Shareholder,
The two halves of the Vanguard U.S. Sector Index Funds’ fiscal year were nearly mirror images of each other. After continuing to fall steeply and broadly during the first half, stocks staged a dramatic turnaround in March as investors became more confident about credit markets and the economy. But when the dust settled, each of the funds and the broad U.S. market lost ground for the 12-month period.
The relatively recession-resistant Consumer Staples and Health Care Index Funds were among the five funds that performed better than the broad market. At the other end of the performance scale were the more economically sensitive Industrials Index Fund and Energy Index Fund (which was also hurt by the sharp fall in oil prices during the first six months).
To be considered successful, an index fund should closely track the performance of its target index whether markets are falling or rising. During a period of historically high stock price volatility, Vanguard Quantitative Equity Group—the sector funds’ advisor—achieved this in all sectors except for consumer staples, energy, and telecommunication services. Because there are regulatory limits on the percentage of a fund’s assets that can be
invested in any single stock, the advisor is not always able to match the composition of the target index—especially in highly concentrated sectors where a few stocks can have a disproportionate influence on results. In those sectors, fund returns may diverge from those of the target index.
If you hold shares in a taxable account, you may wish to review the table and discussion on after-tax returns for the fiscal year, based on the highest tax bracket, later in this report.
Stocks sank, then soared as credit and economy stabilized
The 12 months ended August 31 spanned two strikingly different half-years. The period began with the September collapse of a major investment bank and the government-engineered rescue of several giant financial institutions. Stocks sank as the ensuing crisis spread from Wall Street to Main Street and around the globe. Stricken by seized-up credit markets and a near-total lack of confidence, businesses and consumers put the brakes on economic growth.
Governments in the United States and abroad responded with unprecedented stimulus and other programs. Over the past six months, these efforts started to take hold. Credit-market conditions improved, and the outlook for the U.S.
| | | |
| Market Barometer | | | |
| | | Average Annual Total Returns |
| | | Periods Ended August 31, 2009 |
| One Year | Three Years | Five Years |
| Stocks | | | |
| Russell 1000 Index (Large-caps) | –18.39% | –5.61% | 0.94% |
| Russell 2000 Index (Small-caps) | –21.29 | –6.08 | 2.21 |
| Dow Jones U.S. Total Stock Market Index | –18.10 | –5.17 | 1.45 |
| MSCI All Country World Index ex USA (International) | –13.96 | –2.41 | 8.18 |
| |
| Bonds | | | |
| Barclays Capital U.S. Aggregate Bond Index (Broad taxable market) | 7.94% | 6.35% | 4.96% |
| Barclays Capital Municipal Bond Index | 5.67 | 4.14 | 4.15 |
| Citigroup 3-Month Treasury Bill Index | 0.51 | 2.77 | 2.98 |
| |
| CPI | | | |
| Consumer Price Index | –1.48% | 1.91% | 2.64% |
2
economy brightened. From their early March lows, stocks took off on an almost-unbroken winning streak.
Even so, the broad U.S. stock market ended the 12 months in negative territory, with a return of about –18%. International markets performed somewhat better, as major European economies emerged from recession; the MSCI All Country World Index ex USA returned about –14%.
Despite the second-half rally, it may be premature to sound the all-clear signal. As the fiscal year came to a close, home foreclosures and the unemployment rate were rising, and the federal government’s list of problem banks had climbed above 400—the most since June 1994. There is considerable historical evidence that recovery from a recession caused by a financial crisis tends to take longer than average.
Among bond investors, safety and yield traded places
The U.S. bond market also performed a U-turn during the year. Early on, as credit markets deteriorated, investors rushed to the relative safety and liquidity of U.S. Treasury securities, driving their prices up and yields down. Investors were so risk-averse that short-term Treasury yields briefly turned negative. November and December were among the ten best months ever for Treasury returns (adjusted for inflation). Corporate bonds, especially those of lower credit quality, struggled, and their yield spreads above comparable Treasuries widened to near-historic levels during the first six months.
Several moves by the Treasury and the Federal Reserve—which slashed its target level for short-term interest rates to a range of 0%–0.25% in December—helped credit markets to attain some stability by the spring. In a dramatic reversal, investors regained their appetite for risk, favoring corporate bonds over Treasuries.
After all the ups and downs, Treasuries and high-yield corporate bonds produced similar 12-month returns of about 6%–7%.
Overall, the broad U.S. taxable bond market returned about 8%. Tax-exempt municipal bonds, after a flat first half, returned more than 5% for the fiscal year.
Stocks still behind, despite broad and steep rebound
An investor seeking to make sense of market trends during the past year or so could be easily forgiven for being confused. Amid all the major developments and noise, there may have been only one constant—inconsistency.
For example, just when consumers hunkered down and began adapting to record-high prices at the gas pump, crude oil prices abruptly began dropping. Ultra-safe Treasury bonds were the place to be, and then they weren’t. And the stock market sectors that fell the hardest during the bear market were among those that rebounded most strongly when the recovery began, while the previously more resilient sectors lagged.
The financial and materials sectors, on the one hand, and the consumer staples and health care sectors, on the other hand, illustrate the point. During the fiscal first half, the Financials and Materials Index Funds were the worst performers, losing more than half of their value. Many financial institutions struggled amid high-profile bank failures, tight credit, and troubled assets. At the same time, commodity-oriented companies—including chemical, fertilizer, and metals and mining firms—were hurt by falling prices and weak demand.
When global credit markets and the economy began stabilizing, financial and materials companies were among the major beneficiaries (the Financials Index Fund, for example, was the standout performer, returning more than 80% in the last six months of the period). Nevertheless, the gains were not sufficient to overcome the earlier steep losses (and the sometimes confounding arithmetic of percentages, in which, for example, a loss of 50% would require a gain of 100% to get back to even). As a result, the
Financials Index Fund (–25.35%) and the Materials Index Fund (–25.91%) finished the year in the bottom half of the ten sector funds. (Please note: In this discussion, returns refer to the funds’ Admiral Shares; ETF returns are detailed in the tables.)
In contrast, consumer staples and health care held up better during the first six months (although they suffered losses), but were pushed aside during the second-half rally that was led by lower-quality, higher-risk stocks. Yet, buoyed by their relatively stronger first-half performance, the Consumer Staples Index Fund (–8.26%) and the Health Care Index Fund (–10.74%) ranked at or near the top of the sector funds for the 12 months.
The Information Technology Index Fund (–9.79%), with middle-of-the pack returns in both the first and second halves of the fiscal year, ended up being the second-best performer. As the business outlook brightened, chip makers and computer firms helped reinvigorate the tech sector. Rounding out the group of five funds that outperformed the broad market for the full 12 months were the Consumer Discretionary Index Fund (–12.34%)—bolstered by improved consumer confidence—and the Telecommunication Services Index Fund (–15.90%), which represents a very small slice of the broad market.
The Utilities Index Fund (–18.39%), representing another small market segment, performed in line with the broad market. The Energy (–30.51%) and Industrials (–28.44%) Index Funds joined the financial and materials sectors in lagging the broad market for the year.
Still a place for sector funds in a well-balanced portfolio
Stocks have taken investors on a roller-coaster ride for almost two years. After soaring to record highs in October 2007, the U.S. stock market plunged in 2008, suffering its worst calendar year since the 1930s, before turning around this past spring. Will the recent rally continue? It’s anyone’s guess. But one thing is clear:
3
Investors who maintained a portfolio that was diversified across stocks, bonds, and money market funds were partly cushioned during the market’s gyrations.
Sector funds can play an important role in a well-balanced portfolio. For example, they can help you selectively increase exposure to key components of the economy in a low-cost and efficient manner if your strategy calls for such tactical decisions. And because the various sectors do not perform in lockstep, adding some sector funds to a portfolio can offer the opportunity to increase diversification.
Whether markets are rising or falling, indexing has proven its worth as a tax-efficient strategy to help investors capture the return of broad markets and of chosen market segments. For more than 30 years, Vanguard Quantitative Equity Group has been a leader in index fund management, delivering results that generally track their target indexes closely. And the low costs of Vanguard’s U.S. Sector Index Funds help you keep more of their returns, an important benefit that compounds over time.
Thank you for entrusting your assets to Vanguard.
Sincerely,

F. William McNabb III
President and Chief Executive Officer
September 15, 2009
| | | | |
| Your Fund’s Performance at a Glance | | | | |
| August 31, 2008–August 31, 2009 | | | | |
| |
| | | | Distributions Per Share |
| | Starting | Ending | Income | Capital |
| | Share Price | Share Price | Dividends | Gains |
| Consumer Discretionary Index Fund | | | | |
| Admiral Shares | $25.03 | $21.43 | $0.395 | $0.000 |
| ETF Shares | 48.38 | 41.37 | 0.786 | 0.000 |
| Consumer Staples Index Fund | | | | |
| Admiral Shares | $34.06 | $30.62 | $0.569 | $0.000 |
| ETF Shares | 69.04 | 62.07 | 1.173 | 0.000 |
| Energy Index Fund | | | | |
| Admiral Shares | $54.66 | $37.34 | $0.563 | $0.000 |
| ETF Shares | 109.54 | 74.74 | 1.183 | 0.000 |
| Financials Index Fund | | | | |
| Admiral Shares | $20.38 | $14.72 | $0.453 | $0.000 |
| ETF Shares | 40.66 | 29.38 | 0.914 | 0.000 |
| Health Care Index Fund | | | | |
| Admiral Shares | $28.68 | $25.19 | $0.364 | $0.000 |
| ETF Shares | 57.36 | 50.37 | 0.754 | 0.000 |
| Industrials Index Fund | | | | |
| Admiral Shares | $34.20 | $23.85 | $0.557 | $0.000 |
| ETF Shares | 66.65 | 46.45 | 1.111 | 0.000 |
| Information Technology Index Fund | | | | |
| Admiral Shares | $27.28 | $24.39 | $0.156 | $0.000 |
| ETF Shares | 53.32 | 47.64 | 0.326 | 0.000 |
| Materials Index Fund | | | | |
| Admiral Shares | $42.85 | $30.68 | $0.796 | $0.000 |
| ETF Shares | 84.27 | 60.23 | 1.599 | 0.000 |
| Telecommunication Services Index Fund | | | | |
| Admiral Shares | $31.58 | $25.77 | $0.673 | $0.000 |
| ETF Shares | 62.05 | 50.58 | 1.373 | 0.000 |
| Utilities Index Fund | | | | |
| Admiral Shares | $39.26 | $30.73 | $1.251 | $0.000 |
| ETF Shares | 78.22 | 61.24 | 2.514 | 0.000 |
4
Results of Proxy Voting
At a special meeting of shareholders on July 2, 2009, fund shareholders approved the following two proposals:
Proposal 1—Elect trustees for each fund.*
The individuals listed in the table below were elected as trustees for each fund. All trustees with the exception of Messrs. McNabb and Volanakis (both of whom already served as directors of The Vanguard Group, Inc.) served as trustees to the funds prior to the shareholder meeting.
Consumer Discretionary Index Fund, Consumer Staples Index Fund, Energy Index Fund, Financials Index Fund, Health Care Index Fund, Industrials Index Fund, Information Technology Index Fund, Materials Index Fund, Telecommunication Services Index Fund, Utilities Index Fund
| | | |
| | | | Percentage |
| Trustee | For | Withheld | For |
| John J. Brennan | 816,325,661 | 25,839,114 | 96.9% |
| Charles D. Ellis | 811,618,878 | 30,545,897 | 96.4% |
| Emerson U. Fullwood | 816,960,560 | 25,204,215 | 97.0% |
| Rajiv L. Gupta | 815,607,429 | 26,557,346 | 96.8% |
| Amy Gutmann | 818,039,387 | 24,125,388 | 97.1% |
| JoAnn Heffernan Heisen | 815,771,400 | 26,393,375 | 96.9% |
| F. William McNabb III | 817,559,701 | 24,605,074 | 97.1% |
| André F. Perold | 814,833,250 | 27,331,525 | 96.8% |
| Alfred M. Rankin, Jr. | 815,942,907 | 26,221,868 | 96.9% |
| Peter F. Volanakis | 817,780,699 | 24,384,076 | 97.1% |
| * Results are for all funds within the same trust. | | | |
Proposal 2—Update and standardize the funds’ fundamental policies regarding:
(a) Purchasing and selling real estate.
(b) Issuing senior securities.
(c) Borrowing money.
(d) Making loans.
(e) Purchasing and selling commodities.
(f) Concentrating investments in a particular industry or group of industries.
(g) Eliminating outdated fundamental investment policies not required by law.
The revised fundamental policies are clearly stated and simple, yet comprehensive, making oversight and compliance more efficient than under the former policies. The revised fundamental policies will allow the funds to respond more quickly to regulatory and market changes, while avoiding the costs and delays associated with successive shareholder meetings.
| | | | | |
| | | | | Broker | Percentage |
| Vanguard Fund | For | Abstain | Against | Non-Votes | For |
| Consumer Discretionary Index Fund | | | | | |
| 2a | 1,030,496 | 5,817 | 6,877 | 322,376 | 75.5% |
| 2b | 1,027,809 | 6,809 | 8,570 | 322,378 | 75.3% |
| 2c | 1,024,001 | 10,641 | 8,545 | 322,378 | 75.0% |
| 2d | 1,022,815 | 11,478 | 8,898 | 322,376 | 74.9% |
| 2e | 1,022,695 | 11,316 | 9,179 | 322,376 | 74.9% |
| 2f | 1,025,345 | 9,947 | 7,899 | 322,376 | 75.1% |
| 2g | 1,023,766 | 9,781 | 9,642 | 322,377 | 75.0% |
| Consumer Staples Index Fund | | | | | |
| 2a | 5,395,960 | 82,108 | 83,909 | 2,149,901 | 70.0% |
| 2b | 5,386,842 | 91,188 | 83,948 | 2,149,900 | 69.9% |
| 2c | 5,377,701 | 84,472 | 99,808 | 2,149,897 | 69.7% |
| 2d | 5,377,305 | 83,347 | 101,323 | 2,149,903 | 69.7% |
| 2e | 5,380,205 | 85,000 | 96,774 | 2,149,899 | 69.8% |
| 2f | 5,389,858 | 84,940 | 87,182 | 2,149,898 | 69.9% |
| 2g | 5,391,778 | 80,961 | 89,241 | 2,149,898 | 69.9% |
5
| | | | | |
| | | | | Broker | Percentage |
| Vanguard Fund | For | Abstain | Against | Non-Votes | For |
| Energy Index Fund | | | | | |
| 2a | 5,984,167 | 151,517 | 93,308 | 1,991,076 | 72.8% |
| 2b | 6,007,020 | 142,860 | 79,110 | 1,991,078 | 73.1% |
| 2c | 5,919,728 | 166,365 | 142,897 | 1,991,078 | 72.0% |
| 2d | 5,922,177 | 174,855 | 131,958 | 1,991,078 | 72.0% |
| 2e | 5,972,028 | 142,377 | 114,587 | 1,991,076 | 72.7% |
| 2f | 6,017,142 | 147,148 | 64,702 | 1,991,076 | 73.2% |
| 2g | 6,025,346 | 137,549 | 66,099 | 1,991,074 | 73.3% |
| Financials Index Fund | | | | | |
| 2a | 11,300,444 | 170,818 | 290,509 | 3,377,134 | 74.6% |
| 2b | 11,357,431 | 194,699 | 209,642 | 3,377,134 | 75.0% |
| 2c | 11,297,873 | 192,619 | 271,279 | 3,377,134 | 74.6% |
| 2d | 11,348,241 | 182,847 | 230,685 | 3,377,132 | 75.0% |
| 2e | 11,282,082 | 165,848 | 313,841 | 3,377,134 | 74.5% |
| 2f | 11,380,060 | 180,675 | 201,035 | 3,377,135 | 75.2% |
| 2g | 11,382,407 | 176,899 | 202,463 | 3,377,136 | 75.2% |
| Health Care Index Fund | | | | | |
| 2a | 8,639,883 | 302,475 | 154,223 | 2,610,086 | 73.8% |
| 2b | 8,618,222 | 309,731 | 168,627 | 2,610,087 | 73.6% |
| 2c | 8,611,807 | 307,544 | 177,231 | 2,610,086 | 73.6% |
| 2d | 8,620,515 | 308,918 | 167,148 | 2,610,086 | 73.6% |
| 2e | 8,615,150 | 305,842 | 175,588 | 2,610,087 | 73.6% |
| 2f | 8,642,276 | 305,647 | 148,656 | 2,610,088 | 73.8% |
| 2g | 8,478,737 | 304,116 | 313,726 | 2,610,088 | 72.4% |
| Industrials Index Fund | | | | | |
| 2a | 1,869,328 | 19,639 | 46,686 | 797,506 | 68.4% |
| 2b | 1,872,867 | 22,559 | 40,227 | 797,507 | 68.5% |
| 2c | 1,874,811 | 22,766 | 38,078 | 797,505 | 68.6% |
| 2d | 1,867,457 | 22,497 | 45,701 | 797,504 | 68.3% |
| 2e | 1,867,831 | 22,223 | 45,598 | 797,507 | 68.3% |
| 2f | 1,875,432 | 22,766 | 37,454 | 797,507 | 68.6% |
| 2g | 1,882,226 | 18,705 | 34,723 | 797,506 | 68.9% |
| Information Technology Index Fund | | | | | |
| 2a | 5,814,868 | 56,635 | 63,970 | 1,403,210 | 79.2% |
| 2b | 5,808,867 | 53,151 | 73,455 | 1,403,210 | 79.2% |
| 2c | 5,807,196 | 56,470 | 71,806 | 1,403,211 | 79.1% |
| 2d | 5,809,088 | 53,752 | 72,632 | 1,403,211 | 79.2% |
| 2e | 5,813,456 | 54,501 | 67,515 | 1,403,211 | 79.2% |
| 2f | 5,819,520 | 52,675 | 63,278 | 1,403,210 | 79.3% |
| 2g | 5,818,243 | 56,709 | 60,520 | 1,403,211 | 79.3% |
| Materials Index Fund | | | | | |
| 2a | 3,735,564 | 146,031 | 79,298 | 763,871 | 79.1% |
| 2b | 3,713,921 | 154,742 | 92,229 | 763,871 | 78.6% |
| 2c | 3,713,013 | 149,473 | 98,407 | 763,870 | 78.6% |
| 2d | 3,702,408 | 153,636 | 104,849 | 763,870 | 78.4% |
| 2e | 3,719,037 | 155,371 | 86,485 | 763,870 | 78.7% |
| 2f | 3,722,773 | 156,188 | 81,932 | 763,870 | 78.8% |
| 2g | 3,723,376 | 150,048 | 87,467 | 763,872 | 78.8% |
6
| | | | | |
| | | | | Broker | Percentage |
| Vanguard Fund | For | Abstain | Against | Non-Votes | For |
| Telecommunication Services Index Fund | | | | |
| 2a | 1,646,488 | 40,513 | 28,919 | 380,139 | 78.6% |
| 2b | 1,639,141 | 40,377 | 36,402 | 380,139 | 78.2% |
| 2c | 1,636,068 | 42,305 | 37,548 | 380,138 | 78.1% |
| 2d | 1,639,925 | 42,629 | 33,364 | 380,139 | 78.2% |
| 2e | 1,651,638 | 39,047 | 25,235 | 380,138 | 78.8% |
| 2f | 1,646,392 | 39,874 | 29,654 | 380,138 | 78.5% |
| 2g | 1,642,528 | 43,487 | 29,905 | 380,138 | 78.4% |
| Utilities Index Fund | | | | | |
| 2a | 4,665,382 | 94,719 | 140,772 | 817,502 | 81.6% |
| 2b | 4,678,535 | 83,138 | 139,197 | 817,505 | 81.8% |
| 2c | 4,642,411 | 96,876 | 161,584 | 817,504 | 81.2% |
| 2d | 4,637,426 | 88,704 | 174,741 | 817,504 | 81.1% |
| 2e | 4,650,148 | 112,469 | 138,255 | 817,503 | 81.3% |
| 2f | 4,704,636 | 89,086 | 107,151 | 817,503 | 82.3% |
| 2g | 4,652,466 | 81,776 | 166,629 | 817,504 | 81.4% |
Fund shareholders did not approve this proposal:
Proposal 3—Institute procedures to prevent holding investments in companies that, in the judgment of the board, substantially contribute to genocide or crimes against humanity, the most egregious violations of human rights.
The trustees recommended a vote against the proposal because it called for procedures that duplicate existing practices and procedures of the Vanguard funds.
| | | | | |
| | | | | Broker | Percentage |
| Vanguard Fund | For | Abstain | Against | Non-Votes | For |
| Energy Index Fund | 576,604 | 264,612 | 5,387,774 | 1,991,078 | 7.0% |
7
Consumer Discretionary Index Fund
Fund Profile
As of August 31, 2009
| | | |
| Portfolio Characteristics | | |
| | | Target | Broad |
| | Fund | Index1 | Index2 |
| Number of Stocks | 386 | 384 | 2,501 |
| Median Market Cap | $13.7B | $13.7B | $27.3B |
| Price/Earnings Ratio | 318.6x | 302.7x | 25.6x |
| Price/Book Ratio | 2.2x | 2.2x | 2.1x |
| Yield3 | | 1.4% | 1.9% |
| Admiral Shares | 1.1% | | |
| ETF Shares | 1.1% | | |
| Return on Equity | 15.7% | 15.7% | 19.3% |
| Earnings Growth Rate | 8.5% | 8.5% | 9.9% |
| Foreign Holdings | 0.0% | 0.0% | 0.0% |
| Turnover Rate | 5% | — | — |
| Expense Ratio4 | | — | — |
| Admiral Shares | 0.28% | | |
| ETF Shares | 0.25% | | |
| Short-Term Reserves | 0.0% | — | — |
| |
| |
| Volatility Measures5 | | | |
| Fund Versus | Fund Versus |
| Target Index1 | Broad Index2 |
| R-Squared | 1.00 | | 0.85 |
| Beta | 1.00 | | 1.19 |
| |
| Industry Diversification (% of equity exposure) |
| |
| Advertising | 1.6% |
| Apparel Retail | 6.1 |
| Apparel, Accessories & Luxury Goods | 3.1 |
| Auto Parts & Equipment | 2.7 |
| Automobile Manufacturers | 2.0 |
| Automotive Retail | 2.1 |
| Broadcasting | 1.3 |
| Cable & Satellite | 9.5 |
| Casinos & Gaming | 2.4 |
| Computer & Electronics Retail | 1.8 |
| Department Stores | 3.4 |
| Education Services | 2.3 |
| Footwear | 2.4 |
| General Merchandise Stores | 4.1 |
| Home Improvement Retail | 7.6 |
| Homebuilding | 2.0 |
| Homefurnishing Retail | 1.2 |
| Hotels, Resorts & Cruise Lines | 3.1 |
| Household Appliances | 1.2 |
| Housewares & Specialties | 1.4 |
| Internet Retail | 4.0 |
| Leisure Products | 1.4 |
| Movies & Entertainment | 11.7 |
| Publishing | 2.1 |
| Restaurants | 11.1 |
| Specialized Consumer Services | 1.5 |
| Specialty Stores | 3.0 |
| Other Consumer Discretionary | 3.9 |
| |
| Ten Largest Holdings6 (% of total net assets) |
| |
| McDonald’s Corp. | 5.6% |
| Home Depot, Inc. | 4.2 |
| The Walt Disney Co. | 4.2 |
| Comcast Corp. | 3.8 |
| Target Corp. | 3.0 |
| Time Warner Inc. | 3.0 |
| Lowe’s Cos., Inc. | 2.9 |
| Amazon.com, Inc. | 2.5 |
| News Corp. | 2.2 |
| Ford Motor Co. | 1.9 |
| Top Ten | 33.3% |
1 MSCI US IMI/Consumer Discretionary.
2 MSCI US IMI/2500.
3 30-day SEC yield for the fund; annualized dividend yield for the indexes. See the Glossary.
4 The expense ratios shown are from the prospectuses dated December 29, 2008, and represent estimated costs for the current fiscal year based on the fund’s net assets as of the prospectus date.
For the fiscal year ended August 31, 2009, the expense ratios were 0.28% for the Admiral Shares and 0.25% for the ETF Shares.
5 For an explanation of R-squared, beta, and other terms used here, see the Glossary.
6 The holdings listed exclude any temporary cash investments and equity index products.
8
Consumer Discretionary Index Fund
Performance Summary
All of the returns in this report represent past performance, which is not a guarantee of future results that may be achieved by the fund. (Current performance may be lower or higher than the performance data cited. For performance data current to the most recent month-end, visit our website at www.vanguard.com/performance.) Note, too, that both investment returns and principal value can fluctuate widely, so an investor’s shares, when sold, could be worth more or less than their original cost. The returns shown do not reflect taxes that a shareholder would pay on fund distributions or on the sale of fund shares.
Cumulative Performance: January 26, 2004–August 31, 2009
Initial Investment of $10,000
| | | | |
| | | Average Annual Total Returns | |
| | | Periods Ended August 31, 2009 | Final Value |
| | | | Since | of a $10,000 |
| | One Year | Five Years | Inception1 | Investment |
| Consumer Discretionary Index Fund | | | | |
| ETF Shares Net Asset Value2 | –12.32% | –1.47% | –2.43% | $8,713 |
| Consumer Discretionary Index Fund | | | | |
| ETF Shares Market Price | –12.29 | –1.46 | –2.43 | 8,714 |
| MSCI US IMI/2500 | –18.26 | 1.36 | 0.52 | 10,295 |
| MSCI US IMI/Consumer Discretionary | –12.30 | –1.36 | –2.31 | 8,776 |
| | | |
| | | | Final Value |
| | | Since | of a $100,000 |
| | One Year | Inception1 | Investment |
| Consumer Discretionary Index Fund Admiral Shares3 | –12.34% | –5.50% | $79,164 |
| MSCI US IMI/2500 | –18.26 | –1.81 | 92,740 |
| MSCI US IMI/Consumer Discretionary | –12.30 | –5.37 | 79,616 |
1 Performance for the fund and its comparative standards is calculated since the following inception dates: January 26, 2004, for ETF Shares; July 14, 2005, for Admiral Shares.
2 For more information about how the ETF Shares’ market prices have compared with their net asset value, visit www.vanguard.com, select your ETF, and then select the Performance tab. The Premium/Discount
table there shows the percentages of days on which the ETF Shares’ market price was above or below the NAV.
3 Total returns do not reflect the 2% fee assessed on redemptions of shares held for less than one year.
Note: See Financial Highlights tables for dividend and capital gains information.
9
Consumer Discretionary Index Fund
Fiscal-Year Total Returns (%): January 26, 2004–August 31, 2009
Cumulative Returns: ETF Shares, January 26, 2004–August 31, 2009
| | | |
| | | | Cumulative |
| | | | Since |
| | One Year | Five Years | Inception |
| Consumer Discretionary Index Fund ETF Shares Market Price | –12.29% | –7.10% | –12.86% |
| Consumer Discretionary Index Fund ETF Shares Net Asset Value | –12.32 | –7.12 | –12.87 |
| MSCI US IMI/Consumer Discretionary | –12.30 | –6.61 | –12.24 |
Average Annual Total Returns: Periods Ended June 30, 2009
This table presents average annual total returns through the latest calendar quarter—rather than through the end of the fiscal period. Securities and Exchange Commission rules require that we provide this information.
| | | | |
| | | | | Since |
| | Inception Date | One Year | Five Years | Inception |
| ETF Shares | 1/26/2004 | | | |
| Market Price | | –17.73% | –5.02% | –4.91% |
| Net Asset Value | | –17.81 | –5.01 | –4.92 |
| Admiral Shares1 | 7/14/2005 | –17.81 | — | –8.90 |
1 Total returns do not reflect the 2% fee assessed on redemptions of shares held for less than one year.
Note: See Financial Highlights tables for dividend and capital gains information.
10
Consumer Discretionary Index Fund
Financial Statements
Statement of Net Assets
As of August 31, 2009
The fund provides a complete list of its holdings four times in each fiscal year, at the quarter-ends. For the second and fourth fiscal quarters, the lists appear in the fund’s semiannual and annual reports to shareholders. For the first and third fiscal quarters, the fund files the lists with the Securities and Exchange Commission on Form N-Q. Shareholders can look up the fund’s Forms N-Q on the SEC’s website at www.sec.gov. Forms N-Q may also be reviewed and copied at the SEC’s Public Reference Room (see the back cover of this report for further information).
| | | |
| | | | Market |
| | | | Value• |
| | | Shares | ($000) |
| Common Stocks (99.9%) | | |
| Auto Components (3.1%) | | |
| | Johnson Controls, Inc. | 76,498 | 1,895 |
| * | The Goodyear Tire | | |
| | & Rubber Co. | 29,505 | 486 |
| | BorgWarner, Inc. | 14,991 | 445 |
| | Autoliv, Inc. | 10,945 | 351 |
| | Gentex Corp. | 17,816 | 260 |
| * | TRW Automotive | | |
| | Holdings Corp. | 8,918 | 157 |
| | WABCO Holdings Inc. | 8,224 | 157 |
| | Cooper Tire & Rubber Co. | 7,244 | 103 |
| * | Tenneco Automotive, Inc. | 6,027 | 95 |
| * | Exide Technologies | 9,698 | 69 |
| * | Dana Holding Corp. | 12,924 | 68 |
| | ArvinMeritor, Inc. | 9,006 | 66 |
| * | Fuel Systems Solutions, Inc. | 1,654 | 55 |
| * | Drew Industries, Inc. | 2,575 | 53 |
| | Superior Industries | | |
| | International, Inc. | 2,946 | 42 |
| | American Axle & | | |
| | Manufacturing Holdings, Inc. | 5,921 | 37 |
| | Modine Manufacturing Co. | 3,956 | 33 |
| * | Dorman Products, Inc. | 1,582 | 22 |
| | Spartan Motors, Inc. | 3,983 | 22 |
| * | Raser Technologies, Inc. | 4,878 | 10 |
| | | | 4,426 |
| Automobiles (2.5%) | | |
| * | Ford Motor Co. | 359,455 | 2,732 |
| | Harley-Davidson, Inc. | 30,161 | 723 |
| | Thor Industries, Inc. | 4,620 | 120 |
| | Winnebago Industries, Inc. | 3,632 | 44 |
| | | | 3,619 |
| Distributors (0.8%) | | |
| | Genuine Parts Co. | 20,501 | 759 |
| * | LKQ Corp. | 16,242 | 282 |
| * | Core-Mark Holding Co., Inc. | 1,213 | 35 |
| | | | 1,076 |
| Diversified Consumer Services (3.8%) | |
| * | Apollo Group, Inc. Class A | 17,534 | 1,137 |
| | H & R Block, Inc. | 43,666 | 755 |
| * | ITT Educational Services, Inc. | 4,930 | 518 |
| | DeVry, Inc. | 8,292 | 424 |
| | Strayer Education, Inc. | 1,803 | 381 |
| * | Career Education Corp. | 11,585 | 275 |
| | Service Corp. International | 32,280 | 228 |
| * | Corinthian Colleges, Inc. | 10,633 | 204 |
| * | Brink’s Home Security | | |
| | Holdings, Inc. | 5,884 | 184 |
| | Hillenbrand Inc. | 7,970 | 160 |
| | Matthews International Corp. | 3,953 | 138 |
| | Sotheby’s | 8,649 | 137 |
| * | Coinstar, Inc. | 3,884 | 128 |
| | Weight Watchers | | |
| | International, Inc. | 4,449 | 122 |
| | Regis Corp. | 7,111 | 115 |
| * | Capella Education Co. | 1,807 | 114 |
| | | |
| | | | Market |
| | | | Value• |
| | | Shares | ($000) |
| * | American Public | | |
| | Education, Inc. | 2,198 | 76 |
| * | Steiner Leisure Ltd. | 1,779 | 59 |
| | Stewart Enterprises, Inc. | | |
| | Class A | 10,785 | 57 |
| * | Universal Technical | | |
| | Institute Inc. | 2,579 | 52 |
| * | K12 Inc. | 2,219 | 46 |
| * | Pre-Paid Legal Services, Inc. | 964 | 44 |
| * | Lincoln Educational Services | 1,359 | 30 |
| | Jackson Hewitt Tax | | |
| | Service Inc. | 3,660 | 20 |
| * | Grand Canyon Education Inc. | 1,123 | 19 |
| | | | 5,423 |
| Hotels, Restaurants & Leisure (16.9%) | |
| | McDonald’s Corp. | 141,919 | 7,981 |
| | Yum! Brands, Inc. | 59,378 | 2,034 |
| * | Starbucks Corp. | 94,666 | 1,798 |
| | Carnival Corp. | 56,358 | 1,648 |
| | Marriott International, Inc. | | |
| | Class A | 38,778 | 927 |
| | International | | |
| | Game Technology | 38,116 | 797 |
| | Starwood Hotels & | | |
| | Resorts Worldwide, Inc. | 24,011 | 715 |
| | Tim Hortons, Inc. | 23,281 | 658 |
| * | Las Vegas Sands Corp. | 42,395 | 605 |
| | Darden Restaurants Inc. | 16,773 | 552 |
| * | Wynn Resorts Ltd. | 9,499 | 514 |
| | Wyndham Worldwide Corp. | 22,908 | 347 |
| | Royal Caribbean Cruises, Ltd. | 17,803 | 340 |
| * | MGM Mirage, Inc. | 34,039 | 288 |
| * | Bally Technologies Inc. | 6,659 | 269 |
| * | WMS Industries, Inc. | 6,288 | 266 |
| | Wendy’s/Arby’s Group, Inc. | 51,413 | 259 |
| * | Penn National Gaming, Inc. | 8,581 | 251 |
| | Burger King Holdings Inc. | 12,122 | 217 |
| * | Panera Bread Co. | 3,823 | 200 |
| | Brinker International, Inc. | 13,119 | 191 |
| * | Chipotle Mexican Grill, Inc. | | |
| | Class B | 2,219 | 165 |
| * | Chipotle Mexican Grill, Inc. | 1,863 | 156 |
| * | Jack in the Box Inc. | 7,289 | 149 |
| * | Life Time Fitness, Inc. | 4,663 | 145 |
| * | Scientific Games Corp. | 8,939 | 138 |
| * | The Cheesecake Factory Inc. | 7,357 | 135 |
| | Choice Hotels | | |
| | International, Inc. | 4,280 | 126 |
| * | Vail Resorts Inc. | 3,327 | 110 |
| * | Gaylord Entertainment Co. | 5,251 | 107 |
| | Bob Evans Farms, Inc. | 3,967 | 107 |
| | International Speedway Corp. | 3,550 | 99 |
| | Orient-Express Hotel Ltd. | 9,884 | 98 |
| * | P.F. Chang’s China Bistro, Inc. | 2,897 | 92 |
| * | Buffalo Wild Wings Inc. | 2,182 | 90 |
| * | Sonic Corp. | 7,332 | 84 |
| | Cracker Barrel Old | | |
| | Country Store Inc. | 2,862 | 81 |
| | | |
| | | | Market |
| | | | Value• |
| | | Shares | ($000) |
| * | CEC Entertainment Inc. | 2,911 | 78 |
| * | Boyd Gaming Corp. | 7,268 | 75 |
| * | Pinnacle Entertainment, Inc. | 7,692 | 72 |
| * | Texas Roadhouse, Inc. | 6,644 | 68 |
| * | Papa John’s International, Inc. | 2,861 | 67 |
| | CKE Restaurants Inc. | 6,025 | 58 |
| * | Ruby Tuesday, Inc. | 7,750 | 57 |
| | Ameristar Casinos, Inc. | 3,289 | 55 |
| * | Shuffle Master, Inc. | 6,979 | 53 |
| * | Interval Leisure Group, Inc. | 5,007 | 52 |
| | Churchill Downs, Inc. | 1,214 | 46 |
| * | Peet’s Coffee & Tea Inc. | 1,715 | 45 |
| * | Domino’s Pizza, Inc. | 5,572 | 45 |
| | DineEquity, Inc. | 2,016 | 42 |
| * | BJ’s Restaurants Inc. | 2,400 | 41 |
| * | California Pizza Kitchen, Inc. | 2,899 | 41 |
| * | Red Robin Gourmet | | |
| | Burgers, Inc. | 1,938 | 37 |
| * | Steak n Shake Co. | 3,301 | 35 |
| | The Marcus Corp. | 2,720 | 34 |
| | Ambassadors Group, Inc. | 2,126 | 34 |
| * | Denny’s Corp. | 12,236 | 31 |
| | Speedway Motorsports, Inc. | 1,931 | 30 |
| * | AFC Enterprises, Inc. | 3,196 | 27 |
| * | Isle of Capri Casinos, Inc. | 2,199 | 22 |
| * | Krispy Kreme Doughnuts, Inc. | 7,246 | 22 |
| | O’Charley’s Inc. | 2,787 | 21 |
| * | Morgans Hotel Group | 3,407 | 17 |
| * | Landry’s Restaurants, Inc. | 1,504 | 15 |
| * | Monarch Casino & Resort, Inc. | 1,228 | 12 |
| | Dover Downs Gaming | | |
| | & Entertainment, Inc. | 1,946 | 12 |
| * | Town Sports International | | |
| | Holdings, Inc. | 2,141 | 6 |
| | | | 23,989 |
| Household Durables (5.9%) | | |
| | Fortune Brands, Inc. | 19,331 | 770 |
| | Whirlpool Corp. | 9,498 | 610 |
| | Pulte Homes, Inc. | 44,086 | 563 |
| | Garmin Ltd. | 15,441 | 508 |
| | Newell Rubbermaid, Inc. | 35,645 | 496 |
| | D. R. Horton, Inc. | 36,681 | 492 |
| * | NVR, Inc. | 595 | 402 |
| * | Toll Brothers, Inc. | 17,593 | 400 |
| * | Mohawk Industries, Inc. | 7,486 | 375 |
| | The Stanley Works | 9,131 | 374 |
| | Leggett & Platt, Inc. | 19,136 | 349 |
| | Black & Decker Corp. | 7,731 | 341 |
| | Tupperware Brands Corp. | 8,055 | 298 |
| | Snap-On Inc. | 7,394 | 276 |
| * | Jarden Corp. | 11,295 | 275 |
| | Harman International | | |
| | Industries, Inc. | 8,470 | 254 |
| | Lennar Corp. Class A | 16,597 | 251 |
| | KB Home | 10,291 | 187 |
| | MDC Holdings, Inc. | 4,793 | 180 |
| | Tempur-Pedic | | |
| | International Inc. | 8,671 | 128 |
| | Ryland Group, Inc. | 5,502 | 126 |
| * | Meritage Corp. | 3,830 | 86 |
| * | Helen of Troy Ltd. | 3,701 | 80 |
| | American Greetings Corp. | | |
| | Class A | 4,621 | 64 |
| | La-Z-Boy Inc. | 6,715 | 57 |
| | Ethan Allen Interiors, Inc. | 3,476 | 54 |
| | National Presto | | |
| | Industries, Inc. | 616 | 52 |
11
| | | |
| | Consumer Discretionary Index Fund | | Market |
| | | | Value• |
| | | Shares | ($000) |
| * | Standard Pacific Corp. | 13,419 | 49 |
| | Blyth, Inc. | 816 | 37 |
| * | Hovnanian Enterprises Inc. | | |
| | Class A | 6,735 | 36 |
| * | M/I Homes, Inc. | 2,238 | 35 |
| * | Universal Electronics, Inc. | 1,784 | 34 |
| * | Furniture Brands | | |
| | International Inc. | 5,114 | 29 |
| * | iRobot Corp. | 2,398 | 27 |
| | CSS Industries, Inc. | 991 | 21 |
| * | Beazer Homes USA, Inc. | 4,723 | 20 |
| * | Sealy Corp. | 5,762 | 15 |
| * | Brookfield Homes Corp. | 1,349 | 10 |
| | | | 8,361 |
| Internet & Catalog Retail (4.5%) | | |
| * | Amazon.com, Inc. | 44,216 | 3,590 |
| * | Priceline.com, Inc. | 5,091 | 784 |
| * | Liberty Media | | |
| | Corp.-Interactive Series A | 72,904 | 698 |
| * | Expedia, Inc. | 25,338 | 584 |
| * | Netflix.com, Inc. | 6,309 | 275 |
| * | Blue Nile Inc. | 1,855 | 103 |
| * | HSN, Inc. | 5,410 | 56 |
| | PetMed Express, Inc. | 3,049 | 55 |
| | NutriSystem, Inc. | 3,586 | 51 |
| * | Ticketmaster | | |
| | Entertainment Inc. | 5,035 | 49 |
| * | Shutterfly, Inc. | 2,422 | 35 |
| * | Orbitz Worldwide, Inc. | 4,649 | 29 |
| * | Overstock.com, Inc. | 1,991 | 25 |
| * | Stamps.com Inc. | 1,935 | 17 |
| * | Gaiam, Inc. | 2,069 | 12 |
| * | 1-800-FLOWERS.COM, Inc. | 3,485 | 11 |
| | | | 6,374 |
| Leisure Equipment & Products (1.5%) | |
| | Mattel, Inc. | 46,184 | 831 |
| | Hasbro, Inc. | 16,190 | 460 |
| | Eastman Kodak Co. | 34,476 | 183 |
| | Polaris Industries, Inc. | 3,984 | 150 |
| | Pool Corp. | 6,222 | 148 |
| | Brunswick Corp. | 11,256 | 105 |
| | Callaway Golf Co. | 8,322 | 59 |
| * | JAKKS Pacific, Inc. | 3,576 | 48 |
| * | RC2 Corp. | 2,677 | 42 |
| | Sturm, Ruger & Co., Inc. | 2,473 | 34 |
| * | Smith & Wesson Holding Corp. | 6,164 | 33 |
| * | Leapfrog Enterprises, Inc. | 4,457 | 18 |
| | Marine Products Corp. | 1,586 | 8 |
| | | | 2,119 |
| Media (26.1%) | | |
| | The Walt Disney Co. | 226,906 | 5,909 |
| | Time Warner Inc. | 153,963 | 4,297 |
| | Comcast Corp. Class A | 221,382 | 3,392 |
| | News Corp., Class A | 260,859 | 2,796 |
| | Comcast Corp. Special | | |
| | Class A | 134,992 | 1,970 |
| * | Liberty Media Corp. | 63,627 | 1,775 |
| * | Viacom Inc. Class B | 70,672 | 1,770 |
| * | Time Warner Cable Inc. | 45,355 | 1,674 |
| * | DIRECTV Group, Inc. | 64,832 | 1,605 |
| | Omnicom Group Inc. | 40,012 | 1,453 |
| | The McGraw-Hill Cos., Inc. | 40,489 | 1,361 |
| | CBS Corp. | 75,940 | 786 |
| | Cablevision Systems | | |
| | NY Group Class A | 31,777 | 710 |
| * | Discovery | | |
| | Communications Inc. | | |
| | Class A | 17,247 | 447 |
| * | DISH Network Corp. | 26,837 | 438 |
| | | | |
| | | | | Market |
| | | | | Value• |
| | | | Shares | ($000) |
| * | Discovery | | | |
| | Communications Inc. | | | |
| | Class C | | 18,097 | 423 |
| | Virgin Media Inc. | | 35,904 | 410 |
| * | Interpublic Group | | | |
| | of Cos., Inc. | | 61,540 | 387 |
| * | Liberty Global, Inc. Class A | 17,507 | 383 |
| | Scripps Networks Interactive | 11,520 | 374 |
| | News Corp., Class B | | 29,376 | 371 |
| * | Liberty Global, Inc. Series C | 15,916 | 345 |
| | Washington Post Co. Class B | 785 | 341 |
| * | Sirius XM Radio Inc. | | 496,191 | 334 |
| * | Marvel Entertainment, Inc. | 6,606 | 320 |
| * | DreamWorks | | | |
| | Animation SKG, Inc. | | 8,714 | 294 |
| | Gannett Co., Inc. | | 29,901 | 258 |
| * | Liberty Media | | | |
| | Corp.-Capital Series A | | 11,561 | 221 |
| * | Lamar Advertising Co. | | | |
| | Class A | | 9,334 | 214 |
| | John Wiley & Sons Class A | 5,703 | 183 |
| | Regal Entertainment Group | | |
| | Class A | | 10,829 | 137 |
| | New York Times Co. Class A | 17,431 | 133 |
| | Meredith Corp. | | 4,593 | 127 |
| | Interactive Data Corp. | | 4,805 | 111 |
| * | Morningstar, Inc. | | 2,452 | 109 |
| | Scholastic Corp. | | 4,021 | 98 |
| * | Lions Gate | | | |
| | Entertainment Corp. | | 14,889 | 98 |
| * | Valassis | | | |
| | Communications, Inc. | | 6,181 | 97 |
| | National CineMedia Inc. | | 5,409 | 81 |
| * | CTC Media, Inc. | | 5,881 | 78 |
| | Harte-Hanks, Inc. | | 5,264 | 69 |
| * | Live Nation, Inc. | | 9,266 | 65 |
| | Arbitron Inc. | | 3,392 | 62 |
| * | RCN Corp. | | 4,746 | 44 |
| * | Ascent Media Corp. | | 1,704 | 44 |
| | Cinemark Holdings Inc. | | 4,167 | 42 |
| | World Wrestling | | | |
| | Entertainment, Inc. | | 2,875 | 41 |
| | Belo Corp. Class A | | 11,490 | 38 |
| * | Clear Channel Outdoor | | | |
| | Holdings, Inc. Class A | | 5,264 | 36 |
| * | CKX, Inc. | | 5,643 | 36 |
| * | Dolan Media Co. | | 3,025 | 32 |
| * | Knology, Inc. | | 3,843 | 28 |
| * | Warner Music Group Corp. | 5,948 | 27 |
| | E.W. Scripps Co. Class A | 3,872 | 27 |
| * | Mediacom | | | |
| | Communications Corp. | | 5,188 | 26 |
| * | Martha Stewart Living | | | |
| | Omnimedia, Inc. | | 3,264 | 23 |
| * | Fisher Communications, Inc. | 927 | 19 |
| | Journal Communications, Inc. | 4,986 | 18 |
| | Sinclair Broadcast Group, Inc. | 6,329 | 18 |
| * | Lin TV Corp. | | 3,579 | 13 |
| * | Outdoor Channel Holdings Inc. | 1,779 | 12 |
| * | Crown Media Holdings, Inc. | 1,826 | 3 |
| | | | | 37,033 |
| Multiline Retail (7.5%) | | | |
| | Target Corp. | | 91,899 | 4,319 |
| * | Kohl’s Corp. | | 37,267 | 1,923 |
| | Macy’s Inc. | | 54,039 | 839 |
| | J.C. Penney Co., Inc. | | | |
| | (Holding Co.) | | 27,189 | 817 |
| | Nordstrom, Inc. | | 20,860 | 585 |
| * | Dollar Tree, Inc. | | 11,564 | 577 |
| | Family Dollar Stores, Inc. | 17,138 | 519 |
| *,^ | Sears Holdings Corp. | | 7,177 | 455 |
| | | |
| | | | Market |
| | | | Value• |
| | | Shares | ($000) |
| * | Big Lots Inc. | 10,622 | 270 |
| * | Saks Inc. | 17,130 | 104 |
| * | 99 Cents Only Stores | 6,256 | 85 |
| | Dillard’s Inc. | 7,180 | 82 |
| | Fred’s, Inc. | 4,885 | 64 |
| * | Retail Ventures, Inc. | 3,619 | 18 |
| | | | 10,657 |
| Specialty Retail (21.8%) | | |
| | Home Depot, Inc. | 218,271 | 5,957 |
| | Lowe’s Cos., Inc. | 189,614 | 4,077 |
| | Staples, Inc. | 92,020 | 1,989 |
| | TJX Cos., Inc. | 53,163 | 1,911 |
| | Best Buy Co., Inc. | 45,518 | 1,651 |
| | The Gap, Inc. | 62,647 | 1,231 |
| * | Bed Bath & Beyond, Inc. | 33,557 | 1,224 |
| | Sherwin-Williams Co. | 12,826 | 772 |
| | Ross Stores, Inc. | 16,305 | 760 |
| * | O’Reilly Automotive, Inc. | 17,451 | 668 |
| * | AutoZone Inc. | 4,221 | 621 |
| | Tiffany & Co. | 15,942 | 580 |
| | Limited Brands, Inc. | 35,156 | 524 |
| | Advance Auto Parts, Inc. | 12,252 | 518 |
| * | CarMax, Inc. | 28,387 | 491 |
| * | GameStop Corp. Class A | 20,118 | 479 |
| * | Urban Outfitters, Inc. | 16,213 | 461 |
| | Abercrombie & Fitch Co. | 11,300 | 365 |
| | PetSmart, Inc. | 16,345 | 342 |
| * | Aeropostale, Inc. | 8,674 | 340 |
| | American Eagle | | |
| | Outfitters, Inc. | 23,912 | 323 |
| * | Chico’s FAS, Inc. | 22,881 | 291 |
| * | AutoNation, Inc. | 14,761 | 280 |
| * | Dick’s Sporting Goods, Inc. | 11,215 | 251 |
| | Guess ?, Inc. | 7,102 | 249 |
| | RadioShack Corp. | 16,063 | 243 |
| | Williams-Sonoma, Inc. | 11,526 | 220 |
| * | J. Crew Group, Inc. | 6,424 | 219 |
| | Foot Locker, Inc. | 19,950 | 213 |
| * | Tractor Supply Co. | 4,178 | 197 |
| * | Office Depot, Inc. | 35,235 | 184 |
| * | Rent-A-Center, Inc. | 8,573 | 169 |
| * | The Gymboree Corp. | 3,721 | 167 |
| | Men’s Wearhouse, Inc. | 6,366 | 165 |
| | Aaron Rents, Inc. | 5,900 | 154 |
| * | Collective Brands, Inc. | 8,175 | 129 |
| | OfficeMax, Inc. | 9,774 | 111 |
| * | AnnTaylor Stores Corp. | 7,533 | 106 |
| | Barnes & Noble, Inc. | 5,113 | 106 |
| * | Jos. A. Bank Clothiers, Inc. | 2,332 | 103 |
| * | The Dress Barn, Inc. | 6,212 | 101 |
| * | The Children’s Place | | |
| | Retail Stores, Inc. | 3,205 | 97 |
| | The Buckle, Inc. | 3,547 | 94 |
| | Penske Automotive | | |
| | Group Inc. | 5,296 | 94 |
| * | Jo-Ann Stores, Inc. | 3,403 | 93 |
| | Group 1 Automotive, Inc. | 3,089 | 87 |
| * | Cabela’s Inc. | 5,168 | 83 |
| * | Charming Shoppes, Inc. | 14,846 | 78 |
| * | Sally Beauty Co. Inc. | 10,552 | 75 |
| | Stage Stores, Inc. | 4,924 | 66 |
| * | Hibbett Sports Inc. | 3,651 | 64 |
| | The Pep Boys (Manny, | | |
| | Moe & Jack) | 7,006 | 63 |
| | Cato Corp. Class A | 3,562 | 61 |
| | Monro Muffler Brake, Inc. | 2,357 | 61 |
| * | Coldwater Creek Inc. | 7,938 | 59 |
| * | Genesco, Inc. | 2,485 | 54 |
| | Finish Line, Inc. | 6,435 | 53 |
| * | Asbury Automotive Group, Inc. | 4,053 | 51 |
| | Sonic Automotive, Inc. | 3,709 | 48 |
12
Consumer Discretionary Index Fund
| | | |
| | | | Market |
| | | | Value• |
| | | Shares | ($000) |
| * | Charlotte Russe Holding Inc. | 2,706 | 47 |
| * | hhgregg, Inc. | 2,421 | 42 |
| | Brown Shoe Co., Inc. | 5,500 | 41 |
| * | Citi Trends Inc. | 1,839 | 41 |
| * | Stein Mart, Inc. | 3,292 | 41 |
| | Big 5 Sporting Goods Corp. | 2,656 | 41 |
| * | The Wet Seal, Inc. Class A | 11,486 | 40 |
| * | Hot Topic, Inc. | 5,625 | 39 |
| * | Ulta Salon, Cosmetics & | | |
| | Fragrance, Inc. | 3,329 | 38 |
| * | Lumber Liquidators, Inc. | 1,718 | 38 |
| * | Pacific Sunwear of | | |
| | California, Inc. | 8,494 | 38 |
| * | Zumiez Inc. | 2,712 | 34 |
| | Christopher & Banks Corp. | 4,568 | 31 |
| * | Pier 1 Imports Inc. | 11,237 | 28 |
| * | DSW Inc. Class A | 1,799 | 27 |
| * | Zale Corp. | 4,163 | 27 |
| * | America’s Car-Mart, Inc. | 1,288 | 26 |
| | Haverty Furniture Cos., Inc. | 2,211 | 26 |
| | bebe stores, inc. | 3,365 | 26 |
| * | Borders Group, Inc. | 7,783 | 25 |
| * | Tween Brands, Inc. | 3,197 | 24 |
| | Talbots Inc. | 3,288 | 20 |
| * | New York & Co., Inc. | 3,331 | 15 |
| * | Conn’s, Inc. | 1,308 | 15 |
| * | Blockbuster Inc. Class A | 13,171 | 13 |
| * | Systemax Inc. | 930 | 12 |
| * | Build-A-Bear-Workshop, Inc. | 1,865 | 9 |
| * | Blockbuster Inc. Class B | 9,460 | 5 |
| | | | 31,032 |
| Textiles, Apparel & Luxury Goods (5.5%) | |
| | NIKE, Inc. Class B | 47,498 | 2,631 |
| | Coach, Inc. | 40,853 | 1,156 |
| | VF Corp. | 11,384 | 792 |
| | Polo Ralph Lauren Corp. | 7,217 | 479 |
| * | Hanesbrands Inc. | 12,183 | 257 |
| | Phillips-Van Heusen Corp. | 6,613 | 250 |
| * | The Warnaco Group, Inc. | 5,890 | 224 |
| * | Carter’s, Inc. | 7,251 | 182 |
| | Jones Apparel Group, Inc. | 10,958 | 171 |
| | Wolverine World Wide, Inc. | 6,278 | 156 |
| * | Iconix Brand Group Inc. | 8,924 | 153 |
| * | Fossil, Inc. | 5,991 | 152 |
| * | Deckers Outdoor Corp. | 1,677 | 114 |
| * | Under Armour, Inc. | 4,247 | 101 |
| * | Lululemon Athletica, Inc. | 4,976 | 100 |
| * | Skechers U.S.A., Inc. | 4,261 | 76 |
| | UniFirst Corp. | 1,847 | 74 |
| * | Timberland Co. | 5,537 | 72 |
| * | True Religion Apparel, Inc. | 3,097 | 70 |
| * | Crocs, Inc. | 10,819 | 69 |
| | | | |
| | | | | Market |
| | | | | Value• |
| | | Shares | ($000) |
| | Columbia Sportswear Co. | | 1,740 | 68 |
| * | Steven Madden, Ltd. | | 2,065 | 66 |
| | Liz Claiborne, Inc. | 12,156 | 52 |
| * | Quiksilver, Inc. | 16,345 | 46 |
| * | Maidenform Brands, Inc. | 2,466 | 40 |
| | K-Swiss, Inc. | | 3,415 | 33 |
| * | Volcom, Inc. | | 2,190 | 31 |
| | Movado Group, Inc. | 2,308 | 30 |
| * | FGX International Holdings Ltd. | 1,844 | 27 |
| | Oxford Industries, Inc. | | 1,719 | 24 |
| | Weyco Group, Inc. | | 960 | 22 |
| * | American Apparel, Inc. | | 4,106 | 15 |
| * | Unifi, Inc. | 6,287 | 14 |
| | Kenneth Cole Productions, Inc. | 1,174 | 12 |
| | | | | 7,759 |
| Total Common Stocks | | | |
| (Cost $176,505) | | | 141,868 |
| Convertible Preferred Stock (0.0%) | | |
| Household Durables (0.0%) | | | |
| 1 | Sealy Corp., 8.000% (Cost $38) | 350 | 24 |
| Temporary Cash Investment (0.2%) | |
| Money Market Fund (0.2%) | | | |
| 2,3 | Vanguard Market | | | |
| | Liquidity Fund, 0.277% | | | |
| | (Cost $285) | 284,899 | 285 |
| Total Investments (100.1%) | | | |
| (Cost $176,828) | | | 142,177 |
| Other Assets and Liabilities (–0.1%) | |
| Other Assets | | | 519 |
| Liabilities3 | | | (660) |
| | | | | (141) |
| Net Assets (100%) | | | 142,036 |
| |
| At August 31, 2009, net assets consisted of: |
| | Amount |
| | ($000) |
| Paid-in Capital | 189,468 |
| Undistributed Net Investment Income | 758 |
| Accumulated Net Realized Losses | (13,539) |
| Unrealized Appreciation (Depreciation) | (34,651) |
| Net Assets | 142,036 |
| |
| |
| Admiral Shares—Net Assets | |
| Applicable to 59,543 outstanding | |
| $.001 par value shares of beneficial | |
| interest (unlimited authorization) | 1,276 |
| Net Asset Value Per Share— | |
| Admiral Shares | $21.43 |
| |
| |
| ETF Shares—Net Assets | |
| Applicable to 3,402,208 outstanding | |
| $.001 par value shares of beneficial | |
| interest (unlimited authorization) | 140,760 |
| Net Asset Value Per Share— | |
| ETF Shares | $41.37 |
• See Note A in Notes to Financial Statements.
* Non-income-producing security.
^ Part of security position is on loan to broker-dealers. The total value of securities on loan is $209,000.
1 Non-income producing security—new issue that has not paid a dividend as of August 31, 2009.
2 Affiliated money market fund available only to Vanguard funds and certain trusts and accounts managed by Vanguard. Rate shown is the 7-day yield.
3 Includes $218,000 of collateral received for securities on loan.
See accompanying Notes, which are an integral part of the Financial Statements.
13
Consumer Discretionary Index Fund
Statement of Operations
| |
| | Year Ended |
| August 31, 2009 |
| | ($000) |
| Investment Income | |
| Income | |
| Dividends | 1,959 |
| Interest1 | 1 |
| Security Lending | 156 |
| Total Income | 2,116 |
| Expenses | |
| The Vanguard Group—Note B | |
| Investment Advisory Services | 16 |
| Management and Administrative— | |
| Admiral Shares | 1 |
| Management and Administrative— | |
| ETF Shares | 153 |
| Marketing and Distribution— | |
| Admiral Shares | — |
| Marketing and Distribution— | |
| ETF Shares | 39 |
| Custodian Fees | 17 |
| Auditing Fees | 24 |
| Shareholders’ Reports and Proxies— | |
| Admiral Shares | — |
| Shareholders’ Reports and Proxies— | |
| ETF Shares | 28 |
| Total Expenses | 278 |
| Net Investment Income | 1,838 |
| Realized Net Gain (Loss) on | |
| Investment Securities Sold | (63,452) |
| Change in Unrealized Appreciation | |
| (Depreciation) of Investment Securities | 1,356 |
| Net Increase (Decrease) in Net Assets | |
| Resulting from Operations | (60,258) |
Statement of Changes in Net Assets
| | |
| | Year Ended August 31, |
| | 2009 | 2008 |
| | ($000) | ($000) |
| Increase (Decrease) in Net Assets | | |
| Operations | | |
| Net Investment Income | 1,838 | 1,962 |
| Realized Net Gain (Loss) | (63,452) | 2,340 |
| Change in Unrealized Appreciation (Depreciation) | 1,356 | (33,599) |
| Net Increase (Decrease) in Net Assets Resulting from Operations | (60,258) | (29,297) |
| Distributions | | |
| Net Investment Income | | |
| Admiral Shares | (11) | (4) |
| ETF Shares | (2,360) | (1,197) |
| Realized Capital Gain | | |
| Admiral Shares | — | — |
| ETF Shares | — | — |
| Total Distributions | (2,371) | (1,201) |
| Capital Share Transactions | | |
| Admiral Shares | 597 | (123) |
| ETF Shares | (53,138) | 172,810 |
| Net Increase (Decrease) from Capital Share Transactions | (52,541) | 172,687 |
| Total Increase (Decrease) | (115,170) | 142,189 |
| Net Assets | | |
| Beginning of Period | 257,206 | 115,017 |
| End of Period2 | 142,036 | 257,206 |
1 Interest income from an affiliated company of the fund was $1,000.
2 Net Assets—End of Period includes undistributed net investment income of $758,000 and $1,291,000.
See accompanying Notes, which are an integral part of the Financial Statements.
14
Consumer Discretionary Index Fund
Financial Highlights
| | | | | |
| Admiral Shares | | | | | |
| | | | | | July 14, |
| | | | | | 20051 to |
| | | | Year Ended August 31, | Aug. 31, |
| For a Share Outstanding Throughout Each Period | 2009 | 2008 | 2007 | 2006 | 2005 |
| Net Asset Value, Beginning of Period | $25.03 | $31.02 | $27.03 | $27.75 | $28.29 |
| Investment Operations | | | | | |
| Net Investment Income | .398 | .2852 | .217 | .2452 | .1602 |
| Net Realized and Unrealized Gain (Loss) | | | | | |
| on Investments | (3.603) | (6.075) | 4.015 | (.808) | (.700) |
| Total from Investment Operations | (3.205) | (5.790) | 4.232 | (.563) | (.540) |
| Distributions | | | | | |
| Dividends from Net Investment Income | (.395) | (.200) | (.242) | (.157) | — |
| Distributions from Realized Capital Gains | — | — | — | — | — |
| Total Distributions | (.395) | (.200) | (.242) | (.157) | — |
| Net Asset Value, End of Period | $21.43 | $25.03 | $31.02 | $27.03 | $27.75 |
| |
| Total Return3 | –12.34% | –18.74% | 15.64% | –2.03% | –1.91% |
| |
| Ratios/Supplemental Data | | | | | |
| Net Assets, End of Period (Millions) | $1.3 | $0.7 | $1.0 | $0.6 | $0.1 |
| Ratio of Total Expenses to | | | | | |
| Average Net Assets | 0.28% | 0.25% | 0.27% | 0.28% | 0.28%4 |
| Ratio of Net Investment Income to | | | | | |
| Average Net Assets | 1.58% | 1.11% | 0.84% | 0.89% | 0.67%4 |
| Portfolio Turnover Rate5 | 5% | 12% | 8% | 10% | 13% |
1 Inception.
2 Calculated based on average shares outstanding.
3 Total returns do not reflect the 2% fee assessed on redemptions of shares held for less than one year.
4 Annualized.
5 Excludes the value of portfolio securities received or delivered as a result of in-kind purchases or redemptions of the fund’s capital shares,
including ETF Creation Units.
See accompanying Notes, which are an integral part of the Financial Statements.
15
Consumer Discretionary Index Fund
Financial Highlights
| | | | | |
| ETF Shares | | | | | |
| |
| | | | | Year Ended August 31, |
| For a Share Outstanding Throughout Each Period | 2009 | 2008 | 2007 | 2006 | 2005 |
| Net Asset Value, Beginning of Period | $48.38 | $60.02 | $52.28 | $53.65 | $46.99 |
| Investment Operations | | | | | |
| Net Investment Income | .764 | .5921 | .450 | .4941 | .3501 |
| Net Realized and Unrealized Gain (Loss) | | | | | |
| on Investments | (6.988) | (11.772) | 7.760 | (1.556) | 6.660 |
| Total from Investment Operations | (6.224) | (11.180) | 8.210 | (1.062) | 7.010 |
| Distributions | | | | | |
| Dividends from Net Investment Income | (.786) | (.460) | (.470) | (.308) | (.350) |
| Distributions from Realized Capital Gains | — | — | — | — | — |
| Total Distributions | (.786) | (.460) | (.470) | (.308) | (.350) |
| Net Asset Value, End of Period | $41.37 | $48.38 | $60.02 | $52.28 | $53.65 |
| |
| Total Return | –12.32% | –18.70% | 15.69% | –1.99% | 14.91% |
| |
| Ratios/Supplemental Data | | | | | |
| Net Assets, End of Period (Millions) | $141 | $257 | $114 | $47 | $32 |
| Ratio of Total Expenses to | | | | | |
| Average Net Assets | 0.25% | 0.20% | 0.22% | 0.25% | 0.26% |
| Ratio of Net Investment Income to | | | | | |
| Average Net Assets | 1.61% | 1.16% | 0.89% | 0.92% | 0.69% |
| Portfolio Turnover Rate2 | 5% | 12% | 8% | 10% | 13% |
1 Calculated based on average shares outstanding.
2 Excludes the value of portfolio securities received or delivered as a result of in-kind purchases or redemptions of the fund’s capital shares,
including ETF Creation Units.
See accompanying Notes, which are an integral part of the Financial Statements.
16
Consumer Discretionary Index Fund
Notes to Financial Statements
Vanguard Consumer Discretionary Index Fund is registered under the Investment Company Act of 1940 as an open-end investment company, or mutual fund. The fund offers two classes of shares, Admiral Shares and ETF Shares. Admiral Shares are available to any investor who meets the fund’s minimum purchase requirements. ETF Shares are listed for trading on the NYSE Arca, Inc.; they can be purchased and sold through a broker.
A. The following significant accounting policies conform to generally accepted accounting principles for U.S. mutual funds. The fund consistently follows such policies in preparing its financial statements.
1. Security Valuation: Securities are valued as of the close of trading on the New York Stock Exchange (generally 4 p.m., Eastern time) on the valuation date. Equity securities are valued at the latest quoted sales prices or official closing prices taken from the primary market in which each security trades; such securities not traded on the valuation date are valued at the mean of the latest quoted bid and asked prices. Securities for which market quotations are not readily available, or whose values have been materially affected by events occurring before the fund’s pricing time but after the close of the securities’ primary markets, are valued by methods deemed by the board of trustees to represent fair value. Investments in Vanguard Market Liquidity Fund are valued at that fund’s net asset value.
2. Federal Income Taxes: The fund intends to continue to qualify as a regulated investment company and distribute all of its taxable income. Management has analyzed the fund’s tax positions taken for all open federal income tax years (August 31, 2006–2009), and has concluded that no provision for federal income tax is required in the fund’s financial statements.
3. Distributions: Distributions to shareholders are recorded on the ex-dividend date.
4. Security Lending: The fund may lend its securities to qualified institutional borrowers to earn additional income. Security loans are required to be secured at all times by collateral at least equal to the market value of securities loaned. The fund invests cash collateral received in Vanguard Market Liquidity Fund, and records a liability for the return of the collateral, during the period the securities are on loan. Security lending income represents the income earned on investing cash collateral, less expenses associated with the loan.
5. Other: Dividend income is recorded on the ex-dividend date. Interest income includes income distributions received from Vanguard Market Liquidity Fund and is accrued daily. Security transactions are accounted for on the date securities are bought or sold. Costs used to determine realized gains (losses) on the sale of investment securities are those of the specific securities sold. Fees assessed on redemptions of capital shares are credited to paid-in capital.
Each class of shares has equal rights as to assets and earnings, except that each class separately bears certain class-specific expenses related to maintenance of shareholder accounts (included in Management and Administrative expenses), shareholder reporting, and proxies. Marketing and distribution expenses are allocated to each class of shares based on a method approved by the board of trustees. Income, other non-class-specific expenses, and gains and losses on investments are allocated to each class of shares based on its relative net assets.
B. The Vanguard Group furnishes at cost investment advisory, corporate management, administrative, marketing, and distribution services. The costs of such services are allocated to the fund under methods approved by the board of trustees. The fund has committed to provide up to 0.40% of its net assets in capital contributions to Vanguard. At August 31, 2009, the fund had contributed capital of $26,000 to Vanguard (included in Other Assets), representing 0.02% of the fund’s net assets and 0.01% of Vanguard’s capitalization. The fund’s trustees and officers are also directors and officers of Vanguard.
C. Various inputs may be used to determine the value of the fund’s investments. These inputs are summarized in three broad levels for financial statement purposes. The inputs or methodologies used to value securities are not necessarily an indication of the risk associated with investing in those securities.
Level 1—Quoted prices in active markets for identical securities.
Level 2—Other significant observable inputs (including quoted prices for similar securities, interest rates, prepayment speeds, credit risk, etc.).
Level 3—Significant unobservable inputs (including the fund’s own assumptions used to determine the fair value of investments).
At August 31, 2009, 100% of the fund’s investments were valued based on Level 1 inputs.
17
Consumer Discretionary Index Fund
D. Distributions are determined on a tax basis and may differ from net investment income and realized capital gains for financial reporting purposes. Differences may be permanent or temporary. Permanent differences are reclassified among capital accounts in the financial statements to reflect their tax character. Temporary differences arise when certain items of income, expense, gain, or loss are recognized in different periods for financial statement and tax purposes; these differences will reverse at some time in the future. Differences in classification may also result from the treatment of short-term gains as ordinary income for tax purposes.
During the year ended August 31, 2009, the fund realized $56,236,000 of net capital losses resulting from in-kind redemptions—in which shareholders exchanged fund shares for securities held by the fund rather than for cash. Because such losses are not taxable losses to the fund, they have been reclassified from accumulated net realized losses to paid-in capital.
For tax purposes, at August 31, 2009, the fund had $862,000 of ordinary income available for distribution. The fund had available capital loss carryforwards totaling $6,383,000 to offset future net capital gains of $36,000 through August 31, 2013, $86,000 through August 31, 2014, $178,000 through August 31, 2015, $1,526,000 through August 31, 2016, and $4,557,000 through August 31, 2017. In addition, the fund realized losses of $7,145,000 during the period from November 1, 2008, through August 31, 2009, which are deferred and will be treated as realized for tax purposes in fiscal 2010.
At August 31, 2009, the cost of investment securities for tax purposes was $176,839,000. Net unrealized depreciation of investment securities for tax purposes was $34,662,000, consisting of unrealized gains of $2,058,000 on securities that had risen in value since their purchase and $36,720,000 in unrealized losses on securities that had fallen in value since their purchase.
E. During the year ended August 31, 2009, the fund purchased $106,930,000 of investment securities and sold $160,051,000 of investment securities, other than temporary cash investments.
| | | | |
| F. Capital share transactions for each class of shares were: | | | |
| | | | Year Ended August 31, |
| | | 2009 | | 2008 |
| | Amount | Shares | Amount | Shares |
| | ($000) | (000) | ($000) | (000) |
| Admiral Shares | | | | |
| Issued | 659 | 34 | 414 | 16 |
| Issued in Lieu of Cash Distributions | 10 | 1 | 4 | — |
| Redeemed1 | (72) | (4) | (541) | (19) |
| Net Increase (Decrease)—Admiral Shares | 597 | 31 | (123) | (3) |
| ETF Shares | | | | |
| Issued | 100,999 | 2,600 | 252,012 | 5,002 |
| Issued in Lieu of Cash Distributions | — | — | — | — |
| Redeemed1 | (154,137) | (4,500) | (79,202) | (1,600) |
| Net Increase (Decrease)—ETF Shares | (53,138) | (1,900) | 172,810 | 3,402 |
| 1 Net of redemption fees for fiscal 2009 and 2008 of $0 and $7,000, respectively (fund totals). | | | |
G. In preparing the financial statements as of August 31, 2009, management considered the impact of subsequent events occurring through October 15, 2009, for potential recognition or disclosure in these financial statements.
18
Consumer Staples Index Fund
Fund Profile
As of August 31, 2009
| | | |
| Portfolio Characteristics | | |
| | | Target | Broad |
| | Fund | Index1 | Index2 |
| Number of Stocks | 112 | 112 | 2,501 |
| Median Market Cap | $41.8B | $88.2B | $27.3B |
| Price/Earnings Ratio | 16.8x | 16.4x | 25.6x |
| Price/Book Ratio | 3.0x | 3.1x | 2.1x |
| Yield3 | | 3.0% | 1.9% |
| Admiral Shares | 2.6% | | |
| ETF Shares | 2.7% | | |
| Return on Equity | 23.4% | 24.2% | 19.3% |
| Earnings Growth Rate | 8.4% | 8.4% | 9.9% |
| Foreign Holdings | 0.0% | 0.0% | 0.0% |
| Turnover Rate | 17% | — | — |
| Expense Ratio4 | | — | — |
| Admiral Shares | 0.28% | | |
| ETF Shares | 0.25% | | |
| Short-Term Reserves | 0.0% | — | — |
| |
| Industry Diversification (% of equity exposure) |
| |
| Agricultural Products | 2.8% |
| Drug Retail | 8.0 |
| Food Distributors | 1.9 |
| Food Retail | 3.7 |
| Household Products | 20.5 |
| Hypermarkets & Supercenters | 11.8 |
| Packaged Foods & Meats | 16.1 |
| Personal Products | 3.5 |
| Soft Drinks | 17.2 |
| Tobacco | 12.8 |
| Other Consumer Staples | 1.7 |
| | |
| Volatility Measures5 | |
| | Fund Versus | Fund Versus |
| | Target Index1 | Broad Index2 |
| R-Squared | 0.99 | 0.78 |
| Beta | 1.01 | 0.60 |
| |
| Ten Largest Holdings6 (% of total net assets) |
| |
| The Procter & Gamble Co. | 12.9% |
| Wal-Mart Stores, Inc. | 9.5 |
| The Coca-Cola Co. | 7.9 |
| Philip Morris International Inc. | 7.0 |
| PepsiCo, Inc. | 6.7 |
| CVS Caremark Corp. | 4.9 |
| Kraft Foods Inc. | 3.8 |
| Altria Group, Inc. | 3.4 |
| Colgate-Palmolive Co. | 3.3 |
| Walgreen Co. | 3.0 |
| Top Ten | 62.4% |
1 MSCI US IMI/Consumer Staples.
2 MSCI US IMI/2500.
3 30-day SEC yield for the fund; annualized dividend yield for the indexes. See the Glossary.
4 The expense ratios shown are from the prospectuses dated December 29, 2008, and represent estimated costs for the current fiscal year based on the fund’s net assets as of the prospectus date.
For the fiscal year ended August 31, 2009, the expense ratios were 0.28% for the Admiral Shares and 0.25% for the ETF Shares.
5 For an explanation of R-squared, beta, and other terms used here, see the Glossary.
6 The holdings listed exclude any temporary cash investments and equity index products.
19
Consumer Staples Index Fund
Performance Summary
All of the returns in this report represent past performance, which is not a guarantee of future results that may be achieved by the fund. (Current performance may be lower or higher than the performance data cited. For performance data current to the most recent month-end, visit our website at www.vanguard.com/performance.) Note, too, that both investment returns and principal value can fluctuate widely, so an investor’s shares, when sold, could be worth more or less than their original cost. The returns shown do not reflect taxes that a shareholder would pay on fund distributions or on the sale of fund shares.
Cumulative Performance: January 26, 2004–August 31, 2009
Initial Investment of $10,000
| | | | |
| | | Average Annual Total Returns | |
| | | Periods Ended August 31, 2009 | Final Value |
| | | | Since | of a $10,000 |
| | One Year | Five Years | Inception1 | Investment |
| Consumer Staples Index Fund | | | | |
| ETF Shares Net Asset Value2 | –8.22% | 5.25% | 5.20% | $13,278 |
| Consumer Staples Index Fund | | | | |
| ETF Shares Market Price | –8.17 | 5.27 | 5.21 | 13,284 |
| MSCI US IMI/2500 | –18.26 | 1.36 | 0.52 | 10,295 |
| MSCI US IMI/Consumer Staples | –9.22 | 5.18 | 5.09 | 13,199 |
| | | | |
| | | | | Final Value |
| | | | Since | of a $100,000 |
| | One Year | Five Years | Inception1 | Investment |
| Consumer Staples Index Fund Admiral Shares3 | –8.26% | 5.21% | 5.26% | $133,134 |
| MSCI US IMI/2500 | –18.26 | 1.36 | 0.92 | 105,229 |
| MSCI US IMI/Consumer Staples | –9.22 | 5.18 | 5.18 | 132,559 |
1 Performance for the fund and its comparative standards is calculated since the following inception dates: January 26, 2004, for ETF Shares; January 30, 2004, for Admiral Shares.
2 For more information about how the ETF Shares’ market prices have compared with their net asset value, visit www.vanguard.com, select your ETF, and then select the Performance tab. The Premium/Discount
table there shows the percentages of days on which the ETF Shares’ market price was above or below the NAV.
3 Total returns do not reflect the 2% fee assessed on redemptions of shares held for less than one year.
Note: See Financial Highlights tables for dividend and capital gains information.
20
Consumer Staples Index Fund
Fiscal-Year Total Returns (%): January 26, 2004–August 31, 2009
| | | |
| Cumulative Returns: ETF Shares, January 26, 2004–August 31, 2009 | | |
| | | | Cumulative |
| | | | Since |
| | One Year | Five Years | Inception |
| Consumer Staples Index Fund ETF Shares Market Price | –8.17% | 29.30% | 32.84% |
| Consumer Staples Index Fund ETF Shares Net Asset Value | –8.22 | 29.13 | 32.78 |
| MSCI US IMI/Consumer Staples | –9.22 | 28.74 | 31.99 |
Average Annual Total Returns: Periods Ended June 30, 2009
This table presents average annual total returns through the latest calendar quarter—rather than through the end of the fiscal period. Securities and Exchange Commission rules require that we provide this information.
| | | | |
| | | | | Since |
| | Inception Date | One Year | Five Years | Inception |
| ETF Shares | 1/26/2004 | | | |
| Market Price | | –9.63% | 2.95% | 3.94% |
| Net Asset Value | | –9.63 | 2.97 | 3.95 |
| Admiral Shares1 | 1/30/2004 | –9.67 | 2.94 | 4.01 |
1 Total returns do not reflect the 2% fee assessed on redemptions of shares held for less than one year.
Note: See Financial Highlights tables for dividend and capital gains information.
21
Consumer Staples Index Fund
Financial Statements
Statement of Net Assets
As of August 31, 2009
The fund provides a complete list of its holdings four times in each fiscal year, at the quarter-ends. For the second and fourth fiscal quarters, the lists appear in the fund’s semiannual and annual reports to shareholders. For the first and third fiscal quarters, the fund files the lists with the Securities and Exchange Commission on Form N-Q. Shareholders can look up the fund’s Forms N-Q on the SEC’s website at www.sec.gov. Forms N-Q may also be reviewed and copied at the SEC’s Public Reference Room (see the back cover of this report for further information).
| | | | |
| | | | | Market |
| | | | | Value• |
| | | | Shares | ($000) |
| Common Stocks (100.0%) | | |
| Beverages (18.9%) | | | |
| | The Coca-Cola Co. | | 943,185 | 45,999 |
| | PepsiCo, Inc. | | 686,504 | 38,904 |
| | Molson Coors Brewing Co. | | |
| | Class B | | 87,917 | 4,166 |
| * | Dr. Pepper Snapple | | | |
| | Group, Inc. | | 148,738 | 3,933 |
| | Coca-Cola Enterprises, Inc. | 172,559 | 3,487 |
| | The Pepsi Bottling | | | |
| | Group, Inc. | | 87,904 | 3,141 |
| | Brown-Forman Corp. | | | |
| | Class B | | 50,615 | 2,263 |
| * | Constellation Brands, Inc. | | |
| | Class A | | 127,500 | 1,886 |
| * | Hansen Natural Corp. | | 51,845 | 1,693 |
| | PepsiAmericas, Inc. | | 47,294 | 1,323 |
| * | Central European | | | |
| | Distribution Corp. | | 30,094 | 969 |
| * | Heckmann Corp. | | 141,997 | 591 |
| | Coca-Cola Bottling Co. | | 9,763 | 528 |
| * | Boston Beer Co., Inc. | | | |
| | Class A | | 13,275 | 528 |
| * | National Beverage Corp. | 39,536 | 401 |
| | | | | 109,812 |
| Food & Staples Retailing (25.4%) | |
| | Wal-Mart Stores, Inc. | 1,080,890 | 54,985 |
| | CVS Caremark Corp. | | 754,258 | 28,300 |
| | Walgreen Co. | | 521,407 | 17,665 |
| | Costco Wholesale Corp. | 231,426 | 11,798 |
| | Sysco Corp. | | 322,356 | 8,217 |
| | The Kroger Co. | | 333,801 | 7,207 |
| | Safeway, Inc. | | 236,834 | 4,512 |
| * | Whole Foods Market, Inc. | 84,673 | 2,462 |
| | SUPERVALU Inc. | | 129,895 | 1,864 |
| * | BJ’s Wholesale Club, Inc. | 40,454 | 1,319 |
| | Casey’s General Stores, Inc. | 40,895 | 1,135 |
| | Ruddick Corp. | | 38,665 | 1,027 |
| * | United Natural Foods, Inc. | 35,856 | 969 |
| | The Andersons, Inc. | | 25,262 | 831 |
| * | Rite Aid Corp. | | 506,456 | 780 |
| * | Winn-Dixie Stores, Inc. | 54,038 | 744 |
| | Ingles Markets, Inc. | | 35,901 | 592 |
| | PriceSmart, Inc. | | 30,366 | 539 |
| | Weis Markets, Inc. | | 16,505 | 515 |
| | Nash-Finch Co. | | 18,729 | 508 |
| | Village Super Market Inc. | | |
| | Class A | | 15,597 | 447 |
| * | The Great Atlantic & | | | |
| | Pacific Tea Co., Inc. | | 57,622 | 387 |
| * | The Pantry, Inc. | | 24,624 | 373 |
| | | |
| | | | Market |
| | | | Value• |
| | | Shares | ($000) |
| | Spartan Stores, Inc. | 20,826 | 276 |
| | Arden Group Inc. Class A | 2,266 | 267 |
| * | Susser Holdings Corp. | 16,444 | 176 |
| | | | 147,895 |
| Food Products (18.9%) | | |
| | Kraft Foods Inc. | 773,825 | 21,938 |
| | General Mills, Inc. | 176,269 | 10,529 |
| | Archer-Daniels-Midland Co. | 308,688 | 8,899 |
| | Kellogg Co. | 143,712 | 6,767 |
| | H.J. Heinz Co. | 167,816 | 6,461 |
| | ConAgra Foods, Inc. | 250,781 | 5,149 |
| | Bunge Ltd. | 73,885 | 4,951 |
| | Campbell Soup Co. | 126,079 | 3,954 |
| | Sara Lee Corp. | 379,563 | 3,678 |
| | The Hershey Co. | 93,708 | 3,676 |
| | J.M. Smucker Co. | 70,008 | 3,659 |
| | McCormick & Co., Inc. | 75,084 | 2,445 |
| * | Ralcorp Holdings, Inc. | 36,977 | 2,320 |
| | Tyson Foods, Inc. | 178,432 | 2,139 |
| * | Dean Foods Co. | 104,943 | 1,904 |
| | Hormel Foods Corp. | 49,394 | 1,825 |
| | Corn Products | | |
| | International, Inc. | 53,475 | 1,586 |
| | Del Monte Foods Co. | 147,457 | 1,547 |
| | Flowers Foods, Inc. | 61,617 | 1,465 |
| * | Green Mountain Coffee | | |
| | Roasters, Inc. | 22,155 | 1,333 |
| * | TreeHouse Foods Inc. | 29,795 | 1,104 |
| | Lancaster Colony Corp. | 20,730 | 1,042 |
| * | Smithfield Foods, Inc. | 76,668 | 941 |
| * | Chiquita Brands | | |
| | International, Inc. | 57,065 | 879 |
| * | American Italian Pasta Co. | 26,292 | 796 |
| * | Hain Celestial Group, Inc. | 48,351 | 774 |
| | Lance, Inc. | 31,208 | 757 |
| | J & J Snack Foods Corp. | 17,301 | 756 |
| | Sanderson Farms, Inc. | 17,581 | 731 |
| | Diamond Foods, Inc. | 25,858 | 723 |
| | Cal-Maine Foods, Inc. | 24,146 | 689 |
| * | American Dairy, Inc. | 21,926 | 673 |
| * | Darling International, Inc. | 92,855 | 651 |
| | B&G Foods Inc. | 70,459 | 643 |
| | Tootsie Roll Industries, Inc. | 24,412 | 577 |
| | Calavo Growers, Inc. | 28,190 | 496 |
| * | Smart Balance Inc. | 76,058 | 486 |
| | Alico, Inc. | 14,372 | 426 |
| | Farmer Brothers, Inc. | 20,635 | 426 |
| | | | 109,795 |
| Household Products (20.5%) | | |
| | The Procter & Gamble Co. | 1,390,002 | 75,213 |
| | Colgate-Palmolive Co. | 266,531 | 19,377 |
| | | | |
| | | | | Market |
| | | | | Value• |
| | | | Shares | ($000) |
| | Kimberly-Clark Corp. | | 220,866 | 13,354 |
| | The Clorox Co. | | 77,408 | 4,574 |
| * | Energizer Holdings, Inc. | 40,935 | 2,678 |
| | Church & Dwight, Inc. | | 42,202 | 2,411 |
| * | Central Garden & Pet Co. | | |
| | Class A | | 55,929 | 615 |
| | WD-40 Co. | | 22,403 | 604 |
| * | Central Garden & Pet Co. | 20,922 | 254 |
| | | | | 119,080 |
| Personal Products (3.5%) | | | |
| | Avon Products, Inc. | | 231,925 | 7,391 |
| | The Estee Lauder Cos. Inc. | | |
| | Class A | | 68,486 | 2,455 |
| | Alberto-Culver Co. | | 64,464 | 1,701 |
| * | NBTY, Inc. | | 43,296 | 1,605 |
| | Herbalife Ltd. | | 41,886 | 1,268 |
| | Mead Johnson Nutrition Co. | 26,367 | 1,046 |
| * | Chattem, Inc. | | 15,514 | 950 |
| | Nu Skin Enterprises, Inc. | 44,594 | 769 |
| * | Bare Escentuals, Inc. | | 74,196 | 689 |
| | Inter Parfums, Inc. | | 54,692 | 528 |
| * | Prestige Brands | | | |
| | Holdings Inc. | | 69,483 | 515 |
| * | USANA Health | | | |
| | Sciences, Inc. | | 12,808 | 404 |
| * | American Oriental | | | |
| | Bioengineering, Inc. | | 73,164 | 372 |
| * | Elizabeth Arden, Inc. | | 30,676 | 316 |
| * | Revlon, Inc. | | 40,335 | 183 |
| | | | | 20,192 |
| Tobacco (12.8%) | | | |
| | Philip Morris | | | |
| | International Inc. | | 892,640 | 40,802 |
| | Altria Group, Inc. | 1,086,361 | 19,859 |
| | Lorillard, Inc. | | 91,640 | 6,669 |
| | Reynolds American Inc. | 100,088 | 4,575 |
| | Universal Corp. (VA) | | 23,758 | 876 |
| | Vector Group Ltd. | | 47,275 | 746 |
| * | Alliance One | | | |
| | International, Inc. | | 125,368 | 480 |
| * | Star Scientific, Inc. | | 182,105 | 182 |
| | | | | 74,189 |
| Total Investments (100.0%) | | |
| (Cost $629,635) | | | 580,963 |
| Other Assets and Liabilities (0.0%) | |
| Other Assets | | | 954 |
| Liabilities | | | (867) |
| | | | | 87 |
| Net Assets (100%) | | | 581,050 |
22
Consumer Staples Index Fund
| |
| At August 31, 2009, net assets consisted of: |
| | Amount |
| | ($000) |
| Paid-in Capital | 636,664 |
| Undistributed Net Investment Income | 9,418 |
| Accumulated Net Realized Losses | (16,360) |
| Unrealized Appreciation (Depreciation) | (48,672) |
| Net Assets | 581,050 |
| |
| |
| Admiral Shares—Net Assets | |
| Applicable to 933,858 outstanding | |
| $.001 par value shares of beneficial | |
| interest (unlimited authorization) | 28,596 |
| Net Asset Value Per Share— | |
| Admiral Shares | $30.62 |
| |
| |
| ETF Shares—Net Assets | |
| Applicable to 8,900,000 outstanding | |
| $.001 par value shares of beneficial | |
| interest (unlimited authorization) | 552,454 |
| Net Asset Value Per Share— | |
| ETF Shares | $62.07 |
• See Note A in Notes to Financial Statements.
* Non-income-producing security.
See accompanying Notes, which are an integral part of the Financial Statements.
23
Consumer Staples Index Fund
| |
| Statement of Operations |
| |
| | Year Ended |
| August 31, 2009 |
| | ($000) |
| Investment Income | |
| Income | |
| Dividends | 16,686 |
| Interest1 | 9 |
| Security Lending | 146 |
| Total Income | 16,841 |
| Expenses | |
| The Vanguard Group—Note B | |
| Investment Advisory Services | 81 |
| Management and Administrative— | |
| Admiral Shares | 53 |
| Management and Administrative— | |
| ETF Shares | 889 |
| Marketing and Distribution— | |
| Admiral Shares | 5 |
| Marketing and Distribution— | |
| ETF Shares | 164 |
| Custodian Fees | 18 |
| Auditing Fees | 24 |
| Shareholders’ Reports and Proxies— | |
| Admiral Shares | 1 |
| Shareholders’ Reports and Proxies— | |
| ETF Shares | 147 |
| Trustees’ Fees and Expenses | 1 |
| Total Expenses | 1,383 |
| Net Investment Income | 15,458 |
| Realized Net Gain (Loss) on Investment | |
| Securities Sold | 2,903 |
| Change in Unrealized Appreciation | |
| (Depreciation) of Investment Securities | (59,656) |
| Net Increase (Decrease) in Net Assets | |
| Resulting from Operations | (41,295) |
| | |
| Statement of Changes in Net Assets | | |
| |
| | Year Ended August 31, |
| | 2009 | 2008 |
| | ($000) | ($000) |
| Increase (Decrease) in Net Assets | | |
| Operations | | |
| Net Investment Income | 15,458 | 8,312 |
| Realized Net Gain (Loss) | 2,903 | 21,737 |
| Change in Unrealized Appreciation (Depreciation) | (59,656) | (19,968) |
| Net Increase (Decrease) in Net Assets Resulting from Operations | (41,295) | 10,081 |
| Distributions | | |
| Net Investment Income | | |
| Admiral Shares | (425) | (184) |
| ETF Shares | (11,495) | (6,259) |
| Realized Capital Gain | | |
| Admiral Shares | — | — |
| ETF Shares | — | — |
| Total Distributions | (11,920) | (6,443) |
| Capital Share Transactions | | |
| Admiral Shares | 11,397 | 9,079 |
| ETF Shares | 86,801 | 204,450 |
| Net Increase (Decrease) from Capital Share Transactions | 98,198 | 213,529 |
| Total Increase (Decrease) | 44,983 | 217,167 |
| Net Assets | | |
| Beginning of Period | 536,067 | 318,900 |
| End of Period2 | 581,050 | 536,067 |
1 Interest income from an affiliated company of the fund was $9,000.
2 Net Assets—End of Period includes undistributed net investment income of $9,418,000 and $5,872,000.
See accompanying Notes, which are an integral part of the Financial Statements.
24
Consumer Staples Index Fund
Financial Highlights
| | | | | |
| Admiral Shares | | | | | |
| |
| | | | | Year Ended August 31, |
| For a Share Outstanding Throughout Each Period | 2009 | 2008 | 2007 | 2006 | 2005 |
| Net Asset Value, Beginning of Period | $34.06 | $33.22 | $30.56 | $27.64 | $25.82 |
| Investment Operations | | | | | |
| Net Investment Income | .7771 | .6341 | .662 | .5471 | .4271 |
| Net Realized and Unrealized Gain (Loss) | | | | | |
| on Investments | (3.648) | .766 | 2.460 | 2.716 | 1.952 |
| Total from Investment Operations | (2.871) | 1.400 | 3.122 | 3.263 | 2.379 |
| Distributions | | | | | |
| Dividends from Net Investment Income | (.569) | (.560) | (.462) | (.343) | (.440) |
| Distributions from Realized Capital Gains | — | — | — | — | (.119) |
| Total Distributions | (.569) | (.560) | (.462) | (.343) | (.559) |
| Net Asset Value, End of Period | $30.62 | $34.06 | $33.22 | $30.56 | $27.64 |
| |
| Total Return2 | –8.26% | 4.15% | 10.30% | 11.92% | 9.29% |
| |
| Ratios/Supplemental Data | | | | | |
| Net Assets, End of Period (Millions) | $29 | $18 | $9 | $6 | $4 |
| Ratio of Total Expenses to | | | | | |
| Average Net Assets | 0.28% | 0.25% | 0.26% | 0.28% | 0.28% |
| Ratio of Net Investment Income to | | | | | |
| Average Net Assets | 2.77% | 1.88% | 2.16% | 1.90% | 1.69% |
| Portfolio Turnover Rate3 | 17% | 13% | 12% | 14% | 7% |
1 Calculated based on average shares outstanding.
2 Total returns do not reflect the 2% fee assessed on redemptions of shares held for less than one year.
3 Excludes the value of portfolio securities received or delivered as a result of in-kind purchases or redemptions of the fund’s capital shares,
including ETF Creation Units.
| | | | | |
| ETF Shares | | | | | |
| |
| | | | | Year Ended August 31, |
| For a Share Outstanding Throughout Each Period | 2009 | 2008 | 2007 | 2006 | 2005 |
| Net Asset Value, Beginning of Period | $69.04 | $67.35 | $61.94 | $56.03 | $52.28 |
| Investment Operations | | | | | |
| Net Investment Income | 1.6161 | 1.3271 | 1.370 | 1.0901 | .9501 |
| Net Realized and Unrealized Gain (Loss) | | | | | |
| on Investments | (7.413) | 1.522 | 5.000 | 5.523 | 3.894 |
| Total from Investment Operations | (5.797) | 2.849 | 6.370 | 6.613 | 4.844 |
| Distributions | | | | | |
| Dividends from Net Investment Income | (1.173) | (1.159) | (.960) | (.703) | (.853) |
| Distributions from Realized Capital Gains | — | — | — | — | (.241) |
| Total Distributions | (1.173) | (1.159) | (.960) | (.703) | (1.094) |
| Net Asset Value, End of Period | $62.07 | $69.04 | $67.35 | $61.94 | $56.03 |
| |
| Total Return | –8.22% | 4.18% | 10.38% | 11.91% | 9.33% |
| |
| Ratios/Supplemental Data | | | | | |
| Net Assets, End of Period (Millions) | $552 | $518 | $310 | $211 | $73 |
| Ratio of Total Expenses to | | | | | |
| Average Net Assets | 0.25% | 0.20% | 0.22% | 0.25% | 0.26% |
| Ratio of Net Investment Income to | | | | | |
| Average Net Assets | 2.80% | 1.93% | 2.20% | 1.93% | 1.71% |
| Portfolio Turnover Rate2 | 17% | 13% | 12% | 14% | 7% |
1 Calculated based on average shares outstanding.
2 Excludes the value of portfolio securities received or delivered as a result of in-kind purchases or redemptions of the fund’s capital shares,
including ETF Creation Units.
See accompanying Notes, which are an integral part of the Financial Statements.
25
Consumer Staples Index Fund
Notes to Financial Statements
Vanguard Consumer Staples Index Fund is registered under the Investment Company Act of 1940 as an open-end investment company, or mutual fund. The fund offers two classes of shares, Admiral Shares and ETF Shares. Admiral Shares are available to any investor who meets the fund’s minimum purchase requirements. ETF Shares are listed for trading on the NYSE Arca, Inc.; they can be purchased and sold through a broker.
A. The following significant accounting policies conform to generally accepted accounting principles for U.S. mutual funds. The fund consistently follows such policies in preparing its financial statements.
1. Security Valuation: Securities are valued as of the close of trading on the New York Stock Exchange (generally 4 p.m., Eastern time) on the valuation date. Equity securities are valued at the latest quoted sales prices or official closing prices taken from the primary market in which each security trades; such securities not traded on the valuation date are valued at the mean of the latest quoted bid and asked prices. Securities for which market quotations are not readily available, or whose values have been materially affected by events occurring before the fund’s pricing time but after the close of the securities’ primary markets, are valued by methods deemed by the board of trustees to represent fair value. Investments in Vanguard Market Liquidity Fund are valued at that fund’s net asset value.
2. Federal Income Taxes: The fund intends to continue to qualify as a regulated investment company and distribute all of its taxable income. Management has analyzed the fund’s tax positions taken for all open federal income tax years (August 31, 2006–2009), and has concluded that no provision for federal income tax is required in the fund’s financial statements.
3. Distributions: Distributions to shareholders are recorded on the ex-dividend date.
4. Security Lending: The fund may lend its securities to qualified institutional borrowers to earn additional income. Security loans are required to be secured at all times by collateral at least equal to the market value of securities loaned. The fund invests cash collateral received in Vanguard Market Liquidity Fund, and records a liability for the return of the collateral, during the period the securities are on loan. Security lending income represents the income earned on investing cash collateral, less expenses associated with the loan.
5. Other: Dividend income is recorded on the ex-dividend date. Interest income includes income distributions received from Vanguard Market Liquidity Fund and is accrued daily. Security transactions are accounted for on the date securities are bought or sold. Costs used to determine realized gains (losses) on the sale of investment securities are those of the specific securities sold. Fees assessed on redemptions of capital shares are credited to paid-in capital.
Each class of shares has equal rights as to assets and earnings, except that each class separately bears certain class-specific expenses related to maintenance of shareholder accounts (included in Management and Administrative expenses), shareholder reporting, and proxies. Marketing and distribution expenses are allocated to each class of shares based on a method approved by the board of trustees. Income, other non-class-specific expenses, and gains and losses on investments are allocated to each class of shares based on its relative net assets.
B. The Vanguard Group furnishes at cost investment advisory, corporate management, administrative, marketing, and distribution services. The costs of such services are allocated to the fund under methods approved by the board of trustees. The fund has committed to provide up to 0.40% of its net assets in capital contributions to Vanguard. At August 31, 2009, the fund had contributed capital of $127,000 to Vanguard (included in Other Assets), representing 0.02% of the fund’s net assets and 0.05% of Vanguard’s capitalization. The fund’s trustees and officers are also directors and officers of Vanguard.
C. Various inputs may be used to determine the value of the fund’s investments. These inputs are summarized in three broad levels for financial statement purposes. The inputs or methodologies used to value securities are not necessarily an indication of the risk associated with investing in those securities.
Level 1—Quoted prices in active markets for identical securities.
Level 2—Other significant observable inputs (including quoted prices for similar securities, interest rates, prepayment speeds, credit risk, etc.).
Level 3—Significant unobservable inputs (including the fund’s own assumptions used to determine the fair value of investments).
At August 31, 2009, 100% of the fund’s investments were valued based on Level 1 inputs.
26
Consumer Staples Index Fund
D. Distributions are determined on a tax basis and may differ from net investment income and realized capital gains for financial reporting purposes. Differences may be permanent or temporary. Permanent differences are reclassified among capital accounts in the financial statements to reflect their tax character. Temporary differences arise when certain items of income, expense, gain, or loss are recognized in different periods for financial statement and tax purposes; these differences will reverse at some time in the future. Differences in classification may also result from the treatment of short-term gains as ordinary income for tax purposes.
During the year ended August 31, 2009, the fund realized $12,714,000 of net capital gains resulting from in-kind redemptions—in which shareholders exchanged fund shares for securities held by the fund rather than for cash. Because such gains are not taxable to the fund, and are not distributed to shareholders, they have been reclassified from accumulated net realized losses to paid-in capital.
For tax purposes, at August 31, 2009, the fund had $9,733,000 of ordinary income available for distribution. The fund had available capital loss carryforwards totaling $5,981,000 to offset future net capital gains of $276,000 through August 31, 2014, $773,000 through August 31, 2015, $2,261,000 through August 31, 2016, and $2,671,000 through August 31, 2017. In addition, the fund realized losses of $10,379,000 during the period from November 1, 2008, through August 31, 2009, which are deferred and will be treated as realized for tax purposes in fiscal 2010.
At August 31, 2009, the cost of investment securities for tax purposes was $629,635,000. Net unrealized depreciation of investment securities for tax purposes was $48,672,000, consisting of unrealized gains of $13,452,000 on securities that had risen in value since their purchase and $62,124,000 in unrealized losses on securities that had fallen in value since their purchase.
E. During the year ended August 31, 2009, the fund purchased $365,348,000 of investment securities and sold $263,392,000 of investment securities, other than temporary cash investments.
F. Capital share transactions for each class of shares were:
| | | | |
| | | | Year Ended August 31, |
| | | 2009 | | 2008 |
| | Amount | Shares | Amount | Shares |
| | ($000) | (000) | ($000) | (000) |
| Admiral Shares | | | | |
| Issued | 17,568 | 619 | 12,663 | 371 |
| Issued in Lieu of Cash Distributions | 400 | 14 | 172 | 5 |
| Redeemed1 | (6,571) | (236) | (3,756) | (113) |
| Net Increase (Decrease)—Admiral Shares | 11,397 | 397 | 9,079 | 263 |
| ETF Shares | | | | |
| Issued | 258,009 | 4,400 | 327,325 | 4,700 |
| Issued in Lieu of Cash Distributions | — | — | — | — |
| Redeemed1 | (171,208) | (3,000) | (122,875) | (1,800) |
| Net Increase (Decrease)—ETF Shares | 86,801 | 1,400 | 204,450 | 2,900 |
| 1 Net of redemption fees for fiscal 2009 and 2008 of $49,000 and $35,000, respectively (fund totals). | | |
G. In preparing the financial statements as of August 31, 2009, management considered the impact of subsequent events occurring through October 15, 2009, for potential recognition or disclosure in these financial statements.
27
Energy Index Fund
Fund Profile
As of August 31, 2009
| | | |
| Portfolio Characteristics | | |
| | | Target | Broad |
| | Fund | Index1 | Index2 |
| Number of Stocks | 158 | 158 | 2,501 |
| Median Market Cap | $28.5B | $66.7B | $27.3B |
| Price/Earnings Ratio | 16.2x | 15.5x | 25.6x |
| Price/Book Ratio | 1.7x | 1.9x | 2.1x |
| Yield3 | | 2.0% | 1.9% |
| Admiral Shares | 1.6% | | |
| ETF Shares | 1.6% | | |
| Return on Equity | 25.1% | 26.3% | 19.3% |
| Earnings Growth Rate | 22.4% | 19.6% | 9.9% |
| Foreign Holdings | 0.0% | 0.0% | 0.0% |
| Turnover Rate | 25% | — | — |
| Expense Ratio4 | | — | — |
| Admiral Shares | 0.28% | | |
| ETF Shares | 0.25% | | |
| Short-Term Reserves | 0.0% | — | — |
| |
| Industry Diversification (% of equity exposure) |
| |
| Coal & Consumable Fuels | 2.6% |
| Integrated Oil & Gas | 47.0 |
| Oil & Gas Drilling | 6.1 |
| Oil & Gas Equipment & Services | 17.6 |
| Oil & Gas Exploration & Production | 21.3 |
| Oil & Gas Refining & Marketing | 2.1 |
| Oil & Gas Storage & Transportation | 3.3 |
| |
| Ten Largest Holdings6 (% of total net assets) |
| |
| ExxonMobil Corp. | 19.8% |
| Chevron Corp. | 12.5 |
| Schlumberger Ltd. | 6.5 |
| ConocoPhillips Co. | 6.3 |
| Occidental Petroleum Corp. | 4.8 |
| Apache Corp. | 2.3 |
| Anadarko Petroleum Corp. | 2.2 |
| Devon Energy Corp. | 2.1 |
| Transocean Ltd. | 2.0 |
| Marathon Oil Corp. | 1.7 |
| Top Ten | 60.2% |
| | |
| Volatility Measures5 | |
| | Fund Versus | Fund Versus |
| | Target Index1 | Broad Index2 |
| R-Squared | 0.99 | 0.50 |
| Beta | 1.06 | 0.95 |
1 MSCI US IMI/Energy.
2 MSCI US IMI/2500.
3 30-day SEC yield for the fund; annualized dividend yield for the indexes. See the Glossary.
4 The expense ratios shown are from the prospectuses dated December 29, 2008, and represent estimated costs for the current fiscal year based on the fund’s net assets as of the prospectus date. For the fiscal year
ended August 31, 2009, the expense ratios were 0.28% for Admiral Shares and 0.25% for ETF Shares.
5 For an explanation of R-squared, beta, and other terms used here, see the Glossary.
6 The holdings listed exclude any temporary cash investments and equity index products.
28
Energy Index Fund
Performance Summary
All of the returns in this report represent past performance, which is not a guarantee of future results that may be achieved by the fund. (Current performance may be lower or higher than the performance data cited. For performance data current to the most recent month-end, visit our website at www.vanguard.com/performance.) Note, too, that both investment returns and principal value can fluctuate widely, so an investor’s shares, when sold, could be worth more or less than their original cost. The returns shown do not reflect taxes that a shareholder would pay on fund distributions or on the sale of fund shares.
Cumulative Performance: September 23, 2004–August 31, 2009
Initial Investment of $10,000
| | | |
| | Average Annual Total Returns | Final Value |
| | Periods Ended August 31, 2009 | of a $10,000 |
| | One Year | Since Inception1 | Investment |
| Energy Index Fund ETF Shares Net Asset Value2 | –30.49% | 9.96% | $15,980 |
| Energy Index Fund ETF Shares Market Price | –30.45 | 9.99 | 15,999 |
| MSCI US IMI/2500 | –18.26 | 1.20 | 10,605 |
| MSCI US IMI/Energy | –29.18 | 9.91 | 15,941 |
| | | |
| | | | Final Value |
| | | | of a $100,000 |
| | One Year | Since Inception1 | Investment |
| Energy Index Fund Admiral Shares3 | –30.51% | 8.77% | $150,922 |
| MSCI US IMI/2500 | –18.26 | �� 0.77 | 103,819 |
| MSCI US IMI/Energy | –29.18 | 8.68 | 150,335 |
1 Performance for the fund and its comparative standards is calculated since the following inception dates: September 23, 2004, for ETF Shares; October 7, 2004, for Admiral Shares.
2 For more information about how the ETF Shares’ market prices have compared with their net asset value, visit www.vanguard.com, select your ETF, and then select the Performance tab. The Premium/Discount
table there shows the percentages of days on which the ETF Shares’ market price was above or below the NAV.
3 Total returns do not reflect the 2% fee assessed on redemptions of shares held for less than one year.
Note: See Financial Highlights tables for dividend and capital gains information.
29
Energy Index Fund
Fiscal-Year Total Returns (%): September 23, 2004–August 31, 2009
| | |
| Cumulative Returns: ETF Shares, September 23, 2004–August 31, 2009 | | |
| | | Cumulative |
| | | Since |
| | One Year | Inception |
| Energy Index Fund ETF Shares Market Price | –30.45% | 59.99% |
| Energy Index Fund ETF Shares Net Asset Value | –30.49 | 59.80 |
| MSCI US IMI/Energy | –29.18 | 59.41 |
Average Annual Total Returns: Periods Ended June 30, 2009
This table presents average annual total returns through the latest calendar quarter—rather than through the end of the fiscal period. Securities and Exchange Commission rules require that we provide this information.
| | | |
| | | | Since |
| | Inception Date | One Year | Inception |
| ETF Shares | 9/23/2004 | | |
| Market Price | | –45.13% | 8.79% |
| Net Asset Value | | –45.13 | 8.80 |
| Admiral Shares1 | 10/7/2004 | –45.16 | 7.57 |
1 Total returns do not reflect the 2% fee assessed on redemptions of shares held for less than one year.
Note: See Financial Highlights tables for dividend and capital gains information.
30
Energy Index Fund
Financial Statements
Statement of Net Assets
As of August 31, 2009
The fund provides a complete list of its holdings four times in each fiscal year, at the quarter-ends. For the second and fourth fiscal quarters, the lists appear in the fund’s semiannual and annual reports to shareholders. For the first and third fiscal quarters, the fund files the lists with the Securities and Exchange Commission on Form N-Q. Shareholders can look up the fund’s Forms N-Q on the SEC’s website at www.sec.gov. Forms N-Q may also be reviewed and copied at the SEC’s Public Reference Room (see the back cover of this report for further information).
| | | |
| | | | Market |
| | | | Value• |
| | | Shares | ($000) |
| Common Stocks (100.0%) | | |
| Energy Equipment & Services (23.7%) | |
| | Oil & Gas Drilling (6.1%) | | |
| * | Transocean Ltd. | 259,144 | 19,653 |
| | Noble Corp. | 215,310 | 7,542 |
| | Diamond Offshore | | |
| | Drilling, Inc. | 59,089 | 5,284 |
| | ENSCO International, Inc. | 118,000 | 4,354 |
| * | Nabors Industries, Inc. | 244,152 | 4,317 |
| * | Pride International, Inc. | 150,761 | 3,887 |
| | Helmerich & Payne, Inc. | 91,190 | 3,051 |
| | Rowan Cos., Inc. | 105,399 | 2,183 |
| | Patterson-UTI Energy, Inc. | 147,435 | 1,959 |
| * | Unit Corp. | 46,192 | 1,728 |
| * | Atwood Oceanics, Inc. | 60,555 | 1,725 |
| * | Parker Drilling Co. | 272,975 | 1,231 |
| * | Hercules Offshore, Inc. | 229,504 | 1,056 |
| * | Pioneer Drilling Co. | 132,004 | 752 |
| * | Bronco Drilling Co., Inc. | 111,510 | 413 |
| * | Seahawk Drilling Inc. | 10,050 | 224 |
| |
| | Oil & Gas Equipment & Services (17.6%) | |
| | Schlumberger Ltd. | 1,128,716 | 63,434 |
| | Halliburton Co. | 694,090 | 16,457 |
| * | National Oilwell Varco Inc. | 327,611 | 11,909 |
| * | Weatherford | | |
| | International Ltd. | 539,132 | 10,756 |
| | Baker Hughes Inc. | 246,043 | 8,476 |
| * | Cameron International Corp. 177,038 | 6,322 |
| * | FMC Technologies Inc. | 103,875 | 4,955 |
| | Smith International, Inc. | 176,655 | 4,870 |
| | BJ Services Co. | 245,052 | 3,935 |
| * | Oceaneering | | |
| | International, Inc. | 49,565 | 2,586 |
| * | Dresser Rand Group, Inc. | 75,428 | 2,240 |
| | Core Laboratories N.V. | 20,725 | 1,921 |
| | Tidewater Inc. | 43,456 | 1,876 |
| * | SEACOR Holdings Inc. | 22,332 | 1,700 |
| * | Oil States International, Inc. | 53,892 | 1,588 |
| * | Key Energy Services, Inc. | 216,167 | 1,546 |
| * | TETRA Technologies, Inc. | 169,794 | 1,498 |
| * | Superior Energy | | |
| | Services, Inc. | 80,772 | 1,472 |
| * | Global Industries Ltd. | 149,677 | 1,422 |
| * | Dril-Quip, Inc. | 32,543 | 1,388 |
| * | Complete Production | | |
| | Services, Inc. | 143,244 | 1,289 |
| * | Exterran Holdings, Inc. | 71,300 | 1,285 |
| * | NATCO Group Inc. | 30,499 | 1,269 |
| | CARBO Ceramics Inc. | 28,517 | 1,228 |
| * | Helix Energy Solutions | | |
| | Group, Inc. | 97,773 | 1,144 |
| * | Cal Dive International, Inc. | 98,249 | 1,025 |
| * | Bristow Group, Inc. | 35,002 | 1,022 |
| * | PHI Inc. Non-Voting Shares | 48,231 | 1,006 |
| * | Allis-Chalmers Energy Inc. | 274,429 | 900 |
| * | Dawson Geophysical Co. | 33,759 | 837 |
| * | Gulfmark Offshore, Inc. | 27,050 | 807 |
| | | |
| | | | Market |
| | | | Value• |
| | | Shares | ($000) |
| | Lufkin Industries, Inc. | 18,203 | 805 |
| | Gulf Island Fabrication, Inc. | 53,045 | 794 |
| *,^ | SulphCo, Inc. | 477,711 | 759 |
| | RPC Inc. | 82,986 | 758 |
| * | Willbros Group, Inc. | 58,973 | 734 |
| * | ION Geophysical Corp. | 278,655 | 711 |
| * | Hornbeck Offshore | | |
| | Services, Inc. | 32,120 | 708 |
| * | OYO Geospace Corp. | 34,152 | 687 |
| * | Superior Well Services, Inc. | 73,402 | 663 |
| * | Matrix Service Co. | 58,956 | 650 |
| * | Tesco Corp. | 81,338 | 625 |
| * | T-3 Energy Services, Inc. | 35,043 | 616 |
| * | Newpark Resources, Inc. | 215,952 | 577 |
| * | Basic Energy Services Inc. | 68,823 | 467 |
| | | | 231,076 |
| Oil, Gas & Consumable Fuels (76.3%) | |
| | Coal & Consumable Fuels (2.6%) | |
| | Peabody Energy Corp. | 212,673 | 6,950 |
| | CONSOL Energy, Inc. | 152,622 | 5,710 |
| * | Alpha Natural | | |
| | Resources, Inc. | 122,468 | 3,957 |
| | Arch Coal, Inc. | 148,556 | 2,573 |
| | Massey Energy Co. | 86,042 | 2,330 |
| * | Patriot Coal Corp. | 150,261 | 1,331 |
| * | International Coal | | |
| | Group, Inc. | 308,506 | 938 |
| * | James River Coal Co. | 43,741 | 728 |
| * | USEC Inc. | 130,316 | 593 |
| |
| | Integrated Oil & Gas (47.2%) | |
| | ExxonMobil Corp. | 2,792,730 | 193,117 |
| | Chevron Corp. | 1,751,992 | 122,534 |
| | ConocoPhillips Co. | 1,358,104 | 61,156 |
| | Occidental Petroleum Corp. | 647,964 | 47,366 |
| | Marathon Oil Corp. | 542,520 | 16,748 |
| | Hess Corp. | 227,126 | 11,490 |
| | Murphy Oil Corp. | 146,638 | 8,358 |
| |
| | Oil & Gas Exploration & Production (21.2%) |
| | Apache Corp. | 268,005 | 22,767 |
| | Anadarko Petroleum Corp. | 400,864 | 21,194 |
| | Devon Energy Corp. | 341,490 | 20,961 |
| | XTO Energy, Inc. | 425,218 | 16,413 |
| | EOG Resources, Inc. | 194,087 | 13,974 |
| | Chesapeake Energy Corp. | 448,505 | 10,244 |
| * | Southwestern Energy Co. | 271,889 | 10,022 |
| | Noble Energy, Inc. | 134,897 | 8,156 |
| | Range Resources Corp. | 127,840 | 6,184 |
| * | Ultra Petroleum Corp. | 120,437 | 5,592 |
| * | Petrohawk Energy Corp. | 254,884 | 5,488 |
| * | Newfield Exploration Co. | 110,099 | 4,260 |
| * | Denbury Resources, Inc. | 212,909 | 3,240 |
| | Cimarex Energy Co. | 82,210 | 3,210 |
| | Cabot Oil & Gas Corp. | 90,176 | 3,179 |
| * | Plains Exploration | | |
| | & Production Co. | 116,017 | 3,045 |
| | | |
| | | | Market |
| | | | Value• |
| | | Shares | ($000) |
| | Pioneer Natural | | |
| | Resources Co. | 103,362 | 2,993 |
| * | Whiting Petroleum Corp. | 52,307 | 2,539 |
| * | EXCO Resources, Inc. | 158,949 | 2,330 |
| | St. Mary Land & | | |
| | Exploration Co. | 74,682 | 1,964 |
| * | Encore Acquisition Co. | 50,205 | 1,892 |
| * | SandRidge Energy, Inc. | 154,698 | 1,887 |
| * | Continental Resources, Inc. | 52,301 | 1,846 |
| * | Concho Resources, Inc. | 53,426 | 1,741 |
| * | Comstock Resources, Inc. | 46,212 | 1,633 |
| * | Forest Oil Corp. | 91,091 | 1,432 |
| * | Brigham Exploration Co. | 207,342 | 1,358 |
| * | Mariner Energy Inc. | 110,465 | 1,340 |
| * | Bill Barrett Corp. | 43,669 | 1,277 |
| * | Quicksilver Resources, Inc. | 116,836 | 1,264 |
| * | Swift Energy Co. | 61,077 | 1,244 |
| * | Gulfport Energy Corp. | 163,131 | 1,224 |
| * | Stone Energy Corp. | 95,662 | 1,221 |
| | Penn Virginia Corp. | 61,949 | 1,187 |
| * | Arena Resources, Inc. | 38,528 | 1,178 |
| | Berry Petroleum Class A | 51,844 | 1,170 |
| * | CNX Gas Corp. | 40,490 | 1,145 |
| * | Rosetta Resources, Inc. | 95,911 | 1,133 |
| * | McMoRan Exploration Co. | 130,219 | 1,086 |
| | Atlas America, Inc. | 47,653 | 1,057 |
| * | Goodrich Petroleum Corp. | 37,589 | 900 |
| * | Carrizo Oil & Gas, Inc. | 43,042 | 832 |
| | W&T Offshore, Inc. | 79,998 | 790 |
| * | Contango Oil & Gas Co. | 17,344 | 779 |
| * | Rex Energy Corp. | 127,630 | 761 |
| * | ATP Oil & Gas Corp. | 68,088 | 759 |
| * | PetroQuest Energy, Inc. | 161,587 | 672 |
| * | Harvest Natural | | |
| | Resources, Inc. | 124,520 | 644 |
| * | Veneco Inc. | 79,862 | 643 |
| * | Warren Resources Inc. | 246,619 | 604 |
| * | BPZ Energy, Inc. | 99,362 | 604 |
| * | Oilsands Quest, Inc. | 675,138 | 594 |
| | Vaalco Energy, Inc. | 125,850 | 594 |
| * | Petroleum | | |
| | Development Corp. | 41,821 | 573 |
| * | GMX Resources Inc. | 53,545 | 567 |
| * | Delta Petroleum Corp. | 307,916 | 554 |
| * | Approach Resources Inc. | 69,541 | 522 |
| * | Northern Oil and Gas, Inc. | 68,332 | 437 |
| * | Clayton Williams Energy, Inc. | 18,579 | 368 |
| * | Endeavor International Corp. | 242,529 | 269 |
| |
| | Oil & Gas Refining & Marketing (2.1%) | |
| | Valero Energy Corp. | 464,371 | 8,702 |
| | Sunoco, Inc. | 103,619 | 2,787 |
| | Tesoro Corp. | 122,121 | 1,719 |
| | World Fuel Services Corp. | 30,946 | 1,391 |
| | Frontier Oil Corp. | 104,359 | 1,339 |
| | Holly Corp. | 50,726 | 1,159 |
| * | CVR Energy, Inc. | 100,423 | 972 |
| * | Clean Energy Fuels Corp. | 73,629 | 922 |
| * | Western Refining, Inc. | 82,563 | 501 |
| | Delek US Holdings, Inc. | 49,543 | 401 |
| | Alon USA Energy, Inc. | 33,136 | 312 |
| |
| | Oil & Gas Storage & Transportation (3.2%) |
| | Spectra Energy Corp. | 492,283 | 9,265 |
| | Williams Cos., Inc. | 472,332 | 7,765 |
| | El Paso Corp. | 593,686 | 5,480 |
31
Energy Index Fund
| | | |
| | | | Market |
| | | | Value• |
| | | Shares | ($000) |
| * | Kinder Morgan | | |
| | Management, LLC | 63,148 | 2,989 |
| | Southern Union Co. | 111,900 | 2,220 |
| | Overseas Shipholding | | |
| | Group Inc. | 34,993 | 1,238 |
| | Crosstex Energy, Inc. | 245,832 | 941 |
| * | Enbridge Energy | | |
| | Management LLC | 21,149 | 891 |
| | General Maritime Corp. | 87,368 | 694 |
| * | Cheniere Energy, Inc. | 132,110 | 363 |
| | | | 745,466 |
| Total Common Stocks | | |
| (Cost $1,031,756) | | 976,542 |
| Temporary Cash Investment (0.0%) | |
| Money Market Fund (0.0%) | | |
| 1,2 | Vanguard Market | | |
| | Liquidity Fund, 0.277% | | |
| | (Cost $249) | 248,600 | 249 |
| Total Investments (100.0%) | | |
| (Cost $1,032,005) | | 976,791 |
| Other Assets and Liabilities (0.0%) | |
| Other Assets | | 4,521 |
| Liabilities2 | | (4,301) |
| | | | 220 |
| Net Assets (100%) | | 977,011 |
| |
| At August 31, 2009, net assets consisted of: |
| | Amount |
| | ($000) |
| Paid-in Capital | 1,108,733 |
| Undistributed Net Investment Income | 10,269 |
| Accumulated Net Realized Losses | (86,777) |
| Unrealized Appreciation (Depreciation) | (55,214) |
| Net Assets | 977,011 |
| |
| |
| Admiral Shares—Net Assets | |
| Applicable to 2,885,656 outstanding | |
| $.001 par value shares of beneficial | |
| interest (unlimited authorization) | 107,744 |
| Net Asset Value Per Share— | |
| Admiral Shares | $37.34 |
| |
| |
| ETF Shares—Net Assets | |
| Applicable to 11,630,703 outstanding | |
| $.001 par value shares of beneficial | |
| interest (unlimited authorization) | 869,267 |
| Net Asset Value Per Share— | |
| ETF Shares | $74.74 |
• See Note A in Notes to Financial Statements.
* Non-income-producing security.
^ Part of security position is on loan to broker-dealers. The total value of securities on loan is $198,000.
1 Affiliated money market fund available only to Vanguard funds and certain trusts and accounts managed by Vanguard. Rate shown is the 7-day yield.
2 Includes $249,000 of collateral received for securities on loan.
See accompanying Notes, which are an integral part of the Financial Statements.
32
Energy Index Fund
Statement of Operations
| |
| | Year Ended |
| August 31, 2009 |
| | ($000) |
| Investment Income | |
| Income | |
| Dividends | 15,691 |
| Interest1 | 5 |
| Security Lending | 85 |
| Total Income | 15,781 |
| Expenses | |
| The Vanguard Group—Note B | |
| Investment Advisory Services | 91 |
| Management and Administrative— | |
| Admiral Shares | 218 |
| Management and Administrative— | |
| ETF Shares | 1,138 |
| Marketing and Distribution— | |
| Admiral Shares | 27 |
| Marketing and Distribution— | |
| ETF Shares | 211 |
| Custodian Fees | 13 |
| Auditing Fees | 24 |
| Shareholders’ Reports and Proxies— | |
| Admiral Shares | 1 |
| Shareholders’ Reports and Proxies— | |
| ETF Shares | 175 |
| Trustees’ Fees and Expenses | 1 |
| Total Expenses | 1,899 |
| Net Investment Income | 13,882 |
| Realized Net Gain (Loss) on | |
| Investment Securities Sold | (45,410) |
| Change in Unrealized Appreciation | |
| (Depreciation) of Investment Securities | (235,527) |
| Net Increase (Decrease) in Net Assets | |
| Resulting from Operations | (267,055) |
Statement of Changes in Net Assets
| | |
| | Year Ended August 31, |
| | 2009 | 2008 |
| | ($000) | ($000) |
| Increase (Decrease) in Net Assets | | |
| Operations | | |
| Net Investment Income | 13,882 | 9,456 |
| Realized Net Gain (Loss) | (45,410) | 52,425 |
| Change in Unrealized Appreciation (Depreciation) | (235,527) | 11,906 |
| Net Increase (Decrease) in Net Assets Resulting from Operations | (267,055) | 73,787 |
| Distributions | | |
| Net Investment Income | | |
| Admiral Shares | (1,381) | (1,147) |
| ETF Shares | (9,252) | (6,303) |
| Realized Capital Gain | | |
| Admiral Shares | — | — |
| ETF Shares | — | — |
| Total Distributions | (10,633) | (7,450) |
| Capital Share Transactions | | |
| Admiral Shares | 4,816 | 24,896 |
| ETF Shares | 256,766 | 130,701 |
| Net Increase (Decrease) from Capital Share Transactions | 261,582 | 155,597 |
| Total Increase (Decrease) | (16,106) | 221,934 |
| Net Assets | | |
| Beginning of Period | 993,117 | 771,183 |
| End of Period2 | 977,011 | 993,117 |
1 Interest income from an affiliated company of the fund was $5,000.
2 Net Assets—End of Period includes undistributed net investment income of $10,269,000 and $7,020,000.
See accompanying Notes, which are an integral part of the Financial Statements.
33
Energy Index Fund
Financial Highlights
| | | | | |
| Admiral Shares | | | | | |
| | | | | | Oct. 7, |
| | | | | | 20041 to |
| | | | Year Ended August 31, | Aug. 31, |
| For a Share Outstanding Throughout Each Period | 2009 | 2008 | 2007 | 2006 | 2005 |
| Net Asset Value, Beginning of Period | $54.66 | $50.36 | $40.36 | $36.29 | $25.98 |
| Investment Operations | | | | | |
| Net Investment Income | .578 | .504 | .5012 | .4602 | .5882,3 |
| Net Realized and Unrealized Gain (Loss) | | | | | |
| on Investments | (17.335) | 4.246 | 9.944 | 3.960 | 9.833 |
| Total from Investment Operations | (16.757) | 4.750 | 10.445 | 4.420 | 10.421 |
| Distributions | | | | | |
| Dividends from Net Investment Income | (.563) | (.450) | (.445) | (.350) | (.111) |
| Distributions from Realized Capital Gains | — | — | — | — | — |
| Total Distributions | (.563) | (.450) | (.445) | (.350) | (.111) |
| Net Asset Value, End of Period | $37.34 | $54.66 | $50.36 | $40.36 | $36.29 |
| |
| Total Return4 | –30.51% | 9.42% | 26.03% | 12.27% | 40.27% |
| |
| Ratios/Supplemental Data | | | | | |
| Net Assets, End of Period (Millions) | $108 | $148 | $115 | $83 | $60 |
| Ratio of Total Expenses to | | | | | |
| Average Net Assets | 0.28% | 0.25% | 0.26% | 0.28% | 0.28%5 |
| Ratio of Net Investment Income to | | | | | |
| Average Net Assets | 1.81% | 0.99% | 1.16% | 1.20% | 1.95%3,5 |
| Portfolio Turnover Rate6 | 25% | 11% | 15% | 21% | 16% |
1 Inception.
2 Calculated based on average shares outstanding.
3 Net investment income per share and the ratio of net investment income to average net assets include $.163 and 0.52%, respectively,
resulting from a cash payment received in connection with the merger of Chevron Corp. and Unocal Corp. in August 2005.
4 Total returns do not reflect the 2% fee assessed on redemptions of shares held for less than one year.
5 Annualized.
6 Excludes the value of portfolio securities received or delivered as a result of in-kind purchases or redemptions of the fund’s capital shares,
including ETF Creation Units.
See accompanying Notes, which are an integral part of the Financial Statements.
34
Energy Index Fund
Financial Highlights
| | | | | |
| ETF Shares | | | | | |
| | | | | | Sept. 23, |
| | | | | | 20041 to |
| | | | Year Ended August 31, | Aug. 31, |
| For a Share Outstanding Throughout Each Period | 2009 | 2008 | 2007 | 2006 | 2005 |
| Net Asset Value, Beginning of Period | $109.54 | $100.92 | $80.90 | $72.72 | $49.24 |
| Investment Operations | | | | | |
| Net Investment Income | 1.191 | 1.059 | 1.0802 | .9662 | 1.1692,3 |
| Net Realized and Unrealized Gain (Loss) | | | | | |
| on Investments | (34.808) | 8.501 | 19.869 | 7.915 | 22.527 |
| Total from Investment Operations | (33.617) | 9.560 | 20.949 | 8.881 | 23.696 |
| Distributions | | | | | |
| Dividends from Net Investment Income | (1.183) | (.940) | (.929) | (.701) | (.216) |
| Distributions from Realized Capital Gains | — | — | — | — | — |
| Total Distributions | (1.183) | (.940) | (.929) | (.701) | (.216) |
| Net Asset Value, End of Period | $74.74 | $109.54 | $100.92 | $80.90 | $72.72 |
| |
| Total Return | –30.49% | 9.47% | 26.09% | 12.31% | 48.29% |
| |
| Ratios/Supplemental Data | | | | | |
| Net Assets, End of Period (Millions) | $869 | $845 | $656 | $340 | $182 |
| Ratio of Total Expenses to | | | | | |
| Average Net Assets | 0.25% | 0.20% | 0.22% | 0.25% | 0.26%4 |
| Ratio of Net Investment Income to | | | | | |
| Average Net Assets | 1.84% | 1.04% | 1.20% | 1.23% | 1.97%3,4 |
| Portfolio Turnover Rate5 | 25% | 11% | 15% | 21% | 16% |
1 Inception.
2 Calculated based on average shares outstanding.
3 Net investment income per share and the ratio of net investment income to average net assets include $.324 and 0.52%, respectively,
resulting from a cash payment received in connection with the merger of Chevron Corp. and Unocal Corp. in August 2005.
4 Annualized.
5 Excludes the value of portfolio securities received or delivered as a result of in-kind purchases or redemptions of the fund’s capital shares,
including ETF Creation Units.
See accompanying Notes, which are an integral part of the Financial Statements.
35
Energy Index Fund
Notes to Financial Statements
Vanguard Energy Index Fund is registered under the Investment Company Act of 1940 as an open-end investment company, or mutual fund. The fund offers two classes of shares: Admiral Shares and ETF Shares. Admiral Shares are available to any investor who meets the fund’s minimum purchase requirements. ETF Shares are listed for trading on the NYSE Arca, Inc.; they can be purchased and sold through a broker.
A. The following significant accounting policies conform to generally accepted accounting principles for U.S. mutual funds. The fund consistently follows such policies in preparing its financial statements.
1. Security Valuation: Securities are valued as of the close of trading on the New York Stock Exchange (generally 4 p.m., Eastern time) on the valuation date. Equity securities are valued at the latest quoted sales prices or official closing prices taken from the primary market in which each security trades; such securities not traded on the valuation date are valued at the mean of the latest quoted bid and asked prices. Securities for which market quotations are not readily available, or whose values have been materially affected by events occurring before the fund’s pricing time but after the close of the securities’ primary markets, are valued by methods deemed by the board of trustees to represent fair value. Investments in Vanguard Market Liquidity Fund are valued at that fund’s net asset value.
2. Federal Income Taxes: The fund intends to continue to qualify as a regulated investment company and distribute all of its taxable income. Management has analyzed the fund’s tax positions taken for all open federal income tax years (August 31, 2006–2009), and has concluded that no provision for federal income tax is required in the fund’s financial statements.
3. Distributions: Distributions to shareholders are recorded on the ex-dividend date.
4. Security Lending: The fund may lend its securities to qualified institutional borrowers to earn additional income. Security loans are required to be secured at all times by collateral at least equal to the market value of securities loaned. The fund invests cash collateral received in Vanguard Market Liquidity Fund, and records a liability for the return of the collateral, during the period the securities are on loan. Security lending income represents the income earned on investing cash collateral, less expenses associated with the loan.
5. Other: Dividend income is recorded on the ex-dividend date. Interest income includes income distributions received from Vanguard Market Liquidity Fund and is accrued daily. Security transactions are accounted for on the date securities are bought or sold. Costs used to determine realized gains (losses) on the sale of investment securities are those of the specific securities sold. Fees assessed on redemptions of capital shares are credited to paid-in capital.
Each class of shares has equal rights as to assets and earnings, except that each class separately bears certain class-specific expenses related to maintenance of shareholder accounts (included in Management and Administrative expenses), shareholder reporting, and proxies. Marketing and distribution expenses are allocated to each class of shares based on a method approved by the board of trustees. Income, other non-class-specific expenses, and gains and losses on investments are allocated to each class of shares based on its relative net assets.
B. The Vanguard Group furnishes at cost investment advisory, corporate management, administrative, marketing, and distribution services. The costs of such services are allocated to the fund under methods approved by the board of trustees. The fund has committed to provide up to 0.40% of its net assets in capital contributions to Vanguard. At August 31, 2009, the fund had contributed capital of $214,000 to Vanguard (included in Other Assets), representing 0.02% of the fund’s net assets and 0.09% of Vanguard’s capitalization. The fund’s trustees and officers are also directors and officers of Vanguard.
C. Various inputs may be used to determine the value of the fund’s investments. These inputs are summarized in three broad levels for financial statement purposes. The inputs or methodologies used to value securities are not necessarily an indication of the risk associated with investing in those securities.
Level 1—Quoted prices in active markets for identical securities.
Level 2—Other significant observable inputs (including quoted prices for similar securities, interest rates, prepayment speeds, credit risk, etc.).
Level 3—Significant unobservable inputs (including the fund’s own assumptions used to determine the fair value of investments).
At August 31, 2009, 100% of the fund’s investments were valued based on Level 1 inputs.
36
Energy Index Fund
D. Distributions are determined on a tax basis and may differ from net investment income and realized capital gains for financial reporting purposes. Differences may be permanent or temporary. Permanent differences are reclassified among capital accounts in the financial statements to reflect their tax character. Temporary differences arise when certain items of income, expense, gain, or loss are recognized in different periods for financial statement and tax purposes; these differences will reverse at some time in the future. Differences in classification may also result from the treatment of short-term gains as ordinary income for tax purposes.
During the year ended August 31, 2009, the fund realized $28,252,000 of net capital gains resulting from in-kind redemptions—in which shareholders exchanged fund shares for securities held by the fund rather than for cash. Because such gains are not taxable to the fund, and are not distributed to shareholders, they have been reclassified from accumulated net realized losses to paid-in capital.
For tax purposes, at August 31, 2009, the fund had $10,882,000 of ordinary income available for distribution. The fund had available capital loss carryforwards totaling $24,215,000 to offset future net capital gains of $5,000 through August 31, 2013, $789,000 through August 31, 2014, $461,000 through August 31, 2015, $1,694,000 through August 31, 2016, and $21,266,000 through August 31, 2017. In addition, the fund realized losses of $62,562,000 during the period from November 1, 2008, through August 31, 2009, which are deferred and will be treated as realized for tax purposes in fiscal 2010.
At August 31, 2009, the cost of investment securities for tax purposes was $1,032,005,000. Net unrealized depreciation of investment securities for tax purposes was $55,214,000, consisting of unrealized gains of $43,674,000 on securities that had risen in value since their purchase and $98,888,000 in unrealized losses on securities that had fallen in value since their purchase.
E. During the year ended August 31, 2009, the fund purchased $564,897,000 of investment securities and sold $293,047,000 of investment securities, other than temporary cash investments.
F. Capital share transactions for each class of shares were:
| | | | |
| | | | Year Ended August 31, |
| | | 2009 | | 2008 |
| | Amount | Shares | Amount | Shares |
| | ($000) | (000) | ($000) | (000) |
| Admiral Shares | | | | |
| Issued | 40,669 | 1,162 | 58,522 | 1,041 |
| Issued in Lieu of Cash Distributions | 1,181 | 36 | 1,022 | 18 |
| Redeemed1 | (37,034) | (1,022) | (34,648) | (630) |
| Net Increase (Decrease)—Admiral Shares | 4,816 | 176 | 24,896 | 429 |
| ETF Shares | | | | |
| Issued | 350,914 | 5,017 | 261,143 | 2,311 |
| Issued in Lieu of Cash Distributions | — | — | — | — |
| Redeemed1 | (94,148) | (1,100) | (130,442) | (1,100) |
| Net Increase (Decrease)—ETF Shares | 256,766 | 3,917 | 130,701 | 1,211 |
| 1 Net of redemption fees for fiscal 2009 and 2008 of $243,000 and $241,000, respectively (fund totals). | | |
G. In preparing the financial statements as of August 31, 2009, management considered the impact of subsequent events occurring through October 15, 2009, for potential recognition or disclosure in these financial statements.
37
Financials Index Fund
Fund Profile
As of August 31, 2009
| | | |
| Portfolio Characteristics | | |
| | | Target | Broad |
| | Fund | Index1 | Index2 |
| Number of Stocks | 503 | 502 | 2,501 |
| Median Market Cap | $20.9B | $20.9B | $27.3B |
| Price/Earnings Ratio | 82.2x | 82.0x | 25.6x |
| Price/Book Ratio | 1.2x | 1.2x | 2.1x |
| Yield3 | | 1.7% | 1.9% |
| Admiral Shares | 2.0% | | |
| ETF Shares | 2.0% | | |
| Return on Equity | 13.2% | 13.2% | 19.3% |
| Earnings Growth Rate | –10.5% | –10.5% | 9.9% |
| Foreign Holdings | 0.0% | 0.0% | 0.0% |
| Turnover Rate | 17% | — | — |
| Expense Ratio4 | | — | — |
| Admiral Shares | 0.28% | | |
| ETF Shares | 0.25% | | |
| Short-Term Reserves | 0.0% | — | — |
| | |
| Volatility Measures5 | |
| | Fund Versus | Fund Versus |
| | Target Index1 | Broad Index2 |
| R-Squared | 1.00 | 0.78 |
| Beta | 1.00 | 1.44 |
| |
| Industry Diversification (% of equity exposure) |
| |
| Asset Management & Custody Banks | 8.3% |
| Consumer Finance | 4.0 |
| Diversified Banks | 9.4 |
| Insurance Brokers | 1.8 |
| Investment Banking & Brokerage | 8.7 |
| Life & Health Insurance | 6.1 |
| Mortgage REITs | 1.1 |
| Multiline Insurance | 2.2 |
| Office REITs | 1.9 |
| Other Diversified Financial Services | 21.0 |
| Property & Casualty Insurance | 10.5 |
| Regional Banks | 8.4 |
| Reinsurance | 1.8 |
| Residential REITs | 1.6 |
| Retail REITs | 2.7 |
| Specialized Finance | 2.6 |
| Specialized REITs | 3.5 |
| Thrifts & Mortgage Finance | 2.0 |
| Other Financials | 2.4 |
| |
| Ten Largest Holdings6 (% of total net assets) |
| |
| JPMorgan Chase & Co. | 9.2% |
| Bank of America Corp. | 8.6 |
| Wells Fargo & Co. | 6.8 |
| The Goldman Sachs Group, Inc. | 4.5 |
| Citigroup Inc. | 3.2 |
| U.S. Bancorp | 2.4 |
| Berkshire Hathaway Inc. Class B | 2.1 |
| American Express Co. | 2.0 |
| Bank of New York Mellon Corp. | 2.0 |
| Morgan Stanley | 1.9 |
| Top Ten | 42.7% |
1 MSCI US IMI/Financials.
2 MSCI US IMI/2500.
3 30-day SEC yield for the fund; annualized dividend yield for the indexes. See the Glossary.
4 The expense ratios shown are from the prospectuses dated December 29, 2008, and represent estimated costs for the current fiscal year based on the fund’s net assets as of the prospectus date. For the fiscal
year ended August 31, 2009, the expense ratios were 0.28% for Admiral Shares and 0.25% for ETF Shares.
5 For an explanation of R-squared, beta, and other terms used here, see the Glossary.
6 The holdings listed exclude any temporary cash investments and equity index products.
38
Financials Index Fund
Performance Summary
All of the returns in this report represent past performance, which is not a guarantee of future results that may be achieved by the fund. (Current performance may be lower or higher than the performance data cited. For performance data current to the most recent month-end, visit our website at www.vanguard.com/performance.) Note, too, that both investment returns and principal value can fluctuate widely, so an investor’s shares, when sold, could be worth more or less than their original cost. The returns shown do not reflect taxes that a shareholder would pay on fund distributions or on the sale of fund shares.
Cumulative Performance: January 26, 2004–August 31, 2009
Initial Investment of $10,000
| | | | |
| | | Average Annual Total Returns | |
| | | Periods Ended August 31, 2009 | Final Value |
| | | | Since | of a $10,000 |
| | One Year | Five Years | Inception1 | Investment |
| Financials Index Fund ETF Shares | | | | |
| Net Asset Value2 | –25.31% | –7.88% | –7.05% | $6,642 |
| Financials Index Fund ETF Shares | | | | |
| Market Price | –25.16 | –7.83 | –7.04 | 6,646 |
| MSCI US IMI/2500 | –18.26 | 1.36 | 0.52 | 10,295 |
| MSCI US IMI/Financials | –25.67 | –7.86 | –7.01 | 6,658 |
| | | | |
| | | | | Final Value |
| | | | Since | of a $100,000 |
| | One Year | Five Years | Inception1 | Investment |
| Financials Index Fund Admiral Shares3 | –25.35% | 7.91% | –6.83% | $67,413 |
| MSCI US IMI/2500 | –18.26 | 1.36 | 1.04 | 105,926 |
| MSCI US IMI/Financials | –25.67 | –7.86 | –6.76 | 67,698 |
1 Performance for the fund and its comparative standards is calculated since the following inception dates: January 26, 2004, for ETF Shares; February 4, 2004, for Admiral Shares.
2 For more information about how the ETF Shares’ market prices have compared with their net asset value, visit www.vanguard.com, select your ETF, and then select the Performance tab. The Premium/Discount
table there shows the percentages of days on which the ETF Shares’ market price was above or below the NAV.
3 Total returns do not reflect the 2% fee assessed on redemptions of shares held for less than one year.
Note: See Financial Highlights tables for dividend and capital gains information.
39
Financials Index Fund
Fiscal-Year Total Returns (%): January 26, 2004–August 31, 2009
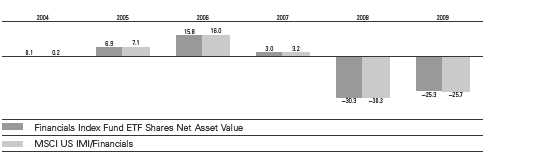
| | | |
| Cumulative Returns: ETF Shares, January 26, 2004–August 31, 2009 | | |
| | | | Cumulative |
| | | | Since |
| | One Year | Five Years | Inception |
| Financials Index Fund ETF Shares Market Price | –25.16% | –33.49% | –33.54% |
| Financials Index Fund ETF Shares Net Asset Value | –25.31 | –33.66 | –33.58 |
| MSCI US IMI/Financials | –25.67 | –33.57 | –33.42 |
Average Annual Total Returns: Periods Ended June 30, 2009
This table presents average annual total returns through the latest calendar quarter—rather than through the end of
the fiscal period. Securities and Exchange Commission rules require that we provide this information.
| | | | |
| | | | | Since |
| | Inception Date | One Year | Five Years | Inception |
| ETF Shares | 1/26/2004 | | | |
| Market Price | | –34.60% | –11.19% | –10.62% |
| Net Asset Value | | –34.58 | –11.78 | –10.61 |
| Admiral Shares1 | 2/4/2004 | –34.55 | –11.19 | –10.40 |
1 Total returns do not reflect the 2% fee assessed on redemptions of shares held for less than one year.
Note: See Financial Highlights tables for dividend and capital gains information.
40
Financials Index Fund
Financial Statements
Statement of Net Assets
As of August 31, 2009
The fund provides a complete list of its holdings four times in each fiscal year, at the quarter-ends. For the second and fourth fiscal quarters, the lists appear in the fund’s semiannual and annual reports to shareholders. For the first and third fiscal quarters, the fund files the lists with the Securities and Exchange Commission on Form N-Q. Shareholders can look up the fund’s Forms N-Q on the SEC’s website at www.sec.gov. Forms N-Q may also be reviewed and copied at the SEC’s Public Reference Room (see the back cover of this report for further information).
| | | |
| | | | Market |
| | | | Value• |
| | | Shares | ($000) |
| Common Stocks (100.1%) | | |
| Capital Markets (17.0%) | | |
| | The Goldman Sachs | | |
| | Group, Inc. | 176,059 | 29,131 |
| | Bank of New York | | |
| | Mellon Corp. | 439,891 | 13,025 |
| | Morgan Stanley | 433,409 | 12,551 |
| | State Street Corp. | 178,985 | 9,393 |
| | Charles Schwab Corp. | 362,969 | 6,555 |
| | Franklin Resources, Inc. | 59,770 | 5,578 |
| | Northern Trust Corp. | 79,082 | 4,623 |
| | T. Rowe Price Group Inc. | 94,082 | 4,264 |
| | Invesco, Ltd. | 151,449 | 3,143 |
| | Ameriprise Financial, Inc. | 93,875 | 2,819 |
| * | TD Ameritrade Holding Corp. | 96,697 | 1,860 |
| | BlackRock, Inc. | 7,811 | 1,559 |
| | Legg Mason Inc. | 52,045 | 1,497 |
| | Eaton Vance Corp. | 40,544 | 1,158 |
| * | Affiliated Managers | | |
| | Group, Inc. | 15,212 | 994 |
| | SEI Investments Co. | 49,192 | 907 |
| | Federated Investors, Inc. | 34,040 | 894 |
| * | Jefferies Group, Inc. | 37,762 | 893 |
| | Janus Capital Group Inc. | 66,300 | 843 |
| | Waddell & Reed | | |
| | Financial, Inc. | 31,397 | 833 |
| | Raymond James | | |
| | Financial, Inc. | 36,213 | 824 |
| * | E*TRADE Financial Corp. | 388,679 | 684 |
| * | Knight Capital Group, Inc. | | |
| | Class A | 32,590 | 656 |
| | Greenhill & Co., Inc. | 7,276 | 576 |
| | Apollo Investment Corp. | 58,926 | 546 |
| * | Stifel Financial Corp. | 9,056 | 510 |
| * | Investment Technology | | |
| | Group, Inc. | 16,013 | 395 |
| | Ares Capital Corp. | 40,121 | 373 |
| * | Piper Jaffray Cos., Inc. | 7,020 | 356 |
| * | KBW Inc. | 11,626 | 333 |
| * | MF Global Ltd. | 37,955 | 271 |
| | optionsXpress Holdings Inc. | 15,987 | 266 |
| | American Capital Ltd. | 101,640 | 252 |
| | Allied Capital Corp. | 66,510 | 199 |
| | GFI Group Inc. | 26,377 | 189 |
| | Prospect Energy Corp. | 17,506 | 179 |
| * | Riskmetrics Group Inc. | 11,304 | 176 |
| | BlackRock Kelso | | |
| | Capital Corp. | 20,685 | 164 |
| * | Broadpoint Gleacher | | |
| | Securities Inc. | 21,665 | 164 |
| | SWS Group, Inc. | 9,238 | 134 |
| | Evercore Partners Inc. | 5,238 | 132 |
| | Cohen & Steers, Inc. | 6,217 | 122 |
| | Duff & Phelps Corp. | 7,095 | 121 |
| | Hercules Technology | | |
| | Growth Capital, Inc. | 12,213 | 113 |
| * | TradeStation Group, Inc. | 12,715 | 91 |
| * | FBR Capital Markets Corp. | 16,274 | 88 |
| | | | |
| | �� | | | Market |
| | | | | Value• |
| | | | Shares | ($000) |
| | Gamco Investors Inc. | | | |
| | Class A | | 1,853 | 84 |
| | Calamos Asset | | | |
| | Management, Inc. | | 7,209 | 81 |
| | Westwood Holdings | | | |
| | Group, Inc. | | 2,062 | 79 |
| | MVC Capital, Inc. | | 8,080 | 74 |
| | Capital Southwest Corp. | 952 | 72 |
| * | LaBranche & Co. Inc. | | 18,257 | 70 |
| | BGC Partners, Inc. | | 15,553 | 70 |
| * | Penson Worldwide, Inc. | 5,283 | 54 |
| | NGP Capital Resources Co. | 7,916 | 51 |
| * | FCStone Group, Inc. | | 9,755 | 47 |
| * | Thomas Weisel Partners | | |
| | Group, Inc. | | 7,000 | 31 |
| | | | | 111,147 |
| Commercial Banks (17.8%) | | |
| | Wells Fargo & Co. | 1,610,723 | 44,327 |
| | U.S. Bancorp | | 698,675 | 15,804 |
| | BB&T Corp. | | 251,062 | 7,015 |
| | PNC Financial | | | |
| | Services Group | | 163,814 | 6,977 |
| | SunTrust Banks, Inc. | | 171,151 | 4,000 |
| | Fifth Third Bancorp | | 278,211 | 3,044 |
| | Regions Financial Corp. | 403,388 | 2,364 |
| | KeyCorp | | 287,029 | 1,912 |
| | M & T Bank Corp. | | 27,969 | 1,727 |
| | Comerica, Inc. | | 55,613 | 1,483 |
| * | First Horizon National Corp. | 79,121 | 1,059 |
| | Cullen/Frost Bankers, Inc. | 19,686 | 970 |
| | Huntington Bancshares Inc. | 200,103 | 912 |
| | Marshall & Ilsley Corp. | | 123,323 | 878 |
| | Commerce Bancshares, Inc. | 23,839 | 876 |
| | Zions Bancorp | | 40,306 | 712 |
| | Bank of Hawaii Corp. | | 17,619 | 695 |
| | BancorpSouth, Inc. | | 27,740 | 638 |
| | City National Corp. | | 15,880 | 627 |
| | TCF Financial Corp. | | 42,593 | 586 |
| | Valley National Bancorp | 49,786 | 581 |
| | Westamerica | | | |
| | Bancorporation | | 10,727 | 552 |
| | FirstMerit Corp. | | 30,375 | 546 |
| | Prosperity Bancshares, Inc. | 15,367 | 531 |
| * | SVB Financial Group | | 12,224 | 486 |
| | Fulton Financial Corp. | | 64,763 | 475 |
| | Associated Banc-Corp. | | 44,697 | 464 |
| | UMB Financial Corp. | | 11,229 | 449 |
| * | Signature Bank | | 14,674 | 445 |
| | BOK Financial Corp. | | 8,755 | 396 |
| | CapitalSource Inc. | | 95,266 | 394 |
| | Synovus Financial Corp. | 104,222 | 386 |
| | PrivateBancorp, Inc. | | 15,103 | 364 |
| | Wilmington Trust Corp. | 25,712 | 361 |
| | Trustmark Corp. | | 17,923 | 341 |
| | IBERIABANK Corp. | | 7,005 | 339 |
| | Glacier Bancorp, Inc. | | 22,746 | 339 |
| | Hancock Holding Co. | | 8,784 | 337 |
| | Umpqua Holdings Corp. | 30,941 | 319 |
| | | |
| | | | Market |
| | | | Value• |
| | | Shares | ($000) |
| | First Financial | | |
| | Bankshares, Inc. | 6,172 | 308 |
| | United Bankshares, Inc. | 15,309 | 301 |
| | International | | |
| | Bancshares Corp. | 19,088 | 295 |
| | F.N.B. Corp. | 40,940 | 290 |
| | NBT Bancorp, Inc. | 12,677 | 286 |
| | Old National Bancorp | 24,643 | 262 |
| | Webster Financial Corp. | 19,539 | 255 |
| | Park National Corp. | 4,130 | 247 |
| | East West Bancorp, Inc. | 26,741 | 246 |
| | Wintrust Financial Corp. | 8,801 | 244 |
| | Sterling Bancshares, Inc. | 29,780 | 237 |
| | First Citizens BancShares | | |
| | Class A | 1,631 | 226 |
| | Whitney Holdings Corp. | 25,039 | 226 |
| | Community Bank | | |
| | System, Inc. | 12,148 | 217 |
| | CVB Financial Corp. | 30,630 | 215 |
| | Popular, Inc. | 99,194 | 213 |
| * | Texas Capital | | |
| | Bancshares, Inc. | 12,388 | 205 |
| | PacWest Bancorp | 10,262 | 202 |
| | City Holding Co. | 5,974 | 190 |
| | Susquehanna | | |
| | Bancshares, Inc. | 32,077 | 187 |
| | First Midwest Bancorp, Inc. | 17,958 | 184 |
| * | Investors Bancorp, Inc. | 19,324 | 179 |
| | First Commonwealth | | |
| | Financial Corp. | 28,217 | 174 |
| | MB Financial, Inc. | 12,337 | 171 |
| * | Pinnacle Financial | | |
| | Partners, Inc. | 11,268 | 170 |
| | Chemical Financial Corp. | 7,889 | 165 |
| | Columbia Banking | | |
| | System, Inc. | 9,998 | 164 |
| | Independent Bank Corp. (MA) | 7,005 | 162 |
| | National Penn | | |
| | Bancshares Inc. | 28,234 | 158 |
| | Cathay General Bancorp | 16,449 | 152 |
| * | Western Alliance Bancorp | 20,139 | 148 |
| | First Financial Bancorp | 16,432 | 139 |
| | Community Trust Bancorp Inc. | 4,740 | 127 |
| | WesBanco, Inc. | 8,413 | 123 |
| | Bank of the Ozarks, Inc. | 4,947 | 123 |
| | S & T Bancorp, Inc. | 8,608 | 119 |
| | Boston Private Financial | | |
| | Holdings, Inc. | 23,608 | 119 |
| | SCBT Financial Corp. | 4,587 | 118 |
| | Oriental Financial Group Inc. | 8,641 | 117 |
| | StellarOne Corp. | 8,347 | 117 |
| | Simmons First National Corp. | 4,106 | 116 |
| | Renasant Corp. | 7,379 | 112 |
| | Univest Corp. of Pennsylvania | 5,386 | 112 |
| | First Financial Corp. (IN) | 3,609 | 109 |
| | Tompkins Trustco, Inc. | 2,464 | 108 |
| | The South Financial | | |
| | Group, Inc. | 59,324 | 104 |
| | Home Bancshares Inc. | 5,068 | 103 |
| | Suffolk Bancorp | 3,528 | 102 |
| | Arrow Financial Corp. | 3,690 | 100 |
| * | United Community Banks, Inc. | 14,570 | 98 |
| | Southside Bancshares, Inc. | 4,534 | 98 |
| | Sandy Spring Bancorp, Inc. | 6,128 | 96 |
| | First Bancorp (NC) | 5,428 | 95 |
| | TowneBank | 7,503 | 95 |
| | First BanCorp Puerto Rico | 29,406 | 94 |
41
Financials Index Fund
| | | |
| | | | Market |
| | | | Value• |
| | | Shares | ($000) |
| | S.Y. Bancorp, Inc. | 4,215 | 94 |
| | Northfield Bancorp, Inc. | 7,432 | 91 |
| | Washington Trust | | |
| | Bancorp, Inc. | 5,205 | 91 |
| | Harleysville National Corp. | 15,210 | 88 |
| | Lakeland Financial Corp. | 4,304 | 86 |
| | First Source Corp. | 5,257 | 85 |
| | Camden National Corp. | 2,625 | 85 |
| | TriCo Bancshares | 4,948 | 84 |
| | BancFirst Corp. | 2,246 | 82 |
| | Cardinal Financial Corp. | 10,168 | 80 |
| | Union Bankshares Corp. | 4,770 | 80 |
| | Republic Bancorp, Inc. | | |
| | Class A | 3,670 | 78 |
| | Nara Bancorp, Inc. | 8,474 | 74 |
| | Lakeland Bancorp, Inc. | 7,784 | 69 |
| | Great Southern Bancorp, Inc. | 3,224 | 68 |
| | Southwest Bancorp, Inc. | 5,220 | 67 |
| | First Community | | |
| | Bancshares, Inc. | 5,385 | 67 |
| | Heartland Financial USA, Inc. | 4,320 | 65 |
| | First Busey Corp. | 10,394 | 65 |
| | Citizens & Northern Corp. | 3,308 | 60 |
| | Wilshire Bancorp Inc. | 7,038 | 58 |
| | Capital City Bank Group, Inc. | 3,799 | 56 |
| | CoBiz Inc. | 11,584 | 55 |
| | First Merchants Corp. | 7,509 | 53 |
| | UCBH Holdings, Inc. | 39,768 | 52 |
| | Ames National Corp. | 2,148 | 52 |
| | Sterling Bancorp | 6,299 | 48 |
| | Mainsource Financial | | |
| | Group, Inc. | 7,086 | 46 |
| | Pacific Capital Bancorp | 17,016 | 41 |
| | Sterling Financial Corp. | 19,497 | 41 |
| * | Citizens Banking Corp. | 48,075 | 36 |
| * | Sun Bancorp, Inc. (NJ) | 5,493 | 31 |
| | Central Pacific Financial Co. | 10,568 | 29 |
| | Greene County Bancshares | 4,238 | 26 |
| | Capitol Bancorp Ltd. | 5,372 | 25 |
| | Old Second Bancorp, Inc. | 4,538 | 25 |
| * | Hanmi Financial Corp. | 13,704 | 21 |
| | Banner Corp. | 4,471 | 14 |
| ^ | Frontier Financial Corp. | 17,252 | 13 |
| | | | 116,315 |
| Consumer Finance (4.0%) | | |
| | American Express Co. | 386,840 | 13,083 |
| | Capital One Financial Corp. | 166,367 | 6,204 |
| | Discover Financial Services | 197,832 | 2,720 |
| * | SLM Corp. | 172,114 | 1,532 |
| * | AmeriCredit Corp. | 48,635 | 839 |
| | Cash America | | |
| | International Inc. | 10,738 | 301 |
| * | EZCORP, Inc. | 13,562 | 181 |
| * | First Cash Financial | | |
| | Services, Inc. | 8,596 | 161 |
| * | Nelnet, Inc. | 10,542 | 156 |
| * | Dollar Financial Corp. | 8,869 | 155 |
| * | World Acceptance Corp. | 5,408 | 141 |
| * | Credit Acceptance Corp. | 3,967 | 121 |
| | Advance America, Cash | | |
| | Advance Centers, Inc. | 13,543 | 78 |
| | Student Loan Corp. | 1,517 | 74 |
| * | The First Marblehead Corp. | 24,136 | 64 |
| * | Cardtronics Inc. | 4,568 | 36 |
| * | CompuCredit Holdings Corp. | 5,685 | 25 |
| | Advanta Corp. Class B | 12,790 | 9 |
| | Advanta Corp. Class A | 3,229 | 2 |
| | | | 25,882 |
| | | | |
| | | | | Market |
| | | | | Value• |
| | | | Shares | ($000) |
| Diversified Financial Services (23.9%) | |
| | JPMorgan Chase & Co. | 1,384,023 | 60,150 |
| | Bank of America Corp. | 3,181,881 | 55,969 |
| | Citigroup Inc. | 4,177,534 | 20,888 |
| | CME Group, Inc. | | 21,983 | 6,398 |
| | NYSE Euronext | | 95,825 | 2,716 |
| * | IntercontinentalExchange | | | |
| | Inc. | | 22,751 | 2,134 |
| | Moody’s Corp. | | 73,762 | 2,009 |
| * | Leucadia National Corp. | | 70,211 | 1,746 |
| * | Nasdaq OMX Group, Inc. | | 51,853 | 1,138 |
| * | MSCI, Inc.-Class A Shares | | 36,813 | 1,083 |
| * | PHH Corp. | | 20,137 | 428 |
| * | Interactive Brokers | | | |
| | Group, Inc. | | 14,968 | 284 |
| * | Portfolio Recovery | | | |
| | Associates, Inc. | | 5,709 | 251 |
| * | PICO Holdings, Inc. | | 7,290 | 242 |
| | CIT Group Inc. | 138,801 | 241 |
| | Financial Federal Corp. | | 9,071 | 212 |
| * | MarketAxess Holdings, Inc. | | 11,008 | 122 |
| | Fifth Street Finance Corp. | | 10,844 | 112 |
| | Compass Diversified Trust | | 10,768 | 109 |
| | Life Partners Holdings | | 2,773 | 48 |
| * | Asset Acceptance | | | |
| | Capital Corp. | | 5,658 | 41 |
| * | NewStar Financial, Inc. | | 10,713 | 30 |
| | Teton Advisors Inc. Class B | | 25 | — |
| | | | | 156,351 |
| Insurance (22.5%) | | | |
| * | Berkshire Hathaway Inc. | | | |
| | Class B | | 4,095 | 13,456 |
| | MetLife, Inc. | 301,283 | 11,376 |
| | The Travelers Cos., Inc. | 215,556 | 10,868 |
| | Prudential Financial, Inc. | 167,907 | 8,493 |
| | AFLAC Inc. | 172,107 | 6,991 |
| | Ace Ltd. | 123,651 | 6,452 |
| | The Chubb Corp. | 129,670 | 6,404 |
| | The Allstate Corp. | 187,606 | 5,514 |
| | Marsh & McLennan | | | |
| | Cos., Inc. | 192,425 | 4,530 |
| | Loews Corp. | 128,175 | 4,377 |
| * | Progressive Corp. of Ohio | 237,858 | 3,929 |
| | Aon Corp. | | 91,698 | 3,829 |
| | The Principal Financial | | | |
| | Group, Inc. | 114,383 | 3,248 |
| | The Hartford Financial | | | |
| | Services Group Inc. | 119,752 | 2,841 |
| | Lincoln National Corp. | 108,942 | 2,750 |
| | Unum Group | 121,919 | 2,747 |
| | XL Capital Ltd. Class A | 125,916 | 2,185 |
| *,^ | American International | | | |
| | Group Inc. | | 44,552 | 2,020 |
| | Everest Re Group, Ltd. | | 22,630 | 1,908 |
| | Genworth Financial Inc. | 159,447 | 1,684 |
| | Willis Group Holdings Ltd. | | 61,497 | 1,586 |
| | PartnerRe Ltd. | | 20,782 | 1,536 |
| | Axis Capital Holdings Ltd. | | 49,794 | 1,518 |
| | Cincinnati Financial Corp. | | 56,777 | 1,460 |
| | W.R. Berkley Corp. | | 52,971 | 1,353 |
| | Assurant, Inc. | | 43,459 | 1,302 |
| | Torchmark Corp. | | 30,439 | 1,297 |
| | RenaissanceRe Holdings Ltd. | 22,980 | 1,251 |
| | Fidelity National Financial, Inc. | | |
| | Class A | | 81,767 | 1,228 |
| | Reinsurance Group | | | |
| | of America, Inc. | | 26,706 | 1,150 |
| * | Markel Corp. | | 3,440 | 1,131 |
| | HCC Insurance Holdings, Inc. | 41,296 | 1,092 |
| | Old Republic | | | |
| | International Corp. | | 88,631 | 1,056 |
| | | |
| | | | Market |
| | | | Value• |
| | | Shares | ($000) |
| * | Arch Capital Group Ltd. | 15,617 | 1,015 |
| | Transatlantic Holdings, Inc. | 19,581 | 957 |
| | First American Corp. | 29,227 | 921 |
| | White Mountains | | |
| | Insurance Group Inc. | 2,939 | 917 |
| | Brown & Brown, Inc. | 44,278 | 880 |
| | Arthur J. Gallagher & Co. | 36,931 | 878 |
| | Assured Guaranty Ltd. | 40,497 | 806 |
| | The Hanover Insurance | | |
| | Group Inc. | 18,831 | 770 |
| | Aspen Insurance | | |
| | Holdings Ltd. | 30,226 | 768 |
| | Allied World Assurance | | |
| | Holdings, Ltd. | 15,375 | 712 |
| | American Financial Group, Inc. | 27,759 | 712 |
| | StanCorp Financial Group, Inc. | 18,122 | 686 |
| | Platinum Underwriters | | |
| | Holdings, Ltd. | 18,874 | 684 |
| | IPC Holdings Ltd. | 20,451 | 663 |
| | Protective Life Corp. | 30,743 | 663 |
| | Endurance Specialty | | |
| | Holdings Ltd. | 17,999 | 620 |
| * | ProAssurance Corp. | 11,509 | 604 |
| * | Alleghany Corp. | 2,019 | 560 |
| | Montpelier Re Holdings Ltd. | 30,206 | 486 |
| | Erie Indemnity Co. Class A | 11,402 | 441 |
| | Delphi Financial Group, Inc. | 17,705 | 414 |
| * | MBIA, Inc. | 61,139 | 411 |
| * | Argo Group International | | |
| | Holdings | 11,420 | 403 |
| | Odyssey Re Holdings Corp. | 7,803 | 395 |
| | Mercury General Corp. | 10,154 | 377 |
| | Zenith National | | |
| | Insurance Corp. | 13,842 | 373 |
| | Max Re Capital Ltd. | 17,573 | 360 |
| | R.L.I. Corp. | 6,761 | 358 |
| | Unitrin, Inc. | 18,535 | 351 |
| | Selective Insurance Group | 19,566 | 333 |
| | Validus Holdings, Ltd. | 12,635 | 324 |
| | Tower Group, Inc. | 13,375 | 321 |
| * | Conseco, Inc. | 68,446 | 294 |
| * | Navigators Group, Inc. | 5,316 | 276 |
| | Employers Holdings, Inc. | 17,148 | 254 |
| | Infinity Property & | | |
| | Casualty Corp. | 5,049 | 222 |
| * | Hilltop Holdings Inc. | 16,799 | 206 |
| | Ambac Financial Group, Inc. | 105,805 | 186 |
| | Horace Mann Educators Corp. | 14,585 | 179 |
| | Harleysville Group, Inc. | 5,166 | 167 |
| | United Fire & Casualty Co. | 8,352 | 167 |
| | Meadowbrook Insurance | | |
| | Group, Inc. | 20,379 | 162 |
| | Safety Insurance Group, Inc. | 4,925 | 158 |
| | Flagstone Reinsurance | | |
| | Holdings Ltd. | 14,079 | 153 |
| | American Equity Investment | | |
| | Life Holding Co. | 18,466 | 149 |
| | National Western Life | | |
| | Insurance Co. Class A | 879 | 145 |
| * | eHealth, Inc. | 7,732 | 143 |
| * | Greenlight Capital Re. Ltd. | 7,667 | 140 |
| | The Phoenix Cos., Inc. | 42,776 | 127 |
| | Amtrust Financial Services Inc. | 9,997 | 126 |
| | OneBeacon Insurance | | |
| | Group Ltd. | 8,697 | 119 |
| * | Amerisafe Inc. | 6,937 | 118 |
| | National Financial | | |
| | Partners Corp. | 14,860 | 117 |
| | American Physicians | | |
| | Capital, Inc. | 3,647 | 109 |
| * | CNA Surety Corp. | 6,598 | 105 |
42
Financials Index Fund
| | | | |
| | | | | Market |
| | | | | Value• |
| | | | Shares | ($000) |
| * | Citizens, Inc. | | 15,219 | 104 |
| | State Auto Financial Corp. | | 5,755 | 99 |
| | FBL Financial Group, Inc. | | | |
| | Class A | | 5,342 | 91 |
| | Stewart Information | | | |
| | Services Corp. | | 6,274 | 89 |
| * | FPIC Insurance Group, Inc. | | 2,672 | 85 |
| | First Mercury Financial Corp. | | 5,731 | 83 |
| | Presidential Life Corp. | | 8,246 | 82 |
| * | Seabright Insurance | | | |
| | Holdings, Inc. | | 7,901 | 79 |
| * | United America | | | |
| | Indemnity, Ltd. | | 12,012 | 75 |
| | Donegal Group Inc. Class A | | 4,527 | 66 |
| | Baldwin & Lyons, Inc. Class B | 2,856 | 63 |
| | Kansas City Life Insurance Co. | 1,630 | 58 |
| | EMC Insurance Group, Inc. | | 2,257 | 49 |
| | National Interstate Corp. | | 2,353 | 42 |
| | Universal Insurance | | | |
| | Holdings, Inc. | | 6,890 | 35 |
| * | Crawford & Co. Class B | | 4,426 | 21 |
| * | Crawford & Co. Class A | | 5,100 | 18 |
| | | | | 146,686 |
| Real Estate Investment Trusts (12.3%) | |
| | Simon Property Group, Inc. | | | |
| | REIT | 103,355 | 6,575 |
| | Annaly Capital | | | |
| | Management Inc. REIT | 200,457 | 3,476 |
| | Vornado Realty Trust REIT | | 58,025 | 3,338 |
| | Public Storage, Inc. REIT | | 46,488 | 3,280 |
| | HCP, Inc. REIT | 107,056 | 3,049 |
| | Boston Properties, Inc. REIT | | 50,159 | 3,039 |
| | Equity Residential REIT | 100,815 | 2,753 |
| | Ventas, Inc. REIT | | 57,585 | 2,258 |
| | Host Hotels & | | | |
| | Resorts Inc. REIT | 218,149 | 2,175 |
| | Avalonbay | | | |
| | Communities, Inc. REIT | | 29,380 | 1,893 |
| | Plum Creek | | | |
| | Timber Co. Inc. REIT | | 59,983 | 1,817 |
| | ProLogis REIT | 162,838 | 1,811 |
| | Health Care Inc. REIT | | 40,979 | 1,750 |
| | Kimco Realty Corp. REIT | 131,579 | 1,651 |
| | Federal Realty Investment | | | |
| | Trust REIT | | 21,663 | 1,351 |
| | Rayonier Inc. REIT | | 28,999 | 1,246 |
| | Liberty Property Trust REIT | | 37,857 | 1,241 |
| | AMB Property Corp. REIT | | 53,795 | 1,228 |
| | Nationwide Health | | | |
| | Properties, Inc. REIT | | 37,909 | 1,209 |
| | Digital Realty Trust, Inc. REIT | | 26,650 | 1,161 |
| | Regency Centers Corp. REIT | | 29,564 | 992 |
| | Realty Income Corp. REIT | | 38,338 | 980 |
| | SL Green Realty Corp. REIT | | 27,436 | 968 |
| | Duke Realty Corp. REIT | | 82,421 | 949 |
| | Mack-Cali Realty Corp. REIT | | 28,227 | 904 |
| | Senior Housing Properties | | | |
| | Trust REIT | | 44,464 | 892 |
| | Camden Property Trust REIT | | 24,003 | 881 |
| | Chimera | | | |
| | Investment Corp. REIT | 223,978 | 851 |
| | Weingarten Realty | | | |
| | Investors REIT | | 41,875 | 832 |
| | The Macerich Co. REIT | | 28,995 | 831 |
| | Hospitality Properties | | | |
| | Trust REIT | | 44,955 | 819 |
| | Alexandria Real Estate | | | |
| | Equities, Inc. REIT | | 14,474 | 806 |
| | MFA Mortgage | | | |
| | Investments, Inc. REIT | 100,363 | 795 |
| | |
| | | Market |
| | | Value• |
| | Shares | ($000) |
| Corporate Office Properties | | |
| Trust, Inc. REIT | 21,152 | 780 |
| Highwood | | |
| Properties, Inc. REIT | 25,721 | 755 |
| Essex Property | | |
| Trust, Inc. REIT | 10,110 | 754 |
| UDR, Inc. REIT | 55,049 | 704 |
| Taubman Co. REIT | 19,466 | 616 |
| National Retail | | |
| Properties REIT | 29,297 | 601 |
| Washington REIT | 21,507 | 580 |
| Tanger Factory Outlet | | |
| Centers, Inc. REIT | 14,712 | 553 |
| BRE Properties Inc. | | |
| Class A REIT | 18,987 | 537 |
| HRPT Properties Trust REIT | 82,425 | 534 |
| Apartment Investment & | | |
| Management Co. | | |
| Class A REIT | 43,047 | 524 |
| Omega Healthcare | | |
| Investors, Inc. REIT | 30,389 | 514 |
| American Campus | | |
| Communities, Inc. REIT | 18,862 | 491 |
| BioMed Realty | | |
| Trust, Inc. REIT | 36,022 | 486 |
| Brandywine Realty | | |
| Trust REIT | 45,623 | 484 |
| Healthcare Realty | | |
| Trust Inc. REIT | 21,931 | 475 |
| Home Properties, Inc. REIT | 12,042 | 457 |
| Mid-America Apartment | | |
| Communities, Inc. REIT | 10,371 | 454 |
| Douglas Emmett, Inc. REIT | 35,700 | 432 |
| Kilroy Realty Corp. REIT | 15,500 | 430 |
| Potlatch Corp. REIT | 14,587 | 424 |
| CBL & Associates | | |
| Properties, Inc. REIT | 45,259 | 424 |
| Equity Lifestyle | | |
| Properties, Inc. REIT | 10,521 | 423 |
| Redwood Trust, Inc. REIT | 26,260 | 421 |
| Entertainment Properties | | |
| Trust REIT | 12,886 | 404 |
| Hatteras Financial Corp. REIT | 13,377 | 400 |
| Developers Diversified | | |
| Realty Corp. REIT | 50,197 | 394 |
| DCT Industrial Trust Inc. REIT | 74,392 | 393 |
| LaSalle Hotel Properties REIT | 23,386 | 387 |
| PS Business Parks, Inc. REIT | 7,006 | 371 |
| EastGroup | | |
| Properties, Inc. REIT | 9,299 | 350 |
| Capstead | | |
| Mortgage Corp. REIT | 23,453 | 320 |
| Franklin Street | | |
| Properties Corp. REIT | 22,256 | 316 |
| Extra Space Storage Inc. REIT 30,302 | 300 |
| National Health Investors REIT | 8,696 | 288 |
| Post Properties, Inc. REIT | 16,398 | 279 |
| Anworth Mortgage | | |
| Asset Corp. REIT | 36,845 | 276 |
| DiamondRock | | |
| Hospitality Co. REIT | 39,309 | 269 |
| Equity One, Inc. REIT | 16,018 | 252 |
| Sovran Self Storage, Inc. REIT | 8,153 | 240 |
| Inland Real Estate Corp. REIT | 27,628 | 232 |
| Medical Properties | | |
| Trust Inc. REIT | 29,146 | 221 |
| Investors Real Estate | | |
| Trust REIT | 23,629 | 219 |
| Acadia Realty Trust REIT | 13,756 | 211 |
| Alexander’s, Inc. REIT | 740 | 210 |
| LTC Properties, Inc. REIT | 7,681 | 196 |
| | | | |
| | | | | Market |
| | | | | Value• |
| | | | Shares | ($000) |
| | DuPont Fabros | | | |
| | Technology Inc. REIT | | 14,804 | 194 |
| | U-Store-It Trust REIT | | 29,652 | 192 |
| | Sunstone Hotel | | | |
| | Investors, Inc. REIT | | 27,008 | 169 |
| | Getty Realty | | | |
| | Holding Corp. REIT | | 6,917 | 163 |
| | Saul Centers, Inc. REIT | | 4,927 | 161 |
| | American Capital | | | |
| | Agency Corp. REIT | | 6,248 | 156 |
| | Colonial Properties Trust REIT | 16,796 | 152 |
| | Lexington Realty Trust REIT | | 32,255 | 150 |
| | Parkway Properties Inc. REIT | | 8,078 | 146 |
| | Universal Health Realty | | | |
| | Income REIT | | 4,205 | 141 |
| | Cousins Properties, Inc. REIT | | 15,477 | 128 |
| | Education Realty | | | |
| | Trust, Inc. REIT | | 19,906 | 116 |
| | Sun Communities, Inc. REIT | | 6,506 | 116 |
| | First Potomac REIT | | 10,272 | 110 |
| | Cedar Shopping | | | |
| | Centers, Inc. REIT | | 16,405 | 105 |
| | Walter Investment | | | |
| | Management Corp. REIT | | 7,214 | 104 |
| | Urstadt Biddle Properties | | | |
| | Class A REIT | | 6,366 | 98 |
| | FelCor Lodging | | | |
| | Trust, Inc. REIT | | 23,477 | 96 |
| | Pennsylvania REIT | | 13,805 | 92 |
| | NorthStar Realty | | | |
| | Finance Corp. REIT | | 23,680 | 90 |
| | Ashford Hospitality | | | |
| | Trust REIT | | 28,816 | 89 |
| | First Industrial Realty | | | |
| | Trust REIT | | 15,501 | 81 |
| * | iStar Financial Inc. REIT | | 38,300 | 81 |
| | Kite Realty Group Trust REIT | | 22,143 | 81 |
| | CapLease, Inc. REIT | | 17,451 | 72 |
| | Ramco-Gershenson | | | |
| | Properties Trust REIT | | 6,865 | 72 |
| | RAIT Financial Trust REIT | | 23,467 | 67 |
| | Hersha Hospitality Trust REIT | | 18,364 | 57 |
| | Glimcher Realty Trust REIT | | 14,126 | 57 |
| | Winthrop Realty Trust REIT | | 4,949 | 45 |
| | Strategic Hotels and | | | |
| | Resorts, Inc. REIT | | 27,885 | 38 |
| * | Gramercy Capital Corp. REIT | | 16,102 | 26 |
| | Urstadt Biddle Properties REIT | 1,308 | 19 |
| | | | | 80,646 |
| Real Estate Management & Development (0.6%) |
| * | The St. Joe Co. | | 33,984 | 1,115 |
| * | CB Richard Ellis Group, Inc. | | 82,862 | 981 |
| | Jones Lang LaSalle Inc. | | 15,190 | 712 |
| | Forest City Enterprise | | | |
| | Class A | | 41,843 | 387 |
| * | Forestar Real Estate | | | |
| | Group, Inc. | | 12,628 | 182 |
| * | Tejon Ranch Co. | | 4,777 | 122 |
| | Consolidated-Tomoka | | | |
| | Land Co. | | 2,030 | 71 |
| * | Altisource Portfolio | | | |
| | Solutions SA | | 4,684 | 67 |
| * | Avatar Holding, Inc. | | 2,115 | 40 |
| * | Grubb & Ellis Co. | | 14,068 | 11 |
| | | | | 3,688 |
| Thrifts & Mortgage Finance (2.0%) | |
| | Hudson City Bancorp, Inc. | 172,903 | 2,269 |
| | People’s United Financial Inc. | 128,204 | 2,059 |
| | New York Community | | | |
| | Bancorp, Inc. | 120,676 | 1,284 |
| * | Fannie Mae | 403,609 | 779 |
43
Financials Index Fund
| | | | |
| | | | | Market |
| | | | | Value• |
| | | | Shares | ($000) |
| | First Niagara Financial | | | |
| | Group, Inc. | | 55,211 | 722 |
| *,^ | Freddie Mac | 239,739 | 549 |
| | Washington Federal Inc. | 32,350 | 480 |
| | NewAlliance Bancshares, Inc. | 35,328 | 416 |
| | TFS Financial Corp. | | 34,072 | 388 |
| | MGIC Investment Corp. | 46,378 | 377 |
| | Astoria Financial Corp. | | 30,310 | 312 |
| | Radian Group, Inc. | | 30,006 | 275 |
| * | Ocwen Financial Corp. | | 26,347 | 273 |
| | Capitol Federal Financial | 8,216 | 264 |
| | Brookline Bancorp, Inc. | 21,620 | 226 |
| | Provident Financial | | | |
| | Services Inc. | | 19,882 | 219 |
| | TrustCo Bank NY | | 28,344 | 176 |
| | Northwest Bancorp, Inc. | 7,173 | 147 |
| | Bank Mutual Corp. | | 16,323 | 144 |
| | Provident New York | | | |
| | Bancorp, Inc. | | 13,393 | 123 |
| | Berkshire Hills Bancorp, Inc. | 5,066 | 114 |
| * | Beneficial Mutual | | | |
| | Bancorp, Inc. | | 12,359 | 110 |
| | The PMI Group Inc. | | 30,563 | 102 |
| | Dime Community Bancshares | 8,766 | 98 |
| | Westfield Financial, Inc. | 10,386 | 95 |
| | Flushing Financial Corp. | 6,872 | 90 |
| | Kearny Financial Corp. | | 7,777 | 85 |
| | Danvers Bancorp, Inc. | | 5,889 | 76 |
| | First Financial Holdings, Inc. | 4,166 | 75 |
| | BankFinancial Corp. | | 7,300 | 72 |
| | United Financial Bancorp, Inc. | 5,550 | 68 |
| | Essa Bancorp Inc. | | 4,938 | 63 |
| | WSFS Financial Corp. | | 2,214 | 61 |
| | Abington Community | | | |
| | Bancorp Inc. | | 7,182 | 58 |
| | Oritani Financial Corp. | | 4,228 | 56 |
| | ViewPoint Financial Group | 4,113 | 52 |
| | First Financial Northwest, Inc. | 6,605 | 48 |
| | Rockville Financial, Inc. | 3,383 | 45 |
| | Clifton Savings Bancorp, Inc. | 3,538 | 37 |
| | Roma Financial Corp. | | 2,923 | 37 |
| * | Meridian Interstate | | | |
| | Bancorp, Inc. | | 3,820 | 35 |
| | NASB Financial Inc. | | 1,088 | 34 |
| * | Flagstar Bancorp, Inc. | | 23,555 | 19 |
| * | Waterstone Financial, Inc. | 2,864 | 14 |
| | | | | 13,026 |
| Total Common Stocks | | | |
| (Cost $895,834) | | | 653,741 |
| Temporary Cash Investment (0.2%) | |
| Money Market Fund (0.2%) | | |
| 1,2 | Vanguard Market | | | |
| | Liquidity Fund, 0.277% | | |
| | (Cost $1,491) | 1,491,301 | 1,491 |
| Total Investments (100.3%) | | |
| (Cost $897,325) | | | 655,232 |
| Other Assets and Liabilities (–0.3%) | |
| Other Assets | | | 3,370 |
| Liabilities2 | | | (5,068) |
| | | | | (1,698) |
| Net Assets (100%) | | | 653,534 |
| |
| At August 31, 2009, net assets consisted of: |
| | Amount |
| | ($000) |
| Paid-in Capital | 1,044,136 |
| Undistributed Net Investment Income | 1,936 |
| Accumulated Net Realized Losses | (150,445) |
| Unrealized Appreciation (Depreciation) | (242,093) |
| Net Assets | 653,534 |
| |
| |
| Admiral Shares—Net Assets | |
| Applicable to 5,019,812 outstanding | |
| $.001 par value shares of beneficial | |
| interest (unlimited authorization) | 73,910 |
| Net Asset Value Per Share— | |
| Admiral Shares | $14.72 |
| |
| |
| ETF Shares—Net Assets | |
| Applicable to 19,728,783 outstanding | |
| $.001 par value shares of beneficial | |
| interest (unlimited authorization) | 579,624 |
| Net Asset Value Per Share— | |
| ETF Shares | $29.38 |
• See Note A in Notes to Financial Statements.
* Non-income-producing security.
^ Part of security position is on loan to broker-dealers. The total value of securities on loan is $1,258,000.
1 Affiliated money market fund available only to Vanguard funds and certain trusts and accounts managed by Vanguard. Rate shown is the 7-day yield.
2 Includes $1,491,000 of collateral received for securities on loan.
REIT—Real Estate Investment Trust.
See accompanying Notes, which are an integral part of the Financial Statements.
44
Financials Index Fund
Statement of Operations
| |
| | Year Ended |
| August 31, 2009 |
| | ($000) |
| Investment Income | |
| Income | |
| Dividends | 15,026 |
| Interest1 | 3 |
| Security Lending | 960 |
| Total Income | 15,989 |
| Expenses | |
| The Vanguard Group—Note B | |
| Investment Advisory Services | 71 |
| Management and Administrative— | |
| Admiral Shares | 122 |
| Management and Administrative— | |
| ETF Shares | 646 |
| Marketing and Distribution— | |
| Admiral Shares | 17 |
| Marketing and Distribution— | |
| ETF Shares | 141 |
| Custodian Fees | 67 |
| Auditing Fees | 25 |
| Shareholders’ Reports and Proxies— | |
| Admiral Shares | 1 |
| Shareholders’ Reports and Proxies— | |
| ETF Shares | 147 |
| Trustees’ Fees and Expenses | 1 |
| Total Expenses | 1,238 |
| Net Investment Income | 14,751 |
| Realized Net Gain (Loss) on | |
| Investment Securities Sold | (140,463) |
| Change in Unrealized Appreciation | |
| (Depreciation) of Investment Securities | (46,975) |
| Net Increase (Decrease) in Net Assets | |
| Resulting from Operations | (172,687) |
Statement of Changes in Net Assets
| | |
| | Year Ended August 31, |
| | 2009 | 2008 |
| | ($000) | ($000) |
| Increase (Decrease) in Net Assets | | |
| Operations | | |
| Net Investment Income | 14,751 | 15,734 |
| Realized Net Gain (Loss) | (140,463) | (5,892) |
| Change in Unrealized Appreciation (Depreciation) | (46,975) | (183,247) |
| Net Increase (Decrease) in Net Assets Resulting from Operations | (172,687) | (173,405) |
| Distributions | | |
| Net Investment Income | | |
| Admiral Shares | (1,971) | (1,097) |
| ETF Shares | (14,745) | (12,437) |
| Realized Capital Gain | | |
| Admiral Shares | — | — |
| ETF Shares | — | — |
| Total Distributions | (16,716) | (13,534) |
| Capital Share Transactions | | |
| Admiral Shares | 13,533 | 78,669 |
| ETF Shares | 96,692 | 540,089 |
| Net Increase (Decrease) from Capital Share Transactions | 110,225 | 618,758 |
| Total Increase (Decrease) | (79,178) | 431,819 |
| Net Assets | | |
| Beginning of Period | 732,712 | 300,893 |
| End of Period2 | 653,534 | 732,712 |
1 Interest income from an affiliated company of the fund was $3,000.
2 Net Assets—End of Period includes undistributed net investment income of $1,936,000 and $3,901,000.
See accompanying Notes, which are an integral part of the Financial Statements.
45
Financials Index Fund
Financial Highlights
| | | | | |
| Admiral Shares | | | | | |
| |
| | | | | Year Ended August 31, |
| For a Share Outstanding Throughout Each Period | 2009 | 2008 | 2007 | 2006 | 2005 |
| Net Asset Value, Beginning of Period | $20.38 | $30.10 | $29.86 | $26.36 | $25.35 |
| Investment Operations | | | | | |
| Net Investment Income | .389 | .7001 | .7701 | .7161 | .6601 |
| Net Realized and Unrealized Gain (Loss) | | | | | |
| on Investments2 | (5.596) | (9.699) | .145 | 3.392 | 1.086 |
| Total from Investment Operations | (5.207) | (8.999) | .915 | 4.108 | 1.746 |
| Distributions | | | | | |
| Dividends from Net Investment Income | (.453) | (.721) | (.675) | (.608) | (.736) |
| Distributions from Realized Capital Gains | — | — | — | — | — |
| Total Distributions | (.453) | (.721) | (.675) | (.608) | (.736) |
| Net Asset Value, End of Period | $14.72 | $20.38 | $30.10 | $29.86 | $26.36 |
| |
| Total Return3 | –25.35% | –30.36% | 2.95% | 15.76% | 6.88% |
| |
| Ratios/Supplemental Data | | | | | |
| Net Assets, End of Period (Millions) | $74 | $81 | $19 | $8 | $3 |
| Ratio of Total Expenses to | | | | | |
| Average Net Assets | 0.28% | 0.25% | 0.26% | 0.28% | 0.28% |
| Ratio of Net Investment Income to | | | | | |
| Average Net Assets | 2.97% | 3.06% | 2.37% | 2.49% | 2.59% |
| Portfolio Turnover Rate4 | 17% | 10% | 12% | 6% | 6% |
1 Calculated based on average shares outstanding.
2 Includes increases from redemption fees of $.01, $.00, $.00, $.01, and $.00.
3 Total returns do not reflect the 2% fee assessed on redemptions of shares held for less than one year.
4 Excludes the value of portfolio securities received or delivered as a result of in-kind purchases or redemptions of the fund’s capital shares,
including ETF Creation Units.
| | | | | |
| ETF Shares | | | | | |
| |
| | | | | Year Ended August 31, |
| For a Share Outstanding Throughout Each Period | 2009 | 2008 | 2007 | 2006 | 2005 |
| Net Asset Value, Beginning of Period | $40.66 | $60.04 | $59.57 | $52.57 | $50.57 |
| Investment Operations | | | | | |
| Net Investment Income | .784 | 1.4491 | 1.5571 | 1.4301 | 1.3161 |
| Net Realized and Unrealized Gain (Loss) | | | | | |
| on Investments2 | (11.150) | (19.368) | .282 | 6.800 | 2.160 |
| Total from Investment Operations | (10.366) | (17.919) | 1.839 | 8.230 | 3.476 |
| Distributions | | | | | |
| Dividends from Net Investment Income | (.914) | (1.461) | (1.369) | (1.230) | (1.476) |
| Distributions from Realized Capital Gains | — | — | — | — | — |
| Total Distributions | (.914) | (1.461) | (1.369) | (1.230) | (1.476) |
| Net Asset Value, End of Period | $29.38 | $40.66 | $60.04 | $59.57 | $52.57 |
| |
| Total Return | –25.31% | –30.30% | 2.97% | 15.82% | 6.85% |
| |
| Ratios/Supplemental Data | | | | | |
| Net Assets, End of Period (Millions) | $580 | $651 | $282 | $125 | $53 |
| Ratio of Total Expenses to | | | | | |
| Average Net Assets | 0.25% | 0.20% | 0.22% | 0.25% | 0.26% |
| Ratio of Net Investment Income to | | | | | |
| Average Net Assets | 3.00% | 3.11% | 2.41% | 2.52% | 2.61% |
| Portfolio Turnover Rate3 | 17% | 10% | 12% | 6% | 6% |
1 Calculated based on average shares outstanding.
2 Includes increases from redemption fees of $.02, $.01, $.01, $.01, and $.00.
3 Excludes the value of portfolio securities received or delivered as a result of in-kind purchases or redemptions of the fund’s capital shares,
including ETF Creation Units.
See accompanying Notes, which are an integral part of the Financial Statements.
46
Financials Index Fund
Notes to Financial Statements
Vanguard Financials Index Fund is registered under the Investment Company Act of 1940 as an open-end investment company, or mutual fund. The fund offers two classes of shares, Admiral Shares and ETF Shares. Admiral Shares are available to any investor who meets the fund’s minimum purchase requirements. ETF Shares are listed for trading on the NYSE Arca, Inc.; they can be purchased and sold through a broker.
A. The following significant accounting policies conform to generally accepted accounting principles for U.S. mutual funds. The fund consistently follows such policies in preparing its financial statements.
1. Security Valuation: Securities are valued as of the close of trading on the New York Stock Exchange (generally 4 p.m., Eastern time) on the valuation date. Equity securities are valued at the latest quoted sales prices or official closing prices taken from the primary market in which each security trades; such securities not traded on the valuation date are valued at the mean of the latest quoted bid and asked prices. Securities for which market quotations are not readily available, or whose values have been materially affected by events occurring before the fund’s pricing time but after the close of the securities’ primary markets, are valued by methods deemed by the board of trustees to represent fair value. Investments in Vanguard Market Liquidity Fund are valued at that fund’s net asset value.
2. Federal Income Taxes: The fund intends to continue to qualify as a regulated investment company and distribute all of its taxable income. Management has analyzed the fund’s tax positions taken for all open federal income tax years (August 31, 2006–2009), and has concluded that no provision for federal income tax is required in the fund’s financial statements.
3. Distributions: Distributions to shareholders are recorded on the ex-dividend date.
4. Security Lending: The fund may lend its securities to qualified institutional borrowers to earn additional income. Security loans are required to be secured at all times by collateral at least equal to the market value of securities loaned. The fund invests cash collateral received in Vanguard Market Liquidity Fund, and records a liability for the return of the collateral, during the period the securities are on loan. Security lending income represents the income earned on investing cash collateral, less expenses associated with the loan.
5. Other: Dividend income is recorded on the ex-dividend date. Interest income includes income distributions received from Vanguard Market Liquidity Fund and is accrued daily. Security transactions are accounted for on the date securities are bought or sold. Costs used to determine realized gains (losses) on the sale of investment securities are those of the specific securities sold. Fees assessed on redemptions of capital shares are credited to paid-in capital.
Each class of shares has equal rights as to assets and earnings, except that each class separately bears certain class-specific expenses related to maintenance of shareholder accounts (included in Management and Administrative expenses), shareholder reporting, and proxies. Marketing and distribution expenses are allocated to each class of shares based on a method approved by the board of trustees. Income, other non-class-specific expenses, and gains and losses on investments are allocated to each class of shares based on its relative net assets.
B. The Vanguard Group furnishes at cost investment advisory, corporate management, administrative, marketing, and distribution services. The costs of such services are allocated to the fund under methods approved by the board of trustees. The fund has committed to provide up to 0.40% of its net assets in capital contributions to Vanguard. At August 31, 2009, the fund had contributed capital of $134,000 to Vanguard (included in Other Assets), representing 0.02% of the fund’s net assets and 0.05% of Vanguard’s capitalization. The fund’s trustees and officers are also directors and officers of Vanguard.
C. Various inputs may be used to determine the value of the fund’s investments. These inputs are summarized in three broad levels for financial statement purposes. The inputs or methodologies used to value securities are not necessarily an indication of the risk associated with investing in those securities.
Level 1—Quoted prices in active markets for identical securities.
Level 2—Other significant observable inputs (including quoted prices for similar securities, interest rates, prepayment speeds, credit risk, etc.).
Level 3—Significant unobservable inputs (including the fund’s own assumptions used to determine the fair value of investments).
At August 31, 2009, 100% of the fund’s investments were valued based on Level 1 inputs.
D. Distributions are determined on a tax basis and may differ from net investment income and realized capital gains for financial reporting purposes. Differences may be permanent or temporary. Permanent differences are reclassified among capital accounts in the financial statements to reflect their tax
47
Financials Index Fund
character. Temporary differences arise when certain items of income, expense, gain, or loss are recognized in different periods for financial statement and tax purposes; these differences will reverse at some time in the future. Differences in classification may also result from the treatment of short-term gains as ordinary income for tax purposes.
During the year ended August 31, 2009, the fund realized $3,938,000 of net capital losses resulting from in-kind redemptions—in which shareholders exchanged fund shares for securities held by the fund rather than for cash. Because such losses are not taxable losses to the fund, they have been reclassified from accumulated net realized losses to paid-in capital.
For tax purposes, at August 31, 2009, the fund had $2,221,000 of ordinary income available for distribution. The fund had available capital loss carryforwards totaling $30,027,000 to offset future net capital gains of $85,000 through August 31, 2014, $11,000 through August 31, 2015, $1,313,000 through August 31, 2016, and $28,618,000 through August 31, 2017. In addition, the fund realized losses of $118,026,000 during the period from November 1, 2008, through August 31, 2009, which are deferred and will be treated as realized for tax purposes in fiscal 2010.
At August 31, 2009, the cost of investment securities for tax purposes was $899,716,000. Net unrealized depreciation of investment securities for tax purposes was $244,484,000, consisting of unrealized gains of $6,449,000 on securities that had risen in value since their purchase and $250,933,000 in unrealized losses on securities that had fallen in value since their purchase.
E. During the year ended August 31, 2009, the fund purchased $444,317,000 of investment securities and sold $333,070,000 of investment securities, other than temporary cash investments.
F. Capital share transactions for each class of shares were:
| | | | |
| | | | Year Ended August 31, |
| | | 2009 | | 2008 |
| | Amount | Shares | Amount | Shares |
| | ($000) | (000) | ($000) | (000) |
| Admiral Shares | | | | |
| Issued | 39,058 | 3,069 | 96,727 | 4,152 |
| Issued in Lieu of Cash Distributions | 1,834 | 135 | 889 | 39 |
| Redeemed1 | (27,359) | (2,179) | (18,947) | (817) |
| Net Increase (Decrease)—Admiral Shares | 13,533 | 1,025 | 78,669 | 3,374 |
| ETF Shares | | | | |
| Issued | 342,606 | 13,213 | 592,724 | 12,516 |
| Issued in Lieu of Cash Distributions | — | — | — | — |
| Redeemed1 | (245,914) | (9,500) | (52,635) | (1,200) |
| Net Increase (Decrease)—ETF Shares | 96,692 | 3,713 | 540,089 | 11,316 |
| 1 Net of redemption fees for fiscal 2009 and 2008 of $383,000 and $200,000, respectively (fund totals). | | |
G. In preparing the financial statements as of August 31, 2009, management considered the impact of subsequent events occurring through October 15, 2009, for potential recognition or disclosure in these financial statements.
48
Health Care Index Fund
Fund Profile
As of August 31, 2009
| | | |
| Portfolio Characteristics | | |
| | | Target | Broad |
| | Fund | Index1 | Index2 |
| Number of Stocks | 303 | 303 | 2,501 |
| Median Market Cap | $38.4B | $38.4B | $27.3B |
| Price/Earnings Ratio | 18.5x | 18.4x | 25.6x |
| Price/Book Ratio | 2.7x | 2.7x | 2.1x |
| Yield3 | | 1.8% | 1.9% |
| Admiral Shares | 1.5% | | |
| ETF Shares | 1.5% | | |
| Return on Equity | 18.8% | 18.8% | 19.3% |
| Earnings Growth Rate | 11.9% | 11.9% | 9.9% |
| Foreign Holdings | 0.0% | 0.0% | 0.0% |
| Turnover Rate | 6% | — | — |
| Expense Ratio4 | | — | — |
| Admiral Shares | 0.28% | | |
| ETF Shares | 0.25% | | |
| Short-Term Reserves | 0.0% | — | — |
| | |
| Volatility Measures5 | |
| | Fund Versus | Fund Versus |
| | Target Index1 | Broad Index2 |
| R-Squared | 1.00 | 0.68 |
| Beta | 1.00 | 0.68 |
| |
| Industry Diversification (% of equity exposure) |
| |
| Biotechnology | 14.6% |
| Health Care Distributors | 3.1 |
| Health Care Equipment | 16.6 |
| Health Care Facilities | 1.4 |
| Health Care Services | 5.9 |
| Health Care Supplies | 1.1 |
| Health Care Technology | 1.0 |
| Life Sciences Tools & Services | 4.3 |
| Managed Health Care | 6.6 |
| Pharmaceuticals | 45.4 |
| |
| Ten Largest Holdings6 (% of total net assets) |
| |
| Johnson & Johnson | 11.4% |
| Pfizer Inc. | 7.7 |
| Abbott Laboratories | 4.8 |
| Merck & Co., Inc. | 4.7 |
| Wyeth | 4.4 |
| Amgen Inc. | 4.2 |
| Schering-Plough Corp. | 3.1 |
| Bristol-Myers Squibb Co. | 3.0 |
| Medtronic, Inc. | 2.9 |
| Gilead Sciences, Inc. | 2.8 |
| Top Ten | 49.0% |
1 MSCI US IMI/Health Care.
2 MSCI US IMI/2500.
3 30-day SEC yield for the fund; annualized dividend yield for the indexes. See the Glossary.
4 The expense ratios shown are from the prospectuses dated December 29, 2008, and represent estimated costs for the current fiscal year based on the fund’s net assets as of the prospectus date. For the fiscal year
ended August 31, 2009, the expense ratios were 0.28% for Admiral Shares and 0.25% for ETF Shares.
5 For an explanation of R-squared, beta, and other terms used here, see the Glossary.
6 The holdings listed exclude any temporary cash investments and equity index products.
49
Health Care Index Fund
Performance Summary
All of the returns in this report represent past performance, which is not a guarantee of future results that may be achieved by the fund. (Current performance may be lower or higher than the performance data cited. For performance data current to the most recent month-end, visit our website at www.vanguard.com/performance.) Note, too, that both investment returns and principal value can fluctuate widely, so an investor’s shares, when sold, could be worth more or less than their original cost. The returns shown do not reflect taxes that a shareholder would pay on fund distributions or on the sale of fund shares.
Cumulative Performance: January 26, 2004–August 31, 2009
Initial Investment of $10,000
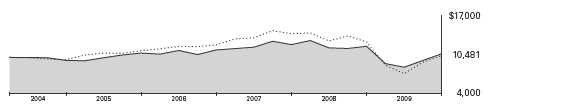
| | | | |
| | | Average Annual Total Returns | |
| | | Periods Ended August 31, 2009 | Final Value |
| | | | Since | of a $10,000 |
| | One Year | Five Years | Inception1 | Investment |
| Health Care Index Fund ETF Shares | | | | |
| Net Asset Value2 | –10.70% | 2.04% | 0.84% | $10,481 |
| Health Care Index Fund ETF Shares | | | | |
| Market Price | –10.68 | 2.06 | 0.84 | 10,482 |
| MSCI US IMI/2500 | –18.26 | 1.36 | 0.52 | 10,295 |
| MSCI US IMI/Health Care | –10.52 | 2.27 | 1.06 | 10,609 |
| | | | |
| | | | | Final Value |
| | | | Since | of a $100,000 |
| | One Year | Five Years | Inception1 | Investment |
| Health Care Index Fund Admiral Shares3 | –10.74% | 2.00% | 0.79% | $104,493 |
| MSCI US IMI/2500 | –18.26 | 1.36 | 1.00 | 105,693 |
| MSCI US IMI/Health Care | –10.52 | 2.27 | 1.05 | 105,985 |
1 Performance for the fund and its comparative standards is calculated since the following inception dates: January 26, 2004, for ETF Shares; February 5, 2004, for Admiral Shares.
2 For more information about how the ETF Shares’ market prices have compared with their net asset value, visit www.vanguard.com, select your ETF, and then select the Performance tab. The Premium/Discount
table there shows the percentages of days on which the ETF Shares’ market price was above or below the NAV.
3 Total returns do not reflect the 2% fee assessed on redemptions of shares held for less than one year.
Note: See Financial Highlights tables for dividend and capital gains information.
50
Health Care Index Fund
Fiscal-Year Total Returns (%): January 26, 2004–August 31, 2009
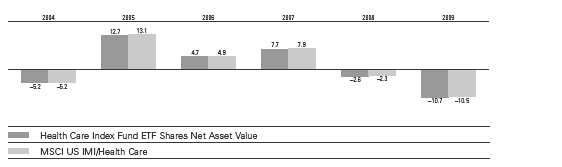
| | | |
| Cumulative Returns: ETF Shares, January 26, 2004–August 31, 2009 | | |
| | | | Cumulative |
| | | | Since |
| | One Year | Five Years | Inception |
| Health Care Index Fund ETF Shares Market Price | –10.68% | 10.75% | 4.82% |
| Health Care Index Fund ETF Shares Net Asset Value | –10.70 | 10.61 | 4.81 |
| MSCI US IMI/Health Care | –10.52 | 11.86 | 6.09 |
Average Annual Total Returns: Periods Ended June 30, 2009
This table presents average annual total returns through the latest calendar quarter—rather than through the end
of the fiscal period. Securities and Exchange Commission rules require that we provide this information.
| | | | |
| | | | | Since |
| | Inception Date | One Year | Five Years | Inception |
| ETF Shares | 1/26/2004 | | | |
| Market Price | | –10.72% | –0.48% | –0.57% |
| Net Asset Value | | –10.76 | –0.48 | –0.57 |
| Admiral Shares1 | 2/5/2004 | –10.82 | –0.52 | –0.64 |
1 Total returns do not reflect the 2% fee assessed on redemptions of shares held for less than one year.
Note: See Financial Highlights tables for dividend and capital gains information.
51
Health Care Index Fund
Financial Statements
Statement of Net Assets
As of August 31, 2009
The fund provides a complete list of its holdings four times in each fiscal year, at the quarter-ends. For the second and fourth fiscal quarters, the lists appear in the fund’s semiannual and annual reports to shareholders. For the first and third fiscal quarters, the fund files the lists with the Securities and Exchange Commission on Form N-Q. Shareholders can look up the fund’s Forms N-Q on the SEC’s website at www.sec.gov. Forms N-Q may also be reviewed and copied at the SEC’s Public Reference Room (see the back cover of this report for further information).
| | | |
| | | | Market |
| | | | Value• |
| | | Shares | ($000) |
| Common Stocks (100.0%) | | |
| Biotechnology (14.6%) | | |
| * | Amgen Inc. | 462,509 | 27,630 |
| * | Gilead Sciences, Inc. | 413,880 | 18,649 |
| * | Celgene Corp. | 210,391 | 10,976 |
| * | Genzyme Corp. | 123,012 | 6,853 |
| * | Biogen Idec Inc. | 131,856 | 6,620 |
| * | Vertex Pharmaceuticals, Inc. | 79,185 | 2,962 |
| * | Cephalon, Inc. | 33,557 | 1,910 |
| * | Alexion Pharmaceuticals, Inc. | 37,184 | 1,678 |
| * | Human Genome | | |
| | Sciences, Inc. | 72,854 | 1,441 |
| * | Myriad Genetics, Inc. | 43,175 | 1,320 |
| * | Dendreon Corp. | 50,967 | 1,191 |
| * | United Therapeutics Corp. | 10,857 | 994 |
| * | Onyx Pharmaceuticals, Inc. | 27,829 | 892 |
| * | OSI Pharmaceuticals, Inc. | 26,349 | 881 |
| * | Amylin Pharmaceuticals, Inc. | 62,836 | 792 |
| * | BioMarin Pharmaceutical Inc. | 45,617 | 751 |
| * | Isis Pharmaceuticals, Inc. | 42,252 | 682 |
| * | Regeneron | | |
| | Pharmaceuticals, Inc. | 28,315 | 644 |
| * | Cubist Pharmaceuticals, Inc. | 26,217 | 542 |
| | PDL BioPharma Inc. | 54,545 | 494 |
| * | Seattle Genetics, Inc. | 37,846 | 464 |
| * | Alkermes, Inc. | 43,352 | 392 |
| * | Acorda Therapeutics Inc. | 17,233 | 390 |
| * | Savient Pharmaceuticals Inc. | 27,852 | 387 |
| | Martek Biosciences Corp. | 15,202 | 373 |
| * | Alnylam Pharmaceuticals Inc. | 16,068 | 359 |
| * | Theravance, Inc. | 21,753 | 339 |
| * | Medivation Inc. | 12,793 | 324 |
| * | AMAG Pharmaceuticals, Inc. | 7,761 | 318 |
| * | Cepheid, Inc. | 26,410 | 317 |
| * | Halozyme Therapeutics Inc. | 38,625 | 287 |
| * | Geron Corp. | 39,292 | 279 |
| * | Exelixis, Inc. | 48,088 | 274 |
| * | Incyte Corp. | 39,786 | 262 |
| * | InterMune Inc. | 16,565 | 251 |
| * | Celera Corp. | 36,781 | 241 |
| * | MannKind Corp. | 30,314 | 236 |
| * | Allos Therapeutics Inc. | 28,370 | 209 |
| * | Arena Pharmaceuticals, Inc. | 42,176 | 196 |
| * | ImmunoGen, Inc. | 24,514 | 179 |
| * | Pharmasset, Inc. | 9,636 | 178 |
| * | Enzon Pharmaceuticals, Inc. | 20,496 | 147 |
| * | Momenta | | |
| | Pharmaceuticals, Inc. | 13,664 | 135 |
| * | Genomic Health, Inc. | 6,598 | 132 |
| * | Micromet, Inc. | 19,695 | 125 |
| * | Rigel Pharmaceuticals, Inc. | 16,862 | 119 |
| * | Ligand Pharmaceuticals Inc. | | |
| | Class B | 48,481 | 116 |
| * | Emergent BioSolutions Inc. | 6,221 | 115 |
| * | Affymax Inc. | 5,027 | 115 |
| * | Sangamo BioSciences, Inc. | 15,971 | 112 |
| * | Facet Biotech Corp. | 11,070 | 111 |
| | | |
| | | | Market |
| | | | Value• |
| | | Shares | ($000) |
| * | Zymogenetics, Inc. | 18,681 | 110 |
| *,^ | Osiris Therapeutics, Inc. | 7,263 | 106 |
| * | ArQule, Inc. | 19,186 | 104 |
| * | Abraxis BioScience | 3,639 | 98 |
| * | Orexigen Therapeutics Inc. | 12,208 | 97 |
| * | SIGA Technologies, Inc. | 13,092 | 96 |
| * | Clinical Data, Inc. | 5,752 | 91 |
| * | NPS Pharmaceuticals Inc. | 21,586 | 90 |
| * | Maxygen Inc. | 12,685 | 90 |
| * | Array BioPharma Inc. | 21,087 | 87 |
| * | Nabi Biopharmaceuticals | 24,303 | 74 |
| * | Progenics | | |
| | Pharmaceuticals, Inc. | 13,889 | 73 |
| * | GTx, Inc. | 7,484 | 70 |
| * | Opko Health, Inc. | 28,207 | 66 |
| * | Lexicon Pharmaceuticals Inc. | 37,410 | 56 |
| * | XOMA Ltd. | 63,820 | 56 |
| * | Neurocrine Biosciences, Inc. | 17,596 | 53 |
| * | Myriad Pharmaceuticals Inc. | 10,632 | 48 |
| * | Amicus Therapeutics, Inc. | 3,610 | 35 |
| * | Idenix Pharmaceuticals Inc. | 10,278 | 31 |
| | | | 96,915 |
| Health Care Equipment & Supplies (17.7%) | |
| | Medtronic, Inc. | 511,461 | 19,589 |
| | Baxter International, Inc. | 276,398 | 15,733 |
| | Covidien PLC | 230,399 | 9,117 |
| * | Boston Scientific Corp. | 688,363 | 8,088 |
| | Becton, Dickinson & Co. | 109,530 | 7,625 |
| * | St. Jude Medical, Inc. | 158,362 | 6,103 |
| | Stryker Corp. | 136,199 | 5,647 |
| * | Zimmer Holdings, Inc. | 98,271 | 4,653 |
| * | Intuitive Surgical, Inc. | 17,294 | 3,851 |
| | C.R. Bard, Inc. | 45,257 | 3,647 |
| * | Hospira, Inc. | 73,393 | 2,869 |
| * | Varian Medical Systems, Inc. | 56,755 | 2,444 |
| | DENTSPLY International Inc. | 64,207 | 2,164 |
| | Beckman Coulter, Inc. | 31,144 | 2,109 |
| * | Hologic, Inc. | 116,946 | 1,924 |
| * | ResMed Inc. | 34,559 | 1,587 |
| * | Edwards Lifesciences Corp. | 25,355 | 1,569 |
| * | IDEXX Laboratories, Inc. | 26,889 | 1,365 |
| * | Inverness Medical | | |
| | Innovations, Inc. | 33,860 | 1,205 |
| * | Gen-Probe Inc. | 23,808 | 918 |
| | Teleflex Inc. | 18,205 | 825 |
| | STERIS Corp. | 26,944 | 782 |
| * | Kinetic Concepts, Inc. | 24,288 | 776 |
| * | Thoratec Corp. | 25,648 | 673 |
| * | Nuvasive, Inc. | 16,519 | 662 |
| * | Haemonetics Corp. | 11,564 | 609 |
| | West Pharmaceutical | | |
| | Services, Inc. | 15,003 | 603 |
| * | Immucor Inc. | 32,215 | 583 |
| | The Cooper Companies, Inc. | 20,710 | 566 |
| | Hill-Rom Holdings, Inc. | 27,188 | 557 |
| * | Masimo Corp. | 22,156 | 557 |
| | | |
| | | | Market |
| | | | Value• |
| | | Shares | ($000) |
| * | American Medical Systems | | |
| | Holdings, Inc. | 33,468 | 510 |
| | Meridian Bioscience Inc. | 18,514 | 446 |
| * | ev3 Inc. | 29,037 | 370 |
| * | Align Technology, Inc. | 26,125 | 350 |
| * | Integra LifeSciences Holdings | 9,461 | 320 |
| * | Sirona Dental Systems Inc. | 11,300 | 299 |
| | Invacare Corp. | 13,459 | 291 |
| * | Wright Medical Group, Inc. | 17,397 | 282 |
| * | Volcano Corp. | 19,639 | 281 |
| * | Abaxis, Inc. | 10,080 | 268 |
| * | Conceptus, Inc. | 13,865 | 251 |
| * | CONMED Corp. | 13,268 | 237 |
| * | ICU Medical, Inc. | 6,087 | 226 |
| * | Greatbatch, Inc. | 10,459 | 225 |
| * | Merit Medical Systems, Inc. | 12,225 | 221 |
| | Analogic Corp. | 6,092 | 217 |
| * | Quidel Corp. | 13,393 | 207 |
| * | Orthofix International N.V. | 7,038 | 193 |
| * | Cyberonics, Inc. | 12,614 | 190 |
| * | SonoSite, Inc. | 7,848 | 183 |
| * | Natus Medical Inc. | 12,725 | 181 |
| * | Symmetry Medical Inc. | 16,406 | 181 |
| * | Neogen Corp. | 6,441 | 180 |
| * | Zoll Medical Corp. | 9,765 | 176 |
| * | SurModics, Inc. | 7,063 | 162 |
| * | Dexcom Inc. | 17,707 | 138 |
| * | Orthovita, Inc. | 31,190 | 132 |
| * | Accuray Inc. | 20,270 | 130 |
| * | Kensey Nash Corp. | 4,774 | 125 |
| * | ABIOMED, Inc. | 14,263 | 118 |
| * | RTI Biologics, Inc. | 24,723 | 112 |
| * | Palomar Medical | | |
| | Technologies, Inc. | 8,043 | 112 |
| | Atrion Corp. | 772 | 106 |
| * | CryoLife Inc. | 12,527 | 93 |
| * | IRIS International, Inc. | 8,407 | 86 |
| * | Cantel Medical Corp. | 6,368 | 86 |
| * | Synovis Life | | |
| | Technologies, Inc. | 5,246 | 82 |
| * | Insulet Corp. | 8,256 | 76 |
| * | MAKO Surgical Corp. | 8,891 | 76 |
| * | Somanetics Corp. | 5,482 | 72 |
| * | ATS Medical, Inc. | 21,131 | 57 |
| * | Exactech, Inc. | 3,791 | 56 |
| * | OraSure Technologies, Inc. | 21,335 | 56 |
| * | TomoTherapy, Inc. | 16,056 | 54 |
| * | Cynosure Inc. | 4,665 | 51 |
| * | Stereotaxis Inc. | 14,315 | 50 |
| * | Hansen Medical Inc. | 11,591 | 39 |
| | | | 117,754 |
| Health Care Providers & Services (17.0%) | |
| | UnitedHealth Group Inc. | 543,441 | 15,216 |
| * | Medco Health | | |
| | Solutions, Inc. | 220,354 | 12,168 |
| * | WellPoint Inc. | 221,450 | 11,704 |
| * | Express Scripts Inc. | 117,805 | 8,508 |
| | McKesson Corp. | 123,940 | 7,047 |
| | Aetna Inc. | 204,203 | 5,820 |
| | Cardinal Health, Inc. | 163,875 | 5,667 |
| | Quest Diagnostics, Inc. | 71,986 | 3,884 |
| | CIGNA Corp. | 124,657 | 3,669 |
| * | Laboratory Corp. of | | |
| | America Holdings | 49,237 | 3,436 |
| | AmerisourceBergen Corp. | 138,550 | 2,952 |
52
Health Care Index Fund
| | | |
| | | | Market |
| | | | Value• |
| | | Shares | ($000) |
| * | Humana Inc. | 77,531 | 2,768 |
| * | DaVita, Inc. | 47,239 | 2,443 |
| * | Henry Schein, Inc. | 40,820 | 2,163 |
| * | Coventry Health Care Inc. | 68,004 | 1,484 |
| * | Community Health | | |
| | Systems, Inc. | 41,605 | 1,280 |
| | Omnicare, Inc. | 54,013 | 1,236 |
| | Universal Health Services | | |
| | Class B | 20,878 | 1,227 |
| * | Patterson Companies, Inc. | 41,493 | 1,130 |
| * | MEDNAX, Inc. | 20,859 | 1,086 |
| * | Tenet Healthcare Corp. | 217,750 | 1,015 |
| * | VCA Antech, Inc. | 38,657 | 957 |
| * | Lincare Holdings, Inc. | 32,490 | 857 |
| | Owens & Minor, Inc. | 18,981 | 840 |
| * | Health Management | | |
| | Associates Class A | 111,479 | 770 |
| * | Health Net Inc. | 47,391 | 726 |
| * | Psychiatric Solutions, Inc. | 24,246 | 650 |
| * | HealthSouth Corp. | 40,204 | 628 |
| * | LifePoint Hospitals, Inc. | 23,653 | 594 |
| * | AMERIGROUP Corp. | 24,207 | 572 |
| * | PSS World Medical, Inc. | 27,592 | 564 |
| * | Amedisys Inc. | 12,390 | 552 |
| * | Magellan Health | | |
| | Services, Inc. | 16,128 | 518 |
| * | Catalyst Health | | |
| | Solutions, Inc. | 16,834 | 481 |
| * | WellCare Health Plans Inc. | 19,253 | 467 |
| | Chemed Corp. | 10,287 | 448 |
| * | HMS Holdings Corp. | 11,601 | 436 |
| | Brookdale Senior Living Inc. | 23,878 | 379 |
| * | Centene Corp. | 19,638 | 340 |
| * | Emergency Medical | | |
| | Services LP Class A | 6,936 | 315 |
| * | Healthspring, Inc. | 22,612 | 299 |
| * | AmSurg Corp. | 14,422 | 293 |
| * | PharMerica Corp. | 13,972 | 280 |
| * | Gentiva Health Services, Inc. | 12,597 | 278 |
| * | inVentiv Health, Inc. | 15,147 | 241 |
| | Landauer, Inc. | 4,313 | 237 |
| * | Kindred Healthcare, Inc. | 14,322 | 204 |
| * | Universal American Corp. | 22,218 | 204 |
| * | Healthways, Inc. | 15,403 | 201 |
| * | Hanger Orthopedic | | |
| | Group, Inc. | 14,118 | 198 |
| * | Odyssey Healthcare, Inc. | 15,191 | 196 |
| * | MWI Veterinary Supply Inc. | 5,258 | 196 |
| * | IPC The Hospitalist Co. | 6,271 | 185 |
| * | LHC Group Inc. | 7,544 | 184 |
| * | Bio-Reference | | |
| | Laboratories, Inc. | 5,408 | 180 |
| * | Emeritus Corp. | 9,800 | 177 |
| * | RehabCare Group, Inc. | 8,224 | 173 |
| * | Triple-S Management Corp. | 9,169 | 170 |
| * | Air Methods Corp. | 4,976 | 170 |
| * | Res-Care, Inc. | 11,477 | 166 |
| * | Sun Healthcare Group Inc. | 19,778 | 163 |
| * | AMN Healthcare | | |
| | Services, Inc. | 15,625 | 154 |
| * | Genoptix, Inc. | 4,621 | 133 |
| * | Molina Healthcare Inc. | 6,369 | 129 |
| * | Cross Country | | |
| | Healthcare, Inc. | 13,534 | 125 |
| * | CorVel Corp. | 3,891 | 117 |
| | National Healthcare Corp. | 3,030 | 116 |
| | | | |
| | | | | Market |
| | | | | Value• |
| | | | Shares | ($000) |
| * | Almost Family Inc. | | 3,356 | 92 |
| * | Assisted Living Concepts Inc. | 4,499 | 91 |
| * | Clarient, Inc. | | 21,398 | 84 |
| * | Chindex International, Inc. | | 5,878 | 80 |
| | Ensign Group Inc. | | 5,153 | 71 |
| * | Skilled Healthcare Group Inc. | 9,450 | 71 |
| * | MedCath Corp. | | 7,643 | 70 |
| * | Nighthawk Radiology | | | |
| | Holdings, Inc. | | 11,187 | 70 |
| * | Alliance HealthCare | | | |
| | Services Inc. | | 11,891 | 66 |
| * | Sunrise Senior Living, Inc. | | 20,913 | 46 |
| * | CardioNet, Inc. | | 6,385 | 46 |
| * | Virtual Radiologic Corp. | | 3,358 | 39 |
| | | | | 112,992 |
| Health Care Technology (1.0%) | | |
| * | Cerner Corp. | | 31,291 | 1,931 |
| | IMS Health, Inc. | | 83,151 | 1,153 |
| * | HLTH Corp. | | 44,001 | 639 |
| | Quality Systems, Inc. | | 8,394 | 452 |
| | Allscripts Healthcare | | | |
| | Solutions, Inc. | | 29,969 | 445 |
| * | Eclipsys Corp. | | 25,559 | 428 |
| * | AthenaHealth Inc. | | 9,948 | 400 |
| * | MedAssets, Inc. | | 12,352 | 276 |
| * | Phase Forward Inc. | | 19,539 | 251 |
| | Computer Programs and | | | |
| | Systems, Inc. | | 4,481 | 173 |
| * | Omnicell, Inc. | | 14,429 | 159 |
| * | Vital Images, Inc. | | 6,783 | 86 |
| | | | | 6,393 |
| Life Sciences Tools & Services (4.3%) | |
| * | Thermo Fisher Scientific, Inc. | 191,019 | 8,636 |
| * | Life Technologies Corp. | | 79,873 | 3,557 |
| * | Waters Corp. | | 43,984 | 2,212 |
| * | Illumina, Inc. | | 56,279 | 1,985 |
| * | Millipore Corp. | | 25,230 | 1,671 |
| * | Covance, Inc. | | 28,953 | 1,537 |
| * | Mettler-Toledo | | | |
| | International Inc. | | 15,287 | 1,336 |
| * | Charles River | | | |
| | Laboratories, Inc. | | 30,426 | 1,049 |
| | Techne Corp. | | 16,208 | 1,000 |
| | Pharmaceutical Product | | | |
| | Development, Inc. | | 48,471 | 975 |
| | PerkinElmer, Inc. | | 52,952 | 966 |
| * | Bio-Rad Laboratories, Inc. | | | |
| | Class A | | 8,600 | 742 |
| * | Varian, Inc. | | 13,355 | 684 |
| * | Dionex Corp. | | 8,201 | 493 |
| * | PAREXEL International Corp. | 26,378 | 338 |
| * | Luminex Corp. | | 18,059 | 276 |
| * | Bruker BioSciences Corp. | | 26,183 | 266 |
| * | Affymetrix, Inc. | | 31,915 | 246 |
| * | Sequenom, Inc. | | 26,281 | 168 |
| * | eResearch Technology, Inc. | | 19,659 | 124 |
| * | Albany Molecular | | | |
| | Research, Inc. | | 11,096 | 89 |
| * | Kendle International Inc. | | 6,468 | 85 |
| * | Enzo Biochem, Inc. | | 15,593 | 79 |
| * | Life Sciences Research, Inc. | 4,599 | 36 |
| | | | | 28,550 |
| Pharmaceuticals (45.4%) | | | |
| | Johnson & Johnson | 1,259,228 | 76,108 |
| | Pfizer Inc. | 3,083,499 | 51,494 |
| | Abbott Laboratories | 706,233 | 31,943 |
| | | |
| | | | Market |
| | | | Value• |
| | | Shares | ($000) |
| | Merck & Co., Inc. | 963,475 | 31,246 |
| | Wyeth | 609,410 | 29,160 |
| | Schering-Plough Corp. | 743,189 | 20,943 |
| | Bristol-Myers Squibb Co. | 905,228 | 20,033 |
| | Eli Lilly & Co. | 472,551 | 15,812 |
| | Allergan, Inc. | 139,135 | 7,780 |
| * | Forest Laboratories, Inc. | 137,114 | 4,013 |
| * | Mylan Inc. | 139,079 | 2,040 |
| * | Watson | | |
| | Pharmaceuticals, Inc. | 45,403 | 1,602 |
| * | Endo Pharmaceuticals | | |
| | Holdings, Inc. | 52,696 | 1,189 |
| * | King Pharmaceuticals, Inc. | 112,436 | 1,167 |
| | Perrigo Co. (U.S. Shares) | 35,977 | 1,062 |
| * | Warner Chilcott PLC | 45,740 | 932 |
| * | Valeant Pharmaceuticals | | |
| | International | 35,251 | 913 |
| * | Sepracor Inc. | 49,664 | 901 |
| * | Auxilium | | |
| | Pharmaceuticals, Inc. | 19,303 | 556 |
| | Medicis | | |
| | Pharmaceutical Corp. | 25,793 | 476 |
| * | Nektar Therapeutics | 42,056 | 349 |
| * | Par Pharmaceutical Cos. Inc. | 15,775 | 323 |
| * | ViroPharma Inc. | 35,940 | 288 |
| * | Salix Pharmaceuticals, Ltd. | 21,877 | 274 |
| * | Xenoport Inc. | 12,341 | 225 |
| * | Inspire Pharmaceuticals, Inc. | 33,440 | 200 |
| * | Vivus, Inc. | 29,947 | 185 |
| * | The Medicines Co. | 23,863 | 182 |
| * | Questcor | | |
| | Pharmaceuticals, Inc. | 27,267 | 158 |
| * | Cypress Bioscience, Inc. | 17,277 | 120 |
| * | Cadence | | |
| | Pharmaceuticals, Inc. | 9,477 | 103 |
| * | Pain Therapeutics, Inc. | 16,479 | 84 |
| * | Durect Corp. | 33,509 | 82 |
| * | Pozen Inc. | 11,559 | 78 |
| * | MAP Pharmaceuticals Inc. | 6,123 | 54 |
| * | K-V Pharmaceutical Co. | | |
| | Class A | 15,922 | 36 |
| * | Akorn, Inc. | 26,476 | 35 |
| * | Sucampo | | |
| | Pharmaceuticals Inc. | 3,601 | 20 |
| * | Caraco Pharmaceutical | | |
| | Laboratories, Ltd. | 158 | 1 |
| | | | 302,167 |
| Total Common Stocks | | |
| (Cost $784,004) | | 664,771 |
| Temporary Cash Investment (0.0%) | |
| Money Market Fund (0.0%) | | |
| 1,2 | Vanguard Market | | |
| | Liquidity Fund, 0.277% | | |
| | (Cost $49) | 49,000 | 49 |
| Total Investments (100.0%) | | |
| (Cost $784,053) | | 664,820 |
| Other Assets and Liabilities (0.0%) | |
| Other Assets | | 4,309 |
| Liabilities2 | | (4,056) |
| | | | 253 |
| Net Assets (100%) | | 665,073 |
53
Health Care Index Fund
| |
| At August 31, 2009, net assets consisted of: |
| | Amount |
| | ($000) |
| Paid-in Capital | 798,382 |
| Undistributed Net Investment Income | 7,265 |
| Accumulated Net Realized Losses | (21,341) |
| Unrealized Appreciation (Depreciation) | (119,233) |
| Net Assets | 665,073 |
| |
| |
| Admiral Shares—Net Assets | |
| Applicable to 4,399,329 outstanding | |
| $.001 par value shares of beneficial | |
| interest (unlimited authorization) | 110,824 |
| Net Asset Value Per Share— | |
| Admiral Shares | $25.19 |
| |
| |
| ETF Shares—Net Assets | |
| Applicable to 11,002,626 outstanding | |
| $.001 par value shares of beneficial | |
| interest (unlimited authorization) | 554,249 |
| Net Asset Value Per Share— | |
| ETF Shares | $50.37 |
• See Note A in Notes to Financial Statements.
* Non-income-producing security.
^ Part of security position is on loan to broker-dealers. The total value of securities on loan is $48,000.
1 Affiliated money market fund available only to Vanguard funds and certain trusts and accounts managed by Vanguard. Rate shown is the 7-day yield.
2 Includes $49,000 of collateral received for securities on loan.
See accompanying Notes, which are an integral part of the Financial Statements.
54
Health Care Index Fund
Statement of Operations
| |
| | Year Ended |
| August 31, 2009 |
| | ($000) |
| Investment Income | |
| Income | |
| Dividends | 12,674 |
| Interest1 | 4 |
| Security Lending | 57 |
| Total Income | 12,735 |
| Expenses | |
| The Vanguard Group—Note B | |
| Investment Advisory Services | 87 |
| Management and Administrative— | |
| Admiral Shares | 243 |
| Management and Administrative— | |
| ETF Shares | 896 |
| Marketing and Distribution— | |
| Admiral Shares | 25 |
| Marketing and Distribution— | |
| ETF Shares | 167 |
| Custodian Fees | 14 |
| Auditing Fees | 24 |
| Shareholders’ Reports and Proxies— | |
| Admiral Shares | 1 |
| Shareholders’ Reports and Proxies— | |
| ETF Shares | 135 |
| Trustees’ Fees and Expenses | 1 |
| Total Expenses | 1,593 |
| Net Investment Income | 11,142 |
| Realized Net Gain (Loss) on | |
| Investment Securities Sold | 7,908 |
| Change in Unrealized Appreciation | |
| (Depreciation) of Investment Securities | (100,604) |
| Net Increase (Decrease) in Net Assets | |
| Resulting from Operations | (81,554) |
Statement of Changes in Net Assets
| | |
| | Year Ended August 31, |
| | 2009 | 2008 |
| | ($000) | ($000) |
| Increase (Decrease) in Net Assets | | |
| Operations | | |
| Net Investment Income | 11,142 | 9,098 |
| Realized Net Gain (Loss) | 7,908 | 3,694 |
| Change in Unrealized Appreciation (Depreciation) | (100,604) | (35,268) |
| Net Increase (Decrease) in Net Assets Resulting from Operations | (81,554) | (22,476) |
| Distributions | | |
| Net Investment Income | | |
| Admiral Shares | (1,658) | (1,807) |
| ETF Shares | (8,673) | (6,890) |
| Realized Capital Gain | | |
| Admiral Shares | — | — |
| ETF Shares | — | — |
| Total Distributions | (10,331) | (8,697) |
| Capital Share Transactions | | |
| Admiral Shares | (7,704) | 10,131 |
| ETF Shares | 14,318 | 162,011 |
| Net Increase (Decrease) from Capital Share Transactions | 6,614 | 172,142 |
| Total Increase (Decrease) | (85,271) | 140,969 |
| Net Assets | | |
| Beginning of Period | 750,344 | 609,375 |
| End of Period2 | 665,073 | 750,344 |
1 Interest income from an affiliated company of the fund was $4,000.
2 Net Assets—End of Period includes undistributed net investment income of $7,265,000 and $6,454,000.
See accompanying Notes, which are an integral part of the Financial Statements.
55
Health Care Index Fund
Financial Highlights
| | | | | |
| Admiral Shares | | | | | |
| |
| | | | | Year Ended August 31, |
| For a Share Outstanding Throughout Each Period | 2009 | 2008 | 2007 | 2006 | 2005 |
| Net Asset Value, Beginning of Period | $28.68 | $29.82 | $27.99 | $26.92 | $23.97 |
| Investment Operations | | | | | |
| Net Investment Income | .398 | .345 | .392 | .3041 | .2741 |
| Net Realized and Unrealized Gain (Loss) | | | | | |
| on Investments | (3.524) | (1.090) | 1.736 | .951 | 2.762 |
| Total from Investment Operations | (3.126) | (.745) | 2.128 | 1.255 | 3.036 |
| Distributions | | | | | |
| Dividends from Net Investment Income | (.364) | (.395) | (.298) | (.185) | (.086) |
| Distributions from Realized Capital Gains | — | — | — | — | — |
| Total Distributions | (.364) | (.395) | (.298) | (.185) | (.086) |
| Net Asset Value, End of Period | $25.19 | $28.68 | $29.82 | $27.99 | $26.92 |
| |
| Total Return2 | –10.74% | –2.59% | 7.65% | 4.68% | 12.70% |
| |
| Ratios/Supplemental Data | | | | | |
| Net Assets, End of Period (Millions) | $111 | $136 | $132 | $108 | $73 |
| Ratio of Total Expenses to | | | | | |
| Average Net Assets | 0.28% | 0.25% | 0.26% | 0.28% | 0.28% |
| Ratio of Net Investment Income to | | | | | |
| Average Net Assets | 1.75% | 1.36% | 1.42% | 1.12% | 1.11% |
| Portfolio Turnover Rate3 | 6% | 8% | 10% | 11% | 9% |
1 Calculated based on average shares outstanding.
2 Total returns do not reflect the 2% fee assessed on redemptions of shares held for less than one year.
3 Excludes the value of portfolio securities received or delivered as a result of in-kind purchases or redemptions of the fund’s capital shares,
including ETF Creation Units.
| | | | | |
| ETF Shares | | | | | |
| |
| | | | | Year Ended August 31, |
| For a Share Outstanding Throughout Each Period | 2009 | 2008 | 2007 | 2006 | 2005 |
| Net Asset Value, Beginning of Period | $57.36 | $59.65 | $55.99 | $53.85 | $47.90 |
| Investment Operations | | | | | |
| Net Investment Income | .809 | .720 | .809 | .6221 | .5971 |
| Net Realized and Unrealized Gain (Loss) | | | | | |
| on Investments | (7.045) | (2.190) | 3.466 | 1.905 | 5.486 |
| Total from Investment Operations | (6.236) | (1.470) | 4.275 | 2.527 | 6.083 |
| Distributions | | | | | |
| Dividends from Net Investment Income | (.754) | (.820) | (.615) | (.387) | (.133) |
| Distributions from Realized Capital Gains | — | — | — | — | — |
| Total Distributions | (.754) | (.820) | (.615) | (.387) | (.133) |
| Net Asset Value, End of Period | $50.37 | $57.36 | $59.65 | $55.99 | $53.85 |
| |
| Total Return | –10.70% | –2.55% | 7.69% | 4.71% | 12.72% |
| |
| Ratios/Supplemental Data | | | | | |
| Net Assets, End of Period (Millions) | $554 | $614 | $477 | $364 | $205 |
| Ratio of Total Expenses to | | | | | |
| Average Net Assets | 0.25% | 0.20% | 0.22% | 0.25% | 0.26% |
| Ratio of Net Investment Income to | | | | | |
| Average Net Assets | 1.78% | 1.41% | 1.46% | 1.15% | 1.13% |
| Portfolio Turnover Rate2 | 6% | 8% | 10% | 11% | 9% |
1 Calculated based on average shares outstanding.
2 Excludes the value of portfolio securities received or delivered as a result of in-kind purchases or redemptions of the fund’s capital shares,
including ETF Creation Units.
See accompanying Notes, which are an integral part of the Financial Statements.
56
Health Care Index Fund
Notes to Financial Statements
Vanguard Health Care Index Fund is registered under the Investment Company Act of 1940 as an open-end investment company, or mutual fund. The fund offers two classes of shares, Admiral Shares and ETF Shares. Admiral Shares are available to any investor who meets the fund’s minimum purchase requirements. ETF Shares are listed for trading on the NYSE Arca, Inc.; they can be purchased and sold through a broker.
A. The following significant accounting policies conform to generally accepted accounting principles for U.S. mutual funds. The fund consistently follows such policies in preparing its financial statements.
1. Security Valuation: Securities are valued as of the close of trading on the New York Stock Exchange (generally 4 p.m., Eastern time) on the valuation date. Equity securities are valued at the latest quoted sales prices or official closing prices taken from the primary market in which each security trades; such securities not traded on the valuation date are valued at the mean of the latest quoted bid and asked prices. Securities for which market quotations are not readily available, or whose values have been materially affected by events occurring before the fund’s pricing time but after the close of the securities’ primary markets, are valued by methods deemed by the board of trustees to represent fair value. Investments in Vanguard Market Liquidity Fund are valued at that fund’s net asset value.
2. Federal Income Taxes: The fund intends to continue to qualify as a regulated investment company and distribute all of its taxable income. Management has analyzed the fund’s tax positions taken for all open federal income tax years (August 31, 2006–2009), and has concluded that no provision for federal income tax is required in the fund’s financial statements.
3. Distributions: Distributions to shareholders are recorded on the ex-dividend date.
4. Security Lending: The fund may lend its securities to qualified institutional borrowers to earn additional income. Security loans are required to be secured at all times by collateral at least equal to the market value of securities loaned. The fund invests cash collateral received in Vanguard Market Liquidity Fund, and records a liability for the return of the collateral, during the period the securities are on loan. Security lending income represents the income earned on investing cash collateral, less expenses associated with the loan.
5. Other: Dividend income is recorded on the ex-dividend date. Interest income includes income distributions received from Vanguard Market Liquidity Fund and is accrued daily. Security transactions are accounted for on the date securities are bought or sold. Costs used to determine realized gains (losses) on the sale of investment securities are those of the specific securities sold. Fees assessed on redemptions of capital shares are credited to paid-in capital.
Each class of shares has equal rights as to assets and earnings, except that each class separately bears certain class-specific expenses related to maintenance of shareholder accounts (included in Management and Administrative expenses), shareholder reporting, and proxies. Marketing and distribution expenses are allocated to each class of shares based on a method approved by the board of trustees. Income, other non-class-specific expenses, and gains and losses on investments are allocated to each class of shares based on its relative net assets.
B. The Vanguard Group furnishes at cost investment advisory, corporate management, administrative, marketing, and distribution services. The costs of such services are allocated to the fund under methods approved by the board of trustees. The fund has committed to provide up to 0.40% of its net assets in capital contributions to Vanguard. At August 31, 2009, the fund had contributed capital of $145,000 to Vanguard (included in Other Assets), representing 0.02% of the fund’s net assets and 0.06% of Vanguard’s capitalization. The fund’s trustees and officers are also directors and officers of Vanguard.
C. Various inputs may be used to determine the value of the fund’s investments. These inputs are summarized in three broad levels for financial statement purposes. The inputs or methodologies used to value securities are not necessarily an indication of the risk associated with investing in those securities.
Level 1—Quoted prices in active markets for identical securities.
Level 2—Other significant observable inputs (including quoted prices for similar securities, interest rates, prepayment speeds, credit risk, etc.).
Level 3—Significant unobservable inputs (including the fund’s own assumptions used to determine the fair value of investments).
At August 31, 2009, 100% of the fund’s investments were valued based on Level 1 inputs.
57
Health Care Index Fund
D. Distributions are determined on a tax basis and may differ from net investment income and realized capital gains for financial reporting purposes. Differences may be permanent or temporary. Permanent differences are reclassified among capital accounts in the financial statements to reflect their tax character. Temporary differences arise when certain items of income, expense, gain, or loss are recognized in different periods for financial statement and tax purposes; these differences will reverse at some time in the future. Differences in classification may also result from the treatment of short-term gains as ordinary income for tax purposes.
During the year ended August 31, 2009, the fund realized $18,590,000 of net capital gains resulting from in-kind redemptions—in which shareholders exchanged fund shares for securities held by the fund rather than for cash. Because such gains are not taxable to the fund, and are not distributed to shareholders, they have been reclassified from accumulated net realized losses to paid-in capital.
For tax purposes, at August 31, 2009, the fund had $7,895,000 of ordinary income available for distribution. The fund had available capital loss carryforwards totaling $10,937,000 to offset future net capital gains of $207,000 through August 31, 2014, $343,000 through August 31, 2015, $3,126,000 through August 31, 2016, and $7,261,000 through August 31, 2017. In addition, the fund realized losses of $10,493,000 during the period from November 1, 2008, through August 31, 2009, which are deferred and will be treated as realized for tax purposes in fiscal 2010.
At August 31, 2009, the cost of investment securities for tax purposes was $784,071,000. Net unrealized depreciation of investment securities for tax purposes was $119,251,000, consisting of unrealized gains of $19,721,000 on securities that had risen in value since their purchase and $138,972,000 in unrealized losses on securities that had fallen in value since their purchase.
E. During the year ended August 31, 2009, the fund purchased $224,876,000 of investment securities and sold $216,796,000 of investment securities, other than temporary cash investments.
F. Capital share transactions for each class of shares were:
| | | | |
| | | | Year Ended August 31, |
| | | 2009 | | 2008 |
| | Amount | Shares | Amount | Shares |
| | ($000) | (000) | ($000) | (000) |
| Admiral Shares | | | | |
| Issued | 9,782 | 428 | 26,987 | 923 |
| Issued in Lieu of Cash Distributions | 758 | 34 | 847 | 28 |
| Redeemed1 | (18,244) | (819) | (17,703) | (622) |
| Net Increase (Decrease)—Admiral Shares | (7,704) | (357) | 10,131 | 329 |
| ETF Shares | | | | |
| Issued | 189,315 | 4,100 | 222,891 | 3,800 |
| Issued in Lieu of Cash Distributions | — | — | — | — |
| Redeemed1 | (174,997) | (3,800) | (60,880) | (1,100) |
| Net Increase (Decrease)—ETF Shares | 14,318 | 300 | 162,011 | 2,700 |
| 1 Net of redemption fees for fiscal 2009 and 2008 of $72,000 and $106,000, respectively (fund totals). | | |
G. In preparing the financial statements as of August 31, 2009, management considered the impact of subsequent events occurring through October 15, 2009, for potential recognition or disclosure in these financial statements.
Industrials Index Fund
Fund Profile
As of August 31, 2009
| | | |
| Portfolio Characteristics | | |
| | | Target | Broad |
| | Fund | Index1 | Index2 |
| Number of Stocks | 374 | 374 | 2,501 |
| Median Market Cap | $18.4B | $18.4B | $27.3B |
| Price/Earnings Ratio | 19.5x | 19.5x | 25.6x |
| Price/Book Ratio | 2.2x | 2.2x | 2.1x |
| Yield3 | | 2.1% | 1.9% |
| Admiral Shares | 1.8% | | |
| ETF Shares | 1.8% | | |
| Return on Equity | 19.4% | 19.4% | 19.3% |
| Earnings Growth Rate | 11.1% | 11.1% | 9.9% |
| Foreign Holdings | 0.0% | 0.0% | 0.0% |
| Turnover Rate | 8% | — | — |
| Expense Ratio4 | | — | — |
| Admiral Shares | 0.28% | | |
| ETF Shares | 0.25% | | |
| Short-Term Reserves | 0.0% | — | — |
| | |
| Volatility Measures5 | |
| | Fund Versus | Fund Versus |
| | Target Index1 | Broad Index2 |
| R-Squared | 1.00 | 0.92 |
| Beta | 1.00 | 1.22 |
| |
| Industry Diversification (% of equity exposure) |
| |
| Aerospace & Defense | 22.0% |
| Air Freight & Logistics | 6.6 |
| Airlines | 1.8 |
| Building Products | 1.3 |
| Construction & Engineering | 3.7 |
| Construction & Farm Machinery & Heavy Trucks | 7.8 |
| Diversified Support Services | 1.3 |
| Electrical Components & Equipment | 6.5 |
| Environmental & Facilities Services | 3.3 |
| Human Resource & Employment Services | 1.4 |
| Industrial Conglomerates | 19.0 |
| Industrial Machinery | 10.0 |
| Office Services & Supplies | 1.2 |
| Railroads | 8.1 |
| Research & Consulting Services | 1.5 |
| Trading Companies & Distributors | 1.8 |
| Trucking | 1.4 |
| Other Industrial | 1.3 |
| |
| Ten Largest Holdings6 (% of total net assets) |
| |
| General Electric Co. | 12.5% |
| United Technologies Corp. | 4.5 |
| 3M Co. | 4.0 |
| United Parcel Service, Inc. | 3.2 |
| The Boeing Co. | 2.9 |
| Union Pacific Corp. | 2.6 |
| Burlington Northern Santa Fe Corp. | 2.4 |
| Emerson Electric Co. | 2.4 |
| Caterpillar, Inc. | 2.3 |
| Honeywell International Inc. | 2.2 |
| Top Ten | 39.0% |
1 MSCI US IMI/Industrials.
2 MSCI US IMI/2500.
3 30-day SEC yield for the fund; annualized dividend yield for the indexes. See the Glossary.
4 The expense ratios shown are from the prospectuses dated December 29, 2008, and represent estimated costs for the current fiscal year based on the fund’s net assets as of the prospectus date. For the fiscal year
ended August 31, 2009, the expense ratios were 0.28% for Admiral Shares and 0.25% for ETF Shares.
5 For an explanation of R-squared, beta, and other terms used here, see the Glossary.
6 The holdings listed exclude any temporary cash investments and equity index products.
59
Industrials Index Fund
Performance Summary
All of the returns in this report represent past performance, which is not a guarantee of future results that may be achieved by the fund. (Current performance may be lower or higher than the performance data cited. For performance data current to the most recent month-end, visit our website at www.vanguard.com/performance.) Note, too, that both investment returns and principal value can fluctuate widely, so an investor’s shares, when sold, could be worth more or less than their original cost. The returns shown do not reflect taxes that a shareholder would pay on fund distributions or on the sale of fund shares.
Cumulative Performance: September 23, 2004–August 31, 2009
Initial Investment of $10,000

| | | |
| | Average Annual Total Returns | Final Value |
| | Periods Ended August 31, 2009 | of a $10,000 |
| | One Year | Since Inception1 | Investment |
| Industrials Index Fund ETF Shares Net Asset Value2 | –28.41% | 0.32% | $10,160 |
| Industrials Index Fund ETF Shares Market Price | –28.40 | 0.33 | 10,162 |
| MSCI US IMI/2500 | –18.26 | 1.20 | 10,605 |
| MSCI US IMI/Industrials | –28.38 | 0.13 | 10,062 |
| | | |
| | | | Final Value |
| | | | of a $100,000 |
| | One Year | Since Inception1 | Investment |
| Industrials Index Fund Admiral Shares3 | –28.44% | –8.86% | $73,533 |
| MSCI US IMI/2500 | –18.26 | –5.35 | 83,339 |
| MSCI US IMI/Industrials | –28.38 | –8.74 | 73,857 |
1 Performance for the fund and its comparative standards is calculated since the following inception dates: September 23, 2004, for ETF Shares; May 8, 2006, for Admiral Shares.
2 For more information about how the ETF Shares’ market prices have compared with their net asset value, visit www.vanguard.com, select your ETF, and then select the Performance tab. The Premium/Discount
table there shows the percentages of days on which the ETF Shares’ market price was above or below the NAV.
3 Total returns do not reflect the 2% fee assessed on redemptions of shares held for less than one year.
Note: See Financial Highlights tables for dividend and capital gains information.
60
Industrials Index Fund
Fiscal-Year Total Returns (%): September 23, 2004–August 31, 2009
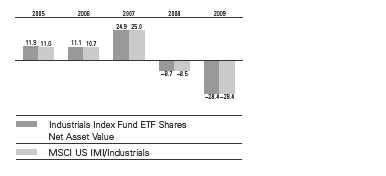
| | |
| Cumulative Returns: ETF Shares, September 23, 2004–August 31, 2009 | | |
| | | Cumulative |
| | | Since |
| | One Year | Inception |
| Industrials Index Fund ETF Shares Market Price | –28.40% | 1.62% |
| Industrials Index Fund ETF Shares Net Asset Value | –28.41 | 1.60 |
| MSCI US IMI/Industrials | –28.38 | 0.62 |
Average Annual Total Returns: Periods Ended June 30, 2009
This table presents average annual total returns through the latest calendar quarter—rather than through the end
of the fiscal period. Securities and Exchange Commission rules require that we provide this information.
| | | |
| | | | Since |
| | Inception Date | One Year | Inception |
| ETF Shares | 9/23/2004 | | |
| Market Price | | –34.87% | –2.33% |
| Net Asset Value | | –34.93 | –2.33 |
| Admiral Shares1 | 5/8/2006 | –34.94 | –12.93 |
1 Total returns do not reflect the 2% fee assessed on redemptions of shares held for less than one year.
Note: See Financial Highlights tables for dividend and capital gains information.
61
Industrials Index Fund
Financial Statements
Statement of Net Assets
As of August 31, 2009
The fund provides a complete list of its holdings four times in each fiscal year, at the quarter-ends. For the second and fourth fiscal quarters, the lists appear in the fund’s semiannual and annual reports to shareholders. For the first and third fiscal quarters, the fund files the lists with the Securities and Exchange Commission on Form N-Q. Shareholders can look up the fund’s Forms N-Q on the SEC’s website at www.sec.gov. Forms N-Q may also be reviewed and copied at the SEC’s Public Reference Room (see the back cover of this report for further information).
| | | |
| | | | Market |
| | | | Value• |
| | | Shares | ($000) |
| Common Stocks (100.0%) | | |
| Aerospace & Defense (21.8%) | | |
| | United Technologies Corp. | 146,185 | 8,678 |
| | The Boeing Co. | 112,691 | 5,597 |
| | Honeywell International Inc. | 115,430 | 4,243 |
| | Lockheed Martin Corp. | 54,730 | 4,104 |
| | General Dynamics Corp. | 53,458 | 3,164 |
| | Raytheon Co. | 64,371 | 3,037 |
| | Northrop Grumman Corp. | 50,196 | 2,450 |
| | Precision Castparts Corp. | 22,860 | 2,087 |
| | L-3 Communications | | |
| | Holdings, Inc. | 19,016 | 1,415 |
| | ITT Industries, Inc. | 28,229 | 1,414 |
| | Rockwell Collins, Inc. | 25,872 | 1,191 |
| | Goodrich Corp. | 20,219 | 1,115 |
| * | Alliant Techsystems, Inc. | 5,349 | 413 |
| * | TransDigm Group, Inc. | 6,294 | 280 |
| * | BE Aerospace, Inc. | 15,647 | 268 |
| * | Spirit Aerosystems | | |
| | Holdings Inc. | 16,976 | 264 |
| | Curtiss-Wright Corp. | 7,356 | 240 |
| * | Teledyne Technologies, Inc. | 5,563 | 188 |
| * | Moog Inc. | 6,321 | 183 |
| * | Hexcel Corp. | 15,736 | 171 |
| * | Esterline Technologies Corp. | 4,858 | 150 |
| * | Orbital Sciences Corp. | 9,204 | 136 |
| | Triumph Group, Inc. | 2,708 | 118 |
| * | AAR Corp. | 6,373 | 108 |
| * | DynCorp International Inc. | | |
| | Class A | 5,988 | 103 |
| | Cubic Corp. | 2,657 | 94 |
| | American Science & | | |
| | Engineering, Inc. | 1,488 | 92 |
| * | Axsys Technologies, Inc. | 1,554 | 84 |
| * | Ceradyne, Inc. | 4,136 | 78 |
| | HEICO Corp. Class A | 2,330 | 72 |
| * | Aerovironment Inc. | 2,413 | 68 |
| * | Stanley Inc. | 2,309 | 59 |
| | Applied Signal | | |
| | Technology, Inc. | 2,018 | 51 |
| * | Argon ST, Inc. | 2,307 | 46 |
| * | Taser International Inc. | 9,543 | 43 |
| * | Ladish Co., Inc. | 2,538 | 37 |
| | HEICO Corp. | 950 | 35 |
| * | GenCorp, Inc. | 7,367 | 33 |
| | Ducommun, Inc. | 1,629 | 29 |
| | | | 41,938 |
| Air Freight & Logistics (6.6%) | | |
| | United Parcel Service, Inc. | 114,220 | 6,106 |
| | FedEx Corp. | 48,317 | 3,320 |
| | C.H. Robinson | | |
| | Worldwide Inc. | 27,682 | 1,557 |
| | Expeditors International | | |
| | of Washington, Inc. | 34,686 | 1,133 |
| * | UTI Worldwide, Inc. | 15,463 | 199 |
| * | Hub Group, Inc. | 6,042 | 133 |
| | | |
| | | | Market |
| | | | Value• |
| | | Shares | ($000) |
| * | Atlas Air Worldwide | | |
| | Holdings, Inc. | 2,919 | 73 |
| | Pacer International, Inc. | 5,672 | 23 |
| | | | 12,653 |
| Airlines (1.8%) | | |
| | Southwest Airlines Co. | 121,117 | 991 |
| * | Delta Air Lines Inc. | 125,898 | 909 |
| * | Continental Airlines, Inc. | | |
| | Class B | 22,556 | 299 |
| * | AMR Corp. | 46,492 | 254 |
| * | JetBlue Airways Corp. | 38,295 | 223 |
| * | Alaska Air Group, Inc. | 5,938 | 150 |
| * | UAL Corp. | 23,484 | 146 |
| | Skywest, Inc. | 9,314 | 144 |
| * | AirTran Holdings, Inc. | 18,533 | 123 |
| * | Allegiant Travel Co. | 1,997 | 78 |
| * | US Airways Group Inc. | 21,409 | 73 |
| * | Hawaiian Holdings, Inc. | 8,420 | 62 |
| * | Republic Airways | | |
| | Holdings Inc. | 5,582 | 51 |
| | | | 3,503 |
| Building Products (1.3%) | | |
| | Masco Corp. | 58,661 | 849 |
| * | Owens Corning Inc. | 12,562 | 281 |
| | Lennox International Inc. | 7,694 | 276 |
| * | USG Corp. | 11,315 | 168 |
| | Simpson Manufacturing Co. | 6,337 | 163 |
| | Universal Forest | | |
| | Products, Inc. | 2,813 | 116 |
| | Ameron International Corp. | 1,434 | 116 |
| * | Armstrong Worldwide | | |
| | Industries, Inc. | 3,270 | 109 |
| * | Griffon Corp. | 8,728 | 92 |
| | Quanex Building | | |
| | Products Corp. | 6,131 | 83 |
| | Apogee Enterprises, Inc. | 4,602 | 61 |
| | Gibraltar Industries Inc. | 3,915 | 47 |
| | AAON, Inc. | 2,150 | 45 |
| | American Woodmark Corp. | 1,490 | 30 |
| * | Builders FirstSource, Inc. | 2,931 | 23 |
| * | NCI Building Systems, Inc. | 3,197 | 9 |
| * | China Architectural | | |
| | Engineering Inc. | 2,493 | 4 |
| | | | 2,472 |
| Commercial Services & Supplies (6.8%) | | |
| | Waste Management Inc. | 76,294 | 2,283 |
| | Republic Services, Inc. | | |
| | Class A | 61,876 | 1,585 |
| * | Iron Mountain, Inc. | 29,730 | 871 |
| | Pitney Bowes, Inc. | 33,762 | 754 |
| * | Stericycle, Inc. | 13,201 | 654 |
| | Cintas Corp. | 22,475 | 617 |
| | R.R. Donnelley & Sons Co. | 33,520 | 598 |
| | Avery Dennison Corp. | 16,555 | 511 |
| * | Copart, Inc. | 11,583 | 409 |
| * | Corrections Corp. of America | 18,792 | 373 |
| * | Covanta Holding Corp. | 20,148 | 361 |
| | | |
| | | | Market |
| | | | Value• |
| | | Shares | ($000) |
| * | Waste Connections, Inc. | 13,092 | 358 |
| * | Tetra Tech, Inc. | 9,793 | 289 |
| * | Clean Harbors Inc. | 3,846 | 227 |
| | The Brink’s Co. | 7,050 | 186 |
| * | United Stationers, Inc. | 3,860 | 176 |
| | ABM Industries Inc. | 7,082 | 159 |
| * | Geo Group Inc. | 8,352 | 153 |
| | Mine Safety Appliances Co. | 5,542 | 148 |
| | Herman Miller, Inc. | 8,801 | 143 |
| | Deluxe Corp. | 8,355 | 140 |
| | HNI Corp. | 6,140 | 132 |
| | Rollins, Inc. | 7,388 | 132 |
| * | Sykes Enterprises, Inc. | 5,726 | 120 |
| | Healthcare Services | | |
| | Group, Inc. | 6,711 | 119 |
| | EnergySolutions | 12,266 | 109 |
| * | Mobile Mini, Inc. | 5,704 | 101 |
| * | EnerNOC Inc. | 2,891 | 78 |
| * | GeoEye Inc. | 2,988 | 76 |
| | Knoll, Inc. | 7,677 | 74 |
| | McGrath RentCorp | 3,716 | 73 |
| | G & K Services, Inc. Class A | 3,107 | 73 |
| | Steelcase Inc. | 10,841 | 68 |
| * | ATC Technology Corp. | 3,227 | 67 |
| | Viad Corp. | 3,345 | 60 |
| | Ennis, Inc. | 4,205 | 57 |
| * | American Reprographics Co. | 5,975 | 55 |
| | Interface, Inc. | 8,213 | 54 |
| | American Ecology Corp. | 2,841 | 52 |
| * | Team, Inc. | 2,893 | 50 |
| * | Acco Brands Corp. | 8,982 | 50 |
| * | Cornell Cos., Inc. | 2,288 | 46 |
| | Bowne & Co., Inc. | 6,255 | 44 |
| * | Cenveo Inc. | 8,362 | 43 |
| * | M&F Worldwide Corp. | 2,021 | 40 |
| * | Consolidated Graphics, Inc. | 1,612 | 33 |
| * | Innerworkings, Inc. | 5,143 | 29 |
| * | Fuel-Tech N.V. | 2,740 | 28 |
| | Schawk, Inc. | 2,445 | 28 |
| | Courier Corp. | 1,618 | 26 |
| * | APAC Teleservices, Inc. | 4,547 | 25 |
| | Kimball International, Inc. | | |
| | Class B | 3,874 | 25 |
| * | Standard Parking Corp. | 1,389 | 24 |
| * | Waste Services, Inc. | 4,599 | 20 |
| * | Metalico, Inc. | 4,167 | 17 |
| | The Standard Register Co. | 1,572 | 7 |
| | | | 13,030 |
| Construction & Engineering (3.7%) | |
| | Fluor Corp. | 29,341 | 1,552 |
| * | Jacobs Engineering | | |
| | Group Inc. | 20,166 | 887 |
| * | Quanta Services, Inc. | 32,206 | 712 |
| * | Foster Wheeler AG | 20,603 | 597 |
| | KBR Inc. | 26,180 | 593 |
| * | URS Corp. | 13,645 | 590 |
| * | Shaw Group, Inc. | 13,640 | 400 |
| * | Aecom Technology Corp. | 14,246 | 391 |
| * | EMCOR Group, Inc. | 10,766 | 249 |
| | Granite Construction Co. | 5,686 | 183 |
| * | Insituform Technologies Inc. | | |
| | Class A | 6,336 | 121 |
| * | Mastec Inc. | 9,886 | 94 |
| * | Orion Marine Group, Inc. | 4,265 | 87 |
| * | Tutor Perini Corp. | 4,353 | 85 |
62
Industrials Index Fund
| | | | |
| | | | | Market |
| | | | | Value• |
| | | | Shares | ($000) |
| * | Layne Christensen Co. | | 3,149 | 81 |
| | Comfort Systems USA, Inc. | | 6,468 | 77 |
| * | Dycom Industries, Inc. | | 6,601 | 74 |
| * | MYR Group, Inc. | | 3,053 | 63 |
| | Great Lakes Dredge & | | | |
| | Dock Co. | | 8,595 | 56 |
| * | Northwest Pipe Co. | | 1,535 | 51 |
| * | Michael Baker Corp. | | 1,302 | 44 |
| * | Pike Electric Corp. | | 2,987 | 33 |
| * | Sterling Construction Co., Inc. | 2,038 | 33 |
| * | Furmanite Corp. | | 5,805 | 21 |
| * | Argan Inc. | | 892 | 12 |
| | Primoris Services Corp. | | 978 | 7 |
| | | | | 7,093 |
| Electrical Equipment (6.6%) | | | |
| | Emerson Electric Co. | | 122,746 | 4,526 |
| | Rockwell Automation, Inc. | | 23,168 | 970 |
| * | First Solar, Inc. | | 7,580 | 922 |
| | Cooper Industries, Inc. | | | |
| | Class A | | 27,237 | 878 |
| | Roper Industries Inc. | | 14,791 | 701 |
| | AMETEK, Inc. | | 17,548 | 552 |
| | Hubbell Inc. Class B | | 8,005 | 308 |
| * | General Cable Corp. | | 8,440 | 298 |
| * | GrafTech International Ltd. | | 19,644 | 279 |
| | Regal-Beloit Corp. | | 5,766 | 262 |
| * | Thomas & Betts Corp. | | 8,689 | 241 |
| | Brady Corp. Class A | | 8,000 | 237 |
| * | SunPower Corp. Class A | | 8,667 | 220 |
| * | American | | | |
| | Superconductor Corp. | | 6,708 | 217 |
| | Acuity Brands, Inc. | | 6,691 | 215 |
| | Woodward Governor Co. | | 10,043 | 211 |
| | Baldor Electric Co. | | 7,163 | 201 |
| | Belden Inc. | | 7,632 | 160 |
| * | EnerSys | | 7,461 | 148 |
| * | SunPower Corp. Class B | | 6,863 | 147 |
| | A.O. Smith Corp. | | 3,195 | 122 |
| * | II-VI, Inc. | | 4,147 | 111 |
| | Franklin Electric, Inc. | | 3,031 | 95 |
| * | Energy Conversion | | | |
| | Devices, Inc. | | 7,466 | 83 |
| | Encore Wire Corp. | | 3,011 | 71 |
| * | AZZ Inc. | | 2,061 | 71 |
| * | Powell Industries, Inc. | | 1,401 | 53 |
| * | Evergreen Solar, Inc. | | 31,317 | 53 |
| * | Ener1, Inc. | | 7,526 | 48 |
| * | Polypore International Inc. | | 3,990 | 45 |
| * | FuelCell Energy, Inc. | | 9,967 | 36 |
| * | GT Solar International Inc. | | 5,822 | 30 |
| | Vicor Corp. | | 3,172 | 23 |
| * | Fushi Copperweld, Inc. | | 2,463 | 19 |
| | Preformed Line Products Co. | 428 | 16 |
| * | Valence Technology Inc. | | 10,005 | 15 |
| * | Power-One, Inc. | | 10,570 | 14 |
| * | Orion Energy Systems Inc. | | 2,839 | 9 |
| * | Plug Power, Inc. | | 12,573 | 9 |
| | | | | 12,616 |
| Industrial Conglomerates (19.0%) | |
| | General Electric Co. | 1,729,770 | 24,044 |
| | 3M Co. | | 107,624 | 7,760 |
| | Tyco International Ltd. | | 77,325 | 2,450 |
| * | McDermott | | | |
| | International, Inc. | | 37,253 | 885 |
| | Textron, Inc. | | 43,402 | 667 |
| | Carlisle Co., Inc. | | 10,033 | 331 |
| | Otter Tail Corp. | | 5,492 | 129 |
| | Raven Industries, Inc. | | 2,643 | 76 |
| | Seaboard Corp. | | 61 | 67 |
| | | |
| | | | Market |
| | | | Value• |
| | | Shares | ($000) |
| | Tredegar Corp. | 4,177 | 63 |
| | Standex International Corp. | 1,965 | 34 |
| | | | 36,506 |
| Machinery (17.8%) | | |
| | Caterpillar, Inc. | 98,295 | 4,454 |
| | Deere & Co. | 69,043 | 3,010 |
| | Illinois Tool Works, Inc. | 69,324 | 2,899 |
| | Danaher Corp. | 44,251 | 2,687 |
| | PACCAR, Inc. | 56,359 | 2,039 |
| | Ingersoll-Rand PLC | 52,124 | 1,610 |
| | Cummins Inc. | 31,318 | 1,419 |
| | Eaton Corp. | 25,668 | 1,385 |
| | Parker Hannifin Corp. | 26,227 | 1,276 |
| | Dover Corp. | 30,440 | 1,053 |
| | Flowserve Corp. | 9,152 | 789 |
| | Joy Global Inc. | 16,649 | 647 |
| | Pall Corp. | 19,274 | 573 |
| | Oshkosh Truck Corp. | 14,286 | 480 |
| * | AGCO Corp. | 15,099 | 472 |
| | Donaldson Co., Inc. | 11,941 | 449 |
| * | Navistar International Corp. | 10,341 | 447 |
| | SPX Corp. | 7,994 | 445 |
| | Pentair, Inc. | 15,318 | 434 |
| | Harsco Corp. | 13,092 | 408 |
| | Bucyrus International, Inc. | 12,235 | 365 |
| | IDEX Corp. | 13,165 | 348 |
| | Lincoln Electric Holdings, Inc. | 6,989 | 318 |
| | Kennametal, Inc. | 13,096 | 289 |
| * | Terex Corp. | 17,190 | 283 |
| | The Timken Co. | 13,379 | 282 |
| | Wabtec Corp. | 7,403 | 277 |
| * | Gardner Denver Inc. | 8,512 | 276 |
| | CLARCOR Inc. | 8,315 | 267 |
| | Nordson Corp. | 4,933 | 264 |
| | Valmont Industries, Inc. | 3,017 | 248 |
| | Graco, Inc. | 9,791 | 246 |
| | The Toro Co. | 5,945 | 226 |
| | Trinity Industries, Inc. | 12,993 | 205 |
| | Kaydon Corp. | 5,490 | 183 |
| | Crane Co. | 7,631 | 179 |
| * | ESCO Technologies Inc. | 4,293 | 159 |
| | Actuant Corp. | 10,809 | 153 |
| | Mueller Industries Inc. | 6,068 | 147 |
| | Watts Water Technologies, Inc. | 4,753 | 143 |
| | Briggs & Stratton Corp. | 8,104 | 143 |
| | The Manitowoc Co., Inc. | 21,401 | 142 |
| * | The Middleby Corp. | 2,738 | 129 |
| | Barnes Group, Inc. | 7,258 | 107 |
| | Robbins & Myers, Inc. | 4,548 | 106 |
| | Mueller Water Products, Inc. | | |
| | Class A | 18,887 | 87 |
| * | Chart Industries, Inc. | 4,634 | 87 |
| | Badger Meter, Inc. | 2,289 | 83 |
| | Lindsay Manufacturing Co. | 1,899 | 79 |
| * | Astec Industries, Inc. | 3,112 | 79 |
| | Albany International Corp. | 4,478 | 77 |
| | John Bean Technologies Corp. | 4,489 | 75 |
| * | EnPro Industries, Inc. | 3,313 | 71 |
| | CIRCOR International, Inc. | 2,762 | 71 |
| | Tennant Co. | 2,679 | 69 |
| * | Blount International, Inc. | 6,581 | 60 |
| * | Force Protection, Inc. | 11,190 | 59 |
| | Gorman-Rupp Co. | 2,461 | 58 |
| | Federal Signal Corp. | 7,720 | 55 |
| | NACCO Industries, Inc. | | |
| | Class A | 930 | 54 |
| * | L.B. Foster Co. Class A | 1,669 | 50 |
| * | Colfax Corp. | 4,303 | 46 |
| | Titan International, Inc. | 5,318 | 44 |
| | Sun Hydraulics Corp. | 2,019 | 37 |
| | | |
| | | | Market |
| | | | Value• |
| | | Shares | ($000) |
| | Freightcar America Inc. | 1,940 | 37 |
| * | Columbus McKinnon Corp. | 2,915 | 36 |
| * | K-Tron International, Inc. | 408 | 34 |
| | Cascade Corp. | 1,329 | 34 |
| | Dynamic Materials Corp. | 2,084 | 34 |
| | Ampco-Pittsburgh Corp. | 1,406 | 34 |
| | The Greenbrier Cos., Inc. | 2,533 | 33 |
| * | Energy Recovery Inc. | 5,325 | 28 |
| * | 3D Systems Corp. | 3,106 | 25 |
| * | Kadant Inc. | 2,101 | 25 |
| * | Tecumseh Products Co. | | |
| | Class A | 2,195 | 20 |
| | American Railcar | | |
| | Industries, Inc. | 1,745 | 17 |
| * | TriMas Corp. | 2,800 | 14 |
| | Sauer-Danfoss, Inc. | 1,968 | 11 |
| * | Tecumseh Products Co. | | |
| | Class B | 486 | 5 |
| | | | 34,089 |
| Marine (0.4%) | | |
| * | Kirby Corp. | 8,300 | 307 |
| | Alexander & Baldwin, Inc. | 6,817 | 196 |
| | Genco Shipping and | | |
| | Trading Ltd. | 4,635 | 90 |
| | Eagle Bulk Shipping Inc. | 7,591 | 38 |
| * | American Commercial | | |
| | Lines Inc. | 1,652 | 35 |
| | Horizon Lines Inc. | 4,715 | 26 |
| * | TBS International Ltd. | 2,089 | 17 |
| | | | 709 |
| Professional Services (2.9%) | | |
| | Manpower Inc. | 12,797 | 662 |
| | The Dun & Bradstreet Corp. | 8,699 | 635 |
| | Robert Half International, Inc. | 23,686 | 623 |
| | Equifax, Inc. | 20,646 | 571 |
| * | IHS Inc. Class A | 8,225 | 398 |
| * | FTI Consulting, Inc. | 8,386 | 365 |
| * | Monster Worldwide Inc. | 19,537 | 317 |
| | Watson Wyatt & Co. Holdings | 6,960 | 304 |
| * | MPS Group, Inc. | 15,079 | 149 |
| | The Corporate Executive | | |
| | Board Co. | 5,602 | 135 |
| * | CoStar Group, Inc. | 3,074 | 117 |
| * | Resources Connection, Inc. | 7,045 | 108 |
| * | Navigant Consulting, Inc. | 8,151 | 103 |
| * | Korn/Ferry International | 7,304 | 101 |
| * | TrueBlue, Inc. | 7,098 | 96 |
| | Administaff, Inc. | 3,754 | 91 |
| * | School Specialty, Inc. | 3,075 | 70 |
| * | The Advisory Board Co. | 2,630 | 69 |
| * | Exponent, Inc. | 2,249 | 64 |
| * | Huron Consulting Group Inc. | 3,221 | 61 |
| * | Kforce Inc. | 5,373 | 60 |
| | Heidrick & Struggles | | |
| | International, Inc. | 2,771 | 58 |
| * | CBIZ Inc. | 7,593 | 54 |
| | Kelly Services, Inc. Class A | 4,601 | 53 |
| * | CRA International Inc. | 1,762 | 49 |
| * | Spherion Corp. | 8,467 | 46 |
| * | ICF International, Inc. | 1,457 | 40 |
| | CDI Corp. | 2,139 | 32 |
| * | First Advantage Corp. Class A | 1,518 | 27 |
| * | Hill International Inc. | 3,987 | 24 |
| * | Volt Information Sciences Inc. | 2,334 | 23 |
| * | Odyssey Marine | | |
| | Exploration, Inc. | 8,251 | 15 |
| * | LECG Corp. | 3,971 | 13 |
| | | | 5,533 |
63
Industrials Index Fund
| | | |
| | | | Market |
| | | | Value• |
| | | Shares | ($000) |
| Road & Rail (9.5%) | | |
| | Union Pacific Corp. | 82,344 | 4,925 |
| | Burlington Northern | | |
| | Santa Fe Corp. | 55,443 | 4,603 |
| | Norfolk Southern Corp. | 59,955 | 2,750 |
| | CSX Corp. | 63,944 | 2,718 |
| | J.B. Hunt Transport | | |
| | Services, Inc. | 14,378 | 403 |
| * | Kansas City Southern | 14,930 | 357 |
| | Ryder System, Inc. | 9,092 | 346 |
| | Con-way, Inc. | 7,564 | 316 |
| | Landstar System, Inc. | 8,438 | 294 |
| * | Hertz Global Holdings Inc. | 29,582 | 293 |
| * | Genesee & Wyoming Inc. | | |
| | Class A | 6,149 | 193 |
| | Knight Transportation, Inc. | 10,273 | 169 |
| * | Old Dominion Freight Line, Inc. | 4,567 | 163 |
| * | Avis Budget Group, Inc. | 16,530 | 161 |
| | Heartland Express, Inc. | 9,805 | 139 |
| | Werner Enterprises, Inc. | 7,502 | 131 |
| | Arkansas Best Corp. | 3,920 | 125 |
| * | Amerco, Inc. | 1,113 | 51 |
| * | Marten Transport, Ltd. | 2,678 | 45 |
| * | Saia, Inc. | 2,205 | 39 |
| * | YRC Worldwide, Inc. | 9,732 | 22 |
| * | Patriot Transportation | | |
| | Holding, Inc. | 273 | 21 |
| | Universal Truckload | | |
| | Services, Inc. | 1,046 | 17 |
| | | | 18,281 |
| Trading Companies & Distributors (1.8%) | |
| | W.W. Grainger, Inc. | 10,152 | 888 |
| | Fastenal Co. | 21,790 | 789 |
| | MSC Industrial | | |
| | Direct Co., Inc. Class A | 7,159 | 283 |
| | Watsco, Inc. | 4,011 | 212 |
| | GATX Corp. | 7,700 | 211 |
| * | WESCO International, Inc. | 6,499 | 156 |
| | Applied Industrial | | |
| | Technology, Inc. | 6,294 | 130 |
| * | Beacon Roofing Supply, Inc. | 7,363 | 124 |
| * | Interline Brands, Inc. | 5,297 | 89 |
| | Kaman Corp. Class A | 4,198 | 87 |
| * | United Rentals, Inc. | 8,816 | 81 |
| | Aircastle Ltd. | 8,349 | 78 |
| * | Rush Enterprises, Inc. | | |
| | Class A | 4,276 | 60 |
| * | H&E Equipment Services, Inc. | 3,410 | 34 |
| | TAL International Group, Inc. | 2,633 | 32 |
| | Houston Wire & Cable Co. | 2,703 | 31 |
| * | RSC Holdings Inc. | 4,213 | 30 |
| | Aceto Corp. | 4,036 | 27 |
| * | Titan Machinery, Inc. | 2,169 | 26 |
| * | Rush Enterprises, Inc. Class B | 1,230 | 16 |
| | Lawson Products, Inc. | 720 | 13 |
| | | | 3,397 |
| Transportation Infrastructure (0.0%) | |
| | Macquarie Infrastructure | | |
| | Co. LLC | 7,097 | 44 |
| Total Investments (100.0%) | | |
| (Cost $294,972) | | 191,864 |
| Other Assets and Liabilities (0.0%) | |
| Other Assets | | 985 |
| Liabilities | | (972) |
| | | | 13 |
| Net Assets (100%) | | 191,877 |
| |
| At August 31, 2009, net assets consisted of: |
| | Amount |
| | ($000) |
| Paid-in Capital | 309,717 |
| Undistributed Net Investment Income | 2,743 |
| Accumulated Net Realized Losses | (17,475) |
| Unrealized Appreciation (Depreciation) | (103,108) |
| Net Assets | 191,877 |
| |
| |
| Admiral Shares—Net Assets | |
| Applicable to 252,176 outstanding | |
| $.001 par value shares of beneficial | |
| interest (unlimited authorization) | 6,014 |
| Net Asset Value Per Share— | |
| Admiral Shares | $23.85 |
| |
| |
| ETF Shares—Net Assets | |
| Applicable to 4,001,305 outstanding | |
| $.001 par value shares of beneficial | |
| interest (unlimited authorization) | 185,863 |
| Net Asset Value Per Share— | |
| ETF Shares | $46.45 |
• See Note A in Notes to Financial Statements.
* Non-income-producing security.
See accompanying Notes, which are an integral part of the Financial Statements.
64
Industrials Index Fund
Statement of Operations
| |
| | Year Ended |
| August 31, 2009 |
| | ($000) |
| Investment Income | |
| Income | |
| Dividends | 5,681 |
| Interest1 | 1 |
| Security Lending | 5 |
| Total Income | 5,687 |
| Expenses | |
| The Vanguard Group—Note B | |
| Investment Advisory Services | 29 |
| Management and Administrative— | |
| Admiral Shares | 13 |
| Management and Administrative— | |
| ETF Shares | 224 |
| Marketing and Distribution— | |
| Admiral Shares | 2 |
| Marketing and Distribution— | |
| ETF Shares | 67 |
| Custodian Fees | 37 |
| Auditing Fees | 24 |
| Shareholders’ Reports and Proxies— | |
| Admiral Shares | — |
| Shareholders’ Reports and Proxies— | |
| ETF Shares | 78 |
| Total Expenses | 474 |
| Net Investment Income | 5,213 |
| Realized Net Gain (Loss) on | |
| Investment Securities Sold | (28,412) |
| Change in Unrealized Appreciation | |
| (Depreciation) of Investment Securities | (81,669) |
| Net Increase (Decrease) in Net Assets | |
| Resulting from Operations | (104,868) |
Statement of Changes in Net Assets
| | |
| | Year Ended August 31, |
| | 2009 | 2008 |
| | ($000) | ($000)�� |
| Increase (Decrease) in Net Assets | | |
| Operations | | |
| Net Investment Income | 5,213 | 4,411 |
| Realized Net Gain (Loss) | (28,412) | 18,166 |
| Change in Unrealized Appreciation (Depreciation) | (81,669) | (46,076) |
| Net Increase (Decrease) in Net Assets Resulting from Operations | (104,868) | (23,499) |
| Distributions | | |
| Net Investment Income | | |
| Admiral Shares | (158) | (67) |
| ETF Shares | (5,112) | (3,337) |
| Realized Capital Gain | | |
| Admiral Shares | — | — |
| ETF Shares | — | — |
| Total Distributions | (5,270) | (3,404) |
| Capital Share Transactions | | |
| Admiral Shares | (1,396) | 7,721 |
| ETF Shares | (54,110) | 143,649 |
| Net Increase (Decrease) from Capital Share Transactions | (55,506) | 151,370 |
| Total Increase (Decrease) | (165,644) | 124,467 |
| Net Assets | | |
| Beginning of Period | 357,521 | 233,054 |
| End of Period2 | 191,877 | 357,521 |
1 Interest income from an affiliated company of the fund was $1,000.
2 Net Assets—End of Period includes undistributed net investment income of $2,743,000 and $2,797,000.
See accompanying Notes, which are an integral part of the Financial Statements.
65
Industrials Index Fund
Financial Highlights
| | | | |
| Admiral Shares | | | | |
| | | | | May 8, |
| | | Year Ended | 20061 to |
| | | August 31, | Aug. 31, |
| For a Share Outstanding Throughout Each Period | 2009 | 2008 | 2007 | 2006 |
| Net Asset Value, Beginning of Period | $34.20 | $37.94 | $30.72 | $34.10 |
| Investment Operations | | | | |
| Net Investment Income | .635 | .5762 | .5102 | .1642 |
| Net Realized and Unrealized Gain (Loss) | | | | |
| on Investments | (10.428) | (3.816) | 7.090 | (3.544) |
| Total from Investment Operations | (9.793) | (3.240) | 7.600 | (3.380) |
| Distributions | | | | |
| Dividends from Net Investment Income | (.557) | (.500) | (.380) | — |
| Distributions from Realized Capital Gains | — | — | — | — |
| Total Distributions | (.557) | (.500) | (.380) | — |
| Net Asset Value, End of Period | $23.85 | $34.20 | $37.94 | $30.72 |
| |
| Total Return3 | –28.44% | –8.67% | 24.90% | –9.91% |
| |
| Ratios/Supplemental Data | | | | |
| Net Assets, End of Period (Millions) | $6 | $11 | $4 | $0.2 |
| Ratio of Total Expenses to Average Net Assets | 0.28% | 0.25% | 0.26% | 0.28%4 |
| Ratio of Net Investment Income to Average Net Assets | 2.71% | 1.63% | 1.46% | 1.35%4 |
| Portfolio Turnover Rate5 | 8% | 7% | 13% | 9% |
1 Inception.
2 Calculated based on average shares outstanding.
3 Total returns do not reflect the 2% fee assessed on redemptions of shares held for less than one year.
4 Annualized.
5 Excludes the value of portfolio securities received or delivered as a result of in-kind purchases or redemptions of the fund’s capital shares,
including ETF Creation Units
See accompanying Notes, which are an integral part of the Financial Statements.
66
Industrials Index Fund
Financial Highlights
| | | | | |
| ETF Shares | | | | | |
| | | | | | Sept. 23, |
| | | | | | 20041 to |
| | | | Year Ended August 31, | Aug. 31, |
| For a Share Outstanding Throughout Each Period | 2009 | 2008 | 2007 | 2006 | 2005 |
| Net Asset Value, Beginning of Period | $66.65 | $73.94 | $59.85 | $54.30 | $48.79 |
| Investment Operations | | | | | |
| Net Investment Income | 1.253 | 1.1572 | 1.0262 | .8422 | .650 |
| Net Realized and Unrealized Gain (Loss) | | | | | |
| on Investments | (20.342) | (7.466) | 13.808 | 5.160 | 5.180 |
| Total from Investment Operations | (19.089) | (6.309) | 14.834 | 6.002 | 5.830 |
| Distributions | | | | | |
| Dividends from Net Investment Income | (1.111) | (.981) | (.744) | (.452) | (.320) |
| Distributions from Realized Capital Gains | — | — | — | — | — |
| Total Distributions | (1.111) | (.981) | (.744) | (.452) | (.320) |
| Net Asset Value, End of Period | $46.45 | $66.65 | $73.94 | $59.85 | $54.30 |
| |
| Total Return | –28.41% | –8.65% | 24.95% | 11.08% | 11.94% |
| |
| Ratios/Supplemental Data | | | | | |
| Net Assets, End of Period (Millions) | $186 | $347 | $229 | $120 | $16 |
| Ratio of Total Expenses to Average Net Assets | 0.25% | 0.20% | 0.22% | 0.25% | 0.26%3 |
| Ratio of Net Investment Income to | | | | | |
| Average Net Assets | 2.74% | 1.68% | 1.50% | 1.38% | 1.30%3 |
| Portfolio Turnover Rate4 | 8% | 7% | 13% | 9% | 11% |
1 Inception.
2 Calculated based on average shares outstanding.
3 Annualized.
4 Excludes the value of portfolio securities received or delivered as a result of in-kind purchases or redemptions of the fund’s capital shares,
including ETF Creation Units.
See accompanying Notes, which are an integral part of the Financial Statements.
67
Industrials Index Fund
Notes to Financial Statements
Vanguard Industrials Index Fund is registered under the Investment Company Act of 1940 as an open-end investment company, or mutual fund. The fund offers two classes of shares: Admiral Shares and ETF Shares. Admiral Shares are available to any investor who meets the fund’s minimum purchase requirements. ETF Shares are listed for trading on the NYSE Arca, Inc.; they can be purchased and sold through a broker.
A. The following significant accounting policies conform to generally accepted accounting principles for U.S. mutual funds. The fund consistently follows such policies in preparing its financial statements.
1. Security Valuation: Securities are valued as of the close of trading on the New York Stock Exchange (generally 4 p.m., Eastern time) on the valuation date. Equity securities are valued at the latest quoted sales prices or official closing prices taken from the primary market in which each security trades; such securities not traded on the valuation date are valued at the mean of the latest quoted bid and asked prices. Securities for which market quotations are not readily available, or whose values have been materially affected by events occurring before the fund’s pricing time but after the close of the securities’ primary markets, are valued by methods deemed by the board of trustees to represent fair value. Investments in Vanguard Market Liquidity Fund are valued at that fund’s net asset value.
2. Federal Income Taxes: The fund intends to continue to qualify as a regulated investment company and distribute all of its taxable income. Management has analyzed the fund’s tax positions taken for all open federal income tax years (August 31, 2006–2009), and has concluded that no provision for federal income tax is required in the fund’s financial statements.
3. Distributions: Distributions to shareholders are recorded on the ex-dividend date.
4. Security Lending: The fund may lend its securities to qualified institutional borrowers to earn additional income. Security loans are required to be secured at all times by collateral at least equal to the market value of securities loaned. The fund invests cash collateral received in Vanguard Market Liquidity Fund, and records a liability for the return of the collateral, during the period the securities are on loan. Security lending income represents the income earned on investing cash collateral, less expenses associated with the loan.
5. Other: Dividend income is recorded on the ex-dividend date. Interest income includes income distributions received from Vanguard Market Liquidity Fund and is accrued daily. Security transactions are accounted for on the date securities are bought or sold. Costs used to determine realized gains (losses) on the sale of investment securities are those of the specific securities sold. Fees assessed on redemptions of capital shares are credited to paid-in capital.
Each class of shares has equal rights as to assets and earnings, except that each class separately bears certain class-specific expenses related to maintenance of shareholder accounts (included in Management and Administrative expenses), shareholder reporting, and proxies. Marketing and distribution expenses are allocated to each class of shares based on a method approved by the board of trustees. Income, other non-class-specific expenses, and gains and losses on investments are allocated to each class of shares based on its relative net assets.
B. The Vanguard Group furnishes at cost investment advisory, corporate management, administrative, marketing, and distribution services. The costs of such services are allocated to the fund under methods approved by the board of trustees. The fund has committed to provide up to 0.40% of its net assets in capital contributions to Vanguard. At August 31, 2009, the fund had contributed capital of $39,000 to Vanguard (included in Other Assets), representing 0.02% of the fund’s net assets and 0.02% of Vanguard’s capitalization. The fund’s trustees and officers are also directors and officers of Vanguard.
C. Various inputs may be used to determine the value of the fund’s investments. These inputs are summarized in three broad levels for financial statement purposes. The inputs or methodologies used to value securities are not necessarily an indication of the risk associated with investing in those securities.
Level 1—Quoted prices in active markets for identical securities.
Level 2—Other significant observable inputs (including quoted prices for similar securities, interest rates, prepayment speeds, credit risk, etc.).
Level 3—Significant unobservable inputs (including the fund’s own assumptions used to determine the fair value of investments).
At August 31, 2009, 100% of the fund’s investments were valued based on Level 1 inputs.
68
Industrials Index Fund
D. Distributions are determined on a tax basis and may differ from net investment income and realized capital gains for financial reporting purposes. Differences may be permanent or temporary. Permanent differences are reclassified among capital accounts in the financial statements to reflect their tax character. Temporary differences arise when certain items of income, expense, gain, or loss are recognized in different periods for financial statement and tax purposes; these differences will reverse at some time in the future. Differences in classification may also result from the treatment of short-term gains as ordinary income for tax purposes.
During the year ended August 31, 2009, the fund realized $14,979,000 of net capital losses resulting from in-kind redemptions—in which shareholders exchanged fund shares for securities held by the fund rather than for cash. Because such losses are not taxable losses to the fund, they have been reclassified from accumulated net realized losses to paid-in capital.
For tax purposes, at August 31, 2009, the fund had $2,906,000 of ordinary income available for distribution. The fund had available capital loss carryforwards totaling $5,549,000 to offset future net capital gains of $18,000 through August 31, 2014, $283,000 through August 31, 2015, $552,000 through August 31, 2016, and $4,696,000 through August 31, 2017. In addition, the fund realized losses of $11,763,000 during the period from November 1, 2008, through August 31, 2009, which are deferred and will be treated as realized for tax purposes in fiscal 2010.
At August 31, 2009, the cost of investment securities for tax purposes was $295,135,000. Net unrealized depreciation of investment securities for tax purposes was $103,271,000, consisting of unrealized gains of $842,000 on securities that had risen in value since their purchase and $104,113,000 in unrealized losses on securities that had fallen in value since their purchase.
E. During the year ended August 31, 2009, the fund purchased $94,330,000 of investment securities and sold $149,730,000 of investment securities, other than temporary cash investments.
F. Capital share transactions for each class of shares were:
| | | | |
| | | | Year Ended August 31, |
| | | 2009 | | 2008 |
| | Amount | Shares | Amount | Shares |
| | ($000) | (000) | ($000) | (000) |
| Admiral Shares | | | | |
| Issued | 3,309 | 160 | 9,334 | 262 |
| Issued in Lieu of Cash Distributions | 128 | 6 | 56 | 2 |
| Redeemed1 | (4,833) | (231) | (1,669) | (48) |
| Net Increase (Decrease)—Admiral Shares | (1,396) | (65) | 7,721 | 216 |
| ETF Shares | | | | |
| Issued | 77,709 | 1,900 | 250,498 | 3,601 |
| Issued in Lieu of Cash Distributions | — | — | — | — |
| Redeemed1 | (131,819) | (3,100) | (106,849) | (1,500) |
| Net Increase (Decrease)—ETF Shares | (54,110) | (1,200) | 143,649 | 2,101 |
| 1 Net of redemption fees for fiscal 2009 and 2008 of $42,000 and $25,000, respectively (fund totals). | | |
G. In preparing the financial statements as of August 31, 2009, management considered the impact of subsequent events occurring through October 15, 2009, for potential recognition or disclosure in these financial statements.
69
Information Technology Index Fund
Fund Profile
As of August 31, 2009
| | | |
| Portfolio Characteristics | | |
| | | Target | Broad |
| | Fund | Index1 | Index2 |
| Number of Stocks | 419 | 418 | 2,501 |
| Median Market Cap | $107.4B | $107.4B | $27.3B |
| Price/Earnings Ratio | 34.5x | 34.4x | 25.6x |
| Price/Book Ratio | 3.3x | 3.3x | 2.1x |
| Yield3 | | 0.9% | 1.9% |
| Admiral Shares | 0.6% | | |
| ETF Shares | 0.7% | | |
| Return on Equity | 22.6% | 22.6% | 19.3% |
| Earnings Growth Rate | 20.7% | 20.7% | 9.9% |
| Foreign Holdings | 0.0% | 0.0% | 0.0% |
| Turnover Rate | 12% | — | — |
| Expense Ratio4 | | — | — |
| Admiral Shares | 0.28% | | |
| ETF Shares | 0.25% | | |
| Short-Term Reserves | 0.0% | — | — |
| | |
| Volatility Measures5 | |
| | Fund Versus | Fund Versus |
| | Target Index1 | Broad Index2 |
| R-Squared | 1.00 | 0.86 |
| Beta | 1.00 | 1.09 |
| |
| Industry Diversification (% of equity exposure) |
| |
| Application Software | 4.1% |
| Communications Equipment | 13.5 |
| Computer Hardware | 22.4 |
| Computer Storage & Peripherals | 3.3 |
| Data Processing & Outsourced Services | 7.3 |
| Electronic Components | 1.7 |
| Electronic Equipment & Instruments | 1.1 |
| Electronic Manufacturing Services | 1.4 |
| Internet Software & Services | 9.1 |
| IT Consulting & Other Services | 2.2 |
| Semiconductor Equipment | 2.3 |
| Semiconductors | 13.0 |
| Systems Software | 16.7 |
| Other Information Technology | 1.9 |
| |
| Ten Largest Holdings6 (% of total net assets) |
| |
| Microsoft Corp. | 9.7% |
| International Business Machines Corp. | 7.6 |
| Apple Inc. | 7.4 |
| Cisco Systems, Inc. | 6.1 |
| Intel Corp. | 5.6 |
| Google Inc. | 5.5 |
| Hewlett-Packard Co. | 5.3 |
| Oracle Corp. | 4.3 |
| QUALCOMM Inc. | 3.8 |
| EMC Corp. | 1.6 |
| Top Ten | 56.9% |
1 MSCI US IMI/Information Technology.
2 MSCI US IMI/2500.
3 30-day SEC yield for the fund; annualized dividend yield for the indexes. See the Glossary.
4 The expense ratios shown are from the prospectuses dated December 29, 2008, and represent estimated costs for the current fiscal year based on the fund’s net assets as of the prospectus date. For the fiscal year
ended August 31, 2009, the expense ratios were 0.28% for the Admiral Shares and 0.25% for the ETF Shares.
5 For an explanation of R-squared, beta, and other terms used here, see the Glossary.
6 The holdings listed exclude any temporary cash investments and equity index products.
70
Information Technology Index Fund
Performance Summary
All of the returns in this report represent past performance, which is not a guarantee of future results that may be achieved by the fund. (Current performance may be lower or higher than the performance data cited. For performance data current to the most recent month-end, visit our website at www.vanguard.com/performance.) Note, too, that both investment returns and principal value can fluctuate widely, so an investor’s shares, when sold, could be worth more or less than their original cost. The returns shown do not reflect taxes that a shareholder would pay on fund distributions or on the sale of fund shares.
Cumulative Performance: January 26, 2004–August 31, 2009
Initial Investment of $10,000
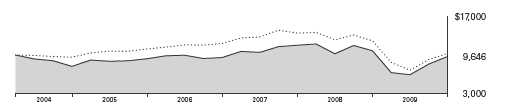
| | | | |
| | | Average Annual Total Returns | |
| | | Periods Ended August 31, 2009 | Final Value |
| | | | Since | of a $10,000 |
| | One Year | Five Years | Inception1 | Investment |
| Information Technology Index Fund | | | | |
| ETF Shares Net Asset Value2 | –9.78% | 3.94% | –0.64% | $9,646 |
| Information Technology Index Fund | | | | |
| ETF Shares Market Price | –9.73 | 3.98 | –0.62 | 9,656 |
| MSCI US IMI/2500 | –18.26 | 1.36 | 0.52 | 10,295 |
| MSCI US IMI/Information Technology | –9.62 | 4.14 | –0.46 | 9,746 |
| | | | |
| | | | | Final Value |
| | | | Since | of a $100,000 |
| | One Year | Five Years | Inception1 | Investment |
| Information Technology Index Fund | | | | |
| Admiral Shares3 | –9.79% | 3.91% | 1.30% | $107,273 |
| MSCI US IMI/2500 | –18.26 | 1.36 | 1.23 | 106,858 |
| MSCI US IMI/Information Technology | –9.62 | 4.14 | 1.51 | 108,494 |
1 Performance for the fund and its comparative standards is calculated since the following inception dates: January 26, 2004, for ETF Shares; March 25, 2004, for Admiral Shares.
2 For more information about how the ETF Shares’ market prices have compared with their net asset value, visit www.vanguard.com, select your ETF, and then select the Performance tab. The Premium/Discount
table there shows the percentages of days on which the ETF Shares’ market price was above or below the NAV.
3 Total returns do not reflect the 2% fee assessed on redemptions of shares held for less than one year.
Note: See Financial Highlights tables for dividend and capital gains information.
71
Information Technology Index Fund
Fiscal-Year Total Returns (%): January 26, 2004–August 31, 2009
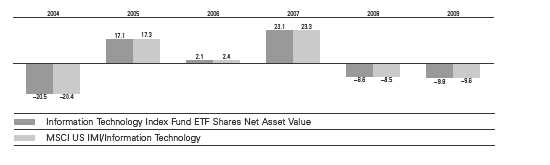
| | | |
| Cumulative Returns: ETF Shares, January 26, 2004–August 31, 2009 | | |
| | | | Cumulative |
| | | | Since |
| | One Year | Five Years | Inception |
| Information Technology Index Fund ETF Shares Market Price | –9.73% | 21.54% | –3.44% |
| Information Technology Index Fund ETF Shares Net Asset Value | –9.78 | 21.33 | –3.54 |
| MSCI US IMI/Information Technology | –9.62 | 22.47 | –2.54 |
Average Annual Total Returns: Periods Ended June 30, 2009
This table presents average annual total returns through the latest calendar quarter—rather than through the end
of the fiscal period. Securities and Exchange Commission rules require that we provide this information.
| | | | |
| | | | | Since |
| | Inception Date | One Year | Five Years | Inception |
| ETF Shares | 1/26/2004 | | | |
| Market Price | | –18.51% | –1.26% | –2.71% |
| Net Asset Value | | –18.54 | –1.26 | –2.71 |
| Admiral Shares1 | 3/25/2004 | –18.55 | –1.29 | –0.81 |
1 Total returns do not reflect the 2% fee assessed on redemptions of shares held for less than one year.
Note: See Financial Highlights tables for dividend and capital gains information.
72
Information Technology Index Fund
Financial Statements
Statement of Net Assets
As of August 31, 2009
The fund provides a complete list of its holdings four times in each fiscal year, at the quarter-ends. For the second and fourth fiscal quarters, the lists appear in the fund’s semiannual and annual reports to shareholders. For the first and third fiscal quarters, the fund files the lists with the Securities and Exchange Commission on Form N-Q. Shareholders can look up the fund’s Forms N-Q on the SEC’s website at www.sec.gov. Forms N-Q may also be reviewed and copied at the SEC’s Public Reference Room (see the back cover of this report for further information).
| | | | |
| | | | | Market |
| | | | | Value• |
| | | | Shares | ($000) |
| Common Stocks (100.0%) | | |
| Communications Equipment (13.5%) | |
| * | Cisco Systems, Inc. | 1,899,079 | 41,020 |
| | QUALCOMM Inc. | | 544,918 | 25,295 |
| | Motorola, Inc. | | 755,015 | 5,421 |
| * | Juniper Networks, Inc. | | 172,305 | 3,975 |
| | Harris Corp. | | 43,920 | 1,525 |
| * | Brocade Communications | | |
| | Systems, Inc. | | 127,046 | 919 |
| * | F5 Networks, Inc. | | 26,084 | 900 |
| * | Tellabs, Inc. | | 124,262 | 788 |
| * | CommScope, Inc. | | 26,831 | 723 |
| * | Polycom, Inc. | | 27,451 | 648 |
| * | 3Com Corp. | | 127,067 | 553 |
| * | Arris Group Inc. | | 40,790 | 541 |
| * | Palm, Inc. | | 38,589 | 514 |
| * | JDS Uniphase Corp. | | 70,460 | 484 |
| | ADTRAN Inc. | | 18,417 | 419 |
| * | Ciena Corp. | | 29,827 | 400 |
| | Plantronics, Inc. | | 15,984 | 382 |
| * | Riverbed Technology, Inc. | 18,121 | 349 |
| * | Comtech | | | |
| | Telecommunications Corp. | 9,265 | 315 |
| * | Tekelec | | 19,507 | 304 |
| * | InterDigital, Inc. | | 14,174 | 297 |
| * | Starent Networks Corp. | 13,790 | 279 |
| * | ADC Telecommunications, Inc. | 31,740 | 270 |
| * | Emulex Corp. | | 27,043 | 262 |
| * | Blue Coat Systems, Inc. | 12,773 | 250 |
| * | Avocent Corp. | | 14,689 | 240 |
| * | EchoStar Corp. | | 12,223 | 227 |
| * | ViaSat, Inc. | | 9,175 | 222 |
| * | Harmonic, Inc. | | 31,143 | 206 |
| * | Sycamore Networks, Inc. | 65,114 | 198 |
| * | NETGEAR, Inc. | | 11,531 | 197 |
| * | Infinera Corp. | | 27,926 | 195 |
| * | Sonus Networks, Inc. | | 89,145 | 188 |
| * | Aruba Networks, Inc. | | 19,868 | 181 |
| | Black Box Corp. | | 5,740 | 144 |
| * | Harris Stratex Networks, Inc. | | |
| | Class A | | 19,191 | 116 |
| * | Finisar Corp. | | 131,473 | 116 |
| * | DG FastChannel Inc. | | 6,479 | 112 |
| * | EMS Technologies, Inc. | | 5,000 | 94 |
| * | Oplink Communications, Inc. | 6,635 | 92 |
| * | ShoreTel, Inc. | | 14,279 | 90 |
| * | SeaChange International, Inc. | 9,478 | 85 |
| * | Hughes Communications Inc. | 3,199 | 83 |
| * | Loral Space and | | | |
| | Communications Ltd. | | 4,003 | 83 |
| * | Symmetricom Inc. | | 14,323 | 75 |
| * | Acme Packet, Inc. | | 9,088 | 74 |
| * | Ixia | | 12,113 | 74 |
| * | Anaren, Inc. | | 4,511 | 73 |
| | | |
| | | | Market |
| | | | Value• |
| | | Shares | ($000) |
| * | Extreme Networks, Inc. | 28,977 | 70 |
| * | Digi International, Inc. | 7,751 | 66 |
| * | UTStarcom, Inc. | 34,410 | 56 |
| * | Airvana, Inc. | 8,185 | 53 |
| * | Powerwave Technologies, Inc. | 42,302 | 52 |
| * | BigBand Networks Inc. | 12,598 | 49 |
| | Bel Fuse, Inc. Class B | 2,726 | 46 |
| * | Cogo Group, Inc. | 8,448 | 46 |
| * | EMCORE Corp. | 24,224 | 26 |
| * | OpNext, Inc. | 7,078 | 19 |
| | Bel Fuse, Inc. Class A | 681 | 12 |
| | | | 90,493 |
| Computers & Peripherals (25.7%) | |
| | International Business | | |
| | Machines Corp. | 435,071 | 51,360 |
| * | Apple Inc. | 293,728 | 49,408 |
| | Hewlett-Packard Co. | 787,379 | 35,345 |
| * | EMC Corp. | 662,991 | 10,542 |
| * | Dell Inc. | 578,328 | 9,155 |
| * | Western Digital Corp. | 73,381 | 2,516 |
| * | NetApp, Inc. | 109,596 | 2,493 |
| * | Sun Microsystems, Inc. | 246,382 | 2,286 |
| | Seagate Technology | 161,798 | 2,241 |
| * | Teradata Corp. | 56,879 | 1,532 |
| * | SanDisk Corp. | 74,687 | 1,322 |
| * | NCR Corp. | 51,893 | 692 |
| | Diebold, Inc. | 21,717 | 655 |
| * | QLogic Corp. | 39,855 | 630 |
| * | STEC Inc. | 12,174 | 493 |
| * | Lexmark International, Inc. | 25,778 | 486 |
| * | Synaptics Inc. | 11,190 | 288 |
| * | Intermec, Inc. | 16,153 | 230 |
| * | Electronics for Imaging, Inc. | 16,814 | 179 |
| * | Avid Technology, Inc. | 12,102 | 158 |
| * | Netezza Corp. | 12,634 | 121 |
| * | Adaptec, Inc. | 39,953 | 117 |
| * | Novatel Wireless, Inc. | 10,079 | 97 |
| * | Stratasys, Inc. | 6,368 | 92 |
| | Imation Corp. | 10,399 | 89 |
| * | Quantum Corp. | 68,917 | 85 |
| * | 3PAR, Inc. | 9,053 | 80 |
| * | Compellent Technologies, Inc. | 4,574 | 68 |
| * | Super Micro Computer Inc. | 8,476 | 68 |
| * | Silicon Graphics | | |
| | International Corp. | 9,583 | 53 |
| * | Isilon Systems Inc. | 7,128 | 41 |
| | | | 172,922 |
| Electronic Equipment, Instruments & | |
| Components (4.9%) | | |
| | Corning, Inc. | 511,573 | 7,715 |
| * | Tyco Electronics Ltd. | 150,805 | 3,441 |
| * | Agilent Technologies, Inc. | 113,711 | 2,920 |
| | Amphenol Corp. Class A | 56,271 | 1,967 |
| * | Flextronics International Ltd. | 266,168 | 1,578 |
| | | |
| | | | Market |
| | | | Value• |
| | | Shares | ($000) |
| * | Avnet, Inc. | 49,598 | 1,322 |
| * | FLIR Systems, Inc. | 49,469 | 1,139 |
| * | Arrow Electronics, Inc. | 39,242 | 1,085 |
| * | Trimble Navigation Ltd. | 39,255 | 999 |
| * | Ingram Micro, Inc. Class A | 48,705 | 816 |
| * | Itron, Inc. | 12,974 | 711 |
| * | Dolby Laboratories Inc. | 17,307 | 675 |
| | Jabil Circuit, Inc. | 59,712 | 654 |
| * | Tech Data Corp. | 16,422 | 626 |
| | National Instruments Corp. | 19,516 | 500 |
| * | Vishay Intertechnology, Inc. | 56,601 | 457 |
| | Molex, Inc. Class A | 24,217 | 408 |
| | Molex, Inc. | 20,587 | 375 |
| * | Benchmark Electronics, Inc. | 21,430 | 351 |
| * | Anixter International Inc. | 9,832 | 345 |
| * | Plexus Corp. | 12,894 | 325 |
| * | ScanSource, Inc. | 8,657 | 242 |
| * | Rofin-Sinar Technologies Inc. | 9,478 | 216 |
| * | Checkpoint Systems, Inc. | 12,760 | 213 |
| | Cognex Corp. | 12,537 | 201 |
| * | L-1 Identity Solutions Inc. | 27,701 | 199 |
| | AVX Corp. | 16,693 | 194 |
| * | SYNNEX Corp. | 6,469 | 192 |
| * | Sanmina-SCI Corp. | 28,935 | 183 |
| * | Coherent, Inc. | 8,024 | 179 |
| * | Littelfuse, Inc. | 7,134 | 179 |
| * | Insight Enterprises, Inc. | 15,004 | 172 |
| * | Brightpoint, Inc. | 21,448 | 157 |
| * | DTS Inc. | 5,781 | 155 |
| * | Cogent Inc. | 14,705 | 154 |
| * | TTM Technologies, Inc. | 14,061 | 142 |
| | Park Electrochemical Corp. | 6,349 | 137 |
| * | Rogers Corp. | 5,157 | 135 |
| | MTS Systems Corp. | 4,935 | 131 |
| * | Universal Display Corp. | 10,623 | 116 |
| * | Echelon Corp. | 9,925 | 113 |
| | Technitrol, Inc. | 13,400 | 110 |
| | Methode Electronics, Inc. | | |
| | Class A | 12,630 | 109 |
| * | Electro Scientific | | |
| | Industries, Inc. | 8,785 | 108 |
| * | Maxwell Technologies, Inc. | 7,341 | 99 |
| | CTS Corp. | 11,072 | 98 |
| * | Multi-Fineline Electronix, Inc. | 3,306 | 91 |
| | Daktronics, Inc. | 11,319 | 91 |
| * | IPG Photonics Corp. | 7,377 | 89 |
| * | FARO Technologies, Inc. | 5,223 | 89 |
| * | OSI Systems Inc. | 5,241 | 88 |
| * | Newport Corp. | 11,745 | 83 |
| | Electro Rent Corp. | 6,241 | 64 |
| * | Comverge Inc. | 5,383 | 60 |
| * | Smart Modular | | |
| | Technologies Inc. | 13,100 | 50 |
| | Agilysys, Inc. | 7,527 | 48 |
| * | CPI International, Inc. | 2,422 | 23 |
| * | ICx Technologies, Inc. | 3,876 | 18 |
| | | | 33,137 |
| Internet Software & Services (9.1%) | |
| * | Google Inc. | 79,379 | 36,647 |
| * | eBay Inc. | 360,184 | 7,975 |
| * | Yahoo! Inc. | 436,682 | 6,380 |
| * | VeriSign, Inc. | 63,486 | 1,345 |
| * | Equinix, Inc. | 12,498 | 1,053 |
73
Information Technology Index Fund
| | | |
| | | | Market |
| | | | Value• |
| | | Shares | ($000) |
| * | Akamai Technologies, Inc. | 56,921 | 1,004 |
| * | IAC/InterActiveCorp | 34,117 | 632 |
| * | Sohu.com Inc. | 10,016 | 612 |
| * | VistaPrint Ltd. | 13,158 | 545 |
| * | Digital River, Inc. | 12,569 | 444 |
| * | Omniture, Inc. | 22,488 | 322 |
| * | j2 Global Communications, Inc. | 14,460 | 309 |
| * | EarthLink, Inc. | 35,456 | 295 |
| * | ValueClick, Inc. | 28,429 | 291 |
| * | DealerTrack Holdings Inc. | 12,397 | 250 |
| * | GSI Commerce, Inc. | 12,997 | 225 |
| * | SAVVIS, Inc. | 12,505 | 212 |
| * | Rackspace Hosting, Inc. | 15,812 | 205 |
| | United Online, Inc. | 27,274 | 191 |
| * | Art Technology Group, Inc. | 42,430 | 171 |
| * | Constant Contact, Inc. | 6,896 | 144 |
| * | Move, Inc. | 47,584 | 138 |
| * | Bankrate, Inc. | 4,618 | 132 |
| * | RealNetworks, Inc. | 31,664 | 112 |
| * | ModusLink Global | | |
| | Solutions, Inc. | 14,825 | 106 |
| * | WebMD Health Corp. Class A | 3,199 | 105 |
| | NIC Inc. | 13,465 | 103 |
| * | Switch and Data Inc. | 7,311 | 99 |
| * | Vocus, Inc. | 5,864 | 99 |
| * | The Knot, Inc. | 9,514 | 96 |
| * | InfoSpace, Inc. | 11,410 | 92 |
| * | ComScore Inc. | 6,184 | 86 |
| * | Internet Capital Group Inc. | 12,418 | 82 |
| * | Perficient, Inc. | 10,588 | 82 |
| * | Terremark Worldwide, Inc. | 13,771 | 73 |
| * | LoopNet, Inc. | 8,973 | 72 |
| * | Internet Brands Inc. | 8,634 | 63 |
| * | Liquidity Services, Inc. | 5,498 | 60 |
| * | Internap Network | | |
| | Services Corp. | 16,054 | 49 |
| * | DivX, Inc. | 8,842 | 46 |
| * | Dice Holdings Inc. | 6,858 | 40 |
| * | Limelight Networks Inc. | 11,936 | 40 |
| | Marchex, Inc. | 8,088 | 35 |
| * | TechTarget | 4,076 | 26 |
| | | | 61,088 |
| IT Services (9.5%) | | |
| | Visa Inc. | 147,912 | 10,517 |
| | Accenture Ltd. | 201,902 | 6,663 |
| | Automatic Data | | |
| | Processing, Inc. | 165,218 | 6,336 |
| | MasterCard, Inc. Class A | 29,191 | 5,915 |
| | Western Union Co. | 230,972 | 4,167 |
| * Cognizant Technology | | |
| | Solutions Corp. | 96,212 | 3,356 |
| | Paychex, Inc. | 106,913 | 3,025 |
| * Fiserv, Inc. | 51,246 | 2,473 |
| * Computer Sciences Corp. | 49,878 | 2,437 |
| | Fidelity National Information | | |
| | Services, Inc. | 62,966 | 1,546 |
| * Affiliated Computer | | |
| | Services, Inc. Class A | 29,893 | 1,339 |
| * SAIC, Inc. | 68,447 | 1,266 |
| | Global Payments Inc. | 26,374 | 1,119 |
| | Lender Processing | | |
| | Services, Inc. | 31,238 | 1,071 |
| * Alliance Data Systems Corp. | 19,121 | 1,062 |
| * Hewitt Associates, Inc. | 27,758 | 1,000 |
| | Broadridge Financial | | |
| | Solutions LLC | 46,147 | 961 |
| * | Metavante Technologies | 29,649 | 934 |
| | | |
| | | | Market |
| | | | Value• |
| | | Shares | ($000) |
| | Total System Services, Inc. | 55,029 | 840 |
| * | DST Systems, Inc. | 13,066 | 599 |
| * | NeuStar, Inc. Class A | 23,803 | 552 |
| * | Perot Systems Corp. | 29,591 | 493 |
| * | CACI International, Inc. | 9,840 | 452 |
| * | Convergys Corp. | 40,146 | 435 |
| * | ManTech International Corp. | 7,215 | 381 |
| * | Wright Express Corp. | 11,940 | 376 |
| * | Euronet Worldwide, Inc. | 14,869 | 351 |
| * | Gartner, Inc. Class A | 20,052 | 334 |
| * | CyberSource Corp. | 21,650 | 332 |
| | Syntel, Inc. | 8,162 | 327 |
| * | Genpact, Ltd. | 24,581 | 311 |
| * | Unisys Corp. | 121,917 | 298 |
| * | VeriFone Holdings, Inc. | 24,992 | 288 |
| * | SRA International, Inc. | 13,898 | 276 |
| * | Sapient Corp. | 33,279 | 244 |
| | MAXIMUS, Inc. | 5,723 | 238 |
| * | TeleTech Holdings, Inc. | 13,237 | 226 |
| | Acxiom Corp. | 24,274 | 221 |
| * | TNS Inc. | 8,221 | 213 |
| * | CSG Systems | | |
| | International, Inc. | 11,332 | 171 |
| * | Forrester Research, Inc. | 5,323 | 125 |
| * | Global Cash Access, Inc. | 14,125 | 102 |
| * | RightNow Technologies Inc. | 7,459 | 94 |
| | Heartland Payment | | |
| | Systems, Inc. | 7,453 | 93 |
| * | Ciber, Inc. | 21,316 | 83 |
| | Cass Information | | |
| | Systems, Inc. | 2,381 | 74 |
| * | Ness Technologies Inc. | 11,796 | 71 |
| * | infoGROUP, Inc. | 11,286 | 70 |
| * | NCI, Inc. | 2,214 | 65 |
| * | ExlService Holdings, Inc. | 4,648 | 56 |
| | iGATE Corp. | 7,977 | 53 |
| * | Integral Systems, Inc. | 5,644 | 35 |
| * | China Information Security | | |
| | Technology, Inc. | 8,347 | 32 |
| | | | 64,098 |
| Office Electronics (0.5%) | | |
| | Xerox Corp. | 284,709 | 2,463 |
| * | Zebra Technologies Corp. | | |
| | Class A | 20,024 | 500 |
| | | | 2,963 |
| Semiconductors & Semiconductor | |
| Equipment (15.3%) | | |
| | Intel Corp. | 1,838,866 | 37,366 |
| | Texas Instruments, Inc. | 419,586 | 10,318 |
| | Applied Materials, Inc. | 437,653 | 5,768 |
| * | Broadcom Corp. | 141,557 | 4,027 |
| | Analog Devices, Inc. | 95,887 | 2,709 |
| * | Marvell Technology | | |
| | Group Ltd. | 173,075 | 2,639 |
| * | NVIDIA Corp. | 179,894 | 2,612 |
| * | Micron Technology, Inc. | 275,222 | 2,028 |
| | Xilinx, Inc. | 90,096 | 2,004 |
| | Linear Technology Corp. | 73,175 | 1,944 |
| | Maxim Integrated | | |
| | Products, Inc. | 100,350 | 1,885 |
| | Altera Corp. | 96,415 | 1,852 |
| | KLA-Tencor Corp. | 55,803 | 1,741 |
| | Microchip Technology, Inc. | 59,836 | 1,589 |
| * | LAM Research Corp. | 41,613 | 1,278 |
| * | MEMC Electronic | | |
| | Materials, Inc. | 73,786 | 1,177 |
| | | |
| | | | Market |
| | | | Value• |
| | | Shares | ($000) |
| | National | | |
| | Semiconductor Corp. | 75,414 | 1,144 |
| * | LSI Corp. | 213,627 | 1,113 |
| * | ON Semiconductor Corp. | 131,523 | 1,061 |
| * | Cree, Inc. | 26,353 | 971 |
| * | Advanced Micro Devices, Inc. | 186,814 | 815 |
| * | Varian Semiconductor | | |
| | Equipment Associates, Inc. | 23,971 | 733 |
| * | PMC Sierra Inc. | 72,984 | 663 |
| * | Skyworks Solutions, Inc. | 55,125 | 642 |
| * | Silicon Laboratories Inc. | 13,967 | 629 |
| * | Rambus Inc. | 32,555 | 622 |
| * | Novellus Systems, Inc. | 32,071 | 614 |
| | Intersil Corp. | 40,358 | 597 |
| * | Atmel Corp. | 140,997 | 582 |
| * | Atheros | | |
| | Communications, Inc. | 19,979 | 552 |
| * | Cypress Semiconductor Corp. | 47,248 | 478 |
| * | Teradyne, Inc. | 56,991 | 470 |
| * | International Rectifier Corp. | 23,688 | 445 |
| * | Fairchild Semiconductor | | |
| | International, Inc. | 40,659 | 409 |
| * | Tessera Technologies, Inc. | 15,930 | 400 |
| * | RF Micro Devices, Inc. | 82,343 | 387 |
| * | Integrated Device | | |
| | Technology Inc. | 54,985 | 376 |
| * | Microsemi Corp. | 26,591 | 375 |
| * | Semtech Corp. | 20,045 | 366 |
| * | TriQuint Semiconductor, Inc. | 48,514 | 355 |
| * | FormFactor Inc. | 16,080 | 353 |
| * | Cymer, Inc. | 9,242 | 325 |
| * | FEI Co. | 12,207 | 289 |
| * | MKS Instruments, Inc. | 15,348 | 283 |
| * | Netlogic Microsystems Inc. | 6,095 | 268 |
| * | Cabot Microelectronics Corp. | 7,644 | 264 |
| * | Avago Technologies Ltd. | 13,569 | 247 |
| * | Cavium Networks, Inc. | 12,124 | 246 |
| * | OmniVision Technologies, Inc. | 16,745 | 245 |
| * | Veeco Instruments, Inc. | 10,526 | 226 |
| * | Hittite Microwave Corp. | 6,519 | 224 |
| * | Diodes Inc. | 10,894 | 221 |
| * | Amkor Technology, Inc. | 39,128 | 217 |
| * | Monolithic Power Systems | 9,397 | 212 |
| * | Verigy Ltd. | 19,341 | 207 |
| * | Zoran Corp. | 16,687 | 184 |
| * | ATMI, Inc. | 10,393 | 177 |
| * | Applied Micro Circuits Corp. | 21,475 | 171 |
| * | Standard Microsystem Corp. | 7,195 | 167 |
| * | Entegris Inc. | 36,932 | 148 |
| * | Brooks Automation, Inc. | 20,921 | 136 |
| * | Volterra Semiconductor Corp. | 7,449 | 132 |
| * | Sigma Designs, Inc. | 8,654 | 122 |
| * | Kulicke & Soffa | | |
| | Industries, Inc. | 22,424 | 118 |
| | Micrel, Inc. | 14,932 | 116 |
| * | Advanced Energy | | |
| | Industries, Inc. | 10,998 | 115 |
| * | Cirrus Logic, Inc. | 20,263 | 101 |
| * | Supertex, Inc. | 3,770 | 97 |
| * | Lattice Semiconductor Corp. | 38,086 | 94 |
| * | Actel Corp. | 8,478 | 92 |
| * | Exar Corp. | 12,032 | 90 |
| | Cohu, Inc. | 7,321 | 87 |
| * | Kopin Corp. | 22,172 | 85 |
| * | Ultratech, Inc. | 7,332 | 79 |
| * | ANADIGICS, Inc. | 20,240 | 78 |
| * | Silicon Image, Inc. | 24,445 | 74 |
74
Information Technology Index Fund
| | | | |
| | | | | Market |
| | | | | Value• |
| | | | Shares | ($000) |
| * | Pericom Semiconductor Corp. | 8,259 | 71 |
| * | DSP Group Inc. | | 8,485 | 67 |
| * | Advanced Analogic | | | |
| | Technologies, Inc. | | 13,867 | 63 |
| * | Rudolph Technologies, Inc. | | 9,375 | 60 |
| * | Silicon Storage | | | |
| | Technology, Inc. | | 28,372 | 52 |
| * | Rubicon Technology, Inc. | | 4,241 | 52 |
| | IXYS Corp. | | 7,431 | 51 |
| * | Trident Microsystems, Inc. | | 20,787 | 50 |
| * | Conexant Systems, Inc. | | 16,401 | 45 |
| * | Mattson Technology, Inc. | | 15,914 | 26 |
| | | | | 102,563 |
| Software (21.5%) | | | |
| | Microsoft Corp. | 2,637,216 | 65,007 |
| | Oracle Corp. | 1,312,634 | 28,707 |
| * | Adobe Systems, Inc. | | 172,300 | 5,414 |
| * | Symantec Corp. | | 270,288 | 4,087 |
| | CA, Inc. | | 136,651 | 3,046 |
| * | Intuit, Inc. | | 100,507 | 2,791 |
| * | Activision Blizzard, Inc. | | 190,710 | 2,214 |
| * | BMC Software, Inc. | | 60,882 | 2,170 |
| * | Citrix Systems, Inc. | | 59,707 | 2,130 |
| * | McAfee Inc. | | 51,173 | 2,036 |
| * | Electronic Arts Inc. | | 106,325 | 1,937 |
| * | salesforce.com, inc. | | 36,608 | 1,899 |
| * | Autodesk, Inc. | | 73,648 | 1,726 |
| * | Red Hat, Inc. | | 62,482 | 1,435 |
| * | ANSYS, Inc. | | 28,865 | 1,014 |
| * | Rovi Corp. | | 33,308 | 1,014 |
| * | Synopsys, Inc. | | 47,468 | 1,008 |
| * | Sybase, Inc. | | 27,387 | 954 |
| | FactSet Research | | | |
| | Systems Inc. | | 14,689 | 809 |
| * | Nuance Communications, Inc. | 64,913 | 800 |
| * | MICROS Systems, Inc. | | 26,411 | 736 |
| | Jack Henry & Associates Inc. | 26,271 | 612 |
| * | VMware Inc. | | 16,652 | 590 |
| * | Compuware Corp. | | 81,063 | 584 |
| * | Solera Holdings, Inc. | | 21,667 | 571 |
| * | Cadence Design Systems, Inc. | 86,754 | 544 |
| * | TIBCO Software Inc. | | 58,333 | 517 |
| * | Informatica Corp. | | 28,573 | 512 |
| * | Parametric Technology Corp. | 37,970 | 505 |
| * | Novell, Inc. | | 113,297 | 493 |
| * | Concur Technologies, Inc. | | 13,535 | 479 |
| * | Quest Software, Inc. | | 21,798 | 359 |
| | Fair Isaac, Inc. | | 16,068 | 358 |
| * | Blackboard Inc. | | 9,807 | 337 |
| * | TiVo Inc. | | 34,398 | 337 |
| * | Ariba, Inc. | | 28,526 | 327 |
| * | SPSS, Inc. | | 5,975 | 298 |
| * | Progress Software Corp. | | 13,110 | 292 |
| * | Mentor Graphics Corp. | | 31,577 | 279 |
| | Take-Two Interactive | | | |
| | Software, Inc. | | 26,409 | 277 |
| | Blackbaud, Inc. | | 14,224 | 274 |
| * | Lawson Software, Inc. | | 42,697 | 263 |
| * | Commvault Systems, Inc. | | 12,911 | 236 |
| | | |
| | | | Market |
| | | | Value• |
| | | Shares | ($000) |
| * | Websense, Inc. | 14,759 | 224 |
| * | Advent Software, Inc. | 5,714 | 221 |
| * | The Ultimate Software | | |
| | Group, Inc. | 7,874 | 208 |
| * | JDA Software Group, Inc. | 9,726 | 188 |
| * | MicroStrategy Inc. | 2,973 | 184 |
| * | Tyler Technologies, Inc. | 11,543 | 176 |
| * | AsiaInfo Holdings, Inc. | 9,871 | 170 |
| | Pegasystems Inc. | 5,288 | 162 |
| * | Taleo Corp. Class A | 8,742 | 158 |
| * | ACI Worldwide, Inc. | 11,405 | 155 |
| * | EPIQ Systems, Inc. | 9,914 | 149 |
| * | Manhattan Associates, Inc. | 7,832 | 140 |
| * | SonicWALL, Inc. | 17,561 | 132 |
| * | SuccessFactors Inc. | 11,003 | 131 |
| * | THQ Inc. | 22,014 | 121 |
| * | Ebix, Inc. | 2,325 | 115 |
| * | MSC Software Corp. | 14,897 | 113 |
| * | S1 Corp. | 17,815 | 112 |
| * | Epicor Software Corp. | 17,589 | 111 |
| * | Smith Micro Software, Inc. | 9,187 | 106 |
| * | NetScout Systems, Inc. | 9,147 | 105 |
| * | ArcSight, Inc. | 5,142 | 100 |
| * | Telecommunication | | |
| | Systems, Inc. | 12,991 | 98 |
| * | Sourcefire Inc. | 5,022 | 95 |
| * | Bottomline Technologies, Inc. | 7,699 | 93 |
| * | Radiant Systems, Inc. | 8,552 | 92 |
| * | VASCO Data Security | | |
| | International, Inc. | 9,658 | 84 |
| * | Kenexa Corp. | 6,680 | 82 |
| * | Interactive Intelligence Inc. | 4,145 | 71 |
| * | Synchronoss Technologies, Inc. | 6,535 | 69 |
| * | DemandTec, Inc. | 8,103 | 69 |
| * | NetSuite Inc. | 4,998 | 69 |
| * | Symyx Technologies, Inc. | 11,057 | 68 |
| * | FalconStor Software, Inc. | 12,297 | 62 |
| * | Monotype Imaging | | |
| | Holdings Inc. | 7,331 | 60 |
| * | PROS Holdings, Inc. | 5,883 | 48 |
| * | Double-Take Software Inc. | 5,391 | 47 |
| | OPNET Technologies, Inc. | 4,370 | 41 |
| * | Chordiant Software, Inc. | 9,761 | 38 |
| * | Deltek, Inc. | 5,244 | 38 |
| * | OpenTV Corp. | 28,286 | 36 |
| | Renaissance Learning, Inc. | 2,837 | 28 |
| * | Magma Design | | |
| | Automation, Inc. | 14,215 | 20 |
| | | | 144,567 |
| Total Investments (100.0%) | | |
| (Cost $717,574) | | 671,831 |
| Other Assets and Liabilities (0.0%) | |
| Other Assets | | 6,562 |
| Liabilities | | (6,405) |
| | | | 157 |
| Net Assets (100%) | | 671,988 |
| |
| At August 31, 2009, net assets consisted of: |
| | Amount |
| | ($000) |
| Paid-in Capital | 751,570 |
| Undistributed Net Investment Income | 2,394 |
| Accumulated Net Realized Losses | (36,233) |
| Unrealized Appreciation (Depreciation) | (45,743) |
| Net Assets | 671,988 |
| |
| |
| Admiral Shares—Net Assets | |
| Applicable to 1,344,760 outstanding | |
| $.001 par value shares of beneficial | |
| interest (unlimited authorization) | 32,797 |
| Net Asset Value Per Share— | |
| Admiral Shares | $24.39 |
| |
| |
| ETF Shares—Net Assets | |
| Applicable to 13,416,155 outstanding | |
| $.001 par value shares of beneficial | |
| interest (unlimited authorization) | 639,191 |
| Net Asset Value Per Share— | |
| ETF Shares | $47.64 |
• See Note A in Notes to Financial Statements.
* Non-income-producing security.
See accompanying Notes, which are an integral part of the Financial Statements.
75
Information Technology Index Fund
| |
| Statement of Operations |
| |
| | Year Ended |
| August 31, 2009 |
| | ($000) |
| Investment Income | |
| Income | |
| Dividends | 4,659 |
| Interest1 | 3 |
| Security Lending | 16 |
| Total Income | 4,678 |
| Expenses | |
| The Vanguard Group—Note B | |
| Investment Advisory Services | 58 |
| Management and Administrative— | |
| Admiral Shares | 45 |
| Management and Administrative— | |
| ETF Shares | 683 |
| Marketing and Distribution— | |
| Admiral Shares | 6 |
| Marketing and Distribution— | |
| ETF Shares | 124 |
| Custodian Fees | 38 |
| Auditing Fees | 24 |
| Shareholders’ Reports and Proxies— | |
| Admiral Shares | — |
| Shareholders’ Reports and Proxies— | |
| ETF Shares | 89 |
| Trustees’ Fees and Expenses | 1 |
| Total Expenses | 1,068 |
| Net Investment Income | 3,610 |
| Realized Net Gain (Loss) on | |
| Investment Securities Sold | (27,908) |
| Change in Unrealized Appreciation | |
| (Depreciation) of Investment Securities | 5,476 |
| Net Increase (Decrease) in Net Assets | |
| Resulting from Operations | (18,822) |
Statement of Changes in Net Assets
| | |
| | Year Ended August 31, |
| | 2009 | 2008 |
| | ($000) | ($000) |
| Increase (Decrease) in Net Assets | | |
| Operations | | |
| Net Investment Income | 3,610 | 2,711 |
| Realized Net Gain (Loss) | (27,908) | 32,592 |
| Change in Unrealized Appreciation (Depreciation) | 5,476 | (98,555) |
| Net Increase (Decrease) in Net Assets Resulting from Operations | (18,822) | (63,252) |
| Distributions | | |
| Net Investment Income | | |
| Admiral Shares | (133) | (64) |
| ETF Shares | (3,037) | (1,663) |
| Realized Capital Gain | | |
| Admiral Shares | — | — |
| ETF Shares | — | — |
| Total Distributions | (3,170) | (1,727) |
| Capital Share Transactions | | |
| Admiral Shares | 7,447 | 16,473 |
| ETF Shares | 163,810 | 119,838 |
| Net Increase (Decrease) from Capital Share Transactions | 171,257 | 136,311 |
| Total Increase (Decrease) | 149,265 | 71,332 |
| Net Assets | | |
| Beginning of Period | 522,723 | 451,391 |
| End of Period2 | 671,988 | 522,723 |
1 Interest income from an affiliated company of the fund was $3,000.
2 Net Assets—End of Period includes undistributed net investment income of $2,394,000 and $1,954,000.
See accompanying Notes, which are an integral part of the Financial Statements.
76
| | | | | |
| Information Technology Index Fund | | | | | |
| |
| |
| Financial Highlights | | | | | |
| |
| Admiral Shares | | | | | |
| |
| | | | | Year Ended August 31, |
| For a Share Outstanding Throughout Each Period | 2009 | 2008 | 2007 | 2006 | 2005 |
| Net Asset Value, Beginning of Period | $27.28 | $29.95 | $24.40 | $23.93 | $20.72 |
| Investment Operations | | | | | |
| Net Investment Income | .1631 | .121 | .1101 | .0841 | .3512 |
| Net Realized and Unrealized Gain (Loss) | | | | | |
| on Investments | (2.897) | (2.706) | 5.500 | .424 | 3.182 |
| Total from Investment Operations | (2.734) | (2.585) | 5.610 | .508 | 3.533 |
| Distributions | | | | | |
| Dividends from Net Investment Income | (.156) | (.085) | (.060) | (.038) | (.323) |
| Distributions from Realized Capital Gains | — | — | — | — | — |
| Total Distributions | (.156) | (.085) | (.060) | (.038) | (.323) |
| Net Asset Value, End of Period | $24.39 | $27.28 | $29.95 | $24.40 | $23.93 |
| |
| Total Return3 | –9.79% | –8.67% | 23.02% | 2.12% | 17.05% |
| |
| Ratios/Supplemental Data | | | | | |
| Net Assets, End of Period (Millions) | $33 | $26 | $12 | $5 | $2 |
| Ratio of Total Expenses to Average Net Assets | 0.28% | 0.25% | 0.26% | 0.28% | 0.28% |
| Ratio of Net Investment Income to | | | | | |
| Average Net Assets | 0.82% | 0.46% | 0.38% | 0.33% | 1.26%2 |
| Portfolio Turnover Rate4 | 12% | 11% | 8% | 8% | 7% |
1 Calculated based on average shares outstanding.
2 Net investment income per share and the ratio of net investment income to average net assets include $.284 and 1.00%, respectively,
resulting from a special dividend from Microsoft Corp. in November 2004.
3 Total returns do not reflect the 2% fee assessed on redemptions of shares held for less than one year.
4 Excludes the value of portfolio securities received or delivered as a result of in-kind purchases or redemptions of the fund’s capital shares,
including ETF Creation Units.
| | | | | |
| ETF Shares | | | | | |
| |
| | | | | Year Ended August 31, |
| For a Share Outstanding Throughout Each Period | 2009 | 2008 | 2007 | 2006 | 2005 |
| Net Asset Value, Beginning of Period | $53.32 | $58.52 | $47.66 | $46.76 | $40.46 |
| Investment Operations | | | | | |
| Net Investment Income | .3311 | .249 | .2311 | .1751 | .6702 |
| Net Realized and Unrealized Gain (Loss) | | | | | |
| on Investments | (5.685) | (5.274) | 10.765 | .816 | 6.239 |
| Total from Investment Operations | (5.354) | (5.025) | 10.996 | .991 | 6.909 |
| Distributions | | | | | |
| Dividends from Net Investment Income | (.326) | (.175) | (.136) | (.091) | (.609) |
| Distributions from Realized Capital Gains | — | — | — | — | — |
| Total Distributions | (.326) | (.175) | (.136) | (.091) | (.609) |
| Net Asset Value, End of Period | $47.64 | $53.32 | $58.52 | $47.66 | $46.76 |
| |
| Total Return | –9.78% | –8.62% | 23.10% | 2.11% | 17.07% |
| |
| Ratios/Supplemental Data | | | | | |
| Net Assets, End of Period (Millions) | $639 | $497 | $439 | $172 | $51 |
| Ratio of Total Expenses to Average Net Assets | 0.25% | 0.20% | 0.22% | 0.25% | 0.26% |
| Ratio of Net Investment Income to | | | | | |
| Average Net Assets | 0.85% | 0.51% | 0.42% | 0.36% | 1.28%2 |
| Portfolio Turnover Rate3 | 12% | 11% | 8% | 8% | 7% |
1 Calculated based on average shares outstanding.
2 Net investment income per share and the ratio of net investment income to average net assets include $.553 and 1.00%, respectively,
resulting from a special dividend from Microsoft Corp. in November 2004.
3 Excludes the value of portfolio securities received or delivered as a result of in-kind purchases or redemptions of the fund’s capital shares,
including ETF Creation Units.
See accompanying Notes, which are an integral part of the Financial Statements.
77
Information Technology Index Fund
Notes to Financial Statements
Vanguard Information Technology Index Fund is registered under the Investment Company Act of 1940 as an open-end investment company, or mutual fund. The fund offers two classes of shares, Admiral Shares and ETF Shares. Admiral Shares are available to any investor who meets the fund’s minimum purchase requirements. ETF Shares are listed for trading on the NYSE Arca, Inc.; they can be purchased and sold through a broker.
A. The following significant accounting policies conform to generally accepted accounting principles for U.S. mutual funds. The fund consistently follows such policies in preparing its financial statements.
1. Security Valuation: Securities are valued as of the close of trading on the New York Stock Exchange (generally 4 p.m., Eastern time) on the valuation date. Equity securities are valued at the latest quoted sales prices or official closing prices taken from the primary market in which each security trades; such securities not traded on the valuation date are valued at the mean of the latest quoted bid and asked prices. Securities for which market quotations are not readily available, or whose values have been materially affected by events occurring before the fund’s pricing time but after the close of the securities’ primary markets, are valued by methods deemed by the board of trustees to represent fair value. Investments in Vanguard Market Liquidity Fund are valued at that fund’s net asset value.
2. Federal Income Taxes: The fund intends to continue to qualify as a regulated investment company and distribute all of its taxable income. Management has analyzed the fund’s tax positions taken for all open federal income tax years (August 31, 2006–2009), and has concluded that no provision for federal income tax is required in the fund’s financial statements.
3. Distributions: Distributions to shareholders are recorded on the ex-dividend date.
4. Security Lending: The fund may lend its securities to qualified institutional borrowers to earn additional income. Security loans are required to be secured at all times by collateral at least equal to the market value of securities loaned. The fund invests cash collateral received in Vanguard Market Liquidity Fund, and records a liability for the return of the collateral, during the period the securities are on loan. Security lending income represents the income earned on investing cash collateral, less expenses associated with the loan.
5. Other: Dividend income is recorded on the ex-dividend date. Interest income includes income distributions received from Vanguard Market Liquidity Fund and is accrued daily. Security transactions are accounted for on the date securities are bought or sold. Costs used to determine realized gains (losses) on the sale of investment securities are those of the specific securities sold. Fees assessed on redemptions of capital shares are credited to paid-in capital.
Each class of shares has equal rights as to assets and earnings, except that each class separately bears certain class-specific expenses related to maintenance of shareholder accounts (included in Management and Administrative expenses), shareholder reporting, and proxies. Marketing and distribution expenses are allocated to each class of shares based on a method approved by the board of trustees. Income, other non-class-specific expenses, and gains and losses on investments are allocated to each class of shares based on its relative net assets.
B. The Vanguard Group furnishes at cost investment advisory, corporate management, administrative, marketing, and distribution services. The costs of such services are allocated to the fund under methods approved by the board of trustees. The fund has committed to provide up to 0.40% of its net assets in capital contributions to Vanguard. At August 31, 2009, the fund had contributed capital of $140,000 to Vanguard (included in Other Assets), representing 0.02% of the fund’s net assets and 0.06% of Vanguard’s capitalization. The fund’s trustees and officers are also directors and officers of Vanguard.
C. Various inputs may be used to determine the value of the fund’s investments. These inputs are summarized in three broad levels for financial statement purposes. The inputs or methodologies used to value securities are not necessarily an indication of the risk associated with investing in those securities.
Level 1—Quoted prices in active markets for identical securities.
Level 2—Other significant observable inputs (including quoted prices for similar securities, interest rates, prepayment speeds, credit risk, etc.).
Level 3—Significant unobservable inputs (including the fund’s own assumptions used to determine the fair value of investments).
At August 31, 2009, 100% of the fund’s investments were valued based on Level 1 inputs.
78
Information Technology Index Fund
D. Distributions are determined on a tax basis and may differ from net investment income and realized capital gains for financial reporting purposes. Differences may be permanent or temporary. Permanent differences are reclassified among capital accounts in the financial statements to reflect their tax character. Temporary differences arise when certain items of income, expense, gain, or loss are recognized in different periods for financial statement and tax purposes; these differences will reverse at some time in the future. Differences in classification may also result from the treatment of short-term gains as ordinary income for tax purposes.
During the year ended August 31, 2009, the fund realized $1,533,000 of net capital losses resulting from in-kind redemptions—in which shareholders exchanged fund shares for securities held by the fund rather than for cash. Because such losses are not taxable losses to the fund, they have been reclassified from accumulated net realized losses to paid-in capital.
For tax purposes, at August 31, 2009, the fund had $2,711,000 of ordinary income available for distribution. The fund had available capital loss carryforwards totaling $15,094,000 to offset future net capital gains of $63,000 through August 31, 2013, $188,000 through August 31, 2014, $612,000 through August 31, 2015, $218,000 through August 31, 2016, and $14,013,000 through August 31, 2017. In addition, the fund realized losses of $20,087,000 during the period from November 1, 2008, through August 31, 2009, which are deferred and will be treated as realized for tax purposes in fiscal 2010.
At August 31, 2009, the cost of investment securities for tax purposes was $718,626,000. Net unrealized depreciation of investment securities for tax purposes was $46,795,000, consisting of unrealized gains of $25,697,000 on securities that had risen in value since their purchase and $72,492,000 in unrealized losses on securities that had fallen in value since their purchase.
E. During the year ended August 31, 2009, the fund purchased $326,120,000 of investment securities and sold $154,777,000 of investment securities, other than temporary cash investments.
F. Capital share transactions for each class of shares were:
| | | | |
| | | | Year Ended August 31, |
| | | 2009 | | 2008 |
| | Amount | Shares | Amount | Shares |
| | ($000) | (000) | ($000) | (000) |
| Admiral Shares | | | | |
| Issued | 14,130 | 714 | 22,099 | 752 |
| Issued in Lieu of Cash Distributions | 116 | 7 | 58 | 2 |
| Redeemed1 | (6,799) | (333) | (5,684) | (206) |
| Net Increase (Decrease)—Admiral Shares | 7,447 | 388 | 16,473 | 548 |
| ETF Shares | | | | |
| Issued | 264,940 | 6,802 | 344,646 | 6,010 |
| Issued in Lieu of Cash Distributions | — | — | — | — |
| Redeemed1 | (101,130) | (2,700) | (224,808) | (4,200) |
| Net Increase (Decrease)—ETF Shares | 163,810 | 4,102 | 119,838 | 1,810 |
| 1 Net of redemption fees for fiscal 2009 and 2008 of $74,000 and $70,000, respectively (fund totals). | | |
G. In preparing the financial statements as of August 31, 2009, management considered the impact of subsequent events occurring through October 15, 2009, for potential recognition or disclosure in these financial statements.
79
Materials Index Fund
Fund Profile
As of August 31, 2009
| | | |
| Portfolio Characteristics | | |
| | | Target | Broad |
| | Fund | Index1 | Index2 |
| Number of Stocks | 120 | 120 | 2,501 |
| Median Market Cap | $11.7B | $11.7B | $27.3B |
| Price/Earnings Ratio | 55.7x | 55.1x | 25.6x |
| Price/Book Ratio | 2.4x | 2.4x | 2.1x |
| Yield3 | | 1.8% | 1.9% |
| Admiral Shares | 1.5% | | |
| ETF Shares | 1.5% | | |
| Return on Equity | 19.9% | 19.9% | 19.3% |
| Earnings Growth Rate | 12.9% | 13.0% | 9.9% |
| Foreign Holdings | 0.0% | 0.0% | 0.0% |
| Turnover Rate | 12% | — | — |
| Expense Ratio4 | | — | — |
| Admiral Shares | 0.28% | | |
| ETF Shares | 0.25% | | |
| Short-Term Reserves | 0.0% | — | — |
| | |
| Volatility Measures5 | |
| | Fund Versus | Fund Versus |
| | Target Index1 | Broad Index2 |
| R-Squared | 1.00 | 0.86 |
| Beta | 1.00 | 1.28 |
| |
| Industry Diversification (% of equity exposure) |
| |
| Aluminum | 3.1% |
| Commodity Chemicals | 1.4 |
| Construction Materials | 2.9 |
| Diversified Chemicals | 18.3 |
| Diversified Metals & Mining | 8.0 |
| Fertilizers & Agricultural Chemicals | 15.2 |
| Forest Products | 2.2 |
| Gold | 5.1 |
| Industrial Gases | 10.2 |
| Metal & Glass Containers | 5.4 |
| Paper Packaging | 3.4 |
| Paper Products | 3.8 |
| Specialty Chemicals | 11.0 |
| Steel | 9.5 |
| Other Materials | 0.5 |
| |
| Ten Largest Holdings6 (% of total net assets) |
| |
| Monsanto Co. | 11.0% |
| E.I. du Pont de Nemours & Co. | 6.9 |
| Freeport-McMoRan Copper & Gold, Inc. | |
| Class B | 6.2 |
| Praxair, Inc. | 5.6 |
| Dow Chemical Co. | 5.5 |
| Newmont Mining Corp. (Holding Co.) | 4.6 |
| Air Products & Chemicals, Inc. | 3.8 |
| Nucor Corp. | 3.4 |
| Alcoa Inc. | 2.8 |
| Ecolab, Inc. | 2.4 |
| Top Ten | 52.2% |
1 MSCI US IMI/Materials.
2 MSCI US IMI/2500.
3 30-day SEC yield for the fund; annualized dividend yield for the indexes. See the Glossary.
4 The expense ratios shown are from the prospectuses dated December 29, 2008, and represent estimated costs for the current fiscal year based on the fund’s net assets as of the prospectus date.
For the fiscal year ended August 31, 2009, the expense ratios were 0.28% for the Admiral Shares and 0.25% for the ETF Shares.
5 For an explanation of R-squared, beta, and other terms used here, see the Glossary.
6 The holdings listed exclude any temporary cash investments and equity index products.
80
Materials Index Fund
Performance Summary
All of the returns in this report represent past performance, which is not a guarantee of future results that may be achieved by the fund. (Current performance may be lower or higher than the performance data cited. For performance data current to the most recent month-end, visit our website at www.vanguard.com/performance.) Note, too, that both investment returns and principal value can fluctuate widely, so an investor’s shares, when sold, could be worth more or less than their original cost. The returns shown do not reflect taxes that a shareholder would pay on fund distributions or on the sale of fund shares.
Cumulative Performance: January 26, 2004–August 31, 2009
Initial Investment of $10,000
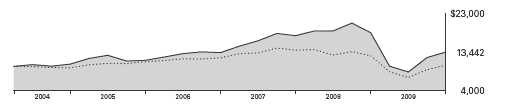
| | | | |
| | | Average Annual Total Returns | |
| | | Periods Ended August 31, 2009 | Final Value |
| | | | Since | of a $10,000 |
| | One Year | Five Years | Inception1 | Investment |
| Materials Index Fund ETF Shares | | | | |
| Net Asset Value2 | –25.88% | 4.99% | 5.43% | $13,442 |
| Materials Index Fund ETF Shares | | | | |
| Market Price | –25.84 | 5.02 | 5.44 | 13,452 |
| MSCI US IMI/2500 | –18.26 | 1.36 | 0.52 | 10,295 |
| MSCI US IMI/Materials | –26.00 | 5.08 | 5.53 | 13,515 |
| | | | |
| | | | | Final Value |
| | | | Since | of a $100,000 |
| | One Year | Five Years | Inception1 | Investment |
| Materials Index Fund Admiral Shares3 | –25.91% | 4.96% | 4.73% | $129,263 |
| MSCI US IMI/2500 | –18.26 | 1.36 | 0.48 | 102,707 |
| MSCI US IMI/Materials | –26.00 | 5.08 | 4.87 | 130,179 |
1 Performance for the fund and its comparative standards is calculated since the following inception dates: January 26, 2004, for ETF Shares; February 11, 2004, for Admiral Shares.
2 For more information about how the ETF Shares’ market prices have compared with their net asset value, visit www.vanguard.com, select your ETF, and then select the Performance tab. The Premium/Discount
table there shows the percentages of days on which the ETF Shares’ market price was above or below the NAV.
3 Total returns do not reflect the 2% fee assessed on redemptions of shares held for less than one year.
Note: See Financial Highlights tables for dividend and capital gains information.
81
Materials Index Fund
Fiscal-Year Total Returns (%): January 26, 2004–August 31, 2009
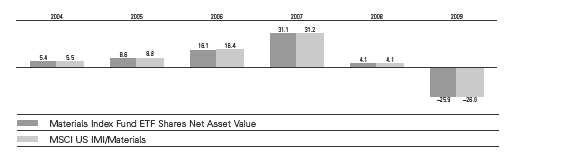
| | | |
| Cumulative Returns: ETF Shares, January 26, 2004–August 31, 2009 | | |
| | | | Cumulative |
| | | | Since |
| | One Year | Five Years | Inception |
| Materials Index Fund ETF Shares Market Price | –25.84% | 27.74% | 34.52% |
| Materials Index Fund ETF Shares Net Asset Value | –25.88 | 27.58 | 34.42 |
| MSCI US IMI/Materials | –26.00 | 28.13 | 35.15 |
Average Annual Total Returns: Periods Ended June 30, 2009
This table presents average annual total returns through the latest calendar quarter—rather than through the end
of the fiscal period. Securities and Exchange Commission rules require that we provide this information.
| | | | |
| | | | | Since |
| | Inception Date | One Year | Five Years | Inception |
| ETF Shares | 1/26/2004 | | | |
| Market Price | | –40.08% | 1.82% | 2.77% |
| Net Asset Value | | –40.08 | 1.80 | 2.77 |
| Admiral Shares1 | 2/11/2004 | –40.10 | 1.77 | 2.05 |
1 Total returns do not reflect the 2% fee assessed on redemptions of shares held for less than one year.
Note: See Financial Highlights tables for dividend and capital gains information.
82
Materials Index Fund
Financial Statements
Statement of Net Assets
As of August 31, 2009
The fund provides a complete list of its holdings four times in each fiscal year, at the quarter-ends. For the second and fourth fiscal quarters, the lists appear in the fund’s semiannual and annual reports to shareholders. For the first and third fiscal quarters, the fund files the lists with the Securities and Exchange Commission on Form N-Q. Shareholders can look up the fund’s Forms N-Q on the SEC’s website at www.sec.gov. Forms N-Q may also be reviewed and copied at the SEC’s Public Reference Room (see the back cover of this report for further information).
| | | |
| | | | Market |
| | | | Value• |
| | | Shares | ($000) |
| Common Stocks (100.0%) | | |
| Chemicals (56.1%) | | |
| | Monsanto Co. | 608,973 | 51,081 |
| | E.I. du Pont | | |
| | de Nemours & Co. | 1,008,280 | 32,194 |
| | Praxair, Inc. | 343,017 | 26,282 |
| | Dow Chemical Co. | 1,200,609 | 25,561 |
| | Air Products & | | |
| | Chemicals, Inc. | 234,098 | 17,564 |
| | Ecolab, Inc. | 263,851 | 11,158 |
| | PPG Industries, Inc. | 183,738 | 10,179 |
| | The Mosaic Co. | 173,574 | 8,413 |
| | Sigma-Aldrich Corp. | 136,233 | 6,921 |
| | Lubrizol Corp. | 75,259 | 4,796 |
| | Eastman Chemical Co. | 81,069 | 4,229 |
| | CF Industries Holdings, Inc. | 51,452 | 4,202 |
| | Celanese Corp. Series A | 160,689 | 4,093 |
| | Airgas, Inc. | 81,896 | 3,808 |
| | FMC Corp. | 77,408 | 3,692 |
| | Terra Industries, Inc. | 111,497 | 3,469 |
| | International Flavors & | | |
| | Fragrances, Inc. | 88,198 | 3,142 |
| | Ashland, Inc. | 78,131 | 2,866 |
| | Valspar Corp. | 106,586 | 2,854 |
| | Nalco Holding Co. | 154,466 | 2,765 |
| | Albemarle Corp. | 81,980 | 2,642 |
| | RPM International, Inc. | 143,631 | 2,338 |
| | Scotts Miracle-Gro Co. | 51,225 | 2,084 |
| | Huntsman Corp. | 185,453 | 1,593 |
| * | Solutia Inc. | 127,817 | 1,563 |
| | Cytec Industries, Inc. | 52,999 | 1,531 |
| | Cabot Corp. | 73,626 | 1,457 |
| | Olin Corp. | 86,569 | 1,449 |
| | Sensient Technologies Corp. | 54,319 | 1,416 |
| * | W.R. Grace & Co. | 81,302 | 1,360 |
| * | Intrepid Potash, Inc. | 50,522 | 1,187 |
| | NewMarket Corp. | 13,472 | 1,120 |
| | H.B. Fuller Co. | 53,844 | 1,063 |
| * | Rockwood Holdings, Inc. | 49,296 | 1,004 |
| | Minerals Technologies, Inc. | 20,770 | 931 |
| * | OM Group, Inc. | 33,812 | 920 |
| * | Calgon Carbon Corp. | 57,365 | 820 |
| | Arch Chemicals, Inc. | 27,820 | 813 |
| | Koppers Holdings, Inc. | 22,902 | 625 |
| | Westlake Chemical Corp. | 22,241 | 535 |
| | A. Schulman Inc. | 25,992 | 522 |
| | Balchem Corp. | 20,560 | 512 |
| * | PolyOne Corp. | 97,263 | 496 |
| | Stepan Co. | 8,563 | 463 |
| | Spartech Corp. | 33,708 | 389 |
| | Ferro Corp. | 48,429 | 382 |
| | Zep, Inc. | 23,422 | 374 |
| | Innophos Holdings Inc. | 19,602 | 374 |
| | | | |
| | | | | Market |
| | | | | Value• |
| | | | Shares | ($000) |
| | Innospec, Inc. | | 25,879 | 354 |
| * | GenTek, Inc. | | 11,217 | 308 |
| * | Zoltek Cos., Inc. | | 32,713 | 305 |
| * | LSB Industries, Inc. | | 17,394 | 269 |
| | Hawkins, Inc. | | 9,434 | 201 |
| | American Vanguard Corp. | 22,183 | 194 |
| * | Landec Corp. | | 27,060 | 165 |
| | | | | 261,028 |
| Construction Materials (2.9%) | | |
| | Vulcan Materials Co. | | 136,172 | 6,814 |
| | Martin Marietta Materials, Inc. | 47,407 | 4,152 |
| | Eagle Materials, Inc. | | 46,617 | 1,227 |
| | Texas Industries, Inc. | | 26,176 | 1,041 |
| * | Headwaters Inc. | | 46,397 | 178 |
| * | United States Lime & Mineral | 3,098 | 116 |
| | | | | 13,528 |
| Containers & Packaging (8.9%) | | |
| * | Owens-Illinois, Inc. | | 187,204 | 6,354 |
| | Ball Corp. | | 99,650 | 4,829 |
| * | Crown Holdings, Inc. | | 178,051 | 4,421 |
| * | Pactiv Corp. | | 147,313 | 3,661 |
| | Sealed Air Corp. | | 176,723 | 3,342 |
| | Bemis Co., Inc. | | 120,378 | 3,201 |
| | Sonoco Products Co. | | 111,508 | 2,892 |
| | AptarGroup Inc. | | 75,858 | 2,608 |
| | Packaging Corp. of America | 115,064 | 2,343 |
| | Rock-Tenn Co. | | 40,782 | 2,092 |
| | Temple-Inland Inc. | | 113,833 | 1,925 |
| | Silgan Holdings, Inc. | | 29,846 | 1,451 |
| | Greif Inc. Class A | | 27,125 | 1,344 |
| | Myers Industries, Inc. | | 33,913 | 347 |
| * | Graphic Packaging Holding Co. | 92,622 | 197 |
| * | Bway Holding Co. | | 11,962 | 185 |
| | | | | 41,192 |
| Metals & Mining (26.1%) | | | |
| | Freeport-McMoRan Copper | | |
| | & Gold, Inc. Class B | | 459,403 | 28,933 |
| | Newmont Mining Corp. | | | |
| | (Holding Co.) | | 534,434 | 21,479 |
| | Nucor Corp. | | 350,636 | 15,617 |
| | Alcoa Inc. | 1,087,232 | 13,101 |
| | United States Steel Corp. | 160,014 | 7,006 |
| | Cliffs Natural Resources Inc. | 144,273 | 3,652 |
| | Steel Dynamics, Inc. | | 212,120 | 3,511 |
| | Walter Industries, Inc. | | 58,904 | 3,058 |
| | Allegheny Technologies Inc. | 97,893 | 2,973 |
| | Reliance Steel & | | | |
| | Aluminum Co. | | 73,905 | 2,730 |
| | AK Steel Holding Corp. | | 121,857 | 2,476 |
| | Commercial Metals Co. | | 125,953 | 2,132 |
| | Compass Minerals | | | |
| | International, Inc. | | 36,457 | 1,939 |
| | Royal Gold, Inc. | | 43,500 | 1,726 |
| | | |
| | | | Market |
| | | | Value• |
| | | Shares | ($000) |
| | Schnitzer Steel Industries, | | |
| | Inc. Class A | 24,206 | 1,307 |
| * | Coeur d’Alene Mines Corp. | 76,640 | 1,160 |
| | Titanium Metals Corp. | 130,722 | 1,075 |
| | Carpenter Technology Corp. | 48,834 | 1,041 |
| | Worthington Industries, Inc. | 71,361 | 940 |
| * | Hecla Mining Co. | 243,646 | 726 |
| | AMCOL International Corp. | 25,517 | 565 |
| * | Century Aluminum Co. | 54,685 | 560 |
| | Kaiser Aluminum Corp. | 16,763 | 542 |
| * | Brush Engineered | | |
| | Materials Inc. | 22,331 | 495 |
| * | RTI International Metals, Inc. | 25,400 | 488 |
| * | Horsehead Holding Corp. | 38,757 | 434 |
| * | Allied Nevada Gold Corp. | 51,337 | 415 |
| * | Haynes International, Inc. | 13,654 | 370 |
| * | Stillwater Mining Co. | 51,216 | 328 |
| | Olympic Steel, Inc. | 10,108 | 272 |
| | A.M. Castle & Co. | 18,678 | 206 |
| * | General Moly, Inc. | 70,112 | 192 |
| | | | 121,449 |
| Paper & Forest Products (6.0%) | | |
| | International Paper Co. | 458,251 | 10,517 |
| | Weyerhaeuser Co. | 235,818 | 8,817 |
| | MeadWestvaco Corp. | 191,706 | 4,208 |
| * | Louisiana-Pacific Corp. | 116,926 | 880 |
| | Schweitzer-Mauduit | | |
| | International, Inc. | 17,117 | 842 |
| | Deltic Timber Corp. | 11,960 | 611 |
| * | Clearwater Paper Corp. | 12,777 | 590 |
| | Glatfelter | 49,924 | 521 |
| | Wausau Paper Corp. | 51,018 | 493 |
| * | Buckeye Technology, Inc. | 42,854 | 432 |
| | Neenah Paper Inc. | 16,075 | 182 |
| | | | 28,093 |
| Total Investments (100.0%) | | |
| (Cost $557,352) | | 465,290 |
| Other Assets and Liabilities (0.0%) | |
| Other Assets | | 2,306 |
| Liabilities | | (2,318) |
| | | | (12) |
| Net Assets (100%) | | 465,278 |
83
Materials Index Fund
| |
| At August 31, 2009, net assets consisted of: |
| | Amount |
| | ($000) |
| Paid-in Capital | 589,753 |
| Undistributed Net Investment Income | 3,882 |
| Accumulated Net Realized Losses | (36,295) |
| Unrealized Appreciation (Depreciation) | (92,062) |
| Net Assets | 465,278 |
| |
| |
| Admiral Shares—Net Assets | |
| Applicable to 2,932,456 outstanding | |
| $.001 par value shares of beneficial | |
| interest (unlimited authorization) | 89,979 |
| Net Asset Value Per Share— | |
| Admiral Shares | $30.68 |
| |
| |
| ETF Shares—Net Assets | |
| Applicable to 6,230,611 outstanding | |
| $.001 par value shares of beneficial | |
| interest (unlimited authorization) | 375,299 |
| Net Asset Value Per Share— | |
| ETF Shares | $60.23 |
• See Note A in Notes to Financial Statements.
* Non-income-producing security.
See accompanying Notes, which are an integral part of the Financial Statements.
84
Materials Index Fund
Statement of Operations
| |
| | Year Ended |
| August 31, 2009 |
| | ($000) |
| Investment Income | |
| Income | |
| Dividends | 7,204 |
| Interest1 | 4 |
| Security Lending | 187 |
| Total Income | 7,395 |
| Expenses | |
| The Vanguard Group—Note B | |
| Investment Advisory Services | 38 |
| Management and Administrative— | |
| Admiral Shares | 143 |
| Management and Administrative— | |
| ETF Shares | 342 |
| Marketing and Distribution— | |
| Admiral Shares | 19 |
| Marketing and Distribution— | |
| ETF Shares | 76 |
| Custodian Fees | 11 |
| Auditing Fees | 24 |
| Shareholders’ Reports and Proxies— | |
| Admiral Shares | 1 |
| Shareholders’ Reports and Proxies— | |
| ETF Shares | 95 |
| Total Expenses | 749 |
| Net Investment Income | 6,646 |
| Realized Net Gain (Loss) on | |
| Investment Securities Sold | (21,222) |
| Change in Unrealized Appreciation | |
| (Depreciation) of Investment Securities | (80,514) |
| Net Increase (Decrease) in Net Assets | |
| Resulting from Operations | (95,090) |
Statement of Changes in Net Assets
| | |
| | Year Ended August 31, |
| | 2009 | 2008 |
| | ($000) | ($000) |
| Increase (Decrease) in Net Assets | | |
| Operations | | |
| Net Investment Income | 6,646 | 7,970 |
| Realized Net Gain (Loss) | (21,222) | 34,834 |
| Change in Unrealized Appreciation (Depreciation) | (80,514) | (35,820) |
| Net Increase (Decrease) in Net Assets Resulting from Operations | (95,090) | 6,984 |
| Distributions | | |
| Net Investment Income | | |
| Admiral Shares | (1,751) | (1,057) |
| ETF Shares | (5,802) | (5,116) |
| Realized Capital Gain | | |
| Admiral Shares | — | — |
| ETF Shares | — | — |
| Total Distributions | (7,553) | (6,173) |
| Capital Share Transactions | | |
| Admiral Shares | 10,896 | 52,003 |
| ETF Shares | 85,342 | 49,893 |
| Net Increase (Decrease) from Capital Share Transactions | 96,238 | 101,896 |
| Total Increase (Decrease) | (6,405) | 102,707 |
| Net Assets | | |
| Beginning of Period | 471,683 | 368,976 |
| End of Period2 | 465,278 | 471,683 |
1 Interest income from an affiliated company of the fund was $4,000.
2 Net Assets—End of Period includes undistributed net investment income of $3,882,000 and $4,789,000.
See accompanying Notes, which are an integral part of the Financial Statements.
85
| | | | | |
| Materials Index Fund | | | | | |
| |
| |
| Financial Highlights | | | | | |
| |
| Admiral Shares | | | | | |
| |
| | | | | Year Ended August 31, |
| For a Share Outstanding Throughout Each Period | 2009 | 2008 | 2007 | 2006 | 2005 |
| Net Asset Value, Beginning of Period | $42.85 | $41.75 | $32.37 | $28.34 | $26.53 |
| Investment Operations | | | | | |
| Net Investment Income | .622 | .732 | .7001 | .6721 | .480 |
| Net Realized and Unrealized Gain (Loss) | | | | | |
| on Investments2 | (11.996) | 1.008 | 9.250 | 3.853 | 1.830 |
| Total from Investment Operations | (11.374) | 1.740 | 9.950 | 4.525 | 2.310 |
| Distributions | | | | | |
| Dividends from Net Investment Income | (.796) | (.640) | (.570) | (.495) | (.500) |
| Distributions from Realized Capital Gains | — | — | — | — | — |
| Total Distributions | (.796) | (.640) | (.570) | (.495) | (.500) |
| Net Asset Value, End of Period | $30.68 | $42.85 | $41.75 | $32.37 | $28.34 |
| |
| Total Return3 | –25.91% | 4.09% | 31.00% | 16.08% | 8.61% |
| |
| Ratios/Supplemental Data | | | | | |
| Net Assets, End of Period (Millions) | $90 | $107 | $57 | $12 | $7 |
| Ratio of Total Expenses to Average Net Assets | 0.28% | 0.25% | 0.26% | 0.28% | 0.28% |
| Ratio of Net Investment Income to | | | | | |
| Average Net Assets | 2.23% | 1.74% | 1.80% | 2.13% | 1.81% |
| Portfolio Turnover Rate4 | 12% | 10% | 6% | 13% | 12% |
1 Calculated based on average shares outstanding.
2 Includes increases from redemption fees of $.02, $.02, $.01, $.00, and $.00.
3 Total returns do not reflect the 2% fee assessed on redemptions of shares held for less than one year.
4 Excludes the value of portfolio securities received or delivered as a result of in-kind purchases or redemptions of the fund’s capital shares,
including ETF Creation Units.
| | | | | |
| ETF Shares | | | | | |
| |
| | | | | Year Ended August 31, |
| For a Share Outstanding Throughout Each Period | 2009 | 2008 | 2007 | 2006 | 2005 |
| Net Asset Value, Beginning of Period | $84.27 | $82.10 | $63.65 | $55.70 | $52.13 |
| Investment Operations | | | | | |
| Net Investment Income | 1.242 | 1.470 | 1.4181 | 1.3361 | .915 |
| Net Realized and Unrealized Gain (Loss) | | | | | |
| on Investments2 | (23.683) | 1.977 | 18.168 | 7.582 | 3.630 |
| Total from Investment Operations | (22.441) | 3.447 | 19.586 | 8.918 | 4.545 |
| Distributions | | | | | |
| Dividends from Net Investment Income | (1.599) | (1.277) | (1.136) | (.968) | (.975) |
| Distributions from Realized Capital Gains | — | — | — | — | — |
| Total Distributions | (1.599) | (1.277) | (1.136) | (.968) | (.975) |
| Net Asset Value, End of Period | $60.23 | $84.27 | $82.10 | $63.65 | $55.70 |
| |
| Total Return | –25.88% | 4.15% | 31.06% | 16.11% | 8.62% |
| |
| Ratios/Supplemental Data | | | | | |
| Net Assets, End of Period (Millions) | $375 | $365 | $312 | $95 | $50 |
| Ratio of Total Expenses to Average Net Assets | 0.25% | 0.20% | 0.22% | 0.25% | 0.26% |
| Ratio of Net Investment Income to | | | | | |
| Average Net Assets | 2.26% | 1.79% | 1.84% | 2.16% | 1.83% |
| Portfolio Turnover Rate3 | 12% | 10% | 6% | 13% | 12% |
1 Calculated based on average shares outstanding.
2 Includes increases from redemption fees of $.03, $.04, $.02, $.00, and $.00.
3 Excludes the value of portfolio securities received or delivered as a result of in-kind purchases or redemptions of the fund’s capital shares,
including ETF Creation Units.
See accompanying Notes, which are an integral part of the Financial Statements.
86
Materials Index Fund
Notes to Financial Statements
Vanguard Materials Index Fund is registered under the Investment Company Act of 1940 as an open-end investment company, or mutual fund. The fund offers two classes of shares, Admiral Shares and ETF Shares. Admiral Shares are available to any investor who meets the fund’s minimum purchase requirements. ETF Shares are listed for trading on the NYSE Arca, Inc.; they can be purchased and sold through a broker.
A. The following significant accounting policies conform to generally accepted accounting principles for U.S. mutual funds. The fund consistently follows such policies in preparing its financial statements.
1. Security Valuation: Securities are valued as of the close of trading on the New York Stock Exchange (generally 4 p.m., Eastern time) on the valuation date. Equity securities are valued at the latest quoted sales prices or official closing prices taken from the primary market in which each security trades; such securities not traded on the valuation date are valued at the mean of the latest quoted bid and asked prices. Securities for which market quotations are not readily available, or whose values have been materially affected by events occurring before the fund’s pricing time but after the close of the securities’ primary markets, are valued by methods deemed by the board of trustees to represent fair value. Investments in Vanguard Market Liquidity Fund are valued at that fund’s net asset value.
2. Federal Income Taxes: The fund intends to continue to qualify as a regulated investment company and distribute all of its taxable income. Management has analyzed the fund’s tax positions taken for all open federal income tax years (August 31, 2006–2009), and has concluded that no provision for federal income tax is required in the fund’s financial statements.
3. Distributions: Distributions to shareholders are recorded on the ex-dividend date.
4. Security Lending: The fund may lend its securities to qualified institutional borrowers to earn additional income. Security loans are required to be secured at all times by collateral at least equal to the market value of securities loaned. The fund invests cash collateral received in Vanguard Market Liquidity Fund, and records a liability for the return of the collateral, during the period the securities are on loan. Security lending income represents the income earned on investing cash collateral, less expenses associated with the loan.
5. Other: Dividend income is recorded on the ex-dividend date. Interest income includes income distributions received from Vanguard Market Liquidity Fund and is accrued daily. Security transactions are accounted for on the date securities are bought or sold. Costs used to determine realized gains (losses) on the sale of investment securities are those of the specific securities sold. Fees assessed on redemptions of capital shares are credited to paid-in capital.
Each class of shares has equal rights as to assets and earnings, except that each class separately bears certain class-specific expenses related to maintenance of shareholder accounts (included in Management and Administrative expenses), shareholder reporting, and proxies. Marketing and distribution expenses are allocated to each class of shares based on a method approved by the board of trustees. Income, other non-class-specific expenses, and gains and losses on investments are allocated to each class of shares based on its relative net assets.
B. The Vanguard Group furnishes at cost investment advisory, corporate management, administrative, marketing, and distribution services. The costs of such services are allocated to the fund under methods approved by the board of trustees. The fund has committed to provide up to 0.40% of its net assets in capital contributions to Vanguard. At August 31, 2009, the fund had contributed capital of $95,000 to Vanguard (included in Other Assets), representing 0.02% of the fund’s net assets and 0.04% of Vanguard’s capitalization. The fund’s trustees and officers are also directors and officers of Vanguard.
C. Various inputs may be used to determine the value of the fund’s investments. These inputs are summarized in three broad levels for financial statement purposes. The inputs or methodologies used to value securities are not necessarily an indication of the risk associated with investing in those securities.
Level 1—Quoted prices in active markets for identical securities.
Level 2—Other significant observable inputs (including quoted prices for similar securities, interest rates, prepayment speeds, credit risk, etc.).
Level 3—Significant unobservable inputs (including the fund’s own assumptions used to determine the fair value of investments).
At August 31, 2009, 100% of the fund’s investments were valued based on Level 1 inputs.
87
Materials Index Fund
D. Distributions are determined on a tax basis and may differ from net investment income and realized capital gains for financial reporting purposes. Differences may be permanent or temporary. Permanent differences are reclassified among capital accounts in the financial statements to reflect their tax character. Temporary differences arise when certain items of income, expense, gain, or loss are recognized in different periods for financial statement and tax purposes; these differences will reverse at some time in the future. Differences in classification may also result from the treatment of short-term gains as ordinary income for tax purposes.
During the year ended August 31, 2009, the fund realized $7,338,000 of net capital gains resulting from in-kind redemptions—in which shareholders exchanged fund shares for securities held by the fund rather than for cash. Because such gains are not taxable to the fund, and are not distributed to shareholders, they have been reclassified from accumulated net realized losses to paid-in capital.
For tax purposes, at August 31, 2009, the fund had $4,136,000 of ordinary income available for distribution. The fund had available capital loss carryforwards totaling $14,998,000 to offset future net capital gains of $6,000 through August 31, 2014, $698,000 through August 31, 2015, $1,458,000 through August 31, 2016, and $12,836,000 through August 31, 2017. In addition, the fund realized losses of $20,530,000 during the period from November 1, 2008, through August 31, 2009, which are deferred and will be treated as realized for tax purposes in fiscal 2010.
At August 31, 2009, the cost of investment securities for tax purposes was $558,119,000. Net unrealized depreciation of investment securities for tax purposes was $92,829,000, consisting of unrealized gains of $6,753,000 on securities that had risen in value since their purchase and $99,582,000 in unrealized losses on securities that had fallen in value since their purchase.
E. During the year ended August 31, 2009, the fund purchased $206,312,000 of investment securities and sold $111,135,000 of investment securities, other than temporary cash investments.
F. Capital share transactions for each class of shares were:
| | | | |
| | | | Year Ended August 31, |
| | | 2009 | | 2008 |
| | Amount | Shares | Amount | Shares |
| | ($000) | (000) | ($000) | (000) |
| Admiral Shares | | | | |
| Issued | 36,435 | 1,409 | 72,955 | 1,626 |
| Issued in Lieu of Cash Distributions | 1,643 | 72 | 987 | 22 |
| Redeemed1 | (27,182) | (1,046) | (21,939) | (507) |
| Net Increase (Decrease)—Admiral Shares | 10,896 | 435 | 52,003 | 1,141 |
| ETF Shares | | | | |
| Issued | 160,431 | 3,104 | 200,303 | 2,323 |
| Issued in Lieu of Cash Distributions | — | — | — | — |
| Redeemed1 | (75,089) | (1,200) | (150,410) | (1,800) |
| Net Increase (Decrease)—ETF Shares | 85,342 | 1,904 | 49,893 | 523 |
| 1 Net of redemption fees for fiscal 2009 and 2008 of $263,000 and $237,000, respectively (fund totals). | | |
G. In preparing the financial statements as of August 31, 2009, management considered the impact of subsequent events occurring through October 15, 2009, for potential recognition or disclosure in these financial statements.
88
Telecommunication Services Index Fund
Fund Profile
As of August 31, 2009
| | | |
| Portfolio Characteristics | | |
| | | Target | Broad |
| | Fund | Index1 | Index2 |
| Number of Stocks | 42 | 42 | 2,501 |
| Median Market Cap | $9.6B | $88.2B | $27.3B |
| Price/Earnings Ratio | 28.3x | 17.9x | 25.6x |
| Price/Book Ratio | 2.0x | 1.7x | 2.1x |
| Yield3 | | 5.4% | 1.9% |
| Admiral Shares | 3.9% | | |
| ETF Shares | 4.0% | | |
| Return on Equity | 8.9% | 11.4% | 19.3% |
| Earnings Growth Rate | 9.2% | 9.0% | 9.9% |
| Foreign Holdings | 0.0% | 0.0% | 0.0% |
| Turnover Rate | 25% | — | — |
| Expense Ratio4 | | — | — |
| Admiral Shares | 0.28% | | |
| ETF Shares | 0.25% | | |
| Short-Term Reserves | 0.2% | — | — |
| | |
| Volatility Measures5 | |
| | Fund Versus | Fund Versus |
| | Target Index1 | Broad Index2 |
| R-Squared | 0.90 | 0.71 |
| Beta | 0.98 | 0.85 |
| |
| Industry Diversification (% of equity exposure) |
| |
| Alternative Carriers | 10.4% |
| Integrated Telecommunication Services | 61.4 |
| Wireless Telecommunication Services | 28.2 |
| |
| Ten Largest Holdings6 (% of total net assets) |
| |
| AT&T Inc. | 20.6% |
| Verizon Communications Inc. | 19.8 |
| CenturyTel, Inc. | 4.9 |
| American Tower Corp. Class A | 4.2 |
| Sprint Nextel Corp. | 3.9 |
| Crown Castle International Corp. | 3.6 |
| Qwest Communications International Inc. | 2.5 |
| NII Holdings Inc. | 2.4 |
| Atlantic Tele-Network, Inc. | 2.0 |
| Windstream Corp. | 1.9 |
| Top Ten | 65.8% |
1 MSCI US IMI/Telecommunication Services.
2 MSCI US IMI/2500.
3 30-day SEC yield for the fund; annualized dividend yield for the indexes. See the Glossary.
4 The expense ratios shown are from the prospectuses dated December 29, 2008, and represent estimated costs for the current fiscal year based on the fund’s net assets as of the prospectus date. For the fiscal year
ended August 31, 2009, the expense ratios were 0.28% for the Admiral Shares and 0.25% for the ETF Shares.
5 For an explanation of R-squared, beta, and other terms used here, see the Glossary.
6 The holdings listed exclude any temporary cash investments and equity index products.
89
Telecommunication Services Index Fund
Performance Summary
All of the returns in this report represent past performance, which is not a guarantee of future results that may be achieved by the fund. (Current performance may be lower or higher than the performance data cited. For performance data current to the most recent month-end, visit our website at www.vanguard.com/performance.) Note, too, that both investment returns and principal value can fluctuate widely, so an investor’s shares, when sold, could be worth more or less than their original cost. The returns shown do not reflect taxes that a shareholder would pay on fund distributions or on the sale of fund shares.
Cumulative Performance: September 23, 2004–August 31, 2009
Initial Investment of $10,000
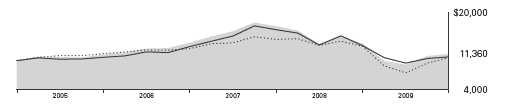
| | | |
| | | Average Annual Total Returns | |
| | | Periods Ended August 31, 2009 | Final Value |
| | | Since | of a $10,000 |
| | One Year | Inception1 | Investment |
| Telecommunication Services Index Fund | | | |
| ETF Shares Net Asset Value2 | –15.88% | 2.62% | $11,360 |
| Telecommunication Services Index Fund | | | |
| ETF Shares Market Price | –15.82 | 2.61 | 11,354 |
| MSCI US IMI/2500 | –18.26 | 1.20 | 10,605 |
| MSCI US IMI/Telecommunication Services | –17.86 | 1.51 | 10,766 |
| | | |
| | | | Final Value |
| | | Since | of a $100,000 |
| | One Year | Inception1 | Investment |
| Telecommunication Services Index Fund | | | |
| Admiral Shares3 | –15.90% | 1.33% | $106,091 |
| MSCI US IMI/2500 | –18.26 | –0.84 | 96,306 |
| MSCI US IMI/Telecommunication Services | –17.86 | 0.85 | 103,882 |
1 Performance for the fund and its comparative standards is calculated since the following inception dates: September 23, 2004, for ETF Shares; March 11, 2005, for Admiral Shares.
2 For more information about how the ETF Shares’ market prices have compared with their net asset value, visit www.vanguard.com, select your ETF, and then select the Performance tab. The Premium/Discount
table there shows the percentages of days on which the ETF Shares’ market price was above or below the NAV.
3 Total returns do not reflect the 2% fee assessed on redemptions of shares held for less than one year.
Note: See Financial Highlights tables for dividend and capital gains information.
90
Telecommunication Services Index Fund
Fiscal-Year Total Returns (%): September 23, 2004–August 31, 2009
| | |
| Cumulative Returns: ETF Shares, September 23, 2004–August 31, 2009 | | |
| | | Cumulative |
| | | Since |
| | One Year | Inception |
| Telecommunication Services Index Fund ETF Shares Market Price | –15.82% | 13.54% |
| Telecommunication Services Index Fund ETF Shares Net Asset Value | –15.88 | 13.60 |
| MSCI US IMI/Telecommunication Services | –17.86 | 7.66 |
Average Annual Total Returns: Periods Ended June 30, 2009
This table presents average annual total returns through the latest calendar quarter—rather than through the end
of the fiscal period. Securities and Exchange Commission rules require that we provide this information.
| | | |
| | | | Since |
| | Inception Date | One Year | Inception |
| ETF Shares | 9/23/2004 | | |
| Market Price | | –17.65% | 2.32% |
| Net Asset Value | | –17.72 | 2.31 |
| Admiral Shares1 | 3/11/2005 | –17.76 | 0.94 |
1 Total returns do not reflect the 2% fee assessed on redemptions of shares held for less than one year.
Note: See Financial Highlights tables for dividend and capital gains information.
91
Telecommunication Services Index Fund
Financial Statements
Statement of Net Assets
As of August 31, 2009
The fund provides a complete list of its holdings four times in each fiscal year, at the quarter-ends. For the second and fourth fiscal quarters, the lists appear in the fund’s semiannual and annual reports to shareholders. For the first and third fiscal quarters, the fund files the lists with the Securities and Exchange Commission on Form N-Q. Shareholders can look up the fund’s Forms N-Q on the SEC’s website at www.sec.gov. Forms N-Q may also be reviewed and copied at the SEC’s Public Reference Room (see the back cover of this report for further information).
| | | |
| | | | Market |
| | | | Value• |
| | | Shares | ($000) |
| Common Stocks (99.8%) | | |
| Diversified Telecommunication Services (71.6%) |
| | Alternative Carriers (10.3%) | |
| * | Level 3 | | |
| | Communications, Inc. | 2,273,021 | 2,728 |
| * | tw telecom inc. | 223,407 | 2,558 |
| * | Cogent Communications | | |
| | Group, Inc. | 254,447 | 2,455 |
| * | Global Crossing Ltd. | 209,983 | 2,360 |
| *,^ Vonage Holdings Corp. | 1,380,881 | 1,975 |
| * | Premiere Global | | |
| | Services, Inc. | 172,811 | 1,618 |
| * | PAETEC Holding Corp. | 565,039 | 1,582 |
| * | Neutral Tandem, Inc. | 46,556 | 1,164 |
| |
| | Integrated Telecommunication Services (61.3%) | |
| | AT&T Inc. | 1,257,715 | 32,764 |
| | Verizon | | |
| | Communications Inc. | 1,013,734 | 31,466 |
| | CenturyTel, Inc. | 243,580 | 7,851 |
| | Qwest Communications | | |
| | International Inc. | 1,108,272 | 3,979 |
| | Atlantic Tele-Network, Inc. | 67,035 | 3,204 |
| | Windstream Corp. | 357,064 | 3,060 |
| * | Cincinnati Bell Inc. | 845,948 | 2,817 |
| | Frontier | | |
| | Communications Corp. | 314,721 | 2,238 |
| | Consolidated | | |
| | Communications | | |
| | Holdings, Inc. | 137,617 | 1,940 |
| * | Cbeyond Inc. | 112,732 | 1,619 |
| * | SureWest | | |
| | Communications | 125,963 | 1,596 |
| * | General | | |
| | Communication, Inc. | 222,322 | 1,483 |
| | Alaska Communications | | |
| | Systems Holdings, Inc. | 169,818 | 1,353 |
| | Iowa Telecommunications | | |
| | Services Inc. | 106,594 | 1,216 |
| | FairPoint | | |
| | Communications, Inc. | 894,724 | 725 |
| | | | 113,751 |
| | | |
| | | | Market |
| | | | Value• |
| | | Shares | ($000) |
| Wireless Telecommunication Services (28.2%) |
| * | American Tower Corp. | | |
| | Class A | 213,001 | 6,742 |
| * | Sprint Nextel Corp. | 1,671,616 | 6,118 |
| * | Crown Castle | | |
| | International Corp. | 215,305 | 5,783 |
| * | NII Holdings Inc. | 159,093 | 3,772 |
| * | SBA Communications Corp. | 111,667 | 2,692 |
| * | Syniverse Holdings Inc. | 128,534 | 2,297 |
| * | Fibertower Corp. | 2,816,723 | 1,831 |
| * | USA Mobility, Inc. | 135,051 | 1,719 |
| * | iPCS, Inc. | 98,564 | 1,556 |
| * | Centennial Communications | | |
| | Corp. Class A | 197,686 | 1,497 |
| * | MetroPCS | | |
| | Communications Inc. | 186,416 | 1,484 |
| * | U.S. Cellular Corp. | 40,063 | 1,463 |
| * | Leap Wireless | | |
| | International, Inc. | 80,849 | 1,333 |
| | Telephone & | | |
| | Data Systems, Inc. | 46,504 | 1,226 |
| | Telephone & | | |
| | Data Systems, Inc.— | | |
| | Special Common Shares | 45,314 | 1,148 |
| | NTELOS Holdings Corp. | 70,252 | 1,139 |
| | Shenandoah | | |
| | Telecommunications Co. | 65,648 | 1,132 |
| * | TerreStar Corp. | 855,835 | 1,061 |
| * | ICO Global Communications | | |
| | (Holdings) Ltd. | 1,117,228 | 782 |
| | | | 44,775 |
| Total Common Stocks | | |
| (Cost $204,071) | | 158,526 |
| Temporary Cash Investment (0.2%) | |
| Money Market Fund (0.2%) | | |
| 1,2 Vanguard Market | | |
| | Liquidity Fund, 0.277% | | |
| | (Cost $307) | 306,933 | 307 |
| Total Investments (100.0%) | | |
| (Cost $204,378) | | 158,833 |
| Other Assets and Liabilities (0.0%) | |
| Other Assets | | 158 |
| Liabilities2 | | (219) |
| | | | (61) |
| Net Assets (100%) | | 158,772 |
| |
| At August 31, 2009, net assets consisted of: |
| | Amount |
| | ($000) |
| Paid-in Capital | 247,456 |
| Undistributed Net Investment Income | 3,157 |
| Accumulated Net Realized Losses | (46,296) |
| Unrealized Appreciation (Depreciation) | (45,545) |
| Net Assets | 158,772 |
| |
| |
| Admiral Shares—Net Assets | |
| Applicable to 465,154 outstanding | |
| $.001 par value shares of beneficial | |
| interest (unlimited authorization) | 11,986 |
| Net Asset Value Per Share— | |
| Admiral Shares | $25.77 |
| |
| |
| ETF Shares—Net Assets | |
| Applicable to 2,902,158 outstanding | |
| $.001 par value shares of beneficial | |
| interest (unlimited authorization) | 146,786 |
| Net Asset Value Per Share— | |
| ETF Shares | $50.58 |
• See Note A in Notes to Financial Statements.
* Non-income-producing security.
^ Part of security position is on loan to broker-dealers. The total value of securities on loan is $40,000.
1 Affiliated money market fund available only to Vanguard funds and certain trusts and accounts managed by Vanguard. Rate shown is the 7-day yield.
2 Includes $56,000 of collateral received for securities on loan.
See accompanying Notes, which are an integral part of the Financial Statements.
92
Telecommunication Services Index Fund
Statement of Operations
| |
| | Year Ended |
| August 31, 2009 |
| | ($000) |
| Investment Income | |
| Income | |
| Dividends | 5,112 |
| Interest1 | 4 |
| Security Lending | 40 |
| Total Income | 5,156 |
| Expenses | |
| The Vanguard Group—Note B | |
| Investment Advisory Services | 20 |
| Management and Administrative— | |
| Admiral Shares | 26 |
| Management and Administrative— | |
| ETF Shares | 203 |
| Marketing and Distribution— | |
| Admiral Shares | 4 |
| Marketing and Distribution— | |
| ETF Shares | 41 |
| Auditing Fees | 24 |
| Shareholders’ Reports and Proxies— | |
| Admiral Shares | — |
| Shareholders’ Reports and Proxies— | |
| ETF Shares | 35 |
| Total Expenses | 353 |
| Net Investment Income | 4,803 |
| Realized Net Gain (Loss) on | |
| Investment Securities Sold | (15,383) |
| Change in Unrealized Appreciation | |
| (Depreciation) of Investment Securities | (4,088) |
| Net Increase (Decrease) in Net Assets | |
| Resulting from Operations | (14,668) |
Statement of Changes in Net Assets
| | |
| | Year Ended August 31, |
| | 2009 | 2008 |
| | ($000) | ($000) |
| Increase (Decrease) in Net Assets | | |
| Operations | | |
| Net Investment Income | 4,803 | 5,535 |
| Realized Net Gain (Loss) | (15,383) | (7,019) |
| Change in Unrealized Appreciation (Depreciation) | (4,088) | (51,454) |
| Net Increase (Decrease) in Net Assets Resulting from Operations | (14,668) | (52,938) |
| Distributions | | |
| Net Investment Income | | |
| Admiral Shares | (326) | (1,069) |
| ETF Shares | (4,534) | (5,594) |
| Realized Capital Gain | | |
| Admiral Shares | — | — |
| ETF Shares | — | — |
| Total Distributions | (4,860) | (6,663) |
| Capital Share Transactions | | |
| Admiral Shares | (2,971) | (22,656) |
| ETF Shares | 19,785 | (73,150) |
| Net Increase (Decrease) from Capital Share Transactions | 16,814 | (95,806) |
| Total Increase (Decrease) | (2,714) | (155,407) |
| Net Assets | | |
| Beginning of Period | 161,486 | 316,893 |
| End of Period2 | 158,772 | 161,486 |
1 Interest income from an affiliated company of the fund was $3,000.
2 Net Assets—End of Period includes undistributed net investment income of $3,157,000 and $3,214,000.
See accompanying Notes, which are an integral part of the Financial Statements.
93
| | | | | |
| Telecommunication Services Index Fund | | | | | |
| |
| |
| Financial Highlights | | | | | |
| |
| Admiral Shares | | | | | |
| | | | | | Mar. 11, |
| | | | | | 20051 to |
| | | | Year Ended August 31, | Aug. 31, |
| For a Share Outstanding Throughout Each Period | 2009 | 2008 | 2007 | 2006 | 2005 |
| Net Asset Value, Beginning of Period | $31.58 | $41.01 | $33.29 | $28.18 | $26.75 |
| Investment Operations | | | | | |
| Net Investment Income | .8402 | .9082 | .8882 | .8612,3 | .3402 |
| Net Realized and Unrealized Gain (Loss) | | | | | |
| on Investments4 | (5.977) | (9.338) | 7.308 | 5.041 | 1.090 |
| Total from Investment Operations | (5.137) | (8.430) | 8.196 | 5.902 | 1.430 |
| Distributions | | | | | |
| Dividends from Net Investment Income | (.673) | (1.000) | (.476) | (.792) | — |
| Distributions from Realized Capital Gains | — | — | — | — | — |
| Total Distributions | (.673) | (1.000) | (.476) | (.792) | — |
| Net Asset Value, End of Period | $25.77 | $31.58 | $41.01 | $33.29 | $28.18 |
| |
| Total Return5 | –15.90% | –20.98% | 24.77% | 21.47% | 5.35% |
| |
| Ratios/Supplemental Data | | | | | |
| Net Assets, End of Period (Millions) | $12 | $19 | $51 | $6 | $1 |
| Ratio of Total Expenses to Average Net Assets | 0.28% | 0.25% | 0.27% | 0.28% | 0.28%6 |
| Ratio of Net Investment Income to | | | | | |
| Average Net Assets | 3.39% | 2.50% | 2.17% | 3.28%3 | 2.70%6 |
| Portfolio Turnover Rate7 | 25% | 28% | 17% | 32% | 41% |
1 Inception.
2 Calculated based on average shares outstanding.
3 Net investment income per share and the ratio of net investment income to average net assets include $.112 and 0.38%, respectively,
resulting from a special dividend from MCI in December 2005.
4 Includes increases from redemption fees of $.00, $.05, $.01, $.00, and $.00.
5 Total returns do not reflect the 2% fee assessed on redemptions of shares held for less than one year.
6 Annualized.
7 Excludes the value of portfolio securities received or delivered as a result of in-kind purchases or redemptions of the fund’s capital shares,
including ETF Creation Units.
See accompanying Notes, which are an integral part of the Financial Statements.
94
| | | | | |
| Telecommunication Services Index Fund | | | | | |
| |
| |
| Financial Highlights | | | | | |
| |
| ETF Shares | | | | | |
| | | | | | Sept. 23, |
| | | | | | 20041 to |
| | | | Year Ended August 31, | Aug. 31, |
| For a Share Outstanding Throughout Each Period | 2009 | 2008 | 2007 | 2006 | 2005 |
| Net Asset Value, Beginning of Period | $62.05 | $80.60 | $65.40 | $55.35 | $49.50 |
| Investment Operations | | | | | |
| Net Investment Income | 1.6022 | 1.7642 | 1.7412 | 2.0402,3 | 1.3002 |
| Net Realized and Unrealized Gain (Loss) | | | | | |
| on Investments4 | (11.699) | (18.316) | 14.386 | 9.567 | 4.960 |
| Total from Investment Operations | (10.097) | (16.552) | 16.127 | 11.607 | 6.260 |
| Distributions | | | | | |
| Dividends from Net Investment Income | (1.373) | (1.998) | (.927) | (1.557) | (.410) |
| Distributions from Realized Capital Gains | — | — | — | — | — |
| Total Distributions | (1.373) | (1.998) | (.927) | (1.557) | (.410) |
| Net Asset Value, End of Period | $50.58 | $62.05 | $80.60 | $65.40 | $55.35 |
| |
| Total Return | –15.88% | –20.94% | 24.81% | 21.49% | 12.65% |
| |
| Ratios/Supplemental Data | | | | | |
| Net Assets, End of Period (Millions) | $147 | $143 | $266 | $72 | $17 |
| Ratio of Total Expenses to Average Net Assets | 0.25% | 0.20% | 0.23% | 0.25% | 0.26%5 |
| Ratio of Net Investment Income to | | | | | |
| Average Net Assets | 3.42% | 2.55% | 2.21% | 3.31%3 | 2.72%5 |
| Portfolio Turnover Rate6 | 25% | 28% | 17% | 32% | 41% |
| 1 | Inception. |
| 2 | Calculated based on average shares outstanding. |
| 3 | Net investment income per share and the ratio of net investment income to average net assets include $.219 and 0.38%, respectively, resulting from a special dividend from MCI in December 2005. |
| 4 | Includes increases from redemption fees of $.00, $.08, $.03, $.00, and $.00. |
| 5 | Annualized. |
| 6 | Excludes the value of portfolio securities received or delivered as a result of in-kind purchases or redemptions of the fund’s capital shares, including ETF Creation Units. |
See accompanying Notes, which are an integral part of the Financial Statements.
95
Telecommunication Services Index Fund
Notes to Financial Statements
Vanguard Telecommunication Services Index Fund is registered under the Investment Company Act of 1940 as an open-end investment company, or mutual fund. The fund offers two classes of shares: Admiral Shares and ETF Shares. Admiral Shares are available to any investor who meets the fund’s minimum purchase requirements. ETF Shares are listed for trading on the NYSE Arca, Inc.; they can be purchased and sold through a broker.
A. The following significant accounting policies conform to generally accepted accounting principles for U.S. mutual funds. The fund consistently follows such policies in preparing its financial statements.
1. Security Valuation: Securities are valued as of the close of trading on the New York Stock Exchange (generally 4 p.m., Eastern time) on the valuation date. Equity securities are valued at the latest quoted sales prices or official closing prices taken from the primary market in which each security trades; such securities not traded on the valuation date are valued at the mean of the latest quoted bid and asked prices. Securities for which market quotations are not readily available, or whose values have been materially affected by events occurring before the fund’s pricing time but after the close of the securities’ primary markets, are valued by methods deemed by the board of trustees to represent fair value. Investments in Vanguard Market Liquidity Fund are valued at that fund’s net asset value.
2. Federal Income Taxes: The fund intends to continue to qualify as a regulated investment company and distribute all of its taxable income. Management has analyzed the fund’s tax positions taken for all open federal income tax years (August 31, 2006–2009), and has concluded that no provision for federal income tax is required in the fund’s financial statements.
3. Distributions: Distributions to shareholders are recorded on the ex-dividend date.
4. Security Lending: The fund may lend its securities to qualified institutional borrowers to earn additional income. Security loans are required to be secured at all times by collateral at least equal to the market value of securities loaned. The fund invests cash collateral received in Vanguard Market Liquidity Fund, and records a liability for the return of the collateral, during the period the securities are on loan. Security lending income represents the income earned on investing cash collateral, less expenses associated with the loan.
5. Other: Dividend income is recorded on the ex-dividend date. Interest income includes income distributions received from Vanguard Market Liquidity Fund and is accrued daily. Security transactions are accounted for on the date securities are bought or sold. Costs used to determine realized gains (losses) on the sale of investment securities are those of the specific securities sold. Fees assessed on redemptions of capital shares are credited to paid-in capital.
Each class of shares has equal rights as to assets and earnings, except that each class separately bears certain class-specific expenses related to maintenance of shareholder accounts (included in Management and Administrative expenses), shareholder reporting, and proxies. Marketing and distribution expenses are allocated to each class of shares based on a method approved by the board of trustees. Income, other non-class-specific expenses, and gains and losses on investments are allocated to each class of shares based on its relative net assets.
B. The Vanguard Group furnishes at cost investment advisory, corporate management, administrative, marketing, and distribution services. The costs of such services are allocated to the fund under methods approved by the board of trustees. The fund has committed to provide up to 0.40% of its net assets in capital contributions to Vanguard. At August 31, 2009, the fund had contributed capital of $36,000 to Vanguard (included in Other Assets), representing 0.02% of the fund’s net assets and 0.01% of Vanguard’s capitalization. The fund’s trustees and officers are also directors and officers of Vanguard.
C. Various inputs may be used to determine the value of the fund’s investments. These inputs are summarized in three broad levels for financial statement purposes. The inputs or methodologies used to value securities are not necessarily an indication of the risk associated with investing in those securities.
Level 1—Quoted prices in active markets for identical securities.
Level 2—Other significant observable inputs (including quoted prices for similar securities, interest rates, prepayment speeds, credit risk, etc.).
Level 3—Significant unobservable inputs (including the fund’s own assumptions used to determine the fair value of investments).
At August 31, 2009, 100% of the fund’s investments were valued based on Level 1 inputs.
96
Telecommunication Services Index Fund
D. Distributions are determined on a tax basis and may differ from net investment income and realized capital gains for financial reporting purposes. Differences may be permanent or temporary. Permanent differences are reclassified among capital accounts in the financial statements to reflect their tax character. Temporary differences arise when certain items of income, expense, gain, or loss are recognized in different periods for financial statement and tax purposes; these differences will reverse at some time in the future. Differences in classification may also result from the treatment of short-term gains as ordinary income for tax purposes.
During the year ended August 31, 2009, the fund realized $7,902,000 of net capital gains resulting from in-kind redemptions—in which shareholders exchanged fund shares for securities held by the fund rather than for cash. Because such gains are not taxable to the fund, and are not distributed to shareholders, they have been reclassified from accumulated net realized losses to paid-in capital.
For tax purposes, at August 31, 2009, the fund had $3,306,000 of ordinary income available for distribution. The fund had available capital loss carryforwards totaling $23,697,000 to offset future net capital gains of $29,000 through August 31, 2014, $818,000 through August 31, 2015, $4,154,000 through August 31, 2016, and $18,696,000 through August 31, 2017. In addition, the fund realized losses of $22,599,000 during the period from November 1, 2008, through August 31, 2009, which are deferred and will be treated as realized for tax purposes in fiscal 2010.
At August 31, 2009, the cost of investment securities for tax purposes was $204,378,000. Net unrealized depreciation of investment securities for tax purposes was $45,545,000, consisting of unrealized gains of $5,573,000 on securities that had risen in value since their purchase and $51,118,000 in unrealized losses on securities that had fallen in value since their purchase.
E. During the year ended August 31, 2009, the fund purchased $152,660,000 of investment securities and sold $136,425,000 of investment securities, other than temporary cash investments.
F. Capital share transactions for each class of shares were:
| | | | |
| | | | Year Ended August 31, |
| | | 2009 | | 2008 |
| | Amount | Shares | Amount | Shares |
| | ($000) | (000) | ($000) | (000) |
| Admiral Shares | | | | |
| Issued | 1,801 | 74 | 4,265 | 123 |
| Issued in Lieu of Cash Distributions | 299 | 14 | 1,014 | 26 |
| Redeemed1 | (5,071) | (217) | (27,935) | (796) |
| Net Increase (Decrease)—Admiral Shares | (2,971) | (129) | (22,656) | (647) |
| ETF Shares | | | | |
| Issued | 117,888 | 2,702 | 93,859 | 1,400 |
| Issued in Lieu of Cash Distributions | — | — | — | — |
| Redeemed1 | (98,103) | (2,100) | (167,009) | (2,400) |
| Net Increase (Decrease)—ETF Shares | 19,785 | 602 | (73,150) | (1,000) |
| 1 Net of redemption fees for fiscal 2009 and 2008 of $7,000 and $220,000, respectively (fund totals). | | |
G. In preparing the financial statements as of August 31, 2009, management considered the impact of subsequent events occurring through October 15, 2009, for potential recognition or disclosure in these financial statements.
97
Utilities Index Fund
Fund Profile
As of August 31, 2009
| | | |
| Portfolio Characteristics | | |
| | | Target | Broad |
| | Fund | Index1 | Index2 |
| Number of Stocks | 88 | 88 | 2,501 |
| Median Market Cap | $11.1B | $11.1B | $27.3B |
| Price/Earnings Ratio | 14.3x | 14.4x | 25.6x |
| Price/Book Ratio | 1.4x | 1.4x | 2.1x |
| Yield3 | | 4.3% | 1.9% |
| Admiral Shares | 4.0% | | |
| ETF Shares | 4.1% | | |
| Return on Equity | 13.6% | 13.6% | 19.3% |
| Earnings Growth Rate | 10.1% | 10.1% | 9.9% |
| Foreign Holdings | 0.0% | 0.0% | 0.0% |
| Turnover Rate | 10% | — | — |
| Expense Ratio4 | | — | — |
| Admiral Shares | 0.28% | | |
| ETF Shares | 0.25% | | |
| Short-Term Reserves | 0.0% | — | —- |
| | |
| Volatility Measures5 | |
| | Fund Versus | Fund Versus |
| | Target Index1 | Broad Index2 |
| R-Squared | 1.00 | 0.49 |
| Beta | 1.00 | 0.60 |
| |
| Industry Diversification (% of equity exposure) |
| |
| Electric Utilities | 50.1% |
| Gas Utilities | 9.0 |
| Independent Power Producers & | |
| Energy Traders | 7.4 |
| Multi-Utilities | 31.8 |
| Water Utilities | 1.7 |
| |
| Ten Largest Holdings6 (% of total net assets) |
| |
| Exelon Corp. | 7.6% |
| Southern Co. | 5.7 |
| FPL Group, Inc. | 5.1 |
| Duke Energy Corp. | 4.6 |
| Dominion Resources, Inc. | 4.5 |
| Public Service Enterprise Group, Inc. | 3.7 |
| Entergy Corp. | 3.6 |
| American Electric Power Co., Inc. | 3.5 |
| PG&E Corp. | 3.5 |
| FirstEnergy Corp. | 3.2 |
| Top Ten | 45.0% |
1 MSCI US IMI/Utilities.
2 MSCI US IMI/2500.
3 30-day SEC yield for the fund; annualized dividend yield for the indexes. See the Glossary.
4 The expense ratios shown are from the prospectuses dated December 29, 2008, and represent estimated costs for the current fiscal year based on the fund’s net assets as of the prospectus date. For the fiscal year
ended August 31, 2009, the expense ratios were 0.28% for the Admiral Shares and 0.25% for the ETF Shares.
5 For an explanation of R-squared, beta, and other terms used here, see the Glossary.
6 The holdings listed exclude any temporary cash investments and equity index products.
98
Utilities Index Fund
Performance Summary
All of the returns in this report represent past performance, which is not a guarantee of future results that may be achieved by the fund. (Current performance may be lower or higher than the performance data cited. For performance data current to the most recent month-end, visit our website at www.vanguard.com/performance.) Note, too, that both investment returns and principal value can fluctuate widely, so an investor’s shares, when sold, could be worth more or less than their original cost. The returns shown do not reflect taxes that a shareholder would pay on fund distributions or on the sale of fund shares.
Cumulative Performance: January 26, 2004–August 31, 2009
Initial Investment of $10,000
| | | | |
| | | Average Annual Total Returns | |
| | | Periods Ended August 31, 2009 | Final Value |
| | | | Since | of a $10,000 |
| | One Year | Five Years | Inception1 | Investment |
| Utilities Index Fund ETF Shares | | | | |
| Net Asset Value2 | –18.34% | 6.39% | 6.99% | $14,593 |
| Utilities Index Fund ETF Shares | | | | |
| Market Price | –18.28 | 6.43 | 7.00 | 14,602 |
| MSCI US IMI/2500 | –18.26 | 1.36 | 0.52 | 10,295 |
| MSCI US IMI/Utilities | –18.21 | 6.60 | 7.21 | 14,759 |
| | | | |
| | | | | Final Value |
| | | | Since | of a $100,000 |
| | One Year | Five Years | Inception1 | Investment |
| Utilities Index Fund Admiral Shares3 | –18.39% | 6.35% | 7.22% | $145,115 |
| MSCI US IMI/2500 | –18.26 | 1.36 | 1.03 | 105,600 |
| MSCI US IMI/Utilities | –18.21 | 6.60 | 7.47 | 146,954 |
1 Performance for the fund and its comparative standards is calculated since the following inception dates: January 26, 2004, for ETF Shares; April 28, 2004, for Admiral Shares.
2 For more information about how the ETF Shares’ market prices have compared with their net asset value, visit www.vanguard.com, select your ETF, and then select the Performance tab. The Premium/Discount
table there shows the percentages of days on which the ETF Shares’ market price was above or below the NAV.
3 Total returns do not reflect the 2% fee assessed on redemptions of shares held for less than one year.
Note: See Financial Highlights tables for dividend and capital gains information.
99
Utilities Index Fund
Fiscal-Year Total Returns (%): January 26, 2004–August 31, 2009
| | | |
| Cumulative Returns: ETF Shares, January 26, 2004–August 31, 2009 | | |
| | | | Cumulative |
| | | | Since |
| | One Year | Five Years | Inception |
| Utilities Index Fund ETF Shares Market Price | –18.28% | 36.57% | 46.02% |
| Utilities Index Fund ETF Shares Net Asset Value | –18.34 | 36.32 | 45.93 |
| MSCI US IMI/Utilities | –18.21 | 37.66 | 47.59 |
Average Annual Total Returns: Periods Ended June 30, 2009
This table presents average annual total returns through the latest calendar quarter—rather than through the end
of the fiscal period. Securities and Exchange Commission rules require that we provide this information.
| | | | |
| | | | | Since |
| | Inception Date | One Year | Five Years | Inception |
| ETF Shares | 1/26/2004 | | | |
| Market Price | | –27.37% | 6.43% | 6.29% |
| Net Asset Value | | –27.49 | 6.40 | 6.27 |
| Admiral Shares1 | 4/28/2004 | –27.53 | 6.36 | 6.47 |
1 Total returns do not reflect the 2% fee assessed on redemptions of shares held for less than one year.
Note: See Financial Highlights tables for dividend and capital gains information.
100
Utilities Index Fund
Financial Statements
Statement of Net Assets
As of August 31, 2009
The fund provides a complete list of its holdings four times in each fiscal year, at the quarter-ends. For the second and fourth fiscal quarters, the lists appear in the fund’s semiannual and annual reports to shareholders. For the first and third fiscal quarters, the fund files the lists with the Securities and Exchange Commission on Form N-Q. Shareholders can look up the fund’s Forms N-Q on the SEC’s website at www.sec.gov. Forms N-Q may also be reviewed and copied at the SEC’s Public Reference Room (see the back cover of this report for further information).
| | | | |
| | | | | Market |
| | | | | Value• |
| | | | Shares | ($000) |
| Common Stocks (100.0%) | | |
| Electric Utilities (50.0%) | | | |
| | Exelon Corp. | | 679,238 | 33,975 |
| | Southern Co. | | 806,763 | 25,171 |
| | FPL Group, Inc. | | 402,387 | 22,606 |
| | Duke Energy Corp. | 1,327,141 | 20,557 |
| | Entergy Corp. | | 202,201 | 15,974 |
| | American Electric | | | |
| | Power Co., Inc. | | 491,586 | 15,451 |
| | FirstEnergy Corp. | | 314,313 | 14,185 |
| | PPL Corp. | | 387,742 | 11,400 |
| | Progress Energy, Inc. | | 287,716 | 11,373 |
| | Edison International | | 319,144 | 10,663 |
| | Allegheny Energy, Inc. | | 174,666 | 4,613 |
| | Northeast Utilities | | 180,575 | 4,296 |
| | Pinnacle West Capital Corp. | 104,226 | 3,430 |
| | Pepco Holdings, Inc. | | 226,831 | 3,250 |
| | DPL Inc. | | 119,568 | 2,962 |
| | NV Energy Inc. | | 241,684 | 2,915 |
| | Great Plains Energy, Inc. | 137,700 | 2,413 |
| | ITC Holdings Corp. | | 51,304 | 2,390 |
| | Westar Energy, Inc. | | 112,050 | 2,299 |
| | Hawaiian Electric | | | |
| | Industries Inc. | | 94,036 | 1,636 |
| | Cleco Corp. | | 62,574 | 1,528 |
| | Portland General Electric Co. | 77,468 | 1,512 |
| | IDACORP, Inc. | | 48,731 | 1,388 |
| | UniSource Energy Corp. | 36,866 | 1,078 |
| | PNM Resources Inc. | | 89,842 | 1,049 |
| | ALLETE, Inc. | | 28,811 | 974 |
| | MGE Energy, Inc. | | 23,849 | 845 |
| * | El Paso Electric Co. | | 46,638 | 790 |
| | UIL Holdings Corp. | | 28,934 | 751 |
| | Empire District Electric Co. | 35,340 | 641 |
| | Central Vermont Public | | | |
| | Service Corp. | | 12,015 | 220 |
| | | | | 222,335 |
| Gas Utilities (9.0%) | | | |
| | Questar Corp. | | 179,467 | 6,059 |
| | EQT Corp. | | 128,218 | 5,086 |
| | ONEOK, Inc. | | 103,147 | 3,495 |
| | National Fuel Gas Co. | | 73,791 | 3,298 |
| | Energen Corp. | | 70,237 | 2,949 |
| | UGI Corp. Holding Co. | | 111,634 | 2,848 |
| | AGL Resources Inc. | | 79,570 | 2,673 |
| | Atmos Energy Corp. | | 94,869 | 2,584 |
| | Piedmont Natural Gas, Inc. | 75,768 | 1,820 |
| | WGL Holdings Inc. | | 51,700 | 1,706 |
| | Nicor Inc. | | 46,620 | 1,688 |
| | New Jersey Resources Corp. | 43,450 | 1,597 |
| | Northwest Natural Gas Co. | 27,527 | 1,159 |
| | | |
| | | | Market |
| | | | Value• |
| | | Shares | ($000) |
| | Southwest Gas Corp. | 46,099 | 1,122 |
| | South Jersey Industries, Inc. | 30,879 | 1,070 |
| | The Laclede Group, Inc. | 21,838 | 711 |
| | Chesapeake Utilities Corp. | 7,073 | 218 |
| | | | 40,083 |
| Independent Power Producers & | |
| Energy Traders (7.5%) | | |
| * | AES Corp. | 687,393 | 9,397 |
| * | NRG Energy, Inc. | 270,885 | 7,273 |
| | Constellation Energy | | |
| | Group, Inc. | 184,847 | 5,851 |
| * | Calpine Corp. | 353,705 | 4,160 |
| * | Mirant Corp. | 148,688 | 2,505 |
| * | RRI Energy, Inc. | 361,346 | 2,146 |
| * | Dynegy, Inc. | 523,751 | 995 |
| | Ormat Technologies Inc. | 21,190 | 764 |
| | | | 33,091 |
| Multi-Utilities (31.8%) | | |
| | Dominion Resources, Inc. | 608,305 | 20,123 |
| | Public Service | | |
| | Enterprise Group, Inc. | 521,719 | 16,523 |
| | PG&E Corp. | 379,998 | 15,424 |
| | Sempra Energy | 239,293 | 12,005 |
| | Consolidated Edison Inc. | 282,934 | 11,371 |
| | Xcel Energy, Inc. | 469,832 | 9,279 |
| | Ameren Corp. | 220,200 | 5,939 |
| | DTE Energy Co. | 168,972 | 5,877 |
| | Wisconsin Energy Corp. | 120,549 | 5,481 |
| | CenterPoint Energy Inc. | 342,095 | 4,242 |
| | SCANA Corp. | 119,331 | 4,138 |
| | NiSource, Inc. | 283,130 | 3,740 |
| | MDU Resources Group, Inc. | 180,197 | 3,498 |
| | NSTAR | 110,129 | 3,484 |
| | CMS Energy Corp. | 233,884 | 3,136 |
| | OGE Energy Corp. | 99,024 | 3,097 |
| | Alliant Energy Corp. | 114,078 | 3,005 |
| | TECO Energy, Inc. | 208,522 | 2,778 |
| | Integrys Energy Group, Inc. | 78,801 | 2,705 |
| | Vectren Corp. | 79,382 | 1,838 |
| | Avista Corp. | 56,597 | 1,105 |
| | Black Hills Corp. | 39,980 | 1,023 |
| | NorthWestern Corp. | 37,373 | 897 |
| | CH Energy Group, Inc. | 16,391 | 750 |
| | | | 141,458 |
| Water Utilities (1.7%) | | |
| | American Water | | |
| | Works Co., Inc. | 134,992 | 2,713 |
| | Aqua America, Inc. | 139,866 | 2,357 |
| | California Water | | |
| | Service Group | 20,438 | 761 |
| | American States Water Co. | 19,033 | 628 |
| | |
| | | Market |
| | | Value• |
| | Shares | ($000) |
| SJW Corp. | 14,351 | 317 |
| Consolidated Water Co., Ltd. | 14,332 | 264 |
| Middlesex Water Co. | 13,904 | 212 |
| Connecticut Water | | |
| Services, Inc. | 8,773 | 194 |
| | | 7,446 |
| Total Investments (100.0%) | | |
| (Cost $550,627) | | 444,413 |
| Other Assets and Liabilities (0.0%) | |
| Other Assets | | 4,739 |
| Liabilities | | (4,635) |
| | | 104 |
| Net Assets (100%) | | 444,517 |
| |
| |
| At August 31, 2009, net assets consisted of: |
| | | Amount |
| | | ($000) |
| Paid-in Capital | | 566,167 |
| Undistributed Net Investment Income | 3,240 |
| Accumulated Net Realized Losses | | (18,676) |
| Unrealized Appreciation (Depreciation) | (106,214) |
| Net Assets | | 444,517 |
| |
| |
| Admiral Shares—Net Assets | | |
| Applicable to 2,631,155 outstanding | |
| $.001 par value shares of beneficial | |
| interest (unlimited authorization) | 80,863 |
| Net Asset Value Per Share— | | |
| Admiral Shares | | $30.73 |
| |
| |
| ETF Shares—Net Assets | | |
| Applicable to 5,938,600 outstanding | |
| $.001 par value shares of beneficial | |
| interest (unlimited authorization) | 363,654 |
| Net Asset Value Per Share— | | |
| ETF Shares | | $61.24 |
• See Note A in Notes to Financial Statements.
* Non-income-producing security.
See accompanying Notes, which are an integral part of the Financial Statements.
101
Utilities Index Fund
Statement of Operations
| |
| | Year Ended |
| August 31, 2009 |
| | ($000) |
| Investment Income | |
| Income | |
| Dividends | 17,553 |
| Interest1 | 3 |
| Total Income | 17,556 |
| Expenses | |
| The Vanguard Group—Note B | |
| Investment Advisory Services | 56 |
| Management and Administrative— | |
| Admiral Shares | 172 |
| Management and Administrative— | |
| ETF Shares | 473 |
| Marketing and Distribution— | |
| Admiral Shares | 22 |
| Marketing and Distribution— | |
| ETF Shares | 99 |
| Custodian Fees | 24 |
| Auditing Fees | 24 |
| Shareholders’ Reports and Proxies— | |
| Admiral Shares | 1 |
| Shareholders’ Reports and Proxies— | |
| ETF Shares | 110 |
| Trustees’ Fees and Expenses | 1 |
| Total Expenses | 982 |
| Net Investment Income | 16,574 |
| Realized Net Gain (Loss) on | |
| Investment Securities Sold | (17,489) |
| Change in Unrealized Appreciation | |
| (Depreciation) of Investment Securities | (83,085) |
| Net Increase (Decrease) in Net Assets | |
| Resulting from Operations | (84,000) |
Statement of Changes in Net Assets
| | |
| | Year Ended August 31, |
| | 2009 | 2008 |
| | ($000) | ($000) |
| Increase (Decrease) in Net Assets | | |
| Operations | | |
| Net Investment Income | 16,574 | 12,740 |
| Realized Net Gain (Loss) | (17,489) | 3,952 |
| Change in Unrealized Appreciation (Depreciation) | (83,085) | (26,543) |
| Net Increase (Decrease) in Net Assets Resulting from Operations | (84,000) | (9,851) |
| Distributions | | |
| Net Investment Income | | |
| Admiral Shares | (3,297) | (3,122) |
| ETF Shares | (12,782) | (9,062) |
| Realized Capital Gain | | |
| Admiral Shares | — | — |
| ETF Shares | — | — |
| Total Distributions | (16,079) | (12,184) |
| Capital Share Transactions | | |
| Admiral Shares | (4,742) | 6,878 |
| ETF Shares | 69,532 | 102,404 |
| Net Increase (Decrease) from Capital Share Transactions | 64,790 | 109,282 |
| Total Increase (Decrease) | (35,289) | 87,247 |
| Net Assets | | |
| Beginning of Period | 479,806 | 392,559 |
| End of Period2 | 444,517 | 479,806 |
1 Interest income from an affiliated company of the fund was $2,000.
2 Net Assets—End of Period includes undistributed net investment income of $3,240,000 and $2,745,000.
See accompanying Notes, which are an integral part of the Financial Statements.
102
| | | | | |
| Utilities Index Fund | | | | | |
| |
| |
| Financial Highlights | | | | | |
| |
| Admiral Shares | | | | | |
| |
| | | | | Year Ended August 31, |
| For a Share Outstanding Throughout Each Period | 2009 | 2008 | 2007 | 2006 | 2005 |
| Net Asset Value, Beginning of Period | $39.26 | $40.60 | $36.47 | $34.03 | $26.70 |
| Investment Operations | | | | | |
| Net Investment Income | 1.251 | 1.126 | 1.080 | 1.0801 | .9721 |
| Net Realized and Unrealized Gain (Loss) | | | | | |
| on Investments2 | (8.530) | (1.340) | 4.089 | 2.378 | 7.623 |
| Total from Investment Operations | (7.279) | (.214) | 5.169 | 3.458 | 8.595 |
| Distributions | | | | | |
| Dividends from Net Investment Income | (1.251) | (1.126) | (1.039) | (1.018) | (1.265) |
| Distributions from Realized Capital Gains | — | — | — | — | — |
| Total Distributions | (1.251) | (1.126) | (1.039) | (1.018) | (1.265) |
| Net Asset Value, End of Period | $30.73 | $39.26 | $40.60 | $36.47 | $34.03 |
| |
| Total Return3 | –18.39% | –0.69% | 14.33% | 10.48% | 32.87% |
| |
| Ratios/Supplemental Data | | | | | |
| Net Assets, End of Period (Millions) | $81 | $109 | $108 | $52 | $30 |
| Ratio of Total Expenses to Average Net Assets | 0.28% | 0.25% | 0.26% | 0.28% | 0.28% |
| Ratio of Net Investment Income to | | | | | |
| Average Net Assets | 4.28% | 2.75% | 2.70% | 3.26% | 3.34% |
| Portfolio Turnover Rate4 | 10% | 18% | 12% | 9% | 7% |
1 Calculated based on average shares outstanding.
2 Includes increases from redemption fees of $.01, $.02, $.02, $.04, and $.00.
3 Total returns do not reflect the 2% fee assessed on redemptions of shares held for less than one year.
4 Excludes the value of portfolio securities received or delivered as a result of in-kind purchases or redemptions of the fund’s capital shares,
including ETF Creation Units.
| | | | | |
| ETF Shares | | | | | |
| |
| | | | | Year Ended August 31, |
| For a Share Outstanding Throughout Each Period | 2009 | 2008 | 2007 | 2006 | 2005 |
| Net Asset Value, Beginning of Period | $78.22 | $80.92 | $72.68 | $67.80 | $53.14 |
| Investment Operations | | | | | |
| Net Investment Income | 2.512 | 2.285 | 2.180 | 2.2141 | 2.0361 |
| Net Realized and Unrealized Gain (Loss) | | | | | |
| on Investments2 | (16.978) | (2.695) | 8.156 | 4.704 | 15.115 |
| Total from Investment Operations | (14.466) | (.410) | 10.336 | 6.918 | 17.151 |
| Distributions | | | | | |
| Dividends from Net Investment Income | (2.514) | (2.290) | (2.096) | (2.038) | (2.491) |
| Distributions from Realized Capital Gains | — | — | — | — | — |
| Total Distributions | (2.514) | (2.290) | (2.096) | (2.038) | (2.491) |
| Net Asset Value, End of Period | $61.24 | $78.22 | $80.92 | $72.68 | $67.80 |
| |
| Total Return | –18.34% | –0.66% | 14.37% | 10.52% | 32.93% |
| |
| Ratios/Supplemental Data | | | | | |
| Net Assets, End of Period (Millions) | $364 | $371 | $285 | $183 | $95 |
| Ratio of Total Expenses to Average Net Assets | 0.25% | 0.20% | 0.22% | 0.25% | 0.26% |
| Ratio of Net Investment Income to | | | | | |
| Average Net Assets | 4.31% | 2.80% | 2.74% | 3.29% | 3.36% |
| Portfolio Turnover Rate3 | 10% | 18% | 12% | 9% | 7% |
1 Calculated based on average shares outstanding.
2 Includes increases from redemption fees of $.02, $.04, $.03, $.06, and $.01.
3 Excludes the value of portfolio securities received or delivered as a result of in-kind purchases or redemptions of the fund’s capital shares,
including ETF Creation Units.
See accompanying Notes, which are an integral part of the Financial Statements.
103
Utilities Index Fund
Notes to Financial Statements
Vanguard Utilities Index Fund is registered under the Investment Company Act of 1940 as an open-end investment company, or mutual fund. The fund offers two classes of shares: Admiral Shares and ETF Shares. Admiral Shares are available to any investor who meets the fund’s minimum purchase requirements. ETF Shares are listed for trading on the NYSE Arca, Inc.; they can be purchased and sold through a broker.
A. The following significant accounting policies conform to generally accepted accounting principles for U.S. mutual funds. The fund consistently follows such policies in preparing its financial statements.
1. Security Valuation: Securities are valued as of the close of trading on the New York Stock Exchange (generally 4 p.m., Eastern time) on the valuation date. Equity securities are valued at the latest quoted sales prices or official closing prices taken from the primary market in which each security trades; such securities not traded on the valuation date are valued at the mean of the latest quoted bid and asked prices. Securities for which market quotations are not readily available, or whose values have been materially affected by events occurring before the fund’s pricing time but after the close of the securities’ primary markets, are valued by methods deemed by the board of trustees to represent fair value. Investments in Vanguard Market Liquidity Fund are valued at that fund’s net asset value.
2. Federal Income Taxes: The fund intends to continue to qualify as a regulated investment company and distribute all of its taxable income. Management has analyzed the fund’s tax positions taken for all open federal income tax years (August 31, 2006–2009), and has concluded that no provision for federal income tax is required in the fund’s financial statements.
3. Distributions: Distributions to shareholders are recorded on the ex-dividend date.
4. Other: Dividend income is recorded on the ex-dividend date. Interest income includes income distributions received from Vanguard Market Liquidity Fund and is accrued daily. Security transactions are accounted for on the date securities are bought or sold. Costs used to determine realized gains (losses) on the sale of investment securities are those of the specific securities sold. Fees assessed on redemptions of capital shares are credited to paid-in capital.
Each class of shares has equal rights as to assets and earnings, except that each class separately bears certain class-specific expenses related to maintenance of shareholder accounts (included in Management and Administrative expenses), shareholder reporting, and proxies. Marketing and distribution expenses are allocated to each class of shares based on a method approved by the board of trustees. Income, other non-class-specific expenses, and gains and losses on investments are allocated to each class of shares based on its relative net assets.
B. The Vanguard Group furnishes at cost investment advisory, corporate management, administrative, marketing, and distribution services. The costs of such services are allocated to the fund under methods approved by the board of trustees. The fund has committed to provide up to 0.40% of its net assets in capital contributions to Vanguard. At August 31, 2009, the fund had contributed capital of $97,000 to Vanguard (included in Other Assets), representing 0.02% of the fund’s net assets and 0.04% of Vanguard’s capitalization. The fund’s trustees and officers are also directors and officers of Vanguard.
C. Various inputs may be used to determine the value of the fund’s investments. These inputs are summarized in three broad levels for financial statement purposes. The inputs or methodologies used to value securities are not necessarily an indication of the risk associated with investing in those securities.
Level 1—Quoted prices in active markets for identical securities.
Level 2—Other significant observable inputs (including quoted prices for similar securities, interest rates, prepayment speeds, credit risk, etc.).
Level 3—Significant unobservable inputs (including the fund’s own assumptions used to determine the fair value of investments).
At August 31, 2009, 100% of the fund’s investments were valued based on Level 1 inputs.
D. Distributions are determined on a tax basis and may differ from net investment income and realized capital gains for financial reporting purposes. Differences may be permanent or temporary. Permanent differences are reclassified among capital accounts in the financial statements to reflect their tax character. Temporary differences arise when certain items of income, expense, gain, or loss are recognized in different periods for financial statement and tax purposes; these differences will reverse at some time in the future. Differences in classification may also result from the treatment of short-term gains as ordinary income for tax purposes.
Utilities Index Fund
During the year ended August 31, 2009, the fund realized $2,395,000 of net capital losses resulting from in-kind redemptions—in which shareholders exchanged fund shares for securities held by the fund rather than for cash. Because such losses are not taxable losses to the fund, they have been reclassified from accumulated net realized losses to paid-in capital.
For tax purposes, at August 31, 2009, the fund had $3,560,000 of ordinary income available for distribution. The fund had available capital loss carryforwards totaling $3,425,000 to offset future net capital gains of $515,000 through August 31, 2015, and $2,910,000 through August 31, 2017. In addition, the fund realized losses of $14,092,000 during the period from November 1, 2008, through August 31, 2009, which are deferred and will be treated as realized for tax purposes in fiscal 2010.
At August 31, 2009, the cost of investment securities for tax purposes was $551,786,000. Net unrealized depreciation of investment securities for tax purposes was $107,373,000, consisting of unrealized gains of $556,000 on securities that had risen in value since their purchase and $107,929,000 in unrealized losses on securities that had fallen in value since their purchase.
E. During the year ended August 31, 2009, the fund purchased $193,693,000 of investment securities and sold $128,103,000 of investment securities, other than temporary cash investments.
F. Capital share transactions for each class of shares were:
| | | | |
| | | | Year Ended August 31, |
| | | 2009 | | 2008 |
| | Amount | Shares | Amount | Shares |
| | ($000) | (000) | ($000) | (000) |
| Admiral Shares | | | | |
| Issued | 20,497 | 698 | 42,121 | 996 |
| Issued in Lieu of Cash Distributions | 2,918 | 98 | 2,849 | 68 |
| Redeemed1 | (28,157) | (949) | (38,092) | (935) |
| Net Increase (Decrease)—Admiral Shares | (4,742) | (153) | 6,878 | 129 |
| ETF Shares | | | | |
| Issued | 153,405 | 2,602 | 127,421 | 1,518 |
| Issued in Lieu of Cash Distributions | — | — | — | — |
| Redeemed1 | (83,873) | (1,400) | (25,017) | (300) |
| Net Increase (Decrease)—ETF Shares | 69,532 | 1,202 | 102,404 | 1,218 |
| 1 Net of redemption fees for fiscal 2009 and 2008 of $113,000 and $228,000, respectively (fund totals). | | |
G. In preparing the financial statements as of August 31, 2009, management considered the impact of subsequent events occurring through October 15, 2009, for potential recognition or disclosure in these financial statements.
105
Report of Independent Registered
Public Accounting Firm
To the Trustees of Vanguard World Fund and the Shareholders of Vanguard Consumer Discretionary Index Fund, Vanguard Consumer Staples Index Fund, Vanguard Energy Index Fund, Vanguard Financials Index Fund, Vanguard Health Care Index Fund, Vanguard Industrials Index Fund, Vanguard Information Technology Index Fund, Vanguard Materials Index Fund, Vanguard Telecommunication Services Index Fund and Vanguard Utilities Index Fund:
In our opinion, the accompanying statements of net assets, and the related statements of operations and of changes in net assets and the financial highlights present fairly, in all material respects, the financial position of Vanguard Consumer Discretionary Index Fund, Vanguard Consumer Staples Index Fund, Vanguard Energy Index Fund, Vanguard Financials Index Fund, Vanguard Health Care Index Fund, Vanguard Industrials Index Fund, Vanguard Information Technology Index Fund, Vanguard Materials Index Fund, Vanguard Telecommunication Services Index Fund and Vanguard Utilities Index Fund (the “Funds”) at August 31, 2009, and the results of each of their operations for the year then ended, the changes in each of their net assets for each of the two years in the period then ended and the financial highlights for each of the periods indicated, in conformity with accounting principles generally accepted in the United Stat es of America. These financial statements and financial highlights (hereafter referred to as “financial statements”) are the responsibility of the Funds’ management; our responsibility is to express an opinion on these financial statements based on our audits. We conducted our audits of these financial statements in accordance with the standards of the Public Company Accounting Oversight Board (United States). Those standards require that we plan and perform the audit to obtain reasonable assurance about whether the financial statements are free of material misstatement. An audit includes examining, on a test basis, evidence supporting the amounts and disclosures in the financial statements, assessing the accounting principles used and significant estimates made by management, and evaluating the overall financial statement presentation. We believe that our audits, which included confirmation of securities at August 31, 2009 by correspondence with the custodian and by agreement to the underlyin g ownership records for Vanguard Market Liquidity Fund, provide a reasonable basis for our opinion.
PricewaterhouseCoopers LLP
Philadelphia, Pennsylvania
October 15, 2009
Special 2009 tax information (unaudited) for Vanguard U.S. Sector Index Funds
This information for the fiscal year ended August 31, 2009, is included pursuant to provisions of the Internal Revenue Code.
The funds distributed qualified dividend income to shareholders during the fiscal year as follows:
For corporate shareholders, the percentage of investment income (dividend income plus short-term gains, if any) that qualifies for the dividends-received deduction is as follows:
| |
| | Qualified Dividend |
| Index Fund | Income ($000) |
| Consumer Discretionary | 2,371 |
| Consumer Staples | 11,920 |
| Energy | 10,633 |
| Financials | 13,425 |
| Health Care | 10,331 |
| Industrials | 5,270 |
| Information Technology | 3,170 |
| Materials | 7,553 |
| Telecommunication Services | 4,860 |
| Utilities | 16,079 |
| |
| Index Fund | Percentage |
| Consumer Discretionary | 100.0% |
| Consumer Staples | 100.0 |
| Energy | 100.0 |
| Financials | 73.7 |
| Health Care | 100.0 |
| Industrials | 100.0 |
| Information Technology | 100.0 |
| Materials | 100.0 |
| Telecommunication Services | 100.0 |
| Utilities | 100.0 |
106
Your Fund’s After-Tax Returns
This table presents returns for your fund both before and after taxes. The after-tax returns are shown in two ways: (1) assuming that an investor owned the fund during the entire period and paid taxes on the fund’s distributions, and (2) assuming that an investor paid taxes on the fund’s distributions and sold all shares at the end of each period.
Calculations are based on the highest individual federal income tax and capital gains tax rates in effect at the times of the distributions and the hypothetical sales. State and local taxes were not considered. After-tax returns reflect any qualified dividend income, using actual prior-year figures and estimates for 2009. (In the example, returns after the sale of fund shares may be higher than those assuming no sale. This occurs when the sale would have produced a capital loss. The calculation assumes that the investor received a tax deduction for the loss.)
The table shows returns, based on the net asset value, for ETF Shares only; returns for other share classes will differ. Please note that your actual after-tax returns will depend on your tax situation and may differ from those shown. Also note that if you own the fund in a tax-deferred account, such as an individual retirement account or a 401(k) plan, this information does not apply to you. Such accounts are not subject to current taxes.
Finally, keep in mind that a fund’s performance—whether before or after taxes—does not guarantee future results.
| | | |
| Average Annual Total Returns: U.S. Sector Index Funds | | | |
| Periods Ended August 31, 2009 | | | |
| | One | Five | Since |
| | Year | Years Inception1 |
| Consumer Discretionary ETF | | | |
| Returns Before Taxes | –12.32% | –1.47% | –2.43% |
| Returns After Taxes on Distributions | –12.64 | –1.62 | –2.57 |
| Returns After Taxes on Distributions and Sale of Fund Shares | –7.74 | –1.24 | –2.04 |
| |
| Consumer Staples ETF | | | |
| Returns Before Taxes | –8.22% | 5.25% | 5.20% |
| Returns After Taxes on Distributions | –8.50 | 4.96 | 4.95 |
| Returns After Taxes on Distributions and Sale of Fund Shares | –5.02 | 4.48 | 4.46 |
| |
| Energy ETF | | | |
| Returns Before Taxes | –30.49% | — | 9.96% |
| Returns After Taxes on Distributions | –30.68 | — | 9.79 |
| Returns After Taxes on Distributions and Sale of Fund Shares | –19.62 | — | 8.67 |
| |
| Financials ETF | | | |
| Returns Before Taxes | –25.31% | –7.88% | –7.05% |
| Returns After Taxes on Distributions | –25.77 | –8.32 | –7.45 |
| Returns After Taxes on Distributions and Sale of Fund Shares | –16.11 | –6.44 | –5.76 |
| |
| Health Care ETF | | | |
| Returns Before Taxes | –10.70% | 2.04% | 0.84% |
| Returns After Taxes on Distributions | –10.92 | 1.88 | 0.71 |
| Returns After Taxes on Distributions and Sale of Fund Shares | –6.71 | 1.74 | 0.72 |
| |
| Industrials ETF | | | |
| Returns Before Taxes | –28.41% | — | 0.32% |
| Returns After Taxes on Distributions | –28.69 | — | 0.13 |
| Returns After Taxes on Distributions and Sale of Fund Shares | –18.16 | — | 0.30 |
| |
| Information Technology ETF | | | |
| Returns Before Taxes | –9.78% | 3.94% | –0.64% |
| Returns After Taxes on Distributions | –9.91 | 3.85 | –0.72 |
| Returns After Taxes on Distributions and Sale of Fund Shares | –6.26 | 3.37 | –0.55 |
| |
| Materials ETF | | | |
| Returns Before Taxes | –25.88% | 4.99% | 5.43% |
| Returns After Taxes on Distributions | –26.28 | 4.68 | 5.15 |
| Returns After Taxes on Distributions and Sale of Fund Shares | –16.52 | 4.25 | 4.65 |
| |
| Telecommunication Services ETF | | | |
| Returns Before Taxes | –15.88% | — | 2.62% |
| Returns After Taxes on Distributions | –16.27 | — | 2.29 |
| Returns After Taxes on Distributions and Sale of Fund Shares | –9.92 | — | 2.25 |
| |
| Utilities ETF | | | |
| Returns Before Taxes | –18.34% | 6.39% | 6.99% |
| Returns After Taxes on Distributions | –18.85 | 5.86 | 6.51 |
| Returns After Taxes on Distributions and Sale of Fund Shares | –11.29 | 5.53 | 6.07 |
1 For the Consumer Discretionary, Consumer Staples, Financials, Health Care, Information Technology, Materials, and Utilities ETFs, January 26, 2004; for the Energy, Industrials, and Telecommunication
Services ETFs, September 23, 2004.
107
About Your Fund’s Expenses
As a shareholder of the fund, you incur ongoing costs, which include costs for portfolio management, administrative services, and shareholder reports (like this one), among others. Operating expenses, which are deducted from a fund’s gross income, directly reduce the investment return of the fund.
A fund’s expenses are expressed as a percentage of its average net assets. This figure is known as the expense ratio. The examples on this page are intended to help you understand the ongoing costs (in dollars) of investing in your fund and to compare these costs with those of other mutual funds. The examples are based on an investment of $1,000 made at the beginning of the period shown and held for the entire period.
The acompanying table illustrates your fund’s costs in two ways:
• Based on actual fund return. This section helps you to estimate the actual expenses that you paid over the period. The “Ending Account Value” shown is derived from the fund’s actual return, and the third column shows the dollar amount that would have been paid by an investor who started with $1,000 in the fund. You may use the information here, together with the amount you invested, to estimate the expenses that you paid over the period.
To do so, simply divide your account value by $1,000 (for example, an $8,600 account value divided by $1,000 = 8.6), then multiply the result by the number given for your fund under the heading “Expenses Paid During Period.”
• Based on hypothetical 5% yearly return. This section is intended to help you compare your fund’s costs with those of other mutual funds. It assumes that the fund had a yearly return of 5% before expenses, but that the expense ratio is unchanged. In this case—because the return used is not the fund’s actual return—the results do not apply to your investment. The example is useful in making comparisons because the Securities and Exchange Commission requires all mutual funds to calculate expenses based on a 5% return. You can assess your fund’s costs by comparing this hypothetical example with the hypothetical examples that appear in shareholder reports of other funds.
Note that the expenses shown in the table are meant to highlight and help you compare ongoing costs only and do not reflect transaction costs incurred by the fund for buying and selling securities. Further, the expenses do not include the 2% fee on redemptions of Admiral Shares held for less than one year. If this fee were applied to your account, your costs would be higher. Your fund does not carry a “sales load.”
The calculations assume no shares were bought or sold during the period. Your actual costs may have been higher or lower, depending on the amount of your investment and the timing of any purchases or redemptions.
You can find more information about the fund’s expenses in the Financial Statements section of this report. For additional information on operating expenses and other shareholder costs, please refer to your fund’s current prospectus.
108
| | | | |
| Six Months Ended August 31, 2009 | | | | |
| |
| | | Beginning | Ending | Expenses |
| | | Account Value | Account Value | Paid During |
| Index Fund | Share Class | 2/28/2009 | 8/31/2009 | Period1 |
| Based on Actual Fund Return | | | | |
| Consumer Discretionary | Admiral | $1,000.00 | $1,543.95 | $1.86 |
| | ETF | 1,000.00 | 1,544.81 | 1.73 |
| Consumer Staples | Admiral | $1,000.00 | $1,251.84 | $1.65 |
| | ETF | 1,000.00 | 1,252.17 | 1.48 |
| Energy | Admiral | $1,000.00 | $1,291.59 | $1.68 |
| | ETF | 1,000.00 | 1,291.74 | 1.50 |
| Financials | Admiral | $1,000.00 | $1,807.76 | $2.12 |
| | ETF | 1,000.00 | 1,808.60 | 1.84 |
| Health Care | Admiral | $1,000.00 | $1,269.02 | $1.66 |
| | ETF | 1,000.00 | 1,269.41 | 1.49 |
| Industrials | Admiral | $1,000.00 | $1,490.63 | $1.88 |
| | ETF | 1,000.00 | 1,491.17 | 1.63 |
| Information Technology | Admiral | $1,000.00 | $1,509.28 | $1.83 |
| | ETF | 1,000.00 | 1,509.51 | 1.64 |
| Materials | Admiral | $1,000.00 | $1,569.31 | $1.88 |
| | ETF | 1,000.00 | 1,569.31 | 1.68 |
| Telecommunication Services | Admiral | $1,000.00 | $1,241.33 | $1.58 |
| | ETF | 1,000.00 | 1,241.53 | 1.47 |
| Utilities | Admiral | $1,000.00 | $1,189.81 | $1.60 |
| | ETF | 1,000.00 | 1,190.18 | 1.44 |
| Based on Hypothetical 5% Yearly Return | | | |
| Consumer Discretionary | Admiral | $1,000.00 | $1,023.74 | $1.48 |
| | ETF | 1,000.00 | 1,023.84 | 1.38 |
| Consumer Staples | Admiral | $1,000.00 | $1,023.74 | $1.48 |
| | ETF | 1,000.00 | 1,023.89 | 1.33 |
| Energy | Admiral | $1,000.00 | $1,023.74 | $1.48 |
| | ETF | 1,000.00 | 1,023.89 | 1.33 |
| Financials | Admiral | $1,000.00 | $1,023.69 | $1.53 |
| | ETF | 1,000.00 | 1,023.89 | 1.33 |
| Health Care | Admiral | $1,000.00 | $1,023.74 | $1.48 |
| | ETF | 1,000.00 | 1,023.89 | 1.33 |
| Industrials | Admiral | $1,000.00 | $1,023.69 | $1.53 |
| | ETF | 1,000.00 | 1,023.89 | 1.33 |
| Information Technology | Admiral | $1,000.00 | $1,023.74 | $1.48 |
| | ETF | 1,000.00 | 1,023.89 | 1.33 |
| Materials | Admiral | $1,000.00 | $1,023.74 | $1.48 |
| | ETF | 1,000.00 | 1,023.89 | 1.33 |
| Telecommunication Services | Admiral | $1,000.00 | $1,023.79 | $1.43 |
| | ETF | 1,000.00 | 1,023.89 | 1.33 |
| Utilities | Admiral | $1,000.00 | $1,023.74 | $1.48 |
| | ETF | 1,000.00 | 1,023.89 | 1.33 |
1 The calculations are based on expenses incurred in the most recent six-month period. The funds’ annualized six-month expense ratios for that period are: for the Consumer Discretionary Index Fund, 0.29% for Admiral Shares and 0.27% for ETF Shares; for the Consumer Staples Index Fund, 0.29% for Admiral Shares and 0.26% for ETF Shares; for the Energy Index Fund, 0.29% for Admiral Shares and 0.26% for ETF
Shares; for the Financials Index Fund, 0.30% for Admiral Shares and 0.26% for ETF Shares; for the Health Care Index Fund, 0.29% for Admiral Shares and 0.26% for ETF Shares; for the Industrials Index Fund, 0.30% for Admiral Shares and 0.26% for ETF Shares; for the Information Technology Index Fund, 0.29% for Admiral Shares and 0.26% for ETF Shares; for the Materials Index Fund, 0.29% for Admiral Shares and 0.26% for ETF Shares; for the Telecommunication Services Index Fund, 0.28% for Admiral Shares and 0.26% for ETF Shares; for the Utilities Index Fund, 0.29% for Admiral Shares and 0.26% for ETF Shares. The dollar amounts shown as “Expenses Paid” are equal to the annualized expense ratio multiplied by the average account value over the period, multiplied by the number of days in the most recent six-month period, then divided by the number of days in the most recent 12-month period.
109
Trustees Approve Advisory Arrangement
The board of trustees of Vanguard Consumer Discretionary Index Fund, Consumer Staples Index Fund, Energy Index Fund, Financials Index Fund, Health Care Index Fund, Industrials Index Fund, Information Technology Index Fund, Materials Index Fund, Telecommunication Services Index Fund, and Utilities Index Fund has renewed the funds’ investment advisory arrangement with The Vanguard Group, Inc. Vanguard—through its Quantitative Equity Group—serves as the investment advisor to the funds.
The board determined that continuing the funds’ internalized management structure was in the best interests of the funds and their shareholders.
The board based its decision upon an evaluation of the advisor’s investment staff, portfolio management process, and performance. The trustees considered the factors discussed below, among others. However, no single factor determined whether the board approved the arrangement. Rather, it was the totality of the circumstances that drove the board’s decision.
Nature, extent, and quality of services
The board considered the quality of the funds’ investment management over both the short and long term, and took into account the organizational depth and stability of the advisor. The board noted that Vanguard has been managing investments for more than three decades. The Quantitative Equity Group adheres to a sound, disciplined investment management process; the team has considerable experience, stability, and depth.
The board concluded that Vanguard’s experience, stability, depth, and performance, among other factors, warranted continuation of the advisory arrangements.
Investment performance
The board considered the short- and long-term performance of the funds, including any periods of outperformance or underperformance of their target indexes and peer groups. The board concluded that the funds have performed in line with expectations, and that their results have been consistent with their investment strategies. Information about each fund’s most recent performance can be found on the Performance Summary pages of this report.
Cost
The board concluded that the funds’ expense ratios were well below the average expense ratios charged by funds in their respective peer groups and that the funds’ advisory expense ratios were also well below their peer-group averages. Information about the funds’ expense ratios appears in the About Your Fund’s Expenses section of this report.
The board does not conduct a profitability analysis of Vanguard, because of Vanguard’s unique “at-cost” structure. Unlike most other mutual fund management companies, Vanguard is owned by the funds it oversees, and produces “profits” only in the form of reduced expenses for fund shareholders.
The benefit of economies of scale
The board concluded that the funds’ low-cost arrangement with Vanguard ensures that the funds will realize economies of scale as they grow, with the cost to shareholders declining as the funds’ assets increase.
The board will consider whether to renew the advisory arrangement again after a one-year period.
110
Glossary
Beta. A measure of the magnitude of a fund’s past share-price fluctuations in relation to the ups and downs of a given market index. The index is assigned a beta of 1.00. Compared with a given index, a fund with a beta of 1.20 typically would have seen its share price rise or fall by 12% when the index rose or fell by 10%. For this report, beta is based on returns over the past 36 months for both the fund and the index. Note that a fund’s beta should be reviewed in conjunction with its R-squared (see definition below). The lower the R-squared, the less correlation there is between the fund and the index, and the less reliable beta is as an indicator of volatility.
Earnings Growth Rate. The average annual rate of growth in earnings over the past five years for the stocks now in a fund.
Equity Exposure. A measure that reflects a fund’s investments in stocks and stock futures. Any holdings in short-term reserves are excluded.
Expense Ratio. The percentage of a fund’s average net assets used to pay its annual administrative and advisory expenses. These expenses directly reduce returns to investors.
Foreign Holdings. The percentage of a fund represented by stocks or depositary receipts of companies based outside the United States.
Inception Date. The date on which the assets of a fund (or one of its share classes) are first invested in accordance with the fund’s investment objective. For funds with a subscription period, the inception date is the day after that period ends. Investment performance is measured from the inception date.
Median Market Cap. An indicator of the size of companies in which a fund invests; the midpoint of market capitalization (market price x shares outstanding) of a fund’s stocks, weighted by the proportion of the fund’s assets invested in each stock. Stocks representing half of the fund’s assets have market capitalizations above the median, and the rest are below it.
Price/Book Ratio. The share price of a stock divided by its net worth, or book value, per share. For a fund, the weighted average price/book ratio of the stocks it holds.
Price/Earnings Ratio. The ratio of a stock’s current price to its per-share earnings over the past year. For a fund, the weighted average P/E of the stocks it holds. P/E is an indicator of market expectations about corporate prospects; the higher the P/E, the greater the expectations for a company’s future growth.
R-Squared. A measure of how much of a fund’s past returns can be explained by the returns from the market in general, as measured by a given index. If a fund’s total returns were precisely synchronized with an index’s returns, its R-squared would be 1.00. If the fund’s returns bore no relationship to the index’s returns, its R-squared would be 0. For this report, R-squared is based on returns over the past 36 months for both the fund and the index.
Return on Equity. The annual average rate of return generated by a company during the past five years for each dollar of shareholder’s equity (net income divided by shareholder’s equity). For a fund, the weighted average return on equity for the companies whose stocks it holds.
Short-Term Reserves. The percentage of a fund invested in highly liquid, short-term securities that can be readily converted to cash.
Turnover Rate. An indication of the fund’s trading activity. Funds with high turnover rates incur higher transaction costs and may be more likely to distribute capital gains (which may be taxable to investors). The turnover rate excludes in-kind transactions, which have minimal impact on costs.
Yield. A fund’s 30-day SEC yield is derived using a formula specified by the U.S. Securities and Exchange Commission. Under the formula, data related to the fund’s security holdings in the previous 30 days are used to calculate the fund’s hypothetical net income for that period, which is then annualized and divided by the fund’s estimated average net assets over the calculation period. For the purposes of this calculation, a security’s income is based on its current market yield to maturity (in the case of bonds) or its projected dividend yield (for stocks). Because the SEC yield represents hypothetical annualized income, it will differ—at times significantly—from the fund’s actual experience. As a result, the fund’s income distributions may be higher or lower than implied by the SEC yield.
111
This page intentionally left blank.
The People Who Govern Your Fund
The trustees of your mutual fund are there to see that the fund is operated and managed in your best interests since, as a shareholder, you are a part owner of the fund. Your fund’s trustees also serve on the board of directors of The Vanguard Group, Inc., which is owned by the Vanguard funds and provides services to them on an at-cost basis.
A majority of Vanguard’s board members are independent, meaning that they have no affiliation with Vanguard or the funds they oversee, apart from the sizable personal investments they have made as private individuals. The independent board members have distinguished backgrounds in business, academia, and public service. Each of the trustees and executive officers oversees 157 Vanguard funds.
The following table provides information for each trustee and executive officer of the fund. More information about the trustees is in the Statement of Additional Information, which can be obtained, without charge, by contacting Vanguard at 800-662-7447, or online at www.vanguard.com.
|
| Interested Trustees |
| |
| John J. Brennan1 |
| Born 1954. Trustee Since May 1987. Chairman of |
| the Board. Principal Occupation(s) During the Past |
| Five Years: Chairman of the Board and Director/Trustee |
| of The Vanguard Group, Inc., and of each of the |
| investment companies served by The Vanguard Group; |
| Chief Executive Officer and President of The Vanguard |
| Group and of each of the investment companies served |
| by The Vanguard Group (1996–2008); Chairman of |
| the Financial Accounting Foundation; Governor of |
| the Financial Industry Regulatory Authority (FINRA); |
| Director of United Way of Southeastern Pennsylvania. |
| |
| F. William McNabb III1 |
| Born 1957. Trustee Since July 2009. Principal |
| Occupation(s) During the Past Five Years: Director of |
| The Vanguard Group, Inc., since 2008; Chief Executive |
| Officer and President of The Vanguard Group and of |
| each of the investment companies served by The |
| Vanguard Group since 2008; Director of Vanguard |
| Marketing Corporation; Managing Director of The |
| Vanguard Group (1995–2008). |
| |
| |
| Independent Trustees |
| |
| Charles D. Ellis |
| Born 1937. Trustee Since January 2001. Principal |
| Occupation(s) During the Past Five Years: Applecore |
| Partners (pro bono ventures in education); Senior |
| Advisor to Greenwich Associates (international business |
| strategy consulting); Successor Trustee of Yale University; |
| Overseer of the Stern School of Business at New York |
| University; Trustee of the Whitehead Institute for |
| Biomedical Research. |
| |
| Emerson U. Fullwood |
| Born 1948. Trustee Since January 2008. Principal |
| Occupation(s) During the Past Five Years: Retired |
| Executive Chief Staff and Marketing Officer for North |
| America and Corporate Vice President of Xerox |
| Corporation (photocopiers and printers); Director of |
| SPX Corporation (multi-industry manufacturing), the |
| United Way of Rochester, the Boy Scouts of America, |
| Amerigroup Corporation (direct health and medical |
| insurance carriers), and Monroe Community College |
| Foundation. |
|
| Rajiv L. Gupta |
| Born 1945. Trustee Since December 2001.2 Principal |
| Occupation(s) During the Past Five Years: Retired |
| Chairman and Chief Executive Officer of Rohm and |
| Haas Co. (chemicals); President of Rohm and Haas Co. |
| (2006–2008); Board Member of American Chemistry |
| Council; Director of Tyco International, Ltd. (diversified |
| manufacturing and services) and Hewlett-Packard Co. |
| (electronic computer manufacturing); Trustee of The |
| Conference Board. |
| |
| Amy Gutmann |
| Born 1949. Trustee Since June 2006. Principal |
| Occupation(s) During the Past Five Years: President of |
| the University of Pennsylvania; Christopher H. Browne |
| Distinguished Professor of Political Science in the School |
| of Arts and Sciences with Secondary Appointments |
| at the Annenberg School for Communication and the |
| Graduate School of Education of the University of |
| Pennsylvania; Director of Carnegie Corporation of |
| New York, Schuylkill River Development Corporation, |
| and Greater Philadelphia Chamber of Commerce; |
| Trustee of the National Constitution Center. |
| |
| JoAnn Heffernan Heisen |
| Born 1950. Trustee Since July 1998. Principal |
| Occupation(s) During the Past Five Years: Retired |
| Corporate Vice President, Chief Global Diversity Officer, |
| and Member of the Executive Committee of Johnson |
| & Johnson (pharmaceuticals/consumer products); |
| Vice President and Chief Information Officer of Johnson |
| & Johnson (1997–2005); Director of the University |
| Medical Center at Princeton and Women’s Research |
| and Education Institute. |
| |
| André F. Perold |
| Born 1952. Trustee Since December 2004. Principal |
| Occupation(s) During the Past Five Years: George Gund |
| Professor of Finance and Banking, Harvard Business |
| School; Director and Chairman of UNX, Inc. (equities |
| trading firm); Chair of the Investment Committee of |
| HighVista Strategies LLC (private investment firm). |
| |
| Alfred M. Rankin, Jr. |
| Born 1941. Trustee Since January 1993. Principal |
| Occupation(s) During the Past Five Years: Chairman, |
| President, Chief Executive Officer, and Director of |
| NACCO Industries, Inc. (forklift trucks/housewares/ |
| lignite); Director of Goodrich Corporation (industrial |
| products/aircraft systems and services). |
| |
| Peter F. Volanakis | |
| Born 1955. Trustee Since July 2009. Principal |
| Occupation(s) During the Past Five Years: President |
| since 2007 and Chief Operating Officer since 2005 |
| of Corning Incorporated (communications equipment); |
| President of Corning Technologies (2001–2005); |
| Director of Corning Incorporated and Dow Corning; |
| Trustee of the Corning Incorporated Foundation and |
| the Corning Museum of Glass; Overseer of the |
| Amos Tuck School of Business Administration at |
| Dartmouth College. | |
| |
| |
| Executive Officers | |
| |
| Thomas J. Higgins1 | |
| Born 1957. Chief Financial Officer Since September |
| 2008. Principal Occupation(s) During the Past Five |
| Years: Principal of The Vanguard Group, Inc.; Chief |
| Financial Officer of each of the investment companies |
| served by The Vanguard Group since 2008; Treasurer |
| of each of the investment companies served by The |
| Vanguard Group (1998–2008). |
| |
| Kathryn J. Hyatt1 | |
| Born 1955. Treasurer Since November 2008. Principal |
| Occupation(s) During the Past Five Years: Principal of |
| The Vanguard Group, Inc.; Treasurer of each of the |
| investment companies served by The Vanguard |
| Group since 2008; Assistant Treasurer of each of the |
| investment companies served by The Vanguard Group |
| (1988–2008). | |
| |
| Heidi Stam1 | |
| Born 1956. Secretary Since July 2005. Principal |
| Occupation(s) During the Past Five Years: Managing |
| Director of The Vanguard Group, Inc., since 2006; |
| General Counsel of The Vanguard Group since 2005; |
| Secretary of The Vanguard Group and of each of the |
| investment companies served by The Vanguard Group |
| since 2005; Director and Senior Vice President of |
| Vanguard Marketing Corporation since 2005; Principal |
| of The Vanguard Group (1997–2006). |
| |
| |
| Vanguard Senior Management Team |
| |
| R. Gregory Barton | Michael S. Miller |
| Mortimer J. Buckley | James M. Norris |
| Kathleen C. Gubanich | Glenn W. Reed |
| Paul A. Heller | George U. Sauter |
| |
| |
| Founder | |
| |
| John C. Bogle | |
| Chairman and Chief Executive Officer, 1974–1996 |
1 These individuals are “interested persons” as defined in the Investment Company Act of 1940.
2 December 2002 for Vanguard Equity Income Fund, Vanguard Growth Equity Fund, the Vanguard Municipal Bond Funds, and the Vanguard
State Tax-Exempt Funds.

P. O. Box 2600
Valley Forge, PA 19482-2600
Connect with Vanguard® > www.vanguard.com
| |
| Fund Information > 800-662-7447 | The funds or securities referred to herein are not sponsored, |
| | endorsed, or promoted by MSCI, and MSCI bears no liability |
| Direct Investor Account Services > 800-662-2739 | with respect to any such funds or securities. For any such funds |
| | or securities, the prospectus or the Statement of Additional |
| Institutional Investor Services > 800-523-1036 | Information contains a more detailed description of the limited |
| | relationship MSCI has with The Vanguard Group and any |
| TextTelephone for People | related funds. |
| | |
| With Hearing Impairment > 800-952-3335 | |
| | |
| |
| | All comparative mutual fund data are from Lipper Inc. or |
| | Morningstar, Inc., unless otherwise noted. |
| This material may be used in conjunction with | |
| the offering of shares of any Vanguard fund | You can obtain a free copy of Vanguard’s proxy voting guidelines |
| only if preceded or accompanied by the fund’s | by visiting our website, www.vanguard.com, and searching for |
| current prospectus. | “proxy voting guidelines,” or by calling Vanguard at 800-662-2739. |
| | The guidelines are also available from the SEC’s website, |
| | www.sec.gov. In addition, you may obtain a free report on how your |
| | fund voted the proxies for securities it owned during the 12 months |
| | ended June 30. To get the report, visit either www.vanguard.com |
| | or www.sec.gov. |
| |
| | You can review and copy information about your fund at the SEC’s |
| | Public Reference Room in Washington, D.C. To find out more about |
| | this public service, call the SEC at 202-551-8090. Information about |
| | your fund is also available on the SEC’s website, and you can |
| | receive copies of this information, for a fee, by sending a request in |
| | either of two ways: via e-mail addressed to publicinfo@sec.gov or |
| | via regular mail addressed to the Public Reference Section, |
| | Securities and Exchange Commission, Washington, DC 20549-0102. |
| |
| |
| |
| |
| | © 2009 The Vanguard Group, Inc. |
| | All rights reserved. |
| | Vanguard Marketing Corporation, Distributor. |
| | Q4830 102009 |

| Vanguard Extended Duration Treasury |
| Index Fund Annual Report |
| August 31, 2009 |

> For the fiscal year ended August 31, 2009, Vanguard Extended Duration Treasury
Index Fund’s Institutional Shares returned 8.05% and the fund’s ETF Shares,
as measured by net asset value, returned 7.98%.
> The strong demand for Treasury securities in the first half of the fiscal year
reversed in the second half, as investors perceived that the credit markets
and the economy were improving.
> The fund’s return was only a few steps behind the 8.39% return of its benchmark,
the Barclays Capital U.S. Treasury STRIPS 20–30 Year Equal Par Bond Index.
| |
| Contents | |
| |
| Your Fund’s Total Returns | 1 |
| President’s Letter | 2 |
| Results of Proxy Voting | 7 |
| Fund Profile | 8 |
| Performance Summary | 9 |
| Financial Statements | 11 |
| About Your Fund’s Expenses | 21 |
| Trustees Approve Advisory Arrangement | 23 |
| Glossary | 24 |
Please note: The opinions expressed in this report are just that—informed opinions. They should not be considered promises or advice.
Also, please keep in mind that the information and opinions cover the period through the date on the front of this report. Of course, the
risks of investing in your fund are spelled out in the prospectus.
Cover photograph: Veronica Coia.
Your Fund’s Total Returns
| | |
| Fiscal Year Ended August 31, 2009 | | |
| | Ticker | Total |
| | Symbol | Returns |
| Vanguard Extended Duration Treasury Index Fund | | |
| Institutional Shares1 | VEDTX | 8.05% |
| ETF Shares2 | EDV | |
| Market Price | | 9.67 |
| Net Asset Value | | 7.98 |
| Barclays Capital U.S. Treasury STRIPS 20–30 Year Equal Par Bond Index | | 8.39 |
| | | | |
| Your Fund’s Performance at a Glance | | | | |
| August 31, 2008–August 31, 2009 | | | | |
| | | | Distributions Per Share |
| | Starting | Ending | Income | Capital |
| | Share Price | Share Price | Dividends | Gains |
| Vanguard Extended Duration Treasury | | | | |
| Index Fund | | | | |
| Institutional Shares | $29.52 | $30.69 | $1.324 | $0.000 |
| ETF Shares | 98.11 | 101.91 | 4.397 | 0.000 |
1 This class of shares carries low expenses and is available for a minimum initial investment of $5 million.
2 Vanguard ETF™ Shares are traded on the NYSE Arca exchange and are available only through brokers. The table shows ETF returns
based on both the NYSE Arca market price and the net asset value for a share. U.S. Pat. No. 6,879,964 B2; 7,337,138.
1

President’s Letter
Dear Shareholder,
The fiscal year ended August 31, 2009—the first full year of operation for Vanguard Extended Duration Treasury Index Fund—was one of the financial markets’ most turbulent periods. It included frozen corporate credit markets that sparked a rush toward the safety and liquidity of Treasuries, boosting the fund’s return. Aggressive government measures were then implemented to thaw those markets, helping produce a rally in corporate bonds. The resulting decline in demand for Treasuries dampened the fund’s return.
For the fiscal year as a whole, these contrary trends produced a total return of about 8% for the Extended Duration Treasury Index Fund, split evenly between capital return and income return. A high degree of short-term volatility can be expected for this fund because of its focus on long-term Treasury securities, which are particularly sensitive to fluctuations in interest rates and changes in demand during stressful periods.
Please note: As a result of the spike in Treasury prices early in the period and significant redemptions, the fund expects to distribute a sizable capital gain in December 2009.
2
Among bond investors, safety and yield traded places
The 12 months ended August 31 spanned two strikingly different half-years. The period began with the September collapse of Lehman Brothers and the government-engineered rescue of several giant financial institutions. Stocks sank as the ensuing crisis spread from Wall Street to Main Street and around the globe. Stricken by seized-up credit markets and a near-total lack of confidence, businesses and consumers put the brakes on economic growth.
Governments in the United States and abroad responded with unprecedented stimulus and other programs. Over the past six months, these efforts started to take hold. Credit-market conditions improved, and the outlook for the U.S.
economy brightened. From their early-March lows, stocks took off on an almost-unbroken winning streak.
The U.S. bond market also performed a U-turn during the year. Early on, as credit markets deteriorated, investors rushed to the relative safety and liquidity of U.S. Treasury securities, driving their prices up and yields down. Investors were so risk-averse that short-term Treasury yields briefly turned negative. November and December were among the ten best months ever for Treasury returns, adjusted for inflation. (The fund returned about 22% in each of those months.) Corporate bonds, especially those of lower credit quality, struggled, and their yield spreads above comparable Treasuries widened to near-historic levels during the first six months.
| | | |
| Market Barometer | | | |
| | | Average Annual Total Returns |
| | | Periods Ended August 31, 2009 |
| One Year | Three Years | Five Years |
| Bonds | | | |
| Barclays Capital U.S. Aggregate Bond Index (Broad taxable market) | 7.94% | 6.35% | 4.96% |
| Barclays Capital Municipal Bond Index | 5.67 | 4.14 | 4.15 |
| Citigroup 3-Month Treasury Bill Index | 0.51 | 2.77 | 2.98 |
| |
| Stocks | | | |
| Russell 1000 Index (Large-caps) | –18.39% | –5.61% | 0.94% |
| Russell 2000 Index (Small-caps) | –21.29 | –6.08 | 2.21 |
| Dow Jones U.S. Total Stock Market Index | –18.10 | –5.17 | 1.45 |
| MSCI All Country World Index ex USA (International) | –13.96 | –2.41 | 8.18 |
| |
| CPI | | | |
| Consumer Price Index | –1.48% | 1.91% | 2.64% |
3
Several moves by the Treasury and the Federal Reserve Board—which slashed its target level for short-term interest rates to historic lows of 0%–0.25% in December—helped credit markets to attain some stability by the spring. In a dramatic reversal, investors regained their appetite for risk, favoring corporate bonds—especially high-yield bonds—over Treasuries.
After all the ups and downs, Treasuries and high-yield corporate bonds produced similar 12-month returns of about 6%–7%. Overall, the broad U.S. taxable bond market returned about 8%. Tax-exempt municipal bonds, after a flat first half, returned more than 5% for the fiscal year.
Stocks sank, then soared as credit and economy stabilized
The stock market’s first-half results weighed on its full-year returns. The broad U.S. stock market ended the 12 months in negative territory, with a return of about –18%. International markets performed somewhat better, as major European economies emerged from recession; the MSCI All Country World Index ex USA returned about –14%.
Despite the robust second-half rally, it may be premature to sound the all-clear signal. As the fiscal year came to a close, home foreclosures and the unemployment rate were rising, and the federal government’s list of problem banks
| | |
| Expense Ratio1 | | |
| | Institutional | ETF |
| | Shares | Shares |
| Extended Duration Treasury Index Fund | 0.11% | 0.14% |
1 The fund expense ratios shown are from the prospectuses dated December 29, 2008, and represent estimated costs for the current fiscal year based on the fund’s net assets as of the prospectus date. For the fiscal year ended August 31, 2009, the expense ratios were 0.11% for Institutional Shares and 0.14% for the ETF Shares.
4
had climbed above 400—the most since June 1994. There is considerable historical evidence that recovery from a recession caused by a financial crisis tends to take longer than average.
Short-term volatility marks the fund’s fiscal-year results
The jagged ups and downs of the 30-year Treasury bond yields shown in the chart on page 6 help explain the volatility of returns experienced during fiscal-year 2009 by Vanguard Extended Duration Treasury Index Fund. Bond yields and prices are linked, moving up and down at the same time, but in opposite directions; the longer the maturity—the fund invests in long-term Treasury securities from 20 to 30 years in maturity—the greater the fluctuation.
The opening six months of the fund’s 2009 fiscal year were particularly volatile. Fears of financial-system collapse spurred investors toward Treasuries, driving down the fund’s yields—the sag in the chart represents a cumulative drop of 1.7 percentage points in yield in November and December. As we reported to you in our semiannual report, the extraordinary demand for Treasury securities, and the related decline in interest rates across the maturity spectrum, helped produce a return of almost 17% for the fund for the first half of the fiscal year.
Strong actions by the Fed and other central banks began having a salutary effect on the credit markets as the initial six months drew to a close. At the same
| |
| Total Returns | |
| November 28, 20071 Through August 31, 2009 | |
| | Average |
| | Annual Return |
| Extended Duration Treasury Index Fund Institutional Shares | 4.74% |
| Barclays Capital U.S. Treasury STRIPS 20–30 Year Equal Par Bond Index | 5.18 |
The performance data shown represent past performance, which is not a guarantee of future results. Investment
returns and principal value will fluctuate, so investors’ shares, when sold, may be worth more or less than their
original cost. Current performance may be lower or higher than the performance data cited. For performance data
current to the most recent month-end, visit our website at www.vanguard.com/performance.
1 Fund inception.
5
time, investors interpreted a growing number of economic signals as suggesting that the economic slump was likely ending.
As a result, what had been a flight to quality in the first half of the year became, in the second half, a flight from quality. Demand for Treasuries fell, and demand for corporate bonds—especially high-yield bonds—and stocks rose. Long-term Treasury yields climbed back to about where they were 12 months before. Also helping keep yields higher was the large issuance of Treasury securities, as well as investor expectations of future issuance, to finance the federal government’s economic stimulus package and other programs.
The fund returned about –8% for the second half of the fiscal year, bringing the result for the fiscal year as a whole to, coincidentally, about 8%.
Monthly yields of 30-year Treasury bonds:
August 2008–August 2009
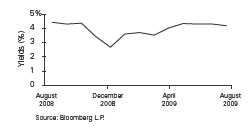
The fund can minimize an asset–liability mismatch
Vanguard Extended Duration Treasury Index Fund is designed to be used as a long-term investment tool. The fund was designed primarily as an instrument for managing defined-benefit pension plans. From a pension fund manager’s perspective, the fund’s total return is less important than how that total return relates to changes in the value of a pension plan’s liabilities. The fund invests in assets that move up and down in value in the same direction as long-term pension liabilities—since both respond similarly to interest-rate fluctuations—thus helping to reduce volatility in the ratio of a plan’s assets to its liabilities.
In addition, the fund invests in U.S. Treasury securities, deemed the safest of all bonds in terms of credit quality.
The fund also operates at a very low cost: As you know, low costs can be an important ally to any investor over the long term.
As always, thank you for entrusting your assets to Vanguard.
Sincerely,

F. William McNabb III
President and Chief Executive Officer
September 12, 2009

Results of Proxy Voting
At a special meeting of shareholders on July 2, 2009, fund shareholders approved the following two proposals:
Proposal 1—Elect trustees for the fund.*
The individuals listed in the table below were elected as trustees for the fund. All trustees with the exception of Messrs. McNabb and Volanakis (both of whom already served as directors of The Vanguard Group, Inc.) served as trustees to the fund prior to the shareholder meeting.
| | | |
| | | | Percentage |
| Trustee | For | Withheld | For |
| John J. Brennan | 816,325,661 | 25,839,114 | 96.9% |
| Charles D. Ellis | 811,618,878 | 30,545,897 | 96.4% |
| Emerson U. Fullwood | 816,960,560 | 25,204,215 | 97.0% |
| Rajiv L. Gupta | 815,607,429 | 26,557,346 | 96.8% |
| Amy Gutmann | 818,039,387 | 24,125,388 | 97.1% |
| JoAnn Heffernan Heisen | 815,771,400 | 26,393,375 | 96.9% |
| F. William McNabb III | 817,559,701 | 24,605,074 | 97.1% |
| André F. Perold | 814,833,250 | 27,331,525 | 96.8% |
| Alfred M. Rankin, Jr. | 815,942,907 | 26,221,868 | 96.9% |
| Peter F. Volanakis | 817,780,699 | 24,384,076 | 97.1% |
| * Results are for all funds within the same trust. | | | |
Proposal 2—Update and standardize the fund’s fundamental policies regarding:
(a) Purchasing and selling real estate.
(b) Issuing senior securities.
(c) Borrowing money.
(d) Making loans.
(e) Purchasing and selling commodities.
(f) Concentrating investments in a particular industry or group of industries.
(g) Eliminating outdated fundamental investment policies not required by law.
The revised fundamental policies are clearly stated and simple, yet comprehensive, making oversight and compliance more efficient than under the former policies. The revised fundamental policies will allow the fund to respond more quickly to regulatory and market changes, while avoiding the costs and delays associated with successive shareholder meetings.
| | | | | |
| Extended Duration Treasury | | | | Broker | Percentage |
| Index Fund | For | Abstain | Against | Non-Votes | For |
| 2a | 2,480,855 | 2,255 | 84,360 | 66,734 | 94.2% |
| 2b | 2,480,869 | 2,211 | 84,390 | 66,734 | 94.2% |
| 2c | 2,482,099 | 698 | 84,673 | 66,734 | 94.2% |
| 2d | 2,480,548 | 2,330 | 84,592 | 66,734 | 94.2% |
| 2e | 2,480,743 | 2,294 | 84,433 | 66,734 | 94.2% |
| 2f | 2,480,713 | 2,308 | 84,449 | 66,734 | 94.2% |
| 2g | 2,480,676 | 2,212 | 84,582 | 66,734 | 94.2% |
7
Extended Duration Treasury Index Fund
Fund Profile
As of August 31, 2009
| | |
| Financial Attributes | | |
| | | Target |
| | Fund | Index1 |
| Number of Issues | 50 | 50 |
| Yield2 | | 4.4% |
| Institutional Shares | 4.3% | |
| ETF Shares | 4.3% | |
| Yield to Maturity | 4.4%3 | 4.4% |
| Average Coupon | 0.0% | 0.0% |
| Average Effective Maturity | 25.1 years | 24.7 years |
| Average Quality4 | Aaa | Aaa |
| Average Duration | 25.7 years | 25.3 years |
| Expense Ratio5 | | — |
| Institutional Shares | 0.11% | |
| ETF Shares | 0.14% | |
| Short-Term Reserves | 0.0% | — |
| |
| Sector Diversification (% of portfolio) | |
| Treasury/Agency | 100.0% |
| Distribution by Maturity (% of portfolio) | |
| 20–30 Years | 100.0% |
| Distribution by Credit Quality4 (% of portfolio) |
| Aaa | 100.0% |
Investment Focus
1 Barclays Capital U.S. Treasury STRIPS 20-30 Year Equal Par Bond Index.
2 30-day SEC yield for the fund; index yield assumes that all bonds are called or prepaid at the earliest possible date.
3 Before expenses.
4 Moody’s Investors Service.
5 The fund expense ratios shown are from the prospectus dated December 29, 2008, and represent estimated costs for the current fiscal
year based on the fund’s net assets as of the prospectus date. For the fiscal year ended August 31, 2009, the expense ratios were 0.11%
8
Extended Duration Treasury Index Fund
Performance Summary
All of the returns in this report represent past performance, which is not a guarantee of future results that may be achieved by the fund. (Current performance may be lower or higher than the performance data cited. For performance data current to the most recent month-end, visit our website at www.vanguard.com/performance.) Note, too, that both investment returns and principal value can fluctuate widely, so an investor’s shares, when sold, could be worth more or less than their original cost. The returns shown do not reflect taxes that a shareholder would pay on fund distributions or on the sale of fund shares.
Cumulative Performance: November 28, 2007–August 31, 2009
Initial Investment of $5,000,000
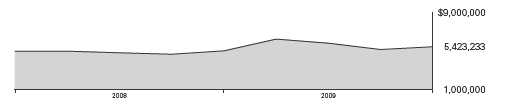
| | | |
| | Total Returns | |
| | Periods Ended August 31, 2009 | Final Value |
| | | Since | of a $5,000,000 |
| | One Year | Inception1 | Investment |
| Extended Duration Treasury Index Fund | | | |
| Institutional Shares | 8.05% | 4.74% | $5,423,233 |
| Barclays Capital U.S. Treasury STRIPS | | | |
| 20–30 Year Equal Par Bond Index | 8.39 | 5.18 | 5,463,435 |
| | | |
| | | | Final Value |
| | | Since | of a $10,000 |
| | One Year | Inception1 | Investment |
| Extended Duration Treasury Index Fund | | | |
| ETF Shares Net Asset Value2 | 7.98% | 5.90% | $11,046 |
| Barclays Capital U.S. Treasury STRIPS | | | |
| 20–30 Year Equal Par Bond Index | 8.39 | 6.65 | 11,182 |
1 Performance for the fund and its comparative standards is calculated since the fund’s inception: November 28, 2007, for Institutional
Shares and December 6, 2007, for the ETF Shares.
2 For more information about how the ETF Shares’ market prices have compared with their net asset value, visit www.vanguard.com, select
your ETF, and then select the Performance tab. The Premium/Discount table there shows the percentages of days on which the ETF Shares’
market price was above or below the NAV.
9
Extended Duration Treasury Index Fund
| | |
| Cumulative Returns: ETF Shares, December 6, 2007–August 31, 2009 | | |
| | | Cumulative |
| | | Since |
| | One Year | Inception1 |
| Extended Duration Treasury Index Fund ETF Shares Market Price | 9.67% | 12.57% |
| Extended Duration Treasury Index Fund ETF Shares Net Asset Value | 7.98 | 10.46 |
| Barclays Capital U.S. Treasury STRIPS 20–30 Year Equal Par Bond Index | 8.39 | 11.82 |
| | | | |
| Total Returns (%): November 28, 2007–August 31, 2009 | | | |
| | | | | Barclays |
| | Institutional Shares | Capital2 |
| Fiscal | Capital | Income | Total | Total |
| Year | Return | Return | Return | Returns |
| 20083 | –1.6% | 2.0% | 0.4% | 0.8% |
| 2009 | 3.9 | 4.1 | 8.0 | 8.4 |
| | | | | |
| Total Returns: Periods Ended June 30, 2009 | | | | | |
| | | | Since Inception |
| | Inception Date | One Year | Capital | Income | Total |
| Institutional Shares | 11/28/2007 | 6.42% | –1.03% | 3.72% | 2.69% |
| ETF Shares | 12/6/2007 | | | | |
| Market Price | | 8.22 | — | — | 4.85 |
| Net Asset Value | | 6.32 | 0.12 | 3.79 | 3.91 |
1 Performance for the fund and its comparative standards is calculated since the ETF Shares’ inception on December 6, 2007.
2 Barclays Capital U.S. Treasury STRIPS 20–30 Year Equal Par Bond Index.
3 Since the Institutional Shares’ inception on November 28, 2007.
Note: See Financial Highlights tables for dividend and capital gains information.
10
Extended Duration Treasury Index Fund
Financial Statements
Statement of Net Assets
As of August 31, 2009
The fund provides a complete list of its holdings four times in each fiscal year, at the quarter-ends. For the second and fourth fiscal quarters, the lists appear in the fund’s semiannual and annual reports to shareholders. For the first and third fiscal quarters, the fund files the lists with the Securities and Exchange Commission on Form N-Q. Shareholders can look up the fund’s Forms N-Q on the SEC’s website at www.sec.gov. Forms N-Q may also be reviewed and copied at the SEC’s Public Reference Room (see the back cover of this report for further information).
| | | | |
| | | | Face | Market |
| | | Maturity | Amount | Value• |
| | Coupon | Date | ($000) | ($000) |
| U.S. Government Securities (99.9%) | | | | |
| U.S. Treasury STRIPS Coupon | 0.00% | 11/15/29 | 12,450 | 5,127 |
| U.S. Treasury STRIPS Coupon | 0.00% | 2/15/30 | 10,650 | 4,340 |
| U.S. Treasury STRIPS Coupon | 0.00% | 5/15/30 | 15,700 | 6,319 |
| U.S. Treasury STRIPS Coupon | 0.00% | 8/15/30 | 12,250 | 4,884 |
| U.S. Treasury STRIPS Coupon | 0.00% | 11/15/30 | 11,175 | 4,416 |
| U.S. Treasury STRIPS Coupon | 0.00% | 2/15/31 | 14,650 | 5,716 |
| U.S. Treasury STRIPS Coupon | 0.00% | 5/15/31 | 12,790 | 4,943 |
| U.S. Treasury STRIPS Coupon | 0.00% | 8/15/31 | 11,050 | 4,222 |
| U.S. Treasury STRIPS Coupon | 0.00% | 11/15/31 | 11,300 | 4,273 |
| U.S. Treasury STRIPS Coupon | 0.00% | 2/15/32 | 12,850 | 4,801 |
| U.S. Treasury STRIPS Coupon | 0.00% | 5/15/32 | 11,905 | 4,403 |
| U.S. Treasury STRIPS Coupon | 0.00% | 8/15/32 | 12,100 | 4,429 |
| U.S. Treasury STRIPS Coupon | 0.00% | 11/15/32 | 11,745 | 4,258 |
| U.S. Treasury STRIPS Coupon | 0.00% | 2/15/33 | 10,800 | 3,873 |
| U.S. Treasury STRIPS Coupon | 0.00% | 5/15/33 | 11,300 | 4,014 |
| U.S. Treasury STRIPS Coupon | 0.00% | 8/15/33 | 12,150 | 4,267 |
| U.S. Treasury STRIPS Coupon | 0.00% | 11/15/33 | 11,250 | 3,911 |
| U.S. Treasury STRIPS Coupon | 0.00% | 2/15/34 | 11,800 | 4,056 |
| U.S. Treasury STRIPS Coupon | 0.00% | 5/15/34 | 12,360 | 4,207 |
| U.S. Treasury STRIPS Coupon | 0.00% | 8/15/34 | 12,600 | 4,244 |
| U.S. Treasury STRIPS Coupon | 0.00% | 11/15/34 | 10,225 | 3,405 |
| U.S. Treasury STRIPS Coupon | 0.00% | 2/15/35 | 13,150 | 4,334 |
| U.S. Treasury STRIPS Coupon | 0.00% | 5/15/35 | 12,025 | 3,924 |
| U.S. Treasury STRIPS Coupon | 0.00% | 8/15/35 | 11,050 | 3,565 |
| U.S. Treasury STRIPS Coupon | 0.00% | 11/15/35 | 11,435 | 3,664 |
| U.S. Treasury STRIPS Coupon | 0.00% | 2/15/36 | 14,000 | 4,419 |
| U.S. Treasury STRIPS Coupon | 0.00% | 5/15/36 | 12,920 | 4,031 |
| U.S. Treasury STRIPS Coupon | 0.00% | 8/15/36 | 11,800 | 3,645 |
| U.S. Treasury STRIPS Coupon | 0.00% | 11/15/36 | 10,430 | 3,185 |
| U.S. Treasury STRIPS Coupon | 0.00% | 2/15/37 | 19,045 | 5,763 |
| U.S. Treasury STRIPS Coupon | 0.00% | 5/15/37 | 14,000 | 4,189 |
| U.S. Treasury STRIPS Coupon | 0.00% | 8/15/37 | 10,445 | 3,106 |
| U.S. Treasury STRIPS Coupon | 0.00% | 11/15/37 | 12,200 | 3,574 |
| U.S. Treasury STRIPS Coupon | 0.00% | 2/15/38 | 10,750 | 3,146 |
| U.S. Treasury STRIPS Coupon | 0.00% | 5/15/38 | 10,750 | 3,112 |
| U.S. Treasury STRIPS Coupon | 0.00% | 8/15/38 | 8,200 | 2,363 |
| U.S. Treasury STRIPS Coupon | 0.00% | 11/15/38 | 5,000 | 1,429 |
| U.S. Treasury STRIPS Coupon | 0.00% | 2/15/39 | 7,100 | 2,029 |
| U.S. Treasury STRIPS Coupon | 0.00% | 5/15/39 | 5,900 | 1,654 |
| U.S. Treasury STRIPS Coupon | 0.00% | 8/15/39 | 9,400 | 2,607 |
11
Extended Duration Treasury Index Fund
| | | | |
| | | | Face | Market |
| | | Maturity | Amount | Value• |
| | Coupon | Date | ($000) | ($000) |
| U.S. Treasury STRIPS Principal | 0.00% | 5/15/30 | 8,550 | 3,500 |
| U.S. Treasury STRIPS Principal | 0.00% | 2/15/31 | 8,100 | 3,212 |
| U.S. Treasury STRIPS Principal | 0.00% | 2/15/36 | 8,050 | 2,626 |
| U.S. Treasury STRIPS Principal | 0.00% | 2/15/37 | 5,200 | 1,623 |
| U.S. Treasury STRIPS Principal | 0.00% | 5/15/37 | 9,250 | 2,854 |
| U.S. Treasury STRIPS Principal | 0.00% | 2/15/38 | 12,700 | 3,789 |
| U.S. Treasury STRIPS Principal | 0.00% | 5/15/38 | 18,495 | 5,482 |
| U.S. Treasury STRIPS Principal | 0.00% | 2/15/39 | 18,950 | 5,438 |
| U.S. Treasury STRIPS Principal | 0.00% | 5/15/39 | 23,075 | 6,542 |
| U.S. Treasury STRIPS Principal | 0.00% | 8/15/39 | 13,400 | 3,757 |
| Total Investments (99.9%) (Cost $190,843) | | | | 196,670 |
| Other Assets and Liabilities (0.1%) | | | | |
| Other Assets | | | | 9,000 |
| Liabilities | | | | (8,878) |
| | | | | 122 |
| Net Assets (100%) | | | | 196,792 |
| |
| At August 31, 2009, net assets consisted of: | |
| | Amount |
| | ($000) |
| Paid-in Capital | 160,590 |
| Undistributed Net Investment Income | 1,444 |
| Accumulated Net Realized Gains | 28,931 |
| Unrealized Appreciation (Depreciation) | 5,827 |
| Net Assets | 196,792 |
| |
| Institutional Shares—Net Assets | |
| Applicable to 4,917,683 outstanding $.001 par value shares of | |
| beneficial interest (unlimited authorization) | 150,934 |
| Net Asset Value Per Share—Institutional Shares | $30.69 |
| |
| ETF Shares—Net Assets | |
| Applicable to 450,000 outstanding $.001 par value shares of | |
| beneficial interest (unlimited authorization) | 45,858 |
| Net Asset Value Per Share—ETF Shares | $101.91 |
• See Note A in Notes to Financial Statements.
See accompanying Notes, which are an integral part of the Financial Statements.
12
Extended Duration Treasury Index Fund
Statement of Operations
| |
| | Year Ended |
| | August 31, 2009 |
| | ($000) |
| Investment Income | |
| Income | |
| Interest1 | 9,019 |
| Total Income | 9,019 |
| Expenses | |
| The Vanguard Group—Note B | |
| Investment Advisory Services | 26 |
| Management and Administrative—Institutional Shares | 74 |
| Management and Administrative—ETF Shares | 21 |
| Marketing and Distribution—Institutional Shares | 63 |
| Marketing and Distribution—ETF Shares | 10 |
| Custodian Fees | 26 |
| Auditing Fees | 27 |
| Shareholders’ Reports and Proxies—Institutional Shares | — |
| Shareholders’ Reports and Proxies—ETF Shares | 9 |
| Total Expenses | 256 |
| Net Investment Income | 8,763 |
| Realized Net Gain (Loss) on Investment Securities Sold | 42,012 |
| Change in Unrealized Appreciation (Depreciation) of Investment Securities | 5,603 |
| Net Increase (Decrease) in Net Assets Resulting from Operations | 56,378 |
1 Interest income from an affiliated company of the fund was $3,000.
See accompanying Notes, which are an integral part of the Financial Statements.
13
Extended Duration Treasury Index Fund
Statement of Changes in Net Assets
| | |
| | | November 28, |
| | Year Ended | 20071 to |
| | August 31, | August 31, |
| | 2009 | 2008 |
| | ($000) | ($000) |
| Increase (Decrease) in Net Assets | | |
| Operations | | |
| Net Investment Income | 8,763 | 4,313 |
| Realized Net Gain (Loss) | 42,012 | (927) |
| Change in Unrealized Appreciation (Depreciation) | 5,603 | 224 |
| Net Increase (Decrease) in Net Assets Resulting from Operations | 56,378 | 3,610 |
| Distributions | | |
| Net Investment Income | | |
| Institutional Shares | (7,647) | (2,278) |
| ETF Shares | (1,511) | (196) |
| Realized Capital Gain | | |
| Institutional Shares | — | — |
| ETF Shares | — | — |
| Total Distributions | (9,158) | (2,474) |
| Capital Share Transactions | | |
| Institutional Shares | (154,948) | 256,542 |
| ETF Shares | 41,503 | 5,339 |
| Net Increase (Decrease) from Capital Share Transactions | (113,445) | 261,881 |
| Total Increase (Decrease) | (66,225) | 263,017 |
| Net Assets | | |
| Beginning of Period | 263,017 | — |
| End of Period2 | 196,792 | 263,017 |
1 Inception.
2 Net Assets—End of Period includes undistributed net investment income of $1,444,000 and $1,839,000.
See accompanying Notes, which are an integral part of the Financial Statements.
14
Extended Duration Treasury Index Fund
Financial Highlights
| | |
| Institutional Shares | | |
| | Year | Nov. 28, |
| | Ended | 20071 to |
| | Aug. 31, | Aug. 31, |
| For a Share Outstanding Throughout Each Period | 2009 | 2008 |
| Net Asset Value, Beginning of Period | $29.52 | $30.00 |
| Investment Operations | | |
| Net Investment Income | 1.2732 | 1.0232 |
| Net Realized and Unrealized Gain (Loss) on Investments3 | 1.221 | (.928) |
| Total from Investment Operations | 2.494 | .095 |
| Distributions | | |
| Dividends from Net Investment Income | (1.324) | (.575) |
| Distributions from Realized Capital Gains | — | — |
| Total Distributions | (1.324) | (.575) |
| Net Asset Value, End of Period | $30.69 | $29.52 |
| |
| Total Return4 | 8.05% | 0.39% |
| |
| Ratios/Supplemental Data | | |
| Net Assets, End of Period (Millions) | $151 | $258 |
| Ratio of Total Expenses to Average Net Assets | 0.11% | 0.11%5 |
| Ratio of Net Investment Income to Average Net Assets | 3.93% | 4.55%5 |
| Portfolio Turnover Rate6 | 39% | 36% |
1 Inception.
2 Calculated based on average shares outstanding.
3 Includes increases from purchase fees of $.01 and $.03.
4 Total returns do not include a portfolio transaction fee that may apply to aggregate purchases of more than $20 million by a single investor.
5 Annualized.
6 Excludes the value of portfolio securities received or delivered as a result of in-kind purchases or redemptions of the fund’s capital shares,
including ETF Creation Units.
See accompanying Notes, which are an integral part of the Financial Statements.
15
Extended Duration Treasury Index Fund
Financial Highlights
| | |
| ETF Shares | | |
| | Year | Dec. 6, |
| | Ended | 20071 to |
| | Aug. 31, | Aug. 31, |
| For a Share Outstanding Throughout Each Period | 2009 | 2008 |
| Net Asset Value, Beginning of Period | $98.11 | $97.78 |
| Investment Operations | | |
| Net Investment Income | 4.3172 | 3.1662 |
| Net Realized and Unrealized Gain (Loss) on Investments3 | 3.880 | (.983) |
| Total from Investment Operations | 8.197 | 2.183 |
| Distributions | | |
| Dividends from Net Investment Income | (4.397) | (1.853) |
| Distributions from Realized Capital Gains | — | — |
| Total Distributions | (4.397) | (1.853) |
| Net Asset Value, End of Period | $101.91 | $98.11 |
| |
| Total Return | 7.98% | 2.29% |
| |
| Ratios/Supplemental Data | | |
| Net Assets, End of Period (Millions) | $46 | $5 |
| Ratio of Total Expenses to Average Net Assets | 0.14% | 0.14%4 |
| Ratio of Net Investment Income to Average Net Assets | 3.90% | 4.52%4 |
| Portfolio Turnover Rate5 | 39% | 36% |
1 Inception.
2 Calculated based on average shares outstanding.
3 Includes increases from purchase fees of $.02 and $.11.
4 Annualized.
5 Excludes the value of portfolio securities received or delivered as a result of in-kind purchases or redemptions of the fund’s capital shares,
including ETF Creation Units.
See accompanying Notes, which are an integral part of the Financial Statements.
16
Extended Duration Treasury Index Fund
Notes to Financial Statements
Vanguard Extended Duration Treasury Index Fund is registered under the Investment Company Act of 1940 as an open-end investment company, or mutual fund. The fund offers three classes of shares: Institutional Shares, Institutional Plus Shares, and ETF Shares. Institutional Shares are designed for investors who meet certain administrative and service criteria and invest a minimum of $5 million. Institutional Plus Shares are available to investors who invest a minimum of $100 million. The fund has not issued any Institutional Plus Shares through August 31, 2009. ETF Shares are listed for trading on the NYSE Arca, Inc.; they can be purchased and sold through a broker.
A. The following significant accounting policies conform to generally accepted accounting principles for U.S. mutual funds. The fund consistently follows such policies in preparing its financial statements.
1. Security Valuation: Bonds, and temporary cash investments acquired over 60 days to maturity, are valued using the latest bid prices or using valuations based on a matrix system (which considers such factors as security prices, yields, maturities, and ratings), both as furnished by independent pricing services. Investments in Vanguard Market Liquidity Fund are valued at that fund’s net asset value. Securities for which market quotations are not readily available, or whose values have been affected by events occurring before the fund’s pricing time but after the close of the securities’ primary markets, are valued by methods deemed by the board of trustees to represent fair value.
2. Federal Income Taxes: The fund intends to continue to qualify as a regulated investment company and distribute all of its taxable income. Management has analyzed the fund’s tax positions taken for all open federal income tax years (August 31, 2008–2009), and has concluded that no provision for federal income tax is required in the fund’s financial statements.
3. Distributions: Distributions to shareholders are recorded on the ex-dividend date.
4. Other: Interest income includes income distributions received from Vanguard Market Liquidity Fund and is accrued daily. Premiums and discounts on debt securities purchased are amortized and accreted, respectively, to interest income over the lives of the respective securities. Security transactions are accounted for on the date securities are bought or sold. Costs used to determine realized gains (losses) on the sale of investment securities are those of the specific securities sold. Fees, if any, assessed on purchases of Institutional Shares are credited to paid-in capital.
Each class of shares has equal rights as to assets and earnings, except that each class separately bears certain class-specific expenses related to maintenance of shareholder accounts (included in Management and Administrative expenses), shareholder reporting, and proxies. Marketing and distribution expenses are allocated to each class of shares based on a method approved by the board of trustees. Income, other non-class-specific expenses, and gains and losses on investments are allocated to each class of shares based on its relative net assets.
B. The Vanguard Group furnishes at cost investment advisory, corporate management, administrative, marketing, and distribution services. The costs of such services are allocated to the fund under methods approved by the board of trustees. The fund has committed to provide up to 0.40% of its net assets in capital contributions to Vanguard. At August 31, 2009, the fund had contributed capital of $39,000 to Vanguard (included in Other Assets), representing 0.02% of the fund’s net assets and 0.02% of Vanguard’s capitalization. The fund’s trustees and officers are also directors and officers of Vanguard.
17
Extended Duration Treasury Index Fund
C. Various inputs may be used to determine the value of the fund’s investments. These inputs are summarized in three broad levels for financial statement purposes. The inputs or methodologies used to value securities are not necessarily an indication of the risk associated with investing in those securities.
Level 1—Quoted prices in active markets for identical securities.
Level 2—Other significant observable inputs (including quoted prices for similar securities,
interest rates, prepayment speeds, credit risk, etc.).
Level 3—Significant unobservable inputs (including the fund’s own assumptions used to
determine the fair value of investments).
At August 31, 2009, 100% of the fund’s investments were valued based on Level 2 inputs.
D. Distributions are determined on a tax basis and may differ from net investment income and realized capital gains for financial reporting purposes. Differences may be permanent or temporary. Permanent differences are reclassified among capital accounts in the financial statements to reflect their tax character. Temporary differences arise when certain items of income, expense, gain, or loss are recognized in different periods for financial statement and tax purposes; these differences will reverse at some time in the future. Differences in classification may also result from the treatment of short-term gains as ordinary income for tax purposes.
During the year ended August 31, 2009, the fund realized $5,146,000 of net capital gains resulting from in-kind redemptions—in which shareholders exchanged fund shares for securities held by the fund rather than for cash. Because such gains are not taxable to the fund, and are not distributed to shareholders, they have been reclassified from accumulated net realized gains to paid-in capital.
The fund used a tax accounting practice to treat a portion of the price of capital shares redeemed during the year as distributions from realized capital gains. Accordingly, the fund has reclassified $7,487,000 from accumulated net realized gains to paid-in capital.
The fund used a capital loss carryforward of $435,000 to offset taxable capital gains realized during the year ended August 31, 2009, reducing the amount of capital gains that would otherwise be available to distribute to shareholders. For tax purposes, at August 31, 2009, the fund had $30,442,000 of ordinary income available for distribution.
At August 31, 2009, the cost of investment securities for tax purposes was $190,843,000. Net unrealized appreciation of investment securities for tax purposes was $5,827,000, consisting of unrealized gains of $8,157,000 on securities that had risen in value since their purchase and $2,330,000 in unrealized losses on securities that had fallen in value since their purchase.
E. During the year ended August 31, 2009, the fund purchased $146,800,000 of investment securities and sold $269,853,000 of investment securities, other than temporary cash investments.
18
Extended Duration Treasury Index Fund
F. Capital share transactions for each class of shares were:
| | | | |
| | Year Ended | Inception1 to |
| | August 31, 2009 | August 31, 2008 |
| | Amount | Shares | Amount | Shares |
| | ($000) | (000) | ($000) | (000) |
| Institutional Shares | | | | |
| Issued2 | 40,704 | 1,396 | 256,993 | 8,769 |
| Issued in Lieu of Cash Distributions | 7,647 | 222 | 2,278 | 80 |
| Redeemed | (203,299) | (5,443) | (2,729) | (106) |
| Net Increase (Decrease)—Institutional Shares | (154,948) | (3,825) | 256,542 | 8,743 |
| ETF Shares | | | | |
| Issued2 | 60,981 | 550 | 14,691 | 150 |
| Issued in Lieu of Cash Distributions | — | — | — | — |
| Redeemed | (19,478) | (150) | (9,352) | (100) |
| Net Increase (Decrease)—ETF Shares | 41,503 | 400 | 5,339 | 50 |
| 1 Inception was November 28, 2007, for Institutional Shares and December 6, 2007, for ETF Shares. | | |
| 2 Includes purchase fees of $42,000 and $289,000 (fund totals). | | | | |
G. In preparing the financial statements as of August 31, 2009, management considered the impact of subsequent events occurring through October 15, 2009, for potential recognition or disclosure in these financial statements.
19
Report of Independent Registered
Public Accounting Firm
To the Trustees of Vanguard World Fund and the Shareholders of Vanguard Extended Duration Treasury Index Fund:
In our opinion, the accompanying statement of net assets, and the related statements of operations and of changes in net assets and the financial highlights present fairly, in all material respects, the financial position of Vanguard Extended Duration Treasury Index Fund (the “Fund”) at August 31, 2009, the results of its operations for the year then ended, the changes in its net assets and the financial highlights for each of the periods indicated, in conformity with accounting principles generally accepted in the United States of America. These financial statements and financial highlights (hereafter referred to as “financial statements”) are the responsibility of the Fund’s management; our responsibility is to express an opinion on these financial statements based on our audits. We conducted our audits of these financial statements in accordance with the standards of the Public Company Accountin g Oversight Board (United States). Those standards require that we plan and perform the audit to obtain reasonable assurance about whether the financial statements are free of material misstatement. An audit includes examining, on a test basis, evidence supporting the amounts and disclosures in the financial statements, assessing the accounting principles used and significant estimates made by management, and evaluating the overall financial statement presentation. We believe that our audits, which included confirmation of securities at August 31, 2009 by correspondence with the custodian, provide a reasonable basis for our opinion.
PricewaterhouseCoopers LLP
Philadelphia, Pennsylvania
October 15, 2009

Special 2009 tax information (unaudited) for Vanguard Extended Duration Treasury Index Fund
This information for the fiscal year ended August 31, 2009, is included pursuant to provisions of the
Internal Revenue Code.
The fund distributed $3,294,000 as capital gain dividends (from net long-term capital gains) to
shareholders during the fiscal year.
For nonresident alien shareholders, 100% of income dividends are interest-related dividends.
20
About Your Fund’s Expenses
As a shareholder of the fund, you incur ongoing costs, which include costs for portfolio management, administrative services, and shareholder reports (like this one), among others. Operating expenses, which are deducted from a fund’s gross income, directly reduce the investment return of the fund.
A fund’s expenses are expressed as a percentage of its average net assets. This figure is known as the expense ratio. The following examples are intended to help you understand the ongoing costs (in dollars) of investing in your fund and to compare these costs with those of other mutual funds. The examples are based on an investment of $1,000 made at the beginning of the period shown and held for the entire period.
The accompanying table illustrates your fund’s costs in two ways:
• Based on actual fund return. This section helps you to estimate the actual expenses that you paid over the period. The “Ending Account Value” shown is derived from the fund’s actual return, and the third column shows the dollar amount that would have been paid by an investor who started with $1,000 in the fund. You may use the information here, together with the amount you invested, to estimate the expenses that you paid over the period.
To do so, simply divide your account value by $1,000 (for example, an $8,600 account value divided by $1,000 = 8.6), then multiply the result by the number given for your fund under the heading “Expenses Paid During Period.”
• Based on hypothetical 5% yearly return. This section is intended to help you compare your fund’s costs with those of other mutual funds. It assumes that the fund had a yearly return of 5% before expenses, but that the expense ratio is unchanged. In this case—because the return used is not the fund’s actual return—the results do not apply to your investment. The example is useful in making comparisons because the Securities and Exchange Commission requires all mutual funds to calculate expenses based on a 5% return. You can assess your fund’s costs by comparing this hypothetical example with the hypothetical examples that appear in shareholder reports of other funds.
| | | |
| Six Months Ended August 31, 2009 | | | |
| | Beginning | Ending | Expenses |
| | Account Value | Account Value | Paid During |
| Extended Duration Treasury Index Fund | 2/29/2009 | 8/31/2009 | Period1 |
| Based on Actual Fund Return | | | |
| Institutional Shares | $1,000.00 | $924.21 | $0.53 |
| ETF Shares | 1,000.00 | 924.21 | 0.68 |
| Based on Hypothetical 5% Yearly Return | | | |
| Institutional Shares | $1,000.00 | $1,024.65 | $0.56 |
| ETF Shares | 1,000.00 | 1024.50 | 0.71 |
1 The calculations are based on expenses incurred in the most recent six-month period. The fund’s annualized six-month expense ratios for
that period are 0.11% for Institutional Shares and 0.14% for ETF Shares. The dollar amounts shown as “Expenses Paid” are equal to the
annualized expense ratio multiplied by the average account value over the period, multiplied by the number of days in the most recent
six-month period, then divided by the number of days in the most recent 12-month period.
21
Note that the expenses shown in the table are meant to highlight and help you compare ongoing costs only and do not reflect transaction costs incurred by the fund for buying and selling securities. Your fund does not carry a “sales load.”
The calculations assume no shares were bought or sold during the period. Your actual costs may have been higher or lower, depending on the amount of your investment and the timing of any purchases or redemptions.
You can find more information about the fund’s expenses, including annual expense ratios, in the Financial Statements section of this report. For additional information on operating expenses and other shareholder costs, please refer to your fund’s current prospectus.
22
Trustees Approve Advisory Arrangement
The board of trustees of Vanguard Extended Duration Treasury Index Fund has renewed the fund’s investment advisory arrangement with The Vanguard Group, Inc. Vanguard—through its Fixed Income Group—serves as the investment advisor to the fund. The board determined that continuing the fund’s internalized management structure was in the best interests of the fund and its shareholders.
The board based its decision upon an evaluation of the advisor’s investment staff, portfolio management process, and performance. The trustees considered the factors discussed below, among others. However, no single factor determined whether the board approved the arrangement. Rather, it was the totality of the circumstances that drove the board’s decision.
Nature, extent, and quality of services
The board considered the quality of the investment management services provided to the fund since its inception in 2007, and took into account the organizational depth and stability of the advisor. The board noted that Vanguard has been managing investments for more than three decades. The Fixed Income Group adheres to a sound, disciplined investment management process; the team has considerable experience, stability, and depth.
The board concluded that Vanguard’s experience, stability, depth, and performance, among other factors, warranted continuation of the advisory arrangements.
Investment performance
The board considered the fund’s performance since its inception in 2007, including any periods of outperformance or underperformance of its target index and peer group. The board concluded that the fund has performed in line with expectations, and that the results have been consistent with the fund’s investment strategies. Information about the fund’s most recent performance can be found in the Performance Summary section of this report.
Cost
The board concluded that the fund’s expense ratio was well below the average expense ratio charged by funds in its peer group and that the fund’s advisory expense ratio was also well below its peer-group average. Information about the fund’s expense ratio appears in the About Your Fund’s Expenses section of this report.
The board does not conduct a profitability analysis of Vanguard, because of Vanguard’s unique “at-cost” structure. Unlike most other mutual fund management companies, Vanguard is owned by the funds it oversees, and produces “profits” only in the form of reduced expenses for fund shareholders.
The benefit of economies of scale
The board concluded that the fund’s low-cost arrangement with Vanguard ensures that the fund will realize economies of scale as it grows, with the cost to shareholders declining as fund assets increase.
The board will consider whether to renew the advisory arrangement again after a one-year period.
23
Glossary
Average Coupon. The average interest rate paid on the fixed income securities held by a fund. It is expressed as a percentage of face value.
Average Duration. An estimate of how much the value of the bonds held by a fund will fluctuate in response to a change in interest rates. To see how the value could change, multiply the average duration by the change in rates. If interest rates rise by 1 percentage point, the value of the bonds in a fund with an average duration of five years would decline by about 5%. If rates decrease by a percentage point, the value would rise by 5%.
Average Effective Maturity. The average length of time until fixed income securities held by a fund reach maturity and are repaid, taking into consideration the possibility that the issuer may call the bond before its maturity date. The figure reflects the proportion of fund assets represented by each security; it also reflects any futures contracts held. In general, the longer the average effective maturity, the more a fund’s share price will fluctuate in response to changes in market interest rates.
Average Quality. An indicator of credit risk, this figure is the average of the ratings assigned to a fund’s fixed income holdings by credit-rating agencies. The agencies make their judgment after appraising an issuer’s ability to meet its obligations. Quality is graded on a scale, with Aaa or AAA indicating the most creditworthy bond issuers. U.S. Treasury securities are considered to have the highest credit quality.
Distribution by Coupon. A breakdown of the securities in a fund according to coupon rate—the interest rate that an issuer promises to pay, expressed as an annual percentage of face value. Securities with unusually high coupon rates may be subject to call risk, the possibility that they will be redeemed (or “called”) early by the issuer.
Expense Ratio. The percentage of a fund’s average net assets used to pay its annual administrative and advisory expenses. These expenses directly reduce returns to investors.
Inception Date. The date on which the assets of a fund (or one of its share classes) are first invested in accordance with the fund’s investment objective. For funds with a subscription period, the inception date is the day after that period ends. Investment performance is measured from the inception date.
Short-Term Reserves. The percentage of a fund invested in highly liquid, short-term securities that can be readily converted to cash.
Yield. A fund’s 30-day SEC yield is derived using a formula specified by the U.S. Securities and Exchange Commission. Under the formula, data related to the fund’s security holdings in the previous 30 days are used to calculate the fund’s hypothetical net income for that period, which is then annualized and divided by the fund’s estimated average net assets over the calculation period. For the purposes of this calculation, a security’s income is based on its current market yield to maturity (in the case of bonds) or its projected dividend yield (for stocks). Because the SEC yield represents hypothetical annualized income, it will differ—at times significantly—from the fund’s actual experience. As a result, the fund’s income distributions may be higher or lower than implied by the SEC yield.
Yield to Maturity. The rate of return an investor would receive if the fixed income securities held by a fund were held to their maturity dates.
24
This page intentionally left blank.
This page intentionally left blank.
This page intentionally left blank.
The People Who Govern Your Fund
The trustees of your mutual fund are there to see that the fund is operated and managed in your best interests since, as a shareholder, you are a part owner of the fund. Your fund’s trustees also serve on the board of directors of The Vanguard Group, Inc., which is owned by the Vanguard funds and provides services to them on an at-cost basis.
A majority of Vanguard’s board members are independent, meaning that they have no affiliation with Vanguard or the funds they oversee, apart from the sizable personal investments they have made as private individuals. The independent board members have distinguished backgrounds in business, academia, and public service. Each of the trustees and executive officers oversees 157 Vanguard funds.
The following table provides information for each trustee and executive officer of the fund. More information about the trustees is in the Statement of Additional Information, which can be obtained, without charge, by contacting Vanguard at 800-662-7447, or online at www.vanguard.com.
| |
| Interested Trustees | Emerson U. Fullwood |
| | Born 1948. Trustee Since January 2008. Principal |
| John J. Brennan1 | Occupation(s) During the Past Five Years: Retired |
| Born 1954. Trustee Since May 1987. Chairman of | Executive Chief Staff and Marketing Officer for North |
| the Board. Principal Occupation(s) During the Past | America and Corporate Vice President of Xerox |
| Five Years: Chairman of the Board and Director/Trustee | Corporation (photocopiers and printers); Director of |
| of The Vanguard Group, Inc., and of each of the | SPX Corporation (multi-industry manufacturing), the |
| investment companies served by The Vanguard Group; | United Way of Rochester, the Boy Scouts of America, |
| Chief Executive Officer and President of The Vanguard | Amerigroup Corporation (direct health and medical |
| Group and of each of the investment companies served | insurance carriers), and Monroe Community College |
| by The Vanguard Group (1996–2008); Chairman of | Foundation. |
| the Financial Accounting Foundation; Governor of | |
| the Financial Industry Regulatory Authority (FINRA); | Rajiv L. Gupta |
| Director of United Way of Southeastern Pennsylvania. | Born 1945. Trustee Since December 2001.2 Principal |
| | Occupation(s) During the Past Five Years: Retired |
| F. William McNabb III1 | Chairman and Chief Executive Officer of Rohm and |
| Born 1957. Trustee Since July 2009. Principal | Haas Co. (chemicals); President of Rohm and Haas Co. |
| Occupation(s) During the Past Five Years: Director of | (2006–2008); Board Member of American Chemistry |
| The Vanguard Group, Inc., since 2008; Chief Executive | Council; Director of Tyco International, Ltd. (diversified |
| Officer and President of The Vanguard Group and of | manufacturing and services) and Hewlett-Packard Co. |
| each of the investment companies served by The | (electronic computer manufacturing); Trustee of The |
| Vanguard Group since 2008; Director of Vanguard | Conference Board. |
| Marketing Corporation; Managing Director of The | |
| Vanguard Group (1995–2008). | Amy Gutmann |
| | Born 1949. Trustee Since June 2006. Principal |
| | Occupation(s) During the Past Five Years: President of |
| Independent Trustees | the University of Pennsylvania; Christopher H. Browne |
| | Distinguished Professor of Political Science in the School |
| Charles D. Ellis | of Arts and Sciences with Secondary Appointments |
| Born 1937. Trustee Since January 2001. Principal | at the Annenberg School for Communication and the |
| Occupation(s) During the Past Five Years: Applecore | Graduate School of Education of the University of |
| Partners (pro bono ventures in education); Senior | Pennsylvania; Director of Carnegie Corporation of |
| Advisor to Greenwich Associates (international business | New York, Schuylkill River Development Corporation, |
| strategy consulting); Successor Trustee of Yale University; | and Greater Philadelphia Chamber of Commerce; |
| Overseer of the Stern School of Business at New York | Trustee of the National Constitution Center. |
| University; Trustee of the Whitehead Institute for | |
| Biomedical Research. | |
| | |
| JoAnn Heffernan Heisen | Executive Officers | |
| Born 1950. Trustee Since July 1998. Principal | | |
| Occupation(s) During the Past Five Years: Retired | Thomas J. Higgins1 | |
| Corporate Vice President, Chief Global Diversity Officer, | Born 1957. Chief Financial Officer Since September |
| and Member of the Executive Committee of Johnson | 2008. Principal Occupation(s) During the Past Five |
| & Johnson (pharmaceuticals/consumer products); | Years: Principal of The Vanguard Group, Inc.; Chief |
| Vice President and Chief Information Officer of Johnson | Financial Officer of each of the investment companies |
| & Johnson (1997–2005); Director of the University | served by The Vanguard Group since 2008; Treasurer |
| Medical Center at Princeton and Women’s Research | of each of the investment companies served by The |
| and Education Institute. | Vanguard Group (1998–2008). |
| |
| André F. Perold | Kathryn J. Hyatt1 | |
| Born 1952. Trustee Since December 2004. Principal | Born 1955. Treasurer Since November 2008. Principal |
| Occupation(s) During the Past Five Years: George Gund | Occupation(s) During the Past Five Years: Principal of |
| Professor of Finance and Banking, Harvard Business | The Vanguard Group, Inc.; Treasurer of each of the |
| School; Director and Chairman of UNX, Inc. (equities | investment companies served by The Vanguard |
| trading firm); Chair of the Investment Committee of | Group since 2008; Assistant Treasurer of each of the |
| HighVista Strategies LLC (private investment firm). | investment companies served by The Vanguard Group |
| | (1988–2008). | |
| Alfred M. Rankin, Jr. | | |
| Born 1941. Trustee Since January 1993. Principal | Heidi Stam1 | |
| Occupation(s) During the Past Five Years: Chairman, | Born 1956. Secretary Since July 2005. Principal |
| President, Chief Executive Officer, and Director of | Occupation(s) During the Past Five Years: Managing |
| NACCO Industries, Inc. (forklift trucks/housewares/ | Director of The Vanguard Group, Inc., since 2006; |
| lignite); Director of Goodrich Corporation (industrial | General Counsel of The Vanguard Group since 2005; |
| products/aircraft systems and services). | Secretary of The Vanguard Group and of each of the |
| | investment companies served by The Vanguard Group |
| Peter F. Volanakis | since 2005; Director and Senior Vice President of |
| Born 1955. Trustee Since July 2009. Principal | Vanguard Marketing Corporation since 2005; Principal |
| Occupation(s) During the Past Five Years: President | of The Vanguard Group (1997–2006). |
| since 2007 and Chief Operating Officer since 2005 | | |
| of Corning Incorporated (communications equipment); | | |
| President of Corning Technologies (2001–2005); Director | Vanguard Senior Management Team |
| of Corning Incorporated and Dow Corning; Trustee of | | |
| the Corning Incorporated Foundation and the Corning | R. Gregory Barton | Michael S. Miller |
| Museum of Glass; Overseer of the Amos Tuck School | Mortimer J. Buckley | James M. Norris |
| of Business Administration at Dartmouth College. | Kathleen C. Gubanich | Glenn W. Reed |
| | Paul A. Heller | George U. Sauter |
| |
| |
| | Founder | |
| | John C. Bogle | |
| | Chairman and Chief Executive Officer, 1974–1996 |
1 These individuals are “interested persons” as defined in the Investment Company Act of 1940.
2 December 2002 for Vanguard Equity Income Fund, Vanguard Growth Equity Fund, the Vanguard Municipal Bond Funds, and the Vanguard
State Tax-Exempt Funds.

P.O. Box 2600
Valley Forge, PA 19482-2600
Connect with Vanguard® > www.vanguard.com
| |
| Fund Information > 800-662-7447 | All comparative mutual fund data are from Lipper Inc. |
| | or Morningstar, Inc., unless otherwise noted. |
| Direct Investor Account Services > 800-662-2739 | |
| | |
| Institutional Investor Services > 800-523-1036 | You can obtain a free copy of Vanguard’s proxy voting |
| | guidelines by visiting our website, www.vanguard.com, |
| Text Telephone for People | and searching for “proxy voting guidelines,” or by |
| With Hearing Impairment > 800-952-3335 | calling Vanguard at 800-662-2739. The guidelines are |
| | also available from the SEC’s website, www.sec.gov. |
| | In addition, you may obtain a free report on how your |
| | fund voted the proxies for securities it owned during |
| This material may be used in conjunction | the 12 months ended June 30. To get the report, visit |
| with the offering of shares of any Vanguard | either www.vanguard.com or www.sec.gov. |
| fund only if preceded or accompanied by | |
| the fund’s current prospectus. | |
| You can review and copy information about your fund |
| | at the SEC’s Public Reference Room in Washington, D.C. |
| | To find out more about this public service, call the SEC |
| | at 202-551-8090. Information about your fund is also |
| | available on the SEC’s website, and you can receive |
| | copies of this information, for a fee, by sending a |
| | request in either of two ways: via e-mail addressed to |
| | publicinfo@sec.gov or via regular mail addressed to the |
| | Public Reference Section, Securities and Exchange |
| | Commission, Washington, DC 20549-0102. |
| |
| |
| |
| |
| | © 2009 The Vanguard Group, Inc. |
| | All rights reserved. |
| | Vanguard Marketing Corporation, Distributor. |
| | Q12750 102009 |

| Vanguard Mega Cap 300 Index Funds |
| Annual Report |
| August 31, 2009 |

| Vanguard Mega Cap 300 Index Fund |
| Vanguard Mega Cap 300 Growth Index Fund |
| Vanguard Mega Cap 300 Value Index Fund |
> For the 12 months ended August 31, 2009, Vanguard’s Mega Cap 300 Index
Funds posted returns ranging from –18.32% to –17.28% for their ETF Shares,
as determined by the net asset value per share. The returns of the Institutional
Shares were marginally different.
> Despite dismal returns, all three of the funds closely tracked their target indexes.
> Stocks in the financial, energy, and industrial sectors of the market detracted
significantly from the funds’ returns.
| |
| Contents | |
| |
| Your Fund’s Total Returns | 1 |
| President’s Letter | 2 |
| Results of Proxy Voting | 8 |
| Mega Cap 300 Index Fund | 10 |
| Mega Cap 300 Growth Index Fund | 25 |
| Mega Cap 300 Value Index Fund | 38 |
| Your Fund’s After-Tax Returns | 53 |
| About Your Fund’s Expenses | 54 |
| Trustees Approve Advisory Arrangement | 56 |
| Glossary | 57 |

Mega Cap 300 Index Fund
Mega Cap 300 Growth Index Fund
Mega Cap 300 Value Index Fund
Please note: The opinions expressed in this report are just that—informed opinions. They should not be considered promises or advice.
Also, please keep in mind that the information and opinions cover the period through the date on the front of this report. Of course, the
risks of investing in your fund are spelled out in the prospectus.
Cover photograph: Veronica Coia.
Your Fund’s Total Returns
| | |
| Fiscal Year Ended August 31, 2009 | | |
| | Ticker | Total |
| | Symbol | Returns |
| Vanguard Mega Cap 300 Index Fund | | |
| Institutional Shares1 | VMCTX | –17.84% |
| ETF Shares2 | MGC | |
| Market Price | | –17.81 |
| Net Asset Value | | –17.85 |
| MSCI US Large Cap 300 Index | | –17.83 |
| Large-Cap Core Funds Average3 | | –17.76 |
| |
| Vanguard Mega Cap 300 Growth Index Fund | | |
| Institutional Shares1 | VMGAX | –17.25% |
| ETF Shares2 | MGK | |
| Market Price | | –17.28 |
| Net Asset Value | | –17.28 |
| MSCI US Large Cap Growth Index | | –17.23 |
| Large-Cap Growth Funds Average3 | | –17.84 |
| |
| Vanguard Mega Cap 300 Value Index Fund | | |
| Institutional Shares1 | VMVLX | –18.29% |
| ETF Shares2 | MGV | |
| Market Price | | –18.28 |
| Net Asset Value | | –18.32 |
| MSCI US Large Cap Value Index | | –18.45 |
| Large-Cap Value Funds Average3 | | –17.99 |
1 This class of shares carries low expenses and is available for a minimum investment of $5 million.
2 Vanguard ETF™ Shares are traded on the NYSE Arca exchange and are available only through brokers. The table shows ETF returns based
on both the NYSE Arca market price and the net asset value for a share. U.S. Pat. No. 6,879,964 B2; 7,337,138.
3 Derived from data provided by Lipper Inc.
1

President’s Letter
Dear Shareholder,
Vanguard’s Mega Cap 300 Index Funds are designed to capture the performance of the largest stocks in the U.S. market. The funds, which track MSCI large-cap indexes, allow shareholders to invest in the market segment as a whole through the Mega Cap 300 Index Fund, or directly in its growth or value segments through one of the other two funds.
All three funds turned in disappointing results for the 12 months ended August 31, 2009, as almost every segment of the stock market sustained a significant hit from the late-2008 financial crisis. The Mega Cap 300 Growth Index Fund produced the best results—meaning it declined the least—with an ETF return of –17.28%, as determined by the net asset value per share. The Mega Cap 300 Index Fund ETF was next in line, returning –17.85% for the period, while the Mega Cap 300 Value Index Fund ETF returned –18.32%. The funds closely tracked their respective indexes.
The Mega Cap 300 Index Funds also offer Institutional Shares, which are available for a minimum initial investment of $5 million. The table on page 1 shows the 12-month returns for the funds and their target indexes, along with the average returns for their peer groups.
2
Stocks sank, then soared as credit and economy stabilized
The 12 months ended August 31 spanned two strikingly different half-years. The period began with the September collapse of a major investment bank and the government-engineered rescue of several giant financial institutions. Stocks sank as the ensuing crisis spread from Wall Street to Main Street and around the globe. Stricken by seized-up credit markets and a near-total lack of confidence, businesses and consumers put the brakes on economic growth.
Governments in the United States and abroad responded with unprecedented stimulus and other programs. Over the past six months, these efforts started to take hold. Credit-market conditions
improved, and the outlook for the U.S. economy brightened. From their early-March lows, stocks took off on an almost-unbroken winning streak.
Even so, the broad U.S. stock market ended the 12 months in negative territory, with a return of about –18%. International markets performed somewhat better, as major European economies emerged from recession; the MSCI All Country World Index ex USA returned about –14%.
Despite the robust second-half rally, it may be premature to sound the all-clear signal. As the fiscal year came to a close, home foreclosures and the unemployment rate were rising, and the federal government’s list of problem banks had climbed above 400—the most since June 1994. There
| | | |
| Market Barometer | | | |
| | | Average Annual Total Returns |
| | | Periods Ended August 31, 2009 |
| | One Year | Three Years | Five Years |
| Stocks | | | |
| Russell 1000 Index (Large-caps) | –18.39% | –5.61% | 0.94% |
| Russell 2000 Index (Small-caps) | –21.29 | –6.08 | 2.21 |
| Dow Jones U.S. Total Stock Market Index | –18.10 | –5.17 | 1.45 |
| MSCI All Country World Index ex USA (International) | –13.96 | –2.41 | 8.18 |
| |
| Bonds | | | |
| Barclays Capital U.S. Aggregate Bond Index | | | |
| (Broad taxable market) | 7.94% | 6.35% | 4.96% |
| Barclays Capital Municipal Bond Index | 5.67 | 4.14 | 4.15 |
| Citigroup 3-Month Treasury Bill Index | 0.51 | 2.77 | 2.98 |
| |
| CPI | | | |
| Consumer Price Index | –1.48% | 1.91% | 2.64% |
3
is considerable historical evidence that recovery from a recession caused by a financial crisis tends to take longer than average.
Among bond investors, safety and yield traded places
The U.S. bond market also performed a U-turn during the year. Early on, as credit markets deteriorated, investors rushed to the relative safety and liquidity of U.S. Treasury securities, driving their prices up and yields down. Investors were so risk-averse that short-term Treasury yields briefly turned negative. November and December were among the ten best months ever for Treasury returns (adjusted for inflation). Corporate bonds, especially those of lower credit quality, struggled,
and their yield spreads above comparable Treasuries widened to near-historic levels during the first six months.
Several moves by the Treasury and the Federal Reserve Board—which slashed its target level for short-term interest rates to a range of 0%–0.25% in December—helped credit markets to attain some stability by the spring. In a dramatic reversal, investors regained their appetite for risk, favoring corporate bonds over Treasuries.
After all the ups and downs, Treasuries and high-yield corporate bonds produced similar 12-month returns of about 6%–7%. Overall, the broad U.S. taxable bond market
| | | |
| Expense Ratios1 | | | |
| Your Fund Compared With Its Peer Group | | | |
| | Institutional | ETF | Peer |
| | Shares | Shares | Group |
| Mega Cap 300 Index Fund | 0.11% | 0.13% | 1.26% |
| Mega Cap 300 Growth Index Fund | 0.11 | 0.13 | 1.34 |
| Mega Cap 300 Value Index Fund | 0.11 | 0.13 | 1.25 |
1 The fund expense ratios shown are from the prospectuses dated December 29, 2008, and represent estimated costs for the current fiscal
year based on the funds’ net assets as of the prospectus date. The expense ratios for the fiscal year ended August 31, 2009, were: for the
Mega Cap 300 Index Fund, 0.11% for Institutional Shares and 0.13% for ETF Shares; for the Mega Cap 300 Growth Index Fund, 0.11% for
Institutional Shares and 0.13% for ETF Shares; and for the Mega Cap 300 Value Index Fund, 0.11% for Institutional Shares and 0.13% for
ETF Shares. Peer groups are: for the Mega Cap 300 Index Fund, the Large-Cap Core Funds Average; for the Mega Cap 300 Growth Index
Fund, the Large-Cap Growth Funds Average; and for the Mega Cap 300 Value Index Fund, the Large-Cap Value Funds Average. Peer-group
expense ratios are derived from data provided by Lipper Inc. and capture information through year-end 2008.
4
returned about 8%. Tax-exempt municipal bonds, after a flat first half, returned more than 5% for the fiscal year.
Overall weakness in stocks weighed on returns
The big-company stocks that make up the Mega Cap 300 Index Funds took a harsh pounding in the first several months of the fiscal year. Although stocks began to bounce back in mid-March, the rally wasn’t enough to overcome the earlier severe declines by the fiscal year-end.
Of the three funds, Mega Cap 300 Growth Index Fund fared the best for the 12-month period. Despite negative results from all ten market sectors, limited exposure to financial stocks turned out to be a small
win for the fund and its index. However, big losses from energy and industrial holdings took their toll on returns.
The Mega Cap 300 Value Index Fund turned in the worst performance of the three. Although the fund earned a positive contribution to returns from its holdings in the information technology and consumer discretionary sectors, the fund’s performance was dominated by the ongoing turmoil in the financial industry. As financial stocks continued to struggle throughout the year, the fund’s heavy weighting in the sector—about 25% of assets, on average, during the period—was a major drawback. Overall, financial stocks subtracted about 8 percentage points from the fund’s return.
| |
| Total Returns | |
| December 17, 2007,1 Through August 31, 2009 | |
| | Average |
| | Annual Return |
| Mega Cap 300 Index Fund ETF Shares Net Asset Value | –16.04% |
| MSCI US Large Cap 300 Index | –16.02 |
| Large-Cap Core Funds Average2 | –16.32 |
| |
| Mega Cap 300 Growth Index Fund ETF Shares Net Asset Value | –13.68% |
| MSCI US Large Cap Growth Index | –13.62 |
| Large-Cap Growth Funds Average2 | –16.35 |
| |
| Mega Cap 300 Value Index Fund ETF Shares Net Asset Value | –18.48% |
| MSCI US Large Cap Value Index | –18.54 |
| Large-Cap Value Funds Average2 | –17.42 |
The figures shown represent past performance, which is not a guarantee of future results. (Current performance
may be lower or higher than the performance data cited. For performance data current to the most recent month-
end, visit our website at www.vanguard.com/performance.) Note, too, that both investment returns and principal
value can fluctuate widely, so an investor’s shares, when sold, could be worth more or less than their original cost.
1 Inception date for ETF Shares.
2 Derived from data provided by Lipper Inc.
5
As you would expect, the return of the Mega Cap 300 Index Fund—which invests in both growth and value stocks—fell between those of the other two funds. Because it holds essentially the same stocks they do, its most significant losses stemmed from the same sectors: financials, energy, and industrials. Information technology stocks proved to be the fund’s one bright spot.
The funds have successfully tracked their indexes
The Vanguard Mega Cap 300 Index Funds were introduced in December 2007. Since then, the U.S. stock market has experienced one of the worst bear markets in history. Although their absolute returns are nothing to celebrate, the funds have succeeded over this tumultuous period by the standards of an index portfolio.
Despite the unsettled investment environment, the funds’ advisor, Vanguard Quantitative Equity Group, has managed to do an exceptional job of meeting the funds’ shared objective of tracking their respective indexes. The advisor is helped in this task by the funds’ low expense ratios, which are far below the average costs of peer funds.
Focus on the long term regardless of market conditions
During the past 12 months, U.S. stocks have experienced one of the toughest economic periods since the 1930s. Although at this point the market has recovered from some of its losses, the only certainty about its near-term direction is continued uncertainty.
At Vanguard, we encourage you to maintain a long-term perspective and avoid making hasty investment decisions based on the markets’ short-term volatility. One of the best ways to do that is to develop a well-balanced and diversified portfolio that is consistent with your long-term goals, time horizon, and risk tolerance—and then plan to stick with it. Such a portfolio should include a stable, cost-efficient mix of stocks, bonds, and short-term reserves.
Such a carefully planned investment program can help to cushion the stock market’s occasionally sharp declines while allowing you to participate in its long-term potential for growth. By providing a low-cost means of investing in the largest-capitalization stocks, either broadly or with a focus on their growth or value segments, the Vanguard Mega Cap 300 Index Funds can play an important role in your long-term investment plan.
Thank you for investing with Vanguard.
Sincerely,

F. William McNabb III
President and Chief Executive Officer
September 16, 2009
6
| | | | |
| Your Fund’s Performance at a Glance | | | | |
| August 31, 2008–August 31, 2009 | | | | |
| | | | Distributions Per Share |
| | Starting | Ending | Income | Capital |
| | Share Price | Share Price | Dividends | Gains |
| Mega Cap 300 Index Fund | | | | |
| Institutional Shares | $87.14 | $69.95 | $1.462 | $0.000 |
| ETF Shares | 44.21 | 35.49 | 0.734 | 0.000 |
| Mega Cap 300 Growth Index Fund | | | | |
| Institutional Shares | $91.10 | $74.21 | $1.043 | $0.000 |
| ETF Shares | 46.04 | 37.50 | 0.520 | 0.000 |
| Mega Cap 300 Value Index Fund | | | | |
| Institutional Shares | $83.69 | $66.02 | $2.147 | $0.000 |
| ETF Shares | 42.21 | 33.29 | 1.075 | 0.000 |
7
Results of Proxy Voting
At a special meeting of shareholders on July 2, 2009, fund shareholders approved the following two proposals:
Proposal 1—Elect trustees for each fund.*
The individuals listed in the table below were elected as trustees for each fund. All trustees with
the exception of Messrs. McNabb and Volanakis (both of whom already served as directors of
The Vanguard Group, Inc.) served as trustees to the funds prior to the shareholder meeting.
| | | |
| Mega Cap 300 Index Fund, Mega Cap 300 Growth Index Fund, Mega Cap 300 Value Index Fund |
| | | | Percentage |
| Trustee | For | Withheld | For |
| John J. Brennan | 816,325,661 | 25,839,114 | 96.9% |
| Charles D. Ellis | 811,618,878 | 30,545,897 | 96.4% |
| Emerson U. Fullwood | 816,960,560 | 25,204,215 | 97.0% |
| Rajiv L. Gupta | 815,607,429 | 26,557,346 | 96.8% |
| Amy Gutmann | 818,039,387 | 24,125,388 | 97.1% |
| JoAnn Heffernan Heisen | 815,771,400 | 26,393,375 | 96.9% |
| F. William McNabb III | 817,559,701 | 24,605,074 | 97.1% |
| André F. Perold | 814,833,250 | 27,331,525 | 96.8% |
| Alfred M. Rankin, Jr. | 815,942,907 | 26,221,868 | 96.9% |
| Peter F. Volanakis | 817,780,699 | 24,384,076 | 97.1% |
| * Results are for all funds within the same trust. | | | |
Proposal 2—Update and standardize the funds’ fundamental policies regarding:
(a) Purchasing and selling real estate.
(b) Issuing senior securities.
(c) Borrowing money.
(d) Making loans.
(e) Purchasing and selling commodities.
(f) Concentrating investments in a particular industry or group of industries.
(g) Eliminating outdated fundamental investment policies not required by law.
The revised fundamental policies are clearly stated and simple, yet comprehensive, making oversight and compliance more efficient than under the former policies. The revised fundamental policies will allow the funds to respond more quickly to regulatory and market changes, while avoiding the costs and delays associated with successive shareholder meetings.
| | | | | |
| | | | | Broker | Percentage |
| Vanguard Fund | For | Abstain | Against | Non-Votes | For |
| Mega Cap 300 Index Fund | | | | | |
| 2a | 3,029,690 | 120,798 | 413,104 | 707,369 | 70.9% |
| 2b | 3,026,047 | 123,159 | 414,386 | 707,369 | 70.9% |
| 2c | 2,868,635 | 121,543 | 573,413 | 707,370 | 67.2% |
| 2d | 2,861,682 | 123,007 | 578,904 | 707,368 | 67.0% |
| 2e | 2,856,608 | 123,078 | 583,905 | 707,370 | 67.0% |
| 2f | 2,861,469 | 120,758 | 581,365 | 707,369 | 67.0% |
| 2g | 3,017,484 | 119,727 | 426,381 | 707,369 | 70.7% |
8
| | | | | |
| | | | | Broker | Percentage |
| Vanguard Fund | For | Abstain | Against | Non-Votes | For |
| Mega Cap 300 Growth Index Fund | | | | | |
| 2a | 2,903,193 | 40,184 | 17,465 | 1,190,431 | 69.9% |
| 2b | 2,898,270 | 40,034 | 22,538 | 1,190,431 | 69.8% |
| 2c | 2,893,581 | 41,046 | 26,215 | 1,190,431 | 69.7% |
| 2d | 2,899,256 | 40,034 | 21,552 | 1,190,431 | 69.8% |
| 2e | 2,895,519 | 39,823 | 25,500 | 1,190,431 | 69.8% |
| 2f | 2,901,813 | 40,464 | 18,565 | 1,190,431 | 69.9% |
| 2g | 2,898,375 | 40,464 | 22,003 | 1,190,431 | 69.8% |
| | | | | |
| Mega Cap 300 Value Index Fund | | | | | |
| 2a | 2,691,309 | 16,409 | 16,147 | 1,062,659 | 71.1% |
| 2b | 2,689,661 | 16,431 | 17,773 | 1,062,659 | 71.0% |
| 2c | 2,680,798 | 16,209 | 26,859 | 1,062,658 | 70.8% |
| 2d | 2,686,805 | 16,331 | 20,729 | 1,062,659 | 71.0% |
| 2e | 2,681,467 | 16,431 | 25,968 | 1,062,658 | 70.8% |
| 2f | 2,686,167 | 18,997 | 18,701 | 1,062,659 | 70.9% |
| 2g | 2,682,393 | 18,762 | 22,709 | 1,062,660 | 70.8% |
9
Mega Cap 300 Index Fund
Fund Profile
As of August 31, 2009
| | | |
| Portfolio Characteristics | | |
| | | Target | Broad |
| | Fund | Index1 | Index2 |
| Number of Stocks | 303 | 304 | 4,345 |
| Median Market Cap | $50.1B | $50.1B | $27.3B |
| Price/Earnings Ratio | 21.2x | 21.2x | 26.0x |
| Price/Book Ratio | 2.2x | 2.2x | 2.1x |
| Yield3 | | 2.1% | 2.0% |
| Institutional Shares | 2.1% | | |
| ETF Shares | 2.1% | | |
| Return on Equity | 21.1% | 21.1% | 19.2% |
| Earnings Growth Rate | 10.3% | 10.0% | 9.7% |
| Foreign Holdings | 0.0% | 0.0% | 0.0% |
| Turnover Rate | 10% | — | — |
| Expense Ratio4 | | — | — |
| Institutional Shares | 0.11% | | |
| ETF Shares | 0.13% | | |
| Short-Term Reserves | 0.0% | — | — |
| | | |
| Sector Diversification (% of equity exposure) |
| | | Target | Broad |
| | Fund | Index1 | Index2 |
| Consumer Discretionary | 8.3% | 8.3% | 10.0% |
| Consumer Staples | 12.0 | 12.0 | 10.0 |
| Energy | 12.4 | 12.4 | 11.2 |
| Financials | 15.0 | 15.0 | 16.5 |
| Health Care | 13.9 | 13.9 | 13.2 |
| Industrials | 9.6 | 9.6 | 10.3 |
| Information Technology | 18.9 | 19.0 | 18.2 |
| Materials | 3.0 | 3.0 | 3.8 |
| Telecommunication | | | |
| Services | 3.5 | 3.5 | 2.9 |
| Utilities | 3.4 | 3.3 | 3.9 |
| | |
| Ten Largest Holdings5 (% of total net assets) |
| |
| ExxonMobil Corp. | integrated oil | |
| | and gas | 4.1% |
| Microsoft Corp. | systems software | 2.4 |
| Johnson & Johnson | pharmaceuticals | 2.0 |
| JPMorgan Chase & Co. | diversified financial | |
| | services | 2.0 |
| The Procter & Gamble Co. | household products | 1.9 |
| International Business | computer | |
| Machines Corp. | hardware | 1.9 |
| AT&T Inc. | integrated | |
| | telecommunication | |
| | services | 1.9 |
| Bank of America Corp. | diversified financial | |
| | services | 1.8 |
| Apple Inc. | computer hardware | 1.8 |
| General Electric Co. | industrial | |
| | conglomerates | 1.8 |
| Top Ten | | 21.6% |
Investment Focus
1 MSCI US Large Cap 300 Index.
2 Dow Jones U.S. Total Stock Market Index.
3 30-day SEC yield for the fund; annualized dividend yield for the indexes. See the Glossary.
4 The expense ratios shown are from the prospectuses dated December 29, 2008, and represent estimated costs for the current fiscal year
based on the fund’s net assets as of the prospectus date. For the fiscal year ended August 31, 2009, the expense ratios were 0.11% for
Institutional Shares and 0.13% for ETF Shares.
5 The holdings listed exclude any temporary cash investments and equity index products.
10
Mega Cap 300 Index Fund
Performance Summary
All of the returns in this report represent past performance, which is not a guarantee of future results that may be achieved by the fund. (Current performance may be lower or higher than the performance data cited. For performance data current to the most recent month-end, visit our website at www.vanguard.com/performance.) Note, too, that both investment returns and principal value can fluctuate widely, so an investor’s shares, when sold, could be worth more or less than their original cost. The returns shown do not reflect taxes that a shareholder would pay on fund distributions or on the sale of fund shares.
Cumulative Performance: December 17, 2007–August 31, 2009
Initial Investment of $10,000
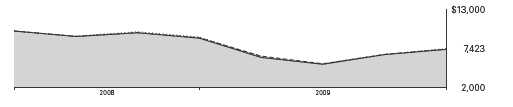
| | | |
| | Average Annual Total Returns | |
| | Periods Ended August 31, 2009 | Final Value of |
| | | Since | a $10,000 |
| | One Year | Inception1 | Investment |
| Mega Cap 300 Index Fund ETF Shares Net Asset Value | –17.85% | –16.04% | $7,423 |
| Mega Cap 300 Index Fund ETF Shares Market Price | –17.81 | –16.01 | 7,428 |
| Dow Jones U.S. Total Stock Market Index | –18.10 | –15.63 | 7,486 |
| MSCI US Large Cap 300 Index | –17.83 | –16.02 | 7,426 |
| Large-Cap Core Funds Average2 | –17.76 | –16.32 | 7,382 |
| | | | Final Value of |
| | | Since | a $5,000,000 |
| | One Year | Inception1 | Investment |
| Mega Cap 300 Index Fund Institutional Shares | –17.84% | –14.26% | $3,956,685 |
| Dow Jones U.S. Total Stock Market Index | –18.10 | –14.03 | 3,972,863 |
| MSCI US Large Cap 300 Index | –17.83 | –14.28 | 3,955,615 |
1 Performance for the fund and its comparative standards is calculated since the following inception dates: December 17, 2007, for
ETF Shares and February 22, 2008, for Institutional Shares.
2 Derived from data provided by Lipper Inc.
11
Mega Cap 300 Index Fund
| Cumulative Returns of ETF Shares: December 17, 2007–August 31, 2009 | | |
| | | Cumulative |
| | | Since |
| | One Year | Inception1 |
| Mega Cap 300 Index Fund ETF Shares Market Price | –17.81% | –25.72% |
| Mega Cap 300 Index Fund ETF Shares Net Asset Value | –17.85 | –25.77 |
| MSCI US Large Cap 300 Index | –17.83 | –25.74 |
Fiscal-Year Total Returns (%): December 17, 2007–August 31, 2009
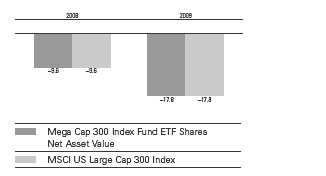
Average Annual Total Returns: Periods Ended June 30, 2009
This table presents average annual total returns through the latest calendar quarter—rather than through the end of the fiscal period. Securities and Exchange Commission rules require that we provide this information.
| | | |
| | | | Since |
| | Inception Date | One Year | Inception |
| ETF Shares | 12/17/2007 | | |
| Market Price | | –25.18% | –22.97% |
| Net Asset Value | | –25.26 | –23.01 |
| Institutional Shares | 2/22/2008 | –25.23 | –22.08 |
1 Performance for the fund’s ETF Shares and comparative standards is calculated since the ETF Shares’ inception: December 17, 2007.
Note: See Financial Highlights tables for dividend and capital gains information.
12
Mega Cap 300 Index Fund
Financial Statements
Statement of Net Assets
As of August 31, 2009
The fund provides a complete list of its holdings four times in each fiscal year, at the quarter-ends. For the second and fourth fiscal quarters, the lists appear in the fund’s semiannual and annual reports to shareholders. For the first and third fiscal quarters, the fund files the lists with the Securities and Exchange Commission on Form N-Q. Shareholders can look up the fund’s Forms N-Q on the SEC’s website at www.sec.gov. Forms N-Q may also be reviewed and copied at the SEC’s Public Reference Room (see the back cover of this report for further information).
| | | |
| | | | Market |
| | | | Value• |
| | | Shares | ($000) |
| Common Stocks (100.0%) | | |
| Consumer Discretionary (8.3%) | | |
| | McDonald’s Corp. | 40,023 | 2,251 |
| | Home Depot, Inc. | 61,537 | 1,679 |
| | The Walt Disney Co. | 63,992 | 1,666 |
| | Target Corp. | 25,893 | 1,217 |
| | Time Warner Inc. | 43,406 | 1,211 |
| | Lowe’s Cos., Inc. | 53,475 | 1,150 |
| | Comcast Corp. Class A | 66,966 | 1,026 |
| * | Amazon.com, Inc. | 12,470 | 1,012 |
| | News Corp., Class A | 74,525 | 799 |
| * | Ford Motor Co. | 101,295 | 770 |
| | NIKE, Inc. Class B | 13,395 | 742 |
| | Yum! Brands, Inc. | 16,746 | 574 |
| | Staples, Inc. | 25,952 | 561 |
| | TJX Cos., Inc. | 15,103 | 543 |
| * | Kohl’s Corp. | 10,499 | 542 |
| | Johnson Controls, Inc. | 21,550 | 534 |
| * | Starbucks Corp. | 26,646 | 506 |
| * | Liberty Media Corp. | 17,898 | 499 |
| * | Viacom Inc. Class B | 19,921 | 499 |
| | Comcast Corp. Special | | |
| | Class A | 33,553 | 490 |
| * | Time Warner Cable Inc. | 12,783 | 472 |
| | Best Buy Co., Inc. | 12,837 | 466 |
| | Carnival Corp. | 15,886 | 465 |
| * | DIRECTV Group, Inc. | 18,429 | 456 |
| | Omnicom Group Inc. | 11,279 | 410 |
| | The McGraw-Hill Cos., Inc. | 11,409 | 383 |
| | The Gap, Inc. | 17,945 | 353 |
| * | Bed Bath & Beyond, Inc. | 9,464 | 345 |
| | Coach, Inc. | 11,645 | 329 |
| * | Apollo Group, Inc. Class A | 4,945 | 321 |
| | Marriott International, Inc. | | |
| | Class A | 10,839 | 259 |
| | Macy’s Inc. | 15,294 | 237 |
| | J.C. Penney Co., Inc. | | |
| | (Holding Co.) | 7,652 | 230 |
| | VF Corp. | 3,202 | 223 |
| | CBS Corp. | 21,273 | 220 |
| | | |
| | | | Market |
| | | | Value• |
| | | Shares | ($000) |
| | Sherwin-Williams Co. | 3,621 | 218 |
| | Fortune Brands, Inc. | 5,449 | 217 |
| * | AutoZone Inc. | 1,190 | 175 |
| * | Las Vegas Sands Corp. | 11,957 | 170 |
| | Garmin Ltd. | 4,354 | 143 |
| *,^ | Sears Holdings Corp. | 2,022 | 128 |
| * | DISH Network Corp. | 7,557 | 123 |
| * | Liberty Global, Inc. Class A | 4,946 | 108 |
| * | Liberty Global, Inc. Series C | 4,547 | 99 |
| | News Corp., Class B | 7,118 | 90 |
| | | | 24,911 |
| Consumer Staples (12.0%) | | |
| | The Procter & Gamble Co. | 105,740 | 5,721 |
| | Wal-Mart Stores, Inc. | 85,191 | 4,334 |
| | The Coca-Cola Co. | 75,586 | 3,686 |
| | Philip Morris International Inc. | 71,162 | 3,253 |
| | PepsiCo, Inc. | 56,478 | 3,201 |
| | CVS Caremark Corp. | 52,817 | 1,982 |
| | Kraft Foods Inc. | 53,429 | 1,515 |
| | Altria Group, Inc. | 75,011 | 1,371 |
| | Colgate-Palmolive Co. | 18,123 | 1,317 |
| | Walgreen Co. | 35,978 | 1,219 |
| | Kimberly-Clark Corp. | 14,996 | 907 |
| | Costco Wholesale Corp. | 15,746 | 803 |
| | General Mills, Inc. | 11,935 | 713 |
| | Archer-Daniels-Midland Co. | 20,930 | 603 |
| | Sysco Corp. | 21,373 | 545 |
| | Avon Products, Inc. | 15,465 | 493 |
| | The Kroger Co. | 22,422 | 484 |
| | Kellogg Co. | 9,698 | 457 |
| | Lorillard, Inc. | 6,099 | 444 |
| | H.J. Heinz Co. | 11,417 | 439 |
| | ConAgra Foods, Inc. | 16,225 | 333 |
| | The Clorox Co. | 5,044 | 298 |
| | Safeway, Inc. | 15,564 | 296 |
| | Reynolds American Inc. | 6,325 | 289 |
| | Molson Coors Brewing Co. | | |
| | Class B | 5,501 | 261 |
| | Campbell Soup Co. | 7,791 | 244 |
| | Sara Lee Corp. | 24,009 | 233 |
13
Mega Cap 300 Index Fund
| | | |
| | | | Market |
| | | | Value• |
| | | Shares | ($000) |
| | The Hershey Co. | 5,731 | 225 |
| | Coca-Cola Enterprises, Inc. | 10,637 | 215 |
| | The Pepsi Bottling Group, Inc. | 5,383 | 192 |
| | Brown-Forman Corp. Class B | 2,911 | 130 |
| | | | 36,203 |
| Energy (12.4%) | | |
| | ExxonMobil Corp. | 177,027 | 12,241 |
| | Chevron Corp. | 72,727 | 5,087 |
| | Schlumberger Ltd. | 43,404 | 2,439 |
| | ConocoPhillips Co. | 51,061 | 2,299 |
| | Occidental Petroleum Corp. | 29,407 | 2,150 |
| | Apache Corp. | 12,160 | 1,033 |
| | Anadarko Petroleum Corp. | 18,081 | 956 |
| | Devon Energy Corp. | 15,279 | 938 |
| * | Transocean Ltd. | 11,635 | 882 |
| | Marathon Oil Corp. | 25,677 | 793 |
| | Halliburton Co. | 32,486 | 770 |
| | XTO Energy, Inc. | 19,944 | 770 |
| | EOG Resources, Inc. | 9,081 | 654 |
| * | National Oilwell Varco Inc. | 15,141 | 550 |
| | Hess Corp. | 10,678 | 540 |
| * | Weatherford | | |
| | International Ltd. | 25,331 | 505 |
| | Chesapeake Energy Corp. | 21,581 | 493 |
| * | Southwestern Energy Co. | 12,466 | 460 |
| | Spectra Energy Corp. | 23,399 | 440 |
| | Baker Hughes Inc. | 11,236 | 387 |
| | Noble Energy, Inc. | 6,280 | 380 |
| | Valero Energy Corp. | 20,184 | 378 |
| | Murphy Oil Corp. | 6,566 | 374 |
| | Williams Cos., Inc. | 21,019 | 346 |
| | Noble Corp. | 9,507 | 333 |
| | Peabody Energy Corp. | 9,675 | 316 |
| * | Ultra Petroleum Corp. | 5,496 | 255 |
| | Diamond Offshore | | |
| | Drilling, Inc. | 2,511 | 225 |
| | Smith International, Inc. | 7,902 | 218 |
| | | | 37,212 |
| Financials (15.0%) | | |
| | JPMorgan Chase & Co. | 136,377 | 5,927 |
| | Bank of America Corp. | 313,517 | 5,515 |
| | Wells Fargo & Co. | 158,704 | 4,367 |
| | The Goldman Sachs | | |
| | Group, Inc. | 17,351 | 2,871 |
| | Citigroup Inc. | 411,619 | 2,058 |
| | U.S. Bancorp | 68,842 | 1,557 |
| * | Berkshire Hathaway Inc. | | |
| | Class B | 404 | 1,327 |
| | American Express Co. | 38,124 | 1,289 |
| | Bank of New York | | |
| | Mellon Corp. | 43,369 | 1,284 |
| | Morgan Stanley | 42,708 | 1,237 |
| | MetLife, Inc. | 29,695 | 1,121 |
| | The Travelers Cos., Inc. | 21,239 | 1,071 |
| | State Street Corp. | 17,615 | 924 |
| | Prudential Financial, Inc. | 16,506 | 835 |
| | | |
| | | | Market |
| | | | Value• |
| | | Shares | ($000) |
| | BB&T Corp. | 24,677 | 689 |
| | PNC Financial | | |
| | Services Group | 16,149 | 688 |
| | AFLAC Inc. | 16,918 | 687 |
| | Simon Property Group, Inc. | | |
| | REIT | 10,185 | 648 |
| | Charles Schwab Corp. | 35,750 | 646 |
| | Ace Ltd. | 12,186 | 636 |
| | The Chubb Corp. | 12,870 | 636 |
| | CME Group, Inc. | 2,184 | 636 |
| | Capital One Financial Corp. | 16,381 | 611 |
| | Franklin Resources, Inc. | 5,917 | 552 |
| | The Allstate Corp. | 18,467 | 543 |
| | Northern Trust Corp. | 7,796 | 456 |
| | Marsh & McLennan | | |
| | Cos., Inc. | 18,957 | 446 |
| | Loews Corp. | 12,593 | 430 |
| | T. Rowe Price Group Inc. | 9,259 | 420 |
| | SunTrust Banks, Inc. | 16,866 | 394 |
| * | Progressive Corp. of Ohio | 23,471 | 388 |
| | Aon Corp. | 9,038 | 377 |
| | Annaly Capital | | |
| | Management Inc. REIT | 19,777 | 343 |
| | Vornado Realty Trust REIT | 5,712 | 329 |
| | Public Storage, Inc. REIT | 4,601 | 325 |
| | The Principal Financial | | |
| | Group, Inc. | 11,273 | 320 |
| | Invesco, Ltd. | 14,872 | 309 |
| | Boston Properties, Inc. REIT | 4,952 | 300 |
| | Ameriprise Financial, Inc. | 9,277 | 279 |
| | NYSE Euronext | 9,630 | 273 |
| | Equity Residential REIT | 9,871 | 270 |
| | Hudson City Bancorp, Inc. | 17,016 | 223 |
| | Moody’s Corp. | 7,251 | 197 |
| * | TD Ameritrade Holding Corp. | 9,564 | 184 |
| * | Leucadia National Corp. | 6,922 | 172 |
| | M & T Bank Corp. | 2,759 | 170 |
| | BlackRock, Inc. | 785 | 157 |
| | | | 45,117 |
| Health Care (13.8%) | | |
| | Johnson & Johnson | 99,967 | 6,042 |
| | Pfizer Inc. | 244,806 | 4,088 |
| | Abbott Laboratories | 56,067 | 2,536 |
| | Merck & Co., Inc. | 76,595 | 2,484 |
| | Wyeth | 48,380 | 2,315 |
| * | Amgen Inc. | 36,727 | 2,194 |
| | Schering-Plough Corp. | 58,945 | 1,661 |
| | Bristol-Myers Squibb Co. | 71,864 | 1,590 |
| | Medtronic, Inc. | 40,606 | 1,555 |
| * | Gilead Sciences, Inc. | 32,910 | 1,483 |
| | Eli Lilly & Co. | 37,516 | 1,255 |
| | Baxter International, Inc. | 21,949 | 1,249 |
| | UnitedHealth Group Inc. | 43,153 | 1,208 |
| * | Medco Health Solutions, Inc. | 17,499 | 966 |
| * | WellPoint Inc. | 17,581 | 929 |
| * | Celgene Corp. | 16,668 | 870 |
14
Mega Cap 300 Index Fund
| | | |
| | | | Market |
| | | | Value• |
| | | Shares | ($000) |
| | Covidien PLC | 18,245 | 722 |
| * | Thermo Fisher Scientific, Inc. | 15,207 | 688 |
| * | Express Scripts Inc. | 9,325 | 674 |
| * | Boston Scientific Corp. | 54,650 | 642 |
| | Allergan, Inc. | 11,047 | 618 |
| | Becton, Dickinson & Co. | 8,673 | 604 |
| | McKesson Corp. | 9,933 | 565 |
| * | Genzyme Corp. | 9,785 | 545 |
| * | Biogen Idec Inc. | 10,468 | 526 |
| * | St. Jude Medical, Inc. | 12,566 | 484 |
| | Aetna Inc. | 16,212 | 462 |
| | Cardinal Health, Inc. | 13,079 | 452 |
| | Stryker Corp. | 10,759 | 446 |
| * | Zimmer Holdings, Inc. | 7,803 | 370 |
| * | Forest Laboratories, Inc. | 10,913 | 319 |
| | Quest Diagnostics, Inc. | 5,716 | 309 |
| | CIGNA Corp. | 9,896 | 291 |
| | C.R. Bard, Inc. | 3,607 | 291 |
| * | Laboratory Corp. of | | |
| | America Holdings | 3,937 | 275 |
| | | | 41,708 |
| Industrials (9.6%) | | |
| | General Electric Co. | 384,173 | 5,340 |
| | United Technologies Corp. | 32,488 | 1,929 |
| | 3M Co. | 23,903 | 1,723 |
| | United Parcel Service, Inc. | 25,368 | 1,356 |
| | The Boeing Co. | 24,988 | 1,241 |
| | Union Pacific Corp. | 18,289 | 1,094 |
| | Burlington Northern | | |
| | Santa Fe Corp. | 12,319 | 1,023 |
| | Emerson Electric Co. | 27,354 | 1,009 |
| | Caterpillar, Inc. | 21,831 | 989 |
| | Honeywell International Inc. | 25,637 | 942 |
| | Lockheed Martin Corp. | 12,173 | 913 |
| | FedEx Corp. | 10,708 | 736 |
| | General Dynamics Corp. | 11,881 | 703 |
| | Raytheon Co. | 14,296 | 674 |
| | Deere & Co. | 15,302 | 667 |
| | Illinois Tool Works, Inc. | 15,398 | 644 |
| | Norfolk Southern Corp. | 13,285 | 609 |
| | CSX Corp. | 14,201 | 604 |
| | Danaher Corp. | 9,823 | 596 |
| | Northrop Grumman Corp. | 11,148 | 544 |
| | Tyco International Ltd. | 17,168 | 544 |
| | Waste Management Inc. | 16,918 | 506 |
| | Precision Castparts Corp. | 5,078 | 464 |
| | PACCAR, Inc. | 12,499 | 452 |
| | Ingersoll-Rand PLC | 11,523 | 356 |
| | Republic Services, Inc. | | |
| | Class A | 13,668 | 350 |
| | Fluor Corp. | 6,595 | 349 |
| | C.H. Robinson | | |
| | Worldwide Inc. | 6,156 | 346 |
| | L-3 Communications | | |
| | Holdings, Inc. | 4,302 | 320 |
| | | |
| | | | Market |
| | | | Value• |
| | | Shares | ($000) |
| | Cummins Inc. | 6,952 | 315 |
| | ITT Industries, Inc. | 6,247 | 313 |
| | Eaton Corp. | 5,684 | 307 |
| | Parker Hannifin Corp. | 5,839 | 284 |
| | Expeditors International of | | |
| | Washington, Inc. | 7,701 | 252 |
| | Southwest Airlines Co. | 26,999 | 221 |
| * | First Solar, Inc. | 1,686 | 205 |
| | | | 28,920 |
| Information Technology (19.0%) | |
| | Microsoft Corp. | 290,581 | 7,163 |
| | International Business | | |
| | Machines Corp. | 47,938 | 5,659 |
| * | Apple Inc. | 32,365 | 5,444 |
| * | Cisco Systems, Inc. | 209,249 | 4,520 |
| | Intel Corp. | 202,615 | 4,117 |
| * | Google Inc. | 8,747 | 4,038 |
| | Hewlett-Packard Co. | 86,757 | 3,895 |
| | Oracle Corp. | 144,632 | 3,163 |
| | QUALCOMM Inc. | 60,042 | 2,787 |
| * | EMC Corp. | 73,028 | 1,161 |
| | Visa Inc. | 16,293 | 1,159 |
| | Texas Instruments, Inc. | 46,253 | 1,137 |
| * | Dell Inc. | 63,703 | 1,008 |
| * | eBay Inc. | 39,675 | 878 |
| | Corning, Inc. | 56,300 | 849 |
| | Accenture Ltd. | 22,247 | 734 |
| * | Yahoo! Inc. | 48,101 | 703 |
| | Automatic Data | | |
| | Processing, Inc. | 18,270 | 701 |
| | MasterCard, Inc. Class A | 3,208 | 650 |
| | Applied Materials, Inc. | 48,220 | 636 |
| * | Adobe Systems, Inc. | 19,017 | 598 |
| | Motorola, Inc. | 83,165 | 597 |
| | Western Union Co. | 25,441 | 459 |
| * | Symantec Corp. | 29,780 | 450 |
| * | Broadcom Corp. | 15,593 | 444 |
| * | Juniper Networks, Inc. | 19,170 | 442 |
| * | Tyco Electronics Ltd. | 16,539 | 377 |
| * | Cognizant Technology | | |
| | Solutions Corp. | 10,580 | 369 |
| | CA, Inc. | 15,024 | 335 |
| | Paychex, Inc. | 11,783 | 333 |
| * | Agilent Technologies, Inc. | 12,525 | 322 |
| * | Intuit, Inc. | 11,034 | 306 |
| | Analog Devices, Inc. | 10,567 | 299 |
| * | NVIDIA Corp. | 19,816 | 288 |
| * | NetApp, Inc. | 12,009 | 273 |
| | Xerox Corp. | 31,238 | 270 |
| * | Sun Microsystems, Inc. | 27,060 | 251 |
| * | Activision Blizzard, Inc. | 21,006 | 244 |
| * | Electronic Arts Inc. | 11,616 | 212 |
| * | VMware Inc. | 1,835 | 65 |
| | | | 57,336 |
15
Mega Cap 300 Index Fund
| | | |
| | | | Market |
| | | | Value• |
| | | Shares | ($000) |
| Materials (3.0%) | | |
| | Monsanto Co. | 19,783 | 1,659 |
| | E.I. du Pont de | | |
| | Nemours & Co. | 32,781 | 1,047 |
| | Freeport-McMoRan Copper | | |
| | & Gold, Inc. Class B | 14,913 | 939 |
| | Praxair, Inc. | 11,134 | 853 |
| | Dow Chemical Co. | 39,033 | 831 |
| | Newmont Mining Corp. | | |
| | (Holding Co.) | 17,334 | 697 |
| | Air Products & | | |
| | Chemicals, Inc. | 7,613 | 571 |
| | Nucor Corp. | 11,391 | 507 |
| | Alcoa Inc. | 35,346 | 426 |
| | Ecolab, Inc. | 8,643 | 365 |
| | International Paper Co. | 14,896 | 342 |
| | PPG Industries, Inc. | 5,960 | 330 |
| | Weyerhaeuser Co. | 7,665 | 287 |
| | The Mosaic Co. | 5,643 | 274 |
| | | | 9,128 |
| Telecommunication Services (3.5%) | |
| | AT&T Inc. | 214,043 | 5,576 |
| | Verizon | | |
| | Communications Inc. | 103,052 | 3,199 |
| * | American Tower Corp. | | |
| | Class A | 14,410 | 456 |
| * | Sprint Nextel Corp. | 101,451 | 371 |
| | CenturyTel, Inc. | 10,741 | 346 |
| * | Crown Castle | | |
| | International Corp. | 10,489 | 282 |
| | Qwest Communications | | |
| | International Inc. | 55,807 | 200 |
| | | | 10,430 |
| Utilities (3.4%) | | |
| | Exelon Corp. | 23,860 | 1,193 |
| | Southern Co. | 28,386 | 886 |
| | FPL Group, Inc. | 14,158 | 795 |
| | |
| | | Market |
| | | Value• |
| | Shares | ($000) |
| Duke Energy Corp. | 46,695 | 723 |
| Dominion Resources, Inc. | 21,403 | 708 |
| Public Service Enterprise | | |
| Group, Inc. | 18,308 | 580 |
| Entergy Corp. | 7,115 | 562 |
| American Electric | | |
| Power Co., Inc. | 17,297 | 544 |
| PG&E Corp. | 13,364 | 542 |
| FirstEnergy Corp. | 11,062 | 499 |
| Sempra Energy | 8,392 | 421 |
| Progress Energy, Inc. | 10,124 | 400 |
| PPL Corp. | 13,593 | 400 |
| Consolidated Edison Inc. | 9,938 | 399 |
| Edison International | 11,232 | 375 |
| * AES Corp. | 24,063 | 329 |
| Xcel Energy, Inc. | 16,531 | 327 |
| Ameren Corp. | 7,704 | 208 |
| Constellation Energy | | |
| Group, Inc. | 6,462 | 205 |
| | | 10,096 |
| Total Common Stocks | | |
| (Cost $327,607) | | 301,061 |
| Temporary Cash Investment (0.0%) | |
| Money Market Fund (0.0%) | | |
| 1,2 Vanguard Market | | |
| Liquidity Fund, 0.277% | | |
| (Cost $119) | 118,801 | 119 |
| Total Investments (100.0%) | | |
| (Cost $327,726) | | 301,180 |
| Other Assets and Liabilities (0.0%) | |
| Other Assets | | 1,714 |
| Liabilities2 | | (1,709) |
| | | 5 |
| Net Assets (100%) | | 301,185 |
16
Mega Cap 300 Index Fund
| |
| At August 31, 2009, net assets consisted of: |
| | Amount |
| | ($000) |
| Paid-in Capital | 341,004 |
| Undistributed Net Investment Income | 1,167 |
| Accumulated Net Realized Losses | (14,440) |
| Unrealized Appreciation (Depreciation) | (26,546) |
| Net Assets | 301,185 |
| |
| |
| Institutional Shares—Net Assets | |
| Applicable to 1,464,915 outstanding | |
| $.001 par value shares of beneficial | |
| interest (unlimited authorization) | 102,468 |
| Net Asset Value Per Share— | |
| Institutional Shares | $69.95 |
| |
| |
| ETF Shares—Net Assets | |
| Applicable to 5,600,000 outstanding | |
| $.001 par value shares of beneficial | |
| interest (unlimited authorization) | 198,717 |
| Net Asset Value Per Share— | |
| ETF Shares | $35.49 |
• See Note A in Notes to Financial Statements.
* Non-income-producing security.
^ Part of security position is on loan to broker-dealers. The total value of securities on loan is $114,000.
1 Affiliated money market fund available only to Vanguard funds and certain trusts and accounts managed by Vanguard. Rate shown is the
7-day yield.
2 Includes $119,000 of collateral received for securities on loan.
REIT—Real Estate Investment Trust.
See accompanying Notes, which are an integral part of the Financial Statements.
17
Mega Cap 300 Index Fund
Statement of Operations
| |
| | Year Ended |
| | August 31, 2009 |
| | ($000) |
| Investment Income | |
| Income | |
| Dividends | 5,963 |
| Interest1 | 3 |
| Security Lending | 39 |
| Total Income | 6,005 |
| Expenses | |
| The Vanguard Group—Note B | |
| Investment Advisory Services | 32 |
| Management and Administrative—Institutional Shares | 37 |
| Management and Administrative—ETF Shares | 73 |
| Marketing and Distribution—Institutional Shares | 25 |
| Marketing and Distribution—ETF Shares | 35 |
| Custodian Fees | 27 |
| Auditing Fees | 24 |
| Shareholders’ Reports and Proxies—Institutional Shares | — |
| Shareholders’ Reports and Proxies—ETF Shares | 18 |
| Total Expenses | 271 |
| Net Investment Income | 5,734 |
| Realized Net Gain (Loss) | |
| Investment Securities Sold | (9,477) |
| Futures Contracts | 111 |
| Realized Net Gain (Loss) | (9,366) |
| Change in Unrealized Appreciation (Depreciation) of Investment Securities | (19,732) |
| Net Increase (Decrease) in Net Assets Resulting from Operations | (23,364) |
1 Interest income from an affiliated company of the fund was $3,000.
See accompanying Notes, which are an integral part of the Financial Statements.
18
Mega Cap 300 Index Fund
Statement of Changes in Net Assets
| | |
| | | December 17, |
| | Year Ended | 20071 to |
| | August 31, | August 31, |
| | 2009 | 2008 |
| | ($000) | ($000) |
| Increase (Decrease) in Net Assets | | |
| Operations | | |
| Net Investment Income | 5,734 | 1,004 |
| Realized Net Gain (Loss) | (9,366) | 416 |
| Change in Unrealized Appreciation (Depreciation) | (19,732) | (6,814) |
| Net Increase (Decrease) in Net Assets Resulting from Operations | (23,364) | (5,394) |
| Distributions | | |
| Net Investment Income | | |
| Institutional Shares | (2,078) | (216) |
| ETF Shares | (2,970) | (307) |
| Realized Capital Gain | | |
| Institutional Shares | — | — |
| ETF Shares | — | — |
| Total Distributions | (5,048) | (523) |
| Capital Share Transactions | | |
| Institutional Shares | 69,994 | 56,057 |
| ETF Shares | 118,353 | 91,110 |
| Net Increase (Decrease) from Capital Share Transactions | 188,347 | 147,167 |
| Total Increase (Decrease) | 159,935 | 141,250 |
| Net Assets | | |
| Beginning of Period | 141,250 | — |
| End of Period2 | 301,185 | 141,250 |
1 Inception.
2 Net Assets—End of Period includes undistributed net investment income of $1,167,000 and $481,000.
See accompanying Notes, which are an integral part of the Financial Statements.
19
Mega Cap 300 Index Fund
Financial Highlights
| | |
| Institutional Shares | | |
| | Year | Feb. 22, |
| | Ended | 20081 to |
| | August 31, | August 31, |
| For a Share Outstanding Throughout Each Period | 2009 | 2008 |
| Net Asset Value, Beginning of Period | $87.14 | $91.07 |
| Investment Operations | | |
| Net Investment Income | 1.6812 | .685 |
| Net Realized and Unrealized Gain (Loss) on Investments | (17.409) | (4.028) |
| Total from Investment Operations | (15.728) | (3.343) |
| Distributions | | |
| Dividends from Net Investment Income | (1.462) | (.587) |
| Distributions from Realized Capital Gains | — | — |
| Total Distributions | (1.462) | (.587) |
| Net Asset Value, End of Period | $69.95 | $87.14 |
| |
| Total Return | –17.84% | –3.69% |
| |
| Ratios/Supplemental Data | | |
| Net Assets, End of Period (Millions) | $102 | $53 |
| Ratio of Total Expenses to Average Net Assets | 0.11% | 0.08%3 |
| Ratio of Net Investment Income to Average Net Assets | 2.59% | 2.14%3 |
| Portfolio Turnover Rate4 | 10% | 30% |
1 Inception.
2 Calculated based on average shares outstanding.
3 Annualized.
4 Excludes the value of portfolio securities received or delivered as a result of in-kind purchases or redemptions of the fund’s capital shares,
including ETF Creation Units.
See accompanying Notes, which are an integral part of the Financial Statements.
20
Mega Cap 300 Index Fund
Financial Highlights
| | |
| ETF Shares | | |
| | Year | Dec. 17, |
| | Ended | 20071 to |
| | August 31, | August 31, |
| For a Share Outstanding Throughout Each Period | 2009 | 2008 |
| Net Asset Value, Beginning of Period | $44.21 | $49.24 |
| Investment Operations | | |
| Net Investment Income | .8222 | .441 |
| Net Realized and Unrealized Gain (Loss) on Investments | (8.808) | (5.179) |
| Total from Investment Operations | (7.986) | (4.738) |
| Distributions | | |
| Dividends from Net Investment Income | (.734) | (.292) |
| Distributions from Realized Capital Gains | — | — |
| Total Distributions | (.734) | (.292) |
| Net Asset Value, End of Period | $35.49 | $44.21 |
| |
| Total Return | –17.85% | –9.64% |
| |
| Ratios/Supplemental Data | | |
| Net Assets, End of Period (Millions) | $199 | $88 |
| Ratio of Total Expenses to Average Net Assets | 0.13% | 0.13%3 |
| Ratio of Net Investment Income to Average Net Assets | 2.57% | 2.09%3 |
| Portfolio Turnover Rate4 | 10% | 30% |
1 Inception.
2 Calculated based on average shares outstanding.
3 Annualized.
4 Excludes the value of portfolio securities received or delivered as a result of in-kind purchases or redemptions of the fund’s capital shares,
including ETF Creation Units.
See accompanying Notes, which are an integral part of the Financial Statements.
21
Mega Cap 300 Index Fund
Notes to Financial Statements
Vanguard Mega Cap 300 Index Fund is registered under the Investment Company Act of 1940 as an open-end investment company, or mutual fund. The fund offers two classes of shares: Institutional Shares and ETF Shares. Institutional Shares are designed for investors who meet certain administrative and service criteria and invest a minimum of $5 million. ETF Shares are listed for trading on the NYSE Arca, Inc.; they can be purchased and sold through a broker.
A. The following significant accounting policies conform to generally accepted accounting principles for U.S. mutual funds. The fund consistently follows such policies in preparing its financial statements.
1. Security Valuation: Securities are valued as of the close of trading on the New York Stock Exchange (generally 4 p.m., Eastern time) on the valuation date. Equity securities are valued at the latest quoted sales prices or official closing prices taken from the primary market in which each security trades; such securities not traded on the valuation date are valued at the mean of the latest quoted bid and asked prices. Securities for which market quotations are not readily available, or whose values have been materially affected by events occurring before the fund’s pricing time but after the close of the securities’ primary markets, are valued by methods deemed by the board of trustees to represent fair value. Investments in Vanguard Market Liquidity Fund are valued at that fund’s net asset value.
2. Futures Contracts: The fund uses index futures contracts to a limited extent, with the objectives of maintaining full exposure to the stock market, enhancing returns, maintaining liquidity, and minimizing transaction costs. The fund may purchase futures contracts to immediately invest incoming cash in the market, or sell futures in response to cash outflows, thereby simulating a fully invested position in the underlying index while maintaining a cash balance for liquidity. The fund may seek to enhance returns by using futures contracts instead of the underlying securities when futures are believed to be priced more attractively than the underlying securities. The primary risks associated with the use of futures contracts are imperfect correlation between changes in market values of stocks held by the fund and the prices of futures contracts, and the possibility of an illiquid market.
Futures contracts are valued at their quoted daily settlement prices. The aggregate principal amounts of the contracts are not recorded in the Statement of Net Assets. Fluctuations in the value of the contracts are recorded in the Statement of Net Assets as an asset (liability) and in the Statement of Operations as unrealized appreciation (depreciation) until the contracts are closed, when they are recorded as realized futures gains (losses).
3. Federal Income Taxes: The fund intends to continue to qualify as a regulated investment company and distribute all of its taxable income. Management has analyzed the fund’s tax positions taken for all open federal income tax years (August 31, 2008–2009), and has concluded that no provision for federal income tax is required in the fund’s financial statements.
4. Distributions: Distributions to shareholders are recorded on the ex-dividend date.
5. Security Lending: The fund may lend its securities to qualified institutional borrowers to earn additional income. Security loans are required to be secured at all times by collateral at least equal to the market value of securities loaned. The fund invests cash collateral received in Vanguard Market Liquidity Fund, and records a liability for the return of the collateral, during the period the securities are on loan. Security lending income represents the income earned on investing cash collateral, less expenses associated with the loan.
22
Mega Cap 300 Index Fund
6. Other: Dividend income is recorded on the ex-dividend date. Interest income includes income distributions received from Vanguard Market Liquidity Fund and is accrued daily. Security transactions are accounted for on the date securities are bought or sold. Costs used to determine realized gains (losses) on the sale of investment securities are those of the specific securities sold.
Each class of shares has equal rights as to assets and earnings, except that each class separately bears certain class-specific expenses related to maintenance of shareholder accounts (included in Management and Administrative expenses), shareholder reporting, and proxies. Marketing and distribution expenses are allocated to each class of shares based on a method approved by the board of trustees. Income, other non-class-specific expenses, and gains and losses on investments are allocated to each class of shares based on its relative net assets.
B. The Vanguard Group furnishes at cost investment advisory, corporate management, administrative, marketing, and distribution services. The costs of such services are allocated to the fund under methods approved by the board of trustees. The fund has committed to provide up to 0.40% of its net assets in capital contributions to Vanguard. At August 31, 2009, the fund had contributed capital of $64,000 to Vanguard (included in Other Assets), representing 0.02% of the fund’s net assets and 0.03% of Vanguard’s capitalization. The fund’s trustees and officers are also directors and officers of Vanguard.
C. Various inputs may be used to determine the value of the fund’s investments. These inputs are summarized in three broad levels for financial statement purposes. The inputs or methodologies used to value securities are not necessarily an indication of the risk associated with investing in those securities.
Level 1—Quoted prices in active markets for identical securities.
Level 2—Other significant observable inputs (including quoted prices for similar securities, interest
rates, prepayment speeds, credit risk, etc.).
Level 3—Significant unobservable inputs (including the fund’s own assumptions used to determine the
fair value of investments).
At August 31, 2009, 100% of the fund’s investments were valued based on Level 1 inputs.
D. Distributions are determined on a tax basis and may differ from net investment income and realized capital gains for financial reporting purposes. Differences may be permanent or temporary. Permanent differences are reclassified among capital accounts in the financial statements to reflect their tax character. Temporary differences arise when certain items of income, expense, gain, or loss are recognized in different periods for financial statement and tax purposes; these differences will reverse at some time in the future. Differences in classification may also result from the treatment of short-term gains as ordinary income for tax purposes.
During the year ended August 31, 2009, the fund realized $3,235,000 of net capital gains resulting from in-kind redemptions—in which shareholders exchanged fund shares for securities held by the fund rather than for cash. Because such gains are not taxable to the fund, and are not distributed to shareholders, they have been reclassified from accumulated net realized losses to paid-in capital.
For tax purposes, at August 31, 2009, the fund had $1,216,000 of ordinary income available for distribution. The fund had available capital loss carryforwards totaling $948,000 to offset future net capital gains through August 31, 2017. In addition, the fund realized losses of $13,472,000 during the period from November 1, 2008, through August 31, 2009, which are deferred and will be treated as realized for tax purposes in fiscal 2010.
23
Mega Cap 300 Index Fund
At August 31, 2009, the cost of investment securities for tax purposes was $327,746,000. Net unrealized depreciation of investment securities for tax purposes was $26,566,000, consisting of unrealized gains of $8,155,000 on securities that had risen in value since their purchase and $34,721,000 in unrealized losses on securities that had fallen in value since their purchase.
E. During the year ended August 31, 2009, the fund purchased $391,851,000 of investment securities and sold $202,659,000 of investment securities, other than temporary cash investments.
F. Capital share transactions for each class of shares were:
| | | | |
| | Year Ended | Inception1 to |
| | August 31, 2009 | August 31, 2008 |
| | Amount | Shares | Amount | Shares |
| | ($000) | (000) | ($000) | (000) |
| Institutional Shares | | | | |
| Issued | 69,116 | 847 | 60,241 | 673 |
| Issued in Lieu of Cash Distributions | 2,078 | 33 | 216 | 2 |
| Redeemed | (1,200) | (21) | (6,200) | (69) |
| Net Increase (Decrease)—Institutional Shares | 69,994 | 859 | 56,057 | 606 |
| ETF Shares | | | | |
| Issued | 299,108 | 8,500 | 117,638 | 2,600 |
| Issued in Lieu of Cash Distributions | — | — | — | — |
| Redeemed | (180,755) | (4,900) | (26,528) | (600) |
| Net Increase (Decrease)—ETF Shares | 118,353 | 3,600 | 91,110 | 2,000 |
| 1 Inception was February 22, 2008, for Institutional Shares and December 17, 2007, for ETF Shares. | | |
The amount of Institutional Shares issued during the year ended August 31, 2009, includes $58,176,000 in purchases that were processed late and should have been recorded in the prior fiscal period. Vanguard, as transfer agent for the fund, offset any impact to the fund resulting from late processing of shareholder transactions. Accordingly, the purchases had no impact to the fund’s net asset value per share or total returns.
G. In preparing the financial statements as of August 31, 2009, management considered the impact of subsequent events occurring through October 15, 2009, for potential recognition or disclosure in these financial statements.
24
Mega Cap 300 Growth Index Fund
Fund Profile
As of August 31, 2009
| | | |
| Portfolio Characteristics | | |
| | | Target | Broad |
| | Fund | Index1 | Index2 |
| Number of Stocks | 178 | 178 | 4,345 |
| Median Market Cap | $46.3B | $46.3B | $27.3B |
| Price/Earnings Ratio | 19.2x | 19.1x | 26.0x |
| Price/Book Ratio | 3.3x | 3.4x | 2.1x |
| Yield3 | | 1.5% | 2.0% |
| Institutional Shares | 1.3% | | |
| ETF Shares | 1.3% | | |
| Return on Equity | 23.8% | 23.8% | 19.2% |
| Earnings Growth Rate | 19.5% | 19.2% | 9.7% |
| Foreign Holdings | 0.0% | 0.0% | 0.0% |
| Turnover Rate | 31% | — | — |
| Expense Ratio4 | | — | — |
| Institutional Shares | 0.11% | | |
| ETF Shares | 0.13% | | |
| Short-Term Reserves | 0.0% | — | — |
| | | |
| Sector Diversification (% of equity exposure) |
| | | Target | Broad |
| | Fund | Index1 | Index2 |
| Consumer Discretionary | 11.1% | 11.1% | 10.0% |
| Consumer Staples | 16.7 | 16.7 | 10.0 |
| Energy | 5.8 | 5.8 | 11.2 |
| Financials | 4.7 | 4.7 | 16.5 |
| Health Care | 15.2 | 15.3 | 13.2 |
| Industrials | 6.4 | 6.4 | 10.3 |
| Information Technology | 36.1 | 36.0 | 18.2 |
| Materials | 3.4 | 3.4 | 3.8 |
| Telecommunication | | | |
| Services | 0.5 | 0.5 | 2.9 |
| Utilities | 0.1 | 0.1 | 3.9 |
| | |
| Ten Largest Holdings5 (% of total net assets) |
| |
| Microsoft Corp. | systems software | 4.9% |
| International Business | computer | |
| Machines Corp. | hardware | 3.9 |
| Apple Inc. | computer | |
| | hardware | 3.7 |
| Cisco Systems, Inc. | communication | |
| | equipment | 3.1 |
| Wal-Mart Stores, Inc. | hypermarkets and | |
| | supercenters | 3.0 |
| Google Inc. | internet software and |
| | services | 2.8 |
| Hewlett-Packard Co. | computer hardware | 2.7 |
| The Procter & Gamble Co. | household products | 2.5 |
| Philip Morris | | |
| International Inc. | tobacco | 2.2 |
| PepsiCo, Inc. | soft drinks | 2.2 |
| Top Ten | | 31.0% |
Investment Focus
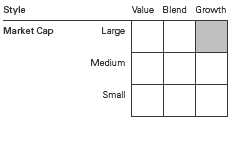
1 MSCI US Large Cap Growth Index.
2 Dow Jones U.S. Total Stock Market Index.
3 30-day SEC yield for the fund; annualized dividend yield for the indexes. See the Glossary.
4 The expense ratios shown are from the prospectuses dated December 29, 2008, and represent estimated costs for the current fiscal year
based on the fund’s net assets as of the prospectus date. For the fiscal year ended August 31, 2009, the expense ratios were 0.11% for
Institutional Shares and 0.13% for ETF Shares.
5 The holdings listed exclude any temporary cash investments and equity index products.
25
Mega Cap 300 Growth Index Fund
Performance Summary
All of the returns in this report represent past performance, which is not a guarantee of future results that may be achieved by the fund. (Current performance may be lower or higher than the performance data cited. For performance data current to the most recent month-end, visit our website at www.vanguard.com/performance.) Note, too, that both investment returns and principal value can fluctuate widely, so an investor’s shares, when sold, could be worth more or less than their original cost. The returns shown do not reflect taxes that a shareholder would pay on fund distributions or on the sale of fund shares.
Cumulative Performance: December 17, 2007–August 31, 2009
Initial Investment of $10,000
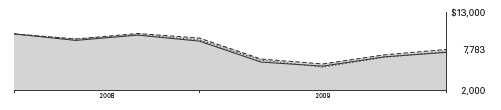
| | | |
| | Average Annual Total Returns | |
| | Periods Ended August 31, 2009 | Final Value of |
| | | Since | a $10,000 |
| | One Year | Inception1 | Investment |
| Mega Cap 300 Growth Index Fund ETF Shares | | | |
| Net Asset Value | –17.28% | –13.68% | $7,783 |
| Mega Cap 300 Growth Index Fund ETF Shares | | | |
| Market Price | –17.28 | –13.64 | 7,789 |
| Dow Jones U.S. Total Stock Market Index | –18.10 | –15.63 | 7,486 |
| MSCI US Large Cap Growth Index | –17.23 | –13.62 | 7,792 |
| Large-Cap Growth Funds Average2 | –17.84 | –16.35 | 7,377 |
| | | |
| | | | Final Value of |
| | | Since | a $5,000,000 |
| | One Year | Inception1 | Investment |
| Mega Cap 300 Growth Index Fund Institutional Shares | –17.25% | –13.19% | $4,096,357 |
| Dow Jones U.S. Total Stock Market Index | –18.10 | –15.79 | 3,924,643 |
| MSCI US Large Cap Growth Index | –17.23 | –13.17 | 4,098,105 |
1 Performance for the fund and its comparative standards is calculated since the following inception dates: December 17, 2007, for
ETF Shares and April 3, 2008, for Institutional Shares.
2 Derived from data provided by Lipper Inc.
26
Mega Cap 300 Growth Index Fund
Cumulative Returns of ETF Shares: December 17, 2007–August 31, 2009
| | |
| | | Cumulative |
| | | Since |
| | One Year | Inception1 |
| Mega Cap 300 Growth Index Fund ETF Shares Market Price | –17.28% | –22.17% |
| Mega Cap 300 Growth Index Fund ETF Shares Net Asset Value | –17.28 | –22.11 |
| MSCI US Large Cap Growth Index | –17.23 | –22.08 |
Fiscal-Year Total Returns (%): December 17, 2007–August 31, 2009
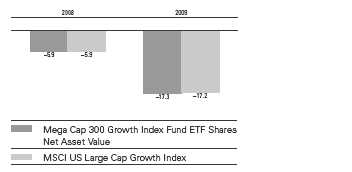
Average Annual Total Returns: Periods Ended June 30, 2009
This table presents average annual total returns through the latest calendar quarter—rather than through the end of the fiscal period. Securities and Exchange Commission rules require that we provide this information.
| | | |
| | | | Since |
| | Inception Date | One Year | Inception |
| ETF Shares | 12/17/2007 | | |
| Market Price | | –23.64% | –19.66% |
| Net Asset Value | | –23.68 | –19.69 |
| Institutional Shares | 4/3/2008 | –23.65 | –20.55 |
1 Performance for the fund’s ETF Shares and comparative standards is calculated since the ETF Shares’ inception: December 17, 2007.
Note: See Financial Highlights tables for dividend and capital gains information.
27
Mega Cap 300 Growth Index Fund
Financial Statements
Statement of Net Assets
As of August 31, 2009
The fund provides a complete list of its holdings four times in each fiscal year, at the quarter-ends. For the second and fourth fiscal quarters, the lists appear in the fund’s semiannual and annual reports to shareholders. For the first and third fiscal quarters, the fund files the lists with the Securities and Exchange Commission on Form N-Q. Shareholders can look up the fund’s Forms N-Q on the SEC’s website at www.sec.gov. Forms N-Q may also be reviewed and copied at the SEC’s Public Reference Room (see the back cover of this report for further information).
| | | |
| | | | Market |
| | | | Value• |
| | | Shares | ($000) |
| Common Stocks (100.0%) | | |
| Consumer Discretionary (11.1%) | |
| | McDonald’s Corp. | 163,219 | 9,179 |
| | Target Corp. | 105,660 | 4,966 |
| | Lowe’s Cos., Inc. | 218,021 | 4,687 |
| * | Amazon.com, Inc. | 50,840 | 4,128 |
| | Home Depot, Inc. | 125,434 | 3,423 |
| * | Ford Motor Co. | 413,174 | 3,140 |
| | NIKE, Inc. Class B | 54,615 | 3,025 |
| | Yum! Brands, Inc. | 68,272 | 2,338 |
| | Comcast Corp. Class A | 150,088 | 2,299 |
| | Staples, Inc. | 105,807 | 2,287 |
| * | Kohl’s Corp. | 42,815 | 2,209 |
| | TJX Cos., Inc. | 61,365 | 2,206 |
| * | Starbucks Corp. | 108,850 | 2,067 |
| * | Viacom Inc. Class B | 81,207 | 2,033 |
| | Best Buy Co., Inc. | 52,333 | 1,899 |
| * | DIRECTV Group, Inc. | 74,561 | 1,846 |
| | Omnicom Group Inc. | 45,998 | 1,671 |
| | The McGraw-Hill Cos., Inc. | 46,539 | 1,564 |
| | Comcast Corp. Special | | |
| | Class A | 98,330 | 1,435 |
| * | Bed Bath & Beyond, Inc. | 38,582 | 1,407 |
| | Coach, Inc. | 47,324 | 1,339 |
| * | Apollo Group, Inc. Class A | 20,158 | 1,307 |
| | Marriott International, Inc. | | |
| | Class A | 44,584 | 1,066 |
| | Sherwin-Williams Co. | 14,689 | 884 |
| * | AutoZone Inc. | 4,859 | 716 |
| * | Las Vegas Sands Corp. | 48,727 | 695 |
| | J.C. Penney Co., Inc. | | |
| | (Holding Co.) | 20,254 | 608 |
| | The Gap, Inc. | 25,534 | 502 |
| * | Liberty Global, Inc. Class A | 20,083 | 440 |
| * | Liberty Global, Inc. Series C | 18,479 | 401 |
| | Garmin Ltd. | 11,508 | 378 |
| * | DISH Network Corp. | 19,977 | 326 |
| | | | 66,471 |
| | | |
| | | | Market |
| | | | Value• |
| | | Shares | ($000) |
| Consumer Staples (16.7%) | | |
| | Wal-Mart Stores, Inc. | 347,408 | 17,673 |
| | The Procter & Gamble Co. | 280,363 | 15,170 |
| | Philip Morris | | |
| | International Inc. | 290,271 | 13,268 |
| | PepsiCo, Inc. | 230,369 | 13,055 |
| | CVS Caremark Corp. | 215,436 | 8,083 |
| | Colgate-Palmolive Co. | 73,910 | 5,373 |
| | The Coca-Cola Co. | 107,866 | 5,261 |
| | Walgreen Co. | 146,678 | 4,969 |
| | Costco Wholesale Corp. | 64,199 | 3,273 |
| | Avon Products, Inc. | 63,138 | 2,012 |
| | General Mills, Inc. | 31,629 | 1,889 |
| | Kellogg Co. | 39,603 | 1,865 |
| | Kimberly-Clark Corp. | 21,453 | 1,297 |
| | Archer-Daniels-Midland Co. | 42,751 | 1,233 |
| | The Clorox Co. | 20,578 | 1,216 |
| | The Hershey Co. | 23,430 | 919 |
| | Lorillard, Inc. | 12,422 | 904 |
| | H.J. Heinz Co. | 23,318 | 898 |
| | Campbell Soup Co. | 20,650 | 648 |
| | Coca-Cola Enterprises, Inc. | 21,566 | 436 |
| | The Pepsi Bottling Group, Inc. | 7,794 | 279 |
| | Brown-Forman Corp. Class B | 4,144 | 185 |
| | | | 99,906 |
| Energy (5.8%) | | |
| | Schlumberger Ltd. | 177,059 | 9,951 |
| | Occidental Petroleum Corp. | 41,964 | 3,068 |
| | Anadarko Petroleum Corp. | 48,015 | 2,539 |
| * | Transocean Ltd. | 30,834 | 2,338 |
| * | Weatherford | | |
| | International Ltd. | 103,268 | 2,060 |
| * | Southwestern Energy Co. | 50,824 | 1,873 |
| | EOG Resources, Inc. | 24,062 | 1,732 |
| | Noble Energy, Inc. | 25,638 | 1,550 |
| | Hess Corp. | 28,294 | 1,431 |
| | Peabody Energy Corp. | 39,540 | 1,292 |
| * | National Oilwell Varco Inc. | 30,939 | 1,125 |
| | XTO Energy, Inc. | 28,547 | 1,102 |
| * | Ultra Petroleum Corp. | 22,432 | 1,042 |
28
Mega Cap 300 Growth Index Fund
| | | |
| | | | Market |
| | | | Value• |
| | | Shares | ($000) |
| | Murphy Oil Corp. | 17,459 | 995 |
| | Diamond Offshore | | |
| | Drilling, Inc. | 10,288 | 920 |
| | Smith International, Inc. | 32,453 | 895 |
| | Noble Corp. | 25,071 | 878 |
| | | | 34,791 |
| Financials (4.7%) | | |
| * | Berkshire Hathaway Inc. | | |
| | Class B | 1,645 | 5,405 |
| | Charles Schwab Corp. | 145,758 | 2,632 |
| | American Express Co. | 77,712 | 2,628 |
| | CME Group, Inc. | 8,836 | 2,572 |
| | State Street Corp. | 46,757 | 2,454 |
| | Franklin Resources, Inc. | 24,079 | 2,247 |
| | U.S. Bancorp | 98,228 | 2,222 |
| | Northern Trust Corp. | 31,775 | 1,857 |
| | T. Rowe Price Group Inc. | 37,836 | 1,715 |
| | Public Storage, Inc. REIT | 18,721 | 1,321 |
| | Moody’s Corp. | 29,662 | 808 |
| * | TD Ameritrade Holding Corp. | 38,975 | 750 |
| | BlackRock, Inc. | 3,140 | 627 |
| | Aon Corp. | 12,893 | 538 |
| | Hudson City Bancorp, Inc. | 34,732 | 456 |
| | | | 28,232 |
| Health Care (15.2%) | | |
| | Johnson & Johnson | 203,895 | 12,323 |
| | Abbott Laboratories | 228,711 | 10,345 |
| * | Amgen Inc. | 149,844 | 8,952 |
| | Schering-Plough Corp. | 240,550 | 6,779 |
| | Medtronic, Inc. | 165,561 | 6,341 |
| * | Gilead Sciences, Inc. | 134,260 | 6,050 |
| | Baxter International, Inc. | 89,517 | 5,095 |
| * | Medco Health Solutions, Inc. | 71,375 | 3,941 |
| * | Celgene Corp. | 68,084 | 3,552 |
| * | Express Scripts Inc. | 38,100 | 2,752 |
| | Allergan, Inc. | 45,033 | 2,518 |
| | Becton, Dickinson & Co. | 35,472 | 2,470 |
| | McKesson Corp. | 40,154 | 2,283 |
| * | Genzyme Corp. | 39,909 | 2,223 |
| * | Biogen Idec Inc. | 42,708 | 2,144 |
| * | St. Jude Medical, Inc. | 51,226 | 1,974 |
| * | WellPoint Inc. | 35,861 | 1,895 |
| | Stryker Corp. | 44,053 | 1,827 |
| | UnitedHealth Group Inc. | 61,607 | 1,725 |
| * | Zimmer Holdings, Inc. | 31,844 | 1,508 |
| | Quest Diagnostics, Inc. | 23,320 | 1,258 |
| | C.R. Bard, Inc. | 14,676 | 1,183 |
| * | Laboratory Corp. of | | |
| | America Holdings | 16,038 | 1,119 |
| | Aetna Inc. | 23,149 | 660 |
| | | | 90,917 |
| Industrials (6.4%) | | |
| | United Parcel Service, Inc. | 103,473 | 5,532 |
| | Union Pacific Corp. | 74,564 | 4,460 |
| | Lockheed Martin Corp. | 49,595 | 3,719 |
| | | |
| | | | Market |
| | | | Value• |
| | | Shares | ($000) |
| | FedEx Corp. | 43,770 | 3,007 |
| | Raytheon Co. | 58,307 | 2,751 |
| | Danaher Corp. | 40,065 | 2,432 |
| | Precision Castparts Corp. | 20,726 | 1,892 |
| | PACCAR, Inc. | 51,029 | 1,846 |
| | Fluor Corp. | 26,748 | 1,415 |
| | C.H. Robinson | | |
| | Worldwide Inc. | 25,075 | 1,411 |
| | Deere & Co. | 31,273 | 1,363 |
| | Honeywell International Inc. | 36,577 | 1,345 |
| | L-3 Communications | | |
| | Holdings, Inc. | 17,247 | 1,283 |
| | ITT Industries, Inc. | 25,572 | 1,281 |
| | Parker Hannifin Corp. | 23,780 | 1,157 |
| | Expeditors International | | |
| | of Washington, Inc. | 31,426 | 1,026 |
| | Southwest Airlines Co. | 109,708 | 897 |
| * | First Solar, Inc. | 6,869 | 835 |
| | Waste Management Inc. | 24,238 | 725 |
| | | | 38,377 |
| Information Technology (36.0%) | |
| | Microsoft Corp. | 1,185,253 | 29,216 |
| | International Business | | |
| | Machines Corp. | 195,514 | 23,080 |
| * | Apple Inc. | 132,012 | 22,206 |
| * | Cisco Systems, Inc. | 853,594 | 18,438 |
| * | Google Inc. | 35,676 | 16,471 |
| | Hewlett-Packard Co. | 353,892 | 15,886 |
| | Oracle Corp. | 589,850 | 12,900 |
| | QUALCOMM Inc. | 244,905 | 11,368 |
| | Intel Corp. | 289,122 | 5,875 |
| * | EMC Corp. | 297,837 | 4,736 |
| | Visa Inc. | 66,429 | 4,723 |
| * | Dell Inc. | 259,721 | 4,111 |
| * | eBay Inc. | 161,756 | 3,581 |
| | Corning, Inc. | 229,818 | 3,466 |
| | Texas Instruments, Inc. | 122,494 | 3,012 |
| | Accenture Ltd. | 90,689 | 2,993 |
| * | Yahoo! Inc. | 196,101 | 2,865 |
| | Automatic Data | | |
| | Processing, Inc. | 74,436 | 2,855 |
| | MasterCard, Inc. Class A | 13,114 | 2,657 |
| * | Adobe Systems, Inc. | 77,462 | 2,434 |
| | Western Union Co. | 103,756 | 1,872 |
| * | Symantec Corp. | 121,423 | 1,836 |
| * | Broadcom Corp. | 63,566 | 1,808 |
| * | Juniper Networks, Inc. | 77,820 | 1,795 |
| | Applied Materials, Inc. | 127,863 | 1,685 |
| * | Cognizant Technology | | |
| | Solutions Corp. | 43,202 | 1,507 |
| | CA, Inc. | 61,421 | 1,369 |
| | Paychex, Inc. | 48,062 | 1,360 |
| * | Agilent Technologies, Inc. | 51,087 | 1,312 |
| * | Intuit, Inc. | 45,131 | 1,253 |
| * | NetApp, Inc. | 49,214 | 1,120 |
| * | Sun Microsystems, Inc. | 110,632 | 1,027 |
29
Mega Cap 300 Growth Index Fund
| | | |
| | | | Market |
| | | | Value• |
| | | Shares | ($000) |
| * | Activision Blizzard, Inc. | 85,698 | 995 |
| * | Electronic Arts Inc. | 47,790 | 871 |
| | Motorola, Inc. | 118,656 | 852 |
| | Analog Devices, Inc. | 27,926 | 789 |
| * | NVIDIA Corp. | 52,500 | 762 |
| * | VMware Inc. | 7,487 | 265 |
| | | | 215,351 |
| Materials (3.5%) | | |
| | Monsanto Co. | 80,759 | 6,774 |
| | Freeport-McMoRan Copper | | |
| | & Gold, Inc. Class B | 60,899 | 3,835 |
| | Praxair, Inc. | 45,480 | 3,485 |
| | Newmont Mining Corp. | | |
| | (Holding Co.) | 70,838 | 2,847 |
| | Ecolab, Inc. | 35,119 | 1,485 |
| | Air Products | | |
| | & Chemicals, Inc. | 10,839 | 813 |
| | The Mosaic Co. | 14,993 | 727 |
| | Weyerhaeuser Co. | 15,687 | 587 |
| | | | 20,553 |
| Telecommunication Services (0.5%) | |
| * | American Tower Corp. | | |
| | Class A | 58,817 | 1,862 |
| * | Crown Castle | | |
| | International Corp. | 43,017 | 1,155 |
| | | | 3,017 |
| Utilities (0.1%) | | |
| * | AES Corp. | 49,448 | 676 |
| Total Investments (100.0%) | | |
| (Cost $577,465) | | 598,291 |
| Other Assets and Liabilities (0.0%) | |
| Other Assets | | 2,963 |
| Liabilities | | (2,933) |
| | | | 30 |
| Net Assets (100%) | | 598,321 |
| |
| At August 31, 2009, net assets consisted of: |
| | Amount |
| | ($000) |
| Paid-in Capital | 609,050 |
| Undistributed Net Investment Income | 1,388 |
| Accumulated Net Realized Losses | (32,943) |
| Unrealized Appreciation (Depreciation) | 20,826 |
| Net Assets | 598,321 |
| |
| |
| Institutional Shares—Net Assets | |
| Applicable to 836,466 outstanding | |
| $.001 par value shares of beneficial | |
| interest (unlimited authorization) | 62,074 |
| Net Asset Value Per Share— | |
| Institutional Shares | $74.21 |
| |
| |
| ETF Shares—Net Assets | |
| Applicable to 14,300,000 outstanding | |
| $.001 par value shares of beneficial | |
| interest (unlimited authorization) | 536,247 |
| Net Asset Value Per Share— | |
| ETF Shares | $37.50 |
• See Note A in Notes to Financial Statements.
* Non-income-producing security.
REIT—Real Estate Investment Trust.
See accompanying Notes, which are an integral part of the Financial Statements.
30
Mega Cap 300 Growth Index Fund
Statement of Operations
| |
| | Year Ended |
| | August 31, 2009 |
| | ($000) |
| Investment Income | |
| Income | |
| Dividends | 4,976 |
| Interest1 | 4 |
| Security Lending | 13 |
| Total Income | 4,993 |
| Expenses | |
| The Vanguard Group—Note B | |
| Investment Advisory Services | 36 |
| Management and Administrative—Institutional Shares | 20 |
| Management and Administrative—ETF Shares | 189 |
| Marketing and Distribution—Institutional Shares | 15 |
| Marketing and Distribution—ETF Shares | 57 |
| Custodian Fees | 22 |
| Auditing Fees | 24 |
| Shareholders’ Reports and Proxies—Institutional Shares | — |
| Shareholders’ Reports and Proxies—ETF Shares | 9 |
| Total Expenses | 372 |
| Net Investment Income | 4,621 |
| Realized Net Gain (Loss) on Investment Securities Sold | (47,518) |
| Change in Unrealized Appreciation (Depreciation) of Investment Securities | 22,156 |
| Net Increase (Decrease) in Net Assets Resulting from Operations | (20,741) |
1 Interest income from an affiliated company of the fund was $4,000.
See accompanying Notes, which are an integral part of the Financial Statements.
31
Mega Cap 300 Growth Index Fund
Statement of Changes in Net Assets
| | |
| | | December 17, |
| | Year Ended | 20071 to |
| | August 31, | August 31, |
| | 2009 | 2008 |
| | ($000) | ($000) |
| Increase (Decrease) in Net Assets | | |
| Operations | | |
| Net Investment Income | 4,621 | 833 |
| Realized Net Gain (Loss) | (47,518) | (334) |
| Change in Unrealized Appreciation (Depreciation) | 22,156 | (1,330) |
| Net Increase (Decrease) in Net Assets Resulting from Operations | (20,741) | (831) |
| Distributions | | |
| Net Investment Income | | |
| Institutional Shares | (753) | (84) |
| ETF Shares | (2,928) | (301) |
| Realized Capital Gain | | |
| Institutional Shares | — | — |
| ETF Shares | — | — |
| Total Distributions | (3,681) | (385) |
| Capital Share Transactions | | |
| Institutional Shares | (32,148) | 96,712 |
| ETF Shares | 397,215 | 162,180 |
| Net Increase (Decrease) from Capital Share Transactions | 365,067 | 258,892 |
| Total Increase (Decrease) | 340,645 | 257,676 |
| Net Assets | | |
| Beginning of Period | 257,676 | — |
| End of Period2 | 598,321 | 257,676 |
1 Inception.
2 Net Assets—End of Period includes undistributed net investment income of $1,388,000 and $448,000.
See accompanying Notes, which are an integral part of the Financial Statements.
32
Mega Cap 300 Growth Index Fund
Financial Highlights
| | |
| Institutional Shares | | |
| | Year | April 3, |
| | Ended | 20081 to |
| | August 31, | August 31, |
| For a Share Outstanding Throughout Each Period | 2009 | 2008 |
| Net Asset Value, Beginning of Period | $91.10 | $92.21 |
| Investment Operations | | |
| Net Investment Income | 1.053 | .343 |
| Net Realized and Unrealized Gain (Loss) on Investments | (16.900) | (1.250) |
| Total from Investment Operations | (15.847) | (.907) |
| Distributions | | |
| Dividends from Net Investment Income | (1.043) | (.203) |
| Distributions from Realized Capital Gains | — | — |
| Total Distributions | (1.043) | (.203) |
| Net Asset Value, End of Period | $74.21 | $91.10 |
| |
| Total Return | –17.25% | –0.99% |
| |
| Ratios/Supplemental Data | | |
| Net Assets, End of Period (Millions) | $62 | $97 |
| Ratio of Total Expenses to Average Net Assets | 0.11% | 0.08%2 |
| Ratio of Net Investment Income to Average Net Assets | 1.59% | 1.16%2 |
| Portfolio Turnover Rate3 | 31% | 9% |
1 Inception.
2 Annualized.
3 Excludes the value of portfolio securities received or delivered as a result of in-kind purchases or redemptions of the fund’s capital shares,
including ETF Creation Units.
See accompanying Notes, which are an integral part of the Financial Statements.
33
Mega Cap 300 Growth Index Fund
Financial Highlights
| | |
| ETF Shares | | |
| | Year | Dec. 17, |
| | Ended | 20071 to |
| | August 31, | August 31, |
| For a Share Outstanding Throughout Each Period | 2009 | 2008 |
| Net Asset Value, Beginning of Period | $46.04 | $49.10 |
| Investment Operations | | |
| Net Investment Income | .528 | .237 |
| Net Realized and Unrealized Gain (Loss) on Investments | (8.548) | (3.139) |
| Total from Investment Operations | (8.020) | (2.902) |
| Distributions | | |
| Dividends from Net Investment Income | (.520) | (.158) |
| Distributions from Realized Capital Gains | — | — |
| Total Distributions | (.520) | (.158) |
| Net Asset Value, End of Period | $37.50 | $46.04 |
| |
| Total Return | –17.28% | –5.91% |
| |
| Ratios/Supplemental Data | | |
| Net Assets, End of Period (Millions) | $536 | $161 |
| Ratio of Total Expenses to Average Net Assets | 0.13% | 0.13%2 |
| Ratio of Net Investment Income to Average Net Assets | 1.57% | 1.11%2 |
| Portfolio Turnover Rate3 | 31% | 9% |
1 Inception.
2 Annualized.
3 Excludes the value of portfolio securities received or delivered as a result of in-kind purchases or redemptions of the fund’s capital shares,
including ETF Creation Units.
See accompanying Notes, which are an integral part of the Financial Statements.
34
Mega Cap 300 Growth Index Fund
Notes to Financial Statements
Vanguard Mega Cap 300 Growth Index Fund is registered under the Investment Company Act of 1940 as an open-end investment company, or mutual fund. The fund offers two classes of shares: Institutional Shares and ETF Shares. Institutional Shares are designed for investors who meet certain administrative and service criteria and invest a minimum of $5 million. ETF Shares are listed for trading on the NYSE Arca, Inc.; they can be purchased and sold through a broker.
A. The following significant accounting policies conform to generally accepted accounting principles for U.S. mutual funds. The fund consistently follows such policies in preparing its financial statements.
1. Security Valuation: Securities are valued as of the close of trading on the New York Stock Exchange (generally 4 p.m., Eastern time) on the valuation date. Equity securities are valued at the latest quoted sales prices or official closing prices taken from the primary market in which each security trades; such securities not traded on the valuation date are valued at the mean of the latest quoted bid and asked prices. Securities for which market quotations are not readily available, or whose values have been materially affected by events occurring before the fund’s pricing time but after the close of the securities’ primary markets, are valued by methods deemed by the board of trustees to represent fair value. Investments in Vanguard Market Liquidity Fund are valued at that fund’s net asset value.
2. Federal Income Taxes: The fund intends to continue to qualify as a regulated investment company and distribute all of its taxable income. Management has analyzed the fund’s tax positions taken for all open federal income tax years (August 31, 2008–2009), and has concluded that no provision for federal income tax is required in the fund’s financial statements.
3. Distributions: Distributions to shareholders are recorded on the ex-dividend date.
4. Security Lending: The fund may lend its securities to qualified institutional borrowers to earn additional income. Security loans are required to be secured at all times by collateral at least equal to the market value of securities loaned. The fund invests cash collateral received in Vanguard Market Liquidity Fund, and records a liability for the return of the collateral, during the period the securities are on loan. Security lending income represents the income earned on investing cash collateral, less expenses associated with the loan.
5. Other: Dividend income is recorded on the ex-dividend date. Interest income includes income distributions received from Vanguard Market Liquidity Fund and is accrued daily. Security transactions are accounted for on the date securities are bought or sold. Costs used to determine realized gains (losses) on the sale of investment securities are those of the specific securities sold.
Each class of shares has equal rights as to assets and earnings, except that each class separately bears certain class-specific expenses related to maintenance of shareholder accounts (included in Management and Administrative expenses), shareholder reporting, and proxies. Marketing and distribution expenses are allocated to each class of shares based on a method approved by the board of trustees. Income, other non-class-specific expenses, and gains and losses on investments are allocated to each class of shares based on its relative net assets.
35
Mega Cap 300 Growth Index Fund
B. The Vanguard Group furnishes at cost investment advisory, corporate management, administrative, marketing, and distribution services. The costs of such services are allocated to the fund under methods approved by the board of trustees. The fund has committed to provide up to 0.40% of its net assets in capital contributions to Vanguard. At August 31, 2009, the fund had contributed capital of $123,000 to Vanguard (included in Other Assets), representing 0.02% of the fund’s net assets and 0.05% of Vanguard’s capitalization. The fund’s trustees and officers are also directors and officers of Vanguard.
C. Various inputs may be used to determine the value of the fund’s investments. These inputs are summarized in three broad levels for financial statement purposes. The inputs or methodologies used to value securities are not necessarily an indication of the risk associated with investing in those securities.
Level 1—Quoted prices in active markets for identical securities.
Level 2—Other significant observable inputs (including quoted prices for similar securities, interest
rates, prepayment speeds, credit risk, etc.).
Level 3—Significant unobservable inputs (including the fund’s own assumptions used to determine
the fair value of investments).
At August 31, 2009, 100% of the fund’s investments were valued based on Level 1 inputs.
D. Distributions are determined on a tax basis and may differ from net investment income and realized capital gains for financial reporting purposes. Differences may be permanent or temporary. Permanent differences are reclassified among capital accounts in the financial statements to reflect their tax character. Temporary differences arise when certain items of income, expense, gain, or loss are recognized in different periods for financial statement and tax purposes; these differences will reverse at some time in the future. Differences in classification may also result from the treatment of short-term gains as ordinary income for tax purposes.
During the year ended August 31, 2009, the fund realized $15,393,000 of net capital losses resulting from in-kind redemptions—in which shareholders exchanged fund shares for securities held by the fund rather than for cash. Because such losses are not taxable losses to the fund, they have been reclassified from accumulated net realized losses to paid-in capital.
For tax purposes, at August 31, 2009, the fund had $1,458,000 of ordinary income available for distribution. The fund had available capital loss carryforwards totaling $7,258,000 to offset future net capital gains through August 31, 2017. In addition, the fund realized losses of $25,649,000 during the period from November 1, 2008, through August 31, 2009, which are deferred and will be treated as realized for tax purposes in fiscal 2010.
At August 31, 2009, the cost of investment securities for tax purposes was $577,501,000. Net unrealized appreciation of investment securities for tax purposes was $20,790,000, consisting of unrealized gains of $34,777,000 on securities that had risen in value since their purchase and $13,987,000 in unrealized losses on securities that had fallen in value since their purchase.
E. During the year ended August 31, 2009, the fund purchased $866,769,000 of investment securities and sold $500,677,000 of investment securities, other than temporary cash investments.
36
Mega Cap 300 Growth Index Fund
| | | | |
| F. Capital share transactions for each class of shares were: | | | |
| | | Year Ended | Inception1 to |
| | August 31, 2009 | August 31, 2008 |
| | Amount | Shares | Amount | Shares |
| | ($000) | (000) | ($000) | (000) |
| Institutional Shares | | | | |
| Issued | (32,901) | (235) | 96,628 | 1,059 |
| Issued in Lieu of Cash Distributions | 753 | 12 | 84 | 1 |
| Redeemed | — | — | — | — |
| Net Increase (Decrease)—Institutional Shares | (32,148) | (223) | 96,712 | 1,060 |
| ETF Shares | | | | |
| Issued | 773,526 | 23,100 | 167,115 | 3,600 |
| Issued in Lieu of Cash Distributions | — | — | — | — |
| Redeemed | (376,311) | (12,300) | (4,935) | (100) |
| Net Increase (Decrease)—ETF Shares | 397,215 | 10,800 | 162,180 | 3,500 |
| 1 Inception was April 3, 2008, for Institutional Shares and December 17, 2007, for ETF Shares. | | |
The amounts of Institutional Shares issued during the year ended August 31, 2009, are negative because they reflect the cancellation of $58,176,000 of purchases recorded during the prior fiscal period that were determined to have been processed incorrectly. Vanguard, as a transfer agent for the fund, offset any impact to the fund resulting from incorrectly processed shareholder transactions. Accordingly, the cancelled purchases had no impact to the fund’s net asset values per share or total returns.
G. In preparing the financial statements as of August 31, 2009, management considered the impact of subsequent events occurring through October 15, 2009, for potential recognition or disclosure in these financial statements.
37
Mega Cap 300 Value Index Fund
| | | |
| Fund Profile | | | |
| As of August 31, 2009 | | | |
| |
| Portfolio Characteristics | | |
| | | Target | Broad |
| | Fund | Index1 | Index2 |
| Number of Stocks | 174 | 175 | 4,345 |
| Median Market Cap | $50.1B | $50.1B | $27.3B |
| Price/Earnings Ratio | 23.7x | 23.6x | 26.0x |
| Price/Book Ratio | 1.7x | 1.7x | 2.1x |
| Yield3 | | 2.8% | 2.0% |
| Institutional Shares | 2.8% | | |
| ETF Shares | 2.8% | | |
| Return on Equity | 18.7% | 18.7% | 19.2% |
| Earnings Growth Rate | 1.7% | 1.5% | 9.7% |
| Foreign Holdings | 0.0% | 0.0% | 0.0% |
| Turnover Rate | 31% | — | — |
| Expense Ratio4 | | — | — |
| Institutional Shares | 0.11% | | |
| ETF Shares | 0.13% | | |
| Short-Term Reserves | 0.0% | — | — |
| | | |
| Sector Diversification (% of equity exposure) |
| | | Target | Broad |
| | Fund | Index1 | Index2 |
| Consumer Discretionary | 5.6% | 5.6% | 10.0% |
| Consumer Staples | 7.6 | 7.6 | 10.0 |
| Energy | 18.6 | 18.7 | 11.2 |
| Financials | 24.7 | 24.7 | 16.5 |
| Health Care | 12.6 | 12.6 | 13.2 |
| Industrials | 12.6 | 12.6 | 10.3 |
| Information Technology | 2.9 | 2.9 | 18.2 |
| Materials | 2.7 | 2.6 | 3.8 |
| Telecommunication | | | |
| Services | 6.3 | 6.3 | 2.9 |
| Utilities | 6.4 | 6.4 | 3.9 |
| | |
| Ten Largest Holdings5 (% of total net assets) |
| |
| ExxonMobil Corp. | integrated oil | |
| | and gas | 7.9% |
| JPMorgan Chase & Co. | diversified financial | |
| | services | 3.8 |
| AT&T Inc. | integrated | |
| | telecommunication | |
| | services | 3.6 |
| Bank of America Corp. | diversified financial | |
| | services | 3.6 |
| General Electric Co. | industrial | |
| | conglomerates | 3.5 |
| Chevron Corp. | integrated oil | |
| | and gas | 3.3 |
| Wells Fargo & Co. | diversified banks | 2.8 |
| Pfizer Inc. | pharmaceuticals | 2.6 |
| Verizon | integrated | |
| Communications Inc. | telecommunication | |
| | services | 2.1 |
| Johnson & Johnson | pharmaceuticals | 2.0 |
| Top Ten | | 35.2% |
Investment Focus
1 MSCI US Large Cap Value Index.
2 Dow Jones U.S. Total Stock Market Index.
3 30-day SEC yield for the fund; annualized dividend yield for the indexes. See the Glossary.
4 The expense ratios shown are from the prospectuses dated December 29, 2008, and represent estimated costs for the current fiscal year
based on the fund’s net assets as of the prospectus date. For the fiscal year ended August 31, 2009, the expense ratios were 0.11% for
Institutional Shares and 0.13% for ETF Shares.
5 The holdings listed exclude any temporary cash investments and equity index products.

Mega Cap 300 Value Index Fund
Performance Summary
All of the returns in this report represent past performance, which is not a guarantee of future results that may be achieved by the fund. (Current performance may be lower or higher than the performance data cited. For performance data current to the most recent month-end, visit our website at www.vanguard.com/performance.) Note, too, that both investment returns and principal value can fluctuate widely, so an investor’s shares, when sold, could be worth more or less than their original cost. The returns shown do not reflect taxes that a shareholder would pay on fund distributions or on the sale of fund shares.
Cumulative Performance: December 17, 2007–August 31, 2009
Initial Investment of $10,000
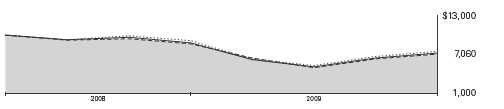
| | | |
| | Average Annual Total Returns | |
| | Periods Ended August 31, 2009 | Final Value of |
| | | Since | a $10,000 |
| | One Year | Inception1 | Investment |
| Mega Cap 300 Value Index Fund ETF Shares | | | |
| Net Asset Value | –18.32% | –18.48% | $7,060 |
| Mega Cap 300 Value Index Fund ETF Shares | | | |
| Market Price | –18.28 | –18.44 | 7,066 |
| Dow Jones U.S. Total Stock Market Index | –18.10 | –15.63 | 7,486 |
| MSCI US Large Cap Value Index | –18.45 | –18.54 | 7,051 |
| Large-Cap Value Funds Average2 | –17.99 | –17.42 | 7,217 |
| | | |
| | | | Final Value of |
| | | Since | a $5,000,000 |
| | One Year | Inception1 | Investment |
| Mega Cap 300 Value Index Fund Institutional Shares | –18.29% | –16.22% | $3,842,084 |
| Dow Jones U.S. Total Stock Market Index | –18.10 | –13.55 | 4,025,661 |
| MSCI US Large Cap Value Index | –18.45 | –16.35 | 3,833,248 |
1 Performance for the fund and its comparative standards is calculated since the following inception dates: December 17, 2007,
for ETF Shares and March 5, 2008, for Institutional Shares.
2 Derived from data provided by Lipper Inc.
39
Mega Cap 300 Value Index Fund
Cumulative Returns of ETF Shares: December 17, 2007–August 31, 2009
| | |
| | | Cumulative |
| | | Since |
| | One Year | Inception1 |
| Mega Cap 300 Value Index Fund ETF Shares Market Price | –18.28% | –29.34% |
| Mega Cap 300 Value Index Fund ETF Shares Net Asset Value | –18.32 | –29.40 |
| MSCI US Large Cap Value Index | –18.45 | –29.49 |
Fiscal-Year Total Returns (%): December 17, 2007–August 31, 2009
Average Annual Total Returns: Periods Ended June 30, 2009
This table presents average annual total returns through the latest calendar quarter—rather than through the end of the fiscal period. Securities and Exchange Commission rules require that we provide this information.
| | | |
| | | | Since |
| | Inception Date | One Year | Inception |
| ETF Shares | 12/17/2007 | | |
| Market Price | | –26.52% | –26.27% |
| Net Asset Value | | –26.64 | –26.29 |
| Institutional Shares | 3/5/2008 | –26.63 | –25.25 |
1 Performance for the fund’s ETF Shares and comparative standards is calculated since the ETF Shares’ inception: December 17, 2007.
Note: See Financial Highlights tables for dividend and capital gains information.
Mega Cap 300 Value Index Fund
Financial Statements
Statement of Net Assets
As of August 31, 2009
The fund provides a complete list of its holdings four times in each fiscal year, at the quarter-ends. For the second and fourth fiscal quarters, the lists appear in the fund’s semiannual and annual reports to shareholders. For the first and third fiscal quarters, the fund files the lists with the Securities and Exchange Commission on Form N-Q. Shareholders can look up the fund’s Forms N-Q on the SEC’s website at www.sec.gov. Forms N-Q may also be reviewed and copied at the SEC’s Public Reference Room (see the back cover of this report for further information).
| | | |
| | | | Market |
| | | | Value• |
| | | Shares | ($000) |
| Common Stocks (100.0%) | | |
| Consumer Discretionary (5.6%) | | |
| | The Walt Disney Co. | 96,718 | 2,519 |
| | Time Warner Inc. | 65,477 | 1,827 |
| | Home Depot, Inc. | 46,414 | 1,267 |
| | News Corp., Class A | 116,565 | 1,250 |
| | Johnson Controls, Inc. | 32,549 | 806 |
| * | Liberty Media Corp. | 27,069 | 755 |
| * | Time Warner Cable Inc. | 19,282 | 712 |
| | Carnival Corp. | 24,111 | 705 |
| | Comcast Corp. Class A | 37,809 | 579 |
| | Macy’s Inc. | 22,980 | 357 |
| | The Gap, Inc. | 17,323 | 340 |
| | VF Corp. | 4,843 | 337 |
| | CBS Corp. | 32,312 | 334 |
| | Fortune Brands, Inc. | 8,220 | 327 |
| | Comcast Corp. Special | | |
| | Class A | 22,117 | 323 |
| *,^ | Sears Holdings Corp. | 3,043 | 193 |
| | J.C. Penney Co., Inc. | | |
| | (Holding Co.) | 4,019 | 121 |
| | News Corp., Class B | 7,202 | 91 |
| | Garmin Ltd. | 2,290 | 75 |
| * | DISH Network Corp. | 3,990 | 65 |
| | | | 12,983 |
| Consumer Staples (7.6%) | | |
| | The Coca-Cola Co. | 74,216 | 3,620 |
| | The Procter & Gamble Co. | 55,922 | 3,026 |
| | Kraft Foods Inc. | 80,774 | 2,290 |
| | Altria Group, Inc. | 113,153 | 2,068 |
| | Kimberly-Clark Corp. | 14,726 | 890 |
| | Sysco Corp. | 32,283 | 823 |
| | The Kroger Co. | 33,896 | 732 |
| | ConAgra Foods, Inc. | 24,474 | 502 |
| | Archer-Daniels-Midland Co. | 15,810 | 456 |
| | Safeway, Inc. | 23,307 | 444 |
| | Reynolds American Inc. | 9,562 | 437 |
| | Molson Coors Brewing Co. | | |
| | Class B | 8,283 | 392 |
| | General Mills, Inc. | 6,302 | 376 |
| | | |
| | | | Market |
| | | | Value• |
| | | Shares | ($000) |
| | Sara Lee Corp. | 36,074 | 350 |
| | Lorillard, Inc. | 4,601 | 335 |
| | H.J. Heinz Co. | 8,584 | 330 |
| | The Pepsi Bottling Group, Inc. | 5,317 | 190 |
| | Coca-Cola Enterprises, Inc. | 7,962 | 161 |
| | Campbell Soup Co. | 4,105 | 129 |
| | Brown-Forman Corp. Class B | 2,835 | 127 |
| | | | 17,678 |
| Energy (18.6%) | | |
| | ExxonMobil Corp. | 267,344 | 18,487 |
| | Chevron Corp. | 109,830 | 7,682 |
| | ConocoPhillips Co. | 77,135 | 3,473 |
| | Occidental Petroleum Corp. | 28,834 | 2,108 |
| | Apache Corp. | 18,402 | 1,563 |
| | Devon Energy Corp. | 23,158 | 1,421 |
| | Marathon Oil Corp. | 38,734 | 1,196 |
| | Halliburton Co. | 49,290 | 1,169 |
| | XTO Energy, Inc. | 19,581 | 756 |
| | Chesapeake Energy Corp. | 32,555 | 744 |
| | Spectra Energy Corp. | 35,297 | 664 |
| | Baker Hughes Inc. | 16,949 | 584 |
| | Valero Energy Corp. | 30,443 | 570 |
| | Williams Cos., Inc. | 31,746 | 522 |
| | Anadarko Petroleum Corp. | 9,565 | 506 |
| * | Transocean Ltd. | 6,143 | 466 |
| * | National Oilwell Varco Inc. | 11,423 | 415 |
| | EOG Resources, Inc. | 4,781 | 344 |
| | Hess Corp. | 5,638 | 285 |
| | Murphy Oil Corp. | 3,472 | 198 |
| | Noble Corp. | 5,005 | 175 |
| | | | 43,328 |
| Financials (24.7%) | | |
| | JPMorgan Chase & Co. | 205,953 | 8,951 |
| | Bank of America Corp. | 473,467 | 8,328 |
| | Wells Fargo & Co. | 239,672 | 6,596 |
| | The Goldman Sachs | | |
| | Group, Inc. | 26,204 | 4,336 |
| | Citigroup Inc. | 621,756 | 3,109 |
| | Bank of New York | | |
| | Mellon Corp. | 65,595 | 1,942 |
41
| | | |
| Mega Cap 300 Value Index Fund | |
| |
| |
| |
| | | | Market |
| | | | Value• |
| | | Shares | ($000) |
| | Morgan Stanley | 64,585 | 1,870 |
| | MetLife, Inc. | 44,926 | 1,696 |
| | The Travelers Cos., Inc. | 32,139 | 1,620 |
| | U.S. Bancorp | 67,680 | 1,531 |
| | Prudential Financial, Inc. | 25,045 | 1,267 |
| | BB&T Corp. | 37,326 | 1,043 |
| | AFLAC Inc. | 25,622 | 1,041 |
| | PNC Financial | | |
| | Services Group | 24,360 | 1,037 |
| | Simon Property Group, Inc. | | |
| | REIT | 15,363 | 977 |
| | American Express Co. | 28,755 | 973 |
| | Ace Ltd. | 18,383 | 959 |
| | The Chubb Corp. | 19,269 | 952 |
| | Capital One Financial Corp. | 24,831 | 926 |
| | The Allstate Corp. | 27,894 | 820 |
| | Marsh & | | |
| | McLennan Cos., Inc. | 28,597 | 673 |
| | Loews Corp. | 19,051 | 651 |
| | SunTrust Banks, Inc. | 25,411 | 594 |
| * | Progressive Corp. of Ohio | 35,406 | 585 |
| | Annaly Capital | | |
| | Management Inc. REIT | 29,785 | 516 |
| | Vornado Realty Trust REIT | 8,634 | 497 |
| | State Street Corp. | 9,296 | 488 |
| | The Principal Financial | | |
| | Group, Inc. | 16,983 | 482 |
| | Invesco, Ltd. | 22,488 | 467 |
| | Boston Properties, Inc. REIT | 7,452 | 451 |
| | Ameriprise Financial, Inc. | 13,963 | 419 |
| | Equity Residential REIT | 14,987 | 409 |
| | NYSE Euronext | 14,228 | 403 |
| | Aon Corp. | 8,862 | 370 |
| * | Leucadia National Corp. | 10,442 | 260 |
| | M & T Bank Corp. | 4,160 | 257 |
| | Hudson City Bancorp, Inc. | 12,788 | 168 |
| | | | 57,664 |
| Health Care (12.6%) | | |
| | Pfizer Inc. | 369,702 | 6,174 |
| | Johnson & Johnson | 75,485 | 4,562 |
| | Merck & Co., Inc. | 115,536 | 3,747 |
| | Wyeth | 73,085 | 3,497 |
| | Bristol-Myers Squibb Co. | 108,632 | 2,404 |
| | Eli Lilly & Co. | 56,742 | 1,899 |
| | UnitedHealth Group Inc. | 42,312 | 1,185 |
| | Covidien PLC | 27,573 | 1,091 |
| * | Thermo Fisher Scientific, Inc. | 22,892 | 1,035 |
| * | Boston Scientific Corp. | 82,439 | 969 |
| * | WellPoint Inc. | 13,261 | 701 |
| | | |
| | | | Market |
| | | | Value• |
| | | Shares | ($000) |
| | Cardinal Health, Inc. | 19,736 | 682 |
| * | Forest Laboratories, Inc. | 16,528 | 484 |
| | Aetna Inc. | 15,896 | 453 |
| | CIGNA Corp. | 14,928 | 439 |
| | | | 29,322 |
| Industrials (12.6%) | | |
| | General Electric Co. | 580,170 | 8,064 |
| | United Technologies Corp. | 49,059 | 2,912 |
| | 3M Co. | 36,113 | 2,604 |
| | The Boeing Co. | 37,839 | 1,879 |
| | Burlington Northern | | |
| | Santa Fe Corp. | 18,643 | 1,548 |
| | Emerson Electric Co. | 41,257 | 1,521 |
| | Caterpillar, Inc. | 33,040 | 1,497 |
| | General Dynamics Corp. | 17,909 | 1,060 |
| | Illinois Tool Works, Inc. | 23,327 | 976 |
| | Honeywell International Inc. | 25,137 | 924 |
| | Norfolk Southern Corp. | 20,087 | 921 |
| | CSX Corp. | 21,422 | 910 |
| | Tyco International Ltd. | 25,917 | 821 |
| | Northrop Grumman Corp. | 16,816 | 821 |
| | Ingersoll-Rand PLC | 17,436 | 539 |
| | Republic Services, Inc. | | |
| | Class A | 20,731 | 531 |
| | Deere & Co. | 11,559 | 504 |
| | Waste Management Inc. | 16,616 | 497 |
| | Cummins Inc. | 10,474 | 475 |
| | Eaton Corp. | 8,610 | 465 |
| | | | 29,469 |
| Information Technology (2.9%) | | |
| | Intel Corp. | 198,914 | 4,042 |
| | Texas Instruments, Inc. | 24,433 | 601 |
| | Motorola, Inc. | 81,545 | 585 |
| * | Tyco Electronics Ltd. | 25,068 | 572 |
| | Xerox Corp. | 47,309 | 409 |
| | Applied Materials, Inc. | 25,460 | 336 |
| | Analog Devices, Inc. | 5,579 | 158 |
| * | NVIDIA Corp. | 10,462 | 152 |
| | | | 6,855 |
| Materials (2.7%) | | |
| | E.I. du Pont de | | |
| | Nemours & Co. | 49,603 | 1,584 |
| | Dow Chemical Co. | 58,880 | 1,254 |
| | Nucor Corp. | 17,184 | 765 |
| | Alcoa Inc. | 53,318 | 642 |
| | Air Products & | | |
| | Chemicals, Inc. | 7,451 | 559 |
| | International Paper Co. | 22,471 | 516 |
| | PPG Industries, Inc. | 9,003 | 499 |
42
| | | |
| Mega Cap 300 Value Index Fund | |
| |
| |
| |
| | | | Market |
| | | | Value• |
| | | Shares | ($000) |
| | Weyerhaeuser Co. | 5,784 | 216 |
| | The Mosaic Co. | 2,962 | 144 |
| | | | 6,179 |
| Telecommunication Services (6.3%) | |
| | AT&T Inc. | 323,243 | 8,420 |
| | Verizon Communications Inc. | 155,627 | 4,831 |
| * | Sprint Nextel Corp. | 153,037 | 560 |
| | CenturyTel, Inc. | 16,228 | 523 |
| | Qwest Communications | | |
| | International Inc. | 84,725 | 304 |
| | | | 14,638 |
| Utilities (6.4%) | | |
| | Exelon Corp. | 36,150 | 1,808 |
| | Southern Co. | 42,819 | 1,336 |
| | FPL Group, Inc. | 21,357 | 1,200 |
| | Duke Energy Corp. | 70,439 | 1,091 |
| | Dominion Resources, Inc. | 32,286 | 1,068 |
| | Public Service Enterprise | | |
| | Group, Inc. | 27,728 | 878 |
| | Entergy Corp. | 10,732 | 848 |
| | American Electric | | |
| | Power Co., Inc. | 26,091 | 820 |
| | PG&E Corp. | 20,159 | 818 |
| | FirstEnergy Corp. | 16,689 | 753 |
| | Sempra Energy | 12,701 | 637 |
| | PPL Corp. | 20,580 | 605 |
| | Progress Energy, Inc. | 15,271 | 604 |
| | Consolidated Edison Inc. | 15,017 | 604 |
| | Edison International | 16,930 | 566 |
| | Xcel Energy, Inc. | 24,937 | 492 |
| | Ameren Corp. | 11,688 | 315 |
| | Constellation Energy | | |
| | Group, Inc. | 9,811 | 311 |
| * | AES Corp. | 18,219 | 249 |
| | | | 15,003 |
| Total Common Stocks | | |
| (Cost $241,279) | | 233,119 |
| | |
| | | Market |
| | | Value• |
| | Shares | ($000) |
| Temporary Cash Investment (0.1%) | |
| Money Market Fund (0.1%) | | |
| 1,2 Vanguard Market | | |
| Liquidity Fund, 0.277% | | |
| (Cost $185) | 184,802 | 185 |
| Total Investments (100.1%) | | |
| (Cost $241,464) | | 233,304 |
| Other Assets and Liabilities (–0.1%) | |
| Other Assets | | 1,509 |
| Liabilities2 | | (1,705) |
| | | (196) |
| Net Assets (100%) | | 233,108 |
At August 31, 2009, net assets consisted of:
| Amount |
| | ($000) |
| Paid-in Capital | 260,651 |
| Undistributed Net Investment Income | 1,264 |
| Accumulated Net Realized Losses | (20,647) |
| Unrealized Appreciation (Depreciation) | (8,160) |
| Net Assets | 233,108 |
| |
| |
| Institutional Shares—Net Assets | |
| Applicable to 1,059,957 outstanding | |
| $.001 par value shares of beneficial | |
| interest (unlimited authorization) | 69,973 |
| Net Asset Value Per Share— | |
| Institutional Shares | $66.02 |
| |
| |
| ETF Shares—Net Assets | |
| Applicable to 4,900,000 outstanding | |
| $.001 par value shares of beneficial | |
| interest (unlimited authorization) | 163,135 |
| Net Asset Value Per Share— | |
| ETF Shares | $33.29 |
• See Note A in Notes to Financial Statements.
* Non-income-producing security.
^ Part of security position is on loan to broker-dealers. The total value of securities on loan is $178,000.
1 Affiliated money market fund available only to Vanguard funds and certain trusts and accounts managed by Vanguard. Rate shown is the
7-day yield.
2 Includes $185,000 of collateral received for securities on loan.
REIT—Real Estate Investment Trust.
See accompanying Notes, which are an integral part of the Financial Statements.
43
Mega Cap 300 Value Index Fund
Statement of Operations
| |
| | Year Ended |
| | August 31, 2009 |
| | ($000) |
| Investment Income | |
| Income | |
| Dividends | 6,246 |
| Interest1 | 3 |
| Security Lending | 158 |
| Total Income | 6,407 |
| Expenses | |
| The Vanguard Group—Note B | |
| Investment Advisory Services | 24 |
| Management and Administrative—Institutional Shares | 17 |
| Management and Administrative—ETF Shares | 57 |
| Marketing and Distribution—Institutional Shares | 15 |
| Marketing and Distribution—ETF Shares | 32 |
| Custodian Fees | 31 |
| Auditing Fees | 24 |
| Shareholders’ Reports and Proxies—Institutional Shares | 1 |
| Shareholders’ Reports and Proxies—ETF Shares | 9 |
| Total Expenses | 210 |
| Net Investment Income | 6,197 |
| Realized Net Gain (Loss) | |
| Investment Securities Sold | (16,926) |
| Futures Contracts | 15 |
| Realized Net Gain (Loss) | (16,911) |
| Change in Unrealized Appreciation (Depreciation) of Investment Securities | (1,817) |
| Net Increase (Decrease) in Net Assets Resulting from Operations | (12,531) |
1 Interest income from an affiliated company of the fund was $3,000.
See accompanying Notes, which are an integral part of the Financial Statements.
44
Mega Cap 300 Value Index Fund
Statement of Changes in Net Assets
| | |
| | | December 17, |
| | Year Ended | 20071 to |
| | August 31, | August 31, |
| | 2009 | 2008 |
| | ($000) | ($000) |
| Increase (Decrease) in Net Assets | | |
| Operations | | |
| Net Investment Income | 6,197 | 1,283 |
| Realized Net Gain (Loss) | (16,911) | (340) |
| Change in Unrealized Appreciation (Depreciation) | (1,817) | (6,343) |
| Net Increase (Decrease) in Net Assets Resulting from Operations | (12,531) | (5,400) |
| Distributions | | |
| Net Investment Income | | |
| Institutional Shares | (1,849) | (127) |
| ETF Shares | (3,745) | (495) |
| Realized Capital Gain | | |
| Institutional Shares | — | — |
| ETF Shares | — | — |
| Total Distributions | (5,594) | (622) |
| Capital Share Transactions | | |
| Institutional Shares | 26,850 | 53,693 |
| ETF Shares | 74,049 | 102,663 |
| Net Increase (Decrease) from Capital Share Transactions | 100,899 | 156,356 |
| Total Increase (Decrease) | 82,774 | 150,334 |
| Net Assets | | |
| Beginning of Period | 150,334 | — |
| End of Period2 | 233,108 | 150,334 |
1 Inception.
2 Net Assets—End of Period includes undistributed net investment income of $1,264,000 and $661,000.
See accompanying Notes, which are an integral part of the Financial Statements.
45
Mega Cap 300 Value Index Fund
Financial Highlights
| | |
| Institutional Shares | | |
| | Year | March 5, |
| | Ended | 20081 to |
| | August 31, | August 31, |
| For a Share Outstanding Throughout Each Period | 2009 | 2008 |
| Net Asset Value, Beginning of Period | $83.69 | $90.01 |
| Investment Operations | | |
| Net Investment Income | 2.135 | 1.1242 |
| Net Realized and Unrealized Gain (Loss) on Investments | (17.658) | (6.444) |
| Total from Investment Operations | (15.523) | (5.320) |
| Distributions | | |
| Dividends from Net Investment Income | (2.147) | (1.000) |
| Distributions from Realized Capital Gains | — | — |
| Total Distributions | (2.147) | (1.000) |
| Net Asset Value, End of Period | $66.02 | $83.69 |
| |
| Total Return | –18.29% | –5.96% |
| |
| Ratios/Supplemental Data | | |
| Net Assets, End of Period (Millions) | $70 | $53 |
| Ratio of Total Expenses to Average Net Assets | 0.11% | 0.08%3 |
| Ratio of Net Investment Income to Average Net Assets | 3.66% | 3.19%3 |
| Portfolio Turnover Rate4 | 31% | 12% |
1 Inception.
2 Calculated based on average shares outstanding.
3 Annualized.
4 Excludes the value of portfolio securities received or delivered as a result of in-kind purchases or redemptions of the fund’s capital shares,
including ETF Creation Units.
See accompanying Notes, which are an integral part of the Financial Statements.
46
Mega Cap 300 Value Index Fund
Financial Highlights
| | |
| ETF Shares | | |
| | Year | Dec. 17, |
| | Ended | 20071 to |
| | August 31, | August 31, |
| For a Share Outstanding Throughout Each Period | 2009 | 2008 |
| Net Asset Value, Beginning of Period | $42.21 | $49.38 |
| Investment Operations | | |
| Net Investment Income | 1.070 | .8862 |
| Net Realized and Unrealized Gain (Loss) on Investments | (8.915) | (7.560) |
| Total from Investment Operations | (7.845) | (6.674) |
| Distributions | | |
| Dividends from Net Investment Income | (1.075) | (.496) |
| Distributions from Realized Capital Gains | — | — |
| Total Distributions | (1.075) | (.496) |
| Net Asset Value, End of Period | $33.29 | $42.21 |
| |
| Total Return | –18.32% | –13.56% |
| |
| Ratios/Supplemental Data | | |
| Net Assets, End of Period (Millions) | $163 | $97 |
| Ratio of Total Expenses to Average Net Assets | 0.13% | 0.13%3 |
| Ratio of Net Investment Income to Average Net Assets | 3.64% | 3.14%3 |
| Portfolio Turnover Rate4 | 31% | 12% |
1 Inception.
2 Calculated based on average shares outstanding.
3 Annualized.
4 Excludes the value of portfolio securities received or delivered as a result of in-kind purchases or redemptions of the fund’s capital shares,
including ETF Creation Units.
See accompanying Notes, which are an integral part of the Financial Statements.
47
Mega Cap 300 Value Index Fund
Notes to Financial Statements
Vanguard Mega Cap 300 Value Index Fund is registered under the Investment Company Act of 1940 as an open-end investment company, or mutual fund. The fund offers two classes of shares: Institutional Shares and ETF Shares. Institutional Shares are designed for investors who meet certain administrative and service criteria and invest a minimum of $5 million. ETF Shares are listed for trading on the NYSE Arca, Inc.; they can be purchased and sold through a broker.
A. The following significant accounting policies conform to generally accepted accounting principles for
U.S. mutual funds. The fund consistently follows such policies in preparing its financial statements.
1. Security Valuation: Securities are valued as of the close of trading on the New York Stock Exchange (generally 4 p.m., Eastern time) on the valuation date. Equity securities are valued at the latest quoted sales prices or official closing prices taken from the primary market in which each security trades; such securities not traded on the valuation date are valued at the mean of the latest quoted bid and asked prices. Securities for which market quotations are not readily available, or whose values have been materially affected by events occurring before the fund’s pricing time but after the close of the securities’ primary markets, are valued by methods deemed by the board of trustees to represent fair value. Investments in Vanguard Market Liquidity Fund are valued at that fund’s net asset value.
2. Futures Contracts: The fund uses index futures contracts to a limited extent, with the objectives of maintaining full exposure to the stock market, enhancing returns, maintaining liquidity, and minimizing transaction costs. The fund may purchase futures contracts to immediately invest incoming cash in the market, or sell futures in response to cash outflows, thereby simulating a fully invested position in the underlying index while maintaining a cash balance for liquidity. The fund may seek to enhance returns by using futures contracts instead of the underlying securities when futures are believed to be priced more attractively than the underlying securities. The primary risks associated with the use of futures contracts are imperfect correlation between changes in market values of stocks held by the fund and the prices of futures contracts, and the possibility of an illiquid market.
Futures contracts are valued at their quoted daily settlement prices. The aggregate principal amounts of the contracts are not recorded in the Statement of Net Assets. Fluctuations in the value of the contracts are recorded in the Statement of Net Assets as an asset (liability) and in the Statement of Operations as unrealized appreciation (depreciation) until the contracts are closed, when they are recorded as realized futures gains (losses).
3. Federal Income Taxes: The fund intends to continue to qualify as a regulated investment company and distribute all of its taxable income. Management has analyzed the fund’s tax positions taken for all open federal income tax years (August 31, 2008–2009), and has concluded that no provision for federal income tax is required in the fund’s financial statements.
4. Distributions: Distributions to shareholders are recorded on the ex-dividend date.
5. Security Lending: The fund may lend its securities to qualified institutional borrowers to earn additional income. Security loans are required to be secured at all times by collateral at least equal to the market value of securities loaned. The fund invests cash collateral received in Vanguard Market Liquidity Fund, and records a liability for the return of the collateral, during the period the securities are on loan. Security lending income represents the income earned on investing cash collateral, less expenses associated with the loan.
48
Mega Cap 300 Value Index Fund
6. Other: Dividend income is recorded on the ex-dividend date. Interest income includes income distributions received from Vanguard Market Liquidity Fund and is accrued daily. Security transactions are accounted for on the date securities are bought or sold. Costs used to determine realized gains (losses) on the sale of investment securities are those of the specific securities sold.
Each class of shares has equal rights as to assets and earnings, except that each class separately bears certain class-specific expenses related to maintenance of shareholder accounts (included in Management and Administrative expenses), shareholder reporting, and proxies. Marketing and distribution expenses are allocated to each class of shares based on a method approved by the board of trustees. Income, other non-class-specific expenses, and gains and losses on investments are allocated to each class of shares based on its relative net assets.
B. The Vanguard Group furnishes at cost investment advisory, corporate management, administrative, marketing, and distribution services. The costs of such services are allocated to the fund under methods approved by the board of trustees. The fund has committed to provide up to 0.40% of its net assets in capital contributions to Vanguard. At August 31, 2009, the fund had contributed capital of $49,000 to Vanguard (included in Other Assets), representing 0.02% of the fund’s net assets and 0.02% of Vanguard’s capitalization. The fund’s trustees and officers are also directors and officers of Vanguard.
C. Various inputs may be used to determine the value of the fund’s investments. These inputs are summarized in three broad levels for financial statement purposes. The inputs or methodologies used to value securities are not necessarily an indication of the risk associated with investing in those securities.
Level 1—Quoted prices in active markets for identical securities.
Level 2—Other significant observable inputs (including quoted prices for similar securities, interest
rates, prepayment speeds, credit risk, etc.).
Level 3—Significant unobservable inputs (including the fund’s own assumptions used to determine
the fair value of investments).
At August 31, 2009, 100% of the fund’s investments were valued based on Level 1 inputs.
D. Distributions are determined on a tax basis and may differ from net investment income and realized capital gains for financial reporting purposes. Differences may be permanent or temporary. Permanent differences are reclassified among capital accounts in the financial statements to reflect their tax character. Temporary differences arise when certain items of income, expense, gain, or loss are recognized in different periods for financial statement and tax purposes; these differences will reverse at some time in the future. Differences in classification may also result from the treatment of short-term gains as ordinary income for tax purposes.
During the year ended August 31, 2009, the fund realized $3,396,000 of net capital gains resulting from in-kind redemptions—in which shareholders exchanged fund shares for securities held by the fund rather than for cash. Because such gains are not taxable to the fund, and are not distributed to shareholders, they have been reclassified from accumulated net realized losses to paid-in capital.
For tax purposes, at August 31, 2009, the fund had $1,304,000 of ordinary income available for distribution. The fund had available capital loss carryforwards totaling $851,000 to offset future net capital gains through August 31, 2017. In addition, the fund realized losses of $19,616,000 during the period from November 1, 2008, through August 31, 2009, which are deferred and will be treated as realized for tax purposes in fiscal 2010.
49
Mega Cap 300 Value Index Fund
At August 31, 2009, the cost of investment securities for tax purposes was $241,643,000. Net unrealized depreciation of investment securities for tax purposes was $8,339,000, consisting of unrealized gains of $14,211,000 on securities that had risen in value since their purchase and $22,550,000 in unrealized losses on securities that had fallen in value since their purchase.
E. During the year ended August 31, 2009, the fund purchased $205,595,000 of investment securities and sold $103,655,000 of investment securities, other than temporary cash investments.
F. Capital share transactions for each class of shares were:
| | | | |
| | | Year Ended | Inception1 to |
| | August 31, 2009 | August 31, 2008 |
| | Amount | Shares | Amount | Shares |
| | ($000) | (000) | ($000) | (000) |
| Institutional Shares | | | | |
| Issued | 32,907 | 536 | 53,949 | 639 |
| Issued in Lieu of Cash Distributions | 1,849 | 31 | 127 | 1 |
| Redeemed | (7,906) | (143) | (383) | (4) |
| Net Increase (Decrease)—Institutional Shares | 26,850 | 424 | 53,693 | 636 |
| ETF Shares | | | | |
| Issued | 123,860 | 4,200 | 102,663 | 2,300 |
| Issued in Lieu of Cash Distributions | — | — | — | — |
| Redeemed | (49,811) | (1,600) | — | — |
| Net Increase (Decrease)—ETF Shares | 74,049 | 2,600 | 102,663 | 2,300 |
| 1 Inception was March 5, 2008, for Institutional Shares and December 17, 2007, for ETF Shares. | | |
G. In preparing the financial statements as of August 31, 2009, management considered the impact of subsequent events occurring through October 15, 2009, for potential recognition or disclosure in these financial statements.
50
Report of Independent Registered
Public Accounting Firm
To the Trustees of Vanguard World Fund and the Shareholders of Vanguard Mega Cap 300 Index Fund, Vanguard Mega Cap 300 Growth Index Fund and Vanguard Mega Cap 300 Value Index Fund:
In our opinion, the accompanying statements of net assets, and the related statements of operations and of changes in net assets and the financial highlights present fairly, in all material respects, the financial position of Vanguard Mega Cap 300 Index Fund, Vanguard Mega Cap 300 Growth Index Fund and Vanguard Mega Cap 300 Value Index Fund (the “Funds”) at August 31, 2009, the results of each of their operations for the year then ended, the changes in each of their net assets and the financial highlights for each of the periods indicated, in conformity with accounting principles generally accepted in the United States of America. These financial statements and financial highlights (hereafter referred to as “financial statements”) are the responsibility of the Funds’ management; our responsibility is to express an opinion on these financial statements based on our audits. We conducted our audits of these financial statements in accordance with the standards of the Public Company Accounting Oversight Board (United States). Those standards require that we plan and perform the audit to obtain reasonable assurance about whether the financial statements are free of material misstatement. An audit includes examining, on a test basis, evidence supporting the amounts and disclosures in the financial statements, assessing the accounting principles used and significant estimates made by management, and evaluating the overall financial statement presentation. We believe that our audits, which included confirmation of securities at August 31, 2009 by correspondence with the custodian and by agreement to the underlying ownership records for Vanguard Market Liquidity Fund, provide a reasonable basis for our opinion.
PricewaterhouseCoopers LLP
Philadelphia, Pennsylvania
October 15, 2009
51
Special 2009 tax information (unaudited) for Vanguard Mega Cap 300 Index Funds
This information for the fiscal period ended August 31, 2009, is included pursuant to provisions of the Internal Revenue Code.
The funds distributed qualified dividend income to shareholders during the fiscal year as follows:
| |
| | Qualified Dividend Income |
| Index Fund | ($000) |
| Mega Cap 300 | 5,048 |
| Mega Cap 300 Growth | 3,600 |
| Mega Cap 300 Value | 5,594 |
For corporate shareholders, the percentage of investment income (dividend income plus short-term gains, if any) qualifies for the dividends-received deduction as follows:
| |
| Index Fund | Percentage |
| Mega Cap 300 | 99.1% |
| Mega Cap 300 Growth | 98.1 |
| Mega Cap 300 Value | 97.0 |
52
Your Fund’s After-Tax Returns
This table presents returns for your fund both before and after taxes. The after-tax returns are shown in two ways: (1) assuming that an investor owned the fund during the entire period and paid taxes on the fund’s distributions, and (2) assuming that an investor paid taxes on the fund’s distributions and sold all shares at the end of each period.
Calculations are based on the highest individual federal income tax and capital gains tax rates in effect at the times of the distributions and the hypothetical sales. State and local taxes were not considered. After-tax returns reflect any qualified dividend income, using actual prior-year figures and estimates for 2009. (In the example, returns after the sale of fund shares may be higher than those assuming no sale. This occurs when the sale would have produced a capital loss. The calculation assumes that the investor received a tax deduction for the loss.)
The table shows returns, based on the net asset value, for ETF Shares only; returns for other share classes will differ. Please note that your actual after-tax returns will depend on your tax situation and may differ from those shown. Also note that if you own the fund in a tax-deferred account, such as an individual retirement account or a 401(k) plan, this information does not apply to you. Such accounts are not subject to current taxes.
Finally, keep in mind that a fund’s performance—whether before or after taxes—does not guarantee future results.
| | |
| Average Annual Total Returns: Mega Cap 300 Index Funds | | |
| Periods Ended August 31, 2009 | | |
| | One | Since |
| | Year | Inception1 |
| Mega Cap 300 Index Fund ETF Shares | | |
| Returns Before Taxes | –17.85% | –16.04% |
| Returns After Taxes on Distributions | –18.13 | –16.26 |
| Returns After Taxes on Distributions and Sale of Fund Shares | –11.29 | –13.51 |
| |
| Mega Cap 300 Growth Index Fund ETF Shares | | |
| Returns Before Taxes | –17.28% | –13.68% |
| Returns After Taxes on Distributions | –17.48 | –13.83 |
| Returns After Taxes on Distributions and Sale of Fund Shares | –11.03 | –11.55 |
| |
| Mega Cap 300 Value Index Fund ETF Shares | | |
| Returns Before Taxes | –18.32% | –18.48% |
| Returns After Taxes on Distributions | –18.75 | –18.81 |
| Returns After Taxes on Distributions and Sale of Fund Shares | –11.42 | –15.53 |
1 Inception date for ETF Shares is December 17, 2007.
53
About Your Fund’s Expenses
As a shareholder of the fund, you incur ongoing costs, which include costs for portfolio management, administrative services, and shareholder reports (like this one), among others. Operating expenses, which are deducted from a fund’s gross income, directly reduce the investment return of the fund.
A fund’s expenses are expressed as a percentage of its average net assets. This figure is known as the expense ratio. The following examples are intended to help you understand the ongoing costs (in dollars) of investing in your fund and to compare these costs with those of other mutual funds. The examples are based on an investment of $1,000 made at the beginning of the period shown and held for the entire period.
The accompanying table illustrates your fund’s costs in two ways:
• Based on actual fund return. This section helps you to estimate the actual expenses that you paid over the period. The “Ending Account Value” shown is derived from the fund’s actual return, and the third column shows the dollar amount that would have been paid by an investor who started with $1,000 in the fund. You may use the information here, together with the amount you invested, to estimate the expenses that you paid over the period.
To do so, simply divide your account value by $1,000 (for example, an $8,600 account value divided by $1,000 = 8.6), then multiply the result by the number given for your fund under the heading “Expenses Paid During Period.”
• Based on hypothetical 5% yearly return. This section is intended to help you compare your fund’s costs with those of other mutual funds. It assumes that the fund had a yearly return of 5% before expenses, but that the expense ratio is unchanged. In this case—because the return used is not the fund’s actual return—the results do not apply to your investment. The example is useful in making comparisons because the Securities and Exchange Commission requires all mutual funds to calculate expenses based on a 5% return. You can assess your fund’s costs by comparing this hypothetical example with the hypothetical examples that appear in shareholder reports of other funds.
Note that the expenses shown in the table are meant to highlight and help you compare ongoing costs only and do not reflect transaction costs incurred by the fund for buying and selling securities. Your fund does not charge transaction fees, such as purchase or redemption fees, nor does it carry a “sales load.”
The calculations assume no shares were bought or sold during the period. Your actual costs may have been higher or lower, depending on the amount of your investment and the timing of any purchases or redemptions.
You can find more information about the fund’s expenses, including annual expense ratios, in the Financial Statements section of this report. For additional information on operating expenses and other shareholder costs, please refer to your fund’s current prospectus.
54
| | | |
| Six Months Ended August 31, 2009 | | | |
| | Beginning | Ending | Expenses |
| | Account Value | Account Value | Paid During |
| Index Fund | 2/28/2009 | 8/31/2009 | Period1 |
| Based on Actual Fund Return | | | |
| Mega Cap 300 | | | |
| Institutional Shares | $1,000.00 | $1,390.42 | $0.72 |
| ETF Shares | 1,000.00 | 1,390.24 | 0.78 |
| Mega Cap 300 Growth | | | |
| Institutional Shares | $1,000.00 | $1,358.93 | $0.65 |
| ETF Shares | 1,000.00 | 1,358.67 | 0.77 |
| Mega Cap 300 Value | | | |
| Institutional Shares | $1,000.00 | $1,426.47 | $0.73 |
| ETF Shares | 1,000.00 | 1,425.79 | 0.79 |
| Based on Hypothetical 5% Yearly Return | | | |
| Mega Cap 300 | | | |
| Institutional Shares | $1,000.00 | $1,024.60 | $0.61 |
| ETF Shares | 1,000.00 | 1,024.55 | 0.66 |
| Mega Cap 300 Growth | | | |
| Institutional Shares | $1,000.00 | $1,024.65 | $0.56 |
| ETF Shares | 1,000.00 | 1,024.55 | 0.66 |
| Mega Cap 300 Value | | | |
| Institutional Shares | $1,000.00 | $1,024.60 | $0.61 |
| ETF Shares | 1,000.00 | 1,024.55 | 0.66 |
1 The calculations are based on expenses incurred in the most recent six-month period. The funds’ annualized six-month expense ratios for that period are: 0.12% for the Mega Cap 300 Index Fund Institutional Shares, and 0.13% for ETF Shares; 0.11% for the Mega Cap 300 Growth Index Fund Institutional Shares, and 0.13% for ETF Shares; 0.12% for the Mega Cap 300 Value Index Fund Institutional Shares, and 0.13% for ETF Shares. The dollar amounts shown as “Expenses Paid” are equal to the annualized expense ratio multiplied by the average account value over the period, multiplied by the number of days in the most recent six-month period, then divided by the number of days in the most recent 12-month period.
55
Trustees Approve Advisory Arrangement
The board of trustees of Vanguard Mega Cap 300 Index Fund, Mega Cap 300 Growth Index Fund, and Mega Cap 300 Value Index Fund has renewed the funds’ investment advisory arrangement with The Vanguard Group, Inc. Vanguard—through its Quantitative Equity Group—serves as investment advisor to the funds. The board determined that continuing the funds’ internalized management structure was in the best interests of the funds and their shareholders.
The board based its decision upon an evaluation of the advisor’s investment staff, portfolio management process, and performance. The trustees considered the factors discussed below, among others. However, no single factor determined whether the board approved the arrangement. Rather, it was the totality of the circumstances that drove the board’s decision.
Nature, extent, and quality of services
The board considered the quality of the funds’ investment management since their inceptions in 2007 and took into account the organizational depth and stability of the advisor. The board noted that Vanguard has been managing investments for more than three decades. The Quantitative Equity Group adheres to a sound, disciplined investment management process; the team has considerable experience, stability, and depth.
The board concluded that Vanguard’s experience, stability, depth, and performance, among other factors, warranted approval of the advisory arrangement.
Investment performance
The board considered the funds’ performance since their inceptions including any periods of outperformance and underperformance of their target indexes and peer groups. The board concluded that the funds have performed in line with expectations, and that their results have been consistent with their investment strategies. Information about each fund’s most recent performance can be found on the Performance Summary pages of this report.
Cost
The board concluded that the funds’ expense ratios were well below the average expense ratios charged by funds in their respective peer groups and that the funds’ advisory expense ratios were also well below their peer-group averages. Information about the funds’ expense ratios appears in the About Your Fund’s Expenses section of this report.
The board does not conduct a profitability analysis of Vanguard, because of Vanguard’s unique “at-cost” structure. Unlike most other mutual fund management companies, Vanguard is owned by the funds it oversees, and produces “profits” only in the form of reduced expenses for fund shareholders.
The benefit of economies of scale
The board concluded that the funds’ low-cost arrangement with Vanguard ensures that the funds will realize economies of scale as they grow, with the cost to shareholders declining as fund assets increase.
The board will consider whether to renew the advisory arrangement again after a one-year period.
56
Glossary
Earnings Growth Rate. The average annual rate of growth in earnings over the past five years for the stocks now in a fund.
Equity Exposure. A measure that reflects a fund’s investments in stocks and stock futures. Any holdings in short-term reserves are excluded.
Expense Ratio. The percentage of a fund’s average net assets used to pay its annual administrative and advisory expenses. These expenses directly reduce returns to investors.
Foreign Holdings. The percentage of a fund represented by stocks or depositary receipts of companies based outside the United States.
Inception Date. The date on which the assets of a fund (or one of its share classes) are first invested in accordance with the fund’s investment objective. For funds with a subscription period, the inception date is the day after that period ends. Investment performance is measured from the inception date.
Median Market Cap. An indicator of the size of companies in which a fund invests; the midpoint of market capitalization (market price x shares outstanding) of a fund’s stocks, weighted by the proportion of the fund’s assets invested in each stock. Stocks representing half of the fund’s assets have market capitalizations above the median, and the rest are below it.
Price/Book Ratio. The share price of a stock divided by its net worth, or book value, per share. For a fund, the weighted average price/book ratio of the stocks it holds.
Price/Earnings Ratio. The ratio of a stock’s current price to its per-share earnings over the past year. For a fund, the weighted average P/E of the stocks it holds. P/E is an indicator of market expectations about corporate prospects; the higher the P/E, the greater the expectations for a company’s future growth.
Return on Equity. The annual average rate of return generated by a company during the past five years for each dollar of shareholder’s equity (net income divided by shareholder’s equity). For a fund, the weighted average return on equity for the companies whose stocks it holds.
Short-Term Reserves. The percentage of a fund invested in highly liquid, short-term securities that can be readily converted to cash.
Turnover Rate. An indication of the fund’s trading activity. Funds with high turnover rates incur higher transaction costs and may be more likely to distribute capital gains (which may be taxable to investors). The turnover rate excludes in-kind transactions, which have minimal impact on costs.
Yield. A fund’s 30-day SEC yield is derived using a formula specified by the U.S. Securities and Exchange Commission. Under the formula, data related to the fund’s security holdings in the previous 30 days are used to calculate the fund’s hypothetical net income for that period, which is then annualized and divided by the fund’s estimated average net assets over the calculation period. For the purposes of this calculation, a security’s income is based on its current market yield to maturity (in the case of bonds) or its projected dividend yield (for stocks). Because the SEC yield represents hypothetical annualized income, it will differ—at times significantly—from the fund’s actual experience. As a result, the fund’s income distributions may be higher or lower than implied by the SEC yield.
57
This page intentionally left blank.
This page intentionally left blank.
The People Who Govern Your Fund
The trustees of your mutual fund are there to see that the fund is operated and managed in your best interests since, as a shareholder, you are a part owner of the fund. Your fund’s trustees also serve on the board of directors of The Vanguard Group, Inc., which is owned by the Vanguard funds and provides services to them on an at-cost basis.
A majority of Vanguard’s board members are independent, meaning that they have no affiliation with Vanguard or the funds they oversee, apart from the sizable personal investments they have made as private individuals. The independent board members have distinguished backgrounds in business, academia, and public service. Each of the trustees and executive officers oversees 157 Vanguard funds.
The following table provides information for each trustee and executive officer of the fund. More information about the trustees is in the Statement of Additional Information, which can be obtained, without charge, by contacting Vanguard at 800-662-7447, or online at www.vanguard.com.
| |
| Interested Trustees | Emerson U. Fullwood |
| | Born 1948. Trustee Since January 2008. Principal |
| John J. Brennan1 | Occupation(s) During the Past Five Years: Retired |
| Born 1954. Trustee Since May 1987. Chairman of | Executive Chief Staff and Marketing Officer for North |
| the Board. Principal Occupation(s) During the Past | America and Corporate Vice President of Xerox |
| Five Years: Chairman of the Board and Director/Trustee | Corporation (photocopiers and printers); Director of |
| of The Vanguard Group, Inc., and of each of the | SPX Corporation (multi-industry manufacturing), the |
| investment companies served by The Vanguard Group; | United Way of Rochester, the Boy Scouts of America, |
| Chief Executive Officer and President of The Vanguard | Amerigroup Corporation (direct health and medical |
| Group and of each of the investment companies served | insurance carriers), and Monroe Community College |
| by The Vanguard Group (1996–2008); Chairman of | Foundation. |
| the Financial Accounting Foundation; Governor of | |
| the Financial Industry Regulatory Authority (FINRA); | Rajiv L. Gupta |
| Director of United Way of Southeastern Pennsylvania. | Born 1945. Trustee Since December 2001.2 Principal |
| | Occupation(s) During the Past Five Years: Retired |
| F. William McNabb III1 | Chairman and Chief Executive Officer of Rohm and |
| Born 1957. Trustee Since July 2009. Principal | Haas Co. (chemicals); President of Rohm and Haas Co. |
| Occupation(s) During the Past Five Years: Director of | (2006–2008); Board Member of American Chemistry |
| The Vanguard Group, Inc., since 2008; Chief Executive | Council; Director of Tyco International, Ltd. (diversified |
| Officer and President of The Vanguard Group and of | manufacturing and services) and Hewlett-Packard Co. |
| each of the investment companies served by The | (electronic computer manufacturing); Trustee of The |
| Vanguard Group since 2008; Director of Vanguard | Conference Board. |
| Marketing Corporation; Managing Director of The | |
| Vanguard Group (1995–2008). | Amy Gutmann |
| | Born 1949. Trustee Since June 2006. Principal |
| | Occupation(s) During the Past Five Years: President of |
| Independent Trustees | the University of Pennsylvania; Christopher H. Browne |
| | Distinguished Professor of Political Science in the School |
| Charles D. Ellis | of Arts and Sciences with Secondary Appointments |
| Born 1937. Trustee Since January 2001. Principal | at the Annenberg School for Communication and the |
| Occupation(s) During the Past Five Years: Applecore | Graduate School of Education of the University of |
| Partners (pro bono ventures in education); Senior | Pennsylvania; Director of Carnegie Corporation of |
| Advisor to Greenwich Associates (international business | New York, Schuylkill River Development Corporation, |
| strategy consulting); Successor Trustee of Yale University; | and Greater Philadelphia Chamber of Commerce; |
| Overseer of the Stern School of Business at New York | Trustee of the National Constitution Center. |
| University; Trustee of the Whitehead Institute for | |
| Biomedical Research. | |
| | |
| JoAnn Heffernan Heisen | Executive Officers | |
| Born 1950. Trustee Since July 1998. Principal | | |
| Occupation(s) During the Past Five Years: Retired | Thomas J. Higgins1 | |
| Corporate Vice President, Chief Global Diversity Officer, | Born 1957. Chief Financial Officer Since September |
| and Member of the Executive Committee of Johnson | 2008. Principal Occupation(s) During the Past Five |
| & Johnson (pharmaceuticals/consumer products); | Years: Principal of The Vanguard Group, Inc.; Chief |
| Vice President and Chief Information Officer of Johnson | Financial Officer of each of the investment companies |
| & Johnson (1997–2005); Director of the University | served by The Vanguard Group since 2008; Treasurer |
| Medical Center at Princeton and Women’s Research | of each of the investment companies served by The |
| and Education Institute. | Vanguard Group (1998–2008). |
| |
| André F. Perold | Kathryn J. Hyatt1 | |
| Born 1952. Trustee Since December 2004. Principal | Born 1955. Treasurer Since November 2008. Principal |
| Occupation(s) During the Past Five Years: George Gund | Occupation(s) During the Past Five Years: Principal of |
| Professor of Finance and Banking, Harvard Business | The Vanguard Group, Inc.; Treasurer of each of the |
| School; Director and Chairman of UNX, Inc. (equities | investment companies served by The Vanguard |
| trading firm); Chair of the Investment Committee of | Group since 2008; Assistant Treasurer of each of the |
| HighVista Strategies LLC (private investment firm). | investment companies served by The Vanguard Group |
| | (1988–2008). | |
| Alfred M. Rankin, Jr. | | |
| Born 1941. Trustee Since January 1993. Principal | Heidi Stam1 | |
| Occupation(s) During the Past Five Years: Chairman, | Born 1956. Secretary Since July 2005. Principal |
| President, Chief Executive Officer, and Director of | Occupation(s) During the Past Five Years: Managing |
| NACCO Industries, Inc. (forklift trucks/housewares/ | Director of The Vanguard Group, Inc., since 2006; |
| lignite); Director of Goodrich Corporation (industrial | General Counsel of The Vanguard Group since 2005; |
| products/aircraft systems and services). | Secretary of The Vanguard Group and of each of the |
| | investment companies served by The Vanguard Group |
| Peter F. Volanakis | since 2005; Director and Senior Vice President of |
| Born 1955. Trustee Since July 2009. Principal | Vanguard Marketing Corporation since 2005; Principal |
| Occupation(s) During the Past Five Years: President | of The Vanguard Group (1997–2006). |
| since 2007 and Chief Operating Officer since 2005 | | |
| of Corning Incorporated (communications equipment); | | |
| President of Corning Technologies (2001–2005); Director | Vanguard Senior Management Team |
| of Corning Incorporated and Dow Corning; Trustee of | | |
| the Corning Incorporated Foundation and the Corning | R. Gregory Barton | Michael S. Miller |
| Museum of Glass; Overseer of the Amos Tuck School | Mortimer J. Buckley | James M. Norris |
| of Business Administration at Dartmouth College. | Kathleen C. Gubanich | Glenn W. Reed |
| | Paul A. Heller | George U. Sauter |
| |
| |
| | Founder | |
| | John C. Bogle | |
| | Chairman and Chief Executive Officer, 1974–1996 |
1 These individuals are “interested persons” as defined in the Investment Company Act of 1940.
2 December 2002 for Vanguard Equity Income Fund, Vanguard Growth Equity Fund, the Vanguard Municipal Bond Funds, and the Vanguard
State Tax-Exempt Funds.

P.O. Box 2600
Valley Forge, PA 19482-2600
Connect with Vanguard® > www.vanguard.com
| |
| Fund Information > 800-662-7447 | All comparative mutual fund data are from Lipper Inc. |
| | or Morningstar, Inc., unless otherwise noted. |
| Direct Investor Account Services > 800-662-2739 | |
| | You can obtain a free copy of Vanguard’s proxy voting |
| Institutional Investor Services > 800-523-1036 | guidelines by visiting our website, www.vanguard.com, |
| | and searching for “proxy voting guidelines,” or by |
| Text Telephone for People | calling Vanguard at 800-662-2739. The guidelines are |
| With Hearing Impairment > 800-952-3335 | also available from the SEC’s website, www.sec.gov. |
| | In addition, you may obtain a free report on how your |
| | fund voted the proxies for securities it owned during |
| | the 12 months ended June 30. To get the report, visit |
| This material may be used in conjunction | either www.vanguard.com or www.sec.gov. |
| with the offering of shares of any Vanguard | |
| fund only if preceded or accompanied by | You can review and copy information about your fund |
| the fund’s current prospectus. | at the SEC’s Public Reference Room in Washington, D.C. |
| To find out more about this public service, call the SEC |
| | at 202-551-8090. Information about your fund is also |
| The funds or securities referred to herein are not | available on the SEC’s website, and you can receive |
| sponsored, endorsed, or promoted by MSCI, and MSCI | copies of this information, for a fee, by sending a |
| bears no liability with respect to any such funds or | request in either of two ways: via e-mail addressed to |
| securities. For any such funds or securities, the | publicinfo@sec.gov or via regular mail addressed to the |
| prospectus or the Statement of Additional Information | Public Reference Section, Securities and Exchange |
| contains a more detailed description of the limited | Commission, Washington, DC 20549-0102. |
| relationship MSCI has with The Vanguard Group and | |
| any related funds. | |
| |
| |
| |
| |
| | © 2009 The Vanguard Group, Inc. |
| | All rights reserved. |
| | Vanguard Marketing Corporation, Distributor. |
| | Q8280 102009 |
Item 2: Code of Ethics. The Registrant has adopted a code of ethics that applies to the Registrant’s principal executive officer, principal financial officer, principal accounting officer or controller or persons performing similar functions. The Code of Ethics was amended during the reporting period covered by this report to make certain technical, non-material changes.
Item 3: Audit Committee Financial Expert. The following members of the Audit Committee have been determined by the Registrant’s Board of Trustees to be Audit Committee Financial Experts serving on its Audit Committee, and to be independent: Charles D. Ellis, Rajiv L. Gupta, JoAnn Heffernan Heisen, André F. Perold, and Alfred M. Rankin, Jr.
Item 4: Principal Accountant Fees and Services.
(a) Audit Fees.
Audit Fees of the Registrant
Fiscal Year Ended August 31, 2009: $423,000
Fiscal Year Ended August 31, 2008: $405,000
Doc#0212032
Aggregate Audit Fees of Registered Investment Companies in the Vanguard Group.
Fiscal Year Ended August 31, 2009: $3,354,640
Fiscal Year Ended August 31, 2008: $3,055,590
(b) Audit-Related Fees.
Fiscal Year Ended August 31, 2009: $876,210
Fiscal Year Ended August 31, 2008: $626,240
Includes fees billed in connection with assurance and related services provided to the Registrant, The Vanguard Group, Inc., Vanguard Marketing Corporation, and other registered investment companies in the Vanguard Group.
(c) Tax Fees.
Fiscal Year Ended August 31, 2009: $423,070
Fiscal Year Ended August 31, 2008: $230,400
Includes fees billed in connection with tax compliance, planning and advice services provided to the Registrant, The Vanguard Group, Inc., Vanguard Marketing Corporation, and other registered investment companies in the Vanguard Group and related to income and excise taxes.
(d) All Other Fees.
Fiscal Year Ended August 31, 2009: $0
Fiscal Year Ended August 31, 2008: $0
Includes fees billed for services related to risk management and privacy matters. Services were provided to the Registrant, The Vanguard Group, Inc., Vanguard Marketing Corporation, and other registered investment companies in the Vanguard Group.
(e) (1) Pre-Approval Policies. The policy of the Registrant’s Audit Committee is to consider and, if appropriate, approve before the principal accountant is engaged for such services, all specific audit and non-audit services provided to: (1) the Registrant; (2) The Vanguard Group, Inc.; (3) other entities controlled by The Vanguard Group, Inc. that provide ongoing services to the Registrant; and (4) other registered investment companies in the Vanguard Group. In making a determination, the Audit Committee considers whether the services are consistent with maintaining the principal accountant’s independence.
In the event of a contingency situation in which the principal accountant is needed to provide services in between scheduled Audit Committee meetings, the Chairman of the Audit Committee would be called on to consider and, if appropriate, pre-approve audit or permitted non-audit services in an amount sufficient to complete services through the next Audit Committee meeting, and to determine if such services would be consistent with maintaining the accountant’s independence. At the next scheduled Audit Committee meeting, services and fees would be presented to the Audit Committee for formal consideration, and, if appropriate, approval by the entire Audit Committee. The Audit Committee would again consider whether such services and fees are consistent with maintaining the principal accountant’s independence.
The Registrant’s Audit Committee is informed at least annually of all audit and non-audit services provided by the principal accountant to the Vanguard complex, whether such services are provided to: (1) the Registrant; (2) The Vanguard Group, Inc.; (3) other entities controlled by The Vanguard Group, Inc. that provide ongoing services to the Registrant; or (4) other registered investment companies in the Vanguard Group.
(2) No percentage of the principal accountant’s fees or services were approved pursuant to the waiver provision of paragraph (c)(7)(i)(C) of Rule 2-01 of Regulation S-X.
(f) For the most recent fiscal year, over 50% of the hours worked under the principal accountant’s engagement were not performed by persons other than full-time, permanent employees of the principal accountant.
(g) Aggregate Non-Audit Fees.
Fiscal Year Ended August 31, 2009: $423,070
Fiscal Year Ended August 31, 2008: $230,400
Includes fees billed for non-audit services provided to the Registrant, The Vanguard Group, Inc., Vanguard Marketing Corporation, and other registered investment companies in the Vanguard Group.
(h) For the most recent fiscal year, the Audit Committee has determined that the provision of all non-audit services was consistent with maintaining the principal accountant’s independence.
Item 5: Not Applicable.
Item 6: Not Applicable.
Item 7: Not Applicable.
Item 8: Not Applicable.
Item 9: Not Applicable.
Item 10: Not Applicable.
Item 11: Controls and Procedures.
(a) Disclosure Controls and Procedures. The Principal Executive and Financial Officers concluded that the Registrant's Disclosure Controls and Procedures are effective based on their evaluation of the Disclosure Controls and Procedures as of a date within 90 days of the filing date of this report.
(b) Internal Control Over Financial Reporting. There were no significant changes in Registrant’s Internal Control Over Financial Reporting or in other factors that could significantly affect this control subsequent to the date of the evaluation, including any corrective actions with regard to significant deficiencies and material weaknesses.
Item 12: Exhibits.
(a) Code of Ethics.
(b) Certifications.
Pursuant to the requirements of the Securities Exchange Act of 1934 and the Investment Company Act of 1940, the registrant has duly caused this report to be signed on its behalf by the undersigned, thereunto duly authorized.
| |
| | VANGUARD WORLD FUNDS |
| |
| |
| BY: | /s/ F. WILLIAM MCNABB III* |
| | F. WILLIAM MCNABB III |
| | CHIEF EXECUTIVE OFFICER |
Date: October 22, 2009
Pursuant to the requirements of the Securities Exchange Act of 1934 and the Investment Company Act of 1940, this report has been signed below by the following persons on behalf of the registrant and in the capacities and on the dates indicated.
| |
| | VANGUARD WORLD FUNDS |
| |
| |
| BY: | /s/ F. WILLIAM MCNABB III* |
| | F. WILLIAM MCNABB III |
| | CHIEF EXECUTIVE OFFICER |
Date: October 22, 2009
| |
| | VANGUARD WORLD FUNDS |
| |
| |
| BY: | /s/ THOMAS J. HIGGINS* |
| | THOMAS J. HIGGINS |
| | CHIEF FINANCIAL OFFICER |
Date: October 22, 2009
* By: /s/ Heidi Stam
Heidi Stam, pursuant to a Power of Attorney filed on July 24, 2009, see file Number
2-88373, and a Power of Attorney filed on October 16, 2009, see File Number 2-52698, both
Incorporated by Reference