UNITED STATES
SECURITIES AND EXCHANGE COMMISSION
Washington, D.C. 20549
FORM N-CSR
CERTIFIED SHAREHOLDER REPORT
OF
REGISTERED MANAGEMENT INVESTMENT COMPANIES
| | |
| Investment Company Act file number: | 811-01027 |
Name of Registrant: | Vanguard World Fund |
Address of Registrant: | P.O. Box 2600 |
| | Valley Forge, PA 19482 |
Name and address of agent for service: | Anne E. Robinson, Esquire |
| | P.O. Box 876 |
| | Valley Forge, PA 19482 |
Registrant’s telephone number, including area code: (610) 669-1000 |
Date of fiscal year end: August 31 |
Date of reporting period: September 1, 2016 – February 28, 2017 |
Item 1: Reports to Shareholders |
Semiannual Report | February 28, 2017
Vanguard U.S. Growth Fund
A new format, unwavering commitment
As you begin reading this report, you’ll notice that we’ve made some improvements to the opening sections—based on feedback from you, our clients.
Page 1 starts with a new ”Your Fund’s Performance at a Glance,” a concise, handy summary of how your fund performed during the period.
In the renamed ”Chairman’s Perspective,” Bill McNabb will focus on enduring principles and investment insights.
We’ve modified some tables, and eliminated some redundancy, but we haven’t removed any information.
At Vanguard, we’re always looking for better ways to communicate and to help you make sound investment decisions. Thank you for entrusting your assets to us.
| |
| Contents | |
| Your Fund’s Performance at a Glance. | 1 |
| Chairman’s Perspective. | 2 |
| Advisors’ Report. | 5 |
| Fund Profile. | 11 |
| Performance Summary. | 13 |
| Financial Statements. | 14 |
| About Your Fund’s Expenses. | 28 |
| Trustees Approve Advisory Arrangements. | 30 |
| Glossary. | 32 |
Please note: The opinions expressed in this report are just that—informed opinions. They should not be considered promises or advice.
Also, please keep in mind that the information and opinions cover the period through the date on the front of this report. Of course, the
risks of investing in your fund are spelled out in the prospectus.
See the Glossary for definitions of investment terms used in this report.
About the cover: No matter what language you speak, Vanguard has one consistent message and set of principles. Our primary
focus is on you, our clients. We conduct our business with integrity as a faithful steward of your assets. This message is shown
translated into seven languages, reflecting our expanding global presence.
Your Fund’s Performance at a Glance
• Vanguard U.S. Growth Fund returned almost 5% for the six months ended February 28, 2017. It trailed the 9.15% return of its benchmark, the Russell 1000 Growth Index, and the 7.44% average return of its large-capitalization growth peers.
• The fund’s five advisors manage their portions of the portfolio separately, but all seek to hold the stocks of large, high-quality companies with long-term growth potential.
• Value stocks outperformed growth during the half-year, and small-cap stocks topped large- and mid-caps.
• Information technology stocks, which made up about 40% of the portfolio, added the most to the fund’s absolute return but lagged those contained in the benchmark. The advisors’ consumer discretionary, industrial, and health care stocks also recorded subpar returns versus their benchmark counterparts.
• The fund held stocks in 9 of 11 industry sectors at the period’s end; only consumer staples declined.
| |
| Total Returns: Six Months Ended February 28, 2017 | |
| | Total |
| | Returns |
| Vanguard U.S. Growth Fund | |
| Investor Shares | 4.75% |
| Admiral™ Shares | 4.81 |
| Russell 1000 Growth Index | 9.15 |
| Large-Cap Growth Funds Average | 7.44 |
| Large-Cap Growth Funds Average: Derived from data provided by Lipper, a Thomson Reuters Company. |
| Admiral Shares carry lower expenses and are available to investors who meet certain account-balance requirements. |
| | | |
| Expense Ratios | | | |
| Your Fund Compared With Its Peer Group | | | |
| | Investor | Admiral | Peer Group |
| | Shares | Shares | Average |
| U.S. Growth Fund | 0.46% | 0.32% | 1.14% |
The fund expense ratios shown are from the prospectus dated December 22, 2016, and represent estimated costs for the current fiscal year.
For the six months ended February 28, 2017, the annualized expense ratios were 0.41% for Investor Shares and 0.28% for Admiral Shares.
The peer-group expense ratio is derived from data provided by Lipper, a Thomson Reuters Company, and captures information through
year-end 2016.
Peer group: Large-Cap Growth Funds.
1
Chairman’s Perspective

Bill McNabb
Chairman and Chief Executive Officer
Dear Shareholder,
More than a decade ago, a Vanguard client asked us to help improve its defined contribution retirement plan. New hires were participating in the plan at lower rates than in previous years, and the client wanted to reverse this trend. Another priority was to help more participants invest their retirement savings in balanced portfolios.
The overall goal of this longtime client: Give employees a better chance to achieve financial security in retirement.
Today, that plan automatically enrolls employees at a 5% contribution rate, puts them in a low-cost target-date fund that takes on less risk as they near retirement, and offers a comprehensive suite of advice services. On top of that, employees get an employer contribution of 5% and are eligible for a company match.
Because of this combination of attractive features and generous employer contributions, nearly all new hires now participate in the plan, 81% of plan participants invest their retirement savings in balanced portfolios, and 87% of participants meet or exceed Vanguard’s recommended total retirement savings target. (Vanguard generally recommends that retirement investors save 12%–15% of pay, including company matches.)
2
Changing the retirement landscape
Am I singling out an isolated Vanguard success story? Absolutely not.
Stories like these are becoming increasingly common with employer-based retirement plans, particularly among large and midsize companies. Solutions such as automatic enrollment, automatic contribution increases, and default investment in target-date funds are having a positive effect.
Insights from the relatively new discipline of behavioral finance have contributed to the advances. Simply put, retirement plans are making natural human inertia work for future retirees, rather than against them, by putting savings on autopilot as much as possible.
More than 60% of Vanguard participants are in plans with automatic enrollment, which has led to a big jump in participation. Today, more than four-fifths of eligible employees are saving for retirement, compared with only two-thirds ten years ago.
In addition, many plans have adopted automatic-escalation features, which increase plan contributions at regular intervals until a maximum level is reached or an employee opts out. Automatic increases are a crucial tool for boosting retirement savings rates.
The growing use of target-date funds is another enormous benefit. More than 70% of all participants in Vanguard plans invest at least part of their retirement savings in
| | | |
| Market Barometer | | | |
| | | | Total Returns |
| | | Periods Ended February 28, 2017 |
| | Six | One | Five Years |
| | Months | Year | (Annualized) |
| Stocks | | | |
| Russell 1000 Index (Large-caps) | 10.10% | 25.53% | 13.94% |
| Russell 2000 Index (Small-caps) | 12.61 | 36.11 | 12.89 |
| Russell 3000 Index (Broad U.S. market) | 10.29 | 26.29 | 13.85 |
| FTSE All-World ex US Index (International) | 5.40 | 19.87 | 4.00 |
| |
| Bonds | | | |
| Bloomberg Barclays U.S. Aggregate Bond Index | | | |
| (Broad taxable market) | -2.19% | 1.42% | 2.24% |
| Bloomberg Barclays Municipal Bond Index | | | |
| (Broad tax-exempt market) | -2.80 | 0.25 | 3.07 |
| Citigroup Three-Month U.S. Treasury Bill Index | 0.19 | 0.32 | 0.10 |
| |
| CPI | | | |
| Consumer Price Index | 1.14% | 2.74% | 1.36% |
3
these age-appropriate, diversified strategies. And nearly 50% of Vanguard participants are invested solely in a single target-date fund.
Consider a do-it-yourself autopilot
But what if you don’t have access to a world-class, employer-based retirement plan? Unfortunately, not everyone does, which is an important policy issue.
However, you can still put the features of these plans to work. For example, you can set up automatic contributions from your paycheck to an IRA. And you can adopt your own automatic escalation by investing any pay raises.
You can also take a page from top-quality retirement plans by considering a low-cost, globally diversified target-date fund. The beauty of this approach is that you don’t need to remember to rebalance your portfolio—the fund does it for you.
Of course, you can take a more active role in picking your own investments, and this can be a good choice for some. But keep in mind the lessons from successful employer-based plans: Busy workers, faced with a lot of competing priorities, are often best served by putting their retirement savings on autopilot.
Winning by default
In highlighting some recent successes in retirement savings, I don’t want to minimize the challenges we still face. We’re living in a slow-growth, uncertain world, and investment returns for both stocks and bonds could well be modest in the coming decade.
But I believe the innovations we’ve seen in the last ten years in many retirement plans—you might call it the “default revolution”—point the way toward a solution. And that even goes for people whose employers don’t have a world-class retirement plan.
As always, thank you for investing with Vanguard.
Sincerely,

F. William McNabb III
Chairman and Chief Executive Officer
March 14, 2017
4
Advisors’ Report
For the six months ended February 28, 2017, Vanguard U.S. Growth Fund returned nearly 5%. It trailed its benchmark, the Russell 1000 Growth Index, and the average return of its peers. Your fund is managed by five advisors. The use of multiple independent advisors enhances the fund’s diversification by providing exposure to distinct yet complementary investment approaches. It is not uncommon for different advisors to have different views about individual securities or the broader investment environment.
The table on page 10 presents the advisors, the percentage and amount of fund assets that each manages, and brief descriptions of their investment strategies. Each advisor has also prepared a discussion of the investment environment during the fiscal half-year and of how the portfolio’s positioning reflects this assessment. These reports were prepared on March 16, 2017.
Wellington Management Company llp
Portfolio Manager:
Andrew J. Shilling, CFA,
Senior Managing Director
We aim for our portion of the fund to outperform growth benchmarks and, in the longer term, the broader market. We employ proprietary fundamental research and a rigorous valuation discipline to invest in large-capitalization companies with attractive growth characteristics. Our investment approach is based on identifying companies with a clear competitive advantage that will enable them to sustain above-average growth.
Weak security selection in the industrial, information technology, and health care sectors weighed on our portion of the fund over the last six months. Choices in consumer discretionary also detracted from relative results. Our selection was stronger in real estate, helping to partially offset weakness elsewhere. An underweighted exposure to consumer staples and an overweighted allocation to information technology (a result of our bottom-up stock selection) further boosted results.
The largest detractors from relative performance included athletic apparel-maker Under Armour, medical equipment supplier Edwards Lifesciences, and energy and soft drink company Monster Beverage.
Netflix was the leading contributor. Other standouts included consumer electronics company Harman International Industries and technology products and services provider CDW.
At the period’s close, we were most overweighted in the information technology, financial, and industrial sectors. We reduced our exposure to consumer discretionary, where we now have an underweighted allocation. We also remained underweighted in health care, consumer staples, and materials.
5
In today’s environment of low global growth and elevated uncertainty, we have maintained the portfolio’s exposure to secular trends and long-cycle growth. We believe these durable growth drivers will yield attractive relative returns during a challenging period for investors. We remain true to our process, seeking to invest in companies with competitive advantages, strong balance sheets, experienced and proven management, and the ability to sustain above-average growth.
Jackson Square Partners, LLC
Portfolio Managers:
Jeffrey S. Van Harte, CFA,
Chairman and Chief Investment Officer
Christopher J. Bonavico, CFA,
Equity Analyst
Christopher M. Ericksen, CFA,
Equity Analyst
Daniel J. Prislin, CFA,
Equity Analyst
Stock selection hurt the portfolio during the period. TripAdvisor Holdings was the biggest detractor. The company is transitioning to a business model that allows users to book directly online through its site. Although usage trends for InstantBook are improving, user behavior has been more difficult to change than expected. The company plans to increase its marketing spending in order to accelerate revenue growth and attract customers to the new feature. Such a campaign could push revenues higher, but it could also temporarily affect EBITDA. Despite InstantBook’s slow takeoff, we believe the company has the assets in place to build a successful transaction business that will supplement its core travel search business.
Our largest relative contributor during the period was Celgene Corporation. Revlimid, its drug for multiple myeloma, has grown nearly 30% year-over-year, with notable international success. We believe the company is poised to benefit from additional indications for some of its drugs (particularly Revlimid), increased use of others, and international growth opportunities.
The equity market has delivered positive absolute results over the past several years. However, Jackson Square Partners believes that ever-changing market sentiment has demonstrated that more than just fundamental factors are affecting stock prices. A lack of confidence in the tepid fundamental outlook since the financial crisis suggests that many investors have struggled to accurately predict the pace of global economic recovery. They are also uncertain about assessing external factors that threaten economic fundamentals, such as central bank actions and fiscal policy debates across the globe.
President Trump’s surprising victory in November and the corresponding market reaction reflect growing investor optimism,
6
at least in the short term, that upcoming policy shifts could stimulate economic growth. We believe it is too early to determine the direction or magnitude of such moves, but we will closely monitor the launch of Trump’s tenure with a keen eye on potentially significant changes.
William Blair Investment
Management, LLC
Portfolio Managers:
James Golan, CFA, Partner
David Ricci, CFA, Partner
Equity market strength over the six months was fueled by positive U.S. economic data and the surprise election of Donald Trump. The president’s proposed policies of lower taxes, increased fiscal spending, and looser regulations were generally perceived as pro-growth. This gave a boost to cheaper and more economically sensitive areas of the market. At the same time, U.S. economic data, including retail sales, housing starts, unemployment claims, and wages, strengthened.
The portfolio was hindered during the period by disappointing stock selection and a challenging environment for our investment style. The market’s preference for cheaper stocks hurt because the portfolio’s quality growth companies typically trade at a valuation premium. At the sector level, our largest detractors were information technology—mainly our decision to not own Apple—and consumer discretionary, in part because of a position in O’Reilly Automotive. Other top individual detractors included health care holding Cerner Corporation and consumer staples companies Monster Beverage Corporation, Kroger, and Estee Lauder. Top contributors included UnitedHealth Group (health care), Union Pacific (industrials), Adobe Systems (information technology), Affiliated Managers Group (financials), and Mastercard (information technology).
As always, we believe other investors’ focus on near-term events creates opportunities for investors such as ourselves, who analyze companies over the long term to achieve excess returns. We remain focused on identifying companies with durable growth drivers whose stocks present compelling risk/reward opportunities.
Jennison Associates LLC
Portfolio Managers:
Kathleen A. McCarragher,
Managing Director
Blair A. Boyer, Managing Director
Hurt by the U.S. election’s focus on drug pricing earlier in the period, health care stocks dragged on portfolio returns despite a later rebound as concerns abated somewhat. Bristol-Myers Squibb declined following disappointing clinical data from its immuno-oncology program. Allergan and Shire, which have grown through acquisitions, were affected by
7
regulatory changes that threatened to remove the tax benefits of mergers between U.S. and offshore companies.
Technology positions were strong contributors but underperformed the benchmark sector. Apple’s strength reflected the proliferation of the iOS platform across mobile phones, tablets, and personal computers and the financial power and attractive margins of the company’s hardware products. Semiconductor-maker NVIDIA benefited from its focus on high-growth markets, where it is offering high-value-added graphics products. Qualcomm fell because of new and ongoing antitrust litigation.
In the wake of the U.S. election, the financial and industrial sectors performed well in anticipation of a less onerous regulatory environment and stimulus to infrastructure investment. We believe Goldman Sachs’s strong capital base and leading positions in investment banking, capital markets, trading, and asset management provide attractive exposure to long-term global economic expansion. Morgan Stanley is a formidable competitor and has a balanced and diversified business model.
Boeing’s gain reflected strong financial results and the 787 Dreamliner commercial jet’s cash generation. In consumer discretionary, Netflix rose on robust subscriber growth. As the company develops into a global network, its earnings potential grows significantly.
We conduct rigorous research to determine company, industry, and sector fundamentals and prospects over intermediate and longer terms, projecting how markets, industries, and businesses will evolve over time. With this perspective, we build the portfolio through individual stock selection based on company fundamentals.
Baillie Gifford Overseas Ltd.
Portfolio Managers:
Tom Slater, Investment Manager, Partner
Gary Robinson, Investment Manager
The election victory of Donald Trump dominated the news during the period. As in 2016, markets were primarily driven by politics and sentiment. Given our long-term view and focus on company fundamentals, it was pleasing to see the companies held by the portfolio continue to deliver outstanding operational results. We are heartened by their extensive investment for future growth.
Our philosophy and process focus on finding and holding exceptional growth companies, as defined by their culture, growth opportunity, and competitive edge. As a result of our research, we acquired a diverse range of stocks with attractive and durable growth prospects. CoStar Group (commercial real estate data), Ellie Mae (mortgage origination software), NVIDIA (graphic-chip designer), and Vertex Pharmaceuticals (cystic fibrosis drug developer) were all purchased over the
8
period. Funds for these stocks came from the complete sales of Apache, Colgate-Palmolive, Genomic Health, Idexx Laboratories, and O’Reilly Automotive.
Despite political uncertainties, we remain very optimistic about the portfolio’s prospects; some of its holdings are literally changing the world through their innovation, expertise, and vision. We look forward to updating you on their progress and finding more exceptional growth companies over the coming year.
9
| | | |
| Vanguard U.S. Growth Fund Investment Advisors | |
| |
| | Fund Assets Managed | |
| Investment Advisor | % | $ Million | Investment Strategy |
| Wellington Management | 37 | 2,536 | Employs proprietary fundamental research and a |
| Company LLP | | | rigorous valuation discipline in an effort to invest in |
| | | | high-quality, large-cap, sustainable-growth companies. |
| | | | The investment approach is based on the belief that |
| | | | stock prices often overreact to short-term trends and |
| | | | that bottom-up, intensive research focused on |
| | | | longer-term fundamentals can be used to identify |
| | | | stocks that will outperform the market over time. |
| Jackson Square Partners, LLC | 36 | 2,511 | Uses a bottom-up approach, seeking companies that |
| | | | have large end-market potential, dominant business |
| | | | models, and strong free cash flow generation that is |
| | | | attractively priced compared with the intrinsic value of |
| | | | the securities. |
| William Blair Investment | 13 | 882 | Uses a fundamental investment approach in pursuit of |
| Management, LLC | | | superior long-term investment results from |
| | | | growth-oriented companies with leadership positions |
| | | | and strong market presence. |
| Jennison Associates LLC | 6 | 441 | Uses a research-driven, fundamental investment |
| | | | approach that relies on in-depth company knowledge |
| | | | gleaned through meetings with management, |
| | | | customers, and suppliers. |
| Baillie Gifford Overseas Ltd. | 6 | 428 | Uses a long-term, active, bottom-up investment |
| | | | approach to identify companies that can generate |
| | | | above-average growth in earnings and cash flow. |
| Cash Investments | 2 | 127 | These short-term reserves are invested by Vanguard in |
| | | | equity index products to simulate investment in stocks. |
| | | | Each advisor may also maintain a modest cash |
| | | | position. |
10
U.S. Growth Fund
Fund Profile
As of February 28, 2017
| | |
| Share-Class Characteristics | |
| | Investor | Admiral |
| | Shares | Shares |
| Ticker Symbol | VWUSX | VWUAX |
| Expense Ratio1 | 0.46% | 0.32% |
| 30-Day SEC Yield | 0.45% | 0.60% |
| | | |
| Portfolio Characteristics | | |
| | | | DJ |
| | | | U.S. |
| | | Russell | Total |
| | | 1000 | Market |
| | | Growth | FA |
| | Fund | Index | Index |
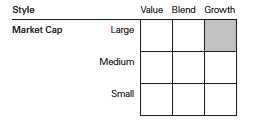
| Number of Stocks | 156 | 610 | 3,807 |
| Median Market Cap | $53.4B | $82.4B | $57.6B |
| Price/Earnings Ratio | 31.6x | 24.7x | 24.8x |
| Price/Book Ratio | 5.0x | 5.9x | 3.0x |
| Return on Equity | 21.0% | 22.5% | 16.4% |
| Earnings Growth | | | |
| Rate | 12.7% | 11.6% | 7.6% |
| Dividend Yield | 0.9% | 1.5% | 1.9% |
| Foreign Holdings | 1.1% | 0.0% | 0.0% |
| Turnover Rate | | | |
| (Annualized) | 33% | — | — |
| Short-Term | | | |
| Reserves | 1.1% | — | — |
| | |
| Volatility Measures | | |
| | | DJ |
| | | U.S. Total |
| | Russell 1000 | Market |
| | Growth Index | FA Index |
| R-Squared | 0.92 | 0.79 |
| Beta | 1.01 | 0.97 |
| These measures show the degree and timing of the fund’s |
| fluctuations compared with the indexes over 36 months. |
| | |
| Ten Largest Holdings (% of total net assets) |
| Alphabet Inc. | Internet Software & | |
| | Services | 6.0% |
| Facebook Inc. | Internet Software & | |
| | Services | 3.9 |
| Microsoft Corp. | Systems Software | 3.9 |
| Mastercard Inc. | Data Processing & | |
| | Outsourced Services | 3.3 |
| Visa Inc. | Data Processing & | |
| | Outsourced Services | 3.1 |
| Amazon.com Inc. | Internet & Direct | |
| | Marketing Retail | 2.7 |
| Apple Inc. | Technology | |
| | Hardware, Storage & | |
| | Peripherals | 2.6 |
| PayPal Holdings Inc. | Data Processing & | |
| | Outsourced Services | 2.5 |
| Celgene Corp. | Biotechnology | 2.5 |
| Allergan plc | Pharmaceuticals | 2.1 |
| Top Ten | | 32.6% |
| The holdings listed exclude any temporary cash investments and |
| equity index products. |
Investment Focus
1 The expense ratios shown are from the prospectus dated December 22, 2016, and represent estimated costs for the current fiscal year. For the six
months ended February 28, 2017, the annualized expense ratios were 0.41% for Investor Shares and 0.28% for Admiral Shares.
11
U.S. Growth Fund
| | | |
| Sector Diversification (% of equity exposure) |
| | | | DJ |
| | | | U.S. |
| | | Russell | Total |
| | | 1000 | Market |
| | | Growth | FA |
| | Fund | Index | Index |
| Consumer | | | |
| Discretionary | 16.6% | 20.6% | 12.4% |
| Consumer Staples | 3.6 | 9.3 | 8.4 |
| Energy | 0.5 | 0.5 | 6.2 |
| Financials | 7.0 | 2.9 | 15.3 |
| Health Care | 15.4 | 16.2 | 13.4 |
| Industrials | 8.8 | 10.9 | 10.8 |
| Information | | | |
| Technology | 41.7 | 32.3 | 20.7 |
| Materials | 0.8 | 3.5 | 3.4 |
| Other | 1.8 | 0.0 | 0.0 |
| Real Estate | 3.8 | 2.8 | 4.1 |
| Telecommunication | | | |
| Services | 0.0 | 1.0 | 2.1 |
| Utilities | 0.0 | 0.0 | 3.2 |
12
U.S. Growth Fund
Performance Summary
All of the returns in this report represent past performance, which is not a guarantee of future results that may be achieved by the fund. (Current performance may be lower or higher than the performance data cited. For performance data current to the most recent month-end, visit our website at vanguard.com/performance.) Note, too, that both investment returns and principal value can fluctuate widely, so an investor’s shares, when sold, could be worth more or less than their original cost. The returns shown do not reflect taxes that a shareholder would pay on fund distributions or on the sale of fund shares.
Fiscal-Year Total Returns (%): August 31, 2006, Through February 28, 2017
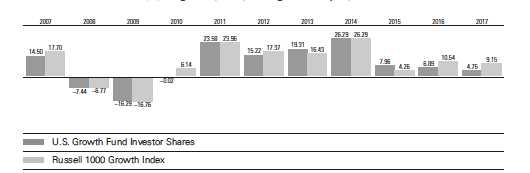
Note: For 2017, performance data reflect the six months ended February 28, 2017.
Average Annual Total Returns: Periods Ended December 31, 2016
This table presents returns through the latest calendar quarter—rather than through the end of the fiscal period.
Securities and Exchange Commission rules require that we provide this information.
| | | | |
| | Inception | One | Five | Ten |
| | Date | Year | Years | Years |
| Investor Shares | 1/6/1959 | -0.75% | 14.32% | 7.18% |
| Admiral Shares | 8/13/2001 | -0.59 | 14.48 | 7.35 |
See Financial Highlights for dividend and capital gains information.
13
U.S. Growth Fund
Financial Statements (unaudited)
Statement of Net Assets
As of February 28, 2017
The fund reports a complete list of its holdings in regulatory filings four times in each fiscal year, at the quarter-ends. For the second and fourth fiscal quarters, the lists appear in the fund’s semiannual and annual reports to shareholders. For the first and third fiscal quarters, the fund files the lists with the Securities and Exchange Commission on Form N-Q. Shareholders can look up the fund’s Forms N-Q on the SEC’s website at sec.gov. Forms N-Q may also be reviewed and copied at the SEC’s Public Reference Room (see the back cover of this report for further information).
| | | |
| | | | Market |
| | | | Value• |
| | | Shares | ($000) |
| Common Stocks (96.0%)1 | | |
| Consumer Discretionary (16.3%) | |
| * | Amazon.com Inc. | 223,927 | 189,227 |
| | Home Depot Inc. | 829,918 | 120,263 |
| * | Liberty Interactive Corp. | | |
| | QVC Group Class A | 4,656,094 | 87,907 |
| * | Netflix Inc. | 597,274 | 84,891 |
| * | Liberty Global plc | 1,881,595 | 66,025 |
| * | TripAdvisor Inc. | 1,513,701 | 62,773 |
| * | O’Reilly Automotive Inc. | 226,143 | 61,445 |
| | NIKE Inc. Class B | 869,228 | 49,685 |
| | Dollar General Corp. | 672,388 | 49,098 |
| | Starbucks Corp. | 825,973 | 46,973 |
| * | Priceline Group Inc. | 25,840 | 44,552 |
| ^ | Tesla Inc. | 130,819 | 32,703 |
| | Ross Stores Inc. | 393,741 | 27,003 |
| * | Chipotle Mexican Grill Inc. | | |
| | Class A | 57,790 | 24,199 |
| * | Hilton Worldwide | | |
| | Holdings Inc. | 418,642 | 23,946 |
| * | Under Armour Inc. | 1,185,878 | 22,010 |
| * | AutoZone Inc. | 28,136 | 20,724 |
| | Las Vegas Sands Corp. | 390,933 | 20,700 |
| * | Liberty Global plc Class A | 501,593 | 17,907 |
| | Lennar Corp. Class A | 298,631 | 14,570 |
| | adidas AG | 59,368 | 9,959 |
| | Marriott International Inc. | | |
| | Class A | 109,409 | 9,518 |
| ^ | Wayfair Inc. | 239,189 | 9,044 |
| | Industria de Diseno Textil | | |
| | SA ADR | 549,830 | 8,797 |
| | Charter Communications | | |
| | Inc. Class A | 20,104 | 6,495 |
| | CarMax Inc. | 89,514 | 5,777 |
| | Harley-Davidson Inc. | 87,428 | 4,929 |
| | Ulta Beauty Inc. | 14,945 | 4,086 |
| | Expedia Inc. | 28,280 | 3,367 |
| | | | 1,128,573 |
| | | |
| Consumer Staples (3.5%) | | |
| * | Monster Beverage Corp. | 1,269,295 | 52,599 |
| | Walgreens Boots Alliance | | |
| | Inc. | 523,500 | 45,220 |
| | Estee Lauder Cos. Inc. | | |
| | Class A | 449,633 | 37,252 |
| | Constellation Brands Inc. | | |
| | Class A | 229,601 | 36,463 |
| | Kroger Co. | 975,100 | 31,008 |
| | PepsiCo Inc. | 148,225 | 16,361 |
| | Costco Wholesale Corp. | 64,294 | 11,392 |
| | Mondelez International Inc. | | |
| | Class A | 132,213 | 5,807 |
| | Brown-Forman Corp. | | |
| | Class B | 80,411 | 3,921 |
| | | | 240,023 |
| Energy (0.4%) | | |
| | Schlumberger Ltd. | 201,447 | 16,188 |
| | Concho Resources Inc. | 39,274 | 5,202 |
| | EOG Resources Inc. | 37,884 | 3,674 |
| | | | 25,064 |
| Financials (6.7%) | | |
| | Intercontinental Exchange | | |
| | Inc. | 2,464,830 | 140,816 |
| | Charles Schwab Corp. | 1,688,205 | 68,220 |
| | MarketAxess Holdings | | |
| | Inc. | 304,193 | 59,388 |
| * | Markel Corp. | 43,200 | 42,324 |
| | Marsh & McLennan Cos. | | |
| | Inc. | 447,559 | 32,887 |
| | MSCI Inc. Class A | 269,311 | 25,474 |
| | First Republic Bank | 239,467 | 22,469 |
| | Affiliated Managers | | |
| | Group Inc. | 121,600 | 20,420 |
| | TD Ameritrade Holding | | |
| | Corp. | 349,576 | 13,669 |
| | Goldman Sachs Group Inc. | 44,455 | 11,028 |
| | Morgan Stanley | 200,680 | 9,165 |
14
U.S. Growth Fund
| | | |
| | | | Market |
| | | | Value• |
| | | Shares | ($000) |
| | American Express Co. | 104,261 | 8,347 |
| | M&T Bank Corp. | 43,105 | 7,197 |
| | Interactive Brokers Group | | |
| | Inc. | 162,552 | 5,967 |
| | | | 467,371 |
| Health Care (15.0%) | | |
| * | Celgene Corp. | 1,404,163 | 173,428 |
| | Allergan plc | 599,713 | 146,822 |
| * | Biogen Inc. | 428,458 | 123,653 |
| | Bristol-Myers Squibb Co. | 1,573,259 | 89,220 |
| * | Quintiles IMS Holdings | | |
| | Inc. | 1,019,919 | 78,932 |
| | UnitedHealth Group Inc. | 446,990 | 73,923 |
| | Dentsply Sirona Inc. | 1,084,720 | 68,901 |
| * | Edwards Lifesciences | | |
| | Corp. | 425,253 | 39,991 |
| * | Illumina Inc. | 216,436 | 36,231 |
| | Medtronic plc | 413,911 | 33,490 |
| | Zoetis Inc. | 567,600 | 30,259 |
| * | ABIOMED Inc. | 220,850 | 26,054 |
| | Danaher Corp. | 253,600 | 21,695 |
| * | Cerner Corp. | 334,900 | 18,433 |
| * | Regeneron | | |
| | Pharmaceuticals Inc. | 49,095 | 18,337 |
| | Alexion Pharmaceuticals | | |
| | Inc. | 86,611 | 11,368 |
| | BioMarin Pharmaceutical | | |
| | Inc. | 120,546 | 11,323 |
| | Waters Corp. | 55,868 | 8,659 |
| | Bioverativ Inc. | 166,229 | 8,657 |
| | Shire plc ADR | 43,912 | 7,935 |
| | Vertex Pharmaceuticals Inc. | 61,810 | 5,601 |
| | Juno Therapeutics Inc. | 135,822 | 3,265 |
| | Alnylam Pharmaceuticals | | |
| | Inc. | 58,026 | 2,996 |
| | Seattle Genetics Inc. | 45,430 | 2,982 |
| | | | 1,042,155 |
| Industrials (8.6%) | | |
| | Nielsen Holdings plc | 1,682,770 | 74,648 |
| * | Verisk Analytics Inc. | | |
| | Class A | 578,690 | 47,985 |
| | Union Pacific Corp. | 383,000 | 41,341 |
| | FedEx Corp. | 198,285 | 38,265 |
| | AMETEK Inc. | 643,769 | 34,744 |
| * | TransUnion | 934,737 | 34,669 |
| | Equifax Inc. | 262,396 | 34,403 |
| | Lockheed Martin Corp. | 124,507 | 33,191 |
| | Fastenal Co. | 648,268 | 32,433 |
| * | IHS Markit Ltd. | 775,944 | 30,883 |
| | TransDigm Group Inc. | 119,959 | 30,494 |
| | Fortive Corp. | 454,266 | 26,188 |
| | Northrop Grumman Corp. | 97,801 | 24,166 |
| | Fortune Brands Home & | | |
| | Security Inc. | 391,681 | 22,651 |
| | JB Hunt Transport | | |
| | Services Inc. | 214,707 | 21,078 |
| | | |
| | Snap-on Inc. | 96,304 | 16,340 |
| | Watsco Inc. | 92,794 | 13,758 |
| | Boeing Co. | 56,451 | 10,174 |
| | Wabtec Corp. | 101,519 | 8,134 |
| | Parker-Hannifin Corp. | 38,499 | 5,961 |
| | NOW Inc. | 307,754 | 5,890 |
| | CSX Corp. | 97,275 | 4,724 |
| | | | 592,120 |
| Information Technology (41.0%) | |
| * | Facebook Inc. Class A | 2,010,099 | 272,449 |
| | Microsoft Corp. | 4,203,891 | 268,965 |
| * | Alphabet Inc. Class C | 314,253 | 258,696 |
| | Mastercard Inc. Class A | 2,069,448 | 228,591 |
| | Visa Inc. Class A | 2,421,729 | 212,967 |
| | Apple Inc. | 1,319,952 | 180,820 |
| * | PayPal Holdings Inc. | 4,155,713 | 174,540 |
| * | Alphabet Inc. Class A | 183,496 | 155,041 |
| * | eBay Inc. | 4,218,220 | 142,998 |
| * | Electronic Arts Inc. | 1,098,366 | 95,009 |
| | Symantec Corp. | 2,729,680 | 77,987 |
| * | Adobe Systems Inc. | 633,817 | 75,006 |
| | Intuit Inc. | 433,143 | 54,333 |
| | QUALCOMM Inc. | 918,900 | 51,900 |
| * | salesforce.com Inc. | 555,138 | 45,161 |
| * | Alibaba Group Holding | | |
| | Ltd. ADR | 408,429 | 42,027 |
| * | ServiceNow Inc. | 456,471 | 39,676 |
| | CDW Corp. | 655,997 | 38,638 |
| * | Autodesk Inc. | 430,631 | 37,163 |
| | ASML Holding NV | 297,845 | 36,245 |
| | Alliance Data Systems | | |
| | Corp. | 147,795 | 35,911 |
| | Texas Instruments Inc. | 462,700 | 35,452 |
| * | Workday Inc. Class A | 426,634 | 35,381 |
| * | FleetCor Technologies Inc. | 201,112 | 34,189 |
| | Global Payments Inc. | 415,835 | 33,138 |
| * | Red Hat Inc. | 399,095 | 33,049 |
| | NVIDIA Corp. | 290,034 | 29,433 |
| | Accenture plc Class A | 166,600 | 20,409 |
| *,^ | Zillow Group Inc. | 485,598 | 16,481 |
| | Microchip Technology Inc. | 192,370 | 13,951 |
| | GrubHub Inc. | 364,128 | 12,766 |
| | Tencent Holdings Ltd. | 430,849 | 11,433 |
| | Ellie Mae Inc. | 73,867 | 7,059 |
| | Tableau Software Inc. | | |
| | Class A | 124,316 | 6,556 |
| | CoStar Group Inc. | 29,335 | 5,960 |
| | Palo Alto Networks Inc. | 37,956 | 5,766 |
| | Splunk Inc. | 78,349 | 4,837 |
| | Mobileye NV | 101,912 | 4,639 |
| | Analog Devices Inc. | 38,206 | 3,130 |
| | Advanced Micro Devices | | |
| | Inc. | 186,577 | 2,698 |
| | | | 2,840,450 |
15
U.S. Growth Fund
| | | |
| | | | Market |
| | | | Value• |
| | | Shares | ($000) |
| Materials (0.7%) | | |
| | Sherwin-Williams Co. | 79,172 | 24,428 |
| | PPG Industries Inc. | 159,100 | 16,297 |
| | Martin Marietta Materials | | |
| | Inc. | 51,536 | 11,129 |
| | | | 51,854 |
| Other (0.0%) | | |
| *,2 | WeWork Class A PP | 52,398 | 2,630 |
| 3 | Vanguard Growth ETF | 3,100 | 373 |
| | | | 3,003 |
| Real Estate (3.8%) | | |
| | Crown Castle International | | |
| | Corp. | 1,231,864 | 115,216 |
| | Equinix Inc. | 157,271 | 59,145 |
| | American Tower | | |
| | Corporation | 362,296 | 41,588 |
| | Public Storage | 118,040 | 26,849 |
| * | SBA Communications | | |
| | Corp. Class A | 146,800 | 16,995 |
| | | | 259,793 |
| Total Common Stocks | | |
| (Cost $4,713,308) | | 6,650,406 |
| Preferred Stocks (1.6%) | | |
| *,2 | Uber Technologies PP | 1,408,784 | 68,709 |
| *,2 | WeWork Pfd. D1 PP | 260,418 | 13,071 |
| *,2 | WeWork Pfd. D2 PP | 204,614 | 10,270 |
| *,2 | Pinterest Prf G PP | 1,596,475 | 10,154 |
| *,2 | Cloudera, Inc. Pfd. | 300,088 | 5,681 |
| Total Preferred Stocks | | |
| (Cost $45,428) | | 107,885 |
| Convertible Preferred Stocks (0.2%) | |
| *,2 | Airbnb Inc. (Cost $11,928) | 128,123 | 13,453 |
| Temporary Cash Investments (3.2%)1 | |
| Money Market Fund (2.9%) | | |
| 4,5 | Vanguard Market | | |
| | Liquidity Fund, | | |
| | 0.864% | 2,014,480 | 201,468 |
| | | |
| | | Face | Market |
| | | Amount | Value• |
| | | ($000) | ($000) |
| Repurchase Agreement (0.2%) | | |
| | Bank of America Securities, | | |
| | LLC 0.530%, 3/1/17 | | |
| | (Dated 2/28/17, Repurchase | | |
| | Value $12,700,000, | | |
| | collateralized by Federal | | |
| | Home Loan Bank 0.000%, | | |
| | 8/25/17, with a value of | | |
| | $12,955,000) | 12,700 | 12,700 |
| |
| U.S. Government and Agency Obligations (0.1%) |
| 6 | United States Treasury Bill, | | |
| | 0.534%, 6/8/17 | 6,000 | 5,992 |
| 6 | United States Treasury Bill, | | |
| | 0.593%, 7/13/17 | 2,500 | 2,494 |
| | | | 8,486 |
| Total Temporary Cash Investments | |
| (Cost $222,643) | | 222,654 |
| Total Investments (101.0%) | | |
| (Cost $4,993,307) | | 6,994,398 |
| |
| | Amount |
| | ($000) |
| Other Assets and Liabilities (-1.0%) | |
| Other Assets | |
| Investment in Vanguard | 485 |
| Receivables for Investment Securities Sold 15,137 |
| Receivables for Accrued Income | 7,373 |
| Receivables for Capital Shares Issued | 2,867 |
| Other Assets | 195 |
| Total Other Assets | 26,057 |
| Liabilities | |
| Payables for Investment Securities | |
| Purchased | (35,423) |
| Collateral for Securities on Loan | (19,089) |
| Payables to Investment Advisor | (2,320) |
| Payables for Capital Shares Redeemed | (24,516) |
| Payables to Vanguard | (12,798) |
| Other Liabilities | (806) |
| Total Liabilities | (94,952) |
| Net Assets (100%) | 6,925,503 |
16
U.S. Growth Fund
| |
| At February 28, 2017, net assets consisted of: |
| | Amount |
| | ($000) |
| Paid-in Capital | 4,771,514 |
| Overdistributed Net Investment Income | (4,324) |
| Accumulated Net Realized Gains | 153,464 |
| Unrealized Appreciation (Depreciation) | |
| Investment Securities | 2,001,091 |
| Futures Contracts | 3,758 |
| Net Assets | 6,925,503 |
| |
| |
| Investor Shares—Net Assets | |
| Applicable to 120,903,751 outstanding | |
| $.001 par value shares of beneficial | |
| interest (unlimited authorization) | 3,782,875 |
| Net Asset Value Per Share— | |
| Investor Shares | $31.29 |
| |
| |
| Admiral Shares—Net Assets | |
| Applicable to 38,816,046 outstanding | |
| $.001 par value shares of beneficial | |
| interest (unlimited authorization) | 3,142,628 |
| Net Asset Value Per Share— | |
| Admiral Shares | $80.96 |
• See Note A in Notes to Financial Statements.
* Non-income-producing security.
^ Includes partial security positions on loan to broker-dealers. The total value of securities on loan is $18,642,000.
1 The fund invests a portion of its cash reserves in equity markets through the use of index futures contracts. After giving effect to futures
investments, the fund’s effective common stock and temporary cash investment positions represent 97.8% and 1.4%, respectively, of
net assets.
2 Restricted securities totaling $123,968,000, representing 1.8% of net assets.
3 Considered an affiliated company of the fund as the issuer is another member of The Vanguard Group.
4 Affiliated money market fund available only to Vanguard funds and certain trusts and accounts managed by Vanguard. Rate shown is the
7-day yield.
5 Includes $19,089,000 of collateral received for securities on loan.
6 Securities with a value of $6,569,000 have been segregated as initial margin for open futures contracts.
ADR—American Depositary Receipt.
PP—Private Placement.
See accompanying Notes, which are an integral part of the Financial Statements.
17
U.S. Growth Fund
Statement of Operations
| |
| | Six Months Ended |
| | February 28, 2017 |
| | ($000) |
| Investment Income | |
| Income | |
| Dividends1,2 | 29,933 |
| Interest1 | 694 |
| Securities Lending—Net | 251 |
| Total Income | 30,878 |
| Expenses | |
| Investment Advisory Fees—Note B | |
| Basic Fee | 5,924 |
| Performance Adjustment | (908) |
| The Vanguard Group—Note C | |
| Management and Administrative—Investor Shares | 4,395 |
| Management and Administrative—Admiral Shares | 1,797 |
| Marketing and Distribution—Investor Shares | 339 |
| Marketing and Distribution—Admiral Shares | 128 |
| Custodian Fees | 29 |
| Shareholders’ Reports—Investor Shares | 71 |
| Shareholders’ Reports—Admiral Shares | 14 |
| Trustees’ Fees and Expenses | 9 |
| Total Expenses | 11,798 |
| Expenses Paid Indirectly | (123) |
| Net Expenses | 11,675 |
| Net Investment Income | 19,203 |
| Realized Net Gain (Loss) | |
| Investment Securities Sold1 | 214,001 |
| Futures Contracts | 10,448 |
| Realized Net Gain (Loss) | 224,449 |
| Change in Unrealized Appreciation (Depreciation) | |
| Investment Securities | 70,223 |
| Futures Contracts | 2,856 |
| Change in Unrealized Appreciation (Depreciation) | 73,079 |
| Net Increase (Decrease) in Net Assets Resulting from Operations | 316,731 |
| 1 Dividend income, interest income, and realized net gain (loss) from affiliated companies of the fund were $3,000, $642,000, and |
| $4,000, respectively. |
| 2 Dividends are net of foreign withholding taxes of $15,000. |
See accompanying Notes, which are an integral part of the Financial Statements.
18
U.S. Growth Fund
Statement of Changes in Net Assets
| | |
| | Six Months Ended | Year Ended |
| | February 28, | August 31, |
| | 2017 | 2016 |
| | ($000) | ($000) |
| Increase (Decrease) in Net Assets | | |
| Operations | | |
| Net Investment Income | 19,203 | 38,023 |
| Realized Net Gain (Loss) | 224,449 | 71,168 |
| Change in Unrealized Appreciation (Depreciation) | 73,079 | 333,653 |
| Net Increase (Decrease) in Net Assets Resulting from Operations | 316,731 | 442,844 |
| Distributions | | |
| Net Investment Income | | |
| Investor Shares | (14,717) | (19,111) |
| Admiral Shares | (16,728) | (16,735) |
| Realized Capital Gain1 | | |
| Investor Shares | (38,970) | (327,359) |
| Admiral Shares | (32,022) | (218,490) |
| Total Distributions | (102,437) | (581,695) |
| Capital Share Transactions | | |
| Investor Shares | (128,312) | (96,179) |
| Admiral Shares | (20,865) | 699,217 |
| Net Increase (Decrease) from Capital Share Transactions | (149,177) | 603,038 |
| Total Increase (Decrease) | 65,117 | 464,187 |
| Net Assets | | |
| Beginning of Period | 6,860,386 | 6,396,199 |
| End of Period2 | 6,925,503 | 6,860,386 |
| 1 Includes fiscal 2017 and 2016 short-term gain distributions totaling $0 and $0, respectively. Short-term gain distributions are treated as |
| ordinary income dividends for tax purposes. |
| 2 Net Assets—End of Period includes undistributed (overdistributed) net investment income of ($4,324,000) and $7,918,000. |
See accompanying Notes, which are an integral part of the Financial Statements.
19
U.S. Growth Fund
Financial Highlights
| | | | | | | |
| Investor Shares | | | | | | | |
| | Six Months | | | | | |
| | | Ended | | | | | |
| For a Share Outstanding | February 28, | Year Ended August 31, |
| Throughout Each Period | | 2017 | 2016 | 2015 | 2014 | 2013 | 2012 |
| Net Asset Value, Beginning of Period | $30.32 | $30.89 | $31.03 | $24.67 | $20.79 | $18.12 |
| Investment Operations | | | | | | | |
| Net Investment Income | | .078 | .151 | .169 | .168 | .134 | .068 |
| Net Realized and Unrealized Gain (Loss) | | | | | | |
| on Investments | | 1.333 | 1.944 | 2.168 | 6.303 | 3.861 | 2.679 |
| Total from Investment Operations | 1.411 | 2.095 | 2.337 | 6.471 | 3.995 | 2.747 |
| Distributions | | | | | | | |
| Dividends from Net Investment Income | (.121) | (.147) | (.194) | (.111) | (.115) | (. 077) |
| Distributions from Realized Capital Gains | (.320) | (2.518) | (2.283) | — | — | — |
| Total Distributions | | (.441) | (2.665) | (2.477) | (.111) | (.115) | (.077) |
| Net Asset Value, End of Period | $31.29 | $30.32 | $30.89 | $31.03 | $24.67 | $20.79 |
| |
| Total Return1 | | 4.75% | 6.89% | 7.96% | 26.29% | 19.31% | 15.22% |
| |
| Ratios/Supplemental Data | | | | | | | |
| Net Assets, End of Period (Millions) | $3,783 | $3,794 | $3,975 | $4,038 | $3,137 | $2,975 |
| Ratio of Total Expenses to | | | | | | | |
| Average Net Assets2 | | 0.41% | 0.46% | 0.47% | 0.44% | 0.45% | 0.45% |
| Ratio of Net Investment Income to | | | | | | |
| Average Net Assets | | 0.53% | 0.50% | 0.53% | 0.59% | 0.59% | 0.35% |
| Portfolio Turnover Rate | | 33% | 32% | 38% | 36% | 38% | 43% |
The expense ratio, net investment income ratio, and turnover rate for the current period have been annualized.
1 Total returns do not include account service fees that may have applied in the periods shown. Fund prospectuses provide information about
any applicable account service fees.
2 Includes performance-based investment advisory fee increases (decreases) of (0.03%), 0.02%, 0.03%, (0.01%), (0.01%), and (0.01%).
See accompanying Notes, which are an integral part of the Financial Statements.
20
U.S. Growth Fund
Financial Highlights
| | | | | | | |
| Admiral Shares | | | | | | | |
| | Six Months | | | | | |
| | | Ended | | | | | |
| For a Share Outstanding | February 28, | Year Ended August 31, |
| Throughout Each Period | | 2017 | 2016 | 2015 | 2014 | 2013 | 2012 |
| Net Asset Value, Beginning of Period | $78.52 | $80.01 | $80.37 | $63.91 | $53.85 | $46.94 |
| Investment Operations | | | | | | | |
| Net Investment Income | | . 257 | .506 | .563 | .557 | .440 | . 258 |
| Net Realized and Unrealized Gain (Loss) | | | | | | |
| on Investments | | 3.445 | 5.018 | 5.607 | 16.293 | 10.002 | 6.924 |
| Total from Investment Operations | 3.702 | 5.524 | 6.170 | 16.850 | 10.442 | 7.182 |
| Distributions | | | | | | | |
| Dividends from Net Investment Income | (. 433) | (. 499) | (. 623) | (. 390) | (. 382) | (. 272) |
| Distributions from Realized Capital Gains | (.829) | (6.515) | (5.907) | — | — | — |
| Total Distributions | | (1.262) | (7.014) | (6.530) | (.390) | (.382) | (.272) |
| Net Asset Value, End of Period | $80.96 | $78.52 | $80.01 | $80.37 | $63.91 | $53.85 |
| |
| Total Return1 | | 4.81% | 7.03% | 8.12% | 26.44% | 19.51% | 15.38% |
| |
| Ratios/Supplemental Data | | | | | | | |
| Net Assets, End of Period (Millions) | $3,143 | $3,066 | $2,421 | $1,868 | $1,141 | $869 |
| Ratio of Total Expenses to | | | | | | | |
| Average Net Assets2 | | 0.28% | 0.32% | 0.33% | 0.30% | 0.31% | 0.31% |
| Ratio of Net Investment Income to | | | | | | |
| Average Net Assets | | 0.66% | 0.64% | 0.67% | 0.73% | 0.73% | 0.49% |
| Portfolio Turnover Rate | | 33% | 32% | 38% | 36% | 38% | 43% |
The expense ratio, net investment income ratio, and turnover rate for the current period have been annualized.
1 Total returns do not include account service fees that may have applied in the periods shown. Fund prospectuses provide information about
any applicable account service fees.
2 Includes performance-based investment advisory fee increases (decreases) of (0.03%), 0.02%, 0.03%, (0.01%), (0.01%), and (0.01%).
See accompanying Notes, which are an integral part of the Financial Statements.
21
U.S. Growth Fund
Notes to Financial Statements
Vanguard U.S. Growth Fund is registered under the Investment Company Act of 1940 as an open-end investment company, or mutual fund. The fund offers two classes of shares: Investor Shares and Admiral Shares. Investor Shares are available to any investor who meets the fund’s minimum purchase requirements. Admiral Shares are designed for investors who meet certain administrative, service, and account-size criteria.
A. The following significant accounting policies conform to generally accepted accounting principles for U.S. investment companies. The fund consistently follows such policies in preparing its financial statements.
1. Security Valuation: Securities are valued as of the close of trading on the New York Stock Exchange (generally 4 p.m., Eastern time) on the valuation date. Equity securities are valued at the latest quoted sales prices or official closing prices taken from the primary market in which each security trades; such securities not traded on the valuation date are valued at the mean of the latest quoted bid and asked prices. Securities for which market quotations are not readily available, or whose values have been affected by events occurring before the fund’s pricing time but after the close of the securities’ primary markets, are valued at their fair values calculated according to procedures adopted by the board of trustees. These procedures include obtaining quotations from an independent pricing service, monitoring news to identify significant market- or security-specific events, and evaluating changes in the values of foreign market proxies (for example, ADRs, futures contracts, or exchange-traded funds), between the time the foreign markets close and the fund’s pricing time. When fair-value pricing is employed, the prices of securities used by a fund to calculate its net asset value may differ from quoted or published prices for the same securities. Investments in Vanguard Market Liquidity Fund are valued at that fund’s net asset value. Temporary cash investments are valued using the latest bid prices or using valuations based on a matrix system (which considers such factors as security prices, yields, maturities, and ratings), both as furnished by independent pricing services.
2. Foreign Currency: Securities and other assets and liabilities denominated in foreign currencies are translated into U.S. dollars using exchange rates obtained from an independent third party as of the fund’s pricing time on the valuation date. Realized gains (losses) and unrealized appreciation (depreciation) on investment securities include the effects of changes in exchange rates since the securities were purchased, combined with the effects of changes in security prices. Fluctuations in the value of other assets and liabilities resulting from changes in exchange rates are recorded as unrealized foreign currency gains (losses) until the assets or liabilities are settled in cash, at which time they are recorded as realized foreign currency gains (losses).
3. Futures Contracts: The fund uses index futures contracts to a limited extent, with the objective of maintaining full exposure to the stock market while maintaining liquidity. The fund may purchase or sell futures contracts to achieve a desired level of investment, whether to accommodate portfolio turnover or cash flows from capital share transactions. The primary risks associated with the use of futures contracts are imperfect correlation between changes in market values of stocks held by the fund and the prices of futures contracts, and the possibility of an illiquid market. Counterparty risk involving futures is mitigated because a regulated clearinghouse is the counterparty instead of the clearing broker. To further mitigate counterparty risk, the fund trades futures contracts on an exchange, monitors the financial strength of its clearing brokers and clearinghouse, and has entered into clearing agreements with its clearing brokers. The clearinghouse imposes initial margin requirements to secure the fund’s performance and requires daily settlement of variation margin representing changes in the market value of each contract.
22
U.S. Growth Fund
Futures contracts are valued at their quoted daily settlement prices. The aggregate settlement values of the contracts are not recorded in the Statement of Net Assets. Fluctuations in the value of the contracts are recorded in the Statement of Net Assets as an asset (liability) and in the Statement of Operations as unrealized appreciation (depreciation) until the contracts are closed, when they are recorded as realized futures gains (losses).
During the six months ended February 28, 2017, the fund’s average investments in long and short futures contracts represented 2% and 0% of net assets, respectively, based on the average of aggregate settlement values at each quarter-end during the period.
4. Repurchase Agreements: The fund enters into repurchase agreements with institutional counterparties. Securities pledged as collateral to the fund under repurchase agreements are held by a custodian bank until the agreements mature, and in the absence of a default, such collateral cannot be repledged, resold, or rehypothecated. Each agreement requires that the market value of the collateral be sufficient to cover payments of interest and principal. The fund further mitigates its counterparty risk by entering into repurchase agreements only with a diverse group of prequalified counterparties, monitoring their financial strength, and entering into master repurchase agreements with its counterparties. The master repurchase agreements provide that, in the event of a counterparty’s default (including bankruptcy), the fund may terminate any repurchase agreements with that counterparty, determine the net amount owed, and sell or retain the collateral up to the net amount owed to the fund. Such action may be subject to legal proceedings, which may delay or limit the disposition of collateral.
5. Federal Income Taxes: The fund intends to continue to qualify as a regulated investment company and distribute all of its taxable income. Management has analyzed the fund’s tax positions taken for all open federal income tax years (August 31, 2013–2016), and for the period ended February 28, 2017, and has concluded that no provision for federal income tax is required in the fund’s financial statements.
6. Distributions: Distributions to shareholders are recorded on the ex-dividend date.
7. Securities Lending: To earn additional income, the fund lends its securities to qualified institutional borrowers. Security loans are subject to termination by the fund at any time, and are required to be secured at all times by collateral in an amount at least equal to the market value of securities loaned. Daily market fluctuations could cause the value of loaned securities to be more or less than the value of the collateral received. When this occurs, the collateral is adjusted and settled on the next business day. The fund further mitigates its counterparty risk by entering into securities lending transactions only with a diverse group of prequalified counterparties, monitoring their financial strength, and entering into master securities lending agreements with its counterparties. The master securities lending agreements provide that, in the event of a counterparty’s default (including bankruptcy), the fund may terminate any loans with that borrower, determine the net amount owed, and sell or retain the collateral up to the net amount owed to the fund; however, such actions may be subject to legal proceedings. While collateral mitigates counterparty risk, in the absence of a default the fund may experience delays and costs in recovering the securities loaned. The fund invests cash collateral received in Vanguard Market Liquidity Fund, and records a liability in the Statement of Net Assets for the return of the collateral, during the period the securities are on loan. Securities lending income represents fees charged to borrowers plus income earned on invested cash collateral, less expenses associated with the loan. During the term of the loan, the fund is entitled to all distributions made on or in respect of the loaned securities.
23
U.S. Growth Fund
8. Credit Facility: The fund and certain other funds managed by The Vanguard Group (“Vanguard”) participate in a $3.1 billion committed credit facility provided by a syndicate of lenders pursuant to a credit agreement that may be renewed annually; each fund is individually liable for its borrowings, if any, under the credit facility. Borrowings may be utilized for temporary and emergency purposes, and are subject to the fund’s regulatory and contractual borrowing restrictions. The participating funds are charged administrative fees and an annual commitment fee of 0.10% of the undrawn amount of the facility; these fees are allocated to the funds based on a method approved by the fund’s board of trustees and included in Management and Administrative expenses on the fund’s Statement of Operations. Any borrowings under this facility bear interest at a rate based upon the higher of the one-month London Interbank Offered Rate, federal funds effective rate, or overnight bank funding rate plus an agreed-upon spread.
The fund had no borrowings outstanding at February 28, 2017, or at any time during the period then ended.
9. Other: Dividend income is recorded on the ex-dividend date. Interest income includes income distributions received from Vanguard Market Liquidity Fund and is accrued daily. Premiums and discounts on debt securities purchased are amortized and accreted, respectively, to interest income over the lives of the respective securities. Security transactions are accounted for on the date securities are bought or sold. Costs used to determine realized gains (losses) on the sale of investment securities are those of the specific securities sold.
Each class of shares has equal rights as to assets and earnings, except that each class separately bears certain class-specific expenses related to maintenance of shareholder accounts (included in Management and Administrative expenses) and shareholder reporting. Marketing and distribution expenses are allocated to each class of shares based on a method approved by the board of trustees. Income, other non-class-specific expenses, and gains and losses on investments are allocated to each class of shares based on its relative net assets.
B. The investment advisory firms Wellington Management Company LLP, Jackson Square Partners, LLC, William Blair Investment Management, LLC, Jennison Associates LLC, and Baillie Gifford Overseas Ltd. each provide investment advisory services to a portion of the fund for a fee calculated at an annual percentage rate of average net assets managed by the advisor. The basic fees of Wellington Management Company LLP, Jackson Square Partners, LLC, and Jennison Associates LLC are subject to quarterly adjustments based on performance relative to the Russell 1000 Growth Index for the preceding three years. The basic fee of William Blair Investment Management, LLC, is subject to quarterly adjustments based on performance relative to the Russell 1000 Growth Index for the preceding five years. The basic fee of Baillie Gifford Overseas Ltd. is subject to quarterly adjustments based on performance relative to the S&P 500 Index for the preceding three years.
Vanguard manages the cash reserves of the fund as described below.
For the six months ended February 28, 2017, the aggregate investment advisory fee represented an effective annual basic rate of 0.18% of the fund’s average net assets, before a decrease of $908,000 (0.03%) based on performance.
C. In accordance with the terms of a Funds’ Service Agreement (the “FSA”) between Vanguard and the fund, Vanguard furnishes to the fund corporate management, administrative, marketing, distribution, and cash management services at Vanguard’s cost of operations (as defined by the FSA). These costs of operations are allocated to the fund based on methods and guidelines approved by the
24
U.S. Growth Fund
board of trustees. Vanguard does not require reimbursement in the current period for certain costs of operations (such as deferred compensation/benefits and risk/insurance costs); the fund’s liability for these costs of operations is included in Payables to Vanguard on the Statement of Net Assets.
Upon the request of Vanguard, the fund may invest up to 0.40% of its net assets as capital in Vanguard. At February 28, 2017, the fund had contributed to Vanguard capital in the amount of $485,000, representing 0.01% of the fund’s net assets and 0.19% of Vanguard’s capitalization. The fund’s trustees and officers are also directors and employees, respectively, of Vanguard.
D. The fund has asked its investment advisors to direct certain security trades, subject to obtaining the best price and execution, to brokers who have agreed to rebate to the fund part of the commissions generated. Such rebates are used solely to reduce the fund’s management and administrative expenses. For the six months ended February 28, 2017, these arrangements reduced the fund’s expenses by $123,000 (an annual rate of 0.00% of average net assets).
E. Various inputs may be used to determine the value of the fund’s investments. These inputs are summarized in three broad levels for financial statement purposes. The inputs or methodologies used to value securities are not necessarily an indication of the risk associated with investing in those securities.
Level 1—Quoted prices in active markets for identical securities.
Level 2—Other significant observable inputs (including quoted prices for similar securities, interest rates, prepayment speeds, credit risk, etc.).
Level 3—Significant unobservable inputs (including the fund’s own assumptions used to determine the fair value of investments).
The following table summarizes the market value of the fund’s investments as of February 28, 2017, based on the inputs used to value them:
| | | |
| | Level 1 | Level 2 | Level 3 |
| Investments | ($000) | ($000) | ($000) |
| Common Stocks | 6,626,384 | 21,392 | 2,630 |
| Preferred Stocks | — | — | 107,885 |
| Convertible Preferred Stocks | — | — | 13,453 |
| Temporary Cash Investments | 201,468 | 21,186 | — |
| Futures Contracts—Liabilities1 | (806) | — | — |
| Total | 6,827,046 | 42,578 | 123,968 |
| 1 Represents variation margin on the last day of the reporting period. |
The determination of Level 3 fair value measurements is governed by documented policies and procedures adopted by the board of trustees. The board has designated a pricing review committee, as an agent of the board, to ensure the timely analysis and valuation of Level 3 securities held by the fund in accordance with established policies and procedures. The pricing review committee employs various methods for calibrating valuation approaches, including a regular review of key inputs and assumptions, transactional back-testing or disposition analysis, and reviews of any related market activity. All valuation decisions made by the pricing review committee are reported to the board on a quarterly basis for review and ratification. The board reviews the adequacy of the fair value measurement policies and procedures in place on an annual basis.
25
U.S. Growth Fund
The following table summarizes changes in investments valued based on Level 3 inputs during the six months ended February 28, 2017. Transfers into or out of Level 3 are recognized based on values as of the date of transfer.
| | | |
| | | | Investments in |
| | Investments in | Investments in | Convertible |
| | Common Stocks | Preferred Stocks | Preferred Stocks |
| Amount Valued Based on Level 3 Inputs | ($000) | ($000) | ($000) |
| Balance as of August 31, 2016 | 2,630 | 107,612 | 13,453 |
| Change in Unrealized Appreciation (Depreciation) | — | 273 | — |
| Balance as of February 28, 2017 | 2,630 | 107,885 | 13,453 |
The following table provides quantitative information about the significant unobservable inputs used in fair value measurement as of February 28, 2017:
| | | | |
| | Fair Value | | | |
| Security Type | ($000) | Valuation Technique | Unobservable Input | Amount |
| Common Stocks | 2,630 | Market Approach | Recent Market Transaction | $50.192 |
| Preferred Stocks | 107,885 | Market Approach | Recent Market Transaction | 50.192 |
| | | | Recent Market Transaction | 48.772 |
| | | | Comparable Company Approach | 18.930 |
| | | | Comparable Company Approach | 6.360 |
| Convertible | | | | |
| Preferred Stocks | 13,453 | Market Approach | Recent Market Transaction | 105.000 |
Significant increases or decreases in the significant unobservable inputs used in the fair value measurement of the portfolio’s Level 3 securities, in isolation, could result in a significantly higher or lower fair value measurement.
F. At February 28, 2017, the aggregate settlement value of open futures contracts and the related unrealized appreciation (depreciation) were:
| | | | |
| | | | | ($000) |
| | | | Aggregate | |
| | | Number of | Settlement | Unrealized |
| | | Long (Short) | Value | Appreciation |
| Futures Contracts | Expiration | Contracts | Long (Short) | (Depreciation) |
| E-mini S&P 500 Index | March 2017 | 691 | 81,635 | 2,796 |
| E-mini S&P Mid-Cap 400 Index | March 2017 | 262 | 45,266 | 962 |
| | | | | 3,758 |
Unrealized appreciation (depreciation) on open futures contracts is required to be treated as realized gain (loss) for tax purposes.
G. Distributions are determined on a tax basis and may differ from net investment income and realized capital gains for financial reporting purposes. Differences may be permanent or temporary. Permanent differences are reclassified among capital accounts in the financial statements to reflect their tax character. Temporary differences arise when certain items of income, expense, gain, or loss are recognized in different periods for financial statement and tax purposes. These differences will
26
U.S. Growth Fund
reverse at some time in the future. Differences in classification may also result from the treatment of short-term gains as ordinary income for tax purposes. The fund’s tax-basis capital gains and losses are determined only at the end of each fiscal year.
At February 28, 2017, the cost of investment securities for tax purposes was $4,993,307,000. Net unrealized appreciation of investment securities for tax purposes was $2,001,091,000, consisting of unrealized gains of $2,140,369,000 on securities that had risen in value since their purchase and $139,278,000 in unrealized losses on securities that had fallen in value since their purchase.
H. During the six months ended February 28, 2017, the fund purchased $1,089,501,000 of investment securities and sold $1,250,278,000 of investment securities, other than temporary cash investments.
I. Capital share transactions for each class of shares were:
| | | | |
| | Six Months Ended | Year Ended |
| | February 28, 2017 | August 31, 2016 |
| | Amount | Shares | Amount | Shares |
| | ($000) | (000) | ($000) | (000) |
| Investor Shares | | | | |
| Issued | 117,563 | 3,900 | 566,832 | 18,852 |
| Issued in Lieu of Cash Distributions | 52,776 | 1,792 | 340,874 | 11,389 |
| Redeemed | (298,651) | (9,922) | (1,003,885) | (33,788) |
| Net Increase (Decrease)—Investor Shares | (128,312) | (4,230) | (96,179) | (3,547) |
| Admiral Shares | | | | |
| Issued | 270,896 | 3,489 | 1,021,665 | 13,128 |
| Issued in Lieu of Cash Distributions | 46,252 | 607 | 223,265 | 2,883 |
| Redeemed | (338,013) | (4,332) | (545,713) | (7,215) |
| Net Increase (Decrease)—Admiral Shares | (20,865) | (236) | 699,217 | 8,796 |
J. Management has determined that no material events or transactions occurred subsequent to February 28, 2017, that would require recognition or disclosure in these financial statements.
27
About Your Fund’s Expenses
As a shareholder of the fund, you incur ongoing costs, which include costs for portfolio management, administrative services, and shareholder reports (like this one), among others. Operating expenses, which are deducted from a fund’s gross income, directly reduce the investment return of the fund.
A fund’s expenses are expressed as a percentage of its average net assets. This figure is known as the expense ratio. The following examples are intended to help you understand the ongoing costs (in dollars) of investing in your fund and to compare these costs with those of other mutual funds. The examples are based on an investment of $1,000 made at the beginning of the period shown and held for the entire period.
The accompanying table illustrates your fund’s costs in two ways:
• Based on actual fund return. This section helps you to estimate the actual expenses that you paid over the period. The ”Ending Account Value“ shown is derived from the fund‘s actual return, and the third column shows the dollar amount that would have been paid by an investor who started with $1,000 in the fund. You may use the information here, together with the amount you invested, to estimate the expenses that you paid over the period.
To do so, simply divide your account value by $1,000 (for example, an $8,600 account value divided by $1,000 = 8.6), then multiply the result by the number given for your fund under the heading ”Expenses Paid During Period.“
• Based on hypothetical 5% yearly return. This section is intended to help you compare your fund‘s costs with those of other mutual funds. It assumes that the fund had a yearly return of 5% before expenses, but that the expense ratio is unchanged. In this case—because the return used is not the fund’s actual return—the results do not apply to your investment. The example is useful in making comparisons because the Securities and Exchange Commission requires all mutual funds to calculate expenses based on a 5% return. You can assess your fund’s costs by comparing this hypothetical example with the hypothetical examples that appear in shareholder reports of other funds.
Note that the expenses shown in the table are meant to highlight and help you compare ongoing costs only and do not reflect transaction costs incurred by the fund for buying and selling securities. Further, the expenses do not include any purchase, redemption, or account service fees described in the fund prospectus. If such fees were applied to your account, your costs would be higher. Your fund does not carry a “sales load.”
The calculations assume no shares were bought or sold during the period. Your actual costs may have been higher or lower, depending on the amount of your investment and the timing of any purchases or redemptions.
You can find more information about the fund’s expenses, including annual expense ratios, in the Financial Statements section of this report. For additional information on operating expenses and other shareholder costs, please refer to your fund’s current prospectus.
28
| | | |
| Six Months Ended February 28, 2017 | | | |
| | Beginning | Ending | Expenses |
| | Account Value | Account Value | Paid During |
| U.S. Growth Fund | 8/31/2016 | 2/28/2017 | Period |
| Based on Actual Fund Return | | | |
| Investor Shares | $1,000.00 | $1,047.46 | $2.08 |
| Admiral Shares | 1,000.00 | 1,048.15 | 1.42 |
| Based on Hypothetical 5% Yearly Return | | | |
| Investor Shares | $1,000.00 | $1,022.76 | $2.06 |
| Admiral Shares | 1,000.00 | 1,023.41 | 1.40 |
The calculations are based on expenses incurred in the most recent six-month period. The fund’s annualized six-month expense ratios for that
period are 0.41% for Investor Shares and 0.28% for Admiral Shares. The dollar amounts shown as “Expenses Paid” are equal to the
annualized expense ratio multiplied by the average account value over the period, multiplied by the number of days in the most recent
six-month period, then divided by the number of days in the most recent 12-month period (181/365).
29
Trustees Approve Advisory Arrangements
The board of trustees of Vanguard U.S. Growth Fund has renewed the fund’s investment advisory arrangements with Baillie Gifford Overseas Ltd. (Baillie Gifford), Jackson Square Partners, LLC (Jackson Square), Jennison Associates LLC (Jennison), Wellington Management Company LLP (Wellington Management), and William Blair Investment Management, LLC (William Blair). The board determined that renewing the fund’s advisory arrangements was in the best interests of the fund and its shareholders.
The board based its decision upon an evaluation of each advisor’s investment staff, portfolio management process, and performance. This evaluation included information provided to the board by Vanguard’s Portfolio Review Department, which is responsible for fund and advisor oversight and product management. The Portfolio Review Department met regularly with the advisors and made monthly presentations to the board during the fiscal year that directed the board’s focus to relevant information and topics.
The board, or an investment committee made up of board members, also received information throughout the year during advisor presentations. For each advisor presentation, the board was provided with letters and reports that included information about, among other things, the advisory firm and the advisor’s assessment of the investment environment, portfolio performance, and portfolio characteristics.
In addition, the board received monthly reports, which included a Market and Economic Report, a Fund Dashboard Monthly Summary, and a Fund Performance Report.
Prior to their meeting, the trustees were provided with a memo and materials that summarized the information they received over the course of the year. They also considered the factors discussed below, among others. However, no single factor determined whether the board approved the arrangements. Rather, it was the totality of the circumstances that drove the board’s decision.
Nature, extent, and quality of services
The board reviewed the quality of the fund’s investment management services over both the short and long term and took into account the organizational depth and stability of each advisor. The board considered the following:
Baillie Gifford. Baillie Gifford is a unit of Baillie Gifford & Co., which was founded in 1908 and is among the largest independently owned investment management firms in the United Kingdom. Baillie Gifford aims to deliver outstanding investment performance for its clients by identifying exceptional growth companies in the United States and investing in them long enough for the advantages of their business models and strength of their cultures to become the dominant drivers of their stock prices. This long-term horizon allows the advisor to harness the asymmetry inherent in equity markets to capture the disproportionate impact of successful investments in its clients’ portfolios. Baillie Gifford began managing a portion of the fund in 2014.
Jackson Square. Founded in February 2014, Jackson Square invests primarily in common stocks of large-capitalization, growth-oriented companies that it believes have long-term capital appreciation potential and are expected to grow faster than the U.S. economy. Jackson Square uses a bottom-up approach, seeking companies that have large-end market potential, dominant business models, and strong free cash flow generation that is attractively priced compared to the intrinsic value of the securities. Jackson Square was founded by the same investment team that has managed a portion of the fund since 2010, previously as a part of Delaware Investments.
30
Jennison. Jennison, founded in 1969, is an indirect, wholly owned subsidiary of Prudential Financial Inc. Jennison uses internal fundamental research and a highly interactive stock selection process to identify companies that exhibit above-average growth in units, revenues, earnings, and cash flows. When analyzing a company for purchase or sale, Jennison focuses on the duration of the company’s growth opportunity and seeks to capture inflection points in its growth trajectory. Jennison began managing a portion of the fund in 2014.
Wellington Management. Founded in 1928, Wellington Management is among the nation’s oldest and most respected institutional investment managers. The firm employs a traditional, bottom-up fundamental research approach to identify companies with sustainable growth advantages and reasonable valuations. Wellington Management identifies companies that have demonstrated above-average growth in the past and follows up with a thorough review of each company’s business model and an assessment of its valuation. The goal of this review is to identify companies with high returns on capital, superior business management, and high-quality balance sheets. Wellington Management has managed a portion of the fund since 2010.
William Blair. Founded in 1935, William Blair is an independently owned full-service investment firm. William Blair uses an investment process that relies on thorough fundamental research. Based on this process, it invests in quality growth companies that it believes will grow faster than the market expects or sustain an above-average growth rate for longer than the market expects. In selecting stocks, William Blair considers each company’s leadership position within the company’s market, the quality of products or services it provides, its return on equity, its accounting policies, and the quality of the management team. William Blair has advised a portion of the fund since 2004.
The board concluded that each advisor’s experience, stability, depth, and performance, among other factors, warranted continuation of the advisory arrangements.
Investment performance
The board considered the short- and long-term performance of the fund and each advisor, including any periods of outperformance or underperformance compared with a relevant benchmark and peer group. The board concluded that the performance was such that each advisory arrangement should continue. Information about the fund’s most recent performance can be found in the Performance Summary section of this report.
Cost
The board concluded that the fund’s expense ratio was below the average expense ratio charged by funds in its peer group and that the fund’s advisory fee rate was also well below its peer-group average. Information about the fund’s expenses appears in the About Your Fund’s Expenses section of this report as well as in the Financial Statements section, which also includes information about the fund’s advisory fee rate.
The board did not consider the profitability of the fund’s advisors in determining whether to approve the advisory fees because the advisors are independent of Vanguard, and the advisory fees are the result of arm’s-length negotiations.
The benefit of economies of scale
The board concluded that the fund’s shareholders benefit from economies of scale because of breakpoints in the fund’s advisory fee schedules. The breakpoints reduce the effective rate of the fees as the fund’s assets managed by each advisor increase.
The board will consider whether to renew the advisory arrangements again after a one-year period.
31
Glossary
30-Day SEC Yield. A fund’s 30-day SEC yield is derived using a formula specified by the U.S. Securities and Exchange Commission. Under the formula, data related to the fund’s security holdings in the previous 30 days are used to calculate the fund’s hypothetical net income for that period, which is then annualized and divided by the fund’s estimated average net assets over the calculation period. For the purposes of this calculation, a security’s income is based on its current market yield to maturity (for bonds), its actual income (for asset-backed securities), or its projected dividend yield (for stocks). Because the SEC yield represents hypothetical annualized income, it will differ—at times significantly—from the fund’s actual experience. As a result, the fund’s income distributions may be higher or lower than implied by the SEC yield.
Beta. A measure of the magnitude of a fund’s past share-price fluctuations in relation to the ups and downs of a given market index. The index is assigned a beta of 1.00. Compared with a given index, a fund with a beta of 1.20 typically would have seen its share price rise or fall by 12% when the index rose or fell by 10%. For this report, beta is based on returns over the past 36 months for both the fund and the index. Note that a fund’s beta should be reviewed in conjunction with its R-squared (see definition). The lower the R-squared, the less correlation there is between the fund and the index, and the less reliable beta is as an indicator of volatility.
Dividend Yield. Dividend income earned by stocks, expressed as a percentage of the aggregate market value (or of net asset value, for a fund). The yield is determined by dividing the amount of the annual dividends by the aggregate value (or net asset value) at the end of the period. For a fund, the dividend yield is based solely on stock holdings and does not include any income produced by other investments.
Earnings Growth Rate. The average annual rate of growth in earnings over the past five years for the stocks now in a fund.
Equity Exposure. A measure that reflects a fund’s investments in stocks and stock futures. Any holdings in short-term reserves are excluded.
Expense Ratio. A fund’s total annual operating expenses expressed as a percentage of the fund’s average net assets. The expense ratio includes management and administrative expenses, but does not include the transaction costs of buying and selling portfolio securities.
Foreign Holdings. The percentage of a fund represented by securities or depositary receipts of companies based outside the United States.
Inception Date. The date on which the assets of a fund (or one of its share classes) are first invested in accordance with the fund’s investment objective. For funds with a subscription period, the inception date is the day after that period ends. Investment performance is measured from the inception date.
Median Market Cap. An indicator of the size of companies in which a fund invests; the midpoint of market capitalization (market price x shares outstanding) of a fund’s stocks, weighted by the proportion of the fund’s assets invested in each stock. Stocks representing half of the fund’s assets have market capitalizations above the median, and the rest are below it.
Price/Book Ratio. The share price of a stock divided by its net worth, or book value, per share. For a fund, the weighted average price/book ratio of the stocks it holds.
32
Price/Earnings Ratio. The ratio of a stock’s current price to its per-share earnings over the past year. For a fund, the weighted average P/E of the stocks it holds. P/E is an indicator of market expectations about corporate prospects; the higher the P/E, the greater the expectations for a company’s future growth.
R-Squared. A measure of how much of a fund’s past returns can be explained by the returns from the market in general, as measured by a given index. If a fund’s total returns were precisely synchronized with an index’s returns, its R-squared would be 1.00. If the fund’s returns bore no relationship to the index’s returns, its R-squared would be 0. For this report, R-squared is based on returns over the past 36 months for both the fund and the index.
Return on Equity. The annual average rate of return generated by a company during the past five years for each dollar of shareholder’s equity (net income divided by shareholder’s equity). For a fund, the weighted average return on equity for the companies whose stocks it holds.
Short-Term Reserves. The percentage of a fund invested in highly liquid, short-term securities that can be readily converted to cash.
Turnover Rate. An indication of the fund’s trading activity. Funds with high turnover rates incur higher transaction costs and may be more likely to distribute capital gains (which may be taxable to investors). The turnover rate excludes in-kind transactions, which have minimal impact on costs.
33
This page intentionally left blank.
This page intentionally left blank.
The People Who Govern Your Fund
The trustees of your mutual fund are there to see that the fund is operated and managed in your best interests since, as a shareholder, you are a part owner of the fund. Your fund’s trustees also serve on the board of directors of The Vanguard Group, Inc., which is owned by the Vanguard funds and provides services to them on an at-cost basis.
A majority of Vanguard’s board members are independent, meaning that they have no affiliation with Vanguard or the funds they oversee, apart from the sizable personal investments they have made as private individuals. The independent board members have distinguished backgrounds in business, academia, and public service. Each of the trustees and executive officers oversees 195 Vanguard funds.
The following table provides information for each trustee and executive officer of the fund. The mailing address of the trustees and officers is P.O. Box 876, Valley Forge, PA 19482. More information about the trustees is in the Statement of Additional Information, which can be obtained, without charge, by contacting Vanguard at 800-662-7447, or online at vanguard.com.
InterestedTrustee1
F. William McNabb III
Born 1957. Trustee Since July 2009. Chairman of the Board. Principal Occupation(s) During the Past Five Years and Other Experience: Chairman of the Board of The Vanguard Group, Inc., and of each of the investment companies served by The Vanguard Group, since January 2010; Director of The Vanguard Group since 2008; Chief Executive Officer and President of The Vanguard Group, and of each of the investment companies served by The Vanguard Group, since 2008; Director of Vanguard Marketing Corporation; Managing Director of The Vanguard Group (1995–2008).
IndependentTrustees
Emerson U. Fullwood
Born 1948. Trustee Since January 2008. Principal Occupation(s) During the Past Five Years and Other Experience: Executive Chief Staff and Marketing Officer for North America and Corporate Vice President (retired 2008) of Xerox Corporation (document management products and services); Executive in Residence and 2009–2010 Distinguished Minett Professor at the Rochester Institute of Technology; Lead Director of SPX FLOW, Inc. (multi-industry manufacturing); Director of the United Way of Rochester, the University of Rochester Medical Center, Monroe Community College Foundation, North Carolina A&T University, and Roberts Wesleyan College.
Rajiv L. Gupta
Born 1945. Trustee Since December 2001.2 Principal Occupation(s) During the Past Five Years and Other Experience: Chairman and Chief Executive Officer (retired 2009) and President (2006–2008) of Rohm and Haas Co. (chemicals); Director of Arconic Inc. (diversified manufacturer), HP Inc. (printer and personal computer manufacturing), and Delphi Automotive plc (automotive components); Senior Advisor at New Mountain Capital.
Amy Gutmann
Born 1949. Trustee Since June 2006. Principal Occupation(s) During the Past Five Years and Other Experience: President of the University of Pennsylvania; Christopher H. Browne Distinguished Professor of Political Science, School of Arts and Sciences, and Professor of Communication, Annenberg School for Communication, with secondary faculty appointments in the Department of Philosophy, School of Arts and Sciences, and at the Graduate School of Education, University of Pennsylvania; Trustee of the National Constitution Center; Chair of the Presidential Commission for the Study of Bioethical Issues.
JoAnn Heffernan Heisen
Born 1950. Trustee Since July 1998. Principal Occupation(s) During the Past Five Years and Other Experience: Corporate Vice President and Chief Global Diversity Officer (retired 2008) and Member of the Executive Committee (1997–2008) of Johnson & Johnson (pharmaceuticals/medical devices/consumer products); Director of Skytop Lodge Corporation (hotels) and the Robert Wood Johnson Foundation; Member of the Advisory Board of the Institute for Women’s Leadership at Rutgers University.
F. Joseph Loughrey
Born 1949. Trustee Since October 2009. Principal Occupation(s) During the Past Five Years and Other Experience: President and Chief Operating Officer (retired 2009) of Cummins Inc. (industrial machinery); Chairman of the Board of Hillenbrand, Inc. (specialized consumer services), Oxfam America, and the Lumina
Foundation for Education; Director of SKF AB (industrial machinery), Hyster-Yale Materials Handling, Inc. (forklift trucks), and the V Foundation for Cancer Research; Member of the Advisory Council for the College of Arts and Letters and Chair of the Advisory Board to the Kellogg Institute for International Studies, both at the University of Notre Dame.
Mark Loughridge
Born 1953. Trustee Since March 2012. Principal Occupation(s) During the Past Five Years and Other Experience: Senior Vice President and Chief Financial Officer (retired 2013) at IBM (information technology services); Fiduciary Member of IBM’s Retirement Plan Committee (2004–2013); Director of the Dow Chemical Company; Member of the Council on Chicago Booth.
Scott C. Malpass
Born 1962. Trustee Since March 2012. Principal Occupation(s) During the Past Five Years and Other Experience: Chief Investment Officer and Vice President at the University of Notre Dame; Assistant Professor of Finance at the Mendoza College of Business at Notre Dame; Member of the Notre Dame 403(b) Investment Committee, the Board of Advisors for Spruceview Capital Partners, and the Investment Advisory Committee of Major League Baseball; Board Member of TIFF Advisory Services, Inc., and Catholic Investment Services, Inc. (investment advisors); Member of the Board of Superintendence of the Institute for the Works of Religion.
André F. Perold
Born 1952. Trustee Since December 2004. Principal Occupation(s) During the Past Five Years and Other Experience: George Gund Professor of Finance and Banking, Emeritus at the Harvard Business School (retired 2011); Chief Investment Officer and Co-Managing Partner of HighVista Strategies LLC (private investment firm); Overseer of the Museum of Fine Arts Boston.
Peter F. Volanakis
Born 1955. Trustee Since July 2009. Principal Occupation(s) During the Past Five Years and Other Experience: President and Chief Operating Officer (retired 2010) of Corning Incorporated (communications equipment); Chairman of the Board of Trustees of Colby-Sawyer College; Member of the Board of Hypertherm, Inc. (industrial cutting systems, software, and consumables).
Executive Officers
Glenn Booraem
Born 1967. Investment Stewardship Officer Since February 2017. Principal Occupation(s) During the Past Five Years and Other Experience: Principal of The Vanguard Group, Inc.; Treasurer (2015–2017), Controller (2010–2015), and Assistant Controller (2001–2010) of each of the investment companies served by The Vanguard Group.
Thomas J. Higgins
Born 1957. Chief Financial Officer Since September 2008. Principal Occupation(s) During the Past Five Years and Other Experience: Principal of The Vanguard Group, Inc.; Chief Financial Officer of each of the investment companies served by The Vanguard Group; Treasurer of each of the investment companies served by The Vanguard Group (1998–2008).
Peter Mahoney
Born 1974. Controller Since May 2015. Principal Occupation(s) During the Past Five Years and Other Experience: Principal of The Vanguard Group, Inc.; Controller of each of the investment companies served by The Vanguard Group; Head of International Fund Services at The Vanguard Group (2008–2014).
Anne E. Robinson
Born 1970. Secretary Since September 2016. Principal Occupation(s) During the Past Five Years and Other Experience: Managing Director of The Vanguard Group, Inc.; General Counsel of The Vanguard Group; Secretary of The Vanguard Group and of each of the investment companies served by The Vanguard Group; Director and Senior Vice President of Vanguard Marketing Corporation; Managing Director and General Counsel of Global Cards and Consumer Services at Citigroup (2014–2016); Counsel at American Express (2003–2014).
Michael Rollings
Born 1963. Treasurer Since February 2017. Principal Occupation(s) During the Past Five Years and Other Experience: Managing Director of The Vanguard Group, Inc.; Treasurer of each of the investment companies served by The Vanguard Group; Executive Vice President and Chief Financial Officer of MassMutual Financial Group (2006–2016).
| |
| Vanguard Senior Management Team |
| Mortimer J. Buckley | James M. Norris |
| John James | Thomas M. Rampulla |
| Martha G. King | Glenn W. Reed |
| John T. Marcante | Karin A. Risi |
| Chris D. McIsaac | |
| |
| Chairman Emeritus and Senior Advisor |
| John J. Brennan | |
| Chairman, 1996–2009 | |
| Chief Executive Officer and President, 1996–2008 |
| |
| Founder | |
| John C. Bogle | |
| Chairman and Chief Executive Officer, 1974–1996 |
1 Mr. McNabb is considered an “interested person,” as defined in the Investment Company Act of 1940, because he is an officer of the Vanguard funds.
2 December 2002 for Vanguard Equity Income Fund, the Vanguard Municipal Bond Funds, and the Vanguard State Tax-Exempt Funds.
| |  |
| | | P.O. Box 2600 |
| | | Valley Forge, PA 19482-2600 |
| |
| |
| |
| Connect with Vanguard® > vanguard.com |
| |
| |
| |
| Fund Information > 800-662-7447 | | CFA® is a registered trademark owned by CFA Institute. |
| Direct Investor Account Services > 800-662-2739 | |
| Institutional Investor Services > 800-523-1036 | |
| Text Telephone for People | | |
| Who Are Deaf or Hard of Hearing > 800-749-7273 | |
| |
| This material may be used in conjunction | |
| with the offering of shares of any Vanguard | |
| fund only if preceded or accompanied by | |
| the fund’s current prospectus. | |
| |
| All comparative mutual fund data are from Lipper, a | |
| Thomson Reuters Company, or Morningstar, Inc., unless | |
| otherwise noted. | | |
| |
| You can obtain a free copy of Vanguard’s proxy voting | |
| guidelines by visiting vanguard.com/proxyreporting or by | |
| calling Vanguard at 800-662-2739. The guidelines are | |
| also available from the SEC’s website, sec.gov. In | |
| addition, you may obtain a free report on how your fund | |
| voted the proxies for securities it owned during the 12 | |
| months ended June 30. To get the report, visit either | |
| vanguard.com/proxyreporting or sec.gov. | |
| |
| You can review and copy information about your fund at | |
| the SEC’s Public Reference Room in Washington, D.C. To | |
| find out more about this public service, call the SEC at | |
| 202-551-8090. Information about your fund is also | |
| available on the SEC’s website, and you can receive | |
| copies of this information, for a fee, by sending a | |
| request in either of two ways: via email addressed to | |
| publicinfo@sec.gov or via regular mail addressed to the | |
| Public Reference Section, Securities and Exchange | |
| Commission, Washington, DC 20549-1520. | |
| |
| | | © 2017 The Vanguard Group, Inc. |
| | | All rights reserved. |
| | | Vanguard Marketing Corporation, Distributor. |
| |
| | | Q232 042017 |
Semiannual Report | February 28, 2017
Vanguard International Growth Fund
A new format, unwavering commitment
As you begin reading this report, you’ll notice that we’ve made some improvements to the opening sections—based on feedback from you, our clients.
Page 1 starts with a new ”Your Fund’s Performance at a Glance,” a concise, handy summary of how your fund performed during the period.
In the renamed ”Chairman’s Perspective,” Bill McNabb will focus on enduring principles and investment insights.
We’ve modified some tables, and eliminated some redundancy, but we haven’t removed any information.
At Vanguard, we’re always looking for better ways to communicate and to help you make sound investment decisions. Thank you for entrusting your assets to us.
| |
| Contents | |
| Your Fund’s Performance at a Glance. | 1 |
| Chairman’s Perspective. | 2 |
| Advisors’ Report. | 5 |
| Fund Profile. | 9 |
| Performance Summary. | 11 |
| Financial Statements. | 12 |
| About Your Fund’s Expenses. | 30 |
| Trustees Approve Advisory Arrangements. | 32 |
| Glossary. | 34 |
Please note: The opinions expressed in this report are just that—informed opinions. They should not be considered promises or advice.
Also, please keep in mind that the information and opinions cover the period through the date on the front of this report. Of course, the
risks of investing in your fund are spelled out in the prospectus.
See the Glossary for definitions of investment terms used in this report.
About the cover: No matter what language you speak, Vanguard has one consistent message and set of principles. Our primary
focus is on you, our clients. We conduct our business with integrity as a faithful steward of your assets. This message is shown
translated into seven languages, reflecting our expanding global presence.
Your Fund’s Performance at a Glance
• Vanguard International Growth Fund returned almost 4% for the six months ended February 28, 2017, behind its benchmark but ahead of the average return for its peers.
• The fund’s advisors added value in Europe, notably among Italian, Dutch, Swedish, and Danish stocks.
• Results for the fund from Pacific region countries were negative or more or less flat.
Japanese health care stocks and an underweighting of Australian financial institutions were among the biggest detractors.
• Overall returns from emerging markets were slightly negative. The fund’s lack or near-lack of exposure to poorly performing countries like Malaysia, the Philippines, and Mexico was more than offset by disappointing selection in Brazil and South Korea.
• In terms of sectors, the fund’s performance relative to its benchmark was mixed.
The advisors added value in consumer discretionary and telecommunication services, but their selections proved subpar in financials, industrials, information technology, and materials.
| |
| Total Returns: Six Months Ended February 28, 2017 | |
| | Total |
| | Returns |
| Vanguard International Growth Fund | |
| Investor Shares | 3.85% |
| Admiral™ Shares | 3.91 |
| MSCI All Country World Index ex USA | 5.15 |
| International Funds Average | 3.44 |
| International Funds Average: Derived from data provided by Lipper, a Thomson Reuters Company. |
| Admiral Shares carry lower expenses and are available to investors who meet certain account-balance requirements. |
| | | |
| Expense Ratios | | | |
| Your Fund Compared With Its Peer Group | | | |
| | Investor | Admiral | Peer Group |
| | Shares | Shares | Average |
| International Growth Fund | 0.46% | 0.33% | 1.34% |
The fund expense ratios shown are from the prospectus dated December 22, 2016, and represent estimated costs for the current fiscal year.
For the six months ended February 28, 2017, the fund’s annualized expense ratios were 0.45% for Investor Shares and 0.32% for Admiral
Shares. The peer-group expense ratio is derived from data provided by Lipper, a Thomson Reuters Company, and captures information through
year-end 2016.
Peer group: International Funds.
1
Chairman’s Perspective

Bill McNabb
Chairman and Chief Executive Officer
Dear Shareholder,
More than a decade ago, a Vanguard client asked us to help improve its defined contribution retirement plan. New hires were participating in the plan at lower rates than in previous years, and the client wanted to reverse this trend. Another priority was to help more participants invest their retirement savings in balanced portfolios.
The overall goal of this longtime client: Give employees a better chance to achieve financial security in retirement.
Today, that plan automatically enrolls employees at a 5% contribution rate, puts them in a low-cost target-date fund that takes on less risk as they near retirement, and offers a comprehensive suite of advice services. On top of that, employees get an employer contribution of 5% and are eligible for a company match.
Because of this combination of attractive features and generous employer contributions, nearly all new hires now participate in the plan, 81% of plan participants invest their retirement savings in balanced portfolios, and 87% of participants meet or exceed Vanguard’s recommended total retirement savings target. (Vanguard generally recommends that retirement investors save 12%–15% of pay, including company matches.)
2
Changing the retirement landscape
Am I singling out an isolated Vanguard success story? Absolutely not.
Stories like these are becoming increasingly common with employer-based retirement plans, particularly among large and midsize companies. Solutions such as automatic enrollment, automatic contribution increases, and default investment in target-date funds are having a positive effect.
Insights from the relatively new discipline of behavioral finance have contributed to the advances. Simply put, retirement plans are making natural human inertia work for future retirees, rather than against them, by putting savings on autopilot as much as possible.
More than 60% of Vanguard participants are in plans with automatic enrollment, which has led to a big jump in participation. Today, more than four-fifths of eligible employees are saving for retirement, compared with only two-thirds ten years ago.
In addition, many plans have adopted automatic-escalation features, which increase plan contributions at regular intervals until a maximum level is reached or an employee opts out. Automatic increases are a crucial tool for boosting retirement savings rates.
The growing use of target-date funds is another enormous benefit. More than 70% of all participants in Vanguard plans invest at least part of their retirement savings in
| | | |
| Market Barometer | | | |
| | Total Returns |
| | Periods Ended February 28, 2017 |
| | Six | One | Five Years |
| | Months | Year | (Annualized) |
| Stocks | | | |
| Russell 1000 Index (Large-caps) | 10.10% | 25.53% | 13.94% |
| Russell 2000 Index (Small-caps) | 12.61 | 36.11 | 12.89 |
| Russell 3000 Index (Broad U.S. market) | 10.29 | 26.29 | 13.85 |
| FTSE All-World ex US Index (International) | 5.40 | 19.87 | 4.00 |
| |
| Bonds | | | |
| Bloomberg Barclays U.S. Aggregate Bond Index | | | |
| (Broad taxable market) | -2.19% | 1.42% | 2.24% |
| Bloomberg Barclays Municipal Bond Index | | | |
| (Broad tax-exempt market) | -2.80 | 0.25 | 3.07 |
| Citigroup Three-Month U.S. Treasury Bill Index | 0.19 | 0.32 | 0.10 |
| |
| CPI | | | |
| Consumer Price Index | 1.14% | 2.74% | 1.36% |
3
these age-appropriate, diversified strategies. And nearly 50% of Vanguard participants are invested solely in a single target-date fund.
Consider a do-it-yourself autopilot
But what if you don’t have access to a world-class, employer-based retirement plan? Unfortunately, not everyone does, which is an important policy issue.
However, you can still put the features of these plans to work. For example, you can set up automatic contributions from your paycheck to an IRA. And you can adopt your own automatic escalation by investing any pay raises.
You can also take a page from top-quality retirement plans by considering a low-cost, globally diversified target-date fund. The beauty of this approach is that you don’t need to remember to rebalance your portfolio—the fund does it for you.
Of course, you can take a more active role in picking your own investments, and this can be a good choice for some. But keep in mind the lessons from successful employer-based plans: Busy workers, faced with a lot of competing priorities, are often best served by putting their retirement savings on autopilot.
Winning by default
In highlighting some recent successes in retirement savings, I don’t want to minimize the challenges we still face. We’re living in a slow-growth, uncertain world, and investment returns for both stocks and bonds could well be modest in the coming decade.
But I believe the innovations we’ve seen in the last ten years in many retirement plans—you might call it the “default revolution”—point the way toward a solution. And that even goes for people whose employers don’t have a world-class retirement plan.
As always, thank you for investing with Vanguard.
Sincerely,

F. William McNabb III
Chairman and Chief Executive Officer
March 14, 2017
4
Advisors’ Report
For the six months ended February 28, 2017, Vanguard International Growth Fund returned 3.85% for Investor Shares (3.91% for Admiral Shares), behind its benchmark index but ahead of the average return of peer funds. Your fund is managed by two independent advisors, a strategy that enhances the fund’s diversification by providing exposure to distinct yet complementary investment approaches. It is not uncommon for advisors to have different views about individual securities or the broader investment environment.
The advisors, the amount and percentage of fund assets each manages, and brief descriptions of their investment strategies are presented in the table below. The advisors have also prepared a discussion of the investment environment that existed
during the fiscal half year and of how the portfolio’s positioning reflects this assessment. These comments were prepared on March 16, 2017.
Baillie Gifford Overseas Ltd.
Portfolio Managers:
James K. Anderson,
Head of Global Equities
Thomas Coutts,
Head of European Equities
We seek to invest in a relatively small number of exceptional growth companies; often, these companies are creating or capitalizing on the remarkable technological changes that are sweeping the world. While there have been some seismic
| | | |
| Vanguard International Growth Fund Investment Advisors |
| |
| | Fund Assets Managed | |
| Investment Advisor | % | $ Million | Investment Strategy |
| Baillie Gifford Overseas Ltd. | 60 | 14,130 | The advisor seeks stocks that can generate |
| | | | above-average growth in earnings and cash flow, |
| | | | producing a bottom-up, stock-driven approach to |
| | | | country and asset allocation. An in-depth view on each |
| | | | company is measured against the consensus view, |
| | | | leading to discrepancies and potential opportunities to |
| | | | add value. |
| Schroder Investment | 38 | 8,982 | Equity analysts located around the world and an |
| Management North America Inc. | | | international team of global sector specialists help to |
| | | | identify reasonably priced companies with strong |
| | | | growth prospects and a sustainable competitive |
| | | | advantage. |
| Cash Investments | 2 | 321 | These short-term reserves are invested by Vanguard in |
| | | | equity index products to simulate investment in stocks. |
| | | | Each advisor may also maintain a modest cash |
| | | | position. |
5
political events in the last six months, and more are surely on the horizon, we think that the deeper trends are more important. Accordingly, we have not changed our portfolio, or our approach, in response to recent events.
Politics matters, of course. But over the long term, a company’s success or failure is far more likely to be driven by management strategy and execution than by any other factor. Our job as investors is to cut through the short-term noise and focus on identifying long-term trends and tomorrow’s winning companies.
Long-term trends can only be exploited by leaders who run their businesses with long-term time horizons. Therefore, we seek companies with outstanding management teams and strong, deeply entrenched cultures. At a time of chronic underinvestment, we admire companies that are prepared to be bold, because we know that really important breakthroughs are hard to achieve. They require heavy investment, risk-taking, and an atmosphere in which creativity is allowed to flourish.
Founder-led or family-owned companies remain a fertile hunting ground for these rare corporate traits, and many of our holdings exhibiting them did well. Amazon, SoftBank, and Tesla are all led by founders who have visions for their businesses that extend decades into the future. These companies also share a commitment to investing the resources to realize those visions. In Europe, there may be fewer iconic entrepreneurs, but the supportive influence of significant shareholders with investment horizons stretching across generations can be incredibly important. Family control at luxury goods companies Kering and Richemont has helped build and protect valuable brands, while the Agnelli family’s stake in Fiat and Ferrari has been vital in supporting CEO Sergio Marchionne’s ambitious plans for growth.
Some companies decide to take a different path. During the half year, several holdings in our portfolio agreed to be acquired (in two cases, by other portfolio holdings). Swiss agribusiness Syngenta was bought by ChemChina; U.K. chip designer ARM was taken over by Japanese telecommunications and internet giant SoftBank; and U.K. travel website Skyscanner was purchased by Ctrip, China’s largest travel company.
While all deals were at a premium and we are pleased to retain indirect exposure to ARM and Skyscanner through their new owners, there is a sense of disappointment that these exciting businesses could not remain independent. Nervousness about both the scale of future investment and the patience of markets was a common feature in these deals—a detail that reminds us of how important it is to support great companies.
There were no particular themes among the weaker performers. Spain’s Banco Popular has continued to struggle following its rights issue last year, while ANI Technologies, the Indian online taxi-hailing business known as Ola Cabs, fell
6
in value after raising additional capital from SoftBank. While Ola has a market-leading position in India, it faces competition from Uber; for long-term growth, the company needs the resources of an investor like SoftBank.
We have not made any new purchases, preferring to add to existing holdings such as Dutch semiconductor manufacturer ASML and Danish biotechnology company Genmab. In both cases, this addition reflects our increasing confidence in the opportunity available to these businesses. We have also added to AIA, the Asian life insurance company, using funds from our sale of Prudential.
Schroder Investment Management
North America Inc.
Portfolio Manager:
Simon Webber, CFA
International equities made modest progress over the half year, navigating a changing macroeconomic and political framework. After the U.S. presidential election, market focus was firmly on the question of whether Donald Trump would follow through on his promised tax cuts and trade-policy reforms. Earlier, a period of rising global growth expectations began over the summer, supported by rising commodity prices and an inventory-stocking cycle that gave a boost to cyclical stocks. A fourth-quarter tilt toward value stocks was the most pronounced shift in style over a single quarter in more than a decade. With global yields expected to rise, and the operating environment for banks expected to improve, the financial sector was particularly strong. Conversely, quality growth stocks and defensive sectors were among the market’s weaker performers.
Against a backdrop of aggressive rotation into cyclical stocks and lower quality leverage, the portfolio underperformed the index, largely because of style factors. However, performance was also adversely affected by concerns regarding two stocks, Capita and GEA Group. In the case of business process outsourcing company Capita, the firm disclosed a number of charges for underperforming contracts, blemishing a historically exemplary record of delivering good service levels and savings for clients. This has raised execution concerns under current management. We sold our position given the deteriorating outlook and higher risk profile.
GEA, which supplies manufacturing equipment to the food and dairy industries, also fell following warnings of a weaker outlook. Its announcement was even more of a surprise than Capita’s was, as it came just two weeks after a capital markets day at which the company had outlined plans for significant cost reductions and efficiency improvements. While management credibility has clearly been damaged, we believe much of the shortfall is caused by cyclical issues, and we still see attractive long-term growth drivers and plenty of scope for management to improve execution. We continue to monitor the position and its alignment with our investment thesis.
7
One of the strongest holdings was diversified miner BHP Billiton, which benefited from an ongoing rally in the price of its key commodities—iron ore, copper, and coking coal. Because BHP’s key assets are among the lowest cost in their respective markets, the company has weathered the recent downturn better than most of its competitors.
An enduring theme in the portfolio is the excellent structural growth prospects for technology companies, from software enablers like SAP to internet platforms such as Tencent and Alibaba. We opened a position in Recruit, which owns Indeed—the world’s biggest and most successful online job-finding site. We believe the market underappreciates this asset, and we expect Recruit’s domestic Japanese business to benefit from a shrinking labor force. We also purchased Deutsche Telekom, as the outlook for its domestic market looks more promising in light of recent announcements that competitors were cutting back promotions. The company is still gaining market share in the United States via its strategic majority stake in T-Mobile US, which continues to grow through its disruptive strategy and remains a takeover target.
Going forward, we believe that plenty of opportunity remains in international equity markets. Continental European economies are in the midst of their most robust and sustainable economic growth since before the global financial crisis, yet the market focus remains on political risks. This sets up the potential of a strong equity market if those risks fail to manifest. An upturn in global trade is also set to help many Asian businesses in 2017. We look ahead with confidence and believe that a disciplined strategy of identifying companies that have strong competitive advantages—and sustainably manage their business for the long term—will continue to pay off.
8
International Growth Fund
Fund Profile
As of February 28, 2017
| | |
| Share-Class Characteristics | |
| | Investor | Admiral |
| | Shares | Shares |
| Ticker Symbol | VWIGX | VWILX |
| Expense Ratio1 | 0.46% | 0.33% |
| | |
| Portfolio Characteristics | | |
| | | MSCI AC |
| | | World Index |
| | Fund | ex USA |
| Number of Stocks | 124 | 1,845 |
| Median Market Cap | $39.9B | $30.8B |
| Price/Earnings Ratio | 32.0x | 20.2x |
| Price/Book Ratio | 2.9x | 1.7x |
| Return on Equity | 16.8% | 14.4% |
| Earnings Growth | | |
| Rate | 11.4% | 6.7% |
| Dividend Yield | 1.5% | 2.9% |
| Turnover Rate | | |
| (Annualized) | 19% | — |
| Short-Term Reserves | 0.3% | — |
| | |
| Sector Diversification (% of equity exposure) |
| | | MSCI AC |
| | | World Index |
| | Fund | ex USA |
| Consumer Discretionary | 22.6% | 11.3% |
| Consumer Staples | 6.3 | 9.8 |
| Energy | 1.4 | 6.7 |
| Financials | 17.4 | 23.4 |
| Health Care | 9.5 | 8.2 |
| Industrials | 10.3 | 11.8 |
| Information Technology | 22.8 | 9.6 |
| Materials | 4.4 | 8.2 |
| Other | 1.3 | 0.0 |
| Real Estate | 0.0 | 3.3 |
| Telecommunication Services | 4.0 | 4.6 |
| Utilities | 0.0 | 3.1 |
| |
| Volatility Measures | |
| | MSCI AC |
| | World |
| | Index |
| | ex USA |
| R-Squared | 0.90 |
| Beta | 1.06 |
| These measures show the degree and timing of the fund’s |
| fluctuations compared with the indexes over 36 months. |
| | |
| Ten Largest Holdings (% of total net assets) |
| Tencent Holdings Ltd. | Internet Software & | |
| | Services | 4.8% |
| Alibaba Group Holding | Internet Software & | |
| Ltd. | Services | 4.2 |
| AIA Group Ltd. | Life & Health | |
| | Insurance | 3.5 |
| ASML Holding NV | Semiconductor | |
| | Equipment | 3.1 |
| Baidu Inc. | Internet Software & | |
| | Services | 3.1 |
| Amazon.com Inc. | Internet & Direct | |
| | Marketing Retail | 3.0 |
| Industria de Diseno | | |
| Textil SA | Apparel Retail | 2.8 |
| SoftBank Group Corp. | Wireless | |
| | Telecommunication | |
| | Services | 2.0 |
| Zalando SE | Internet & Direct | |
| | Marketing Retail | 1.8 |
| Atlas Copco AB | Industrial Machinery | 1.8 |
| Top Ten | | 30.1% |
| The holdings listed exclude any temporary cash investments and |
| equity index products. |
Allocation by Region (% of equity exposure)
1 The expense ratios shown are from the prospectus dated December 22, 2016, and represent estimated costs for the current fiscal year. For the six
months ended February 28, 2017, the annualized expense ratios were 0.45% for Investor Shares and 0.32% for Admiral Shares.
9
International Growth Fund
| | |
| Market Diversification (% of equity exposure) |
| | | MSCI AC |
| | | World |
| | | Index |
| | Fund | ex USA |
| Europe | | |
| Germany | 9.7% | 6.4% |
| United Kingdom | 7.6 | 12.6 |
| Sweden | 5.4 | 2.0 |
| France | 4.7 | 6.8 |
| Spain | 4.5 | 2.2 |
| Italy | 3.3 | 1.4 |
| Denmark | 3.3 | 1.2 |
| Netherlands | 3.2 | 2.3 |
| Switzerland | 2.9 | 6.1 |
| Norway | 1.4 | 0.5 |
| Other | 1.2 | 2.1 |
| Subtotal | 47.2% | 43.6% |
| Pacific | | |
| Japan | 12.5% | 16.9% |
| Hong Kong | 4.9 | 2.4 |
| South Korea | 2.1 | 3.5 |
| Other | 0.7 | 6.3 |
| Subtotal | 20.2% | 29.1% |
| Emerging Markets | | |
| China | 15.3% | 6.3% |
| India | 2.4 | 2.0 |
| Taiwan | 1.2 | 2.9 |
| Brazil | 1.0 | 1.9 |
| Other | 1.3 | 6.7 |
| Subtotal | 21.2% | 19.8% |
| North America | | |
| United States | 7.6% | 0.0% |
| Canada | 2.0 | 6.8 |
| Subtotal | 9.6% | 6.8% |
| Middle East | | |
| Israel | 1.8% | 0.7% |
10
International Growth Fund
Performance Summary
All of the returns in this report represent past performance, which is not a guarantee of future results that may be achieved by the fund. (Current performance may be lower or higher than the performance data cited. For performance data current to the most recent month-end, visit our website at vanguard.com/performance.) Note, too, that both investment returns and principal value can fluctuate widely, so an investor’s shares, when sold, could be worth more or less than their original cost. The returns shown do not reflect taxes that a shareholder would pay on fund distributions or on the sale of fund shares.
Fiscal-Year Total Returns (%): August 31, 2006, Through February 28, 2017
For a benchmark description, see the Glossary.
Note: For 2017, performance data reflect the six months ended February 28, 2017.
Average Annual Total Returns: Periods Ended December 31, 2016
This table presents returns through the latest calendar quarter—rather than through the end of the fiscal period.
Securities and Exchange Commission rules require that we provide this information.
| | | | |
| | Inception | One | Five | Ten |
| | Date | Year | Years | Years |
| Investor Shares | 9/30/1981 | 1.71% | 7.06% | 2.42% |
| Admiral Shares | 8/13/2001 | 1.84 | 7.21 | 2.58 |
See Financial Highlights for dividend and capital gains information.
11
International Growth Fund
Financial Statements (unaudited)
Statement of Net Assets
As of February 28, 2017
The fund reports a complete list of its holdings in regulatory filings four times in each fiscal year, at the quarter-ends. For the second and fourth fiscal quarters, the lists appear in the fund’s semiannual and annual reports to shareholders. For the first and third fiscal quarters, the fund files the lists with the Securities and Exchange Commission on Form N-Q. Shareholders can look up the fund’s Forms N-Q on the SEC’s website at sec.gov. Forms N-Q may also be reviewed and copied at the SEC’s Public Reference Room (see the back cover of this report for further information).
| | | |
| | | | Market |
| | | | Value• |
| | | Shares | ($000) |
| Common Stocks (98.0%)1 | | |
| Australia (0.4%) | | |
| | Brambles Ltd. | 12,205,050 | 87,114 |
| |
| Belgium (0.2%) | | |
| | Umicore SA | 941,373 | 49,557 |
| |
| Brazil (1.0%) | | |
| | BM&FBovespa SA - | | |
| | Bolsa de Valores | | |
| | Mercadorias e Futuros | 14,186,100 | 86,427 |
| | Raia Drogasil SA | 4,201,749 | 80,103 |
| | Telefonica Brasil SA | | |
| | Preference Shares | 4,806,200 | 70,666 |
| | | | 237,196 |
| Canada (2.0%) | | |
| | Toronto-Dominion Bank | 5,579,439 | 287,583 |
| | Canadian Pacific | | |
| | Railway Ltd. | 701,426 | 103,207 |
| | Goldcorp Inc. | 4,495,116 | 71,241 |
| | | | 462,031 |
| China (15.2%) | | |
| | Tencent Holdings Ltd. | 42,018,500 | 1,115,044 |
| * | Alibaba Group | | |
| | Holding Ltd. ADR | 9,619,022 | 989,797 |
| * | Baidu Inc. ADR | 4,162,238 | 724,771 |
| * | Ctrip.com International | | |
| | Ltd. ADR | 7,161,724 | 339,752 |
| * | New Oriental Education | | |
| | & Technology Group | | |
| | Inc. ADR | 3,301,491 | 159,825 |
| * | TAL Education Group | | |
| | ADR | 1,553,687 | 134,347 |
| | China Pacific Insurance | | |
| | Group Co. Ltd. | 24,886,600 | 91,111 |
| | | | 3,554,647 |
| Denmark (3.2%) | | |
| * | Genmab A/S | 2,065,568 | 408,496 |
| * | Novozymes A/S | 3,575,387 | 137,460 |
| | Chr Hansen Holding A/S | 1,658,818 | 98,908 |
| | | | |
| | Novo Nordisk A/S Class B | 1,871,763 | 66,274 |
| | Vestas Wind Systems A/S | 669,036 | 49,542 |
| | | | | 760,680 |
| France (4.4%) | | | |
| | L’Oreal SA | | 1,421,187 | 264,588 |
| | Kering | | 983,955 | 239,415 |
| | Essilor International SA | 1,561,734 | 179,282 |
| | Schneider Electric SE | 2,507,791 | 169,917 |
| | Danone SA | | 1,398,013 | 92,490 |
| | LVMH Moet Hennessy | | |
| | Louis Vuitton SE | | 456,402 | 91,682 |
| | | | | 1,037,374 |
| Germany (9.4%) | | | |
| *,2 | Zalando SE | | 10,683,180 | 426,422 |
| | BASF SE | | 3,327,614 | 309,581 |
| | SAP SE | | 2,354,582 | 219,335 |
| | Bayerische Motoren | | |
| | Werke AG | | 2,304,553 | 205,788 |
| | Bayer AG | | 1,782,681 | 196,216 |
| | Deutsche Telekom AG | 8,949,706 | 154,538 |
| | Continental AG | | 743,693 | 150,734 |
| | HeidelbergCement AG | 1,257,100 | 117,367 |
| | GEA Group AG | | 2,289,862 | 89,001 |
| | adidas AG | | 396,458 | 66,508 |
| | Fresenius Medical | | | |
| | Care AG & Co. KGaA | 655,445 | 54,533 |
| *,^,2 Rocket Internet SE | | 2,762,933 | 52,087 |
| *,3,4 HOME 24AG | | 23,630 | 44,854 |
| *,3 | HELLOFRESH | | 2,476,051 | 42,285 |
| * | MorphoSys AG | | 664,989 | 37,823 |
| *,3 | CureVac GmbH | | 12,600 | 28,497 |
| * | AIXTRON SE | | 3,130,112 | 10,708 |
| | | | | 2,206,277 |
| Hong Kong (4.8%) | | | |
| | AIA Group Ltd. | 131,225,800 | 828,290 |
| | Jardine Matheson | | | |
| | Holdings Ltd. | | 3,023,525 | 187,622 |
| | Hong Kong Exchanges | | |
| | & Clearing Ltd. | | 4,767,930 | 118,357 |
| | | | | 1,134,269 |
12
International Growth Fund
| | | |
| | | | Market |
| | | | Value• |
| | | Shares | ($000) |
| India (2.4%) | | |
| | Housing Development | | |
| | Finance Corp. Ltd. | 7,874,012 | 161,450 |
| | HDFC Bank Ltd. | 7,477,936 | 155,694 |
| | Zee Entertainment | | |
| | Enterprises Ltd. | 13,318,141 | 101,568 |
| | Idea Cellular Ltd. | 43,222,638 | 74,965 |
| *,3 | ANI Technologies | 166,185 | 31,155 |
| *,2,3 Flipkart G Series | 338,176 | 23,243 |
| *,2,3 Flipkart H Series | 135,569 | 10,536 |
| | | | 558,611 |
| Indonesia (0.3%) | | |
| | Bank Mandiri Persero | | |
| | Tbk PT | 90,616,100 | 76,490 |
| |
| Ireland (0.4%) | | |
| | Kerry Group plc Class A | 1,064,490 | 81,732 |
| |
| Israel (1.8%) | | |
| * | Check Point Software | | |
| | Technologies Ltd. | 2,921,261 | 288,942 |
| * | Mobileye NV | 2,829,083 | 128,780 |
| | | | 417,722 |
| Italy (3.3%) | | |
| | Ferrari NV | 4,824,304 | 314,665 |
| *,^ | Fiat Chrysler | | |
| | Automobiles NV | 16,407,504 | 179,431 |
| * | EXOR NV | 3,262,980 | 154,536 |
| | Intesa Sanpaolo SPA | | |
| | (Registered) | 51,279,371 | 119,398 |
| | | | 768,030 |
| Japan (12.1%) | | |
| | SoftBank Group Corp. | 6,366,800 | 474,995 |
| | SMC Corp. | 1,446,100 | 409,274 |
| | M3 Inc. | 12,243,600 | 310,860 |
| | Bridgestone Corp. | 4,628,300 | 184,694 |
| | Rakuten Inc. | 17,699,000 | 175,510 |
| | Sekisui Chemical Co. Ltd. | 8,991,100 | 148,520 |
| | KDDI Corp. | 5,667,900 | 148,116 |
| | Kubota Corp. | 8,718,700 | 138,736 |
| | Sumitomo Mitsui | | |
| | Financial Group Inc. | 3,433,500 | 133,760 |
| | ORIX Corp. | 8,567,100 | 133,305 |
| | Recruit Holdings Co. Ltd. | 2,409,400 | 118,249 |
| | Pigeon Corp. | 3,300,800 | 97,264 |
| | Keyence Corp. | 244,800 | 94,660 |
| | Suntory Beverage | | |
| | & Food Ltd. | 1,997,300 | 83,815 |
| | Suzuki Motor Corp. | 2,105,400 | 82,289 |
| | SBI Holdings Inc. | 4,470,400 | 62,544 |
| | Fuji Heavy Industries Ltd. | 1,280,900 | 47,928 |
| | | | 2,844,519 |
| Luxembourg (0.3%) | | |
| *,3 | Spotify Technology SA | 26,474 | 59,000 |
| | | |
| Mexico (0.3%) | | |
| | Grupo Financiero Banorte | | |
| | SAB de CV | 13,899,786 | 69,079 |
| |
| Netherlands (3.1%) | | |
| | ASML Holding NV | 5,983,482 | 727,356 |
| |
| Norway (1.4%) | | |
| ^ | Statoil ASA | 5,080,268 | 89,571 |
| | DNB ASA | 4,683,937 | 76,796 |
| | Schibsted ASA Class A | 2,449,459 | 64,598 |
| | Norsk Hydro ASA | 7,847,761 | 44,431 |
| | Schibsted ASA Class B | 1,760,994 | 42,727 |
| | | | 318,123 |
| Other (0.2%) | | |
| 5 | Vanguard FTSE All-World | | |
| | ex-US ETF | 1,128,434 | 52,574 |
| |
| Peru (0.1%) | | |
| | Credicorp Ltd. | 153,844 | 25,326 |
| |
| Portugal (0.3%) | | |
| | Jeronimo Martins | | |
| | SGPS SA | 3,627,182 | 58,360 |
| |
| South Korea (2.1%) | | |
| | NAVER Corp. | 444,611 | 304,828 |
| *,^ | Celltrion Inc. | 2,049,104 | 183,855 |
| | | | 488,683 |
| Spain (4.4%) | | |
| | Industria de Diseno | | |
| | Textil SA | 20,350,848 | 652,161 |
| | Banco Bilbao Vizcaya | | |
| | Argentaria SA | 38,199,155 | 248,867 |
| | Distribuidora | | |
| | Internacional de | | |
| | Alimentacion SA | 12,745,795 | 70,646 |
| *,^ | Banco Popular | | |
| | Espanol SA | 76,855,408 | 67,926 |
| | | | 1,039,600 |
| Sweden (5.3%) | | |
| | Atlas Copco AB Class A | 12,605,874 | 411,789 |
| | Svenska Handelsbanken | | |
| | AB Class A | 29,471,523 | 409,202 |
| * | Kinnevik AB | 8,819,732 | 238,088 |
| | Assa Abloy AB Class B | 6,766,973 | 131,312 |
| ^ | Elekta AB Class B | 6,427,670 | 60,976 |
| | | | 1,251,367 |
| Switzerland (2.9%) | | |
| | Nestle SA | 3,069,062 | 226,491 |
| | Roche Holding AG | 759,168 | 184,785 |
| | Cie Financiere | | |
| | Richemont SA | 2,061,828 | 151,873 |
| | Lonza Group AG | 587,904 | 108,268 |
| | | | 671,417 |
13
International Growth Fund
| | | |
| | | | Market |
| | | | Value• |
| | | Shares | ($000) |
| Taiwan (1.2%) | | |
| | Taiwan Semiconductor | | |
| | Manufacturing Co. Ltd. | 46,450,000 | 284,578 |
| |
| Thailand (0.5%) | | |
| | Kasikornbank PCL | | |
| | (Foreign) | 23,270,756 | 127,346 |
| |
| United Kingdom (7.4%) | | |
| | Rolls-Royce Holdings plc | 36,783,215 | 359,254 |
| | Diageo plc | 8,294,103 | 233,854 |
| | Royal Dutch Shell plc | | |
| | Class A | 8,028,303 | 208,014 |
| | Burberry Group plc | 9,067,261 | 194,149 |
| | BHP Billiton plc | 9,683,484 | 156,079 |
| | Reckitt Benckiser | | |
| | Group plc | 1,513,380 | 137,416 |
| | Aviva plc | 17,140,879 | 105,810 |
| | Aggreko plc | 7,374,149 | 96,465 |
| | Barclays plc | 30,488,931 | 85,696 |
| | Lloyds Banking | | |
| | Group plc | 86,599,736 | 73,828 |
| * | Standard Chartered plc | 5,325,132 | 47,733 |
| *,^ | Ocado Group plc | 12,833,540 | 39,632 |
| | | | 1,737,930 |
| United States (7.6%) | | |
| * | Amazon.com Inc. | 823,751 | 696,103 |
| * | Illumina Inc. | 2,408,021 | 403,103 |
| | MercadoLibre Inc. | 1,574,407 | 331,995 |
| *,^ | Tesla Inc. | 1,356,844 | 339,197 |
| | | | 1,770,398 |
| Total Common Stocks | | |
| (Cost $18,333,435) | | 22,957,386 |
| Preferred Stocks (0.5%) | | |
| *,3 | Internet Plus | | |
| | Holdings Ltd. | 18,638,108 | 71,956 |
| *,3,4 You & Mr. Jones | 44,800,000 | 51,431 |
| Total Preferred Stocks | | |
| (Cost $116,756) | | 123,387 |
| Temporary Cash Investments (3.1%)1 | |
| Money Market Fund (3.0%) | | |
| 6,7 | Vanguard Market | | |
| | Liquidity Fund, 0.864% | 7,005,059 | 700,576 |
| | | |
| | | Face | Market |
| | | Amount | Value• |
| | | ($000) | ($000) |
| U.S. Government and Agency Obligations (0.1%) |
| 8 | United States Treasury Bill, | | |
| | 0.454%, 4/20/17 | 4,700 | 4,697 |
| 8 | United States Treasury Bill, | | |
| | 0.557%–0.566%, 4/27/17 | 1,600 | 1,599 |
| 8,9 | United States Treasury Bill, | | |
| | 0.566%–0.597%, 5/4/17 | 6,200 | 6,194 |
| 9 | United States Treasury Bill, | | |
| | 0.516%–0.521%, 6/1/17 | 3,500 | 3,495 |
| 8,9 | United States Treasury Bill, | | |
| | 0.647%, 8/10/17 | 400 | 399 |
| | United States Treasury Bill, | | |
| | 0.638%, 8/24/17 | 2,500 | 2,491 |
| | | | 18,875 |
| Total Temporary Cash Investments | |
| (Cost $719,428) | | 719,451 |
| Total Investments (101.6%) | | |
| (Cost $19,169,619) | | 23,800,224 |
| |
| | Amount |
| | ($000) |
| Other Assets and Liabilities (-1.6%) | |
| Other Assets | |
| Investment in Vanguard | 1,657 |
| Receivables for Investment Securities Sold 27,164 |
| Receivables for Accrued Income | 30,243 |
| Receivables for Capital Shares Issued | 13,127 |
| Other Assets 8 | 4,966 |
| Total Other Assets | 77,157 |
| Liabilities | |
| Payables for Investment | |
| Securities Purchased | (7,784) |
| Collateral for Securities on Loan | (368,866) |
| Payables for Capital Shares Redeemed | (12,956) |
| Payables to Investment Advisor | (9,396) |
| Payables to Vanguard | (42,755) |
| Other Liabilities | (2,883) |
| Total Liabilities | (444,640) |
| Net Assets (100%) | 23,432,741 |
14
International Growth Fund
| |
| At February 28, 2017, net assets consisted of: |
| | Amount |
| | ($000) |
| Paid-in Capital | 19,128,183 |
| Overdistributed Net Investment Income | (45,230) |
| Accumulated Net Realized Losses | (283,578) |
| Unrealized Appreciation (Depreciation) | |
| Investment Securities | 4,630,605 |
| Futures Contracts | 4,792 |
| Forward Currency Contracts | (202) |
| Foreign Currencies | (1,829) |
| Net Assets | 23,432,741 |
| |
| |
| Investor Shares—Net Assets | |
| Applicable to 285,671,287 outstanding | |
| $.001 par value shares of beneficial | |
| interest (unlimited authorization) | 6,555,293 |
| Net Asset Value Per Share— | |
| Investor Shares | $22.95 |
| |
| |
| Admiral Shares—Net Assets | |
| Applicable to 231,426,455 outstanding | |
| $.001 par value shares of beneficial | |
| interest (unlimited authorization) | 16,877,448 |
| Net Asset Value Per Share— | |
| Admiral Shares | $72.93 |
• See Note A in Notes to Financial Statements.
* Non-income-producing security.
^ Includes partial security positions on loan to broker-dealers. The total value of securities on loan is $356,079,000.
1 The fund invests a portion of its cash reserves in equity markets through the use of index futures contracts. After giving effect to futures
investments, the fund’s effective common stock and temporary cash investment positions represent 99.2% and 1.9%, respectively,
of net assets.
2 Security exempt from registration under Rule 144A of the Securities Act of 1933. Such securities may be sold in transactions exempt from
registration, normally to qualified institutional buyers. At February 28, 2017, the aggregate value of these securities was $512,288,000,
representing 2.2% of net assets.
3 Restricted securities totaling $362,957,000, representing 1.5% of net assets.
4 Considered an affiliated company of the fund as the fund owns more than 5% of the outstanding voting securities of such company.
5 Considered an affiliated company of the fund as the issuer is another member of The Vanguard Group.
6 Affiliated money market fund available only to Vanguard funds and certain trusts and accounts managed by Vanguard. Rate shown is
the 7-day yield.
7 Includes $368,866,000 of collateral received for securities on loan.
8 Securities with a value of $12,524,000 and cash of $2,370,000 have been segregated as initial margin for open futures contracts.
9 Securities with a value of $1,786,000 have been segregated as collateral for open forward currency contracts.
ADR—American Depositary Receipt.
See accompanying Notes, which are an integral part of the Financial Statements.
15
International Growth Fund
Statement of Operations
| |
| | Six Months Ended |
| | February 28, 2017 |
| | ($000) |
| Investment Income | |
| Income | |
| Dividends1 | 70,288 |
| Interest | 962 |
| Securities Lending—Net | 11,228 |
| Total Income | 82,478 |
| Expenses | |
| Investment Advisory Fees—Note B | |
| Basic Fee | 16,303 |
| Performance Adjustment | 2,394 |
| The Vanguard Group—Note C | |
| Management and Administrative—Investor Shares | 7,980 |
| Management and Administrative—Admiral Shares | 10,236 |
| Marketing and Distribution—Investor Shares | 565 |
| Marketing and Distribution—Admiral Shares | 633 |
| Custodian Fees | 1,578 |
| Shareholders’ Reports—Investor Shares | 111 |
| Shareholders’ Reports—Admiral Shares | 46 |
| Trustees’ Fees and Expenses | 27 |
| Total Expenses | 39,873 |
| Net Investment Income | 42,605 |
| Realized Net Gain (Loss) | |
| Investment Securities Sold | 201,319 |
| Futures Contracts | 13,160 |
| Foreign Currencies and Forward Currency Contracts | (26,511) |
| Realized Net Gain (Loss) | 187,968 |
| Change in Unrealized Appreciation (Depreciation) | |
| Investment Securities | 639,508 |
| Futures Contracts | 3,626 |
| Foreign Currencies and Forward Currency Contracts | (264) |
| Change in Unrealized Appreciation (Depreciation) | 642,870 |
| Net Increase (Decrease) in Net Assets Resulting from Operations | 873,443 |
| 1 Dividends are net of foreign withholding taxes of $8,033,000. |
See accompanying Notes, which are an integral part of the Financial Statements.
16
International Growth Fund
Statement of Changes in Net Assets
| | |
| | Six Months Ended | Year Ended |
| | February 28, | August 31, |
| | 2017 | 2016 |
| | ($000) | ($000) |
| Increase (Decrease) in Net Assets | | |
| Operations | | |
| Net Investment Income | 42,605 | 328,597 |
| Realized Net Gain (Loss) | 187,968 | (250,024) |
| Change in Unrealized Appreciation (Depreciation) | 642,870 | 1,785,241 |
| Net Increase (Decrease) in Net Assets Resulting from Operations | 873,443 | 1,863,814 |
| Distributions | | |
| Net Investment Income | | |
| Investor Shares | (77,644) | (98,317) |
| Admiral Shares | (214,864) | (219,641) |
| Realized Capital Gain | | |
| Investor Shares | — | — |
| Admiral Shares | — | — |
| Total Distributions | (292,508) | (317,958) |
| Capital Share Transactions | | |
| Investor Shares | (312,439) | (951,188) |
| Admiral Shares | 760,644 | 885,360 |
| Net Increase (Decrease) from Capital Share Transactions | 448,205 | (65,828) |
| Total Increase (Decrease) | 1,029,140 | 1,480,028 |
| Net Assets | | |
| Beginning of Period | 22,403,601 | 20,923,573 |
| End of Period1 | 23,432,741 | 22,403,601 |
| 1 Net Assets—End of Period includes undistributed (overdistributed) net investment income of ($45,230,000) and $225,153,000. |
See accompanying Notes, which are an integral part of the Financial Statements.
17
International Growth Fund
| | | | | | | |
| Investor Shares | | | | | | | |
| | Six Months | | | | | |
| | | Ended | | | | | |
| For a Share Outstanding | February 28, | Year Ended August 31, |
| Throughout Each Period | | 2017 | 2016 | 2015 | 2014 | 2013 | 2012 |
| Net Asset Value, Beginning of Period | $22.38 | $20.83 | $23.79 | $20.42 | $17.69 | $18.27 |
| Investment Operations | | | | | | | |
| Net Investment Income | | . 030 | . 304 | . 308 | . 4711 | .336 | .361 |
| Net Realized and Unrealized Gain (Loss) | | | | | | |
| on Investments | | .808 | 1.539 | (2.774) | 3.235 | 2.741 | (.607) |
| Total from Investment Operations | .838 | 1.843 | (2.466) | 3.706 | 3.077 | (.246) |
| Distributions | | | | | | | |
| Dividends from Net Investment Income | (. 268) | (. 293) | (. 494) | (. 336) | (. 347) | (. 334) |
| Distributions from Realized Capital Gains | — | — | — | — | — | — |
| Total Distributions | | (. 268) | (. 293) | (. 494) | (. 336) | (. 347) | (. 334) |
| Net Asset Value, End of Period | $22.95 | $22.38 | $20.83 | $23.79 | $20.42 | $17.69 |
| |
| Total Return2 | | 3.85% | 8.95% | -10.46% | 18.26% | 17.54% | -1.14% |
| |
| Ratios/Supplemental Data | | | | | | | |
| Net Assets, End of Period (Millions) | $6,555 | $6,700 | $7,172 | $8,976 | $9,056 | $9,115 |
| Ratio of Total Expenses to | | | | | | | |
| Average Net Assets3 | | 0.45% | 0.46% | 0.47% | 0.47% | 0.48% | 0.49% |
| Ratio of Net Investment Income to | | | | | | |
| Average Net Assets | | 0.28% | 1.47% | 1.34% | 2.08%1 | 1.71% | 2.04% |
| Portfolio Turnover Rate | | 19% | 29% | 29% | 21% | 31% | 30% |
The expense ratio, net investment income ratio, and turnover rate for the current period have been annualized.
1 Net investment income per share and the ratio of net investment income to average net assets include $.080 and 0.35%, respectively,
resulting from income received from Vodafone Group plc in the form of cash and shares in Verizon Communications Inc. in February 2014.
2 Total returns do not include transaction or account service fees that may have applied in the periods shown. Fund prospectuses provide
information about any applicable transaction and account service fees.
3 Includes performance-based investment advisory fee increases (decreases) of 0.02%, 0.04%, 0.03%, 0.03%, 0.03%, and 0.04%.
See accompanying Notes, which are an integral part of the Financial Statements.
18
International Growth Fund
Financial Highlights
| | | | | | | |
| Admiral Shares | | | | | | | |
| | Six Months | | | | | |
| | | Ended | | | | | |
| For a Share Outstanding | February 28, | Year Ended August 31, |
| Throughout Each Period | | 2017 | 2016 | 2015 | 2014 | 2013 | 2012 |
| Net Asset Value, Beginning of Period | $71.19 | $66.28 | $75.70 | $64.98 | $56.31 | $58.17 |
| Investment Operations | | | | | | | |
| Net Investment Income | | .147 | 1.062 | 1.088 | 1.6131 | 1.157 | 1.229 |
| Net Realized and Unrealized Gain (Loss) | | | | | | |
| on Investments | | 2.549 | 4.877 | (8.821) | 10.277 | 8.697 | (1.945) |
| Total from Investment Operations | 2.696 | 5.939 | (7.733) | 11.890 | 9.854 | (.716) |
| Distributions | | | | | | | |
| Dividends from Net Investment Income | (.956) | (1.029) | (1.687) | (1.170) | (1.184) | (1.144) |
| Distributions from Realized Capital Gains | — | — | — | — | — | — |
| Total Distributions | | (.956) | (1.029) | (1.687) | (1.170) | (1.184) | (1.144) |
| Net Asset Value, End of Period | $72.93 | $71.19 | $66.28 | $75.70 | $64.98 | $56.31 |
| |
| Total Return2 | | 3.91% | 9.07% | -10.32% | 18.42% | 17.66% | -1.01% |
| |
| Ratios/Supplemental Data | | | | | | | |
| Net Assets, End of Period (Millions) $16,877 | $15,704 | $13,752 | $14,415 | $10,556 | $7,523 |
| Ratio of Total Expenses to | | | | | | | |
| Average Net Assets3 | | 0.32% | 0.33% | 0.34% | 0.34% | 0.35% | 0.36% |
| Ratio of Net Investment Income to | | | | | | |
| Average Net Assets | | 0.41% | 1.60% | 1.47% | 2.21%1 | 1.84% | 2.17% |
| Portfolio Turnover Rate | | 19% | 29% | 29% | 21% | 31% | 30% |
The expense ratio, net investment income ratio, and turnover rate for the current period have been annualized.
1 Net investment income per share and the ratio of net investment income to average net assets include $.255 and 0.35%, respectively,
resulting from income received from Vodafone Group plc in the form of cash and shares in Verizon Communications Inc. in February 2014.
2 Total returns do not include transaction or account service fees that may have applied in the periods shown. Fund prospectuses provide
information about any applicable transaction and account service fees.
3 Includes performance-based investment advisory fee increases (decreases) of 0.02%, 0.04%, 0.03%, 0.03%, 0.03%, and 0.04%.
See accompanying Notes, which are an integral part of the Financial Statements.
19
International Growth Fund
Notes to Financial Statements
Vanguard International Growth Fund is registered under the Investment Company Act of 1940 as an open-end investment company, or mutual fund. The fund invests in securities of foreign issuers, which may subject it to investment risks not normally associated with investing in securities of U.S. corporations. The fund offers two classes of shares: Investor Shares and Admiral Shares. Investor Shares are available to any investor who meets the fund’s minimum purchase requirements. Admiral Shares are designed for investors who meet certain administrative, service, and account-size criteria.
A. The following significant accounting policies conform to generally accepted accounting principles for U.S. investment companies. The fund consistently follows such policies in preparing its financial statements.
1. Security Valuation: Securities are valued as of the close of trading on the New York Stock Exchange (generally 4 p.m., Eastern time) on the valuation date. Equity securities are valued at the latest quoted sales prices or official closing prices taken from the primary market in which each security trades; such securities not traded on the valuation date are valued at the mean of the latest quoted bid and asked prices. Securities for which market quotations are not readily available, or whose values have been affected by events occurring before the fund’s pricing time but after the close of the securities’ primary markets, are valued at their fair values calculated according to procedures adopted by the board of trustees. These procedures include obtaining quotations from an independent pricing service, monitoring news to identify significant market- or security-specific events, and evaluating changes in the values of foreign market proxies (for example, ADRs, futures contracts, or exchange-traded funds), between the time the foreign markets close and the fund’s pricing time. When fair-value pricing is employed, the prices of securities used by a fund to calculate its net asset value may differ from quoted or published prices for the same securities. Investments in Vanguard Market Liquidity Fund are valued at that fund’s net asset value. Temporary cash investments are valued using the latest bid prices or using valuations based on a matrix system (which considers such factors as security prices, yields, maturities, and ratings), both as furnished by independent pricing services.
2. Foreign Currency: Securities and other assets and liabilities denominated in foreign currencies are translated into U.S. dollars using exchange rates obtained from an independent third party as of the fund’s pricing time on the valuation date. Realized gains (losses) and unrealized appreciation (depreciation) on investment securities include the effects of changes in exchange rates since the securities were purchased, combined with the effects of changes in security prices. Fluctuations in the value of other assets and liabilities resulting from changes in exchange rates are recorded as unrealized foreign currency gains (losses) until the assets or liabilities are settled in cash, at which time they are recorded as realized foreign currency gains (losses).
3. Futures and Forward Currency Contracts: The fund uses index futures contracts to a limited extent, with the objective of maintaining full exposure to the stock market while maintaining liquidity. The fund may purchase or sell futures contracts to achieve a desired level of investment, whether to accommodate portfolio turnover or cash flows from capital share transactions. The primary risks associated with the use of futures contracts are imperfect correlation between changes in market values of stocks held by the fund and the prices of futures contracts, and the possibility of an illiquid market. Counterparty risk involving futures is mitigated because a regulated clearinghouse is the counterparty instead of the clearing broker. To further mitigate counterparty risk, the fund trades futures contracts on an exchange, monitors the financial strength of its clearing brokers and clearing-
20
International Growth Fund
house, and has entered into clearing agreements with its clearing brokers. The clearinghouse imposes initial margin requirements to secure the fund’s performance and requires daily settlement of variation margin representing changes in the market value of each contract.
The fund enters into forward currency contracts to provide the appropriate currency exposure related to any open futures contracts or to protect the value of securities and related receivables and payables against changes in foreign exchange rates. The fund’s risks in using these contracts include movement in the values of the foreign currencies relative to the U.S. dollar and the ability of the counterparties to fulfill their obligations under the contracts. The fund mitigates its counterparty risk by entering into forward currency contracts only with a diverse group of prequalified counter-parties, monitoring their financial strength, entering into master netting arrangements with its counterparties, and requiring its counterparties to transfer collateral as security for their performance. In the absence of a default, the collateral pledged or received by the fund cannot be repledged, resold, or rehypothecated. The master netting arrangements provide that, in the event of a counterparty’s default (including bankruptcy), the fund may terminate the forward currency contracts, determine the net amount owed by either party in accordance with its master netting arrangements, and sell or retain any collateral held up to the net amount owed to the fund under the master netting arrangements. The forward currency contracts contain provisions whereby a counterparty may terminate open contracts if the fund’s net assets decline below a certain level, triggering a payment by the fund if the fund is in a net liability position at the time of the termination. The payment amount would be reduced by any collateral the fund has pledged. Any assets pledged as collateral for open contracts are noted in the Statement of Net Assets. The value of collateral received or pledged is compared daily to the value of the forward currency contracts exposure with each counterparty, and any difference, if in excess of a specified minimum transfer amount, is adjusted and settled within two business days.
Futures contracts are valued at their quoted daily settlement prices. Forward currency contracts are valued at their quoted daily prices obtained from an independent third party, adjusted for currency risk based on the expiration date of each contract. The aggregate settlement values and notional amounts of the contracts are not recorded in the Statement of Net Assets. Fluctuations in the value of the contracts are recorded in the Statement of Net Assets as an asset (liability) and in the Statement of Operations as unrealized appreciation (depreciation) until the contracts are closed, when they are recorded as realized gains (losses) on futures or forward currency contracts.
During the six months ended February 28, 2017, the fund’s average investments in long and short futures contracts represented less than 1% and 0% of net assets, respectively, based on the average of aggregate settlement values at each quarter-end during the period. The fund’s average investment in forward currency contracts represented 2% of net assets, based on the average of notional amounts at each quarter-end during the period.
4. Federal Income Taxes: The fund intends to continue to qualify as a regulated investment company and distribute all of its taxable income. Management has analyzed the fund’s tax positions taken for all open federal income tax years (August 31, 2013–2016), and for the period ended February 28, 2017, and has concluded that no provision for federal income tax is required in the fund’s financial statements.
21
International Growth Fund
5. Distributions: Distributions to shareholders are recorded on the ex-dividend date.
6. Securities Lending: To earn additional income, the fund lends its securities to qualified institutional borrowers. Security loans are subject to termination by the fund at any time, and are required to be secured at all times by collateral in an amount at least equal to the market value of securities loaned. Daily market fluctuations could cause the value of loaned securities to be more or less than the value of the collateral received. When this occurs, the collateral is adjusted and settled on the next business day. The fund further mitigates its counterparty risk by entering into securities lending transactions only with a diverse group of prequalified counterparties, monitoring their financial strength, and entering into master securities lending agreements with its counterparties. The master securities lending agreements provide that, in the event of a counterparty’s default (including bankruptcy), the fund may terminate any loans with that borrower, determine the net amount owed, and sell or retain the collateral up to the net amount owed to the fund; however, such actions may be subject to legal proceedings. While collateral mitigates counterparty risk, in the absence of a default the fund may experience delays and costs in recovering the securities loaned. The fund invests cash collateral received in Vanguard Market Liquidity Fund, and records a liability in the Statement of Net Assets for the return of the collateral, during the period the securities are on loan. Securities lending income represents fees charged to borrowers plus income earned on invested cash collateral, less expenses associated with the loan. During the term of the loan, the fund is entitled to all distributions made on or in respect of the loaned securities.
7. Credit Facility: The fund and certain other funds managed by The Vanguard Group (“Vanguard”) participate in a $3.1 billion committed credit facility provided by a syndicate of lenders pursuant to a credit agreement that may be renewed annually; each fund is individually liable for its borrowings, if any, under the credit facility. Borrowings may be utilized for temporary and emergency purposes, and are subject to the fund’s regulatory and contractual borrowing restrictions. The participating funds are charged administrative fees and an annual commitment fee of 0.10% of the undrawn amount of the facility; these fees are allocated to the funds based on a method approved by the fund’s board of trustees and included in Management and Administrative expenses on the fund’s Statement of Operations. Any borrowings under this facility bear interest at a rate based upon the higher of the one-month London Interbank Offered Rate, federal funds effective rate, or overnight bank funding rate plus an agreed-upon spread.
The fund had no borrowings outstanding at February 28, 2017, or at any time during the period then ended.
8. Other: Dividend income is recorded on the ex-dividend date. Interest income includes income distributions received from Vanguard Market Liquidity Fund and is accrued daily. Premiums and discounts on debt securities purchased are amortized and accreted, respectively, to interest income over the lives of the respective securities. Security transactions are accounted for on the date securities are bought or sold. Costs used to determine realized gains (losses) on the sale of investment securities are those of the specific securities sold.
Withholding taxes on foreign dividends and capital gains have been provided for in accordance with the fund’s understanding of the applicable countries’ tax rules and rates. The fund has filed tax reclaims for previously withheld taxes on dividends earned in certain European Union countries. These filings are subject to various administrative and judicial proceedings within these countries.
22
International Growth Fund
Such tax reclaims received during the year, if any, are included in dividend income. No other amounts for additional tax reclaims are reflected in the financial statements due to the uncertainty as to the ultimate resolution of proceedings, the likelihood of receipt of these reclaims, and the potential timing of payment.
Each class of shares has equal rights as to assets and earnings, except that each class separately bears certain class-specific expenses related to maintenance of shareholder accounts (included in Management and Administrative expenses) and shareholder reporting. Marketing and distribution expenses are allocated to each class of shares based on a method approved by the board of trustees. Income, other non-class-specific expenses, and gains and losses on investments are allocated to each class of shares based on its relative net assets.
B. The investment advisory firms Baillie Gifford Overseas Ltd. and Schroder Investment Management North America Inc. each provide investment advisory services to a portion of the fund for a fee calculated at an annual percentage rate of average net assets managed by the advisor. The basic fees of Baillie Gifford Overseas Ltd. and Schroder Investment Management North America Inc. are subject to quarterly adjustments based on performance relative to the MSCI All Country World Index ex USA for the preceding three years.
Vanguard manages the cash reserves of the fund as described below.
For the six months ended February 28, 2017, the aggregate investment advisory fee represented an effective annual basic rate of 0.15% of the fund’s average net assets, before an increase of $2,394,000 (0.02%) based on performance.
C. In accordance with the terms of a Funds’ Service Agreement (the “FSA”) between Vanguard and the fund, Vanguard furnishes to the fund corporate management, administrative, marketing, distribution, and cash management services at Vanguard’s cost of operations (as defined by the FSA). These costs of operations are allocated to the fund based on methods and guidelines approved by the board of trustees. Vanguard does not require reimbursement in the current period for certain costs of operations (such as deferred compensation/benefits and risk/insurance costs); the fund’s liability for these costs of operations is included in Payables to Vanguard on the Statement of Net Assets.
Upon the request of Vanguard, the fund may invest up to 0.40% of its net assets as capital in Vanguard. At February 28, 2017, the fund had contributed to Vanguard capital in the amount of $1,657,000, representing 0.01% of the fund’s net assets and 0.66% of Vanguard’s capitalization. The fund’s trustees and officers are also directors and employees, respectively, of Vanguard.
D. Various inputs may be used to determine the value of the fund’s investments. These inputs are summarized in three broad levels for financial statement purposes. The inputs or methodologies used to value securities are not necessarily an indication of the risk associated with investing in those securities.
Level 1—Quoted prices in active markets for identical securities.
Level 2—Other significant observable inputs (including quoted prices for similar securities, interest rates, prepayment speeds, credit risk, etc.).
Level 3—Significant unobservable inputs (including the fund’s own assumptions used to determine the fair value of investments).
23
International Growth Fund
The following table summarizes the market value of the fund’s investments as of February 28, 2017, based on the inputs used to value them:
| | | |
| | Level 1 | Level 2 | Level 3 |
| Investments | ($000) | ($000) | ($000) |
| Common Stocks—North and South America | 2,564,030 | — | — |
| Common Stocks—Other | 2,818,788 | 17,334,998 | 239,570 |
| Preferred Stocks | — | — | 123,387 |
| Temporary Cash Investments | 700,576 | 18,875 | — |
| Futures Contracts—Assets1 | 532 | — | — |
| Futures Contracts—Liabilities1 | (219) | — | — |
| Forward Currency Contracts—Assets | — | 2,064 | — |
| Forward Currency Contracts—Liabilities | — | (2,266) | — |
| Total | 6,083,707 | 17,353,671 | 362,957 |
| 1 Represents variation margin on the last day of the reporting period. |
The determination of Level 3 fair value measurements is governed by documented policies and procedures adopted by the board of trustees. The board has designated a pricing review committee, as an agent of the board, to ensure the timely analysis and valuation of Level 3 securities held by the fund in accordance with established policies and procedures. The pricing review committee employs various methods for calibrating valuation approaches, including a regular review of key inputs and assumptions, transactional back-testing or disposition analysis, and reviews of any related market activity. All valuation decisions made by the pricing review committee are reported to the board on a quarterly basis for review and ratification. The board reviews the adequacy of the fair value measurement policies and procedures in place on an annual basis.
The following table summarizes changes in investments valued based on Level 3 inputs during the six months ended February 28, 2017. Transfers into or out of Level 3 are recognized based on values as of the date of transfer.
| | |
| | Investments in | Investments in |
| | Common Stocks | Preferred Stocks |
| Amount Valued Based on Level 3 Inputs | ($000) | ($000) |
| Balance as of August 31, 2016 | 327,541 | 116,756 |
| Purchases | 339 | — |
| Sales | (67,484) | — |
| Net Realized Gain (Loss) | 11,589 | — |
| Change in Unrealized Appreciation (Depreciation) | (32,415) | 6,631 |
| Balance as of February 28, 2017 | 239,570 | 123,387 |
| Net change in unrealized appreciation (depreciation) from investments still held as of February 28, 2017, was ($32,567,000). |
24
International Growth Fund
The following table provides quantitative information about the significant unobservable inputs used in fair value measurement as of February 28, 2017:
| | | | |
| | Fair Value | | | |
| Security Type | ($000) | Valuation Technique | Unobservable Input | Amount |
| Common Stocks | 239,570 | Market Approach | Purchase Price | $2,261.672 |
| | | | Purchase Price | 2,228.610 |
| | | | Recent Market Transaction | 1,898.202 |
| | | | Recent Market Transaction | 187.474 |
| | | | Discounted Purchase Price | 77.720 |
| | | | Discounted Recent Market | 68.730 |
| | | | Transaction | |
| | | | Recent Market Transaction | 17.078 |
| Preferred Stocks | 123,387 | Market Approach | Recent Market Transaction | 3.861 |
| | | | Valuation of Underlying Holdings | 1.148 |
Significant increases or decreases in the significant unobservable inputs used in the fair value measurement of the portfolio’s Level 3 securities, in isolation, could result in a significantly higher or lower fair value measurement.
E. At February 28, 2017, the fair values of derivatives were reflected in the Statement of Net Assets as follows:
| | | |
| | | Foreign | |
| | Equity | Exchange | |
| | Contracts | Contracts | Total |
| Statement of Net Assets Caption | ($000) | ($000) | ($000) |
| Other Assets | 532 | 2,064 | 2,596 |
| Other Liabilities | (219) | (2,266) | (2,485) |
Realized net gain (loss) and the change in unrealized appreciation (depreciation) on derivatives for the six months ended February 28, 2017, were:
| | | |
| | | Foreign | |
| | Equity | Exchange | |
| | Contracts | Contracts | Total |
| Realized Net Gain (Loss) on Derivatives | ($000) | ($000) | ($000) |
| Futures Contracts | 13,160 | — | 13,160 |
| Forward Currency Contracts | — | (6,031) | (6,031) |
| Realized Net Gain (Loss) on Derivatives | 13,160 | (6,031) | 7,129 |
| |
| Change in Unrealized Appreciation (Depreciation) on Derivatives | | | |
| Futures Contracts | 3,626 | — | 3,626 |
| Forward Currency Contracts | — | (960) | (960) |
| Change in Unrealized Appreciation (Depreciation) on Derivatives | 3,626 | (960) | 2,666 |
25
International Growth Fund
At February 28, 2017, the aggregate settlement value of open futures contracts and the related unrealized appreciation (depreciation) were:
| | | | |
| | | | ($000) |
| | | | Aggregate | |
| | | Number of | Settlement | Unrealized |
| | | Long (Short) | Value | Appreciation |
| Futures Contracts | Expiration | Contracts | Long (Short) | (Depreciation) |
| Dow Jones EURO STOXX 50 Index | March 2017 | 3,616 | 127,721 | 2,441 |
| Topix Index | March 2017 | 463 | 63,480 | 1,075 |
| S&P ASX 200 Index | March 2017 | 568 | 62,056 | 922 |
| FTSE 100 Index | March 2017 | 179 | 16,184 | 354 |
| | | | | 4,792 |
Unrealized appreciation (depreciation) on open Dow Jones EURO STOXX 50 Index and FTSE 100 Index futures contracts is required to be treated as realized gain (loss) for tax purposes.
At February 28, 2017, the fund had open forward currency contracts to receive and deliver currencies as follows. Unrealized appreciation (depreciation) on open forward currency contracts is treated as realized gain (loss) for tax purposes.
| | | | | | |
| | | | | | | Unrealized |
| | Contract | | | | | Appreciation |
| | Settlement | Contract Amount (000) | (Depreciation) |
| Counterparty | Date | | Receive | | Deliver | ($000) |
| Barclays Bank plc | 3/22/17 | EUR | 72,677 | USD | 77,636 | (557) |
| Toronto Dominion Securities | 3/14/17 | JPY | 4,523,118 | USD | 39,895 | 393 |
| Credit Suisse International | 3/21/17 | AUD | 46,893 | USD | 35,182 | 754 |
| Barclays Bank plc | 3/14/17 | JPY | 2,923,445 | USD | 25,744 | 294 |
| Goldman Sachs International | 3/22/17 | EUR | 15,718 | USD | 16,861 | (191) |
| JPMorgan Chase Bank N.A. | 3/22/17 | EUR | 12,176 | USD | 13,013 | (100) |
| Citibank, N.A. | 3/22/17 | EUR | 11,374 | USD | 12,032 | 29 |
| Deutsche Bank AG | 3/22/17 | EUR | 10,678 | USD | 11,278 | 47 |
| BNP Paribas | 3/22/17 | EUR | 6,527 | USD | 6,992 | (70) |
| Barclays Bank plc | 3/22/17 | EUR | 6,283 | USD | 6,655 | 9 |
| Citibank, N.A. | 3/22/17 | EUR | 5,434 | USD | 5,869 | (106) |
| Toronto Dominion Securities | 3/22/17 | GBP | 4,242 | USD | 5,390 | (123) |
| BNP Paribas | 3/21/17 | AUD | 6,924 | USD | 5,326 | (20) |
| Barclays Bank plc | 3/21/17 | AUD | 6,354 | USD | 4,786 | 83 |
| Barclays Bank plc | 3/21/17 | AUD | 4,981 | USD | 3,820 | (3) |
| Citibank, N.A. | 3/21/17 | AUD | 4,755 | USD | 3,657 | (13) |
| BNP Paribas | 3/21/17 | AUD | 4,628 | USD | 3,527 | 20 |
| Bank of America N.A. | 3/14/17 | JPY | 394,513 | USD | 3,478 | 36 |
26
International Growth Fund
| | | | | | |
| | | | | | | Unrealized |
| | Contract | | | | | Appreciation |
| | | | | Contract Amount (000) | |
| | Settlement | | | | | (Depreciation) |
| Counterparty | Date | | Receive | | Deliver | ($000) |
| Goldman Sachs International | 3/22/17 | GBP | 2,680 | USD | 3,296 | 32 |
| Citibank, N.A. | 3/14/17 | JPY | 304,500 | USD | 2,725 | (13) |
| Goldman Sachs International | 3/21/17 | AUD | 3,719 | USD | 2,710 | 140 |
| JPMorgan Chase Bank N.A. | 3/21/17 | AUD | 3,442 | USD | 2,558 | 80 |
| JPMorgan Chase Bank N.A. | 3/22/17 | GBP | 1,937 | USD | 2,433 | (28) |
| Citibank, N.A. | 3/22/17 | GBP | 1,922 | USD | 2,406 | (19) |
| Goldman Sachs International | 3/21/17 | AUD | 2,925 | USD | 2,243 | (1) |
| BNP Paribas | 3/14/17 | JPY | 198,055 | USD | 1,751 | 13 |
| Goldman Sachs International | 3/22/17 | GBP | 1,363 | USD | 1,700 | (7) |
| Citibank, N.A. | 3/21/17 | AUD | 1,971 | USD | 1,415 | 95 |
| Bank of America N.A. | 3/21/17 | AUD | 1,611 | USD | 1,205 | 29 |
| Citibank, N.A. | 3/22/17 | GBP | 712 | USD | 874 | 10 |
| Barclays Bank plc | 3/22/17 | GBP | 569 | USD | 715 | (9) |
| Bank of America N.A. | 3/22/17 | GBP | 431 | USD | 548 | (13) |
| BNP Paribas | 3/22/17 | USD | 12,754 | EUR | 12,049 | (24) |
| JPMorgan Chase Bank N.A. | 3/22/17 | USD | 12,567 | EUR | 12,000 | (160) |
| Goldman Sachs International | 3/14/17 | USD | 12,147 | JPY | 1,418,740 | (489) |
| Citibank, N.A. | 3/21/17 | USD | 6,723 | AUD | 9,146 | (285) |
| Goldman Sachs International | 3/22/17 | USD | 1,568 | GBP | 1,292 | (35) |
| | | | | | | (202) |
| AUD—Australian dollar. |
| EUR—Euro. |
| GBP—British pound. |
| JPY—Japanese yen. |
| USD—U.S. dollar. |
At February 28, 2017, the counterparty had deposited in segregated accounts cash with a value of $710,000 in connection with open forward currency contracts.
F. Distributions are determined on a tax basis and may differ from net investment income and realized capital gains for financial reporting purposes. Differences may be permanent or temporary. Permanent differences are reclassified among capital accounts in the financial statements to reflect their tax character. Temporary differences arise when certain items of income, expense, gain, or loss are recognized in different periods for financial statement and tax purposes. These differences will reverse at some time in the future. Differences in classification may also result from the treatment of short-term gains as ordinary income for tax purposes.
27
International Growth Fund
During the six months ended February 28, 2017, the fund realized net foreign currency losses of $20,480,000, which decreased distributable net income for tax purposes; accordingly, such losses have been reclassified from accumulated net realized losses to overdistributed net investment income.
The fund’s tax-basis capital gains and losses are determined only at the end of each fiscal year. For tax purposes, at August 31, 2016, the fund had available capital losses totaling $491,209,000 to offset future net capital gains. Of this amount, $212,308,000 is subject to expiration on August 31, 2018. Capital losses of $278,901,000 realized beginning in fiscal 2012 may be carried forward indefinitely under the Regulated Investment Company Modernization Act of 2010, but must be used before any expiring loss carryforwards. The fund will use these capital losses to offset net taxable capital gains, if any, realized during the year ending August 31, 2017; should the fund realize net capital losses for the year, the losses will be added to the loss carryforward balance above.
At February 28, 2017, the cost of investment securities for tax purposes was $19,175,100,000.
Net unrealized appreciation of investment securities for tax purposes was $4,625,124,000, consisting of unrealized gains of $5,931,547,000 on securities that had risen in value since their purchase and $1,306,423,000 in unrealized losses on securities that had fallen in value since their purchase.
G. During the six months ended February 28, 2017, the fund purchased $2,150,558,000 of investment securities and sold $2,112,567,000 of investment securities, other than temporary cash investments.
H. Capital share transactions for each class of shares were:
| | | | |
| | Six Months Ended | Year Ended |
| | February 28, 2017 | August 31, 2016 |
| | Amount | Shares | Amount | Shares |
| | ($000) | (000) | ($000) | (000) |
| Investor Shares | | | | |
| Issued | 358,676 | 16,192 | 586,228 | 28,784 |
| Issued in Lieu of Cash Distributions | 75,179 | 3,578 | 95,657 | 4,579 |
| Redeemed | (746,294) | (33,462) | (1,633,073) | (78,218) |
| Net Increase (Decrease)—Investor Shares | (312,439) | (13,692) | (951,188) | (44,855) |
| Admiral Shares | | | | |
| Issued | 1,459,751 | 20,676 | 2,523,382 | 38,141 |
| Issued in Lieu of Cash Distributions | 197,994 | 2,966 | 202,133 | 3,045 |
| Redeemed | (897,101) | (12,802) | (1,840,155) | (28,076) |
| Net Increase (Decrease)—Admiral Shares | 760,644 | 10,840 | 885,360 | 13,110 |
28
International Growth Fund
I. Certain of the fund’s investments are in companies that are considered to be affiliated companies of the fund because the fund owns more than 5% of the outstanding voting securities of the company or the issuer is another member of The Vanguard Group. Transactions during the period in securities of these companies were as follows:
| | | | | | |
| | | Current Period Transactions | |
| | Aug. 31, | | Proceeds | | | Feb. 28, |
| | 2016 | | from | | Capital Gain | 2017 |
| | Market | Purchases | Securities | | Distributions | Market |
| | Value | at Cost | Sold1 | Income | Received | Value |
| | ($000) | ($000) | ($000) | ($000) | ($000) | ($000) |
| Home 24AG | 38,841 | — | — | — | — | 44,854 |
| Vanguard FTSE All-World ex-US | | | | | | |
| ETF | 50,757 | — | — | 711 | — | 52,574 |
| Vanguard Market Liquidity Fund | 565,037 | NA2 | NA 2 | 924 | — | 700,576 |
| You & Mr. Jones | 44,800 | — | — | — | — | 51,431 |
| Total | 699,435 | | | 1,635 | — | 849,435 |
| 1 Includes net realized gain (loss) on affiliated investment securities sold of $17,000. |
| 2 Not applicable—purchases and sales are for temporary cash investment purposes. |
J. Management has determined that no material events or transactions occurred subsequent to February 28, 2017, that would require recognition or disclosure in these financial statements.
29
About Your Fund’s Expenses
As a shareholder of the fund, you incur ongoing costs, which include costs for portfolio management, administrative services, and shareholder reports (like this one), among others. Operating expenses, which are deducted from a fund’s gross income, directly reduce the investment return of the fund.
A fund’s expenses are expressed as a percentage of its average net assets. This figure is known as the expense ratio. The following examples are intended to help you understand the ongoing costs (in dollars) of investing in your fund and to compare these costs with those of other mutual funds. The examples are based on an investment of $1,000 made at the beginning of the period shown and held for the entire period.
The accompanying table illustrates your fund’s costs in two ways:
• Based on actual fund return. This section helps you to estimate the actual expenses that you paid over the period. The ”Ending Account Value“ shown is derived from the fund‘s actual return, and the third column shows the dollar amount that would have been paid by an investor who started with $1,000 in the fund. You may use the information here, together with the amount you invested, to estimate the expenses that you paid over the period.
To do so, simply divide your account value by $1,000 (for example, an $8,600 account value divided by $1,000 = 8.6), then multiply the result by the number given for your fund under the heading ”Expenses Paid During Period.“
• Based on hypothetical 5% yearly return. This section is intended to help you compare your fund‘s costs with those of other mutual funds. It assumes that the fund had a yearly return of 5% before expenses, but that the expense ratio is unchanged. In this case—because the return used is not the fund’s actual return—the results do not apply to your investment. The example is useful in making comparisons because the Securities and Exchange Commission requires all mutual funds to calculate expenses based on a 5% return. You can assess your fund’s costs by comparing this hypothetical example with the hypothetical examples that appear in shareholder reports of other funds.
Note that the expenses shown in the table are meant to highlight and help you compare ongoing costs only and do not reflect transaction costs incurred by the fund for buying and selling securities. Further, the expenses do not include any purchase, redemption, or account service fees described in the fund prospectus. If such fees were applied to your account, your costs would be higher. Your fund does not carry a “sales load.”
The calculations assume no shares were bought or sold during the period. Your actual costs may have been higher or lower, depending on the amount of your investment and the timing of any purchases or redemptions.
You can find more information about the fund’s expenses, including annual expense ratios, in the Financial Statements section of this report. For additional information on operating expenses and other shareholder costs, please refer to your fund’s current prospectus.
30
| | | |
| Six Months Ended February 28, 2017 | | | |
| | Beginning | Ending | Expenses |
| | Account Value | Account Value | Paid During |
| International Growth Fund | 8/31/2016 | 2/28/2017 | Period |
| Based on Actual Fund Return | | | |
| Investor Shares | $1,000.00 | $1,038.55 | $2.27 |
| Admiral Shares | 1,000.00 | 1,039.11 | 1.62 |
| Based on Hypothetical 5% Yearly Return | | | |
| Investor Shares | $1,000.00 | $1,022.56 | $2.26 |
| Admiral Shares | 1,000.00 | 1,023.21 | 1.61 |
The calculations are based on expenses incurred in the most recent six-month period. The fund’s annualized six-month expense ratios for that
period are 0.45% for Investor Shares and 0.32% for Admiral Shares. The dollar amounts shown as “Expenses Paid” are equal to the
annualized expense ratio multiplied by the average account value over the period, multiplied by the number of days in the most recent
six-month period, then divided by the number of days in the most recent 12-month period (181/365).
31
Trustees Approve Advisory Arrangements
The board of trustees of Vanguard International Growth Fund has renewed the fund’s investment advisory arrangements with Baillie Gifford Overseas Ltd. (Baillie Gifford) and Schroder Investment Management North America Inc. (Schroder Inc.), as well as the sub-advisory agreement with Schroder Investment Management North America Ltd. (Schroder Ltd.). The board determined that renewing the fund’s advisory arrangements was in the best interests of the fund and its shareholders. Please note that in July, the fund’s trustees modified its investment advisory arrangement. M&G Investment Management Limited no longer serves as one of the fund’s advisors.
The board based its decision upon an evaluation of each advisor’s investment staff, portfolio management process, and performance. This evaluation included information provided to the board by Vanguard’s Portfolio Review Department, which is responsible for fund and advisory oversight and product management. The Portfolio Review Department met regularly with the advisors and made monthly presentations to the board during the fiscal year that directed the board’s focus to relevant information and topics.
The board, or an investment committee made up of board members, also received information throughout the year during advisor presentations. For each advisor presentation, the board was provided with letters and reports that included information about, among other things, the advisory firm and the advisor’s assessment of the investment environment, portfolio performance, and portfolio characteristics.
In addition, the board received monthly reports, which included a Market and Economic Report, a Fund Dashboard Monthly Summary, and a Fund Performance Report.
Prior to their meeting, the trustees were provided with a memo and materials that summarized the information they received over the course of the year. They also considered the factors discussed below, among others. However, no single factor determined whether the board approved the arrangements. Rather, it was the totality of the circumstances that drove the board’s decision.
Nature, extent, and quality of services
The board reviewed the quality of the fund’s investment management services over both the short and long term, and took into account the organizational depth and stability of each advisor. The board considered the following:
Baillie Gifford. Baillie Gifford is a unit of Baillie Gifford & Co., which was founded in 1908 and is among the largest independently owned investment management firms in the United Kingdom. Baillie Gifford uses fundamental research to make long-term investments in companies that have above-average growth potential resulting from sustainable competitive advantages, special cultures and management, or competitive strength in underestimated technology shifts. Baillie Gifford believes that equities’ asymmetrical return pattern means that alpha is generated by focusing on the upside and the potential to earn exponential returns rather than being overly concerned with avoiding losing investments. The advisor takes a bottom-up, stock-driven approach to sector and country allocation. Baillie Gifford has advised a portion of the fund since 2003.
Schroder. Schroders plc, the parent company of Schroder Inc. and Schroder Ltd. (collectively, Schroder), founded in 1804, specializes in global equity and fixed income management. Schroder seeks to invest in securities of international companies where it has identified a significant growth gap, which is defined as forward earnings growth that is not yet recognized by the market. Schroder believes that market inefficiencies often drive material differences between underlying company
32
fundamentals and market estimates. The advisor also believes that in-depth fundamental research, incorporating a comprehensive macroeconomic viewpoint and a robust framework of fundamental risk analysis, is the most reliable means of finding those companies and identifying the growth gap. Schroder Inc. has advised the fund since its inception in 1981, and its affiliate Schroder Ltd. has advised the fund since 2003.
The board concluded that each advisor’s experience, stability, depth, and performance, among other factors, warranted continuation of the advisory arrangements.
Investment performance
The board considered the short- and long-term performance of the fund and each advisor, including any periods of outperformance or underperformance compared with a relevant benchmark and peer group. The board concluded that the performance was such that each advisory arrangement should continue. Information about the fund’s most recent performance can be found in the Performance Summary section of this report.
Cost
The board concluded that the fund’s expense ratio was well below the average expense ratio charged by funds in its peer group and that the fund’s advisory fee rate was also well below its peer-group average. Information about the fund’s expenses appears in the About Your Fund’s Expenses section of this report as well as in the Financial Statements section, which also includes information about the fund’s advisory fee rate.
The board did not consider profitability of the fund’s advisors in determining whether to approve the advisory fees, because the firms are independent of Vanguard, and the advisory fees are the result of arm’s-length negotiations.
The benefit of economies of scale
The board concluded that the fund’s shareholders benefit from economies of scale because of breakpoints in the fund’s advisory fee schedules. The breakpoints reduce the effective rate of the fees as the fund’s assets managed by each advisor increase.
The board will consider whether to renew the advisory arrangements again after a one-year period.
33
Glossary
Beta. A measure of the magnitude of a fund’s past share-price fluctuations in relation to the ups and downs of a given market index. The index is assigned a beta of 1.00. Compared with a given index, a fund with a beta of 1.20 typically would have seen its share price rise or fall by 12% when the index rose or fell by 10%. For this report, beta is based on returns over the past 36 months for both the fund and the index. Note that a fund’s beta should be reviewed in conjunction with its R-squared (see definition). The lower the R-squared, the less correlation there is between the fund and the index, and the less reliable beta is as an indicator of volatility.
Dividend Yield. Dividend income earned by stocks, expressed as a percentage of the aggregate market value (or of net asset value, for a fund). The yield is determined by dividing the amount of the annual dividends by the aggregate value (or net asset value) at the end of the period. For a fund, the dividend yield is based solely on stock holdings and does not include any income produced by other investments.
Earnings Growth Rate. The average annual rate of growth in earnings over the past five years for the stocks now in a fund.
Equity Exposure. A measure that reflects a fund’s investments in stocks and stock futures. Any holdings in short-term reserves are excluded.
Expense Ratio. A fund’s total annual operating expenses expressed as a percentage of the fund’s average net assets. The expense ratio includes management and administrative expenses, but does not include the transaction costs of buying and selling portfolio securities.
Inception Date. The date on which the assets of a fund (or one of its share classes) are first invested in accordance with the fund’s investment objective. For funds with a subscription period, the inception date is the day after that period ends. Investment performance is measured from the inception date.
Median Market Cap. An indicator of the size of companies in which a fund invests; the midpoint of market capitalization (market price x shares outstanding) of a fund’s stocks, weighted by the proportion of the fund’s assets invested in each stock. Stocks representing half of the fund’s assets have market capitalizations above the median, and the rest are below it.
Price/Book Ratio. The share price of a stock divided by its net worth, or book value, per share. For a fund, the weighted average price/book ratio of the stocks it holds.
Price/Earnings Ratio. The ratio of a stock’s current price to its per-share earnings over the past year. For a fund, the weighted average P/E of the stocks it holds. P/E is an indicator of market expectations about corporate prospects; the higher the P/E, the greater the expectations for a company’s future growth.
R-Squared. A measure of how much of a fund’s past returns can be explained by the returns from the market in general, as measured by a given index. If a fund’s total returns were precisely synchronized with an index’s returns, its R-squared would be 1.00. If the fund’s returns bore no relationship to the index’s returns, its R-squared would be 0. For this report, R-squared is based on returns over the past 36 months for both the fund and the index.
34
Return on Equity. The annual average rate of return generated by a company during the past five years for each dollar of shareholder’s equity (net income divided by shareholder’s equity). For a fund, the weighted average return on equity for the companies whose stocks it holds.
Short-Term Reserves. The percentage of a fund invested in highly liquid, short-term securities that can be readily converted to cash.
Turnover Rate. An indication of the fund’s trading activity. Funds with high turnover rates incur higher transaction costs and may be more likely to distribute capital gains (which may be taxable to investors). The turnover rate excludes in-kind transactions, which have minimal impact on costs.
Benchmark Information
Spliced International Index: MSCI EAFE Index through May 31, 2010; MSCI All Country World
Index ex USA thereafter.
35
The People Who Govern Your Fund
The trustees of your mutual fund are there to see that the fund is operated and managed in your best interests since, as a shareholder, you are a part owner of the fund. Your fund’s trustees also serve on the board of directors of The Vanguard Group, Inc., which is owned by the Vanguard funds and provides services to them on an at-cost basis.
A majority of Vanguard’s board members are independent, meaning that they have no affiliation with Vanguard or the funds they oversee, apart from the sizable personal investments they have made as private individuals. The independent board members have distinguished backgrounds in business, academia, and public service. Each of the trustees and executive officers oversees 195 Vanguard funds.
The following table provides information for each trustee and executive officer of the fund. The mailing address of the trustees and officers is P.O. Box 876, Valley Forge, PA 19482. More information about the trustees is in the Statement of Additional Information, which can be obtained, without charge, by contacting Vanguard at 800-662-7447, or online at vanguard.com.
InterestedTrustee1
F. William McNabb III
Born 1957. Trustee Since July 2009. Chairman of the Board. Principal Occupation(s) During the Past Five Years and Other Experience: Chairman of the Board of The Vanguard Group, Inc., and of each of the investment companies served by The Vanguard Group, since January 2010; Director of The Vanguard Group since 2008; Chief Executive Officer and President of The Vanguard Group, and of each of the investment companies served by The Vanguard Group, since 2008; Director of Vanguard Marketing Corporation; Managing Director of The Vanguard Group (1995–2008).
IndependentTrustees
Emerson U. Fullwood
Born 1948. Trustee Since January 2008. Principal Occupation(s) During the Past Five Years and Other Experience: Executive Chief Staff and Marketing Officer for North America and Corporate Vice President (retired 2008) of Xerox Corporation (document management products and services); Executive in Residence and 2009–2010 Distinguished Minett Professor at the Rochester Institute of Technology; Lead Director of SPX FLOW, Inc. (multi-industry manufacturing); Director of the United Way of Rochester, the University of Rochester Medical Center, Monroe Community College Foundation, North Carolina A&T University, and Roberts Wesleyan College.
Rajiv L. Gupta
Born 1945. Trustee Since December 2001.2 Principal Occupation(s) During the Past Five Years and Other Experience: Chairman and Chief Executive Officer (retired 2009) and President (2006–2008) of Rohm and Haas Co. (chemicals); Director of Arconic Inc. (diversified manufacturer), HP Inc. (printer and personal computer manufacturing), and Delphi Automotive plc (automotive components); Senior Advisor at New Mountain Capital.
Amy Gutmann
Born 1949. Trustee Since June 2006. Principal Occupation(s) During the Past Five Years and Other Experience: President of the University of Pennsylvania; Christopher H. Browne Distinguished Professor of Political Science, School of Arts and Sciences, and Professor of Communication, Annenberg School for Communication, with secondary faculty appointments in the Department of Philosophy, School of Arts and Sciences, and at the Graduate School of Education, University of Pennsylvania; Trustee of the National Constitution Center; Chair of the Presidential Commission for the Study of Bioethical Issues.
JoAnn Heffernan Heisen
Born 1950. Trustee Since July 1998. Principal Occupation(s) During the Past Five Years and Other Experience: Corporate Vice President and Chief Global Diversity Officer (retired 2008) and Member of the Executive Committee (1997–2008) of Johnson & Johnson (pharmaceuticals/medical devices/consumer products); Director of Skytop Lodge Corporation (hotels) and the Robert Wood Johnson Foundation; Member of the Advisory Board of the Institute for Women’s Leadership at Rutgers University.
F. Joseph Loughrey
Born 1949. Trustee Since October 2009. Principal Occupation(s) During the Past Five Years and Other Experience: President and Chief Operating Officer (retired 2009) of Cummins Inc. (industrial machinery); Chairman of the Board of Hillenbrand, Inc. (specialized consumer services), Oxfam America, and the Lumina
Foundation for Education; Director of SKF AB (industrial machinery), Hyster-Yale Materials Handling, Inc. (forklift trucks), and the V Foundation for Cancer Research; Member of the Advisory Council for the College of Arts and Letters and Chair of the Advisory Board to the Kellogg Institute for International Studies, both at the University of Notre Dame.
Mark Loughridge
Born 1953. Trustee Since March 2012. Principal Occupation(s) During the Past Five Years and Other Experience: Senior Vice President and Chief Financial Officer (retired 2013) at IBM (information technology services); Fiduciary Member of IBM’s Retirement Plan Committee (2004–2013); Director of the Dow Chemical Company; Member of the Council on Chicago Booth.
Scott C. Malpass
Born 1962. Trustee Since March 2012. Principal Occupation(s) During the Past Five Years and Other Experience: Chief Investment Officer and Vice President at the University of Notre Dame; Assistant Professor of Finance at the Mendoza College of Business at Notre Dame; Member of the Notre Dame 403(b) Investment Committee, the Board of Advisors for Spruceview Capital Partners, and the Investment Advisory Committee of Major League Baseball; Board Member of TIFF Advisory Services, Inc., and Catholic Investment Services, Inc. (investment advisors); Member of the Board of Superintendence of the Institute for the Works of Religion.
André F. Perold
Born 1952. Trustee Since December 2004. Principal Occupation(s) During the Past Five Years and Other Experience: George Gund Professor of Finance and Banking, Emeritus at the Harvard Business School (retired 2011); Chief Investment Officer and Co-Managing Partner of HighVista Strategies LLC (private investment firm); Overseer of the Museum of Fine Arts Boston.
Peter F. Volanakis
Born 1955. Trustee Since July 2009. Principal Occupation(s) During the Past Five Years and Other Experience: President and Chief Operating Officer (retired 2010) of Corning Incorporated (communications equipment); Chairman of the Board of Trustees of Colby-Sawyer College; Member of the Board of Hypertherm, Inc. (industrial cutting systems, software, and consumables).
Executive Officers
Glenn Booraem
Born 1967. Investment Stewardship Officer Since February 2017. Principal Occupation(s) During the Past Five Years and Other Experience: Principal of The Vanguard Group, Inc.; Treasurer (2015–2017), Controller (2010–2015), and Assistant Controller (2001–2010) of each of the investment companies served by The Vanguard Group.
Thomas J. Higgins
Born 1957. Chief Financial Officer Since September 2008. Principal Occupation(s) During the Past Five Years and Other Experience: Principal of The Vanguard Group, Inc.; Chief Financial Officer of each of the investment companies served by The Vanguard Group; Treasurer of each of the investment companies served by The Vanguard Group (1998–2008).
Peter Mahoney
Born 1974. Controller Since May 2015. Principal Occupation(s) During the Past Five Years and Other Experience: Principal of The Vanguard Group, Inc.; Controller of each of the investment companies served by The Vanguard Group; Head of International Fund Services at The Vanguard Group (2008–2014).
Anne E. Robinson
Born 1970. Secretary Since September 2016. Principal Occupation(s) During the Past Five Years and Other Experience: Managing Director of The Vanguard Group, Inc.; General Counsel of The Vanguard Group; Secretary of The Vanguard Group and of each of the investment companies served by The Vanguard Group; Director and Senior Vice President of Vanguard Marketing Corporation; Managing Director and General Counsel of Global Cards and Consumer Services at Citigroup (2014–2016); Counsel at American Express (2003–2014).
Michael Rollings
Born 1963. Treasurer Since February 2017. Principal Occupation(s) During the Past Five Years and Other Experience: Managing Director of The Vanguard Group, Inc.; Treasurer of each of the investment companies served by The Vanguard Group; Executive Vice President and Chief Financial Officer of MassMutual Financial Group (2006–2016).
| |
| Vanguard Senior Management Team |
| Mortimer J. Buckley | James M. Norris |
| John James | Thomas M. Rampulla |
| Martha G. King | Glenn W. Reed |
| John T. Marcante | Karin A. Risi |
| Chris D. McIsaac | |
| |
| Chairman Emeritus and Senior Advisor |
| John J. Brennan | |
| Chairman, 1996–2009 | |
| Chief Executive Officer and President, 1996–2008 |
| |
| Founder | |
| John C. Bogle | |
| Chairman and Chief Executive Officer, 1974–1996 |
1 Mr. McNabb is considered an “interested person,” as defined in the Investment Company Act of 1940, because he is an officer of the Vanguard funds.
2 December 2002 for Vanguard Equity Income Fund, the Vanguard Municipal Bond Funds, and the Vanguard State Tax-Exempt Funds.
| |  |
| | | P.O. Box 2600 |
| | | Valley Forge, PA 19482-2600 |
| |
| |
| |
| Connect with Vanguard® > vanguard.com |
| |
| |
| |
| Fund Information > 800-662-7447 | | CFA® is a registered trademark owned by CFA Institute. |
| Direct Investor Account Services > 800-662-2739 | |
| Institutional Investor Services > 800-523-1036 | |
| Text Telephone for People | | |
| Who Are Deaf or Hard of Hearing > 800-749-7273 | |
| |
| This material may be used in conjunction | |
| with the offering of shares of any Vanguard | |
| fund only if preceded or accompanied by | |
| the fund’s current prospectus. | |
| |
| All comparative mutual fund data are from Lipper, a | |
| Thomson Reuters Company, or Morningstar, Inc., unless | |
| otherwise noted. | | |
| |
| You can obtain a free copy of Vanguard’s proxy voting | |
| guidelines by visiting vanguard.com/proxyreporting or by | |
| calling Vanguard at 800-662-2739. The guidelines are | |
| also available from the SEC’s website, sec.gov. In | |
| addition, you may obtain a free report on how your fund | |
| voted the proxies for securities it owned during the 12 | |
| months ended June 30. To get the report, visit either | |
| vanguard.com/proxyreporting or sec.gov. | |
| |
| You can review and copy information about your fund at | |
| the SEC’s Public Reference Room in Washington, D.C. To | |
| find out more about this public service, call the SEC at | |
| 202-551-8090. Information about your fund is also | |
| available on the SEC’s website, and you can receive | |
| copies of this information, for a fee, by sending a | |
| request in either of two ways: via email addressed to | |
| publicinfo@sec.gov or via regular mail addressed to the | |
| Public Reference Section, Securities and Exchange | |
| Commission, Washington, DC 20549-1520. | |
| |
| | | © 2017 The Vanguard Group, Inc. |
| | | All rights reserved. |
| | | Vanguard Marketing Corporation, Distributor. |
| |
| | | Q812 042017 |
Semiannual Report | February 28, 2017
Vanguard FTSE Social Index Fund
A new format, unwavering commitment
As you begin reading this report, you’ll notice that we’ve made some improvements to the opening sections—based on feedback from you, our clients.
Page 1 starts with a new ”Your Fund’s Performance at a Glance,” a concise, handy summary of how your fund performed during the period.
In the renamed ”Chairman’s Perspective,” Bill McNabb will focus on enduring principles and investment insights.
We’ve modified some tables, and eliminated some redundancy, but we haven’t removed any information.
At Vanguard, we’re always looking for better ways to communicate and to help you make sound investment decisions. Thank you for entrusting your assets to us.
| |
| Contents | |
| Your Fund’s Performance at a Glance. | 1 |
| Chairman’s Perspective. | 2 |
| Fund Profile. | 5 |
| Performance Summary. | 6 |
| Financial Statements. | 7 |
| About Your Fund’s Expenses. | 21 |
| Glossary. | 23 |
Please note: The opinions expressed in this report are just that—informed opinions. They should not be considered promises or advice. Also, please keep in mind that the information and opinions cover the period through the date on the front of this report. Of course, the risks of investing in your fund are spelled out in the prospectus.
See the Glossary for definitions of investment terms used in this report.
About the cover: No matter what language you speak, Vanguard has one consistent message and set of principles. Our primary focus is on you, our clients. We conduct our business with integrity as a faithful steward of your assets. This message is shown translated into seven languages, reflecting our expanding global presence.
Your Fund’s Performance at a Glance
• Vanguard FTSE Social Index Fund returned more than 10% for the six months ended February 28, 2017, closely tracking its target benchmark, the FTSE4Good US Select Index, and outpacing the average return of its large-capitalization growth fund peers.
• In tracking its socially conscious benchmark, the fund tends to have greater exposure to sectors where companies are more likely to meet the index’s environmental, social, and human rights criteria, such as the financial, technology, and health care sectors. It has less exposure to sectors where companies may fall short of the index’s requirements, such as oil and gas and industrials.
• All ten sectors advanced. Financials, the largest sector in the fund, returned 19% and had the biggest impact on overall returns. Banks and financial service firms did particularly well.
• Technology and industrials (both +14%) were the other top contributors. Basic materials (+7%), consumer services (+6%), health care (+5%), and consumer goods (+2%) contributed modestly.
| |
| Total Returns: Six Months Ended February 28, 2017 | |
| | Total |
| | Returns |
| Vanguard FTSE Social Index Fund | |
| Investor Shares | 10.57% |
| Institutional Shares | 10.69 |
| FTSE4Good US Select Index | 10.75 |
| Large-Cap Growth Funds Average | 7.44 |
| Large-Cap Growth Funds Average: Derived from data provided by Lipper, a Thomson Reuters Company. |
| Institutional Shares are available to certain institutional investors who meet specific administrative, service, and account-size criteria. |
| | | |
| Expense Ratios | | | |
| Your Fund Compared With Its Peer Group | | | |
| | Investor | Institutional | Peer Group |
| | Shares | Shares | Average |
| FTSE Social Index Fund | 0.22% | 0.12% | 1.14% |
The fund expense ratios shown are from the prospectus dated December 22, 2016, and represent estimated costs for the current fiscal year.
For the six months ended February 28, 2017, the fund’s annualized expense ratios were 0.23% for Investor Shares and 0.12% for Institutional
Shares. The peer-group expense ratio is derived from data provided by Lipper, a Thomson Reuters Company, and captures information through
year-end 2016.
Peer group: Large-Cap Growth Funds.
1
Chairman’s Perspective

Bill McNabb
Chairman and Chief Executive Officer
Dear Shareholder,
More than a decade ago, a Vanguard client asked us to help improve its defined contribution retirement plan. New hires were participating in the plan at lower rates than in previous years, and the client wanted to reverse this trend. Another priority was to help more participants invest their retirement savings in balanced portfolios.
The overall goal of this longtime client: Give employees a better chance to achieve financial security in retirement.
Today, that plan automatically enrolls employees at a 5% contribution rate, puts them in a low-cost target-date fund that takes on less risk as they near retirement, and offers a comprehensive suite of advice services. On top of that, employees get an employer contribution of 5% and are eligible for a company match.
Because of this combination of attractive features and generous employer contributions, nearly all new hires now participate in the plan, 81% of plan participants invest their retirement savings in balanced portfolios, and 87% of participants meet or exceed Vanguard’s recommended total retirement savings target. (Vanguard generally recommends that retirement investors save 12%–15% of pay, including company matches.)
2
Changing the retirement landscape
Am I singling out an isolated Vanguard success story? Absolutely not.
Stories like these are becoming increasingly common with employer-based retirement plans, particularly among large and midsize companies. Solutions such as automatic enrollment, automatic contribution increases, and default investment in target-date funds are having a positive effect.
Insights from the relatively new discipline of behavioral finance have contributed to the advances. Simply put, retirement plans are making natural human inertia work for future retirees, rather than against them, by putting savings on autopilot as much as possible.
More than 60% of Vanguard participants are in plans with automatic enrollment, which has led to a big jump in participation. Today, more than four-fifths of eligible employees are saving for retirement, compared with only two-thirds ten years ago.
In addition, many plans have adopted automatic-escalation features, which increase plan contributions at regular intervals until a maximum level is reached or an employee opts out. Automatic increases are a crucial tool for boosting retirement savings rates.
The growing use of target-date funds is another enormous benefit. More than 70% of all participants in Vanguard plans invest at least part of their retirement savings in
| | | |
| Market Barometer | | | |
| | | | Total Returns |
| | | Periods Ended February 28, 2017 |
| | Six | One | Five Years |
| | Months | Year | (Annualized) |
| Stocks | | | |
| Russell 1000 Index (Large-caps) | 10.10% | 25.53% | 13.94% |
| Russell 2000 Index (Small-caps) | 12.61 | 36.11 | 12.89 |
| Russell 3000 Index (Broad U.S. market) | 10.29 | 26.29 | 13.85 |
| FTSE All-World ex US Index (International) | 5.40 | 19.87 | 4.00 |
| |
| Bonds | | | |
| Bloomberg Barclays U.S. Aggregate Bond Index | | | |
| (Broad taxable market) | -2.19% | 1.42% | 2.24% |
| Bloomberg Barclays Municipal Bond Index | | | |
| (Broad tax-exempt market) | -2.80 | 0.25 | 3.07 |
| Citigroup Three-Month U.S. Treasury Bill Index | 0.19 | 0.32 | 0.10 |
| |
| CPI | | | |
| Consumer Price Index | 1.14% | 2.74% | 1.36% |
3
these age-appropriate, diversified strategies. And nearly 50% of Vanguard participants are invested solely in a single target-date fund.
Consider a do-it-yourself autopilot
But what if you don’t have access to a world-class, employer-based retirement plan? Unfortunately, not everyone does, which is an important policy issue.
However, you can still put the features of these plans to work. For example, you can set up automatic contributions from your paycheck to an IRA. And you can adopt your own automatic escalation by investing any pay raises.
You can also take a page from top-quality retirement plans by considering a low-cost, globally diversified target-date fund. The beauty of this approach is that you don’t need to remember to rebalance your portfolio—the fund does it for you.
Of course, you can take a more active role in picking your own investments, and this can be a good choice for some. But keep in mind the lessons from successful employer-based plans: Busy workers, faced with a lot of competing priorities, are often best served by putting their retirement savings on autopilot.
Winning by default
In highlighting some recent successes in retirement savings, I don’t want to minimize the challenges we still face. We’re living in a slow-growth, uncertain world, and investment returns for both stocks and bonds could well be modest in the coming decade.
But I believe the innovations we’ve seen in the last ten years in many retirement plans—you might call it the “default revolution”—point the way toward a solution. And that even goes for people whose employers don’t have a world-class retirement plan.
As always, thank you for investing with Vanguard.
Sincerely,

F. William McNabb III
Chairman and Chief Executive Officer
March 14, 2017
4
FTSE Social Index Fund
Fund Profile
As of February 28, 2017
| | |
| Share-Class Characteristics | |
| | Investor | Institutional |
| | Shares | Shares |
| Ticker Symbol | VFTSX | VFTNX |
| Expense Ratio1 | 0.22% | 0.12% |
| 30-Day SEC Yield | 1.61% | 1.71% |
| | | |
| Portfolio Characteristics | | |
| | | FTSE | DJ |
| | | 4Good | U.S. Total |
| | | US Select | Market |
| | Fund | Index | FA Index |
| Number of Stocks | 444 | 441 | 3,807 |
| Median Market Cap | $79.2B | $79.2B | $57.6B |
| Price/Earnings Ratio | 23.8x | 23.8x | 24.8x |
| Price/Book Ratio | 3.0x | 3.0x | 3.0x |
| Return on Equity | 18.6% | 18.6% | 16.4% |
| Earnings Growth | | | |
| Rate | 7.3% | 7.3% | 7.6% |
| Dividend Yield | 1.8% | 1.8% | 1.9% |
| Foreign Holdings | 0.0% | 0.0% | 0.0% |
| Turnover Rate | | | |
| (Annualized) | 11% | — | — |
| Short-Term Reserves | 0.0% | — | — |
| | | |
| Sector Diversification (% of equity exposure) |
| | | | DJ |
| | | | U.S. |
| | | FTSE | Total |
| | | 4Good | Market |
| | | US Select | FA |
| | Fund | Index | Index |
| Basic Materials | 1.9% | 1.9% | 2.6% |
| Consumer Goods | 9.8 | 9.8 | 9.8 |
| Consumer Services | 9.6 | 9.6 | 13.1 |
| Financials | 25.0 | 25.0 | 20.6 |
| Health Care | 17.3 | 17.3 | 12.6 |
| Industrials | 8.1 | 8.1 | 12.8 |
| Oil & Gas | 4.0 | 4.0 | 6.2 |
| Technology | 23.7 | 23.7 | 17.1 |
| Telecommunications | 0.3 | 0.3 | 2.1 |
| Utilities | 0.3 | 0.3 | 3.1 |
| | |
| Volatility Measures | | |
| | FTSE | DJ |
| | 4Good | U.S. Total |
| | US Select | Market |
| | Index | FA Index |
| R-Squared | 1.00 | 0.97 |
| Beta | 1.00 | 1.03 |
| These measures show the degree and timing of the fund’s |
| fluctuations compared with the indexes over 36 months. |
| | |
| Ten Largest Holdings (% of total net assets) |
| Apple Inc. | Computer Hardware | 5.0% |
| Alphabet Inc. | Internet | 3.3 |
| Microsoft Corp. | Software | 3.3 |
| Johnson & Johnson | Pharmaceuticals | 2.3 |
| JPMorgan Chase & Co. | Banks | 2.2 |
| Facebook Inc. | Internet | 2.0 |
| Wells Fargo & Co. | Banks | 2.0 |
| Bank of America Corp. | Banks | 1.7 |
| Procter & Gamble Co. | Nondurable | |
| | Household Products | 1.6 |
| Pfizer Inc. | Pharmaceuticals | 1.4 |
| Top Ten | | 24.8% |
| The holdings listed exclude any temporary cash investments and |
| equity index products. |
Investment Focus
1 The expense ratios shown are from the prospectus dated December 22, 2016, and represent estimated costs for the current fiscal year. For the six
months ended February 28, 2017, the annualized expense ratios were 0.23% for Investor Shares and 0.12% for Institutional Shares.
5
FTSE Social Index Fund
Performance Summary
All of the returns in this report represent past performance, which is not a guarantee of future results that may be achieved by the fund. (Current performance may be lower or higher than the performance data cited. For performance data current to the most recent month-end, visit our website at vanguard.com/performance.) Note, too, that both investment returns and principal value can fluctuate widely, so an investor’s shares, when sold, could be worth more or less than their original cost. The returns shown do not reflect taxes that a shareholder would pay on fund distributions or on the sale of fund shares.
Fiscal-Year Total Returns (%): August 31, 2006, Through February 28, 2017
Note: For 2017, performance data reflect the six months ended February 28, 2017.
Average Annual Total Returns: Periods Ended December 31, 2016
This table presents returns through the latest calendar quarter—rather than through the end of the fiscal period.
Securities and Exchange Commission rules require that we provide this information.
| | | | |
| | Inception | One | Five | Ten |
| | Date | Year | Years | Years |
| Investor Shares | 5/31/2000 | 10.24% | 15.80% | 6.04% |
| Institutional Shares | 1/14/2003 | 10.34 | 15.90 | 6.17 |
See Financial Highlights for dividend and capital gains information.
6
FTSE Social Index Fund
Financial Statements (unaudited)
Statement of Net Assets
As of February 28, 2017
The fund reports a complete list of its holdings in regulatory filings four times in each fiscal year, at the quarter-ends. For the second and fourth fiscal quarters, the lists appear in the fund’s semiannual and annual reports to shareholders. For the first and third fiscal quarters, the fund files the lists with the Securities and Exchange Commission on Form N-Q. Shareholders can look up the fund’s Forms N-Q on the SEC’s website at sec.gov. Forms N-Q may also be reviewed and copied at the SEC’s Public Reference Room (see the back cover of this report for further information).
| | | |
| | | | Market |
| | | | Value• |
| | | Shares | ($000) |
| Common Stocks (100.0%) | | |
| Basic Materials (1.9%) | | |
| | Praxair Inc. | 54,605 | 6,482 |
| | Ecolab Inc. | 50,602 | 6,273 |
| | LyondellBasell Industries | | |
| | NV Class A | 65,621 | 5,987 |
| | Air Products & Chemicals | | |
| | Inc. | 41,512 | 5,831 |
| | PPG Industries Inc. | 50,606 | 5,184 |
| | Nucor Corp. | 60,715 | 3,799 |
| | Newmont Mining Corp. | 101,384 | 3,471 |
| | Arconic Inc. | 83,245 | 2,397 |
| | Albemarle Corp. | 21,555 | 2,188 |
| | Mosaic Co. | 67,572 | 2,108 |
| | International Flavors & | | |
| | Fragrances Inc. | 15,279 | 1,920 |
| | FMC Corp. | 25,544 | 1,472 |
| | Ashland Global Holdings | | |
| | Inc. | 11,894 | 1,435 |
| | CF Industries Holdings Inc. | 44,672 | 1,404 |
| | Avery Dennison Corp. | 17,094 | 1,380 |
| * | Alcoa Corp. | 34,986 | 1,210 |
| * | Versum Materials Inc. | 20,558 | 623 |
| * | AdvanSix Inc. | 6,119 | 167 |
| | | | 53,331 |
| Consumer Goods (9.8%) | | |
| | Procter & Gamble Co. | 490,109 | 44,634 |
| | PepsiCo Inc. | 275,904 | 30,454 |
| | Mondelez International Inc. | | |
| | Class A | 297,540 | 13,068 |
| | Colgate-Palmolive Co. | 170,409 | 12,437 |
| | NIKE Inc. Class B | 212,026 | 12,119 |
| | Kraft Heinz Co. | 114,152 | 10,446 |
| | General Motors Co. | 269,280 | 9,920 |
| | Ford Motor Co. | 744,756 | 9,332 |
| | Kimberly-Clark Corp. | 69,042 | 9,152 |
| | General Mills Inc. | 114,278 | 6,899 |
| | Activision Blizzard Inc. | 133,029 | 6,004 |
| *,^ | Tesla Inc. | 23,064 | 5,766 |
| | | |
| * | Electronic Arts Inc. | 55,350 | 4,788 |
| | Newell Brands Inc. | 92,430 | 4,532 |
| | Delphi Automotive plc | 52,328 | 3,984 |
| | Stanley Black & Decker Inc. | 28,776 | 3,659 |
| | Conagra Brands Inc. | 83,661 | 3,448 |
| * | Monster Beverage Corp. | 82,100 | 3,402 |
| | Estee Lauder Cos. Inc. | | |
| | Class A | 40,961 | 3,394 |
| | Clorox Co. | 24,746 | 3,386 |
| | Kellogg Co. | 45,637 | 3,380 |
| | VF Corp. | 63,173 | 3,313 |
| | Dr Pepper Snapple Group | | |
| | Inc. | 35,210 | 3,290 |
| | Hershey Co. | 29,285 | 3,173 |
| | Mead Johnson Nutrition | | |
| | Co. | 35,733 | 3,137 |
| | JM Smucker Co. | 21,648 | 3,068 |
| | Genuine Parts Co. | 28,683 | 2,745 |
| * | Mohawk Industries Inc. | 11,896 | 2,693 |
| | Whirlpool Corp. | 14,395 | 2,571 |
| | Church & Dwight Co. Inc. | 49,194 | 2,452 |
| | Bunge Ltd. | 26,718 | 2,187 |
| | McCormick & Co. Inc. | 21,961 | 2,161 |
| | DR Horton Inc. | 65,162 | 2,085 |
| | Coach Inc. | 53,762 | 2,048 |
| | Campbell Soup Co. | 34,444 | 2,044 |
| | Lear Corp. | 13,455 | 1,911 |
| | Harley-Davidson Inc. | 33,885 | 1,910 |
| | Hormel Foods Corp. | 52,562 | 1,853 |
| | Snap-on Inc. | 10,667 | 1,810 |
| ^ | Autoliv Inc. | 16,871 | 1,766 |
| | Goodyear Tire & Rubber | | |
| | Co. | 50,299 | 1,763 |
| | BorgWarner Inc. | 41,066 | 1,733 |
| | Mattel Inc. | 65,582 | 1,687 |
| * | LKQ Corp. | 53,184 | 1,680 |
| | Coca-Cola European | | |
| | Partners plc | 44,432 | 1,541 |
| | Ingredion Inc. | 12,534 | 1,515 |
7
FTSE Social Index Fund
| | | |
| | | | Market |
| | | | Value• |
| | | Shares | ($000) |
| | Harman International | | |
| | Industries Inc. | 13,371 | 1,493 |
| | Hanesbrands Inc. | 72,376 | 1,448 |
| | PVH Corp. | 14,759 | 1,352 |
| * | Lululemon Athletica Inc. | 18,822 | 1,228 |
| * | Adient plc | 18,043 | 1,211 |
| | Gentex Corp. | 55,069 | 1,158 |
| | PulteGroup Inc. | 52,075 | 1,148 |
| * | Michael Kors Holdings Ltd. | 30,543 | 1,115 |
| | Lamb Weston Holdings Inc. | 27,885 | 1,093 |
| * | Herbalife Ltd. | 17,789 | 1,005 |
| * | Toll Brothers Inc. | 28,828 | 984 |
| ^ | Polaris Industries Inc. | 11,399 | 971 |
| | Ralph Lauren Corp. Class A | 10,678 | 847 |
| * | Edgewell Personal Care Co. | 11,390 | 841 |
| * | Under Armour Inc. Class A | 33,701 | 695 |
| * | Under Armour Inc. | 37,077 | 688 |
| | | | 277,617 |
| Consumer Services (9.6%) | | |
| | Home Depot Inc. | 236,871 | 34,325 |
| | Walt Disney Co. | 308,092 | 33,918 |
| | McDonald’s Corp. | 159,205 | 20,322 |
| | CVS Health Corp. | 205,894 | 16,591 |
| * | Priceline Group Inc. | 9,544 | 16,455 |
| | Starbucks Corp. | 269,598 | 15,332 |
| | Time Warner Inc. | 149,114 | 14,644 |
| | Lowe’s Cos. Inc. | 167,679 | 12,470 |
| | TJX Cos. Inc. | 126,978 | 9,961 |
| | McKesson Corp. | 43,137 | 6,476 |
| | Ross Stores Inc. | 76,589 | 5,252 |
| | Sysco Corp. | 97,505 | 5,140 |
| | Cardinal Health Inc. | 61,075 | 4,970 |
| * | O’Reilly Automotive Inc. | 18,198 | 4,945 |
| * | AutoZone Inc. | 5,533 | 4,075 |
| | Omnicom Group Inc. | 45,338 | 3,858 |
| | Dollar General Corp. | 50,232 | 3,668 |
| * | Dollar Tree Inc. | 42,595 | 3,266 |
| * | Ulta Beauty Inc. | 11,526 | 3,152 |
| | Nielsen Holdings plc | 65,750 | 2,917 |
| | AmerisourceBergen Corp. | | |
| | Class A | 31,645 | 2,896 |
| | Viacom Inc. Class B | 66,438 | 2,887 |
| | Expedia Inc. | 22,994 | 2,737 |
| * | CarMax Inc. | 36,702 | 2,369 |
| *,^ | Chipotle Mexican Grill Inc. | | |
| | Class A | 5,598 | 2,344 |
| | Alaska Air Group Inc. | 23,624 | 2,311 |
| | Advance Auto Parts Inc. | 14,038 | 2,198 |
| | L Brands Inc. | 41,263 | 2,171 |
| | Best Buy Co. Inc. | 48,653 | 2,147 |
| | Tiffany & Co. | 22,218 | 2,041 |
| | Macy’s Inc. | 59,121 | 1,964 |
| | Foot Locker Inc. | 25,541 | 1,933 |
| * | Yum China Holdings Inc. | 70,346 | 1,870 |
| | | |
| | Interpublic Group of | | |
| | Cos. Inc. | 76,087 | 1,834 |
| | Darden Restaurants Inc. | 23,590 | 1,762 |
| * | Liberty Media Corp-Liberty | | |
| | SiriusXM | 35,289 | 1,374 |
| | Kohl’s Corp. | 32,016 | 1,365 |
| | Tractor Supply Co. | 19,119 | 1,356 |
| ^ | Nordstrom Inc. | 26,941 | 1,257 |
| | Bed Bath & Beyond Inc. | 29,141 | 1,177 |
| | Staples Inc. | 123,863 | 1,114 |
| | Scripps Networks | | |
| | Interactive Inc. Class A | 13,667 | 1,104 |
| | Gap Inc. | 43,447 | 1,078 |
| | TEGNA Inc. | 41,302 | 1,059 |
| | Signet Jewelers Ltd. | 15,032 | 956 |
| | H&R Block Inc. | 42,824 | 880 |
| * | TripAdvisor Inc. | 19,871 | 824 |
| | Dun & Bradstreet Corp. | 7,123 | 752 |
| * | Liberty Media Corp-Liberty | | |
| | SiriusXM | 17,254 | 679 |
| * | AutoNation Inc. | 12,613 | 579 |
| | | | 270,755 |
| Financials (25.0%) | | |
| | JPMorgan Chase & Co. | 692,450 | 62,750 |
| | Wells Fargo & Co. | 962,810 | 55,727 |
| | Bank of America Corp. | 1,937,180 | 47,810 |
| | Citigroup Inc. | 546,300 | 32,674 |
| | Visa Inc. Class A | 361,647 | 31,803 |
| | Mastercard Inc. Class A | 186,052 | 20,551 |
| | US Bancorp | 325,856 | 17,922 |
| | Goldman Sachs Group Inc. | 71,657 | 17,775 |
| | American International | | |
| | Group Inc. | 196,911 | 12,587 |
| | American Express Co. | 154,080 | 12,336 |
| | Chubb Ltd. | 88,803 | 12,270 |
| | PNC Financial Services | | |
| | Group Inc. | 94,202 | 11,985 |
| | Morgan Stanley | 254,904 | 11,641 |
| | Simon Property Group Inc. | 60,239 | 11,108 |
| | Bank of New York Mellon | | |
| | Corp. | 202,693 | 9,555 |
| | American Tower | | |
| | Corporation | 81,007 | 9,299 |
| | Prudential Financial Inc. | 82,429 | 9,112 |
| | BlackRock Inc. | 23,303 | 9,029 |
| | MetLife Inc. | 170,601 | 8,946 |
| | Capital One Financial Corp. | 92,453 | 8,678 |
| | Charles Schwab Corp. | 214,035 | 8,649 |
| | BB&T Corp. | 155,467 | 7,497 |
| | CME Group Inc. | 61,198 | 7,433 |
| | Marsh & McLennan | | |
| | Cos. Inc. | 98,852 | 7,264 |
| | Travelers Cos. Inc. | 54,456 | 6,657 |
| | Intercontinental Exchange | | |
| | Inc. | 113,817 | 6,502 |
8
FTSE Social Index Fund
| | | |
| | | | Market |
| | | | Value• |
| | | Shares | ($000) |
| | Crown Castle International | | |
| | Corp. | 69,129 | 6,466 |
| | S&P Global Inc. | 49,671 | 6,431 |
| | Public Storage | 27,801 | 6,324 |
| | State Street Corp. | 73,945 | 5,894 |
| | Aon plc | 50,788 | 5,874 |
| | Allstate Corp. | 70,597 | 5,800 |
| | Synchrony Financial | 159,158 | 5,768 |
| | SunTrust Banks Inc. | 95,020 | 5,653 |
| | Aflac Inc. | 75,376 | 5,453 |
| | Discover Financial Services | 75,607 | 5,379 |
| | Prologis Inc. | 100,452 | 5,128 |
| | Equinix Inc. | 13,625 | 5,124 |
| | Welltower Inc. | 69,493 | 4,891 |
| | Weyerhaeuser Co. | 143,213 | 4,829 |
| | AvalonBay Communities | | |
| | Inc. | 26,238 | 4,822 |
| | M&T Bank Corp. | 28,235 | 4,714 |
| | Ventas Inc. | 67,881 | 4,416 |
| | Equity Residential | 69,075 | 4,357 |
| | Moody’s Corp. | 36,865 | 4,106 |
| | Boston Properties Inc. | 29,406 | 4,088 |
| | Progressive Corp. | 102,823 | 4,029 |
| | Ameriprise Financial Inc. | 30,297 | 3,984 |
| | Fifth Third Bancorp | 144,823 | 3,974 |
| | KeyCorp | 207,410 | 3,893 |
| | Northern Trust Corp. | 43,737 | 3,820 |
| | Citizens Financial Group | | |
| | Inc. | 98,108 | 3,666 |
| | Regions Financial Corp. | 235,922 | 3,602 |
| | Vornado Realty Trust | 32,481 | 3,569 |
| | Hartford Financial Services | | |
| | Group Inc. | 72,403 | 3,540 |
| | Principal Financial Group | | |
| | Inc. | 55,128 | 3,448 |
| | Willis Towers Watson plc | 26,338 | 3,383 |
| | Digital Realty Trust Inc. | 30,541 | 3,298 |
| | T. Rowe Price Group Inc. | 44,798 | 3,190 |
| | Lincoln National Corp. | 43,808 | 3,074 |
| | Realty Income Corp. | 49,380 | 3,026 |
| | Equifax Inc. | 22,809 | 2,990 |
| | Huntington Bancshares Inc. | 207,571 | 2,935 |
| | HCP Inc. | 89,143 | 2,923 |
| | First Republic Bank | 29,443 | 2,763 |
| * | SBA Communications Corp. | | |
| | Class A | 22,707 | 2,629 |
| | Invesco Ltd. | 78,734 | 2,534 |
| * | Markel Corp. | 2,468 | 2,418 |
| | Loews Corp. | 51,322 | 2,411 |
| * | GGP Inc. | 96,546 | 2,400 |
| | Comerica Inc. | 33,011 | 2,353 |
| | SL Green Realty Corp. | 19,418 | 2,188 |
| | Unum Group | 44,487 | 2,172 |
| | Annaly Capital | | |
| | Management Inc. | 195,264 | 2,167 |
| | | | |
| | XL Group Ltd. | | 51,565 | 2,088 |
| | Ally Financial Inc. | | 92,287 | 2,075 |
| * | Arch Capital Group Ltd. | 21,826 | 2,064 |
| | Cincinnati Financial Corp. | 27,206 | 1,985 |
| | Kimco Realty Corp. | | 81,447 | 1,975 |
| * | CBRE Group Inc. Class A | 54,933 | 1,957 |
| | Arthur J Gallagher & Co. | 33,865 | 1,929 |
| * | Alleghany Corp. | | 2,984 | 1,927 |
| | UDR Inc. | | 51,194 | 1,869 |
| | Macerich Co. | | 27,526 | 1,855 |
| | Everest Re Group Ltd. | 7,854 | 1,847 |
| | Western Union Co. | | 92,942 | 1,825 |
| * | E*TRADE Financial Corp. | 52,452 | 1,810 |
| | Zions Bancorporation | | 39,445 | 1,771 |
| | Nasdaq Inc. | | 24,873 | 1,769 |
| | Duke Realty Corp. | | 67,970 | 1,743 |
| | VEREIT Inc. | | 184,967 | 1,678 |
| | Torchmark Corp. | | 21,602 | 1,675 |
| | Iron Mountain Inc. | | 45,971 | 1,671 |
| | CIT Group Inc. | | 38,694 | 1,660 |
| | TD Ameritrade Holding | | |
| | Corp. | | 39,538 | 1,546 |
| | Voya Financial Inc. | | 37,296 | 1,538 |
| | Regency Centers Corp. | 20,017 | 1,408 |
| | New York Community | | | |
| | Bancorp Inc. | | 89,216 | 1,363 |
| | WR Berkley Corp. | | 19,146 | 1,360 |
| | AGNC Investment Corp. | 63,755 | 1,251 |
| | SEI Investments Co. | | 22,997 | 1,158 |
| | People’s United Financial | | |
| | Inc. | | 59,403 | 1,140 |
| | Liberty Property Trust | | 28,309 | 1,116 |
| | RenaissanceRe Holdings | | |
| | Ltd. | | 7,525 | 1,111 |
| | Axis Capital Holdings Ltd. | 15,929 | 1,104 |
| | Commerce Bancshares Inc. | 18,436 | 1,088 |
| | Assurant Inc. | | 10,973 | 1,086 |
| | Hospitality Properties Trust | 31,469 | 1,000 |
| | Navient Corp. | | 58,080 | 895 |
| | Weingarten Realty Investors | 22,304 | 791 |
| * | Quality Care Properties Inc. | 17,980 | 341 |
| | | | | 705,925 |
| Health Care (17.3%) | | | |
| | Johnson & Johnson | | 526,477 | 64,341 |
| | Pfizer Inc. | 1,162,673 | 39,670 |
| | Merck & Co. Inc. | | 532,034 | 35,045 |
| | UnitedHealth Group Inc. | 184,001 | 30,430 |
| | Amgen Inc. | | 143,463 | 25,326 |
| | Medtronic plc | | 267,144 | 21,615 |
| | AbbVie Inc. | | 310,052 | 19,174 |
| * | Celgene Corp. | | 149,844 | 18,507 |
| | Bristol-Myers Squibb Co. | 319,667 | 18,128 |
| | Allergan plc | | 71,905 | 17,604 |
| | Eli Lilly & Co. | | 188,718 | 15,628 |
| | Abbott Laboratories | | 329,802 | 14,867 |
9
FTSE Social Index Fund
| | | |
| | | | Market |
| | | | Value• |
| | | Shares | ($000) |
| * | Biogen Inc. | 41,919 | 12,098 |
| | Aetna Inc. | 67,423 | 8,681 |
| * | Express Scripts Holding Co. | 118,209 | 8,351 |
| | Anthem Inc. | 50,495 | 8,323 |
| | Stryker Corp. | 62,920 | 8,089 |
| | Becton Dickinson and Co. | 40,817 | 7,472 |
| | Cigna Corp. | 49,339 | 7,347 |
| * | Boston Scientific Corp. | 260,102 | 6,386 |
| | Humana Inc. | 28,400 | 5,999 |
| * | Regeneron Pharmaceuticals | | |
| | Inc. | 15,579 | 5,819 |
| * | Alexion Pharmaceuticals Inc. | 42,947 | 5,637 |
| * | Intuitive Surgical Inc. | 7,379 | 5,438 |
| | Baxter International Inc. | 104,260 | 5,309 |
| | Zoetis Inc. | 95,848 | 5,110 |
| * | HCA Holdings Inc. | 55,308 | 4,825 |
| | Zimmer Biomet Holdings | | |
| | Inc. | 38,115 | 4,463 |
| * | Vertex Pharmaceuticals Inc. | 47,230 | 4,280 |
| * | Incyte Corp. | 32,074 | 4,269 |
| * | Edwards Lifesciences Corp. | 40,593 | 3,817 |
| * | Mylan NV | 87,155 | 3,647 |
| | CR Bard Inc. | 14,162 | 3,473 |
| * | BioMarin Pharmaceutical | | |
| | Inc. | 32,081 | 3,013 |
| | Dentsply Sirona Inc. | 44,253 | 2,811 |
| * | Laboratory Corp. of | | |
| | America Holdings | 19,629 | 2,792 |
| * | Henry Schein Inc. | 15,431 | 2,647 |
| * | DaVita Inc. | 37,840 | 2,626 |
| | Quest Diagnostics Inc. | 26,650 | 2,597 |
| * | Waters Corp. | 14,671 | 2,274 |
| * | Centene Corp. | 31,867 | 2,247 |
| * | Hologic Inc. | 53,438 | 2,169 |
| | Universal Health Services | | |
| | Inc. Class B | 17,206 | 2,161 |
| * | Quintiles IMS Holdings Inc. | 27,300 | 2,113 |
| | ResMed Inc. | 26,897 | 1,937 |
| | Perrigo Co. plc | 25,527 | 1,909 |
| * | Varian Medical Systems | | |
| | Inc. | 17,894 | 1,501 |
| * | Jazz Pharmaceuticals plc | 10,422 | 1,382 |
| | Bioverativ Inc. | 21,053 | 1,096 |
| * | Mallinckrodt plc | 20,741 | 1,087 |
| * | Alnylam Pharmaceuticals | | |
| | Inc. | 14,102 | 728 |
| | Patterson Cos. Inc. | 15,340 | 697 |
| * | Endo International plc | 42,500 | 580 |
| * | Varex Imaging Corp. | 7,397 | 258 |
| | | | 487,793 |
| Industrials (8.1%) | | |
| | Union Pacific Corp. | 157,991 | 17,054 |
| | Accenture plc Class A | 125,646 | 15,392 |
| | United Parcel Service Inc. | | |
| | Class B | 132,368 | 13,999 |
| | | |
| | FedEx Corp. | 47,853 | 9,235 |
| | Automatic Data Processing | | |
| | Inc. | 87,332 | 8,962 |
| | CSX Corp. | 181,350 | 8,806 |
| * | PayPal Holdings Inc. | 208,236 | 8,746 |
| | Illinois Tool Works Inc. | 60,566 | 7,995 |
| | Johnson Controls | | |
| | International plc | 180,430 | 7,567 |
| | Norfolk Southern Corp. | 56,275 | 6,811 |
| | Deere & Co. | 56,986 | 6,239 |
| | Eaton Corp. plc | 86,591 | 6,233 |
| | Waste Management Inc. | 84,728 | 6,212 |
| * | Fiserv Inc. | 41,609 | 4,802 |
| | Cummins Inc. | 32,329 | 4,800 |
| | PACCAR Inc. | 67,766 | 4,527 |
| | Sherwin-Williams Co. | 14,496 | 4,473 |
| | Parker-Hannifin Corp. | 25,572 | 3,960 |
| | Rockwell Automation Inc. | 24,806 | 3,748 |
| | Fortive Corp. | 56,313 | 3,246 |
| | Agilent Technologies Inc. | 62,180 | 3,190 |
| | Vulcan Materials Co. | 25,430 | 3,067 |
| | Republic Services Inc. | | |
| | Class A | 44,678 | 2,768 |
| | Alliance Data Systems | | |
| | Corp. | 11,071 | 2,690 |
| | Martin Marietta Materials | | |
| | Inc. | 12,170 | 2,628 |
| | WestRock Co. | 48,660 | 2,614 |
| | Fastenal Co. | 51,171 | 2,560 |
| * | Verisk Analytics Inc. | | |
| | Class A | 29,804 | 2,471 |
| | Ball Corp. | 33,398 | 2,456 |
| | WW Grainger Inc. | 9,820 | 2,435 |
| | AMETEK Inc. | 44,739 | 2,415 |
| | Dover Corp. | 29,991 | 2,402 |
| | Global Payments Inc. | 29,062 | 2,316 |
| | CH Robinson Worldwide | | |
| | Inc. | 27,145 | 2,182 |
| | Masco Corp. | 62,919 | 2,125 |
| | Expeditors International of | | |
| | Washington Inc. | 34,899 | 1,968 |
| * | Vantiv Inc. Class A | 29,339 | 1,918 |
| * | United Rentals Inc. | 14,529 | 1,860 |
| | Kansas City Southern | 20,798 | 1,843 |
| | Sealed Air Corp. | 37,052 | 1,722 |
| | Fortune Brands Home & | | |
| | Security Inc. | 29,565 | 1,710 |
| * | Flex Ltd. | 103,493 | 1,707 |
| | Acuity Brands Inc. | 8,058 | 1,703 |
| | Valspar Corp. | 15,232 | 1,694 |
| | JB Hunt Transport Services | | |
| | Inc. | 17,059 | 1,675 |
| | Xylem Inc. | 34,377 | 1,654 |
| | Total System Services Inc. | 29,912 | 1,630 |
10
FTSE Social Index Fund
| | | | |
| | | | | Market |
| | | | | Value• |
| | | | Shares | ($000) |
| | Broadridge Financial | | | |
| | Solutions Inc. | | 22,669 | 1,572 |
| | Xerox Corp. | | 194,060 | 1,444 |
| | Allegion plc | | 18,346 | 1,332 |
| * | Sensata Technologies | | | |
| | Holding NV | | 32,325 | 1,327 |
| * | Stericycle Inc. | | 15,491 | 1,284 |
| | ManpowerGroup Inc. | | 12,845 | 1,246 |
| * | Arrow Electronics Inc. | | 17,158 | 1,239 |
| * | Keysight Technologies Inc. | | 32,820 | 1,234 |
| | Avnet Inc. | | 24,613 | 1,134 |
| | Robert Half International Inc. | 23,455 | 1,131 |
| | MDU Resources Group Inc. | 37,440 | 1,015 |
| | Bemis Co. Inc. | | 17,959 | 890 |
| | Jabil Circuit Inc. | | 32,808 | 837 |
| * | Conduent Inc. | | 38,513 | 620 |
| | | | | 228,515 |
| Oil & Gas (4.0%) | | | |
| | Schlumberger Ltd. | | 266,815 | 21,441 |
| | ConocoPhillips | | 235,372 | 11,197 |
| | EOG Resources Inc. | | 110,519 | 10,719 |
| | Occidental Petroleum Corp. | 146,471 | 9,601 |
| | Kinder Morgan Inc. | | 363,639 | 7,749 |
| | Anadarko Petroleum Corp. | | 106,140 | 6,862 |
| | Pioneer Natural Resources | | | |
| | Co. | | 32,515 | 6,047 |
| | Valero Energy Corp. | | 86,780 | 5,897 |
| | Baker Hughes Inc. | | 81,043 | 4,885 |
| | Devon Energy Corp. | | 100,460 | 4,356 |
| | Williams Cos. Inc. | | 143,270 | 4,060 |
| | Apache Corp. | | 72,181 | 3,796 |
| | Marathon Oil Corp. | | 161,735 | 2,588 |
| | Cimarex Energy Co. | | 18,179 | 2,286 |
| | EQT Corp. | | 33,117 | 1,983 |
| | Tesoro Corp. | | 21,286 | 1,813 |
| * | Newfield Exploration Co. | | 37,986 | 1,385 |
| | Helmerich & Payne Inc. | | 19,568 | 1,338 |
| | Range Resources Corp. | | 39,094 | 1,080 |
| * | Transocean Ltd. | | 70,292 | 972 |
| | Core Laboratories NV | | 8,402 | 961 |
| | Murphy Oil Corp. | | 30,802 | 871 |
| * | First Solar Inc. | | 14,094 | 510 |
| | Enbridge Inc. | | 2,024 | 85 |
| | | | | 112,482 |
| Technology (23.7%) | | | |
| | Apple Inc. | 1,022,241 | 140,037 |
| | Microsoft Corp. | 1,449,073 | 92,712 |
| * | Facebook Inc. Class A | | 426,315 | 57,783 |
| * | Alphabet Inc. Class A | | 56,534 | 47,767 |
| * | Alphabet Inc. Class C | | 55,628 | 45,793 |
| | Cisco Systems Inc. | | 964,714 | 32,974 |
| | Intel Corp. | | 907,933 | 32,867 |
| | Oracle Corp. | | 606,056 | 25,812 |
| | Broadcom Ltd. | | 76,170 | 16,066 |
| | | |
| | QUALCOMM Inc. | 281,600 | 15,905 |
| | Texas Instruments Inc. | 192,525 | 14,751 |
| * | Adobe Systems Inc. | 96,152 | 11,379 |
| | NVIDIA Corp. | 98,275 | 9,973 |
| * | salesforce.com Inc. | 118,353 | 9,628 |
| | Applied Materials Inc. | 208,787 | 7,562 |
| * | Cognizant Technology | | |
| | Solutions Corp. Class A | 117,036 | 6,937 |
| | HP Inc. | 331,018 | 5,750 |
| | Intuit Inc. | 45,789 | 5,744 |
| * | NXP Semiconductors NV | 52,401 | 5,387 |
| | Corning Inc. | 182,327 | 5,034 |
| * | Micron Technology Inc. | 200,202 | 4,693 |
| | Western Digital Corp. | 51,990 | 3,997 |
| | Lam Research Corp. | 31,210 | 3,700 |
| * | Autodesk Inc. | 42,538 | 3,671 |
| | Symantec Corp. | 119,517 | 3,415 |
| | Skyworks Solutions Inc. | 35,942 | 3,408 |
| * | Cerner Corp. | 55,738 | 3,068 |
| * | Red Hat Inc. | 34,426 | 2,851 |
| | Xilinx Inc. | 48,406 | 2,847 |
| | KLA-Tencor Corp. | 29,892 | 2,694 |
| | Seagate Technology plc | 54,553 | 2,629 |
| * | ServiceNow Inc. | 30,233 | 2,628 |
| * | Dell Technologies Inc. | | |
| | Class V | 41,317 | 2,623 |
| * | Check Point Software | | |
| | Technologies Ltd. | 25,146 | 2,487 |
| | Maxim Integrated Products | | |
| | Inc. | 54,613 | 2,419 |
| * | Citrix Systems Inc. | 29,849 | 2,357 |
| | NetApp Inc. | 53,340 | 2,231 |
| * | Synopsys Inc. | 29,042 | 2,075 |
| | Juniper Networks Inc. | 72,897 | 2,041 |
| * | Akamai Technologies Inc. | 32,152 | 2,013 |
| * | Twitter Inc. | 123,341 | 1,945 |
| * | Workday Inc. Class A | 23,386 | 1,939 |
| | CA Inc. | 59,917 | 1,933 |
| | CDK Global Inc. | 28,779 | 1,912 |
| | Computer Sciences Corp. | 26,918 | 1,845 |
| * | F5 Networks Inc. | 12,519 | 1,794 |
| | Amdocs Ltd. | 28,972 | 1,757 |
| * | VeriSign Inc. | 20,044 | 1,653 |
| * | Mobileye NV | 34,459 | 1,569 |
| * | Splunk Inc. | 24,867 | 1,535 |
| | Marvell Technology Group | | |
| | Ltd. | 80,858 | 1,261 |
| *,^ | VMware Inc. Class A | 12,185 | 1,095 |
| * | Yandex NV Class A | 47,351 | 1,065 |
| | CSRA Inc. | 31,317 | 934 |
| | | | 669,945 |
| Telecommunications (0.3%) | | |
| * | Level 3 Communications | | |
| | Inc. | 55,845 | 3,197 |
| * | T-Mobile US Inc. | 50,454 | 3,155 |
11
FTSE Social Index Fund
| | |
| | | Market |
| | | Value• |
| | Shares | ($000) |
| * Sprint Corp. | 159,775 | 1,408 |
| Frontier Communications | | |
| Corp. | 220,855 | 647 |
| | | 8,407 |
| Utilities (0.3%) | | |
| American Water Works | | |
| Co. Inc. | 34,285 | 2,674 |
| CenterPoint Energy Inc. | 81,826 | 2,236 |
| ONEOK Inc. | 40,284 | 2,177 |
| NiSource Inc. | 61,625 | 1,473 |
| * Calpine Corp. | 57,919 | 678 |
| Avangrid Inc. | 11,407 | 499 |
| | | 9,737 |
| Total Common Stocks | | |
| (Cost $2,133,384) | | 2,824,507 |
| Temporary Cash Investments (0.2%) | |
| Money Market Fund (0.2%) | | |
| 1,2 Vanguard Market Liquidity | | |
| Fund, 0.864% | 39,988 | 3,999 |
| |
| | Face | |
| | Amount | |
| | ($000) | |
| U.S. Government and Agency Obligations (0.0%) |
| United States Treasury Bill, | | |
| 0.501%, 3/16/17 | 200 | 200 |
| United States Treasury Bill, | | |
| 0.607%, 5/25/17 | 100 | 100 |
| | | 300 |
| Total Temporary Cash Investments | |
| (Cost $4,299) | | 4,299 |
| Total Investments (100.2%) | | |
| (Cost $2,137,683) | | 2,828,806 |
| |
| | Amount |
| | ($000) |
| Other Assets and Liabilities (-0.2%) | |
| Other Assets | |
| Investment in Vanguard | 187 |
| Receivables for Investment Securities Sold 5,299 |
| Receivables for Accrued Income | 4,618 |
| Receivables for Capital Shares Issued | 60,308 |
| Total Other Assets | 70,412 |
| Liabilities | |
| Payables for Investment Securities | |
| Purchased | (66,083) |
| Collateral for Securities on Loan | (3,997) |
| Payables for Capital Shares Redeemed | (2,166) |
| Payables to Vanguard | (1,339) |
| Other Liabilities | (1,750) |
| Total Liabilities | (75,335) |
| Net Assets (100%) | 2,823,883 |
| |
| At February 28, 2017, net assets consisted of: |
| | Amount |
| | ($000) |
| Paid-in Capital | 2,142,350 |
| Undistributed Net Investment Income | 4,264 |
| Accumulated Net Realized Losses | (13,854) |
| Unrealized Appreciation (Depreciation) | 691,123 |
| Net Assets | 2,823,883 |
| |
| |
| Investor Shares—Net Assets | |
| Applicable to 109,461,921 outstanding | |
| $.001 par value shares of beneficial | |
| interest (unlimited authorization) | 1,671,806 |
| Net Asset Value Per Share— | |
| Investor Shares | $15.27 |
| |
| |
| Institutional Shares—Net Assets | |
| Applicable to 75,367,488 outstanding | |
| $.001 par value shares of beneficial | |
| interest (unlimited authorization) | 1,152,077 |
| Net Asset Value Per Share— | |
| Institutional Shares | $15.29 |
• See Note A in Notes to Financial Statements.
* Non-income-producing security.
^ Includes partial security positions on loan to broker-dealers. The total value of securities on loan is $3,895,000.
1 Affiliated money market fund available only to Vanguard funds and certain trusts and accounts managed by Vanguard. Rate shown is the
7-day yield.
2 Includes $3,997,000 of collateral received for securities on loan.
See accompanying Notes, which are an integral part of the Financial Statements.
12
FTSE Social Index Fund
Statement of Operations
| |
| | Six Months Ended |
| | February 28, 2017 |
| | ($000) |
| Investment Income | |
| Income | |
| Dividends | 22,118 |
| Interest1 | 12 |
| Securities Lending—Net | 38 |
| Total Income | 22,168 |
| Expenses | |
| The Vanguard Group—Note B | |
| Investment Advisory Services | 175 |
| Management and Administrative—Investor Shares | 1,373 |
| Management and Administrative—Institutional Shares | 452 |
| Marketing and Distribution—Investor Shares | 177 |
| Marketing and Distribution—Institutional Shares | 14 |
| Custodian Fees | 37 |
| Shareholders’ Reports—Investor Shares | 16 |
| Shareholders’ Reports—Institutional Shares | 15 |
| Trustees’ Fees and Expenses | 1 |
| Total Expenses | 2,260 |
| Net Investment Income | 19,908 |
| Realized Net Gain (Loss) | |
| Investment Securities Sold1 | 8,433 |
| Futures Contracts | 25 |
| Realized Net Gain (Loss) | 8,458 |
| Change in Unrealized Appreciation (Depreciation) of Investment Securities | 229,496 |
| Net Increase (Decrease) in Net Assets Resulting from Operations | 257,862 |
| 1 Interest income and realized net gain (loss) from an affiliated company of the fund were $11,000 and $1,000, respectively. |
See accompanying Notes, which are an integral part of the Financial Statements.
13
FTSE Social Index Fund
Statement of Changes in Net Assets
| | |
| | Six Months Ended | Year Ended |
| | February 28, | August 31, |
| | 2017 | 2016 |
| | ($000) | ($000) |
| Increase (Decrease) in Net Assets | | |
| Operations | | |
| Net Investment Income | 19,908 | 38,816 |
| Realized Net Gain (Loss) | 8,458 | 2,858 |
| Change in Unrealized Appreciation (Depreciation) | 229,496 | 159,803 |
| Net Increase (Decrease) in Net Assets Resulting from Operations | 257,862 | 201,477 |
| Distributions | | |
| Net Investment Income | | |
| Investor Shares | (14,929) | (28,370) |
| Institutional Shares | (9,632) | (18,570) |
| Realized Capital Gain | | |
| Investor Shares | — | — |
| Institutional Shares | — | — |
| Total Distributions | (24,561) | (46,940) |
| Capital Share Transactions | | |
| Investor Shares | 92,902 | 208,652 |
| Institutional Shares | 186,300 | 111,431 |
| Net Increase (Decrease) from Capital Share Transactions | 279,202 | 320,083 |
| Total Increase (Decrease) | 512,503 | 474,620 |
| Net Assets | | |
| Beginning of Period | 2,311,380 | 1,836,760 |
| End of Period1 | 2,823,883 | 2,311,380 |
| 1 Net Assets—End of Period includes undistributed (overdistributed) net investment income of $4,264,000 and $8,917,000. |
See accompanying Notes, which are an integral part of the Financial Statements.
14
FTSE Social Index Fund
Financial Highlights
| | | | | | | |
| Investor Shares | | | | | | | |
| | Six Months | | | | | |
| | | Ended | | | | | |
| For a Share Outstanding | February 28, | Year Ended August 31, |
| Throughout Each Period | | 2017 | 2016 | 2015 | 2014 | 2013 | 2012 |
| Net Asset Value, Beginning of Period | $13.95 | $12.99 | $12.74 | $10.28 | $8.30 | $7.31 |
| Investment Operations | | | | | | | |
| Net Investment Income | | .111 | .241 | .183 | .167 | .153 | .117 |
| Net Realized and Unrealized Gain (Loss) | | | | | | |
| on Investments | | 1.351 | 1.025 | .231 | 2.442 | 1.969 | .962 |
| Total from Investment Operations | 1.462 | 1.266 | .414 | 2.609 | 2.122 | 1.079 |
| Distributions | | | | | | | |
| Dividends from Net Investment Income | (.142) | (. 306) | (.164) | (.149) | (.142) | (. 089) |
| Distributions from Realized Capital Gains | — | — | — | — | — | — |
| Total Distributions | | (.142) | (. 306) | (.164) | (.149) | (.142) | (. 089) |
| Net Asset Value, End of Period | $15.27 | $13.95 | $12.99 | $12.74 | $10.28 | $8.30 |
| |
| Total Return1 | | 10.57% | 9.95% | 3.25% | 25.58% | 25.90% | 14.94% |
| |
| Ratios/Supplemental Data | | | | | | | |
| Net Assets, End of Period (Millions) | $1,672 | $1,435 | $1,131 | $800 | $553 | $379 |
| Ratio of Total Expenses to | | | | | | | |
| Average Net Assets | | 0.23% | 0.22% | 0.25% | 0.27% | 0.28% | 0.29% |
| Ratio of Net Investment Income to | | | | | | |
| Average Net Assets | | 1.57% | 1.87% | 1.63% | 1.51% | 1.63% | 1.50% |
| Portfolio Turnover Rate2 | | 11% | 16% | 20% | 14% | 29% | 45% |
The expense ratio, net investment income ratio, and turnover rate for the current period have been annualized.
1 Total returns do not include account service fees that may have applied in the periods shown. Fund prospectuses provide information about
any applicable account service fees.
2 Excludes the value of portfolio securities received or delivered as a result of in-kind purchases or redemptions of the fund’s capital shares.
See accompanying Notes, which are an integral part of the Financial Statements
15
FTSE Social Index Fund
Financial Highlights
| | | | | | | |
| Institutional Shares | | | | | | | |
| | Six Months | | | | | |
| | | Ended | | | | | |
| For a Share Outstanding | February 28, | Year Ended August 31, |
| Throughout Each Period | | 2017 | 2016 | 2015 | 2014 | 2013 | 2012 |
| Net Asset Value, Beginning of Period | $13.96 | $13.00 | $12.75 | $10.29 | $8.31 | $7.32 |
| Investment Operations | | | | | | | |
| Net Investment Income | | .119 | .254 | .193 | .180 | .163 | .128 |
| Net Realized and Unrealized Gain (Loss) | | | | | | |
| on Investments | | 1.361 | 1.029 | .233 | 2.440 | 1.971 | .960 |
| Total from Investment Operations | 1.480 | 1.283 | .426 | 2.620 | 2.134 | 1.088 |
| Distributions | | | | | | | |
| Dividends from Net Investment Income | (.150) | (. 323) | (.176) | (.160) | (.154) | (. 098) |
| Distributions from Realized Capital Gains | — | — | — | — | — | — |
| Total Distributions | | (.150) | (. 323) | (.176) | (.160) | (.154) | (. 098) |
| Net Asset Value, End of Period | $15.29 | $13.96 | $13.00 | $12.75 | $10.29 | $8.31 |
| |
| Total Return | | 10.69% | 10.09% | 3.34% | 25.68% | 26.05% | 15.06% |
| |
| Ratios/Supplemental Data | | | | | | | |
| Net Assets, End of Period (Millions) | $1,152 | $876 | $706 | $429 | $276 | $202 |
| Ratio of Total Expenses to | | | | | | | |
| Average Net Assets | | 0.12% | 0.12% | 0.15% | 0.16% | 0.16% | 0.16% |
| Ratio of Net Investment Income to | | | | | | |
| Average Net Assets | | 1.68% | 1.97% | 1.73% | 1.62% | 1.75% | 1.63% |
| Portfolio Turnover Rate1 | | 11% | 16% | 20% | 14% | 29% | 45% |
| The expense ratio, net investment income ratio, and turnover rate for the current period have been annualized. |
| 1 Excludes the value of portfolio securities received or delivered as a result of in-kind purchases or redemptions of the fund’s capital shares. |
See accompanying Notes, which are an integral part of the Financial Statements.
16
FTSE Social Index Fund
Notes to Financial Statements
Vanguard FTSE Social Index Fund is registered under the Investment Company Act of 1940 as an open-end investment company, or mutual fund. The fund offers two classes of shares: Investor Shares and Institutional Shares. Investor Shares are available to any investor who meets the fund’s minimum purchase requirements. Institutional Shares are designed for investors who meet certain administrative, service, and account-size criteria.
A. The following significant accounting policies conform to generally accepted accounting principles for U.S. investment companies. The fund consistently follows such policies in preparing its financial statements.
1. Security Valuation: Securities are valued as of the close of trading on the New York Stock Exchange (generally 4 p.m., Eastern time) on the valuation date. Equity securities are valued at the latest quoted sales prices or official closing prices taken from the primary market in which each security trades; such securities not traded on the valuation date are valued at the mean of the latest quoted bid and asked prices. Securities for which market quotations are not readily available, or whose values have been materially affected by events occurring before the fund’s pricing time but after the close of the securities’ primary markets, are valued by methods deemed by the board of trustees to represent fair value. Investments in Vanguard Market Liquidity Fund are valued at that fund’s net asset value. Temporary cash investments are valued using the latest bid prices or using valuations based on a matrix system (which considers such factors as security prices, yields, maturities, and ratings), both as furnished by independent pricing services.
2. Futures Contracts: The fund uses index futures contracts to a limited extent, with the objectives of maintaining full exposure to the stock market, enhancing returns, maintaining liquidity, and minimizing transaction costs. The fund may purchase futures contracts to immediately invest incoming cash in the market, or sell futures in response to cash outflows, thereby simulating a fully invested position in the underlying index while maintaining a cash balance for liquidity. The fund may seek to enhance returns by using futures contracts instead of the underlying securities when futures are believed to be priced more attractively than the underlying securities. The primary risks associated with the use of futures contracts are imperfect correlation between changes in market values of stocks held by the fund and the prices of futures contracts, and the possibility of an illiquid market. Counterparty risk involving futures is mitigated because a regulated clearinghouse is the counterparty instead of the clearing broker. To further mitigate counterparty risk, the fund trades futures contracts on an exchange, monitors the financial strength of its clearing brokers and clearinghouse, and has entered into clearing agreements with its clearing brokers. The clearinghouse imposes initial margin requirements to secure the fund’s performance and requires daily settlement of variation margin representing changes in the market value of each contract.
Futures contracts are valued at their quoted daily settlement prices. The aggregate settlement values of the contracts are not recorded in the Statement of Net Assets. Fluctuations in the value of the contracts are recorded in the Statement of Net Assets as an asset (liability) and in the Statement of Operations as unrealized appreciation (depreciation) until the contracts are closed, when they are recorded as realized futures gains (losses).
During the six months ended February 28, 2017, the fund’s average investments in long and short futures contracts represented 0% and 0% of net assets, respectively, based on the average of aggregate settlement values at each quarter-end during the period. The fund had no open futures contracts at February 28, 2017.
17
FTSE Social Index Fund
3. Federal Income Taxes: The fund intends to continue to qualify as a regulated investment company and distribute all of its taxable income. Management has analyzed the fund’s tax positions taken for all open federal income tax years (August 31, 2013–2016), and for the period ended February 28, 2017, and has concluded that no provision for federal income tax is required in the fund’s financial statements.
4. Distributions: Distributions to shareholders are recorded on the ex-dividend date.
5. Securities Lending: To earn additional income, the fund lends its securities to qualified institutional borrowers. Security loans are subject to termination by the fund at any time, and are required to be secured at all times by collateral in an amount at least equal to the market value of securities loaned. Daily market fluctuations could cause the value of loaned securities to be more or less than the value of the collateral received. When this occurs, the collateral is adjusted and settled on the next business day. The fund further mitigates its counterparty risk by entering into securities lending transactions only with a diverse group of prequalified counterparties, monitoring their financial strength, and entering into master securities lending agreements with its counterparties. The master securities lending agreements provide that, in the event of a counterparty’s default (including bankruptcy), the fund may terminate any loans with that borrower, determine the net amount owed, and sell or retain the collateral up to the net amount owed to the fund; however, such actions may be subject to legal proceedings. While collateral mitigates counterparty risk, in the absence of a default the fund may experience delays and costs in recovering the securities loaned. The fund invests cash collateral received in Vanguard Market Liquidity Fund, and records a liability in the Statement of Net Assets for the return of the collateral, during the period the securities are on loan. Securities lending income represents fees charged to borrowers plus income earned on invested cash collateral, less expenses associated with the loan. During the term of the loan, the fund is entitled to all distributions made on or in respect of the loaned securities.
6. Credit Facility: The fund and certain other funds managed by The Vanguard Group (“Vanguard”) participate in a $3.1 billion committed credit facility provided by a syndicate of lenders pursuant to a credit agreement that may be renewed annually; each fund is individually liable for its borrowings, if any, under the credit facility. Borrowings may be utilized for temporary and emergency purposes, and are subject to the fund’s regulatory and contractual borrowing restrictions. The participating funds are charged administrative fees and an annual commitment fee of 0.10% of the undrawn amount of the facility; these fees are allocated to the funds based on a method approved by the fund’s board of trustees and included in Management and Administrative expenses on the fund’s Statement of Operations. Any borrowings under this facility bear interest at a rate based upon the higher of the one-month London Interbank Offered Rate, federal funds effective rate, or overnight bank funding rate plus an agreed-upon spread.
The fund had no borrowings outstanding at February 28, 2017, or at any time during the period then ended.
7. Other: Dividend income is recorded on the ex-dividend date. Interest income includes income distributions received from Vanguard Market Liquidity Fund and is accrued daily. Premiums and discounts on debt securities purchased are amortized and accreted, respectively, to interest income over the lives of the respective securities. Security transactions are accounted for on the date securities are bought or sold. Costs used to determine realized gains (losses) on the sale of investment securities are those of the specific securities sold.
18
FTSE Social Index Fund
Each class of shares has equal rights as to assets and earnings, except that each class separately bears certain class-specific expenses related to maintenance of shareholder accounts (included in Management and Administrative expenses) and shareholder reporting. Marketing and distribution expenses are allocated to each class of shares based on a method approved by the board of trustees. Income, other non-class-specific expenses, and gains and losses on investments are allocated to each class of shares based on its relative net assets.
B. In accordance with the terms of a Funds’ Service Agreement (the “FSA”) between Vanguard and the fund, Vanguard furnishes to the fund investment advisory, corporate management, administrative, marketing, and distribution services at Vanguard’s cost of operations (as defined by the FSA). These costs of operations are allocated to the fund based on methods and guidelines approved by the board of trustees. Vanguard does not require reimbursement in the current period for certain costs of operations (such as deferred compensation/benefits and risk/insurance costs); the fund’s liability for these costs of operations is included in Payables to Vanguard on the Statement of Net Assets.
Upon the request of Vanguard, the fund may invest up to 0.40% of its net assets as capital in Vanguard. At February 28, 2017, the fund had contributed to Vanguard capital in the amount of $187,000, representing 0.01% of the fund’s net assets and 0.07% of Vanguard’s capitalization. The fund’s trustees and officers are also directors and employees, respectively, of Vanguard.
C. Various inputs may be used to determine the value of the fund’s investments. These inputs a re summarized in three broad levels for financial statement purposes. The inputs or methodologies used to value securities are not necessarily an indication of the risk associated with investing in those securities.
Level 1—Quoted prices in active markets for identical securities.
Level 2—Other significant observable inputs (including quoted prices for similar securities, interest rates, prepayment speeds, credit risk, etc.).
Level 3—Significant unobservable inputs (including the fund’s own assumptions used to determine the fair value of investments).
The following table summarizes the market value of the fund’s investments as of February 28, 2017, based on the inputs used to value them:
| | | |
| | Level 1 | Level 2 | Level 3 |
| Investments | ($000) | ($000) | ($000) |
| Common Stocks | 2,824,507 | — | — |
| Temporary Cash Investments | 3,999 | 300 | — |
| Total | 2,828,506 | 300 | — |
D. Distributions are determined on a tax basis and may differ from net investment income and realized capital gains for financial reporting purposes. Differences may be permanent or temporary. Permanent differences are reclassified among capital accounts in the financial statements to reflect their tax character. Temporary differences arise when certain items of income, expense, gain, or loss are recognized in different periods for financial statement and tax purposes. These differences will reverse at some time in the future. Differences in classification may also result from the treatment of short-term gains as ordinary income for tax purposes.
19
FTSE Social Index Fund
The fund’s tax-basis capital gains and losses are determined only at the end of each fiscal year. For tax purposes, at August 31, 2016, the fund had available capital losses totaling $22,292,000 to offset future net capital gains. Of this amount, $394,000 is subject to expiration on August 31, 2019. Capital losses of $21,898,000 realized beginning in fiscal 2012 may be carried forward indefinitely under the Regulated Investment Company Modernization Act of 2010, but must be used before any expiring loss carryforwards. The fund will use these capital losses to offset net taxable capital gains, if any, realized during the year ending August 31, 2017; should the fund realize net capital losses for the year, the losses will be added to the loss carryforward balance above.
At February 28, 2017, the cost of investment securities for tax purposes was $2,137,683,000. Net unrealized appreciation of investment securities for tax purposes was $691,123,000, consisting of unrealized gains of $724,490,000 on securities that had risen in value since their purchase and $33,367,000 in unrealized losses on securities that had fallen in value since their purchase.
E. During the six months ended February 28, 2017, the fund purchased $481,599,000 of investment securities and sold $202,917,000 of investment securities, other than temporary cash investments.
F. Capital share transactions for each class of shares were:
| | | | |
| | Six Months Ended | Year Ended |
| | February 28, 2017 | August 31, 2016 |
| | Amount | Shares | Amount | Shares |
| | ($000) | (000) | ($000) | (000) |
| Investor Shares | | | | |
| Issued | 241,643 | 16,863 | 495,860 | 38,032 |
| Issued in Lieu of Cash Distributions | 13,424 | 952 | 25,725 | 1,988 |
| Redeemed | (162,165) | (11,267) | (312,933) | (24,156) |
| Net Increase (Decrease)—Investor Shares | 92,902 | 6,548 | 208,652 | 15,864 |
| Institutional Shares | | | | |
| Issued | 245,309 | 16,741 | 206,714 | 15,806 |
| Issued in Lieu of Cash Distributions | 9,451 | 669 | 18,514 | 1,430 |
| Redeemed | (68,460) | (4,819) | (113,797) | (8,748) |
| Net Increase (Decrease)—Institutional Shares | 186,300 | 12,591 | 111,431 | 8,488 |
G. Management has determined that no material events or transactions occurred subsequent to February 28, 2017, that would require recognition or disclosure in these financial statements.
20
About Your Fund’s Expenses
As a shareholder of the fund, you incur ongoing costs, which include costs for portfolio management, administrative services, and shareholder reports (like this one), among others. Operating expenses, which are deducted from a fund’s gross income, directly reduce the investment return of the fund.
A fund’s expenses are expressed as a percentage of its average net assets. This figure is known as the expense ratio. The following examples are intended to help you understand the ongoing costs (in dollars) of investing in your fund and to compare these costs with those of other mutual funds. The examples are based on an investment of $1,000 made at the beginning of the period shown and held for the entire period.
The accompanying table illustrates your fund’s costs in two ways:
• Based on actual fund return. This section helps you to estimate the actual expenses that you paid over the period. The ”Ending Account Value“ shown is derived from the fund‘s actual return, and the third column shows the dollar amount that would have been paid by an investor who started with $1,000 in the fund. You may use the information here, together with the amount you invested, to estimate the expenses that you paid over the period.
To do so, simply divide your account value by $1,000 (for example, an $8,600 account value divided by $1,000 = 8.6), then multiply the result by the number given for your fund under the heading ”Expenses Paid During Period.“
• Based on hypothetical 5% yearly return. This section is intended to help you compare your fund‘s costs with those of other mutual funds. It assumes that the fund had a yearly return of 5% before expenses, but that the expense ratio is unchanged. In this case—because the return used is not the fund’s actual return—the results do not apply to your investment. The example is useful in making comparisons because the Securities and Exchange Commission requires all mutual funds to calculate expenses based on a 5% return. You can assess your fund’s costs by comparing this hypothetical example with the hypothetical examples that appear in shareholder reports of other funds.
Note that the expenses shown in the table are meant to highlight and help you compare ongoing costs only and do not reflect transaction costs incurred by the fund for buying and selling securities. Further, the expenses do not include any purchase, redemption, or account service fees described in the fund prospectus. If such fees were applied to your account, your costs would be higher. Your fund does not carry a “sales load.”
The calculations assume no shares were bought or sold during the period. Your actual costs may have been higher or lower, depending on the amount of your investment and the timing of any purchases or redemptions.
You can find more information about the fund’s expenses, including annual expense ratios, in the Financial Statements section of this report. For additional information on operating expenses and other shareholder costs, please refer to your fund’s current prospectus.
21
| | | |
| Six Months Ended February 28, 2017 | | | |
| | Beginning | Ending | Expenses |
| | Account Value | Account Value | Paid During |
| FTSE Social Index Fund | 8/31/2016 | 2/28/2017 | Period |
| Based on Actual Fund Return | | | |
| Investor Shares | $1,000.00 | $1,105.67 | $1.20 |
| Institutional Shares | 1,000.00 | 1,106.95 | 0.63 |
| Based on Hypothetical 5% Yearly Return | | | |
| Investor Shares | $1,000.00 | $1,023.65 | $1.15 |
| Institutional Shares | 1,000.00 | 1,024.20 | 0.60 |
The calculations are based on expenses incurred in the most recent six-month period. The fund’s annualized six-month expense ratios for that
period are 0.23% for Investor Shares and 0.12% for Institutional Shares. The dollar amounts shown as “Expenses Paid” are equal to the
annualized expense ratio multiplied by the average account value over the period, multiplied by the number of days in the most recent
six-month period, then divided by the number of days in the most recent 12-month period (181/365).
22
Glossary
30-Day SEC Yield. A fund’s 30-day SEC yield is derived using a formula specified by the U.S. Securities and Exchange Commission. Under the formula, data related to the fund’s security holdings in the previous 30 days are used to calculate the fund’s hypothetical net income for that period, which is then annualized and divided by the fund’s estimated average net assets over the calculation period. For the purposes of this calculation, a security’s income is based on its current market yield to maturity (for bonds), its actual income (for asset-backed securities), or its projected dividend yield (for stocks). Because the SEC yield represents hypothetical annualized income, it will differ—at times significantly—from the fund’s actual experience. As a result, the fund’s income distributions may be higher or lower than implied by the SEC yield.
Beta. A measure of the magnitude of a fund’s past share-price fluctuations in relation to the ups and downs of a given market index. The index is assigned a beta of 1.00. Compared with a given index, a fund with a beta of 1.20 typically would have seen its share price rise or fall by 12% when the index rose or fell by 10%. For this report, beta is based on returns over the past 36 months for both the fund and the index. Note that a fund’s beta should be reviewed in conjunction with its R-squared (see definition). The lower the R-squared, the less correlation there is between the fund and the index, and the less reliable beta is as an indicator of volatility.
Dividend Yield. Dividend income earned by stocks, expressed as a percentage of the aggregate market value (or of net asset value, for a fund). The yield is determined by dividing the amount of the annual dividends by the aggregate value (or net asset value) at the end of the period. For a fund, the dividend yield is based solely on stock holdings and does not include any income produced by other investments.
Earnings Growth Rate. The average annual rate of growth in earnings over the past five years for the stocks now in a fund.
Equity Exposure. A measure that reflects a fund’s investments in stocks and stock futures. Any holdings in short-term reserves are excluded.
Expense Ratio. A fund’s total annual operating expenses expressed as a percentage of the fund’s average net assets. The expense ratio includes management and administrative expenses, but does not include the transaction costs of buying and selling portfolio securities.
Foreign Holdings. The percentage of a fund represented by securities or depositary receipts of companies based outside the United States.
Inception Date. The date on which the assets of a fund (or one of its share classes) are first invested in accordance with the fund’s investment objective. For funds with a subscription period, the inception date is the day after that period ends. Investment performance is measured from the inception date.
Median Market Cap. An indicator of the size of companies in which a fund invests; the midpoint of market capitalization (market price x shares outstanding) of a fund’s stocks, weighted by the proportion of the fund’s assets invested in each stock. Stocks representing half of the fund’s assets have market capitalizations above the median, and the rest are below it.
Price/Book Ratio. The share price of a stock divided by its net worth, or book value, per share. For a fund, the weighted average price/book ratio of the stocks it holds.
23
Price/Earnings Ratio. The ratio of a stock’s current price to its per-share earnings over the past year. For a fund, the weighted average P/E of the stocks it holds. P/E is an indicator of market expectations about corporate prospects; the higher the P/E, the greater the expectations for a company’s future growth.
R-Squared. A measure of how much of a fund’s past returns can be explained by the returns from the market in general, as measured by a given index. If a fund’s total returns were precisely synchronized with an index’s returns, its R-squared would be 1.00. If the fund’s returns bore no relationship to the index’s returns, its R-squared would be 0. For this report, R-squared is based on returns over the past 36 months for both the fund and the index.
Return on Equity. The annual average rate of return generated by a company during the past five years for each dollar of shareholder’s equity (net income divided by shareholder’s equity). For a fund, the weighted average return on equity for the companies whose stocks it holds.
Short-Term Reserves. The percentage of a fund invested in highly liquid, short-term securities that can be readily converted to cash.
Turnover Rate. An indication of the fund’s trading activity. Funds with high turnover rates incur higher transaction costs and may be more likely to distribute capital gains (which may be taxable to investors). The turnover rate excludes in-kind transactions, which have minimal impact on costs.
24
This page intentionally left blank.
This page intentionally left blank.
This page intentionally left blank.
The People Who Govern Your Fund
The trustees of your mutual fund are there to see that the fund is operated and managed in your best interests since, as a shareholder, you are a part owner of the fund. Your fund’s trustees also serve on the board of directors of The Vanguard Group, Inc., which is owned by the Vanguard funds and provides services to them on an at-cost basis.
A majority of Vanguard’s board members are independent, meaning that they have no affiliation with Vanguard or the funds they oversee, apart from the sizable personal investments they have made as private individuals. The independent board members have distinguished backgrounds in business, academia, and public service. Each of the trustees and executive officers oversees 195 Vanguard funds.
The following table provides information for each trustee and executive officer of the fund. The mailing address of the trustees and officers is P.O. Box 876, Valley Forge, PA 19482. More information about the trustees is in the Statement of Additional Information, which can be obtained, without charge, by contacting Vanguard at 800-662-7447, or online at vanguard.com.
InterestedTrustee1
F. William McNabb III
Born 1957. Trustee Since July 2009. Chairman of the Board. Principal Occupation(s) During the Past Five Years and Other Experience: Chairman of the Board of The Vanguard Group, Inc., and of each of the investment companies served by The Vanguard Group, since January 2010; Director of The Vanguard Group since 2008; Chief Executive Officer and President of The Vanguard Group, and of each of the investment companies served by The Vanguard Group, since 2008; Director of Vanguard Marketing Corporation; Managing Director of The Vanguard Group (1995–2008).
IndependentTrustees
Emerson U. Fullwood
Born 1948. Trustee Since January 2008. Principal Occupation(s) During the Past Five Years and Other Experience: Executive Chief Staff and Marketing Officer for North America and Corporate Vice President (retired 2008) of Xerox Corporation (document management products and services); Executive in Residence and 2009–2010 Distinguished Minett Professor at the Rochester Institute of Technology; Lead Director of SPX FLOW, Inc. (multi-industry manufacturing); Director of the United Way of Rochester, the University of Rochester Medical Center, Monroe Community College Foundation, North Carolina A&T University, and Roberts Wesleyan College.
Rajiv L. Gupta
Born 1945. Trustee Since December 2001.2 Principal Occupation(s) During the Past Five Years and Other Experience: Chairman and Chief Executive Officer (retired 2009) and President (2006–2008) of Rohm and Haas Co. (chemicals); Director of Arconic Inc. (diversified manufacturer), HP Inc. (printer and personal computer manufacturing), and Delphi Automotive plc (automotive components); Senior Advisor at New Mountain Capital.
Amy Gutmann
Born 1949. Trustee Since June 2006. Principal Occupation(s) During the Past Five Years and Other Experience: President of the University of Pennsylvania; Christopher H. Browne Distinguished Professor of Political Science, School of Arts and Sciences, and Professor of Communication, Annenberg School for Communication, with secondary faculty appointments in the Department of Philosophy, School of Arts and Sciences, and at the Graduate School of Education, University of Pennsylvania; Trustee of the National Constitution Center; Chair of the Presidential Commission for the Study of Bioethical Issues.
JoAnn Heffernan Heisen
Born 1950. Trustee Since July 1998. Principal Occupation(s) During the Past Five Years and Other Experience: Corporate Vice President and Chief Global Diversity Officer (retired 2008) and Member of the Executive Committee (1997–2008) of Johnson & Johnson (pharmaceuticals/medical devices/consumer products); Director of Skytop Lodge Corporation (hotels) and the Robert Wood Johnson Foundation; Member of the Advisory Board of the Institute for Women’s Leadership at Rutgers University.
F. Joseph Loughrey
Born 1949. Trustee Since October 2009. Principal Occupation(s) During the Past Five Years and Other Experience: President and Chief Operating Officer (retired 2009) of Cummins Inc. (industrial machinery); Chairman of the Board of Hillenbrand, Inc. (specialized consumer services), Oxfam America, and the Lumina
Foundation for Education; Director of SKF AB (industrial machinery), Hyster-Yale Materials Handling, Inc. (forklift trucks), and the V Foundation for Cancer Research; Member of the Advisory Council for the College of Arts and Letters and Chair of the Advisory Board to the Kellogg Institute for International Studies, both at the University of Notre Dame.
Mark Loughridge
Born 1953. Trustee Since March 2012. Principal Occupation(s) During the Past Five Years and Other Experience: Senior Vice President and Chief Financial Officer (retired 2013) at IBM (information technology services); Fiduciary Member of IBM’s Retirement Plan Committee (2004–2013); Director of the Dow Chemical Company; Member of the Council on Chicago Booth.
Scott C. Malpass
Born 1962. Trustee Since March 2012. Principal Occupation(s) During the Past Five Years and Other Experience: Chief Investment Officer and Vice President at the University of Notre Dame; Assistant Professor of Finance at the Mendoza College of Business at Notre Dame; Member of the Notre Dame 403(b) Investment Committee, the Board of Advisors for Spruceview Capital Partners, and the Investment Advisory Committee of Major League Baseball; Board Member of TIFF Advisory Services, Inc., and Catholic Investment Services, Inc. (investment advisors); Member of the Board of Superintendence of the Institute for the Works of Religion.
André F. Perold
Born 1952. Trustee Since December 2004. Principal Occupation(s) During the Past Five Years and Other Experience: George Gund Professor of Finance and Banking, Emeritus at the Harvard Business School (retired 2011); Chief Investment Officer and Co-Managing Partner of HighVista Strategies LLC (private investment firm); Overseer of the Museum of Fine Arts Boston.
Peter F. Volanakis
Born 1955. Trustee Since July 2009. Principal Occupation(s) During the Past Five Years and Other Experience: President and Chief Operating Officer (retired 2010) of Corning Incorporated (communications equipment); Chairman of the Board of Trustees of Colby-Sawyer College; Member of the Board of Hypertherm, Inc. (industrial cutting systems, software, and consumables).
Executive Officers
Glenn Booraem
Born 1967. Investment Stewardship Officer Since February 2017. Principal Occupation(s) During the Past Five Years and Other Experience: Principal of The Vanguard Group, Inc.; Treasurer (2015–2017), Controller (2010–2015), and Assistant Controller (2001–2010) of each of the investment companies served by The Vanguard Group.
Thomas J. Higgins
Born 1957. Chief Financial Officer Since September 2008. Principal Occupation(s) During the Past Five Years and Other Experience: Principal of The Vanguard Group, Inc.; Chief Financial Officer of each of the investment companies served by The Vanguard Group; Treasurer of each of the investment companies served by The Vanguard Group (1998–2008).
Peter Mahoney
Born 1974. Controller Since May 2015. Principal Occupation(s) During the Past Five Years and Other Experience: Principal of The Vanguard Group, Inc.; Controller of each of the investment companies served by The Vanguard Group; Head of International Fund Services at The Vanguard Group (2008–2014).
Anne E. Robinson
Born 1970. Secretary Since September 2016. Principal Occupation(s) During the Past Five Years and Other Experience: Managing Director of The Vanguard Group, Inc.; General Counsel of The Vanguard Group; Secretary of The Vanguard Group and of each of the investment companies served by The Vanguard Group; Director and Senior Vice President of Vanguard Marketing Corporation; Managing Director and General Counsel of Global Cards and Consumer Services at Citigroup (2014–2016); Counsel at American Express (2003–2014).
Michael Rollings
Born 1963. Treasurer Since February 2017. Principal Occupation(s) During the Past Five Years and Other Experience: Managing Director of The Vanguard Group, Inc.; Treasurer of each of the investment companies served by The Vanguard Group; Executive Vice President and Chief Financial Officer of MassMutual Financial Group (2006–2016).
| |
| Vanguard Senior Management Team |
| Mortimer J. Buckley | James M. Norris |
| John James | Thomas M. Rampulla |
| Martha G. King | Glenn W. Reed |
| John T. Marcante | Karin A. Risi |
| Chris D. McIsaac | |
| |
| Chairman Emeritus and Senior Advisor |
| John J. Brennan | |
| Chairman, 1996–2009 | |
| Chief Executive Officer and President, 1996–2008 |
| |
| Founder | |
| John C. Bogle | |
| Chairman and Chief Executive Officer, 1974–1996 |
1 Mr. McNabb is considered an “interested person,” as defined in the Investment Company Act of 1940, because he is an officer of the Vanguard funds.
2 December 2002 for Vanguard Equity Income Fund, the Vanguard Municipal Bond Funds, and the Vanguard State Tax-Exempt Funds.
|  |
| | P.O. Box 2600 |
| | Valley Forge, PA 19482-2600 |
| |
| |
| |
| Connect with Vanguard® > vanguard.com |
| |
| |
| |
| Fund Information > 800-662-7447 | |
| |
| Direct Investor Account Services > 800-662-2739 | London Stock Exchange Group companies include FTSE |
| Institutional Investor Services > 800-523-1036 | International Limited (”FTSE”), Frank Russell Company |
| | (”Russell”), MTS Next Limited (”MTS”), and FTSE TMX |
| Text Telephone for People | Global Debt Capital Markets Inc. (”FTSE TMX”). All |
| Who Are Deaf or Hard of Hearing > 800-749-7273 | rights reserved. ”FTSE®”, “Russell®”, ”MTS®”, ”FTSE |
| This material may be used in conjunction | TMX®” and ”FTSE Russell” and other service marks |
| | and trademarks related to the FTSE or Russell indexes |
| with the offering of shares of any Vanguard | are trademarks of the London Stock Exchange Group |
| fund only if preceded or accompanied by | companies and are used by FTSE, MTS, FTSE TMX and |
| the fund’s current prospectus. | Russell under licence. All information is provided for |
| | information purposes only. No responsibility or liability |
| All comparative mutual fund data are from Lipper, a | can be accepted by the London Stock Exchange Group |
| Thomson Reuters Company, or Morningstar, Inc., unless | companies nor its licensors for any errors or for any |
| otherwise noted. | loss from use of this publication. Neither the London |
| You can obtain a free copy of Vanguard’s proxy voting | Stock Exchange Group companies nor any of its |
| guidelines by visiting vanguard.com/proxyreporting or by | licensors make any claim, prediction, warranty or |
| calling Vanguard at 800-662-2739. The guidelines are | representation whatsoever, expressly or impliedly, |
| also available from the SEC’s website, sec.gov. In | either as to the results to be obtained from the use of |
| addition, you may obtain a free report on how your fund | the FTSE4Good US Select Index or the fitness or |
| voted the proxies for securities it owned during the 12 | suitability of the FTSE4Good US Select Index for any |
| months ended June 30. To get the report, visit either | particular purpose to which it might be put. |
| vanguard.com/proxyreporting or sec.gov. | The Industry Classification Benchmark (”ICB”) is owned |
| | by FTSE. FTSE does not accept any liability to any |
| You can review and copy information about your fund at | person for any loss or damage arising out of any error |
| the SEC’s Public Reference Room in Washington, D.C. To | or omission in the ICB. |
| find out more about this public service, call the SEC at | |
| 202-551-8090. Information about your fund is also | |
| available on the SEC’s website, and you can receive | |
| copies of this information, for a fee, by sending a | |
| request in either of two ways: via email addressed to | |
| publicinfo@sec.gov or via regular mail addressed to the | |
| Public Reference Section, Securities and Exchange | |
| Commission, Washington, DC 20549-1520. | |
| |
| | © 2017 The Vanguard Group, Inc. |
| | All rights reserved. |
| | Vanguard Marketing Corporation, Distributor. |
| |
| | Q2132 042017 |
Semiannual Report | February 28, 2017
Vanguard U.S. Sector Index Funds
Vanguard Consumer Discretionary Index Fund
Vanguard Consumer Staples Index Fund
Vanguard Energy Index Fund
Vanguard Financials Index Fund
Vanguard Health Care Index Fund
Vanguard Industrials Index Fund
Vanguard Information Technology Index Fund
Vanguard Materials Index Fund
Vanguard Telecommunication Services Index Fund
Vanguard Utilities Index Fund
A new format, unwavering commitment
As you begin reading this report, you’ll notice that we’ve made some improvements to
the opening sections—based on feedback from you, our clients.
Page 1 starts with a new “Your Fund’s Performance at a Glance,” a concise, handy
summary of how your fund performed during the period.
In the renamed “Chairman’s Perspective,” Bill McNabb will focus on enduring principles
and investment insights.
We’ve modified some tables, and eliminated some redundancy, but we haven’t removed
any information.
At Vanguard, we’re always looking for better ways to communicate and to help you make
sound investment decisions. Thank you for entrusting your assets to us.

Please note: The opinions expressed in this report are just that—informed opinions. They should not be considered promises or advice. Also, please keep in mind that the information and
opinions cover the period through the date on the front of this report. Of course, the risks of investing in your fund are spelled out in the prospectus.
See the Glossary for definitions of investment terms used in this report.
About the cover: No matter what language you speak, Vanguard has one consistent message and set of principles. Our primary focus is on you, our clients. We conduct our business
with integrity as a faithful steward of your assets. This message is shown translated into seven languages, reflecting our expanding global presence.
Your Fund’s Performance at a Glance
• For the six months ended February 28, 2017, returns for the Vanguard U.S. Sector Index Funds ranged from almost 3% to about 24%. All ten funds closely tracked their target indexes. Versus their peer groups, results were mixed.
• Four of the funds outpaced the broad U.S. stock market, which returned about 10%.
• The holdings of the top performer, Vanguard Financials Index Fund, benefited from prospects for a more favorable operating environment and risinginterest rates. Vanguard Information Technology Index Fund also posted a double-digit return. So did Vanguard IndustrialsIndexFundandVanguardMaterialsIndexFund,inpartbecauseofthepotential for increased infrastructure spending.
• Given the stock market rally, funds in sectors that are traditionally considered defensive posted the smallest gains. They included Vanguard Consumer Staples Index Fund and Vanguard Telecommunication Services Index Fund.
Total Returns: Six Months Ended February 28, 2017
ETF Shares1 and Admiral™ Shares2
| |
| | Total |
| | Returns |
| Vanguard Consumer Discretionary ETF | |
| Market Price | 8.43% |
| Net Asset Value | 8.43 |
| Vanguard Consumer Discretionary Index Fund | 8.44 |
| MSCI US IMI/Consumer Discretionary 25/50 | 8.45 |
| Consumer Services Funds Average3 | 5.63 |
| |
| Vanguard Consumer Staples ETF | |
| Market Price | 2.68% |
| Net Asset Value | 2.67 |
| Vanguard Consumer Staples Index Fund | 2.65 |
| MSCI US IMI/Consumer Staples 25/50 | 2.69 |
| Consumer Goods Funds Average3 | 3.06 |
| |
| Vanguard Energy ETF | |
| Market Price | 4.73% |
| Net Asset Value | 4.73 |
| Vanguard Energy Index Fund | 4.70 |
| MSCI US IMI/Energy 25/50 | 4.74 |
| Natural Resources Funds Average3 | 7.46 |
| |
| Vanguard Financials ETF | |
| Market Price | 23.93% |
| Net Asset Value | 23.89 |
| Vanguard Financials Index Fund | 23.85 |
| MSCI US IMI/Financials 25/50 | 23.95 |
| Financial Services Funds Average3 | 20.15 |
| |
| | Total |
| | Returns |
| Vanguard Health Care ETF | |
| Market Price | 4.80% |
| Net Asset Value | 4.79 |
| Vanguard Health Care Index Fund | 4.79 |
| MSCI US IMI/Health Care 25/50 | 4.83 |
| Health/Biotechnology Funds Average3 | 6.82 |
| |
| Vanguard Industrials ETF | |
| Market Price | 13.18% |
| Net Asset Value | 13.21 |
| Vanguard Industrials Index Fund | 13.19 |
| MSCI US IMI/Industrials 25/50 | 13.22 |
| Industrials Funds Average3 | 12.11 |
| |
| Vanguard Information Technology ETF | |
| Market Price | 13.66% |
| Net Asset Value | 13.67 |
| Vanguard Information Technology Index Fund 13.68 |
| MSCI US IMI/Information Technology 25/50 | 13.72 |
| Science and Technology Funds Average3 | 11.95 |
| |
| Vanguard Materials ETF | |
| Market Price | 11.10% |
| Net Asset Value | 11.10 |
| Vanguard Materials Index Fund | 11.11 |
| MSCI US IMI/Materials 25/50 | 11.14 |
| Basic Materials Funds Average3 | 15.85 |
| |
| | Total |
| | Returns |
| Vanguard Telecommunication Services ETF | |
| Market Price | 4.53% |
| Net Asset Value | 4.41 |
| Vanguard Telecommunication Services | |
| Index Fund | 4.39 |
| MSCI US IMI/Telecommunication | |
| Services 25/50 | 4.39 |
| Telecommunication Funds Average3 | 5.28 |
| |
| Vanguard Utilities ETF | |
| Market Price | 7.70% |
| Net Asset Value | 7.66 |
| Vanguard Utilities Index Fund | 7.63 |
| MSCI US IMI/Utilities 25/50 | 7.67 |
| Utility Funds Average3 | 5.83 |
| |
| MSCI US IMI/2500 | 10.30% |
1 TheVanguardETF® Sharesshownaretradedonthe NYSEArcaexchangeandareavailable onlythroughbrokers. Thetable provides ETFreturnsbasedonboththe NYSEArca market priceandthenet asset value
for a share. U.S. Pat. Nos. 6,879,964; 7,337,138; 7,720,749; 7,925,573; 8,090,646; and 8,417,623.
2 Admiral Shares carry lower expenses and are available to investors who meet certain account-balance requirements.
3 Derived from data provided by Lipper, a Thomson Reuters Company.
For the ETF Shares, the market price is determinedbythe midpoint of the bid-offer spreadas of theclosingtime of the New YorkStock Exchange (generally 4p.m., Easterntime). The net asset value is also
determined as of the NYSE closing time. For more information about how the ETF Shares’ market prices have compared with their net asset value, visit vanguard.com, select your ETF, and then select the Price
and Performance tab. The ETF premium/discount analysis there shows the percentages of days on which the ETF Shares’ market price was above or below the NAV.
Note: MSCI US IMI/2500 is the MSCI® US Investable Market 2500 Index.
1
| | | |
| Expense Ratios | | | |
| Your Fund Compared With Its Peer Group | | | |
| |
| | ETF | Admiral | Peer Group |
| | Shares | Shares | Average |
| Consumer Discretionary Index Fund | 0.10% | 0.10% | 1.36% |
| Consumer Staples Index Fund | 0.10 | 0.10 | 1.41 |
| Energy Index Fund | 0.10 | 0.10 | 1.66 |
| Financials Index Fund | 0.10 | 0.10 | 1.53 |
| Health Care Index Fund | 0.10 | 0.10 | 1.39 |
| Industrials Index Fund | 0.10 | 0.10 | 1.32 |
| Information Technology Index Fund | 0.10 | 0.10 | 1.48 |
| Materials Index Fund | 0.10 | 0.10 | 1.24 |
| Telecommunication Services Index Fund | 0.10 | 0.10 | 1.49 |
| Utilities Index Fund | 0.10 | 0.10 | 1.25 |
The fundexpenseratios shownare from the prospectus dated December22, 2016, andrepresentestimatedcosts forthe currentfiscal year. For the six months ended February 28, 2017, the fund’s annualized expense ratios were: for the Consumer Discretionary Index Fund, 0.10% for ETF Shares and 0.10% for Admiral Shares; for the Consumer Staples Index Fund, 0.10% for ETF Shares and 0.10% for Admiral Shares; for the Energy Index Fund, 0.10% for ETF Shares and 0.10% for Admiral Shares; for the Financials Index Fund, 0.10% for ETF Shares and 0.10% for Admiral Shares; for the Health Care Index Fund, 0.10% for ETF Shares and 0.10% for Admiral Shares; for the Industrials Index Fund, 0.10% for ETF Shares and 0.11% for Admiral Shares; for the Information Technology Index Fund, 0.10% for ETF Shares and 0.10% for Admiral Shares; for the Materials Index Fund, 0.10% for ETF Shares and 0.10% for Admiral Shares; for the Telecommunication Services IndexFund, 0.10%forETF Shares and0.10%forAdmiralShares; andforthe Utilities IndexFund, 0.10%forETF Shares and 0.10% for Admiral Shares. Peer-group expense ratios are derived from data provided by Lipper, a Thomson Reuters Company, and capture information through year-end 2016.
Peer groupsare:fortheConsumerDiscretionaryIndexFund, ConsumerServices Funds;forthe ConsumerStaplesIndexFund, Consumer Goods Funds; for the Energy Index Fund, Natural Resources Funds; for the Financials Index Fund, Financial Services Funds; for the Health Care Index Fund, Health/Biotechnology Funds; for the Industrials Index Fund, Industrials Funds; for the Information Technology Index Fund, Science and Technology Funds; for the Materials Index Fund, Basic Materials Funds; for the Telecommunication Services Index Fund, Telecommunication Funds; and for the Utilities Index Fund, Utility Funds.
2
Chairman’s Perspective

Bill McNabb
Chairman and Chief Executive Officer
Dear Shareholder,
More than a decade ago, a Vanguard client asked us to help improve its defined contribution retirement plan. New hires were participating in the plan at lower rates than in previous years, and the client wanted to reverse this trend. Another priority was to help more participants invest their retirement savings in balanced portfolios.
The overall goal of this longtime client: Give employees a better chance to achieve financial security in retirement.
Today, that plan automatically enrolls employees at a 5% contribution rate, puts them in a low-cost target-date fund that takes on less risk as they near retirement, and offers a comprehensive suite of advice services. On top of that, employees get an employer contribution of 5% and are eligible for a company match.
Because of this combination of attractive features and generous employer contributions, nearly all new hires now participate in the plan, 81% of plan participants invest their retirement savings in balanced portfolios, and 87% of participants meet or exceed Vanguard’s recommended total retirement savings target. (Vanguard generally recommends that retirement investors save 12%–15% of pay, including company matches.)
Changing the retirement landscape Am I singling out an isolated Vanguard success story? Absolutely not.
Stories like these are becoming increasingly common with employer-based retirement plans, particularly among large and midsize companies. Solutions such as automatic enrollment, automatic contribution increases, and default investment in target-date funds are having a positive effect.
Insights from the relatively new discipline of behavioral finance have contributed to the advances. Simply put, retirement plans are making natural human inertia work for future retirees, rather than against them, by putting savings on autopilot as much as possible.
| | | |
| Market Barometer | | | |
| | Total Returns |
| | Periods Ended February 28, 2017 |
| | Six | One | Five Years |
| | Months | Year | (Annualized) |
| Stocks | | | |
| Russell 1000 Index (Large-caps) | 10.10% | 25.53% | 13.94% |
| Russell 2000 Index (Small-caps) | 12.61 | 36.11 | 12.89 |
| Russell 3000 Index (Broad U.S. market) | 10.29 | 26.29 | 13.85 |
| FTSE All-World ex US Index (International) | 5.40 | 19.87 | 4.00 |
| |
| Bonds | | | |
| Bloomberg Barclays U.S. Aggregate Bond Index | | | |
| (Broad taxable market) | -2.19% | 1.42% | 2.24% |
| Bloomberg Barclays Municipal Bond Index | | | |
| (Broad tax-exempt market) | -2.80 | 0.25 | 3.07 |
| Citigroup Three-Month U.S. Treasury Bill Index | 0.19 | 0.32 | 0.10 |
| |
| CPI | | | |
| Consumer Price Index | 1.14% | 2.74% | 1.36% |
3
More than 60% of Vanguard participants are in plans with automatic enrollment, which has led to a big jump in participation. Today, more than four-fifths of eligible employees are saving for retirement, compared with only two-thirds ten years ago.
In addition, many plans have adopted automatic-escalation features, which increase plan contributions at regular intervals until a maximum level is reached or an employee opts out. Automatic increases are a crucial tool for boosting retirement savings rates.
The growing use of target-date funds is another enormous benefit. More than 70% of all participants in Vanguard plans invest at least part of their retirement savings in these age-appropriate, diversified strategies. And nearly 50% of Vanguard participants are invested solely in a single target-date fund.
Consider a do-it-yourself autopilot But what if you don’t have access to a world-class, employer-based retirement plan? Unfortunately, not everyone does, which is an important policy issue.
However, you can still put the features of these plans to work. For example, you can set up automatic contributions from your paycheck to an IRA. And you can adopt your own automatic escalation by investing any pay raises.
You can also take a page from top-quality retirement plans by considering a low-cost, globally diversified target-date fund. The beauty of this approach is that you don’t need to remember to rebalance your portfolio—the fund does it for you.
Of course, you can take a more active role in picking your own investments, and this can be a good choice for some. But keep in mind the lessons from successful employer-based plans: Busy workers, faced with a lot of competing priorities, are often best served by putting their retirement savings on autopilot.
Winning by default
In highlighting some recent successes in retirement savings, I don’t want to minimize the challenges we still face. We’re living in a slow-growth, uncertain world, and investment returns for both stocks and bonds could well be modest in the coming decade.
But I believe the innovations we’ve seen in the last ten years in many retirement plans—you might call it the “default revolution”—point the way toward a solution. And that even goes for people whoseemployersdon’thaveaworld-class retirement plan.
As always, thank you for investing with Vanguard.
Sincerely,

F. William McNabb III
Chairman and Chief Executive Officer
March 14, 2017
4
Consumer Discretionary Index Fund
Fund Profile
As of February 28, 2017
| | |
| Share-Class Characteristics | | |
| | ETF | Admiral |
| | Shares | Shares |
| Ticker Symbol | VCR | VCDAX |
| Expense Ratio1 | 0.10% | 0.10% |
| 30-Day SEC Yield | 1.34% | 1.33% |
| | | |
| Portfolio Characteristics | | |
| | | MSCI | |
| | | US IMI/ | |
| | | Consumer | MSCI |
| | | Discretionary | US IMI/ |
| | Fund | 25/50 | 2500 |
| Number of Stocks | 378 | 378 | 2,479 |
| Median Market Cap | $56.2B | $56.2B | $57.6B |
| Price/Earnings Ratio | 23.0x | 23.0x | 24.7x |
| Price/Book Ratio | 4.6x | 4.6x | 3.0x |
| Return on Equity | 22.4% | 22.4% | 16.5% |
| Earnings Growth Rate | 12.9% | 12.9% | 7.6% |
| Dividend Yield | 1.4% | 1.4% | 1.9% |
| Foreign Holdings | 0.1% | 0.0% | 0.0% |
| Turnover Rate | | | |
| (Annualized) | 8% | — | — |
| Short-Term Reserves | 0.0% | — | — |
| | |
| Volatility Measures | | |
| | MSCI US | |
| | IMI/Consumer | |
| | Discretionary | MSCI US |
| | 25/50 | IMI/2500 |
| R-Squared | 1.00 | 0.85 |
| Beta | 1.00 | 1.05 |
| These measures show the degree and timing of the fund’s |
| fluctuations compared with the indexes over 36 months. |
| |
| Subindustry Diversification | |
| (% of equity exposure) | |
| |
| Advertising | 1.0% |
| Apparel Retail | 4.3 |
| Apparel, Accessories & Luxury Goods | 2.6 |
| Auto Parts & Equipment | 2.7 |
| Automobile Manufacturers | 4.4 |
| Automotive Retail | 2.9 |
| Broadcasting | 2.0 |
| Cable & Satellite | 10.9 |
| Casinos & Gaming | 1.7 |
| Department Stores | 1.0 |
| Distributors | 1.0 |
| Footwear | 2.8 |
| General Merchandise Stores | 2.4 |
| Home Improvement Retail | 7.8 |
| Homebuilding | 1.8 |
| Hotels, Resorts & Cruise Lines | 3.5 |
| Internet & Direct Marketing Retail | 17.2 |
| Leisure Products | 1.1 |
| Movies & Entertainment | 10.5 |
| Restaurants | 9.6 |
| Specialty Stores | 2.2 |
| Other Consumer Discretionary | 6.6 |
| | |
| Ten Largest Holdings (% of total net assets) |
| |
| Amazon.com Inc. | Internet & Direct | |
| | Marketing Retail | 11.0% |
| Comcast Corp. | Cable & Satellite | 5.8 |
| Home Depot Inc. | Home Improvement Retail | 5.7 |
| Walt Disney Co. | Movies & Entertainment | 5.4 |
| McDonald’s Corp. | Restaurants | 3.4 |
| Priceline | Internet &Direct | |
| Group Inc. | Marketing Retail | 2.8 |
| Starbucks Corp. | Restaurants | 2.7 |
| NIKE Inc. | Footwear | 2.5 |
| Time Warner Inc. | Movies & Entertainment | 2.4 |
| Charter | | |
| Communications | | |
| Inc. | Cable & Satellite | 2.3 |
| Top Ten | | 44.0% |
| The holdings listed exclude any temporary cash investments and |
| equity indexproducts. | | |
1 The expense ratios shown are from the prospectus dated December 22, 2016, and represent estimated costs for the current fiscal year. For the six months ended February 28, 2017, the annualized expense ratios
were 0.10% for ETF Shares and 0.10% for Admiral Shares.
5
Consumer Discretionary Index Fund
Performance Summary
All of the returns in this report represent past performance, which is not a guarantee of future results that may be achieved by the fund. (Current performance may be lower or higher than theperformancedatacited.For performance data currenttothemostrecentmonth-end, visit our website at vanguard.com/performance.) Note, too, that both investment returns and principal value can fluctuate widely, so an investor’s shares, when sold, could be worth more or less than their original cost. The returns shown do not reflect taxes that a shareholder would pay on fund distributions or on the sale of fund shares.
Fiscal-Year Total Returns (%): August 31, 2006–February 28, 2017
For a benchmark description, see the Glossary.
Note: For 2017, performance data reflect the six months ended February 28, 2017.
Average Annual Total Returns: Periods Ended December 31, 2016
This table presents returns through the latest calendar quarter—rather than through the end of the fiscal period.
Securities and Exchange Commission rules require that we provide this information.
| | | | |
| | Inception Date | One Year | Five Years | Ten Years |
| ETF Shares | 1/26/2004 | | | |
| Market Price | | 6.64% | 17.31% | 9.22% |
| Net Asset Value | | 6.64 | 17.31 | 9.23 |
| Admiral Shares | 7/14/2005 | 6.64 | 17.31 | 9.22 |
See Financial Highlights for dividend and capital gains information.
6
Consumer Discretionary Index Fund
Financial Statements (unaudited)
Statement of Net Assets
As of February 28, 2017
The fund reports a complete list of its holdings in regulatory filings four times in each fiscal year, at the quarter-ends. For the second and fourth fiscal quarters, the lists appear in the fund’s semiannual and annual reports to shareholders. For the first and third fiscal quarters, the fund files the lists with the Securities and Exchange Commission on Form N-Q. Shareholders can look up the fund’s Forms N-Q on the SEC’s website at sec.gov. Forms N-Q may also be reviewed and copied at the SEC’s Public Reference Room (see the back cover of this report for further information).
| | | |
| | | | Market |
| | | | Value• |
| | | Shares | ($000) |
| Common Stocks (100.0%) | | |
| Auto Components (3.1%) | | |
| | Delphi Automotive plc | 202,360 | 15,406 |
| | Lear Corp. | 52,403 | 7,441 |
| ^ | Autoliv Inc. | 65,996 | 6,910 |
| | Goodyear Tire & Rubber Co. | 195,077 | 6,837 |
| | BorgWarner Inc. | 159,252 | 6,719 |
| * | Adient plc | 70,024 | 4,701 |
| | Gentex Corp. | 214,199 | 4,505 |
| * | Tenneco Inc. | 41,069 | 2,641 |
| * | Visteon Corp. | 25,507 | 2,364 |
| | Dana Inc. | 107,383 | 2,028 |
| * | LCI Industries | 17,513 | 1,886 |
| * | Dorman Products Inc. | 23,348 | 1,825 |
| | Cooper Tire & Rubber Co. | 39,891 | 1,614 |
| * | Cooper-Standard Holdings | | |
| | Inc. | 9,938 | 1,113 |
| * | American Axle & | | |
| | Manufacturing Holdings | | |
| | Inc. | 54,372 | 1,078 |
| * | Gentherm Inc. | 27,209 | 986 |
| | Standard Motor Products | | |
| | Inc. | 15,388 | 738 |
| * | Fox Factory Holding Corp. | 21,766 | 583 |
| | Tower International Inc. | 15,102 | 417 |
| * | Motorcar Parts of America | | |
| | Inc. | 14,050 | 399 |
| * | Modine Manufacturing Co. | 35,104 | 398 |
| | Superior Industries | | |
| | International Inc. | 16,179 | 362 |
| * | Stoneridge Inc. | 19,842 | 335 |
| | Metaldyne Performance | | |
| | Group Inc. | 12,182 | 284 |
| | | | 71,570 |
| Automobiles (4.7%) | | |
| | General Motors Co. | 1,027,088 | 37,838 |
| | Ford Motor Co. | 2,771,121 | 34,722 |
| ^,* Tesla Inc. | 96,193 | 24,047 |
| | Harley-Davidson Inc. | 132,103 | 7,448 |
| | Thor Industries Inc. | 37,388 | 4,143 |
| | Winnebago Industries Inc. | 20,285 | 670 |
| | | | 108,868 |
| Distributors (1.0%) | | |
| | Genuine Parts Co. | 111,176 | 10,641 |
| * | LKQ Corp. | 229,896 | 7,260 |
| | Pool Corp. | 30,827 | 3,536 |
| | Core-Mark Holding Co. Inc. | 34,495 | 1,122 |
| | | | 22,559 |
| Diversified Consumer Services (1.1%) | |
| | Service Corp. International | 142,314 | 4,373 |
| * | ServiceMaster Global | | |
| | Holdings Inc. | 100,721 | 4,012 |
| | H&R Block Inc. | 163,765 | 3,367 |
| * | Bright Horizons Family | | |
| | Solutions Inc. | 33,358 | 2,305 |
| * | Grand Canyon Education | | |
| | Inc. | 33,682 | 2,067 |
| | | | |
| | Graham Holdings Co. | | | |
| | Class B | | 3,302 | 1,777 |
| | DeVry Education Group Inc. | 44,522 | 1,431 |
| * | Sotheby's | | 25,646 | 1,157 |
| * | Houghton Mifflin Harcourt | | |
| | Co. | | 77,361 | 855 |
| | Capella Education Co. | | 8,551 | 651 |
| * | Strayer Education Inc. | | 7,946 | 616 |
| * | K12 Inc. | | 26,925 | 481 |
| * | Career Education Corp. | 51,222 | 427 |
| * | Chegg Inc. | | 44,901 | 355 |
| * | Regis Corp. | | 27,009 | 333 |
| ^,* Weight Watchers | | | |
| | International Inc. | | 20,738 | 298 |
| | Carriage Services Inc. | | | |
| | Class A | | 11,231 | 290 |
| * | American Public Education | | |
| | Inc. | | 11,420 | 276 |
| * | Bridgepoint Education Inc. | 13,084 | 122 |
| * | Ascent Capital Group Inc. | | |
| | Class A | | 6,779 | 109 |
| | | | | 25,302 |
| Hotels, Restaurants & Leisure (15.4%) | |
| | McDonald's Corp. | | 620,627 | 79,223 |
| | Starbucks Corp. | 1,087,716 | 61,858 |
| | Marriott International Inc. | | |
| | Class A | | 248,111 | 21,583 |
| | Las Vegas Sands Corp. | 326,728 | 17,300 |
| | Yum! Brands Inc. | | 260,549 | 17,019 |
| | Carnival Corp. | | 261,110 | 14,609 |
| | Royal Caribbean Cruises | | |
| | Ltd. | | 128,373 | 12,337 |
| * | Chipotle Mexican Grill Inc. | | |
| | Class A | | 21,646 | 9,064 |
| * | MGM Resorts International | 342,834 | 9,013 |
| * | Hilton Worldwide Holdings | | |
| | Inc. | | 147,989 | 8,465 |
| | Domino's Pizza Inc. | | 36,007 | 6,835 |
| | Wyndham Worldwide Corp. | 80,504 | 6,701 |
| | Darden Restaurants Inc. | 87,340 | 6,523 |
| | Aramark | | 173,823 | 6,212 |
| * | Norwegian Cruise Line | | | |
| | Holdings Ltd. | | 118,893 | 6,028 |
| | Wynn Resorts Ltd. | | 60,845 | 5,850 |
| | Vail Resorts Inc. | | 29,875 | 5,413 |
| | Dunkin' Brands Group Inc. | 68,632 | 3,775 |
| * | Panera Bread Co. Class A | 16,311 | 3,765 |
| | Six Flags Entertainment | | |
| | Corp. | | 55,142 | 3,342 |
| ^ | Cracker Barrel Old Country | | |
| | Store Inc. | | 14,390 | 2,317 |
| | Jack in the Box Inc. | | 24,102 | 2,259 |
| | Wendy's Co. | | 153,656 | 2,142 |
| | Texas Roadhouse Inc. | | | |
| | Class A | | 50,121 | 2,120 |
| * | Buffalo Wild Wings Inc. | 13,535 | 2,098 |
| | Cheesecake Factory Inc. | 33,627 | 2,053 |
| | ILG Inc. | | 89,899 | 1,697 |
| | | |
| | Choice Hotels International | | |
| | Inc. | 27,165 | 1,646 |
| | Papa John's International | | |
| | Inc. | 20,639 | 1,629 |
| | Marriott Vacations | | |
| | Worldwide Corp. | 17,220 | 1,617 |
| | Brinker International Inc. | 37,075 | 1,566 |
| | Churchill Downs Inc. | 9,951 | 1,496 |
| | Extended Stay America Inc. | 80,420 | 1,391 |
| * | Dave & Buster's | | |
| | Entertainment Inc. | 23,655 | 1,353 |
| | Bloomin' Brands Inc. | 78,699 | 1,345 |
| * | Hilton Grand Vacations Inc. | 44,434 | 1,330 |
| * | Boyd Gaming Corp. | 63,104 | 1,241 |
| * | Popeyes Louisiana Kitchen | | |
| | Inc. | 15,424 | 1,219 |
| * | Hyatt Hotels Corp. Class A | 21,495 | 1,104 |
| | SeaWorld Entertainment | | |
| | Inc. | 49,582 | 955 |
| * | La Quinta Holdings Inc. | 64,891 | 899 |
| * | Belmond Ltd. Class A | 68,497 | 887 |
| | Sonic Corp. | 34,142 | 863 |
| | ClubCorp Holdings Inc. | 49,020 | 838 |
| | Planet Fitness Inc. Class A | 38,718 | 833 |
| * | Penn National Gaming Inc. | 56,679 | 820 |
| * | Scientific Games Corp. | | |
| | Class A | 39,318 | 812 |
| | Bob Evans Farms Inc. | 13,395 | 760 |
| | DineEquity Inc. | 12,126 | 725 |
| | International Speedway | | |
| | Corp. Class A | 19,372 | 719 |
| * | Pinnacle Entertainment Inc. | 39,890 | 693 |
| * | Denny's Corp. | 54,777 | 688 |
| | Red Rock Resorts Inc. | | |
| | Class A | 31,067 | 683 |
| | Wingstop Inc. | 21,537 | 566 |
| * | BJ's Restaurants Inc. | 13,890 | 505 |
| * | Isle of Capri Casinos Inc. | 18,806 | 457 |
| * | Red Robin Gourmet | | |
| | Burgers Inc. | 9,700 | 443 |
| * | Shake Shack Inc. Class A | 11,238 | 403 |
| * | Fiesta Restaurant Group Inc. | 20,255 | 402 |
| | Marcus Corp. | 12,625 | 394 |
| | Ruth's Hospitality Group Inc. | 22,789 | 384 |
| * | Biglari Holdings Inc. | 855 | 367 |
| * | Caesars Entertainment | | |
| | Corp. | 38,405 | 363 |
| * | Chuy's Holdings Inc. | 12,663 | 361 |
| * | Del Taco Restaurants Inc. | 26,369 | 327 |
| * | Eldorado Resorts Inc. | 17,657 | 288 |
| * | Del Frisco's Restaurant | | |
| | Group Inc. | 17,672 | 281 |
| * | Bojangles' Inc. | 12,073 | 254 |
| * | Zoe's Kitchen Inc. | 14,007 | 251 |
| * | Intrawest Resorts Holdings | | |
| | Inc. | 10,497 | 247 |
| * | Potbelly Corp. | 16,690 | 218 |
| * | El Pollo Loco Holdings Inc. | 17,285 | 216 |
7
Consumer Discretionary Index Fund
| | | |
| | | | Market |
| | | | Value• |
| | | Shares | ($000) |
| | Speedway Motorsports Inc. | 9,597 | 205 |
| * | Habit Restaurants Inc. | | |
| | Class A | 13,698 | 184 |
| * | Lindblad Expeditions | | |
| | Holdings Inc. | 14,604 | 131 |
| * | Ruby Tuesday Inc. | 44,351 | 84 |
| * | Fogo De Chao Inc. | 4,261 | 60 |
| * | Noodles & Co. Class A | 9,439 | 36 |
| | | | 355,140 |
| Household Durables (4.5%) | | |
| | Newell Brands Inc. | 324,585 | 15,914 |
| * | Mohawk Industries Inc. | 47,117 | 10,665 |
| | Whirlpool Corp. | 56,156 | 10,029 |
| | DR Horton Inc. | 264,789 | 8,473 |
| | Lennar Corp. Class A | 152,145 | 7,423 |
| | Harman International | | |
| | Industries Inc. | 52,159 | 5,822 |
| * | NVR Inc. | 2,682 | 5,190 |
| | Leggett & Platt Inc. | 99,976 | 4,917 |
| | PulteGroup Inc. | 222,390 | 4,904 |
| | Garmin Ltd. | 88,666 | 4,576 |
| * | Toll Brothers Inc. | 116,344 | 3,972 |
| | Tupperware Brands Corp. | 37,874 | 2,287 |
| * | Helen of Troy Ltd. | 20,890 | 2,041 |
| ^,* | Tempur Sealy International | | |
| | Inc. | 43,410 | 2,005 |
| | CalAtlantic Group Inc. | 56,339 | 1,990 |
| * | TRI Pointe Group Inc. | 113,596 | 1,356 |
| * | TopBuild Corp. | 28,339 | 1,190 |
| * | iRobot Corp. | 18,331 | 1,046 |
| * | Meritage Homes Corp. | 28,333 | 1,007 |
| ^ | KB Home | 56,665 | 1,006 |
| | La-Z-Boy Inc. | 36,284 | 980 |
| | MDC Holdings Inc. | 30,553 | 892 |
| * | Cavco Industries Inc. | 6,322 | 754 |
| * | Universal Electronics Inc. | 10,956 | 753 |
| * | Installed Building Products | | |
| | Inc. | 14,144 | 665 |
| ^,* | GoPro Inc. Class A | 66,155 | 622 |
| * | Taylor Morrison Home Corp. | | |
| | Class A | 30,062 | 605 |
| | Ethan Allen Interiors Inc. | 18,665 | 537 |
| * | M/I Homes Inc. | 18,116 | 428 |
| * | William Lyon Homes | | |
| | Class A | 18,816 | 347 |
| ^,* LGI Homes Inc. | 11,867 | 344 |
| * | Beazer Homes USA Inc. | 23,532 | 287 |
| * | Century Communities Inc. | 11,101 | 254 |
| | Libbey Inc. | 16,492 | 231 |
| * | Hovnanian Enterprises Inc. | | |
| | Class A | 85,476 | 203 |
| | NACCO Industries Inc. | | |
| | Class A | 2,766 | 178 |
| | | | 103,893 |
| Internet & Direct Marketing Retail (17.2%) |
| * | Amazon.com Inc. | 301,869 | 255,091 |
| * | Priceline Group Inc. | 36,884 | 63,593 |
| * | Netflix Inc. | 320,768 | 45,591 |
| | Expedia Inc. | 92,354 | 10,994 |
| * | Liberty Interactive Corp. | | |
| | QVC Group Class A | 310,602 | 5,864 |
| * | TripAdvisor Inc. | 89,412 | 3,708 |
| * | Liberty Ventures Class A | 60,748 | 2,664 |
| * | Liberty Expedia Holdings | | |
| | Inc. Class A | 42,632 | 1,845 |
| * | Groupon Inc. Class A | 319,603 | 1,352 |
| * | Shutterfly Inc. | 24,197 | 1,098 |
| | Nutrisystem Inc. | 22,038 | 1,025 |
| | HSN Inc. | 25,376 | 957 |
| ^,* Wayfair Inc. | 22,240 | 841 |
| | | |
| * | Liberty TripAdvisor | | |
| | Holdings Inc. Class A | 51,194 | 689 |
| * | Etsy Inc. | 47,511 | 576 |
| * | FTD Cos. Inc. | 12,882 | 311 |
| ^,* | Duluth Holdings Inc. | 14,138 | 298 |
| * | Overstock.com Inc. | 12,543 | 231 |
| ^,* Lands' End Inc. | 12,026 | 223 |
| * | 1-800-Flowers.com Inc. | | |
| | Class A | 19,088 | 191 |
| | | | 397,142 |
| Leisure Products (1.1%) | | |
| | Hasbro Inc. | 83,903 | 8,128 |
| | Mattel Inc. | 255,697 | 6,579 |
| | Brunswick Corp. | 67,090 | 4,018 |
| ^ | Polaris Industries Inc. | 45,535 | 3,880 |
| * | Vista Outdoor Inc. | 43,865 | 887 |
| * | American Outdoor Brands | | |
| | Corp. | 42,082 | 818 |
| | Callaway Golf Co. | 70,426 | 712 |
| ^ | Sturm Ruger & Co. Inc. | 14,262 | 711 |
| * | Nautilus Inc. | 22,170 | 357 |
| * | Arctic Cat Inc. | 9,670 | 179 |
| | | | 26,269 |
| Media (25.0%) | | |
| | Comcast Corp. Class A | 3,562,568 | 133,311 |
| | Walt Disney Co. | 1,129,872 | 124,388 |
| | Time Warner Inc. | 576,274 | 56,596 |
| * | Charter Communications | | |
| | Inc. Class A | 161,839 | 52,284 |
| | Twenty-First Century Fox | | |
| | Inc. Class A | 789,867 | 23,633 |
| | CBS Corp. Class B | 292,926 | 19,310 |
| * | Liberty Global plc | 453,618 | 15,917 |
| | Omnicom Group Inc. | 176,356 | 15,008 |
| | Viacom Inc. Class B | 259,719 | 11,285 |
| * | DISH Network Corp. | | |
| | Class A | 169,416 | 10,504 |
| | Twenty-First Century Fox | | |
| | Inc. | 328,050 | 9,628 |
| | Interpublic Group of | | |
| | Cos. Inc. | 296,715 | 7,151 |
| * | Liberty Broadband Corp. | 80,106 | 6,884 |
| * | Liberty Global plc Class A | 182,400 | 6,512 |
| ^ | Sirius XM Holdings Inc. | 1,262,059 | 6,424 |
| * | Liberty Media Corp-Liberty | | |
| | SiriusXM | 149,883 | 5,835 |
| | Scripps Networks | | |
| | Interactive Inc. Class A | 60,585 | 4,893 |
| | News Corp. Class A | 370,455 | 4,749 |
| * | Discovery Communications | | |
| | Inc. | 166,598 | 4,676 |
| | TEGNA Inc. | 152,253 | 3,902 |
| * | Discovery Communications | | |
| | Inc. Class A | 113,569 | 3,266 |
| | Cinemark Holdings Inc. | 77,991 | 3,266 |
| * | Live Nation Entertainment | | |
| | Inc. | 98,831 | 2,808 |
| * | Liberty Media Corp-Liberty | | |
| | SiriusXM | 68,931 | 2,711 |
| * | AMC Networks Inc. | | |
| | Class A | 44,015 | 2,633 |
| * | Madison Square Garden | | |
| | Co. Class A | 13,882 | 2,490 |
| | Nexstar Media Group Inc. | | |
| | Class A | 33,322 | 2,298 |
| | Cable One Inc. | 3,638 | 2,275 |
| * | Lions Gate Entertainment | | |
| | Corp. Class B | 81,823 | 2,044 |
| * | Liberty Global PLC LiLAC | 81,412 | 2,002 |
| | | |
| | Sinclair Broadcast Group Inc. | | |
| | Class A | 48,275 | 1,926 |
| | Tribune Media Co. Class A | 55,475 | 1,915 |
| | Meredith Corp. | 29,366 | 1,841 |
| | Regal Entertainment Group | | |
| | Class A | 84,582 | 1,825 |
| | John Wiley & Sons Inc. | | |
| | Class A | 34,354 | 1,793 |
| * | Liberty Broadband Corp. | | |
| | Class A | 19,666 | 1,657 |
| * | IMAX Corp. | 45,184 | 1,462 |
| | New York Times Co. | | |
| | Class A | 95,881 | 1,381 |
| | Time Inc. | 73,974 | 1,298 |
| * | Liberty Media Corp-Liberty | | |
| | Formula One | 38,996 | 1,197 |
| | AMC Entertainment | | |
| | Holdings Inc. Class A | 37,779 | 1,184 |
| * | Lions Gate Entertainment | | |
| | Corp. Class A | 38,344 | 1,027 |
| * | MSG Networks Inc. | 46,033 | 1,004 |
| * | Liberty Global PLC LiLAC | | |
| | Class A | 38,154 | 933 |
| * | EW Scripps Co. Class A | 39,851 | 918 |
| | Scholastic Corp. | 19,539 | 880 |
| | Gannett Co. Inc. | 83,233 | 726 |
| * | Gray Television Inc. | 49,630 | 675 |
| | National CineMedia Inc. | 47,250 | 606 |
| | New Media Investment | | |
| | Group Inc. | 39,197 | 605 |
| | World Wrestling | | |
| | Entertainment Inc. | | |
| | Class A | 27,404 | 575 |
| * | Liberty Media Corp-Liberty | | |
| | Braves | 25,602 | 563 |
| * | Liberty Media Corp-Liberty | | |
| | Formula One Class A | 17,119 | 515 |
| * | Loral Space & | | |
| | Communications Inc. | 10,506 | 430 |
| | MDC Partners Inc. Class A | 39,532 | 346 |
| | Entercom Communications | | |
| | Corp. Class A | 17,382 | 272 |
| | Entravision Communications | | |
| | Corp. Class A | 46,506 | 249 |
| * | tronc Inc. | 11,807 | 172 |
| * | Global Eagle Entertainment | | |
| | Inc. | 38,678 | 169 |
| ^,* Hemisphere Media Group | | |
| | Inc. Class A | 12,925 | 150 |
| * | Liberty Media Corp-Liberty | | |
| | Braves | 6,549 | 144 |
| * | Harte-Hanks Inc. | 36,909 | 57 |
| | News Corp. Class B | 3,542 | 47 |
| | | | 577,225 |
| Multiline Retail (3.3%) | | |
| | Target Corp. | 398,777 | 23,436 |
| | Dollar General Corp. | 210,614 | 15,379 |
| * | Dollar Tree Inc. | 176,261 | 13,516 |
| | Macy's Inc. | 228,620 | 7,595 |
| | Kohl's Corp. | 134,213 | 5,720 |
| ^ | Nordstrom Inc. | 97,204 | 4,536 |
| | Big Lots Inc. | 33,273 | 1,708 |
| ^,* | JC Penney Co. Inc. | 230,506 | 1,461 |
| * | Ollie's Bargain Outlet | | |
| | Holdings Inc. | 35,765 | 1,121 |
| | Dillard's Inc. Class A | 14,719 | 803 |
| | Fred's Inc. Class A | 26,537 | 471 |
| ^,* Sears Holdings Corp. | 19,279 | 151 |
| * | Tuesday Morning Corp. | 34,097 | 124 |
| | | | 76,021 |
8
Consumer Discretionary Index Fund
| | | |
| | | | Market |
| | | | Value• |
| | | Shares | ($000) |
| Other (0.0%) | | |
| * | Media General Inc. CVR | 69,182 | 20 |
| |
| Specialty Retail (18.2%) | | |
| | Home Depot Inc. | 910,418 | 131,929 |
| | Lowe's Cos. Inc. | 650,076 | 48,346 |
| | TJX Cos. Inc. | 487,166 | 38,218 |
| | Ross Stores Inc. | 296,355 | 20,324 |
| * | O'Reilly Automotive Inc. | 70,607 | 19,185 |
| * | AutoZone Inc. | 21,562 | 15,881 |
| * | Ulta Beauty Inc. | 44,288 | 12,110 |
| | L Brands Inc. | 181,725 | 9,562 |
| | Best Buy Co. Inc. | 213,410 | 9,418 |
| * | CarMax Inc. | 142,308 | 9,185 |
| | Advance Auto Parts Inc. | 55,092 | 8,628 |
| | Tiffany & Co. | 93,022 | 8,546 |
| | Foot Locker Inc. | 99,508 | 7,530 |
| | Tractor Supply Co. | 98,031 | 6,951 |
| * | Burlington Stores Inc. | 52,740 | 4,694 |
| | Bed Bath & Beyond Inc. | 113,568 | 4,588 |
| | Gap Inc. | 178,773 | 4,437 |
| | Staples Inc. | 486,248 | 4,371 |
| | Dick's Sporting Goods Inc. | 65,776 | 3,220 |
| | Williams-Sonoma Inc. | 62,618 | 3,043 |
| | Signet Jewelers Ltd. | 44,131 | 2,806 |
| | CST Brands Inc. | 56,665 | 2,727 |
| * | AutoNation Inc. | 52,729 | 2,420 |
| * | Sally Beauty Holdings Inc. | 108,031 | 2,363 |
| | American Eagle Outfitters | | |
| | Inc. | 129,077 | 2,046 |
| * | Michaels Cos. Inc. | 94,000 | 1,888 |
| ^ | GameStop Corp. Class A | 76,111 | 1,860 |
| * | Murphy USA Inc. | 28,830 | 1,836 |
| * | Urban Outfitters Inc. | 65,120 | 1,695 |
| | Lithia Motors Inc. Class A | 17,500 | 1,674 |
| | Penske Automotive Group | | |
| | Inc. | 31,852 | 1,602 |
| * | Five Below Inc. | 41,056 | 1,583 |
| | Office Depot Inc. | 375,159 | 1,564 |
| * | Cabela's Inc. | 33,083 | 1,550 |
| | Monro Muffler Brake Inc. | 24,233 | 1,393 |
| | Children's Place Inc. | 13,409 | 1,358 |
| | Chico's FAS Inc. | 91,648 | 1,327 |
| | Aaron's Inc. | 48,314 | 1,318 |
| | Group 1 Automotive Inc. | 15,992 | 1,242 |
| | DSW Inc. Class A | 52,973 | 1,114 |
| * | Asbury Automotive Group | | |
| | Inc. | 15,005 | 978 |
| | Caleres Inc. | 32,027 | 957 |
| * | Genesco Inc. | 15,326 | 893 |
| ^,* RH | 27,100 | 825 |
| * | Select Comfort Corp. | 33,538 | 788 |
| | Tailored Brands Inc. | 32,739 | 757 |
| | Abercrombie & Fitch Co. | 50,647 | 606 |
| | Guess? Inc. | 47,387 | 602 |
| * | Express Inc. | 53,161 | 598 |
| * | Ascena Retail Group Inc. | 116,230 | 535 |
| | Finish Line Inc. Class A | 30,218 | 493 |
| * | Hibbett Sports Inc. | 16,448 | 485 |
| * | Francesca's Holdings Corp. | 28,267 | 480 |
| | Cato Corp. Class A | 18,720 | 468 |
| | | |
| | | | Market |
| | | | Value• |
| | | Shares | ($000) |
| | Sonic Automotive Inc. | | |
| | Class A | 20,638 | 448 |
| * | Tile Shop Holdings Inc. | 24,978 | 440 |
| * | MarineMax Inc. | 19,333 | 435 |
| ^ | Buckle Inc. | 21,857 | 434 |
| ^ | GNC Holdings Inc. Class A | 51,331 | 426 |
| | Barnes & Noble Inc. | 43,418 | 425 |
| | Pier 1 Imports Inc. | 63,216 | 425 |
| * | Lumber Liquidators Holdings | | |
| | Inc. | 20,432 | 362 |
| * | Vitamin Shoppe Inc. | 16,561 | 353 |
| | Rent-A-Center Inc. | 40,104 | 348 |
| * | Party City Holdco Inc. | 22,811 | 330 |
| | Haverty Furniture Cos. Inc. | 12,817 | 297 |
| * | Zumiez Inc. | 13,857 | 283 |
| * | Barnes & Noble Education | | |
| | Inc. | 27,624 | 265 |
| | Shoe Carnival Inc. | 10,310 | 261 |
| | Winmark Corp. | 1,625 | 184 |
| * | America's Car-Mart Inc. | 5,758 | 183 |
| * | Conn's Inc. | 13,264 | 127 |
| * | Kirkland's Inc. | 10,128 | 114 |
| * | Sportsman's Warehouse | | |
| | Holdings Inc. | 23,216 | 113 |
| * | Boot Barn Holdings Inc. | 10,702 | 110 |
| | Stein Mart Inc. | 23,262 | 84 |
| * | Container Store Group Inc. | 12,879 | 54 |
| ^ | Stage Stores Inc. | 21,715 | 51 |
| | | | 421,549 |
| Textiles, Apparel & Luxury Goods (5.4%) |
| | NIKE Inc. Class B | 998,648 | 57,083 |
| | VF Corp. | 247,366 | 12,974 |
| | Coach Inc. | 209,627 | 7,985 |
| | Hanesbrands Inc. | 282,534 | 5,654 |
| | PVH Corp. | 59,905 | 5,487 |
| * | Lululemon Athletica Inc. | 81,994 | 5,351 |
| * | Michael Kors Holdings Ltd. | 122,725 | 4,480 |
| | Ralph Lauren Corp. Class A | 42,180 | 3,346 |
| | Carter's Inc. | 36,897 | 3,247 |
| ^,* Under Armour Inc. Class A | 137,369 | 2,833 |
| * | Under Armour Inc. | 139,776 | 2,594 |
| * | Skechers U. S. A. Inc. | | |
| | Class A | 99,649 | 2,558 |
| * | Kate Spade & Co. | 95,838 | 2,287 |
| | Wolverine World Wide Inc. | 73,821 | 1,858 |
| * | Steven Madden Ltd. | 40,696 | 1,520 |
| * | Deckers Outdoor Corp. | 22,866 | 1,208 |
| | Columbia Sportswear Co. | 20,921 | 1,149 |
| * | G-III Apparel Group Ltd. | 30,625 | 788 |
| | Oxford Industries Inc. | 11,198 | 629 |
| * | Fossil Group Inc. | 32,176 | 608 |
| * | Crocs Inc. | 54,305 | 361 |
| * | Unifi Inc. | 11,617 | 317 |
| | Movado Group Inc. | 11,474 | 278 |
| * | Iconix Brand Group Inc. | 31,500 | 243 |
| * | Sequential Brands Group Inc. | 42,095 | 165 |
| * | Vera Bradley Inc. | 14,305 | 150 |
| | | | 125,153 |
| Total Common Stocks | | |
| (Cost $2,106,453) | | 2,310,711 |
| | |
| | | Market |
| | | Value• |
| | Shares | ($000) |
| |
| Temporary Cash Investment (1.3%) | |
| Money Market Fund (1.3%) | |
| 1,2 Vanguard Market | | |
| Liquidity Fund, 0.864% | |
| (Cost $30,485) | 304,825 | 30,485 |
| Total Investments (101.3%) | |
| (Cost $2,136,938) | | 2,341,196 |
| |
| | | Amount |
| | | ($000) |
| Other Assets and Liabilities (-1.3%) | |
| Other Assets | | |
| Investment in Vanguard | | 165 |
| Receivables for Investment Securities Sold | 9,791 |
| Receivables for Accrued Income | 2,692 |
| Receivables for Capital Shares Issued | 369 |
| Other Assets2 | | 43 |
| Total Other Assets | | 13,060 |
| Liabilities | | |
| Payables for Investment Securities | |
| Purchased | | (9,867) |
| Collateral for Securities on Loan | (30,527) |
| Payables for Capital Shares Redeemed | (278) |
| Payables to Vanguard | | (803) |
| Other Liabilities | | (820) |
| Total Liabilities | | (42,295) |
| Net Assets (100%) | | 2,311,961 |
| |
| At February 28, 2017, net assets consisted of: |
| | Amount |
| | ($000) |
| Paid-in Capital | 2,146,988 |
| Undistributed Net Investment Income | 3,056 |
| Accumulated Net Realized Losses | (42,341) |
| Unrealized Appreciation (Depreciation) | 204,258 |
| Net Assets | 2,311,961 |
| |
| |
| ETF Shares—Net Assets | |
| Applicable to 15,652,548 outstanding | |
| $.001 par value shares of beneficial | |
| interest (unlimited authorization) | 2,126,329 |
| Net Asset Value Per Share— | |
| ETF Shares | $135.85 |
| |
| |
| Admiral Shares—Net Assets | |
| Applicable to 2,639,954 outstanding | |
| $.001 par value shares of beneficial | |
| interest (unlimited authorization) | 185,632 |
| Net Asset Value Per Share— | |
| Admiral Shares | $70.32 |
• See Note A in Notes toFinancial Statements.
^ Includes partial security positions on loan to broker-dealers. The total value of securities on loan is $28,746,000.
* Non-income-producing security.
1 Affiliated money market fund available only to Vanguard funds and certain trusts and accounts managed by Vanguard. Rate shown is the 7-day yield.
2 Includes$30,527,000ofcollateralreceivedforsecurities onloan, ofwhich$43,000is heldincash.
CVR—Contingent Value Rights.
See accompanying Notes, which are an integral part of the Financial Statements.
9
Consumer Discretionary Index Fund
| |
| Statement of Operations |
| |
| Six Months Ended |
| February 28, 2017 |
| | ($000) |
| Investment Income | |
| Income | |
| Dividends | 18,139 |
| Interest 1 | 1 |
| Securities Lending—Net | 429 |
| Total Income | 18,569 |
| Expenses | |
| The Vanguard Group—Note B | |
| Investment Advisory Services | 157 |
| Management and Administrative— | |
| ETF Shares | 706 |
| Management and Administrative— | |
| Admiral Shares | 61 |
| Marketing and Distribution— | |
| ETF Shares | 76 |
| Marketing and Distribution— | |
| Admiral Shares | 9 |
| Custodian Fees | 14 |
| Shareholders' Reports—ETF Shares | 61 |
| Shareholders' Reports—Admiral Shares | 2 |
| Trustees' Fees and Expenses | 1 |
| Total Expenses | 1,087 |
| Net Investment Income | 17,482 |
| Realized Net Gain (Loss) | |
| Investment Securities Sold1 | 25,728 |
| Futures Contracts | (4) |
| Realized Net Gain (Loss) | 25,724 |
| Change in Unrealized Appreciation | |
| (Depreciation) | |
| Investment Securities | 131,633 |
| Futures Contracts | 10 |
| Change in Unrealized Appreciation | |
| (Depreciation) | 131,643 |
| Net Increase (Decrease) in Net Assets | |
| Resulting from Operations | 174,849 |
| 1 Interest income and realized net gain (loss) from an affiliated |
| company of the fund were $1,000 and $1,000, respectively. |
| | |
| Statement of Changes in NetAssets | | |
| |
| | Six Months Ended | Year Ended |
| | February 28, | August 31, |
| | 2017 | 2016 |
| | ($000) | ($000) |
| Increase (Decrease) in Net Assets | | |
| Operations | | |
| Net Investment Income | 17,482 | 31,588 |
| Realized Net Gain (Loss) | 25,724 | 104,493 |
| Change in Unrealized Appreciation (Depreciation) | 131,643 | (20,586) |
| Net Increase (Decrease) in Net Assets Resulting from Operations | 174,849 | 115,495 |
| Distributions | | |
| Net Investment Income | | |
| ETF Shares | (18,505) | (38,225) |
| Admiral Shares | (1,618) | (3,309) |
| Realized Capital Gain | | |
| ETF Shares | — | — |
| Admiral Shares | — | — |
| Total Distributions | (20,123) | (41,534) |
| Capital Share Transactions | | |
| ETF Shares | 58,611 | 15,097 |
| Admiral Shares | 3,755 | 24,861 |
| Net Increase (Decrease) from Capital Share Transactions | 62,366 | 39,958 |
| Total Increase (Decrease) | 217,092 | 113,919 |
| Net Assets | | |
| Beginning of Period | 2,094,869 | 1,980,950 |
| End of Period 1 | 2,311,961 | 2,094,869 |
| 1 Net Assets—End of Period includes undistributed (overdistributed) net investment income of $3,056,000 and $5,697,000. | |
See accompanying Notes, which are an integral part of the Financial Statements.
10
Consumer Discretionary Index Fund
Financial Highlights
| | | | | | | |
| ETF Shares | | | | | | | |
| | Six Months | | | | | |
| | | Ended | | | | | |
| For a Share Outstanding | February 28, | Year Ended August 31, |
| Throughout Each Period | | 2017 | 2016 | 2015 | 2014 | 2013 | 2012 |
| Net Asset Value, Beginning of Period | $126.45 | $120.80 | $111.79 | $93.38 | $72.65 | $60.29 |
| Investment Operations | | | | | | | |
| Net Investment Income | | 1.022 | 1.875 | 1.542 | 1.251 | 1.111 | .936 |
| Net Realized and Unrealized Gain (Loss) | | | | | | |
| on Investments | | 9.564 | 6.259 | 8.900 | 18.072 | 20.771 | 12.277 |
| Total from Investment Operations | 10.586 | 8.134 | 10.442 | 19.323 | 21.882 | 13.213 |
| Distributions | | | | | | | |
| Dividends from Net Investment Income | (1.186) | (2.484) | (1.432) | (. 913) | (1.152) | (. 853) |
| Distributions from Realized Capital Gains | — | — | — | — | — | — |
| Total Distributions | | (1.186) | (2.484) | (1.432) | (. 913) | (1.152) | (. 853) |
| Net Asset Value, End of Period | $135.85 | $126.45 | $120.80 | $111.79 | $93.38 | $72.65 |
| |
| Total Return | | 8.43% | 6.84% | 9.41% | 20.75% | 30.47% | 22.18% |
| |
| Ratios/Supplemental Data | | | | | | | |
| Net Assets, End of Period (Millions) | $2,126 | $1,926 | $1,842 | $1,298 | $1,018 | $531 |
| Ratio of Total Expenses to | | | | | | | |
| Average Net Assets | | 0.10% | 0.10% | 0.10% | 0.12% | 0.14% | 0.14% |
| Ratio of Net Investment Income to | | | | | | |
| Average Net Assets | | 1.60% | 1.54% | 1.31% | 1.26% | 1.44% | 1.48% |
| Portfolio Turnover Rate1 | | 8% | 7% | 6% | 7% | 6% | 6% |
| The expense ratio, net investment income ratio, and turnover rate for the current period have been annualized. | |
| 1 Excludes the value of portfolio securities received or delivered as a result of in-kind purchases or redemptions of the fund's capital shares, |
| including ETF Creation Units. |
See accompanying Notes, which are an integral part of the Financial Statements.
11
Consumer Discretionary Index Fund
Financial Highlights
| | | | | | | |
| Admiral Shares | | | | | | | |
| | Six Months | | | | | |
| | | Ended | | | | | |
| For a Share Outstanding | February 28, | Year Ended August 31, |
| Throughout Each Period | | 2017 | 2016 | 2015 | 2014 | 2013 | 2012 |
| Net Asset Value, Beginning of Period | $65.45 | $62.53 | $57.87 | $48.34 | $37.62 | $31.22 |
| Investment Operations | | | | | | | |
| Net Investment Income | | .530 | .971 | .805 | .648 | .579 | .483 |
| Net Realized and Unrealized Gain (Loss) | | | | | | |
| on Investments | | 4.956 | 3.239 | 4.595 | 9.361 | 10.741 | 6.356 |
| Total from Investment Operations | 5.486 | 4.210 | 5.400 | 10.009 | 11.320 | 6.839 |
| Distributions | | | | | | | |
| Dividends from Net Investment Income | (. 616) | (1.290) | (. 740) | (. 479) | (. 600) | (. 439) |
| Distributions from Realized Capital Gains | — | — | — | — | — | — |
| Total Distributions | | (. 616) | (1.290) | (. 740) | (. 479) | (. 600) | (. 439) |
| Net Asset Value, End of Period | $70.32 | $65.45 | $62.53 | $57.87 | $48.34 | $37.62 |
| |
| Total Return 1 | | 8.44% | 6.83% | 9.43% | 20.77% | 30.45% | 22.17% |
| |
| Ratios/Supplemental Data | | | | | | | |
| Net Assets, End of Period (Millions) | $186 | $169 | $139 | $83 | $63 | $19 |
| Ratio of Total Expenses to | | | | | | | |
| Average Net Assets | | 0.10% | 0.10% | 0.09% | 0.12% | 0.14% | 0.14% |
| Ratio of Net Investment Income to | | | | | | |
| Average Net Assets | | 1.60% | 1.54% | 1.32% | 1.26% | 1.44% | 1.48% |
| Portfolio Turnover Rate2 | | 8% | 7% | 6% | 7% | 6% | 6% |
The expense ratio, net investment income ratio, and turnover rate for the current period have been annualized.
1 Total returns do not include transaction or account service fees that may have applied in the periods shown. Fund prospectuses provide
information about any applicable transaction and account service fees.
2 Excludes the value of portfolio securities received or delivered as a result of in-kind purchases or redemptions of the fund's capital shares,
including ETF Creation Units.
See accompanying Notes, which are an integral part of the Financial Statements.
12
Consumer Discretionary Index Fund
Notes to Financial Statements
Vanguard Consumer Discretionary Index Fund is registered under the Investment Company Act of 1940 as an open-end investment company, or mutual fund. The fund offers two classes of shares: ETF Shares and Admiral Shares. ETF Shares are listed for trading on NYSE Arca; they can be purchased and sold through a broker. Admiral Shares are designed for investors who meet certain administrative, service, and account-size criteria.
A. The following significant accounting policies conform to generally accepted accounting principles for U.S. investment companies. The fund consistently follows such policies in preparing its financial statements.
1. SecurityValuation:SecuritiesarevaluedasofthecloseoftradingontheNewYorkStockExchange (generally 4 p.m., Eastern time) on the valuation date. Equity securities are valued at thelatestquoted sales prices or official closing prices taken from the primary market in which each security trades; such securities not traded on the valuation date are valued at the mean of the latest quoted bid and asked prices. Securities for whichmarket quotations are not readily available, or whose valueshave been materially affected by events occurring before the fund’s pricing time but after the close of the securities’ primary markets, are valued by methods deemed by the board of trustees to represent fairvalue.InvestmentsinVanguard MarketLiquidityFundarevaluedatthatfund’snetassetvalue.
2. Futures Contracts: The fund uses index futures contracts to a limited extent, with the objectives of maintaining full exposure to the stock market, enhancing returns, maintaining liquidity, and minimizing transaction costs. The fund may purchase futures contracts to immediately invest incoming cash in the market, or sell futures in response to cash outflows, thereby simulating a fully invested position in the underlying index while maintaining a cash balance for liquidity. The fund may seek to enhance returns by using futures contracts instead of the underlying securities when futures are believed to be priced more attractively than the underlying securities. The primary risks associated with the use of futures contracts are imperfect correlation between changes in market values of stocks held by the fund and the prices of futures contracts, and the possibility of an illiquid market. Counterparty risk involving futures is mitigated because a regulated clearinghouse is the counterparty instead of the clearing broker. To further mitigate counterparty risk, the fund trades futures contracts on an exchange, monitors the financial strength of its clearing brokers and clearinghouse, and has entered into clearing agreements with its clearing brokers. The clearinghouse imposes initial margin requirements to secure the fund’s performance and requires daily settlement of variation margin representing changes in the market value of each contract.
Futures contracts are valued at their quoted daily settlement prices. The aggregate settlement values of the contracts are not recorded in the Statement of Net Assets. Fluctuations in the value of the contracts are recorded in the Statement of Net Assets as an asset (liability) and in the Statement of Operations as unrealized appreciation (depreciation) until the contracts are closed, when they are recorded as realized futures gains (losses).
During the six months ended February 28, 2017, the fund’s average investments in long and short futures contracts represented less than 1% and 0% of net assets, respectively, based on the average of aggregate settlement values at each quarter-end during the period. The fund had no open futures contracts at February 28, 2017.
3. Federal Income Taxes: The fund intends to continue to qualify as a regulated investment company and distribute all of its taxable income. Management has analyzed the fund’s tax positions taken for all open federal income tax years (August 31, 2013–2016), and for the period ended February 28, 2017, and has concluded that no provision for federal income tax is required in the fund’s financial statements. 4. Distributions: Distributions to shareholders are recorded on the ex-dividend date.
5. Securities Lending: To earn additional income, the fund lends its securities to qualified institutional borrowers. Security loans are subject to termination by the fund at any time, and are required to be secured at all times by collateral in an amount at least equal to the market value of securities loaned. Daily market fluctuations could cause the value of loaned securities to be more or less than the value of the collateral received. When this occurs, the collateral is adjusted and settled on the next business day. The fund further mitigates its counterparty risk by entering into securities lending transactions only with a diverse group of prequalified counterparties, monitoring their financial strength, and entering into master securities lending agreements with its counterparties. The master securities lending agreements provide that, in the event of a counterparty’s default (including bankruptcy), the fund may terminate any loans with that borrower, determine the net amount owed, and sell or retain the collateral up to the net amount owed to the fund; however, such actions may be subject to legal proceedings. While collateral mitigates counterparty risk, in the absence of a default the fund may
13
Consumer Discretionary Index Fund
experience delays and costs in recovering the securities loaned. The fund invests cash collateral received in Vanguard Market Liquidity Fund, and records a liability in the Statement of Net Assets for the return of the collateral, during the period the securities are on loan. Securities lending income represents feeschargedto borrowers plusincome earned oninvested cash collateral,less expenses associated with the loan. During the term of the loan, the fund is entitled to all distributions made on or in respect of the loaned securities.
6. Credit Facility: The fund and certain other funds managed by The Vanguard Group (“Vanguard”) participate in a $3.1 billion committed credit facility provided by a syndicate of lenders pursuant to a credit agreement that may be renewed annually; each fund is individually liable for its borrowings, if any, under the credit facility. Borrowings may be utilized for temporary and emergency purposes, and are subject to the fund’s regulatory and contractual borrowing restrictions. The participating funds are charged administrative fees and an annual commitment fee of 0.10% of the undrawn amount of the facility; these fees are allocated to the funds based on a method approved by the fund’s board of trustees and included in Management and Administrative expenses on the fund’s Statement of Operations. Any borrowings under this facility bear interest at a rate based upon the higher of the one-month London Interbank Offered Rate, federal funds effective rate, or overnight bank funding rate plus an agreed-upon spread.
The fund had no borrowings outstanding at February 28, 2017, or at any time during the period then ended.
7. Other: Dividend income is recorded on the ex-dividend date. Interest income includes income distributions received from Vanguard Market Liquidity Fund and is accrued daily. Security transactions are accounted for on the date securities are bought or sold. Costs used to determine realized gains (losses) on the sale of investment securities are those of the specific securities sold.
Each class of shares has equal rights as to assets and earnings, except that each class separately bears certain class-specific expenses related to maintenance of shareholder accounts (included in Management and Administrative expenses) and shareholder reporting. Marketing and distribution expenses are allocated to each class of shares based on a method approved by the board of trustees. Income, other non-class-specific expenses, and gains and losses on investments are allocated to each class of shares based on its relative net assets.
B. In accordance with the terms of a Funds’ Service Agreement (the “FSA”) between Vanguard and the fund, Vanguard furnishes to the fund investment advisory, corporate management, administrative, marketing, and distribution services at Vanguard’s cost of operations (as defined by the FSA). These costs of operations are allocated to the fund based on methods and guidelines approved by the board of trustees. Vanguard does not require reimbursement in the current period for certain costs of operations (such as deferred compensation/benefits and risk/insurance costs); the fund’s liability forthese costs of operations isincluded in Payables to Vanguard on the Statement of Net Assets.
Upon the request of Vanguard, the fund may invest up to 0.40% of its net assets as capital in Vanguard. At February 28, 2017,the fund had contributedto Vanguard capitalinthe amountof $165,000, representing 0.01% of the fund’s net assets and 0.07% of Vanguard’s capitalization. The fund’s trustees and officers are also directors and employees, respectively, of Vanguard.
C. Variousinputs may be used to determine the value of the fund’sinvestments. Theseinputs are summarized in three broad levels for financial statement purposes. The inputs or methodologies used to value securities are not necessarily an indication of the risk associated with investing in those securities.
Level 1—Quoted prices in active markets for identical securities.
Level 2—Other significant observable inputs (including quoted prices for similar securities, interest rates, prepayment speeds, credit risk, etc.).
Level 3—Significant unobservable inputs (including the fund’s own assumptions used to determine the fair value of investments).
The following table summarizes the market value of the fund’sinvestments as of February 28, 2017, based on the inputs used to value them:
| | | |
| | Level 1 | Level 2 | Level 3 |
| Investments | ($000) | ($000) | ($000) |
| Common Stocks | 2,310,690 | — | 21 |
| Temporary Cash Investments | 30,485 | — | — |
| Total | 2,341,175 | — | 21 |
14
Consumer Discretionary Index Fund
D. Distributions are determined on a tax basis and may differ from net investment income and realized capital gains for financial reporting purposes. Differences may be permanent or temporary. Permanent differences are reclassified among capital accounts in the financial statements to reflect their tax character. Temporary differences arise when certain items of income, expense, gain, or loss are recognized in different periods for financial statement and tax purposes. These differences will reverse at some time in the future. Differences in classification may also result from the treatment of short-term gains as ordinary income for tax purposes.
During the six months ended February 28, 2017, the fund realized $33,523,000 of net capital gains resulting from in-kind redemptions—in which shareholders exchanged fund shares for securities held by the fund rather than for cash. Because such gains are not taxable to the fund, and are not distributed to shareholders, they have been reclassified from accumulated net realized losses to paid-in capital.
The fund’s tax-basis capital gains and losses are determined only at the end of each fiscal year. For tax purposes, at August 31, 2016, the fund had available capital losses totaling $34,552,000 to offset future net capital gains. Of this amount, $9,625,000 is subject to expiration dates; $858,000 may be used to offset future net capital gains through August 31, 2017, $7,274,000 through August 31, 2018, and $1,493,000 through August 31, 2019. Capital losses of $24,927,000 realized beginning in fiscal 2012 may be carried forward indefinitely under the Regulated Investment Company Modernization Act of 2010, but must be used before any expiring loss carryforwards. The fund will use these capital losses to offset net taxable capital gains, if any, realized during the year ending August 31, 2017; should the fund realize net capital losses for the year, the losses will be added to the loss carryforward balance above.
At February 28, 2017, the cost of investment securities for tax purposes was $2,136,938,000. Net unrealized appreciation of investment securities for tax purposes was $204,258,000, consisting of unrealized gains of $366,866,000 on securities that had risen in value since their purchase and $162,608,000 in unrealized losses on securities that had fallen in value since their purchase.
E. During the six months ended February 28, 2017, the fund purchased $268,825,000 of investment securities and sold $207,569,000 of investment securities, other than temporary cash investments. Purchases and sales include $163,519,000 and $124,454,000, respectively, in connection with in-kind purchases and redemptions of the fund’s capital shares.
The fund purchased securities from and sold securities to other Vanguard funds or accounts managed by Vanguard or its affiliates, in accordance with procedures adopted by the board of trustees in compliance with Rule 17a-7 of the Investment Company Act of 1940. For the six months ended February 28, 2017, such purchases and sales were $1,205,000 and $22,182,000, respectively; these amounts are included in the purchases and sales of investment securities noted above.
F. Capital share transactions for each class of shares were:
| | | | |
| | Six Months Ended | Year Ended |
| | February 28, 2017 | August 31, 2016 |
| | Amount | Shares | Amount | Shares |
| | ($000) | (000) | ($000) | (000) |
| ETF Shares | | | | |
| Issued | 183,129 | 1,400 | 526,973 | 4,227 |
| Issued in Lieu of Cash Distributions | — | — | — | — |
| Redeemed | (124,518) | (975) | (511,876) | (4,250) |
| Net Increase (Decrease)—ETF Shares | 58,611 | 425 | 15,097 | (23) |
| Admiral Shares | | | | |
| Issued | 37,290 | 554 | 129,244 | 2,037 |
| Issued in Lieu of Cash Distributions | 1,447 | 22 | 2,970 | 47 |
| Redeemed | (34,982) | (524) | (107,353) | (1,715) |
| Net Increase (Decrease)—Admiral Shares | 3,755 | 52 | 24,861 | 369 |
G. Management has determined that no material events or transactions occurred subsequent to February 28, 2017, that would require recognition or disclosure in these financial statements.
15
Consumer Staples Index Fund
Fund Profile
As of February 28, 2017
| | |
| Share-Class Characteristics | | |
| | ETF | Admiral |
| | Shares | Shares |
| Ticker Symbol | VDC | VCSAX |
| Expense Ratio1 | 0.10% | 0.10% |
| 30-Day SEC Yield | 2.41% | 2.41% |
| | | |
| Portfolio Characteristics | | |
| | | MSCI | |
| | | US IMI/ | |
| | | Consumer | MSCI |
| | | Staples | US IMI/ |
| | Fund | 25/50 | 2500 |
| Number of Stocks | 103 | 103 | 2,479 |
| Median Market Cap | $93.3B | $93.3B | $57.6B |
| Price/Earnings Ratio | 21.8x | 21.8x | 24.7x |
| Price/Book Ratio | 5.0x | 5.0x | 3.0x |
| Return on Equity | 21.0% | 21.0% | 16.5% |
| Earnings Growth Rate | 4.8% | 4.8% | 7.6% |
| Dividend Yield | 2.5% | 2.5% | 1.9% |
| Foreign Holdings | 0.8% | 0.0% | 0.0% |
| Turnover Rate | | | |
| (Annualized) | 3% | — | — |
| Short-Term Reserves | 0.0% | — | — |
| | |
| Volatility Measures | | |
| | MSCI US | |
| | IMI/Consumer | MSCI US |
| | Staples 25/50 | IMI/2500 |
| R-Squared | 1.00 | 0.37 |
| Beta | 1.00 | 0.56 |
| These measures show the degree and timing of the fund’s |
| fluctuations compared with the indexes over 36 months. |
| |
| Subindustry Diversification | |
| (% of equity exposure) | |
| |
| Agricultural Products | 2.8% |
| Brewers | 1.1 |
| Distillers & Vintners | 1.9 |
| Drug Retail | 7.6 |
| Food Distributors | 1.8 |
| Food Retail | 2.8 |
| Household Products | 18.6 |
| Hypermarkets & Super Centers | 8.8 |
| Packaged Foods & Meats | 18.6 |
| Personal Products | 2.5 |
| Soft Drinks | 16.7 |
| Tobacco | 16.8 |
| | |
| Ten Largest Holdings (% of total net assets) |
| |
| Procter & Gamble Co. | Household Products | 10.8% |
| Coca-Cola Co. | Soft Drinks | 7.8 |
| Philip Morris | | |
| International Inc. | Tobacco | 7.6 |
| PepsiCo Inc. | Soft Drinks | 7.1 |
| Altria Group Inc. | Tobacco | 6.4 |
| Wal-Mart Stores Inc. | Hypermarkets | |
| | & Super Centers | 4.9 |
| Costco Wholesale | Hypermarkets | |
| Corp. | & Super Centers | 3.8 |
| CVS Health Corp. | Drug Retail | 3.7 |
| Walgreens Boots | | |
| Alliance Inc. | Drug Retail | 3.6 |
| Mondelez | Packaged Foods | |
| International Inc. | & Meats | 3.3 |
| Top Ten | | 59.0% |
| The holdings listedexcludeany temporary cashinvestments and |
| equity index products. |
1 The expense ratios shown are from the prospectus dated December 22, 2016, and represent estimated costs for the current fiscal year. For the six months ended February 28, 2017, the annualized expense ratios
were 0.10% for ETF Shares and 0.10% for Admiral Shares.
16
Consumer Staples IndexFund
Performance Summary
All of the returns in this report represent past performance, which is not a guarantee of future
results that may be achieved by the fund. (Current performance may be lower or higher than
theperformancedatacited.For performance data currenttothemostrecentmonth-end,
visit our website at vanguard.com/performance.) Note, too, that both investment returns and
principal value can fluctuate widely, so an investor’s shares, when sold, could be worth more
or less than their original cost. The returns shown do not reflect taxes that a shareholder would
pay on fund distributions or on the sale of fund shares.
Fiscal-Year Total Returns (%): August 31, 2006–February 28, 2017

For a benchmark description, see the Glossary.
Note: For 2017, performance data reflect the six months ended February 28, 2017
Average Annual Total Returns: Periods Ended December 31, 2016
This table presents returns through the latest calendar quarter—rather than through the end of the fiscal period.
Securities and Exchange Commission rules require that we provide this information.
| | | | |
| | Inception Date | One Year | Five Years | Ten Years |
| ETF Shares | 1/26/2004 | | | |
| Market Price | | 6.30% | 13.15% | 10.22% |
| Net Asset Value | | 6.31 | 13.15 | 10.22 |
| Admiral Shares | 1/30/2004 | 6.30 | 13.17 | 10.21 |
See Financial Highlights for dividend and capital gains information.
17
Consumer Staples IndexFund
Financial Statements (unaudited)
Statement of Net Assets
As of February 28, 2017
The fund reports a complete list of its holdings in regulatory filings four times in each fiscal year, at the quarter-ends. For the second and fourth fiscal quarters, the lists appear in the fund’s semiannual and annual reports to shareholders. For the first and third fiscal quarters, the fund files the lists with the Securities and Exchange Commission on Form N-Q. Shareholders can look up the fund’s Forms N-Q on the SEC’s website at sec.gov. Forms N-Q may also be reviewed and copied at the SEC’s Public Reference Room (see the back cover of this report for further information).
| | | |
| | | | Market |
| | | | Value• |
| | | Shares | ($000) |
| Common Stocks (100.0%) | | |
| Beverages (19.7%) | | |
| | Coca-Cola Co. | 7,933,307 | 332,882 |
| | PepsiCo Inc. | 2,764,215 | 305,114 |
| | Constellation Brands Inc. | | |
| | Class A | 364,744 | 57,925 |
| | Molson Coors Brewing Co. | | |
| | Class B | 404,064 | 40,564 |
| | Dr Pepper Snapple Group | | |
| | Inc. | 411,086 | 38,412 |
| * | Monster Beverage Corp. | 861,373 | 35,695 |
| | Brown-Forman Corp. | | |
| | Class B | 507,592 | 24,750 |
| * | Boston Beer Co. Inc. | | |
| | Class A | 27,388 | 4,345 |
| | Coca-Cola Bottling Co. | | |
| | Consolidated | 19,992 | 3,440 |
| | National Beverage Corp. | 4,062 | 237 |
| | MGP Ingredients Inc. | 4,290 | 190 |
| | | | 843,554 |
| Food & Staples Retailing (21.0%) | |
| | Wal-Mart Stores Inc. | 2,945,387 | 208,916 |
| | Costco Wholesale Corp. | 910,374 | 161,300 |
| | CVS Health Corp. | 1,945,575 | 156,774 |
| | Walgreens Boots Alliance | | |
| | Inc. | 1,809,741 | 156,325 |
| | Kroger Co. | 1,954,852 | 62,164 |
| | Sysco Corp. | 1,139,786 | 60,090 |
| | Whole Foods Market Inc. | 756,382 | 23,198 |
| * | Rite Aid Corp. | 2,311,360 | 13,868 |
| | Casey’s General Stores | | |
| | Inc. | 95,706 | 10,966 |
| * | Sprouts Farmers Market | | |
| | Inc. | 373,749 | 6,899 |
| * | United Natural Foods Inc. | 143,992 | 6,199 |
| | SpartanNash Co. | 158,559 | 5,534 |
| | PriceSmart Inc. | 59,303 | 5,242 |
| | Andersons Inc. | 110,043 | 4,352 |
| | Weis Markets Inc. | 68,745 | 4,125 |
| | Ingles Markets Inc. | | |
| | Class A | 57,627 | 2,700 |
| * | SUPERVALU Inc. | 692,738 | 2,619 |
| | Village Super Market Inc. | | |
| | Class A | 85,802 | 2,541 |
| * | Smart & Final Stores Inc. | 166,508 | 2,323 |
| * | Chefs’ Warehouse Inc. | 139,323 | 1,951 |
| * | Natural Grocers by Vitamin | | |
| | Cottage Inc. | 110,669 | 1,336 |
| * | Performance Food Group | | |
| | Co. | 20,041 | 473 |
| * | US Foods Holding Corp. | 15,951 | 439 |
| | | | 900,334 |
| | | |
| Food Products (21.3%) | | |
| | Mondelez International Inc. | | |
| | Class A | 3,270,215 | 143,628 |
| | Kraft Heinz Co. | 1,251,232 | 114,500 |
| | General Mills Inc. | 1,258,571 | 75,980 |
| | Archer-Daniels-Midland | | |
| | Co. | 1,266,954 | 59,509 |
| | Kellogg Co. | 569,669 | 42,195 |
| | Tyson Foods Inc. Class A | 655,381 | 41,001 |
| | Conagra Brands Inc. | 918,986 | 37,871 |
| | Mead Johnson Nutrition | | |
| | Co. | 420,119 | 36,882 |
| | Hershey Co. | 325,718 | 35,292 |
| | JM Smucker Co. | 247,781 | 35,118 |
| | Bunge Ltd. | 321,695 | 26,331 |
| | McCormick & Co. Inc. | 258,825 | 25,474 |
| | Campbell Soup Co. | 416,841 | 24,740 |
| | Hormel Foods Corp. | 645,588 | 22,757 |
| * | WhiteWave Foods Co. | | |
| | Class A | 404,928 | 22,303 |
| | Ingredion Inc. | 164,622 | 19,901 |
| | Pinnacle Foods Inc. | 269,949 | 15,422 |
| * | Post Holdings Inc. | 152,007 | 12,445 |
| | Lamb Weston Holdings Inc. | 306,522 | 12,013 |
| * | TreeHouse Foods Inc. | 139,386 | 11,859 |
| | Snyder’s-Lance Inc. | 240,188 | 9,507 |
| ^ | Flowers Foods Inc. | 464,553 | 8,947 |
| * | Hain Celestial Group Inc. | 251,080 | 8,883 |
| | B&G Foods Inc. | 193,054 | 8,205 |
| | Lancaster Colony Corp. | 55,209 | 7,277 |
| * | Darling Ingredients Inc. | 515,083 | 6,701 |
| | Fresh Del Monte Produce | | |
| | Inc. | 111,354 | 6,444 |
| ^ | Sanderson Farms Inc. | 66,617 | 6,331 |
| | J&J Snack Foods Corp. | 46,463 | 6,217 |
| | Dean Foods Co. | 290,870 | 5,305 |
| ^ | Pilgrim’s Pride Corp. | 222,152 | 4,527 |
| ^ | Tootsie Roll Industries Inc. | 98,174 | 3,843 |
| ^ | Cal-Maine Foods Inc. | 95,406 | 3,621 |
| | Calavo Growers Inc. | 63,784 | 3,597 |
| * | Seneca Foods Corp. | | |
| | Class A | 79,654 | 2,991 |
| * | Farmer Brothers Co. | 79,594 | 2,601 |
| * | Landec Corp. | 198,621 | 2,503 |
| ^,* Freshpet Inc. | 245,120 | 2,476 |
| * | Blue Buffalo Pet Products | | |
| | Inc. | 14,525 | 355 |
| | John B Sanfilippo | | |
| | & Son Inc. | 4,990 | 306 |
| | Omega Protein Corp. | 8,842 | 225 |
| ^,* | Amplify Snack Brands Inc. | 22,393 | 224 |
| | | | 916,307 |
| | | |
| Household Products (18.7%) | | |
| | Procter & Gamble Co. | 5,080,317 | 462,664 |
| | Colgate-Palmolive Co. | 1,776,852 | 129,675 |
| | Kimberly-Clark Corp. | 760,365 | 100,786 |
| | Clorox Co. | 277,823 | 38,009 |
| | Church & Dwight Co. Inc. | 578,054 | 28,810 |
| | Spectrum Brands Holdings | | |
| | Inc. | 74,234 | 10,075 |
| | Energizer Holdings Inc. | 180,652 | 9,911 |
| | HRG Group Inc. | 317,547 | 5,836 |
| * | Central Garden & Pet Co. | | |
| | Class A | 172,664 | 5,517 |
| | WD-40 Co. | 48,041 | 5,280 |
| * | Central Garden & Pet Co. | 118,876 | 4,012 |
| | | | 800,575 |
| Personal Products (2.5%) | | |
| | Estee Lauder Cos. Inc. | | |
| | Class A | 483,390 | 40,049 |
| | Coty Inc. Class A | 1,079,178 | 20,267 |
| * | Edgewell Personal Care | | |
| | Co. | 149,702 | 11,054 |
| ^,* | Herbalife Ltd. | 173,676 | 9,811 |
| ^ | Nu Skin Enterprises Inc. | | |
| | Class A | 165,294 | 8,189 |
| * | Avon Products Inc. | 1,410,653 | 6,207 |
| | Inter Parfums Inc. | 101,942 | 3,527 |
| | Medifast Inc. | 77,049 | 3,455 |
| * | Revlon Inc. Class A | 93,246 | 3,133 |
| * | USANA Health Sciences | | |
| | Inc. | 51,267 | 2,976 |
| ^ | Natural Health Trends Corp. | 8,172 | 227 |
| | | | 108,895 |
| Tobacco (16.8%) | | |
| | Philip Morris International | | |
| | Inc. | 2,966,984 | 324,440 |
| | Altria Group Inc. | 3,690,786 | 276,514 |
| | Reynolds American Inc. | 1,794,888 | 110,511 |
| | Vector Group Ltd. | 274,499 | 6,253 |
| | Universal Corp. | 76,397 | 5,172 |
| | | | 722,890 |
| Total Common Stocks | | |
| (Cost $3,673,301) | | 4,292,555 |
| Temporary Cash Investment (0.3%) | |
| Money Market Fund (0.3%) | | |
| 1,2 | Vanguard Market | | |
| | Liquidity Fund, 0.864% | | |
| | (Cost $12,128) | 121,279 | 12,129 |
| Total Investments (100.3%) | | |
| (Cost $3,685,429) | | 4,304,684 |
18
Consumer Staples IndexFund
| |
| | Amount |
| | ($000) |
| Other Assets and Liabilities (-0.3%) | |
| Other Assets | |
| Investment in Vanguard | 290 |
| Receivables for Investment Securities Sold | 2,609 |
| Receivables for Accrued Income | 3,323 |
| Receivables for Capital Shares Issued | 1,107 |
| Total Other Assets | 7,329 |
| Liabilities | |
| Payables for Investment Securities | |
| Purchased | (2,733) |
| Collateral for Securities on Loan | (12,128) |
| Payables for Capital Shares Redeemed | (1,068) |
| Payables to Vanguard | (1,515) |
| Other Liabilities | (1,309) |
| Total Liabilities | (18,753) |
| Net Assets (100%) | 4,293,260 |
| |
| At February 28, 2017, net assets consisted of: |
| | Amount |
| | ($000) |
| Paid-in Capital | 3,688,193 |
| Undistributed Net Investment Income | 9,177 |
| Accumulated Net Realized Losses | (23,365) |
| Unrealized Appreciation (Depreciation) | 619,255 |
| Net Assets | 4,293,260 |
| |
| |
| ETF Shares—Net Assets | |
| Applicable to 25,182,575 outstanding | |
| $.001 par value shares of beneficial | |
| interest (unlimited authorization) | 3,570,725 |
| Net Asset Value Per Share— | |
| ETF Shares | $141.79 |
| |
| |
| Admiral Shares—Net Assets | |
| Applicable to 10,334,766 outstanding | |
| $.001 par value shares of beneficial | |
| interest (unlimited authorization) | 722,535 |
| Net Asset Value Per Share— | |
| Admiral Shares | $69.91 |
• See Note A in Notes toFinancial Statements.
* Non-income-producing security.
^ Includes partial security positions on loan to broker-dealers. The total value of securities on loan is $11,718,000.
1 Affiliated money market fund available only to Vanguard funds and certain trusts and accounts managed by Vanguard. Rate shown is the 7-day yield.
2 Includes $12,128,000 of collateral received for securities on loan.
See accompanying Notes, which are an integral part of the Financial Statements.
19
Consumer Staples IndexFund
Statement of Operations
| |
| Six Months Ended |
| February 28, 2017 |
| | ($000) |
| Investment Income | |
| Income | |
| Dividends | 47,961 |
| Interest 1 | 3 |
| Securities Lending—Net | 588 |
| Total Income | 48,552 |
| Expenses | |
| The Vanguard Group—Note B | |
| Investment Advisory Services | 283 |
| Management and Administrative— | |
| ETF Shares | 1,252 |
| Management and Administrative— | |
| Admiral Shares | 258 |
| Marketing and Distribution— | |
| ETF Shares | 114 |
| Marketing and Distribution— | |
| Admiral Shares | 37 |
| Custodian Fees | 27 |
| Shareholders’ Reports—ETF Shares | 100 |
| Shareholders’ Reports—Admiral Shares | 12 |
| Trustees’ Fees and Expenses | 2 |
| Total Expenses | 2,085 |
| Net Investment Income | 46,467 |
| Realized Net Gain (Loss) | |
| Investment Securities Sold1 | 90,082 |
| Futures Contracts | (31) |
| Realized Net Gain (Loss) | 90,051 |
| Change in Unrealized Appreciation | |
| (Depreciation) | |
| Investment Securities | (31,301) |
| Futures Contracts | 28 |
| Change in Unrealized Appreciation | |
| (Depreciation) | (31,273) |
| Net Increase (Decrease) in Net Assets | |
| Resulting from Operations | 105,245 |
| 1 Interest income and realized net gain (loss) from an affiliated |
| company of the fund were $3,000 and $1,000, respectively. |
Statement of Changes in NetAssets
| | |
| | Six Months Ended | Year Ended |
| | February 28, | August 31, |
| | 2017 | 2016 |
| | ($000) | ($000) |
| Increase (Decrease) in Net Assets | | |
| Operations | | |
| Net Investment Income | 46,467 | 84,850 |
| Realized Net Gain (Loss) | 90,051 | 117,518 |
| Change in Unrealized Appreciation (Depreciation) | (31,273) | 319,186 |
| Net Increase (Decrease) in Net Assets Resulting from Operations | 105,245 | 521,554 |
| Distributions | | |
| Net Investment Income | | |
| ETF Shares | (45,515) | (98,108) |
| Admiral Shares | (9,418) | (14,792) |
| Realized Capital Gain | | |
| ETF Shares | — | — |
| Admiral Shares | — | — |
| Total Distributions | (54,933) | (112,900) |
| Capital Share Transactions | | |
| ETF Shares | 10,888 | 774,804 |
| Admiral Shares | (13,586) | 349,687 |
| Net Increase (Decrease) from Capital Share Transactions | (2,698) | 1,124,491 |
| Total Increase (Decrease) | 47,614 | 1,533,145 |
| Net Assets | | |
| Beginning of Period | 4,245,646 | 2,712,501 |
| End of Period 1 | 4,293,260 | 4,245,646 |
| 1 Net Assets—End of Period includes undistributed (overdistributed) net investment income of $9,177,000 and $17,643,000. | |
See accompanying Notes, which are an integral part of the Financial Statements.
Consumer Staples IndexFund
Financial Highlights
| | | | | | | |
| ETF Shares | | | | | | | |
| | Six Months | | | | | |
| | | Ended | | | | | |
| For a Share Outstanding | February 28, | Year Ended August 31, |
| Throughout Each Period | | 2017 | 2016 | 2015 | 2014 | 2013 | 2012 |
| Net Asset Value, Beginning of Period | $139.97 | $123.72 | $117.12 | $101.97 | $90.12 | $78.96 |
| Investment Operations | | | | | | | |
| Net Investment Income | | 1.534 | 3.189 | 2.903 | 2.602 | 2.606 | 2.180 |
| Net Realized and Unrealized Gain (Loss) | | | | | | |
| on Investments | | 2.098 | 17.752 | 6.114 | 14.976 | 11.835 | 10.874 |
| Total from Investment Operations | 3.632 | 20.941 | 9.017 | 17.578 | 14.441 | 13.054 |
| Distributions | | | | | | | |
| Dividends from Net Investment Income | (1.812) | (4.691) | (2.417) | (2.428) | (2.591) | (1.894) |
| Distributions from Realized Capital Gains | — | — | — | — | — | — |
| Total Distributions | | (1.812) | (4.691) | (2.417) | (2.428) | (2.591) | (1.894) |
| Net Asset Value, End of Period | $141.79 | $139.97 | $123.72 | $117.12 | $101.97 | $90.12 |
| |
| Total Return | | 2.67% | 17.36% | 7.67% | 17.42% | 16.43% | 16.80% |
| |
| Ratios/Supplemental Data | | | | | | | |
| Net Assets, End of Period (Millions) | $3,571 | $3,518 | $2,393 | $1,936 | $1,481 | $1,110 |
| Ratio of Total Expenses to | | | | | | | |
| Average Net Assets | | 0.10% | 0.10% | 0.10% | 0.12% | 0.14% | 0.14% |
| Ratio of Net Investment Income to | | | | | | |
| Average Net Assets | | 2.30% | 2.50% | 2.53% | 2.52% | 2.80% | 2.80% |
| Portfolio Turnover Rate1 | | 3% | 6% | 6% | 5% | 10% | 7% |
| The expense ratio, net investment income ratio, and turnover rate for the current period have been annualized. | | |
| 1 Excludes the value of portfolio securities received or delivered as a result of in-kind purchases or redemptions of the fund’s capital shares, |
| including ETF Creation Units. |
See accompanying Notes, which are an integral part of the Financial Statements.
21
Consumer Staples IndexFund
Financial Highlights
| | | | | | | |
| Admiral Shares | | | | | | | |
| | Six Months | | | | | |
| | | Ended | | | | | |
| For a Share Outstanding | February 28, | Year Ended August 31, |
| Throughout Each Period | | 2017 | 2016 | 2015 | 2014 | 2013 | 2012 |
| Net Asset Value, Beginning of Period | $69.02 | $61.01 | $57.74 | $50.28 | $44.44 | $38.94 |
| Investment Operations | | | | | | | |
| Net Investment Income | | .756 | 1.575 | 1.431 | 1.281 | 1.287 | 1.077 |
| Net Realized and Unrealized Gain (Loss) | | | | | | |
| on Investments | | 1.029 | 8.752 | 3.025 | 7.379 | 5.832 | 5.357 |
| Total from Investment Operations | 1.785 | 10.327 | 4.456 | 8.660 | 7.119 | 6.434 |
| Distributions | | | | | | | |
| Dividends from Net Investment Income | (. 895) | (2.317) | (1.186) | (1.200) | (1.279) | (. 934) |
| Distributions from Realized Capital Gains | — | — | — | — | — | — |
| Total Distributions | | (. 895) | (2.317) | (1.186) | (1.200) | (1.279) | (. 934) |
| Net Asset Value, End of Period | $69.91 | $69.02 | $61.01 | $57.74 | $50.28 | $44.44 |
| |
| Total Return 1 | | 2.65% | 17.37% | 7.73% | 17.41% | 16.44% | 16.81% |
| |
| Ratios/Supplemental Data | | | | | | | |
| Net Assets, End of Period (Millions) | $723 | $728 | $319 | $218 | $175 | $105 |
| Ratio of Total Expenses to | | | | | | | |
| Average Net Assets | | 0.10% | 0.10% | 0.10% | 0.12% | 0.14% | 0.14% |
| Ratio of Net Investment Income to | | | | | | |
| Average Net Assets | | 2.30% | 2.50% | 2.53% | 2.52% | 2.80% | 2.80% |
| Portfolio Turnover Rate2 | | 3% | 6% | 6% | 5% | 10% | 7% |
The expense ratio, net investment income ratio, and turnover rate for the current period have been annualized.
1 Total returns do not include transaction or account service fees that may have applied in the periods shown. Fund prospectuses provide
information about any applicable transaction and account service fees.
2 Excludes the value of portfolio securities received or delivered as a result of in-kind purchases or redemptions of the fund’s capital shares,
including ETF Creation Units.
See accompanying Notes, which are an integral part of the Financial Statements.
22
Consumer Staples IndexFund
Notes to Financial Statements
Vanguard Consumer Staples Index Fund is registered under the Investment Company Act of 1940 as an open-end investment company, or mutual fund. The fund offers two classes of shares: ETF Shares and Admiral Shares. ETF Shares are listed for trading on NYSE Arca; they can be purchased and sold through a broker. Admiral Shares are designed for investors who meet certain administrative, service, and account-size criteria.
A. The following significant accounting policies conform to generally accepted accounting principles for U.S. investment companies. The fund consistently follows such policies in preparing its financial statements.
1. SecurityValuation:SecuritiesarevaluedasofthecloseoftradingontheNewYorkStockExchange (generally 4 p.m., Eastern time) on the valuation date. Equity securities are valued at thelatestquoted sales prices or official closing prices taken from the primary market in which each security trades; such securities not traded on the valuation date are valued at the mean of the latest quoted bid and asked prices. Securities for whichmarket quotations are not readily available, or whose valueshave been materially affected by events occurring before the fund’s pricing time but after the close of the securities’ primary markets, are valued by methods deemed by the board of trustees to represent fairvalue.InvestmentsinVanguard MarketLiquidityFundarevaluedatthatfund’snetassetvalue.
2. Futures Contracts: The fund uses index futures contracts to a limited extent, with the objectives of maintaining full exposure to the stock market, enhancing returns, maintaining liquidity, and minimizing transaction costs. The fund may purchase futures contracts to immediately invest incoming cash in the market, or sell futures in response to cash outflows, thereby simulating a fully invested position in the underlying index while maintaining a cash balance for liquidity. The fund may seek to enhance returns by using futures contracts instead of the underlying securities when futures are believed to be priced more attractively than the underlying securities. The primary risks associated with the use of futures contracts are imperfect correlation between changes in market values of stocks held by the fund and the prices of futures contracts, and the possibility of an illiquid market. Counterparty risk involving futures is mitigated because a regulated clearinghouse is the counterparty instead of the clearing broker. To further mitigate counterparty risk, the fund trades futures contracts on an exchange, monitors the financial strength of its clearing brokers and clearinghouse, and has entered into clearing agreements with its clearing brokers. The clearinghouse imposes initial margin requirements to secure the fund’s performance and requires daily settlement of variation margin representing changes in the market value of each contract.
Futures contracts are valued at their quoted daily settlement prices. The aggregate settlement values of the contracts are not recorded in the Statement of Net Assets. Fluctuations in the value of the contracts are recorded in the Statement of Net Assets as an asset (liability) and in the Statement of Operations as unrealized appreciation (depreciation) until the contracts are closed, when they are recorded as realized futures gains (losses).
During the six months ended February 28, 2017, the fund’s average investments in long and short futures contracts represented less than 1% and 0% of net assets, respectively, based on the average of aggregate settlement values at each quarter-end during the period. The fund had no open futures contracts at February 28, 2017.
3. Federal Income Taxes: The fund intends to continue to qualify as a regulated investment company and distribute all of its taxable income. Management has analyzed the fund’s tax positions taken for all open federal income tax years (August 31, 2013–2016), and for the period ended February 28, 2017, and has concluded that no provision for federal income tax is required in the fund’s financial statements. 4. Distributions: Distributions to shareholders are recorded on the ex-dividend date.
5. Securities Lending: To earn additional income, the fund lends its securities to qualified institutional borrowers. Security loans are subject to termination by the fund at any time, and are required to be secured at all times by collateral in an amount at least equal to the market value of securities loaned. Daily market fluctuations could cause the value of loaned securities to be more or less than the value of the collateral received. When this occurs, the collateral is adjusted and settled on the next business day. The fund further mitigates its counterparty risk by entering into securities lending transactions only with a diverse group of prequalified counterparties, monitoring their financial strength, and entering into master securities lending agreements with its counterparties. The master securities lending agreements provide that, in the event of a counterparty’s default (including bankruptcy),
23
Consumer Staples IndexFund
the fund may terminate any loans with that borrower, determine the net amount owed, and sell or retain the collateral up to the net amount owed to the fund; however, such actions may be subject to legal proceedings. While collateral mitigates counterparty risk, in the absence of a default the fund may experience delays and costs in recovering the securities loaned. The fund invests cash collateral received in Vanguard Market Liquidity Fund, and records a liability in the Statement of Net Assets for the return of the collateral, during the period the securities are on loan. Securities lending income represents feeschargedto borrowers plusincome earned oninvested cash collateral,less expenses associated with the loan. During the term of the loan, the fund is entitled to all distributions made on or in respect of the loaned securities.
6. Credit Facility: The fund and certain other funds managed by The Vanguard Group (“Vanguard”) participate in a $3.1 billion committed credit facility provided by a syndicate of lenders pursuant to a credit agreement that may be renewed annually; each fund is individually liable for its borrowings, if any, under the credit facility. Borrowings may be utilized for temporary and emergency purposes, and are subject to the fund’s regulatory and contractual borrowing restrictions. The participating funds are charged administrative fees and an annual commitment fee of 0.10% of the undrawn amount of the facility; these fees are allocated to the funds based on a method approved by the fund’s board of trustees and included in Management and Administrative expenses on the fund’s Statement of Operations. Any borrowings under this facility bear interest at a rate based upon the higher of the one-month London Interbank Offered Rate, federal funds effective rate, or overnight bank funding rate plus an agreed-upon spread.
The fund had no borrowings outstanding at February 28, 2017, or at any time during the period then ended.
7. Other: Dividend income is recorded on the ex-dividend date. Interest income includes income distributions received from Vanguard Market Liquidity Fund and is accrued daily. Security transactions are accounted for on the date securities are bought or sold. Costs used to determine realized gains (losses) on the sale of investment securities are those of the specific securities sold.
Each class of shares has equal rights as to assets and earnings, except that each class separately bears certain class-specific expenses related to maintenance of shareholder accounts (included in Management and Administrative expenses) and shareholder reporting. Marketing and distribution expenses are allocated to each class of shares based on a method approved by the board of trustees. Income, other non-class-specific expenses, and gains and losses on investments are allocated to each class of shares based on its relative net assets.
B. In accordance with the terms of a Funds’ Service Agreement (the “FSA”) between Vanguard and the fund, Vanguard furnishes to the fund investment advisory, corporate management, administrative, marketing, and distribution services at Vanguard’s cost of operations (as defined by the FSA). These costs of operations are allocated to the fund based on methods and guidelines approved by the board of trustees. Vanguard does not require reimbursement in the current period for certain costs of operations (such as deferred compensation/benefits and risk/insurance costs); the fund’s liability forthese costs of operations isincluded in Payables to Vanguard on the Statement of Net Assets.
Upon the request of Vanguard, the fund may invest up to 0.40% of its net assets as capital in Vanguard. At February 28, 2017,the fund had contributedto Vanguard capitalinthe amountof $290,000, representing 0.01% of the fund’s net assets and 0.12% of Vanguard’s capitalization. The fund’s trustees and officers are also directors and employees, respectively, of Vanguard.
C. Variousinputs may be used to determine the value of the fund’sinvestments. Theseinputs are summarized in three broad levels for financial statement purposes. The inputs or methodologies used to value securities are not necessarily an indication of the risk associated with investing in those securities.
Level 1—Quoted prices in active markets for identical securities.
Level 2—Other significant observable inputs (including quoted prices for similar securities, interest rates, prepayment speeds, credit risk, etc.).
Level 3—Significant unobservable inputs (including the fund’s own assumptions used to determine the fair value of investments).
At February 28, 2017, 100% of the market value of the fund’s investments was determined based on Level 1 inputs.
24
Consumer Staples IndexFund
D. Distributions are determined on a tax basis and may differ from net investment income and realized capital gains for financial reporting purposes. Differences may be permanent or temporary. Permanent differences are reclassified among capital accounts in the financial statements to reflect their tax character. Temporary differences arise when certain items of income, expense, gain, or loss are recognized in different periods for financial statement and tax purposes. These differences will reverse at some time in the future. Differences in classification may also result from the treatment of short-term gains as ordinary income for tax purposes.
During the six months ended February 28, 2017, the fund realized $89,035,000 of net capital gains resulting from in-kind redemptions—in which shareholders exchanged fund shares for securities held by the fund rather than for cash. Because such gains are not taxable to the fund, and are not distributed to shareholders, they have been reclassified from accumulated net realized losses to paid-in capital.
The fund’s tax-basis capital gains and losses are determined only at the end of each fiscal year. For tax purposes, at August 31, 2016, the fund had available capital losses totaling $24,410,000 to offset future net capital gains. Of this amount, $5,537,000 is subject to expiration on August 31, 2018. Capital losses of $18,873,000 realized beginning in fiscal 2012 may be carried forward indefinitely under the Regulated Investment Company Modernization Act of 2010, but must be used before any expiring loss carryforwards. The fund will use these capital losses to offset net taxable capital gains, if any, realized during the year ending August 31, 2017; should the fund realize net capital losses for the year, the losses will be added to the loss carryforward balance above.
At February 28, 2017, the cost of investment securities for tax purposes was $3,685,429,000. Net unrealized appreciation of investment securities for tax purposes was $619,255,000, consisting of unrealized gains of $643,977,000 on securities that had risen in value since their purchase and $24,722,000 in unrealized losses on securities that had fallen in value since their purchase.
E. During the six months ended February 28, 2017, the fund purchased $290,705,000 of investment securities and sold $297,321,000 of investment securities, other than temporary cash investments. Purchases and sales include $199,183,000 and $236,019,000, respectively, in connection with in-kind purchases and redemptions of the fund’s capital shares.
F. Capital share transactions for each class of shares were:
| | | | |
| | Six Months Ended | Year Ended |
| | February 28, 2017 | August 31, 2016 |
| | Amount | Shares | Amount | Shares |
| | ($000) | (000) | ($000) | (000) |
| ETF Shares | | | | |
| Issued | 247,076 | 1,802 | 1,104,521 | 8,312 |
| Issued in Lieu of Cash Distributions | — | — | — | — |
| Redeemed | (236,188) | (1,750) | (329,717) | (2,525) |
| Net Increase (Decrease)—ETF Shares | 10,888 | 52 | 774,804 | 5,787 |
| Admiral Shares | | | | |
| Issued | 176,333 | 2,645 | 482,450 | 7,328 |
| Issued in Lieu of Cash Distributions | 8,384 | 126 | 13,091 | 207 |
| Redeemed | (198,303) | (2,984) | (145,854) | (2,219) |
| Net Increase (Decrease)—Admiral Shares | (13,586) | (213) | 349,687 | 5,316 |
G. Management has determined that no material events or transactions occurred subsequent to February 28, 2017, that would require recognition or disclosure in these financial statements.
25
Energy Index Fund
Fund Profile
As of February 28, 2017
| | |
| Share-Class Characteristics | | |
| | ETF | Admiral |
| | Shares | Shares |
| Ticker Symbol | VDE | VENAX |
| Expense Ratio1 | 0.10% | 0.10% |
| 30-Day SEC Yield | 2.41% | 2.41% |
| | | |
| Portfolio Characteristics | | |
| | | MSCI | |
| | | US IMI/ | MSCI |
| | | Energy | US IMI/ |
| | Fund | 25/50 | 2500 |
| Number of Stocks | 130 | 131 | 2,479 |
| Median Market Cap | $53.4B | $50.1B | $57.6B |
| Price/Earnings Ratio | -107.3x | -112.7x | 24.7x |
| Price/Book Ratio | 2.0x | 2.0x | 3.0x |
| Return on Equity | 8.1% | 8.0% | 16.5% |
| Earnings Growth Rate | -26.7% | -25.8% | 7.6% |
| Dividend Yield | 2.5% | 2.5% | 1.9% |
| Foreign Holdings | 0.0% | 0.0% | 0.0% |
| Turnover Rate | | | |
| (Annualized) | 12% | — | — |
| Short-Term Reserves | -0.3% | — | — |
| | |
| Volatility Measures | | |
| | MSCI US | |
| | IMI/Energy | MSCI US |
| | 25/50 | IMI/2500 |
| R-Squared | 1.00 | 0.31 |
| Beta | 0.99 | 1.04 |
| These measures show the degree and timing of the fund’s |
| fluctuations compared with the indexes over 36 months. |
| |
| Subindustry Diversification | |
| (% of equity exposure) | |
| |
| Coal & Consumable Fuels | 0.2% |
| Integrated Oil & Gas | 38.9 |
| Oil & Gas Drilling | 2.1 |
| Oil & Gas Equipment & Services | 16.4 |
| Oil & Gas Exploration & Production | 27.6 |
| Oil & Gas Refining & Marketing | 7.9 |
| Oil & Gas Storage & Transportation | 6.9 |
| | |
| Ten Largest Holdings (% of total net assets) |
| |
| Exxon Mobil Corp. | Integrated Oil & Gas | 21.6% |
| Chevron Corp. | Integrated Oil & Gas | 13.8 |
| Schlumberger Ltd. | Oil & Gas Equipment | |
| | & Services | 7.3 |
| ConocoPhillips | Oil & Gas Exploration | |
| | & Production | 3.8 |
| EOG Resources | Oil & Gas Exploration | |
| Inc. | & Production | 3.7 |
| Occidental | | |
| Petroleum Corp. | Integrated Oil & Gas | 3.3 |
| Halliburton Co. | Oil & Gas Equipment | |
| | & Services | 3.0 |
| Kinder Morgan Inc. Oil & Gas Storage | |
| | & Transportation | 2.6 |
| Phillips 66 | Oil & Gas Refining | |
| | & Marketing | 2.4 |
| Anadarko | Oil & Gas Exploration | |
| Petroleum Corp. | & Production | 2.4 |
| Top Ten | | 63.9% |
| The holdings listedexcludeany temporary cashinvestments and |
| equity index products. |
1 The expense ratios shown are from the prospectus dated December 22, 2016, and represent estimated costs for the current fiscal year. For the six months ended February 28, 2017, the annualized expense ratios
were 0.10% for ETF Shares and 0.10% for Admiral Shares.
26
Energy Index Fund
Performance Summary
All of the returns in this report represent past performance, which is not a guarantee of future results that may be achieved by the fund. (Current performance may be lower or higher than theperformancedatacited.For performance data currenttothemostrecentmonth-end, visit our website at vanguard.com/performance.) Note, too, that both investment returns and principal value can fluctuate widely, so an investor’s shares, when sold, could be worth more or less than their original cost. The returns shown do not reflect taxes that a shareholder would pay on fund distributions or on the sale of fund shares.
Fiscal-Year Total Returns (%): August 31, 2006–February 28, 2017
For a benchmark description, see the Glossary.
Note: For 2017, performance data reflect the six months ended February 28, 2017.
Average Annual Total Returns: Periods Ended December 31, 2016
This table presents returns through the latest calendar quarter—rather than through the end of the fiscal period.
Securities and Exchange Commission rules require that we provide this information.
| | | | |
| | Inception Date | One Year | Five Years | Ten Years |
| ETF Shares | 9/23/2004 | | | |
| Market Price | | 28.93% | 3.02% | 3.98% |
| Net Asset Value | | 28.96 | 3.03 | 3.98 |
| Admiral Shares | 10/7/2004 | 28.94 | 3.04 | 3.97 |
See Financial Highlights for dividend and capital gains information
27
Energy Index Fund
Financial Statements (unaudited)
Statement of Net Assets
As of February 28, 2017
The fund reports a complete list of its holdings in regulatory filings four times in each fiscal year, at the quarter-ends. For the second and fourth fiscal quarters, the lists appear in the fund’s semiannual and annual reports to shareholders. For the first and third fiscal quarters, the fund files the lists with the Securities and Exchange Commission on Form N-Q. Shareholders can look up the fund’s Forms N-Q on the SEC’s website at sec.gov. Forms N-Q may also be reviewed and copied at the SEC’s Public Reference Room (see the back cover of this report for further information).
| | | |
| | | | Market |
| | | | Value• |
| | | Shares | ($000) |
| Common Stocks (99.7%) 1 | | |
| Energy Equipment & Services (18.5%) | |
| | Oil & Gas Drilling (2.1%) | | |
| ^ | Helmerich & Payne Inc. | 361,561 | 24,720 |
| * | Transocean Ltd. | 1,199,770 | 16,581 |
| | Patterson-UTI Energy Inc. | 548,023 | 15,136 |
| | Nabors Industries Ltd. | 947,261 | 13,868 |
| | Ensco plc Class A | 1,012,706 | 9,864 |
| * | Rowan Cos. plc Class A | 398,125 | 7,214 |
| | Noble Corp. plc | 812,460 | 5,427 |
| * | Unit Corp. | 171,909 | 4,665 |
| ^,* Diamond Offshore Drilling | | |
| | Inc. | 229,015 | 3,857 |
| * | Atwood Oceanics Inc. | 248,450 | 2,611 |
| * | Pioneer Energy Services | | |
| | Corp. | 356,974 | 1,874 |
| * | Parker Drilling Co. | 633,127 | 1,203 |
| |
| | Oil & Gas Equipment & Services (16.4%) |
| | Schlumberger Ltd. | 4,652,271 | 373,856 |
| | Halliburton Co. | 2,890,682 | 154,536 |
| | Baker Hughes Inc. | 1,342,752 | 80,941 |
| | National Oilwell Varco Inc. | 1,262,064 | 51,013 |
| * | TechnipFMC plc | 1,481,202 | 47,872 |
| * | Weatherford International | | |
| | plc | 3,117,707 | 17,646 |
| ^ | Core Laboratories NV | 147,368 | 16,862 |
| | US Silica Holdings Inc. | 266,090 | 13,456 |
| | Oceaneering International | | |
| | Inc. | 327,675 | 9,280 |
| * | Superior Energy Services | | |
| | Inc. | 506,994 | 8,365 |
| * | Dril-Quip Inc. | 125,480 | 7,698 |
| * | Oil States International Inc. | 171,612 | 6,315 |
| * | McDermott International | | |
| | Inc. | 806,137 | 5,933 |
| * | Fairmount Santrol Holdings | | |
| | Inc. | 483,709 | 4,586 |
| ^ | RPC Inc. | 217,853 | 4,357 |
| * | Forum Energy | | |
| | Technologies Inc. | 198,450 | 4,306 |
| * | Exterran Corp. | 130,312 | 3,967 |
| * | Helix Energy Solutions | | |
| | Group Inc. | 457,705 | 3,781 |
| * | SEACOR Holdings Inc. | 54,902 | 3,780 |
| | Archrock Inc. | 220,730 | 3,013 |
| * | Newpark Resources Inc. | 312,430 | 2,406 |
| ^ | Frank’s International NV | 185,778 | 2,266 |
| * | TETRA Technologies Inc. | 424,718 | 1,907 |
| | Bristow Group Inc. | 111,093 | 1,745 |
| * | Tesco Corp. | 182,698 | 1,526 |
| * | Matrix Service Co. | 93,691 | 1,518 |
| ^,* CARBO Ceramics Inc. | 111,427 | 1,430 |
| * | Era Group Inc. | 71,975 | 992 |
| * | RigNet Inc. | 49,165 | 868 |
| * | PHI Inc. | 49,774 | 721 |
| | | | |
| ^,* Hornbeck OffshoreServices | |
| | Inc. | | 158,381 | 711 |
| ^,* Tidewater Inc. | | 242,408 | 330 |
| | | | | 945,003 |
| Oil, Gas & Consumable Fuels (81.2%) | |
| | Coal & Consumable Fuels (0.2%) | |
| * | CONSOL Energy Inc. | | 613,447 | 9,551 |
| * | Westmoreland Coal Co. | 51,933 | 750 |
| |
| | Integrated Oil & Gas (38.7%) | |
| | Exxon Mobil Corp. | 13,581,231 | 1,104,426 |
| | Chevron Corp. | | 6,290,563 | 707,688 |
| | Occidental Petroleum | | |
| | Corp. | | 2,555,326 | 167,502 |
| |
| | Oil & Gas Exploration & Production (27.5%) |
| | ConocoPhillips | | 4,143,139 | 197,089 |
| | EOG Resources Inc. | | 1,928,015 | 186,998 |
| | Anadarko Petroleum Corp. | 120,822 |
| | Pioneer Natural Resources | 1,868,866 | |
| | Co. | | 567,658 | 105,567 |
| | Devon Energy Corp. | | 1,575,699 | 68,322 |
| | Apache Corp. | | 1,268,715 | 66,722 |
| * | Concho Resources Inc. | 488,431 | 64,693 |
| | Noble Energy Inc. | | 1,436,740 | 52,312 |
| | Hess Corp. | | 952,900 | 49,017 |
| | Marathon Oil Corp. | | 2,830,356 | 45,286 |
| | Cimarex Energy Co. | | 317,429 | 39,907 |
| | EQT Corp. | | 577,489 | 34,586 |
| | Cabot Oil & Gas Corp. | 1,552,864 | 34,008 |
| * | Diamondback Energy Inc. | 295,991 | 29,854 |
| * | Newfield Exploration Co. | 664,872 | 24,241 |
| * | Parsley Energy Inc. | | | |
| | Class A | | 725,049 | 22,034 |
| | Range Resources Corp. | 619,602 | 17,113 |
| * | Energen Corp. | | 324,446 | 17,033 |
| * | WPX Energy Inc. | | 1,301,880 | 16,794 |
| | Murphy Oil Corp. | | 546,826 | 15,470 |
| ^,* | Chesapeake Energy Corp. | 2,672,606 | 14,566 |
| * | Continental Resources Inc. | 312,930 | 14,144 |
| * | RSP Permian Inc. | | 339,472 | 13,406 |
| * | PDC Energy Inc. | | 188,023 | 12,709 |
| * | Antero Resources Corp. | 525,911 | 12,611 |
| * | Southwestern Energy Co. | 1,655,261 | 12,431 |
| * | QEP Resources Inc. | | 800,663 | 11,017 |
| * | Oasis Petroleum Inc. | | 750,525 | 10,627 |
| * | Whiting Petroleum Corp. | 951,456 | 10,323 |
| * | Rice Energy Inc. | | 541,793 | 10,104 |
| * | Gulfport Energy Corp. | 516,289 | 8,953 |
| * | Callon Petroleum Co. | | 671,745 | 8,477 |
| | SM Energy Co. | | 321,993 | 7,937 |
| * | Laredo Petroleum Inc. | 525,452 | 7,267 |
| * | Matador Resources Co. | 299,172 | 7,201 |
| * | Carrizo Oil & Gas Inc. | | 206,702 | 6,728 |
| ^,* Synergy Resources Corp. | 636,573 | 5,201 |
| * | Kosmos Energy Ltd. | | 645,385 | 3,963 |
| | | |
| ^,* Denbury Resources Inc. | 1,330,895 | 3,607 |
| * | Gran Tierra Energy Inc. | 1,305,625 | 3,499 |
| * | Sanchez Energy Corp. | 231,347 | 2,661 |
| ^,* California Resources Corp. | 137,462 | 2,456 |
| * | Clayton Williams Energy | | |
| | Inc. | 17,458 | 2,363 |
| * | Ring Energy Inc. | 166,711 | 2,061 |
| * | Resolute Energy Corp. | 39,455 | 1,837 |
| * | Bill Barrett Corp. | 245,598 | 1,353 |
| ^,* Northern Oil and Gas Inc. | 332,718 | 998 |
| * | Eclipse Resources Corp. | 410,829 | 887 |
| * | W&T Offshore Inc. | 352,013 | 884 |
| * | Cobalt International Energy | | |
| | Inc. | 1,159,763 | 823 |
| ^,* Jones Energy Inc. Class A | 215,649 | 690 |
| * | Contango Oil & Gas Co. | 86,484 | 642 |
| * | EXCO Resources Inc. | 868,075 | 484 |
| |
| | Oil & Gas Refining & Marketing (7.9%) |
| | Phillips 66 | 1,567,331 | 122,550 |
| | Valero Energy Corp. | 1,513,292 | 102,828 |
| | Marathon Petroleum Corp. 1,764,751 | 87,532 |
| | Tesoro Corp. | 390,759 | 33,289 |
| | HollyFrontier Corp. | 560,477 | 16,411 |
| | Western Refining Inc. | 289,891 | 10,587 |
| | PBF Energy Inc. Class A | 361,349 | 8,849 |
| | World Fuel Services Corp. | 235,433 | 8,516 |
| | Delek US Holdings Inc. | 165,227 | 3,977 |
| | Green Plains Inc. | 121,683 | 3,048 |
| * | REX American Resources | | |
| | Corp. | 19,597 | 1,631 |
| ^ | CVR Energy Inc. | 57,789 | 1,324 |
| * | Par Pacific Holdings Inc. | 80,251 | 1,172 |
| | Alon USA Energy Inc. | 95,174 | 1,157 |
| * | Clean Energy Fuels Corp. | 403,946 | 990 |
| * | Renewable Energy Group | | |
| | Inc. | 109,596 | 975 |
| |
| | Oil & Gas Storage & Transportation (6.9%) |
| | Kinder Morgan Inc. | 6,344,846 | 135,209 |
| | Williams Cos. Inc. | 2,728,413 | 77,323 |
| | ONEOK Inc. | 703,771 | 38,039 |
| | Targa Resources Corp. | 604,899 | 34,177 |
| * | Cheniere Energy Inc. | 667,713 | 32,084 |
| | Plains GP Holdings LP | | |
| | Class A | 475,854 | 15,641 |
| | SemGroup Corp. Class A | 220,802 | 7,761 |
| ^ | Tallgrass Energy GP LP | | |
| | Class A | 174,545 | 4,959 |
| * | Enbridge Energy | | |
| | Management LLC | 223,858 | 3,895 |
| | EnLink Midstream LLC | 180,273 | 3,461 |
| * | Gener8 Maritime Inc. | 156,498 | 764 |
| * | International Seaways Inc. | 35,269 | 661 |
| | | | 4,159,505 |
| Total Common Stocks | | |
| (Cost $5,625,573) | | 5,104,508 |
28
Energy Index Fund
| | |
| | | Market |
| | | Value• |
| | Shares | ($000) |
| Temporary Cash Investment (0.8%) 1 | |
| Money Market Fund (0.8%) | |
| 2,3 Vanguard Market | | |
| Liquidity Fund, 0.864% | | |
| (Cost $40,451) | 404,494 | 40,453 |
| Total Investments (100.5%) | |
| (Cost $5,666,024) | | 5,144,961 |
| |
| | | Amount |
| | | ($000) |
| Other Assets and Liabilities (-0.5%) | |
| Other Assets | | |
| Investment in Vanguard | | 379 |
| Receivables for Investment Securities Sold | 157,296 |
| Receivables for Accrued Income | 25,255 |
| Receivables for Capital Shares Issued | 8,435 |
| Other Assets | | 6 |
| Total Other Assets | | 191,371 |
| Liabilities | | |
| Payables for Investment Securities | |
| Purchased | | (147,545) |
| Collateral for Securities on Loan | (40,449) |
| Payables for Capital Shares Redeemed | (1,946) |
| Payables to Vanguard | | (2,426) |
| Other Liabilities | | (22,596) |
| Total Liabilities | | (214,962) |
| Net Assets (100%) | | 5,121,370 |
| |
| At February 28, 2017, net assets consisted of: |
| | Amount |
| | ($000) |
| Paid-in Capital | 6,105,509 |
| Undistributed Net Investment Income | 24,970 |
| Accumulated Net Realized Losses | (488,053) |
| Unrealized Appreciation(Depreciation) | |
| Investment Securities | (521,063) |
| Futures Contracts | 7 |
| Net Assets | 5,121,370 |
| |
| |
| ETF Shares—Net Assets | |
| Applicable to 42,614,518 outstanding | |
| $.001 par value shares of beneficial | |
| interest (unlimited authorization) | 4,191,318 |
| Net Asset Value Per Share— | |
| ETF Shares | $98.35 |
| |
| |
| Admiral Shares—Net Assets | |
| Applicable to 18,930,026 outstanding | |
| $.001 par value shares of beneficial | |
| interest (unlimited authorization) | 930,052 |
| Net Asset Value Per Share— | |
| Admiral Shares | $49.13 |
• See Note A in Notes toFinancial Statements.
^ Includes partial security positions on loan to broker-dealers. The total value of securities on loan is $38,566,000.
* Non-income-producing security.
1 The fund invests a portion of its cash reserves in equity markets through the use of index futures contracts. After giving effect to futures investments, the fund’s effective common stock and temporary cash
investment positions represent 100.0% and 0.5%, respectively, of net assets.
2 Affiliated money market fund available only to Vanguard funds and certain trusts and accounts managed by Vanguard. Rate shown is the 7-day yield.
3 Includes $40,449,000 of collateral received for securities on loan.
See accompanying Notes, which are an integral part of the Financial Statements.
29
Energy Index Fund
Statement of Operations
| |
| Six Months Ended |
| February 28, 2017 |
| | ($000) |
| Investment Income | |
| Income | |
| Dividends | 64,764 |
| Interest 1 | 6 |
| Securities Lending—Net | 321 |
| Total Income | 65,091 |
| Expenses | |
| The Vanguard Group—Note B | |
| Investment Advisory Services | 363 |
| Management and Administrative— | |
| ETF Shares | 1,406 |
| Management and Administrative— | |
| Admiral Shares | 334 |
| Marketing and Distribution— | |
| ETF Shares | 159 |
| Marketing and Distribution— | |
| Admiral Shares | 51 |
| Custodian Fees | 33 |
| Shareholders’ Reports—ETF Shares | 168 |
| Shareholders’ Reports—Admiral Shares | 14 |
| Trustees’ Fees and Expenses | 2 |
| Total Expenses | 2,530 |
| Net Investment Income | 62,561 |
| Realized Net Gain (Loss) on | |
| Investment Securities Sold 1 | (37,384) |
| Change in Unrealized Appreciation | |
| (Depreciation) | |
| Investment Securities | 191,150 |
| Futures Contracts | 7 |
| Change in Unrealized Appreciation | |
| (Depreciation) | 191,157 |
| Net Increase (Decrease) in Net Assets | |
| Resulting from Operations | 216,334 |
| 1 Interest income and realized net gain (loss) from an affiliated |
| company of the fund were $5,000 and $2,000, respectively. |
Statement of Changes in NetAssets
| | |
| | Six Months Ended | Year Ended |
| | February 28, | August 31, |
| | 2017 | 2016 |
| | ($000) | ($000) |
| Increase (Decrease) in Net Assets | | |
| Operations | | |
| Net Investment Income | 62,561 | 129,797 |
| Realized Net Gain (Loss) | (37,384) | (152,029) |
| Change in Unrealized Appreciation (Depreciation) | 191,157 | 275,863 |
| Net Increase (Decrease) in Net Assets Resulting from Operations | 216,334 | 253,631 |
| Distributions | | |
| Net Investment Income | | |
| ETF Shares | (49,909) | (161,400) |
| Admiral Shares | (11,285) | (32,917) |
| Realized Capital Gain | | |
| ETF Shares | — | — |
| Admiral Shares | — | — |
| Total Distributions | (61,194) | (194,317) |
| Capital Share Transactions | | |
| ETF Shares | 123,740 | 192,098 |
| Admiral Shares | 4,659 | 117,493 |
| Net Increase (Decrease) from Capital Share Transactions | 128,399 | 309,591 |
| Total Increase (Decrease) | 283,539 | 368,905 |
| Net Assets | | |
| Beginning of Period | 4,837,831 | 4,468,926 |
| End of Period 1 | 5,121,370 | 4,837,831 |
| 1 Net Assets—End of Period includes undistributed (overdistributed) net investment income of $24,970,000 and $23,603,000. |
See accompanying Notes, which are an integral part of the Financial Statements.
30
Energy Index Fund
Financial Highlights
| | | | | | | |
| ETF Shares | | | | | | | |
| | Six Months | | | | | |
| | | Ended | | | | | |
| For a Share Outstanding | February 28, | Year Ended August 31, |
| Throughout Each Period | | 2017 | 2016 | 2015 | 2014 | 2013 | 2012 |
| Net Asset Value, Beginning of Period | $95.06 | $93.86 | $142.26 | $116.47 | $103.35 | $100.41 |
| Investment Operations | | | | | | | |
| Net Investment Income | | 1.211 | 2.470 | 2.9531 | 2.329 | 2.215 | 1.827 |
| Net Realized and Unrealized Gain (Loss) | | | | | | |
| on Investments | | 3.274 | 2.587 | (49.144) | 25.655 | 12.899 | 2.731 |
| Total from Investment Operations | 4.485 | 5.057 | (46.191) | 27.984 | 15.114 | 4.558 |
| Distributions | | | | | | | |
| Dividends from Net Investment Income | (1.195) | (3.857) | (2.209) | (2.194) | (1.994) | (1.618) |
| Distributions from Realized Capital Gains | — | — | — | — | — | — |
| Total Distributions | | (1.195) | (3.857) | (2.209) | (2.194) | (1.994) | (1.618) |
| Net Asset Value, End of Period | $98.35 | $95.06 | $93.86 | $142.26 | $116.47 | $103.35 |
| |
| Total Return | | 4.73% | 5.82% | -32.70% | 24.31% | 14.85% | 4.60% |
| |
| Ratios/Supplemental Data | | | | | | | |
| Net Assets, End of Period (Millions) | $4,191 | $3,944 | $3,736 | $3,467 | $2,255 | $1,917 |
| Ratio of Total Expenses to | | | | | | | |
| Average Net Assets | | 0.10% | 0.10% | 0.10% | 0.12% | 0.14% | 0.14% |
| Ratio of Net Investment Income to | | | | | | |
| Average Net Assets | | 2.47% | 2.86% | 2.65% | 1.98% | 2.02% | 1.81% |
| Portfolio Turnover Rate2 | | 12% | 15% | 4% | 4% | 9% | 12% |
| The expense ratio, net investment income ratio, and turnover rate for the current period have been annualized. | | |
| 1 Calculated based on average shares outstanding. |
| 2 Excludes the value of portfolio securities received or delivered as a result of in-kind purchases or redemptions of the fund’s capital shares, |
| including ETF Creation Units. |
See accompanying Notes, which are an integral part of the Financial Statements.
31
Energy Index Fund
Financial Highlights
| | | | | | | |
| Admiral Shares | | | | | | | |
| | Six Months | | | | | |
| | | Ended | | | | | |
| For a Share Outstanding | February 28, | Year Ended August 31, |
| Throughout Each Period | | 2017 | 2016 | 2015 | 2014 | 2013 | 2012 |
| Net Asset Value, Beginning of Period | $47.49 | $46.89 | $71.06 | $58.18 | $51.63 | $50.17 |
| Investment Operations | | | | | | | |
| Net Investment Income | | .604 | 1.234 | 1.4951 | 1.164 | 1.108 | .913 |
| Net Realized and Unrealized Gain (Loss) | | | | | | |
| on Investments | | 1.633 | 1.293 | (24.561) | 12.815 | 6.439 | 1.358 |
| Total from Investment Operations | 2.237 | 2.527 | (23.066) | 13.979 | 7.547 | 2.271 |
| Distributions | | | | | | | |
| Dividends from Net Investment Income | (. 597) | (1.927) | (1.104) | (1.099) | (. 997) | (.811) |
| Distributions from Realized Capital Gains | — | — | — | — | — | — |
| Total Distributions | | (. 597) | (1.927) | (1.104) | (1.099) | (. 997) | (.811) |
| Net Asset Value, End of Period | $49.13 | $47.49 | $46.89 | $71.06 | $58.18 | $51.63 |
| |
| Total Return 2 | | 4.70% | 5.83% | -32.66% | 24.32% | 14.86% | 4.61% |
| |
| Ratios/Supplemental Data | | | | | | | |
| Net Assets, End of Period (Millions) | $930 | $894 | $733 | $575 | $460 | $254 |
| Ratio of Total Expenses to | | | | | | | |
| Average Net Assets | | 0.10% | 0.10% | 0.10% | 0.12% | 0.14% | 0.14% |
| Ratio of Net Investment Income to | | | | | | |
| Average Net Assets | | 2.47% | 2.86% | 2.65% | 1.98% | 2.02% | 1.81% |
| Portfolio Turnover Rate3 | | 12% | 15% | 4% | 4% | 9% | 12% |
The expense ratio, net investment income ratio, and turnover rate for the current period have been annualized.
1 Calculated based on average shares outstanding.
2 Total returns do not include transaction or account service fees that may have applied in the periods shown. Fund prospectuses provide
information about any applicable transaction and account service fees.
3 Excludes the value of portfolio securities received or delivered as a result of in-kind purchases or redemptions of the fund’s capital shares,
including ETF Creation Units.
See accompanying Notes, which are an integral part of the Financial Statements.
32
Energy Index Fund
Notes to Financial Statements
Vanguard Energy Index Fund is registered under the Investment Company Act of 1940 as an open-end investment company, or mutual fund. The fund offers two classes of shares: ETF Shares and Admiral Shares. ETF Shares are listed for trading on NYSE Arca; they can be purchased and sold through a broker. Admiral Shares are designed for investors who meet certain administrative, service, and account-size criteria.
A. The following significant accounting policies conform to generally accepted accounting principles for U.S. investment companies. The fund consistently follows such policies in preparing its financial statements.
1. SecurityValuation:SecuritiesarevaluedasofthecloseoftradingontheNewYorkStockExchange (generally 4 p.m., Eastern time) on the valuation date. Equity securities are valued at thelatestquoted sales prices or official closing prices taken from the primary market in which each security trades; such securities not traded on the valuation date are valued at the mean of the latest quoted bid and asked prices. Securities for whichmarket quotations are not readily available, or whose valueshave been materially affected by events occurring before the fund’s pricing time but after the close of the securities’ primary markets, are valued by methods deemed by the board of trustees to represent fairvalue.InvestmentsinVanguard MarketLiquidityFundarevaluedatthatfund’snetassetvalue.
2. Futures Contracts: The fund uses index futures contracts to a limited extent, with the objectives of maintaining full exposure to the stock market, enhancing returns, maintaining liquidity, and minimizing transaction costs. The fund may purchase futures contracts to immediately invest incoming cash in the market, or sell futures in response to cash outflows, thereby simulating a fully invested position in the underlying index while maintaining a cash balance for liquidity. The fund may seek to enhance returns by using futures contracts instead of the underlying securities when futures are believed to be priced more attractively than the underlying securities. The primary risks associated with the use of futures contracts are imperfect correlation between changes in market values of stocks held by the fund and the prices of futures contracts, and the possibility of an illiquid market. Counterparty risk involving futures is mitigated because a regulated clearinghouse is the counterparty instead of the clearing broker. To further mitigate counterparty risk, the fund trades futures contracts on an exchange, monitors the financial strength of its clearing brokers and clearinghouse, and has entered into clearing agreements with its clearing brokers. The clearinghouse imposes initial margin requirements to secure the fund’s performance and requires daily settlement of variation margin representing changes in the market value of each contract.
Futures contracts are valued at their quoted daily settlement prices. The aggregate settlement values of the contracts are not recorded in the Statement of Net Assets. Fluctuations in the value of the contracts are recorded in the Statement of Net Assets as an asset (liability) and in the Statement of Operations as unrealized appreciation (depreciation) until the contracts are closed, when they are recorded as realized futures gains (losses).
During the six months ended February 28, 2017, the fund’s average investments in long and short futures contracts represented less than 1% and 0% of net assets, respectively, based on the average of aggregate settlement values at each quarter-end during the period.
3. Federal Income Taxes: The fund intends to continue to qualify as a regulated investment company and distribute all of its taxable income. Management has analyzed the fund’s tax positions taken for all open federal income tax years (August 31, 2013–2016), and for the period ended February 28, 2017, and has concluded that no provision for federal income tax is required in the fund’s financial statements. 4. Distributions: Distributions to shareholders are recorded on the ex-dividend date.
5. Securities Lending: To earn additional income, the fund lends its securities to qualified institutional borrowers. Security loans are subject to termination by the fund at any time, and are required to be secured at all times by collateral in an amount at least equal to the market value of securities loaned. Daily market fluctuations could cause the value of loaned securities to be more or less than the value of the collateral received. When this occurs, the collateral is adjusted and settled on the next business day. The fund further mitigates its counterparty risk by entering into securities lending transactions only with a diverse group of prequalified counterparties, monitoring their financial strength, and entering into master securities lending agreements with its counterparties. The master securities lending agreements provide that, in the event of a counterparty’s default (including bankruptcy), the fund may terminate any loans with that borrower, determine the net amount owed, and sell or retain the collateral up to the net amount owed to the fund; however, such actions may be subject to legal proceedings. While collateral mitigates counterparty risk, in the absence of a default the fund may experience delays and costs in recovering the securities loaned. The fund invests cash collateral received in Vanguard Market Liquidity Fund, and records a liability in the Statement of Net Assets for the return of the collateral, during the period the securities are on loan. Securities lending income
33
Energy Index Fund
represents feeschargedto borrowers plusincome earned oninvested cash collateral,less expenses associated with the loan. During the term of the loan, the fund is entitled to all distributions made on or in respect of the loaned securities.
6. Credit Facility: The fund and certain other funds managed by The Vanguard Group (“Vanguard”) participate in a $3.1 billion committed credit facility provided by a syndicate of lenders pursuant to a credit agreement that may be renewed annually; each fund is individually liable for its borrowings, if any, under the credit facility. Borrowings may be utilized for temporary and emergency purposes, and are subject to the fund’s regulatory and contractual borrowing restrictions. The participating funds are charged administrative fees and an annual commitment fee of 0.10% of the undrawn amount of the facility; these fees are allocated to the funds based on a method approved by the fund’s board of trustees and included in Management and Administrative expenses on the fund’s Statement of Operations. Any borrowings under this facility bear interest at a rate based upon the higher of the one-month London Interbank Offered Rate, federal funds effective rate, or overnight bank funding rate plus an agreed-upon spread.
The fund had no borrowings outstanding at February 28, 2017, or at any time during the period then ended.
7. Other: Dividend income is recorded on the ex-dividend date. Interest income includes income distributions received from Vanguard Market Liquidity Fund and is accrued daily. Security transactions are accounted for on the date securities are bought or sold. Costs used to determine realized gains (losses) on the sale of investment securities are those of the specific securities sold.
Each class of shares has equal rights as to assets and earnings, except that each class separately bears certain class-specific expenses related to maintenance of shareholder accounts (included in Management and Administrative expenses) and shareholder reporting. Marketing and distribution expenses are allocated to each class of shares based on a method approved by the board of trustees. Income, other non-class-specific expenses, and gains and losses on investments are allocated to each class of shares based on its relative net assets.
B. In accordance with the terms of a Funds’ Service Agreement (the “FSA”) between Vanguard and the fund, Vanguard furnishes to the fund investment advisory, corporate management, administrative, marketing,anddistributionservices atVanguard’scostofoperations (as defined bythe FSA).These costs of operations are allocated to the fund based on methods and guidelines approved by the board of trustees. Vanguard does not require reimbursement in the current period for certain costs ofoperations(such asdeferred compensation/benefitsand risk/insurance costs);thefund’sliability for these costs of operations isincluded in Payables to Vanguard on the Statement of Net Assets.
Upon the request of Vanguard, the fund may invest up to 0.40% of its net assets as capital in Vanguard. At February 28, 2017,the fund had contributedto Vanguard capitalinthe amountof $379,000, representing 0.01% of the fund’s net assets and 0.15% of Vanguard’s capitalization. The fund’s trustees and officers are also directors and employees, respectively, of Vanguard.
C. Variousinputs may be used to determine the value of the fund’sinvestments. Theseinputs are summarized in three broad levels for financial statement purposes. The inputs or methodologies used to value securities are not necessarily an indication of the risk associated with investing in those securities.
Level 1—Quoted prices in active markets for identical securities.
Level 2—Other significant observable inputs (including quoted prices for similar securities, interest rates, prepayment speeds, credit risk, etc.).
Level 3—Significant unobservable inputs (including the fund’s own assumptions used to determine the fair value of investments).
At February 28, 2017, 100% of the market value of the fund’s investments was determined based on Level 1 inputs.
D. At February 28, 2017, the aggregate settlement value of open futures contracts and the related unrealized appreciation (depreciation) were:
| | | | |
| | | | ($000) |
| | | | Aggregate | |
| | | Number of | Settlement | Unrealized |
| | | Long (Short) | Value | Appreciation |
| Futures Contracts | Expiration | Contracts | Long (Short) | (Depreciation) |
| E-mini S&P 500 Index | March 2017 | 150 | 17,721 | 7 |
Unrealized appreciation (depreciation) on open futures contracts is required to be treated as realized gain (loss) for tax purposes.
34
Energy Index Fund
E. Distributions are determined on a tax basis and may differ from net investment income and realized capital gains for financial reporting purposes. Differences may be permanent or temporary. Permanent differences are reclassified among capital accounts in the financial statements to reflect their tax character. Temporary differences arise when certain items of income, expense, gain, or loss are recognized in different periods for financial statement and tax purposes. These differences will reverse at some time in the future. Differences in classification may also result from the treatment of short-term gains as ordinary income for tax purposes.
During the six months ended February 28, 2017, the fund realized $42,497,000 of net capital gains resulting from in-kind redemptions—in which shareholders exchanged fund shares for securities held by the fund rather than for cash. Because such gains are not taxable to the fund, and are not distributed to shareholders, they have been reclassified from accumulated net realized losses to paid-in capital.
The fund’s tax-basis capital gains and losses are determined only at the end of each fiscal year. For tax purposes, at August 31, 2016, the fund had available capital losses totaling $408,172,000 to offset future net capital gains. Of this amount, $68,284,000 is subject to expiration dates; $37,585,000 may be used to offset future net capital gains through August 31, 2018, and $30,699,000 through August 31, 2019. Capital losses of $339,888,000 realized beginning in fiscal 2012 may be carried forward indefinitely under the Regulated Investment Company Modernization Act of 2010, but must be used before any expiring loss carryforwards. The fund will use these capital losses to offset net taxable capital gains, if any, realized during the year ending August 31, 2017; should the fund realize net capital losses for the year, the losses will be added to the loss carryforward balance above.
At February 28, 2017, the cost of investment securities for tax purposes was $5,666,024,000. Net unrealized depreciation of investment securities for tax purposes was $521,063,000, consisting of unrealized gains of $236,868,000 on securities that had risen in value since their purchase and $757,931,000 in unrealized losses on securities that had fallen in value since their purchase.
F. During the six months ended February 28, 2017, the fund purchased $625,944,000 of investment securities and sold $514,642,000 of investment securities, other than temporary cash investments. Purchases and sales include $265,018,000 and $208,297,000, respectively, in connection with in-kind purchases and redemptions of the fund’s capital shares.
G. Capital share transactions for each class of shares were:
| | | | |
| | Six Months Ended | Year Ended |
| | February 28, 2017 | August 31, 2016 |
| | Amount | Shares | Amount | Shares |
| | ($000) | (000) | ($000) | (000) |
| ETF Shares | | | | |
| Issued | 332,643 | 3,277 | 1,239,731 | 14,359 |
| Issued in Lieu of Cash Distributions | — | — | — | — |
| Redeemed | (208,903) | (2,150) | (1,047,633) | (12,675) |
| Net Increase (Decrease)—ETF Shares | 123,740 | 1,127 | 192,098 | 1,684 |
| Admiral Shares | | | | |
| Issued | 137,154 | 2,732 | 385,314 | 9,176 |
| Issued in Lieu of Cash Distributions | 10,116 | 204 | 30,038 | 689 |
| Redeemed | (142,611) | (2,835) | (297,859) | (6,669) |
| Net Increase (Decrease)—Admiral Shares | 4,659 | 101 | 117,493 | 3,196 |
H. Management has determined that no material events or transactions occurred subsequent to February 28, 2017, that would require recognition or disclosure in these financial statements.
35
Financials Index Fund
Fund Profile
As of February 28, 2017
| | |
| Share-Class Characteristics | | |
| | ETF | Admiral |
| | Shares | Shares |
| Ticker Symbol | VFH | VFAIX |
| Expense Ratio1 | 0.10% | 0.10% |
| 30-Day SEC Yield | 1.69% | 1.71% |
| | | |
| Portfolio Characteristics | | |
| | | MSCI | |
| | | US IMI/ | MSCI |
| | | Financials | US IMI/ |
| | Fund | 25/50 | 2500 |
| Number of Stocks | 399 | 398 | 2,479 |
| Median Market Cap | $57.6B | $57.6B | $57.6B |
| Price/Earnings Ratio | 17.0x | 17.0x | 24.7x |
| Price/Book Ratio | 1.4x | 1.5x | 3.0x |
| Return on Equity | 10.5% | 10.5% | 16.5% |
| Earnings Growth Rate | 11.2% | 11.2% | 7.6% |
| Dividend Yield | 1.8% | 1.8% | 1.9% |
| Foreign Holdings | 0.0% | 0.0% | 0.0% |
| Turnover Rate | | | |
| (Annualized) | 3% | — | — |
| Short-Term Reserves | 0.0% | — | — |
| | |
| Volatility Measures | | |
| | MSCI US | |
| | IMI/Financials | MSCI US |
| | 25/50 | IMI/2500 |
| R-Squared | 1.00 | 0.69 |
| Beta | 1.00 | 1.11 |
| These measures show the degree and timing of the fund’s |
| fluctuations compared with the indexes over 36 months. |
| |
| Subindustry Diversification | |
| (% of equity exposure) | |
| |
| Asset Management & Custody Banks | 7.0% |
| Consumer Finance | 5.4 |
| Diversified Banks | 30.8 |
| Financial Exchanges & Data | 4.6 |
| Insurance Brokers | 2.8 |
| Investment Banking & Brokerage | 6.9 |
| Life & Health Insurance | 5.3 |
| Mortgage REITs | 1.6 |
| Multi-line Insurance | 3.2 |
| Multi-Sector Holdings | 6.1 |
| Property & Casualty Insurance | 7.8 |
| Regional Banks | 15.5 |
| Reinsurance | 1.4 |
| Thrifts & Mortgage Finance | 1.4 |
| Other Financials | 0.2 |
| | |
| Ten Largest Holdings (% of total net assets) |
| |
| JPMorgan | | |
| Chase & Co. | Diversified Banks | 8.9% |
| Wells Fargo & Co. | Diversified Banks | 7.6 |
| Bank of America | | |
| Corp. | Diversified Banks | 6.8 |
| Berkshire | | |
| Hathaway Inc. | | |
| Class B | Multi-Sector Holdings | 5.8 |
| Citigroup Inc. | Diversified Banks | 4.7 |
| US Bancorp | Diversified Banks | 2.6 |
| Goldman Sachs | Investment Banking | |
| Group Inc. | & Brokerage | 2.4 |
| American | | |
| International | | |
| Group Inc. | Multi-line Insurance | 1.8 |
| Chubb Ltd. | Property & Casualty | |
| | Insurance | 1.8 |
| Morgan Stanley | Investment Banking | |
| | & Brokerage | 1.8 |
| Top Ten | | 44.2% |
| The holdings listedexcludeany temporary cashinvestments and |
| equity index products. | | |
1The expense ratios shown are from the prospectus dated December 22, 2016, and represent estimated costs for the current fiscal year. For the six months ended February 28, 2017, the annualized expense ratios
were 0.10% for ETF Shares and 0.10% for Admiral Shares.
36
Financials Index Fund
Performance Summary
All of the returns in this report represent past performance, which is not a guarantee of future results that may be achieved by the fund. (Current performance may be lower or higher than theperformancedatacited.For performance data currenttothemostrecentmonth-end, visit our website at vanguard.com/performance.) Note, too, that both investment returns and principal value can fluctuate widely, so an investor’s shares, when sold, could be worth more or less than their original cost. The returns shown do not reflect taxes that a shareholder would pay on fund distributions or on the sale of fund shares.
Fiscal-Year Total Returns (%): August 31, 2006–February 28, 2017
For a benchmark description, see the Glossary.
Note: For 2017, performance data reflect the six months ended February 28, 2017.
Average Annual Total Returns: Periods Ended December 31, 2016
This table presents returns through the latest calendar quarter—rather than through the end of the fiscal period.
Securities and Exchange Commission rules require that we provide this information.
| | | | |
| | Inception Date | One Year | Five Years | Ten Years |
| ETF Shares | 1/26/2004 | | | |
| Market Price | | 24.75% | 18.89% | 1.18% |
| Net Asset Value | | 24.69 | 18.89 | 1.20 |
| Admiral Shares | 2/4/2004 | 24.68 | 18.90 | 1.19 |
See Financial Highlights for dividend and capital gains information.
37
Financials Index Fund
Financial Statements (unaudited)
Statement of Net Assets
As of February 28, 2017
The fund reports a complete list of its holdings in regulatory filings four times in each fiscal year, at the quarter-ends. For the second and fourth fiscal quarters, the lists appear in the fund’s semiannual and annual reports to shareholders. For the first and third fiscal quarters, the fund files the lists with the Securities and Exchange Commission on Form N-Q. Shareholders can look up the fund’s Forms N-Q on the SEC’s website at sec.gov. Forms N-Q may also be reviewed and copied at the SEC’s Public Reference Room (see the back cover of this report for further information).
| | | | |
| | | | | Market |
| | | | | Value• |
| | | | Shares | ($000) |
| Common Stocks (99.9%) | | | |
| Banks (46.4%) | | | |
| | JPMorgan Chase & Co. | | 6,146,910 | 557,033 |
| | Wells Fargo & Co. | | 8,195,874 | 474,377 |
| | Bank of America Corp. | 17,358,998 | 428,420 |
| | Citigroup Inc. | | 4,895,852 | 292,821 |
| | US Bancorp | | 2,919,870 | 160,593 |
| | PNC Financial Services | | | |
| | Group Inc. | | 835,771 | 106,335 |
| | BB&T Corp. | 1,394,129 | 67,225 |
| | SunTrust Banks Inc. | | 843,316 | 50,169 |
| | M&T Bank Corp. | | 239,797 | 40,039 |
| | Fifth Third Bancorp | 1,298,681 | 35,636 |
| | KeyCorp | 1,855,964 | 34,836 |
| | Citizens Financial Group | | | |
| | Inc. | | 879,790 | 32,878 |
| | Regions Financial Corp. | 2,114,240 | 32,284 |
| | Huntington Bancshares | | | |
| | Inc. | 1,862,874 | 26,341 |
| | First Republic Bank | | 264,765 | 24,843 |
| | Comerica Inc. | | 296,196 | 21,113 |
| * | SVB Financial Group | | 89,520 | 17,088 |
| | Zions Bancorporation | | 349,799 | 15,706 |
| | CIT Group Inc. | | 347,080 | 14,890 |
| * | Signature Bank | | 92,231 | 14,527 |
| | East West Bancorp Inc. | | 247,622 | 13,401 |
| | PacWest Bancorp | | 196,313 | 10,817 |
| | People’s United Financial | | | |
| | Inc. | | 534,769 | 10,268 |
| | Bank of the Ozarks Inc. | | 176,931 | 9,683 |
| | Commerce Bancshares Inc. | 156,725 | 9,250 |
| | Cullen/Frost Bankers Inc. | | 97,335 | 9,001 |
| | Synovus Financial Corp. | | 210,430 | 8,884 |
| | Webster Financial Corp. | | 157,613 | 8,658 |
| | Prosperity Bancshares Inc. | | 113,392 | 8,452 |
| * | Western Alliance Bancorp | | 162,470 | 8,390 |
| | First Horizon National Corp. | 400,575 | 7,987 |
| | Popular Inc. | | 178,299 | 7,856 |
| | Investors Bancorp Inc. | | 531,231 | 7,772 |
| * | Texas Capital Bancshares | | | |
| | Inc. | | 84,262 | 7,512 |
| | PrivateBancorp Inc. | | 130,074 | 7,362 |
| | Umpqua Holdings Corp. | | 378,163 | 7,113 |
| | BankUnited Inc. | | 178,923 | 7,091 |
| | Hancock Holding Co. | | 143,026 | 6,787 |
| | Associated Banc-Corp | | 258,462 | 6,655 |
| | Wintrust Financial Corp. | | 89,005 | 6,560 |
| | Chemical Financial Corp. | | 121,233 | 6,458 |
| | IBERIABANK Corp. | | 76,135 | 6,452 |
| | United Bankshares Inc. | | 139,275 | 6,233 |
| | Bank of Hawaii Corp. | | 73,326 | 6,193 |
| | MB Financial Inc. | | 136,311 | 6,137 |
| | Home BancShares Inc. | | 217,139 | 6,110 |
| | UMB Financial Corp. | | 72,421 | 5,708 |
| | Fulton Financial Corp. | | 297,584 | 5,691 |
| | FNB Corp. | | 361,477 | 5,628 |
| | | |
| | Pinnacle Financial Partners | | |
| | Inc. | 80,453 | 5,583 |
| | Sterling Bancorp | 220,562 | 5,459 |
| | Valley National Bancorp | 415,317 | 5,137 |
| | Cathay General Bancorp | 128,780 | 5,058 |
| | TCF Financial Corp. | 279,306 | 4,860 |
| | Glacier Bancorp Inc. | 131,455 | 4,853 |
| | Hope Bancorp Inc. | 220,646 | 4,722 |
| | Community Bank System | | |
| | Inc. | 76,256 | 4,530 |
| | BancorpSouth Inc. | 144,982 | 4,494 |
| | First Citizens BancShares | | |
| | Inc. Class A | 12,286 | 4,377 |
| | Great Western Bancorp | | |
| | Inc. | 100,846 | 4,310 |
| | South State Corp. | 47,714 | 4,270 |
| | CVB Financial Corp. | 176,452 | 4,191 |
| | Old National Bancorp | 220,275 | 4,042 |
| | First Financial Bankshares | | |
| | Inc. | 90,761 | 3,994 |
| | Columbia Banking System | | |
| | Inc. | 99,843 | 3,983 |
| | Hilltop Holdings Inc. | 135,423 | 3,843 |
| | Trustmark Corp. | 116,184 | 3,839 |
| | International Bancshares | | |
| | Corp. | 96,329 | 3,665 |
| | First Midwest Bancorp Inc. | 139,738 | 3,414 |
| | United Community Banks | | |
| | Inc. | 115,946 | 3,350 |
| | LegacyTexas Financial | | |
| | Group Inc. | 77,986 | 3,321 |
| * | Eagle Bancorp Inc. | 52,103 | 3,243 |
| | ServisFirst Bancshares Inc. | 76,845 | 3,194 |
| | Towne Bank | 96,465 | 3,140 |
| | NBT Bancorp Inc. | 74,321 | 3,001 |
| | Renasant Corp. | 72,371 | 2,970 |
| | First Financial Bancorp | 106,928 | 2,967 |
| | Independent Bank Corp. | 45,454 | 2,955 |
| * | FCB Financial Holdings Inc. | | |
| | Class A | 59,766 | 2,905 |
| | WesBanco Inc. | 71,905 | 2,902 |
| | BNC Bancorp | 80,684 | 2,901 |
| | BOK Financial Corp. | 34,089 | 2,811 |
| | Simmons First National | | |
| | Corp. Class A | 48,357 | 2,781 |
| | Ameris Bancorp | 57,277 | 2,766 |
| | Union Bankshares Corp. | 74,832 | 2,713 |
| | First Merchants Corp. | 66,938 | 2,686 |
| | Westamerica | | |
| | Bancorporation | 44,374 | 2,567 |
| | Yadkin Financial Corp. | 75,898 | 2,547 |
| | Boston Private Financial | | |
| | Holdings Inc. | 142,737 | 2,455 |
| | Park National Corp. | 22,393 | 2,406 |
| | CenterState Banks Inc. | 87,290 | 2,157 |
| | S&T Bancorp Inc. | 59,758 | 2,127 |
| | | |
| | First Commonwealth | | |
| | Financial Corp. | 152,477 | 2,124 |
| | Capital Bank Financial Corp. | 48,839 | 1,993 |
| | Tompkins Financial Corp. | 21,996 | 1,974 |
| | Lakeland Financial Corp. | 43,435 | 1,972 |
| | Brookline Bancorp Inc. | 120,959 | 1,917 |
| * | Pacific Premier Bancorp Inc. | 47,556 | 1,902 |
| | Berkshire Hills Bancorp Inc. | 53,399 | 1,888 |
| | Heartland Financial USA Inc. | 37,912 | 1,879 |
| | Hanmi Financial Corp. | 55,874 | 1,866 |
| * | First BanCorp | 281,112 | 1,794 |
| | Sandy Spring Bancorp Inc. | 41,396 | 1,783 |
| | Cardinal Financial Corp. | 56,374 | 1,761 |
| | City Holding Co. | 25,796 | 1,690 |
| | Banner Corp. | 28,957 | 1,683 |
| * | Customers Bancorp Inc. | 48,899 | 1,679 |
| | Central Pacific Financial | | |
| | Corp. | 52,970 | 1,673 |
| | Stock Yards Bancorp Inc. | 37,032 | 1,637 |
| | Southside Bancshares Inc. | 46,430 | 1,636 |
| | State Bank Financial Corp. | 59,950 | 1,626 |
| | First Busey Corp. | 52,362 | 1,619 |
| | First Interstate BancSystem | | |
| | Inc. Class A | 35,126 | 1,540 |
| | Enterprise Financial Services | | |
| | Corp. | 34,206 | 1,503 |
| | National Bank Holdings Corp. | | |
| | Class A | 44,531 | 1,469 |
| | Lakeland Bancorp Inc. | 72,634 | 1,431 |
| | Banc of California Inc. | 72,408 | 1,408 |
| * | Seacoast Banking Corp. of | | |
| | Florida | 58,984 | 1,370 |
| | MainSource Financial Group | | |
| | Inc. | 39,696 | 1,360 |
| | 1st Source Corp. | 29,056 | 1,357 |
| | Washington Trust Bancorp | | |
| | Inc. | 24,980 | 1,354 |
| | Flushing Financial Corp. | 46,633 | 1,303 |
| | Heritage Financial Corp. | 51,982 | 1,300 |
| | TriCo Bancshares | 35,148 | 1,277 |
| | ConnectOne Bancorp Inc. | 49,682 | 1,247 |
| | Community Trust Bancorp | | |
| | Inc. | 27,143 | 1,246 |
| | Univest Corp. of | | |
| | Pennsylvania | 43,842 | 1,221 |
| | Independent Bank Group Inc. | 19,203 | 1,216 |
| | BancFirst Corp. | 12,108 | 1,155 |
| | Preferred Bank | 20,465 | 1,149 |
| | Bridge Bancorp Inc. | 31,336 | 1,117 |
| | CoBiz Financial Inc. | 63,719 | 1,086 |
| | Bryn Mawr Bank Corp. | 26,370 | 1,083 |
| | Guaranty Bancorp | 41,313 | 1,023 |
| | Stonegate Bank | 21,954 | 1,018 |
| | German American Bancorp | | |
| | Inc. | 21,188 | 1,005 |
| | First of Long Island Corp. | 36,313 | 999 |
38
Financials Index Fund
| | | |
| | | | Market |
| | | | Value• |
| | | Shares | ($000) |
| | OFG Bancorp | 75,687 | 976 |
| | First Bancorp | 31,409 | 944 |
| * | TriState Capital Holdings | | |
| | Inc. | 39,567 | 932 |
| | Fidelity Southern Corp. | 36,333 | 856 |
| | Opus Bank | 38,795 | 838 |
| | Great Southern Bancorp | | |
| | Inc. | 16,680 | 835 |
| | Peoples Bancorp Inc. | 25,346 | 824 |
| | Southwest Bancorp Inc. | 30,633 | 816 |
| | Financial Institutions Inc. | 23,494 | 804 |
| | Blue Hills Bancorp Inc. | 42,224 | 775 |
| | Arrow Financial Corp. | 20,979 | 732 |
| * | First Foundation Inc. | 44,427 | 729 |
| | First Financial Corp. | 15,607 | 725 |
| | Midland States Bancorp | | |
| | Inc. | 19,774 | 695 |
| | Live Oak Bancshares Inc. | 30,093 | 691 |
| | Republic Bancorp Inc. | | |
| | Class A | 17,939 | 620 |
| * | Atlantic Capital Bancshares | | |
| | Inc. | 30,947 | 557 |
| * | HarborOne Bancorp Inc. | 24,821 | 490 |
| | Sun Bancorp Inc. | 17,736 | 458 |
| * | First NBC Bank Holding Co. | 26,802 | 119 |
| | | | 2,906,501 |
| Capital Markets (18.5%) | | |
| | Goldman Sachs Group Inc. | 614,868 | 152,524 |
| | Morgan Stanley | 2,413,274 | 110,214 |
| | Bank of New York Mellon | | |
| | Corp. | 1,816,482 | 85,629 |
| | Charles Schwab Corp. | 2,049,608 | 82,825 |
| | BlackRock Inc. | 208,832 | 80,914 |
| | CME Group Inc. | 583,099 | 70,823 |
| | Intercontinental Exchange | | |
| | Inc. | 1,023,695 | 58,484 |
| | S&P Global Inc. | 445,173 | 57,637 |
| | State Street Corp. | 662,858 | 52,836 |
| | Ameriprise Financial Inc. | 271,635 | 35,720 |
| | Moody’s Corp. | 295,551 | 32,915 |
| | Northern Trust Corp. | 369,483 | 32,274 |
| | T. Rowe Price Group Inc. 418,481 | 29,800 |
| | Franklin Resources Inc. | 635,518 | 27,353 |
| | Invesco Ltd. | 701,610 | 22,585 |
| | TD Ameritrade Holding | | |
| | Corp. | 451,783 | 17,665 |
| | Raymond James Financial | | |
| | Inc. | 219,451 | 17,240 |
| * | E*TRADE Financial Corp. | 470,278 | 16,229 |
| | Affiliated Managers Group | | |
| | Inc. | 94,148 | 15,810 |
| | MSCI Inc. Class A | 153,599 | 14,529 |
| | Nasdaq Inc. | 198,662 | 14,127 |
| | CBOE Holdings Inc. | 169,489 | 13,229 |
| | MarketAxess Holdings Inc. | 64,566 | 12,605 |
| | FactSet Research Systems | | |
| | Inc. | 68,741 | 12,229 |
| | SEI Investments Co. | 233,700 | 11,767 |
| | Eaton Vance Corp. | 195,021 | 9,094 |
| * | Stifel Financial Corp. | 113,824 | 6,142 |
| | Legg Mason Inc. | 156,137 | 5,889 |
| | Evercore Partners Inc. | | |
| | Class A | 66,890 | 5,321 |
| | LPL Financial Holdings Inc. | 130,063 | 5,143 |
| | Federated Investors Inc. | | |
| | Class B | 157,947 | 4,291 |
| | Financial Engines Inc. | 95,725 | 4,241 |
| | | |
| | Interactive Brokers Group | | |
| | Inc. | 110,723 | 4,065 |
| | BGC Partners Inc. Class A | 356,241 | 4,018 |
| | Janus Capital Group Inc. | 251,042 | 3,178 |
| | Waddell & Reed Financial | | |
| | Inc. Class A | 142,274 | 2,737 |
| | Morningstar Inc. | 33,226 | 2,666 |
| | Artisan Partners Asset | | |
| | Management Inc. | | |
| | Class A | 73,830 | 2,100 |
| | Piper Jaffray Cos. | 26,044 | 1,843 |
| | WisdomTree Investments | | |
| | Inc. | 200,778 | 1,829 |
| | Moelis & Co. Class A | 43,956 | 1,618 |
| * | KCG Holdings Inc. Class A | 111,365 | 1,542 |
| | OM Asset Management | | |
| | plc | 98,270 | 1,465 |
| | Greenhill & Co. Inc. | 47,956 | 1,417 |
| | Cohen & Steers Inc. | 35,252 | 1,326 |
| | Virtus Investment Partners | | |
| | Inc. | 11,702 | 1,283 |
| | Houlihan Lokey Inc. | | |
| | Class A | 36,286 | 1,143 |
| * | Donnelley Financial | | |
| | Solutions Inc. | 47,570 | 1,099 |
| | PJT Partners Inc. | 29,358 | 1,087 |
| | Diamond Hill Investment | | |
| | Group Inc. | 5,303 | 1,063 |
| | Virtu Financial Inc. Class A | 60,902 | 1,057 |
| * | INTL. FCStone Inc. | 27,181 | 1,026 |
| | Investment Technology | | |
| | Group Inc. | 50,286 | 1,007 |
| | Westwood Holdings | | |
| | Group Inc. | 12,918 | 734 |
| * | Cowen Group Inc. Class A | 42,350 | 606 |
| | Arlington Asset Investment | | |
| | Corp. Class A | 39,324 | 580 |
| * | Safeguard Scientifics Inc. | 35,320 | 447 |
| * | Ladenburg Thalmann | | |
| | Financial Services Inc. | 186,578 | 414 |
| | Associated Capital Group | | |
| | Inc. Class A | 7,736 | 289 |
| | Pzena Investment | | |
| | Management Inc. | | |
| | Class A | 24,358 | 245 |
| | GAMCO Investors Inc. | | |
| | Class A | 7,231 | 215 |
| | Fifth Street Asset | | |
| | Management Inc. | 12,650 | 65 |
| | | | 1,160,248 |
| Consumer Finance (5.4%) | | |
| | American Express Co. | 1,336,517 | 107,002 |
| | Capital One Financial Corp. | 828,874 | 77,798 |
| | Synchrony Financial | 1,418,298 | 51,399 |
| | Discover Financial | | |
| | Services | 677,762 | 48,216 |
| | Ally Financial Inc. | 729,057 | 16,396 |
| | Navient Corp. | 520,617 | 8,023 |
| * | SLM Corp. | 597,414 | 7,163 |
| | FirstCash Inc. | 83,327 | 3,696 |
| * | PRA Group Inc. | 79,643 | 3,249 |
| * | Santander Consumer USA | | |
| | Holdings Inc. | 215,428 | 3,184 |
| * | OneMain Holdings Inc. | | |
| | Class A | 104,556 | 2,930 |
| *,^ Credit Acceptance Corp. | 12,230 | 2,452 |
| * | Green Dot Corp. Class A | 77,599 | 2,274 |
| * | LendingClub Corp. | 406,250 | 2,169 |
| | | |
| | Nelnet Inc. Class A | 39,436 | 1,766 |
| * | Encore Capital Group Inc. | 41,846 | 1,393 |
| * | EZCORP Inc. Class A | 88,521 | 779 |
| * | World Acceptance Corp. | 11,586 | 608 |
| * | Enova International Inc. | 40,252 | 578 |
| | | | 341,075 |
| Diversified Financial Services (6.3%) | |
| * | Berkshire Hathaway Inc. | | |
| | Class B | 2,103,507 | 360,583 |
| | Leucadia National Corp. | 556,491 | 14,814 |
| | Voya Financial Inc. | 334,300 | 13,783 |
| | Texas Pacific Land Trust | 13,664 | 4,079 |
| * | PICO Holdings Inc. | 37,474 | 513 |
| * | NewStar Financial Inc. | 35,232 | 351 |
| * | On Deck Capital Inc. | 51,039 | 273 |
| | | | 394,396 |
| Insurance (20.4%) | | |
| | American International | | |
| | Group Inc. | 1,765,065 | 112,823 |
| | Chubb Ltd. | 799,411 | 110,455 |
| | MetLife Inc. | 1,604,916 | 84,162 |
| | Prudential Financial Inc. | 738,781 | 81,665 |
| | Marsh & McLennan | | |
| | Cos. Inc. | 885,949 | 65,100 |
| | Travelers Cos. Inc. | 488,101 | 59,665 |
| | Aon plc | 452,091 | 52,284 |
| | Allstate Corp. | 632,791 | 51,990 |
| | Aflac Inc. | 700,927 | 50,712 |
| | Progressive Corp. | 996,661 | 39,049 |
| | Hartford Financial Services | | |
| | Group Inc. | 649,372 | 31,748 |
| | Principal Financial Group | | |
| | Inc. | 494,027 | 30,896 |
| | Willis Towers Watson plc | 223,223 | 28,669 |
| | Lincoln National Corp. | 392,550 | 27,541 |
| * | Markel Corp. | 24,035 | 23,548 |
| | Loews Corp. | 491,903 | 23,110 |
| * | Arch Capital Group Ltd. | 210,712 | 19,927 |
| | Cincinnati Financial Corp. | 268,773 | 19,610 |
| | Unum Group | 399,173 | 19,492 |
| | XL Group Ltd. | 462,121 | 18,711 |
| | Arthur J Gallagher& Co. | 305,923 | 17,422 |
| * | Alleghany Corp. | 26,505 | 17,117 |
| | Everest Re Group Ltd. | 70,208 | 16,509 |
| | FNF Group | 420,364 | 16,113 |
| | Torchmark Corp. | 193,583 | 15,008 |
| | Reinsurance Group of | | |
| | America Inc. Class A | 110,292 | 14,345 |
| | WR Berkley Corp. | 166,761 | 11,843 |
| | American Financial Group | | |
| | Inc. | 119,360 | 11,227 |
| | Axis Capital Holdings Ltd. | 151,841 | 10,523 |
| | RenaissanceRe Holdings | | |
| | Ltd. | 70,673 | 10,434 |
| | Endurance Specialty | | |
| | Holdings Ltd. | 110,342 | 10,254 |
| | Assurant Inc. | 98,179 | 9,720 |
| | Assured Guaranty Ltd. | 223,909 | 9,205 |
| | Old Republic International | | |
| | Corp. | 428,350 | 8,871 |
| | Brown & Brown Inc. | 204,726 | 8,824 |
| | Allied World Assurance Co. | | |
| | Holdings AG | 149,470 | 7,895 |
| | Validus Holdings Ltd. | 136,293 | 7,859 |
| | First American Financial | | |
| | Corp. | 188,644 | 7,370 |
| | White Mountains | | |
| | Insurance Group Ltd. | 7,838 | 7,338 |
39
Financials Index Fund
| | | |
| | | | Market |
| | | | Value• |
| | | Shares | ($000) |
| | Hanover Insurance Group | | |
| | Inc. | 73,059 | 6,577 |
| | Primerica Inc. | 78,589 | 6,346 |
| | CNO Financial Group Inc. | 298,472 | 6,241 |
| | Aspen Insurance Holdings | | |
| | Ltd. | 103,517 | 5,802 |
| | ProAssurance Corp. | 91,552 | 5,411 |
| | Erie Indemnity Co. | | |
| | Class A | 43,713 | 5,185 |
| | Selective Insurance Group | | |
| | Inc. | 99,372 | 4,402 |
| | American Equity | | |
| | Investment Life Holding | | |
| | Co. | 151,279 | 4,071 |
| | RLI Corp. | 67,982 | 3,974 |
| * | Enstar Group Ltd. | 18,158 | 3,518 |
| * | Genworth Financial Inc. | | |
| | Class A | 858,220 | 3,510 |
| | Argo Group International | | |
| | Holdings Ltd. | 51,489 | 3,447 |
| | AmTrust Financial Services | | |
| | Inc. | 146,564 | 3,371 |
| | Kemper Corp. | 70,534 | 2,994 |
| | Horace Mann Educators | | |
| | Corp. | 69,124 | 2,896 |
| | Mercury General Corp. | 47,470 | 2,783 |
| | National General Holdings | | |
| | Corp. | 100,523 | 2,447 |
| | Navigators Group Inc. | 42,606 | 2,345 |
| * | MBIA Inc. | 220,947 | 2,280 |
| | AMERISAFE Inc. | 33,130 | 2,130 |
| | Employers Holdings Inc. | 55,668 | 2,093 |
| | Maiden Holdings Ltd. | 125,542 | 1,940 |
| | Infinity Property | | |
| | & Casualty Corp. | 19,153 | 1,805 |
| | Safety Insurance Group Inc. | 24,941 | 1,771 |
| | Stewart Information | | |
| | Services Corp. | 38,410 | 1,706 |
| | American National | | |
| | Insurance Co. | 13,928 | 1,673 |
| * | Ambac Financial Group Inc. | 74,591 | 1,648 |
| | United Fire Group Inc. | 37,230 | 1,572 |
| | Universal Insurance | | |
| | Holdings Inc. | 57,205 | 1,542 |
| * | FNFV Group | 114,393 | 1,424 |
| | National Western Life | | |
| | Group Inc. Class A | 4,183 | 1,330 |
| | James River Group | | |
| | Holdings Ltd. | 30,427 | 1,309 |
| | FBL Financial Group Inc. | | |
| | Class A | 19,128 | 1,307 |
| * | Third Point Reinsurance | | |
| | Ltd. | 101,161 | 1,254 |
| * | Greenlight Capital Re Ltd. | | |
| | Class A | 53,420 | 1,191 |
| | State Auto Financial Corp. | 28,601 | 767 |
| *,^ | Citizens Inc. Class A | 81,098 | 740 |
| | HCI Group Inc. | 14,795 | 729 |
| | State National Cos. Inc. | 50,968 | 712 |
| | Heritage Insurance | | |
| | Holdings Inc. | 46,075 | 680 |
| * | Global Indemnity Ltd. | 15,331 | 608 |
| | OneBeacon Insurance | | |
| | Group Ltd. Class A | 35,820 | 585 |
| ^ | Fidelity & Guaranty Life | 20,452 | 544 |
| | United Insurance Holdings | | |
| | Corp. | 29,726 | 503 |
| * | WMIH Corp. | 353,112 | 477 |
| | | | |
| *,^ | Trupanion Inc. | | 27,835 | 433 |
| | EMC Insurance Group Inc. | 14,975 | 416 |
| | Baldwin & Lyons Inc. | | 15,691 | 373 |
| | Donegal Group Inc. Class A | 16,745 | 278 |
| | Crawford & Co. Class B | 18,599 | 201 |
| *,^ | Patriot National Inc. | | 15,256 | 70 |
| | | | | 1,280,445 |
| Mortgage Real Estate Investment Trusts | |
| (REITs) (1.5%) | | | |
| | AG Mortgage Investment | | |
| | Trust Inc. | | 48,529 | 867 |
| | AGNC Investment Corp. | 568,533 | 11,160 |
| | Altisource Residential Corp. | 92,991 | 1,248 |
| | Annaly Capital | | | |
| | Management Inc. | 1,749,309 | 19,417 |
| | Anworth Mortgage Asset | | |
| | Corp. | | 166,693 | 907 |
| | Apollo Commercial Real | | |
| | Estate Finance Inc. | | 149,803 | 2,755 |
| | Arbor Realty Trust Inc. | | 70,315 | 519 |
| | Ares Commercial Real | | | |
| | Estate Corp. | | 47,537 | 643 |
| ^ | ARMOUR Residential REIT | | |
| | Inc. | | 63,472 | 1,427 |
| | Blackstone Mortgage Trust | | |
| | Inc. Class A | | 161,324 | 5,024 |
| | Capstead Mortgage Corp. | 165,575 | 1,752 |
| | Chimera Investment Corp. | 306,344 | 5,894 |
| | CYS Investments Inc. | | 261,710 | 2,099 |
| | Dynex Capital Inc. | | 79,911 | 548 |
| | Hannon Armstrong | �� | | |
| | Sustainable Infrastructure | | |
| | Capital Inc. | | 77,253 | 1,529 |
| | Invesco Mortgage Capital | | |
| | Inc. | | 191,662 | 2,980 |
| | Ladder Capital Corp. | | | |
| | Class A | | 98,446 | 1,421 |
| | MFA Financial Inc. | | 637,396 | 5,112 |
| | MTGE Investment Corp. | 74,948 | 1,240 |
| | New Residential | | | |
| | Investment Corp. | | 515,190 | 8,691 |
| ^ | New York Mortgage Trust | | |
| | Inc. | | 188,549 | 1,193 |
| | PennyMac Mortgage | | | |
| | Investment Trust | | 109,947 | 1,854 |
| | Redwood Trust Inc. | | 131,717 | 2,156 |
| | Resource Capital Corp. | 53,865 | 452 |
| | Starwood Property Trust | | |
| | Inc. | | 440,399 | 10,068 |
| | Two Harbors Investment | | |
| | Corp. | | 596,987 | 5,552 |
| | Western Asset Mortgage | | |
| | Capital Corp. | | 73,322 | 763 |
| | | | | 97,271 |
| Other (0.0%)1 | | | |
| | Winthrop Realty Trust | | 23,515 | 188 |
| |
| Thrifts & Mortgage Finance (1.4%) | |
| | New York Community | | | |
| | Bancorp Inc. | | 836,429 | 12,781 |
| | Radian Group Inc. | | 368,317 | 6,854 |
| * | MGIC Investment Corp. | 582,076 | 6,199 |
| | Washington Federal Inc. | 152,934 | 5,177 |
| * | Essent Group Ltd. | | 111,963 | 3,897 |
| | EverBank Financial Corp. | 196,037 | 3,811 |
| | Capitol Federal Financial | | |
| | Inc. | | 224,948 | 3,394 |
| *,^ BofI Holding Inc. | | 97,877 | 3,087 |
| | | |
| | Northwest Bancshares Inc. | 165,247 | 2,998 |
| | Astoria Financial Corp. | 157,005 | 2,903 |
| | Provident Financial Services | | |
| | Inc. | 102,068 | 2,710 |
| | Kearny Financial Corp. | 153,064 | 2,349 |
| | WSFS Financial Corp. | 51,087 | 2,330 |
| | Beneficial Bancorp Inc. | 130,373 | 2,125 |
| | TFS Financial Corp. | 123,071 | 2,091 |
| * | Walker & Dunlop Inc. | 47,621 | 1,936 |
| | Meridian Bancorp Inc. | 87,988 | 1,676 |
| *,^ LendingTree Inc. | 13,308 | 1,576 |
| | United Financial Bancorp Inc. 82,871 | 1,480 |
| | Northfield Bancorp Inc. | 74,354 | 1,395 |
| | OceanFirst Financial Corp. | 47,141 | 1,376 |
| | TrustCo Bank Corp. NY | 163,693 | 1,367 |
| * | Nationstar Mortgage | | |
| | Holdings Inc. | 67,256 | 1,221 |
| | Meta Financial Group Inc. | 13,834 | 1,184 |
| | Dime Community | | |
| | Bancshares Inc. | 54,848 | 1,179 |
| * | PHH Corp. | 92,572 | 1,168 |
| | Oritani Financial Corp. | 66,429 | 1,143 |
| * | Flagstar Bancorp Inc. | 38,851 | 1,103 |
| * | HomeStreet Inc. | 36,401 | 994 |
| * | NMI Holdings Inc. Class A | 82,161 | 912 |
| | Federal Agricultural | | |
| | Mortgage Corp. | 15,719 | 905 |
| | Waterstone Financial Inc. | 40,947 | 760 |
| * | Ocwen Financial Corp. | 160,753 | 709 |
| | Clifton Bancorp Inc. | 36,755 | 591 |
| * | PennyMac Financial Services | |
| | Inc. Class A | 32,244 | 576 |
| * | Walter Investment | | |
| | Management Corp. | 33,920 | 115 |
| | | | 86,072 |
| Total Common Stocks | | |
| (Cost $5,382,125) | | 6,266,196 |
| Temporary Cash Investment (0.1%) | |
| Money Market Fund (0.1%) | | |
| 2,3 | Vanguard Market | | |
| | Liquidity Fund, 0.864% | | |
| | (Cost $3,562) | 35,618 | 3,562 |
| Total Investments (100.0%) | | |
| (Cost $5,385,687) | | 6,269,758 |
40
Financials Index Fund
| |
| | Amount |
| | ($000) |
| Other Assets and Liabilities (0.0%) | |
| Other Assets | |
| Investment in Vanguard | 408 |
| Receivables for Investment Securities Sold | 26,076 |
| Receivables for Accrued Income | 7,277 |
| Receivables for Capital Shares Issued | 1,817 |
| Total Other Assets | 35,578 |
| Liabilities | |
| Payables for Investment Securities | |
| Purchased | (27,828) |
| Collateral for Securities on Loan | (3,561) |
| Payables for Capital Shares Redeemed | (540) |
| Payables to Vanguard | (1,617) |
| Other Liabilities | (2,846) |
| Total Liabilities | (36,392) |
| Net Assets (100%) | 6,268,944 |
| |
| At February 28, 2017, net assets consisted of: |
| | Amount |
| | ($000) |
| Paid-in Capital | 5,534,530 |
| Undistributed Net Investment Income | 7,435 |
| Accumulated Net Realized Losses | (157,092) |
| Unrealized Appreciation (Depreciation) | 884,071 |
| Net Assets | 6,268,944 |
| |
| |
| ETF Shares—Net Assets | |
| Applicable to 91,762,814 outstanding | |
| $.001 par value shares of beneficial | |
| interest (unlimited authorization) | 5,716,668 |
| Net Asset Value Per Share— | |
| ETF Shares | $62.30 |
| |
| |
| Admiral Shares—Net Assets | |
| Applicable to 17,689,426 outstanding | |
| $.001 par value shares of beneficial | |
| interest (unlimited authorization) | 552,276 |
| Net Asset Value Per Share— | |
| Admiral Shares | $31.22 |
• See Note A in Notes toFinancial Statements.
* Non-income-producing security.
^ Includes partial security positions on loan to broker-dealers. The total value of securities on loan is $3,410,000.
1 “Other” represents securities that are not classified by the fund’s benchmark index.
2 Affiliated money market fund available only to Vanguard funds and certain trusts and accounts managed by Vanguard. Rate shown is the 7-day yield.
3 Includes $3,561,000 of collateral received for securities on loan.
REIT—Real Estate Investment Trust.
See accompanying Notes, which are an integral part of the Financial Statements.
41
Financials Index Fund
Statement of Operations
| |
| Six Months Ended |
| February 28, 2017 |
| | ($000) |
| Investment Income | |
| Income | |
| Dividends | 36,180 |
| Interest 1 | 11 |
| Securities Lending—Net | 92 |
| Total Income | 36,283 |
| Expenses | |
| The Vanguard Group—Note B | |
| Investment Advisory Services | 361 |
| Management and Administrative— | |
| ETF Shares | 1,532 |
| Management and Administrative— | |
| Admiral Shares | 136 |
| Marketing and Distribution— | |
| ETF Shares | 168 |
| Marketing and Distribution— | |
| Admiral Shares | 18 |
| Custodian Fees | 41 |
| Shareholders’ Reports—ETF Shares | 82 |
| Shareholders’ Reports—Admiral Shares | 2 |
| Trustees’ Fees and Expenses | 2 |
| Total Expenses | 2,342 |
| Net Investment Income | 33,941 |
| Realized Net Gain (Loss) | |
| Investment Securities Sold1 | 90,323 |
| Futures Contracts | (5) |
| Realized Net Gain (Loss) | 90,318 |
| Change in Unrealized Appreciation | |
| (Depreciation) | |
| Investment Securities | 848,397 |
| Futures Contracts | 7 |
| Change in Unrealized Appreciation | |
| (Depreciation) | 848,404 |
| Net Increase (Decrease) in Net Assets | |
| Resulting from Operations | 972,663 |
| 1 Interest income and realized net gain (loss) from an affiliated |
| company of the fund were $11,000 and $0, respectively. |
Statement of Changes in NetAssets
| | |
| | Six Months Ended | Year Ended |
| | February 28, | August 31, |
| | 2017 | 2016 |
| | ($000) | ($000) |
| Increase (Decrease) in Net Assets | | |
| Operations | | |
| Net Investment Income | 33,941 | 84,751 |
| Realized Net Gain (Loss) | 90,318 | 247,776 |
| Change in Unrealized Appreciation (Depreciation) | 848,404 | 11,898 |
| Net Increase (Decrease) in Net Assets Resulting from Operations | 972,663 | 344,425 |
| Distributions | | |
| Net Investment Income | | |
| ETF Shares | (42,782) | (74,919) |
| Admiral Shares | (3,185) | (4,706) |
| Realized Capital Gain | | |
| ETF Shares | — | — |
| Admiral Shares | — | — |
| Total Distributions | (45,967) | (79,625) |
| Capital Share Transactions | | |
| ETF Shares | 1,128,431 | 403,306 |
| Admiral Shares | 234,776 | 26,082 |
| Net Increase (Decrease) from Capital Share Transactions | 1,363,207 | 429,388 |
| Total Increase (Decrease) | 2,289,903 | 694,188 |
| Net Assets | | |
| Beginning of Period | 3,979,041 | 3,284,853 |
| End of Period 1 | 6,268,944 | 3,979,041 |
| 1 Net Assets—End of Period includes undistributed (overdistributed) net investment income of $7,435,000 and $19,461,000. | |
See accompanying Notes, which are an integral part of the Financial Statements.
42
Financials Index Fund
Financial Highlights
| | | | | | | |
| ETF Shares | | | | | | | |
| | Six Months | | | | | |
| | | Ended | | | | | |
| For a Share Outstanding | February 28, | Year Ended August 31, |
| Throughout Each Period | | 2017 | 2016 | 2015 | 2014 | 2013 | 2012 |
| Net Asset Value, Beginning of Period | $50.81 | $47.70 | $47.32 | $39.80 | $32.03 | $28.25 |
| Investment Operations | | | | | | | |
| Net Investment Income | | .381 | 1.108 | .917 | .876 | .825 | .639 |
| Net Realized and Unrealized Gain (Loss) | | | | | | |
| on Investments | | 11.664 | 3.070 | .349 | 7.494 | 7.747 | 3.747 |
| Total from Investment Operations | 12.045 | 4.178 | 1.266 | 8.370 | 8.572 | 4.386 |
| Distributions | | | | | | | |
| Dividends from Net Investment Income | (. 555) | (1.068) | (. 886) | (. 850) | (. 802) | (. 606) |
| Distributions from Realized Capital Gains | — | — | — | — | — | — |
| Total Distributions | | (. 555) | (1.068) | (. 886) | (. 850) | (. 802) | (. 606) |
| Net Asset Value, End of Period | $62.30 | $50.81 | $47.70 | $47.32 | $39.80 | $32.03 |
| |
| Total Return | | 23.89% | 8.93% | 2.63% | 21.20% | 27.10% | 15.87% |
| |
| Ratios/Supplemental Data | | | | | | | |
| Net Assets, End of Period (Millions) | $5,717 | $3,735 | $3,081 | $2,191 | $1,464 | $768 |
| Ratio of Total Expenses to | | | | | | | |
| Average Net Assets | | 0.10% | 0.10% | 0.10% | 0.12% | 0.14% | 0.14% |
| Ratio of Net Investment Income to | | | | | | |
| Average Net Assets | | 1.62% | 2.39% | 1.99% | 2.00% | 2.26% | 2.16% |
| Portfolio Turnover Rate1 | | 3% | 21% | 4% | 5% | 9% | 7% |
The expense ratio, net investment income ratio, and turnover rate for the current period have been annualized.
1 Excludes the value of portfolio securities received or delivered as a result of in-kind purchases or redemptions of the fund’s capital shares,
including ETF Creation Units.
See accompanying Notes, which are an integral part of the Financial Statements.
43
Financials Index Fund
Financial Highlights
| | | | | | | |
| Admiral Shares | | | | | | | |
| | Six Months | | | | | |
| | | Ended | | | | | |
| For a Share Outstanding | February 28, | Year Ended August 31, |
| Throughout Each Period | | 2017 | 2016 | 2015 | 2014 | 2013 | 2012 |
| Net Asset Value, Beginning of Period | $25.47 | $23.91 | $23.72 | $19.95 | $16.05 | $14.16 |
| Investment Operations | | | | | | | |
| Net Investment Income | | .191 | .556 | .460 | .438 | .414 | .320 |
| Net Realized and Unrealized Gain (Loss) | | | | | | |
| on Investments | | 5.838 | 1.539 | .174 | 3.758 | 3.888 | 1.874 |
| Total from Investment Operations | 6.029 | 2.095 | .634 | 4.196 | 4.302 | 2.194 |
| Distributions | | | | | | | |
| Dividends from Net Investment Income | (. 279) | (. 535) | (. 444) | (. 426) | (. 402) | (. 304) |
| Distributions from Realized Capital Gains | — | — | — | — | — | — |
| Total Distributions | | (. 279) | (. 535) | (. 444) | (. 426) | (. 402) | (. 304) |
| Net Asset Value, End of Period | $31.22 | $25.47 | $23.91 | $23.72 | $19.95 | $16.05 |
| |
| Total Return 1 | | 23.85% | 8.96% | 2.64% | 21.19% | 27.13% | 15.84% |
| |
| Ratios/Supplemental Data | | | | | | | |
| Net Assets, End of Period (Millions) | $552 | $244 | $204 | $155 | $132 | $73 |
| Ratio of Total Expenses to | | | | | | | |
| Average Net Assets | | 0.10% | 0.10% | 0.10% | 0.12% | 0.14% | 0.14% |
| Ratio of Net Investment Income to | | | | | | |
| Average Net Assets | | 1.62% | 2.39% | 1.99% | 2.00% | 2.26% | 2.16% |
| Portfolio Turnover Rate2 | | 3% | 21% | 4% | 5% | 9% | 7% |
The expense ratio, net investment income ratio, and turnover rate for the current period have been annualized.
1 Total returns do not include transaction or account service fees that may have applied in the periods shown. Fund prospectuses provide
information about any applicable transaction and account service fees.
2 Excludes the value of portfolio securities received or delivered as a result of in-kind purchases or redemptions of the fund’s capital shares,
including ETF Creation Units.
See accompanying Notes, which are an integral part of the Financial Statements.
44
Financials Index Fund
Notes to Financial Statements
Vanguard Financials Index Fund is registered under the Investment Company Act of 1940 as an open-end investment company, or mutual fund. The fund offers two classes of shares: ETF Shares and Admiral Shares. ETF Shares are listed for trading on NYSE Arca; they can be purchased and sold through a broker. Admiral Shares are designed for investors who meet certain administrative, service, and account-size criteria.
A. The following significant accounting policies conform to generally accepted accounting principles for U.S. investment companies. The fund consistently follows such policies in preparing its financial statements.
1. SecurityValuation:SecuritiesarevaluedasofthecloseoftradingontheNewYorkStockExchange (generally 4 p.m., Eastern time) on the valuation date. Equity securities are valued at thelatestquoted sales prices or official closing prices taken from the primary market in which each security trades; such securities not traded on the valuation date are valued at the mean of the latest quoted bid and asked prices. Securities for whichmarket quotations are not readily available, or whose valueshave been materially affected by events occurring before the fund’s pricing time but after the close of the securities’ primary markets, are valued by methods deemed by the board of trustees to represent fairvalue.InvestmentsinVanguard MarketLiquidityFundarevaluedatthatfund’snetassetvalue.
2. Futures Contracts: The fund uses index futures contracts to a limited extent, with the objectives of maintaining full exposure to the stock market, enhancing returns, maintaining liquidity, and minimizing transaction costs. The fund may purchase futures contracts to immediately invest incoming cash in the market, or sell futures in response to cash outflows, thereby simulating a fully invested position in the underlying index while maintaining a cash balance for liquidity. The fund may seek to enhance returns by using futures contracts instead of the underlying securities when futures are believed to be priced more attractively than the underlying securities. The primary risks associated with the use of futures contracts are imperfect correlation between changes in market values of stocks held by the fund and the prices of futures contracts, and the possibility of an illiquid market. Counterparty risk involving futures is mitigated because a regulated clearinghouse is the counterparty instead of the clearing broker. To further mitigate counterparty risk, the fund trades futures contracts on an exchange, monitors the financial strength of its clearing brokers and clearinghouse, and has entered into clearing agreements with its clearing brokers. The clearinghouse imposes initial margin requirements to secure the fund’s performance and requires daily settlement of variation margin representing changes in the market value of each contract.
Futures contracts are valued at their quoted daily settlement prices. The aggregate settlement values of the contracts are not recorded in the Statement of Net Assets. Fluctuations in the value of the contracts are recorded in the Statement of Net Assets as an asset (liability) and in the Statement of Operations as unrealized appreciation (depreciation) until the contracts are closed, when they are recorded as realized futures gains (losses).
During the six months ended February 28, 2017, the fund’s average investments in long and short futures contracts represented less than 1% and 0% of net assets, respectively, based on the average of aggregate settlement values at each quarter-end during the period. The fund had no open futures contracts at February 28, 2017.
4. Federal Income Taxes: The fund intends to continue to qualify as a regulated investment company and distribute all of its taxable income. Management has analyzed the fund’s tax positions taken for all open federal income tax years (August 31, 2013–2016), and for the period ended February 28, 2017, and has concluded that no provision for federal income tax is required in the fund’s financial statements. 5. Distributions: Distributions to shareholders are recorded on the ex-dividend date.
6. Securities Lending: To earn additional income, the fund lends its securities to qualified institutional borrowers. Security loans are subject to termination by the fund at any time, and are required to be secured at all times by collateral in an amount at least equal to the market value of securities loaned. Daily market fluctuations could cause the value of loaned securities to be more or less than the value of the collateral received. When this occurs, the collateral is adjusted and settled on the next business day. The fund further mitigates its counterparty risk by entering into securities lending transactions only with a diverse group of prequalified counterparties, monitoring their financial strength, and entering into master securities lending agreements with its counterparties. The master securities lending agreements provide that, in the event of a counterparty’s default (including bankruptcy), the fund may terminate any loans with that borrower, determine the net amount owed, and sell or retain the collateral up to the net amount owed to the fund; however, such actions may be subject to legal proceedings. While collateral mitigates counterparty risk, in the absence of a default the fund may
45
Financials Index Fund
experience delays and costs in recovering the securities loaned. The fund invests cash collateral received in Vanguard Market Liquidity Fund, and records a liability in the Statement of Net Assets for the return of the collateral, during the period the securities are on loan. Securities lending income represents feeschargedto borrowers plusincome earned oninvested cash collateral,less expenses associated with the loan. During the term of the loan, the fund is entitled to all distributions made on or in respect of the loaned securities.
7. Credit Facility: The fund and certain other funds managed by The Vanguard Group (“Vanguard”) participate in a $3.1 billion committed credit facility provided by a syndicate of lenders pursuant to a credit agreement that may be renewed annually; each fund is individually liable for its borrowings, if any, under the credit facility. Borrowings may be utilized for temporary and emergency purposes, and are subject to the fund’s regulatory and contractual borrowing restrictions. The participating funds are charged administrative fees and an annual commitment fee of 0.10% of the undrawn amount of the facility; these fees are allocated to the funds based on a method approved by the fund’s board of trustees and included in Management and Administrative expenses on the fund’s Statement of Operations. Any borrowings under this facility bear interest at a rate based upon the higher of the one-month London Interbank Offered Rate, federal funds effective rate, or overnight bank funding rate plus an agreed-upon spread.
The fund had no borrowings outstanding at February 28, 2017, or at any time during the period then ended.
8. Other: Dividend income is recorded on the ex-dividend date. Interest income includes income distributions received from Vanguard Market Liquidity Fund and is accrued daily. Security transactions are accounted for on the date securities are bought or sold. Costs used to determine realized gains (losses) on the sale of investment securities are those of the specific securities sold.
Each class of shares has equal rights as to assets and earnings, except that each class separately bears certain class-specific expenses related to maintenance of shareholder accounts (included in Management and Administrative expenses) and shareholder reporting. Marketing and distribution expenses are allocated to each class of shares based on a method approved by the board of trustees. Income, other non-class-specific expenses, and gains and losses on investments are allocated to each class of shares based on its relative net assets.
B. In accordance with the terms of a Funds’ Service Agreement (the “FSA”) between Vanguard and the fund, Vanguard furnishes to the fund investment advisory, corporate management, administrative, marketing,anddistributionservices atVanguard’scostofoperations (as defined bythe FSA).These costs of operations are allocated to the fund based on methods and guidelines approved by the board of trustees. Vanguard does not require reimbursement in the current period for certain costs ofoperations(such asdeferred compensation/benefitsand risk/insurance costs);thefund’sliability for these costs of operations isincluded in Payables to Vanguard on the Statement of Net Assets.
Upon the request of Vanguard, the fund may invest up to 0.40% of its net assets as capital in Vanguard. At February 28, 2017,the fund had contributedto Vanguard capitalinthe amountof $408,000, representing 0.01% of the fund’s net assets and 0.16% of Vanguard’s capitalization. The fund’s trustees and officers are also directors and employees, respectively, of Vanguard.
C. Variousinputs may be used to determine the value of the fund’sinvestments. Theseinputs are summarized in three broad levels for financial statement purposes. The inputs or methodologies used to value securities are not necessarily an indication of the risk associated with investing in those securities.
Level 1—Quoted prices in active markets for identical securities.
Level 2—Other significant observable inputs (including quoted prices for similar securities, interest rates, prepayment speeds, credit risk, etc.).
Level 3—Significant unobservable inputs (including the fund’s own assumptions used to determine the fair value of investments).
The following table summarizes the market value of the fund’sinvestments as of February 28, 2017, based on the inputs used to value them:
| | | |
| | Level 1 | Level 2 | Level 3 |
| Investments | ($000) | ($000) | ($000) |
| Common Stocks | 6,266,008 | — | 188 |
| Temporary Cash Investments | 3,562 | — | — |
| Total | 6,269,570 | — | 188 |
46
Financials Index Fund
D. Distributions are determined on a tax basis and may differ from net investment income and realized capital gains for financial reporting purposes. Differences may be permanent or temporary. Permanent differences are reclassified among capital accounts in the financial statements to reflect their tax character. Temporary differences arise when certain items of income, expense, gain, or loss are recognized in different periods for financial statement and tax purposes. These differences will reverse at some time in the future. Differences in classification may also result from the treatment of short-term gains as ordinary income for tax purposes.
During the six months ended February 28, 2017, the fund realized $90,002,000 of net capital gains resulting from in-kind redemptions—in which shareholders exchanged fund shares for securities held by the fund rather than for cash. Because such gains are not taxable to the fund, and are not distributed to shareholders, they have been reclassified from accumulated net realized losses to paid-in capital.
The fund’s tax-basis capital gains and losses are determined only at the end of each fiscal year. For tax purposes, at August 31, 2016, the fund had available capital losses totaling $157,415,000 to offset future net capital gains. Of this amount, $144,329,000 is subject to expiration dates; $76,963,000 may be used to offset future net capital gains through August 31, 2018, and $67,366,000 through August 31, 2019. Capital losses of $13,086,000 realized beginning in fiscal 2012 may be carried forward indefinitely under the Regulated Investment Company Modernization Act of 2010, but must be used before any expiring loss carryforwards. The fund will use these capital losses to offset net taxable capital gains, if any, realized during the year ending August 31, 2017; should the fund realize net capital losses for the year, the losses will be added to the loss carryforward balance above.
At February 28, 2017, the cost of investment securities for tax purposes was $5,385,687,000. Net unrealized appreciation of investment securities for tax purposes was $884,071,000, consisting of unrealized gains of $920,316,000 on securities that had risen in value since their purchase and $36,245,000 in unrealized losses on securities that had fallen in value since their purchase.
E. During the six months ended February 28, 2017, the fund purchased $1,965,390,000 of investment securities and sold $614,359,000 of investment securities, other than temporary cash investments. Purchases and sales include $1,630,130,000 and $535,090,000, respectively, in connection with in-kind purchases and redemptions of the fund’s capital shares.
F. Capital share transactions for each class of shares were:
| | | | |
| | Six Months Ended | Year Ended |
| | February 28, 2017 | August 31, 2016 |
| | Amount | Shares | Amount | Shares |
| | ($000) | (000) | ($000) | (000) |
| ETF Shares | | | | |
| Issued | 1,674,450 | 29,211 | 1,621,931 | 34,106 |
| Issued in Lieu of Cash Distributions | — | — | — | — |
| Redeemed | (546,019) | (10,950) | (1,218,625) | (25,200) |
| Net Increase (Decrease)—ETF Shares | 1,128,431 | 18,261 | 403,306 | 8,906 |
| Admiral Shares | | | | |
| Issued | 303,215 | 10,469 | 110,433 | 4,670 |
| Issued in Lieu of Cash Distributions | 2,794 | 103 | 4,147 | 175 |
| Redeemed | (71,233) | (2,478) | (88,498) | (3,771) |
| Net Increase (Decrease)—Admiral Shares | 234,776 | 8,094 | 26,082 | 1,074 |
At February 28, 2017, one shareholder was the record or beneficial owner of 26% of the fund’s net assets. If the shareholder were to redeem its investment in the fund, the redemption might result in an increase in the fund’s expense ratio.
G. Management has determined that no material events or transactions occurred subsequent to February 28, 2017, that would require recognition or disclosure in these financial statements.
47
Health Care Index Fund
Fund Profile
As of February 28, 2017
| | |
| Share-Class Characteristics | | |
| | ETF | Admiral |
| | Shares | Shares |
| Ticker Symbol | VHT | VHCIX |
| Expense Ratio1 | 0.10% | 0.10% |
| 30-Day SEC Yield | 1.44% | 1.44% |
| | | |
| Portfolio Characteristics | | |
| | | MSCI | |
| | | US IMI/ | |
| | | Health | MSCI |
| | | Care | US IMI/ |
| | Fund | 25/50 | 2500 |
| Number of Stocks | 358 | 358 | 2,479 |
| Median Market Cap | $81.9B | $81.9B | $57.6B |
| Price/Earnings Ratio | 26.2x | 26.2x | 24.7x |
| Price/Book Ratio | 3.8x | 3.8x | 3.0x |
| Return on Equity | 16.2% | 16.2% | 16.5% |
| Earnings Growth Rate | 8.8% | 8.8% | 7.6% |
| Dividend Yield | 1.5% | 1.5% | 1.9% |
| Foreign Holdings | 0.0% | 0.0% | 0.0% |
| Turnover Rate | | | |
| (Annualized) | 5% | — | — |
| Short-Term Reserves | 0.0% | — | — |
| | |
| Volatility Measures | | |
| | MSCI US | |
| | IMI/Health Care | MSCI US |
| | 25/50 | IMI/2500 |
| R-Squared | 1.00 | 0.65 |
| Beta | 1.00 | 1.03 |
| These measures show the degreeand timing ofthe fund’s |
| fluctuations compared with the indexes over 36 months. |
| |
| Subindustry Diversification | |
| (% of equity exposure) | |
| |
| Biotechnology | 22.5% |
| Health Care Distributors | 2.9 |
| Health Care Equipment | 17.8 |
| Health Care Facilities | 2.0 |
| Health Care Services | 3.4 |
| Health Care Supplies | 1.7 |
| Health Care Technology | 1.1 |
| Life Sciences Tools & Services | 5.3 |
| Managed Health Care | 10.2 |
| Pharmaceuticals | 33.1 |
| | |
| Ten Largest Holdings (% of total net assets) |
| |
| Johnson & Johnson | Pharmaceuticals | 10.0% |
| Pfizer Inc. | Pharmaceuticals | 6.2 |
| Merck & Co. Inc. | Pharmaceuticals | 5.5 |
| UnitedHealth Group Inc. | Managed | |
| | Health Care | 4.7 |
| Amgen Inc. | Biotechnology | 4.0 |
| Medtronic plc | Health Care | |
| | Equipment | 3.4 |
| AbbVie Inc. | Biotechnology | 3.0 |
| Celgene Corp. | Biotechnology | 2.9 |
| Bristol-Myers Squibb Co. | Pharmaceuticals | 2.9 |
| Gilead Sciences Inc. | Biotechnology | 2.8 |
| Top Ten | | 45.4% |
| The holdings listedexcludeany temporary cashinvestments and |
| equity index products. |
1 The expense ratios shown are from the prospectus dated December 22, 2016, and represent estimated costs for the current fiscal year. For the six months ended February 28, 2017, the annualized expense ratios were 0.10% for ETF Shares and 0.10% for Admiral Shares.
48
Health Care Index Fund
Performance Summary
All of the returns in this report represent past performance, which is not a guarantee of future results that may be achieved by the fund. (Current performance may be lower or higher than theperformancedatacited.For performance data currenttothemostrecentmonth-end, visit our website at vanguard.com/performance.) Note, too, that both investment returns and principal value can fluctuate widely, so an investor’s shares, when sold, could be worth more or less than their original cost. The returns shown do not reflect taxes that a shareholder would pay on fund distributions or on the sale of fund shares.
Fiscal-Year Total Returns (%): August 31, 2006–February 28, 2017
For a benchmark description, see the Glossary.
Note: For 2017, performance data reflect the six months ended February 28,2017.
Average Annual Total Returns: Periods Ended December 31, 2016
This table presents returns through the latest calendar quarter—rather than through the end of the fiscal period.
Securities and Exchange Commission rules require that we provide this information.
| | | | |
| | Inception Date | One Year | Five Years | Ten Years |
| ETF Shares | 1/26/2004 | | | |
| Market Price | | -3.32% | 17.16% | 10.02% |
| Net Asset Value | | -3.33 | 17.17 | 10.02 |
| Admiral Shares | 2/5/2004 | -3.33 | 17.17 | 10.01 |
See Financial Highlights for dividend and capital gains information.
49
Health Care Index Fund
Financial Statements (unaudited)
Statement of Net Assets
As of February 28, 2017
The fund reports a complete list of its holdings in regulatory filings four times in each fiscal year, at the quarter-ends. For the second and fourth fiscal quarters, the lists appear in the fund’s semiannual and annual reports to shareholders. For the first and third fiscal quarters, the fund files the lists with the Securities and Exchange Commission on Form N-Q. Shareholders can look up the fund’s Forms N-Q on the SEC’s website at sec.gov. Forms N-Q may also be reviewed and copied at the SEC’s Public Reference Room (see the back cover of this report for further information).
| | | |
| | | | Market |
| | | | Value• |
| | | Shares | ($000) |
| Common Stocks (100.0%) | | |
| Biotechnology (22.5%) | | |
| | Amgen Inc. | 1,520,162 | 268,354 |
| | AbbVie Inc. | 3,320,729 | 205,354 |
| * | Celgene Corp. | 1,584,112 | 195,654 |
| | Gilead Sciences Inc. | 2,692,101 | 189,739 |
| * | Biogen Inc. | 444,598 | 128,311 |
| * | Alexion Pharmaceuticals | | |
| | Inc. | 458,296 | 60,151 |
| * | Regeneron | | |
| | Pharmaceuticals Inc. | 158,752 | 59,294 |
| * | Incyte Corp. | 346,494 | 46,118 |
| * | Vertex Pharmaceuticals | | |
| | Inc. | 506,826 | 45,929 |
| * | BioMarin Pharmaceutical | | |
| | Inc. | 351,538 | 33,020 |
| * | Alkermes plc | 310,865 | 17,564 |
| * | TESARO Inc. | 76,326 | 14,378 |
| * | Seattle Genetics Inc. | 202,334 | 13,283 |
| * | United Therapeutics Corp. | 86,593 | 12,792 |
| * | Ionis Pharmaceuticals Inc. | 247,547 | 12,320 |
| * | Exelixis Inc. | 555,264 | 11,955 |
| | Bioverativ Inc. | 223,690 | 11,650 |
| * | Alnylam Pharmaceuticals | | |
| | Inc. | 157,756 | 8,147 |
| * | Neurocrine Biosciences | | |
| | Inc. | 177,382 | 7,833 |
| * | ACADIA Pharmaceuticals | | |
| | Inc. | 197,813 | 7,539 |
| * | Bluebird Bio Inc. | 82,966 | 7,272 |
| * | Ultragenyx Pharmaceutical | | |
| | Inc. | 79,321 | 6,749 |
| *,^ | Kite Pharma Inc. | 81,483 | 5,767 |
| *,^ | OPKO Health Inc. | 683,019 | 5,731 |
| * | Exact Sciences Corp. | 221,371 | 4,764 |
| * | Clovis Oncology Inc. | 80,299 | 4,642 |
| *,^ | Intercept Pharmaceuticals | | |
| | Inc. | 35,487 | 4,528 |
| * | Sage Therapeutics Inc. | 64,497 | 4,347 |
| * | Ironwood Pharmaceuticals | | |
| | Inc. Class A | 254,417 | 4,297 |
| * | Ligand Pharmaceuticals | | |
| | Inc. | 40,619 | 4,250 |
| * | Portola Pharmaceuticals | | |
| | Inc. | 115,501 | 4,006 |
| * | Array BioPharma Inc. | 309,690 | 3,561 |
| * | Prothena Corp. plc | 59,940 | 3,516 |
| * | Agios Pharmaceuticals Inc. | 68,679 | 3,327 |
| * | Sarepta Therapeutics Inc. | 105,929 | 3,296 |
| *,^ | Juno Therapeutics Inc. | 129,773 | 3,120 |
| * | Spark Therapeutics Inc. | 47,202 | 3,011 |
| * | Halozyme Therapeutics | | |
| | Inc. | 224,716 | 2,881 |
| * | Myriad Genetics Inc. | 140,002 | 2,720 |
| *,^ | Intrexon Corp. | 121,088 | 2,695 |
| * | Radius Health Inc. | 61,438 | 2,589 |
| * | FibroGen Inc. | 103,155 | 2,579 |
| * | Acorda Therapeutics Inc. | 94,853 | 2,509 |
| | | |
| * | Puma Biotechnology Inc. | 67,716 | 2,485 |
| * | Five Prime Therapeutics Inc. | 52,312 | 2,400 |
| * | Synergy Pharmaceuticals | | |
| | Inc. | 411,531 | 2,383 |
| * | Emergent BioSolutions Inc. | 70,273 | 2,205 |
| * | Repligen Corp. | 69,094 | 2,177 |
| * | Momenta Pharmaceuticals | | |
| | Inc. | 138,918 | 2,146 |
| *,^ | Avexis Inc. | 33,944 | 2,081 |
| * | Xencor Inc. | 80,056 | 1,989 |
| * | Insmed Inc. | 120,716 | 1,923 |
| * | Alder Biopharmaceuticals | | |
| | Inc. | 82,234 | 1,879 |
| *,^ MiMedx Group Inc. | 211,581 | 1,813 |
| * | Global Blood Therapeutics | | |
| | Inc. | 64,788 | 1,804 |
| * | Blueprint Medicines Corp. | 50,026 | 1,760 |
| *,^ | Amicus Therapeutics Inc. | 263,833 | 1,712 |
| * | Progenics Pharmaceuticals | | |
| | Inc. | 142,999 | 1,607 |
| * | AMAG Pharmaceuticals Inc. | 70,441 | 1,581 |
| * | Acceleron Pharma Inc. | 58,358 | 1,559 |
| *,^ | Lexicon Pharmaceuticals | | |
| | Inc. | 96,209 | 1,544 |
| * | Coherus Biosciences Inc. | 64,438 | 1,521 |
| * | Loxo Oncology Inc. | 33,758 | 1,500 |
| * | Eagle Pharmaceuticals Inc. | 19,043 | 1,460 |
| * | Retrophin Inc. | 65,504 | 1,393 |
| *,^ | ZIOPHARM Oncology Inc. | 212,962 | 1,352 |
| *,^ | Heron Therapeutics Inc. | 89,014 | 1,273 |
| * | MacroGenics Inc. | 57,198 | 1,209 |
| * | Epizyme Inc. | 83,656 | 1,188 |
| * | Vanda Pharmaceuticals Inc. | 80,756 | 1,151 |
| * | Genomic Health Inc. | 37,818 | 1,142 |
| * | Versartis Inc. | 50,463 | 1,103 |
| *,^ | Immunomedics Inc. | 204,839 | 1,024 |
| *,^ | Inovio Pharmaceuticals Inc. | 143,685 | 1,013 |
| * | Spectrum Pharmaceuticals | | |
| | Inc. | 147,219 | 942 |
| * | Aimmune Therapeutics Inc. | 45,918 | 931 |
| *,^ | Editas Medicine Inc. | 37,038 | 923 |
| * | Achillion Pharmaceuticals | | |
| | Inc. | 219,955 | 882 |
| * | Flexion Therapeutics Inc. | 43,101 | 864 |
| * | PTC Therapeutics Inc. | 62,379 | 850 |
| * | Novavax Inc. | 550,205 | 831 |
| * | Enanta Pharmaceuticals Inc. | 28,775 | 829 |
| *,^ | Keryx Biopharmaceuticals | | |
| | Inc. | 160,463 | 807 |
| *,^ Merrimack Pharmaceuticals | | |
| | Inc. | 256,158 | 786 |
| * | Ardelyx Inc. | 57,354 | 780 |
| * | Arena Pharmaceuticals Inc. | 488,265 | 772 |
| * | REGENXBIO Inc. | 40,235 | 740 |
| * | BioCryst Pharmaceuticals | | |
| | Inc. | 118,077 | 737 |
| *,^ | Celldex Therapeutics Inc. | 206,476 | 731 |
| *,^ | Foundation Medicine Inc. | 29,230 | 725 |
| * | Esperion Therapeutics Inc. | 27,391 | 717 |
| | | |
| *,^ | Geron Corp. | 330,057 | 710 |
| * | NewLink Genetics Corp. | 44,624 | 701 |
| * | CoLucid Pharmaceuticals | | |
| | Inc. | 15,044 | 700 |
| | PDL BioPharma Inc. | 321,495 | 688 |
| * | Agenus Inc. | 158,408 | 672 |
| * | Axovant Sciences Ltd. | 51,078 | 649 |
| *,^ | Organovo Holdings Inc. | 205,587 | 641 |
| * | Otonomy Inc. | 42,229 | 627 |
| *,^ | Cara Therapeutics Inc. | 38,628 | 619 |
| * | Sangamo Therapeutics Inc. | 135,144 | 615 |
| *,^ | Advaxis Inc. | 69,214 | 608 |
| *,^ | ImmunoGen Inc. | 176,030 | 599 |
| *,^ | Corbus Pharmaceuticals | | |
| | Holdings Inc. | 69,681 | 596 |
| *,^ | Insys Therapeutics Inc. | 43,357 | 553 |
| *,^ | Aduro Biotech Inc. | 48,095 | 541 |
| * | Atara Biotherapeutics Inc. | 34,589 | 534 |
| * | Karyopharm Therapeutics | | |
| | Inc. | 50,552 | 524 |
| * | TG Therapeutics Inc. | 88,966 | 507 |
| *,^ | Sorrento Therapeutics Inc. | 93,252 | 485 |
| *,^ | XBiotech Inc. | 35,574 | 480 |
| * | Chimerix Inc. | 83,599 | 475 |
| * | Natera Inc. | 48,346 | 462 |
| * | Minerva Neurosciences | | |
| | Inc. | 49,290 | 431 |
| * | OncoMed Pharmaceuticals | | |
| | Inc. | 40,321 | 410 |
| * | CytomX Therapeutics Inc. | 32,458 | 406 |
| *,^ | Bellicum Pharmaceuticals | | |
| | Inc. | 32,811 | 405 |
| * | Intellia Therapeutics Inc. | 25,487 | 364 |
| *,^ | Dynavax Technologies | | |
| | Corp. | 73,731 | 332 |
| *,^ | MannKind Corp. | 579,315 | 307 |
| *,^ | Arrowhead | | |
| | Pharmaceuticals Inc. | 129,300 | 292 |
| *,^ | Voyager Therapeutics Inc. | 21,782 | 282 |
| * | Trevena Inc. | 68,866 | 280 |
| * | Seres Therapeutics Inc. | 27,703 | 268 |
| * | Infinity Pharmaceuticals | | |
| | Inc. | 89,825 | 250 |
| * | Corvus Pharmaceuticals | | |
| | Inc. | 16,924 | 243 |
| *,^ | NantKwest Inc. | 48,716 | 230 |
| *,^ | Osiris Therapeutics Inc. | 36,856 | 212 |
| *,^ | Arbutus Biopharma Corp. | 74,934 | 201 |
| * | Ophthotech Corp. | 54,075 | 194 |
| * | Syros Pharmaceuticals Inc. | 16,682 | 184 |
| * | Zafgen Inc. | 38,616 | 153 |
| * | Adverum Biotechnologies | | |
| | Inc. | 54,280 | 144 |
| * | Immune Design Corp. | 25,215 | 129 |
| * | OvaScience Inc. | 59,066 | 87 |
| *,^ | Dicerna Pharmaceuticals | | |
| | Inc. | 25,154 | 72 |
| * | Regulus Therapeutics Inc. | 64,019 | 67 |
| | | | 1,525,695 |
50
Health Care Index Fund
| | | |
| | | | Market |
| | | | Value• |
| | | Shares | ($000) |
| Health Care Equipment & Supplies (19.5%) |
| | Medtronic plc | 2,847,559 | 230,396 |
| | Abbott Laboratories | 3,516,879 | 158,541 |
| | Danaher Corp. | 1,272,086 | 108,827 |
| | Stryker Corp. | 688,741 | 88,545 |
| | Becton Dickinson and Co. | 433,777 | 79,403 |
| * | Boston Scientific Corp. | 2,782,673 | 68,315 |
| * | Intuitive Surgical Inc. | 79,156 | 58,338 |
| | Baxter International Inc. | 1,000,397 | 50,940 |
| | Zimmer Biomet Holdings | | |
| | Inc. | 409,413 | 47,934 |
| * | Edwards Lifesciences | | |
| | Corp. | 436,969 | 41,093 |
| | CR Bard Inc. | 150,254 | 36,848 |
| | Dentsply Sirona Inc. | 471,852 | 29,972 |
| * | IDEXX Laboratories Inc. | 183,360 | 26,576 |
| * | Hologic Inc. | 512,018 | 20,778 |
| | ResMed Inc. | 288,364 | 20,771 |
| | Cooper Cos. Inc. | 99,548 | 19,824 |
| | Teleflex Inc. | 90,006 | 17,207 |
| * | Varian Medical Systems | | |
| | Inc. | 190,801 | 16,006 |
| * | Align Technology Inc. | 146,724 | 15,077 |
| * | DexCom Inc. | 172,625 | 13,492 |
| | West Pharmaceutical | | |
| | Services Inc. | 149,633 | 12,340 |
| | STERIS plc | 174,383 | 12,229 |
| * | ABIOMED Inc. | 84,137 | 9,926 |
| | Hill-Rom Holdings Inc. | 134,208 | 8,918 |
| * | Masimo Corp. | 96,412 | 8,712 |
| * | NuVasive Inc. | 102,830 | 7,688 |
| * | Alere Inc. | 177,671 | 6,805 |
| | Cantel Medical Corp. | 76,668 | 6,295 |
| * | Wright Medical Group NV | 189,841 | 5,293 |
| * | Integra LifeSciences | | |
| | Holdings Corp. | 122,610 | 5,240 |
| * | Insulet Corp. | 117,340 | 5,111 |
| * | Neogen Corp. | 77,025 | 4,996 |
| * | ICU Medical Inc. | 31,746 | 4,775 |
| * | LivaNova plc | 89,536 | 4,513 |
| * | Nevro Corp. | 44,134 | 4,236 |
| *,^ Penumbra Inc. | 55,005 | 4,224 |
| * | Globus Medical Inc. | 146,871 | 4,084 |
| * | Zeltiq Aesthetics Inc. | 73,452 | 4,066 |
| * | Haemonetics Corp. | 105,546 | 3,940 |
| * | NxStage Medical Inc. | 132,010 | 3,770 |
| * | Halyard Health Inc. | 95,389 | 3,726 |
| * | Cynosure Inc. Class A | 48,973 | 3,232 |
| * | Merit Medical Systems Inc. | 91,705 | 2,824 |
| * | Varex Imaging Corp. | 75,922 | 2,644 |
| * | Natus Medical Inc. | 67,267 | 2,491 |
| * | Spectranetics Corp. | 88,204 | 2,454 |
| | Abaxis Inc. | 46,333 | 2,310 |
| * | Inogen Inc. | 32,962 | 2,262 |
| | Analogic Corp. | 25,384 | 2,090 |
| * | Integer Holdings Corp. | 56,867 | 2,056 |
| | CONMED Corp. | 48,355 | 2,012 |
| * | Cardiovascular Systems | | |
| | Inc. | 67,540 | 1,918 |
| | Atrion Corp. | 2,983 | 1,456 |
| * | Anika Therapeutics Inc. | 30,016 | 1,404 |
| * | K2M Group Holdings Inc. | 68,671 | 1,377 |
| * | Orthofix International NV | 36,518 | 1,304 |
| * | OraSure Technologies Inc. | 114,476 | 1,283 |
| * | AtriCure Inc. | 67,343 | 1,229 |
| * | Quidel Corp. | 56,696 | 1,191 |
| * | AngioDynamics Inc. | 66,950 | 1,095 |
| | Meridian Bioscience Inc. | 85,012 | 1,092 |
| * | Glaukos Corp. | 23,838 | 1,085 |
| | | |
| * | Endologix Inc. | 154,569 | 1,022 |
| * | GenMark Diagnostics Inc. | 83,138 | 941 |
| * | CryoLife Inc. | 57,383 | 918 |
| * | Accuray Inc. | 168,849 | 870 |
| *,^ | Cerus Corp. | 203,510 | 853 |
| | Invacare Corp. | 60,811 | 736 |
| * | Novocure Ltd. | 87,322 | 664 |
| * | STAAR Surgical Co. | 62,314 | 620 |
| *,^ | Rockwell Medical Inc. | 97,943 | 582 |
| * | ConforMIS Inc. | 48,815 | 246 |
| * | Tandem Diabetes Care Inc. | 36,822 | 88 |
| * | Wright Medical Group Inc. | | |
| | CVR | 14,554 | 22 |
| | | | 1,326,141 |
| Health Care Providers & Services (18.6%) |
| | UnitedHealth Group Inc. | 1,944,983 | 321,661 |
| | Aetna Inc. | 717,116 | 92,336 |
| * | Express Scripts Holding | | |
| | Co. | 1,260,198 | 89,033 |
| | Anthem Inc. | 538,365 | 88,733 |
| | Cigna Corp. | 524,764 | 78,137 |
| | McKesson Corp. | 462,055 | 69,368 |
| | Humana Inc. | 304,711 | 64,370 |
| * | HCA Holdings Inc. | 612,348 | 53,421 |
| | Cardinal Health Inc. | 653,843 | 53,203 |
| | AmerisourceBergen Corp. | | |
| | Class A | 337,602 | 30,894 |
| * | Laboratory Corp. of | | |
| | America Holdings | 210,586 | 29,958 |
| * | Henry Schein Inc. | 164,537 | 28,228 |
| | Quest Diagnostics Inc. | 283,392 | 27,614 |
| * | Centene Corp. | 349,426 | 24,635 |
| | Universal Health Services | | |
| | Inc. Class B | 183,300 | 23,022 |
| * | DaVita Inc. | 328,460 | 22,798 |
| * | Envision Healthcare Corp. | 239,650 | 16,776 |
| * | VCA Inc. | 165,745 | 15,066 |
| * | MEDNAX Inc. | 191,189 | 13,611 |
| * | WellCare Health Plans Inc. | 90,481 | 12,776 |
| | Patterson Cos. Inc. | 171,991 | 7,817 |
| | HealthSouth Corp. | 183,416 | 7,762 |
| * | Acadia Healthcare Co. Inc. | 151,902 | 6,793 |
| | Chemed Corp. | 33,177 | 5,924 |
| * | Brookdale Senior Living Inc. 379,892 | 5,470 |
| * | LifePoint Health Inc. | 81,910 | 5,246 |
| | Owens & Minor Inc. | 125,580 | 4,531 |
| * | AMN Healthcare Services | | |
| | Inc. | 98,013 | 4,033 |
| * | HealthEquity Inc. | 90,724 | 3,965 |
| * | Molina Healthcare Inc. | 81,081 | 3,933 |
| * | Tenet Healthcare Corp. | 203,470 | 3,927 |
| * | Surgical Care Affiliates Inc. | 57,604 | 3,267 |
| * | Premier Inc. Class A | 102,278 | 3,215 |
| * | Magellan Health Inc. | 46,321 | 3,203 |
| * | Select Medical Holdings | | |
| | Corp. | 216,185 | 3,113 |
| * | Air Methods Corp. | 73,180 | 2,770 |
| * | Amedisys Inc. | 55,153 | 2,659 |
| * | Community Health | | |
| | Systems Inc. | 231,216 | 2,254 |
| * | Tivity Health Inc. | 71,159 | 2,057 |
| | US Physical Therapy Inc. | 25,743 | 1,947 |
| | Ensign Group Inc. | 98,328 | 1,853 |
| * | PharMerica Corp. | 63,356 | 1,559 |
| | Kindred Healthcare Inc. | 173,164 | 1,558 |
| * | Teladoc Inc. | 69,892 | 1,541 |
| * | LHC Group Inc. | 31,637 | 1,519 |
| | National HealthCare Corp. | 20,140 | 1,503 |
| * | BioTelemetry Inc. | 54,768 | 1,394 |
| | | |
| * | Almost Family Inc. | 23,193 | 1,152 |
| * | Diplomat Pharmacy Inc. | 82,594 | 1,119 |
| | Landauer Inc. | 19,536 | 1,021 |
| * | Providence Service Corp. | 24,573 | 998 |
| | Aceto Corp. | 62,275 | 955 |
| * | Capital Senior Living Corp. | 55,452 | 932 |
| * | Triple-S Management Corp. | | |
| | Class B | 48,414 | 904 |
| * | Surgery Partners Inc. | 40,010 | 900 |
| * | CorVel Corp. | 21,796 | 881 |
| * | Universal American Corp. | 86,700 | 863 |
| * | Civitas Solutions Inc. | 30,717 | 568 |
| * | American Renal Associates | | |
| | Holdings Inc. | 24,981 | 565 |
| * | Quorum Health Corp. | 59,499 | 509 |
| * | Genesis Healthcare Inc. | 90,408 | 291 |
| * | Adeptus Health Inc. | | |
| | Class A | 30,818 | 208 |
| *,^ AAC Holdings Inc. | 18,631 | 171 |
| | | | 1,262,490 |
| Health Care Technology (1.1%) | | |
| * | Cerner Corp. | 624,446 | 34,370 |
| * | athenahealth Inc. | 80,611 | 9,506 |
| * | Veeva Systems Inc. | | |
| | Class A | 186,020 | 8,127 |
| * | Medidata Solutions Inc. | 117,750 | 6,585 |
| * | Allscripts Healthcare | | |
| | Solutions Inc. | 358,899 | 4,371 |
| * | HMS Holdings Corp. | 172,477 | 3,213 |
| * | Omnicell Inc. | 74,618 | 2,837 |
| * | Inovalon Holdings Inc. | | |
| | Class A | 128,689 | 1,544 |
| * | Quality Systems Inc. | 94,733 | 1,446 |
| * | Evolent Health Inc. Class A | 64,351 | 1,268 |
| * | HealthStream Inc. | 51,627 | 1,263 |
| * | Vocera Communications | | |
| | Inc. | 50,299 | 1,041 |
| ^ | Computer Programs | | |
| | & Systems Inc. | 22,072 | 594 |
| * | Castlight Health Inc. | | |
| | Class B | 48,911 | 174 |
| | | | 76,339 |
| Life Sciences Tools & Services (5.3%) | |
| | Thermo Fisher Scientific | | |
| | Inc. | 807,192 | 127,278 |
| * | Illumina Inc. | 300,215 | 50,256 |
| | Agilent Technologies Inc. | 662,982 | 34,011 |
| * | Mettler-Toledo | | |
| | International Inc. | 53,633 | 25,541 |
| * | Waters Corp. | 164,594 | 25,510 |
| * | Quintiles IMS Holdings Inc. | 301,977 | 23,370 |
| | PerkinElmer Inc. | 223,650 | 12,135 |
| * | Charles River Laboratories | | |
| | International Inc. | 96,723 | 8,412 |
| * | Bio-Rad Laboratories Inc. | | |
| | Class A | 42,389 | 8,251 |
| | Bio-Techne Corp. | 76,198 | 8,101 |
| * | PAREXEL International | | |
| | Corp. | 108,845 | 7,041 |
| | Bruker Corp. | 229,157 | 5,534 |
| * | VWR Corp. | 188,507 | 5,297 |
| * | PRA Health Sciences Inc. | 81,395 | 4,803 |
| * | INC Research Holdings Inc. | | |
| | Class A | 108,878 | 4,753 |
| * | Cambrex Corp. | 65,622 | 3,698 |
| *,^ | Accelerate Diagnostics Inc. | 63,148 | 1,610 |
| * | Luminex Corp. | 80,060 | 1,488 |
| * | NeoGenomics Inc. | 152,313 | 1,229 |
51
Health Care Index Fund
| | | |
| | | | Market |
| | | | Value• |
| | | Shares | ($000) |
| * | Pacific Biosciences of | | |
| | California Inc. | 182,706 | 923 |
| *,^ | Albany Molecular | | |
| | Research Inc. | 56,534 | 846 |
| * | Fluidigm Corp. | 52,550 | 345 |
| | | | 360,432 |
| Other (0.0%) 1 | | |
| * | Dyax Corp CVR | | |
| | Exp. 12/31/2019 | 299,743 | 333 |
| * | Durata Therapeutics Inc | | |
| | CVR Exp. 12/31/2018 | 48 | — |
| * | Clinical Data Contingent | | |
| | Value Rights | 8,685 | — |
| * | Cubist Pharmaceuticals, | | |
| | Inc. CVR | 31,107 | — |
| | | | 333 |
| Pharmaceuticals (33.0%) | | |
| | Johnson & Johnson | 5,559,211 | 679,391 |
| | Pfizer Inc. | 12,399,943 | 423,086 |
| | Merck & Co. Inc. | 5,633,964 | 371,109 |
| | Bristol-Myers Squibb Co. | 3,415,020 | 193,666 |
| | Allergan plc | 766,542 | 187,665 |
| | Eli Lilly & Co. | 2,030,212 | 168,122 |
| | Zoetis Inc. | 958,705 | 51,109 |
| * | Mylan NV | 929,449 | 38,897 |
| | Perrigo Co. plc | 293,207 | 21,923 |
| * | Jazz Pharmaceuticals plc | 122,568 | 16,255 |
| * | Mallinckrodt plc | 216,103 | 11,328 |
| * | Medicines Co. | 144,306 | 7,564 |
| * | Catalent Inc. | 254,779 | 7,312 |
| * | Prestige Brands Holdings | | |
| | Inc. | 108,481 | 6,142 |
| * | Endo International plc | 419,605 | 5,728 |
| * | Horizon Pharma plc | 296,372 | 4,757 |
| * | Nektar Therapeutics | | |
| | Class A | 312,077 | 4,082 |
| * | Pacira Pharmaceuticals | | |
| | Inc | 76 180 | 3 329 |
| * | Akorn Inc. | 154,011 | 3,205 |
| * | Aerie Pharmaceuticals Inc. | 57,934 | 2,743 |
| * | Theravance Biopharma Inc. | 79,133 | 2,423 |
| * | Supernus Pharmaceuticals | | |
| | I | 80 411 | 2 067 |
| * | Depomed Inc. | 125,758 | 2,061 |
| *,^ | TherapeuticsMD Inc. | 321,707 | 2,020 |
| * | Impax Laboratories Inc. | 127,536 | 1,817 |
| *,^ | Innoviva Inc. | 155,307 | 1,794 |
| * | Dermira Inc. | 47,259 | 1,592 |
| | | |
| *,^ | Corcept Therapeutics Inc. | 160,021 | 1,439 |
| *,^ | Lannett Co. Inc. | 60,533 | 1,332 |
| * | Amphastar | | |
| | Pharmaceuticals Inc. | 74,585 | 1,154 |
| * | Aclaris Therapeutics Inc. | 36,235 | 1,132 |
| * | ANI Pharmaceuticals Inc. | 17,972 | 1,062 |
| | Phibro Animal Health Corp. | | |
| | Class A | 37,296 | 1,039 |
| *,^ Omeros Corp. | 82,271 | 1,001 |
| * | SciClone Pharmaceuticals | | |
| | Inc. | 97,836 | 969 |
| * | Revance Therapeutics Inc. | 41,219 | 866 |
| * | Intra-Cellular Therapies Inc. | | |
| | Class A | 65,515 | 855 |
| * | Intersect ENT Inc. | 42,728 | 581 |
| * | Sucampo Pharmaceuticals | | |
| | Inc. Class A | 46,321 | 544 |
| * | Teligent Inc. | 75,259 | 538 |
| *,^ | Collegium Pharmaceutical | | |
| | Inc. | 37,690 | 500 |
| * | Aratana Therapeutics Inc. | 68,074 | 450 |
| *,^ | WaVe Life Sciences Ltd. | 14,225 | 428 |
| * | MyoKardia Inc. | 32,141 | 390 |
| *,^ | Ocular Therapeutix Inc. | 43,826 | 365 |
| * | Tetraphase Pharmaceuticals | | |
| | Inc. | 66,635 | 344 |
| * | Cempra Inc. | 84,276 | 287 |
| * | Clearside Biomedical Inc. | 34,855 | 274 |
| *,^ | BioDelivery Sciences | | |
| | International Inc. | 100,758 | 201 |
| | | | 2,236,938 |
| Total Common Stocks | | |
| (Cost $6,050,088) | | 6,788,368 |
| Temporary Cash Investment (0.4%) | |
| |
| Money Market Fund (0.4%) | | |
| 2,3 | Vanguard Market | | |
| | Liquidity Fund, 0.864% | | |
| | (Cost $24,223) | 242,226 | 24,225 |
| Total Investments (100.4%) | | |
| (Cost $6,074,311) | | 6,812,593 |
| |
| | Amount |
| | ($000) |
| Other Assets and Liabilities (-0.4%) | |
| Other Assets | |
| Investment in Vanguard | 455 |
| Receivables for Investment Securities Sold | 22,744 |
| Receivables for Accrued Income | 12,283 |
| Receivables for Capital Shares Issued | 1,315 |
| Other Assets3 | 64 |
| Total Other Assets | 36,861 |
| Liabilities | |
| Payables for Investment Securities | |
| Purchased | (29,216) |
| Collateral for Securities on Loan | (24,289) |
| Payables for Capital Shares Redeemed | (956) |
| Payables to Vanguard | (2,390) |
| Other Liabilities | (5,063) |
| Total Liabilities | (61,914) |
| Net Assets (100%) | 6,787,540 |
| |
| |
| At February 28, 2017, net assets consisted of: |
| | Amount |
| | ($000) |
| Paid-in Capital | 6,125,601 |
| Undistributed Net Investment Income | 13,753 |
| Accumulated Net Realized Losses | (90,096) |
| Unrealized Appreciation (Depreciation) | 738,282 |
| Net Assets | 6,787,540 |
| |
| |
| ETF Shares—Net Assets | |
| Applicable to 43,386,392 outstanding | |
| $.001 par value shares of beneficial | |
| interest (unlimited authorization) | 6,010,946 |
| Net Asset Value Per Share— | |
| ETF Shares | $138.54 |
| |
| |
| Admiral Shares—Net Assets | |
| Applicable to 11,205,842 outstanding | |
| $.001 par value shares of beneficial | |
| interest (unlimited authorization) | 776,594 |
| Net Asset Value Per Share— | |
| Admiral Shares | $69.30 |
• See Note A in Notes toFinancial Statements.
* Non-income-producing security.
^ Includes partial security positions on loan to broker-dealers. The total value of securities on loan is $22,697,000.
1 “Other” represents securities that are not classified by the fund’s benchmark index.
2 Affiliated money market fund available only to Vanguard funds and certain trusts and accounts managed by Vanguard. Rate shown is the 7-day yield.
3Includes$24,289,000ofcollateralreceivedforsecuritiesonloan,ofwhich$64,000isheldincash.
CVR—Contingent Value Rights.
See accompanying Notes, which are an integral part of the Financial Statements.
52
Health Care Index Fund
Statement of Operations
| |
| Six Months Ended |
| February 28, 2017 |
| | ($000) |
| Investment Income | |
| Income | |
| Dividends | 49,222 |
| Interest 1 | 5 |
| Securities Lending—Net | 546 |
| Total Income | 49,773 |
| Expenses | |
| The Vanguard Group—Note B | |
| Investment Advisory Services | 451 |
| Management and Administrative— | |
| ETF Shares | 1,943 |
| Management and Administrative— | |
| Admiral Shares | 271 |
| Marketing and Distribution— | |
| ETF Shares | 199 |
| Marketing and Distribution— | |
| Admiral Shares | 39 |
| Custodian Fees | 50 |
| Shareholders’ Reports—ETF Shares | 165 |
| Shareholders’ Reports—Admiral Shares | 4 |
| Trustees’ Fees and Expenses | 3 |
| Total Expenses | 3,125 |
| Net Investment Income | 46,648 |
| Realized Net Gain (Loss) on Investment | |
| Securities Sold1 | 132,476 |
| Change in Unrealized Appreciation | |
| (Depreciation) of Investment Securities | 124,810 |
| Net Increase (Decrease) in Net Assets | |
| Resulting from Operations | 303,934 |
| 1 Interest income and realized net gain (loss) from an affiliated |
| company of the fund were $5,000 and $0, respectively. |
Statement of Changes in NetAssets
| | |
| | Six Months Ended | Year Ended |
| | February 28, | August 31, |
| | 2017 | 2016 |
| | ($000) | ($000) |
| Increase (Decrease) in Net Assets | | |
| Operations | | |
| Net Investment Income | 46,648 | 88,250 |
| Realized Net Gain (Loss) | 132,476 | 246,042 |
| Change in Unrealized Appreciation (Depreciation) | 124,810 | (201,841) |
| Net Increase (Decrease) in Net Assets Resulting from Operations | 303,934 | 132,451 |
| Distributions | | |
| Net Investment Income | | |
| ETF Shares | (43,769) | (106,021) |
| Admiral Shares | (5,957) | (15,301) |
| Realized Capital Gain | | |
| ETF Shares | — | — |
| Admiral Shares | — | — |
| Total Distributions | (49,726) | (121,322) |
| Capital Share Transactions | | |
| ETF Shares | 75,844 | (126,109) |
| Admiral Shares | (50,309) | (27,942) |
| Net Increase (Decrease) from Capital Share Transactions | 25,535 | (154,051) |
| Total Increase (Decrease) | 279,743 | (142,922) |
| Net Assets | | |
| Beginning of Period | 6,507,797 | 6,650,719 |
| End of Period 1 | 6,787,540 | 6,507,797 |
| 1 Net Assets—End of Period includes undistributed (overdistributed) net investment income of $13,753,000 and $16,826,000. |
See accompanying Notes, which are an integral part of the Financial Statements.
53
Health Care Index Fund
Financial Highlights
| | | | | | | |
| ETF Shares | | | | | | | |
| | Six Months | | | | | |
| | | Ended | | | | | |
| For a Share Outstanding | February 28, | Year Ended August 31, |
| Throughout Each Period | | 2017 | 2016 | 2015 | 2014 | 2013 | 2012 |
| Net Asset Value, Beginning of Period | $133.25 | $132.34 | $117.17 | $89.94 | $70.32 | $59.58 |
| Investment Operations | | | | | | | |
| Net Investment Income | | .956 | 1.795 | 1.350 | 1.333 | 1.155 | 1.197 |
| Net Realized and Unrealized Gain (Loss) | | | | | | |
| on Investments | | 5.353 | 1.559 | 15.105 | 27.033 | 19.663 | 10.592 |
| Total from Investment Operations | 6.309 | 3.354 | 16.455 | 28.366 | 20.818 | 11.789 |
| Distributions | | | | | | | |
| Dividends from Net Investment Income | (1.019) | (2.444) | (1.285) | (1.136) | (1.198) | (1.049) |
| Distributions from Realized Capital Gains | — | — | — | — | — | — |
| Total Distributions | | (1.019) | (2.444) | (1.285) | (1.136) | (1.198) | (1.049) |
| Net Asset Value, End of Period | $138.54 | $133.25 | $132.34 | $117.17 | $89.94 | $70.32 |
| |
| Total Return | | 4.79% | 2.61% | 14.08% | 31.76% | 30.01% | 20.07% |
| |
| Ratios/Supplemental Data | | | | | | | |
| Net Assets, End of Period (Millions) | $6,011 | $5,708 | $5,826 | $3,319 | $1,918 | $894 |
| Ratio of Total Expenses to | | | | | | | |
| Average Net Assets | | 0.10% | 0.10% | 0.09% | 0.12% | 0.14% | 0.14% |
| Ratio of Net Investment Income to | | | | | | |
| Average Net Assets | | 1.49% | 1.40% | 1.25% | 1.40% | 1.69% | 1.92% |
| Portfolio Turnover Rate1 | | 5% | 7% | 4% | 5% | 5% | 9% |
The expense ratio, net investment income ratio, and turnover rate for the current period have been annualized.
1 Excludes the value of portfolio securities received or delivered as a result of in-kind purchases or redemptions of the fund’s capital shares,
including ETF Creation Units.
See accompanying Notes, which are an integral part of the Financial Statements.
54
Health Care Index Fund
Financial Highlights
| | | | | | | |
| Admiral Shares | | | | | | | |
| | Six Months | | | | | |
| | | Ended | | | | | |
| For a Share Outstanding | February 28, | Year Ended August 31, |
| Throughout Each Period | | 2017 | 2016 | 2015 | 2014 | 2013 | 2012 |
| Net Asset Value, Beginning of Period | $66.65 | $66.20 | $58.61 | $44.99 | $35.18 | $29.81 |
| Investment Operations | | | | | | | |
| Net Investment Income | | .477 | .898 | .676 | .666 | .580 | .599 |
| Net Realized and Unrealized Gain (Loss) | | | | | | |
| on Investments | | 2.682 | .774 | 7.557 | 13.523 | 9.831 | 5.298 |
| Total from Investment Operations | 3.159 | 1.672 | 8.233 | 14.189 | 10.411 | 5.897 |
| Distributions | | | | | | | |
| Dividends from Net Investment Income | (. 509) | (1.222) | (. 643) | (. 569) | (. 601) | (. 527) |
| Distributions from Realized Capital Gains | — | — | — | — | — | — |
| Total Distributions | | (. 509) | (1.222) | (. 643) | (. 569) | (. 601) | (. 527) |
| Net Asset Value, End of Period | $69.30 | $66.65 | $66.20 | $58.61 | $44.99 | $35.18 |
| |
| Total Return 1 | | 4.79% | 2.61% | 14.11% | 31.77% | 30.00% | 20.08% |
| |
| Ratios/Supplemental Data | | | | | | | |
| Net Assets, End of Period (Millions) | $777 | $800 | $824 | $413 | $247 | $98 |
| Ratio of Total Expenses to | | | | | | | |
| Average Net Assets | | 0.10% | 0.10% | 0.10% | 0.12% | 0.14% | 0.14% |
| Ratio of Net Investment Income to | | | | | | |
| Average Net Assets | | 1.49% | 1.40% | 1.24% | 1.40% | 1.69% | 1.92% |
| Portfolio Turnover Rate2 | | 5% | 7% | 4% | 5% | 5% | 9% |
The expense ratio, net investment income ratio, and turnover rate for the current period have been annualized.
1 Total returns do not include transaction or account service fees that may have applied in the periods shown. Fund prospectuses provide
information about any applicable transaction and account service fees.
2 Excludes the value of portfolio securities received or delivered as a result of in-kind purchases or redemptions of the fund’s capital shares,
including ETF Creation Units.
See accompanying Notes, which are an integral part of the Financial Statements.
55
Health Care Index Fund
Notes to Financial Statements
Vanguard Health Care Index Fund is registered under the Investment Company Act of 1940 as an open-end investment company, or mutual fund. The fund offers two classes of shares: ETF Shares and Admiral Shares. ETF Shares are listed for trading on NYSE Arca; they can be purchased and sold through a broker. Admiral Shares are designed for investors who meet certain administrative, service, and account-size criteria.
A. The following significant accounting policies conform to generally accepted accounting principles for U.S. investment companies. The fund consistently follows such policies in preparing its financial statements.
1. SecurityValuation:SecuritiesarevaluedasofthecloseoftradingontheNewYorkStockExchange (generally 4 p.m., Eastern time) on the valuation date. Equity securities are valued at thelatestquoted sales prices or official closing prices taken from the primary market in which each security trades; such securities not traded on the valuation date are valued at the mean of the latest quoted bid and asked prices. Securities for whichmarket quotations are not readily available, or whose valueshave been materially affected by events occurring before the fund’s pricing time but after the close of the securities’ primary markets, are valued by methods deemed by the board of trustees to represent fairvalue.InvestmentsinVanguard MarketLiquidityFundarevaluedatthatfund’snetassetvalue.
2. Federal Income Taxes: The fund intends to continue to qualify as a regulated investment company and distribute all of its taxable income. Management has analyzed the fund’s tax positions taken for all open federal income tax years (August 31, 2013–2016), and for the period ended February 28, 2017, and has concluded that no provision for federal income tax is required in the fund’s financial statements. 3. Distributions: Distributions to shareholders are recorded on the ex-dividend date.
4. Securities Lending: To earn additional income, the fund lends its securities to qualified institutional borrowers. Security loans are subject to termination by the fund at any time, and are required to be secured at all times by collateral in an amount at least equal to the market value of securities loaned. Daily market fluctuations could cause the value of loaned securities to be more or less than the value of the collateral received. When this occurs, the collateral is adjusted and settled on the next business day. The fund further mitigates its counterparty risk by entering into securities lending transactions only with a diverse group of prequalified counterparties, monitoring their financial strength, and entering into master securities lending agreements with its counterparties. The master securities lending agreements provide that, in the event of a counterparty’s default (including bankruptcy), the fund may terminate any loans with that borrower, determine the net amount owed, and sell or retain the collateral up to the net amount owed to the fund; however, such actions may be subject to legal proceedings. While collateral mitigates counterparty risk, in the absence of a default the fund may experience delays and costs in recovering the securities loaned. The fund invests cash collateral received in Vanguard Market Liquidity Fund, and records a liability in the Statement of Net Assets for the return of the collateral, during the period the securities are on loan. Securities lending income represents feeschargedto borrowers plusincome earned oninvested cash collateral,less expenses associated with the loan. During the term of the loan, the fund is entitled to all distributions made on or in respect of the loaned securities.
5. Credit Facility: The fund and certain other funds managed by The Vanguard Group (“Vanguard”) participate in a $3.1 billion committed credit facility provided by a syndicate of lenders pursuant to a credit agreement that may be renewed annually; each fund is individually liable for its borrowings, if any, under the credit facility. Borrowings may be utilized for temporary and emergency purposes, and are subject to the fund’s regulatory and contractual borrowing restrictions. The participating funds are charged administrative fees and an annual commitment fee of 0.10% of the undrawn amount of the facility; these fees are allocated to the funds based on a method approved by the fund’s board of trustees and included in Management and Administrative expenses on the fund’s Statement of Operations. Any borrowings under this facility bear interest at a rate based upon the higher of the one-month London Interbank Offered Rate, federal funds effective rate, or overnight bank funding rate plus an agreed-upon spread.
The fund had no borrowings outstanding at February 28, 2017, or at any time during the period then ended.
6. Other: Dividend income is recorded on the ex-dividend date. Interest income includes income distributions received from Vanguard Market Liquidity Fund and is accrued daily. Security transactions are accounted for on the date securities are bought or sold. Costs used to determine realized gains (losses) on the sale of investment securities are those of the specific securities sold.
56
Health Care Index Fund
Each class of shares has equal rights as to assets and earnings, except that each class separately bears certain class-specific expenses related to maintenance of shareholder accounts (included in Management and Administrative expenses) and shareholder reporting. Marketing and distribution expenses are allocated to each class of shares based on a method approved by the board of trustees. Income, other non-class-specific expenses, and gains and losses on investments are allocated to each class of shares based on its relative net assets.
B. In accordance with the terms of a Funds’ Service Agreement (the “FSA”) between Vanguard and the fund, Vanguard furnishes to the fund investment advisory, corporate management, administrative, marketing,anddistributionservices atVanguard’scostofoperations (as defined bythe FSA).These costs of operations are allocated to the fund based on methods and guidelines approved by the board of trustees. Vanguard does not require reimbursement in the current period for certain costs ofoperations(such asdeferred compensation/benefitsand risk/insurance costs);thefund’sliability for these costs of operations isincluded in Payables to Vanguard on the Statement of Net Assets.
Upon the request of Vanguard, the fund may invest up to 0.40% of its net assets as capital in Vanguard. At February 28, 2017,the fund had contributedto Vanguard capitalinthe amountof $455,000, representing 0.01% of the fund’s net assets and 0.18% of Vanguard’s capitalization. The fund’s trustees and officers are also directors and employees, respectively, of Vanguard.
C. Variousinputs may be used to determine the value of the fund’sinvestments. Theseinputs are summarized in three broad levels for financial statement purposes. The inputs or methodologies used to value securities are not necessarily an indication of the risk associated with investing in those securities.
Level 1—Quoted prices in active markets for identical securities.
Level 2—Other significant observable inputs (including quoted prices for similar securities, interest rates, prepayment speeds, credit risk, etc.).
Level 3—Significant unobservable inputs (including the fund’s own assumptions used to determine the fair value of investments).
The following table summarizes the market value of the fund’sinvestments as of February 28, 2017, based on the inputs used to value them:
| | | |
| | Level 1 | Level 2 | Level 3 |
| Investments | ($000) | ($000) | ($000) |
| Common Stocks | 6,788,035 | — | 333 |
| Temporary Cash Investments | 24,225 | — | — |
| Total | 6,812,260 | — | 333 |
D. Distributions are determined on a tax basis and may differ from net investment income and realized capital gains for financial reporting purposes. Differences may be permanent or temporary. Permanent differences are reclassified among capital accounts in the financial statements to reflect their tax character. Temporary differences arise when certain items of income, expense, gain, or loss are recognized in different periods for financial statement and tax purposes. These differences will reverse at some time in the future. Differences in classification may also result from the treatment of short-term gains as ordinary income for tax purposes.
During the six months ended February 28, 2017, the fund realized $133,421,000 of net capital gains resulting from in-kind redemptions—in which shareholders exchanged fund shares for securities held by the fund rather than for cash. Because such gains are not taxable to the fund, and are not distributed to shareholders, they have been reclassified from accumulated net realized losses to paid-in capital.
The fund’s tax-basis capital gains and losses are determined only at the end of each fiscal year. For tax purposes, at August 31, 2016, the fund had available capital losses totaling $89,253,000 that may be carried forward indefinitely to offset future net capital gains. The fund will use these capital losses to offset net taxable capital gains, if any, realized during the year ending August 31, 2017; should the fund realize net capital losses for the year, the losses will be added to the loss carryforward balance above.
At February 28, 2017, the cost of investment securities for tax purposes was $6,074,376,000. Net unrealized appreciation of investment securities for tax purposes was $738,217,000, consisting of unrealized gains of $1,050,837,000 on securities that had risen in value since their purchase and $312,620,000 in unrealized losses on securities that had fallen in value since their purchase.
57
Health Care Index Fund
E. During the six months ended February 28, 2017, the fund purchased $567,911,000 of investment securities and sold $546,063,000 of investment securities, other than temporary cash investments. Purchases and sales include $406,581,000 and $373,687,000, respectively, in connection with in-kind purchases and redemptions of the fund’s capital shares.
F. Capital share transactions for each class of shares were:
| | | | |
| | Six Months Ended | Year Ended |
| | February 28, 2017 | August 31, 2016 |
| | Amount | Shares | Amount | Shares |
| | ($000) | (000) | ($000) | (000) |
| ETF Shares | | | | |
| Issued | 449,777 | 3,428 | 754,915 | 5,758 |
| Issued in Lieu of Cash Distributions | — | — | �� | — |
| Redeemed | (373,933) | (2,875) | (881,024) | (6,950) |
| Net Increase (Decrease)—ETF Shares | 75,844 | 553 | (126,109) | (1,192) |
| Admiral Shares | | | | |
| Issued | 137,374 | 2,116 | 239,770 | 3,728 |
| Issued in Lieu of Cash Distributions | 5,411 | 83 | 14,078 | 219 |
| Redeemed | (193,094) | (2,999) | (281,790) | (4,393) |
| Net Increase (Decrease)—Admiral Shares | (50,309) | (800) | (27,942) | (446) |
G. Management has determined that no material events or transactions occurred subsequent to February 28, 2017, that would require recognition or disclosure in these financial statements.
58
Industrials Index Fund
Fund Profile
As of February 28, 2017
| | |
| Share-Class Characteristics | | |
| | ETF | Admiral |
| | Shares | Shares |
| Ticker Symbol | VIS | VINAX |
| Expense Ratio1 | 0.10% | 0.10% |
| 30-Day SEC Yield | 1.78% | 1.79% |
| | | |
| Portfolio Characteristics | | |
| | | MSCI | |
| | | US IMI/ | MSCI |
| | | Industrials | US IMI/ |
| | Fund | 25/50 | 2500 |
| Number of Stocks | 347 | 347 | 2,479 |
| Median Market Cap | $36.9B | $36.9B | $57.6B |
| Price/Earnings Ratio | 23.5x | 23.5x | 24.7x |
| Price/Book Ratio | 4.1x | 4.1x | 3.0x |
| Return on Equity | 18.3% | 18.2% | 16.5% |
| Earnings Growth Rate | 6.0% | 6.0% | 7.6% |
| Dividend Yield | 1.9% | 1.9% | 1.9% |
| Foreign Holdings | 0.0% | 0.0% | 0.0% |
| Turnover Rate | | | |
| (Annualized) | 6% | — | — |
| Short-Term Reserves | -0.1% | — | — |
| | |
| Volatility Measures | | |
| | MSCI US | |
| | IMI/Industrials | MSCI US |
| | 25/50 | IMI/2500 |
| R-Squared | 1.00 | 0.86 |
| Beta | 1.00 | 1.10 |
| These measures show the degree and timing of the fund’s |
| fluctuations compared with the indexes over 36 months. |
| |
| Subindustry Diversification | |
| (% of equity exposure) | |
| |
| Aerospace & Defense | 20.1% |
| Agricultural & Farm Machinery | 1.5 |
| Air Freight & Logistics | 5.8 |
| Airlines | 5.6 |
| Building Products | 4.2 |
| Construction & Engineering | 1.9 |
| Construction Machinery & Heavy Trucks | 5.5 |
| Diversified Support Services | 1.3 |
| Electrical Components & Equipment | 5.2 |
| Environmental & Facilities Services | 3.2 |
| Industrial Conglomerates | 18.5 |
| Industrial Machinery | 10.1 |
| Railroads | 6.9 |
| Research & Consulting Services | 3.0 |
| Trading Companies & Distributors | 3.3 |
| Trucking | 1.4 |
| Other Industrials | 2.5 |
| | |
| Ten Largest Holdings (% of total net assets) |
| |
| General Electric Co. | Industrial Conglomerates | 9.8% |
| 3M Co. | Industrial Conglomerates | 4.2 |
| Boeing Co. | Aerospace & Defense | 3.9 |
| Honeywell | | |
| International Inc. | Industrial Conglomerates | 3.4 |
| Union Pacific Corp. | Railroads | 3.3 |
| United Technologies | | |
| Corp. | Aerospace & Defense | 3.3 |
| United Parcel | | |
| Service Inc. Class B | Air Freight & Logistics | 2.7 |
| Lockheed Martin | | |
| Corp. | Aerospace & Defense | 2.6 |
| Caterpillar Inc. | Construction Machinery | |
| | & Heavy Trucks | 2.1 |
| General Dynamics | | |
| Corp. | Aerospace & Defense | 1.8 |
| Top Ten | | 37.1% |
| The holdings listedexcludeany temporary cashinvestments and |
| equity index products. |
1 The expense ratios shown are from the prospectus dated December 22, 2016, and represent estimated costs for the current fiscal year. For the six months ended February 28, 2017, the annualized expense ratios were 0.10% for ETF Shares and 0.11% for Admiral Shares.
59
Industrials Index Fund
Performance Summary
All of the returns in this report represent past performance, which is not a guarantee of future results that may be achieved by the fund. (Current performance may be lower or higher than theperformancedatacited.For performance data currenttothemostrecentmonth-end, visit our website at vanguard.com/performance.) Note, too, that both investment returns and principal value can fluctuate widely, so an investor’s shares, when sold, could be worth more or less than their original cost. The returns shown do not reflect taxes that a shareholder would pay on fund distributions or on the sale of fund shares.
Fiscal-Year Total Returns (%): August 31, 2006–February 28, 2017
For a benchmark description, see the Glossary.
Note: For 2017, performance data reflect the six months ended February 28, 2017.
Average Annual Total Returns: Periods Ended December 31, 2016
This table presents returns through the latest calendar quarter—rather than through the end of the fiscal period.
Securities and Exchange Commission rules require that we provide this information.
| | | | |
| | Inception Date | One Year | Five Years | Ten Years |
| ETF Shares | 9/23/2004 | | | |
| Market Price | | 20.43% | 15.93% | 8.04% |
| Net Asset Value | | 20.37 | 15.92 | 8.05 |
| Admiral Shares | 5/8/2006 | 20.36 | 15.93 | 8.04 |
See Financial Highlights for dividend and capital gains information.
60
Industrials Index Fund
Financial Statements (unaudited)
Statement of Net Assets
As of February 28, 2017
The fund reports a complete list of its holdings in regulatory filings four times in each fiscal year, at the quarter-ends. For the second and fourth fiscal quarters, the lists appear in the fund’s semiannual and annual reports to shareholders. For the first and third fiscal quarters, the fund files the lists with the Securities and Exchange Commission on Form N-Q. Shareholders can look up the fund’s Forms N-Q on the SEC’s website at sec.gov. Forms N-Q may also be reviewed and copied at the SEC’s Public Reference Room (see the back cover of this report for further information).
| | | |
| | | | Market |
| | | | Value• |
| | | Shares | ($000) |
| Common Stocks (99.9%)1 | | |
| Aerospace & Defense (20.0%) | | |
| | Boeing Co. | 666,740 | 120,167 |
| | United Technologies Corp. | 889,551 | 100,119 |
| | Lockheed Martin Corp. | 299,850 | 79,934 |
| | General Dynamics Corp. | 294,349 | 55,870 |
| | Raytheon Co. | 333,929 | 51,475 |
| | Northrop Grumman Corp. | 190,422 | 47,051 |
| | TransDigm Group Inc. | 60,666 | 15,421 |
| | L3 Technologies Inc. | 87,914 | 14,798 |
| | Textron Inc. | 307,272 | 14,534 |
| | Arconic Inc. | 498,625 | 14,355 |
| | Rockwell Collins Inc. | 148,125 | 14,159 |
| | Huntington Ingalls | | |
| | Industries Inc. | 52,727 | 11,521 |
| | Spirit AeroSystems | | |
| | Holdings Inc. Class A | 138,418 | 8,528 |
| | B/E Aerospace Inc. | 115,654 | 7,356 |
| | Orbital ATK Inc. | 66,697 | 6,164 |
| | Hexcel Corp. | 104,418 | 5,741 |
| * | Teledyne Technologies Inc. | 37,656 | 4,948 |
| | BWX Technologies Inc. | 101,320 | 4,705 |
| | Curtiss-Wright Corp. | 47,811 | 4,677 |
| | HEICO Corp. Class A | 43,536 | 3,089 |
| * | KLX Inc. | 59,915 | 3,016 |
| * | Esterline Technologies | | |
| | Corp. | 31,873 | 2,834 |
| * | Moog Inc. Class A | 36,629 | 2,475 |
| * | DigitalGlobe Inc. | 70,390 | 2,228 |
| * | Mercury Systems Inc. | 53,571 | 2,001 |
| | HEICO Corp. | 23,006 | 1,890 |
| * | TASER International Inc. | 59,368 | 1,524 |
| | Triumph Group Inc. | 53,524 | 1,488 |
| | Cubic Corp. | 26,214 | 1,378 |
| | AAR Corp. | 37,454 | 1,289 |
| * | Aerojet Rocketdyne | | |
| | Holdings Inc. | 63,134 | 1,224 |
| * | Wesco Aircraft Holdings | | |
| | Inc. | 66,781 | 808 |
| * | Engility Holdings Inc. | 23,205 | 727 |
| * | Aerovironment Inc. | 23,729 | 641 |
| * | Kratos Defense & Security | | |
| | Solutions Inc. | 69,657 | 575 |
| * | Astronics Corp. | 17,083 | 572 |
| * | National Presto Industries | | |
| | Inc. | 5,400 | 538 |
| *,^ KEYW Holding Corp. | 50,056 | 497 |
| * | Astronics Corp. Class B | 5,016 | 172 |
| | | | 610,489 |
| Air Freight & Logistics (5.8%) | | |
| | United Parcel Service Inc. | | |
| | Class B | 783,924 | 82,908 |
| | FedEx Corp. | 287,104 | 55,405 |
| | CH Robinson Worldwide | | |
| | Inc. | 161,149 | 12,951 |
| | Expeditors International of | | |
| | Washington Inc. | 205,119 | 11,565 |
| * | XPO Logistics Inc. | 126,254 | 6,438 |
| | | |
| * | Hub Group Inc. Class A | 37,912 | 1,914 |
| | Forward Air Corp. | 34,626 | 1,716 |
| * | Atlas Air Worldwide | | |
| | Holdings Inc. | 28,562 | 1,624 |
| * | Air Transport Services | | |
| | Group Inc. | 55,291 | 941 |
| * | Echo Global Logistics Inc. | 29,706 | 649 |
| | Park-Ohio Holdings Corp. | 9,075 | 405 |
| | | | 176,516 |
| Airlines (5.6%) | | |
| | Delta Air Lines Inc. | 851,637 | 42,522 |
| | Southwest Airlines Co. | 700,046 | 40,463 |
| | American Airlines Group | | |
| | Inc. | 589,211 | 27,316 |
| * | United Continental | | |
| | Holdings Inc. | 360,815 | 26,733 |
| | Alaska Air Group Inc. | 140,181 | 13,713 |
| * | JetBlue Airways Corp. | 368,504 | 7,355 |
| * | Spirit Airlines Inc. | 79,101 | 4,130 |
| * | Hawaiian Holdings Inc. | 57,579 | 2,801 |
| | Allegiant Travel Co. | | |
| | Class A | 15,017 | 2,614 |
| | SkyWest Inc. | 58,885 | 2,070 |
| | | | 169,717 |
| Building Products (4.2%) | | |
| | Johnson Controls | | |
| | International plc | 1,065,206 | 44,675 |
| | Masco Corp. | 373,344 | 12,612 |
| | Fortune Brands Home | | |
| | & Security Inc. | 175,480 | 10,148 |
| | AO Smith Corp. | 167,993 | 8,460 |
| | Allegion plc | 109,130 | 7,922 |
| | Owens Corning | 128,984 | 7,544 |
| | Lennox International Inc. | 44,101 | 7,260 |
| * | USG Corp. | 107,977 | 3,642 |
| * | Masonite International | | |
| | Corp. | 29,210 | 2,281 |
| * | Trex Co. Inc. | 33,521 | 2,280 |
| | Universal Forest Products | | |
| | Inc. | 23,121 | 2,215 |
| * | Armstrong World Industries | |
| | Inc. | 47,244 | 2,173 |
| | Simpson Manufacturing | | |
| | Co. Inc. | 45,849 | 1,979 |
| | Apogee Enterprises Inc. | 33,025 | 1,888 |
| | AAON Inc. | 47,846 | 1,610 |
| * | American Woodmark Corp. | 16,735 | 1,447 |
| * | Gibraltar Industries Inc. | 33,837 | 1,403 |
| * | Builders FirstSource Inc. | 101,471 | 1,313 |
| * | Patrick Industries Inc. | 14,464 | 1,155 |
| * | Continental Building | | |
| | Products Inc. | 45,926 | 1,123 |
| | Advanced Drainage | | |
| | Systems Inc. | 47,407 | 1,045 |
| | Griffon Corp. | 33,704 | 848 |
| | Insteel Industries Inc. | 20,798 | 751 |
| | Quanex Building Products | | |
| | Corp. | 35,404 | 692 |
| | | |
| * | CSW Industrials Inc. | 17,844 | 662 |
| * | NCI Building Systems Inc. | 40,317 | 645 |
| * | PGT Innovations Inc. | 56,578 | 569 |
| * | Ply Gem Holdings Inc. | 27,190 | 473 |
| * | Armstrong Flooring Inc. | 21,775 | 465 |
| | | | 129,280 |
| Commercial Services & Supplies (5.6%) | |
| | Waste Management Inc. | 502,634 | 36,853 |
| | Waste Connections Inc. | 199,490 | 17,433 |
| | Republic Services Inc. | | |
| | Class A | 270,619 | 16,765 |
| | Cintas Corp. | 95,465 | 11,266 |
| * | Stericycle Inc. | 96,820 | 8,024 |
| | KAR Auction Services Inc. | 157,292 | 7,050 |
| * | Copart Inc. | 117,406 | 6,943 |
| | Rollins Inc. | 111,471 | 4,075 |
| | Deluxe Corp. | 55,200 | 4,062 |
| * | Clean Harbors Inc. | 62,060 | 3,597 |
| | Healthcare Services Group | | |
| | Inc. | 82,345 | 3,407 |
| | Pitney Bowes Inc. | 211,240 | 2,881 |
| | Brink’s Co. | 50,934 | 2,722 |
| | MSA Safety Inc. | 36,335 | 2,625 |
| | Tetra Tech Inc. | 65,081 | 2,620 |
| | ABM Industries Inc. | 59,981 | 2,447 |
| | Matthews International Corp. | |
| | Class A | 36,697 | 2,417 |
| | UniFirst Corp. | 17,472 | 2,326 |
| | HNI Corp. | 50,525 | 2,315 |
| | Covanta Holding Corp. | 133,234 | 2,158 |
| | G&K Services Inc. Class A | 22,428 | 2,120 |
| | Brady Corp. Class A | 53,711 | 2,055 |
| | Herman Miller Inc. | 67,773 | 2,020 |
| | Mobile Mini Inc. | 50,693 | 1,650 |
| * | ACCO Brands Corp. | 122,261 | 1,638 |
| | Steelcase Inc. Class A | 99,231 | 1,588 |
| | Interface Inc. Class A | 73,567 | 1,390 |
| | RR Donnelley & Sons Co. | 79,928 | 1,340 |
| | US Ecology Inc. | 24,970 | 1,267 |
| | West Corp. | 52,437 | 1,254 |
| | Knoll Inc. | 55,960 | 1,251 |
| | Multi-Color Corp. | 15,515 | 1,112 |
| | Viad Corp. | 22,982 | 1,085 |
| * | Team Inc. | 31,270 | 1,074 |
| | McGrath RentCorp | 25,540 | 961 |
| | Quad/Graphics Inc. | 33,524 | 910 |
| | LSC Communications Inc. | 31,836 | 905 |
| | Essendant Inc. | 42,225 | 673 |
| * | SP Plus Corp. | 19,166 | 618 |
| | Kimball International Inc. | | |
| �� | Class B | 35,463 | 582 |
| * | Civeo Corp. | 136,836 | 480 |
| | Ennis Inc. | 29,305 | 479 |
| * | InnerWorkings Inc. | 46,138 | 448 |
| | CECO Environmental Corp. | 32,978 | 373 |
| * | ARC Document Solutions | | |
| | Inc. | 46,397 | 187 |
| | | | 169,446 |
61
Industrials Index Fund
| | | |
| | | | Market |
| | | | Value• |
| | | Shares | ($000) |
| Construction & Engineering (1.9%) | |
| | Fluor Corp. | 158,415 | 8,775 |
| | Jacobs Engineering Group | | |
| | Inc. | 137,653 | 7,765 |
| * | Quanta Services Inc. | 171,725 | 6,409 |
| * | AECOM | 175,316 | 6,373 |
| | EMCOR Group Inc. | 68,966 | 4,240 |
| | Valmont Industries Inc. | 25,623 | 4,029 |
| | Chicago Bridge & Iron Co. | | |
| | NV | 113,544 | 3,812 |
| * | MasTec Inc. | 75,084 | 2,947 |
| * | Dycom Industries Inc. | 35,782 | 2,940 |
| | KBR Inc. | 161,847 | 2,436 |
| | Granite Construction Inc. | 45,037 | 2,387 |
| | Comfort Systems USA | | |
| | Inc. | 42,547 | 1,623 |
| * | Tutor Perini Corp. | 44,956 | 1,369 |
| | Primoris Services Corp. | 46,694 | 1,161 |
| | Argan Inc. | 15,508 | 1,068 |
| * | Aegion Corp. Class A | 39,356 | 896 |
| * | MYR Group Inc. | 18,480 | 693 |
| * | NV5 Global Inc. | 8,609 | 317 |
| | | | 59,240 |
| Electrical Equipment (5.3%) | | |
| | Emerson Electric Co. | 730,949 | 43,930 |
| | Eaton Corp. plc | 513,664 | 36,974 |
| | Rockwell Automation Inc. | 145,820 | 22,033 |
| | AMETEK Inc. | 263,179 | 14,204 |
| | Acuity Brands Inc. | 50,131 | 10,593 |
| * | Sensata Technologies | | |
| | Holding NV | 194,434 | 7,982 |
| | Hubbell Inc. Class B | 59,866 | 7,101 |
| | Regal Beloit Corp. | 50,987 | 3,796 |
| | EnerSys | 49,412 | 3,791 |
| * | Generac Holdings Inc. | 72,420 | 2,827 |
| | AZZ Inc. | 29,578 | 1,735 |
| | Encore Wire Corp. | 22,244 | 1,057 |
| * | Atkore International Group | |
| | Inc. | 35,793 | 938 |
| | General Cable Corp. | 55,779 | 932 |
| * | Babcock & Wilcox | | |
| | Enterprises Inc. | 49,708 | 820 |
| * | Thermon Group Holdings | | |
| | Inc. | 36,689 | 740 |
| *,^ Sunrun Inc. | 63,613 | 362 |
| | Powell Industries Inc. | 10,547 | 344 |
| * | Vicor Corp. | 19,785 | 322 |
| *,^ Plug Power Inc. | 205,673 | 222 |
| | Allied Motion Technologies | |
| | Inc. | 6,765 | 163 |
| *,^ FuelCell Energy Inc. | 27,949 | 43 |
| *,^ | Power Solutions | | |
| | International Inc. | 4,763 | 25 |
| | | | 160,934 |
| Industrial Conglomerates (18.5%) | |
| | General Electric Co. | 10,059,997 | 299,888 |
| | 3M Co. | 683,974 | 127,459 |
| | Honeywell International | | |
| | Inc. | 823,332 | 102,505 |
| | Roper Technologies Inc. | 115,349 | 24,131 |
| | Carlisle Cos. Inc. | 73,353 | 7,577 |
| | Raven Industries Inc. | 41,231 | 1,218 |
| | | | 562,778 |
| Machinery (17.1%) | | |
| | Caterpillar Inc. | 665,327 | 64,311 |
| | Illinois Tool Works Inc. | 359,241 | 47,423 |
| | Deere & Co. | 303,920 | 33,276 |
| | Cummins Inc. | 181,791 | 26,994 |
| | PACCAR Inc. | 398,621 | 26,632 |
| | | |
| | Parker-Hannifin Corp. | 151,697 | 23,489 |
| | Ingersoll-Rand plc | 293,767 | 23,313 |
| | Stanley Black & Decker Inc. 171,359 | 21,788 |
| | Fortive Corp. | 353,849 | 20,399 |
| | Dover Corp. | 176,657 | 14,150 |
| | Pentair plc | 196,335 | 11,399 |
| | Snap-on Inc. | 65,985 | 11,196 |
| | Xylem Inc. | 204,022 | 9,818 |
| * | Middleby Corp. | 65,456 | 9,079 |
| | Wabtec Corp. | 101,356 | 8,121 |
| | IDEX Corp. | 86,758 | 7,998 |
| | Toro Co. | 124,422 | 7,491 |
| | Nordson Corp. | 58,534 | 7,026 |
| | Flowserve Corp. | 148,511 | 6,898 |
| * | WABCO Holdings Inc. | 59,586 | 6,690 |
| | Donaldson Co. Inc. | 143,333 | 6,156 |
| | Graco Inc. | 63,323 | 5,747 |
| | Allison Transmission | | |
| | Holdings Inc. | 159,475 | 5,738 |
| | Oshkosh Corp. | 84,474 | 5,735 |
| | Lincoln Electric Holdings | | |
| | Inc. | 67,415 | 5,677 |
| | Trinity Industries Inc. | 172,726 | 4,636 |
| | AGCO Corp. | 72,845 | 4,438 |
| | Woodward Inc. | 62,919 | 4,433 |
| | ITT Inc. | 100,058 | 4,099 |
| * | Colfax Corp. | 104,629 | 3,981 |
| | Crane Co. | 53,233 | 3,848 |
| | Terex Corp. | 120,139 | 3,753 |
| | Timken Co. | 79,687 | 3,522 |
| | Kennametal Inc. | 90,679 | 3,363 |
| | Joy Global Inc. | 111,628 | 3,147 |
| | John Bean Technologies | | |
| | Corp. | 33,157 | 2,964 |
| | Barnes Group Inc. | 57,865 | 2,900 |
| * | Manitowoc Foodservice | | |
| | Inc. | 149,268 | 2,845 |
| | Hillenbrand Inc. | 71,706 | 2,607 |
| | Mueller Industries Inc. | 61,988 | 2,592 |
| * | Rexnord Corp. | 116,273 | 2,578 |
| * | RBC Bearings Inc. | 26,888 | 2,509 |
| | Mueller Water Products Inc. | | |
| | Class A | 184,175 | 2,282 |
| | Watts Water Technologies | | |
| | Inc. Class A | 30,026 | 1,920 |
| | Franklin Electric Co. Inc. | 44,506 | 1,865 |
| | Actuant Corp. Class A | 66,578 | 1,768 |
| * | SPX FLOW Inc. | 47,348 | 1,610 |
| | EnPro Industries Inc. | 24,430 | 1,595 |
| | ESCO Technologies Inc. | 29,260 | 1,586 |
| * | Proto Labs Inc. | 28,309 | 1,546 |
| * | Meritor Inc. | 93,505 | 1,529 |
| | Wabash National Corp. | 70,377 | 1,488 |
| | Albany International Corp. | 32,721 | 1,484 |
| | Standex International Corp. | 14,398 | 1,375 |
| * | Navistar International Corp. | 50,729 | 1,371 |
| ^ | Greenbrier Cos. Inc. | 32,450 | 1,365 |
| | Tennant Co. | 19,060 | 1,339 |
| | Astec Industries Inc. | 20,853 | 1,317 |
| * | Harsco Corp. | 90,449 | 1,275 |
| * | Chart Industries Inc. | 34,973 | 1,245 |
| * | SPX Corp. | 47,156 | 1,244 |
| * | TriMas Corp. | 52,196 | 1,151 |
| | Altra Industrial Motion Corp. | 29,153 | 1,133 |
| | Briggs & Stratton Corp. | 48,142 | 1,030 |
| | Federal Signal Corp. | 67,629 | 1,006 |
| | CIRCOR International Inc. | 15,771 | 980 |
| * | Lydall Inc. | 19,301 | 979 |
| | Lindsay Corp. | 11,989 | 960 |
| | | |
| | Sun Hydraulics Corp. | 25,726 | 952 |
| * | Manitowoc Co. Inc. | 151,079 | 919 |
| | Douglas Dynamics Inc. | 25,612 | 854 |
| | Global Brass & Copper | | |
| | Holdings Inc. | 24,729 | 832 |
| | Alamo Group Inc. | 11,005 | 827 |
| | Kadant Inc. | 12,362 | 765 |
| | Gorman-Rupp Co. | 22,542 | 702 |
| | Titan International Inc. | 52,025 | 689 |
| * | Milacron Holdings Corp. | 34,657 | 629 |
| | Hyster-Yale Materials | | |
| | Handling Inc. | 9,929 | 605 |
| | NN Inc. | 29,390 | 591 |
| | Columbus McKinnon Corp. | 21,869 | 564 |
| | American Railcar Industries | | |
| | Inc. | 9,763 | 435 |
| * | Energy Recovery Inc. | 38,693 | 325 |
| * | Blue Bird Corp. | 8,634 | 147 |
| | | | 521,038 |
| Marine (0.2%) | | |
| * | Kirby Corp. | 61,242 | 4,238 |
| | Matson Inc. | 48,504 | 1,646 |
| | | | 5,884 |
| Professional Services (3.9%) | | |
| | Nielsen Holdings plc | 406,459 | 18,031 |
| | Equifax Inc. | 136,188 | 17,856 |
| * | IHS Markit Ltd. | 407,855 | 16,233 |
| * | Verisk Analytics Inc. | | |
| | Class A | 180,901 | 15,000 |
| | ManpowerGroup Inc. | 76,330 | 7,407 |
| | Robert Half International | | |
| | Inc. | 146,735 | 7,078 |
| * | TransUnion | 123,498 | 4,581 |
| | Dun & Bradstreet Corp. | 41,729 | 4,404 |
| * | WageWorks Inc. | 41,668 | 3,208 |
| | CEB Inc. | 36,668 | 2,844 |
| * | On Assignment Inc. | 57,025 | 2,691 |
| * | Advisory Board Co. | 45,432 | 2,044 |
| * | FTI Consulting Inc. | 48,073 | 1,934 |
| | Korn/Ferry International | 59,071 | 1,826 |
| | Exponent Inc. | 29,171 | 1,676 |
| | Insperity Inc. | 17,021 | 1,417 |
| * | TriNet Group Inc. | 47,280 | 1,269 |
| * | TrueBlue Inc. | 48,681 | 1,263 |
| * | Navigant Consulting Inc. | 53,412 | 1,244 |
| * | Huron Consulting Group | | |
| | Inc. | 24,743 | 1,075 |
| * | ICF International Inc. | 20,658 | 887 |
| * | CBIZ Inc. | 58,159 | 774 |
| | Kelly Services Inc. Class A | 35,824 | 766 |
| | Kforce Inc. | 28,430 | 732 |
| * | RPX Corp. | 56,638 | 609 |
| | Resources Connection Inc. | 32,160 | 544 |
| | Heidrick & Struggles | | |
| | International Inc. | 19,452 | 476 |
| * | Mistras Group Inc. | 20,225 | 455 |
| * | GP Strategies Corp. | 15,023 | 370 |
| * | Acacia Research Corp. | 55,680 | 326 |
| | | | 119,020 |
| Road & Rail (8.3%) | | |
| | Union Pacific Corp. | 937,168 | 101,158 |
| | CSX Corp. | 1,065,156 | 51,724 |
| | Norfolk Southern Corp. | 331,990 | 40,181 |
| | Kansas City Southern | 122,337 | 10,843 |
| | JB Hunt Transport | | |
| | Services Inc. | 102,069 | 10,020 |
| * | Old Dominion Freight Line | | |
| | Inc. | 70,350 | 6,455 |
62
Industrials Index Fund
| | | |
| | | | Market |
| | | | Value• |
| | | Shares | ($000) |
| * | Genesee & Wyoming Inc. | | |
| | Class A | 69,709 | 5,168 |
| | Ryder System Inc. | 60,656 | 4,619 |
| | Landstar System Inc. | 47,473 | 4,121 |
| * | Avis Budget Group Inc. | 89,737 | 3,103 |
| | AMERCO | 7,805 | 3,015 |
| | Knight Transportation Inc. | 72,997 | 2,387 |
| * | Swift Transportation Co. | 93,739 | 2,036 |
| | Werner Enterprises Inc. | 53,319 | 1,493 |
| * | Saia Inc. | 28,789 | 1,392 |
| * | Hertz Global Holdings Inc. | 56,498 | 1,284 |
| | Heartland Express Inc. | 51,642 | 1,071 |
| | ArcBest Corp. | 27,948 | 820 |
| | Marten Transport Ltd. | 27,994 | 687 |
| * | YRC Worldwide Inc. | 32,025 | 411 |
| | Celadon Group Inc. | 32,361 | 261 |
| * | Roadrunner Transportation | | |
| | Systems Inc. | 33,332 | 251 |
| | | | 252,500 |
| Trading Companies & Distributors (3.3%) | |
| | Fastenal Co. | 328,679 | 16,444 |
| | WW Grainger Inc. | 64,356 | 15,958 |
| * | United Rentals Inc. | 95,780 | 12,263 |
| * | HD Supply Holdings Inc. | 228,627 | 9,831 |
| | Watsco Inc. | 34,576 | 5,127 |
| | MSC Industrial Direct | | |
| | Co. Inc. Class A | 50,651 | 5,095 |
| | Air Lease Corp. Class A | 111,102 | 4,325 |
| * | Univar Inc. | 119,567 | 3,850 |
| * | WESCO International Inc. | 55,077 | 3,828 |
| | Applied Industrial | | |
| | Technologies Inc. | 42,197 | 2,660 |
| * | Beacon Roofing Supply Inc. | 58,025 | 2,637 |
| | GATX Corp. | 43,363 | 2,518 |
| * | NOW Inc. | 122,350 | 2,342 |
| * | MRC Global Inc. | 108,927 | 2,201 |
| | Aircastle Ltd. | 66,831 | 1,606 |
| | Kaman Corp. | 27,768 | 1,437 |
| * | Herc Holdings Inc. | 27,123 | 1,402 |
| * | BMC Stock Holdings Inc. | 64,082 | 1,346 |
| * | Rush Enterprises Inc. | | |
| | Class A | 34,280 | 1,182 |
| | Triton International Ltd. | 46,244 | 1,143 |
| * | SiteOne Landscape | | |
| | Supply Inc. | 24,780 | 972 |
| | H&E Equipment Services | | |
| | Inc. | 36,064 | 946 |
| * | GMS Inc. | 28,325 | 852 |
| * | DXP Enterprises Inc. | 18,684 | 654 |
| | | |
| * | Veritiv Corp. | 10,515 | 585 |
| * | CAI International Inc. | 19,271 | 298 |
| * | Nexeo Solutions Inc. | 29,592 | 274 |
| * | Rush Enterprises Inc. | | |
| | Class B | 6,037 | 193 |
| | | | 101,969 |
| Transportation Infrastructure (0.2%) | |
| | Macquarie Infrastructure | | |
| | Corp. | 88,522 | 6,811 |
| Total Common Stocks | | |
| (Cost $2,648,633) | | 3,045,622 |
| Temporary Cash Investment (0.1%) 1 | |
| Money Market Fund (0.1%) | | |
| 2,3 | Vanguard Market | | |
| | Liquidity Fund, 0.864% | | |
| | (Cost $786) | 7,866 | 787 |
| Total Investments (100.0%) | |
| (Cost $2,649,419) | | 3,046,409 |
| |
| | | | Amount |
| | | | ($000) |
| Other Assets and Liabilities (0.0%) | |
| Other Assets | | |
| Investment in Vanguard | | 209 |
| Receivables for Investment Securities Sold | 9,951 |
| Receivables for Accrued Income | 9,712 |
| Receivables for Capital Shares Issued | 914 |
| Other Assets4 | | 185 |
| Total Other Assets | | 20,971 |
| Liabilities | | |
| Payables for Investment Securities | |
| Purchased | | (17,318) |
| Collateral for Securities on Loan | (783) |
| Payables for Capital Shares | Redeemed | (432) |
| Payables to Vanguard | | (937) |
| Other Liabilities | | (16) |
| Total Liabilities | | (19,486) |
| |
| Net Assets (100%) | | 3,047,894 |
| |
| At February 28, 2017, net assets consisted of: |
| | Amount |
| | ($000) |
| Paid-in Capital | 2,664,742 |
| Undistributed Net Investment Income | 9,993 |
| Accumulated Net Realized Losses | (23,827) |
| Unrealized Appreciation (Depreciation) | |
| Investment Securities | 396,990 |
| Futures Contracts | (4) |
| Net Assets | 3,047,894 |
| |
| |
| ETF Shares—Net Assets | |
| Applicable to 23,127,178 outstanding | |
| $.001 par value shares of beneficial | |
| interest (unlimited authorization) | 2,891,024 |
| Net Asset Value Per Share— | |
| ETF Shares | $125.01 |
| |
| |
| Admiral Shares—Net Assets | |
| Applicable to 2,442,584 outstanding | |
| $.001 par value shares of beneficial | |
| interest (unlimited authorization) | 156,870 |
| Net Asset Value Per Share— | |
| Admiral Shares | $64.22 |
• See Note A in Notes toFinancial Statements.
* Non-income-producing security.
^ Includes partial security positions on loan to broker-dealers. The total value of securities on loan is $605,000.
1 The fund invests a portion of its cash reserves in equity markets through the use of index futures contracts. After giving effect to futures investments, the fund’s effective common stock and temporary cash
investment positions represent 100.0% and 0.0%, respectively, of net assets.
2 Affiliated money market fund available only to Vanguard funds and certain trusts and accounts managed by Vanguard. Rate shown is the 7-day yield.
3 Includes $783,000 of collateral received for securities on loan.
4 Cash of $180,000 has been segregated as initial margin for open futures contracts.
See accompanying Notes, which are an integral part of the Financial Statements.
63
Industrials Index Fund
Statement of Operations
| |
| Six Months Ended |
| February 28, 2017 |
| | ($000) |
| Investment Income | |
| Income | |
| Dividends | 28,973 |
| Interest 1 | 3 |
| Securities Lending—Net | 272 |
| Total Income | 29,248 |
| Expenses | |
| The Vanguard Group—Note B | |
| Investment Advisory Services | 193 |
| Management and Administrative— | |
| ETF Shares | 925 |
| Management and Administrative— | |
| Admiral Shares | 39 |
| Marketing and Distribution— | |
| ETF Shares | 82 |
| Marketing and Distribution— | |
| Admiral Shares | 6 |
| Custodian Fees | 50 |
| Shareholders’ Reports—ETF Shares | 34 |
| Shareholders’ Reports—Admiral Shares | 1 |
| Trustees’ Fees and Expenses | 1 |
| Total Expenses | 1,331 |
| Net Investment Income | 27,917 |
| Realized Net Gain (Loss) | |
| Investment Securities Sold1 | 86,047 |
| Futures Contracts | (42) |
| Realized Net Gain (Loss) | 86,005 |
| Change in Unrealized Appreciation | |
| (Depreciation) | |
| Investment Securities | 210,604 |
| Futures Contracts | 1 |
| Change in Unrealized Appreciation | |
| (Depreciation) | 210,605 |
| Net Increase (Decrease) in Net Assets | |
| Resulting from Operations | 324,527 |
| 1 Interest income and realized net gain (loss) from an affiliated |
| company of the fund were $3,000 and $0, respectively. |
Statement of Changes in NetAssets
| | |
| | Six Months Ended | Year Ended |
| | February 28, | August 31, |
| | 2017 | 2016 |
| | ($000) | ($000) |
| Increase (Decrease) in Net Assets | | |
| Operations | | |
| Net Investment Income | 27,917 | 44,292 |
| Realized Net Gain (Loss) | 86,005 | 57,227 |
| Change in Unrealized Appreciation (Depreciation) | 210,605 | 201,269 |
| Net Increase (Decrease) in Net Assets Resulting from Operations | 324,527 | 302,788 |
| Distributions | | |
| Net Investment Income | | |
| ETF Shares | (25,724) | (58,676) |
| Admiral Shares | (1,014) | (1,953) |
| Realized Capital Gain | | |
| ETF Shares | — | — |
| Admiral Shares | — | — |
| Total Distributions | (26,738) | (60,629) |
| Capital Share Transactions | | |
| ETF Shares | 267,929 | 205,564 |
| Admiral Shares | 67,204 | 3,504 |
| Net Increase (Decrease) from Capital Share Transactions | 335,133 | 209,068 |
| Total Increase (Decrease) | 632,922 | 451,227 |
| Net Assets | | |
| Beginning of Period | 2,414,972 | 1,963,745 |
| End of Period 1 | 3,047,894 | 2,414,972 |
| 1 Net Assets—End of Period includes undistributed (overdistributed) net investment income of $9,993,000 and $8,799,000. |
See accompanying Notes, which are an integral part of the Financial Statements.
64
Industrials Index Fund
Financial Highlights
| | | | | | | |
| ETF Shares | | | | | | | |
| | Six Months | | | | | |
| | | Ended | | | | | |
| For a Share Outstanding | February 28, | Year Ended August 31, |
| Throughout Each Period | | 2017 | 2016 | 2015 | 2014 | 2013 | 2012 |
| Net Asset Value, Beginning of Period | $111.57 | $99.23 | $103.95 | $84.17 | $67.82 | $60.12 |
| Investment Operations | | | | | | | |
| Net Investment Income | | 1.177 | 2.083 | 1.914 | 1.508 | 1.5171 | 1.360 |
| Net Realized and Unrealized Gain (Loss) | | | | | | |
| on Investments | | 13.438 | 13.204 | (4.961) | 19.332 | 16.321 | 7.557 |
| Total from Investment Operations | 14.615 | 15.287 | (3.047) | 20.840 | 17.838 | 8.917 |
| Distributions | | | | | | | |
| Dividends from Net Investment Income | (1.175) | (2.947) | (1.673) | (1.060) | (1.488) | (1.217) |
| Distributions from Realized Capital Gains | — | — | — | — | — | — |
| Total Distributions | | (1.175) | (2.947) | (1.673) | (1.060) | (1.488) | (1.217) |
| Net Asset Value, End of Period | $125.01 | $111.57 | $99.23 | $103.95 | $84.17 | $67.82 |
| |
| Total Return | | 13.21% | 15.78% | -3.03% | 24.83% | 26.69% | 15.04% |
| |
| Ratios/Supplemental Data | | | | | | | |
| Net Assets, End of Period (Millions) | $2,891 | $2,338 | $1,898 | $1,883 | $1,104 | $482 |
| Ratio of Total Expenses to | | | | | | | |
| Average Net Assets | | 0.10% | 0.10% | 0.10% | 0.12% | 0.14% | 0.14% |
| Ratio of Net Investment Income to | | | | | | |
| Average Net Assets | | 2.07% | 2.08% | 1.83% | 1.69% | 1.97% | 1.99% |
| Portfolio Turnover Rate2 | | 6% | 8% | 4% | 5% | 6% | 6% |
The expense ratio, net investment income ratio, and turnover rate for the current period have been annualized.
1 Calculated based on average shares outstanding.
2 Excludes the value of portfolio securities received or delivered as a result of in-kind purchases or redemptions of the fund’s capital shares,
including ETF Creation Units.
See accompanying Notes, which are an integral part of the Financial Statements.
65
Industrials Index Fund
Financial Highlights
| | | | | | | |
| Admiral Shares | | | | | | | |
| | Six Months | | | | | |
| | | Ended | | | | | |
| For a Share Outstanding | February 28, | Year Ended August 31, |
| Throughout Each Period | | 2017 | 2016 | 2015 | 2014 | 2013 | 2012 |
| Net Asset Value, Beginning of Period | $57.32 | $50.98 | $53.40 | $43.24 | $34.84 | $30.89 |
| Investment Operations | | | | | | | |
| Net Investment Income | | .607 | 1.069 | .982 | .780 | .7801 | .699 |
| Net Realized and Unrealized Gain (Loss) | | | | | | |
| on Investments | | 6.897 | 6.783 | (2.541) | 9.922 | 8.382 | 3.878 |
| Total from Investment Operations | 7.504 | 7.852 | (1.559) | 10.702 | 9.162 | 4.577 |
| Distributions | | | | | | | |
| Dividends from Net Investment Income | (. 604) | (1.512) | (. 861) | (. 542) | (. 762) | (. 627) |
| Distributions from Realized Capital Gains | — | — | — | — | — | — |
| Total Distributions | | (. 604) | (1.512) | (. 861) | (. 542) | (. 762) | (. 627) |
| Net Asset Value, End of Period | $64.22 | $57.32 | $50.98 | $53.40 | $43.24 | $34.84 |
| |
| Total Return 2 | | 13.19% | 15.77% | -2.98% | 24.84% | 26.70% | 15.03% |
| |
| Ratios/Supplemental Data | | | | | | | |
| Net Assets, End of Period (Millions) | $157 | $77 | $66 | $71 | $18 | $14 |
| Ratio of Total Expenses to | | | | | | | |
| Average Net Assets | | 0.11% | 0.10% | 0.10% | 0.12% | 0.14% | 0.14% |
| Ratio of Net Investment Income to | | | | | | |
| Average Net Assets | | 2.06% | 2.08% | 1.83% | 1.69% | 1.97% | 1.99% |
| Portfolio Turnover Rate3 | | 6% | 8% | 4% | 5% | 6% | 6% |
The expense ratio, net investment income ratio, and turnover rate for the current period have been annualized.
1 Calculated based on average shares outstanding.
2 Total returns do not include transaction or account service fees that may have applied in the periods shown. Fund prospectuses provide
information about any applicable transaction and account service fees.
3 Excludes the value of portfolio securities received or delivered as a result of in-kind purchases or redemptions of the fund’s capital shares,
including ETF Creation Units.
See accompanying Notes, which are an integral part of the Financial Statements.
66
Industrials Index Fund
Notes to Financial Statements
Vanguard Industrials Index Fund is registered under the Investment Company Act of 1940 as an open-end investment company, or mutual fund. The fund offers two classes of shares: ETF Shares and Admiral Shares. ETF Shares are listed for trading on NYSE Arca; they can be purchased and sold through a broker. Admiral Shares are designed for investors who meet certain administrative, service, and account-size criteria.
A. The following significant accounting policies conform to generally accepted accounting principles for U.S. investment companies. The fund consistently follows such policies in preparing its financial statements.
1. SecurityValuation:SecuritiesarevaluedasofthecloseoftradingontheNewYorkStockExchange (generally 4 p.m., Eastern time) on the valuation date. Equity securities are valued at thelatestquoted sales prices or official closing prices taken from the primary market in which each security trades; such securities not traded on the valuation date are valued at the mean of the latest quoted bid and asked prices. Securities for whichmarket quotations are not readily available, or whose valueshave been materially affected by events occurring before the fund’s pricing time but after the close of the securities’ primary markets, are valued by methods deemed by the board of trustees to represent fairvalue.InvestmentsinVanguard MarketLiquidityFundarevaluedatthatfund’snetassetvalue.
2. Futures Contracts: The fund uses index futures contracts to a limited extent, with the objectives of maintaining full exposure to the stock market, enhancing returns, maintaining liquidity, and minimizing transaction costs. The fund may purchase futures contracts to immediately invest incoming cash in the market, or sell futures in response to cash outflows, thereby simulating a fully invested position in the underlying index while maintaining a cash balance for liquidity. The fund may seek to enhance returns by using futures contracts instead of the underlying securities when futures are believed to be priced more attractively than the underlying securities. The primary risks associated with the use of futures contracts are imperfect correlation between changes in market values of stocks held by the fund and the prices of futures contracts, and the possibility of an illiquid market. Counterparty risk involving futures is mitigated because a regulated clearinghouse is the counterparty instead of the clearing broker. To further mitigate counterparty risk, the fund trades futures contracts on an exchange, monitors the financial strength of its clearing brokers and clearinghouse, and has entered into clearing agreements with its clearing brokers. The clearinghouse imposes initial margin requirements to secure the fund’s performance and requires daily settlement of variation margin representing changes in the market value of each contract.
Futures contracts are valued at their quoted daily settlement prices. The aggregate settlement values of the contracts are not recorded in the Statement of Net Assets. Fluctuations in the value of the contracts are recorded in the Statement of Net Assets as an asset (liability) and in the Statement of Operations as unrealized appreciation (depreciation) until the contracts are closed, when they are recorded as realized futures gains (losses).
During the six months ended February 28, 2017, the fund’s average investments in long and short futures contracts represented less than 1% and 0% of net assets, respectively, based on the average of aggregate settlement values at each quarter-end during the period.
3. Federal Income Taxes: The fund intends to continue to qualify as a regulated investment company and distribute all of its taxable income. Management has analyzed the fund’s tax positions taken for all open federal income tax years (August 31, 2013–2016), and for the period ended February 28, 2017, and has concluded that no provision for federal income tax is required in the fund’s financial statements. 4. Distributions: Distributions to shareholders are recorded on the ex-dividend date.
5. Securities Lending: To earn additional income, the fund lends its securities to qualified institutional borrowers. Security loans are subject to termination by the fund at any time, and are required to be secured at all times by collateral in an amount at least equal to the market value of securities loaned. Daily market fluctuations could cause the value of loaned securities to be more or less than the value of the collateral received. When this occurs, the collateral is adjusted and settled on the next business day. The fund further mitigates its counterparty risk by entering into securities lending transactions only with a diverse group of prequalified counterparties, monitoring their financial strength, and entering into master securities lending agreements with its counterparties. The master securities lending agreements provide that, in the event of a counterparty’s default (including bankruptcy), the fund may terminate any loans with that borrower, determine the net amount owed, and sell or retain the collateral up to the net amount owed to the fund; however, such actions may be subject to legal proceedings. While collateral mitigates counterparty risk, in the absence of a default the fund may experience delays and costs in recovering the securities loaned. The fund invests cash collateral received in Vanguard Market Liquidity Fund, and records a liability in the Statement of Net Assets for the return of the collateral, during the period the securities are on loan. Securities lending income
67
Industrials Index Fund
represents feeschargedto borrowers plusincome earned oninvested cash collateral,less expenses associated with the loan. During the term of the loan, the fund is entitled to all distributions made on or in respect of the loaned securities.
6. Credit Facility: The fund and certain other funds managed by The Vanguard Group (“Vanguard”) participate in a $3.1 billion committed credit facility provided by a syndicate of lenders pursuant to a credit agreement that may be renewed annually; each fund is individually liable for its borrowings, if any, under the credit facility. Borrowings may be utilized for temporary and emergency purposes, and are subject to the fund’s regulatory and contractual borrowing restrictions. The participating funds are charged administrative fees and an annual commitment fee of 0.10% of the undrawn amount of the facility; these fees are allocated to the funds based on a method approved by the fund’s board of trustees and included in Management and Administrative expenses on the fund’s Statement of Operations. Any borrowings under this facility bear interest at a rate based upon the higher of the one-month London Interbank Offered Rate, federal funds effective rate, or overnight bank funding rate plus an agreed-upon spread.
The fund had no borrowings outstanding at February 28, 2017, or at any time during the period then ended.
7. Other: Dividend income is recorded on the ex-dividend date. Interest income includes income distributions received from Vanguard Market Liquidity Fund and is accrued daily. Security transactions are accounted for on the date securities are bought or sold. Costs used to determine realized gains (losses) on the sale of investment securities are those of the specific securities sold.
Each class of shares has equal rights as to assets and earnings, except that each class separately bears certain class-specific expenses related to maintenance of shareholder accounts (included in Management and Administrative expenses) and shareholder reporting. Marketing and distribution expenses are allocated to each class of shares based on a method approved by the board of trustees. Income, other non-class-specific expenses, and gains and losses on investments are allocated to each class of shares based on its relative net assets.
B. In accordance with the terms of a Funds’ Service Agreement (the “FSA”) between Vanguard and the fund, Vanguard furnishes to the fund investment advisory, corporate management, administrative, marketing, and distribution services at Vanguard’s cost of operations (as defined by the FSA). These costs of operations are allocated to the fund based on methods and guidelines approved by the board of trustees. Vanguard does not require reimbursement in the current period for certain costs ofoperations(suchasdeferredcompensation/benefitsandrisk/insurancecosts);thefund’sliability for these costs of operations isincluded in Payables to Vanguard on the Statement of Net Assets.
Upon the request of Vanguard, the fund may invest up to 0.40% of its net assets as capital in Vanguard. At February 28, 2017,the fund had contributedto Vanguard capitalinthe amountof $209,000, representing 0.01% of the fund’s net assets and 0.08% of Vanguard’s capitalization. The fund’s trustees and officers are also directors and employees, respectively, of Vanguard.
C. Variousinputs may be used to determine the value of the fund’sinvestments. Theseinputs are summarized in three broad levels for financial statement purposes. The inputs or methodologies used to value securities are not necessarily an indication of the risk associated with investing in those securities.
Level 1—Quoted prices in active markets for identical securities.
Level 2—Other significant observable inputs (including quoted prices for similar securities, interest rates, prepayment speeds, credit risk, etc.).
Level 3—Significant unobservable inputs (including the fund’s own assumptions used to determine the fair value of investments).
At February 28, 2017, 100% of the market value of the fund’s investments was determined based on Level 1 inputs.
D. At February 28, 2017, the aggregate settlement value of open futures contracts and the related unrealized appreciation (depreciation) were:
| | | | |
| | | | | ($000) |
| | | | Aggregate | |
| | | Number of | Settlement | Unrealized |
| | | Long (Short) | Value | Appreciation |
| Futures Contracts | Expiration | Contracts | Long (Short) | (Depreciation) |
| E-mini S&P 500 Index | March 2017 | 16 | 1,890 | (4) |
Unrealized appreciation (depreciation) on open futures contracts is required to be treated as realized gain (loss) for tax purposes.
68
Industrials Index Fund
E. Distributions are determined on a tax basis and may differ from net investment income and realized capital gains for financial reporting purposes. Differences may be permanent or temporary. Permanent differences are reclassified among capital accounts in the financial statements to reflect their tax character. Temporary differences arise when certain items of income, expense, gain, or loss are recognized in different periods for financial statement and tax purposes. These differences will reverse at some time in the future. Differences in classification may also result from the treatment of short-term gains as ordinary income for tax purposes.
During the six months ended February 28, 2017, the fund realized $93,187,000 of net capital gains resulting from in-kind redemptions—in which shareholders exchanged fund shares for securities held by the fund rather than for cash. Because such gains are not taxable to the fund, and are not distributed to shareholders, they have been reclassified from accumulated net realized losses to paid-in capital.
The fund’s tax-basis capital gains and losses are determined only at the end of each fiscal year. For tax purposes, at August 31, 2016, the fund had available capital losses totaling $16,635,000 to offset future net capital gains of $11,504,000 through August 31, 2018, and $5,131,000 through August 31, 2019. The fund will use these capital losses to offset net taxable capital gains, if any, realized during the year ending August 31, 2017; should the fund realize net capital losses for the year, the losses will be added to the loss carryforward balance above.
At February 28, 2017, the cost of investment securities for tax purposes was $2,649,509,000. Net unrealized appreciation of investment securities for tax purposes was $396,900,000, consisting of unrealized gains of $456,070,000 on securities that had risen in value since their purchase and $59,170,000 in unrealized losses on securities that had fallen in value since their purchase.
F. During the six months ended February 28, 2017, the fund purchased $772,480,000 of investment securities and sold $435,353,000 of investment securities, other than temporary cash investments. Purchases and sales include $593,045,000 and $351,166,000, respectively, in connection with in-kind purchases and redemptions of the fund’s capital shares.
G. Capital share transactions for each class of shares were:
| | | | |
| | Six Months Ended | Year Ended |
| | February 28, 2017 | August 31, 2016 |
| | Amount | Shares | Amount | Shares |
| | ($000) | (000) | ($000) | (000) |
| ETF Shares | | | | |
| Issued | 619,302 | 5,225 | 445,652 | 4,225 |
| Issued in Lieu of Cash Distributions | — | — | — | — |
| Redeemed | (351,373) | (3,050) | (240,088) | (2,400) |
| Net Increase (Decrease)—ETF Shares | 267,929 | 2,175 | 205,564 | 1,825 |
| Admiral Shares | | | | |
| Issued | 90,803 | 1,482 | 32,083 | 601 |
| Issued in Lieu of Cash Distributions | 931 | 16 | 1,846 | 36 |
| Redeemed | (24,530) | (405) | (30,425) | (578) |
| Net Increase (Decrease)—Admiral Shares | 67,204 | 1,093 | 3,504 | 59 |
At February 28, 2017, one shareholder was the record or beneficial owner of 46% of the fund’s net assets. If the shareholder were to redeem its investment in the fund, the redemption might result in an increase in the fund’s expense ratio.
H. Management has determined that no material events or transactions occurred subsequent to February 28, 2017, that would require recognition or disclosure in these financial statements.
69
Information Technology Index Fund
Fund Profile
As of February 28, 2017
| | |
| Share-Class Characteristics | | |
| | ETF | Admiral |
| | Shares | Shares |
| Ticker Symbol | VGT | VITAX |
| Expense Ratio1 | 0.10% | 0.10% |
| 30-Day SEC Yield | 1.21% | 1.21% |
| | | |
| Portfolio Characteristics | | |
| | | MSCI | |
| | | US IMI/ | |
| | | Information | MSCI |
| | | Technology | US IMI/ |
| | Fund | 25/50 | 2500 |
| Number of Stocks | 360 | 361 | 2,479 |
| Median Market Cap $171.9B | $171.9B | $57.6B |
| Price/Earnings Ratio | 26.3x | 26.4x | 24.7x |
| Price/Book Ratio | 4.6x | 4.6x | 3.0x |
| Return on Equity | 22.4% | 22.4% | 16.5% |
| Earnings Growth Rate | 6.2% | 6.2% | 7.6% |
| Dividend Yield | 1.3% | 1.3% | 1.9% |
| Foreign Holdings | 0.0% | 0.0% | 0.0% |
| Turnover Rate | | | |
| (Annualized) | 6% | — | — |
| Short-Term Reserves | -0.1% | — | — |
| | |
| Volatility Measures | | |
| | MSCI US | |
| | IMI/Information | |
| | Technology | MSCI US |
| | 25/50 | IMI/2500 |
| R-Squared | 1.00 | 0.77 |
| Beta | 1.00 | 1.14 |
| These measures show the degree and timing of the fund’s |
| fluctuations compared with the indexes over 36 months. |
| |
| Subindustry Diversification | |
| (% of equity exposure) | |
| |
| Application Software | 6.0% |
| Communications Equipment | 5.6 |
| Data Processing & Outsourced Services | 11.1 |
| Electronic Components | 1.4 |
| Electronic Manufacturing Services | 1.2 |
| Home Entertainment Software | 1.2 |
| Internet Software & Services | 19.7 |
| IT Consulting & Other Services | 6.4 |
| Semiconductor Equipment | 2.0 |
| Semiconductors | 13.3 |
| Systems Software | 13.7 |
| Technology Hardware, Storage & Peripherals | 16.9 |
| Other Information Technology | 1.5 |
| | |
| Ten Largest Holdings (% of total net assets) |
| |
| Apple Inc. | Technology Hardware, | |
| | Storage & Peripherals | 14.2% |
| Alphabet Inc. | Internet Software | |
| | & Services | 9.8 |
| Microsoft Corp. | Systems Software | 9.2 |
| Facebook Inc. | Internet Software | |
| | & Services | 6.2 |
| Cisco Systems Inc. Communications | |
| | Equipment | 3.3 |
| Intel Corp. | Semiconductors | 3.3 |
| Visa Inc. | Data Processing | |
| | & Outsourced Services | 3.2 |
| International | | |
| Business | IT Consulting | |
| Machines Corp. | & Other Services | 3.2 |
| Oracle Corp. | Systems Software | 2.6 |
| Mastercard Inc. | Data Processing | |
| | & Outsourced Services | 2.1 |
| Top Ten | | 57.1% |
| The holdings listedexcludeany temporary cashinvestments and |
| equity index products. | | |
1 The expense ratios shown are from the prospectus dated December 22, 2016, and represent estimated costs for the current fiscal year. For the six months ended February 28, 2017, the annualized expense ratios were 0.10% for ETF Shares and 0.10% for Admiral Shares.
70
Information Technology Index Fund
Performance Summary
All of the returns in this report represent past performance, which is not a guarantee of future results that may be achieved by the fund. (Current performance may be lower or higher than theperformancedatacited.For performance data currenttothemostrecentmonth-end, visit our website at vanguard.com/performance.) Note, too, that both investment returns and principal value can fluctuate widely, so an investor’s shares, when sold, could be worth more or less than their original cost. The returns shown do not reflect taxes that a shareholder would pay on fund distributions or on the sale of fund shares.
Fiscal-Year Total Returns (%): August 31, 2006–February 28, 2017
For a benchmark description, see the Glossary.
Note: For 2017, performance data reflect the six months ended February 28, 2017.
Average Annual Total Returns: Periods Ended December 31, 2016
This table presents returns through the latest calendar quarter—rather than through the end of the fiscal period.
Securities and Exchange Commission rules require that we provide this information.
| | | | |
| | Inception Date | One Year | Five Years | Ten Years |
| ETF Shares | 1/26/2004 | | | |
| Market Price | | 13.75% | 16.05% | 9.75% |
| Net Asset Value | | 13.73 | 16.05 | 9.75 |
| Admiral Shares | 3/25/2004 | 13.75 | 16.06 | 9.75 |
See Financial Highlights for dividend and capital gains information.
71
Information Technology Index Fund
Financial Statements (unaudited)
Statement of Net Assets
As of February 28, 2017
The fund reports a complete list of its holdings in regulatory filings four times in each fiscal year, at the quarter-ends. For the second and fourth fiscal quarters, the lists appear in the fund’s semiannual and annual reports to shareholders. For the first and third fiscal quarters, the fund files the lists with the Securities and Exchange Commission on Form N-Q. Shareholders can look up the fund’s Forms N-Q on the SEC’s website at sec.gov. Forms N-Q may also be reviewed and copied at the SEC’s Public Reference Room (see the back cover of this report for further information).
| | | | |
| | | | | Market |
| | | | | Value• |
| | | | Shares | ($000) |
| Common Stocks (99.9%)1 | | |
| Communications Equipment (5.6%) | |
| | Cisco Systems Inc. | 12,035,903 | 411,387 |
| * | Palo Alto Networks Inc. | 219,694 | 33,372 |
| | Harris Corp. | | 298,129 | 32,764 |
| | Motorola Solutions Inc. | 357,786 | 28,254 |
| | Juniper Networks Inc. | 819,987 | 22,960 |
| * | F5 Networks Inc. | | 156,395 | 22,407 |
| * | CommScope Holding | | | |
| | Co. Inc. | | 462,995 | 17,617 |
| * | Arista Networks Inc. | | 109,392 | 13,017 |
| | Brocade Communications | | |
| | Systems Inc. | | 965,695 | 11,888 |
| * | ARRIS International plc | 433,079 | 11,173 |
| * | Finisar Corp. | | 264,727 | 8,863 |
| * | Ciena Corp. | | 333,791 | 8,792 |
| * | ViaSat Inc. | | 127,167 | 8,754 |
| * | NetScout Systems Inc. | 197,902 | 7,312 |
| | InterDigital Inc. | | 81,928 | 6,886 |
| * | EchoStar Corp. Class A | 110,920 | 5,909 |
| * | Viavi Solutions Inc. | | 556,571 | 5,577 |
| * | Lumentum Holdings Inc. | 115,697 | 5,310 |
| * | NETGEAR Inc. | | 79,552 | 4,359 |
| | Plantronics Inc. | | 80,127 | 4,292 |
| * | Infinera Corp. | | 343,559 | 3,728 |
| * | Oclaro Inc. | | 399,207 | 3,393 |
| * | Ubiquiti Networks Inc. | 68,696 | 3,376 |
| * | Ixia | | 138,535 | 2,715 |
| | ADTRAN Inc. | | 116,709 | 2,468 |
| * | Mitel Networks Corp. | | 220,550 | 1,460 |
| * | CalAmp Corp. | | 86,226 | 1,398 |
| * | ShoreTel Inc. | | 161,475 | 1,050 |
| * | Harmonic Inc. | | 184,353 | 995 |
| * | Calix Inc. | | 103,451 | 714 |
| * | Sonus Networks Inc. | | 114,430 | 675 |
| | Comtech | | | |
| | Telecommunications | | |
| | Corp. | | 53,525 | 611 |
| | | | | 693,476 |
| Electronic Equipment, Instruments | |
| & Components (4.1%) | | | |
| | TE Connectivity Ltd. | | 852,171 | 63,461 |
| | Corning Inc. | | 2,281,887 | 63,003 |
| | Amphenol Corp. Class A | 739,836 | 51,204 |
| * | Flex Ltd. | | 1,293,652 | 21,332 |
| | CDW Corp. | | 346,094 | 20,385 |
| * | Trimble Inc. | | 600,341 | 18,629 |
| * | Arrow Electronics Inc. | 214,545 | 15,490 |
| * | Keysight Technologies Inc. | 407,888 | 15,337 |
| | Cognex Corp. | | 195,010 | 14,979 |
| | Avnet Inc. | | 306,354 | 14,117 |
| | FLIR Systems Inc. | | 328,532 | 12,060 |
| * | Zebra Technologies Corp. | 126,476 | 11,473 |
| * | Coherent Inc. | | 58,860 | 10,747 |
| * | IPG Photonics Corp. | | 89,254 | 10,559 |
| | Jabil Circuit Inc. | | 400,168 | 10,208 |
| | | |
| | National Instruments Corp. | 278,655 | 8,984 |
| | Littelfuse Inc. | 54,104 | 8,735 |
| * | Universal Display Corp. | 101,127 | 8,581 |
| | SYNNEX Corp. | 71,262 | 8,332 |
| * | Tech Data Corp. | 84,213 | 7,326 |
| | Belden Inc. | 100,595 | 7,107 |
| * | Sanmina Corp. | 176,731 | 6,892 |
| | Dolby Laboratories Inc. | | |
| | Class A | 136,776 | 6,687 |
| * | Anixter International Inc. | 71,282 | 5,938 |
| * | Itron Inc. | 87,200 | 5,642 |
| * | VeriFone Systems Inc. | 265,247 | 5,483 |
| | Vishay Intertechnology Inc. | 321,888 | 5,102 |
| * | II-VI Inc. | 134,752 | 4,797 |
| * | Plexus Corp. | 79,813 | 4,475 |
| *,^ | Knowles Corp. | 213,383 | 4,039 |
| * | Benchmark Electronics Inc. | 116,552 | 3,625 |
| * | Insight Enterprises Inc. | 84,707 | 3,588 |
| * | Rogers Corp. | 43,077 | 3,554 |
| | Methode Electronics Inc. | 83,608 | 3,470 |
| * | OSI Systems Inc. | 43,656 | 3,292 |
| * | Fabrinet | 75,426 | 3,134 |
| * | TTM Technologies Inc. | 192,091 | 3,104 |
| | Badger Meter Inc. | 69,631 | 2,548 |
| * | InvenSense Inc. | 202,277 | 2,498 |
| * | ScanSource Inc. | 61,003 | 2,455 |
| | MTS Systems Corp. | 39,488 | 2,170 |
| *,^ | Fitbit Inc. Class A | 346,240 | 2,150 |
| * | ePlus Inc. | 16,012 | 2,033 |
| * | Novanta Inc. | 78,448 | 1,906 |
| | AVX Corp. | 120,208 | 1,866 |
| | CTS Corp. | 73,959 | 1,620 |
| * | FARO Technologies Inc. | 39,328 | 1,357 |
| * | Kimball Electronics Inc. | 66,488 | 1,070 |
| | Park Electrochemical Corp. | 46,940 | 897 |
| | Daktronics Inc. | 89,919 | 843 |
| | PC Connection Inc. | 27,861 | 746 |
| | | | 499,030 |
| Internet Software & Services (19.5%) | |
| * | Facebook Inc. Class A | 5,612,354 | 760,698 |
| * | Alphabet Inc. Class C | 744,662 | 613,013 |
| * | Alphabet Inc. Class A | 709,902 | 599,818 |
| * | Yahoo! Inc. | 2,173,554 | 99,245 |
| * | eBay Inc. | 2,546,783 | 86,336 |
| * | Akamai Technologies Inc. | 415,082 | 25,984 |
| *,^ | Twitter Inc. | 1,370,105 | 21,607 |
| | MercadoLibre Inc. | 95,223 | 20,080 |
| * | VeriSign Inc. | 225,426 | 18,591 |
| * | CoStar Group Inc. | 78,211 | 15,891 |
| * | IAC/InterActiveCorp | 176,565 | 13,055 |
| | LogMeIn Inc. | 125,472 | 11,512 |
| *,^ Zillow Group Inc. | 275,862 | 9,363 |
| | j2 Global Inc. | 109,679 | 8,930 |
| * | Pandora Media Inc. | 532,484 | 6,592 |
| * | Yelp Inc. Class A | 187,873 | 6,331 |
| * | GrubHub Inc. | 163,589 | 5,735 |
| | | |
| * | Cornerstone OnDemand | | |
| | Inc. | 127,509 | 5,326 |
| * | Stamps.com Inc. | 39,408 | 4,969 |
| * | WebMD Health Corp. | 90,122 | 4,677 |
| * | GoDaddy Inc. Class A | 125,729 | 4,633 |
| *,^ | Cimpress NV | 57,182 | 4,587 |
| * | Zillow Group Inc. Class A | 123,537 | 4,155 |
| * | Envestnet Inc. | 93,284 | 3,605 |
| | NIC Inc. | 149,923 | 3,163 |
| * | 2U Inc. | 83,969 | 3,069 |
| * | SPS Commerce Inc. | 40,611 | 2,247 |
| * | Q2 Holdings Inc. | 62,034 | 2,230 |
| * | New Relic Inc. | 62,907 | 2,213 |
| * | Box Inc. | 122,475 | 2,158 |
| * | Quotient Technology Inc. | 169,837 | 2,021 |
| * | Shutterstock Inc. | 45,971 | 2,005 |
| * | Web.com Group Inc. | 103,568 | 1,994 |
| * | GTT Communications Inc. | 66,293 | 1,850 |
| *,^ | Match Group Inc. | 106,984 | 1,729 |
| *,^ | Twilio Inc. Class A | 54,094 | 1,716 |
| *,^ | TrueCar Inc. | 113,575 | 1,597 |
| * | Five9 Inc. | 95,559 | 1,520 |
| * | Blucora Inc. | 94,887 | 1,480 |
| * | Endurance International | | |
| | Group Holdings Inc. | 169,216 | 1,438 |
| *,^ | Gogo Inc. | 134,346 | 1,424 |
| * | Bankrate Inc. | 130,304 | 1,420 |
| * | CommerceHub Inc. | 68,574 | 1,121 |
| * | XO Group Inc. | 60,348 | 1,112 |
| *,^ | Nutanix Inc. | 36,292 | 1,088 |
| * | Actua Corp. | 74,324 | 1,018 |
| * | LivePerson Inc. | 130,343 | 919 |
| * | Hortonworks Inc. | 86,675 | 862 |
| * | MINDBODY Inc. Class A | 32,352 | 859 |
| * | Benefitfocus Inc. | 31,328 | 832 |
| * | Bazaarvoice Inc. | 170,803 | 760 |
| * | Alarm.com Holdings Inc. | 26,435 | 754 |
| * | Instructure Inc. | 29,654 | 679 |
| * | RetailMeNot Inc. | 74,715 | 669 |
| * | DHI Group Inc. | 113,228 | 561 |
| * | CommerceHub Inc. | | |
| | Class A | 30,826 | 509 |
| * | Angie’s List Inc. | 91,890 | 490 |
| * | comScore Inc. | 13,744 | 330 |
| * | Appfolio Inc. | 11,723 | 291 |
| * | Internap Corp. | 101,990 | 230 |
| * | Rocket Fuel Inc. | 59,950 | 169 |
| | | | 2,403,260 |
| IT Services (17.6%) | | |
| | Visa Inc. Class A | 4,478,108 | 393,805 |
| | International Business | | |
| | Machines Corp. | 2,165,972 | 389,485 |
| | Mastercard Inc. Class A | 2,308,076 | 254,950 |
| | Accenture plc Class A | 1,487,420 | 182,209 |
| | Automatic Data | | |
| | Processing Inc. | 1,081,900 | 111,025 |
72
Information Technology Index Fund
| | | |
| | | | Market |
| | | | Value• |
| | | Shares | ($000) |
| * | PayPal Holdings Inc. | 2,604,048 | 109,370 |
| * | Cognizant Technology | | |
| | Solutions Corp. Class A | 1,454,893 | 86,232 |
| | Fidelity National | | |
| | Information Services Inc. | 747,844 | 61,525 |
| * | Fiserv Inc. | 520,554 | 60,072 |
| | Paychex Inc. | 780,673 | 47,949 |
| * | FleetCor Technologies Inc. | 222,366 | 37,802 |
| | Alliance Data Systems | | |
| | Corp. | 124,616 | 30,279 |
| | Global Payments Inc. | 368,719 | 29,383 |
| * | Vantiv Inc. Class A | 385,896 | 25,230 |
| | Computer Sciences Corp. | 337,423 | 23,134 |
| | Western Union Co. | 1,166,403 | 22,908 |
| | Total System Services Inc. | 396,882 | 21,622 |
| * | Gartner Inc. | 198,209 | 20,457 |
| | Broadridge Financial | | |
| | Solutions Inc. | 285,245 | 19,776 |
| | Jack Henry & Associates | | |
| | Inc. | 187,014 | 17,536 |
| | Leidos Holdings Inc. | 324,775 | 17,310 |
| | Booz Allen Hamilton | | |
| | Holding Corp. Class A | 357,752 | 12,797 |
| * | First Data Corp. Class A | 769,840 | 12,394 |
| | CSRA Inc. | 391,504 | 11,675 |
| * | WEX Inc. | 102,599 | 11,412 |
| | Sabre Corp. | 504,494 | 11,053 |
| * | Euronet Worldwide Inc. | 119,134 | 9,862 |
| * | Teradata Corp. | 311,404 | 9,685 |
| | MAXIMUS Inc. | 154,892 | 9,242 |
| | DST Systems Inc. | 74,594 | 8,921 |
| | Science Applications | | |
| | International Corp. | 100,569 | 8,746 |
| * | EPAM Systems Inc. | 110,358 | 8,126 |
| * | CoreLogic Inc. | 206,903 | 8,109 |
| * | CACI International Inc. | | |
| | Class A | 58,216 | 7,300 |
| * | Conduent Inc. | 411,708 | 6,624 |
| * | Square Inc. | 377,874 | 6,545 |
| * | Acxiom Corp. | 185,600 | 5,293 |
| | Convergys Corp. | 228,235 | 4,994 |
| * | Blackhawk Network | | |
| | Holdings Inc. | 134,132 | 4,889 |
| * | Cardtronics plc Class A | 108,596 | 4,787 |
| * | NeuStar Inc. Class A | 131,421 | 4,357 |
| | Travelport Worldwide Ltd. | 295,960 | 3,759 |
| * | ExlService Holdings Inc. | 79,772 | 3,563 |
| | CSG Systems | | |
| | International Inc. | 77,615 | 3,059 |
| | EVERTEC Inc. | 151,343 | 2,550 |
| * | Sykes Enterprises Inc. | 93,333 | 2,541 |
| | ManTech International | | |
| | Corp. Class A | 61,166 | 2,240 |
| * | Black Knight Financial | | |
| | Services Inc. Class A | 57,685 | 2,221 |
| * | Virtusa Corp. | 68,286 | 2,118 |
| * | Net 1 UEPS Technologies | | |
| | Inc. | 130,951 | 1,742 |
| | Cass Information Systems | | |
| | Inc. | 26,363 | 1,718 |
| * | Perficient Inc. | 86,413 | 1,570 |
| * | Unisys Corp. | 112,765 | 1,567 |
| | Syntel Inc. | 80,182 | 1,418 |
| | TeleTech Holdings Inc. | 39,145 | 1,186 |
| * | MoneyGram International | | |
| | Inc. | 71,732 | 915 |
| | Forrester Research Inc. | 21,033 | 768 |
| * | Everi Holdings Inc. | 153,801 | 500 |
| | | | 2,162,305 |
| | | | |
| Semiconductors & Semiconductor | |
| Equipment (15.3%) | | | |
| | Intel Corp. | 11,362,424 | 411,320 |
| | Broadcom Ltd. | | 964,615 | 203,466 |
| | QUALCOMM Inc. | | 3,541,226 | 200,008 |
| | Texas Instruments Inc. | 2,396,633 | 183,630 |
| | NVIDIA Corp. | | 1,292,474 | 131,160 |
| | Applied Materials Inc. | 2,591,923 | 93,879 |
| | Analog Devices Inc. | | 739,024 | 60,548 |
| * | Micron Technology Inc. | 2,497,740 | 58,547 |
| | Lam Research Corp. | | 390,591 | 46,301 |
| | Skyworks Solutions Inc. | 445,738 | 42,260 |
| | Microchip Technology Inc. | 517,568 | 37,534 |
| | Linear Technology Corp. | 575,812 | 37,186 |
| | Xilinx Inc. | | 604,891 | 35,580 |
| | KLA-Tencor Corp. | | 374,542 | 33,754 |
| | Maxim Integrated Products | | |
| | Inc. | | 678,498 | 30,058 |
| * | Advanced Micro Devices | | |
| | Inc. | | 1,887,027 | 27,286 |
| * | Qorvo Inc. | | 305,950 | 20,223 |
| | Marvell Technology Group | | |
| | Ltd. | | 1,044,293 | 16,291 |
| * | ON Semiconductor Corp. | 1,000,549 | 15,138 |
| * | Microsemi Corp. | | 274,635 | 14,232 |
| | Teradyne Inc. | | 483,667 | 13,756 |
| * | Cavium Inc. | | 160,578 | 10,520 |
| | Cypress Semiconductor | | |
| | Corp. | | 774,672 | 10,280 |
| | MKS Instruments Inc. | 128,227 | 8,412 |
| * | Cirrus Logic Inc. | | 152,691 | 8,258 |
| | Monolithic Power Systems | | |
| | Inc. | | 92,823 | 8,166 |
| * | Integrated Device | | | |
| | Technology Inc. | | 320,796 | 7,670 |
| * | Versum Materials Inc. | 246,138 | 7,460 |
| * | Entegris Inc. | | 337,816 | 7,162 |
| * | First Solar Inc. | | 187,223 | 6,776 |
| * | Cree Inc. | | 241,286 | 6,549 |
| * | Silicon Laboratories Inc. | 95,303 | 6,433 |
| * | Advanced Energy | | | |
| | Industries Inc. | | 95,422 | 5,926 |
| * | Semtech Corp. | | 157,815 | 5,279 |
| *,^ Mellanox Technologies Ltd. | 105,480 | 5,105 |
| *,^ Ambarella Inc. | | 78,496 | 4,627 |
| * | MACOM Technology | | | |
| | Solutions Holdings Inc. | 99,266 | 4,575 |
| * | Synaptics Inc. | | 83,629 | 4,445 |
| | Power Integrations Inc. | 70,059 | 4,428 |
| * | Inphi Corp. | | 89,299 | 4,192 |
| | Xperi Corp. | | 116,022 | 4,159 |
| | Cabot Microelectronics | | |
| | Corp. | | 59,205 | 4,098 |
| * | MaxLinear Inc. | | 139,340 | 3,628 |
| * | Kulicke & Soffa Industries | | |
| | Inc. | | 169,189 | 3,463 |
| | Brooks Automation Inc. | 164,533 | 3,432 |
| * | Rambus Inc. | | 265,794 | 3,338 |
| * | Veeco Instruments Inc. | 97,960 | 2,679 |
| * | Amkor Technology Inc. | 256,095 | 2,515 |
| * | Diodes Inc. | | 98,791 | 2,358 |
| * | Lattice Semiconductor | | |
| | Corp. | | 289,294 | 2,045 |
| * | Ultratech Inc. | | 61,314 | 1,769 |
| * | Photronics Inc. | | 162,753 | 1,741 |
| * | CEVA Inc. | | 51,314 | 1,714 |
| * | FormFactor Inc. | | 159,510 | 1,699 |
| * | Nanometrics Inc. | | 56,783 | 1,545 |
| * | Rudolph Technologies Inc. | 70,579 | 1,517 |
| | | |
| * | PDF Solutions Inc. | 64,833 | 1,386 |
| *,^ | SunPower Corp. Class A | 145,891 | 1,278 |
| * | Xcerra Corp. | 130,873 | 1,144 |
| * | Exar Corp. | 100,367 | 1,050 |
| * | Alpha & Omega | | |
| | Semiconductor Ltd. | 43,705 | 842 |
| *,^ SolarEdge Technologies | | |
| | Inc. | 54,631 | 800 |
| | IXYS Corp. | 58,377 | 721 |
| * | NeoPhotonics Corp. | 68,734 | 698 |
| | | | 1,888,039 |
| Software (20.9%) | | |
| | Microsoft Corp. | 17,710,483 | 1,133,117 |
| | Oracle Corp. | 7,383,182 | 314,450 |
| * | Adobe Systems Inc. | 1,192,279 | 141,094 |
| * | salesforce.com Inc. | 1,546,941 | 125,844 |
| | Intuit Inc. | 584,731 | 73,349 |
| | Activision Blizzard Inc. | 1,425,827 | 64,347 |
| * | Electronic Arts Inc. | 723,658 | 62,596 |
| | Symantec Corp. | 1,495,235 | 42,719 |
| * | Autodesk Inc. | 478,998 | 41,337 |
| * | Red Hat Inc. | 430,780 | 35,673 |
| * | ServiceNow Inc. | 397,690 | 34,567 |
| * | Dell Technologies Inc. | | |
| | Class V | 534,797 | 33,954 |
| * | Citrix Systems Inc. | 374,170 | 29,541 |
| * | Synopsys Inc. | 363,105 | 25,940 |
| | CA Inc. | 751,443 | 24,249 |
| * | Workday Inc. Class A | 292,274 | 24,238 |
| * | ANSYS Inc. | 207,262 | 22,127 |
| * | Cadence Design Systems | | |
| | Inc. | 686,927 | 21,226 |
| | CDK Global Inc. | 305,197 | 20,274 |
| * | Splunk Inc. | 322,335 | 19,898 |
| | SS&C Technologies | | |
| | Holdings Inc. | 437,323 | 15,315 |
| * | PTC Inc. | 277,001 | 14,928 |
| *,^ | VMware Inc. Class A | 160,385 | 14,417 |
| * | Fortinet Inc. | 353,013 | 13,185 |
| * | Ultimate Software Group | | |
| | Inc. | 66,150 | 12,793 |
| * | Tyler Technologies Inc. | 83,440 | 12,654 |
| * | Take-Two Interactive | | |
| | Software Inc. | 207,784 | 11,839 |
| * | Nuance Communications | | |
| | Inc. | 654,913 | 11,153 |
| * | Aspen Technology Inc. | 185,054 | 10,759 |
| * | Guidewire Software Inc. | 176,193 | 9,627 |
| | Fair Isaac Corp. | 73,930 | 9,616 |
| * | Manhattan Associates Inc. | 170,986 | 8,575 |
| | Mentor Graphics Corp. | 223,029 | 8,274 |
| | Blackbaud Inc. | 113,823 | 8,141 |
| * | Ellie Mae Inc. | 80,709 | 7,712 |
| * | Proofpoint Inc. | 96,765 | 7,622 |
| * | Tableau Software Inc. | | |
| | Class A | 138,396 | 7,299 |
| * | Verint Systems Inc. | 151,781 | 5,730 |
| * | ACI Worldwide Inc. | 281,914 | 5,517 |
| * | Paycom Software Inc. | 100,338 | 5,401 |
| * | TiVo Corp. | 286,370 | 5,298 |
| * | CommVault Systems Inc. | 103,098 | 5,057 |
| * | Zendesk Inc. | 182,724 | 4,976 |
| * | Zynga Inc. Class A | 1,863,270 | 4,938 |
| * | RealPage Inc. | 135,027 | 4,557 |
| * | MicroStrategy Inc. | | |
| | Class A | 22,476 | 4,313 |
| * | FireEye Inc. | 366,974 | 4,132 |
| | Pegasystems Inc. | 91,778 | 3,946 |
| ^ | Ebix Inc. | 61,968 | 3,873 |
73
Information Technology Index Fund
| | | |
| | | | Market |
| | | | Value• |
| | | Shares | ($000) |
| * | HubSpot Inc. | 55,290 | 3,290 |
| * | RingCentral Inc. Class A | 122,284 | 3,265 |
| * | 8x8 Inc. | 214,939 | 3,246 |
| * | BroadSoft Inc. | 72,551 | 3,105 |
| | Progress Software Corp. | 105,747 | 3,033 |
| * | Imperva Inc. | 70,584 | 2,894 |
| * | Callidus Software Inc. | 152,849 | 2,881 |
| * | Synchronoss Technologies | | |
| | Inc. | 96,721 | 2,619 |
| * | Bottomline Technologies | | |
| | de Inc. | 97,541 | 2,434 |
| * | Qualys Inc. | 68,858 | 2,407 |
| * | Gigamon Inc. | 69,662 | 2,372 |
| | Monotype Imaging | | |
| | Holdings Inc. | 100,444 | 2,024 |
| * | Paylocity Holding Corp. | 55,441 | 1,955 |
| * | PROS Holdings Inc. | 62,621 | 1,455 |
| * | Barracuda Networks Inc. | 56,759 | 1,343 |
| * | A10 Networks Inc. | 114,131 | 1,080 |
| * | Silver Spring Networks Inc. | 78,592 | 963 |
| * | VASCO Data Security | | |
| | International Inc. | 72,584 | 944 |
| * | Workiva Inc. | 51,296 | 767 |
| * | Varonis Systems Inc. | 27,684 | 758 |
| * | Rubicon Project Inc. | 79,568 | 695 |
| | QAD Inc. Class A | 24,124 | 662 |
| * | Glu Mobile Inc. | 268,306 | 518 |
| * | Rapid7 Inc. | 34,112 | 517 |
| * | Jive Software Inc. | 95,433 | 420 |
| * | Tangoe Inc. | 72,547 | 416 |
| * | MobileIron Inc. | 82,266 | 395 |
| | | | 2,578,645 |
| Technology Hardware, Storage | |
| & Peripherals (16.9%) | | |
| | Apple Inc. | 12,785,354 | 1,751,466 |
| | Hewlett Packard | | |
| | Enterprise Co. | 3,994,949 | 91,165 |
| | HP Inc. | 4,102,739 | 71,265 |
| | Western Digital Corp. | 684,636 | 52,635 |
| | Seagate Technology plc | 705,610 | 34,003 |
| | NetApp Inc. | 668,462 | 27,962 |
| | Xerox Corp. | 2,062,635 | 15,346 |
| * | NCR Corp. | 297,825 | 14,316 |
| * Electronics For Imaging | | |
| | Inc. | 111,978 | 5,159 |
| | Diebold Nixdorf Inc. | 170,133 | 5,138 |
| | | |
| *,^ 3D Systems Corp. | 256,217 | 3,894 |
| * | Super Micro Computer | | |
| | Inc. | 93,913 | 2,442 |
| * | Cray Inc. | 97,147 | 2,025 |
| * | Nimble Storage Inc. | 144,256 | 1,308 |
| * | Pure Storage Inc. Class A | 92,162 | 1,051 |
| * | Eastman Kodak Co. | 48,739 | 699 |
| * | Avid Technology Inc. | 75,132 | 422 |
| ^ | CPI Card Group Inc. | 44,588 | 201 |
| | | | 2,080,497 |
| Total Common Stocks | | |
| (Cost $9,004,162) | | 12,305,252 |
| Temporary Cash Investment (0.2%) 1 | |
| Money Market Fund (0.2%) | | |
| 2,3 | Vanguard Market | | |
| | Liquidity Fund, 0.864% | | |
| | (Cost $27,092) | 270,909 | 27,094 |
| Total Investments (100.1%) | | |
| (Cost $9,031,254) | | 12,332,346 |
| |
| | | | Amount |
| | | | ($000) |
| Other Assets and Liabilities (-0.1%) | |
| Other Assets | | |
| Investment in Vanguard | | 815 |
| Receivables for Investment Securities Sold 45,003 |
| Receivables for Accrued Income | | 18,556 |
| Receivables for Capital Shares Issued | 6,855 |
| Other Assets4 | | 450 |
| Total Other Assets | | 71,679 |
| Liabilities | | |
| Payables for Investment Securities | |
| Purchased | | (53,135) |
| Collateral for Securities on Loan | | (25,528) |
| Payables for Capital Shares Redeemed | (953) |
| Payables to Vanguard | | (3,292) |
| Other Liabilities | | (43) |
| Total Liabilities | | (82,951) |
| Net Assets (100%) | | 12,321,074 |
| |
| At February 28, 2017, net assets consisted of: |
| | Amount |
| | ($000) |
| Paid-in Capital | 9,056,556 |
| Undistributed Net Investment Income | 27,421 |
| Accumulated Net Realized Losses | (63,966) |
| Unrealized Appreciation (Depreciation) | |
| Investment Securities | 3,301,092 |
| Futures Contracts | (29) |
| Net Assets | 12,321,074 |
| |
| |
| ETF Shares—Net Assets | |
| Applicable to 87,508,960 outstanding | |
| $.001 par value shares of beneficial | |
| interest (unlimited authorization) | 11,638,940 |
| |
| Net Asset Value Per Share— | |
| ETF Shares | $133.00 |
| |
| |
| Admiral Shares—Net Assets | |
| Applicable to 10,015,551 outstanding | |
| $.001 par value shares of beneficial | |
| interest (unlimited authorization) | 682,134 |
| Net Asset Value Per Share— | |
| Admiral Shares | $68.11 |
• See Note A in Notes toFinancial Statements.
* Non-income-producing security.
^ Includes partial security positions on loan to broker-dealers. The total value of securities on loan is $24,088,000.
1 The fund invests a portion of its cash reserves in equity markets through the use of index futures contracts. After giving effect to futures investments, the fund’s effective common stock and temporary cash
investment positions represent 100.0% and 0.1%, respectively, of net assets.
2 Affiliated money market fund available only to Vanguard funds and certain trusts and accounts managed by Vanguard. Rate shown is the 7-day yield.
3 Includes $25,528,000 of collateral received for securities on loan.
4 Cash of $450,000 has been segregated as initial margin for open futures contracts.
See accompanying Notes, which are an integral part of the Financial Statements.
74
Information Technology Index Fund
Statement of Operations
| |
| Six Months Ended |
| February 28, 2017 |
| | ($000) |
| Investment Income | |
| Income | |
| Dividends | 75,523 |
| Interest 1 | 24 |
| Securities Lending—Net | 473 |
| Total Income | 76,020 |
| Expenses | |
| The Vanguard Group—Note B | |
| Investment Advisory Services | 708 |
| Management and Administrative— | |
| ETF Shares | 4,067 |
| Management and Administrative— | |
| Admiral Shares | 210 |
| Marketing and Distribution— | |
| ETF Shares | 295 |
| Marketing and Distribution— | |
| Admiral Shares | 29 |
| Custodian Fees | 40 |
| Shareholders’ Reports—ETF Shares | 179 |
| Shareholders’ Reports—Admiral Shares | 4 |
| Trustees’ Fees and Expenses | 4 |
| Total Expenses | 5,536 |
| Net Investment Income | 70,484 |
| Realized Net Gain (Loss) on Investment | |
| Securities Sold1 | 321,569 |
| Change in Unrealized Appreciation | |
| (Depreciation) | |
| Investment Securities | 1,027,977 |
| Futures Contracts | (29) |
| Change in Unrealized Appreciation | |
| (Depreciation) | 1,027,948 |
| Net Increase (Decrease) in Net Assets | |
| Resulting from Operations | 1,420,001 |
| 1 Interest income and realized net gain (loss) from an affiliated |
| company of the fund were $24,000 and $0, respectively. |
Statement of Changes in NetAssets
| | |
| | Six Months Ended | Year Ended |
| | February 28, | August 31, |
| | 2017 | 2016 |
| | ($000) | ($000) |
| Increase (Decrease) in Net Assets | | |
| Operations | | |
| Net Investment Income | 70,484 | 128,868 |
| Realized Net Gain (Loss) | 321,569 | 338,452 |
| Change in Unrealized Appreciation (Depreciation) | 1,027,948 | 916,055 |
| Net Increase (Decrease) in Net Assets Resulting from Operations | 1,420,001 | 1,383,375 |
| Distributions | | |
| Net Investment Income | | |
| ETF Shares | (69,560) | (160,757) |
| Admiral Shares | (3,489) | (7,596) |
| Realized Capital Gain | | |
| ETF Shares | — | — |
| Admiral Shares | — | — |
| Total Distributions | (73,049) | (168,353) |
| Capital Share Transactions | | |
| ETF Shares | 932,208 | 1,010,938 |
| Admiral Shares | 157,186 | 58,361 |
| Net Increase (Decrease) from Capital Share Transactions | 1,089,394 | 1,069,299 |
| Total Increase (Decrease) | 2,436,346 | 2,284,321 |
| Net Assets | | |
| Beginning of Period | 9,884,728 | 7,600,407 |
| End of Period 1 | 12,321,074 | 9,884,728 |
| 1 Net Assets—End of Period includes undistributed (overdistributed) net investment income of $27,421,000 and $29,986,000. |
See accompanying Notes, which are an integral part of the Financial Statements.
75
Information Technology Index Fund
Financial Highlights
| | | | | | | |
| ETF Shares | | | | | | | |
| | Six Months | | | | | |
| | | Ended | | | | | |
| For a Share Outstanding | February 28, | Year Ended August 31, |
| Throughout Each Period | | 2017 | 2016 | 2015 | 2014 | 2013 | 2012 |
| Net Asset Value, Beginning of Period | $117.82 | $102.35 | $101.41 | $77.63 | $72.58 | $59.17 |
| Investment Operations | | | | | | | |
| Net Investment Income | | .775 | 1.566 | 1.277 | 1.135 | 1.011 | .628 |
| Net Realized and Unrealized Gain (Loss) | | | | | | |
| on Investments | | 15.241 | 16.049 | .834 | 23.589 | 4.872 | 13.267 |
| Total from Investment Operations | 16.016 | 17.615 | 2.111 | 24.724 | 5.883 | 13.895 |
| Distributions | | | | | | | |
| Dividends from Net Investment Income | (. 836) | (2.145) | (1.171) | (. 944) | (. 833) | (. 485) |
| Distributions from Realized Capital Gains | — | — | — | — | — | — |
| Total Distributions | | (. 836) | (2.145) | (1.171) | (. 944) | (. 833) | (. 485) |
| Net Asset Value, End of Period | $133.00 | $117.82 | $102.35 | $101.41 | $77.63 | $72.58 |
| |
| Total Return | | 13.67% | 17.48% | 2.05% | 32.04% | 8.23% | 23.65% |
| |
| Ratios/Supplemental Data | | | | | | | |
| Net Assets, End of Period (Millions) | $11,639 | $9,429 | $7,259 | $5,876 | $3,497 | $2,536 |
| Ratio of Total Expenses to | | | | | | | |
| Average Net Assets | | 0.10% | 0.10% | 0.10% | 0.12% | 0.14% | 0.14% |
| Ratio of Net Investment Income to | | | | | | |
| Average Net Assets | | 1.30% | 1.50% | 1.35% | 1.38% | 1.53% | 1.01% |
| Portfolio Turnover Rate1 | | 6% | 5% | 3% | 6% | 6% | 6% |
The expense ratio, net investment income ratio, and turnover rate for the current period have been annualized.
1 Excludes the value of portfolio securities received or delivered as a result of in-kind purchases or redemptions of the fund’s capital shares,
including ETF Creation Units.
See accompanying Notes, which are an integral part of the Financial Statements.
76
Information Technology Index Fund
Financial Highlights
| | | | | | | |
| Admiral Shares | | | | | | | |
| | Six Months | | | | | |
| | | Ended | | | | | |
| For a Share Outstanding | February 28, | Year Ended August 31, |
| Throughout Each Period | | 2017 | 2016 | 2015 | 2014 | 2013 | 2012 |
| Net Asset Value, Beginning of Period | $60.33 | $52.41 | $51.93 | $39.75 | $37.17 | $30.30 |
| Investment Operations | | | | | | | |
| Net Investment Income | | .397 | .802 | .655 | .580 | .521 | .320 |
| Net Realized and Unrealized Gain (Loss) | | | | | | |
| on Investments | | 7.811 | 8.216 | .426 | 12.079 | 2.493 | 6.797 |
| Total from Investment Operations | 8.208 | 9.018 | 1.081 | 12.659 | 3.014 | 7.117 |
| Distributions | | | | | | | |
| Dividends from Net Investment Income | (. 428) | (1.098) | (. 601) | (. 479) | (. 434) | (. 247) |
| Distributions from Realized Capital Gains | — | — | — | — | — | — |
| Total Distributions | | (. 428) | (1.098) | (. 601) | (. 479) | (. 434) | (. 247) |
| Net Asset Value, End of Period | $68.11 | $60.33 | $52.41 | $51.93 | $39.75 | $37.17 |
| |
| Total Return 1 | | 13.68% | 17.49% | 2.09% | 32.05% | 8.24% | 23.63% |
| |
| Ratios/Supplemental Data | | | | | | | |
| Net Assets, End of Period (Millions) | $682 | $456 | $342 | $241 | $152 | $95 |
| Ratio of Total Expenses to | | | | | | | |
| Average Net Assets | | 0.10% | 0.10% | 0.10% | 0.12% | 0.14% | 0.14% |
| Ratio of Net Investment Income to | | | | | | |
| Average Net Assets | | 1.30% | 1.50% | 1.35% | 1.38% | 1.53% | 1.01% |
| Portfolio Turnover Rate2 | | 6% | 5% | 3% | 6% | 6% | 6% |
The expense ratio, net investment income ratio, and turnover rate for the current period have been annualized.
1 Total returns do not include transaction or account service fees that may have applied in the periods shown. Fund prospectuses provide
information about any applicable transaction and account service fees.
2 Excludes the value of portfolio securities received or delivered as a result of in-kind purchases or redemptions of the fund’s capital shares,
including ETF Creation Units.
See accompanying Notes, which are an integral part of the Financial Statements.
77
Information Technology Index Fund
Notes to Financial Statements
Vanguard Information Technology Index Fund is registered under the Investment Company Act of 1940 as an open-end investment company, or mutual fund. The fund offers two classes of shares: ETF Shares and Admiral Shares. ETF Shares are listed for trading on NYSE Arca; they can be purchased and sold through a broker. Admiral Shares are designed for investors who meet certain administrative, service, and account-size criteria.
A. The following significant accounting policies conform to generally accepted accounting principles for U.S. investment companies. The fund consistently follows such policies in preparing its financial statements.
1. SecurityValuation:SecuritiesarevaluedasofthecloseoftradingontheNewYorkStockExchange (generally 4 p.m., Eastern time) on the valuation date. Equity securities are valued at thelatestquoted sales prices or official closing prices taken from the primary market in which each security trades; such securities not traded on the valuation date are valued at the mean of the latest quoted bid and asked prices. Securities for whichmarket quotations are not readily available, or whose valueshave been materially affected by events occurring before the fund’s pricing time but after the close of the securities’ primary markets, are valued by methods deemed by the board of trustees to represent fairvalue.InvestmentsinVanguard MarketLiquidityFundarevaluedatthatfund’snetassetvalue.
2. Futures Contracts: The fund uses index futures contracts to a limited extent, with the objectives of maintaining full exposure to the stock market, enhancing returns, maintaining liquidity, and minimizing transaction costs. The fund may purchase futures contracts to immediately invest incoming cash in the market, or sell futures in response to cash outflows, thereby simulating a fully invested position in the underlying index while maintaining a cash balance for liquidity. The fund may seek to enhance returns by using futures contracts instead of the underlying securities when futures are believed to be priced more attractively than the underlying securities. The primary risks associated with the use of futures contracts are imperfect correlation between changes in market values of stocks held by the fund and the prices of futures contracts, and the possibility of an illiquid market. Counterparty risk involving futures is mitigated because a regulated clearinghouse is the counterparty instead of the clearing broker. To further mitigate counterparty risk, the fund trades futures contracts on an exchange, monitors the financial strength of its clearing brokers and clearinghouse, and has entered into clearing agreements with its clearing brokers. The clearinghouse imposes initial margin requirements to secure the fund’s performance and requires daily settlement of variation margin representing changes in the market value of each contract.
Futures contracts are valued at their quoted daily settlement prices. The aggregate settlement values of the contracts are not recorded in the Statement of Net Assets. Fluctuations in the value of the contracts are recorded in the Statement of Net Assets as an asset (liability) and in the Statement of Operations as unrealized appreciation (depreciation) until the contracts are closed, when they are recorded as realized futures gains (losses).
During the six months ended February 28, 2017, the fund’s average investments in long and short futures contracts represented less than 1% and 0% of net assets, respectively, based on the average of aggregate settlement values at each quarter-end during the period.
3. Federal Income Taxes: The fund intends to continue to qualify as a regulated investment company and distribute all of its taxable income. Management has analyzed the fund’s tax positions taken for all open federal income tax years (August 31, 2013–2016), and for the period ended February 28, 2017, and has concluded that no provision for federal income tax is required in the fund’s financial statements. 4. Distributions: Distributions to shareholders are recorded on the ex-dividend date.
5. Securities Lending: To earn additional income, the fund lends its securities to qualified institutional borrowers. Security loans are subject to termination by the fund at any time, and are required to be secured at all times by collateral in an amount at least equal to the market value of securities loaned. Daily market fluctuations could cause the value of loaned securities to be more or less than the value of the collateral received. When this occurs, the collateral is adjusted and settled on the next business day. The fund further mitigates its counterparty risk by entering into securities lending transactions only with a diverse group of prequalified counterparties, monitoring their financial strength, and entering into master securities lending agreements with its counterparties. The master securities lending agreements provide that, in the event of a counterparty’s default (including bankruptcy), the fund may terminate any loans with that borrower, determine the net amount owed, and sell or retain the collateral up to the net amount owed to the fund; however, such actions may be subject to legal
78
Information Technology Index Fund
proceedings. While collateral mitigates counterparty risk, in the absence of a default the fund may experience delays and costs in recovering the securities loaned. The fund invests cash collateral received in Vanguard Market Liquidity Fund, and records a liability in the Statement of Net Assets for the return of the collateral, during the period the securities are on loan. Securities lending income represents feeschargedto borrowers plusincome earned oninvested cash collateral,less expenses associated with the loan. During the term of the loan, the fund is entitled to all distributions made on or in respect of the loaned securities.
6. Credit Facility: The fund and certain other funds managed by The Vanguard Group (“Vanguard”) participate in a $3.1 billion committed credit facility provided by a syndicate of lenders pursuant to a credit agreement that may be renewed annually; each fund is individually liable for its borrowings, if any, under the credit facility. Borrowings may be utilized for temporary and emergency purposes, and are subject to the fund’s regulatory and contractual borrowing restrictions. The participating funds are charged administrative fees and an annual commitment fee of 0.10% of the undrawn amount of the facility; these fees are allocated to the funds based on a method approved by the fund’s board of trustees and included in Management and Administrative expenses on the fund’s Statement of Operations. Any borrowings under this facility bear interest at a rate based upon the higher of the one-month London Interbank Offered Rate, federal funds effective rate, or overnight bank funding rate plus an agreed-upon spread.
The fund had no borrowings outstanding at February 28, 2017, or at any time during the period then ended.
7. Other: Dividend income is recorded on the ex-dividend date. Interest income includes income distributions received from Vanguard Market Liquidity Fund and is accrued daily. Security transactions are accounted for on the date securities are bought or sold. Costs used to determine realized gains (losses) on the sale of investment securities are those of the specific securities sold.
Each class of shares has equal rights as to assets and earnings, except that each class separately bears certain class-specific expenses related to maintenance of shareholder accounts (included in Management and Administrative expenses) and shareholder reporting. Marketing and distribution expenses are allocated to each class of shares based on a method approved by the board of trustees. Income, other non-class-specific expenses, and gains and losses on investments are allocated to each class of shares based on its relative net assets.
B. In accordance with the terms of a Funds’ Service Agreement (the “FSA”) between Vanguard and the fund, Vanguard furnishes to the fund investment advisory, corporate management, administrative, marketing,anddistributionservices atVanguard’scostofoperations (as defined bythe FSA).These costs of operations are allocated to the fund based on methods and guidelines approved by the board of trustees. Vanguard does not require reimbursement in the current period for certain costs ofoperations(such asdeferred compensation/benefitsand risk/insurance costs);thefund’sliability for these costs of operations isincluded in Payables to Vanguard on the Statement of Net Assets.
Upon the request of Vanguard, the fund may invest up to 0.40% of its net assets as capital in Vanguard. At February 28, 2017,the fund had contributedto Vanguard capitalinthe amountof $815,000, representing 0.01% of the fund’s net assets and 0.33% of Vanguard’s capitalization. The fund’s trustees and officers are also directors and employees, respectively, of Vanguard.
C. Variousinputs may be used to determine the value of the fund’sinvestments. Theseinputs are summarized in three broad levels for financial statement purposes. The inputs or methodologies used to value securities are not necessarily an indication of the risk associated with investing in those securities.
Level 1—Quoted prices in active markets for identical securities.
Level 2—Other significant observable inputs (including quoted prices for similar securities, interest rates, prepayment speeds, credit risk, etc.).
Level 3—Significant unobservable inputs (including the fund’s own assumptions used to determine the fair value of investments).
79
Information Technology Index Fund
The following table summarizes the market value of the fund’sinvestments as of February 28, 2017, based on the inputs used to value them:
| | | |
| | Level 1 | Level 2 | Level 3 |
| Investments | ($000) | ($000) | ($000) |
| Common Stocks | 12,305,252 | — | — |
| Temporary Cash Investments | 27,094 | — | — |
| Futures Contracts—Liabilities1 | (25) | — | — |
| Total | 12,332,321 | — | — |
| 1 Represents variation margin on the last day of the reporting period. |
D. At February 28, 2017, the aggregate settlement value of open futures contracts and the related unrealized appreciation (depreciation) were:
| | | | |
| | | | ($000) |
| | | | Aggregate | |
| | | Number of | Settlement | Unrealized |
| | | Long (Short) | Value | Appreciation |
| Futures Contracts | Expiration | Contracts | Long (Short) | (Depreciation) |
| E-mini S&P 500 Index | March 2017 | 90 | 10,633 | (29) |
Unrealized appreciation (depreciation) on open futures contracts is required to be treated as realized gain (loss) for tax purposes.
E. Distributions are determined on a tax basis and may differ from net investment income and realized capital gains for financial reporting purposes. Differences may be permanent or temporary. Permanent differences are reclassified among capital accounts in the financial statements to reflect their tax character. Temporary differences arise when certain items of income, expense, gain, or loss are recognized in different periods for financial statement and tax purposes. These differences will reverse at some time in the future. Differences in classification may also result from the treatment of short-term gains as ordinary income for tax purposes.
During the six months ended February 28, 2017, the fund realized $302,803,000 of net capital gains resulting from in-kind redemptions—in which shareholders exchanged fund shares for securities held by the fund rather than for cash. Because such gains are not taxable to the fund, and are not distributed to shareholders, they have been reclassified from accumulated net realized losses to paid-in capital.
The fund’s tax-basis capital gains and losses are determined only at the end of each fiscal year. For tax purposes, at August 31, 2016, the fund had available capital losses totaling $82,732,000 to offset future net capital gains. Of this amount, $47,958,000 is subject to expiration dates; $7,582,000 through August 31, 2017, $20,048,000 through August 31, 2018, and $20,328,000 through August 31, 2019. Capital losses of $34,774,000 realized beginning in fiscal 2012 may be carried forward indefinitely under the Regulated Investment Company Modernization Act of 2010, but must be used before any expiring loss carryforwards. The fund will use these capital losses to offset net taxable capital gains, if any, realized during the year ending August 31, 2017; should the fund realize net capital losses for the year, the losses will be added to the loss carryforward balance above.
At February 28, 2017, the cost of investment securities for tax purposes was $9,031,254,000. Net unrealized appreciation of investment securities for tax purposes was $3,301,092,000, consisting of unrealized gains of $3,433,792,000 on securities that had risen in value since their purchase and $132,700,000 in unrealized losses on securities that had fallen in value since their purchase.
F. During the six months ended February 28, 2017, the fund purchased $1,970,182,000 of investment securities and sold $895,116,000 of investment securities, other than temporary cash investments. Purchases and sales include $1,455,059,000 and $588,213,000, respectively, in connection with in-kind purchases and redemptions of the fund’s capital shares.
80
Information Technology Index Fund
G. Capital share transactions for each class of shares were:
| | | | |
| | Six Months Ended | | Year Ended |
| | February 28, 2017 | August 31, 2016 |
| | Amount | Shares | Amount | Shares |
| | ($000) | (000) | ($000) | (000) |
| ETF Shares | | | | |
| Issued | 1,526,902 | 12,376 | 1,784,206 | 16,565 |
| Issued in Lieu of Cash Distributions | — | — | — | — |
| Redeemed | (594,694) | (4,900) | (773,268) | (7,450) |
| Net Increase (Decrease)—ETF Shares | 932,208 | 7,476 | 1,010,938 | 9,115 |
| Admiral Shares | | | | |
| Issued | 222,783 | 3,510 | 172,599 | 3,127 |
| Issued in Lieu of Cash Distributions | 3,207 | 52 | 7,052 | 131 |
| Redeemed | (68,804) | (1,097) | (121,290) | (2,228) |
| Net Increase (Decrease)—Admiral Shares | 157,186 | 2,465 | 58,361 | 1,030 |
At February 28, 2017, one shareholder was the record or beneficial owner of 34% of the fund’s net assets. If the shareholder were to redeem its investment in the fund, the redemption might result in an increase in the fund’s expense ratio.
H. Management has determined that no material events or transactions occurred subsequent to February 28, 2017, that would require recognition or disclosure in these financial statements.
81
Materials Index Fund
Fund Profile
As of February 28, 2017
| | |
| Share-Class Characteristics | | |
| | ETF | Admiral |
| | Shares | Shares |
| |
| Ticker Symbol | VAW | VMIAX |
| Expense Ratio1 | 0.10% | 0.10% |
| 30-Day SEC Yield | 1.75% | 1.75% |
| | | |
| Portfolio Characteristics | | |
| | | MSCI | |
| | | US IMI/ | MSCI |
| | | Materials | US IMI/ |
| | Fund | 25/50 | 2500 |
| Number of Stocks | 123 | 123 | 2,479 |
| Median Market Cap | $18.2B | $18.2B | $57.6B |
| Price/Earnings Ratio | 25.8x | 25.8x | 24.7x |
| Price/Book Ratio | 3.8x | 3.8x | 3.0x |
| Return on Equity | 17.7% | 17.7% | 16.5% |
| Earnings Growth Rate | 5.8% | 5.8% | 7.6% |
| Dividend Yield | 1.8% | 1.8% | 1.9% |
| Foreign Holdings | 0.0% | 0.0% | 0.0% |
| Turnover Rate | | | |
| (Annualized) | 5% | — | — |
| Short-Term Reserves | -0.1% | — | — |
| | |
| Volatility Measures | | |
| | MSCI US | |
| | IMI/Materials | MSCI US |
| | 25/50 | IMI/2500 |
| R-Squared | 1.00 | 0.72 |
| Beta | 1.00 | 1.34 |
| These measures show the degree and timing of the fund’s |
| fluctuations compared with the indexes over 36 months. |
| |
| Subindustry Diversification | |
| (% of equity exposure) | |
| |
| Commodity Chemicals | 6.2% |
| Construction Materials | 4.7 |
| Copper | 2.1 |
| Diversified Chemicals | 19.4 |
| Fertilizers & Agricultural Chemicals | 9.7 |
| Gold | 2.8 |
| Industrial Gases | 7.6 |
| Metal & Glass Containers | 4.6 |
| Paper Packaging | 8.9 |
| Paper Products | 1.2 |
| Specialty Chemicals | 23.0 |
| Steel | 7.1 |
| Other Materials | 2.7 |
| | |
| Ten Largest Holdings (% of total net assets) |
| |
| Dow Chemical Co. | Diversified Chemicals | 8.4% |
| EI du Pont de | | |
| Nemours & Co. | Diversified Chemicals | 8.2 |
| Monsanto Co. | Fertilizers & Agricultural | |
| | Chemicals | 6.0 |
| Praxair Inc. | Industrial Gases | 4.1 |
| Ecolab Inc. | Specialty Chemicals | 3.9 |
| LyondellBasell | | |
| Industries NV | Commodity Chemicals | 3.8 |
| Air Products | | |
| & Chemicals Inc. | Industrial Gases | 3.5 |
| PPG Industries Inc. | Specialty Chemicals | 3.3 |
| Sherwin-Williams | | |
| Co. | Specialty Chemicals | 2.9 |
| International Paper | | |
| Co. | Paper Packaging | 2.5 |
| Top Ten | | 46.6% |
| The holdings listedexcludeany temporary cashinvestments and |
| equity index products. |
1 The expense ratios shown are from the prospectus dated December 22, 2016, and represent estimated costs for the current fiscal year. For the six months ended February 28, 2017, the annualized expense ratios were 0.10% for ETF Shares and 0.10% for Admiral Shares.
82
Materials Index Fund
Performance Summary
All of the returns in this report represent past performance, which is not a guarantee of future results that may be achieved by the fund. (Current performance may be lower or higher than the performance data cited. For performance data current to the most recentmonth-end, visit our website at vanguard.com/performance.) Note, too, that both investment returns and principal value can fluctuate widely, so an investor’s shares, when sold, could be worth more or less than their original cost. The returns shown do not reflect taxes that a shareholder would pay on fund distributions or on the sale of fund shares.
Fiscal-Year Total Returns (%): August 31, 2006–February 28, 2017
For a benchmark description, see the Glossary.
Note: For 2017, performance data reflect the six months ended February 28, 2017.
Average Annual Total Returns: Periods Ended December 31, 2016
This table presents returns through the latest calendar quarter—rather than through the end of the fiscal period.
Securities and Exchange Commission rules require that we provide this information.
| | | | |
| | Inception Date | One Year | Five Years | Ten Years |
| ETF Shares | 1/26/2004 | | | |
| Market Price | | 21.46% | 11.13% | 6.92% |
| Net Asset Value | | 21.43 | 11.10 | 6.92 |
| Admiral Shares | 2/11/2004 | 21.41 | 11.11 | 6.91 |
See Financial Highlights for dividend and capital gains information.
83
Materials Index Fund
Financial Statements (unaudited)
Statement of Net Assets
As of February 28, 2017
The fund reports a complete list of its holdings in regulatory filings four times in each fiscal year, at the quarter-ends. For the second and fourth fiscal quarters, the lists appear in the fund’s semiannual and annual reports to shareholders. For the first and third fiscal quarters, the fund files the lists with the Securities and Exchange Commission on Form N-Q. Shareholders can look up the fund’s Forms N-Q on the SEC’s website at sec.gov. Forms N-Q may also be reviewed and copied at the SEC’s Public Reference Room (see the back cover of this report for further information).
| | | |
| | | | Market |
| | | | Value• |
| | | Shares | ($000) |
| Common Stocks (99.9%) 1 | | |
| Chemicals (65.9%) | | |
| | Dow Chemical Co. | 3,124,311 | 194,520 |
| | EI du Pont de Nemours | | |
| | & Co. | 2,422,118 | 190,233 |
| | Monsanto Co. | 1,220,908 | 138,976 |
| | Praxair Inc. | 795,221 | 94,401 |
| | Ecolab Inc. | 731,116 | 90,636 |
| | LyondellBasell Industries | | |
| | NV Class A | 965,006 | 88,047 |
| | Air Products & Chemicals | | |
| | Inc. | 573,278 | 80,528 |
| | PPG Industries Inc. | 735,465 | 75,334 |
| | Sherwin-Williams Co. | 220,048 | 67,894 |
| | Celanese Corp. Class A | 398,878 | 35,568 |
| | Eastman Chemical Co. | 408,796 | 32,806 |
| | Albemarle Corp. | 313,436 | 31,817 |
| | Mosaic Co. | 927,124 | 28,917 |
| | International Flavors | | |
| | & Fragrances Inc. | 221,217 | 27,807 |
| | Valspar Corp. | 210,085 | 23,366 |
| | FMC Corp. | 372,636 | 21,471 |
| | Ashland Global Holdings | | |
| | Inc. | 173,323 | 20,913 |
| | CF Industries Holdings Inc. | 649,145 | 20,396 |
| | RPM International Inc. | 371,681 | 19,807 |
| * | Axalta Coating Systems | | |
| | Ltd. | 603,055 | 17,555 |
| | Chemours Co. | 506,715 | 17,056 |
| | Olin Corp. | 459,961 | 14,295 |
| | WR Grace & Co. | 195,212 | 13,829 |
| | Huntsman Corp. | 563,260 | 12,730 |
| | NewMarket Corp. | 26,379 | 11,493 |
| | Scotts Miracle-Gro Co. | 125,486 | 11,373 |
| | Cabot Corp. | 173,506 | 10,060 |
| | Sensient Technologies | | |
| | Corp. | 124,010 | 9,913 |
| | Trinseo SA | 124,402 | 8,602 |
| | PolyOne Corp. | 233,878 | 7,877 |
| | Balchem Corp. | 88,439 | 7,709 |
| | Minerals Technologies Inc. | 97,108 | 7,502 |
| * | Platform Specialty Products | |
| | Corp. | 543,202 | 7,165 |
| | HB Fuller Co. | 140,250 | 6,930 |
| | Westlake Chemical Corp. | 107,814 | 6,839 |
| * | Ingevity Corp. | 117,340 | 6,333 |
| * | Chemtura Corp. | 166,951 | 5,534 |
| * | GCP Applied Technologies | | |
| | Inc. | 197,647 | 5,208 |
| | Quaker Chemical Corp. | 36,888 | 4,857 |
| | Innospec Inc. | 66,870 | 4,367 |
| | Stepan Co. | 56,025 | 4,236 |
| | Tronox Ltd. Class A | 180,570 | 3,129 |
| * | Ferro Corp. | 208,109 | 2,913 |
| | | |
| | Innophos Holdings Inc. | 54,138 | 2,869 |
| | A Schulman Inc. | 81,656 | 2,756 |
| ^ | Valvoline Inc. | 113,521 | 2,545 |
| * | Koppers Holdings Inc. | 57,556 | 2,524 |
| * | Kraton Corp. | 85,851 | 2,338 |
| * | AdvanSix Inc. | 80,272 | 2,190 |
| ^,* Flotek Industries Inc. | 148,904 | 2,013 |
| | Calgon Carbon Corp. | 141,111 | 1,990 |
| | Chase Corp. | 19,409 | 1,775 |
| | Rayonier Advanced | | |
| | Materials Inc. | 120,632 | 1,599 |
| | Hawkins Inc. | 26,358 | 1,303 |
| | American Vanguard Corp. | 73,032 | 1,150 |
| | Tredegar Corp. | 59,246 | 1,126 |
| | Kronos Worldwide Inc. | 63,827 | 885 |
| | FutureFuel Corp. | 66,391 | 878 |
| ^,* LSB Industries Inc. | 70,439 | 766 |
| * | Intrepid Potash Inc. | 159,325 | 319 |
| * | AgroFresh Solutions Inc. | 60,235 | 163 |
| | | | 1,520,131 |
| Construction Materials (4.7%) | | |
| | Vulcan Materials Co. | 368,634 | 44,461 |
| | Martin Marietta Materials | | |
| | Inc. | 167,999 | 36,280 |
| | Eagle Materials Inc. | 134,338 | 13,932 |
| * | Summit Materials Inc. | | |
| | Class A | 287,817 | 6,876 |
| * | Headwaters Inc. | 206,267 | 4,744 |
| * | US Concrete Inc. | 41,625 | 2,622 |
| | United States Lime | | |
| | & Minerals Inc. | 6,097 | 464 |
| | | | 109,379 |
| Containers & Packaging (13.5%) | |
| | International Paper Co. | 1,088,540 | 57,366 |
| | WestRock Co. | 699,565 | 37,581 |
| | Ball Corp. | 462,761 | 34,027 |
| | Sealed Air Corp. | 538,514 | 25,030 |
| | Packaging Corp. of | | |
| | America | 262,397 | 24,253 |
| * | Crown Holdings Inc. | 389,568 | 20,877 |
| | Avery Dennison Corp. | 248,017 | 20,018 |
| * | Berry Plastics Group Inc. | 358,281 | 18,032 |
| | Sonoco Products Co. | 278,195 | 14,834 |
| | AptarGroup Inc. | 174,598 | 13,009 |
| | Bemis Co. Inc. | 261,050 | 12,940 |
| | Graphic Packaging Holding | | |
| | Co. | 884,812 | 11,812 |
| * | Owens-Illinois Inc. | 428,441 | 8,483 |
| | Silgan Holdings Inc. | 107,243 | 6,394 |
| | Greif Inc. Class A | 71,821 | 4,096 |
| * | Multi Packaging Solutions | | |
| | International Ltd. | 86,201 | 1,536 |
| | Myers Industries Inc. | 66,602 | 936 |
| | | | 311,224 |
| | | |
| Metals & Mining (14.0%) | | |
| | Nucor Corp. | 887,439 | 55,527 |
| | Newmont Mining Corp. | 1,478,857 | 50,636 |
| * | Freeport-McMoRan Inc. | 3,604,771 | 48,304 |
| | Steel Dynamics Inc. | 679,414 | 24,867 |
| | United States Steel Corp. | 480,681 | 18,612 |
| | Reliance Steel | | |
| | & Aluminum Co. | 202,206 | 17,117 |
| * | Alcoa Corp. | 406,433 | 14,058 |
| | Royal Gold Inc. | 181,766 | 12,006 |
| * | Cliffs Natural Resources | | |
| | Inc. | 761,429 | 8,117 |
| * | AK Steel Holding Corp. | 872,355 | 7,267 |
| ^ | Compass Minerals | | |
| | International Inc. | 94,108 | 7,133 |
| | Commercial Metals Co. | 321,988 | 6,804 |
| | Worthington Industries Inc. | 132,716 | 6,510 |
| | Hecla Mining Co. | 1,101,517 | 6,146 |
| ^ | Allegheny Technologies | | |
| | Inc. | 303,375 | 5,828 |
| * | Stillwater Mining Co. | 336,488 | 5,740 |
| | Carpenter Technology | | |
| | Corp. | 129,739 | 5,262 |
| * | Coeur Mining Inc. | 524,237 | 4,503 |
| | Kaiser Aluminum Corp. | 49,952 | 3,938 |
| * | TimkenSteel Corp. | 104,732 | 2,191 |
| ^ | McEwen Mining Inc. | 623,396 | 2,138 |
| * | Century Aluminum Co. | 144,712 | 2,038 |
| | Materion Corp. | 55,644 | 1,939 |
| | Schnitzer Steel Industries | | |
| | Inc. | 73,779 | 1,756 |
| * | SunCoke Energy Inc. | 169,525 | 1,653 |
| | Haynes International Inc. | 34,738 | 1,357 |
| * | Ryerson Holding Corp. | 45,518 | 494 |
| | | | 321,941 |
| Paper & Forest Products (1.8%) | |
| * | Louisiana-Pacific Corp. | 395,299 | 9,321 |
| | Domtar Corp. | 174,196 | 6,635 |
| | KapStone Paper and | | |
| | Packaging Corp. | 255,236 | 5,768 |
| | Schweitzer-Mauduit | | |
| | International Inc. | 85,059 | 3,490 |
| | Neenah Paper Inc. | 46,702 | 3,421 |
| * | Boise Cascade Co. | 106,840 | 2,895 |
| | PH Glatfelter Co. | 121,125 | 2,677 |
| * | Clearwater Paper Corp. | 46,508 | 2,586 |
| | Deltic Timber Corp. | 30,327 | 2,254 |
| | Mercer International Inc. | 125,841 | 1,517 |
| * | Resolute Forest Products | | |
| | Inc. | 173,221 | 788 |
| | | | 41,352 |
| Total Common Stocks | | |
| (Cost $2,173,567) | | 2,304,027 |
84
Materials Index Fund
| | |
| | | Market |
| | | Value• |
| | Shares | ($000) |
| Temporary Cash Investment (0.3%) 1 | |
| Money Market Fund (0.3%) | | |
| 2,3 Vanguard Market | | |
| Liquidity Fund, 0.864% | | |
| (Cost $6,726) | 67,255 | 6,726 |
| Total Investments (100.2%) | | |
| (Cost $2,180,293) | | 2,310,753 |
| |
| | | Amount |
| | | ($000) |
| Other Assets and Liabilities (-0.2%) | |
| Other Assets | | |
| Investment in Vanguard | | 162 |
| Receivables for Investment Securities Sold | 5,983 |
| Receivables for Accrued Income | 3,402 |
| Receivables for Capital Shares Issued | 15,336 |
| Other Assets 4 | | 59 |
| |
| Total Other Assets | | 24,942 |
| Liabilities | | |
| Payables for Investment Securities | |
| Purchased | | (5,468) |
| Collateral for Securities on Loan | (6,725) |
| Payables for Capital Shares Redeemed | (345) |
| Payables to Vanguard | | (900) |
| Other Liabilities | | (15,019) |
| Total Liabilities | | (28,457) |
| Net Assets (100%) | | 2,307,238 |
| |
| At February 28, 2017, net assets consisted of: |
| | Amount |
| | ($000) |
| Paid-in Capital | 2,252,296 |
| Undistributed Net Investment Income | 6,061 |
| Accumulated Net Realized Losses | (81,578) |
| Unrealized Appreciation(Depreciation) | |
| Investment Securities | 130,460 |
| Futures Contracts | (1) |
| Net Assets | 2,307,238 |
| |
| |
| ETF Shares—Net Assets | |
| Applicable to 16,962,563 outstanding | |
| $.001 par value shares of beneficial | |
| interest (unlimited authorization) | 2,018,591 |
| Net Asset Value Per Share— | |
| ETF Shares | $119.00 |
| |
| |
| Admiral Shares—Net Assets | |
| Applicable to 4,760,286 outstanding | |
| $.001 par value shares of beneficial | |
| interest (unlimited authorization) | 288,647 |
| Net Asset Value Per Share— | |
| Admiral Shares | $60.64 |
• See Note A in Notes toFinancial Statements.
* Non-income-producing security.
^ Includes partial security positions on loan to broker-dealers. The total value of securities on loan is $6,262,000.
1 The fund invests a portion of its cash reserves in equity markets through the use of index futures contracts. After giving effect to futures investments, the fund’s effective common stock and temporary cash
investment positions represent 100.0% and 0.2%, respectively, of net assets.
2 Affiliated money market fund available only to Vanguard funds and certain trusts and accounts managed by Vanguard. Rate shown is the 7-day yield.
3 Includes $6,725,000 of collateral received for securities on loan.
4 Cash of $59,000 has been segregated as initial margin for open futures contracts.
See accompanying Notes, which are an integral part of the Financial Statements.
85
Materials Index Fund
Statement of Operations
| |
| Six Months Ended |
| February 28, 2017 |
| | ($000) |
| Investment Income | |
| Income | |
| Dividends | 18,391 |
| Interest 1 | 2 |
| Securities Lending—Net | 54 |
| Total Income | 18,447 |
| Expenses | |
| The Vanguard Group—Note B | |
| Investment Advisory Services | 145 |
| Management and Administrative— | |
| ETF Shares | 575 |
| Management and Administrative— | |
| Admiral Shares | 94 |
| Marketing and Distribution— | |
| ETF Shares | 57 |
| Marketing and Distribution— | |
| Admiral Shares | 14 |
| Custodian Fees | 19 |
| Shareholders’ Reports—ETF Shares | 49 |
| Shareholders’ Reports—Admiral Shares | 2 |
| Trustees’ Fees and Expenses | 1 |
| Total Expenses | 956 |
| Net Investment Income | 17,491 |
| Realized Net Gain (Loss) | |
| Investment Securities Sold1 | 30,173 |
| Futures Contracts | (7) |
| Realized Net Gain (Loss) | 30,166 |
| Change in Unrealized Appreciation | |
| (Depreciation) | |
| Investment Securities | 145,782 |
| Futures Contracts | (1) |
| Change in Unrealized Appreciation | |
| (Depreciation) | 145,781 |
| Net Increase (Decrease) in Net Assets | |
| Resulting from Operations | 193,438 |
| 1 Interest income and realized net gain (loss) from an affiliated |
| company of the fund were $2,000 and $0, respectively. |
Statement of Changes in NetAssets
| | |
| | Six Months Ended | Year Ended |
| | February 28, | August 31, |
| | 2017 | 2016 |
| | ($000) | ($000) |
| Increase (Decrease) in Net Assets | | |
| Operations | | |
| Net Investment Income | 17,491 | 27,238 |
| Realized Net Gain (Loss) | 30,166 | 49,519 |
| Change in Unrealized Appreciation (Depreciation) | 145,781 | 121,531 |
| Net Increase (Decrease) in Net Assets Resulting from Operations | 193,438 | 198,288 |
| Distributions | | |
| Net Investment Income | | |
| ETF Shares | (15,131) | (32,837) |
| Admiral Shares | (2,421) | (5,856) |
| Realized Capital Gain | | |
| ETF Shares | — | — |
| Admiral Shares | — | — |
| Total Distributions | (17,552) | (38,693) |
| Capital Share Transactions | | |
| ETF Shares | 420,121 | 290,064 |
| Admiral Shares | 28,027 | 18,673 |
| Net Increase (Decrease) from Capital Share Transactions | 448,148 | 308,737 |
| Total Increase (Decrease) | 624,034 | 468,332 |
| Net Assets | | |
| Beginning of Period | 1,683,204 | 1,214,872 |
| End of Period 1 | 2,307,238 | 1,683,204 |
| 1 Net Assets—End of Period includes undistributed (overdistributed) net investment income of $6,061,000 and $6,122,000. |
See accompanying Notes, which are an integral part of the Financial Statements.
86
Materials Index Fund
Financial Highlights
| | | | | | | |
| ETF Shares | | | | | | | |
| | Six Months | | | | | |
| | | Ended | | | | | |
| For a Share Outstanding | February 28, | Year Ended August 31, |
| Throughout Each Period | | 2017 | 2016 | 2015 | 2014 | 2013 | 2012 |
| Net Asset Value, Beginning of Period | $108.16 | $96.39 | $113.50 | $90.94 | $79.81 | $77.59 |
| Investment Operations | | | | | | | |
| Net Investment Income | | .987 | 1.980 | 2.126 | 1.847 | 1.993 | 1.537 |
| Net Realized and Unrealized Gain (Loss) | | | | | | |
| on Investments | | 10.920 | 12.770 | (17.344) | 22.612 | 10.708 | 2.259 |
| Total from Investment Operations | 11.907 | 14.750 | (15.218) | 24.459 | 12.701 | 3.796 |
| Distributions | | | | | | | |
| Dividends from Net Investment Income | (1.067) | (2.980) | (1.892) | (1.899) | (1.571) | (1.576) |
| Distributions from Realized Capital Gains | — | — | — | — | — | — |
| Total Distributions | | (1.067) | (2.980) | (1.892) | (1.899) | (1.571) | (1.576) |
| Net Asset Value, End of Period | $119.00 | $108.16 | $96.39 | $113.50 | $90.94 | $79.81 |
| |
| Total Return | | 11.10% | 15.83% | -13.56% | 27.17% | 16.08% | 5.09% |
| |
| Ratios/Supplemental Data | | | | | | | |
| Net Assets, End of Period (Millions) | $2,019 | $1,448 | $1,022 | $1,323 | $796 | $642 |
| Ratio of Total Expenses to | | | | | | | |
| Average Net Assets | | 0.10% | 0.10% | 0.10% | 0.12% | 0.14% | 0.14% |
| Ratio of Net Investment Income to | | | | | | |
| Average Net Assets | | 1.87% | 2.06% | 1.86% | 1.88% | 2.32% | 1.93% |
| Portfolio Turnover Rate1 | | 5% | 6% | 4% | 4% | 7% | 7% |
The expense ratio, net investment income ratio, and turnover rate for the current period have been annualized.
1 Excludes the value of portfolio securities received or delivered as a result of in-kind purchases or redemptions of the fund’s capital shares,
including ETF Creation Units.
See accompanying Notes, which are an integral part of the Financial Statements.
87
Materials Index Fund
Financial Highlights
| | | | | | | |
| Admiral Shares | | | | | | | |
| | Six Months | | | | | |
| | | Ended | | | | | |
| For a Share Outstanding | February 28, | Year Ended August 31, |
| Throughout Each Period | | 2017 | 2016 | 2015 | 2014 | 2013 | 2012 |
| Net Asset Value, Beginning of Period | $55.11 | $49.12 | $57.84 | $46.34 | $40.66 | $39.53 |
| Investment Operations | | | | | | | |
| Net Investment Income | | .502 | 1.008 | 1.088 | .936 | 1.014 | .783 |
| Net Realized and Unrealized Gain (Loss) | | | | | | |
| on Investments | | 5.572 | 6.505 | (8.846) | 11.528 | 5.464 | 1.151 |
| Total from Investment Operations | 6.074 | 7.513 | (7.758) | 12.464 | 6.478 | 1.934 |
| Distributions | | | | | | | |
| Dividends from Net Investment Income | (. 544) | (1.523) | (. 962) | (. 964) | (. 798) | (. 804) |
| Distributions from Realized Capital Gains | — | — | — | — | — | — |
| Total Distributions | | (. 544) | (1.523) | (. 962) | (. 964) | (. 798) | (. 804) |
| Net Asset Value, End of Period | $60.64 | $55.11 | $49.12 | $57.84 | $46.34 | $40.66 |
| |
| Total Return1 | | 11.11% | 15.80% | -13.54% | 27.18% | 16.12% | 5.10% |
| |
| Ratios/Supplemental Data | | | | | | | |
| Net Assets, End of Period (Millions) | $289 | $235 | $193 | $175 | $139 | $123 |
| Ratio of Total Expenses to | | | | | | | |
| Average Net Assets | | 0.10% | 0.10% | 0.10% | 0.12% | 0.14% | 0.14% |
| Ratio of Net Investment Income to | | | | | | |
| Average Net Assets | | 1.87% | 2.06% | 1.86% | 1.88% | 2.32% | 1.93% |
| Portfolio Turnover Rate2 | | 5% | 6% | 4% | 4% | 7% | 7% |
The expense ratio, net investment income ratio, and turnover rate for the current period have been annualized.
1 Total returns do not include transaction or account service fees that may have applied in the periods shown. Fund prospectuses provide
information about any applicable transaction and account service fees.
2 Excludes the value of portfolio securities received or delivered as a result of in-kind purchases or redemptions of the fund’s capital shares,
including ETF Creation Units.
See accompanying Notes, which are an integral part of the Financial Statements.
88
Materials Index Fund
Notes to Financial Statements
Vanguard Materials Index Fund is registered under the Investment Company Act of 1940 as an open-end investment company, or mutual fund. The fund offers two classes of shares: ETF Shares and Admiral Shares. ETF Shares are listed for trading on NYSE Arca; they can be purchased and sold through a broker. Admiral Shares are designed for investors who meet certain administrative, service, and account-size criteria.
A. The following significant accounting policies conform to generally accepted accounting principles for U.S. investment companies. The fund consistently follows such policies in preparing its financial statements.
1. SecurityValuation:SecuritiesarevaluedasofthecloseoftradingontheNewYorkStockExchange (generally 4 p.m., Eastern time) on the valuation date. Equity securities are valued at thelatestquoted sales prices or official closing prices taken from the primary market in which each security trades; such securities not traded on the valuation date are valued at the mean of the latest quoted bid and asked prices. Securities for whichmarket quotations are not readily available, or whose valueshave been materially affected by events occurring before the fund’s pricing time but after the close of the securities’ primary markets, are valued by methods deemed by the board of trustees to represent fairvalue.InvestmentsinVanguard MarketLiquidityFundarevaluedatthatfund’snetassetvalue.
2. Futures Contracts: The fund uses index futures contracts to a limited extent, with the objectives of maintaining full exposure to the stock market, enhancing returns, maintaining liquidity, and minimizing transaction costs. The fund may purchase futures contracts to immediately invest incoming cash in the market, or sell futures in response to cash outflows, thereby simulating a fully invested position in the underlying index while maintaining a cash balance for liquidity. The fund may seek to enhance returns by using futures contracts instead of the underlying securities when futures are believed to be priced more attractively than the underlying securities. The primary risks associated with the use of futures contracts are imperfect correlation between changes in market values of stocks held by the fund and the prices of futures contracts, and the possibility of an illiquid market. Counterparty risk involving futures is mitigated because a regulated clearinghouse is the counterparty instead of the clearing broker. To further mitigate counterparty risk, the fund trades futures contracts on an exchange, monitors the financial strength of its clearing brokers and clearinghouse, and has entered into clearing agreements with its clearing brokers. The clearinghouse imposes initial margin requirements to secure the fund’s performance and requires daily settlement of variation margin representing changes in the market value of each contract.
Futures contracts are valued at their quoted daily settlement prices. The aggregate settlement values of the contracts are not recorded in the Statement of Net Assets. Fluctuations in the value of the contracts are recorded in the Statement of Net Assets as an asset (liability) and in the Statement of Operations as unrealized appreciation (depreciation) until the contracts are closed, when they are recorded as realized futures gains (losses).
During the six months ended February 28, 2017, the fund’s average investments in long and short futures contracts represented less than 1% and 0% of net assets, respectively, based on the average of aggregate settlement values at each quarter-end during the period.
3. Federal Income Taxes: The fund intends to continue to qualify as a regulated investment company and distribute all of its taxable income. Management has analyzed the fund’s tax positions taken for all open federal income tax years (August 31, 2013–2016), and for the period ended February 28, 2017, and has concluded that no provision for federal income tax is required in the fund’s financial statements. 4. Distributions: Distributions to shareholders are recorded on the ex-dividend date.
5. Securities Lending: To earn additional income, the fund lends its securities to qualified institutional borrowers. Security loans are subject to termination by the fund at any time, and are required to be secured at all times by collateral in an amount at least equal to the market value of securities loaned. Daily market fluctuations could cause the value of loaned securities to be more or less than the value of the collateral received. When this occurs, the collateral is adjusted and settled on the next business day. The fund further mitigates its counterparty risk by entering into securities lending transactions only with a diverse group of prequalified counterparties, monitoring their financial strength, and entering into master securities lending agreements with its counterparties. The master securities lending agreements provide that, in the event of a counterparty’s default (including bankruptcy), the fund may terminate any loans with that borrower, determine the net amount owed, and sell or retain the collateral up to the net amount owed to the fund; however, such actions may be subject to legal proceedings. While collateral mitigates counterparty risk, in the absence of a default the fund may experience delays and costs in recovering the securities loaned. The fund invests cash collateral received in Vanguard Market Liquidity Fund, and records a liability in the Statement of Net Assets for the return of the collateral, during the period the securities are on loan. Securities lending income
89
Materials Index Fund
represents feeschargedto borrowers plusincome earned oninvested cash collateral,less expenses associated with the loan. During the term of the loan, the fund is entitled to all distributions made on or in respect of the loaned securities.
6. Credit Facility: The fund and certain other funds managed by The Vanguard Group (“Vanguard”) participate in a $3.1 billion committed credit facility provided by a syndicate of lenders pursuant to a credit agreement that may be renewed annually; each fund is individually liable for its borrowings, if any, under the credit facility. Borrowings may be utilized for temporary and emergency purposes, and are subject to the fund’s regulatory and contractual borrowing restrictions. The participating funds are charged administrative fees and an annual commitment fee of 0.10% of the undrawn amount of the facility; these fees are allocated to the funds based on a method approved by the fund’s board of trustees and included in Management and Administrative expenses on the fund’s Statement of Operations. Any borrowings under this facility bear interest at a rate based upon the higher of the one-month London Interbank Offered Rate, federal funds effective rate, or overnight bank funding rate plus an agreed-upon spread.
The fund had no borrowings outstanding at February 28, 2017, or at any time during the period then ended.
7. Other: Dividend income is recorded on the ex-dividend date. Interest income includes income distributions received from Vanguard Market Liquidity Fund and is accrued daily. Security transactions are accounted for on the date securities are bought or sold. Costs used to determine realized gains (losses) on the sale of investment securities are those of the specific securities sold.
Each class of shares has equal rights as to assets and earnings, except that each class separately bears certain class-specific expenses related to maintenance of shareholder accounts (included in Management and Administrative expenses) and shareholder reporting. Marketing and distribution expenses are allocated to each class of shares based on a method approved by the board of trustees. Income, other non-class-specific expenses, and gains and losses on investments are allocated to each class of shares based on its relative net assets.
B. In accordance with the terms of a Funds’ Service Agreement (the “FSA”) between Vanguard and the fund, Vanguard furnishes to the fund investment advisory, corporate management, administrative, marketing,anddistributionservices atVanguard’scostofoperations (as defined bythe FSA).These costs of operations are allocated to the fund based on methods and guidelines approved by the board of trustees. Vanguard does not require reimbursement in the current period for certain costs ofoperations(such asdeferred compensation/benefitsand risk/insurance costs);thefund’sliability for these costs of operations isincluded in Payables to Vanguard on the Statement of Net Assets.
Upon the request of Vanguard, the fund may invest up to 0.40% of its net assets as capital in Vanguard. At February 28, 2017,the fund had contributedto Vanguard capitalinthe amountof $162,000, representing 0.01% of the fund’s net assets and 0.06% of Vanguard’s capitalization. The fund’s trustees and officers are also directors and employees, respectively, of Vanguard.
C. Variousinputs may be used to determine the value of the fund’sinvestments. Theseinputs are summarized in three broad levels for financial statement purposes. The inputs or methodologies used to value securities are not necessarily an indication of the risk associated with investing in those securities.
Level 1—Quoted prices in active markets for identical securities.
Level 2—Other significant observable inputs (including quoted prices for similar securities, interest rates, prepayment speeds, credit risk, etc.).
Level 3—Significant unobservable inputs (including the fund’s own assumptions used to determine the fair value of investments).
At February 28, 2017, 100% of the market value of the fund’s investments was determined based on Level 1 inputs.
D. At February 28, 2017, the aggregate settlement value of open futures contracts and the related unrealized appreciation (depreciation) were:
| | | | |
| | | | ($000) |
| | | | Aggregate | |
| | | Number of | Settlement | Unrealized |
| | | Long (Short) | Value | Appreciation |
| Futures Contracts | Expiration | Contracts | Long (Short) | (Depreciation) |
| E-mini S&P 500 Index | March 2017 | 22 | 2,599 | (1) |
Unrealized appreciation (depreciation) on open futures contracts is required to be treated as realized gain (loss) for tax purposes.
90
Materials Index Fund
E. Distributions are determined on a tax basis and may differ from net investment income and realized capital gains for financial reporting purposes. Differences may be permanent or temporary. Permanent differences are reclassified among capital accounts in the financial statements to reflect their tax character. Temporary differences arise when certain items of income, expense, gain, or loss are recognized in different periods for financial statement and tax purposes. These differences will reverse at some time in the future. Differences in classification may also result from the treatment of short-term gains as ordinary income for tax purposes.
During the six months ended February 28, 2017, the fund realized $48,482,000 of net capital gains resulting from in-kind redemptions—in which shareholders exchanged fund shares for securities held by the fund rather than for cash. Because such gains are not taxable to the fund, and are not distributed to shareholders, they have been reclassified from accumulated net realized losses to paid-in capital.
The fund’s tax-basis capital gains and losses are determined only at the end of each fiscal year. For tax purposes, at August 31, 2016, the fund had available capital losses totaling $63,262,000 to offset future net capital gains. Of this amount, $39,290,000 is subject to expiration dates; $18,156,000 may be used to offset future net capital gains through August 31, 2018, and $21,134,000 through August 31, 2019. Capital losses of $23,972,000 realized beginning in fiscal 2012 may be carried forward indefinitely under the Regulated Investment Company Modernization Act of 2010, but must be used before any expiring loss carryforwards.The fund will use these capital losses to offset net taxable capital gains, if any, realized during the year ending August 31, 2017; should the fund realize net capital losses for the year, the losses will be added to the loss carryforward balance above.
At February 28, 2017, the cost of investment securities for tax purposes was $2,180,293,000. Net unrealized appreciation of investment securities for tax purposes was $130,460,000, consisting of unrealized gains of $269,021,000 on securities that had risen in value since their purchase and $138,561,000 in unrealized losses on securities that had fallen in value since their purchase.
F. During the six months ended February 28, 2017, the fund purchased $630,458,000 of investment securities and sold $185,387,000 of investment securities, other than temporary cash investments. Purchases and sales include $530,653,000 and $141,925,000, respectively, in connection with in-kind purchases and redemptions of the fund’s capital shares.
G. Capital share transactions for each class of shares were:
| | | | |
| | Six Months Ended | Year Ended |
| | February 28, 2017 | August 31, 2016 |
| | Amount | Shares | Amount | Shares |
| | ($000) | (000) | ($000) | (000) |
| ETF Shares | | | | |
| Issued | 562,228 | 4,850 | 490,113 | 4,832 |
| Issued in Lieu of Cash Distributions | — | — | — | — |
| Redeemed | (142,107) | (1,275) | (200,049) | (2,050) |
| Net Increase (Decrease)—ETF Shares | 420,121 | 3,575 | 290,064 | 2,782 |
| Admiral Shares | | | | |
| Issued | 75,125 | 1,302 | 86,862 | 1,723 |
| Issued in Lieu of Cash Distributions | 2,154 | 38 | 5,125 | 107 |
| Redeemed | (49,252) | (848) | (73,314) | (1,482) |
| Net Increase (Decrease)—Admiral Shares | 28,027 | 492 | 18,673 | 348 |
H. Management has determined that no material events or transactions occurred subsequent to February 28, 2017, that would require recognition or disclosure in these financial statements.
91
Telecommunication Services Index Fund
Fund Profile
As of February 28, 2017
| | |
| Share-Class Characteristics | | |
| | ETF | Admiral |
| | Shares | Shares |
| Ticker Symbol | VOX | VTCAX |
| Expense Ratio1 | 0.10% | 0.10% |
| 30-Day SEC Yield | 3.05% | 3.07% |
| | | |
| Portfolio Characteristics | | |
| | | MSCI | |
| | | US IMI/ | |
| | | Telecom MSCI |
| | | Services | US IMI/ |
| | Fund | 25/50 | 2500 |
| Number of Stocks | 28 | 28 | 2,479 |
| Median Market Cap | $51.4B | $51.4B | $57.6B |
| Price/Earnings Ratio | 27.3x | 28.1x | 24.7x |
| Price/Book Ratio | 2.3x | 2.5x | 3.0x |
| Return on Equity | 6.4% | 6.7% | 16.5% |
| Earnings Growth Rate | 25.0% | 25.0% | 7.6% |
| Dividend Yield | 3.3% | 3.1% | 1.9% |
| Foreign Holdings | 0.0% | 0.0% | 0.0% |
| Turnover Rate | | | |
| (Annualized) | 23% | — | — |
| Short-Term Reserves | -0.2% | — | — |
| | |
| Volatility Measures | | |
| | MSCI US | |
| | IMI/Telecom | |
| | Services | MSCI US |
| | 25/50 | IMI/2500 |
| R-Squared | 1.00 | 0.30 |
| Beta | 1.00 | 0.62 |
| These measures show the degree and timing of the fund’s |
| fluctuations compared with the indexes over 36 months. |
| |
| Subindustry Diversification | |
| (% of equity exposure) | |
| |
| Alternative Carriers | 19.4% |
| Integrated Telecommunication Services | 64.8 |
| Wireless Telecommunication Services | 15.8 |
| | |
| Ten Largest Holdings (% of total net assets) |
| |
| AT&T Inc. | Integrated | |
| | Telecommunication | |
| | Services | 22.8% |
| Verizon | Integrated | |
| Communications Inc. | Telecommunication | |
| | Services | 22.6 |
| T-Mobile US Inc. | Wireless | |
| | Telecommunication | |
| | Services | 4.5 |
| Level 3 | | |
| Communications Inc. | Alternative Carriers | 4.5 |
| CenturyLink Inc. | Integrated | |
| | Telecommunication | |
| | Services | 4.0 |
| Windstream | Integrated | |
| Holdings Inc. | Telecommunication | |
| | Services | 3.3 |
| Sprint Corp. | Wireless | |
| | Telecommunication | |
| | Services | 3.1 |
| Zayo Group | | |
| Holdings Inc. | Alternative Carriers | 2.5 |
| Frontier | Integrated | |
| Communications | Telecommunication | |
| Corp. | Services | 2.0 |
| Lumos Networks | | |
| Corp. | Alternative Carriers | 2.0 |
| Top Ten | | 71.3% |
| The holdings listedexcludeany temporary cashinvestments and |
| equity index products. |
1 The expense ratios shown are from the prospectus dated December 22, 2016, and represent estimated costs for the current fiscal year. For the six months ended February 28, 2017, the annualized expense ratios
were 0.10% for ETF Shares and 0.10% for Admiral Shares.
92
Telecommunication Services IndexFund
Performance Summary
All of the returns in this report represent past performance, which is not a guarantee of future results that may be achieved by the fund. (Current performance may be lower or higher than theperformancedatacited.For performance data currenttothemostrecentmonth-end, visit our website at vanguard.com/performance.) Note, too, that both investment returns and principal value can fluctuate widely, so an investor’s shares, when sold, could be worth more or less than their original cost. The returns shown do not reflect taxes that a shareholder would pay on fund distributions or on the sale of fund shares.
Fiscal-Year Total Returns (%): August 31, 2006–February 28, 2017
For a benchmark description, see the Glossary.
Note: For 2017, performance data reflect the six months ended February 28, 2017.
Average Annual Total Returns: Periods Ended December 31, 2016
This table presents returns through the latest calendar quarter—rather than through the end of the fiscal period.
Securities and Exchange Commission rules require that we provide this information.
| | | | |
| | Inception Date | One Year | Five Years | Ten Years |
| ETF Shares | 9/23/2004 | | | |
| Market Price | | 22.60% | 13.69% | 6.37% |
| Net Asset Value | | 22.56 | 13.66 | 6.37 |
| Admiral Shares | 3/11/2005 | 22.54 | 13.68 | 6.37 |
See Financial Highlights for dividend and capital gains information.
93
Telecommunication Services IndexFund
Financial Statements (unaudited)
Statement of Net Assets
As of February 28, 2017
The fund reports a complete list of its holdings in regulatory filings four times in each fiscal year, at the quarter-ends. For the second and fourth fiscal quarters, the lists appear in the fund’s semiannual and annual reports to shareholders. For the first and third fiscal quarters, the fund files the lists with the Securities and Exchange Commission on Form N-Q. Shareholders can look up the fund’s Forms N-Q on the SEC’s website at sec.gov. Forms N-Q may also be reviewed and copied at the SEC’s Public Reference Room (see the back cover of this report for further information).
| | | |
| | | | Market |
| | | | Value• |
| | | Shares | ($000) |
| Common Stocks (99.7%) 1 | | |
| Diversified Telecommunication Services (84.0%) |
| | Alternative Carriers (19.4%) | |
| * | Level 3 Communications | | |
| | Inc. | 1,175,722 | 67,310 |
| * | Zayo Group Holdings Inc. | 1,203,522 | 37,935 |
| *,2 | Lumos Networks Corp. | 1,663,081 | 29,453 |
| | Cogent Communications | | |
| | Holdings Inc. | 686,460 | 28,454 |
| * | Vonage Holdings Corp. | 4,516,013 | 27,186 |
| * | ORBCOMM Inc. | 3,097,538 | 26,546 |
| *,^,2 pdvWireless Inc. | 995,624 | 25,637 |
| *,^ Globalstar Inc. | 18,125,842 | 24,833 |
| *,^ Iridium Communications | | |
| | Inc. | 2,840,701 | 24,714 |
| |
| | Integrated Telecommunication Services (64.6%) |
| | AT&T Inc. | 8,197,584 | 342,577 |
| | Verizon Communications | | |
| | Inc. | 6,863,278 | 340,625 |
| | CenturyLink Inc. | 2,500,168 | 60,654 |
| ^ | Windstream Holdings Inc. 6,659,633 | 49,747 |
| ^ | Frontier Communications | | |
| | Corp. | 10,449,825 | 30,618 |
| * | General Communication | | |
| | Inc. Class A | 1,449,805 | 29,214 |
| * | Cincinnati Bell Inc. | 1,288,022 | 24,859 |
| | IDT Corp. Class B | 1,283,533 | 24,772 |
| | Consolidated | | |
| | Communications | | |
| | Holdings Inc. | 1,043,420 | 23,529 |
| *,2 | FairPoint Communications | | |
| | Inc. | 1,447,434 | 22,942 |
| | ATN International Inc. | 325,493 | 22,260 |
| | | | 1,263,865 |
| Equity Real Estate Investment Trusts (REITs) (0.0%) |
| | Specialized REITs (0.0%) | | |
| * | SBA Communications | | |
| | Corp. Class A | 1,778 | 206 |
| |
| Wireless Telecommunication Services (15.7%) |
| * | T-Mobile US Inc. | 1,081,081 | 67,600 |
| *,^ | Sprint Corp. | 5,266,570 | 46,399 |
| | Telephone & Data | | |
| | Systems Inc. | 1,018,469 | 27,529 |
| | Shenandoah | | |
| | Telecommunications Co. | 928,399 | 26,088 |
| | |
| 2 Spok Holdings Inc. | 1,317,047 | 23,970 |
| *,2 NII Holdings Inc. | 11,954,617 | 23,909 |
| * United States Cellular | | |
| Corp. | 559,855 | 20,933 |
| | | 236,428 |
| Total Common Stocks | | |
| (Cost $1,503,617) | | 1,500,499 |
| Temporary Cash Investment (4.0%) 1 | |
| Money Market Fund (4.0%) | | |
| 3,4 Vanguard Market | | |
| Liquidity Fund, 0.864% | | |
| (Cost $60,119) | 601,146 | 60,121 |
| Total Investments (103.7%) | |
| (Cost $1,563,736) | | 1,560,620 |
| Other Assets and Liabilities (-3.7%) | |
| Other Assets | | 89,365 |
| Liabilities4 | | (145,424) |
| | | (56,059) |
| Net Assets (100%) | | 1,504,561 |
| |
| |
| | | Amount |
| | | ($000) |
| Statement of Assets and Liabilities | |
| Assets | | |
| Investments in Securities, at Value | |
| Unaffiliated Issuers | | 1,374,588 |
| Affiliated Vanguard Funds | | 60,121 |
| Other Affiliated Issuers | | 125,911 |
| Total Investments in Securities | 1,560,620 |
| Investment in Vanguard | | 113 |
| Receivables for Investment Securities Sold | 87,998 |
| Receivables for Accrued Income | 323 |
| Receivables for Capital Shares Issued | 278 |
| Other Assets | | 653 |
| Total Assets | | 1,649,985 |
| Liabilities | | |
| Payables for Investment Securities | |
| Purchased | | 83,234 |
| Collateral for Securities on Loan | 60,071 |
| Payables for Capital Shares | Redeemed | 1,570 |
| Payables to Vanguard | | 549 |
| Total Liabilities | | 145,424 |
| Net Assets | | 1,504,561 |
| |
| At February 28, 2017, net assets consisted of: |
| | Amount |
| | ($000) |
| Paid-in Capital | 1,564,987 |
| Undistributed Net Investment Income | 8,708 |
| Accumulated Net Realized Losses | (66,020) |
| Unrealized Appreciation (Depreciation) | |
| Investment Securities | (3,116) |
| Futures Contracts | 2 |
| Net Assets | 1,504,561 |
| |
| |
| ETF Shares—Net Assets | |
| Applicable to 14,787,497 outstanding | |
| $.001 par value shares of beneficial | |
| interest (unlimited authorization) | 1,445,076 |
| Net Asset Value Per Share— | |
| ETF Shares | $97.72 |
| |
| |
| Admiral Shares—Net Assets | |
| Applicable to 1,194,437 outstanding | |
| $.001 par value shares of beneficial | |
| interest (unlimited authorization) | 59,485 |
| Net Asset Value Per Share— | |
| Admiral Shares | $49.80 |
• See Note A in Notes toFinancial Statements.
* Non-income-producing security.
^ Includes partial security positions on loan to broker-dealers. The total value of securities on loan is $49,899,000.
1 The fund invests a portion of its cash reserves in equity markets through the use of index futures contracts. After giving effect to futures investments, the fund’s effective common stock and temporary cash
investment positions represent 100.0% and 3.7%, respectively, of net assets.
2 Considered an affiliated company of the fund as the fund owns more than 5% of the outstanding voting securities of such company.
3 Affiliated money market fund available only to Vanguard funds and certain trusts and accounts managed by Vanguard. Rate shown is the 7-day yield.
4 Includes $60,071,000 of collateral received for securities on loan.
See accompanying Notes, which are an integral part of the Financial Statements.
94
Telecommunication Services IndexFund
| |
| Statement of Operations |
| |
| Six Months Ended |
| February 28, 2017 |
| | ($000) |
| Investment Income | |
| Income | |
| Dividends | 22,203 |
| Interest | 6 |
| Securities Lending—Net | 414 |
| Total Income | 22,623 |
| Expenses | |
| The Vanguard Group—Note B | |
| Investment Advisory Services | 106 |
| Management and Administrative— | |
| ETF Shares | 462 |
| Management and Administrative— | |
| Admiral Shares | 22 |
| Marketing and Distribution— | |
| ETF Shares | 57 |
| Marketing and Distribution— | |
| Admiral Shares | 3 |
| Custodian Fees | 18 |
| Shareholders’ Reports—ETF Shares | 72 |
| Shareholders’ Reports—Admiral Shares | 1 |
| Trustees’ Fees and Expenses | 1 |
| Total Expenses | 742 |
| Net Investment Income | 21,881 |
| Realized Net Gain (Loss) | |
| Investment Securities Sold | 65,775 |
| Futures Contracts | 3 |
| Realized Net Gain (Loss) | 65,778 |
| Change in Unrealized Appreciation | |
| (Depreciation) | |
| Investment Securities | (32,518) |
| Futures Contracts | 2 |
| Change in Unrealized Appreciation | |
| (Depreciation) | (32,516) |
| Net Increase (Decrease) in Net Assets | |
| Resulting from Operations | 55,143 |
| | |
| Statement of Changes in NetAssets | | |
| |
| | Six Months Ended | Year Ended |
| | February 28, | August 31, |
| | 2017 | 2016 |
| | ($000) | ($000) |
| Increase (Decrease) in Net Assets | | |
| Operations | | |
| Net Investment Income | 21,881 | 38,141 |
| Realized Net Gain (Loss) | 65,778 | 88,022 |
| Change in Unrealized Appreciation (Depreciation) | (32,516) | 78,564 |
| Net Increase (Decrease) in Net Assets Resulting from Operations | 55,143 | 204,727 |
| Distributions | | |
| Net Investment Income | | |
| ETF Shares | (23,701) | (46,291) |
| Admiral Shares | (1,053) | (1,424) |
| Realized Capital Gain | | |
| ETF Shares | — | — |
| Admiral Shares | — | — |
| Total Distributions | (24,754) | (47,715) |
| Capital Share Transactions | | |
| ETF Shares | (67,323) | 535,585 |
| Admiral Shares | (6,525) | 35,852 |
| Net Increase (Decrease) from Capital Share Transactions | (73,848) | 571,437 |
| Total Increase (Decrease) | (43,459) | 728,449 |
| Net Assets | | |
| Beginning of Period | 1,548,020 | 819,571 |
| End of Period 1 | 1,504,561 | 1,548,020 |
| 1 Net Assets—End of Period includes undistributed (overdistributed) net investment income of $8,708,000 and $11,581,000. |
See accompanying Notes, which are an integral part of the Financial Statements.
95
Telecommunication Services IndexFund
Financial Highlights
| | | | | | | |
| ETF Shares | | | | | | | |
| | Six Months | | | | | |
| | | Ended | | | | | |
| For a Share Outstanding | February 28, | Year Ended August 31, |
| Throughout Each Period | | 2017 | 2016 | 2015 | 2014 | 2013 | 2012 |
| Net Asset Value, Beginning of Period | $95.16 | $83.80 | $88.44 | $78.54 | $70.82 | $65.11 |
| Investment Operations | | | | | | | |
| Net Investment Income | | 1.437 | 2.622 | 2.789 | 2.394 | 3.7341 | 2.1052 |
| Net Realized and Unrealized Gain (Loss) | | | | | | |
| on Investments | | 2.706 | 12.811 | (5.178) | 10.749 | 6.455 | 5.614 |
| Total from Investment Operations | 4.143 | 15.433 | (2.389) | 13.143 | 10.189 | 7.719 |
| Distributions | | | | | | | |
| Dividends from Net Investment Income | (1.583) | (4.073) | (2.251) | (3.243) | (2.469) | (2.009) |
| Distributions from Realized Capital Gains | — | — | — | — | — | — |
| Total Distributions | | (1.583) | (4.073) | (2.251) | (3.243) | (2.469) | (2.009) |
| Net Asset Value, End of Period | $97.72 | $95.16 | $83.80 | $88.44 | $78.54 | $70.82 |
| |
| Total Return | | 4.41% | 19.14% | -2.72% | 17.08% | 14.78% | 12.33% |
| |
| Ratios/Supplemental Data | | | | | | | |
| Net Assets, End of Period (Millions) | $1,445 | $1,483 | $795 | $743 | $511 | $524 |
| Ratio of Total Expenses to | | | | | | | |
| Average Net Assets | | 0.10% | 0.10% | 0.10% | 0.12% | 0.14% | 0.14% |
| Ratio of Net Investment Income to | | | | | | |
| Average Net Assets | | 2.92% | 3.10% | 3.20% | 3.29% | 4.56% 1 | 3.24% |
| Portfolio Turnover Rate3 | | 23% | 20% | 18% | 19% | 19% | 28% |
The expense ratio, net investment income ratio, and turnover rate for the current period have been annualized.
1 Net investment income per share and the ratio of net investment income to average net assets include $0.704 and 0.89%, respectively,
resulting from a special dividend received in connection with a merger between T-Mobile US Inc. and MetroPCS Communications Inc. in
May 2013.
2 Calculated based on average shares outstanding
3 Excludes the value of portfolio securities received or delivered as a result of in-kind purchases or redemptions of the fund’s capital shares,
including ETF Creation Units.
See accompanying Notes, which are an integral part of the Financial Statements.
96
Telecommunication Services IndexFund
Financial Highlights
| | | | | | | |
| Admiral Shares | | | | | | | |
| | Six Months | | | | | |
| | | Ended | | | | | |
| For a Share Outstanding | February 28, | Year Ended August 31, |
| Throughout Each Period | | 2017 | 2016 | 2015 | 2014 | 2013 | 2012 |
| Net Asset Value, Beginning of Period | $48.50 | $42.71 | $45.07 | $40.02 | $36.09 | $33.18 |
| Investment Operations | | | | | | | |
| Net Investment Income | | .732 | 1.337 | 1.419 | 1.217 | 1.9061 | 1.0822 |
| Net Realized and Unrealized Gain (Loss) | | | | | | |
| on Investments | | 1.375 | 6.529 | (2.637) | 5.486 | 3.284 | 2.845 |
| Total from Investment Operations | 2.107 | 7.866 | (1.218) | 6.703 | 5.190 | 3.927 |
| Distributions | | | | | | | |
| Dividends from Net Investment Income | (. 807) | (2.076) | (1.142) | (1.653) | (1.260) | (1.017) |
| Distributions from Realized Capital Gains | — | — | — | — | — | — |
| Total Distributions | | (. 807) | (2.076) | (1.142) | (1.653) | (1.260) | (1.017) |
| Net Asset Value, End of Period | $49.80 | $48.50 | $42.71 | $45.07 | $40.02 | $36.09 |
| |
| Total Return 3 | | 4.39% | 19.14% | -2.66% | 17.13% | 14.80% | 12.33% |
| |
| Ratios/Supplemental Data | | | | | | | |
| Net Assets, End of Period (Millions) | $59 | $65 | $24 | $26 | $21 | $19 |
| Ratio of Total Expenses to | | | | | | | |
| Average Net Assets | | 0.10% | 0.10% | 0.10% | 0.12% | 0.14% | 0.14% |
| Ratio of Net Investment Income to | | | | | | |
| Average Net Assets | | 2.92% | 3.10% | 3.20% | 3.29% | 4.56% 1 | 3.24% |
| Portfolio Turnover Rate4 | | 23% | 20% | 18% | 19% | 19% | 28% |
The expense ratio, net investment income ratio, and turnover rate for the current period have been annualized.
1 Net investment income per share and the ratio of net investment income to average net assets include $0.359 and 0.89%, respectively,
resulting from a special dividend received in connection with a merger between T-Mobile US Inc. and MetroPCS Communications Inc. in
May 2013.
2 Calculated based on average shares outstanding.
3 Total returns do not include transaction or account service fees that may have applied in the periods shown. Fund prospectuses provide
information about any applicable transaction and account service fees.
4 Excludes the value of portfolio securities received or delivered as a result of in-kind purchases or redemptions of the fund’s capital shares,
including ETF Creation Units.
See accompanying Notes, which are an integral part of the Financial Statements.
97
Telecommunication Services IndexFund
Notes to Financial Statements
Vanguard Telecommunication Services Index Fund is registered under the Investment Company Act of 1940 as an open-end investment company, or mutual fund. The fund offers two classes of shares: ETF Shares and Admiral Shares. ETF Shares are listed for trading on NYSE Arca; they can be purchased and sold through a broker. Admiral Shares are designed for investors who meet certain administrative, service, and account-size criteria.
A. The following significant accounting policies conform to generally accepted accounting principles for U.S. investment companies. The fund consistently follows such policies in preparing its financial statements.
1. Security Valuation: Securities are valued as of the close of trading on the New York Stock Exchange (generally 4 p.m., Eastern time) on the valuation date. Equity securities are valued at the latest quoted sales prices or official closing prices taken from the primary market in which each security trades; such securities not traded on the valuation date are valued at the mean of the latest quoted bid and asked prices. Securities for which market quotations are not readily available, or whose values have been materially affected by events occurring before the fund’s pricing time but after the close of the securities’ primary markets, are valued by methods deemed by the board of trustees to represent fair value. Investments in Vanguard Market Liquidity Fund are valued at that fund’s net asset value. Temporary cash investments are valued using the latest bid prices or using valuations based on a matrix system (which considers such factors as security prices, yields, maturities, and ratings), both as furnished by independent pricing services.
2. Futures Contracts: The fund uses index futures contracts to a limited extent, with the objectives of maintaining full exposure to the stock market, enhancing returns, maintaining liquidity, and minimizing transaction costs. The fund may purchase futures contracts to immediately invest incoming cash in the market, or sell futures in response to cash outflows, thereby simulating a fully invested position in the underlying index while maintaining a cash balance for liquidity. The fund may seek to enhance returns by using futures contracts instead of the underlying securities when futures are believed to be priced more attractively than the underlying securities. The primary risks associated with the use of futures contracts are imperfect correlation between changes in market values of stocks held by the fund and the prices of futures contracts, and the possibility of an illiquid market. Counterparty risk involving futures is mitigated because a regulated clearinghouse is the counterparty instead of the clearing broker. To further mitigate counterparty risk, the fund trades futures contracts on an exchange, monitors the financial strength of its clearing brokers and clearinghouse, and has entered into clearing agreements with its clearing brokers. The clearinghouse imposes initial margin requirements to secure the fund’s performance and requires daily settlement of variation margin representing changes in the market value of each contract.
Futures contracts are valued at their quoted daily settlement prices. The aggregate settlement values of the contracts are not recorded in the Statement of Assets and Liabilities. Fluctuations in the value of the contracts are recorded in the Statement of Assets and Liabilities as an asset (liability) and in the Statement of Operations as unrealized appreciation (depreciation) until the contracts are closed, when they are recorded as realized futures gains (losses).
During the six months ended February 28, 2017, the fund’s average investments in long and short futures contracts represented less than 1% and 0% of net assets, respectively, based on the average of aggregate settlement values at each quarter-end during the period.
3. Federal Income Taxes: The fund intends to continue to qualify as a regulated investment company and distribute all of its taxable income. Management has analyzed the fund’s tax positions taken for all open federal income tax years (August 31, 2013–2016), and for the period ended February 28, 2017, and has concluded that no provision for federal income tax is required in the fund’s financial statements. 4. Distributions: Distributions to shareholders are recorded on the ex-dividend date.
5. Securities Lending: To earn additional income, the fund lends its securities to qualified institutional borrowers. Security loans are subject to termination by the fund at any time, and are required to be secured at all times by collateral in an amount at least equal to the market value of securities loaned. Daily market fluctuations could cause the value of loaned securities to be more or less than the value of the collateral received. When this occurs, the collateral is adjusted and settled on the next business day. The fund further mitigates its counterparty risk by entering into securities lending transactions only with a diverse group of prequalified counterparties, monitoring their financial strength, and entering into master securities lending agreements with its counterparties. The master securities lending agreements provide that, in the event of a counterparty’s default (including bankruptcy),
98
Telecommunication Services IndexFund
the fund may terminate any loans with that borrower, determine the net amount owed, and sell or retain the collateral up to the net amount owed to the fund; however, such actions may be subject to legal proceedings. While collateral mitigates counterparty risk, in the absence of a default the fund may experience delays and costs in recovering the securitiesloaned. The fundinvests cash collateral received in Vanguard Market Liquidity Fund, and records a liability in the Statement of Assets and Liabilities for the return of the collateral, during the period the securities are onloan. Securitieslending income represents fees charged to borrowers plus income earned on invested cash collateral, less expenses associated with the loan. During the term of the loan, the fund is entitled to all distributions made on or in respect of the loaned securities.
6. Credit Facility: The fund and certain other funds managed by The Vanguard Group (“Vanguard”) participate in a $3.1 billion committed credit facility provided by a syndicate of lenders pursuant to a credit agreement that may be renewed annually; each fund is individually liable for its borrowings, if any, under the credit facility. Borrowings may be utilized for temporary and emergency purposes, and are subject to the fund’s regulatory and contractual borrowing restrictions. The participating funds are charged administrative fees and an annual commitment fee of 0.10% of the undrawn amount of the facility; these fees are allocated to the funds based on a method approved by the fund’s board of trustees and included in Management and Administrative expenses on the fund’s Statement of Operations. Any borrowings under this facility bear interest at a rate based upon the higher of the one-month London Interbank Offered Rate, federal funds effective rate, or overnight bank funding rate plus an agreed-upon spread.
The fund had no borrowings outstanding at February 28, 2017, or at any time during the period then ended.
7. Other: Dividend income is recorded on the ex-dividend date. Interest income includes income distributions received from Vanguard Market Liquidity Fund and is accrued daily. Premiums and discounts on debt securities purchased are amortized and accreted, respectively, to interest income over the lives of the respective securities. Security transactions are accounted for on the date securities are bought or sold. Costs used to determine realized gains (losses) on the sale of investment securities are those of the specific securities sold.
Each class of shares has equal rights as to assets and earnings, except that each class separately bears certain class-specific expenses related to maintenance of shareholder accounts (included in Management and Administrative expenses) and shareholder reporting. Marketing and distribution expenses are allocated to each class of shares based on a method approved by the board of trustees. Income, other non-class-specific expenses, and gains and losses on investments are allocated to each class of shares based on its relative net assets.
B. In accordance with the terms of a Funds’ Service Agreement (the “FSA”) between Vanguard and the fund, Vanguard furnishes to the fund investment advisory, corporate management, administrative, marketing,anddistributionservices atVanguard’scostofoperations (as defined bythe FSA).These costs of operations are allocated to the fund based on methods and guidelines approved by the board of trustees. Vanguard does not require reimbursement in the current period for certain costs ofoperations(such asdeferred compensation/benefitsand risk/insurance costs);thefund’sliability for these costs of operations isincluded in Payables to Vanguard on the Statement of Assets and Liabilities.
Upon the request of Vanguard, the fund may invest up to 0.40% of its net assets as capital in Vanguard. At February 28, 2017,the fund had contributedto Vanguard capitalinthe amountof $113,000 representing 0.01% of the fund’s net assets and 0.05% of Vanguard’s capitalization. The fund’s trustees and officers are also directors and employees, respectively, of Vanguard.
C. Variousinputs may be used to determine the value of the fund’sinvestments. Theseinputs are summarized in three broad levels for financial statement purposes. The inputs or methodologies used to value securities are not necessarily an indication of the risk associated with investing in those securities.
Level 1—Quoted prices in active markets for identical securities.
Level 2—Other significant observable inputs (including quoted prices for similar securities, interest rates, prepayment speeds, credit risk, etc.).
Level 3—Significant unobservable inputs (including the fund’s own assumptions used to determine the fair value of investments).
At February 28, 2017, 100% of the market value of the fund’s investments was determined based on Level 1 inputs.
99
Telecommunication Services IndexFund
D. At February 28, 2017, the aggregate settlement value of open futures contracts and the related unrealized appreciation (depreciation) were:
| | | | |
| | | | ($000) |
| | | | Aggregate | |
| | | Number of | Settlement | Unrealized |
| | | Long (Short) | Value | Appreciation |
| Futures Contracts | Expiration | Contracts | Long (Short) | (Depreciation) |
| E-mini S&P 500 Index | March 2017 | 31 | 3,662 | 2 |
Unrealized appreciation (depreciation) on open futures contracts is required to be treated as realized gain (loss) for tax purposes.
E. Distributions are determined on a tax basis and may differ from net investment income and realized capital gains for financial reporting purposes. Differences may be permanent or temporary. Permanent differences are reclassified among capital accounts in the financial statements to reflect their tax character. Temporary differences arise when certain items of income, expense, gain, or loss are recognized in different periods for financial statement and tax purposes. These differences will reverse at some time in the future. Differences in classification may also result from the treatment of short-term gains as ordinary income for tax purposes.
During the six months ended February 28, 2017, the fund realized $54,098,000 of net capital gains resulting from in-kind redemptions—in which shareholders exchanged fund shares for securities held by the fund rather than for cash. Because such gains are not taxable to the fund, and are not distributed to shareholders, they have been reclassified from accumulated net realized losses to paid-in capital.
The fund’s tax-basis capital gains and losses are determined only at the end of each fiscal year. For tax purposes, at August 31, 2016, the fund had available capital losses totaling $77,701,000 to offset future net capital gains. Of this amount, $45,285,000 is subject to expiration dates; $7,492,000 may be used to offset future net capital gains through August 31, 2017, $26,335,000 through August 31, 2018, and $11,458,000 through August 31, 2019. Capital losses of $32,416,000 realized beginning in fiscal 2012 may be carried forward indefinitely under the Regulated Investment Company Modernization Act of 2010, but must be used before any expiring loss carryforwards. The fund will use these capital losses to offset net taxable capital gains, if any, realized during the year ending August 31, 2017; should the fund realize net capital losses for the year, the losses will be added to the loss carryforward balance above.
At February 28, 2017, the cost of investment securities for tax purposes was $1,563,736,000. Net unrealized depreciation of investment securities for tax purposes was $3,116,000, consisting of unrealized gains of $101,844,000 on securities that had risen in value since their purchase and $104,960,000 in unrealized losses on securities that had fallen in value since their purchase.
F. Duringthe six monthsendedFebruary 28, 2017,thefundpurchased $436,802,000 ofinvestment securitiesandsold$511,686,000ofinvestmentsecurities,otherthantemporarycashinvestments. Purchases and sales include $250,739,000 and $340,966,000, respectively, in connection with in-kind purchases and redemptions of the fund’s capital shares.
G. Capital share transactions for each class of shares were:
| | | | |
| | Six Months Ended | Year Ended |
| | February 28, 2017 | August 31, 2016 |
| | Amount | Shares | Amount | Shares |
| | ($000) | (000) | ($000) | (000) |
| ETF Shares | | | | |
| Issued | 274,948 | 2,775 | 956,306 | 10,625 |
| Issued in Lieu of Cash Distributions | — | — | — | — |
| Redeemed | (342,271) | (3,575) | (420,721) | (4,525) |
| Net Increase (Decrease)—ETF Shares | (67,323) | (800) | 535,585 | 6,100 |
| Admiral Shares | | | | |
| Issued | 24,258 | 491 | 55,638 | 1,179 |
| Issued in Lieu of Cash Distributions | 944 | 19 | 1,210 | 28 |
| Redeemed | (31,727) | (650) | (20,996) | (446) |
| Net Increase (Decrease)—Admiral Shares | (6,525) | (140) | 35,852 | 761 |
100
Telecommunication Services IndexFund
At February 28, 2017, one shareholder was the record or beneficial owner of 32% of the fund’s net assets. If the shareholder were to redeem its investment in the fund, the redemption might result in an increase in the fund’s expense ratio.
H. Certain of the fund’s investments are in companies that are considered to be affiliated companies of the fund because the fund owns more than 5% of the outstanding voting securities of the company or the issuer is another member of The Vanguard Group. Transactions during the period in securities of these companies were as follows:
| | | | | | |
| | | Current Period Transactions | |
| | Aug. 31, | | Proceeds | | | Feb. 28, |
| | 2016 | | from | | Capital Gain | 2017 |
| | Market | Purchases | Securities | | Distributions | Market |
| | Value | at Cost | Sold1 | Income | Received | Value |
| | ($000) | ($000) | ($000) | ($000) | ($000) | ($000) |
| FairPoint Communications Inc. | 21,062 | 4,984 | 5,627 | — | — | 22,942 |
| Lumos Networks Corp. | 24,351 | 6,011 | 7,379 | — | — | 29,453 |
| NII Holdings Inc. | 25,113 | 16,734 | 5,946 | — | — | 23,909 |
| pdvWireless Inc. | 22,562 | 7,614 | 4,381 | — | — | 25,637 |
| Spok Holdings Inc. | 21,005 | 6,371 | 5,158 | 447 | — | 23,970 |
| Vanguard Market Liquidity Fund | 71,748 | NA2 | NA2 | 6 | — | 60,121 |
| Total | 185,841 | | | 453 | — | 186,032 |
| 1 Includes net realized gain (loss) on affiliated investment securities sold of $1,038,000. |
| 2 Not applicable—purchases and sales are for temporary cash investment purposes. |
I. Management has determined that no material events or transactions occurred subsequent to February 28, 2017, that would require recognition or disclosure in these financial statements.
101
Utilities Index Fund
Fund Profile
As of February 28, 2017
| | |
| Share-Class Characteristics | | |
| | ETF | Admiral |
| | Shares | Shares |
| Ticker Symbol | VPU | VUIAX |
| Expense Ratio1 | 0.10% | 0.10% |
| 30-Day SEC Yield | 3.33% | 3.33% |
| | | |
| Portfolio Characteristics | | |
| | | MSCI | |
| | | US IMI/ | MSCI |
| | | Utilities | US IMI/ |
| | Fund | 25/50 | 2500 |
| Number of Stocks | 75 | 75 | 2,479 |
| Median Market Cap | $25.0B | $25.0B | $57.6B |
| Price/Earnings Ratio | 23.2x | 23.2x | 24.7x |
| Price/Book Ratio | 2.0x | 2.0x | 3.0x |
| Return on Equity | 9.5% | 9.5% | 16.5% |
| Earnings Growth Rate | 2.6% | 2.6% | 7.6% |
| Dividend Yield | 3.4% | 3.4% | 1.9% |
| Foreign Holdings | 0.0% | 0.0% | 0.0% |
| Turnover Rate | | | |
| (Annualized) | 8% | — | — |
| Short-Term Reserves | 0.0% | — | — |
| | |
| Volatility Measures | | |
| | MSCI US | |
| | IMI/Utilities | MSCI US |
| | 25/50 | IMI/2500 |
| R-Squared | 1.00 | 0.04 |
| Beta | 1.00 | 0.26 |
| These measures show the degree and timing of the fund’s |
| fluctuations compared with the indexes over 36 months. |
| |
| Subindustry Diversification | |
| (% of equity exposure) | |
| |
| Electric Utilities | 58.1% |
| Gas Utilities | 5.7 |
| Independent Power Producers | |
| & Energy Traders | 2.4 |
| Multi-Utilities | 29.8 |
| Water Utilities | 3.2 |
| Other Utilities | 0.8 |
| | |
| Ten Largest Holdings (% of total net assets) |
| |
| NextEra Energy Inc. | Electric Utilities | 7.8% |
| Duke Energy Corp. | Electric Utilities | 7.3 |
| Southern Co. | Electric Utilities | 6.4 |
| Dominion Resources Inc. | Multi-Utilities | 6.3 |
| Exelon Corp. | Electric Utilities | 4.3 |
| PG&E Corp. | Electric Utilities | 4.3 |
| American Electric | | |
| Power Co. Inc. | Electric Utilities | 4.2 |
| Sempra Energy | Multi-Utilities | 3.4 |
| Edison International | Electric Utilities | 3.3 |
| PPL Corp. | Electric Utilities | 3.2 |
| Top Ten | | 50.5% |
| The holdings listedexcludeany temporary cashinvestments and |
| equity index products. |
1 The expense ratios shown are from the prospectus dated December 22, 2016, and represent estimated costs for the current fiscal year. For the six months ended February 28, 2017, the annualized expense ratios were 0.10% for ETF Shares and 0.10% for Admiral Shares.
102
Utilities Index Fund
Performance Summary
All of the returns in this report represent past performance, which is not a guarantee of future results that may be achieved by the fund. (Current performance may be lower or higher than theperformancedatacited.For performance data currenttothemostrecentmonth-end, visit our website at vanguard.com/performance.) Note, too, that both investment returns and principal value can fluctuate widely, so an investor’s shares, when sold, could be worth more or less than their original cost. The returns shown do not reflect taxes that a shareholder would pay on fund distributions or on the sale of fund shares.
Fiscal-Year Total Returns (%): August 31, 2006–February 28, 2017
For a benchmark description, see the Glossary.
Note: For 2017, performance data reflect the six months ended February 28, 2017.
Average Annual Total Returns: Periods Ended December 31, 2016
This table presents returns through the latest calendar quarter—rather than through the end of the fiscal period.
Securities and Exchange Commission rules require that we provide this information.
| | | | |
| | Inception Date | One Year | Five Years | Ten Years |
| ETF Shares | 1/26/2004 | | | |
| Market Price | | 17.56% | 10.71% | 7.10% |
| Net Asset Value | | 17.52 | 10.71 | 7.11 |
| Admiral Shares | 4/28/2004 | 17.51 | 10.72 | 7.10 |
See Financial Highlights for dividend and capital gains information.
103
Utilities Index Fund
Financial Statements (unaudited)
Statement of Net Assets
As of February 28, 2017
The fund reports a complete list of its holdings in regulatory filings four times in each fiscal year, at the quarter-ends. For the second and fourth fiscal quarters, the lists appear in the fund’s semiannual and annual reports to shareholders. For the first and third fiscal quarters, the fund files the lists with the Securities and Exchange Commission on Form N-Q. Shareholders can look up the fund’s Forms N-Q on the SEC’s website at sec.gov. Forms N-Q may also be reviewed and copied at the SEC’s Public Reference Room (see the back cover of this report for further information).
| | |
| | | Market |
| | | Value• |
| | Shares | ($000) |
| Common Stocks (100.1%) | | |
| Electric Utilities (58.1%) | | |
| NextEra Energy Inc. | 1,831,147 | 239,880 |
| Duke Energy Corp. | 2,706,587 | 223,429 |
| Southern Co. | 3,844,738 | 195,390 |
| Exelon Corp. | 3,625,395 | 133,088 |
| PG&E Corp. | 1,979,902 | 132,158 |
| American Electric Power | | |
| Co. Inc. | 1,931,694 | 129,366 |
| Edison International | 1,279,905 | 102,060 |
| PPL Corp. | 2,665,911 | 98,319 |
| Xcel Energy Inc. | 1,997,217 | 87,298 |
| Eversource Energy | 1,247,182 | 73,160 |
| Entergy Corp. | 704,400 | 53,999 |
| FirstEnergy Corp. | 1,637,033 | 53,089 |
| Pinnacle West Capital | | |
| Corp. | 437,167 | 35,931 |
| Alliant Energy Corp. | 893,931 | 35,292 |
| Westar Energy Inc. | | |
| Class A | 557,311 | 30,084 |
| OGE Energy Corp. | 785,274 | 28,922 |
| Great Plains Energy Inc. | 820,092 | 23,832 |
| IDACORP Inc. | 198,387 | 16,452 |
| Portland General Electric | | |
| Co. | 349,904 | 15,861 |
| Hawaiian Electric | | |
| Industries Inc. | 425,723 | 14,168 |
| ALLETE Inc. | 184,750 | 12,417 |
| PNM Resources Inc. | 317,146 | 11,512 |
| Avangrid Inc. | 244,592 | 10,694 |
| MGE Energy Inc. | 136,574 | 8,734 |
| El Paso Electric Co. | 160,028 | 7,817 |
| Otter Tail Corp. | 137,502 | 5,170 |
| ^ Spark Energy Inc. | | |
| Class A | 23,469 | 634 |
| | | 1,778,756 |
| Gas Utilities (5.7%) | | |
| UGI Corp. | 681,250 | 32,857 |
| Atmos Energy Corp. | 408,382 | 31,972 |
| National Fuel Gas Co. | 284,195 | 17,137 |
| WGL Holdings Inc. | 200,892 | 16,772 |
| Southwest Gas Holdings | | |
| Inc. | 186,917 | 15,987 |
| ONE Gas Inc. | 206,522 | 13,537 |
| New Jersey Resources | | |
| Corp. | 339,385 | 13,372 |
| Spire Inc. | 180,888 | 11,921 |
| | | |
| | South Jersey Industries | | |
| | Inc. | 313,311 | 10,972 |
| | Northwest Natural Gas Co. | 109,019 | 6,552 |
| | Chesapeake Utilities Corp. | 60,666 | 4,183 |
| | | | 175,262 |
| Independent Power and Renewable Electricity |
| Producers (3.3%) | | |
| | AES Corp. | 2,616,030 | 30,137 |
| | NRG Energy Inc. | 1,246,249 | 20,638 |
| * | Calpine Corp. | 1,360,009 | 15,926 |
| | Ormat Technologies Inc. | 146,501 | 8,077 |
| | NextEra Energy Partners | | |
| | LP | 212,361 | 6,536 |
| | Pattern Energy Group Inc. | | |
| | Class A | 225,603 | 4,690 |
| | NRG Yield Inc. | 193,487 | 3,367 |
| * | TerraForm Power Inc. | | |
| | Class A | 216,056 | 2,487 |
| * | Dynegy Inc. | 299,264 | 2,406 |
| ^ | 8Point3 Energy Partners | | |
| | LP Class A | 107,673 | 1,433 |
| | TerraForm Global Inc. | | |
| | Class A | 323,726 | 1,408 |
| | NRG Yield Inc. Class A | 81,149 | 1,364 |
| ^,* Vivint Solar Inc. | 88,545 | 305 |
| | | | 98,774 |
| Multi-Utilities (29.8%) | | |
| | Dominion Resources Inc. | 2,466,969 | 191,535 |
| | Sempra Energy | 932,315 | 102,825 |
| | Consolidated Edison Inc. | 1,196,936 | 92,212 |
| | Public Service Enterprise | | |
| | Group Inc. | 1,989,239 | 91,465 |
| | WEC Energy Group Inc. | 1,241,020 | 74,796 |
| | DTE Energy Co. | 705,516 | 71,525 |
| | Ameren Corp. | 954,034 | 52,176 |
| | CMS Energy Corp. | 1,100,240 | 48,983 |
| | CenterPoint Energy Inc. | 1,608,710 | 43,950 |
| | SCANA Corp. | 533,816 | 37,020 |
| | NiSource Inc. | 1,269,588 | 30,356 |
| | MDU Resources Group | | |
| | Inc. | 730,111 | 19,793 |
| | Vectren Corp. | 325,765 | 18,357 |
| | Black Hills Corp. | 206,097 | 13,372 |
| | NorthWestern Corp. | 190,463 | 11,142 |
| | Avista Corp. | 251,534 | 10,029 |
| | Unitil Corp. | 52,660 | 2,349 |
| | | | 911,885 |
| | |
| Water Utilities (3.2%) | | |
| American Water Works | | |
| Co. Inc. | 699,525 | 54,563 |
| Aqua America Inc. | 697,499 | 22,139 |
| California Water Service | | |
| Group | 188,759 | 6,937 |
| American States Water Co. | 143,855 | 6,433 |
| SJW Group | 60,673 | 2,944 |
| Connecticut Water Service | | |
| Inc. | 44,464 | 2,537 |
| Middlesex Water Co. | 64,434 | 2,426 |
| | | 97,979 |
| Total Common Stocks | | |
| (Cost $2,844,331) | | 3,062,656 |
| Temporary Cash Investment (0.0%) | |
| Money Market Fund (0.0%) | | |
| 1,2 Vanguard Market | | |
| Liquidity Fund, 0.864% | | |
| (Cost $755) | 7,554 | 754 |
| Total Investments (100.1%) | | |
| (Cost $2,845,086) | | 3,063,410 |
| |
| | | Amount |
| | | ($000) |
| Other Assets and Liabilities (-0.1%) | |
| Other Assets | | |
| Investment in Vanguard | | 212 |
| Receivables for Accrued Income | | 14,349 |
| Receivables for Capital Shares Issued | 1,225 |
| Total Other Assets | | 15,786 |
| Liabilities | | |
| Payables for Investment Securities | |
| Purchased | | (2,135) |
| Collateral for Securities on Loan | | (754) |
| Payables for Capital Shares Redeemed | (1,205) |
| Payables to Vanguard | | (1,354) |
| Other Liabilities | | (12,448) |
| Total Liabilities | | (17,896) |
104
Utilities Index Fund
| |
| At February 28, 2017, net assets consisted of: |
| | Amount |
| | ($000) |
| Paid-in Capital | 2,841,476 |
| Undistributed Net Investment Income | 16,543 |
| Accumulated Net Realized Losses | (15,043) |
| Unrealized Appreciation (Depreciation) | 218,324 |
| Net Assets | 3,061,300 |
| |
| |
| ETF Shares—Net Assets | |
| Applicable to 20,558,316 outstanding | |
| $.001 par value shares of beneficial | |
| interest (unlimited authorization) | 2,335,112 |
| Net Asset Value Per Share— | |
| ETF Shares | $113.58 |
| |
| |
| Admiral Shares—Net Assets | |
| Applicable to 12,743,531 outstanding | |
| $.001 par value shares of beneficial | |
| interest (unlimited authorization) | 726,188 |
| Net Asset Value Per Share— | |
| Admiral Shares | $56.98 |
• See Note A in Notes toFinancial Statements.
^ Includes partial security positions on loan to broker-dealers. The total value of securities on loan is $700,000.
* Non-income-producing security.
1 Affiliated money market fund available only to Vanguard funds and certain trusts and accounts managed by Vanguard. Rate shown is the 7-day yield.
2 Includes $754,000 of collateral received for securities on loan.
See accompanying Notes, which are an integral part of the Financial Statements.
105
Utilities Index Fund
Statement of Operations
| |
| Six Months Ended |
| February 28, 2017 |
| | ($000) |
| Investment Income | |
| Income | |
| Dividends | 49,299 |
| Interest 1 | 5 |
| Securities Lending—Net | 36 |
| Total Income | 49,340 |
| Expenses | |
| The Vanguard Group—Note B | |
| Investment Advisory Services | 206 |
| Management and Administrative— | |
| ETF Shares | 736 |
| Management and Administrative— | |
| Admiral Shares | 255 |
| Marketing and Distribution— | |
| ETF Shares | 88 |
| Marketing and Distribution— | |
| Admiral Shares | 35 |
| Custodian Fees | 28 |
| Shareholders’ Reports—ETF Shares | 74 |
| Shareholders’ Reports—Admiral Shares | 6 |
| Trustees’ Fees and Expenses | 1 |
| Total Expenses | 1,429 |
| Net Investment Income | 47,911 |
| Realized Net Gain (Loss) | |
| Investment Securities Sold1 | 73,113 |
| Futures Contracts | 34 |
| Realized Net Gain (Loss) | 73,147 |
| Change in Unrealized Appreciation | |
| (Depreciation) of Investment Securities | 91,994 |
| Net Increase (Decrease) in Net Assets | |
| Resulting from Operations | 213,052 |
| 1 Interest income and realized net gain (loss) from an affiliated |
| company of the fund were $5,000 and $0, respectively. |
Statement of Changes in NetAssets
| | |
| | Six Months Ended | Year Ended |
| | February 28, | August 31, |
| | 2017 | 2016 |
| | ($000) | ($000) |
| Increase (Decrease) in Net Assets | | |
| Operations | | |
| Net Investment Income | 47,911 | 88,162 |
| Realized Net Gain (Loss) | 73,147 | 206,278 |
| Change in Unrealized Appreciation (Depreciation) | 91,994 | 183,126 |
| Net Increase (Decrease) in Net Assets Resulting from Operations | 213,052 | 477,566 |
| Distributions | | |
| Net Investment Income | | |
| ETF Shares | (38,192) | (65,440) |
| Admiral Shares | (12,102) | (17,938) |
| Realized Capital Gain | | |
| ETF Shares | — | — |
| Admiral Shares | — | — |
| Total Distributions | (50,294) | (83,378) |
| Capital Share Transactions | | |
| ETF Shares | (38,118) | 357,214 |
| Admiral Shares | (16,355) | 172,991 |
| Net Increase (Decrease) from Capital Share Transactions | (54,473) | 530,205 |
| Total Increase (Decrease) | 108,285 | 924,393 |
| Net Assets | | |
| Beginning of Period | 2,953,015 | 2,028,622 |
| End of Period 1 | 3,061,300 | 2,953,015 |
| 1 Net Assets—End of Period includes undistributed (overdistributed) net investment income of $16,543,000 and $18,926,000. |
See accompanying Notes, which are an integral part of the Financial Statements.
106
Utilities Index Fund
Financial Highlights
| | | | | | | |
| ETF Shares | | | | | | | |
| | Six Months | | | | | |
| | | Ended | | | | | |
| For a Share Outstanding | February 28, | Year Ended August 31, |
| Throughout Each Period | | 2017 | 2016 | 2015 | 2014 | 2013 | 2012 |
| Net Asset Value, Beginning of Period | $107.35 | $91.41 | $94.61 | $81.32 | $77.69 | $72.52 |
| Investment Operations | | | | | | | |
| Net Investment Income | | 1.788 | 3.355 | 3.337 | 3.127 | 3.043 | 2.880 |
| Net Realized and Unrealized Gain (Loss) | | | | | | |
| on Investments | | 6.304 | 15.889 | (3.261) | 13.261 | 3.675 | 5.080 |
| Total from Investment Operations | 8.092 | 19.244 | .076 | 16.388 | 6.718 | 7.960 |
| Distributions | | | | | | | |
| Dividends from Net Investment Income | (1.862) | (3.304) | (3.276) | (3.098) | (3.088) | (2.790) |
| Distributions from Realized Capital Gains | — | — | — | — | — | — |
| Total Distributions | | (1.862) | (3.304) | (3.276) | (3.098) | (3.088) | (2.790) |
| Net Asset Value, End of Period | $113.58 | $107.35 | $91.41 | $94.61 | $81.32 | $77.69 |
| |
| Total Return | | 7.66% | 21.40% | -0.02% | 20.55% | 8.82% | 11.20% |
| |
| Ratios/Supplemental Data | | | | | | | |
| Net Assets, End of Period (Millions) | $2,335 | $2,249 | $1,581 | $1,711 | $1,356 | $1,154 |
| Ratio of Total Expenses to | | | | | | | |
| Average Net Assets | | 0.10% | 0.10% | 0.10% | 0.12% | 0.14% | 0.14% |
| Ratio of Net Investment Income to | | | | | | |
| Average Net Assets | | 3.33% | 3.38% | 3.39% | 3.59% | 3.72% | 3.93% |
| Portfolio Turnover Rate1 | | 8% | 3% | 7% | 7% | 7% | 5% |
The expense ratio, net investment income ratio, and turnover rate for the current period have been annualized.
1 Excludes the value of portfolio securities received or delivered as a result of in-kind purchases or redemptions of the fund’s capital shares,
including ETF Creation Units.
See accompanying Notes, which are an integral part of the Financial Statements.
107
Utilities Index Fund
Financial Highlights
| | | | | | | |
| Admiral Shares | | | | | | | |
| | Six Months | | | | | |
| | | Ended | | | | | |
| For a Share Outstanding | February 28, | Year Ended August 31, |
| Throughout Each Period | | 2017 | 2016 | 2015 | 2014 | 2013 | 2012 |
| Net Asset Value, Beginning of Period | $53.86 | $45.86 | $47.47 | $40.80 | $38.99 | $36.40 |
| Investment Operations | | | | | | | |
| Net Investment Income | | .895 | 1.683 | 1.676 | 1.569 | 1.529 | 1.452 |
| Net Realized and Unrealized Gain (Loss) | | | | | | |
| on Investments | | 3.159 | 7.974 | (1.641) | 6.656 | 1.838 | 2.539 |
| Total from Investment Operations | 4.054 | 9.657 | .035 | 8.225 | 3.367 | 3.991 |
| Distributions | | | | | | | |
| Dividends from Net Investment Income | (. 934) | (1.657) | (1.645) | (1.555) | (1.557) | (1.401) |
| Distributions from Realized Capital Gains | — | — | — | — | — | — |
| Total Distributions | | (. 934) | (1.657) | (1.645) | (1.555) | (1.557) | (1.401) |
| Net Asset Value, End of Period | $56.98 | $53.86 | $45.86 | $47.47 | $40.80 | $38.99 |
| |
| Total Return 1 | | 7.63% | 21.42% | -0.01% | 20.58% | 8.83% | 11.22% |
| |
| Ratios/Supplemental Data | | | | | | | |
| Net Assets, End of Period (Millions) | $726 | $704 | $447 | $442 | $347 | $310 |
| Ratio of Total Expenses to | | | | | | | |
| Average Net Assets | | 0.10% | 0.10% | 0.10% | 0.12% | 0.14% | 0.14% |
| Ratio of Net Investment Income to | | | | | | |
| Average Net Assets | | 3.33% | 3.38% | 3.39% | 3.59% | 3.72% | 3.93% |
| Portfolio Turnover Rate2 | | 8% | 3% | 7% | 7% | 7% | 5% |
The expense ratio, net investment income ratio, and turnover rate for the current period have been annualized.
1 Total returns do not include transaction or account service fees that may have applied in the periods shown. Fund prospectuses provide
information about any applicable transaction and account service fees.
2 Excludes the value of portfolio securities received or delivered as a result of in-kind purchases or redemptions of the fund’s capital shares,
including ETF Creation Units.
See accompanying Notes, which are an integral part of the Financial Statements.
108
Utilities Index Fund
Notes to Financial Statements
Vanguard Utilities Index Fund is registered under the Investment Company Act of 1940 as an open-end investment company, or mutual fund. The fund offers two classes of shares: ETF Shares and Admiral Shares. ETF Shares are listed for trading on NYSE Arca; they can be purchased and sold through a broker. Admiral Shares are designed for investors who meet certain administrative, service, and account-size criteria.
A. The following significant accounting policies conform to generally accepted accounting principles for U.S. investment companies. The fund consistently follows such policies in preparing its financial statements.
1. SecurityValuation:SecuritiesarevaluedasofthecloseoftradingontheNewYorkStockExchange (generally 4 p.m., Eastern time) on the valuation date. Equity securities are valued at thelatestquoted sales prices or official closing prices taken from the primary market in which each security trades; such securities not traded on the valuation date are valued at the mean of the latest quoted bid and asked prices. Securities for whichmarket quotations are not readily available, or whose valueshave been materially affected by events occurring before the fund’s pricing time but after the close of the securities’ primary markets, are valued by methods deemed by the board of trustees to represent fairvalue.InvestmentsinVanguard MarketLiquidityFundarevaluedatthatfund’snetassetvalue.
2. Futures Contracts: The fund uses index futures contracts to a limited extent, with the objectives of maintaining full exposure to the stock market, enhancing returns, maintaining liquidity, and minimizing transaction costs. The fund may purchase futures contracts to immediately invest incoming cash in the market, or sell futures in response to cash outflows, thereby simulating a fully invested position in the underlying index while maintaining a cash balance for liquidity. The fund may seek to enhance returns by using futures contracts instead of the underlying securities when futures are believed to be priced more attractively than the underlying securities. The primary risks associated with the use of futures contracts are imperfect correlation between changes in market values of stocks held by the fund and the prices of futures contracts, and the possibility of an illiquid market. Counterparty risk involving futures is mitigated because a regulated clearinghouse is the counterparty instead of the clearing broker. To further mitigate counterparty risk, the fund trades futures contracts on an exchange, monitors the financial strength of its clearing brokers and clearinghouse, and has entered into clearing agreements with its clearing brokers. The clearinghouse imposes initial margin requirements to secure the fund’s performance and requires daily settlement of variation margin representing changes in the market value of each contract.
Futures contracts are valued at their quoted daily settlement prices. The aggregate settlement values of the contracts are not recorded in the Statement of Net Assets. Fluctuations in the value of the contracts are recorded in the Statement of Net Assets as an asset (liability) and in the Statement of Operations as unrealized appreciation (depreciation) until the contracts are closed, when they are recorded as realized futures gains (losses).
During the six months ended February 28, 2017, the fund’s average investments in long and short futures contracts represented 0% and 0% of net assets, respectively, based on the average of aggregate settlement values at each quarter-end during the period. The fund had no open futures contracts at February 28, 2017.
3. Federal Income Taxes: The fund intends to continue to qualify as a regulated investment company and distribute all of its taxable income. Management has analyzed the fund’s tax positions taken for all open federal income tax years (August 31, 2013–2016), and for the period ended February 28, 2017, and has concluded that no provision for federal income tax is required in the fund’s financial statements. 4. Distributions: Distributions to shareholders are recorded on the ex-dividend date.
5. Securities Lending: To earn additional income, the fund lends its securities to qualified institutional borrowers. Security loans are subject to termination by the fund at any time, and are required to be secured at all times by collateral in an amount at least equal to the market value of securities loaned. Daily market fluctuations could cause the value of loaned securities to be more or less than the value of the collateral received. When this occurs, the collateral is adjusted and settled on the next business day. The fund further mitigates its counterparty risk by entering into securities lending transactions only with a diverse group of prequalified counterparties, monitoring their financial strength, and entering into master securities lending agreements with its counterparties. The master securities lending agreements provide that, in the event of a counterparty’s default (including bankruptcy), the fund may terminate any loans with that borrower, determine the net amount owed, and sell
109
Utilities Index Fund
or retain the collateral up to the net amount owed to the fund; however, such actions may be subject tolegal proceedings. While collateral mitigates counterparty risk, in the absence of a default the fund may experiencedelaysandcostsin recoveringthesecuritiesloaned.Thefundinvestscashcollateral received in Vanguard Market Liquidity Fund, and records a liability in the Statement of Net Assets for the return of the collateral, during the period the securities are on loan. Securities lending income representsfeeschargedtoborrowers plusincome earnedoninvested cashcollateral,lessexpenses associated with the loan. During the term of the loan, the fund is entitled to all distributions made on or in respect of the loaned securities.
6. Credit Facility: The fund and certain other funds managed by The Vanguard Group (“Vanguard”) participate in a $3.1 billion committed credit facility provided by a syndicate of lenders pursuant to a credit agreement that may be renewed annually; each fund is individually liable for its borrowings, if any, under the credit facility. Borrowings may be utilized for temporary and emergency purposes, and are subject to the fund’s regulatory and contractual borrowing restrictions. The participating funds are charged administrative fees and an annual commitment fee of 0.10% of the undrawn amount of the facility; these fees are allocated to the funds based on a method approved by the fund’s board of trustees and included in Management and Administrative expenses on the fund’s Statement of Operations. Any borrowings under this facility bear interest at a rate based upon the higher of the one-month London Interbank Offered Rate, federal funds effective rate, or overnight bank funding rate plus an agreed-upon spread.
The fund had no borrowings outstanding at February 28, 2017, or at any time during the period then ended.
7. Other: Dividend income is recorded on the ex-dividend date. Interest income includes income distributions received from Vanguard Market Liquidity Fund and is accrued daily. Security transactions are accounted for on the date securities are bought or sold. Costs used to determine realized gains (losses) on the sale of investment securities are those of the specific securities sold.
Each class of shares has equal rights as to assets and earnings, except that each class separately bears certain class-specific expenses related to maintenance of shareholder accounts (included in Management and Administrative expenses) and shareholder reporting. Marketing and distribution expenses are allocated to each class of shares based on a method approved by the board of trustees. Income, other non-class-specific expenses, and gains and losses on investments are allocated to each class of shares based on its relative net assets.
B. In accordance with the terms of a Funds’ Service Agreement (the “FSA”) between Vanguard and the fund, Vanguard furnishes to the fund investment advisory, corporate management, administrative, marketing,anddistributionservices atVanguard’scostofoperations (as defined bythe FSA).These costs of operations are allocated to the fund based on methods and guidelines approved by the board of trustees. Vanguard does not require reimbursement in the current period for certain costs ofoperations(such asdeferred compensation/benefitsand risk/insurance costs);thefund’sliability for these costs of operations isincluded in Payables to Vanguard on the Statement of Net Assets.
Upon the request of Vanguard, the fund may invest up to 0.40% of its net assets as capital in Vanguard. At February 28, 2017,the fund had contributedto Vanguard capitalinthe amountof $212,000, representing 0.01% of the fund’s net assets and 0.08% of Vanguard’s capitalization. The fund’s trustees and officers are also directors and employees, respectively, of Vanguard.
C. Variousinputs may be used to determine the value of the fund’sinvestments. Theseinputs are summarized in three broad levels for financial statement purposes. The inputs or methodologies used to value securities are not necessarily an indication of the risk associated with investing in those securities.
Level 1—Quoted prices in active markets for identical securities.
Level 2—Other significant observable inputs (including quoted prices for similar securities, interest rates, prepayment speeds, credit risk, etc.).
Level 3—Significant unobservable inputs (including the fund’s own assumptions used to determine the fair value of investments).
At February 28, 2017, 100% of the market value of the fund’s investments was determined based on Level 1 inputs.
110
Utilities Index Fund
D. Distributions are determined on a tax basis and may differ from net investment income and realized capital gains for financial reporting purposes. Differences may be permanent or temporary. Permanent differences are reclassified among capital accounts in the financial statements to reflect their tax character. Temporary differences arise when certain items of income, expense, gain, or loss are recognized in different periods for financial statement and tax purposes. These differences will reverse at some time in the future. Differences in classification may also result from the treatment of short-term gains as ordinary income for tax purposes.
During the six months ended February 28, 2017, the fund realized $67,554,000 of net capital gains resulting from in-kind redemptions—in which shareholders exchanged fund shares for securities held by the fund rather than for cash. Because such gains are not taxable to the fund, and are not distributed to shareholders, they have been reclassified from accumulated net realized losses to paid-in capital.
The fund’s tax-basis capital gains and losses are determined only at the end of each fiscal year. For tax purposes, at August 31, 2016, the fund had available capital losses totaling $20,636,000 to offset future net capital gains. Of this amount, $6,018,000 is subject to expiration dates; $2,655,000 may be used to offset future net capital gains through August 31, 2018, and $3,363,000 through August 31, 2019. Capital losses of $14,618,000 realized beginning in fiscal 2012 may be carried forward indefinitely under the Regulated Investment Company Modernization Act of 2010, but must be used before any expiring loss carryforwards. The fund will use these capital losses to offset net taxable capital gains, if any, realized during the year ending August 31, 2017; should the fund realize net capital losses for the year, the losses will be added to the loss carryforward balance above.
At February 28, 2017, the cost of investment securities for tax purposes was $2,845,086,000. Net unrealized appreciation of investment securities for tax purposes was $218,324,000, consisting of unrealized gains of $312,739,000 on securities that had risen in value since their purchase and $94,415,000 in unrealized losses on securities that had fallen in value since their purchase.
E. During the six months ended February 28, 2017, the fund purchased $387,514,000 of investment securities and sold $443,308,000 of investment securities, other than temporary cash investments. Purchases and sales include $262,690,000 and $325,774,000, respectively, in connection with in-kind purchases and redemptions of the fund’s capital shares.
F. Capital share transactions for each class of shares were:
| | | | |
| | Six Months Ended | Year Ended |
| | February 28, 2017 | August 31, 2016 |
| | Amount | Shares | Amount | Shares |
| | ($000) | (000) | ($000) | (000) |
| ETF Shares | | | | |
| Issued | 287,940 | 2,684 | 1,178,906 | 11,352 |
| Issued in Lieu of Cash Distributions | — | — | — | — |
| Redeemed | (326,058) | (3,075) | (821,692) | (7,700) |
| Net Increase (Decrease)—ETF Shares | (38,118) | (391) | 357,214 | 3,652 |
| Admiral Shares | | | | |
| Issued | 123,850 | 2,317 | 305,428 | 5,854 |
| Issued in Lieu of Cash Distributions | 9,546 | 177 | 13,618 | 273 |
| Redeemed | (149,751) | (2,821) | (146,055) | (2,814) |
| Net Increase (Decrease)—Admiral Shares | (16,355) | (327) | 172,991 | 3,313 |
G. Management has determined that no material events or transactions occurred subsequent to February 28, 2017, that would require recognition or disclosure in these financial statements.
111
About Your Fund’s Expenses
As a shareholder of the fund, you incur ongoing costs, which include costs for portfolio management, administrative services, and shareholder reports (like this one), among others. Operating expenses, which are deducted from a fund’s gross income, directly reduce the investment return of the fund.
A fund’s expenses are expressed as a percentage of its average net assets. This figure is known as the expense ratio. The following examples are intended to help you understand the ongoing costs (in dollars) of investing in your fund and to compare these costs with those of other mutual funds. The examples are based on an investment of $1,000 made at the beginning of the period shown and held for the entire period.
The accompanying table illustrates your fund’s costs in two ways:
• Based on actual fund return. This section helps you to estimate the actual expenses that you paid over the period. The “Ending Account Value” shown is derived from the fund’s actual return, and the third column shows the dollar amount that would have been paid by an investor who started with $1,000 in the fund. You may use the information here, together with the amount you invested, to estimate the expenses that you paid over the period.
To do so, simply divide your account value by $1,000 (for example, an $8,600 account value divided by $1,000 = 8.6), then multiply the result by the number given for your fund under the heading “Expenses Paid During Period.”
• Based on hypothetical 5% yearly return. This section is intended to help you compare your fund’s costs with those of other mutual funds. It assumes that the fund had a yearly return of 5% before expenses, but that the expense ratio is unchanged. In this case—because the return used is not the fund’s actual return—the results do not apply to your investment. The example is useful in making comparisons because the Securities and Exchange Commission requires all mutual funds to calculate expenses based on a 5% return. You can assess your fund’s costs by comparing this hypothetical example with the hypothetical examples that appear in shareholder reports of other funds.
Note that the expenses shown in the table are meant to highlight and help you compare ongoing costs only and do not reflect transaction costs incurred by the fund for buying and selling securities. Further, the expenses do not include any purchase, redemption, or account service fees described in the fund prospectus. If such fees were applied to your account, your costs would be higher. Your fund does not carry a “sales load.” The calculations assume no shares were bought or sold during the period. Your actual costs may have been higher or lower, depending on the amount of your investment and the timing of any purchases or redemptions.
You can find more information about the fund’s expenses in the Financial Statements section of this report. For additional information on operating expenses and other shareholder costs, please refer to your fund’s current prospectus.
112
| | | | |
| Six Months Ended February 28, 2017 | | | | |
| | | Beginning | Ending | Expenses |
| | | Account Value | Account Value | Paid During |
| Index Fund | Share Class | 8/31/2016 | 2/28/2017 | Period1 |
| Based on Actual Fund Return | | | | |
| Consumer Discretionary | ETF | $1,000.00 | $1,084.30 | $0.52 |
| | Admiral | 1,000.00 | 1,084.37 | 0.52 |
| Consumer Staples | ETF | $1,000.00 | $1,026.70 | $0.50 |
| | Admiral | 1,000.00 | 1,026.55 | 0.50 |
| Energy | ETF | $1,000.00 | $1,047.28 | $0.51 |
| | Admiral | 1,000.00 | 1,047.00 | 0.51 |
| Financials | ETF | $1,000.00 | $1,238.87 | $0.56 |
| | Admiral | 1,000.00 | 1,238.50 | 0.56 |
| Health Care | ETF | $1,000.00 | $1,047.62 | $0.51 |
| | Admiral | 1,000.00 | 1,047.92 | 0.51 |
| Industrials | ETF | $1,000.00 | $1,132.06 | $0.53 |
| | Admiral | 1,000.00 | 1,131.92 | 0.58 |
| Information Technology | ETF | $1,000.00 | $1,136.67 | $0.53 |
| | Admiral | 1,000.00 | 1,136.77 | 0.53 |
| Materials | ETF | $1,000.00 | $1,111.02 | $0.52 |
| | Admiral | 1,000.00 | 1,111.07 | 0.52 |
| Telecommunication Services | ETF | $1,000.00 | $1,044.14 | $0.51 |
| | Admiral | 1,000.00 | 1,043.90 | 0.51 |
| Utilities | ETF | $1,000.00 | $1,076.52 | $0.51 |
| | Admiral | 1,000.00 | 1,076.30 | 0.51 |
| Based on Hypothetical 5% Yearly Return | | | |
| Consumer Discretionary | ETF | $1,000.00 | $1,024.30 | $0.50 |
| | Admiral | 1,000.00 | 1,024.30 | 0.50 |
| Consumer Staples | ETF | $1,000.00 | $1,024.30 | $0.50 |
| | Admiral | 1,000.00 | 1,024.30 | 0.50 |
| Energy | ETF | $1,000.00 | $1,024.30 | $0.50 |
| | Admiral | 1,000.00 | 1,024.30 | 0.50 |
| Financials | ETF | $1,000.00 | $1,024.30 | $0.50 |
| | Admiral | 1,000.00 | 1,024.30 | 0.50 |
| Health Care | ETF | $1,000.00 | $1,024.30 | $0.50 |
| | Admiral | 1,000.00 | 1,024.30 | 0.50 |
| Industrials | ETF | $1,000.00 | $1,024.30 | $0.50 |
| | Admiral | 1,000.00 | 1,024.25 | 0.55 |
| Information Technology | ETF | $1,000.00 | $1,024.30 | $0.50 |
| | Admiral | 1,000.00 | 1,024.30 | 0.50 |
| Materials | ETF | $1,000.00 | $1,024.30 | $0.50 |
| | Admiral | 1,000.00 | 1,024.30 | 0.50 |
| Telecommunication Services | ETF | $1,000.00 | $1,024.30 | $0.50 |
| | Admiral | 1,000.00 | 1,024.30 | 0.50 |
| Utilities | ETF | $1,000.00 | $1,024.30 | $0.50 |
| | Admiral | 1,000.00 | 1,024.30 | 0.50 |
1 The calculations are based on expenses incurred in the most recent six-month period. The funds’ annualized six-month expense ratios for
thatperiodare 0.10%fortheConsumer DiscretionaryIndexFundETFSharesand0.10%forthe AdmiralShares;0.10%fortheConsumer
StaplesIndex FundETF Shares and0.10% for the Admiral Shares; 0.10% for the EnergyIndex Fund ETF Shares and 0.10% for the Admiral
Shares; 0.10% for the Financials Index Fund ETF Shares and 0.10% for the Admiral Shares; 0.10% for the Health Care Index Fund ETF Shares
and 0.10% for the Admiral Shares; 0.10% for the Industrials Index Fund ETF Shares and 0.11% for the Admiral Shares; 0.10% for the
Information TechnologyIndex Fund ETF Shares and 0.10% for the Admiral Shares; 0.10% for the Materials Index Fund ETF Shares and
0.10% for the Admiral Shares; 0.10% for the Telecommunication Services Index Fund ETF Shares and 0.10% for the Admiral Shares; 0.10%
for the Utilities IndexFund ETF Shares and 0.10% for the Admiral Shares. The dollar amounts shown as “Expenses Paid”are equal tothe
annualized expense ratio multiplied by the average account value over the period, multiplied by the number of days in the most recent
six-month period, then divided by the number of days in the most recent 12-month period (181/365).
113
Glossary
30-Day SEC Yield. A fund’s 30-day SEC yield is derived using a formula specified by the U.S. Securities and Exchange Commission. Under the formula, data related to the fund’s security holdings in the previous 30 days are used to calculate the fund’s hypothetical net income for that period, which is then annualized and divided by the fund’s estimated average net assets over the calculation period. For the purposes of this calculation, a security’s income is based on its current market yield to maturity (for bonds), its actual income (for asset-backed securities), or its projected dividend yield (for stocks). Because the SEC yield represents hypothetical annualized income, it will differ—at times significantly—from the fund’s actual experience. As a result, the fund’s income distributions may be higher or lower than implied by the SEC yield.
Beta. A measure of the magnitude of a fund’s past share-price fluctuations in relation to the ups and downs of a given market index. The index is assigned a beta of 1.00. Compared with a given index, a fund with a beta of 1.20 typically would have seen its share price rise or fall by 12% when the index rose or fell by 10%. For this report, beta is based on returns over the past 36 months for both the fund and the index. Note that a fund’s beta should be reviewed in conjunction with its R-squared (see definition below). The lower the R-squared, the less correlation there is between the fund and the index, and the less reliable beta is as an indicator of volatility.
Earnings Growth Rate. The average annual rate of growth in earnings over the past five years for the stocks now in a fund.
Equity Exposure. A measure that reflects a fund’s investments in stocks and stock futures. Any holdingsinshort-termreservesareexcluded.
Expense Ratio. A fund’s total annual operating expenses expressed as a percentage of the fund’s average net assets. The expense ratio includes management administrative expenses, but does not include the transaction costs of buying and selling portfolio securities.
Foreign Holdings. The percentage of a fund represented by stocks or depositary receipts of companies based outside the United States.
Inception Date. The date on which the assets of a fund (or one of its share classes) are first invested in accordance with the fund’s investment objective. For funds with a subscription period, the inception date is the day after that period ends. Investment performance is measured from the inception date.
Median Market Cap. An indicator of the size of companies in which a fund invests; the midpoint of market capitalization (market price x shares outstanding) of a fund’s stocks, weighted by the proportion of the fund’s assets invested in each stock. Stocks representing half of the fund’s assets have market capitalizations above the median, and the rest are below it.
Price/Book Ratio. The share price of a stock divided by its net worth, or book value, per share. For a fund, the weighted average price/book ratio of the stocks it holds.
Price/Earnings Ratio. The ratio of a stock’s current price to its per-share earnings over the past year. For a fund, the weighted average P/E of the stocks it holds. P/E is an indicator of market expectations about corporate prospects; the higher the P/E, the greater the expectations for a company’s future growth.
R-Squared. A measure of how much of a fund’s past returns can be explained by the returns from the market in general, as measured by a given index. If a fund’s total returns were precisely synchronized with an index’s returns, its R-squared would be 1.00. If the fund’s returns bore no relationship to the index’s returns, its R-squared would be 0. For this report, R-squared is based on returns over the past 36 months for both the fund and the index.
Return on Equity. The annual average rate of return generated by a company during the past five years for each dollar of shareholder’s equity (netincome divided by shareholder’s equity). For a fund, the weighted average return on equity for the companies whose stocks it holds.
Short-Term Reserves. The percentage of a fund invested in highly liquid, short-term securities that can be readily converted to cash.
Turnover Rate. An indication of the fund’s trading activity. Funds with high turnover rates incur higher transaction costs and may be more likely to distribute capital gains (which may be taxable to investors). The turnover rate excludes in-kind transactions, which have minimal impact on costs.
114
Benchmark Information
Spliced US IMI/Consumer Discretionary 25/50. MSCI US IMI/Consumer Discretionary
through February 26, 2010; MSCI US IMI/Consumer Discretionary 25/50 thereafter.
Spliced US IMI/Consumer Staples 25/50. MSCI US IMI/Consumer Staples through
February 26, 2010; MSCI US IMI/Consumer Staples 25/50 thereafter.
Spliced US IMI/Energy 25/50. MSCI US IMI/Energy through February 26, 2010;
MSCI US IMI/Energy 25/50 thereafter.
Spliced US IMI/Financials 25/50. MSCI US IMI/Financials through February 26, 2010;
MSCI US IMI/Financials 25/50 thereafter.
Spliced US IMI/Health Care 25/50. MSCI US IMI/Health Care through February 26, 2010;
MSCI US IMI/Health Care 25/50 thereafter.
Spliced US IMI/Industrials 25/50. MSCI US IMI/Industrials through February 26, 2010;
MSCI US IMI/Industrials 25/50 thereafter.
Spliced US IMI/Information Technology 25/50. MSCI US IMI/Information Technology Index
through February 26, 2010; MSCI US IMI/Information Technology 25/50 Index thereafter.
Spliced US IMI/Materials 25/50. MSCI US IMI/Materials through February 26, 2010;
MSCI US IMI/Materials 25/50 thereafter.
Spliced US IMI/Telecommunication Services 25/50. MSCI US IMI/Telecommunication
Services through February 26, 2010; MSCI US IMI/Telecommunication Services 25/50
thereafter.
Spliced US IMI/Utilities 25/50. MSCI US IMI/Utilities through February 26, 2010;
MSCIUSIMI/Utilities 25/50thereafter.
115
This page intentionally left blank.
The People Who Govern Your Fund
The trustees of your mutual fund are there to see that the fund is operated and managed in your best interests since, as a shareholder, you are a part owner of the fund. Your fund’s trustees also serve on the board of directors of The Vanguard Group, Inc., which is owned by the Vanguard funds and provides services to them on an at-cost basis.
A majority of Vanguard’s board members are independent, meaning that they have no affiliation with Vanguard or the funds they oversee, apart from the sizable personal investments they have made as private individuals.
The independent board members have distinguished backgrounds in business, academia, and public service. Each of the trustees and executive officers oversees 195 Vanguardfunds.
The following table provides information for each trustee and executive officer of the fund. The mailing address of the trustees and officers is P.O. Box 876, Valley Forge, PA 19482. More information about the trustees is in the Statement of Additional Information, which can be obtained, without charge, by contacting Vanguard at 800-662-7447, or online at vanguard.com.
Interested Trustee1
F. William McNabb III
Born 1957. Trustee Since July 2009. Chairman of the Board. Principal Occupation(s) During the Past Five Years and Other Experience: Chairman of the Board of The Vanguard Group, Inc., and of each of the investment companies served by The Vanguard Group, since January 2010; Director of The Vanguard Group since 2008; Chief Executive Officer and President of The Vanguard Group, and of each of the investment companies served by The Vanguard Group, since 2008; Director of Vanguard Marketing Corporation; Managing Director of The Vanguard Group (1995–2008).
Independent Trustees
Emerson U. Fullwood
Born 1948. Trustee Since January 2008. Principal Occupation(s) During the Past Five Years and Other Experience: Executive Chief Staff and Marketing Officer for North America and Corporate Vice President (retired 2008) of Xerox Corporation (document management products and services); Executive in Residence and 2009–2010 Distinguished Minett Professor at the Rochester Institute of Technology; Lead Director of SPX FLOW, Inc. (multi-industry manufacturing); Director of the United Way of Rochester, the University of Rochester Medical Center, Monroe Community College Foundation, North Carolina A&T University, and Roberts Wesleyan College.
Rajiv L. Gupta
Born 1945. Trustee Since December 2001.2 Principal Occupation(s) During the Past Five Years and Other Experience: Chairman and Chief Executive Officer (retired 2009) and President (2006–2008) of Rohm and Haas Co. (chemicals); Director of Arconic Inc. (diversified manufacturer), HP Inc. (printer and personal computer manufacturing), and Delphi Automotive plc (automotive components); Senior Advisor at New Mountain Capital.
Amy Gutmann
Born 1949. Trustee Since June 2006. Principal Occupation(s) During the Past Five Years and Other Experience: President of the University of Pennsylvania; Christopher H. Browne Distinguished Professor of Political Science, School of Arts and Sciences, and Professor of Communication, Annenberg School for Communication, with secondary faculty appointments in the Department of Philosophy, School of Arts and Sciences, and at the Graduate School of Education, University of Pennsylvania; Trustee of the National Constitution Center; Chair of the Presidential Commission for the Study of Bioethical Issues.
JoAnn Heffernan Heisen
Born 1950. Trustee Since July 1998. Principal Occupation(s) During the Past Five Years and Other Experience: Corporate Vice President and Chief Global Diversity Officer (retired 2008) and Member of the Executive Committee (1997–2008) of Johnson & Johnson (pharmaceuticals/medical devices/consumer
products); Director of Skytop Lodge Corporation (hotels) and the Robert Wood Johnson Foundation; Member of the Advisory Board of the Institute for Women’s Leadership at Rutgers University.
F. Joseph Loughrey
Born 1949. Trustee Since October 2009. Principal Occupation(s) During the Past Five Years and Other Experience: President and Chief Operating Officer (retired 2009) of Cummins Inc. (industrial machinery); Chairman of the Board of Hillenbrand, Inc. (specialized consumer services), Oxfam America, and the Lumina Foundation for Education; Director of SKF AB (industrial machinery), Hyster-Yale Materials Handling, Inc. (forklift trucks), and the V Foundation for Cancer Research; Member of the Advisory Council for the College of Arts and Letters and Chair of the Advisory Board to the Kellogg Institute for International Studies, both at the University of Notre Dame.
Mark Loughridge
Born 1953. Trustee Since March 2012. Principal Occupation(s) During the Past Five Years and Other Experience: Senior Vice President and Chief Financial Officer (retired 2013) at IBM (information technology services); Fiduciary Member of IBM’s Retirement Plan Committee (2004–2013); Director of the Dow Chemical Company; Member of the Council on Chicago Booth.
Scott C. Malpass
Born 1962. Trustee Since March 2012. Principal Occupation(s) During the Past Five Years and Other Experience: Chief Investment Officer and Vice President at the University of Notre Dame; Assistant Professor of Finance at the Mendoza College of Business at Notre Dame; Member of the Notre Dame 403(b) Investment Committee, the Board of Advisors for Spruceview Capital Partners, and the Investment Advisory Committee of Major League Baseball; Board Member of TIFF Advisory Services, Inc., and Catholic Investment Services, Inc. (investment advisors); Member of the Board of Superintendence of the Institute for the Works of Religion.
André F. Perold
Born 1952. Trustee Since December 2004. Principal Occupation(s) During the Past Five Years and Other Experience: George Gund Professor of Finance and Banking, Emeritus at the Harvard Business School (retired 2011); Chief Investment Officer and Co-Managing Partner of HighVista Strategies LLC (private investment firm); Overseer of the Museum of Fine Arts Boston.
Peter F. Volanakis
Born 1955. Trustee Since July 2009. Principal Occupation(s) During the Past Five Years and Other Experience: President and Chief Operating Officer (retired 2010) of Corning Incorporated (communications equipment); Chairman of the Board of Trustees of Colby-Sawyer College; Member of the Board of Hypertherm, Inc. (industrial cutting systems, software, and consumables).
Executive Officers
Glenn Booraem
Born 1967. Investment Stewardship Officer Since February 2017. Principal Occupation(s) During the Past Five Years and Other Experience: Principal of The Vanguard Group, Inc.; Treasurer (2015–2017), Controller (2010–2015), and Assistant Controller (2001–2010) of each of the investment companies served by The Vanguard Group.
Thomas J. Higgins
Born 1957. Chief Financial Officer Since September 2008. Principal Occupation(s) During the Past Five Years and Other Experience: Principal of The Vanguard Group, Inc.; Chief Financial Officer of each of the investment companies served by The Vanguard Group; Treasurer of each of the investment companies served by The Vanguard Group (1998–2008).
Peter Mahoney
Born 1974. Controller Since May 2015. Principal Occupation(s) During the Past Five Years and Other Experience: Principal of The Vanguard Group, Inc.; Controller of each of the investment companies served by The Vanguard Group; Head of International Fund Services at The Vanguard Group (2008–2014).
Anne E. Robinson
Born 1970. Secretary Since September 2016. Principal Occupation(s) During the Past Five Years and Other Experience: Managing Director of The Vanguard Group, Inc.; General Counsel of The Vanguard Group; Secretary of The Vanguard Group and of each of the investment companies served by The Vanguard Group; Director and Senior Vice President of Vanguard Marketing Corporation; Managing Director and General Counsel of Global Cards and Consumer Services at Citigroup (2014–2016); Counsel at American Express (2003–2014).
Michael Rollings
Born 1963. Treasurer Since February 2017. Principal Occupation(s) During the Past Five Years and Other Experience: Managing Director of The Vanguard Group, Inc.; Treasurer of each of the investment companies served by The Vanguard Group; Executive Vice President and Chief Financial Officer of MassMutual Financial Group (2006–2016).
| |
| Vanguard Senior Management Team |
| Mortimer J. Buckley | James M. Norris |
| John James | Thomas M. Rampulla |
| Martha G. King | Glenn W. Reed |
| John T. Marcante | Karin A. Risi |
| Chris D. McIsaac | |
| |
| Chairman Emeritus and Senior Advisor |
| John J. Brennan | |
| Chairman, 1996–2009 | |
| Chief Executive Officer and President, 1996–2008 |
| |
| Founder | |
| John C. Bogle | |
| Chairman and Chief Executive Officer, 1974–1996 |
1 Mr. McNabb is considered an “interested person,” as defined in the Investment Company Act of 1940, because he is an officer of the Vanguard funds.
2 December 2002 for Vanguard Equity Income Fund, the Vanguard Municipal Bond Funds, and the Vanguard State Tax-Exempt Funds.
|  |
| | P.O. Box 2600 |
| | Valley Forge, PA 19482-2600 |
| |
| |
| |
| |
| Connect with Vanguard® > vanguard.com |
| |
| |
| |
| |
| Fund Information > 800-662-7447 | All comparative mutual fund data are from Lipper Inc., a |
| | Thomson Reuters Company, or Morningstar, Inc., unless |
| Direct Investor Account Services > 800-662-2739 | otherwise noted. |
| Institutional Investor Services > 800-523-1036 | |
| | Youcanobtain a freecopyofVanguard’sproxyvoting |
| Text Telephone for People | guidelines by visiting vanguard.com/proxyreporting or |
| WhoAre DeaforHard of Hearing > 800-749-7273 | bycallingVanguardat800-662-2739.Theguidelines |
| | are also available from the SEC’s website, sec.gov. |
| | In addition, you may obtain a free report on how your |
| |
| This material may be used in conjunction | fund voted the proxies for securities it owned during |
| | the 12 months ended June 30. Toget the report, visit |
| with the offering of shares of any Vanguard | either vanguard.com/proxyreporting or sec.gov. |
| fund only if preceded or accompanied by the | |
| fund’s currentprospectus. | You can review and copy information about your fund |
| | at the SEC’s Public Reference Room in Washington, D.C. |
| The funds or securities referred to herein are not | To find out more about this public service, call the SEC |
| sponsored, endorsed, or promoted by MSCI, and MSCI | at 202-551-8090. Information about your fund is also |
| bears no liability with respect to any such funds or | availableon theSEC’swebsite,andyoucanreceive |
| securities. The prospectus or the Statement of Additional | copies of this information, for a fee, by sending a |
| Information contains a more detailed description of the | request in either of two ways: via e-mail addressed to |
| limited relationship MSCI has with Vanguard and any | publicinfo@sec.gov or via regular mail addressed to the |
| related funds. | Public Reference Section, Securities and Exchange |
| | Commission, Washington, DC20549-1520. |
| |
| |
| |
| |
| | © 2017 The Vanguard Group, Inc. |
| | All rights reserved. |
| | Vanguard Marketing Corporation, Distributor. |
| | Q4832 042017 |
Semiannual Report | February 28, 2017
Vanguard Extended Duration Treasury
Index Fund
A new format, unwavering commitment
As you begin reading this report, you’ll notice that we’ve made some improvements to the opening sections—based on feedback from you, our clients.
Page 1 starts with a new ”Your Fund’s Performance at a Glance,” a concise, handy summary of how your fund performed during the period.
In the renamed ”Chairman’s Perspective,” Bill McNabb will focus on enduring principles and investment insights.
We’ve modified some tables, and eliminated some redundancy, but we haven’t removed any information.
At Vanguard, we’re always looking for better ways to communicate and to help you make sound investment decisions. Thank you for entrusting your assets to us.
| |
| Contents | |
| Your Fund’s Performance at a Glance. | 1 |
| Chairman’s Perspective. | 3 |
| Fund Profile. | 6 |
| Performance Summary. | 7 |
| Financial Statements. | 8 |
| About Your Fund’s Expenses. | 19 |
| Glossary. | 21 |
Please note: The opinions expressed in this report are just that—informed opinions. They should not be considered promises or advice.
Also, please keep in mind that the information and opinions cover the period through the date on the front of this report. Of course, the
risks of investing in your fund are spelled out in the prospectus.
See the Glossary for definitions of investment terms used in this report.
About the cover: No matter what language you speak, Vanguard has one consistent message and set of principles. Our primary
focus is on you, our clients. We conduct our business with integrity as a faithful steward of your assets. This message is shown
translated into seven languages, reflecting our expanding global presence.
Your Fund’s Performance at a Glance
• ETF Shares of Vanguard Extended Duration Treasury Index Fund returned –16.43% for the six months ended February 28, 2017, slightly better than the fund’s benchmark (–16.62%).
• The fund’s return trailed the average return of general U.S. Treasury securities because the broader Treasury market includes a wider range of maturities. Treasury prices declined across the maturity spectrum, but longer-term Treasuries (a focus of the fund) fell the most.
• U.S. bond prices declined as the markets grew more upbeat during the period about the prospect of faster growth and higher inflation. That sentiment accelerated following the November election of a new administration that promised more spending on infrastructure, greater deregulation, and possible changes in the federal tax code.
• The sell-off of longer-term Treasuries pushed down their prices and boosted their yields. The 30-day SEC yield of the fund’s ETF Shares began the period at 2.28% and ended it at 3.05%.
| | | | |
| Total Returns: Six Months Ended February 28, 2017 | | | | |
| | 30-Day SEC | Income | Capital | Total |
| | Yields | Returns | Returns | Returns |
| Vanguard Extended Duration Treasury Index Fund | | | | |
| ETF Shares | 3.05% | | | |
| Market Price | | | | -16.56% |
| Net Asset Value | | | | -16.43 |
| Institutional Shares | 3.06 | 1.26% | -17.70% | -16.44 |
| Institutional Plus Shares | 3.09 | 1.27 | -17.69 | -16.42 |
| Bloomberg Barclays U.S. Treasury STRIPS 20–30 Year | | | | |
| Equal Par Bond Index | | | | -16.62 |
| General U.S. Treasury Funds Average | | | | -6.26 |
| General U.S. Treasury Funds Average: Derived from data provided by Lipper, a Thomson Reuters Company. |
Institutional Shares and Institutional Plus Shares are available to certain institutional investors who meet specific administrative, service, and
account-size criteria. The Vanguard ETF® Shares shown are traded on the NYSE Arca exchange and are available only through brokers. The
table provides ETF returns based on both the NYSE Arca market price and the net asset value for a share. U.S. Pat. Nos. 6,879,964; 7,337,138;
7,720,749; 7,925,573; 8,090,646; and 8,417,623.
For the ETF Shares, the market price is determined by the midpoint of the bid-offer spread as of the closing time of the New York Stock
Exchange (generally 4 p.m., Eastern time). The net asset value is also determined as of the NYSE closing time. For more information about
how the ETF Shares' market prices have compared with their net asset value, visit vanguard.com, select your ETF, and then select the Price
and Performance tab. The ETF premium/discount analysis there shows the percentages of days on which the ETF Shares' market price was
above or below the NAV.
1
| | | | |
| Expense Ratios | | | | |
| Your Fund Compared With Its Peer Group | | | | |
| | ETF | Institutional | Institutional | Peer Group |
| | Shares | Shares | Plus Shares | Average |
| Extended Duration Treasury Index Fund | 0.07% | 0.06% | 0.04% | 0.42% |
| The fund expense ratios shown are from the prospectus dated December 22, 2016, and represent estimated costs for the current fiscal year. |
| For the six months ended February 28, 2017, the annualized expense ratios were 0.07% for ETF Shares, 0.06% for Institutional Shares, and |
| 0.04% for Institutional Plus Shares. |
| |
| Peer group: General U.S. Treasury Funds. |
2
Chairman’s Perspective

Bill McNabb
Chairman and Chief Executive Officer
Dear Shareholder,
More than a decade ago, a Vanguard client asked us to help improve its defined contribution retirement plan. New hires were participating in the plan at lower rates than in previous years, and the client wanted to reverse this trend. Another priority was to help more participants invest their retirement savings in balanced portfolios.
The overall goal of this longtime client: Give employees a better chance to achieve financial security in retirement.
Today, that plan automatically enrolls employees at a 5% contribution rate, puts them in a low-cost target-date fund that takes on less risk as they near retirement, and offers a comprehensive suite of advice services. On top of that, employees get an employer contribution of 5% and are eligible for a company match.
Because of this combination of attractive features and generous employer contributions, nearly all new hires now participate in the plan, 81% of plan participants invest their retirement savings in balanced portfolios, and 87% of participants meet or exceed Vanguard’s recommended total retirement savings target. (Vanguard generally recommends that retirement investors save 12%–15% of pay, including company matches.)
3
Changing the retirement landscape
Am I singling out an isolated Vanguard success story? Absolutely not.
Stories like these are becoming increasingly common with employer-based retirement plans, particularly among large and midsize companies. Solutions such as automatic enrollment, automatic contribution increases, and default investment in target-date funds are having a positive effect.
Insights from the relatively new discipline of behavioral finance have contributed to the advances. Simply put, retirement plans are making natural human inertia work for future retirees, rather than against them, by putting savings on autopilot as much as possible.
More than 60% of Vanguard participants are in plans with automatic enrollment, which has led to a big jump in participation. Today, more than four-fifths of eligible employees are saving for retirement, compared with only two-thirds ten years ago.
In addition, many plans have adopted automatic-escalation features, which increase plan contributions at regular intervals until a maximum level is reached or an employee opts out. Automatic increases are a crucial tool for boosting retirement savings rates.
The growing use of target-date funds is another enormous benefit. More than 70% of all participants in Vanguard plans invest at least part of their retirement savings in
| | | |
| Market Barometer | | | |
| | Total Returns |
| | | Periods Ended February 28, 2017 |
| | Six | One | Five Years |
| | Months | Year | (Annualized) |
| Stocks | | | |
| Russell 1000 Index (Large-caps) | 10.10% | 25.53% | 13.94% |
| Russell 2000 Index (Small-caps) | 12.61 | 36.11 | 12.89 |
| Russell 3000 Index (Broad U.S. market) | 10.29 | 26.29 | 13.85 |
| FTSE All-World ex US Index (International) | 5.40 | 19.87 | 4.00 |
| |
| Bonds | | | |
| Bloomberg Barclays U.S. Aggregate Bond Index | | | |
| (Broad taxable market) | -2.19% | 1.42% | 2.24% |
| Bloomberg Barclays Municipal Bond Index | | | |
| (Broad tax-exempt market) | -2.80 | 0.25 | 3.07 |
| Citigroup Three-Month U.S. Treasury Bill Index | 0.19 | 0.32 | 0.10 |
| |
| CPI | | | |
| Consumer Price Index | 1.14% | 2.74% | 1.36% |
4
these age-appropriate, diversified strategies. And nearly 50% of Vanguard participants are invested solely in a single target-date fund.
Consider a do-it-yourself autopilot
But what if you don’t have access to a world-class, employer-based retirement plan? Unfortunately, not everyone does, which is an important policy issue.
However, you can still put the features of these plans to work. For example, you can set up automatic contributions from your paycheck to an IRA. And you can adopt your own automatic escalation by investing any pay raises.
You can also take a page from top-quality retirement plans by considering a low-cost, globally diversified target-date fund. The beauty of this approach is that you don’t need to remember to rebalance your portfolio—the fund does it for you.
Of course, you can take a more active role in picking your own investments, and this can be a good choice for some. But keep in mind the lessons from successful employer-based plans: Busy workers, faced with a lot of competing priorities, are often best served by putting their retirement savings on autopilot.
Winning by default
In highlighting some recent successes in retirement savings, I don’t want to minimize the challenges we still face. We’re living in a slow-growth, uncertain world, and investment returns for both stocks and bonds could well be modest in the coming decade.
But I believe the innovations we’ve seen in the last ten years in many retirement plans—you might call it the “default revolution”—point the way toward a solution. And that even goes for people whose employers don’t have a world-class retirement plan.
As always, thank you for investing with Vanguard.
Sincerely,

F. William McNabb III
Chairman and Chief Executive Officer
March 14, 2017
5
Extended Duration Treasury Index Fund
Fund Profile
As of February 28, 2017
| | | |
| Share-Class Characteristics | | |
| |
| | | | Institutional |
| | ETF | Institutional | Plus |
| | Shares | Shares | Shares |
| Ticker Symbol | EDV | VEDTX | VEDIX |
| Expense Ratio1 | 0.07% | 0.06% | 0.04% |
| 30-Day SEC Yield | 3.05% | 3.06% | 3.09% |
| | |
| Financial Attributes | | |
| |
| |
| | | Bloomberg |
| | | Barclays |
| | | Treasury |
| | | STRIPS |
| | | 20–30 Year |
| | Fund | Index |
| |
| Number of Bonds | 77 | 76 |
| |
| Yield to Maturity | | |
| (before expenses) | 3.1% | 3.1% |
| |
| Average Coupon | 0.0% | 0.0% |
| |
| Average Duration | 24.4 years | 24.6 years |
| |
| Average Effective | | |
| Maturity | 24.8 years | 22.4 years |
| |
| Short-Term Reserves | 0.0% | — |
| |
| Sector Diversification (% of portfolio) | |
| Treasury/Agency | 100.0% |
| The agency and mortgage-backed securities sectors may include |
| issues from government-sponsored enterprises; such issues are |
| generally not backed by the full faith and credit of the U.S. |
| government. | |
| |
| Volatility Measures | |
| | Bloomberg |
| | Barclays |
| | Treasury |
| | STRIPS |
| | 20–30 Year |
| | Index |
| R-Squared | 0.99 |
| Beta | 1.05 |
| These measures show the degree and timing of the fund’s |
| fluctuations compared with the index over 36 months. |
| |
| Distribution by Effective Maturity | |
| (% of portfolio) | |
| 10 - 20 Years | 3.6% |
| 20 - 30 Years | 96.4% |
| |
| Distribution by Credit Quality (% of portfolio) |
| U.S. Government | 100.0% |
Credit-quality ratings are obtained from Barclays and are from Moody's, Fitch, and S&P. When ratings from all three agencies are used, the median rating is shown. When ratings from two of the agencies are used, the lower rating for each issue is shown. "Not Rated" is used to classify securities for which a rating is not available. For more information about these ratings, see the Glossary entry for Credit Quality.
Investment Focus
1 The expense ratios shown are from the prospectus dated December 22, 2016, and represent estimated costs for the current fiscal year. For the six
months ended February 28, 2017, the annualized expense ratios were 0.07% for ETF Shares, 0.06% for Institutional Shares, and 0.04% for
Institutional Plus Shares.
6
Extended Duration Treasury Index Fund
Performance Summary
All of the returns in this report represent past performance, which is not a guarantee of future results that may be achieved by the fund. (Current performance may be lower or higher than the performance data cited. For performance data current to the most recent month-end, visit our website at vanguard.com/performance.) Note, too, that both investment returns and principal value can fluctuate widely, so an investor’s shares, when sold, could be worth more or less than their original cost. The returns shown do not reflect taxes that a shareholder would pay on fund distributions or on the sale of fund shares.
| | |
| Fiscal-Year Total Returns (%): December 6, 2007, Through February 28, 2017 | |
| | | Bloomberg |
| | | Barclays |
| | | Treasury |
| | | STRIPS |
| | | 20–30 Year |
| | ETF Shares Net Asset Value | Index |
| Fiscal Year | Total Returns | Total Returns |
| 2008 | 2.29% | 3.16% |
| 2009 | 7.98 | 8.39 |
| 2010 | 20.80 | 21.48 |
| 2011 | 1.33 | 1.99 |
| 2012 | 37.90 | 36.86 |
| 2013 | -21.34 | -20.48 |
| 2014 | 24.17 | 23.70 |
| 2015 | 5.90 | 6.38 |
| 2016 | 25.30 | 24.92 |
| 2017 | -16.43 | -16.62 |
| Note: For 2017, performance data reflect the six months ended February 28, 2017. |
Average Annual Total Returns: Periods Ended December 31, 2016
This table presents returns through the latest calendar quarter—rather than through the end of the fiscal period.
Securities and Exchange Commission rules require that we provide this information.
| | | | | | |
| | | | | Since Inception |
| | Inception Date | One Year | Five Years | Income | Capital | Total |
| ETF Shares | 12/6/2007 | | | | | |
| Market Price | | 1.69% | 2.86% | | | 7.71% |
| Net Asset Value | | 1.52 | 2.88 | | | 7.71 |
| Institutional Shares | 11/28/2007 | 1.53 | 2.91 | 3.66% | 3.83% | 7.49 |
| Fee-Adjusted Returns | | 1.03 | 2.81 | | | 7.43 |
| Institutional Plus Shares | 8/28/2013 | 1.55 | — | 3.50 | 6.06 | 9.56 |
| Fee-Adjusted Returns | | 1.04 | — | | | 9.40 |
Vanguard fund returns are adjusted to reflect the 0.50% fee on purchases of fund shares. The fee does not apply to the ETF Shares. The
Fiscal-Year Total Returns table is not adjusted for fees.
See Financial Highlights for dividend and capital gains information.
7
Extended Duration Treasury Index Fund
Financial Statements (unaudited)
Statement of Net Assets
As of February 28, 2017
The fund reports a complete list of its holdings in regulatory filings four times in each fiscal year, at the quarter-ends. For the second and fourth fiscal quarters, the lists appear in the fund’s semiannual and annual reports to shareholders. For the first and third fiscal quarters, the fund files the lists with the Securities and Exchange Commission on Form N-Q. Shareholders can look up the fund’s Forms N-Q on the SEC’s website at sec.gov. Forms N-Q may also be reviewed and copied at the SEC’s Public Reference Room (see the back cover of this report for further information).
| | | | |
| | | | Face | Market |
| | | Maturity | Amount | Value• |
| | Coupon | Date | ($000) | ($000) |
| U.S. Government and Agency Obligations (100.0%) | | | | |
| U.S. Government Securities (100.0%) | | | | |
| United States Treasury Strip Coupon | 0.000% | 2/15/37 | 5,015 | 2,765 |
| United States Treasury Strip Coupon | 0.000% | 5/15/37 | 62,080 | 33,916 |
| United States Treasury Strip Coupon | 0.000% | 8/15/37 | 49,990 | 27,041 |
| United States Treasury Strip Coupon | 0.000% | 11/15/37 | 51,930 | 27,843 |
| United States Treasury Strip Coupon | 0.000% | 2/15/38 | 47,960 | 25,516 |
| United States Treasury Strip Coupon | 0.000% | 5/15/38 | 59,185 | 31,179 |
| United States Treasury Strip Coupon | 0.000% | 8/15/38 | 38,155 | 19,909 |
| United States Treasury Strip Coupon | 0.000% | 11/15/38 | 38,520 | 19,913 |
| United States Treasury Strip Coupon | 0.000% | 2/15/39 | 30,860 | 15,799 |
| United States Treasury Strip Coupon | 0.000% | 5/15/39 | 38,880 | 19,738 |
| United States Treasury Strip Coupon | 0.000% | 8/15/39 | 29,955 | 15,066 |
| United States Treasury Strip Coupon | 0.000% | 11/15/39 | 31,890 | 15,868 |
| United States Treasury Strip Coupon | 0.000% | 2/15/40 | 34,380 | 16,964 |
| United States Treasury Strip Coupon | 0.000% | 5/15/40 | 16,215 | 7,922 |
| United States Treasury Strip Coupon | 0.000% | 8/15/40 | 30,850 | 14,921 |
| United States Treasury Strip Coupon | 0.000% | 11/15/40 | 33,215 | 15,912 |
| United States Treasury Strip Coupon | 0.000% | 2/15/41 | 44,505 | 21,136 |
| United States Treasury Strip Coupon | 0.000% | 5/15/41 | 38,660 | 18,176 |
| United States Treasury Strip Coupon | 0.000% | 8/15/41 | 42,735 | 19,885 |
| United States Treasury Strip Coupon | 0.000% | 11/15/41 | 39,750 | 18,335 |
| United States Treasury Strip Coupon | 0.000% | 2/15/42 | 42,565 | 19,480 |
| United States Treasury Strip Coupon | 0.000% | 5/15/42 | 40,080 | 18,193 |
| United States Treasury Strip Coupon | 0.000% | 8/15/42 | 47,080 | 21,190 |
| United States Treasury Strip Coupon | 0.000% | 11/15/42 | 56,690 | 25,307 |
| United States Treasury Strip Coupon | 0.000% | 2/15/43 | 54,625 | 24,138 |
| United States Treasury Strip Coupon | 0.000% | 5/15/43 | 54,125 | 23,739 |
| United States Treasury Strip Coupon | 0.000% | 8/15/43 | 43,290 | 18,794 |
| United States Treasury Strip Coupon | 0.000% | 11/15/43 | 47,565 | 20,490 |
| United States Treasury Strip Coupon | 0.000% | 2/15/44 | 49,075 | 21,003 |
| United States Treasury Strip Coupon | 0.000% | 5/15/44 | 43,845 | 18,665 |
| United States Treasury Strip Coupon | 0.000% | 8/15/44 | 43,930 | 18,625 |
| United States Treasury Strip Coupon | 0.000% | 11/15/44 | 25,275 | 10,621 |
| United States Treasury Strip Coupon | 0.000% | 2/15/45 | 26,870 | 11,224 |
| United States Treasury Strip Coupon | 0.000% | 5/15/45 | 31,965 | 13,270 |
| United States Treasury Strip Coupon | 0.000% | 8/15/45 | 36,355 | 15,025 |
| United States Treasury Strip Coupon | 0.000% | 11/15/45 | 34,360 | 14,125 |
| United States Treasury Strip Coupon | 0.000% | 2/15/46 | 30,425 | 12,422 |
8
| | | | |
| Extended Duration Treasury Index Fund | | | | |
| |
| |
| |
| | | | Face | Market |
| | | Maturity | Amount | Value• |
| | Coupon | Date | ($000) | ($000) |
| United States Treasury Strip Coupon | 0.000% | 5/15/46 | 27,150 | 11,008 |
| United States Treasury Strip Coupon | 0.000% | 8/15/46 | 16,225 | 6,546 |
| United States Treasury Strip Coupon | 0.000% | 11/15/46 | 1,150 | 462 |
| United States Treasury Strip Coupon | 0.000% | 2/15/47 | 1,150 | 459 |
| United States Treasury Strip Principal | 0.000% | 5/15/37 | 42,950 | 24,639 |
| United States Treasury Strip Principal | 0.000% | 2/15/38 | 27,735 | 15,417 |
| United States Treasury Strip Principal | 0.000% | 5/15/38 | 41,005 | 22,569 |
| United States Treasury Strip Principal | 0.000% | 2/15/39 | 26,745 | 14,116 |
| United States Treasury Strip Principal | 0.000% | 5/15/39 | 27,175 | 14,144 |
| United States Treasury Strip Principal | 0.000% | 8/15/39 | 15,570 | 8,011 |
| United States Treasury Strip Principal | 0.000% | 11/15/39 | 31,125 | 15,844 |
| United States Treasury Strip Principal | 0.000% | 2/15/40 | 25,030 | 12,625 |
| United States Treasury Strip Principal | 0.000% | 5/15/40 | 23,860 | 11,893 |
| United States Treasury Strip Principal | 0.000% | 8/15/40 | 30,495 | 15,031 |
| United States Treasury Strip Principal | 0.000% | 11/15/40 | 32,395 | 15,826 |
| United States Treasury Strip Principal | 0.000% | 2/15/41 | 22,510 | 10,935 |
| United States Treasury Strip Principal | 0.000% | 5/15/41 | 25,400 | 12,214 |
| United States Treasury Strip Principal | 0.000% | 8/15/41 | 24,370 | 11,568 |
| United States Treasury Strip Principal | 0.000% | 11/15/41 | 22,985 | 10,808 |
| United States Treasury Strip Principal | 0.000% | 2/15/42 | 26,375 | 12,303 |
| United States Treasury Strip Principal | 0.000% | 5/15/42 | 50,310 | 23,276 |
| United States Treasury Strip Principal | 0.000% | 8/15/42 | 45,025 | 20,592 |
| United States Treasury Strip Principal | 0.000% | 11/15/42 | 41,355 | 18,778 |
| United States Treasury Strip Principal | 0.000% | 2/15/43 | 50,370 | 22,694 |
| United States Treasury Strip Principal | 0.000% | 5/15/43 | 55,545 | 24,822 |
| United States Treasury Strip Principal | 0.000% | 8/15/43 | 41,335 | 18,417 |
| United States Treasury Strip Principal | 0.000% | 11/15/43 | 40,530 | 17,944 |
| United States Treasury Strip Principal | 0.000% | 2/15/44 | 36,460 | 15,968 |
| United States Treasury Strip Principal | 0.000% | 5/15/44 | 35,455 | 15,379 |
| United States Treasury Strip Principal | 0.000% | 8/15/44 | 45,185 | 19,451 |
| United States Treasury Strip Principal | 0.000% | 11/15/44 | 42,220 | 17,980 |
| United States Treasury Strip Principal | 0.000% | 2/15/45 | 44,200 | 18,654 |
| United States Treasury Strip Principal | 0.000% | 5/15/45 | 49,725 | 20,838 |
| United States Treasury Strip Principal | 0.000% | 8/15/45 | 58,425 | 24,297 |
| United States Treasury Strip Principal | 0.000% | 11/15/45 | 57,770 | 23,843 |
| United States Treasury Strip Principal | 0.000% | 2/15/46 | 49,780 | 20,402 |
| United States Treasury Strip Principal | 0.000% | 5/15/46 | 57,105 | 23,235 |
| United States Treasury Strip Principal | 0.000% | 8/15/46 | 34,100 | 13,792 |
| United States Treasury Strip Principal | 0.000% | 11/15/46 | 32,750 | 13,195 |
| United States Treasury Strip Principal | 0.000% | 2/15/47 | 73,550 | 29,437 |
| Total U.S. Government and Agency Obligations (Cost $1,319,180) | | | 1,343,527 |
| |
| | | | Shares | |
| Temporary Cash Investment (0.0%) | | | | |
| Money Market Fund (0.0%) | | | | |
| 1 Vanguard Market Liquidity Fund (Cost $114) | 0.864% | | 1,140 | 114 |
| Total Investments (100.0%) (Cost $1,319,294) | | | | 1,343,641 |
9
| |
| Extended Duration Treasury Index Fund | |
| |
| |
| |
| |
| | Amount |
| | ($000) |
| Other Assets and Liabilities (0.0%) | |
| Other Assets | |
| Investment in Vanguard | 94 |
| Receivables for Investment Securities Sold | 45,957 |
| Receivables for Capital Shares Issued | 4 |
| Other Assets | 2 |
| Total Other Assets | 46,057 |
| Liabilities | |
| Payables for Investment Securities Purchased | (45,606) |
| Payables for Capital Shares Redeemed | (416) |
| Payables to Vanguard | (522) |
| Total Liabilities | (46,544) |
| Net Assets (100%) | 1,343,154 |
| |
| At February 28, 2017, net assets consisted of: | |
| | Amount |
| | ($000) |
| Paid-in Capital | 1,313,403 |
| Undistributed Net Investment Income | 6,038 |
| Accumulated Net Realized Losses | (634) |
| Unrealized Appreciation (Depreciation) | 24,347 |
| Net Assets | 1,343,154 |
| |
| ETF Shares—Net Assets | |
| Applicable to 3,800,000 outstanding $.001 par value shares of | |
| beneficial interest (unlimited authorization) | 427,055 |
| Net Asset Value Per Share—ETF Shares | $112.38 |
| |
| Institutional Shares—Net Assets | |
| Applicable to 16,984,497 outstanding $.001 par value shares of | |
| beneficial interest (unlimited authorization) | 576,497 |
| Net Asset Value Per Share—Institutional Shares | $33.94 |
| |
| Institutional Plus Shares—Net Assets | |
| Applicable to 3,985,661 outstanding $.001 par value shares of | |
| beneficial interest (unlimited authorization) | 339,602 |
| Net Asset Value Per Share—Institutional Plus Shares | $85.21 |
• See Note A in Notes to Financial Statements.
1 Affiliated money market fund available only to Vanguard funds and certain trusts and accounts managed by Vanguard. Rate shown is the
7-day yield.
See accompanying Notes, which are an integral part of the Financial Statements.
10
Extended Duration Treasury Index Fund
Statement of Operations
| |
| | Six Months Ended |
| | February 28, 2017 |
| | ($000) |
| Investment Income | |
| Income | |
| Interest1 | 19,060 |
| Total Income | 19,060 |
| Expenses | |
| The Vanguard Group—Note B | |
| Investment Advisory Services | 21 |
| Management and Administrative—ETF Shares | 124 |
| Management and Administrative—Institutional Shares | 148 |
| Management and Administrative—Institutional Plus Shares | 48 |
| Marketing and Distribution—ETF Shares | 18 |
| Marketing and Distribution—Institutional Shares | 7 |
| Marketing and Distribution—Institutional Plus Shares | 1 |
| Custodian Fees | 1 |
| Shareholders’ Reports—ETF Shares | 17 |
| Shareholders’ Reports—Institutional Shares | — |
| Shareholders’ Reports—Institutional Plus Shares | — |
| Trustees’ Fees and Expenses | 1 |
| Total Expenses | 386 |
| Net Investment Income | 18,674 |
| Realized Net Gain (Loss) on Investment Securities Sold1 | 22,281 |
| Change in Unrealized Appreciation (Depreciation) of Investment Securities | (277,808) |
| Net Increase (Decrease) in Net Assets Resulting from Operations | (236,853) |
| 1 Interest income and realized net gain (loss) from an affiliated company of the fund were $2,000 and $0, respectively. |
See accompanying Notes, which are an integral part of the Financial Statements.
11
Extended Duration Treasury Index Fund
Statement of Changes in Net Assets
| | |
| | Six Months Ended | Year Ended |
| | February 28, | August 31, |
| | 2017 | 2016 |
| | ($000) | ($000) |
| Increase (Decrease) in Net Assets | | |
| Operations | | |
| Net Investment Income | 18,674 | 35,248 |
| Realized Net Gain (Loss) | 22,281 | 45,970 |
| Change in Unrealized Appreciation (Depreciation) | (277,808) | 212,836 |
| Net Increase (Decrease) in Net Assets Resulting from Operations | (236,853) | 294,054 |
| Distributions | | |
| Net Investment Income | | |
| ETF Shares | (7,991) | (12,598) |
| Institutional Shares | (8,824) | (14,501) |
| Institutional Plus Shares | (3,421) | (7,073) |
| Realized Capital Gain1 | | |
| ETF Shares | (9,446) | (4,079) |
| Institutional Shares | (12,810) | (5,279) |
| Institutional Plus Shares | (4,467) | (2,699) |
| Total Distributions | (46,959) | (46,229) |
| Capital Share Transactions | | |
| ETF Shares | (66,545) | 154,937 |
| Institutional Shares | 36,268 | 70,728 |
| Institutional Plus Shares | 124,562 | (40,014) |
| Net Increase (Decrease) from Capital Share Transactions | 94,289 | 185,651 |
| Total Increase (Decrease) | (189,523) | 433,476 |
| Net Assets | | |
| Beginning of Period | 1,532,677 | 1,099,201 |
| End of Period2 | 1,343,154 | 1,532,677 |
| 1 Includes fiscal 2017 and 2016 short-term gain distributions totaling $372,000 and $289,000, respectively. Short-term gain distributions are |
| treated as ordinary income dividends for tax purposes. |
| 2 Net Assets—End of Period includes undistributed (overdistributed) net investment income of $6,038,000 and $7,600,000. |
See accompanying Notes, which are an integral part of the Financial Statements.
12
Extended Duration Treasury Index Fund
Financial Highlights
| | | | | | | |
| ETF Shares | | | | | | | |
| | Six Months | | | | | |
| | | Ended | | | | | |
| For a Share Outstanding | February 28, | | | Year Ended August 31, |
| Throughout Each Period | | 2017 | 2016 | 2015 | 2014 | 2013 | 2012 |
| Net Asset Value, Beginning of Period | $139.77 | $116.00 | $113.24 | $95.57 | $131.02 | $100.09 |
| Investment Operations | | | | | | | |
| Net Investment Income | | 1.660 | 3.420 | 3.524 | 3.311 | 3.695 | 3.566 |
| Net Realized and Unrealized Gain (Loss) | | | | | | |
| on Investments1 | | (24.746) | 25.019 | 3.113 | 18.824 | (30.430) | 33.594 |
| Total from Investment Operations | (23.086) | 28.439 | 6.637 | 22.135 | (26.735) | 37.160 |
| Distributions | | | | | | | |
| Dividends from Net Investment Income | (1.850) | (3.414) | (3.506) | (3.236) | (3.779) | (3.628) |
| Distributions from Realized Capital Gains | (2.454) | (1.255) | (.371) | (1.229) | (4.936) | (2.602) |
| Total Distributions | | (4.304) | (4.669) | (3.877) | (4.465) | (8.715) | (6.230) |
| Net Asset Value, End of Period | $112.38 | $139.77 | $116.00 | $113.24 | $95.57 | $131.02 |
| |
| Total Return | | -16.43% | 25.30% | 5.90% | 24.17% | -21.34% | 37.90% |
| |
| Ratios/Supplemental Data | | | | | | | |
| Net Assets, End of Period (Millions) | $427 | $615 | $365 | $249 | $158 | $203 |
| Ratio of Total Expenses to | | | | | | | |
| Average Net Assets | | 0.07% | 0.07% | 0.10% | 0.12% | 0.12% | 0.12% |
| Ratio of Net Investment Income to | | | | | | |
| Average Net Assets | | 2.86% | 2.77% | 2.93% | 3.59% | 3.15% | 3.06% |
| Portfolio Turnover Rate 2 | | 20% | 20% | 16% | 17% | 31% | 47% |
The expense ratio, net investment income ratio, and turnover rate for the current period have been annualized.
1 Includes increases from purchase and redemption fees of $0.20, $0.06, $0.05, $0.19, $0.10, and $0.18. Effective May 23, 2012, the
redemption fee was eliminated.
2 Excludes the value of portfolio securities received or delivered as a result of in-kind purchases or redemptions of the fund’s capital shares,
including ETF Creation Units.
See accompanying Notes, which are an integral part of the Financial Statements.
13
Extended Duration Treasury Index Fund
Financial Highlights
| | | | | | | |
| Institutional Shares | | | | | | | |
| | Six Months | | | | | |
| | | Ended | | | | | |
| For a Share Outstanding | February 28, | Year Ended August 31, |
| Throughout Each Period | | 2017 | 2016 | 2015 | 2014 | 2013 | 2012 |
| Net Asset Value, Beginning of Period | $42.20 | $35.02 | $34.18 | $28.85 | $39.55 | $30.19 |
| Investment Operations | | | | | | | |
| Net Investment Income | | .504 | 1.036 | 1.069 | 1.006 | 1.121 | 1.084 |
| Net Realized and Unrealized Gain (Loss) | | | | | | |
| on Investments1 | | (7.464) | 7.558 | .947 | 5.678 | (9.183) | 10.162 |
| Total from Investment Operations | (6.960) | 8.594 | 2.016 | 6.684 | (8.062) | 11.246 |
| Distributions | | | | | | | |
| Dividends from Net Investment Income | (.560) | (1.035) | (1.064) | (.983) | (1.148) | (1.101) |
| Distributions from Realized Capital Gains | (.740) | (. 379) | (.112) | (. 371) | (1.490) | (.785) |
| Total Distributions | | (1.300) | (1.414) | (1.176) | (1.354) | (2.638) | (1.886) |
| Net Asset Value, End of Period | $33.94 | $42.20 | $35.02 | $34.18 | $28.85 | $39.55 |
| |
| Total Return2 | | -16.44% | 25.33% | 5.89% | 24.27% | -21.30% | 37.92% |
| |
| Ratios/Supplemental Data | | | | | | | |
| Net Assets, End of Period (Millions) | $576 | $660 | $484 | $529 | $375 | $586 |
| Ratio of Total Expenses to | | | | | | | |
| Average Net Assets | | 0.06% | 0.06% | 0.08% | 0.10% | 0.10% | 0.10% |
| Ratio of Net Investment Income to | | | | | | |
| Average Net Assets | | 2.87% | 2.78% | 2.95% | 3.61% | 3.17% | 3.08% |
| Portfolio Turnover Rate 3 | | 20% | 20% | 16% | 17% | 31% | 47% |
The expense ratio, net investment income ratio, and turnover rate for the current period have been annualized.
1 Includes increases from purchase and redemption fees of $0.05, $0.02, $0.01, $0.06, $0.03, and $0.05. Effective May 23, 2012, the
redemption fee was eliminated.
2 Total returns do not include transaction fees that may have applied in the periods shown. Fund prospectuses provide information about any
applicable transaction fees.
3 Excludes the value of portfolio securities received or delivered as a result of in-kind purchases or redemptions of the fund’s capital shares,
including ETF Creation Units.
See accompanying Notes, which are an integral part of the Financial Statements.
14
Extended Duration Treasury Index Fund
Financial Highlights
| | | | | |
| Institutional Plus Shares | | | | | |
| | Six Months | | | | Aug. 28, |
| | Ended | | | | 20131 to |
| | February 28, | Year Ended August 31, | Aug. 31, |
| For a Share Outstanding Throughout Each Period | 2017 | 2016 | 2015 | 2014 | 2013 |
| Net Asset Value, Beginning of Period | $105.93 | $87.92 | $85.80 | $72.42 | $71.46 |
| Investment Operations | | | | | |
| Net Investment Income | 1.272 | 2.620 | 2.701 | 2.542 | — |
| Net Realized and Unrealized Gain (Loss) | | | | | |
| on Investments 2 | (18.716) | 18.958 | 2.389 | 14.260 | .960 |
| Total from Investment Operations | (17.444) | 21.578 | 5.090 | 16.802 | .960 |
| Distributions | | | | | |
| Dividends from Net Investment Income | (1.416) | (2.616) | (2.688) | (2.491) | — |
| Distributions from Realized Capital Gains | (1.860) | (.952) | (.282) | (.931) | — |
| Total Distributions | (3.276) | (3.568) | (2.970) | (3.422) | — |
| Net Asset Value, End of Period | $85.21 | $105.93 | $87.92 | $85.80 | $72.42 |
| |
| Total Return3 | -16.42% | 25.34% | 5.93% | 24.31% | 1.34% |
| |
| Ratios/Supplemental Data | | | | | |
| Net Assets, End of Period (Millions) | $340 | $258 | $250 | $324 | $25 |
| Ratio of Total Expenses to Average Net Assets | 0.04% | 0.04% | 0.06% | 0.08% | 0.08%4 |
| Ratio of Net Investment Income to | | | | | |
| Average Net Assets | 2.89% | 2.80% | 2.97% | 3.63% | 3.19%4 |
| Portfolio Turnover Rate 5 | 20% | 20% | 16% | 17% | 31% |
The expense ratio, net investment income ratio, and turnover rate for the current period have been annualized.
1 Inception.
2 Includes increases from purchase fees of $0.10, $0.05, $0.04, $0.15, and $0.07.
3 Total returns do not include transaction fees that may have applied in the periods shown. Fund prospectuses provide information about any
applicable transaction fees.
4 Annualized.
5 Excludes the value of portfolio securities received or delivered as a result of in-kind purchases or redemptions of the fund’s capital shares,
including ETF Creation Units.
See accompanying Notes, which are an integral part of the Financial Statements.
15
Extended Duration Treasury Index Fund
Notes to Financial Statements
Vanguard Extended Duration Treasury Index Fund is registered under the Investment Company Act of 1940 as an open-end investment company, or mutual fund. The fund offers three classes of shares: ETF Shares, Institutional Shares, and Institutional Plus Shares. ETF Shares are listed for trading on Nasdaq; they can be purchased and sold through a broker. Institutional Shares and Institutional Plus Shares are designed for investors who meet certain administrative, service, and account-size criteria.
A. The following significant accounting policies conform to generally accepted accounting principles for U.S. investment companies. The fund consistently follows such policies in preparing its financial statements.
1. Security Valuation: Securities are valued as of the close of trading on the New York Stock Exchange (generally 4 p.m., Eastern time) on the valuation date. Bonds and temporary cash investments are valued using the latest bid prices or using valuations based on a matrix system (which considers such factors as security prices, yields, maturities, and ratings), both as furnished by independent pricing services. Investments in Vanguard Market Liquidity Fund are valued at that fund’s net asset value. Securities for which market quotations are not readily available, or whose values have been affected by events occurring before the fund’s pricing time but after the close of the securities’ primary markets, are valued by methods deemed by the board of trustees to represent fair value.
2. Federal Income Taxes: The fund intends to continue to qualify as a regulated investment company and distribute all of its taxable income. Management has analyzed the fund’s tax positions taken for all open federal income tax years (August 31, 2013–2016), and for the period ended February 28, 2017, and has concluded that no provision for federal income tax is required in the fund’s financial statements.
3. Distributions: Distributions to shareholders are recorded on the ex-dividend date.
4. Credit Facility: The fund and certain other funds managed by The Vanguard Group (“Vanguard”) participate in a $3.1 billion committed credit facility provided by a syndicate of lenders pursuant to a credit agreement that may be renewed annually; each fund is individually liable for its borrowings, if any, under the credit facility. Borrowings may be utilized for temporary and emergency purposes, and are subject to the fund’s regulatory and contractual borrowing restrictions. The participating funds are charged administrative fees and an annual commitment fee of 0.10% of the undrawn amount of the facility; these fees are allocated to the funds based on a method approved by the fund’s board of trustees and included in Management and Administrative expenses on the fund’s Statement of Operations. Any borrowings under this facility bear interest at a rate based upon the higher of the one-month London Interbank Offered Rate, federal funds effective rate, or overnight bank funding rate plus an agreed-upon spread.
The fund had no borrowings outstanding at February 28, 2017, or at any time during the period then ended.
5. Other: Interest income includes income distributions received from Vanguard Market Liquidity Fund and is accrued daily. Premiums and discounts on debt securities purchased are amortized and accreted, respectively, to interest income over the lives of the respective securities. Security transactions are accounted for on the date securities are bought or sold. Costs used to determine realized gains (losses) on the sale of investment securities are those of the specific securities sold. Fees assessed on purchases of Institutional Shares and Institutional Plus Shares are credited to paid-in capital.
16
Extended Duration Treasury Index Fund
Each class of shares has equal rights as to assets and earnings, except that each class separately bears certain class-specific expenses related to maintenance of shareholder accounts (included in Management and Administrative expenses) and shareholder reporting. Marketing and distribution expenses are allocated to each class of shares based on a method approved by the board of trustees. Income, other non-class-specific expenses, and gains and losses on investments are allocated to each class of shares based on its relative net assets.
B. In accordance with the terms of a Funds’ Service Agreement (the “FSA”) between Vanguard and the fund, Vanguard furnishes to the fund investment advisory, corporate management, administrative, marketing, and distribution services at Vanguard’s cost of operations (as defined by the FSA). These costs of operations are allocated to the fund based on methods and guidelines approved by the board of trustees. Vanguard does not require reimbursement in the current period for certain costs of operations (such as deferred compensation/benefits and risk/insurance costs); the fund’s liability for these costs of operations is included in Payables to Vanguard on the Statement of Net Assets.
Upon the request of Vanguard, the fund may invest up to 0.40% of its net assets as capital in Vanguard. At February 28, 2017, the fund had contributed to Vanguard capital in the amount of $94,000, representing 0.01% of the fund’s net assets and 0.04% of Vanguard’s capitalization. The fund’s trustees and officers are also directors and employees, respectively, of Vanguard.
C. Various inputs may be used to determine the value of the fund’s investments. These inputs are summarized in three broad levels for financial statement purposes. The inputs or methodologies used to value securities are not necessarily an indication of the risk associated with investing in those securities.
Level 1—Quoted prices in active markets for identical securities.
Level 2—Other significant observable inputs (including quoted prices for similar securities, interest rates, prepayment speeds, credit risk, etc.).
Level 3—Significant unobservable inputs (including the fund’s own assumptions used to determine the fair value of investments).
The following table summarizes the market value of the fund’s investments as of February 28, 2017, based on the inputs used to value them:
| | | |
| | Level 1 | Level 2 | Level 3 |
| Investments | ($000) | ($000) | ($000) |
| U.S. Government and Agency Obligations | — | 1,343,527 | — |
| Temporary Cash Investments | 114 | — | — |
| Total | 114 | 1,343,527 | — |
D. Distributions are determined on a tax basis and may differ from net investment income and realized capital gains for financial reporting purposes. Differences may be permanent or temporary. Permanent differences are reclassified among capital accounts in the financial statements to reflect their tax character. Temporary differences arise when certain items of income, expense, gain, or loss are recognized in different periods for financial statement and tax purposes. These differences will reverse at some time in the future. Differences in classification may also result from the treatment of short-term gains as ordinary income for tax purposes. The fund’s tax-basis capital gains and losses are determined only at the end of each fiscal year.
17
Extended Duration Treasury Index Fund
During the six months ended February 28, 2017, the fund realized $22,386,000 of net capital gains resulting from in-kind redemptions—in which shareholders exchanged fund shares for securities held by the fund rather than for cash. Because such gains are not taxable to the fund, and are not distributed to shareholders, they have been reclassified from accumulated net realized gains to paid-in capital.
At February 28, 2017, the cost of investment securities for tax purposes was $1,319,294,000. Net unrealized appreciation of investment securities for tax purposes was $24,347,000, consisting of unrealized gains of $58,255,000 on securities that had risen in value since their purchase and $33,908,000 in unrealized losses on securities that had fallen in value since their purchase.
E. During the six months ended February 28, 2017, the fund purchased $322,030,000 of investment securities and sold $274,848,000 of investment securities, other than temporary cash investments. Purchases and sales include $11,217,000 and $139,305,000, respectively, in connection with in-kind purchases and redemptions of the fund’s capital shares.
F. Capital share transactions for each class of shares were:
| | | | |
| | Six Months Ended | Year Ended |
| | February 28, 2017 | August 31, 2016 |
| | Amount | Shares | Amount | Shares |
| | ($000) | (000) | ($000) | (000) |
| ETF Shares | | | | |
| Issued1 | 73,391 | 550 | 241,630 | 1,950 |
| Issued in Lieu of Cash Distributions | — | — | — | — |
| Redeemed | (139,936) | (1,150) | (86,693) | (700) |
| Net Increase (Decrease)—ETF Shares | (66,545) | (600) | 154,937 | 1,250 |
| Institutional Shares | | | | |
| Issued1 | 229,707 | 6,844 | 120,369 | 3,103 |
| Issued in Lieu of Cash Distributions | 21,073 | 631 | 19,486 | 545 |
| Redeemed | (214,512) | (6,135) | (69,127) | (1,832) |
| Net Increase (Decrease) —Institutional Shares | 36,268 | 1,340 | 70,728 | 1,816 |
| Institutional Plus Shares | | | | |
| Issued1 | 122,156 | 1,517 | — | — |
| Issued in Lieu of Cash Distributions | 7,888 | 94 | 9,772 | 109 |
| Redeemed | (5,482) | (56) | (49,786) | (516) |
| Net Increase (Decrease) —Institutional Plus Shares | 124,562 | 1,555 | (40,014) | (407) |
| 1 Includes purchase fees for fiscal 2017 and 2016 of $2,020,000 and $653,000, respectively (fund totals). |
G. Management has determined that no material events or transactions occurred subsequent to
February 28, 2017, that would require recognition or disclosure in these financial statements.
18
About Your Fund’s Expenses
As a shareholder of the fund, you incur ongoing costs, which include costs for portfolio management, administrative services, and shareholder reports (like this one), among others. Operating expenses, which are deducted from a fund’s gross income, directly reduce the investment return of the fund.
A fund’s expenses are expressed as a percentage of its average net assets. This figure is known as the expense ratio. The following examples are intended to help you understand the ongoing costs (in dollars) of investing in your fund and to compare these costs with those of other mutual funds. The examples are based on an investment of $1,000 made at the beginning of the period shown and held for the entire period.
The accompanying table illustrates your fund’s costs in two ways:
• Based on actual fund return. This section helps you to estimate the actual expenses that you paid over the period. The ”Ending Account Value“ shown is derived from the fund‘s actual return, and the third column shows the dollar amount that would have been paid by an investor who started with $1,000 in the fund. You may use the information here, together with the amount you invested, to estimate the expenses that you paid over the period.
To do so, simply divide your account value by $1,000 (for example, an $8,600 account value divided by $1,000 = 8.6), then multiply the result by the number given for your fund under the heading ”Expenses Paid During Period.“
• Based on hypothetical 5% yearly return. This section is intended to help you compare your fund‘s costs with those of other mutual funds. It assumes that the fund had a yearly return of 5% before expenses, but that the expense ratio is unchanged. In this case—because the return used is not the fund’s actual return—the results do not apply to your investment. The example is useful in making comparisons because the Securities and Exchange Commission requires all mutual funds to calculate expenses based on a 5% return. You can assess your fund’s costs by comparing this hypothetical example with the hypothetical examples that appear in shareholder reports of other funds.
Note that the expenses shown in the table are meant to highlight and help you compare ongoing costs only and do not reflect transaction costs incurred by the fund for buying and selling securities. Further, the expenses do not include any purchase, redemption, or account service fees described in the fund prospectus. If such fees were applied to your account, your costs would be higher. Your fund does not carry a “sales load.”
The calculations assume no shares were bought or sold during the period. Your actual costs may have been higher or lower, depending on the amount of your investment and the timing of any purchases or redemptions.
You can find more information about the fund’s expenses, including annual expense ratios, in the Financial Statements section of this report. For additional information on operating expenses and other shareholder costs, please refer to your fund’s current prospectus.
19
| | | |
| Six Months Ended February 28, 2017 | | | |
| | Beginning | Ending | Expenses |
| | Account Value | Account Value | Paid During |
| Extended Duration Treasury Index Fund | 8/31/2016 | 2/28/2017 | Period |
| Based on Actual Fund Return | | | |
| ETF Shares | $1,000.00 | $835.67 | $0.32 |
| Institutional Shares | 1,000.00 | 835.60 | 0.27 |
| Institutional Plus Shares | 1,000.00 | 835.83 | 0.18 |
| Based on Hypothetical 5% Yearly Return | | | |
| ETF Shares | $1,000.00 | $1,024.45 | $0.35 |
| Institutional Shares | 1,000.00 | 1,024.50 | 0.30 |
| Institutional Plus Shares | 1,000.00 | 1,024.60 | 0.20 |
The calculations are based on expenses incurred in the most recent six-month period. The fund’s annualized six-month expense ratios for that
period are 0.07% for ETF Shares, 0.06% for Institutional Shares, and 0.04% for Institutional Plus Shares. The dollar amounts shown as
“Expenses Paid” are equal to the annualized expense ratio multiplied by the average account value over the period, multiplied by the number
of days in the most recent six-month period, then divided by the number of days in the most recent 12-month period (181/365).
20
Glossary
30-Day SEC Yield. A fund’s 30-day SEC yield is derived using a formula specified by the U.S. Securities and Exchange Commission. Under the formula, data related to the fund’s security holdings in the previous 30 days are used to calculate the fund’s hypothetical net income for that period, which is then annualized and divided by the fund’s estimated average net assets over the calculation period. For the purposes of this calculation, a security’s income is based on its current market yield to maturity (for bonds), its actual income (for asset-backed securities), or its projected dividend yield (for stocks). Because the SEC yield represents hypothetical annualized income, it will differ—at times significantly—from the fund’s actual experience. As a result, the fund’s income distributions may be higher or lower than implied by the SEC yield.
Average Coupon. The average interest rate paid on the fixed income securities held by a fund. It is expressed as a percentage of face value.
Average Duration. An estimate of how much the value of the bonds held by a fund will fluctuate in response to a change in interest rates. To see how the value could change, multiply the average duration by the change in rates. If interest rates rise by 1 percentage point, the value of the bonds in a fund with an average duration of five years would decline by about 5%. If rates decrease by a percentage point, the value would rise by 5%.
Average Effective Maturity. The average length of time until fixed income securities held by a fund reach maturity and are repaid, taking into consideration the possibility that the issuer may call the bond before its maturity date. The figure reflects the proportion of fund assets represented by each security; it also reflects any futures contracts held. In general, the longer the average effective maturity, the more a fund’s share price will fluctuate in response to changes in market interest rates.
Beta. A measure of the magnitude of a fund’s past share-price fluctuations in relation to the ups and downs of a given market index. The index is assigned a beta of 1.00. Compared with a given index, a fund with a beta of 1.20 typically would have seen its share price rise or fall by 12% when the index rose or fell by 10%. For this report, beta is based on returns over the past 36 months for both the fund and the index. Note that a fund’s beta should be reviewed in conjunction with its R-squared (see definition). The lower the R-squared, the less correlation there is between the fund and the index, and the less reliable beta is as an indicator of volatility.
Credit Quality. Credit-quality ratings are measured on a scale that generally ranges from AAA (highest) to D (lowest). U.S. Treasury, U.S. Agency, and U.S. Agency mortgage-backed securities appear under “U.S. Government.” Credit-quality ratings are obtained from Barclays and are from Moody’s, Fitch, and S&P. When ratings from all three agencies are used, the median rating is shown. When ratings from two of the agencies are used, the lower rating for each issue is shown. “Not Rated” is used to classify securities for which a rating is not available.
Distribution by Coupon. A breakdown of the securities in a fund according to coupon rate—the interest rate that an issuer promises to pay, expressed as an annual percentage of face value. Securities with unusually high coupon rates may be subject to call risk, the possibility that they will be redeemed (or “called”) early by the issuer.
Expense Ratio. A fund’s total annual operating expenses expressed as a percentage of the fund’s average net assets. The expense ratio includes management and administrative expenses, but does not include the transaction costs of buying and selling portfolio securities.
21
Inception Date. The date on which the assets of a fund (or one of its share classes) are first invested in accordance with the fund’s investment objective. For funds with a subscription period, the inception date is the day after that period ends. Investment performance is measured from the inception date.
R-Squared. A measure of how much of a fund’s past returns can be explained by the returns from the market in general, as measured by a given index. If a fund’s total returns were precisely synchronized with an index’s returns, its R-squared would be 1.00. If the fund’s returns bore no relationship to the index’s returns, its R-squared would be 0. For this report, R-squared is based on returns over the past 36 months for both the fund and the index.
Short-Term Reserves. The percentage of a fund invested in highly liquid, short-term securities that can be readily converted to cash.
Yield to Maturity. The rate of return an investor would receive if the fixed income securities held by a fund were held to their maturity dates.
22
Vanguard Extended Duration Treasury Index Fund is not sponsored, endorsed, issued, sold, or promoted by Barclays Risk
Analytics and Index Solutions Limited or any of its affiliates (“Barclays”). Barclays makes no representation or warranty,
express or implied, to the owners or purchasers of Vanguard Extended Duration Treasury Index Fund or any member of the
public regarding the advisability of investing in securities generally or in Vanguard Extended Duration Treasury Index Fund
particularly or the ability of the Barclays index to track general bond market performance. Barclays has not passed on the
legality or suitability of Vanguard Extended Duration Treasury Index Fund with respect to any person or entity. Barclays’ only
relationship to Vanguard and Vanguard Extended Duration Treasury Index Fund is the licensing of the Barclays index, which is
determined, composed, and calculated by Barclays without regard to Vanguard or Vanguard Extended Duration Treasury Index
Fund or any owners or purchasers of Vanguard Extended Duration Treasury Index Fund. Barclays has no obligation to take the
needs of Vanguard, Vanguard Extended Duration Treasury Index Fund, or the owners of Vanguard Extended Duration Treasury
Index Fund into consideration in determining, composing, or calculating the Barclays index. Barclays is not responsible for and
has not participated in the determination of the timing of, prices at, or quantities of Vanguard Extended Duration Treasury
Index Fund to be issued. Barclays has no obligation or liability in connection with the administration, marketing, or trading
of Vanguard Extended Duration Treasury Index Fund.
BARCLAYS SHALL HAVE NO LIABILITY TO THIRD PARTIES FOR THE QUALITY, ACCURACY, AND/OR COMPLETENESS OF THE
INDEX OR ANY DATA INCLUDED THEREIN OR FOR INTERRUPTIONS IN THE DELIVERY OF THE INDEX. BARCLAYS MAKES NO
WARRANTY, EXPRESS OR IMPLIED, AS TO RESULTS TO BE OBTAINED BY OWNERS OF VANGUARD EXTENDED DURATION
TREASURY INDEX FUND OR ANY OTHER PERSON OR ENTITY FROM THE USE OF THE INDEX OR ANY DATA INCLUDED
THEREIN IN CONNECTION WITH THE RIGHTS LICENSED HEREUNDER OR FOR ANY OTHER USE. BARCLAYS RESERVES THE
RIGHT TO CHANGE THE METHODS OF CALCULATION OR PUBLICATION, OR TO CEASE THE CALCULATION OR PUBLICATION
OF THE BLOOMBERG BARCLAYS U.S. TREASURY STRIPS 20–30 YEAR EQUAL PAR BOND INDEX, AND BARCLAYS SHALL NOT
BE LIABLE FOR ANY MISCALCULATION OF OR ANY INCORRECT, DELAYED, OR INTERRUPTED PUBLICATION WITH RESPECT
TO THE BLOOMBERG BARCLAYS U.S. TREASURY STRIPS 20–30 YEAR EQUAL PAR BOND INDEX. BARCLAYS MAKES NO
EXPRESS OR IMPLIED WARRANTIES, AND HEREBY EXPRESSLY DISCLAIMS ALL WARRANTIES OF MERCHANTABILITY
OR FITNESS FOR A PARTICULAR PURPOSE OR USE WITH RESPECT TO THE INDEX OR ANY DATA INCLUDED THEREIN.
BARCLAYS SHALL NOT BE LIABLE FOR ANY DAMAGES, INCLUDING, WITHOUT LIMITATION, ANY INDIRECT OR
CONSEQUENTIAL DAMAGES RESULTING FROM THE USE OF THE INDEX OR ANY DATA INCLUDED THEREIN.
© 2017 Barclays. Used with Permission.
Source: Barclays Global Family of Indices. Copyright 2017, Barclays. All rights reserved.
23
The People Who Govern Your Fund
The trustees of your mutual fund are there to see that the fund is operated and managed in your best interests since, as a shareholder, you are a part owner of the fund. Your fund’s trustees also serve on the board of directors of The Vanguard Group, Inc., which is owned by the Vanguard funds and provides services to them on an at-cost basis.
A majority of Vanguard’s board members are independent, meaning that they have no affiliation with Vanguard or the funds they oversee, apart from the sizable personal investments they have made as private individuals. The independent board members have distinguished backgrounds in business, academia, and public service. Each of the trustees and executive officers oversees 195 Vanguard funds.
The following table provides information for each trustee and executive officer of the fund. The mailing address of the trustees and officers is P.O. Box 876, Valley Forge, PA 19482. More information about the trustees is in the Statement of Additional Information, which can be obtained, without charge, by contacting Vanguard at 800-662-7447, or online at vanguard.com.
InterestedTrustee1
F. William McNabb III
Born 1957. Trustee Since July 2009. Chairman of the Board. Principal Occupation(s) During the Past Five Years and Other Experience: Chairman of the Board of The Vanguard Group, Inc., and of each of the investment companies served by The Vanguard Group, since January 2010; Director of The Vanguard Group since 2008; Chief Executive Officer and President of The Vanguard Group, and of each of the investment companies served by The Vanguard Group, since 2008; Director of Vanguard Marketing Corporation; Managing Director of The Vanguard Group (1995–2008).
IndependentTrustees
Emerson U. Fullwood
Born 1948. Trustee Since January 2008. Principal Occupation(s) During the Past Five Years and Other Experience: Executive Chief Staff and Marketing Officer for North America and Corporate Vice President (retired 2008) of Xerox Corporation (document management products and services); Executive in Residence and 2009–2010 Distinguished Minett Professor at the Rochester Institute of Technology; Lead Director of SPX FLOW, Inc. (multi-industry manufacturing); Director of the United Way of Rochester, the University of Rochester Medical Center, Monroe Community College Foundation, North Carolina A&T University, and Roberts Wesleyan College.
Rajiv L. Gupta
Born 1945. Trustee Since December 2001.2 Principal Occupation(s) During the Past Five Years and Other Experience: Chairman and Chief Executive Officer (retired 2009) and President (2006–2008) of Rohm and Haas Co. (chemicals); Director of Arconic Inc.
(diversified manufacturer), HP Inc. (printer and personal computer manufacturing), and Delphi Automotive plc (automotive components); Senior Advisor at New Mountain Capital.
Amy Gutmann
Born 1949. Trustee Since June 2006. Principal Occupation(s) During the Past Five Years and Other Experience: President of the University of Pennsylvania; Christopher H. Browne Distinguished Professor of Political Science, School of Arts and Sciences, and Professor of Communication, Annenberg School for Communication, with secondary faculty appointments in the Department of Philosophy, School of Arts and Sciences, and at the Graduate School of Education, University of Pennsylvania; Trustee of the National Constitution Center; Chair of the Presidential Commission for the Study of Bioethical Issues.
JoAnn Heffernan Heisen
Born 1950. Trustee Since July 1998. Principal Occupation(s) During the Past Five Years and Other Experience: Corporate Vice President and Chief Global Diversity Officer (retired 2008) and Member of the Executive Committee (1997–2008) of Johnson & Johnson (pharmaceuticals/medical devices/consumer products); Director of Skytop Lodge Corporation (hotels) and the Robert Wood Johnson Foundation; Member of the Advisory Board of the Institute for Women’s Leadership at Rutgers University.
F. Joseph Loughrey
Born 1949. Trustee Since October 2009. Principal Occupation(s) During the Past Five Years and Other Experience: President and Chief Operating Officer (retired 2009) of Cummins Inc. (industrial machinery); Chairman of the Board of Hillenbrand, Inc. (specialized consumer services), Oxfam America, and the Lumina
Foundation for Education; Director of SKF AB (industrial machinery), Hyster-Yale Materials Handling, Inc. (forklift trucks), and the V Foundation for Cancer Research; Member of the Advisory Council for the College of Arts and Letters and Chair of the Advisory Board to the Kellogg Institute for International Studies, both at the University of Notre Dame.
Mark Loughridge
Born 1953. Trustee Since March 2012. Principal Occupation(s) During the Past Five Years and Other Experience: Senior Vice President and Chief Financial Officer (retired 2013) at IBM (information technology services); Fiduciary Member of IBM’s Retirement Plan Committee (2004–2013); Director of the Dow Chemical Company; Member of the Council on Chicago Booth.
Scott C. Malpass
Born 1962. Trustee Since March 2012. Principal Occupation(s) During the Past Five Years and Other Experience: Chief Investment Officer and Vice President at the University of Notre Dame; Assistant Professor of Finance at the Mendoza College of Business at Notre Dame; Member of the Notre Dame 403(b) Investment Committee, the Board of Advisors for Spruceview Capital Partners, and the Investment Advisory Committee of Major League Baseball; Board Member of TIFF Advisory Services, Inc., and Catholic Investment Services, Inc. (investment advisors); Member of the Board of Superintendence of the Institute for the Works of Religion.
André F. Perold
Born 1952. Trustee Since December 2004. Principal Occupation(s) During the Past Five Years and Other Experience: George Gund Professor of Finance and Banking, Emeritus at the Harvard Business School (retired 2011); Chief Investment Officer and Co-Managing Partner of HighVista Strategies LLC (private investment firm); Overseer of the Museum of Fine Arts Boston.
Peter F. Volanakis
Born 1955. Trustee Since July 2009. Principal Occupation(s) During the Past Five Years and Other Experience: President and Chief Operating Officer (retired 2010) of Corning Incorporated (communications equipment); Chairman of the Board of Trustees of Colby-Sawyer College; Member of the Board of Hypertherm, Inc. (industrial cutting systems, software, and consumables).
Executive Officers
Glenn Booraem
Born 1967. Investment Stewardship Officer Since February 2017. Principal Occupation(s) During the Past Five Years and Other Experience: Principal of The Vanguard Group, Inc.; Treasurer (2015–2017), Controller (2010–2015), and Assistant Controller (2001–2010) of each of the investment companies served by The Vanguard Group.
Thomas J. Higgins
Born 1957. Chief Financial Officer Since September 2008. Principal Occupation(s) During the Past Five Years and Other Experience: Principal of The Vanguard Group, Inc.; Chief Financial Officer of each of the investment companies served by The Vanguard Group; Treasurer of each of the investment companies served by The Vanguard Group (1998–2008).
Peter Mahoney
Born 1974. Controller Since May 2015. Principal Occupation(s) During the Past Five Years and Other Experience: Principal of The Vanguard Group, Inc.; Controller of each of the investment companies served by The Vanguard Group; Head of International Fund Services at The Vanguard Group (2008–2014).
Anne E. Robinson
Born 1970. Secretary Since September 2016. Principal Occupation(s) During the Past Five Years and Other Experience: Managing Director of The Vanguard Group, Inc.; General Counsel of The Vanguard Group; Secretary of The Vanguard Group and of each of the investment companies served by The Vanguard Group; Director and Senior Vice President of Vanguard Marketing Corporation; Managing Director and General Counsel of Global Cards and Consumer Services at Citigroup (2014–2016); Counsel at American Express (2003–2014).
Michael Rollings
Born 1963. Treasurer Since February 2017. Principal Occupation(s) During the Past Five Years and Other Experience: Managing Director of The Vanguard Group, Inc.; Treasurer of each of the investment companies served by The Vanguard Group; Executive Vice President and Chief Financial Officer of MassMutual Financial Group (2006–2016).
| |
| Vanguard Senior Management Team |
| Mortimer J. Buckley | James M. Norris |
| John James | Thomas M. Rampulla |
| Martha G. King | Glenn W. Reed |
| John T. Marcante | Karin A. Risi |
| Chris D. McIsaac | |
| |
| Chairman Emeritus and Senior Advisor |
| John J. Brennan | |
| Chairman, 1996–2009 | |
| Chief Executive Officer and President, 1996–2008 |
| |
| Founder | |
| John C. Bogle | |
| Chairman and Chief Executive Officer, 1974–1996 |
1 Mr. McNabb is considered an “interested person,” as defined in the Investment Company Act of 1940, because he is an officer of the Vanguard funds.
2 December 2002 for Vanguard Equity Income Fund, the Vanguard Municipal Bond Funds, and the Vanguard State Tax-Exempt Funds.
|  |
| | P.O. Box 2600 |
| | Valley Forge, PA 19482-2600 |
| |
| |
| |
| Connect with Vanguard® > vanguard.com |
| |
| |
| |
| Fund Information > 800-662-7447 | |
| Direct Investor Account Services > 800-662-2739 | |
| Institutional Investor Services > 800-523-1036 | |
| Text Telephone for People | |
| Who Are Deaf or Hard of Hearing > 800-749-7273 | |
| |
| This material may be used in conjunction | |
| with the offering of shares of any Vanguard | |
| fund only if preceded or accompanied by | |
| the fund’s current prospectus. | |
| |
| All comparative mutual fund data are from Lipper, a | |
| Thomson Reuters Company, or Morningstar, Inc., unless | |
| otherwise noted. | |
| |
| You can obtain a free copy of Vanguard’s proxy voting | |
| guidelines by visiting vanguard.com/proxyreporting or by | |
| calling Vanguard at 800-662-2739. The guidelines are | |
| also available from the SEC’s website, sec.gov. In | |
| addition, you may obtain a free report on how your fund | |
| voted the proxies for securities it owned during the 12 | |
| months ended June 30. To get the report, visit either | |
| vanguard.com/proxyreporting or sec.gov. | |
| |
| You can review and copy information about your fund at | |
| the SEC’s Public Reference Room in Washington, D.C. To | |
| find out more about this public service, call the SEC at | |
| 202-551-8090. Information about your fund is also | |
| available on the SEC’s website, and you can receive | |
| copies of this information, for a fee, by sending a | |
| request in either of two ways: via email addressed to | |
| publicinfo@sec.gov or via regular mail addressed to the | |
| Public Reference Section, Securities and Exchange | |
| Commission, Washington, DC 20549-1520. | |
| |
| | © 2017 The Vanguard Group, Inc. |
| | All rights reserved. |
| | Vanguard Marketing Corporation, Distributor. |
| |
| | Q12752 042017 |

Semiannual Report | February 28, 2017
Vanguard Mega Cap Index Funds
Vanguard Mega Cap Index Fund
Vanguard Mega Cap Growth Index Fund
Vanguard Mega Cap Value Index Fund
A new format, unwavering commitment
As you begin reading this report, you’ll notice that we’ve made some improvements to the opening sections—based on feedback from you, our clients.
Page 1 starts with a new ”Your Fund’s Performance at a Glance,” a concise, handy summary of how your fund performed during the period.
In the renamed ”Chairman’s Perspective,” Bill McNabb will focus on enduring principles and investment insights.
We’ve modified some tables, and eliminated some redundancy, but we haven’t removed any information.
At Vanguard, we’re always looking for better ways to communicate and to help you make sound investment decisions. Thank you for entrusting your assets to us.
| |
| Contents | |
| Your Fund’s Performance at a Glance. | 1 |
| Chairman’s Perspective. | 3 |
| Mega Cap Index Fund. | 6 |
| Mega Cap Growth Index Fund. | 22 |
| Mega Cap Value Index Fund. | 36 |
| About Your Fund’s Expenses. | 50 |
| Glossary. | 52 |
Please note: The opinions expressed in this report are just that—informed opinions. They should not be considered promises or advice.
Also, please keep in mind that the information and opinions cover the period through the date on the front of this report. Of course, the
risks of investing in your fund are spelled out in the prospectus.
See the Glossary for definitions of investment terms used in this report.
About the cover: No matter what language you speak, Vanguard has one consistent message and set of principles. Our primary
focus is on you, our clients. We conduct our business with integrity as a faithful steward of your assets. This message is shown
translated into seven languages, reflecting our expanding global presence.
Your Fund’s Performance at a Glance
• Value stocks generally outperformed their growth brethren over the six months ended February 28, 2017. This trend was reflected in the performance of the Vanguard Mega Cap Index Funds.
• Results for the half year ranged from about 11% for the Value Index Fund to about 9% for the Growth Index Fund. The Mega Cap Index Fund, which includes both value and growth stocks, returned about 10%.
• All three funds closely tracked their target indexes. The Mega Cap Index and Growth Index Funds exceeded the average returns of their peers, while the Value Index Fund slightly trailed its peers.
• Across all three funds, only the consumer services sector of the Value Index Fund posted negative returns.
• Financials was the top contributor for the Mega Cap Index and Value Index Funds, while technology contributed the most to the Growth Index Fund.
| |
| Total Returns: Six Months Ended February 28, 2017 | |
| | Total |
| | Returns |
| Vanguard Mega Cap Index Fund | |
| ETF Shares | |
| Market Price | 10.32% |
| Net Asset Value | 10.32 |
| Institutional Shares | 10.33 |
| CRSP US Mega Cap Index | 10.36 |
| Large-Cap Core Funds Average | 9.23 |
| Large-Cap Core Funds Average: Derived from data provided by Lipper, a Thomson Reuters Company. |
| |
| Vanguard Mega Cap Growth Index Fund | |
| ETF Shares | |
| Market Price | 9.37% |
| Net Asset Value | 9.37 |
| Institutional Shares | 9.38 |
| CRSP US Mega Cap Growth Index | 9.41 |
| Large-Cap Growth Funds Average | 7.44 |
| Large-Cap Growth Funds Average: Derived from data provided by Lipper, a Thomson Reuters Company. |
1
| |
| | Total |
| | Returns |
| Vanguard Mega Cap Value Index Fund | |
| ETF Shares | |
| Market Price | 11.17% |
| Net Asset Value | 11.18 |
| Institutional Shares | 11.19 |
| CRSP US Mega Cap Value Index | 11.22 |
| Large-Cap Value Funds Average | 11.57 |
Large-Cap Value Funds Average: Derived from data provided by Lipper, a Thomson Reuters Company.
Institutional Shares are available to certain institutional investors who meet specific administrative, service, and account-size criteria. The Vanguard ETF® Shares shown are traded on the NYSE Arca exchange and are available only through brokers. The table provides ETF returns based on both the NYSE Arca market price and the net asset value for a share. U.S. Pat. Nos. 6,879,964; 7,337,138; 7,720,749; 7,925,573; 8,090,646; and 8,417,623.
For the ETF Shares, the market price is determined by the midpoint of the bid-offer spread as of the closing time of the New York Stock Exchange (generally 4 p.m., Eastern time). The net asset value is also determined as of the NYSE closing time. For more information about how the ETF Shares' market prices have compared with their net asset value, visit vanguard.com, select your ETF, and then select the Price and Performance tab. The ETF premium/discount analysis there shows the percentages of days on which the ETF Shares' market price was above or below the NAV.
| | | |
| Expense Ratios | | | |
| Your Fund Compared With Its Peer Group | | | |
| | ETF | Institutional | Peer Group |
| | Shares | Shares | Average |
| Mega Cap Index Fund | 0.07% | 0.06% | 1.07% |
| Mega Cap Growth Index Fund | 0.07 | 0.06 | 1.14 |
| Mega Cap Value Index Fund | 0.07 | 0.06 | 1.09 |
The fund expense ratios shown are from the prospectus dated December 22, 2016, and represent estimated costs for the current fiscal year.
For the six months ended February 28, 2017, the annualized expense ratios were: for the Mega Cap Index Fund, 0.07% for ETF Shares and
0.06% for Institutional Shares; for the Mega Cap Growth Index Fund, 0.07% for ETF Shares and 0.06% for Institutional Shares; and for the
Mega Cap Value Index Fund, 0.07% for ETF Shares and 0.06% for Institutional Shares. Peer-group expense ratios are derived from data
provided by Lipper, a Thomson Reuters Company, and capture information through year-end 2016.
Peer groups: For the Mega Cap Index Fund, Large-Cap Core Funds; for the Mega Cap Growth Index Fund, Large-Cap Growth Funds; and for the
Mega Cap Value Index Fund, Large-Cap Value Funds.
2
Chairman’s Perspective

Bill McNabb
Chairman and Chief Executive Officer
Dear Shareholder,
More than a decade ago, a Vanguard client asked us to help improve its defined contribution retirement plan. New hires were participating in the plan at lower rates than in previous years, and the client wanted to reverse this trend. Another priority was to help more participants invest their retirement savings in balanced portfolios.
The overall goal of this longtime client: Give employees a better chance to achieve financial security in retirement.
Today, that plan automatically enrolls employees at a 5% contribution rate, puts them in a low-cost target-date fund that takes on less risk as they near retirement, and offers a comprehensive suite of advice services. On top of that, employees get an employer contribution of 5% and are eligible for a company match.
Because of this combination of attractive features and generous employer contributions, nearly all new hires now participate in the plan, 81% of plan participants invest their retirement savings in balanced portfolios, and 87% of participants meet or exceed Vanguard’s recommended total retirement savings target. (Vanguard generally recommends that retirement investors save 12%–15% of pay, including company matches.)
3
Changing the retirement landscape
Am I singling out an isolated Vanguard success story? Absolutely not.
Stories like these are becoming increasingly common with employer-based retirement plans, particularly among large and midsize companies. Solutions such as automatic enrollment, automatic contribution increases, and default investment in target-date funds are having a positive effect.
Insights from the relatively new discipline of behavioral finance have contributed to the advances. Simply put, retirement plans are making natural human inertia work for future retirees, rather than against them, by putting savings on autopilot as much as possible.
More than 60% of Vanguard participants are in plans with automatic enrollment, which has led to a big jump in participation. Today, more than four-fifths of eligible employees are saving for retirement, compared with only two-thirds ten years ago.
In addition, many plans have adopted automatic-escalation features, which increase plan contributions at regular intervals until a maximum level is reached or an employee opts out. Automatic increases are a crucial tool for boosting retirement savings rates.
The growing use of target-date funds is another enormous benefit. More than 70% of all participants in Vanguard plans invest at least part of their retirement savings in
| | | |
| Market Barometer | | | |
| | Total Returns |
| | | Periods Ended February 28, 2017 |
| | Six | One | Five Years |
| | Months | Year | (Annualized) |
| Stocks | | | |
| Russell 1000 Index (Large-caps) | 10.10% | 25.53% | 13.94% |
| Russell 2000 Index (Small-caps) | 12.61 | 36.11 | 12.89 |
| Russell 3000 Index (Broad U.S. market) | 10.29 | 26.29 | 13.85 |
| FTSE All-World ex US Index (International) | 5.40 | 19.87 | 4.00 |
| |
| Bonds | | | |
| Bloomberg Barclays U.S. Aggregate Bond Index | | | |
| (Broad taxable market) | -2.19% | 1.42% | 2.24% |
| Bloomberg Barclays Municipal Bond Index | | | |
| (Broad tax-exempt market) | -2.80 | 0.25 | 3.07 |
| Citigroup Three-Month U.S. Treasury Bill Index | 0.19 | 0.32 | 0.10 |
| |
| CPI | | | |
| Consumer Price Index | 1.14% | 2.74% | 1.36% |
4
these age-appropriate, diversified strategies. And nearly 50% of Vanguard participants are invested solely in a single target-date fund.
Consider a do-it-yourself autopilot
But what if you don’t have access to a world-class, employer-based retirement plan? Unfortunately, not everyone does, which is an important policy issue.
However, you can still put the features of these plans to work. For example, you can set up automatic contributions from your paycheck to an IRA. And you can adopt your own automatic escalation by investing any pay raises.
You can also take a page from top-quality retirement plans by considering a low-cost, globally diversified target-date fund. The beauty of this approach is that you don’t need to remember to rebalance your portfolio—the fund does it for you.
Of course, you can take a more active role in picking your own investments, and this can be a good choice for some. But keep in mind the lessons from successful employer-based plans: Busy workers, faced with a lot of competing priorities, are often best served by putting their retirement savings on autopilot.
Winning by default
In highlighting some recent successes in retirement savings, I don’t want to minimize the challenges we still face. We’re living in a slow-growth, uncertain world, and investment returns for both stocks and bonds could well be modest in the coming decade.
But I believe the innovations we’ve seen in the last ten years in many retirement plans—you might call it the “default revolution”—point the way toward a solution. And that even goes for people whose employers don’t have a world-class retirement plan.
As always, thank you for investing with Vanguard.
Sincerely,

F. William McNabb III
Chairman and Chief Executive Officer
March 14, 2017
5
Mega Cap Index Fund
Fund Profile
As of February 28, 2017
| | |
| Share-Class Characteristics | |
| |
| | ETF | Institutional |
| | Shares | Shares |
| Ticker Symbol | MGC | VMCTX |
| Expense Ratio1 | 0.07% | 0.06% |
| 30-Day SEC Yield | 2.01% | 2.01% |
| | | |
| Portfolio Characteristics | | |
| | | | DJ |
| | | CRSP US | U.S. Total |
| | | Mega Cap | Market |
| | Fund | Index | FA Index |
| Number of Stocks | 275 | 276 | 3,807 |
| Median Market Cap | $111.3B | $111.3B | $57.6B |
| Price/Earnings Ratio | 23.1x | 23.1x | 24.8x |
| Price/Book Ratio | 3.1x | 3.2x | 3.0x |
| Return on Equity | 17.9% | 17.7% | 16.4% |
| Earnings Growth | | | |
| Rate | 6.7% | 7.1% | 7.6% |
| Dividend Yield | 2.1% | 2.1% | 1.9% |
| Foreign Holdings | 0.0% | 0.0% | 0.0% |
| Turnover Rate | | | |
| (Annualized) | 7% | — | — |
| Short-Term Reserves | -0.1% | — | — |
| | | |
| Sector Diversification (% of equity exposure) |
| | | | DJ |
| | | | U.S. |
| | | | Total |
| | | CRSP US | Market |
| | | Mega Cap | FA |
| | Fund | Index | Index |
| Basic Materials | 1.9% | 1.9% | 2.6% |
| Consumer Goods | 9.7 | 9.7 | 9.8 |
| Consumer Services | 13.7 | 13.7 | 13.1 |
| Financials | 18.9 | 18.9 | 20.6 |
| Health Care | 13.9 | 13.9 | 12.6 |
| Industrials | 10.9 | 10.9 | 12.8 |
| Oil & Gas | 6.7 | 6.7 | 6.2 |
| Technology | 18.8 | 18.8 | 17.1 |
| Telecommunications | 2.8 | 2.8 | 2.1 |
| Utilities | 2.7 | 2.7 | 3.1 |
| | |
| Volatility Measures | | |
| | | DJ |
| | CRSP US | U.S. Total |
| | Mega Cap | Market |
| | Index | FA Index |
| R-Squared | 1.00 | 0.98 |
| Beta | 1.00 | 0.96 |
| These measures show the degree and timing of the fund’s |
| fluctuations compared with the indexes over 36 months. |
| | |
| Ten Largest Holdings (% of total net assets) |
| Apple Inc. | Computer Hardware | 3.9% |
| Alphabet Inc. | Internet | 2.8 |
| Microsoft Corp. | Software | 2.7 |
| Amazon.com Inc. | Broadline Retailers | 1.9 |
| Exxon Mobil Corp. | Integrated Oil & Gas | 1.9 |
| Johnson & Johnson | Pharmaceuticals | 1.9 |
| Berkshire Hathaway Inc. Reinsurance | 1.9 |
| JPMorgan Chase & Co. | Banks | 1.8 |
| Facebook Inc. | Internet | 1.8 |
| General Electric Co. | Diversified Industrials | 1.5 |
| Top Ten | | 22.1% |
| The holdings listed exclude any temporary cash investments and |
| equity index products. |
Investment Focus
1 The expense ratios shown are from the prospectus dated December 22, 2016, and represent estimated costs for the current fiscal year. For the six
months ended February 28, 2017, the annualized expense ratios were 0.07% for ETF Shares and 0.06% for Institutional Shares.
6
Mega Cap Index Fund
Performance Summary
All of the returns in this report represent past performance, which is not a guarantee of future results that may be achieved by the fund. (Current performance may be lower or higher than the performance data cited. For performance data current to the most recent month-end, visit our website at vanguard.com/performance.) Note, too, that both investment returns and principal value can fluctuate widely, so an investor’s shares, when sold, could be worth more or less than their original cost. The returns shown do not reflect taxes that a shareholder would pay on fund distributions or on the sale of fund shares.
Fiscal-Year Total Returns (%): December 17, 2007, Through February 28, 2017
For a benchmark description, see the Glossary.
Note: For 2017, performance data reflect the six months ended February 28, 2017.
Average Annual Total Returns: Periods Ended December 31, 2016
This table presents returns through the latest calendar quarter—rather than through the end of the fiscal period.
Securities and Exchange Commission rules require that we provide this information.
| | | | |
| | Inception | One | Five | Since |
| | Date | Year | Years | Inception |
| ETF Shares | 12/17/2007 | | | |
| Market Price | | 11.80% | 14.55% | 7.18% |
| Net Asset Value | | 11.78 | 14.54 | 7.17 |
| Institutional Shares | 2/22/2008 | 11.79 | 14.57 | 8.12 |
See Financial Highlights for dividend and capital gains information.
7
Mega Cap Index Fund
Financial Statements (unaudited)
Statement of Net Assets
As of February 28, 2017
The fund reports a complete list of its holdings in regulatory filings four times in each fiscal year, at the quarter-ends. For the second and fourth fiscal quarters, the lists appear in the fund’s semiannual and annual reports to shareholders. For the first and third fiscal quarters, the fund files the lists with the Securities and Exchange Commission on Form N-Q. Shareholders can look up the fund’s Forms N-Q on the SEC’s website at sec.gov. Forms N-Q may also be reviewed and copied at the SEC’s Public Reference Room (see the back cover of this report for further information).
| | |
| | | Market |
| | | Value• |
| | Shares | ($000) |
| Common Stocks (99.8%)1 | | |
| Basic Materials (1.9%) | | |
| Dow Chemical Co. | 80,806 | 5,031 |
| EI du Pont de | | |
| Nemours & Co. | 62,811 | 4,933 |
| Praxair Inc. | 20,625 | 2,448 |
| Ecolab Inc. | 18,868 | 2,339 |
| Air Products & | | |
| Chemicals Inc. | 15,686 | 2,204 |
| LyondellBasell Industries | | |
| NV Class A | 23,495 | 2,144 |
| PPG Industries Inc. | 18,971 | 1,943 |
| International Paper Co. | 29,711 | 1,566 |
| Nucor Corp. | 23,030 | 1,441 |
| | | 24,049 |
| Consumer Goods (9.7%) | | |
| Procter & Gamble Co. | 193,102 | 17,586 |
| Philip Morris | | |
| International Inc. | 111,949 | 12,242 |
| Coca-Cola Co. | 280,037 | 11,750 |
| PepsiCo Inc. | 103,445 | 11,418 |
| Altria Group Inc. | 140,787 | 10,548 |
| NIKE Inc. Class B | 96,449 | 5,513 |
| Colgate-Palmolive Co. | 64,128 | 4,680 |
| Mondelez International Inc. | | |
| Class A | 105,681 | 4,641 |
| Kraft Heinz Co. | 43,869 | 4,014 |
| Reynolds American Inc. | 61,687 | 3,798 |
| Monsanto Co. | 31,671 | 3,605 |
| Ford Motor Co. | 281,317 | 3,525 |
| General Motors Co. | 93,352 | 3,439 |
| Kimberly-Clark Corp. | 25,851 | 3,427 |
| General Mills Inc. | 42,616 | 2,573 |
| Activision Blizzard Inc. | 48,276 | 2,179 |
| ^,* Tesla Inc. | 8,689 | 2,172 |
| Archer-Daniels-Midland Co. | 41,403 | 1,945 |
| Constellation Brands Inc. | | |
| Class A | 12,199 | 1,937 |
| Stanley Black & Decker Inc. | 10,905 | 1,387 |
| | | |
| | Estee Lauder Cos. Inc. | | |
| | Class A | 15,984 | 1,324 |
| | Kellogg Co. | 17,791 | 1,318 |
| * | Monster Beverage Corp. | 30,803 | 1,276 |
| | Mead Johnson Nutrition Co. | 13,368 | 1,174 |
| | Hershey Co. | 9,801 | 1,062 |
| | VF Corp. | 19,350 | 1,015 |
| | Campbell Soup Co. | 14,496 | 860 |
| | Delphi Automotive plc | 9,878 | 752 |
| | Tyson Foods Inc. Class A | 10,376 | 649 |
| | Brown-Forman Corp. | | |
| | Class B | 13,131 | 640 |
| | | | 122,449 |
| Consumer Services (13.7%) | | |
| * | Amazon.com Inc. | 29,138 | 24,623 |
| | Comcast Corp. Class A | 343,922 | 12,869 |
| | Home Depot Inc. | 87,845 | 12,730 |
| | Walt Disney Co. | 103,385 | 11,382 |
| | Wal-Mart Stores Inc. | 111,504 | 7,909 |
| | McDonald’s Corp. | 59,924 | 7,649 |
| | CVS Health Corp. | 76,871 | 6,194 |
| * | Priceline Group Inc. | 3,555 | 6,129 |
| | Walgreens Boots | | |
| | Alliance Inc. | 66,368 | 5,733 |
| | Starbucks Corp. | 99,716 | 5,671 |
| | Costco Wholesale Corp. | 31,551 | 5,590 |
| | Time Warner Inc. | 52,816 | 5,187 |
| * | Charter Communications | | |
| | Inc. Class A | 14,633 | 4,727 |
| | Lowe’s Cos. Inc. | 63,184 | 4,699 |
| * | Netflix Inc. | 29,404 | 4,179 |
| | TJX Cos. Inc. | 44,962 | 3,527 |
| | Delta Air Lines Inc. | 54,072 | 2,700 |
| * | eBay Inc. | 76,534 | 2,594 |
| | Southwest Airlines Co. | 44,447 | 2,569 |
| | McKesson Corp. | 16,330 | 2,452 |
| | Target Corp. | 40,408 | 2,375 |
| | Twenty-First Century | | |
| | Fox Inc. Class A | 76,129 | 2,278 |
| | Kroger Co. | 67,984 | 2,162 |
| | Cardinal Health Inc. | 23,100 | 1,880 |
8
Mega Cap Index Fund
| | | |
| | | | Market |
| | | | Value• |
| | | Shares | ($000) |
| | Sysco Corp. | 35,486 | 1,871 |
| * | O’Reilly Automotive Inc. | 6,812 | 1,851 |
| | Marriott International Inc. | | |
| | Class A | 21,150 | 1,840 |
| | CBS Corp. Class B | 27,307 | 1,800 |
| | American Airlines Group Inc. | 35,470 | 1,644 |
| | Yum! Brands Inc. | 25,166 | 1,644 |
| * | AutoZone Inc. | 2,072 | 1,526 |
| | Las Vegas Sands Corp. | 28,684 | 1,519 |
| | Carnival Corp. | 27,088 | 1,516 |
| | Dollar General Corp. | 20,396 | 1,489 |
| | Omnicom Group Inc. | 17,029 | 1,449 |
| | Viacom Inc. Class B | 25,830 | 1,122 |
| | Ross Stores Inc. | 14,294 | 980 |
| * | DISH Network Corp. | | |
| | Class A | 15,639 | 970 |
| | L Brands Inc. | 17,389 | 915 |
| | Twenty-First Century | | |
| | Fox Inc. | 28,912 | 849 |
| * | Hilton Worldwide | | |
| | Holdings Inc. | 14,340 | 820 |
| * | United Continental | | |
| | Holdings Inc. | 9,970 | 739 |
| ^ | Sirius XM Holdings Inc. | 123,203 | 627 |
| | AmerisourceBergen Corp. | | |
| | Class A | 5,902 | 540 |
| | | | 173,519 |
| Financials (18.8%) | | |
| * | Berkshire Hathaway Inc. | | |
| | Class B | 137,832 | 23,627 |
| | JPMorgan Chase & Co. | 258,168 | 23,395 |
| | Wells Fargo & Co. | 326,153 | 18,878 |
| | Bank of America Corp. | 729,066 | 17,993 |
| | Citigroup Inc. | 205,633 | 12,299 |
| | Visa Inc. Class A | 134,671 | 11,843 |
| | Mastercard Inc. Class A | 69,453 | 7,672 |
| | US Bancorp | 116,396 | 6,402 |
| | Goldman Sachs Group Inc. | 25,796 | 6,399 |
| | American International | | |
| | Group Inc. | 74,038 | 4,733 |
| | Morgan Stanley | 101,257 | 4,624 |
| | American Express Co. | 56,214 | 4,501 |
| | PNC Financial Services | | |
| | Group Inc. | 35,048 | 4,459 |
| | Chubb Ltd. | 31,836 | 4,399 |
| | Simon Property Group Inc. | 22,704 | 4,187 |
| | American Tower | | |
| | Corporation | 30,806 | 3,536 |
| | Charles Schwab Corp. | 86,006 | 3,476 |
| | Prudential Financial Inc. | 30,957 | 3,422 |
| | Bank of New York | | |
| | Mellon Corp. | 72,346 | 3,410 |
| | MetLife Inc. | 63,373 | 3,323 |
| | Capital One Financial Corp. | 34,745 | 3,261 |
| | BlackRock Inc. | 7,603 | 2,946 |
| | CME Group Inc. | 23,328 | 2,834 |
| | | |
| | BB&T Corp. | 58,601 | 2,826 |
| | Marsh & McLennan | | |
| | Cos. Inc. | 37,221 | 2,735 |
| | Travelers Cos. Inc. | 20,479 | 2,503 |
| | Intercontinental | | |
| | Exchange Inc. | 42,989 | 2,456 |
| | Crown Castle | | |
| | International Corp. | 26,099 | 2,441 |
| | S&P Global Inc. | 18,713 | 2,423 |
| | Public Storage | 10,601 | 2,411 |
| | Aon plc | 18,955 | 2,192 |
| | Allstate Corp. | 26,500 | 2,177 |
| | Synchrony Financial | 59,597 | 2,160 |
| | Aflac Inc. | 29,471 | 2,132 |
| | SunTrust Banks Inc. | 35,287 | 2,099 |
| | Discover Financial Services | 28,428 | 2,022 |
| | State Street Corp. | 24,995 | 1,992 |
| | Prologis Inc. | 37,969 | 1,938 |
| | Welltower Inc. | 26,053 | 1,834 |
| | Weyerhaeuser Co. | 53,771 | 1,813 |
| | Ventas Inc. | 25,621 | 1,667 |
| | Equity Residential | 26,405 | 1,665 |
| | Progressive Corp. | 41,723 | 1,635 |
| | Boston Properties Inc. | 11,115 | 1,545 |
| | Ameriprise Financial Inc. | 11,390 | 1,498 |
| | Fifth Third Bancorp | 54,448 | 1,494 |
| | Northern Trust Corp. | 15,490 | 1,353 |
| | Vornado Realty Trust | 12,233 | 1,344 |
| | T. Rowe Price Group Inc. | 16,677 | 1,188 |
| | GGP Inc. | 44,771 | 1,113 |
| | HCP Inc. | 33,925 | 1,112 |
| | Franklin Resources Inc. | 24,494 | 1,054 |
| | Loews Corp. | 20,718 | 973 |
| | AvalonBay Communities Inc. | 4,922 | 905 |
| | TD Ameritrade | | |
| | Holding Corp. | 17,175 | 672 |
| * | Berkshire Hathaway Inc. | | |
| | Class A | 1 | 257 |
| | | | 239,248 |
| Health Care (13.9%) | | |
| | Johnson & Johnson | 196,304 | 23,990 |
| | Pfizer Inc. | 437,874 | 14,940 |
| | Merck & Co. Inc. | 198,801 | 13,095 |
| | UnitedHealth Group Inc. | 68,712 | 11,364 |
| | Amgen Inc. | 53,680 | 9,476 |
| | Medtronic plc | 99,735 | 8,069 |
| | AbbVie Inc. | 117,296 | 7,253 |
| * | Celgene Corp. | 55,874 | 6,901 |
| | Bristol-Myers Squibb Co. | 120,536 | 6,836 |
| | Gilead Sciences Inc. | 95,010 | 6,696 |
| | Allergan plc | 27,035 | 6,619 |
| | Eli Lilly & Co. | 71,617 | 5,931 |
| | Abbott Laboratories | 124,064 | 5,593 |
| * | Biogen Inc. | 15,684 | 4,526 |
| | Thermo Fisher Scientific Inc. | 28,473 | 4,490 |
| | Aetna Inc. | 25,255 | 3,252 |
9
Mega Cap Index Fund
| | | |
| | | | Market |
| | | | Value• |
| | | Shares | ($000) |
| * | Express Scripts Holding Co. | 44,408 | 3,137 |
| | Anthem Inc. | 18,988 | 3,130 |
| | Becton Dickinson and Co. | 15,304 | 2,801 |
| | Stryker Corp. | 21,645 | 2,783 |
| | Cigna Corp. | 18,491 | 2,753 |
| * | Boston Scientific Corp. | 98,318 | 2,414 |
| | Humana Inc. | 10,747 | 2,270 |
| * | Regeneron | | |
| | Pharmaceuticals Inc. | 5,610 | 2,095 |
| * | Intuitive Surgical Inc. | 2,795 | 2,060 |
| * | Alexion Pharmaceuticals Inc. | 15,327 | 2,012 |
| | Zoetis Inc. | 35,691 | 1,903 |
| * | HCA Holdings Inc. | 21,607 | 1,885 |
| | Baxter International Inc. | 35,345 | 1,800 |
| * | Illumina Inc. | 10,643 | 1,782 |
| | Zimmer Biomet | | |
| | Holdings Inc. | 14,531 | 1,701 |
| * | Vertex Pharmaceuticals Inc. | 17,959 | 1,627 |
| * | Mylan NV | 30,817 | 1,290 |
| | | | 176,474 |
| Industrials (10.8%) | | |
| | General Electric Co. | 638,205 | 19,025 |
| | 3M Co. | 43,436 | 8,094 |
| | Boeing Co. | 42,354 | 7,633 |
| | Honeywell International Inc. | 54,958 | 6,842 |
| | Union Pacific Corp. | 59,476 | 6,420 |
| | United Technologies Corp. | 53,451 | 6,016 |
| | Accenture plc Class A | 44,734 | 5,480 |
| | United Parcel Service Inc. | | |
| | Class B | 49,698 | 5,256 |
| | Lockheed Martin Corp. | 17,951 | 4,785 |
| | Caterpillar Inc. | 42,231 | 4,082 |
| | Danaher Corp. | 44,886 | 3,840 |
| | General Dynamics Corp. | 18,688 | 3,547 |
| * | PayPal Holdings Inc. | 82,609 | 3,470 |
| | FedEx Corp. | 17,306 | 3,340 |
| | CSX Corp. | 67,475 | 3,277 |
| | Raytheon Co. | 21,154 | 3,261 |
| | Automatic Data | | |
| | Processing Inc. | 30,924 | 3,173 |
| | Northrop Grumman Corp. | 12,698 | 3,138 |
| | Illinois Tool Works Inc. | 22,783 | 3,008 |
| | Johnson Controls | | |
| | International plc | 67,469 | 2,830 |
| | Emerson Electric Co. | 46,312 | 2,783 |
| | Norfolk Southern Corp. | 21,093 | 2,553 |
| | Deere & Co. | 21,570 | 2,362 |
| | Eaton Corp. plc | 32,516 | 2,340 |
| | Waste Management Inc. | 31,787 | 2,331 |
| | Fidelity National Information | | |
| | Services Inc. | 23,733 | 1,952 |
| | TE Connectivity Ltd. | 25,603 | 1,907 |
| | Cummins Inc. | 12,090 | 1,795 |
| | Sherwin-Williams Co. | 5,707 | 1,761 |
| | PACCAR Inc. | 25,192 | 1,683 |
| | Parker-Hannifin Corp. | 9,652 | 1,494 |
| | | |
| | Ingersoll-Rand plc | 18,671 | 1,482 |
| | Paychex Inc. | 23,445 | 1,440 |
| | Rockwell Automation Inc. | 9,206 | 1,391 |
| | Fortive Corp. | 22,548 | 1,300 |
| | Agilent Technologies Inc. | 23,431 | 1,202 |
| | Republic Services Inc. | | |
| | Class A | 17,225 | 1,067 |
| | | | 137,360 |
| Oil & Gas (6.7%) | | |
| | Exxon Mobil Corp. | 299,190 | 24,330 |
| | Chevron Corp. | 136,207 | 15,323 |
| | Schlumberger Ltd. | 100,400 | 8,068 |
| | ConocoPhillips | 89,325 | 4,249 |
| | EOG Resources Inc. | 41,582 | 4,033 |
| | Occidental Petroleum Corp. | 55,059 | 3,609 |
| | Halliburton Co. | 59,326 | 3,172 |
| | Kinder Morgan Inc. | 136,782 | 2,915 |
| | Anadarko Petroleum Corp. | 40,344 | 2,608 |
| | Phillips 66 | 32,035 | 2,505 |
| | Pioneer Natural | | |
| | Resources Co. | 12,294 | 2,286 |
| | Valero Energy Corp. | 32,542 | 2,211 |
| | Marathon Petroleum Corp. | 37,945 | 1,882 |
| | Baker Hughes Inc. | 30,417 | 1,834 |
| | Williams Cos. Inc. | 58,912 | 1,670 |
| | Apache Corp. | 27,323 | 1,437 |
| | Noble Energy Inc. | 31,058 | 1,131 |
| | Hess Corp. | 20,471 | 1,053 |
| | Devon Energy Corp. | 18,037 | 782 |
| * | Continental Resources Inc. | 3,414 | 154 |
| | Enbridge Inc. | 285 | 12 |
| | | | 85,264 |
| Technology (18.8%) | | |
| | Apple Inc. | 365,516 | 50,072 |
| | Microsoft Corp. | 532,908 | 34,095 |
| * | Facebook Inc. Class A | 168,876 | 22,889 |
| * | Alphabet Inc. Class A | 21,369 | 18,055 |
| * | Alphabet Inc. Class C | 21,169 | 17,427 |
| | Cisco Systems Inc. | 362,211 | 12,380 |
| | Intel Corp. | 341,910 | 12,377 |
| | International Business | | |
| | Machines Corp. | 61,714 | 11,097 |
| | Oracle Corp. | 221,992 | 9,455 |
| | QUALCOMM Inc. | 106,498 | 6,015 |
| | Broadcom Ltd. | 27,234 | 5,744 |
| | Texas Instruments Inc. | 72,042 | 5,520 |
| * | Adobe Systems Inc. | 35,910 | 4,250 |
| * | salesforce.com Inc. | 47,754 | 3,885 |
| | NVIDIA Corp. | 36,934 | 3,748 |
| * | Yahoo! Inc. | 61,965 | 2,829 |
| | Applied Materials Inc. | 78,039 | 2,827 |
| | Hewlett Packard | | |
| | Enterprise Co. | 120,250 | 2,744 |
| * | Cognizant Technology | | |
| | Solutions Corp. Class A | 43,800 | 2,596 |
| | Intuit Inc. | 17,610 | 2,209 |
10
Mega Cap Index Fund
| | | |
| | | | Market |
| | | | Value• |
| | | Shares | ($000) |
| | HP Inc. | 123,286 | 2,142 |
| | Corning Inc. | 68,512 | 1,892 |
| | Analog Devices Inc. | 22,227 | 1,821 |
| * | Micron Technology Inc. | 37,696 | 884 |
| | CA Inc. | 22,774 | 735 |
| ^,* | VMware Inc. Class A | 4,938 | 444 |
| | | | 238,132 |
| Telecommunications (2.8%) | | |
| | AT&T Inc. | 443,098 | 18,517 |
| | Verizon | | |
| | Communications Inc. | 294,158 | 14,599 |
| * | T-Mobile US Inc. | 20,843 | 1,303 |
| | CenturyLink Inc. | 39,454 | 957 |
| * | Sprint Corp. | 42,601 | 376 |
| | | | 35,752 |
| Utilities (2.7%) | | |
| | NextEra Energy Inc. | 34,587 | 4,531 |
| | Duke Energy Corp. | 49,656 | 4,099 |
| | Southern Co. | 70,820 | 3,599 |
| | Dominion Resources Inc. | 45,298 | 3,517 |
| | Exelon Corp. | 66,553 | 2,443 |
| | PG&E Corp. | 36,408 | 2,430 |
| | American Electric | | |
| | Power Co. Inc. | 35,544 | 2,381 |
| | Sempra Energy | 18,063 | 1,992 |
| | Edison International | 23,600 | 1,882 |
| | PPL Corp. | 49,031 | 1,808 |
| | Consolidated Edison Inc. | 22,031 | 1,697 |
| | Public Service Enterprise | | |
| | Group Inc. | 36,604 | 1,683 |
| | Xcel Energy Inc. | 36,770 | 1,607 |
| | FirstEnergy Corp. | 30,791 | 999 |
| | | | 34,668 |
| Total Common Stocks | | |
| (Cost $855,916) | | 1,266,915 |
| Temporary Cash Investments (0.2%)1 | |
| Money Market Fund (0.2%) | | |
| 2,3 | Vanguard Market | | |
| | Liquidity Fund, 0.864% | 29,356 | 2,936 |
| | |
| | Face | Market |
| | Amount | Value• |
| | ($000) | ($000) |
| U.S. Government and Agency Obligations (0.0%) |
| 4 United States Treasury | | |
| Bill, 0.564%, 5/4/17 | 200 | 200 |
| Total Temporary Cash Investments | |
| (Cost $3,136) | | 3,136 |
| Total Investments (100.0%) | | |
| (Cost $859,052) | | 1,270,051 |
| |
| | | Amount |
| | | ($000) |
| Other Assets and Liabilities (0.0%) | |
| Other Assets | | |
| Investment in Vanguard | | 87 |
| Receivables for Investment Securities Sold 2,002 |
| Receivables for Accrued Income | 2,763 |
| Other Assets | | 1 |
| Total Other Assets | | 4,853 |
| Liabilities | | |
| Payables for Investment | | |
| Securities Purchased | | (2,699) |
| Collateral for Securities on Loan | (1,653) |
| Payables to Vanguard | | (541) |
| Other Liabilities | | (9) |
| Total Liabilities | | (4,902) |
| Net Assets (100%) | | 1,270,002 |
11
Mega Cap Index Fund
| |
| At February 28, 2017, net assets consisted of: |
| | Amount |
| | ($000) |
| Paid-in Capital | 895,047 |
| Undistributed Net Investment Income | 3,249 |
| Accumulated Net Realized Losses | (39,430) |
| Unrealized Appreciation (Depreciation) | |
| Investment Securities | 410,999 |
| Futures Contracts | 137 |
| Net Assets | 1,270,002 |
| |
| |
| ETF Shares—Net Assets | |
| Applicable to 14,375,000 outstanding | |
| $.001 par value shares of beneficial | |
| interest (unlimited authorization) | 1,162,702 |
| Net Asset Value Per Share— | |
| ETF Shares | $80.88 |
| |
| |
| Institutional Shares—Net Assets | |
| Applicable to 672,862 outstanding | |
| $.001 par value shares of beneficial | |
| interest (unlimited authorization) | 107,300 |
| Net Asset Value Per Share— | |
| Institutional Shares | $159.47 |
• See Note A in Notes to Financial Statements.
^ Includes partial security positions on loan to broker-dealers. The total value of securities on loan is $1,534,000.
* Non-income-producing security.
1 The fund invests a portion of its cash reserves in equity markets through the use of index futures contracts. After giving effect to futures
investments, the fund’s effective common stock and temporary cash investment positions represent 100.0% and 0.0%, respectively,
of net assets.
2 Affiliated money market fund available only to Vanguard funds and certain trusts and accounts managed by Vanguard. Rate shown is the
7-day yield.
3 Includes $1,653,000 of collateral received for securities on loan.
4 Securities with a value of $200,000 have been segregated as initial margin for open futures contracts.
See accompanying Notes, which are an integral part of the Financial Statements.
12
Mega Cap Index Fund
Statement of Operations
| |
| | Six Months Ended |
| | February 28, 2017 |
| | ($000) |
| Investment Income | |
| Income | |
| Dividends | 12,691 |
| Interest1 | 13 |
| Securities Lending—Net | 32 |
| Total Income | 12,736 |
| Expenses | |
| The Vanguard Group—Note B | |
| Investment Advisory Services | 84 |
| Management and Administrative—ETF Shares | 220 |
| Management and Administrative—Institutional Shares | 25 |
| Marketing and Distribution—ETF Shares | 32 |
| Marketing and Distribution—Institutional Shares | 1 |
| Custodian Fees | 11 |
| Shareholders’ Reports—ETF Shares | 35 |
| Shareholders’ Reports—Institutional Shares | — |
| Total Expenses | 408 |
| Net Investment Income | 12,328 |
| Realized Net Gain (Loss) | |
| Investment Securities Sold1 | 19,005 |
| Futures Contracts | 313 |
| Realized Net Gain (Loss) | 19,318 |
| Change in Unrealized Appreciation (Depreciation) | |
| Investment Securities | 88,005 |
| Futures Contracts | (85) |
| Change in Unrealized Appreciation (Depreciation) | 87,920 |
| Net Increase (Decrease) in Net Assets Resulting from Operations | 119,566 |
| 1 Interest income and realized net gain (loss) from an affiliated company of the fund were $13,000 and $0, respectively. |
See accompanying Notes, which are an integral part of the Financial Statements.
13
Mega Cap Index Fund
Statement of Changes in Net Assets
| | |
| | Six Months Ended | Year Ended |
| | February 28, | August 31, |
| | 2017 | 2016 |
| | ($000) | ($000) |
| Increase (Decrease) in Net Assets | | |
| Operations | | |
| Net Investment Income | 12,328 | 26,379 |
| Realized Net Gain (Loss) | 19,318 | 76,699 |
| Change in Unrealized Appreciation (Depreciation) | 87,920 | 34,213 |
| Net Increase (Decrease) in Net Assets Resulting from Operations | 119,566 | 137,291 |
| Distributions | | |
| Net Investment Income | | |
| ETF Shares | (12,750) | (21,835) |
| Institutional Shares | (1,515) | (4,593) |
| Realized Capital Gain | | |
| ETF Shares | — | — |
| Institutional Shares | — | — |
| Total Distributions | (14,265) | (26,428) |
| Capital Share Transactions | | |
| ETF Shares | 10,390 | (10,659) |
| Institutional Shares | (36,031) | (177,997) |
| Net Increase (Decrease) from Capital Share Transactions | (25,641) | (188,656) |
| Total Increase (Decrease) | 79,660 | (77,793) |
| Net Assets | | |
| Beginning of Period | 1,190,342 | 1,268,135 |
| End of Period1 | 1,270,002 | 1,190,342 |
| 1 Net Assets—End of Period includes undistributed (overdistributed) net investment income of $3,249,000 and $5,186,000. |
See accompanying Notes, which are an integral part of the Financial Statements.
14
Mega Cap Index Fund
Financial Highlights
| | | | | | | |
| ETF Shares | | | | | | | |
| | Six Months | | | | | |
| | | Ended | | | | | |
| For a Share Outstanding | February 28, | Year Ended August 31, |
| Throughout Each Period | | 2017 | 2016 | 2015 | 2014 | 2013 | 2012 |
| Net Asset Value, | | | | | | | |
| Beginning of Period | | $74.19 | $67.35 | $68.69 | $55.99 | $48.52 | $41.80 |
| Investment Operations | | | | | | | |
| Net Investment Income | | .776 | 1.582 | 1.399 | 1.250 | 1.189 | 1.000 |
| Net Realized and Unrealized Gain (Loss) | | | | | | |
| on Investments | | 6.807 | 6.793 | (1.377) | 12.687 | 7.471 | 6.648 |
| Total from Investment Operations | 7.583 | 8.375 | .022 | 13.937 | 8.660 | 7.648 |
| Distributions | | | | | | | |
| Dividends from Net Investment Income | (.893) | (1.535) | (1.362) | (1.237) | (1.190) | (.928) |
| Distributions from Realized Capital Gains | — | — | — | — | — | — |
| Total Distributions | | (.893) | (1.535) | (1.362) | (1.237) | (1.190) | (.928) |
| Net Asset Value, End of Period | $80.88 | $74.19 | $67.35 | $68.69 | $55.99 | $48.52 |
| |
| Total Return | | 10.32% | 12.61% | -0.05% | 25.13% | 18.10% | 18.58% |
| |
| Ratios/Supplemental Data | | | | | | | |
| Net Assets, End of Period (Millions) | $1,163 | $1,057 | $970 | $810 | $588 | $442 |
| Ratio of Total Expenses to | | | | | | | |
| Average Net Assets | | 0.07% | 0.07% | 0.09% | 0.11% | 0.11% | 0.12% |
| Ratio of Net Investment Income to | | | | | | |
| Average Net Assets | | 2.11% | 2.23% | 2.02% | 2.00% | 2.26% | 2.24% |
| Portfolio Turnover Rate1 | | 7% | 7% | 8% | 6% | 10% | 19% |
The expense ratio, net investment income ratio, and turnover rate for the current period have been annualized.
1 Excludes the value of portfolio securities received or delivered as a result of in-kind purchases or redemptions of the fund’s capital shares,
including ETF Creation Units.
See accompanying Notes, which are an integral part of the Financial Statements.
15
Mega Cap Index Fund
Financial Highlights
| | | | | | | |
| Institutional Shares | | | | | | | |
| | Six Months | | | | | |
| | | Ended | | | | | |
| For a Share Outstanding | February 28, | Year Ended August 31, |
| Throughout Each Period | | 2017 | 2016 | 2015 | 2014 | 2013 | 2012 |
| Net Asset Value, | | | | | | | |
| Beginning of Period | $146.25 | $132.77 | $135.41 | $110.38 | $95.66 | $82.40 |
| Investment Operations | | | | | | | |
| Net Investment Income | | 1.536 | 3.117 | 2.798 | 2.498 | 2.373 | 2.000 |
| Net Realized and Unrealized Gain (Loss) | | | | | | |
| on Investments | | 13.427 | 13.419 | (2.717) | 25.000 | 14.727 | 13.113 |
| Total from Investment Operations | | 14.963 | 16.536 | .081 | 27.498 | 17.100 | 15.113 |
| Distributions | | | | | | | |
| Dividends from Net Investment Income | (1.743) | (3.056) | (2.721) | (2.468) | (2.380) | (1.853) |
| Distributions from Realized Capital Gains | — | — | — | — | — | — |
| Total Distributions | | (1.743) | (3.056) | (2.721) | (2.468) | (2.380) | (1.853) |
| Net Asset Value, End of Period | $159.47 | $146.25 | $132.77 | $135.41 | $110.38 | $95.66 |
| |
| Total Return | | 10.33% | 12.63% | -0.01% | 25.15% | 18.13% | 18.63% |
| |
| Ratios/Supplemental Data | | | | | | | |
| Net Assets, End of Period (Millions) | | $107 | $133 | $298 | $314 | $339 | $250 |
| Ratio of Total Expenses to | | | | | | | |
| Average Net Assets | | 0.06% | 0.06% | 0.06% | 0.08% | 0.08% | 0.08% |
| Ratio of Net Investment Income to | | | | | | | |
| Average Net Assets | | 2.12% | 2.24% | 2.05% | 2.03% | 2.29% | 2.28% |
| Portfolio Turnover Rate1 | | 7% | 7% | 8% | 6% | 10% | 19% |
The expense ratio, net investment income ratio, and turnover rate for the current period have been annualized.
1 Excludes the value of portfolio securities received or delivered as a result of in-kind purchases or redemptions of the fund’s capital shares,
including ETF Creation Units.
See accompanying Notes, which are an integral part of the Financial Statements.
16
Mega Cap Index Fund
Notes to Financial Statements
Vanguard Mega Cap Index Fund is registered under the Investment Company Act of 1940 as an open-end investment company, or mutual fund. The fund offers two classes of shares: ETF Shares and Institutional Shares. ETF Shares are listed for trading on NYSE Arca; they can be purchased and sold through a broker. Institutional Shares are designed for investors who meet certain administrative, service, and account-size criteria.
A. The following significant accounting policies conform to generally accepted accounting principles for U.S. investment companies. The fund consistently follows such policies in preparing its financial statements.
1. Security Valuation: Securities are valued as of the close of trading on the New York Stock Exchange (generally 4 p.m., Eastern time) on the valuation date. Equity securities are valued at the latest quoted sales prices or official closing prices taken from the primary market in which each security trades; such securities not traded on the valuation date are valued at the mean of the latest quoted bid and asked prices. Securities for which market quotations are not readily available, or whose values have been materially affected by events occurring before the fund’s pricing time but after the close of the securities’ primary markets, are valued by methods deemed by the board of trustees to represent fair value. Investments in Vanguard Market Liquidity Fund are valued at that fund’s net asset value. Temporary cash investments are valued using the latest bid prices or using valuations based on a matrix system (which considers such factors as security prices, yields, maturities, and ratings), both as furnished by independent pricing services.
2. Futures Contracts: The fund uses index futures contracts to a limited extent, with the objectives of maintaining full exposure to the stock market, enhancing returns, maintaining liquidity, and minimizing transaction costs. The fund may purchase futures contracts to immediately invest incoming cash in the market, or sell futures in response to cash outflows, thereby simulating a fully invested position in the underlying index while maintaining a cash balance for liquidity. The fund may seek to enhance returns by using futures contracts instead of the underlying securities when futures are believed to be priced more attractively than the underlying securities. The primary risks associated with the use of futures contracts are imperfect correlation between changes in market values of stocks held by the fund and the prices of futures contracts, and the possibility of an illiquid market. Counterparty risk involving futures is mitigated because a regulated clearinghouse is the counterparty instead of the clearing broker. To further mitigate counterparty risk, the fund trades futures contracts on an exchange, monitors the financial strength of its clearing brokers and clearinghouse, and has entered into clearing agreements with its clearing brokers. The clearinghouse imposes initial margin requirements to secure the fund’s performance and requires daily settlement of variation margin representing changes in the market value of each contract.
Futures contracts are valued at their quoted daily settlement prices. The aggregate settlement values of the contracts are not recorded in the Statement of Net Assets. Fluctuations in the value of the contracts are recorded in the Statement of Net Assets as an asset (liability) and in the Statement of Operations as unrealized appreciation (depreciation) until the contracts are closed, when they are recorded as realized futures gains (losses).
During the six months ended February 28, 2017, the fund’s average investments in long and short futures contracts represented less than 1% and 0% of net assets, respectively, based on the average of aggregate settlement values at each quarter-end during the period.
17
Mega Cap Index Fund
3. Federal Income Taxes: The fund intends to continue to qualify as a regulated investment company and distribute all of its taxable income. Management has analyzed the fund’s tax positions taken for all open federal income tax years (August 31, 2013–2016), and for the period ended February 28, 2017, and has concluded that no provision for federal income tax is required in the fund’s financial statements.
4. Distributions: Distributions to shareholders are recorded on the ex-dividend date.
5. Securities Lending: To earn additional income, the fund lends its securities to qualified institutional borrowers. Security loans are subject to termination by the fund at any time, and are required to be secured at all times by collateral in an amount at least equal to the market value of securities loaned. Daily market fluctuations could cause the value of loaned securities to be more or less than the value of the collateral received. When this occurs, the collateral is adjusted and settled on the next business day. The fund further mitigates its counterparty risk by entering into securities lending transactions only with a diverse group of prequalified counterparties, monitoring their financial strength, and entering into master securities lending agreements with its counterparties. The master securities lending agreements provide that, in the event of a counterparty’s default (including bankruptcy), the fund may terminate any loans with that borrower, determine the net amount owed, and sell or retain the collateral up to the net amount owed to the fund; however, such actions may be subject to legal proceedings. While collateral mitigates counterparty risk, in the absence of a default the fund may experience delays and costs in recovering the securities loaned. The fund invests cash collateral received in Vanguard Market Liquidity Fund, and records a liability in the Statement of Net Assets for the return of the collateral, during the period the securities are on loan. Securities lending income represents fees charged to borrowers plus income earned on invested cash collateral, less expenses associated with the loan. During the term of the loan, the fund is entitled to all distributions made on or in respect of the loaned securities.
6. Credit Facility: The fund and certain other funds managed by The Vanguard Group (“Vanguard”) participate in a $3.1 billion committed credit facility provided by a syndicate of lenders pursuant to a credit agreement that may be renewed annually; each fund is individually liable for its borrowings, if any, under the credit facility. Borrowings may be utilized for temporary and emergency purposes, and are subject to the fund’s regulatory and contractual borrowing restrictions. The participating funds are charged administrative fees and an annual commitment fee of 0.10% of the undrawn amount of the facility; these fees are allocated to the funds based on a method approved by the fund’s board of trustees and included in Management and Administrative expenses on the fund’s Statement of Operations. Any borrowings under this facility bear interest at a rate based upon the higher of the one-month London Interbank Offered Rate, federal funds effective rate, or overnight bank funding rate plus an agreed-upon spread.
The fund had no borrowings outstanding at February 28, 2017, or at any time during the period then ended.
7. Other: Dividend income is recorded on the ex-dividend date. Interest income includes income distributions received from Vanguard Market Liquidity Fund and is accrued daily. Premiums and discounts on debt securities purchased are amortized and accreted, respectively, to interest income
18
Mega Cap Index Fund
over the lives of the respective securities. Security transactions are accounted for on the date securities are bought or sold. Costs used to determine realized gains (losses) on the sale of investment securities are those of the specific securities sold.
Each class of shares has equal rights as to assets and earnings, except that each class separately bears certain class-specific expenses related to maintenance of shareholder accounts (included in Management and Administrative expenses) and shareholder reporting. Marketing and distribution expenses are allocated to each class of shares based on a method approved by the board of trustees. Income, other non-class-specific expenses, and gains and losses on investments are allocated to each class of shares based on its relative net assets.
B. In accordance with the terms of a Funds’ Service Agreement (the “FSA”) between Vanguard and the fund, Vanguard furnishes to the fund investment advisory, corporate management, administrative, marketing, and distribution services at Vanguard’s cost of operations (as defined by the FSA). These costs of operations are allocated to the fund based on methods and guidelines approved by the board of trustees. Vanguard does not require reimbursement in the current period for certain costs of operations (such as deferred compensation/benefits and risk/insurance costs); the fund’s liability for these costs of operations is included in Payables to Vanguard on the Statement of Net Assets.
Upon the request of Vanguard, the fund may invest up to 0.40% of its net assets as capital in Vanguard. At February 28, 2017, the fund had contributed to Vanguard capital in the amount of $87,000, representing 0.01% of the fund’s net assets and 0.03% of Vanguard’s capitalization. The fund’s trustees and officers are also directors and employees, respectively, of Vanguard.
C. Various inputs may be used to determine the value of the fund’s investments. These inputs are summarized in three broad levels for financial statement purposes. The inputs or methodologies used to value securities are not necessarily an indication of the risk associated with investing in those securities.
Level 1—Quoted prices in active markets for identical securities.
Level 2—Other significant observable inputs (including quoted prices for similar securities, interest rates, prepayment speeds, credit risk, etc.).
Level 3—Significant unobservable inputs (including the fund’s own assumptions used to determine the fair value of investments).
The following table summarizes the market value of the fund’s investments as of February 28, 2017, based on the inputs used to value them:
| | | |
| | Level 1 | Level 2 | Level 3 |
| Investments | ($000) | ($000) | ($000) |
| Common Stocks | 1,266,915 | — | — |
| Temporary Cash Investments | 2,936 | 200 | — |
| Futures Contracts—Liabilities1 | (8) | — | — |
| Total | 1,269,843 | 200 | — |
| 1 Represents variation margin on the last day of the reporting period. |
19
Mega Cap Index Fund
D. At February 28, 2017, the aggregate settlement value of open futures contracts and the related unrealized appreciation (depreciation) were:
| | | | |
| | | | ($000) |
| | | | Aggregate | |
| | | Number of | Settlement | Unrealized |
| | | Long (Short) | Value | Appreciation |
| Futures Contracts | Expiration | Contracts | Long (Short) | (Depreciation) |
| E-mini S&P 500 Index | March 2017 | 28 | 3,308 | 137 |
Unrealized appreciation (depreciation) on open futures contracts is required to be treated as realized gain (loss) for tax purposes.
E. Distributions are determined on a tax basis and may differ from net investment income and realized capital gains for financial reporting purposes. Differences may be permanent or temporary. Permanent differences are reclassified among capital accounts in the financial statements to reflect their tax character. Temporary differences arise when certain items of income, expense, gain, or loss are recognized in different periods for financial statement and tax purposes. These differences will reverse at some time in the future. Differences in classification may also result from the treatment of short-term gains as ordinary income for tax purposes.
During the six months ended February 28, 2017, the fund realized $17,716,000 of net capital gains resulting from in-kind redemptions—in which shareholders exchanged fund shares for securities held by the fund rather than for cash. Because such gains are not taxable to the fund, and are not distributed to shareholders, they have been reclassified from accumulated net realized losses to paid-in capital.
The fund’s tax-basis capital gains and losses are determined only at the end of each fiscal year. For tax purposes, at August 31, 2016, the fund had available capital losses totaling $40,810,000 to offset future net capital gains. Of this amount, $18,779,000 is subject to expiration dates; $12,576,000 may be used to offset future net capital gains through August 31, 2018 and $6,203,000 through August 31, 2019. Capital losses of $22,031,000 realized beginning in 2012 may be carried forward indefinitely under the Regulated Investment Company Modernization Act of 2010, but must be used before any expiring loss carryforwards. The fund will use these capital losses to offset net taxable capital gains, if any, realized during the year ending August 31, 2017; should the fund realize net capital losses for the year, the losses will be added to the loss carryforward balance above.
At February 28, 2017, the cost of investment securities for tax purposes was $859,052,000.
Net unrealized appreciation of investment securities for tax purposes was $410,999,000, consisting of unrealized gains of $424,825,000 on securities that had risen in value since their purchase and $13,826,000 in unrealized losses on securities that had fallen in value since their purchase.
F. During the six months ended February 28, 2017, the fund purchased $63,564,000 of investment securities and sold $77,962,000 of investment securities, other than temporary cash investments. Purchases and sales include $23,203,000 and $37,268,000, respectively, in connection with in-kind purchases and redemptions of the fund’s capital shares.
20
Mega Cap Index Fund
G. Capital share transactions for each class of shares were:
| | | | |
| | Six Months Ended | Year Ended |
| | February 28, 2017 | August 31, 2016 |
| | Amount | Shares | Amount | Shares |
| | ($000) | (000) | ($000) | (000) |
| ETF Shares | | | | |
| Issued | 48,169 | 625 | 205,540 | 2,975 |
| Issued in Lieu of Cash Distributions | — | — | — | — |
| Redeemed | (37,779) | (500) | (216,199) | (3,125) |
| Net Increase (Decrease)—ETF Shares | 10,390 | 125 | (10,659) | (150) |
| Institutional Shares | | | | |
| Issued | 1,565 | 12 | 30,619 | 218 |
| Issued in Lieu of Cash Distributions | 1,515 | 10 | 4,396 | 32 |
| Redeemed | (39,111) | (259) | (213,012) | (1,587) |
| Net Increase (Decrease)—Institutional Shares | (36,031) | (237) | (177,997) | (1,337) |
H. Management has determined that no material events or transactions occurred subsequent to February 28, 2017, that would require recognition or disclosure in these financial statements.
21
Mega Cap Growth Index Fund
Fund Profile
As of February 28, 2017
| | |
| Share-Class Characteristics | |
| |
| | ETF | Institutional |
| | Shares | Shares |
| Ticker Symbol | MGK | VMGAX |
| Expense Ratio1 | 0.07% | 0.06% |
| 30-Day SEC Yield | 1.48% | 1.49% |
| | | |
| Portfolio Characteristics | | |
| | | CRSP US | DJ |
| | | Mega Cap | U.S. Total |
| | | Growth | Market |
| | Fund | Index | FA Index |
| Number of Stocks | 143 | 143 | 3,807 |
| Median Market Cap | $94.7B | $94.7B | $57.6B |
| Price/Earnings Ratio | 27.2x | 27.2x | 24.8x |
| Price/Book Ratio | 5.3x | 5.3x | 3.0x |
| Return on Equity | 21.9% | 21.4% | 16.4% |
| Earnings Growth | | | |
| Rate | 11.2% | 12.1% | 7.6% |
| Dividend Yield | 1.5% | 1.5% | 1.9% |
| Foreign Holdings | 0.0% | 0.0% | 0.0% |
| Turnover Rate | | | |
| (Annualized) | 8% | — | — |
| Short-Term Reserves | 0.0% | — | — |
| | | |
| Sector Diversification (% of equity exposure) |
| | | | DJ |
| | | | U.S. |
| | | CRSP US | Total |
| | | Mega Cap | Market |
| | | Growth | FA |
| | Fund | Index | Index |
| Basic Materials | 1.6% | 1.6% | 2.6% |
| Consumer Goods | 11.2 | 11.2 | 9.8 |
| Consumer Services | 23.4 | 23.4 | 13.1 |
| Financials | 10.7 | 10.7 | 20.6 |
| Health Care | 13.9 | 13.9 | 12.6 |
| Industrials | 9.5 | 9.5 | 12.8 |
| Oil & Gas | 3.5 | 3.5 | 6.2 |
| Technology | 26.0 | 26.0 | 17.1 |
| Telecommunications | 0.2 | 0.2 | 2.1 |
| Utilities | 0.0 | 0.0 | 3.1 |
| | |
| Volatility Measures | | |
| | CRSP US | DJ |
| | Mega Cap | U.S. Total |
| | Growth | Market |
| | Index | FA Index |
| R-Squared | 1.00 | 0.90 |
| Beta | 1.00 | 1.04 |
| These measures show the degree and timing of the fund’s |
| fluctuations compared with the indexes over 36 months. |
| | |
| Ten Largest Holdings (% of total net assets) |
| Apple Inc. | Computer Hardware | 8.5% |
| Alphabet Inc. | Internet | 6.0 |
| Amazon.com Inc. | Broadline Retailers | 4.2 |
| Facebook Inc. | Internet | 3.9 |
| Comcast Corp. | Broadcasting & | |
| | Entertainment | 2.2 |
| Home Depot Inc. | Home Improvement | |
| | Retailers | 2.2 |
| Philip Morris | | |
| International Inc. | Tobacco | 2.1 |
| Visa Inc. | Consumer Finance | 2.0 |
| Coca-Cola Co. | Soft Drinks | 2.0 |
| Walt Disney Co. | Broadcasting & | |
| | Entertainment | 1.9 |
| Top Ten | | 35.0% |
| The holdings listed exclude any temporary cash investments and |
| equity index products. |
Investment Focus
1 The expense ratios shown are from the prospectus dated December 22, 2016, and represent estimated costs for the current fiscal year. For the six
months ended February 28, 2017, the annualized expense ratios were 0.07% for ETF Shares and 0.06% for Institutional Shares.
22
Mega Cap Growth Index Fund
Performance Summary
All of the returns in this report represent past performance, which is not a guarantee of future results that may be achieved by the fund. (Current performance may be lower or higher than the performance data cited. For performance data current to the most recent month-end, visit our website at vanguard.com/performance.) Note, too, that both investment returns and principal value can fluctuate widely, so an investor’s shares, when sold, could be worth more or less than their original cost. The returns shown do not reflect taxes that a shareholder would pay on fund distributions or on the sale of fund shares.
Fiscal-Year Total Returns (%): December 17, 2007, Through February 28, 2017
For a benchmark description, see the Glossary.
Note: For 2017, performance data reflect the six months ended February 28, 2017.
Average Annual Total Returns: Periods Ended December 31, 2016
This table presents returns through the latest calendar quarter—rather than through the end of the fiscal period.
Securities and Exchange Commission rules require that we provide this information.
| | | | |
| | Inception | One | Five | Since |
| | Date | Year | Years | Inception |
| ETF Shares | 12/17/2007 | | | |
| Market Price | | 6.47% | 14.28% | 8.06% |
| Net Asset Value | | 6.40 | 14.27 | 8.06 |
| Institutional Shares | 4/3/2008 | 6.42 | 14.28 | 8.99 |
See Financial Highlights for dividend and capital gains information.
23
Mega Cap Growth Index Fund
Financial Statements (unaudited)
Statement of Net Assets
As of February 28, 2017
The fund reports a complete list of its holdings in regulatory filings four times in each fiscal year, at the quarter-ends. For the second and fourth fiscal quarters, the lists appear in the fund’s semiannual and annual reports to shareholders. For the first and third fiscal quarters, the fund files the lists with the Securities and Exchange Commission on Form N-Q. Shareholders can look up the fund’s Forms N-Q on the SEC’s website at sec.gov. Forms N-Q may also be reviewed and copied at the SEC’s Public Reference Room (see the back cover of this report for further information).
| | | | |
| | | | | Market |
| | | | | Value• |
| | | | Shares | ($000) |
| Common Stocks (99.8%)1 | | | |
| Basic Materials (1.6%) | | | |
| | Praxair Inc. | | 91,137 | 10,819 |
| | Ecolab Inc. | | 83,718 | 10,379 |
| | PPG Industries Inc. | | 84,195 | 8,624 |
| | Nucor Corp. | | 101,732 | 6,365 |
| | Air Products & | | | |
| | Chemicals Inc. | | 34,681 | 4,872 |
| | | | | 41,059 |
| Consumer Goods (11.2%) | | | |
| | Philip Morris | | | |
| | International Inc. | | 495,115 | 54,141 |
| | Coca-Cola Co. | 1,238,732 | 51,977 |
| | NIKE Inc. Class B | | 426,503 | 24,379 |
| | Altria Group Inc. | | 311,240 | 23,318 |
| | Colgate-Palmolive Co. | | 283,681 | 20,703 |
| | Kraft Heinz Co. | | 194,143 | 17,766 |
| | Reynolds American Inc. | | 273,088 | 16,814 |
| | Monsanto Co. | | 139,791 | 15,912 |
| | Activision Blizzard Inc. | | 213,553 | 9,638 |
| ^,* | Tesla Inc. | | 38,536 | 9,634 |
| | Constellation Brands Inc. | | | |
| | Class A | | 53,968 | 8,571 |
| | Stanley Black & Decker Inc. | 48,056 | 6,110 |
| | Estee Lauder Cos. Inc. | | | |
| | Class A | | 70,991 | 5,882 |
| * | Monster Beverage Corp. | | 136,420 | 5,653 |
| | Mead Johnson Nutrition Co. | 58,965 | 5,176 |
| | Hershey Co. | | 43,560 | 4,720 |
| | VF Corp. | | 85,895 | 4,505 |
| | Delphi Automotive plc | | 43,249 | 3,293 |
| | Brown-Forman Corp. | | | |
| | Class B | | 58,330 | 2,844 |
| | | | | 291,036 |
| Consumer Services (23.4%) | | | |
| * | Amazon.com Inc. | | 128,895 | 108,921 |
| | Comcast Corp. Class A | 1,521,232 | 56,925 |
| | Home Depot Inc. | | 388,825 | 56,345 |
| | Walt Disney Co. | | 457,116 | 50,324 |
| | McDonald’s Corp. | | 265,119 | 33,843 |
| | | |
| * | Priceline Group Inc. | 15,746 | 27,148 |
| | Walgreens Boots | | |
| | Alliance Inc. | 293,881 | 25,386 |
| | Starbucks Corp. | 441,318 | 25,098 |
| | Costco Wholesale Corp. | 139,515 | 24,719 |
| | Time Warner Inc. | 233,837 | 22,965 |
| * | Charter Communications | | |
| | Inc. Class A | 64,756 | 20,920 |
| | Lowe’s Cos. Inc. | 279,154 | 20,761 |
| * | Netflix Inc. | 130,089 | 18,490 |
| | TJX Cos. Inc. | 199,032 | 15,614 |
| | Southwest Airlines Co. | 196,837 | 11,377 |
| | Twenty-First Century | | |
| | Fox Inc. Class A | 337,670 | 10,103 |
| * | O’Reilly Automotive Inc. | 30,153 | 8,193 |
| | Marriott International Inc. | | |
| | Class A | 93,395 | 8,124 |
| | CBS Corp. Class B | 121,062 | 7,980 |
| | Yum! Brands Inc. | 111,089 | 7,256 |
| * | AutoZone Inc. | 9,236 | 6,803 |
| | Las Vegas Sands Corp. | 126,746 | 6,711 |
| | Dollar General Corp. | 89,779 | 6,556 |
| | Ross Stores Inc. | 63,184 | 4,333 |
| * | DISH Network Corp. Class A | 68,636 | 4,255 |
| | L Brands Inc. | 77,689 | 4,088 |
| | Twenty-First Century | | |
| | Fox Inc. | 127,168 | 3,732 |
| * | Hilton Worldwide | | |
| | Holdings Inc. | 63,050 | 3,607 |
| | Carnival Corp. | 59,860 | 3,349 |
| ^ | Sirius XM Holdings Inc. | 537,660 | 2,737 |
| | AmerisourceBergen Corp. | | |
| | Class A | 26,218 | 2,399 |
| | CBS Corp. Class A | 141 | 9 |
| | | | 609,071 |
| Financials (10.7%) | | |
| | Visa Inc. Class A | 596,027 | 52,415 |
| | Mastercard Inc. Class A | 307,197 | 33,933 |
| | Simon Property Group Inc. | 100,281 | 18,492 |
| | American Tower | | |
| | Corporation | 135,804 | 15,589 |
24
Mega Cap Growth Index Fund
| | | |
| | | | Market |
| | | | Value• |
| | | Shares | ($000) |
| | Charles Schwab Corp. | 380,561 | 15,378 |
| | BlackRock Inc. | 33,618 | 13,026 |
| | Marsh & McLennan | | |
| | Cos. Inc. | 164,482 | 12,086 |
| | Intercontinental | | |
| | Exchange Inc. | 190,019 | 10,856 |
| | Crown Castle | | |
| | International Corp. | 115,113 | 10,766 |
| | S&P Global Inc. | 82,657 | 10,702 |
| | Public Storage | 47,035 | 10,698 |
| | Aon plc | 83,941 | 9,708 |
| | Prologis Inc. | 167,354 | 8,543 |
| | Welltower Inc. | 115,526 | 8,131 |
| | Weyerhaeuser Co. | 238,474 | 8,041 |
| | Ventas Inc. | 113,084 | 7,356 |
| | Boston Properties Inc. | 49,121 | 6,829 |
| | Vornado Realty Trust | 54,206 | 5,956 |
| | T. Rowe Price Group Inc. | 73,930 | 5,264 |
| * | GGP Inc. | 197,504 | 4,910 |
| | AvalonBay | | |
| | Communities Inc. | 21,970 | 4,038 |
| | TD Ameritrade Holding Corp. | 75,515 | 2,953 |
| | HCP Inc. | 75,856 | 2,487 |
| | | | 278,157 |
| Health Care (13.9%) | | |
| | Amgen Inc. | 237,406 | 41,909 |
| | Medtronic plc | 441,076 | 35,687 |
| | AbbVie Inc. | 518,704 | 32,077 |
| * | Celgene Corp. | 247,466 | 30,564 |
| | Bristol-Myers Squibb Co. | 533,353 | 30,246 |
| | Gilead Sciences Inc. | 420,290 | 29,622 |
| | Allergan plc | 119,713 | 29,308 |
| * | Biogen Inc. | 69,438 | 20,040 |
| | Thermo Fisher Scientific Inc. | 126,057 | 19,877 |
| | Becton Dickinson and Co. | 67,794 | 12,410 |
| | Stryker Corp. | 95,601 | 12,290 |
| * | Boston Scientific Corp. | 434,339 | 10,663 |
| * | Regeneron | | |
| | Pharmaceuticals Inc. | 24,797 | 9,262 |
| * | Intuitive Surgical Inc. | 12,362 | 9,111 |
| * | Alexion Pharmaceuticals Inc. | 68,074 | 8,935 |
| | Zoetis Inc. | 157,546 | 8,399 |
| * | Illumina Inc. | 46,904 | 7,852 |
| * | Vertex Pharmaceuticals Inc. | 79,018 | 7,160 |
| * | Mylan NV | 136,677 | 5,720 |
| | | | 361,132 |
| Industrials (9.4%) | | |
| | 3M Co. | 191,949 | 35,770 |
| | Boeing Co. | 187,144 | 33,729 |
| | Union Pacific Corp. | 262,915 | 28,379 |
| | Accenture plc Class A | 197,966 | 24,251 |
| | United Parcel Service Inc. | | |
| | Class B | 220,014 | 23,269 |
| | Danaher Corp. | 198,639 | 16,994 |
| * | PayPal Holdings Inc. | 365,646 | 15,357 |
| | | |
| | Automatic Data | | |
| | Processing Inc. | 136,759 | 14,034 |
| | Fidelity National | | |
| | Information Services Inc. | 104,782 | 8,620 |
| | Sherwin-Williams Co. | 25,208 | 7,778 |
| | FedEx Corp. | 38,175 | 7,367 |
| | Illinois Tool Works Inc. | 50,347 | 6,646 |
| | Paychex Inc. | 103,729 | 6,371 |
| | Rockwell Automation Inc. | 40,890 | 6,178 |
| | Fortive Corp. | 99,170 | 5,717 |
| | Agilent Technologies Inc. | 103,393 | 5,304 |
| | | | 245,764 |
| Oil & Gas (3.5%) | | |
| | Schlumberger Ltd. | 221,965 | 17,837 |
| | EOG Resources Inc. | 183,860 | 17,833 |
| | Kinder Morgan Inc. | 605,251 | 12,898 |
| | Anadarko Petroleum Corp. | 178,280 | 11,526 |
| | Pioneer Natural | | |
| | Resources Co. | 54,165 | 10,073 |
| | Williams Cos. Inc. | 260,044 | 7,370 |
| | Halliburton Co. | 130,866 | 6,996 |
| | Noble Energy Inc. | 136,901 | 4,984 |
| | Devon Energy Corp. | 39,632 | 1,718 |
| * | Continental Resources Inc. | 15,352 | 694 |
| | | | 91,929 |
| Technology (25.9%) | | |
| | Apple Inc. | 1,616,611 | 221,460 |
| * | Facebook Inc. Class A | 747,074 | 101,258 |
| * | Alphabet Inc. Class A | 94,493 | 79,840 |
| * | Alphabet Inc. Class C | 93,608 | 77,059 |
| | Broadcom Ltd. | 120,468 | 25,410 |
| | Texas Instruments Inc. | 318,823 | 24,428 |
| | Oracle Corp. | 491,347 | 20,927 |
| * | Adobe Systems Inc. | 158,725 | 18,784 |
| * | salesforce.com Inc. | 211,142 | 17,176 |
| | NVIDIA Corp. | 163,343 | 16,576 |
| | QUALCOMM Inc. | 235,727 | 13,314 |
| * | Yahoo! Inc. | 273,970 | 12,510 |
| | Applied Materials Inc. | 344,738 | 12,486 |
| * | Cognizant Technology | | |
| | Solutions Corp. Class A | 193,468 | 11,467 |
| | Intuit Inc. | 77,730 | 9,750 |
| | Analog Devices Inc. | 98,214 | 8,047 |
| * | Micron Technology Inc. | 165,889 | 3,888 |
| ^,* | VMware Inc. Class A | 21,279 | 1,913 |
| | | | 676,293 |
| Telecommunications (0.2%) | | |
| * | T-Mobile US Inc. | 91,852 | 5,744 |
| Total Common Stocks | | |
| (Cost $1,916,174) | | 2,600,185 |
| Temporary Cash Investments (0.5%)1 | |
| Money Market Fund (0.5%) | | |
| 2,3 | Vanguard Market | | |
| | Liquidity Fund, 0.864% | 130,182 | 13,019 |
25
Mega Cap Growth Index Fund
| | |
| | Face | Market |
| | Amount | Value• |
| | ($000) | ($000) |
| U.S. Government and Agency Obligations (0.0%) |
| 4 United States Treasury | | |
| Bill, 0.557%–0.601%, | | |
| 4/27/17 | 200 | 200 |
| Total Temporary Cash Investments | |
| (Cost $13,219) | | 13,219 |
| Total Investments (100.3%) | | |
| (Cost $1,929,393) | | 2,613,404 |
| |
| | | Amount |
| | | ($000) |
| Other Assets and Liabilities (-0.3%) | |
| Other Assets | | |
| Investment in Vanguard | | 175 |
| Receivables for Accrued Income | 2,492 |
| Receivables for Capital Shares Issued | 5 |
| Other Assets 4 | | 62 |
| Total Other Assets | | 2,734 |
| Liabilities | | |
| Payables for Investment | | |
| Securities Purchased | | (1,501) |
| Collateral for Securities on Loan | (7,226) |
| Payables for Capital Shares Redeemed | (1) |
| Payables to Vanguard | | (827) |
| Other Liabilities | | (17) |
| Total Liabilities | | (9,572) |
| Net Assets (100%) | | 2,606,566 |
| |
| At February 28, 2017, net assets consisted of: |
| | Amount |
| | ($000) |
| Paid-in Capital | 1,969,787 |
| Undistributed Net Investment Income | 2,440 |
| Accumulated Net Realized Losses | (49,895) |
| Unrealized Appreciation (Depreciation) | |
| Investment Securities | 684,011 |
| Futures Contracts | 223 |
| Net Assets | 2,606,566 |
| |
| |
| ETF Shares—Net Assets | |
| Applicable to 27,239,005 outstanding | |
| $.001 par value shares of beneficial | |
| interest (unlimited authorization) | 2,574,391 |
| Net Asset Value Per Share— | |
| ETF Shares | $94.51 |
| |
| |
| Institutional Shares—Net Assets | |
| Applicable to 171,407 outstanding | |
| $.001 par value shares of beneficial | |
| interest (unlimited authorization) | 32,175 |
| Net Asset Value Per Share— | |
| Institutional Shares | $187.71 |
• See Note A in Notes to Financial Statements.
^ Includes partial security positions on loan to broker-dealers. The total value of securities on loan is $6,715,000.
* Non-income-producing security.
1 The fund invests a portion of its cash reserves in equity markets through the use of index futures contracts. After giving effect to futures
investments, the fund’s effective common stock and temporary cash investment positions represent 100.0% and 0.3%, respectively,
of net assets.
2 Affiliated money market fund available only to Vanguard funds and certain trusts and accounts managed by Vanguard. Rate shown is the
7-day yield.
3 Includes $7,226,000 of collateral received for securities on loan.
4 Securities with a value of $200,000 and cash of $62,000 have been segregated as initial margin for open futures contracts.
See accompanying Notes, which are an integral part of the Financial Statements.
26
Mega Cap Growth Index Fund
Statement of Operations
| |
| | Six Months Ended |
| | February 28, 2017 |
| | ($000) |
| Investment Income | |
| Income | |
| Dividends | 16,560 |
| Interest1 | 15 |
| Securities Lending—Net | 58 |
| Total Income | 16,633 |
| Expenses | |
| The Vanguard Group—Note B | |
| Investment Advisory Services | 167 |
| Management and Administrative—ETF Shares | 518 |
| Management and Administrative—Institutional Shares | 6 |
| Marketing and Distribution—ETF Shares | 68 |
| Marketing and Distribution—Institutional Shares | 1 |
| Custodian Fees | 10 |
| Shareholders’ Reports—ETF Shares | 46 |
| Shareholders’ Reports—Institutional Shares | — |
| Trustees’ Fees and Expenses | 1 |
| Total Expenses | 817 |
| Net Investment Income | 15,816 |
| Realized Net Gain (Loss) | |
| Investment Securities Sold1 | 19,521 |
| Futures Contracts | 357 |
| Realized Net Gain (Loss) | 19,878 |
| Change in Unrealized Appreciation (Depreciation) | |
| Investment Securities | 184,000 |
| Futures Contracts | (54) |
| Change in Unrealized Appreciation (Depreciation) | 183,946 |
| Net Increase (Decrease) in Net Assets Resulting from Operations | 219,640 |
| 1 Interest income and realized net gain (loss) from an affiliated company of the fund were $15,000 and $1,000, respectively. |
See accompanying Notes, which are an integral part of the Financial Statements.
27
Mega Cap Growth Index Fund
Statement of Changes in Net Assets
| | |
| | Six Months Ended | Year Ended |
| | February 28, | August 31, |
| | 2017 | 2016 |
| | ($000) | ($000) |
| Increase (Decrease) in Net Assets | | |
| Operations | | |
| Net Investment Income | 15,816 | 32,752 |
| Realized Net Gain (Loss) | 19,878 | 52,526 |
| Change in Unrealized Appreciation (Depreciation) | 183,946 | 112,174 |
| Net Increase (Decrease) in Net Assets Resulting from Operations | 219,640 | 197,452 |
| Distributions | | |
| Net Investment Income | | |
| ETF Shares | (19,532) | (31,000) |
| Institutional Shares | (255) | (520) |
| Realized Capital Gain | | |
| ETF Shares | — | — |
| Institutional Shares | — | — |
| Total Distributions | (19,787) | (31,520) |
| Capital Share Transactions | | |
| ETF Shares | 129,794 | 155,971 |
| Institutional Shares | (958) | (7,135) |
| Net Increase (Decrease) from Capital Share Transactions | 128,836 | 148,836 |
| Total Increase (Decrease) | 328,689 | 314,768 |
| Net Assets | | |
| Beginning of Period | 2,277,877 | 1,963,109 |
| End of Period1 | 2,606,566 | 2,277,877 |
| 1 Net Assets—End of Period includes undistributed (overdistributed) net investment income of $2,440,000 and $6,411,000. |
See accompanying Notes, which are an integral part of the Financial Statements.
28
Mega Cap Growth Index Fund
Financial Highlights
| | | | | | | |
| ETF Shares | | | | | | | |
| | Six Months | | | | | |
| | | Ended | | | | | |
| For a Share Outstanding | February 28, | Year Ended August 31, |
| Throughout Each Period | | 2017 | 2016 | 2015 | 2014 | 2013 | 2012 |
| Net Asset Value, | | | | | | | |
| Beginning of Period | | $87.15 | $80.22 | $79.16 | $62.69 | $55.92 | $46.87 |
| Investment Operations | | | | | | | |
| Net Investment Income | | .585 | 1.269 | 1.148 | .994 | 1.006 | .7711 |
| Net Realized and Unrealized Gain (Loss) | | | | | | |
| on Investments | | 7.517 | 6.897 | 1.013 | 16.475 | 6.751 | 8.966 |
| Total from Investment Operations | 8.102 | 8.166 | 2.161 | 17.469 | 7.757 | 9.737 |
| Distributions | | | | | | | |
| Dividends from Net Investment Income | (.742) | (1.236) | (1.101) | (.999) | (.987) | (.687) |
| Distributions from Realized Capital Gains | — | — | — | — | — | — |
| Total Distributions | | (.742) | (1.236) | (1.101) | (.999) | (.987) | (.687) |
| Net Asset Value, End of Period | $94.51 | $87.15 | $80.22 | $79.16 | $62.69 | $55.92 |
| |
| Total Return | | 9.37% | 10.28% | 2.70% | 28.05% | 14.04% | 20.98% |
| |
| Ratios/Supplemental Data | | | | | | | |
| Net Assets, End of Period (Millions) | $2,574 | $2,247 | $1,928 | $1,520 | $1,034 | $884 |
| Ratio of Total Expenses to | | | | | | | |
| Average Net Assets | | 0.07% | 0.07% | 0.09% | 0.11% | 0.11% | 0.12% |
| Ratio of Net Investment Income to | | | | | | |
| Average Net Assets | | 1.43% | 1.55% | 1.43% | 1.40% | 1.69% | 1.49% |
| Portfolio Turnover Rate 2 | | 8% | 12% | 9% | 11% | 41% | 16% |
The expense ratio, net investment income ratio, and turnover rate for the current period have been annualized.
1 Calculated based on average shares outstanding.
2 Excludes the value of portfolio securities received or delivered as a result of in-kind purchases or redemptions of the fund’s capital shares,
including ETF Creation Units.
See accompanying Notes, which are an integral part of the Financial Statements.
29
Mega Cap Growth Index Fund
Financial Highlights
| | | | | | | |
| Institutional Shares | | | | | | | |
| | Six Months | | | | | |
| | | Ended | | | | | |
| For a Share Outstanding | February 28, | Year Ended August 31, |
| Throughout Each Period | | 2017 | 2016 | 2015 | 2014 | 2013 | 2012 |
| Net Asset Value, | | | | | | | |
| Beginning of Period | $173.07 | $159.31 | $157.21 | $124.49 | $110.67 | $92.75 |
| Investment Operations | | | | | | | |
| Net Investment Income | | 1.169 | 2.528 | 2.293 | 1.978 | 2.027 | 1.4531 |
| Net Realized and Unrealized Gain (Loss) | | | | | | |
| on Investments | | 14.946 | 13.693 | 2.011 | 32.732 | 13.374 | 17.831 |
| Total from Investment Operations | | 16.115 | 16.221 | 4.304 | 34.710 | 15.401 | 19.284 |
| Distributions | | | | | | | |
| Dividends from Net Investment Income | (1.475) | (2.461) | (2.204) | (1.990) | (1.581) | (1.364) |
| Distributions from Realized Capital Gains | — | — | — | — | — | — |
| Total Distributions | | (1.475) | (2.461) | (2.204) | (1.990) | (1.581) | (1.364) |
| Net Asset Value, End of Period | | $187.71 | $173.07 | $159.31 | $157.21 | $124.49 | $110.67 |
| |
| Total Return | | 9.38% | 10.28% | 2.71% | 28.07% | 14.05% | 21.00% |
| |
| Ratios/Supplemental Data | | | | | | | |
| Net Assets, End of Period (Millions) | | $32 | $30 | $35 | $15 | $21 | $0.2 |
| Ratio of Total Expenses to | | | | | | | |
| Average Net Assets | | 0.06% | 0.06% | 0.08% | 0.10% | 0.10% | 0.09% |
| Ratio of Net Investment Income to | | | | | | | |
| Average Net Assets | | 1.44% | 1.56% | 1.44% | 1.41% | 1.70% | 1.52% |
| Portfolio Turnover Rate 2 | | 8% | 12% | 9% | 11% | 41% | 16% |
The expense ratio, net investment income ratio, and turnover rate for the current period have been annualized.
1 Calculated based on average shares outstanding.
2 Excludes the value of portfolio securities received or delivered as a result of in-kind purchases or redemptions of the fund’s capital shares,
including ETF Creation Units.
See accompanying Notes, which are an integral part of the Financial Statements.
30
Mega Cap Growth Index Fund
Notes to Financial Statements
Vanguard Mega Cap Growth Index Fund is registered under the Investment Company Act of 1940 as an open-end investment company, or mutual fund. The fund offers two classes of shares: ETF Shares and Institutional Shares. ETF Shares are listed for trading on NYSE Arca; they can be purchased and sold through a broker. Institutional Shares are designed for investors who meet certain administrative, service, and account-size criteria.
A. The following significant accounting policies conform to generally accepted accounting principles for U.S. investment companies. The fund consistently follows such policies in preparing its financial statements.
1. Security Valuation: Securities are valued as of the close of trading on the New York Stock Exchange (generally 4 p.m., Eastern time) on the valuation date. Equity securities are valued at the latest quoted sales prices or official closing prices taken from the primary market in which each security trades; such securities not traded on the valuation date are valued at the mean of the latest quoted bid and asked prices. Securities for which market quotations are not readily available, or whose values have been materially affected by events occurring before the fund’s pricing time but after the close of the securities’ primary markets, are valued by methods deemed by the board of trustees to represent fair value. Investments in Vanguard Market Liquidity Fund are valued at that fund’s net asset value. Temporary cash investments are valued using the latest bid prices or using valuations based on a matrix system (which considers such factors as security prices, yields, maturities, and ratings), both as furnished by independent pricing services.
2. Futures Contracts: The fund uses index futures contracts to a limited extent, with the objectives of maintaining full exposure to the stock market, enhancing returns, maintaining liquidity, and minimizing transaction costs. The fund may purchase futures contracts to immediately invest incoming cash in the market, or sell futures in response to cash outflows, thereby simulating a fully invested position in the underlying index while maintaining a cash balance for liquidity. The fund may seek to enhance returns by using futures contracts instead of the underlying securities when futures are believed to be priced more attractively than the underlying securities. The primary risks associated with the use of futures contracts are imperfect correlation between changes in market values of stocks held by the fund and the prices of futures contracts, and the possibility of an illiquid market. Counterparty risk involving futures is mitigated because a regulated clearinghouse is the counterparty instead of the clearing broker. To further mitigate counterparty risk, the fund trades futures contracts on an exchange, monitors the financial strength of its clearing brokers and clearinghouse, and has entered into clearing agreements with its clearing brokers. The clearinghouse imposes initial margin requirements to secure the fund’s performance and requires daily settlement of variation margin representing changes in the market value of each contract.
Futures contracts are valued at their quoted daily settlement prices. The aggregate settlement values of the contracts are not recorded in the Statement of Net Assets. Fluctuations in the value of the contracts are recorded in the Statement of Net Assets as an asset (liability) and in the Statement of Operations as unrealized appreciation (depreciation) until the contracts are closed, when they are recorded as realized futures gains (losses).
During the six months ended February 28, 2017, the fund’s average investments in long and short futures contracts represented less than 1% and 0% of net assets, respectively, based on the average of aggregate settlement values at each quarter-end during the period.
31
Mega Cap Growth Index Fund
3. Federal Income Taxes: The fund intends to continue to qualify as a regulated investment company and distribute all of its taxable income. Management has analyzed the fund’s tax positions taken for all open federal income tax years (August 31, 2013–2016), and for the period ended February 28, 2017, and has concluded that no provision for federal income tax is required in the fund’s financial statements.
4. Distributions: Distributions to shareholders are recorded on the ex-dividend date.
5. Securities Lending: To earn additional income, the fund lends its securities to qualified institutional borrowers. Security loans are subject to termination by the fund at any time, and are required to be secured at all times by collateral in an amount at least equal to the market value of securities loaned. Daily market fluctuations could cause the value of loaned securities to be more or less than the value of the collateral received. When this occurs, the collateral is adjusted and settled on the next business day. The fund further mitigates its counterparty risk by entering into securities lending transactions only with a diverse group of prequalified counterparties, monitoring their financial strength, and entering into master securities lending agreements with its counterparties. The master securities lending agreements provide that, in the event of a counterparty’s default (including bankruptcy), the fund may terminate any loans with that borrower, determine the net amount owed, and sell or retain the collateral up to the net amount owed to the fund; however, such actions may be subject to legal proceedings. While collateral mitigates counterparty risk, in the absence of a default the fund may experience delays and costs in recovering the securities loaned. The fund invests cash collateral received in Vanguard Market Liquidity Fund, and records a liability in the Statement of Net Assets for the return of the collateral, during the period the securities are on loan. Securities lending income represents fees charged to borrowers plus income earned on invested cash collateral, less expenses associated with the loan. During the term of the loan, the fund is entitled to all distributions made on or in respect of the loaned securities.
6. Credit Facility: The fund and certain other funds managed by The Vanguard Group (“Vanguard”) participate in a $3.1 billion committed credit facility provided by a syndicate of lenders pursuant to a credit agreement that may be renewed annually; each fund is individually liable for its borrowings, if any, under the credit facility. Borrowings may be utilized for temporary and emergency purposes, and are subject to the fund’s regulatory and contractual borrowing restrictions. The participating funds are charged administrative fees and an annual commitment fee of 0.10% of the undrawn amount of the facility; these fees are allocated to the funds based on a method approved by the fund’s board of trustees and included in Management and Administrative expenses on the fund’s Statement of Operations. Any borrowings under this facility bear interest at a rate based upon the higher of the one-month London Interbank Offered Rate, federal funds effective rate, or overnight bank funding rate plus an agreed-upon spread.
The fund had no borrowings outstanding at February 28, 2017, or at any time during the period then ended.
7. Other: Dividend income is recorded on the ex-dividend date. Interest income includes income distributions received from Vanguard Market Liquidity Fund and is accrued daily. Premiums and discounts on debt securities purchased are amortized and accreted, respectively, to interest income over the lives of the respective securities. Security transactions are accounted for on the date securities are bought or sold. Costs used to determine realized gains (losses) on the sale of investment securities are those of the specific securities sold.
32
Mega Cap Growth Index Fund
Each class of shares has equal rights as to assets and earnings, except that each class separately bears certain class-specific expenses related to maintenance of shareholder accounts (included in Management and Administrative expenses) and shareholder reporting. Marketing and distribution expenses are allocated to each class of shares based on a method approved by the board of trustees. Income, other non-class-specific expenses, and gains and losses on investments are allocated to each class of shares based on its relative net assets.
B. In accordance with the terms of a Funds’ Service Agreement (the “FSA”) between Vanguard and the fund, Vanguard furnishes to the fund investment advisory, corporate management, administrative, marketing, and distribution services at Vanguard’s cost of operations (as defined by the FSA). These costs of operations are allocated to the fund based on methods and guidelines approved by the board of trustees. Vanguard does not require reimbursement in the current period for certain costs of operations (such as deferred compensation/benefits and risk/insurance costs); the fund’s liability for these costs of operations is included in Payables to Vanguard on the Statement of Net Assets.
Upon the request of Vanguard, the fund may invest up to 0.40% of its net assets as capital in Vanguard. At February 28, 2017, the fund had contributed to Vanguard capital in the amount of $175,000, representing 0.01% of the fund’s net assets and 0.07% of Vanguard’s capitalization. The fund’s trustees and officers are also directors and employees, respectively, of Vanguard.
C. Various inputs may be used to determine the value of the fund’s investments. These inputs are summarized in three broad levels for financial statement purposes. The inputs or methodologies used to value securities are not necessarily an indication of the risk associated with investing in those securities.
Level 1—Quoted prices in active markets for identical securities.
Level 2—Other significant observable inputs (including quoted prices for similar securities, interest rates, prepayment speeds, credit risk, etc.).
Level 3—Significant unobservable inputs (including the fund’s own assumptions used to determine the fair value of investments).
The following table summarizes the market value of the fund’s investments as of February 28, 2017, based on the inputs used to value them:
| | | |
| | Level 1 | Level 2 | Level 3 |
| Investments | ($000) | ($000) | ($000) |
| Common Stocks | 2,600,185 | — | — |
| Temporary Cash Investments | 13,019 | 200 | — |
| Futures Contracts—Liabilities1 | (14) | — | — |
| Total | 2,613,190 | 200 | — |
| 1 Represents variation margin on the last day of the reporting period. |
33
Mega Cap Growth Index Fund
D. At February 28, 2017, the aggregate settlement value of open futures contracts and the related unrealized appreciation (depreciation) were:
| | | | |
| | | | ($000) |
| | | | Aggregate | |
| | | Number of | Settlement | Unrealized |
| | | Long (Short) | Value | Appreciation |
| Futures Contracts | Expiration | Contracts | Long (Short) | (Depreciation) |
| E-mini S&P 500 Index | March 2017 | 52 | 6,143 | 223 |
Unrealized appreciation (depreciation) on open futures contracts is required to be treated as realized gain (loss) for tax purposes.
E. Distributions are determined on a tax basis and may differ from net investment income and realized capital gains for financial reporting purposes. Differences may be permanent or temporary. Permanent differences are reclassified among capital accounts in the financial statements to reflect their tax character. Temporary differences arise when certain items of income, expense, gain, or loss are recognized in different periods for financial statement and tax purposes. These differences will reverse at some time in the future. Differences in classification may also result from the treatment of short-term gains as ordinary income for tax purposes.
During the six months ended February 28, 2017, the fund realized $23,562,000 of net capital gains resulting from in-kind redemptions—in which shareholders exchanged fund shares for securities held by the fund rather than for cash. Because such gains are not taxable to the fund, and are not distributed to shareholders, they have been reclassified from accumulated net realized losses to paid-in capital.
The fund’s tax-basis capital gains and losses are determined only at the end of each fiscal year. For tax purposes, at August 31, 2016, the fund had available capital losses totaling $45,935,000 to offset future net capital gains. Of this amount,$4,562,000 is subject to expiration on August 31, 2019. Capital losses of $41,373,000 realized beginning in fiscal 2012 may be carried forward indefinitely under the Regulated Investment Company Modernization Act of 2010, but must be used before any expiring loss carryforwards. The fund will use these capital losses to offset net taxable capital gains, if any, realized during the year ending August 31, 2017; should the fund realize net capital losses for the year, the losses will be added to the loss carryforward balance above.
At February 28, 2017, the cost of investment securities for tax purposes was $1,929,393,000.
Net unrealized appreciation of investment securities for tax purposes was $684,011,000, consisting of unrealized gains of $716,141,000 on securities that had risen in value since their purchase and $32,130,000 in unrealized losses on securities that had fallen in value since their purchase.
F. During the six months ended February 28, 2017, the fund purchased $277,238,000 of investment securities and sold $145,144,000 of investment securities, other than temporary cash investments. Purchases and sales include $166,693,000 and $51,622,000, respectively, in connection with in-kind purchases and redemptions of the fund’s capital shares.
34
Mega Cap Growth Index Fund
The fund purchased securities from and sold securities to other Vanguard funds or accounts managed by Vanguard or its affiliates, in accordance with procedures adopted by the board of trustees in compliance with Rule 17a-7 of the Investment Company Act of 1940. For the six months ended February 28, 2017, such purchases and sales were $9,163,000 and $31,571,000, respectively; these amounts are included in the purchases and sales of investment securities noted above.
G. Capital share transactions for each class of shares were:
| | | | |
| | Six Months Ended | Year Ended |
| | February 28, 2017 | August 31, 2016 |
| | Amount | Shares | Amount | Shares |
| | ($000) | (000) | ($000) | (000) |
| ETF Shares | | | | |
| Issued | 182,318 | 2,050 | 345,671 | 4,100 |
| Issued in Lieu of Cash Distributions | — | — | — | — |
| Redeemed | (52,524) | (600) | (189,700) | (2,350) |
| Net Increase (Decrease)—ETF Shares | 129,794 | 1,450 | 155,971 | 1,750 |
| Institutional Shares | | | | |
| Issued | 5,630 | 33 | 15,163 | 94 |
| Issued in Lieu of Cash Distributions | 180 | 1 | 377 | 2 |
| Redeemed | (6,768) | (39) | (22,675) | (137) |
| Net Increase (Decrease)—Institutional Shares | (958) | (5) | (7,135) | (41) |
H. Management has determined that no material events or transactions occurred subsequent to February 28, 2017, that would require recognition or disclosure in these financial statements.
35
Mega Cap Value Index Fund
Fund Profile
As of February 28, 2017
| | |
| Share-Class Characteristics | |
| |
| | ETF | Institutional |
| | Shares | Shares |
| Ticker Symbol | MGV | VMVLX |
| Expense Ratio1 | 0.07% | 0.06% |
| 30-Day SEC Yield | 2.48% | 2.47% |
| | | |
| Portfolio Characteristics | | |
| | | CRSP US | DJ |
| | | Mega Cap | U.S. Total |
| | | Value | Market |
| | Fund | Index | FA Index |
| Number of Stocks | 144 | 144 | 3,807 |
| Median Market Cap $165.8B | $165.8B | $57.6B |
| Price/Earnings Ratio | 20.3x | 20.3x | 24.8x |
| Price/Book Ratio | 2.3x | 2.3x | 3.0x |
| Return on Equity | 14.9% | 14.9% | 16.4% |
| Earnings Growth | | | |
| Rate | 3.3% | 3.3% | 7.6% |
| Dividend Yield | 2.5% | 2.5% | 1.9% |
| Foreign Holdings | 0.0% | 0.0% | 0.0% |
| Turnover Rate | | | |
| (Annualized) | 6% | — | — |
| Short-Term Reserves | -0.3% | — | — |
| | | |
| Sector Diversification (% of equity exposure) |
| | | | DJ |
| | | | U.S. |
| | | CRSP US | Total |
| | | Mega Cap | Market |
| | | Value | FA |
| | Fund | Index | Index |
| Basic Materials | 2.2% | 2.2% | 2.6% |
| Consumer Goods | 8.3 | 8.3 | 9.8 |
| Consumer Services | 5.3 | 5.3 | 13.1 |
| Financials | 25.9 | 26.0 | 20.6 |
| Health Care | 14.0 | 14.0 | 12.6 |
| Industrials | 12.0 | 12.0 | 12.8 |
| Oil & Gas | 9.5 | 9.5 | 6.2 |
| Technology | 12.6 | 12.5 | 17.1 |
| Telecommunications | 5.1 | 5.1 | 2.1 |
| Utilities | 5.1 | 5.1 | 3.1 |
| | |
| Volatility Measures | | |
| | CRSP US | DJ |
| | Mega Cap | U.S. Total |
| | Value | Market |
| | Index | FA Index |
| R-Squared | 1.00 | 0.90 |
| Beta | 1.00 | 0.89 |
| These measures show the degree and timing of the fund’s |
| fluctuations compared with the indexes over 36 months. |
| | |
| Ten Largest Holdings (% of total net assets) |
| Microsoft Corp. | Software | 5.0% |
| Exxon Mobil Corp. | Integrated Oil & Gas | 3.6 |
| Johnson & Johnson | Pharmaceuticals | 3.5 |
| Berkshire Hathaway Inc. Reinsurance | 3.5 |
| JPMorgan Chase & Co. | Banks | 3.4 |
| General Electric Co. | Diversified Industrials | 2.8 |
| Wells Fargo & Co. | Banks | 2.8 |
| AT&T Inc. | Fixed Line | |
| | Telecommunications | 2.7 |
| Bank of America Corp. | Banks | 2.6 |
| Procter & Gamble Co. | Nondurable | |
| | Household Products | 2.6 |
| Top Ten | | 32.5% |
| The holdings listed exclude any temporary cash investments and |
| equity index products. |
Investment Focus
1 The expense ratios shown are from the prospectus dated December 22, 2016, and represent estimated costs for the current fiscal year. For the six
months ended February 28, 2017, the annualized expense ratios were 0.07% for ETF Shares and 0.06% for Institutional Shares.
36
Mega Cap Value Index Fund
Performance Summary
All of the returns in this report represent past performance, which is not a guarantee of future results that may be achieved by the fund. (Current performance may be lower or higher than the performance data cited. For performance data current to the most recent month-end, visit our website at vanguard.com/performance.) Note, too, that both investment returns and principal value can fluctuate widely, so an investor’s shares, when sold, could be worth more or less than their original cost. The returns shown do not reflect taxes that a shareholder would pay on fund distributions or on the sale of fund shares.
Fiscal-Year Total Returns (%): December 17, 2007, Through February 28, 2017
For a benchmark description, see the Glossary.
Note: For 2017, performance data reflect the six months ended February 28, 2017.
Average Annual Total Returns: Periods Ended December 31, 2016
This table presents returns through the latest calendar quarter—rather than through the end of the fiscal period.
Securities and Exchange Commission rules require that we provide this information.
| | | | |
| | Inception | One | Five | Since |
| | Date | Year | Years | Inception |
| ETF Shares | 12/17/2007 | | | |
| Market Price | | 16.67% | 14.85% | 6.28% |
| Net Asset Value | | 16.62 | 14.84 | 6.27 |
| Institutional Shares | 3/5/2008 | 16.64 | 14.87 | 7.48 |
See Financial Highlights for dividend and capital gains information.
37
Mega Cap Value Index Fund
Financial Statements (unaudited)
Statement of Net Assets
As of February 28, 2017
The fund reports a complete list of its holdings in regulatory filings four times in each fiscal year, at the quarter-ends. For the second and fourth fiscal quarters, the lists appear in the fund’s semiannual and annual reports to shareholders. For the first and third fiscal quarters, the fund files the lists with the Securities and Exchange Commission on Form N-Q. Shareholders can look up the fund’s Forms N-Q on the SEC’s website at sec.gov. Forms N-Q may also be reviewed and copied at the SEC’s Public Reference Room (see the back cover of this report for further information).
| | |
| | | Market |
| | | Value• |
| | Shares | ($000) |
| Common Stocks (99.6%)1 | | |
| Basic Materials (2.2%) | | |
| Dow Chemical Co. | 207,520 | 12,920 |
| EI du Pont de | | |
| Nemours & Co. | 160,897 | 12,637 |
| LyondellBasell Industries | | |
| NV Class A | 60,433 | 5,514 |
| International Paper Co. | 75,994 | 4,005 |
| Air Products & | | |
| Chemicals Inc. | 20,153 | 2,831 |
| | | 37,907 |
| Consumer Goods (8.3%) | | |
| Procter & Gamble Co. | 495,673 | 45,141 |
| PepsiCo Inc. | 265,681 | 29,326 |
| Altria Group Inc. | 180,609 | 13,531 |
| Mondelez International Inc. | | |
| Class A | 271,517 | 11,925 |
| Ford Motor Co. | 722,383 | 9,052 |
| General Motors Co. | 239,770 | 8,833 |
| Kimberly-Clark Corp. | 66,347 | 8,794 |
| General Mills Inc. | 109,383 | 6,603 |
| Archer-Daniels-Midland Co. | 106,466 | 5,001 |
| Kellogg Co. | 45,557 | 3,374 |
| Campbell Soup Co. | 37,161 | 2,206 |
| Tyson Foods Inc. Class A | 27,003 | 1,689 |
| | | 145,475 |
| Consumer Services (5.3%) | | |
| Wal-Mart Stores Inc. | 286,525 | 20,323 |
| CVS Health Corp. | 197,564 | 15,920 |
| Delta Air Lines Inc. | 138,568 | 6,919 |
| * eBay Inc. | 196,429 | 6,659 |
| McKesson Corp. | 41,826 | 6,279 |
| Target Corp. | 103,882 | 6,105 |
| Kroger Co. | 174,683 | 5,555 |
| Cardinal Health Inc. | 59,210 | 4,818 |
| Sysco Corp. | 91,067 | 4,801 |
| American Airlines | | |
| Group Inc. | 91,025 | 4,220 |
| Omnicom Group Inc. | 43,716 | 3,720 |
| | |
| Viacom Inc. Class B | 66,272 | 2,880 |
| Carnival Corp. | 34,766 | 1,945 |
| * United Continental | | |
| Holdings Inc. | 25,373 | 1,880 |
| | | 92,024 |
| Financials (25.9%) | | |
| * Berkshire Hathaway Inc. | | |
| Class B | 356,140 | 61,049 |
| JPMorgan Chase & Co. | 662,716 | 60,055 |
| Wells Fargo & Co. | 837,147 | 48,454 |
| Bank of America Corp. | 1,871,449 | 46,187 |
| Citigroup Inc. | 527,803 | 31,568 |
| US Bancorp | 299,133 | 16,452 |
| Goldman Sachs Group Inc. | 66,243 | 16,432 |
| American International | | |
| Group Inc. | 190,075 | 12,150 |
| Morgan Stanley | 259,920 | 11,871 |
| American Express Co. | 143,969 | 11,526 |
| PNC Financial Services | | |
| Group Inc. | 90,169 | 11,472 |
| Chubb Ltd. | 81,959 | 11,324 |
| Prudential Financial Inc. | 79,567 | 8,795 |
| Bank of New York | | |
| Mellon Corp. | 185,822 | 8,760 |
| MetLife Inc. | 162,718 | 8,533 |
| Capital One Financial Corp. | 89,365 | 8,388 |
| BB&T Corp. | 150,373 | 7,251 |
| CME Group Inc. | 59,663 | 7,247 |
| Travelers Cos. Inc. | 52,565 | 6,426 |
| Allstate Corp. | 68,275 | 5,609 |
| Synchrony Financial | 152,686 | 5,533 |
| Aflac Inc. | 75,644 | 5,473 |
| SunTrust Banks Inc. | 90,741 | 5,398 |
| Discover Financial Services | 72,922 | 5,188 |
| State Street Corp. | 64,359 | 5,130 |
| Equity Residential | 67,592 | 4,263 |
| Progressive Corp. | 107,401 | 4,208 |
| Ameriprise Financial Inc. | 29,314 | 3,855 |
| Fifth Third Bancorp | 140,155 | 3,846 |
| Northern Trust Corp. | 39,882 | 3,484 |
38
Mega Cap Value Index Fund
| | | |
| | | | Market |
| | | | Value• |
| | | Shares | ($000) |
| | Franklin Resources Inc. | 63,324 | 2,725 |
| | Loews Corp. | 52,934 | 2,487 |
| | HCP Inc. | 43,361 | 1,422 |
| * | Berkshire Hathaway Inc. | | |
| | Class A | 1 | 257 |
| | | | 452,818 |
| Health Care (13.9%) | | |
| | Johnson & Johnson | 503,866 | 61,577 |
| | Pfizer Inc. | 1,123,877 | 38,347 |
| | Merck & Co. Inc. | 510,642 | 33,636 |
| | UnitedHealth Group Inc. | 176,285 | 29,154 |
| | Eli Lilly & Co. | 184,017 | 15,238 |
| | Abbott Laboratories | 318,558 | 14,361 |
| | Aetna Inc. | 65,010 | 8,371 |
| * | Express Scripts Holding Co. | 114,248 | 8,072 |
| | Anthem Inc. | 48,752 | 8,035 |
| | Cigna Corp. | 47,501 | 7,073 |
| | Humana Inc. | 27,584 | 5,827 |
| * | HCA Holdings Inc. | 55,601 | 4,851 |
| | Baxter International Inc. | 90,735 | 4,620 |
| | Zimmer Biomet | | |
| | Holdings Inc. | 37,149 | 4,349 |
| | | | 243,511 |
| Industrials (12.0%) | | |
| | General Electric Co. | 1,638,326 | 48,839 |
| | Honeywell | | |
| | International Inc. | 141,195 | 17,579 |
| | United Technologies Corp. | 137,166 | 15,438 |
| | Lockheed Martin Corp. | 46,096 | 12,288 |
| | Caterpillar Inc. | 108,445 | 10,482 |
| | General Dynamics Corp. | 48,026 | 9,116 |
| | CSX Corp. | 173,314 | 8,416 |
| | Raytheon Co. | 54,395 | 8,385 |
| | Northrop Grumman Corp. | 32,615 | 8,059 |
| | Johnson Controls | | |
| | International plc | 173,279 | 7,267 |
| | Emerson Electric Co. | 118,886 | 7,145 |
| | Norfolk Southern Corp. | 54,124 | 6,551 |
| | Deere & Co. | 55,404 | 6,066 |
| | Eaton Corp. plc | 83,530 | 6,012 |
| | Waste Management Inc. | 81,737 | 5,993 |
| | TE Connectivity Ltd. | 65,744 | 4,896 |
| | Cummins Inc. | 31,199 | 4,633 |
| | PACCAR Inc. | 64,978 | 4,341 |
| | FedEx Corp. | 22,186 | 4,281 |
| | Illinois Tool Works Inc. | 29,325 | 3,871 |
| | Parker-Hannifin Corp. | 24,803 | 3,841 |
| | Ingersoll-Rand plc | 47,903 | 3,802 |
| | Republic Services Inc. | | |
| | Class A | 44,194 | 2,738 |
| | | | 210,039 |
| Oil & Gas (9.4%) | | |
| | Exxon Mobil Corp. | 767,931 | 62,448 |
| | Chevron Corp. | 349,665 | 39,337 |
| | ConocoPhillips | 229,260 | 10,906 |
| | |
| Schlumberger Ltd. | 128,907 | 10,359 |
| Occidental Petroleum Corp. | 141,395 | 9,268 |
| Phillips 66 | 82,069 | 6,417 |
| Valero Energy Corp. | 83,719 | 5,689 |
| Marathon Petroleum Corp. | 97,656 | 4,844 |
| Baker Hughes Inc. | 78,203 | 4,714 |
| Halliburton Co. | 76,126 | 4,070 |
| Apache Corp. | 70,113 | 3,687 |
| Hess Corp. | 52,877 | 2,720 |
| Devon Energy Corp. | 23,058 | 1,000 |
| Enbridge Inc. | 732 | 31 |
| | | 165,490 |
| Technology (12.5%) | | |
| Microsoft Corp. | 1,367,952 | 87,522 |
| Cisco Systems Inc. | 929,725 | 31,778 |
| Intel Corp. | 877,716 | 31,773 |
| International Business | | |
| Machines Corp. | 158,500 | 28,501 |
| Oracle Corp. | 284,946 | 12,136 |
| QUALCOMM Inc. | 136,612 | 7,716 |
| Hewlett Packard | | |
| Enterprise Co. | 308,262 | 7,035 |
| HP Inc. | 316,340 | 5,495 |
| Corning Inc. | 175,968 | 4,858 |
| CA Inc. | 58,210 | 1,878 |
| | | 218,692 |
| Telecommunications (5.0%) | | |
| AT&T Inc. | 1,137,319 | 47,529 |
| Verizon | | |
| Communications Inc. | 755,050 | 37,473 |
| CenturyLink Inc. | 101,395 | 2,460 |
| * Sprint Corp. | 111,507 | 982 |
| | | 88,444 |
| Utilities (5.1%) | | |
| NextEra Energy Inc. | 88,843 | 11,638 |
| Duke Energy Corp. | 127,654 | 10,538 |
| Southern Co. | 181,350 | 9,216 |
| Dominion Resources Inc. | 115,991 | 9,006 |
| Exelon Corp. | 170,552 | 6,261 |
| PG&E Corp. | 93,523 | 6,243 |
| American Electric | | |
| Power Co. Inc. | 90,966 | 6,092 |
| Sempra Energy | 46,384 | 5,116 |
| Edison International | 60,400 | 4,816 |
| PPL Corp. | 125,474 | 4,627 |
| Consolidated Edison Inc. | 56,353 | 4,341 |
| Public Service Enterprise | | |
| Group Inc. | 93,477 | 4,298 |
| Xcel Energy Inc. | 93,883 | 4,104 |
| FirstEnergy Corp. | 78,717 | 2,553 |
| | | 88,849 |
| Total Common Stocks | | |
| (Cost $1,359,418) | | 1,743,249 |
39
Mega Cap Value Index Fund
| | |
| | | Market |
| | | Value• |
| | Shares | ($000) |
| Temporary Cash Investments (0.0%)1 | |
| Money Market Fund (0.0%) | | |
| 2 Vanguard Market | | |
| Liquidity Fund, 0.864% | 3 | — |
| |
| | Face | |
| | Amount | |
| | ($000) | |
| U.S. Government and Agency Obligations (0.0%) |
| 3 United States Treasury | | |
| Bill, 0.597%, 5/25/17 | 100 | 100 |
| Total Temporary Cash Investments | |
| (Cost $100) | | 100 |
| Total Investments (99.6%) | | |
| (Cost $1,359,518) | | 1,743,349 |
| |
| | | Amount |
| | | ($000) |
| Other Assets and Liabilities (0.4%) | |
| Other Assets | | |
| Investment in Vanguard | | 121 |
| Receivables for Investment Securities Sold | 5,148 |
| Receivables for Accrued Income | 5,650 |
| Receivables for Capital Shares Issued | 5 |
| Other Assets 3 | | 141 |
| Total Other Assets | | 11,065 |
| Liabilities | | |
| Payables for Investment Securities | |
| Purchased | | (2,001) |
| Payables for Capital Shares Redeemed | (298) |
| Payables to Vanguard | | (559) |
| Other Liabilities | | (1,974) |
| Total Liabilities | | (4,832) |
| Net Assets (100%) | | 1,749,582 |
| |
| At February 28, 2017, net assets consisted of: |
| | Amount |
| | ($000) |
| Paid-in Capital | 1,382,454 |
| Undistributed Net Investment Income | 7,378 |
| Accumulated Net Realized Losses | (24,143) |
| Unrealized Appreciation (Depreciation) | |
| Investment Securities | 383,831 |
| Futures Contracts | 62 |
| Net Assets | 1,749,582 |
| |
| |
| ETF Shares—Net Assets | |
| Applicable to 23,054,818 outstanding | |
| $.001 par value shares of beneficial | |
| interest (unlimited authorization) | 1,605,353 |
| Net Asset Value Per Share— | |
| ETF Shares | $69.63 |
| |
| |
| Institutional Shares—Net Assets | |
| Applicable to 1,044,621 outstanding | |
| $.001 par value shares of beneficial | |
| interest (unlimited authorization) | 144,229 |
| Net Asset Value Per Share— | |
| Institutional Shares | $138.07 |
• See Note A in Notes to Financial Statements.
* Non-income-producing security.
1 The fund invests a portion of its cash reserves in equity markets through the use of index futures contracts. After giving effect to futures
investments, the fund’s effective common stock and temporary cash investment positions represent 99.9% and -0.3%, respectively, of
net assets.
2 Affiliated money market fund available only to Vanguard funds and certain trusts and accounts managed by Vanguard. Rate shown is the
7-day yield.
3 Securities with a value of $100,000 and cash of $141,000 have been segregated as initial margin for open futures contracts.
See accompanying Notes, which are an integral part of the Financial Statements.
40
Mega Cap Value Index Fund
Statement of Operations
| |
| | Six Months Ended |
| | February 28, 2017 |
| | ($000) |
| Investment Income | |
| Income | |
| Dividends | 22,103 |
| Interest1 | 2 |
| Securities Lending—Net | 46 |
| Total Income | 22,151 |
| Expenses | |
| The Vanguard Group—Note B | |
| Investment Advisory Services | 113 |
| Management and Administrative—ETF Shares | 323 |
| Management and Administrative—Institutional Shares | 31 |
| Marketing and Distribution—ETF Shares | 41 |
| Marketing and Distribution—Institutional Shares | 2 |
| Custodian Fees | 24 |
| Shareholders’ Reports—ETF Shares | 19 |
| Shareholders’ Reports—Institutional Shares | 2 |
| Trustees’ Fees and Expenses | 1 |
| Total Expenses | 556 |
| Net Investment Income | 21,595 |
| Realized Net Gain (Loss) | |
| Investment Securities Sold1 | 13,997 |
| Futures Contracts | 68 |
| Realized Net Gain (Loss) | 14,065 |
| Change in Unrealized Appreciation (Depreciation) | |
| Investment Securities | 137,257 |
| Futures Contracts | 38 |
| Change in Unrealized Appreciation (Depreciation) | 137,295 |
| Net Increase (Decrease) in Net Assets Resulting from Operations | 172,955 |
| 1 Interest income and realized net gain (loss) from an affiliated company of the fund were $2,000 and $0, respectively. |
See accompanying Notes, which are an integral part of the Financial Statements.
41
Mega Cap Value Index Fund
Statement of Changes in Net Assets
| | |
| | Six Months Ended | Year Ended |
| | February 28, | August 31, |
| | 2017 | 2016 |
| | ($000) | ($000) |
| Increase (Decrease) in Net Assets | | |
| Operations | | |
| Net Investment Income | 21,595 | 37,496 |
| Realized Net Gain (Loss) | 14,065 | 18,515 |
| Change in Unrealized Appreciation (Depreciation) | 137,295 | 130,325 |
| Net Increase (Decrease) in Net Assets Resulting from Operations | 172,955 | 186,336 |
| Distributions | | |
| Net Investment Income | | |
| ETF Shares | (20,053) | (29,412) |
| Institutional Shares | (2,646) | (5,913) |
| Realized Capital Gain | | |
| ETF Shares | — | — |
| Institutional Shares | — | — |
| Total Distributions | (22,699) | (35,325) |
| Capital Share Transactions | | |
| ETF Shares | 148,249 | 237,968 |
| Institutional Shares | (77,595) | (30,150) |
| Net Increase (Decrease) from Capital Share Transactions | 70,654 | 207,818 |
| Total Increase (Decrease) | 220,910 | 358,829 |
| Net Assets | | |
| Beginning of Period | 1,528,672 | 1,169,843 |
| End of Period1 | 1,749,582 | 1,528,672 |
| 1 Net Assets—End of Period includes undistributed (overdistributed) net investment income of $7,378,000 and $8,482,000. |
See accompanying Notes, which are an integral part of the Financial Statements.
42
Mega Cap Value Index Fund
Financial Highlights
| | | | | | | |
| ETF Shares | | | | | | | |
| | Six Months | | | | | |
| | | Ended | | | | | |
| For a Share Outstanding | February 28, | Year Ended August 31, |
| Throughout Each Period | | 2017 | 2016 | 2015 | 2014 | 2013 | 2012 |
| Net Asset Value, | | | | | | | |
| Beginning of Period | | $63.52 | $56.89 | $59.60 | $49.65 | $41.80 | $37.09 |
| Investment Operations | | | | | | | |
| Net Investment Income | | .864 | 1.638 | 1.484 | 1.338 | 1.2721 | 1.164 |
| Net Realized and Unrealized Gain (Loss) | | | | | | |
| on Investments | | 6.169 | 6.583 | (2.733) | 9.911 | 7.809 | 4.689 |
| Total from Investment Operations | 7.033 | 8.221 | (1.249) | 11.249 | 9.081 | 5.853 |
| Distributions | | | | | | | |
| Dividends from Net Investment Income | (.923) | (1.591) | (1.461) | (1.299) | (1.231) | (1.143) |
| Distributions from Realized Capital Gains | — | — | — | — | — | — |
| Total Distributions | | (.923) | (1.591) | (1.461) | (1.299) | (1.231) | (1.143) |
| Net Asset Value, End of Period | $69.63 | $63.52 | $56.89 | $59.60 | $49.65 | $41.80 |
| |
| Total Return | | 11.18% | 14.71% | -2.22% | 22.92% | 22.05% | 16.13% |
| |
| Ratios/Supplemental Data | | | | | | | |
| Net Assets, End of Period (Millions) | $1,605 | $1,322 | $957 | $870 | $611 | $414 |
| Ratio of Total Expenses to | | | | | | | |
| Average Net Assets | | 0.07% | 0.07% | 0.09% | 0.11% | 0.11% | 0.12% |
| Ratio of Net Investment Income to | | | | | | |
| Average Net Assets | | 2.71% | 2.84% | 2.51% | 2.47% | 2.72% | 2.97% |
| Portfolio Turnover Rate 2 | | 6% | 8% | 5% | 8% | 34% | 17% |
The expense ratio, net investment income ratio, and turnover rate for the current period have been annualized.
1 Calculated based on average shares outstanding.
2 Excludes the value of portfolio securities received or delivered as a result of in-kind purchases or redemptions of the fund’s capital shares,
including ETF Creation Units.
See accompanying Notes, which are an integral part of the Financial Statements.
43
Mega Cap Value Index Fund
Financial Highlights
| | | | | | | |
| Institutional Shares | | | | | | | |
| | Six Months | | | | | |
| | | Ended | | | | | |
| For a Share Outstanding | February 28, | Year Ended August 31, |
| Throughout Each Period | | 2017 | 2016 | 2015 | 2014 | 2013 | 2012 |
| Net Asset Value, | | | | | | | |
| Beginning of Period | | $125.94 | $112.80 | $118.18 | $98.45 | $82.90 | $73.55 |
| Investment Operations | | | | | | | |
| Net Investment Income | | 1.717 | 3.259 | 2.976 | 2.687 | 2.5311 | 2.339 |
| Net Realized and Unrealized Gain (Loss) | | | | | | |
| on Investments | | 12.239 | 13.063 | (5.427) | 19.649 | 15.493 | 9.303 |
| Total from Investment Operations | | 13.956 | 16.322 | (2.451) | 22.336 | 18.024 | 11.642 |
| Distributions | | | | | | | |
| Dividends from Net Investment Income | (1.826) | (3.182) | (2.929) | (2.606) | (2.474) | (2.292) |
| Distributions from Realized Capital Gains | — | — | — | — | — | — |
| Total Distributions | | (1.826) | (3.182) | (2.929) | (2.606) | (2.474) | (2.292) |
| Net Asset Value, End of Period | $138.07 | $125.94 | $112.80 | $118.18 | $98.45 | $82.90 |
| |
| Total Return | | 11.19% | 14.72% | -2.19% | 22.95% | 22.07% | 16.19% |
| |
| Ratios/Supplemental Data | | | | | | | |
| Net Assets, End of Period (Millions) | | $144 | $207 | $213 | $212 | $164 | $110 |
| Ratio of Total Expenses to | | | | | | | |
| Average Net Assets | | 0.06% | 0.06% | 0.06% | 0.08% | 0.08% | 0.08% |
| Ratio of Net Investment Income to | | | | | | | |
| Average Net Assets | | 2.72% | 2.85% | 2.54% | 2.50% | 2.75% | 3.01% |
| Portfolio Turnover Rate 2 | | 6% | 8% | 5% | 8% | 34% | 17% |
The expense ratio, net investment income ratio, and turnover rate for the current period have been annualized.
1 Calculated based on average shares outstanding.
2 Excludes the value of portfolio securities received or delivered as a result of in-kind purchases or redemptions of the fund’s capital shares,
including ETF Creation Units.
See accompanying Notes, which are an integral part of the Financial Statements.
44
Mega Cap Value Index Fund
Notes to Financial Statements
Vanguard Mega Cap Value Index Fund is registered under the Investment Company Act of 1940 as an open-end investment company, or mutual fund. The fund offers two classes of shares: ETF Shares and Institutional Shares. ETF Shares are listed for trading on NYSE Arca; they can be purchased and sold through a broker. Institutional Shares are designed for investors who meet certain administrative, service, and account-size criteria.
A. The following significant accounting policies conform to generally accepted accounting principles for U.S. investment companies. The fund consistently follows such policies in preparing its financial statements.
1. Security Valuation: Securities are valued as of the close of trading on the New York Stock Exchange (generally 4 p.m., Eastern time) on the valuation date. Equity securities are valued at the latest quoted sales prices or official closing prices taken from the primary market in which each security trades; such securities not traded on the valuation date are valued at the mean of the latest quoted bid and asked prices. Securities for which market quotations are not readily available, or whose values have been materially affected by events occurring before the fund’s pricing time but after the close of the securities’ primary markets, are valued by methods deemed by the board of trustees to represent fair value. Investments in Vanguard Market Liquidity Fund are valued at that fund’s net asset value. Temporary cash investments are valued using the latest bid prices or using valuations based on a matrix system (which considers such factors as security prices, yields, maturities, and ratings), both as furnished by independent pricing services.
2. Futures Contracts: The fund uses index futures contracts to a limited extent, with the objectives of maintaining full exposure to the stock market, enhancing returns, maintaining liquidity, and minimizing transaction costs. The fund may purchase futures contracts to immediately invest incoming cash in the market, or sell futures in response to cash outflows, thereby simulating a fully invested position in the underlying index while maintaining a cash balance for liquidity. The fund may seek to enhance returns by using futures contracts instead of the underlying securities when futures are believed to be priced more attractively than the underlying securities. The primary risks associated with the use of futures contracts are imperfect correlation between changes in market values of stocks held by the fund and the prices of futures contracts, and the possibility of an illiquid market. Counterparty risk involving futures is mitigated because a regulated clearinghouse is the counterparty instead of the clearing broker. To further mitigate counterparty risk, the fund trades futures contracts on an exchange, monitors the financial strength of its clearing brokers and clearinghouse, and has entered into clearing agreements with its clearing brokers. The clearinghouse imposes initial margin requirements to secure the fund’s performance and requires daily settlement of variation margin representing changes in the market value of each contract.
Futures contracts are valued at their quoted daily settlement prices. The aggregate settlement values of the contracts are not recorded in the Statement of Net Assets. Fluctuations in the value of the contracts are recorded in the Statement of Net Assets as an asset (liability) and in the Statement of Operations as unrealized appreciation (depreciation) until the contracts are closed, when they are recorded as realized futures gains (losses).
During the six months ended February 28, 2017, the fund’s average investments in long and short futures contracts represented less than 1% and 0% of net assets, respectively, based on the average of aggregate settlement values at each quarter-end during the period.
45
Mega Cap Value Index Fund
3. Federal Income Taxes: The fund intends to continue to qualify as a regulated investment company and distribute all of its taxable income. Management has analyzed the fund’s tax positions taken for all open federal income tax years (August 31, 2013–2016), and for the period ended February 28, 2017, and has concluded that no provision for federal income tax is required in the fund’s financial statements.
4. Distributions: Distributions to shareholders are recorded on the ex-dividend date.
5. Securities Lending: To earn additional income, the fund lends its securities to qualified institutional borrowers. Security loans are subject to termination by the fund at any time, and are required to be secured at all times by collateral in an amount at least equal to the market value of securities loaned. Daily market fluctuations could cause the value of loaned securities to be more or less than the value of the collateral received. When this occurs, the collateral is adjusted and settled on the next business day. The fund further mitigates its counterparty risk by entering into securities lending transactions only with a diverse group of prequalified counterparties, monitoring their financial strength, and entering into master securities lending agreements with its counterparties. The master securities lending agreements provide that, in the event of a counterparty’s default (including bankruptcy), the fund may terminate any loans with that borrower, determine the net amount owed, and sell or retain the collateral up to the net amount owed to the fund; however, such actions may be subject to legal proceedings. While collateral mitigates counterparty risk, in the absence of a default the fund may experience delays and costs in recovering the securities loaned. The fund invests cash collateral received in Vanguard Market Liquidity Fund, and records a liability in the Statement of Net Assets for the return of the collateral, during the period the securities are on loan. Securities lending income represents fees charged to borrowers plus income earned on invested cash collateral, less expenses associated with the loan. During the term of the loan, the fund is entitled to all distributions made on or in respect of the loaned securities.
6. Credit Facility: The fund and certain other funds managed by The Vanguard Group (“Vanguard”) participate in a $3.1 billion committed credit facility provided by a syndicate of lenders pursuant to a credit agreement that may be renewed annually; each fund is individually liable for its borrowings, if any, under the credit facility. Borrowings may be utilized for temporary and emergency purposes, and are subject to the fund’s regulatory and contractual borrowing restrictions. The participating funds are charged administrative fees and an annual commitment fee of 0.10% of the undrawn amount of the facility; these fees are allocated to the funds based on a method approved by the fund’s board of trustees and included in Management and Administrative expenses on the fund’s Statement of Operations. Any borrowings under this facility bear interest at a rate based upon the higher of the one-month London Interbank Offered Rate, federal funds effective rate, or overnight bank funding rate plus an agreed-upon spread.
The fund had no borrowings outstanding at February 28, 2017, or at any time during the period then ended.
7. Other: Dividend income is recorded on the ex-dividend date. Interest income includes income distributions received from Vanguard Market Liquidity Fund and is accrued daily. Premiums and discounts on debt securities purchased are amortized and accreted, respectively, to interest income
46
Mega Cap Value Index Fund
over the lives of the respective securities. Security transactions are accounted for on the date securities are bought or sold. Costs used to determine realized gains (losses) on the sale of investment securities are those of the specific securities sold.
Each class of shares has equal rights as to assets and earnings, except that each class separately bears certain class-specific expenses related to maintenance of shareholder accounts (included in Management and Administrative expenses) and shareholder reporting. Marketing and distribution expenses are allocated to each class of shares based on a method approved by the board of trustees. Income, other non-class-specific expenses, and gains and losses on investments are allocated to each class of shares based on its relative net assets.
B. In accordance with the terms of a Funds’ Service Agreement (the “FSA”) between Vanguard and the fund, Vanguard furnishes to the fund investment advisory, corporate management, administrative, marketing, and distribution services at Vanguard’s cost of operations (as defined by the FSA). These costs of operations are allocated to the fund based on methods and guidelines approved by the board of trustees. Vanguard does not require reimbursement in the current period for certain costs of operations (such as deferred compensation/benefits and risk/insurance costs); the fund’s liability for these costs of operations is included in Payables to Vanguard on the Statement of Net Assets.
Upon the request of Vanguard, the fund may invest up to 0.40% of its net assets as capital in Vanguard. At February 28, 2017, the fund had contributed to Vanguard capital in the amount of $121,000, representing 0.01% of the fund’s net assets and 0.05% of Vanguard’s capitalization. The fund’s trustees and officers are also directors and employees, respectively, of Vanguard.
C. Various inputs may be used to determine the value of the fund’s investments. These inputs are summarized in three broad levels for financial statement purposes. The inputs or methodologies used to value securities are not necessarily an indication of the risk associated with investing in those securities.
Level 1—Quoted prices in active markets for identical securities.
Level 2—Other significant observable inputs (including quoted prices for similar securities, interest rates, prepayment speeds, credit risk, etc.).
Level 3—Significant unobservable inputs (including the fund’s own assumptions used to determine the fair value of investments).
The following table summarizes the market value of the fund’s investments as of February 28, 2017, based on the inputs used to value them:
| | | |
| | Level 1 | Level 2 | Level 3 |
| Investments | ($000) | ($000) | ($000) |
| Common Stocks | 1,743,249 | — | — |
| Temporary Cash Investments | — | 100 | — |
| Futures Contracts—Liabilities1 | (13) | — | — |
| Total | 1,743,236 | 100 | — |
| 1 Represents variation margin on the last day of the reporting period. |
47
Mega Cap Value Index Fund
D. At February 28, 2017, the aggregate settlement value of open futures contracts and the related unrealized appreciation (depreciation) were:
| | | | |
| | | | ($000) |
| | | | Aggregate | |
| | | Number of | Settlement | Unrealized |
| | | Long (Short) | Value | Appreciation |
| Futures Contracts | Expiration | Contracts | Long (Short) | (Depreciation) |
| E-mini S&P 500 Index | March 2017 | 48 | 5,671 | 62 |
Unrealized appreciation (depreciation) on open futures contracts is required to be treated as realized gain (loss) for tax purposes.
E. Distributions are determined on a tax basis and may differ from net investment income and realized capital gains for financial reporting purposes. Differences may be permanent or temporary. Permanent differences are reclassified among capital accounts in the financial statements to reflect their tax character. Temporary differences arise when certain items of income, expense, gain, or loss are recognized in different periods for financial statement and tax purposes. These differences will reverse at some time in the future. Differences in classification may also result from the treatment of short-term gains as ordinary income for tax purposes.
During the six months ended February 28, 2017, the fund realized $16,780,000 of net capital gains resulting from in-kind redemptions—in which shareholders exchanged fund shares for securities held by the fund rather than for cash. Because such gains are not taxable to the fund, and are not distributed to shareholders, they have been reclassified from accumulated net realized losses to paid-in capital.
The fund’s tax-basis capital gains and losses are determined only at the end of each fiscal year. For tax purposes, at August 31, 2016, the fund had available capital losses totaling $21,404,000 to offset future net capital gains. Of this amount, $4,326,000 is subject to expiration on August 31, 2019. Capital losses of $17,078,000 realized beginning in 2012 may be carried forward indefinitely under the Regulated Investment Company Modernization Act of 2010, but must be used before any expiring loss carryforwards. The fund will use these capital losses to offset net taxable capital gains, if any, realized during the year ending August 31, 2017; should the fund realize net capital losses for the year, the losses will be added to the loss carryforward balance above.
At February 28, 2017, the cost of investment securities for tax purposes was $1,359,518,000.
Net unrealized appreciation of investment securities for tax purposes was $383,831,000, consisting of unrealized gains of $400,539,000 on securities that had risen in value since their purchase and $16,708,000 in unrealized losses on securities that had fallen in value since their purchase.
F. During the six months ended February 28, 2017, the fund purchased $224,726,000 of investment securities and sold $160,060,000 of investment securities, other than temporary cash investments. Purchases and sales include $174,614,000 and $45,687,000, respectively, in connection with in-kind purchases and redemptions of the fund’s capital shares.
48
Mega Cap Value Index Fund
G. Capital share transactions for each class of shares were:
| | | | |
| | Six Months Ended | Year Ended |
| | February 28, 2017 | August 31, 2016 |
| | Amount | Shares | Amount | Shares |
| | ($000) | (000) | ($000) | (000) |
| ETF Shares | | | | |
| Issued | 195,991 | 2,975 | 364,263 | 6,137 |
| Issued in Lieu of Cash Distributions | — | — | — | — |
| Redeemed | (47,742) | (725) | (126,295) | (2,150) |
| Net Increase (Decrease)—ETF Shares | 148,249 | 2,250 | 237,968 | 3,987 |
| Institutional Shares | | | | |
| Issued | 5,597 | 45 | 22,320 | 195 |
| Issued in Lieu of Cash Distributions | 1,837 | 14 | 4,297 | 37 |
| Redeemed | (85,029) | (659) | (56,767) | (477) |
| Net Increase (Decrease)—Institutional Shares | (77,595) | (600) | (30,150) | (245) |
H. Management has determined that no material events or transactions occurred subsequent to February 28, 2017, that would require recognition or disclosure in these financial statements.
49
About Your Fund’s Expenses
As a shareholder of the fund, you incur ongoing costs, which include costs for portfolio management, administrative services, and shareholder reports (like this one), among others. Operating expenses, which are deducted from a fund’s gross income, directly reduce the investment return of the fund.
A fund’s expenses are expressed as a percentage of its average net assets. This figure is known as the expense ratio. The following examples are intended to help you understand the ongoing costs (in dollars) of investing in your fund and to compare these costs with those of other mutual funds. The examples are based on an investment of $1,000 made at the beginning of the period shown and held for the entire period.
The accompanying table illustrates your fund’s costs in two ways:
• Based on actual fund return. This section helps you to estimate the actual expenses that you paid over the period. The ”Ending Account Value“ shown is derived from the fund‘s actual return, and the third column shows the dollar amount that would have been paid by an investor who started with $1,000 in the fund. You may use the information here, together with the amount you invested, to estimate the expenses that you paid over the period.
To do so, simply divide your account value by $1,000 (for example, an $8,600 account value divided by $1,000 = 8.6), then multiply the result by the number given for your fund under the heading ”Expenses Paid During Period.“
• Based on hypothetical 5% yearly return. This section is intended to help you compare your fund‘s costs with those of other mutual funds. It assumes that the fund had a yearly return of 5% before expenses, but that the expense ratio is unchanged. In this case—because the return used is not the fund’s actual return—the results do not apply to your investment. The example is useful in making comparisons because the Securities and Exchange Commission requires all mutual funds to calculate expenses based on a 5% return. You can assess your fund’s costs by comparing this hypothetical example with the hypothetical examples that appear in shareholder reports of other funds.
Note that the expenses shown in the table are meant to highlight and help you compare ongoing costs only and do not reflect transaction costs incurred by the fund for buying and selling securities. Further, the expenses do not include any purchase, redemption, or account service fees described in the fund prospectus. If such fees were applied to your account, your costs would be higher. Your fund does not carry a “sales load.”
The calculations assume no shares were bought or sold during the period. Your actual costs may have been higher or lower, depending on the amount of your investment and the timing of any purchases or redemptions.
You can find more information about the fund’s expenses, including annual expense ratios, in the Financial Statements section of this report. For additional information on operating expenses and other shareholder costs, please refer to your fund’s current prospectus.
50
| | | |
| Six Months Ended February 28, 2017 | | | |
| | Beginning | Ending | Expenses |
| | Account Value | Account Value | Paid During |
| | 8/31/2016 | 2/28/2017 | Period |
| Based on Actual Fund Return | | | |
| Mega Cap Index Fund | | | |
| ETF Shares | $1,000.00 | $1,103.17 | $0.37 |
| Institutional Shares | 1,000.00 | 1,103.29 | 0.31 |
| Mega Cap Growth Index Fund | | | |
| ETF Shares | $1,000.00 | $1,093.67 | $0.36 |
| Institutional Shares | 1,000.00 | 1,093.85 | 0.31 |
| Mega Cap Value Index Fund | | | |
| ETF Shares | $1,000.00 | $1,111.83 | $0.37 |
| Institutional Shares | 1,000.00 | 1,111.95 | 0.31 |
| Based on Hypothetical 5% Yearly Return | | | |
| Mega Cap Index Fund | | | |
| ETF Shares | $1,000.00 | $1,024.45 | $0.35 |
| Institutional Shares | 1,000.00 | 1,024.50 | 0.30 |
| Mega Cap Growth Index Fund | | | |
| ETF Shares | $1,000.00 | $1,024.45 | $0.35 |
| Institutional Shares | 1,000.00 | 1,024.50 | 0.30 |
| Mega Cap Value Index Fund | | | |
| ETF Shares | $1,000.00 | $1,024.45 | $0.35 |
| Institutional Shares | 1,000.00 | 1,024.50 | 0.30 |
The calculations are based on expenses incurred in the most recent six-month period. The funds’ annualized six-month expense ratios for that
period are: for the Mega Cap Index Fund, 0.07% for ETF Shares and 0.06% for Institutional Shares; for the Mega Cap Growth Index Fund,
0.07% for ETF Shares and 0.06% for Institutional Shares; and for the Mega Cap Value Index Fund, 0.07% for ETF Shares and 0.06% for
Institutional Shares. The dollar amounts shown as “Expenses Paid” are equal to the annualized expense ratio multiplied by the average
account value over the period, multiplied by the number of days in the most recent six-month period, then divided by the number of days in
the most recent 12-month period (181/365).
51
Glossary
30-Day SEC Yield. A fund’s 30-day SEC yield is derived using a formula specified by the U.S. Securities and Exchange Commission. Under the formula, data related to the fund’s security holdings in the previous 30 days are used to calculate the fund’s hypothetical net income for that period, which is then annualized and divided by the fund’s estimated average net assets over the calculation period. For the purposes of this calculation, a security’s income is based on its current market yield to maturity (for bonds), its actual income (for asset-backed securities), or its projected dividend yield (for stocks). Because the SEC yield represents hypothetical annualized income, it will differ—at times significantly—from the fund’s actual experience. As a result, the fund’s income distributions may be higher or lower than implied by the SEC yield.
Beta. A measure of the magnitude of a fund’s past share-price fluctuations in relation to the ups and downs of a given market index. The index is assigned a beta of 1.00. Compared with a given index, a fund with a beta of 1.20 typically would have seen its share price rise or fall by 12% when the index rose or fell by 10%. For this report, beta is based on returns over the past 36 months for both the fund and the index. Note that a fund’s beta should be reviewed in conjunction with its R-squared (see definition). The lower the R-squared, the less correlation there is between the fund and the index, and the less reliable beta is as an indicator of volatility.
Dividend Yield. Dividend income earned by stocks, expressed as a percentage of the aggregate market value (or of net asset value, for a fund). The yield is determined by dividing the amount of the annual dividends by the aggregate value (or net asset value) at the end of the period. For a fund, the dividend yield is based solely on stock holdings and does not include any income produced by other investments.
Earnings Growth Rate. The average annual rate of growth in earnings over the past five years for the stocks now in a fund.
Equity Exposure. A measure that reflects a fund’s investments in stocks and stock futures. Any holdings in short-term reserves are excluded.
Expense Ratio. A fund’s total annual operating expenses expressed as a percentage of the fund’s average net assets. The expense ratio includes management and administrative expenses, but does not include the transaction costs of buying and selling portfolio securities.
Foreign Holdings. The percentage of a fund represented by securities or depositary receipts of companies based outside the United States.
Inception Date. The date on which the assets of a fund (or one of its share classes) are first invested in accordance with the fund’s investment objective. For funds with a subscription period, the inception date is the day after that period ends. Investment performance is measured from the inception date.
Median Market Cap. An indicator of the size of companies in which a fund invests; the midpoint of market capitalization (market price x shares outstanding) of a fund’s stocks, weighted by the proportion of the fund’s assets invested in each stock. Stocks representing half of the fund’s assets have market capitalizations above the median, and the rest are below it.
Price/Book Ratio. The share price of a stock divided by its net worth, or book value, per share. For a fund, the weighted average price/book ratio of the stocks it holds.
52
Price/Earnings Ratio. The ratio of a stock’s current price to its per-share earnings over the past year. For a fund, the weighted average P/E of the stocks it holds. P/E is an indicator of market expectations about corporate prospects; the higher the P/E, the greater the expectations for a company’s future growth.
R-Squared. A measure of how much of a fund’s past returns can be explained by the returns from the market in general, as measured by a given index. If a fund’s total returns were precisely synchronized with an index’s returns, its R-squared would be 1.00. If the fund’s returns bore no relationship to the index’s returns, its R-squared would be 0. For this report, R-squared is based on returns over the past 36 months for both the fund and the index.
Return on Equity. The annual average rate of return generated by a company during the past five years for each dollar of shareholder’s equity (net income divided by shareholder’s equity). For a fund, the weighted average return on equity for the companies whose stocks it holds.
Short-Term Reserves. The percentage of a fund invested in highly liquid, short-term securities that can be readily converted to cash.
Turnover Rate. An indication of the fund’s trading activity. Funds with high turnover rates incur higher transaction costs and may be more likely to distribute capital gains (which may be taxable to investors). The turnover rate excludes in-kind transactions, which have minimal impact on costs.
Benchmark Information
Spliced Mega Cap Growth Index: MSCI US Large Cap Growth Index through April 16, 2013; CRSP
US Mega Cap Growth Index thereafter.
Spliced Mega Cap Index: MSCI US Large Cap 300 Index through January 30, 2013; CRSP US
Mega Cap Index thereafter.
Spliced Mega Cap Value Index: MSCI US Large Cap Value Index through April 16, 2013; CRSP US
Mega Cap Value Index thereafter.
53
This page intentionally left blank.
This page intentionally left blank.
The People Who Govern Your Fund
The trustees of your mutual fund are there to see that the fund is operated and managed in your best interests since, as a shareholder, you are a part owner of the fund. Your fund’s trustees also serve on the board of directors of The Vanguard Group, Inc., which is owned by the Vanguard funds and provides services to them on an at-cost basis.
A majority of Vanguard’s board members are independent, meaning that they have no affiliation with Vanguard or the funds they oversee, apart from the sizable personal investments they have made as private individuals. The independent board members have distinguished backgrounds in business, academia, and public service. Each of the trustees and executive officers oversees 195 Vanguard funds.
The following table provides information for each trustee and executive officer of the fund. The mailing address of the trustees and officers is P.O. Box 876, Valley Forge, PA 19482. More information about the trustees is in the Statement of Additional Information, which can be obtained, without charge, by contacting Vanguard at 800-662-7447, or online at vanguard.com.
InterestedTrustee1
F. William McNabb III
Born 1957. Trustee Since July 2009. Chairman of the Board. Principal Occupation(s) During the Past Five Years and Other Experience: Chairman of the Board of The Vanguard Group, Inc., and of each of the investment companies served by The Vanguard Group, since January 2010; Director of The Vanguard Group since 2008; Chief Executive Officer and President of The Vanguard Group, and of each of the investment companies served by The Vanguard Group, since 2008; Director of Vanguard Marketing Corporation; Managing Director of The Vanguard Group (1995–2008).
IndependentTrustees
Emerson U. Fullwood
Born 1948. Trustee Since January 2008. Principal Occupation(s) During the Past Five Years and Other Experience: Executive Chief Staff and Marketing Officer for North America and Corporate Vice President (retired 2008) of Xerox Corporation (document management products and services); Executive in Residence and 2009–2010 Distinguished Minett Professor at the Rochester Institute of Technology; Lead Director of SPX FLOW, Inc. (multi-industry manufacturing); Director of the United Way of Rochester, the University of Rochester Medical Center, Monroe Community College Foundation, North Carolina A&T University, and Roberts Wesleyan College.
Rajiv L. Gupta
Born 1945. Trustee Since December 2001.2 Principal Occupation(s) During the Past Five Years and Other Experience: Chairman and Chief Executive Officer (retired 2009) and President (2006–2008) of Rohm and Haas Co. (chemicals); Director of Arconic Inc. (diversified manufacturer), HP Inc. (printer and personal computer manufacturing), and Delphi Automotive plc (automotive components); Senior Advisor at New Mountain Capital.
Amy Gutmann
Born 1949. Trustee Since June 2006. Principal Occupation(s) During the Past Five Years and Other Experience: President of the University of Pennsylvania; Christopher H. Browne Distinguished Professor of Political Science, School of Arts and Sciences, and Professor of Communication, Annenberg School for Communication, with secondary faculty appointments in the Department of Philosophy, School of Arts and Sciences, and at the Graduate School of Education, University of Pennsylvania; Trustee of the National Constitution Center; Chair of the Presidential Commission for the Study of Bioethical Issues.
JoAnn Heffernan Heisen
Born 1950. Trustee Since July 1998. Principal Occupation(s) During the Past Five Years and Other Experience: Corporate Vice President and Chief Global Diversity Officer (retired 2008) and Member of the Executive Committee (1997–2008) of Johnson & Johnson (pharmaceuticals/medical devices/consumer products); Director of Skytop Lodge Corporation (hotels) and the Robert Wood Johnson Foundation; Member of the Advisory Board of the Institute for Women’s Leadership at Rutgers University.
F. Joseph Loughrey
Born 1949. Trustee Since October 2009. Principal Occupation(s) During the Past Five Years and Other Experience: President and Chief Operating Officer (retired 2009) of Cummins Inc. (industrial machinery); Chairman of the Board of Hillenbrand, Inc. (specialized consumer services), Oxfam America, and the Lumina
Foundation for Education; Director of SKF AB (industrial machinery), Hyster-Yale Materials Handling, Inc. (forklift trucks), and the V Foundation for Cancer Research; Member of the Advisory Council for the College of Arts and Letters and Chair of the Advisory Board to the Kellogg Institute for International Studies, both at the University of Notre Dame.
Mark Loughridge
Born 1953. Trustee Since March 2012. Principal Occupation(s) During the Past Five Years and Other Experience: Senior Vice President and Chief Financial Officer (retired 2013) at IBM (information technology services); Fiduciary Member of IBM’s Retirement Plan Committee (2004–2013); Director of the Dow Chemical Company; Member of the Council on Chicago Booth.
Scott C. Malpass
Born 1962. Trustee Since March 2012. Principal Occupation(s) During the Past Five Years and Other Experience: Chief Investment Officer and Vice President at the University of Notre Dame; Assistant Professor of Finance at the Mendoza College of Business at Notre Dame; Member of the Notre Dame 403(b) Investment Committee, the Board of Advisors for Spruceview Capital Partners, and the Investment Advisory Committee of Major League Baseball; Board Member of TIFF Advisory Services, Inc., and Catholic Investment Services, Inc. (investment advisors); Member of the Board of Superintendence of the Institute for the Works of Religion.
André F. Perold
Born 1952. Trustee Since December 2004. Principal Occupation(s) During the Past Five Years and Other Experience: George Gund Professor of Finance and Banking, Emeritus at the Harvard Business School (retired 2011); Chief Investment Officer and Co-Managing Partner of HighVista Strategies LLC (private investment firm); Overseer of the Museum of Fine Arts Boston.
Peter F. Volanakis
Born 1955. Trustee Since July 2009. Principal Occupation(s) During the Past Five Years and Other Experience: President and Chief Operating Officer (retired 2010) of Corning Incorporated (communications equipment); Chairman of the Board of Trustees of Colby-Sawyer College; Member of the Board of Hypertherm, Inc. (industrial cutting systems, software, and consumables).
Executive Officers
Glenn Booraem
Born 1967. Investment Stewardship Officer Since February 2017. Principal Occupation(s) During the Past Five Years and Other Experience: Principal of The Vanguard Group, Inc.; Treasurer (2015–2017), Controller (2010–2015), and Assistant Controller (2001–2010) of each of the investment companies served by The Vanguard Group.
Thomas J. Higgins
Born 1957. Chief Financial Officer Since September 2008. Principal Occupation(s) During the Past Five Years and Other Experience: Principal of The Vanguard Group, Inc.; Chief Financial Officer of each of the investment companies served by The Vanguard Group; Treasurer of each of the investment companies served by The Vanguard Group (1998–2008).
Peter Mahoney
Born 1974. Controller Since May 2015. Principal Occupation(s) During the Past Five Years and Other Experience: Principal of The Vanguard Group, Inc.; Controller of each of the investment companies served by The Vanguard Group; Head of International Fund Services at The Vanguard Group (2008–2014).
Anne E. Robinson
Born 1970. Secretary Since September 2016. Principal Occupation(s) During the Past Five Years and Other Experience: Managing Director of The Vanguard Group, Inc.; General Counsel of The Vanguard Group; Secretary of The Vanguard Group and of each of the investment companies served by The Vanguard Group; Director and Senior Vice President of Vanguard Marketing Corporation; Managing Director and General Counsel of Global Cards and Consumer Services at Citigroup (2014–2016); Counsel at American Express (2003–2014).
Michael Rollings
Born 1963. Treasurer Since February 2017. Principal Occupation(s) During the Past Five Years and Other Experience: Managing Director of The Vanguard Group, Inc.; Treasurer of each of the investment companies served by The Vanguard Group; Executive Vice President and Chief Financial Officer of MassMutual Financial Group (2006–2016).
| |
| Vanguard Senior Management Team |
| Mortimer J. Buckley | James M. Norris |
| John James | Thomas M. Rampulla |
| Martha G. King | Glenn W. Reed |
| John T. Marcante | Karin A. Risi |
| Chris D. McIsaac | |
| |
| Chairman Emeritus and Senior Advisor |
| John J. Brennan | |
| Chairman, 1996–2009 | |
| Chief Executive Officer and President, 1996–2008 |
| |
| Founder | |
| John C. Bogle | |
| Chairman and Chief Executive Officer, 1974–1996 |
1 Mr. McNabb is considered an “interested person,” as defined in the Investment Company Act of 1940, because he is an officer of the Vanguard funds.
2 December 2002 for Vanguard Equity Income Fund, the Vanguard Municipal Bond Funds, and the Vanguard State Tax-Exempt Funds.
|  |
| | P.O. Box 2600 |
| | Valley Forge, PA 19482-2600 |
| |
| |
| |
| Connect with Vanguard® > vanguard.com |
| |
| |
| |
| Fund Information > 800-662-7447 | |
| Direct Investor Account Services > 800-662-2739 | |
| Institutional Investor Services > 800-523-1036 | |
| Text Telephone for People | |
| Who Are Deaf or Hard of Hearing > 800-749-7273 | |
| |
| This material may be used in conjunction | |
| with the offering of shares of any Vanguard | |
| fund only if preceded or accompanied by | |
| the fund’s current prospectus. | |
| |
| All comparative mutual fund data are from Lipper, a | |
| Thomson Reuters Company, or Morningstar, Inc., unless | |
| otherwise noted. | |
| |
| You can obtain a free copy of Vanguard’s proxy voting | |
| guidelines by visiting vanguard.com/proxyreporting or by | |
| calling Vanguard at 800-662-2739. The guidelines are | |
| also available from the SEC’s website, sec.gov. In | |
| addition, you may obtain a free report on how your fund | |
| voted the proxies for securities it owned during the 12 | |
| months ended June 30. To get the report, visit either | |
| vanguard.com/proxyreporting or sec.gov. | |
| |
| You can review and copy information about your fund at | |
| the SEC’s Public Reference Room in Washington, D.C. To | |
| find out more about this public service, call the SEC at | |
| 202-551-8090. Information about your fund is also | |
| available on the SEC’s website, and you can receive | |
| copies of this information, for a fee, by sending a | |
| request in either of two ways: via email addressed to | |
| publicinfo@sec.gov or via regular mail addressed to the | |
| Public Reference Section, Securities and Exchange | |
| Commission, Washington, DC 20549-1520. | |
| |
| | © 2017 The Vanguard Group, Inc. |
| | All rights reserved. |
| | Vanguard Marketing Corporation, Distributor. |
| |
| | Q8282 042017 |
Item 2: Code of Ethics. The Registrant has adopted a code of ethics that applies to the Registrant’s principal executive officer, principal financial officer, principal accounting officer or controller or persons performing similar functions. The Code of Ethics was amended during the reporting period covered by this report to make certain technical, non-material changes.
Item 3: Audit Committee Financial Expert.
Not Applicable.
Item 4: Principal Accountant Fees and Services.
(a) Audit Fees.
Not Applicable.
Item 5: Audit Committee of Listed Registrants.
Not Applicable.
Item 6: Investments.
Not Applicable.
Item 7: Disclosure of Proxy Voting Policies and Procedures for Closed-End Management
Investment Companies.
Not Applicable.
Item 8: Portfolio Managers of Closed-End Management Investment Companies.
Not Applicable.
Item 9: Purchase of Equity Securities by Closed-End Management Investment Company and
Affiliated Purchasers.
Not Applicable.
Item 10: Submission of Matters to a Vote of Security Holders.
Not Applicable.
Item 11: Controls and Procedures.
(a) Disclosure Controls and Procedures. The Principal Executive and Financial Officers concluded that the Registrant’s Disclosure Controls and Procedures are effective based on their evaluation of the Disclosure Controls and Procedures as of a date within 90 days of the filing date of this report.
(b) Internal Control Over Financial Reporting. There were no significant changes in Registrant’s Internal Control Over Financial Reporting or in other factors that could significantly affect this control subsequent to the date of the evaluation, including any corrective actions with regard to significant deficiencies and material weaknesses.
Item 12: Exhibits.
(a) Certifications.
Pursuant to the requirements of the Securities Exchange Act of 1934 and the Investment Company Act of 1940, the registrant has duly caused this report to be signed on its behalf by the undersigned, thereunto duly authorized.
| |
| | VANGUARD WORLD FUND |
| |
| |
| BY: | /s/ F. WILLIAM MCNABB III* |
| | F. WILLIAM MCNABB III |
| | CHIEF EXECUTIVE OFFICER |
| |
| Date: April 17, 2017 |
Pursuant to the requirements of the Securities Exchange Act of 1934 and the Investment Company Act of 1940, this report has been signed below by the following persons on behalf of the registrant and in the capacities and on the dates indicated.
| |
| | VANGUARD WORLD FUND |
BY: | /s/ F. WILLIAM MCNABB III* |
| | F. WILLIAM MCNABB III |
| | CHIEF EXECUTIVE OFFICER |
Date: April 17, 2017 |
| | VANGUARD WORLD FUND |
BY: | /s/ THOMAS J. HIGGINS* |
| | THOMAS J. HIGGINS |
| | CHIEF FINANCIAL OFFICER |
Date: April 17, 2017 |
* By: /s/ Anne E. Robinson
Anne E. Robinson, pursuant to a Power of Attorney filed on October 4, 2016 see file Number
33-32548, Incorporated by Reference.