UNITED STATES
SECURITIES AND EXCHANGE COMMISSION
Washington, D.C. 20549
FORM N-CSR
CERTIFIED SHAREHOLDER REPORT
OF
REGISTERED MANAGEMENT INVESTMENT COMPANIES
| | |
| Investment Company Act file number: | 811-01027 |
Name of Registrant: | Vanguard World Fund |
Address of Registrant: | P.O. Box 2600 |
| | Valley Forge, PA 19482 |
Name and address of agent for service: | Anne E. Robinson, Esquire |
| | P.O. Box 876 |
| | Valley Forge, PA 19482 |
Registrant’s telephone number, including area code: (610) 669-1000 |
Date of fiscal year end: August 31 | |
Date of reporting period: September 1, 2017 – February 28, 2018 |
Item 1: Reports to Shareholders | |

Semiannual Report | February 28, 2018
Vanguard U.S. Growth Fund
Vanguard’s Principles for Investing Success
We want to give you the best chance of investment success. These principles, grounded in Vanguard’s research and experience, can put you on the right path.
Goals. Create clear, appropriate investment goals.
Balance. Develop a suitable asset allocation using broadly diversified funds.
Cost. Minimize cost.
Discipline. Maintain perspective and long-term discipline.
A single theme unites these principles: Focus on the things you can control.
We believe there is no wiser course for any investor.
| |
| Contents | |
| Your Fund’s Performance at a Glance. | 1 |
| CEO’s Perspective. | 2 |
| Advisors’ Report. | 5 |
| Results of Proxy Voting. | 11 |
| Fund Profile. | 12 |
| Performance Summary. | 14 |
| Financial Statements. | 15 |
| About Your Fund’s Expenses. | 31 |
| Trustees Approve Advisory Arrangements. | 33 |
| Glossary. | 36 |
Please note: The opinions expressed in this report are just that—informed opinions. They should not be considered promises
or advice. Also, please keep in mind that the information and opinions cover the period through the date on the front of this
report. Of course, the risks of investing in your fund are spelled out in the prospectus.
See the Glossary for definitions of investment terms used in this report.
About the cover: Nautical images have been part of Vanguard’s rich heritage since its start in 1975. For an
incoming ship, a lighthouse offers a beacon and safe path to shore. You can similarly depend on Vanguard to put
you first––and light the way––as you strive to meet your financial goals. Our client focus and low costs,
stemming from our unique ownership structure, assure that your interests are paramount.
Your Fund’s Performance at a Glance
• Vanguard U.S. Growth Fund returned more than 14% for the six months ended February 28, 2018. It surpassed the 13.94% return of its benchmark, the Russell 1000 Growth Index, and the 13.29% average return of its large-capitalization growth peers.
• The broad stock market recorded robust returns over the period’s first five months as corporate earnings generally exceeded expectations and investors were willing to pay more for those earnings. Stocks retreated in February as inflation concerns increased.
• Large-cap stocks outperformed their mid- and small-cap brethren, while growth stocks exceeded value stocks.
• The fund’s five advisors manage their portions of the portfolio separately, but all seek to hold the stocks of large, high-quality companies with long-term growth potential.
• Information technology stocks contributed the most to the fund’s return. Consumer discretionary stocks also powered results. Only the fund’s health care and real estate stocks declined.
| | | |
| Total Returns: Six Months Ended February 28, 2018 | | | |
| | | | Total |
| | | | Returns |
| Vanguard U.S. Growth Fund | | | |
| Investor Shares | | | 14.46% |
| Admiral™ Shares | | | 14.53 |
| Russell 1000 Growth Index | | | 13.94 |
| Large-Cap Growth Funds Average | | | 13.29 |
| Large-Cap Growth Funds Average: Derived from data provided by Lipper, a Thomson Reuters Company. | | |
| Admiral Shares carry lower expenses and are available to investors who meet certain account-balance requirements. | |
| |
| |
| Expense Ratios | | | |
| Your Fund Compared With Its Peer Group | | | |
| | Investor | Admiral | Peer Group |
| | Shares | Shares | Average |
| U.S. Growth Fund | 0.43% | 0.30% | 1.10% |
The fund expense ratios shown are from the prospectus dated December 21, 2017, and represent estimated costs for the current fiscal
year. For the six months ended February 28, 2018, the annualized expense ratios were 0.44% for Investor Shares and 0.31% for Admiral
Shares. The peer-group expense ratio is derived from data provided by Lipper, a Thomson Reuters Company, and captures information
through year-end 2017.
Peer group: Large-Cap Growth Funds.
1
CEO’s Perspective

Tim Buckley
President and Chief Executive Officer
Dear Shareholder,
As I begin my tenure as Vanguard’s fourth chief executive, I’ve been reflecting on both the past and the future of the company where I have spent my entire professional career.
I feel extremely fortunate to have the chance to lead a company filled with people who come to work every day passionate about Vanguard’s core purpose: to take a stand for all investors, to treat them fairly, and to give them the best chance for investment success.
Making a real difference
When I joined Vanguard in 1991, I found a mission-driven team focused on improving lives—helping people retire more comfortably, put their children through college, and achieve financial security. I found a company with purpose in an industry ripe for improvement.
It was clear, even early in my career, that the cards were stacked against most investors. Hidden fees, performance-chasing, and poor advice were relentlessly eroding investors’ dreams.
We knew Vanguard could be different and, as a result, could make a real difference. Over the past 25 years, for example, Vanguard has lowered our funds’ asset-weighted average expense ratio
2
from 0.31% to 0.12%. And over the past decade, 94% of our funds have beaten the average annual return of their peers.1
Focused on your success
Vanguard is built for Vanguard investors—as a client-owned company, we focus solely on you, our fund shareholders. Everything we do is designed to give our clients the best chance for investment success. In my role as CEO, I intend to keep this priority front and center. We’re proud of what we’ve achieved, but we’re even more excited about what’s to come.
As I write this, we’ve experienced a period of pronounced market volatility. Strong economic growth and budding signs of inflation have raised concerns about a more aggressive Federal Reserve. Although volatility can test investors’ nerves, we sometimes think of this as “Vanguard weather”—a time when having a disciplined, low-cost, and long-term approach to investment management serves investors well.
| | | |
| Market Barometer | | | |
| | | | Total Returns |
| | | Periods Ended February 28, 2018 |
| | Six | One | Five Years |
| | Months | Year | (Annualized) |
| Stocks | | | |
| Russell 1000 Index (Large-caps) | 10.62% | 16.70% | 14.56% |
| Russell 2000 Index (Small-caps) | 8.30 | 10.51 | 12.19 |
| Russell 3000 Index (Broad U.S. market) | 10.45 | 16.22 | 14.37 |
| FTSE All-World ex US Index (International) | 7.84 | 21.50 | 6.69 |
| |
| Bonds | | | |
| Bloomberg Barclays U.S. Aggregate Bond Index | | | |
| (Broad taxable market) | -2.18% | 0.51% | 1.71% |
| Bloomberg Barclays Municipal Bond Index | | | |
| (Broad tax-exempt market) | -1.24 | 2.50 | 2.57 |
| Citigroup Three-Month U.S. Treasury Bill Index | 0.59 | 0.98 | 0.27 |
| |
| CPI | | | |
| Consumer Price Index | 1.41% | 2.21% | 1.41% |
The performance data shown represent past performance, which is not a guarantee of future results.
1 For the ten-year period through December 31, 2017, 9 of 9 Vanguard money market funds, 56 of 60 bond funds, 21 of 22 balanced funds,
and 131 of 140 stock funds, or 217 of 231 Vanguard funds, outperformed their peer-group averages. Sources: Vanguard, based on data
from Lipper, a Thomson Reuters Company.
3
Steady, time-tested guidance
Our guidance for investors, as always, is to stay the course, tune out the hyperbolic headlines, and focus on your goals and what you can control, such as costs and how much you save. This time-tested advice has served our clients well over the decades.
Regardless of how the markets perform in the short term, I’m incredibly optimistic about the future for our investors. We have a dedicated team serving you, and we will never stop striving to make Vanguard the best place for you to invest through our high-quality funds and services, advice and guidance to help you meet your financial goals, and an experience that makes you feel good about entrusting us with your hard-earned savings.
Thank you for your continued loyalty.
Sincerely,

Mortimer J. Buckley
President and Chief Executive Officer
March 19, 2018
4
Advisors’ Report
For the six months ended February 28, 2018, Vanguard U.S. Growth Fund returned more than 14%, exceeding the return of its benchmark, the Russell 1000 Growth Index, and the average return of its peers. Your fund is managed by five advisors. The use of multiple independent advisors enhances the fund’s diversification by providing exposure to distinct yet complementary investment approaches. It is not uncommon for different advisors to have different views about individual securities or the broader investment environment.
The table on page 10 presents the advisors, the percentage and amount of fund assets that each manages, and brief descriptions of their investment strategies. Each advisor has also prepared a discussion of the investment environment during the fiscal year and of how the portfolio’s positioning reflects this assessment. These reports were prepared on March 16, 2018.
Jackson Square Partners, LLC
Portfolio Managers:
Jeffrey S. Van Harte, CFA,
Chairman and Chief Investment Officer
Christopher J. Bonavico, CFA,
Equity Analyst
Christopher M. Ericksen, CFA,
Equity Analyst
Daniel J. Prislin, CFA,
Equity Analyst
Despite positive absolute returns in the equity market over the past several years, we believe that a lack of meaningful volatility combined with tepid investor confidence in the global macroeconomic outlook demonstrates that there are more than just fundamental factors affecting stock prices.
President Trump’s surprising victory in 2016 and the periodic corresponding market reactions during the first year of his presidency reflect growing investor optimism, at least in the short-term, that potential policy shifts could stimulate economic growth. We believe it is too early to determine the long-term direction or magnitude of such outcomes, but we will closely monitor President Trump’s tenure with a keen eye on the execution of significant policy shifts.
Nonetheless, regardless of policy outcomes, we remain consistent in our long-term investment philosophy: We want to own what we view as strong secular-growth companies with solid business models and competitive positions that we believe can grow market share and have the potential to deliver shareholder value in a variety of market environments.
Our largest relative contributor to performance was PayPal Holdings. PayPal continues to perform with increasing business momentum, experiencing significant growth in both total payment volume and active users. We believe that
5
PayPal’s core payment product will continue to perform as it further expands its reach into physical merchants via Venmo and infrastructure offerings via Braintree.
Celgene was the largest detractor from performance. The stock was down sharply after third-quarter earnings because of lower pricing and higher marketing spending on key drug Otezla, which treats psoriasis and psoriatic arthritis. There is also market concern surrounding the 2027 patent expiration of cancer drug Revlimid. We believe that the existing franchise is undervalued and that the company has levers to pull to potentially offset patent expirations. Despite this, we have decided to redeploy the capital that had been in Celgene, as its path to future value creation has become considerably less visible and probably more reliant on acquisitions.
Wellington Management Company llp
Portfolio Managers:
Andrew J. Shilling, CFA,
Senior Managing Director
We aim for our portion of the fund to outperform growth benchmarks and, in the longer term, the broader market. We employ proprietary fundamental research and a rigorous valuation discipline to invest in large-capitalization companies that have attractive growth characteristics and that are protected by competitive barriers to entry. Our investment approach is based on identifying companies with a clear competitive advantage that will enable them to sustain above-average growth. We take a long-term perspective because we believe that investors often underestimate the potential for growth.
U.S. equities, as measured by the Standard & Poor’s 500 Index, gained 10.8% during the period. Growth stocks outperformed value stocks, and large-capitalization companies led their smaller-cap peers.
Notable contributors to performance included FleetCor Technologies, a provider of fuel cards for vehicle fleets and workforce payment products and services; ServiceNow, a provider of enterprise cloud-based services; and MasterCard, a global payments and technology company. Our avoidance of Comcast, a telecommunications conglomerate, also benefited relative results.
Detractors included our positions in Uber Technologies, a privately held transportation and ride-sharing company, and Dexcom, which develops and distributes continuous glucose monitoring systems for diabetes management.
Our decision not to hold Boeing, a diversified aerospace company, and AbbVie, a pharmaceutical company, also weighed on results.
6
Given the combination of synchronized global growth and geopolitical uncertainty, we have maintained the portfolio’s exposure to quality growth companies benefiting from secular trends and long-cycle growth. We believe these companies, supported by strong barriers to entry, can outgrow the broader market through the coming years.
We remain true to our process, seeking to invest in companies with competitive advantages, strong balance sheets, experienced and proven management, and the ability to sustain above-average growth. We are confident that this time-tested process will continue to yield a portfolio that is well-positioned to outperform.
William Blair Investment
Management, LLC
Portfolio Managers:
James Golan, CFA, Partner
David Ricci, CFA, Partner
Improving economic data and solid corporate earnings growth supported a steady market advance from September to January. Equity market volatility increased in February, and the market experienced a modest pullback. Despite that pullback, the Russell 1000 Growth Index still advanced significantly during the six-month period.
Strong portfolio performance was broad-based as nearly every sector had a positive effect on relative returns. Information technology was a standout contributor thanks to strong stock selection, including positions in Red Hat, MasterCard, and Adobe Systems. Shares of Red Hat advanced as the company benefited from the shift in enterprise IT architectures to cloud-based environments. MasterCard advanced on strength in its core business and on optimism about additional opportunities for faster payments and international markets. Other top contributors were Amazon.com in consumer discretionary and Zoetis in health care. From a style perspective, our higher growth bias also boosted relative results.
Top detractors included Biogen in health care, SBA Communications in real estate, and Starbucks, Vail Resorts, and Chipotle Mexican Grill in consumer discretionary. Biogen underperformed because of disappointing trial data, while SBA Communications lagged the overall benchmark despite outperforming its sector, which underperformed in the strong market.
We continue to focus on identifying durable businesses with significant competitive advantages and robust growth prospects that present compelling risk/ reward opportunities.
7
Baillie Gifford Overseas Ltd.
Portfolio Managers:
Tom Slater, Investment Manager, Partner
Gary Robinson, Investment Manager
February’s spike in market volatility, and the subsequent intense speculation as to its causes and implications, reminded us of two of our key beliefs: focus on the long term, and ignore the noise. We remain resolutely focused on finding exceptional growth companies in America and holding them for long periods. We were pleased to see the companies in the portfolio continue to deliver outstanding operational results while also investing for future growth.
Over the last six months we made a number of new investments, including in four health care stocks. Health care has been an increasing area of focus for the team. There is huge unmet need in the U.S. health system, and there is great room for improvement. We bought holdings in Agios Pharmaceuticals (whose treatments affect the metabolism of cancer cells), Denali Therapeutics (which is seeking a cure for Alzheimer’s), Novocure (which uses electric fields to stop cancer cells from dividing), and Penumbra (which develops medical tools to treat blood clots). Funds for these purchases came from the complete sales of Chipotle Mexican Grill, TripAdvisor, and Verisk Analytics. We also sold Juno Therapeutics after another of the companies in the portfolio, Celgene, agreed to acquire it at the beginning of the year.
The companies we look for share three general characteristics: they have distinctive cultures, they address large growth opportunites, and they are able to create deep competitive moats.
We remain very optimistic about the portfolio’s prospects over the next five years and beyond.
Jennison Associates LLC
Portfolio Managers:
Kathleen A. McCarragher,
Managing Director
Blair A. Boyer, Managing Director
Our sleeve posted a solid advance over the period and outperformed the benchmark, as both stock selection and sector allocations were broadly beneficial. Technology positions contributed strongly to returns. Tencent continues to perform well, driven by its dominant position and monetization opportunities in China’s online gaming and instant messaging markets, as well as its advertising and payment service efforts. Chipmaker Nvidia is driving high-growth markets such as gaming, automotive, high-performance computing, and cloud and enterprise, where developers have coalesced around its platform. Historically known for Photoshop and the PDF and Flash
8
platforms, Adobe has transformed into a subscription-based provider of digital services in two of the fastest-growing markets in enterprise software—content creation and digital marketing.
In consumer discretionary, Amazon’s scale dominance allows an advantageous cost structure and ability to aggressively invest in its businesses. Netflix rose on robust subscriber growth. As the company develops into a global network, its earnings potential grows significantly. Another consumer holding, cable operator Charter Communications, declined as subscriber metrics fell short of expectations and capital expenditures dampened free cash flow. In industrials, Boeing’s gain reflected cash generation from the 787 Dreamliner commercial jet, solid cost controls, and ramped-up 737 jet production.
Health care positions detracted from performance. Celgene lowered its long-term guidance because of pipeline disappointments. Still largely tied to its leading product, the company is in the early stages of its diversification strategy. Alexion Pharmaceuticals is pursuing label expansion opportunities for its flagship product in other disease settings, but it is in a transitionary phase as new management settles in. Allergan’s decline reflected potential patent expirations and constraints on its ability to raise drug prices.
We examine company, industry, and sector fundamentals and prospects over short and longer terms, projecting how markets, industries, and businesses will evolve over time. With this perspective, we build the portfolio through individual stock selection, based on individual company fundamentals.
9
| | | |
| Vanguard U.S. Growth Fund Investment Advisors | |
| |
| | Fund Assets Managed | |
| Investment Advisor | % | $ Million | Investment Strategy |
| Jackson Square Partners, LLC | 36 | 3,312 | Uses a bottom-up approach, seeking companies that |
| | | | have large end-market potential, dominant business |
| | | | models, and strong free cash flow generation that is |
| | | | attractively priced compared with the intrinsic value |
| | | | of the securities. |
| Wellington Management | 36 | 3,296 | Employs proprietary fundamental research and a |
| Company LLP | | | rigorous valuation discipline in an effort to invest in |
| | | | high-quality, large-cap, sustainable-growth |
| | | | companies. The investment approach is based on the |
| | | | belief that stock prices often overreact to short-term |
| | | | trends and that bottom-up, intensive research |
| | | | focused on longer-term fundamentals can be used to |
| | | | identify stocks that will outperform the market over |
| | | | time. |
| William Blair Investment | 13 | 1,153 | Uses a fundamental investment approach in pursuit |
| Management, LLC | | | of superior long-term investment results from |
| | | | growth-oriented companies with leadership positions |
| | | | and strong market presence. |
| Baillie Gifford Overseas Ltd. | 7 | 611 | Uses an active, bottom-up approach to identify |
| | | | exceptional growth companies and own them for |
| | | | long periods. Such companies have special cultures, |
| | | | address large market opportunities, and enjoy |
| | | | sustainable competitive advantages. This approach is |
| | | | based on the belief that these factors drive long-term |
| | | | returns, and a long investment horizon enables the |
| | | | inherent asymmetry of equity market returns to be |
| | | | captured. |
| Jennison Associates LLC | 6 | 591 | Uses a research-driven, fundamental investment |
| | | | approach that relies on in-depth company knowledge |
| | | | gleaned through meetings with management, |
| | | | customers, and suppliers. |
| Cash Investments | 2 | 233 | These short-term reserves are invested by Vanguard |
| | | | in equity index products to simulate investment in |
| | | | stocks. Each advisor may also maintain a modest |
| | | | cash position. |
10
Results of Proxy Voting
At a special meeting of shareholders on November 15, 2017, fund shareholders approved the following proposals:
Proposal 1—Elect trustees for the fund.*
The individuals listed in the table below were elected as trustees for the fund. All trustees with the exception of Ms. Mulligan, Ms. Raskin, and Mr. Buckley (each of whom already serves as a director of The Vanguard Group, Inc.) served as trustees to the funds prior to the shareholder meeting.
| | | |
| | | | Percentage |
| Trustee | For | Withheld | For |
| Mortimer J. Buckley | 1,040,401,220 | 33,553,324 | 96.9% |
| Emerson U. Fullwood | 1,039,160,376 | 34,794,169 | 96.8% |
| Amy Gutmann | 1,040,321,884 | 33,632,661 | 96.9% |
| JoAnn Heffernan Heisen | 1,041,268,182 | 32,686,363 | 97.0% |
| F. Joseph Loughrey | 1,040,201,842 | 33,752,703 | 96.9% |
| Mark Loughridge | 1,039,909,454 | 34,045,090 | 96.8% |
| Scott C. Malpass | 1,039,175,722 | 34,778,823 | 96.8% |
| F. William McNabb III | 1,038,914,560 | 35,039,985 | 96.7% |
| Deanna Mulligan | 1,041,175,691 | 32,778,854 | 96.9% |
| André F. Perold | 1,028,804,958 | 45,149,587 | 95.8% |
| Sarah Bloom Raskin | 1,040,743,960 | 33,210,585 | 96.9% |
| Peter F. Volanakis | 1,039,529,631 | 34,424,914 | 96.8% |
| * Results are for all funds within the same trust. | | | |
Proposal 3—Approve a manager-of-managers arrangement with wholly owned subsidiaries of Vanguard.
This arrangement enables Vanguard or the fund to enter into and materially amend investment advisory arrangements with wholly owned subsidiaries of Vanguard, subject to the approval of the fund’s board of trustees and any conditions imposed by the Securities and Exchange Commission (SEC), while avoiding the costs and delays associated with obtaining future shareholder approval. The ability of the fund to operate in this manner is contingent upon the SEC’s approval of a pending application for an order of exemption.
| | | | | |
| | | | | Broker | Percentage |
| Vanguard Fund | For | Abstain | Against | Non-Votes | For |
| U.S. Growth Fund | 108,214,441 | 6,174,410 | 4,775,094 | 9,622,105 | 84.0% |
11
| | |
| U.S. Growth Fund | |
| |
| |
| Fund Profile | | |
| As of February 28, 2018 | | |
| |
| Share-Class Characteristics | |
| | Investor | Admiral |
| | Shares | Shares |
| Ticker Symbol | VWUSX | VWUAX |
| Expense Ratio1 | 0.43% | 0.30% |
| 30-Day SEC Yield | 0.30% | 0.43% |
| | | |
| Portfolio Characteristics | | |
| | | Russell | DJ |
| | | 1000 | U.S. Total |
| | | Growth | Market |
| | Fund | Index | FA Index |
| Number of Stocks | 160 | 551 | 3,746 |
| Median Market Cap | $62.7B | $101.7B | $68.2B |
| Price/Earnings Ratio | 35.1x | 28.4x | 21.7x |
| Price/Book Ratio | 5.7x | 6.6x | 3.0x |
| Return on Equity | 15.9% | 22.1% | 15.0% |
| Earnings Growth | | | |
| Rate | 14.1% | 11.9% | 8.5% |
| Dividend Yield | 0.7% | 1.2% | 1.7% |
| Foreign Holdings | 1.1% | 0.0% | 0.0% |
| Turnover Rate | | | |
| (Annualized) | 35% | — | — |
| Short-Term | | | |
| Reserves | 1.7% | — | — |
| | |
| Volatility Measures | | |
| | Russell | DJ |
| | 1000 | U.S. Total |
| | Growth | Market |
| | Index | FA Index |
| R-Squared | 0.92 | 0.75 |
| Beta | 1.00 | 0.96 |
These measures show the degree and timing of the fund’s fluctuations compared with the indexes over 36 months.
| | |
| Ten Largest Holdings (% of total net assets) |
| Microsoft Corp. | Systems Software | 6.0% |
| Alphabet Inc. | Internet Software & | |
| | Services | 5.7 |
| Mastercard Inc. | Data Processing & | |
| | Outsourced Services | 4.0 |
| PayPal Holdings Inc. | Data Processing & | |
| | Outsourced Services | 3.5 |
| Amazon.com Inc. | Internet & Direct | |
| | Marketing Retail | 3.5 |
| Facebook Inc. | Internet Software & | |
| | Services | 3.3 |
| Visa Inc. | Data Processing & | |
| | Outsourced Services | 3.3 |
| eBay Inc. | Internet Software & | |
| | Services | 2.1 |
| Intercontinental | Financial Exchanges | |
| Exchange Inc. | & Data | 2.0 |
| Apple Inc. | Technology | |
| | Hardware, Storage & | |
| | Peripherals | 1.8 |
| Top Ten | | 35.2% |
The holdings listed exclude any temporary cash investments and
equity index products.
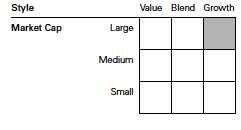
Investment Focus
1 The expense ratios shown are from the prospectus dated December 21, 2017, and represent estimated costs for the current fiscal year.
For the six months ended February 28, 2018, the annualized expense ratios were 0.44% for Investor Shares and 0.31% for Admiral Shares.
12
U.S. Growth Fund
Sector Diversification (% of equity exposure)
| | | |
| | | Russell | DJ |
| | | 1000 | U.S. Total |
| | | Growth | Market |
| | Fund | Index | FA Index |
| Consumer Discretionary | 15.5% | 18.6% | 13.0% |
| Consumer Staples | 3.4 | 6.2 | 6.8 |
| Energy | 0.3 | 0.8 | 5.2 |
| Financials | 8.5 | 3.4 | 15.4 |
| Health Care | 11.3 | 12.8 | 13.4 |
| Industrials | 7.9 | 12.6 | 10.8 |
| Information Technology | 48.2 | 39.0 | 24.2 |
| Materials | 0.9 | 3.5 | 3.3 |
| Other | 0.8 | 0.0 | 0.0 |
| Real Estate | 3.1 | 2.2 | 3.5 |
| Telecommunication | | | |
| Services | 0.0 | 0.9 | 1.7 |
| Utilities | 0.1 | 0.0 | 2.7 |
Sector categories are based on the Global Industry Classification
Standard (“GICS”), except for the “Other” category (if applicable),
which includes securities that have not been provided a GICS
classification as of the effective reporting period.
13
U.S. Growth Fund
Performance Summary
All of the returns in this report represent past performance, which is not a guarantee of future results that may be achieved by the fund. (Current performance may be lower or higher than the performance data cited. For performance data current to the most recent month-end, visit our website at vanguard.com/performance.) Note, too, that both investment returns and principal value can fluctuate widely, so an investor’s shares, when sold, could be worth more or less than their original cost. The returns shown do not reflect taxes that a shareholder would pay on fund distributions or on the sale of fund shares.
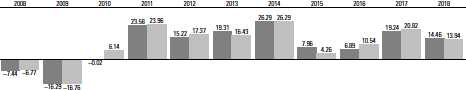
Fiscal-Year Total Returns (%): August 31, 2007, Through February 28, 2018
| | |
| | U.S. Growth Fund Investor Shares |
| | Russell 1000 Growth Index |
| Note: For 2018, performance data reflect the six months ended February 28, 2018. |
Average Annual Total Returns: Periods Ended December 31, 2017
This table presents returns through the latest calendar quarter—rather than through the end of the fiscal period.
Securities and Exchange Commission rules require that we provide this information.
| | | | |
| | Inception | One | Five | Ten |
| | Date | Year | Years | Years |
| Investor Shares | 1/6/1959 | 31.60% | 16.76% | 9.10% |
| Admiral Shares | 8/13/2001 | 31.74 | 16.92 | 9.26 |
See Financial Highlights for dividend and capital gains information.
14
U.S. Growth Fund
Financial Statements (unaudited)
Statement of Net Assets
As of February 28, 2018
The fund reports a complete list of its holdings in regulatory filings four times in each fiscal year, at the quarter-ends. For the second and fourth fiscal quarters, the lists appear in the fund’s semiannual and annual reports to shareholders. For the first and third fiscal quarters, the fund files the lists with the Securities and Exchange Commission on Form N-Q. Shareholders can look up the fund’s Forms N-Q on the SEC’s website at sec.gov. Forms N-Q may also be reviewed and copied at the SEC’s Public Reference Room (see the back cover of this report for further information).
| | | |
| | | | Market |
| | | | Value• |
| | | Shares | ($000) |
| Common Stocks (96.0%)1 | | |
| Consumer Discretionary (15.1%) | |
| * | Amazon.com Inc. | 210,668 | 318,625 |
| * | Netflix Inc. | 378,226 | 110,207 |
| * | Liberty Interactive Corp. | | |
| | QVC Group Class A | 3,511,021 | 101,363 |
| | Home Depot Inc. | 528,580 | 96,344 |
| * | Liberty Global plc | 2,988,828 | 89,754 |
| | Dollar General Corp. | 802,333 | 75,893 |
| *,^ | TripAdvisor Inc. | 1,859,247 | 74,519 |
| | Domino’s Pizza Inc. | 317,391 | 70,591 |
| * | O’Reilly Automotive Inc. | 251,505 | 61,415 |
| ^ | Tesla Inc. | 145,473 | 49,906 |
| * | Booking Holdings Inc. | 24,457 | 49,747 |
| | McDonald’s Corp. | 264,297 | 41,690 |
| | Starbucks Corp. | 654,200 | 37,355 |
| | Hilton Worldwide | | |
| | Holdings Inc. | 395,444 | 31,948 |
| | Ross Stores Inc. | 393,510 | 30,729 |
| | Las Vegas Sands Corp. | 305,744 | 22,261 |
| * | Liberty Global plc | | |
| | Class A | 685,983 | 21,362 |
| | Wayfair Inc. | 234,914 | 18,187 |
| * | Live Nation | | |
| | Entertainment Inc. | 381,200 | 17,078 |
| | Marriott | | |
| | International Inc. | | |
| | Class A | 111,157 | 15,696 |
| | NIKE Inc. Class B | 182,242 | 12,216 |
| | Charter Communications | | |
| | Inc. Class A | 32,436 | 11,091 |
| | Kering SA | 20,447 | 9,595 |
| * | AutoZone Inc. | 10,378 | 6,898 |
| ^ | Under Armour Inc. | 330,088 | 4,968 |
| ^ | Stitch Fix Inc. Class A | 199,928 | 4,139 |
| | | | 1,383,577 |
| | | |
| | | | Market |
| | | | Value• |
| | | Shares | ($000) |
| Consumer Staples (3.2%) | | |
| * | Monster Beverage Corp. | 1,578,660 | 100,040 |
| | Estee Lauder Cos. Inc. | | |
| | Class A | 648,157 | 89,731 |
| | Constellation Brands Inc. | | |
| | Class A | 201,835 | 43,492 |
| * | Blue Buffalo Pet | | |
| | Products Inc. | 819,180 | 32,816 |
| | PepsiCo Inc. | 141,581 | 15,536 |
| | Costco Wholesale Corp. | 73,978 | 14,122 |
| | | | 295,737 |
| Energy (0.2%) | | |
| | EOG Resources Inc. | 105,000 | 10,649 |
| | Schlumberger Ltd. | 90,263 | 5,925 |
| | | | 16,574 |
| Financials (8.1%) | | |
| | Intercontinental | | |
| | Exchange Inc. | 2,572,871 | 188,025 |
| | Charles Schwab Corp. | 2,161,939 | 114,626 |
| | CME Group Inc. | 478,844 | 79,565 |
| | MarketAxess Holdings | | |
| | Inc. | 359,326 | 72,728 |
| * | Markel Corp. | 41,157 | 45,767 |
| | TD Ameritrade Holding | | |
| | Corp. | 723,332 | 41,592 |
| | Progressive Corp. | 679,600 | 39,131 |
| | Marsh & McLennan Cos. | | |
| | Inc. | 403,627 | 33,509 |
| | MSCI Inc. Class A | 211,119 | 29,878 |
| | Bank of America Corp. | 744,152 | 23,887 |
| | First Republic Bank | 217,610 | 20,194 |
| | Goldman Sachs Group | | |
| | Inc. | 50,443 | 13,263 |
| | Interactive Brokers Group | | |
| | Inc. | 184,329 | 12,792 |
| | Morgan Stanley | 208,314 | 11,670 |
| | JPMorgan Chase & Co. | 75,509 | 8,721 |
| | American Express Co. | 86,087 | 8,394 |
| | | | 743,742 |
15
| | | |
| U.S. Growth Fund | | |
| |
| |
| |
| | | | Market |
| | | | Value• |
| | | Shares | ($000) |
| Health Care (10.9%) | | |
| * | Biogen Inc. | 451,107 | 130,365 |
| * | IQVIA Holdings Inc. | 1,172,595 | 115,301 |
| | UnitedHealth Group Inc. | 474,921 | 107,408 |
| * | Illumina Inc. | 401,982 | 91,660 |
| | Dentsply Sirona Inc. | 1,469,774 | 82,396 |
| | Allergan plc | 464,061 | 71,567 |
| | Bristol-Myers Squibb Co. | 1,030,147 | 68,196 |
| * | Edwards Lifesciences | | |
| | Corp. | 416,272 | 55,643 |
| | Zoetis Inc. | 526,800 | 42,597 |
| | Thermo Fisher Scientific | | |
| | Inc. | 155,343 | 32,401 |
| | Danaher Corp. | 276,400 | 27,026 |
| | Stryker Corp. | 150,500 | 24,405 |
| | ABIOMED Inc. | 88,518 | 23,739 |
| * | DexCom Inc. | 422,670 | 23,729 |
| | Vertex Pharmaceuticals | | |
| | Inc. | 113,674 | 18,873 |
| | Celgene Corp. | 147,923 | 12,887 |
| | Waters Corp. | 55,101 | 11,276 |
| | Alnylam Pharmaceuticals | | |
| | Inc. | 86,698 | 10,418 |
| | BioMarin Pharmaceutical | | |
| | Inc. | 116,926 | 9,491 |
| ^ | Denali Therapeutics Inc. | 325,427 | 7,449 |
| | Penumbra Inc. | 64,069 | 6,932 |
| | AbbVie Inc. | 57,559 | 6,667 |
| | Agios Pharmaceuticals | | |
| | Inc. | 81,486 | 6,551 |
| | Alexion Pharmaceuticals | | |
| | Inc. | 55,271 | 6,492 |
| | Novocure Ltd. | 276,190 | 5,676 |
| | Glaukos Corp. | 151,567 | 4,744 |
| | Seattle Genetics Inc. | 45,430 | 2,453 |
| | | | 1,006,342 |
| Industrials (7.6%) | | |
| | FedEx Corp. | 480,096 | 118,300 |
| * | TransUnion | 921,065 | 52,565 |
| | AMETEK Inc. | 669,411 | 50,701 |
| | Fastenal Co. | 862,729 | 47,209 |
| * | IHS Markit Ltd. | 987,735 | 46,473 |
| | Equifax Inc. | 370,369 | 41,852 |
| | Lockheed Martin Corp. | 117,098 | 41,270 |
| | Union Pacific Corp. | 290,400 | 37,825 |
| | Northrop Grumman Corp. | 92,381 | 32,337 |
| | Fortive Corp. | 376,121 | 28,886 |
| * | Verisk Analytics Inc. | | |
| | Class A | 280,400 | 28,654 |
| | Raytheon Co. | 107,000 | 23,274 |
| | Fortune Brands Home | | |
| | & Security Inc. | 332,128 | 20,147 |
| | Boeing Co. | 54,755 | 19,833 |
| * | Copart Inc. | 369,000 | 17,273 |
| | | |
| | | | Market |
| | | | Value• |
| | | Shares | ($000) |
| | TransDigm Group Inc. | 54,400 | 15,684 |
| | Snap-on Inc. | 96,265 | 15,327 |
| | Watsco Inc. | 92,030 | 15,219 |
| | Parker-Hannifin Corp. | 63,894 | 11,403 |
| | CoStar Group Inc. | 28,647 | 9,801 |
| ^ | Wabtec Corp. | 98,684 | 8,027 |
| | HEICO Corp. Class A | 97,011 | 7,033 |
| | Caterpillar Inc. | 33,914 | 5,244 |
| | NOW Inc. | 307,754 | 2,921 |
| | | | 697,258 |
| Information Technology (47.2%) | |
| | Microsoft Corp. | 5,924,943 | 555,582 |
| | Mastercard Inc. Class A | 2,077,891 | 365,210 |
| * | PayPal Holdings Inc. | 4,101,186 | 325,675 |
| * | Alphabet Inc. Class C | 293,810 | 324,581 |
| * | Facebook Inc. Class A | 1,707,476 | 304,477 |
| | Visa Inc. Class A | 2,449,712 | 301,168 |
| * | Alphabet Inc. Class A | 181,351 | 200,197 |
| * | eBay Inc. | 4,404,063 | 188,758 |
| | Apple Inc. | 927,460 | 165,199 |
| * | Take-Two Interactive | | |
| | Software Inc. | 1,071,865 | 119,909 |
| * | Adobe Systems Inc. | 564,254 | 118,002 |
| | Applied Materials Inc. | 1,868,187 | 107,589 |
| * | Electronic Arts Inc. | 738,186 | 91,314 |
| * | FleetCor Technologies | | |
| | Inc. | 381,953 | 76,364 |
| | NVIDIA Corp. | 306,500 | 74,173 |
| * | Arista Networks Inc. | 271,036 | 73,109 |
| * | ServiceNow Inc. | 449,767 | 72,417 |
| * | salesforce.com Inc. | 588,498 | 68,413 |
| * | Alibaba Group Holding | | |
| | Ltd. ADR | 364,852 | 67,913 |
| | Symantec Corp. | 2,470,060 | 64,938 |
| | ASML Holding NV | 297,263 | 58,082 |
| * | Workday Inc. Class A | 409,794 | 51,909 |
| * | Autodesk Inc. | 406,473 | 47,748 |
| * | Red Hat Inc. | 321,435 | 47,379 |
| | Global Payments Inc. | 398,560 | 45,193 |
| | Microchip Technology | | |
| | Inc. | 502,134 | 44,655 |
| | CDW Corp. | 593,585 | 43,290 |
| | Alliance Data Systems | | |
| | Corp. | 174,264 | 41,991 |
| | GrubHub Inc. | 359,272 | 35,715 |
| | Accenture plc Class A | 201,300 | 32,411 |
| | Texas Instruments Inc. | 287,200 | 31,118 |
| | SS&C Technologies | | |
| | Holdings Inc. | 499,955 | 24,758 |
| * | Zillow Group Inc. | 517,880 | 24,687 |
| | Intuit Inc. | 142,800 | 23,828 |
| | Tencent Holdings Ltd. | 417,908 | 22,863 |
| * | Gartner Inc. | 173,862 | 19,718 |
| | Activision Blizzard Inc. | 222,204 | 16,250 |
16
| | | |
| U.S. Growth Fund | | |
| |
| |
| |
| | | | Market |
| | | | Value• |
| | | Shares | ($000) |
| | Broadcom Ltd. | 43,561 | 10,736 |
| | Tableau Software Inc. | | |
| | Class A | 121,346 | 9,910 |
| | Shopify Inc. | 70,196 | 9,702 |
| | Ellie Mae Inc. | 107,895 | 9,567 |
| | New Relic Inc. | 96,415 | 6,921 |
| | Splunk Inc. | 62,926 | 5,865 |
| * | Cloudera Inc. | 300,088 | 5,717 |
| *,†,2,3 WeWork Class A PP | 19,046 | 987 |
| | | | 4,335,988 |
| Materials (0.8%) | | |
| | Sherwin-Williams Co. | 62,211 | 24,983 |
| | PPG Industries Inc. | 178,100 | 20,025 |
| | Praxair Inc. | 133,600 | 20,007 |
| | Martin Marietta Materials | |
| | Inc. | 39,310 | 8,016 |
| | | | 73,031 |
| Other (0.0%) | | |
| 4 | Vanguard Growth ETF | 3,100 | 452 |
| |
| Real Estate (2.9%) | | |
| | Crown Castle | | |
| | International Corp. | 1,251,024 | 137,688 |
| | Equinix Inc. | 139,735 | 54,790 |
| | American Tower Corp. | 368,229 | 51,305 |
| * | SBA Communications | | |
| | Corp. Class A | 136,900 | 21,530 |
| ^ | Redfin Corp. | 261,773 | 5,390 |
| | | | 270,703 |
| Total Common Stocks | | |
| (Cost $5,390,410) | | 8,823,404 |
| Preferred Stocks (0.9%) | | |
| *,†,2,3 Uber Technologies PP, | | |
| | 8.00% | 999,588 | 35,086 |
| *,†,2,3 WeWork Pfd. D1 PP | 260,418 | 13,492 |
| *,†,2,3 Airbnb Inc., 8.00% | 128,123 | 13,453 |
| *,†,2,3 Pinterest Prf G PP, | | |
| | 8.00% | 1,596,475 | 11,095 |
| *,†,2,3 WeWork Pfd. D2 PP | 204,614 | 10,601 |
| Total Preferred Stocks | | |
| (Cost $46,639) | | 83,727 |
| Temporary Cash Investments (4.6%)1 | |
| Money Market Fund (4.1%) | | |
| 5,6 | Vanguard Market | | |
| | Liquidity Fund, | | |
| | 1.601% | 3,818,067 | 381,768 |
| | |
| | Face | Market |
| | Amount | Value • |
| | ($000) | ($000) |
| Repurchase Agreement (0.3%) | |
| Bank of America Securities, | | |
| LLC 1.390%, 3/1/18 | | |
| (Dated 2/28/18, Repurchase | |
| Value $27,701,000, | | |
| collateralized by | | |
| Government National | | |
| Mortgage Assn. 3.500%, | | |
| 5/20/46, with a value | | |
| of $28,254,000) | 27,700 | 27,700 |
| |
| U. S. Government and Agency Obligations (0.2%) |
| United States Treasury Bill, | | |
| 1.398%, 5/3/18 | 700 | 698 |
| United States Treasury Bill, | | |
| 1.446%, 5/31/18 | 600 | 598 |
| 7 United States Treasury Bill, | | |
| 1.512%–1.518%, 6/28/18 | 14,000 | 13,923 |
| | | 15,219 |
| Total Temporary Cash Investments | |
| (Cost $424,724) | | 424,687 |
| Total Investments (101.5%) | | |
| (Cost $5,861,773) | | 9,331,818 |
| Other Assets and Liabilities (-1.5%) | |
| Other Assets | | 128,033 |
| Liabilities 6 | | (263,364) |
| | | (135,331) |
| Net Assets (100%) | | 9,196,487 |
17
U.S. Growth Fund
| |
| | Amount |
| | ($000) |
| Statement of Assets and Liabilities | |
| Assets | |
| Investments in Securities, at Value | |
| Unaffiliated Issuers | 8,936,023 |
| Collateral for Futures Contracts | 13,575 |
| Total Unaffiliated Issuers | 8,949,598 |
| Affiliated Vanguard Funds | 382,220 |
| Total Investments in Securities | 9,331,818 |
| Investment in Vanguard | 487 |
| Receivables for Investment | |
| Securities Sold | 21,878 |
| Receivables for Accrued Income | 6,487 |
| Receivables for Capital Shares Issued | 98,151 |
| Other Assets | 1,030 |
| Total Assets | 9,459,851 |
| Liabilities | |
| Payables for Investment | |
| Securities Purchased | 114,907 |
| Collateral for Securities on Loan | 33,893 |
| Payables to Investment Advisor | 3,930 |
| Payables for Capital Shares Redeemed | 93,889 |
| Payables to Vanguard | 11,965 |
| Variation Margin Payable— | |
| Futures Contracts | 4,780 |
| Total Liabilities | 263,364 |
| Net Assets | 9,196,487 |
| |
| At February 28, 2018, net assets consisted of: |
| | Amount |
| | ($000) |
| Paid-in Capital | 5,362,896 |
| Overdistributed Net Investment Income | (4,816) |
| Accumulated Net Realized Gains | 370,606 |
| Unrealized Appreciation (Depreciation) | |
| Investment Securities | 3,470,045 |
| Futures Contracts | (2,246) |
| Foreign Currencies | 2 |
| Net Assets | 9,196,487 |
| |
| | Amount |
| | ($000) |
| Investor Shares—Net Assets | |
| Applicable to 111,371,076 outstanding | |
| $.001 par value shares of beneficial | |
| interest (unlimited authorization) | 4,326,028 |
| Net Asset Value Per Share— | |
| Investor Shares | $38.84 |
| |
| |
| Admiral Shares—Net Assets | |
| Applicable to 48,392,673 outstanding | |
| $.001 par value shares of beneficial | |
| interest (unlimited authorization) | 4,870,459 |
| Net Asset Value Per Share— | |
| Admiral Shares | $100.64 |
• See Note A in Notes to Financial Statements.
* Non-income-producing security.
^ Includes partial security positions on loan to broker-dealers.
The total value of securities on loan is $33,002,000.
† Perpetual security with no stated maturity date.
1 The fund invests a portion of its cash reserves in equity
markets through the use of index futures contracts. After
giving effect to futures investments, the fund’s effective
common stock and temporary cash investment positions
represent 98.5% and 2.1%, respectively, of net assets.
2 Security value determined using significant unobservable
inputs.
3 Restricted securities totaling $84,714,000, representing
0.9% of net assets. See Restricted Securities table for
additional information.
4 Considered an affiliated company of the fund as the issuer is
another member of The Vanguard Group.
5 Affiliated money market fund available only to Vanguard funds
and certain trusts and accounts managed by Vanguard. Rate
shown is the 7-day yield.
6 Includes $33,893,000 of collateral received for securities
on loan.
7 Securities with a value of $13,575,000 have been segregated
as initial margin for open futures contracts.
ADR—American Depositary Receipt.
18
| | |
| U.S. Growth Fund | | |
| |
| |
| Restricted Securities as of Period End | | |
| |
| | | Acquisition |
| | Acquisition | Cost |
| Security Name | Date | ($000) |
| Uber Technologies PP | June 2014 | 21,855 |
| WeWork Pfd. D1 PP | December 2014 | 4,336 |
| WeWork Pfd. D2 PP | December 2014 | 3,407 |
| WeWork Class A PP | December 2014 | 872 |
| Pinterest Prf G PP | March 2015 | 11,461 |
| Airbnb Inc. | June 2015 | 11,928 |
| |
| |
| Derivative Financial Instruments Outstanding as of Period End | | |
| | | | |
| Futures Contracts | | | | |
| | | | | ($000) |
| | | | | Value and |
| | | Number of | | Unrealized |
| | | Long (Short) | Notional | Appreciation |
| | Expiration | Contracts | Amount | (Depreciation) |
| Long Futures Contracts | | | | |
| E-mini S&P 500 Index | March 2018 | 1,353 | 183,629 | (1,472) |
| E-mini S&P Mid-Cap 400 Index | March 2018 | 262 | 48,850 | (774) |
| | | | | (2,246) |
Unrealized appreciation (depreciation) on open futures contracts is required to be treated as realized gain (loss) for tax purposes.
See accompanying Notes, which are an integral part of the Financial Statements.
19
| |
| U.S. Growth Fund | |
| |
| |
| Statement of Operations | |
| |
| |
| | Six Months Ended |
| | February28,2018 |
| | ($000) |
| Investment Income | |
| Income | |
| Dividends Received from Unaffiliated Issuers1 | 27,185 |
| Dividends Received from Affiliated Issuers | 3 |
| Interest Received from Unaffiliated Issuers | 172 |
| Interest Received from Affiliated Issuers | 1,934 |
| Securities Lending—Net | 828 |
| Total Income | 30,122 |
| Expenses | |
| Investment Advisory Fees—Note B | |
| Basic Fee | 7,224 |
| Performance Adjustment | 216 |
| The Vanguard Group—Note C | |
| Management and Administrative—Investor Shares | 4,985 |
| Management and Administrative—Admiral Shares | 2,609 |
| Marketing and Distribution—Investor Shares | 267 |
| Marketing and Distribution—Admiral Shares | 121 |
| Custodian Fees | 36 |
| Shareholders’ Reports and Proxy—Investor Shares | 86 |
| Shareholders’ Reports and Proxy—Admiral Shares | 30 |
| Trustees’ Fees and Expenses | 8 |
| Total Expenses | 15,582 |
| Expenses Paid Indirectly | (125) |
| Net Expenses | 15,457 |
| Net Investment Income | 14,665 |
| Realized Net Gain (Loss) | |
| Investment Securities Sold—Unaffiliated Issuers | 427,838 |
| Investment Securities Sold—Affiliated Issuers | (11) |
| Futures Contracts | 29,327 |
| Foreign Currencies | (20) |
| Realized Net Gain (Loss) | 457,134 |
| Change in Unrealized Appreciation (Depreciation) | |
| Investment Securities—Unaffiliated Issuers | 676,965 |
| Investment Securities—Affiliated Issuers | (20) |
| Futures Contracts | (4,089) |
| Foreign Currencies | 1 |
| Change in Unrealized Appreciation (Depreciation) | 672,857 |
| Net Increase (Decrease) in Net Assets Resulting from Operations | 1,144,656 |
| 1 Dividends are net of foreign withholding taxes of $9,000. | |
| See accompanying Notes, which are an integral part of the Financial Statements. | |
20
| | |
| U.S. Growth Fund | | |
| |
| |
| Statement of Changes in Net Assets | | |
| |
| | Six Months Ended | Year Ended |
| | February 28, | August 31, |
| | 2018 | 2017 |
| | ($000) | ($000) |
| Increase (Decrease) in Net Assets | | |
| Operations | | |
| Net Investment Income | 14,665 | 38,021 |
| Realized Net Gain (Loss) | 457,134 | 376,701 |
| Change in Unrealized Appreciation (Depreciation) | 672,857 | 863,174 |
| Net Increase (Decrease) in Net Assets Resulting from Operations | 1,144,656 | 1,277,896 |
| Distributions | | |
| Net Investment Income | | |
| Investor Shares | (15,531) | (14,717) |
| Admiral Shares | (16,499) | (16,728) |
| Realized Capital Gain1 | | |
| Investor Shares | (180,527) | (38,970) |
| Admiral Shares | (192,762) | (32,022) |
| Total Distributions | (405,319) | (102,437) |
| Capital Share Transactions | | |
| Investor Shares | (152,915) | (313,395) |
| Admiral Shares | 705,965 | 181,650 |
| Net Increase (Decrease) from Capital Share Transactions | 553,050 | (131,745) |
| Total Increase (Decrease) | 1,292,387 | 1,043,714 |
| Net Assets | | |
| Beginning of Period | 7,904,100 | 6,860,386 |
| End of Period2 | 9,196,487 | 7,904,100 |
1 Includes fiscal 2018 and 2017 short-term gain distributions totaling $24,987,000 and $0, respectively. Short-term gain distributions
are treated as ordinary income dividends for tax purposes.
2 Net Assets—End of Period includes undistributed (overdistributed) net investment income of ($4,816,000) and $12,569,000.
See accompanying Notes, which are an integral part of the Financial Statements.
21
| | | | | | | |
| U.S. Growth Fund | | | | | | | |
| |
| |
| Financial Highlights | | | | | | |
| |
| |
| Investor Shares | | | | | | | |
| | Six Months | | | | | |
| | | Ended | | | | | |
| For a Share Outstanding | February 28, | | | Year Ended August 31, |
| Throughout Each Period | | 2018 | 2017 | 2016 | 2015 | 2014 | 2013 |
| Net Asset Value, Beginning of Period | $35.62 | $30.32 | $30.89 | $31.03 | $24.67 | $20.79 |
| Investment Operations | | | | | | | |
| Net Investment Income | | . 0511 | .1511 | .151 | .169 | .168 | .134 |
| Net Realized and Unrealized Gain (Loss) | | | | | | |
| on Investments | | 5.007 | 5.590 | 1.944 | 2.168 | 6.303 | 3.861 |
| Total from Investment Operations | 5.058 | 5.741 | 2.095 | 2.337 | 6.471 | 3.995 |
| Distributions | | | | | | | |
| Dividends from Net Investment Income | (.146) | (.121) | (.147) | (.194) | (.111) | (.115) |
| Distributions from Realized Capital Gains | (1.692) | (.320) | (2.518) | (2.283) | — | — |
| Total Distributions | | (1.838) | (.441) | (2.665) | (2.477) | (.111) | (.115) |
| Net Asset Value, End of Period | | $38.84 | $35.62 | $30.32 | $30.89 | $31.03 | $24.67 |
| |
| Total Return2 | | 14.46% | 19.24% | 6.89% | 7.96% | 26.29% | 19.31% |
| |
| Ratios/Supplemental Data | | | | | | | |
| Net Assets, End of Period (Millions) | $4,326 | $4,113 | $3,794 | $3,975 | $4,038 | $3,137 |
| Ratio of Total Expenses to | | | | | | | |
| Average Net Assets3 | | 0.44% | 0.43% | 0.46% | 0.47% | 0.44% | 0.45% |
| Ratio of Net Investment Income to | | | | | | |
| Average Net Assets | | 0.28% | 0.47% | 0.50% | 0.53% | 0.59% | 0.59% |
| Portfolio Turnover Rate | | 35% | 27% | 32% | 38% | 36% | 38% |
The expense ratio, net investment income ratio, and turnover rate for the current period have been annualized.
1 Calculated based on average shares outstanding.
2 Total returns do not include account service fees that may have applied in the periods shown. Fund prospectuses provide information
about any applicable account service fees.
3 Includes performance-based investment advisory fee increases (decreases) of 0.01%, (0.01%), 0.02%, 0.03%, (0.01%), and (0.01%).
See accompanying Notes, which are an integral part of the Financial Statements.
22
| | | | | | | |
| U.S. Growth Fund | | | | | | | |
| |
| |
| Financial Highlights | | | | | | |
| |
| |
| Admiral Shares | | | | | | | |
| | Six Months | | | | | |
| | | Ended | | | | | |
| For a Share Outstanding | February 28, | | | Year Ended August 31, |
| Throughout Each Period | | 2018 | 2017 | 2016 | 2015 | 2014 | 2013 |
| Net Asset Value, Beginning of Period | $92.24 | $78.52 | $80.01 | $80.37 | $63.91 | $53.85 |
| Investment Operations | | | | | | | |
| Net Investment Income | | . 2031 | .5021 | .506 | .563 | .557 | .440 |
| Net Realized and Unrealized Gain (Loss) | | | | | | |
| on Investments | | 12.956 | 14.480 | 5.018 | 5.607 | 16.293 | 10.002 |
| Total from Investment Operations | 13.159 | 14.982 | 5.524 | 6.170 | 16.850 | 10.442 |
| Distributions | | | | | | | |
| Dividends from Net Investment Income | (. 375) | (. 433) | (. 499) | (. 623) | (. 390) | (. 382) |
| Distributions from Realized Capital Gains | (4.384) | (.829) | (6.515) | (5.907) | — | — |
| Total Distributions | | (4.759) | (1.262) | (7.014) | (6.530) | (.390) | (.382) |
| Net Asset Value, End of Period | | $100.64 | $92.24 | $78.52 | $80.01 | $80.37 | $63.91 |
| |
| Total Return2 | | 14.53% | 19.42% | 7.03% | 8.12% | 26.44% | 19.51% |
| |
| Ratios/Supplemental Data | | | | | | | |
| Net Assets, End of Period (Millions) | $4,870 | $3,791 | $3,066 | $2,421 | $1,868 | $1,141 |
| Ratio of Total Expenses to | | | | | | | |
| Average Net Assets3 | | 0.31% | 0.30% | 0.32% | 0.33% | 0.30% | 0.31% |
| Ratio of Net Investment Income to | | | | | | |
| Average Net Assets | | 0.41% | 0.60% | 0.64% | 0.67% | 0.73% | 0.73% |
| Portfolio Turnover Rate | | 35% | 27% | 32% | 38% | 36% | 38% |
The expense ratio, net investment income ratio, and turnover rate for the current period have been annualized.
1 Calculated based on average shares outstanding.
2 Total returns do not include account service fees that may have applied in the periods shown. Fund prospectuses provide information
about any applicable account service fees.
3 Includes performance-based investment advisory fee increases (decreases) of 0.01%, (0.01%), 0.02%, 0.03%, (0.01%), and (0.01%).
See accompanying Notes, which are an integral part of the Financial Statements.
23
U.S. Growth Fund
Notes to Financial Statements
Vanguard U.S. Growth Fund is registered under the Investment Company Act of 1940 as an open-end investment company, or mutual fund. The fund offers two classes of shares: Investor Shares and Admiral Shares. Investor Shares are available to any investor who meets the fund’s minimum purchase requirements. Admiral Shares are designed for investors who meet certain administrative, service, and account-size criteria.
A. The following significant accounting policies conform to generally accepted accounting principles for U.S. investment companies. The fund consistently follows such policies in preparing its financial statements.
1. Security Valuation: Securities are valued as of the close of trading on the New York Stock Exchange (generally 4 p.m., Eastern time) on the valuation date. Equity securities are valued at the latest quoted sales prices or official closing prices taken from the primary market in which each security trades; such securities not traded on the valuation date are valued at the mean of the latest quoted bid and asked prices. Securities for which market quotations are not readily available, or whose values have been affected by events occurring before the fund’s pricing time but after the close of the securities’ primary markets, are valued at their fair values calculated according to procedures adopted by the board of trustees. These procedures include obtaining quotations from an independent pricing service, monitoring news to identify significant market- or security-specific events, and evaluating changes in the values of foreign market proxies (for example, ADRs, futures contracts, or exchange-traded funds), between the time the foreign markets close and the fund’s pricing time. When fair-value pricing is employed, the prices of securities used by a fund to calculate its net asset value may differ from quoted or published prices for the same securities. Investments in Vanguard Market Liquidity Fund are valued at that fund’s net asset value. Temporary cash investments are valued using the latest bid prices or using valuations based on a matrix system (which considers such factors as security prices, yields, maturities, and ratings), both as furnished by independent pricing services.
2. Foreign Currency: Securities and other assets and liabilities denominated in foreign currencies are translated into U.S. dollars using exchange rates obtained from an independent third party as of the fund’s pricing time on the valuation date. Realized gains (losses) and unrealized appreciation (depreciation) on investment securities include the effects of changes in exchange rates since the securities were purchased, combined with the effects of changes in security prices. Fluctuations in the value of other assets and liabilities resulting from changes in exchange rates are recorded as unrealized foreign currency gains (losses) until the assets or liabilities are settled in cash, at which time they are recorded as realized foreign currency gains (losses).
3. Futures Contracts: The fund uses index futures contracts to a limited extent, with the objective of maintaining full exposure to the stock market while maintaining liquidity. The fund may purchase or sell futures contracts to achieve a desired level of investment, whether to accommodate portfolio turnover or cash flows from capital share transactions. The primary risks associated with the use of futures contracts are imperfect correlation between changes in market values of stocks held by the fund and the prices of futures contracts, and the possibility of an illiquid market. Counterparty risk involving futures is mitigated because a regulated clearinghouse is the counterparty instead of the clearing broker. To further mitigate counterparty risk, the fund trades futures contracts on an exchange, monitors the financial strength of its clearing brokers and clearinghouse, and has entered into clearing agreements with its clearing brokers. The clearinghouse imposes initial margin requirements to secure the fund’s performance and requires daily settlement of variation margin representing changes in the market value of each contract.
24
U.S. Growth Fund
Futures contracts are valued at their quoted daily settlement prices. The notional amounts of the contracts are not recorded in the Statement of Net Assets. Fluctuations in the value of the contracts are recorded in the Statement of Assets and Liabilities as an asset (liability) and in the Statement of Operations as unrealized appreciation (depreciation) until the contracts are closed, when they are recorded as realized futures gains (losses).
During the six months ended February 28, 2018, the fund’s average investments in long and short futures contracts represented 3% and 0% of net assets, respectively, based on the average of the notional amounts at each quarter-end during the period.
4. Repurchase Agreements: The fund enters into repurchase agreements with institutional counterparties. Securities pledged as collateral to the fund under repurchase agreements are held by a custodian bank until the agreements mature, and in the absence of a default, such collateral cannot be repledged, resold, or rehypothecated. Each agreement requires that the market value of the collateral be sufficient to cover payments of interest and principal. The fund further mitigates its counterparty risk by entering into repurchase agreements only with a diverse group of prequalified counterparties, monitoring their financial strength, and entering into master repurchase agreements with its counterparties. The master repurchase agreements provide that, in the event of a counterparty’s default (including bankruptcy), the fund may terminate any repurchase agreements with that counterparty, determine the net amount owed, and sell or retain the collateral up to the net amount owed to the fund. Such action may be subject to legal proceedings, which may delay or limit the disposition of collateral.
5. Federal Income Taxes: The fund intends to continue to qualify as a regulated investment company and distribute all of its taxable income. Management has analyzed the fund’s tax positions taken for all open federal income tax years (August 31, 2014–2017), and for the period ended February 28, 2018, and has concluded that no provision for federal income tax is required in the fund’s financial statements.
6. Distributions: Distributions to shareholders are recorded on the ex-dividend date.
7. Securities Lending: To earn additional income, the fund lends its securities to qualified institutional borrowers. Security loans are subject to termination by the fund at any time, and are required to be secured at all times by collateral in an amount at least equal to the market value of securities loaned. Daily market fluctuations could cause the value of loaned securities to be more or less than the value of the collateral received. When this occurs, the collateral is adjusted and settled on the next business day. The fund further mitigates its counterparty risk by entering into securities lending transactions only with a diverse group of prequalified counterparties, monitoring their financial strength, and entering into master securities lending agreements with its counterparties. The master securities lending agreements provide that, in the event of a counterparty’s default (including bankruptcy), the fund may terminate any loans with that borrower, determine the net amount owed, and sell or retain the collateral up to the net amount owed to the fund; however, such actions may be subject to legal proceedings. While collateral mitigates counterparty risk, in the event of a default, the fund may experience delays and costs in recovering the securities loaned. The fund invests cash collateral received in Vanguard Market Liquidity Fund, and records a liability in the Statement of Assets and Liabilities for the return of the collateral, during the period the securities are on loan. Securities lending income represents fees charged to borrowers plus income earned on invested cash collateral, less expenses associated with the loan. During the term of the loan, the fund is entitled to all distributions made on or in respect of the loaned securities.
25
U.S. Growth Fund
8. Credit Facility: The fund and certain other funds managed by The Vanguard Group (“Vanguard”) participate in a $3.1 billion committed credit facility provided by a syndicate of lenders pursuant to a credit agreement that may be renewed annually; each fund is individually liable for its borrowings, if any, under the credit facility. Borrowings may be utilized for temporary and emergency purposes, and are subject to the fund’s regulatory and contractual borrowing restrictions. The participating funds are charged administrative fees and an annual commitment fee of 0.10% of the undrawn amount of the facility; these fees are allocated to the funds based on a method approved by the fund’s board of trustees and included in Management and Administrative expenses on the fund’s Statement of Operations. Any borrowings under this facility bear interest at a rate based upon the higher of the one-month London Interbank Offered Rate, federal funds effective rate, or overnight bank funding rate plus an agreed-upon spread.
The fund had no borrowings outstanding at February 28, 2018, or at any time during the period then ended.
9. Other: Dividend income is recorded on the ex-dividend date. Interest income includes income distributions received from Vanguard Market Liquidity Fund and is accrued daily. Premiums and discounts on debt securities purchased are amortized and accreted, respectively, to interest income over the lives of the respective securities. Security transactions are accounted for on the date securities are bought or sold. Costs used to determine realized gains (losses) on the sale of investment securities are those of the specific securities sold.
Each class of shares has equal rights as to assets and earnings, except that each class separately bears certain class-specific expenses related to maintenance of shareholder accounts (included in Management and Administrative expenses), shareholder reporting, and the proxy. Marketing and distribution expenses are allocated to each class of shares based on a method approved by the board of trustees. Income, other non-class-specific expenses, and gains and losses on investments are allocated to each class of shares based on its relative net assets.
B. The investment advisory firms Jackson Square Partners, LLC, Wellington Management Company LLP, William Blair Investment Management, LLC, Baillie Gifford Overseas Ltd., and Jennison Associates LLC each provide investment advisory services to a portion of the fund for a fee calculated at an annual percentage rate of average net assets managed by the advisor. The basic fees of Jackson Square Partners, LLC, Wellington Management Company LLP, and Jennison Associates LLC are subject to quarterly adjustments based on performance relative to the Russell 1000 Growth Index for the preceding three years. The basic fee of William Blair Investment Management, LLC, is subject to quarterly adjustments based on performance relative to the Russell 1000 Growth Index for the preceding five years. The basic fee of Baillie Gifford Overseas Ltd. is subject to quarterly adjustments based on performance relative to the S&P 500 Index for the preceding three years.
Vanguard manages the cash reserves of the fund as described below.
For the six months ended February 28, 2018, the aggregate investment advisory fee represented an effective annual basic rate of 0.17% of the fund’s average net assets, before a net increase of $216,000 (0.01%) based on performance.
C. In accordance with the terms of a Funds’ Service Agreement (the “FSA”) between Vanguard and the fund, Vanguard furnishes to the fund corporate management, administrative, marketing, distribution, and cash management services at Vanguard’s cost of operations (as defined by the FSA). These costs of operations are allocated to the fund based on methods and guidelines
26
U.S. Growth Fund
approved by the board of trustees. Vanguard does not require reimbursement in the current period for certain costs of operations (such as deferred compensation/benefits and risk/insurance costs); the fund’s liability for these costs of operations is included in Payables to Vanguard on the Statement of Assets and Liabilities. All other costs of operations payable to Vanguard are generally settled twice a month.
Upon the request of Vanguard, the fund may invest up to 0.40% of its net assets as capital in Vanguard. At February 28, 2018, the fund had contributed to Vanguard capital in the amount of $487,000, representing 0.01% of the fund’s net assets and 0.19% of Vanguard’s capitalization. The fund’s trustees and officers are also directors and employees, respectively, of Vanguard.
D. The fund has asked its investment advisors to direct certain security trades, subject to obtaining the best price and execution, to brokers who have agreed to rebate to the fund part of the commissions generated. Such rebates are used solely to reduce the fund’s management and administrative expenses. The fund’s custodian bank has also agreed to reduce its fees when the fund maintains cash on deposit in the non-interest-bearing custody account. For the six months ended February 28, 2018, these arrangements reduced the fund’s management and administrative expenses by $121,000 and custodian fees by $4,000. The total expense reduction represented an effective annual rate of 0.00% of the fund’s average net assets.
E. Various inputs may be used to determine the value of the fund’s investments. These inputs are summarized in three broad levels for financial statement purposes. The inputs or methodologies used to value securities are not necessarily an indication of the risk associated with investing in those securities.
Level 1—Quoted prices in active markets for identical securities.
Level 2—Other significant observable inputs (including quoted prices for similar securities, interest
rates, prepayment speeds, credit risk, etc.).
Level 3—Significant unobservable inputs (including the fund’s own assumptions used to determine
the fair value of investments). Any investments valued with significant unobservable inputs are
noted on the Statement of Net Assets.
The following table summarizes the market value of the fund’s investments as of February 28, 2018, based on the inputs used to value them:
| | | |
| | Level 1 | Level 2 | Level 3 |
| Investments | ($000) | ($000) | ($000) |
| Common Stocks | 8,789,959 | 32,458 | 987 |
| Preferred Stocks | — | — | 83,727 |
| Temporary Cash Investments | 381,768 | 42,919 | — |
| Futures Contracts—Liabilities1 | (4,780) | — | — |
| Total | 9,166,947 | 75,377 | 84,714 |
| 1 Represents variation margin on the last day of the reporting period. | | | |
The determination of Level 3 fair value measurements is governed by documented policies and procedures adopted by the board of trustees. The board has designated a pricing review committee, as an agent of the board, to ensure the timely analysis and valuation of Level 3 securities held by the fund in accordance with established policies and procedures. The pricing review committee employs various methods for calibrating valuation approaches, including a
27
U.S. Growth Fund
regular review of key inputs and assumptions, transactional back-testing or disposition analysis, and reviews of any related market activity. All valuation decisions made by the pricing review committee are reported to the board on a quarterly basis for review and ratification. The board reviews the adequacy of the fair value measurement policies and procedures in place on an annual basis.
The following table summarizes changes in investments valued based on Level 3 inputs during the six months ended February 28, 2018. Transfers into or out of Level 3 are recognized based on values as of the date of transfer.
| | |
| | Investments in | Investments in |
| | Common Stocks | Preferred Stocks |
| Amount Valued Based on Level 3 Inputs | ($000) | ($000) |
| Balance as of August 31, 2017 | 2,715 | 107,415 |
| Sales | (1,728) | (13,481) |
| Net Realized Gain (Loss) | 1,173 | 7,133 |
| Change in Unrealized Appreciation (Depreciation) | (1,173) | (17,340) |
| Balance as of February 28, 2018 | 987 | 83,727 |
Net change in unrealized appreciation (depreciation) from investments still held as of February 28, 2018, was ($18,513,000).
The following table provides quantitative information about the significant unobservable inputs used in fair value measurement as of February 28, 2018:
| | | | |
| | Fair Value | | | |
| | at 2/28/2018 | | | Amount or Range/ |
| Security Type | ($000) | Valuation Technique | Unobservable Input | Weighted Avg. |
| Common Stocks | 987 | Recent Market | Transaction Price | $51.81 |
| | | Transaction | | |
| Preferred Stocks | 37,546 | Recent Market | Transaction Price | $51.81–$105.00/ |
| | | Transaction | | $70.87 |
| | 35,086 | Recent Market | Weighted Average | $35.10 |
| | | Transaction1 | Price of Recent Deals | |
| | 11,095 | Comparable Company | EV/NTM Multiple | 7.1x |
| | | Approach 2 | IPO/M&A Probability | 75%/25% |
| | | | Illiquidity Discount | 10% |
1 During the period ended February 28, 2018, the valuation technique was changed from Recent Market Transaction with Uncertainty
Discount to Recent Market Transaction. This was considered to be a more relevant measure of fair value for this investment.
2 During the period ended February 28, 2018, the valuation technique was changed from Recent Market Transaction to Comparable
Company Approach. This was considered to be a more relevant measure of fair value for this investment.
Significant increases or decreases in the significant unobservable inputs used in the fair value measurement of the portfolio’s Level 3 securities, in isolation, could result in a significantly higher or lower fair value measurement.
28
U.S. Growth Fund
F. Distributions are determined on a tax basis and may differ from net investment income and realized capital gains for financial reporting purposes. Differences may be permanent or temporary. Permanent differences are reclassified among capital accounts in the financial statements to reflect their tax character. Temporary differences arise when certain items of income, expense, gain, or loss are recognized in different periods for financial statement and tax purposes. These differences will reverse at some time in the future. Differences in classification may also result from the treatment of short-term gains as ordinary income for tax purposes. The fund’s tax-basis capital gains and losses are determined only at the end of each fiscal year.
At February 28, 2018, the cost of investment securities for tax purposes was $5,861,773,000. Net unrealized appreciation of investment securities for tax purposes was $3,470,045,000, consisting of unrealized gains of $3,623,941,000 on securities that had risen in value since their purchase and $153,896,000 in unrealized losses on securities that had fallen in value since their purchase.
G. During the six months ended February 28, 2018, the fund purchased $1,649,862,000 of investment securities and sold $1,452,566,000 of investment securities, other than temporary cash investments.
| | | | |
| H. Capital share transactions for each class of shares were: | | | |
| | Six Months Ended | | Year Ended |
| | February 28, 2018 | August 31, 2017 |
| | Amount | Shares | Amount | Shares |
| | ($000) | (000) | ($000) | (000) |
| Investor Shares | | | | |
| Issued | 367,222 | 9,742 | 285,406 | 8,912 |
| Issued in Lieu of Cash Distributions | 192,106 | 5,198 | 52,776 | 1,792 |
| Redeemed | (712,243) | (19,034) | (651,577) | (20,372) |
| Net Increase (Decrease)—Investor Shares | (152,915) | (4,094) | (313,395) | (9,668) |
| Admiral Shares | | | | |
| Issued | 953,877 | 9,805 | 701,009 | 8,412 |
| Issued in Lieu of Cash Distributions | 199,343 | 2,082 | 46,252 | 607 |
| Redeemed | (447,255) | (4,594) | (565,611) | (6,971) |
| Net Increase (Decrease)—Admiral Shares | 705,965 | 7,293 | 181,650 | 2,048 |
29
U.S. Growth Fund
I. Certain of the fund’s investments are in companies that are considered to be affiliated companies of the fund because the fund owns more than 5% of the outstanding voting securities of the company or the issuer is another member of The Vanguard Group. Transactions during the period in securities of these companies were as follows:
| | | | | | | | |
| | | | | | Current Period Transactions | |
| | Aug. 31, | | Proceeds | Realized | | | | Feb. 28, |
| | 2017 | | from | Net | Change in | | Capital Gain | 2018 |
| | Market | Purchases | Securities | Gain | Unrealized | | Distributions | Market |
| | Value | at Cost | Sold | (Loss) | App. (Dep.) | Income | Received | Value |
| | ($000) | ($000) | ($000) | ($000) | ($000) | ($000) | ($000) | ($000) |
| Vanguard Growth ETF | 409 | — | — | — | 43 | 3 | — | 452 |
| Vanguard Market | | | | | | | | |
| Liquidity Fund | 286,634 | NA1 | NA1 | (11) | (63) | 1,934 | — | 381,768 |
| Total | 287,043 | | | (11) | (20) | 1,937 | — | 382,220 |
1 Not applicable—purchases and sales are for temporary cash investment purposes.
J. Management has determined that no material events or transactions occurred subsequent
to February 28, 2018, that would require recognition or disclosure in these financial statements.
30
About Your Fund’s Expenses
As a shareholder of the fund, you incur ongoing costs, which include costs for portfolio management, administrative services, and shareholder reports (like this one), among others. Operating expenses, which are deducted from a fund’s gross income, directly reduce the investment return of the fund.
A fund’s expenses are expressed as a percentage of its average net assets. This figure is known as the expense ratio. The following examples are intended to help you understand the ongoing costs (in dollars) of investing in your fund and to compare these costs with those of other mutual funds. The examples are based on an investment of $1,000 made at the beginning of the period shown and held for the entire period.
The accompanying table illustrates your fund’s costs in two ways:
• Based on actual fund return. This section helps you to estimate the actual expenses that you paid over the period. The ”Ending Account Value“ shown is derived from the fund‘s actual return, and the third column shows the dollar amount that would have been paid by an investor who started with $1,000 in the fund. You may use the information here, together with the amount you invested, to estimate the expenses that you paid over the period.
To do so, simply divide your account value by $1,000 (for example, an $8,600 account value divided by $1,000 = 8.6), then multiply the result by the number given for your fund under the heading ”Expenses Paid During Period.“
• Based on hypothetical 5% yearly return. This section is intended to help you compare your fund‘s costs with those of other mutual funds. It assumes that the fund had a yearly return of 5% before expenses, but that the expense ratio is unchanged. In this case—because the return used is not the fund’s actual return—the results do not apply to your investment. The example is useful in making comparisons because the Securities and Exchange Commission requires all mutual funds to calculate expenses based on a 5% return. You can assess your fund’s costs by comparing this hypothetical example with the hypothetical examples that appear in shareholder reports of other funds.
Note that the expenses shown in the table are meant to highlight and help you compare ongoing costs only and do not reflect transaction costs incurred by the fund for buying and selling securities. Further, the expenses do not include any purchase, redemption, or account service fees described in the fund prospectus. If such fees were applied to your account, your costs would be higher. Your fund does not carry a “sales load.”
The calculations assume no shares were bought or sold during the period. Your actual costs may have been higher or lower, depending on the amount of your investment and the timing of any purchases or redemptions.
You can find more information about the fund’s expenses, including annual expense ratios, in the Financial Statements section of this report. For additional information on operating expenses and other shareholder costs, please refer to your fund’s current prospectus.
31
| | | |
| Six Months Ended February 28, 2018 | | | |
| | Beginning | Ending | Expenses |
| | Account Value | Account Value | Paid During |
| U.S. Growth Fund | 8/31/2017 | 2/28/2018 | Period |
| Based on Actual Fund Return | | | |
| Investor Shares | $1,000.00 | $1,144.62 | $2.34 |
| Admiral Shares | 1,000.00 | 1,145.42 | 1.65 |
| Based on Hypothetical 5% Yearly Return | | | |
| Investor Shares | $1,000.00 | $1,022.61 | $2.21 |
| Admiral Shares | 1,000.00 | 1,023.26 | 1.56 |
The calculations are based on expenses incurred in the most recent six-month period. The fund’s annualized six-month expense ratios for
that period are 0.44% for Investor Shares and 0.31% for Admiral Shares. The dollar amounts shown as “Expenses Paid” are equal to the
annualized expense ratio multiplied by the average account value over the period, multiplied by the number of days in the most recent
six-month period, then divided by the number of days in the most recent 12-month period (181/365).
32
Trustees Approve Advisory Arrangements
The board of trustees of Vanguard U.S. Growth Fund has renewed the fund’s investment advisory arrangements with Baillie Gifford Overseas Ltd. (Baillie Gifford), Jackson Square Partners, LLC (Jackson Square), Jennison Associates LLC (Jennison), Wellington Management Company LLP (Wellington Management), and William Blair Investment Management, LLC (William Blair). The board determined that renewing the fund’s advisory arrangements was in the best interests of the fund and its shareholders.
The board based its decision upon an evaluation of each advisor’s investment staff, portfolio management process, and performance. This evaluation included information provided to the board by Vanguard’s Portfolio Review Department, which is responsible for fund and advisor oversight and product management. The Portfolio Review Department met regularly with the advisors and made monthly presentations to the board during the fiscal year that directed the board’s focus to relevant information and topics.
The board, or an investment committee made up of board members, also received information throughout the year during advisor presentations. For each advisor presentation, the board was provided with letters and reports that included information about, among other things, the advisory firm and the advisor’s assessment of the investment environment, portfolio performance, and portfolio characteristics.
In addition, the board received monthly reports, which included a Market and Economic Report, a Fund Dashboard Monthly Summary, and a Fund Performance Report.
Prior to their meeting, the trustees were provided with a memo and materials that summarized the information they received over the course of the year. They also considered the factors discussed below, among others. However, no single factor determined whether the board approved the arrangements. Rather, it was the totality of the circumstances that drove the board’s decision.
Nature, extent, and quality of services
The board reviewed the quality of the fund’s investment management services over both the short and long term and took into account the organizational depth and stability of each advisor. The board considered the following:
Baillie Gifford. Baillie Gifford—a unit of Baillie Gifford & Co., founded in 1908—is among the largest independently owned investment management firms in the United Kingdom. Baillie Gifford aims to deliver outstanding investment performance by identifying exceptional growth companies in the United States and investing in them long enough for the advantages of their business models and strength of their cultures to become the dominant drivers of their stock prices. This long-term horizon allows the advisor to harness the asymmetry inherent in equity markets to capture the disproportionate impact of successful investments in the portfolio. Baillie Gifford has managed a portion of the fund since 2014.
33
Jackson Square. Founded in February 2014, Jackson Square invests primarily in common stocks of large-capitalization, growth-oriented companies that it believes have long-term capital appreciation potential and are expected to grow faster than the U.S. economy. Jackson Square uses a bottom-up approach, seeking companies that have large-end market potential, dominant business models, and strong free cash flow generation that is attractively priced compared to the intrinsic value of the securities. Jackson Square was founded by the same investment team that has managed a portion of the fund since 2010, previously as a part of Delaware Investments.
Jennison. Jennison, founded in 1969, is an indirect, wholly owned subsidiary of Prudential Financial Inc. Jennison uses internal fundamental research and a highly interactive stock selection process to identify companies that exhibit above-average growth in units, revenues, earnings, and cash flows. When analyzing a company for purchase or sale, Jennison focuses on the duration of the company’s growth opportunity and seeks to capture inflection points in its growth trajectory. Jennison has managed a portion of the fund since 2014.
Wellington Management. Founded in 1928, Wellington Management is among the nation’s oldest and most respected institutional investment managers. The advisor employs a traditional, bottom-up fundamental research approach to identify companies with sustainable growth advantages and reasonable valuations. Wellington Management identifies companies that have demonstrated above-average growth in the past and follows up with a thorough review of each company’s business model and an assessment of its valuation. The goal of this review is to identify companies with high returns on capital, superior business management, and high-quality balance sheets. Wellington Management has managed a portion of the fund since 2010.
William Blair. Founded in 1935, William Blair is an independently owned full-service investment firm. William Blair uses an investment process that relies on thorough fundamental research. Based on this process, the advisor invests in quality growth companies that it believes will grow faster than the market expects or sustain an above-average growth rate for longer than the market expects. In selecting stocks, William Blair considers each company’s leadership position within the company’s market, the quality of products or services it provides, its return on equity, its accounting policies, and the quality of the management team. William Blair has managed a portion of the fund since 2004.
The board concluded that each advisor’s experience, stability, depth, and performance, among other factors, warranted continuation of the advisory arrangements.
Investment performance
The board considered the short- and long-term performance of the fund and each advisor, including any periods of outperformance or underperformance compared with a relevant benchmark and peer group. The board concluded that the performance was such that each advisory arrangement should continue. Information about the fund’s most recent performance can be found in the Performance Summary section of this report.
34
Cost
The board concluded that the fund’s expense ratio was below the average expense ratio charged by funds in its peer group and that the fund’s advisory fee rate was also well below the peer-group average. Information about the fund’s expense ratio appears in the About Your Fund’s Expenses section of this report as well as in the Financial Statements section, which also includes information about the fund’s advisory fee rate.
The board did not consider the profitability of Baillie Gifford, Jackson Square, Jennison, Wellington Management, or William Blair in determining whether to approve the advisory fees, because the advisors are independent of Vanguard and the advisory fees are the result of arm’s-length negotiations.
The benefit of economies of scale
The board concluded that the fund’s shareholders benefit from economies of scale because of breakpoints in the advisory fee schedules for Baillie Gifford, Jackson Square, Jennison, Wellington Management, and William Blair. The breakpoints reduce the effective rate of the fees as the fund’s assets managed by each advisor increase.
The board will consider whether to renew the advisory arrangement again after a one-year period.
35
Glossary
30-Day SEC Yield. A fund’s 30-day SEC yield is derived using a formula specified by the U.S. Securities and Exchange Commission. Under the formula, data related to the fund’s security holdings in the previous 30 days are used to calculate the fund’s hypothetical net income for that period, which is then annualized and divided by the fund’s estimated average net assets over the calculation period. For the purposes of this calculation, a security’s income is based on its current market yield to maturity (for bonds), its actual income (for asset-backed securities), or its projected dividend yield (for stocks). Because the SEC yield represents hypothetical annualized income, it will differ—at times significantly—from the fund’s actual experience. As a result, the fund’s income distributions may be higher or lower than implied by the SEC yield.
Beta. A measure of the magnitude of a fund’s past share-price fluctuations in relation to the ups and downs of a given market index. The index is assigned a beta of 1.00. Compared with a given index, a fund with a beta of 1.20 typically would have seen its share price rise or fall by 12% when the index rose or fell by 10%. For this report, beta is based on returns over the past 36 months for both the fund and the index. Note that a fund’s beta should be reviewed in conjunction with its R-squared (see definition). The lower the R-squared, the less correlation there is between the fund and the index, and the less reliable beta is as an indicator of volatility.
Dividend Yield. Dividend income earned by stocks, expressed as a percentage of the aggregate market value (or of net asset value, for a fund). The yield is determined by dividing the amount of the annual dividends by the aggregate value (or net asset value) at the end of the period. For a fund, the dividend yield is based solely on stock holdings and does not include any income produced by other investments.
Earnings Growth Rate. The average annual rate of growth in earnings over the past five years for the stocks now in a fund.
Equity Exposure. A measure that reflects a fund’s investments in stocks and stock futures. Any holdings in short-term reserves are excluded.
Expense Ratio. A fund’s total annual operating expenses expressed as a percentage of the fund’s average net assets. The expense ratio includes management and administrative expenses, but does not include the transaction costs of buying and selling portfolio securities.
Foreign Holdings. The percentage of a fund represented by securities or depositary receipts of companies based outside the United States.
Inception Date. The date on which the assets of a fund (or one of its share classes) are first invested in accordance with the fund’s investment objective. For funds with a subscription period, the inception date is the day after that period ends. Investment performance is measured from the inception date.
Median Market Cap. An indicator of the size of companies in which a fund invests; the midpoint of market capitalization (market price x shares outstanding) of a fund’s stocks, weighted by the proportion of the fund’s assets invested in each stock. Stocks representing half of the fund’s assets have market capitalizations above the median, and the rest are below it.
Price/Book Ratio. The share price of a stock divided by its net worth, or book value, per share. For a fund, the weighted average price/book ratio of the stocks it holds.
36
Price/Earnings Ratio. The ratio of a stock’s current price to its per-share earnings over the past year. For a fund, the weighted average P/E of the stocks it holds. P/E is an indicator of market expectations about corporate prospects; the higher the P/E, the greater the expectations for a company’s future growth.
R-Squared. A measure of how much of a fund’s past returns can be explained by the returns from the market in general, as measured by a given index. If a fund’s total returns were precisely synchronized with an index’s returns, its R-squared would be 1.00. If the fund’s returns bore no relationship to the index’s returns, its R-squared would be 0. For this report, R-squared is based on returns over the past 36 months for both the fund and the index.
Return on Equity. The annual average rate of return generated by a company during the past five years for each dollar of shareholder’s equity (net income divided by shareholder’s equity). For a fund, the weighted average return on equity for the companies whose stocks it holds.
Short-Term Reserves. The percentage of a fund invested in highly liquid, short-term securities that can be readily converted to cash.
Turnover Rate. An indication of the fund’s trading activity. Funds with high turnover rates incur higher transaction costs and may be more likely to distribute capital gains (which may be taxable to investors). The turnover rate excludes in-kind transactions, which have minimal impact on costs.
37
The Global Industry Classification Standard (“GICS”) was developed by and is the exclusive property and a service mark
of MSCI Inc. (“MSCI”) and Standard and Poor’s, a division of McGraw-Hill Companies, Inc. (“S&P”), and is licensed for use
by Vanguard. Neither MSCI, S&P nor any third party involved in making or compiling the GICS or any GICS classification
makes any express or implied warranties or representations with respect to such standard or classification (or the results
to be obtained by the use thereof), and all such parties hereby expressly disclaim all warranties of originality, accuracy,
completeness, merchantability or fitness for a particular purpose with respect to any such standard or classification.
Without limiting any of the foregoing, in no event shall MSCI, S&P, any of its affiliates or any third party involved in
making or compiling the GICS or any GICS classification have any liability for any direct, indirect, special, punitive,
consequential or any other damages (including lost profits) even if notified of the possibility of such damages.
38
The People Who Govern Your Fund
The trustees of your mutual fund are there to see that the fund is operated and managed in your best interests since, as a shareholder, you are a part owner of the fund. Your fund’s trustees also serve on the board of directors of The Vanguard Group, Inc., which is owned by the Vanguard funds and provides services to them on an at-cost basis.
A majority of Vanguard’s board members are independent, meaning that they have no affiliation with Vanguard or the funds they oversee, apart from the sizable personal investments they have made as private individuals. The independent board members have distinguished backgrounds in business, academia, and public service. Each of the trustees and executive officers oversees 208 Vanguard funds.
Information for each trustee and executive officer of the fund appears below. The mailing address of the trustees and officers is P.O. Box 876, Valley Forge, PA 19482. More information about the trustees is in the Statement of Additional Information, which can be obtained, without charge, by contacting Vanguard at 800-662-7447, or online at vanguard.com.
Interested Trustees1
F. William McNabb III
Born in 1957. Trustee since July 2009. Principal occupation(s) during the past five years and other experience: chairman of the board (January 2010–present) of Vanguard and of each of the investment companies served by Vanguard, trustee (2009–present) of each of the investment companies served by Vanguard, and director (2008–present) of Vanguard. Chief executive officer and president (2008–2017) of Vanguard and each of the investment companies served by Vanguard, managing director (1995–2008) of Vanguard, and director (1997–2018) of Vanguard Marketing Corporation. Director (2018–present) of UnitedHealth Group.
Mortimer J. Buckley
Born in 1969. Trustee since January 2018. Principal occupation(s) during the past five years and other experience: chief executive officer (January 2018–present) of Vanguard; chief executive officer, president, and trustee (January 2018–present) of each of the investment companies served by Vanguard; president and director (2017–present) of Vanguard; and president (February 2018–present) of Vanguard Marketing Corporation. Chief investment officer (2013–2017), managing director (2002–2017), head of the Retail Investor Group (2006–2012), and chief information officer (2001–2006) of Vanguard. Chairman of the board (2011–2017) of the Children’s Hospital of Philadelphia.
Independent Trustees
Emerson U. Fullwood
Born in 1948. Trustee since January 2008. Principal occupation(s) during the past five years and other experience: executive chief staff and marketing officer for North America and corporate vice president (retired 2008) of Xerox Corporation (document management products and services). Former president of the Worldwide Channels Group, Latin America, and Worldwide Customer Service and executive chief staff officer of Developing Markets of Xerox. Executive in residence and 2009–2010 Distinguished Minett Professor at the Rochester Institute of Technology. Lead director of SPX FLOW, Inc. (multi-industry manufacturing). Director of the University of Rochester Medical Center, the Monroe Community College Foundation, the United Way of Rochester, North Carolina A&T University, and Roberts Wesleyan College. Trustee of the University of Rochester.
Amy Gutmann
Born in 1949. Trustee since June 2006. Principal occupation(s) during the past five years and other experience: president (2004–present) of the University of Pennsylvania. Christopher H. Browne Distinguished Professor of Political Science, School of Arts and Sciences, and professor of communication, Annenberg School for Communication, with secondary faculty appointments in the Department of Philosophy, School of Arts and Sciences, and at the Graduate School of Education, University of Pennsylvania. Trustee of the National Constitution Center.
1 Mr. McNabb and Mr. Buckley are considered “interested persons,” as defined in the Investment Company Act of 1940, because
they are officers of the Vanguard funds.
JoAnn Heffernan Heisen
Born in 1950. Trustee since July 1998. Principal occupation(s) during the past five years and other experience: corporate vice president of Johnson & Johnson (pharmaceuticals/medical devices/consumer products) and member of its executive committee (1997–2008). Chief global diversity officer (retired 2008), vice president and chief information officer (1997–2006), controller (1995–1997), treasurer (1991–1995), and assistant treasurer (1989–1991) of Johnson & Johnson. Director of Skytop Lodge Corporation (hotels) and the Robert Wood Johnson Foundation. Member of the advisory board of the Institute for Women’s Leadership at Rutgers University.
F. Joseph Loughrey
Born in 1949. Trustee since October 2009. Principal occupation(s) during the past five years and other experience: president and chief operating officer (retired 2009) and vice chairman of the board (2008–2009) of Cummins Inc. (industrial machinery). Chairman of the board of Hillenbrand, Inc. (specialized consumer services), Oxfam America, and the Lumina Foundation for Education. Director of the V Foundation for Cancer Research. Member of the advisory council for the College of Arts and Letters and chair of the advisory board to the Kellogg Institute for International Studies, both at the University of Notre Dame.
Mark Loughridge
Born in 1953. Trustee since March 2012. Principal occupation(s) during the past five years and other experience: senior vice president and chief financial officer (retired 2013) of IBM (information technology services). Fiduciary member of IBM’s Retirement Plan Committee (2004–2013), senior vice president and general manager (2002–2004) of IBM Global Financing, vice president and controller (1998–2002) of IBM, and a variety of other prior management roles at IBM. Member of the Council on Chicago Booth.
Scott C. Malpass
Born in 1962. Trustee since March 2012. Principal occupation(s) during the past five years and other experience: chief investment officer (1989–present) and vice president (1996–present) of the University of Notre Dame. Assistant professor of finance at the Mendoza College of Business, University of Notre Dame, and member of the Notre Dame 403(b) Investment Committee. Chairman of the board of TIFF Advisory Services, Inc. Member of the board of Catholic Investment Services, Inc. (investment advisors), the board of advisors for Spruceview Capital Partners, and the board of superintendence of the Institute for the Works of Religion.
Deanna Mulligan
Born in 1963. Trustee since January 2018. Principal occupation(s) during the past five years and other experience: president (2010–present) and chief executive officer (2011–present) of The Guardian Life Insurance Company of America. Chief operating officer (2010–2011) and executive vice president (2008–2010) of Individual Life and Disability of The Guardian Life Insurance Company of America. Member of the board of The Guardian Life Insurance Company of America, the American Council of Life Insurers, the Partnership for New York City (business leadership), and the Committee Encouraging Corporate Philanthropy. Trustee of the Economic Club of New York and the Bruce Museum (arts and science). Member of the Advisory Council for the Stanford Graduate School of Business.
André F. Perold
Born in 1952. Trustee since December 2004. Principal occupation(s) during the past five years and other experience: George Gund Professor of Finance and Banking, Emeritus at the Harvard Business School (retired 2011). Chief investment officer and co-managing partner of HighVista Strategies LLC (private investment firm). Overseer of the Museum of Fine Arts Boston.
Sarah Bloom Raskin
Born in 1961. Trustee since January 2018. Principal occupation(s) during the past five years and other experience: deputy secretary (2014–2017) of the United States Department of the Treasury. Governor (2010–2014) of the Federal Reserve Board. Commissioner (2007–2010) of financial regulation for the State of Maryland. Member of the board of directors (2012–2014) of Neighborhood Reinvestment Corporation. Director of i(x) Investments, LLC.
Peter F. Volanakis
Born in 1955. Trustee since July 2009. Principal occupation(s) during the past five years and other experience: president and chief operating officer (retired 2010) of Corning Incorporated (communications equipment) and director of Corning Incorporated (2000–2010) and Dow Corning (2001–2010). Director (2012) of SPX Corporation (multi-industry manufacturing). Overseer of the Amos Tuck School of Business Administration, Dartmouth College (2001–2013). Chairman of the board of trustees of Colby-Sawyer College. Member of the Board of Hypertherm Inc. (industrial cutting systems, software, and consumables).
Executive Officers
Glenn Booraem
Born in 1967. Principal occupation(s) during the past five years and other experience: principal of Vanguard. Investment stewardship officer (2017–present), treasurer (2015–2017), controller (2010–2015), and assistant controller (2001–2010) of each of the investment companies served by Vanguard.
Christine M. Buchanan
Born in 1970. Principal occupation(s) during the past five years and other experience: principal of Vanguard and global head of Fund Administration at Vanguard. Treasurer (2017–present) of each of the investment companies served by Vanguard. Partner (2005–2017) at KPMG LLP (audit, tax, and advisory services).
Brian Dvorak
Born in 1973. Principal occupation(s) during the past five years and other experience: principal of Vanguard. Chief compliance officer (2017–present) of Vanguard and each of the investment companies served by Vanguard. Assistant vice president (2017–present) of Vanguard Marketing Corporation. Vice president and director of Enterprise Risk Management (2011–2013) at Oppenheimer Funds, Inc.
Thomas J. Higgins
Born in 1957. Principal occupation(s) during the past five years and other experience: principal of Vanguard. Chief financial officer (2008–present) and treasurer (1998–2008) of each of the investment companies served by Vanguard.
Peter Mahoney
Born in 1974. Principal occupation(s) during the past five years and other experience: principal of Vanguard. Controller (2015–present) of each of the investment companies served by Vanguard. Head of International Fund Services (2008–2014) at Vanguard.
Anne E. Robinson
Born in 1970. Principal occupation(s) during the past five years and other experience: general counsel (2016–present) of Vanguard. Secretary (2016–present) of Vanguard and of each of the investment companies served by Vanguard. Managing director (2016–present) of Vanguard. Director and senior vice president (2016–2018) of Vanguard Marketing Corporation. Managing director and general counsel of Global Cards and Consumer Services (2014–2016) at Citigroup. Counsel (2003–2014) at American Express.
Michael Rollings
Born in 1963. Principal occupation(s) during the past five years and other experience: finance director (2017–present) and treasurer (2017) of each of the investment companies served by Vanguard. Managing director (2016–present) of Vanguard. Chief financial officer (2016–present) of Vanguard. Director (2016–present) of Vanguard Marketing Corporation. Executive vice president and chief financial officer (2006–2016) of MassMutual Financial Group.
| |
| Vanguard Senior Management Team |
| |
| Mortimer J. Buckley | James M. Norris |
| Gregory Davis | Thomas M. Rampulla |
| John James | Karin A. Risi |
| Martha G. King | Anne E. Robinson |
| John T. Marcante | Michael Rollings |
| Chris D. McIsaac | |
Chairman Emeritus and Senior Advisor
John J. Brennan
Chairman, 1996–2009
Chief Executive Officer and President, 1996–2008
Founder
John C. Bogle
Chairman and Chief Executive Officer, 1974–1996
| |
|  |
| | P.O. Box 2600 |
| | Valley Forge, PA 19482-2600 |
| |
| |
| |
| Connect with Vanguard® > vanguard.com |
| |
| |
| |
| Fund Information > 800-662-7447 | Source for Bloomberg Barclays indexes: Bloomberg |
| Direct Investor Account Services > 800-662-2739 | Index Services Limited. Copyright 2018, Bloomberg. All |
| | rights reserved. |
| Institutional Investor Services > 800-523-1036 | |
| | CFA® is a registered trademark owned by CFA Institute. |
| Text Telephone for People | |
| Who Are Deaf or Hard of Hearing > 800-749-7273 | |
| |
| This material may be used in conjunction | |
| with the offering of shares of any Vanguard | |
| fund only if preceded or accompanied by | |
| the fund’s current prospectus. | |
| |
| All comparative mutual fund data are from Lipper, a | |
| Thomson Reuters Company, or Morningstar, Inc., unless | |
| otherwise noted. | |
| |
| You can obtain a free copy of Vanguard’s proxy voting | |
| guidelines by visiting vanguard.com/proxyreporting or by | |
| calling Vanguard at 800-662-2739. The guidelines are | |
| also available from the SEC’s website, sec.gov. In | |
| addition, you may obtain a free report on how your fund | |
| voted the proxies for securities it owned during the 12 | |
| months ended June 30. To get the report, visit either | |
| vanguard.com/proxyreporting or sec.gov. | |
| |
| You can review and copy information about your fund at | |
| the SEC’s Public Reference Room in Washington, D.C. To | |
| find out more about this public service, call the SEC at | |
| 202-551-8090. Information about your fund is also | |
| available on the SEC’s website, and you can receive | |
| copies of this information, for a fee, by sending a | |
| request in either of two ways: via email addressed to | |
| publicinfo@sec.gov or via regular mail addressed to the | |
| Public Reference Section, Securities and Exchange | |
| Commission, Washington, DC 20549-1520. | |
| | © 2018 The Vanguard Group, Inc. |
| | All rights reserved. |
| | Vanguard Marketing Corporation, Distributor. |
| |
| | Q232 042018 |

Semiannual Report | February 28, 2018
Vanguard International Growth Fund
Vanguard’s Principles for Investing Success
We want to give you the best chance of investment success. These principles, grounded in Vanguard’s research and experience, can put you on the right path.
Goals. Create clear, appropriate investment goals.
Balance. Develop a suitable asset allocation using broadly diversified funds.
Cost. Minimize cost.
Discipline. Maintain perspective and long-term discipline.
A single theme unites these principles: Focus on the things you can control.
We believe there is no wiser course for any investor.
| |
| Contents | |
| Your Fund’s Performance at a Glance. | 1 |
| CEO’s Perspective. | 2 |
| Advisors’ Report. | 5 |
| Results of Proxy Voting. | 9 |
| Fund Profile. | 11 |
| Performance Summary. | 13 |
| Financial Statements. | 14 |
| About Your Fund’s Expenses. | 34 |
| Trustees Approve Advisory Arrangements. | 36 |
| Glossary. | 38 |
Please note: The opinions expressed in this report are just that—informed opinions. They should not be considered promises
or advice. Also, please keep in mind that the information and opinions cover the period through the date on the front of this
report. Of course, the risks of investing in your fund are spelled out in the prospectus.
See the Glossary for definitions of investment terms used in this report.
About the cover: Nautical images have been part of Vanguard’s rich heritage since its start in 1975. For an
incoming ship, a lighthouse offers a beacon and safe path to shore. You can similarly depend on Vanguard to put
you first––and light the way––as you strive to meet your financial goals. Our client focus and low costs,
stemming from our unique ownership structure, assure that your interests are paramount.
Your Fund’s Performance at a Glance
• Vanguard International Growth Fund returned about 12% for the six months ended February 28, 2018, well ahead of its benchmark index and peer group.
• The fund’s advisors added value in North America, the Pacific region, emerging markets, and Europe. In North America, U.S. companies were the strongest performers, while South Korea was the strongest performer in the Pacific region and China led the way among emerging markets.
• Although the fund performed better than its index in emerging markets overall, its limited exposure to Russia, Brazil, and South Africa modestly detracted from relative performance.
• In terms of sectors, the fund’s performance relative to its benchmark index was mostly positive. The advisors added value in 9 of 11 sectors, with information technology, health care, and consumer discretionary turning in the strongest performances. Energy and financials were the only two sectors that detracted from relative performance.
| | | |
| Total Returns: Six Months Ended February 28, 2018 | | | |
| | | | Total |
| | | | Returns |
| Vanguard International Growth Fund | | | |
| Investor Shares | | | 11.61% |
| Admiral™ Shares | | | 11.70 |
| MSCI All Country World Index ex USA | | | 7.59 |
| International Funds Average | | | 6.51 |
| International Funds Average: Derived from data provided by Lipper, a Thomson Reuters Company. | | |
| Admiral Shares carry lower expenses and are available to investors who meet certain account-balance requirements. | |
| |
| |
| Expense Ratios | | | |
| Your Fund Compared With Its Peer Group | | | |
| | Investor | Admiral | Peer Group |
| | Shares | Shares | Average |
| International Growth Fund | 0.45% | 0.32% | 1.31% |
The fund expense ratios shown are from the prospectus dated December 21, 2017, and represent estimated costs for the current fiscal
year. For the six months ended February 28, 2018, the fund’s annualized expense ratios were 0.45% for Investor Shares and 0.32% for
Admiral Shares. The peer-group expense ratio is derived from data provided by Lipper, a Thomson Reuters Company, and captures
information through year-end 2017.
Peer group: International Funds.
1
CEO’s Perspective

Tim Buckley
President and Chief Executive Officer
Dear Shareholder,
As I begin my tenure as Vanguard’s fourth chief executive, I’ve been reflecting on both the past and the future of the company where I have spent my entire professional career.
I feel extremely fortunate to have the chance to lead a company filled with people who come to work every day passionate about Vanguard’s core purpose: to take a stand for all investors, to treat them fairly, and to give them the best chance for investment success.
Making a real difference
When I joined Vanguard in 1991, I found a mission-driven team focused on improving lives—helping people retire more comfortably, put their children through college, and achieve financial security. I found a company with purpose in an industry ripe for improvement.
It was clear, even early in my career, that the cards were stacked against most investors. Hidden fees, performance-chasing, and poor advice were relentlessly eroding investors’ dreams.
We knew Vanguard could be different and, as a result, could make a real difference. Over the past 25 years, for example, Vanguard has lowered our funds’ asset-weighted average expense ratio
2
from 0.31% to 0.12%. And over the past decade, 94% of our funds have beaten the average annual return of their peers.1
Focused on your success
Vanguard is built for Vanguard investors—as a client-owned company, we focus solely on you, our fund shareholders. Everything we do is designed to give our clients the best chance for investment success. In my role as CEO, I intend to keep this priority front and center. We’re proud of what we’ve achieved, but we’re even more excited about what’s to come.
As I write this, we’ve experienced a period of pronounced market volatility. Strong economic growth and budding signs of inflation have raised concerns about a more aggressive Federal Reserve. Although volatility can test investors’ nerves, we sometimes think of this as “Vanguard weather”—a time when having a disciplined, low-cost, and long-term approach to investment management serves investors well.
| | | |
| Market Barometer | | | |
| | | | Total Returns |
| | | Periods Ended February 28, 2018 |
| | Six | One | Five Years |
| | Months | Year | (Annualized) |
| Stocks | | | |
| Russell 1000 Index (Large-caps) | 10.62% | 16.70% | 14.56% |
| Russell 2000 Index (Small-caps) | 8.30 | 10.51 | 12.19 |
| Russell 3000 Index (Broad U.S. market) | 10.45 | 16.22 | 14.37 |
| FTSE All-World ex US Index (International) | 7.84 | 21.50 | 6.69 |
| |
| Bonds | | | |
| Bloomberg Barclays U.S. Aggregate Bond Index | | | |
| (Broad taxable market) | -2.18% | 0.51% | 1.71% |
| Bloomberg Barclays Municipal Bond Index | | | |
| (Broad tax-exempt market) | -1.24 | 2.50 | 2.57 |
| Citigroup Three-Month U.S. Treasury Bill Index | 0.59 | 0.98 | 0.27 |
| |
| CPI | | | |
| Consumer Price Index | 1.41% | 2.21% | 1.41% |
The performance data shown represent past performance, which is not a guarantee of future results.
1 For the ten-year period through December 31, 2017, 9 of 9 Vanguard money market funds, 56 of 60 bond funds, 21 of 22 balanced funds,
and 131 of 140 stock funds, or 217 of 231 Vanguard funds, outperformed their peer-group averages. Sources: Vanguard, based on data
from Lipper, a Thomson Reuters Company.
3
Steady, time-tested guidance
Our guidance for investors, as always, is to stay the course, tune out the hyperbolic headlines, and focus on your goals and what you can control, such as costs and how much you save. This time-tested advice has served our clients well over the decades.
Regardless of how the markets perform in the short term, I’m incredibly optimistic about the future for our investors. We have a dedicated team serving you, and we will never stop striving to make Vanguard the best place for you to invest through our high-quality funds and services, advice and guidance to help you meet your financial goals, and an experience that makes you feel good about entrusting us with your hard-earned savings.
Thank you for your continued loyalty.
Sincerely,

Mortimer J. Buckley
President and Chief Executive Officer
March 19, 2018
4
Advisors’ Report
For the six months ended February 28, 2018, Vanguard International Growth Fund returned 11.61% for Investor Shares (11.70% for Admiral Shares), ahead of its benchmark index and the average return of peer funds. Your fund is managed by two independent advisors, a strategy that enhances the fund’s diversification by providing exposure to distinct yet complementary investment approaches. It is not uncommon for advisors to have different views about individual securities or the broader investment environment.
The advisors, the amount and percentage of fund assets each manages, and brief descriptions of their investment strategies are presented in the table below. The advisors have also prepared a discussion of the investment environment that existed during the fiscal half year and of how the portfolio’s positioning reflects this assessment. These comments were prepared on March 19, 2018.
Baillie Gifford Overseas Ltd.
Portfolio Managers:
James K. Anderson,
Head of Global Equities
Thomas Coutts,
Head of European Equities
Exceptional companies have always been critical to investment returns, with a small handful responsible for lifting stock market results. We anticipate that this
Vanguard International Growth Fund Investment Advisors
| | | |
| | Fund Assets Managed | |
| Investment Advisor | % | $ Million | Investment Strategy |
| Baillie Gifford Overseas Ltd. | 60 | 22,275 | The advisor seeks stocks that can generate |
| | | | above-average growth in earnings and cash |
| | | | flow, producing a bottom-up, stock-driven |
| | | | approach to country and asset allocation. An |
| | | | in-depth view on each company is measured |
| | | | against the consensus view, leading to |
| | | | discrepancies and potential opportunities to add |
| | | | value. |
| Schroder Investment | 39 | 14,442 | Equity analysts located around the world and an |
| Management North America Inc. | | | international team of global sector specialists |
| | | | help to identify reasonably priced companies |
| | | | with strong growth prospects and a sustainable |
| | | | competitive advantage. |
| Cash Investments | 1 | 379 | These short-term reserves are invested by |
| | | | Vanguard in equity index products to simulate |
| | | | investment in stocks. Each advisor may also |
| | | | maintain a modest cash position. |
5
concentration of returns will persist and may even intensify. As investors, we aim to identify and own substantial positions in enough of the winners to generate attractive returns for our clients. To benefit fully, we must also avoid the pitfalls of taking profits and rebalancing into inferior opportunities. While many of our holdings have risen substantially over the period, we believe the potential for further growth is great, so we have made few changes to the portfolio.
How large can a successful company become in the modern era? It is increasingly apparent that the scale advantages of large technology platforms are intensifying, and are transferable to adjacent business areas. It is highly unusual for companies as large as Alibaba, Amazon, and Tencent to report rapid and accelerating growth. Their success reflects the dynamics of a digitized and interconnected global economy, and an increasing advantage for companies that can take a long-term view.
ASML, the Dutch supplier of lithography equipment for the semiconductor industry, is a good example of a company that thinks in terms of decades rather than quarters. Advancing Moore’s Law of computing power is one of the most important engineering challenges of our generation. ASML continues to drive the technology forward with its industry-leading chip-making machines. It has fought its way through the challenges of extreme ultraviolet lithography and now believes it has a clear path to develop this technology until around 2030. This will enable continued development in big data, machine learning, the internet of things, and artificial intelligence. Very few areas of the economy will be unaffected by this transformation.
The detractors over the period included two long-term holdings, Inditex, the Spanish clothing retailer, and Genmab, a Danish biotechnology company. Inditex, the owner of the Zara retail chain, has faced some currency headwinds. We still believe that this is a remarkable company with a substantial opportunity to expand its “fast fashion” model globally, both offline and online. Genmab is engaged in the development of antibody therapies for cancer. It has one successful product, Darzalex, on the market and others in various stages of clinical trials. After a few strong years, its share price has been weaker in the past six months, but we remain enthusiastic about the long-term prospects for the company. We added to both holdings over the period.
The only new purchases over the last six months were Delivery Hero and Umicore. Delivery Hero is a German food delivery company that operates online takeaway marketplaces in 42 countries in Europe, the Middle East, Asia, and North Africa. Umicore is a Belgian materials and recycling company. We have also added to Swedish bank Svenska Handelsbanken and German meal box provider HelloFresh, following its initial public offering in November. These additions were partly
6
funded by the sale of holdings in NAVER, the South Korean internet search platform, and EXOR, the Italian holding company.
Schroder Investment Management
North America Inc.
Portfolio Manager:
Simon Webber, CFA
International markets posted solid gains over the six-month period, led by generally supportive economic data and improving corporate earnings growth. Expectations of higher interest rates hurt defensive sectors, while more cyclical sectors led the market higher. The information technology sector was among the strongest-performing sectors as a number of the largest companies continued to post better-than-expected earnings, accompanied by healthy guidance. The energy sector also performed well as oil prices were supported by geopolitical tensions and OPEC’s renewed commitment to cutting production.
Our positions in information technology particularly helped performance, as did our zero-weight exposure to the poorly performing utilities sector. Our holdings in the consumer discretionary and health care sectors were relative detractors.
Check Point Software was a notable detractor amid softer revenue growth. While Check Point continues to generate a lot of cash and has strong products, growth has slowed despite what should be a healthy environment for cybersecurity spending amid several high-profile corporate attacks. We attribute this to a number of factors, including the competitive environment, which remains difficult; the emergence of “private label” security offerings from public cloud service providers AWS and Google Cloud; and a disappointing sales force reorganization in the United States. While the sales execution issues should improve, the public cloud competition could intensify, and we have reduced the position to reflect the increased risk.
Umicore, a leading supplier of cathode components for electric vehicle batteries, was one of our strongest performers and has been making significant investments in capacity to bolster its long-term growth and leadership position. The scale of the investment in its cathode business will consume most of its free cash flow over the next three years, but as demand for cathode materials is expected to remain high over the next decade, we expect Umicore’s capacity ramp-up to deliver strong results over the long term.
We are moving into a new phase of the business cycle where strong economic growth increases the upside risks to inflation and central banks become less accommodative. We are generally cautious toward companies that have high debt or limited pricing power to offset higher inflation.
7
After years of spending restraint, improved corporate confidence and higher manufacturing utilization warrant a positive view on the capital spending cycle. We retain active exposure in areas likely to benefit, such as factory automation, construction-related products, and electrical infrastructure.
This view also supports our materials exposure, which is focused more on materials benefiting from structural trends such as electrification of automotive powertrains than on traditional “bulk” commodities.
Consumer discretionary stocks are well-represented in our portfolio. The competitive landscape in content and media consumption is changing rapidly and represents a rich source of opportunity—particularly for social media, music, and gaming.
We believe that a period of disruption is unfolding across many industries, and this will be a powerful source of investment performance. It remains critical for businesses and investors to ensure that they are on the right side of the disruption. We are focused on identifying businesses that are willing to invest for the long term, for change, and to create sustainable growth business models.
8
Results of Proxy Voting
At a special meeting of shareholders on November 15, 2017, fund shareholders approved the following proposals:
Proposal 1—Elect trustees for the fund.*
The individuals listed in the table below were elected as trustees for the fund. All trustees with the exception of Ms. Mulligan, Ms. Raskin, and Mr. Buckley (each of whom already serves as a director of The Vanguard Group, Inc.) served as trustees to the funds prior to the shareholder meeting.
| | | |
| | | | Percentage |
| Trustee | For | Withheld | For |
| Mortimer J. Buckley | 1,040,401,220 | 33,553,324 | 96.9% |
| Emerson U. Fullwood | 1,039,160,376 | 34,794,169 | 96.8% |
| Amy Gutmann | 1,040,321,884 | 33,632,661 | 96.9% |
| JoAnn Heffernan Heisen | 1,041,268,182 | 32,686,363 | 97.0% |
| F. Joseph Loughrey | 1,040,201,842 | 33,752,703 | 96.9% |
| Mark Loughridge | 1,039,909,454 | 34,045,090 | 96.8% |
| Scott C. Malpass | 1,039,175,722 | 34,778,823 | 96.8% |
| F. William McNabb III | 1,038,914,560 | 35,039,985 | 96.7% |
| Deanna Mulligan | 1,041,175,691 | 32,778,854 | 96.9% |
| André F. Perold | 1,028,804,958 | 45,149,587 | 95.8% |
| Sarah Bloom Raskin | 1,040,743,960 | 33,210,585 | 96.9% |
| Peter F. Volanakis | 1,039,529,631 | 34,424,914 | 96.8% |
| * Results are for all funds within the same trust. | | | |
Proposal 3—Approve a manager-of-managers arrangement with wholly owned subsidiaries of Vanguard.
This arrangement enables Vanguard or the fund to enter into and materially amend investment advisory arrangements with wholly owned subsidiaries of Vanguard, subject to the approval of the fund’s board of trustees and any conditions imposed by the Securities and Exchange Commission (SEC), while avoiding the costs and delays associated with obtaining future shareholder approval. The ability of the fund to operate in this manner is contingent upon the SEC’s approval of a pending application for an order of exemption.
| | | | | |
| | | | | Broker | Percentage |
| Vanguard Fund | For | Abstain | Against | Non-Votes | For |
| International Growth Fund | 337,037,649 | 16,443,457 | 15,798,577 | 34,671,694 | 83.4% |
9
Fund shareholders did not approve the following proposal:
Proposal 7—Institute transparent procedures to avoid holding investments in companies that, in management’s judgment, substantially contribute to genocide or crimes against humanity, the most egregious violations of human rights. Such procedures may include time-limited engagement with problem companies if management believes that their behavior can be changed.
The trustees recommended a vote against the proposal for the following reasons: (1) Vanguard is fully compliant with all applicable U.S. laws and regulations that prohibit the investment in any company owned or controlled by the government of Sudan; (2) the addition of further investment constraints is not in fund shareholders’ best interests if those constraints are unrelated to a fund’s stated investment objective, policies, and strategies; and (3) divestment is an ineffective means to implement social change, as it often puts the shares into the hands of another owner with no direct impact to the company’s capitalization.
| | | | | |
| | | | | Broker | Percentage |
| Vanguard Fund | For | Abstain | Against | Non-Votes | For |
| International Growth Fund | 76,468,418 | 31,267,796 | 261,543,469 | 34,671,694 | 18.9% |
10
International Growth Fund
Fund Profile
As of February 28, 2018
| | |
| Share-Class Characteristics | |
| | Investor | Admiral |
| | Shares | Shares |
| Ticker Symbol | VWIGX | VWILX |
| Expense Ratio1 | 0.45% | 0.32% |
| | |
| Portfolio Characteristics | | |
| | | MSCI AC |
| | | World Index |
| | Fund | ex USA |
| Number of Stocks | 124 | 1,862 |
| Median Market Cap | $55.9B | $36.7B |
| Price/Earnings Ratio | 22.9x | 14.8x |
| Price/Book Ratio | 3.2x | 1.7x |
| Return on Equity | 15.6% | 12.2% |
| Earnings Growth Rate | 16.7% | 9.1% |
| Dividend Yield | 1.4% | 2.8% |
| Turnover Rate | | |
| (Annualized) | 15% | — |
| Short-Term Reserves | 0.0% | — |
| | |
| Sector Diversification (% of equity exposure) |
| | | MSCI AC |
| | | World Index |
| | Fund | ex USA |
| Consumer Discretionary | 23.9% | 11.5% |
| Consumer Staples | 6.1 | 9.2 |
| Energy | 1.3 | 6.6 |
| Financials | 15.4 | 23.6 |
| Health Care | 9.4 | 7.6 |
| Industrials | 9.6 | 11.8 |
| Information Technology | 24.1 | 11.7 |
| Materials | 6.0 | 8.2 |
| Other | 0.6 | 0.0 |
| Real Estate | 0.0 | 3.1 |
| Telecommunication Services | 3.6 | 3.9 |
| Utilities | 0.0 | 2.8 |
Sector categories are based on the Global Industry Classification
Standard (“GICS”), except for the “Other” category (if applicable),
which includes securities that have not been provided a GICS
classification as of the effective reporting period.
| |
| Volatility Measures | |
| | MSCI AC |
| | World |
| | Index |
| | ex USA |
| R-Squared | 0.89 |
| Beta | 1.11 |
These measures show the degree and timing of the fund’s
fluctuations compared with the indexes over 36 months.
| | |
| Ten Largest Holdings (% of total net assets) |
| Alibaba Group Holding | Internet Software & | |
| Ltd. | Services | 5.2% |
| Tencent Holdings Ltd. | Internet Software & | |
| | Services | 4.8 |
| ASML Holding NV | Semiconductor | |
| | Equipment | 3.6 |
| Amazon.com Inc. | Internet & Direct | |
| | Marketing Retail | 3.3 |
| Baidu Inc. | Internet Software & | |
| | Services | 3.3 |
| AIA Group Ltd. | Life & Health | |
| | Insurance | 2.8 |
| Industria de Diseno | | |
| Textil SA | Apparel Retail | 2.0 |
| TAL Education Group | Education Services | 1.9 |
| Celltrion Inc. | Biotechnology | 1.8 |
| Illumina Inc. | Life Sciences Tools | |
| | & Services | 1.7 |
| Top Ten | | 30.4% |
The holdings listed exclude any temporary cash investments and
equity index products.
Allocation by Region (% of equity exposure)
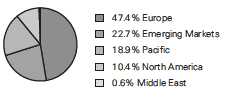
1 The expense ratios shown are from the prospectus dated December 21, 2017, and represent estimated costs for the current fiscal year.
For the six months ended February 28, 2018, the annualized expense ratios were 0.45% for Investor Shares and 0.32% for Admiral Shares.
11
International Growth Fund
| | |
| Market Diversification (% of equity exposure) |
| | | MSCI AC |
| | | World |
| | | Index |
| | Fund | ex USA |
| Europe | | |
| Germany | 10.2% | 6.6% |
| United Kingdom | 7.3 | 11.6 |
| France | 6.5 | 7.4 |
| Sweden | 5.1 | 1.8 |
| Spain | 3.8 | 2.2 |
| Netherlands | 3.7 | 2.5 |
| Switzerland | 3.0 | 5.4 |
| Italy | 3.0 | 1.7 |
| Denmark | 2.5 | 1.3 |
| Belgium | 1.3 | 0.8 |
| Other | 1.0 | 1.9 |
| Subtotal | 47.4% | 43.2% |
| Pacific | | |
| Japan | 12.3% | 16.9% |
| Hong Kong | 3.8 | 2.5 |
| South Korea | 2.0 | 3.7 |
| Other | 0.8 | 5.7 |
| Subtotal | 18.9% | 28.8% |
| Emerging Markets | | |
| China | 18.0% | 7.7% |
| India | 2.1 | 2.1 |
| Taiwan | 1.2 | 2.9 |
| Other | 1.4 | 8.8 |
| Subtotal | 22.7% | 21.5% |
| North America | | |
| United States | 9.0% | 0.0% |
| Canada | 1.4 | 6.1 |
| Subtotal | 10.4% | 6.1% |
| Middle East | | |
| Israel | 0.6% | 0.3% |
12
International Growth Fund
Performance Summary
All of the returns in this report represent past performance, which is not a guarantee of future results that may be achieved by the fund. (Current performance may be lower or higher than the performance data cited. For performance data current to the most recent month-end, visit our website at vanguard.com/performance.) Note, too, that both investment returns and principal value can fluctuate widely, so an investor’s shares, when sold, could be worth more or less than their original cost. The returns shown do not reflect taxes that a shareholder would pay on fund distributions or on the sale of fund shares.
Fiscal-Year Total Returns (%): August 31, 2007, Through February 28, 2018
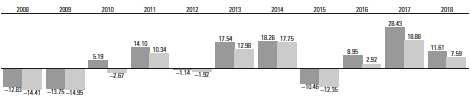
| |
| | International Growth Fund Investor Shares |
| | Spliced International Index |
| For a benchmark description, see the Glossary. |
| Note: For 2018, performance data reflect the six months ended February 28, 2018. |
Average Annual Total Returns: Periods Ended December 31, 2017
This table presents returns through the latest calendar quarter—rather than through the end of the fiscal period.
Securities and Exchange Commission rules require that we provide this information.
| | | | |
| | Inception | One | Five | Ten |
| | Date | Year | Years | Years |
| Investor Shares | 9/30/1981 | 42.96% | 10.88% | 4.59% |
| Admiral Shares | 8/13/2001 | 43.16 | 11.02 | 4.74 |
See Financial Highlights for dividend and capital gains information.
13
International Growth Fund
Financial Statements (unaudited)
Statement of Net Assets
As of February 28, 2018
The fund reports a complete list of its holdings in regulatory filings four times in each fiscal year, at the quarter-ends. For the second and fourth fiscal quarters, the lists appear in the fund’s semiannual and annual reports to shareholders. For the first and third fiscal quarters, the fund files the lists with the Securities and Exchange Commission on Form N-Q. Shareholders can look up the fund’s Forms N-Q on the SEC’s website at sec.gov. Forms N-Q may also be reviewed and copied at the SEC’s Public Reference Room (see the back cover of this report for further information).
| | | |
| | | | Market |
| | | | Value• |
| | | Shares | ($000) |
| Common Stocks (98.2%)1 | | |
| Australia (0.4%) | | |
| | Brambles Ltd. | 19,210,845 | 142,027 |
| |
| Belgium (1.3%) | | |
| * | Umicore SA | 8,785,681 | 495,253 |
| |
| Brazil (0.6%) | | |
| | Telefonica Brasil SA | | |
| | Preference Shares | 6,900,800 | 107,649 |
| | Raia Drogasil SA | 4,326,949 | 103,599 |
| | | | 211,248 |
| Canada (1.4%) | | |
| | Toronto-Dominion Bank | 5,920,561 | 341,429 |
| * | Nutrien Ltd. | 3,573,661 | 175,592 |
| | | | 517,021 |
| China (17.6%) | | |
| * | Alibaba Group Holding | | |
| | Ltd. ADR | 10,430,571 | 1,941,546 |
| | Tencent Holdings Ltd. | 32,265,800 | 1,765,214 |
| * | Baidu Inc. ADR | 4,801,703 | 1,211,662 |
| | TAL Education Group | | |
| | ADR | 18,485,132 | 697,999 |
| * | Ctrip.com International | | |
| | Ltd. ADR | 9,001,376 | 413,883 |
| | New Oriental Education | | |
| | & Technology Group | | |
| | Inc. ADR | 3,750,739 | 342,780 |
| | China Pacific Insurance | | |
| | Group Co. Ltd. | 31,290,000 | 152,214 |
| | | | 6,525,298 |
| Denmark (2.5%) | | |
| * | Genmab A/S | 2,594,661 | 527,678 |
| | Novozymes A/S | 2,821,811 | 145,025 |
| | Chr Hansen Holding A/S | 1,658,818 | 137,783 |
| | Vestas Wind Systems | | |
| | A/S | 1,497,498 | 108,226 |
| | | | 918,712 |
| | | |
| | | | Market |
| | | | Value• |
| | | Shares | ($000) |
| France (6.2%) | | |
| | L’Oreal SA | 2,749,942 | 591,294 |
| | Kering SA | 1,108,608 | 520,237 |
| | Schneider Electric SE | 4,831,845 | 418,771 |
| | Essilor International | | |
| | Cie Generale | | |
| | d’Optique SA | 2,037,356 | 266,827 |
| | Vivendi SA | 7,326,402 | 188,391 |
| | TOTAL SA | 3,281,526 | 186,650 |
| | LVMH Moet Hennessy | | |
| | Louis Vuitton SE | 397,570 | 118,912 |
| | | | 2,291,082 |
| Germany (9.6%) | | |
| *,2 | Zalando SE | 10,683,180 | 607,987 |
| | BASF SE | 4,736,950 | 494,868 |
| | Bayerische Motoren | | |
| | Werke AG | 3,342,345 | 351,164 |
| | Bayer AG | 2,386,501 | 278,496 |
| | SAP SE | 2,355,195 | 245,788 |
| | Continental AG | 776,572 | 212,196 |
| | Deutsche Telekom AG | 12,368,193 | 198,716 |
| | HeidelbergCement AG | 1,846,448 | 185,290 |
| *,2 | Delivery Hero AG | 3,461,555 | 151,100 |
| | adidas AG | 647,010 | 143,355 |
| *,3 | HelloFresh SE | 8,076,894 | 131,946 |
| * | Linde AG- Tender Line | 560,638 | 124,405 |
| | Infineon Technologies | | |
| | AG | 4,380,041 | 118,536 |
| | GEA Group AG | 1,804,242 | 85,288 |
| *,2 | Rocket Internet SE | 2,762,933 | 82,459 |
| * | MorphoSys AG | 664,989 | 66,185 |
| * | AIXTRON SE | 3,130,112 | 62,142 |
| * | HelloFresh AG | 2,476,051 | 36,567 |
| | | | 3,576,488 |
14
| | |
| International Growth Fund | |
| |
| |
| |
| | | Market |
| | | Value• |
| | Shares | ($000) |
| Hong Kong (3.8%) | | |
| AIA Group Ltd. | 124,698,200 | 1,034,820 |
| Jardine Matheson | | |
| Holdings Ltd. | 3,108,325 | 202,508 |
| Hong Kong Exchanges | | |
| & Clearing Ltd. | 4,767,930 | 170,797 |
| | | 1,408,125 |
| India (2.1%) | | |
| Housing Development | |
| Finance Corp. Ltd. | 11,680,736 | 322,501 |
| HDFC Bank Ltd. | 7,956,722 | 229,087 |
| Zee Entertainment | | |
| Enterprises Ltd. | 15,971,869 | 137,817 |
| * Idea Cellular Ltd. | 45,357,324 | 57,966 |
| *,†,4,5 ANI Technologies | 166,185 | 34,491 |
| | | 781,862 |
| Indonesia (0.3%) | | |
| Bank Central Asia Tbk | | |
| PT | 66,247,400 | 111,492 |
| |
| Israel (0.6%) | | |
| * Check Point Software | | |
| Technologies Ltd. | 2,122,720 | 220,529 |
| |
| Italy (3.0%) | | |
| Ferrari NV | 4,824,304 | 597,837 |
| * Fiat Chrysler | | |
| Automobiles NV | 13,737,294 | 289,968 |
| Intesa Sanpaolo SPA | | |
| (Registered) | 55,319,653 | 207,549 |
| | | 1,095,354 |
| Japan (12.0%) | | |
| SMC Corp. | 1,369,300 | 570,693 |
| SoftBank Group Corp. | 6,366,800 | 524,604 |
| M3 Inc. | 13,418,200 | 520,213 |
| Nintendo Co. Ltd. | 663,700 | 302,554 |
| Nidec Corp. | 1,569,800 | 250,682 |
| Recruit Holdings Co. | | |
| Ltd. | 9,699,600 | 234,560 |
| Bridgestone Corp. | 5,072,900 | 225,184 |
| Kubota Corp. | 11,587,900 | 209,692 |
| Toyota Motor Corp. | 2,810,700 | 189,394 |
| Sekisui Chemical Co. | | |
| Ltd. | 9,982,200 | 187,020 |
| Shiseido Co. Ltd. | 3,040,500 | 182,342 |
| Keyence Corp. | 291,600 | 176,593 |
| ORIX Corp. | 9,152,600 | 162,043 |
| KDDI Corp. | 6,190,900 | 152,032 |
| Pigeon Corp. | 3,300,800 | 133,277 |
| Murata Manufacturing | | |
| Co. Ltd. | 745,100 | 103,780 |
| Suzuki Motor Corp. | 1,795,300 | 102,415 |
| SBI Holdings Inc. | 4,470,400 | 102,156 |
| | |
| | | Market |
| | | Value• |
| | Shares | ($000) |
| Sumitomo Mitsui | | |
| Financial Group Inc. | 1,710,600 | 73,935 |
| Rakuten Inc. | 4,621,300 | 42,019 |
| | | 4,445,188 |
| Luxembourg (0.3%) | | |
| *,†,4,5 Spotify Technology SA | 26,474 | 127,075 |
| |
| Mexico (0.1%) | | |
| Grupo Financiero | | |
| Banorte SAB de CV | 3,437,913 | 20,638 |
| |
| Netherlands (3.6%) | | |
| ASML Holding NV | 6,909,881 | 1,347,594 |
| |
| Norway (0.8%) | | |
| Norsk Hydro ASA | 22,115,159 | 148,592 |
| DNB ASA | 7,357,991 | 144,329 |
| | | 292,921 |
| Other (0.2%) | | |
| 6 Vanguard FTSE All-World | |
| ex-US ETF | 1,128,434 | 61,804 |
| |
| Portugal (0.2%) | | |
| Jeronimo Martins | | |
| SGPS SA | 3,627,182 | 75,239 |
| |
| Singapore (0.3%) | | |
| Oversea-Chinese | | |
| Banking Corp. Ltd. | 13,222,600 | 129,392 |
| |
| South Korea (2.0%) | | |
| *,^ Celltrion Inc. | 2,090,080 | 676,008 |
| NAVER Corp. | 110,437 | 81,786 |
| | | 757,794 |
| Spain (3.8%) | | |
| Industria de Diseno | | |
| Textil SA | 24,860,027 | 752,668 |
| Banco Bilbao Vizcaya | | |
| Argentaria SA | 71,553,514 | 595,302 |
| Distribuidora | | |
| Internacional de | | |
| Alimentacion SA | 12,745,795 | 60,691 |
| | | 1,408,661 |
| Sweden (5.1%) | | |
| Svenska Handelsbanken | | |
| AB Class A | 43,576,778 | 596,213 |
| Atlas Copco AB | | |
| Class A | 12,605,874 | 536,219 |
| Kinnevik AB | 10,340,628 | 377,399 |
| Assa Abloy AB Class B | 7,200,239 | 160,808 |
| SKF AB | 7,039,386 | 147,130 |
| ^ Elekta AB Class B | 6,427,670 | 58,615 |
| | | 1,876,384 |
15
| | | |
| International Growth Fund | | |
| |
| |
| |
| | | | Market |
| | | | Value• |
| | | Shares | ($000) |
| Switzerland (3.0%) | | |
| | Nestle SA | 5,348,370 | 424,934 |
| | UBS Group AG | 15,015,080 | 284,534 |
| | Lonza Group AG | 673,697 | 170,687 |
| | Cie Financiere | | |
| | Richemont SA | 1,475,303 | 129,370 |
| | Roche Holding AG | 414,493 | 95,740 |
| | | | 1,105,265 |
| Taiwan (1.2%) | | |
| | Taiwan Semiconductor | | |
| | Manufacturing Co. | | |
| | Ltd. | 54,222,000 | 450,237 |
| |
| Thailand (0.5%) | | |
| | Kasikornbank PCL | | |
| | (Foreign) | 25,854,356 | 190,016 |
| |
| United Kingdom (7.0%) | | |
| | Rolls-Royce Holdings | | |
| | plc | 38,179,418 | 439,158 |
| | Diageo plc | 9,722,037 | 329,877 |
| | Vodafone Group plc | 92,984,584 | 259,949 |
| | Royal Dutch Shell plc | | |
| | Class A | 8,156,158 | 258,770 |
| | Aviva plc | 30,842,356 | 213,655 |
| | BHP Billiton plc | 10,012,881 | 203,273 |
| | Burberry Group plc | 9,613,354 | 201,736 |
| * | Standard Chartered plc | 16,490,296 | 182,829 |
| | AstraZeneca plc | 2,631,669 | 172,250 |
| | Reckitt Benckiser | | |
| | Group plc | 2,052,151 | 162,893 |
| *,^ | Ocado Group plc | 12,833,540 | 97,325 |
| | Antofagasta plc | 7,105,720 | 84,477 |
| | | | 2,606,192 |
| United States (8.7%) | | |
| * | Amazon.com Inc. | 807,252 | 1,220,928 |
| * | Illumina Inc. | 2,734,956 | 623,625 |
| | MercadoLibre Inc. | 1,574,407 | 610,823 |
| *,^ | Tesla Inc. | 1,518,380 | 520,895 |
| * | Booking Holdings Inc. | 69,082 | 140,516 |
| | Philip Morris | | |
| | International Inc. | 1,123,213 | 116,309 |
| | | | 3,233,096 |
| Total Common Stocks | | |
| (Cost $23,284,429) | | 36,421,987 |
| | |
| | | Market |
| | | Value• |
| | Shares | ($000) |
| Preferred Stocks (0.7%) | | |
| *,†,4,5 Internet Plus | | |
| Holdings Ltd., | | |
| 8.00% | 18,638,108 | 102,510 |
| *,†,3,4,5 HOME 24AG | 23,630 | 51,517 |
| *,†,3,4,5 You & Mr. Jones | 44,800,000 | 39,514 |
| *,†,2,4,5 Flipkart G Series, | | |
| 0.01% | 284,847 | 34,113 |
| *,†,4,5 CureVac GmbH | 12,600 | 32,817 |
| *,†,2,4,5 Flipkart H Series, | | |
| 0.01% | 114,190 | 16,242 |
| Total Preferred Stocks | | |
| (Cost $264,821) | | 276,713 |
| Temporary Cash Investments (2.5%)1 | |
| Money Market Fund (2.4%) | |
| 7,8 Vanguard Market | | |
| Liquidity Fund, | | |
| 1.601% | 9,004,076 | 900,318 |
| | | |
| | | Face | |
| | | Amount | |
| | | ($000) | |
| U.S. Government and Agency Obligations (0.1%) |
| | United States Treasury | | |
| | Bill, 1.403%, 5/10/18 | 4,380 | 4,367 |
| | United States Treasury | | |
| | Bill, 1.462%, 5/17/18 | 3,000 | 2,990 |
| 9 | United States Treasury | | |
| | Bill, 1.602%, 5/24/18 | 5,000 | 4,981 |
| 9 | United States Treasury | | |
| | Bill, 1.512%–1.541%, | | |
| | 6/28/18 | 11,200 | 11,138 |
| | | | 23,476 |
| Total Temporary Cash Investments | |
| (Cost $923,874) | | 923,794 |
| Total Investments (101.4%) | | |
| (Cost $24,473,124) | | 37,622,494 |
16
| |
| International Growth Fund | |
| |
| |
| |
| |
| | Amount |
| | ($000) |
| Other Assets and Liabilities (-1.4%) | |
| Other Assets | |
| Investment in Vanguard | 2,015 |
| Receivables for Investment | |
| Securities Sold | 35,394 |
| Receivables for Accrued Income | 39,194 |
| Receivables for Capital Shares Issued | 28,469 |
| Variation Margin Receivable— | |
| Futures Contracts | 10,428 |
| Unrealized Appreciation— | |
| Forward Currency Contracts | 42,999 |
| Other Assets10 | 116,346 |
| Total Other Assets | 274,845 |
| Liabilities | |
| Payables for Investment Securities | |
| Purchased | (59,435) |
| Collateral for Securities on Loan | (628,466) |
| Payables for Capital Shares Redeemed | (19,352) |
| Payables to Investment Advisor | (14,758) |
| Payables to Vanguard | (40,381) |
| Variation Margin Payable— | |
| Futures Contracts | (12,481) |
| Unrealized Depreciation— | |
| Forward Currency Contracts | (26,492) |
| Total Liabilities | (801,365) |
| Net Assets (100%) | 37,095,974 |
| |
| At February 28, 2018, net assets consisted of: |
| | Amount |
| | ($000) |
| Paid-in Capital | 23,722,200 |
| Overdistributed Net Investment | |
| Income | (55,860) |
| Accumulated Net Realized Gains | 259,067 |
| Unrealized Appreciation (Depreciation) | |
| Investment Securities | 13,149,370 |
| Futures Contracts | 2,487 |
| Forward Currency Contracts | 16,507 |
| Foreign Currencies | 2,203 |
| Net Assets | 37,095,974 |
| |
| | Amount |
| | ($000) |
| Investor Shares—Net Assets | |
| Applicable to 270,000,155 outstanding | |
| $.001 par value shares of beneficial | |
| interest (unlimited authorization) | 8,480,797 |
| Net Asset Value Per Share— | |
| Investor Shares | $31.41 |
| |
| |
| Admiral Shares—Net Assets | |
| Applicable to 286,286,051 outstanding |
| $.001 par value shares of beneficial | |
| interest (unlimited authorization) | 28,615,177 |
| Net Asset Value Per Share— | |
| Admiral Shares | $99.95 |
• See Note A in Notes to Financial Statements.
* Non-income-producing security.
^ Includes partial security positions on loan to broker-dealers.
The total value of securities on loan is $595,439,000.
† Perpetual security with no stated maturity date.
1 The fund invests a portion of its cash reserves in equity
markets through the use of index futures contracts. After
giving effect to futures investments, the fund’s effective
common stock and temporary cash investment positions
represent 99.0% and 1.7%, respectively, of net assets.
2 Security exempt from registration under Rule 144A of the
Securities Act of 1933. Such securities may be sold in
transactions exempt from registration, normally to qualified
institutional buyers. At February 28, 2018, the aggregate
value of these securities was $891,901,000, representing
2.4% of net assets.
3 Considered an affiliated company of the fund as the fund
owns more than 5% of the outstanding voting securities of
such company.
4 Security value determined using significant unobservable
inputs.
5 Restricted securities totaling $438,279,000, representing
1.2% of net assets. See Restricted Securities table for
additional information.
6 Considered an affiliated company of the fund as the issuer is
another member of The Vanguard Group.
7 Affiliated money market fund available only to Vanguard
funds and certain trusts and accounts managed by Vanguard.
Rate shown is the 7-day yield.
8 Includes $628,466,000 of collateral received for securities on
loan.
9 Securities with a value of $14,725,000 have been segregated
as initial margin for open futures contracts.
10 Cash of $5,320,000 has been segregated as collateral for
open forward currency contracts.
ADR—American Depositary Receipt.
17
| | | | |
| International Growth Fund | | | | |
| |
| |
| Restricted Securities as of Period End | | | | |
| |
| | | | | Acquisition |
| | | | Acquisition | Cost |
| Security Name | | | Date | ($000) |
| Flipkart G Series | | December 2014 | 34,113 |
| Spotify Technology SA | | | April 2015 | 59,000 |
| Flipkart H Series | | | April 2015 | 16,243 |
| HOME 24AG | | | June 2015 | 66,827 |
| You & Mr. Jones | | September 2015 | 44,800 |
| CureVac GmbH | | | October 2015 | 30,882 |
| ANI Technologies | | December 2015 | 51,748 |
| Internet Plus Holdings Ltd. | | December 2015 | 71,956 |
| |
| |
| Derivative Financial Instruments Outstanding as of Period End | | |
| |
| Futures Contracts | | | | |
| | | | | ($000) |
| | | | | Value and |
| | | Number of | | Unrealized |
| | | Long (Short) | Notional | Appreciation |
| | Expiration | Contracts | Amount | (Depreciation) |
| Long Futures Contracts | | | | |
| Dow Jones EURO STOXX 50 Index | March 2018 | 2,779 | 116,529 | 846 |
| Topix Index | March 2018 | 521 | 86,325 | 640 |
| S&P ASX 200 Index | March 2018 | 453 | 52,959 | 856 |
| FTSE 100 Index | March 2018 | 399 | 39,726 | 145 |
| | | | | 2,487 |
Unrealized appreciation (depreciation) on open futures contracts, except for Topix Index and S&P ASX 200 Index, is required to be treated as realized gain (loss) for tax purposes. Unrealized appreciation (depreciation) for Topix and S&P ASX 200 Index futures contracts is generally treated the same for financial reporting and tax purposes.
| | | | | | |
| Forward Currency Contracts | | | | | | |
| | | | | | | Unrealized |
| | Contract | | | | | Appreciation |
| | Settlement | Contract Amount (000) | (Depreciation) |
| Counterparty | Date | | Receive | | Deliver | ($000) |
| BNP Paribas | 3/13/2018 | JPY | 17,641,105 | USD | 160,033 | 5,473 |
| BNP Paribas | 3/21/2018 | EUR | 108,103 | USD | 128,862 | 3,255 |
| Citibank, N.A. | 3/20/2018 | AUD | 112,426 | USD | 88,848 | (1,524) |
| Citibank, N.A. | 3/13/2018 | JPY | 9,674,750 | USD | 88,283 | 2,484 |
| Citibank, N.A. | 3/21/2018 | EUR | 64,864 | USD | 79,926 | (652) |
18
| | | | | | |
| International Growth Fund | | | | | | |
| |
| |
| Forward Currency Contracts (continued) | | | | | |
| | | | | | | Unrealized |
| | Contract | | | | | Appreciation |
| | Settlement | Contract Amount (000) | (Depreciation) |
| Counterparty | Date | | Receive | | Deliver | ($000) |
| Goldman Sachs International | 3/21/2018 | EUR | 65,831 | USD | 78,889 | 1,566 |
| Barclays Bank plc | 3/13/2018 | JPY | 7,703,940 | USD | 68,965 | 3,313 |
| Goldman Sachs International | 3/13/2018 | JPY | 7,486,083 | USD | 66,992 | 3,241 |
| JPMorgan Chase Bank, N.A. | 3/21/2018 | EUR | 52,479 | USD | 63,423 | 713 |
| Citibank, N.A. | 3/21/2018 | EUR | 49,650 | USD | 59,481 | 1,198 |
| JPMorgan Chase Bank, N.A. | 3/13/2018 | JPY | 6,188,455 | USD | 55,797 | 2,261 |
| JPMorgan Chase Bank, N.A. | 3/21/2018 | EUR | 36,379 | USD | 45,297 | (835) |
| Goldman Sachs International | 3/16/2018 | EUR | 34,643 | USD | 42,865 | (544) |
| BNP Paribas | 3/21/2018 | EUR | 34,099 | USD | 42,147 | (471) |
| Bank of America, N.A. | 3/21/2018 | GBP | 29,715 | USD | 39,845 | 1,108 |
| Goldman Sachs International | 3/20/2018 | AUD | 51,950 | USD | 39,836 | 515 |
| Barclays Bank plc | 3/20/2018 | AUD | 47,732 | USD | 37,371 | (295) |
| Barclays Bank plc | 3/8/2018 | JPY | 3,540,020 | USD | 32,085 | 1,114 |
| Credit Suisse International | 3/21/2018 | GBP | 22,103 | USD | 30,971 | (509) |
| Goldman Sachs International | 3/21/2018 | EUR | 22,225 | USD | 27,193 | (31) |
| Citibank, N.A. | 3/16/2018 | EUR | 21,010 | USD | 25,937 | (270) |
| Deutsche Bank AG | 3/16/2018 | EUR | 20,190 | USD | 24,781 | (116) |
| Deutsche Bank AG | 3/21/2018 | EUR | 19,132 | USD | 23,990 | (608) |
| JPMorgan Chase Bank, N.A. | 3/21/2018 | GBP | 17,604 | USD | 23,872 | 389 |
| JPMorgan Chase Bank, N.A. | 3/16/2018 | EUR | 18,566 | USD | 22,754 | (74) |
| JPMorgan Chase Bank, N.A. | 3/15/2018 | AUD | 26,861 | USD | 21,482 | (619) |
| Citibank, N.A. | 3/13/2018 | JPY | 2,276,970 | USD | 21,429 | (67) |
| Deutsche Bank AG | 3/20/2018 | AUD | 22,425 | USD | 17,592 | (175) |
| JPMorgan Chase Bank, N.A. | 3/16/2018 | GBP | 12,327 | USD | 17,383 | (396) |
| BNP Paribas | 3/20/2018 | AUD | 19,992 | USD | 15,925 | (397) |
| UBS AG | 3/21/2018 | EUR | 12,714 | USD | 15,643 | (105) |
| Goldman Sachs International | 3/20/2018 | AUD | 19,537 | USD | 15,496 | (321) |
| JPMorgan Chase Bank, N.A. | 3/8/2018 | JPY | 1,689,665 | USD | 15,478 | 368 |
| Goldman Sachs International | 3/8/2018 | JPY | 1,653,080 | USD | 14,926 | 577 |
| Morgan Stanley Capital Services LLC | 3/21/2018 | GBP | 10,139 | USD | 14,119 | (145) |
| Citibank, N.A. | 3/8/2018 | JPY | 1,530,900 | USD | 13,860 | 497 |
| Credit Suisse International | 3/21/2018 | GBP | 10,185 | USD | 13,767 | 269 |
| JPMorgan Chase Bank, N.A. | 3/20/2018 | AUD | 14,307 | USD | 11,177 | (64) |
| Goldman Sachs International | 3/15/2018 | AUD | 13,838 | USD | 11,080 | (331) |
| Citibank, N.A. | 3/15/2018 | AUD | 13,652 | USD | 11,007 | (403) |
| BNP Paribas | 3/21/2018 | GBP | 6,895 | USD | 9,718 | (216) |
| Deutsche Bank AG | 3/16/2018 | GBP | 6,505 | USD | 9,178 | (215) |
| Citibank, N.A. | 3/16/2018 | GBP | 6,511 | USD | 9,087 | (115) |
19
| | | | | | |
| International Growth Fund | | | | | | |
| |
| |
| Forward Currency Contracts (continued) | | | | | |
| | | | | | | Unrealized |
| | Contract | | | | | Appreciation |
| | Settlement | Contract Amount (000) | (Depreciation) |
| Counterparty | Date | | Receive | | Deliver | ($000) |
| Goldman Sachs International | 3/21/2018 | GBP | 6,116 | USD | 8,498 | (68) |
| UBS AG | 3/20/2018 | AUD | 10,535 | USD | 8,227 | (44) |
| Barclays Bank plc | 3/15/2018 | AUD | 9,649 | USD | 7,725 | (230) |
| UBS AG | 3/21/2018 | GBP | 5,722 | USD | 7,721 | 165 |
| BNP Paribas | 3/20/2018 | AUD | 9,533 | USD | 7,346 | 58 |
| Deutsche Bank AG | 3/21/2018 | GBP | 5,195 | USD | 7,005 | 154 |
| Goldman Sachs International | 3/16/2018 | GBP | 4,528 | USD | 6,327 | (89) |
| Barclays Bank plc | 3/21/2018 | GBP | 4,121 | USD | 5,722 | (42) |
| Deutsche Bank AG | 3/21/2018 | GBP | 3,990 | USD | 5,609 | (111) |
| Citibank, N.A. | 3/21/2018 | GBP | 3,870 | USD | 5,224 | 109 |
| JPMorgan Chase Bank, N.A. | 3/21/2018 | GBP | 3,628 | USD | 5,132 | (132) |
| BNP Paribas | 3/21/2018 | GBP | 3,771 | USD | 5,065 | 132 |
| Barclays Bank plc | 3/20/2018 | AUD | 5,113 | USD | 3,940 | 31 |
| Goldman Sachs International | 2/28/2018 | AUD | 4,980 | USD | 3,879 | (11) |
| Barclays Bank plc | 3/21/2018 | GBP | 2,422 | USD | 3,248 | 91 |
| Bank of America, N.A. | 3/13/2018 | JPY | 279,155 | USD | 2,473 | 146 |
| Morgan Stanley Capital Services LLC | 3/21/2018 | GBP | 607 | USD | 824 | 12 |
| JPMorgan Chase Bank, N.A. | 3/13/2018 | USD | 178,441 | JPY | 19,593,745 | (5,386) |
| JPMorgan Chase Bank, N.A. | 3/21/2018 | USD | 167,210 | EUR | 134,316 | 3,056 |
| Goldman Sachs International | 3/21/2018 | USD | 155,489 | EUR | 126,146 | 1,320 |
| BNP Paribas | 3/21/2018 | USD | 126,991 | EUR | 106,122 | (2,707) |
| BNP Paribas | 3/21/2018 | USD | 119,442 | EUR | 96,970 | 930 |
| BNP Paribas | 3/13/2018 | USD | 98,169 | JPY | 10,653,930 | (1,784) |
| Morgan Stanley Capital Services LLC | 3/13/2018 | USD | 90,096 | JPY | 10,114,400 | (4,795) |
| BNP Paribas | 3/13/2018 | USD | 86,569 | JPY | 9,225,760 | 14 |
| Citibank, N.A. | 3/20/2018 | USD | 75,199 | AUD | 92,685 | 3,209 |
| Barclays Bank plc | 3/20/2018 | USD | 66,068 | AUD | 82,989 | 1,608 |
| BNP Paribas | 3/21/2018 | USD | 60,798 | GBP | 42,968 | 1,579 |
| BNP Paribas | 3/20/2018 | USD | 58,375 | AUD | 74,680 | 370 |
| Goldman Sachs International | 3/20/2018 | USD | 53,378 | AUD | 68,259 | 359 |
| Citibank, N.A. | 3/21/2018 | USD | 52,962 | GBP | 38,376 | 73 |
| Credit Suisse International | 3/21/2018 | USD | 42,272 | GBP | 30,210 | 637 |
| BNP Paribas | 3/21/2018 | USD | 36,381 | GBP | 26,903 | (696) |
| Citibank, N.A. | 3/21/2018 | USD | 20,361 | EUR | 16,408 | 309 |
| Barclays Bank plc | 3/13/2018 | USD | 14,181 | JPY | 1,594,120 | (775) |
| Barclays Bank plc | 3/21/2018 | USD | 12,866 | EUR | 10,478 | 60 |
| Goldman Sachs International | 3/21/2018 | USD | 10,200 | GBP | 7,305 | 133 |
20
| | | | | | |
| International Growth Fund | | | | | | |
| |
| |
| |
| Forward Currency Contracts (continued) | | | | | |
| | | | | | | Unrealized |
| | Contract | | | | | Appreciation |
| | Settlement | Contract Amount (000) | (Depreciation) |
| Counterparty | Date | | Receive | | Deliver | ($000) |
| Deutsche Bank AG | 3/20/2018 | USD | 6,595 | AUD | 8,358 | 103 |
| BNP Paribas | 3/20/2018 | USD | 6,579 | AUD | 8,594 | (96) |
| Barclays Bank plc | 3/21/2018 | USD | 1,656 | GBP | 1,222 | (28) |
| | | | | | | 16,507 |
| AUD—Australian dollar. | | | | | | |
| EUR—Euro. | | | | | | |
| GBP—British pound. | | | | | | |
| JPY—Japanese yen. | | | | | | |
| USD—U.S. dollar. | | | | | | |
Unrealized appreciation (depreciation) on open forward currency contracts is treated as realized gain (loss) for tax purposes.
At February 28, 2018, the counterparties had deposited in segregated accounts securities and cash with a value of $22,675,000 in connection with open forward currency contracts.
See accompanying Notes, which are an integral part of the Financial Statements.
21
| |
| International Growth Fund | |
| |
| |
| Statement of Operations | |
| |
| | Six Months Ended |
| | February28,2018 |
| | ($000) |
| Investment Income | |
| Income | |
| Dividends Received from Unaffiliated Issuers1 | 92,496 |
| Dividends Received from Affiliated Issuers | 859 |
| Interest Received from Unaffiliated Issuers | 144 |
| Interest Received from Affiliated Issuers | 3,128 |
| Securities Lending—Net | 5,212 |
| Total Income | 101,839 |
| Expenses | |
| Investment Advisory Fees—Note B | |
| Basic Fee | 24,214 |
| Performance Adjustment | 4,312 |
| The Vanguard Group—Note C | |
| Management and Administrative—Investor Shares | 9,883 |
| Management and Administrative—Admiral Shares | 16,428 |
| Marketing and Distribution—Investor Shares | 550 |
| Marketing and Distribution—Admiral Shares | 717 |
| Custodian Fees | 2,562 |
| Shareholders’ Reports and Proxy—Investor Shares | 168 |
| Shareholders’ Reports and Proxy—Admiral Shares | 212 |
| Trustees’ Fees and Expenses | 29 |
| Total Expenses | 59,075 |
| Net Investment Income | 42,764 |
| Realized Net Gain (Loss) | |
| Investment Securities Sold—Unaffiliated Issuers | 787,903 |
| Investment Securities Sold—Affiliated Issuers | (46) |
| Futures Contracts | 8,875 |
| Foreign Currencies and Forward Currency Contracts | 7,157 |
| Realized Net Gain (Loss) | 803,889 |
| Change in Unrealized Appreciation (Depreciation) | |
| Investment Securities Sold—Unaffiliated Issuers | 2,761,458 |
| Investment Securities Sold—Affiliated Issuers | 31,260 |
| Futures Contracts | 3,381 |
| Foreign Currencies and Forward Currency Contracts | 8,877 |
| Change in Unrealized Appreciation (Depreciation) | 2,804,976 |
| Net Increase (Decrease) in Net Assets Resulting from Operations | 3,651,629 |
| 1 Dividends are net of foreign withholding taxes of $9,664,000. | |
| |
| See accompanying Notes, which are an integral part of the Financial Statements. | |
22
| | |
| International Growth Fund | | |
| |
| |
| Statement of Changes in Net Assets | | |
| |
| | Six Months Ended | Year Ended |
| | February 28, | August 31, |
| | 2018 | 2017 |
| | ($000) | ($000) |
| Increase (Decrease) in Net Assets | | |
| Operations | | |
| Net Investment Income | 42,764 | 273,937 |
| Realized Net Gain (Loss) | 803,889 | (73,896) |
| Change in Unrealized Appreciation (Depreciation) | 2,804,976 | 6,375,095 |
| Net Increase (Decrease) in Net Assets Resulting from Operations | 3,651,629 | 6,575,136 |
| Distributions | | |
| Net Investment Income | | |
| Investor Shares | (66,639) | (77,643) |
| Admiral Shares | (217,469) | (214,863) |
| Realized Capital Gain | | |
| Investor Shares | — | — |
| Admiral Shares | — | — |
| Total Distributions | (284,108) | (292,506) |
| Capital Share Transactions | | |
| Investor Shares | (60,527) | (656,313) |
| Admiral Shares | 2,956,958 | 2,802,104 |
| Net Increase (Decrease) from Capital Share Transactions | 2,896,431 | 2,145,791 |
| Total Increase (Decrease) | 6,263,952 | 8,428,421 |
| Net Assets | | |
| Beginning of Period | 30,832,022 | 22,403,601 |
| End of Period1 | 37,095,974 | 30,832,022 |
1 Net Assets—End of Period includes undistributed (overdistributed) net investment income of ($55,860,000) and $187,387,000.
See accompanying Notes, which are an integral part of the Financial Statements.
23
| | | | | | | |
| International Growth Fund | | | | | | | |
| |
| |
| Financial Highlights | | | | | | |
| |
| |
| Investor Shares | | | | | | | |
| | Six Months | | | | | |
| | | Ended | | | | | |
| For a Share Outstanding | February 28, | | | Year Ended August 31, |
| Throughout Each Period | | 2018 | 2017 | 2016 | 2015 | 2014 | 2013 |
| Net Asset Value, Beginning of Period | $28.38 | $22.38 | $20.83 | $23.79 | $20.42 | $17.69 |
| Investment Operations | | | | | | | |
| Net Investment Income | | . 0241 | .2401 | .304 | .308 | .4712 | .336 |
| Net Realized and Unrealized Gain (Loss) | | | | | | |
| on Investments | | 3.259 | 6.028 | 1.539 | (2.774) | 3.235 | 2.741 |
| Total from Investment Operations | 3.283 | 6.268 | 1.843 | (2.466) | 3.706 | 3.077 |
| Distributions | | | | | | | |
| Dividends from Net Investment Income | (. 253) | (. 268) | (. 293) | (. 494) | (. 336) | (. 347) |
| Distributions from Realized Capital Gains | — | — | — | — | — | — |
| Total Distributions | | (. 253) | (. 268) | (. 293) | (. 494) | (. 336) | (. 347) |
| Net Asset Value, End of Period | | $31.41 | $28.38 | $22.38 | $20.83 | $23.79 | $20.42 |
| Total Return3 | | 11.61% | 28.43% | 8.95% | -10.46% | 18.26% | 17.54% |
| Ratios/Supplemental Data | | | | | | | |
| Net Assets, End of Period (Millions) | $8,481 | $7,731 | $6,700 | $7,172 | $8,976 | $9,056 |
| Ratio of Total Expenses to | | | | | | | |
| Average Net Assets4 | | 0.45% | 0.45% | 0.46% | 0.47% | 0.47% | 0.48% |
| Ratio of Net Investment Income to | | | | | | |
| Average Net Assets | | 0.15% | 1.01% | 1.47% | 1.34% | 2.08%2 | 1.71% |
| Portfolio Turnover Rate | | 15% | 15% | 29% | 29% | 21% | 31% |
The expense ratio, net investment income ratio, and turnover rate for the current period have been annualized.
1 Calculated based on average shares outstanding.
2 Net investment income per share and the ratio of net investment income to average net assets include $.080 and 0.35%, respectively,
resulting from income received from Vodafone Group plc in the form of cash and shares in Verizon Communications Inc. in
February 2014.
3 Total returns do not include account service fees that may have applied in the periods shown. Fund prospectuses provide information
about any applicable account service fees.
4 Includes performance-based investment advisory fee increases (decreases) of 0.03%, 0.03%, 0.04%, 0.03%, 0.03%, and 0.03%.
See accompanying Notes, which are an integral part of the Financial Statements.
24
| | | | | | | |
| International Growth Fund | | | | | | | |
| |
| |
| Financial Highlights | | | | | | |
| |
| |
| Admiral Shares | | | | | | | |
| | Six Months | | | | | |
| | | Ended | | | | | |
| For a Share Outstanding | February 28, | | | Year Ended August 31, |
| Throughout Each Period | | 2018 | 2017 | 2016 | 2015 | 2014 | 2013 |
| Net Asset Value, Beginning of Period | $90.24 | $71.19 | $66.28 | $75.70 | $64.98 | $56.31 |
| Investment Operations | | | | | | | |
| Net Investment Income | | .1341 | .8791 | 1.062 | 1.088 | 1.6132 | 1.157 |
| Net Realized and Unrealized Gain (Loss) | | | | | | |
| on Investments | | 10.383 | 19.127 | 4.877 | (8.821) | 10.277 | 8.697 |
| Total from Investment Operations | 10.517 | 20.006 | 5.939 | (7.733) | 11.890 | 9.854 |
| Distributions | | | | | | | |
| Dividends from Net Investment Income | (.807) | (.956) | (1.029) | (1.687) | (1.170) | (1.184) |
| Distributions from Realized Capital Gains | — | — | — | — | — | — |
| Total Distributions | | (.807) | (.956) | (1.029) | (1.687) | (1.170) | (1.184) |
| Net Asset Value, End of Period | | $99.95 | $90.24 | $71.19 | $66.28 | $75.70 | $64.98 |
| Total Return3 | | 11.70% | 28.57% | 9.07% | -10.32% | 18.42% | 17.66% |
| Ratios/Supplemental Data | | | | | | | |
| Net Assets, End of Period (Millions) | $28,615 | $23,101 | $15,704 | $13,752 | $14,415 | $10,556 |
| Ratio of Total Expenses to | | | | | | | |
| Average Net Assets4 | | 0.32% | 0.32% | 0.33% | 0.34% | 0.34% | 0.35% |
| Ratio of Net Investment Income to | | | | | | |
| Average Net Assets | | 0.28% | 1.14% | 1.60% | 1.47% | 2.21%2 | 1.84% |
| Portfolio Turnover Rate | | 15% | 15% | 29% | 29% | 21% | 31% |
The expense ratio, net investment income ratio, and turnover rate for the current period have been annualized.
1 Calculated based on average shares outstanding.
2 Net investment income per share and the ratio of net investment income to average net assets include $.255 and 0.35%, respectively,
resulting from income received from Vodafone Group plc in the form of cash and shares in Verizon Communications Inc. in
February 2014.
3 Total returns do not include account service fees that may have applied in the periods shown. Fund prospectuses provide information
about any applicable account service fees.
4 Includes performance-based investment advisory fee increases (decreases) of 0.03%, 0.03%, 0.04%, 0.03%, 0.03%, and 0.03%.
See accompanying Notes, which are an integral part of the Financial Statements.
25
International Growth Fund
Notes to Financial Statements
Vanguard International Growth Fund is registered under the Investment Company Act of 1940 as an open-end investment company, or mutual fund. The fund invests in securities of foreign issuers, which may subject it to investment risks not normally associated with investing in securities of U.S. corporations. The fund offers two classes of shares: Investor Shares and Admiral Shares. Investor Shares are available to any investor who meets the fund’s minimum purchase requirements. Admiral Shares are designed for investors who meet certain administrative, service, and account-size criteria.
A. The following significant accounting policies conform to generally accepted accounting principles for U.S. investment companies. The fund consistently follows such policies in preparing its financial statements.
1. Security Valuation: Securities are valued as of the close of trading on the New York Stock Exchange (generally 4 p.m., Eastern time) on the valuation date. Equity securities are valued at the latest quoted sales prices or official closing prices taken from the primary market in which each security trades; such securities not traded on the valuation date are valued at the mean of the latest quoted bid and asked prices. Securities for which market quotations are not readily available, or whose values have been affected by events occurring before the fund’s pricing time but after the close of the securities’ primary markets, are valued at their fair values calculated according to procedures adopted by the board of trustees. These procedures include obtaining quotations from an independent pricing service, monitoring news to identify significant market- or security-specific events, and evaluating changes in the values of foreign market proxies (for example, ADRs, futures contracts, or exchange-traded funds), between the time the foreign markets close and the fund’s pricing time. When fair-value pricing is employed, the prices of securities used by a fund to calculate its net asset value may differ from quoted or published prices for the same securities. Investments in Vanguard Market Liquidity Fund are valued at that fund’s net asset value. Temporary cash investments are valued using the latest bid prices or using valuations based on a matrix system (which considers such factors as security prices, yields, maturities, and ratings), both as furnished by independent pricing services.
2. Foreign Currency: Securities and other assets and liabilities denominated in foreign currencies are translated into U.S. dollars using exchange rates obtained from an independent third party as of the fund’s pricing time on the valuation date. Realized gains (losses) and unrealized appreciation (depreciation) on investment securities include the effects of changes in exchange rates since the securities were purchased, combined with the effects of changes in security prices. Fluctuations in the value of other assets and liabilities resulting from changes in exchange rates are recorded as unrealized foreign currency gains (losses) until the assets or liabilities are settled in cash, at which time they are recorded as realized foreign currency gains (losses).
3. Futures and Forward Currency Contracts: The fund uses index futures contracts to a limited extent, with the objective of maintaining full exposure to the stock market while maintaining liquidity. The fund may purchase or sell futures contracts to achieve a desired level of investment, whether to accommodate portfolio turnover or cash flows from capital share transactions. The primary risks associated with the use of futures contracts are imperfect correlation between changes in market values of stocks held by the fund and the prices of futures contracts, and the possibility of an illiquid market. Counterparty risk involving futures is mitigated because a regulated clearinghouse is the counterparty instead of the clearing broker. To further mitigate counterparty risk, the fund trades futures contracts on an exchange, monitors the financial strength of its clearing
26
International Growth Fund
brokers and clearinghouse, and has entered into clearing agreements with its clearing brokers. The clearinghouse imposes initial margin requirements to secure the fund’s performance and requires daily settlement of variation margin representing changes in the market value of each contract.
The fund enters into forward currency contracts to provide the appropriate currency exposure related to any open futures contracts or to protect the value of securities and related receivables and payables against changes in foreign exchange rates. The fund’s risks in using these contracts include movement in the values of the foreign currencies relative to the U.S. dollar and the ability of the counterparties to fulfill their obligations under the contracts. The fund mitigates its counterparty risk by entering into forward currency contracts only with a diverse group of prequalified counterparties, monitoring their financial strength, entering into master netting arrangements with its counterparties, and requiring its counterparties to transfer collateral as security for their performance. In the absence of a default, the collateral pledged or received by the fund cannot be repledged, resold, or rehypothecated. The master netting arrangements provide that, in the event of a counterparty’s default (including bankruptcy), the fund may terminate the forward currency contracts, determine the net amount owed by either party in accordance with its master netting arrangements, and sell or retain any collateral held up to the net amount owed to the fund under the master netting arrangements. The forward currency contracts contain provisions whereby a counterparty may terminate open contracts if the fund’s net assets decline below a certain level, triggering a payment by the fund if the fund is in a net liability position at the time of the termination. The payment amount would be reduced by any collateral the fund has pledged. Any assets pledged as collateral for open contracts are noted in the Statement of Net Assets. The value of collateral received or pledged is compared daily to the value of the forward currency contracts exposure with each counterparty, and any difference, if in excess of a specified minimum transfer amount, is adjusted and settled within two business days.
Futures contracts are valued at their quoted daily settlement prices. Forward currency contracts are valued at their quoted daily prices obtained from an independent third party, adjusted for currency risk based on the expiration date of each contract. The notional amounts of the contracts are not recorded in the Statement of Net Assets. Fluctuations in the value of the contracts are recorded in the Statement of Net Assets as an asset (liability) and in the Statement of Operations as unrealized appreciation (depreciation) until the contracts are closed, when they are recorded as realized gains (losses) on futures or forward currency contracts.
During the six months ended February 28, 2018, the fund’s average investments in long and short futures contracts represented less than 1% and 0% of net assets, respectively, based on the average of the notional amounts at each quarter-end during the period. The fund’s average investment in forward currency contracts represented 4% of net assets, based on the average of the notional amounts at each quarter-end during the period.
4. Federal Income Taxes: The fund intends to continue to qualify as a regulated investment company and distribute all of its taxable income. Management has analyzed the fund’s tax positions taken for all open federal income tax years (August 31, 2014–2017), and for the period ended February 28, 2018, and has concluded that no provision for federal income tax is required in the fund’s financial statements.
5. Distributions: Distributions to shareholders are recorded on the ex-dividend date.
27
International Growth Fund
6. Securities Lending: To earn additional income, the fund lends its securities to qualified institutional borrowers. Security loans are subject to termination by the fund at any time, and are required to be secured at all times by collateral in an amount at least equal to the market value of securities loaned. Daily market fluctuations could cause the value of loaned securities to be more or less than the value of the collateral received. When this occurs, the collateral is adjusted and settled on the next business day. The fund further mitigates its counterparty risk by entering into securities lending transactions only with a diverse group of prequalified counterparties, monitoring their financial strength, and entering into master securities lending agreements with its counterparties. The master securities lending agreements provide that, in the event of a counterparty’s default (including bankruptcy), the fund may terminate any loans with that borrower, determine the net amount owed, and sell or retain the collateral up to the net amount owed to the fund; however, such actions may be subject to legal proceedings. While collateral mitigates counterparty risk, in the event of a default, the fund may experience delays and costs in recovering the securities loaned. The fund invests cash collateral received in Vanguard Market Liquidity Fund, and records a liability in the Statement of Net Assets for the return of the collateral, during the period the securities are on loan. Securities lending income represents fees charged to borrowers plus income earned on invested cash collateral, less expenses associated with the loan. During the term of the loan, the fund is entitled to all distributions made on or in respect of the loaned securities.
7. Credit Facility: The fund and certain other funds managed by The Vanguard Group (“Vanguard”) participate in a $3.1 billion committed credit facility provided by a syndicate of lenders pursuant to a credit agreement that may be renewed annually; each fund is individually liable for its borrowings, if any, under the credit facility. Borrowings may be utilized for temporary and emergency purposes, and are subject to the fund’s regulatory and contractual borrowing restrictions. The participating funds are charged administrative fees and an annual commitment fee of 0.10% of the undrawn amount of the facility; these fees are allocated to the funds based on a method approved by the fund’s board of trustees and included in Management and Administrative expenses on the fund’s Statement of Operations. Any borrowings under this facility bear interest at a rate based upon the higher of the one-month London Interbank Offered Rate, federal funds effective rate, or overnight bank funding rate plus an agreed-upon spread.
The fund had no borrowings outstanding at February 28, 2018, or at any time during the period then ended.
8. Other: Dividend income is recorded on the ex-dividend date. Interest income includes income distributions received from Vanguard Market Liquidity Fund and is accrued daily. Premiums and discounts on debt securities purchased are amortized and accreted, respectively, to interest income over the lives of the respective securities. Security transactions are accounted for on the date securities are bought or sold. Costs used to determine realized gains (losses) on the sale of investment securities are those of the specific securities sold.
Withholding taxes on foreign dividends and capital gains have been provided for in accordance with the fund’s understanding of the applicable countries’ tax rules and rates. The fund has filed tax reclaims for previously withheld taxes on dividends earned in certain European Union countries. These filings are subject to various administrative and judicial proceedings within these countries. Such tax reclaims received during the year, if any, are included in dividend income. No other
28
International Growth Fund
amounts for additional tax reclaims are reflected in the financial statements due to the uncertainty as to the ultimate resolution of proceedings, the likelihood of receipt of these reclaims, and the potential timing of payment.
Each class of shares has equal rights as to assets and earnings, except that each class separately bears certain class-specific expenses related to maintenance of shareholder accounts (included in Management and Administrative expenses), shareholder reporting, and the proxy. Marketing and distribution expenses are allocated to each class of shares based on a method approved by the board of trustees. Income, other non-class-specific expenses, and gains and losses on investments are allocated to each class of shares based on its relative net assets.
B. The investment advisory firms Baillie Gifford Overseas Ltd. and Schroder Investment Management North America Inc. each provide investment advisory services to a portion of the fund for a fee calculated at an annual percentage rate of average net assets managed by the advisor. The basic fee of Baillie Gifford Overseas Ltd. and Schroder Investment Management North America Inc. are subject to quarterly adjustments based on performance relative to the MSCI All Country World Index ex USA for the preceding three years.
Vanguard manages the cash reserves of the fund as described below.
For the six months ended February 28, 2018, the aggregate investment advisory fee represented an effective annual basic rate of 0.14% of the fund’s average net assets, before an increase of $4,312,000 (0.03%) based on performance.
C. In accordance with the terms of a Funds’ Service Agreement (the “FSA”) between Vanguard and the fund, Vanguard furnishes to the fund corporate management, administrative, marketing, distribution, and cash management services at Vanguard’s cost of operations (as defined by the FSA). These costs of operations are allocated to the fund based on methods and guidelines approved by the board of trustees. Vanguard does not require reimbursement in the current period for certain costs of operations (such as deferred compensation/benefits and risk/insurance costs); the fund’s liability for these costs of operations is included in Payables to Vanguard on the Statement of Net Assets. All other costs of operations payable to Vanguard are generally settled twice a month.
Upon the request of Vanguard, the fund may invest up to 0.40% of its net assets as capital in Vanguard. At February 28, 2018, the fund had contributed to Vanguard capital in the amount of $2,015,000, representing 0.01% of the fund’s net assets and 0.81% of Vanguard’s capitalization. The fund’s trustees and officers are also directors and employees, respectively, of Vanguard.
D. Various inputs may be used to determine the value of the fund’s investments. These inputs are summarized in three broad levels for financial statement purposes. The inputs or methodologies used to value securities are not necessarily an indication of the risk associated with investing in those securities.
Level 1—Quoted prices in active markets for identical securities.
Level 2—Other significant observable inputs (including quoted prices for similar securities, interest
rates, prepayment speeds, credit risk, etc.).
Level 3—Significant unobservable inputs (including the fund’s own assumptions used to determine
the fair value of investments). Any investments valued with significant unobservable inputs are
noted on the Statement of Net Assets.
29
International Growth Fund
The following table summarizes the market value of the fund’s investments as of February 28, 2018, based on the inputs used to value them:
| | | |
| | Level 1 | Level 2 | Level 3 |
| Investments | ($000) | ($000) | ($000) |
| Common Stocks—North and South America | 3,982,003 | — | — |
| Common Stocks—Other | 4,890,203 | 27,388,215 | 161,566 |
| Preferred Stocks | — | — | 276,713 |
| Temporary Cash Investments | 900,318 | 23,476 | — |
| Futures Contracts—Assets1 | 10,428 | — | — |
| Futures Contracts—Liabilities1 | (12,481) | — | — |
| Forward Currency Contracts—Assets | — | 42,999 | — |
| Forward Currency Contracts—Liabilities | — | (26,492) | — |
| Total | 9,770,471 | 27,428,198 | 438,279 |
| 1 Represents variation margin on the last day of the reporting period. | | | |
The determination of Level 3 fair value measurements is governed by documented policies and procedures adopted by the board of trustees. The board has designated a pricing review committee, as an agent of the board, to ensure the timely analysis and valuation of Level 3 securities held by the fund in accordance with established policies and procedures. The pricing review committee employs various methods for calibrating valuation approaches, including a regular review of key inputs and assumptions, transactional back-testing or disposition analysis, and reviews of any related market activity. All valuation decisions made by the pricing review committee are reported to the board on a quarterly basis for review and ratification. The board reviews the adequacy of the fair value measurement policies and procedures in place on an annual basis.
The following table summarizes changes in investments valued based on Level 3 inputs during the six months ended February 28, 2018. Transfers into or out of Level 3 are recognized based on values as of the date of transfer.
| | |
| | Investments in | Investments in |
| | Common Stocks | Preferred Stocks |
| Amount Valued Based on Level 3 Inputs | ($000) | ($000) |
| Balance as of August 31, 2017 | 119,867 | 318,484 |
| Sales | — | (9,127) |
| Net Realized Gain (Loss) | — | (301) |
| Transfers Out of Level 3 | — | (36,567) |
| Change in Unrealized Appreciation (Depreciation) | 41,699 | 4,224 |
| Balance as of February 28, 2018 | 161,566 | 276,713 |
Net change in unrealized appreciation (depreciation) from investments still held as of February 28, 2018, was $48,354,000.
30
International Growth Fund
The following table provides quantitative information about the significant unobservable inputs used in fair value measurement as of February 28, 2018:
| | | | |
| | Fair Value at | | | |
| | 2/28/2018 | | | Amount or Range/ |
| Security Type | ($000) | Valuation Technique | Unobservable Input | Weighted Avg. |
| Common Stocks | 161,566 | Recent Market | Transaction Price | $207.54– |
| | | Transaction | | 4,800/3,819.60 |
| Preferred Stocks | 185,682 | Recent Market | Transaction Price | $5.50– |
| | | Transaction | | 2,603.49/497.62 |
| | 51,517 | Recent Market | Scenario Probability | 50% |
| | | Transaction | Transaction Price | $1265.85 |
| | 39,514 | Comparable Companies | EV/Revenue | 2.18x |
| | | & Valuation of Underlying | Liquidity Discount | 10% |
| | | Holdings | | |
Significant increases or decreases in the significant unobservable inputs used in the fair value measurement of the portfolio’s Level 3 securities, in isolation, could result in a significantly higher or lower fair value measurement.
E. At February 28, 2018, the fair values of derivatives were reflected in the Statement of Net Assets as follows:
| | | |
| | | Foreign | |
| | Equity | Exchange | |
| | Contracts | Contracts | Total |
| Statement of Net Assets Caption | ($000) | ($000) | ($000) |
| Variation Margin Receivable—Futures Contracts | 10,428 | — | 10,428 |
| Variation Margin Payable—Futures Contracts | (12,481) | — | (12,481) |
| Unrealized Appreciation—Forward Currency Contracts | — | 42,999 | 42,999 |
| Unrealized Depreciation—Forward Currency Contracts | — | (26,492) | (26,492) |
Realized net gain (loss) and the change in unrealized appreciation (depreciation) on derivatives for the six months ended February 28, 2018, were:
| | | |
| | | Foreign | |
| | Equity | Exchange | |
| | Contracts | Contracts | Total |
| Realized Net Gain (Loss) on Derivatives | ($000) | ($000) | ($000) |
| Futures Contracts | 8,875 | — | 8,875 |
| Forward Currency Contracts | — | 9,060 | 9,060 |
| Realized Net Gain (Loss) on Derivatives | 8,875 | 9,060 | 17,935 |
| |
| Change in Unrealized Appreciation (Depreciation) on Derivatives | | | |
| Futures Contracts | 3,381 | — | 3,381 |
| Forward Currency Contracts | — | 6,910 | 6,910 |
| Change in Unrealized Appreciation (Depreciation) on Derivatives | 3,381 | 6,910 | 10,291 |
31
International Growth Fund
F. Distributions are determined on a tax basis and may differ from net investment income and realized capital gains for financial reporting purposes. Differences may be permanent or temporary. Permanent differences are reclassified among capital accounts in the financial statements to reflect their tax character. Temporary differences arise when gains or losses are recognized in different periods for financial statement and tax purposes. These differences will reverse at some time in the future. Differences in classification may also result from the treatment of short-term gains as ordinary income for tax purposes.
The fund’s tax-basis capital gains and losses are determined only at the end of each fiscal year. For tax purposes, at August 31, 2017, the fund had available capital losses totaling $538,520,000 to offset future net capital gains. Of this amount, $154,471,000 is subject to expiration on August 31, 2018. Capital losses of $384,049,000 realized beginning in fiscal 2012 may be carried forward indefinitely under the Regulated Investment Company Modernization Act of 2010, but must be used before any expiring loss carryforwards. The fund will use these capital losses to offset net taxable capital gains, if any, realized during the year ending August 31, 2018; should the fund realize net capital losses for the year, the losses will be added to the loss carryforward balance above.
At February 28, 2018, the cost of investment securities for tax purposes was $24,492,492,000. Net unrealized appreciation of investment securities for tax purposes was $13,130,002,000, consisting of unrealized gains of $13,537,399,000 on securities that had risen in value since their purchase and $407,397,000 in unrealized losses on securities that had fallen in value since their purchase.
G. During the six months ended February 28, 2018, the fund purchased $5,286,970,000 of investment securities and sold $2,485,506,000 of investment securities, other than temporary cash investments.
| | | | |
| H. Capital share transactions for each class of shares were: | | | |
| | Six Months Ended | | Year Ended |
| | February 28, 2018 | August 31, 2017 |
| | Amount | Shares | Amount | Shares |
| | ($000) | (000) | ($000) | (000) |
| Investor Shares | | | | |
| Issued | 1,343,430 | 43,823 | 1,133,334 | 45,828 |
| Issued in Lieu of Cash Distributions | 64,011 | 2,138 | 75,179 | 3,578 |
| Redeemed | (1,467,968) | (48,411) | (1,864,826) | (76,319) |
| Net Increase (Decrease)—Investor Shares | (60,527) | (2,450) | (656,313) | (26,913) |
| Admiral Shares | | | | |
| Issued | 4,286,674 | 44,048 | 4,361,979 | 55,736 |
| Issued in Lieu of Cash Distributions | 199,775 | 2,098 | 197,992 | 2,966 |
| Redeemed | (1,529,491) | (15,842) | (1,757,867) | (23,306) |
| Net Increase (Decrease) —Admiral Shares | 2,956,958 | 30,304 | 2,802,104 | 35,396 |
32
International Growth Fund
I. Certain of the fund’s investments are in companies that are considered to be affiliated companies of the fund because the fund owns more than 5% of the outstanding voting securities of the company or the issuer is another member of The Vanguard Group. Transactions during the period in securities of these companies were as follows:
| | | | | | | | |
| | | | | | Current Period Transactions | |
| | Aug. 31, | | Proceeds | Net | Change | | | Feb. 28, |
| | 2017 | | from | Realized | in Net | | Capital Gain | 2018 |
| | Market | Purchases | Securities | Gain | Unrealized | | Distributions | Market |
| | Value | at Cost | Sold | (Loss) | App. (Dep.) | Income | Received | Value |
| | ($000) | ($000) | ($000) | ($000) | ($000) | ($000) | ($000) | ($000) |
| HelloFresh SE | NA1 | 93,241 | — | — | 38,705 | — | — | 131,946 |
| Home 24AG | 50,404 | — | — | — | 1,113 | — | — | 51,517 |
| Vanguard FTSE | | | | | | | | |
| All-World ex-US ETF | 58,735 | — | — | — | 3,069 | 859 | — | 61,804 |
| Vanguard Market | | | | | | | | |
| Liquidity Fund | 830,790 | NA 2 | NA 2 | (46) | (159) | 3,128 | — | 900,318 |
| You & Mr. Jones | 50,982 | — | — | — | (11,468) | — | — | 39,514 |
| Total | 990,911 | | | (46) | 31,260 | 3,987 | — | 1,185,099 |
1 Not applicable—at August 31, 2017, the issuer was not an affiliated company of the fund.
2 Not applicable—purchases and sales are for temporary cash investment purposes.
J. Management has determined that no material events or transactions occurred subsequent to February 28, 2018, that would require recognition or disclosure in these financial statements.
33
About Your Fund’s Expenses
As a shareholder of the fund, you incur ongoing costs, which include costs for portfolio management, administrative services, and shareholder reports (like this one), among others. Operating expenses, which are deducted from a fund’s gross income, directly reduce the investment return of the fund.
A fund’s expenses are expressed as a percentage of its average net assets. This figure is known as the expense ratio. The following examples are intended to help you understand the ongoing costs (in dollars) of investing in your fund and to compare these costs with those of other mutual funds. The examples are based on an investment of $1,000 made at the beginning of the period shown and held for the entire period.
The accompanying table illustrates your fund’s costs in two ways:
• Based on actual fund return. This section helps you to estimate the actual expenses that you paid over the period. The ”Ending Account Value“ shown is derived from the fund‘s actual return, and the third column shows the dollar amount that would have been paid by an investor who started with $1,000 in the fund. You may use the information here, together with the amount you invested, to estimate the expenses that you paid over the period.
To do so, simply divide your account value by $1,000 (for example, an $8,600 account value divided by $1,000 = 8.6), then multiply the result by the number given for your fund under the heading ”Expenses Paid During Period.“
• Based on hypothetical 5% yearly return. This section is intended to help you compare your fund‘s costs with those of other mutual funds. It assumes that the fund had a yearly return of 5% before expenses, but that the expense ratio is unchanged. In this case—because the return used is not the fund’s actual return—the results do not apply to your investment. The example is useful in making comparisons because the Securities and Exchange Commission requires all mutual funds to calculate expenses based on a 5% return. You can assess your fund’s costs by comparing this hypothetical example with the hypothetical examples that appear in shareholder reports of other funds.
Note that the expenses shown in the table are meant to highlight and help you compare ongoing costs only and do not reflect transaction costs incurred by the fund for buying and selling securities. Further, the expenses do not include any purchase, redemption, or account service fees described in the fund prospectus. If such fees were applied to your account, your costs would be higher. Your fund does not carry a “sales load.”
The calculations assume no shares were bought or sold during the period. Your actual costs may have been higher or lower, depending on the amount of your investment and the timing of any purchases or redemptions.
You can find more information about the fund’s expenses, including annual expense ratios, in the Financial Statements section of this report. For additional information on operating expenses and other shareholder costs, please refer to your fund’s current prospectus.
34
| | | |
| Six Months Ended February 28, 2018 | | | |
| | Beginning | Ending | Expenses |
| | Account Value | Account Value | Paid During |
| International Growth Fund | 8/31/2017 | 2/28/2018 | Period |
| Based on Actual Fund Return | | | |
| Investor Shares | $1,000.00 | $1,116.13 | $2.36 |
| Admiral Shares | 1,000.00 | 1,116.98 | 1.68 |
| Based on Hypothetical 5% Yearly Return | | | |
| Investor Shares | $1,000.00 | $1,022.56 | $2.26 |
| Admiral Shares | 1,000.00 | 1,023.21 | 1.61 |
The calculations are based on expenses incurred in the most recent six-month period. The fund’s annualized six-month expense ratios for
that period are 0.45% for Investor Shares and 0.32% for Admiral Shares. The dollar amounts shown as “Expenses Paid” are equal to the
annualized expense ratio multiplied by the average account value over the period, multiplied by the number of days in the most recent
six-month period, then divided by the number of days in the most recent 12-month period (181/365).
35
Trustees Approve Advisory Arrangements
The board of trustees of Vanguard International Growth Fund has renewed the fund’s investment advisory arrangements with Baillie Gifford Overseas Ltd. (Baillie Gifford) and Schroder Investment Management North America Inc. (Schroder Inc.), as well as the sub-advisory agreement with Schroder Investment Management North America Ltd. (Schroder Ltd.). The board determined that renewing the fund’s advisory arrangements was in the best interests of the fund and its shareholders.
The board based its decision upon an evaluation of each advisor’s investment staff, portfolio management process, and performance. This evaluation included information provided to the board by Vanguard’s Portfolio Review Department, which is responsible for fund and advisory oversight and product management. The Portfolio Review Department met regularly with the advisors and made monthly presentations to the board during the fiscal year that directed the board’s focus to relevant information and topics.
The board, or an investment committee made up of board members, also received information throughout the year during advisor presentations. For each advisor presentation, the board was provided with letters and reports that included information about, among other things, the advisory firm and the advisor’s assessment of the investment environment, portfolio performance, and portfolio characteristics.
In addition, the board received monthly reports, which included a Market and Economic Report, a Fund Dashboard Monthly Summary, and a Fund Performance Report.
Prior to their meeting, the trustees were provided with a memo and materials that summarized the information they received over the course of the year. They also considered the factors discussed below, among others. However, no single factor determined whether the board approved the arrangements. Rather, it was the totality of the circumstances that drove the board’s decision.
Nature, extent, and quality of services
The board reviewed the quality of the fund’s investment management services over both the short and long term, and took into account the organizational depth and stability of each advisor. The board considered the following:
Baillie Gifford. Baillie Gifford—a unit of Baillie Gifford & Co., founded in 1908—is among the largest independently owned investment management firms in the United Kingdom. Baillie Gifford uses fundamental research to make long-term investments in companies that have above-average growth potential resulting from sustainable competitive advantages, special cultures and management, or competitive strength in underestimated technology shifts. Baillie Gifford believes that equities’ asymmetrical return pattern means that alpha is generated by focusing on the upside and the potential to earn exponential returns rather than being overly concerned with avoiding losing investments. The advisor takes a bottom-up, stock-driven approach to sector and country allocation. Baillie Gifford has advised a portion of the fund since 2003.
Schroder. Schroders plc, the parent company of Schroder Inc. and Schroder Ltd. (collectively, Schroder), was founded in 1804 in London, England. Schroder specializes in global equity and fixed income management and seeks to invest in securities of international companies where it has identified a significant growth gap, which is defined as forward earnings growth that is not yet recognized by the market. Schroder believes that market inefficiencies often drive material differences between underlying company fundamentals and market estimates. The advisor also
36
believes that in-depth fundamental research, incorporating a comprehensive macroeconomic viewpoint and a robust framework of fundamental risk analysis, is the most reliable means of finding those companies and identifying the growth gap. Schroder Inc. has advised the fund since its inception in 1981, and its affiliate Schroder Ltd. has advised the fund since 2003.
The board concluded that each advisor’s experience, stability, depth, and performance, among other factors, warranted continuation of the advisory arrangements.
Investment performance
The board considered the short- and long-term performance of the fund and each advisor, including any periods of outperformance or underperformance compared with a relevant benchmark and peer group. The board concluded that the performance was such that each advisory arrangement should continue. Information about the fund’s most recent performance can be found in the Performance Summary section of this report.
Cost
The board concluded that the fund’s expense ratio was well below the average expense ratio charged by funds in its peer group and that the fund’s advisory fee rate was also well below the peer-group average. Information about the fund’s expense ratio appears in the About Your Fund’s Expenses section of this report as well as in the Financial Statements section, which also includes information about the fund’s advisory fee rate.
The board did not consider the profitability of Baillie Gifford or Schroder in determining whether to approve the advisory fees, because the firms are independent of Vanguard and the advisory fees are the result of arm’s-length negotiations.
The benefit of economies of scale
The board concluded that the fund’s shareholders benefit from economies of scale because of breakpoints in the advisory fee schedules for Baillie Gifford and Schroder. The breakpoints reduce the effective rate of the fees as the fund’s assets managed by each advisor increase.
The board will consider whether to renew the advisory arrangements again after a one-year period.
37
Glossary
Beta. A measure of the magnitude of a fund’s past share-price fluctuations in relation to the ups and downs of a given market index. The index is assigned a beta of 1.00. Compared with a given index, a fund with a beta of 1.20 typically would have seen its share price rise or fall by 12% when the index rose or fell by 10%. For this report, beta is based on returns over the past 36 months for both the fund and the index. Note that a fund’s beta should be reviewed in conjunction with its R-squared (see definition). The lower the R-squared, the less correlation there is between the fund and the index, and the less reliable beta is as an indicator of volatility.
Dividend Yield. Dividend income earned by stocks, expressed as a percentage of the aggregate market value (or of net asset value, for a fund). The yield is determined by dividing the amount of the annual dividends by the aggregate value (or net asset value) at the end of the period. For a fund, the dividend yield is based solely on stock holdings and does not include any income produced by other investments.
Earnings Growth Rate. The average annual rate of growth in earnings over the past five years for the stocks now in a fund.
Equity Exposure. A measure that reflects a fund’s investments in stocks and stock futures. Any holdings in short-term reserves are excluded.
Expense Ratio. A fund’s total annual operating expenses expressed as a percentage of the fund’s average net assets. The expense ratio includes management and administrative expenses, but does not include the transaction costs of buying and selling portfolio securities.
Inception Date. The date on which the assets of a fund (or one of its share classes) are first invested in accordance with the fund’s investment objective. For funds with a subscription period, the inception date is the day after that period ends. Investment performance is measured from the inception date.
Median Market Cap. An indicator of the size of companies in which a fund invests; the midpoint of market capitalization (market price x shares outstanding) of a fund’s stocks, weighted by the proportion of the fund’s assets invested in each stock. Stocks representing half of the fund’s assets have market capitalizations above the median, and the rest are below it.
Price/Book Ratio. The share price of a stock divided by its net worth, or book value, per share. For a fund, the weighted average price/book ratio of the stocks it holds.
Price/Earnings Ratio. The ratio of a stock’s current price to its per-share earnings over the past year. For a fund, the weighted average P/E of the stocks it holds. P/E is an indicator of market expectations about corporate prospects; the higher the P/E, the greater the expectations for a company’s future growth.
R-Squared. A measure of how much of a fund’s past returns can be explained by the returns from the market in general, as measured by a given index. If a fund’s total returns were precisely synchronized with an index’s returns, its R-squared would be 1.00. If the fund’s returns bore no relationship to the index’s returns, its R-squared would be 0. For this report, R-squared is based on returns over the past 36 months for both the fund and the index.
38
Return on Equity. The annual average rate of return generated by a company during the past five years for each dollar of shareholder’s equity (net income divided by shareholder’s equity). For a fund, the weighted average return on equity for the companies whose stocks it holds.
Short-Term Reserves. The percentage of a fund invested in highly liquid, short-term securities that can be readily converted to cash.
Turnover Rate. An indication of the fund’s trading activity. Funds with high turnover rates incur higher transaction costs and may be more likely to distribute capital gains (which may be taxable to investors). The turnover rate excludes in-kind transactions, which have minimal impact on costs.
Benchmark Information
Spliced International Index: MSCI EAFE Index through May 31, 2010; MSCI All Country World Index ex USA thereafter.
39
The Global Industry Classification Standard (“GICS”) was developed by and is the exclusive property and a service mark
of MSCI Inc. (“MSCI”) and Standard and Poor’s, a division of McGraw-Hill Companies, Inc. (“S&P”), and is licensed for use
by Vanguard. Neither MSCI, S&P nor any third party involved in making or compiling the GICS or any GICS classification
makes any express or implied warranties or representations with respect to such standard or classification (or the results
to be obtained by the use thereof), and all such parties hereby expressly disclaim all warranties of originality, accuracy,
completeness, merchantability or fitness for a particular purpose with respect to any such standard or classification.
Without limiting any of the foregoing, in no event shall MSCI, S&P, any of its affiliates or any third party involved in
making or compiling the GICS or any GICS classification have any liability for any direct, indirect, special, punitive,
consequential or any other damages (including lost profits) even if notified of the possibility of such damages.
40
This page intentionally left blank.
This page intentionally left blank.
The People Who Govern Your Fund
The trustees of your mutual fund are there to see that the fund is operated and managed in your best interests since, as a shareholder, you are a part owner of the fund. Your fund’s trustees also serve on the board of directors of The Vanguard Group, Inc., which is owned by the Vanguard funds and provides services to them on an at-cost basis.
A majority of Vanguard’s board members are independent, meaning that they have no affiliation with Vanguard or the funds they oversee, apart from the sizable personal investments they have made as private individuals. The independent board members have distinguished backgrounds in business, academia, and public service. Each of the trustees and executive officers oversees 208 Vanguard funds.
Information for each trustee and executive officer of the fund appears below. The mailing address of the trustees and officers is P.O. Box 876, Valley Forge, PA 19482. More information about the trustees is in the Statement of Additional Information, which can be obtained, without charge, by contacting Vanguard at 800-662-7447, or online at vanguard.com.
Interested Trustees1
F. William McNabb III
Born in 1957. Trustee since July 2009. Principal occupation(s) during the past five years and other experience: chairman of the board (January 2010–present) of Vanguard and of each of the investment companies served by Vanguard, trustee (2009–present) of each of the investment companies served by Vanguard, and director (2008–present) of Vanguard. Chief executive officer and president (2008–2017) of Vanguard and each of the investment companies served by Vanguard, managing director (1995–2008) of Vanguard, and director (1997–2018) of Vanguard Marketing Corporation. Director (2018–present) of UnitedHealth Group.
Mortimer J. Buckley
Born in 1969. Trustee since January 2018. Principal occupation(s) during the past five years and other experience: chief executive officer (January 2018–present) of Vanguard; chief executive officer, president, and trustee (January 2018–present) of each of the investment companies served by Vanguard; president and director (2017–present) of Vanguard; and president (February 2018–present) of Vanguard Marketing Corporation. Chief investment officer (2013–2017), managing director (2002–2017), head of the Retail Investor Group (2006–2012), and chief information officer (2001–2006) of Vanguard. Chairman of the board (2011–2017) of the Children’s Hospital of Philadelphia.
Independent Trustees
Emerson U. Fullwood
Born in 1948. Trustee since January 2008. Principal occupation(s) during the past five years and other experience: executive chief staff and marketing officer for North America and corporate vice president (retired 2008) of Xerox Corporation (document management products and services). Former president of the Worldwide Channels Group, Latin America, and Worldwide Customer Service and executive chief staff officer of Developing Markets of Xerox. Executive in residence and 2009–2010 Distinguished Minett Professor at the Rochester Institute of Technology. Lead director of SPX FLOW, Inc. (multi-industry manufacturing). Director of the University of Rochester Medical Center, the Monroe Community College Foundation, the United Way of Rochester, North Carolina A&T University, and Roberts Wesleyan College. Trustee of the University of Rochester.
Amy Gutmann
Born in 1949. Trustee since June 2006. Principal occupation(s) during the past five years and other experience: president (2004–present) of the University of Pennsylvania. Christopher H. Browne Distinguished Professor of Political Science, School of Arts and Sciences, and professor of communication, Annenberg School for Communication, with secondary faculty appointments in the Department of Philosophy, School of Arts and Sciences, and at the Graduate School of Education, University of Pennsylvania. Trustee of the National Constitution Center.
1 Mr. McNabb and Mr. Buckley are considered “interested persons,” as defined in the Investment Company Act of 1940, because
they are officers of the Vanguard funds.
JoAnn Heffernan Heisen
Born in 1950. Trustee since July 1998. Principal occupation(s) during the past five years and other experience: corporate vice president of Johnson & Johnson (pharmaceuticals/medical devices/consumer products) and member of its executive committee (1997–2008). Chief global diversity officer (retired 2008), vice president and chief information officer (1997–2006), controller (1995–1997), treasurer (1991–1995), and assistant treasurer (1989–1991) of Johnson & Johnson. Director of Skytop Lodge Corporation (hotels) and the Robert Wood Johnson Foundation. Member of the advisory board of the Institute for Women’s Leadership at Rutgers University.
F. Joseph Loughrey
Born in 1949. Trustee since October 2009. Principal occupation(s) during the past five years and other experience: president and chief operating officer (retired 2009) and vice chairman of the board (2008–2009) of Cummins Inc. (industrial machinery). Chairman of the board of Hillenbrand, Inc. (specialized consumer services), Oxfam America, and the Lumina Foundation for Education. Director of the V Foundation for Cancer Research. Member of the advisory council for the College of Arts and Letters and chair of the advisory board to the Kellogg Institute for International Studies, both at the University of Notre Dame.
Mark Loughridge
Born in 1953. Trustee since March 2012. Principal occupation(s) during the past five years and other experience: senior vice president and chief financial officer (retired 2013) of IBM (information technology services). Fiduciary member of IBM’s Retirement Plan Committee (2004–2013), senior vice president and general manager (2002–2004) of IBM Global Financing, vice president and controller (1998–2002) of IBM, and a variety of other prior management roles at IBM. Member of the Council on Chicago Booth.
Scott C. Malpass
Born in 1962. Trustee since March 2012. Principal occupation(s) during the past five years and other experience: chief investment officer (1989–present) and vice president (1996–present) of the University of Notre Dame. Assistant professor of finance at the Mendoza College of Business, University of Notre Dame, and member of the Notre Dame 403(b) Investment Committee. Chairman of the board of TIFF Advisory Services, Inc. Member of the board of Catholic Investment Services, Inc. (investment advisors), the board of advisors for Spruceview Capital Partners, and the board of superintendence of the Institute for the Works of Religion.
Deanna Mulligan
Born in 1963. Trustee since January 2018. Principal occupation(s) during the past five years and other experience: president (2010–present) and chief executive officer (2011–present) of The Guardian Life Insurance Company of America. Chief operating officer (2010–2011) and executive vice president (2008–2010) of Individual Life and Disability of The Guardian Life Insurance Company of America. Member of the board of The Guardian Life Insurance Company of America, the American Council of Life Insurers, the Partnership for New York City (business leadership), and the Committee Encouraging Corporate Philanthropy. Trustee of the Economic Club of New York and the Bruce Museum (arts and science). Member of the Advisory Council for the Stanford Graduate School of Business.
André F. Perold
Born in 1952. Trustee since December 2004. Principal occupation(s) during the past five years and other experience: George Gund Professor of Finance and Banking, Emeritus at the Harvard Business School (retired 2011). Chief investment officer and co-managing partner of HighVista Strategies LLC (private investment firm). Overseer of the Museum of Fine Arts Boston.
Sarah Bloom Raskin
Born in 1961. Trustee since January 2018. Principal occupation(s) during the past five years and other experience: deputy secretary (2014–2017) of the United States Department of the Treasury. Governor (2010–2014) of the Federal Reserve Board. Commissioner (2007–2010) of financial regulation for the State of Maryland. Member of the board of directors (2012–2014) of Neighborhood Reinvestment Corporation. Director of i(x) Investments, LLC.
Peter F. Volanakis
Born in 1955. Trustee since July 2009. Principal occupation(s) during the past five years and other experience: president and chief operating officer (retired 2010) of Corning Incorporated (communications equipment) and director of Corning Incorporated (2000–2010) and Dow Corning (2001–2010). Director (2012) of SPX Corporation (multi-industry manufacturing). Overseer of the Amos Tuck School of Business Administration, Dartmouth College (2001–2013). Chairman of the board of trustees of Colby-Sawyer College. Member of the Board of Hypertherm Inc. (industrial cutting systems, software, and consumables).
Executive Officers
Glenn Booraem
Born in 1967. Principal occupation(s) during the past five years and other experience: principal of Vanguard. Investment stewardship officer (2017–present), treasurer (2015–2017), controller (2010–2015), and assistant controller (2001–2010) of each of the investment companies served by Vanguard.
Christine M. Buchanan
Born in 1970. Principal occupation(s) during the past five years and other experience: principal of Vanguard and global head of Fund Administration at Vanguard. Treasurer (2017–present) of each of the investment companies served by Vanguard. Partner (2005–2017) at KPMG LLP (audit, tax, and advisory services).
Brian Dvorak
Born in 1973. Principal occupation(s) during the past five years and other experience: principal of Vanguard. Chief compliance officer (2017–present) of Vanguard and each of the investment companies served by Vanguard. Assistant vice president (2017–present) of Vanguard Marketing Corporation. Vice president and director of Enterprise Risk Management (2011–2013) at Oppenheimer Funds, Inc.
Thomas J. Higgins
Born in 1957. Principal occupation(s) during the past five years and other experience: principal of Vanguard. Chief financial officer (2008–present) and treasurer (1998–2008) of each of the investment companies served by Vanguard.
Peter Mahoney
Born in 1974. Principal occupation(s) during the past five years and other experience: principal of Vanguard. Controller (2015–present) of each of the investment companies served by Vanguard. Head of International Fund Services (2008–2014) at Vanguard.
Anne E. Robinson
Born in 1970. Principal occupation(s) during the past five years and other experience: general counsel (2016–present) of Vanguard. Secretary (2016–present) of Vanguard and of each of the investment companies served by Vanguard. Managing director (2016–present) of Vanguard. Director and senior vice president (2016–2018) of Vanguard Marketing Corporation. Managing director and general counsel of Global Cards and Consumer Services (2014–2016) at Citigroup. Counsel (2003–2014) at American Express.
Michael Rollings
Born in 1963. Principal occupation(s) during the past five years and other experience: finance director (2017–present) and treasurer (2017) of each of the investment companies served by Vanguard. Managing director (2016–present) of Vanguard. Chief financial officer (2016–present) of Vanguard. Director (2016–present) of Vanguard Marketing Corporation. Executive vice president and chief financial officer (2006–2016) of MassMutual Financial Group.
| |
| Vanguard Senior Management Team |
| |
| Mortimer J. Buckley | James M. Norris |
| Gregory Davis | Thomas M. Rampulla |
| John James | Karin A. Risi |
| Martha G. King | Anne E. Robinson |
| John T. Marcante | Michael Rollings |
| Chris D. McIsaac | |
Chairman Emeritus and Senior Advisor
John J. Brennan
Chairman, 1996–2009
Chief Executive Officer and President, 1996–2008
Founder
John C. Bogle
Chairman and Chief Executive Officer, 1974–1996
| |
|  |
| | P.O. Box 2600 |
| | Valley Forge, PA 19482-2600 |
| |
| |
| |
| Connect with Vanguard® > vanguard.com |
| |
| |
| |
| Fund Information > 800-662-7447 | Source for Bloomberg Barclays indexes: Bloomberg |
| Direct Investor Account Services > 800-662-2739 | Index Services Limited. Copyright 2018, Bloomberg. All |
| | rights reserved. |
| Institutional Investor Services > 800-523-1036 | |
| | CFA® is a registered trademark owned by CFA Institute. |
| Text Telephone for People | |
| Who Are Deaf or Hard of Hearing > 800-749-7273 | |
| |
| This material may be used in conjunction | |
| with the offering of shares of any Vanguard | |
| fund only if preceded or accompanied by | |
| the fund’s current prospectus. | |
| |
| All comparative mutual fund data are from Lipper, a | |
| Thomson Reuters Company, or Morningstar, Inc., unless | |
| otherwise noted. | |
| |
| You can obtain a free copy of Vanguard’s proxy voting | |
| guidelines by visiting vanguard.com/proxyreporting or by | |
| calling Vanguard at 800-662-2739. The guidelines are | |
| also available from the SEC’s website, sec.gov. In | |
| addition, you may obtain a free report on how your fund | |
| voted the proxies for securities it owned during the 12 | |
| months ended June 30. To get the report, visit either | |
| vanguard.com/proxyreporting or sec.gov. | |
| |
| You can review and copy information about your fund at | |
| the SEC’s Public Reference Room in Washington, D.C. To | |
| find out more about this public service, call the SEC at | |
| 202-551-8090. Information about your fund is also | |
| available on the SEC’s website, and you can receive | |
| copies of this information, for a fee, by sending a | |
| request in either of two ways: via email addressed to | |
| publicinfo@sec.gov or via regular mail addressed to the | |
| Public Reference Section, Securities and Exchange | |
| Commission, Washington, DC 20549-1520. | |
| | © 2018 The Vanguard Group, Inc. |
| | All rights reserved. |
| | Vanguard Marketing Corporation, Distributor. |
| |
| | Q812 042018 |

Semiannual Report | February 28, 2018
Vanguard FTSE Social Index Fund
Vanguard’s Principles for Investing Success
We want to give you the best chance of investment success. These principles, grounded in Vanguard’s research and experience, can put you on the right path.
Goals. Create clear, appropriate investment goals.
Balance. Develop a suitable asset allocation using broadly diversified funds.
Cost. Minimize cost.
Discipline. Maintain perspective and long-term discipline.
A single theme unites these principles: Focus on the things you can control.
We believe there is no wiser course for any investor.
| |
| Contents | |
| Your Fund’s Performance at a Glance. | 1 |
| CEO’s Perspective. | 2 |
| Results of Proxy Voting. | 5 |
| Fund Profile. | 7 |
| Performance Summary. | 8 |
| Financial Statements. | 9 |
| About Your Fund’s Expenses. | 25 |
| Glossary. | 27 |
Please note: The opinions expressed in this report are just that—informed opinions. They should not be considered promises
or advice. Also, please keep in mind that the information and opinions cover the period through the date on the front of this
report. Of course, the risks of investing in your fund are spelled out in the prospectus.
See the Glossary for definitions of investment terms used in this report.
About the cover: Nautical images have been part of Vanguard’s rich heritage since its start in 1975. For an
incoming ship, a lighthouse offers a beacon and safe path to shore. You can similarly depend on Vanguard to put
you first––and light the way––as you strive to meet your financial goals. Our client focus and low costs,
stemming from our unique ownership structure, assure that your interests are paramount.
Your Fund’s Performance at a Glance
• Vanguard FTSE Social Index Fund returned more than 11% for the six months ended February 28, 2018. It closely tracked its benchmark, the FTSE4Good US Select Index, but trailed the average return of its large-capitalization growth fund peers.
• In tracking its socially conscious benchmark, the fund tends to have greater exposure to sectors where companies are more likely to meet the index’s environmental, social, and human rights criteria, such as financials, technology, and health care. It has less exposure to sectors where companies may fall short of the index’s requirements, such as oil and gas and industrials.
• Eight of ten sectors advanced. Technology, the fund’s largest sector, returned 17% and had the highest impact on overall returns. Industrials and financials (both +13%) rounded out the top three contributors. Health care also was positive (+3%).
• The only sectors that lost ground were telecommunications (–8%) and utilities (–7%), both of which were lightly represented in the fund.
| |
| Total Returns: Six Months Ended February 28, 2018 | |
| | Total |
| | Returns |
| Vanguard FTSE Social Index Fund | |
| Investor Shares | 11.45% |
| Institutional Shares | 11.48 |
| FTSE4Good US Select Index | 11.57 |
| Large-Cap Growth Funds Average | 13.29 |
| Large-Cap Growth Funds Average: Derived from data provided by Lipper, a Thomson Reuters Company. | |
| Institutional Shares are available to certain institutional investors who meet specific administrative, service, and account-size criteria. |
| | | |
| Expense Ratios | | | |
| Your Fund Compared With Its Peer Group | | | |
| | Investor | Institutional | Peer Group |
| | Shares | Shares | Average |
| FTSE Social Index Fund | 0.20% | 0.12% | 1.10% |
The fund expense ratios shown are from the prospectus dated December 21, 2017, and represent estimated costs for the current fiscal
year. For the six months ended February 28, 2018, the fund’s annualized expense ratios were 0.20% for Investor Shares and 0.12% for
Institutional Shares. The peer-group expense ratio is derived from data provided by Lipper, a Thomson Reuters Company, and captures
information through year-end 2017.
Peer group: Large-Cap Growth Funds.
1
CEO’s Perspective

Tim Buckley
President and Chief Executive Officer
Dear Shareholder,
As I begin my tenure as Vanguard’s fourth chief executive, I’ve been reflecting on both the past and the future of the company where I have spent my entire professional career.
I feel extremely fortunate to have the chance to lead a company filled with people who come to work every day passionate about Vanguard’s core purpose: to take a stand for all investors, to treat them fairly, and to give them the best chance for investment success.
Making a real difference
When I joined Vanguard in 1991, I found a mission-driven team focused on improving lives—helping people retire more comfortably, put their children through college, and achieve financial security. I found a company with purpose in an industry ripe for improvement.
It was clear, even early in my career, that the cards were stacked against most investors. Hidden fees, performance-chasing, and poor advice were relentlessly eroding investors’ dreams.
We knew Vanguard could be different and, as a result, could make a real difference. Over the past 25 years, for example, Vanguard has lowered our funds’ asset-weighted average expense ratio
2
from 0.31% to 0.12%. And over the past decade, 94% of our funds have beaten the average annual return of their peers.1
Focused on your success
Vanguard is built for Vanguard investors—as a client-owned company, we focus solely on you, our fund shareholders. Everything we do is designed to give our clients the best chance for investment success. In my role as CEO, I intend to keep this priority front and center. We’re proud of what we’ve achieved, but we’re even more excited about what’s to come.
As I write this, we’ve experienced a period of pronounced market volatility. Strong economic growth and budding signs of inflation have raised concerns about a more aggressive Federal Reserve. Although volatility can test investors’ nerves, we sometimes think of this as “Vanguard weather”—a time when having a disciplined, low-cost, and long-term approach to investment management serves investors well.
| | | |
| Market Barometer | | | |
| | | | Total Returns |
| | | Periods Ended February 28, 2018 |
| | Six | One | Five Years |
| | Months | Year | (Annualized) |
| Stocks | | | |
| Russell 1000 Index (Large-caps) | 10.62% | 16.70% | 14.56% |
| Russell 2000 Index (Small-caps) | 8.30 | 10.51 | 12.19 |
| Russell 3000 Index (Broad U.S. market) | 10.45 | 16.22 | 14.37 |
| FTSE All-World ex US Index (International) | 7.84 | 21.50 | 6.69 |
| |
| Bonds | | | |
| Bloomberg Barclays U.S. Aggregate Bond Index | | | |
| (Broad taxable market) | -2.18% | 0.51% | 1.71% |
| Bloomberg Barclays Municipal Bond Index | | | |
| (Broad tax-exempt market) | -1.24 | 2.50 | 2.57 |
| Citigroup Three-Month U.S. Treasury Bill Index | 0.59 | 0.98 | 0.27 |
| |
| CPI | | | |
| Consumer Price Index | 1.41% | 2.21% | 1.41% |
The performance data shown represent past performance, which is not a guarantee of future results.
1 For the ten-year period through December 31, 2017, 9 of 9 Vanguard money market funds, 56 of 60 bond funds, 21 of 22 balanced funds,
and 131 of 140 stock funds, or 217 of 231 Vanguard funds, outperformed their peer-group averages. Sources: Vanguard, based on data
from Lipper, a Thomson Reuters Company.
3
Steady, time-tested guidance
Our guidance for investors, as always, is to stay the course, tune out the hyperbolic headlines, and focus on your goals and what you can control, such as costs and how much you save. This time-tested advice has served our clients well over the decades.
Regardless of how the markets perform in the short term, I’m incredibly optimistic about the future for our investors. We have a dedicated team serving you, and we will never stop striving to make Vanguard the best place for you to invest through our high-quality funds and services, advice and guidance to help you meet your financial goals, and an experience that makes you feel good about entrusting us with your hard-earned savings.
Thank you for your continued loyalty.
Sincerely,

Mortimer J. Buckley
President and Chief Executive Officer
March 19, 2018
4
Results of Proxy Voting
At a special meeting of shareholders on November 15, 2017, fund shareholders approved the following proposals:
Proposal 1—Elect trustees for the fund.*
The individuals listed in the table below were elected as trustees for the fund. All trustees with the exception of Ms. Mulligan, Ms. Raskin, and Mr. Buckley (each of whom already serves as a director of The Vanguard Group, Inc.) served as trustees to the funds prior to the shareholder meeting.
| | | |
| | | | Percentage |
| Trustee | For | Withheld | For |
| Mortimer J. Buckley | 1,040,401,220 | 33,553,324 | 96.9% |
| Emerson U. Fullwood | 1,039,160,376 | 34,794,169 | 96.8% |
| Amy Gutmann | 1,040,321,884 | 33,632,661 | 96.9% |
| JoAnn Heffernan Heisen | 1,041,268,182 | 32,686,363 | 97.0% |
| F. Joseph Loughrey | 1,040,201,842 | 33,752,703 | 96.9% |
| Mark Loughridge | 1,039,909,454 | 34,045,090 | 96.8% |
| Scott C. Malpass | 1,039,175,722 | 34,778,823 | 96.8% |
| F. William McNabb III | 1,038,914,560 | 35,039,985 | 96.7% |
| Deanna Mulligan | 1,041,175,691 | 32,778,854 | 96.9% |
| André F. Perold | 1,028,804,958 | 45,149,587 | 95.8% |
| Sarah Bloom Raskin | 1,040,743,960 | 33,210,585 | 96.9% |
| Peter F. Volanakis | 1,039,529,631 | 34,424,914 | 96.8% |
| * Results are for all funds within the same trust. | | | |
Proposal 2—Approve a manager-of-managers arrangement with third-party investment advisors.
This arrangement enables the fund to enter into and materially amend investment advisory arrangements with third-party investment advisors, subject to the approval of the fund’s board of trustees and certain conditions imposed by the Securities and Exchange Commission, while avoiding the costs and delays associated with obtaining future shareholder approval.
| | | | | |
| | | | | Broker | Percentage |
| Vanguard Fund | For | Abstain | Against | Non-Votes | For |
| FTSE Social Index Fund | 86,343,035 | 7,344,834 | 6,600,160 | 11,983,970 | 76.9% |
Proposal 3—Approve a manager-of-managers arrangement with wholly owned subsidiaries of Vanguard.
This arrangement enables Vanguard or the fund to enter into and materially amend investment advisory arrangements with wholly owned subsidiaries of Vanguard, subject to the approval of the fund’s board of trustees and any conditions imposed by the Securities and Exchange Commission (SEC), while avoiding the costs and delays associated with obtaining future shareholder approval. The ability of the fund to operate in this manner is contingent upon the SEC’s approval of a pending application for an order of exemption.
| | | | | |
| | | | | Broker | Percentage |
| Vanguard Fund | For | Abstain | Against | Non-Votes | For |
| FTSE Social Index Fund | 87,172,639 | 7,113,060 | 6,002,329 | 11,983,970 | 77.6% |
5
Fund shareholders did not approve the following proposal:
Proposal 7—Institute transparent procedures to avoid holding investments in companies that, in management’s judgment, substantially contribute to genocide or crimes against humanity, the most egregious violations of human rights. Such procedures may include time-limited engagement with problem companies if management believes that their behavior can be changed.
The trustees recommended a vote against the proposal for the following reasons: (1) Vanguard is fully compliant with all applicable U.S. laws and regulations that prohibit the investment in any company owned or controlled by the government of Sudan; (2) the addition of further investment constraints is not in fund shareholders’ best interests if those constraints are unrelated to a fund’s stated investment objective, policies, and strategies; and (3) divestment is an ineffective means to implement social change, as it often puts the shares into the hands of another owner with no direct impact to the company’s capitalization.
| | | | | |
| | | | | Broker | Percentage |
| Vanguard Fund | For | Abstain | Against | Non-Votes | For |
| FTSE Social Index Fund | 44,210,672 | 4,893,760 | 51,183,597 | 11,983,970 | 39.4% |
6
FTSE Social Index Fund
Fund Profile
As of February 28, 2018
| | |
| Share-Class Characteristics | |
| | Investor | Institutional |
| | Shares | Shares |
| Ticker Symbol | VFTSX | VFTNX |
| Expense Ratio1 | 0.20% | 0.12% |
| 30-Day SEC Yield | 1.54% | 1.62% |
| | | |
| Portfolio Characteristics | | |
| | | FTSE | DJ |
| | | 4Good | U.S. Total |
| | | US Select | Market |
| | Fund | Index | FA Index |
| Number of Stocks | 453 | 456 | 3,746 |
| Median Market Cap | $89.7B | $89.7B | $68.2B |
| Price/Earnings Ratio | 23.3x | 23.2x | 21.7x |
| Price/Book Ratio | 3.2x | 3.2x | 3.0x |
| Return on Equity | 16.1% | 16.1% | 15.0% |
| Earnings Growth Rate | 7.9% | 7.9% | 8.5% |
| Dividend Yield | 1.6% | 1.6% | 1.7% |
| Foreign Holdings | 0.4% | 0.0% | 0.0% |
| Turnover Rate | 10% | — | — |
| Short-Term Reserves | 0.5% | — | — |
| | | |
| Sector Diversification (% of equity exposure) |
| | | FTSE | DJ |
| | | 4Good | U.S. Total |
| | | US Select | Market |
| | Fund | Index | FA Index |
| Basic Materials | 1.8% | 1.8% | 2.6% |
| Consumer Goods | 8.8 | 8.8 | 8.5 |
| Consumer Services | 8.4 | 8.4 | 13.2 |
| Financials | 24.4 | 24.4 | 20.5 |
| Health Care | 16.5 | 16.5 | 12.6 |
| Industrials | 8.2 | 8.2 | 13.2 |
| Oil & Gas | 2.7 | 2.7 | 5.2 |
| Technology | 28.3 | 28.3 | 19.8 |
| Telecommunications | 0.1 | 0.1 | 1.7 |
| Utilities | 0.8 | 0.8 | 2.7 |
Sector categories are based on the Industry Classification
Benchmark (“ICB”), except for the “Other” category (if applicable),
which includes securities that have not been provided an ICB
classification as of the effective reporting period.
| | |
| Volatility Measures | | |
| | FTSE | DJ |
| | 4Good | U.S. Total |
| | US Select | Market |
| | Index | FA Index |
| R-Squared | 1.00 | 0.98 |
| Beta | 1.00 | 1.01 |
These measures show the degree and timing of the fund’s
fluctuations compared with the indexes over 36 months.
| | |
| Ten Largest Holdings (% of total net assets) |
| Apple Inc. | Computer Hardware | 5.3% |
| Microsoft Corp. | Software | 4.1 |
| Alphabet Inc. | Internet | 3.8 |
| Facebook Inc. | Internet | 2.4 |
| JPMorgan Chase & Co. | Banks | 2.3 |
| Johnson & Johnson | Pharmaceuticals | 2.0 |
| Bank of America Corp. | Banks | 1.8 |
| Wells Fargo & Co. | Banks | 1.5 |
| Intel Corp. | Systems Software | 1.4 |
| Visa Inc. | Consumer Finance | 1.3 |
| Top Ten | | 25.9% |
The holdings listed exclude any temporary cash investments and
equity index products.
Investment Focus
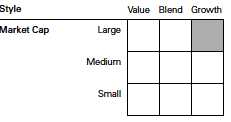
1 The expense ratios shown are from the prospectus dated December 21, 2017, and represent estimated costs for the current fiscal year.
For the six months ended February 28, 2018, the annualized expense ratios were 0.20% for Investor Shares and 0.12% for Institutional
Shares.
7
FTSE Social Index Fund
Performance Summary
All of the returns in this report represent past performance, which is not a guarantee of future results that may be achieved by the fund. (Current performance may be lower or higher than the performance data cited. For performance data current to the most recent month-end, visit our website at vanguard.com/performance.) Note, too, that both investment returns and principal value can fluctuate widely, so an investor’s shares, when sold, could be worth more or less than their original cost. The returns shown do not reflect taxes that a shareholder would pay on fund distributions or on the sale of fund shares.
Fiscal-Year Total Returns (%): August 31, 2007, Through February 28, 2018
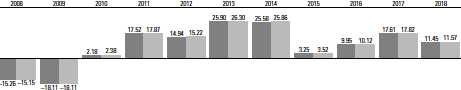
| | |
| | FTSE Social Index Fund Investor Shares |
| | FTSE4Good US Select Index |
| Note: For 2018, performance data reflect the six months ended February 28, 2018. |
Average Annual Total Returns: Periods Ended December 31, 2017
This table presents returns through the latest calendar quarter—rather than through the end of the fiscal period.
Securities and Exchange Commission rules require that we provide this information.
| | | | |
| | Inception | One | Five | Ten |
| | Date | Year | Years | Years |
| Investor Shares | 5/31/2000 | 24.11% | 17.00% | 8.61% |
| Institutional Shares | 1/14/2003 | 24.19 | 17.12 | 8.73 |
See Financial Highlights for dividend and capital gains information.
8
FTSE Social Index Fund
Financial Statements (unaudited)
Statement of Net Assets
As of February 28, 2018
The fund reports a complete list of its holdings in regulatory filings four times in each fiscal year, at the quarter-ends. For the second and fourth fiscal quarters, the lists appear in the fund’s semiannual and annual reports to shareholders. For the first and third fiscal quarters, the fund files the lists with the Securities and Exchange Commission on Form N-Q. Shareholders can look up the fund’s Forms N-Q on the SEC’s website at sec.gov. Forms N-Q may also be reviewed and copied at the SEC’s Public Reference Room (see the back cover of this report for further information).
| | | |
| | | | Market |
| | | | Value• |
| | | Shares | ($000) |
| Common Stocks (99.7%)1 | | |
| Basic Materials (1.8%) | | |
| | Praxair Inc. | 66,748 | 9,995 |
| | LyondellBasell Industries | | |
| | NV Class A | 75,910 | 8,215 |
| | Air Products & Chemicals | | |
| | Inc. | 50,050 | 8,048 |
| | Ecolab Inc. | 59,997 | 7,827 |
| | PPG Industries Inc. | 59,897 | 6,735 |
| | Nucor Corp. | 77,906 | 5,095 |
| | Newmont Mining Corp. | 126,814 | 4,844 |
| | Albemarle Corp. | 27,021 | 2,714 |
| | International Flavors | | |
| | & Fragrances Inc. | 18,498 | 2,613 |
| | Arconic Inc. | 103,253 | 2,518 |
| | FMC Corp. | 31,347 | 2,460 |
| | Avery Dennison Corp. | 20,663 | 2,441 |
| | CF Industries Holdings Inc. | 56,594 | 2,334 |
| | Mosaic Co. | 88,440 | 2,328 |
| * | Alcoa Corp. | 45,119 | 2,029 |
| | Ashland Global Holdings | | |
| | Inc. | 15,020 | 1,064 |
| | Westlake Chemical Corp. | 8,288 | 897 |
| | | | 72,157 |
| Consumer Goods (8.8%) | | |
| | Procter & Gamble Co. | 603,225 | 47,365 |
| | PepsiCo Inc. | 334,633 | 36,719 |
| | NIKE Inc. Class B | 312,492 | 20,946 |
| | Mondelez International | | |
| | Inc. Class A | 345,903 | 15,185 |
| | Colgate-Palmolive Co. | 203,080 | 14,007 |
| | Activision Blizzard Inc. | 175,720 | 12,850 |
| | General Motors Co. | 310,344 | 12,212 |
| *,^ | Tesla Inc. | 31,607 | 10,843 |
| | Ford Motor Co. | 956,941 | 10,153 |
| | Kimberly-Clark Corp. | 87,280 | 9,681 |
| | Kraft Heinz Co. | 142,765 | 9,572 |
| * | Electronic Arts Inc. | 71,325 | 8,823 |
| | | |
| | | | Market |
| | | | Value• |
| | | Shares | ($000) |
| | Estee Lauder Cos. Inc. | | |
| | Class A | 51,049 | 7,067 |
| | General Mills Inc. | 137,237 | 6,937 |
| * | Monster Beverage Corp. | 96,484 | 6,114 |
| | VF Corp. | 79,727 | 5,945 |
| | Aptiv plc | 62,440 | 5,703 |
| | Stanley Black & Decker | | |
| | Inc. | 35,784 | 5,697 |
| | Dr Pepper Snapple Group | | |
| | Inc. | 44,316 | 5,152 |
| | Tyson Foods Inc. Class A | 65,023 | 4,836 |
| | Kellogg Co. | 59,057 | 3,910 |
| | Clorox Co. | 30,269 | 3,907 |
| | Lennar Corp. Class A | 65,161 | 3,687 |
| | Tapestry Inc. | 72,285 | 3,680 |
| * | Mohawk Industries Inc. | 14,879 | 3,569 |
| | JM Smucker Co. | 28,059 | 3,544 |
| | DR Horton Inc. | 83,997 | 3,520 |
| | Conagra Brands Inc. | 96,154 | 3,474 |
| | Genuine Parts Co. | 35,740 | 3,282 |
| | Hershey Co. | 32,190 | 3,163 |
| | McCormick & Co. Inc. | 28,374 | 3,030 |
| | Lear Corp. | 15,937 | 2,973 |
| | Church & Dwight Co. Inc. | 59,642 | 2,934 |
| | Autoliv Inc. | 20,356 | 2,920 |
| | Whirlpool Corp. | 17,675 | 2,871 |
| * | LKQ Corp. | 71,737 | 2,832 |
| | PVH Corp. | 19,529 | 2,818 |
| | Bunge Ltd. | 34,077 | 2,571 |
| | BorgWarner Inc. | 49,363 | 2,423 |
| | Snap-on Inc. | 14,484 | 2,306 |
| | Coty Inc. Class A | 116,062 | 2,242 |
| * | Michael Kors Holdings Ltd. | 35,487 | 2,233 |
| | Ingredion Inc. | 16,581 | 2,166 |
| | Hormel Foods Corp. | 64,271 | 2,086 |
| * | Lululemon Athletica Inc. | 25,595 | 2,076 |
| | PulteGroup Inc. | 71,746 | 2,014 |
| | Harley-Davidson Inc. | 42,621 | 1,934 |
9
| | | |
| FTSE Social Index Fund | | |
| |
| |
| |
| | | | Market |
| | | | Value• |
| | | Shares | ($000) |
| | Lamb Weston Holdings | | |
| | Inc. | 34,020 | 1,840 |
| | Toll Brothers Inc. | 40,899 | 1,793 |
| | Newell Brands Inc. | 66,797 | 1,716 |
| | Goodyear Tire & Rubber | | |
| | Co. | 58,541 | 1,694 |
| | Coca-Cola European | | |
| | Partners plc | 43,636 | 1,659 |
| | Ralph Lauren Corp. | | |
| | Class A | 15,638 | 1,655 |
| | Polaris Industries Inc. | 14,171 | 1,615 |
| | Leggett & Platt Inc. | 36,838 | 1,601 |
| | Gentex Corp. | 65,524 | 1,488 |
| ^ | Mattel Inc. | 91,288 | 1,452 |
| * | Herbalife Ltd. | 15,697 | 1,446 |
| | Adient plc | 22,746 | 1,412 |
| | Campbell Soup Co. | 25,379 | 1,093 |
| | Delphi Technologies plc | 20,966 | 1,001 |
| | Hanesbrands Inc. | 27,510 | 534 |
| * | Edgewell Personal Care | | |
| | Co. | 4,992 | 250 |
| | | | 356,221 |
| Consumer Services (8.4%) | | |
| | Home Depot Inc. | 277,155 | 50,517 |
| | Walt Disney Co. | 365,336 | 37,688 |
| | McDonald’s Corp. | 187,957 | 29,648 |
| * | Booking Holdings Inc. | 11,586 | 23,566 |
| | Starbucks Corp. | 333,433 | 19,039 |
| | Lowe’s Cos. Inc. | 196,862 | 17,637 |
| | Time Warner Inc. | 182,537 | 16,969 |
| | CVS Health Corp. | 242,251 | 16,408 |
| | TJX Cos. Inc. | 150,837 | 12,471 |
| | McKesson Corp. | 50,371 | 7,517 |
| | Ross Stores Inc. | 88,871 | 6,940 |
| | Sysco Corp. | 112,440 | 6,707 |
| | Dollar General Corp. | 65,937 | 6,237 |
| * | Dollar Tree Inc. | 54,663 | 5,611 |
| | Cardinal Health Inc. | 76,805 | 5,316 |
| * | O’Reilly Automotive Inc. | 20,149 | 4,920 |
| * | AutoZone Inc. | 6,692 | 4,448 |
| | Best Buy Co. Inc. | 60,512 | 4,383 |
| | Omnicom Group Inc. | 55,799 | 4,254 |
| | Yum China Holdings Inc. | 86,200 | 3,734 |
| | AmerisourceBergen Corp. | | |
| | Class A | 38,296 | 3,644 |
| | Expedia Inc. | 30,424 | 3,200 |
| * | Ulta Beauty Inc. | 14,392 | 2,927 |
| | Viacom Inc. Class B | 86,314 | 2,878 |
| | Kohl’s Corp. | 42,625 | 2,817 |
| | Darden Restaurants Inc. | 30,093 | 2,774 |
| * | CarMax Inc. | 44,749 | 2,771 |
| | L Brands Inc. | 53,820 | 2,655 |
| | Tiffany & Co. | 26,131 | 2,640 |
| | Aramark | 56,966 | 2,376 |
| | | | |
| | | | | Market |
| | | | | Value• |
| | | | Shares | ($000) |
| | Interpublic Group of | | | |
| | Cos. Inc. | | 96,111 | 2,249 |
| | Advance Auto Parts Inc. | | 18,378 | 2,100 |
| | Tractor Supply Co. | | 31,107 | 2,020 |
| | Gap Inc. | | 59,274 | 1,872 |
| * | Liberty Media Corp- | | | |
| | Liberty SiriusXM Class C | | 44,046 | 1,839 |
| | Scripps Networks | | | |
| | Interactive Inc. Class A | | 20,224 | 1,817 |
| * | Chipotle Mexican Grill Inc. | | |
| | Class A | | 5,417 | 1,725 |
| | Macy’s Inc. | | 57,700 | 1,697 |
| | Nielsen Holdings plc | | 50,248 | 1,640 |
| | Nordstrom Inc. | | 31,408 | 1,611 |
| | Foot Locker Inc. | | 34,511 | 1,584 |
| | H&R Block Inc. | | 53,488 | 1,355 |
| * | Discovery Communications | | |
| | Inc. | | 57,400 | 1,319 |
| | Dun & Bradstreet Corp. | | 9,752 | 1,219 |
| | Bed Bath & Beyond Inc. | | 46,672 | 1,001 |
| * | Discovery Communications | | |
| | Inc. Class A | | 35,100 | 854 |
| * | Liberty Media Corp- | | | |
| | Liberty SiriusXM Class A | | 18,583 | 779 |
| *,^ | AutoNation Inc. | | 14,759 | 741 |
| | Alaska Air Group Inc. | | 9,182 | 592 |
| | Signet Jewelers Ltd. | | 135 | 7 |
| | | | | 340,713 |
| Financials (24.3%) | | | |
| | JPMorgan Chase & Co. | | 814,018 | 94,019 |
| | Bank of America Corp. | 2,291,931 | 73,571 |
| | Wells Fargo & Co. | 1,047,034 | 61,157 |
| | Visa Inc. Class A | | 427,413 | 52,546 |
| | Citigroup Inc. | | 623,980 | 47,104 |
| | Mastercard Inc. Class A | | 220,575 | 38,768 |
| | Goldman Sachs Group Inc. | 84,585 | 22,240 |
| | US Bancorp | | 364,828 | 19,832 |
| | PNC Financial Services | | | |
| | Group Inc. | | 113,229 | 17,852 |
| | Morgan Stanley | | 308,018 | 17,255 |
| | American Express Co. | | 168,610 | 16,441 |
| | BlackRock Inc. | | 29,052 | 15,962 |
| | Chubb Ltd. | | 109,190 | 15,496 |
| | Charles Schwab Corp. | | 280,954 | 14,896 |
| | American Tower Corp. | | 99,555 | 13,871 |
| | Bank of New York Mellon | | | |
| | Corp. | | 234,390 | 13,367 |
| | CME Group Inc. | | 79,597 | 13,226 |
| | American International | | | |
| | Group Inc. | | 214,632 | 12,307 |
| | S&P Global Inc. | | 60,353 | 11,576 |
| | Simon Property Group Inc. | 74,743 | 11,474 |
| | Capital One Financial | | | |
| | Corp. | | 116,757 | 11,434 |
10
| | | |
| FTSE Social Index Fund | | |
| |
| |
| |
| | | | Market |
| | | | Value• |
| | | Shares | ($000) |
| | Prudential Financial Inc. | 101,980 | 10,842 |
| | Crown Castle International | | |
| | Corp. | 95,113 | 10,468 |
| | Intercontinental Exchange | | |
| | Inc. | 137,241 | 10,030 |
| | BB&T Corp. | 184,160 | 10,009 |
| | Marsh & McLennan | | |
| | Cos. Inc. | 120,310 | 9,988 |
| | MetLife Inc. | 215,923 | 9,973 |
| | State Street Corp. | 87,834 | 9,324 |
| | Travelers Cos. Inc. | 64,763 | 9,002 |
| | Aon plc | 58,034 | 8,143 |
| | Aflac Inc. | 90,731 | 8,064 |
| | SunTrust Banks Inc. | 113,632 | 7,936 |
| | Allstate Corp. | 85,268 | 7,867 |
| | Progressive Corp. | 135,364 | 7,794 |
| | Prologis Inc. | 123,493 | 7,494 |
| | Equinix Inc. | 18,608 | 7,296 |
| | Synchrony Financial | 192,085 | 6,990 |
| | Discover Financial | | |
| | Services | 88,459 | 6,973 |
| | Public Storage | 35,673 | 6,936 |
| | Moody’s Corp. | 38,927 | 6,496 |
| | M&T Bank Corp. | 33,113 | 6,286 |
| | Weyerhaeuser Co. | 176,544 | 6,184 |
| | T. Rowe Price Group Inc. | 55,018 | 6,156 |
| | Fifth Third Bancorp | 167,405 | 5,533 |
| | KeyCorp | 259,293 | 5,479 |
| | Ameriprise Financial Inc. | 34,950 | 5,468 |
| | Regions Financial Corp. | 279,092 | 5,417 |
| | AvalonBay Communities | | |
| | Inc. | 34,335 | 5,357 |
| | Northern Trust Corp. | 49,720 | 5,264 |
| | Citizens Financial Group | | |
| | Inc. | 120,166 | 5,226 |
| | Welltower Inc. | 96,681 | 5,076 |
| | Digital Realty Trust Inc. | 50,093 | 5,041 |
| | Equity Residential | 87,767 | 4,935 |
| | Willis Towers Watson plc | 29,577 | 4,670 |
| | Boston Properties Inc. | 39,149 | 4,654 |
| * | SBA Communications | | |
| | Corp. Class A | 28,392 | 4,465 |
| | Ventas Inc. | 91,367 | 4,415 |
| | Hartford Financial Services | | |
| | Group Inc. | 83,042 | 4,389 |
| * | IHS Markit Ltd. | 90,039 | 4,236 |
| | Huntington Bancshares | | |
| | Inc. | 267,618 | 4,202 |
| | Lincoln National Corp. | 52,460 | 3,996 |
| | Comerica Inc. | 40,956 | 3,982 |
| | Principal Financial Group | | |
| | Inc. | 62,338 | 3,886 |
| | Realty Income Corp. | 77,907 | 3,831 |
| | First Republic Bank | 39,552 | 3,670 |
| | | |
| | | | Market |
| | | | Value• |
| | | Shares | ($000) |
| * | Markel Corp. | 3,184 | 3,541 |
| | TD Ameritrade Holding | | |
| | Corp. | 60,225 | 3,463 |
| | Equifax Inc. | 30,532 | 3,450 |
| * | E*TRADE Financial Corp. | 63,584 | 3,321 |
| | Invesco Ltd. | 101,498 | 3,303 |
| * | CBRE Group Inc. Class A | 70,026 | 3,274 |
| | GGP Inc. | 154,020 | 3,261 |
| | Loews Corp. | 65,152 | 3,214 |
| | Ally Financial Inc. | 107,212 | 2,991 |
| | Raymond James Financial | | |
| | Inc. | 31,729 | 2,942 |
| | Arthur J Gallagher & Co. | 41,438 | 2,864 |
| | Unum Group | 54,731 | 2,789 |
| | Zions Bancorporation | 49,943 | 2,745 |
| | XL Group Ltd. | 63,390 | 2,682 |
| | Cincinnati Financial Corp. | 35,914 | 2,679 |
| | Mid-America Apartment | | |
| | Communities Inc. | 30,658 | 2,631 |
| | SL Green Realty Corp. | 26,949 | 2,612 |
| * | Arch Capital Group Ltd. | 28,713 | 2,534 |
| | FNF Group | 61,420 | 2,452 |
| | Everest Re Group Ltd. | 10,084 | 2,423 |
| | Torchmark Corp. | 26,915 | 2,298 |
| | Duke Realty Corp. | 92,507 | 2,291 |
| | Regency Centers Corp. | 39,328 | 2,285 |
| | SEI Investments Co. | 31,307 | 2,280 |
| | Voya Financial Inc. | 44,559 | 2,273 |
| | Iron Mountain Inc. | 72,240 | 2,273 |
| | UDR Inc. | 67,245 | 2,261 |
| | AGNC Investment Corp. | 125,203 | 2,246 |
| * | Alleghany Corp. | 3,623 | 2,196 |
| | Nasdaq Inc. | 27,184 | 2,195 |
| | Western Union Co. | 105,709 | 2,095 |
| | People’s United Financial | | |
| | Inc. | 101,677 | 1,946 |
| | CIT Group Inc. | 32,374 | 1,717 |
| | Janus Henderson Group | | |
| | plc | 45,123 | 1,595 |
| | WR Berkley Corp. | 22,332 | 1,527 |
| | Liberty Property Trust | 38,694 | 1,519 |
| | Vornado Realty Trust | 22,832 | 1,518 |
| | Annaly Capital | | |
| | Management Inc. | 149,007 | 1,495 |
| | RenaissanceRe Holdings | | |
| | Ltd. | 10,903 | 1,399 |
| | Hospitality Properties | | |
| | Trust | 53,141 | 1,352 |
| | Commerce Bancshares | | |
| | Inc. | 22,030 | 1,273 |
| | HCP Inc. | 58,044 | 1,256 |
| | Assurant Inc. | 14,536 | 1,242 |
| | Weingarten Realty | | |
| | Investors | 44,732 | 1,214 |
11
| | | |
| FTSE Social Index Fund | | |
| |
| |
| |
| | | | Market |
| | | | Value• |
| | | Shares | ($000) |
| | Macerich Co. | 20,493 | 1,208 |
| * | Brighthouse Financial Inc. | 21,538 | 1,169 |
| | VEREIT Inc. | 157,762 | 1,081 |
| | Navient Corp. | 80,434 | 1,042 |
| | Santander Consumer USA | | |
| | Holdings Inc. | 38,228 | 625 |
| | Axis Capital Holdings Ltd. | 12,054 | 595 |
| | New York Community | | |
| | Bancorp Inc. | 32,656 | 445 |
| | Kimco Realty Corp. | 18,241 | 273 |
| | | | 987,192 |
| Health Care (16.5%) | | |
| | Johnson & Johnson | 639,319 | 83,035 |
| | Pfizer Inc. | 1,405,177 | 51,022 |
| | UnitedHealth Group Inc. | 225,583 | 51,018 |
| | AbbVie Inc. | 377,570 | 43,734 |
| | Merck & Co. Inc. | 653,179 | 35,415 |
| | Amgen Inc. | 176,884 | 32,506 |
| | Bristol-Myers Squibb Co. | 392,479 | 25,982 |
| | Medtronic plc | 322,165 | 25,738 |
| | Abbott Laboratories | 396,670 | 23,931 |
| | Eli Lilly & Co. | 235,017 | 18,101 |
| * | Celgene Corp. | 187,770 | 16,359 |
| * | Biogen Inc. | 51,200 | 14,796 |
| | Anthem Inc. | 60,418 | 14,221 |
| | Becton Dickinson and Co. | 61,703 | 13,699 |
| | Aetna Inc. | 74,553 | 13,200 |
| | Stryker Corp. | 79,480 | 12,888 |
| | Allergan plc | 81,776 | 12,612 |
| * | Intuitive Surgical Inc. | 26,039 | 11,104 |
| | Cigna Corp. | 55,861 | 10,943 |
| * | Express Scripts Holding | | |
| | Co. | 135,149 | 10,197 |
| * | Vertex Pharmaceuticals | | |
| | Inc. | 60,445 | 10,036 |
| | Zoetis Inc. | 115,820 | 9,365 |
| | Humana Inc. | 33,558 | 9,122 |
| * | Boston Scientific Corp. | 328,396 | 8,952 |
| | Baxter International Inc. | 116,604 | 7,905 |
| * | Illumina Inc. | 34,533 | 7,874 |
| | HCA Healthcare Inc. | 68,758 | 6,824 |
| * | Edwards Lifesciences | | |
| | Corp. | 49,157 | 6,571 |
| | Zimmer Biomet Holdings | | |
| | Inc. | 48,381 | 5,624 |
| * | Mylan NV | 130,469 | 5,261 |
| * | Regeneron | | |
| | Pharmaceuticals Inc. | 15,459 | 4,954 |
| * | Align Technology Inc. | 18,582 | 4,878 |
| * | Alexion Pharmaceuticals | | |
| | Inc. | 40,484 | 4,755 |
| * | Laboratory Corp. of | | |
| | America Holdings | 23,841 | 4,117 |
| * | Centene Corp. | 40,211 | 4,078 |
| | | |
| | | | Market |
| | | | Value• |
| | | Shares | ($000) |
| * | IDEXX Laboratories Inc. | 20,888 | 3,911 |
| * | IQVIA Holdings Inc. | 38,003 | 3,737 |
| * | Waters Corp. | 18,033 | 3,690 |
| * | BioMarin Pharmaceutical | | |
| | Inc. | 45,177 | 3,667 |
| | Quest Diagnostics Inc. | 32,966 | 3,397 |
| | Dentsply Sirona Inc. | 55,757 | 3,126 |
| | ResMed Inc. | 32,604 | 3,106 |
| * | Bioverativ Inc. | 26,848 | 2,810 |
| | Cooper Cos. Inc. | 11,880 | 2,739 |
| * | DaVita Inc. | 37,758 | 2,719 |
| * | Henry Schein Inc. | 39,611 | 2,622 |
| * | Hologic Inc. | 67,369 | 2,616 |
| * | Varian Medical Systems | | |
| | Inc. | 21,515 | 2,568 |
| | Universal Health Services | | |
| | Inc. Class B | 21,500 | 2,455 |
| * | Incyte Corp. | 26,797 | 2,282 |
| * | Jazz Pharmaceuticals plc | 14,840 | 2,149 |
| | Perrigo Co. plc | 20,602 | 1,678 |
| | Patterson Cos. Inc. | 25,593 | 808 |
| | | | 670,897 |
| Industrials (8.1%) | | |
| | Union Pacific Corp. | 185,362 | 24,143 |
| | Accenture plc Class A | 145,200 | 23,379 |
| * | PayPal Holdings Inc. | 266,272 | 21,145 |
| | United Parcel Service Inc. | | |
| | Class B | 164,067 | 17,130 |
| | FedEx Corp. | 59,443 | 14,647 |
| | Automatic Data | | |
| | Processing Inc. | 105,356 | 12,150 |
| | Deere & Co. | 74,431 | 11,974 |
| | Illinois Tool Works Inc. | 71,314 | 11,513 |
| | CSX Corp. | 202,171 | 10,861 |
| | Norfolk Southern Corp. | 67,677 | 9,412 |
| | Waste Management Inc. | 101,667 | 8,776 |
| | Eaton Corp. plc | 108,240 | 8,735 |
| | Johnson Controls | | |
| | International plc | 224,706 | 8,285 |
| | Sherwin-Williams Co. | 19,107 | 7,673 |
| * | Fiserv Inc. | 49,502 | 7,098 |
| | Cummins Inc. | 37,726 | 6,344 |
| | PACCAR Inc. | 82,991 | 5,941 |
| | Rockwell Automation Inc. | 31,605 | 5,714 |
| * | Worldpay Inc. Class A | 69,135 | 5,619 |
| | Fortive Corp. | 71,927 | 5,524 |
| | Parker-Hannifin Corp. | 30,872 | 5,510 |
| | Agilent Technologies Inc. | 75,885 | 5,205 |
| | Global Payments Inc. | 35,983 | 4,080 |
| | Fastenal Co. | 72,384 | 3,961 |
| | WestRock Co. | 58,671 | 3,858 |
| | Vulcan Materials Co. | 31,885 | 3,754 |
| | Total System Services Inc. | 42,509 | 3,739 |
12
| | | |
| FTSE Social Index Fund | | |
| |
| |
| |
| | | | Market |
| | | | Value• |
| | | Shares | ($000) |
| | Republic Services Inc. | | |
| | Class A | 54,119 | 3,636 |
| * | Mettler-Toledo | | |
| | International Inc. | 5,881 | 3,624 |
| | Dover Corp. | 36,187 | 3,622 |
| * | Verisk Analytics Inc. | | |
| | Class A | 35,374 | 3,615 |
| * | United Rentals Inc. | 20,617 | 3,610 |
| | WW Grainger Inc. | 13,043 | 3,411 |
| | CH Robinson Worldwide | | |
| | Inc. | 35,722 | 3,335 |
| | Ball Corp. | 81,799 | 3,268 |
| | Martin Marietta Materials | | |
| | Inc. | 15,466 | 3,154 |
| | Xylem Inc. | 41,873 | 3,123 |
| | Expeditors International of | | |
| | Washington Inc. | 44,894 | 2,916 |
| | Alliance Data Systems | | |
| | Corp. | 12,032 | 2,899 |
| | Broadridge Financial | | |
| | Solutions Inc. | 27,371 | 2,747 |
| | Packaging Corp. of | | |
| | America | 21,866 | 2,606 |
| | Kansas City Southern | 24,341 | 2,508 |
| | JB Hunt Transport | | |
| | Services Inc. | 20,256 | 2,402 |
| | Fortune Brands Home | | |
| | & Security Inc. | 37,032 | 2,246 |
| * | Sensata Technologies | | |
| | Holding NV | 40,542 | 2,143 |
| * | Keysight Technologies Inc. | 43,264 | 2,034 |
| | Sealed Air Corp. | 44,594 | 1,889 |
| | Allegion plc | 22,436 | 1,887 |
| | ManpowerGroup Inc. | 15,625 | 1,851 |
| | Robert Half International | | |
| | Inc. | 30,836 | 1,760 |
| | Xerox Corp. | 57,688 | 1,749 |
| * | Arrow Electronics Inc. | 20,691 | 1,688 |
| * | Stericycle Inc. | 23,500 | 1,473 |
| | Avnet Inc. | 32,737 | 1,398 |
| | MDU Resources Group Inc. | 47,456 | 1,248 |
| | Bemis Co. Inc. | 22,534 | 994 |
| | Jabil Inc. | 32,048 | 868 |
| | Acuity Brands Inc. | 1,709 | 244 |
| | | | 330,118 |
| Oil & Gas (2.7%) | | |
| | ConocoPhillips | 287,988 | 15,641 |
| | EOG Resources Inc. | 139,429 | 14,141 |
| | Occidental Petroleum | | |
| | Corp. | 183,063 | 12,009 |
| | Valero Energy Corp. | 104,016 | 9,405 |
| | Anadarko Petroleum Corp. | 135,630 | 7,736 |
| | Pioneer Natural Resources | | |
| | Co. | 41,410 | 7,049 |
| | | |
| | | | Market |
| | | | Value• |
| | | Shares | ($000) |
| | Kinder Morgan Inc. | 381,054 | 6,173 |
| | Williams Cos. Inc. | 200,202 | 5,558 |
| | Andeavor | 37,978 | 3,404 |
| | Apache Corp. | 97,070 | 3,315 |
| | Marathon Oil Corp. | 219,047 | 3,181 |
| | EQT Corp. | 60,076 | 3,022 |
| | Devon Energy Corp. | 92,806 | 2,846 |
| | Cabot Oil & Gas Corp. | 115,267 | 2,785 |
| | Targa Resources Corp. | 57,857 | 2,583 |
| | Helmerich & Payne Inc. | 30,598 | 1,975 |
| | HollyFrontier Corp. | 43,004 | 1,842 |
| | Cimarex Energy Co. | 17,320 | 1,664 |
| | Baker Hughes a GE Co. | 60,739 | 1,604 |
| | Core Laboratories NV | 12,776 | 1,315 |
| * | Newfield Exploration Co. | 56,113 | 1,309 |
| | Murphy Oil Corp. | 49,979 | 1,267 |
| * | Weatherford International | | |
| | plc | 254,932 | 671 |
| | | | 110,495 |
| Other (0.0%) | | |
| *,2 | Herbalife Ltd. CVR | 2,328 | 23 |
| |
| Technology (28.2%) | | |
| | Apple Inc. | 1,215,052 | 216,425 |
| | Microsoft Corp. | 1,770,167 | 165,989 |
| * | Facebook Inc. Class A | 551,639 | 98,368 |
| * | Alphabet Inc. Class C | 71,951 | 79,486 |
| * | Alphabet Inc. Class A | 69,694 | 76,937 |
| | Intel Corp. | 1,114,100 | 54,914 |
| | Cisco Systems Inc. | 1,172,488 | 52,504 |
| | Oracle Corp. | 689,328 | 34,928 |
| | NVIDIA Corp. | 133,826 | 32,386 |
| | Texas Instruments Inc. | 231,694 | 25,104 |
| * | Adobe Systems Inc. | 115,848 | 24,227 |
| | Broadcom Ltd. | 95,707 | 23,588 |
| | QUALCOMM Inc. | 350,215 | 22,764 |
| * | salesforce.com Inc. | 158,203 | 18,391 |
| | Applied Materials Inc. | 252,570 | 14,546 |
| * | Micron Technology Inc. | 258,234 | 12,604 |
| | Cognizant Technology | | |
| | Solutions Corp. Class A | 137,119 | 11,247 |
| * | NXP Semiconductors NV | 80,080 | 9,983 |
| | Intuit Inc. | 56,927 | 9,499 |
| | HP Inc. | 393,984 | 9,215 |
| | Analog Devices Inc. | 86,185 | 7,770 |
| | Lam Research Corp. | 38,268 | 7,342 |
| | Hewlett Packard | | |
| | Enterprise Co. | 390,095 | 7,252 |
| | DXC Technology Co. | 66,203 | 6,788 |
| * | ServiceNow Inc. | 39,728 | 6,397 |
| | Western Digital Corp. | 71,582 | 6,230 |
| * | Red Hat Inc. | 41,385 | 6,100 |
| | Corning Inc. | 203,466 | 5,917 |
| * | Autodesk Inc. | 50,273 | 5,906 |
13
| | | |
| FTSE Social Index Fund | | |
| |
| |
| |
| | | | Market |
| | | | Value• |
| | | Shares | ($000) |
| * | Twitter Inc. | 158,789 | 5,059 |
| | Skyworks Solutions Inc. | 44,452 | 4,856 |
| * | Cerner Corp. | 67,709 | 4,344 |
| | Xilinx Inc. | 58,699 | 4,182 |
| * | Workday Inc. Class A | 32,430 | 4,108 |
| | Maxim Integrated | | |
| | Products Inc. | 66,284 | 4,039 |
| | Symantec Corp. | 151,423 | 3,981 |
| | NetApp Inc. | 64,998 | 3,936 |
| * | Palo Alto Networks Inc. | 22,026 | 3,819 |
| | Seagate Technology plc | 69,911 | 3,733 |
| * | Dell Technologies Inc. | | |
| | Class V | 50,059 | 3,719 |
| * | Citrix Systems Inc. | 36,502 | 3,358 |
| * | Arista Networks Inc. | 12,387 | 3,341 |
| * | Splunk Inc. | 33,704 | 3,141 |
| * | Check Point Software | | |
| | Technologies Ltd. | 29,761 | 3,092 |
| * | Synopsys Inc. | 35,052 | 2,968 |
| * | Akamai Technologies Inc. | 40,431 | 2,727 |
| | CA Inc. | 75,060 | 2,635 |
| | CDW Corp. | 34,951 | 2,549 |
| * | Yandex NV Class A | 60,583 | 2,489 |
| *,^ | Advanced Micro Devices | | |
| | Inc. | 204,481 | 2,476 |
| | Juniper Networks Inc. | 94,593 | 2,427 |
| * | F5 Networks Inc. | 15,681 | 2,329 |
| * | VeriSign Inc. | 19,941 | 2,314 |
| * | VMware Inc. Class A | 17,252 | 2,273 |
| | Amdocs Ltd. | 33,654 | 2,214 |
| | CDK Global Inc. | 30,383 | 2,087 |
| | Garmin Ltd. | 29,416 | 1,743 |
| | CSRA Inc. | 41,373 | 1,677 |
| | DST Systems Inc. | 15,113 | 1,257 |
| | | | 1,145,680 |
| Telecommunications (0.1%) | | |
| * | T-Mobile US Inc. | 68,634 | 4,160 |
| *,^ | Sprint Corp. | 165,322 | 858 |
| | | | 5,018 |
| Utilities (0.8%) | | |
| | Consolidated Edison Inc. | 75,036 | 5,619 |
| | ONEOK Inc. | 90,652 | 5,106 |
| | PPL Corp. | 173,368 | 4,967 |
| | WEC Energy Group Inc. | 74,027 | 4,436 |
| | American Water Works | | |
| | Co. Inc. | 41,696 | 3,309 |
| | CenterPoint Energy Inc. | 105,732 | 2,860 |
| | NiSource Inc. | 90,433 | 2,092 |
| | CMS Energy Corp. | 37,525 | 1,593 |
| | |
| | | Market |
| | | Value• |
| | Shares | ($000) |
| * Calpine Corp. | 83,672 | 1,273 |
| Avangrid Inc. | 13,389 | 650 |
| | | 31,905 |
| Total Common Stocks | | |
| (Cost $2,795,580) | | 4,050,419 |
| Temporary Cash Investments (0.5%) | |
| Money Market Fund (0.5%) | | |
| 3,4 Vanguard Market | | |
| Liquidity Fund, | | |
| 1.601% | 187,589 | 18,757 |
| | |
| | Face | |
| | Amount | |
| | ($000) | |
| U. S. Government and Agency Obligations (0.0%) |
| 5 United States Treasury | | |
| Bill, 1.432%, 4/26/18 | 650 | 648 |
| Total Temporary Cash Investments | |
| (Cost $19,406) | | 19,405 |
| Total Investments (100.2%) | | |
| (Cost $2,814,986) | | 4,069,824 |
| |
| | | Amount |
| | | ($000) |
| Other Assets and Liabilities (-0.2%) | |
| Other Assets | | |
| Investment in Vanguard | | 219 |
| Receivables for Accrued Income | 6,013 |
| Receivables for Capital Shares Issued | 7,858 |
| Total Other Assets | | 14,090 |
| Liabilities | | |
| Payables for Investment Securities | |
| Purchased | | (11,617) |
| Collateral for Securities on Loan | (5,403) |
| Payables for Capital Shares Redeemed | (1,823) |
| Payables to Vanguard | | (1,395) |
| Variation Margin Payable—Futures | |
| Contracts | | (151) |
| Total Liabilities | | (20,389) |
| Net Assets (100%) | | 4,063,525 |
14
FTSE Social Index Fund
At February 28, 2018, net assets consisted of:
| |
| | Amount |
| | ($000) |
| Paid-in Capital | 2,842,531 |
| Undistributed Net Investment Income | 8,147 |
| Accumulated Net Realized Losses | (42,016) |
| Unrealized Appreciation (Depreciation) | |
| Investment Securities | 1,254,838 |
| Futures Contracts | 25 |
| Net Assets | 4,063,525 |
| |
| |
| Investor Shares—Net Assets | |
| Applicable to 134,558,208 outstanding | |
| $.001 par value shares of beneficial | |
| interest (unlimited authorization) | 2,398,705 |
| Net Asset Value Per Share— | |
| Investor Shares | $17.83 |
| |
| | Amount |
| | ($000) |
| Institutional Shares—Net Assets | |
| Applicable to 93,312,381 outstanding | |
| $.001 par value shares of beneficial | |
| interest (unlimited authorization) | 1,664,820 |
| Net Asset Value Per Share— | |
| Institutional Shares | $17.84 |
• See Note A in Notes to Financial Statements.
* Non-income-producing security.
^ Includes partial security positions on loan to broker-dealers.
The total value of securities on loan is $5,076,000.
1 The fund invests a portion of its cash reserves in equity
markets through the use of index futures contracts. After
giving effect to futures investments, the fund’s effective
common stock and temporary cash investment positions
represent 100.0% and 0.2%, respectively, of net assets.
2 Security value determined using significant unobservable
inputs.
3 Affiliated money market fund available only to Vanguard
funds and certain trusts and accounts managed by Vanguard.
Rate shown is the 7-day yield.
4 Includes $5,403,000 of collateral received for securities on
loan.
5 Securities with a value of $648,000 have been segregated
as initial margin for open futures contracts.
CVR—Contingent Value Rights.
| | | | |
| Derivative Financial Instruments Outstanding as of Period End | | |
| |
| Futures Contracts | | | | |
| | | | | ($000) |
| | | | | Value and |
| | | Number of | | Unrealized |
| | | Long (Short) | Notional | Appreciation |
| | Expiration | Contracts | Amount | (Depreciation) |
| Long Futures Contracts | | | | |
| E-mini S&P 500 Index | March 2018 | 91 | 12,351 | 25 |
Unrealized appreciation (depreciation) on open futures contracts is required to be treated as realized gain (loss) for tax purposes.
See accompanying Notes, which are an integral part of the Financial Statements.
15
| |
| FTSE Social Index Fund | |
| |
| |
| Statement of Operations | |
| |
| | Six Months Ended |
| | February28,2018 |
| | ($000) |
| Investment Income | |
| Income | |
| Dividends | 31,153 |
| Interest1 | 77 |
| Securities Lending—Net | 21 |
| Total Income | 31,251 |
| Expenses | |
| The Vanguard Group—Note B | |
| Investment Advisory Services | 450 |
| Management and Administrative—Investor Shares | 1,662 |
| Management and Administrative—Institutional Shares | 649 |
| Marketing and Distribution—Investor Shares | 188 |
| Marketing and Distribution—Institutional Shares | 18 |
| Custodian Fees | 42 |
| Shareholders’ Reports and Proxy—Investor Shares | 36 |
| Shareholders’ Reports and Proxy—Institutional Shares | 79 |
| Trustees’ Fees and Expenses | 2 |
| Total Expenses | 3,126 |
| Net Investment Income | 28,125 |
| Realized Net Gain (Loss) | |
| Investment Securities Sold1 | (17,252) |
| Futures Contracts | 1,404 |
| Realized Net Gain (Loss) | (15,848) |
| Change in Unrealized Appreciation (Depreciation) | |
| Investment Securities1 | 388,464 |
| Futures Contracts | (88) |
| Change in Unrealized Appreciation (Depreciation) | 388,376 |
| Net Increase (Decrease) in Net Assets Resulting from Operations | 400,653 |
1 Interest income, realized net gain (loss), and change in unrealized appreciation (depreciation) from an affiliated company of the fund
were $67,000, $1,000, and ($1,000), respectively. Purchase and sales are for temporary cash investment purposes.
See accompanying Notes, which are an integral part of the Financial Statements.
16
| | |
| FTSE Social Index Fund | | |
| |
| |
| Statement of Changes in Net Assets | | |
| |
| | Six Months Ended | Year Ended |
| | February 28, | August 31, |
| | 2018 | 2017 |
| | ($000) | ($000) |
| Increase (Decrease) in Net Assets | | |
| Operations | | |
| Net Investment Income | 28,125 | 48,418 |
| Realized Net Gain (Loss) | (15,848) | (3,856) |
| Change in Unrealized Appreciation (Depreciation) | 388,376 | 404,860 |
| Net Increase (Decrease) in Net Assets Resulting from Operations | 400,653 | 449,422 |
| Distributions | | |
| Net Investment Income | | |
| Investor Shares | (18,712) | (26,127) |
| Institutional Shares | (14,185) | (18,289) |
| Realized Capital Gain | | |
| Investor Shares | — | — |
| Institutional Shares | — | — |
| Total Distributions | (32,897) | (44,416) |
| Capital Share Transactions | | |
| Investor Shares | 235,281 | 274,057 |
| Institutional Shares | 65,141 | 404,904 |
| Net Increase (Decrease) from Capital Share Transactions | 300,422 | 678,961 |
| Total Increase (Decrease) | 668,178 | 1,083,967 |
| Net Assets | | |
| Beginning of Period | 3,395,347 | 2,311,380 |
| End of Period1 | 4,063,525 | 3,395,347 |
1 Net Assets—End of Period includes undistributed (overdistributed) net investment income of $8,147,000 and $12,919,000.
See accompanying Notes, which are an integral part of the Financial Statements.
17
| | | | | | | |
| FTSE Social Index Fund | | | | | | | |
| |
| |
| Financial Highlights | | | | | | |
| |
| |
| Investor Shares | | | | | | | |
| | Six Months | | | | | |
| | | Ended | | | | | |
| For a Share Outstanding | February 28, | | | Year Ended August 31, |
| Throughout Each Period | | 2018 | 2017 | 2016 | 2015 | 2014 | 2013 |
| Net Asset Value, Beginning of Period | $16.14 | $13.95 | $12.99 | $12.74 | $10.28 | $8.30 |
| Investment Operations | | | | | | | |
| Net Investment Income | | .1251 | .2561 | .241 | .183 | .167 | .153 |
| Net Realized and Unrealized Gain (Loss) | | | | | | |
| on Investments | | 1.715 | 2.175 | 1.025 | .231 | 2.442 | 1.969 |
| Total from Investment Operations | 1.840 | 2.431 | 1.266 | .414 | 2.609 | 2.122 |
| Distributions | | | | | | | |
| Dividends from Net Investment Income | (.150) | (. 241) | (. 306) | (.164) | (.149) | (.142) |
| Distributions from Realized Capital Gains | — | — | — | — | — | — |
| Total Distributions | | (.150) | (. 241) | (. 306) | (.164) | (.149) | (.142) |
| Net Asset Value, End of Period | | $17.83 | $16.14 | $13.95 | $12.99 | $12.74 | $10.28 |
| Total Return2 | | 11.45% | 17.61% | 9.95% | 3.25% | 25.58% | 25.90% |
| Ratios/Supplemental Data | | | | | | | |
| Net Assets, End of Period (Millions) | $2,399 | $1,952 | $1,435 | $1,131 | $800 | $553 |
| Ratio of Total Expenses to | | | | | | | |
| Average Net Assets | | 0.20% | 0.20% | 0.22% | 0.25% | 0.27% | 0.28% |
| Ratio of Net Investment Income to | | | | | | |
| Average Net Assets | | 1.46% | 1.71% | 1.87% | 1.63% | 1.51% | 1.63% |
| Portfolio Turnover Rate | | 10% | 11% | 16%3 | 20%3 | 14%3 | 29% |
The expense ratio, net investment income ratio, and turnover rate for the current period have been annualized.
1 Calculated based on average shares outstanding.
2 Total returns do not include account service fees that may have applied in the periods shown. Fund prospectuses provide information
about any applicable account service fees.
3 Excludes the value of portfolio securities received or delivered as a result of in-kind purchases or redemptions of the fund’s capital shares.
See accompanying Notes, which are an integral part of the Financial Statements.
18
| | | | | | | |
| FTSE Social Index Fund | | | | | | | |
| |
| |
| Financial Highlights | | | | | | |
| |
| |
| Institutional Shares | | | | | | | |
| | Six Months | | | | | |
| | | Ended | | | | | |
| For a Share Outstanding | February 28, | | | Year Ended August 31, |
| Throughout Each Period | | 2018 | 2017 | 2016 | 2015 | 2014 | 2013 |
| Net Asset Value, Beginning of Period | $16.15 | $13.96 | $13.00 | $12.75 | $10.29 | $8.31 |
| Investment Operations | | | | | | | |
| Net Investment Income | | .1321 | .2711 | .254 | .193 | .180 | .163 |
| Net Realized and Unrealized Gain (Loss) | | | | | | |
| on Investments | | 1.713 | 2.175 | 1.029 | .233 | 2.440 | 1.971 |
| Total from Investment Operations | 1.845 | 2.446 | 1.283 | .426 | 2.620 | 2.134 |
| Distributions | | | | | | | |
| Dividends from Net Investment Income | (.155) | (. 256) | (. 323) | (.176) | (.160) | (.154) |
| Distributions from Realized Capital Gains | — | — | — | — | — | — |
| Total Distributions | | (.155) | (. 256) | (. 323) | (.176) | (.160) | (.154) |
| Net Asset Value, End of Period | | $17.84 | $16.15 | $13.96 | $13.00 | $12.75 | $10.29 |
| Total Return | | 11.48% | 17.72% | 10.09% | 3.34% | 25.68% | 26.05% |
| Ratios/Supplemental Data | | | | | | | |
| Net Assets, End of Period (Millions) | $1,665 | $1,443 | $876 | $706 | $429 | $276 |
| Ratio of Total Expenses to | | | | | | | |
| Average Net Assets | | 0.12% | 0.12% | 0.12% | 0.15% | 0.16% | 0.16% |
| Ratio of Net Investment Income to | | | | | | |
| Average Net Assets | | 1.54% | 1.79% | 1.97% | 1.73% | 1.62% | 1.75% |
| Portfolio Turnover Rate | | 10% | 11% | 16%2 | 20%2 | 14%2 | 29% |
The expense ratio, net investment income ratio, and turnover rate for the current period have been annualized.
1 Calculated based on average shares outstanding.
2 Excludes the value of portfolio securities received or delivered as a result of in-kind purchases or redemptions of the fund’s capital shares.
See accompanying Notes, which are an integral part of the Financial Statements.
19
FTSE Social Index Fund
Notes to Financial Statements
Vanguard FTSE Social Index Fund is registered under the Investment Company Act of 1940 as an open-end investment company, or mutual fund. The fund offers two classes of shares: Investor Shares and Institutional Shares. Investor Shares are available to any investor who meets the fund’s minimum purchase requirements. Institutional Shares are designed for investors who meet certain administrative, service, and account-size criteria.
A. The following significant accounting policies conform to generally accepted accounting principles for U.S. investment companies. The fund consistently follows such policies in preparing its financial statements.
1. Security Valuation: Securities are valued as of the close of trading on the New York Stock Exchange (generally 4 p.m., Eastern time) on the valuation date. Equity securities are valued at the latest quoted sales prices or official closing prices taken from the primary market in which each security trades; such securities not traded on the valuation date are valued at the mean of the latest quoted bid and asked prices. Securities for which market quotations are not readily available, or whose values have been materially affected by events occurring before the fund’s pricing time but after the close of the securities’ primary markets, are valued by methods deemed by the board of trustees to represent fair value. Investments in Vanguard Market Liquidity Fund are valued at that fund’s net asset value. Temporary cash investments are valued using the latest bid prices or using valuations based on a matrix system (which considers such factors as security prices, yields, maturities, and ratings), both as furnished by independent pricing services.
2. Futures Contracts: The fund uses index futures contracts to a limited extent, with the objectives of maintaining full exposure to the stock market, maintaining liquidity, and minimizing transaction costs. The fund may purchase futures contracts to immediately invest incoming cash in the market, or sell futures in response to cash outflows, thereby simulating a fully invested position in the underlying index while maintaining a cash balance for liquidity. The primary risks associated with the use of futures contracts are imperfect correlation between changes in market values of stocks held by the fund and the prices of futures contracts, and the possibility of an illiquid market. Counterparty risk involving futures is mitigated because a regulated clearinghouse is the counterparty instead of the clearing broker. To further mitigate counterparty risk, the fund trades futures contracts on an exchange, monitors the financial strength of its clearing brokers and clearinghouse, and has entered into clearing agreements with its clearing brokers. The clearinghouse imposes initial margin requirements to secure the fund’s performance and requires daily settlement of variation margin representing changes in the market value of each contract.
Futures contracts are valued at their quoted daily settlement prices. The notional amounts of the contracts are not recorded in the Statement of Net Assets. Fluctuations in the value of the contracts are recorded in the Statement of Net Assets as an asset (liability) and in the Statement of Operations as unrealized appreciation (depreciation) until the contracts are closed, when they are recorded as realized futures gains (losses).
During the six months ended February 28, 2018, the fund’s average investments in long and short futures contracts represented less than 1% and 0% of net assets, respectively, based on the average of the notional amounts at each quarter-end during the period.
20
FTSE Social Index Fund
3. Federal Income Taxes: The fund intends to continue to qualify as a regulated investment company and distribute all of its taxable income. Management has analyzed the fund’s tax positions taken for all open federal income tax years (August 31, 2014–2017), and for the period ended February 28, 2018, and has concluded that no provision for federal income tax is required in the fund’s financial statements.
4. Distributions: Distributions to shareholders are recorded on the ex-dividend date.
5. Securities Lending: To earn additional income, the fund lends its securities to qualified institutional borrowers. Security loans are subject to termination by the fund at any time, and are required to be secured at all times by collateral in an amount at least equal to the market value of securities loaned. Daily market fluctuations could cause the value of loaned securities to be more or less than the value of the collateral received. When this occurs, the collateral is adjusted and settled on the next business day. The fund further mitigates its counterparty risk by entering into securities lending transactions only with a diverse group of prequalified counterparties, monitoring their financial strength, and entering into master securities lending agreements with its counterparties. The master securities lending agreements provide that, in the event of a counterparty’s default (including bankruptcy), the fund may terminate any loans with that borrower, determine the net amount owed, and sell or retain the collateral up to the net amount owed to the fund; however, such actions may be subject to legal proceedings. While collateral mitigates counterparty risk, in the event of a default, the fund may experience delays and costs in recovering the securities loaned. The fund invests cash collateral received in Vanguard Market Liquidity Fund, and records a liability in the Statement of Net Assets for the return of the collateral, during the period the securities are on loan. Securities lending income represents fees charged to borrowers plus income earned on invested cash collateral, less expenses associated with the loan. During the term of the loan, the fund is entitled to all distributions made on or in respect of the loaned securities.
6. Credit Facility: The fund and certain other funds managed by The Vanguard Group (“Vanguard”) participate in a $3.1 billion committed credit facility provided by a syndicate of lenders pursuant to a credit agreement that may be renewed annually; each fund is individually liable for its borrowings, if any, under the credit facility. Borrowings may be utilized for temporary and emergency purposes, and are subject to the fund’s regulatory and contractual borrowing restrictions. The participating funds are charged administrative fees and an annual commitment fee of 0.10% of the undrawn amount of the facility; these fees are allocated to the funds based on a method approved by the fund’s board of trustees and included in Management and Administrative expenses on the fund’s Statement of Operations. Any borrowings under this facility bear interest at a rate based upon the higher of the one-month London Interbank Offered Rate, federal funds effective rate, or overnight bank funding rate plus an agreed-upon spread.
The fund had no borrowings outstanding at February 28, 2018, or at any time during the period then ended.
7. Other: Dividend income is recorded on the ex-dividend date. Interest income includes income distributions received from Vanguard Market Liquidity Fund and is accrued daily. Premiums and discounts on debt securities purchased are amortized and accreted, respectively, to interest income over the lives of the respective securities. Security transactions are accounted for on the date securities are bought or sold. Costs used to determine realized gains (losses) on the sale of investment securities are those of the specific securities sold.
21
FTSE Social Index Fund
Each class of shares has equal rights as to assets and earnings, except that each class separately bears certain class-specific expenses related to maintenance of shareholder accounts (included in Management and Administrative expenses), shareholder reporting, and the proxy. Marketing and distribution expenses are allocated to each class of shares based on a method approved by the board of trustees. Income, other non-class-specific expenses, and gains and losses on investments are allocated to each class of shares based on its relative net assets.
B. In accordance with the terms of a Funds’ Service Agreement (the “FSA”) between Vanguard and the fund, Vanguard furnishes to the fund investment advisory, corporate management, administrative, marketing, and distribution services at Vanguard’s cost of operations (as defined by the FSA). These costs of operations are allocated to the fund based on methods and guidelines approved by the board of trustees. Vanguard does not require reimbursement in the current period for certain costs of operations (such as deferred compensation/benefits and risk/insurance costs); the fund’s liability for these costs of operations is included in Payables to Vanguard on the Statement of Net Assets. All other costs of operations payable to Vanguard are generally settled twice a month.
Upon the request of Vanguard, the fund may invest up to 0.40% of its net assets as capital in Vanguard. At February 28, 2018, the fund had contributed to Vanguard capital in the amount of $219,000, representing 0.01% of the fund’s net assets and 0.08% of Vanguard’s capitalization. The fund’s trustees and officers are also directors and employees, respectively, of Vanguard.
C. Various inputs may be used to determine the value of the fund’s investments. These inputs are summarized in three broad levels for financial statement purposes. The inputs or methodologies used to value securities are not necessarily an indication of the risk associated with investing in those securities.
Level 1—Quoted prices in active markets for identical securities.
Level 2—Other significant observable inputs (including quoted prices for similar securities, interest
rates, prepayment speeds, credit risk, etc.).
Level 3—Significant unobservable inputs (including the fund’s own assumptions used to determine
the fair value of investments). Any investments valued with significant unobservable inputs are
noted on the Statement of Net Assets.
The following table summarizes the market value of the fund’s investments as of February 28, 2018, based on the inputs used to value them:
| | | |
| | Level 1 | Level 2 | Level 3 |
| Investments | ($000) | ($000) | ($000) |
| Common Stocks | 4,050,396 | — | 23 |
| Temporary Cash Investments | 18,757 | 648 | — |
| Futures Contracts—Liabilities1 | (151) | — | — |
| Total | 4,069,002 | 648 | 23 |
| 1 Represents variation margin on the last day of the reporting period. | | | |
22
FTSE Social Index Fund
D. Distributions are determined on a tax basis and may differ from net investment income and realized capital gains for financial reporting purposes. Differences may be permanent or temporary. Permanent differences are reclassified among capital accounts in the financial statements to reflect their tax character. Temporary differences arise when certain items of income, expense, gain, or loss are recognized in different periods for financial statement and tax purposes. These differences will reverse at some time in the future. Differences in classification may also result from the treatment of short-term gains as ordinary income for tax purposes.
The fund’s tax-basis capital gains and losses are determined only at the end of each fiscal year. For tax purposes, at August 31, 2017, the fund had available capital losses totaling $26,035,000 to offset future net capital gains. Of this amount, $394,000 is subject to expiration on August 31, 2019. Capital losses of $25,641,000 realized beginning in fiscal 2012 may be carried forward indefinitely under the Regulated Investment Company Modernization Act of 2010, but must be used before any expiring loss carryforwards. The fund will use these capital losses to offset net taxable capital gains, if any, realized during the year ending August 31, 2018; should the fund realize net capital losses for the year, the losses will be added to the loss carryforward balance above.
At February 28, 2018, the cost of investment securities for tax purposes was $2,814,986,000. Net unrealized appreciation of investment securities for tax purposes was $1,254,838,000, consisting of unrealized gains of $1,298,156,000 on securities that had risen in value since their purchase and $43,318,000 in unrealized losses on securities that had fallen in value since their purchase.
E. During the six months ended February 28, 2018, the fund purchased $491,345,000 of investment securities and sold $193,347,000 of investment securities, other than temporary cash investments.
The fund purchased securities from and sold securities to other Vanguard funds or accounts managed by Vanguard or its affiliates, in accordance with procedures adopted by the board of trustees in compliance with Rule 17a-7 of the Investment Company Act of 1940. For the six months ended February 28, 2018, such purchases and sales were $57,640,000 and $37,334,000, respectively; these amounts are included in the purchases and sales of investment securities noted above.
23
FTSE Social Index Fund
| | | | |
| F. Capital share transactions for each class of shares were: | | | |
| | Six Months Ended | | Year Ended |
| | February 28, 2018 | August 31, 2017 |
| | Amount | Shares | Amount | Shares |
| | ($000) | (000) | ($000) | (000) |
| Investor Shares | | | | |
| Issued | 397,332 | 22,863 | 569,817 | 37,790 |
| Issued in Lieu of Cash Distributions | 16,480 | 976 | 23,412 | 1,593 |
| Redeemed | (178,531) | (10,272) | (319,172) | (21,307) |
| Net Increase (Decrease)—Investor Shares | 235,281 | 13,567 | 274,057 | 18,076 |
| Institutional Shares | | | | |
| Issued | 155,640 | 9,019 | 500,495 | 33,070 |
| Issued in Lieu of Cash Distributions | 13,935 | 825 | 17,987 | 1,217 |
| Redeemed | (104,434) | (5,907) | (113,578) | (7,688) |
| Net Increase (Decrease)—Institutional Shares | 65,141 | 3,937 | 404,904 | 26,599 |
G. Management has determined that no material events or transactions occurred subsequent to February 28, 2018, that would require recognition or disclosure in these financial statements.
24
About Your Fund’s Expenses
As a shareholder of the fund, you incur ongoing costs, which include costs for portfolio management, administrative services, and shareholder reports (like this one), among others. Operating expenses, which are deducted from a fund’s gross income, directly reduce the investment return of the fund.
A fund’s expenses are expressed as a percentage of its average net assets. This figure is known as the expense ratio. The following examples are intended to help you understand the ongoing costs (in dollars) of investing in your fund and to compare these costs with those of other mutual funds. The examples are based on an investment of $1,000 made at the beginning of the period shown and held for the entire period.
The accompanying table illustrates your fund’s costs in two ways:
• Based on actual fund return. This section helps you to estimate the actual expenses that you paid over the period. The ”Ending Account Value“ shown is derived from the fund‘s actual return, and the third column shows the dollar amount that would have been paid by an investor who started with $1,000 in the fund. You may use the information here, together with the amount you invested, to estimate the expenses that you paid over the period.
To do so, simply divide your account value by $1,000 (for example, an $8,600 account value divided by $1,000 = 8.6), then multiply the result by the number given for your fund under the heading ”Expenses Paid During Period.“
• Based on hypothetical 5% yearly return. This section is intended to help you compare your fund‘s costs with those of other mutual funds. It assumes that the fund had a yearly return of 5% before expenses, but that the expense ratio is unchanged. In this case—because the return used is not the fund’s actual return—the results do not apply to your investment. The example is useful in making comparisons because the Securities and Exchange Commission requires all mutual funds to calculate expenses based on a 5% return. You can assess your fund’s costs by comparing this hypothetical example with the hypothetical examples that appear in shareholder reports of other funds.
Note that the expenses shown in the table are meant to highlight and help you compare ongoing costs only and do not reflect transaction costs incurred by the fund for buying and selling securities. Further, the expenses do not include any purchase, redemption, or account service fees described in the fund prospectus. If such fees were applied to your account, your costs would be higher. Your fund does not carry a “sales load.”
The calculations assume no shares were bought or sold during the period. Your actual costs may have been higher or lower, depending on the amount of your investment and the timing of any purchases or redemptions.
You can find more information about the fund’s expenses, including annual expense ratios, in the Financial Statements section of this report. For additional information on operating expenses and other shareholder costs, please refer to your fund’s current prospectus.
25
| | | |
| Six Months Ended February 28, 2018 | | | |
| | Beginning | Ending | Expenses |
| | Account Value | Account Value | Paid During |
| FTSE Social Index Fund | 8/31/2017 | 2/28/2018 | Period |
| Based on Actual Fund Return | | | |
| Investor Shares | $1,000.00 | $1,114.53 | $1.05 |
| Institutional Shares | 1,000.00 | 1,114.79 | 0.63 |
| Based on Hypothetical 5% Yearly Return | | | |
| Investor Shares | $1,000.00 | $1,023.80 | $1.00 |
| Institutional Shares | 1,000.00 | 1,024.20 | 0.60 |
The calculations are based on expenses incurred in the most recent six-month period. The fund’s annualized six-month expense ratios for
that period are 0.20% for Investor Shares and 0.12% for Institutional Shares. The dollar amounts shown as “Expenses Paid” are equal to
the annualized expense ratio multiplied by the average account value over the period, multiplied by the number of days in the most recent
six-month period, then divided by the number of days in the most recent 12-month period (181/365).
26
Glossary
30-Day SEC Yield. A fund’s 30-day SEC yield is derived using a formula specified by the U.S. Securities and Exchange Commission. Under the formula, data related to the fund’s security holdings in the previous 30 days are used to calculate the fund’s hypothetical net income for that period, which is then annualized and divided by the fund’s estimated average net assets over the calculation period. For the purposes of this calculation, a security’s income is based on its current market yield to maturity (for bonds), its actual income (for asset-backed securities), or its projected dividend yield (for stocks). Because the SEC yield represents hypothetical annualized income, it will differ—at times significantly—from the fund’s actual experience. As a result, the fund’s income distributions may be higher or lower than implied by the SEC yield.
Beta. A measure of the magnitude of a fund’s past share-price fluctuations in relation to the ups and downs of a given market index. The index is assigned a beta of 1.00. Compared with a given index, a fund with a beta of 1.20 typically would have seen its share price rise or fall by 12% when the index rose or fell by 10%. For this report, beta is based on returns over the past 36 months for both the fund and the index. Note that a fund’s beta should be reviewed in conjunction with its R-squared (see definition). The lower the R-squared, the less correlation there is between the fund and the index, and the less reliable beta is as an indicator of volatility.
Dividend Yield. Dividend income earned by stocks, expressed as a percentage of the aggregate market value (or of net asset value, for a fund). The yield is determined by dividing the amount of the annual dividends by the aggregate value (or net asset value) at the end of the period. For a fund, the dividend yield is based solely on stock holdings and does not include any income produced by other investments.
Earnings Growth Rate. The average annual rate of growth in earnings over the past five years for the stocks now in a fund.
Equity Exposure. A measure that reflects a fund’s investments in stocks and stock futures. Any holdings in short-term reserves are excluded.
Expense Ratio. A fund’s total annual operating expenses expressed as a percentage of the fund’s average net assets. The expense ratio includes management and administrative expenses, but does not include the transaction costs of buying and selling portfolio securities.
Foreign Holdings. The percentage of a fund represented by securities or depositary receipts of companies based outside the United States.
Inception Date. The date on which the assets of a fund (or one of its share classes) are first invested in accordance with the fund’s investment objective. For funds with a subscription period, the inception date is the day after that period ends. Investment performance is measured from the inception date.
Median Market Cap. An indicator of the size of companies in which a fund invests; the midpoint of market capitalization (market price x shares outstanding) of a fund’s stocks, weighted by the proportion of the fund’s assets invested in each stock. Stocks representing half of the fund’s assets have market capitalizations above the median, and the rest are below it.
Price/Book Ratio. The share price of a stock divided by its net worth, or book value, per share. For a fund, the weighted average price/book ratio of the stocks it holds.
27
Price/Earnings Ratio. The ratio of a stock’s current price to its per-share earnings over the past year. For a fund, the weighted average P/E of the stocks it holds. P/E is an indicator of market expectations about corporate prospects; the higher the P/E, the greater the expectations for a company’s future growth.
R-Squared. A measure of how much of a fund’s past returns can be explained by the returns from the market in general, as measured by a given index. If a fund’s total returns were precisely synchronized with an index’s returns, its R-squared would be 1.00. If the fund’s returns bore no relationship to the index’s returns, its R-squared would be 0. For this report, R-squared is based on returns over the past 36 months for both the fund and the index.
Return on Equity. The annual average rate of return generated by a company during the past five years for each dollar of shareholder’s equity (net income divided by shareholder’s equity). For a fund, the weighted average return on equity for the companies whose stocks it holds.
Short-Term Reserves. The percentage of a fund invested in highly liquid, short-term securities that can be readily converted to cash.
Turnover Rate. An indication of the fund’s trading activity. Funds with high turnover rates incur higher transaction costs and may be more likely to distribute capital gains (which may be taxable to investors). The turnover rate excludes in-kind transactions, which have minimal impact on costs.
28
This page intentionally left blank.
This page intentionally left blank.
The People Who Govern Your Fund
The trustees of your mutual fund are there to see that the fund is operated and managed in your best interests since, as a shareholder, you are a part owner of the fund. Your fund’s trustees also serve on the board of directors of The Vanguard Group, Inc., which is owned by the Vanguard funds and provides services to them on an at-cost basis.
A majority of Vanguard’s board members are independent, meaning that they have no affiliation with Vanguard or the funds they oversee, apart from the sizable personal investments they have made as private individuals. The independent board members have distinguished backgrounds in business, academia, and public service. Each of the trustees and executive officers oversees 208 Vanguard funds.
Information for each trustee and executive officer of the fund appears below. The mailing address of the trustees and officers is P.O. Box 876, Valley Forge, PA 19482. More information about the trustees is in the Statement of Additional Information, which can be obtained, without charge, by contacting Vanguard at 800-662-7447, or online at vanguard.com.
Interested Trustees1
F. William McNabb III
Born in 1957. Trustee since July 2009. Principal occupation(s) during the past five years and other experience: chairman of the board (January 2010–present) of Vanguard and of each of the investment companies served by Vanguard, trustee (2009–present) of each of the investment companies served by Vanguard, and director (2008–present) of Vanguard. Chief executive officer and president (2008–2017) of Vanguard and each of the investment companies served by Vanguard, managing director (1995–2008) of Vanguard, and director (1997–2018) of Vanguard Marketing Corporation. Director (2018–present) of UnitedHealth Group.
Mortimer J. Buckley
Born in 1969. Trustee since January 2018. Principal occupation(s) during the past five years and other experience: chief executive officer (January 2018–present) of Vanguard; chief executive officer, president, and trustee (January 2018–present) of each of the investment companies served by Vanguard; president and director (2017–present) of Vanguard; and president (February 2018–present) of Vanguard Marketing Corporation. Chief investment officer (2013–2017), managing director (2002–2017), head of the Retail Investor Group (2006–2012), and chief information officer (2001–2006) of Vanguard. Chairman of the board (2011–2017) of the Children’s Hospital of Philadelphia.
Independent Trustees
Emerson U. Fullwood
Born in 1948. Trustee since January 2008. Principal occupation(s) during the past five years and other experience: executive chief staff and marketing officer for North America and corporate vice president (retired 2008) of Xerox Corporation (document management products and services). Former president of the Worldwide Channels Group, Latin America, and Worldwide Customer Service and executive chief staff officer of Developing Markets of Xerox. Executive in residence and 2009–2010 Distinguished Minett Professor at the Rochester Institute of Technology. Lead director of SPX FLOW, Inc. (multi-industry manufacturing). Director of the University of Rochester Medical Center, the Monroe Community College Foundation, the United Way of Rochester, North Carolina A&T University, and Roberts Wesleyan College. Trustee of the University of Rochester.
Amy Gutmann
Born in 1949. Trustee since June 2006. Principal occupation(s) during the past five years and other experience: president (2004–present) of the University of Pennsylvania. Christopher H. Browne Distinguished Professor of Political Science, School of Arts and Sciences, and professor of communication, Annenberg School for Communication, with secondary faculty appointments in the Department of Philosophy, School of Arts and Sciences, and at the Graduate School of Education, University of Pennsylvania. Trustee of the National Constitution Center.
1 Mr. McNabb and Mr. Buckley are considered “interested persons,” as defined in the Investment Company Act of 1940, because
they are officers of the Vanguard funds.
JoAnn Heffernan Heisen
Born in 1950. Trustee since July 1998. Principal occupation(s) during the past five years and other experience: corporate vice president of Johnson & Johnson (pharmaceuticals/medical devices/consumer products) and member of its executive committee (1997–2008). Chief global diversity officer (retired 2008), vice president and chief information officer (1997–2006), controller (1995–1997), treasurer (1991–1995), and assistant treasurer (1989–1991) of Johnson & Johnson. Director of Skytop Lodge Corporation (hotels) and the Robert Wood Johnson Foundation. Member of the advisory board of the Institute for Women��s Leadership at Rutgers University.
F. Joseph Loughrey
Born in 1949. Trustee since October 2009. Principal occupation(s) during the past five years and other experience: president and chief operating officer (retired 2009) and vice chairman of the board (2008–2009) of Cummins Inc. (industrial machinery). Chairman of the board of Hillenbrand, Inc. (specialized consumer services), Oxfam America, and the Lumina Foundation for Education. Director of the V Foundation for Cancer Research. Member of the advisory council for the College of Arts and Letters and chair of the advisory board to the Kellogg Institute for International Studies, both at the University of Notre Dame.
Mark Loughridge
Born in 1953. Trustee since March 2012. Principal occupation(s) during the past five years and other experience: senior vice president and chief financial officer (retired 2013) of IBM (information technology services). Fiduciary member of IBM’s Retirement Plan Committee (2004–2013), senior vice president and general manager (2002–2004) of IBM Global Financing, vice president and controller (1998–2002) of IBM, and a variety of other prior management roles at IBM. Member of the Council on Chicago Booth.
Scott C. Malpass
Born in 1962. Trustee since March 2012. Principal occupation(s) during the past five years and other experience: chief investment officer (1989–present) and vice president (1996–present) of the University of Notre Dame. Assistant professor of finance at the Mendoza College of Business, University of Notre Dame, and member of the Notre Dame 403(b) Investment Committee. Chairman of the board of TIFF Advisory Services, Inc. Member of the board of Catholic Investment Services, Inc. (investment advisors), the board of advisors for Spruceview Capital Partners, and the board of superintendence of the Institute for the Works of Religion.
Deanna Mulligan
Born in 1963. Trustee since January 2018. Principal occupation(s) during the past five years and other experience: president (2010–present) and chief executive officer (2011–present) of The Guardian Life Insurance Company of America. Chief operating officer (2010–2011) and executive vice president (2008–2010) of Individual Life and Disability of The Guardian Life Insurance Company of America. Member of the board of The Guardian Life Insurance Company of America, the American Council of Life Insurers, the Partnership for New York City (business leadership), and the Committee Encouraging Corporate Philanthropy. Trustee of the Economic Club of New York and the Bruce Museum (arts and science). Member of the Advisory Council for the Stanford Graduate School of Business.
André F. Perold
Born in 1952. Trustee since December 2004. Principal occupation(s) during the past five years and other experience: George Gund Professor of Finance and Banking, Emeritus at the Harvard Business School (retired 2011). Chief investment officer and co-managing partner of HighVista Strategies LLC (private investment firm). Overseer of the Museum of Fine Arts Boston.
Sarah Bloom Raskin
Born in 1961. Trustee since January 2018. Principal occupation(s) during the past five years and other experience: deputy secretary (2014–2017) of the United States Department of the Treasury. Governor (2010–2014) of the Federal Reserve Board. Commissioner (2007–2010) of financial regulation for the State of Maryland. Member of the board of directors (2012–2014) of Neighborhood Reinvestment Corporation. Director of i(x) Investments, LLC.
Peter F. Volanakis
Born in 1955. Trustee since July 2009. Principal occupation(s) during the past five years and other experience: president and chief operating officer (retired 2010) of Corning Incorporated (communications equipment) and director of Corning Incorporated (2000–2010) and Dow Corning (2001–2010). Director (2012) of SPX Corporation (multi-industry manufacturing). Overseer of the Amos Tuck School of Business Administration, Dartmouth College (2001–2013). Chairman of the board of trustees of Colby-Sawyer College. Member of the Board of Hypertherm Inc. (industrial cutting systems, software, and consumables).
Executive Officers
Glenn Booraem
Born in 1967. Principal occupation(s) during the past five years and other experience: principal of Vanguard. Investment stewardship officer (2017–present), treasurer (2015–2017), controller (2010–2015), and assistant controller (2001–2010) of each of the investment companies served by Vanguard.
Christine M. Buchanan
Born in 1970. Principal occupation(s) during the past five years and other experience: principal of Vanguard and global head of Fund Administration at Vanguard. Treasurer (2017–present) of each of the investment companies served by Vanguard. Partner (2005–2017) at KPMG LLP (audit, tax, and advisory services).
Brian Dvorak
Born in 1973. Principal occupation(s) during the past five years and other experience: principal of Vanguard. Chief compliance officer (2017–present) of Vanguard and each of the investment companies served by Vanguard. Assistant vice president (2017–present) of Vanguard Marketing Corporation. Vice president and director of Enterprise Risk Management (2011–2013) at Oppenheimer Funds, Inc.
Thomas J. Higgins
Born in 1957. Principal occupation(s) during the past five years and other experience: principal of Vanguard. Chief financial officer (2008–present) and treasurer (1998–2008) of each of the investment companies served by Vanguard.
Peter Mahoney
Born in 1974. Principal occupation(s) during the past five years and other experience: principal of Vanguard. Controller (2015–present) of each of the investment companies served by Vanguard. Head of International Fund Services (2008–2014) at Vanguard.
Anne E. Robinson
Born in 1970. Principal occupation(s) during the past five years and other experience: general counsel (2016–present) of Vanguard. Secretary (2016–present) of Vanguard and of each of the investment companies served by Vanguard. Managing director (2016–present) of Vanguard. Director and senior vice president (2016–2018) of Vanguard Marketing Corporation. Managing director and general counsel of Global Cards and Consumer Services (2014–2016) at Citigroup. Counsel (2003–2014) at American Express.
Michael Rollings
Born in 1963. Principal occupation(s) during the past five years and other experience: finance director (2017–present) and treasurer (2017) of each of the investment companies served by Vanguard. Managing director (2016–present) of Vanguard. Chief financial officer (2016–present) of Vanguard. Director (2016–present) of Vanguard Marketing Corporation. Executive vice president and chief financial officer (2006–2016) of MassMutual Financial Group.
| |
| Vanguard Senior Management Team |
| |
| Mortimer J. Buckley | James M. Norris |
| Gregory Davis | Thomas M. Rampulla |
| John James | Karin A. Risi |
| Martha G. King | Anne E. Robinson |
| John T. Marcante | Michael Rollings |
| Chris D. McIsaac | |
Chairman Emeritus and Senior Advisor
John J. Brennan
Chairman, 1996–2009
Chief Executive Officer and President, 1996–2008
Founder
John C. Bogle
Chairman and Chief Executive Officer, 1974–1996
| |
|  |
| | P.O. Box 2600 |
| | Valley Forge, PA 19482-2600 |
| |
| |
| |
| Connect with Vanguard® > vanguard.com |
| |
| |
| |
| Fund Information > 800-662-7447 | |
| |
| Direct Investor Account Services > 800-662-2739 | Source for Bloomberg Barclays indexes: Bloomberg |
| Institutional Investor Services > 800-523-1036 | Index Services Limited. Copyright 2018, Bloomberg. |
| | All rights reserved. |
| Text Telephone for People | |
| Who Are Deaf or Hard of Hearing > 800-749-7273 | London Stock Exchange Group companies include |
| | FTSE International Limited (”FTSE”), Frank Russell |
| This material may be used in conjunction | Company (”Russell”), MTS Next Limited (”MTS”), and |
| with the offering of shares of any Vanguard | FTSE TMX Global Debt Capital Markets Inc. (”FTSE |
| fund only if preceded or accompanied by | TMX”). All rights reserved. ”FTSE®”, “Russell®”, |
| the fund’s current prospectus. | ”MTS®”, ”FTSE TMX®” and ”FTSE Russell” and other |
| | service marks and trademarks related to the FTSE or |
| All comparative mutual fund data are from Lipper, a | Russell indexes are trademarks of the London Stock |
| Thomson Reuters Company, or Morningstar, Inc., unless | Exchange Group companies and are used by FTSE, |
| otherwise noted. | MTS, FTSE TMX and Russell under licence. All |
| | information is provided for information purposes only. |
| You can obtain a free copy of Vanguard’s proxy voting | No responsibility or liability can be accepted by the |
| guidelines by visiting vanguard.com/proxyreporting or by | London Stock Exchange Group companies nor its |
| calling Vanguard at 800-662-2739. The guidelines are | licensors for any errors or for any loss from use of this |
| also available from the SEC’s website, sec.gov. In | publication. Neither the London Stock Exchange |
| addition, you may obtain a free report on how your fund | Group companies nor any of its licensors make any |
| voted the proxies for securities it owned during the 12 | claim, prediction, warranty or representation |
| months ended June 30. To get the report, visit either | whatsoever, expressly or impliedly, either as to the |
| vanguard.com/proxyreporting or sec.gov. | results to be obtained from the use of the FTSE4Good |
| You can review and copy information about your fund at | US Select Index or the fitness or suitability of the |
| the SEC’s Public Reference Room in Washington, D.C. To | FTSE4Good US Select Index for any particular purpose |
| find out more about this public service, call the SEC at | to which it might be put. |
| 202-551-8090. Information about your fund is also | The Industry Classification Benchmark (”ICB”) is |
| available on the SEC’s website, and you can receive | owned by FTSE. FTSE does not accept any liability to |
| copies of this information, for a fee, by sending a | any person for any loss or damage arising out of any |
| request in either of two ways: via email addressed to | error or omission in the ICB. |
| publicinfo@sec.gov or via regular mail addressed to the | |
| Public Reference Section, Securities and Exchange | |
| Commission, Washington, DC 20549-1520. | |
| | © 2018 The Vanguard Group, Inc. |
| | All rights reserved. |
| | Vanguard Marketing Corporation, Distributor. |
| |
| | Q2132 042018 |

Semiannual Report | February 28, 2018
Vanguard U.S. Sector Index Funds
Vanguard Consumer Discretionary Index Fund
Vanguard Consumer Staples Index Fund
Vanguard Energy Index Fund
Vanguard Financials Index Fund
Vanguard Health Care Index Fund
Vanguard Industrials Index Fund
Vanguard Information Technology Index Fund
Vanguard Materials Index Fund
Vanguard Telecommunication Services Index Fund
Vanguard Utilities Index Fund
Vanguard’s Principles for Investing Success
We want to give you the best chance of investment success. These principles, grounded in Vanguard’s research and experience, can put you on the right path.
Goals. Create clear, appropriate investment goals.
Balance. Develop a suitable asset allocation using broadly diversified funds.
Cost. Minimize cost.
Discipline. Maintain perspective and long-term discipline.
A single theme unites these principles: Focus on the things you can control.
We believe there is no wiser course for any investor.
| |
| Contents | |
| |
| Your Fund’s Performance at a Glance | 1 |
| CEO’s Perspective | 3 |
| Consumer Discretionary Index Fund | 7 |
| Consumer Staples Index Fund | 18 |
| Energy Index Fund | 28 |
| Financials Index Fund | 38 |
| Health Care Index Fund | 50 |
| Industrials Index Fund | 61 |
| Information Technology Index Fund | 72 |
| Materials Index Fund | 83 |
| Telecommunication Services Index Fund | 93 |
| Utilities Index Fund | 104 |
| About Your Fund’s Expenses | 113 |
| Glossary | 115 |

Please note: The opinions expressed in this report are just that—informed opinions. They should not be considered promises or advice. Also, please keep in mind that the information and
opinions cover the period through the date on the front of this report. Of course, the risks of investing in your fund are spelled out in the prospectus.
See the Glossary for definitions of investment terms used in this report.
About the cover: Nautical images have been part of Vanguard’s rich heritage since its start in 1975. For an incoming ship, a lighthouse offers a beacon and safe path to shore.
You can similarly depend on Vanguard to put you first—and light the way—as you strive to meet your financial goals. Our client focus and low costs, stemming from our unique
ownership structure, assure that your interests are paramount.
Your Fund’s Performance at a Glance
• For the six months ended February 28, 2018, returns for the Vanguard U.S. Sector Index Funds ranged from about –9% to about 18%. All ten funds closely tracked their target indexes. Compared with their peer groups, results were mixed.
• Strong corporate earnings helped the information technology sector top the leaderboard.
Sectors that are more defensive, such as utilities and telecommunication services, lagged.
• Please note that the index provider intends to broaden the telecommunication services sector and rename it the communication services sector. Our fund for that sector will reflect the change, becoming Vanguard Communication Services Index Fund. This expanded sector will include some companies currently in the consumer discretionary and information technology sectors. The changes to the three indexes will take effect in the second half of 2018, but we will transition the three Vanguard funds that seek to track those indexes in advance to minimize the market impact of the trades.
Total Returns: Six Months Ended February 28, 2018
ETF Shares1 and Admiral™ Shares2
| | |
| Total |
| Returns |
| Vanguard Consumer Discretionary ETF | |
| Market Price | 15.69% |
| Net Asset Value | 15.59 |
| Vanguard Consumer Discretionary Index Fund 15.60 |
| MSCI US IMI/Consumer Discretionary 25/50 | 15.62 |
| Consumer Services Funds Average3 | 13.54 |
| |
| Vanguard Consumer Staples ETF | |
| Market Price | -0.61% |
| Net Asset Value | -0.61 |
| Vanguard Consumer Staples Index Fund | -0.62 |
| MSCI US IMI/Consumer Staples 25/50 | -0.57 |
| Consumer Goods Funds Average3 | 3.45 |
| |
| Vanguard Energy ETF | |
| Market Price | 8.34% |
| Net Asset Value | 8.31 |
| Vanguard Energy Index Fund | 8.31 |
| MSCI US IMI/Energy 25/50 | 8.35 |
| Natural Resources Funds Average3 | 8.48 |
| |
| Vanguard Financials ETF | |
| Market Price | 16.83% |
| Net Asset Value | 16.81 |
| Vanguard Financials Index Fund | 16.81 |
| MSCI US IMI/Financials 25/50 | 16.86 |
| Financial Services Funds Average3 | 12.78 |
| | |
| Total |
| Returns |
| Vanguard Health Care ETF | |
| Market Price | 5.14% |
| Net Asset Value | 5.09 |
| Vanguard Health Care Index Fund | 5.08 |
| MSCI US IMI/Health Care 25/50 | 5.12 |
| Health/Biotechnology Funds Average3 | 5.59 |
| |
| Vanguard Industrials ETF | |
| Market Price | 11.72% |
| Net Asset Value | 11.67 |
| Vanguard Industrials Index Fund | 11.67 |
| MSCI US IMI/Industrials 25/50 | 11.75 |
| Industrials Funds Average3 | 11.59 |
| |
| Vanguard Information Technology ETF | |
| Market Price | 18.00% |
| Net Asset Value | 17.91 |
| Vanguard Information Technology Index Fund | 17.91 |
| MSCI US IMI/Information Technology 25/50 | 17.96 |
| Science and Technology Funds Average3 | 16.29 |
| |
| Vanguard Materials ETF | |
| Market Price | 9.00% |
| Net Asset Value | 8.92 |
| Vanguard Materials Index Fund | 8.91 |
| MSCI US IMI/Materials 25/50 | 8.80 |
| Basic Materials Funds Average3 | 10.15 |
| | |
| Total |
| Returns |
| Vanguard Telecommunication Services ETF | |
| Market Price | -5.11% |
| Net Asset Value | -5.17 |
| Vanguard Telecommunication Services | |
| Index Fund | -5.19 |
| MSCI US IMI/Telecommunication | |
| Services 25/50 | -5.32 |
| Telecommunication Funds Average3 | -0.36 |
| |
| Vanguard Utilities ETF | |
| Market Price | -8.87% |
| Net Asset Value | -8.90 |
| Vanguard Utilities Index Fund | -8.90 |
| MSCI US IMI/Utilities 25/50 | -8.87 |
| Utility Funds Average3 | -7.82 |
| | |
| MSCI US IMI/2500 | 10.46% |
1 The Vanguard ETF® Shares shown are traded on the NYSE Arca exchange and are available only through brokers. The table provides ETF returns based on both the NYSE Arca market price and the net asset value
for a share. U.S. Pat. Nos. 6,879,964; 7,337,138; 7,720,749; 7,925,573; 8,090,646; and 8,417,623.
2 Admiral Shares carry lower expenses and are available to investors who meet certain account-balance requirements.
3 Derived from data provided by Lipper, a Thomson Reuters Company.
For the ETF Shares, the market price is determined by the midpoint of the bid-offer spread as of the closing time of the New York Stock Exchange (generally 4 p.m., Eastern time). The net asset value is also
determined as of the NYSE closing time. For more information about how the ETF Shares’ market prices have compared with their net asset value, visit vanguard.com, select your ETF, and then select the Price
and Performance tab. The ETF premium/discount analysis there shows the percentages of days on which the ETF Shares’ market price was above or below the NAV.
Note: MSCI US IMI/2500 is the MSCI® US Investable Market 2500 Index.
1
Expense Ratios
Your Fund Compared With Its Peer Group
| | | |
| ETF | Admiral | Peer Group |
| Shares | Shares | Average |
| Consumer Discretionary Index Fund | 0.10% | 0.10% | 1.36% |
| Consumer Staples Index Fund | 0.10 | 0.10 | 1.37 |
| Energy Index Fund | 0.10 | 0.10 | 1.61 |
| Financials Index Fund | 0.10 | 0.10 | 1.54 |
| Health Care Index Fund | 0.10 | 0.10 | 1.37 |
| Industrials Index Fund | 0.10 | 0.10 | 1.34 |
| Information Technology Index Fund | 0.10 | 0.10 | 1.43 |
| Materials Index Fund | 0.10 | 0.10 | 1.25 |
| Telecommunication Services Index Fund | 0.10 | 0.10 | 1.42 |
| Utilities Index Fund | 0.10 | 0.10 | 1.22 |
The fund expense ratios shown are from the prospectus dated December 21, 2017, and represent estimated costs for the current fiscal
year. For the six months ended February 28, 2018, the fund annualized expense ratios were: for the Consumer Discretionary Index Fund,
0.10% for ETF Shares and 0.10% for Admiral Shares; for the Consumer Staples Index Fund, 0.10% for ETF Shares and 0.10% for Admiral
Shares; for the Energy Index Fund, 0.10% for ETF Shares and 0.10% for Admiral Shares; for the Financials Index Fund, 0.10% for ETF
Shares and 0.10% for Admiral Shares; for the Health Care Index Fund, 0.10% for ETF Shares and 0.10% for Admiral Shares; for the
Industrials Index Fund, 0.10% for ETF Shares and 0.10% for Admiral Shares; for the Information Technology Index Fund, 0.10% for
ETF Shares and 0.10% for Admiral Shares; for the Materials Index Fund, 0.10% for ETF Shares and 0.10% for Admiral Shares; for the
Telecommunication Services Index Fund, 0.10% for ETF Shares and 0.10% for Admiral Shares; for the Utilities Index Fund, 0.10% for
ETF Shares and 0.10% for Admiral Shares. Peer-group expense ratios are derived from data provided by Lipper, a Thomson Reuters
Company, and capture information through year-end 2017.
Peer groups are: for the Consumer Discretionary Index Fund, Consumer Services Funds; for the Consumer Staples Index Fund, Consumer
Goods Funds; for the Energy Index Fund, Natural Resources Funds; for the Financials Index Fund, Financial Services Funds; for the Health
Care Index Fund, Health/Biotechnology Funds; for the Industrials Index Fund, Industrials Funds; for the Information Technology Index
Fund, Science and Technology Funds; for the Materials Index Fund, Basic Materials Funds; for the Telecommunication Services Index
Fund, Telecommunication Funds; for the Utilities Index Fund, Utility Funds.
2
CEO’s Perspective

Tim Buckley
President and Chief Executive Officer
Dear Shareholder,
As I begin my tenure as Vanguard’s fourth chief executive, I’ve been reflecting on both the past and the future of the company where I have spent my entire professional career.
I feel extremely fortunate to have the chance to lead a company filled with people who come to work every day passionate about Vanguard’s core purpose: to take a stand for all investors, to treat them fairly, and to give them the best chance for investment success.
Making a real difference
When I joined Vanguard in 1991, I found a mission-driven team focused on improving lives—helping people retire more comfortably, put their children through college, and achieve financial security. I found a company with purpose in an industry ripe for improvement.
It was clear, even early in my career, that the cards were stacked against most investors. Hidden fees, performance-chasing, and poor advice were relentlessly eroding investors’ dreams.
We knew Vanguard could be different and, as a result, could make a real difference. Over the past 25 years, for example, Vanguard has lowered our funds’ asset-weighted average expense ratio from 0.31% to 0.12%. And over the past decade, 94% of our funds have beaten the average annual return of their peers.1
Focused on your success
Vanguard is built for Vanguard investors—as a client-owned company, we focus solely on you, our fund shareholders. Everything we do is designed to give our clients the best chance for investment success. In my role as CEO, I intend to keep this priority front and center. We’re proud of what we’ve achieved, but we’re even more excited about what’s to come.
As I write this, we’ve experienced a period of pronounced market volatility. Strong economic growth and budding signs of inflation have raised concerns about a more aggressive Federal Reserve. Although volatility can test investors’ nerves, we sometimes think of this as “Vanguard weather”—a time when having a disciplined, low-cost, and long-term approach to investment management serves investors well.
| | | |
| Market Barometer | | | |
| | | Total Returns |
| | Periods Ended February 28, 2018 |
| Six | One | Five Years |
| Months | Year | (Annualized) |
| Stocks | | | |
| Russell 1000 Index (Large-caps) | 10.62% | 16.70% | 14.56% |
| Russell 2000 Index (Small-caps) | 8.30 | 10.51 | 12.19 |
| Russell 3000 Index (Broad U.S. market) | 10.45 | 16.22 | 14.37 |
| FTSE All-World ex US Index (International) | 7.84 | 21.50 | 6.69 |
| |
| Bonds | | | |
| Bloomberg Barclays U.S. Aggregate Bond Index | | | |
| (Broad taxable market) | -2.18% | 0.51% | 1.71% |
| Bloomberg Barclays Municipal Bond Index | | | |
| (Broad tax-exempt market) | -1.24 | 2.50 | 2.57 |
| Citigroup Three-Month U.S. Treasury Bill Index | 0.59 | 0.98 | 0.27 |
| |
| CPI | | | |
| Consumer Price Index | 1.41% | 2.21% | 1.41% |
The performance data shown represent past performance, which is not a guarantee of future results.
1 For the ten-year period through December 31, 2017, 9 of 9 Vanguard money market funds, 56 of 60 bond funds, 21 of 22 balanced funds, and 131 of 140 stock funds, or 217 of 231 Vanguard funds, outperformed their
peer-group averages. Sources: Vanguard, based on data from Lipper, a Thomson Reuters Company.
3
Steady, time-tested guidance
Our guidance for investors, as always, is to stay the course, tune out the hyperbolic headlines, and focus on your goals and what you can control, such as costs and how much you save. This time-tested advice has served our clients well over the decades.
Regardless of how the markets perform in the short term, I’m incredibly optimistic about the future for our investors. We have a dedicated team serving you, and we will never stop striving to make Vanguard the best place for you to invest through our high-quality funds and services, advice and guidance to help you meet your financial goals, and an experience that makes you feel good about entrusting us with your hard-earned savings.
Thank you for your continued loyalty.
Sincerely,

Mortimer J. Buckley
President and Chief Executive Officer
March 19, 2018
4
Results of Proxy Voting
At a special meeting of shareholders on November 15, 2017, fund shareholders approved the following proposals:
Proposal 1—Elect trustees for the fund.*
The individuals listed in the table below were elected as trustees for the fund. All trustees with the exception of Ms. Mulligan, Ms. Raskin, and Mr. Buckley (each of whom already serves as a director of The Vanguard Group, Inc.) served as trustees to the funds prior to the shareholder meeting.
| | | |
| Percentage |
| Trustee | For | Withheld | For |
| Mortimer J. Buckley | 1,040,401,220 | 33,553,324 | 96.9% |
| Emerson U. Fullwood | 1,039,160,376 | 34,794,169 | 96.8% |
| Amy Gutmann | 1,040,321,884 | 33,632,661 | 96.9% |
| JoAnn Heffernan Heisen | 1,041,268,182 | 32,686,363 | 97.0% |
| F. Joseph Loughrey | 1,040,201,842 | 33,752,703 | 96.9% |
| Mark Loughridge | 1,039,909,454 | 34,045,090 | 96.8% |
| Scott C. Malpass | 1,039,175,722 | 34,778,823 | 96.8% |
| F. William McNabb III | 1,038,914,560 | 35,039,985 | 96.7% |
| Deanna Mulligan | 1,041,175,691 | 32,778,854 | 96.9% |
| André F. Perold | 1,028,804,958 | 45,149,587 | 95.8% |
| Sarah Bloom Raskin | 1,040,743,960 | 33,210,585 | 96.9% |
| Peter F. Volanakis | 1,039,529,631 | 34,424,914 | 96.8% |
| * Results are for all funds within the same trust. | | | |
Proposal 2—Approve a manager-of-managers arrangement with third-party investment advisors.
This arrangement enables the fund to enter into and materially amend investment advisory arrangements with third-party investment advisors, subject to the approval of the fund’s board of trustees and certain conditions imposed by the Securities and Exchange Commission, while avoiding the costs and delays associated with obtaining future shareholder approval.
| | | | | |
| Broker | Percentage |
| Vanguard Fund | For | Abstain | Against | Non-Votes | For |
| Consumer Discretionary | | | | | |
| Index Fund | 9,536,861 | 297,949 | 329,359 | 2,762,358 | 73.8% |
| Consumer Staples Index Fund | 19,743,521 | 887,407 | 1,030,430 | 6,269,834 | 70.7% |
| Energy Index Fund | 25,231,975 | 1,020,540 | 1,375,945 | 8,591,798 | 69.7% |
| Financials Index Fund | 67,404,620 | 1,473,688 | 1,533,626 | 20,797,065 | 73.9% |
| Health Care Index Fund | 27,098,285 | 1,162,531 | 1,388,543 | 8,361,618 | 71.3% |
| Industrials Index Fund | 18,066,828 | 248,015 | 237,258 | 4,480,567 | 78.4% |
| Information Technology | | | | | |
| Index Fund | 64,933,695 | 1,058,740 | 1,324,313 | 17,028,062 | 77.0% |
| Materials Index Fund | 10,530,001 | 375,560 | 347,049 | 3,612,789 | 70.8% |
| Telecommunication Services | | | | | |
| Index Fund | 9,619,142 | 180,546 | 151,931 | 3,229,349 | 73.0% |
| Utilities Index Fund | 18,459,436 | 1,103,078 | 1,065,517 | 5,037,806 | 71.9% |
5
Proposal 3—Approve a manager-of-managers arrangement with wholly owned subsidiaries of Vanguard.
This arrangement enables Vanguard or the fund to enter into and materially amend investment advisory arrangements with wholly owned subsidiaries of Vanguard, subject to the approval of the fund’s board of trustees and any conditions imposed by the Securities and Exchange Commission (SEC), while avoiding the costs and delays associated with obtaining future shareholder approval. The ability of the fund to operate in this manner is contingent upon the SEC’s approval of a pending application for an order of exemption.
| | | | | |
| Broker | Percentage |
| Vanguard Fund | For | Abstain | Against | Non-Votes | For |
| Consumer Discretionary | | | | | |
| Index Fund | 9,552,190 | 273,422 | 338,557 | 2,762,358 | 73.9% |
| Consumer Staples Index Fund | 19,972,148 | 839,878 | 849,332 | 6,269,834 | 71.5% |
| Energy Index Fund | 25,426,856 | 985,351 | 1,216,253 | 8,591,798 | 70.2% |
| Financials Index Fund | 67,533,485 | 1,474,069 | 1,404,380 | 20,797,065 | 74.0% |
| Health Care Index Fund | 27,385,789 | 1,080,625 | 1,182,944 | 8,361,618 | 72.0% |
| Industrials Index Fund | 18,108,596 | 230,077 | 213,429 | 4,480,567 | 78.6% |
| Information Technology | | | | | |
| Index Fund | 65,234,173 | 1,032,452 | 1,050,123 | 17,028,062 | 77.3% |
| Materials Index Fund | 10,599,346 | 367,964 | 285,301 | 3,612,789 | 71.3% |
| Telecommunication Services | | | | | |
| Index Fund | 9,666,283 | 171,761 | 113,575 | 3,229,349 | 73.3% |
| Utilities Index Fund | 18,940,286 | 792,512 | 895,233 | 5,037,806 | 73.8% |
Shareholders of Vanguard Energy Index Fund did not approve the following proposal:
Proposal 7—Institute transparent procedures to avoid holding investments in companies that, in management’s judgment, substantially contribute to genocide or crimes against humanity, the most egregious violations of human rights. Such procedures may include time-limited engagement with problem companies if management believes that their behavior can be changed.
The trustees recommended a vote against the proposal for the following reasons: (1) Vanguard is fully compliant with all applicable U.S. laws and regulations that prohibit the investment in any company owned or controlled by the government of Sudan; (2) the addition of further investment constraints is not in fund shareholders’ best interests if those constraints are unrelated to a fund’s stated investment objective, policies, and strategies; and (3) divestment is an ineffective means to implement social change, as it often puts the shares into the hands of another owner with no direct impact to the company’s capitalization.
| | | | | |
| Broker | Percentage |
| Vanguard Fund | For | Abstain | Against | Non-Votes | For |
| Energy Index Fund | 4,951,570 | 1,333,293 | 21,343,597 | 8,591,798 | 13.7% |
6
Consumer Discretionary Index Fund
| | | |
| Fund Profile | | |
| As of February 28, 2018 | | |
| |
| Share-Class Characteristics | | |
| | ETF | Admiral |
| | Shares | Shares |
| Ticker Symbol | | VCR | VCDAX |
| Expense Ratio1 | | 0.10% | 0.10% |
| 30-Day SEC Yield | | 1.19% | 1.19% |
| |
| |
| Portfolio Characteristics | | |
| MSCI | |
| US IMI/ | |
| Consumer | MSCI |
| Discretionary | US IMI/ |
| Fund | 25/50 | 2500 |
| Number of Stocks | 371 | 368 | 2,469 |
| Median Market Cap | $74.4B | $74.4B | $68.2B |
| Price/Earnings Ratio | 20.8x | 20.8x | 21.9x |
| Price/Book Ratio | 4.5x | 4.5x | 3.1x |
| Return on Equity | 18.5% | 18.5% | 15.0% |
| Earnings Growth Rate | 16.2% | 16.2% | 8.5% |
| Dividend Yield | 1.2% | 1.2% | 1.8% |
| Foreign Holdings | 0.0% | 0.0% | 0.0% |
| Turnover Rate | | | |
| (Annualized) | 3% | — | — |
| Short-Term Reserves | 0.0% | — | — |
| |
| |
| Volatility Measures | | | |
| MSCI US | |
| IMI/Consumer | |
| Discretionary | MSCI US |
| | 25/50 | IMI/2500 |
| R-Squared | | 1.00 | 0.84 |
| Beta | | 1.00 | 1.03 |
These measures show the degree and timing of the fund’s
fluctuations compared with the indexes over 36 months.
| |
| Subindustry Diversification | |
| (% of equity exposure) | |
| Advertising | 0.8% |
| Apparel Retail | 3.8 |
| Apparel, Accessories & Luxury Goods | 2.7 |
| Auto Parts & Equipment | 2.8 |
| Automobile Manufacturers | 4.0 |
| Automotive Retail | 2.1 |
| Broadcasting | 1.5 |
| Cable & Satellite | 8.5 |
| Casinos & Gaming | 2.1 |
| Computer & Electronics Retail | 0.6 |
| Consumer Electronics | 0.2 |
| Department Stores | 0.8 |
| Distributors | 0.9 |
| Education Services | 0.6 |
| Footwear | 2.8 |
| General Merchandise Stores | 2.6 |
| Home Furnishings | 0.7 |
| Home Improvement Retail | 8.0 |
| Homebuilding | 2.1 |
| Homefurnishing Retail | 0.4 |
| Hotels, Resorts & Cruise Lines | 4.2 |
| Household Appliances | 0.5 |
| Housewares & Specialties | 0.4 |
| Internet & Direct Marketing Retail | 24.6 |
| Leisure Facilities | 0.5 |
| Leisure Products | 0.9 |
| Motorcycle Manufacturers | 0.2 |
| Movies & Entertainment | 9.2 |
| Publishing | 0.6 |
| Restaurants | 8.6 |
| Specialized Consumer Services | 0.7 |
| Specialty Stores | 1.4 |
| Tires & Rubber | 0.2 |
Sector categories are based on the Global Industry Classification Standard (“GICS”), except for the “Other” category (if applicable), which includes securities that have not been provided a GICS classification as of the effective reporting period.
| | |
| Ten Largest Holdings (% of total net assets) |
| Amazon.com Inc. | Internet & Direct | |
| Marketing Retail | 17.2% |
| Home Depot Inc. | Home Improvement Retail | 5.9 |
| Comcast Corp. | Cable & Satellite | 4.7 |
| Walt Disney Co. | Movies & Entertainment | 4.3 |
| Netflix Inc. | Internet & Direct | |
| Marketing Retail | 3.5 |
| McDonald’s Corp. | Restaurants | 3.5 |
| Booking Holdings | Internet & Direct | |
| Inc. | Marketing Retail | 2.7 |
| NIKE Inc. | Footwear | 2.4 |
| Starbucks Corp. | Restaurants | 2.3 |
| Lowe’s Cos. Inc. | Home Improvement Retail | 2.1 |
| Top Ten | 48.6% |
The holdings listed exclude any temporary cash investments and
equity index products.
1 The expense ratios shown are from the prospectus dated December 21, 2017, and represent estimated costs for the current fiscal year. For the six months ended February 28, 2018, the annualized expense ratios
were 0.10% for ETF Shares and 0.10% for Admiral Shares.
7
Consumer Discretionary Index Fund
Performance Summary
All of the returns in this report represent past performance, which is not a guarantee of future results that may be achieved by the fund. (Current performance may be lower or higher than the performance data cited. For performance data current to the most recent month-end, visit our website at vanguard.com/performance.) Note, too, that both investment returns and principal value can fluctuate widely, so an investor’s shares, when sold, could be worth more or less than their original cost. The returns shown do not reflect taxes that a shareholder would pay on fund distributions or on the sale of fund shares.
Fiscal-Year Total Returns (%): August 31, 2007–February 28, 2018
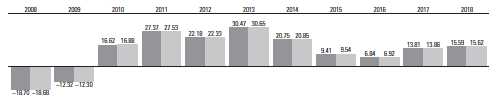
| |
| Consumer Discretionary Index Fund ETF Shares Net Asset Value |
| Spliced US IMI/Consumer Discretionary 25/50 |
| For a benchmark description, see the Glossary. |
| Note: For 2018, performance data reflect the six months ended February 28, 2018. |
Average Annual Total Returns: Periods Ended December 31, 2017
This table presents returns through the latest calendar quarter—rather than through the end of the fiscal period.
Securities and Exchange Commission rules require that we provide this information.
| | | | | |
| Inception Date | One Year | Five Years | Ten Years |
| ETF Shares | 1/26/2004 | | | |
| Market Price | | 22.85% | 16.97% | 12.88% |
| Net Asset Value | | 22.83 | 16.95 | 12.87 |
| Admiral Shares | 7/14/2005 | 22.83 | 16.96 | 12.87 |
See Financial Highlights for dividend and capital gains information.
8
Consumer Discretionary Index Fund
Financial Statements (unaudited)
Statement of Net Assets
As of February 28, 2018
The fund reports a complete list of its holdings in regulatory filings four times in each fiscal year, at the quarter-ends. For the second and fourth fiscal quarters, the lists appear in the fund’s semiannual and annual reports to shareholders. For the first and third fiscal quarters, the fund files the lists with the Securities and Exchange Commission on Form N-Q. Shareholders can look up the fund’s Forms N-Q on the SEC’s website at sec.gov. Forms N-Q may also be reviewed and copied at the SEC’s Public Reference Room (see the back cover of this report for further information).
| | | |
| Market |
| Value• |
| | Shares | ($000) |
| Common Stocks (100.1%) | | |
| Auto Components (3.1%) | | |
| Aptiv plc | 211,172 | 19,286 |
| Lear Corp. | 53,559 | 9,992 |
| Autoliv Inc. | 68,931 | 9,887 |
| BorgWarner Inc. | 167,181 | 8,205 |
| Goodyear Tire & Rubber | | |
| | Co. | 195,258 | 5,651 |
| Gentex Corp. | 225,010 | 5,110 |
| Adient plc | 73,921 | 4,588 |
| Delphi Technologies plc | 70,382 | 3,361 |
| * | Visteon Corp. | 24,690 | 3,058 |
| Dana Inc. | 114,928 | 3,054 |
| LCI Industries | 19,831 | 2,168 |
| Tenneco Inc. | 40,931 | 2,151 |
| * | Cooper-Standard Holdings | | |
| | Inc. | 13,913 | 1,695 |
| * | Dorman Products Inc. | 24,080 | 1,661 |
| Cooper Tire & Rubber Co. | 40,916 | 1,283 |
| * | American Axle & | | |
| | Manufacturing Holdings | | |
| | Inc. | 79,345 | 1,171 |
| * | Fox Factory Holding Corp. | 28,214 | 1,059 |
| * | Modine Manufacturing Co. | 39,807 | 916 |
| * | Gentherm Inc. | 28,968 | 892 |
| Standard Motor Products | | |
| | Inc. | 15,941 | 744 |
| * | Stoneridge Inc. | 20,880 | 454 |
| Tower International Inc. | 15,963 | 417 |
| * | Motorcar Parts of America | | |
| | Inc. | 15,452 | 315 |
| Superior Industries | | |
| | International Inc. | 17,643 | 255 |
| 87,373 |
| Automobiles (4.2%) | | |
| General Motors Co. | 1,015,227 | 39,949 |
| *,^ Tesla Inc. | 106,708 | 36,607 |
| Ford Motor Co. | 2,944,592 | 31,242 |
| Harley-Davidson Inc. | 133,401 | 6,054 |
| Thor Industries Inc. | 41,772 | 5,389 |
| Winnebago Industries Inc. | 23,967 | 1,044 |
| 120,285 |
| Distributors (0.9%) | | |
| Genuine Parts Co. | 116,194 | 10,671 |
| * | LKQ Corp. | 244,945 | 9,670 |
| Pool Corp. | 31,838 | 4,395 |
| Core-Mark Holding Co. Inc. | 37,084 | 759 |
| 25,495 |
| Diversified Consumer Services (1.3%) | |
| Service Corp. | | |
| | International/US | 148,567 | 5,561 |
| * | ServiceMaster Global | | |
| | Holdings Inc. | 107,043 | 5,498 |
| H&R Block Inc. | 166,025 | 4,205 |
| * | Bright Horizons Family | | |
| | Solutions Inc. | 43,751 | 4,181 |
| * | Grand Canyon Education | | |
| | Inc. | 36,290 | 3,562 |
| | | | |
| Market |
| Value• |
| | | Shares | ($000) |
| Graham Holdings Co. | | | |
| | Class B | | 3,637 | 2,110 |
| * | Adtalem Global Education | | |
| | Inc. | | 45,670 | 2,103 |
| * | Weight Watchers | | | |
| | International Inc. | | 22,990 | 1,555 |
| * | Chegg Inc. | | 73,101 | 1,455 |
| * | Sotheby’s | | 29,064 | 1,342 |
| Strayer Education Inc. | 8,006 | 718 |
| Capella Education Co. | 9,094 | 707 |
| * | Career Education Corp. | 52,897 | 700 |
| * | Houghton Mifflin Harcourt | | |
| | Co. | | 83,377 | 567 |
| * | Regis Corp. | | 27,479 | 442 |
| * | American Public Education | | |
| | Inc. | | 13,761 | 423 |
| * | K12 Inc. | | 28,140 | 420 |
| Carriage Services Inc. | | | |
| | Class A | | 11,415 | 311 |
| * | Bridgepoint Education Inc. | | |
| | Class A | | 21,519 | 143 |
| 36,003 |
| Hotels, Restaurants & Leisure (15.4%) | |
| McDonald’s Corp. | | 632,466 | 99,765 |
| Starbucks Corp. | | 1,128,907 | 64,461 |
| Marriott International Inc. | | |
| | Class A | | 245,926 | 34,727 |
| Las Vegas Sands Corp. | 313,725 | 22,842 |
| Yum! Brands Inc. | | 254,288 | 20,694 |
| Carnival Corp. | | 276,570 | 18,505 |
| Royal Caribbean Cruises | | |
| | Ltd. | | 135,824 | 17,195 |
| Hilton Worldwide Holdings | | |
| | Inc. | | 152,515 | 12,322 |
| MGM Resorts International | 359,810 | 12,316 |
| Wynn Resorts Ltd. | | 65,166 | 10,915 |
| Wyndham Worldwide Corp. | 80,305 | 9,298 |
| Darden Restaurants Inc. | 98,007 | 9,035 |
| * | Norwegian Cruise Line | | |
| | Holdings Ltd. | | 156,458 | 8,902 |
| Aramark | | 194,347 | 8,106 |
| Domino’s Pizza Inc. | | 34,642 | 7,705 |
| Vail Resorts Inc. | | 32,014 | 6,591 |
| * | Chipotle Mexican Grill Inc. | | |
| | Class A | | 20,137 | 6,412 |
| Dunkin’ Brands Group Inc. | 71,612 | 4,289 |
| Six Flags Entertainment | | |
| | Corp. | | 56,456 | 3,618 |
| Extended Stay America Inc. | 152,426 | 3,053 |
| Texas Roadhouse Inc. | | | |
| | Class A | | 53,591 | 2,961 |
| * | Hyatt Hotels Corp. Class A | 36,301 | 2,805 |
| ILG Inc. | | 88,645 | 2,691 |
| * | Hilton Grand Vacations Inc. | 59,071 | 2,549 |
| * | Planet Fitness Inc. Class A | 68,306 | 2,526 |
| Marriott Vacations | | | |
| | Worldwide Corp. | | 17,859 | 2,509 |
| Churchill Downs Inc. | | 9,670 | 2,497 |
| Wendy’s Co. | | 153,449 | 2,447 |
| | | |
| Market |
| Value• |
| | Shares | ($000) |
| Boyd Gaming Corp. | 67,378 | 2,384 |
| Cracker Barrel Old Country | | |
| | Store Inc. | 15,240 | 2,379 |
| Choice Hotels International | | |
| | Inc. | 29,024 | 2,297 |
| Jack in the Box Inc. | 23,260 | 2,095 |
| * | Scientific Games Corp. | 42,847 | 1,905 |
| Red Rock Resorts Inc. | | |
| | Class A | 54,691 | 1,832 |
| * | Penn National Gaming Inc. | 68,654 | 1,827 |
| Bloomin’ Brands Inc. | 72,354 | 1,671 |
| Cheesecake Factory Inc. | 34,462 | 1,602 |
| * | Dave & Buster’s | | |
| | Entertainment Inc. | 32,816 | 1,469 |
| * | Caesars Entertainment Corp. | 111,621 | 1,418 |
| *,^ Eldorado Resorts Inc. | 39,522 | 1,348 |
| * | Pinnacle Entertainment Inc. | 42,968 | 1,296 |
| Brinker International Inc. | 36,684 | 1,263 |
| * | La Quinta Holdings Inc. | 66,158 | 1,249 |
| ^ | Papa John’s International | | |
| | Inc. | 20,831 | 1,203 |
| Wingstop Inc. | 23,203 | 1,051 |
| Dine Brands Global Inc. | 13,562 | 1,030 |
| International Speedway | | |
| | Corp. Class A | 19,134 | 861 |
| ^ | Sonic Corp. | 31,790 | 799 |
| *,^ SeaWorld Entertainment Inc. | 54,237 | 793 |
| * | Belmond Ltd. Class A | 68,659 | 793 |
| * | Denny’s Corp. | 52,241 | 786 |
| *,^ Shake Shack Inc. Class A | 16,633 | 649 |
| BJ’s Restaurants Inc. | 14,108 | 614 |
| Ruth’s Hospitality Group Inc. | 23,133 | 568 |
| * | Red Robin Gourmet | | |
| | Burgers Inc. | 10,454 | 561 |
| * | Playa Hotels & Resorts NV | 47,220 | 476 |
| Marcus Corp. | 14,727 | 398 |
| * | Monarch Casino & Resort | | |
| | Inc. | 8,898 | 376 |
| * | Chuy’s Holdings Inc. | 13,804 | 373 |
| * | Biglari Holdings Inc. | 845 | 354 |
| * | Fiesta Restaurant Group Inc. | 20,742 | 353 |
| * | Carrols Restaurant Group | | |
| | Inc. | 26,352 | 339 |
| * | Del Taco Restaurants Inc. | 26,812 | 338 |
| * | Del Frisco’s Restaurant | | |
| | Group Inc. | 16,820 | 280 |
| * | Zoe’s Kitchen Inc. | 16,146 | 240 |
| * | Potbelly Corp. | 18,408 | 237 |
| Speedway Motorsports Inc. | 9,751 | 191 |
| * | Bojangles’ Inc. | 14,114 | 185 |
| * | El Pollo Loco Holdings Inc. | 17,579 | 171 |
| * | Lindblad Expeditions | | |
| | Holdings Inc. | 17,657 | 163 |
| * | Habit Restaurants Inc. | | |
| | Class A | 17,169 | 148 |
| * | Fogo De Chao Inc. | 8,696 | 136 |
| *,^ Noodles & Co. Class A | 14,128 | 88 |
| 442,325 |
9
| | | |
| Consumer Discretionary Index Fund | |
| |
| |
| |
| |
| Market |
| Value• |
| | Shares | ($000) |
| Household Durables (3.9%) | | |
| Lennar Corp. Class A | 225,385 | 12,752 |
| * | Mohawk Industries Inc. | 50,234 | 12,050 |
| DR Horton Inc. | 282,466 | 11,835 |
| Newell Brands Inc. | 388,420 | 9,979 |
| Whirlpool Corp. | 56,965 | 9,253 |
| * | NVR Inc. | 2,816 | 8,006 |
| PulteGroup Inc. | 209,806 | 5,889 |
| Garmin Ltd. | 96,643 | 5,725 |
| Toll Brothers Inc. | 119,221 | 5,226 |
| Leggett & Platt Inc. | 104,336 | 4,534 |
| * | TopBuild Corp. | 28,590 | 1,991 |
| * | Taylor Morrison Home Corp. | | |
| | Class A | 88,225 | 1,980 |
| Tupperware Brands Corp. | 40,137 | 1,969 |
| * | Helen of Troy Ltd. | 21,631 | 1,948 |
| * | TRI Pointe Group Inc. | 119,298 | 1,829 |
| *,^ Tempur Sealy International | | |
| | Inc. | 36,720 | 1,815 |
| KB Home | 61,758 | 1,714 |
| *,^ iRobot Corp. | 21,960 | 1,492 |
| * | Meritage Homes Corp. | 30,319 | 1,286 |
| La-Z-Boy Inc. | 37,558 | 1,153 |
| * | Cavco Industries Inc. | 6,853 | 1,090 |
| * | Installed Building Products | | |
| | Inc. | 17,786 | 1,063 |
| MDC Holdings Inc. | 33,017 | 914 |
| * | LGI Homes Inc. | 14,680 | 831 |
| * | M/I Homes Inc. | 21,917 | 637 |
| * | William Lyon Homes | | |
| | Class A | 21,887 | 553 |
| * | Universal Electronics Inc. | 11,132 | 551 |
| Ethan Allen Interiors Inc. | 21,176 | 503 |
| * | Century Communities Inc. | 15,627 | 465 |
| *,^ GoPro Inc. Class A | 83,166 | 447 |
| * | Beazer Homes USA Inc. | 24,760 | 389 |
| Flexsteel Industries Inc. | 5,771 | 224 |
| PICO Holdings Inc. | 17,695 | 217 |
| * | Hovnanian Enterprises Inc. | | |
| | Class A | 92,580 | 202 |
| Hamilton Beach Brands | | |
| | Holding Co. Class A | 4,639 | 115 |
| * | Green Brick Partners Inc. | 11,249 | 114 |
| Libbey Inc. | 16,799 | 105 |
| Lennar Corp. Class B | 2,098 | 95 |
| 110,941 |
| Internet & Direct Marketing Retail (24.8%) | |
| * | Amazon.com Inc. | 324,982 | 491,519 |
| * | Netflix Inc. | 343,375 | 100,053 |
| * | Booking Holdings Inc. | 38,710 | 78,738 |
| Expedia Inc. | 99,679 | 10,483 |
| * | Liberty Interactive Corp. | | |
| | QVC Group Class A | 360,453 | 10,406 |
| * | TripAdvisor Inc. | 89,764 | 3,598 |
| * | Liberty Ventures Class A | 64,549 | 3,455 |
| * | Wayfair Inc. | 31,388 | 2,430 |
| * | Shutterfly Inc. | 23,448 | 1,799 |
| * | Liberty Expedia Holdings | | |
| | Inc. Class A | 43,408 | 1,704 |
| * | Groupon Inc. Class A | 329,983 | 1,412 |
| *,^ Overstock.com Inc. | 12,741 | 770 |
| Nutrisystem Inc. | 23,752 | 730 |
| PetMed Express Inc. | 16,129 | 729 |
| * | Liberty TripAdvisor | | |
| | Holdings Inc. Class A | 58,267 | 606 |
| *,^ Duluth Holdings Inc. | 14,369 | 242 |
| * | 1-800-Flowers.com Inc. | | |
| | Class A | 19,417 | 226 |
| *,^ Lands’ End Inc. | 9,725 | 175 |
| * | FTD Cos. Inc. | 13,100 | 79 |
| 709,154 |
| | | |
| Market |
| Value• |
| | Shares | ($000) |
| Leisure Products (0.9%) | | |
| Hasbro Inc. | 88,854 | 8,492 |
| Polaris Industries Inc. | 47,063 | 5,365 |
| ^ | Mattel Inc. | 272,537 | 4,333 |
| Brunswick Corp./DE | 69,617 | 3,982 |
| Callaway Golf Co. | 74,621 | 1,155 |
| * | Vista Outdoor Inc. | 45,712 | 788 |
| Sturm Ruger & Co. Inc. | 13,793 | 594 |
| Acushnet Holdings Corp. | 27,539 | 583 |
| *,^ American Outdoor Brands | | |
| | Corp. | 41,954 | 377 |
| * | MCBC Holdings Inc. | 14,511 | 356 |
| * | Nautilus Inc. | 23,538 | 279 |
| 26,304 |
| Media (20.4%) | | |
| Comcast Corp. Class A | 3,701,000 | 134,013 |
| Walt Disney Co. | 1,198,340 | 123,621 |
| Time Warner Inc. | 617,686 | 57,420 |
| * | Charter Communications | | |
| | Inc. Class A | 147,955 | 50,590 |
| Twenty-First Century Fox | | |
| | Inc. Class A | 836,005 | 30,782 |
| CBS Corp. Class B | 273,971 | 14,512 |
| Omnicom Group Inc. | 183,070 | 13,955 |
| * | Liberty Global plc | 441,254 | 13,251 |
| Twenty-First Century Fox | | |
| | Inc. | 348,993 | 12,710 |
| Viacom Inc. Class B | 279,601 | 9,322 |
| ^ | Sirius XM Holdings Inc. | 1,276,731 | 8,018 |
| * | DISH Network Corp. | | |
| | Class A | 180,614 | 7,530 |
| * | Liberty Broadband Corp. | 84,973 | 7,467 |
| Interpublic Group of Cos. | | |
| | Inc. | 307,940 | 7,206 |
| News Corp. Class A | 392,157 | 6,326 |
| Scripps Networks | | |
| | Interactive Inc. Class A | 68,807 | 6,183 |
| * | Liberty Media Corp-Liberty | | |
| | SiriusXM C | 141,674 | 5,916 |
| * | Liberty Media Corp-Liberty | | |
| | Formula One | 159,947 | 5,267 |
| * | Live Nation Entertainment | | |
| | Inc. | 114,732 | 5,140 |
| * | Liberty Global plc Class A | 160,296 | 4,992 |
| * | Discovery Communications | | |
| | Inc. | 164,429 | 3,779 |
| * | Madison Square Garden | | |
| | Co. Class A | 15,083 | 3,683 |
| Cinemark Holdings Inc. | 83,296 | 3,545 |
| * | Liberty Media Corp-Liberty | | |
| | SiriusXM A | 73,321 | 3,076 |
| * | Discovery Communications | | |
| | Inc. Class A | 122,198 | 2,972 |
| Tribune Media Co. Class A | 65,761 | 2,740 |
| New York Times Co. | | |
| | Class A | 102,799 | 2,478 |
| Nexstar Media Group Inc. | | |
| | Class A | 34,198 | 2,443 |
| John Wiley & Sons Inc. | | |
| | Class A | 36,367 | 2,337 |
| Cable One Inc. | 3,403 | 2,317 |
| * | Lions Gate Entertainment | | |
| | Corp. Class B | 81,597 | 2,190 |
| * | AMC Networks Inc. | | |
| | Class A | 39,915 | 2,098 |
| TEGNA Inc. | 161,811 | 2,081 |
| Regal Entertainment | | |
| | Group Class A | 89,596 | 2,060 |
| Sinclair Broadcast Group | | |
| | Inc. Class A | 60,461 | 2,044 |
| * | Liberty Latin America Ltd. | 95,974 | 1,963 |
| | | |
| Market |
| Value• |
| | Shares | ($000) |
| * | Liberty Broadband Corp. | | |
| | Class A | 20,785 | 1,816 |
| Meredith Corp. | 31,458 | 1,803 |
| * | MSG Networks Inc. | 48,830 | 1,191 |
| * | Lions Gate Entertainment | | |
| | Corp. Class A | 41,479 | 1,171 |
| World Wrestling | | |
| | Entertainment Inc. Class A | 29,655 | 1,131 |
| Entercom Communications | | |
| | Corp. Class A | 100,705 | 997 |
| * | IMAX Corp. | 46,648 | 984 |
| * | Gray Television Inc. | 64,665 | 892 |
| Scholastic Corp. | 24,008 | 874 |
| Gannett Co. Inc. | 84,640 | 850 |
| * | Liberty Latin America Ltd. | | |
| | Class A | 36,505 | 756 |
| New Media Investment | | |
| | Group Inc. | 42,565 | 734 |
| * | Liberty Media Corp-Liberty | | |
| | Formula One Class A | 20,042 | 633 |
| * | Liberty Media Corp-Liberty | | |
| | Braves | 27,320 | 627 |
| AMC Entertainment | | |
| | Holdings Inc. Class A | 40,640 | 610 |
| EW Scripps Co. Class A | 42,135 | 580 |
| National CineMedia Inc. | 62,267 | 469 |
| * | Loral Space & | | |
| | Communications Inc. | 9,935 | 440 |
| * | MDC Partners Inc. Class A | 46,767 | 367 |
| Entravision Communications | | |
| | Corp. Class A | 53,776 | 347 |
| Emerald Expositions Events | | |
| | Inc. | 14,040 | 299 |
| * | tronc Inc. | 12,010 | 230 |
| *,^ WideOpenWest Inc. | 20,742 | 200 |
| * | Liberty Media Corp-Liberty | | |
| | Braves | 7,859 | 180 |
| * | Hemisphere Media Group | | |
| | Inc. Class A | 13,153 | 147 |
| News Corp. Class B | 7,651 | 126 |
| * | Global Eagle Entertainment | | |
| | Inc. | 39,313 | 53 |
| 584,534 |
| Multiline Retail (3.4%) | | |
| Target Corp. | 410,007 | 30,919 |
| Dollar General Corp. | 216,999 | 20,526 |
| * | Dollar Tree Inc. | 188,285 | 19,326 |
| Kohl’s Corp. | 133,574 | 8,828 |
| Macy’s Inc. | 241,472 | 7,102 |
| Nordstrom Inc. | 98,992 | 5,079 |
| * | Ollie’s Bargain Outlet | | |
| | Holdings Inc. | 38,945 | 2,311 |
| Big Lots Inc. | 33,616 | 1,889 |
| * | JC Penney Co. Inc. | 249,046 | 1,078 |
| Dillard’s Inc. Class A | 11,632 | 949 |
| *,^ Tuesday Morning Corp. | 34,655 | 109 |
| ^ | Fred’s Inc. Class A | 26,985 | 90 |
| *,^ Sears Holdings Corp. | 19,616 | 47 |
| 98,253 |
| Other (0.0%)1 | | |
| *,2 Media General Inc. CVR | 69,182 | 3 |
| | | |
| Specialty Retail (16.2%) | | |
| Home Depot Inc. | 926,493 | 168,872 |
| Lowe’s Cos. Inc. | 659,441 | 59,079 |
| TJX Cos. Inc. | 501,969 | 41,503 |
| Ross Stores Inc. | 306,245 | 23,915 |
| * | O’Reilly Automotive Inc. | 67,526 | 16,489 |
| Best Buy Co. Inc. | 213,795 | 15,487 |
| * | AutoZone Inc. | 21,835 | 14,514 |
| Tiffany & Co. | 98,521 | 9,955 |
10
Consumer Discretionary Index Fund
| | | |
| Market |
| Value• |
| | Shares | ($000) |
| L Brands Inc. | 191,204 | 9,432 |
| * | Ulta Beauty Inc. | 45,916 | 9,337 |
| * | CarMax Inc. | 144,559 | 8,951 |
| Advance Auto Parts Inc. | 58,637 | 6,699 |
| * | Burlington Stores Inc. | 54,085 | 6,633 |
| Tractor Supply Co. | 99,494 | 6,460 |
| Gap Inc. | 184,860 | 5,838 |
| Foot Locker Inc. | 98,244 | 4,510 |
| ^ | Williams-Sonoma Inc. | 63,574 | 3,291 |
| * | Five Below Inc. | 43,851 | 2,931 |
| American Eagle Outfitters | | |
| | Inc. | 134,343 | 2,589 |
| Bed Bath & Beyond Inc. | 113,841 | 2,441 |
| Aaron’s Inc. | 50,395 | 2,329 |
| Signet Jewelers Ltd. | 45,244 | 2,275 |
| *,^ AutoNation Inc. | 43,378 | 2,178 |
| * | Michaels Cos. Inc. | 92,763 | 2,135 |
| * | Urban Outfitters Inc. | 60,031 | 2,119 |
| Dick’s Sporting Goods Inc. | 65,494 | 2,097 |
| Lithia Motors Inc. Class A | 19,029 | 1,977 |
| Children’s Place Inc. | 13,829 | 1,968 |
| * | Murphy USA Inc. | 26,194 | 1,967 |
| * | Sally Beauty Holdings Inc. | 101,764 | 1,714 |
| Penske Automotive Group | | |
| | Inc. | 30,688 | 1,406 |
| Monro Inc. | 25,779 | 1,312 |
| * | RH | 15,148 | 1,286 |
| GameStop Corp. Class A | 80,775 | 1,267 |
| * | Floor & Decor Holdings Inc. | | |
| | Class A | 26,405 | 1,190 |
| Abercrombie & Fitch Co. | 54,298 | 1,120 |
| Group 1 Automotive Inc. | 15,738 | 1,083 |
| * | Sleep Number Corp. | 31,448 | 1,083 |
| Office Depot Inc. | 408,409 | 1,074 |
| Camping World Holdings | | |
| | Inc. Class A | 24,612 | 1,029 |
| Chico’s FAS Inc. | 102,405 | 1,028 |
| DSW Inc. Class A | 51,111 | 1,002 |
| * | Asbury Automotive Group | | |
| | Inc. | 14,686 | 967 |
| Caleres Inc. | 34,463 | 965 |
| Tailored Brands Inc. | 35,340 | 827 |
| Guess? Inc. | 49,876 | 788 |
| * | Genesco Inc. | 15,579 | 612 |
| * | Conn’s Inc. | 16,167 | 529 |
| * | Lumber Liquidators Holdings | | |
| | Inc. | 22,786 | 528 |
| Buckle Inc. | 23,628 | 497 |
| * | Express Inc. | 62,881 | 454 |
| * | Hibbett Sports Inc. | 16,669 | 429 |
| *,^ Party City Holdco Inc. | 27,366 | 395 |
| Sonic Automotive Inc. | | |
| | Class A | 20,036 | 393 |
| * | MarineMax Inc. | 18,438 | 385 |
| Finish Line Inc. Class A | 32,977 | 350 |
| * | At Home Group Inc. | 11,775 | 348 |
| Haverty Furniture Cos. Inc. | 15,159 | 309 |
| * | Zumiez Inc. | 15,581 | 307 |
| ^ | Rent-A-Center Inc. | 40,772 | 307 |
| | | | |
| Market |
| Value• |
| | | Shares | ($000) |
| * | America’s Car-Mart Inc./TX | 5,838 | 284 |
| * | Ascena Retail Group Inc. | 118,185 | 268 |
| Winmark Corp. | | 1,962 | 249 |
| *,^ GNC Holdings Inc. Class A | 52,194 | 222 |
| Shoe Carnival Inc. | | 9,275 | 217 |
| Cato Corp. Class A | | 18,968 | 215 |
| * | Barnes & Noble Education | | |
| | Inc. | | 28,095 | 205 |
| Barnes & Noble Inc. | | 44,154 | 199 |
| Pier 1 Imports Inc. | | 57,272 | 178 |
| * | Francesca’s Holdings Corp. | 28,716 | 150 |
| * | Sportsman’s Warehouse | | |
| | Holdings Inc. | | 28,820 | 140 |
| Tile Shop Holdings Inc. | 25,417 | 137 |
| * | Vitamin Shoppe Inc. | | 16,879 | 63 |
| Stage Stores Inc. | | 6,245 | 12 |
| 465,494 |
| Textiles, Apparel & Luxury Goods (5.6%) | |
| NIKE Inc. Class B | 1,041,220 | 69,793 |
| VF Corp. | | 266,663 | 19,885 |
| Tapestry Inc. | | 225,938 | 11,503 |
| PVH Corp. | | 61,416 | 8,861 |
| * | Michael Kors Holdings Ltd. | 120,526 | 7,585 |
| * | Lululemon Athletica Inc. | 80,523 | 6,530 |
| Hanesbrands Inc. | | 289,421 | 5,615 |
| Ralph Lauren Corp. Class A | 44,014 | 4,658 |
| Carter’s Inc. | | 37,505 | 4,376 |
| * | Skechers U.S.A. Inc. | | | |
| | Class A | | 105,938 | 4,335 |
| *,^ Under Armour Inc. Class A | 145,997 | 2,421 |
| * | Deckers Outdoor Corp. | 25,511 | 2,413 |
| *,^ Under Armour Inc. | | 150,430 | 2,264 |
| Wolverine World Wide Inc. | 75,916 | 2,223 |
| * | Steven Madden Ltd. | | 41,964 | 1,842 |
| Columbia Sportswear Co. | 22,062 | 1,667 |
| * | G-III Apparel Group Ltd. | 34,639 | 1,279 |
| Oxford Industries Inc. | 12,087 | 966 |
| * | Crocs Inc. | | 55,818 | 683 |
| * | Fossil Group Inc. | | 34,836 | 466 |
| * | Unifi Inc. | | 12,503 | 438 |
| Movado Group Inc. | | 12,561 | 389 |
| Culp Inc. | | 8,519 | 237 |
| * | Vera Bradley Inc. | | 14,547 | 146 |
| * | Sequential Brands Group Inc. | 30,937 | 61 |
| *,^ Iconix Brand Group Inc. | 36,943 | 51 |
| 160,687 |
| Total Common Stocks | | | |
| (Cost $2,294,897) | 2,866,851 |
| Temporary Cash Investment (1.0%) | |
| Money Market Fund (1.0%) | | |
| 3,4 Vanguard Market Liquidity | | |
| | Fund, 1.601% | | | |
| | (Cost $29,306) | | 293,066 | 29,304 |
| Total Investments (101.1%) | | |
| (Cost $2,324,203) | 2,896,155 |
| |
| |
| Amount |
| ($000) |
| Other Assets and Liabilities (-1.1%) | |
| Other Assets | |
| Investment in Vanguard | 154 |
| Receivables for Investment | |
| Securities Sold | 9,164 |
| Receivables for Accrued Income | 2,914 |
| Receivables for Capital Shares Issued | 412 |
| Other Assets | 64 |
| Total Other Assets | 12,708 |
| Liabilities | |
| Payables for Investment | |
| Securities Purchased | (13,226) |
| Collateral for Securities on Loan | (28,002) |
| Payables for Capital Shares Redeemed | (1,946) |
| Payables to Vanguard | (816) |
| Total Liabilities | (43,990) |
| Net Assets (100%) 2,864,873 |
| |
| |
| At February 28, 2018, net assets consisted of: |
| Amount |
| ($000) |
| Paid-in Capital | 2,344,317 |
| Undistributed Net Investment Income | 3,743 |
| Accumulated Net Realized Losses | (55,139) |
| Unrealized Appreciation (Depreciation) | 571,952 |
| Net Assets | 2,864,873 |
| |
| ETF Shares—Net Assets | |
| Applicable to 16,006,037 outstanding | |
| $.001 par value shares of beneficial | |
| interest (unlimited authorization) | 2,603,995 |
| Net Asset Value Per Share— | |
| ETF Shares $162.69 |
| |
| Admiral Shares—Net Assets | |
| Applicable to 3,097,958 outstanding | |
| $.001 par value shares of beneficial | |
| interest (unlimited authorization) | 260,878 |
| Net Asset Value Per Share— | |
| Admiral Shares $84.21 |
• See Note A in Notes to Financial Statements.
* Non-income-producing security.
^ Includes partial security positions on loan to broker-dealers.
The total value of securities on loan is $26,240,000.
1 “Other” represents securities that are not classified by the
fund’s benchmark index.
2 Security value determined using significant unobservable inputs.
3 Affiliated money market fund available only to Vanguard funds
and certain trusts and accounts managed by Vanguard. Rate
shown is the 7-day yield.
4 Includes $28,002,000 of collateral received for securities on loan.
CVR—Contingent Value Rights.
See accompanying Notes, which are an integral part of the Financial Statements.
11
Consumer Discretionary Index Fund
Statement of Operations
| | | |
| Six Months Ended |
| February 28, 2018 |
| | ($000) |
| Investment Income | | |
| Income | | |
| Dividends | 15,804 |
| Interest1 | 6 |
| Securities Lending—Net | 335 |
| Total Income | 16,145 |
| Expenses | | |
| The Vanguard Group—Note B | | |
| Investment Advisory Services | 331 |
| Management and Administrative— | |
| ETF Shares | 657 |
| Management and Administrative— | |
| Admiral Shares | 69 |
| Marketing and Distribution— | | |
| ETF Shares | 61 |
| Marketing and Distribution— | | |
| Admiral Shares | 9 |
| Custodian Fees | 22 |
| Shareholders’ Reports and Proxy— | |
| ETF Shares | 122 |
| Shareholders’ Reports and Proxy— | |
| Admiral Shares | 4 |
| Trustees’ Fees and Expenses | 1 |
| Total Expenses | 1,276 |
| Net Investment Income | 14,869 |
| Realized Net Gain (Loss) on | | |
| Investment Securities Sold1 | 37,761 |
| Change in Unrealized Appreciation | |
| (Depreciation) of Investment Securities1 | 311,198 |
| Net Increase (Decrease) in Net Assets | |
| Resulting from Operations | | 363,828 |
1 Interest income, realized net gain (loss), and change in unrealized
appreciation (depreciation) from an affiliated company of the
fund were $6,000, ($1,000), and ($5,000), respectively. Purchases
and sales are for temporary cash investment purposes.
| | | | |
| Statement of Changes in Net Assets | | | |
| |
| Six Months Ended | Year Ended |
| | February 28, | August 31, |
| | 2018 | 2017 |
| ($000) | ($000) |
| Increase (Decrease) in Net Assets | | | |
| Operations | | | |
| Net Investment Income | | 14,869 | 35,087 |
| Realized Net Gain (Loss) | | 37,761 | 66,127 |
| Change in Unrealized Appreciation (Depreciation) | | 311,198 | 188,139 |
| Net Increase (Decrease) in Net Assets Resulting from Operations | | 363,828 | 289,353 |
| Distributions | | | |
| Net Investment Income | | | |
| ETF Shares | | (15,841) | (31,760) |
| Admiral Shares | | (1,503) | (2,806) |
| Realized Capital Gain | | | |
| ETF Shares | | — | — |
| Admiral Shares | | — | — |
| Total Distributions | | (17,344) | (34,566) |
| Capital Share Transactions | | | |
| ETF Shares | | 90,046 | 38,353 |
| Admiral Shares | | 26,767 | 13,567 |
| Net Increase (Decrease) from Capital Share Transactions | | 116,813 | 51,920 |
| Total Increase (Decrease) | | 463,297 | 306,707 |
| Net Assets |
| Beginning of Period | | 2,401,576 | 2,094,869 |
| End of Period1 | | 2,864,873 | 2,401,576 |
| 1 Net Assets—End of Period includes undistributed (overdistributed) net investment income of $3,743,000 and $6,218,000. | |
See accompanying Notes, which are an integral part of the Financial Statements.
12
| | | | | | | |
| Consumer Discretionary Index Fund | | | | | | |
| |
| |
| Financial Highlights | | | | | |
| |
| ETF Shares | | | | | | | |
| Six Months | | | | | |
| | Ended | | | | | |
| For a Share Outstanding | February 28, | | | Year Ended August 31, |
| Throughout Each Period | 2018 | 2017 | 2016 | 2015 | 2014 | 2013 |
| Net Asset Value, Beginning of Period | $141.74 | $126.45 | $120.80 | $111.79 | $93.38 | $72.65 |
| Investment Operations | |
| Net Investment Income | | . 8841 | 2.0681 | 1.875 | 1.542 | 1.251 | 1.111 |
| Net Realized and Unrealized Gain (Loss) | | | | | | |
| on Investments | | 21.107 | 15.248 | 6.259 | 8.900 | 18.072 | 20.771 |
| Total from Investment Operations | | 21.991 | 17.316 | 8.134 | 10.442 | 19.323 | 21.882 |
| Distributions | |
| Dividends from Net Investment Income | (1.041) | (2.026) | (2.484) | (1.432) | (.913) | (1.152) |
| Distributions from Realized Capital Gains | — | — | — | — | — | — |
| Total Distributions | | (1.041) | (2.026) | (2.484) | (1.432) | (.913) | (1.152) |
| Net Asset Value, End of Period | | $162.69 | $141.74 | $126.45 | $120.80 | $111.79 | $93.38 |
| Total Return | | 15.59% | 13.81% | 6.84% | 9.41% | 20.75% | 30.47% |
| Ratios/Supplemental Data | |
| Net Assets, End of Period (Millions) | | $2,604 | $2,198 | $1,926 | $1,842 | $1,298 | $1,018 |
| Ratio of Total Expenses to | | | | | | | |
| Average Net Assets | | 0.10% | 0.10% | 0.10% | 0.10% | 0.12% | 0.14% |
| Ratio of Net Investment Income to | | | | | | | |
| Average Net Assets | | 1.15% | 1.53% | 1.54% | 1.31% | 1.26% | 1.44% |
| Portfolio Turnover Rate2 | | 3% | 6% | 7% | 6% | 7% | 6% |
The expense ratio, net investment income ratio, and turnover rate for the current period have been annualized.
1 Calculated based on average shares outstanding.
2 Excludes the value of portfolio securities received or delivered as a result of in-kind purchases or redemptions of the fund’s capital shares,
including ETF Creation Units.
See accompanying Notes, which are an integral part of the Financial Statements.
13
| | | | | | | |
| Consumer Discretionary Index Fund | | | | | | |
| |
| |
| Financial Highlights | | | | | |
| |
| Admiral Shares | | | | | | | |
| Six Months | | | | | |
| | Ended | | | | | |
| For a Share Outstanding | February 28, | | | Year Ended August 31, |
| Throughout Each Period | 2018 | 2017 | 2016 | 2015 | 2014 | 2013 |
| Net Asset Value, Beginning of Period | $73.36 | $65.45 | $62.53 | $57.87 | $48.34 | $37.62 |
| Investment Operations | |
| Net Investment Income | | . 4591 | 1.0711 | .971 | .805 | .648 | .579 |
| Net Realized and Unrealized Gain (Loss) | | | | | | |
| on Investments | | 10.929 | 7.890 | 3.239 | 4.595 | 9.361 | 10.741 |
| Total from Investment Operations | | 11.388 | 8.961 | 4.210 | 5.400 | 10.009 | 11.320 |
| Distributions | |
| Dividends from Net Investment Income | (.538) | (1.051) | (1.290) | (.740) | (.479) | (.600) |
| Distributions from Realized Capital Gains | — | — | — | — | — | — |
| Total Distributions | | (.538) | (1.051) | (1.290) | (.740) | (.479) | (.600) |
| Net Asset Value, End of Period | | $84.21 | $73.36 | $65.45 | $62.53 | $57.87 | $48.34 |
| Total Return2 | | 15.60% | 13.81% | 6.83% | 9.43% | 20.77% | 30.45% |
| Ratios/Supplemental Data | |
| Net Assets, End of Period (Millions) | | $261 | $204 | $169 | $139 | $83 | $63 |
| Ratio of Total Expenses to | | | | | | | |
| Average Net Assets | | 0.10% | 0.10% | 0.10% | 0.09% | 0.12% | 0.14% |
| Ratio of Net Investment Income to | | | | | | | |
| Average Net Assets | | 1.15% | 1.53% | 1.54% | 1.32% | 1.26% | 1.44% |
| Portfolio Turnover Rate3 | | 3% | 6% | 7% | 6% | 7% | 6% |
The expense ratio, net investment income ratio, and turnover rate for the current period have been annualized.
1 Calculated based on average shares outstanding.
2 Total returns do not include account service fees that may have applied in the periods shown. Fund prospectuses provide information about
any applicable account service fees.
3 Excludes the value of portfolio securities received or delivered as a result of in-kind purchases or redemptions of the fund’s capital shares,
including ETF Creation Units.
See accompanying Notes, which are an integral part of the Financial Statements.
14
Consumer Discretionary Index Fund
Notes to Financial Statements
Vanguard Consumer Discretionary Index Fund is registered under the Investment Company Act of 1940 as an open-end investment company, or mutual fund. The fund offers two classes of shares: ETF Shares and Admiral Shares. ETF Shares are listed for trading on NYSE Arca; they can be purchased and sold through a broker. Admiral Shares are designed for investors who meet certain administrative, service, and account-size criteria.
A. The following significant accounting policies conform to generally accepted accounting principles for U.S. investment companies. The fund consistently follows such policies in preparing its financial statements.
1. Security Valuation: Securities are valued as of the close of trading on the New York Stock Exchange (generally 4 p.m., Eastern time) on the valuation date. Equity securities are valued at the latest quoted sales prices or official closing prices taken from the primary market in which each security trades; such securities not traded on the valuation date are valued at the mean of the latest quoted bid and asked prices. Securities for which market quotations are not readily available, or whose values have been materially affected by events occurring before the fund’s pricing time but after the close of the securities’ primary markets, are valued by methods deemed by the board of trustees to represent fair value. Investments in Vanguard Market Liquidity Fund are valued at that fund’s net asset value.
2. Federal Income Taxes: The fund intends to continue to qualify as a regulated investment company and distribute all of its taxable income. Management has analyzed the fund’s tax positions taken for all open federal income tax years (August 31, 2014–2017), and for the period ended February 28, 2018, and has concluded that no provision for federal income tax is required in the fund’s financial statements. 3. Distributions: Distributions to shareholders are recorded on the ex-dividend date.
4. Securities Lending: To earn additional income, the fund lends its securities to qualified institutional borrowers. Security loans are subject to termination by the fund at any time, and are required to be secured at all times by collateral in an amount at least equal to the market value of securities loaned. Daily market fluctuations could cause the value of loaned securities to be more or less than the value of the collateral received. When this occurs, the collateral is adjusted and settled on the next business day. The fund further mitigates its counterparty risk by entering into securities lending transactions only with a diverse group of prequalified counterparties, monitoring their financial strength, and entering into master securities lending agreements with its counterparties. The master securities lending agreements provide that, in the event of a counterparty’s default (including bankruptcy), the fund may terminate any loans with that borrower, determine the net amount owed, and sell or retain the collateral up to the net amount owed to the fund; however, such actions may be subject to legal proceedings. While collateral mitigates counterparty risk, in the event of a default, the fund may experience delays and costs in recovering the securities loaned. The fund invests cash collateral received in Vanguard Market Liquidity Fund, and records a liability in the Statement of Net Assets for the return of the collateral, during the period the securities are on loan. Securities lending income represents fees charged to borrowers plus income earned on invested cash collateral, less expenses associated with the loan. During the term of the loan, the fund is entitled to all distributions made on or in respect of the loaned securities.
5. Credit Facility: The fund and certain other funds managed by The Vanguard Group (“Vanguard”) participate in a $3.1 billion committed credit facility provided by a syndicate of lenders pursuant to a credit agreement that may be renewed annually; each fund is individually liable for its borrowings, if any, under the credit facility. Borrowings may be utilized for temporary and emergency purposes, and are subject to the fund’s regulatory and contractual borrowing restrictions. The participating funds are charged administrative fees and an annual commitment fee of 0.10% of the undrawn amount of the facility; these fees are allocated to the funds based on a method approved by the fund’s board of trustees and included in Management and Administrative expenses on the fund’s Statement of Operations. Any borrowings under this facility bear interest at a rate based upon the higher of the one-month London Interbank Offered Rate, federal funds effective rate, or overnight bank funding rate plus an agreed-upon spread.
The fund had no borrowings outstanding at February 28, 2018, or at any time during the period then ended.
6. Other: Dividend income is recorded on the ex-dividend date. Interest income includes income distributions received from Vanguard Market Liquidity Fund and is accrued daily. Security transactions are accounted for on the date securities are bought or sold. Costs used to determine realized gains (losses) on the sale of investment securities are those of the specific securities sold.
15
Consumer Discretionary Index Fund
Each class of shares has equal rights as to assets and earnings, except that each class separately bears certain class-specific expenses related to maintenance of shareholder accounts (included in Management and Administrative expenses), shareholder reporting, and the proxy. Marketing and distribution expenses are allocated to each class of shares based on a method approved by the board of trustees. Income, other non-class-specific expenses, and gains and losses on investments are allocated to each class of shares based on its relative net assets.
B. In accordance with the terms of a Funds’ Service Agreement (the “FSA”) between Vanguard and the fund, Vanguard furnishes to the fund investment advisory, corporate management, administrative, marketing, and distribution services at Vanguard’s cost of operations (as defined by the FSA). These costs of operations are allocated to the fund based on methods and guidelines approved by the board of trustees. Vanguard does not require reimbursement in the current period for certain costs of operations (such as deferred compensation/benefits and risk/insurance costs); the fund’s liability for these costs of operations is included in Payables to Vanguard on the Statement of Net Assets. All other costs of operations payable to Vanguard are generally settled twice a month.
Upon the request of Vanguard, the fund may invest up to 0.40% of its net assets as capital in Vanguard. At February 28, 2018, the fund had contributed to Vanguard capital in the amount of $154,000, representing 0.01% of the fund’s net assets and 0.06% of Vanguard’s capitalization. The fund’s trustees and officers are also directors and employees, respectively, of Vanguard.
C. Various inputs may be used to determine the value of the fund’s investments. These inputs are summarized in three broad levels for financial statement purposes. The inputs or methodologies used to value securities are not necessarily an indication of the risk associated with investing in those securities.
Level 1—Quoted prices in active markets for identical securities.
Level 2—Other significant observable inputs (including quoted prices for similar securities, interest
rates, prepayment speeds, credit risk, etc.).
Level 3—Significant unobservable inputs (including the fund’s own assumptions used to determine
the fair value of investments). Any investments valued with significant unobservable inputs are noted
on the Statement of Net Assets.
The following table summarizes the market value of the fund’s investments as of February 28, 2018, based on the inputs used to value them:
| | | |
| Level 1 | Level 2 | Level 3 |
| Investments | ($000) | ($000) | ($000) |
| Common Stocks | 2,866,848 | — | 3 |
| Temporary Cash Investments | 29,304 | — | — |
| Total | 2,896,152 | — | 3 |
D. Distributions are determined on a tax basis and may differ from net investment income and realized capital gains for financial reporting purposes. Differences may be permanent or temporary. Permanent differences are reclassified among capital accounts in the financial statements to reflect their tax character. Temporary differences arise when certain items of income, expense, gain, or loss are recognized in different periods for financial statement and tax purposes. These differences will reverse at some time in the future. Differences in classification may also result from the treatment of short-term gains as ordinary income for tax purposes.
During the six months ended February 28, 2018, the fund realized $44,855,000 of net capital gains resulting from in-kind redemptions—in which shareholders exchanged fund shares for securities held by the fund rather than for cash. Because such gains are not taxable to the fund, and are not distributed to shareholders, they have been reclassified from accumulated net realized losses to paid-in capital.
The fund’s tax-basis capital gains and losses are determined only at the end of each fiscal year. For tax purposes, at August 31, 2017, the fund had available capital losses totaling $48,045,000 to offset future net capital gains. Of this amount, $8,767,000 is subject to expiration dates; $7,274,000 may be used to offset future net capital gains through August 31, 2018, and $1,493,000 through August 31, 2019. Capital losses of $39,278,000 realized beginning in fiscal 2012 may be carried forward indefinitely under the Regulated Investment Company Modernization Act of 2010, but must be used before any expiring loss carryforwards. The fund will use these capital losses to offset net taxable capital gains, if any, realized during the year ending August 31, 2018; should the fund realize net capital losses for the year, the losses will be added to the loss carryforward balance above.
16
Consumer Discretionary Index Fund
At February 28, 2018, the cost of investment securities for tax purposes was $2,324,203,000. Net unrealized appreciation of investment securities for tax purposes was $571,952,000, consisting of unrealized gains of $732,629,000 on securities that had risen in value since their purchase and $160,677,000 in unrealized losses on securities that had fallen in value since their purchase.
E. During the six months ended February 28, 2018, the fund purchased $291,856,000 of investment securities and sold $173,460,000 of investment securities, other than temporary cash investments. Purchases and sales include $210,535,000 and $140,222,000, respectively, in connection with in-kind purchases and redemptions of the fund’s capital shares.
| | | | |
| F. Capital share transactions for each class of shares were: | | | |
| Six Months Ended | | Year Ended |
| February 28, 2018 | August 31, 2017 |
| Amount | Shares | Amount | Shares |
| ($000) | (000) | ($000) | (000) |
| ETF Shares | | | | |
| Issued | 233,317 | 1,475 | 306,903 | 2,278 |
| Issued in Lieu of Cash Distributions | — | — | — | — |
| Redeemed | (143,271) | (975) | (268,550) | (2,000) |
| Net Increase (Decrease)—ETF Shares | 90,046 | 500 | 38,353 | 278 |
| Admiral Shares | | | | |
| Issued | 56,912 | 699 | 78,882 | 1,127 |
| Issued in Lieu of Cash Distributions | 1,327 | 17 | 2,502 | 36 |
| Redeemed | (31,472) | (396) | (67,817) | (972) |
| Net Increase (Decrease)—Admiral Shares | 26,767 | 320 | 13,567 | 191 |
G. Management has determined that no material events or transactions occurred subsequent to February 28, 2018, that would require recognition or disclosure in these financial statements.
17
Consumer Staples Index Fund
| | | |
| Fund Profile | | | |
| As of February 28, 2018 | | |
| |
| Share-Class Characteristics | | |
| | ETF | Admiral |
| Shares | Shares |
| Ticker Symbol | | VDC | VCSAX |
| Expense Ratio1 | 0.10% | 0.10% |
| 30-Day SEC Yield | 2.61% | 2.61% |
| |
| |
| Portfolio Characteristics | | |
| MSCI | |
| US IMI/ | |
| Consumer | MSCI |
| Staples | US IMI/ |
| Fund | 25/50 | 2500 |
| Number of Stocks | 100 | 99 | 2,469 |
| Median Market Cap | $83.8B | $83.8B | $68.2B |
| Price/Earnings Ratio | 21.7x | 21.7x | 21.9x |
| Price/Book Ratio | 3.9x | 3.9x | 3.1x |
| Return on Equity | 20.1% | 20.1% | 15.0% |
| Earnings Growth Rate | 4.5% | 4.4% | 8.5% |
| Dividend Yield | 2.6% | 2.6% | 1.8% |
| Foreign Holdings | 0.0% | 0.0% | 0.0% |
| Turnover Rate | | | |
| (Annualized) | 6% | — | — |
| Short-Term Reserves | 0.0% | — | — |
| | |
| Volatility Measures | | |
| MSCI US |
| IMI/Consumer | MSCI US |
| Staples 25/50 | IMI/2500 |
| R-Squared | 1.00 | 0.31 |
| Beta | 1.00 | 0.56 |
These measures show the degree and timing of the fund’s
fluctuations compared with the indexes over 36 months.
| |
| Subindustry Diversification | |
| (% of equity exposure) | |
| Agricultural Products | 2.9% |
| Brewers | 0.9 |
| Distillers & Vintners | 2.9 |
| Drug Retail | 6.9 |
| Food Distributors | 2.5 |
| Food Retail | 2.1 |
| Household Products | 18.0 |
| Hypermarkets & Super Centers | 11.1 |
| Packaged Foods & Meats | 17.3 |
| Personal Products | 3.5 |
| Soft Drinks | 19.2 |
| Tobacco | 12.7 |
Sector categories are based on the Global Industry
Classification Standard (“GICS”), except for the “Other”
category (if applicable), which includes securities that have
not been provided a GICS classification as of the effective
reporting period.
| | |
| Ten Largest Holdings (% of total net assets) |
| Procter & Gamble Co. | Household Products | 10.1% |
| Coca-Cola Co. | Soft Drinks | 8.8 |
| Philip Morris | | |
| International Inc. | Tobacco | 8.0 |
| PepsiCo Inc. | Soft Drinks | 7.8 |
| Walmart Inc. | Hypermarkets | |
| & Super Centers | 6.6 |
| Altria Group Inc. | Tobacco | 4.5 |
| Costco Wholesale Corp. | Hypermarkets | |
| & Super Centers | 4.4 |
| Mondelez International | Packaged Foods | |
| Inc. Class A | & Meats | 3.6 |
| CVS Health Corp. | Drug Retail | 3.6 |
| Walgreens Boots | | |
| Alliance Inc. | Drug Retail | 3.2 |
| Top Ten | 60.6% |
The holdings listed exclude any temporary cash investments and
equity index products.
1 The expense ratios shown are from the prospectus dated December 21, 2017, and represent estimated costs for the current fiscal year. For the six months ended February 28, 2018, the annualized expense ratios
were 0.10% for ETF Shares and 0.10% for Admiral Shares.
18
Consumer Staples Index Fund
Performance Summary
All of the returns in this report represent past performance, which is not a guarantee of future results that may be achieved by the fund. (Current performance may be lower or higher than the performance data cited. For performance data current to the most recent month-end, visit our website at vanguard.com/performance.) Note, too, that both investment returns and principal value can fluctuate widely, so an investor’s shares, when sold, could be worth more or less than their original cost. The returns shown do not reflect taxes that a shareholder would pay on fund distributions or on the sale of fund shares.
Fiscal-Year Total Returns (%): August 31, 2007–February 28, 2018
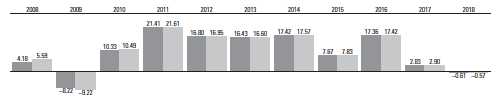
| |
| Consumer Staples Index Fund ETF Shares Net Asset Value |
| Spliced US IMI/Consumer Staples 25/50 |
| For a benchmark description, see the Glossary. |
| Note: For 2018, performance data reflect the six months ended February 28, 2018. |
Average Annual Total Returns: Periods Ended December 31, 2017
This table presents returns through the latest calendar quarter—rather than through the end of the fiscal period.
Securities and Exchange Commission rules require that we provide this information.
| | | | | |
| Inception Date | One Year | Five Years | Ten Years |
| ETF Shares | 1/26/2004 | | | |
| Market Price | | 11.85% | 13.32% | 10.13% |
| Net Asset Value | | 11.81 | 13.30 | 10.11 |
| Admiral Shares | 1/30/2004 | 11.80 | 13.31 | 10.11 |
See Financial Highlights for dividend and capital gains information.
19
Consumer Staples Index Fund
Financial Statements (unaudited)
Statement of Net Assets
As of February 28, 2018
The fund reports a complete list of its holdings in regulatory filings four times in each fiscal year, at the quarter-ends. For the second and fourth fiscal quarters, the lists appear in the fund’s semiannual and annual reports to shareholders. For the first and third fiscal quarters, the fund files the lists with the Securities and Exchange Commission on Form N-Q. Shareholders can look up the fund’s Forms N-Q on the SEC’s website at sec.gov. Forms N-Q may also be reviewed and copied at the SEC’s Public Reference Room (see the back cover of this report for further information).
| | | |
| Market |
| Value• |
| | Shares | ($000) |
| Common Stocks (100.0%) | | |
| Beverages (23.0%) | | |
| Coca-Cola Co. | 8,790,261 | 379,915 |
| PepsiCo Inc. | 3,074,944 | 337,414 |
| Constellation Brands Inc. | | |
| | Class A | 399,789 | 86,146 |
| * | Monster Beverage Corp. | 944,068 | 59,826 |
| Dr Pepper Snapple Group | | |
| | Inc. | 450,422 | 52,362 |
| Brown-Forman Corp. | | |
| | Class B | 556,198 | 38,817 |
| Molson Coors Brewing | | |
| | Co. Class B | 442,604 | 33,748 |
| * | Boston Beer Co. Inc. | | |
| | Class A | 30,074 | 4,904 |
| Coca-Cola Bottling Co. | | |
| | Consolidated | 21,919 | 4,090 |
| National Beverage Corp. | 5,101 | 500 |
| MGP Ingredients Inc. | 5,735 | 481 |
| 998,203 |
| Food & Staples Retailing (22.7%) | |
| Walmart Inc. | 3,197,862 | 287,839 |
| Costco Wholesale Corp. | 997,527 | 190,428 |
| CVS Health Corp. | 2,297,991 | 155,643 |
| Walgreens Boots Alliance | | |
| | Inc. | 2,017,928 | 139,015 |
| Sysco Corp. | 1,242,311 | 74,104 |
| Kroger Co. | 2,141,795 | 58,085 |
| * | US Foods Holding Corp. | 386,095 | 12,892 |
| Casey’s General Stores | | |
| | Inc. | 104,930 | 11,785 |
| * | Sprouts Farmers Market | | |
| | Inc. | 410,794 | 10,582 |
| * | United Natural Foods Inc. | 158,107 | 6,746 |
| PriceSmart Inc. | 65,064 | 5,124 |
| *,^ Rite Aid Corp. | 2,528,890 | 4,982 |
| * | Performance Food | | |
| | Group Co. | 147,595 | 4,524 |
| Andersons Inc. | 120,352 | 4,218 |
| * | Chefs’ Warehouse Inc. | 163,250 | 3,681 |
| SpartanNash Co. | 173,759 | 2,914 |
| Weis Markets Inc. | 75,414 | 2,811 |
| Village Super Market Inc. | | |
| | Class A | 93,636 | 2,219 |
| Ingles Markets Inc. | | |
| | Class A | 62,971 | 2,028 |
| SUPERVALU Inc. | 108,368 | 1,542 |
| * | Smart & Final Stores Inc. | 183,057 | 1,318 |
| * | Natural Grocers by Vitamin | | |
| | Cottage Inc. | 120,702 | 839 |
| 983,319 |
| Food Products (20.1%) | | |
| Mondelez International Inc. | | |
| | Class A | 3,566,101 | 156,552 |
| Kraft Heinz Co. | 1,371,013 | 91,926 |
| General Mills Inc. | 1,378,946 | 69,706 |
| Archer-Daniels-Midland Co. | 1,388,196 | 57,638 |
| | | | |
| Market |
| Value• |
| | | Shares | ($000) |
| Tyson Foods Inc. Class A | | 718,123 | 53,414 |
| Kellogg Co. | | 624,091 | 41,315 |
| Conagra Brands Inc. | 1,006,605 | 36,369 |
| Hershey Co. | | 356,805 | 35,060 |
| JM Smucker Co. | | 271,261 | 34,260 |
| McCormick & Co. Inc. | | 283,490 | 30,271 |
| Bunge Ltd. | | 352,332 | 26,576 |
| Ingredion Inc. | | 180,404 | 23,568 |
| Hormel Foods Corp. | | 707,153 | 22,954 |
| Campbell Soup Co. | | 456,582 | 19,656 |
| Lamb Weston Holdings Inc. | 335,744 | 18,160 |
| Pinnacle Foods Inc. | | 295,806 | 15,962 |
| Snyder’s-Lance Inc. | | 262,994 | 13,118 |
| * | Post Holdings Inc. | | 166,783 | 12,639 |
| Flowers Foods Inc. | | 509,434 | 10,566 |
| * | Darling Ingredients Inc. | | 565,035 | 10,278 |
| * | Hain Celestial Group Inc. | | 275,898 | 9,596 |
| Sanderson Farms Inc. | | 73,007 | 8,991 |
| Lancaster Colony Corp. | | 60,572 | 7,168 |
| J&J Snack Foods Corp. | | 50,976 | 6,848 |
| * | Pilgrim’s Pride Corp. | | 244,230 | 6,155 |
| Calavo Growers Inc. | | 70,072 | 5,981 |
| B&G Foods Inc. | | 211,843 | 5,868 |
| * | TreeHouse Foods Inc. | | 152,780 | 5,809 |
| Fresh Del Monte Produce | | | |
| | Inc. | | 122,480 | 5,717 |
| * | Blue Buffalo Pet Products | | | |
| | Inc. | | 139,380 | 5,584 |
| * | Freshpet Inc. | | 267,524 | 5,350 |
| * | Cal-Maine Foods Inc. | | 105,339 | 4,487 |
| ^ | Tootsie Roll Industries Inc. | | 110,997 | 3,707 |
| * | Landec Corp. | | 217,255 | 2,824 |
| Dean Foods Co. | | 318,491 | 2,761 |
| * | Farmer Brothers Co. | | 87,119 | 2,718 |
| * | Seneca Foods Corp. Class A | 87,613 | 2,549 |
| John B Sanfilippo & Son Inc. | 5,768 | 333 |
| * | Hostess Brands Inc. Class A | 12,460 | 152 |
| 872,586 |
| Household Products (18.0%) | | | |
| Procter & Gamble Co. | 5,590,569 | 438,972 |
| Colgate-Palmolive Co. | 1,946,850 | 134,274 |
| Kimberly-Clark Corp. | | 833,089 | 92,406 |
| Clorox Co. | | 304,428 | 39,296 |
| Church & Dwight Co. Inc. | | 633,433 | 31,159 |
| Energizer Holdings Inc. | | 197,950 | 10,784 |
| Spectrum Brands Holdings | | | |
| | Inc. | | 81,346 | 8,030 |
| * | Central Garden & Pet Co. | | | |
| | Class A | | 189,704 | 6,875 |
| WD-40 Co. | | 52,802 | 6,584 |
| * | HRG Group Inc. | | 347,780 | 5,491 |
| * | Central Garden & Pet Co. | | 130,037 | 5,023 |
| 778,894 |
| Personal Products (3.5%) | | | |
| Estee Lauder Cos. Inc. | | | |
| | Class A | | 529,797 | 73,345 |
| Coty Inc. Class A | 1,182,170 | 22,840 |
| | | |
| Market |
| Value• |
| | Shares | ($000) |
| *,^ Herbalife Ltd. | 166,137 | 15,301 |
| Nu Skin Enterprises Inc. | | |
| | Class A | 181,198 | 12,756 |
| * | Edgewell Personal Care Co. | 164,344 | 8,242 |
| Medifast Inc. | 84,480 | 5,389 |
| Inter Parfums Inc. | 111,916 | 4,745 |
| * | USANA Health Sciences | | |
| | Inc. | 56,352 | 4,305 |
| * | Avon Products Inc. | 1,547,142 | 4,069 |
| *,^ Revlon Inc. Class A | 102,214 | 2,014 |
| *,1 Herbalife Ltd. CVR | 28,862 | 280 |
| Natural Health Trends Corp. | 9,591 | 167 |
| *,^ elf Beauty Inc. | 7,312 | 135 |
| 153,588 |
| Tobacco (12.7%) | | |
| Philip Morris | | |
| | International Inc. | 3,352,994 | 347,203 |
| Altria Group Inc. | 3,103,717 | 195,379 |
| Vector Group Ltd. | 316,701 | 6,347 |
| Universal Corp. | 83,530 | 4,105 |
| 553,034 |
| Total Common Stocks | | |
| (Cost $4,084,836) | 4,339,624 |
| Temporary Cash Investment (0.2%) | |
| Money Market Fund (0.2%) | | |
| 2,3 Vanguard Market Liquidity | | |
| | Fund, 1.601% | 57,596 | 5,759 |
| Total Temporary Cash Investments | |
| (Cost $5,759) | 5,759 |
| Total Investments (100.2%) | | |
| (Cost $4,090,595) | 4,345,383 |
| | | |
| Amount |
| ($000) |
| Other Assets and Liabilities (-0.2%) | |
| Other Assets | | |
| Investment in Vanguard | | 248 |
| Receivables for Investment | | |
| | Securities Sold | | 7,790 |
| Receivables for Accrued Income | 3,964 |
| Receivables for Capital Shares Issued | 419 |
| Other Assets 3 | | 2 |
| Total Other Assets | 12,423 |
| Liabilities | | |
| Payables for Investment | | |
| | Securities Purchased | | (3,767) |
| Collateral for Securities on Loan | (5,761) |
| Payables for Capital Shares Redeemed | (3,145) |
| Payables to Vanguard | | (1,507) |
| Other Liabilities | | (5,259) |
| Total Liabilities | (19,439) |
| Net Assets (100%) | 4,338,367 |
20
Consumer Staples Index Fund
| |
| At February 28, 2018, net assets consisted of: |
| Amount |
| ($000) |
| Paid-in Capital | 4,117,407 |
| Undistributed Net Investment Income | 9,993 |
| Accumulated Net Realized Losses | (43,821) |
| Unrealized Appreciation (Depreciation) | 254,788 |
| Net Assets | 4,338,367 |
| |
| ETF Shares—Net Assets | |
| Applicable to 26,921,028 outstanding | |
| $.001 par value shares of beneficial | |
| interest (unlimited authorization) | 3,702,640 |
| Net Asset Value Per Share— | |
| ETF Shares $137.54 |
| |
| Admiral Shares—Net Assets | |
| Applicable to 9,374,641 outstanding | |
| $.001 par value shares of beneficial | |
| interest (unlimited authorization) | 635,727 |
| Net Asset Value Per Share— | |
| Admiral Shares | $67.81 |
• See Note A in Notes to Financial Statements.
* Non-income-producing security.
^ Includes partial security positions on loan to broker-dealers.
The total value of securities on loan is $4,968,000.
1 Security value determined using significant unobservable inputs.
2 Affiliated money market fund available only to Vanguard funds
and certain trusts and accounts managed by Vanguard. Rate
shown is the 7-day yield.
3 Includes $5,761,000 of collateral received for securities on loan,
of which $5,759,000 is held in Vanguard Market Liquidity Fund
and $2,000 is held in cash.
CVR—Contingent Value Rights.
See accompanying Notes, which are an integral part of the Financial Statements.
21
Consumer Staples Index Fund
Statement of Operations
| | | |
| Six Months Ended |
| February 28, 2018 |
| | ($000) |
| Investment Income | | |
| Income | | |
| Dividends | 53,478 |
| Interest1 | 6 |
| Securities Lending—Net | 279 |
| Total Income | 53,763 |
| Expenses | | |
| The Vanguard Group—Note B | | |
| Investment Advisory Services | 574 |
| Management and Administrative— | |
| ETF Shares | 1,087 |
| Management and Administrative— | |
| Admiral Shares | 198 |
| Marketing and Distribution— | | |
| ETF Shares | 99 |
| Marketing and Distribution— | | |
| Admiral Shares | 27 |
| Custodian Fees | 57 |
| Shareholders’ Reports and Proxy— | |
| ETF Shares | 179 |
| Shareholders’ Reports and Proxy— | |
| Admiral Shares | 25 |
| Trustees’ Fees and Expenses | 2 |
| Total Expenses | 2,248 |
| Net Investment Income | 51,515 |
| Realized Net Gain (Loss) on | | |
| Investment Securities Sold1 | 95,438 |
| Change in Unrealized Appreciation | |
| (Depreciation) of Investment Securities1 (175,901) |
| Net Increase (Decrease) in Net Assets | |
| Resulting from Operations | | (28,948) |
1 Interest income, realized net gain (loss), and change in unrealized
appreciation (depreciation) from an affiliated company of the
fund were $6,000, ($2,000), and ($3,000), respectively. Purchases
and sales are for temporary cash investment purposes.
| | | | |
| Statement of Changes in Net Assets | | | |
| |
| Six Months Ended | Year Ended |
| | February 28, | August 31, |
| | 2018 | 2017 |
| ($000) | ($000) |
| Increase (Decrease) in Net Assets | | | |
| Operations | | | |
| Net Investment Income | | 51,515 | 111,902 |
| Realized Net Gain (Loss) | | 95,438 | 215,369 |
| Change in Unrealized Appreciation (Depreciation) | | (175,901) | (219,839) |
| Net Increase (Decrease) in Net Assets Resulting from Operations | | (28,948) | 107,432 |
| Distributions | | | |
| Net Investment Income | | | |
| ETF Shares | | (48,746) | (94,086) |
| Admiral Shares | | (9,040) | (19,195) |
| Realized Capital Gain | | | |
| ETF Shares | | — | — |
| Admiral Shares | | — | — |
| Total Distributions | | (57,786) | (113,281) |
| Capital Share Transactions | | | |
| ETF Shares | | (2,322) | 267,194 |
| Admiral Shares | | (94,780) | 15,212 |
| Net Increase (Decrease) from Capital Share Transactions | | (97,102) | 282,406 |
| Total Increase (Decrease) | | (183,836) | 276,557 |
| Net Assets |
| Beginning of Period | | 4,522,203 | 4,245,646 |
| End of Period1 | | 4,338,367 | 4,522,203 |
| 1 Net Assets—End of Period includes undistributed (overdistributed) net investment income of $9,993,000 and $16,264,000. | |
See accompanying Notes, which are an integral part of the Financial Statements.
22
| | | | | | | |
| Consumer Staples Index Fund | | | | | | | |
| |
| |
| Financial Highlights | | | | | |
| |
| ETF Shares | | | | | | | |
| Six Months | | | | | |
| | Ended | | | | | |
| For a Share Outstanding | February 28, | | | Year Ended August 31, |
| Throughout Each Period | 2018 | 2017 | 2016 | 2015 | 2014 | 2013 |
| Net Asset Value, Beginning of Period | $140.15 | $139.97 | $123.72 | $117.12 | $101.97 | $90.12 |
| Investment Operations | |
| Net Investment Income | | 1.6141 | 3.6511 | 3.189 | 2.903 | 2.602 | 2.606 |
| Net Realized and Unrealized Gain (Loss) | | | | | | |
| on Investments | | (2.417) | 0.212 | 17.752 | 6.114 | 14.976 | 11.835 |
| Total from Investment Operations | | (.803) | 3.863 | 20.941 | 9.017 | 17.578 | 14.441 |
| Distributions | |
| Dividends from Net Investment Income | (1.807) | (3.683) | (4.691) | (2.417) | (2.428) | (2.591) |
| Distributions from Realized Capital Gains | — | — | — | — | — | — |
| Total Distributions | | (1.807) | (3.683) | (4.691) | (2.417) | (2.428) | (2.591) |
| Net Asset Value, End of Period | | $137.54 | $140.15 | $139.97 | $123.72 | $117.12 | $101.97 |
| Total Return | | -0.61% | 2.83% | 17.36% | 7.67% | 17.42% | 16.43% |
| Ratios/Supplemental Data | |
| Net Assets, End of Period (Millions) | | $3,703 | $3,780 | $3,518 | $2,393 | $1,936 | $1,481 |
| Ratio of Total Expenses to | | | | | | | |
| Average Net Assets | | 0.10% | 0.10% | 0.10% | 0.10% | 0.12% | 0.14% |
| Ratio of Net Investment Income to | | | | | | | |
| Average Net Assets | | 2.29% | 2.63% | 2.50% | 2.53% | 2.52% | 2.80% |
| Portfolio Turnover Rate2 | | 6% | 5% | 6% | 6% | 5% | 10% |
The expense ratio, net investment income ratio, and turnover rate for the current period have been annualized.
1 Calculated based on average shares outstanding.
2 Excludes the value of portfolio securities received or delivered as a result of in-kind purchases or redemptions of the fund’s capital shares,
including ETF Creation Units.
See accompanying Notes, which are an integral part of the Financial Statements.
23
| | | | | | | |
| Consumer Staples Index Fund | | | | | | | |
| |
| |
| Financial Highlights | | | | | |
| |
| Admiral Shares | | | | | | | |
| Six Months | | | | | |
| | Ended | | | | | |
| For a Share Outstanding | February 28, | | | Year Ended August 31, |
| Throughout Each Period | 2018 | 2017 | 2016 | 2015 | 2014 | 2013 |
| Net Asset Value, Beginning of Period | $69.10 | $69.02 | $61.01 | $57.74 | $50.28 | $44.44 |
| Investment Operations | |
| Net Investment Income | | . 8011 | 1.7971 | 1.575 | 1.431 | 1.281 | 1.287 |
| Net Realized and Unrealized Gain (Loss) | | | | | | |
| on Investments | | (1.201) | 0.101 | 8.752 | 3.025 | 7.379 | 5.832 |
| Total from Investment Operations | | (.400) | 1.898 | 10.327 | 4.456 | 8.660 | 7.119 |
| Distributions | |
| Dividends from Net Investment Income | (.890) | (1.818) | (2.317) | (1.186) | (1.200) | (1.279) |
| Distributions from Realized Capital Gains | — | — | — | — | — | — |
| Total Distributions | | (.890) | (1.818) | (2.317) | (1.186) | (1.200) | (1.279) |
| Net Asset Value, End of Period | | $67.81 | $69.10 | $69.02 | $61.01 | $57.74 | $50.28 |
| Total Return2 | | -0.62% | 2.81% | 17.37% | 7.73% | 17.41% | 16.44% |
| Ratios/Supplemental Data | |
| Net Assets, End of Period (Millions) | | $636 | $742 | $728 | $319 | $218 | $175 |
| Ratio of Total Expenses to | | | | | | | |
| Average Net Assets | | 0.10% | 0.10% | 0.10% | 0.10% | 0.12% | 0.14% |
| Ratio of Net Investment Income to | | | | | | | |
| Average Net Assets | | 2.29% | 2.63% | 2.50% | 2.53% | 2.52% | 2.80% |
| Portfolio Turnover Rate3 | | 6% | 5% | 6% | 6% | 5% | 10% |
The expense ratio, net investment income ratio, and turnover rate for the current period have been annualized.
1 Calculated based on average shares outstanding.
2 Total returns do not include account service fees that may have applied in the periods shown. Fund prospectuses provide information about
any applicable account service fees.
3 Excludes the value of portfolio securities received or delivered as a result of in-kind purchases or redemptions of the fund’s capital shares,
including ETF Creation Units.
See accompanying Notes, which are an integral part of the Financial Statements.
24
Consumer Staples Index Fund
Notes to Financial Statements
Vanguard Consumer Staples Index Fund is registered under the Investment Company Act of 1940 as an open-end investment company, or mutual fund. The fund offers two classes of shares: ETF Shares and Admiral Shares. ETF Shares are listed for trading on NYSE Arca; they can be purchased and sold through a broker. Admiral Shares are designed for investors who meet certain administrative, service, and account-size criteria.
A. The following significant accounting policies conform to generally accepted accounting principles for U.S. investment companies. The fund consistently follows such policies in preparing its financial statements.
1. Security Valuation: Securities are valued as of the close of trading on the New York Stock Exchange (generally 4 p.m., Eastern time) on the valuation date. Equity securities are valued at the latest quoted sales prices or official closing prices taken from the primary market in which each security trades; such securities not traded on the valuation date are valued at the mean of the latest quoted bid and asked prices. Securities for which market quotations are not readily available, or whose values have been materially affected by events occurring before the fund’s pricing time but after the close of the securities’ primary markets, are valued by methods deemed by the board of trustees to represent fair value. Investments in Vanguard Market Liquidity Fund are valued at that fund’s net asset value.
2. Federal Income Taxes: The fund intends to continue to qualify as a regulated investment company and distribute all of its taxable income. Management has analyzed the fund’s tax positions taken for all open federal income tax years (August 31, 2014–2017), and for the period ended February 28, 2018, and has concluded that no provision for federal income tax is required in the fund’s financial statements. 3. Distributions: Distributions to shareholders are recorded on the ex-dividend date.
4. Securities Lending: To earn additional income, the fund lends its securities to qualified institutional borrowers. Security loans are subject to termination by the fund at any time, and are required to be secured at all times by collateral in an amount at least equal to the market value of securities loaned. Daily market fluctuations could cause the value of loaned securities to be more or less than the value of the collateral received. When this occurs, the collateral is adjusted and settled on the next business day. The fund further mitigates its counterparty risk by entering into securities lending transactions only with a diverse group of prequalified counterparties, monitoring their financial strength, and entering into master securities lending agreements with its counterparties. The master securities lending agreements provide that, in the event of a counterparty’s default (including bankruptcy), the fund may terminate any loans with that borrower, determine the net amount owed, and sell or retain the collateral up to the net amount owed to the fund; however, such actions may be subject to legal proceedings. While collateral mitigates counterparty risk, in the event of a default, the fund may experience delays and costs in recovering the securities loaned. The fund invests cash collateral received in Vanguard Market Liquidity Fund, and records a liability in the Statement of Net Assets for the return of the collateral, during the period the securities are on loan. Securities lending income represents fees charged to borrowers plus income earned on invested cash collateral, less expenses associated with the loan. During the term of the loan, the fund is entitled to all distributions made on or in respect of the loaned securities.
5. Credit Facility: The fund and certain other funds managed by The Vanguard Group (“Vanguard”) participate in a $3.1 billion committed credit facility provided by a syndicate of lenders pursuant to a credit agreement that may be renewed annually; each fund is individually liable for its borrowings, if any, under the credit facility. Borrowings may be utilized for temporary and emergency purposes, and are subject to the fund’s regulatory and contractual borrowing restrictions. The participating funds are charged administrative fees and an annual commitment fee of 0.10% of the undrawn amount of the facility; these fees are allocated to the funds based on a method approved by the fund’s board of trustees and included in Management and Administrative expenses on the fund’s Statement of Operations. Any borrowings under this facility bear interest at a rate based upon the higher of the one-month London Interbank Offered Rate, federal funds effective rate, or overnight bank funding rate plus an agreed-upon spread.
The fund had no borrowings outstanding at February 28, 2018, or at any time during the period then ended.
6. Other: Dividend income is recorded on the ex-dividend date. Interest income includes income distributions received from Vanguard Market Liquidity Fund and is accrued daily. Premiums and discounts on debt securities purchased are amortized and accreted, respectively, to interest income
25
Consumer Staples Index Fund
over the lives of the respective securities. Security transactions are accounted for on the date securities are bought or sold. Costs used to determine realized gains (losses) on the sale of investment securities are those of the specific securities sold.
Each class of shares has equal rights as to assets and earnings, except that each class separately bears certain class-specific expenses related to maintenance of shareholder accounts (included in Management and Administrative expenses), shareholder reporting, and the proxy. Marketing and distribution expenses are allocated to each class of shares based on a method approved by the board of trustees. Income, other non-class-specific expenses, and gains and losses on investments are allocated to each class of shares based on its relative net assets.
B. In accordance with the terms of a Funds’ Service Agreement (the “FSA”) between Vanguard and the fund, Vanguard furnishes to the fund investment advisory, corporate management, administrative, marketing, and distribution services at Vanguard’s cost of operations (as defined by the FSA). These costs of operations are allocated to the fund based on methods and guidelines approved by the board of trustees. Vanguard does not require reimbursement in the current period for certain costs of operations (such as deferred compensation/benefits and risk/insurance costs); the fund’s liability for these costs of operations is included in Payables to Vanguard on the Statement of Net Assets. All other costs of operations payable to Vanguard are generally settled twice a month.
Upon the request of Vanguard, the fund may invest up to 0.40% of its net assets as capital in Vanguard. At February 28, 2018, the fund had contributed to Vanguard capital in the amount of $248,000, representing 0.01% of the fund’s net assets and 0.10% of Vanguard’s capitalization. The fund’s trustees and officers are also directors and employees, respectively, of Vanguard.
C. Various inputs may be used to determine the value of the fund’s investments. These inputs are summarized in three broad levels for financial statement purposes. The inputs or methodologies used to value securities are not necessarily an indication of the risk associated with investing in those securities.
Level 1—Quoted prices in active markets for identical securities.
Level 2—Other significant observable inputs (including quoted prices for similar securities, interest
rates, prepayment speeds, credit risk, etc.).
Level 3—Significant unobservable inputs (including the fund’s own assumptions used to determine
the fair value of investments). Any investments valued with significant unobservable inputs are noted
on the Statement of Net Assets.
The following table summarizes the market value of the fund’s investments as of February 28, 2018, based on the inputs used to value them:
| | | |
| Level 1 | Level 2 | Level 3 |
| Investments | ($000) | ($000) | ($000) |
| Common Stocks | 4,339,344 | — | 280 |
| Temporary Cash Investments | 5,759 | — | — |
| Total | 4,345,103 | — | 280 |
D. Distributions are determined on a tax basis and may differ from net investment income and realized capital gains for financial reporting purposes. Differences may be permanent or temporary. Permanent differences are reclassified among capital accounts in the financial statements to reflect their tax character. Temporary differences arise when certain items of income, expense, gain, or loss are recognized in different periods for financial statement and tax purposes. These differences will reverse at some time in the future. Differences in classification may also result from the treatment of short-term gains as ordinary income for tax purposes.
During the six months ended February 28, 2018, the fund realized $116,501,000 of net capital gains resulting from in-kind redemptions—in which shareholders exchanged fund shares for securities held by the fund rather than for cash. Because such gains are not taxable to the fund, and are not distributed to shareholders, they have been reclassified from accumulated net realized losses to paid-in capital.
The fund’s tax-basis capital gains and losses are determined only at the end of each fiscal year. For tax purposes, at August 31, 2017, the fund had available capital losses totaling $22,758,000 to offset future net capital gains. Of this amount, $5,537,000 is subject to expiration on August 31, 2018.
26
Consumer Staples Index Fund
Capital losses of $17,221,000 realized beginning in fiscal 2012 may be carried forward indefinitely under the Regulated Investment Company Modernization Act of 2010, but must be used before any expiring loss carryforwards. The fund will use these capital losses to offset net taxable capital gains, if any, realized during the year ending August 31, 2018; should the fund realize net capital losses for the year, the losses will be added to the loss carryforward balance above.
At February 28, 2018, the cost of investment securities for tax purposes was $4,090,595,000. Net unrealized appreciation of investment securities for tax purposes was $254,788,000, consisting of unrealized gains of $401,204,000 on securities that had risen in value since their purchase and $146,416,000 in unrealized losses on securities that had fallen in value since their purchase.
E. During the six months ended February 28, 2018, the fund purchased $386,732,000 of investment securities and sold $490,346,000 of investment securities, other than temporary cash investments. Purchases and sales include $253,934,000 and $352,760,000, respectively, in connection with in-kind purchases and redemptions of the fund’s capital shares.
| | | | |
| F. Capital share transactions for each class of shares were: | | | |
| Six Months Ended | | Year Ended |
| February 28, 2018 | August 31, 2017 |
| Amount | Shares | Amount | Shares |
| ($000) | (000) | ($000) | (000) |
| ETF Shares | | | | |
| Issued | 350,523 | 2,451 | 867,405 | 6,164 |
| Issued in Lieu of Cash Distributions | — | — | — | — |
| Redeemed | (352,845) | (2,500) | (600,211) | (4,325) |
| Net Increase (Decrease)—ETF Shares | (2,322) | (49) | 267,194 | 1,839 |
| Admiral Shares | | | | |
| Issued | 92,892 | 1,328 | 311,051 | 4,565 |
| Issued in Lieu of Cash Distributions | 7,743 | 110 | 16,884 | 248 |
| Redeemed | (195,415) | (2,806) | (312,723) | (4,619) |
| Net Increase (Decrease)—Admiral Shares | (94,780) | (1,368) | 15,212 | 194 |
G. Management has determined that no material events or transactions occurred subsequent to February 28, 2018, that would require recognition or disclosure in these financial statements.
27
| | |
| Energy Index Fund | |
| |
| |
| Fund Profile | | |
| As of February 28, 2018 | | |
| Share-Class Characteristics | | |
| ETF | Admiral |
| Shares | Shares |
| Ticker Symbol | VDE | VENAX |
| Expense Ratio1 | 0.10% | 0.10% |
| 30-Day SEC Yield | 2.74% | 2.74% |
| | | |
| Portfolio Characteristics | | |
| MSCI |
| US IMI/ | MSCI |
| Energy | US IMI/ |
| Fund | 25/50 | 2500 |
| Number of Stocks | 142 | 140 | 2,469 |
| Median Market Cap | $58.7B | $58.7B | $68.2B |
| Price/Earnings Ratio | 16.5x | 16.8x | 21.9x |
| Price/Book Ratio | 1.7x | 1.7x | 3.1x |
| Return on Equity | 7.3% | 7.3% | 15.0% |
| Earnings Growth Rate | -19.0% | -18.8% | 8.5% |
| Dividend Yield | 2.7% | 2.7% | 1.8% |
| Foreign Holdings | 0.0% | 0.0% | 0.0% |
| Turnover Rate | | | |
| (Annualized) | 4% | — | — |
| Short-Term Reserves | 0.3% | — | — |
| | |
| Volatility Measures | | |
| MSCI US | |
| IMI/Energy | MSCI US |
| 25/50 | IMI/2500 |
| R-Squared | 1.00 | 0.37 |
| Beta | 0.99 | 1.20 |
These measures show the degree and timing of the fund’s fluctuations compared with the indexes over 36 months.
| |
| Subindustry Diversification | |
| (% of equity exposure) | |
| Coal & Consumable Fuels | 0.4% |
| Integrated Oil & Gas | 39.8 |
| Oil & Gas Drilling | 1.6 |
| Oil & Gas Equipment & Services | 13.6 |
| Oil & Gas Exploration & Production | 27.8 |
| Oil & Gas Refining & Marketing | 9.6 |
| Oil & Gas Storage & Transportation | 7.2 |
Sector categories are based on the Global Industry
Classification Standard (“GICS”), except for the “Other”
category (if applicable), which includes securities that have
not been provided a GICS classification as of the effective
reporting period.
| | |
| Ten Largest Holdings (% of total net assets) |
| Exxon Mobil Corp. | Integrated Oil & Gas | 21.9% |
| Chevron Corp. | Integrated Oil & Gas | 14.5 |
| Schlumberger Ltd. | Oil & Gas Equipment | |
| & Services | 6.2 |
| ConocoPhillips | Oil & Gas Exploration | |
| & Production | 4.6 |
| EOG Resources | Oil & Gas Exploration | |
| Inc. | & Production | 4.0 |
| Occidental | | |
| Petroleum Corp. | Integrated Oil & Gas | 3.4 |
| Halliburton Co. | Oil & Gas Equipment | |
| & Services | 2.8 |
| Valero Energy | Oil & Gas Refining | |
| Corp. | & Marketing | 2.7 |
| Phillips 66 | Oil & Gas Refining | |
| & Marketing | 2.7 |
| Kinder Morgan Inc. | Oil & Gas Storage | |
| & Transportation | 2.2 |
| Top Ten | 65.0% |
The holdings listed exclude any temporary cash investments and equity index products.
1 The expense ratios shown are from the prospectus dated December 21, 2017, and represent estimated costs for the current fiscal year. For the six months ended February 28, 2018, the annualized expense ratios
were 0.10% for ETF Shares and 0.10% for Admiral Shares.
28
Energy Index Fund
Performance Summary
All of the returns in this report represent past performance, which is not a guarantee of future results that may be achieved by the fund. (Current performance may be lower or higher than the performance data cited. For performance data current to the most recent month-end, visit our website at vanguard.com/performance.) Note, too, that both investment returns and principal value can fluctuate widely, so an investor’s shares, when sold, could be worth more or less than their original cost. The returns shown do not reflect taxes that a shareholder would pay on fund distributions or on the sale of fund shares.
Fiscal-Year Total Returns (%): August 31, 2007–February 28, 2018
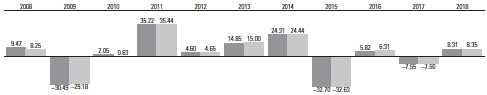
| |
| Energy Index Fund ETF Shares Net Asset Value |
| Spliced US IMI/Energy 25/50 |
| For a benchmark description, see the Glossary. |
| Note: For 2018, performance data reflect the six months ended February 28, 2018. |
Average Annual Total Returns: Periods Ended December 31, 2017
This table presents returns through the latest calendar quarter—rather than through the end of the fiscal period.
Securities and Exchange Commission rules require that we provide this information.
| | | | | |
| Inception Date | One Year | Five Years | Ten Years |
| ETF Shares | 9/23/2004 | | | |
| Market Price | | -2.35% | 1.84% | 0.68% |
| Net Asset Value | | -2.40 | 1.83 | 0.67 |
| Admiral Shares | 10/7/2004 | -2.39 | 1.84 | 0.67 |
See Financial Highlights for dividend and capital gains information.
29
Energy Index Fund
Financial Statements (unaudited)
Statement of Net Assets
As of February 28, 2018
The fund reports a complete list of its holdings in regulatory filings four times in each fiscal year, at the quarter-ends. For the second and fourth fiscal quarters, the lists appear in the fund’s semiannual and annual reports to shareholders. For the first and third fiscal quarters, the fund files the lists with the Securities and Exchange Commission on Form N-Q. Shareholders can look up the fund’s Forms N-Q on the SEC’s website at sec.gov. Forms N-Q may also be reviewed and copied at the SEC’s Public Reference Room (see the back cover of this report for further information).
| | | |
| Market |
| Value• |
| | Shares | ($000) |
| Common Stocks (100.3%)1 | | |
| Energy Equipment & Services (15.2%) | |
| Oil & Gas Drilling (1.6%) | | |
| Helmerich & Payne Inc. | 326,496 | 21,075 |
| Patterson-UTI Energy Inc. | 668,749 | 12,084 |
| ^,* | Transocean Ltd. | 1,323,314 | 12,056 |
| Nabors Industries Ltd. | 954,895 | 6,178 |
| Ensco plc Class A | 1,310,800 | 5,820 |
| * | Rowan Cos. plc Class A | 360,570 | 4,385 |
| * | Unit Corp. | 158,988 | 3,046 |
| ^,* | Diamond Offshore Drilling | | |
| | Inc. | 206,280 | 2,991 |
| * | Noble Corp. plc | 736,527 | 2,858 |
| * | Parker Drilling Co. | 417,884 | 376 |
| |
| Oil & Gas Equipment & Services (13.6%) |
| Schlumberger Ltd. | 4,164,414 | 273,352 |
| Halliburton Co. | 2,623,060 | 121,762 |
| National Oilwell Varco Inc. | 1,142,455 | 40,089 |
| TechnipFMC plc | 1,334,334 | 38,455 |
| Baker Hughes a GE Co. | 1,222,837 | 32,283 |
| ^ | Core Laboratories NV | 132,716 | 13,664 |
| ^,* | Weatherford International | | |
| | plc | 2,983,950 | 7,848 |
| US Silica Holdings Inc. | 244,203 | 6,322 |
| * | McDermott International | | |
| | Inc. | 853,844 | 6,233 |
| Oceaneering International | | |
| | Inc. | 295,463 | 5,431 |
| * | Dril-Quip Inc. | 113,821 | 5,128 |
| * | C&J Energy Services Inc. | 190,134 | 4,563 |
| * | Oil States International Inc. | 163,699 | 4,027 |
| * | Superior Energy Services | | |
| | Inc. | 460,278 | 3,935 |
| ^ | RPC Inc. | 195,347 | 3,837 |
| * | Exterran Corp. | 107,615 | 2,784 |
| * | Helix Energy Solutions | | |
| | Group Inc. | 453,748 | 2,704 |
| * | Forum Energy | | |
| | Technologies Inc. | 227,509 | 2,571 |
| * | ProPetro Holding Corp. | 149,816 | 2,417 |
| * | Newpark Resources Inc. | 265,573 | 2,191 |
| * | SEACOR Holdings Inc. | 51,012 | 2,117 |
| * | Fairmount Santrol Holdings | | |
| | Inc. | 471,647 | 2,113 |
| * | Keane Group Inc. | 134,529 | 2,092 |
| Archrock Inc. | 192,172 | 1,826 |
| Bristow Group Inc. | 101,011 | 1,491 |
| * | TETRA Technologies Inc. | 402,505 | 1,461 |
| * | Basic Energy Services Inc. | 71,270 | 1,153 |
| * | Matrix Service Co. | 80,419 | 1,150 |
| Frank’s International NV | 167,755 | 877 |
| * | SEACOR Marine Holdings | | |
| | Inc. | 49,968 | 845 |
| * | Mammoth Energy Services | | |
| | Inc. | 26,768 | 701 |
| * | RigNet Inc. | 46,516 | 623 |
| ^,* | Smart Sand Inc. | 66,822 | 496 |
| | | | |
| Market |
| Value• |
| | | Shares | ($000) |
| * | NCS Multistage Holdings | | |
| | Inc. | | 33,023 | 483 |
| ^,* | CARBO Ceramics Inc. | 65,299 | 444 |
| * | PHI Inc. | | 43,521 | 429 |
| * | Key Energy Services Inc. | 24,207 | 325 |
| ^,* | Hornbeck Offshore Services | |
| | Inc. | | 100,269 | 324 |
| 669,415 |
| Oil, Gas & Consumable Fuels (85.1%) | |
| Coal & Consumable Fuels (0.5%) | |
| Peabody Energy Corp. | 282,737 | 11,510 |
| Arch Coal Inc. Class A | 59,210 | 5,667 |
| * | CONSOL Energy Inc. | 67,461 | 2,138 |
| |
| Integrated Oil & Gas (39.9%) | |
| Exxon Mobil Corp. | 12,737,746 | 964,757 |
| Chevron Corp. | | 5,709,966 | 639,060 |
| Occidental Petroleum | | |
| | Corp. | | 2,300,493 | 150,912 |
| |
| Oil & Gas Exploration & Production (27.8%) |
| ConocoPhillips | | 3,730,275 | 202,591 |
| EOG Resources Inc. | | 1,738,268 | 176,295 |
| Anadarko Petroleum Corp. | 1,644,901 | 93,825 |
| Pioneer Natural Resources | | |
| | Co. | | 511,561 | 87,083 |
| * | Concho Resources Inc. | 447,017 | 67,410 |
| Devon Energy Corp. | | 1,499,390 | 45,986 |
| Noble Energy Inc. | | 1,389,747 | 41,456 |
| Apache Corp. | | 1,145,230 | 39,110 |
| Hess Corp. | | 859,750 | 39,050 |
| EQT Corp. | | 759,766 | 38,224 |
| Marathon Oil Corp. | | 2,554,363 | 37,089 |
| Cabot Oil & Gas Corp. | 1,412,465 | 34,125 |
| * | Diamondback Energy Inc. | 265,610 | 33,106 |
| Cimarex Energy Co. | | 286,384 | 27,519 |
| * | Parsley Energy Inc. | | | |
| | Class A | | 676,289 | 17,097 |
| * | WPX Energy Inc. | | 1,197,009 | 16,914 |
| * | Energen Corp. | | 292,217 | 15,987 |
| * | Newfield Exploration Co. | 600,131 | 14,001 |
| * | RSP Permian Inc. | | 357,609 | 13,700 |
| * | Continental Resources Inc. | 282,005 | 13,398 |
| Murphy Oil Corp. | | 492,889 | 12,495 |
| * | Antero Resources Corp. | 664,218 | 12,494 |
| Range Resources Corp. | 746,012 | 9,915 |
| CNX Resources Corp. | 553,337 | 8,892 |
| * | PDC Energy Inc. | | 168,340 | 8,843 |
| * | Matador Resources Co. | 293,443 | 8,469 |
| ^,* | Chesapeake Energy Corp. | 2,732,052 | 7,704 |
| ^,* | Centennial Resource | | | |
| | Development Inc. Class A | 391,185 | 7,464 |
| * | Whiting Petroleum Corp. | 272,681 | 7,420 |
| * | Callon Petroleum Co. | 606,835 | 6,414 |
| * | Oasis Petroleum Inc. | 809,688 | 6,380 |
| * | SRC Energy Inc. | | 709,167 | 6,290 |
| * | QEP Resources Inc. | | 724,383 | 6,244 |
| SM Energy Co. | | 302,039 | 5,539 |
| | | |
| Market |
| Value• |
| | Shares | ($000) |
| * | Southwestern Energy Co. | 1,540,395 | 5,499 |
| * | Gulfport Energy Corp. | 495,564 | 4,807 |
| * | Laredo Petroleum Inc. | 473,947 | 3,976 |
| * | Kosmos Energy Ltd. | 702,383 | 3,786 |
| * | Extraction Oil & Gas Inc. | 310,403 | 3,750 |
| * | Carrizo Oil & Gas Inc. | 244,912 | 3,441 |
| * | Gran Tierra Energy Inc. | 1,208,459 | 3,021 |
| * | Denbury Resources Inc. | 1,209,184 | 2,648 |
| * | Ring Energy Inc. | 169,972 | 2,307 |
| * | Halcon Resources Corp. | 379,083 | 2,293 |
| * | Ultra Petroleum Corp. | 590,369 | 2,178 |
| * | Jagged Peak Energy Inc. | 160,086 | 1,969 |
| * | Stone Energy Corp. | 60,135 | 1,820 |
| ^,* | Resolute Energy Corp. | 54,077 | 1,758 |
| * | Tellurian Inc. | 191,850 | 1,675 |
| ^,* | California Resources Corp. | 116,004 | 1,637 |
| * | Bonanza Creek Energy Inc. | 52,275 | 1,465 |
| * | Penn Virginia Corp. | 38,343 | 1,430 |
| * | SandRidge Energy Inc. | 96,509 | 1,357 |
| * | Bill Barrett Corp. | 292,528 | 1,325 |
| ^,* | WildHorse Resource | | |
| | Development Corp. | 76,061 | 1,292 |
| ^,* | Sanchez Energy Corp. | 222,175 | 651 |
| * | Midstates Petroleum Co. | | |
| | Inc. | 37,818 | 510 |
| * | Eclipse Resources Corp. | 276,644 | 445 |
| ^,* | Jones Energy Inc. Class A | 128,430 | 118 |
| * | Cobalt International Energy | | |
| | Inc. | 2 | — |
| |
| Oil & Gas Refining & Marketing (9.6%) | |
| Valero Energy Corp. | 1,315,467 | 118,945 |
| Phillips 66 | 1,307,053 | 118,118 |
| Marathon Petroleum Corp. | 1,468,280 | 94,058 |
| Andeavor | 445,514 | 39,927 |
| HollyFrontier Corp. | 506,285 | 21,684 |
| PBF Energy Inc. Class A | 330,806 | 9,696 |
| Delek US Holdings Inc. | 240,046 | 8,190 |
| World Fuel Services Corp. | 208,623 | 4,767 |
| Green Plains Inc. | 118,644 | 2,171 |
| CVR Energy Inc. | 52,217 | 1,547 |
| * | REX American Resources | | |
| | Corp. | 17,377 | 1,403 |
| * | Par Pacific Holdings Inc. | 73,121 | 1,245 |
| * | Renewable Energy Group | | |
| | Inc. | 105,075 | 1,166 |
| * | Clean Energy Fuels Corp. | 386,240 | 537 |
| |
| Oil & Gas Storage & Transportation (7.3%) |
| Kinder Morgan Inc. | 6,042,260 | 97,885 |
| Williams Cos. Inc. | 2,485,387 | 68,994 |
| ONEOK Inc. | 1,152,697 | 64,932 |
| * | Cheniere Energy Inc. | 607,318 | 31,896 |
| Targa Resources Corp. | 648,255 | 28,945 |
| Plains GP Holdings LP | | |
| | Class A | 442,229 | 9,198 |
| SemGroup Corp. Class A | 201,083 | 4,464 |
| Antero Midstream GP LP | 223,901 | 4,142 |
30
Energy Index Fund
| | | |
| Market |
| Value• |
| | Shares | ($000) |
| Tallgrass Energy GP LP | | |
| | Class A | 159,583 | 3,216 |
| EnLink Midstream LLC | 190,051 | 2,794 |
| ^,* | Enbridge Energy | | |
| | Management LLC | 222,401 | 2,620 |
| * | International Seaways Inc. | 43,721 | 711 |
| * | Gener8 Maritime Inc. | 124,754 | 692 |
| * | Dorian LPG Ltd. | 2 | — |
| 3,741,674 |
| Total Common Stocks | | |
| (Cost $5,208,880) | 4,411,089 |
| Temporary Cash Investment (0.6%)1 | |
| Money Market Fund (0.6%) | | |
| 2,3 Vanguard Market Liquidity | | |
| | Fund, 1.601% | | |
| | (Cost $26,006) | 260,066 | 26,004 |
| Total Investments (100.9%) | | |
| (Cost $5,234,886) | 4,437,093 |
| | | |
| Amount |
| ($000) |
| Other Assets and Liabilities (-0.9%) | |
| Other Assets | | |
| Investment in Vanguard | | 261 |
| Receivables for Investment | | |
| Securities Sold | | 50,586 |
| Receivables for Accrued Income | 22,987 |
| Receivables for Capital Shares Issued | 607 |
| Other Assets 3 | | 6 |
| Total Other Assets | 74,447 |
| Liabilities | | |
| Payables for Investment | | |
| Securities Purchased | | (60,332) |
| Collateral for Securities on Loan | (26,007) |
| Payables for Capital Shares Redeemed | (1,354) |
| Payables to Vanguard | | (2,275) |
| Other Liabilities | | (22,298) |
| Total Liabilities | (112,266) |
| Net Assets (100%) 4,399,274 |
| | |
| At February 28, 2018, net assets consisted of: |
| | Amount |
| | ($000) |
| Paid-in Capital | 5,861,525 |
| Undistributed Net Investment Income | | 23,258 |
| Accumulated Net Realized Losses | | (687,723) |
| Unrealized Appreciation (Depreciation) | | |
| Investment Securities | | (797,793) |
| Futures Contracts | | 7 |
| Net Assets | 4,399,274 |
| |
| |
| ETF Shares—Net Assets | | |
| Applicable to 42,400,915 outstanding | | |
| $.001 par value shares of beneficial | | |
| interest (unlimited authorization) | 3,865,766 |
| Net Asset Value Per Share— | | |
| ETF Shares | $91.17 |
| |
| |
| Admiral Shares—Net Assets | | |
| Applicable to 11,713,744 outstanding | | |
| $.001 par value shares of beneficial | | |
| interest (unlimited authorization) | | 533,508 |
| Net Asset Value Per Share— | | |
| Admiral Shares | $45.55 |
• See Note A in Notes to Financial Statements.
^ Includes partial security positions on loan to broker-dealers.
The total value of securities on loan is $23,446,000.
* Non-income-producing security.
1 The fund invests a portion of its cash reserves in equity markets
through the use of index futures contracts. After giving effect to
futures investments, the fund’s effective common stock and
temporary cash investment positions represent 100.6% and
0.3%, respectively, of net assets.
2 Affiliated money market fund available only to Vanguard funds
and certain trusts and accounts managed by Vanguard. Rate
shown is the 7-day yield.
3 Includes $26,007,000 of collateral received for securities on loan,
of which $26,004,000 is held in Vanguard Market Liquidity Fund
and $3,000 is held in cash.
| | | | |
| Derivative Financial Instruments Outstanding as of Period End | | | |
| Futures Contracts | | | | |
| | | | ($000) |
| Value and |
| Number of | Unrealized |
| Long (Short) | Notional | Appreciation |
| Expiration | Contracts | Amount | (Depreciation) |
| Short Futures Contracts | |
| E-mini S&P 500 Index | March 2018 | (85) | (11,536) | 7 |
Unrealized appreciation (depreciation) on open futures contracts is required to be treated as realized gain (loss) for tax purposes.
See accompanying Notes, which are an integral part of the Financial Statements.
31
Energy Index Fund
Statement of Operations
| | | |
| Six Months Ended |
| February 28, 2018 |
| | ($000) |
| Investment Income | | |
| Income | | |
| Dividends | 62,346 |
| Interest1 | 10 |
| Securities Lending—Net | 343 |
| Total Income | 62,699 |
| Expenses | | |
| The Vanguard Group—Note B | | |
| Investment Advisory Services | 618 |
| Management and Administrative— | |
| ETF Shares | 1,051 |
| Management and Administrative— | |
| Admiral Shares | 153 |
| Marketing and Distribution— | | |
| ETF Shares | 110 |
| Marketing and Distribution— | | |
| Admiral Shares | 22 |
| Custodian Fees | 64 |
| Shareholders’ Reports and Proxy— | |
| ETF Shares | 243 |
| Shareholders’ Reports and Proxy— | |
| Admiral Shares | 12 |
| Trustees’ Fees and Expenses | 2 |
| Total Expenses | 2,275 |
| Net Investment Income | 60,424 |
| Realized Net Gain (Loss) on | | |
| Investment Securities Sold1 | 5,982 |
| Change in Unrealized Appreciation | |
| (Depreciation) | | |
| Investment Securities1 | 268,349 |
| Futures Contracts | 7 |
| Change in Unrealized Appreciation | |
| (Depreciation) | 268,356 |
| Net Increase (Decrease) in Net Assets | |
| Resulting from Operations | | 334,762 |
1 Interest income, realized net gain (loss), and change in unrealized
appreciation (depreciation) from an affiliated company of the
fund were $10,000, ($2,000), and ($8,000), respectively. Purchases
and sales are for temporary cash investment purposes.
| | | | |
| Statement of Changes in Net Assets | | | |
| |
| Six Months Ended | Year Ended |
| | February 28, | August 31, |
| | 2018 | 2017 |
| ($000) | ($000) |
| Increase (Decrease) in Net Assets | | | |
| Operations | | | |
| Net Investment Income | | 60,424 | 143,753 |
| Realized Net Gain (Loss) | | 5,982 | (157,249) |
| Change in Unrealized Appreciation (Depreciation) | | 268,356 | (353,929) |
| Net Increase (Decrease) in Net Assets Resulting from Operations | | 334,762 | (367,425) |
| Distributions | | | |
| Net Investment Income | | | |
| ETF Shares | | (71,947) | (100,189) |
| Admiral Shares | | (10,346) | (22,040) |
| Realized Capital Gain | | | |
| ETF Shares | | — | — |
| Admiral Shares | | — | — |
| Total Distributions | | (82,293) | (122,229) |
| Capital Share Transactions | | | |
| ETF Shares | | (8,145) | 126,143 |
| Admiral Shares | | (23,184) | (296,186) |
| Net Increase (Decrease) from Capital Share Transactions | | (31,329) | (170,043) |
| Total Increase (Decrease) | | 221,140 | (659,697) |
| Net Assets |
| Beginning of Period | | 4,178,134 | 4,837,831 |
| End of Period1 | | 4,399,274 | 4,178,134 |
| 1 Net Assets—End of Period includes undistributed (overdistributed) net investment income of $23,258,000 and $45,127,000. | |
See accompanying Notes, which are an integral part of the Financial Statements.
32
| | | | | | | |
| Energy Index Fund | | | | | | | |
| |
| |
| Financial Highlights | | | | | |
| |
| ETF Shares | | | | | | | |
| Six Months | | | | | |
| | Ended | | | | | |
| For a Share Outstanding | February 28, | | | Year Ended August 31, |
| Throughout Each Period | 2018 | 2017 | 2016 | 2015 | 2014 | 2013 |
| Net Asset Value, Beginning of Period | $85.71 | $95.06 | $93.86 | $142.26 | $116.47 | $103.35 |
| Investment Operations | |
| Net Investment Income | | 1.2551 | 2.8191,2 | 2.470 | 2.9531 | 2.329 | 2.215 |
| Net Realized and Unrealized Gain (Loss) | | | | | | |
| on Investments | | 5.903 | (9.801) | 2.587 | (49.144) | 25.655 | 12.899 |
| Total from Investment Operations | | 7.158 | (6.982) | 5.057 | (46.191) | 27.984 | 15.114 |
| Distributions | |
| Dividends from Net Investment Income | (1.698) | (2.368) | (3.857) | (2.209) | (2.194) | (1.994) |
| Distributions from Realized Capital Gains | — | — | — | — | — | — |
| Total Distributions | | (1.698) | (2.368) | (3.857) | (2.209) | (2.194) | (1.994) |
| Net Asset Value, End of Period | | $91.17 | $85.71 | $95.06 | $93.86 | $142.26 | $116.47 |
| Total Return | | 8.31% | -7.55% | 5.82% | -32.70% | 24.31% | 14.85% |
| Ratios/Supplemental Data | |
| Net Assets, End of Period (Millions) | | $3,866 | $3,656 | $3,944 | $3,736 | $3,467 | $2,255 |
| Ratio of Total Expenses to | | | | | | | |
| Average Net Assets | | 0.10% | 0.10% | 0.10% | 0.10% | 0.12% | 0.14% |
| Ratio of Net Investment Income to | | | | | | | |
| Average Net Assets | | 2.65% | 2.93%2 | 2.86% | 2.65% | 1.98% | 2.02% |
| Portfolio Turnover Rate3 | | 4% | 11% | 15% | 4% | 4% | 9% |
The expense ratio, net investment income ratio, and turnover rate for the current period have been annualized.
1 Calculated based on average shares outstanding.
2 Net investment income per share and the ratio of net investment income to average net assets include $.453 and 0.47%, respectively, from
income received as a result of General Electric Co. and Baker Hughes Inc. merger in July 2017.
3 Excludes the value of portfolio securities received or delivered as a result of in-kind purchases or redemptions of the fund’s capital shares,
including ETF Creation Units.
See accompanying Notes, which are an integral part of the Financial Statements.
33
| | | | | | | |
| Energy Index Fund | | | | | | | |
| |
| |
| Financial Highlights | | | | | |
| |
| Admiral Shares | | | | | | | |
| Six Months | | | | | |
| | Ended | | | | | |
| For a Share Outstanding | February 28, | | | Year Ended August 31, |
| Throughout Each Period | 2018 | 2017 | 2016 | 2015 | 2014 | 2013 |
| Net Asset Value, Beginning of Period $42.82 | $47.49 | $46.89 | $71.06 | $58.18 | $51.63 |
| Investment Operations | |
| Net Investment Income | | . 6211 | 1.3751,2 | 1.234 | 1.4951 | 1.164 | 1.108 |
| Net Realized and Unrealized Gain (Loss) | | | | | | |
| on Investments | | 2.956 | (4.863) | 1.293 | (24.561) | 12.815 | 6.439 |
| Total from Investment Operations | | 3.577 | (3.488) | 2.527 | (23.066) | 13.979 | 7.547 |
| Distributions | |
| Dividends from Net Investment Income | (.847) | (1.182) | (1.927) | (1.104) | (1.099) | (.997) |
| Distributions from Realized Capital Gains | — | — | — | — | — | — |
| Total Distributions | | (.847) | (1.182) | (1.927) | (1.104) | (1.099) | (.997) |
| Net Asset Value, End of Period | | $45.55 | $42.82 | $47.49 | $46.89 | $71.06 | $58.18 |
| Total Return 3 | | 8.31% | -7.56% | 5.83% | -32.66% | 24.32% | 14.86% |
| Ratios/Supplemental Data | |
| Net Assets, End of Period (Millions) | | $534 | $523 | $894 | $733 | $575 | $460 |
| Ratio of Total Expenses to | | | | | | | |
| Average Net Assets | | 0.10% | 0.10% | 0.10% | 0.10% | 0.12% | 0.14% |
| Ratio of Net Investment Income to | | | | | | | |
| Average Net Assets | | 2.65% | 2.93%2 | 2.86% | 2.65% | 1.98% | 2.02% |
| Portfolio Turnover Rate4 | | 4% | 11% | 15% | 4% | 4% | 9% |
The expense ratio, net investment income ratio, and turnover rate for the current period have been annualized.
1 Calculated based on average shares outstanding.
2 Net investment income per share and the ratio of net investment income to average net assets include $.228 and 0.47%, respectively,
from income received as a result of General Electric Co. and Baker Hughes Inc. merger in July 2017.
3 Total returns do not include account service fees that may have applied in the periods shown. Fund prospectuses provide information about
any applicable account service fees.
4 Excludes the value of portfolio securities received or delivered as a result of in-kind purchases or redemptions of the fund’s capital shares,
including ETF Creation Units.
See accompanying Notes, which are an integral part of the Financial Statements.
34
Energy Index Fund
Notes to Financial Statements
Vanguard Energy Index Fund is registered under the Investment Company Act of 1940 as an open-end investment company, or mutual fund. The fund offers two classes of shares: ETF Shares and Admiral Shares. ETF Shares are listed for trading on NYSE Arca; they can be purchased and sold through a broker. Admiral Shares are designed for investors who meet certain administrative, service, and account-size criteria.
A. The following significant accounting policies conform to generally accepted accounting principles for U.S. investment companies. The fund consistently follows such policies in preparing its financial statements.
1. Security Valuation: Securities are valued as of the close of trading on the New York Stock Exchange (generally 4 p.m., Eastern time) on the valuation date. Equity securities are valued at the latest quoted sales prices or official closing prices taken from the primary market in which each security trades; such securities not traded on the valuation date are valued at the mean of the latest quoted bid and asked prices. Securities for which market quotations are not readily available, or whose values have been materially affected by events occurring before the fund’s pricing time but after the close of the securities’ primary markets, are valued by methods deemed by the board of trustees to represent fair value. Investments in Vanguard Market Liquidity Fund are valued at that fund’s net asset value.
2. Futures Contracts: The fund uses index futures contracts to a limited extent, with the objectives of maintaining full exposure to the stock market, maintaining liquidity, and minimizing transaction costs. The fund may purchase futures contracts to immediately invest incoming cash in the market, or sell futures in response to cash outflows, thereby simulating a fully invested position in the underlying index while maintaining a cash balance for liquidity. The primary risks associated with the use of futures contracts are imperfect correlation between changes in market values of stocks held by the fund and the prices of futures contracts, and the possibility of an illiquid market. Counterparty risk involving futures is mitigated because a regulated clearinghouse is the counterparty instead of the clearing broker. To further mitigate counterparty risk, the fund trades futures contracts on an exchange, monitors the financial strength of its clearing brokers and clearinghouse, and has entered into clearing agreements with its clearing brokers. The clearinghouse imposes initial margin requirements to secure the fund’s performance and requires daily settlement of variation margin representing changes in the market value of each contract.
Futures contracts are valued at their quoted daily settlement prices. The notional amounts of the contracts are not recorded in the Statement of Net Assets. Fluctuations in the value of the contracts are recorded in the Statement of Net Assets as an asset (liability) and in the Statement of Operations as unrealized appreciation (depreciation) until the contracts are closed, when they are recorded as realized futures gains (losses).
During the six months ended February 28, 2018, the fund’s average investments in long and short futures contracts represented 0% and less than 1% of net assets, respectively, based on the average of the notional amounts at each quarter-end during the period.
3. Federal Income Taxes: The fund intends to continue to qualify as a regulated investment company and distribute all of its taxable income. Management has analyzed the fund’s tax positions taken for all open federal income tax years (August 31, 2014–2017), and for the period ended February 28, 2018, and has concluded that no provision for federal income tax is required in the fund’s financial statements. 4. Distributions: Distributions to shareholders are recorded on the ex-dividend date.
5. Securities Lending: To earn additional income, the fund lends its securities to qualified institutional borrowers. Security loans are subject to termination by the fund at any time, and are required to be secured at all times by collateral in an amount at least equal to the market value of securities loaned. Daily market fluctuations could cause the value of loaned securities to be more or less than the value of the collateral received. When this occurs, the collateral is adjusted and settled on the next business day. The fund further mitigates its counterparty risk by entering into securities lending transactions only with a diverse group of prequalified counterparties, monitoring their financial strength, and entering into master securities lending agreements with its counterparties. The master securities lending agreements provide that, in the event of a counterparty’s default (including bankruptcy), the fund may terminate any loans with that borrower, determine the net amount owed, and sell or retain the collateral up to the net amount owed to the fund; however, such actions may be subject to legal proceedings. While collateral mitigates counterparty risk, in the event of a default, the fund may experience delays and costs in recovering the securities loaned. The fund invests cash collateral received in Vanguard Market Liquidity Fund, and records a liability in the Statement of Net Assets for the return of the collateral, during the period the securities are on loan. Securities lending income
35
Energy Index Fund
represents fees charged to borrowers plus income earned on invested cash collateral, less expenses associated with the loan. During the term of the loan, the fund is entitled to all distributions made on or in respect of the loaned securities.
6. Credit Facility: The fund and certain other funds managed by The Vanguard Group (“Vanguard”) participate in a $3.1 billion committed credit facility provided by a syndicate of lenders pursuant to a credit agreement that may be renewed annually; each fund is individually liable for its borrowings, if any, under the credit facility. Borrowings may be utilized for temporary and emergency purposes, and are subject to the fund’s regulatory and contractual borrowing restrictions. The participating funds are charged administrative fees and an annual commitment fee of 0.10% of the undrawn amount of the facility; these fees are allocated to the funds based on a method approved by the fund’s board of trustees and included in Management and Administrative expenses on the fund’s Statement of Operations. Any borrowings under this facility bear interest at a rate based upon the higher of the one-month London Interbank Offered Rate, federal funds effective rate, or overnight bank funding rate plus an agreed-upon spread.
The fund had no borrowings outstanding at February 28, 2018, or at any time during the period then ended.
7. Other: Dividend income is recorded on the ex-dividend date. Interest income includes income distributions received from Vanguard Market Liquidity Fund and is accrued daily. Security transactions are accounted for on the date securities are bought or sold. Costs used to determine realized gains (losses) on the sale of investment securities are those of the specific securities sold. Fees assessed on capital share transactions are credited to paid-in capital.
Each class of shares has equal rights as to assets and earnings, except that each class separately bears certain class-specific expenses related to maintenance of shareholder accounts (included in Management and Administrative expenses), shareholder reporting, and the proxy. Marketing and distribution expenses are allocated to each class of shares based on a method approved by the board of trustees. Income, other non-class-specific expenses, and gains and losses on investments are allocated to each class of shares based on its relative net assets.
B. In accordance with the terms of a Funds’ Service Agreement (the “FSA”) between Vanguard and the fund, Vanguard furnishes to the fund investment advisory, corporate management, administrative, marketing, and distribution services at Vanguard’s cost of operations (as defined by the FSA). These costs of operations are allocated to the fund based on methods and guidelines approved by the board of trustees. Vanguard does not require reimbursement in the current period for certain costs of operations (such as deferred compensation/benefits and risk/insurance costs); the fund’s liability for these costs of operations is included in Payables to Vanguard on the Statement of Net Assets. All other costs of operations payable to Vanguard are generally settled twice a month.
Upon the request of Vanguard, the fund may invest up to 0.40% of its net assets as capital in Vanguard. At February 28, 2018, the fund had contributed to Vanguard capital in the amount of $261,000, representing 0.01% of the fund’s net assets and 0.10% of Vanguard’s capitalization. The fund’s trustees and officers are also directors and employees, respectively, of Vanguard.
C. Various inputs may be used to determine the value of the fund’s investments. These inputs are summarized in three broad levels for financial statement purposes. The inputs or methodologies used to value securities are not necessarily an indication of the risk associated with investing in those securities.
Level 1—Quoted prices in active markets for identical securities.
Level 2—Other significant observable inputs (including quoted prices for similar securities, interest
rates, prepayment speeds, credit risk, etc.).
Level 3—Significant unobservable inputs (including the fund’s own assumptions used to determine
the fair value of investments). Any investments valued with significant unobservable inputs are noted
on the Statement of Net Assets.
At February 28, 2018, 100% of the market value of the fund’s investments was determined based on Level 1 inputs.
D. Distributions are determined on a tax basis and may differ from net investment income and realized capital gains for financial reporting purposes. Differences may be permanent or temporary. Permanent differences are reclassified among capital accounts in the financial statements to reflect their tax character. Temporary differences arise when certain items of income, expense, gain, or loss are recognized in different periods for financial statement and tax purposes. These differences will reverse at some time in the future. Differences in classification may also result from the treatment of short-term gains as ordinary income for tax purposes.
36
Energy Index Fund
During the six months ended February 28, 2018, the fund realized $57,123,000 of net capital gains resulting from in-kind redemptions—in which shareholders exchanged fund shares for securities held by the fund rather than for cash. Because such gains are not taxable to the fund, and are not distributed to shareholders, they have been reclassified from accumulated net realized losses to paid-in capital.
The fund’s tax-basis capital gains and losses are determined only at the end of each fiscal year. For tax purposes, at August 31, 2017, the fund had available capital losses totaling $636,582,000 to offset future net capital gains. Of this amount, $68,284,000 is subject to expiration dates; $37,585,000 may be used to offset future net capital gains through August 31, 2018, and $30,699,000 through August 31, 2019. Capital losses of $568,298,000 realized beginning in fiscal 2012 may be carried forward indefinitely under the Regulated Investment Company Modernization Act of 2010, but must be used before any expiring loss carryforwards. The fund will use these capital losses to offset net taxable capital gains, if any, realized during the year ending August 31, 2018; should the fund realize net capital losses for the year, the losses will be added to the loss carryforward balance above.
At February 28, 2018, the cost of investment securities for tax purposes was $5,234,886,000. Net unrealized depreciation of investment securities for tax purposes was $797,793,000, consisting of unrealized gains of $195,845,000 on securities that had risen in value since their purchase and $993,638,000 in unrealized losses on securities that had fallen in value since their purchase.
E. During the six months ended February 28, 2018, the fund purchased $429,151,000 of investment securities and sold $472,016,000 of investment securities, other than temporary cash investments. Purchases and sales include $274,533,000 and $375,364,000, respectively, in connection with in-kind purchases and redemptions of the fund’s capital shares.
| | | | |
| F. Capital share transactions for each class of shares were: | | | |
| Six Months Ended | | Year Ended |
| February 28, 2018 | August 31, 2017 |
| Amount | Shares | Amount | Shares |
| ($000) | (000) | ($000) | (000) |
| ETF Shares | | | | |
| Issued | 370,030 | 3,753 | 541,520 | 5,586 |
| Issued in Lieu of Cash Distributions | — | — | — | — |
| Redeemed | (378,175) | (4,000) | (415,377) | (4,425) |
| Net Increase (Decrease)—ETF Shares | (8,145) | (247) | 126,143 | 1,161 |
| Admiral Shares | | | | |
| Issued | 90,694 | 1,883 | 230,026 | 4,766 |
| Issued in Lieu of Cash Distributions | 8,904 | 191 | 19,744 | 417 |
| Redeemed | (122,782) | (2,565) | (545,956) | (11,807) |
| Net Increase (Decrease)—Admiral Shares | (23,184) | (491) | (296,186) | (6,624) |
G. Management has determined that no material events or transactions occurred subsequent to February 28, 2018, that would require recognition or disclosure in these financial statements.
37
Financials Index Fund
Fund Profile
As of February 28, 2018
| | | |
| Share-Class Characteristics | | |
| | ETF | Admiral |
| Shares | Shares |
| Ticker Symbol | | VFH | VFAIX |
| Expense Ratio1 | 0.10% | 0.10% |
| 30-Day SEC Yield | 1.74% | 1.74% |
| |
| |
| Portfolio Characteristics | | |
| MSCI | |
| US IMI/ | MSCI |
| Financials | US IMI/ |
| Fund | 25/50 | 2500 |
| Number of Stocks | 405 | 401 | 2,469 |
| Median Market Cap | $57.8B | $57.8B | $68.2B |
| Price/Earnings Ratio | 16.7x | 16.7x | 21.9x |
| Price/Book Ratio | 1.6x | 1.6x | 3.1x |
| Return on Equity | 9.4% | 9.4% | 15.0% |
| Earnings Growth Rate | 11.5% | 11.5% | 8.5% |
| Dividend Yield | 1.7% | 1.7% | 1.8% |
| Foreign Holdings | 0.0% | 0.0% | 0.0% |
| Turnover Rate | | | |
| (Annualized) | 2% | — | — |
| Short-Term Reserves | 0.0% | — | — |
| |
| |
| Volatility Measures | | | |
| MSCI US | |
| IMI/Financials | MSCI US |
| | 25/50 | IMI/2500 |
| R-Squared | | 1.00 | 0.64 |
| Beta | | 1.00 | 1.13 |
These measures show the degree and timing of the fund’s
fluctuations compared with the indexes over 36 months.
| |
| Subindustry Diversification | |
| (% of equity exposure) | |
| Asset Management & Custody Banks | 7.6% |
| Consumer Finance | 5.2 |
| Diversified Banks | 30.9 |
| Financial Exchanges & Data | 5.5 |
| Insurance Brokers | 2.8 |
| Investment Banking & Brokerage | 7.4 |
| Life & Health Insurance | 4.9 |
| Mortgage REITs | 1.4 |
| Multi-line Insurance | 2.5 |
| Multi-Sector Holdings | 6.6 |
| Other Diversified Financial Services | 0.2 |
| Property & Casualty Insurance | 7.1 |
| Regional Banks | 15.6 |
| Reinsurance | 1.1 |
| Thrifts & Mortgage Finance | 1.2 |
Sector categories are based on the Global Industry
Classification Standard (“GICS”), except for the “Other”
category (if applicable), which includes securities that have
not been provided a GICS classification as of the effective
reporting period.
| | |
| Ten Largest Holdings (% of total net assets) |
| JPMorgan Chase | | |
| & Co. | Diversified Banks | 9.7% |
| Bank of America | | |
| Corp. | Diversified Banks | 7.7 |
| Wells Fargo & Co. | Diversified Banks | 6.6 |
| Berkshire | | |
| Hathaway Inc. | Multi-Sector Holdings | 6.3 |
| Citigroup Inc. | Diversified Banks | 4.8 |
| Goldman Sachs | Investment Banking | |
| Group Inc. | & Brokerage | 2.3 |
| US Bancorp | Diversified Banks | 2.2 |
| Morgan Stanley | Investment Banking | |
| & Brokerage | 1.8 |
| PNC Financial | | |
| Services Group Inc. | Regional Banks | 1.8 |
| American | | |
| Express Co. | Consumer Finance | 1.7 |
| Top Ten | 44.9% |
The holdings listed exclude any temporary cash investments and
equity index products.
1 The expense ratios shown are from the prospectus dated December 21, 2017, and represent estimated costs for the current fiscal year. For the six months ended February 28, 2018, the annualized expense ratios
were 0.10% for ETF Shares and 0.10% for Admiral Shares.
38
Financials Index Fund
Performance Summary
All of the returns in this report represent past performance, which is not a guarantee of future results that may be achieved by the fund. (Current performance may be lower or higher than the performance data cited. For performance data current to the most recent month-end, visit our website at vanguard.com/performance.) Note, too, that both investment returns and principal value can fluctuate widely, so an investor’s shares, when sold, could be worth more or less than their original cost. The returns shown do not reflect taxes that a shareholder would pay on fund distributions or on the sale of fund shares.
Fiscal-Year Total Returns (%): August 31, 2007–February 28, 2018
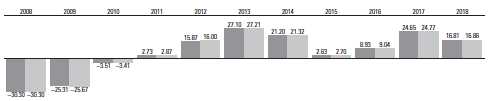
| |
| Financials Index Fund ETF Shares Net Asset Value |
| Spliced US IMI/Financials 25/50 |
| For a benchmark description, see the Glossary. |
| Note: For 2018, performance data reflect the six months ended February 28, 2018. |
Average Annual Total Returns: Periods Ended December 31, 2017
This table presents returns through the latest calendar quarter—rather than through the end of the fiscal period.
Securities and Exchange Commission rules require that we provide this information.
| | | | | |
| Inception Date | One Year | Five Years | Ten Years |
| ETF Shares | 1/26/2004 | | | |
| Market Price | | 20.04% | 17.67% | 5.08% |
| Net Asset Value | | 20.07 | 17.70 | 5.06 |
| Admiral Shares | 2/4/2004 | 20.06 | 17.69 | 5.05 |
See Financial Highlights for dividend and capital gains information.
39
Financials Index Fund
Financial Statements (unaudited)
Statement of Net Assets
As of February 28, 2018
The fund reports a complete list of its holdings in regulatory filings four times in each fiscal year, at the quarter-ends. For the second and fourth fiscal quarters, the lists appear in the fund’s semiannual and annual reports to shareholders. For the first and third fiscal quarters, the fund files the lists with the Securities and Exchange Commission on Form N-Q. Shareholders can look up the fund’s Forms N-Q on the SEC’s website at sec.gov. Forms N-Q may also be reviewed and copied at the SEC’s Public Reference Room (see the back cover of this report for further information).
| | | | |
| Market |
| Value• |
| | | Shares | ($000) |
| Common Stocks (99.9%) | | | |
| Banks (46.5%) | | | |
| JPMorgan Chase & Co. | | 7,424,366 | 857,514 |
| Bank of America Corp. | 21,203,048 | 680,618 |
| Wells Fargo & Co. | 10,009,864 | 584,676 |
| Citigroup Inc. | | 5,657,594 | 427,092 |
| US Bancorp | | 3,550,829 | 193,023 |
| PNC Financial Services | | | |
| | Group Inc. | | 1,018,076 | 160,510 |
| BB&T Corp. | | 1,688,076 | 91,747 |
| SunTrust Banks Inc. | | 1,018,712 | 71,147 |
| M&T Bank Corp. | | 289,857 | 55,026 |
| Fifth Third Bancorp | | 1,509,793 | 49,899 |
| KeyCorp | | 2,301,118 | 48,623 |
| Regions Financial Corp. | | 2,482,139 | 48,178 |
| Citizens Financial Group | | | |
| | Inc. | | 1,052,779 | 45,785 |
| Huntington Bancshares | | | |
| | Inc. | | 2,312,407 | 36,305 |
| Comerica Inc. | | 372,164 | 36,182 |
| First Republic Bank | | 337,556 | 31,325 |
| * | SVB Financial Group | | 112,859 | 28,100 |
| Zions Bancorporation | | 427,426 | 23,496 |
| East West Bancorp Inc. | | 309,313 | 20,275 |
| * | Signature Bank | | 117,638 | 17,197 |
| CIT Group Inc. | | 280,866 | 14,900 |
| PacWest Bancorp | | 275,917 | 14,386 |
| People’s United Financial | | | |
| | Inc. | | 740,779 | 14,178 |
| Cullen/Frost Bankers Inc. | | 128,412 | 13,354 |
| Bank of the Ozarks | | 260,628 | 13,003 |
| Synovus Financial Corp. | | 255,746 | 12,608 |
| * | Western Alliance Bancorp | 214,460 | 12,537 |
| First Horizon National Corp. | 626,345 | 11,932 |
| Commerce Bancshares Inc. | 205,466 | 11,870 |
| Webster Financial Corp. | | 197,056 | 10,755 |
| Sterling Bancorp | | 456,614 | 10,616 |
| Prosperity Bancshares Inc. | 141,274 | 10,596 |
| Pinnacle Financial Partners | | |
| | Inc. | | 157,995 | 10,199 |
| Wintrust Financial Corp. | | 119,683 | 10,114 |
| Umpqua Holdings Corp. | | 471,302 | 10,043 |
| FNB Corp. | | 691,830 | 9,699 |
| * | Texas Capital Bancshares | | | |
| | Inc. | | 106,214 | 9,580 |
| Hancock Holding Co. | | 182,292 | 9,424 |
| IBERIABANK Corp. | | 115,288 | 9,315 |
| BankUnited Inc. | | 228,589 | 9,194 |
| Popular Inc. | | 218,395 | 9,175 |
| Associated Banc-Corp | | 364,959 | 9,014 |
| Chemical Financial Corp. | | 152,309 | 8,406 |
| Valley National Bancorp | | 669,227 | 8,345 |
| TCF Financial Corp. | | 349,532 | 7,795 |
| Home BancShares Inc. | | 334,445 | 7,689 |
| United Bankshares Inc. | | 213,466 | 7,578 |
| Investors Bancorp Inc. | | 556,714 | 7,516 |
| Bank of Hawaii Corp. | | 90,868 | 7,452 |
| | | |
| Market |
| Value• |
| | Shares | ($000) |
| MB Financial Inc. | 170,558 | 6,995 |
| South State Corp. | 78,569 | 6,812 |
| Fulton Financial Corp. | 374,710 | 6,782 |
| Cathay General Bancorp | 164,335 | 6,748 |
| UMB Financial Corp. | 90,698 | 6,621 |
| Columbia Banking System | | |
| | Inc. | 156,131 | 6,523 |
| Glacier Bancorp Inc. | 166,959 | 6,495 |
| First Citizens BancShares | | |
| | Inc. Class A | 15,308 | 6,232 |
| Community Bank System | | |
| | Inc. | 108,291 | 5,773 |
| BancorpSouth Bank | 173,863 | 5,477 |
| First Midwest Bancorp Inc. | 219,879 | 5,325 |
| First Financial Bankshares | | |
| | Inc. | 113,406 | 5,217 |
| CVB Financial Corp. | 224,046 | 5,153 |
| Great Western Bancorp | | |
| | Inc. | 125,968 | 5,151 |
| Hope Bancorp Inc. | 275,514 | 4,976 |
| Old National Bancorp | 289,946 | 4,929 |
| United Community Banks | | |
| | Inc. | 157,792 | 4,877 |
| * | FCB Financial Holdings Inc. | | |
| | Class A | 89,210 | 4,786 |
| Union Bankshares Corp. | 126,023 | 4,711 |
| International Bancshares | | |
| | Corp. | 120,240 | 4,647 |
| Trustmark Corp. | 144,962 | 4,529 |
| Simmons First National | | |
| | Corp. Class A | 157,411 | 4,478 |
| Renasant Corp. | 105,547 | 4,408 |
| First Merchants Corp. | 105,156 | 4,346 |
| * | Eagle Bancorp Inc. | 69,484 | 4,242 |
| Ameris Bancorp | 79,684 | 4,235 |
| Independent Bank Corp. | 58,728 | 4,076 |
| Hilltop Holdings Inc. | 164,363 | 3,996 |
| BOK Financial Corp. | 42,022 | 3,969 |
| Towne Bank | 138,638 | 3,958 |
| CenterState Bank Corp. | 145,236 | 3,956 |
| WesBanco Inc. | 94,196 | 3,882 |
| LegacyTexas Financial | | |
| | Group Inc. | 92,545 | 3,877 |
| ServisFirst Bancshares Inc. | 96,379 | 3,871 |
| * | Pacific Premier Bancorp Inc. | 89,037 | 3,744 |
| Banner Corp. | 66,554 | 3,679 |
| First Financial Bancorp | 132,830 | 3,613 |
| Berkshire Hills Bancorp Inc. | 92,004 | 3,381 |
| First Hawaiian Inc. | 119,472 | 3,320 |
| NBT Bancorp Inc. | 93,170 | 3,242 |
| Westamerica | | |
| | Bancorporation | 56,391 | 3,231 |
| Park National Corp. | 29,335 | 2,963 |
| S&T Bancorp Inc. | 74,860 | 2,954 |
| First Commonwealth | | |
| | Financial Corp. | 209,124 | 2,921 |
| Heartland Financial USA | | |
| | Inc. | 54,474 | 2,906 |
| | | |
| Market |
| Value• |
| | Shares | ($000) |
| Sandy Spring Bancorp Inc. | 72,181 | 2,798 |
| Boston Private Financial | | |
| | Holdings Inc. | 180,336 | 2,633 |
| First Busey Corp. | 88,458 | 2,623 |
| Brookline Bancorp Inc. | 164,463 | 2,607 |
| * | First BanCorp (New York | | |
| | Shares) | 416,450 | 2,511 |
| Lakeland Financial Corp. | 51,431 | 2,330 |
| Independent Bank Group | | |
| | Inc. | 33,046 | 2,320 |
| Enterprise Financial Services | | |
| | Corp. | 49,342 | 2,312 |
| State Bank Financial Corp. | 79,659 | 2,305 |
| First Interstate BancSystem | | |
| | Inc. Class A | 57,223 | 2,260 |
| City Holding Co. | 33,500 | 2,257 |
| Tompkins Financial Corp. | 29,239 | 2,244 |
| Heritage Financial Corp. | 72,874 | 2,168 |
| Hanmi Financial Corp. | 68,972 | 2,107 |
| * | Seacoast Banking Corp. of | | |
| | Florida | 78,860 | 2,068 |
| MainSource Financial Group | | |
| | Inc. | 54,637 | 2,064 |
| BancFirst Corp. | 37,338 | 1,988 |
| First Bancorp | 57,394 | 1,988 |
| Southside Bancshares Inc. | 59,506 | 1,987 |
| 1st Source Corp. | 38,613 | 1,904 |
| National Bank Holdings Corp. | | |
| | Class A | 57,808 | 1,884 |
| ConnectOne Bancorp Inc. | 64,674 | 1,863 |
| * | Customers Bancorp Inc. | 62,841 | 1,844 |
| Lakeland Bancorp Inc. | 95,968 | 1,833 |
| Banc of California Inc. | 90,634 | 1,808 |
| Central Pacific Financial Corp. | 64,261 | 1,791 |
| Preferred Bank | 28,675 | 1,787 |
| Bryn Mawr Bank Corp. | 40,817 | 1,778 |
| Washington Trust Bancorp | | |
| | Inc. | 33,130 | 1,718 |
| Univest Corp. of | | |
| | Pennsylvania | 62,346 | 1,708 |
| TriCo Bancshares | 44,263 | 1,653 |
| Carolina Financial Corp. | 42,513 | 1,650 |
| Stock Yards Bancorp Inc. | 45,795 | 1,607 |
| Flushing Financial Corp. | 58,317 | 1,557 |
| German American Bancorp | | |
| | Inc. | 46,911 | 1,554 |
| CoBiz Financial Inc. | 81,376 | 1,543 |
| Opus Bank | 53,795 | 1,509 |
| Community Trust Bancorp | | |
| | Inc. | 33,992 | 1,479 |
| Guaranty Bancorp | 53,158 | 1,459 |
| Camden National Corp. | 33,427 | 1,411 |
| Horizon Bancorp | 49,151 | 1,391 |
| Live Oak Bancshares Inc. | 52,796 | 1,378 |
| First of Long Island Corp. | 47,414 | 1,292 |
| QCR Holdings Inc. | 28,219 | 1,230 |
| Heritage Commerce Corp. | 77,797 | 1,228 |
| Peoples Bancorp Inc. | 35,406 | 1,221 |
40
Financials Index Fund
| | | | |
| Market |
| Value• |
| | | Shares | ($000) |
| * | First Foundation Inc. | | 65,219 | 1,191 |
| Mercantile Bank Corp. | | 35,469 | 1,174 |
| Bridge Bancorp Inc. | | 33,884 | 1,125 |
| * | Green Bancorp Inc. | | 51,313 | 1,119 |
| Great Southern Bancorp Inc. | 22,775 | 1,102 |
| Fidelity Southern Corp. | | 48,753 | 1,097 |
| * | TriState Capital Holdings Inc. | 48,837 | 1,091 |
| Independent Bank Corp. | | | |
| | Michigan | | 45,710 | 1,044 |
| Blue Hills Bancorp Inc. | | 51,494 | 1,038 |
| * | Veritex Holdings Inc. | | 36,672 | 1,018 |
| * | Nicolet Bankshares Inc. | | 18,689 | 1,010 |
| * | HomeTrust Bancshares Inc. | 38,864 | 1,009 |
| OFG Bancorp | | 93,620 | 1,006 |
| Midland States Bancorp Inc. | 30,827 | 966 |
| * | Atlantic Capital Bancshares | | | |
| | Inc. | | 54,773 | 948 |
| Financial Institutions Inc. | | 30,082 | 924 |
| Arrow Financial Corp. | | 27,125 | 875 |
| Access National Corp. | | 31,020 | 867 |
| First Community | | | |
| | Bancshares Inc. | | 30,579 | 830 |
| Republic Bancorp Inc. | | | |
| | Class A | | 21,867 | 815 |
| West Bancorporation Inc. | | 33,362 | 811 |
| * | Byline Bancorp Inc. | | 34,466 | 795 |
| First Financial Corp. | | 18,335 | 787 |
| MidWestOne Financial | | | |
| | Group Inc. | | 23,610 | 751 |
| * | FB Financial Corp. | | 16,131 | 638 |
| * | HarborOne Bancorp Inc. | | 30,963 | 596 |
| Southern National Bancorp | | | |
| | of Virginia Inc. | | 37,622 | 579 |
| 4,127,854 |
| Capital Markets (20.4%) | | | |
| Goldman Sachs Group Inc. | | 766,775 | 201,608 |
| Morgan Stanley | 2,901,380 | 162,535 |
| BlackRock Inc. | | 257,303 | 141,370 |
| Charles Schwab Corp. | 2,581,647 | 136,879 |
| Bank of New York Mellon | | | |
| | Corp. | 2,191,121 | 124,960 |
| CME Group Inc. | | 728,118 | 120,984 |
| S&P Global Inc. | | 545,634 | 104,653 |
| • | Intercontinental Exchange | | | |
| | Inc. | 1,251,797 | 91,481 |
| State Street Corp. | | 793,437 | 84,223 |
| Moody’s Corp. | | 368,010 | 61,413 |
| T. Rowe Price Group Inc. | | 518,476 | 58,017 |
| Ameriprise Financial Inc. | | 316,534 | 49,519 |
| Northern Trust Corp. | | 462,289 | 48,943 |
| TD Ameritrade Holding | | | |
| | Corp. | | 606,506 | 34,874 |
| * | E*TRADE Financial Corp. | | 573,462 | 29,952 |
| Invesco Ltd. | | 871,057 | 28,344 |
| Franklin Resources Inc. | | 711,133 | 27,500 |
| MSCI Inc. Class A | | 192,725 | 27,274 |
| Raymond James Financial | | | |
| | Inc. | | 278,098 | 25,782 |
| Cboe Global Markets Inc. | | 218,498 | 24,474 |
| Affiliated Managers Group | | | |
| | Inc. | | 118,936 | 22,522 |
| SEI Investments Co. | | 286,374 | 20,857 |
| Nasdaq Inc. | | 248,951 | 20,103 |
| FactSet Research Systems | | | |
| | Inc. | | 83,684 | 17,003 |
| MarketAxess Holdings Inc. | 80,318 | 16,256 |
| Janus Henderson Group | | | |
| | plc | | 407,392 | 14,397 |
| | | | |
| Market |
| Value• |
| | | Shares | ($000) |
| Eaton Vance Corp. | | 252,654 | 13,373 |
| LPL Financial Holdings Inc. | 173,684 | 11,163 |
| Interactive Brokers Group | | |
| | Inc. | | 145,290 | 10,083 |
| Stifel Financial Corp. | | 146,526 | 9,359 |
| Evercore Inc. Class A | | 82,640 | 7,690 |
| Legg Mason Inc. | | 186,912 | 7,460 |
| Federated Investors Inc. | | |
| | Class B | | 194,312 | 6,331 |
| BGC Partners Inc. Class A | 462,027 | 6,108 |
| Financial Engines Inc. | | 135,505 | 4,539 |
| Morningstar Inc. | | 40,935 | 3,825 |
| Moelis & Co. Class A | | 71,370 | 3,622 |
| Waddell & Reed Financial | | |
| | Inc. Class A | | 178,443 | 3,569 |
| Artisan Partners Asset | | |
| | Management Inc. Class A | 101,646 | 3,431 |
| Virtu Financial Inc. Class A | 105,040 | 3,120 |
| OM Asset Management plc | 176,598 | 2,707 |
| Houlihan Lokey Inc. Class A | 56,806 | 2,637 |
| Piper Jaffray Cos. | | 30,720 | 2,565 |
| WisdomTree Investments | | |
| | Inc. | | 249,094 | 2,394 |
| Virtus Investment Partners | | |
| | Inc. | | 15,221 | 1,873 |
| PJT Partners Inc. | | 37,678 | 1,801 |
| Cohen & Steers Inc. | | 44,515 | 1,781 |
| Diamond Hill Investment | | |
| | Group Inc. | | 7,044 | 1,444 |
| * | INTL. FCStone Inc. | | 34,264 | 1,359 |
| Investment Technology | | |
| | Group Inc. | | 67,807 | 1,344 |
| * | Donnelley Financial | | | |
| | Solutions Inc. | | 72,164 | 1,249 |
| Greenhill & Co. Inc. | | 53,270 | 1,084 |
| Westwood Holdings Group | | |
| | Inc. | | 16,286 | 885 |
| * | Cowen Inc. Class A | | 60,384 | 866 |
| Ladenburg Thalmann | | | |
| | Financial Services Inc. | 231,282 | 772 |
| ^ | Arlington Asset | | | |
| | Investment Corp. Class A | 60,169 | 651 |
| B. Riley Financial Inc. | | 34,508 | 638 |
| Pzena Investment | | | |
| | Management Inc. Class A | 32,251 | 351 |
| Associated Capital Group | | |
| | Inc. Class A | | 9,449 | 326 |
| GAMCO Investors Inc. | | |
| | Class A | | 9,945 | 267 |
| 1,816,590 |
| Consumer Finance (5.2%) | | |
| American Express Co. | 1,578,688 | 153,938 |
| Capital One Financial Corp. | 1,037,229 | 101,576 |
| Discover Financial Services | 777,556 | 61,295 |
| Synchrony Financial | 1,674,583 | 60,938 |
| Ally Financial Inc. | | 946,177 | 26,398 |
| * | SLM Corp. | | 924,188 | 10,083 |
| FirstCash Inc. | | 100,940 | 7,439 |
| Navient Corp. | | 562,849 | 7,295 |
| * | Green Dot Corp. Class A | 86,995 | 5,666 |
| * | OneMain Holdings Inc. | 159,265 | 4,883 |
| ^,* | Credit Acceptance Corp. | 14,464 | 4,552 |
| Santander Consumer USA | | |
| | Holdings Inc. | | 269,570 | 4,407 |
| * | PRA Group Inc. | | 96,000 | 3,677 |
| Nelnet Inc. Class A | | 43,999 | 2,435 |
| * | Encore Capital Group Inc. | 52,232 | 2,236 |
| * | LendingClub Corp. | | 665,855 | 2,097 |
| | | |
| Market |
| Value• |
| | Shares | ($000) |
| * | World Acceptance Corp. | 14,233 | 1,530 |
| * | EZCORP Inc. Class A | 110,376 | 1,435 |
| * | Enova International Inc. | 57,274 | 1,260 |
| 463,140 |
| Diversified Financial Services (6.9%) | |
| * | Berkshire Hathaway Inc. | | |
| | Class B | 2,717,538 | 563,074 |
| Voya Financial Inc. | 384,632 | 19,624 |
| Leucadia National Corp. | 686,074 | 16,459 |
| Texas Pacific Land Trust | 13,418 | 7,233 |
| * | Cannae Holdings Inc. | 136,330 | 2,506 |
| * | On Deck Capital Inc. | 86,363 | 448 |
| *,1 NewStar Financial Inc. | | |
| | CVR Line | 42,593 | 23 |
| 609,367 |
| Insurance (18.3%) | | |
| Chubb Ltd. | 993,307 | 140,970 |
| American International | | |
| | Group Inc. | 1,923,521 | 110,295 |
| Prudential Financial Inc. | 907,268 | 96,461 |
| Marsh & McLennan Cos. | | |
| | Inc. | 1,092,005 | 90,658 |
| MetLife Inc. | 1,913,923 | 88,404 |
| Travelers Cos. Inc. | 585,673 | 81,409 |
| Aon plc | 534,724 | 75,032 |
| Aflac Inc. | 841,210 | 74,767 |
| Progressive Corp. | 1,244,461 | 71,656 |
| Allstate Corp. | 767,785 | 70,836 |
| Willis Towers Watson plc | 268,287 | 42,362 |
| Hartford Financial Services | | |
| | Group Inc. | 763,276 | 40,339 |
| Principal Financial Group | | |
| | Inc. | 617,881 | 38,513 |
| Lincoln National Corp. | 468,262 | 35,668 |
| * | Markel Corp. | 29,724 | 33,053 |
| Loews Corp. | 612,221 | 30,201 |
| Arthur J Gallagher & Co. | 386,844 | 26,735 |
| Cincinnati Financial Corp. | 333,516 | 24,877 |
| * | Arch Capital Group Ltd. | 280,023 | 24,709 |
| Unum Group | 480,146 | 24,468 |
| XL Group Ltd. | 547,869 | 23,180 |
| FNF Group | 556,372 | 22,216 |
| Reinsurance Group of | | |
| | America Inc. Class A | 137,805 | 21,193 |
| Everest Re Group Ltd. | 87,880 | 21,112 |
| Torchmark Corp. | 234,698 | 20,036 |
| * | Alleghany Corp. | 32,932 | 19,962 |
| American Financial Group | | |
| | Inc. | 160,251 | 18,076 |
| WR Berkley Corp. | 208,452 | 14,254 |
| First American Financial | | |
| | Corp. | 237,126 | 13,760 |
| Brown & Brown Inc. | 253,504 | 13,344 |
| Validus Holdings Ltd. | 170,035 | 11,501 |
| RenaissanceRe Holdings | | |
| | Ltd. | 85,650 | 10,987 |
| * | Athene Holding Ltd. | | |
| | Class A | 231,299 | 10,920 |
| Old Republic International | | |
| | Corp. | 536,266 | 10,741 |
| Assurant Inc. | 115,138 | 9,841 |
| Hanover Insurance Group | | |
| | Inc. | 90,879 | 9,807 |
| * | Brighthouse Financial Inc. | 179,408 | 9,736 |
| Primerica Inc. | 94,685 | 9,232 |
| Axis Capital Holdings Ltd. | 177,937 | 8,779 |
| Assured Guaranty Ltd. | 251,337 | 8,691 |
| CNO Financial Group Inc. | 358,502 | 8,081 |
41
| | | | |
| Financials Index Fund | | | |
| |
| |
| |
| |
| Market |
| Value• |
| | | Shares | ($000) |
| Selective Insurance Group | | |
| | Inc. | | 124,939 | 7,103 |
| White Mountains Insurance | | |
| | Group Ltd. | | 8,035 | 6,483 |
| Erie Indemnity Co. Class A | 54,350 | 6,287 |
| American Equity Investment | | |
| | Life Holding Co. | | 181,197 | 5,546 |
| ProAssurance Corp. | | 114,285 | 5,463 |
| Kemper Corp. | | 88,083 | 4,968 |
| RLI Corp. | | 80,144 | 4,873 |
| Aspen Insurance Holdings | | |
| | Ltd. | | 127,099 | 4,626 |
| * | Enstar Group Ltd. | | 22,899 | 4,534 |
| Argo Group International | | |
| | Holdings Ltd. | | 63,505 | 3,699 |
| Horace Mann Educators | | |
| | Corp. | | 87,023 | 3,581 |
| American National | | | |
| | Insurance Co. | | 28,885 | 3,377 |
| * | Genworth Financial Inc. | | |
| | Class A | 1,068,294 | 2,906 |
| Infinity Property & | | | |
| | Casualty Corp. | | 23,282 | 2,746 |
| Navigators Group Inc. | 50,625 | 2,729 |
| Employers Holdings Inc. | 69,390 | 2,717 |
| Mercury General Corp. | 59,215 | 2,703 |
| National General Holdings | | |
| | Corp. | | 114,623 | 2,634 |
| * | Third Point Reinsurance | | |
| | Ltd. | | 183,845 | 2,555 |
| ^ | AmTrust Financial | | | |
| | Services Inc. | | 209,763 | 2,511 |
| AMERISAFE Inc. | | 40,986 | 2,295 |
| Safety Insurance Group Inc. | 30,930 | 2,207 |
| Universal Insurance | | | |
| | Holdings Inc. | | 69,686 | 2,042 |
| United Fire Group Inc. | 45,093 | 2,006 |
| Kinsale Capital Group Inc. | 40,556 | 1,987 |
| James River Group | | | |
| | Holdings Ltd. | | 53,989 | 1,766 |
| National Western Life | | | |
| | Group Inc. Class A | | 5,152 | 1,571 |
| FBL Financial Group Inc. | | |
| | Class A | | 23,963 | 1,555 |
| Stewart Information | | | |
| | Services Corp. | | 38,368 | 1,540 |
| ^,* | MBIA Inc. | | 186,661 | 1,491 |
| * | Ambac Financial Group Inc. | 96,339 | 1,460 |
| ^,* | Trupanion Inc. | | 41,392 | 1,226 |
| United Insurance Holdings | | |
| | Corp. | | 54,959 | 1,074 |
| * | Greenlight Capital Re Ltd. | | |
| | Class A | | 63,311 | 1,038 |
| State Auto Financial Corp. | 36,245 | 1,000 |
| Maiden Holdings Ltd. | | 156,830 | 941 |
| ^ | Heritage Insurance | | | |
| | Holdings Inc. | | 53,751 | 897 |
| ^,* | Citizens Inc. Class A | | 100,738 | 690 |
| * | Global Indemnity Ltd. | | 18,559 | 687 |
| HCI Group Inc. | | 17,052 | 591 |
| ^,* | WMIH Corp. | | 432,814 | 558 |
| EMC Insurance Group Inc. | 20,803 | 543 |
| Baldwin & Lyons Inc. | | 20,019 | 453 |
| Donegal Group Inc. Class A | 25,781 | 408 |
| Crawford & Co. Class B | 24,814 | 223 |
| Fairfax Financial Holdings Ltd. 126 | 61 |
| * | Patriot National Inc. | | 12 | — |
| 1,629,213 |
| | | |
| Market |
| Value• |
| | Shares | ($000) |
| Mortgage Real Estate Investment Trusts | |
| (REITs) (1.4%) | | |
| Annaly Capital | | |
| | Management Inc. | 2,481,109 | 24,885 |
| AGNC Investment Corp. | 837,242 | 15,020 |
| New Residential | | |
| | Investment Corp. | 711,227 | 11,472 |
| Starwood Property Trust | | |
| | Inc. | 558,252 | 11,305 |
| Blackstone Mortgage Trust | | |
| | Inc. Class A | 214,652 | 6,665 |
| Chimera Investment Corp. | 361,650 | 6,061 |
| MFA Financial Inc. | 849,377 | 6,047 |
| Two Harbors Investment | | |
| | Corp. | 373,368 | 5,485 |
| Apollo Commercial Real | | |
| | Estate Finance Inc. | 229,117 | 4,184 |
| Invesco Mortgage Capital | | |
| | Inc. | 238,889 | 3,672 |
| Redwood Trust Inc. | 165,020 | 2,417 |
| PennyMac Mortgage | | |
| | Investment Trust | 140,309 | 2,339 |
| Ladder Capital Corp. | | |
| | Class A | 152,213 | 2,248 |
| CYS Investments Inc. | 331,754 | 2,097 |
| Hannon Armstrong | | |
| | Sustainable Infrastructure | | |
| | Capital Inc. | 113,726 | 2,002 |
| ARMOUR Residential REIT | | |
| | Inc. | 89,616 | 1,920 |
| Capstead Mortgage Corp. | 204,262 | 1,706 |
| MTGE Investment Corp. | 98,686 | 1,678 |
| Granite Point Mortgage | | |
| | Trust Inc. | 92,086 | 1,552 |
| New York Mortgage Trust | | |
| | Inc. | 239,286 | 1,318 |
| AG Mortgage Investment | | |
| | Trust Inc. | 60,944 | 997 |
| Anworth Mortgage Asset | | |
| | Corp. | 211,161 | 963 |
| Arbor Realty Trust Inc. | 104,187 | 892 |
| Western Asset Mortgage | | |
| | Capital Corp. | 90,348 | 797 |
| Ares Commercial Real | | |
| | Estate Corp. | 57,221 | 705 |
| ^ | Orchid Island Capital Inc. | 97,240 | 699 |
| Dynex Capital Inc. | 108,219 | 651 |
| Resource Capital Corp. | 64,356 | 559 |
| Sutherland Asset | | |
| | Management Corp. | 38,347 | 529 |
| 120,865 |
| Other (0.0%)2 | | |
| 1 | Winthrop Realty Trust | 23,515 | 157 |
| | | |
| Thrifts & Mortgage Finance (1.2%) | |
| New York Community | | |
| | Bancorp Inc. | 1,046,487 | 14,253 |
| * | MGIC Investment Corp. | 792,999 | 10,935 |
| Radian Group Inc. | 461,300 | 9,466 |
| * | Essent Group Ltd. | 179,061 | 8,074 |
| Washington Federal Inc. | 185,935 | 6,452 |
| ^,* | LendingTree Inc. | 16,648 | 5,802 |
| ^,* | BofI Holding Inc. | 122,604 | 4,560 |
| Capitol Federal Financial | | |
| | Inc. | 280,914 | 3,509 |
| Northwest Bancshares Inc. | 208,606 | 3,423 |
| Provident Financial | | |
| | Services Inc. | 135,160 | 3,363 |
| | | |
| Market |
| Value• |
| | Shares | ($000) |
| WSFS Financial Corp. | 67,200 | 3,205 |
| Walker & Dunlop Inc. | 63,213 | 3,055 |
| * | NMI Holdings Inc. Class A | 122,384 | 2,429 |
| Meridian Bancorp Inc. | 109,728 | 2,200 |
| Beneficial Bancorp Inc. | 146,280 | 2,194 |
| Kearny Financial Corp. | 164,622 | 2,140 |
| Meta Financial Group Inc. | 19,657 | 2,111 |
| OceanFirst Financial Corp. | 81,570 | 2,111 |
| TFS Financial Corp. | 119,733 | 1,755 |
| TrustCo Bank Corp. NY | 205,789 | 1,749 |
| * | Flagstar Bancorp Inc. | 49,113 | 1,732 |
| United Financial Bancorp | | |
| | Inc. | 108,463 | 1,692 |
| * | HomeStreet Inc. | 54,368 | 1,560 |
| Federal Agricultural | | |
| | Mortgage Corp. | 19,347 | 1,472 |
| Northfield Bancorp Inc. | 94,087 | 1,460 |
| Oritani Financial Corp. | 84,597 | 1,320 |
| Dime Community | | |
| | Bancshares Inc. | 67,546 | 1,216 |
| First Defiance Financial | | |
| | Corp. | 21,712 | 1,155 |
| * | Nationstar Mortgage | | |
| | Holdings Inc. | 63,370 | 1,085 |
| * | PennyMac Financial | | |
| | Services Inc. Class A | 42,271 | 985 |
| Waterstone Financial Inc. | 53,525 | 921 |
| * | Ocwen Financial Corp. | 221,869 | 808 |
| * | PHH Corp. | 69,882 | 739 |
| Clifton Bancorp Inc. | 42,381 | 654 |
| 109,585 |
| Total Common Stocks | | |
| (Cost $7,144,377) | 8,876,771 |
| Temporary Cash Investment (0.1%) | |
| Money Market Fund (0.1%) | | |
| 3,4 Vanguard Market Liquidity | | |
| | Fund, 1.601% | | |
| | (Cost $7,407) | 74,074 | 7,407 |
| Total Investments (100.0%) | | |
| (Cost $7,151,784) | 8,884,178 |
| | | |
| Amount |
| ($000) |
| Other Assets and Liabilities (0.0%) | |
| Other Assets | | |
| Investment in Vanguard | | 463 |
| Receivables for Investment | | |
| | Securities Sold | | 36,509 |
| Receivables for Accrued Income | 10,136 |
| Receivables for Capital Shares Issued | 1,445 |
| Total Other Assets | 48,553 |
| Liabilities | | |
| Payables for Investment | | |
| | Securities Purchased | | (37,315) |
| Collateral for Securities on Loan | (7,407) |
| Payables for Capital Shares Redeemed | (308) |
| Payables to Vanguard | | (1,714) |
| Other Liabilities | | (4,970) |
| Total Liabilities | (51,714) |
| Net Assets (100%) 8,881,017 |
42
Financials Index Fund
| | |
| At February 28, 2018, net assets consisted of: |
| | Amount |
| | ($000) |
| Paid-in Capital | 7,270,202 |
| Undistributed Net Investment Income | | 22,690 |
| Accumulated Net Realized Losses | | (144,269) |
| Unrealized Appreciation (Depreciation) | 1,732,394 |
| Net Assets | 8,881,017 |
| | |
| ETF Shares—Net Assets | | |
| Applicable to 113,589,441 outstanding | | |
| $.001 par value shares of beneficial | | |
| interest (unlimited authorization) | 8,180,393 |
| Net Asset Value Per Share— | | |
| ETF Shares | $72.02 |
| | |
| Admiral Shares—Net Assets | | |
| Applicable to 19,412,231 outstanding | | |
| $.001 par value shares of beneficial | | |
| interest (unlimited authorization) | | 700,624 |
| Net Asset Value Per Share— | | |
| Admiral Shares | $36.09 |
• See Note A in Notes to Financial Statements.
* Non-income-producing security.
^ Includes partial security positions on loan to broker-dealers. The
total value of securities on loan is $6,959,000.
1 Security value determined using significant unobservable inputs.
2 “Other” represents securities that are not classified by the fund’s
benchmark index.
3 Affiliated money market fund available only to Vanguard funds
and certain trusts and accounts managed by Vanguard. Rate
shown is the 7-day yield.
4 Includes $7,407,000 of collateral received for securities on loan.
CVR—Contingent Value Rights.
REIT—Real Estate Investment Trust.
See accompanying Notes, which are an integral part of the Financial Statements.
43
Financials Index Fund
Statement of Operations
| | | |
| Six Months Ended |
| February 28, 2018 |
| | ($000) |
| Investment Income | | |
| Income | | |
| Dividends | 71,366 |
| Interest1 | 12 |
| Securities Lending—Net | 110 |
| Total Income | 71,488 |
| Expenses | | |
| The Vanguard Group—Note B | | |
| Investment Advisory Services | 940 |
| Management and Administrative— | |
| ETF Shares | 1,892 |
| Management and Administrative— | |
| Admiral Shares | 184 |
| Marketing and Distribution— | | |
| ETF Shares | 218 |
| Marketing and Distribution— | | |
| Admiral Shares | 24 |
| Custodian Fees | 87 |
| Shareholders’ Reports and Proxy— | |
| ETF Shares | 450 |
| Shareholders’ Reports and Proxy— | |
| Admiral Shares | 12 |
| Trustees’ Fees and Expenses | 2 |
| Total Expenses | 3,809 |
| Net Investment Income | 67,679 |
| Realized Net Gain (Loss) | | |
| Investment Securities Sold1 | 118,617 |
| Futures Contracts | (15) |
| Realized Net Gain (Loss) | 118,602 |
| Change in Unrealized Appreciation | |
| (Depreciation) of Investment Securities1 | 942,445 |
| Net Increase (Decrease) in Net Assets | |
| Resulting from Operations | | 1,128,726 |
1 Interest income, realized net gain (loss), and change in unrealized
appreciation (depreciation) from an affiliated company of the
fund were $12,000, ($1,000), and ($1,000), respectively. Purchases
and sales are for temporary cash investment purposes.
| | | | |
| Statement of Changes in Net Assets | | | |
| |
| Six Months Ended | Year Ended |
| | February 28, | August 31, |
| | 2018 | 2017 |
| ($000) | ($000) |
| Increase (Decrease) in Net Assets | | | |
| Operations | | | |
| Net Investment Income | | 67,679 | 96,855 |
| Realized Net Gain (Loss) | | 118,602 | 151,576 |
| Change in Unrealized Appreciation (Depreciation) | | 942,445 | 754,282 |
| Net Increase (Decrease) in Net Assets Resulting from Operations | | 1,128,726 | 1,002,713 |
| Distributions | | | |
| Net Investment Income | | | |
| ETF Shares | | (66,748) | (82,225) |
| Admiral Shares | | (5,637) | (6,782) |
| Realized Capital Gain | | | |
| ETF Shares | | — | — |
| Admiral Shares | | — | — |
| Total Distributions | | (72,385) | (89,007) |
| Capital Share Transactions | | | |
| ETF Shares | | 1,079,557 | 1,550,552 |
| Admiral Shares | | 99,709 | 202,111 |
| Net Increase (Decrease) from Capital Share Transactions | | 1,179,266 | 1,752,663 |
| Total Increase (Decrease) | | 2,235,607 | 2,666,369 |
| Net Assets |
| Beginning of Period | | 6,645,410 | 3,979,041 |
| End of Period1 | | 8,881,017 | 6,645,410 |
| 1 Net Assets—End of Period includes undistributed (overdistributed) net investment income of $22,690,000 and $27,396,000. | |
See accompanying Notes, which are an integral part of the Financial Statements.
44
| | | | | | | |
| Financials Index Fund | | | | | | | |
| |
| |
| Financial Highlights | | | | | |
| |
| ETF Shares | | | | | | | |
| Six Months | | | | | |
| | Ended | | | | | |
| For a Share Outstanding | February 28, | | | Year Ended August 31, |
| Throughout Each Period | 2018 | 2017 | 2016 | 2015 | 2014 | 2013 |
| Net Asset Value, Beginning of Period | $62.26 | $50.81 | $47.70 | $47.32 | $39.80 | $32.03 |
| Investment Operations | |
| Net Investment Income | | . 6041 | 1.0351 | 1.108 | .917 | .876 | .825 |
| Net Realized and Unrealized Gain (Loss) | | | | | | |
| on Investments | | 9.813 | 11.387 | 3.070 | .349 | 7.494 | 7.747 |
| Total from Investment Operations | | 10.417 | 12.422 | 4.178 | 1.266 | 8.370 | 8.572 |
| Distributions | |
| Dividends from Net Investment Income | (.657) | (.972) | (1.068) | (.886) | (.850) | (.802) |
| Distributions from Realized Capital Gains | — | — | — | — | — | — |
| Total Distributions | | (.657) | (.972) | (1.068) | (.886) | (.850) | (.802) |
| Net Asset Value, End of Period | | $72.02 | $62.26 | $50.81 | $47.70 | $47.32 | $39.80 |
| Total Return | | 16.81% | 24.65% | 8.93% | 2.63% | 21.20% | 27.10% |
| Ratios/Supplemental Data | |
| Net Assets, End of Period (Millions) | | $8,180 | $6,127 | $3,735 | $3,081 | $2,191 | $1,464 |
| Ratio of Total Expenses to | | | | | | | |
| Average Net Assets | | 0.10% | 0.10% | 0.10% | 0.10% | 0.12% | 0.14% |
| Ratio of Net Investment Income to | | | | | | | |
| Average Net Assets | | 1.74% | 1.75% | 2.39% | 1.99% | 2.00% | 2.26% |
| Portfolio Turnover Rate2 | | 2% | 5% | 21% | 4% | 5% | 9% |
The expense ratio, net investment income ratio, and turnover rate for the current period have been annualized.
1 Calculated based on average shares outstanding.
2 Excludes the value of portfolio securities received or delivered as a result of in-kind purchases or redemptions of the fund’s capital shares,
including ETF Creation Units.
See accompanying Notes, which are an integral part of the Financial Statements.
45
| | | | | | | |
| Financials Index Fund | | | | | | | |
| |
| |
| Financial Highlights | | | | | |
| |
| Admiral Shares | | | | | | | |
| Six Months | | | | | |
| | Ended | | | | | |
| For a Share Outstanding | February 28, | | | Year Ended August 31, |
| Throughout Each Period | 2018 | 2017 | 2016 | 2015 | 2014 | 2013 |
| Net Asset Value, Beginning of Period | $31.20 | $25.47 | $23.91 | $23.72 | $19.95 | $16.05 |
| Investment Operations | |
| Net Investment Income | | . 3041 | .5141 | .556 | .460 | .438 | .414 |
| Net Realized and Unrealized Gain (Loss) | | | | | | |
| on Investments | | 4.916 | 5.704 | 1.539 | .174 | 3.758 | 3.888 |
| Total from Investment Operations | | 5.220 | 6.218 | 2.095 | .634 | 4.196 | 4.302 |
| Distributions | |
| Dividends from Net Investment Income | (.330) | (.488) | (.535) | (.444) | (.426) | (.402) |
| Distributions from Realized Capital Gains | — | — | — | — | — | — |
| Total Distributions | | (.330) | (.488) | (.535) | (.444) | (.426) | (.402) |
| Net Asset Value, End of Period | | $36.09 | $31.20 | $25.47 | $23.91 | $23.72 | $19.95 |
| Total Return2 | | 16.81% | 24.62% | 8.96% | 2.64% | 21.19% | 27.13% |
| Ratios/Supplemental Data | |
| Net Assets, End of Period (Millions) | | $701 | $518 | $244 | $204 | $155 | $132 |
| Ratio of Total Expenses to | | | | | | | |
| Average Net Assets | | 0.10% | 0.10% | 0.10% | 0.10% | 0.12% | 0.14% |
| Ratio of Net Investment Income to | | | | | | | |
| Average Net Assets | | 1.74% | 1.75% | 2.39% | 1.99% | 2.00% | 2.26% |
| Portfolio Turnover Rate3 | | 2% | 5% | 21% | 4% | 5% | 9% |
The expense ratio, net investment income ratio, and turnover rate for the current period have been annualized.
1 Calculated based on average shares outstanding.
2 Total returns do not include account service fees that may have applied in the periods shown. Fund prospectuses provide information about
any applicable account service fees.
3 Excludes the value of portfolio securities received or delivered as a result of in-kind purchases or redemptions of the fund’s capital shares,
including ETF Creation Units.
See accompanying Notes, which are an integral part of the Financial Statements.
46
Financials Index Fund
Notes to Financial Statements
Vanguard Financials Index Fund is registered under the Investment Company Act of 1940 as an open-end investment company, or mutual fund. The fund offers two classes of shares: ETF Shares and Admiral Shares. ETF Shares are listed for trading on NYSE Arca; they can be purchased and sold through a broker. Admiral Shares are designed for investors who meet certain administrative, service, and account-size criteria.
A. The following significant accounting policies conform to generally accepted accounting principles for U.S. investment companies. The fund consistently follows such policies in preparing its financial statements.
1. Security Valuation: Securities are valued as of the close of trading on the New York Stock Exchange (generally 4 p.m., Eastern time) on the valuation date. Equity securities are valued at the latest quoted sales prices or official closing prices taken from the primary market in which each security trades; such securities not traded on the valuation date are valued at the mean of the latest quoted bid and asked prices. Securities for which market quotations are not readily available, or whose values have been materially affected by events occurring before the fund’s pricing time but after the close of the securities’ primary markets, are valued by methods deemed by the board of trustees to represent fair value. Investments in Vanguard Market Liquidity Fund are valued at that fund’s net asset value.
2. Futures Contracts: The fund uses index futures contracts to a limited extent, with the objectives of maintaining full exposure to the stock market, maintaining liquidity, and minimizing transaction costs. The fund may purchase futures contracts to immediately invest incoming cash in the market, or sell futures in response to cash outflows, thereby simulating a fully invested position in the underlying index while maintaining a cash balance for liquidity. The primary risks associated with the use of futures contracts are imperfect correlation between changes in market values of stocks held by the fund and the prices of futures contracts, and the possibility of an illiquid market. Counterparty risk involving futures is mitigated because a regulated clearinghouse is the counterparty instead of the clearing broker. To further mitigate counterparty risk, the fund trades futures contracts on an exchange, monitors the financial strength of its clearing brokers and clearinghouse, and has entered into clearing agreements with its clearing brokers. The clearinghouse imposes initial margin requirements to secure the fund’s performance and requires daily settlement of variation margin representing changes in the market value of each contract.
Futures contracts are valued at their quoted daily settlement prices. The notional amounts of the contracts are not recorded in the Statement of Net Assets. Fluctuations in the value of the contracts are recorded in the Statement of Net Assets as an asset (liability) and in the Statement of Operations as unrealized appreciation (depreciation) until the contracts are closed, when they are recorded as realized futures gains (losses).
During the six months ended February 28, 2018, the fund’s average investments in long and short futures contracts represented less than 1% and 0% of net assets, respectively, based on the average of the notional amounts at each quarter-end during the period. The fund had no open futures contracts at February 28, 2018.
3. Federal Income Taxes: The fund intends to continue to qualify as a regulated investment company and distribute all of its taxable income. Management has analyzed the fund’s tax positions taken for all open federal income tax years (August 31, 2014–2017), and for the period ended February 28, 2018, and has concluded that no provision for federal income tax is required in the fund’s financial statements. 4. Distributions: Distributions to shareholders are recorded on the ex-dividend date.
5. Securities Lending: To earn additional income, the fund lends its securities to qualified institutional borrowers. Security loans are subject to termination by the fund at any time, and are required to be secured at all times by collateral in an amount at least equal to the market value of securities loaned. Daily market fluctuations could cause the value of loaned securities to be more or less than the value of the collateral received. When this occurs, the collateral is adjusted and settled on the next business day. The fund further mitigates its counterparty risk by entering into securities lending transactions only with a diverse group of prequalified counterparties, monitoring their financial strength, and entering into master securities lending agreements with its counterparties. The master securities lending agreements provide that, in the event of a counterparty’s default (including bankruptcy), the fund may terminate any loans with that borrower, determine the net amount owed, and sell or retain the collateral up to the net amount owed to the fund; however, such actions may be subject to legal proceedings. While collateral mitigates counterparty risk, in the event of a default, the fund may experience delays and costs in recovering the securities loaned. The fund invests cash collateral received in Vanguard Market Liquidity Fund, and records a liability in the Statement of Net Assets
47
Financials Index Fund
for the return of the collateral, during the period the securities are on loan. Securities lending income represents fees charged to borrowers plus income earned on invested cash collateral, less expenses associated with the loan. During the term of the loan, the fund is entitled to all distributions made on or in respect of the loaned securities.
6. Credit Facility: The fund and certain other funds managed by The Vanguard Group (“Vanguard”) participate in a $3.1 billion committed credit facility provided by a syndicate of lenders pursuant to a credit agreement that may be renewed annually; each fund is individually liable for its borrowings, if any, under the credit facility. Borrowings may be utilized for temporary and emergency purposes, and are subject to the fund’s regulatory and contractual borrowing restrictions. The participating funds are charged administrative fees and an annual commitment fee of 0.10% of the undrawn amount of the facility; these fees are allocated to the funds based on a method approved by the fund’s board of trustees and included in Management and Administrative expenses on the fund’s Statement of Operations. Any borrowings under this facility bear interest at a rate based upon the higher of the one-month London Interbank Offered Rate, federal funds effective rate, or overnight bank funding rate plus an agreed-upon spread.
The fund had no borrowings outstanding at February 28, 2018, or at any time during the period then ended.
7. Other: Dividend income is recorded on the ex-dividend date. Interest income includes income distributions received from Vanguard Market Liquidity Fund and is accrued daily. Security transactions are accounted for on the date securities are bought or sold. Costs used to determine realized gains (losses) on the sale of investment securities are those of the specific securities sold.
Each class of shares has equal rights as to assets and earnings, except that each class separately bears certain class-specific expenses related to maintenance of shareholder accounts (included in Management and Administrative expenses), shareholder reporting, and the proxy. Marketing and distribution expenses are allocated to each class of shares based on a method approved by the board of trustees. Income, other non-class-specific expenses, and gains and losses on investments are allocated to each class of shares based on its relative net assets.
B. In accordance with the terms of a Funds’ Service Agreement (the “FSA”) between Vanguard and the fund, Vanguard furnishes to the fund investment advisory, corporate management, administrative, marketing, and distribution services at Vanguard’s cost of operations (as defined by the FSA). These costs of operations are allocated to the fund based on methods and guidelines approved by the board of trustees. Vanguard does not require reimbursement in the current period for certain costs of operations (such as deferred compensation/benefits and risk/insurance costs); the fund’s liability for these costs of operations is included in Payables to Vanguard on the Statement of Net Assets. All other costs of operations payable to Vanguard are generally settled twice a month.
Upon the request of Vanguard, the fund may invest up to 0.40% of its net assets as capital in Vanguard. At February 28, 2018, the fund had contributed to Vanguard capital in the amount of $463,000, representing 0.01% of the fund’s net assets and 0.19% of Vanguard’s capitalization. The fund’s trustees and officers are also directors and employees, respectively, of Vanguard.
C. Various inputs may be used to determine the value of the fund’s investments. These inputs are summarized in three broad levels for financial statement purposes. The inputs or methodologies used to value securities are not necessarily an indication of the risk associated with investing in those securities.
Level 1—Quoted prices in active markets for identical securities.
Level 2—Other significant observable inputs (including quoted prices for similar securities, interest
rates, prepayment speeds, credit risk, etc.).
Level 3—Significant unobservable inputs (including the fund’s own assumptions used to determine
the fair value of investments). Any investments valued with significant unobservable inputs are noted
on the Statement of Net Assets.
The following table summarizes the market value of the fund’s investments as of February 28, 2018, based on the inputs used to value them:
| | | |
| Level 1 | Level 2 | Level 3 |
| Investments | ($000) | ($000) | ($000) |
| Common Stocks | 8,876,591 | — | 180 |
| Temporary Cash Investments | 7,407 | — | — |
| Total | 8,883,998 | — | 180 |
48
Financials Index Fund
D. Distributions are determined on a tax basis and may differ from net investment income and realized capital gains for financial reporting purposes. Differences may be permanent or temporary. Permanent differences are reclassified among capital accounts in the financial statements to reflect their tax character. Temporary differences arise when certain items of income, expense, gain, or loss are recognized in different periods for financial statement and tax purposes. These differences will reverse at some time in the future. Differences in classification may also result from the treatment of short-term gains as ordinary income for tax purposes.
During the six months ended February 28, 2018, the fund realized $99,375,000 of net capital gains resulting from in-kind redemptions—in which shareholders exchanged fund shares for securities held by the fund rather than for cash. Because such gains are not taxable to the fund, and are not distributed to shareholders, they have been reclassified from accumulated net realized losses to paid-in capital.
The fund’s tax-basis capital gains and losses are determined only at the end of each fiscal year. For tax purposes, at August 31, 2017, the fund had available capital losses totaling $163,496,000 to offset future net capital gains. Of this amount, $144,329,000 is subject to expiration dates; $76,963,000 may be used to offset future net capital gains through August 31, 2018, and $67,366,000 through August 31, 2019. Capital losses of $19,167,000 realized beginning in fiscal 2012 may be carried forward indefinitely under the Regulated Investment Company Modernization Act of 2010, but must be used before any expiring loss carryforwards. The fund will use these capital losses to offset net taxable capital gains, if any, realized during the year ending August 31, 2018; should the fund realize net capital losses for the year, the losses will be added to the loss carryforward balance above.
At February 28, 2018, the cost of investment securities for tax purposes was $7,151,784,000. Net unrealized appreciation of investment securities for tax purposes was $1,732,394,000, consisting of unrealized gains of $1,796,976,000 on securities that had risen in value since their purchase and $64,582,000 in unrealized losses on securities that had fallen in value since their purchase.
E. During the six months ended February 28, 2018, the fund purchased $1,735,483,000 of investment securities and sold $561,814,000 of investment securities, other than temporary cash investments. Purchases and sales include $1,477,983,000 and $465,683,000, respectively, in connection with in-kind purchases and redemptions of the fund’s capital shares.
| | | | |
| F. Capital share transactions for each class of shares were: | | | |
| Six Months Ended | | Year Ended |
| February 28, 2018 | August 31, 2017 |
| Amount | Shares | Amount | Shares |
| ($000) | (000) | ($000) | (000) |
| ETF Shares | | | | |
| Issued | 1,548,933 | 22,102 | 2,349,435 | 40,011 |
| Issued in Lieu of Cash Distributions | — | — | — | — |
| Redeemed | (469,376) | (6,925) | (798,883) | (15,100) |
| Net Increase (Decrease)—ETF Shares | 1,079,557 | 15,177 | 1,550,552 | 24,911 |
| Admiral Shares | | | | |
| Issued | 238,478 | 6,815 | 449,363 | 15,226 |
| Issued in Lieu of Cash Distributions | 4,970 | 148 | 5,964 | 207 |
| Redeemed | (143,739) | (4,159) | (253,216) | (8,420) |
| Net Increase (Decrease)—Admiral Shares | 99,709 | 2,804 | 202,111 | 7,013 |
G. Management has determined that no material events or transactions occurred subsequent to February 28, 2018, that would require recognition or disclosure in these financial statements.
49
Health Care Index Fund
| | | |
| Fund Profile | | | |
| As of February 28, 2018 | | |
| |
| Share-Class Characteristics | | |
| | ETF | Admiral |
| Shares | Shares |
| Ticker Symbol | | VHT | VHCIX |
| Expense Ratio1 | 0.10% | 0.10% |
| 30-Day SEC Yield | 1.41% | 1.41% |
| |
| |
| Portfolio Characteristics | | |
| MSCI | |
| US IMI/ | |
| Health | MSCI |
| Care | US IMI/ |
| Fund | 25/50 | 2500 |
| Number of Stocks | 364 | 361 | 2,469 |
| Median Market Cap | $68.1B | $68.1B | $68.2B |
| Price/Earnings Ratio | 29.2x | 29.3x | 21.9x |
| Price/Book Ratio | 4.1x | 4.1x | 3.1x |
| Return on Equity | 15.8% | 15.8% | 15.0% |
| Earnings Growth Rate | 3.4% | 3.4% | 8.5% |
| Dividend Yield | 1.4% | 1.4% | 1.8% |
| Foreign Holdings | 0.0% | 0.0% | 0.0% |
| Turnover Rate | | | |
| (Annualized) | 4% | — | — |
| Short-Term Reserves | 0.0% | — | — |
| | |
| Volatility Measures | | |
| MSCI US | |
| IMI/Health Care | MSCI US |
| 25/50 | IMI/2500 |
| R-Squared | 1.00 | 0.67 |
| Beta | 1.00 | 1.09 |
These measures show the degree and timing of the fund’s
fluctuations compared with the indexes over 36 months.
| |
| Subindustry Diversification | |
| (% of equity exposure) | |
| Biotechnology | 23.8% |
| Health Care Distributors | 2.2 |
| Health Care Equipment | 18.9 |
| Health Care Facilities | 1.6 |
| Health Care Services | 3.1 |
| Health Care Supplies | 1.9 |
| Health Care Technology | 1.3 |
| Life Sciences Tools & Services | 6.0 |
| Managed Health Care | 12.2 |
| Pharmaceuticals | 29.0 |
Sector categories are based on the Global Industry
Classification Standard (“GICS”), except for the “Other”
category (if applicable), which includes securities that have
not been provided a GICS classification as of the effective
reporting period.
| | |
| Ten Largest Holdings (% of total net assets) |
| Johnson & Johnson | Pharmaceuticals | 9.3% |
| UnitedHealth Group Inc. | Managed | |
| Health Care | 5.9 |
| Pfizer Inc. | Pharmaceuticals | 5.8 |
| AbbVie Inc. | Biotechnology | 5.0 |
| Merck & Co. Inc. | Pharmaceuticals | 4.0 |
| Amgen Inc. | Biotechnology | 3.6 |
| Bristol-Myers Squibb Co. | Pharmaceuticals | 2.9 |
| Medtronic plc | Health Care | |
| Equipment | 2.9 |
| Abbott Laboratories | Health Care | |
| Equipment | 2.8 |
| Gilead Sciences Inc. | Biotechnology | 2.8 |
| Top Ten | 45.0% |
The holdings listed exclude any temporary cash investments and
equity index products.
1 The expense ratios shown are from the prospectus dated December 21, 2017, and represent estimated costs for the current fiscal year. For the six months ended February 28, 2018, the annualized expense ratios
were 0.10% for ETF Shares and 0.10% for Admiral Shares.
50
Health Care Index Fund
Performance Summary
All of the returns in this report represent past performance, which is not a guarantee of future results that may be achieved by the fund. (Current performance may be lower or higher than the performance data cited. For performance data current to the most recent month-end, visit our website at vanguard.com/performance.) Note, too, that both investment returns and principal value can fluctuate widely, so an investor’s shares, when sold, could be worth more or less than their original cost. The returns shown do not reflect taxes that a shareholder would pay on fund distributions or on the sale of fund shares.
Fiscal-Year Total Returns (%): August 31, 2007–February 28, 2018
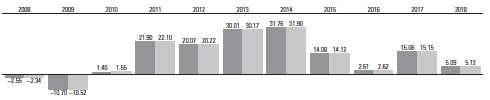
| |
| Health Care Index Fund ETF Shares Net Asset Value |
| Spliced US IMI/Health Care 25/50 |
| For a benchmark description, see the Glossary. |
| Note: For 2018, performance data reflect the six months ended February 28, 2018. |
Average Annual Total Returns: Periods Ended December 31, 2017
This table presents returns through the latest calendar quarter—rather than through the end of the fiscal period.
Securities and Exchange Commission rules require that we provide this information.
| | | | | |
| Inception Date | One Year | Five Years | Ten Years |
| ETF Shares | 1/26/2004 | | | |
| Market Price | | 23.35% | 17.99% | 11.53% |
| Net Asset Value | | 23.34 | 17.99 | 11.51 |
| Admiral Shares | 2/5/2004 | 23.36 | 18.00 | 11.51 |
See Financial Highlights for dividend and capital gains information.
51
Health Care Index Fund
Financial Statements (unaudited)
Statement of Net Assets
As of February 28, 2018
The fund reports a complete list of its holdings in regulatory filings four times in each fiscal year, at the quarter-ends. For the second and fourth fiscal quarters, the lists appear in the fund’s semiannual and annual reports to shareholders. For the first and third fiscal quarters, the fund files the lists with the Securities and Exchange Commission on Form N-Q. Shareholders can look up the fund’s Forms N-Q on the SEC’s website at sec.gov. Forms N-Q may also be reviewed and copied at the SEC’s Public Reference Room (see the back cover of this report for further information).
| | | | |
| Market |
| Value• |
| | | Shares | ($000) |
| Common Stocks (100.0%) | | | |
| Biotechnology (23.8%) | | | |
| AbbVie Inc. | 3,555,518 | 411,836 |
| Amgen Inc. | 1,616,755 | 297,111 |
| Gilead Sciences Inc. | 2,909,314 | 229,050 |
| * | Celgene Corp. | 1,753,508 | 152,766 |
| * | Biogen Inc. | | 470,997 | 136,113 |
| * | Vertex Pharmaceuticals | | | |
| | Inc. | | 563,250 | 93,516 |
| * | Alexion Pharmaceuticals | | | |
| | Inc. | | 497,478 | 58,429 |
| * | Regeneron Pharmaceuticals | | |
| | Inc. | | 176,275 | 56,486 |
| * | Incyte Corp. | | 399,522 | 34,023 |
| * | BioMarin Pharmaceutical | | | |
| | Inc. | | 391,339 | 31,765 |
| * | Bioverativ Inc. | | 229,013 | 23,973 |
| * | Alnylam Pharmaceuticals | | | |
| | Inc. | | 197,269 | 23,704 |
| * | Bluebird Bio Inc. | | 109,919 | 22,094 |
| * | Alkermes plc | | 342,671 | 19,560 |
| * | Exelixis Inc. | | 659,010 | 17,002 |
| * | Neurocrine Biosciences Inc. | 197,126 | 16,643 |
| * | Sage Therapeutics Inc. | | 101,402 | 16,362 |
| * | Juno Therapeutics Inc. | | 177,996 | 15,445 |
| * | Ionis Pharmaceuticals Inc. | | 278,175 | 14,693 |
| * | Seattle Genetics Inc. | | 242,441 | 13,092 |
| * | Exact Sciences Corp. | | 266,662 | 11,896 |
| * | United Therapeutics Corp. | | 96,267 | 11,153 |
| * | Agios Pharmaceuticals Inc. | 111,960 | 9,000 |
| * | Sarepta Therapeutics Inc. | | 136,962 | 8,597 |
| * | FibroGen Inc. | | 155,276 | 8,556 |
| * | Avexis Inc. | | 63,865 | 7,902 |
| * | Blueprint Medicines Corp. | | 85,935 | 7,439 |
| * | Array BioPharma Inc. | | 416,909 | 7,221 |
| * | Ligand Pharmaceuticals Inc. | 47,144 | 7,161 |
| * | Portola Pharmaceuticals Inc. | 145,383 | 6,153 |
| * | Clovis Oncology Inc. | | 103,625 | 6,018 |
| * | Global Blood Therapeutics | | | |
| | Inc. | | 97,906 | 5,742 |
| * | Amicus Therapeutics Inc. | | 413,329 | 5,687 |
| * | Halozyme Therapeutics Inc. | 285,047 | 5,604 |
| *,^ ACADIA Pharmaceuticals | | | |
| | Inc. | | 221,418 | 5,517 |
| * | Loxo Oncology Inc. | | 46,552 | 5,178 |
| * | Myriad Genetics Inc. | | 154,328 | 5,003 |
| * | Spectrum Pharmaceuticals | | | |
| | Inc. | | 224,195 | 4,822 |
| * | Ultragenyx Pharmaceutical | | | |
| | Inc. | | 99,251 | 4,745 |
| * | TESARO Inc. | | 84,703 | 4,678 |
| * | Immunomedics Inc. | | 270,770 | 4,579 |
| * | Sangamo Therapeutics Inc. | 188,300 | 4,510 |
| * | Puma Biotechnology Inc. | | 66,907 | 4,372 |
| * | Ironwood Pharmaceuticals | | | |
| | Inc. Class A | | 285,559 | 4,055 |
| * | Spark Therapeutics Inc. | | 70,098 | 4,003 |
| * | Insmed Inc. | | 162,137 | 3,925 |
| | | |
| Market |
| Value• |
| | Shares | ($000) |
| * | Emergent BioSolutions Inc. | 78,884 | 3,921 |
| * | Esperion Therapeutics Inc. | 46,675 | 3,753 |
| * | Acceleron Pharma Inc. | 85,695 | 3,593 |
| * | Arena Pharmaceuticals Inc. | 87,406 | 3,389 |
| * | AnaptysBio Inc. | 26,112 | 3,206 |
| * | ImmunoGen Inc. | 279,716 | 3,108 |
| * | Prothena Corp. plc | 85,518 | 2,881 |
| *,^ Radius Health Inc. | 74,571 | 2,840 |
| * | Repligen Corp. | 81,957 | 2,810 |
| * | Momenta Pharmaceuticals | | |
| | Inc. | 161,517 | 2,754 |
| * | Xencor Inc. | 89,407 | 2,739 |
| * | Aimmune Therapeutics Inc. | 82,495 | 2,681 |
| * | Foundation Medicine Inc. | 32,010 | 2,649 |
| *,^ Heron Therapeutics Inc. | 128,420 | 2,613 |
| *,^ OPKO Health Inc. | 748,224 | 2,536 |
| * | Enanta Pharmaceuticals Inc. | 31,855 | 2,504 |
| * | Acorda Therapeutics Inc. | 104,099 | 2,472 |
| *,^ Intercept Pharmaceuticals | | |
| | Inc. | 38,922 | 2,325 |
| * | PTC Therapeutics Inc. | 88,167 | 2,270 |
| * | Dynavax Technologies Corp. | 136,050 | 2,197 |
| * | Retrophin Inc. | 83,728 | 2,095 |
| * | Atara Biotherapeutics Inc. | 54,243 | 2,090 |
| * | Editas Medicine Inc. | 56,610 | 2,074 |
| *,^ CRISPR Therapeutics AG | 40,647 | 1,970 |
| * | MacroGenics Inc. | 78,492 | 1,969 |
| *,^ Epizyme Inc. | 109,052 | 1,930 |
| * | Alder Biopharmaceuticals | | |
| | Inc. | 136,228 | 1,894 |
| * | Audentes Therapeutics Inc. | 55,550 | 1,871 |
| * | Vanda Pharmaceuticals Inc. | 94,117 | 1,774 |
| *,^ TG Therapeutics Inc. | 126,180 | 1,767 |
| *,^ Intrexon Corp. | 133,569 | 1,739 |
| * | REGENXBIO Inc. | 59,832 | 1,702 |
| *,^ Flexion Therapeutics Inc. | 66,975 | 1,699 |
| *,^ MiMedx Group Inc. | 238,052 | 1,688 |
| * | AMAG Pharmaceuticals Inc. | 79,139 | 1,666 |
| * | Five Prime Therapeutics Inc. | 75,840 | 1,612 |
| *,^ Novavax Inc. | 698,821 | 1,516 |
| * | Genomic Health Inc. | 46,082 | 1,475 |
| *,^ Sorrento Therapeutics Inc. | 147,131 | 1,464 |
| * | CytomX Therapeutics Inc. | 47,062 | 1,398 |
| * | Biohaven Pharmaceutical | | |
| | Holding Co. Ltd. | 40,097 | 1,359 |
| *,^ La Jolla Pharmaceutical Co. | 39,851 | 1,238 |
| *,^ uniQure NV | 48,015 | 1,221 |
| *,^ Intellia Therapeutics Inc. | 46,640 | 1,217 |
| * | Kura Oncology Inc. | 53,857 | 1,217 |
| * | Karyopharm Therapeutics | | |
| | Inc. | 79,910 | 1,180 |
| * | GlycoMimetics Inc. | 49,725 | 1,144 |
| *,^ Adamas Pharmaceuticals | | |
| | Inc. | 46,077 | 1,127 |
| * | Arrowhead Pharmaceuticals | | |
| | Inc. | 169,902 | 1,101 |
| * | Voyager Therapeutics Inc. | 38,124 | 1,095 |
| * | Agenus Inc. | 203,113 | 1,095 |
| | | |
| Market |
| Value• |
| | Shares | ($000) |
| * | BioCryst Pharmaceuticals | | |
| | Inc. | 215,502 | 1,071 |
| *,^ ZIOPHARM Oncology Inc. | 286,832 | 1,070 |
| * | Progenics Pharmaceuticals | | |
| | Inc. | 154,106 | 1,029 |
| * | Eagle Pharmaceuticals Inc. | 17,977 | 1,009 |
| *,^ Synergy Pharmaceuticals | | |
| | Inc. | 544,294 | 985 |
| *,^ Abeona Therapeutics Inc. | 68,276 | 946 |
| *,^ Lexicon Pharmaceuticals | | |
| | Inc. | 105,002 | 906 |
| *,^ Keryx Biopharmaceuticals | | |
| | Inc. | 196,416 | 902 |
| *,^ Geron Corp. | 361,244 | 834 |
| * | Coherus Biosciences Inc. | 84,114 | 833 |
| *,^ Cara Therapeutics Inc. | 57,010 | 797 |
| * | Achillion Pharmaceuticals | | |
| | Inc. | 242,123 | 787 |
| *,^ Inovio Pharmaceuticals Inc. | 190,823 | 782 |
| * | PDL BioPharma Inc. | 322,713 | 775 |
| * | Cytokinetics Inc. | 94,684 | 734 |
| *,^ Corbus Pharmaceuticals | | |
| | Holdings Inc. | 96,877 | 717 |
| * | Celldex Therapeutics Inc. | 307,844 | 693 |
| *,^ Jounce Therapeutics Inc. | 31,859 | 672 |
| *,^ Achaogen Inc. | 62,174 | 648 |
| *,1 Dyax Corp. CVR | | |
| | Exp. 12/31/2019 | 299,743 | 600 |
| * | Natera Inc. | 59,162 | 532 |
| * | Aduro Biotech Inc. | 81,698 | 511 |
| *,^ MannKind Corp. | 164,706 | 483 |
| * | Syros Pharmaceuticals Inc. | 45,539 | 480 |
| *,^ NewLink Genetics Corp. | 63,889 | 459 |
| * | G1 Therapeutics Inc. | 18,655 | 421 |
| *,^ Seres Therapeutics Inc. | 43,773 | 416 |
| *,^ Bellicum Pharmaceuticals | | |
| | Inc. | 54,401 | 378 |
| * | Ardelyx Inc. | 68,835 | 370 |
| *,^ Insys Therapeutics Inc. | 47,511 | 346 |
| * | Minerva Neurosciences | | |
| | Inc. | 64,159 | 337 |
| * | Otonomy Inc. | 52,337 | 311 |
| * | Mersana Therapeutics Inc. | 17,858 | 309 |
| * | Merrimack | | |
| | Pharmaceuticals Inc. | 26,802 | 298 |
| * | Ra Pharmaceuticals Inc. | 41,482 | 265 |
| *,^ NantKwest Inc. | 55,440 | 246 |
| * | Advaxis Inc. | 124,293 | 231 |
| * | Regulus Therapeutics Inc. | 206,715 | 229 |
| *,^ Organovo Holdings Inc. | 215,055 | 217 |
| * | Immune Design Corp. | 69,718 | 202 |
| *,^ XBiotech Inc. | 33,468 | 161 |
| * | Trevena Inc. | 85,200 | 153 |
| * | Infinity Pharmaceuticals | | |
| | Inc. | 79,500 | 149 |
| * | Corvus Pharmaceuticals | | |
| | Inc. | 17,752 | 145 |
52
Health Care Index Fund
| | | |
| Market |
| Value• |
| | Shares | ($000) |
| * | OncoMed Pharmaceuticals | | |
| | Inc. | 45,218 | 105 |
| * | Axovant Sciences Ltd. | 69,520 | 100 |
| * | Versartis Inc. | 54,358 | 87 |
| *,1 Clinical Data CVR | 8,685 | — |
| 1,977,538 |
| Health Care Equipment & Supplies (20.8%) |
| Medtronic plc | 3,014,673 | 240,842 |
| Abbott Laboratories | 3,876,400 | 233,863 |
| Danaher Corp. | 1,394,487 | 136,353 |
| Becton Dickinson and Co. | 589,868 | 130,962 |
| Stryker Corp. | 750,110 | 121,638 |
| * | Intuitive Surgical Inc. | 249,583 | 106,435 |
| * | Boston Scientific Corp. | 3,058,177 | 83,366 |
| Baxter International Inc. | 1,091,984 | 74,026 |
| * | Edwards Lifesciences | | |
| | Corp. | 471,343 | 63,004 |
| Zimmer Biomet Holdings | | |
| | Inc. | 450,743 | 52,399 |
| * | Align Technology Inc. | 169,542 | 44,508 |
| * | IDEXX Laboratories Inc. | 194,264 | 36,372 |
| ResMed Inc. | 316,076 | 30,113 |
| Dentsply Sirona Inc. | 511,560 | 28,678 |
| Cooper Cos. Inc. | 109,104 | 25,151 |
| * | ABIOMED Inc. | 93,582 | 25,097 |
| Teleflex Inc. | 100,364 | 25,074 |
| * | Varian Medical Systems | | |
| | Inc. | 204,024 | 24,348 |
| * | Hologic Inc. | 614,117 | 23,846 |
| STERIS plc | 189,464 | 17,298 |
| West Pharmaceutical | | |
| | Services Inc. | 165,513 | 14,436 |
| Hill-Rom Holdings Inc. | 146,373 | 12,246 |
| * | DexCom Inc. | 193,588 | 10,868 |
| * | Insulet Corp. | 129,897 | 9,754 |
| Cantel Medical Corp. | 83,659 | 9,730 |
| * | Masimo Corp. | 109,355 | 9,572 |
| * | Haemonetics Corp. | 117,902 | 8,359 |
| * | ICU Medical Inc. | 35,868 | 8,294 |
| * | LivaNova plc | 91,273 | 8,191 |
| * | Globus Medical Inc. | 161,457 | 7,692 |
| * | Integra LifeSciences | | |
| | Holdings Corp. | 140,084 | 7,387 |
| * | Penumbra Inc. | 64,433 | 6,972 |
| * | Neogen Corp. | 113,631 | 6,621 |
| * | NuVasive Inc. | 114,007 | 5,513 |
| * | Halyard Health Inc. | 104,297 | 5,150 |
| * | Merit Medical Systems Inc. | 111,908 | 5,092 |
| * | Inogen Inc. | 39,545 | 4,778 |
| * | Wright Medical Group NV | 221,116 | 4,500 |
| * | Nevro Corp. | 52,675 | 4,273 |
| * | NxStage Medical Inc. | 147,023 | 3,423 |
| CONMED Corp. | 56,211 | 3,402 |
| Abaxis Inc. | 50,515 | 3,368 |
| * | Integer Holdings Corp. | 63,526 | 3,243 |
| * | Varex Imaging Corp. | 84,083 | 2,934 |
| * | Quidel Corp. | 64,371 | 2,808 |
| * | OraSure Technologies Inc. | 135,523 | 2,339 |
| Analogic Corp. | 27,880 | 2,328 |
| * | Orthofix International NV | 40,216 | 2,252 |
| * | Natus Medical Inc. | 69,523 | 2,166 |
| * | Novocure Ltd. | 99,260 | 2,040 |
| Atrion Corp. | 3,327 | 1,959 |
| * | AxoGen Inc. | 63,724 | 1,861 |
| * | Cardiovascular Systems Inc. | 76,162 | 1,811 |
| * | Anika Therapeutics Inc. | 32,696 | 1,702 |
| * | K2M Group Holdings Inc. | 76,468 | 1,584 |
| Meridian Bioscience Inc. | 93,557 | 1,305 |
| * | CryoLife Inc. | 67,442 | 1,278 |
| | | |
| Market |
| Value• |
| | Shares | ($000) |
| * | iRhythm Technologies Inc. | 20,435 | 1,270 |
| * | AtriCure Inc. | 71,819 | 1,269 |
| * | AngioDynamics Inc. | 77,516 | 1,263 |
| Invacare Corp. | 72,758 | 1,251 |
| * | Cerus Corp. | 284,974 | 1,220 |
| * | Glaukos Corp. | 34,902 | 1,092 |
| * | Accuray Inc. | 189,054 | 1,049 |
| * | STAAR Surgical Co. | 64,128 | 1,007 |
| * | Tactile Systems Technology | |
| | Inc. | 31,004 | 1,003 |
| * | Heska Corp. | 14,509 | 986 |
| * | Lantheus Holdings Inc. | 62,386 | 954 |
| * | Endologix Inc. | 175,773 | 707 |
| *,^ Rockwell Medical Inc. | 110,121 | 642 |
| * | GenMark Diagnostics Inc. | 113,209 | 466 |
| *,^ ViewRay Inc. | 52,769 | 439 |
| *,^ Pulse Biosciences Inc. | 10,647 | 197 |
| * | ConforMIS Inc. | 118,017 | 160 |
| * | Wright Medical Group Inc. | | |
| | CVR | 14,554 | 19 |
| 1,729,598 |
| Health Care Providers & Services (19.1%) |
| UnitedHealth Group Inc. | 2,158,254 | 488,111 |
| Anthem Inc. | 571,876 | 134,608 |
| Aetna Inc. | 726,262 | 128,592 |
| Cigna Corp. | 549,123 | 107,568 |
| * | Express Scripts Holding | | |
| | Co. | 1,261,528 | 95,182 |
| Humana Inc. | 318,178 | 86,487 |
| McKesson Corp. | 464,344 | 69,294 |
| HCA Healthcare Inc. | 630,895 | 62,616 |
| Cardinal Health Inc. | 700,772 | 48,500 |
| * | Laboratory Corp. of | | |
| | America Holdings | 226,726 | 39,156 |
| * | Centene Corp. | 384,301 | 38,976 |
| AmerisourceBergen Corp. | | |
| | Class A | 364,336 | 34,670 |
| Quest Diagnostics Inc. | 303,592 | 31,285 |
| * | DaVita Inc. | 326,730 | 23,531 |
| * | Henry Schein Inc. | 349,601 | 23,140 |
| Universal Health Services | | |
| | Inc. Class B | 195,221 | 22,294 |
| * | WellCare Health Plans Inc. | 99,163 | 19,229 |
| * | Encompass Health Corp. | 218,828 | 11,655 |
| * | MEDNAX Inc. | 208,160 | 11,445 |
| * | Envision Healthcare Corp. | 268,910 | 10,353 |
| Chemed Corp. | 35,591 | 9,240 |
| * | Molina Healthcare Inc. | 95,513 | 6,906 |
| * | HealthEquity Inc. | 114,714 | 6,605 |
| * | Acadia Healthcare Co. Inc. | 166,876 | 6,358 |
| Patterson Cos. Inc. | 192,110 | 6,067 |
| * | AMN Healthcare Services | | |
| | Inc. | 106,698 | 5,938 |
| * | Magellan Health Inc. | 53,598 | 5,408 |
| *,^ Tenet Healthcare Corp. | 225,218 | 4,639 |
| * | Select Medical Holdings | | |
| | Corp. | 237,764 | 4,304 |
| * | Premier Inc. Class A | 127,538 | 4,228 |
| * | LifePoint Health Inc. | 87,934 | 4,054 |
| * | Amedisys Inc. | 64,359 | 3,811 |
| * | Tivity Health Inc. | 78,836 | 3,039 |
| Ensign Group Inc. | 107,566 | 2,872 |
| * | Brookdale Senior Living Inc. | 416,387 | 2,719 |
| * | LHC Group Inc. | 36,474 | 2,348 |
| Owens & Minor Inc. | 136,460 | 2,239 |
| * | Diplomat Pharmacy Inc. | 106,899 | 2,228 |
| * | BioTelemetry Inc. | 68,691 | 2,219 |
| US Physical Therapy Inc. | 27,939 | 2,165 |
| Kindred Healthcare Inc. | 195,485 | 1,798 |
| | | |
| Market |
| Value• |
| | Shares | ($000) |
| * | Providence Service Corp. | 25,483 | 1,620 |
| * | Almost Family Inc. | 26,376 | 1,555 |
| National HealthCare Corp. | 23,525 | 1,380 |
| *,^ Community Health Systems | | |
| | Inc. | 254,149 | 1,301 |
| * | R1 RCM Inc. | 196,010 | 1,286 |
| * | Triple-S Management Corp. | | |
| | Class B | 51,908 | 1,261 |
| * | CorVel Corp. | 22,708 | 1,112 |
| * | Cross Country Healthcare | | |
| | Inc. | 80,881 | 1,047 |
| *,^ Surgery Partners Inc. | 44,357 | 703 |
| * | Capital Senior Living Corp. | 54,336 | 641 |
| * | American Renal Associates | | |
| | Holdings Inc. | 28,177 | 558 |
| Aceto Corp. | 68,162 | 489 |
| * | Civitas Solutions Inc. | 33,962 | 442 |
| * | Quorum Health Corp. | 69,237 | 411 |
| * | AAC Holdings Inc. | 25,767 | 244 |
| *,^ Genesis Healthcare Inc. | 123,213 | 164 |
| 1,590,091 |
| Health Care Technology (1.3%) | | |
| * | Cerner Corp. | 666,136 | 42,739 |
| * | Veeva Systems Inc. | | |
| | Class A | 255,055 | 17,777 |
| * | athenahealth Inc. | 89,223 | 12,468 |
| * | Medidata Solutions Inc. | 130,345 | 8,559 |
| * | Allscripts Healthcare | | |
| | Solutions Inc. | 382,691 | 5,308 |
| *,^ Teladoc Inc. | 120,267 | 4,823 |
| * | Omnicell Inc. | 84,800 | 3,702 |
| * | Cotiviti Holdings Inc. | 92,198 | 3,090 |
| * | HMS Holdings Corp. | 187,273 | 3,004 |
| *,^ Evolent Health Inc. Class A | 133,877 | 1,961 |
| * | Vocera Communications Inc. | 58,852 | 1,618 |
| * | Inovalon Holdings Inc. | | |
| | Class A | 130,117 | 1,561 |
| * | HealthStream Inc. | 59,854 | 1,446 |
| * | Quality Systems Inc. | 105,518 | 1,324 |
| * | Tabula Rasa HealthCare Inc. | 27,595 | 892 |
| Computer Programs & | | |
| | Systems Inc. | 25,949 | 773 |
| * | Castlight Health Inc. Class B | 148,959 | 529 |
| 111,574 |
| Life Sciences Tools & Services (6.0%) | |
| Thermo Fisher Scientific Inc. | 893,034 | 186,269 |
| * | Illumina Inc. | 325,159 | 74,143 |
| Agilent Technologies Inc. | 717,000 | 49,179 |
| * | Waters Corp. | 177,107 | 36,243 |
| * | Mettler-Toledo International | | |
| | Inc. | 56,960 | 35,100 |
| * | IQVIA Holdings Inc. | 301,070 | 29,604 |
| PerkinElmer Inc. | 245,662 | 18,754 |
| * | Bio-Rad Laboratories Inc. | | |
| | Class A | 46,493 | 12,555 |
| Bio-Techne Corp. | 83,537 | 11,807 |
| * | Charles River Laboratories | | |
| | International Inc. | 105,494 | 11,247 |
| * | PRA Health Sciences Inc. | 112,868 | 9,481 |
| Bruker Corp. | 242,532 | 7,433 |
| * | Syneos Health Inc. | 127,106 | 5,326 |
| * | Cambrex Corp. | 72,934 | 3,789 |
| *,^ Accelerate Diagnostics Inc. | 74,318 | 1,954 |
| Luminex Corp. | 87,733 | 1,720 |
| * | NeoGenomics Inc. | 134,008 | 1,126 |
| * | Medpace Holdings Inc. | 19,559 | 627 |
| *,^ Pacific Biosciences of | | |
| | California Inc. | 242,725 | 578 |
| 496,935 |
53
Health Care Index Fund
| | | | |
| Market |
| Value• |
| | | Shares | ($000) |
| Pharmaceuticals (29.0%) | | |
| Johnson & Johnson | | 5,983,326 | 777,114 |
| Pfizer Inc. | 13,275,490 | 482,033 |
| Merck & Co. Inc. | | 6,067,840 | 328,998 |
| Bristol-Myers Squibb Co. | 3,645,224 | 241,314 |
| Eli Lilly & Co. | | 2,207,111 | 169,992 |
| Allergan plc | | 740,779 | 114,243 |
| Zoetis Inc. | | 1,085,251 | 87,753 |
| * | Mylan NV | | 1,015,657 | 40,951 |
| * | Nektar Therapeutics | | | |
| | Class A | | 350,705 | 30,357 |
| Perrigo Co. plc | | 282,334 | 22,999 |
| * | Jazz Pharmaceuticals plc | 133,545 | 19,337 |
| * | Catalent Inc. | | 296,004 | 12,358 |
| * | Horizon Pharma plc | | 364,749 | 5,318 |
| * | Medicines Co. | | 162,240 | 4,968 |
| * | Supernus Pharmaceuticals | | |
| | Inc. | | 114,262 | 4,445 |
| * | Prestige Brands Holdings | | |
| | Inc. | | 118,033 | 3,990 |
| * | Aerie Pharmaceuticals Inc. | 69,680 | 3,564 |
| * | Mallinckrodt plc | | 212,071 | 3,537 |
| * | Akorn Inc. | | 208,272 | 3,528 |
| * | Impax Laboratories Inc. | 157,924 | 3,222 |
| * | Zogenix Inc. | | 72,493 | 3,074 |
| * | Corcept Therapeutics Inc. | 189,920 | 2,885 |
| * | Endo International plc | 447,505 | 2,822 |
| * | Pacira Pharmaceuticals Inc. | 89,708 | 2,808 |
| * | MyoKardia Inc. | | 47,797 | 2,782 |
| * | Innoviva Inc. | | 168,271 | 2,610 |
| *,^ Theravance Biopharma Inc. | 96,225 | 2,537 |
| * | Intersect ENT Inc. | | 58,845 | 2,168 |
| * | Assembly Biosciences Inc. | 37,387 | 2,121 |
| * | Revance Therapeutics Inc. | 63,880 | 1,977 |
| *,^ TherapeuticsMD Inc. | 384,542 | 1,923 |
| * | Intra-Cellular Therapies Inc. | 97,583 | 1,890 |
| * | Dermira Inc. | | 69,042 | 1,775 |
| * | Cymabay Therapeutics Inc. | 117,248 | 1,746 |
| Phibro Animal Health Corp. | | |
| | Class A | | 43,920 | 1,689 |
| * | Amphastar | | | |
| | Pharmaceuticals Inc. | 82,111 | 1,508 |
| *,^ WaVe Life Sciences Ltd. | 25,109 | 1,279 |
| * | ANI Pharmaceuticals Inc. | 18,121 | 1,161 |
| * | Collegium Pharmaceutical | | |
| | Inc. | | 47,193 | 1,132 |
| * | Aclaris Therapeutics Inc. | 55,863 | 1,114 |
| | | |
| Market |
| Value• |
| | Shares | ($000) |
| *,^ Omeros Corp. | 102,150 | 1,032 |
| *,^ Lannett Co. Inc. | 61,955 | 991 |
| * | Depomed Inc. | 126,028 | 866 |
| *,^ Dova Pharmaceuticals Inc. | 28,231 | 854 |
| * | Corium International Inc. | 58,944 | 766 |
| *,^ Reata Pharmaceuticals Inc. | | |
| | Class A | 28,820 | 694 |
| *,^ Ocular Therapeutix Inc. | 68,495 | 358 |
| * | Aratana Therapeutics Inc. | 78,778 | 293 |
| * | Melinta Therapeutics Inc. | 22,427 | 279 |
| * | Teligent Inc. | 92,058 | 258 |
| * | Clearside Biomedical Inc. | 39,741 | 257 |
| 2,407,670 |
| Total Common Stocks | | |
| (Cost $6,880,900) | 8,313,406 |
| Temporary Cash Investment (0.3%) | |
| Money Market Fund (0.3%) | | |
| 2,3 Vanguard Market Liquidity | | |
| | Fund, 1.601% | | |
| | (Cost $28,851) | 288,511 | 28,848 |
| Total Investments (100.3%) | | |
| (Cost $6,909,751) | 8,342,254 |
| | | |
| Amount |
| ($000) |
| Other Assets and Liabilities (-0.3%) | |
| Other Assets | | |
| Investment in Vanguard | | 455 |
| Receivables for Investment | | |
| | Securities Sold | | 15,122 |
| Receivables for Accrued Income | 14,302 |
| Receivables for Capital Shares Issued | 2,354 |
| Total Other Assets | 32,233 |
| Liabilities | | |
| Payables for Investment | | |
| | Securities Purchased | | (15,092) |
| Collateral for Securities on Loan | (28,848) |
| Payables for Capital Shares Redeemed | (1,321) |
| Payables to Vanguard | | (2,432) |
| Other Liabilities | | (11,300) |
| Total Liabilities | (58,993) |
| Net Assets (100%) 8,315,494 |
See accompanying Notes, which are an integral part of the Financial Statements.
| |
| At February 28, 2018, net assets consisted of: |
| Amount |
| ($000) |
| Paid-in Capital | 6,929,523 |
| Undistributed Net Investment Income | 16,301 |
| Accumulated Net Realized Losses | (62,833) |
| Unrealized Appreciation (Depreciation) | 1,432,503 |
| Net Assets | 8,315,494 |
| |
| |
| ETF Shares—Net Assets | |
| Applicable to 46,154,984 outstanding | |
| $.001 par value shares of beneficial | |
| interest (unlimited authorization) | 7,278,514 |
| Net Asset Value Per Share— | |
| ETF Shares $157.70 |
| |
| Admiral Shares—Net Assets | |
| Applicable to 13,145,670 outstanding | |
| $.001 par value shares of beneficial | |
| interest (unlimited authorization) | 1,036,980 |
Net Asset Value Per Share—
Admiral Shares $78.88
• See Note A in Notes to Financial Statements.
* Non-income-producing security.
^ Includes partial security positions on loan to broker-dealers.
The total value of securities on loan is $26,194,000.
1 Security value determined using significant unobservable inputs.
2 Affiliated money market fund available only to Vanguard funds
and certain trusts and accounts managed by Vanguard. Rate
shown is the 7-day yield.
3 Includes $28,848,000 of collateral received for securities on loan.
CVR—Contingent Value Rights.
54
Health Care Index Fund
Statement of Operations
| | | |
| Six Months Ended |
| February 28, 2018 |
| | ($000) |
| Investment Income | | |
| Income | | |
| Dividends | 58,431 |
| Interest1 | 14 |
| Securities Lending—Net | 625 |
| Total Income | 59,070 |
| Expenses | | |
| The Vanguard Group—Note B | | |
| Investment Advisory Services | 990 |
| Management and Administrative— | |
| ETF Shares | 2,189 |
| Management and Administrative— | |
| Admiral Shares | 313 |
| Marketing and Distribution— | | |
| ETF Shares | 156 |
| Marketing and Distribution— | | |
| Admiral Shares | 37 |
| Custodian Fees | 67 |
| Shareholders’ Reports and Proxy— | |
| ETF Shares | 306 |
| Shareholders’ Reports and Proxy— | |
| Admiral Shares | 9 |
| Trustees’ Fees and Expenses | 3 |
| Total Expenses | 4,070 |
| Net Investment Income | 55,000 |
| Realized Net Gain (Loss) | | |
| Investment Securities Sold1 | 246,113 |
| Futures Contracts | 67 |
| Realized Net Gain (Loss) | 246,180 |
| Change in Unrealized Appreciation | |
| (Depreciation) | | |
| Investment Securities1 | 99,637 |
| Futures Contracts | (55) |
| Change in Unrealized Appreciation | |
| (Depreciation) | 99,582 |
| Net Increase (Decrease) in Net Assets | |
| Resulting from Operations | | 400,762 |
1 Interest income, realized net gain (loss), and change in unrealized
appreciation (depreciation) from an affiliated company of the
fund were $14,000, ($1,000), and ($6,000), respectively. Purchases
and sales are for temporary cash investment purposes.
| | | | |
| Statement of Changes in Net Assets | | | |
| |
| Six Months Ended | Year Ended |
| | February 28, | August 31, |
| | 2018 | 2017 |
| ($000) | ($000) |
| Increase (Decrease) in Net Assets | | | |
| Operations | | | |
| Net Investment Income | | 55,000 | 98,941 |
| Realized Net Gain (Loss) | | 246,180 | 170,277 |
| Change in Unrealized Appreciation (Depreciation) | | 99,582 | 719,449 |
| Net Increase (Decrease) in Net Assets Resulting from Operations | | 400,762 | 988,667 |
| Distributions | | | |
| Net Investment Income | | | |
| ETF Shares | | (50,419) | (85,891) |
| Admiral Shares | | (6,720) | (11,451) |
| Realized Capital Gain | | | |
| ETF Shares | | — | — |
| Admiral Shares | | — | — |
| Total Distributions | | (57,139) | (97,342) |
| Capital Share Transactions | | | |
| ETF Shares | | (26,978) | 504,061 |
| Admiral Shares | | 73,339 | 22,327 |
| Net Increase (Decrease) from Capital Share Transactions | | 46,361 | 526,388 |
| Total Increase (Decrease) | | 389,984 | 1,417,713 |
| Net Assets |
| Beginning of Period | | 7,925,510 | 6,507,797 |
| End of Period1 | | 8,315,494 | 7,925,510 |
| 1 Net Assets—End of Period includes undistributed (overdistributed) net investment income of $16,301,000 and $18,438,000. | |
See accompanying Notes, which are an integral part of the Financial Statements.
55
| | | | | | | |
| Health Care Index Fund | | | | | | | |
| |
| |
| Financial Highlights | | | | | |
| |
| ETF Shares | | | | | | | |
| Six Months | | | | | |
| | Ended | | | | | |
| For a Share Outstanding | February 28, | | | Year Ended August 31, |
| Throughout Each Period | 2018 | 2017 | 2016 | 2015 | 2014 | 2013 |
| Net Asset Value, Beginning of Period | $151.13 | $133.25 | $132.34 | $117.17 | $89.94 | $70.32 |
| Investment Operations | |
| Net Investment Income | | 1.0431 | 1.9941 | 1.795 | 1.350 | 1.333 | 1.155 |
| Net Realized and Unrealized Gain (Loss) | | | | | | |
| on Investments | | 6.609 | 17.846 | 1.559 | 15.105 | 27.033 | 19.663 |
| Total from Investment Operations | | 7.652 | 19.840 | 3.354 | 16.455 | 28.366 | 20.818 |
| Distributions | |
| Dividends from Net Investment Income | (1.082) | (1.960) | (2.444) | (1.285) | (1.136) | (1.198) |
| Distributions from Realized Capital Gains | — | — | — | — | — | — |
| Total Distributions | | (1.082) | (1.960) | (2.444) | (1.285) | (1.136) | (1.198) |
| Net Asset Value, End of Period | | $157.70 | $151.13 | $133.25 | $132.34 | $117.17 | $89.94 |
| Total Return | | 5.09% | 15.06% | 2.61% | 14.08% | 31.76% | 30.01% |
| Ratios/Supplemental Data | |
| Net Assets, End of Period (Millions) | | $7,279 | $7,002 | $5,708 | $5,826 | $3,319 | $1,918 |
| Ratio of Total Expenses to | | | | | | | |
| Average Net Assets | | 0.10% | 0.10% | 0.10% | 0.09% | 0.12% | 0.14% |
| Ratio of Net Investment Income to | | | | | | | |
| Average Net Assets | | 1.35% | 1.46% | 1.40% | 1.25% | 1.40% | 1.69% |
| Portfolio Turnover Rate2 | | 4% | 4% | 7% | 4% | 5% | 5% |
The expense ratio, net investment income ratio, and turnover rate for the current period have been annualized.
1 Calculated based on average shares outstanding.
2 Excludes the value of portfolio securities received or delivered as a result of in-kind purchases or redemptions of the fund’s capital shares,
including ETF Creation Units.
See accompanying Notes, which are an integral part of the Financial Statements.
56
| | | | | | | |
| Health Care Index Fund | | | | | | | |
| |
| |
| Financial Highlights | | | | | |
| |
| Admiral Shares | | | | | | | |
| Six Months | | | | | |
| | Ended | | | | | |
| For a Share Outstanding | February 28, | | | Year Ended August 31, |
| Throughout Each Period | 2018 | 2017 | 2016 | 2015 | 2014 | 2013 |
| Net Asset Value, Beginning of Period | $75.60 | $66.65 | $66.20 | $58.61 | $44.99 | $35.18 |
| Investment Operations | |
| Net Investment Income | | . 5221 | .9961 | .898 | .676 | .666 | .580 |
| Net Realized and Unrealized Gain (Loss) | | | | | | |
| on Investments | | 3.299 | 8.934 | .774 | 7.557 | 13.523 | 9.831 |
| Total from Investment Operations | | 3.821 | 9.930 | 1.672 | 8.233 | 14.189 | 10.411 |
| Distributions | |
| Dividends from Net Investment Income | (.541) | (.980) | (1.222) | (.643) | (.569) | (.601) |
| Distributions from Realized Capital Gains | — | — | — | — | — | — |
| Total Distributions | | (.541) | (.980) | (1.222) | (.643) | (.569) | (.601) |
| Net Asset Value, End of Period | | $78.88 | $75.60 | $66.65 | $66.20 | $58.61 | $44.99 |
| Total Return2 | | 5.08% | 15.07% | 2.61% | 14.11% | 31.77% | 30.00% |
| Ratios/Supplemental Data | |
| Net Assets, End of Period (Millions) | | $1,037 | $924 | $800 | $824 | $413 | $247 |
| Ratio of Total Expenses to | | | | | | | |
| Average Net Assets | | 0.10% | 0.10% | 0.10% | 0.10% | 0.12% | 0.14% |
| Ratio of Net Investment Income to | | | | | | | |
| Average Net Assets | | 1.35% | 1.46% | 1.40% | 1.24% | 1.40% | 1.69% |
| Portfolio Turnover Rate3 | | 4% | 4% | 7% | 4% | 5% | 5% |
The expense ratio, net investment income ratio, and turnover rate for the current period have been annualized.
1 Calculated based on average shares outstanding.
2 Total returns do not include account service fees that may have applied in the periods shown. Fund prospectuses provide information about
any applicable account service fees.
3 Excludes the value of portfolio securities received or delivered as a result of in-kind purchases or redemptions of the fund’s capital shares,
including ETF Creation Units.
See accompanying Notes, which are an integral part of the Financial Statements.
57
Health Care Index Fund
Notes to Financial Statements
Vanguard Health Care Index Fund is registered under the Investment Company Act of 1940 as an open-end investment company, or mutual fund. The fund offers two classes of shares: ETF Shares and Admiral Shares. ETF Shares are listed for trading on NYSE Arca; they can be purchased and sold through a broker. Admiral Shares are designed for investors who meet certain administrative, service, and account-size criteria.
A. The following significant accounting policies conform to generally accepted accounting principles for U.S. investment companies. The fund consistently follows such policies in preparing its financial statements.
1. Security Valuation: Securities are valued as of the close of trading on the New York Stock Exchange (generally 4 p.m., Eastern time) on the valuation date. Equity securities are valued at the latest quoted sales prices or official closing prices taken from the primary market in which each security trades; such securities not traded on the valuation date are valued at the mean of the latest quoted bid and asked prices. Securities for which market quotations are not readily available, or whose values have been materially affected by events occurring before the fund’s pricing time but after the close of the securities’ primary markets, are valued by methods deemed by the board of trustees to represent fair value. Investments in Vanguard Market Liquidity Fund are valued at that fund’s net asset value.
2. Futures Contracts: The fund uses index futures contracts to a limited extent, with the objectives of maintaining full exposure to the stock market, maintaining liquidity, and minimizing transaction costs. The fund may purchase futures contracts to immediately invest incoming cash in the market, or sell futures in response to cash outflows, thereby simulating a fully invested position in the underlying index while maintaining a cash balance for liquidity. The primary risks associated with the use of futures contracts are imperfect correlation between changes in market values of stocks held by the fund and the prices of futures contracts, and the possibility of an illiquid market. Counterparty risk involving futures is mitigated because a regulated clearinghouse is the counterparty instead of the clearing broker. To further mitigate counterparty risk, the fund trades futures contracts on an exchange, monitors the financial strength of its clearing brokers and clearinghouse, and has entered into clearing agreements with its clearing brokers. The clearinghouse imposes initial margin requirements to secure the fund’s performance and requires daily settlement of variation margin representing changes in the market value of each contract.
Futures contracts are valued at their quoted daily settlement prices. The notional amounts of the contracts are not recorded in the Statement of Net Assets. Fluctuations in the value of the contracts are recorded in the Statement of Net Assets as an asset (liability) and in the Statement of Operations as unrealized appreciation (depreciation) until the contracts are closed, when they are recorded as realized futures gains (losses).
During the six months ended February 28, 2018, the fund’s average investments in long and short futures contracts represented less than 1% and 0% of net assets, respectively, based on the average of the notional amounts at each quarter-end during the period. The fund had no open futures contracts at February 28, 2018.
3. Federal Income Taxes: The fund intends to continue to qualify as a regulated investment company and distribute all of its taxable income. Management has analyzed the fund’s tax positions taken for all open federal income tax years (August 31, 2014–2017), and for the period ended February 28, 2018, and has concluded that no provision for federal income tax is required in the fund’s financial statements. 4. Distributions: Distributions to shareholders are recorded on the ex-dividend date.
5. Securities Lending: To earn additional income, the fund lends its securities to qualified institutional borrowers. Security loans are subject to termination by the fund at any time, and are required to be secured at all times by collateral in an amount at least equal to the market value of securities loaned. Daily market fluctuations could cause the value of loaned securities to be more or less than the value of the collateral received. When this occurs, the collateral is adjusted and settled on the next business day. The fund further mitigates its counterparty risk by entering into securities lending transactions only with a diverse group of prequalified counterparties, monitoring their financial strength, and entering into master securities lending agreements with its counterparties. The master securities lending agreements provide that, in the event of a counterparty’s default (including bankruptcy), the fund may terminate any loans with that borrower, determine the net amount owed, and sell or retain the collateral up to the net amount owed to the fund; however, such actions may be subject to legal proceedings. While collateral mitigates counterparty risk, in the event of a default, the fund may experience delays and costs in recovering the securities loaned. The fund invests cash collateral received in Vanguard Market Liquidity Fund, and records a liability in the Statement of Net Assets
58
Health Care Index Fund
for the return of the collateral, during the period the securities are on loan. Securities lending income represents fees charged to borrowers plus income earned on invested cash collateral, less expenses associated with the loan. During the term of the loan, the fund is entitled to all distributions made on or in respect of the loaned securities.
6. Credit Facility: The fund and certain other funds managed by The Vanguard Group (“Vanguard”) participate in a $3.1 billion committed credit facility provided by a syndicate of lenders pursuant to a credit agreement that may be renewed annually; each fund is individually liable for its borrowings, if any, under the credit facility. Borrowings may be utilized for temporary and emergency purposes, and are subject to the fund’s regulatory and contractual borrowing restrictions. The participating funds are charged administrative fees and an annual commitment fee of 0.10% of the undrawn amount of the facility; these fees are allocated to the funds based on a method approved by the fund’s board of trustees and included in Management and Administrative expenses on the fund’s Statement of Operations. Any borrowings under this facility bear interest at a rate based upon the higher of the one-month London Interbank Offered Rate, federal funds effective rate, or overnight bank funding rate plus an agreed-upon spread.
The fund had no borrowings outstanding at February 28, 2018, or at any time during the period then ended.
7. Other: Dividend income is recorded on the ex-dividend date. Interest income includes income distributions received from Vanguard Market Liquidity Fund and is accrued daily. Security transactions are accounted for on the date securities are bought or sold. Costs used to determine realized gains (losses) on the sale of investment securities are those of the specific securities sold.
Each class of shares has equal rights as to assets and earnings, except that each class separately bears certain class-specific expenses related to maintenance of shareholder accounts (included in Management and Administrative expenses), shareholder reporting, and the proxy. Marketing and distribution expenses are allocated to each class of shares based on a method approved by the board of trustees. Income, other non-class-specific expenses, and gains and losses on investments are allocated to each class of shares based on its relative net assets.
B. In accordance with the terms of a Funds’ Service Agreement (the “FSA”) between Vanguard and the fund, Vanguard furnishes to the fund investment advisory, corporate management, administrative, marketing, and distribution services at Vanguard’s cost of operations (as defined by the FSA). These costs of operations are allocated to the fund based on methods and guidelines approved by the board of trustees. Vanguard does not require reimbursement in the current period for certain costs of operations (such as deferred compensation/benefits and risk/insurance costs); the fund’s liability for these costs of operations is included in Payables to Vanguard on the Statement of Net Assets. All other costs of operations payable to Vanguard are generally settled twice a month.
Upon the request of Vanguard, the fund may invest up to 0.40% of its net assets as capital in Vanguard. At February 28, 2018, the fund had contributed to Vanguard capital in the amount of $455,000, representing 0.01% of the fund’s net assets and 0.18% of Vanguard’s capitalization. The fund’s trustees and officers are also directors and employees, respectively, of Vanguard.
C. Various inputs may be used to determine the value of the fund’s investments. These inputs are summarized in three broad levels for financial statement purposes. The inputs or methodologies used to value securities are not necessarily an indication of the risk associated with investing in those securities.
Level 1—Quoted prices in active markets for identical securities.
Level 2—Other significant observable inputs (including quoted prices for similar securities, interest
rates, prepayment speeds, credit risk, etc.).
Level 3—Significant unobservable inputs (including the fund’s own assumptions used to determine
the fair value of investments). Any investments valued with significant unobservable inputs are noted
on the Statement of Net Assets.
The following table summarizes the market value of the fund’s investments as of February 28, 2018, based on the inputs used to value them:
| | | |
| Level 1 | Level 2 | Level 3 |
| Investments | ($000) | ($000) | ($000) |
| Common Stocks | 8,312,806 | — | 600 |
| Temporary Cash Investments | 28,848 | — | — |
| Total | 8,341,654 | — | 600 |
59
Health Care Index Fund
D. Distributions are determined on a tax basis and may differ from net investment income and realized capital gains for financial reporting purposes. Differences may be permanent or temporary. Permanent differences are reclassified among capital accounts in the financial statements to reflect their tax character. Temporary differences arise when certain items of income, expense, gain, or loss are recognized in different periods for financial statement and tax purposes. These differences will reverse at some time in the future. Differences in classification may also result from the treatment of short-term gains as ordinary income for tax purposes.
During the six months ended February 28, 2018, the fund realized $204,671,000 of net capital gains resulting from in-kind redemptions—in which shareholders exchanged fund shares for securities held by the fund rather than for cash. Because such gains are not taxable to the fund, and are not distributed to shareholders, they have been reclassified from accumulated net realized losses to paid-in capital.
The fund’s tax-basis capital gains and losses are determined only at the end of each fiscal year. For tax purposes, at August 31,2017, the fund had available capital losses totaling $104,392,000. The fund will use these capital losses to offset net taxable capital gains, if any, realized during the year ending August 31, 2018; should the fund realize net capital losses for the year, the losses will be added to the loss carryforward balance above.
At February 28, 2018, the cost of investment securities for tax purposes was $6,909,844,000. Net unrealized appreciation of investment securities for tax purposes was $1,432,410,000, consisting of unrealized gains of $1,887,574,000 on securities that had risen in value since their purchase and $455,164,000 in unrealized losses on securities that had fallen in value since their purchase.
E. During the six months ended February 28, 2018, the fund purchased $728,911,000 of investment securities and sold $680,285,000 of investment securities, other than temporary cash investments. Purchases and sales include $435,540,000 and $510,830,000, respectively, in connection with in-kind purchases and redemptions of the fund’s capital shares.
| | | | |
| F. Capital share transactions for each class of shares were: | | | |
| Six Months Ended | | Year Ended |
| February 28, 2018 | August 31, 2017 |
| Amount | Shares | Amount | Shares |
| ($000) | (000) | ($000) | (000) |
| ETF Shares | | | | |
| Issued | 490,012 | 3,128 | 1,016,695 | 7,344 |
| Issued in Lieu of Cash Distributions | — | — | — | — |
| Redeemed | (516,990) | (3,300) | (512,634) | (3,850) |
| Net Increase (Decrease)—ETF Shares | (26,978) | (172) | 504,061 | 3,494 |
| Admiral Shares | | | | |
| Issued | 195,893 | 2,492 | 304,504 | 4,456 |
| Issued in Lieu of Cash Distributions | 5,978 | 78 | 10,353 | 152 |
| Redeemed | (128,532) | (1,646) | (292,530) | (4,393) |
| Net Increase (Decrease)—Admiral Shares | 73,339 | 924 | 22,327 | 215 |
G. Management has determined that no material events or transactions occurred subsequent to February 28, 2018, that would require recognition or disclosure in these financial statements.
60
Industrials Index Fund
Fund Profile
As of February 28, 2018
| | | |
| Share-Class Characteristics | | |
| | ETF | Admiral |
| Shares | Shares |
| Ticker Symbol | | VIS | VINAX |
| Expense Ratio1 | 0.10% | 0.10% |
| 30-Day SEC Yield | 1.57% | 1.57% |
| |
| |
| Portfolio Characteristics | | |
| MSCI | |
| US IMI/ | MSCI |
| Industrials | US IMI/ |
| Fund | 25/50 | 2500 |
| Number of Stocks | 347 | 344 | 2,469 |
| Median Market Cap | $38.1B | $38.1B | $68.2B |
| Price/Earnings Ratio | 21.5x | 21.3x | 21.9x |
| Price/Book Ratio | 4.0x | 4.0x | 3.1x |
| Return on Equity | 21.6% | 21.6% | 15.0% |
| Earnings Growth Rate | 8.4% | 8.2% | 8.5% |
| Dividend Yield | 1.6% | 1.7% | 1.8% |
| Foreign Holdings | 0.0% | 0.0% | 0.0% |
| Turnover Rate | | | |
| (Annualized) | 4% | — | — |
| Short-Term Reserves | 0.0% | — | — |
| |
| |
| Volatility Measures | | | |
| MSCI US | |
| IMI/Industrials | MSCI US |
| | 25/50 | IMI/2500 |
| R-Squared | | 1.00 | 0.84 |
| Beta | | 1.00 | 1.07 |
These measures show the degree and timing of the fund’s
fluctuations compared with the indexes over 36 months.
| |
| Subindustry Diversification | |
| (% of equity exposure) | |
| Aerospace & Defense | 24.9% |
| Agricultural & Farm Machinery | 1.9 |
| Air Freight & Logistics | 5.8 |
| Airlines | 4.6 |
| Airport Services | 0.1 |
| Building Products | 4.1 |
| Commerical Printing | 0.4 |
| Construction & Engineering | 1.7 |
| Construction Machinery & Heavy Trucks | 6.2 |
| Diversified Support Services | 1.5 |
| Electrical Components & Equipment | 5.2 |
| Environmental & Facilities Services | 3.2 |
| Human Resource & Employment Services | 1.0 |
| Industrial Conglomerates | 13.4 |
| Industrial Machinery | 10.6 |
| Marine | 0.2 |
| Office Services & Supplies | 0.5 |
| Railroads | 6.7 |
| Research & Consulting Services | 3.1 |
| Security & Alarm Services | 0.1 |
| Trading Companies & Distributors | 3.2 |
| Trucking | 1.6 |
Sector categories are based on the Global Industry
Classification Standard (“GICS”), except for the “Other”
category (if applicable), which includes securities that have
not been provided a GICS classification as of the effective
reporting period.
| | |
| Ten Largest Holdings (% of total net assets) |
| Boeing Co. | Aerospace & Defense | 6.7% |
| 3M Co. | Industrial Conglomerates | 4.6 |
| General Electric Co. | Industrial Conglomerates | 4.0 |
| Honeywell | | |
| International Inc. | Industrial Conglomerates | 3.6 |
| Union Pacific Corp. | Railroads | 3.4 |
| United Technologies | | |
| Corp. | Aerospace & Defense | 3.4 |
| Caterpillar Inc. | Construction Machinery | |
| & Heavy Trucks | 3.0 |
| Lockheed Martin | | |
| Corp. | Aerospace & Defense | 3.0 |
| United Parcel Service | | |
| Inc. Class B | Air Freight & Logistics | 2.4 |
| Raytheon Co. | Aerospace & Defense | 2.1 |
| Top Ten | 36.2% |
The holdings listed exclude any temporary cash investments and
equity index products.
1 The expense ratios shown are from the prospectus dated December 21, 2017, and represent estimated costs for the current fiscal year. For the six months ended February 28, 2018, the annualized expense ratios
were 0.10% for ETF Shares and 0.10% for Admiral Shares.
61
Industrials Index Fund
Performance Summary
All of the returns in this report represent past performance, which is not a guarantee of future results that may be achieved by the fund. (Current performance may be lower or higher than the performance data cited. For performance data current to the most recent month-end, visit our website at vanguard.com/performance.) Note, too, that both investment returns and principal value can fluctuate widely, so an investor’s shares, when sold, could be worth more or less than their original cost. The returns shown do not reflect taxes that a shareholder would pay on fund distributions or on the sale of fund shares.
Fiscal-Year Total Returns (%): August 31, 2007–February 28, 2018
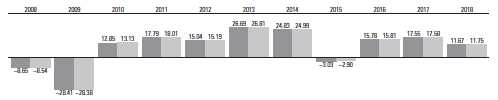
| |
| Industrials Index Fund ETF Shares Net Asset Value |
| Spliced US IMI/Industrials 25/50 |
| For a benchmark description, see the Glossary. |
| Note: For 2018, performance data reflect the six months ended February 28, 2018. |
Average Annual Total Returns: Periods Ended December 31, 2017
This table presents returns through the latest calendar quarter—rather than through the end of the fiscal period.
| | | | |
| Securities and Exchange Commission rules require that we provide this information. | | |
| |
| Inception Date | One Year | Five Years | Ten Years |
| ETF Shares | 9/23/2004 | | | |
| Market Price | | 21.53% | 16.78% | 8.80% |
| Net Asset Value | | 21.50 | 16.78 | 8.78 |
| Admiral Shares | 5/8/2006 | 21.51 | 16.78 | 8.78 |
See Financial Highlights for dividend and capital gains information.
62
Industrials Index Fund
Financial Statements (unaudited)
Statement of Net Assets
As of February 28, 2018
The fund reports a complete list of its holdings in regulatory filings four times in each fiscal year, at the quarter-ends. For the second and fourth fiscal quarters, the lists appear in the fund’s semiannual and annual reports to shareholders. For the first and third fiscal quarters, the fund files the lists with the Securities and Exchange Commission on Form N-Q. Shareholders can look up the fund’s Forms N-Q on the SEC’s website at sec.gov. Forms N-Q may also be reviewed and copied at the SEC’s Public Reference Room (see the back cover of this report for further information).
| | | |
| Market |
| Value• |
| | Shares | ($000) |
| Common Stocks (100.0%) | | |
| Aerospace & Defense (24.9%) | | |
| Boeing Co. | 753,295 | 272,851 |
| United Technologies Corp. | 1,010,029 | 136,091 |
| Lockheed Martin Corp. | 343,592 | 121,096 |
| Raytheon Co. | 384,879 | 83,715 |
| Northrop Grumman Corp. | 220,171 | 77,069 |
| General Dynamics Corp. | 337,882 | 75,162 |
| Rockwell Collins Inc. | 216,909 | 29,873 |
| Harris Corp. | 158,683 | 24,778 |
| L3 Technologies Inc. | 104,029 | 21,591 |
| Textron Inc. | 350,709 | 20,990 |
| TransDigm Group Inc. | 69,180 | 19,945 |
| Huntington Ingalls | | |
| | Industries Inc. | 60,272 | 15,792 |
| Arconic Inc. | 576,896 | 14,070 |
| Spirit AeroSystems | | |
| | Holdings Inc. Class A | 153,839 | 14,044 |
| Orbital ATK Inc. | 76,848 | 10,148 |
| * | Teledyne Technologies Inc. | 44,839 | 8,338 |
| Hexcel Corp. | 119,502 | 8,040 |
| Curtiss-Wright Corp. | 55,775 | 7,528 |
| BWX Technologies Inc. | 119,018 | 7,493 |
| HEICO Corp. Class A | 80,261 | 5,819 |
| * | KLX Inc. | 68,417 | 4,630 |
| HEICO Corp. | 44,774 | 3,833 |
| * | Moog Inc. Class A | 42,936 | 3,599 |
| * | Mercury Systems Inc. | 64,409 | 2,961 |
| * | Esterline Technologies Corp. | 35,795 | 2,645 |
| *,^ Axon Enterprise Inc. | 70,565 | 2,458 |
| * | Aerojet Rocketdyne | | |
| | Holdings Inc. | 85,096 | 2,298 |
| Cubic Corp. | 34,451 | 2,115 |
| AAR Corp. | 43,861 | 1,868 |
| Triumph Group Inc. | 66,108 | 1,848 |
| * | Aerovironment Inc. | 28,705 | 1,427 |
| * | Kratos Defense & Security | | |
| | Solutions Inc. | 117,242 | 1,413 |
| * | Astronics Corp. | 24,270 | 936 |
| * | Engility Holdings Inc. | 27,279 | 745 |
| * | Wesco Aircraft Holdings Inc. | 73,042 | 654 |
| National Presto Industries | | |
| | Inc. | 6,540 | 594 |
| * | KeyW Holding Corp. | 58,818 | 442 |
| * | Astronics Corp. Class B | 4,516 | 174 |
| 1,009,073 |
| Air Freight & Logistics (5.8%) | | |
| United Parcel Service Inc. | | |
| | Class B | 914,753 | 95,509 |
| FedEx Corp. | 339,160 | 83,572 |
| CH Robinson Worldwide | | |
| | Inc. | 185,623 | 17,330 |
| * | XPO Logistics Inc. | 159,648 | 15,714 |
| Expeditors International of | | |
| | Washington Inc. | 236,644 | 15,372 |
| Forward Air Corp. | 39,600 | 2,138 |
| * | Atlas Air Worldwide | | |
| | Holdings Inc. | 33,680 | 2,050 |
| | | | |
| Market |
| Value• |
| | | Shares | ($000) |
| * | Air Transport Services | | | |
| | Group Inc. | | 75,169 | 1,990 |
| * | Hub Group Inc. Class A | 44,576 | 1,946 |
| * | Echo Global Logistics Inc. | 33,418 | 884 |
| 236,505 |
| Airlines (4.6%) | | | |
| Delta Air Lines Inc. | | 949,325 | 51,169 |
| Southwest Airlines Co. | 790,120 | 45,701 |
| American Airlines Group Inc. 573,369 | 31,105 |
| * | United Continental Holdings | | |
| | Inc. | | 394,427 | 26,738 |
| Alaska Air Group Inc. | | 163,704 | 10,559 |
| * | JetBlue Airways Corp. | 426,640 | 8,981 |
| SkyWest Inc. | | 68,986 | 3,780 |
| * | Spirit Airlines Inc. | | 92,202 | 3,673 |
| Allegiant Travel Co. Class A | 17,142 | 2,851 |
| Hawaiian Holdings Inc. | 69,816 | 2,513 |
| 187,070 |
| Building Products (4.1%) | | |
| Johnson Controls | | | |
| | International plc | | 1,232,059 | 45,426 |
| Masco Corp. | | 418,656 | 17,215 |
| AO Smith Corp. | | 194,094 | 12,459 |
| Fortune Brands Home & | | |
| | Security Inc. | | 202,041 | 12,256 |
| Owens Corning | | 148,040 | 12,036 |
| Allegion plc | | 126,471 | 10,637 |
| Lennox International Inc. | 50,038 | 10,239 |
| * | USG Corp. | | 122,395 | 4,090 |
| * | Trex Co. Inc. | | 39,138 | 4,047 |
| * | Armstrong World Industries | | |
| | Inc. | | 52,874 | 3,188 |
| * | JELD-WEN Holding Inc. | 101,807 | 3,172 |
| Simpson Manufacturing | | |
| | Co. Inc. | | 53,600 | 2,965 |
| * | Builders FirstSource Inc. | 150,711 | 2,891 |
| Universal Forest Products | | |
| | Inc. | | 81,724 | 2,692 |
| * | American Woodmark Corp. | 19,444 | 2,497 |
| * | Masonite International Corp. | 37,896 | 2,314 |
| AAON Inc. | | 55,963 | 2,057 |
| * | Patrick Industries Inc. | | 32,030 | 1,968 |
| Apogee Enterprises Inc. | 38,017 | 1,640 |
| * | Gibraltar Industries Inc. | 39,988 | 1,388 |
| * | Continental Building | | | |
| | Products Inc. | | 50,238 | 1,366 |
| Advanced Drainage | | | |
| | Systems Inc. | | 52,252 | 1,335 |
| * | PGT Innovations Inc. | | 66,198 | 1,158 |
| * | CSW Industrials Inc. | | 21,381 | 980 |
| * | NCI Building Systems Inc. | 57,086 | 931 |
| Griffon Corp. | | 41,048 | 768 |
| * | Ply Gem Holdings Inc. | 32,371 | 699 |
| Quanex Building Products | | |
| | Corp. | | 41,369 | 693 |
| Insteel Industries Inc. | | 23,912 | 675 |
| * | Armstrong Flooring Inc. | 25,458 | 357 |
| 164,139 |
| | | |
| Market |
| Value• |
| | Shares | ($000) |
| Commercial Services & Supplies (5.6%) | |
| Waste Management Inc. | 578,151 | 49,906 |
| Waste Connections Inc. | 350,958 | 24,841 |
| Republic Services Inc. | | |
| | Class A | 311,458 | 20,924 |
| Cintas Corp. | 120,289 | 20,528 |
| * | Copart Inc. | 277,241 | 12,978 |
| KAR Auction Services Inc. | 179,904 | 9,729 |
| * | Stericycle Inc. | 113,560 | 7,117 |
| Rollins Inc. | 130,468 | 6,559 |
| * | Cimpress NV | 30,945 | 5,036 |
| Deluxe Corp. | 63,993 | 4,543 |
| Brink’s Co. | 60,441 | 4,442 |
| Healthcare Services Group | | |
| | Inc. | 97,461 | 4,428 |
| MSA Safety Inc. | 45,531 | 3,671 |
| Tetra Tech Inc. | 74,118 | 3,628 |
| * | Clean Harbors Inc. | 71,933 | 3,592 |
| UniFirst Corp. | 20,629 | 3,204 |
| Pitney Bowes Inc. | 248,978 | 3,087 |
| Herman Miller Inc. | 79,478 | 2,853 |
| ABM Industries Inc. | 73,622 | 2,588 |
| Mobile Mini Inc. | 59,231 | 2,485 |
| Brady Corp. Class A | 63,941 | 2,391 |
| Covanta Holding Corp. | 156,835 | 2,345 |
| Matthews International | | |
| | Corp. Class A | 42,958 | 2,202 |
| HNI Corp. | 57,761 | 2,136 |
| Interface Inc. Class A | 80,127 | 1,939 |
| ACCO Brands Corp. | 141,733 | 1,793 |
| * | Advanced Disposal Services | | |
| | Inc. | 70,940 | 1,588 |
| Steelcase Inc. Class A | 113,792 | 1,553 |
| McGrath RentCorp | 30,599 | 1,549 |
| US Ecology Inc. | 28,903 | 1,529 |
| Viad Corp. | 27,235 | 1,418 |
| Knoll Inc. | 66,040 | 1,405 |
| * | Casella Waste Systems Inc. | | |
| | Class A | 52,199 | 1,327 |
| Multi-Color Corp. | 19,006 | 1,204 |
| * | SP Plus Corp. | 29,938 | 1,078 |
| Quad/Graphics Inc. | 40,035 | 1,056 |
| Kimball International Inc. | | |
| | Class B | 49,500 | 813 |
| RR Donnelley & Sons Co. | 93,277 | 703 |
| LSC Communications Inc. | 46,697 | 680 |
| Ennis Inc. | 34,023 | 663 |
| *,^ Team Inc. | 39,990 | 654 |
| * | InnerWorkings Inc. | 65,614 | 606 |
| * | Civeo Corp. | 167,330 | 594 |
| VSE Corp. | 11,605 | 563 |
| Essendant Inc. | 50,057 | 397 |
| CECO Environmental Corp. | 38,932 | 160 |
| 228,485 |
| Construction & Engineering (1.8%) | |
| Fluor Corp. | 186,334 | 10,602 |
| Jacobs Engineering Group | | |
| | Inc. | 169,134 | 10,327 |
| * | AECOM | 209,739 | 7,448 |
63
| | | | |
| Industrials Index Fund | | | |
| |
| |
| |
| |
| Market |
| Value• |
| | | Shares | ($000) |
| * | Quanta Services Inc. | 206,447 | 7,110 |
| EMCOR Group Inc. | | 78,225 | 5,969 |
| * | Dycom Industries Inc. | 41,158 | 4,496 |
| * | MasTec Inc. | | 88,078 | 4,488 |
| Valmont Industries Inc. | 30,067 | 4,423 |
| Granite Construction Inc. | 53,172 | 3,089 |
| KBR Inc. | | 186,509 | 2,824 |
| Chicago Bridge & Iron Co. | | |
| | NV | | 135,346 | 2,363 |
| Comfort Systems USA Inc. | 49,304 | 2,024 |
| Primoris Services Corp. | 55,187 | 1,374 |
| * | Tutor Perini Corp. | | 53,107 | 1,283 |
| * | Aegion Corp. Class A | 43,163 | 991 |
| Argan Inc. | | 19,796 | 791 |
| * | MYR Group Inc. | | 21,808 | 705 |
| * | NV5 Global Inc. | | 10,749 | 465 |
| 70,772 |
| Electrical Equipment (5.3%) | | |
| Emerson Electric Co. | 854,541 | 60,724 |
| Eaton Corp. plc | | 586,624 | 47,341 |
| Rockwell Automation Inc. | 171,080 | 30,931 |
| AMETEK Inc. | | 307,752 | 23,309 |
| * | Sensata Technologies | | |
| | Holding NV | | 228,180 | 12,062 |
| Hubbell Inc. Class B | | 69,146 | 9,062 |
| Acuity Brands Inc. | | 56,081 | 7,996 |
| Regal Beloit Corp. | | 58,949 | 4,262 |
| EnerSys | | 56,049 | 3,906 |
| * | Generac Holdings Inc. | 82,651 | 3,676 |
| General Cable Corp. | | 66,358 | 1,961 |
| Encore Wire Corp. | | 27,663 | 1,450 |
| AZZ Inc. | | 34,747 | 1,419 |
| * | Atkore International Group | | |
| | Inc. | | 52,445 | 1,140 |
| * | Thermon Group Holdings | | |
| | Inc. | | 43,180 | 942 |
| * | Sunrun Inc. | | 93,346 | 624 |
| * | Vicor Corp. | | 23,702 | 610 |
| *,^ Plug Power Inc. | | 305,756 | 569 |
| * | Babcock & Wilcox | | | |
| | Enterprises Inc. | | 58,636 | 373 |
| Powell Industries Inc. | 11,411 | 304 |
| * | TPI Composites Inc. | | 9,246 | 183 |
| *,^ Vivint Solar Inc. | | 38,267 | 115 |
| 212,959 |
| Industrial Conglomerates (13.4%) | |
| 3M Co. | | 793,007 | 186,761 |
| General Electric Co. | 11,545,720 | 162,910 |
| Honeywell International | | |
| | Inc. | | 963,645 | 145,616 |
| Roper Technologies Inc. | 136,281 | 37,490 |
| Carlisle Cos. Inc. | | 82,471 | 8,487 |
| Raven Industries Inc. | 47,580 | 1,615 |
| 542,879 |
| Machinery (18.7%) | | | |
| Caterpillar Inc. | | 792,087 | 122,480 |
| Illinois Tool Works Inc. | 410,548 | 66,279 |
| Deere & Co. | | 363,603 | 58,493 |
| Cummins Inc. | | 209,912 | 35,301 |
| PACCAR Inc. | | 468,084 | 33,510 |
| Stanley Black & Decker | | |
| | Inc. | | 204,166 | 32,501 |
| Fortive Corp. | | 416,474 | 31,985 |
| Parker-Hannifin Corp. | 177,360 | 31,653 |
| Ingersoll-Rand plc | | 332,653 | 29,540 |
| Dover Corp. | | 207,411 | 20,762 |
| Xylem Inc. | | 239,133 | 17,835 |
| Pentair plc | | 229,727 | 15,780 |
| IDEX Corp. | | 101,753 | 13,920 |
| | | |
| Market |
| Value• |
| | Shares | ($000) |
| Snap-on Inc. | 75,935 | 12,090 |
| Graco Inc. | 224,039 | 9,936 |
| * | WABCO Holdings Inc. | 67,805 | 9,355 |
| Wabtec Corp. | 114,945 | 9,350 |
| Nordson Corp. | 69,074 | 9,261 |
| Toro Co. | 143,368 | 9,114 |
| * | Middleby Corp. | 74,387 | 8,945 |
| Oshkosh Corp. | 100,136 | 7,904 |
| Donaldson Co. Inc. | 164,179 | 7,792 |
| Flowserve Corp. | 173,802 | 7,361 |
| Lincoln Electric Holdings Inc. | 78,736 | 6,893 |
| Allison Transmission | | |
| | Holdings Inc. | 169,741 | 6,727 |
| Trinity Industries Inc. | 181,662 | 5,929 |
| ITT Inc. | 117,088 | 5,875 |
| Crane Co. | 63,166 | 5,831 |
| AGCO Corp. | 84,666 | 5,639 |
| Woodward Inc. | 73,320 | 5,193 |
| John Bean Technologies | | |
| | Corp. | 41,996 | 4,651 |
| Terex Corp. | 111,904 | 4,646 |
| Kennametal Inc. | 107,944 | 4,447 |
| Barnes Group Inc. | 67,761 | 4,087 |
| Timken Co. | 92,943 | 4,071 |
| * | Rexnord Corp. | 138,402 | 4,011 |
| * | Colfax Corp. | 122,852 | 3,905 |
| * | RBC Bearings Inc. | 32,223 | 3,883 |
| Hillenbrand Inc. | 83,842 | 3,681 |
| * | Proto Labs Inc. | 33,680 | 3,669 |
| * | Welbilt Inc. | 176,403 | 3,495 |
| * | Gardner Denver Holdings | | |
| | Inc. | 104,185 | 3,335 |
| * | SPX FLOW Inc. | 56,485 | 2,754 |
| * | Meritor Inc. | 112,185 | 2,749 |
| Watts Water Technologies | | |
| | Inc. Class A | 35,035 | 2,645 |
| Albany International Corp. | 38,720 | 2,465 |
| Mueller Water Products Inc. | | |
| | Class A | 210,030 | 2,310 |
| * | Navistar International Corp. | 58,860 | 2,197 |
| * | Harsco Corp. | 107,122 | 2,169 |
| * | Chart Industries Inc. | 38,915 | 2,145 |
| Franklin Electric Co. Inc. | 52,699 | 2,063 |
| EnPro Industries Inc. | 28,448 | 2,061 |
| ESCO Technologies Inc. | 34,535 | 2,034 |
| * | Milacron Holdings Corp. | 92,640 | 1,985 |
| Greenbrier Cos. Inc. | 38,251 | 1,981 |
| Sun Hydraulics Corp. | 37,824 | 1,964 |
| Mueller Industries Inc. | 73,230 | 1,940 |
| Actuant Corp. Class A | 79,796 | 1,811 |
| * | SPX Corp. | 56,641 | 1,769 |
| Wabash National Corp. | 78,939 | 1,725 |
| Federal Signal Corp. | 79,879 | 1,709 |
| Altra Industrial Motion Corp. | 39,017 | 1,693 |
| Standex International Corp. | 16,919 | 1,626 |
| * | TriMas Corp. | 61,172 | 1,584 |
| Astec Industries Inc. | 26,164 | 1,541 |
| Tennant Co. | 23,869 | 1,537 |
| Alamo Group Inc. | 13,158 | 1,462 |
| Kadant Inc. | 14,727 | 1,405 |
| Douglas Dynamics Inc. | 30,192 | 1,344 |
| Manitowoc Co. Inc. | 44,789 | 1,331 |
| Briggs & Stratton Corp. | 57,044 | 1,282 |
| Lindsay Corp. | 14,209 | 1,257 |
| * | Lydall Inc. | 22,967 | 1,106 |
| REV Group Inc. | 38,671 | 1,044 |
| Columbus McKinnon Corp. | 27,458 | 975 |
| CIRCOR International Inc. | 18,793 | 883 |
| Titan International Inc. | 67,870 | 873 |
| | | | |
| Market |
| Value• |
| | | Shares | ($000) |
| NN Inc. | | 34,962 | 836 |
| Global Brass & Copper | | | |
| | Holdings Inc. | | 29,330 | 830 |
| Hyster-Yale Materials | | | |
| | Handling Inc. | | 10,887 | 775 |
| Gorman-Rupp Co. | | 24,263 | 647 |
| Park-Ohio Holdings Corp. | | 10,853 | 432 |
| American Railcar Industries | | | |
| | Inc. | | 10,168 | 379 |
| *,^ Energy Recovery Inc. | | 46,525 | 319 |
| * | Blue Bird Corp. | | 9,775 | 227 |
| 756,979 |
| Marine (0.2%) | | | |
| * | Kirby Corp. | | 79,408 | 5,956 |
| Matson Inc. | | 56,471 | 1,609 |
| * | Genco Shipping & Trading | | | |
| | Ltd. | | 11,526 | 159 |
| 7,724 |
| Professional Services (4.1%) | | | |
| * | IHS Markit Ltd. | | 531,060 | 24,986 |
| * | Verisk Analytics Inc. | | | |
| | Class A | | 208,316 | 21,288 |
| Equifax Inc. | | 159,884 | 18,067 |
| * | CoStar Group Inc. | | 48,122 | 16,464 |
| Nielsen Holdings plc | | 474,298 | 15,476 |
| * | TransUnion | | 206,517 | 11,786 |
| ManpowerGroup Inc. | | 88,173 | 10,445 |
| Robert Half International | | | |
| | Inc. | | 166,773 | 9,518 |
| Dun & Bradstreet Corp. | | 49,173 | 6,149 |
| * | On Assignment Inc. | | 65,747 | 5,042 |
| Insperity Inc. | | 49,840 | 3,254 |
| Korn/Ferry International | | 71,411 | 2,993 |
| * | WageWorks Inc. | | 52,936 | 2,776 |
| Exponent Inc. | | 34,377 | 2,673 |
| * | TriNet Group Inc. | | 55,722 | 2,628 |
| * | FTI Consulting Inc. | | 50,500 | 2,408 |
| * | TrueBlue Inc. | | 55,028 | 1,497 |
| * | ICF International Inc. | | 24,891 | 1,419 |
| * | CBIZ Inc. | | 69,623 | 1,257 |
| Kelly Services Inc. Class A | | 41,612 | 1,227 |
| * | Navigant Consulting Inc. | | 61,088 | 1,214 |
| * | Huron Consulting Group Inc. | 29,462 | 1,031 |
| Kforce Inc. | | 31,838 | 882 |
| Heidrick & Struggles | | | |
| | International Inc. | | 25,137 | 664 |
| RPX Corp. | | 59,583 | 598 |
| Resources Connection Inc. | 37,784 | 587 |
| Forrester Research Inc. | | 11,825 | 479 |
| * | Mistras Group Inc. | | 22,905 | 452 |
| * | GP Strategies Corp. | | 17,049 | 376 |
| 167,636 |
| Road & Rail (8.2%) | | | |
| Union Pacific Corp. | 1,048,029 | 136,506 |
| CSX Corp. | 1,130,360 | 60,723 |
| Norfolk Southern Corp. | | 380,967 | 52,985 |
| Kansas City Southern | | 137,893 | 14,208 |
| JB Hunt Transport Services | | | |
| | Inc. | | 116,927 | 13,864 |
| Old Dominion Freight Line | | | |
| | Inc. | | 82,194 | 11,418 |
| Knight-Swift Transportation | | | |
| | Holdings Inc. | | 177,533 | 8,550 |
| Landstar System Inc. | | 55,827 | 6,074 |
| * | Genesee & Wyoming Inc. | | | |
| | Class A | | 82,043 | 5,704 |
| Ryder System Inc. | | 70,437 | 5,098 |
| * | Avis Budget Group Inc. | | 97,494 | 4,405 |
| AMERCO | | 9,155 | 3,149 |
64
Industrials Index Fund
| | | |
| Market |
| Value• |
| | Shares | ($000) |
| * | Saia Inc. | 33,868 | 2,461 |
| Werner Enterprises Inc. | 62,637 | 2,333 |
| * | Hertz Global Holdings Inc. | 66,957 | 1,218 |
| Heartland Express Inc. | 61,325 | 1,197 |
| Marten Transport Ltd. | 54,305 | 1,176 |
| ArcBest Corp. | 32,737 | 1,084 |
| * | Daseke Inc. | 52,345 | 527 |
| * | YRC Worldwide Inc. | 44,649 | 389 |
| * | Roadrunner Transportation | | |
| | Systems Inc. | 41,259 | 158 |
| 333,227 |
| Trading Companies & Distributors (3.2%) | |
| Fastenal Co. | 382,635 | 20,938 |
| * | United Rentals Inc. | 112,608 | 19,717 |
| WW Grainger Inc. | 72,079 | 18,852 |
| * | HD Supply Holdings Inc. | 235,936 | 8,553 |
| Watsco Inc. | 40,646 | 6,722 |
| Air Lease Corp. Class A | 130,509 | 5,699 |
| MSC Industrial Direct Co. | | |
| | Inc. Class A | 59,264 | 5,184 |
| * | Beacon Roofing Supply Inc. | 90,120 | 4,768 |
| * | Univar Inc. | 149,927 | 4,319 |
| * | WESCO International Inc. | 62,543 | 3,893 |
| * | SiteOne Landscape Supply | | |
| | Inc. | 52,917 | 3,643 |
| Applied Industrial | | |
| | Technologies Inc. | 51,651 | 3,636 |
| GATX Corp. | 48,422 | 3,338 |
| Triton International Ltd. | 80,312 | 2,290 |
| * | MRC Global Inc. | 125,950 | 2,082 |
| Kaman Corp. | 31,351 | 1,919 |
| * | Herc Holdings Inc. | 28,350 | 1,849 |
| * | Rush Enterprises Inc. | | |
| | Class A | 41,648 | 1,770 |
| H&E Equipment Services | | |
| | Inc. | 42,625 | 1,607 |
| * | BMC Stock Holdings Inc. | 80,459 | 1,509 |
| Aircastle Ltd. | 72,836 | 1,419 |
| * | NOW Inc. | 143,480 | 1,362 |
| * | GMS Inc. | 43,844 | 1,357 |
| * | DXP Enterprises Inc. | 21,988 | 654 |
| * | Veritiv Corp. | 15,946 | 387 |
| | | |
| Market |
| Value• |
| | Shares | ($000) |
| * | Foundation Building | | |
| | Materials Inc. | 25,856 | 354 |
| * | Nexeo Solutions Inc. | 36,338 | 338 |
| * | Rush Enterprises Inc. | | |
| | Class B | 5,567 | 222 |
| 128,381 |
| Transportation Infrastructure (0.1%) | |
| Macquarie Infrastructure | | |
| | Corp. | 106,880 | 4,329 |
| 4,329 |
| Total Common Stocks | | |
| (Cost $3,295,478) | 4,050,158 |
| Temporary Cash Investment (0.0%) | |
| Money Market Fund (0.0%) | | |
| 1,2 Vanguard Market Liquidity | | |
| | Fund, 1.601% | | |
| | (Cost $1,093) | 10,929 | 1,093 |
| Total Investments (100.0%) | | |
| (Cost $3,296,571) | 4,051,251 |
| | | |
| Amount |
| ($000) |
| Other Assets and Liabilities (0.0%) | |
| Other Assets | | |
| Investment in Vanguard | | 220 |
| Receivables for Investment | | |
| Securities Sold | | 24,589 |
| Receivables for Accrued Income | 10,662 |
| Receivables for Capital Shares Issued | 143 |
| Total Other Assets | 35,614 |
| Liabilities | | |
| Payables for Investment | | |
| Securities Purchased | | (27,591) |
| Collateral for Securities on Loan | (1,093) |
| Payables for Capital Shares Redeemed | (852) |
| Payables to Vanguard | | (964) |
| Other Liabilities | | (7,053) |
| Total Liabilities | (37,553) |
| Net Assets (100%) 4,049,312 |
See accompanying Notes, which are an integral part of the Financial Statements.
| |
| At February 28, 2018, net assets consisted of: |
| Amount |
| ($000) |
| Paid-in Capital | 3,343,481 |
| Undistributed Net Investment Income | 10,936 |
| Accumulated Net Realized Losses | (59,785) |
| Unrealized Appreciation (Depreciation) | 754,680 |
| Net Assets | 4,049,312 |
| |
| |
| ETF Shares—Net Assets | |
| Applicable to 26,880,405 outstanding | |
| $.001 par value shares of beneficial | |
| interest (unlimited authorization) | 3,829,312 |
| Net Asset Value Per Share— | |
| ETF Shares $142.46 |
| |
| Admiral Shares—Net Assets | |
| Applicable to 3,006,063 outstanding | |
| $.001 par value shares of beneficial | |
| interest (unlimited authorization) | 220,000 |
| Net Asset Value Per Share— | |
| Admiral Shares | $73.19 |
• See Note A in Notes to Financial Statements.
* Non-income-producing security.
^ Includes partial security positions on loan to broker-dealers.
The total value of securities on loan is $1,082,000.
1 Affiliated money market fund available only to Vanguard funds
and certain trusts and accounts managed by Vanguard. Rate
shown is the 7-day yield.
2 Includes $1,093,000 of collateral received for securities on loan.
65
Industrials Index Fund
Statement of Operations
| | | |
| Six Months Ended |
| February 28, 2018 |
| | ($000) |
| Investment Income | | |
| Income | | |
| Dividends | 32,275 |
| Interest1 | 5 |
| Securities Lending—Net | 43 |
| Total Income | 32,323 |
| Expenses | | |
| The Vanguard Group—Note B | | |
| Investment Advisory Services | 459 |
| Management and Administrative— | |
| ETF Shares | 1,035 |
| Management and Administrative— | |
| Admiral Shares | 58 |
| Marketing and Distribution— | | |
| ETF Shares | 93 |
| Marketing and Distribution— | | |
| Admiral Shares | 8 |
| Custodian Fees | 61 |
| Shareholders’ Reports and Proxy— | |
| ETF Shares | 144 |
| Shareholders’ Reports and Proxy— | |
| Admiral Shares | 8 |
| Trustees’ Fees and Expenses | 1 |
| Total Expenses | 1,867 |
| Net Investment Income | 30,456 |
| Realized Net Gain (Loss) on | | |
| Investment Securities Sold1 | 85,148 |
| Change in Unrealized Appreciation | |
| (Depreciation) of Investment Securities1 | 274,681 |
| Net Increase (Decrease) in Net Assets | |
| Resulting from Operations | | 390,285 |
1 Interest income, realized net gain (loss), and change in unrealized
appreciation (depreciation) from an affiliated company of the
fund were $5,000, ($1,000), and ($1,000), respectively. Purchases
and sales are for temporary cash investment purposes.
| | | | |
| Statement of Changes in Net Assets | | | |
| |
| Six Months Ended | Year Ended |
| | February 28, | August 31, |
| | 2018 | 2017 |
| ($000) | ($000) |
| Increase (Decrease) in Net Assets | | | |
| Operations | | | |
| Net Investment Income | | 30,456 | 56,877 |
| Realized Net Gain (Loss) | | 85,148 | 92,010 |
| Change in Unrealized Appreciation (Depreciation) | | 274,681 | 293,618 |
| Net Increase (Decrease) in Net Assets Resulting from Operations | | 390,285 | 442,505 |
| Distributions | | | |
| Net Investment Income | | | |
| ETF Shares | | (30,114) | (51,022) |
| Admiral Shares | | (1,707) | (2,396) |
| Realized Capital Gain | | | |
| ETF Shares | | — | — |
| Admiral Shares | | — | — |
| Total Distributions | | (31,821) | (53,418) |
| Capital Share Transactions | | | |
| ETF Shares | | 287,880 | 492,584 |
| Admiral Shares | | 25,138 | 81,187 |
| Net Increase (Decrease) from Capital Share Transactions | | 313,018 | 573,771 |
| Total Increase (Decrease) | | 671,482 | 962,858 |
| Net Assets |
| Beginning of Period | | 3,377,830 | 2,414,972 |
| End of Period1 | | 4,049,312 | 3,377,830 |
| 1 Net Assets—End of Period includes undistributed (overdistributed) net investment income of $10,936,000 and $12,296,000. | |
See accompanying Notes, which are an integral part of the Financial Statements.
66
| | | | | | | |
| Industrials Index Fund | | | | | | | |
| |
| |
| Financial Highlights | | | | | |
| |
| ETF Shares | | | | | | | |
| Six Months | | | | | |
| | Ended | | | | | |
| For a Share Outstanding | February 28, | | | Year Ended August 31, |
| Throughout Each Period | 2018 | 2017 | 2016 | 2015 | 2014 | 2013 |
| Net Asset Value, Beginning of Period | $128.70 | $111.57 | $99.23 | $103.95 | $84.17 | $67.82 |
| Investment Operations | |
| Net Investment Income | | 1.1251 | 2.3831 | 2.083 | 1.914 | 1.508 | 1.5171 |
| Net Realized and Unrealized Gain (Loss) | | | | | | |
| on Investments | | 13.837 | 16.998 | 13.204 | (4.961) | 19.332 | 16.321 |
| Total from Investment Operations | | 14.962 | 19.381 | 15.287 | (3.047) | 20.840 | 17.838 |
| Distributions | |
| Dividends from Net Investment Income | (1.202) | (2.251) | (2.947) | (1.673) | (1.060) | (1.488) |
| Distributions from Realized Capital Gains | — | — | — | — | — | — |
| Total Distributions | | (1.202) | (2.251) | (2.947) | (1.673) | (1.060) | (1.488) |
| Net Asset Value, End of Period | | $142.46 | $128.70 | $111.57 | $99.23 | $103.95 | $84.17 |
| Total Return | | 11.67% | 17.55% | 15.78% | -3.03% | 24.83% | 26.69% |
| Ratios/Supplemental Data | |
| Net Assets, End of Period (Millions) | | $3,829 | $3,202 | $2,338 | $1,898 | $1,883 | $1,104 |
| Ratio of Total Expenses to | | | | | | | |
| Average Net Assets | | 0.10% | 0.10% | 0.10% | 0.10% | 0.12% | 0.14% |
| Ratio of Net Investment Income to | | | | | | | |
| Average Net Assets | | 1.61% | 1.95% | 2.08% | 1.83% | 1.69% | 1.97% |
| Portfolio Turnover Rate2 | | 4% | 5% | 8% | 4% | 5% | 6% |
The expense ratio, net investment income ratio, and turnover rate for the current period have been annualized.
1 Calculated based on average shares outstanding.
2 Excludes the value of portfolio securities received or delivered as a result of in-kind purchases or redemptions of the fund’s capital shares,
including ETF Creation Units.
See accompanying Notes, which are an integral part of the Financial Statements.
67
| | | | | | | |
| Industrials Index Fund | | | | | | | |
| |
| |
| Financial Highlights | | | | | |
| |
| Admiral Shares | | | | | | | |
| Six Months | | | | | |
| | Ended | | | | | |
| For a Share Outstanding | February 28, | | | Year Ended August 31, |
| Throughout Each Period | 2018 | 2017 | 2016 | 2015 | 2014 | 2013 |
| Net Asset Value, Beginning of Period | $66.12 | $57.32 | $50.98 | $53.40 | $43.24 | $34.84 |
| Investment Operations | |
| Net Investment Income | | . 5761 | 1.2371 | 1.069 | .982 | .780 | .7801 |
| Net Realized and Unrealized Gain (Loss) | | | | | | |
| on Investments | | 7.113 | 8.721 | 6.783 | (2.541) | 9.922 | 8.382 |
| Total from Investment Operations | | 7.689 | 9.958 | 7.852 | (1.559) | 10.702 | 9.162 |
| Distributions | |
| Dividends from Net Investment Income | (.619) | (1.158) | (1.512) | (.861) | (.542) | (.762) |
| Distributions from Realized Capital Gains | — | — | — | — | — | — |
| Total Distributions | | (.619) | (1.158) | (1.512) | (.861) | (.542) | (.762) |
| Net Asset Value, End of Period | | $73.19 | $66.12 | $57.32 | $50.98 | $53.40 | $43.24 |
| Total Return2 | | 11.67% | 17.55% | 15.77% | -2.98% | 24.84% | 26.70% |
| Ratios/Supplemental Data | |
| Net Assets, End of Period (Millions) | | $220 | $176 | $77 | $66 | $71 | $18 |
| Ratio of Total Expenses to | | | | | | | |
| Average Net Assets | | 0.10% | 0.10% | 0.10% | 0.10% | 0.12% | 0.14% |
| Ratio of Net Investment Income to | | | | | | | |
| Average Net Assets | | 1.61% | 1.95% | 2.08% | 1.83% | 1.69% | 1.97% |
| Portfolio Turnover Rate3 | | 4% | 5% | 8% | 4% | 5% | 6% |
The expense ratio, net investment income ratio, and turnover rate for the current period have been annualized.
1 Calculated based on average shares outstanding.
2 Total returns do not include account service fees that may have applied in the periods shown. Fund prospectuses provide information about
any applicable account service fees.
3 Excludes the value of portfolio securities received or delivered as a result of in-kind purchases or redemptions of the fund’s capital shares,
including ETF Creation Units.
See accompanying Notes, which are an integral part of the Financial Statements.
68
Industrials Index Fund
Notes to Financial Statements
Vanguard Industrials Index Fund is registered under the Investment Company Act of 1940 as an open-end investment company, or mutual fund. The fund offers two classes of shares: ETF Shares and Admiral Shares. ETF Shares are listed for trading on NYSE Arca; they can be purchased and sold through a broker. Admiral Shares are designed for investors who meet certain administrative, service, and account-size criteria.
A. The following significant accounting policies conform to generally accepted accounting principles for U.S. investment companies. The fund consistently follows such policies in preparing its financial statements.
1. Security Valuation: Securities are valued as of the close of trading on the New York Stock Exchange (generally 4 p.m., Eastern time) on the valuation date. Equity securities are valued at the latest quoted sales prices or official closing prices taken from the primary market in which each security trades; such securities not traded on the valuation date are valued at the mean of the latest quoted bid and asked prices. Securities for which market quotations are not readily available, or whose values have been materially affected by events occurring before the fund’s pricing time but after the close of the securities’ primary markets, are valued by methods deemed by the board of trustees to represent fair value. Investments in Vanguard Market Liquidity Fund are valued at that fund’s net asset value.
2. Futures Contracts: The fund uses index futures contracts to a limited extent, with the objectives of maintaining full exposure to the stock market, maintaining liquidity, and minimizing transaction costs. The fund may purchase futures contracts to immediately invest incoming cash in the market, or sell futures in response to cash outflows, thereby simulating a fully invested position in the underlying index while maintaining a cash balance for liquidity. The primary risks associated with the use of futures contracts are imperfect correlation between changes in market values of stocks held by the fund and the prices of futures contracts, and the possibility of an illiquid market. Counterparty risk involving futures is mitigated because a regulated clearinghouse is the counterparty instead of the clearing broker. To further mitigate counterparty risk, the fund trades futures contracts on an exchange, monitors the financial strength of its clearing brokers and clearinghouse, and has entered into clearing agreements with its clearing brokers. The clearinghouse imposes initial margin requirements to secure the fund’s performance and requires daily settlement of variation margin representing changes in the market value of each contract.
Futures contracts are valued at their quoted daily settlement prices. The notional amounts of the contracts are not recorded in the Statement of Net Assets. Fluctuations in the value of the contracts are recorded in the Statement of Net Assets as an asset (liability) and in the Statement of Operations as unrealized appreciation (depreciation) until the contracts are closed, when they are recorded as realized futures gains (losses).
During the six months ended February 28, 2018, the fund’s average investments in long and short futures contracts represented less than 1% and 0% of net assets, respectively, based on the average of the notional amounts at each quarter-end during the period. The fund had no open futures contracts at February 28, 2018.
3. Federal Income Taxes: The fund intends to continue to qualify as a regulated investment company and distribute all of its taxable income. Management has analyzed the fund’s tax positions taken for all open federal income tax years (August 31, 2014–2017), and for the period ended February 28, 2018, and has concluded that no provision for federal income tax is required in the fund’s financial statements. 4. Distributions: Distributions to shareholders are recorded on the ex-dividend date.
5. Securities Lending: To earn additional income, the fund lends its securities to qualified institutional borrowers. Security loans are subject to termination by the fund at any time, and are required to be secured at all times by collateral in an amount at least equal to the market value of securities loaned. Daily market fluctuations could cause the value of loaned securities to be more or less than the value of the collateral received. When this occurs, the collateral is adjusted and settled on the next business day. The fund further mitigates its counterparty risk by entering into securities lending transactions only with a diverse group of prequalified counterparties, monitoring their financial strength, and entering into master securities lending agreements with its counterparties. The master securities lending agreements provide that, in the event of a counterparty’s default (including bankruptcy), the fund may terminate any loans with that borrower, determine the net amount owed, and sell or retain the collateral up to the net amount owed to the fund; however, such actions may be subject to legal proceedings. While collateral mitigates counterparty risk, in the event of a default, the fund may experience delays and costs in recovering the securities loaned. The fund invests cash collateral received in Vanguard Market Liquidity Fund, and records a liability in the Statement of Net Assets for the return of the collateral, during the period the securities are on loan. Securities lending income
69
Industrials Index Fund
represents fees charged to borrowers plus income earned on invested cash collateral, less expenses associated with the loan. During the term of the loan, the fund is entitled to all distributions made on or in respect of the loaned securities.
6. Credit Facility: The fund and certain other funds managed by The Vanguard Group (“Vanguard”) participate in a $3.1 billion committed credit facility provided by a syndicate of lenders pursuant to a credit agreement that may be renewed annually; each fund is individually liable for its borrowings, if any, under the credit facility. Borrowings may be utilized for temporary and emergency purposes, and are subject to the fund’s regulatory and contractual borrowing restrictions. The participating funds are charged administrative fees and an annual commitment fee of 0.10% of the undrawn amount of the facility; these fees are allocated to the funds based on a method approved by the fund’s board of trustees and included in Management and Administrative expenses on the fund’s Statement of Operations. Any borrowings under this facility bear interest at a rate based upon the higher of the one-month London Interbank Offered Rate, federal funds effective rate, or overnight bank funding rate plus an agreed-upon spread.
The fund had no borrowings outstanding at February 28, 2018, or at any time during the period then ended.
7. Other: Dividend income is recorded on the ex-dividend date. Interest income includes income distributions received from Vanguard Market Liquidity Fund and is accrued daily. Security transactions are accounted for on the date securities are bought or sold. Costs used to determine realized gains (losses) on the sale of investment securities are those of the specific securities sold.
Each class of shares has equal rights as to assets and earnings, except that each class separately bears certain class-specific expenses related to maintenance of shareholder accounts (included in Management and Administrative expenses), shareholder reporting, and the proxy. Marketing and distribution expenses are allocated to each class of shares based on a method approved by the board of trustees. Income, other non-class-specific expenses, and gains and losses on investments are allocated to each class of shares based on its relative net assets.
B. In accordance with the terms of a Funds’ Service Agreement (the “FSA”) between Vanguard and the fund, Vanguard furnishes to the fund investment advisory, corporate management, administrative, marketing, and distribution services at Vanguard’s cost of operations (as defined by the FSA). These costs of operations are allocated to the fund based on methods and guidelines approved by the board of trustees. Vanguard does not require reimbursement in the current period for certain costs of operations (such as deferred compensation/benefits and risk/insurance costs); the fund’s liability for these costs of operations is included in Payables to Vanguard on the Statement of Net Assets. All other costs of operations payable to Vanguard are generally settled twice a month.
Upon the request of Vanguard, the fund may invest up to 0.40% of its net assets as capital in Vanguard. At February 28, 2018, the fund had contributed to Vanguard capital in the amount of $220,000 representing 0.01% of the fund’s net assets and 0.09% of Vanguard’s capitalization. The fund’s trustees and officers are also directors and employees, respectively, of Vanguard.
C. Various inputs may be used to determine the value of the fund’s investments. These inputs are summarized in three broad levels for financial statement purposes. The inputs or methodologies used to value securities are not necessarily an indication of the risk associated with investing in those securities.
Level 1—Quoted prices in active markets for identical securities.
Level 2—Other significant observable inputs (including quoted prices for similar securities, interest
rates, prepayment speeds, credit risk, etc.).
Level 3—Significant unobservable inputs (including the fund’s own assumptions used to determine
the fair value of investments). Any investments valued with significant unobservable inputs are noted
on the Statement of Net Assets.
At February 28, 2018, 100% of the market value of the fund’s investments was determined based on Level 1 inputs.
D. Distributions are determined on a tax basis and may differ from net investment income and realized capital gains for financial reporting purposes. Differences may be permanent or temporary. Permanent differences are reclassified among capital accounts in the financial statements to reflect their tax character. Temporary differences arise when certain items of income, expense, gain, or loss are recognized in different periods for financial statement and tax purposes. These differences will reverse at some time in the future. Differences in classification may also result from the treatment of short-term gains as ordinary income for tax purposes.
70
Industrials Index Fund
During the six months ended February 28, 2018, the fund realized $91,364,000 of net capital gains resulting from in-kind redemptions—in which shareholders exchanged fund shares for securities held by the fund rather than for cash. Because such gains are not taxable to the fund, and are not distributed to shareholders, they have been reclassified from accumulated net realized losses to paid-in capital.
The fund’s tax-basis capital gains and losses are determined only at the end of each fiscal year. For tax purposes, at August 31, 2017, the fund had available capital losses totaling $53,569,000 to offset future net capital gains. Of this amount, $16,635,000 is subject to expiration dates; $11,504,000 may be used to offset future net capital gains through August 31, 2018, and $5,131,000 through August 31, 2019. Capital losses of $36,934,000 realized beginning in fiscal 2012 may be carried forward indefinitely under the Regulated Investment Company Modernization Act of 2010, but must be used before any expiring loss carryforwards. The fund will use these capital losses to offset net taxable capital gains, if any, realized during the year ending August 31, 2018; should the fund realize net capital losses for the year, the losses will be added to the loss carryforward balance above.
At February 28, 2018, the cost of investment securities for tax purposes was $3,296,780,000. Net unrealized appreciation of investment securities for tax purposes was $754,471,000, consisting of unrealized gains of $974,793,000 on securities that had risen in value since their purchase and $220,322,000 in unrealized losses on securities that had fallen in value since their purchase.
E. During the six months ended February 28, 2018, the fund purchased $655,814,000 of investment securities and sold $341,245,000 of investment securities, other than temporary cash investments. Purchases and sales include $497,985,000 and $265,285,000, respectively, in connection with in-kind purchases and redemptions of the fund’s capital shares.
| | | | |
| F. Capital share transactions for each class of shares were: | | | |
| Six Months Ended | | Year Ended |
| February 28, 2018 | August 31, 2017 |
| Amount | Shares | Amount | Shares |
| ($000) | (000) | ($000) | (000) |
| ETF Shares | | | | |
| Issued | 558,166 | 3,951 | 957,768 | 7,878 |
| Issued in Lieu of Cash Distributions | — | — | — | — |
| Redeemed | (270,286) | (1,950) | (465,184) | (3,950) |
| Net Increase (Decrease)—ETF Shares | 287,880 | 2,001 | 492,584 | 3,928 |
| Admiral Shares | | | | |
| Issued | 70,217 | 974 | 137,665 | 2,204 |
| Issued in Lieu of Cash Distributions | 1,474 | 21 | 2,135 | 34 |
| Redeemed | (46,553) | (646) | (58,613) | (930) |
| Net Increase (Decrease)—Admiral Shares | 25,138 | 349 | 81,187 | 1,308 |
At February 28, 2018, one shareholder was the record or beneficial owner of 48% of the fund’s net assets. If the shareholder were to redeem its investment in the fund, the redemption might result in an increase in the fund’s expense ratio.
G. Management has determined that no material events or transactions occurred subsequent to February 28, 2018, that would require recognition or disclosure in these financial statements.
71
Information Technology Index Fund
| | | |
| Fund Profile | | | |
| As of February 28, 2018 | | |
| |
| Share-Class Characteristics | | |
| | ETF | Admiral |
| Shares | Shares |
| Ticker Symbol | | VGT | VITAX |
| Expense Ratio1 | 0.10% | 0.10% |
| 30-Day SEC Yield | 1.01% | 1.01% |
| |
| |
| Portfolio Characteristics | | |
| MSCI | |
| US IMI/ | |
| Information | MSCI |
| Technology | US IMI/ |
| Fund | 25/50 | 2500 |
| Number of Stocks | 358 | 358 | 2,469 |
| Median Market Cap $209.9B | $209.9B | $68.2B |
| Price/Earnings Ratio | 31.8x | 31.9x | 21.9x |
| Price/Book Ratio | 5.7x | 5.7x | 3.1x |
| Return on Equity | 18.8% | 18.8% | 15.0% |
| Earnings Growth Rate | 8.3% | 8.4% | 8.5% |
| Dividend Yield | 1.0% | 1.0% | 1.8% |
| Foreign Holdings | 0.0% | 0.0% | 0.0% |
| Turnover Rate | | | |
| (Annualized) | 3% | — | — |
| Short-Term Reserves | 0.0% | — | — |
| | |
| Volatility Measures | | |
| MSCI US | |
| IMI/Information | |
| Technology | MSCI US |
| 25/50 | IMI/2500 |
| R-Squared | 1.00 | 0.64 |
| Beta | 1.00 | 1.08 |
These measures show the degree and timing of the fund’s
fluctuations compared with the indexes over 36 months.
| |
| Subindustry Diversification | |
| (% of equity exposure) | |
| Application Software | 6.6% |
| Communications Equipment | 5.0 |
| Data Processing & Outsourced Services | 11.9 |
| Electronic Components | 1.2 |
| Electronic Equipment & Instruments | 1.0 |
| Electronic Manufacturing Services | 1.1 |
| Home Entertainment Software | 1.6 |
| Internet Software & Services | 19.3 |
| IT Consulting & Other Services | 5.5 |
| Semiconductor Equipment | 2.3 |
| Semiconductors | 14.0 |
| Systems Software | 14.6 |
| Technology Distributors | 0.3 |
| Technology Hardware, Storage & Peripherals | 15.6 |
Sector categories are based on the Global Industry
Classification Standard (“GICS”), except for the “Other”
category (if applicable), which includes securities that have
not been provided a GICS classification as of the effective
reporting period.
| | |
| Ten Largest Holdings (% of total net assets) |
| Apple Inc. | Technology Hardware, | |
| Storage & Peripherals | 13.5% |
| Microsoft Corp. | Systems Software | 10.2 |
| Alphabet Inc. | Internet Software | |
| & Services | 10.0 |
| Facebook Inc. | Internet Software | |
| & Services | 6.3 |
| Intel Corp. | Semiconductors | 3.4 |
| Visa Inc. | Data Processing | |
| & Outsourced Services | 3.3 |
| Cisco Systems Inc. | Communications | |
| Equipment | 3.3 |
| Mastercard Inc. | Data Processing | |
| & Outsourced Services | 2.4 |
| Oracle Corp. | Systems Software | 2.3 |
| NVIDIA Corp. | Semiconductors | 2.2 |
| Top Ten | 56.9% |
The holdings listed exclude any temporary cash investments and
equity index products.
1 The expense ratios shown are from the prospectus dated December 21, 2017, and represent estimated costs for the current fiscal year. For the six months ended February 28, 2018, the annualized expense ratios
were 0.10% for Admiral Shares and 0.10% for ETF Shares.
72
Information Technology Index Fund
Performance Summary
All of the returns in this report represent past performance, which is not a guarantee of future results that may be achieved by the fund. (Current performance may be lower or higher than the performance data cited. For performance data current to the most recent month-end, visit our website at vanguard.com/performance.) Note, too, that both investment returns and principal value can fluctuate widely, so an investor’s shares, when sold, could be worth more or less than their original cost. The returns shown do not reflect taxes that a shareholder would pay on fund distributions or on the sale of fund shares.
Fiscal-Year Total Returns (%): August 31, 2007–February 28, 2018
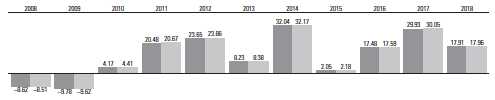
| |
| Information Technology Index Fund ETF Shares Net Asset Value |
| Spliced US IMI/Information Technology 25/50 |
| For a benchmark description, see the Glossary. |
| Note: For 2018, performance data reflect the six months ended February 28, 2018. |
Average Annual Total Returns: Periods Ended December 31, 2017
This table presents returns through the latest calendar quarter—rather than through the end of the fiscal period.
Securities and Exchange Commission rules require that we provide this information.
| | | | |
| Inception Date | One Year | Five Years | Ten Years |
| ETF Shares | 1/26/2004 | | | |
| Market Price | | 37.04% | 20.40% | 11.71% |
| Net Asset Value | | 37.07 | 20.39 | 11.70 |
| Admiral Shares | 3/25/2004 | 37.07 | 20.41 | 11.70 |
See Financial Highlights for dividend and capital gains information.
73
Information Technology Index Fund
Financial Statements (unaudited)
Statement of Net Assets
As of February 28, 2018
The fund reports a complete list of its holdings in regulatory filings four times in each fiscal year, at the quarter-ends. For the second and fourth fiscal quarters, the lists appear in the fund’s semiannual and annual reports to shareholders. For the first and third fiscal quarters, the fund files the lists with the Securities and Exchange Commission on Form N-Q. Shareholders can look up the fund’s Forms N-Q on the SEC’s website at sec.gov. Forms N-Q may also be reviewed and copied at the SEC’s Public Reference Room (see the back cover of this report for further information).
| | | | |
| Market |
| Value• |
| | | Shares | ($000) |
| Common Stocks (100.0%) | | | |
| Commercial Services & Supplies (0.0%) | |
| Commercial Printing (0.0%) | | |
| * | Cimpress NV | | 450 | 73 |
| 73 |
| Communications Equipment (5.0%) | |
| Cisco Systems Inc. | 15,249,903 | 682,891 |
| Motorola Solutions Inc. | | 499,888 | 53,063 |
| * | Palo Alto Networks Inc. | | 283,417 | 49,136 |
| * | Arista Networks Inc. | | 146,596 | 39,543 |
| Juniper Networks Inc. | 1,157,278 | 29,696 |
| * | F5 Networks Inc. | | 193,220 | 28,697 |
| * | CommScope Holding Co. | | | |
| | Inc. | | 587,844 | 22,755 |
| * | ARRIS International plc | | 550,360 | 14,034 |
| *,^ ViaSat Inc. | | 170,678 | 11,912 |
| * | Lumentum Holdings Inc. | | 191,230 | 11,665 |
| * | Ciena Corp. | | 440,219 | 10,200 |
| * | EchoStar Corp. Class A | | 148,455 | 8,613 |
| InterDigital Inc. | | 106,986 | 7,682 |
| * | NetScout Systems Inc. | | 255,200 | 6,775 |
| * | Viavi Solutions Inc. | | 701,423 | 6,748 |
| * | Finisar Corp. | | 351,215 | 6,322 |
| Plantronics Inc. | | 101,806 | 5,502 |
| * | NETGEAR Inc. | | 97,434 | 5,432 |
| *,^ Ubiquiti Networks Inc. | | 83,974 | 5,341 |
| * | Infinera Corp. | | 460,831 | 4,585 |
| * | Extreme Networks Inc. | | 327,599 | 3,738 |
| *,^ Oclaro Inc. | | 519,978 | 3,728 |
| * | CalAmp Corp. | | 108,772 | 2,545 |
| * | Mitel Networks Corp. | | 280,808 | 2,297 |
| ADTRAN Inc. | | 146,607 | 2,294 |
| *,^ Acacia Communications | | | |
| | Inc. | | 54,380 | 2,104 |
| Comtech | | | |
| | Telecommunications Corp. | 72,611 | 1,605 |
| *,^ Applied Optoelectronics Inc. | 56,671 | 1,583 |
| * | Ribbon Communications | | | |
| | Inc. | | 160,290 | 1,039 |
| * | Calix Inc. | | 137,933 | 903 |
| * | Harmonic Inc. | | 248,016 | 750 |
| * | Quantenna | | | |
| | Communications Inc. | | 42,048 | 578 |
| 1,033,756 |
| Electronic Equipment, Instruments | |
| & Components (3.8%) | | | |
| TE Connectivity Ltd. | 1,084,655 | 111,817 |
| Amphenol Corp. Class A | | 941,780 | 86,069 |
| Corning Inc. | 2,681,120 | 77,967 |
| CDW Corp. | | 472,132 | 34,433 |
| * | Flex Ltd. | 1,630,011 | 29,503 |
| * | Trimble Inc. | | 776,528 | 29,454 |
| Cognex Corp. | | 534,323 | 28,698 |
| * | IPG Photonics Corp. | | 115,824 | 28,451 |
| * | Keysight Technologies Inc. | 573,601 | 26,965 |
| * | Zebra Technologies Corp. | | 163,873 | 22,637 |
| * | Arrow Electronics Inc. | | 271,290 | 22,132 |
| | | |
| Market |
| Value• |
| | Shares | ($000) |
| FLIR Systems Inc. | 426,886 | 20,960 |
| National Instruments Corp. | 363,093 | 18,358 |
| Universal Display Corp. | 130,799 | 16,978 |
| * | Coherent Inc. | 76,723 | 16,047 |
| Avnet Inc. | 372,248 | 15,895 |
| Littelfuse Inc. | 76,459 | 15,865 |
| Jabil Inc. | 489,586 | 13,263 |
| * | Tech Data Corp. | 117,903 | 12,184 |
| Dolby Laboratories Inc. | | |
| | Class A | 182,849 | 11,803 |
| SYNNEX Corp. | 92,348 | 11,419 |
| Belden Inc. | 130,041 | 9,458 |
| * | Rogers Corp. | 56,281 | 7,728 |
| * | Itron Inc. | 107,636 | 7,534 |
| Vishay Intertechnology Inc. | 405,215 | 7,456 |
| * | Anixter International Inc. | 92,184 | 6,964 |
| * | II-VI Inc. | 173,099 | 6,664 |
| * | Plexus Corp. | 103,245 | 6,228 |
| * | Sanmina Corp. | 221,785 | 6,110 |
| * | VeriFone Systems Inc. | 344,267 | 5,715 |
| * | Novanta Inc. | 101,178 | 5,651 |
| * | Benchmark Electronics Inc. | 154,900 | 4,647 |
| * | TTM Technologies Inc. | 266,379 | 4,305 |
| Methode Electronics Inc. | 108,574 | 4,283 |
| Badger Meter Inc. | 89,329 | 4,252 |
| * | Knowles Corp. | 275,878 | 3,984 |
| * | Insight Enterprises Inc. | 110,273 | 3,852 |
| * | OSI Systems Inc. | 55,506 | 3,505 |
| * | Fabrinet | 115,065 | 3,469 |
| * | ePlus Inc. | 44,112 | 3,377 |
| * | FARO Technologies Inc. | 51,990 | 3,086 |
| * | KEMET Corp. | 156,050 | 2,806 |
| AVX Corp. | 156,662 | 2,710 |
| MTS Systems Corp. | 54,956 | 2,690 |
| *,^ Fitbit Inc. Class A | 540,778 | 2,585 |
| * | ScanSource Inc. | 78,589 | 2,574 |
| CTS Corp. | 96,999 | 2,493 |
| Systemax Inc. | 74,479 | 2,128 |
| * | Kimball Electronics Inc. | 83,721 | 1,452 |
| Mesa Laboratories Inc. | 10,707 | 1,403 |
| Daktronics Inc. | 120,725 | 1,076 |
| Park Electrochemical Corp. | 58,732 | 1,000 |
| PC Connection Inc. | 36,297 | 901 |
| 782,984 |
| Internet Software & Services (19.3%) | |
| * | Facebook Inc. Class A | 7,355,298 | 1,311,597 |
| * | Alphabet Inc. Class C | 970,175 | 1,071,781 |
| * | Alphabet Inc. Class A | 919,936 | 1,015,536 |
| * | eBay Inc. | 3,061,041 | 131,196 |
| * | Twitter Inc. | 1,947,269 | 62,040 |
| MercadoLibre Inc. | 129,373 | 50,193 |
| * | Akamai Technologies Inc. | 521,763 | 35,198 |
| * | IAC/InterActiveCorp | 234,982 | 34,991 |
| *,^ VeriSign Inc. | 273,588 | 31,742 |
| *,^ GrubHub Inc. | 254,037 | 25,254 |
| * | GoDaddy Inc. Class A | 398,851 | 23,855 |
| LogMeIn Inc. | 162,601 | 18,789 |
| | | |
| Market |
| Value• |
| | Shares | ($000) |
| * | Zillow Group Inc. | 331,027 | 15,780 |
| * | 2U Inc. | 160,844 | 13,315 |
| * | Nutanix Inc. | 331,467 | 12,082 |
| j2 Global Inc. | 148,799 | 11,014 |
| * | Yelp Inc. Class A | 244,195 | 10,637 |
| * | Stamps.com Inc. | 51,152 | 9,773 |
| * | Box Inc. | 347,604 | 8,363 |
| * | Envestnet Inc. | 136,172 | 7,503 |
| * | Zillow Group Inc. Class A | 155,867 | 7,410 |
| * | New Relic Inc. | 101,495 | 7,285 |
| *,^ Twilio Inc. Class A | 201,254 | 6,875 |
| * | Etsy Inc. | 262,363 | 6,640 |
| * | Cornerstone OnDemand Inc. | 160,576 | 6,584 |
| *,^ Match Group Inc. | 155,608 | 6,232 |
| *,^ Cars.com Inc. | 209,450 | 5,737 |
| *,^ Trade Desk Inc. Class A | 92,167 | 5,185 |
| * | GTT Communications Inc. | 100,364 | 5,179 |
| * | Q2 Holdings Inc. | 96,216 | 4,383 |
| * | Five9 Inc. | 137,247 | 4,167 |
| * | Instructure Inc. | 87,488 | 3,797 |
| * | Coupa Software Inc. | 82,911 | 3,698 |
| *,^ Pandora Media Inc. | 780,930 | 3,444 |
| * | MINDBODY Inc. Class A | 91,489 | 3,262 |
| * | SPS Commerce Inc. | 53,873 | 3,234 |
| * | Blucora Inc. | 136,923 | 3,190 |
| * | Quotient Technology Inc. | 226,909 | 2,984 |
| * | Shutterstock Inc. | 59,136 | 2,972 |
| * | Hortonworks Inc. | 152,429 | 2,741 |
| NIC Inc. | 193,345 | 2,610 |
| * | TrueCar Inc. | 231,138 | 2,563 |
| * | LivePerson Inc. | 156,352 | 2,259 |
| * | Web.com Group Inc. | 119,850 | 2,157 |
| * | Apptio Inc. Class A | 72,423 | 2,093 |
| * | Alarm.com Holdings Inc. | 50,155 | 1,812 |
| * | CommerceHub Inc. | 89,572 | 1,706 |
| *,^ Gogo Inc. | 174,946 | 1,589 |
| * | Endurance International | | |
| | Group Holdings Inc. | 199,732 | 1,458 |
| * | XO Group Inc. | 74,220 | 1,430 |
| *,^ Tucows Inc. Class A | 24,670 | 1,426 |
| * | Cision Ltd. | 113,730 | 1,369 |
| * | Appfolio Inc. | 31,718 | 1,272 |
| *,^ Yext Inc. | 96,495 | 1,226 |
| *,^ Benefitfocus Inc. | 49,268 | 1,192 |
| * | CommerceHub Inc. Class A | 41,539 | 823 |
| * | Meet Group Inc. | 214,161 | 561 |
| * | Internap Corp. | 29,174 | 380 |
| *,^ Veritone Inc. | 19,233 | 268 |
| * | DHI Group Inc. | 151,091 | 249 |
| 4,024,081 |
| IT Services (17.3%) | | |
| Visa Inc. Class A | 5,593,871 | 687,710 |
| Mastercard Inc. Class A | 2,897,147 | 509,203 |
| International Business | | |
| | Machines Corp. | 2,712,823 | 422,739 |
| Accenture plc Class A | 1,896,179 | 305,304 |
| * | PayPal Holdings Inc. | 3,521,905 | 279,674 |
74
Information Technology Index Fund
| | | |
| Market |
| Value• |
| | Shares | ($000) |
| Automatic Data | | |
| | Processing Inc. | 1,367,941 | 157,751 |
| Cognizant Technology | | |
| | Solutions Corp. Class A | 1,818,791 | 149,177 |
| Fidelity National | | |
| | Information Services Inc. | 1,029,848 | 100,081 |
| * | Fiserv Inc. | 642,872 | 92,181 |
| DXC Technology Co. | 881,714 | 90,411 |
| * | Worldpay Inc. Class A | 915,853 | 74,441 |
| Paychex Inc. | 997,543 | 64,970 |
| Global Payments Inc. | 490,746 | 55,646 |
| * | FleetCor Technologies Inc. | 276,288 | 55,238 |
| Total System Services Inc. | 510,424 | 44,892 |
| * | Square Inc. | 829,001 | 38,175 |
| Alliance Data Systems | | |
| | Corp. | 153,394 | 36,962 |
| Broadridge Financial | | |
| | Solutions Inc. | 359,363 | 36,073 |
| * | Gartner Inc. | 279,565 | 31,705 |
| Leidos Holdings Inc. | 443,199 | 28,059 |
| Western Union Co. | 1,414,890 | 28,043 |
| Jack Henry & Associates | | |
| | Inc. | 238,300 | 27,953 |
| * | First Data Corp. Class A | 1,405,392 | 21,952 |
| CSRA Inc. | 504,604 | 20,452 |
| * | Black Knight Inc. | 397,029 | 18,918 |
| * | WEX Inc. | 119,080 | 17,808 |
| * | EPAM Systems Inc. | 154,798 | 17,511 |
| Booz Allen Hamilton | | |
| | Holding Corp. Class A | 448,970 | 17,029 |
| DST Systems Inc. | 185,795 | 15,453 |
| Sabre Corp. | 634,918 | 14,584 |
| * | Teradata Corp. | 372,787 | 13,726 |
| MAXIMUS Inc. | 200,456 | 13,427 |
| * | Euronet Worldwide Inc. | 154,529 | 13,115 |
| * | CoreLogic Inc./United | | |
| | States | 253,598 | 11,539 |
| * | CACI International Inc. | | |
| | Class A | 75,929 | 11,317 |
| * | Conduent Inc. | 550,594 | 10,406 |
| Science Applications | | |
| | International Corp. | 133,176 | 9,641 |
| * | Blackhawk Network | | |
| | Holdings Inc. | 165,974 | 7,427 |
| * | Acxiom Corp. | 245,166 | 6,710 |
| Convergys Corp. | 284,954 | 6,614 |
| * | ExlService Holdings Inc. | 104,696 | 5,970 |
| Travelport Worldwide Ltd. | 386,646 | 5,510 |
| CSG Systems International | | |
| | Inc. | 103,349 | 4,824 |
| ManTech International | | |
| | Corp./VA Class A | 79,500 | 4,481 |
| * | Virtusa Corp. | 86,526 | 4,129 |
| * | Sykes Enterprises Inc. | 118,483 | 3,443 |
| * | Cardtronics plc Class A | 141,902 | 3,176 |
| EVERTEC Inc. | 190,323 | 3,083 |
| * | Syntel Inc. | 104,379 | 2,803 |
| Cass Information Systems | | |
| | Inc. | 37,769 | 2,212 |
| * | Perficient Inc. | 108,726 | 2,117 |
| * | Unisys Corp. | 158,910 | 1,780 |
| * | Net 1 UEPS Technologies | | |
| | Inc. | 172,855 | 1,772 |
| * | TTEC Holdings Inc. | 48,855 | 1,742 |
| * | Everi Holdings Inc. | 206,507 | 1,538 |
| * | Presidio Inc. | 98,120 | 1,434 |
| Hackett Group Inc. | 73,878 | 1,332 |
| * | MoneyGram International | | |
| | Inc. | 94,550 | 1,015 |
| 3,616,378 |
| | | | |
| Market |
| Value• |
| | | Shares | ($000) |
| Professional Services (0.0%) | | |
| Research & Consulting Services (0.0%) | |
| * | CoStar Group Inc. | | 690 | 236 |
| 236 |
| Semiconductors & Semiconductor | |
| Equipment (16.3%) | | | |
| Intel Corp. | 14,435,142 | 711,508 |
| NVIDIA Corp. | | 1,869,006 | 452,299 |
| Texas Instruments Inc. | 3,039,792 | 329,361 |
| Broadcom Ltd. | | 1,258,298 | 310,120 |
| QUALCOMM Inc. | | 4,546,783 | 295,541 |
| Applied Materials Inc. | 3,289,270 | 189,429 |
| * | Micron Technology Inc. | 3,555,164 | 173,528 |
| Analog Devices Inc. | | 1,136,792 | 102,482 |
| Lam Research Corp. | 499,469 | 95,828 |
| Microchip Technology Inc. | 721,267 | 64,142 |
| Skyworks Solutions Inc. | 566,598 | 61,901 |
| Xilinx Inc. | | 773,834 | 55,136 |
| KLA-Tencor Corp. | | 483,248 | 54,757 |
| Maxim Integrated | | | |
| | Products Inc. | | 868,044 | 52,899 |
| * | Qorvo Inc. | | 392,062 | 31,643 |
| * | ON Semiconductor Corp. | 1,307,268 | 31,270 |
| *,^ Advanced Micro Devices | | |
| | Inc. | | 2,529,930 | 30,637 |
| Marvell Technology | | | |
| | Group Ltd. | | 1,212,279 | 28,476 |
| Teradyne Inc. | | 605,399 | 27,485 |
| * | Microsemi Corp. | | 362,187 | 23,506 |
| * | Cavium Inc. | | 213,234 | 18,986 |
| MKS Instruments Inc. | 167,497 | 18,651 |
| Cypress Semiconductor | | |
| | Corp. | | 1,027,799 | 17,956 |
| * | First Solar Inc. | | 241,740 | 15,193 |
| Entegris Inc. | | 437,917 | 14,539 |
| Monolithic Power | | | |
| | Systems Inc. | | 121,562 | 14,230 |
| Versum Materials Inc. | 336,326 | 12,451 |
| * | Integrated Device | | | |
| | Technology Inc. | | 409,498 | 12,424 |
| * | Silicon Laboratories Inc. | 131,409 | 12,287 |
| * | Cree Inc. | | 302,686 | 11,451 |
| * | Mellanox Technologies Ltd. | 141,887 | 9,762 |
| * | Cirrus Logic Inc. | | 197,575 | 8,755 |
| * | Advanced Energy Industries | | |
| | Inc. | | 123,043 | 8,160 |
| Cabot Microelectronics | | |
| | Corp. | | 77,975 | 7,946 |
| * | Semtech Corp. | | 203,932 | 6,862 |
| Power Integrations Inc. | 91,608 | 6,156 |
| Brooks Automation Inc. | 216,936 | 5,794 |
| * | Kulicke & Soffa Industries | | |
| | Inc. | | 217,368 | 5,065 |
| * | Ambarella Inc. | | 103,469 | 4,975 |
| * | Synaptics Inc. | | 104,343 | 4,849 |
| * | MaxLinear Inc. | | 207,115 | 4,708 |
| * | SolarEdge Technologies Inc. 86,666 | 4,338 |
| * | Rambus Inc. | | 339,194 | 4,311 |
| * | Diodes Inc. | | 121,105 | 3,645 |
| Xperi Corp. | | 152,645 | 3,366 |
| * | Amkor Technology Inc. | 330,689 | 3,323 |
| *,^ Inphi Corp. | | 117,262 | 3,254 |
| * | FormFactor Inc. | | 223,821 | 2,932 |
| *,^ MACOM Technology | | |
| | Solutions Holdings Inc. | 128,571 | 2,744 |
| * | Veeco Instruments Inc. | 150,437 | 2,730 |
| * | CEVA Inc. | | 67,602 | 2,484 |
| * | Rudolph Technologies Inc. | 91,803 | 2,437 |
| * | Axcelis Technologies Inc. | 96,025 | 2,348 |
| * | Ultra Clean Holdings Inc. | 118,201 | 2,277 |
| | | |
| Market |
| Value• |
| | Shares | ($000) |
| * | Lattice Semiconductor | | |
| | Corp. | 358,134 | 2,152 |
| * | Nanometrics Inc. | 75,565 | 1,994 |
| * | Xcerra Corp. | 171,643 | 1,716 |
| * | Photronics Inc. | 217,089 | 1,693 |
| *,^ Ichor Holdings Ltd. | 63,738 | 1,647 |
| *,^ SunPower Corp. Class A | 195,484 | 1,386 |
| * | SMART Global Holdings | | |
| | Inc. | 30,104 | 1,045 |
| * | PDF Solutions Inc. | 84,602 | 943 |
| * | Alpha & Omega | | |
| | Semiconductor Ltd. | 57,678 | 887 |
| *,^ Impinj Inc. | 52,803 | 673 |
| *,^ NeoPhotonics Corp. | 108,664 | 660 |
| 3,398,133 |
| Software (22.7%) | | |
| Microsoft Corp. | 22,604,854 | 2,119,657 |
| Oracle Corp. | 9,653,851 | 489,161 |
| * | Adobe Systems Inc. | 1,520,460 | 317,974 |
| * | salesforce.com Inc. | 2,116,368 | 246,028 |
| Activision Blizzard Inc. | 2,215,463 | 162,017 |
| Intuit Inc. | 749,102 | 124,995 |
| * | Electronic Arts Inc. | 949,757 | 117,485 |
| * | ServiceNow Inc. | 532,620 | 85,757 |
| * | Red Hat Inc. | 545,800 | 80,451 |
| * | Autodesk Inc. | 608,443 | 71,474 |
| * | Workday Inc. Class A | 422,475 | 53,515 |
| Symantec Corp. | 1,911,949 | 50,265 |
| * | Dell Technologies Inc. | | |
| | Class V | 626,540 | 46,546 |
| * | Citrix Systems Inc. | 464,690 | 42,751 |
| * | ANSYS Inc. | 261,823 | 41,876 |
| * | Splunk Inc. | 431,713 | 40,236 |
| * | Take-Two Interactive | | |
| | Software Inc. | 351,635 | 39,337 |
| * | Synopsys Inc. | 463,568 | 39,250 |
| CA Inc. | 968,181 | 33,983 |
| * | Cadence Design Systems | | |
| | Inc. | 870,963 | 33,767 |
| *,^ VMware Inc. Class A | 218,569 | 28,796 |
| SS&C Technologies | | |
| | Holdings Inc. | 539,844 | 26,733 |
| * | PTC Inc. | 358,144 | 26,417 |
| CDK Global Inc. | 381,764 | 26,220 |
| * | Fortinet Inc. | 455,316 | 22,980 |
| * | Tyler Technologies Inc. | 110,235 | 22,390 |
| * | Ultimate Software Group | | |
| | Inc. | 87,562 | 20,880 |
| * | Guidewire Software Inc. | 232,076 | 18,640 |
| * | Aspen Technology Inc. | 223,369 | 17,262 |
| *,^ Snap Inc. | 933,597 | 16,170 |
| * | Tableau Software Inc. | | |
| | Class A | 197,751 | 16,150 |
| Fair Isaac Corp. | 92,490 | 15,718 |
| Blackbaud Inc. | 148,161 | 15,189 |
| * | Proofpoint Inc. | 138,352 | 14,827 |
| * | Nuance Communications | | |
| | Inc. | 895,440 | 14,381 |
| *,^ Paycom Software Inc. | 143,590 | 14,204 |
| * | Zendesk Inc. | 313,893 | 13,554 |
| * | HubSpot Inc. | 104,117 | 11,562 |
| * | RingCentral Inc. Class A | 180,008 | 11,277 |
| * | Ellie Mae Inc. | 106,617 | 9,454 |
| * | RealPage Inc. | 179,358 | 9,371 |
| * | Manhattan Associates Inc. | 213,566 | 8,991 |
| * | ACI Worldwide Inc. | 364,505 | 8,621 |
| * | FireEye Inc. | 514,566 | 8,537 |
| * | Zynga Inc. Class A | 2,413,506 | 8,351 |
| * | Verint Systems Inc. | 197,944 | 7,700 |
| * | Callidus Software Inc. | 210,054 | 7,541 |
75
Information Technology Index Fund
| | | | |
| Market |
| Value• |
| | | Shares | ($000) |
| * | Qualys Inc. | | 99,077 | 7,337 |
| * | CommVault Systems Inc. | 135,916 | 7,074 |
| Pegasystems Inc. | | 120,528 | 6,991 |
| Progress Software Corp. | 133,659 | 6,265 |
| TiVo Corp. | | 375,714 | 5,636 |
| Ebix Inc. | | 63,194 | 5,305 |
| * | 8x8 Inc. | | 282,949 | 5,164 |
| * | Bottomline Technologies | | |
| | de Inc. | | 125,133 | 4,753 |
| * | Paylocity Holding Corp. | 89,060 | 4,165 |
| * | Imperva Inc. | | 88,619 | 4,134 |
| * | MicroStrategy Inc. Class A | 29,328 | 3,753 |
| * | Blackline Inc. | | 72,604 | 3,195 |
| Monotype Imaging | | | |
| | Holdings Inc. | | 128,072 | 3,086 |
| * | Varonis Systems Inc. | 47,352 | 2,659 |
| * | PROS Holdings Inc. | | 84,239 | 2,641 |
| * | Rapid7 Inc. | | 90,956 | 2,402 |
| * | Everbridge Inc. | | 69,250 | 2,210 |
| * | Workiva Inc. | | 73,246 | 1,666 |
| QAD Inc. Class A | | 31,918 | 1,436 |
| * | Synchronoss Technologies | | |
| | Inc. | | 140,749 | 1,315 |
| * | Glu Mobile Inc. | | 331,924 | 1,231 |
| * | VASCO Data Security | | |
| | International Inc. | | 91,474 | 1,102 |
| * | A10 Networks Inc. | | 152,949 | 960 |
| * | Upland Software Inc. | 31,516 | 752 |
| * | MobileIron Inc. | | 127,784 | 613 |
| * | Rubicon Project Inc. | | 133,943 | 216 |
| 4,744,502 |
| Technology Hardware, Storage | |
| & Peripherals (15.6%) | | | |
| Apple Inc. | 15,836,763 | 2,820,844 |
| HP Inc. | | 5,151,950 | 120,504 |
| Hewlett Packard | | | |
| | Enterprise Co. | | 4,920,092 | 91,464 |
| Western Digital Corp. | 912,271 | 79,404 |
| NetApp Inc. | | 822,949 | 49,830 |
| Seagate Technology plc | 892,306 | 47,649 |
| Xerox Corp. | | 667,150 | 20,228 |
| | | |
| Market |
| Value• |
| | Shares | ($000) |
| * | NCR Corp. | 374,926 | 12,373 |
| * | Pure Storage Inc. Class A | 254,120 | 5,507 |
| * | Electronics For Imaging Inc. | 140,740 | 3,855 |
| ^ | Diebold Nixdorf Inc. | 210,541 | 3,305 |
| *,^ 3D Systems Corp. | 333,229 | 3,166 |
| * | Cray Inc. | 125,675 | 2,740 |
| * | Super Micro Computer Inc. | 120,063 | 2,173 |
| *,^ Eastman Kodak Co. | 74,091 | 389 |
| 3,263,431 |
| Total Common Stocks | | |
| (Cost $13,646,146) 20,863,574 |
| Temporary Cash Investment (0.3%) | |
| Money Market Fund (0.3%) | | |
| 1,2 Vanguard Market Liquidity | | |
| | Fund, 1.601% | | |
| | (Cost $67,024) | 670,256 | 67,019 |
| Total Investments (100.3%) | | |
| (Cost $13,713,170) 20,930,593 |
| | | |
| Amount |
| ($000) |
| Other Assets and Liabilities (-0.3%) | |
| Other Assets | | |
| Investment in Vanguard | 1,062 |
| Receivables for Investment Securities Sold 57,204 |
| Receivables for Accrued Income | 25,264 |
| Receivables for Capital Shares Issued | 5,384 |
| Other Assets2 | 4,368 |
| Total Other Assets | 93,282 |
| Liabilities | | |
| Payables for Investment | | |
| | Securities Purchased | (87,037) |
| Collateral for Securities on Loan | (69,042) |
| Payables for Capital Shares Redeemed | (6,405) |
| Payables to Vanguard | (3,689) |
| Total Liabilities | (166,173) |
| Net Assets (100%) | | 20,857,702 |
| |
| At February 28, 2018, net assets consisted of: |
| Amount |
| ($000) |
| Paid-in Capital 13,709,522 |
| Undistributed Net Investment Income | 39,421 |
| Accumulated Net Realized Losses | (108,664) |
| Unrealized Appreciation (Depreciation) | 7,217,423 |
| Net Assets 20,857,702 |
| |
| ETF Shares—Net Assets | |
| Applicable to 109,329,670 outstanding | |
| $.001 par value shares of beneficial | |
| interest (unlimited authorization) | 19,383,812 |
| Net Asset Value Per Share— | |
| ETF Shares $177.30 |
| |
| Admiral Shares—Net Assets | |
| Applicable to 16,234,246 outstanding | |
| $.001 par value shares of beneficial | |
| interest (unlimited authorization) | 1,473,890 |
| Net Asset Value Per Share— | |
| Admiral Shares $90.79 |
• See Note A in Notes to Financial Statements.
* Non-income-producing security.
^ Includes partial security positions on loan to broker-dealers.
The total value of securities on loan is $67,220,000.
1 Affiliated money market fund available only to Vanguard funds
and certain trusts and accounts managed by Vanguard. Rate
shown is the 7-day yield.
2 Includes $69,042,000 of collateral received for securities on loan,
of which $64,675,000 is held in Vanguard Market Liquidity Fund
and $4,367,000 is held in cash.
See accompanying Notes, which are an integral part of the Financial Statements.
76
Information Technology Index Fund
Statement of Operations
| | | |
| Six Months Ended |
| February 28, 2018 |
| | ($000) |
| Investment Income | | |
| Income | | |
| Dividends 103,875 |
| Interest1 | 36 |
| Securities Lending—Net | 1,253 |
| Total Income | 105,164 |
| Expenses | | |
| The Vanguard Group—Note B | | |
| Investment Advisory Services | 1,378 |
| Management and Administrative— | |
| ETF Shares | 5,872 |
| Management and Administrative— | |
| Admiral Shares | 426 |
| Marketing and Distribution— | | |
| ETF Shares | 383 |
| Marketing and Distribution— | | |
| Admiral Shares | 44 |
| Custodian Fees | 101 |
| Shareholders’ Reports and Proxy— | |
| ETF Shares | 653 |
| Shareholders’ Reports and Proxy— | |
| Admiral Shares | 14 |
| Trustees’ Fees and Expenses | 5 |
| Total Expenses | 8,876 |
| Net Investment Income | 96,288 |
| Realized Net Gain (Loss) | | |
| Investment Securities Sold1 444,944 |
| Futures Contracts | (133) |
| Realized Net Gain (Loss) | 444,811 |
| Change in Unrealized Appreciation | |
| (Depreciation) of Investment Securities1 2,396,485 |
| Net Increase (Decrease) in Net Assets | |
| Resulting from Operations | | 2,937,584 |
1 Interest income, realized net gain (loss), and change in unrealized
appreciation (depreciation) from an affiliated company of the
fund were $36,000, ($5,000), and ($11,000), respectively. Purchases
and sales are for temporary cash investment purposes.
| | | | |
| Statement of Changes in Net Assets | | | |
| |
| Six Months Ended | Year Ended |
| | February 28, | August 31, |
| | 2018 | 2017 |
| ($000) | ($000) |
| Increase (Decrease) in Net Assets | | | |
| Operations | | | |
| Net Investment Income | | 96,288 | 153,008 |
| Realized Net Gain (Loss) | | 444,811 | 568,141 |
| Change in Unrealized Appreciation (Depreciation) | | 2,396,485 | 2,547,823 |
| Net Increase (Decrease) in Net Assets Resulting from Operations | | 2,937,584 | 3,268,972 |
| Distributions | | | |
| Net Investment Income | | | |
| ETF Shares | | (86,522) | (139,774) |
| Admiral Shares | | (5,816) | (7,749) |
| Realized Capital Gain | | | |
| ETF Shares | | — | — |
| Admiral Shares | | — | — |
| Return of Capital | | | |
| Total Distributions | | (92,338) | (147,523) |
| Capital Share Transactions | | | |
| ETF Shares | | 2,085,346 | 2,257,412 |
| Admiral Shares | | 356,283 | 307,238 |
| Net Increase (Decrease) from Capital Share Transactions | | 2,441,629 | 2,564,650 |
| Total Increase (Decrease) | | 5,286,875 | 5,686,099 |
| Net Assets |
| Beginning of Period | | 15,570,827 | 9,884,728 |
| End of Period1 | | 20,857,702 | 15,570,827 |
| 1 Net Assets—End of Period includes undistributed (overdistributed) net investment income of $39,421,000 and $35,471,000. | |
See accompanying Notes, which are an integral part of the Financial Statements.
77
| | | | | | | |
| Information Technology Index Fund | | | | | | |
| |
| |
| Financial Highlights | | | | | |
| |
| ETF Shares | | | | | | | |
| Six Months | | | | | |
| | Ended | | | | | |
| For a Share Outstanding | February 28, | | | Year Ended August 31, |
| Throughout Each Period | 2018 | 2017 | 2016 | 2015 | 2014 | 2013 |
| Net Asset Value, Beginning of Period | $151.19 | $117.82 | $102.35 | $101.41 | $77.63 | $72.58 |
| Investment Operations | | |
| Net Investment Income | | . 8821 | 1.6461 | 1.566 | 1.277 | 1.135 | 1.011 |
| Net Realized and Unrealized Gain (Loss) | | | | | | |
| on Investments | | 26.084 | 33.329 | 16.049 | .834 | 23.589 | 4.872 |
| Total from Investment Operations | | 26.966 | 34.975 | 17.615 | 2.111 | 24.724 | 5.883 |
| Distributions | | |
| Dividends from Net Investment Income | (.856) | (1.605) | (2.145) | (1.171) | (.944) | (.833) |
| Distributions from Realized Capital Gains | — | — | — | — | — | — |
| Total Distributions | | (.856) | (1.605) | (2.145) | (1.171) | (.944) | (.833) |
| Net Asset Value, End of Period | | $177.30 | $151.19 | $117.82 | $102.35 | $101.41 | $77.63 |
| Total Return | | 17.91% | 29.93% | 17.48% | 2.05% | 32.04% | 8.23% |
| Ratios/Supplemental Data | | |
| Net Assets, End of Period (Millions) | | $19,384 | $14,638 | $9,429 | $7,259 | $5,876 | $3,497 |
| Ratio of Total Expenses to | | | | | | | |
| Average Net Assets | | 0.10% | 0.10% | 0.10% | 0.10% | 0.12% | 0.14% |
| Ratio of Net Investment Income to | | | | | | | |
| Average Net Assets | | 1.07% | 1.24% | 1.50% | 1.35% | 1.38% | 1.53% |
| Portfolio Turnover Rate2 | | 3% | 6% | 5% | 3% | 6% | 6% |
The expense ratio, net investment income ratio, and turnover rate for the current period have been annualized.
1 Calculated based on average shares outstanding.
2 Excludes the value of portfolio securities received or delivered as a result of in-kind purchases or redemptions of the fund’s capital shares,
including ETF Creation Units.
See accompanying Notes, which are an integral part of the Financial Statements.
78
| | | | | | | |
| Information Technology Index Fund | | | | | | |
| |
| |
| Financial Highlights | | | | | |
| |
| Admiral Shares | | | | | | | |
| Six Months | | | | | |
| | Ended | | | | | |
| For a Share Outstanding | February 28, | | | Year Ended August 31, |
| Throughout Each Period | 2018 | 2017 | 2016 | 2015 | 2014 | 2013 |
| Net Asset Value, Beginning of Period | $77.42 | $60.33 | $52.41 | $51.93 | $39.75 | $37.17 |
| Investment Operations | | |
| Net Investment Income | | . 4601 | .8501 | .802 | .655 | .580 | .521 |
| Net Realized and Unrealized Gain (Loss) | | | | | | |
| on Investments | | 13.350 | 17.062 | 8.216 | .426 | 12.079 | 2.493 |
| Total from Investment Operations | | 13.810 | 17.912 | 9.018 | 1.081 | 12.659 | 3.014 |
| Distributions | | |
| Dividends from Net Investment Income | (.440) | (.822) | (1.098) | (.601) | (.479) | (.434) |
| Distributions from Realized Capital Gains | — | — | — | — | — | — |
| Total Distributions | | (.440) | (.822) | (1.098) | (.601) | (.479) | (.434) |
| Net Asset Value, End of Period | | $90.79 | $77.42 | $60.33 | $52.41 | $51.93 | $39.75 |
| Total Return2 | | 17.91% | 29.94% | 17.49% | 2.09% | 32.05% | 8.24% |
| Ratios/Supplemental Data | | |
| Net Assets, End of Period (Millions) | | $1,474 | $933 | $456 | $342 | $241 | $152 |
| Ratio of Total Expenses to | | | | | | | |
| Average Net Assets | | 0.10% | 0.10% | 0.10% | 0.10% | 0.12% | 0.14% |
| Ratio of Net Investment Income to | | | | | | | |
| Average Net Assets | | 1.07% | 1.24% | 1.50% | 1.35% | 1.38% | 1.53% |
| Portfolio Turnover Rate3 | | 3% | 6% | 5% | 3% | 6% | 6% |
The expense ratio, net investment income ratio, and turnover rate for the current period have been annualized.
1 Calculated based on average shares outstanding.
2 Total returns do not include account service fees that may have applied in the periods shown. Fund prospectuses provide information about
any applicable account service fees.
3 Excludes the value of portfolio securities received or delivered as a result of in-kind purchases or redemptions of the fund’s capital shares,
including ETF Creation Units.
See accompanying Notes, which are an integral part of the Financial Statements.
79
Information Technology Index Fund
Notes to Financial Statements
Vanguard Information Technology Index Fund is registered under the Investment Company Act of 1940 as an open-end investment company, or mutual fund. The fund offers two classes of shares: ETF Shares and Admiral Shares. ETF Shares are listed for trading on NYSE Arca; they can be purchased and sold through a broker. Admiral Shares are designed for investors who meet certain administrative, service, and account-size criteria.
A. The following significant accounting policies conform to generally accepted accounting principles for U.S. investment companies. The fund consistently follows such policies in preparing its financial statements.
1. Security Valuation: Securities are valued as of the close of trading on the New York Stock Exchange (generally 4 p.m., Eastern time) on the valuation date. Equity securities are valued at the latest quoted sales prices or official closing prices taken from the primary market in which each security trades; such securities not traded on the valuation date are valued at the mean of the latest quoted bid and asked prices. Securities for which market quotations are not readily available, or whose values have been materially affected by events occurring before the fund’s pricing time but after the close of the securities’ primary markets, are valued by methods deemed by the board of trustees to represent fair value. Investments in Vanguard Market Liquidity Fund are valued at that fund’s net asset value.
2. Futures Contracts: The fund uses index futures contracts to a limited extent, with the objectives of maintaining full exposure to the stock market, maintaining liquidity, and minimizing transaction costs. The fund may purchase futures contracts to immediately invest incoming cash in the market, or sell futures in response to cash outflows, thereby simulating a fully invested position in the underlying index while maintaining a cash balance for liquidity. The primary risks associated with the use of futures contracts are imperfect correlation between changes in market values of stocks held by the fund and the prices of futures contracts, and the possibility of an illiquid market. Counterparty risk involving futures is mitigated because a regulated clearinghouse is the counterparty instead of the clearing broker. To further mitigate counterparty risk, the fund trades futures contracts on an exchange, monitors the financial strength of its clearing brokers and clearinghouse, and has entered into clearing agreements with its clearing brokers. The clearinghouse imposes initial margin requirements to secure the fund’s performance and requires daily settlement of variation margin representing changes in the market value of each contract.
Futures contracts are valued at their quoted daily settlement prices. The notional amounts of the contracts are not recorded in the Statement of Net Assets. Fluctuations in the value of the contracts are recorded in the Statement of Net Assets as an asset (liability) and in the Statement of Operations as unrealized appreciation (depreciation) until the contracts are closed, when they are recorded as realized futures gains (losses).
During the six months ended February 28, 2018, the fund’s average investments in long and short futures contracts represented less than 1% and 0% of net assets, respectively, based on the average of the notional amounts at each quarter-end during the period. The fund had no open futures contracts at February 28, 2018.
3. Federal Income Taxes: The fund intends to continue to qualify as a regulated investment company and distribute all of its taxable income. Management has analyzed the fund’s tax positions taken for all open federal income tax years (August 31, 2014–2017), and for the period ended February 28, 2018, and has concluded that no provision for federal income tax is required in the fund’s financial statements. 4. Distributions: Distributions to shareholders are recorded on the ex-dividend date.
5. Securities Lending: To earn additional income, the fund lends its securities to qualified institutional borrowers. Security loans are subject to termination by the fund at any time, and are required to be secured at all times by collateral in an amount at least equal to the market value of securities loaned. Daily market fluctuations could cause the value of loaned securities to be more or less than the value of the collateral received. When this occurs, the collateral is adjusted and settled on the next business day. The fund further mitigates its counterparty risk by entering into securities lending transactions only with a diverse group of prequalified counterparties, monitoring their financial strength, and entering into master securities lending agreements with its counterparties. The master securities lending agreements provide that, in the event of a counterparty’s default (including bankruptcy), the fund may terminate any loans with that borrower, determine the net amount owed, and sell or retain the collateral up to the net amount owed to the fund; however, such actions may be subject to legal proceedings. While collateral mitigates counterparty risk, in the event of a default, the fund may
80
Information Technology Index Fund
experience delays and costs in recovering the securities loaned. The fund invests cash collateral received in Vanguard Market Liquidity Fund, and records a liability in the Statement of Net Assets for the return of the collateral, during the period the securities are on loan. Securities lending income represents fees charged to borrowers plus income earned on invested cash collateral, less expenses associated with the loan. During the term of the loan, the fund is entitled to all distributions made on or in respect of the loaned securities.
6. Credit Facility: The fund and certain other funds managed by The Vanguard Group (“Vanguard”) participate in a $3.1 billion committed credit facility provided by a syndicate of lenders pursuant to a credit agreement that may be renewed annually; each fund is individually liable for its borrowings, if any, under the credit facility. Borrowings may be utilized for temporary and emergency purposes, and are subject to the fund’s regulatory and contractual borrowing restrictions. The participating funds are charged administrative fees and an annual commitment fee of 0.10% of the undrawn amount of the facility; these fees are allocated to the funds based on a method approved by the fund’s board of trustees and included in Management and Administrative expenses on the fund’s Statement of Operations. Any borrowings under this facility bear interest at a rate based upon the higher of the one-month London Interbank Offered Rate, federal funds effective rate, or overnight bank funding rate plus an agreed-upon spread.
The fund had no borrowings outstanding at February 28, 2018, or at any time during the period then ended.
7. Other: Dividend income is recorded on the ex-dividend date. Interest income includes income distributions received from Vanguard Market Liquidity Fund and is accrued daily. Premiums and discounts on debt securities purchased are amortized and accreted, respectively, to interest income over the lives of the respective securities. Security transactions are accounted for on the date securities are bought or sold. Costs used to determine realized gains (losses) on the sale of investment securities are those of the specific securities sold.
Each class of shares has equal rights as to assets and earnings, except that each class separately bears certain class-specific expenses related to maintenance of shareholder accounts (included in Management and Administrative expenses), shareholder reporting, and the proxy. Marketing and distribution expenses are allocated to each class of shares based on a method approved by the board of trustees. Income, other non-class-specific expenses, and gains and losses on investments are allocated to each class of shares based on its relative net assets.
B. In accordance with the terms of a Funds’ Service Agreement (the “FSA”) between Vanguard and the fund, Vanguard furnishes to the fund investment advisory, corporate management, administrative, marketing, and distribution services at Vanguard’s cost of operations (as defined by the FSA). These costs of operations are allocated to the fund based on methods and guidelines approved by the board of trustees. Vanguard does not require reimbursement in the current period for certain costs of operations (such as deferred compensation/benefits and risk/insurance costs); the fund’s liability for these costs of operations is included in Payables to Vanguard on the Statement of Net Assets. All other costs of operations payable to Vanguard are generally settled twice a month.
Upon the request of Vanguard, the fund may invest up to 0.40% of its net assets as capital in Vanguard. At February 28, 2018, the fund had contributed to Vanguard capital in the amount of $1,062,000, representing 0.01% of the fund’s net assets and 0.42% of Vanguard’s capitalization. The fund’s trustees and officers are also directors and employees, respectively, of Vanguard.
C. Various inputs may be used to determine the value of the fund’s investments. These inputs are summarized in three broad levels for financial statement purposes. The inputs or methodologies used to value securities are not necessarily an indication of the risk associated with investing in those securities.
Level 1—Quoted prices in active markets for identical securities.
Level 2—Other significant observable inputs (including quoted prices for similar securities, interest
rates, prepayment speeds, credit risk, etc.).
Level 3—Significant unobservable inputs (including the fund’s own assumptions used to determine
the fair value of investments). Any investments valued with significant unobservable inputs are noted
on the Statement of Net Assets.
At February 28, 2018, 100% of the market value of the fund’s investments was determined based on Level 1 inputs.
81
Information Technology Index Fund
D. Distributions are determined on a tax basis and may differ from net investment income and realized capital gains for financial reporting purposes. Differences may be permanent or temporary. Permanent differences are reclassified among capital accounts in the financial statements to reflect their tax character. Temporary differences arise when certain items of income, expense, gain, or loss are recognized in different periods for financial statement and tax purposes. These differences will reverse at some time in the future. Differences in classification may also result from the treatment of short-term gains as ordinary income for tax purposes.
During the six months ended February 28, 2018, the fund realized $435,008,000 of net capital gains resulting from in-kind redemptions—in which shareholders exchanged fund shares for securities held by the fund rather than for cash. Because such gains are not taxable to the fund, and are not distributed to shareholders, they have been reclassified from accumulated net realized losses to paid-in capital.
The fund’s tax-basis capital gains and losses are determined only at the end of each fiscal year. For tax purposes, at August 31, 2017, the fund had available capital losses totaling $118,467,000 to offset future net capital gains. Of this amount, $40,376,000 is subject to expiration dates; $20,048,000 may be used to offset future net capital gains through August 31, 2018, and $20,328,000 through August 31, 2019. Capital losses of $78,091,000 realized beginning in fiscal 2012 may be carried forward indefinitely under the Regulated Investment Company Modernization Act of 2010, but must be used before any expiring loss carryforwards. The fund will use these capital losses to offset net taxable capital gains, if any, realized during the year ending August 31, 2018; should the fund realize net capital losses for the year, the losses will be added to the loss carryforward balance above.
At February 28, 2018, the cost of investment securities for tax purposes was $13,713,170,000. Net unrealized appreciation of investment securities for tax purposes was $7,217,423,000, consisting of unrealized gains of $7,311,229,000 on securities that had risen in value since their purchase and $93,806,000 in unrealized losses on securities that had fallen in value since their purchase.
E. During the six months ended February 28, 2018, the fund purchased $3,424,089,000 of investment securities and sold $973,311,000 of investment securities, other than temporary cash investments. Purchases and sales include $2,487,325,000 and $744,411,000, respectively, in connection with in-kind purchases and redemptions of the fund’s capital shares.
| | | | |
| F. Capital share transactions for each class of shares were: | | | |
| Six Months Ended | | Year Ended |
| February 28, 2018 | August 31, 2017 |
| Amount | Shares | Amount | Shares |
| ($000) | (000) | ($000) | (000) |
| ETF Shares | | | | |
| Issued | 2,841,840 | 17,113 | 3,439,668 | 25,884 |
| Issued in Lieu of Cash Distributions | — | — | — | — |
| Redeemed | (756,494) | (4,600) | (1,182,256) | (9,100) |
| Net Increase (Decrease)—ETF Shares | 2,085,346 | 12,513 | 2,257,412 | 16,784 |
| Admiral Shares | | | | |
| Issued | 547,189 | 6,437 | 580,247 | 8,420 |
| Issued in Lieu of Cash Distributions | 5,268 | 66 | 7,094 | 107 |
| Redeemed | (196,174) | (2,320) | (280,103) | (4,026) |
| Net Increase (Decrease)—Admiral Shares | 356,283 | 4,183 | 307,238 | 4,501 |
At February 28, 2018, one shareholder was the record or beneficial owner of 32% of the fund’s net assets. If the shareholder were to redeem its investment in the fund, the redemption might result in an increase in the fund’s expense ratio.
G. Management has determined that no material events or transactions occurred subsequent to February 28, 2018, that would require recognition or disclosure in these financial statements.
82
Materials Index Fund
Fund Profile
As of February 28, 2018
| | | |
| Share-Class Characteristics | | |
| | ETF | Admiral |
| Shares | Shares |
| Ticker Symbol | | VAW | VMIAX |
| Expense Ratio1 | 0.10% | 0.10% |
| 30-Day SEC Yield | 1.66% | 1.66% |
| |
| |
| Portfolio Characteristics | | |
| MSCI | |
| US IMI/ | MSCI |
| Materials | US IMI/ |
| Fund | 25/50 | 2500 |
| Number of Stocks | 119 | 119 | 2,469 |
| Median Market Cap $24.6B | $24.6B | $68.2B |
| Price/Earnings Ratio | 21.5x | 21.5x | 21.9x |
| Price/Book Ratio | 2.9x | 2.9x | 3.1x |
| Return on Equity | 17.2% | 17.2% | 15.0% |
| Earnings Growth Rate | 7.7% | 7.7% | 8.5% |
| Dividend Yield | 1.7% | 1.7% | 1.8% |
| Foreign Holdings | 0.0% | 0.0% | 0.0% |
| Turnover Rate | | | |
| (Annualized) | 2% | — | — |
| Short-Term Reserves | 0.0% | — | — |
| |
| |
| Volatility Measures | | | |
| MSCI US | |
| IMI/Materials | MSCI US |
| | 25/50 | IMI/2500 |
| R-Squared | | 1.00 | 0.71 |
| Beta | | 1.00 | 1.34 |
These measures show the degree and timing of the fund’s
fluctuations compared with the indexes over 36 months.
| |
| Subindustry Diversification | |
| (% of equity exposure) | |
| Aluminum | 1.2% |
| Commodity Chemicals | 6.9 |
| Construction Materials | 4.1 |
| Copper | 2.8 |
| Diversified Chemicals | 21.0 |
| Diversified Metals & Mining | 0.3 |
| Fertilizers & Agricultural Chemicals | 9.5 |
| Forest Products | 0.6 |
| Gold | 2.8 |
| Industrial Gases | 8.4 |
| Metal & Glass Containers | 4.3 |
| Paper Packaging | 8.9 |
| Paper Products | 1.2 |
| Silver | 0.3 |
| Specialty Chemicals | 20.8 |
| Steel | 6.9 |
Sector categories are based on the Global Industry
Classification Standard (“GICS”), except for the “Other”
category (if applicable), which includes securities that have
not been provided a GICS classification as of the effective
reporting period.
| | |
| Ten Largest Holdings (% of total net assets) |
| DowDuPont Inc. | Diversified Chemicals | 17.7% |
| Monsanto Co. | Fertilizers & | |
| Aricultural Chemicals | 5.8 |
| Praxair Inc. | Industrial Gases | 4.6 |
| LyondellBasell | | |
| Industries NV | Commodity Chemicals | 3.9 |
| Air Products & | | |
| Chemicals Inc. | Industrial Gases | 3.8 |
| Ecolab Inc. | Specialty Chemicals | 3.7 |
| Sherwin-Williams | | |
| Co. | Specialty Chemicals | 3.6 |
| PPG Industries Inc. | Specialty Chemicals | 3.1 |
| Freeport-McMoRan | | |
| Inc. | Copper | 2.8 |
| International Paper | | |
| Co. | Paper Packaging | 2.5 |
| Top Ten | 51.5% |
The holdings listed exclude any temporary cash investments and
equity index products.
1 The expense ratios shown are from the prospectus dated December 21, 2017, and represent estimated costs for the current fiscal year. For the six months ended February 28, 2018, the annualized expense ratios
were 0.10% for ETF Shares and 0.10% for Admiral Shares.
83
Materials Index Fund
Performance Summary
All of the returns in this report represent past performance, which is not a guarantee of future results that may be achieved by the fund. (Current performance may be lower or higher than the performance data cited. For performance data current to the most recent month-end, visit our website at vanguard.com/performance.) Note, too, that both investment returns and principal value can fluctuate widely, so an investor’s shares, when sold, could be worth more or less than their original cost. The returns shown do not reflect taxes that a shareholder would pay on fund distributions or on the sale of fund shares.
Fiscal-Year Total Returns (%): August 31, 2007–February 28, 2018
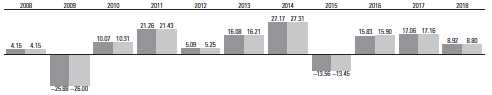
| |
| Materials Index Fund ETF Shares Net Asset Value |
| Spliced US IMI/Materials 25/50 |
| For a benchmark description, see the Glossary. |
| Note: For 2018, performance data reflect the six months ended February 28, 2018. |
Average Annual Total Returns: Periods Ended December 31, 2017
This table presents returns through the latest calendar quarter—rather than through the end of the fiscal period.
Securities and Exchange Commission rules require that we provide this information.
| | | | |
| Inception Date | One Year | Five Years | Ten Years |
| ETF Shares | 1/26/2004 | | | |
| Market Price | | 23.71% | 12.30% | 6.71% |
| Net Asset Value | | 23.66 | 12.29 | 6.69 |
| Admiral Shares | 2/11/2004 | 23.68 | 12.30 | 6.68 |
See Financial Highlights for dividend and capital gains information.
84
Materials Index Fund
Financial Statements (unaudited)
Statement of Net Assets
As of February 28, 2018
The fund reports a complete list of its holdings in regulatory filings four times in each fiscal year, at the quarter-ends. For the second and fourth fiscal quarters, the lists appear in the fund’s semiannual and annual reports to shareholders. For the first and third fiscal quarters, the fund files the lists with the Securities and Exchange Commission on Form N-Q. Shareholders can look up the fund’s Forms N-Q on the SEC’s website at sec.gov. Forms N-Q may also be reviewed and copied at the SEC’s Public Reference Room (see the back cover of this report for further information).
| | | |
| Market |
| Value• |
| | Shares | ($000) |
| Common Stocks (99.9%) | | |
| Chemicals (66.5%) | | |
| DowDuPont Inc. | 7,200,537 | 506,198 |
| Monsanto Co. | 1,354,443 | 167,098 |
| Praxair Inc. | 881,010 | 131,931 |
| LyondellBasell Industries | | |
| | NV Class A | 1,031,778 | 111,659 |
| Air Products & Chemicals | | |
| | Inc. | 672,717 | 108,166 |
| Ecolab Inc. | 800,108 | 104,374 |
| Sherwin-Williams Co. | 258,979 | 104,001 |
| PPG Industries Inc. | 783,079 | 88,049 |
| Eastman Chemical Co. | 442,320 | 44,710 |
| Celanese Corp. Class A | 417,425 | 42,101 |
| International Flavors & | | |
| | Fragrances Inc. | 243,039 | 34,329 |
| Albemarle Corp. | 340,019 | 34,148 |
| FMC Corp. | 413,170 | 32,426 |
| CF Industries Holdings Inc. | 717,815 | 29,603 |
| Chemours Co. | 569,831 | 27,073 |
| Mosaic Co. | 1,026,285 | 27,012 |
| * | Axalta Coating Systems | | |
| | Ltd. | 674,746 | 20,782 |
| RPM International Inc. | 410,971 | 20,454 |
| Huntsman Corp. | 627,852 | 20,261 |
| Olin Corp. | 512,249 | 16,648 |
| Valvoline Inc. | 623,343 | 14,281 |
| WR Grace & Co. | 208,595 | 13,805 |
| Ashland Global Holdings | | |
| | Inc. | 191,295 | 13,548 |
| Westlake Chemical Corp. | 119,242 | 12,909 |
| NewMarket Corp. | 29,160 | 12,186 |
| Scotts Miracle-Gro Co. | 132,860 | 11,936 |
| Cabot Corp. | 190,767 | 11,480 |
| Trinseo SA | 134,527 | 10,708 |
| PolyOne Corp. | 248,922 | 10,283 |
| * | Ingevity Corp. | 129,745 | 9,719 |
| Sensient Technologies | | |
| | Corp. | 133,945 | 9,637 |
| HB Fuller Co. | 154,691 | 7,795 |
| Minerals Technologies Inc. | 108,721 | 7,469 |
| Balchem Corp. | 98,375 | 7,403 |
| * | Platform Specialty Products | | |
| | Corp. | 707,012 | 7,381 |
| * | GCP Applied Technologies | | |
| | Inc. | 220,296 | 6,774 |
| Quaker Chemical Corp. | 40,901 | 5,830 |
| * | Ferro Corp. | 244,884 | 5,238 |
| Tronox Ltd. Class A | 279,781 | 5,114 |
| Stepan Co. | 62,338 | 4,993 |
| Innospec Inc. | 74,154 | 4,816 |
| * | Kraton Corp. | 96,332 | 4,085 |
| | | |
| Market |
| Value• |
| | Shares | ($000) |
| A Schulman Inc. | 90,793 | 3,981 |
| * | AdvanSix Inc. | 93,743 | 3,876 |
| Calgon Carbon Corp. | 156,734 | 3,331 |
| Rayonier Advanced | | |
| | Materials Inc. | 159,568 | 3,250 |
| * | Koppers Holdings Inc. | 63,544 | 2,567 |
| Innophos Holdings Inc. | 60,318 | 2,507 |
| Chase Corp. | 23,012 | 2,393 |
| American Vanguard Corp. | 83,017 | 1,619 |
| Kronos Worldwide Inc. | 70,966 | 1,522 |
| * | OMNOVA Solutions Inc. | 137,738 | 1,391 |
| Tredegar Corp. | 75,910 | 1,211 |
| * | Flotek Industries Inc. | 176,560 | 1,051 |
| Hawkins Inc. | 29,896 | 1,002 |
| * | Intrepid Potash Inc. | 300,235 | 994 |
| FutureFuel Corp. | 80,131 | 961 |
| *,^ LSB Industries Inc. | 77,347 | 578 |
| * | AgroFresh Solutions Inc. | 68,688 | 532 |
| 1,901,179 |
| Construction Materials (4.1%) | |
| Vulcan Materials Co. | 407,076 | 47,925 |
| Martin Marietta Materials | | |
| | Inc. | 193,438 | 39,448 |
| Eagle Materials Inc. | 149,670 | 15,001 |
| * | Summit Materials Inc. | | |
| | Class A | 338,809 | 10,717 |
| *,^ US Concrete Inc. | 48,616 | 3,537 |
| United States Lime & | | |
| | Minerals Inc. | 6,761 | 481 |
| *,^ Forterra Inc. | 59,200 | 420 |
| 117,529 |
| Containers & Packaging (13.2%) | |
| International Paper Co. | 1,207,097 | 71,931 |
| WestRock Co. | 783,489 | 51,522 |
| Ball Corp. | 1,023,257 | 40,879 |
| Packaging Corp. of | | |
| | America | 290,331 | 34,608 |
| Avery Dennison Corp. | 270,905 | 32,007 |
| Sealed Air Corp. | 555,092 | 23,519 |
| * | Berry Global Group Inc. | 403,064 | 21,927 |
| * | Crown Holdings Inc. | 413,130 | 20,590 |
| AptarGroup Inc. | 191,696 | 17,142 |
| Sonoco Products Co. | 305,867 | 14,672 |
| Graphic Packaging Holding | | |
| | Co. | 953,277 | 14,595 |
| Bemis Co. Inc. | 279,427 | 12,320 |
| * | Owens-Illinois Inc. | 476,914 | 10,282 |
| Silgan Holdings Inc. | 237,794 | 6,765 |
| Greif Inc. Class A | 79,396 | 4,571 |
| Myers Industries Inc. | 75,443 | 1,430 |
| 378,760 |
| | | | |
| Market |
| Value• |
| | | Shares | ($000) |
| Metals & Mining (14.3%) | | | |
| * | Freeport-McMoRan Inc. | 4,231,906 | 78,713 |
| Nucor Corp. | | 978,410 | 63,988 |
| Newmont Mining Corp. | 1,641,222 | 62,695 |
| Steel Dynamics Inc. | | 729,285 | 33,729 |
| * | Alcoa Corp. | | 569,401 | 25,606 |
| United States Steel Corp. | | 538,534 | 23,432 |
| Reliance Steel & Aluminum | | | |
| | Co. | | 224,490 | 20,242 |
| Royal Gold Inc. | | 201,444 | 16,271 |
| * | Allegheny Technologies | | | |
| | Inc. | | 387,498 | 10,040 |
| Commercial Metals Co. | | 358,482 | 8,711 |
| Carpenter Technology Corp. | 143,955 | 7,333 |
| Worthington Industries Inc. | 145,590 | 6,441 |
| Compass Minerals | | | |
| | International Inc. | | 104,237 | 6,285 |
| * | Cleveland-Cliffs Inc. | | 865,421 | 6,084 |
| Kaiser Aluminum Corp. | | 51,982 | 5,217 |
| *,^ AK Steel Holding Corp. | | 970,333 | 5,007 |
| Hecla Mining Co. | 1,225,067 | 4,484 |
| * | Coeur Mining Inc. | | 570,546 | 4,365 |
| Warrior Met Coal Inc. | | 106,632 | 3,328 |
| Materion Corp. | | 61,526 | 3,101 |
| * | Century Aluminum Co. | | 161,627 | 3,079 |
| Schnitzer Steel Industries | | | |
| | Inc. | | 82,495 | 2,805 |
| * | SunCoke Energy Inc. | | 177,823 | 1,899 |
| * | TimkenSteel Corp. | | 115,737 | 1,893 |
| ^ | McEwen Mining Inc. | | 823,486 | 1,606 |
| Haynes International Inc. | | 38,523 | 1,603 |
| * | Ryerson Holding Corp. | | 50,655 | 512 |
| 408,469 |
| Paper & Forest Products (1.8%) | | |
| Louisiana-Pacific Corp. | | 445,964 | 12,710 |
| KapStone Paper and | | | |
| | Packaging Corp. | | 268,400 | 9,364 |
| Domtar Corp. | | 193,090 | 8,643 |
| Boise Cascade Co. | | 118,936 | 4,793 |
| Neenah Inc. | | 51,652 | 3,959 |
| Schweitzer-Mauduit | | | |
| | International Inc. | | 94,315 | 3,698 |
| PH Glatfelter Co. | | 134,665 | 2,749 |
| * | Clearwater Paper Corp. | | 50,298 | 1,891 |
| Mercer International Inc. | | 139,478 | 1,841 |
| * | Resolute Forest Products | | | |
| | Inc. | | 178,620 | 1,447 |
| 51,095 |
| Total Common Stocks | | | |
| (Cost $2,578,443) | 2,857,032 |
85
Materials Index Fund
| | |
| Market |
| Value• |
| Shares | ($000) |
| Temporary Cash Investment (0.2%) | |
| Money Market Fund (0.2%) | | |
| 1,2 Vanguard Market Liquidity | |
| Fund, 1.601% | | |
| (Cost $5,096) | 50,955 | 5,095 |
| Total Investments (100.1%) | | |
| (Cost $2,583,539) | 2,862,127 |
| | |
| Amount |
| ($000) |
| Other Assets and Liabilities (-0.1%) | |
| Other Assets | | |
| Investment in Vanguard | | 158 |
| Receivables for Investment Securities Sold 8,120 |
| Receivables for Accrued Income | 5,282 |
| Receivables for Capital Shares Issued | 583 |
| Total Other Assets | 14,143 |
| Liabilities | | |
| Payables for Investment | | |
| Securities Purchased | | (9,166) |
| Collateral for Securities on Loan | (5,095) |
| Payables for Capital Shares Redeemed | (330) |
| Payables to Vanguard | | (894) |
| Other Liabilities | | (2,889) |
| Total Liabilities | (18,374) |
| Net Assets (100%) | | 2,857,896 |
| |
| At February 28, 2018, net assets consisted of: |
| Amount |
| ($000) |
| Paid-in Capital | 2,655,198 |
| Undistributed Net Investment Income | 5,946 |
| Accumulated Net Realized Losses | (81,836) |
| Unrealized Appreciation (Depreciation) | 278,588 |
| Net Assets | 2,857,896 |
| |
| ETF Shares—Net Assets | |
| Applicable to 17,891,390 outstanding | |
| $.001 par value shares of beneficial | |
| interest (unlimited authorization) | 2,400,192 |
| Net Asset Value Per Share— | |
| ETF Shares $134.15 |
| |
| Admiral Shares—Net Assets | |
| Applicable to 6,696,143 outstanding | |
| $.001 par value shares of beneficial | |
| interest (unlimited authorization) | 457,704 |
| Net Asset Value Per Share— | |
| Admiral Shares $68.35 |
• See Note A in Notes to Financial Statements.
* Non-income-producing security.
^ Includes partial security positions on loan to broker-dealers.
The total value of securities on loan is $4,029,000.
1 Affiliated money market fund available only to Vanguard funds
and certain trusts and accounts managed by Vanguard. Rate
shown is the 7-day yield.
2 Includes $5,095,000 of collateral received for securities on loan.
See accompanying Notes, which are an integral part of the Financial Statements.
86
Materials Index Fund
Statement of Operations
| | | |
| Six Months Ended |
| February 28, 2018 |
| | ($000) |
| Investment Income | | |
| Income | | |
| Dividends | 22,049 |
| Interest1 | 5 |
| Securities Lending—Net | 30 |
| Total Income | 22,084 |
| Expenses | | |
| The Vanguard Group—Note B | | |
| Investment Advisory Services | 332 |
| Management and Administrative— | |
| ETF Shares | 578 |
| Management and Administrative— | |
| Admiral Shares | 134 |
| Marketing and Distribution— | | |
| ETF Shares | 68 |
| Marketing and Distribution— | | |
| Admiral Shares | 17 |
| Custodian Fees | 27 |
| Shareholders’ Reports and Proxy— | |
| ETF Shares | 153 |
| Shareholders’ Reports and Proxy— | |
| Admiral Shares | 8 |
| Trustees’ Fees and Expenses | 1 |
| Total Expenses | 1,318 |
| Net Investment Income | 20,766 |
| Realized Net Gain (Loss) on | | |
| Investment Securities Sold1 | 28,966 |
| Change in Unrealized Appreciation | |
| (Depreciation) of Investment Securities1 | 148,983 |
| Net Increase (Decrease) in Net Assets | |
| Resulting from Operations | | 198,715 |
1 Interest income, realized net gain (loss), and change in unrealized
appreciation (depreciation) from affiliated companies of the
fund were $5,000, ($1,000), and ($1,000), respectively. Purchases
and sales are for temporary cash investment purposes.
| | | | |
| Statement of Changes in Net Assets | | | |
| |
| Six Months Ended | Year Ended |
| | February 28, | August 31, |
| | 2018 | 2017 |
| ($000) | ($000) |
| Increase (Decrease) in Net Assets | | | |
| Operations | | | |
| Net Investment Income | | 20,766 | 38,799 |
| Realized Net Gain (Loss) | | 28,966 | 126,614 |
| Change in Unrealized Appreciation (Depreciation) | | 148,983 | 144,927 |
| Net Increase (Decrease) in Net Assets Resulting from Operations | | 198,715 | 310,340 |
| Distributions | | | |
| Net Investment Income | | | |
| ETF Shares | | (18,964) | (32,075) |
| Admiral Shares | | (3,688) | (5,084) |
| Realized Capital Gain | | | |
| ETF Shares | | — | — |
| Admiral Shares | | — | — |
| Total Distributions | | (22,652) | (37,159) |
| Capital Share Transactions | | | |
| ETF Shares | | 340,377 | 231,525 |
| Admiral Shares | | 56,565 | 96,981 |
| Net Increase (Decrease) from Capital Share Transactions | | 396,942 | 328,506 |
| Total Increase (Decrease) | | 573,005 | 601,687 |
| Net Assets |
| Beginning of Period | | 2,284,891 | 1,683,204 |
| End of Period1 | | 2,857,896 | 2,284,891 |
| 1 Net Assets—End of Period includes undistributed (overdistributed) net investment income of $5,946,000 and $7,832,000. | |
See accompanying Notes, which are an integral part of the Financial Statements.
87
| | | | | | | |
| Materials Index Fund | | | | | | | |
| |
| |
| Financial Highlights | | | | | |
| |
| ETF Shares | | | | | | | |
| Six Months | | | | | |
| | Ended | | | | | |
| For a Share Outstanding | February 28, | | | Year Ended August 31, |
| Throughout Each Period | 2018 | 2017 | 2016 | 2015 | 2014 | 2013 |
| Net Asset Value, Beginning of Period | $124.29 | $108.16 | $96.39 | $113.50 | $90.94 | $79.81 |
| Investment Operations | |
| Net Investment Income | | 1.0481 | 2.1751 | 1.980 | 2.126 | 1.847 | 1.993 |
| Net Realized and Unrealized Gain (Loss) | | | | | | |
| on Investments | | 9.991 | 16.072 | 12.770 | (17.344) | 22.612 | 10.708 |
| Total from Investment Operations | | 11.039 | 18.247 | 14.750 | (15.218) | 24.459 | 12.701 |
| Distributions | |
| Dividends from Net Investment Income | (1.179) | (2.117) | (2.980) | (1.892) | (1.899) | (1.571) |
| Distributions from Realized Capital Gains | — | — | — | — | — | — |
| Total Distributions | | (1.179) | (2.117) | (2.980) | (1.892) | (1.899) | (1.571) |
| Net Asset Value, End of Period | | $134.15 | $124.29 | $108.16 | $96.39 | $113.50 | $90.94 |
| Total Return | | 8.92% | 17.06% | 15.83% | -13.56% | 27.17% | 16.08% |
| Ratios/Supplemental Data | |
| Net Assets, End of Period (Millions) | | $2,400 | $1,913 | $1,448 | $1,022 | $1,323 | $796 |
| Ratio of Total Expenses to | | | | | | | |
| Average Net Assets | | 0.10% | 0.10% | 0.10% | 0.10% | 0.12% | 0.14% |
| Ratio of Net Investment Income to | | | | | | | |
| Average Net Assets | | 1.58% | 1.87% | 2.06% | 1.86% | 1.88% | 2.32% |
| Portfolio Turnover Rate2 | | 2% | 5% | 6% | 4% | 4% | 7% |
The expense ratio, net investment income ratio, and turnover rate for the current period have been annualized.
1 Calculated based on average shares outstanding.
2 Excludes the value of portfolio securities received or delivered as a result of in-kind purchases or redemptions of the fund’s capital shares,
including ETF Creation Units.
See accompanying Notes, which are an integral part of the Financial Statements.
88
| | | | | | | |
| Materials Index Fund | | | | | | | |
| |
| |
| Financial Highlights | | | | | |
| |
| Admiral Shares | | | | | | | |
| Six Months | | | | | |
| | Ended | | | | | |
| For a Share Outstanding | February 28, | | | Year Ended August 31, |
| Throughout Each Period | 2018 | 2017 | 2016 | 2015 | 2014 | 2013 |
| Net Asset Value, Beginning of Period | $63.33 | $55.11 | $49.12 | $57.84 | $46.34 | $40.66 |
| Investment Operations | |
| Net Investment Income | | . 5331 | 1.1041 | 1.008 | 1.088 | .936 | 1.014 |
| Net Realized and Unrealized Gain (Loss) | | | | | | |
| on Investments | | 5.089 | 8.195 | 6.505 | (8.846) | 11.528 | 5.464 |
| Total from Investment Operations | | 5.622 | 9.299 | 7.513 | (7.758) | 12.464 | 6.478 |
| Distributions | |
| Dividends from Net Investment Income | (.602) | (1.079) | (1.523) | (.962) | (.964) | (.798) |
| Distributions from Realized Capital Gains | — | — | — | — | — | — |
| Total Distributions | | (.602) | (1.079) | (1.523) | (.962) | (.964) | (.798) |
| Net Asset Value, End of Period | | $68.35 | $63.33 | $55.11 | $49.12 | $57.84 | $46.34 |
| Total Return2 | | 8.91% | 17.06% | 15.80% | -13.54% | 27.18% | 16.12% |
| Ratios/Supplemental Data | |
| Net Assets, End of Period (Millions) | | $458 | $372 | $235 | $193 | $175 | $139 |
| Ratio of Total Expenses to | | | | | | | |
| Average Net Assets | | 0.10% | 0.10% | 0.10% | 0.10% | 0.12% | 0.14% |
| Ratio of Net Investment Income to | | | | | | | |
| Average Net Assets | | 1.58% | 1.87% | 2.06% | 1.86% | 1.88% | 2.32% |
| Portfolio Turnover Rate3 | | 2% | 5% | 6% | 4% | 4% | 7% |
The expense ratio, net investment income ratio, and turnover rate for the current period have been annualized.
1 Calculated based on average shares outstanding.
2 Total returns do not include account service fees that may have applied in the periods shown. Fund prospectuses provide information about
any applicable account service fees.
3 Excludes the value of portfolio securities received or delivered as a result of in-kind purchases or redemptions of the fund’s capital shares,
including ETF Creation Units.
See accompanying Notes, which are an integral part of the Financial Statements.
89
Materials Index Fund
Notes to Financial Statements
Vanguard Materials Index Fund is registered under the Investment Company Act of 1940 as an open-end investment company, or mutual fund. The fund offers two classes of shares: ETF Shares and Admiral Shares. ETF Shares are listed for trading on NYSE Arca; they can be purchased and sold through a broker. Admiral Shares are designed for investors who meet certain administrative, service, and account-size criteria.
A. The following significant accounting policies conform to generally accepted accounting principles for U.S. investment companies. The fund consistently follows such policies in preparing its financial statements.
1. Security Valuation: Securities are valued as of the close of trading on the New York Stock Exchange (generally 4 p.m., Eastern time) on the valuation date. Equity securities are valued at the latest quoted sales prices or official closing prices taken from the primary market in which each security trades; such securities not traded on the valuation date are valued at the mean of the latest quoted bid and asked prices. Securities for which market quotations are not readily available, or whose values have been materially affected by events occurring before the fund’s pricing time but after the close of the securities’ primary markets, are valued by methods deemed by the board of trustees to represent fair value. Investments in Vanguard Market Liquidity Fund are valued at that fund’s net asset value.
2. Federal Income Taxes: The fund intends to continue to qualify as a regulated investment company and distribute all of its taxable income. Management has analyzed the fund’s tax positions taken for all open federal income tax years (August 31, 2014–2017), and for the period ended February 28, 2018, and has concluded that no provision for federal income tax is required in the fund’s financial statements. 3. Distributions: Distributions to shareholders are recorded on the ex-dividend date.
4. Securities Lending: To earn additional income, the fund lends its securities to qualified institutional borrowers. Security loans are subject to termination by the fund at any time, and are required to be secured at all times by collateral in an amount at least equal to the market value of securities loaned. Daily market fluctuations could cause the value of loaned securities to be more or less than the value of the collateral received. When this occurs, the collateral is adjusted and settled on the next business day. The fund further mitigates its counterparty risk by entering into securities lending transactions only with a diverse group of prequalified counterparties, monitoring their financial strength, and entering into master securities lending agreements with its counterparties. The master securities lending agreements provide that, in the event of a counterparty’s default (including bankruptcy), the fund may terminate any loans with that borrower, determine the net amount owed, and sell or retain the collateral up to the net amount owed to the fund; however, such actions may be subject to legal proceedings. While collateral mitigates counterparty risk, in the event of a default, the fund may experience delays and costs in recovering the securities loaned. The fund invests cash collateral received in Vanguard Market Liquidity Fund, and records a liability in the Statement of Net Assets for the return of the collateral, during the period the securities are on loan. Securities lending income represents fees charged to borrowers plus income earned on invested cash collateral, less expenses associated with the loan. During the term of the loan, the fund is entitled to all distributions made on or in respect of the loaned securities.
5. Credit Facility: The fund and certain other funds managed by The Vanguard Group (“Vanguard”) participate in a $3.1 billion committed credit facility provided by a syndicate of lenders pursuant to a credit agreement that may be renewed annually; each fund is individually liable for its borrowings, if any, under the credit facility. Borrowings may be utilized for temporary and emergency purposes, and are subject to the fund’s regulatory and contractual borrowing restrictions. The participating funds are charged administrative fees and an annual commitment fee of 0.10% of the undrawn amount of the facility; these fees are allocated to the funds based on a method approved by the fund’s board of trustees and included in Management and Administrative expenses on the fund’s Statement of Operations. Any borrowings under this facility bear interest at a rate based upon the higher of the one-month London Interbank Offered Rate, federal funds effective rate, or overnight bank funding rate plus an agreed-upon spread.
The fund had no borrowings outstanding at February 28, 2018, or at any time during the period then ended.
6. Other: Dividend income is recorded on the ex-dividend date. Interest income includes income distributions received from Vanguard Market Liquidity Fund and is accrued daily. Security transactions are accounted for on the date securities are bought or sold. Costs used to determine realized gains (losses) on the sale of investment securities are those of the specific securities sold.
90
Materials Index Fund
Each class of shares has equal rights as to assets and earnings, except that each class separately bears certain class-specific expenses related to maintenance of shareholder accounts (included in Management and Administrative expenses), shareholder reporting, and the proxy. Marketing and distribution expenses are allocated to each class of shares based on a method approved by the board of trustees. Income, other non-class-specific expenses, and gains and losses on investments are allocated to each class of shares based on its relative net assets.
B. In accordance with the terms of a Funds’ Service Agreement (the “FSA”) between Vanguard and the fund, Vanguard furnishes to the fund investment advisory, corporate management, administrative, marketing, and distribution services at Vanguard’s cost of operations (as defined by the FSA). These costs of operations are allocated to the fund based on methods and guidelines approved by the board of trustees. Vanguard does not require reimbursement in the current period for certain costs of operations (such as deferred compensation/benefits and risk/insurance costs); the fund’s liability for these costs of operations is included in Payables to Vanguard on the Statement of Net Assets. All other costs of operations payable to Vanguard are generally settled twice a month.
Upon the request of Vanguard, the fund may invest up to 0.40% of its net assets as capital in Vanguard. At February 28, 2018, the fund had contributed to Vanguard capital in the amount of $158,000, representing 0.01% of the fund’s net assets and 0.06% of Vanguard’s capitalization. The fund’s trustees and officers are also directors and employees, respectively, of Vanguard.
C. Various inputs may be used to determine the value of the fund’s investments. These inputs are summarized in three broad levels for financial statement purposes. The inputs or methodologies used to value securities are not necessarily an indication of the risk associated with investing in those securities.
Level 1—Quoted prices in active markets for identical securities.
Level 2—Other significant observable inputs (including quoted prices for similar securities, interest
rates, prepayment speeds, credit risk, etc.).
Level 3—Significant unobservable inputs (including the fund’s own assumptions used to determine
the fair value of investments). Any investments valued with significant unobservable inputs are noted
on the Statement of Net Assets.
At February 28, 2018, 100% of the market value of the fund’s investments was determined based on Level 1 inputs.
D. Distributions are determined on a tax basis and may differ from net investment income and realized capital gains for financial reporting purposes. Differences may be permanent or temporary. Permanent differences are reclassified among capital accounts in the financial statements to reflect their tax character. Temporary differences arise when certain items of income, expense, gain, or loss are recognized in different periods for financial statement and tax purposes. These differences will reverse at some time in the future. Differences in classification may also result from the treatment of short-term gains as ordinary income for tax purposes.
During the six months ended February 28, 2018, the fund realized $29,510,000 of net capital gains resulting from in-kind redemptions—in which shareholders exchanged fund shares for securities held by the fund rather than for cash. Because such gains are not taxable to the fund, and are not distributed to shareholders, they have been reclassified from accumulated net realized losses to paid-in capital.
The fund’s tax-basis capital gains and losses are determined only at the end of each fiscal year. For tax purposes, at August 31, 2017, the fund had available capital losses totaling $81,292,000 to offset future net capital gains. Of this amount, $39,290,000 is subject to expiration dates; $18,156,000 may be used to offset future net capital gains through August 31, 2018, and $21,134,000 through August 31, 2019. Capital losses of $42,002,000 realized beginning in fiscal 2012 may be carried forward indefinitely under the Regulated Investment Company Modernization Act of 2010, but must be used before any expiring loss carryforwards.The fund will use these capital losses to offset net taxable capital gains, if any, realized during the year ending August 31, 2018; should the fund realize net capital losses for the year, the losses will be added to the loss carryforward balance above.
At February 28, 2018, the cost of investment securities for tax purposes was $2,583,539,000. Net unrealized appreciation of investment securities for tax purposes was $278,588,000, consisting of unrealized gains of $398,530,000 on securities that had risen in value since their purchase and $119,942,000 in unrealized losses on securities that had fallen in value since their purchase.
91
Materials Index Fund
E. During the six months ended February 28, 2018, the fund purchased $513,202,000 of investment securities and sold $119,570,000 of investment securities, other than temporary cash investments. Purchases and sales include $413,481,000 and $96,993,000, respectively, in connection with in-kind purchases and redemptions of the fund’s capital shares.
| | | | |
| F. Capital share transactions for each class of shares were: | | | |
| Six Months Ended | | Year Ended |
| February 28, 2018 | August 31, 2017 |
| Amount | Shares | Amount | Shares |
| ($000) | (000) | ($000) | (000) |
| ETF Shares | | | | |
| Issued | 440,708 | 3,251 | 683,681 | 5,853 |
| Issued in Lieu of Cash Distributions | — | — | — | — |
| Redeemed | (100,331) | (750) | (452,156) | (3,850) |
| Net Increase (Decrease)—ETF Shares | 340,377 | 2,501 | 231,525 | 2,003 |
| Admiral Shares | | | | |
| Issued | 110,733 | 1,609 | 183,082 | 3,049 |
| Issued in Lieu of Cash Distributions | 3,358 | 50 | 4,532 | 77 |
| Redeemed | (57,526) | (837) | (90,633) | (1,520) |
| Net Increase (Decrease)—Admiral Shares | 56,565 | 822 | 96,981 | 1,606 |
G. Management has determined that no material events or transactions occurred subsequent to February 28, 2018, that would require recognition or disclosure in these financial statements.
92
Telecommunication Services Index Fund
| | | |
| Fund Profile | | | |
| As of February 28, 2018 | | |
| |
| Share-Class Characteristics | | |
| | ETF | Admiral |
| Shares | Shares |
| Ticker Symbol | | VOX | VTCAX |
| Expense Ratio1 | 0.10% | 0.10% |
| 30-Day SEC Yield | 3.69% | 3.69% |
| |
| |
| Portfolio Characteristics | | |
| MSCI | |
| US IMI/ | |
| Telecom | MSCI |
| Services | US IMI/ |
| Fund | 25/50 | 2500 |
| Number of Stocks | 23 | 24 | 2,469 |
| Median Market Cap | $52.1B | $52.1B | $68.2B |
| Price/Earnings Ratio | 8.4x | 8.4x | 21.9x |
| Price/Book Ratio | 1.5x | 1.5x | 3.1x |
| Return on Equity | 14.5% | 14.5% | 15.0% |
| Earnings Growth Rate | 29.6% | 28.5% | 8.5% |
| Dividend Yield | 5.0% | 5.1% | 1.8% |
| Foreign Holdings | 0.0% | 0.0% | 0.0% |
| Turnover Rate | | | |
| (Annualized) | 25% | — | — |
| Short-Term Reserves | -0.5% | — | — |
| | |
| Volatility Measures | | |
| MSCI US | |
| IMI/Telecom | |
| Services | MSCI US |
| 25/50 | IMI/2500 |
| R-Squared | 1.00 | 0.28 |
| Beta | 1.00 | 0.61 |
These measures show the degree and timing of the fund’s
fluctuations compared with the indexes over 36 months.
| |
| Subindustry Diversification | |
| (% of equity exposure) | |
| Alternative Carriers | 22.8% |
| Integrated Telecommunication Services | 60.7 |
| Wireless Telecommunication Services | 16.5 |
Sector categories are based on the Global Industry
Classification Standard (“GICS”), except for the “Other”
category (if applicable), which includes securities that have
not been provided a GICS classification as of the effective
reporting period.
| | |
| Ten Largest Holdings (% of total net assets) |
| Verizon | Integrated | |
| Communications | Telecommunication | |
| Inc. | Services | 24.3% |
| AT&T Inc. | Integrated | |
| Telecommunication | |
| Services | 22.2 |
| CenturyLink Inc. | Alternative Carriers | 5.0 |
| T-Mobile US Inc. | Wireless | |
| Telecommunication | |
| Services | 4.6 |
| Zayo Group | | |
| Holdings Inc. | Alternative Carriers | 3.4 |
| Vonage Holdings | | |
| Corp | Alternative Carriers | 3.0 |
| Iridium | | |
| Communications Inc. | Alternative Carriers | 2.6 |
| Telephone & Data | Wireless | |
| Systems Inc. | Telecommunication | |
| Services | 2.6 |
| Sprint Corp. | Wireless | |
| Telecommunication | |
| Services | 2.6 |
| Shenandoah | Wireless | |
| Telecommunications | Telecommunication | |
| Co. | Services | 2.4 |
| Top Ten | 72.7% |
The holdings listed exclude any temporary cash investments and
equity index products.
1 The expense ratios shown are from the prospectus dated December 21, 2017, and represent estimated costs for the current fiscal year. For the six months ended February 28, 2018, the annualized expense ratios
were 0.10% for ETF and 0.10% for Admiral Shares.
93
Telecommunication Services Index Fund
Performance Summary
All of the returns in this report represent past performance, which is not a guarantee of future results that may be achieved by the fund. (Current performance may be lower or higher than the performance data cited. For performance data current to the most recent month-end, visit our website at vanguard.com/performance.) Note, too, that both investment returns and principal value can fluctuate widely, so an investor’s shares, when sold, could be worth more or less than their original cost. The returns shown do not reflect taxes that a shareholder would pay on fund distributions or on the sale of fund shares.
Fiscal-Year Total Returns (%): August 31, 2007–February 28, 2018
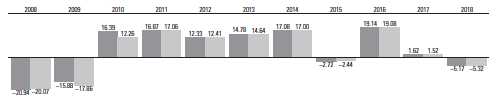
| |
| Telecommunication Services Index Fund ETF Shares Net Asset Value |
| Spliced US IMI/Telecommunication Services 25/50 |
| For a benchmark description, see the Glossary. |
| Note: For 2018, performance data reflect the six months ended February 28, 2018. |
Average Annual Total Returns: Periods Ended December 31, 2017
This table presents returns through the latest calendar quarter—rather than through the end of the fiscal period.
Securities and Exchange Commission rules require that we provide this information.
| | | | |
| Inception Date | One Year | Five Years | Ten Years |
| ETF Shares | 9/23/2004 | | | |
| Market Price | | -5.42% | 9.02% | 5.24% |
| Net Asset Value | | -5.55 | 8.98 | 5.21 |
| Admiral Shares | 3/11/2005 | -5.56 | 8.99 | 5.21 |
See Financial Highlights for dividend and capital gains information.
94
Telecommunication Services Index Fund
Financial Statements (unaudited)
Statement of Net Assets
As of February 28, 2018
The fund reports a complete list of its holdings in regulatory filings four times in each fiscal year, at the quarter-ends. For the second and fourth fiscal quarters, the lists appear in the fund’s semiannual and annual reports to shareholders. For the first and third fiscal quarters, the fund files the lists with the Securities and Exchange Commission on Form N-Q. Shareholders can look up the fund’s Forms N-Q on the SEC’s website at sec.gov. Forms N-Q may also be reviewed and copied at the SEC’s Public Reference Room (see the back cover of this report for further information).
| | | |
| Market |
| Value• |
| | Shares | ($000) |
| Common Stocks (98.9%)1 | | |
| Diversified Telecommunication Services (82.6%) |
| Alternative Carriers (22.5%) | |
| CenturyLink Inc. | 3,100,306 | 54,782 |
| * | Zayo Group Holdings Inc. | 1,040,519 | 37,303 |
| * | Vonage Holdings Corp. | 3,262,841 | 33,118 |
| *,^ Iridium Communications | | |
| | Inc. | 2,469,793 | 28,897 |
| *,2 pdvWireless Inc. | 793,793 | 25,560 |
| Cogent Communications | | |
| | Holdings Inc. | 593,355 | 25,425 |
| * | ORBCOMM Inc. | 2,422,775 | 25,197 |
| *,^ Globalstar Inc. | 19,840,161 | 18,860 |
| |
| Integrated Telecommunication Services (60.1%) |
| Verizon Communications | | |
| | Inc. | 5,634,789 | 269,005 |
| AT&T Inc. | 6,749,597 | 245,010 |
| * | GCI Liberty Inc. | 656,086 | 25,226 |
| ATN International Inc. | 394,708 | 23,643 |
| Consolidated | | |
| | Communications | | |
| | Holdings Inc. | 1,954,638 | 22,596 |
| * | Cincinnati Bell Inc. | 1,383,194 | 22,339 |
| IDT Corp. Class B | 1,832,407 | 22,135 |
| ^ | Frontier Communications | | |
| | Corp. | 2,899,646 | 20,385 |
| ^ | Windstream Holdings Inc. | 8,908,425 | 14,075 |
| 913,556 |
| Wireless Telecommunication Services (16.3%) |
| * | T-Mobile US Inc. | 838,565 | 50,825 |
| Telephone & Data | | |
| | Systems Inc. | 1,021,992 | 28,657 |
| *,^ Sprint Corp. | 5,518,523 | 28,641 |
| Shenandoah | | |
| | Telecommunications Co. | 807,486 | 26,486 |
| * | United States Cellular | | |
| | Corp. | 629,332 | 24,286 |
| 2 | Spok Holdings Inc. | 1,374,452 | 21,373 |
| 180,268 |
| Total Common Stocks | | |
| (Cost $1,269,718) | 1,093,824 |
| | |
| Market |
| Value• |
| Shares | ($000) |
| Temporary Cash Investment (5.7%)1 | |
| Money Market Fund (5.7%) | |
| 3,4 Vanguard Market Liquidity | |
| Fund, 1.601% | | |
| (Cost $63,007) | 630,076 | 63,001 |
| Total Investments (104.6%) | |
| (Cost $1,332,725) | 1,156,825 |
| Other Assets and Liabilities (-4.6%) | |
| Other Assets | | 39,275 |
| Liabilities 4 | | (90,120) |
| (50,845) |
| Net Assets (100%) | 1,105,980 |
| | |
| Amount |
| ($000) |
| Statement of Assets and Liabilities | |
| Assets | | |
| Investments in Securities, at Value | |
| Unaffiliated Issuers | | 1,046,891 |
| Affiliated Vanguard Funds | 63,001 |
| Other Affiliated Issuers | | 46,933 |
| Total Investments in Securities | 1,156,825 |
| Investment in Vanguard | | 61 |
| Receivables for Investment | |
| Securities Sold | | 38,961 |
| Receivables for Capital Shares Issued | 249 |
| Unrealized Appreciation—Swap Contracts — |
| Other Assets | | 4 |
| Total Assets | 1,196,100 |
| Liabilities | | |
| Payables for Investment | | |
| Securities Purchased | | 27,088 |
| Collateral for Securities on Loan | 62,253 |
| Payables for Capital Shares Redeemed | 263 |
| Payables to Vanguard | | 511 |
| Variation Margin Payable—Futures Contracts 5 |
| Total Liabilities | 90,120 |
| Net Assets | | 1,105,980 |
| | |
| At February 28, 2018, net assets consisted of: |
| | Amount |
| | ($000) |
| Paid-in Capital | 1,388,350 |
| Undistributed Net Investment Income | | 7,416 |
| Accumulated Net Realized Losses | | (113,881) |
| Unrealized Appreciation (Depreciation) | | |
| Investment Securities | | (175,900) |
| Futures Contracts | | (5) |
| Swap Contracts | | — |
| Net Assets | 1,105,980 |
| | |
| ETF Shares—Net Assets | | |
| Applicable to 12,214,812 outstanding | | |
| $.001 par value shares of beneficial | | |
| interest (unlimited authorization) | 1,061,036 |
| Net Asset Value Per Share— | | |
| ETF Shares | $86.86 |
| | |
| Admiral Shares—Net Assets | | |
| Applicable to 1,015,353 outstanding | | |
| $.001 par value shares of beneficial | | |
| interest (unlimited authorization) | | 44,944 |
| Net Asset Value Per Share— | | |
| Admiral Shares | $44.26 |
• See Note A in Notes to Financial Statements.
* Non-income-producing security.
^ Includes partial security positions on loan to broker-dealers.
The total value of securities on loan is $51,445,000.
1 The fund invests a portion of its cash reserves in equity markets
through the use of index futures contracts and swap contracts.
After giving effect to futures and swap investments, the fund’s
effective common stock and temporary cash investment positions
represent 99.9% and 4.7%, respectively, of net assets.
2 Considered an affiliated company of the fund as the fund
owns more than 5% of the outstanding voting securities of
such company.
3 Affiliated money market fund available only to Vanguard funds
and certain trusts and accounts managed by Vanguard. Rate
shown is the 7-day yield.
4 Includes $62,253,000 of collateral received for securities on loan.
95
| | | | |
| Telecommunication Services Index Fund | | | | |
| |
| |
| |
| |
| Derivative Financial Instruments Outstanding as of Period End | | | |
| |
| Futures Contracts | | | | |
| | | | ($000) |
| Value and |
| Number of | | Unrealized |
| Long (Short) | Notional | Appreciation |
| Expiration | Contracts | Amount | (Depreciation) |
| Long Futures Contracts |
| E-mini S&P 500 Index | March 2018 | 45 | 6,107 | (5) |
Unrealized appreciation (depreciation) on open futures contracts is required to be treated as realized gain (loss) for tax purposes.
| | | | | |
| Total Return Swaps | | | | | |
| Floating | Value and |
| Interest | Unrealized |
| Notional | Rate | Appreciation |
| Termination | | Amount | Received | (Depreciation) |
| Reference Entity | Date | Counterparty | ($000) | (Paid)1 | ($000) |
| Windstream Holdings Inc. | 5/31/18 | GSCM | 4,770 | (2.070%) | — |
GSCM—Goldman Sachs Capital Management.
1 Payment received/paid monthly.
Unrealized appreciation (depreciation) on open swap contracts is required to be treated as ordinary income (loss) for tax purposes.
See accompanying Notes, which are an integral part of the Financial Statements.
96
Telecommunication Services Index Fund
Statement of Operations
| | | |
| Six Months Ended |
| February 28, 2018 |
| | ($000) |
| Investment Income | | |
| Income | | |
| Dividends Received from | | |
| Unaffiliated Issuers | 21,653 |
| Dividends Received from | | |
| Affiliated Issuers | 162 |
| Interest Received from | | |
| Affiliated Vanguard Fund | 15 |
| Securities Lending—Net | 1,948 |
| Total Income | 23,778 |
| Expenses | | |
| The Vanguard Group—Note B | | |
| Investment Advisory Services | 166 |
| Management and Administrative— | |
| ETF Shares | 199 |
| Management and Administrative— | |
| Admiral Shares | 13 |
| Marketing and Distribution— | | |
| ETF Shares | 36 |
| Marketing and Distribution— | | |
| Admiral Shares | 2 |
| Custodian Fees | 27 |
| Shareholders’ Reports and Proxy— | |
| ETF Shares | 182 |
| Shareholders’ Reports and Proxy— | |
| Admiral Shares | 1 |
| Total Expenses | 626 |
| Net Investment Income | 23,152 |
| Realized Net Gain (Loss) | | |
| Investment Securities Sold— | | |
| Unaffiliated Issuers | 20,973 |
| Investment Securities Sold— | | |
| Affiliated Issuers | (35,219) |
| Futures Contracts | 60 |
| Realized Net Gain (Loss) | (14,186) |
| Change in Unrealized Appreciation | |
| (Depreciation) | | |
| Investment Securities— | | |
| Unaffiliated Issuers | (111,117) |
| Investment Securities— | | |
| Affiliated Issuers | 27,837 |
| Futures Contracts | (5) |
| Change in Unrealized Appreciation | |
| (Depreciation) | (83,285) |
| Net Increase (Decrease) in Net Assets | |
| Resulting from Operations | | (74,319) |
| | | | |
| Statement of Changes in Net Assets | | | |
| |
| Six Months Ended | Year Ended |
| | February 28, | August 31, |
| | 2018 | 2017 |
| ($000) | ($000) |
| Increase (Decrease) in Net Assets | | | |
| Operations | | | |
| Net Investment Income | | 23,152 | 47,661 |
| Realized Net Gain (Loss) | | (14,186) | 89,169 |
| Change in Unrealized Appreciation (Depreciation) | | (83,285) | (122,022) |
| Net Increase (Decrease) in Net Assets Resulting from Operations | | (74,319) | 14,808 |
| Distributions | | | |
| Net Investment Income | | | |
| ETF Shares | | (25,699) | (46,292) |
| Admiral Shares | | (1,030) | (1,957) |
| Realized Capital Gain | | | |
| ETF Shares | | — | — |
| Admiral Shares | | — | — |
| Total Distributions | | (26,729) | (48,249) |
| Capital Share Transactions | | | |
| ETF Shares | | (229,474) | (62,939) |
| Admiral Shares | | (1,762) | (13,376) |
| Net Increase (Decrease) from Capital Share Transactions | | (231,236) | (76,315) |
| Total Increase (Decrease) | | (332,284) | (109,756) |
| Net Assets |
| Beginning of Period | | 1,438,264 | 1,548,020 |
| End of Period1 | | 1,105,980 | 1,438,264 |
| 1 Net Assets—End of Period includes undistributed (overdistributed) net investment income of $7,416,000 and $10,993,000. | |
See accompanying Notes, which are an integral part of the Financial Statements.
97
| | | | | | | |
| Telecommunication Services Index Fund | | | | | |
| |
| |
| Financial Highlights | | | | | |
| |
| ETF Shares | | | | | | | |
| Six Months | | | | | |
| | Ended | | | | | |
| For a Share Outstanding | February 28, | | | Year Ended August 31, |
| Throughout Each Period | 2018 | 2017 | 2016 | 2015 | 2014 | 2013 |
| Net Asset Value, Beginning of Period | $93.54 | $95.16 | $83.80 | $88.44 | $78.54 | $70.82 |
| Investment Operations | | |
| Net Investment Income | | 1.6541 | 3.1081 | 2.622 | 2.789 | 2.394 | 3.7342 |
| Net Realized and Unrealized Gain (Loss) | | | | | | |
| on Investments | | (6.401) | (1.587) | 12.811 | (5.178) | 10.749 | 6.455 |
| Total from Investment Operations | | (4.747) | 1.521 | 15.433 | (2.389) | 13.143 | 10.189 |
| Distributions | | |
| Dividends from Net Investment Income | (1.933) | (3.141) | (4.073) | (2.251) | (3.243) | (2.469) |
| Distributions from Realized Capital Gains | — | — | — | — | — | — |
| Total Distributions | | (1.933) | (3.141) | (4.073) | (2.251) | (3.243) | (2.469) |
| Net Asset Value, End of Period | | $86.86 | $93.54 | $95.16 | $83.80 | $88.44 | $78.54 |
| Total Return | | -5.17% | 1.62% | 19.14% | -2.72% | 17.08% | 14.78% |
| Ratios/Supplemental Data | | |
| Net Assets, End of Period (Millions) | | $1,061 | $1,388 | $1,483 | $795 | $743 | $511 |
| Ratio of Total Expenses to | | | | | | | |
| Average Net Assets | | 0.10% | 0.10% | 0.10% | 0.10% | 0.12% | 0.14% |
| Ratio of Net Investment Income to | | | | | | | |
| Average Net Assets | | 3.66% | 3.26% | 3.10% | 3.20% | 3.29% | 4.56%2 |
| Portfolio Turnover Rate3 | | 25% | 18% | 20% | 18% | 19% | 19% |
The expense ratio, net investment income ratio, and turnover rate for the current period have been annualized.
1 Calculated based on average shares outstanding.
2 Net investment income per share and the ratio of net investment income to average net assets include $0.704 and 0.89%, respectively,
resulting from a special dividend received in connection with a merger between T-Mobile US Inc. and MetroPCS Communications Inc. in
May 2013.
3 Excludes the value of portfolio securities received or delivered as a result of in-kind purchases or redemptions of the fund’s capital shares,
including ETF Creation Units.
See accompanying Notes, which are an integral part of the Financial Statements.
98
| | | | | | | |
| Telecommunication Services Index Fund | | | | | |
| |
| |
| Financial Highlights | | | | | |
| |
| Admiral Shares | | | | | | | |
| Six Months | | | | | |
| | Ended | | | | | |
| For a Share Outstanding | February 28, | | | Year Ended August 31, |
| Throughout Each Period | 2018 | 2017 | 2016 | 2015 | 2014 | 2013 |
| Net Asset Value, Beginning of Period | $47.67 | $48.50 | $42.71 | $45.07 | $40.02 | $36.09 |
| Investment Operations | | |
| Net Investment Income | | . 8501 | 1.6011 | 1.337 | 1.419 | 1.217 | 1.9062 |
| Net Realized and Unrealized Gain (Loss) | | | | | | |
| on Investments | | (3.274) | (.829) | 6.529 | (2.637) | 5.486 | 3.284 |
| Total from Investment Operations | | (2.424) | .772 | 7.866 | (1.218) | 6.703 | 5.190 |
| Distributions | | |
| Dividends from Net Investment Income | (.986) | (1.602) | (2.076) | (1.142) | (1.653) | (1.260) |
| Distributions from Realized Capital Gains | — | — | — | — | — | — |
| Total Distributions | | (.986) | (1.602) | (2.076) | (1.142) | (1.653) | (1.260) |
| Net Asset Value, End of Period | | $44.26 | $47.67 | $48.50 | $42.71 | $45.07 | $40.02 |
| Total Return 3 | | -5.19% | 1.61% | 19.14% | -2.66% | 17.13% | 14.80% |
| Ratios/Supplemental Data | | |
| Net Assets, End of Period (Millions) | | $45 | $50 | $65 | $24 | $26 | $21 |
| Ratio of Total Expenses to | | | | | | | |
| Average Net Assets | | 0.10% | 0.10% | 0.10% | 0.10% | 0.12% | 0.14% |
| Ratio of Net Investment Income to | | | | | | | |
| Average Net Assets | | 3.66% | 3.26% | 3.10% | 3.20% | 3.29% | 4.56%2 |
| Portfolio Turnover Rate4 | | 25% | 18% | 20% | 18% | 19% | 19% |
The expense ratio, net investment income ratio, and turnover rate for the current period have been annualized.
1 Calculated based on average shares outstanding.
2 Net investment income per share and the ratio of net investment income to average net assets include $0.359 and 0.89%, respectively,
resulting from a special dividend received in connection with a merger between T-Mobile US Inc. and MetroPCS Communications Inc. in
May 2013.
3 Total returns do not include account service fees that may have applied in the periods shown. Fund prospectuses provide information about
any applicable account service fees.
4 Excludes the value of portfolio securities received or delivered as a result of in-kind purchases or redemptions of the fund’s capital shares,
including ETF Creation Units.
See accompanying Notes, which are an integral part of the Financial Statements.
99
Telecommunication Services Index Fund
Notes to Financial Statements
Vanguard Telecommunication Services Index Fund is registered under the Investment Company Act of 1940 as an open-end investment company, or mutual fund. The fund offers two classes of shares: ETF Shares and Admiral Shares. ETF Shares are listed for trading on NYSE Arca; they can be purchased and sold through a broker. Admiral Shares are designed for investors who meet certain administrative, service, and account-size criteria.
A. The following significant accounting policies conform to generally accepted accounting principles for U.S. investment companies. The fund consistently follows such policies in preparing its financial statements.
1. Security Valuation: Securities are valued as of the close of trading on the New York Stock Exchange (generally 4 p.m., Eastern time) on the valuation date. Equity securities are valued at the latest quoted sales prices or official closing prices taken from the primary market in which each security trades; such securities not traded on the valuation date are valued at the mean of the latest quoted bid and asked prices. Securities for which market quotations are not readily available, or whose values have been materially affected by events occurring before the fund’s pricing time but after the close of the securities’ primary markets, are valued by methods deemed by the board of trustees to represent fair value. Investments in Vanguard Market Liquidity Fund are valued at that fund’s net asset value. Temporary cash investments are valued using the latest bid prices or using valuations based on a matrix system (which considers such factors as security prices, yields, maturities, and ratings), both as furnished by independent pricing services.
2. Futures Contracts: The fund uses index futures contracts to a limited extent, with the objectives of maintaining full exposure to the stock market, maintaining liquidity, and minimizing transaction costs. The fund may purchase futures contracts to immediately invest incoming cash in the market, or sell futures in response to cash outflows, thereby simulating a fully invested position in the underlying index while maintaining a cash balance for liquidity. The primary risks associated with the use of futures contracts are imperfect correlation between changes in market values of stocks held by the fund and the prices of futures contracts, and the possibility of an illiquid market. Counterparty risk involving futures is mitigated because a regulated clearinghouse is the counterparty instead of the clearing broker. To further mitigate counterparty risk, the fund trades futures contracts on an exchange, monitors the financial strength of its clearing brokers and clearinghouse, and has entered into clearing agreements with its clearing brokers. The clearinghouse imposes initial margin requirements to secure the fund’s performance and requires daily settlement of variation margin representing changes in the market value of each contract.
Futures contracts are valued at their quoted daily settlement prices. The notional amounts of the contracts are not recorded in the Statement of Net Assets. Fluctuations in the value of the contracts are recorded in the Statement of Assets and Liabilities as an asset (liability) and in the Statement of Operations as unrealized appreciation (depreciation) until the contracts are closed, when they are recorded as realized futures gains (losses).
During the six months ended February 28, 2018, the fund’s average investments in long and short futures contracts represented less than 1% and 0% of net assets, respectively, based on the average of the notional amounts at each quarter-end during the period.
3. Swap Contracts: The fund has entered into equity swap contracts to earn the total return on selected reference stocks in the fund’s target index. Under the terms of the swaps, the fund receives the total return on the referenced stock (i.e., receiving the increase or paying the decrease in value of the selected reference stock and receiving the equivalent of any dividends in respect of the selected referenced stock) over a specified period of time, applied to a notional amount that represents the value of a designated number of shares of the selected reference stock at the beginning of the equity swap contract. The fund also pays a floating rate that is based on short-term interest rates, applied to the notional amount. At the same time, the fund invests an amount approximating the notional amount of the swap in high-quality temporary cash investments.
The notional amounts of swap contracts are not recorded in the Statement of Net Assets. Swaps are valued daily based on market quotations received from independent pricing services or recognized dealers and the change in value is recorded in the Statement of Assets and Liabilities as an asset (liability) and in the Statement of Operations as unrealized appreciation (depreciation) until termination of the swap, at which time realized gain (loss) is recorded.
100
Telecommunication Services Index Fund
A risk associated with all types of swaps is the possibility that a counterparty may default on its obligation to pay net amounts due to the fund. The fund’s maximum amount subject to counterparty risk is the unrealized appreciation on the swap contract. The fund mitigates its counterparty risk by entering into swaps only with a diverse group of prequalified counterparties, monitoring their financial strength, entering into master netting arrangements with its counterparties, and requiring its counter-parties to transfer collateral as security for their performance. In the absence of a default, the collateral pledged or received by the fund cannot be repledged, resold, or rehypothecated. In the event of a counterparty’s default (including bankruptcy), the fund may terminate any swap contracts with that counterparty, determine the net amount owed by either party in accordance with its master netting arrangements, and sell or retain any collateral held up to the net amount owed to the fund under the master netting arrangements. The swap contracts contain provisions whereby a counterparty may terminate open contracts if the fund net assets decline below a certain level, triggering a payment by the fund if the fund is in a net liability position at the time of the termination. The payment amount would be reduced by any collateral the fund has pledged. Any securities pledged as collateral for open contracts are noted in the Statement of Net Assets. The value of collateral received or pledged is compared daily to the value of the swap contracts exposure with each counterparty, and any difference, if in excess of a specified minimum transfer amount, is adjusted and settled within two business days.
During the six months ended February 28, 2018, the fund’s average amounts of investments in total return swaps represented less than 1% of net assets, based on the average of notional amounts at each quarter-end during the period.
4. Federal Income Taxes: The fund intends to continue to qualify as a regulated investment company and distribute all of its taxable income. Management has analyzed the fund’s tax positions taken for all open federal income tax years (August 31, 2014–2017), and for the period ended February 28, 2018, and has concluded that no provision for federal income tax is required in the fund’s financial statements. 5. Distributions: Distributions to shareholders are recorded on the ex-dividend date.
6. Securities Lending: To earn additional income, the fund lends its securities to qualified institutional borrowers. Security loans are subject to termination by the fund at any time, and are required to be secured at all times by collateral in an amount at least equal to the market value of securities loaned. Daily market fluctuations could cause the value of loaned securities to be more or less than the value of the collateral received. When this occurs, the collateral is adjusted and settled on the next business day. The fund further mitigates its counterparty risk by entering into securities lending transactions only with a diverse group of prequalified counterparties, monitoring their financial strength, and entering into master securities lending agreements with its counterparties. The master securities lending agreements provide that, in the event of a counterparty’s default (including bankruptcy), the fund may terminate any loans with that borrower, determine the net amount owed, and sell or retain the collateral up to the net amount owed to the fund; however, such actions may be subject to legal proceedings. While collateral mitigates counterparty risk, in the event of a default, the fund may experience delays and costs in recovering the securities loaned. The fund invests cash collateral received in Vanguard Market Liquidity Fund, and records a liability in the Statement of Assets and Liabilities for the return of the collateral, during the period the securities are on loan. Securities lending income represents fees charged to borrowers plus income earned on invested cash collateral, less expenses associated with the loan. During the term of the loan, the fund is entitled to all distributions made on or in respect of the loaned securities.
7. Credit Facility: The fund and certain other funds managed by The Vanguard Group (“Vanguard”) participate in a $3.1 billion committed credit facility provided by a syndicate of lenders pursuant to a credit agreement that may be renewed annually; each fund is individually liable for its borrowings, if any, under the credit facility. Borrowings may be utilized for temporary and emergency purposes, and are subject to the fund’s regulatory and contractual borrowing restrictions. The participating funds are charged administrative fees and an annual commitment fee of 0.10% of the undrawn amount of the facility; these fees are allocated to the funds based on a method approved by the fund’s board of trustees and included in Management and Administrative expenses on the fund’s Statement of Operations. Any borrowings under this facility bear interest at a rate based upon the higher of the one-month London Interbank Offered Rate, federal funds effective rate, or overnight bank funding rate plus an agreed-upon spread.
The fund had no borrowings outstanding at February 28, 2018, or at any time during the period then ended.
101
Telecommunication Services Index Fund
8. Other: Dividend income is recorded on the ex-dividend date. Interest income includes income distributions received from Vanguard Market Liquidity Fund and is accrued daily. Premiums and discounts on debt securities purchased are amortized and accreted, respectively, to interest income over the lives of the respective securities. Security transactions are accounted for on the date securities are bought or sold. Costs used to determine realized gains (losses) on the sale of investment securities are those of the specific securities sold.
Each class of shares has equal rights as to assets and earnings, except that each class separately bears certain class-specific expenses related to maintenance of shareholder accounts (included in Management and Administrative expenses), shareholder reporting, and the proxy. Marketing and distribution expenses are allocated to each class of shares based on a method approved by the board of trustees. Income, other non-class-specific expenses, and gains and losses on investments are allocated to each class of shares based on its relative net assets.
B. In accordance with the terms of a Funds’ Service Agreement (the “FSA”) between Vanguard and the fund, Vanguard furnishes to the fund investment advisory, corporate management, administrative, marketing, and distribution services at Vanguard’s cost of operations (as defined by the FSA). These costs of operations are allocated to the fund based on methods and guidelines approved by the board of trustees. Vanguard does not require reimbursement in the current period for certain costs of operations (such as deferred compensation/benefits and risk/insurance costs); the fund’s liability for these costs of operations is included in Payables to Vanguard on the Statement of Assets and Liabilities. All other costs of operations payable to Vanguard are generally settled twice a month.
Upon the request of Vanguard, the fund may invest up to 0.40% of its net assets as capital in Vanguard. At February 28, 2018, the fund had contributed to Vanguard capital in the amount of $61,000, representing 0.01% of the fund’s net assets and 0.02% of Vanguard’s capitalization. The fund’s trustees and officers are also directors and employees, respectively, of Vanguard.
C. Various inputs may be used to determine the value of the fund’s investments. These inputs are summarized in three broad levels for financial statement purposes. The inputs or methodologies used to value securities are not necessarily an indication of the risk associated with investing in those securities.
Level 1—Quoted prices in active markets for identical securities.
Level 2—Other significant observable inputs (including quoted prices for similar securities, interest
rates, prepayment speeds, credit risk, etc.).
Level 3—Significant unobservable inputs (including the fund’s own assumptions used to determine
the fair value of investments). Any investments valued with significant unobservable inputs are noted
on the Statement of Net Assets.
The following table summarizes the market value of the fund’s investments as of February 28, 2018, based on the inputs used to value them:
| | | |
| Level 1 | Level 2 | Level 3 |
| Investments | ($000) | ($000) | ($000) |
| Common Stocks | 1,093,824 | — | — |
| Temporary Cash Investments | 63,001 | — | — |
| Futures Contracts—Liabilities1 | (5) | — | — |
| Swap Contracts—Assets | — | — | — |
| Total | 1,156,820 | — | — |
| 1 Represents variation margin on the last day of the reporting period. | | | |
D. Distributions are determined on a tax basis and may differ from net investment income and realized capital gains for financial reporting purposes. Differences may be permanent or temporary. Permanent differences are reclassified among capital accounts in the financial statements to reflect their tax character. Temporary differences arise when certain items of income, expense, gain, or loss are recognized in different periods for financial statement and tax purposes. These differences will reverse at some time in the future. Differences in classification may also result from the treatment of short-term gains as ordinary income for tax purposes.
During the six months ended February 28, 2018, the fund realized $41,212,000 of net capital gains resulting from in-kind redemptions—in which shareholders exchanged fund shares for securities held by the fund rather than for cash. Because such gains are not taxable to the fund, and are not distributed to shareholders, they have been reclassified from accumulated net realized losses to paid-in capital.
102
Telecommunication Services Index Fund
The fund’s tax-basis capital gains and losses are determined only at the end of each fiscal year. For tax purposes, at August 31, 2017, the fund had available capital losses totaling $58,483,000 to offset future net capital gains. Of this amount $37,793,000 is subject to expiration dates; $26,335,000 may be used to offset future net gains through August 31, 2018, and $11,458,000 through August 31, 2019. Capital losses of $20,690,000 realized beginning in fiscal 2012 may be carried forward indefinitely under the Regulated Investment Company Modernization Act of 2010, but must be used before any expiring loss carryforwards. The fund will use these capital losses to offset net taxable capital gains, if any, realized during the year ending August 31, 2018; should the fund realize net capital losses for the year, the losses will be added to the loss carryforward balance above.
At February 28, 2018, the cost of investment securities for tax purposes was $1,332,725,000. Net unrealized depreciation of investment securities for tax purposes was $175,900,000, consisting of unrealized gains of $45,373,000 on securities that had risen in value since their purchase and $221,273,000, in unrealized losses on securities that had fallen in value since their purchase.
E. During the six months ended February 28, 2018, the fund purchased $366,583,000 of investment securities and sold $609,425,000 of investment securities, other than temporary cash investments. Purchases and sales include $189,117,000 and $451,084,000, respectively, in connection with in-kind purchases and redemptions of the fund’s capital shares.
| | | | |
| F. Capital share transactions for each class of shares were: | | | |
| Six Months Ended | | Year Ended |
| February 28, 2018 | August 31, 2017 |
| Amount | Shares | Amount | Shares |
| ($000) | (000) | ($000) | (000) |
| ETF Shares | | | | |
| Issued | 221,958 | 2,425 | 449,451 | 4,627 |
| Issued in Lieu of Cash Distributions | — | — | — | — |
| Redeemed | (451,432) | (5,050) | (512,390) | (5,375) |
| Net Increase (Decrease)—ETF Shares | (229,474) | (2,625) | (62,939) | (748) |
| Admiral Shares | | | | |
| Issued | 17,633 | 385 | 38,492 | 787 |
| Issued in Lieu of Cash Distributions | 883 | 19 | 1,734 | 36 |
| Redeemed | (20,278) | (440) | (53,602) | (1,106) |
| Net Increase (Decrease)—Admiral Shares | (1,762) | (36) | (13,376) | (283) |
G. Certain of the fund’s investments are in companies that are considered to be affiliated companies of the fund because the fund owns more than 5% of the outstanding voting securities of the company or the issuer is another member of The Vanguard Group. Transactions during the period in securities of these companies were as follows:
| | | | | | | | |
| | | Current Period Transactions | |
| Aug. 31, | | Proceeds | Net | Change | | | Feb. 28, |
| 2017 | | from | Realized | in Net | | Capital Gain | 2018 |
| Market | Purchases | Securities | Gain | Unrealized | | Distributions | Market |
| Value | at Cost | Sold | (Loss) | App. (Dep.) | Income | Received | Value |
| ($000) | ($000) | ($000) | ($000) | ($000) | ($000) | ($000) | ($000) |
| Lumos Networks Corp. | 28,619 | 3,417 | 32,064 | 4,960 | (4,932) | — | — | — |
| NII Holding Inc. | 8,079 | 791 | 4,764 | (32,770) | 28,664 | — | — | — |
| pdvWireless Inc. | 30,239 | 6,314 | 13,750 | 1,248 | 1,509 | — | — | 25,560 |
| Spok Holdings Inc. | 22,059 | 8,303 | 7,259 | (378) | (1,352) | 162 | — | 21,373 |
| Vanguard Market | | | | | | | | |
| Liquidity Fund | 59,268 | NA1 | NA1 | (5) | (12) | 15 | — | 63,001 |
| Windstream | | | | | | | | |
| Holdings Inc. | 20,284 | 1,243 | 3,138 | (8,274) | 3,960 | — | — | NA2 |
| Total | 168,548 | | (35,219) | 27,837 | 177 | — | 109,934 |
1 Not applicable—purchases and sales are for temporary cash investment purposes.
2 Not applicable—at February 28, 2018, the security was still held, but the issuer was no longer an affiliated company of the fund.
H. Management has determined that no material events or transactions occurred subsequent to February 28, 2018, that would require recognition or disclosure in these financial statements.
103
| | |
| Utilities Index Fund | |
| |
| |
| Fund Profile | | |
| As of February 28, 2018 | | |
| |
| Share-Class Characteristics | | |
| ETF | Admiral |
| Shares | Shares |
| Ticker Symbol | VPU | VUIAX |
| Expense Ratio1 | 0.10% | 0.10% |
| 30-Day SEC Yield | 3.54% | 3.54% |
| | | |
| Portfolio Characteristics | | |
| MSCI | |
| US IMI/ | MSCI |
| Utilities | US IMI/ |
| Fund | 25/50 | 2500 |
| Number of Stocks | 76 | 76 | 2,469 |
| Median Market Cap | $22.0B | $22.0B | $68.2B |
| Price/Earnings Ratio | 17.4x | 17.4x | 21.9x |
| Price/Book Ratio | 1.8x | 1.8x | 3.1x |
| Return on Equity | 9.1% | 9.1% | 15.0% |
| Earnings Growth Rate | 6.9% | 6.9% | 8.5% |
| Dividend Yield | 3.6% | 3.6% | 1.8% |
| Foreign Holdings | 0.0% | 0.0% | 0.0% |
| Turnover Rate | | | |
| (Annualized) | 3% | — | — |
| Short-Term Reserves | 0.0% | — | — |
| | |
| Volatility Measures | | |
| MSCI US | |
| IMI/Utilities | MSCI US |
| 25/50 | IMI/2500 |
| R-Squared | 1.00 | 0.04 |
| Beta | 1.00 | 0.24 |
These measures show the degree and timing of the fund’s
fluctuations compared with the indexes over 36 months.
| |
| Subindustry Diversification | |
| (% of equity exposure) | |
| Electric Utilities | 56.4% |
| Gas Utilities | 5.5 |
| Independent Power Producers | |
| & Energy Traders | 3.8 |
| Multi-Utilities | 29.9 |
| Renewable Electricity | 0.9 |
| Water Utilities | 3.5 |
Sector categories are based on the Global Industry
Classification Standard (“GICS”), except for the “Other”
category (if applicable), which includes securities that have
not been provided a GICS classification as of the effective
reporting period.
| | |
| Ten Largest Holdings (% of total net assets) |
| NextEra Energy Inc. | Electric Utilities | 9.5% |
| Duke Energy Corp. | Electric Utilities | 7.0 |
| Dominion Resources Inc. | Multi-Utilities | 6.3 |
| Southern Co. | Electric Utilities | 5.7 |
| Exelon Corp. | Electric Utilities | 4.7 |
| American Electric | | |
| Power Co. Inc. | Electric Utilities | 4.3 |
| Sempra Energy | Multi-Utilities | 3.4 |
| Public Service Enterprise | | |
| Group Inc. | Multi-Utilities | 3.2 |
| Consolidated Edison Inc. | Multi-Utilities | 3.1 |
| Xcel Energy Inc. | Electric Utilities | 2.9 |
| Top Ten | 50.1% |
The holdings listed exclude any temporary cash investments and equity index products.
1 The expense ratios shown are from the prospectus dated December 21, 2017, and represent estimated costs for the current fiscal year. For the six months ended February 28, 2018, the annualized expense ratios
were 0.10% for ETF Shares and 0.10% for Admiral Shares.
104
Utilities Index Fund
Performance Summary
All of the returns in this report represent past performance, which is not a guarantee of future results that may be achieved by the fund. (Current performance may be lower or higher than the performance data cited. For performance data current to the most recent month-end, visit our website at vanguard.com/performance.) Note, too, that both investment returns and principal value can fluctuate widely, so an investor’s shares, when sold, could be worth more or less than their original cost. The returns shown do not reflect taxes that a shareholder would pay on fund distributions or on the sale of fund shares.
Fiscal-Year Total Returns (%): August 31, 2007–February 28, 2018
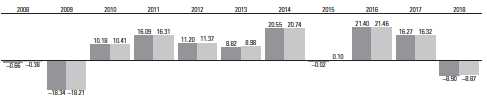
| |
| Utilities Index Fund ETF Shares Net Asset Value |
| Spliced US IMI/Utilities 25/50 |
| For a benchmark description, see the Glossary. |
| Note: For 2018, performance data reflect the six months ended February 28, 2018. |
Average Annual Total Returns: Periods Ended December 31, 2017
This table presents returns through the latest calendar quarter—rather than through the end of the fiscal period.
Securities and Exchange Commission rules require that we provide this information.
| | | | |
| Inception Date | One Year | Five Years | Ten Years |
| ETF Shares | 1/26/2004 | | | |
| Market Price | | 12.50% | 12.92% | 6.69% |
| Net Asset Value | | 12.51 | 12.92 | 6.67 |
| Admiral Shares | 4/28/2004 | 12.50 | 12.92 | 6.67 |
See Financial Highlights for dividend and capital gains information.
105
Utilities Index Fund
Financial Statements (unaudited)
Statement of Net Assets
As of February 28, 2018
The fund reports a complete list of its holdings in regulatory filings four times in each fiscal year, at the quarter-ends. For the second and fourth fiscal quarters, the lists appear in the fund’s semiannual and annual reports to shareholders. For the first and third fiscal quarters, the fund files the lists with the Securities and Exchange Commission on Form N-Q. Shareholders can look up the fund’s Forms N-Q on the SEC’s website at sec.gov. Forms N-Q may also be reviewed and copied at the SEC’s Public Reference Room (see the back cover of this report for further information).
| | | |
| Market |
| Value• |
| | Shares | ($000) |
| Common Stocks (100.0%) | | |
| Electric Utilities (56.4%) | | |
| NextEra Energy Inc. | 2,004,914 | 305,048 |
| Duke Energy Corp. | 2,983,240 | 224,757 |
| Southern Co. | 4,277,452 | 184,187 |
| Exelon Corp. | 4,092,155 | 151,573 |
| American Electric Power | | |
| | Co. Inc. | 2,096,283 | 137,474 |
| Xcel Energy Inc. | 2,163,550 | 93,638 |
| PG&E Corp. | 2,192,982 | 90,110 |
| Edison International | 1,388,906 | 84,154 |
| PPL Corp. | 2,934,578 | 84,076 |
| Eversource Energy | 1,350,728 | 76,992 |
| FirstEnergy Corp. | 1,896,054 | 61,299 |
| Entergy Corp. | 768,374 | 58,258 |
| Alliant Energy Corp. | 985,121 | 38,075 |
| Pinnacle West Capital | | |
| | Corp. | 476,333 | 36,659 |
| Westar Energy Inc. | | |
| | Class A | 605,619 | 29,512 |
| Great Plains Energy Inc. | 919,175 | 26,794 |
| OGE Energy Corp. | 851,759 | 26,694 |
| IDACORP Inc. | 214,720 | 17,403 |
| Hawaiian Electric | | |
| | Industries Inc. | 463,829 | 15,288 |
| Portland General Electric | | |
| | Co. | 379,852 | 15,092 |
| ALLETE Inc. | 217,568 | 14,827 |
| Avangrid Inc. | 263,608 | 12,790 |
| PNM Resources Inc. | 339,676 | 11,957 |
| El Paso Electric Co. | 172,991 | 8,407 |
| MGE Energy Inc. | 147,993 | 7,770 |
| Otter Tail Corp. | 151,738 | 6,039 |
| Spark Energy Inc. Class A | 50,789 | 472 |
| 1,819,345 |
| Gas Utilities (5.5%) | | |
| Atmos Energy Corp. | 453,423 | 36,496 |
| UGI Corp. | 739,246 | 31,854 |
| WGL Holdings Inc. | 219,057 | 18,239 |
| National Fuel Gas Co. | 317,629 | 15,700 |
| ONE Gas Inc. | 223,749 | 14,228 |
| New Jersey Resources | | |
| | Corp. | 371,621 | 14,159 |
| Spire Inc. | 206,189 | 13,980 |
| Southwest Gas Holdings | | |
| | Inc. | 204,005 | 13,440 |
| South Jersey Industries | | |
| | Inc. | 340,532 | 8,925 |
| Northwest Natural Gas Co. | 122,724 | 6,400 |
| Chesapeake Utilities Corp. | 66,491 | 4,432 |
| 177,853 |
| Independent Power and Renewable | |
| Electricity Producers (4.7%) | | |
| NRG Energy Inc. | 1,349,631 | 34,902 |
| AES Corp. | 2,815,369 | 30,603 |
| * | Calpine Corp. | 1,536,081 | 23,379 |
| * | Vistra Energy Corp. | 1,095,647 | 20,763 |
| | | |
| Market |
| Value• |
| | Shares | ($000) |
| Ormat Technologies Inc. | 161,854 | 10,129 |
| NextEra Energy Partners | | |
| | LP | 231,377 | 9,079 |
| Pattern Energy Group Inc. | | |
| | Class A | 354,088 | 6,575 |
| * | Dynegy Inc. | 531,991 | 6,506 |
| NRG Yield Inc. | 274,984 | 4,304 |
| NRG Yield Inc. Class A | 149,421 | 2,298 |
| TerraForm Power Inc. | | |
| | Class A | 155,973 | 1,795 |
| 8Point3 Energy Partners | | |
| | LP Class A | 120,598 | 1,465 |
| 151,798 |
| Multi-Utilities (29.9%) | | |
| Dominion Energy Inc. | 2,742,753 | 203,156 |
| Sempra Energy | 1,016,682 | 110,798 |
| Public Service Enterprise | | |
| | Group Inc. | 2,157,021 | 104,465 |
| Consolidated Edison Inc. | 1,321,670 | 98,980 |
| WEC Energy Group Inc. | 1,345,028 | 80,594 |
| DTE Energy Co. | 764,678 | 77,064 |
| Ameren Corp. | 1,034,146 | 56,154 |
| CMS Energy Corp. | 1,201,929 | 51,022 |
| CenterPoint Energy Inc. | 1,746,463 | 47,242 |
| NiSource Inc. | 1,435,769 | 33,209 |
| SCANA Corp. | 577,638 | 22,915 |
| Vectren Corp. | 353,613 | 21,305 |
| MDU Resources Group Inc. | 791,102 | 20,798 |
| Avista Corp. | 274,382 | 13,124 |
| Black Hills Corp. | 228,122 | 11,586 |
| NorthWestern Corp. | 207,359 | 10,592 |
| Unitil Corp. | 60,230 | 2,532 |
| 965,536 |
| Water Utilities (3.5%) | | |
| American Water Works | | |
| | Co. Inc. | 760,455 | 60,350 |
| Aqua America Inc. | 757,592 | 25,902 |
| American States Water Co. | 156,684 | 8,323 |
| California Water Service | | |
| | Group | 204,658 | 7,767 |
| SJW Group | 65,645 | 3,475 |
| Connecticut Water Service | | |
| | Inc. | 51,354 | 2,651 |
| Middlesex Water Co. | 69,778 | 2,473 |
| York Water Co. | 54,884 | 1,542 |
| * | AquaVenture Holdings Ltd. | 67,020 | 861 |
| 113,344 |
| Total Common Stocks | | |
| (Cost $3,293,292) | 3,227,876 |
| Temporary Cash Investment (0.0%) | |
| Money Market Fund (0.0%) | | |
| 1 | Vanguard Market Liquidity | | |
| | Fund, 1.601% | | |
| | (Cost $1) | 8 | 1 |
| Total Investments (100.0%) | | |
| (Cost $3,293,293) | 3,227,877 |
| |
| Amount |
| ($000) |
| Other Assets and Liabilities (0.0%) | |
| Other Assets | |
| Investment in Vanguard | 177 |
| Receivables for Investment | |
| Securities Sold | 2,965 |
| Receivables for Accrued Income | 16,096 |
| Receivables for Capital Shares Issued | 5,467 |
| Total Other Assets | 24,705 |
| Liabilities | |
| Payables for Investment | |
| Securities Purchased | (8,637) |
| Payables for Capital Shares Redeemed | (1,047) |
| Payables to Vanguard | (1,318) |
| Other Liabilities | (14,083) |
| Total Liabilities | (25,085) |
| Net Assets (100%) 3,227,497 |
| |
| |
| At February 28, 2018, net assets consisted of: |
| Amount |
| ($000) |
| Paid-in Capital | 3,292,510 |
| Undistributed Net Investment Income | 17,548 |
| Accumulated Net Realized Losses | (17,145) |
| Unrealized Appreciation (Depreciation) | (65,416) |
| Net Assets | 3,227,497 |
| |
| ETF Shares—Net Assets | |
| Applicable to 22,744,069 outstanding | |
| $.001 par value shares of beneficial | |
| interest (unlimited authorization) | 2,462,317 |
| Net Asset Value Per Share— | |
| ETF Shares $108.26 |
| |
| Admiral Shares—Net Assets | |
| Applicable to 14,087,671 outstanding | |
| $.001 par value shares of beneficial | |
| interest (unlimited authorization) | 765,180 |
| Net Asset Value Per Share— | |
| Admiral Shares $54.32 |
• See Note A in Notes to Financial Statements.
* Non-income-producing security.
1 Affiliated money market fund available only to Vanguard funds
and certain trusts and accounts managed by Vanguard. Rate
shown is the 7-day yield.
See accompanying Notes, which are an integral part of the Financial Statements.
106
Utilities Index Fund
Statement of Operations
| | | |
| Six Months Ended |
| February 28, 2018 |
| | ($000) |
| Investment Income | | |
| Income | | |
| Dividends | 55,821 |
| Interest1 | 5 |
| Securities Lending—Net | 14 |
| Total Income | 55,840 |
| Expenses | | |
| The Vanguard Group—Note B | | |
| Investment Advisory Services | 432 |
| Management and Administrative— | |
| ETF Shares | 739 |
| Management and Administrative— | |
| Admiral Shares | 256 |
| Marketing and Distribution— | | |
| ETF Shares | 80 |
| Marketing and Distribution— | | |
| Admiral Shares | 32 |
| Custodian Fees | 60 |
| Shareholders’ Reports and Proxy— | |
| ETF Shares | 122 |
| Shareholders’ Reports and Proxy— | |
| Admiral Shares | 10 |
| Trustees’ Fees and Expenses | 1 |
| Total Expenses | 1,732 |
| Net Investment Income | 54,108 |
| Realized Net Gain (Loss) | | |
| Investment Securities Sold1 | 66,967 |
| Futures Contracts | (8) |
| Realized Net Gain (Loss) | 66,959 |
| Change in Unrealized Appreciation | |
| (Depreciation) of Investment Securities1 (441,345) |
| Net Increase (Decrease) in Net Assets | |
| Resulting from Operations | | (320,278) |
1 Interest income, realized net gain (loss), and change in unrealized
appreciation (depreciation)from an affiliated company of the
fund were $5,000, $1,000, and ($1,000), respectively. Purchases
and sales are for temporary cash investment purposes.
| | | | |
| Statement of Changes in Net Assets | | | |
| |
| Six Months Ended | Year Ended |
| | February 28, | August 31, |
| | 2018 | 2017 |
| ($000) | ($000) |
| Increase (Decrease) in Net Assets | | | |
| Operations | | | |
| Net Investment Income | | 54,108 | 102,679 |
| Realized Net Gain (Loss) | | 66,959 | 114,940 |
| Change in Unrealized Appreciation (Depreciation) | | (441,345) | 249,599 |
| Net Increase (Decrease) in Net Assets Resulting from Operations | | (320,278) | 467,218 |
| Distributions | | | |
| Net Investment Income | | | |
| ETF Shares | | (43,556) | (77,123) |
| Admiral Shares | | (13,498) | (23,989) |
| Realized Capital Gain | | | |
| ETF Shares | | — | — |
| Admiral Shares | | — | — |
| Total Distributions | | (57,054) | (101,112) |
| Capital Share Transactions | | | |
| ETF Shares | | 61,099 | 161,163 |
| Admiral Shares | | 9,409 | 54,037 |
| Net Increase (Decrease) from Capital Share Transactions | | 70,508 | 215,200 |
| Total Increase (Decrease) | | (306,824) | 581,306 |
| Net Assets |
| Beginning of Period | | 3,534,321 | 2,953,015 |
| End of Period1 | | 3,227,497 | 3,534,321 |
| 1 Net Assets—End of Period includes undistributed (overdistributed) net investment income of $17,548,000 and $20,494,000. | |
See accompanying Notes, which are an integral part of the Financial Statements.
107
| | | | | | | |
| Utilities Index Fund | | | | | | | |
| |
| |
| Financial Highlights | | | | | |
| |
| ETF Shares | | | | | | | |
| Six Months | | | | | |
| | Ended | | | | | |
| For a Share Outstanding | February 28, | | | Year Ended August 31, |
| Throughout Each Period | 2018 | 2018 | 2017 | 2015 | 2014 | 2013 |
| Net Asset Value, Beginning of Period | $120.75 | $107.35 | $91.41 | $94.61 | $81.32 | $77.69 |
| Investment Operations | |
| Net Investment Income | | 1.8211 | 3.6971 | 3.355 | 3.337 | 3.127 | 3.043 |
| Net Realized and Unrealized Gain (Loss) | | | | | | |
| on Investments | | (12.413) | 13.374 | 15.889 | (3.261) | 13.261 | 3.675 |
| Total from Investment Operations | | (10.592) | 17.071 | 19.244 | .076 | 16.388 | 6.718 |
| Distributions | |
| Dividends from Net Investment Income | (1.898) | (3.671) | (3.304) | (3.276) | (3.098) | (3.088) |
| Distributions from Realized Capital Gains | — | — | — | — | — | — |
| Total Distributions | | (1.898) | (3.671) | (3.304) | (3.276) | (3.098) | (3.088) |
| Net Asset Value, End of Period | | $108.26 | $120.75 | $107.35 | $91.41 | $94.61 | $81.32 |
| Total Return | | -8.90% | 16.27% | 21.40% | -0.02% | 20.55% | 8.82% |
| Ratios/Supplemental Data | |
| Net Assets, End of Period (Millions) | | $2,462 | $2,689 | $2,249 | $1,581 | $1,711 | $1,356 |
| Ratio of Total Expenses to | | | | | | | |
| Average Net Assets | | 0.10% | 0.10% | 0.10% | 0.10% | 0.12% | 0.14% |
| Ratio of Net Investment Income to | | | | | | | |
| Average Net Assets | | 3.13% | 3.33% | 3.38% | 3.39% | 3.59% | 3.72% |
| Portfolio Turnover Rate2 | | 3% | 4% | 3% | 7% | 7% | 7% |
The expense ratio, net investment income ratio, and turnover rate for the current period have been annualized.
1 Calculated based on average shares outstanding.
2 Excludes the value of portfolio securities received or delivered as a result of in-kind purchases or redemptions of the fund’s capital shares,
including ETF Creation Units.
See accompanying Notes, which are an integral part of the Financial Statements.
108
| | | | | | | |
| Utilities Index Fund | | | | | | | |
| |
| |
| Financial Highlights | | | | | |
| |
| Admiral Shares | | | | | | | |
| Six Months | | | | | |
| | Ended | | | | | |
| For a Share Outstanding | February 28, | | | Year Ended August 31, |
| Throughout Each Period | 2018 | 2017 | 2016 | 2015 | 2014 | 2013 |
| Net Asset Value, Beginning of Period | $60.58 | $53.86 | $45.86 | $47.47 | $40.80 | $38.99 |
| Investment Operations | |
| Net Investment Income | | . 9111 | 1.8631 | 1.683 | 1.676 | 1.569 | 1.529 |
| Net Realized and Unrealized Gain (Loss) | | | | | | |
| on Investments | | (6.218) | 6.698 | 7.974 | (1.641) | 6.656 | 1.838 |
| Total from Investment Operations | | (5.307) | 8.561 | 9.657 | .035 | 8.225 | 3.367 |
| Distributions | |
| Dividends from Net Investment Income | (.953) | (1.841) | (1.657) | (1.645) | (1.555) | (1.557) |
| Distributions from Realized Capital Gains | — | — | — | — | — | — |
| Total Distributions | | (.953) | (1.841) | (1.657) | (1.645) | (1.555) | (1.557) |
| Net Asset Value, End of Period | | $54.32 | $60.58 | $53.86 | $45.86 | $47.47 | $40.80 |
| Total Return2 | | -8.90% | 16.24% | 21.42% | -0.01% | 20.58% | 8.83% |
| Ratios/Supplemental Data | |
| Net Assets, End of Period (Millions) | | $765 | $845 | $704 | $447 | $442 | $347 |
| Ratio of Total Expenses to | | | | | | | |
| Average Net Assets | | 0.10% | 0.10% | 0.10% | 0.10% | 0.12% | 0.14% |
| Ratio of Net Investment Income to | | | | | | | |
| Average Net Assets | | 3.13% | 3.33% | 3.38% | 3.39% | 3.59% | 3.72% |
| Portfolio Turnover Rate3 | | 3% | 4% | 3% | 7% | 7% | 7% |
The expense ratio, net investment income ratio, and turnover rate for the current period have been annualized.
1 Calculated based on average shares outstanding.
2 Total returns do not include account service fees that may have applied in the periods shown. Fund prospectuses provide information about
any applicable account service fees.
3 Excludes the value of portfolio securities received or delivered as a result of in-kind purchases or redemptions of the fund’s capital shares,
including ETF Creation Units.
See accompanying Notes, which are an integral part of the Financial Statements.
109
Utilities Index Fund
Notes to Financial Statements
Vanguard Utilities Index Fund is registered under the Investment Company Act of 1940 as an open-end investment company, or mutual fund. The fund offers two classes of shares: ETF Shares and Admiral Shares. ETF Shares are listed for trading on NYSE Arca; they can be purchased and sold through a broker. Admiral Shares are designed for investors who meet certain administrative, service, and account-size criteria.
A. The following significant accounting policies conform to generally accepted accounting principles for U.S. investment companies. The fund consistently follows such policies in preparing its financial statements.
1. Security Valuation: Securities are valued as of the close of trading on the New York Stock Exchange (generally 4 p.m., Eastern time) on the valuation date. Equity securities are valued at the latest quoted sales prices or official closing prices taken from the primary market in which each security trades; such securities not traded on the valuation date are valued at the mean of the latest quoted bid and asked prices. Securities for which market quotations are not readily available, or whose values have been materially affected by events occurring before the fund’s pricing time but after the close of the securities’ primary markets, are valued by methods deemed by the board of trustees to represent fair value. Investments in Vanguard Market Liquidity Fund are valued at that fund’s net asset value.
2. Futures Contracts: The fund uses index futures contracts to a limited extent, with the objectives of maintaining full exposure to the stock market, maintaining liquidity, and minimizing transaction costs. The fund may purchase futures contracts to immediately invest incoming cash in the market, or sell futures in response to cash outflows, thereby simulating a fully invested position in the underlying index while maintaining a cash balance for liquidity. The primary risks associated with the use of futures contracts are imperfect correlation between changes in market values of stocks held by the fund and the prices of futures contracts, and the possibility of an illiquid market. Counterparty risk involving futures is mitigated because a regulated clearinghouse is the counterparty instead of the clearing broker. To further mitigate counterparty risk, the fund trades futures contracts on an exchange, monitors the financial strength of its clearing brokers and clearinghouse, and has entered into clearing agreements with its clearing brokers. The clearinghouse imposes initial margin requirements to secure the fund’s performance and requires daily settlement of variation margin representing changes in the market value of each contract.
Futures contracts are valued at their quoted daily settlement prices. The notional amounts of the contracts are not recorded in the Statement of Net Assets. Fluctuations in the value of the contracts are recorded in the Statement of Net Assets as an asset (liability) and in the Statement of Operations as unrealized appreciation (depreciation) until the contracts are closed, when they are recorded as realized futures gains (losses).
During the six months ended February 28, 2018, the fund’s average investments in long and short futures contracts represented less than 1% and 0% of net assets, respectively, based on the average of the notional amounts at each quarter-end during the period. The fund had no open futures contracts at February 28, 2018.
3. Federal Income Taxes: The fund intends to continue to qualify as a regulated investment company and distribute all of its taxable income. Management has analyzed the fund’s tax positions taken for all open federal income tax years (August 31, 2014–2017), and for the period ended February 28, 2018, and has concluded that no provision for federal income tax is required in the fund’s financial statements. 4. Distributions: Distributions to shareholders are recorded on the ex-dividend date.
5. Securities Lending: To earn additional income, the fund lends its securities to qualified institutional borrowers. Security loans are subject to termination by the fund at any time, and are required to be secured at all times by collateral in an amount at least equal to the market value of securities loaned. Daily market fluctuations could cause the value of loaned securities to be more or less than the value of the collateral received. When this occurs, the collateral is adjusted and settled on the next business day. The fund further mitigates its counterparty risk by entering into securities lending transactions only with a diverse group of prequalified counterparties, monitoring their financial strength, and entering into master securities lending agreements with its counterparties. The master securities lending agreements provide that, in the event of a counterparty’s default (including bankruptcy), the fund may terminate any loans with that borrower, determine the net amount owed, and sell or retain the collateral up to the net amount owed to the fund; however, such actions may be subject to legal proceedings. While collateral mitigates counterparty risk, in the event of a default, the fund may experience delays and costs in recovering the securities loaned. The fund invests cash collateral received in Vanguard Market Liquidity Fund, and records a liability in the Statement of Net Assets for the return of the collateral, during the period the securities are on loan. Securities lending income
110
Utilities Index Fund
represents fees charged to borrowers plus income earned on invested cash collateral, less expenses associated with the loan. During the term of the loan, the fund is entitled to all distributions made on or in respect of the loaned securities.
6. Credit Facility: The fund and certain other funds managed by The Vanguard Group (“Vanguard”) participate in a $3.1 billion committed credit facility provided by a syndicate of lenders pursuant to a credit agreement that may be renewed annually; each fund is individually liable for its borrowings, if any, under the credit facility. Borrowings may be utilized for temporary and emergency purposes, and are subject to the fund’s regulatory and contractual borrowing restrictions. The participating funds are charged administrative fees and an annual commitment fee of 0.10% of the undrawn amount of the facility; these fees are allocated to the funds based on a method approved by the fund’s board of trustees and included in Management and Administrative expenses on the fund’s Statement of Operations. Any borrowings under this facility bear interest at a rate based upon the higher of the one-month London Interbank Offered Rate, federal funds effective rate, or overnight bank funding rate plus an agreed-upon spread.
The fund had no borrowings outstanding at February 28, 2018, or at any time during the period then ended.
7. Other: Dividend income is recorded on the ex-dividend date. Interest income includes income distributions received from Vanguard Market Liquidity Fund and is accrued daily. Security transactions are accounted for on the date securities are bought or sold. Costs used to determine realized gains (losses) on the sale of investment securities are those of the specific securities sold.
Each class of shares has equal rights as to assets and earnings, except that each class separately bears certain class-specific expenses related to maintenance of shareholder accounts (included in Management and Administrative expenses), shareholder reporting, and the proxy. Marketing and distribution expenses are allocated to each class of shares based on a method approved by the board of trustees. Income, other non-class-specific expenses, and gains and losses on investments are allocated to each class of shares based on its relative net assets.
B. In accordance with the terms of a Funds’ Service Agreement (the “FSA”) between Vanguard and the fund, Vanguard furnishes to the fund investment advisory, corporate management, administrative, marketing, and distribution services at Vanguard’s cost of operations (as defined by the FSA). These costs of operations are allocated to the fund based on methods and guidelines approved by the board of trustees. Vanguard does not require reimbursement in the current period for certain costs of operations (such as deferred compensation/benefits and risk/insurance costs); the fund’s liability for these costs of operations is included in Payables to Vanguard on the Statement of Net Assets. All other costs of operations payable to Vanguard are generally settled twice a month.
Upon the request of Vanguard, the fund may invest up to 0.40% of its net assets as capital in Vanguard. At February 28, 2018, the fund had contributed to Vanguard capital in the amount of $177,000 representing 0.01% of the fund’s net assets and 0.07% of Vanguard’s capitalization. The fund’s trustees and officers are also directors and employees, respectively, of Vanguard.
C. Various inputs may be used to determine the value of the fund’s investments. These inputs are summarized in three broad levels for financial statement purposes. The inputs or methodologies used to value securities are not necessarily an indication of the risk associated with investing in those securities.
Level 1—Quoted prices in active markets for identical securities.
Level 2—Other significant observable inputs (including quoted prices for similar securities, interest
rates, prepayment speeds, credit risk, etc.).
Level 3—Significant unobservable inputs (including the fund’s own assumptions used to determine
the fair value of investments). Any investments valued with significant unobservable inputs are noted
on the Statement of Net Assets.
At February 28, 2018, 100% of the market value of the fund’s investments was determined based on Level 1 inputs.
D. Distributions are determined on a tax basis and may differ from net investment income and realized capital gains for financial reporting purposes. Differences may be permanent or temporary. Permanent differences are reclassified among capital accounts in the financial statements to reflect their tax character. Temporary differences arise when certain items of income, expense, gain, or loss are recognized in different periods for financial statement and tax purposes. These differences will reverse at some time in the future. Differences in classification may also result from the treatment of short-term gains as ordinary income for tax purposes.
111
Utilities Index Fund
During the six months ended February 28, 2018, the fund realized $68,551,000 of net capital gains resulting from in-kind redemptions—in which shareholders exchanged fund shares for securities held by the fund rather than for cash. Because such gains are not taxable to the fund, and are not distributed to shareholders, they have been reclassified from accumulated net realized losses to paid-in capital.
The fund’s tax-basis capital gains and losses are determined only at the end of each fiscal year. For tax purposes, at August 31, 2017, the fund had available capital losses totaling $15,553,000 to offset future net capital gains. Of this amount, $6,018,000 is subject to expiration dates; $2,655,000 may be used to offset future net capital gains through August 31, 2018, and $3,363,000 through August 31, 2019. Capital losses of $9,535,000 realized beginning in fiscal 2012 may be carried forward indefinitely under the Regulated Investment Company Modernization Act of 2010, but must be used before any expiring loss carryforwards.The fund will use these capital losses to offset net taxable capital gains, if any, realized during the year ending August 31, 2018; should the fund realize net capital losses for the year, the losses will be added to the loss carryforward balance above.
At February 28, 2018, the cost of investment securities for tax purposes was $3,293,293,000. Net unrealized depreciation of investment securities for tax purposes was $65,416,000, consisting of unrealized gains of $155,110,000 on securities that had risen in value since their purchase and $220,526,000 in unrealized losses on securities that had fallen in value since their purchase.
E. During the six months ended February 28, 2018, the fund purchased $483,229,000 of investment securities and sold $415,310,000 of investment securities, other than temporary cash investments. Purchases and sales include $374,263,000 and $359,403,000, respectively, in connection with in-kind purchases and redemptions of the fund’s capital shares.
| | | | |
| F. Capital share transactions for each class of shares were: | | | |
| Six Months Ended | | Year Ended |
| February 28, 2018 | August 31, 2017 |
| Amount | Shares | Amount | Shares |
| ($000) | (000) | ($000) | (000) |
| ETF Shares | | | | |
| Issued | 422,533 | 3,600 | 666,769 | 5,969 |
| Issued in Lieu of Cash Distributions | — | — | — | — |
| Redeemed | (361,434) | (3,125) | (505,606) | (4,650) |
| Net Increase (Decrease)—ETF Shares | 61,099 | 475 | 161,163 | 1,319 |
| Admiral Shares | | | | |
| Issued | 132,437 | 2,270 | 244,803 | 4,399 |
| Issued in Lieu of Cash Distributions | 10,818 | 181 | 19,033 | 342 |
| Redeemed | (133,846) | (2,315) | (209,799) | (3,860) |
| Net Increase (Decrease)—Admiral Shares | 9,409 | 136 | 54,037 | 881 |
G. Management has determined that no material events or transactions occurred subsequent to February 28, 2018, that would require recognition or disclosure in these financial statements.
112
About Your Fund’s Expenses
As a shareholder of the fund, you incur ongoing costs, which include costs for portfolio management, administrative services, and shareholder reports (like this one), among others. Operating expenses, which are deducted from a fund’s gross income, directly reduce the investment return of the fund.
A fund’s expenses are expressed as a percentage of its average net assets. This figure is known as the expense ratio. The following examples are intended to help you understand the ongoing costs (in dollars) of investing in your fund and to compare these costs with those of other mutual funds. The examples are based on an investment of $1,000 made at the beginning of the period shown and held for the entire period.
The accompanying table illustrates your fund’s costs in two ways:
• Based on actual fund return. This section helps you to estimate the actual expenses that you paid over the period. The “Ending Account Value” shown is derived from the fund’s actual return, and the third column shows the dollar amount that would have been paid by an investor who started with $1,000 in the fund. You may use the information here, together with the amount you invested, to estimate the expenses that you paid over the period.
To do so, simply divide your account value by $1,000 (for example, an $8,600 account value divided by $1,000 = 8.6), then multiply the result by the number given for your fund under the heading “Expenses Paid During Period.”
• Based on hypothetical 5% yearly return. This section is intended to help you compare your fund’s costs with those of other mutual funds. It assumes that the fund had a yearly return of 5% before expenses, but that the expense ratio is unchanged. In this case—because the return used is not the fund’s actual return—the results do not apply to your investment. The example is useful in making comparisons because the Securities and Exchange Commission requires all mutual funds to calculate expenses based on a 5% return. You can assess your fund’s costs by comparing this hypothetical example with the hypothetical examples that appear in shareholder reports of other funds.
Note that the expenses shown in the table are meant to highlight and help you compare ongoing costs only and do not reflect transaction costs incurred by the fund for buying and selling securities. Further, the expenses do not include any purchase, redemption, or account service fees described in the fund prospectus. If such fees were applied to your account, your costs would be higher. Your fund does not carry a “sales load.” The calculations assume no shares were bought or sold during the period. Your actual costs may have been higher or lower, depending on the amount of your investment and the timing of any purchases or redemptions.
You can find more information about the fund’s expenses in the Financial Statements section of this report. For additional information on operating expenses and other shareholder costs, please refer to your fund’s current prospectus.
113
| | | | |
| Six Months Ended February 28, 2018 | | | | |
| Beginning | Ending | Expenses |
| Account Value | Account Value | Paid During |
| Index Fund | Share Class | 8/31/2017 | 2/28/2018 | Period1 |
| Based on Actual Fund Return | |
| Consumer Discretionary | ETF | $1,000.00 | $1,155.89 | $0.53 |
| Admiral | 1,000.00 | 1,156.01 | 0.53 |
| Consumer Staples | ETF | $1,000.00 | $993.93 | $0.49 |
| Admiral | 1,000.00 | 993.80 | 0.49 |
| Energy | ETF | $1,000.00 | $1,083.07 | $0.52 |
| Admiral | 1,000.00 | 1,083.12 | 0.52 |
| Financials | ETF | $1,000.00 | $1,168.12 | $0.54 |
| Admiral | 1,000.00 | 1,168.13 | 0.54 |
| Health Care | ETF | $1,000.00 | $1,051.36 | $0.51 |
| Admiral | 1,000.00 | 1,050.75 | 0.51 |
| Industrials | ETF | $1,000.00 | $1,116.69 | $0.52 |
| Admiral | 1,000.00 | 1,116.70 | 0.52 |
| Information Technology | ETF | $1,000.00 | $1,179.08 | $0.54 |
| Admiral | 1,000.00 | 1,179.14 | 0.54 |
| Materials | ETF | $1,000.00 | 1,089.15 | $0.52 |
| Admiral | 1,000.00 | 1,089.06 | 0.52 |
| Telecommunication Services | ETF | $1,000.00 | $948.35 | $0.48 |
| Admiral | 1,000.00 | 948.14 | 0.48 |
| Utilities | ETF | $1,000.00 | $910.98 | $0.47 |
| Admiral | 1,000.00 | 910.99 | 0.47 |
| Based on Hypothetical 5% Yearly Return | |
| Consumer Discretionary | ETF | $1,000.00 | $1,024.30 | $0.50 |
| Admiral | 1,000.00 | 1,024.30 | 0.50 |
| Consumer Staples | ETF | $1,000.00 | $1,024.30 | $0.50 |
| Admiral | 1,000.00 | 1,024.30 | 0.50 |
| Energy | ETF | $1,000.00 | $1,024.30 | $0.50 |
| Admiral | 1,000.00 | 1,024.30 | 0.50 |
| Financials | ETF | $1,000.00 | $1,024.30 | $0.50 |
| Admiral | 1,000.00 | 1,024.30 | 0.50 |
| Health Care | ETF | $1,000.00 | $1,024.30 | $0.50 |
| Admiral | 1,000.00 | 1,024.30 | 0.50 |
| Industrials | ETF | $1,000.00 | $1,024.30 | $0.50 |
| Admiral | 1,000.00 | 1,024.30 | 0.50 |
| Information Technology | ETF | $1,000.00 | $1,024.30 | $0.50 |
| Admiral | 1,000.00 | 1,024.30 | 0.50 |
| Materials | ETF | $1,000.00 | $1,024.30 | $0.50 |
| Admiral | 1,000.00 | 1,024.30 | 0.50 |
| Telecommunication Services | ETF | $1,000.00 | $1,024.30 | $0.50 |
| Admiral | 1,000.00 | 1,024.30 | 0.50 |
| Utilities | ETF | $1,000.00 | $1,024.30 | $0.50 |
| Admiral | 1,000.00 | 1,024.30 | 0.50 |
1 The calculations are based on expenses incurred in the most recent six-month period. The funds’ annualized six-month expense ratios for
that period are 0.10% for the Consumer Discretionary Index Fund ETF Shares and 0.10% for the Admiral Shares; 0.10% for the Consumer
Staples Index Fund ETF Shares and 0.10% for the Admiral Shares; 0.10% for the Energy Index Fund ETF Shares and 0.10% for the Admiral
Shares; 0.10% for the Financials Index Fund ETF Shares and 0.10% for the Admiral Shares; 0.10% for the Health Care Index Fund ETF Shares
and 0.10% for the Admiral Shares; 0.10% for the Industrials Index Fund ETF Shares and 0.10% for the Admiral Shares; 0.10% for the
Information Technology Index Fund ETF Shares and 0.10% for the Admiral Shares; 0.10% for the Materials Index Fund ETF Shares and
0.10% for the Admiral Shares; 0.10% for the Telecommunication Services Index Fund ETF Shares and 0.10% for the Admiral Shares; 0.10%
for the Utilities Index Fund ETF Shares and 0.10% for the Admiral Shares. The dollar amounts shown as “Expenses Paid” are equal to the
annualized expense ratio multiplied by the average account value over the period, multiplied by the number of days in the most recent
six-month period, then divided by the number of days in the most recent 12-month period (181/365).
114
Glossary
30-Day SEC Yield. A fund’s 30-day SEC yield is derived using a formula specified by the U.S. Securities and Exchange Commission. Under the formula, data related to the fund’s security holdings in the previous 30 days are used to calculate the fund’s hypothetical net income for that period, which is then annualized and divided by the fund’s estimated average net assets over the calculation period. For the purposes of this calculation, a security’s income is based on its current market yield to maturity (for bonds), its actual income (for asset-backed securities), or its projected dividend yield (for stocks). Because the SEC yield represents hypothetical annualized income, it will differ—at times significantly—from the fund’s actual experience. As a result, the fund’s income distributions may be higher or lower than implied by the SEC yield.
Beta. A measure of the magnitude of a fund’s past share-price fluctuations in relation to the ups and downs of a given market index. The index is assigned a beta of 1.00. Compared with a given index, a fund with a beta of 1.20 typically would have seen its share price rise or fall by 12% when the index rose or fell by 10%. For this report, beta is based on returns over the past 36 months for both the fund and the index. Note that a fund’s beta should be reviewed in conjunction with its R-squared (see definition below). The lower the R-squared, the less correlation there is between the fund and the index, and the less reliable beta is as an indicator of volatility.
Earnings Growth Rate. The average annual rate of growth in earnings over the past five years for the stocks now in a fund.
Equity Exposure. A measure that reflects a fund’s investments in stocks and stock futures. Any holdings in short-term reserves are excluded.
Expense Ratio. A fund’s total annual operating expenses expressed as a percentage of the fund’s average net assets. The expense ratio includes management administrative expenses, but does not include the transaction costs of buying and selling portfolio securities.
Foreign Holdings. The percentage of a fund represented by stocks or depositary receipts of companies based outside the United States.
Inception Date. The date on which the assets of a fund (or one of its share classes) are first invested in accordance with the fund’s investment objective. For funds with a subscription period, the inception date is the day after that period ends. Investment performance is measured from the inception date.
Median Market Cap. An indicator of the size of companies in which a fund invests; the midpoint of market capitalization (market price x shares outstanding) of a fund’s stocks, weighted by the proportion of the fund’s assets invested in each stock. Stocks representing half of the fund’s assets have market capitalizations above the median, and the rest are below it.
Price/Book Ratio. The share price of a stock divided by its net worth, or book value, per share. For a fund, the weighted average price/book ratio of the stocks it holds.
Price/Earnings Ratio. The ratio of a stock’s current price to its per-share earnings over the past year. For a fund, the weighted average P/E of the stocks it holds. P/E is an indicator of market expectations about corporate prospects; the higher the P/E, the greater the expectations for a company’s future growth.
R-Squared. A measure of how much of a fund’s past returns can be explained by the returns from the market in general, as measured by a given index. If a fund’s total returns were precisely synchronized with an index’s returns, its R-squared would be 1.00. If the fund’s returns bore no relationship to the index’s returns, its R-squared would be 0. For this report, R-squared is based on returns over the past 36 months for both the fund and the index.
Return on Equity. The annual average rate of return generated by a company during the past five years for each dollar of shareholder’s equity (net income divided by shareholder’s equity). For a fund, the weighted average return on equity for the companies whose stocks it holds.
Short-Term Reserves. The percentage of a fund invested in highly liquid, short-term securities that can be readily converted to cash.
Turnover Rate. An indication of the fund’s trading activity. Funds with high turnover rates incur higher transaction costs and may be more likely to distribute capital gains (which may be taxable to investors). The turnover rate excludes in-kind transactions, which have minimal impact on costs.
115
Benchmark Information
Spliced US IMI/Consumer Discretionary 25/50. MSCI US IMI/Consumer Discretionary through February 26, 2010; MSCI US IMI/Consumer Discretionary 25/50 thereafter.
Spliced US IMI/Consumer Staples 25/50. MSCI US IMI/Consumer Staples through February 26, 2010; MSCI US IMI/Consumer Staples 25/50 thereafter.
Spliced US IMI/Energy 25/50. MSCI US IMI/Energy through February 26, 2010; MSCI US IMI/Energy 25/50 thereafter.
Spliced US IMI/Financials 25/50. MSCI US IMI/Financials through February 26, 2010; MSCI US IMI/Financials 25/50 thereafter.
Spliced US IMI/Health Care 25/50. MSCI US IMI/Health Care through February 26, 2010; MSCI US IMI/Health Care 25/50 thereafter.
Spliced US IMI/Industrials 25/50. MSCI US IMI/Industrials through February 26, 2010; MSCI US IMI/Industrials 25/50 thereafter.
Spliced US IMI/Information Technology 25/50. MSCI US IMI/Information Technology Index through February 26, 2010; MSCI US IMI/Information Technology 25/50 Index thereafter.
Spliced US IMI/Materials 25/50. MSCI US IMI/Materials through February 26, 2010; MSCI US IMI/Materials 25/50 thereafter.
Spliced US IMI/Telecommunication Services 25/50. MSCI US IMI/Telecommunication Services through February 26, 2010; MSCI US IMI/Telecommunication Services 25/50 thereafter.
Spliced US IMI/Utilities 25/50. MSCI US IMI/Utilities through February 26, 2010; MSCI US IMI/Utilities 25/50 thereafter.
116
The Global Industry Classification Standard (“GICS”) was developed by and is the exclusive property and a service mark of MSCI Inc. (“MSCI”) and Standard and Poor’s, a division of McGraw-
Hill Companies, Inc. (“S&P”), and is licensed for use by Vanguard. Neither MSCI, S&P nor any third party involved in making or compiling the GICS or any GICS classification makes any express
or implied warranties or representations with respect to such standard or classification (or the results to be obtained by the use thereof), and all such parties hereby expressly disclaim all
warranties of originality, accuracy, completeness, merchantability or fitness for a particular purpose with respect to any such standard or classification. Without limiting any of the foregoing,
in no event shall MSCI, S&P, any of its affiliates or any third party involved in making or compiling the GICS or any GICS classification have any liability for any direct, indirect, special, punitive,
consequential or any other damages (including lost profits) even if notified of the possibility of such damages.
117
This page intentionally left blank.
This page intentionally left blank.
This page intentionally left blank.
This page intentionally left blank.
This page intentionally left blank.
This page intentionally left blank.
The People Who Govern Your Fund
The trustees of your mutual fund are there to see that the fund is operated and managed in your best interests since, as a shareholder, you are a part owner of the fund. Your fund’s trustees also serve on the board of directors of The Vanguard Group, Inc., which is owned by the Vanguard funds and provides services to them on an at-cost basis.
A majority of Vanguard’s board members are independent, meaning that they have no affiliation with Vanguard or the funds they oversee, apart from the sizable personal investments they have made as private individuals. The independent board members have distinguished backgrounds in business, academia, and public service. Each of the trustees and executive officers oversees 208 Vanguard funds.
Information for each trustee and executive officer of the fund appears below. The mailing address of the trustees and officers is P.O. Box 876, Valley Forge, PA 19482. More information about the trustees is in the Statement of Additional Information, which can be obtained, without charge, by contacting Vanguard at 800-662-7447, or online at vanguard.com.
Interested Trustees1
F. William McNabb III
Born in 1957. Trustee since July 2009. Principal occupation(s) during the past five years and other experience: chairman of the board (January 2010–present) of Vanguard and of each of the investment companies served by Vanguard, trustee (2009–present) of each of the investment companies served by Vanguard, and director (2008–present) of Vanguard. Chief executive officer and president (2008–2017) of Vanguard and each of the investment companies served by Vanguard, managing director (1995–2008) of Vanguard, and director (1997–2018) of Vanguard Marketing Corporation. Director (2018–present) of UnitedHealth Group.
Mortimer J. Buckley
Born in 1969. Trustee since January 2018. Principal occupation(s) during the past five years and other experience: chief executive officer (January 2018–present) of Vanguard; chief executive officer, president, and trustee (January 2018–present) of each of the investment companies served by Vanguard; president and director (2017–present) of Vanguard; and president (February 2018–present) of Vanguard Marketing Corporation. Chief investment officer (2013–2017), managing director (2002–2017), head of the Retail Investor Group (2006–2012), and chief information officer (2001–2006) of Vanguard. Chairman of the board (2011–2017) of the Children’s Hospital of Philadelphia.
Independent Trustees
Emerson U. Fullwood
Born in 1948. Trustee since January 2008. Principal occupation(s) during the past five years and other experience: executive chief staff and marketing officer for North America and corporate vice president (retired 2008) of Xerox Corporation (document management products and services). Former president of the Worldwide Channels Group, Latin America, and Worldwide Customer Service and executive chief staff officer of Developing Markets of Xerox. Executive in residence and 2009–2010 Distinguished Minett Professor at the Rochester Institute of Technology. Lead director of SPX FLOW, Inc. (multi-industry manufacturing). Director of the University of Rochester Medical Center, the Monroe Community College Foundation, the United Way of Rochester, North Carolina A&T University, and Roberts Wesleyan College. Trustee of the University of Rochester.
Amy Gutmann
Born in 1949. Trustee since June 2006. Principal occupation(s) during the past five years and other experience: president (2004–present) of the University of Pennsylvania. Christopher H. Browne Distinguished Professor of Political Science, School of Arts and Sciences, and professor of communication, Annenberg School for Communication, with secondary faculty appointments in the Department of Philosophy, School of Arts and Sciences, and at the Graduate School of Education, University of Pennsylvania. Trustee of the National Constitution Center.
JoAnn Heffernan Heisen
Born in 1950. Trustee since July 1998. Principal occupation(s) during the past five years and other experience: corporate vice president of Johnson & Johnson (pharmaceuticals/medical devices/consumer products) and member of its executive committee (1997–2008). Chief global diversity officer (retired 2008), vice president and chief information officer (1997–2006), controller (1995–1997), treasurer (1991–1995), and assistant treasurer (1989–1991) of Johnson & Johnson. Director of Skytop Lodge Corporation (hotels) and the Robert Wood Johnson Foundation. Member of the advisory board of the Institute for Women’s Leadership at Rutgers University.
F. Joseph Loughrey
Born in 1949. Trustee since October 2009. Principal occupation(s) during the past five years and other experience: president and chief operating officer (retired 2009) and vice chairman of the board (2008–2009) of Cummins Inc. (industrial machinery). Chairman of the board of Hillenbrand, Inc. (specialized consumer services), Oxfam America, and the Lumina Foundation for Education. Director of the V Foundation for Cancer Research. Member of the advisory council for the College of Arts and Letters and chair of the advisory board to the Kellogg Institute for International Studies, both at the University of Notre Dame.
Mark Loughridge
Born in 1953. Trustee since March 2012. Principal occupation(s) during the past five years and other experience: senior vice president and chief financial officer (retired 2013) of IBM (information technology services). Fiduciary member of IBM’s Retirement Plan Committee (2004–2013), senior vice president and general manager (2002–2004) of IBM Global Financing, vice president and controller (1998–2002) of IBM, and a variety of other prior management roles at IBM. Member of the Council on Chicago Booth.
Scott C. Malpass
Born in 1962. Trustee since March 2012. Principal occupation(s) during the past five years and other experience: chief investment officer (1989–present) and vice president (1996–present) of the University of Notre Dame. Assistant professor of finance at the Mendoza College of Business, University of Notre Dame, and member of the Notre Dame 403(b) Investment Committee. Chairman of the board of TIFF Advisory Services, Inc. Member of the board of Catholic Investment Services, Inc. (investment advisors), the board of advisors for Spruceview Capital Partners, and the board of superintendence of the Institute for the Works of Religion.
Deanna Mulligan
Born in 1963. Trustee since January 2018. Principal occupation(s) during the past five years and other experience: president (2010–present) and chief executive officer (2011–present) of The Guardian Life Insurance Company of America. Chief operating officer (2010–2011) and executive vice president (2008–2010) of Individual Life and Disability of The Guardian Life Insurance Company of America. Member of the board of The Guardian Life Insurance Company of America, the American Council of Life Insurers, the Partnership for New York City (business leadership), and the Committee Encouraging Corporate Philanthropy. Trustee of the Economic Club of New York and the Bruce Museum (arts and science). Member of the Advisory Council for the Stanford Graduate School of Business.
André F. Perold
Born in 1952. Trustee since December 2004. Principal occupation(s) during the past five years and other experience: George Gund Professor of Finance and Banking, Emeritus at the Harvard Business School (retired 2011). Chief investment officer and co-managing partner of HighVista Strategies LLC (private investment firm). Overseer of the Museum of Fine Arts Boston.
Sarah Bloom Raskin
Born in 1961. Trustee since January 2018. Principal occupation(s) during the past five years and other experience: deputy secretary (2014–2017) of the United States Department of the Treasury. Governor (2010–2014) of the Federal Reserve Board. Commissioner (2007–2010) of financial regulation for the State of Maryland. Member of the board of directors (2012–2014) of Neighborhood Reinvestment Corporation. Director of i(x) Investments, LLC.
1 Mr. McNabb and Mr. Buckley are considered “interested persons,” as defined in the Investment Company Act of 1940, because they are officers of the Vanguard funds.
Peter F. Volanakis
Born in 1955. Trustee since July 2009. Principal occupation(s) during the past five years and other experience: president and chief operating officer (retired 2010) of Corning Incorporated (communications equipment) and director of Corning Incorporated (2000–2010) and Dow Corning (2001–2010). Director (2012) of SPX Corporation (multi-industry manufacturing). Overseer of the Amos Tuck School of Business Administration, Dartmouth College (2001–2013). Chairman of the board of trustees of Colby-Sawyer College. Member of the Board of Hypertherm Inc. (industrial cutting systems, software, and consumables).
Executive Officers
Glenn Booraem
Born in 1967. Principal occupation(s) during the past five years and other experience: principal of Vanguard. Investment stewardship officer (2017–present), treasurer (2015–2017), controller (2010–2015), and assistant controller (2001–2010) of each of the investment companies served by Vanguard.
Christine M. Buchanan
Born in 1970. Principal occupation(s) during the past five years and other experience: principal of Vanguard and global head of Fund Administration at Vanguard. Treasurer (2017–present) of each of the investment companies served by Vanguard. Partner (2005–2017) at KPMG LLP (audit, tax, and advisory services).
Brian Dvorak
Born in 1973. Principal occupation(s) during the past five years and other experience: principal of Vanguard. Chief compliance officer (2017–present) of Vanguard and each of the investment companies served by Vanguard. Assistant vice president (2017–present) of Vanguard Marketing Corporation. Vice president and director of Enterprise Risk Management (2011–2013) at Oppenheimer Funds, Inc.
Thomas J. Higgins
Born in 1957. Principal occupation(s) during the past five years and other experience: principal of Vanguard. Chief financial officer (2008–present) and treasurer (1998–2008) of each of the investment companies served by Vanguard.
Peter Mahoney
Born in 1974. Principal occupation(s) during the past five years and other experience: principal of Vanguard. Controller (2015–present) of each of the investment companies served by Vanguard. Head of International Fund Services (2008–2014) at Vanguard.
Anne E. Robinson
Born in 1970. Principal occupation(s) during the past five years and other experience: general counsel (2016–present) of Vanguard. Secretary (2016–present) of Vanguard and of each of the investment companies served by Vanguard. Managing director (2016–present) of Vanguard. Director and senior vice president (2016–2018) of Vanguard Marketing Corporation. Managing director and general counsel of Global Cards and Consumer Services (2014–2016) at Citigroup. Counsel (2003–2014) at American Express.
Michael Rollings
Born in 1963. Principal occupation(s) during the past five years and other experience: finance director (2017–present) and treasurer (2017) of each of the investment companies served by Vanguard. Managing director (2016–present) of Vanguard. Chief financial officer (2016–present) of Vanguard. Director (2016–present) of Vanguard Marketing Corporation. Executive vice president and chief financial officer (2006–2016) of MassMutual Financial Group.
| |
| Vanguard Senior Management Team |
| |
| Mortimer J. Buckley | James M. Norris |
| Gregory Davis | Thomas M. Rampulla |
| John James | Karin A. Risi |
| Martha G. King | Anne E. Robinson |
| John T. Marcante | Michael Rollings |
| Chris D. McIsaac | |
Chairman Emeritus and Senior Advisor
John J. Brennan
Chairman, 1996–2009
Chief Executive Officer and President, 1996–2008
Founder
John C. Bogle
Chairman and Chief Executive Officer, 1974–1996
| |
|  |
| | P.O. Box 2600 |
| | Valley Forge, PA 19482-2600 |
| |
| |
| |
| |
| Connect with Vanguard® > vanguard.com | |
| |
| |
| |
| |
| Fund Information > 800-662-7447 | All comparative mutual fund data are from Lipper Inc., a |
| | Thomson Reuters Company, or Morningstar, Inc., unless |
| Direct Investor Account Services > 800-662-2739 | |
| | otherwise noted. |
| Institutional Investor Services > 800-523-1036 | |
| | You can obtain a free copy of Vanguard’s proxy voting |
| Text Telephone for People | guidelines by visiting vanguard.com/proxyreporting or |
| Who Are Deaf or Hard of Hearing > 800-749-7273 | by calling Vanguard at 800-662-2739. The guidelines |
| | are also available from the SEC’s website, sec.gov. |
| | In addition, you may obtain a free report on how your |
| |
| This material may be used in conjunction | fund voted the proxies for securities it owned during |
| | the 12 months ended June 30. To get the report, visit |
| with the offering of shares of any Vanguard | either vanguard.com/proxyreporting or sec.gov. |
| fund only if preceded or accompanied by the | |
| fund’s current prospectus. | You can review and copy information about your fund |
| | at the SEC’s Public Reference Room in Washington, D.C. |
| The funds or securities referred to herein are not | To find out more about this public service, call the SEC |
| sponsored, endorsed, or promoted by MSCI, and MSCI | at 202-551-8090. Information about your fund is also |
| bears no liability with respect to any such funds or | available on the SEC’s website, and you can receive |
| securities. The prospectus or the Statement of Additional | copies of this information, for a fee, by sending a |
| Information contains a more detailed description of the | request in either of two ways: via e-mail addressed to |
| limited relationship MSCI has with Vanguard and any | publicinfo@sec.gov or via regular mail addressed to the |
| related funds. | Public Reference Section, Securities and Exchange |
| | Commission, Washington, DC 20549-1520. |
| |
| | Source for Bloomberg Barclays indexes: Bloomberg |
| | Index Services Limited. Copyright 2018, Bloomberg. All |
| | rights reserved. |
| |
| |
| |
| |
| | © 2018 The Vanguard Group, Inc. |
| | All rights reserved. |
| | Vanguard Marketing Corporation, Distributor. |
| | Q4832 042018 |

Semiannual Report | February 28, 2018
Vanguard Extended Duration Treasury Index Fund
Vanguard’s Principles for Investing Success
We want to give you the best chance of investment success. These principles, grounded in Vanguard’s research and experience, can put you on the right path.
Goals. Create clear, appropriate investment goals.
Balance. Develop a suitable asset allocation using broadly diversified funds.
Cost. Minimize cost.
Discipline. Maintain perspective and long-term discipline.
A single theme unites these principles: Focus on the things you can control.
We believe there is no wiser course for any investor.
| |
| Contents | |
| Your Fund’s Performance at a Glance. | 1 |
| CEO’s Perspective. | 3 |
| Results of Proxy Voting. | 6 |
| Fund Profile. | 8 |
| Performance Summary. | 9 |
| Financial Statements. | 10 |
| About Your Fund’s Expenses. | 22 |
| Glossary. | 24 |
Please note: The opinions expressed in this report are just that—informed opinions. They should not be considered promises
or advice. Also, please keep in mind that the information and opinions cover the period through the date on the front of this
report. Of course, the risks of investing in your fund are spelled out in the prospectus.
See the Glossary for definitions of investment terms used in this report.
About the cover: Nautical images have been part of Vanguard’s rich heritage since its start in 1975. For an
incoming ship, a lighthouse offers a beacon and safe path to shore. You can similarly depend on Vanguard to put
you first––and light the way––as you strive to meet your financial goals. Our client focus and low costs,
stemming from our unique ownership structure, assure that your interests are paramount.
Your Fund’s Performance at a Glance
• ETF Shares of Vanguard Extended Duration Treasury Index Fund returned –7.44% for the six months ended February 28, 2018. This result was a bit lower than that of the fund’s benchmark index (–7.21%).
• The fund is designed for those seeking to moderate changes in the ratio of long-term assets to liabilities. Because the fund invests in zero-coupon U.S. Treasury securities with maturities ranging from 20 to 30 years to achieve this objective, it may exhibit substantial short-term volatility and is best used by long-term investors.
• The fund’s return trailed the average return of general Treasury securities because the broader Treasury market includes a wider range of maturities. Although Treasury prices fell across the maturity spectrum, longer-term Treasuries fared worse than their shorter-term counterparts.
• Treasury prices dropped over the period as markets grew more optimistic about economic growth prospects, even as inflation readings remained modest. The bonds’ price declines raised their yields.
| | | | |
| Total Returns: Six Months Ended February 28, 2018 | | | | |
| | 30-Day SEC | Income | Capital | Total |
| | Yields | Returns | Returns | Returns |
| Vanguard Extended Duration Treasury Index Fund | | | | |
| ETF Shares | 3.14% | | | |
| Market Price | | | | -7.26% |
| Net Asset Value | | | | -7.44 |
| Institutional Shares | 3.15 | 1.29% | -8.73% | -7.44 |
| Institutional Plus Shares | 3.17 | 1.29 | -8.72 | -7.43 |
| Bloomberg Barclays U.S. Treasury STRIPS 20–30 Year | | | | |
| Equal Par Bond Index | | | | -7.21 |
| General U.S. Treasury Funds Average | | | | -4.50 |
General U.S. Treasury Funds Average: Derived from data provided by Lipper, a Thomson Reuters Company.
Institutional Shares and Institutional Plus Shares are available to certain institutional investors who meet specific administrative, service,
and account-size criteria. The Vanguard ETF® Shares shown are traded on the NYSE Arca exchange and are available only through
brokers. The table provides ETF returns based on both the NYSE Arca market price and the net asset value for a share. U.S. Pat. Nos.
6,879,964; 7,337,138; 7,720,749; 7,925,573; 8,090,646; and 8,417,623.
For the ETF Shares, the market price is determined by the midpoint of the bid-offer spread as of the closing time of the New York Stock
Exchange (generally 4 p.m., Eastern time). The net asset value is also determined as of the NYSE closing time. For more information about
how the ETF Shares' market prices have compared with their net asset value, visit vanguard.com, select your ETF, and then select the
Price and Performance tab. The ETF premium/discount analysis there shows the percentages of days on which the ETF Shares' market
price was above or below the NAV.
1
| | | | |
| Expense Ratios | | | | |
| Your Fund Compared With Its Peer Group | | | | |
| | ETF | Institutional | Institutional | Peer Group |
| | Shares | Shares | Plus Shares | Average |
| Extended Duration Treasury Index Fund | 0.07% | 0.06% | 0.04% | 0.37% |
The fund expense ratios shown are from the prospectus dated December 21, 2017, and represent estimated costs for the current fiscal
year. For the six months ended February 28, 2018, the annualized expense ratios were 0.07% for ETF Shares, 0.06% for Institutional
Shares, and 0.04% for Institutional Plus Shares.
Peer group: General U.S. Treasury Funds.
2
CEO’s Perspective

Tim Buckley
President and Chief Executive Officer
Dear Shareholder,
As I begin my tenure as Vanguard’s fourth chief executive, I’ve been reflecting on both the past and the future of the company where I have spent my entire professional career.
I feel extremely fortunate to have the chance to lead a company filled with people who come to work every day passionate about Vanguard’s core purpose: to take a stand for all investors, to treat them fairly, and to give them the best chance for investment success.
Making a real difference
When I joined Vanguard in 1991, I found a mission-driven team focused on improving lives—helping people retire more comfortably, put their children through college, and achieve financial security. I found a company with purpose in an industry ripe for improvement.
It was clear, even early in my career, that the cards were stacked against most investors. Hidden fees, performance-chasing, and poor advice were relentlessly eroding investors’ dreams.
We knew Vanguard could be different and, as a result, could make a real difference. Over the past 25 years, for example, Vanguard has lowered our funds’ asset-weighted average expense ratio
3
from 0.31% to 0.12%. And over the past decade, 94% of our funds have beaten the average annual return of their peers.1
Focused on your success
Vanguard is built for Vanguard investors—as a client-owned company, we focus solely on you, our fund shareholders. Everything we do is designed to give our clients the best chance for investment success. In my role as CEO, I intend to keep this priority front and center. We’re proud of what we’ve achieved, but we’re even more excited about what’s to come.
As I write this, we’ve experienced a period of pronounced market volatility. Strong economic growth and budding signs of inflation have raised concerns about a more aggressive Federal Reserve. Although volatility can test investors’ nerves, we sometimes think of this as “Vanguard weather”—a time when having a disciplined, low-cost, and long-term approach to investment management serves investors well.
| | | |
| Market Barometer | | | |
| | | | Total Returns |
| | | Periods Ended February 28, 2018 |
| | Six | One | Five Years |
| | Months | Year | (Annualized) |
| Stocks | | | |
| Russell 1000 Index (Large-caps) | 10.62% | 16.70% | 14.56% |
| Russell 2000 Index (Small-caps) | 8.30 | 10.51 | 12.19 |
| Russell 3000 Index (Broad U.S. market) | 10.45 | 16.22 | 14.37 |
| FTSE All-World ex US Index (International) | 7.84 | 21.50 | 6.69 |
| |
| Bonds | | | |
| Bloomberg Barclays U.S. Aggregate Bond Index | | | |
| (Broad taxable market) | -2.18% | 0.51% | 1.71% |
| Bloomberg Barclays Municipal Bond Index | | | |
| (Broad tax-exempt market) | -1.24 | 2.50 | 2.57 |
| Citigroup Three-Month U.S. Treasury Bill Index | 0.59 | 0.98 | 0.27 |
| |
| CPI | | | |
| Consumer Price Index | 1.41% | 2.21% | 1.41% |
The performance data shown represent past performance, which is not a guarantee of future results.
1 For the ten-year period through December 31, 2017, 9 of 9 Vanguard money market funds, 56 of 60 bond funds, 21 of 22 balanced funds,
and 131 of 140 stock funds, or 217 of 231 Vanguard funds, outperformed their peer-group averages. Sources: Vanguard, based on data
from Lipper, a Thomson Reuters Company.
4
Steady, time-tested guidance
Our guidance for investors, as always, is to stay the course, tune out the hyperbolic headlines, and focus on your goals and what you can control, such as costs and how much you save. This time-tested advice has served our clients well over the decades.
Regardless of how the markets perform in the short term, I’m incredibly optimistic about the future for our investors. We have a dedicated team serving you, and we will never stop striving to make Vanguard the best place for you to invest through our high-quality funds and services, advice and guidance to help you meet your financial goals, and an experience that makes you feel good about entrusting us with your hard-earned savings.
Thank you for your continued loyalty.
Sincerely,

Mortimer J. Buckley
President and Chief Executive Officer
March 19, 2018
5
Results of Proxy Voting
At a special meeting of shareholders on November 15, 2017, fund shareholders approved the following proposals:
Proposal 1—Elect trustees for the fund.*
The individuals listed in the table below were elected as trustees for the fund. All trustees with the exception of Ms. Mulligan, Ms. Raskin, and Mr. Buckley (each of whom already serves as a director of The Vanguard Group, Inc.) served as trustees to the funds prior to the shareholder meeting.
| | | |
| | | | Percentage |
| Trustee | For | Withheld | For |
| Mortimer J. Buckley | 1,040,401,220 | 33,553,324 | 96.9% |
| Emerson U. Fullwood | 1,039,160,376 | 34,794,169 | 96.8% |
| Amy Gutmann | 1,040,321,884 | 33,632,661 | 96.9% |
| JoAnn Heffernan Heisen | 1,041,268,182 | 32,686,363 | 97.0% |
| F. Joseph Loughrey | 1,040,201,842 | 33,752,703 | 96.9% |
| Mark Loughridge | 1,039,909,454 | 34,045,090 | 96.8% |
| Scott C. Malpass | 1,039,175,722 | 34,778,823 | 96.8% |
| F. William McNabb III | 1,038,914,560 | 35,039,985 | 96.7% |
| Deanna Mulligan | 1,041,175,691 | 32,778,854 | 96.9% |
| André F. Perold | 1,028,804,958 | 45,149,587 | 95.8% |
| Sarah Bloom Raskin | 1,040,743,960 | 33,210,585 | 96.9% |
| Peter F. Volanakis | 1,039,529,631 | 34,424,914 | 96.8% |
| * Results are for all funds within the same trust. | | | |
A sufficient number of votes were not received to pass the following proposals:
Proposal 2—Approve a manager-of-managers arrangement with third-party investment advisors.
This arrangement enables the fund to enter into and materially amend investment advisory arrangements with third-party investment advisors, subject to the approval of the fund’s board of trustees and certain conditions imposed by the Securities and Exchange Commission, while avoiding the costs and delays associated with obtaining future shareholder approval.
| | | | | |
| | | | | Broker | Percentage |
| Vanguard Fund | For | Abstain | Against | Non-Votes | For |
| Extended Duration Treasury | | | | | |
| Index Fund | 9,011,953 | 104,268 | 1,485,119 | 1,615,596 | 73.8%* |
* Although the “Percentage For” was high, the overall percentage of the fund’s shares outstanding that were voted was not
sufficient for the proposal to pass.
6
Proposal 3—Approve a manager-of-managers arrangement with wholly owned subsidiaries of Vanguard.
This arrangement enables Vanguard or the fund to enter into and materially amend investment advisory arrangements with wholly owned subsidiaries of Vanguard, subject to the approval of the fund’s board of trustees and any conditions imposed by the Securities and Exchange Commission (SEC), while avoiding the costs and delays associated with obtaining future shareholder approval. The ability of the fund to operate in this manner is contingent upon the SEC’s approval of a pending application for an order of exemption.
| | | | | |
| | | | | Broker | Percentage |
| Vanguard Fund | For | Abstain | Against | Non-Votes | For |
| Extended Duration Treasury | | | | | |
| Index Fund | 9,029,434 | 104,308 | 1,467,599 | 1,615,596 | 73.9%* |
* Although the “Percentage For” was high, the overall percentage of the fund’s shares outstanding that were voted was not
sufficient for the proposal to pass.
7
Extended Duration Treasury Index Fund
| | | |
| Fund Profile | | |
| As of February 28, 2018 | | |
| |
| Share-Class Characteristics | | |
| | | | Institutional |
| | ETF | Institutional | Plus |
| | Shares | Shares | Shares |
| Ticker Symbol | EDV | VEDTX | VEDIX |
| Expense Ratio1 | 0.07% | 0.06% | 0.04% |
| 30-Day SEC Yield | 3.14% | 3.15% | 3.17% |
| | |
| Financial Attributes | | |
| |
| | | Bloomberg |
| | | Barclays |
| | | Treasury |
| | | STRIPS |
| | | 20–30 Year |
| | Fund | Index |
| |
| Number of Bonds | 79 | 78 |
| |
| Yield to Maturity (before | | |
| expenses) | 3.2% | 3.2% |
| |
| Average Coupon | 0.0% | 0.0% |
| |
| Average Duration | 24.5 years | 24.9 years |
| |
| Average Effective | | |
| Maturity | 24.9 years | 21.5 years |
| |
| Short-Term Reserves | 0.1% | — |
| |
| Sector Diversification (% of portfolio) | |
| Treasury/Agency | 100.0% |
The agency and mortgage-backed securities sectors may include issues from government-sponsored enterprises; such issues are generally not backed by the full faith and credit of the U.S. government.
| |
| Volatility Measures | |
| | Bloomberg |
| | Barclays |
| | Treasury |
| | STRIPS |
| | 20–30 Year |
| | Index |
| R-Squared | 0.99 |
| Beta | 1.04 |
These measures show the degree and timing of the fund’s
fluctuations compared with the index over 36 months.
| |
| Distribution by Effective Maturity | |
| (% of portfolio) | |
| 20 - 30 Years | 100.0% |
| |
| Distribution by Credit Quality (% of portfolio) |
| U.S. Government | 100.0% |
Credit-quality ratings are obtained from Barclays and are from Moody's, Fitch, and S&P. When ratings from all three agencies are used, the median rating is shown. When ratings from two of the agencies are used, the lower rating for each issue is shown. "Not Rated" is used to classify securities for which a rating is not available. For more information about these ratings, see the Glossary entry for Credit Quality.
Investment Focus
1 The expense ratios shown are from the prospectus dated December 21, 2017, and represent estimated costs for the current fiscal year.
For the six months ended February 28, 2018, the annualized expense ratios were 0.07% for ETF Shares, 0.06% for Institutional Shares, and
0.04% for Institutional Plus Shares.
8
Extended Duration Treasury Index Fund
Performance Summary
All of the returns in this report represent past performance, which is not a guarantee of future results that may be achieved by the fund. (Current performance may be lower or higher than the performance data cited. For performance data current to the most recent month-end, visit our website at vanguard.com/performance.) Note, too, that both investment returns and principal value can fluctuate widely, so an investor’s shares, when sold, could be worth more or less than their original cost. The returns shown do not reflect taxes that a shareholder would pay on fund distributions or on the sale of fund shares.
| | |
| Fiscal-Year Total Returns (%): December 6, 2007, Through February 28, 2018 | |
| | | Bloomberg |
| | | Barclays |
| | | Treasury |
| | | STRIPS |
| | | 20–30 Year |
| | ETF Shares Net Asset Value | Index |
| Fiscal Year | Total Returns | Total Returns |
| 2008 | 2.29% | 3.16% |
| 2009 | 7.98 | 8.39 |
| 2010 | 20.80 | 21.48 |
| 2011 | 1.33 | 1.99 |
| 2012 | 37.90 | 36.86 |
| 2013 | -21.34 | -20.48 |
| 2014 | 24.17 | 23.70 |
| 2015 | 5.90 | 6.38 |
| 2016 | 25.30 | 24.92 |
| 2017 | -8.86 | -9.20 |
| 2018 | -7.44 | -7.21 |
| Note: For 2018, performance data reflect the six months ended February 28, 2018. | |
Average Annual Total Returns: Periods Ended December 31, 2017
This table presents returns through the latest calendar quarter—rather than through the end of the fiscal period.
Securities and Exchange Commission rules require that we provide this information.
| | | | | | |
| | | | | | | Ten Years |
| | Inception Date | One Year | Five Years | Income | Capital | Total |
| ETF Shares | 12/6/2007 | | | | | |
| Market Price | | 14.07% | 5.05% | | | 8.33% |
| Net Asset Value | | 13.52 | 4.86 | | | 8.26 |
| Institutional Shares | 11/28/2007 | 13.52 | 4.89 | 3.61 | 4.68 | 8.29 |
| Fee-Adjusted Returns | | 12.96 | 4.78 | | | 8.24 |
| Institutional Plus Shares | 8/28/2013 | 13.55 | — | 3.421 | 7.051 | 10.471 |
| Fee-Adjusted Returns | | 12.99 | — | | | 10.341 |
| 1 Return since inception. | | | | | | |
Vanguard fund returns are adjusted to reflect the 0.50% fee on purchases of fund shares. The fee does not apply to the ETF Shares. The
Fiscal-Year Total Returns table is not adjusted for fees.
See Financial Highlights for dividend and capital gains information.
9
Extended Duration Treasury Index Fund
Financial Statements (unaudited)
Statement of Net Assets
As of February 28, 2018
The fund reports a complete list of its holdings in regulatory filings four times in each fiscal year, at the quarter-ends. For the second and fourth fiscal quarters, the lists appear in the fund’s semiannual and annual reports to shareholders. For the first and third fiscal quarters, the fund files the lists with the Securities and Exchange Commission on Form N-Q. Shareholders can look up the fund’s Forms N-Q on the SEC’s website at sec.gov. Forms N-Q may also be reviewed and copied at the SEC’s Public Reference Room (see the back cover of this report for further information).
| | | | |
| | | | Face | Market |
| | | Maturity | Amount | Value • |
| | Coupon | Date | ($000) | ($000) |
| U. S. Government and Agency Obligations (100.0%) | | | |
| U. S. Government Securities (100.0%) | | | | |
| United States Treasury Strip Coupon | 0.000% | 5/15/38 | 77,850 | 41,328 |
| United States Treasury Strip Coupon | 0.000% | 8/15/38 | 58,583 | 30,834 |
| United States Treasury Strip Coupon | 0.000% | 11/15/38 | 59,230 | 30,920 |
| United States Treasury Strip Coupon | 0.000% | 2/15/39 | 59,390 | 30,721 |
| United States Treasury Strip Coupon | 0.000% | 5/15/39 | 47,890 | 24,589 |
| United States Treasury Strip Coupon | 0.000% | 8/15/39 | 47,740 | 24,329 |
| United States Treasury Strip Coupon | 0.000% | 11/15/39 | 62,790 | 31,773 |
| United States Treasury Strip Coupon | 0.000% | 2/15/40 | 37,720 | 18,925 |
| United States Treasury Strip Coupon | 0.000% | 5/15/40 | 27,990 | 13,916 |
| United States Treasury Strip Coupon | 0.000% | 8/15/40 | 43,135 | 21,254 |
| United States Treasury Strip Coupon | 0.000% | 11/15/40 | 50,880 | 24,832 |
| United States Treasury Strip Coupon | 0.000% | 2/15/41 | 60,565 | 29,284 |
| United States Treasury Strip Coupon | 0.000% | 5/15/41 | 55,195 | 26,442 |
| United States Treasury Strip Coupon | 0.000% | 8/15/41 | 51,390 | 24,434 |
| United States Treasury Strip Coupon | 0.000% | 11/15/41 | 44,199 | 20,815 |
| United States Treasury Strip Coupon | 0.000% | 2/15/42 | 47,755 | 22,292 |
| United States Treasury Strip Coupon | 0.000% | 5/15/42 | 44,950 | 20,817 |
| United States Treasury Strip Coupon | 0.000% | 8/15/42 | 40,805 | 18,735 |
| United States Treasury Strip Coupon | 0.000% | 11/15/42 | 44,975 | 20,446 |
| United States Treasury Strip Coupon | 0.000% | 2/15/43 | 48,290 | 21,772 |
| United States Treasury Strip Coupon | 0.000% | 5/15/43 | 57,445 | 25,666 |
| United States Treasury Strip Coupon | 0.000% | 8/15/43 | 34,600 | 15,319 |
| United States Treasury Strip Coupon | 0.000% | 11/15/43 | 54,875 | 24,081 |
| United States Treasury Strip Coupon | 0.000% | 2/15/44 | 56,095 | 24,410 |
| United States Treasury Strip Coupon | 0.000% | 5/15/44 | 49,355 | 21,315 |
| United States Treasury Strip Coupon | 0.000% | 8/15/44 | 57,550 | 24,657 |
| United States Treasury Strip Coupon | 0.000% | 11/15/44 | 25,775 | 10,969 |
| United States Treasury Strip Coupon | 0.000% | 2/15/45 | 27,820 | 11,750 |
| United States Treasury Strip Coupon | 0.000% | 5/15/45 | 35,320 | 14,824 |
| United States Treasury Strip Coupon | 0.000% | 8/15/45 | 44,575 | 18,589 |
| United States Treasury Strip Coupon | 0.000% | 11/15/45 | 44,270 | 18,358 |
| United States Treasury Strip Coupon | 0.000% | 2/15/46 | 36,790 | 15,130 |
| United States Treasury Strip Coupon | 0.000% | 5/15/46 | 32,440 | 13,257 |
| United States Treasury Strip Coupon | 0.000% | 8/15/46 | 32,240 | 13,062 |
| United States Treasury Strip Coupon | 0.000% | 11/15/46 | 35,490 | 14,251 |
| United States Treasury Strip Coupon | 0.000% | 2/15/47 | 22,570 | 8,998 |
10
| | | | |
| Extended Duration Treasury Index Fund | | | | |
| |
| |
| |
| | | | Face | Market |
| | | Maturity | Amount | Value • |
| | Coupon | Date | ($000) | ($000) |
| United States Treasury Strip Coupon | 0.000% | 5/15/47 | 17,075 | 6,754 |
| United States Treasury Strip Coupon | 0.000% | 8/15/47 | 7,000 | 2,754 |
| United States Treasury Strip Coupon | 0.000% | 11/15/47 | 6,000 | 2,346 |
| United States Treasury Strip Coupon | 0.000% | 2/15/48 | 5,050 | 1,957 |
| United States Treasury Strip Principal | 0.000% | 5/15/38 | 51,995 | 28,337 |
| United States Treasury Strip Principal | 0.000% | 2/15/39 | 48,195 | 25,468 |
| United States Treasury Strip Principal | 0.000% | 5/15/39 | 34,445 | 18,043 |
| United States Treasury Strip Principal | 0.000% | 8/15/39 | 29,625 | 15,387 |
| United States Treasury Strip Principal | 0.000% | 11/15/39 | 32,795 | 16,864 |
| United States Treasury Strip Principal | 0.000% | 2/15/40 | 45,545 | 23,210 |
| United States Treasury Strip Principal | 0.000% | 5/15/40 | 35,515 | 17,943 |
| United States Treasury Strip Principal | 0.000% | 8/15/40 | 38,050 | 19,007 |
| United States Treasury Strip Principal | 0.000% | 11/15/40 | 39,400 | 19,506 |
| United States Treasury Strip Principal | 0.000% | 2/15/41 | 23,200 | 11,388 |
| United States Treasury Strip Principal | 0.000% | 5/15/41 | 24,515 | 11,930 |
| United States Treasury Strip Principal | 0.000% | 8/15/41 | 28,765 | 13,863 |
| United States Treasury Strip Principal | 0.000% | 11/15/41 | 22,270 | 10,629 |
| United States Treasury Strip Principal | 0.000% | 2/15/42 | 16,220 | 7,679 |
| United States Treasury Strip Principal | 0.000% | 5/15/42 | 34,225 | 16,080 |
| United States Treasury Strip Principal | 0.000% | 8/15/42 | 26,765 | 12,441 |
| United States Treasury Strip Principal | 0.000% | 11/15/42 | 45,580 | 21,020 |
| United States Treasury Strip Principal | 0.000% | 2/15/43 | 63,510 | 29,036 |
| United States Treasury Strip Principal | 0.000% | 5/15/43 | 52,050 | 23,581 |
| United States Treasury Strip Principal | 0.000% | 8/15/43 | 51,550 | 23,149 |
| United States Treasury Strip Principal | 0.000% | 11/15/43 | 43,630 | 19,422 |
| United States Treasury Strip Principal | 0.000% | 2/15/44 | 53,300 | 23,498 |
| United States Treasury Strip Principal | 0.000% | 5/15/44 | 62,420 | 27,299 |
| United States Treasury Strip Principal | 0.000% | 8/15/44 | 57,030 | 24,746 |
| United States Treasury Strip Principal | 0.000% | 11/15/44 | 61,205 | 26,342 |
| United States Treasury Strip Principal | 0.000% | 2/15/45 | 59,160 | 25,222 |
| United States Treasury Strip Principal | 0.000% | 5/15/45 | 51,610 | 21,858 |
| United States Treasury Strip Principal | 0.000% | 8/15/45 | 76,280 | 32,002 |
| United States Treasury Strip Principal | 0.000% | 11/15/45 | 84,635 | 35,236 |
| United States Treasury Strip Principal | 0.000% | 2/15/46 | 52,030 | 21,467 |
| United States Treasury Strip Principal | 0.000% | 5/15/46 | 60,010 | 24,562 |
| United States Treasury Strip Principal | 0.000% | 8/15/46 | 59,345 | 24,109 |
| United States Treasury Strip Principal | 0.000% | 11/15/46 | 93,180 | 37,570 |
| United States Treasury Strip Principal | 0.000% | 2/15/47 | 94,535 | 37,843 |
| United States Treasury Strip Principal | 0.000% | 5/15/47 | 80,100 | 31,790 |
| United States Treasury Strip Principal | 0.000% | 8/15/47 | 57,340 | 22,587 |
| United States Treasury Strip Principal | 0.000% | 11/15/47 | 36,550 | 14,257 |
| United States Treasury Strip Principal | 0.000% | 2/15/48 | 63,525 | 24,581 |
| Total U.S. Government and Agency Obligations (Cost $1,677,250) | | | 1,625,857 |
| |
| | | | Shares | |
| Temporary Cash Investment (0.1%) | | | | |
| Money Market Fund (0.1%) | | | | |
| 1 Vanguard Market Liquidity Fund | | | | |
| (Cost $1,588) | 1.601% | | 15,877 | 1,588 |
| Total Investments (100.1%) (Cost $1,678,838) | | | | 1,627,445 |
11
| |
| Extended Duration Treasury Index Fund | |
| |
| |
| |
| | Amount |
| | ($000) |
| Other Assets and Liabilities (-0.1%) | |
| Other Assets | |
| Investment in Vanguard | 94 |
| Receivables for Investment Securities Sold | 61,811 |
| Receivables for Capital Shares Issued | 1,805 |
| Other Assets | 2 |
| Total Other Assets | 63,712 |
| Liabilities | |
| Payables for Investment Securities Purchased | (65,108) |
| Payables to Vanguard | (506) |
| Total Liabilities | (65,614) |
| Net Assets (100%) | 1,625,543 |
| |
| |
| At February 28, 2018, net assets consisted of: | |
| | Amount |
| | ($000) |
| Paid-in Capital | 1,667,805 |
| Undistributed Net Investment Income | 7,617 |
| Accumulated Net Realized Gains | 1,514 |
| Unrealized Appreciation (Depreciation) | (51,393) |
| Net Assets | 1,625,543 |
| |
| ETF Shares—Net Assets | |
| Applicable to 4,400,000 outstanding $.001 par value shares of | |
| beneficial interest (unlimited authorization) | 484,247 |
| Net Asset Value Per Share—ETF Shares | $110.06 |
| |
| Institutional Shares—Net Assets | |
| Applicable to 18,911,110 outstanding $.001 par value shares of | |
| beneficial interest (unlimited authorization) | 628,696 |
| Net Asset Value Per Share—Institutional Shares | $33.24 |
| |
| Institutional Plus Shares—Net Assets | |
| Applicable to 6,142,421 outstanding $.001 par value shares of | |
| beneficial interest (unlimited authorization) | 512,600 |
| Net Asset Value Per Share—Institutional Plus Shares | $83.45 |
• See Note A in Notes to Financial Statements.
1 Affiliated money market fund available only to Vanguard funds and certain trusts and accounts managed by Vanguard. Rate shown
is the 7-day yield.
See accompanying Notes, which are an integral part of the Financial Statements.
12
| |
| Extended Duration Treasury Index Fund | |
| |
| |
| Statement of Operations | |
| |
| | Six Months Ended |
| | February 28, 2018 |
| | ($000) |
| Investment Income | |
| Income | |
| Interest1 | 24,745 |
| Total Income | 24,745 |
| Expenses | |
| The Vanguard Group—Note B | |
| Investment Advisory Services | 34 |
| Management and Administrative—ETF Shares | 146 |
| Management and Administrative—Institutional Shares | 180 |
| Management and Administrative—Institutional Plus Shares | 75 |
| Marketing and Distribution—ETF Shares | 18 |
| Marketing and Distribution—Institutional Shares | 6 |
| Marketing and Distribution—Institutional Plus Shares | 1 |
| Custodian Fees | 5 |
| Shareholders’ Reports and Proxy—ETF Shares | 32 |
| Shareholders’ Reports and Proxy—Institutional Shares | — |
| Shareholders’ Reports and Proxy—Institutional Plus Shares | — |
| Trustees’ Fees and Expenses | 1 |
| Total Expenses | 498 |
| Expenses Paid Indirectly | (5) |
| Net Expenses | 493 |
| Net Investment Income | 24,252 |
| Realized Net Gain (Loss) | |
| Investment Securities Sold1 | 14,193 |
| Futures Contracts | 30 |
| Realized Net Gain (Loss) | 14,223 |
| Change in Unrealized Appreciation (Depreciation) of Investment Securities1 | (177,864) |
| Net Increase (Decrease) in Net Assets Resulting from Operations | (139,389) |
1 Interest income, realized net gain (loss), and change in unrealized appreciation (depreciation) from an affiliated company of the fund
were $3,000, $1,000, and ($1,000), respectively. Purchases and sales are for temporary cash investment purposes.
See accompanying Notes, which are an integral part of the Financial Statements.
13
| | |
| Extended Duration Treasury Index Fund | | |
| |
| |
| Statement of Changes in Net Assets | | |
| |
| | Six Months Ended | Year Ended |
| | February 28, | August 31, |
| | 2018 | 2017 |
| | ($000) | ($000) |
| Increase (Decrease) in Net Assets | | |
| Operations | | |
| Net Investment Income | 24,252 | 40,957 |
| Realized Net Gain (Loss) | 14,223 | 30,442 |
| Change in Unrealized Appreciation (Depreciation) | (177,864) | (175,684) |
| Net Increase (Decrease) in Net Assets Resulting from Operations | (139,389) | (104,285) |
| Distributions | | |
| Net Investment Income | | |
| ETF Shares | (8,715) | (14,774) |
| Institutional Shares | (9,620) | (17,360) |
| Institutional Plus Shares | (6,567) | (8,156) |
| Realized Capital Gain1 | | |
| ETF Shares | (1,545) | (9,446) |
| Institutional Shares | (1,694) | (12,810) |
| Institutional Plus Shares | (1,371) | (4,467) |
| Total Distributions | (29,512) | (67,013) |
| Capital Share Transactions | | |
| ETF Shares | (82,178) | 90,045 |
| Institutional Shares | 8,487 | 94,096 |
| Institutional Plus Shares | 196,460 | 126,155 |
| Net Increase (Decrease) from Capital Share Transactions | 122,769 | 310,296 |
| Total Increase (Decrease) | (46,132) | 138,998 |
| Net Assets | | |
| Beginning of Period | 1,671,675 | 1,532,677 |
| End of Period2 | 1,625,543 | 1,671,675 |
1 Includes fiscal 2018 and 2017 short-term gain distributions totaling $41,000 and $372,000, respectively. Short-term gain
distributions are treated as ordinary income dividends for tax purposes.
2 Net Assets—End of Period includes undistributed (overdistributed) net investment income of $7,617,000 and $8,267,000.
See accompanying Notes, which are an integral part of the Financial Statements.
14
| | | | | | | |
| Extended Duration Treasury Index Fund | | | | | | |
| |
| |
| Financial Highlights | | | | | | |
| |
| |
| ETF Shares | | | | | | | |
| | Six Months | | | | | |
| | | Ended | | | | | |
| For a Share Outstanding | February 28, | | | Year Ended August 31, |
| Throughout Each Period | | 2018 | 2017 | 2016 | 2015 | 2014 | 2013 |
| Net Asset Value, Beginning of Period | $120.92 | $139.77 | $116.00 | $113.24 | $95.57 | $131.02 |
| Investment Operations | | | | | | | |
| Net Investment Income | | 1.6611 | 3.3831 | 3.420 | 3.524 | 3.311 | 3.695 |
| Net Realized and Unrealized Gain (Loss) | | | | | | |
| on Investments 2 | | (10.540) | (16.377) | 25.019 | 3.113 | 18.824 | (30.430) |
| Total from Investment Operations | (8.879) | (12.994) | 28.439 | 6.637 | 22.135 | (26.735) |
| Distributions | | | | | | | |
| Dividends from Net Investment Income | (1.684) | (3.402) | (3.414) | (3.506) | (3.236) | (3.779) |
| Distributions from Realized Capital Gains | (.297) | (2.454) | (1.255) | (.371) | (1.229) | (4.936) |
| Total Distributions | | (1.981) | (5.856) | (4.669) | (3.877) | (4.465) | (8.715) |
| Net Asset Value, End of Period | | $110.06 | $120.92 | $139.77 | $116.00 | $113.24 | $95.57 |
| Total Return | | -7.44% | -8.86% | 25.30% | 5.90% | 24.17% | -21.34% |
| Ratios/Supplemental Data | | | | | | | |
| Net Assets, End of Period (Millions) | $484 | $623 | $615 | $365 | $249 | $158 |
| Ratio of Total Expenses to | | | | | | | |
| Average Net Assets | | 0.07% | 0.07% | 0.07% | 0.10% | 0.12% | 0.12% |
| Ratio of Net Investment Income to | | | | | | |
| Average Net Assets | | 2.87% | 2.90% | 2.77% | 2.93% | 3.59% | 3.15% |
| Portfolio Turnover Rate 3 | | 21% | 18% | 20% | 16% | 17% | 31% |
The expense ratio, net investment income ratio, and turnover rate for the current period have been annualized.
1 Calculated based on average shares outstanding.
2 Includes increases from purchase fees of $0.00, $0.16, $0.06, $0.05, $0.19, and $0.10.
3 Excludes the value of portfolio securities received or delivered as a result of in-kind purchases or redemptions of the fund’s capital
shares, including ETF Creation Units.
See accompanying Notes, which are an integral part of the Financial Statements.
15
| | | | | | | |
| Extended Duration Treasury Index Fund | | | | | | |
| |
| |
| Financial Highlights | | | | | | |
| |
| |
| Institutional Shares | | | | | | | |
| | Six Months | | | | | |
| | | Ended | | | | | |
| For a Share Outstanding | February 28, | | | Year Ended August 31, |
| Throughout Each Period | | 2018 | 2017 | 2016 | 2015 | 2014 | 2013 |
| Net Asset Value, Beginning of Period | $36.52 | $42.20 | $35.02 | $34.18 | $28.85 | $39.55 |
| Investment Operations | | | | | | | |
| Net Investment Income | | . 5041 | 1.0241 | 1.036 | 1.069 | 1.006 | 1.121 |
| Net Realized and Unrealized Gain (Loss) | | | | | | |
| on Investments 2 | | (3.184) | (4.934) | 7.558 | .947 | 5.678 | (9.183) |
| Total from Investment Operations | (2.680) | (3.910) | 8.594 | 2.016 | 6.684 | (8.062) |
| Distributions | | | | | | | |
| Dividends from Net Investment Income | (.510) | (1.030) | (1.035) | (1.064) | (.983) | (1.148) |
| Distributions from Realized Capital Gains | (. 090) | (.740) | (. 379) | (.112) | (. 371) | (1.490) |
| Total Distributions | | (.600) | (1.770) | (1.414) | (1.176) | (1.354) | (2.638) |
| Net Asset Value, End of Period | | $33.24 | $36.52 | $42.20 | $35.02 | $34.18 | $28.85 |
| Total Return3 | | -7.44% | -8.86% | 25.33% | 5.89% | 24.27% | -21.30% |
| Ratios/Supplemental Data | | | | | | | |
| Net Assets, End of Period (Millions) | $629 | $682 | $660 | $484 | $529 | $375 |
| Ratio of Total Expenses to | | | | | | | |
| Average Net Assets | | 0.06% | 0.06% | 0.06% | 0.08% | 0.10% | 0.10% |
| Ratio of Net Investment Income to | | | | | | |
| Average Net Assets | | 2.88% | 2.91% | 2.78% | 2.95% | 3.61% | 3.17% |
| Portfolio Turnover Rate 4 | | 21% | 18% | 20% | 16% | 17% | 31% |
The expense ratio, net investment income ratio, and turnover rate for the current period have been annualized.
1 Calculated based on average shares outstanding.
2 Includes increases from purchase fees of $0.00, $0.05, $0.02, $0.01, $0.06, and $0.03.
3 Total returns do not include transaction fees that may have applied in the periods shown. Fund prospectuses provide information about
any applicable transaction fees.
4 Excludes the value of portfolio securities received or delivered as a result of in-kind purchases or redemptions of the fund’s capital
shares, including ETF Creation Units.
See accompanying Notes, which are an integral part of the Financial Statements.
16
| | | | | | | |
| Extended Duration Treasury Index Fund | | | | | | |
| |
| |
| Financial Highlights | | | | | | |
| |
| |
| Institutional Plus Shares | | | | | | | |
| | Six Months | | | | | Aug. 28, |
| | | Ended | | | | | 20131 to |
| For a Share Outstanding | February 28, | Year Ended August 31, | Aug. 31, |
| Throughout Each Period | | 2018 | 2017 | 2016 | 2015 | 2014 | 2013 |
| Net Asset Value, Beginning of Period | $91.68 | $105.93 | $87.92 | $85.80 | $72.42 | $71.46 |
| Investment Operations | | | | | | | |
| Net Investment Income | | 1.273 2 | 2.588 2 | 2.620 | 2.701 | 2.542 | — |
| Net Realized and Unrealized Gain (Loss) | | | | | | |
| on Investments 3 | | (7.987) | (12.375) | 18.958 | 2.389 | 14.260 | .960 |
| Total from Investment Operations | (6.714) | (9.787) | 21.578 | 5.090 | 16.802 | .960 |
| Distributions | | | | | | | |
| Dividends from Net Investment Income | (1.291) | (2.603) | (2.616) | (2.688) | (2.491) | — |
| Distributions from Realized Capital Gains | (. 225) | (1.860) | (. 952) | (. 282) | (. 931) | — |
| Total Distributions | | (1.516) | (4.463) | (3.568) | (2.970) | (3.422) | — |
| Net Asset Value, End of Period | | $83.45 | $91.68 | $105.93 | $87.92 | $85.80 | $72.42 |
| Total Return4 | | -7.43% | -8.84% | 25.34% | 5.93% | 24.31% | 1.34% |
| Ratios/Supplemental Data | | | | | | | |
| Net Assets, End of Period (Millions) | $513 | $367 | $258 | $250 | $324 | $25 |
| Ratio of Total Expenses to | | | | | | | |
| Average Net Assets | | 0.04% | 0.04% | 0.04% | 0.06% | 0.08% | 0.08%5 |
| Ratio of Net Investment Income to | | | | | | |
| Average Net Assets | | 2.90% | 2.93% | 2.80% | 2.97% | 3.63% | 3.19%5 |
| Portfolio Turnover Rate 6 | | 21% | 18% | 20% | 16% | 17% | 31% |
The expense ratio, net investment income ratio, and turnover rate for the current period have been annualized.
1 Inception.
2 Calculated based on average shares outstanding.
3 Includes increases from purchase fees of $0.00, $0.12, $0.05, $0.04, $0.15, and $0.07.
4 Total returns do not include transaction fees that may have applied in the periods shown. Fund prospectuses provide information
about any applicable transaction fees.
5 Annualized.
6 Excludes the value of portfolio securities received or delivered as a result of in-kind purchases or redemptions of the fund’s capital
shares, including ETF Creation Units.
See accompanying Notes, which are an integral part of the Financial Statements.
17
Extended Duration Treasury Index Fund
Notes to Financial Statements
Vanguard Extended Duration Treasury Index Fund is registered under the Investment Company Act of 1940 as an open-end investment company, or mutual fund. The fund offers three classes of shares: ETF Shares, Institutional Shares, and Institutional Plus Shares. ETF Shares are listed for trading on NYSE Arca; they can be purchased and sold through a broker. Institutional Shares and Institutional Plus Shares are designed for investors who meet certain administrative, service, and account-size criteria.
A. The following significant accounting policies conform to generally accepted accounting principles for U.S. investment companies. The fund consistently follows such policies in preparing its financial statements.
1. Security Valuation: Securities are valued as of the close of trading on the New York Stock Exchange (generally 4 p.m., Eastern time) on the valuation date. Bonds and temporary cash investments are valued using the latest bid prices or using valuations based on a matrix system (which considers such factors as security prices, yields, maturities, and ratings), both as furnished by independent pricing services. Investments in Vanguard Market Liquidity Fund are valued at that fund’s net asset value. Securities for which market quotations are not readily available, or whose values have been affected by events occurring before the fund’s pricing time but after the close of the securities’ primary markets, are valued by methods deemed by the board of trustees to represent fair value.
2. Futures Contracts: The fund uses futures contracts to invest in fixed income asset classes with greater efficiency and lower cost than is possible through direct investment, to add value when these instruments are attractively priced, or to adjust sensitivity to changes in interest rates. The primary risks associated with the use of futures contracts are imperfect correlation between changes in market values of bonds held by the fund and the prices of futures contracts, and the possibility of an illiquid market. Counterparty risk involving futures is mitigated because a regulated clearinghouse is the counterparty instead of the clearing broker. To further mitigate counterparty risk, the fund trades futures contracts on an exchange, monitors the financial strength of its clearing brokers and clearinghouse, and has entered into clearing agreements with its clearing brokers. The clearinghouse imposes initial margin requirements to secure the fund’s performance and requires daily settlement of variation margin representing changes in the market value of each contract.
Futures contracts are valued at their quoted daily settlement prices. The notional amounts of the contracts are not recorded in the Statement of Net Assets. Fluctuations in the value of the contracts are recorded in the Statement of Net Assets as an asset (liability) and in the Statement of Operations as unrealized appreciation (depreciation) until the contracts are closed, when they are recorded as realized futures gains (losses).
During the six months ended February 28, 2018, the fund’s average investments in long and short futures contracts represented 0% and 0% of net assets, respectively, based on the average of the notional amounts at each quarter-end during the period. The fund had no open futures contracts at February 28, 2018.
3. Federal Income Taxes: The fund intends to continue to qualify as a regulated investment company and distribute all of its taxable income. Management has analyzed the fund’s tax positions taken for all open federal income tax years (August 31, 2014–2017), and for the period ended February 28, 2018, and has concluded that no provision for federal income tax is required in the fund’s financial statements.
18
Extended Duration Treasury Index Fund
4. Distributions: Distributions to shareholders are recorded on the ex-dividend date.
5. Credit Facility: The fund and certain other funds managed by The Vanguard Group (“Vanguard”) participate in a $3.1 billion committed credit facility provided by a syndicate of lenders pursuant to a credit agreement that may be renewed annually; each fund is individually liable for its borrowings, if any, under the credit facility. Borrowings may be utilized for temporary and emergency purposes, and are subject to the fund’s regulatory and contractual borrowing restrictions. The participating funds are charged administrative fees and an annual commitment fee of 0.10% of the undrawn amount of the facility; these fees are allocated to the funds based on a method approved by the fund’s board of trustees and included in Management and Administrative expenses on the fund’s Statement of Operations. Any borrowings under this facility bear interest at a rate based upon the higher of the one-month London Interbank Offered Rate, federal funds effective rate, or overnight bank funding rate plus an agreed-upon spread.
The fund had no borrowings outstanding at February 28, 2018, or at any time during the period then ended.
6. Other: Interest income includes income distributions received from Vanguard Market Liquidity Fund and is accrued daily. Premiums and discounts on debt securities purchased are amortized and accreted, respectively, to interest income over the lives of the respective securities. Security transactions are accounted for on the date securities are bought or sold. Costs used to determine realized gains (losses) on the sale of investment securities are those of the specific securities sold. Fees assessed on purchases of capital shares are credited to paid-in capital.
Each class of shares has equal rights as to assets and earnings, except that each class separately bears certain class-specific expenses related to maintenance of shareholder accounts (included in Management and Administrative expenses), shareholder reporting, and the proxy. Marketing and distribution expenses are allocated to each class of shares based on a method approved by the board of trustees. Income, other non-class-specific expenses, and gains and losses on investments are allocated to each class of shares based on its relative net assets.
B. In accordance with the terms of a Funds’ Service Agreement (the “FSA”) between Vanguard and the fund, Vanguard furnishes to the fund investment advisory, corporate management, administrative, marketing, and distribution services at Vanguard’s cost of operations (as defined by the FSA). These costs of operations are allocated to the fund based on methods and guidelines approved by the board of trustees. Vanguard does not require reimbursement in the current period for certain costs of operations (such as deferred compensation/benefits and risk/insurance costs); the fund’s liability for these costs of operations is included in Payables to Vanguard on the Statement of Net Assets. All other costs of operations payable to Vanguard are generally settled twice a month.
Upon the request of Vanguard, the fund may invest up to 0.40% of its net assets as capital in Vanguard. At February 28, 2018, the fund had contributed to Vanguard capital in the amount of $94,000, representing 0.01% of the fund’s net assets and 0.04% of Vanguard’s capitalization. The fund’s trustees and officers are also directors and employees, respectively, of Vanguard.
C. The fund’s custodian bank has agreed to reduce its fees when the fund maintains cash on deposit in the non-interest-bearing custody account. For the six months ended February 28, 2018, custodian fee offset arrangements reduced the fund’s expenses by $5,000 (an annual rate of 0.00% of average net assets).
19
Extended Duration Treasury Index Fund
D. Various inputs may be used to determine the value of the fund’s investments. These inputs are summarized in three broad levels for financial statement purposes. The inputs or methodologies used to value securities are not necessarily an indication of the risk associated with investing in those securities.
Level 1—Quoted prices in active markets for identical securities.
Level 2—Other significant observable inputs (including quoted prices for similar securities, interest
rates, prepayment speeds, credit risk, etc.).
Level 3—Significant unobservable inputs (including the fund’s own assumptions used to determine
the fair value of investments). Any investments valued with significant unobservable inputs are
noted on the Statement of Net Assets.
The following table summarizes the market value of the fund’s investments as of February 28, 2018, based on the inputs used to value them:
| | | |
| | Level 1 | Level 2 | Level 3 |
| Investments | ($000) | ($000) | ($000) |
| U.S. Government and Agency Obligations | — | 1,625,857 | — |
| Temporary Cash Investments | 1,588 | — | — |
| Total | 1,588 | 1,625,857 | — |
E. Distributions are determined on a tax basis and may differ from net investment income and realized capital gains for financial reporting purposes. Differences may be permanent or temporary. Permanent differences are reclassified among capital accounts in the financial statements to reflect their tax character. Temporary differences arise when certain items of income, expense, gain, or loss are recognized in different periods for financial statement and tax purposes. These differences will reverse at some time in the future. Differences in classification may also result from the treatment of short-term gains as ordinary income for tax purposes. The fund’s tax-basis capital gains and losses are determined only at the end of each fiscal year.
During the six months ended February 28, 2018, the fund realized $12,444,000 of net capital gains resulting from in-kind redemptions—in which shareholders exchanged fund shares for securities held by the fund rather than for cash. Because such gains are not taxable to the fund, and are not distributed to shareholders, they have been reclassified from accumulated net realized gains to paid-in capital.
At February 28, 2018, the cost of investment securities for tax purposes was $1,678,838,000. Net unrealized depreciation of investment securities for tax purposes was $51,393,000, consisting of unrealized gains of $27,798,000 on securities that had risen in value since their purchase and $79,191,000 in unrealized losses on securities that had fallen in value since their purchase.
F. During the six months ended February 28, 2018, the fund purchased $402,144,000 of investment securities and sold $309,449,000 of investment securities, other than temporary cash investments. Purchases and sales include $223,549,000 and $122,582,000, respectively, in connection with in-kind purchases and redemptions of the fund’s capital shares.
20
Extended Duration Treasury Index Fund
| | | | |
| G. Capital share transactions for each class of shares were: | | | |
| | Six Months Ended | | Year Ended |
| | February 28, 2018 | August 31, 2017 |
| | Amount | Shares | Amount | Shares |
| | ($000) | (000) | ($000) | (000) |
| ETF Shares | | | | |
| Issued1 | 40,820 | 350 | 247,808 | 2,050 |
| Issued in Lieu of Cash Distributions | — | — | — | — |
| Redeemed | (122,998) | (1,100) | (157,763) | (1,300) |
| Net Increase (Decrease)—ETF Shares | (82,178) | (750) | 90,045 | 750 |
| Institutional Shares | | | | |
| Issued1 | 30,996 | 875 | 309,551 | 9,150 |
| Issued in Lieu of Cash Distributions | 11,230 | 315 | 28,772 | 853 |
| Redeemed | (33,739) | (953) | (244,227) | (6,974) |
| Net Increase (Decrease)—Institutional Shares | 8,487 | 237 | 94,096 | 3,029 |
| Institutional Plus Shares | | | | |
| Issued1 | 188,749 | 2,052 | 122,255 | 1,517 |
| Issued in Lieu of Cash Distributions | 7,938 | 89 | 12,623 | 148 |
| Redeemed | (227) | (2) | (8,723) | (93) |
| Net Increase (Decrease)—Institutional Plus Shares | 196,460 | 2,139 | 126,155 | 1,572 |
| 1 Includes purchase fees for fiscal 2018 and 2017 of $268,000 and $2,236,000, respectively (fund totals). | |
H. Management has determined that no material events or transactions occurred subsequent to February 28, 2018, that would require recognition or disclosure in these financial statements.
21
About Your Fund’s Expenses
As a shareholder of the fund, you incur ongoing costs, which include costs for portfolio management, administrative services, and shareholder reports (like this one), among others. Operating expenses, which are deducted from a fund’s gross income, directly reduce the investment return of the fund.
A fund’s expenses are expressed as a percentage of its average net assets. This figure is known as the expense ratio. The following examples are intended to help you understand the ongoing costs (in dollars) of investing in your fund and to compare these costs with those of other mutual funds. The examples are based on an investment of $1,000 made at the beginning of the period shown and held for the entire period.
The accompanying table illustrates your fund’s costs in two ways:
• Based on actual fund return. This section helps you to estimate the actual expenses that you paid over the period. The ”Ending Account Value“ shown is derived from the fund‘s actual return, and the third column shows the dollar amount that would have been paid by an investor who started with $1,000 in the fund. You may use the information here, together with the amount you invested, to estimate the expenses that you paid over the period.
To do so, simply divide your account value by $1,000 (for example, an $8,600 account value divided by $1,000 = 8.6), then multiply the result by the number given for your fund under the heading ”Expenses Paid During Period.“
• Based on hypothetical 5% yearly return. This section is intended to help you compare your fund‘s costs with those of other mutual funds. It assumes that the fund had a yearly return of 5% before expenses, but that the expense ratio is unchanged. In this case—because the return used is not the fund’s actual return—the results do not apply to your investment. The example is useful in making comparisons because the Securities and Exchange Commission requires all mutual funds to calculate expenses based on a 5% return. You can assess your fund’s costs by comparing this hypothetical example with the hypothetical examples that appear in shareholder reports of other funds.
Note that the expenses shown in the table are meant to highlight and help you compare ongoing costs only and do not reflect transaction costs incurred by the fund for buying and selling securities. Further, the expenses do not include any purchase, redemption, or account service fees described in the fund prospectus. If such fees were applied to your account, your costs would be higher. Your fund does not carry a “sales load.”
The calculations assume no shares were bought or sold during the period. Your actual costs may have been higher or lower, depending on the amount of your investment and the timing of any purchases or redemptions.
You can find more information about the fund’s expenses, including annual expense ratios, in the Financial Statements section of this report. For additional information on operating expenses and other shareholder costs, please refer to your fund’s current prospectus.
22
| | | |
| Six Months Ended February 28, 2018 | | | |
| | Beginning | Ending | Expenses |
| | Account Value | Account Value | Paid During |
| Extended Duration Treasury Index Fund | 8/31/2017 | 2/28/2018 | Period |
| Based on Actual Fund Return | | | |
| ETF Shares | $1,000.00 | $925.65 | $0.33 |
| Institutional Shares | 1,000.00 | 925.57 | 0.29 |
| Institutional Plus Shares | 1,000.00 | 925.73 | 0.19 |
| Based on Hypothetical 5% Yearly Return | | | |
| ETF Shares | $1,000.00 | $1,024.45 | $0.35 |
| Institutional Shares | 1,000.00 | 1,024.50 | 0.30 |
| Institutional Plus Shares | 1,000.00 | 1,024.60 | 0.20 |
The calculations are based on expenses incurred in the most recent six-month period. The fund’s annualized six-month expense ratios for
that period are 0.07% for ETF Shares, 0.06% for Institutional Shares, and 0.04% for Institutional Plus Shares. The dollar amounts shown
as “Expenses Paid” are equal to the annualized expense ratio multiplied by the average account value over the period, multiplied by the
number of days in the most recent six-month period, then divided by the number of days in the most recent 12-month period (181/365).
23
Glossary
30-Day SEC Yield. A fund’s 30-day SEC yield is derived using a formula specified by the U.S. Securities and Exchange Commission. Under the formula, data related to the fund’s security holdings in the previous 30 days are used to calculate the fund’s hypothetical net income for that period, which is then annualized and divided by the fund’s estimated average net assets over the calculation period. For the purposes of this calculation, a security’s income is based on its current market yield to maturity (for bonds), its actual income (for asset-backed securities), or its projected dividend yield (for stocks). Because the SEC yield represents hypothetical annualized income, it will differ—at times significantly—from the fund’s actual experience. As a result, the fund’s income distributions may be higher or lower than implied by the SEC yield.
Average Coupon. The average interest rate paid on the fixed income securities held by a fund. It is expressed as a percentage of face value.
Average Duration. An estimate of how much the value of the bonds held by a fund will fluctuate in response to a change in interest rates. To see how the value could change, multiply the average duration by the change in rates. If interest rates rise by 1 percentage point, the value of the bonds in a fund with an average duration of five years would decline by about 5%. If rates decrease by a percentage point, the value would rise by 5%.
Average Effective Maturity. The average length of time until fixed income securities held by a fund reach maturity and are repaid, taking into consideration the possibility that the issuer may call the bond before its maturity date. The figure reflects the proportion of fund assets represented by each security; it also reflects any futures contracts held. In general, the longer the average effective maturity, the more a fund’s share price will fluctuate in response to changes in market interest rates.
Beta. A measure of the magnitude of a fund’s past share-price fluctuations in relation to the ups and downs of a given market index. The index is assigned a beta of 1.00. Compared with a given index, a fund with a beta of 1.20 typically would have seen its share price rise or fall by 12% when the index rose or fell by 10%. For this report, beta is based on returns over the past 36 months for both the fund and the index. Note that a fund’s beta should be reviewed in conjunction with its R-squared (see definition). The lower the R-squared, the less correlation there is between the fund and the index, and the less reliable beta is as an indicator of volatility.
Credit Quality. Credit-quality ratings are measured on a scale that generally ranges from AAA (highest) to D (lowest). U.S. Treasury, U.S. Agency, and U.S. Agency mortgage-backed securities appear under “U.S. Government.” Credit-quality ratings are obtained from Barclays and are from Moody’s, Fitch, and S&P. When ratings from all three agencies are used, the median rating is shown. When ratings from two of the agencies are used, the lower rating for each issue is shown. “Not Rated” is used to classify securities for which a rating is not available.
Distribution by Coupon. A breakdown of the securities in a fund according to coupon rate—the interest rate that an issuer promises to pay, expressed as an annual percentage of face value. Securities with unusually high coupon rates may be subject to call risk, the possibility that they will be redeemed (or “called”) early by the issuer.
Expense Ratio. A fund’s total annual operating expenses expressed as a percentage of the fund’s average net assets. The expense ratio includes management and administrative expenses, but does not include the transaction costs of buying and selling portfolio securities.
24
Inception Date. The date on which the assets of a fund (or one of its share classes) are first invested in accordance with the fund’s investment objective. For funds with a subscription period, the inception date is the day after that period ends. Investment performance is measured from the inception date.
R-Squared. A measure of how much of a fund’s past returns can be explained by the returns from the market in general, as measured by a given index. If a fund’s total returns were precisely synchronized with an index’s returns, its R-squared would be 1.00. If the fund’s returns bore no relationship to the index’s returns, its R-squared would be 0. For this report, R-squared is based on returns over the past 36 months for both the fund and the index.
Short-Term Reserves. The percentage of a fund invested in highly liquid, short-term securities that can be readily converted to cash.
Yield to Maturity. The rate of return an investor would receive if the fixed income securities held by a fund were held to their maturity dates.
25
BLOOMBERG is a trademark and service mark of Bloomberg Finance L.P. BARCLAYS is a trademark and service mark of
Barclays Bank Plc, used under license. Bloomberg Finance L.P. and its affiliates, including Bloomberg Index Services Limited
(BISL) (collectively, Bloomberg), or Bloomberg’s licensors, own all proprietary rights in the Bloomberg Barclays U.S. Treasury
STRIPS 20–30 Year Equal Par Bond Index (the Index or Bloomberg Barclays Index).
Neither Barclays Bank Plc, Barclays Capital Inc., or any affiliate (collectively Barclays) or Bloomberg is the issuer or
producer of the Extended Duration Treasury Index Fund and neither Bloomberg nor Barclays has any responsibilities,
obligations or duties to investors in the Extended Duration Treasury Index Fund. The Index is licensed for use by The
Vanguard Group, Inc. (Vanguard) as the sponsor of the Extended Duration Treasury Index Fund. Bloomberg and Barclays’
only relationship with Vanguard in respect to the Index is the licensing of the Index, which is determined, composed and
calculated by BISL, or any successor thereto, without regard to the Issuer or the Extended Duration Treasury Index Fund
or the owners of the Extended Duration Treasury Index Fund.
Additionally, Vanguard may for itself execute transaction(s) with Barclays in or relating to the Index in connection with the
Extended Duration Treasury Index Fund. Investors acquire the Extended Duration Treasury Index Fund from Vanguard and
investors neither acquire any interest in the Index nor enter into any relationship of any kind whatsoever with Bloomberg
or Barclays upon making an investment in the Extended Duration Treasury Index Fund. The Extended Duration Treasury
Index Fund is not sponsored, endorsed, sold or promoted by Bloomberg or Barclays. Neither Bloomberg nor Barclays makes
any representation or warranty, express or implied regarding the advisability of investing in the Extended Duration Treasury
Index Fund or the advisability of investing in securities generally or the ability of the Index to track corresponding or relative
market performance. Neither Bloomberg nor Barclays has passed on the legality or suitability of the Extended Duration
Treasury Index Fund with respect to any person or entity. Neither Bloomberg nor Barclays is responsible for and has not
participated in the determination of the timing of, prices at, or quantities of the Extended Duration Treasury Index Fund to
be issued. Neither Bloomberg nor Barclays has any obligation to take the needs of the Issuer or the owners of the Extended
Duration Treasury Index Fund or any other third party into consideration in determining, composing or calculating the Index.
Neither Bloomberg nor Barclays has any obligation or liability in connection with administration, marketing or trading of the
Extended Duration Treasury Index Fund.
26
The licensing agreement between Bloomberg and Barclays is solely for the benefit of Bloomberg and Barclays and not
for the benefit of the owners of the Extended Duration Treasury Index Fund, investors or other third parties. In addition,
the licensing agreement between Vanguard and Bloomberg is solely for the benefit of Vanguard and Bloomberg and not
for the benefit of the owners of the Extended Duration Treasury Index Fund, investors or other third parties.
NEITHER BLOOMBERG NOR BARCLAYS SHALL HAVE ANY LIABILITY TO THE ISSUER, INVESTORS OR TO OTHER THIRD
PARTIES FOR THE QUALITY, ACCURACY AND/OR COMPLETENESS OF THE BLOOMBERG BARCLAYS INDEX OR ANY
DATA INCLUDED THEREIN OR FOR INTERRUPTIONS IN THE DELIVERY OF THE BLOOMBERG BARCLAYS INDEX. NEITHER
BLOOMBERG NOR BARCLAYS MAKES ANY WARRANTY, EXPRESS OR IMPLIED, AS TO RESULTS TO BE OBTAINED BY
THE ISSUER, THE INVESTORS OR ANY OTHER PERSON OR ENTITY FROM THE USE OF THE BLOOMBERG BARCLAYS
INDEX OR ANY DATA INCLUDED THEREIN. NEITHER BLOOMBERG NOR BARCLAYS MAKES ANY EXPRESS OR IMPLIED
WARRANTIES, AND EACH HEREBY EXPRESSLY DISCLAIMS ALL WARRANTIES OF MERCHANTABILITY OR FITNESS
FOR A PARTICULAR PURPOSE OR USE WITH RESPECT TO THE BLOOMBERG BARCLAYS INDEX OR ANY DATA INCLUDED
THEREIN. BLOOMBERG RESERVES THE RIGHT TO CHANGE THE METHODS OF CALCULATION OR PUBLICATION, OR
TO CEASE THE CALCULATION OR PUBLICATION OF THE BLOOMBERG BARCLAYS INDEX, AND NEITHER BLOOMBERG
NOR BARCLAYS SHALL BE LIABLE FOR ANY MISCALCULATION OF OR ANY INCORRECT, DELAYED OR INTERRUPTED
PUBLICATION WITH RESPECT TO THE BLOOMBERG BARCLAYS INDEX. NEITHER BLOOMBERG NOR BARCLAYS SHALL
BE LIABLE FOR ANY DAMAGES, INCLUDING, WITHOUT LIMITATION, ANY SPECIAL, INDIRECT OR CONSEQUENTIAL
DAMAGES, OR ANY LOST PROFITS AND EVEN IF ADVISED OF THE POSSIBILITY OF SUCH, RESULTING FROM THE USE OF
A BLOOMBERG BARCLAYS INDEX OR ANY DATA INCLUDED THEREIN OR WITH RESPECT TO THE EXTENDED DURATION
TREASURY INDEX FUND.
None of the information supplied by Bloomberg or Barclays and used in this publication may be reproduced in any manner
without the prior written permission of both Bloomberg and Barclays Capital, the investment banking division of Barclays
Bank Plc. Barclays Bank Plc is registered in England No. 1026167. Registered office 1 Churchill Place London E14 5HP.
© 2018 Bloomberg. Used with Permission.
Source: Bloomberg Index Services Limited. Copyright 2018, Bloomberg. All rights reserved.
27
This page intentionally left blank.
This page intentionally left blank.
This page intentionally left blank.
The People Who Govern Your Fund
The trustees of your mutual fund are there to see that the fund is operated and managed in your best interests since, as a shareholder, you are a part owner of the fund. Your fund’s trustees also serve on the board of directors of The Vanguard Group, Inc., which is owned by the Vanguard funds and provides services to them on an at-cost basis.
A majority of Vanguard’s board members are independent, meaning that they have no affiliation with Vanguard or the funds they oversee, apart from the sizable personal investments they have made as private individuals. The independent board members have distinguished backgrounds in business, academia, and public service. Each of the trustees and executive officers oversees 208 Vanguard funds.
Information for each trustee and executive officer of the fund appears below. The mailing address of the trustees and officers is P.O. Box 876, Valley Forge, PA 19482. More information about the trustees is in the Statement of Additional Information, which can be obtained, without charge, by contacting Vanguard at 800-662-7447, or online at vanguard.com.
Interested Trustees1
F. William McNabb III
Born in 1957. Trustee since July 2009. Principal occupation(s) during the past five years and other experience: chairman of the board (January 2010–present) of Vanguard and of each of the investment companies served by Vanguard, trustee (2009–present) of each of the investment companies served by Vanguard, and director (2008–present) of Vanguard. Chief executive officer and president (2008–2017) of Vanguard and each of the investment companies served by Vanguard, managing director (1995–2008) of Vanguard, and director (1997–2018) of Vanguard Marketing Corporation. Director (2018–present) of UnitedHealth Group.
Mortimer J. Buckley
Born in 1969. Trustee since January 2018. Principal occupation(s) during the past five years and other experience: chief executive officer (January 2018–present) of Vanguard; chief executive officer, president, and trustee (January 2018–present) of each of the investment companies served by Vanguard; president and director (2017–present) of Vanguard; and president (February 2018–present) of Vanguard Marketing Corporation. Chief investment officer (2013–2017), managing director (2002–2017), head of the Retail Investor Group (2006–2012), and chief information officer (2001–2006) of Vanguard. Chairman of the board (2011–2017) of the Children’s Hospital of Philadelphia.
Independent Trustees
Emerson U. Fullwood
Born in 1948. Trustee since January 2008. Principal occupation(s) during the past five years and other experience: executive chief staff and marketing officer for North America and corporate vice president (retired 2008) of Xerox Corporation (document management products and services). Former president of the Worldwide Channels Group, Latin America, and Worldwide Customer Service and executive chief staff officer of Developing Markets of Xerox. Executive in residence and 2009–2010 Distinguished Minett Professor at the Rochester Institute of Technology. Lead director of SPX FLOW, Inc. (multi-industry manufacturing). Director of the University of Rochester Medical Center, the Monroe Community College Foundation, the United Way of Rochester, North Carolina A&T University, and Roberts Wesleyan College. Trustee of the University of Rochester.
Amy Gutmann
Born in 1949. Trustee since June 2006. Principal occupation(s) during the past five years and other experience: president (2004–present) of the University of Pennsylvania. Christopher H. Browne Distinguished Professor of Political Science, School of Arts and Sciences, and professor of communication, Annenberg School for Communication, with secondary faculty appointments in the Department of Philosophy, School of Arts and Sciences, and at the Graduate School of Education, University of Pennsylvania. Trustee of the National Constitution Center.
1 Mr. McNabb and Mr. Buckley are considered “interested persons,” as defined in the Investment Company Act of 1940, because
they are officers of the Vanguard funds.
JoAnn Heffernan Heisen
Born in 1950. Trustee since July 1998. Principal occupation(s) during the past five years and other experience: corporate vice president of Johnson & Johnson (pharmaceuticals/medical devices/consumer products) and member of its executive committee (1997–2008). Chief global diversity officer (retired 2008), vice president and chief information officer (1997–2006), controller (1995–1997), treasurer (1991–1995), and assistant treasurer (1989–1991) of Johnson & Johnson. Director of Skytop Lodge Corporation (hotels) and the Robert Wood Johnson Foundation. Member of the advisory board of the Institute for Women’s Leadership at Rutgers University.
F. Joseph Loughrey
Born in 1949. Trustee since October 2009. Principal occupation(s) during the past five years and other experience: president and chief operating officer (retired 2009) and vice chairman of the board (2008–2009) of Cummins Inc. (industrial machinery). Chairman of the board of Hillenbrand, Inc. (specialized consumer services), Oxfam America, and the Lumina Foundation for Education. Director of the V Foundation for Cancer Research. Member of the advisory council for the College of Arts and Letters and chair of the advisory board to the Kellogg Institute for International Studies, both at the University of Notre Dame.
Mark Loughridge
Born in 1953. Trustee since March 2012. Principal occupation(s) during the past five years and other experience: senior vice president and chief financial officer (retired 2013) of IBM (information technology services). Fiduciary member of IBM’s Retirement Plan Committee (2004–2013), senior vice president and general manager (2002–2004) of IBM Global Financing, vice president and controller (1998–2002) of IBM, and a variety of other prior management roles at IBM. Member of the Council on Chicago Booth.
Scott C. Malpass
Born in 1962. Trustee since March 2012. Principal occupation(s) during the past five years and other experience: chief investment officer (1989–present) and vice president (1996–present) of the University of Notre Dame. Assistant professor of finance at the Mendoza College of Business, University of Notre Dame, and member of the Notre Dame 403(b) Investment Committee. Chairman of the board of TIFF Advisory Services, Inc. Member of the board of Catholic Investment Services, Inc. (investment advisors), the board of advisors for Spruceview Capital Partners, and the board of superintendence of the Institute for the Works of Religion.
Deanna Mulligan
Born in 1963. Trustee since January 2018. Principal occupation(s) during the past five years and other experience: president (2010–present) and chief executive officer (2011–present) of The Guardian Life Insurance Company of America. Chief operating officer (2010–2011) and executive vice president (2008–2010) of Individual Life and Disability of The Guardian Life Insurance Company of America. Member of the board of The Guardian Life Insurance Company of America, the American Council of Life Insurers, the Partnership for New York City (business leadership), and the Committee Encouraging Corporate Philanthropy. Trustee of the Economic Club of New York and the Bruce Museum (arts and science). Member of the Advisory Council for the Stanford Graduate School of Business.
André F. Perold
Born in 1952. Trustee since December 2004. Principal occupation(s) during the past five years and other experience: George Gund Professor of Finance and Banking, Emeritus at the Harvard Business School (retired 2011). Chief investment officer and co-managing partner of HighVista Strategies LLC (private investment firm). Overseer of the Museum of Fine Arts Boston.
Sarah Bloom Raskin
Born in 1961. Trustee since January 2018. Principal occupation(s) during the past five years and other experience: deputy secretary (2014–2017) of the United States Department of the Treasury. Governor (2010–2014) of the Federal Reserve Board. Commissioner (2007–2010) of financial regulation for the State of Maryland. Member of the board of directors (2012–2014) of Neighborhood Reinvestment Corporation. Director of i(x) Investments, LLC.
Peter F. Volanakis
Born in 1955. Trustee since July 2009. Principal occupation(s) during the past five years and other experience: president and chief operating officer (retired 2010) of Corning Incorporated (communications equipment) and director of Corning Incorporated (2000–2010) and Dow Corning (2001–2010). Director (2012) of SPX Corporation (multi-industry manufacturing). Overseer of the Amos Tuck School of Business Administration, Dartmouth College (2001–2013). Chairman of the board of trustees of Colby-Sawyer College. Member of the Board of Hypertherm Inc. (industrial cutting systems, software, and consumables).
Executive Officers
Glenn Booraem
Born in 1967. Principal occupation(s) during the past five years and other experience: principal of Vanguard. Investment stewardship officer (2017–present), treasurer (2015–2017), controller (2010–2015), and assistant controller (2001–2010) of each of the investment companies served by Vanguard.
Christine M. Buchanan
Born in 1970. Principal occupation(s) during the past five years and other experience: principal of Vanguard and global head of Fund Administration at Vanguard. Treasurer (2017–present) of each of the investment companies served by Vanguard. Partner (2005–2017) at KPMG LLP (audit, tax, and advisory services).
Brian Dvorak
Born in 1973. Principal occupation(s) during the past five years and other experience: principal of Vanguard. Chief compliance officer (2017–present) of Vanguard and each of the investment companies served by Vanguard. Assistant vice president (2017–present) of Vanguard Marketing Corporation. Vice president and director of Enterprise Risk Management (2011–2013) at Oppenheimer Funds, Inc.
Thomas J. Higgins
Born in 1957. Principal occupation(s) during the past five years and other experience: principal of Vanguard. Chief financial officer (2008–present) and treasurer (1998–2008) of each of the investment companies served by Vanguard.
Peter Mahoney
Born in 1974. Principal occupation(s) during the past five years and other experience: principal of Vanguard. Controller (2015–present) of each of the investment companies served by Vanguard. Head of International Fund Services (2008–2014) at Vanguard.
Anne E. Robinson
Born in 1970. Principal occupation(s) during the past five years and other experience: general counsel (2016–present) of Vanguard. Secretary (2016–present) of Vanguard and of each of the investment companies served by Vanguard. Managing director (2016–present) of Vanguard. Director and senior vice president (2016–2018) of Vanguard Marketing Corporation. Managing director and general counsel of Global Cards and Consumer Services (2014–2016) at Citigroup. Counsel (2003–2014) at American Express.
Michael Rollings
Born in 1963. Principal occupation(s) during the past five years and other experience: finance director (2017–present) and treasurer (2017) of each of the investment companies served by Vanguard. Managing director (2016–present) of Vanguard. Chief financial officer (2016–present) of Vanguard. Director (2016–present) of Vanguard Marketing Corporation. Executive vice president and chief financial officer (2006–2016) of MassMutual Financial Group.
| |
| Vanguard Senior Management Team |
| |
| Mortimer J. Buckley | James M. Norris |
| Gregory Davis | Thomas M. Rampulla |
| John James | Karin A. Risi |
| Martha G. King | Anne E. Robinson |
| John T. Marcante | Michael Rollings |
| Chris D. McIsaac | |
Chairman Emeritus and Senior Advisor
John J. Brennan
Chairman, 1996–2009
Chief Executive Officer and President, 1996–2008
Founder
John C. Bogle
Chairman and Chief Executive Officer, 1974–1996
| |
|  |
| P.O. Box 2600 |
| Valley Forge, PA 19482-2600 |
| | |
| | |
| | |
| Connect with Vanguard® > vanguard.com | |
| | |
| | |
| | |
| Fund Information > 800-662-7447 | |
| Direct Investor Account Services > 800-662-2739 | |
| Institutional Investor Services > 800-523-1036 | |
| Text Telephone for People | |
| Who Are Deaf or Hard of Hearing > 800-749-7273 | |
| | |
| This material may be used in conjunction | |
| with the offering of shares of any Vanguard | |
| fund only if preceded or accompanied by | |
| the fund’s current prospectus. | |
| | |
| All comparative mutual fund data are from Lipper, a | |
| Thomson Reuters Company, or Morningstar, Inc., unless | |
| otherwise noted. | |
| | |
| You can obtain a free copy of Vanguard’s proxy voting | |
| guidelines by visiting vanguard.com/proxyreporting or by | |
| calling Vanguard at 800-662-2739. The guidelines are | |
| also available from the SEC’s website, sec.gov. In | |
| addition, you may obtain a free report on how your fund | |
| voted the proxies for securities it owned during the 12 | |
| months ended June 30. To get the report, visit either | |
| vanguard.com/proxyreporting or sec.gov. | |
| | |
| You can review and copy information about your fund at | |
| the SEC’s Public Reference Room in Washington, D.C. To | |
| find out more about this public service, call the SEC at | |
| 202-551-8090. Information about your fund is also | |
| available on the SEC’s website, and you can receive | |
| copies of this information, for a fee, by sending a | |
| request in either of two ways: via email addressed to | |
| publicinfo@sec.gov or via regular mail addressed to the | |
| Public Reference Section, Securities and Exchange | |
| Commission, Washington, DC 20549-1520. | |
| © 2018 The Vanguard Group, Inc. |
| All rights reserved. |
| Vanguard Marketing Corporation, Distributor. |
| | |
| Q12752 042018 |

Semiannual Report | February 28, 2018
Vanguard Mega Cap Index Funds
Vanguard Mega Cap Index Fund
Vanguard Mega Cap Growth Index Fund
Vanguard Mega Cap Value Index Fund
Vanguard’s Principles for Investing Success
We want to give you the best chance of investment success. These principles, grounded in Vanguard’s research and experience, can put you on the right path.
Goals. Create clear, appropriate investment goals.
Balance. Develop a suitable asset allocation using broadly diversified funds.
Cost. Minimize cost.
Discipline. Maintain perspective and long-term discipline.
A single theme unites these principles: Focus on the things you can control.
We believe there is no wiser course for any investor.
| |
| Contents | |
| Your Fund’s Performance at a Glance. | 1 |
| CEO’s Perspective. | 3 |
| Results of Proxy Voting. | 6 |
| Mega Cap Index Fund. | 8 |
| Mega Cap Growth Index Fund. | 24 |
| Mega Cap Value Index Fund. | 39 |
| About Your Fund’s Expenses. | 54 |
| Glossary. | 56 |
Please note: The opinions expressed in this report are just that—informed opinions. They should not be considered promises
or advice. Also, please keep in mind that the information and opinions cover the period through the date on the front of this
report. Of course, the risks of investing in your fund are spelled out in the prospectus.
See the Glossary for definitions of investment terms used in this report.
About the cover: Nautical images have been part of Vanguard’s rich heritage since its start in 1975. For an
incoming ship, a lighthouse offers a beacon and safe path to shore. You can similarly depend on Vanguard to put
you first––and light the way––as you strive to meet your financial goals. Our client focus and low costs,
stemming from our unique ownership structure, assure that your interests are paramount.
Your Fund’s Performance at a Glance
• Growth stocks generally outperformed value stocks over the six months ended February 28, 2018. This trend was borne out in the performance of the three Vanguard Mega Cap Index Funds.
• Results for the period ranged from more than 10% for the Mega Cap Value Index Fund to more than 12% for the Mega Cap Growth Index Fund. The Mega Cap Index Fund, which includes both value and growth stocks, returned more than 11%. Each fund closely tracked its benchmark index.
• Technology contributed the most to returns for the Mega Cap Index and Mega Cap Growth Index Funds, while financials gave the biggest lift to the Mega Cap Value Index Fund.
• The utilities sector detracted the most from performance for the Mega Cap Index and Mega Cap Value Index Funds. Telecommunications crimped returns for the Mega Cap Growth Index Fund.
| |
| Total Returns: Six Months Ended February 28, 2018 | |
| | Total |
| | Returns |
| Vanguard Mega Cap Index Fund | |
| ETF Shares | |
| Market Price | 11.48% |
| Net Asset Value | 11.37 |
| Institutional Shares | 11.38 |
| CRSP US Mega Cap Index | 11.38 |
| Large-Cap Core Funds Average | 10.13 |
| Large-Cap Core Funds Average: Derived from data provided by Lipper, a Thomson Reuters Company. | |
| |
| Vanguard Mega Cap Growth Index Fund | |
| ETF Shares | |
| Market Price | 12.46% |
| Net Asset Value | 12.39 |
| Institutional Shares | 12.39 |
| CRSP US Mega Cap Growth Index | 12.42 |
| Large-Cap Growth Funds Average | 13.29 |
| Large-Cap Growth Funds Average: Derived from data provided by Lipper, a Thomson Reuters Company. | |
1
| |
| | Total |
| | Returns |
| Vanguard Mega Cap Value Index Fund | |
| ETF Shares | |
| Market Price | 10.52% |
| Net Asset Value | 10.51 |
| Institutional Shares | 10.50 |
| CRSP US Mega Cap Value Index | 10.52 |
| Large-Cap Value Funds Average | 8.92 |
| Large-Cap Value Funds Average: Derived from data provided by Lipper, a Thomson Reuters Company. | |
Institutional Shares are available to certain institutional investors who meet specific administrative, service, and account-size criteria. The
Vanguard ETF® Shares shown are traded on the NYSE Arca exchange and are available only through brokers. The table provides ETF
returns based on both the NYSE Arca market price and the net asset value for a share. U.S. Pat. Nos. 6,879,964; 7,337,138; 7,720,749;
7,925,573; 8,090,646; and 8,417,623.
For the ETF Shares, the market price is determined by the midpoint of the bid-offer spread as of the closing time of the New York Stock
Exchange (generally 4 p.m., Eastern time). The net asset value is also determined as of the NYSE closing time. For more information about
how the ETF Shares' market prices have compared with their net asset value, visit vanguard.com, select your ETF, and then select the
Price and Performance tab. The ETF premium/discount analysis there shows the percentages of days on which the ETF Shares' market
price was above or below the NAV.
| | | |
| Expense Ratios | | | |
| Your Fund Compared With Its Peer Group | | | |
| | ETF | Institutional | Peer Group |
| | Shares | Shares | Average |
| Mega Cap Index Fund | 0.07% | 0.06% | 1.03% |
| Mega Cap Growth Index Fund | 0.07 | 0.06 | 1.10 |
| Mega Cap Value Index Fund | 0.07 | 0.06 | 1.04 |
The fund expense ratios shown are from the prospectus dated December 21, 2017, and represent estimated costs for the current fiscal
year. For the six months ended February 28, 2018, the annualized expense ratios were: for the Mega Cap Index Fund, 0.07% for ETF
Shares and 0.06% for Institutional Shares; for the Mega Cap Growth Index Fund, 0.07% for ETF Shares and 0.06% for Institutional Shares;
and for the Mega Cap Value Index Fund, 0.07% for ETF Shares and 0.06% for Institutional Shares. Peer-group expense ratios are derived
from data provided by Lipper, a Thomson Reuters Company, and capture information through year-end 2017.
Peer groups: For the Mega Cap Index Fund, Large-Cap Core Funds; for the Mega Cap Growth Index Fund, Large-Cap Growth Funds; and for
the Mega Cap Value Index Fund, Large-Cap Value Funds.
2
CEO’s Perspective

Tim Buckley
President and Chief Executive Officer
Dear Shareholder,
As I begin my tenure as Vanguard’s fourth chief executive, I’ve been reflecting on both the past and the future of the company where I have spent my entire professional career.
I feel extremely fortunate to have the chance to lead a company filled with people who come to work every day passionate about Vanguard’s core purpose: to take a stand for all investors, to treat them fairly, and to give them the best chance for investment success.
Making a real difference
When I joined Vanguard in 1991, I found a mission-driven team focused on improving lives—helping people retire more comfortably, put their children through college, and achieve financial security. I found a company with purpose in an industry ripe for improvement.
It was clear, even early in my career, that the cards were stacked against most investors. Hidden fees, performance-chasing, and poor advice were relentlessly eroding investors’ dreams.
We knew Vanguard could be different and, as a result, could make a real difference. Over the past 25 years, for example, Vanguard has lowered our funds’ asset-weighted average expense ratio
3
from 0.31% to 0.12%. And over the past decade, 94% of our funds have beaten the average annual return of their peers.1
Focused on your success
Vanguard is built for Vanguard investors—as a client-owned company, we focus solely on you, our fund shareholders. Everything we do is designed to give our clients the best chance for investment success. In my role as CEO, I intend to keep this priority front and center. We’re proud of what we’ve achieved, but we’re even more excited about what’s to come.
As I write this, we’ve experienced a period of pronounced market volatility. Strong economic growth and budding signs of inflation have raised concerns about a more aggressive Federal Reserve. Although volatility can test investors’ nerves, we sometimes think of this as “Vanguard weather”—a time when having a disciplined, low-cost, and long-term approach to investment management serves investors well.
| | | |
| Market Barometer | | | |
| | | | Total Returns |
| | | Periods Ended February 28, 2018 |
| | Six | One | Five Years |
| | Months | Year | (Annualized) |
| Stocks | | | |
| Russell 1000 Index (Large-caps) | 10.62% | 16.70% | 14.56% |
| Russell 2000 Index (Small-caps) | 8.30 | 10.51 | 12.19 |
| Russell 3000 Index (Broad U.S. market) | 10.45 | 16.22 | 14.37 |
| FTSE All-World ex US Index (International) | 7.84 | 21.50 | 6.69 |
| |
| Bonds | | | |
| Bloomberg Barclays U.S. Aggregate Bond Index | | | |
| (Broad taxable market) | -2.18% | 0.51% | 1.71% |
| Bloomberg Barclays Municipal Bond Index | | | |
| (Broad tax-exempt market) | -1.24 | 2.50 | 2.57 |
| Citigroup Three-Month U.S. Treasury Bill Index | 0.59 | 0.98 | 0.27 |
| |
| CPI | | | |
| Consumer Price Index | 1.41% | 2.21% | 1.41% |
The performance data shown represent past performance, which is not a guarantee of future results.
1 For the ten-year period through December 31, 2017, 9 of 9 Vanguard money market funds, 56 of 60 bond funds, 21 of 22 balanced funds,
and 131 of 140 stock funds, or 217 of 231 Vanguard funds, outperformed their peer-group averages. Sources: Vanguard, based on data
from Lipper, a Thomson Reuters Company.
4
Steady, time-tested guidance
Our guidance for investors, as always, is to stay the course, tune out the hyperbolic headlines, and focus on your goals and what you can control, such as costs and how much you save. This time-tested advice has served our clients well over the decades.
Regardless of how the markets perform in the short term, I’m incredibly optimistic about the future for our investors. We have a dedicated team serving you, and we will never stop striving to make Vanguard the best place for you to invest through our high-quality funds and services, advice and guidance to help you meet your financial goals, and an experience that makes you feel good about entrusting us with your hard-earned savings.
Thank you for your continued loyalty.
Sincerely,

Mortimer J. Buckley
President and Chief Executive Officer
March 19, 2018
5
Results of Proxy Voting
At a special meeting of shareholders on November 15, 2017, fund shareholders approved the following proposals:
Proposal 1—Elect trustees for the fund.*
The individuals listed in the table below were elected as trustees for the fund. All trustees with the exception of Ms. Mulligan, Ms. Raskin, and Mr. Buckley (each of whom already serves as a director of The Vanguard Group, Inc.) served as trustees to the funds prior to the shareholder meeting.
| | | |
| | | | Percentage |
| Trustee | For | Withheld | For |
| Mortimer J. Buckley | 1,040,401,220 | 33,553,324 | 96.9% |
| Emerson U. Fullwood | 1,039,160,376 | 34,794,169 | 96.8% |
| Amy Gutmann | 1,040,321,884 | 33,632,661 | 96.9% |
| JoAnn Heffernan Heisen | 1,041,268,182 | 32,686,363 | 97.0% |
| F. Joseph Loughrey | 1,040,201,842 | 33,752,703 | 96.9% |
| Mark Loughridge | 1,039,909,454 | 34,045,090 | 96.8% |
| Scott C. Malpass | 1,039,175,722 | 34,778,823 | 96.8% |
| F. William McNabb III | 1,038,914,560 | 35,039,985 | 96.7% |
| Deanna Mulligan | 1,041,175,691 | 32,778,854 | 96.9% |
| André F. Perold | 1,028,804,958 | 45,149,587 | 95.8% |
| Sarah Bloom Raskin | 1,040,743,960 | 33,210,585 | 96.9% |
| Peter F. Volanakis | 1,039,529,631 | 34,424,914 | 96.8% |
| *Results are for all funds within the same trust. | | | |
Proposal 2—Approve a manager-of-managers arrangement with third-party investment advisors.
This arrangement enables the fund to enter into and materially amend investment advisory arrangements with third-party investment advisors, subject to the approval of the fund’s board of trustees and certain conditions imposed by the Securities and Exchange Commission, while avoiding the costs and delays associated with obtaining future shareholder approval.
| | | | | |
| | | | | Broker | Percentage |
| Vanguard Fund | For | Abstain | Against | Non-Votes | For |
| Mega Cap Growth Index Fund | 15,704,512 | 310,493 | 419,812 | 5,588,458 | 71.3% |
| Mega Cap Index Fund | 6,887,744 | 187,661 | 269,392 | 2,087,563 | 73.0% |
| Mega Cap Value Index Fund | 14,328,868 | 260,328 | 179,223 | 3,116,495 | 80.1% |
6
Proposal 3—Approve a manager-of-managers arrangement with wholly owned subsidiaries of Vanguard.
This arrangement enables Vanguard or the fund to enter into and materially amend investment advisory arrangements with wholly owned subsidiaries of Vanguard, subject to the approval of the fund’s board of trustees and any conditions imposed by the Securities and Exchange Commission (SEC), while avoiding the costs and delays associated with obtaining future shareholder approval. The ability of the fund to operate in this manner is contingent upon the SEC’s approval of a pending application for an order of exemption.
| | | | | |
| | | | | Broker | Percentage |
| Vanguard Fund | For | Abstain | Against | Non-Votes | For |
| Mega Cap Growth Index Fund | 15,760,091 | 318,061 | 356,664 | 5,588,458 | 71.6% |
| Mega Cap Index Fund | 6,900,231 | 188,002 | 256,564 | 2,087,563 | 73.2% |
| Mega Cap Value Index Fund | 14,341,738 | 176,500 | 250,181 | 3,116,495 | 80.2% |
7
Mega Cap Index Fund
Fund Profile
As of February 28, 2018
| | |
| Share-Class Characteristics | | |
| | ETF | Institutional |
| | Shares | Shares |
| Ticker Symbol | MGC | VMCTX |
| Expense Ratio1 | 0.07% | 0.06% |
| 30-Day SEC Yield | 1.87% | 1.88% |
| | | |
| Portfolio Characteristics | | |
| | | | DJ |
| | | CRSP US | U.S. Total |
| | | Mega Cap | Market |
| | Fund | Index | FA Index |
| Number of Stocks | 267 | 267 | 3,746 |
| Median Market Cap $140.1B | $140.1B | $68.2B |
| Price/Earnings Ratio | 22.3x | 22.3x | 21.7x |
| Price/Book Ratio | 3.3x | 3.3x | 3.0x |
| Return on Equity | 16.1% | 16.1% | 15.0% |
| Earnings Growth Rate | 7.9% | 7.9% | 8.5% |
| Dividend Yield | 1.9% | 1.9% | 1.7% |
| Foreign Holdings | 0.0% | 0.0% | 0.0% |
| Turnover Rate | | | |
| (Annualized) | 4% | — | — |
| Short-Term Reserves | 0.0% | — | — |
| | | |
| Sector Diversification (% of equity exposure) |
| | | | DJ |
| | | CRSP US | U.S. Total |
| | | Mega Cap | Market |
| | Fund | Index | FA Index |
| Basic Materials | 1.9% | 1.9% | 2.6% |
| Consumer Goods | 8.2 | 8.2 | 8.5 |
| Consumer Services | 14.0 | 14.0 | 13.2 |
| Financials | 19.2 | 19.2 | 20.5 |
| Health Care | 13.7 | 13.7 | 12.6 |
| Industrials | 11.1 | 11.1 | 13.2 |
| Oil & Gas | 5.4 | 5.4 | 5.2 |
| Technology | 22.0 | 22.0 | 19.8 |
| Telecommunications | 2.2 | 2.2 | 1.7 |
| Utilities | 2.3 | 2.3 | 2.7 |
Sector categories are based on the Industry Classification
Benchmark (“ICB”), except for the “Other” category (if applicable),
which includes securities that have not been provided an ICB
classification as of the effective reporting period.
| | |
| Volatility Measures | | |
| | | DJ |
| | CRSP US | U.S. Total |
| | Mega Cap | Market |
| | Index | FA Index |
| R-Squared | 1.00 | 0.98 |
| Beta | 1.00 | 0.99 |
These measures show the degree and timing of the fund’s
fluctuations compared with the indexes over 36 months.
| | |
| Ten Largest Holdings (% of total net assets) |
| Apple Inc. | Computer Hardware | 4.1% |
| Microsoft Corp. | Software | 3.6 |
| Alphabet Inc. | Internet | 3.3 |
| Amazon.com Inc. | Broadline Retailers | 3.1 |
| Facebook Inc. | Internet | 2.1 |
| Berkshire Hathaway Inc. Diversified Financial | Services | 2.0 |
| JPMorgan Chase & Co. | Banks | 2.0 |
| Johnson & Johnson | Pharmaceuticals | 1.7 |
| Exxon Mobil Corp. | Integrated Oil & Gas | 1.6 |
| Bank of America Corp. | Banks | 1.6 |
| Top Ten | | 25.1% |
The holdings listed exclude any temporary cash investments and
equity index products.
Investment Focus
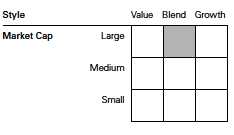
1 The expense ratios shown are from the prospectus dated December 21, 2017, and represent estimated costs for the current fiscal year.
For the six months ended February 28, 2018, the annualized expense ratios were 0.07% for ETF Shares and 0.06% for Institutional Shares.
8
Mega Cap Index Fund
Performance Summary
All of the returns in this report represent past performance, which is not a guarantee of future results that may be achieved by the fund. (Current performance may be lower or higher than the performance data cited. For performance data current to the most recent month-end, visit our website at vanguard.com/performance.) Note, too, that both investment returns and principal value can fluctuate widely, so an investor’s shares, when sold, could be worth more or less than their original cost. The returns shown do not reflect taxes that a shareholder would pay on fund distributions or on the sale of fund shares.
Fiscal-Year Total Returns (%): December 17, 2007, Through February 28, 2018
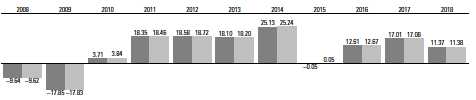
| | |
| | Mega Cap Index Fund ETF Shares Net Asset Value |
| | Spliced Mega Cap Index |
For a benchmark description, see the Glossary.
Note: For 2018, performance data reflect the six months ended February 28, 2018.
Average Annual Total Returns: Periods Ended December 31, 2017
This table presents returns through the latest calendar quarter—rather than through the end of the fiscal period.
Securities and Exchange Commission rules require that we provide this information.
| | | | |
| | Inception | One | Five | Ten |
| | Date | Year | Years | Years |
| ETF Shares | 12/17/2007 | | | |
| Market Price | | 22.57% | 15.81% | 8.48% |
| Net Asset Value | | 22.56 | 15.79 | 8.48 |
| Institutional Shares | 2/22/2008 | 22.57 | 15.82 | 9.511 |
| 1 Return since inception. | | | | |
See Financial Highlights for dividend and capital gains information.
9
Mega Cap Index Fund
Financial Statements (unaudited)
Statement of Net Assets
As of February 28, 2018
The fund reports a complete list of its holdings in regulatory filings four times in each fiscal year, at the quarter-ends. For the second and fourth fiscal quarters, the lists appear in the fund’s semiannual and annual reports to shareholders. For the first and third fiscal quarters, the fund files the lists with the Securities and Exchange Commission on Form N-Q. Shareholders can look up the fund’s Forms N-Q on the SEC’s website at sec.gov. Forms N-Q may also be reviewed and copied at the SEC’s Public Reference Room (see the back cover of this report for further information).
| | | |
| | | | Market |
| | | | Value• |
| | | Shares | ($000) |
| Common Stocks (100.0%)1 | | |
| Basic Materials (1.9%) | | |
| | DowDuPont Inc. | 181,011 | 12,725 |
| | Praxair Inc. | 22,137 | 3,315 |
| | Air Products & Chemicals | | |
| | Inc. | 16,899 | 2,717 |
| | LyondellBasell Industries | | |
| | NV Class A | 24,399 | 2,640 |
| | Ecolab Inc. | 20,168 | 2,631 |
| | PPG Industries Inc. | 19,669 | 2,212 |
| | International Paper Co. | 31,899 | 1,901 |
| | Nucor Corp. | 24,582 | 1,608 |
| | | | 29,749 |
| Consumer Goods (8.2%) | | |
| | Procter & Gamble Co. | 196,231 | 15,408 |
| | Coca-Cola Co. | 296,591 | 12,819 |
| | Philip Morris International | | |
| | Inc. | 120,153 | 12,442 |
| | PepsiCo Inc. | 109,978 | 12,068 |
| | Altria Group Inc. | 147,576 | 9,290 |
| | NIKE Inc. Class B | 100,778 | 6,755 |
| | Mondelez International | | |
| | Inc. Class A | 109,716 | 4,816 |
| | Colgate-Palmolive Co. | 67,900 | 4,683 |
| | Monsanto Co. | 34,090 | 4,206 |
| | Activision Blizzard Inc. | 55,574 | 4,064 |
| | General Motors Co. | 93,433 | 3,677 |
| *,^ | Tesla Inc. | 10,374 | 3,559 |
| | Ford Motor Co. | 301,804 | 3,202 |
| | Kraft Heinz Co. | 47,108 | 3,159 |
| | Kimberly-Clark Corp. | 27,233 | 3,021 |
| * | Electronic Arts Inc. | 23,809 | 2,945 |
| | Constellation Brands Inc. | | |
| | Class A | 12,649 | 2,726 |
| | Estee Lauder Cos. Inc. | | |
| | Class A | 17,410 | 2,410 |
| | General Mills Inc. | 43,935 | 2,221 |
| * | Monster Beverage Corp. | 32,704 | 2,072 |
| | Stanley Black & Decker Inc. | 11,873 | 1,890 |
| | | |
| | | | Market |
| | | | Value• |
| | | Shares | ($000) |
| | VF Corp. | 24,356 | 1,816 |
| | Archer-Daniels-Midland Co. | 43,253 | 1,796 |
| | Kellogg Co. | 21,479 | 1,422 |
| | Hershey Co. | 11,074 | 1,088 |
| | Brown-Forman Corp. | | |
| | Class B | 14,216 | 992 |
| | Aptiv plc | 10,200 | 932 |
| | Tyson Foods Inc. Class A | 11,541 | 858 |
| | Campbell Soup Co. | 7,556 | 325 |
| | | | 126,662 |
| Consumer Services (14.0%) | | |
| * | Amazon.com Inc. | 31,722 | 47,978 |
| | Home Depot Inc. | 90,265 | 16,453 |
| | Comcast Corp. Class A | 360,674 | 13,060 |
| | Walt Disney Co. | 110,904 | 11,441 |
| | Walmart Inc. | 115,461 | 10,393 |
| | McDonald’s Corp. | 61,675 | 9,729 |
| * | Netflix Inc. | 31,744 | 9,250 |
| * | Booking Holdings Inc. | 3,804 | 7,737 |
| | Costco Wholesale Corp. | 33,772 | 6,447 |
| | Starbucks Corp. | 104,487 | 5,966 |
| | Lowe’s Cos. Inc. | 64,443 | 5,773 |
| | Time Warner Inc. | 57,160 | 5,314 |
| | CVS Health Corp. | 78,332 | 5,305 |
| * | Charter Communications | | |
| | Inc. Class A | 14,411 | 4,928 |
| | Walgreens Boots Alliance | | |
| | Inc. | 66,318 | 4,569 |
| | TJX Cos. Inc. | 46,680 | 3,860 |
| * | eBay Inc. | 76,686 | 3,287 |
| | Target Corp. | 42,007 | 3,168 |
| | Twenty-First Century Fox | | |
| | Inc. Class A | 82,080 | 3,022 |
| | Marriott International Inc. | | |
| | Class A | 21,125 | 2,983 |
| | Delta Air Lines Inc. | 49,619 | 2,674 |
| | McKesson Corp. | 16,166 | 2,412 |
| | Southwest Airlines Co. | 41,306 | 2,389 |
| | Las Vegas Sands Corp. | 30,568 | 2,226 |
| | Sysco Corp. | 36,386 | 2,170 |
10
| | | |
| Mega Cap Index Fund | | |
| |
| |
| |
| | | | Market |
| | | | Value• |
| | | Shares | ($000) |
| | Yum! Brands Inc. | 25,997 | 2,116 |
| | Carnival Corp. | 30,938 | 2,070 |
| | Dollar General Corp. | 21,138 | 1,999 |
| | Kroger Co. | 68,656 | 1,862 |
| | American Airlines Group | | |
| | Inc. | 33,177 | 1,800 |
| | Cardinal Health Inc. | 24,365 | 1,686 |
| * | O’Reilly Automotive Inc. | 6,571 | 1,605 |
| | Omnicom Group Inc. | 17,862 | 1,362 |
| | CBS Corp. Class B | 25,640 | 1,358 |
| | Hilton Worldwide Holdings | | |
| | Inc. | 16,111 | 1,302 |
| | Twenty-First Century Fox | | |
| | Inc. | 33,337 | 1,214 |
| | Ross Stores Inc. | 14,986 | 1,170 |
| * | AutoZone Inc. | 1,073 | 713 |
| * | DISH Network Corp. | | |
| | Class A | 16,891 | 704 |
| * | United Continental | | |
| | Holdings Inc. | 10,023 | 679 |
| ^ | Sirius XM Holdings Inc. | 107,664 | 676 |
| | AmerisourceBergen Corp. | | |
| | Class A | 6,357 | 605 |
| * | Altice USA Inc. Class A | 4,357 | 79 |
| | CBS Corp. Class A | 300 | 16 |
| | | | 215,550 |
| Financials (19.2%) | | |
| | JPMorgan Chase & Co. | 268,347 | 30,994 |
| * | Berkshire Hathaway Inc. | | |
| | Class B | 143,202 | 29,671 |
| | Bank of America Corp. | 766,400 | 24,601 |
| | Wells Fargo & Co. | 342,783 | 20,022 |
| | Visa Inc. Class A | 140,219 | 17,238 |
| | Citigroup Inc. | 204,473 | 15,436 |
| | Mastercard Inc. Class A | 72,670 | 12,772 |
| | Goldman Sachs Group Inc. | 26,279 | 6,910 |
| | US Bancorp | 121,911 | 6,627 |
| | Morgan Stanley | 104,831 | 5,873 |
| | PNC Financial Services | | |
| | Group Inc. | 36,791 | 5,800 |
| | American Express Co. | 53,749 | 5,241 |
| | Charles Schwab Corp. | 93,251 | 4,944 |
| | Chubb Ltd. | 34,143 | 4,846 |
| | BlackRock Inc. | 8,674 | 4,766 |
| | American Tower Corp. | 33,175 | 4,622 |
| | CME Group Inc. | 26,276 | 4,366 |
| | Bank of New York Mellon | | |
| | Corp. | 75,249 | 4,291 |
| | American International | | |
| | Group Inc. | 69,514 | 3,986 |
| | S&P Global Inc. | 19,740 | 3,786 |
| | Simon Property Group Inc. | 24,001 | 3,684 |
| | Capital One Financial Corp. | 37,484 | 3,671 |
| | Prudential Financial Inc. | 32,758 | 3,483 |
| | | |
| | | | Market |
| | | | Value• |
| | | Shares | ($000) |
| | Crown Castle International | | |
| | Corp. | 31,392 | 3,455 |
| | BB&T Corp. | 60,966 | 3,313 |
| | Intercontinental Exchange | | |
| | Inc. | 45,223 | 3,305 |
| | Marsh & McLennan Cos. | | |
| | Inc. | 39,470 | 3,277 |
| | MetLife Inc. | 65,129 | 3,008 |
| | Travelers Cos. Inc. | 21,185 | 2,945 |
| | State Street Corp. | 27,206 | 2,888 |
| | Aon plc | 19,326 | 2,712 |
| | Aflac Inc. | 30,398 | 2,702 |
| | Progressive Corp. | 44,912 | 2,586 |
| | SunTrust Banks Inc. | 36,798 | 2,570 |
| | Allstate Corp. | 27,756 | 2,561 |
| | Prologis Inc. | 40,879 | 2,481 |
| | Equinix Inc. | 6,008 | 2,356 |
| | Public Storage | 11,457 | 2,228 |
| | Discover Financial Services | 28,044 | 2,211 |
| | Synchrony Financial | 57,492 | 2,092 |
| | Weyerhaeuser Co. | 58,220 | 2,039 |
| | T. Rowe Price Group Inc. | 17,818 | 1,994 |
| | Fifth Third Bancorp | 54,353 | 1,796 |
| | Ameriprise Financial Inc. | 11,463 | 1,793 |
| | Northern Trust Corp. | 16,690 | 1,767 |
| | Equity Residential | 28,522 | 1,604 |
| * | Berkshire Hathaway Inc. | | |
| | Class A | 5 | 1,551 |
| | Welltower Inc. | 28,526 | 1,498 |
| | Boston Properties Inc. | 11,978 | 1,424 |
| | TD Ameritrade Holding | | |
| | Corp. | 24,141 | 1,388 |
| | Ventas Inc. | 27,703 | 1,339 |
| | Loews Corp. | 23,573 | 1,163 |
| | GGP Inc. | 47,301 | 1,001 |
| | Franklin Resources Inc. | 25,777 | 997 |
| | AvalonBay Communities | | |
| | Inc. | 5,351 | 835 |
| | | | 296,509 |
| Health Care (13.7%) | | |
| | Johnson & Johnson | 207,728 | 26,980 |
| | UnitedHealth Group Inc. | 74,900 | 16,939 |
| | Pfizer Inc. | 461,013 | 16,739 |
| | AbbVie Inc. | 123,495 | 14,304 |
| | Merck & Co. Inc. | 210,653 | 11,422 |
| | Amgen Inc. | 56,138 | 10,317 |
| | Bristol-Myers Squibb Co. | 126,550 | 8,378 |
| | Medtronic plc | 104,685 | 8,363 |
| | Abbott Laboratories | 134,601 | 8,120 |
| | Gilead Sciences Inc. | 100,986 | 7,951 |
| | Thermo Fisher Scientific | | |
| | Inc. | 31,020 | 6,470 |
| | Eli Lilly & Co. | 76,648 | 5,903 |
| * | Celgene Corp. | 60,895 | 5,305 |
11
| | | |
| Mega Cap Index Fund | | |
| |
| |
| |
| | | | Market |
| | | | Value• |
| | | Shares | ($000) |
| * | Biogen Inc. | 16,360 | 4,728 |
| | Anthem Inc. | 19,850 | 4,672 |
| | Becton Dickinson and Co. | 20,571 | 4,567 |
| | Aetna Inc. | 25,227 | 4,467 |
| | Allergan plc | 25,738 | 3,969 |
| | Stryker Corp. | 23,158 | 3,755 |
| | Cigna Corp. | 19,058 | 3,733 |
| * | Intuitive Surgical Inc. | 8,631 | 3,681 |
| * | Express Scripts Holding | | |
| | Co. | 43,791 | 3,304 |
| * | Vertex Pharmaceuticals | | |
| | Inc. | 19,584 | 3,252 |
| | Zoetis Inc. | 37,645 | 3,044 |
| | Humana Inc. | 10,992 | 2,988 |
| * | Boston Scientific Corp. | 106,222 | 2,896 |
| | Baxter International Inc. | 40,000 | 2,712 |
| * | Illumina Inc. | 11,309 | 2,579 |
| | HCA Healthcare Inc. | 21,814 | 2,165 |
| * | Regeneron | | |
| | Pharmaceuticals Inc. | 6,133 | 1,965 |
| * | Alexion Pharmaceuticals | | |
| | Inc. | 16,449 | 1,932 |
| | Zimmer Biomet Holdings | | |
| | Inc. | 15,717 | 1,827 |
| * | Mylan NV | 39,382 | 1,588 |
| | | | 211,015 |
| Industrials (11.1%) | | |
| | Boeing Co. | 43,752 | 15,847 |
| | 3M Co. | 46,090 | 10,855 |
| | General Electric Co. | 670,644 | 9,463 |
| | Honeywell International | | |
| | Inc. | 58,921 | 8,904 |
| | Union Pacific Corp. | 60,896 | 7,932 |
| | United Technologies Corp. | 58,633 | 7,900 |
| | Accenture plc Class A | 47,585 | 7,662 |
| | Caterpillar Inc. | 46,033 | 7,118 |
| * | PayPal Holdings Inc. | 88,334 | 7,015 |
| | Lockheed Martin Corp. | 18,845 | 6,642 |
| | United Parcel Service Inc. | | |
| | Class B | 53,183 | 5,553 |
| | Raytheon Co. | 22,346 | 4,860 |
| | Danaher Corp. | 48,371 | 4,730 |
| | Northrop Grumman Corp. | 13,416 | 4,696 |
| | FedEx Corp. | 18,651 | 4,596 |
| | General Dynamics Corp. | 19,602 | 4,360 |
| | Deere & Co. | 24,866 | 4,000 |
| | Automatic Data | | |
| | Processing Inc. | 32,567 | 3,756 |
| | Illinois Tool Works Inc. | 22,538 | 3,638 |
| | Emerson Electric Co. | 49,655 | 3,528 |
| | CSX Corp. | 65,653 | 3,527 |
| | Norfolk Southern Corp. | 22,088 | 3,072 |
| | Waste Management Inc. | 33,576 | 2,898 |
| | TE Connectivity Ltd. | 27,184 | 2,802 |
| | | |
| | | | Market |
| | | | Value• |
| | | Shares | ($000) |
| | Eaton Corp. plc | 34,064 | 2,749 |
| | Johnson Controls | | |
| | International plc | 71,585 | 2,639 |
| | Sherwin-Williams Co. | 6,557 | 2,633 |
| | Fidelity National | | |
| | Information Services Inc. | 25,752 | 2,503 |
| | Cummins Inc. | 12,161 | 2,045 |
| | PACCAR Inc. | 27,208 | 1,948 |
| | Fortive Corp. | 24,100 | 1,851 |
| | Parker-Hannifin Corp. | 10,331 | 1,844 |
| | Rockwell Automation Inc. | 9,883 | 1,787 |
| | Ingersoll-Rand plc | 19,394 | 1,722 |
| | Agilent Technologies Inc. | 24,875 | 1,706 |
| | Paychex Inc. | 24,962 | 1,626 |
| | Republic Services Inc. | | |
| | Class A | 16,852 | 1,132 |
| | | | 171,539 |
| Oil & Gas (5.4%) | | |
| | Exxon Mobil Corp. | 327,749 | 24,824 |
| | Chevron Corp. | 146,883 | 16,439 |
| | Schlumberger Ltd. | 107,110 | 7,031 |
| | ConocoPhillips | 92,486 | 5,023 |
| | EOG Resources Inc. | 44,711 | 4,535 |
| | Occidental Petroleum Corp. | 59,164 | 3,881 |
| | Valero Energy Corp. | 33,795 | 3,056 |
| | Phillips 66 | 33,367 | 3,015 |
| | Halliburton Co. | 64,130 | 2,977 |
| | Marathon Petroleum Corp. | 37,742 | 2,418 |
| | Anadarko Petroleum Corp. | 42,252 | 2,410 |
| | Kinder Morgan Inc. | 146,602 | 2,375 |
| | Pioneer Natural Resources | | |
| | Co. | 13,194 | 2,246 |
| | Williams Cos. Inc. | 63,912 | 1,774 |
| | Apache Corp. | 29,438 | 1,005 |
| | Devon Energy Corp. | 19,256 | 590 |
| | | | 83,599 |
| Technology (22.0%) | | |
| | Apple Inc. | 357,324 | 63,647 |
| | Microsoft Corp. | 596,641 | 55,947 |
| * | Facebook Inc. Class A | 184,425 | 32,887 |
| * | Alphabet Inc. Class A | 23,098 | 25,498 |
| * | Alphabet Inc. Class C | 22,989 | 25,397 |
| | Intel Corp. | 361,980 | 17,842 |
| | Cisco Systems Inc. | 382,286 | 17,119 |
| | Oracle Corp. | 242,097 | 12,267 |
| | International Business | | |
| | Machines Corp. | 68,057 | 10,605 |
| | NVIDIA Corp. | 42,208 | 10,214 |
| | Texas Instruments Inc. | 76,209 | 8,257 |
| * | Adobe Systems Inc. | 38,104 | 7,969 |
| | Broadcom Ltd. | 31,556 | 7,777 |
| | QUALCOMM Inc. | 114,004 | 7,410 |
| * | salesforce.com Inc. | 53,096 | 6,172 |
| | Applied Materials Inc. | 82,514 | 4,752 |
12
| | | |
| Mega Cap Index Fund | | |
| |
| |
| |
| | | | Market |
| | | | Value• |
| | | Shares | ($000) |
| * | Micron Technology Inc. | 84,705 | 4,135 |
| | Cognizant Technology | | |
| | Solutions Corp. Class A | 45,609 | 3,741 |
| | Intuit Inc. | 18,764 | 3,131 |
| | HP Inc. | 129,261 | 3,023 |
| | Analog Devices Inc. | 28,468 | 2,566 |
| | Hewlett Packard | | |
| | Enterprise Co. | 123,056 | 2,288 |
| | DXC Technology Co. | 22,021 | 2,258 |
| | Corning Inc. | 67,002 | 1,948 |
| | Lam Research Corp. | 6,284 | 1,206 |
| * | VMware Inc. Class A | 5,924 | 781 |
| *,^ | Snap Inc. | 33,502 | 580 |
| | | | 339,417 |
| Telecommunications (2.2%) | | |
| | AT&T Inc. | 474,722 | 17,233 |
| | Verizon Communications | | |
| | Inc. | 318,983 | 15,228 |
| * | T-Mobile US Inc. | 22,626 | 1,371 |
| *,^ | Sprint Corp. | 45,486 | 236 |
| | | | 34,068 |
| Utilities (2.3%) | | |
| | NextEra Energy Inc. | 36,374 | 5,534 |
| | Duke Energy Corp. | 54,170 | 4,081 |
| | Dominion Energy Inc. | 49,729 | 3,684 |
| | Southern Co. | 77,247 | 3,326 |
| | Exelon Corp. | 74,230 | 2,750 |
| | American Electric Power | | |
| | Co. Inc. | 38,026 | 2,494 |
| | Sempra Energy | 19,381 | 2,112 |
| | Public Service Enterprise | | |
| | Group Inc. | 39,189 | 1,898 |
| | Consolidated Edison Inc. | 23,914 | 1,791 |
| | Xcel Energy Inc. | 39,443 | 1,707 |
| | PG&E Corp. | 39,945 | 1,641 |
| | Edison International | 25,305 | 1,533 |
| | PPL Corp. | 53,028 | 1,519 |
| | FirstEnergy Corp. | 17,112 | 553 |
| | | | 34,623 |
| Total Common Stocks | | |
| (Cost $978,844) | | 1,542,731 |
| Temporary Cash Investments (0.2%)1 | |
| Money Market Fund (0.2%) | | |
| 2,3 | Vanguard Market | | |
| | Liquidity Fund, 1.601% | 27,211 | 2,721 |
| | |
| | Face | Market |
| | Amount | Value • |
| | ($000) | ($000) |
| U. S. Government and Agency Obligations (0.0%) |
| 4 United States Treasury | | |
| Bill, 1.602%, 5/24/18 | 400 | 398 |
| Total Temporary Cash Investments | |
| (Cost $3,119) | | 3,119 |
| Total Investments (100.2%) | | |
| (Cost $981,963) | | 1,545,850 |
| |
| | | Amount |
| | | ($000) |
| Other Assets and Liabilities (-0.2%) | |
| Other Assets | | |
| Investment in Vanguard | | 85 |
| Receivables for Investment Securities Sold 10,471 |
| Receivables for Accrued Income | 3,100 |
| Receivables for Capital Shares Issued | 1 |
| Total Other Assets | | 13,657 |
| Liabilities | | |
| Payables for Investment | | |
| Securities Purchased | | (179) |
| Collateral for Securities on Loan | (2,721) |
| Payables for Capital Shares Redeemed | (10,834) |
| Payables to Vanguard | | (520) |
| Variation Margin Payable— | | |
| Futures Contracts | | (2) |
| Other Liabilities | | (2,614) |
| Total Liabilities | | (16,870) |
| Net Assets (100%) | | 1,542,637 |
13
Mega Cap Index Fund
| |
| At February 28, 2018, net assets consisted of: |
| | Amount |
| | ($000) |
| Paid-in Capital | 1,014,416 |
| Undistributed Net Investment Income | 4,187 |
| Accumulated Net Realized Losses | (39,856) |
| Unrealized Appreciation (Depreciation) | |
| Investment Securities | 563,887 |
| Futures Contracts | 3 |
| Net Assets | 1,542,637 |
| |
| |
| ETF Shares—Net Assets | |
| Applicable to 15,100,000 outstanding | |
| $.001 par value shares of beneficial | |
| interest (unlimited authorization) | 1,414,822 |
| Net Asset Value Per Share— | |
| ETF Shares | $93.70 |
| |
| | Amount |
| | ($000) |
| Institutional Shares—Net Assets | |
| Applicable to 691,886 outstanding | |
| $.001 par value shares of beneficial | |
| interest (unlimited authorization) | 127,815 |
| Net Asset Value Per Share— | |
| Institutional Shares | $184.73 |
• See Note A in Notes to Financial Statements.
* Non-income-producing security.
^ Includes partial security positions on loan to broker-dealers.
The total value of securities on loan is $2,569,000.
1 The fund invests a portion of its cash reserves in equity
markets through the use of index futures contracts. After
giving effect to futures investments, the fund’s effective
common stock and temporary cash investment positions
represent 100.0% and 0.2%, respectively, of net assets.
2 Affiliated money market fund available only to Vanguard funds
and certain trusts and accounts managed by Vanguard. Rate
shown is the 7-day yield.
3 Includes $2,721,000 of collateral received for securities
on loan.
4 Securities with a value of $299,000 have been segregated
as initial margin for open futures contracts.
| | | | |
| Derivative Financial Instruments Outstanding as of Period End | | |
| |
| Futures Contracts | | | | |
| | | | | ($000) |
| | | | | Value and |
| | | Number of | | Unrealized |
| | | Long (Short) | Notional | Appreciation |
| | Expiration | Contracts | Amount | (Depreciation) |
| Long Futures Contracts | | | | |
| E-mini S&P 500 Index | March 2018 | 1 | 136 | 3 |
Unrealized appreciation (depreciation) on open futures contracts is required to be treated as realized gain (loss) for tax purposes.
See accompanying Notes, which are an integral part of the Financial Statements.
14
| |
| Mega Cap Index Fund | |
| |
| |
| Statement of Operations | |
| |
| | Six Months Ended |
| | February28,2018 |
| | ($000) |
| Investment Income | |
| Income | |
| Dividends | 14,041 |
| Interest1 | 8 |
| Securities Lending—Net | 13 |
| Total Income | 14,062 |
| Expenses | |
| The Vanguard Group—Note B | |
| Investment Advisory Services | 183 |
| Management and Administrative—ETF Shares | 25 |
| Management and Administrative—Institutional Shares | 21 |
| Marketing and Distribution—ETF Shares | 28 |
| Marketing and Distribution—Institutional Shares | 2 |
| Custodian Fees | 15 |
| Shareholders’ Reports and Proxy—ETF Shares | 232 |
| Shareholders’ Reports and Proxy—Institutional Shares | — |
| Total Expenses | 506 |
| Net Investment Income | 13,556 |
| Realized Net Gain (Loss) | |
| Investment Securities Sold1 | 12,996 |
| Futures Contracts | 286 |
| Realized Net Gain (Loss) | 13,282 |
| Change in Unrealized Appreciation (Depreciation) | |
| Investment Securities1 | 128,939 |
| Futures Contracts | (57) |
| Change in Unrealized Appreciation (Depreciation) | 128,882 |
| Net Increase (Decrease) in Net Assets Resulting from Operations | 155,720 |
1 Interest income, realized net gain (loss), and change in unrealized appreciation (depreciation) from an affiliated company of the fund
were $6,000, $1,000, and ($1,000), respectively. Purchases and sales are for temporary cash investment purposes.
See accompanying Notes, which are an integral part of the Financial Statements.
15
| | |
| Mega Cap Index Fund | | |
| |
| |
| Statement of Changes in Net Assets | | |
| |
| | Six Months Ended | Year Ended |
| | February 28, | August 31, |
| | 2018 | 2017 |
| | ($000) | ($000) |
| Increase (Decrease) in Net Assets | | |
| Operations | | |
| Net Investment Income | 13,556 | 26,751 |
| Realized Net Gain (Loss) | 13,282 | 59,057 |
| Change in Unrealized Appreciation (Depreciation) | 128,882 | 111,792 |
| Net Increase (Decrease) in Net Assets Resulting from Operations | 155,720 | 197,600 |
| Distributions | | |
| Net Investment Income | | |
| ETF Shares | (13,801) | (23,592) |
| Institutional Shares | (1,431) | (2,482) |
| Realized Capital Gain | | |
| ETF Shares | — | — |
| Institutional Shares | — | — |
| Total Distributions | (15,232) | (26,074) |
| Capital Share Transactions | | |
| ETF Shares | 54,923 | 20,632 |
| Institutional Shares | (17,084) | (18,190) |
| Net Increase (Decrease) from Capital Share Transactions | 37,839 | 2,442 |
| Total Increase (Decrease) | 178,327 | 173,968 |
| Net Assets | | |
| Beginning of Period | 1,364,310 | 1,190,342 |
| End of Period1 | 1,542,637 | 1,364,310 |
1 Net Assets—End of Period includes undistributed (overdistributed) net investment income of $4,187,000 and $5,863,000.
See accompanying Notes, which are an integral part of the Financial Statements.
16
| | | | | | | |
| Mega Cap Index Fund | | | | | | | |
| |
| |
| Financial Highlights | | | | | | |
| |
| |
| ETF Shares | | | | | | | |
| | Six Months | | | | | |
| | | Ended | | | | | |
| For a Share Outstanding | February 28, | | | Year Ended August 31, |
| Throughout Each Period | | 2018 | 2017 | 2016 | 2015 | 2014 | 2013 |
| Net Asset Value, Beginning of Period | $85.02 | $74.19 | $67.35 | $68.69 | $55.99 | $48.52 |
| Investment Operations | | | | | | | |
| Net Investment Income | | . 8311 | 1.6761 | 1.582 | 1.399 | 1.250 | 1.189 |
| Net Realized and Unrealized Gain (Loss) | | | | | | |
| on Investments | | 8.783 | 10.788 | 6.793 | (1.377) | 12.687 | 7.471 |
| Total from Investment Operations | 9.614 | 12.464 | 8.375 | .022 | 13.937 | 8.660 |
| Distributions | | | | | | | |
| Dividends from Net Investment Income | (.934) | (1.634) | (1.535) | (1.362) | (1.237) | (1.190) |
| Distributions from Realized Capital Gains | — | — | — | — | — | — |
| Total Distributions | | (.934) | (1.634) | (1.535) | (1.362) | (1.237) | (1.190) |
| Net Asset Value, End of Period | | $93.70 | $85.02 | $74.19 | $67.35 | $68.69 | $55.99 |
| Total Return | | 11.37% | 17.01% | 12.61% | -0.05% | 25.13% | 18.10% |
| Ratios/Supplemental Data | | | | | | | |
| Net Assets, End of Period (Millions) | $1,415 | $1,233 | $1,057 | $970 | $810 | $588 |
| Ratio of Total Expenses to | | | | | | | |
| Average Net Assets | | 0.07% | 0.07% | 0.07% | 0.09% | 0.11% | 0.11% |
| Ratio of Net Investment Income to | | | | | | |
| Average Net Assets | | 1.85% | 2.12% | 2.23% | 2.02% | 2.00% | 2.26% |
| Portfolio Turnover Rate2 | | 4% | 6% | 7% | 8% | 6% | 10% |
The expense ratio, net investment income ratio, and turnover rate for the current period have been annualized.
1 Calculated based on average shares outstanding.
2 Excludes the value of portfolio securities received or delivered as a result of in-kind purchases or redemptions of the fund’s capital
shares, including ETF Creation Units.
See accompanying Notes, which are an integral part of the Financial Statements.
17
| | | | | | | |
| Mega Cap Index Fund | | | | | | | |
| |
| |
| Financial Highlights | | | | | | |
| |
| |
| Institutional Shares | | | | | | | |
| | Six Months | | | | | |
| | | Ended | | | | | |
| For a Share Outstanding | February 28, | | | Year Ended August 31, |
| Throughout Each Period | | 2018 | 2017 | 2016 | 2015 | 2014 | 2013 |
| Net Asset Value, Beginning of Period | $167.62 | $146.25 | $132.77 | $135.41 | $110.38 | $95.66 |
| Investment Operations | | | | | | | |
| Net Investment Income | | 1.6431 | 3.3621 | 3.117 | 2.798 | 2.498 | 2.373 |
| Net Realized and Unrealized Gain (Loss) | | | | | | |
| on Investments | | 17.315 | 21.220 | 13.419 | (2.717) | 25.000 | 14.727 |
| Total from Investment Operations | 18.958 | 24.582 | 16.536 | .081 | 27.498 | 17.100 |
| Distributions | | | | | | | |
| Dividends from Net Investment Income | (1.848) | (3.212) | (3.056) | (2.721) | (2.468) | (2.380) |
| Distributions from Realized Capital Gains | — | — | — | — | — | — |
| Total Distributions | | (1.848) | (3.212) | (3.056) | (2.721) | (2.468) | (2.380) |
| Net Asset Value, End of Period | | $184.73 | $167.62 | $146.25 | $132.77 | $135.41 | $110.38 |
| Total Return | | 11.38% | 17.02% | 12.63% | -0.01% | 25.15% | 18.13% |
| Ratios/Supplemental Data | | | | | | | |
| Net Assets, End of Period (Millions) | $128 | $132 | $133 | $298 | $314 | $339 |
| Ratio of Total Expenses to | | | | | | | |
| Average Net Assets | | 0.06% | 0.06% | 0.06% | 0.06% | 0.08% | 0.08% |
| Ratio of Net Investment Income to | | | | | | |
| Average Net Assets | | 1.86% | 2.13% | 2.24% | 2.05% | 2.03% | 2.29% |
| Portfolio Turnover Rate 2 | | 4% | 6% | 7% | 8% | 6% | 10% |
The expense ratio, net investment income ratio, and turnover rate for the current period have been annualized.
1 Calculated based on average shares outstanding.
2 Excludes the value of portfolio securities received or delivered as a result of in-kind purchases or redemptions of the fund’s capital
shares, including ETF Creation Units.
See accompanying Notes, which are an integral part of the Financial Statements.
18
Mega Cap Index Fund
Notes to Financial Statements
Vanguard Mega Cap Index Fund is registered under the Investment Company Act of 1940 as an open-end investment company, or mutual fund. The fund offers two classes of shares: ETF Shares and Institutional Shares. ETF Shares are listed for trading on NYSE Arca; they can be purchased and sold through a broker. Institutional Shares are designed for investors who meet certain administrative, service, and account-size criteria.
A. The following significant accounting policies conform to generally accepted accounting principles for U.S. investment companies. The fund consistently follows such policies in preparing its financial statements.
1. Security Valuation: Securities are valued as of the close of trading on the New York Stock Exchange (generally 4 p.m., Eastern time) on the valuation date. Equity securities are valued at the latest quoted sales prices or official closing prices taken from the primary market in which each security trades; such securities not traded on the valuation date are valued at the mean of the latest quoted bid and asked prices. Securities for which market quotations are not readily available, or whose values have been materially affected by events occurring before the fund’s pricing time but after the close of the securities’ primary markets, are valued by methods deemed by the board of trustees to represent fair value. Investments in Vanguard Market Liquidity Fund are valued at that fund’s net asset value. Temporary cash investments are valued using the latest bid prices or using valuations based on a matrix system (which considers such factors as security prices, yields, maturities, and ratings), both as furnished by independent pricing services.
2. Futures Contracts: The fund uses index futures contracts to a limited extent, with the objectives of maintaining full exposure to the stock market, maintaining liquidity, and minimizing transaction costs. The fund may purchase futures contracts to immediately invest incoming cash in the market, or sell futures in response to cash outflows, thereby simulating a fully invested position in the underlying index while maintaining a cash balance for liquidity. The primary risks associated with the use of futures contracts are imperfect correlation between changes in market values of stocks held by the fund and the prices of futures contracts, and the possibility of an illiquid market. Counterparty risk involving futures is mitigated because a regulated clearinghouse is the counterparty instead of the clearing broker. To further mitigate counterparty risk, the fund trades futures contracts on an exchange, monitors the financial strength of its clearing brokers and clearinghouse, and has entered into clearing agreements with its clearing brokers. The clearinghouse imposes initial margin requirements to secure the fund’s performance and requires daily settlement of variation margin representing changes in the market value of each contract.
Futures contracts are valued at their quoted daily settlement prices. The notional amounts of the contracts are not recorded in the Statement of Net Assets. Fluctuations in the value of the contracts are recorded in the Statement of Net Assets as an asset (liability) and in the Statement of Operations as unrealized appreciation (depreciation) until the contracts are closed, when they are recorded as realized futures gains (losses).
During the six months ended February 28, 2018, the fund’s average investments in long and short futures contracts represented less than 1% and 0% of net assets, respectively, based on the average of the notional amounts at each quarter-end during the period.
19
Mega Cap Index Fund
3. Federal Income Taxes: The fund intends to continue to qualify as a regulated investment company and distribute all of its taxable income. Management has analyzed the fund’s tax positions taken for all open federal income tax years (August 31, 2014–2017), and for the period ended February 28, 2018, and has concluded that no provision for federal income tax is required in the fund’s financial statements.
4. Distributions: Distributions to shareholders are recorded on the ex-dividend date.
5. Securities Lending: To earn additional income, the fund lends its securities to qualified institutional borrowers. Security loans are subject to termination by the fund at any time, and are required to be secured at all times by collateral in an amount at least equal to the market value of securities loaned. Daily market fluctuations could cause the value of loaned securities to be more or less than the value of the collateral received. When this occurs, the collateral is adjusted and settled on the next business day. The fund further mitigates its counterparty risk by entering into securities lending transactions only with a diverse group of prequalified counterparties, monitoring their financial strength, and entering into master securities lending agreements with its counterparties. The master securities lending agreements provide that, in the event of a counterparty’s default (including bankruptcy), the fund may terminate any loans with that borrower, determine the net amount owed, and sell or retain the collateral up to the net amount owed to the fund; however, such actions may be subject to legal proceedings. While collateral mitigates counterparty risk, in the event of a default, the fund may experience delays and costs in recovering the securities loaned. The fund invests cash collateral received in Vanguard Market Liquidity Fund, and records a liability in the Statement of Net Assets for the return of the collateral, during the period the securities are on loan. Securities lending income represents fees charged to borrowers plus income earned on invested cash collateral, less expenses associated with the loan. During the term of the loan, the fund is entitled to all distributions made on or in respect of the loaned securities.
6. Credit Facility: The fund and certain other funds managed by The Vanguard Group (“Vanguard”) participate in a $3.1 billion committed credit facility provided by a syndicate of lenders pursuant to a credit agreement that may be renewed annually; each fund is individually liable for its borrowings, if any, under the credit facility. Borrowings may be utilized for temporary and emergency purposes, and are subject to the fund’s regulatory and contractual borrowing restrictions. The participating funds are charged administrative fees and an annual commitment fee of 0.10% of the undrawn amount of the facility; these fees are allocated to the funds based on a method approved by the fund’s board of trustees and included in Management and Administrative expenses on the fund’s Statement of Operations. Any borrowings under this facility bear interest at a rate based upon the higher of the one-month London Interbank Offered Rate, federal funds effective rate, or overnight bank funding rate plus an agreed-upon spread.
The fund had no borrowings outstanding at February 28, 2018, or at any time during the period then ended.
20
Mega Cap Index Fund
7. Other: Dividend income is recorded on the ex-dividend date. Interest income includes income distributions received from Vanguard Market Liquidity Fund and is accrued daily. Premiums and discounts on debt securities purchased are amortized and accreted, respectively, to interest income over the lives of the respective securities. Security transactions are accounted for on the date securities are bought or sold. Costs used to determine realized gains (losses) on the sale of investment securities are those of the specific securities sold.
Each class of shares has equal rights as to assets and earnings, except that each class separately bears certain class-specific expenses related to maintenance of shareholder accounts (included in Management and Administrative expenses), shareholder reporting, and the proxy. Marketing and distribution expenses are allocated to each class of shares based on a method approved by the board of trustees. Income, other non-class-specific expenses, and gains and losses on investments are allocated to each class of shares based on its relative net assets.
B. In accordance with the terms of a Funds’ Service Agreement (the “FSA”) between Vanguard and the fund, Vanguard furnishes to the fund investment advisory, corporate management, administrative, marketing, and distribution services at Vanguard’s cost of operations (as defined by the FSA). These costs of operations are allocated to the fund based on methods and guidelines approved by the board of trustees. Vanguard does not require reimbursement in the current period for certain costs of operations (such as deferred compensation/benefits and risk/insurance costs); the fund’s liability for these costs of operations is included in Payables to Vanguard on the Statement of Net Assets. All other costs of operations payable to Vanguard are generally settled twice a month.
Upon the request of Vanguard, the fund may invest up to 0.40% of its net assets as capital in Vanguard. At February 28, 2018, the fund had contributed to Vanguard capital in the amount of $85,000, representing 0.01% of the fund’s net assets and 0.03% of Vanguard’s capitalization. The fund’s trustees and officers are also directors and employees, respectively, of Vanguard.
C. Various inputs may be used to determine the value of the fund’s investments. These inputs are summarized in three broad levels for financial statement purposes. The inputs or methodologies used to value securities are not necessarily an indication of the risk associated with investing in those securities.
Level 1—Quoted prices in active markets for identical securities.
Level 2—Other significant observable inputs (including quoted prices for similar securities, interest
rates, prepayment speeds, credit risk, etc.).
Level 3—Significant unobservable inputs (including the fund’s own assumptions used to determine
the fair value of investments). Any investments valued with significant unobservable inputs are
noted on the Statement of Net Assets.
21
Mega Cap Index Fund
The following table summarizes the market value of the fund’s investments as of February 28, 2018, based on the inputs used to value them:
| | | |
| | Level 1 | Level 2 | Level 3 |
| Investments | ($000) | ($000) | ($000) |
| Common Stocks | 1,542,731 | — | — |
| Temporary Cash Investments | 2,721 | 398 | — |
| Futures Contracts—Liabilities1 | (2) | — | — |
| Total | 1,545,450 | 398 | — |
| 1 Represents variation margin on the last day of the reporting period. | | | |
D. Distributions are determined on a tax basis and may differ from net investment income and realized capital gains for financial reporting purposes. Differences may be permanent or temporary. Permanent differences are reclassified among capital accounts in the financial statements to reflect their tax character. Temporary differences arise when certain items of income, expense, gain, or loss are recognized in different periods for financial statement and tax purposes. These differences will reverse at some time in the future. Differences in classification may also result from the treatment of short-term gains as ordinary income for tax purposes.
During the six months ended February 28, 2018, the fund realized $16,636,000 of net capital gains resulting from in-kind redemptions—in which shareholders exchanged fund shares for securities held by the fund rather than for cash. Because such gains are not taxable to the fund, and are not distributed to shareholders, they have been reclassified from accumulated net realized losses to paid-in capital.
The fund’s tax-basis capital gains and losses are determined only at the end of each fiscal year. For tax purposes, at August 31, 2017, the fund had available capital losses totaling $36,441,000 to offset future net capital gains. Of this amount, $18,779,000 is subject to expiration dates; $12,576,000 may be used to offset future net capital gains through August 31, 2018, and $6,203,000 through August 31, 2019. Capital losses of $17,662,000 realized beginning in fiscal 2012 may be carried forward indefinitely under the Regulated Investment Company Modernization Act of 2010, but must be used before any expiring loss carryforwards. The fund will use these capital losses to offset net taxable capital gains, if any, realized during the year ending August 31, 2018; should the fund realize net capital losses for the year, the losses will be added to the loss carryforward balance above.
At February 28, 2018, the cost of investment securities for tax purposes was $981,963,000. Net unrealized appreciation of investment securities for tax purposes was $563,887,000, consisting of unrealized gains of $592,175,000 on securities that had risen in value since their purchase and $28,288,000 in unrealized losses on securities that had fallen in value since their purchase.
22
Mega Cap Index Fund
E. During the six months ended February 28, 2018, the fund purchased $97,840,000 of investment securities and sold $57,088,000 of investment securities, other than temporary cash investments. Purchases and sales include $71,360,000 and $29,743,000, respectively, in connection with in-kind purchases and redemptions of the fund’s capital shares.
The fund purchased securities from and sold securities to other Vanguard funds or accounts managed by Vanguard or its affiliates, in accordance with procedures adopted by the board of trustees in compliance with Rule 17a-7 of the Investment Company Act of 1940. For the six months ended February 28, 2018, such purchases and sales were $6,664,000 and $7,456,000 respectively; these amounts are included in the purchases and sales of investment securities noted above.
| | | | |
| F. Capital share transactions for each class of shares were: | | | |
| | Six Months Ended | | Year Ended |
| | February 28, 2018 | August 31, 2017 |
| | Amount | Shares | Amount | Shares |
| | ($000) | (000) | ($000) | (000) |
| ETF Shares | | | | |
| Issued | 84,955 | 925 | 131,455 | 1,625 |
| Issued in Lieu of Cash Distributions | — | — | — | — |
| Redeemed | (30,032) | (325) | (110,823) | (1,375) |
| Net Increase (Decrease)—ETF Shares | 54,923 | 600 | 20,632 | 250 |
| Institutional Shares | | | | |
| Issued | 1,998 | 12 | 58,691 | 359 |
| Issued in Lieu of Cash Distributions | 952 | 6 | 2,482 | 16 |
| Redeemed | (20,034) | (111) | (79,363) | (501) |
| Net Increase (Decrease)—Institutional Shares | (17,084) | (93) | (18,190) | (126) |
G. Management has determined that no material events or transactions occurred subsequent to February 28, 2018, that would require recognition or disclosure in these financial statements.
23
Mega Cap Growth Index Fund
| | |
| Fund Profile | | |
| As of February 28, 2018 | | |
| |
| Share-Class Characteristics | | |
| | ETF | Institutional |
| | Shares | Shares |
| Ticker Symbol | MGK | VMGAX |
| Expense Ratio1 | 0.07% | 0.06% |
| 30-Day SEC Yield | 1.32% | 1.33% |
| | | |
| Portfolio Characteristics | | |
| | | CRSP US | DJ |
| | | Mega Cap | U.S. Total |
| | | Growth | Market |
| | Fund | Index | FA Index |
| Number of Stocks | 129 | 129 | 3,746 |
| Median Market Cap $119.7B | $119.7B | $68.2B |
| Price/Earnings Ratio | 28.3x | 28.3x | 21.7x |
| Price/Book Ratio | 6.1x | 6.1x | 3.0x |
| Return on Equity | 19.8% | 19.8% | 15.0% |
| Earnings Growth Rate | 13.8% | 13.8% | 8.5% |
| Dividend Yield | 1.3% | 1.3% | 1.7% |
| Foreign Holdings | 0.0% | 0.0% | 0.0% |
| Turnover Rate | | | |
| (Annualized) | 6% | — | — |
| Short-Term Reserves | 0.0% | — | — |
| | | |
| Sector Diversification (% of equity exposure) |
| | | CRSP US | DJ |
| | | Mega Cap | U.S. Total |
| | | Growth | Market |
| | Fund | Index | FA Index |
| Basic Materials | 1.2% | 1.2% | 2.6% |
| Consumer Goods | 10.4 | 10.4 | 8.5 |
| Consumer Services | 23.1 | 23.2 | 13.2 |
| Financials | 11.3 | 11.3 | 20.5 |
| Health Care | 11.3 | 11.3 | 12.6 |
| Industrials | 10.9 | 10.8 | 13.2 |
| Oil & Gas | 2.9 | 2.9 | 5.2 |
| Technology | 28.7 | 28.7 | 19.8 |
| Telecommunications | 0.2 | 0.2 | 1.7 |
| Utilities | 0.0 | 0.0 | 2.7 |
Sector categories are based on the Industry Classification
Benchmark (“ICB”), except for the “Other” category (if applicable),
which includes securities that have not been provided an ICB
classification as of the effective reporting period.
| | |
| Volatility Measures | | |
| | CRSP US | DJ |
| | Mega Cap | U.S. Total |
| | Growth | Market |
| | Index | FA Index |
| R-Squared | 1.00 | 0.88 |
| Beta | 1.00 | 1.05 |
These measures show the degree and timing of the fund’s
fluctuations compared with the indexes over 36 months.
| | |
| Ten Largest Holdings (% of total net assets) |
| Apple Inc. | Computer Hardware | 8.7% |
| Alphabet Inc. | Internet | 7.0 |
| Amazon.com Inc. | Broadline Retailers | 6.6 |
| Facebook Inc. | Internet | 4.5 |
| Visa Inc. | Consumer Finance | 2.4 |
| Home Depot Inc. | Home Improvement | |
| | Retailers | 2.3 |
| Boeing Co. | Aerospace & | |
| | Defense | 2.2 |
| AbbVie Inc. | Biotechnology | 2.0 |
| Comcast Corp. | Broadcasting & | |
| | Entertainment | 1.8 |
| Coca-Cola Co. | Soft Drinks | 1.8 |
| Top Ten | | 39.3% |
The holdings listed exclude any temporary cash investments and
equity index products.
Investment Focus
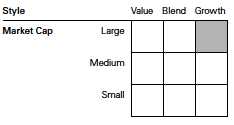
1 The expense ratios shown are from the prospectus dated December 21, 2017, and represent estimated costs for the current fiscal year.
For the six months ended February 28, 2018, the annualized expense ratios were 0.07% for ETF Shares and 0.06% for Institutional Shares.
24
Mega Cap Growth Index Fund
Performance Summary
All of the returns in this report represent past performance, which is not a guarantee of future results that may be achieved by the fund. (Current performance may be lower or higher than the performance data cited. For performance data current to the most recent month-end, visit our website at vanguard.com/performance.) Note, too, that both investment returns and principal value can fluctuate widely, so an investor’s shares, when sold, could be worth more or less than their original cost. The returns shown do not reflect taxes that a shareholder would pay on fund distributions or on the sale of fund shares.
Fiscal-Year Total Returns (%): December 17, 2007, Through February 28, 2018
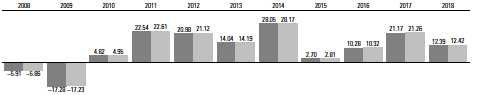
| | |
| | Mega Cap Growth Index Fund ETF Shares Net Asset Value |
| | Spliced Mega Cap Growth Index |
For a benchmark description, see the Glossary.
Note: For 2018, performance data reflect the six months ended February 28, 2018.
Average Annual Total Returns: Periods Ended December 31, 2017
This table presents returns through the latest calendar quarter—rather than through the end of the fiscal period.
Securities and Exchange Commission rules require that we provide this information.
| | | | |
| | Inception | One | Five | Ten |
| | Date | Year | Years | Years |
| ETF Shares | 12/17/2007 | | | |
| Market Price | | 29.45% | 16.56% | 9.85% |
| Net Asset Value | | 29.47 | 16.56 | 9.85 |
| Institutional Shares | 4/3/2008 | 29.49 | 16.57 | 10.931 |
| 1 Return since inception. | | | | |
See Financial Highlights for dividend and capital gains information.
25
Mega Cap Growth Index Fund
Financial Statements (unaudited)
Statement of Net Assets
As of February 28, 2018
The fund reports a complete list of its holdings in regulatory filings four times in each fiscal year, at the quarter-ends. For the second and fourth fiscal quarters, the lists appear in the fund’s semiannual and annual reports to shareholders. For the first and third fiscal quarters, the fund files the lists with the Securities and Exchange Commission on Form N-Q. Shareholders can look up the fund’s Forms N-Q on the SEC’s website at sec.gov. Forms N-Q may also be reviewed and copied at the SEC’s Public Reference Room (see the back cover of this report for further information).
| | | |
| | | | Market |
| | | | Value• |
| | | Shares | ($000) |
| Common Stocks (99.8%)1 | | |
| Basic Materials (1.2%) | | |
| | Praxair Inc. | 111,566 | 16,707 |
| | Ecolab Inc. | 101,137 | 13,193 |
| | Nucor Corp. | 123,671 | 8,088 |
| | PPG Industries Inc. | 49,499 | 5,566 |
| | | | 43,554 |
| Consumer Goods (10.4%) | | |
| | Coca-Cola Co. | 1,492,666 | 64,513 |
| | Philip Morris International | | |
| | Inc. | 604,861 | 62,633 |
| | Altria Group Inc. | 742,772 | 46,757 |
| | NIKE Inc. Class B | 507,044 | 33,987 |
| | Colgate-Palmolive Co. | 341,968 | 23,586 |
| | Monsanto Co. | 171,530 | 21,162 |
| | Activision Blizzard Inc. | 279,784 | 20,461 |
| *,^ | Tesla Inc. | 52,329 | 17,952 |
| | Kraft Heinz Co. | 237,359 | 15,915 |
| * | Electronic Arts Inc. | 119,937 | 14,836 |
| | Constellation Brands Inc. | | |
| | Class A | 63,791 | 13,746 |
| | Estee Lauder Cos. Inc. | | |
| | Class A | 87,443 | 12,106 |
| * | Monster Beverage Corp. | 164,484 | 10,423 |
| | Stanley Black & Decker | | |
| | Inc. | 59,674 | 9,499 |
| | Hershey Co. | 55,417 | 5,445 |
| | Brown-Forman Corp. | | |
| | Class B | 71,095 | 4,962 |
| | Aptiv plc | 51,734 | 4,725 |
| | | | 382,708 |
| Consumer Services (23.1%) | | |
| * | Amazon.com Inc. | 159,454 | 241,166 |
| | Home Depot Inc. | 454,712 | 82,880 |
| | Comcast Corp. Class A | 1,816,121 | 65,762 |
| | Walt Disney Co. | 558,521 | 57,617 |
| | McDonald’s Corp. | 310,352 | 48,955 |
| * | Netflix Inc. | 160,061 | 46,639 |
| | | |
| | | | Market |
| | | | Value• |
| | | Shares | ($000) |
| * | Booking Holdings Inc. | 18,969 | 38,584 |
| | Costco Wholesale Corp. | 170,123 | 32,477 |
| | Starbucks Corp. | 526,222 | 30,047 |
| | Lowe’s Cos. Inc. | 324,302 | 29,054 |
| * | Charter Communications | | |
| | Inc. Class A | 72,615 | 24,829 |
| | Walgreens Boots Alliance | | |
| | Inc. | 334,215 | 23,024 |
| | TJX Cos. Inc. | 235,537 | 19,474 |
| | Marriott International Inc. | | |
| | Class A | 106,521 | 15,042 |
| | Time Warner Inc. | 144,123 | 13,398 |
| | Southwest Airlines Co. | 208,074 | 12,035 |
| | Yum! Brands Inc. | 131,340 | 10,688 |
| | Dollar General Corp. | 106,285 | 10,054 |
| * | O’Reilly Automotive Inc. | 33,054 | 8,071 |
| | CBS Corp. Class B | 127,360 | 6,746 |
| | Hilton Worldwide | | |
| | Holdings Inc. | 80,896 | 6,536 |
| | Ross Stores Inc. | 75,015 | 5,858 |
| | Las Vegas Sands Corp. | 76,843 | 5,595 |
| | Carnival Corp. | 77,852 | 5,209 |
| * | AutoZone Inc. | 5,335 | 3,546 |
| ^ | Sirius XM Holdings Inc. | 536,253 | 3,368 |
| * | DISH Network Corp. | | |
| | Class A | 42,098 | 1,755 |
| *,^ | Altice USA Inc. Class A | 21,628 | 394 |
| | CBS Corp. Class A | 2,944 | 155 |
| | | | 848,958 |
| Financials (11.3%) | | |
| | Visa Inc. Class A | 706,118 | 86,810 |
| | Mastercard Inc. Class A | 365,673 | 64,271 |
| | Charles Schwab Corp. | 469,938 | 24,916 |
| | BlackRock Inc. | 43,706 | 24,013 |
| | American Tower Corp. | 167,031 | 23,273 |
| | S&P Global Inc. | 99,274 | 19,041 |
| | Simon Property Group Inc. | 121,108 | 18,591 |
26
| | | |
| Mega Cap Growth Index Fund | | |
| |
| |
| |
| | | | Market |
| | | | Value• |
| | | Shares | ($000) |
| | Crown Castle | | |
| | International Corp. | 158,226 | 17,414 |
| | Intercontinental | | |
| | Exchange Inc. | 227,898 | 16,655 |
| | Marsh & McLennan | | |
| | Cos. Inc. | 198,800 | 16,504 |
| | Aon plc | 97,199 | 13,639 |
| | Prologis Inc. | 205,954 | 12,497 |
| | Equinix Inc. | 30,475 | 11,949 |
| | Public Storage | 57,725 | 11,224 |
| | Weyerhaeuser Co. | 294,265 | 10,308 |
| | T. Rowe Price Group Inc. | 89,575 | 10,024 |
| | Welltower Inc. | 144,007 | 7,560 |
| | Boston Properties Inc. | 60,003 | 7,133 |
| | TD Ameritrade Holding | | |
| | Corp. | 121,505 | 6,987 |
| | Ventas Inc. | 138,495 | 6,692 |
| | AvalonBay Communities | | |
| | Inc. | 26,834 | 4,187 |
| | | | 413,688 |
| Health Care (11.3%) | | |
| | AbbVie Inc. | 621,628 | 72,003 |
| | Bristol-Myers Squibb Co. | 637,153 | 42,179 |
| | Medtronic plc | 527,139 | 42,113 |
| | Thermo Fisher Scientific | | |
| | Inc. | 156,169 | 32,574 |
| * | Celgene Corp. | 306,469 | 26,700 |
| * | Biogen Inc. | 82,321 | 23,790 |
| | Becton Dickinson and Co. | 103,694 | 23,022 |
| | Gilead Sciences Inc. | 254,270 | 20,019 |
| | Stryker Corp. | 116,647 | 18,915 |
| * | Intuitive Surgical Inc. | 43,676 | 18,626 |
| * | Vertex Pharmaceuticals | | |
| | Inc. | 98,582 | 16,368 |
| | Zoetis Inc. | 189,815 | 15,348 |
| * | Boston Scientific Corp. | 535,001 | 14,584 |
| * | Illumina Inc. | 56,809 | 12,954 |
| | Allergan plc | 64,758 | 9,987 |
| * | Regeneron | | |
| | Pharmaceuticals Inc. | 30,814 | 9,874 |
| * | Alexion Pharmaceuticals | | |
| | Inc. | 82,538 | 9,694 |
| | Baxter International Inc. | 100,676 | 6,825 |
| | | | 415,575 |
| Industrials (10.8%) | | |
| | Boeing Co. | 220,307 | 79,797 |
| | 3M Co. | 231,891 | 54,613 |
| | Union Pacific Corp. | 306,592 | 39,934 |
| | Accenture plc Class A | 239,343 | 38,537 |
| * | PayPal Holdings Inc. | 444,580 | 35,304 |
| | United Parcel Service Inc. | | |
| | Class B | 267,461 | 27,926 |
| | Automatic Data | | |
| | Processing Inc. | 164,060 | 18,919 |
| | | | |
| | | | | Market |
| | | | | Value• |
| | | | Shares | ($000) |
| | Illinois Tool Works Inc. | 113,454 | 18,316 |
| | Sherwin-Williams Co. | 32,806 | 13,174 |
| | Fidelity National | | | |
| | Information Services Inc. | 129,896 | 12,623 |
| | Danaher Corp. | | 121,725 | 11,902 |
| | FedEx Corp. | | 46,960 | 11,571 |
| | Fortive Corp. | | 121,683 | 9,345 |
| | Rockwell Automation Inc. | 49,986 | 9,038 |
| | Agilent Technologies Inc. | 125,191 | 8,587 |
| | Paychex Inc. | | 125,700 | 8,187 |
| | | | | 397,773 |
| Oil & Gas (2.9%) | | | |
| | Schlumberger Ltd. | | 539,262 | 35,397 |
| | EOG Resources Inc. | | 225,266 | 22,846 |
| | Occidental Petroleum | | |
| | Corp. | | 298,131 | 19,557 |
| | Anadarko Petroleum Corp. | 213,151 | 12,158 |
| | Pioneer Natural Resources | | |
| | Co. | | 66,233 | 11,275 |
| | Williams Cos. Inc. | | 160,789 | 4,464 |
| | | | | 105,697 |
| Technology (28.6%) | | | |
| | Apple Inc. | | 1,799,167 | 320,468 |
| * | Facebook Inc. Class A | 928,515 | 165,573 |
| * | Alphabet Inc. Class A | | 116,057 | 128,118 |
| * | Alphabet Inc. Class C | | 115,792 | 127,919 |
| | NVIDIA Corp. | | 212,294 | 51,375 |
| | Texas Instruments Inc. | 383,789 | 41,584 |
| * | Adobe Systems Inc. | | 191,877 | 40,127 |
| | Broadcom Ltd. | | 158,846 | 39,149 |
| * | salesforce.com Inc. | | 267,223 | 31,065 |
| | Applied Materials Inc. | 415,394 | 23,923 |
| * | Micron Technology Inc. | 426,723 | 20,828 |
| | Cognizant Technology | | |
| | Solutions Corp. Class A | 229,584 | 18,830 |
| | Intuit Inc. | | 94,469 | 15,763 |
| | Analog Devices Inc. | | 143,385 | 12,926 |
| | Lam Research Corp. | | 31,530 | 6,049 |
| * | VMware Inc. Class A | | 29,703 | 3,913 |
| *,^ | Snap Inc. | | 167,874 | 2,908 |
| | | | | 1,050,518 |
| Telecommunications (0.2%) | | |
| * | T-Mobile US Inc. | | 113,253 | 6,864 |
| Total Common Stocks | | | |
| (Cost $2,460,173) | | | 3,665,335 |
| Temporary Cash Investments (0.5%)1 | | |
| Money Market Fund (0.5%) | | |
| 2,3 | Vanguard Market | | | |
| | Liquidity Fund, 1.601% | 161,021 | 16,100 |
27
| | |
| Mega Cap Growth Index Fund | | |
| |
| |
| |
| | Face | Market |
| | Amount | Value • |
| | ($000) | ($000) |
| U. S. Government and Agency Obligations (0.0%) |
| United States Treasury | | |
| Bill, 1.461%, 5/3/18 | 600 | 599 |
| 4 United States Treasury | | |
| Bill, 1.370%, 5/17/18 | 800 | 797 |
| | | 1,396 |
| Total Temporary Cash Investments | |
| (Cost $17,498) | | 17,496 |
| Total Investments (100.3%) | | |
| (Cost $2,477,671) | | 3,682,831 |
| |
| | | Amount |
| | | ($000) |
| Other Assets and Liabilities (-0.3%) | |
| Other Assets | | |
| Investment in Vanguard | | 199 |
| Receivables for Accrued Income | 2,724 |
| Receivables for Capital Shares Issued | 1 |
| Other Assets | | 1 |
| Total Other Assets | | 2,925 |
| Liabilities | | |
| Payables for Investment | | |
| Securities Purchased | | (4) |
| Collateral for Securities on Loan | | (12,289) |
| Payables to Vanguard | | (849) |
| Variation Margin Payable— | | |
| Futures Contracts | | (71) |
| Total Liabilities | | (13,213) |
| Net Assets (100%) | | 3,672,543 |
| |
| At February 28, 2018, net assets consisted of: |
| | Amount |
| | ($000) |
| Paid-in Capital | 2,543,107 |
| Undistributed Net Investment Income | 4,250 |
| Accumulated Net Realized Losses | (80,018) |
| Unrealized Appreciation (Depreciation) | |
| Investment Securities | 1,205,160 |
| Futures Contracts | 44 |
| Net Assets | 3,672,543 |
| |
| | Amount |
| | ($000) |
| ETF Shares—Net Assets | |
| Applicable to 31,289,005 outstanding | |
| $.001 par value shares of beneficial | |
| interest (unlimited authorization) | 3,634,175 |
| Net Asset Value Per Share— | |
| ETF Shares | $116.15 |
| |
| |
| Institutional Shares—Net Assets | |
| Applicable to 166,318 outstanding | |
| $.001 par value shares of beneficial | |
| interest (unlimited authorization) | 38,368 |
| Net Asset Value Per Share— | |
| Institutional Shares | $230.69 |
• See Note A in Notes to Financial Statements.
* Non-income-producing security.
^ Includes partial security positions on loan to broker-dealers.
The total value of securities on loan is $11,687,000.
1 The fund invests a portion of its cash reserves in equity
markets through the use of index futures contracts. After
giving effect to futures investments, the fund’s effective
common stock and temporary cash investment positions
represent 100.0% and 0.3%, respectively, of net assets.
2 Affiliated money market fund available only to Vanguard funds
and certain trusts and accounts managed by Vanguard. Rate
shown is the 7-day yield.
3 Includes $12,289,000 of collateral received for securities on
loan.
4 Securities with a value of $498,000 have been segregated as
initial margin for open futures contracts.
28
| | | | |
| Mega Cap Growth Index Fund | | | | |
| |
| |
| Derivative Financial Instruments Outstanding as of Period End | | |
| Futures Contracts | | | | |
| | | | | ($000) |
| | | | | Value and |
| | | Number of | | Unrealized |
| | | Long (Short) | Notional | Appreciation |
| | Expiration | Contracts | Amount | (Depreciation) |
| Long Futures Contracts | | | | |
| E-mini S&P 500 Index | March 2018 | 43 | 5,836 | 44 |
Unrealized appreciation (depreciation) on open futures contracts is required to be treated as realized gain (loss) for tax purposes.
See accompanying Notes, which are an integral part of the Financial Statements.
29
| |
| Mega Cap Growth Index Fund | |
| |
| |
| Statement of Operations | |
| |
| | Six Months Ended |
| | February28,2018 |
| | ($000) |
| Investment Income | |
| Income | |
| Dividends | 21,946 |
| Interest1 | 32 |
| Securities Lending—Net | 78 |
| Total Income | 22,056 |
| Expenses | |
| The Vanguard Group—Note B | |
| Investment Advisory Services | 413 |
| Management and Administrative—ETF Shares | 555 |
| Management and Administrative—Institutional Shares | 6 |
| Marketing and Distribution—ETF Shares | 73 |
| Marketing and Distribution—Institutional Shares | — |
| Custodian Fees | 26 |
| Shareholders’ Reports and Proxy—ETF Shares | 117 |
| Shareholders’ Reports and Proxy—Institutional Shares | — |
| Trustees’ Fees and Expenses | 1 |
| Total Expenses | 1,191 |
| Net Investment Income | 20,865 |
| Realized Net Gain (Loss) | |
| Investment Securities Sold1 | 75,750 |
| Futures Contracts | 574 |
| Realized Net Gain (Loss) | 76,324 |
| Change in Unrealized Appreciation (Depreciation) | |
| Investment Securities1 | 298,459 |
| Futures Contracts | (36) |
| Change in Unrealized Appreciation (Depreciation) | 298,423 |
| Net Increase (Decrease) in Net Assets Resulting from Operations | 395,612 |
1 Interest income, realized net gain (loss), and change in unrealized appreciation (depreciation) from an affiliated company of the fund
were $26,000, $1,000, and ($3,000), respectively. Purchases and sales are for temporary cash investment purposes.
See accompanying Notes, which are an integral part of the Financial Statements.
30
| | |
| Mega Cap Growth Index Fund | | |
| |
| |
| Statement of Changes in Net Assets | | |
| |
| | Six Months Ended | Year Ended |
| | February 28, | August 31, |
| | 2018 | 2017 |
| | ($000) | ($000) |
| Increase (Decrease) in Net Assets | | |
| Operations | | |
| Net Investment Income | 20,865 | 38,027 |
| Realized Net Gain (Loss) | 76,324 | 75,317 |
| Change in Unrealized Appreciation (Depreciation) | 298,423 | 406,493 |
| Net Increase (Decrease) in Net Assets Resulting from Operations | 395,612 | 519,837 |
| Distributions | | |
| Net Investment Income | | |
| ETF Shares | (23,717) | (36,619) |
| Institutional Shares | (261) | (456) |
| Realized Capital Gain | | |
| ETF Shares | — | — |
| Institutional Shares | — | — |
| Total Distributions | (23,978) | (37,075) |
| Capital Share Transactions | | |
| ETF Shares | 131,962 | 410,367 |
| Institutional Shares | (647) | (1,412) |
| Net Increase (Decrease) from Capital Share Transactions | 131,315 | 408,955 |
| Total Increase (Decrease) | 502,949 | 891,717 |
| Net Assets | | |
| Beginning of Period | 3,169,594 | 2,277,877 |
| End of Period1 | 3,672,543 | 3,169,594 |
1 Net Assets—End of Period includes undistributed (overdistributed) net investment income of $4,250,000 and $7,363,000.
See accompanying Notes, which are an integral part of the Financial Statements.
31
| | | | | | | |
| Mega Cap Growth Index Fund | | | | | | | |
| |
| |
| Financial Highlights | | | | | | |
| |
| |
| ETF Shares | | | | | | | |
| | Six Months | | | | | |
| | | Ended | | | | | |
| For a Share Outstanding | February 28, | | | Year Ended August 31, |
| Throughout Each Period | | 2018 | 2017 | 2016 | 2015 | 2014 | 2013 |
| Net Asset Value, Beginning of Period | $104.09 | $87.15 | $80.22 | $79.16 | $62.69 | $55.92 |
| Investment Operations | | | | | | | |
| Net Investment Income | | . 6711 | 1.3511 | 1.269 | 1.148 | .994 | 1.006 |
| Net Realized and Unrealized Gain (Loss) | | | | | | |
| on Investments | | 12.164 | 16.920 | 6.897 | 1.013 | 16.475 | 6.751 |
| Total from Investment Operations | 12.835 | 18.271 | 8.166 | 2.161 | 17.469 | 7.757 |
| Distributions | | | | | | | |
| Dividends from Net Investment Income | (.775) | (1.331) | (1.236) | (1.101) | (.999) | (.987) |
| Distributions from Realized Capital Gains | — | — | — | — | — | — |
| Total Distributions | | (.775) | (1.331) | (1.236) | (1.101) | (.999) | (.987) |
| Net Asset Value, End of Period | | $116.15 | $104.09 | $87.15 | $80.22 | $79.16 | $62.69 |
| Total Return | | 12.39% | 21.17% | 10.28% | 2.70% | 28.05% | 14.04% |
| Ratios/Supplemental Data | | | | | | | |
| Net Assets, End of Period (Millions) | $3,634 | $3,135 | $2,247 | $1,928 | $1,520 | $1,034 |
| Ratio of Total Expenses to | | | | | | | |
| Average Net Assets | | 0.07% | 0.07% | 0.07% | 0.09% | 0.11% | 0.11% |
| Ratio of Net Investment Income to | | | | | | |
| Average Net Assets | | 1.25% | 1.43% | 1.55% | 1.43% | 1.40% | 1.69% |
| Portfolio Turnover Rate2 | | 6% | 8% | 12% | 9% | 11% | 41% |
The expense ratio, net investment income ratio, and turnover rate for the current period have been annualized.
1 Calculated based on average shares outstanding.
2 Excludes the value of portfolio securities received or delivered as a result of in-kind purchases or redemptions of the fund’s capital
shares, including ETF Creation Units.
See accompanying Notes, which are an integral part of the Financial Statements.
32
| | | | | | | |
| Mega Cap Growth Index Fund | | | | | | | |
| |
| |
| Financial Highlights | | | | | | |
| |
| |
| Institutional Shares | | | | | | | |
| | Six Months | | | | | |
| | | Ended | | | | | |
| For a Share Outstanding | February 28, | | | Year Ended August 31, |
| Throughout Each Period | | 2018 | 2017 | 2016 | 2015 | 2014 | 2013 |
| Net Asset Value, Beginning of Period | $206.74 | $173.07 | $159.31 | $157.21 | $124.49 | $110.67 |
| Investment Operations | | | | | | | |
| Net Investment Income | | 1.3461 | 2.6991 | 2.528 | 2.293 | 1.978 | 2.027 |
| Net Realized and Unrealized Gain (Loss) | | | | | | |
| on Investments | | 24.154 | 33.622 | 13.693 | 2.011 | 32.732 | 13.374 |
| Total from Investment Operations | 25.500 | 36.321 | 16.221 | 4.304 | 34.710 | 15.401 |
| Distributions | | | | | | | |
| Dividends from Net Investment Income | (1.550) | (2.651) | (2.461) | (2.204) | (1.990) | (1.581) |
| Distributions from Realized Capital Gains | — | — | — | — | — | — |
| Total Distributions | | (1.550) | (2.651) | (2.461) | (2.204) | (1.990) | (1.581) |
| Net Asset Value, End of Period | | $230.69 | $206.74 | $173.07 | $159.31 | $157.21 | $124.49 |
| Total Return | | 12.39% | 21.20% | 10.28% | 2.71% | 28.07% | 14.05% |
| Ratios/Supplemental Data | | | | | | | |
| Net Assets, End of Period (Millions) | $38 | $35 | $30 | $35 | $15 | $21 |
| Ratio of Total Expenses to | | | | | | | |
| Average Net Assets | | 0.06% | 0.06% | 0.06% | 0.08% | 0.10% | 0.10% |
| Ratio of Net Investment Income to | | | | | | |
| Average Net Assets | | 1.26% | 1.44% | 1.56% | 1.44% | 1.41% | 1.70% |
| Portfolio Turnover Rate2 | | 6% | 8% | 12% | 9% | 11% | 41% |
The expense ratio, net investment income ratio, and turnover rate for the current period have been annualized.
1 Calculated based on average shares outstanding.
2 Excludes the value of portfolio securities received or delivered as a result of in-kind purchases or redemptions of the fund’s capital
shares, including ETF Creation Units.
See accompanying Notes, which are an integral part of the Financial Statements.
33
Mega Cap Growth Index Fund
Notes to Financial Statements
Vanguard Mega Cap Growth Index Fund is registered under the Investment Company Act of 1940 as an open-end investment company, or mutual fund. The fund offers two classes of shares: ETF Shares and Institutional Shares. ETF Shares are listed for trading on NYSE Arca; they can be purchased and sold through a broker. Institutional Shares are designed for investors who meet certain administrative, service, and account-size criteria.
A. The following significant accounting policies conform to generally accepted accounting principles for U.S. investment companies. The fund consistently follows such policies in preparing its financial statements.
1. Security Valuation: Securities are valued as of the close of trading on the New York Stock Exchange (generally 4 p.m., Eastern time) on the valuation date. Equity securities are valued at the latest quoted sales prices or official closing prices taken from the primary market in which each security trades; such securities not traded on the valuation date are valued at the mean of the latest quoted bid and asked prices. Securities for which market quotations are not readily available, or whose values have been materially affected by events occurring before the fund’s pricing time but after the close of the securities’ primary markets, are valued by methods deemed by the board of trustees to represent fair value. Investments in Vanguard Market Liquidity Fund are valued at that fund’s net asset value. Temporary cash investments are valued using the latest bid prices or using valuations based on a matrix system (which considers such factors as security prices, yields, maturities, and ratings), both as furnished by independent pricing services.
2. Futures Contracts: The fund uses index futures contracts to a limited extent, with the objectives of maintaining full exposure to the stock market, maintaining liquidity, and minimizing transaction costs. The fund may purchase futures contracts to immediately invest incoming cash in the market, or sell futures in response to cash outflows, thereby simulating a fully invested position in the underlying index while maintaining a cash balance for liquidity. The primary risks associated with the use of futures contracts are imperfect correlation between changes in market values of stocks held by the fund and the prices of futures contracts, and the possibility of an illiquid market. Counterparty risk involving futures is mitigated because a regulated clearinghouse is the counterparty instead of the clearing broker. To further mitigate counterparty risk, the fund trades futures contracts on an exchange, monitors the financial strength of its clearing brokers and clearinghouse, and has entered into clearing agreements with its clearing brokers. The clearinghouse imposes initial margin requirements to secure the fund’s performance and requires daily settlement of variation margin representing changes in the market value of each contract.
Futures contracts are valued at their quoted daily settlement prices. The notional amounts of the contracts are not recorded in the Statement of Net Assets. Fluctuations in the value of the contracts are recorded in the Statement of Net Assets as an asset (liability) and in the Statement of Operations as unrealized appreciation (depreciation) until the contracts are closed, when they are recorded as realized futures gains (losses).
During the six months ended February 28, 2018, the fund’s average investments in long and short futures contracts represented less than 1% and 0% of net assets, respectively, based on the average of the notional amounts at each quarter-end during the period.
34
Mega Cap Growth Index Fund
3. Federal Income Taxes: The fund intends to continue to qualify as a regulated investment company and distribute all of its taxable income. Management has analyzed the fund’s tax positions taken for all open federal income tax years (August 31, 2014–2017), and for the period ended February 28, 2018, and has concluded that no provision for federal income tax is required in the fund’s financial statements.
4. Distributions: Distributions to shareholders are recorded on the ex-dividend date.
5. Securities Lending: To earn additional income, the fund lends its securities to qualified institutional borrowers. Security loans are subject to termination by the fund at any time, and are required to be secured at all times by collateral in an amount at least equal to the market value of securities loaned. Daily market fluctuations could cause the value of loaned securities to be more or less than the value of the collateral received. When this occurs, the collateral is adjusted and settled on the next business day. The fund further mitigates its counterparty risk by entering into securities lending transactions only with a diverse group of prequalified counterparties, monitoring their financial strength, and entering into master securities lending agreements with its counterparties. The master securities lending agreements provide that, in the event of a counterparty’s default (including bankruptcy), the fund may terminate any loans with that borrower, determine the net amount owed, and sell or retain the collateral up to the net amount owed to the fund; however, such actions may be subject to legal proceedings. While collateral mitigates counterparty risk, in the event of a default, the fund may experience delays and costs in recovering the securities loaned. The fund invests cash collateral received in Vanguard Market Liquidity Fund, and records a liability in the Statement of Net Assets for the return of the collateral, during the period the securities are on loan. Securities lending income represents fees charged to borrowers plus income earned on invested cash collateral, less expenses associated with the loan. During the term of the loan, the fund is entitled to all distributions made on or in respect of the loaned securities.
6. Credit Facility: The fund and certain other funds managed by The Vanguard Group (“Vanguard”) participate in a $3.1 billion committed credit facility provided by a syndicate of lenders pursuant to a credit agreement that may be renewed annually; each fund is individually liable for its borrowings, if any, under the credit facility. Borrowings may be utilized for temporary and emergency purposes, and are subject to the fund’s regulatory and contractual borrowing restrictions. The participating funds are charged administrative fees and an annual commitment fee of 0.10% of the undrawn amount of the facility; these fees are allocated to the funds based on a method approved by the fund’s board of trustees and included in Management and Administrative expenses on the fund’s Statement of Operations. Any borrowings under this facility bear interest at a rate based upon the higher of the one-month London Interbank Offered Rate, federal funds effective rate, or overnight bank funding rate plus an agreed-upon spread.
The fund had no borrowings outstanding at February 28, 2018, or at any time during the period then ended.
7. Other: Dividend income is recorded on the ex-dividend date. Interest income includes income distributions received from Vanguard Market Liquidity Fund and is accrued daily. Premiums and discounts on debt securities purchased are amortized and accreted, respectively, to interest income over the lives of the respective securities. Security transactions are accounted for on the date securities are bought or sold. Costs used to determine realized gains (losses) on the sale of investment securities are those of the specific securities sold.
35
Mega Cap Growth Index Fund
Each class of shares has equal rights as to assets and earnings, except that each class separately bears certain class-specific expenses related to maintenance of shareholder accounts (included in Management and Administrative expenses), shareholder reporting, and the proxy. Marketing and distribution expenses are allocated to each class of shares based on a method approved by the board of trustees. Income, other non-class-specific expenses, and gains and losses on investments are allocated to each class of shares based on its relative net assets.
B. In accordance with the terms of a Funds’ Service Agreement (the “FSA”) between Vanguard and the fund, Vanguard furnishes to the fund investment advisory, corporate management, administrative, marketing, and distribution services at Vanguard’s cost of operations (as defined by the FSA). These costs of operations are allocated to the fund based on methods and guidelines approved by the board of trustees. Vanguard does not require reimbursement in the current period for certain costs of operations (such as deferred compensation/benefits and risk/insurance costs); the fund’s liability for these costs of operations is included in Payables to Vanguard on the Statement of Net Assets. All other costs of operations payable to Vanguard are generally settled twice a month.
Upon the request of Vanguard, the fund may invest up to 0.40% of its net assets as capital in Vanguard. At February 28, 2018, the fund had contributed to Vanguard capital in the amount of $199,000, representing 0.01% of the fund’s net assets and 0.08% of Vanguard’s capitalization. The fund’s trustees and officers are also directors and employees, respectively, of Vanguard.
C. Various inputs may be used to determine the value of the fund’s investments. These inputs are summarized in three broad levels for financial statement purposes. The inputs or methodologies used to value securities are not necessarily an indication of the risk associated with investing in those securities.
Level 1—Quoted prices in active markets for identical securities.
Level 2—Other significant observable inputs (including quoted prices for similar securities, interest
rates, prepayment speeds, credit risk, etc.).
Level 3—Significant unobservable inputs (including the fund’s own assumptions used to determine
the fair value of investments). Any investments valued with significant unobservable inputs are
noted on the Statement of Net Assets.
The following table summarizes the market value of the fund’s investments as of February 28, 2018, based on the inputs used to value them:
| | | |
| | Level 1 | Level 2 | Level 3 |
| Investments | ($000) | ($000) | ($000) |
| Common Stocks | 3,665,335 | — | — |
| Temporary Cash Investments | 16,100 | 1,396 | — |
| Futures Contracts—Liabilities1 | (71) | — | — |
| Total | 3,681,364 | 1,396 | — |
| 1 Represents variation margin on the last day of the reporting period. | | | |
36
Mega Cap Growth Index Fund
D. Distributions are determined on a tax basis and may differ from net investment income and realized capital gains for financial reporting purposes. Differences may be permanent or temporary. Permanent differences are reclassified among capital accounts in the financial statements to reflect their tax character. Temporary differences arise when certain items of income, expense, gain, or loss are recognized in different periods for financial statement and tax purposes. These differences will reverse at some time in the future. Differences in classification may also result from the treatment of short-term gains as ordinary income for tax purposes.
During the six months ended February 28, 2018, the fund realized $93,773,000 of net capital gains resulting from in-kind redemptions—in which shareholders exchanged fund shares for securities held by the fund rather than for cash. Because such gains are not taxable to the fund, and are not distributed to shareholders, they have been reclassified from accumulated net realized losses to paid-in capital.
The fund’s tax-basis capital gains and losses are determined only at the end of each fiscal year. For tax purposes, at August 31, 2017, the fund had available capital losses totaling $62,489,000 to offset future net capital gains. Of this amount, $4,562,000 is subject to expiration on August 31, 2019. Capital losses of $57,927,000 realized beginning in fiscal 2012 may be carried forward indefinitely under the Regulated Investment Company Modernization Act of 2010, but must be used before any expiring loss carryforwards. The fund will use these capital losses to offset net taxable capital gains, if any, realized during the year ending August 31, 2018; should the fund realize net capital losses for the year, the losses will be added to the loss carryforward balance above.
At February 28, 2018, the cost of investment securities for tax purposes was $2,477,671,000. Net unrealized appreciation of investment securities for tax purposes was $1,205,160,000, consisting of unrealized gains of $1,246,751,000 on securities that had risen in value since their purchase and $41,591,000 in unrealized losses on securities that had fallen in value since their purchase.
E. During the six months ended February 28, 2018, the fund purchased $421,244,000 of investment securities and sold $290,934,000 of investment securities, other than temporary cash investments. Purchases and sales include $299,579,000 and $186,905,000, respectively, in connection with in-kind purchases and redemptions of the fund’s capital shares.
The fund purchased securities from and sold securities to other Vanguard funds or accounts managed by Vanguard or its affiliates, in accordance with procedures adopted by the board of trustees in compliance with Rule 17a-7 of the Investment Company Act of 1940. For the six months ended February 28, 2018, such purchases and sales were $47,101,000 and $75,501,000 respectively; these amounts are included in the purchases and sales of investment securities noted above.
37
Mega Cap Growth Index Fund
| | | | |
| F. Capital share transactions for each class of shares were: | | | |
| | Six Months Ended | | Year Ended |
| | February 28, 2018 | August 31, 2017 |
| | Amount | Shares | Amount | Shares |
| | ($000) | (000) | ($000) | (000) |
| ETF Shares | | | | |
| Issued | 324,782 | 2,900 | 601,999 | 6,300 |
| Issued in Lieu of Cash Distributions | — | — | — | — |
| Redeemed | (192,820) | (1,725) | (191,632) | (1,975) |
| Net Increase (Decrease)—ETF Shares | 131,962 | 1,175 | 410,367 | 4,325 |
| Institutional Shares | | | | |
| Issued | 171 | — | 5,641 | 33 |
| Issued in Lieu of Cash Distributions | 182 | 1 | 320 | 2 |
| Redeemed | (1,000) | (4) | (7,373) | (42) |
| Net Increase (Decrease)—Institutional Shares | (647) | (3) | (1,412) | (7) |
G. Management has determined that no material events or transactions occurred subsequent to February 28, 2018, that would require recognition or disclosure in these financial statements.
38
Mega Cap Value Index Fund
Fund Profile
As of February 28, 2018
| | |
| Share-Class Characteristics | | |
| | ETF | Institutional |
| | Shares | Shares |
| Ticker Symbol | MGV | VMVLX |
| Expense Ratio1 | 0.07% | 0.06% |
| 30-Day SEC Yield | 2.37% | 2.38% |
| | | |
| Portfolio Characteristics | | |
| | | CRSP US | DJ |
| | | Mega Cap | U.S. Total |
| | | Value | Market |
| | Fund | Index | FA Index |
| Number of Stocks | 154 | 149 | 3,746 |
| Median Market Cap $155.8B | $155.8B | $68.2B |
| Price/Earnings Ratio | 21.9x | 21.9x | 28.4x |
| Price/Book Ratio | 2.4x | 2.4x | 3.0x |
| Return on Equity | 15.4% | 15.4% | 15.0% |
| Earnings Growth Rate | 3.2% | 3.2% | 8.5% |
| Dividend Yield | 2.4% | 2.4% | 1.7% |
| Foreign Holdings | 0.0% | 0.0% | 0.0% |
| Turnover Rate | | | |
| (Annualized) | 7% | — | — |
| Short-Term Reserves | -0.3% | — | — |
| | | |
| Sector Diversification (% of equity exposure) |
| | | CRSP US | DJ |
| | | Mega Cap | U.S. Total |
| | | Value | Market |
| | Fund | Index | FA Index |
| Basic Materials | 2.6% | 2.6% | 2.6% |
| Consumer Goods | 6.2 | 6.2 | 8.5 |
| Consumer Services | 5.8 | 5.7 | 13.2 |
| Financials | 26.3 | 26.3 | 20.5 |
| Health Care | 15.8 | 15.8 | 12.6 |
| Industrials | 11.3 | 11.4 | 13.2 |
| Oil & Gas | 7.7 | 7.7 | 5.2 |
| Technology | 16.1 | 16.0 | 19.8 |
| Telecommunications | 4.0 | 4.0 | 1.7 |
| Utilities | 4.2 | 4.3 | 2.7 |
Sector categories are based on the Industry Classification
Benchmark (“ICB”), except for the “Other” category (if applicable),
which includes securities that have not been provided an ICB
classification as of the effective reporting period.
| | |
| Volatility Measures | | |
| | CRSP US | DJ |
| | Mega Cap | U.S. Total |
| | Value | Market |
| | Index | FA Index |
| R-Squared | 1.00 | 0.92 |
| Beta | 1.00 | 0.93 |
These measures show the degree and timing of the fund’s
fluctuations compared with the indexes over 36 months.
| | |
| Ten Largest Holdings (% of total net assets) |
| Microsoft Corp. | Software | 6.8% |
| Berkshire Hathaway Inc. Diversified Financial | Services | 3.8 |
| JPMorgan Chase & Co. | Banks | 3.8 |
| Johnson & Johnson | Pharmaceuticals | 3.3 |
| Exxon Mobil Corp. | Integrated Oil & Gas | 3.0 |
| Bank of America Corp. | Banks | 3.0 |
| Wells Fargo & Co. | Banks | 2.4 |
| Intel Corp. | Semiconductors | 2.2 |
| AT&T Inc. | Fixed Line | |
| | Telecommunications | 2.1 |
| Cisco Systems Inc. | Communications | |
| | Equipment | 2.1 |
| Top Ten | | 32.5% |
The holdings listed exclude any temporary cash investments and
equity index products.
Investment Focus
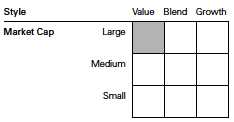
1 The expense ratios shown are from the prospectus dated December 21, 2017, and represent estimated costs for the current fiscal year.
For the six months ended February 28, 2018, the annualized expense ratios were 0.07% for ETF Shares and 0.06% for Institutional Shares.
39
Mega Cap Value Index Fund
Performance Summary
All of the returns in this report represent past performance, which is not a guarantee of future results that may be achieved by the fund. (Current performance may be lower or higher than the performance data cited. For performance data current to the most recent month-end, visit our website at vanguard.com/performance.) Note, too, that both investment returns and principal value can fluctuate widely, so an investor’s shares, when sold, could be worth more or less than their original cost. The returns shown do not reflect taxes that a shareholder would pay on fund distributions or on the sale of fund shares.
Fiscal-Year Total Returns (%): December 17, 2007, Through February 28, 2018
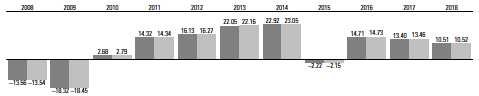
| | |
| | Mega Cap Value Index Fund ETF Shares Net Asset Value |
| | Spliced Mega Cap Value Index |
For a benchmark description, see the Glossary.
Note: For 2018, performance data reflect the six months ended February 28, 2018.
Average Annual Total Returns: Periods Ended December 31, 2017
This table presents returns through the latest calendar quarter—rather than through the end of the fiscal period.
Securities and Exchange Commission rules require that we provide this information.
| | | | |
| | Inception | One | Five | Ten |
| | Date | Year | Years | Years |
| ETF Shares | 12/17/2007 | | | |
| Market Price | | 16.82% | 15.23% | 7.20% |
| Net Asset Value | | 16.79 | 15.20 | 7.18 |
| Institutional Shares | 3/5/2008 | 16.80 | 15.23 | 8.391 |
| 1 Return since inception. | | | | |
See Financial Highlights for dividend and capital gains information.
40
Mega Cap Value Index Fund
Financial Statements (unaudited)
Statement of Net Assets
As of February 28, 2018
The fund reports a complete list of its holdings in regulatory filings four times in each fiscal year, at the quarter-ends. For the second and fourth fiscal quarters, the lists appear in the fund’s semiannual and annual reports to shareholders. For the first and third fiscal quarters, the fund files the lists with the Securities and Exchange Commission on Form N-Q. Shareholders can look up the fund’s Forms N-Q on the SEC’s website at sec.gov. Forms N-Q may also be reviewed and copied at the SEC’s Public Reference Room (see the back cover of this report for further information).
| | |
| | | Market |
| | | Value• |
| | Shares | ($000) |
| Common Stocks (99.7%)1 | | |
| Basic Materials (2.6%) | | |
| DowDuPont Inc. | 453,735 | 31,898 |
| Air Products & Chemicals | | |
| Inc. | 42,461 | 6,827 |
| LyondellBasell Industries | | |
| NV Class A | 61,148 | 6,617 |
| International Paper Co. | 80,176 | 4,778 |
| PPG Industries Inc. | 24,580 | 2,764 |
| | | 52,884 |
| Consumer Goods (6.2%) | | |
| Procter & Gamble Co. | 491,811 | 38,617 |
| PepsiCo Inc. | 275,650 | 30,247 |
| Mondelez International Inc. | | |
| Class A | 275,579 | 12,098 |
| General Motors Co. | 233,896 | 9,204 |
| Ford Motor Co. | 755,696 | 8,018 |
| Kimberly-Clark Corp. | 68,202 | 7,565 |
| General Mills Inc. | 110,379 | 5,580 |
| VF Corp. | 61,370 | 4,576 |
| Archer-Daniels-Midland | | |
| Co. | 108,659 | 4,511 |
| Kellogg Co. | 53,789 | 3,561 |
| Tyson Foods Inc. Class A | 28,903 | 2,150 |
| Campbell Soup Co. | 18,891 | 813 |
| | | 126,940 |
| Consumer Services (5.7%) | | |
| Walmart Inc. | 289,716 | 26,077 |
| CVS Health Corp. | 196,387 | 13,301 |
| * eBay Inc. | 192,344 | 8,244 |
| Target Corp. | 105,323 | 7,942 |
| Twenty-First Century | | |
| Fox Inc. Class A | 206,432 | 7,601 |
| Delta Air Lines Inc. | 124,457 | 6,708 |
| Time Warner Inc. | 71,598 | 6,656 |
| McKesson Corp. | 40,498 | 6,044 |
| Sysco Corp. | 91,063 | 5,432 |
| Kroger Co. | 172,791 | 4,686 |
| | | |
| | | | Market |
| | | | Value• |
| | | Shares | ($000) |
| | American Airlines Group | | |
| | Inc. | 83,759 | 4,544 |
| | Cardinal Health Inc. | 61,210 | 4,236 |
| | Omnicom Group Inc. | 44,801 | 3,415 |
| | Twenty-First Century Fox | | |
| | Inc. | 83,456 | 3,040 |
| | Las Vegas Sands Corp. | 38,222 | 2,783 |
| | Carnival Corp. | 38,697 | 2,589 |
| * | United Continental | | |
| | Holdings Inc. | 24,954 | 1,692 |
| | AmerisourceBergen Corp. | | |
| | Class A | 15,749 | 1,499 |
| * | DISH Network Corp. | | |
| | Class A | 20,880 | 871 |
| | L Brands Inc. | 46 | 2 |
| | | | 117,362 |
| Financials (26.2%) | | |
| * | Berkshire Hathaway Inc. | | |
| | Class B | 376,362 | 77,982 |
| | JPMorgan Chase & Co. | 672,713 | 77,698 |
| | Bank of America Corp. | 1,921,231 | 61,672 |
| | Wells Fargo & Co. | 859,309 | 50,192 |
| | Citigroup Inc. | 512,576 | 38,694 |
| | Goldman Sachs Group Inc. | 65,813 | 17,304 |
| | US Bancorp | 305,539 | 16,609 |
| | Morgan Stanley | 262,951 | 14,731 |
| | PNC Financial Services | | |
| | Group Inc. | 92,369 | 14,563 |
| | American Express Co. | 134,784 | 13,143 |
| | Chubb Ltd. | 85,589 | 12,147 |
| | CME Group Inc. | 66,087 | 10,981 |
| | Bank of New York Mellon | | |
| | Corp. | 188,808 | 10,768 |
| | American International | | |
| | Group Inc. | 174,527 | 10,007 |
| | Capital One Financial Corp. | 94,122 | 9,217 |
| | Prudential Financial Inc. | 82,165 | 8,736 |
| | BB&T Corp. | 152,897 | 8,310 |
41
| | | |
| Mega Cap Value Index Fund | | |
| |
| |
| |
| | | | Market |
| | | | Value• |
| | | Shares | ($000) |
| | MetLife Inc. | 163,163 | 7,537 |
| | Travelers Cos. Inc. | 53,082 | 7,378 |
| | State Street Corp. | 68,220 | 7,242 |
| | Aflac Inc. | 76,216 | 6,774 |
| | Progressive Corp. | 112,898 | 6,501 |
| | SunTrust Banks Inc. | 92,403 | 6,453 |
| | Allstate Corp. | 69,714 | 6,432 |
| | Discover Financial | | |
| | Services | 70,559 | 5,562 |
| | Synchrony Financial | 144,216 | 5,248 |
| | Fifth Third Bancorp | 137,044 | 4,529 |
| | Ameriprise Financial Inc. | 28,640 | 4,480 |
| | Northern Trust Corp. | 41,939 | 4,440 |
| | Equity Residential | 71,012 | 3,993 |
| | Loews Corp. | 58,506 | 2,886 |
| | GGP Inc. | 118,789 | 2,515 |
| | Franklin Resources Inc. | 64,201 | 2,483 |
| * | Berkshire Hathaway Inc. | | |
| | Class A | 1 | 310 |
| | HCP Inc. | 86 | 2 |
| | | | 537,519 |
| Health Care (15.7%) | | |
| | Johnson & Johnson | 520,918 | 67,657 |
| | UnitedHealth Group Inc. | 187,917 | 42,499 |
| | Pfizer Inc. | 1,155,682 | 41,963 |
| | Merck & Co. Inc. | 528,400 | 28,650 |
| | Amgen Inc. | 140,784 | 25,872 |
| | Abbott Laboratories | 337,318 | 20,350 |
| | Eli Lilly & Co. | 192,037 | 14,791 |
| | Anthem Inc. | 49,743 | 11,709 |
| | Aetna Inc. | 63,178 | 11,186 |
| | Gilead Sciences Inc. | 126,692 | 9,974 |
| | Cigna Corp. | 47,788 | 9,361 |
| * | Express Scripts Holding | | |
| | Co. | 109,713 | 8,278 |
| | Humana Inc. | 27,664 | 7,520 |
| | HCA Healthcare Inc. | 55,045 | 5,463 |
| | Allergan plc | 32,220 | 4,969 |
| | Zimmer Biomet Holdings | | |
| | Inc. | 39,328 | 4,572 |
| * | Mylan NV | 98,966 | 3,990 |
| | Baxter International Inc. | 50,373 | 3,415 |
| | | | 322,219 |
| Industrials (11.3%) | | |
| | General Electric Co. | 1,680,946 | 23,718 |
| | Honeywell International | | |
| | Inc. | 147,810 | 22,335 |
| | United Technologies Corp. | 147,219 | 19,836 |
| | Caterpillar Inc. | 115,308 | 17,830 |
| | Lockheed Martin Corp. | 47,222 | 16,643 |
| | Raytheon Co. | 56,043 | 12,190 |
| | Northrop Grumman Corp. | 33,779 | 11,824 |
| | General Dynamics Corp. | 49,259 | 10,958 |
| | Deere & Co. | 62,284 | 10,020 |
| | | | |
| | | | | Market |
| | | | | Value• |
| | | | Shares | ($000) |
| | CSX Corp. | | 164,479 | 8,836 |
| | Emerson Electric Co. | | 124,298 | 8,833 |
| | Norfolk Southern Corp. | | 55,504 | 7,719 |
| | Waste Management Inc. | | 84,236 | 7,271 |
| | TE Connectivity Ltd. | | 68,268 | 7,038 |
| | Eaton Corp. plc | | 85,447 | 6,895 |
| | Johnson Controls | | | |
| | International plc | | 179,500 | 6,618 |
| | Danaher Corp. | | 60,775 | 5,943 |
| | FedEx Corp. | | 23,358 | 5,756 |
| | Cummins Inc. | | 30,538 | 5,136 |
| | PACCAR Inc. | | 68,217 | 4,884 |
| | Parker-Hannifin Corp. | | 25,793 | 4,603 |
| | Ingersoll-Rand plc | | 48,540 | 4,310 |
| | Republic Services Inc. | | | |
| | Class A | | 41,981 | 2,820 |
| | | | | 232,016 |
| Oil & Gas (7.7%) | | | |
| | Exxon Mobil Corp. | | 821,592 | 62,227 |
| | Chevron Corp. | | 368,295 | 41,220 |
| | ConocoPhillips | | 231,896 | 12,594 |
| | Valero Energy Corp. | | 84,839 | 7,671 |
| | Phillips 66 | | 83,560 | 7,551 |
| | Halliburton Co. | | 160,700 | 7,460 |
| | Marathon Petroleum Corp. | 94,789 | 6,072 |
| | Kinder Morgan Inc. | | 368,160 | 5,964 |
| | Apache Corp. | | 73,603 | 2,514 |
| | Williams Cos. Inc. | | 79,927 | 2,219 |
| | Devon Energy Corp. | | 48,221 | 1,479 |
| | Occidental Petroleum Corp. | 142 | 9 |
| | Hess Corp. | | 56 | 3 |
| | Baker Hughes a GE Co. | | 80 | 2 |
| | | | | 156,985 |
| Technology (16.0%) | | | |
| | Microsoft Corp. | | 1,495,831 | 140,264 |
| | Intel Corp. | | 907,476 | 44,729 |
| | Cisco Systems Inc. | | 958,543 | 42,924 |
| | Oracle Corp. | | 607,027 | 30,758 |
| | International Business | | | |
| | Machines Corp. | | 170,522 | 26,572 |
| | QUALCOMM Inc. | | 285,715 | 18,571 |
| | HP Inc. | | 323,781 | 7,573 |
| | Hewlett Packard | | | |
| | Enterprise Co. | | 309,559 | 5,755 |
| | DXC Technology Co. | | 55,352 | 5,676 |
| | Corning Inc. | | 168,794 | 4,909 |
| | | | | 327,731 |
| Telecommunications (4.0%) | | | |
| | AT&T Inc. | | 1,190,217 | 43,205 |
| | Verizon Communications | | | |
| | Inc. | | 799,745 | 38,180 |
| *,^ | Sprint Corp. | | 117,226 | 608 |
| | | | | 81,993 |
42
| | |
| Mega Cap Value Index Fund | | |
| |
| |
| |
| | | Market |
| | | Value• |
| | Shares | ($000) |
| Utilities (4.3%) | | |
| NextEra Energy Inc. | 91,293 | 13,890 |
| Duke Energy Corp. | 135,525 | 10,211 |
| Dominion Energy Inc. | 124,628 | 9,231 |
| Southern Co. | 193,610 | 8,337 |
| Exelon Corp. | 186,105 | 6,893 |
| American Electric Power | | |
| Co. Inc. | 95,629 | 6,271 |
| Sempra Energy | 48,559 | 5,292 |
| Public Service Enterprise | | |
| Group Inc. | 98,266 | 4,759 |
| Consolidated Edison Inc. | 60,272 | 4,514 |
| Xcel Energy Inc. | 98,149 | 4,248 |
| PG&E Corp. | 99,991 | 4,109 |
| Edison International | 63,346 | 3,838 |
| PPL Corp. | 133,581 | 3,827 |
| FirstEnergy Corp. | 43,434 | 1,404 |
| | | 86,824 |
| Total Common Stocks | | |
| (Cost $1,509,713) | | 2,042,473 |
| Temporary Cash Investments (0.1%)1 | |
| Money Market Fund (0.0%) | | |
| 2,3 Vanguard Market Liquidity | | |
| Fund, 1.601% | 8,306 | 831 |
| |
| | Face | |
| | Amount | |
| | ($000) | |
| U. S. Government and Agency Obligations (0.1%) |
| United States Treasury | | |
| Bill, 1.461%, 5/3/18 | 300 | 299 |
| 4 United States Treasury | | |
| Bill, 1.370%, 5/17/18 | 1,000 | 997 |
| | | 1,296 |
| Total Temporary Cash Investments | |
| (Cost $2,127) | | 2,127 |
| Total Investments (99.8%) | | |
| (Cost $1,511,840) | | 2,044,600 |
| |
| | Amount |
| | ($000) |
| Other Assets and Liabilities (0.2%) | |
| Other Assets | |
| Investment in Vanguard | 113 |
| Receivables for Accrued Income | 6,376 |
| Other Assets | 1 |
| Total Other Assets | 6,490 |
| Liabilities | |
| Payables for Investment | |
| Securities Purchased | (429) |
| Collateral for Securities on Loan | (672) |
| Payables for Capital Shares Redeemed | (118) |
| Other Liabilities | (1) |
| Variation Margin Payable— | |
| Futures Contracts | (84) |
| Payables to Vanguard | (556) |
| Total Liabilities | (1,860) |
| Net Assets (100%) | 2,049,230 |
| |
| At February 28, 2018, net assets consisted of: |
| | Amount |
| | ($000) |
| Paid-in Capital | 1,538,767 |
| Undistributed Net Investment Income | 8,688 |
| Accumulated Net Realized Losses | (31,124) |
| Unrealized Appreciation (Depreciation) | |
| Investment Securities | 532,760 |
| Futures Contracts | 139 |
| Net Assets | 2,049,230 |
| |
| |
| ETF Shares—Net Assets | |
| Applicable to 25,079,818 outstanding | |
| $.001 par value shares of beneficial | |
| interest (unlimited authorization) | 1,919,490 |
| Net Asset Value Per Share— | |
| ETF Shares | $76.54 |
43
| |
| Mega Cap Value Index Fund | |
| |
| |
| |
| |
| | Amount |
| | ($000) |
| Institutional Shares—Net Assets | |
| Applicable to 854,907 outstanding | |
| $.001 par value shares of beneficial | |
| interest (unlimited authorization) | 129,740 |
| Net Asset Value Per Share— | |
| Institutional Shares | $151.76 |
• See Note A in Notes to Financial Statements.
* Non-income-producing security.
^ Includes partial security positions on loan to broker-dealers.
The total value of securities on loan is $581,000.
1 The fund invests a portion of its cash reserves in equity
markets through the use of index futures contracts. After
giving effect to futures investments, the fund’s effective
common stock and temporary cash investment positions
represent 100.0% and -0.2%, respectively, of net assets.
2 Affiliated money market fund available only to Vanguard funds
and certain trusts and accounts managed by Vanguard. Rate
shown is the 7-day yield.
3 Includes $672,000 of collateral received for securities on loan.
4 Securities with a value of $299,000 have been segregated as
initial margin for open futures contracts.
| | | | |
| Derivative Financial Instruments Outstanding as of Period End | | |
| |
| Futures Contracts | | | | |
| | | | | ($000) |
| | | | | Value and |
| | | Number of | | Unrealized |
| | | Long (Short) | Notional | Appreciation |
| | Expiration | Contracts | Amount | (Depreciation) |
| Long Futures Contracts | | | | |
| E-mini S&P 500 Index | March 2018 | 51 | 6,922 | 139 |
Unrealized appreciation (depreciation) on open futures contracts is required to be treated as realized gain (loss) for tax purposes.
See accompanying Notes, which are an integral part of the Financial Statements.
44
| |
| Mega Cap Value Index Fund | |
| |
| |
| Statement of Operations | |
| |
| | Six Months Ended |
| | February28,2018 |
| | ($000) |
| Investment Income | |
| Income | |
| Dividends | 24,483 |
| Interest1 | 26 |
| Total Income | 24,509 |
| Expenses | |
| The Vanguard Group—Note B | |
| Investment Advisory Services | 246 |
| Management and Administrative—ETF Shares | 309 |
| Management and Administrative—Institutional Shares | 17 |
| Marketing and Distribution—ETF Shares | 42 |
| Marketing and Distribution—Institutional Shares | 1 |
| Custodian Fees | 22 |
| Shareholders’ Reports and Proxy—ETF Shares | 47 |
| Shareholders’ Reports and Proxy—Institutional Shares | 2 |
| Trustees’ Fees and Expenses | 1 |
| Total Expenses | 687 |
| Net Investment Income | 23,822 |
| Realized Net Gain (Loss) | |
| Investment Securities Sold1 | 13,467 |
| Futures Contracts | 422 |
| Realized Net Gain (Loss) | 13,889 |
| Change in Unrealized Appreciation (Depreciation) | |
| Investment Securities1 | 157,492 |
| Futures Contracts | 67 |
| Change in Unrealized Appreciation (Depreciation) | 157,559 |
| Net Increase (Decrease) in Net Assets Resulting from Operations | 195,270 |
1 Interest income, realized net gain (loss), and change in unrealized appreciation (depreciation) from an affiliated company of the fund
were $21,000, $1,000, and ($1,000), respectively. Purchases and sales are for temporary cash investment purposes.
See accompanying Notes, which are an integral part of the Financial Statements.
45
| | |
| Mega Cap Value Index Fund | | |
| |
| |
| Statement of Changes in Net Assets | | |
| |
| | Six Months Ended | Year Ended |
| | February 28, | August 31, |
| | 2018 | 2017 |
| | ($000) | ($000) |
| Increase (Decrease) in Net Assets | | |
| Operations | | |
| Net Investment Income | 23,822 | 46,235 |
| Realized Net Gain (Loss) | 13,889 | 34,309 |
| Change in Unrealized Appreciation (Depreciation) | 157,559 | 128,742 |
| Net Increase (Decrease) in Net Assets Resulting from Operations | 195,270 | 209,286 |
| Distributions | | |
| Net Investment Income | | |
| ETF Shares | (24,597) | (39,383) |
| Institutional Shares | (1,730) | (4,141) |
| Realized Capital Gain | | |
| ETF Shares | — | — |
| Institutional Shares | — | — |
| Total Distributions | (26,327) | (43,524) |
| Capital Share Transactions | | |
| ETF Shares | 45,139 | 244,910 |
| Institutional Shares | (6,919) | (97,277) |
| Net Increase (Decrease) from Capital Share Transactions | 38,220 | 147,633 |
| Total Increase (Decrease) | 207,163 | 313,395 |
| Net Assets | | |
| Beginning of Period | 1,842,067 | 1,528,672 |
| End of Period1 | 2,049,230 | 1,842,067 |
1 Net Assets—End of Period includes undistributed (overdistributed) net investment income of $8,688,000 and $11,193,000.
See accompanying Notes, which are an integral part of the Financial Statements.
46
| | | | | | | |
| Mega Cap Value Index Fund | | | | | | | |
| |
| |
| Financial Highlights | | | | | | |
| |
| |
| ETF Shares | | | | | | | |
| | Six Months | | | | | |
| | | Ended | | | | | |
| For a Share Outstanding | February 28, | | | Year Ended August 31, |
| Throughout Each Period | | 2018 | 2017 | 2016 | 2015 | 2014 | 2013 |
| Net Asset Value, Beginning of Period | $70.19 | $63.52 | $56.89 | $59.60 | $49.65 | $41.80 |
| Investment Operations | | | | | | | |
| Net Investment Income | | . 8941 | 1.8431 | 1.638 | 1.484 | 1.338 | 1.2721 |
| Net Realized and Unrealized Gain (Loss) | | | | | | |
| on Investments | | 6.441 | 6.557 | 6.583 | (2.733) | 9.911 | 7.809 |
| Total from Investment Operations | 7.335 | 8.400 | 8.221 | (1.249) | 11.249 | 9.081 |
| Distributions | | | | | | | |
| Dividends from Net Investment Income | (.985) | (1.730) | (1.591) | (1.461) | (1.299) | (1.231) |
| Distributions from Realized Capital Gains | — | — | — | — | — | — |
| Total Distributions | | (.985) | (1.730) | (1.591) | (1.461) | (1.299) | (1.231) |
| Net Asset Value, End of Period | | $76.54 | $70.19 | $63.52 | $56.89 | $59.60 | $49.65 |
| Total Return | | 10.51% | 13.40% | 14.71% | -2.22% | 22.92% | 22.05% |
| Ratios/Supplemental Data | | | | | | | |
| Net Assets, End of Period (Millions) | $1,919 | $1,717 | $1,322 | $957 | $870 | $611 |
| Ratio of Total Expenses to | | | | | | | |
| Average Net Assets | | 0.07% | 0.07% | 0.07% | 0.09% | 0.11% | 0.11% |
| Ratio of Net Investment Income to | | | | | | |
| Average Net Assets | | 2.37% | 2.73% | 2.84% | 2.51% | 2.47% | 2.72% |
| Portfolio Turnover Rate2 | | 7% | 8% | 8% | 5% | 8% | 34% |
The expense ratio, net investment income ratio, and turnover rate for the current period have been annualized.
1 Calculated based on average shares outstanding.
2 Excludes the value of portfolio securities received or delivered as a result of in-kind purchases or redemptions of the fund’s capital
shares, including ETF Creation Units.
See accompanying Notes, which are an integral part of the Financial Statements.
47
| | | | | | | |
| Mega Cap Value Index Fund | | | | | | | |
| |
| |
| Financial Highlights | | | | | | |
| |
| |
| Institutional Shares | | | | | | | |
| | Six Months | | | | | |
| | | Ended | | | | | |
| For a Share Outstanding | February 28, | | | Year Ended August 31, |
| Throughout Each Period | | 2018 | 2017 | 2016 | 2015 | 2014 | 2013 |
| Net Asset Value, Beginning of Period | $139.18 | $125.94 | $112.80 | $118.18 | $98.45 | $82.90 |
| Investment Operations | | | | | | | |
| Net Investment Income | | 1.7711 | 3.5961 | 3.259 | 2.976 | 2.687 | 2.5311 |
| Net Realized and Unrealized Gain (Loss) | | | | | | |
| on Investments | | 12.766 | 13.077 | 13.063 | (5.427) | 19.649 | 15.493 |
| Total from Investment Operations | 14.537 | 16.673 | 16.322 | (2.451) | 22.336 | 18.024 |
| Distributions | | | | | | | |
| Dividends from Net Investment Income | (1.957) | (3.433) | (3.182) | (2.929) | (2.606) | (2.474) |
| Distributions from Realized Capital Gains | — | — | — | — | — | — |
| Total Distributions | | (1.957) | (3.433) | (3.182) | (2.929) | (2.606) | (2.474) |
| Net Asset Value, End of Period | | $151.76 | $139.18 | $125.94 | $112.80 | $118.18 | $98.45 |
| Total Return | | 10.50% | 13.41% | 14.72% | -2.19% | 22.95% | 22.07% |
| Ratios/Supplemental Data | | | | | | | |
| Net Assets, End of Period (Millions) | $130 | $125 | $207 | $213 | $212 | $164 |
| Ratio of Total Expenses to | | | | | | | |
| Average Net Assets | | 0.06% | 0.06% | 0.06% | 0.06% | 0.08% | 0.08% |
| Ratio of Net Investment Income to | | | | | | |
| Average Net Assets | | 2.38% | 2.74% | 2.85% | 2.54% | 2.50% | 2.75% |
| Portfolio Turnover Rate2 | | 7% | 8% | 8% | 5% | 8% | 34% |
The expense ratio, net investment income ratio, and turnover rate for the current period have been annualized.
1 Calculated based on average shares outstanding.
2 Excludes the value of portfolio securities received or delivered as a result of in-kind purchases or redemptions of the fund’s capital
shares, including ETF Creation Units.
See accompanying Notes, which are an integral part of the Financial Statements.
48
Mega Cap Value Index Fund
Notes to Financial Statements
Vanguard Mega Cap Value Index Fund is registered under the Investment Company Act of 1940 as an open-end investment company, or mutual fund. The fund offers two classes of shares: ETF Shares and Institutional Shares. ETF Shares are listed for trading on NYSE Arca; they can be purchased and sold through a broker. Institutional Shares are designed for investors who meet certain administrative, service, and account-size criteria.
A. The following significant accounting policies conform to generally accepted accounting principles for U.S. investment companies. The fund consistently follows such policies in preparing its financial statements.
1. Security Valuation: Securities are valued as of the close of trading on the New York Stock Exchange (generally 4 p.m., Eastern time) on the valuation date. Equity securities are valued at the latest quoted sales prices or official closing prices taken from the primary market in which each security trades; such securities not traded on the valuation date are valued at the mean of the latest quoted bid and asked prices. Securities for which market quotations are not readily available, or whose values have been materially affected by events occurring before the fund’s pricing time but after the close of the securities’ primary markets, are valued by methods deemed by the board of trustees to represent fair value. Investments in Vanguard Market Liquidity Fund are valued at that fund’s net asset value. Temporary cash investments are valued using the latest bid prices or using valuations based on a matrix system (which considers such factors as security prices, yields, maturities, and ratings), both as furnished by independent pricing services.
2. Futures Contracts: The fund uses index futures contracts to a limited extent, with the objectives of maintaining full exposure to the stock market, maintaining liquidity, and minimizing transaction costs. The fund may purchase futures contracts to immediately invest incoming cash in the market, or sell futures in response to cash outflows, thereby simulating a fully invested position in the underlying index while maintaining a cash balance for liquidity. The primary risks associated with the use of futures contracts are imperfect correlation between changes in market values of stocks held by the fund and the prices of futures contracts, and the possibility of an illiquid market. Counterparty risk involving futures is mitigated because a regulated clearinghouse is the counterparty instead of the clearing broker. To further mitigate counterparty risk, the fund trades futures contracts on an exchange, monitors the financial strength of its clearing brokers and clearinghouse, and has entered into clearing agreements with its clearing brokers. The clearinghouse imposes initial margin requirements to secure the fund’s performance and requires daily settlement of variation margin representing changes in the market value of each contract.
Futures contracts are valued at their quoted daily settlement prices. The notional amounts of the contracts are not recorded in the Statement of Net Assets. Fluctuations in the value of the contracts are recorded in the Statement of Net Assets as an asset (liability) and in the Statement of Operations as unrealized appreciation (depreciation) until the contracts are closed, when they are recorded as realized futures gains (losses).
During the six months ended February 28, 2018, the fund’s average investments in long and short futures contracts represented less than 1% and 0% of net assets, respectively, based on the average of the notional amounts at each quarter-end during the period.
49
Mega Cap Value Index Fund
3. Federal Income Taxes: The fund intends to continue to qualify as a regulated investment company and distribute all of its taxable income. Management has analyzed the fund’s tax positions taken for all open federal income tax years (August 31, 2014–2017), and for the period ended February 28, 2018, and has concluded that no provision for federal income tax is required in the fund’s financial statements.
4. Distributions: Distributions to shareholders are recorded on the ex-dividend date.
5. Securities Lending: To earn additional income, the fund lends its securities to qualified institutional borrowers. Security loans are subject to termination by the fund at any time, and are required to be secured at all times by collateral in an amount at least equal to the market value of securities loaned. Daily market fluctuations could cause the value of loaned securities to be more or less than the value of the collateral received. When this occurs, the collateral is adjusted and settled on the next business day. The fund further mitigates its counterparty risk by entering into securities lending transactions only with a diverse group of prequalified counterparties, monitoring their financial strength, and entering into master securities lending agreements with its counterparties. The master securities lending agreements provide that, in the event of a counterparty’s default (including bankruptcy), the fund may terminate any loans with that borrower, determine the net amount owed, and sell or retain the collateral up to the net amount owed to the fund; however, such actions may be subject to legal proceedings. While collateral mitigates counterparty risk, in the event of a default, the fund may experience delays and costs in recovering the securities loaned. The fund invests cash collateral received in Vanguard Market Liquidity Fund, and records a liability in the Statement of Net Assets for the return of the collateral, during the period the securities are on loan. Securities lending income represents fees charged to borrowers plus income earned on invested cash collateral, less expenses associated with the loan. During the term of the loan, the fund is entitled to all distributions made on or in respect of the loaned securities.
6. Credit Facility: The fund and certain other funds managed by The Vanguard Group (“Vanguard”) participate in a $3.1 billion committed credit facility provided by a syndicate of lenders pursuant to a credit agreement that may be renewed annually; each fund is individually liable for its borrowings, if any, under the credit facility. Borrowings may be utilized for temporary and emergency purposes, and are subject to the fund’s regulatory and contractual borrowing restrictions. The participating funds are charged administrative fees and an annual commitment fee of 0.10% of the undrawn amount of the facility; these fees are allocated to the funds based on a method approved by the fund’s board of trustees and included in Management and Administrative expenses on the fund’s Statement of Operations. Any borrowings under this facility bear interest at a rate based upon the higher of the one-month London Interbank Offered Rate, federal funds effective rate, or overnight bank funding rate plus an agreed-upon spread.
The fund had no borrowings outstanding at February 28, 2018, or at any time during the period then ended.
7. Other: Dividend income is recorded on the ex-dividend date. Interest income includes income distributions received from Vanguard Market Liquidity Fund and is accrued daily. Premiums and discounts on debt securities purchased are amortized and accreted, respectively, to interest income
50
Mega Cap Value Index Fund
over the lives of the respective securities. Security transactions are accounted for on the date securities are bought or sold. Costs used to determine realized gains (losses) on the sale of investment securities are those of the specific securities sold.
Each class of shares has equal rights as to assets and earnings, except that each class separately bears certain class-specific expenses related to maintenance of shareholder accounts (included in Management and Administrative expenses), shareholder reporting, and the proxy. Marketing and distribution expenses are allocated to each class of shares based on a method approved by the board of trustees. Income, other non-class-specific expenses, and gains and losses on investments are allocated to each class of shares based on its relative net assets.
B. In accordance with the terms of a Funds’ Service Agreement (the “FSA”) between Vanguard and the fund, Vanguard furnishes to the fund investment advisory, corporate management, administrative, marketing, and distribution services at Vanguard’s cost of operations (as defined by the FSA). These costs of operations are allocated to the fund based on methods and guidelines approved by the board of trustees. Vanguard does not require reimbursement in the current period for certain costs of operations (such as deferred compensation/benefits and risk/insurance costs); the fund’s liability for these costs of operations is included in Payables to Vanguard on the Statement of Net Assets. All other costs of operations payable to Vanguard are generally settled twice a month.
Upon the request of Vanguard, the fund may invest up to 0.40% of its net assets as capital in Vanguard. At February 28, 2018, the fund had contributed to Vanguard capital in the amount of $113,000, representing 0.01% of the fund’s net assets and 0.05% of Vanguard’s capitalization. The fund’s trustees and officers are also directors and employees, respectively, of Vanguard.
C. Various inputs may be used to determine the value of the fund’s investments. These inputs are summarized in three broad levels for financial statement purposes. The inputs or methodologies used to value securities are not necessarily an indication of the risk associated with investing in those securities.
Level 1—Quoted prices in active markets for identical securities.
Level 2—Other significant observable inputs (including quoted prices for similar securities, interest
rates, prepayment speeds, credit risk, etc.).
Level 3—Significant unobservable inputs (including the fund’s own assumptions used to determine
the fair value of investments). Any investments valued with significant unobservable inputs are
noted on the Statement of Net Assets.
The following table summarizes the market value of the fund’s investments as of February 28, 2018, based on the inputs used to value them:
| | | |
| | Level 1 | Level 2 | Level 3 |
| Investments | ($000) | ($000) | ($000) |
| Common Stocks | 2,042,473 | — | — |
| Temporary Cash Investments | 831 | 1,296 | — |
| Futures Contracts—Liabilities1 | (84) | — | — |
| Total | 2,043,220 | 1,296 | — |
| 1 Represents variation margin on the last day of the reporting period. | | | |
51
Mega Cap Value Index Fund
D. Distributions are determined on a tax basis and may differ from net investment income and realized capital gains for financial reporting purposes. Differences may be permanent or temporary. Permanent differences are reclassified among capital accounts in the financial statements to reflect their tax character. Temporary differences arise when certain items of income, expense, gain, or loss are recognized in different periods for financial statement and tax purposes. These differences will reverse at some time in the future. Differences in classification may also result from the treatment of short-term gains as ordinary income for tax purposes.
During the six months ended February 28, 2018, the fund realized $19,675,000 of net capital gains resulting from in-kind redemptions—in which shareholders exchanged fund shares for securities held by the fund rather than for cash. Because such gains are not taxable to the fund, and are not distributed to shareholders, they have been reclassified from accumulated net realized gains to paid-in capital.
The fund’s tax-basis capital gains and losses are determined only at the end of each fiscal year. For tax purposes, at August 31, 2017, the fund had available capital losses totaling $25,266,000 to offset future net capital gains. Of this amount, $4,326,000 is subject to expiration on August 31, 2019. Capital losses of $20,940,000 realized beginning in fiscal 2012 may be carried forward indefinitely under the Regulated Investment Company Modernization Act of 2010, but must be used before any expiring loss carryforwards. The fund will use these capital losses to offset net taxable capital gains, if any, realized during the year ending August 31, 2018; should the fund realize net capital losses for the year, the losses will be added to the loss carryforward balance above.
At February 28, 2018, the cost of investment securities for tax purposes was $1,511,840,000. Net unrealized appreciation of investment securities for tax purposes was $532,760,000, consisting of unrealized gains of $576,786,000 on securities that had risen in value since their purchase and $44,026,000 in unrealized losses on securities that had fallen in value since their purchase.
E. During the six months ended February 28, 2018, the fund purchased $152,930,000 of investment securities and sold $119,496,000 of investment securities, other than temporary cash investments. Purchases and sales include $66,744,000 and $45,654,000, respectively, in connection with in-kind purchases and redemptions of the fund’s capital shares.
The fund purchased securities from and sold securities to other Vanguard funds or accounts managed by Vanguard or its affiliates, in accordance with procedures adopted by the board of trustees in compliance with Rule 17a-7 of the Investment Company Act of 1940. For the six months ended February 28, 2018, such purchases and sales were $28,275,000 and $28,470,000 respectively; these amounts are included in the purchases and sales of investment securities noted above.
52
Mega Cap Value Index Fund
| | | | |
| F. Capital share transactions for each class of shares were: | | | |
| | Six Months Ended | | Year Ended |
| | February 28, 2018 | August 31, 2017 |
| | Amount | Shares | Amount | Shares |
| | ($000) | (000) | ($000) | (000) |
| ETF Shares | | | | |
| Issued | 90,897 | 1,225 | 349,985 | 5,200 |
| Issued in Lieu of Cash Distributions | — | — | — | — |
| Redeemed | (45,758) | (600) | (105,075) | (1,550) |
| Net Increase (Decrease)—ETF Shares | 45,139 | 625 | 244,910 | 3,650 |
| Institutional Shares | | | | |
| Issued | 24 | — | 16,316 | 124 |
| Issued in Lieu of Cash Distributions | 871 | 6 | 2,661 | 20 |
| Redeemed | (7,814) | (53) | (116,254) | (887) |
| Net Increase (Decrease)—Institutional Shares | (6,919) | (47) | (97,277) | (743) |
G. Management has determined that no material events or transactions occurred subsequent to February 28, 2018, that would require recognition or disclosure in these financial statements.
53
About Your Fund’s Expenses
As a shareholder of the fund, you incur ongoing costs, which include costs for portfolio management, administrative services, and shareholder reports (like this one), among others. Operating expenses, which are deducted from a fund’s gross income, directly reduce the investment return of the fund.
A fund’s expenses are expressed as a percentage of its average net assets. This figure is known as the expense ratio. The following examples are intended to help you understand the ongoing costs (in dollars) of investing in your fund and to compare these costs with those of other mutual funds. The examples are based on an investment of $1,000 made at the beginning of the period shown and held for the entire period.
The accompanying table illustrates your fund’s costs in two ways:
• Based on actual fund return. This section helps you to estimate the actual expenses that you paid over the period. The ”Ending Account Value“ shown is derived from the fund‘s actual return, and the third column shows the dollar amount that would have been paid by an investor who started with $1,000 in the fund. You may use the information here, together with the amount you invested, to estimate the expenses that you paid over the period.
To do so, simply divide your account value by $1,000 (for example, an $8,600 account value divided by $1,000 = 8.6), then multiply the result by the number given for your fund under the heading ”Expenses Paid During Period.“
• Based on hypothetical 5% yearly return. This section is intended to help you compare your fund‘s costs with those of other mutual funds. It assumes that the fund had a yearly return of 5% before expenses, but that the expense ratio is unchanged. In this case—because the return used is not the fund’s actual return—the results do not apply to your investment. The example is useful in making comparisons because the Securities and Exchange Commission requires all mutual funds to calculate expenses based on a 5% return. You can assess your fund’s costs by comparing this hypothetical example with the hypothetical examples that appear in shareholder reports of other funds.
Note that the expenses shown in the table are meant to highlight and help you compare ongoing costs only and do not reflect transaction costs incurred by the fund for buying and selling securities. Further, the expenses do not include any purchase, redemption, or account service fees described in the fund prospectus. If such fees were applied to your account, your costs would be higher. Your fund does not carry a “sales load.”
The calculations assume no shares were bought or sold during the period. Your actual costs may have been higher or lower, depending on the amount of your investment and the timing of any purchases or redemptions.
You can find more information about the fund’s expenses, including annual expense ratios, in the Financial Statements section of this report. For additional information on operating expenses and other shareholder costs, please refer to your fund’s current prospectus.
54
| | | |
| Six Months Ended February 28, 2018 | | | |
| | Beginning | Ending | Expenses |
| | Account Value | Account Value | Paid During |
| | 8/31/2017 | 2/28/2018 | Period |
| Based on Actual Fund Return | | | |
| Mega Cap Index Fund | | | |
| ETF Shares | $1,000.00 | $1,113.73 | $0.37 |
| Institutional Shares | 1,000.00 | 1,113.77 | 0.31 |
| Mega Cap Growth Index Fund | | | |
| ETF Shares | $1,000.00 | $1,123.88 | $0.37 |
| Institutional Shares | 1,000.00 | 1,123.94 | 0.32 |
| Mega Cap Value Index Fund | | | |
| ETF Shares | $1,000.00 | $1,105.06 | $0.37 |
| Institutional Shares | 1,000.00 | 1,105.03 | 0.31 |
| Based on Hypothetical 5% Yearly Return | | | |
| Mega Cap Index Fund | | | |
| ETF Shares | $1,000.00 | $1,024.86 | $0.35 |
| Institutional Shares | 1,000.00 | 1,024.91 | 0.30 |
| Mega Cap Growth Index Fund | | | |
| ETF Shares | $1,000.00 | $1,024.86 | $0.35 |
| Institutional Shares | 1,000.00 | 1,024.91 | 0.30 |
| Mega Cap Value Index Fund | | | |
| ETF Shares | $1,000.00 | $1,024.86 | $0.35 |
| Institutional Shares | 1,000.00 | 1,024.91 | 0.30 |
The calculations are based on expenses incurred in the most recent six-month period. The funds’ annualized six-month expense ratios for
that period are: for the Mega Cap Index Fund, 0.07% for ETF Shares and 0.06% for Institutional Shares; for the Mega Cap Growth Index
Fund, 0.07% for ETF Shares and 0.06% for Institutional Shares; and for the Mega Cap Value Index Fund, 0.07% for ETF Shares and 0.06%
for Institutional Shares. The dollar amounts shown as “Expenses Paid” are equal to the annualized expense ratio multiplied by the
average account value over the period, multiplied by the number of days in the most recent six-month period, then divided by the number
of days in the most recent 12-month period (181/365).
55
Glossary
30-Day SEC Yield. A fund’s 30-day SEC yield is derived using a formula specified by the U.S. Securities and Exchange Commission. Under the formula, data related to the fund’s security holdings in the previous 30 days are used to calculate the fund’s hypothetical net income for that period, which is then annualized and divided by the fund’s estimated average net assets over the calculation period. For the purposes of this calculation, a security’s income is based on its current market yield to maturity (for bonds), its actual income (for asset-backed securities), or its projected dividend yield (for stocks). Because the SEC yield represents hypothetical annualized income, it will differ—at times significantly—from the fund’s actual experience. As a result, the fund’s income distributions may be higher or lower than implied by the SEC yield.
Beta. A measure of the magnitude of a fund’s past share-price fluctuations in relation to the ups and downs of a given market index. The index is assigned a beta of 1.00. Compared with a given index, a fund with a beta of 1.20 typically would have seen its share price rise or fall by 12% when the index rose or fell by 10%. For this report, beta is based on returns over the past 36 months for both the fund and the index. Note that a fund’s beta should be reviewed in conjunction with its R-squared (see definition). The lower the R-squared, the less correlation there is between the fund and the index, and the less reliable beta is as an indicator of volatility.
Dividend Yield. Dividend income earned by stocks, expressed as a percentage of the aggregate market value (or of net asset value, for a fund). The yield is determined by dividing the amount of the annual dividends by the aggregate value (or net asset value) at the end of the period. For a fund, the dividend yield is based solely on stock holdings and does not include any income produced by other investments.
Earnings Growth Rate. The average annual rate of growth in earnings over the past five years for the stocks now in a fund.
Equity Exposure. A measure that reflects a fund’s investments in stocks and stock futures. Any holdings in short-term reserves are excluded.
Expense Ratio. A fund’s total annual operating expenses expressed as a percentage of the fund’s average net assets. The expense ratio includes management and administrative expenses, but does not include the transaction costs of buying and selling portfolio securities.
Foreign Holdings. The percentage of a fund represented by securities or depositary receipts of companies based outside the United States.
Inception Date. The date on which the assets of a fund (or one of its share classes) are first invested in accordance with the fund’s investment objective. For funds with a subscription period, the inception date is the day after that period ends. Investment performance is measured from the inception date.
Median Market Cap. An indicator of the size of companies in which a fund invests; the midpoint of market capitalization (market price x shares outstanding) of a fund’s stocks, weighted by the proportion of the fund’s assets invested in each stock. Stocks representing half of the fund’s assets have market capitalizations above the median, and the rest are below it.
Price/Book Ratio. The share price of a stock divided by its net worth, or book value, per share. For a fund, the weighted average price/book ratio of the stocks it holds.
56
Price/Earnings Ratio. The ratio of a stock’s current price to its per-share earnings over the past year. For a fund, the weighted average P/E of the stocks it holds. P/E is an indicator of market expectations about corporate prospects; the higher the P/E, the greater the expectations for a company’s future growth.
R-Squared. A measure of how much of a fund’s past returns can be explained by the returns from the market in general, as measured by a given index. If a fund’s total returns were precisely synchronized with an index’s returns, its R-squared would be 1.00. If the fund’s returns bore no relationship to the index’s returns, its R-squared would be 0. For this report, R-squared is based on returns over the past 36 months for both the fund and the index.
Return on Equity. The annual average rate of return generated by a company during the past five years for each dollar of shareholder’s equity (net income divided by shareholder’s equity). For a fund, the weighted average return on equity for the companies whose stocks it holds.
Short-Term Reserves. The percentage of a fund invested in highly liquid, short-term securities that can be readily converted to cash.
Turnover Rate. An indication of the fund’s trading activity. Funds with high turnover rates incur higher transaction costs and may be more likely to distribute capital gains (which may be taxable to investors). The turnover rate excludes in-kind transactions, which have minimal impact on costs.
Benchmark Information
Spliced Mega Cap Growth Index: MSCI US Large Cap Growth Index through April 16, 2013; CRSP US Mega Cap Growth Index thereafter.
Spliced Mega Cap Index: MSCI US Large Cap 300 Index through January 30, 2013; CRSP US Mega Cap Index thereafter.
Spliced Mega Cap Value Index: MSCI US Large Cap Value Index through April 16, 2013; CRSP US Mega Cap Value Index thereafter.
57
This page intentionally left blank.
The People Who Govern Your Fund
The trustees of your mutual fund are there to see that the fund is operated and managed in your best interests since, as a shareholder, you are a part owner of the fund. Your fund’s trustees also serve on the board of directors of The Vanguard Group, Inc., which is owned by the Vanguard funds and provides services to them on an at-cost basis.
A majority of Vanguard’s board members are independent, meaning that they have no affiliation with Vanguard or the funds they oversee, apart from the sizable personal investments they have made as private individuals. The independent board members have distinguished backgrounds in business, academia, and public service. Each of the trustees and executive officers oversees 208 Vanguard funds.
Information for each trustee and executive officer of the fund appears below. The mailing address of the trustees and officers is P.O. Box 876, Valley Forge, PA 19482. More information about the trustees is in the Statement of Additional Information, which can be obtained, without charge, by contacting Vanguard at 800-662-7447, or online at vanguard.com.
Interested Trustees1
F. William McNabb III
Born in 1957. Trustee since July 2009. Principal occupation(s) during the past five years and other experience: chairman of the board (January 2010–present) of Vanguard and of each of the investment companies served by Vanguard, trustee (2009–present) of each of the investment companies served by Vanguard, and director (2008–present) of Vanguard. Chief executive officer and president (2008–2017) of Vanguard and each of the investment companies served by Vanguard, managing director (1995–2008) of Vanguard, and director (1997–2018) of Vanguard Marketing Corporation. Director (2018–present) of UnitedHealth Group.
Mortimer J. Buckley
Born in 1969. Trustee since January 2018. Principal occupation(s) during the past five years and other experience: chief executive officer (January 2018–present) of Vanguard; chief executive officer, president, and trustee (January 2018–present) of each of the investment companies served by Vanguard; president and director (2017–present) of Vanguard; and president (February 2018–present) of Vanguard Marketing Corporation. Chief investment officer (2013–2017), managing director (2002–2017), head of the Retail Investor Group (2006–2012), and chief information officer (2001–2006) of Vanguard. Chairman of the board (2011–2017) of the Children’s Hospital of Philadelphia.
Independent Trustees
Emerson U. Fullwood
Born in 1948. Trustee since January 2008. Principal occupation(s) during the past five years and other experience: executive chief staff and marketing officer for North America and corporate vice president (retired 2008) of Xerox Corporation (document management products and services). Former president of the Worldwide Channels Group, Latin America, and Worldwide Customer Service and executive chief staff officer of Developing Markets of Xerox. Executive in residence and 2009–2010 Distinguished Minett Professor at the Rochester Institute of Technology. Lead director of SPX FLOW, Inc. (multi-industry manufacturing). Director of the University of Rochester Medical Center, the Monroe Community College Foundation, the United Way of Rochester, North Carolina A&T University, and Roberts Wesleyan College. Trustee of the University of Rochester.
Amy Gutmann
Born in 1949. Trustee since June 2006. Principal occupation(s) during the past five years and other experience: president (2004–present) of the University of Pennsylvania. Christopher H. Browne Distinguished Professor of Political Science, School of Arts and Sciences, and professor of communication, Annenberg School for Communication, with secondary faculty appointments in the Department of Philosophy, School of Arts and Sciences, and at the Graduate School of Education, University of Pennsylvania. Trustee of the National Constitution Center.
1 Mr. McNabb and Mr. Buckley are considered “interested persons,” as defined in the Investment Company Act of 1940, because
they are officers of the Vanguard funds.
JoAnn Heffernan Heisen
Born in 1950. Trustee since July 1998. Principal occupation(s) during the past five years and other experience: corporate vice president of Johnson & Johnson (pharmaceuticals/medical devices/consumer products) and member of its executive committee (1997–2008). Chief global diversity officer (retired 2008), vice president and chief information officer (1997–2006), controller (1995–1997), treasurer (1991–1995), and assistant treasurer (1989–1991) of Johnson & Johnson. Director of Skytop Lodge Corporation (hotels) and the Robert Wood Johnson Foundation. Member of the advisory board of the Institute for Women’s Leadership at Rutgers University.
F. Joseph Loughrey
Born in 1949. Trustee since October 2009. Principal occupation(s) during the past five years and other experience: president and chief operating officer (retired 2009) and vice chairman of the board (2008–2009) of Cummins Inc. (industrial machinery). Chairman of the board of Hillenbrand, Inc. (specialized consumer services), Oxfam America, and the Lumina Foundation for Education. Director of the V Foundation for Cancer Research. Member of the advisory council for the College of Arts and Letters and chair of the advisory board to the Kellogg Institute for International Studies, both at the University of Notre Dame.
Mark Loughridge
Born in 1953. Trustee since March 2012. Principal occupation(s) during the past five years and other experience: senior vice president and chief financial officer (retired 2013) of IBM (information technology services). Fiduciary member of IBM’s Retirement Plan Committee (2004–2013), senior vice president and general manager (2002–2004) of IBM Global Financing, vice president and controller (1998–2002) of IBM, and a variety of other prior management roles at IBM. Member of the Council on Chicago Booth.
Scott C. Malpass
Born in 1962. Trustee since March 2012. Principal occupation(s) during the past five years and other experience: chief investment officer (1989–present) and vice president (1996–present) of the University of Notre Dame. Assistant professor of finance at the Mendoza College of Business, University of Notre Dame, and member of the Notre Dame 403(b) Investment Committee. Chairman of the board of TIFF Advisory Services, Inc. Member of the board of Catholic Investment Services, Inc. (investment advisors), the board of advisors for Spruceview Capital Partners, and the board of superintendence of the Institute for the Works of Religion.
Deanna Mulligan
Born in 1963. Trustee since January 2018. Principal occupation(s) during the past five years and other experience: president (2010–present) and chief executive officer (2011–present) of The Guardian Life Insurance Company of America. Chief operating officer (2010–2011) and executive vice president (2008–2010) of Individual Life and Disability of The Guardian Life Insurance Company of America. Member of the board of The Guardian Life Insurance Company of America, the American Council of Life Insurers, the Partnership for New York City (business leadership), and the Committee Encouraging Corporate Philanthropy. Trustee of the Economic Club of New York and the Bruce Museum (arts and science). Member of the Advisory Council for the Stanford Graduate School of Business.
André F. Perold
Born in 1952. Trustee since December 2004. Principal occupation(s) during the past five years and other experience: George Gund Professor of Finance and Banking, Emeritus at the Harvard Business School (retired 2011). Chief investment officer and co-managing partner of HighVista Strategies LLC (private investment firm). Overseer of the Museum of Fine Arts Boston.
Sarah Bloom Raskin
Born in 1961. Trustee since January 2018. Principal occupation(s) during the past five years and other experience: deputy secretary (2014–2017) of the United States Department of the Treasury. Governor (2010–2014) of the Federal Reserve Board. Commissioner (2007–2010) of financial regulation for the State of Maryland. Member of the board of directors (2012–2014) of Neighborhood Reinvestment Corporation. Director of i(x) Investments, LLC.
Peter F. Volanakis
Born in 1955. Trustee since July 2009. Principal occupation(s) during the past five years and other experience: president and chief operating officer (retired 2010) of Corning Incorporated (communications equipment) and director of Corning Incorporated (2000–2010) and Dow Corning (2001–2010). Director (2012) of SPX Corporation (multi-industry manufacturing). Overseer of the Amos Tuck School of Business Administration, Dartmouth College (2001–2013). Chairman of the board of trustees of Colby-Sawyer College. Member of the Board of Hypertherm Inc. (industrial cutting systems, software, and consumables).
Executive Officers
Glenn Booraem
Born in 1967. Principal occupation(s) during the past five years and other experience: principal of Vanguard. Investment stewardship officer (2017–present), treasurer (2015–2017), controller (2010–2015), and assistant controller (2001–2010) of each of the investment companies served by Vanguard.
Christine M. Buchanan
Born in 1970. Principal occupation(s) during the past five years and other experience: principal of Vanguard and global head of Fund Administration at Vanguard. Treasurer (2017–present) of each of the investment companies served by Vanguard. Partner (2005–2017) at KPMG LLP (audit, tax, and advisory services).
Brian Dvorak
Born in 1973. Principal occupation(s) during the past five years and other experience: principal of Vanguard. Chief compliance officer (2017–present) of Vanguard and each of the investment companies served by Vanguard. Assistant vice president (2017–present) of Vanguard Marketing Corporation. Vice president and director of Enterprise Risk Management (2011–2013) at Oppenheimer Funds, Inc.
Thomas J. Higgins
Born in 1957. Principal occupation(s) during the past five years and other experience: principal of Vanguard. Chief financial officer (2008–present) and treasurer (1998–2008) of each of the investment companies served by Vanguard.
Peter Mahoney
Born in 1974. Principal occupation(s) during the past five years and other experience: principal of Vanguard. Controller (2015–present) of each of the investment companies served by Vanguard. Head of International Fund Services (2008–2014) at Vanguard.
Anne E. Robinson
Born in 1970. Principal occupation(s) during the past five years and other experience: general counsel (2016–present) of Vanguard. Secretary (2016–present) of Vanguard and of each of the investment companies served by Vanguard. Managing director (2016–present) of Vanguard. Director and senior vice president (2016–2018) of Vanguard Marketing Corporation. Managing director and general counsel of Global Cards and Consumer Services (2014–2016) at Citigroup. Counsel (2003–2014) at American Express.
Michael Rollings
Born in 1963. Principal occupation(s) during the past five years and other experience: finance director (2017–present) and treasurer (2017) of each of the investment companies served by Vanguard. Managing director (2016–present) of Vanguard. Chief financial officer (2016–present) of Vanguard. Director (2016–present) of Vanguard Marketing Corporation. Executive vice president and chief financial officer (2006–2016) of MassMutual Financial Group.
| |
| Vanguard Senior Management Team |
| |
| Mortimer J. Buckley | James M. Norris |
| Gregory Davis | Thomas M. Rampulla |
| John James | Karin A. Risi |
| Martha G. King | Anne E. Robinson |
| John T. Marcante | Michael Rollings |
| Chris D. McIsaac | |
Chairman Emeritus and Senior Advisor
John J. Brennan
Chairman, 1996–2009
Chief Executive Officer and President, 1996–2008
Founder
John C. Bogle
Chairman and Chief Executive Officer, 1974–1996
| |
|  |
| | P.O. Box 2600 |
| | Valley Forge, PA 19482-2600 |
| |
| |
| |
| Connect with Vanguard® > vanguard.com |
| |
| |
| |
| Fund Information > 800-662-7447 | Source for Bloomberg Barclays indexes: Bloomberg |
| Direct Investor Account Services > 800-662-2739 | Index Services Limited. Copyright 2018, Bloomberg. |
| | All rights reserved. |
| Institutional Investor Services > 800-523-1036 | |
| Text Telephone for People | |
| Who Are Deaf or Hard of Hearing > 800-749-7273 | |
| |
| This material may be used in conjunction | |
| with the offering of shares of any Vanguard | |
| fund only if preceded or accompanied by | |
| the fund’s current prospectus. | |
| |
| All comparative mutual fund data are from Lipper, a | |
| Thomson Reuters Company, or Morningstar, Inc., unless | |
| otherwise noted. | |
| |
| You can obtain a free copy of Vanguard’s proxy voting | |
| guidelines by visiting vanguard.com/proxyreporting or by | |
| calling Vanguard at 800-662-2739. The guidelines are | |
| also available from the SEC’s website, sec.gov. In | |
| addition, you may obtain a free report on how your fund | |
| voted the proxies for securities it owned during the 12 | |
| months ended June 30. To get the report, visit either | |
| vanguard.com/proxyreporting or sec.gov. | |
| |
| You can review and copy information about your fund at | |
| the SEC’s Public Reference Room in Washington, D.C. To | |
| find out more about this public service, call the SEC at | |
| 202-551-8090. Information about your fund is also | |
| available on the SEC’s website, and you can receive | |
| copies of this information, for a fee, by sending a | |
| request in either of two ways: via email addressed to | |
| publicinfo@sec.gov or via regular mail addressed to the | |
| Public Reference Section, Securities and Exchange | |
| Commission, Washington, DC 20549-1520. | |
| | © 2018 The Vanguard Group, Inc. |
| | All rights reserved. |
| | Vanguard Marketing Corporation, Distributor. |
| |
| | Q8282 042018 |

Semiannual Report | February 28, 2018
Vanguard Global Wellington™ Fund
Vanguard’s Principles for Investing Success
We want to give you the best chance of investment success. These principles, grounded in Vanguard’s research and experience, can put you on the right path.
Goals. Create clear, appropriate investment goals.
Balance. Develop a suitable asset allocation using broadly diversified funds.
Cost. Minimize cost.
Discipline. Maintain perspective and long-term discipline.
A single theme unites these principles: Focus on the things you can control.
We believe there is no wiser course for any investor.
| |
| Contents | |
| Your Fund’s Performance at a Glance. | 1 |
| CEO’s Perspective. | 2 |
| Advisor’s Report. | 5 |
| Fund Profile. | 9 |
| Performance Summary. | 12 |
| Financial Statements. | 13 |
| About Your Fund’s Expenses. | 38 |
| Trustees Approve Advisory Arrangement. | 40 |
| Glossary. | 41 |
Please note: The opinions expressed in this report are just that—informed opinions. They should not be considered promises
or advice. Also, please keep in mind that the information and opinions cover the period through the date on the front of this
report. Of course, the risks of investing in your fund are spelled out in the prospectus.
See the Glossary for definitions of investment terms used in this report.
About the cover: Nautical images have been part of Vanguard’s rich heritage since its start in 1975. For an
incoming ship, a lighthouse offers a beacon and safe path to shore. You can similarly depend on Vanguard to put
you first––and light the way––as you strive to meet your financial goals. Our client focus and low costs,
stemming from our unique ownership structure, assure that your interests are paramount.
Your Fund’s Performance at a Glance
• From its November 2, 2017, inception through February 28, 2018, Vanguard Global Wellington Fund returned 1.57% for Investor Shares and 1.63% for Admiral Shares. Its benchmark returned 2.40% and the average return of its peer group was 2.08%.
• The fund seeks to provide long-term capital appreciation and moderate current income with moderate risk. It invests 60% to 70% of its assets in large- and mid-capitalization U.S. and non-U.S. stocks and the remaining 30% to 40% in short-, intermediate-, and long-term government and investment-grade corporate U.S. and non-U.S. bonds.
• For the period through February 28, 2018, global equities advanced by single digits, while the global fixed income market declined.
• Security selection detracted from the fund’s relative performance in both its stock and fixed income portfolios.
| |
| Total Returns: Period Ended February 28, 2018 | |
| | Since Inception |
| Vanguard Global Wellington Fund | |
| Investor Shares (Inception: 11/2/2017) | 1.57% |
| Admiral™ Shares (Inception: 11/2/2017) | 1.63 |
| Global Wellington Composite Index | 2.40 |
| Mixed-Asset Target Allocation Growth Funds Average | 2.08 |
| | | |
| For a benchmark description, see the Glossary. | | | |
| Mixed-Asset Target Allocation Growth Funds Average: Derived from data provided by Lipper, a Thomson Reuters Company. | |
| Admiral Shares carry lower expenses and are available to investors who meet certain account-balance requirements. | |
| |
| |
| Expense Ratios | | | |
| Your Fund Compared With Its Peer Group | | | |
| | Investor | Admiral | Peer Group |
| | Shares | Shares | Average |
| Global Wellington Fund | 0.45% | 0.35% | 0.84% |
The fund expense ratios shown are from the prospectus dated December 21, 2017, and represent estimated costs for the current fiscal
year. For the period from inception through February 28, 2018, the fund’s annualized expense ratios were 0.46% for Investor Shares and
0.36% for Admiral Shares. The peer-group expense ratio is derived from data provided by Lipper, a Thomson Reuters Company, and
captures information through year-end 2017.
Peer group: Mixed-Asset Target Allocation Growth Funds.
1
CEO’s Perspective

Tim Buckley
President and Chief Executive Officer
Dear Shareholder,
As I begin my tenure as Vanguard’s fourth chief executive, I’ve been reflecting on both the past and the future of the company where I have spent my entire professional career.
I feel extremely fortunate to have the chance to lead a company filled with people who come to work every day passionate about Vanguard’s core purpose: to take a stand for all investors, to treat them fairly, and to give them the best chance for investment success.
Making a real difference
When I joined Vanguard in 1991, I found a mission-driven team focused on improving lives—helping people retire more comfortably, put their children through college, and achieve financial security. I found a company with purpose in an industry ripe for improvement.
It was clear, even early in my career, that the cards were stacked against most investors. Hidden fees, performance-chasing, and poor advice were relentlessly eroding investors’ dreams.
We knew Vanguard could be different and, as a result, could make a real difference. Over the past 25 years, for example, Vanguard has lowered our funds’ asset-weighted average expense ratio
2
from 0.31% to 0.12%. And over the past decade, 94% of our funds have beaten the average annual return of their peers.1
Focused on your success
Vanguard is built for Vanguard investors—as a client-owned company, we focus solely on you, our fund shareholders. Everything we do is designed to give our clients the best chance for investment success. In my role as CEO, I intend to keep this priority front and center. We’re proud of what we’ve achieved, but we’re even more excited about what’s to come.
As I write this, we’ve experienced a period of pronounced market volatility. Strong economic growth and budding signs of inflation have raised concerns about a more aggressive Federal Reserve. Although volatility can test investors’ nerves, we sometimes think of this as “Vanguard weather”—a time when having a disciplined, low-cost, and long-term approach to investment management serves investors well.
| | | |
| Market Barometer | | | |
| | | | Total Returns |
| | | Periods Ended February 28, 2018 |
| | Six | One | Five Years |
| | Months | Year | (Annualized) |
| Stocks | | | |
| Russell 1000 Index (Large-caps) | 10.62% | 16.70% | 14.56% |
| Russell 2000 Index (Small-caps) | 8.30 | 10.51 | 12.19 |
| Russell 3000 Index (Broad U.S. market) | 10.45 | 16.22 | 14.37 |
| FTSE All-World ex US Index (International) | 7.84 | 21.50 | 6.69 |
| |
| Bonds | | | |
| Bloomberg Barclays U.S. Aggregate Bond Index | | | |
| (Broad taxable market) | -2.18% | 0.51% | 1.71% |
| Bloomberg Barclays Municipal Bond Index | | | |
| (Broad tax-exempt market) | -1.24 | 2.50 | 2.57 |
| Citigroup Three-Month U.S. Treasury Bill Index | 0.59 | 0.98 | 0.27 |
| |
| CPI | | | |
| Consumer Price Index | 1.41% | 2.21% | 1.41% |
The performance data shown represent past performance, which is not a guarantee of future results.
1 For the ten-year period through December 31, 2017, 9 of 9 Vanguard money market funds, 56 of 60 bond funds, 21 of 22 balanced funds,
and 131 of 140 stock funds, or 217 of 231 Vanguard funds, outperformed their peer-group averages. Sources: Vanguard, based on data
from Lipper, a Thomson Reuters Company.
3
Steady, time-tested guidance
Our guidance for investors, as always, is to stay the course, tune out the hyperbolic headlines, and focus on your goals and what you can control, such as costs and how much you save. This time-tested advice has served our clients well over the decades.
Regardless of how the markets perform in the short term, I’m incredibly optimistic about the future for our investors. We have a dedicated team serving you, and we will never stop striving to make Vanguard the best place for you to invest through our high-quality funds and services, advice and guidance to help you meet your financial goals, and an experience that makes you feel good about entrusting us with your hard-earned savings.
Thank you for your continued loyalty.
Sincerely,

Mortimer J. Buckley
President and Chief Executive Officer
March 19, 2018
4
Advisor’s Report
Vanguard Global Wellington Fund returned 1.57% for Investor Shares and 1.63% for Admiral Shares from its November 2, 2017 inception through February 28, 2018. The fund trailed the 2.40% return of its custom benchmark, which is weighted 65% in the FTSE Developed Index (net of tax) and 35% in the Bloomberg Barclays Fixed Income Composite Index, which itself consists of 80% Bloomberg Barclays Global Aggregate Credit Index (USD Hedged), 10% Bloomberg Barclays Global Aggregate Treasury Index (USD Hedged), and 10% Bloomberg Barclays Global Aggregate Securitized Index (USD Hedged).
The investment environment
From the fund’s inception through February 28, 2018, equity markets advanced by single digits. The Standard & Poor’s 500 Index returned 5.92%, the FTSE Developed Index (net of tax) returned 4.25%, and the MSCI EAFE Index returned 2.37%.
Within the FTSE Developed Index, the fund’s equity benchmark, the consumer discretionary sector performed best, followed by information technology and financials. The utilities sector was the worst performer, followed by real estate and energy.
On the fixed income side, interest rates rose and sovereign yield curves flattened across most developed markets as stronger economic growth and rising consumer and business confidence became global themes. With U.S. fiscal policies likely to provide more stimulus and bond supply, the Federal Reserve appears on course to continue removing monetary stimulus by raising short-term rates and shrinking its portfolio of U.S. Treasuries and mortgage-backed securities.
Other major central banks, with economies that are recovering but still lagging the U.S. recovery, are likely to wait before materially tightening monetary policies, but they have begun making changes to their quantitative easing programs. They have also hinted at future changes, laying the groundwork for less disruptive shifts by telegraphing their intentions to the markets.
The U.S. fixed income market declined over the period, with the Bloomberg Barclays U.S. Aggregate Bond Index returning –1.89%. But non-U.S. bonds broadly returned 0.24%, as measured by the Bloomberg Barclays Global Aggregate ex-USD Hedged Index.
Our shortfalls
In the equity portfolio, both stock selection and sector allocation detracted from overall relative results.
Our underweight allocation to the consumer discretionary and IT sectors hurt performance relative to the benchmark. Selection was weakest in financials and industrials.
United Parcel Service, Canadian Natural Resources, Suncor Energy, and Chubb were among the portfolio’s relative detractors. Our avoidance of benchmark constituent Amazon.com was the largest relative detractor and explained all the underper-formance in consumer discretionary.
5
Amazon’s shares performed well on rising expectations for the company’s international expansion and cloud business. Although the company is strong, it does not fit our overall investment approach, as it pays no dividend and its valuation leaves no safety margin.
UPS declined amid concerns about competitive pressure from Amazon and increasing capital spending over the next several years. We think the market has overreacted, and we believe that UPS will sustain its competitive position. We continue to hold the stock.
On the fixed income side, security selection in corporate credit, specifically within industrials, weighed on returns. The bond portfolio’s modest allocation to collateralized loan obligations and selection within local agencies also hurt relative performance. Yield-curve positioning detracted as the curve steepened.
Our successes
In the stock portfolio, selection was strongest in IT, utilities, and consumer staples.
Our underweight allocation to real estate and overweighting of financials aided relative performance. Sector allocations are generally an outcome of our bottom-up analysis and are largely attributable to our view on companies’ valuations.
Top contributors to the equity portfolio’s relative performance over the period included Cisco Systems, TJX Companies, PNC Financial Services, and Bank of America. Our lack of holdings in General Electric and underweighting of Samsung Electronics also helped.
Cisco performed well as it demonstrated solid improvement, driven by a powerful combination of a turn in a new product cycle and stronger economies globally. Capital allocation is increasingly favorable, with a dividend increase and announcement of substantial share buybacks.
We retain our high conviction in TJX. We believe it has defensive characteristics, including a business model that is resilient to online disruption, an attractive valuation, and a balance sheet with low financial leverage. TJX shares outperformed as the company continued its share-buyback program and announced strong fundamentals, driven by solid same-store sales trends, effective labor cost control, and prospective tax benefits.
In the fixed income portfolio, our short duration positioning was favorable, benefiting from the Fed’s third rate increase of 2017 and projections of more to come in 2018. Our underweighting of mortgage-backed pass-throughs and avoidance of supranationals boosted relative results.
The fund’s positioning and outlook
In the equity portfolio, our largest overweightings at the end of the period were in financials, industrials, energy, and health care. Our largest underweightings were in consumer discretionary, IT, real estate, and consumer staples. As always, sector allocations are determined by
6
our bottom-up analysis and are largely attributable to balancing our view on upside potential with downside risks.
We retain a sizable position in financials, given opportunities we see globally in insurance stocks—an industry that is defensive and provides a stable income source for the portfolio. Some of our largest equity positions in financials are in companies based in Europe and Japan, where we see potential for normalizing valuations, leverage to improving economic conditions, and superior dividend yields.
By region, the equity portfolio is overweighted in Europe, Japan, and Canada and underweighted in the U.S. and the Pacific Basin excluding Japan. This positioning is based on bottom-up stock-level analysis.
We recognize heightened risks and uncertainties from current geopolitics, accelerating technological disruption, the managed wind-down of central bank balance sheets, and new efforts by China to cool down the real estate market. We strongly believe that these uncertainties breed opportunity for fundamentally driven and value-centric investors. Our investment process seeks businesses with sustainable quality and dividends purchased at attractive entry points, with an aim to mitigate the downside risk while capturing attractive upside opportunity.
As always, we focus on quality franchises in leading competitive positions that have staying power to innovate through cyclical transitions. We believe that by purchasing equities while the valuation is attractive, the balance sheet is strong, and dividend income affords downside protection, we can reduce risk in the short run and seek to deliver outperformance for the fund’s shareholders in the long run.
For the fixed income side, whereas 2017 was all about strong global growth, the volatility of early 2018 has brought to the fore an environment favoring inflation and cyclically higher interest rates. We expect rate movements to play a bigger role in relative performance in 2018 than credit events. We expect the Fed to continue raising rates, so we maintain a shorter-than-benchmark duration in the U.S. market.
We are inclined to expect higher yields around the developed world but are less inclined to hold large positions in these markets until their central banks are closer to raising rates. Without a significant rise in global inflation (we focus on labor costs as the key), yields of longer-maturity bonds are not expected to rise as much, resulting in flatter yield curves. We view the possibility of higher trade barriers that could lead to slower global growth as the greatest risk to our outlook. Such a scenario would reduce the need for central bank intervention and result in lower yields than currently expected.
We anticipate continued volatility as fiscal and monetary policies adjust and as uncertainty from the U.S. administration remains high. This volatility may present opportunities for the equity portfolio, and we remain focused on identifying solid, company-specific investment catalysts
7
and mispriced individual securities, rather than investing based on broad themes. We remain disciplined in applying our investment process, which enables us to create a balanced portfolio that we believe should perform well in a variety of environments. We continue to focus on long-term, low-turnover investing and believe this approach will serve the fund’s shareholders well over time.
Nataliya Kofman
Managing Director and
Equity Portfolio Manager
John C. Keogh
Senior Managing Director and
Fixed Income Portfolio Manager
Michael E. Stack, CFA,
Senior Managing Director and
Fixed Income Portfolio Manager
Loren L. Moran, CFA,
Managing Director and
Fixed Income Portfolio Manager
Wellington Management Company llp
March 13, 2018
8
Global Wellington Fund
Fund Profile
As of February 28, 2018
| | |
| Share-Class Characteristics | |
| | Investor | Admiral |
| | Shares | Shares |
| Ticker Symbol | VGWLX | VGWAX |
| Expense Ratio1 | 0.45% | 0.35% |
| |
| Equity and Portfolio Characteristics | |
| | | Fund |
| Number of Stocks | | 82 |
| Median Market Cap | | $74.2B |
| Price/Earnings Ratio | | 16.1x |
| Price/Book Ratio | | 2.0x |
| Return on Equity | | 11.6% |
| Earnings Growth Rate | | 8.6% |
| Dividend Yield | | 2.7% |
| Foreign Holdings | | 29.5% |
| Turnover Rate | | 27% |
| Short-Term Reserves | | 4.7% |
| |
| Fixed Income Characteristics | |
| | | Fund |
| Number of Bonds | | 322 |
| Yield to Maturity (before expenses) | 2.5% |
| Average Coupon | | 2.8% |
| Average Duration | | 5.5 years |
| Average Effective Maturity | 7.5 years |
| | |
| Ten Largest Stocks (% of equity portfolio) | |
| Microsoft Corp. | Systems Software | 3.2% |
| Novartis AG | Pharmaceuticals | 2.4 |
| Chubb Ltd. | Property & Casualty | |
| | Insurance | 2.3 |
| PNC Financial Services | | |
| Group Inc. | Regional Banks | 2.2 |
| Bank of America Corp. | Diversified Banks | 2.2 |
| ING Groep NV | Diversified Banks | 2.1 |
| TOTAL SA | Integrated Oil & Gas | 2.0 |
| United Parcel Service | Air Freight & | |
| Inc. | Logistics | 2.0 |
| Mitsubishi UFJ Financial | | |
| Group Inc. | Diversified Banks | 2.0 |
| TJX Cos. Inc. | Apparel Retail | 2.0 |
| Top Ten | | 22.4% |
| Top Ten as % of Total Net Assets | 14.2% |
The holdings listed exclude any temporary cash investments and equity index products.
Allocation by Region (% of equity exposure)
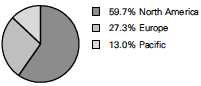
Allocation by Region (% of fixed-income exposure)
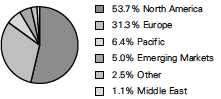
1 The expense ratios shown are from the prospectus dated December 21, 2017, and represent estimated costs for the current fiscal year.
For the period from inception through February 28, 2018, the annualized expense ratios were 0.46% for Investor Shares and 0.36% for
Admiral Shares.
9
Global Wellington Fund
Fund Asset Allocation
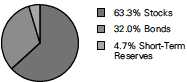
| |
| Sector Diversification (% of equity exposure) |
| | Fund |
| Consumer Discretionary | 6.0% |
| Consumer Staples | 7.0 |
| Energy | 7.7 |
| Financials | 26.5 |
| Health Care | 13.4 |
| Industrials | 14.2 |
| Information Technology | 14.6 |
| Materials | 3.9 |
| Other | 0.0 |
| Real Estate | 0.9 |
| Telecommunication Services | 2.2 |
| Utilities | 3.6 |
Sector categories are based on the Global Industry Classification
Standard (“GICS”), except for the “Other” category (if applicable),
which includes securities that have not been provided a GICS
classification as of the effective reporting period.
| |
| Sector Diversification (% of fixed income | |
| portfolio) | |
| Asset-Backed | 6.2% |
| Commercial Mortgage-Backed | 2.1 |
| Finance | 26.0 |
| Foreign | 17.5 |
| Government Mortgage-Backed | 2.8 |
| Industrial | 28.2 |
| Treasury/Agency | 10.1 |
| Utilities | 4.6 |
| Other | 2.5 |
The agency and mortgage-backed securities sectors may include
issues from government-sponsored enterprises; such issues are
generally not backed by the full faith and credit of the U.S.
government.
Distribution by Credit Quality (% of fixed income portfolio)
| |
| U.S. Government | 14.9% |
| Aaa | 9.3 |
| Aa | 7.8 |
| A | 30.2 |
| Baa | 37.8 |
Credit-quality ratings are obtained from Barclays and are from
Moody's, Fitch, and S&P. When ratings from all three agencies are
used, the median rating is shown. When ratings from two of the
agencies are used, the lower rating for each issue is shown. "Not
Rated" is used to classify securities for which a rating is not
available. Not rated securities include a fund's investment in
Vanguard Market Liquidity Fund or Vanguard Municipal Cash
Management Fund, each of which invests in high-quality money
market instruments and may serve as a cash management vehicle
for the Vanguard funds, trusts, and accounts. For more information
about these ratings, see the Glossary entry for Credit Quality.
Equity Investment Focus
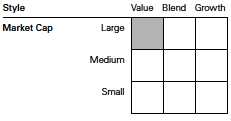
Fixed Income Investment Focus
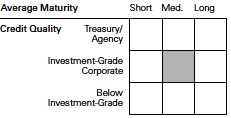
10
Global Wellington Fund
| |
| Market Diversification (% of equity exposure) |
| | Fund |
| Europe | |
| Switzerland | 6.6% |
| United Kingdom | 6.0 |
| France | 5.1 |
| Germany | 3.5 |
| Netherlands | 2.7 |
| Spain | 2.4 |
| Italy | 1.0 |
| Subtotal | 27.3% |
| Pacific | |
| Japan | 11.0% |
| Australia | 1.0 |
| Korea | 1.0 |
| Subtotal | 13.0% |
| North America | |
| United States | 53.4% |
| Canada | 6.3 |
| Subtotal | 59.7% |
11
Global Wellington Fund
Performance Summary
All of the returns in this report represent past performance, which is not a guarantee of future results that may be achieved by the fund. (Current performance may be lower or higher than the performance data cited. For performance data current to the most recent month-end, visit our website at vanguard.com/performance.) Note, too, that both investment returns and principal value can fluctuate widely, so an investor’s shares, when sold, could be worth more or less than their original cost. The returns shown do not reflect taxes that a shareholder would pay on fund distributions or on the sale of fund shares.
Fiscal-Period Total Returns (%): November 2, 2017, Through February 28, 2018
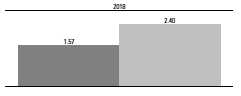
| |
| | Global Wellington Fund Investor Shares |
| | Global Wellington Composite Index |
| For a benchmark description, see the Glossary. |
Total Returns: Period Ended December 31, 2017
This table presents returns through the latest calendar quarter—rather than through the end of the fiscal period.
Securities and Exchange Commission rules require that we provide this information.
| | | | |
| | | | | Since Inception |
| | Inception Date | Income | Capital | Total |
| Investor Shares | 11/2/2017 | 0.24% | 1.68% | 1.92% |
| Admiral Shares | 11/2/2017 | 0.23 | 1.68 | 1.91 |
See Financial Highlights for dividend and capital gains information.
12
Global Wellington Fund
Financial Statements (unaudited)
Statement of Net Assets
As of February 28, 2018
The fund reports a complete list of its holdings in regulatory filings four times in each fiscal year, at the quarter-ends. For the second and fourth fiscal quarters, the lists appear in the fund’s semiannual and annual reports to shareholders. For the first and third fiscal quarters, the fund files the lists with the Securities and Exchange Commission on Form N-Q. Shareholders can look up the fund’s Forms N-Q on the SEC’s website at sec.gov. Forms N-Q may also be reviewed and copied at the SEC’s Public Reference Room (see the back cover of this report for further information).
| | |
| | | Market |
| | | Value• |
| | Shares | ($000) |
| Common Stocks (63.3%) | | |
| Australia (0.6%) | | |
| Coca-Cola Amatil Ltd. | 385,891 | 2,610 |
| QBE Insurance Group Ltd. | 307,003 | 2,411 |
| | | 5,021 |
| Canada (4.0%) | | |
| Suncor Energy Inc. | 320,830 | 10,561 |
| Canadian National Railway Co. | 124,924 | 9,665 |
| Bank of Nova Scotia | 131,711 | 8,161 |
| Canadian Natural Resources Ltd. | 207,076 | 6,415 |
| | | 34,802 |
| France (3.2%) | | |
| TOTAL SA | 200,411 | 11,399 |
| BNP Paribas SA | 134,372 | 10,625 |
| Schneider Electric SE | 73,775 | 6,394 |
| | | 28,418 |
| Germany (2.2%) | | |
| Deutsche Post AG | 145,509 | 6,638 |
| Linde AG | 27,607 | 5,803 |
| Bayerische Motoren Werke AG | 47,496 | 4,990 |
| * Linde AG- Tender Line | 9,626 | 2,136 |
| | | 19,567 |
| Hong Kong (0.3%) | | |
| CK Infrastructure Holdings Ltd. | 287,801 | 2,410 |
| |
| Italy (0.6%) | | |
| Assicurazioni Generali SPA | 303,089 | 5,670 |
| |
| Japan (7.0%) | | |
| Mitsubishi UFJ Financial Group Inc. | 1,595,402 | 11,237 |
| Tokio Marine Holdings Inc. | 240,942 | 11,038 |
| Seven & i Holdings Co. Ltd. | 215,294 | 8,987 |
| Isuzu Motors Ltd. | 432,500 | 6,766 |
| Sumitomo Mitsui Financial Group Inc. | 129,121 | 5,581 |
| Takeda Pharmaceutical Co. Ltd. | 89,565 | 5,078 |
| Daiwa House Industry Co. Ltd. | 136,217 | 5,047 |
13
| | |
| Global Wellington Fund | | |
| |
| |
| |
| | | Market |
| | | Value• |
| | Shares | ($000) |
| Nippon Telegraph & Telephone Corp. | 104,282 | 4,844 |
| Eisai Co. Ltd. | 48,895 | 2,588 |
| | | 61,166 |
| Netherlands (1.7%) | | |
| ING Groep NV | 656,732 | 11,525 |
| ASML Holding NV | 18,645 | 3,636 |
| | | 15,161 |
| South Korea (0.4%) | | |
| Samsung Electronics Co. Ltd. | 1,686 | 3,664 |
| |
| Spain (1.5%) | | |
| Iberdrola SA | 1,163,282 | 8,561 |
| CaixaBank SA | 969,841 | 4,709 |
| | | 13,270 |
| Switzerland (4.2%) | | |
| Novartis AG | 163,106 | 13,607 |
| Zurich Insurance Group AG | 28,272 | 9,296 |
| Julius Baer Group Ltd. | 99,825 | 6,484 |
| ABB Ltd. | 235,732 | 5,704 |
| LafargeHolcim Ltd. | 28,723 | 1,674 |
| | | 36,765 |
| United Kingdom (3.8%) | | |
| BAE Systems plc | 1,331,781 | 10,570 |
| AstraZeneca plc ADR | 216,229 | 7,177 |
| British American Tobacco plc | 113,353 | 6,690 |
| Diageo plc | 151,946 | 5,156 |
| Experian plc | 188,680 | 4,028 |
| | | 33,621 |
| United States (33.8%) | | |
| Microsoft Corp. | 187,612 | 17,592 |
| Chubb Ltd. | 89,092 | 12,644 |
| PNC Financial Services Group Inc. | 78,226 | 12,333 |
| Bank of America Corp. | 375,751 | 12,062 |
| United Parcel Service Inc. Class B | 107,695 | 11,244 |
| TJX Cos. Inc. | 133,852 | 11,067 |
| Intel Corp. | 218,522 | 10,771 |
| Cisco Systems Inc. | 236,109 | 10,573 |
| * Alphabet Inc. Class A | 9,189 | 10,144 |
| Medtronic plc | 124,238 | 9,925 |
| Union Pacific Corp. | 71,018 | 9,250 |
| Cognizant Technology Solutions Corp. Class A | 111,214 | 9,122 |
| Abbott Laboratories | 149,676 | 9,030 |
| JPMorgan Chase & Co. | 73,911 | 8,537 |
| Prudential Financial Inc. | 77,887 | 8,281 |
| Bristol-Myers Squibb Co. | 124,210 | 8,223 |
| Lockheed Martin Corp. | 23,298 | 8,211 |
| Sempra Energy | 71,506 | 7,793 |
| Schlumberger Ltd. | 117,508 | 7,713 |
| Verizon Communications Inc. | 150,631 | 7,191 |
| KLA-Tencor Corp. | 61,631 | 6,983 |
| PPG Industries Inc. | 59,667 | 6,709 |
| ^ Autoliv Inc. | 45,836 | 6,575 |
14
| | | | | |
| Global Wellington Fund | | | | |
| |
| |
| |
| | | | | | Market |
| | | | | | Value• |
| | | | | Shares | ($000) |
| | PepsiCo Inc. | | | 59,220 | 6,498 |
| | Merck & Co. Inc. | | | 118,081 | 6,402 |
| | International Paper Co. | | | 95,044 | 5,664 |
| | Caterpillar Inc. | | | 36,189 | 5,596 |
| | Marsh & McLennan Cos. Inc. | | | 62,289 | 5,171 |
| | Chevron Corp. | | | 46,054 | 5,154 |
| | Accenture plc Class A | | | 31,690 | 5,102 |
| | UnitedHealth Group Inc. | | | 21,987 | 4,973 |
| | Comcast Corp. Class A | | | 107,304 | 3,885 |
| | Cardinal Health Inc. | | | 55,934 | 3,871 |
| | International Business Machines Corp. | | | 24,648 | 3,841 |
| | Philip Morris International Inc. | | | 32,932 | 3,410 |
| | Walgreens Boots Alliance Inc. | | | 48,574 | 3,346 |
| | McKesson Corp. | | | 17,309 | 2,583 |
| | Principal Financial Group Inc. | | | 35,420 | 2,208 |
| | CVS Health Corp. | | | 31,434 | 2,129 |
| | Honeywell International Inc. | | | 11,420 | 1,726 |
| | Hess Corp. | | | 32,209 | 1,463 |
| | NextEra Energy Inc. | | | 9,364 | 1,425 |
| | STERIS plc | | | 13,206 | 1,206 |
| | | | | | 297,626 |
| Total Common Stocks (Cost $554,556) | | | | 557,161 |
| |
| | | | | Face | |
| | | | Maturity | Amount | |
| | | Coupon | Date | ($000) | |
| U. S. Government and Agency Obligations (4.8%) | | | |
| United States (4.8%) | | | | |
| 1,2 | Fannie Mae Pool | 3.000% | 12/1/47 | 890 | 863 |
| 1,2 | Fannie Mae REMICS | 2.000% | 9/25/40 | 204 | 196 |
| 1,2 | Fannie Mae REMICS | 3.500% | 6/25/44 | 514 | 515 |
| 1,2 | Fannie Mae REMICS | 2.500% | 5/25/45 | 662 | 647 |
| 1,2 | Freddie Mac Gold Pool | 3.000% | 11/1/47–12/1/47 | 2,441 | 2,366 |
| 1,2 | Freddie Mac Gold Pool | 3.500% | 11/1/47–12/1/47 | 4,610 | 4,607 |
| 1,2 | Freddie Mac REMICS | 4.000% | 12/15/39–8/15/40 | 1,798 | 1,857 |
| 1,2 | Freddie Mac REMICS | 3.500% | 9/15/40–11/15/40 | 689 | 697 |
| 1,2 | Freddie Mac REMICS | 1.750% | 9/15/42 | 1,679 | 1,593 |
| 1 | Government National Mortgage Assn. | 2.750% | 9/20/44 | 338 | 334 |
| 3 | United States Treasury Note/Bond | 1.500% | 10/31/19 | 950 | 939 |
| | United States Treasury Note/Bond | 1.500% | 8/15/20 | 6,605 | 6,473 |
| | United States Treasury Note/Bond | 1.875% | 9/30/22 | 1,830 | 1,771 |
| | United States Treasury Note/Bond | 2.125% | 12/31/22 | 5,640 | 5,508 |
| | United States Treasury Note/Bond | 2.250% | 11/15/27 | 7,095 | 6,712 |
| | United States Treasury Note/Bond | 2.750% | 8/15/47 | 1,715 | 1,589 |
| | United States Treasury Note/Bond | 2.750% | 11/15/47 | 5,255 | 4,869 |
| | United States Treasury Strip Principal | 0.000% | 5/15/47 | 660 | 262 |
| | United States Treasury Strip Principal | 0.000% | 8/15/47 | 1,130 | 445 |
| Total U.S. Government and Agency Obligations (Cost $43,368) | | 42,243 |
| Asset-Backed/Commercial Mortgage-Backed Securities (2.0%) | | |
| Australia (0.1%) | | | | |
| 4 | National Australia Bank Ltd. | 2.400% | 12/7/21 | 575 | 564 |
15
| | | | | |
| Global Wellington Fund | | | | |
| |
| |
| |
| | | | | Face | Market |
| | | | Maturity | Amount | Value • |
| | | Coupon | Date | ($000) | ($000) |
| Canada (0.1%) | | | | |
| 1,4,† | Master Credit Card Trust II Series 2018-1A | 2.051% | 7/22/24 | 765 | 769 |
| |
| Cayman Islands (0.6%) | | | | |
| 1,4,† | Atlas Senior Loan Fund V Ltd. | 2.982% | 7/16/29 | 750 | 753 |
| 1,4,† | KKR CLO 17 Ltd. | 3.062% | 4/15/29 | 730 | 735 |
| 1,4,† | Madison Park Funding XVIII Ltd. | 2.935% | 10/21/30 | 730 | 735 |
| 1,4,5,† Madison Park Funding XXX Ltd. | 0.000% | 4/15/29 | 1,400 | 1,397 |
| 1,4,† | Magnetite VII Ltd. | 2.620% | 1/15/28 | 1,375 | 1,376 |
| 1,4,† | Race Point IX CLO Ltd. | 2.932% | 10/15/30 | 730 | 734 |
| | | | | | 5,730 |
| Spain (0.1%) | | | | |
| 6 | Bankia SA | 4.125% | 3/24/36 | 450 | 699 |
| |
| United States (1.1%) | | | | |
| 1 | AmeriCredit Automobile Receivables | | | | |
| | Trust 2014-3 | 2.580% | 9/8/20 | 410 | 410 |
| 1,4 | ARI Fleet Lease Trust 2018-A | 2.550% | 10/15/26 | 240 | 240 |
| 1,4,† | Bristol Park CLO Ltd. | 3.142% | 4/15/29 | 685 | 692 |
| 1,4,‡ | CARDS II Trust 2017-2 | 1.847% | 10/17/22 | 720 | 720 |
| 1,4 | Chesapeake Funding II LLC | 1.990% | 5/15/29 | 710 | 703 |
| 1,4 | Chrysler Capital Auto Receivables | | | | |
| | Trust 2016-A | 3.250% | 6/15/22 | 245 | 246 |
| 1,4,§ | COLT 2018-1 Mortgage Loan Trust | 2.930% | 2/25/48 | 350 | 347 |
| 1,4,§ | Deephaven Residential Mortgage | | | | |
| | Trust 2018-1 | 2.976% | 12/25/57 | 485 | 481 |
| 1,4 | First Investors Auto Owner Trust | 2.000% | 3/15/22 | 608 | 605 |
| 1,4 | First Investors Auto Owner Trust | 2.410% | 12/15/22 | 120 | 119 |
| 1,4 | GreatAmerica Leasing Receivables Funding | | | | |
| | LLC Series 2018-1 | 2.600% | 6/15/21 | 255 | 255 |
| 1,4 | GreatAmerica Leasing Receivables Funding | | | | |
| | LLC Series 2018-1 | 2.830% | 6/17/24 | 167 | 167 |
| 1,4,5 | Hyundai Auto Lease Securitization | | | | |
| | Trust 2018-A | 1.950% | 3/15/19 | 536 | 536 |
| 1,4,5 | Hyundai Auto Lease Securitization | | | | |
| | Trust 2018-A | 2.520% | 8/17/20 | 495 | 495 |
| 1,4,† | KKR CLO 16 Ltd. | 3.235% | 1/20/29 | 360 | 363 |
| 1,4 | MMAF Equipment Finance LLC 2016-A | 1.480% | 6/15/20 | 195 | 194 |
| 1,4 | MMAF Equipment Finance LLC 2017-B | 2.210% | 10/17/22 | 170 | 167 |
| 1,4 | OneMain Direct Auto Receivables | | | | |
| | Trust 2017-2 | 2.310% | 12/14/21 | 700 | 696 |
| 1 | Santander Drive Auto Receivables | | | | |
| | Trust 2014-4 | 3.100% | 11/16/20 | 220 | 221 |
| 1 | Santander Drive Auto Receivables | | | | |
| | Trust 2016-3 | 1.890% | 6/15/21 | 565 | 562 |
| 1,4,§ | Towd Point Mortgage Trust 2015-1 | 3.000% | 1/25/58 | 345 | 345 |
| 1,4 | Vantage Data Centers Issuer LLC | 4.072% | 2/16/43 | 300 | 301 |
| 1,4 | Westlake Automobile Receivables | | | | |
| | Trust 2018-1 | 2.240% | 12/15/20 | 740 | 739 |
| | | | | | 9,604 |
| Total Asset-Backed/Commercial Mortgage-Backed Securities (Cost $17,385) | | 17,366 |
16
| | | | | |
| Global Wellington Fund | | | | |
| |
| |
| |
| | | | | Face | Market |
| | | | Maturity | Amount | Value • |
| | | Coupon | Date | ($000) | ($000) |
| Corporate Bonds (18.9%) | | | | |
| Belgium (0.0%) | | | | |
| 7 | Anheuser-Busch InBev SA/NV | 1.750% | 3/7/25 | 250 | 334 |
| |
| Canada (0.3%) | | | | |
| | Agrium Inc. | 3.150% | 10/1/22 | 275 | 274 |
| † | Canadian Imperial Bank of Commerce | 2.320% | 6/16/22 | 570 | 573 |
| | Emera US Finance LP | 2.700% | 6/15/21 | 400 | 392 |
| | Fortis Inc. | 3.055% | 10/4/26 | 775 | 721 |
| 8 | Toronto-Dominion Bank | 1.680% | 6/8/21 | 740 | 563 |
| | TransCanada PipeLines Ltd. | 4.875% | 1/15/26 | 400 | 433 |
| | | | | | 2,956 |
| China (0.3%) | | | | |
| | Alibaba Group Holding Ltd. | 3.125% | 11/28/21 | 825 | 825 |
| | Alibaba Group Holding Ltd. | 3.400% | 12/6/27 | 660 | 628 |
| 4 | Tencent Holdings Ltd. | 3.595% | 1/19/28 | 1,035 | 1,001 |
| | | | | | 2,454 |
| Denmark (0.2%) | | | | |
| 6 | Danske Bank A/S | 0.750% | 6/2/23 | 1,450 | 1,788 |
| |
| France (1.3%) | | | | |
| 1,6 | AXA SA | 5.125% | 7/4/43 | 600 | 871 |
| 6 | Banque Federative du Credit Mutuel SA | 1.250% | 1/14/25 | 1,700 | 2,121 |
| 4 | BNP Paribas SA | 3.375% | 1/9/25 | 815 | 791 |
| 6 | BNP Paribas SA | 1.500% | 11/17/25 | 950 | 1,170 |
| 6 | BNP Paribas SA | 2.750% | 1/27/26 | 1,250 | 1,632 |
| 6 | BPCE SA | 1.125% | 1/18/23 | 700 | 867 |
| 4 | BPCE SA | 5.700% | 10/22/23 | 400 | 433 |
| 1,6 | BPCE SA | 2.750% | 11/30/27 | 700 | 915 |
| 6 | Credit Agricole SA | 2.625% | 3/17/27 | 450 | 579 |
| 6 | Credit Agricole SA | 1.875% | 12/20/26 | 500 | 628 |
| 6 | RCI Banque SA | 0.750% | 9/26/22 | 500 | 614 |
| 6 | RCI Banque SA | 1.375% | 3/8/24 | 475 | 593 |
| | | | | | 11,214 |
| Germany (1.6%) | | | | |
| 7 | Aroundtown SA | 3.000% | 10/16/29 | 1,200 | 1,595 |
| 6 | Commerzbank AG | 4.000% | 3/30/27 | 1,450 | 1,999 |
| 6 | Daimler AG | 0.875% | 1/12/21 | 2,575 | 3,207 |
| 6 | Deutsche Bank AG | 2.375% | 1/11/23 | 800 | 1,032 |
| | Deutsche Bank AG | 3.700% | 5/30/24 | 660 | 643 |
| 7 | E.ON International Finance BV | 5.875% | 10/30/37 | 150 | 286 |
| 6 | E.ON SE | 1.625% | 5/22/29 | 565 | 690 |
| 7 | innogy Finance BV | 4.750% | 1/31/34 | 600 | 981 |
| 4 | Siemens Financieringsmaatschappij NV | 2.900% | 5/27/22 | 650 | 645 |
| 6 | Volkswagen International Finance NV | 1.875% | 3/30/27 | 1,000 | 1,235 |
| 6 | Volkswagen Leasing GmbH | 2.625% | 1/15/24 | 425 | 566 |
| 6 | Vonovia Finance BV | 1.750% | 1/25/27 | 900 | 1,112 |
| | | | | | 13,991 |
| Hong Kong (0.2%) | | | | |
| 4 | CK Hutchison International 17 II Ltd. | 2.750% | 3/29/23 | 1,275 | 1,228 |
| |
| Italy (0.1%) | | | | |
| 6 | Enel SPA | 5.625% | 6/21/27 | 350 | 579 |
17
| | | | | |
| Global Wellington Fund | | | | |
| |
| |
| |
| | | | | Face | Market |
| | | | Maturity | Amount | Value • |
| | | Coupon | Date | ($000) | ($000) |
| Japan (0.3%) | | | | |
| | American Honda Finance Corp. | 2.000% | 11/13/19 | 1,500 | 1,487 |
| 9 | Toyota Finance Australia Ltd. | 2.500% | 12/7/20 | 1,625 | 1,258 |
| | | | | | 2,745 |
| Mexico (0.3%) | | | | |
| 6 | America Movil SAB de CV | 4.125% | 10/25/19 | 575 | 750 |
| | America Movil SAB de CV | 6.375% | 3/1/35 | 350 | 423 |
| | Coca-Cola Femsa SAB de CV | 3.875% | 11/26/23 | 540 | 553 |
| | Grupo Televisa SAB | 6.625% | 1/15/40 | 225 | 263 |
| 4 | Infraestructura Energetica Nova SAB de CV | 4.875% | 1/14/48 | 980 | 902 |
| | | | | | 2,891 |
| Netherlands (1.0%) | | | | |
| 6 | ABN AMRO Bank NV | 2.500% | 11/29/23 | 855 | 1,157 |
| 1,6 | ABN AMRO Bank NV | 2.875% | 1/18/28 | 700 | 922 |
| 1 | ABN AMRO Bank NV | 4.400% | 3/27/28 | 400 | 403 |
| 7 | Cooperatieve Rabobank UA | 5.250% | 9/14/27 | 525 | 848 |
| 7 | Cooperatieve Rabobank UA | 4.625% | 5/23/29 | 200 | 311 |
| 1,6 | ING Groep NV | 3.000% | 4/11/28 | 600 | 795 |
| 1,6 | ING Groep NV | 2.500% | 2/15/29 | 1,200 | 1,543 |
| | Koninklijke KPN NV | 8.375% | 10/1/30 | 550 | 725 |
| | Shell International Finance BV | 4.000% | 5/10/46 | 700 | 692 |
| 6 | VIVAT NV | 2.375% | 5/17/24 | 1,100 | 1,371 |
| | | | | | 8,767 |
| Spain (1.6%) | | | | |
| 6 | Banco Bilbao Vizcaya Argentaria SA | 0.750% | 9/11/22 | 700 | 851 |
| 6 | Banco Bilbao Vizcaya Argentaria SA | 3.500% | 2/10/27 | 800 | 1,076 |
| 6 | Banco de Sabadell SA | 0.875% | 3/5/23 | 1,800 | 2,182 |
| 6 | CaixaBank SA | 1.125% | 1/12/23 | 1,900 | 2,319 |
| 6 | CaixaBank SA | 1.125% | 5/17/24 | 1,400 | 1,705 |
| 6 | Criteria Caixa SAU | 1.500% | 5/10/23 | 1,500 | 1,841 |
| 6 | Santander Issuances SAU | 3.250% | 4/4/26 | 1,000 | 1,325 |
| 6 | Telefonica Emisiones SAU | 2.242% | 5/27/22 | 700 | 917 |
| 6 | Telefonica Emisiones SAU | 1.715% | 1/12/28 | 500 | 607 |
| | Telefonica Emisiones SAU | 4.665% | 3/6/38 | 290 | 291 |
| | Telefonica Emisiones SAU | 4.895% | 3/6/48 | 480 | 479 |
| | | | | | 13,593 |
| Sweden (0.3%) | | | | |
| 6 | Skandinaviska Enskilda Banken AB | 2.000% | 2/19/21 | 550 | 710 |
| 6 | Skandinaviska Enskilda Banken AB | 0.300% | 2/17/22 | 1,750 | 2,138 |
| | | | | | 2,848 |
| Switzerland (0.6%) | | | | |
| 1,6 | Credit Suisse Group AG | 1.250% | 7/17/25 | 1,425 | 1,727 |
| 1,4 | Credit Suisse Group AG | 3.869% | 1/12/29 | 250 | 243 |
| 4 | Roche Holdings Inc. | 2.625% | 5/15/26 | 1,100 | 1,033 |
| 4,† | UBS AG | 1.959% | 12/1/20 | 2,250 | 2,253 |
| | | | | | 5,256 |
| United Kingdom (1.7%) | | | | |
| 6 | Anglo American Capital plc | 2.750% | 6/7/19 | 600 | 757 |
| 6 | Anglo American Capital plc | 1.625% | 9/18/25 | 915 | 1,114 |
| 6 | Aviva plc | 0.100% | 12/13/18 | 950 | 1,162 |
| 4 | BAT Capital Corp. | 3.222% | 8/15/24 | 575 | 555 |
| 4 | BAT Capital Corp. | 3.557% | 8/15/27 | 925 | 883 |
| 6 | BAT International Finance plc | 2.750% | 3/25/25 | 800 | 1,075 |
18
| | | | | |
| Global Wellington Fund | | | | |
| |
| |
| |
| | | | | Face | Market |
| | | | Maturity | Amount | Value • |
| | | Coupon | Date | ($000) | ($000) |
| 6 | BP Capital Markets plc | 2.994% | 2/18/19 | 600 | 755 |
| | BP Capital Markets plc | 3.814% | 2/10/24 | 475 | 486 |
| 7 | CPUK Finance Ltd. | 3.588% | 8/28/25 | 975 | 1,411 |
| 6 | FCE Bank plc | 0.869% | 9/13/21 | 1,800 | 2,224 |
| 7 | Heathrow Funding Ltd. | 6.750% | 12/3/26 | 450 | 814 |
| 1,6 | Heathrow Funding Ltd. | 1.500% | 2/11/32 | 750 | 907 |
| 4 | Imperial Brands Finance plc | 4.250% | 7/21/25 | 800 | 815 |
| 6 | London Stock Exchange Group plc | 0.875% | 9/19/24 | 475 | 577 |
| 4 | Sky plc | 3.125% | 11/26/22 | 725 | 718 |
| | Trinity Acquisition plc | 4.400% | 3/15/26 | 724 | 719 |
| | | | | | 14,972 |
| United States (9.1%) | | | | |
| | 21st Century Fox America Inc. | 6.200% | 12/15/34 | 640 | 801 |
| | Abbott Laboratories | 3.400% | 11/30/23 | 715 | 712 |
| 6 | Allergan Funding SCS | 1.250% | 6/1/24 | 550 | 665 |
| | Allergan Funding SCS | 3.800% | 3/15/25 | 885 | 873 |
| | Allergan Funding SCS | 4.750% | 3/15/45 | 275 | 272 |
| | Amazon.com Inc. | 4.800% | 12/5/34 | 300 | 331 |
| 4 | Amazon.com Inc. | 4.250% | 8/22/57 | 225 | 224 |
| | American Electric Power Co. Inc. | 3.200% | 11/13/27 | 950 | 906 |
| 6 | American International Group Inc. | 1.500% | 6/8/23 | 700 | 879 |
| 6 | American International Group Inc. | 1.875% | 6/21/27 | 925 | 1,136 |
| | American Tower Corp. | 5.000% | 2/15/24 | 1,050 | 1,120 |
| | Amgen Inc. | 3.625% | 5/22/24 | 275 | 277 |
| | Andeavor Logistics LP / Tesoro Logistics | | | | |
| | Finance Corp. | 3.500% | 12/1/22 | 1,405 | 1,382 |
| | Anthem Inc. | 3.500% | 8/15/24 | 275 | 271 |
| | Anthem Inc. | 4.101% | 3/1/28 | 610 | 610 |
| | Anthem Inc. | 4.375% | 12/1/47 | 315 | 308 |
| | Apple Inc. | 2.750% | 1/13/25 | 780 | 748 |
| | Ascension Health | 3.945% | 11/15/46 | 135 | 134 |
| 4 | AT&T Inc. | 4.100% | 2/15/28 | 2,100 | 2,058 |
| | AT&T Inc. | 4.900% | 8/14/37 | 775 | 776 |
| | AutoZone Inc. | 3.700% | 4/15/22 | 600 | 608 |
| | Bank of America Corp. | 3.300% | 1/11/23 | 570 | 568 |
| 1 | Bank of America Corp. | 3.593% | 7/21/28 | 1,285 | 1,248 |
| † | Bank of New York Mellon Corp. | 2.817% | 10/30/23 | 415 | 426 |
| | Berkshire Hathaway Energy Co. | 5.150% | 11/15/43 | 10 | 11 |
| | Brandywine Operating Partnership LP | 3.950% | 11/15/27 | 665 | 641 |
| | Broadcom Corp. / Broadcom Cayman | | | | |
| | Finance Ltd. | 3.625% | 1/15/24 | 690 | 673 |
| | Capital One Financial Corp. | 4.200% | 10/29/25 | 1,075 | 1,066 |
| | Cardinal Health Inc. | 4.500% | 11/15/44 | 280 | 268 |
| 4 | Cargill Inc. | 4.760% | 11/23/45 | 340 | 376 |
| | Catholic Health Initiatives Colorado GO | 4.200% | 8/1/23 | 575 | 593 |
| | Celgene Corp. | 3.250% | 8/15/22 | 1,655 | 1,646 |
| | Charter Communications Operating LLC / | | | | |
| | Charter Communications Operating Capital | 6.384% | 10/23/35 | 410 | 462 |
| | Citigroup Inc. | 2.700% | 3/30/21 | 345 | 341 |
| | Citigroup Inc. | 4.600% | 3/9/26 | 535 | 552 |
| 1 | Citigroup Inc. | 3.520% | 10/27/28 | 2,380 | 2,293 |
| | Comcast Corp. | 6.500% | 11/15/35 | 635 | 811 |
| | Commonwealth Edison Co. | 3.650% | 6/15/46 | 35 | 33 |
| | Commonwealth Edison Co. | 4.000% | 3/1/48 | 245 | 246 |
19
| | | | |
| Global Wellington Fund | | | | |
| |
| |
| |
| | | | Face | Market |
| | | Maturity | Amount | Value • |
| | Coupon | Date | ($000) | ($000) |
| Consolidated Edison Co. of New York Inc. | 6.300% | 8/15/37 | 75 | 97 |
| Consolidated Edison Co. of New York Inc. | 4.625% | 12/1/54 | 290 | 312 |
| 4 Cox Communications Inc. | 4.600% | 8/15/47 | 800 | 769 |
| Crown Castle International Corp. | 3.800% | 2/15/28 | 905 | 874 |
| CVS Health Corp. | 2.875% | 6/1/26 | 1,455 | 1,323 |
| CVS Health Corp. | 5.125% | 7/20/45 | 85 | 89 |
| Devon Energy Corp. | 3.250% | 5/15/22 | 570 | 564 |
| Dignity Health California GO | 3.812% | 11/1/24 | 530 | 538 |
| Dignity Health California GO | 4.500% | 11/1/42 | 146 | 138 |
| Discover Bank | 4.200% | 8/8/23 | 575 | 590 |
| Dominion Energy Gas Holdings LLC | 4.600% | 12/15/44 | 660 | 677 |
| Duke Energy Carolinas LLC | 3.700% | 12/1/47 | 105 | 100 |
| Duke Energy Progress LLC | 4.200% | 8/15/45 | 285 | 294 |
| Energy Transfer LP | 4.900% | 3/15/35 | 1,075 | 1,026 |
| Enterprise Products Operating LLC | 3.900% | 2/15/24 | 535 | 543 |
| Enterprise Products Operating LLC | 4.250% | 2/15/48 | 275 | 263 |
| 4 ERAC USA Finance LLC | 4.500% | 2/15/45 | 640 | 632 |
| Eversource Energy | 3.300% | 1/15/28 | 310 | 299 |
| FedEx Corp. | 3.300% | 3/15/27 | 275 | 267 |
| FirstEnergy Corp. | 3.900% | 7/15/27 | 675 | 668 |
| Florida Power & Light Co. | 3.700% | 12/1/47 | 275 | 264 |
| Ford Motor Credit Co. LLC | 3.096% | 5/4/23 | 575 | 553 |
| GE Capital International Funding Co. | | | | |
| Unlimited Co. | 4.418% | 11/15/35 | 500 | 490 |
| General Motors Co. | 4.200% | 10/1/27 | 475 | 465 |
| General Motors Financial Co. Inc. | 3.450% | 4/10/22 | 1,310 | 1,300 |
| Georgia Power Co. | 4.300% | 3/15/42 | 945 | 963 |
| Goldman Sachs Group Inc. | 2.625% | 4/25/21 | 575 | 565 |
| 1 Goldman Sachs Group Inc. | 3.272% | 9/29/25 | 1,125 | 1,079 |
| 1 Goldman Sachs Group Inc. | 3.814% | 4/23/29 | 335 | 327 |
| Goldman Sachs Group Inc. | 4.750% | 10/21/45 | 250 | 264 |
| HCP Inc. | 4.000% | 6/1/25 | 375 | 376 |
| Humana Inc. | 2.900% | 12/15/22 | 590 | 577 |
| International Paper Co. | 4.350% | 8/15/48 | 500 | 487 |
| 1 JPMorgan Chase & Co. | 3.782% | 2/1/28 | 775 | 772 |
| 1 JPMorgan Chase & Co. | 3.964% | 11/15/48 | 975 | 935 |
| Kaiser Foundation Hospitals | 4.875% | 4/1/42 | 45 | 51 |
| Kaiser Foundation Hospitals | 4.150% | 5/1/47 | 285 | 290 |
| 4 KeySpan Gas East Corp. | 2.742% | 8/15/26 | 400 | 375 |
| 7 Kraft Heinz Foods Co. | 4.125% | 7/1/27 | 500 | 740 |
| Kraft Heinz Foods Co. | 4.375% | 6/1/46 | 595 | 543 |
| Lockheed Martin Corp. | 4.700% | 5/15/46 | 253 | 274 |
| Lockheed Martin Corp. | 4.090% | 9/15/52 | 97 | 94 |
| Medtronic Inc. | 3.150% | 3/15/22 | 550 | 550 |
| Memorial Sloan-Kettering Cancer Center | | | | |
| New York GO | 4.125% | 7/1/52 | 150 | 150 |
| Mercy Health | 3.555% | 8/1/27 | 650 | 634 |
| 4 Metropolitan Life Global Funding I | 3.000% | 9/19/27 | 575 | 545 |
| Microsoft Corp. | 3.700% | 8/8/46 | 1,125 | 1,094 |
| MidAmerican Energy Co. | 4.250% | 5/1/46 | 10 | 10 |
| 6 Molson Coors Brewing Co. | 1.250% | 7/15/24 | 1,075 | 1,312 |
| Morgan Stanley | 2.750% | 5/19/22 | 950 | 929 |
| Morgan Stanley | 3.125% | 7/27/26 | 1,850 | 1,755 |
| 1 Morgan Stanley | 3.772% | 1/24/29 | 145 | 141 |
| 6 Mylan NV | 3.125% | 11/22/28 | 1,025 | 1,297 |
20
| | | | | |
| Global Wellington Fund | | | | |
| |
| |
| |
| | | | | Face | Market |
| | | | Maturity | Amount | Value • |
| | | Coupon | Date | ($000) | ($000) |
| | National Retail Properties Inc. | 3.900% | 6/15/24 | 330 | 331 |
| | National Rural Utilities Cooperative Finance | | | | |
| | Corp. | 2.950% | 2/7/24 | 400 | 392 |
| 4 | Northwestern Mutual Life Insurance Co. | 3.850% | 9/30/47 | 230 | 217 |
| | Occidental Petroleum Corp. | 4.100% | 2/1/21 | 650 | 671 |
| | Oglethorpe Power Corp. | 5.250% | 9/1/50 | 200 | 216 |
| | Omnicom Group Inc. | 3.650% | 11/1/24 | 275 | 274 |
| | Oracle Corp. | 3.400% | 7/8/24 | 575 | 576 |
| | Oracle Corp. | 3.250% | 11/15/27 | 240 | 232 |
| | Oracle Corp. | 4.000% | 11/15/47 | 220 | 218 |
| | Orlando Health Obligated Group | 3.777% | 10/1/28 | 175 | 174 |
| | Orlando Health Obligated Group | 4.089% | 10/1/48 | 105 | 104 |
| | Pacific Gas & Electric Co. | 2.950% | 3/1/26 | 190 | 176 |
| | Pacific Gas & Electric Co. | 5.800% | 3/1/37 | 1,071 | 1,241 |
| 4 | Penske Truck Leasing Co. LP / PTL Finance | | | | |
| | Corp. | 3.375% | 2/1/22 | 145 | 144 |
| 4 | Penske Truck Leasing Co. LP / PTL Finance | | | | |
| | Corp. | 4.250% | 1/17/23 | 1,030 | 1,067 |
| 6 | Philip Morris International Inc. | 2.125% | 5/30/19 | 850 | 1,066 |
| | Philip Morris International Inc. | 2.500% | 11/2/22 | 575 | 555 |
| 6 | Philip Morris International Inc. | 2.875% | 3/3/26 | 425 | 582 |
| | PNC Bank NA | 3.250% | 1/22/28 | 910 | 880 |
| 1 | Providence St. Joseph Health Obligated | | | | |
| | Group | 3.930% | 10/1/48 | 225 | 220 |
| 4 | Santander Holdings USA Inc. | 3.700% | 3/28/22 | 1,750 | 1,740 |
| 4,5 | SBA Tower Trust | 3.448% | 3/15/23 | 675 | 675 |
| | Sempra Energy | 3.250% | 6/15/27 | 400 | 383 |
| | Sierra Pacific Power Co. | 2.600% | 5/1/26 | 149 | 139 |
| | South Carolina Electric & Gas Co. | 5.300% | 5/15/33 | 113 | 124 |
| | South Carolina Electric & Gas Co. | 5.450% | 2/1/41 | 300 | 336 |
| | South Carolina Electric & Gas Co. | 4.600% | 6/15/43 | 230 | 235 |
| | South Carolina Electric & Gas Co. | 4.100% | 6/15/46 | 25 | 24 |
| 5 | Southern California Edison Co. | 4.125% | 3/1/48 | 440 | 439 |
| | Southwestern Public Service Co. | 3.700% | 8/15/47 | 24 | 23 |
| | SSM Health Care Corp. | 3.823% | 6/1/27 | 340 | 341 |
| | Stanford Health Care | 3.795% | 11/15/48 | 90 | 88 |
| | SunTrust Bank | 3.300% | 5/15/26 | 450 | 431 |
| | Synchrony Bank | 3.000% | 6/15/22 | 450 | 439 |
| | Synchrony Financial | 4.250% | 8/15/24 | 525 | 529 |
| 4 | Teachers Insurance & Annuity Assn. of | | | | |
| | America | 4.900% | 9/15/44 | 860 | 937 |
| | The Kroger Co. | 3.850% | 8/1/23 | 1,025 | 1,044 |
| 6 | Thermo Fisher Scientific Inc. | 1.400% | 1/23/26 | 375 | 458 |
| | Time Warner Inc. | 3.600% | 7/15/25 | 850 | 826 |
| | UnitedHealth Group Inc. | 4.625% | 7/15/35 | 185 | 202 |
| | UnitedHealth Group Inc. | 4.200% | 1/15/47 | 65 | 66 |
| | Verizon Communications Inc. | 3.500% | 11/1/24 | 275 | 273 |
| | Verizon Communications Inc. | 4.522% | 9/15/48 | 1,525 | 1,441 |
| | Viacom Inc. | 4.250% | 9/1/23 | 800 | 819 |
| | Wells Fargo & Co. | 4.300% | 7/22/27 | 275 | 279 |
| | Wells Fargo & Co. | 4.750% | 12/7/46 | 800 | 824 |
| | Welltower Inc. | 4.000% | 6/1/25 | 275 | 277 |
| | | | | | 80,337 |
| Total Corporate Bonds (Cost $167,963) | | | | 165,953 |
21
| | | | | |
| Global Wellington Fund | | | | |
| |
| |
| |
| | | | | Face | Market |
| | | | Maturity | Amount | Value • |
| | | Coupon | Date | ($000) | ($000) |
| Sovereign Bonds (5.6%) | | | | |
| Australia (0.2%) | | | | |
| 9 | Commonwealth of Australia | 2.250% | 11/21/22 | 1,260 | 973 |
| 9 | Commonwealth of Australia | 2.750% | 11/21/27 | 135 | 104 |
| 9 | Commonwealth of Australia | 2.250% | 5/21/28 | 380 | 281 |
| | | | | | 1,358 |
| Canada (0.9%) | | | | |
| 8 | Canada | 0.750% | 5/1/19 | 3,815 | 2,943 |
| 8 | Canada | 1.250% | 11/1/19 | 2,550 | 1,971 |
| 8 | Canada | 0.750% | 3/1/21 | 2,110 | 1,590 |
| 8 | Canada | 1.500% | 6/1/23 | 670 | 508 |
| 8 | Canada | 1.000% | 6/1/27 | 515 | 360 |
| 10 | Province of Ontario | 0.250% | 6/28/29 | 985 | 1,014 |
| | | | | | 8,386 |
| Chile (0.1%) | | | | |
| | Corp Nacional del Cobre de Chile | 3.625% | 8/1/27 | 650 | 629 |
| |
| China (0.3%) | | | | |
| 4 | Sinopec Group Overseas Development 2017 | | | | |
| | Ltd. | 3.000% | 4/12/22 | 1,025 | 1,007 |
| 4 | State Grid Overseas Investment 2016 Ltd. | 2.750% | 5/4/22 | 2,135 | 2,082 |
| | | | | | 3,089 |
| France (0.6%) | | | | |
| 6 | Electricite de France SA | 1.875% | 10/13/36 | 600 | 670 |
| 6 | Electricite de France SA | 4.500% | 11/12/40 | 1,000 | 1,602 |
| 6 | RTE Reseau de Transport d’Electricite SA | 2.875% | 9/12/23 | 1,700 | 2,329 |
| 6 | RTE Reseau de Transport d’Electricite SA | 1.875% | 10/23/37 | 900 | 1,093 |
| | | | | | 5,694 |
| Ireland (0.3%) | | | | |
| 6 | ESB Finance Ltd. | 3.494% | 1/12/24 | 1,930 | 2,706 |
| |
| Israel (0.1%) | | | | |
| | State of Israel | 3.250% | 1/17/28 | 475 | 461 |
| |
| Japan (1.4%) | | | | |
| 11 | Japan | 0.100% | 9/20/27 | 578,550 | 5,452 |
| 11 | Japan | 0.100% | 12/20/27 | 410,150 | 3,862 |
| | Japan Bank for International Cooperation | 2.250% | 2/24/20 | 450 | 447 |
| 11 | Japan Treasury Discount Bill | 0.000% | 3/26/18 | 103,000 | 965 |
| 11 | Japan Treasury Discount Bill | 0.000% | 4/10/18 | 158,000 | 1,481 |
| | | | | | 12,207 |
| Mexico (0.4%) | | | | |
| 4 | Mexico City Airport Trust | 5.500% | 7/31/47 | 525 | 492 |
| 6 | Petroleos Mexicanos | 3.750% | 2/21/24 | 2,595 | 3,380 |
| 4 | Petroleos Mexicanos | 6.350% | 2/12/48 | 20 | 20 |
| | | | | | 3,892 |
| Qatar (0.2%) | | | | |
| 4 | State of Qatar | 2.375% | 6/2/21 | 1,400 | 1,353 |
| |
| Saudi Arabia (0.3%) | | | | |
| 4 | Kingdom of Saudi Arabia | 2.875% | 3/4/23 | 2,740 | 2,638 |
22
| | | | | |
| Global Wellington Fund | | | | |
| |
| |
| |
| | | | | Face | Market |
| | | | Maturity | Amount | Value • |
| | | Coupon | Date | ($000) | ($000) |
| United Arab Emirates (0.1%) | | | | |
| | Abu Dhabi Government International Bond | 3.125% | 10/11/27 | 1,235 | 1,165 |
| |
| United Kingdom (0.7%) | | | | |
| 7 | United Kingdom | 1.750% | 7/22/19 | 790 | 1,103 |
| 7 | United Kingdom | 1.500% | 1/22/21 | 1,015 | 1,423 |
| 7 | United Kingdom | 0.500% | 7/22/22 | 430 | 579 |
| 7 | United Kingdom | 1.250% | 7/22/27 | 155 | 208 |
| 7 | United Kingdom | 3.500% | 1/22/45 | 1,400 | 2,554 |
| | | | | | 5,867 |
| Total Sovereign Bonds (Cost $49,201) | | | | 49,445 |
| Taxable Municipal Bonds (0.8%) | | | | |
| | Bay Area Toll Authority California Toll | | | | |
| | Bridge Revenue (San Francisco Bay Area) | 6.907% | 10/1/50 | 75 | 112 |
| | California GO | 7.550% | 4/1/39 | 345 | 520 |
| | California GO | 7.350% | 11/1/39 | 140 | 203 |
| | California GO | 7.625% | 3/1/40 | 95 | 143 |
| | Chicago IL Transit Authority Transfer Tax | | | | |
| | Receipts Revenue | 6.899% | 12/1/40 | 355 | 465 |
| | Chicago IL Transit Authority | 6.300% | 12/1/21 | 70 | 74 |
| | Georgia Municipal Electric Power Authority | | | | |
| | Revenue | 6.637% | 4/1/57 | 225 | 276 |
| | Illinois GO | 5.100% | 6/1/33 | 1,060 | 999 |
| 12 | Kansas Development Finance Authority | 5.371% | 5/1/26 | 775 | 832 |
| | Kansas Development Finance Authority | | | | |
| | Revenue | 4.927% | 4/15/45 | 290 | 312 |
| | North Texas Tollway Authority System | | | | |
| | Revenue | 6.718% | 1/1/49 | 125 | 179 |
| | Port Authority of New York & New Jersey | | | | |
| | Revenue | 4.458% | 10/1/62 | 270 | 291 |
| | San Jose California Redevelopment Agency | | | | |
| | Successor Agency Tax Allocation | 3.375% | 8/1/34 | 195 | 186 |
| | South Carolina Public Service Authority | | | | |
| | Revenue | 2.388% | 12/1/23 | 1,275 | 1,197 |
| | South Carolina Public Service Authority | | | | |
| | Revenue | 6.454% | 1/1/50 | 235 | 309 |
| | State of Connecticut | 2.990% | 1/15/23 | 765 | 742 |
| | University of California Regents Medical | | | | |
| | Center Revenue | 6.548% | 5/15/48 | 190 | 258 |
| Total Taxable Municipal Bonds (Cost $7,321) | | | | 7,098 |
| |
| | | | | Shares | |
| Temporary Cash Investments (5.5%) | | | | |
| 13,14 Vanguard Market Liquidity Fund | 1.601% | | 481,693 | 48,164 |
| Total Temporary Cash Investments (Cost $48,168) | | | 48,164 |
| Total Investments (100.9%) (Cost $887,962) | | | | 887,430 |
23
| |
| Global Wellington Fund | |
| |
| |
| |
| |
| | Amount |
| | ($000) |
| Other Assets and Liabilities (-0.9%) | |
| Other Assets | 8,528 |
| Liabilities14 | (16,111) |
| | (7,583) |
| Net Assets (100%) | 879,847 |
| |
| | Amount |
| | ($000) |
| Statement of Assets and Liabilities | |
| Assets | |
| Investments in Securities, at Value | |
| Unaffiliated Issuers | 838,619 |
| Collateral Pledged for Futures Contracts | 647 |
| Total Unaffiliated Issuers | 839,266 |
| Affiliated Vanguard Funds | 48,164 |
| Total Investments in Securities | 887,430 |
| Investment in Vanguard | 45 |
| Receivables for Investment Securities Sold | 893 |
| Receivables for Accrued Income | 3,270 |
| Receivables for Capital Shares Issued | 2,698 |
| Variation Margin Receivable—Futures Contracts | 39 |
| Unrealized Appreciation—Forward Currency Contracts | 1,228 |
| Other Assets | 355 |
| Total Assets | 895,958 |
| Liabilities | |
| Payables for Investment Securities Purchased | 8,041 |
| Collateral for Securities on Loan | 6,435 |
| Payables for Capital Shares Redeemed | 957 |
| Payables to Investment Advisor | 265 |
| Payables to Vanguard | 80 |
| Variation Margin Payable—Futures Contracts | 132 |
| Unrealized Depreciation—Forward Currency Contracts | 83 |
| Other Liabilities | 118 |
| Total Liabilities | 16,111 |
| Net Assets | 879,847 |
24
| |
| Global Wellington Fund | |
| |
| |
| |
| At February 28, 2018, net assets consisted of: | |
| | Amount |
| | ($000) |
| Paid-in Capital | 878,125 |
| Undistributed Net Investment Income | 2,788 |
| Accumulated Net Realized Losses | (1,848) |
| Unrealized Appreciation (Depreciation) | |
| Investment Securities | (532) |
| Futures Contracts | 147 |
| Forward Currency Contracts | 1,145 |
| Foreign Currencies | 22 |
| Net Assets | 879,847 |
| |
| |
| Investor Shares—Net Assets | |
| Applicable to 10,077,400 outstanding $.001 par value shares of | |
| beneficial interest (unlimited authorization) | 204,303 |
| Net Asset Value Per Share—Investor Shares | $20.27 |
| |
| |
| Admiral Shares—Net Assets | |
| Applicable to 26,650,615 outstanding $.001 par value shares of | |
| beneficial interest (unlimited authorization) | 675,544 |
| Net Asset Value Per Share—Admiral Shares | $25.35 |
• See Note A in Notes to Financial Statements.
* Non-income-producing security.
^ Includes partial security positions on loan to broker-dealers. The total value of securities on loan is $6,154,000.
† Adjustable-rate security based upon 3-month USD LIBOR plus spread.
‡ Adjustable-rate security based upon 1-month USD LIBOR plus spread.
§ Adjustable-rate security.
1 The average or expected maturity is shorter than the final maturity shown because of the possibility of interim principal payments
and prepayments or the possibility of the issue being called.
2 The issuer was placed under federal conservatorship in September 2008; since that time, its daily operations have been managed
by the Federal Housing Finance Agency and it receives capital from the U.S. Treasury, as needed to maintain a positive net worth,
in exchange for senior preferred stock.
3 Securities with a value of $647,000 have been segregated as initial margin for open futures contracts.
4 Security exempt from registration under Rule 144A of the Securities Act of 1933. Such securities may be sold in transactions
exempt from registration, normally to qualified institutional buyers. At February 28, 2018, the aggregate value of these securities
was $44,325,000, representing 5.0% of net assets.
5 Security value determined using significant unobservable inputs.
6 Face amount denominated in euro.
7 Face amount denominated in British pounds.
8 Face amount denominated in Canadian dollars.
9 Face amount denominated in Australian dollars.
10 Face amount denominated in Swiss francs.
11 Face amount denominated in Japanese yen.
12 Scheduled principal and interest payments are guaranteed by AGM (Assured Guaranty Municipal Corporation).
13 Affiliated money market fund available only to Vanguard funds and certain trusts and accounts managed by Vanguard. Rate shown
is the 7-day yield.
14 Includes $6,435,000 of collateral received for securities on loan.
ADR—American Depositary Receipt.
GO—General Obligation Bond.
REMICS—Real Estate Mortgage Investment Conduits.
25
| | | | |
| Global Wellington Fund | | | | |
| |
| |
| Derivative Financial Instruments Outstanding as of Period End | | |
| Futures Contracts | | | | |
| | | | | ($000) |
| | | | | Value and |
| | | Number of | | Unrealized |
| | | Long (Short) | Notional | Appreciation |
| | Expiration | Contracts | Amount | (Depreciation) |
| Long Futures Contracts | | | | |
| Euro-Schatz | March 2018 | 44 | 6,010 | 4 |
| Euro-Buxl | March 2018 | 7 | 1,380 | (1) |
| 30-Year U.S. Treasury Bond | June 2018 | 3 | 430 | 1 |
| 4 |
| |
| Short Futures Contracts | | | | |
| 10-Year U.S. Treasury Note | June 2018 | (153) | (18,367) | 55 |
| Euro-Bobl | March 2018 | (138) | (22,062) | 112 |
| 5-Year U. S. Treasury Note | June 2018 | (36) | (4,102) | 9 |
| Ultra 10-Year U.S. Treasury Note | June 2018 | (29) | (3,714) | (2) |
| Ultra Long U. S. Treasury Bond | June 2018 | (27) | (4,209) | (20) |
| Long Gilt | June 2018 | (18) | (3,000) | (4) |
| Euro-OAT | March 2018 | (9) | (1,687) | (7) |
| | | | | 143 |
| | | | | 147 |
Unrealized appreciation (depreciation) on open futures contracts is required to be treated as realized gain (loss) for tax purposes.
26
| | | | | | |
| Global Wellington Fund | | | | | | |
| |
| |
| Forward Currency Contracts | | | | | | |
| | | | | | | Unrealized |
| | Contract | | | | | Appreciation |
| | Settlement | Contract Amount (000) | (Depreciation) |
| Counterparty | Date | | Receive | | Deliver | ($000) |
| J.P. Morgan Securities LLC | 3/28/18 | EUR | 937 | USD | 1,155 | (9) |
| Bank of America N.A | 3/28/18 | EUR | 589 | USD | 720 | — |
| Goldman Sachs International | 3/28/18 | EUR | 405 | USD | 500 | (5) |
| Goldman Sachs International | 3/28/18 | GBP | 255 | USD | 352 | — |
| J.P. Morgan Securities LLC | 3/28/18 | USD | 78,997 | EUR | 63,875 | 886 |
| J.P. Morgan Securities LLC | 3/28/18 | USD | 13,875 | GBP | 9,920 | 199 |
| J.P. Morgan Securities LLC | 3/28/18 | USD | 9,313 | JPY | 993,306 | (17) |
| J.P. Morgan Securities LLC | 3/28/18 | USD | 8,112 | CAD | 10,262 | 111 |
| J.P. Morgan Securities LLC | 3/28/18 | USD | 2,649 | AUD | 3,382 | 22 |
| Goldman Sachs International | 4/10/18 | USD | 1,485 | JPY | 158,000 | — |
| J.P. Morgan Securities LLC | 3/28/18 | USD | 1,033 | CHF | 964 | 10 |
| Goldman Sachs International | 3/26/18 | USD | 915 | JPY | 103,000 | (52) |
| | | | | | | 1,145 |
| AUD—Australian dollar. | | | | | | |
| CAD—Canadian dollar. | | | | | | |
| CHF—Swiss franc. | | | | | | |
| EUR—euro. | | | | | | |
| GBP—British pound. | | | | | | |
| JPY—Japanese yen. | | | | | | |
| USD—U.S. dollar. | | | | | | |
Unrealized appreciation (depreciation) on open forward currency contracts is treated as ordinary income for tax purposes.
At February 28, 2018, a counterparty had deposited in a segregated account cash of $430,000 in connection with open forward currency contracts.
See accompanying Notes, which are an integral part of the Financial Statements.
27
| |
| Global Wellington Fund | |
| |
| |
| Statement of Operations | |
| |
| | October 18, 20171 to |
| | February28,2018 |
| | ($000) |
| Investment Income | |
| Income | |
| Dividends 2 | 2,700 |
| Interest 3 | 1,745 |
| Securities Lending—Net | — |
| Total Income | 4,445 |
| Expenses | |
| Investment Advisory Fees—Note B | 321 |
| The Vanguard Group—Note C | |
| Management and Administrative—Investor Shares | 136 |
| Management and Administrative—Admiral Shares | 309 |
| Marketing and Distribution—Investor Shares | 9 |
| Marketing and Distribution—Admiral Shares | 10 |
| Custodian Fees | 20 |
| Shareholders’ Reports—Investor Shares | 7 |
| Shareholders’ Reports—Admiral Shares | 3 |
| Total Expenses | 815 |
| Expenses Paid Indirectly | (13) |
| Net Expenses | 802 |
| Net Investment Income | 3,643 |
| Realized Net Gain (Loss) | |
| Investment Securities Sold 3 | 1,789 |
| Futures Contracts | 737 |
| Forward Currency Contracts | (4,036) |
| Foreign Currencies | 137 |
| Realized Net Gain (Loss) | (1,373) |
| Change in Unrealized Appreciation (Depreciation) | |
| Investment Securities 3 | (532) |
| Futures Contracts | 147 |
| Forward Currency Contracts | 1,145 |
| Foreign Currencies | 22 |
| Change in Unrealized Appreciation (Depreciation) | 782 |
| Net Increase (Decrease) in Net Assets Resulting from Operations | 3,052 |
1 Commencement of subscription period for the fund.
2 Dividends are net of foreign withholding taxes of $48,000.
3 Interest income, realized net gain (loss), and change in unrealized appreciation (depreciation) from an affiliated company of the
fund were $210,000, ($3,000), and ($4,000), respectively. Purchases and sales are for temporary cash investment purposes.
See accompanying Notes, which are an integral part of the Financial Statements.
28
| |
| Global Wellington Fund | |
| |
| |
| Statement of Changes in Net Assets | |
| |
| | October 18, 20171 to |
| | February28,2018 |
| | ($000) |
| Increase (Decrease) in Net Assets | |
| Operations | |
| Net Investment Income | 3,643 |
| Realized Net Gain (Loss) | (1,373) |
| Change in Unrealized Appreciation (Depreciation) | 782 |
| Net Increase (Decrease) in Net Assets Resulting from Operations | 3,052 |
| Distributions | |
| Net Investment Income | |
| Investor Shares | (320) |
| Admiral Shares | (1,010) |
| Realized Capital Gain | |
| Investor Shares | — |
| Admiral Shares | — |
| Total Distributions | (1,330) |
| Capital Share Transactions | |
| Investor Shares | 203,592 |
| Admiral Shares | 674,533 |
| Net Increase (Decrease) from Capital Share Transactions | 878,125 |
| Total Increase (Decrease) | 879,847 |
| Net Assets | |
| Beginning of Period | — |
| End of Period2 | 879,847 |
1 Commencement of subscription period for the fund.
2 Net Assets—End of Period includes undistributed (overdistributed) net investment income of $2,788,000.
See accompanying Notes, which are an integral part of the Financial Statements.
29
| |
| Global Wellington Fund | |
| |
| |
| Financial Highlights | |
| |
| |
| Investor Shares | |
| | October 18, 20171, to |
| For a Share Outstanding Throughout the Period | February 28, 2018 |
| Net Asset Value, Beginning of Period | $20.00 |
| Investment Operations | |
| Net Investment Income2 | .108 |
| Net Realized and Unrealized Gain (Loss) on Investments | .206 |
| Total from Investment Operations | .314 |
| Distributions | |
| Dividends from Net Investment Income | (.044) |
| Distributions from Realized Capital Gains | — |
| Total Distributions | (. 044) |
| Net Asset Value, End of Period | $20.27 |
| Total Return3 | 1.57% |
| Ratios/Supplemental Data | |
| Net Assets, End of Period (Millions) | $204 |
| Ratio of Total Expenses to Average Net Assets | 0.46% |
| Ratio of Net Investment Income to Average Net Assets | 1.62% |
| Portfolio Turnover Rate | 27% |
The expense ratio, net investment income ratio, and turnover rate for the current period have been annualized.
1 Subscription period for the fund was October 18, 2017, to November 1, 2017, during which time all assets were held in cash. Performance
measurement began November 2, 2017, the first business day after the subscription period, at a net asset value of $20.00.
2 Calculated based on average shares outstanding.
3 Total returns do not include account service fees that may have applied in the periods shown. Fund prospectuses provide information
about any applicable account service fees.
See accompanying Notes, which are an integral part of the Financial Statements.
30
| |
| Global Wellington Fund | |
| |
| |
| Financial Highlights | |
| |
| |
| Admiral Shares | |
| | October 18, 20171, to |
| For a Share Outstanding Throughout the Period | February 28, 2018 |
| Net Asset Value, Beginning of Period | $25.00 |
| Investment Operations | |
| Net Investment Income2 | .144 |
| Net Realized and Unrealized Gain (Loss) on Investments | .264 |
| Total from Investment Operations | .408 |
| Distributions | |
| Dividends from Net Investment Income | (.058) |
| Distributions from Realized Capital Gains | — |
| Total Distributions | (. 058) |
| Net Asset Value, End of Period | $25.35 |
| Total Return3 | 1.63% |
| Ratios/Supplemental Data | |
| Net Assets, End of Period (Millions) | $676 |
| Ratio of Total Expenses to Average Net Assets | 0.36% |
| Ratio of Net Investment Income to Average Net Assets | 1.72% |
| Portfolio Turnover Rate | 27% |
The expense ratio, net investment income ratio, and turnover rate for the current period have been annualized.
1 Subscription period for the fund was October 18, 2017, to November 1, 2017, during which time all assets were held in cash. Performance
measurement began November 2, 2017, the first business day after the subscription period, at a net asset value of $25.00.
2 Calculated based on average shares outstanding.
3 Total returns do not include account service fees that may have applied in the periods shown. Fund prospectuses provide information
about any applicable account service fees.
See accompanying Notes, which are an integral part of the Financial Statements.
31
Global Wellington Fund
Notes to Financial Statements
Vanguard Global Wellington Fund is registered under the Investment Company Act of 1940 as an open-end investment company, or mutual fund. Certain of the fund’s investments are in corporate debt instruments; the issuers’ abilities to meet their obligations may be affected by economic developments in their respective industries. The fund invests in securities of foreign issuers, which may subject it to investment risks not normally associated with investing in securities of U.S. corporations. The fund offers two classes of shares: Investor Shares and Admiral Shares. Investor Shares are available to any investor who meets the fund’s minimum purchase requirements. Admiral Shares are designed for investors who meet certain administrative, service, and account-size criteria.
A. The following significant accounting policies conform to generally accepted accounting principles for U.S. investment companies. The fund consistently follows such policies in preparing its financial statements.
1. Security Valuation: Securities are valued as of the close of trading on the New York Stock Exchange (generally 4 p.m., Eastern time) on the valuation date. Equity securities are valued at the latest quoted sales prices or official closing prices taken from the primary market in which each security trades; such securities not traded on the valuation date are valued at the mean of the latest quoted bid and asked prices. Bonds and temporary cash investments are valued using the latest bid prices or using valuations based on a matrix system (which considers such factors as security prices, yields, maturities, and ratings), both as furnished by independent pricing services. Structured debt securities, including mortgages and asset-backed securities, are valued using the latest bid prices or using valuations based on a matrix system that considers such factors as issuer, tranche, nominal or option-adjusted spreads, weighted average coupon, weighted average maturity, credit enhancements, and collateral. Investments in Vanguard Market Liquidity Fund are valued at that fund’s net asset value. Securities for which market quotations are not readily available, or whose values have been affected by events occurring before the fund’s pricing time but after the close of the securities’ primary markets, are valued at their fair values calculated according to procedures adopted by the board of trustees. These procedures include obtaining quotations from an independent pricing service, monitoring news to identify significant market-or security-specific events, and evaluating changes in the values of foreign market proxies (for example, ADRs, futures contracts, or exchange-traded funds), between the time the foreign markets close and the fund’s pricing time. When fair-value pricing is employed, the prices of securities used by a fund to calculate its net asset value may differ from quoted or published prices for the same securities.
2. Foreign Currency: Securities and other assets and liabilities denominated in foreign currencies are translated into U.S. dollars using exchange rates obtained from an independent third party as of the fund’s pricing time on the valuation date. Realized gains (losses) and unrealized appreciation (depreciation) on investment securities include the effects of changes in exchange rates since the securities were purchased, combined with the effects of changes in security prices. Fluctuations in the value of other assets and liabilities resulting from changes in exchange rates are recorded as unrealized foreign currency gains (losses) until the assets or liabilities are settled in cash, at which time they are recorded as realized foreign currency gains (losses).
3. Futures Contracts: The fund uses futures contracts to invest in fixed income asset classes with greater efficiency and lower cost than is possible through direct investment, to add value when these instruments are attractively priced, or to adjust sensitivity to changes in interest rates. The primary risks associated with the use of futures contracts are imperfect correlation between
32
Global Wellington Fund
changes in market values of bonds held by the fund and the prices of futures contracts, and the possibility of an illiquid market. Counterparty risk involving futures is mitigated because a regulated clearinghouse is the counterparty instead of the clearing broker. To further mitigate counterparty risk, the fund trades futures contracts on an exchange, monitors the financial strength of its clearing brokers and clearinghouse, and has entered into clearing agreements with its clearing brokers. The clearinghouse imposes initial margin requirements to secure the fund’s performance and requires daily settlement of variation margin representing changes in the market value of each contract.
Futures contracts are valued at their quoted daily settlement prices. The notional amounts of the contracts are not recorded in the Statement of Net Assets. Fluctuations in the value of the contracts are recorded in the Statement of Assets and Liabilities as an asset (liability) and in the Statement of Operations as unrealized appreciation (depreciation) until the contracts are closed, when they are recorded as realized futures gains (losses).
During the period ended February 28, 2018, the fund’s average investments in long and short futures contracts represented less than 1% and 5% of net assets, respectively, based on the average of the notional amounts at each quarter-end during the period.
4. Forward Currency Contracts: The fund enters into forward currency contracts to protect the value of securities and related receivables and payables against changes in future foreign exchange rates. The fund’s risks in using these contracts include movement in the values of the foreign currencies relative to the U.S. dollar and the ability of the counterparties to fulfill their obligations under the contracts. The fund mitigates its counterparty risk by entering into forward currency contracts only with a diverse group of prequalified counterparties, monitoring their financial strength, entering into master netting arrangements with its counterparties, and requiring its counterparties to transfer collateral as security for their performance. In the absence of a default, the collateral pledged or received by the fund cannot be repledged, resold, or rehypothecated.
The master netting arrangements provide that, in the event of a counterparty’s default (including bankruptcy), the fund may terminate the forward currency contracts, determine the net amount owed by either party in accordance with its master netting arrangements, and sell or retain any collateral held up to the net amount owed to the fund under the master netting arrangements. The forward currency contracts contain provisions whereby a counterparty may terminate open contracts if the fund’s net assets decline below a certain level, triggering a payment by the fund if the fund is in a net liability position at the time of the termination. The payment amount would be reduced by any collateral the fund has pledged. Any assets pledged as collateral for open contracts are noted in the Statement of Net Assets. The value of collateral received or pledged is compared daily to the value of the forward currency contracts exposure with each counterparty, and any difference, if in excess of a specified minimum transfer amount, is adjusted and settled within two business days.
Forward currency contracts are valued at their quoted daily prices obtained from an independent third party, adjusted for currency risk based on the expiration date of each contract. The notional amounts of the contracts are not recorded in the Statement of Net Assets. Fluctuations in the value of the contracts are recorded in the Statement of Assets and Liabilities as an asset (liability) and in the Statement of Operations as unrealized appreciation (depreciation) until the contracts are closed, when they are recorded as realized forward currency contract gains (losses).
During the period ended February 28, 2018, the fund’s average investment in forward currency contracts represented 13% of net assets, based on the average of notional amounts at each quarter-end during the period.
33
Global Wellington Fund
5. Federal Income Taxes: The fund intends to qualify as a regulated investment company and distribute all of its taxable income. Management has analyzed the fund’s tax positions taken for the period ended February 28, 2018, and has concluded that no provision for federal income tax is required in the fund’s financial statements.
6. Distributions: Distributions to shareholders are recorded on the ex-dividend date.
7. Securities Lending: To earn additional income, the fund lends its securities to qualified institutional borrowers. Security loans are subject to termination by the fund at any time, and are required to be secured at all times by collateral in an amount at least equal to the market value of securities loaned. Daily market fluctuations could cause the value of loaned securities to be more or less than the value of the collateral received. When this occurs, the collateral is adjusted and settled on the next business day. The fund further mitigates its counterparty risk by entering into securities lending transactions only with a diverse group of prequalified counterparties, monitoring their financial strength, and entering into master securities lending agreements with its counterparties. The master securities lending agreements provide that, in the event of a counterparty’s default (including bankruptcy), the fund may terminate any loans with that borrower, determine the net amount owed, and sell or retain the collateral up to the net amount owed to the fund; however, such actions may be subject to legal proceedings. While collateral mitigates counterparty risk, in the event of a default, the fund may experience delays and costs in recovering the securities loaned. The fund invests cash collateral received in Vanguard Market Liquidity Fund, and records a liability in the Statement of Assets and Liabilities for the return of the collateral, during the period the securities are on loan. Securities lending income represents fees charged to borrowers plus income earned on invested cash collateral, less expenses associated with the loan. During the term of the loan, the fund is entitled to all distributions made on or in respect of the loaned securities.
8. Other: Dividend income is recorded on the ex-dividend date. Interest income includes income distributions received from Vanguard Market Liquidity Fund and is accrued daily. Premiums and discounts on debt securities purchased are amortized and accreted, respectively, to interest income over the lives of the respective securities. Security transactions are accounted for on the date securities are bought or sold. Costs used to determine realized gains (losses) on the sale of investment securities are those of the specific securities sold.
Each class of shares has equal rights as to assets and earnings, except that each class separately bears certain class-specific expenses related to maintenance of shareholder accounts (included in Management and Administrative expenses) and shareholder reporting. Marketing and distribution expenses are allocated to each class of shares based on a method approved by the board of trustees. Income, other non-class-specific expenses, and gains and losses on investments are allocated to each class of shares based on its relative net assets.
B. Wellington Management Company LLP provides investment advisory services to the fund for a fee calculated at an annual percentage rate of average net assets. For the period ended February 28, 2018, the investment advisory fee represented an effective annual basic rate of 0.15% of the fund’s average net assets. In accordance with the advisory contract entered into with Wellington Management Company LLP, beginning December 1, 2018, the basic fee will be subject to quarterly adjustments based on the fund’s performance relative to a combined index comprising the FTSE Developed Index and the Bloomberg Barclays Fixed Income Composite Index since December 1, 2017.
34
Global Wellington Fund
C. In accordance with the terms of a Funds’ Service Agreement (the “FSA”) between Vanguard and the fund, Vanguard furnishes to the fund corporate management, administrative, marketing, and distribution services at Vanguard’s cost of operations (as defined by the FSA). These costs of operations are allocated to the fund based on methods and guidelines approved by the board of trustees. The fund’s liability for these costs of operations is included in Payables to Vanguard on the Statement of Assets and Liabilities. All costs of operations payable to Vanguard are generally settled twice a month.
Upon the request of Vanguard, the fund may invest up to 0.40% of its net assets as capital in Vanguard. At February 28, 2018, the fund had contributed to Vanguard capital in the amount of $45,000, representing 0.01% of the fund’s net assets and 0.02% of Vanguard’s capitalization. The fund’s trustees and officers are also directors and employees, respectively, of Vanguard.
D. The fund’s custodian bank has agreed to reduce its fees when the fund maintains cash on deposit in the non-interest-bearing custody account. For the period ended February 28, 2018, custodian fee offset arrangements reduced the fund’s expenses by $13,000 (an annual rate of 0.01% of average net assets).
E. Various inputs may be used to determine the value of the fund’s investments. These inputs are summarized in three broad levels for financial statement purposes. The inputs or methodologies used to value securities are not necessarily an indication of the risk associated with investing in those securities.
Level 1—Quoted prices in active markets for identical securities.
Level 2—Other significant observable inputs (including quoted prices for similar securities, interest
rates, prepayment speeds, credit risk, etc.).
Level 3—Significant unobservable inputs (including the fund’s own assumptions used to determine
the fair value of investments). Any investments valued with significant unobservable inputs are
noted on the Statement of Net Assets.
The following table summarizes the market value of the fund’s investments as of February 28, 2018, based on the inputs used to value them:
| | | |
| | Level 1 | Level 2 | Level 3 |
| Investments | ($000) | ($000) | ($000) |
| Common Stocks | 339,605 | 217,556 | — |
| U.S. Government and Agency Obligations | — | 42,243 | — |
| Asset-Backed/Commercial Mortgage-Backed Securities | — | 14,938 | 2,428 |
| Corporate Bonds | — | 164,839 | 1,114 |
| Sovereign Bonds | — | 49,445 | — |
| Taxable Municipal Bonds | — | 7,098 | — |
| Temporary Cash Investments | 48,164 | — | — |
| Futures Contracts—Assets1 | 39 | — | — |
| Futures Contracts—Liabilities1 | (132) | — | — |
| Forward Currency Contracts—Assets | — | 1,228 | — |
| Forward Currency Contracts—Liabilities | — | (83) | — |
| Total | 387,676 | 487,264 | 3,542 |
| 1 Represents variation margin on the last day of the reporting period. | | | |
35
Global Wellington Fund
F. At February 28, 2018, the fair values of derivatives were reflected in the Statement of Assets and Liabilities as follows:
| | | |
| | Interest Rate | Currency | |
| | Contracts | Contracts | Total |
| Statement of Assets and Liabilities Caption | ($000) | ($000) | ($000) |
| Variation Margin Receivable—Futures Contracts | 39 | — | 39 |
| Unrealized Appreciation—Forward Currency Contracts | — | 1,228 | 1,228 |
| Total Assets | 39 | 1,228 | 1,267 |
| |
| Variation Margin Payable—Futures Contracts | (132) | — | (132) |
| Unrealized Depreciation —Forward Currency Contracts | — | (83) | (83) |
| Total Liabilities | (132) | (83) | (215) |
Realized net gain (loss) and the change in unrealized appreciation (depreciation) on derivatives for the period ended February 28, 2018, were:
| | | |
| Interest Rate | Currency | |
| | Contracts | Contracts | Total |
| Realized Net Gain (Loss) on Derivatives | ($000) | ($000) | ($000) |
| Futures Contracts | 737 | — | 737 |
| Forward Currency Contracts | — | (4,036) | (4,036) |
| Realized Net Gain (Loss) on Derivatives | 737 | (4,036) | (3,299) |
| |
| Change in Unrealized Appreciation (Depreciation) on Derivatives | | | |
| Futures Contracts | 147 | — | 147 |
| Forward Currency Contracts | — | 1,145 | 1,145 |
| Change in Unrealized Appreciation (Depreciation) on Derivatives | 147 | 1,145 | 1,292 |
G. Distributions are determined on a tax basis and may differ from net investment income and realized capital gains for financial reporting purposes. Differences may be permanent or temporary. Permanent differences are reclassified among capital accounts in the financial statements to reflect their tax character. Temporary differences arise when certain items of income, expense, gain, or loss are recognized in different periods for financial statement and tax purposes. These differences will reverse at some time in the future. Differences in classification may also result from the treatment of short-term gains as ordinary income for tax purposes. The fund’s tax-basis capital gains and losses are determined only at the end of each fiscal year.
At February 28, 2018, the cost of investment securities for tax purposes was $887,962,000. Net unrealized depreciation of investment securities for tax purposes was $532,000, consisting of unrealized gains of $19,176,000 on securities that had risen in value since their purchase and $19,708,000 in unrealized losses on securities that had fallen in value since their purchase.
H. During the period ended February 28, 2018, the fund purchased $825,263,000 of investment securities and sold $53,784,000 of investment securities, other than U.S. government securities and temporary cash investments. Purchases and sales of U.S. government securities were $62,275,000 and $18,807,000, respectively.
36
| | |
| Global Wellington Fund | | |
| |
| |
| |
| |
| I. Capital share transactions for each class of shares were: | | |
| | October 18, 20171 to |
| | February 28, 2018 |
| | Amount | Shares |
| | ($000) | (000) |
| Investor Shares | | |
| Issued | 252,678 | 12,482 |
| Issued in Lieu of Cash Distributions | 277 | 14 |
| Redeemed | (49,363) | (2,419) |
| Net Increase (Decrease)—Investor Shares | 203,592 | 10,077 |
| Admiral Shares | | |
| Issued | 750,372 | 29,633 |
| Issued in Lieu of Cash Distributions | 833 | 33 |
| Redeemed | (76,672) | (3,015) |
| Net Increase (Decrease) —Admiral Shares | 674,533 | 26,651 |
| 1 Commencement of subscription period for the fund. | | |
J. Management has determined that no material events or transactions occurred subsequent to February 28, 2018, that would require recognition or disclosure in these financial statements.
37
About Your Fund’s Expenses
As a shareholder of the fund, you incur ongoing costs, which include costs for portfolio management, administrative services, and shareholder reports (like this one), among others. Operating expenses, which are deducted from a fund’s gross income, directly reduce the investment return of the fund.
A fund’s expenses are expressed as a percentage of its average net assets. This figure is known as the expense ratio. The following examples are intended to help you understand the ongoing costs (in dollars) of investing in your fund and to compare these costs with those of other mutual funds. The examples are based on an investment of $1,000 made at the beginning of the period shown and held for the entire period.
The accompanying table illustrates your fund’s costs in two ways:
• Based on actual fund return. This section helps you to estimate the actual expenses that you paid over the period. The ”Ending Account Value“ shown is derived from the fund‘s actual return, and the third column shows the dollar amount that would have been paid by an investor who started with $1,000 in the fund. You may use the information here, together with the amount you invested, to estimate the expenses that you paid over the period.
To do so, simply divide your account value by $1,000 (for example, an $8,600 account value divided by $1,000 = 8.6), then multiply the result by the number given for your fund under the heading ”Expenses Paid During Period.“
• Based on hypothetical 5% yearly return. This section is intended to help you compare your fund‘s costs with those of other mutual funds. It assumes that the fund had a yearly return of 5% before expenses, but that the expense ratio is unchanged. In this case—because the return used is not the fund’s actual return—the results do not apply to your investment. The example is useful in making comparisons because the Securities and Exchange Commission requires all mutual funds to calculate expenses based on a 5% return. You can assess your fund’s costs by comparing this hypothetical example with the hypothetical examples that appear in shareholder reports of other funds.
Note that the expenses shown in the table are meant to highlight and help you compare ongoing costs only and do not reflect transaction costs incurred by the fund for buying and selling securities. Further, the expenses do not include any purchase, redemption, or account service fees described in the fund prospectus. If such fees were applied to your account, your costs would be higher. Your fund does not carry a “sales load.”
The calculations assume no shares were bought or sold during the period. Your actual costs may have been higher or lower, depending on the amount of your investment and the timing of any purchases or redemptions.
You can find more information about the fund’s expenses, including annual expense ratios, in the Financial Statements section of this report. For additional information on operating expenses and other shareholder costs, please refer to your fund’s current prospectus.
38
| | | |
| Period Ended February 28, 2018 | | | |
| | Beginning | Ending | Expenses |
| | Account Value | Account Value | Paid During |
| Global Wellington Fund | 11/2/2017 | 2/28/2018 | Period |
| Based on Actual Fund Return | | | |
| Investor Shares | $1,000.00 | $1,015.71 | $1.50 |
| Admiral Shares | 1,000.00 | 1,016.31 | 1.17 |
| Based on Hypothetical 5% Yearly Return | | | |
| Investor Shares | $1,000.00 | $1,014.68 | $1.50 |
| Admiral Shares | 1,000.00 | 1,015.00 | 1.17 |
The calculations are based on expenses incurred in the period from the fund’s November 2, 2017 inception through February 28, 2018.
The fund’s annualized expense ratios for the period are 0.46% for Investor Shares and 0.36% for Admiral Shares. The dollar amounts
shown as “Expenses Paid” are equal to the annualized expense ratio multiplied by the average account value over the period from
inception through February 28, multiplied by the number of days in that period, then divided by the number of days in the most recent
12-month period (119/365).
39
Trustees Approve Advisory Arrangement
Effective November 2017, the board of Vanguard World Fund approved the launch of Vanguard Global Wellington Fund and an investment advisory arrangement with Wellington Management Company LLP (Wellington Management). The board determined that the investment advisory arrangement was in the best interests of the fund and its prospective shareholders.
The board based its decision upon an evaluation of the advisor’s investment staff, portfolio management process, and performance. This evaluation included information provided to the board by Vanguard’s Portfolio Review Department, which is responsible for fund and advisor oversight and product management. The trustees considered the factors discussed below, among others. However, no single factor determined whether the board approved the arrangement. Rather, it was the totality of the circumstances that drove the board’s decision.
Nature, extent, and quality of services
The board considered the quality of the investment management services to be provided to the fund and took into account the organizational depth and stability of the advisor. The board considered that Wellington Management, founded in 1928, is among the nation’s oldest and most respected institutional managers.
The board concluded that the advisor’s experience, stability, depth, and performance, among other factors, warranted approval of the advisory arrangement.
Investment performance
The board determined that Wellington Management, in its management of other Vanguard funds (including Vanguard Wellington Fund, which Wellington Management has advised since its inception in 1929), has a track record of consistent performance and a disciplined investment process. The board also determined that in its management of other funds, the strategy Wellington Management will use in managing the fund has produced strong long-term returns compared with its index. Information about the fund’s performance since inception can be found in the Performance Summary section of this report.
Cost
The board concluded that the fund’s expense ratio would be well below the average expense ratio charged by funds in its peer group. Information about the fund’s expense ratio appears in the About Your Fund’s Expenses section of this report as well as in the Financial Statements section, which also includes information about the advisory fee rate.
The board did not consider the profitability of Wellington Management in determining whether to approve the advisory fee, because Wellington Management is independent of Vanguard and the advisory fee is the result of arm’s-length negotiations.
The benefit of economies of scale
The board concluded that the fund’s prospective shareholders would benefit from economies of scale because of breakpoints in the fund’s advisory fee schedule. The breakpoints reduce the effective rate of the fee as the fund’s assets increase.
The board will consider whether to renew the advisory arrangement after a one-year period.
40
Glossary
30-Day SEC Yield. A fund’s 30-day SEC yield is derived using a formula specified by the U.S. Securities and Exchange Commission. Under the formula, data related to the fund’s security holdings in the previous 30 days are used to calculate the fund’s hypothetical net income for that period, which is then annualized and divided by the fund’s estimated average net assets over the calculation period. For the purposes of this calculation, a security’s income is based on its current market yield to maturity (for bonds), its actual income (for asset-backed securities), or its projected dividend yield (for stocks). Because the SEC yield represents hypothetical annualized income, it will differ—at times significantly—from the fund’s actual experience. As a result, the fund’s income distributions may be higher or lower than implied by the SEC yield.
Average Coupon. The average interest rate paid on the fixed income securities held by a fund. It is expressed as a percentage of face value.
Average Duration. An estimate of how much the value of the bonds held by a fund will fluctuate in response to a change in interest rates. To see how the value could change, multiply the average duration by the change in rates. If interest rates rise by 1 percentage point, the value of the bonds in a fund with an average duration of five years would decline by about 5%. If rates decrease by a percentage point, the value would rise by 5%.
Average Effective Maturity. The average length of time until fixed income securities held by a fund reach maturity and are repaid, taking into consideration the possibility that the issuer may call the bond before its maturity date. The figure reflects the proportion of fund assets represented by each security; it also reflects any futures contracts held. In general, the longer the average effective maturity, the more a fund’s share price will fluctuate in response to changes in market interest rates.
Credit Quality. Credit-quality ratings are measured on a scale that generally ranges from AAA (highest) to D (lowest). U.S. Treasury, U.S. Agency, and U.S. Agency mortgage-backed securities appear under “U.S. Government.” Credit-quality ratings are obtained from Barclays and are from Moody’s, Fitch, and S&P. When ratings from all three agencies are used, the median rating is shown. When ratings from two of the agencies are used, the lower rating for each issue is shown. “Not Rated” is used to classify securities for which a rating is not available. Not rated securities include a fund’s investment in Vanguard Market Liquidity Fund or Vanguard Municipal Cash Management Fund, each of which invests in high-quality money market instruments and may serve as a cash management vehicle for the Vanguard funds, trusts, and accounts.
Dividend Yield. The current, annualized rate of dividends paid on a share of stock, divided by its current share price. For a fund, the weighted average yield for stocks it holds. The index yield is based on the current annualized rate of dividends paid on stocks in the index.
Earnings Growth Rate. The average annual rate of growth in earnings over the past five years for the stocks now in a fund.
Equity Exposure. A measure that reflects a fund’s investments in stocks and stock futures. Any holdings in short-term reserves are excluded.
Expense Ratio. A fund’s total annual operating expenses expressed as a percentage of the fund’s average net assets. The expense ratio includes management and administrative expenses, but does not include the transaction costs of buying and selling portfolio securities.
41
Foreign Holdings. The percentage of a fund represented by securities or depositary receipts of companies based outside the United States.
Inception Date. The date on which the assets of a fund (or one of its share classes) are first invested in accordance with the fund’s investment objective. For funds with a subscription period, the inception date is the day after that period ends. Investment performance is measured from the inception date.
Median Market Cap. An indicator of the size of companies in which a fund invests; the midpoint of market capitalization (market price x shares outstanding) of a fund’s stocks, weighted by the proportion of the fund’s assets invested in each stock. Stocks representing half of the fund’s assets have market capitalizations above the median, and the rest are below it.
Price/Book Ratio. The share price of a stock divided by its net worth, or book value, per share. For a fund, the weighted average price/book ratio of the stocks it holds.
Price/Earnings Ratio. The ratio of a stock’s current price to its per-share earnings over the past year. For a fund, the weighted average P/E of the stocks it holds. P/E is an indicator of market expectations about corporate prospects; the higher the P/E, the greater the expectations for a company’s future growth.
Return on Equity. The annual average rate of return generated by a company during the past five years for each dollar of shareholder’s equity (net income divided by shareholder’s equity). For a fund, the weighted average return on equity for the companies whose stocks it holds.
Short-Term Reserves. The percentage of a fund invested in highly liquid, short-term securities that can be readily converted to cash.
Turnover Rate. An indication of the fund’s trading activity. Funds with high turnover rates incur higher transaction costs and may be more likely to distribute capital gains (which may be taxable to investors). The turnover rate excludes in-kind transactions, which have minimal impact on costs.
Yield to Maturity. The rate of return an investor would receive if the fixed income securities held by a fund were held to their maturity dates.
Benchmark Information
Global Wellington Composite Index: 65% FTSE Developed Index (net of tax) and 35% Bloomberg Barclays Fixed Income Composite Index, composed of 80% Bloomberg Barclays Global Aggregate Credit Index (USD Hedged), 10% Bloomberg Barclays Global Aggregate Treasury Index (USD Hedged), and 10% Bloomberg Barclays Global Aggregate Securitized Index (USD Hedged).
42
The Global Industry Classification Standard (“GICS”) was developed by and is the exclusive property and a service mark
of MSCI Inc. (“MSCI”) and Standard and Poor’s, a division of McGraw-Hill Companies, Inc. (“S&P”), and is licensed for use
by Vanguard. Neither MSCI, S&P nor any third party involved in making or compiling the GICS or any GICS classification
makes any express or implied warranties or representations with respect to such standard or classification (or the results
to be obtained by the use thereof), and all such parties hereby expressly disclaim all warranties of originality, accuracy,
completeness, merchantability or fitness for a particular purpose with respect to any such standard or classification.
Without limiting any of the foregoing, in no event shall MSCI, S&P, any of its affiliates or any third party involved in
making or compiling the GICS or any GICS classification have any liability for any direct, indirect, special, punitive,
consequential or any other damages (including lost profits) even if notified of the possibility of such damages.
BLOOMBERG is a trademark and service mark of Bloomberg Finance L.P. BARCLAYS is a trademark and service mark of
Barclays Bank Plc, used under license. Bloomberg Finance L.P. and its affiliates, including Bloomberg Index Services Limited
BISL) (collectively, Bloomberg), or Bloomberg’s licensors, own all proprietary rights in the Bloomberg Barclays Fixed Income
Composite Index, which is composed of 80% Bloomberg Barclays Global Aggregate Credit Index (USD Hedged), 10%
Bloomberg Barclays Global Aggregate Treasury Index (USD Hedged), and 10% Bloomberg Barclays Global Aggregate
Securitized Index (USD Hedged) (the Indices or Bloomberg Barclays Indices).
Neither Barclays Bank Plc, Barclays Capital Inc., or any affiliate (collectively Barclays) or Bloomberg is the issuer or
producer of the Global Wellington Fund and neither Bloomberg nor Barclays has any responsibilities, obligations or duties
to investors in the Global Wellington Fund. The Indices are licensed for use by The Vanguard Group, Inc. (Vanguard) as the
sponsor of the Global Wellington Fund. Bloomberg and Barclays’ only relationship with Vanguard in respect to the Indices
is the licensing of the Indices, which are determined, composed and calculated by BISL, or any successor thereto, without
regard to the Issuer or the Global Wellington Fund or the owners of the Global Wellington Fund.
Additionally, Vanguard may for itself execute transaction(s) with Barclays in or relating to the Indices in connection with
the Global Wellington Fund. Investors acquire the Global Wellington Fund from Vanguard and investors neither acquire
any interest in the Indices nor enter into any relationship of any kind whatsoever with Bloomberg or Barclays upon making
an investment in the Global Wellington Fund. The Global Wellington Fund is not sponsored, endorsed, sold or promoted
by Bloomberg or Barclays. Neither Bloomberg nor Barclays makes any representation or warranty, express or implied
regarding the advisability of investing in the Global Wellington Fund or the advisability of investing in securities generally
or the ability of the Indices to track corresponding or relative market performance. Neither Bloomberg nor Barclays has
passed on the legality or suitability of the Global Wellington Fund with respect to any person or entity. Neither Bloomberg
nor Barclays is responsible for and has not participated in the determination of the timing of, prices at, or quantities of the
Global Wellington Fund to be issued. Neither Bloomberg nor Barclays has any obligation to take the needs of the Issuer
or the owners of the Global Wellington Fund or any other third party into consideration in determining, composing or
calculating the Indices. Neither Bloomberg nor Barclays has any obligation or liability in connection with administration,
marketing or trading of the Global Wellington Fund.
43
The licensing agreement between Bloomberg and Barclays is solely for the benefit of Bloomberg and Barclays and not
for the benefit of the owners of the Global Wellington Fund, investors or other third parties. In addition, the licensing
agreement between Vanguard and Bloomberg is solely for the benefit of Vanguard and Bloomberg and not for the benefit
of the owners of the Global Wellington Fund, investors or other third parties.
NEITHER BLOOMBERG NOR BARCLAYS SHALL HAVE ANY LIABILITY TO THE ISSUER, INVESTORS OR TO OTHER
THIRD PARTIES FOR THE QUALITY, ACCURACY AND/OR COMPLETENESS OF THE BLOOMBERG BARCLAYS INDICES
OR ANY DATA INCLUDED THEREIN OR FOR INTERRUPTIONS IN THE DELIVERY OF THE BLOOMBERG BARCLAYS INDICES.
NEITHER BLOOMBERG NOR BARCLAYS MAKES ANY WARRANTY, EXPRESS OR IMPLIED, AS TO RESULTS TO BE
OBTAINED BY THE ISSUER, THE INVESTORS OR ANY OTHER PERSON OR ENTITY FROM THE USE OF THE BLOOMBERG
BARCLAYS INDICES OR ANY DATA INCLUDED THEREIN. NEITHER BLOOMBERG NOR BARCLAYS MAKES ANY EXPRESS
OR IMPLIED WARRANTIES, AND EACH HEREBY EXPRESSLY DISCLAIMS ALL WARRANTIES OF MERCHANTABILITY
OR FITNESS FOR A PARTICULAR PURPOSE OR USE WITH RESPECT TO THE BLOOMBERG BARCLAYS INDICES OR
ANY DATA INCLUDED THEREIN. BLOOMBERG RESERVES THE RIGHT TO CHANGE THE METHODS OF CALCULATION
OR PUBLICATION, OR TO CEASE THE CALCULATION OR PUBLICATION OF THE BLOOMBERG BARCLAYS INDICES,
AND NEITHER BLOOMBERG NOR BARCLAYS SHALL BE LIABLE FOR ANY MISCALCULATION OF OR ANY INCORRECT,
DELAYED OR INTERRUPTED PUBLICATION WITH RESPECT TO ANY OF THE BLOOMBERG BARCLAYS INDICES. NEITHER
BLOOMBERG NOR BARCLAYS SHALL BE LIABLE FOR ANY DAMAGES, INCLUDING, WITHOUT LIMITATION, ANY
SPECIAL, INDIRECT OR CONSEQUENTIAL DAMAGES, OR ANY LOST PROFITS AND EVEN IF ADVISED OF THE
POSSIBILITY OF SUCH, RESULTING FROM THE USE OF THE BLOOMBERG BARCLAYS INDICES OR ANY DATA INCLUDED
THEREIN OR WITH RESPECT TO THE GLOBAL WELLINGTON FUND.
None of the information supplied by Bloomberg or Barclays and used in this publication may be reproduced in any manner
without the prior written permission of both Bloomberg and Barclays Capital, the investment banking division of Barclays
Bank Plc. Barclays Bank Plc is registered in England No. 1026167. Registered office 1 Churchill Place London E14 5HP.
© 2018 Bloomberg. Used with Permission.
Source: Bloomberg Index Services Limited. Copyright 2018, Bloomberg. All rights reserved.
44
This page intentionally left blank.
This page intentionally left blank.
The People Who Govern Your Fund
The trustees of your mutual fund are there to see that the fund is operated and managed in your best interests since, as a shareholder, you are a part owner of the fund. Your fund’s trustees also serve on the board of directors of The Vanguard Group, Inc., which is owned by the Vanguard funds and provides services to them on an at-cost basis.
A majority of Vanguard’s board members are independent, meaning that they have no affiliation with Vanguard or the funds they oversee, apart from the sizable personal investments they have made as private individuals. The independent board members have distinguished backgrounds in business, academia, and public service. Each of the trustees and executive officers oversees 208 Vanguard funds.
Information for each trustee and executive officer of the fund appears below. The mailing address of the trustees and officers is P.O. Box 876, Valley Forge, PA 19482. More information about the trustees is in the Statement of Additional Information, which can be obtained, without charge, by contacting Vanguard at 800-662-7447, or online at vanguard.com.
Interested Trustees1
F. William McNabb III
Born in 1957. Trustee since July 2009. Principal occupation(s) during the past five years and other experience: chairman of the board (January 2010–present) of Vanguard and of each of the investment companies served by Vanguard, trustee (2009–present) of each of the investment companies served by Vanguard, and director (2008–present) of Vanguard. Chief executive officer and president (2008–2017) of Vanguard and each of the investment companies served by Vanguard, managing director (1995–2008) of Vanguard, and director (1997–2018) of Vanguard Marketing Corporation. Director (2018–present) of UnitedHealth Group.
Mortimer J. Buckley
Born in 1969. Trustee since January 2018. Principal occupation(s) during the past five years and other experience: chief executive officer (January 2018–present) of Vanguard; chief executive officer, president, and trustee (January 2018–present) of each of the investment companies served by Vanguard; president and director (2017–present) of Vanguard; and president (February 2018–present) of Vanguard Marketing Corporation. Chief investment officer (2013–2017), managing director (2002–2017), head of the Retail Investor Group (2006–2012), and chief information officer (2001–2006) of Vanguard. Chairman of the board (2011–2017) of the Children’s Hospital of Philadelphia.
Independent Trustees
Emerson U. Fullwood
Born in 1948. Trustee since January 2008. Principal occupation(s) during the past five years and other experience: executive chief staff and marketing officer for North America and corporate vice president (retired 2008) of Xerox Corporation (document management products and services). Former president of the Worldwide Channels Group, Latin America, and Worldwide Customer Service and executive chief staff officer of Developing Markets of Xerox. Executive in residence and 2009–2010 Distinguished Minett Professor at the Rochester Institute of Technology. Lead director of SPX FLOW, Inc. (multi-industry manufacturing). Director of the University of Rochester Medical Center, the Monroe Community College Foundation, the United Way of Rochester, North Carolina A&T University, and Roberts Wesleyan College. Trustee of the University of Rochester.
Amy Gutmann
Born in 1949. Trustee since June 2006. Principal occupation(s) during the past five years and other experience: president (2004–present) of the University of Pennsylvania. Christopher H. Browne Distinguished Professor of Political Science, School of Arts and Sciences, and professor of communication, Annenberg School for Communication, with secondary faculty appointments in the Department of Philosophy, School of Arts and Sciences, and at the Graduate School of Education, University of Pennsylvania. Trustee of the National Constitution Center.
1 Mr. McNabb and Mr. Buckley are considered “interested persons,” as defined in the Investment Company Act of 1940, because
they are officers of the Vanguard funds.
JoAnn Heffernan Heisen
Born in 1950. Trustee since July 1998. Principal occupation(s) during the past five years and other experience: corporate vice president of Johnson & Johnson (pharmaceuticals/medical devices/consumer products) and member of its executive committee (1997–2008). Chief global diversity officer (retired 2008), vice president and chief information officer (1997–2006), controller (1995–1997), treasurer (1991–1995), and assistant treasurer (1989–1991) of Johnson & Johnson. Director of Skytop Lodge Corporation (hotels) and the Robert Wood Johnson Foundation. Member of the advisory board of the Institute for Women’s Leadership at Rutgers University.
F. Joseph Loughrey
Born in 1949. Trustee since October 2009. Principal occupation(s) during the past five years and other experience: president and chief operating officer (retired 2009) and vice chairman of the board (2008–2009) of Cummins Inc. (industrial machinery). Chairman of the board of Hillenbrand, Inc. (specialized consumer services), Oxfam America, and the Lumina Foundation for Education. Director of the V Foundation for Cancer Research. Member of the advisory council for the College of Arts and Letters and chair of the advisory board to the Kellogg Institute for International Studies, both at the University of Notre Dame.
Mark Loughridge
Born in 1953. Trustee since March 2012. Principal occupation(s) during the past five years and other experience: senior vice president and chief financial officer (retired 2013) of IBM (information technology services). Fiduciary member of IBM’s Retirement Plan Committee (2004–2013), senior vice president and general manager (2002–2004) of IBM Global Financing, vice president and controller (1998–2002) of IBM, and a variety of other prior management roles at IBM. Member of the Council on Chicago Booth.
Scott C. Malpass
Born in 1962. Trustee since March 2012. Principal occupation(s) during the past five years and other experience: chief investment officer (1989–present) and vice president (1996–present) of the University of Notre Dame. Assistant professor of finance at the Mendoza College of Business, University of Notre Dame, and member of the Notre Dame 403(b) Investment Committee. Chairman of the board of TIFF Advisory Services, Inc. Member of the board of Catholic Investment Services, Inc. (investment advisors), the board of advisors for Spruceview Capital Partners, and the board of superintendence of the Institute for the Works of Religion.
Deanna Mulligan
Born in 1963. Trustee since January 2018. Principal occupation(s) during the past five years and other experience: president (2010–present) and chief executive officer (2011–present) of The Guardian Life Insurance Company of America. Chief operating officer (2010–2011) and executive vice president (2008–2010) of Individual Life and Disability of The Guardian Life Insurance Company of America. Member of the board of The Guardian Life Insurance Company of America, the American Council of Life Insurers, the Partnership for New York City (business leadership), and the Committee Encouraging Corporate Philanthropy. Trustee of the Economic Club of New York and the Bruce Museum (arts and science). Member of the Advisory Council for the Stanford Graduate School of Business.
André F. Perold
Born in 1952. Trustee since December 2004. Principal occupation(s) during the past five years and other experience: George Gund Professor of Finance and Banking, Emeritus at the Harvard Business School (retired 2011). Chief investment officer and co-managing partner of HighVista Strategies LLC (private investment firm). Overseer of the Museum of Fine Arts Boston.
Sarah Bloom Raskin
Born in 1961. Trustee since January 2018. Principal occupation(s) during the past five years and other experience: deputy secretary (2014–2017) of the United States Department of the Treasury. Governor (2010–2014) of the Federal Reserve Board. Commissioner (2007–2010) of financial regulation for the State of Maryland. Member of the board of directors (2012–2014) of Neighborhood Reinvestment Corporation. Director of i(x) Investments, LLC.
Peter F. Volanakis
Born in 1955. Trustee since July 2009. Principal occupation(s) during the past five years and other experience: president and chief operating officer (retired 2010) of Corning Incorporated (communications equipment) and director of Corning Incorporated (2000–2010) and Dow Corning (2001–2010). Director (2012) of SPX Corporation (multi-industry manufacturing). Overseer of the Amos Tuck School of Business Administration, Dartmouth College (2001–2013). Chairman of the board of trustees of Colby-Sawyer College. Member of the Board of Hypertherm Inc. (industrial cutting systems, software, and consumables).
Executive Officers
Glenn Booraem
Born in 1967. Principal occupation(s) during the past five years and other experience: principal of Vanguard. Investment stewardship officer (2017–present), treasurer (2015–2017), controller (2010–2015), and assistant controller (2001–2010) of each of the investment companies served by Vanguard.
Christine M. Buchanan
Born in 1970. Principal occupation(s) during the past five years and other experience: principal of Vanguard and global head of Fund Administration at Vanguard. Treasurer (2017–present) of each of the investment companies served by Vanguard. Partner (2005–2017) at KPMG LLP (audit, tax, and advisory services).
Brian Dvorak
Born in 1973. Principal occupation(s) during the past five years and other experience: principal of Vanguard. Chief compliance officer (2017–present) of Vanguard and each of the investment companies served by Vanguard. Assistant vice president (2017–present) of Vanguard Marketing Corporation. Vice president and director of Enterprise Risk Management (2011–2013) at Oppenheimer Funds, Inc.
Thomas J. Higgins
Born in 1957. Principal occupation(s) during the past five years and other experience: principal of Vanguard. Chief financial officer (2008–present) and treasurer (1998–2008) of each of the investment companies served by Vanguard.
Peter Mahoney
Born in 1974. Principal occupation(s) during the past five years and other experience: principal of Vanguard. Controller (2015–present) of each of the investment companies served by Vanguard. Head of International Fund Services (2008–2014) at Vanguard.
Anne E. Robinson
Born in 1970. Principal occupation(s) during the past five years and other experience: general counsel (2016–present) of Vanguard. Secretary (2016–present) of Vanguard and of each of the investment companies served by Vanguard. Managing director (2016–present) of Vanguard. Director and senior vice president (2016–2018) of Vanguard Marketing Corporation. Managing director and general counsel of Global Cards and Consumer Services (2014–2016) at Citigroup. Counsel (2003–2014) at American Express.
Michael Rollings
Born in 1963. Principal occupation(s) during the past five years and other experience: finance director (2017–present) and treasurer (2017) of each of the investment companies served by Vanguard. Managing director (2016–present) of Vanguard. Chief financial officer (2016–present) of Vanguard. Director (2016–present) of Vanguard Marketing Corporation. Executive vice president and chief financial officer (2006–2016) of MassMutual Financial Group.
| |
| Vanguard Senior Management Team |
| |
| Mortimer J. Buckley | James M. Norris |
| Gregory Davis | Thomas M. Rampulla |
| John James | Karin A. Risi |
| Martha G. King | Anne E. Robinson |
| John T. Marcante | Michael Rollings |
| Chris D. McIsaac | |
Chairman Emeritus and Senior Advisor
John J. Brennan
Chairman, 1996–2009
Chief Executive Officer and President, 1996–2008
Founder
John C. Bogle
Chairman and Chief Executive Officer, 1974–1996
| |
|  |
| | P.O. Box 2600 |
| Valley Forge, PA 19482-2600 |
| |
| |
| |
| Connect with Vanguard® > vanguard.com |
| |
| |
| |
| Fund Information > 800-662-7447 |
| Direct Investor Account Services > 800-662-2739 |
| Institutional Investor Services > 800-523-1036 |
| Text Telephone for People |
| Who Are Deaf or Hard of Hearing > 800-749-7273 |
| |
| This material may be used in conjunction |
| with the offering of shares of any Vanguard |
| fund only if preceded or accompanied by |
| the fund’s current prospectus. |
| |
| All comparative mutual fund data are from Lipper, a |
| Thomson Reuters Company, or Morningstar, Inc., unless |
| otherwise noted. |
| |
| You can obtain a free copy of Vanguard’s proxy voting |
| guidelines by visiting vanguard.com/proxyreporting or by |
| calling Vanguard at 800-662-2739. The guidelines are |
| also available from the SEC’s website, sec.gov. In |
| addition, you may obtain a free report on how your fund |
| voted the proxies for securities it owned during the 12 |
| months ended June 30. To get the report, visit either |
| vanguard.com/proxyreporting or sec.gov. |
| |
| You can review and copy information about your fund at |
| the SEC’s Public Reference Room in Washington, D.C. To |
| find out more about this public service, call the SEC at |
| 202-551-8090. Information about your fund is also |
| available on the SEC’s website, and you can receive |
| copies of this information, for a fee, by sending a |
| request in either of two ways: via email addressed to |
| publicinfo@sec.gov or via regular mail addressed to the |
| Public Reference Section, Securities and Exchange |
| Commission, Washington, DC 20549-1520. |
| © 2018 The Vanguard Group, Inc. |
| All rights reserved. |
| Vanguard Marketing Corporation, Distributor. |
| |
| Q15672 042018 |

Semiannual Report | February 28, 2018
Vanguard Global Wellesley® Income Fund
Vanguard’s Principles for Investing Success
We want to give you the best chance of investment success. These principles, grounded in Vanguard’s research and experience, can put you on the right path.
Goals. Create clear, appropriate investment goals.
Balance. Develop a suitable asset allocation using broadly diversified funds.
Cost. Minimize cost.
Discipline. Maintain perspective and long-term discipline.
A single theme unites these principles: Focus on the things you can control.
We believe there is no wiser course for any investor.
| |
| Contents | |
| Your Fund’s Performance at a Glance. | 1 |
| CEO’s Perspective. | 2 |
| Advisor’s Report. | 5 |
| Fund Profile. | 9 |
| Performance Summary. | 12 |
| Financial Statements. | 13 |
| About Your Fund’s Expenses. | 38 |
| Trustees Approve Advisory Arrangement. | 40 |
| Glossary. | 41 |
Please note: The opinions expressed in this report are just that—informed opinions. They should not be considered promises
or advice. Also, please keep in mind that the information and opinions cover the period through the date on the front of this
report. Of course, the risks of investing in your fund are spelled out in the prospectus.
See the Glossary for definitions of investment terms used in this report.
About the cover: Nautical images have been part of Vanguard’s rich heritage since its start in 1975. For an
incoming ship, a lighthouse offers a beacon and safe path to shore. You can similarly depend on Vanguard to put
you first––and light the way––as you strive to meet your financial goals. Our client focus and low costs,
stemming from our unique ownership structure, assure that your interests are paramount.
Your Fund’s Performance at a Glance
• From its inception on November 2, 2017, through February 28, 2018, Vanguard Global Wellesley Income Fund returned –0.27% for Investor Shares and –0.23% for Admiral Shares. Its benchmark returned 0.04% and the average return of its peer group was –0.02%.
• The fund seeks long-term income growth, a high and sustainable level of current income, and moderate long-term capital appreciation. To do that, the fund invests 60% to 70% of its assets in U.S. and foreign investment-grade fixed income securities. The remaining assets are invested in the stocks of mid- and large-capitalization U.S. and foreign companies that have a history of delivering above-average dividends or that the fund’s advisor believes will increase the dividends they pay out.
• For this brief period, global equities advanced by single digits while the global fixed income market declined.
• Overall, security selection disappointed in both the fund’s stock and fixed income portfolios, but allocation calls added value.
| |
| Total Returns: Period Ended February 28, 2018 | |
| | Since Inception |
| Vanguard Global Wellesley Income Fund | |
| Investor Shares (Inception: 11/2/2017) | -0.27% |
| Admiral™ Shares (Inception: 11/2/2017) | -0.23 |
| Global Wellesley Income Composite Index | 0.04 |
| Mixed-Asset Target Allocation Conservative Funds Average | -0.02 |
For a benchmark description, see the Glossary.
Mixed-Asset Target Allocation Conservative Funds Average: Derived from data provided by Lipper, a Thomson Reuters Company.
Admiral Shares carry lower expenses and are available to investors who meet certain account-balance requirements.
| | | |
| Expense Ratios | | | |
| Your Fund Compared With Its Peer Group | | | |
| | Investor | Admiral | Peer Group |
| | Shares | Shares | Average |
| Global Wellesley Income Fund | 0.42% | 0.32% | 0.76% |
The fund expense ratios shown are from the prospectus dated December 21, 2017, and represent estimated costs for the current fiscal
year. For the period from inception through February 28, 2018, the fund’s annualized expense ratios were 0.43% for Investor Shares and
0.33% for Admiral Shares. The peer-group expense ratio is derived from data provided by Lipper, a Thomson Reuters Company, and
captures information through year-end 2017.
Peer group: Mixed-Asset Target Allocation Conservative Funds.
1
CEO’s Perspective

Tim Buckley
President and Chief Executive Officer
Dear Shareholder,
As I begin my tenure as Vanguard’s fourth chief executive, I’ve been reflecting on both the past and the future of the company where I have spent my entire professional career.
I feel extremely fortunate to have the chance to lead a company filled with people who come to work every day passionate about Vanguard’s core purpose: to take a stand for all investors, to treat them fairly, and to give them the best chance for investment success.
Making a real difference
When I joined Vanguard in 1991, I found a mission-driven team focused on improving lives—helping people retire more comfortably, put their children through college, and achieve financial security. I found a company with purpose in an industry ripe for improvement.
It was clear, even early in my career, that the cards were stacked against most investors. Hidden fees, performance-chasing, and poor advice were relentlessly eroding investors’ dreams.
We knew Vanguard could be different and, as a result, could make a real difference. Over the past 25 years, for example, Vanguard has lowered our funds’ asset-weighted average expense ratio
2
from 0.31% to 0.12%. And over the past decade, 94% of our funds have beaten the average annual return of their peers.1
Focused on your success
Vanguard is built for Vanguard investors—as a client-owned company, we focus solely on you, our fund shareholders. Everything we do is designed to give our clients the best chance for investment success. In my role as CEO, I intend to keep this priority front and center. We’re proud of what we’ve achieved, but we’re even more excited about what’s to come.
As I write this, we’ve experienced a period of pronounced market volatility. Strong economic growth and budding signs of inflation have raised concerns about a more aggressive Federal Reserve. Although volatility can test investors’ nerves, we sometimes think of this as “Vanguard weather”—a time when having a disciplined, low-cost, and long-term approach to investment management serves investors well.
| | | |
| Market Barometer | | | |
| | | | Total Returns |
| | | Periods Ended February 28, 2018 |
| | Six | One | Five Years |
| | Months | Year | (Annualized) |
| Stocks | | | |
| Russell 1000 Index (Large-caps) | 10.62% | 16.70% | 14.56% |
| Russell 2000 Index (Small-caps) | 8.30 | 10.51 | 12.19 |
| Russell 3000 Index (Broad U.S. market) | 10.45 | 16.22 | 14.37 |
| FTSE All-World ex US Index (International) | 7.84 | 21.50 | 6.69 |
| |
| Bonds | | | |
| Bloomberg Barclays U.S. Aggregate Bond Index | | | |
| (Broad taxable market) | -2.18% | 0.51% | 1.71% |
| Bloomberg Barclays Municipal Bond Index | | | |
| (Broad tax-exempt market) | -1.24 | 2.50 | 2.57 |
| Citigroup Three-Month U.S. Treasury Bill Index | 0.59 | 0.98 | 0.27 |
| |
| CPI | | | |
| Consumer Price Index | 1.41% | 2.21% | 1.41% |
The performance data shown represent past performance, which is not a guarantee of future results.
1 For the ten-year period through December 31, 2017, 9 of 9 Vanguard money market funds, 56 of 60 bond funds, 21 of 22 balanced funds,
and 131 of 140 stock funds, or 217 of 231 Vanguard funds, outperformed their peer-group averages. Sources: Vanguard, based on data
from Lipper, a Thomson Reuters Company.
3
Steady, time-tested guidance
Our guidance for investors, as always, is to stay the course, tune out the hyperbolic headlines, and focus on your goals and what you can control, such as costs and how much you save. This time-tested advice has served our clients well over the decades.
Regardless of how the markets perform in the short term, I’m incredibly optimistic about the future for our investors. We have a dedicated team serving you, and we will never stop striving to make Vanguard the best place for you to invest through our high-quality funds and services, advice and guidance to help you meet your financial goals, and an experience that makes you feel good about entrusting us with your hard-earned savings.
Thank you for your continued loyalty.
Sincerely,

Mortimer J. Buckley
President and Chief Executive Officer
March 19, 2018
4
Advisor’s Report
Vanguard Global Wellesley Income Fund returned –0.27% for Investor Shares and –0.23% for Admiral Shares from its November 2, 2017 inception through February 28, 2018. The fund’s composite benchmark returned 0.04%. It is weighted 65% Bloomberg Barclays Fixed Income Composite Index—comprising 80% Bloomberg Barclays Global Aggregate Credit Index (USD Hedged), 10% Bloomberg Barclays Global Aggregate Treasury Index (USD Hedged), and 10% Bloomberg Barclays Global Aggregate Securitized Index (USD Hedged)—and 35% FTSE Developed High Dividend Yield Index (net of tax).
The investment environment
From the fund’s inception through February 28, the Standard & Poor’s 500 Index returned 5.92%, the MSCI World Index returned 4.31%, and the MSCI EAFE Index returned 2.37%. The broad fixed income markets fell during this brief period. The Bloomberg Barclays U.S. Aggregate Bond Index returned –1.89% and the higher-quality Bloomberg Barclays U.S. Credit A or Better Bond Index returned –2.06%. The yield on the 10-year U.S. Treasury note reached 2.86% at the end of February, up from 2.34% at the time of the fund’s inception.
As 2017 ended, global equities posted positive returns for the seventh consecutive quarter. In the United States, encouraging economic fundamentals, tax-law changes, and low inflation boosted investor sentiment. The European economy continued on a path of broad improvement, including record-high employment and manufacturing activity and elevated consumer confidence. Developed markets in the Asia-Pacific region also rallied, helped by economic and business activity in Japan and Singapore.
On the fixed income side, interest rates rose and sovereign yield curves flattened across most developed markets as stronger economic growth and rising consumer and business confidence became global themes. U.S. fiscal policy is likely to provide more stimulus and bond supply, and the Federal Reserve appears set to continue raising short-term interest rates and shrinking its portfolio of Treasuries and mortgage-backed securities to reduce reserves. Other major central banks, still lagging the United States, are likely to wait before actively tightening monetary policies but have begun to make changes in their quantitative-easing programs. These central banks are hinting at additional changes in the future, laying the groundwork for less disruptive shifts by telegraphing their intentions to the markets.
As 2018 began, positive global economic momentum continued against a backdrop of rising volatility and a hawkish tone from the major central banks. In the United States, companies began to respond to new tax laws, and strong earnings announcements moved the S&P 500 Index to a record high at the end of January. Developed Europe and Asia-Pacific equities and sovereign yields also rose, fueled by improvements in macroeconomic fundamentals.
5
February brought a sudden change in market sentiment, and investors saw the return of volatility after an unusually long period of calm. From a macroeconomic perspective, it seems the markets finally awoke to the fact that the U.S. tax cuts and large government spending package posed upside risks to inflation, Fed policy, and bond yields. This is on top of pro-growth deregulation. Given the strong economic fundamentals backdrop, the timing of these stimulus efforts spurred some of the spike in volatility as the market grew concerned about higher interest rates and tighter liquidity.
The fund’s successes
Overall sector allocation, a residual effect of our bottom-up security selection process, contributed modestly to performance.
An overweight allocation to information technology and an underweight allocation to consumer staples helped, as did security selection in information technology, financials, and telecommunication services. Top contributors to relative performance included Sberbank and Qualcomm. The portfolio also benefited from lack of exposure to General Electric, which weakened over the period.
In the fixed income sleeve, our slightly short duration positioning was favorable, benefiting from the Fed’s third rate hike of 2017 and projections of more to come in 2018. In addition, our underweighting of investment-grade corporate credit and our avoidance of supranationals helped relative returns.
The fund’s shortfalls
Although the fund’s equity portfolio provided positive absolute returns, its results lagged the portfolio’s benchmark, the FTSE Developed High Dividend Yield Index (net of tax). The fixed income sleeve provided negative absolute and relative returns.
The equity portfolio’s relative underper-formance was driven by weak security selection, particularly within real estate, utilities, consumer staples, and health care. An overweight allocation to utilities, one of the worst-performing sectors in the index, also hurt performance. Our underweighted position in consumer discretionary, as well as a small cash position, also hindered returns. Positions in Edison International and British American Tobacco, and our avoidance of benchmark constituent Boeing, were the largest detractors from relative performance.
On the fixed income side, security selection in investment-grade corporate credit of developed countries outside the United States, and specifically within industrials, weighed on returns. The portfolio’s overweighting to asset-backed securities also hurt relative performance, as did its yield curve positioning given that the curve steepened.
The fund’s positioning
While 2017 was all about strong global growth, concerns about inflation and cyclically higher interest rates came to the fore in early 2018, pushing up volatility. Our expectations for expanded fiscal
6
policies, reduced regulations, and inflationary trade practices have not changed.
We anticipate continued volatility as fiscal and monetary policies adjust and as uncertainty from the new U.S. administration remains high. This volatility may present opportunities for the equity portion of the fund as we remain focused on identifying solid company-specific investment catalysts and mispriced individual securities, rather than investing based on broad themes. We remain disciplined in our investment process, which enables us to create a balanced portfolio that we believe should perform well in a variety of environments. We continue to focus on long-term, low-turnover investing, as we believe this approach will serve the fund’s shareholders well over time.
From the fixed income perspective, we expect that in 2018, interest rate movements will play a bigger role in relative returns than credit events. We expect the Fed will continue to raise interest rates and we will maintain a shorter-than-benchmark duration in the U.S. market. While we are inclined to expect higher yields around the developed world, we are less inclined to have large positions in certain markets until their central banks are closer to raising rates. Without a material rise in global inflation, yields on longer-maturity bonds are not expected to rise as much, resulting in flatter yield curves.
The greatest risk to our outlook is the possibility of higher trade barriers, which could lead to slower global growth. Such a scenario would likely reduce the need for central bank intervention and result in lower-than-expected yields.
On the equity side, areas such as Europe, Japan, and select emerging markets remain attractive hunting grounds for us given the increasingly rich valuations of U.S. equities. In the United States, we see the benefits from the recently enacted tax law, which will provide a boost for domestic companies and support the economic outlook for the region. Much of this looks to be priced into markets already.
We consider the recovery in Europe to be roughly two years behind the United States. We are also encouraged by continued signs of positive momentum in employment and wage numbers, as well as record-high manufacturing purchasing managers’ index data. This backdrop supports our overweight position in the region but political uncertainty there remains an area for caution.
As we saw from the market sell-off in February, the risk of market volatility remains elevated after a sustained period of strong performance across global indexes and low volatility. As valuation-oriented investors, we believe such situations can provide opportunities and we continue to embrace market corrections. While we’ve noted the moves by central banks to unwind accommodative monetary
7
policies over the last few months, we anticipate that rate normalization will be slow. Inflation pressure remains muted for now; however, we are watching for any deterioration in data, particularly with unemployment in the United States and Europe at suppressed levels that could lead to an uptick in inflation.
At the end of the period, the equity portfolio’s largest sector overweights were in real estate, materials, and information technology. The biggest underweights were in consumer discretionary and consumer staples. During the brief period since inception, we initiated new equity positions in Citigroup, TransCanada, Tokio Marine, and Sands China. We eliminated Daito Trust, BlackRock, and ENN Energy and trimmed our exposure to Persimmon.
On a country basis, we are most overweighted in the United Kingdom and China and most underweighted in Australia and Spain.
John C. Keogh
Senior Managing Director and
Fixed Income Portfolio Manager
Michael E. Stack, CFA
Senior Managing Director and
Fixed Income Portfolio Manager
Loren L. Moran, CFA
Managing Director and
Fixed Income Portfolio Manager
Ian R. Link, CFA
Senior Managing Director and
Equity Portfolio Manager
Wellington Management Company llp
March 21, 2018
8
Global Wellesley Income Fund
| | |
| Fund Profile | | |
| As of February 28, 2018 | | |
| |
| Share-Class Characteristics | |
| | Investor | Admiral |
| | Shares | Shares |
| Ticker Symbol | VGWIX | VGYAX |
| Expense Ratio1 | 0.42% | 0.32% |
| |
| Equity and Portfolio Characteristics | |
| | | Fund |
| Number of Stocks | | 69 |
| Median Market Cap | | $68.6B |
| Price/Earnings Ratio | | 12.8x |
| Price/Book Ratio | | 2.1x |
| Return on Equity | | 13.4% |
| Earnings Growth Rate | | 4.4% |
| Dividend Yield | | 3.8% |
| Foreign Holdings | | 20.8% |
| Turnover Rate | | 30% |
| Short-Term Reserves | | 3.5% |
| |
| Fixed Income Characteristics | |
| | | Fund |
| Number of Bonds | | 324 |
| Yield to Maturity (before expenses) | 2.5% |
| Average Coupon | | 2.8% |
| Average Duration | | 5.6 years |
| Average Effective Maturity | 7.6 years |
| | |
| Ten Largest Stocks (% of equity portfolio) | |
| British American | | |
| Tobacco plc | Tobacco | 2.9% |
| Wells Fargo & Co. | Diversified Banks | 2.5 |
| Royal Dutch Shell plc | Integrated Oil & Gas | 2.4 |
| Chevron Corp. | Integrated Oil & Gas | 2.4 |
| TOTAL SA | Integrated Oil & Gas | 2.3 |
| Philip Morris | | |
| International Inc. | Tobacco | 2.3 |
| Roche Holding AG | Pharmaceuticals | 2.3 |
| Merck & Co. Inc. | Pharmaceuticals | 2.3 |
| QUALCOMM Inc. | Semiconductors | 2.2 |
| Cisco Systems Inc. | Communications | |
| | Equipment | 2.1 |
| Top Ten | | 23.7% |
| Top Ten as % of Total Net Assets | 8.6% |
The holdings listed exclude any temporary cash investments and
equity index products.
Allocation by Region (% of equity exposure)
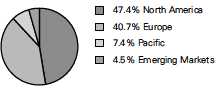
Allocation by Region (% of fixed-income exposure)
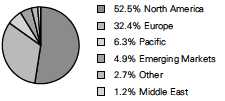
1 The expense ratios shown are from the prospectus dated December 21, 2017, and represent estimated costs for the current fiscal year.
For the period from inception through February 28, 2018, the annualized expense ratios were 0.43% for Investor Shares and 0.33% for
Admiral Shares.
9
Global Wellesley Income Fund
Fund Asset Allocation
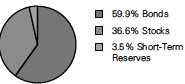
Sector Diversification (% of equity exposure)
| |
| | Fund |
| Consumer Discretionary | 5.4% |
| Consumer Staples | 8.8 |
| Energy | 10.4 |
| Financials | 21.6 |
| Health Care | 9.7 |
| Industrials | 8.7 |
| Information Technology | 11.8 |
| Materials | 7.2 |
| Other | 0.0 |
| Real Estate | 5.3 |
| Telecommunication Services | 5.2 |
| Utilities | 5.9 |
Sector categories are based on the Global Industry Classification
Standard (“GICS”), except for the “Other” category (if applicable),
which includes securities that have not been provided a GICS
classification as of the effective reporting period.
| |
| Sector Diversification (% of fixed income portfolio) | |
| Asset-Backed | 6.4% |
| Commercial Mortgage-Backed | 2.2 |
| Finance | 25.9 |
| Foreign | 18.3 |
| Government Mortgage-Backed | 3.2 |
| Industrial | 28.6 |
| Treasury/Agency | 8.1 |
| Utilities | 4.6 |
| Other | 2.7 |
The agency and mortgage-backed securities sectors may include
issues from government-sponsored enterprises; such issues are
generally not backed by the full faith and credit of the U.S.
government.
Distribution by Credit Quality (% of fixed income portfolio)
| |
| U.S. Government | 13.5% |
| Aaa | 9.7 |
| Aa | 8.5 |
| A | 31.2 |
| Baa | 37.1 |
Credit-quality ratings are obtained from Barclays and are from
Moody's, Fitch, and S&P. When ratings from all three agencies are
used, the median rating is shown. When ratings from two of the
agencies are used, the lower rating for each issue is shown. "Not
Rated" is used to classify securities for which a rating is not
available. Not rated securities include a fund's investment in
Vanguard Market Liquidity Fund or Vanguard Municipal Cash
Management Fund, each of which invests in high-quality money
market instruments and may serve as a cash management vehicle
for the Vanguard funds, trusts, and accounts. For more information
about these ratings, see the Glossary entry for Credit Quality.
Equity Investment Focus
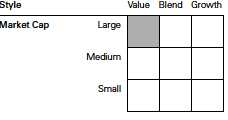
Fixed Income Investment Focus

10
Global Wellesley Income Fund
| |
| Market Diversification (% of equity exposure) |
| | Fund |
| Europe | |
| United Kingdom | 13.3% |
| Netherlands | 4.9 |
| Germany | 4.7 |
| France | 4.5 |
| Switzerland | 4.1 |
| Italy | 3.7 |
| Sweden | 2.4 |
| Belgium | 1.7 |
| Finland | 1.4 |
| Subtotal | 40.7% |
| Pacific | |
| Japan | 5.1% |
| Hong Kong | 1.3 |
| Australia | 1.0 |
| Subtotal | 7.4% |
| Emerging Markets | |
| China | 2.3% |
| Russia | 1.2 |
| Taiwan | 1.0 |
| Subtotal | 4.5% |
| North America | |
| United States | 44.8% |
| Canada | 2.6 |
| Subtotal | 47.4% |
11
Global Wellesley Income Fund
Performance Summary
All of the returns in this report represent past performance, which is not a guarantee of future results that may be achieved by the fund. (Current performance may be lower or higher than the performance data cited. For performance data current to the most recent month-end, visit our website at vanguard.com/performance.) Note, too, that both investment returns and principal value can fluctuate widely, so an investor’s shares, when sold, could be worth more or less than their original cost. The returns shown do not reflect taxes that a shareholder would pay on fund distributions or on the sale of fund shares.
Fiscal-Period Total Returns (%): November 2, 2017, Through February 28, 2018
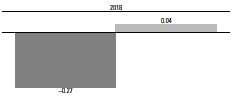
| | |
| | Global Wellesley Income Fund Investor Shares |
| | Global Wellesley Income Composite Index |
| For a benchmark description, see the Glossary. |
Total Returns: Period Ended December 31, 2017
This table presents returns through the latest calendar quarter—rather than through the end of the fiscal period.
Securities and Exchange Commission rules require that we provide this information.
| | | | |
| | | | | Since Inception |
| | Inception Date | Income | Capital | Total |
| Investor Shares | 11/2/2017 | 0.27% | 0.67% | 0.94% |
| Admiral Shares | 11/2/2017 | 0.31 | 0.67 | 0.98 |
See Financial Highlights for dividend and capital gains information.
12
Global Wellesley Income Fund
Financial Statements (unaudited)
Statement of Net Assets
As of February 28, 2018
The fund reports a complete list of its holdings in regulatory filings four times in each fiscal year, at the quarter-ends. For the second and fourth fiscal quarters, the lists appear in the fund’s semiannual and annual reports to shareholders. For the first and third fiscal quarters, the fund files the lists with the Securities and Exchange Commission on Form N-Q. Shareholders can look up the fund’s Forms N-Q on the SEC’s website at sec.gov. Forms N-Q may also be reviewed and copied at the SEC’s Public Reference Room (see the back cover of this report for further information).
| | | | | |
| | | | | Face | Market |
| | | | Maturity | Amount | Value • |
| | | Coupon | Date | ($000) | ($000) |
| U. S. Government and Agency Obligations (8.2%) | | | |
| United States (8.2%) | | | | |
| 1,2 | Fannie Mae Pool | 3.000% | 12/1/47 | 1,656 | 1,606 |
| 1,2 | Fannie Mae REMICS | 2.000% | 9/25/40 | 249 | 239 |
| 1,2 | Fannie Mae REMICS | 3.500% | 6/25/44 | 606 | 606 |
| 1,2 | Fannie Mae REMICS | 2.500% | 5/25/45 | 796 | 778 |
| 1,2 | Freddie Mac Gold Pool | 3.000% | 11/1/47–12/1/47 | 2,934 | 2,844 |
| 1,2 | Freddie Mac Gold Pool | 3.500% | 11/1/47–12/1/47 | 5,510 | 5,507 |
| 1,2 | Freddie Mac REMICS | 4.000% | 12/15/39–8/15/40 | 2,165 | 2,237 |
| 1,2 | Freddie Mac REMICS | 3.500% | 9/15/40–11/15/40 | 827 | 837 |
| 1,2 | Freddie Mac REMICS | 1.750% | 9/15/42 | 1,977 | 1,875 |
| 1 | Government National Mortgage Assn. | 2.750% | 9/20/44 | 401 | 397 |
| 3 | United States Treasury Note/Bond | 1.500% | 10/31/19 | 825 | 815 |
| | United States Treasury Note/Bond | 1.500% | 8/15/20 | 4,585 | 4,493 |
| | United States Treasury Note/Bond | 1.875% | 9/30/22 | 3,370 | 3,261 |
| | United States Treasury Note/Bond | 2.125% | 12/31/22 | 4,875 | 4,761 |
| | United States Treasury Note/Bond | 2.250% | 11/15/27 | 6,545 | 6,192 |
| | United States Treasury Note/Bond | 2.750% | 8/15/47 | 855 | 792 |
| | United States Treasury Note/Bond | 2.750% | 11/15/47 | 4,530 | 4,197 |
| | United States Treasury Strip Principal | 0.000% | 5/15/47 | 585 | 232 |
| | United States Treasury Strip Principal | 0.000% | 8/15/47 | 1,450 | 571 |
| Total U.S. Government and Agency Obligations (Cost $43,339) | | 42,240 |
| Asset-Backed/Commercial Mortgage-Backed Securities (3.8%) | | |
| Australia (0.1%) | | | | |
| 4 | National Australia Bank Ltd. | 2.400% | 12/7/21 | 675 | 662 |
| |
| Canada (0.1%) | | | | |
| 1,4,‡ | Master Credit Card Trust II Series 2018-1A | 2.051% | 7/22/24 | 835 | 840 |
| |
| Cayman Islands (1.3%) | | | | |
| 1,4,† | Atlas Senior Loan Fund V Ltd. | 2.982% | 7/16/29 | 900 | 904 |
| 1,4,† | KKR CLO 17 Ltd. | 3.062% | 4/15/29 | 875 | 881 |
| 1,4,† | Madison Park Funding XVIII Ltd. | 2.935% | 10/21/30 | 875 | 881 |
| 1,4,5,† Madison Park Funding XXX Ltd. | 0.000% | 4/15/29 | 1,570 | 1,567 |
| 1,4,† | Magnetite VII Ltd. | 2.620% | 1/15/28 | 1,510 | 1,511 |
| 1,4,† | Race Point IX CLO Ltd. | 2.932% | 10/15/30 | 870 | 874 |
| | | | | | 6,618 |
13
| | | | | |
| Global Wellesley Income Fund | | | | |
| |
| |
| |
| | | | | Face | Market |
| | | | Maturity | Amount | Value • |
| | | Coupon | Date | ($000) | ($000) |
| Spain (0.2%) | | | | |
| 6 | Bankia SA | 4.125% | 3/24/36 | 550 | 854 |
| |
| United States (2.1%) | | | | |
| 1 | AmeriCredit Automobile Receivables Trust | | | | |
| | 2014-3 | 2.580% | 9/8/20 | 490 | 490 |
| 1,4 | ARI Fleet Lease Trust 2018-A | 2.550% | 10/15/26 | 260 | 260 |
| 1,4,† Bristol Park CLO Ltd. | 3.142% | 4/15/29 | 815 | 823 |
| 1,4,‡ CARDS II Trust 2017-2 | 1.847% | 10/17/22 | 865 | 865 |
| 1,4 | Chesapeake Funding II LLC | 1.990% | 5/15/29 | 790 | 783 |
| 1,4 | Chrysler Capital Auto Receivables Trust | | | | |
| | 2016-A | 3.250% | 6/15/22 | 295 | 296 |
| 1,4,§ COLT 2018-1 Mortgage Loan Trust | 2.930% | 2/25/48 | 395 | 392 |
| 1,4,§ Deephaven Residential Mortgage Trust | | | | |
| | 2018-1 | 2.976% | 12/25/57 | 530 | 526 |
| 1,4 | First Investors Auto Owner Trust | 2.000% | 3/15/22 | 693 | 689 |
| 1,4 | First Investors Auto Owner Trust | 2.410% | 12/15/22 | 140 | 138 |
| 1,4 | GreatAmerica Leasing Receivables | | | | |
| | Funding LLC Series 2018-1 | 2.600% | 6/15/21 | 255 | 255 |
| 1,4 | GreatAmerica Leasing Receivables | | | | |
| | Funding LLC Series 2018-1 | 2.830% | 6/17/24 | 183 | 183 |
| 1,4,5 Hyundai Auto Lease Securitization Trust | | | | |
| | 2018-A | 1.950% | 3/15/19 | 599 | 599 |
| 1,4,5 Hyundai Auto Lease Securitization Trust | | | | |
| | 2018-A | 2.520% | 8/17/20 | 555 | 555 |
| 1,4,† KKR CLO 16 Ltd. | 3.235% | 1/20/29 | 435 | 438 |
| 1,4 | MMAF Equipment Finance LLC 2016-A | 1.480% | 6/15/20 | 230 | 228 |
| 1,4 | MMAF Equipment Finance LLC 2017-B | 2.210% | 10/17/22 | 205 | 202 |
| 1,4 | OneMain Direct Auto Receivables Trust | | | | |
| | 2017-2 | 2.310% | 12/14/21 | 875 | 870 |
| 1 | Santander Drive Auto Receivables Trust | | | | |
| | 2014-4 | 3.100% | 11/16/20 | 250 | 251 |
| 1 | Santander Drive Auto Receivables Trust | | | | |
| | 2016-3 | 1.890% | 6/15/21 | 630 | 627 |
| 1,4,§ Towd Point Mortgage Trust 2015-1 | 3.000% | 1/25/58 | 375 | 375 |
| 1,4 | Vantage Data Centers Issuer LLC | 4.072% | 2/16/43 | 330 | 332 |
| 1,4 | Westlake Automobile Receivables Trust | | | | |
| | 2018-1 | 2.240% | 12/15/20 | 835 | 834 |
| | | | | | 11,011 |
| Total Asset-Backed/Commercial Mortgage-Backed Securities (Cost $20,007) | | 19,985 |
| Corporate Bonds (35.5%) | | | | |
| Belgium (0.1%) | | | | |
| 7 | Anheuser-Busch InBev SA/NV | 1.750% | 3/7/25 | 325 | 434 |
| |
| Canada (0.6%) | | | | |
| | Agrium Inc. | 3.150% | 10/1/22 | 350 | 349 |
| † | Canadian Imperial Bank of Commerce | 2.320% | 6/16/22 | 700 | 704 |
| | Emera US Finance LP | 2.700% | 6/15/21 | 475 | 466 |
| | Fortis Inc. | 3.055% | 10/4/26 | 625 | 581 |
| 8 | Toronto-Dominion Bank | 1.680% | 6/8/21 | 900 | 685 |
| | TransCanada PipeLines Ltd. | 4.875% | 1/15/26 | 475 | 514 |
| | | | | | 3,299 |
14
| | | | | |
| Global Wellesley Income Fund | | | | |
| |
| |
| |
| | | | | Face | Market |
| | | | Maturity | Amount | Value • |
| | | Coupon | Date | ($000) | ($000) |
| China (0.5%) | | | | |
| | Alibaba Group Holding Ltd. | 3.125% | 11/28/21 | 1,000 | 1,000 |
| | Alibaba Group Holding Ltd. | 3.400% | 12/6/27 | 690 | 657 |
| 4 | Tencent Holdings Ltd. | 3.595% | 1/19/28 | 690 | 667 |
| | | | | | 2,324 |
| Denmark (0.4%) | | | | |
| 6 | Danske Bank A/S | 0.750% | 6/2/23 | 1,775 | 2,188 |
| |
| France (2.5%) | | | | |
| 1,6 | AXA SA | 5.125% | 7/4/43 | 750 | 1,089 |
| 6 | Banque Federative du Credit Mutuel SA | 1.250% | 1/14/25 | 2,000 | 2,495 |
| 4 | BNP Paribas SA | 3.375% | 1/9/25 | 995 | 966 |
| 6 | BNP Paribas SA | 1.500% | 11/17/25 | 1,150 | 1,417 |
| 6 | BNP Paribas SA | 2.750% | 1/27/26 | 1,000 | 1,305 |
| 6 | BPCE SA | 1.125% | 1/18/23 | 900 | 1,115 |
| 4 | BPCE SA | 5.700% | 10/22/23 | 400 | 433 |
| 1,6 | BPCE SA | 2.750% | 11/30/27 | 800 | 1,046 |
| 6 | Credit Agricole SA | 2.625% | 3/17/27 | 550 | 707 |
| 6 | Credit Agricole SA | 1.875% | 12/20/26 | 600 | 753 |
| 6 | RCI Banque SA | 0.750% | 9/26/22 | 625 | 768 |
| 6 | RCI Banque SA | 1.375% | 3/8/24 | 575 | 718 |
| | | | | | 12,812 |
| Germany (3.2%) | | | | |
| 7 | Aroundtown SA | 3.000% | 10/16/29 | 1,400 | 1,860 |
| 6 | Commerzbank AG | 4.000% | 3/30/27 | 1,700 | 2,344 |
| 6 | Daimler AG | 0.875% | 1/12/21 | 3,100 | 3,861 |
| 6 | Deutsche Bank AG | 2.375% | 1/11/23 | 1,000 | 1,290 |
| | Deutsche Bank AG | 3.700% | 5/30/24 | 800 | 779 |
| 7 | E.ON International Finance BV | 5.875% | 10/30/37 | 200 | 381 |
| 6 | E.ON SE | 1.625% | 5/22/29 | 620 | 757 |
| 7 | innogy Finance BV | 4.750% | 1/31/34 | 500 | 818 |
| 4 | Siemens Financieringsmaatschappij NV | 2.900% | 5/27/22 | 800 | 794 |
| 6 | Volkswagen International Finance NV | 1.875% | 3/30/27 | 1,200 | 1,482 |
| 6 | Volkswagen Leasing GmbH | 2.625% | 1/15/24 | 525 | 699 |
| 6 | Vonovia Finance BV | 1.750% | 1/25/27 | 1,000 | 1,236 |
| | | | | | 16,301 |
| Hong Kong (0.2%) | | | | |
| 4 | CK Hutchison International 17 II Ltd. | 2.750% | 3/29/23 | 975 | 939 |
| |
| Italy (0.1%) | | | | |
| 6 | Enel SPA | 5.625% | 6/21/27 | 425 | 703 |
| |
| Japan (0.7%) | | | | |
| | American Honda Finance Corp. | 2.000% | 11/13/19 | 1,800 | 1,784 |
| 9 | Toyota Finance Australia Ltd. | 2.500% | 12/7/20 | 2,075 | 1,607 |
| | | | | | 3,391 |
| Mexico (0.7%) | | | | |
| 6 | America Movil SAB de CV | 4.125% | 10/25/19 | 700 | 913 |
| | America Movil SAB de CV | 6.375% | 3/1/35 | 425 | 514 |
| | Coca-Cola Femsa SAB de CV | 3.875% | 11/26/23 | 650 | 665 |
| | Grupo Televisa SAB | 6.625% | 1/15/40 | 275 | 322 |
| 4 | Infraestructura Energetica Nova SAB de CV | 4.875% | 1/14/48 | 1,090 | 1,003 |
| | | | | | 3,417 |
15
| | | | | |
| Global Wellesley Income Fund | | | | |
| |
| |
| |
| | | | | Face | Market |
| | | | Maturity | Amount | Value • |
| | | Coupon | Date | ($000) | ($000) |
| Netherlands (1.8%) | | | | |
| 6 | ABN AMRO Bank NV | 2.500% | 11/29/23 | 1,025 | 1,388 |
| 1,6 | ABN AMRO Bank NV | 2.875% | 1/18/28 | 800 | 1,054 |
| 1 | ABN AMRO Bank NV | 4.400% | 3/27/28 | 600 | 605 |
| 7 | Cooperatieve Rabobank UA | 5.250% | 9/14/27 | 650 | 1,049 |
| 7 | Cooperatieve Rabobank UA | 4.625% | 5/23/29 | 200 | 311 |
| 1,6 | ING Groep NV | 3.000% | 4/11/28 | 700 | 927 |
| 1,6 | ING Groep NV | 2.500% | 2/15/29 | 800 | 1,028 |
| | Koninklijke KPN NV | 8.375% | 10/1/30 | 700 | 923 |
| | Shell International Finance BV | 4.000% | 5/10/46 | 725 | 717 |
| 6 | VIVAT NV | 2.375% | 5/17/24 | 1,225 | 1,527 |
| | | | | | 9,529 |
| Spain (2.8%) | | | | |
| 6 | Banco Bilbao Vizcaya Argentaria SA | 0.750% | 9/11/22 | 800 | 973 |
| 6 | Banco Bilbao Vizcaya Argentaria SA | 3.500% | 2/10/27 | 1,000 | 1,345 |
| 6 | Banco de Sabadell SA | 0.875% | 3/5/23 | 1,900 | 2,303 |
| 6 | CaixaBank SA | 1.125% | 1/12/23 | 2,000 | 2,441 |
| 6 | CaixaBank SA | 1.125% | 5/17/24 | 1,100 | 1,339 |
| 6 | Criteria Caixa SAU | 1.500% | 5/10/23 | 1,500 | 1,841 |
| 6 | Santander Issuances SAU | 3.250% | 4/4/26 | 1,200 | 1,590 |
| 6 | Telefonica Emisiones SAU | 2.242% | 5/27/22 | 800 | 1,048 |
| 6 | Telefonica Emisiones SAU | 1.715% | 1/12/28 | 600 | 728 |
| | Telefonica Emisiones SAU | 4.665% | 3/6/38 | 320 | 321 |
| | Telefonica Emisiones SAU | 4.895% | 3/6/48 | 530 | 529 |
| | | | | | 14,458 |
| Sweden (0.5%) | | | | |
| 6 | Skandinaviska Enskilda Banken AB | 2.000% | 2/19/21 | 675 | 871 |
| 6 | Skandinaviska Enskilda Banken AB | 0.300% | 2/17/22 | 1,475 | 1,802 |
| | | | | | 2,673 |
| Switzerland (1.1%) | | | | |
| 1,6 | Credit Suisse Group AG | 1.250% | 7/17/25 | 1,225 | 1,485 |
| 1,4 | Credit Suisse Group AG | 3.869% | 1/12/29 | 250 | 243 |
| 4 | Roche Holdings Inc. | 2.625% | 5/15/26 | 1,300 | 1,221 |
| 4,† | UBS AG | 1.959% | 12/1/20 | 2,825 | 2,829 |
| | | | | | 5,778 |
| United Kingdom (3.3%) | | | | |
| 6 | Anglo American Capital plc | 2.750% | 6/7/19 | 725 | 915 |
| 6 | Anglo American Capital plc | 1.625% | 9/18/25 | 1,135 | 1,383 |
| 6 | Aviva plc | 0.100% | 12/13/18 | 1,125 | 1,376 |
| 4 | BAT Capital Corp. | 3.222% | 8/15/24 | 675 | 651 |
| 4 | BAT Capital Corp. | 3.557% | 8/15/27 | 825 | 788 |
| 6 | BAT International Finance plc | 2.750% | 3/25/25 | 950 | 1,276 |
| 6 | BP Capital Markets plc | 2.994% | 2/18/19 | 700 | 881 |
| | BP Capital Markets plc | 3.814% | 2/10/24 | 575 | 588 |
| 7 | CPUK Finance Ltd. | 3.588% | 8/28/25 | 1,200 | 1,737 |
| 6 | FCE Bank plc | 0.869% | 9/13/21 | 1,050 | 1,297 |
| 7 | Heathrow Funding Ltd. | 6.750% | 12/3/26 | 550 | 994 |
| 1,6 | Heathrow Funding Ltd. | 1.500% | 2/11/32 | 875 | 1,058 |
| 6 | Imperial Brands Finance plc | 2.250% | 2/26/21 | 700 | 901 |
| 4 | Imperial Brands Finance plc | 4.250% | 7/21/25 | 1,000 | 1,019 |
| 6 | London Stock Exchange Group plc | 0.875% | 9/19/24 | 600 | 728 |
16
| | | | |
| Global Wellesley Income Fund | | | | |
| |
| |
| |
| | | | Face | Market |
| | | Maturity | Amount | Value • |
| | Coupon | Date | ($000) | ($000) |
| 4 Sky plc | 3.125% | 11/26/22 | 825 | 818 |
| Trinity Acquisition plc | 4.400% | 3/15/26 | 888 | 882 |
| | | | | 17,292 |
| United States (17.0%) | | | | |
| 21st Century Fox America Inc. | 6.200% | 12/15/34 | 650 | 814 |
| Abbott Laboratories | 3.400% | 11/30/23 | 875 | 871 |
| 6 Allergan Funding SCS | 1.250% | 6/1/24 | 600 | 725 |
| Allergan Funding SCS | 3.800% | 3/15/25 | 825 | 813 |
| Allergan Funding SCS | 4.750% | 3/15/45 | 325 | 322 |
| Amazon.com Inc. | 4.800% | 12/5/34 | 350 | 387 |
| 4 Amazon.com Inc. | 4.250% | 8/22/57 | 275 | 273 |
| American Electric Power Co. Inc. | 3.200% | 11/13/27 | 1,140 | 1,088 |
| 6 American International Group Inc. | 1.500% | 6/8/23 | 875 | 1,099 |
| 6 American International Group Inc. | 1.875% | 6/21/27 | 1,075 | 1,320 |
| American Tower Corp. | 5.000% | 2/15/24 | 550 | 587 |
| Amgen Inc. | 3.625% | 5/22/24 | 325 | 327 |
| Andeavor Logistics LP / Tesoro Logistics | | | | |
| Finance Corp. | 3.500% | 12/1/22 | 1,325 | 1,303 |
| Anthem Inc. | 3.500% | 8/15/24 | 325 | 321 |
| Anthem Inc. | 4.101% | 3/1/28 | 665 | 665 |
| Anthem Inc. | 4.375% | 12/1/47 | 400 | 391 |
| Apple Inc. | 2.750% | 1/13/25 | 645 | 619 |
| Ascension Health | 3.945% | 11/15/46 | 165 | 164 |
| 4 AT&T Inc. | 4.100% | 2/15/28 | 1,785 | 1,750 |
| AT&T Inc. | 4.900% | 8/14/37 | 875 | 876 |
| AutoZone Inc. | 3.700% | 4/15/22 | 720 | 729 |
| Bank of America Corp. | 3.300% | 1/11/23 | 700 | 698 |
| 1 Bank of America Corp. | 3.593% | 7/21/28 | 1,550 | 1,506 |
| † Bank of New York Mellon Corp. | 2.817% | 10/30/23 | 505 | 518 |
| Berkshire Hathaway Energy Co. | 5.150% | 11/15/43 | 10 | 11 |
| Brandywine Operating Partnership LP | 3.950% | 11/15/27 | 800 | 771 |
| Broadcom Corp. / Broadcom Cayman | | | | |
| Finance Ltd. | 3.625% | 1/15/24 | 850 | 829 |
| Capital One Financial Corp. | 4.200% | 10/29/25 | 1,000 | 992 |
| Cardinal Health Inc. | 4.500% | 11/15/44 | 350 | 335 |
| 4 Cargill Inc. | 4.760% | 11/23/45 | 400 | 442 |
| Catholic Health Initiatives Colorado GO | 4.200% | 8/1/23 | 675 | 696 |
| Celgene Corp. | 3.250% | 8/15/22 | 1,300 | 1,293 |
| Charter Communications Operating LLC / | | | | |
| Charter Communications Operating Capital | 6.384% | 10/23/35 | 500 | 564 |
| Citigroup Inc. | 2.700% | 3/30/21 | 425 | 420 |
| Citigroup Inc. | 4.600% | 3/9/26 | 650 | 671 |
| 1 Citigroup Inc. | 3.520% | 10/27/28 | 2,605 | 2,509 |
| Comcast Corp. | 6.500% | 11/15/35 | 775 | 990 |
| Commonwealth Edison Co. | 3.650% | 6/15/46 | 45 | 43 |
| Commonwealth Edison Co. | 4.000% | 3/1/48 | 265 | 266 |
| Consolidated Edison Co. of New York Inc. | 6.300% | 8/15/37 | 90 | 117 |
| Consolidated Edison Co. of New York Inc. | 4.625% | 12/1/54 | 325 | 349 |
| 4 Cox Communications Inc. | 4.600% | 8/15/47 | 850 | 817 |
| Crown Castle International Corp. | 3.800% | 2/15/28 | 1,035 | 999 |
| CVS Health Corp. | 2.875% | 6/1/26 | 1,325 | 1,205 |
| CVS Health Corp. | 5.125% | 7/20/45 | 170 | 177 |
| Devon Energy Corp. | 3.250% | 5/15/22 | 700 | 692 |
| Dignity Health California GO | 3.812% | 11/1/24 | 590 | 599 |
17
| | | | |
| Global Wellesley Income Fund | | | | |
| |
| |
| |
| | | | Face | Market |
| | | Maturity | Amount | Value • |
| | Coupon | Date | ($000) | ($000) |
| Dignity Health California GO | 4.500% | 11/1/42 | 182 | 172 |
| Discover Bank | 4.200% | 8/8/23 | 700 | 719 |
| Dominion Energy Gas Holdings LLC | 4.600% | 12/15/44 | 625 | 641 |
| Duke Energy Carolinas LLC | 3.700% | 12/1/47 | 120 | 114 |
| Duke Energy Progress LLC | 4.200% | 8/15/45 | 350 | 361 |
| Energy Transfer LP | 4.900% | 3/15/35 | 975 | 931 |
| Enterprise Products Operating LLC | 3.900% | 2/15/24 | 650 | 660 |
| Enterprise Products Operating LLC | 4.250% | 2/15/48 | 295 | 282 |
| 4 ERAC USA Finance LLC | 4.500% | 2/15/45 | 675 | 666 |
| Eversource Energy | 3.300% | 1/15/28 | 375 | 362 |
| FedEx Corp. | 3.300% | 3/15/27 | 350 | 340 |
| FirstEnergy Corp. | 3.900% | 7/15/27 | 825 | 816 |
| Florida Power & Light Co. | 3.700% | 12/1/47 | 335 | 322 |
| Ford Motor Credit Co. LLC | 3.096% | 5/4/23 | 1,150 | 1,107 |
| GE Capital International Funding Co. | | | | |
| Unlimited Co. | 4.418% | 11/15/35 | 575 | 563 |
| General Motors Co. | 4.200% | 10/1/27 | 550 | 539 |
| General Motors Financial Co. Inc. | 3.450% | 4/10/22 | 1,535 | 1,523 |
| Georgia Power Co. | 4.300% | 3/15/42 | 1,130 | 1,152 |
| Goldman Sachs Group Inc. | 2.625% | 4/25/21 | 700 | 688 |
| 1 Goldman Sachs Group Inc. | 3.272% | 9/29/25 | 1,425 | 1,367 |
| 1 Goldman Sachs Group Inc. | 3.814% | 4/23/29 | 235 | 229 |
| Goldman Sachs Group Inc. | 4.750% | 10/21/45 | 300 | 317 |
| HCP Inc. | 4.000% | 6/1/25 | 475 | 477 |
| Humana Inc. | 2.900% | 12/15/22 | 720 | 705 |
| International Paper Co. | 4.350% | 8/15/48 | 475 | 463 |
| 1 JPMorgan Chase & Co. | 3.782% | 2/1/28 | 700 | 697 |
| 1 JPMorgan Chase & Co. | 3.964% | 11/15/48 | 975 | 935 |
| Kaiser Foundation Hospitals | 4.875% | 4/1/42 | 55 | 62 |
| Kaiser Foundation Hospitals | 4.150% | 5/1/47 | 315 | 321 |
| 4 KeySpan Gas East Corp. | 2.742% | 8/15/26 | 500 | 468 |
| 7 Kraft Heinz Foods Co. | 4.125% | 7/1/27 | 550 | 814 |
| Kraft Heinz Foods Co. | 4.375% | 6/1/46 | 795 | 726 |
| Lockheed Martin Corp. | 4.700% | 5/15/46 | 307 | 333 |
| Lockheed Martin Corp. | 4.090% | 9/15/52 | 118 | 114 |
| Medtronic Inc. | 3.150% | 3/15/22 | 675 | 675 |
| Memorial Sloan-Kettering Cancer Center | | | | |
| New York GO | 4.125% | 7/1/52 | 184 | 183 |
| Mercy Health | 3.555% | 8/1/27 | 800 | 780 |
| 4 Metropolitan Life Global Funding I | 3.000% | 9/19/27 | 700 | 663 |
| Microsoft Corp. | 3.700% | 8/8/46 | 1,275 | 1,240 |
| MidAmerican Energy Co. | 4.250% | 5/1/46 | 10 | 10 |
| 6 Molson Coors Brewing Co. | 1.250% | 7/15/24 | 1,175 | 1,434 |
| Morgan Stanley | 2.750% | 5/19/22 | 700 | 684 |
| Morgan Stanley | 3.125% | 7/27/26 | 2,100 | 1,992 |
| 1 Morgan Stanley | 3.772% | 1/24/29 | 215 | 210 |
| 6 Mylan NV | 3.125% | 11/22/28 | 1,125 | 1,424 |
| National Retail Properties Inc. | 3.900% | 6/15/24 | 400 | 402 |
| National Rural Utilities Cooperative Finance | | | | |
| Corp. | 2.950% | 2/7/24 | 475 | 465 |
| 4 Northwestern Mutual Life Insurance Co. | 3.850% | 9/30/47 | 280 | 265 |
| Occidental Petroleum Corp. | 4.100% | 2/1/21 | 775 | 800 |
| Oglethorpe Power Corp. | 4.550% | 6/1/44 | 20 | 20 |
| Oglethorpe Power Corp. | 4.250% | 4/1/46 | 81 | 76 |
18
| | | | | |
| Global Wellesley Income Fund | | | | |
| |
| |
| |
| | | | | Face | Market |
| | | | Maturity | Amount | Value • |
| | | Coupon | Date | ($000) | ($000) |
| | Oglethorpe Power Corp. | 5.250% | 9/1/50 | 250 | 270 |
| | Omnicom Group Inc. | 3.650% | 11/1/24 | 350 | 348 |
| | Oracle Corp. | 3.400% | 7/8/24 | 700 | 702 |
| | Oracle Corp. | 3.250% | 11/15/27 | 285 | 276 |
| | Oracle Corp. | 4.000% | 11/15/47 | 265 | 263 |
| | Orlando Health Obligated Group | 3.777% | 10/1/28 | 190 | 189 |
| | Orlando Health Obligated Group | 4.089% | 10/1/48 | 115 | 114 |
| | Pacific Gas & Electric Co. | 2.950% | 3/1/26 | 210 | 194 |
| | Pacific Gas & Electric Co. | 6.050% | 3/1/34 | 375 | 438 |
| | Pacific Gas & Electric Co. | 5.800% | 3/1/37 | 772 | 894 |
| 4 | Penske Truck Leasing Co. LP / PTL Finance | | | | |
| | Corp. | 4.250% | 1/17/23 | 1,125 | 1,165 |
| 6 | Philip Morris International Inc. | 2.125% | 5/30/19 | 1,000 | 1,254 |
| | Philip Morris International Inc. | 2.500% | 11/2/22 | 700 | 676 |
| 6 | Philip Morris International Inc. | 2.875% | 3/3/26 | 500 | 685 |
| | PNC Bank NA | 3.250% | 1/22/28 | 990 | 958 |
| 1 | Providence St. Joseph Health Obligated | | | | |
| | Group | 3.930% | 10/1/48 | 245 | 239 |
| 4 | Santander Holdings USA Inc. | 3.700% | 3/28/22 | 1,700 | 1,690 |
| 4,5 | SBA Tower Trust | 3.448% | 3/15/23 | 755 | 755 |
| | Sempra Energy | 3.250% | 6/15/27 | 475 | 454 |
| | Sierra Pacific Power Co. | 2.600% | 5/1/26 | 180 | 168 |
| | South Carolina Electric & Gas Co. | 5.300% | 5/15/33 | 129 | 141 |
| | South Carolina Electric & Gas Co. | 5.450% | 2/1/41 | 250 | 280 |
| | South Carolina Electric & Gas Co. | 4.600% | 6/15/43 | 280 | 286 |
| | South Carolina Electric & Gas Co. | 4.100% | 6/15/46 | 30 | 29 |
| 5 | Southern California Edison Co. | 4.125% | 3/1/48 | 480 | 479 |
| | Southwestern Public Service Co. | 3.700% | 8/15/47 | 26 | 25 |
| | SSM Health Care Corp. | 3.823% | 6/1/27 | 400 | 402 |
| | Stanford Health Care | 3.795% | 11/15/48 | 100 | 98 |
| | SunTrust Bank | 3.300% | 5/15/26 | 550 | 527 |
| | Synchrony Bank | 3.000% | 6/15/22 | 550 | 537 |
| 4 | Teachers Insurance & Annuity Assn. | | | | |
| | of America | 4.900% | 9/15/44 | 1,010 | 1,100 |
| | The Kroger Co. | 3.850% | 8/1/23 | 1,175 | 1,196 |
| 6 | Thermo Fisher Scientific Inc. | 1.400% | 1/23/26 | 475 | 580 |
| | Time Warner Inc. | 3.600% | 7/15/25 | 950 | 923 |
| | UnitedHealth Group Inc. | 4.625% | 7/15/35 | 220 | 240 |
| | UnitedHealth Group Inc. | 4.200% | 1/15/47 | 80 | 81 |
| | Verizon Communications Inc. | 3.500% | 11/1/24 | 350 | 347 |
| | Verizon Communications Inc. | 4.522% | 9/15/48 | 1,475 | 1,393 |
| | Viacom Inc. | 4.250% | 9/1/23 | 875 | 895 |
| | Wells Fargo & Co. | 4.300% | 7/22/27 | 325 | 329 |
| | Wells Fargo & Co. | 4.750% | 12/7/46 | 700 | 721 |
| | Welltower Inc. | 4.000% | 6/1/25 | 325 | 327 |
| | | | | | 87,930 |
| Total Corporate Bonds (Cost $185,523) | | | | 183,468 |
| Sovereign Bonds (11.0%) | | | | |
| Australia (0.3%) | | | | |
| 9 | Commonwealth of Australia | 2.250% | 11/21/22 | 1,185 | 915 |
| 9 | Commonwealth of Australia | 2.750% | 11/21/27 | 160 | 124 |
| 9 | Commonwealth of Australia | 2.250% | 5/21/28 | 420 | 310 |
| | | | | | 1,349 |
19
| | | | | |
| Global Wellesley Income Fund | | | | |
| |
| |
| |
| | | | | Face | Market |
| | | | Maturity | Amount | Value • |
| | | Coupon | Date | ($000) | ($000) |
| Canada (1.9%) | | | | |
| 8 | Canada | 0.750% | 5/1/19 | 4,945 | 3,815 |
| 8 | Canada | 1.250% | 11/1/19 | 2,230 | 1,724 |
| 8 | Canada | 0.750% | 3/1/21 | 2,725 | 2,053 |
| 8 | Canada | 1.500% | 6/1/23 | 825 | 625 |
| 8 | Canada | 1.000% | 6/1/27 | 620 | 434 |
| 10 | Province of Ontario | 0.250% | 6/28/29 | 1,075 | 1,106 |
| | | | | | 9,757 |
| Chile (0.1%) | | | | |
| | Corp Nacional del Cobre de Chile | 3.625% | 8/1/27 | 800 | 774 |
| |
| China (0.7%) | | | | |
| 4 | Sinopec Group Overseas Development | | | | |
| | 2017 Ltd. | 3.000% | 4/12/22 | 1,225 | 1,203 |
| 4 | State Grid Overseas Investment 2016 Ltd. | 2.750% | 5/4/22 | 2,485 | 2,423 |
| | | | | | 3,626 |
| France (1.3%) | | | | |
| 6 | Electricite de France SA | 1.875% | 10/13/36 | 700 | 782 |
| 6 | Electricite de France SA | 4.500% | 11/12/40 | 1,150 | 1,842 |
| 6 | RTE Reseau de Transport d’Electricite SA | 2.875% | 9/12/23 | 1,900 | 2,603 |
| 6 | RTE Reseau de Transport d’Electricite SA | 1.875% | 10/23/37 | 1,100 | 1,336 |
| | | | | | 6,563 |
| Ireland (0.6%) | | | | |
| 6 | ESB Finance Ltd. | 3.494% | 1/12/24 | 2,075 | 2,910 |
| |
| Israel (0.1%) | | | | |
| | State of Israel | 3.250% | 1/17/28 | 540 | 524 |
| |
| Japan (2.5%) | | | | |
| 11 | Japan | 0.100% | 9/20/27 | 769,900 | 7,255 |
| 11 | Japan | 0.100% | 12/20/27 | 314,100 | 2,958 |
| | Japan Bank for International Cooperation | 2.250% | 2/24/20 | 550 | 546 |
| 11 | Japan Treasury Discount Bill | 0.000% | 3/26/18 | 88,000 | 825 |
| 11 | Japan Treasury Discount Bill | 0.000% | 4/10/18 | 172,000 | 1,612 |
| | | | | | 13,196 |
| Mexico (0.7%) | | | | |
| 4 | Mexico City Airport Trust | 5.500% | 7/31/47 | 650 | 610 |
| 6 | Petroleos Mexicanos | 3.750% | 2/21/24 | 2,350 | 3,060 |
| 4 | Petroleos Mexicanos | 6.350% | 2/12/48 | 135 | 132 |
| | | | | | 3,802 |
| Qatar (0.3%) | | | | |
| 4 | State of Qatar | 2.375% | 6/2/21 | 1,850 | 1,788 |
| |
| Saudi Arabia (0.6%) | | | | |
| 4 | Kingdom of Saudi Arabia | 2.875% | 3/4/23 | 3,280 | 3,158 |
| |
| United Arab Emirates (0.3%) | | | | |
| | Abu Dhabi Government International Bond | 3.125% | 10/11/27 | 1,435 | 1,353 |
| |
| United Kingdom (1.6%) | | | | |
| 7 | United Kingdom | 1.750% | 7/22/19 | 1,435 | 2,004 |
| 7 | United Kingdom | 1.500% | 1/22/21 | 955 | 1,339 |
| 7 | United Kingdom | 0.500% | 7/22/22 | 775 | 1,043 |
20
| | | | | |
| Global Wellesley Income Fund | | | | |
| |
| |
| |
| | | | | Face | Market |
| | | | Maturity | Amount | Value • |
| | | Coupon | Date | ($000) | ($000) |
| 7 | United Kingdom | 1.250% | 7/22/27 | 445 | 597 |
| 7 | United Kingdom | 3.500% | 1/22/45 | 1,675 | 3,056 |
| | | | | | 8,039 |
| Total Sovereign Bonds (Cost $56,564) | | | | 56,839 |
| Taxable Municipal Bonds (1.6%) | | | | |
| | Bay Area Toll Authority California Toll Bridge | | | | |
| | Revenue (San Francisco Bay Area) | 6.907% | 10/1/50 | 85 | 127 |
| | California GO | 7.550% | 4/1/39 | 420 | 632 |
| | California GO | 7.350% | 11/1/39 | 135 | 196 |
| | California GO | 7.625% | 3/1/40 | 115 | 173 |
| | Chicago IL Transit Authority Transfer Tax | | | | |
| | Receipts Revenue | 6.899% | 12/1/40 | 425 | 557 |
| | Chicago IL Transit Authority | 6.300% | 12/1/21 | 85 | 90 |
| | Georgia Municipal Electric Power Authority | | | | |
| | Revenue | 6.637% | 4/1/57 | 270 | 331 |
| | Illinois GO | 5.100% | 6/1/33 | 1,240 | 1,169 |
| 12 | Kansas Development Finance Authority | 5.371% | 5/1/26 | 960 | 1,030 |
| | Kansas Development Finance Authority | | | | |
| | Revenue | 4.927% | 4/15/45 | 350 | 377 |
| | North Texas Tollway Authority System | | | | |
| | Revenue | 6.718% | 1/1/49 | 150 | 215 |
| | Port Authority of New York & New Jersey | | | | |
| | Revenue | 4.458% | 10/1/62 | 310 | 334 |
| | San Jose California Redevelopment Agency | | | | |
| | Successor Agency Tax Allocation | 3.375% | 8/1/34 | 240 | 228 |
| | South Carolina Public Service Authority | | | | |
| | Revenue | 2.388% | 12/1/23 | 1,425 | 1,338 |
| | South Carolina Public Service Authority | | | | |
| | Revenue | 6.454% | 1/1/50 | 255 | 336 |
| | State of Connecticut | 2.990% | 1/15/23 | 835 | 810 |
| | University of California Regents Medical | | | | |
| | Center Revenue | 6.548% | 5/15/48 | 225 | 306 |
| Total Taxable Municipal Bonds (Cost $8,512) | | | | 8,249 |
| |
| | | | | Shares | |
| Common Stocks (36.8%) | | | | |
| Australia (0.4%) | | | | |
| | Sydney Airport | | | 371,103 | 1,885 |
| |
| Belgium (0.6%) | | | | |
| | Anheuser-Busch InBev SA/NV | | | 31,537 | 3,348 |
| |
| Canada (1.0%) | | | | |
| * | Nutrien Ltd. | | | 51,992 | 2,561 |
| | TransCanada Corp. | | | 56,255 | 2,433 |
| | | | | | 4,994 |
| China (0.8%) | | | | |
| | Jiangsu Expressway Co. Ltd. | | | 1,668,000 | 2,583 |
| | China Longyuan Power Group Corp. Ltd. | | | 2,617,000 | 1,727 |
| | | | | | 4,310 |
21
| | |
| Global Wellesley Income Fund | | |
| |
| |
| |
| | | Market |
| | | Value• |
| | Shares | ($000) |
| Finland (0.5%) | | |
| Nokia Oyj | 449,713 | 2,621 |
| |
| France (1.6%) | | |
| TOTAL SA | 75,966 | 4,321 |
| SES SA Class A | 143,932 | 2,295 |
| Nexity SA | 30,497 | 1,905 |
| | | 8,521 |
| Germany (1.7%) | | |
| Siemens AG | 20,467 | 2,682 |
| 4 Innogy SE | 55,164 | 2,200 |
| E.ON SE | 205,042 | 2,079 |
| Deutsche Post AG | 44,809 | 2,044 |
| | | 9,005 |
| Hong Kong (0.5%) | | |
| Sands China Ltd. | 436,000 | 2,432 |
| |
| Italy (1.4%) | | |
| Intesa Sanpaolo SPA (Registered) | 873,831 | 3,278 |
| Assicurazioni Generali SPA | 113,626 | 2,126 |
| Banca Generali SPA | 49,080 | 1,622 |
| | | 7,026 |
| Japan (1.9%) | | |
| NTT DOCOMO Inc. | 102,300 | 2,617 |
| Tokio Marine Holdings Inc. | 55,400 | 2,538 |
| Eisai Co. Ltd. | 44,900 | 2,377 |
| ITOCHU Corp. | 110,400 | 2,122 |
| | | 9,654 |
| Netherlands (1.8%) | | |
| Unilever NV | 68,636 | 3,592 |
| ING Groep NV | 200,327 | 3,516 |
| Unibail-Rodamco SE | 9,585 | 2,230 |
| | | 9,338 |
| Russia (0.5%) | | |
| Sberbank of Russia PJSC ADR | 117,800 | 2,385 |
| |
| Sweden (1.3%) | | |
| Nordea Bank AB | 265,486 | 3,013 |
| Millicom International Cellular SA | 36,956 | 2,458 |
| * Lundin Petroleum AB | 64,998 | 1,518 |
| | | 6,989 |
| Switzerland (1.5%) | | |
| Roche Holding AG | 18,679 | 4,314 |
| Zurich Insurance Group AG | 10,717 | 3,524 |
| | | 7,838 |
| Taiwan (0.4%) | | |
| Catcher Technology Co. Ltd. | 154,000 | 1,827 |
| |
| United Kingdom (4.9%) | | |
| British American Tobacco plc | 92,013 | 5,431 |
| Royal Dutch Shell plc Class B | 143,772 | 4,560 |
| AstraZeneca plc | 56,812 | 3,719 |
22
| | | |
| Global Wellesley Income Fund | | | |
| |
| |
| |
| | | | Market |
| | | | Value• |
| | | Shares | ($000) |
| Rio Tinto plc | | 44,029 | 2,360 |
| Persimmon plc | | 65,627 | 2,346 |
| SSE plc | | 118,822 | 1,997 |
| IG Group Holdings plc | | 172,413 | 1,913 |
| BT Group plc | | 555,829 | 1,834 |
| National Grid plc | | 110,529 | 1,119 |
| | | | 25,279 |
| United States (16.0%) | | | |
| Wells Fargo & Co. | | 81,388 | 4,754 |
| Chevron Corp. | | 40,471 | 4,530 |
| Philip Morris International Inc. | | 41,722 | 4,320 |
| Merck & Co. Inc. | | 78,978 | 4,282 |
| QUALCOMM Inc. | | 63,857 | 4,151 |
| Cisco Systems Inc. | | 88,661 | 3,970 |
| Intel Corp. | | 77,762 | 3,833 |
| International Paper Co. | | 62,931 | 3,750 |
| Bristol-Myers Squibb Co. | | 56,003 | 3,707 |
| Microsoft Corp. | | 39,439 | 3,698 |
| Verizon Communications Inc. | | 60,513 | 2,889 |
| Citigroup Inc. | | 35,191 | 2,657 |
| DowDuPont Inc. | | 37,652 | 2,647 |
| Caterpillar Inc. | | 17,058 | 2,638 |
| PNC Financial Services Group Inc. | | 16,207 | 2,555 |
| Eaton Corp. plc | | 31,619 | 2,552 |
| JPMorgan Chase & Co. | | 22,057 | 2,548 |
| Marsh & McLennan Cos. Inc. | | 29,906 | 2,483 |
| Kinder Morgan Inc. | | 150,458 | 2,437 |
| Maxim Integrated Products Inc. | | 38,869 | 2,369 |
| LyondellBasell Industries NV Class A | | 21,508 | 2,328 |
| L Brands Inc. | | 45,735 | 2,256 |
| MetLife Inc. | | 48,802 | 2,254 |
| Edison International | | 35,870 | 2,173 |
| Park Hotels & Resorts Inc. | | 81,647 | 2,122 |
| Brixmor Property Group Inc. | | 124,739 | 1,938 |
| Weyerhaeuser Co. | | 54,047 | 1,893 |
| Newell Brands Inc. | | 39,048 | 1,003 |
| | | | 82,737 |
| Total Common Stocks (Cost $190,926) | | | 190,189 |
| |
| | Coupon | | |
| Temporary Cash Investment (3.6%) | | | |
| Money Market Fund (3.6%) | | | |
| 13 Vanguard Market Liquidity Fund (Cost $18,351) | 1.601% | 183,516 | 18,350 |
| Total Investments (100.5%) (Cost $523,222) | | | 519,320 |
23
| |
| Global Wellesley Income Fund | |
| |
| |
| |
| |
| | Amount |
| | ($000) |
| Other Assets and Liabilities (-0.5%) | |
| Other Assets | |
| Investment in Vanguard | 27 |
| Receivables for Investment Securities Sold | 1,428 |
| Receivables for Accrued Income | 2,856 |
| Receivables for Capital Shares Issued | 603 |
| Variation Margin Receivable—Futures Contracts | 42 |
| Unrealized Appreciation—Forward Currency Contracts | 1,392 |
| Other Assets | 260 |
| Total Other Assets | 6,608 |
| Liabilities | |
| Payables for Investment Securities Purchased | (7,584) |
| Payables for Capital Shares Redeemed | (764) |
| Payables to Vanguard | (46) |
| Payables to Investment Advisor | (131) |
| Variation Margin Payable—Futures Contracts | (133) |
| Unrealized Depreciation—Forward Currency Contracts | (247) |
| Other Liabilities | (180) |
| Total Liabilities | (9,085) |
| Net Assets (100%) | 516,843 |
24
| |
| Global Wellesley Income Fund | |
| |
| |
| |
| At February 28, 2018, net assets consisted of: | |
| | Amount |
| | ($000) |
| Paid-in Capital | 521,164 |
| Undistributed Net Investment Income | 2,205 |
| Accumulated Net Realized Losses | (3,943) |
| Unrealized Appreciation (Depreciation) | |
| Investment Securities | (3,902) |
| Futures Contracts | 171 |
| Forward Currency Contracts | 1,145 |
| Foreign Currencies | 3 |
| Net Assets | 516,843 |
| |
| |
| Investor Shares—Net Assets | |
| Applicable to 5,472,783 outstanding $.001 par value shares of | |
| beneficial interest (unlimited authorization) | 108,848 |
| Net Asset Value Per Share—Investor Shares | $19.89 |
| |
| |
| Admiral Shares—Net Assets | |
| Applicable to 16,406,684 outstanding $.001 par value shares of | |
| beneficial interest (unlimited authorization) | 407,995 |
| Net Asset Value Per Share—Admiral Shares | $24.87 |
• See Note A in Notes to Financial Statements.
* Non-income-producing security.
‡ Adjustable-rate security based upon 1-month USD LIBOR plus spread.
† Adjustable-rate security based upon 3-month USD LIBOR plus spread.
§ Adjustable-rate security.
1 The average or expected maturity is shorter than the final maturity shown because of the possibility of interim principal payments
and prepayments or the possibility of the issue being called.
2 The issuer was placed under federal conservatorship in September 2008; since that time, its daily operations have been managed
by the Federal Housing Finance Agency and it receives capital from the U.S. Treasury, as needed to maintain a positive net worth,
in exchange for senior preferred stock.
3 Securities with a value of $657,000 have been segregated as initial margin for open futures contracts.
4 Security exempt from registration under Rule 144A of the Securities Act of 1933. Such securities may be sold in transactions
exempt from registration, normally to qualified institutional buyers. At February 28, 2018, the aggregate value of these securities
was $51,702,000, representing 10.0% of net assets.
5 Security value determined using significant unobservable inputs.
6 Face amount denominated in euro.
7 Face amount denominated in British pounds.
8 Face amount denominated in Canadian dollars.
9 Face amount denominated in Australian dollars.
10 Face amount denominated in Swiss francs.
11 Face amount denominated in Japanese yen.
12 Scheduled principal and interest payments are guaranteed by AGM (Assured Guaranty Municipal Corporation).
13 Affiliated money market fund available only to Vanguard funds and certain trusts and accounts managed by Vanguard. Rate shown
is the 7-day yield.
ADR—American Depositary Receipt.
GO—General Obligation Bond.
REMICs—Real Estate Mortgage Investment Conduits.
25
| | | | |
| Global Wellesley Income Fund | | | | |
| |
| |
| Derivative Financial Instruments Outstanding as of Period End | | |
| Futures Contracts | | | | |
| | | | | ($000) |
| | | | | Value and |
| | | Number of | | Unrealized |
| | | Long (Short) | Notional | Appreciation |
| | Expiration | Contracts | Amount | (Depreciation) |
| Long Futures Contracts | | | | |
| Euro-Schatz | March 2018 | 43 | 5,874 | 2 |
| Euro-Buxl | March 2018 | 8 | 1,576 | (1) |
| 30-Year U.S. Treasury Bond | June 2018 | 2 | 287 | 1 |
| 2 |
| |
| Short Futures Contracts | | | | |
| Euro-Bobl | March 2018 | (144) | (23,021) | 140 |
| 10-Year U.S. Treasury Note | June 2018 | (133) | (15,966) | 43 |
| 5-Year U. S. Treasury Note | June 2018 | (74) | (8,431) | 16 |
| Ultra 10-Year U.S. Treasury Note | June 2018 | (36) | (4,610) | (3) |
| Long Gilt | June 2018 | (28) | (4,667) | (7) |
| Ultra Long U. S. Treasury Bond | June 2018 | (17) | (2,650) | (12) |
| Euro-OAT | March 2018 | (10) | (1,875) | (8) |
| Euro-Bund | March 2018 | (5) | (973) | — |
| | | | | 169 |
| | | | | 171 |
Unrealized appreciation (depreciation) on open futures contracts is required to be treated as realized gain (loss) for tax purposes.
26
| | | | | | |
| Global Wellesley Income Fund | | | | | | |
| |
| |
| Forward Currency Contracts | | | | | | |
| | | | | | | Unrealized |
| | Contract | | | | | Appreciation |
| | | | Contract Amount (000) | |
| | Settlement | | | | | (Depreciation) |
| Counterparty | Date | | Receive | | Deliver | ($000) |
| J.P. Morgan Securities LLC | 3/28/18 | EUR | 1,048 | USD | 1,292 | (10) |
| Bank of America N.A. | 3/28/18 | EUR | 687 | USD | 840 | — |
| Goldman Sachs International | 3/28/18 | EUR | 415 | USD | 512 | (5) |
| Goldman Sachs International | 3/28/18 | GBP | 275 | USD | 379 | — |
| J.P. Morgan Securities LLC | 3/28/18 | USD | 87,300 | EUR | 70,589 | 980 |
| J.P. Morgan Securities LLC | 3/28/18 | USD | 17,250 | GBP | 12,333 | 247 |
| J.P. Morgan Securities LLC | 3/28/18 | USD | 10,214 | JPY | 1,089,369 | (18) |
| J.P. Morgan Securities LLC | 3/28/18 | USD | 9,548 | CAD | 12,078 | 130 |
| J.P. Morgan Securities LLC | 3/21/18 | USD | 4,025 | EUR | 3,380 | (106) |
| J.P. Morgan Securities LLC | 3/28/18 | USD | 2,993 | AUD | 3,821 | 24 |
| Goldman Sachs International | 3/21/18 | USD | 2,549 | GBP | 1,895 | (63) |
| Goldman Sachs International | 4/10/18 | USD | 1,617 | JPY | 172,000 | — |
| J.P. Morgan Securities LLC | 3/28/18 | USD | 1,128 | CHF | 1,052 | 11 |
| Goldman Sachs International | 3/26/18 | USD | 782 | JPY | 88,000 | (45) |
| | | | | | | 1,145 |
| AUD—Australian dollar. | | | | | | |
| CAD—Canadian dollar. | | | | | | |
| CHF—Swiss franc. | | | | | | |
| EUR—euro. | | | | | | |
| GBP—British pound. | | | | | | |
| JPY—Japanese yen. | | | | | | |
| USD—U.S. dollar. | | | | | | |
Unrealized appreciation (depreciation) on open forward currency contracts is treated as ordinary income for tax purposes.
See accompanying Notes, which are an integral part of the Financial Statements.
27
| |
| Global Wellesley Income Fund | |
| |
| |
| Statement of Operations | |
| |
| | October 18, 20171 to |
| | February28,2018 |
| | ($000) |
| Investment Income | |
| Income | |
| Dividends 2 | 1,336 |
| Interest 3 | 1,896 |
| Total Income | 3,232 |
| Expenses | |
| Investment Advisory Fees—Note B | 160 |
| The Vanguard Group—Note C | |
| Management and Administrative—Investor Shares | 73 |
| Management and Administrative—Admiral Shares | 195 |
| Marketing and Distribution—Investor Shares | 5 |
| Marketing and Distribution—Admiral Shares | 6 |
| Custodian Fees | 20 |
| Shareholders’ Reports—Investor Shares | 6 |
| Shareholders’ Reports—Admiral Shares | 2 |
| Total Expenses | 467 |
| Expenses Paid Indirectly | (12) |
| Net Expenses | 455 |
| Net Investment Income | 2,777 |
| Realized Net Gain (Loss) | |
| Investment Securities Sold 3 | 461 |
| Futures Contracts | 801 |
| Forward Currency Contracts | (4,782) |
| Foreign Currencies | 85 |
| Realized Net Gain (Loss) | (3,435) |
| Change in Unrealized Appreciation (Depreciation) | |
| Investment Securities 3 | (3,902) |
| Futures Contracts | 171 |
| Forward Currency Contracts | 1,145 |
| Foreign Currencies | 3 |
| Change in Unrealized Appreciation (Depreciation) | (2,583) |
| Net Increase (Decrease) in Net Assets Resulting from Operations | (3,241) |
1 Commencement of subscription period for the fund.
2 Dividends are net of foreign withholding taxes of $34,000.
3 Interest income, realized net gain (loss), and change in unrealized appreciation (depreciation) from an affiliated company of the fund
were $122,000, ($1,000), and ($2,000), respectively. Purchases and sales are for temporary cash investment purposes.
See accompanying Notes, which are an integral part of the Financial Statements.
28
| |
| Global Wellesley Income Fund | |
| |
| |
| Statement of Changes in Net Assets | |
| |
| | October 18, 20171 to |
| | February28,2018 |
| | ($000) |
| Increase (Decrease) in Net Assets | |
| Operations | |
| Net Investment Income | 2,777 |
| Realized Net Gain (Loss) | (3,435) |
| Change in Unrealized Appreciation (Depreciation) | (2,583) |
| Net Increase (Decrease) in Net Assets Resulting from Operations | (3,241) |
| Distributions | |
| Net Investment Income | |
| Investor Shares | (230) |
| Admiral Shares | (850) |
| Realized Capital Gain | |
| Investor Shares | — |
| Admiral Shares | — |
| Total Distributions | (1,080) |
| Capital Share Transactions | |
| Investor Shares | 109,735 |
| Admiral Shares | 411,429 |
| Net Increase (Decrease) from Capital Share Transactions | 521,164 |
| Total Increase (Decrease) | 516,843 |
| Net Assets | |
| Beginning of Period | — |
| End of Period2 | 516,843 |
1 Commencement of subscription period for the fund.
2 Net Assets—End of Period includes undistributed (overdistributed) net investment income of $2,205,000.
See accompanying Notes, which are an integral part of the Financial Statements.
29
| |
| Global Wellesley Income Fund | |
| |
| |
| Financial Highlights | |
| |
| |
| Investor Shares | |
| | October 18, 20171 to |
| For a Share Outstanding Throughout the Period | February 28, 2018 |
| Net Asset Value, Beginning of Period | $20.00 |
| Investment Operations | |
| Net Investment Income2 | .132 |
| Net Realized and Unrealized Gain (Loss) on Investments | (.185) |
| Total from Investment Operations | (.053) |
| Distributions | |
| Dividends from Net Investment Income | (.057) |
| Distributions from Realized Capital Gains | — |
| Total Distributions | (. 057) |
| Net Asset Value, End of Period | $19.89 |
| Total Return3 | -0.27% |
| Ratios/Supplemental Data | |
| Net Assets, End of Period (Millions) | $109 |
| Ratio of Total Expenses to Average Net Assets | 0.43% |
| Ratio of Net Investment Income to Average Net Assets | 2.01% |
| Portfolio Turnover Rate | 30% |
The expense ratio, net investment income ratio, and turnover rate for the current period have been annualized.
1 Subscription period for the fund was October 18, 2017, to November 1, 2017, during which time all assets were held in cash.
Performance measurement began November 2, 2017, the first business day after the subscription period, at a net asset value of $20.00.
2 Calculated based on average shares outstanding.
3 Total returns do not include account service fees that may have applied in the periods shown. Fund prospectuses provide information
about any applicable account service fees.
See accompanying Notes, which are an integral part of the Financial Statements.
30
| |
| Global Wellesley Income Fund | |
| |
| |
| Financial Highlights | |
| |
| |
| Admiral Shares | |
| | October 18, 20171 to |
| For a Share Outstanding Throughout the Period | February 28, 2018 |
| Net Asset Value, Beginning of Period | $25.00 |
| Investment Operations | |
| Net Investment Income2 | .173 |
| Net Realized and Unrealized Gain (Loss) on Investments | (.229) |
| Total from Investment Operations | (. 056) |
| Distributions | |
| Dividends from Net Investment Income | (.074) |
| Distributions from Realized Capital Gains | — |
| Total Distributions | (. 074) |
| Net Asset Value, End of Period | $24.87 |
| Total Return3 | -0.23% |
| Ratios/Supplemental Data | |
| Net Assets, End of Period (Millions) | $408 |
| Ratio of Total Expenses to Average Net Assets | 0.33% |
| Ratio of Net Investment Income to Average Net Assets | 2.11% |
| Portfolio Turnover Rate | 30% |
The expense ratio, net investment income ratio, and turnover rate for the current period have been annualized.
1 Subscription period for the fund was October 18, 2017, to November 1, 2017, during which time all assets were held in cash.
Performance measurement began November 2, 2017, the first business day after the subscription period, at a net asset value of $25.00.
2 Calculated based on average shares outstanding.
3 Total returns do not include account service fees that may have applied in the periods shown. Fund prospectuses provide information
about any applicable account service fees.
See accompanying Notes, which are an integral part of the Financial Statements.
31
Global Wellesley Income Fund
Notes to Financial Statements
Vanguard Global Wellesley Income Fund is registered under the Investment Company Act of 1940 as an open-end investment company, or mutual fund. Certain of the fund’s investments are in corporate debt instruments; the issuers’ abilities to meet their obligations may be affected by economic developments in their respective industries. The fund invests in securities of foreign issuers, which may subject it to investment risks not normally associated with investing in securities of U.S. corporations. The fund offers two classes of shares: Investor Shares and Admiral Shares. Investor Shares are available to any investor who meets the fund’s minimum purchase requirements. Admiral Shares are designed for investors who meet certain administrative, service, and account-size criteria.
A. The following significant accounting policies conform to generally accepted accounting principles for U.S. investment companies. The fund consistently follows such policies in preparing its financial statements.
1. Security Valuation: Securities are valued as of the close of trading on the New York Stock Exchange (generally 4 p.m., Eastern time) on the valuation date. Equity securities are valued at the latest quoted sales prices or official closing prices taken from the primary market in which each security trades; such securities not traded on the valuation date are valued at the mean of the latest quoted bid and asked prices. Bonds and temporary cash investments are valued using the latest bid prices or using valuations based on a matrix system (which considers such factors as security prices, yields, maturities, and ratings), both as furnished by independent pricing services. Structured debt securities, including mortgages and asset-backed securities, are valued using the latest bid prices or using valuations based on a matrix system that considers such factors as issuer, tranche, nominal or option-adjusted spreads, weighted average coupon, weighted average maturity, credit enhancements, and collateral. Investments in Vanguard Market Liquidity Fund are valued at that fund’s net asset value. Securities for which market quotations are not readily available, or whose values have been affected by events occurring before the fund’s pricing time but after the close of the securities’ primary markets, are valued at their fair values calculated according to procedures adopted by the board of trustees. These procedures include obtaining quotations from an independent pricing service, monitoring news to identify significant market- or security-specific events, and evaluating changes in the values of foreign market proxies (for example, ADRs, futures contracts, or exchange-traded funds), between the time the foreign markets close and the fund’s pricing time. When fair-value pricing is employed, the prices of securities used by a fund to calculate its net asset value may differ from quoted or published prices for the same securities.
2. Foreign Currency: Securities and other assets and liabilities denominated in foreign currencies are translated into U.S. dollars using exchange rates obtained from an independent third party as of the fund’s pricing time on the valuation date. Realized gains (losses) and unrealized appreciation (depreciation) on investment securities include the effects of changes in exchange rates since the securities were purchased, combined with the effects of changes in security prices. Fluctuations in the value of other assets and liabilities resulting from changes in exchange rates are recorded as unrealized foreign currency gains (losses) until the assets or liabilities are settled in cash, at which time they are recorded as realized foreign currency gains (losses).
32
Global Wellesley Income Fund
3. Futures Contracts: The fund uses futures contracts to invest in fixed income asset classes with greater efficiency and lower cost than is possible through direct investment, to add value when these instruments are attractively priced, or to adjust sensitivity to changes in interest rates. The primary risks associated with the use of futures contracts are imperfect correlation between changes in market values of bonds held by the fund and the prices of futures contracts, and the possibility of an illiquid market. Counterparty risk involving futures is mitigated because a regulated clearinghouse is the counterparty instead of the clearing broker. To further mitigate counterparty risk, the fund trades futures contracts on an exchange, monitors the financial strength of its clearing brokers and clearinghouse, and has entered into clearing agreements with its clearing brokers. The clearinghouse imposes initial margin requirements to secure the fund’s performance and requires daily settlement of variation margin representing changes in the market value of each contract.
Futures contracts are valued at their quoted daily settlement prices. The notional amounts of the contracts are not recorded in the Statement of Net Assets. Fluctuations in the value of the contracts are recorded in the Statement of Net Assets as an asset (liability) and in the Statement of Operations as unrealized appreciation (depreciation) until the contracts are closed, when they are recorded as realized futures gains (losses).
During the period ended February 28, 2018, the fund’s average investments in long and short futures contracts represented less than 1% and 10% of net assets, respectively, based on the average of the notional amounts at each quarter-end during the period.
4. Forward Currency Contracts: The fund enters into forward currency contracts to protect the value of securities and related receivables and payables against changes in future foreign exchange rates. The fund’s risks in using these contracts include movement in the values of the foreign currencies relative to the U.S. dollar and the ability of the counterparties to fulfill their obligations under the contracts. The fund mitigates its counterparty risk by entering into forward currency contracts only with a diverse group of prequalified counterparties, monitoring their financial strength, entering into master netting arrangements with its counterparties, and requiring its counterparties to transfer collateral as security for their performance. In the absence of a default, the collateral pledged or received by the fund cannot be repledged, resold, or rehypothecated. The master netting arrangements provide that, in the event of a counterparty’s default (including bankruptcy), the fund may terminate the forward currency contracts, determine the net amount owed by either party in accordance with its master netting arrangements, and sell or retain any collateral held up to the net amount owed to the fund under the master netting arrangements. The forward currency contracts contain provisions whereby a counterparty may terminate open contracts if the fund’s net assets decline below a certain level, triggering a payment by the fund if the fund is in a net liability position at the time of the termination. The payment amount would be reduced by any collateral the fund has pledged. Any assets pledged as collateral for open contracts are noted in the Statement of Net Assets. The value of collateral received or pledged is compared daily to the value of the forward currency contracts exposure with each counterparty, and any difference, if in excess of a specified minimum transfer amount, is adjusted and settled within two business days.
33
Global Wellesley Income Fund
Forward currency contracts are valued at their quoted daily prices obtained from an independent third party, adjusted for currency risk based on the expiration date of each contract. The notional amounts of the contracts are not recorded in the Statement of Net Assets. Fluctuations in the value of the contracts are recorded in the Statement of Net Assets as an asset (liability) and in the Statement of Operations as unrealized appreciation (depreciation) until the contracts are closed, when they are recorded as realized forward currency contract gains (losses).
During the period ended February 28, 2018, the fund’s average investment in forward currency contracts represented 26% of net assets, based on the average of notional amounts at each quarter-end during the period.
5. Federal Income Taxes: The fund intends to qualify as a regulated investment company and distribute all of its taxable income. Management has analyzed the fund’s tax positions taken for the period ended February 28, 2018, and has concluded that no provision for federal income tax is required in the fund’s financial statements.
6. Distributions: Distributions to shareholders are recorded on the ex-dividend date.
7. Other: Dividend income is recorded on the ex-dividend date. Interest income includes income distributions received from Vanguard Market Liquidity Fund and is accrued daily. Premiums and discounts on debt securities purchased are amortized and accreted, respectively, to interest income over the lives of the respective securities. Security transactions are accounted for on the date securities are bought or sold. Costs used to determine realized gains (losses) on the sale of investment securities are those of the specific securities sold.
Each class of shares has equal rights as to assets and earnings, except that each class separately bears certain class-specific expenses related to maintenance of shareholder accounts (included in Management and Administrative expenses) and shareholder reporting. Marketing and distribution expenses are allocated to each class of shares based on a method approved by the board of trustees. Income, other non-class-specific expenses, and gains and losses on investments are allocated to each class of shares based on its relative net assets.
B. Wellington Management Company llp provides investment advisory services to the fund for a fee calculated at an annual percentage rate of average net assets. For the period ended February 28, 2018, the investment advisory fee represented an effective annual basic rate of 0.12% of the fund’s average net assets. In accordance with the advisory contract entered into with Wellington Management Company llp, beginning December 1, 2018, the basic fee will be subject to quarterly adjustments based on the fund’s performance relative to a combined index comprising the Bloomberg Barclays Fixed Income Composite Index and the FTSE High Dividend Yield Index since December 1, 2017.
C. In accordance with the terms of a Funds’ Service Agreement (the “FSA”) between Vanguard and the fund, Vanguard furnishes to the fund corporate management, administrative, marketing, and distribution services at Vanguard’s cost of operations (as defined by the FSA). These costs of operations are allocated to the fund based on methods and guidelines approved by the board of trustees. The fund’s liability for these costs of operations is included in Payables to Vanguard on the Statement of Net Assets. All costs of operations payable to Vanguard are generally settled twice a month.
34
Global Wellesley Income Fund
Upon the request of Vanguard, the fund may invest up to 0.40% of its net assets as capital in Vanguard. At February 28, 2018, the fund had contributed to Vanguard capital in the amount of $27,000, representing 0.01% of the fund’s net assets and 0.01% of Vanguard’s capitalization. The fund’s trustees and officers are also directors and employees, respectively, of Vanguard.
D. The fund’s custodian bank has agreed to reduce its fees when the fund maintains cash on deposit in the non-interest-bearing custody account. For the period ended February 28, 2018, custodian fee offset arrangements reduced the fund’s expenses by $12,000 (an annual rate of 0.01% of average net assets).
E. Various inputs may be used to determine the value of the fund’s investments. These inputs are summarized in three broad levels for financial statement purposes. The inputs or methodologies used to value securities are not necessarily an indication of the risk associated with investing in those securities.
Level 1—Quoted prices in active markets for identical securities.
Level 2—Other significant observable inputs (including quoted prices for similar securities, interest
rates, prepayment speeds, credit risk, etc.).
Level 3—Significant unobservable inputs (including the fund’s own assumptions used to determine
the fair value of investments). Any investments valued with significant unobservable inputs are
noted on the Statement of Net Assets.
The following table summarizes the market value of the fund’s investments as of February 28, 2018, based on the inputs used to value them:
| | | |
| | Level 1 | Level 2 | Level 3 |
| Investments | ($000) | ($000) | ($000) |
| U.S. Government and Agency Obligations | — | 42,240 | — |
| Asset-Backed/Commercial Mortgage-Backed Securities | — | 17,264 | 2,721 |
| Corporate Bonds | — | 182,234 | 1,234 |
| Sovereign Bonds | — | 56,839 | — |
| Taxable Municipal Bonds | — | 8,249 | — |
| Common Stocks | 87,731 | 102,458 | — |
| Temporary Cash Investments | 18,350 | — | — |
| Futures Contracts—Assets1 | 42 | — | — |
| Futures Contracts—Liabilities1 | (133) | — | — |
| Forward Currency Contracts—Assets | — | 1,392 | — |
| Forward Currency Contracts—Liabilities | — | (247) | — |
| Total | 105,990 | 410,429 | 3,955 |
| 1 Represents variation margin on the last day of the reporting period. | | | |
35
Global Wellesley Income Fund
F. At February 28, 2018, the fair values of derivatives were reflected in the Statement of Net Assets as follows:
| | | |
| | Interest Rate | Currency | |
| | Contracts | Contracts | Total |
| Statement of Net Assets Caption | ($000) | ($000) | ($000) |
| Variation Margin Receivable—Futures Contracts | 42 | — | 42 |
| Unrealized Appreciation—Forward Currency Contracts | — | 1,392 | 1,392 |
| Total Assets | 42 | 1,392 | 1,434 |
| Variation Margin Payable—Futures Contracts | (133) | — | (133) |
| Unrealized Depreciation—Forward Currency Contracts | — | (247) | (247) |
| Total Liabilities | (133) | (247) | (380) |
Realized net gain (loss) and the change in unrealized appreciation (depreciation) on derivatives for the period ended February 28, 2018, were:
| | | |
| Interest Rate | Currency | |
| | Contracts | Contracts | Total |
| Realized Net Gain (Loss) on Derivatives | ($000) | ($000) | ($000) |
| Futures Contracts | 801 | — | 801 |
| Forward Currency Contracts | — | (4,782) | (4,782) |
| Realized Net Gain (Loss) on Derivatives | 801 | (4,782) | (3,981) |
| |
| Change in Unrealized Appreciation (Depreciation) on Derivatives | | | |
| Futures Contracts | 171 | — | 171 |
| Forward Currency Contracts | — | 1,145 | 1,145 |
| Change in Unrealized Appreciation (Depreciation) on Derivatives | 171 | 1,145 | 1,316 |
G. Distributions are determined on a tax basis and may differ from net investment income and realized capital gains for financial reporting purposes. Differences may be permanent or temporary. Permanent differences are reclassified among capital accounts in the financial statements to reflect their tax character. Temporary differences arise when certain items of income, expense, gain, or loss are recognized in different periods for financial statement and tax purposes. These differences will reverse at some time in the future. Differences in classification may also result from the treatment of short-term gains as ordinary income for tax purposes. The fund’s tax-basis capital gains and losses are determined only at the end of each fiscal year.
At February 28, 2018, the cost of investment securities for tax purposes was $523,222,000.
Net unrealized depreciation of investment securities for tax purposes was $3,902,000, consisting of unrealized gains of $8,554,000 on securities that had risen in value since their purchase and $12,456,000 in unrealized losses on securities that had fallen in value since their purchase.
H. During the period ended February 28, 2018, the fund purchased $451,783,000 of investment securities and sold $18,500,000 of investment securities, other than U.S. government securities and temporary cash investments. Purchases and sales of U.S. government securities were $73,085,000 and $29,620,000, respectively.
36
| | |
| Global Wellesley Income Fund | | |
| |
| |
| |
| |
| I. Capital share transactions for each class of shares were: | | |
| | October 18, 20171 to |
| | February 28, 2018 |
| | Amount | Shares |
| | ($000) | (000) |
| Investor Shares | | |
| Issued | 142,224 | 7,090 |
| Issued in Lieu of Cash Distributions | 191 | 10 |
| Redeemed | (32,680) | (1,627) |
| Net Increase (Decrease)—Investor Shares | 109,735 | 5,473 |
| Admiral Shares | | |
| Issued | 482,203 | 19,229 |
| Issued in Lieu of Cash Distributions | 701 | 28 |
| Redeemed | (71,475) | (2,850) |
| Net Increase (Decrease) —Admiral Shares | 411,429 | 16,407 |
| 1 Commencement of subscription period for the fund. | | |
J. Management has determined that no material events or transactions occurred subsequent to February 28, 2018, that would require recognition or disclosure in these financial statements.
37
About Your Fund’s Expenses
As a shareholder of the fund, you incur ongoing costs, which include costs for portfolio management, administrative services, and shareholder reports (like this one), among others. Operating expenses, which are deducted from a fund’s gross income, directly reduce the investment return of the fund.
A fund’s expenses are expressed as a percentage of its average net assets. This figure is known as the expense ratio. The following examples are intended to help you understand the ongoing costs (in dollars) of investing in your fund and to compare these costs with those of other mutual funds. The examples are based on an investment of $1,000 made at the beginning of the period shown and held for the entire period.
The accompanying table illustrates your fund’s costs in two ways:
• Based on actual fund return. This section helps you to estimate the actual expenses that you paid over the period. The ”Ending Account Value“ shown is derived from the fund‘s actual return, and the third column shows the dollar amount that would have been paid by an investor who started with $1,000 in the fund. You may use the information here, together with the amount you invested, to estimate the expenses that you paid over the period.
To do so, simply divide your account value by $1,000 (for example, an $8,600 account value divided by $1,000 = 8.6), then multiply the result by the number given for your fund under the heading ”Expenses Paid During Period.“
• Based on hypothetical 5% yearly return. This section is intended to help you compare your fund‘s costs with those of other mutual funds. It assumes that the fund had a yearly return of 5% before expenses, but that the expense ratio is unchanged. In this case—because the return used is not the fund’s actual return—the results do not apply to your investment. The example is useful in making comparisons because the Securities and Exchange Commission requires all mutual funds to calculate expenses based on a 5% return. You can assess your fund’s costs by comparing this hypothetical example with the hypothetical examples that appear in shareholder reports of other funds.
Note that the expenses shown in the table are meant to highlight and help you compare ongoing costs only and do not reflect transaction costs incurred by the fund for buying and selling securities. Further, the expenses do not include any purchase, redemption, or account service fees described in the fund prospectus. If such fees were applied to your account, your costs would be higher. Your fund does not carry a “sales load.”
The calculations assume no shares were bought or sold during the period. Your actual costs may have been higher or lower, depending on the amount of your investment and the timing of any purchases or redemptions.
You can find more information about the fund’s expenses, including annual expense ratios, in the Financial Statements section of this report. For additional information on operating expenses and other shareholder costs, please refer to your fund’s current prospectus.
38
| | | |
| Period Ended February 28, 2018 | | | |
| | Beginning | Ending | Expenses |
| | Account Value | Account Value | Paid During |
| Global Wellesley Income Fund | 11/2/2017 | 2/28/2018 | Period |
| Based on Actual Fund Return | | | |
| Investor Shares | $1,000.00 | $997.34 | $1.39 |
| Admiral Shares | 1,000.00 | 997.74 | 1.07 |
| Based on Hypothetical 5% Yearly Return | | | |
| Investor Shares | $1,000.00 | $1,014.77 | $1.40 |
| Admiral Shares | 1,000.00 | 1,015.10 | 1.07 |
The calculations are based on expenses incurred in the period from the fund’s November 2, 2017 inception through February 28, 2018.
The fund’s annualized expense ratios for the period are 0.43% for Investor Shares and 0.33% for Admiral Shares. The dollar amounts
shown as “Expenses Paid” are equal to the annualized expense ratio multiplied by the average account value over the period from
inception through February 28, multiplied by the number of days in that period, then divided by the number of days in the most recent
12-month period (119/365).
39
Trustees Approve Advisory Arrangement
Effective November 2017, the board of Vanguard World Fund approved the launch of Vanguard Global Wellesley Income Fund and an investment advisory arrangement with Wellington Management Company LLP (Wellington Management). The board determined that the investment advisory arrangement was in the best interests of the fund and its prospective shareholders.
The board based its decision upon an evaluation of the advisor’s investment staff, portfolio management process, and performance. This evaluation included information provided to the board by Vanguard’s Portfolio Review Department, which is responsible for fund and advisor oversight and product management. The trustees considered the factors discussed below, among others. However, no single factor determined whether the board approved the arrangement. Rather, it was the totality of the circumstances that drove the board’s decision.
Nature, extent, and quality of services
The board considered the quality of the investment management services to be provided to the fund and took into account the organizational depth and stability of the advisor. The board considered that Wellington Management, founded in 1928, is among the nation’s oldest and most respected institutional managers.
The board concluded that the advisor’s experience, stability, depth, and performance, among other factors, warranted approval of the advisory arrangement.
Investment performance
The board determined that Wellington Management, in its management of other Vanguard funds (including Vanguard Wellington Fund, which Wellington Management has advised since its inception in 1929), has a track record of consistent performance and a disciplined investment process. The board also determined that in its management of other funds, the strategy Wellington Management will use in managing the fund has produced strong long-term returns as compared with its index. Information about the fund’s performance since inception can be found in the Performance Summary section of this report.
Cost
The board concluded that the fund’s expense ratio will be well below the average expense ratio charged by funds in its peer group. Information about the fund’s expense ratio appears in the About Your Fund’s Expenses section of this report as well as in the Financial Statements section, which also includes information about the advisory fee rate.
The board did not consider the profitability of Wellington Management in determining whether to approve the advisory fee, because Wellington Management is independent of Vanguard and the advisory fee is the result of arm’s-length negotiations.
The benefit of economies of scale
The board concluded that the fund’s prospective shareholders will benefit from economies of scale because of breakpoints in the fund’s advisory fee schedule. The breakpoints reduce the effective rate of the fee as the fund’s assets increase.
The board will consider whether to renew the advisory arrangement after a one-year period.
40
Glossary
30-Day SEC Yield. A fund’s 30-day SEC yield is derived using a formula specified by the U.S. Securities and Exchange Commission. Under the formula, data related to the fund’s security holdings in the previous 30 days are used to calculate the fund’s hypothetical net income for that period, which is then annualized and divided by the fund’s estimated average net assets over the calculation period. For the purposes of this calculation, a security’s income is based on its current market yield to maturity (for bonds), its actual income (for asset-backed securities), or its projected dividend yield (for stocks). Because the SEC yield represents hypothetical annualized income, it will differ—at times significantly—from the fund’s actual experience. As a result, the fund’s income distributions may be higher or lower than implied by the SEC yield.
Average Coupon. The average interest rate paid on the fixed income securities held by a fund. It is expressed as a percentage of face value.
Average Duration. An estimate of how much the value of the bonds held by a fund will fluctuate in response to a change in interest rates. To see how the value could change, multiply the average duration by the change in rates. If interest rates rise by 1 percentage point, the value of the bonds in a fund with an average duration of five years would decline by about 5%. If rates decrease by a percentage point, the value would rise by 5%.
Average Effective Maturity. The average length of time until fixed income securities held by a fund reach maturity and are repaid, taking into consideration the possibility that the issuer may call the bond before its maturity date. The figure reflects the proportion of fund assets represented by each security; it also reflects any futures contracts held. In general, the longer the average effective maturity, the more a fund’s share price will fluctuate in response to changes in market interest rates.
Credit Quality. Credit-quality ratings are measured on a scale that generally ranges from AAA (highest) to D (lowest). U.S. Treasury, U.S. Agency, and U.S. Agency mortgage-backed securities appear under “U.S. Government.” Credit-quality ratings are obtained from Barclays and are from Moody’s, Fitch, and S&P. When ratings from all three agencies are used, the median rating is shown. When ratings from two of the agencies are used, the lower rating for each issue is shown. “Not Rated” is used to classify securities for which a rating is not available. Not rated securities include a fund’s investment in Vanguard Market Liquidity Fund or Vanguard Municipal Cash Management Fund, each of which invests in high-quality money market instruments and may serve as a cash management vehicle for the Vanguard funds, trusts, and accounts.
Dividend Yield. The current, annualized rate of dividends paid on a share of stock, divided by its current share price. For a fund, the weighted average yield for stocks it holds. The index yield is based on the current annualized rate of dividends paid on stocks in the index.
Earnings Growth Rate. The average annual rate of growth in earnings over the past five years for the stocks now in a fund.
Equity Exposure. A measure that reflects a fund’s investments in stocks and stock futures. Any holdings in short-term reserves are excluded.
Expense Ratio. A fund’s total annual operating expenses expressed as a percentage of the fund’s average net assets. The expense ratio includes management and administrative expenses, but does not include the transaction costs of buying and selling portfolio securities.
41
Foreign Holdings. The percentage of a fund represented by securities or depositary receipts of companies based outside the United States.
Inception Date. The date on which the assets of a fund (or one of its share classes) are first invested in accordance with the fund’s investment objective. For funds with a subscription period, the inception date is the day after that period ends. Investment performance is measured from the inception date.
Median Market Cap. An indicator of the size of companies in which a fund invests; the midpoint of market capitalization (market price x shares outstanding) of a fund’s stocks, weighted by the proportion of the fund’s assets invested in each stock. Stocks representing half of the fund’s assets have market capitalizations above the median, and the rest are below it.
Price/Book Ratio. The share price of a stock divided by its net worth, or book value, per share. For a fund, the weighted average price/book ratio of the stocks it holds.
Price/Earnings Ratio. The ratio of a stock’s current price to its per-share earnings over the past year. For a fund, the weighted average P/E of the stocks it holds. P/E is an indicator of market expectations about corporate prospects; the higher the P/E, the greater the expectations for a company’s future growth.
Return on Equity. The annual average rate of return generated by a company during the past five years for each dollar of shareholder’s equity (net income divided by shareholder’s equity). For a fund, the weighted average return on equity for the companies whose stocks it holds.
Short-Term Reserves. The percentage of a fund invested in highly liquid, short-term securities that can be readily converted to cash.
Turnover Rate. An indication of the fund’s trading activity. Funds with high turnover rates incur higher transaction costs and may be more likely to distribute capital gains (which may be taxable to investors). The turnover rate excludes in-kind transactions, which have minimal impact on costs.
Yield to Maturity. The rate of return an investor would receive if the fixed income securities held by a fund were held to their maturity dates.
Benchmark Information
Global Wellesley Income Composite Index: Weighted 65% Bloomberg Barclays Fixed Income Composite Index (composed of 80% Bloomberg Barclays Global Aggregate Credit Index (USD Hedged), 10% Bloomberg Barclays Global Aggregate Treasury Index (USD Hedged), and 10% Bloomberg Barclays Global Aggregate Securitized Index (USD Hedged)), and 35% FTSE Developed High Dividend Yield Index (net of tax).
42
The Global Industry Classification Standard (“GICS”) was developed by and is the exclusive property and a service mark
of MSCI Inc. (“MSCI”) and Standard and Poor’s, a division of McGraw-Hill Companies, Inc. (“S&P”), and is licensed for use
by Vanguard. Neither MSCI, S&P nor any third party involved in making or compiling the GICS or any GICS classification
makes any express or implied warranties or representations with respect to such standard or classification (or the results
to be obtained by the use thereof), and all such parties hereby expressly disclaim all warranties of originality, accuracy,
completeness, merchantability or fitness for a particular purpose with respect to any such standard or classification.
Without limiting any of the foregoing, in no event shall MSCI, S&P, any of its affiliates or any third party involved in
making or compiling the GICS or any GICS classification have any liability for any direct, indirect, special, punitive,
consequential or any other damages (including lost profits) even if notified of the possibility of such damages.
BLOOMBERG is a trademark and service mark of Bloomberg Finance L.P. BARCLAYS is a trademark and service mark of
Barclays Bank Plc, used under license. Bloomberg Finance L.P. and its affiliates, including Bloomberg Index Services Limited
(BISL) (collectively, Bloomberg), or Bloomberg’s licensors, own all proprietary rights in the Bloomberg Barclays Fixed Income
Composite Index, which is composed of 80% Bloomberg Barclays Global Aggregate Credit Index (USD Hedged), 10%
Bloomberg Barclays Global Aggregate Treasury Index (USD Hedged), and 10% Bloomberg Barclays Global Aggregate
Securitized Index (USD Hedged) (the Indices or Bloomberg Barclays Indices).
Neither Barclays Bank Plc, Barclays Capital Inc., or any affiliate (collectively Barclays) or Bloomberg is the issuer or
producer of the Global Wellesley Income Fund and neither Bloomberg nor Barclays has any responsibilities, obligations
or duties to investors in the Global Wellesley Income Fund. The Indices are licensed for use by The Vanguard Group, Inc.
(Vanguard) as the sponsor of the Global Wellesley Income Fund. Bloomberg and Barclays’ only relationship with Vanguard
in respect to the Indices is the licensing of the Indices, which are determined, composed and calculated by BISL, or any
successor thereto, without regard to the Issuer or the Global Wellesley Income Fund or the owners of the Global Wellesley
Income Fund.
Additionally, Vanguard may for itself execute transaction(s) with Barclays in or relating to the Indices in connection with
the Global Wellesley Income Fund. Investors acquire the Global Wellesley Income Fund from Vanguard and investors
neither acquire any interest in the Indices nor enter into any relationship of any kind whatsoever with Bloomberg or
Barclays upon making an investment in the Global Wellesley Income Fund. The Global Wellesley Income Fund is not
sponsored, endorsed, sold or promoted by Bloomberg or Barclays. Neither Bloomberg nor Barclays makes any
representation or warranty, express or implied regarding the advisability of investing in the Global Wellesley Income Fund
or the advisability of investing in securities generally or the ability of the Indices to track corresponding or relative market
performance. Neither Bloomberg nor Barclays has passed on the legality or suitability of the Global Wellesley Income Fund
with respect to any person or entity. Neither Bloomberg nor Barclays is responsible for and has not participated in the
determination of the timing of, prices at, or quantities of the Global Wellesley Income Fund to be issued. Neither Bloomberg
nor Barclays has any obligation to take the needs of the Issuer or the owners of the Global Wellesley Income Fund or any
other third party into consideration in determining, composing or calculating the Indices. Neither Bloomberg nor Barclays
has any obligation or liability in connection with administration, marketing or trading of the Global Wellesley Income Fund.
43
The licensing agreement between Bloomberg and Barclays is solely for the benefit of Bloomberg and Barclays and not for
the benefit of the owners of the Global Wellesley Income Fund, investors or other third parties. In addition, the licensing
agreement between Vanguard and Bloomberg is solely for the benefit of Vanguard and Bloomberg and not for the benefit
of the owners of the Global Wellesley Income Fund, investors or other third parties.
NEITHER BLOOMBERG NOR BARCLAYS SHALL HAVE ANY LIABILITY TO THE ISSUER, INVESTORS OR TO OTHER
THIRD PARTIES FOR THE QUALITY, ACCURACY AND/OR COMPLETENESS OF THE BLOOMBERG BARCLAYS INDICES
OR ANY DATA INCLUDED THEREIN OR FOR INTERRUPTIONS IN THE DELIVERY OF THE BLOOMBERG BARCLAYS INDICES.
NEITHER BLOOMBERG NOR BARCLAYS MAKES ANY WARRANTY, EXPRESS OR IMPLIED, AS TO RESULTS TO BE
OBTAINED BY THE ISSUER, THE INVESTORS OR ANY OTHER PERSON OR ENTITY FROM THE USE OF THE BLOOMBERG
BARCLAYS INDICES OR ANY DATA INCLUDED THEREIN. NEITHER BLOOMBERG NOR BARCLAYS MAKES ANY EXPRESS
OR IMPLIED WARRANTIES, AND EACH HEREBY EXPRESSLY DISCLAIMS ALL WARRANTIES OF MERCHANTABILITY
OR FITNESS FOR A PARTICULAR PURPOSE OR USE WITH RESPECT TO THE BLOOMBERG BARCLAYS INDICES OR
ANY DATA INCLUDED THEREIN. BLOOMBERG RESERVES THE RIGHT TO CHANGE THE METHODS OF CALCULATION
OR PUBLICATION, OR TO CEASE THE CALCULATION OR PUBLICATION OF THE BLOOMBERG BARCLAYS INDICES,
AND NEITHER BLOOMBERG NOR BARCLAYS SHALL BE LIABLE FOR ANY MISCALCULATION OF OR ANY INCORRECT,
DELAYED OR INTERRUPTED PUBLICATION WITH RESPECT TO ANY OF THE BLOOMBERG BARCLAYS INDICES. NEITHER
BLOOMBERG NOR BARCLAYS SHALL BE LIABLE FOR ANY DAMAGES, INCLUDING, WITHOUT LIMITATION, ANY
SPECIAL, INDIRECT OR CONSEQUENTIAL DAMAGES, OR ANY LOST PROFITS AND EVEN IF ADVISED OF THE
POSSIBILITY OF SUCH, RESULTING FROM THE USE OF THE BLOOMBERG BARCLAYS INDICES OR ANY DATA INCLUDED
THEREIN OR WITH RESPECT TO THE VANGUARD GLOBAL WELLESLEY INCOME FUND.
None of the information supplied by Bloomberg or Barclays and used in this publication may be reproduced in any manner
without the prior written permission of both Bloomberg and Barclays Capital, the investment banking division of Barclays
Bank Plc. Barclays Bank Plc is registered in England No. 1026167. Registered office 1 Churchill Place London E14 5HP.
© 2018 Bloomberg. Used with Permission.
Source: Bloomberg Index Services Limited. Copyright 2018, Bloomberg. All rights reserved.
44
This page intentionally left blank.
This page intentionally left blank.
The People Who Govern Your Fund
The trustees of your mutual fund are there to see that the fund is operated and managed in your best interests since, as a shareholder, you are a part owner of the fund. Your fund’s trustees also serve on the board of directors of The Vanguard Group, Inc., which is owned by the Vanguard funds and provides services to them on an at-cost basis.
A majority of Vanguard’s board members are independent, meaning that they have no affiliation with Vanguard or the funds they oversee, apart from the sizable personal investments they have made as private individuals. The independent board members have distinguished backgrounds in business, academia, and public service. Each of the trustees and executive officers oversees 208 Vanguard funds.
Information for each trustee and executive officer of the fund appears below. The mailing address of the trustees and officers is P.O. Box 876, Valley Forge, PA 19482. More information about the trustees is in the Statement of Additional Information, which can be obtained, without charge, by contacting Vanguard at 800-662-7447, or online at vanguard.com.
Interested Trustees1
F. William McNabb III
Born in 1957. Trustee since July 2009. Principal occupation(s) during the past five years and other experience: chairman of the board (January 2010–present) of Vanguard and of each of the investment companies served by Vanguard, trustee (2009–present) of each of the investment companies served by Vanguard, and director (2008–present) of Vanguard. Chief executive officer and president (2008–2017) of Vanguard and each of the investment companies served by Vanguard, managing director (1995–2008) of Vanguard, and director (1997–2018) of Vanguard Marketing Corporation. Director (2018–present) of UnitedHealth Group.
Mortimer J. Buckley
Born in 1969. Trustee since January 2018. Principal occupation(s) during the past five years and other experience: chief executive officer (January 2018–present) of Vanguard; chief executive officer, president, and trustee (January 2018–present) of each of the investment companies served by Vanguard; president and director (2017–present) of Vanguard; and president (February 2018–present) of Vanguard Marketing Corporation. Chief investment officer (2013–2017), managing director (2002–2017), head of the Retail Investor Group (2006–2012), and chief information officer (2001–2006) of Vanguard. Chairman of the board (2011–2017) of the Children’s Hospital of Philadelphia.
Independent Trustees
Emerson U. Fullwood
Born in 1948. Trustee since January 2008. Principal occupation(s) during the past five years and other experience: executive chief staff and marketing officer for North America and corporate vice president (retired 2008) of Xerox Corporation (document management products and services). Former president of the Worldwide Channels Group, Latin America, and Worldwide Customer Service and executive chief staff officer of Developing Markets of Xerox. Executive in residence and 2009–2010 Distinguished Minett Professor at the Rochester Institute of Technology. Lead director of SPX FLOW, Inc. (multi-industry manufacturing). Director of the University of Rochester Medical Center, the Monroe Community College Foundation, the United Way of Rochester, North Carolina A&T University, and Roberts Wesleyan College. Trustee of the University of Rochester.
Amy Gutmann
Born in 1949. Trustee since June 2006. Principal occupation(s) during the past five years and other experience: president (2004–present) of the University of Pennsylvania. Christopher H. Browne Distinguished Professor of Political Science, School of Arts and Sciences, and professor of communication, Annenberg School for Communication, with secondary faculty appointments in the Department of Philosophy, School of Arts and Sciences, and at the Graduate School of Education, University of Pennsylvania. Trustee of the National Constitution Center.
1 Mr. McNabb and Mr. Buckley are considered “interested persons,” as defined in the Investment Company Act of 1940, because
they are officers of the Vanguard funds.
JoAnn Heffernan Heisen
Born in 1950. Trustee since July 1998. Principal occupation(s) during the past five years and other experience: corporate vice president of Johnson & Johnson (pharmaceuticals/medical devices/consumer products) and member of its executive committee (1997–2008). Chief global diversity officer (retired 2008), vice president and chief information officer (1997–2006), controller (1995–1997), treasurer (1991–1995), and assistant treasurer (1989–1991) of Johnson & Johnson. Director of Skytop Lodge Corporation (hotels) and the Robert Wood Johnson Foundation. Member of the advisory board of the Institute for Women’s Leadership at Rutgers University.
F. Joseph Loughrey
Born in 1949. Trustee since October 2009. Principal occupation(s) during the past five years and other experience: president and chief operating officer (retired 2009) and vice chairman of the board (2008–2009) of Cummins Inc. (industrial machinery). Chairman of the board of Hillenbrand, Inc. (specialized consumer services), Oxfam America, and the Lumina Foundation for Education. Director of the V Foundation for Cancer Research. Member of the advisory council for the College of Arts and Letters and chair of the advisory board to the Kellogg Institute for International Studies, both at the University of Notre Dame.
Mark Loughridge
Born in 1953. Trustee since March 2012. Principal occupation(s) during the past five years and other experience: senior vice president and chief financial officer (retired 2013) of IBM (information technology services). Fiduciary member of IBM’s Retirement Plan Committee (2004–2013), senior vice president and general manager (2002–2004) of IBM Global Financing, vice president and controller (1998–2002) of IBM, and a variety of other prior management roles at IBM. Member of the Council on Chicago Booth.
Scott C. Malpass
Born in 1962. Trustee since March 2012. Principal occupation(s) during the past five years and other experience: chief investment officer (1989–present) and vice president (1996–present) of the University of Notre Dame. Assistant professor of finance at the Mendoza College of Business, University of Notre Dame, and member of the Notre Dame 403(b) Investment Committee. Chairman of the board of TIFF Advisory Services, Inc. Member of the board of Catholic Investment Services, Inc. (investment advisors), the board of advisors for Spruceview Capital Partners, and the board of superintendence of the Institute for the Works of Religion.
Deanna Mulligan
Born in 1963. Trustee since January 2018. Principal occupation(s) during the past five years and other experience: president (2010–present) and chief executive officer (2011–present) of The Guardian Life Insurance Company of America. Chief operating officer (2010–2011) and executive vice president (2008–2010) of Individual Life and Disability of The Guardian Life Insurance Company of America. Member of the board of The Guardian Life Insurance Company of America, the American Council of Life Insurers, the Partnership for New York City (business leadership), and the Committee Encouraging Corporate Philanthropy. Trustee of the Economic Club of New York and the Bruce Museum (arts and science). Member of the Advisory Council for the Stanford Graduate School of Business.
André F. Perold
Born in 1952. Trustee since December 2004. Principal occupation(s) during the past five years and other experience: George Gund Professor of Finance and Banking, Emeritus at the Harvard Business School (retired 2011). Chief investment officer and co-managing partner of HighVista Strategies LLC (private investment firm). Overseer of the Museum of Fine Arts Boston.
Sarah Bloom Raskin
Born in 1961. Trustee since January 2018. Principal occupation(s) during the past five years and other experience: deputy secretary (2014–2017) of the United States Department of the Treasury. Governor (2010–2014) of the Federal Reserve Board. Commissioner (2007–2010) of financial regulation for the State of Maryland. Member of the board of directors (2012–2014) of Neighborhood Reinvestment Corporation. Director of i(x) Investments, LLC.
Peter F. Volanakis
Born in 1955. Trustee since July 2009. Principal occupation(s) during the past five years and other experience: president and chief operating officer (retired 2010) of Corning Incorporated (communications equipment) and director of Corning Incorporated (2000–2010) and Dow Corning (2001–2010). Director (2012) of SPX Corporation (multi-industry manufacturing). Overseer of the Amos Tuck School of Business Administration, Dartmouth College (2001–2013). Chairman of the board of trustees of Colby-Sawyer College. Member of the Board of Hypertherm Inc. (industrial cutting systems, software, and consumables).
Executive Officers
Glenn Booraem
Born in 1967. Principal occupation(s) during the past five years and other experience: principal of Vanguard. Investment stewardship officer (2017–present), treasurer (2015–2017), controller (2010–2015), and assistant controller (2001–2010) of each of the investment companies served by Vanguard.
Christine M. Buchanan
Born in 1970. Principal occupation(s) during the past five years and other experience: principal of Vanguard and global head of Fund Administration at Vanguard. Treasurer (2017–present) of each of the investment companies served by Vanguard. Partner (2005–2017) at KPMG LLP (audit, tax, and advisory services).
Brian Dvorak
Born in 1973. Principal occupation(s) during the past five years and other experience: principal of Vanguard. Chief compliance officer (2017–present) of Vanguard and each of the investment companies served by Vanguard. Assistant vice president (2017–present) of Vanguard Marketing Corporation. Vice president and director of Enterprise Risk Management (2011–2013) at Oppenheimer Funds, Inc.
Thomas J. Higgins
Born in 1957. Principal occupation(s) during the past five years and other experience: principal of Vanguard. Chief financial officer (2008–present) and treasurer (1998–2008) of each of the investment companies served by Vanguard.
Peter Mahoney
Born in 1974. Principal occupation(s) during the past five years and other experience: principal of Vanguard. Controller (2015–present) of each of the investment companies served by Vanguard. Head of International Fund Services (2008–2014) at Vanguard.
Anne E. Robinson
Born in 1970. Principal occupation(s) during the past five years and other experience: general counsel (2016–present) of Vanguard. Secretary (2016–present) of Vanguard and of each of the investment companies served by Vanguard. Managing director (2016–present) of Vanguard. Director and senior vice president (2016–2018) of Vanguard Marketing Corporation. Managing director and general counsel of Global Cards and Consumer Services (2014–2016) at Citigroup. Counsel (2003–2014) at American Express.
Michael Rollings
Born in 1963. Principal occupation(s) during the past five years and other experience: finance director (2017–present) and treasurer (2017) of each of the investment companies served by Vanguard. Managing director (2016–present) of Vanguard. Chief financial officer (2016–present) of Vanguard. Director (2016–present) of Vanguard Marketing Corporation. Executive vice president and chief financial officer (2006–2016) of MassMutual Financial Group.
| |
| Vanguard Senior Management Team |
| |
| Mortimer J. Buckley | James M. Norris |
| Gregory Davis | Thomas M. Rampulla |
| John James | Karin A. Risi |
| Martha G. King | Anne E. Robinson |
| John T. Marcante | Michael Rollings |
| Chris D. McIsaac | |
Chairman Emeritus and Senior Advisor
John J. Brennan
Chairman, 1996–2009
Chief Executive Officer and President, 1996–2008
Founder
John C. Bogle
Chairman and Chief Executive Officer, 1974–1996
|
|  |
| P.O. Box 2600 |
| Valley Forge, PA 19482-2600 |
| |
| |
| |
| Connect with Vanguard® > vanguard.com |
| |
| |
| |
| Fund Information > 800-662-7447 |
| Direct Investor Account Services > 800-662-2739 |
| Institutional Investor Services > 800-523-1036 |
| Text Telephone for People |
| Who Are Deaf or Hard of Hearing > 800-749-7273 |
| |
| This material may be used in conjunction |
| with the offering of shares of any Vanguard |
| fund only if preceded or accompanied by |
| the fund’s current prospectus. |
| |
| All comparative mutual fund data are from Lipper, a |
| Thomson Reuters Company, or Morningstar, Inc., unless |
| otherwise noted. |
| |
| You can obtain a free copy of Vanguard’s proxy voting |
| guidelines by visiting vanguard.com/proxyreporting or by |
| calling Vanguard at 800-662-2739. The guidelines are |
| also available from the SEC’s website, sec.gov. In |
| addition, you may obtain a free report on how your fund |
| voted the proxies for securities it owned during the 12 |
| months ended June 30. To get the report, visit either |
| vanguard.com/proxyreporting or sec.gov. |
| |
| You can review and copy information about your fund at |
| the SEC’s Public Reference Room in Washington, D.C. To |
| find out more about this public service, call the SEC at |
| 202-551-8090. Information about your fund is also |
| available on the SEC’s website, and you can receive |
| copies of this information, for a fee, by sending a |
| request in either of two ways: via email addressed to |
| publicinfo@sec.gov or via regular mail addressed to the |
| Public Reference Section, Securities and Exchange |
| Commission, Washington, DC 20549-1520. |
| © 2018 The Vanguard Group, Inc. |
| All rights reserved. |
| Vanguard Marketing Corporation, Distributor. |
| |
| Q14962 042018 |
Item 2: Code of Ethics.
Not Applicable.
Item 3: Audit Committee Financial Expert.
Not Applicable.
Item 4: Principal Accountant Fees and Services.
(a) Audit Fees.
Not Applicable.
Item 5: Audit Committee of Listed Registrants.
Not Applicable.
Item 6: Investments.
Not Applicable.
Item 7: Disclosure of Proxy Voting Policies and Procedures for Closed-End Management
Investment Companies.
Not Applicable.
Item 8: Portfolio Managers of Closed-End Management Investment Companies.
Not Applicable.
Item 9: Purchase of Equity Securities by Closed-End Management Investment Company and
Affiliated Purchasers.
Not Applicable.
Item 10: Submission of Matters to a Vote of Security Holders.
Not Applicable.
Item 11: Controls and Procedures.
(a) Disclosure Controls and Procedures. The Principal Executive and Financial Officers concluded that the Registrant’s Disclosure Controls and Procedures are effective based on their evaluation of the Disclosure Controls and Procedures as of a date within 90 days of the filing date of this report.
(b) Internal Control Over Financial Reporting. There were no significant changes in Registrant’s Internal Control Over Financial Reporting or in other factors that could significantly affect this control subsequent to the date of the evaluation, including any corrective actions with regard to significant deficiencies and material weaknesses.
Item 12: Disclosure of Securities Lending Activities for Closed-End Management
Investment Companies.
Not Applicable.
Item 13: Exhibits.
(a) Certifications.
Pursuant to the requirements of the Securities Exchange Act of 1934 and the Investment Company Act of 1940, the registrant has duly caused this report to be signed on its behalf by the undersigned, thereunto duly authorized.
| |
| | VANGUARD WORLD FUND |
| |
| |
| BY: | /s/ MORTIMER J. BUCKLEY* |
| | MORTIMER J. BUCKLEY |
| | CHIEF EXECUTIVE OFFICER |
| |
| Date: April 17, 2018 |
Pursuant to the requirements of the Securities Exchange Act of 1934 and the Investment Company Act of 1940, this report has been signed below by the following persons on behalf of the registrant and in the capacities and on the dates indicated.
| |
| | VANGUARD WORLD FUND |
| |
| BY: | /s/ MORTIMER J. BUCKLEY* |
| | MORTIMER J. BUCKLEY |
| | CHIEF EXECUTIVE OFFICER |
| Date: April 17, 2018 |
| VANGUARD WORLD FUND |
|
| BY: | /s/ THOMAS J. HIGGINS* |
| | THOMAS J. HIGGINS |
| | CHIEF FINANCIAL OFFICER |
| Date: April 17, 2018 |
* By: /s/ Anne E. Robinson
Anne E. Robinson, pursuant to a Power of Attorney filed on January 18, 2018 see file
Number 33-32216, Incorporated by Reference.