| | UNITED STATES | |
| | SECURITIES AND EXCHANGE COMMISSION | |
| | Washington, D.C. 20549 | |
| | | |
| | FORM N-CSR | |
| | | |
| CERTIFIED SHAREHOLDER REPORT OF REGISTERED MANAGEMENT | |
| | INVESTMENT COMPANIES | |
| | | |
| Investment Company Act file number 811-524 | |
| | | |
| | The Dreyfus/Laurel Funds Trust | |
| | (Exact name of Registrant as specified in charter) | |
| | | |
| | c/o The Dreyfus Corporation | |
| | 200 Park Avenue | |
| | New York, New York 10166 | |
| | (Address of principal executive offices) (Zip code) | |
| | | |
| | Mark N. Jacobs, Esq. | |
| | 200 Park Avenue | |
| | New York, New York 10166 | |
| | (Name and address of agent for service) | |
| | | |
| Registrant's telephone number, including area code: (212) 922-6000 | |
| | | |
| Date of fiscal year end: | 12/31 | |
| | | |
| Date of reporting period: | 12/31/03 | |
FORM N-CSR
Item 1. Reports to Stockholders.
| Dreyfus Premier |
| Core Value Fund |
ANNUAL REPORT December 31, 2003

| The views expressed in this report reflect those of the portfolio |
| manager only through the end of the period covered and do not |
| necessarily represent the views of Dreyfus or any other person in |
| the Dreyfus organization. Any such views are subject to change at |
| any time based upon market or other conditions and Dreyfus dis- |
| claims any responsibility to update such views.These views may not |
| be relied on as investment advice and, because investment decisions |
| for a Dreyfus fund are based on numerous factors, may not be relied |
| on as an indication of trading intent on behalf of any Dreyfus fund. |
| |
| |
| Not FDIC-Insured • Not Bank-Guaranteed • May Lose Value |
Contents
T H E F U N D
2
| Letter from the Chairman
|
3
| Discussion of Fund Performance
|
6
| Fund Performance
|
8
| Statement of Investments
|
12
| Statement of Assets and Liabilities
|
13
| Statement of Operations
|
14
| Statement of Changes in Net Assets
|
17
| Financial Highlights
|
23
| Notes to Financial Statements
|
31
| Independent Auditors’ Report
|
32
| Important Tax Information
|
33
| Board Members Information
|
35
| Officers of the Fund
|
F O R M O R E I N F O R M AT I O N
|
Back Cover
|
| Dreyfus Premier |
| Core Value Fund |

LETTER FROM THE CHAIRMAN
Dear Shareholder:
This annual report for Dreyfus Premier Core Value Fund covers the 12-month period from January 1, 2003, through December 31, 2003. Inside, you’ll find valuable information about how the fund was managed during the reporting period, including a discussion with the fund’s portfolio manager,Valerie J. Sill.
Despite headwinds caused by economic and geopolitical uncertainty early in the year, stocks generally bounced back in 2003, with many stock market indexes generating their first full calendar year of gains since 1999. The combination of historically low interest rates, lower federal income tax rates, progress in the war on terrorism and above-trend economic growth during the second half of the year helped propel stock prices higher.
While stocks in general may no longer be priced as attractively as they were at the start of the year, we believe that market fundamentals remain favorable based on recent forecasts of continued economic growth. However, our optimism is tempered by the understanding that some companies, industries and market sectors always perform better than others.As always, we urge you to speak regularly with your financial advisor, who may be in the best position to suggest the Dreyfus funds designed to meet your current needs, future goals and tolerance for risk.
Thank you for your continued confidence and support.
Sincerely,

| Stephen E. Canter |
| Chairman and Chief Executive Officer |
| The Dreyfus Corporation |
| January 15, 2004 |
2

DISCUSSION OF FUND PERFORMANCE
Valerie J. Sill, Portfolio Manager
How did Dreyfus Premier Core Value Fund perform relative to its benchmark?
For the 12-month period ended December 31, 2003, Dreyfus Premier Core Value Fund produced total returns of 28.09% for its Class A Shares, 27.12% for its Class B Shares, 27.12% for its Class C shares, 28.25% for its Institutional shares, 28.43% for its Class R shares and 27.72% for its Class T shares.1 In comparison, the fund’s benchmark, the S&P 500/BARRA Value Index, produced a total return of 31.79% for the same period.2
After a three-year bear market, stocks bounced back in 2003 after geopolitical tensions waned and the U.S. economy finally showed signs of sustainable growth. Although the fund participated in the stock market’s rise to a significant degree, its returns trailed its benchmark, primarily because of our focus on relatively high-quality, value-oriented companies rather than the more speculative businesses whose stocks posted the market’s greatest gains during the reporting period.
What is the fund’s investment approach?
The fund invests primarily in large-cap companies that are considered undervalued based on traditional measures, such as price-to-earnings ratios. When choosing stocks, we use a “bottom-up” stock selection approach, focusing on individual companies, rather than a “top-down” approach that forecasts market trends. We also focus on a company’s relative value, financial strength, sales and earnings momentum and likely catalysts that could ignite the stock price.
What other factors influenced the fund’s performance?
Stocks began 2003 in an environment characterized by persistent economic weakness as the United States and its allies prepared for war in Iraq. After it became clear that major combat would be over quickly,
The Fund 3
DISCUSSION OF FUND PERFORMANCE (continued)
investors began to grow more optimistic as they turned their attention to economic fundamentals, the expected benefits of lower interest rates from the Federal Reserve Board and new tax cuts enacted by Congress. By the summer of 2003, the U.S. economy had accelerated to its highest quarterly growth rate in nearly 20 years, and the broad stock market rally that began in mid-March persisted through the end of the year.
The fund participated in the 2003 market rally, particularly through its relatively economically sensitive investments in the financial services, capital goods and technology sectors. For example, the economic upturn benefited fund holdings such as Corning, which manufactures telecommunications products and other components, and Deere & Co., which makes agricultural and construction equipment.A stronger economy and rallying stock market boosted stocks of large brokerage firms such as Goldman Sachs and Morgan Stanley, that saw trading volume increase, fees from money management services rise and underwriting volume on new stock issues begin to bounce back. Investors also began to anticipate a rebound in corporate capital spending, which benefited the fund’s holdings of technology companies such as Intel and Koninklijke (Royal) Phillips Electronics.
A number of special situations also contributed to the fund’s performance, including the takeover of FleetBoston Financial by Bank of America. In addition, the fund benefited from the turnaround at McDonald’s, where new management boosted U.S. sales.
On the other hand, the fund’s performance relative to its benchmark in 2003 was hurt by its lack of exposure to many of the lower-quality companies that led the market’s advance. Gains were particularly impressive among smaller, more speculative technology stocks, many of which had no earnings. However, we tended to focus on well-established technology leaders, such as Microsoft, one of the fund’s top-ten holdings during the year. Microsoft did not participate fully in
4
the market rally because investors perceived it as a mature company with less growth potential than many smaller technology firms.While we agree that its business is relatively mature, we see Microsoft as an attractively valued stock that is trading at the low end of its five-year price range and has the ability to produce stable earnings under a variety of economic conditions.
What is the fund’s current strategy?
The fund’s ongoing strategy is to invest in large-capitalization value stocks that, in our judgment, possess strong business fundamentals and have a catalyst in place to generate capital appreciation.We currently believe that several companies in the pharmaceutical industry appear to fit this description. Large drug manufacturers performed relatively poorly in 2003, largely because of investors’ concerns regarding the potential effects of patent expirations on their earnings. However, we believe that many of these stocks already reflect rising competition from generic drugs, and their stock prices may rise as new pharmaceutical products are introduced to the marketplace.
January 15, 2004
1 Total return includes reinvestment of dividends and any capital gains paid, and does not take into consideration the maximum initial sales charges in the case of Class A and Class T shares, or the applicable contingent deferred sales charges imposed on redemptions in the case of Class B and Class C shares. Had these charges been reflected, returns would have been lower. Past performance is no guarantee of future results. Share price and investment return fluctuate such that upon redemption, fund shares may be worth more or less than original cost.
2 SOURCE: LIPPER INC. — Reflects the reinvestment of dividends and, where applicable, capital gain distributions.The S&P 500/BARRA Value Index is a capitalization-weighted index of all the stocks in the Standard & Poor’s 500 Composite Price Index (“S&P 500 Index”) that have low price-to-book ratios.The S&P 500 Index is a widely accepted, unmanaged index of U.S. stock market performance.
The Fund 5
FUND PERFORMANCE
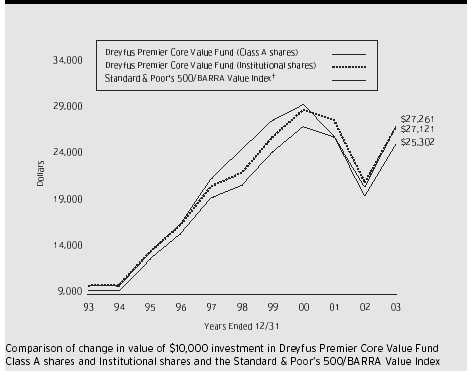
† Source: Lipper Inc.
Past performance is not predictive of future performance.
The above graph compares a $10,000 investment made in Class A shares and Institutional shares of Dreyfus Premier Core Value Fund on 12/31/93 to a $10,000 investment made in the Standard & Poor’s 500/BARRA Value Index (the “Index”) on that date.All dividends and capital gain distributions are reinvested. Performance for Class B, Class C, Class R and Class T shares will vary from the performance of Class A and Institutional shares shown above due to differences in charges and expenses.
The fund’s performance shown in the line graph takes into account the maximum initial sales charge on Class A shares and all other applicable fees and expenses for Class A shares and Institutional shares.The Index is a capitalization-weighted index of all the stocks in the S&P 500 that have low price-to-book ratios.The Index does not take into account charges, fees and other expenses. Further information relating to fund performance, including expense reimbursements, if applicable, is contained in the Financial Highlights section of the prospectus and elsewhere in this report.
6
Average Annual Total Returns as of 12/31/03
| | Inception | | | | | | | | From | |
| | Date | | 1 Year | | 5 Years | | 10 Years | | Inception | |
|
| |
| |
| |
| |
| |
| Class A shares | | | | | | | | | | |
| with maximum sales charge (5.75%) | | | 20.70% | | 2.71% | | 9.73% | | | |
| without sales charge | | | 28.09% | | 3.93% | | 10.38% | | | |
| Class B shares | | | | | | | | | | |
| with applicable redemption charge † | 1/16/98 | | 23.12% | | 2.82% | | — | | 4.20% | |
| without redemption | 1/16/98 | | 27.12% | | 3.14% | | — | | 4.32% | |
| Class C shares | | | | | | | | | | |
| with applicable redemption charge | 1/16/98 | | 26.12% | | 3.14% | | — | | 4.32% | |
| without redemption | 1/16/98 | | 27.12% | | 3.14% | | — | | 4.32% | |
| Class R shares | 8/4/94 | | 28.43% | | 4.19% | | — | | 11.00% | |
| Institutional shares | | | 28.25% | | 4.04% | | 10.49% | | | |
| Class T shares | | | | | | | | | | |
| with applicable sales charge (4.5%) | 8/16/99 | | 21.95% | | — | | — | | 0.39% | |
| without sales charge | 8/16/99 | | 27.72% | | — | | — | | 1.45% | |
Past performance is not predictive of future performance.The fund’s performance shown in the graph and table does not reflect the deduction of taxes that a shareholder would pay on fund distributions or the redemption of fund shares.
†
| The maximum contingent deferred sales charge for Class B shares is 4%.After six years Class B shares convert to Class A shares.
|
††
| The maximum contingent deferred sales charge for Class C shares is 1% for shares redeemed within one year of the date of purchase.
|
The Fund 7
STATEMENT OF INVESTMENTS
December 31, 2003
| Common Stocks—96.8% | | Shares | | Value ($) | |
| |
| |
| |
| Advertising—.5% | | | | | |
| Interpublic Group of Companies | | 259,600 a | | 4,049,760 | |
| Appliance & Household Durables—.6% | | | | | |
| SONY, ADR | | 150,600 | | 5,221,302 | |
| Banking—13.0% | | | | | |
| American Express | | 255,900 | | 12,342,057 | |
| Bank of America | | 149,000 | | 11,984,070 | |
| Citigroup | | 784,033 | | 38,056,962 | |
| Comerica | | 78,200 b | | 4,383,892 | |
| Fannie Mae | | 124,600 | | 9,352,476 | |
| FleetBoston Financial | | 377,847 | | 16,493,021 | |
| U.S. Bancorp | | 404,700 | | 12,051,966 | |
| | | | | 104,664,444 | |
| Basic Industries—2.2% | | | | | |
| Alcoa | | 248,900 | | 9,458,200 | |
| China Steel, ADR | | 7 c | | 117 | |
| International Paper | | 199,000 | | 8,578,890 | |
| | | | | 18,037,207 | |
| Beverage & Tobacco—.8% | | | | | |
| Altria Group | | 114,200 | | 6,214,764 | |
| Brokerage—11.6% | | | | | |
| Bear Stearns Cos. | | 49,100 | | 3,925,545 | |
| Goldman Sachs | | 250,600 | | 24,741,738 | |
| J.P. Morgan Chase & Co. | | 449,600 | | 16,513,808 | |
| Lehman Brothers Holdings | | 111,600 | | 8,617,752 | |
| Merrill Lynch | | 337,950 | | 19,820,768 | |
| Morgan Stanley | | 338,200 | | 19,571,634 | |
| | | | | 93,191,245 | |
| Capital Goods—15.2% | | | | | |
| Corning | | 856,300 a | | 8,931,209 | |
| Deere & Co. | | 234,100 | | 15,228,205 | |
| Eaton | | 80,600 | | 8,703,188 | |
| Emerson Electric | | 137,760 | | 8,919,960 | |
| Ericsson, ADR—Class B | | 589,600 a,b | | 10,435,920 | |
| Nokia, ADR—Series A | | 886,000 | | 15,062,000 | |
| Pitney Bowes | | 114,900 | | 4,667,238 | |
| Rockwell Collins | | 179,200 | | 5,381,376 | |
| Stmicroelectronics (New York Shares) | | 271,500 | | 7,333,215 | |
| | | | | | |
| 8 | | | | | |
| Common Stocks (continued) | Shares | | Value ($) | |
|
| |
| |
| Capital Goods (continued) | | | | |
| United Technologies | 228,300 | | 21,635,991 | |
| Xerox | 1,146,400 a,b | | 15,820,320 | |
| | | | 122,118,622 | |
| Consumer Durables—3.4% | | | | |
| Black & Decker | 80,000 | | 3,945,600 | |
| Koninklijke (Royal) Phillips Electronics | | | | |
| (New York Shares) | 802,800 | | 23,353,452 | |
| | | | 27,299,052 | |
| Consumer Non—Durables—1.5% | | | | |
| Jones Apparel Group | 238,300 | | 8,395,309 | |
| Kimberly-Clark | 68,200 | | 4,029,938 | |
| | | | 12,425,247 | |
| Consumer Services—12.1% | | | | |
| Abercrombie & Fitch, Cl.A | 128,500 a | | 3,175,235 | |
| Brinker | 115,500 a | | 3,829,980 | |
| Gannett | 89,100 | | 7,944,156 | |
| Knight-Ridder | 72,400 | | 5,601,588 | |
| Kroger | 208,300 a | | 3,855,633 | |
| Liberty Media, Cl.A | 1,702,180 a | | 20,238,920 | |
| Limited Brands | 434,500 | | 7,834,035 | |
| McDonald’s | 774,000 | | 19,218,420 | |
| Safeway | 323,400 a | | 7,085,694 | |
| Viacom, Cl.B | 416,700 | | 18,493,146 | |
| | | | 97,276,807 | |
| Data Processing—1.5% | | | | |
| Automatic Data Processing | 301,200 | | 11,930,532 | |
| Energy—8.2% | | | | |
| Anadarko Petrolem | 160,800 | | 8,202,408 | |
| Apache | 51,600 | | 4,184,760 | |
| BP, ADR | 216,400 | | 10,679,340 | |
| Exxon Mobil | 625,632 | | 25,650,912 | |
| Royal Dutch Petroleum (New York Shares) | 127,800 | | 6,695,442 | |
| Schlumberger | 200,200 | | 10,954,944 | |
| | | | 66,367,806 | |
| Health Care—6.3% | | | | |
| Baxter | 408,000 | | 12,452,160 | |
| Becton, Dickinson & Co. | 199,900 | | 8,223,886 | |
| Johnson & Johnson | 146,900 | | 7,588,854 | |
The Fund 9
STATEMENT OF INVESTMENTS (continued)
| Common Stocks (continued) | Shares | | Value ($) | |
|
| |
| |
| Health Care (continued) | | | | |
| McKesson | 217,700 | | 7,001,232 | |
| Pfizer | 280,200 | | 9,899,466 | |
| Wyeth | 133,700 | | 5,675,565 | |
| | | | 50,841,163 | |
| Insurance—6.8% | | | | |
| Allstate | 334,300 | | 14,381,586 | |
| American International Group | 225,293 | | 14,932,420 | |
| Hartford Financial Services Group | 69,700 | | 4,114,391 | |
| Marsh & McLennan Cos. | 144,600 | | 6,924,894 | |
| Principal Financial Group | 210,800 | | 6,971,156 | |
| Travelers Property Casualty, Cl.A | 425,000 | | 7,131,500 | |
| | | | 54,455,947 | |
| Technology—9.4% | | | | |
| Cadence Deign System | 655,800 a | | 11,791,284 | |
| Comverse Technology | 354,500 a | | 6,235,655 | |
| Intel | 399,100 | | 12,851,020 | |
| International Business Machines | 102,900 | | 9,536,772 | |
| Microsoft | 898,300 | | 24,739,182 | |
| SunGard Data Systems | 142,900 a | | 3,959,759 | |
| Tellabs | 449,000 a | | 3,785,070 | |
| 3Com | 383,500 a | | 3,133,195 | |
| | | | 76,031,937 | |
| Telecommunications—1.3% | | | | |
| SK Telecom, ADR | 270 b | | 5,036 | |
| Sprint (FON Group) | 289,400 | | 4,751,948 | |
| Sprint (PCS Group) | 1,052,900 a | | 5,917,298 | |
| | | | 10,674,282 | |
| Transportation—1.2% | | | | |
| Union Pacific | 137,100 | | 9,525,708 | |
| Utilities—1.2% | | | | |
| Verizon Communications | 280,856 | | 9,852,428 | |
| Total Common Stocks | | | | |
| (cost $634,746,850) | | | 780,178,253 | |
10
| Preferred Stocks—1.4% | | Shares | | Value ($) | |
|
|
| |
| |
| Consumer Services; | | | | | |
| News Corp, ADR | | | | | |
| (cost $ | 6,598,190) | | 368,300 | | 11,141,075 | |
|
|
|
| |
| |
| | | | Principal | | | |
| Short-Term Investments—1.4% | Amount ($) | | Value ($) | |
|
| |
| |
| Commercial Paper; | | | | | |
| General Electric Capital, | | | | | |
| .75%, 1/02/2004 | | | | | |
| (cost $ | 11,577,000) | | 11,577,000 | | 11,577,000 | |
|
|
|
| |
| |
| Investment of Cash Collateral | | | | |
| for Securities Loaned—2.7% | Shares | | Value ($) | |
|
| |
| |
| Registered Investment Company; | | | | |
| Dreyfus Institutional Preferred Money Market Fund | | | | |
| (cost $ | 21,340,730) | | 21,340,730 | | 21,340,730 | |
|
|
|
| |
| |
| | | | | | | |
| Total Investments (cost $ | 674,262,770) | 102.3% | | 824,237,058 | |
| Liabilities, Less Cash and Receivables | (2.3%) | | (18,507,908) | |
| Net Assets | | 100.0% | | 805,729,150 | |
a Non-income producing.
b
| All or a portion of these securities are on loan.At December 31, 2003, the total market value of the fund’s securities on loan is $20,942,928 and the total market value of the collateral held by the fund is $21,340,730.
|
c
| Security exempt from registration under Rule 144A of the Securities Act of 1933.This security may be resold in transactions exempt from registration, normally to qualified institutional buyers.At December 31, 2003, this security amounted to $117.
|
See notes to financial statements.
The Fund 11
STATEMENT OF ASSETS AND LIABILITIES
December 31, 2003
| | | | | | | | | Cost | Value | |
|
|
| |
| |
|
|
|
| |
| Assets ($): | | | | | | | | | | |
| Investments in securities—See Statement of Investments | | | | |
| (including securities on loan, valued at | | | | | | |
| $20,942,928)—Note 1(b) | | | | | 674,262,770 | 824,237,058 | |
| Receivable for investment securities sold | | | | | 11,396,167 | |
| Dividends and interest receivable | | | | | 1,041,936 | |
| Receivable for shares of Beneficial Interest subscribed | | | 359,559 | |
| | | | | | | | | | 837,034,720 | |
|
|
| |
| |
|
|
|
| |
| Liabilities ($): | | | | | | | | | |
| Due to The Dreyfus Corporation and affiliates—Note 2 | | | 812,733 | |
| Cash overdraft due to Custodian | | | | | | | 947,675 | |
| Liability for securities on loan—Note 1(b) | | | | | 21,340,730 | |
| Payable for investment securities purchased | | | | | 6,507,697 | |
| Payable for shares of Beneficial Interest redeemed | | | 1,696,735 | |
| | | | | | | | | | 31,305,570 | |
|
|
| |
| |
|
|
|
| |
| Net Assets ( | $) | | | | | | | | 805,729,150 | |
|
|
| |
| |
|
|
|
| |
| Composition of Net Assets ($): | | | | | | |
| Paid-in capital | | | | | | | | | 792,101,102 | |
| Accumulated undistributed investment income—net | | | 421,293 | |
| Accumulated net realized gain (loss) on investments | | | (136,767,533) | |
| Accumulated net unrealized appreciation | | | | | | |
| (depreciation) on investments | | | | | | | 149,974,288 | |
| |
| |
|
|
|
| |
| Net Assets ( | $) | | | | | | | | 805,729,150 | |
|
|
| |
| |
|
|
|
| |
| | | | | | | | | | | |
| | | | | | | | | | | |
| Net Asset Value Per Share | | | | | | |
| | | Class A | | Class B | | Class C | Class R | Class T | Institutional | |
|
|
| |
| |
|
|
|
| |
| Net Assets ($) | 607,632,797 | | 78,780,243 | | 22,480,325 | 52,723,271 | 2,264,199 | 41,848,315 | |
| Shares | | | | | | | | | | |
| Outstanding | | 22,146,936 | | 2,915,478 | | 831,847 | 1,922,207 | 82,539 | 1,526,240 | |
|
|
| |
| |
|
|
|
| |
| Net Asset Value | | | | | | | | |
| Per Share ( | $) 27.44 | | 27.02 | | 27.02 | 27.43 | 27.43 | 27.42 | |
| | | | | | | | | | | |
| See notes to financial statements. | | | | | | | | |
12
STATEMENT OF OPERATIONS
Year Ended December 31, 2003
| Investment Income ( | $): | | |
| Income: | | | |
| Cash dividends (net of $239,105 foreign taxes withheld at source) | 12,880,834 | |
| Interest | | 157,458 | |
| Income on securities lending | 31,761 | |
| Total Income | | 13,070,053 | |
| Expenses: | | | |
| Management fee—Note 2(a) | | 6,321,400 | |
| Distribution and service fees—Note 2(b) | 2,256,297 | |
| Loan commitment fees—Note 4 | 5,922 | |
| Total Expenses | | 8,583,619 | |
| Investment Income—Net | | 4,486,434 | |
|
|
| |
| Realized and Unrealized Gain (Loss) on Investments—Note 3 ($): | | |
| Net realized gain (loss) on investments and | | |
| foreign currency transactions | 2,244,385 | |
| Net realized gain (loss) on forward currency | | |
| exchange contracts | | (20) | |
| Net Realized Gain (Loss) | | 2,244,365 | |
| Net unrealized appreciation (depreciation) on investments | 171,665,107 | |
| Net Realized and Unrealized Gain (Loss) on Investments | 173,909,472 | |
| Net Increase in Net Assets Resulting from Operations | 178,395,906 | |
See notes to financial statements.
The Fund 13
STATEMENT OF CHANGES IN NET ASSETS
| | Year Ended December 31, | |
| |
| |
| | 2003 | | 2002 | |
|
| |
| |
| Operations ($): | | | | |
| Investment income—net | 4,486,434 | | 2,706,736 | |
| Net realized gain (loss) on investments | 2,244,365 | | (129,369,521) | |
| Net unrealized appreciation | | | | |
| (depreciation) on investments | 171,665,107 | | (100,428,701) | |
| Net Increase (Decrease) in Net Assets | | | | |
| Resulting from Operations | 178,395,906 | | (227,091,486) | |
|
| |
| |
| Dividends to Shareholders from ($): | | | | |
| Investment income—net: | | | | |
| Class A shares | (3,672,165) | | (2,095,693) | |
| Class B shares | (42,807) | | — | |
| Class C shares | (12,034) | | — | |
| Class R shares | (431,331) | | (275,395) | |
| Class T shares | (8,129) | | (2,550) | |
| Institutional shares | (294,312) | | (210,983) | |
| Total Dividends | (4,460,778) | | (2,584,621) | |
|
| |
| |
| Beneficial Interest Transactions ($): | | | | |
| Net proceeds from shares sold: | | | | |
| Class A shares | 69,547,747 | | 128,962,355 | |
| Class B shares | 11,334,683 | | 32,985,741 | |
| Class C shares | 9,950,055 | | 11,227,556 | |
| Class R shares | 6,484,312 | | 10,959,857 | |
| Class T shares | 466,996 | | 1,669,295 | |
| Institutional shares | 674,229 | | 1,898,103 | |
14
| | Year Ended December 31, | |
| |
| |
| | 2003 | | 2002 | |
|
| |
| |
| Beneficial Interest Transactions ($) (continued): | | | | |
| Dividends reinvested: | | | | |
| Class A shares | 3,178,046 | | 1,778,780 | |
| Class B shares | 36,527 | | — | |
| Class C shares | 9,238 | | — | |
| Class R shares | 431,021 | | 275,318 | |
| Class T shares | 8,023 | | 2,504 | |
| Institutional shares | 285,477 | | 206,052 | |
| Cost of shares redeemed: | | | | |
| Class A shares | (101,503,555) | | (147,319,203) | |
| Class B shares | (11,884,065) | | (17,126,987) | |
| Class C shares | (12,880,056) | | (7,309,501) | |
| Class R shares | (5,795,921) | | (4,385,465) | |
| Class T shares | (246,690) | | (830,523) | |
| Institutional shares | (5,373,560) | | (9,278,390) | |
| Increase (Decrease) in Net Assets | | | | |
| from Beneficial Interest Transactions | (35,277,493) | | 3,715,492 | |
| Total Increase (Decrease) in Net Assets | 138,657,635 | | (225,960,615) | |
|
| |
| |
| Net Assets ($): | | | | |
| Beginning of Period | 667,071,515 | | 893,032,130 | |
| End of Period | 805,729,150 | | 667,071,515 | |
| Undistributed investment income—net | 421,293 | | 395,675 | |
The Fund 15
STATEMENT OF CHANGES IN NET ASSETS (continued)
| | Year Ended December 31, | |
| |
| |
| | 2003 | | 2002 | |
|
| |
| |
| Capital Share Transactions: | | | | |
| Class Aa | | | | |
| Shares sold | 2,953,000 | | 5,072,535 | |
| Shares issued for dividends reinvested | 134,142 | | 79,513 | |
| Shares redeemed | (4,326,654) | | (6,047,472) | |
| Net Increase (Decrease) in Shares Outstanding | (1,239,512) | | (895,424) | |
|
| |
| |
| Class Ba | | | | |
| Shares sold | 486,046 | | 1,284,876 | |
| Shares issued for dividends reinvested | 1,655 | | — | |
| Shares redeemed | (525,823) | | (736,243) | |
| Net Increase (Decrease) in Shares Outstanding | (38,122) | | 548,633 | |
|
| |
| |
| Class C | | | | |
| Shares sold | 452,412 | | 448,815 | |
| Shares issued for dividends reinvested | 421 | | — | |
| Shares redeemed | (599,607) | | (303,397) | |
| Net Increase (Decrease) in Shares Outstanding | (146,774) | | 145,418 | |
|
| |
| |
| Class R | | | | |
| Shares sold | 271,825 | | 412,401 | |
| Shares issued for dividends reinvested | 18,131 | | 12,008 | |
| Shares redeemed | (237,711) | | (181,176) | |
| Net Increase (Decrease) in Shares Outstanding | 52,245 | | 243,233 | |
|
| |
| |
| Class T | | | | |
| Shares sold | 20,540 | | 67,153 | |
| Shares issued for dividends reinvested | 338 | | 119 | |
| Shares redeemed | (10,977) | | (34,178) | |
| Net Increase (Decrease) in Shares Outstanding | 9,901 | | 33,094 | |
|
| |
| |
| Institutional Shares | | | | |
| Shares sold | 29,399 | | 76,740 | |
| Shares issued for dividends reinvested | 12,070 | | 9,072 | |
| Shares redeemed | (240,152) | | (408,160) | |
| Net Increase (Decrease) in Shares Outstanding | (198,683) | | (322,348) | |
a During the period ended December 31, 2003, 33,502 Class B shares representing $773,643 were automatically converted to 32,995 Class A shares and during the period ended December 31, 2002, 11,870 Class B shares representing $291,033 were automatically converted to 11,716 Class A shares.
See notes to financial statements.
16
FINANCIAL HIGHLIGHTS
The following tables describe the performance for each share class for the fiscal periods indicated. All information (except portfolio turnover rate) reflects financial results for a single fund share.Total return shows how much your investment in the fund would have increased (or decreased) during each period assuming you had reinvested all dividends and distributions.These figures have been derived from the fund’s financial statements.
| | | | Year Ended December 31, | | | |
| | | |
| | | |
| Class A Shares | 2003 | | 2002 | | 2001 | | 2000 | | 1999 | |
|
| |
| |
| |
| |
| |
| Per Share Data ($): | | | | | | | | | | |
| Net asset value, beginning of period | 21.57 | | 28.62 | | 30.93 | | 30.83 | | 29.26 | |
| Investment Operations: | | | | | | | | | | |
| Investment income—neta | .17 | | .10 | | .17 | | .24 | | .13 | |
| Net realized and unrealized | | | | | | | | | | |
| gain (loss) on investments | 5.86 | | (7.06) | | (1.46) | | 3.04 | | 4.78 | |
| Total from Investment Operations | 6.03 | | (6.96) | | (1.29) | | 3.28 | | 4.91 | |
| Distributions: | | | | | | | | | | |
| Dividends from investment income—net | (.16) | | (.09) | | (.16) | | (.23) | | (.13) | |
| Dividends from net realized | | | | | | | | | | |
| gain on investments | — | | — | | (.86) | | (2.95) | | (3.21) | |
| Total Distributions | (.16) | | (.09) | | (1.02) | | (3.18) | | (3.34) | |
| Net asset value, end of period | 27.44 | | 21.57 | | 28.62 | | 30.93 | | 30.83 | |
|
| |
| |
| |
| |
| |
| Total Return (%)b | 28.09 | | (24.36) | | (4.04) | | 11.21 | | 17.29 | |
|
| |
| |
| |
| |
| |
| Ratios/Supplemental Data (%): | | | | | | | | | | |
| Ratio of expenses to average net assets | 1.15 | | 1.15 | | 1.15 | | 1.15 | | 1.15 | |
| Ratio of net investment income | | | | | | | | | | |
| to average net assets | .71 | | .41 | | .58 | | .79 | | .41 | |
| Portfolio Turnover Rate | 54.58 | | 67.21 | | 68.77 | | 88.70 | | 91.22 | |
|
| |
| |
| |
| |
| |
| Net Assets, end of period ($ X 1,000) | 607,633 | | 504,371 | | 695,054 | | 634,410 | | 590,129 | |
a Based on average shares outstanding at each month end.
b Exclusive of sales charge.
See notes to financial statements.
The Fund 17
FINANCIAL HIGHLIGHTS (continued)
| | | | Year Ended December 31, | | | |
| | | |
| | | |
| Class B Shares | 2003 | | 2002 | | 2001 | | 2000 | | 1999 | |
|
| |
| |
| |
| |
| |
| Per Share Data ($): | | | | | | | | | | |
| Net asset value, beginning of period | 21.27 | | 28.33 | | 30.68 | | 30.64 | | 29.19 | |
| Investment Operations: | | | | | | | | | | |
| Investment income (loss)—neta | (.01) | | (.08) | | (.07) | | .01 | | (.10) | |
| Net realized and unrealized | | | | | | | | | | |
| gain (loss) on investments | 5.77 | | (6.98) | | (1.42) | | 3.01 | | 4.76 | |
| Total from Investment Operations | 5.76 | | (7.06) | | (1.49) | | 3.02 | | 4.66 | |
| Distributions: | | | | | | | | | | |
| Dividends from investment income—net | (.01) | | — | | (.00)b | | (.03) | | — | |
| Dividends from net realized | | | | | | | | | | |
| gain on investments | — | | — | | (.86) | | (2.95) | | (3.21) | |
| Total Distributions | (.01) | | — | | (.86) | | (2.98) | | (3.21) | |
| Net asset value, end of period | 27.02 | | 21.27 | | 28.33 | | 30.68 | | 30.64 | |
|
| |
| |
| |
| |
| |
| Total Return (%)c | 27.12 | | (24.92) | | (4.79) | | 10.39 | | 16.37 | |
|
| |
| |
| |
| |
| |
| Ratios/Supplemental Data (%): | | | | | | | | | | |
| Ratio of expenses to average net assets | 1.90 | | 1.90 | | 1.90 | | 1.90 | | 1.90 | |
| Ratio of net investment income | | | | | | | | | | |
| (loss) to average net assets | (.04) | | (.33) | | (.24) | | .03 | | (.33) | |
| Portfolio Turnover Rate | 54.58 | | 67.21 | | 68.77 | | 88.70 | | 91.22 | |
|
| |
| |
| |
| |
| |
| Net Assets, end of period ($ X 1,000) | 78,780 | | 62,820 | | 68,123 | | 17,209 | | 6,792 | |
a Based on average shares outstanding at each month end.
b
| Amount represents less than $.01 per share.
|
c
| Exclusive of sales charge.
|
See notes to financial statements.
18
| | | | Year Ended December 31, | | | |
| | | |
| | | |
| Class C Shares | 2003 | | 2002 | | 2001 | | 2000 | | 1999 | |
|
| |
| |
| |
| |
| |
| Per Share Data ($): | | | | | | | | | | |
| Net asset value, beginning of period | 21.27 | | 28.34 | | 30.68 | | 30.64 | | 29.19 | |
| Investment Operations: | | | | | | | | | | |
| Investment income (loss)—neta | (.01) | | (.08) | | (.06) | | .00b | | (.11) | |
| Net realized and unrealized | | | | | | | | | | |
| gain (loss) on investments | 5.77 | | (6.99) | | (1.42) | | 3.02 | | 4.77 | |
| Total from Investment Operations | 5.76 | | (7.07) | | (1.48) | | 3.02 | | 4.66 | |
| Distributions: | | | | | | | | | | |
| Dividends from investment income—net | (.01) | | — | | (.00)b | | (.03) | | — | |
| Dividends from net realized | | | | | | | | | | |
| gain on investments | — | | — | | (.86) | | (2.95) | | (3.21) | |
| Total Distributions | (.01) | | — | | (.86) | | (2.98) | | (3.21) | |
| Net asset value, end of period | 27.02 | | 21.27 | | 28.34 | | 30.68 | | 30.64 | |
|
| |
| |
| |
| |
| |
| Total Return (%)c | 27.12 | | (24.95) | | (4.75) | | 10.35 | | 16.41 | |
|
| |
| |
| |
| |
| |
| Ratios/Supplemental Data (%): | | | | | | | | | | |
| Ratio of expenses to average net assets | 1.90 | | 1.90 | | 1.90 | | 1.90 | | 1.90 | |
| Ratio of net investment income | | | | | | | | | | |
| (loss) to average net assets | (.04) | | (.32) | | (.24) | | .01 | | (.35) | |
| Portfolio Turnover Rate | 54.58 | | 67.21 | | 68.77 | | 88.70 | | 91.22 | |
|
| |
| |
| |
| |
| |
| Net Assets, end of period ($ X 1,000) | 22,480 | | 20,819 | | 23,612 | | 3,459 | | 1,192 | |
a Based on average shares outstanding at each month end.
b
| Amount represents less than $.01 per share.
|
c
| Exclusive of sales charge.
|
See notes to financial statements.
The Fund 19
FINANCIAL HIGHLIGHTS (continued)
| | | | Year Ended December 31, | | | |
| | | |
| | | |
| Class R Shares | 2003 | | 2002 | | 2001 | | 2000 | | 1999 | |
|
| |
| |
| |
| |
| |
| Per Share Data ($): | | | | | | | | | | |
| Net asset value, beginning of period | 21.56 | | 28.62 | | 30.92 | | 30.82 | | 29.25 | |
| Investment Operations: | | | | | | | | | | |
| Investment income—neta | .22 | | .17 | | .23 | | .32 | | .20 | |
| Net realized and unrealized | | | | | | | | | | |
| gain (loss) on investments | 5.87 | | (7.08) | | (1.44) | | 3.04 | | 4.79 | |
| Total from Investment Operations | 6.09 | | (6.91) | | (1.21) | | 3.36 | | 4.99 | |
| Distributions: | | | | | | | | | | |
| Dividends from investment income—net | (.22) | | (.15) | | (.23) | | (.31) | | (.21) | |
| Dividends from net realized | | | | | | | | | | |
| gain on investments | — | | — | | (.86) | | (2.95) | | (3.21) | |
| Total Distributions | (.22) | | (.15) | | (1.09) | | (3.26) | | (3.42) | |
| Net asset value, end of period | 27.43 | | 21.56 | | 28.62 | | 30.92 | | 30.82 | |
|
| |
| |
| |
| |
| |
| Total Return (%) | 28.43 | | (24.18) | | (3.80) | | 11.49 | | 17.59 | |
|
| |
| |
| |
| |
| |
| Ratios/Supplemental Data (%): | | | | | | | | | | |
| Ratio of expenses to average net assets | .90 | | .90 | | .90 | | .90 | | .90 | |
| Ratio of net investment income | | | | | | | | | | |
| to average net assets | .95 | | .67 | | .78 | | 1.03 | | .65 | |
| Portfolio Turnover Rate | 54.58 | | 67.21 | | 68.77 | | 88.70 | | 91.22 | |
|
| |
| |
| |
| |
| |
| Net Assets, end of period ($ X 1,000) | 52,723 | | 40,320 | | 46,555 | | 1,138 | | 885 | |
a Based on average shares outstanding at each month end. See notes to financial statements.
20
| | | | Year Ended December 31, | | | |
| | | |
| | | |
| Class T Shares | 2003 | | 2002 | | 2001 | | 2000 | | 1999a | |
|
| |
| |
| |
| |
| |
| Per Share Data ($): | | | | | | | | | | |
| Net asset value, beginning of period | 21.57 | | 28.63 | | 30.93 | | 30.84 | | 32.45 | |
| Investment Operations: | | | | | | | | | | |
| Investment income—netb | .11 | | .05 | | .07 | | .17 | | .01 | |
| Net realized and unrealized | | | | | | | | | | |
| gain (loss) on investments | 5.85 | | (7.07) | | (1.42) | | 3.03 | | 1.23 | |
| Total from Investment Operations | 5.96 | | (7.02) | | (1.35) | | 3.20 | | 1.24 | |
| Distributions: | | | | | | | | | | |
| Dividends from investment income—net | (.10) | | (.04) | | (.09) | | (.16) | | (.02) | |
| Dividends from net realized | | | | | | | | | | |
| gain on investments | — | | — | | (.86) | | (2.95) | | (2.83) | |
| Total Distributions | (.10) | | (.04) | | (.95) | | (3.11) | | (2.85) | |
| Net asset value, end of period | 27.43 | | 21.57 | | 28.63 | | 30.93 | | 30.84 | |
|
| |
| |
| |
| |
| |
| Total Return (%)c | 27.72 | | (24.53) | | (4.28) | | 10.89 | | 4.10d | |
|
| |
| |
| |
| |
| |
| Ratios/Supplemental Data (%): | | | | | | | | | | |
| Ratio of expenses to average net assets | 1.40 | | 1.40 | | 1.40 | | 1.40 | | .53d | |
| Ratio of net investment income | | | | | | | | | | |
| to average net assets | .45 | | .21 | | .25 | | .57 | | .05d | |
| Portfolio Turnover Rate | 54.58 | | 67.21 | | 68.77 | | 88.70 | | 91.22 | |
|
| |
| |
| |
| |
| |
| Net Assets, end of period ($ X 1,000) | 2,264 | | 1,567 | | 1,132 | | 154 | | 18 | |
a From August 16, 1999 (commencement of initial offering) to December 31, 1999.
b
| Based on average shares outstanding at each month end.
|
c
| Exclusive of sales charge.
|
d
| Not annualized.
|
See notes to financial statements.
The Fund 21
FINANCIAL HIGHLIGHTS (continued)
| | | | Year Ended December 31, | | | |
| | | |
| | | |
| Institutional Shares | 2003 | | 2002 | | 2001 | | 2000 | | 1999 | |
|
| |
| |
| |
| |
| |
| Per Share Data ($): | | | | | | | | | | |
| Net asset value, beginning of period | 21.55 | | 28.60 | | 30.90 | | 30.81 | | 29.24 | |
| Investment Operations: | | | | | | | | | | |
| Investment income—neta | .19 | | .13 | | .20 | | .27 | | .16 | |
| Net realized and unrealized | | | | | | | | | | |
| gain (loss) on investments | 5.87 | | (7.07) | | (1.45) | | 3.04 | | 4.78 | |
| Total from Investment Operations | 6.06 | | (6.94) | | (1.25) | | 3.31 | | 4.94 | |
| Distributions: | | | | | | | | | | |
| Dividends from investment income—net | (.19) | | (.11) | | (.19) | | (.27) | | (.16) | |
| Dividends from net realized | | | | | | | | | | |
| gain on investments | — | | — | | (.86) | | (2.95) | | (3.21) | |
| Total Distributions | (.19) | | (.11) | | (1.05) | | (3.22) | | (3.37) | |
| Net asset value, end of period | 27.42 | | 21.55 | | 28.60 | | 30.90 | | 30.81 | |
|
| |
| |
| |
| |
| |
| Total Return (%) | 28.25 | | (24.28) | | (3.96) | | 11.30 | | 17.41 | |
|
| |
| |
| |
| |
| |
| Ratios/Supplemental Data (%): | | | | | | | | | | |
| Ratio of expenses to average net assets | 1.05 | | 1.05 | | 1.05 | | 1.05 | | 1.05 | |
| Ratio of net investment income | | | | | | | | | | |
| to average net assets | .81 | | .51 | | .70 | | .89 | | .50 | |
| Portfolio Turnover Rate | 54.58 | | 67.21 | | 68.77 | | 88.70 | | 91.22 | |
|
| |
| |
| |
| |
| |
| Net Assets, end of period ($ X 1,000) | 41,848 | | 37,174 | | 58,557 | | 63,473 | | 65,111 | |
a Based on average shares outstanding at each month end. See notes to financial statements.
22
NOTES TO FINANCIAL STATEMENTS
NOTE 1—Significant Accounting Policies:
Dreyfus Premier Core Value Fund (the “fund”) is a separate diversified series of The Dreyfus/Laurel Funds Trust (the “Trust”) which is registered under the Investment Company Act of 1940, as amended (the “Act”), as an open-end management investment company and operates as a series company currently offering three series, including the fund. The fund’s investment objective is to seek long-term capital growth.The Dreyfus Corporation (the “Manager”) serves as the fund’s investment manager. The Manager is a wholly-owned subsidiary of Mellon Bank, N.A. (“Mellon Bank”), which is a wholly-owned subsidiary of Mellon Financial Corporation.
Dreyfus Service Corporation (the “Distributor”), a wholly-owned subsidiary of the Manager, is the distributor of the fund’s shares. The fund is authorized to issue an unlimited number of shares of Beneficial Interest in each of the following classes of shares: Class A, Class B, Class C, Class R, Class T and Institutional shares. Class A, Class B, Class C and Class T shares are sold primarily to retail investors through financial intermediaries and bear a distribution fee and/or service fee. Class A and Class T shares are subject to a front-end sales charge, while Class B and Class C shares are subject to a contingent deferred sales charge (“CDSC”). Class B shares automatically convert to Class A shares after six years. Class R shares are sold primarily to bank trust departments and other financial service providers (including Mellon Bank and its affiliates) acting on behalf of customers having a qualified trust or investment account or relationship at such institution, and bear no distribution or service fees. Class R and Institutional shares are offered without a front-end sales charge or CDSC. Institutional shares are offered only to those customers of certain financial planners and investment advisers who held shares of a predecessor class of the fund as of April 4, 1994, and bear a distribution fee. Each class of shares has identical rights and privileges, except with respect to the distribution and service fees and voting rights on matters affecting a single class.
The Fund 23
NOTES TO FINANCIAL STATEMENTS (continued)
Investment income, net of expenses (other than class specific expenses) and realized and unrealized gains and losses are allocated daily to each class of shares based upon the relative proportion of net assets of each class.
The fund’s financial statements are prepared in accordance with accounting principles generally accepted in the United States of America, which may require the use of management estimates and assumptions. Actual results could differ from those estimates.
(a) Portfolio valuation: Investments in securities are valued at the last sales price on the securities exchange on which such securities are primarily traded or at the last sales price on the national securities market. Effective April 14, 2003, the fund began pricing securities on the NASDAQ stock market using the NASDAQ official closing price. Securities not listed on an exchange or the national securities market, or securities for which there were no transactions, are valued at the average of the most recent bid and asked prices, except for open short positions, where the asked price is used for valuation purposes. Bid price is used when no asked price is available. Securities for which there are no such valuations are valued at fair value as determined in good faith under the direction of the Board of Trustees. Investments denominated in foreign currencies are translated to U.S. dollars at the prevailing rates of exchange. Forward currency exchange contracts are valued at the forward rate.
(b) Securities transactions and investment income: Securities transactions are recorded on a trade date basis. Realized gain and loss from securities transactions are recorded on the identified cost basis. Dividend income is recognized on the ex-dividend date and interest income including, where applicable, accretion of discount and amortization of premium on investments, is recognized on the accrual basis.
The fund may lend securities to qualified institutions. At origination, all loans are secured by collateral of at least 102% of the value of U.S. securities loaned and 105% of the value of foreign securities loaned. Collateral equivalent to at least 100% of the market value of securities
24
on loan will be maintained at all times. Cash collateral is invested in certain money market mutual funds managed by the Manager as shown in the fund’s Statement of Investments.The fund will be entitled to receive all income on securities loaned, in addition to income earned as a result of the lending transaction. Although each security loaned is fully collateralized, the fund would bear the risk of delay in recovery of, or loss of rights in, the securities loaned should a borrower fail to return the securities in a timely manner.
(c) Foreign currency transactions: The fund does not isolate that portion of the results of operations resulting from changes in foreign exchange rates on investments from the fluctuations arising from changes in the market prices of securities held. Such fluctuations are included with the net realized and unrealized gain or loss from investments.
Net realized foreign exchange gains or losses arise from sales and maturities of short-term securities, sales of foreign currencies, currency gains or losses realized on securities transactions and the difference between the amount of dividends, interest, and foreign withholding taxes recorded on the fund’s books and the U.S. dollar equivalent of the amounts actually received or paid. Net unrealized foreign exchange gains and losses arise from changes in the value of assets and liabilities other than investments in securities, resulting from changes in exchange rates. Such gains and losses are included with net realized and unrealized gain or loss on investments.
(d) Forward currency exchange contracts:The fund enters into forward currency exchange contracts in order to hedge its exposure to changes in foreign currency exchange rates on its foreign portfolio holdings and to settle foreign currency transactions. When executing forward currency exchange contracts, the fund is obligated to buy or sell a foreign currency at a specified rate on a certain date in the future. With respect to sales of forward currency exchange contracts, the fund would incur a loss if the value of the contract increases between the date the forward contract is opened and the date the forward contract
The Fund 25
NOTES TO FINANCIAL STATEMENTS (continued)
is closed.The fund realizes a gain if the value of the contract decreases between those dates. With respect to purchases of forward currency exchange contracts, the fund would incur a loss if the value of the contract decreases between the date the forward contract is opened and the date the forward contract is closed.The fund realizes a gain if the value of the contract increases between those dates. The fund is also exposed to credit risk associated with counter party nonperformance on these forward currency exchange contracts which is typically limited to the unrealized gain on each open contract. At December 31, 2003, there were no open forward currency exchange contracts.
(e) Dividends to shareholders: Dividends are recorded on the ex-dividend date. Dividends from investment income-net are declared and paid on a quarterly basis. Dividends from net realized capital gain, if any, are normally declared and paid annually, but the fund may make distributions on a more frequent basis to comply with the distribution requirements of the Internal Revenue Code of 1986, as amended (the “Code”).To the extent that net realized capital gain can be offset by capital loss carryovers, it is the policy of the fund not to distribute such gain. Income and capital gain distributions are determined in accordance with income tax regulations, which may differ from accounting principles generally accepted in the United States of America.
(f) Federal income taxes: It is the policy of the fund to continue to qualify as a regulated investment company, if such qualification is in the best interests of its shareholders, by complying with the applicable provisions of the Code, and to make distributions of taxable income sufficient to relieve it from substantially all federal income and excise taxes.
At December 31, 2003, the components of accumulated earnings on a tax basis were as follows: undistributed ordinary income $421,293, accumulated capital losses $136,140,578 and unrealized appreciation $149,347,333.
The accumulated capital loss carryover is available to be applied against future net securities profits, if any, realized subsequent to December 31, 2003. If not applied, $4,087,843 of the carryover expires
26
in fiscal 2009, $118,801,482 expires in fiscal 2010 and $13,251,253 expires in fiscal 2011.
The tax character of distributions paid to shareholders during the fiscal periods ended December 31, 2003 and December 31, 2002, respectively, were as follows: ordinary income $4,460,778 and $2,584,621.
During the period ended December 31, 2003, as a result of permanent book to tax differences, the fund decreased accumulated undistributed investment income-net by $38 and increased accumulated net realized gain (loss) on investments by the same amount. Net assets were not affected by this reclassification.
NOTE 2—Investment Management Fee and Other Transactions With Affiliates:
(a) Investment management fee: Pursuant to an Investment Management agreement with the Manager, the Manager provides or arranges for one or more third parties and/or affiliates to provide investment advisory, administrative, custody, fund accounting and transfer agency services to the fund. The Manager also directs the investments of the fund in accordance with its investment objective, policies and limitations. For these services, the fund is contractually obligated to pay the Manager a fee, calculated daily and paid monthly, at the annual rate of .90% of the value of the fund’s average daily net assets. Out of its fee, the Manager pays all of the expenses of the fund except brokerage fees, taxes, interest, commitment fees, Rule 12b-1 distribution fees and expenses, service fees, fees and expenses of non-interested Trustees (including counsel fees) and extraordinary expenses. In addition, the Manager is required to reduce its fee in an amount equal to the fund’s allocable portion of fees and expenses of the non-interested Trustees (including counsel fees). Each Trustee receives $40,000 per year, plus $5,000 for each joint Board meeting of The Dreyfus/Laurel Funds, Inc., The Dreyfus/Laurel Tax-Free Municipal Funds, and the Trust (the “Dreyfus/Laurel Funds”) attended, $2,000 for separate committee meetings attended which are not held in conjunction with a regularly scheduled board meeting and
The Fund 27
NOTES TO FINANCIAL STATEMENTS (continued)
$500 for Board meetings and separate committee meetings attended that are conducted by telephone and is reimbursed for travel and out-of-pocket expenses.The Chairman of the Board receives an additional 25% of such compensation (with the exception of reimbursable amounts).These fees are charged and allocated to each series based on net assets. In the event that there is a joint committee meeting of the Dreyfus/Laurel Funds and the Dreyfus High Yield Strategies Fund, the $2,000 fee will be allocated between the Dreyfus/Laurel Funds and the Dreyfus High Yield Strategies Fund. Amounts required to be paid by the Trust directly to the non-interested Trustees, that would be applied to offset a portion of the management fee payable to the Manager, are in fact paid directly by the Manager to the non-interested Trustees.
During the period ended December 31, 2003, the Distributor retained $55,627 and $462 from commissions earned on sales of the fund’s Class A and Class T shares, respectively, and $231,645 and $6,088 from contingent deferred sales charges on redemptions on the fund’s Class B and Class C shares, respectively.
(b) Distribution and service plan: Under separate Distribution Plans (the “Plans”) adopted pursuant to Rule 12b-1 under the Act, Class A shares and Institutional shares may pay annually up to .25% and .15%, respectively, of the value of their average daily net assets to compensate the Distributor for shareholder servicing activities and expenses primarily intended to result in the sale of Class A shares and Institutional shares. Class B, Class C and Class T shares pay the Distributor for distributing their shares at an aggregate annual rate of .75% of the value of the average daily net assets of Class B and Class C shares, and .25% of the value of average daily net assets of Class T shares. The Distributor may pay one or more agents in respect of advertising, marketing and other distribution services for Class T shares and determines the amounts, if any, to be paid to agents and the basis on which such payments are made. Class B, Class C and Class T shares are also subject to a service plan adopted pursuant to Rule 12b-1 (the
28
“Service Plan”), under which Class B, Class C and Class T shares pay the Distributor for providing certain services to the holders of their shares a fee at the annual rate of .25% of the value of the average daily net assets of Class B, Class C and Class T shares, respectively. During the period ended December 31, 2003, Class A, Class B, Class C, Class T and Institutional shares were charged $1,329,963, $500,307, $145,591, $4,576 and $55,984, respectively, pursuant to their respective Plans. During the period ended December 31, 2003, Class B, Class C and Class T shares were charged $166,769, $48,531 and $4,576, respectively, pursuant to the Service Plan.
Under its terms, the Plans and Service Plan shall remain in effect from year to year, provided such continuance is approved annually by a vote of majority of those Trustees who are not “interested persons” of the Trust and who have no direct or indirect financial interest in the operation of or in any agreement related to the Plans or Service Plan.
On December 9, 2003, the Manager was named in a lawsuit filed in the United States District Court for the Southern District of New York which seeks relief on behalf of the fund and various other funds managed by the Manager. Plaintiffs amended their complaint on February 12, 2004, among other things, by asserting claims derivatively on behalf of the fund and, purportedly, other funds which are named as nominal defendants, and by adding the funds’ directors as defendants. The complaint alleges, in substance, that the Manager and the directors breached their fiduciary duty to fund shareholders under the Investment Company Act of 1940, as amended, and at common law by continuing to charge, and in the case of the directors, by allowing the Manager to continue to charge, 12b-1 fees after the Manager closed certain classes of shares of the funds to new investors.The complaint seeks to recover those 12b-1 fees as well as a portion of the management fees and to enjoin the Manager and its affiliates from charging closed funds 12b-1 fees. The Manager believes that the lawsuit is without merit and intends to contest it vigorously.
The Fund 29
NOTES TO FINANCIAL STATEMENTS (continued)
(c) The Company and the Manager have received an exemptive order from the SEC which, among other things, permits the fund to use cash collateral received in connection with lending the fund’s securities and other uninvested cash to purchase shares of one or more registered money market mutual funds advised by the Manager in excess of the limitations imposed by the Act.
NOTE 3—Securities Transactions:
The aggregate amount of purchases and sales of investment securities, excluding short-term securities and forward currency exchange contracts, during the period ended December 31, 2003, amounted to $375,370,474 and $413,144,142, respectively.
At December 31, 2003, the cost of investments for federal income tax purposes was $674,889,725; accordingly, accumulated net unrealized appreciation on investments was $149,347,333, consisting of $154,968,795 gross unrealized appreciation and $5,621,462 gross unrealized depreciation.
NOTE 4—Bank Line of Credit:
The fund participates with other Dreyfus-managed funds in a $350 million redemption credit facility (“the Facility”) to be utilized for temporary or emergency purposes, including the financing of redemptions. In connection therewith, the fund has agreed to pay commitment fees on its pro rata portion of the Facility. Interest is charged to the fund based on prevailing market rates in effect at the time of borrowings. During the year ended December 31, 2003, the fund did not borrow under the Facility.
30
INDEPENDENT AUDITORS’ REPORT
The Board of Trustees and Shareholders The Dreyfus/Laurel Funds Trust:
We have audited the accompanying statement of assets and liabilities of Dreyfus Premier Core Value Fund (the “Fund”) of The Dreyfus/Laurel Funds Trust, including the statement of investments, as of December 31, 2003, and the related statement of operations for the year then ended, the statement of changes in net assets for each of the two years in the period then ended, and the financial highlights for each of the periods indicated herein.These financial statements and financial highlights are the responsibility of the Fund’s management. Our responsibility is to express an opinion on these financial statements and financial highlights based on our audits.
We conducted our audits in accordance with auditing standards generally accepted in the United States of America.Those standards require that we plan and perform the audit to obtain reasonable assurance about whether the financial statements and financial highlights are free of material misstatement. An audit includes examining, on a test basis, evidence supporting the amounts and disclosures in the financial statements. Our procedures included confirmation of securities owned as of December 31, 2003, by correspondence with the custodian. As to securities purchased and sold but not yet received or delivered, we performed other appropriate auditing procedures.An audit also includes assessing the accounting principles used and significant estimates made by management, as well as evaluating the overall financial statement presentation.We believe that our audits provide a reasonable basis for our opinion.
In our opinion, the financial statements and financial highlights referred to above present fairly, in all material respects, the financial position of Dreyfus Premier Core Value Fund of The Dreyfus/Laurel Funds Trust as of December 31, 2003, the results of its operations for the year then ended, the changes in its net assets for each of the two years in the period then ended, and its financial highlights for each of the periods indicated herein, in conformity with accounting principles generally accepted in the United States of America.
| NewYork, NewYork |
| February 20, 2004 |
The Fund 31
IMPORTANT TAX INFORMATION (Unaudited)
For federal tax purposes, the fund hereby designates 100% of the ordinary dividends paid during the fiscal year ended December 31, 2003 as qualifying for the corporate dividends received deduction.The fund also designates 100% of the ordinary dividends paid during 2003 as qualified dividends, subject to a maximum tax rate of 15%, as provided for by the Jobs and Growth Tax Relief Reconciliation Act of 2003.
32
| BOARD MEMBERS INFORMATION (Unaudited) |
| |
| |
| Joseph S. DiMartino (60) |
| Chairman of the Board (1999) |
| Principal Occupation During Past 5 Years: |
| • Corporate Director and Trustee |
| Other Board Memberships and Affiliations: |
| • The Muscular Dystrophy Association, Director |
| • Levcor International, Inc., an apparel fabric processor, Director |
| • Century Business Services, Inc., a provider of outsourcing functions for small and medium size |
| companies, Director |
| • The Newark Group, a provider of a national market of paper recovery facilities, |
| paperboard mills and paperboard converting plants, Director |
| No. of Portfolios for which Board Member Serves: 186 |
| ——————— |
| James Fitzgibbons (69) |
| Board Member (1994) |
| Principal Occupation During Past 5 Years: |
| • Chairman of the Board, Davidson Cotton Company (1998-2002) |
| Other Board Memberships and Affiliations: |
| • Howes Leather Corporation, Director |
| No. of Portfolios for which Board Member Serves: 23 |
| ——————— |
| J.Tomlinson Fort (75) |
| Board Member (1987) |
| Principal Occupation During Past 5 Years: |
| • Retired; Of Counsel, Reed Smith LLP (1998-January 2003) |
| No. of Portfolios for which Board Member Serves: 23 |
| ——————— |
| Kenneth A. Himmel (57) |
| Board Member (1994) |
| Principal Occupation During Past 5 Years: |
| • President and CEO, Related Urban Development, a real estate development company |
| (1996-present) |
| • President and CEO, Himmel & Company, a real estate development company (1980-present) |
| • CEO, American Food Management, a restaurant company (1983-present) |
| No. of Portfolios for which Board Member Serves: 23 |
The Fund 33
BOARD MEMBERS INFORMATION (Unaudited) (continued)
| Stephen J. Lockwood (56) |
| Board Member (1994) |
| Principal Occupation During Past 5 Years: |
| • Chairman of the Board, Stephen J. Lockwood and Company LLC, an investment company |
| (2000-present) |
| • Chairman of the Board and CEO, LDG Reinsurance Corporation (1977-2000) |
| Other Board Memberships and Affiliations: |
| • BDML Holdings, an insurance company, Chairman of the Board |
| • Affiliated Managers Group, an investment management company, Director |
| No. of Portfolios for which Board Member Serves: 23 |
| ——————— |
| Roslyn Watson (54) |
| Board Member (1994) |
| Principal Occupation During Past 5 Years: |
| • Principal,Watson Ventures, Inc., a real estate investment company (1993-present) |
| Other Board Memberships and Affiliations: |
| • American Express Centurion Bank, Director |
| • The Hyams Foundation Inc., a Massachusetts Charitable Foundation,Trustee |
| • National Osteoporosis Foundation,Trustee |
| No. of Portfolios for which Board Member Serves: 23 |
| ——————— |
| Benaree Pratt Wiley (57) |
| Board Member (1998) |
| Principal Occupation During Past 5 Years: |
| • President and CEO,The Partnership, an organization dedicated to increasing the |
| representation of African Americans in positions of leadership, influence and |
| decision-making in Boston, MA (1991-present) |
| Other Board Memberships and Affiliations: |
| • Boston College,Trustee |
| • The Greater Boston Chamber of Commerce, Director |
| • The First Albany Companies, Inc., an investment bank, Director |
| • Mass. Development, Director |
| • Commonwealth Institute, Director |
| • Efficacy Institute, Director |
| • PepsiCo Africa-America, Advisory Board |
| No. of Portfolios for which Board Member Serves: 23 |
| ——————— |
| Once elected all Board Members serve for an indefinite term.Additional information about the Board Members, including |
| their address is available in the fund’s Statement of Additional Information which can be obtained from Dreyfus free of |
| charge by calling this toll free number: 1-800-554-4611. |
| |
| Ruth Marie Adams, Emeritus Board Member |
| Francis P. Brennan, Emeritus Board Member |
34
OFFICERS OF THE FUND (Unaudited)
| STEPHEN E. CANTER, President since |
| March 2000. |
| Chairman of the Board, Chief Executive |
| Officer and Chief Operating Officer of the |
| Manager, and an officer of 95 investment |
| companies (comprised of 185 portfolios) |
| managed by the Manager. Mr. Canter also is a |
| Board member and, where applicable, an |
| Executive Committee Member of the other |
| investment management subsidiaries of Mellon |
| Financial Corporation, each of which is an |
| affiliate of the Manager. He is 58 years old and |
| has been an employee of the Manager since |
| May 1995. |
| STEPHEN R. BYERS, Executive Vice |
| President since November 2002. |
| Chief Investment Officer,Vice Chairman and a |
| Director of the Manager, and an officer of 95 |
| investment companies (comprised of 185 |
| portfolios) managed by the Manager. Mr. Byers |
| also is an officer, director or an Executive |
| Committee Member of certain other |
| investment management subsidiaries of Mellon |
| Financial Corporation, each of which is an |
| affiliate of the Manager. He is 50 years old and |
| has been an employee of the Manager since |
| January 2000. Prior to joining the Manager, he |
| served as an Executive Vice President-Capital |
| Markets, Chief Financial Officer and Treasurer |
| at Gruntal & Co., L.L.C. |
| MARK N. JACOBS, Vice President since |
| March 2000. |
| Executive Vice President, Secretary and |
| General Counsel of the Manager, and an |
| officer of 96 investment companies (comprised |
| of 201 portfolios) managed by the Manager. |
| He is 57 years old and has been an employee |
| of the Manager since June 1977. |
| STEVEN F. NEWMAN, Secretary since |
| March 2000. |
| Associate General Counsel and Assistant |
| Secretary of the Manager, and an officer of 96 |
| investment companies (comprised of 201 |
| portfolios) managed by the Manager. He is 54 |
| years old and has been an employee of the |
| Manager since July 1980. |
| JEFF PRUSNOFSKY, Assistant Secretary |
| since March 2000. |
| Associate General Counsel of the Manager, |
| and an officer of 24 investment companies |
| (comprised of 81 portfolios) managed by the |
| Manager. He is 38 years old and has been an |
| employee of the Manager since October 1990. |
| MICHAEL A. ROSENBERG, Assistant |
| Secretary since March 2000. |
| Associate General Counsel of the Manager, |
| and an officer of 93 investment companies |
| (comprised of 194 portfolios) managed by the |
| Manager. He is 43 years old and has been an |
| employee of the Manager since October 1991. |
| JAMES WINDELS, Treasurer since |
| November 2001. |
| Director – Mutual Fund Accounting of the |
| Manager, and an officer of 96 investment |
| companies (comprised of 201 portfolios) |
| managed by the Manager. He is 45 years old |
| and has been an employee of the Manager |
| since April 1985. |
| RICHARD CASSARO, Assistant Treasurer |
| since August 2003. |
| Senior Accounting Manager – Equity Funds of |
| the Manager, and an officer of 25 investment |
| companies (comprised of 100 portfolios) |
| managed by the Manager. He is 44 years old |
| and has been an employee of the Manager |
| since September 1982. |
| ERIK D. NAVILOFF, Assistant Treasurer |
| since December 2002. |
| Senior Accounting Manager – Taxable Fixed |
| Income Funds of the Manager, and an officer |
| of 18 investment companies (comprised of 73 |
| portfolios) managed by the Manager. He is 35 |
| years old and has been an employee of the |
| Manager since November 1992. |
The Fund 35
OFFICERS OF THE FUND (Unaudited) (continued)
| ROBERT SVAGNA, Assistant Treasurer |
| since December 2002. |
| Senior Accounting Manager – Equity Funds of |
| the Manager, and an officer of 25 investment |
| companies (comprised of 101 portfolios) |
| managed by the Manager. He is 36 years old |
| and has been an employee of the Manager |
| since November 1990. |
| KENNETH J. SANDGREN, Assistant |
| Treasurer since November 2001. |
| Mutual Funds Tax Director of the Manager, |
| and an officer of 96 investment companies |
| (comprised of 201 portfolios) managed by the |
| Manager. He is 49 years old and has been an |
| employee of the Manager since June 1993. |
| WILLIAM GERMENIS, Anti-Money |
| Laundering Compliance Officer since |
| September 2002. |
| Vice President and Anti-Money Laundering |
| Compliance Officer of the Distributor, and the |
| Anti-Money Laundering Compliance Officer |
| of 91 investment companies (comprised of 196 |
| portfolios) managed by the Manager. He is 33 |
| years old and has been an employee of the |
| Distributor since October 1998. Prior to |
| joining the Distributor, he was a Vice President |
| of Compliance Data Center, Inc. |
36
For More Information
| Dreyfus Premier |
| Core Value Fund |
| 200 Park Avenue |
| New York, NY 10166 |
| |
| Manager |
| The Dreyfus Corporation |
| 200 Park Avenue |
| New York, NY 10166 |
|
| |
| Custodian |
| Mellon Bank, N.A. |
| One Mellon Bank Center |
| Pittsburgh, PA 15258 |
| |
| Transfer Agent & |
| Dividend Disbursing Agent |
| Dreyfus Transfer, Inc. |
| 200 Park Avenue |
| New York, NY 10166 |
| |
| Distributor |
| Dreyfus Service Corporation |
| 200 Park Avenue |
| New York, NY 10166 |
| To obtain information: |
|
| |
| By telephone |
| Call your financial |
| representative or |
| 1-800-554-4611 |
| By mail Write to: |
| The Dreyfus Premier |
| Family of Funds |
| 144 Glenn Curtiss Boulevard |
| Uniondale, NY 11556-0144 |
A description of the policies and procedures that the fund uses to determine how to vote proxies relating to portfolio securities is available, without charge, by calling the telephone number listed above, or by visiting the SEC’s website at http://www.sec.gov
© 2004 Dreyfus Service Corporation 312AR1203
| Dreyfus Premier |
| Limited Term |
| High Yield Fund |
| ANNUAL REPORT December 31, 2003 |

| The views expressed in this report reflect those of the portfolio |
| manager only through the end of the period covered and do not |
| necessarily represent the views of Dreyfus or any other person in |
| the Dreyfus organization. Any such views are subject to change at |
| any time based upon market or other conditions and Dreyfus dis- |
| claims any responsibility to update such views.These views may not |
| be relied on as investment advice and, because investment decisions |
| for a Dreyfus fund are based on numerous factors, may not be relied |
| on as an indication of trading intent on behalf of any Dreyfus fund. |
| |
| |
| Not FDIC-Insured • Not Bank-Guaranteed • May Lose Value |
Contents
THE FUND
2
| Letter from the Chairman
|
3
| Discussion of Fund Performance
|
6
| Fund Performance
|
8
| Statement of Investments
|
22
| Statement of Assets and Liabilities
|
23
| Statement of Operations
|
24
| Statement of Changes in Net Assets
|
26
| Financial Highlights
|
30
| Notes to Financial Statements
|
42
| Independent Auditors’ Report
|
43
| Important Tax Information
|
44
| Board Members Information
|
46
| Officers of the Fund
|
FOR MORE INFORMATION
|
Back Cover
|
| Dreyfus Premier |
| Limited Term High Yield Fund |

LETTER FROM THE CHAIRMAN
Dear Shareholder:
This annual report for Dreyfus Premier Limited Term High Yield Fund covers the 12-month period from January 1, 2003, through December 31, 2003. Inside, you’ll find valuable information about how the fund was managed during the reporting period, including a discussion with Gerald E.Thunelius, portfolio manager and director of the Dreyfus Taxable Fixed Income Team that manages the fund.
The bond market produced mixed results in 2003 as investor sentiment apparently shifted from pessimism at the start of the year toward a more optimistic outlook by year-end.As the U.S. economy gathered momentum, the more interest-rate-sensitive areas of the bond market began to retreat, and U.S. government securities finished the year with modestly positive total returns. On the other hand, the bond market’s more credit-sensitive areas generally benefited from the stronger economy, producing more robust gains for corporate bonds.
While recent economic developments suggest to us that interest rates are more likely to rise in 2004 than to fall further, we continue to believe that bonds deserve a prominent place in most investors’ portfolios. As always, we urge you to speak regularly with your financial advisor, who may be in the best position to suggest the Dreyfus funds designed to meet your current needs, future goals and tolerance for risk.
Thank you for your continued confidence and support.
Sincerely,

| Stephen E. Canter |
| Chairman and Chief Executive Officer |
| The Dreyfus Corporation |
| January 15, 2004 |
2

DISCUSSION OF FUND PERFORMANCE
Gerald E. Thunelius, Senior Portfolio Manager Dreyfus Taxable Fixed Income Team
How did Dreyfus Premier Limited Term High Yield Fund perform relative to its benchmark?
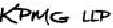
For the 12-month period ended December 31, 2003, the fund achieved total returns of 29.87% for its Class A shares, 29.25% for Class B shares, 29.10% for Class C shares and 30.15% for Class R shares.The fund generated aggregate income dividends of $0.6512 for Class A shares, $0.6175 for Class B shares, $0.6003 for Class C shares and $0.6660 for Class R shares.1 In comparison, the Merrill Lynch High Yield Master II Index, the fund’s benchmark, achieved a total return of 28.15% for the same period.2
The fund’s strong performance was primarily the result of a sharp and sustained rally among high-yield corporate bonds, especially during the first half of 2003, when investors began to anticipate a stronger U.S. economy.The fund’s returns were higher than its benchmark over the reporting period, primarily due to strong results from “fallen angels” held by the fund that rebounded from depressed price levels.
What is the fund’s investment approach?
The fund seeks to maximize total return consisting of capital appreciation and current income.The average effective maturity of the fund is limited to a maximum of 5.5 years.
We normally invest most of the fund’s assets in fixed-income securities of below investment-grade credit quality. Our approach to selecting individual issues is based on careful credit analysis.We thoroughly analyze the business, management and financial strength of each of the companies whose bonds we buy, then project each issuer’s ability to repay its debt.
The Fund 3
DISCUSSION OF FUND PERFORMANCE (continued)
What other factors influenced the fund’s performance?
When 2003 began, the U.S. economy appeared to be mired in persistent weakness as corporate scandals and rising geopolitical tensions took their toll. However, the high-yield corporate bond market had already begun to rally. Investors apparently began to recognize in late 2002 that prices of lower-rated bonds had fallen farther than may have been warranted during the economic downturn.
The Dreyfus Taxable Fixed Income Team largely shared that view, and in 2002 we began to add to the portfolio’s holdings of bonds that we believed did not accurately reflect the underlying strength of their issuers’ businesses.These so called “fallen angels” included bonds from energy companies, such as Calpine,Williams Cos. and El Paso, that had been subject to concerns regarding their debt loads and accounting practices; telecom providers, including Qwest and American Tower, which were hurt by industry-wide overcapacity; and media companies, such as Charter Communications Holdings/Capital and Cablevision, that suffered from competitive pressures in a competitive marketplace.
As we expected, prices of these beaten-down bonds began to recover even before business conditions actually improved, producing attractive levels of income and capital appreciation as investors began to reposition their investments for an eventual economic upturn. As a result, despite the widespread uncertainty leading up to the start of the war in Iraq, high-yield bonds continued to gain value during the first quarter of 2003. After it became clear in the spring that the end of major combat operations was in sight, high-yield corporate bonds rallied further. By mid-summer, when more tangible signs of stronger economic growth had emerged, many corporate bonds had reached prices that suggested to us that they were fully valued.
Although high-yield bonds continued to rally during the second half of the year, their rise was much more modest than it was during the first half of the year.Accordingly, we began to reposition the portfolio,
4
locking in gains on some of the portfolio’s top performers and redeploying assets to the bonds of companies that, in our judgment, enjoyed stronger cash flows and healthier balance sheets.We attempted to upgrade the portfolio’s overall credit quality during the second half of the year toward the “double-B” range, which is the highest rating category for high-yield bonds.We also attempted to diversify the portfolio’s sector exposure, a strategy that was designed to protect the portfolio from disproportionate losses arising from unexpected problems affecting any single holding.
What is the fund’s current strategy?
We have continued to upgrade and diversify the fund in an attempt to position it for a moderate-growth environment. As a result, the fund’s composition has moved closer to that of its benchmark. In addition, because the stronger economy has led to concerns that interest rates may begin to rise in 2004, we have generally focused on bonds that we believe are less vulnerable in a rising interest-rate environment, including higher-yielding, premium-priced bonds that, historically, have tended to retain more of their value during bond market declines. In our view, these are prudent strategies while the bond market continues to adjust to a strengthening economy.
January 15, 2004
1 Total return includes reinvestment of dividends and any capital gains paid, and does not take into consideration the maximum initial sales charge in the case of Class A shares, or the applicable contingent deferred sales charges imposed on redemptions in the case of Class B and Class C shares. Had these charges been reflected, returns would have been lower. Past performance is no guarantee of future results. Share price, yield and investment return fluctuate such that upon redemption, fund shares may be worth more or less than their original cost.
2 SOURCE: LIPPER INC. — Reflects reinvestment of dividends and, where applicable, capital gain distributions.The Merrill Lynch High Yield Master II Index is an unmanaged performance benchmark composed of U.S. domestic and Yankee bonds rated below investment grade with at least $100 million par amount outstanding and greater than or equal to one year to maturity.
The Fund 5
FUND PERFORMANCE
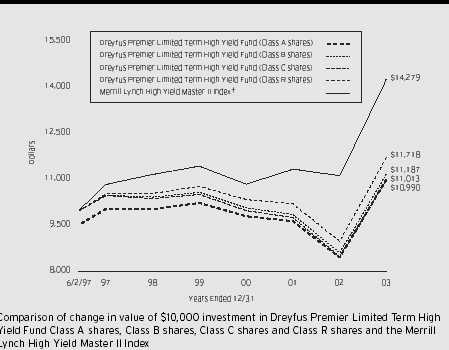
† Source: Lipper Inc.
Past performance is not predictive of future performance.
Effective February 3, 2003, the fund changed its name from Dreyfus Premier Limited Term High Income Fund to Dreyfus Premier Limited Term HighYield Fund.Also effective on that date, pursuant to action by the fund’s Board of Trustees, the fund’s duration restriction requirement was eliminated and the fund’s maturity restriction requirement was increased from 4 years to 5.5 years.Accordingly, the Customized Limited Term HighYield Index prepared by Dreyfus that has been used in past years as a secondary benchmark index for the fund became no longer comparable. Performance for this index will not be shown this year or in subsequent years.
The above graph compares a $10,000 investment made in each of the Class A, Class B, Class C and Class R shares of Dreyfus Premier Limited Term HighYield Fund on 6/2/97 (inception date) to a $10,000 investment made in the Merrill Lynch HighYield Master II Index (the “Index”). For comparative purposes, the value of the Index on 5/31/97 is used as the beginning value on 6/2/97.All dividends and capital gain distributions are reinvested.
The fund’s performance shown in the line graph takes into account the maximum initial sales charge on Class A shares and all other applicable fees and expenses on all classes.The Index is an unmanaged performance benchmark composed of U.S. domestic andYankee bonds rated below investment grade with at least $100 million par amounts outstanding and greater than or equal to one year to maturity. Both interest and price changes are calculated daily based on an accrued schedule and trader pricing.The Index does not take into account charges, fees and other expenses. Further information relating to fund performance, including expense reimbursements, if applicable, is contained in the Financial Highlights section of the prospectus and elsewhere in this report.
|
6
Average Annual Total Returns as of 12/31/03
| | Inception | | | | | | From | |
| | Date | | 1 Year | | 5 Years | | Inception | |
|
| |
| |
| |
| |
| Class A shares | | | | | | | | |
| with maximum sales charge (4.5%) | 6/2/97 | | 23.95% | | 0.91% | | 1.48% | |
| without sales charge | 6/2/97 | | 29.87% | | 1.84% | | 2.19% | |
| Class B shares | | | | | | | | |
| with applicable redemption charge † | 6/2/97 | | 25.25% | | 1.08% | | 1.72% | |
| without redemption | 6/2/97 | | 29.25% | | 1.33% | | 1.72% | |
| Class C shares | | | | | | | | |
| with applicable redemption charge | 6/2/97 | | 28.10% | | 1.11% | | 1.45% | |
| without redemption | 6/2/97 | | 29.10% | | 1.11% | | 1.45% | |
| Class R shares | 6/2/97 | | 30.15% | | 2.10% | | 2.44% | |
Past performance is not predictive of future performance.The fund’s performance shown in the graph and table does not reflect the deduction of taxes that a shareholder would pay on fund distributions or the redemption of fund shares. Performance for Class B shares assumes the conversion of Class B shares to Class A shares at the end of the sixth year following the date of purchase.
|
†
| The maximum contingent deferred sales charge for Class B shares is 4%.After six years Class B shares convert to Class A shares.
|
††
| The maximum contingent deferred sales charge for Class C shares is 1% for shares redeemed within one year of the date of purchase.
|
The Fund 7
| STATEMENT OF INVESTMENTS | | | |
| December 31, 2003 | | | |
|
|
| |
| | | | |
| | | | |
| | | | |
| | | | |
| | Principal | | |
| Bonds and Notes—85.1% % | Amounta | Value ($) | |
|
|
| |
| Advertising—.3% | | | |
| RH Donnelley Finance: | | | |
| Sr. Notes, 8.875%, 2010 | 783,000 b | 884,790 | |
| Sr. Sub. Notes, 10.875%, 2012 | 522,000 b | 621,833 | |
| | | 1,506,623 | |
| Aerospace & Defense—.2% | | | |
| K&F Industries, | | | |
| Sr. Sub. Notes, Ser. B, 9.625%, 2010 | 785,000 c | 884,106 | |
| Agricultural—.2% | | | |
| North Atlantic Trading, | | | |
| Sr. Notes, Ser. B, 11%, 2004 | 925,000 | 885,688 | |
| Seminis, | | | |
| Sr. Sub. Notes, 10.25%, 2013 | 251,000 b | 271,080 | |
| | | 1,156,768 | |
| Airlines—.5% | | | |
| AMR, | | | |
| Debs., 9.75%, 2021 | 200,000 | 153,000 | |
| Aircraft Lease Portfolio Securitization 1996-1, | | | |
| Pass-Through Trust, Ctfs., | | | |
| Cl. D, 12.75%, 2006 | 2,115,124 d | 21,151 | |
| Continental Airlines, | | | |
| Notes, 8%, 2005 | 1,900,000 c | 1,857,250 | |
| Delta Air Lines, | | | |
| Sr. Notes, 10%, 2008 | 664,000 b | 571,040 | |
| | | 2,602,441 | |
| Automotive, Trucks & Parts—.9% | | | |
| Airxcel, | | | |
| Sr. Sub. Notes, Ser. B, 11%, 2007 | 611,000 | 528,515 | |
| Collins & Aikman Products, | | | |
| Sr. Notes, 10.75%, 2011 | 754,000 | 744,575 | |
| Federal-Mogul, | | | |
| Notes, 7.75%, 2006 | 994,000 d | 223,650 | |
| HLI Operating, | | | |
| Sr. Notes, 10.5%, 2010 | 1,040,000 | 1,202,500 | |
| Oxford Automotive, | | | |
| Sr. Secured Notes, 12%, 2010 | 1,000,000 b | 850,000 | |
| UIS, | | | |
| Sr. Sub. Notes, 9.375%, 2013 | 768,000 c | 842,880 | |
| | | 4,392,120 | |
8
| | Principal | | |
| Bonds and Notes (continued) | Amounta | Value ($) | |
|
|
| |
| Building & Construction—1.9% | | | |
| American Builders & Contractors, | | | |
| Sr. Sub. Notes, Ser. B, 10.625%, 2007 | 2,818,000 | 2,930,720 | |
| Atrium Cos., | | | |
| Sr. Sub. Notes, Ser. B, 10.5%, 2009 | 1,890,000 | 2,031,750 | |
| Owens Corning: | | | |
| Debs., 7.5%, 2018 | 2,753,000 d | 1,211,320 | |
| Notes, 7%, 2009 | 5,000,000 d | 2,200,000 | |
| WCI Communities, | | | |
| Sr. Sub. Notes, 10.625%, 2011 | 1,050,000 | 1,191,750 | |
| | | 9,565,540 | |
| Chemicals—5.9% | | | |
| Avecia, | | | |
| Sr. Notes, 11%, 2009 | 3,922,000 c | 3,549,410 | |
| HMP Equity, | | | |
| Units, 0%, 2008 | 526,000 b,e | 323,490 | |
| Huntsman, | | | |
| Secured Notes, 11.625%, 2010 | 5,475,000 b | 5,611,875 | |
| Huntsman ICI Chemicals, | | | |
| Sr. Sub. Notes, 10.125%, 2009 | 5,385,000 c | 5,573,475 | |
| Nalco, | | | |
| Sr. Sub. Notes, 8.875%, 2013 | 2,503,000 b | 2,665,695 | |
| OM Group, | | | |
| Sr. Sub. Notes, 9.25%, 2011 | 1,093,000 | 1,142,185 | |
| PolyOne: | | | |
| Sr. Notes, 8.875%, 2012 | 1,001,000 c | 925,925 | |
| Sr. Notes, 10.625%, 2010 | 1,539,000 c | 1,546,695 | |
| Resolution Performance Products: | | | |
| Secured Notes, 8%, 2009 | 749,000 b | 778,960 | |
| Sr. Sub. Notes, 13.5%, 2010 | 7,793,000 c | 6,818,875 | |
| Rockwood Specialties, | | | |
| Sr. Sub. Notes, 10.625%, 2011 | 1,506,000 b | 1,686,720 | |
| | | 30,623,305 | |
| Commercial Mortgage Pass—Through Ctfs.—.4% | | | |
| Structured Asset Securities, REMIC, | | | |
| Ser. 1996-CFL, Cl. H, 7.75%, 2028 | 1,750,000 b | 2,046,135 | |
| Commercial Services—.9% | | | |
| Brickman, | | | |
| Sr. Sub. Notes, Ser. B, 11.75%, 2009 | 1,037,000 | 1,213,290 | |
The Fund 9
| STATEMENT OF INVESTMENTS (continued) | | | | |
|
|
|
| |
| | | | | |
| | | | | |
| | | | | |
| | | | | |
| | | | | |
| | | Principal | | |
| Bonds and Notes (continued) | | Amounta | Value ($) | |
|
|
|
| |
| Commercial Services (continued) | | | | |
| United Rentals, | | | | |
| Sr. Notes, Ser. B, 10.75%, 2008 | | 1,170,000 c | 1,322,100 | |
| Williams Scotsman: | | | | |
| Sr. Notes, 9.875%, 2007 | | 1,584,000 | 1,611,720 | |
| Sr. Secured Notes, 10%, 2008 | | 484,000 | 533,005 | |
| | | | 4,680,115 | |
| Consumer Products—.8% | | | | |
| Bombardier Recreational Products, | | | | |
| Sr. Sub. Notes, 8.375%, 2013 | | 750,000 b | 787,500 | |
| Playtex Products, | | | | |
| Sr. Sub. Notes, 9.375%, 2011 | | 2,546,000 c | 2,584,190 | |
| Rayovac, | | | | |
| Sr. Sub. Notes, 8.5%, 2013 | | 497,000 | 529,305 | |
| | | | 3,900,995 | |
| Diversified Financial Services—1.5% | | | | |
| Diamond, | | | | |
| Notes, 10%, 2008 | GBP | 1,040,000 | 1,893,846 | |
| Finova, | | | | |
| Notes, 7.5%, 2009 | | 3,609,000 | 2,183,445 | |
| Stena, | | | | |
| Sr. Notes, 7.5%, 2013 | | 1,001,000 b | 1,036,035 | |
| Verizon Global Funding, | | | | |
| Notes, 6.75%, 2005 | | 200,000 b | 217,131 | |
| Williams Holdings of Delaware, | | | | |
| Notes, 6.5%, 2008 | | 2,365,000 | 2,456,644 | |
| | | | 7,787,101 | |
| Electric Utilities—7.0% | | | | |
| Allegheny Energy Statutory Trust 2001: | | | | |
| Secured Notes, 10.25%, 2007 | | 3,572,546 b | 3,733,311 | |
| Secured Notes, 13%, 2007 | | 188,453 b | 187,510 | |
| Allegheny Energy Supply, | | | | |
| Bonds, 8.75%, 2012 | | 5,134,000 b,c | 4,864,465 | |
| CMS Energy, | | | | |
| Sr. Notes, 9.875%, 2007 | | 2,862,000 c | 3,205,440 | |
| Calpine: | | | | |
| Secured Notes, 8.5%, 2010 | | 12,286,000 b,c | 12,040,280 | |
| Secured Notes, 9.875%, 2011 | | 1,002,000 b,c | 1,034,565 | |
| Reliant Resources, | | | | |
| Sr. Secured Notes, 9.25%, 2010 | | 10,325,000 b | 10,996,125 | |
| | | | 36,061,696 | |
| | | | | |
| 10 | | | | |
| | Principal | | |
| Bonds and Notes (continued) | Amounta | Value ($) | |
|
|
| |
| Electrical & Electronics—1.9% | | | |
| Dresser, | | | |
| Sr. Sub. Notes, 9.375%, 2011 | 4,226,000 c | 4,616,905 | |
| Fisher Scientific International, | | | |
| Sr. Sub. Notes, 8%, 2013 | 2,485,000 b | 2,677,588 | |
| Flextronics International, | | | |
| Sr. Sub. Notes, 6.5%, 2013 | 1,450,000 c | 1,508,000 | |
| Imax, | | | |
| Sr. Notes, 9.625%, 2010 | 1,002,000 b | 1,058,362 | |
| | | 9,860,855 | |
| Entertainment—2.1% | | | |
| AMC Entertainment, | | | |
| Sr. Sub. Notes, 9.5%, 2009 | 2,490,000 c | 2,577,150 | |
| Argosy Gaming, | | | |
| Sr. Sub. Notes, 9%, 2011 | 1,768,000 | 1,966,900 | |
| Bally Total Fitness, | | | |
| Sr. Notes, 10.5%, 2011 | 1,789,000 b | 1,806,890 | |
| Old Evangeline Downs, | | | |
| Sr. Secured Notes, 13%, 2010 | 1,186,000 | 1,280,880 | |
| Regal Cinemas, | | | |
| Sr. Sub. Notes, Ser. B, 9.375%, 2012 | 510,000 | 578,850 | |
| Six Flags, | | | |
| Sr. Notes, 9.625%, 2014 | 990,000 b | 1,039,500 | |
| Town Sports International, | | | |
| Sr. Notes, 9.625%, 2011 | 1,557,000 | 1,673,775 | |
| | | 10,923,945 | |
| Environmental Control—2.1% | | | |
| Allied Waste: | | | |
| Sr. Notes, Ser. B, 7.625%, 2006 | 5,630,000 | 5,953,725 | |
| Sr. Notes, 7.875%, 2013 | 1,874,000 c | 2,037,975 | |
| Sr. Sub. Notes, Ser. B, 10%, 2009 | 1,631,000 c | 1,769,635 | |
| Synagro Technologies, | | | |
| Sr. Sub. Notes, 9.5%, 2009 | 1,030,000 c | 1,122,700 | |
| | | 10,884,035 | |
| Food & Beverages—1.9% | | | |
| Agrilink Foods, | | | |
| Sr. Sub. Notes, 11.875%, 2008 | 257,000 | 274,348 | |
| Del Monte, | | | |
| Sr. Sub. Notes, 8.625%, 2012 | 1,031,000 | 1,134,100 | |
| Doane Pet Care, | | | |
| Sr. Notes, 10.75%, 2010 | 1,441,000 | 1,498,640 | |
The Fund 11
| STATEMENT OF INVESTMENTS (continued) | | | | | |
| |
| |
| |
| | | | | | |
| | | | | | |
| | | | | | |
| | | | | | |
| | | | | | |
| | | Principal | | | |
| Bonds and Notes (continued) | | Amounta | | Value ($) | |
| |
| |
| |
| Food & Beverages (continued) | | | | | |
| Dole Foods: | | | | | |
| Debs., 8.75%, 2013 | | 780,000 | | 863,850 | |
| Sr. Notes, 8.625%, 2009 | | 1,005,000 | | 1,108,012 | |
| Sr. Notes, 8.875%, 2011 | | 1,558,000 | | 1,717,695 | |
| Land O’Lakes, | | | | | |
| Sr. Notes, 8.75%, 2011 | | 1,673,000 c | | 1,472,240 | |
| National Beef Packing, | | | | | |
| Sr. Notes, 10.5%, 2011 | | 1,021,000 b | | 1,056,735 | |
| Swift & Co., | | | | | |
| Sr. Notes, 10.125%, 2009 | | 519,000 c | | 552,735 | �� |
| | | | | 9,678,355 | |
| Gaming & Lodging—6.0% | | | | | |
| Coast Hotels & Casinos, | | | | | |
| Sr. Sub. Notes, 9.5%, 2009 | | 1,553,000 | | 1,650,063 | |
| Inn of the Mountain Gods Resort & Casino, | | | | | |
| Sr. Notes, 12%, 2010 | | 1,988,000 b | | 2,122,190 | |
| Kerzner, | | | | | |
| Sr. Notes, 8.875%, 2011 | | 2,394,000 | | 2,627,415 | |
| MGM Mirage: | | | | | |
| Sr. Collateralized Notes, 6.95%, 2005 | | 277,000 | | 289,465 | |
| Sr. Notes, 8.5%, 2010 | | 1,988,000 | | 2,291,170 | |
| Mandalay Resort, | | | | | |
| Sr. Notes, 6.5%, 2009 | | 2,024,000 | | 2,110,020 | |
| Mohegan Tribal Gaming Authority: | | | | | |
| Sr. Sub. Notes, 6.375%, 2009 | | 2,048,000 c | | 2,124,800 | |
| Sr. Sub. Notes, 8.375%, 2011 | | 1,048,000 c | | 1,147,560 | |
| Park Place Entertainment: | | | | | |
| Sr. Sub. Notes, 7.875%, 2005 | | 2,348,000 | | 2,521,165 | |
| Sr. Sub. Notes, 7.875%, 2010 | | 1,266,000 c | | 1,408,425 | |
| Sr. Sub. Notes, 8.875%, 2008 | | 2,353,000 | | 2,670,655 | |
| Resorts International Hotel and Casino, | | | | | |
| First Mortgage, 11.5%, 2009 | | 3,274,000 c | | 3,576,845 | |
| Station Casinos, | | | | | |
| Sr. Sub. Notes, 9.875%, 2010 | | 1,026,000 c | | 1,133,730 | |
| Trump Casino Holdings/Funding, | | | | | |
| First Priority Mortgage Notes, 11.625%, 2010 | | 2,461,000 c | | 2,368,712 | |
| Turning Stone Casino Entertainment, | | | | | |
| Sr. Notes, 9.125%, 2010 | | 811,000 b | | 886,018 | |
| Wynn Las Vegas, | | | | | |
| Second Mortgage, 12%, 2010 | | 1,490,000 | | 1,761,925 | |
| | | | | 30,690,158 | |
| | | | | | |
| 12 | | | | | |
| | Principal | | |
| Bonds and Notes (continued) | Amounta | Value ($) | |
|
|
| |
| Healthcare—3.0% | | | |
| Extended Stay America, | | | |
| Sr. Sub. Notes, 9.875%, 2011 | 790,000 | 888,750 | |
| Extendicare Health Services, | | | |
| Sr. Notes, 9.5%, 2010 | 658,000 | 733,670 | |
| Hanger Orthopedic, | | | |
| Sr. Notes, 10.375%, 2009 | 1,536,000 | 1,751,040 | |
| Healthsouth: | | | |
| Sr. Notes, 6.875%, 2005 | 1,001,000 | 963,463 | |
| Sr. Notes, 7%, 2008 | 2,002,000 | 1,876,875 | |
| Mariner Health Care, | | | |
| Sr. Sub. Notes, 8.25%, 2013 | 2,500,000 b | 2,537,500 | |
| Province Healthcare, | | | |
| Sr. Sub. Notes, 7.5%, 2013 | 2,738,000 c | 2,751,690 | |
| Tenet HealthCare: | | | |
| Notes, 7.375%, 2013 | 1,040,000 c | 1,050,400 | |
| Sr. Notes, 5%, 2007 | 935,000 | 909,288 | |
| Triad Hospitals, | | | |
| Sr. Sub. Notes, 7%, 2013 | 2,243,000 b | 2,271,037 | |
| | | 15,733,713 | |
| Machinery—.9% | | | |
| Case New Holland: | | | |
| Sr. Notes, 9.25%, 2011 | 1,548,000 b | 1,741,500 | |
| Sr. Notes, 9.25%, 2011 | 1,018,000 b | 1,145,250 | |
| Hawk, | | | |
| Sr. Notes, 12%, 2006 | 1,962,211 c | 1,996,550 | |
| | | 4,883,300 | |
| Manufacturing—3.0% | | | |
| Hexcel, | | | |
| Sr. Sub. Notes, 9.75%, 2009 | 3,971,000 c | 4,179,478 | |
| JB Poindexter & Co., | | | |
| Sr. Secured Notes, 12.5%, 2007 | 2,218,000 | 2,076,602 | |
| Key Components, | | | |
| Sr. Notes, 10.5%, 2008 | 1,354,000 | 1,360,770 | |
| Ship Finance International, | | | |
| Sr. Notes, 8.5%, 2013 | 1,501,000 b | 1,493,495 | |
| Tyco International: | | | |
| Gtd. Notes, 5.8%, 2006 | 1,740,000 | 1,848,750 | |
| Gtd. Notes, 6.375%, 2005 | 4,368,000 c | 4,619,160 | |
| | | 15,578,255 | |
The Fund 13
| STATEMENT OF INVESTMENTS (continued) | | | |
|
|
| |
| | | | |
| | | | |
| | | | |
| | | | |
| | | | |
| | Principal | | |
| Bonds and Notes (continued) | Amounta | Value ($) | |
|
|
| |
| Media—7.7% | | | |
| CSC Holdings, | | | |
| Sr. Notes, 7.875%, 2007 | 1,977,000 c | 2,095,620 | |
| Charter Communications Holdings / Capital: | | | |
| Sr. Discount Notes, 0/9.92%, 2011 | 1,546,000 f | 1,329,560 | |
| Sr. Discount Notes, 0/11.75%, 2011 | 3,969,000 c,f | 2,679,075 | |
| Sr. Discount Notes, 0/12.125%, 2012 | 1,544,000 f | 957,280 | |
| Sr. Discount Notes, 0/13.5%, 2011 | 1,401,000 f | 1,050,750 | |
| Sr. Notes, 8.75%, 2013 | 2,503,000 b | 2,559,318 | |
| Sr. Notes, 10%, 2011 | 657,000 | 574,875 | |
| Sr. Notes, 10.25%, 2010 | 3,994,000 b | 4,213,670 | |
| Sr. Notes, 10.75%, 2009 | 3,692,000 | 3,405,870 | |
| Dex Media West/Finance, | | | |
| Sr. Sub. Notes, 9.875%, 2013 | 1,470,000 b,c | 1,716,225 | |
| Granite Broadcasting, | | | |
| Secured Notes, 9.75%, 2010 | 2,000,000 b | 2,005,000 | |
| Gray Television, | | | |
| Sr. Sub. Notes, 9.25%, 2011 | 514,000 | 575,680 | |
| Houghton Mifflin, | | | |
| Sr. Sub. Notes, 9.875%, 2013 | 515,000 c | 569,075 | |
| LBI Media, | | | |
| Sr. Discount Notes, 0/11%, 2013 | 1,492,000 b,f | 973,530 | |
| Lodgenet Entertainment, | | | |
| Sr. Sub. Debs., 9.5%, 2013 | 1,302,000 | 1,432,200 | |
| NTL, | | | |
| Debs., 11.2%, 2007 | 2,574,000 | 2,612,610 | |
| Nexstar Finance, | | | |
| Sr. Sub. Notes, 7%, 2014 | 1,500,000 b | 1,515,000 | |
| Pegasus Communications, | | | |
| Sr. Sub. Notes, Ser. B, 12.5%, 2007 | 4,191,000 c | 3,981,450 | |
| Spanish Broadcasting System, | | | |
| Sr. Sub. Notes, 9.625%, 2009 | 5,321,000 | 5,706,772 | |
| | | 39,953,560 | |
| Mining & Metal—1.3% | | | |
| AK Steel: | | | |
| Sr. Notes, 7.75%, 2012 | 4,788,000 c | 4,117,680 | |
| Sr. Notes, 7.875%, 2009 | 1,415,000 c | 1,248,738 | |
| U.S. Steel, | | | |
| Sr. Notes, 10.75%, 2008 | 981,000 | 1,152,675 | |
| | | 6,519,093 | |
14
| | Principal | | | |
| Bonds and Notes (continued) | Amounta | | Value ($) | |
|
| |
| |
| Oil & Gas—7.1% | | | | |
| Coastal, | | | | |
| Sr. Debs., 6.5%, 2008 | 2,163,000 | | 1,976,441 | |
| Consol Energy, | | | | |
| Notes, 7.875%, 2012 | 3,553,000 c | | 3,755,578 | |
| Eott Energy Partners/Finance: | | | | |
| Sr. Notes, 9%, 2010 | 3,516,876 c | | 3,094,851 | |
| Unit, 11%, 2009 | 9,368,000 g | | 950,852 | |
| Hanover Compressor, | | | | |
| Sr. Notes, 8.625%, 2010 | 1,000,000 | | 1,045,000 | |
| Hanover Equipment Trust: | | | | |
| Sr. Secured Notes, Ser. A, 8.5%, 2008 | 3,243,000 c | | 3,453,795 | |
| Sr. Secured Notes, Ser. B, 8.75%, 2011 | 15,000 | | 15,975 | |
| McMoRan Exploration, | | | | |
| Conv. Sr. Notes, 6%, 2008 | 5,126,000 b | | 7,913,263 | |
| Nuevo Energy, | | | | |
| Sr. Sub. Notes, Ser. B, 9.375%, 2010 | 5,849,000 c | | 6,448,522 | |
| Premcor Refining: | | | | |
| Sr. Notes, 9.25%, 2010 | 1,027,000 | | 1,155,375 | |
| Sr. Notes, 9.5%, 2013 | 962,000 c | | 1,101,490 | |
| Trico Marine Services, | | | | |
| Sr. Notes, 8.875%, 2012 | 2,814,000 c | | 2,068,290 | |
| Wiser Oil, | | | | |
| Sr. Sub Notes, 9.5%, 2007 | 3,762,000 | | 3,743,190 | |
| | | | 36,722,622 | |
| Packaging & Containers—2.3% | | | | |
| Graham Packaging, | | | | |
| Sr. Sub. Notes, 8.75%, 2008 | 1,835,000 b | | 1,885,463 | |
| Owens-Brockway: | | | | |
| Sr. Notes, 8.25%, 2013 | 515,000 c | | 555,556 | |
| Sr. Secured Notes, 7.75%, 2011 | 1,025,000 | | 1,105,718 | |
| Sr. Secured Notes, 8.875%, 2009 | 935,000 | | 1,029,669 | |
| Pliant: | | | | |
| Sr. Secured Notes, 11.125%, 2009 | 520,000 | | 564,200 | |
| Sr. Sub. Notes, 13%, 2010 | 1,025,000 | | 943,000 | |
| Stone Container: | | | | |
| Sr. Notes, 8.375%, 2012 | 1,254,000 | | 1,366,860 | |
| Sr. Notes, 9.75%, 2011 | 2,761,000 | | 3,064,710 | |
| Sweetheart Cup, | | | | |
| Secured Notes, 9.5%, 2007 | 500,000 b | | 505,000 | |
The Fund 15
| STATEMENT OF INVESTMENTS (continued) | | | | |
|
| |
| |
| | | | | |
| | | | | |
| | | | | |
| | | | | |
| | | | | |
| | Principal | | | |
| Bonds and Notes (continued) | Amounta | | Value ($) | |
|
| |
| |
| Packaging & Containers (continued) | | | | |
| Tekni-Plex, | | | | |
| Sr. Sub. Notes, Ser. B, 12.75%, 2010 | 877,000 | | 960,315 | |
| | | | 11,980,491 | |
| Paper & Forest Products—3.3% | | | | |
| Appleton Papers, | | | | |
| Sr. Sub. Notes, Ser. B, 12.5%, 2008 | 1,070,000 | | 1,214,450 | |
| Buckeye Technologies, | | | | |
| Sr. Notes, 8.5%, 2013 | 1,255,000 | | 1,349,125 | |
| Fort James, | | | | |
| Sr. Notes, 6.625%, 2004 | 1,000,000 | | 1,025,000 | |
| Georgia-Pacific: | | | | |
| Sr. Notes, 7.375%, 2008 | 2,080,000 | | 2,246,400 | |
| Sr. Sub. Notes, 8.875%, 2010 | 9,930,000 | | 11,369,850 | |
| | | | 17,204,825 | |
| Pipelines—5.2% | | | | |
| ANR Pipeline, | | | | |
| Notes, 8.875%, 2010 | 2,540,000 | | 2,870,200 | |
| Dynegy: | | | | |
| Secured Notes, 9.875%, 2010 | 1,879,000 b | | 2,123,270 | |
| Secured Notes, 10.125%, 2013 | 2,338,000 b | | 2,700,390 | |
| Leviathan Gas Pipeline Partners, | | | | |
| Sr. Sub. Notes, 10.375%, 2009 | 1,888,000 | | 2,057,920 | |
| Southern Natural Gas, | | | | |
| Notes, 8.875%, 2010 | 2,057,000 | | 2,324,410 | |
| Williams Cos.: | | | | |
| Notes, 6.5%, 2006 | 3,805,000 | | 3,957,200 | |
| Notes, 6.625%, 2004 | 1,064,000 c | | 1,095,920 | |
| Notes, 9.25%, 2004 | 3,325,000 c | | 3,383,188 | |
| Putable Asset Term Securities, Ser. A, 6.75%, 2006 | 3,658,000 c | | 3,804,320 | |
| Sr. Notes, 8.625%, 2010 | 2,120,000 c | | 2,390,300 | |
| | | | 26,707,118 | |
| Residential Mortgage Pass-Through Ctfs.—.3% | | | | |
| Bank of America Mortgage Securities II, | | | | |
| Ser. 2001-8, Cl. B5, 6.5%, 2031 | 273,469 b | | 267,699 | |
| MORSERV, | | | | |
| Ser. 1996-1, Cl. B5, 7%, 2011 | 159,327 b | | 140,478 | |
16
| | Principal | | |
| Bonds and Notes (continued) | Amounta | Value ($) | |
|
|
| |
| Residential Mortgage Pass-Through Ctfs. (continued) | | | |
| Residential Accredit Loans, | | | |
| Mortgage Asset-Backed Pass-Through Ctfs., REMIC: | | | |
| Ser. 1997-QS6, Cl. B2, 7.5%, 2012 | 85,807 | 88,063 | |
| Ser. 1997-QS6, Cl. B3, 7.5%, 2012 | 85,589 | 63,763 | |
| Residential Funding Mortgage Securities I, REMIC: | | | |
| Ser. 1999-S13,CI. B2, 6.5%, 2029 | 688,756 | 670,022 | |
| Ser. 2001-S13, CI. B3, 6.5%, 2016 | 319,823 | 168,451 | |
| | | 1,398,476 | |
| Retail—1.0% | | | |
| Buffets, | | | |
| Sr. Sub. Notes, 11.25%, 2010 | 515,000 c | 554,913 | |
| Dillards, | | | |
| Notes, 6.875%, 2005 | 94,000 | 97,290 | |
| JC Penney, | | | |
| Sr. Notes, 8%, 2010 | 1,550,000 | 1,784,437 | |
| Remington Arms, | | | |
| Sr. Notes, 10.5%, 2011 | 387,000 | 414,090 | |
| Rite Aid: | | | |
| Sr. Secured Notes, 8.125%, 2010 | 1,035,000 c | 1,117,800 | |
| Sr. Secured Notes, 12.5%, 2006 | 1,025,000 c | 1,194,125 | |
| | | 5,162,655 | |
| Structured Index—6.3% | | | |
| AB Svensk Exportkredit, | | | |
| GSCI-ER Indexed Notes, 0%, 2008 | 6,090,000 b,h | 6,009,003 | |
| Crown Street MINTS, | | | |
| Floating Rate Part. Sec., Credit Link, 3.17%, 2007 | 2,750,000 i,j | 2,750,000 | |
| DJ Trac-X NA: | | | |
| Credit Linked Trust Ctfs., 6.05%, 2009 | 23,221,000 b,c,k | 23,888,604 | |
| Credit Linked Trust Ctfs., 7.375%, 2009 | 270,000 b,c,k | 282,825 | |
| | | 32,930,432 | |
| Technology—.3% | | | |
| AMI Semiconductor, | | | |
| Sr. Sub. Notes, 10.75%, 2013 | 1,514,000 | 1,813,015 | |
| Telecommunications—8.2% | | | |
| ACC Escrow, | | | |
| Sr. Notes, 10%, 2011 | 1,532,000 b | 1,715,840 | |
The Fund 17
PLTHY.029AR1203 2/25/04 4:13 PM Page 18
| STATEMENT OF INVESTMENTS (continued) | | | |
|
|
| |
| | | | |
| | | | |
| | | | |
| | | | |
| | | | |
| | Principal | | |
| Bonds and Notes (continued) | Amounta | Value ($) | |
|
|
| |
| Telecommunications (continued) | | | |
| American Tower: | | | |
| Notes, 5%, 2010 | 510,000 | 488,325 | |
| Sr. Notes, 9.375%, 2009 | 4,371,000 c | 4,676,970 | |
| Sr. Sub. Notes, 7.25%, 2011 | 1,001,000 b | 1,023,523 | |
| American Tower Escrow, | | | |
| Discount Notes, 0%, 2008 | 510,000 b | 354,450 | |
| Call-Net Enterprises, | | | |
| Sr. Secured Notes, 10.625%, 2008 | 1,000,000 | 1,001,250 | |
| Crown Castle International: | | | |
| Sr. Notes, 7.5%, 2013 | 1,509,000 b,c | 1,524,090 | |
| Sr. Notes, 9.375%, 2011 | 1,716,000 c | 1,913,340 | |
| Fairpoint Communications, | | | |
| Sr. Notes, 11.875%, 2010 | 515,000 | 602,550 | |
| Horizon PCS, | | | |
| Sr. Notes, 13.75%, 2011 | 2,850,000 d | 726,750 | |
| Innova S de RL, | | | |
| Notes, 9.375%, 2013 | 2,513,000 b | 2,591,531 | |
| Level 3 Financing, | | | |
| Sr. Notes, 10.75%, 2011 | 1,988,000 b,c | 2,112,250 | |
| MJD Communications, | | | |
| Floating Rate Notes, Ser. B, 5.408%, 2008 | 4,500,000 i | 3,802,500 | |
| Metromedia Fiber Network: | | | |
| Sr. Notes, 10%, 2009 | 8,737,000 d | 567,905 | |
| Sr. Notes, 14%, 2007 | 3,765,000 d | 1,882,500 | |
| Sr. Notes, Ser. B, 10%, 2008 | 4,290,000 d | 278,850 | |
| Nextel Partners, | | | |
| Sr. Notes, 12.5%, 2009 | 1,798,000 c | 2,094,670 | |
| Pegasus Satellite Communications, | | | |
| Sr. Notes, 12.375%, 2006 | 750,000 | 709,688 | |
| Qwest: | | | |
| Bank Notes, Ser. A, 6.5%, 2007 | 3,227,000 i | 3,384,316 | |
| Bank Notes, Ser. B, 6.95%, 2010 | 3,381,000 i | 3,473,978 | |
| SBA Communications: | | | |
| Sr. Discount Notes, 0/9.75%, 2011 | 1,825,000 b,f | 1,295,750 | |
| Sr. Notes, 10.25%, 2009 | 2,300,000 c | 2,271,250 | |
| Spectrasite, | | | |
| Sr. Notes, 8.25%, 2010 | 1,559,000 c | 1,672,027 | |
18
| | | | | Principal | | |
| Bonds and Notes (continued) | Amounta | Value ($) | |
|
|
| |
| Telecommunications (continued) | | | |
| U.S. Unwired, | | | | | |
| Sr. Sub. Discount Notes, Ser. B, 0/13.375%, 2009 | 1,000,000 f | 730,000 | |
| Western Wireless, | | | | | |
| Sr. Notes, 9.25%, 2013 | 1,512,000 c | 1,602,720 | |
| | | | | | 42,497,023 | |
| Textiles & Apparel—.0% | | | |
| Levi Strauss & Co., | | | |
| Sr. Notes, 12.25%, 2012 | 353,000 c | 231,214 | |
| Transportation—.7% | | | |
| TFM, S.A. de C.V., | | | | | |
| Sr. Notes, 10.25%, 2007 | 3,245,000 c | 3,407,250 | |
| Total Bonds and Notes | | | |
| (cost $ | | | 427,847,281) | | 439,967,335 | |
|
| |
|
|
| |
| | | | | | | |
| Preferred Stock—4.1% | Shares | Value ($) | |
|
|
| |
| Diversified Financial Services—.1% | | | |
| Williams Holdings Of Delaware, | | | |
| Cum. Conv., 2.75% | 7,800 b | 513,825 | |
| Media—3.2% | | | | | |
| CSC Holdings, | | | | | |
| Ser. H, Cum. $ | | 117.50 | 67,320 | 7,018,110 | |
| Paxson Communications: | | | |
| Cum., $ | 1,325 | | | .25 | 2,017 | |
| Cum. Conv., $ | | 975 | 854 b | 6,918,116 | |
| Spanish Broadcasting System, | | | |
| Cum. $ | 107.5 | | | 2,491 b | 2,603,095 | |
| | | | | | 16,541,338 | |
| Mining & Metal—.8% | | | |
| Kaiser Group Holdings, | | | |
| Cum., $ | 3.85 | | | 79,457 | 4,092,035 | |
| Telecommunications—.0% | | | |
| Adelphia Business Solutions, | | | |
| Ser. B, Cum., $ | | 128.75 | 1,663 d | 17 | |
| Total Preferred Stocks | | | |
| (cost $ | | | 10,615,421) | | 21,147,215 | |
The Fund 19
| STATEMENT OF INVESTMENTS (continued) | | | |
|
|
| |
| | | | | |
| | | | | |
| | | | | |
| | | | | |
| | | | | |
| | | | | |
| Common Stocks—2.5% | Shares | Value ($) | |
|
|
| |
| Oil & Gas—.5% | | | |
| Link Energy | 404,029 c | 2,727,196 | |
| Telecommunications—.1% | | | |
| Neon Communications | 182,744 g,l | 584,781 | |
| Stellex Aerostructures | 429 g,l | 0 | |
| | | | 584,781 | |
| Textiles & Apparel—1.9% | | | |
| HCI Direct, Cl. A | 910,714 g,l,m,o | 9,805,657 | |
| Total Common Stocks | | | |
| (cost $ | 15,870,315) | | 13,117,634 | |
|
|
|
| |
| | | | | |
| Other—.0% | | | |
|
|
| |
| Diversified Financial Services—.0% | | | |
| Ono Finance (warrants) | 1,000 l | 10 | |
| Mining & Metal—.0% | | | |
| Imperial Credit Industries (warrants) | 181 g,l | 0 | |
| Kaiser Group Holdings (rights) | 202,510 g,l,o | 0 | |
| | | | 0 | |
| Telecommunications—.0% | | | |
| American Tower (warrants) | 510 l | 77,713 | |
| Loral Cyberstar (warrants) | 164,345 l | 1,643 | |
| Neon Communications (warrants) | 182,744 l | 0 | |
| | | | 79,356 | |
| Total Other | | | |
| (cost $ | 116,454) | | 79,366 | |
|
|
|
| |
| | | | | |
| Other Investments—7.7% | | | |
|
|
| |
| Regulated Investment Companies: | | | |
| Dreyfus Institutional Cash Advantage Fund | 13,244,333 n | 13,244,333 | |
| Dreyfus Institutional Cash Advantage Plus Fund | 13,244,333 n | 13,244,333 | |
| Dreyfus Institutional Preferred Plus Money Market Fund | 13,244,334 n | 13,244,334 | |
| Total Other Investments | | | |
| (cost $ | 39,733,000) | | 39,733,000 | |
20
PLTHY.029AR1203 2/25/04 4:13 PM Page 21
| Investment of Cash Collateral | | | | |
| for Securities Loaned—23.9% | Shares | | Value ($) | |
|
| |
| |
| Registered Investment Company; | | | | |
| Dreyfus Institutional Preferred Money Market Fund | | | | |
| (cost $ | 123,501,883) | | 123,501,883 | | 123,501,883 | |
|
|
|
| |
| |
| | | | | | | |
| Total Investments (cost $ | 617,684,354) | 123.3% | | 637,546,433 | |
| Liabilities, Less Cash and Receivables | (23.3%) | | (120,500,021) | |
| Net Assets | | 100.0% | | 517,046,412 | |
a Principal amount stated in U.S Dollars unless otherwise noted.
GBP—Great Britian Pound Sterling
b
| Securities exempt from registration under Rule 144A of the Securities Act of 1933.These securities may be resold in transactions exempt from registration, normally to qualified institutional buyers.At December 31, 2003, these securities amounted to $150,395,813 or 29.1% of net assets.
|
c
| All or a portion of these securities are on loan.At December 31, 2003, the total market value of the fund’s securities on loan is $117,958,656 and the total market value of the collateral held by the fund is $123,501,883.
|
d
| Non-income producing—security in default.
|
e
| Units represent bond with warrant attached to purchase common stock.
|
f
| Zero coupon until a specified date at which time the stated coupon rate becomes effective until maturity.
|
g
| The value of these securities has been determined in good faith under the direction of the Board of Trustees.
|
h
| Security linked to Goldman Sachs Commodity Index—Excess Return.
|
i
| Variable rate security—interest rate subject to periodic change.
|
j
| Credit Linked Notes.
|
k
| Security linked to a portfolio of debt securities.
|
l
| Non-income producing security.
|
m
| Investment in non-controlled affiliates (cost $9,805,657)—See note 1(d).
|
n
| Investments in affiliated money market funds—See Note 2(c)
|
o
| Security restricted as to public resale. Investments in restricted securities, with a value of $9,805,657 or 1.9% of net assets:
|
| | Acquisition | | Purchase | | Percentage of | | | |
| Issuer | Date | | Price ($) | | Net Assets (%) | | Valuation ($) | |
|
| |
| |
| |
| |
| HCI Direct, Cl. A | 6/20/2002 | | 10.767 | | 1.9 | | 10.767 | |
| Kaiser Group Holdings (rights) | 6/26/2001 | | — | | — | | — | |
| | | | | | | | | |
| See notes to financial statements. | | | | | | | | |
The Fund 21
STATEMENT OF ASSETS AND LIABILITIES
| December 31, 2003 | | | | | | |
|
| |
|
|
| |
| | | | | | | | | |
| | | | | | | | | |
| | | | | | | | | |
| | | | | | | | | |
| | | | | | | | | |
| | | | | | Cost | Value | |
| | | |
|
|
| |
| Assets ($): | | | | | | | | |
| Investments in securities— | | | | | | |
| See Statement of Investments (including securities | | | | | |
| on loan, valued at $117,958,656)—Note 1(c) | | | 617,684,354 | 637,546,433 | |
| Cash | | | | | | | 2,027,208 | |
| Interest and dividends receivable | | | | | 9,094,259 | |
| Receivable for shares of Beneficial Interest subscribed | | 1,570,036 | |
| Receivable for investment securities sold | | | | 134,265 | |
| Receivable from broker for swaps opened | | | | 69,854 | |
| Receivable on closed forward currency contracts | | | | 66,451 | |
| | | | | | | | 650,508,506 | |
| |
|
| |
|
|
| |
| Liabilities ($): | | | | | | |
| Due to The Dreyfus Corporation and affiliates—Note 2 | | | | 572,408 | |
| Liability for securities on loan—Note 1(c) | | | | 123,501,883 | |
| Payable for investment securities purchased | | | | 7,766,170 | |
| Unrealized depreciation on swaps | | | | | 1,151,653 | |
| Payable for shares of Beneficial Interest redeemed | | | | 466,172 | |
| Payable on closed forward currency contracts | | | | 2,560 | |
| Other liabilities | | | | | 1,248 | |
| | | | | | | | 133,462,094 | |
| |
|
| |
|
|
| |
| Net Assets ( | | $) | | | | | 517,046,412 | |
| |
|
| |
|
|
| |
| Composition of Net Assets ($): | | | | | | |
| Paid-in capital | | | | | | | 949,548,229 | |
| Accumulated distributions in excess of investment income—net | | (23,537) | |
| Accumulated net realized gain (loss) on investments | | | | (451,265,455) | |
| Accumulated net unrealized appreciation (depreciation) | | | |
| on investments and foreign currency transactions | | | | | |
| [including ( | | $ | | | 1,080,097) net unrealized (depreciation) | | | |
| on swap transactions] | | | | | 18,787,175 | |
|
| |
|
|
| |
| Net Assets ( | | $) | | | | | 517,046,412 | |
| |
|
| |
|
|
| |
| | | | | | | | | |
| | | | | | | | | |
| | | | | | | | | |
| Net Asset Value Per Share | | | | | | |
| | | | Class A | | Class B | Class C Class R | |
| |
|
| |
|
| |
| Net Assets ($) | 190,269,659 | | 239,014,780 | 86,478,513 1,283,460 | |
| Shares Outstanding | 25,605,913 | | 32,157,731 | 11,631,571 172,852 | |
|
| |
|
| |
| Net Asset Value Per Share ($) | 7.43 | | 7.43 | 7.43 7.43 | |
| | | | | | | | | |
| See notes to financial statements. | | | | | | |
| | | | | | | | | |
| 22 | | | | | | | | |
STATEMENT OF OPERATIONS
Year Ended December 31, 2003
| Investment Income ($): | | | | |
| Income: | | | | |
| Interest | | | 45,589,905 | |
| Dividends | | | 2,126,621 | |
| Income from securities lending | | | 180,133 | |
| Total Income | | | 47,896,659 | |
| Expenses: | | | | |
| Management fee—Note 2(a) | | | 3,388,650 | |
| Distribution and service fees—Note 2(b) | | | 3,016,075 | |
| Miscellaneous expense | | | 85,866 | |
| Interest expense—Note 4 | | | 9,993 | |
| Total Expenses | | | 6,500,584 | |
| Investment Income—Net | | | 41,396,075 | |
|
| |
| |
| Realized and Unrealized Gain (Loss) on Investments—Note 3 ($): | | | |
| Net realized gain (loss) on investments and | | | | |
| foreign currency transations | | | (55,966,855) | |
| Net realized gain (loss) on financial futures | | | (6,701,556) | |
| Net realized gain (loss) on swaps transactions | | | 3,452,053 | |
| Net realized gain (loss) on options transactions | | | 324,792 | |
| Net realized gain (loss) on forward currency | | | | |
| exchange contracts | | | (410,558) | |
| Net Realized Gain (Loss) | | | (59,302,124) | |
| Net unrealized appreciation (depreciation) on investments | | | |
| and foreign currency transactions (including $ | 1,093,688 | | | |
| net unrealized appreciation on financial futures) | | 141,501,721 | |
| Net Realized and Unrealized Gain (Loss) on Investments | | 82,199,597 | |
| Net Increase in Net Assets Resulting from Operations | | 123,595,672 | |
See notes to financial statements.
The Fund 23
STATEMENT OF CHANGES IN NET ASSETS
| | | Year Ended December 31, | |
| | |
| |
| | | 2003 | | 2002 | |
| |
| |
| |
| Operations ($): | | | | | |
| Investment income—net | | 41,396,075 | | 43,227,622 | |
| Net realized gain (loss) on investments | | (59,302,124) | | (101,467,013) | |
| Net unrealized appreciation (depreciation) | | | | | |
| on investments | | 141,501,721 | | (22,843,235) | |
| Net Increase (Decrease) in Net Assets | | | | | |
| Resulting from Operations | | 123,595,672 | | (81,082,626) | |
| |
| |
| |
| Dividends to Shareholders from ($): | | | | | |
| Investment income—net: | | | | | |
| Class A shares | | (14,764,836) | | (11,118,607) | |
| Class B shares | | (22,036,756) | | (26,792,918) | |
| Class C shares | | (6,525,596) | | (6,883,534) | |
| Class R shares | | (104,181) | | (13,814) | |
| Total Dividends | | (43,431,369) | | (44,808,873) | |
| |
| |
| |
| Beneficial Interest Transactions ($): | | | | | |
| Net proceeds from shares sold: | | | | | |
| Class A shares | | 189,616,421 | | 85,944,475 | |
| Class B shares | | 40,291,681 | | 26,522,601 | |
| Class C shares | | 25,359,160 | | 13,497,371 | |
| Class R shares | | 2,122,931 | | 6,259 | |
| Net assets received in connection with | | | | | |
| reorganization—Note 1 | | — | | 39,728,468 | |
| Dividends reinvested: | | | | | |
| Class A shares | | 7,016,001 | | 4,151,558 | |
| Class B shares | | 6,501,640 | | 7,525,662 | |
| Class C shares | | 2,146,779 | | 2,200,814 | |
| Class R shares | | 101,800 | | 10,778 | |
| Cost of shares redeemed: | | | | | |
| Class A shares | | (154,570,015) | | (71,442,894) | |
| Class B shares | | (79,046,284) | | (70,346,584) | |
| Class C shares | | (15,365,410) | | (22,865,878) | |
| Class R shares | | (1,228,484) | | (10) | |
| Increase (Decrease) in Net Assets from | | | | | |
| Beneficial Interest Transactions | | 22,946,220 | | 14,932,620 | |
| Total Increase (Decrease) in Net Assets | | 103,110,523 | | (110,958,879) | |
| |
| |
| |
| Net Assets ($): | | | | | |
| Beginning of Period | | 413,935,889 | | 524,894,768 | |
| End of Period | | 517,046,412 | | 413,935,889 | |
| Undistributed (distributions in excess of) | | | | | |
| investment income—net | | (23,537) | | 528,486 | |
| | | | | | |
| 24 | | | | | |
| | Year Ended December 31, | |
| |
| |
| | 2003 | | 2002 | |
|
| |
| |
| Capital Share Transactions: | | | | |
| Class Aa | | | | |
| Shares sold | 27,218,889 | | 9,246,589 | |
| Shares issued in connection with | | | | |
| reorganization—Note 1 | — | | 5,594,189 | |
| Shares issued for dividends reinvested | 1,002,962 | | 606,353 | |
| Shares redeemed | (22,017,916) | | (10,511,842) | |
| Net Increase (Decrease) in Shares Outstanding | 6,203,935 | | 4,935,289 | |
|
| |
| |
| Class Ba | | | | |
| Shares sold | 5,811,928 | | 4,016,337 | |
| Shares issued in connection with | | | | |
| reorganization—Note 1 | — | | 827,388 | |
| Shares issued for dividends reinvested | 934,823 | | 1,086,636 | |
| Shares redeemed | (11,228,470) | | (10,319,998) | |
| Net Increase (Decrease) in Shares Outstanding | (4,481,719) | | (4,389,637) | |
|
| |
| |
| Class C | | | | |
| Shares sold | 3,645,801 | | 1,991,518 | |
| Shares issued in connection with | | | | |
| reorganization—Note 1 | — | | 334,407 | |
| Shares issued for dividends reinvested | 307,408 | | 317,632 | |
| Shares redeemed | (2,197,438) | | (3,345,264) | |
| Net Increase (Decrease) in Shares Outstanding | 1,755,771 | | (701,707) | |
|
| |
| |
| Class R | | | | |
| Shares sold | 314,667 | | 182 | |
| Shares issued for dividends reinvested | 14,486 | | 1,550 | |
| Shares redeemed | (174,477) | | (2) | |
| Net Increase (Decrease) in Shares Outstanding | 154,676 | | 1,730 | |
a During the period ended December 31, 2003, 3,158,289 Class B shares representing $22,641,055 were automatically converted to 3,158,302 Class A shares and during the period ended December 31, 2002, 73,242
|
Class B shares representing $488,951 were automatically converted to 73,242 Class A shares. See notes to financial statements.
The Fund 25
FINANCIAL HIGHLIGHTS
The following tables describe the performance for each share class for the fiscal periods indicated.All information (except portfolio turnover rate) reflects financial results for a single fund share.Total return shows how much your investment in the fund would have increased (or decreased) during each period, assuming you had reinvested all dividends and distributions.These figures have been derived from the fund’s financial statements.
| | | | Year Ended December 31, | | | |
| | | |
| | | |
| Class A Shares | 2003 | | 2002 | | 2001 a | | 2000 | | 1999 | |
|
| |
| |
| |
| |
| |
| Per Share Data ($): | | | | | | | | | | |
| Net asset value, beginning of period | 6.28 | | 7.94 | | 8.95 | | 10.45 | | 11.33 | |
| Investment Operations: | | | | | | | | | | |
| Investment income—net | .63b | | .68b | | .84b | | 1.07 | | 1.12 | |
| Net realized and unrealized | | | | | | | | | | |
| gain (loss) on investments | 1.17 | | (1.62) | | (.96) | | (1.47) | | (.90) | |
| Total from Investment Operations | 1.80 | | (.94) | | (.12) | | (.40) | | .22 | |
| Distributions: | | | | | | | | | | |
| Dividends from investment income—net | (.65) | | (.72) | | (.89) | | (1.10) | | (1.10) | |
| Net asset value, end of period | 7.43 | | 6.28 | | 7.94 | | 8.95 | | 10.45 | |
|
| |
| |
| |
| |
| |
| Total Return (%)c | 29.87 | | (12.19) | | (1.62) | | (4.26) | | 1.99 | |
|
| |
| |
| |
| |
| |
| Ratios/Supplemental Data (%): | | | | | | | | | | |
| Ratio of operating expenses | | | | | | | | | | |
| to average net assets | .97 | | .95 | | .95 | | .95 | | .95 | |
| Ratio of interest expense | | | | | | | | | | |
| to average net assets | .00d | | .01 | | .01 | | .01 | | .01 | |
| Ratio of net investment income | | | | | | | | | | |
| to average net assets | 8.87 | | 10.05 | | 9.91 | | 10.80 | | 10.19 | |
| Portfolio Turnover Rate | 235.42 | | 340.47 | | 158.92 | | 26.76 | | 40.79 | |
|
| |
| |
| |
| |
| |
| Net Assets, end of period ($ x 1,000) | 190,270 | | 121,775 | | 114,886 | | 132,652 | | 106,959 | |
a As required, effective January 1, 2001, the fund has adopted the provisions of the AICPA Audit and Accounting Guide for Investment Companies and began amortizing discount or premium on fixed income securities on a scientific basis and including paydown gains and losses in interest income.The effect of this change for the period ended December 31, 2001 was to decrease net investment income per share by $.06, increase net realized and unrealized gain (loss) on investments per share by $.06, and decrease the ratio of net investment income to average net assets from 10.52% to 9.91%. Per share data and ratios/supplemental data for periods prior to January 1, 2001 have not been restated to reflect this change in presentation.
b
| Based on average shares outstanding at each month end.
|
c
| Exclusive of sales charge.
|
d
| Amount represents less than .01%.
|
See notes to financial statements.
26
| | | | Year Ended December 31, | | | |
| | | |
| | | |
| Class B Shares | 2003 | | 2002 | | 2001 a | | 2000 | | 1999 | |
|
| |
| |
| |
| |
| |
| Per Share Data ($): | | | | | | | | | | |
| Net asset value, beginning of period | 6.28 | | 7.94 | | 8.95 | | 10.45 | | 11.33 | |
| Investment Operations: | | | | | | | | | | |
| Investment income—net | .59b | | .66b | | .80b | | 1.02 | | 1.06 | |
| Net realized and unrealized | | | | | | | | | | |
| gain (loss) on investments | 1.18 | | (1.64) | | (.96) | | (1.47) | | (.89) | |
| Total from Investment Operations | 1.77 | | (.98) | | (.16) | | (.45) | | .17 | |
| Distributions: | | | | | | | | | | |
| Dividends from investment income—net | (.62) | | (.68) | | (.85) | | (1.05) | | (1.05) | |
| Net asset value, end of period | 7.43 | | 6.28 | | 7.94 | | 8.95 | | 10.45 | |
|
| |
| |
| |
| |
| |
| Total Return (%)c | 29.25 | | (12.64) | | (2.10) | | (4.74) | | 1.48 | |
|
| |
| |
| |
| |
| |
| Ratios/Supplemental Data (%): | | | | | | | | | | |
| Ratio of operating expenses | | | | | | | | | | |
| to average net assets | 1.47 | | 1.45 | | 1.45 | | 1.45 | | 1.45 | |
| Ratio of interest expense | | | | | | | | | | |
| to average net assets | .00d | | .01 | | .01 | | .01 | | .01 | |
| Ratio of net investment income | | | | | | | | | | |
| to average net assets | 8.46 | | 9.41 | | 9.42 | | 10.32 | | 9.70 | |
| Portfolio Turnover Rate | 235.42 | | 340.47 | | 158.92 | | 26.76 | | 40.79 | |
|
| |
| |
| |
| |
| |
| Net Assets, end of period ($ x 1,000) | 239,015 | | 230,011 | | 325,834 | | 403,702 | | 562,605 | |
a As required, effective January 1, 2001, the fund has adopted the provisions of the AICPA Audit and Accounting Guide for Investment Companies and began amortizing discount or premium on fixed income securities on a scientific basis and including paydown gains and losses in interest income.The effect of this change for the period ended December 31, 2001 was to decrease net investment income per share by $.05, increase net realized and unrealized gain (loss) on investments per share by $.05, and decrease the ratio of net investment income to average net assets from 10.03% to 9.42%. Per share data and ratios/supplemental data for periods prior to January 1, 2001 have not been restated to reflect this change in presentation.
b
| Based on average shares outstanding at each month end.
|
c
| Exclusive of sales charge.
|
d
| Amount represents less than .01%.
|
See notes to financial statements.
The Fund 27
FINANCIAL HIGHLIGHTS (continued)
| | | | Year Ended December 31, | | | |
| | | |
| | | |
| Class C Shares | 2003 | | 2002 | | 2001 a | | 2000 | | 1999 | |
|
| |
| |
| |
| |
| |
| Per Share Data ($): | | | | | | | | | | |
| Net asset value, beginning of period | 6.28 | | 7.95 | | 8.96 | | 10.45 | | 11.33 | |
| Investment Operations: | | | | | | | | | | |
| Investment income—net | .57b | | .64b | | .78b | | 1.01 | | 1.04 | |
| Net realized and unrealized | | | | | | | | | | |
| gain (loss) on investments | 1.18 | | (1.65) | | (.96) | | (1.47) | | (.90) | |
| Total from Investment Operations | 1.75 | | (1.01) | | (.18) | | (.46) | | .14 | |
| Distributions: | | | | | | | | | | |
| Dividends from investment income—net | (.60) | | (.66) | | (.83) | | (1.03) | | (1.02) | |
| Net asset value, end of period | 7.43 | | 6.28 | | 7.95 | | 8.96 | | 10.45 | |
|
| |
| |
| |
| |
| |
| Total Return (%)c | 29.10 | | (12.97) | | (2.23) | | (4.96) | | 1.23 | |
|
| |
| |
| |
| |
| |
| Ratios/Supplemental Data (%): | | | | | | | | | | |
| Ratio of operating expenses | | | | | | | | | | |
| to average net assets | 1.72 | | 1.70 | | 1.70 | | 1.70 | | 1.70 | |
| Ratio of interest expense | | | | | | | | | | |
| to average net assets | .00d | | .01 | | .01 | | .01 | | .01 | |
| Ratio of net investment income | | | | | | | | | | |
| to average net assets | 8.15 | | 9.17 | | 9.17 | | 10.09 | | 9.45 | |
| Portfolio Turnover Rate | 235.42 | | 340.47 | | 158.92 | | 26.76 | | 40.79 | |
|
| |
| |
| |
| |
| |
| Net Assets, end of period ($ x 1,000) | 86,479 | | 62,036 | | 84,044 | | 105,167 | | 170,011 | |
a As required, effective January 1, 2001, the fund has adopted the provisions of the AICPA Audit and Accounting Guide for Investment Companies and began amortizing discount or premium on fixed income securities on a scientific basis and including paydown gains and losses in interest income.The effect of this change for the period ended December 31, 2001 was to decrease net investment income per share by $.05, increase net realized and unrealized gain (loss) on investments per share by $.05, and decrease the ratio of net investment income to average net assets from 9.78% to 9.17%. Per share data and ratios/supplemental data for periods prior to January 1, 2001 have not been restated to reflect this change in presentation.
b
| Based on average shares outstanding at each month end.
|
c
| Exclusive of sales charge.
|
d
| Amount represents less than .01%.
|
See notes to financial statements.
28
| | | | Year Ended December 31, | | | |
| | | |
| | | |
| Class R Shares | 2003 | | 2002 | | 2001 a | | 2000 | | 1999 | |
|
| |
| |
| |
| |
| |
| Per Share Data ($): | | | | | | | | | | |
| Net asset value, beginning of period | 6.27 | | 7.94 | | 8.95 | | 10.44 | | 11.32 | |
| Investment Operations: | | | | | | | | | | |
| Investment income—net | .67b | | .70b | | .86b | | 1.16 | | 1.05 | |
| Net realized and unrealized | | | | | | | | | | |
| gain (loss) on investments | 1.16 | | (1.64) | | (.96) | | (1.52) | | (.80) | |
| Total from Investment Operations | 1.83 | | (.94) | | (.10) | | (.36) | | .25 | |
| Distributions: | | | | | | | | | | |
| Dividends from investment income—net | (.67) | | (.73) | | (.91) | | (1.13) | | (1.13) | |
| Net asset value, end of period | 7.43 | | 6.27 | | 7.94 | | 8.95 | | 10.44 | |
|
| |
| |
| |
| |
| |
| Total Return (%) | 30.15 | | (11.99) | | (1.26) | | (4.02) | | 2.24 | |
|
| |
| |
| |
| |
| |
| Ratios/Supplemental Data (%): | | | | | | | | | | |
| Ratio of operating expenses | | | | | | | | | | |
| to average net assets | .72 | | .70 | | .70 | | .70 | | .70 | |
| Ratio of interest expense | | | | | | | | | | |
| to average net assets | .00c | | .00c | | .01 | | .01 | | .01 | |
| Ratio of net investment income | | | | | | | | | | |
| to average net assets | 9.26 | | 10.08 | | 10.19 | | 11.01 | | 10.65 | |
| Portfolio Turnover Rate | 235.42 | | 340.47 | | 158.92 | | 26.76 | | 40.79 | |
|
| |
| |
| |
| |
| |
| Net Assets, end of period ($ x 1,000) | 1,283 | | 114 | | 131 | | 143 | | 329 | |
a As required, effective January 1, 2001, the fund has adopted the provisions of the AICPA Audit and Accounting Guide for Investment Companies and began amortizing discount or premium on fixed income securities on a scientific basis and including paydown gains and losses in interest income.The effect of this change for the period ended December 31, 2001 was to decrease net investment income per share by $.05 and increase net realized and unrealized gain (loss) on investments per share by $.05, and decrease the ratio of net investment income to average net assets from 10.80% to 10.19%. Per share data and ratios/supplemental data for periods prior to January 1, 2001 have not been restated to reflect this change in presentation.
b
| Based on average shares outstanding at each month end.
|
c
| Amount represents less than .01%.
|
See notes to financial statements.
The Fund 29
NOTES TO FINANCIAL STATEMENTS
NOTE 1—Significant Accounting Policies:
Dreyfus Premier Limited Term High Yield Fund (the “fund”) is a separate diversified series of The Dreyfus/Laurel Funds Trust (the “Trust”) which is registered under the Investment Company Act of 1940, as amended (the “Act”), as an open-end management investment company and operates as a series company currently offering three series, including the fund.The fund’s investment objective is to seek to maximize total return, consisting of capital appreciation and current income.The Dreyfus Corporation (the “Manager”) serves as the fund’s investment manager. The Manager is a wholly-owned subsidiary of Mellon Bank, N.A. (“Mellon Bank”), which is a wholly-owned subsidiary of Mellon Financial Corporation.
On October 30, 2002 (the “Closing Date”), pursuant to an Agreement and Plan of Reorganization previously approved by the fund’s Board of Trustees, substantially all of the assets, subject to the liabilities, of the Dreyfus Premier Fixed Income Funds-Dreyfus Premier High Yield Securities Fund, were transferred to the fund in exchange for shares of Beneficial Interest of the fund in equal value. Class A and Class T shares were converted to Class A shares of the fund.The fund’s net asset values for Class A, Class B, Class C and Class R shares, respectively, on the closing date were $5.88, $5.88, $5.89 and $5.88 per share, and a total of 5,594,189, 827,388 and 334,407 shares for Class A, Class B and Class C shares respectively, representing net assets for Class A, Class B and Class C shares, respectively of $32,897,104, $4,860,934 and $1,970,430 [including for Class A, Class B and Class C shares, respectively, ($22,574,464), $1,877,849 and $644,437 net unrealized appreciation/(depreciation) on investments], were issued to Dreyfus Premier High Yield Securities Fund’s shareholders in the exchange. The exchange was a tax free event to shareholders.
Dreyfus Service Corporation (the “Distributor”), a wholly-owned subsidiary of the Manager, is the Distributor of the fund’s shares.The fund is authorized to issue an unlimited number of shares of Beneficial Interest in each of the following classes of shares: Class A, Class B, Class
30
C and Class R. Class A, Class B and Class C shares are sold primarily to retail investors through financial intermediaries and bear a distribution fee and/or service fee. Class A shares are sold with a front-end sales charge, while Class B and Class C shares are subject to a contingent deferred sales charge (“CDSC”). Class B shares automatically convert to Class A shares after six years. Class R shares are sold primarily to bank trust departments and other financial service providers (including Mellon Bank and its affiliates) acting on behalf of customers having a qualified trust or investment account or relationship at such institution, and bear no distribution or service fees. Class R shares are offered without a front-end sales charge or CDSC. Each class of shares has identical rights and privileges, except with respect to distribution and service fees and voting rights on matters affecting a single class.
Investment income, net of expenses (other than class specific expenses) and realized and unrealized gains and losses are allocated daily to each class of shares based upon the relative proportion of net assets of each class.
The fund’s financial statements are prepared in accordance with accounting principles generally accepted in the United States of America, which may require the use of management estimates and assumptions. Actual results could differ from those estimates.
(a) Portfolio valuation: Investments in securities (excluding short-term investments (other than U.S.Treasury Bills), options, swap transactions and financial futures) are valued each business day by an independent pricing service (the “Service”) approved by the Board of Trustees. Investments for which quoted bid prices are readily available and are representative of the bid side of the market in the judgment of the Service are valued at the mean between the quoted bid prices (as obtained by the Service from dealers in such securities) and asked prices (as calculated by the Service based upon its evaluation of the market for such securities). Other investments (which constitute a majority of the portfolio securities) are valued as determined by the
The Fund 31
NOTES TO FINANCIAL STATEMENTS (continued)
Service, based on methods which include consideration of: yields or prices of securities of comparable quality, coupon, maturity and type; indications as to values from dealers; and general market conditions. Securities for which there are no such valuations are valued at fair value as determined in good faith under the direction of the Board of Trustees. Short-term investments, other than U.S. Treasury Bills, are carried at amortized cost, which approximates value. Financial futures, and options, which are traded on an exchange, are valued at the last sales price on the securities exchange on which such securities are primarily traded or at the last sales price on the national securities market on each business day. Options traded over-the-counter are priced at the mean between the bid prices and asked prices. Investments denominated in foreign currencies are translated to U.S. dollars at the prevailing rates of exchange. Swap transactions are valued based on future cash flows and other factors, such as interest rates and underlying securities.
(b) Foreign currency transactions: The fund does not isolate that portion of the results of operations resulting from changes in foreign exchange rates on investments from the fluctuations arising from changes in the market prices of securities held. Such fluctuations are included with the net realized and unrealized gain or loss from investments.
Net realized foreign exchange gains or losses arise from sales and maturities of short-term securities, sales of foreign currencies, currency gains or losses realized on securities transactions and the difference between the amount of dividends, interest and foreign withholding taxes recorded on the fund’s books and the U.S. dollar equivalent of the amounts actually received or paid. Net unrealized foreign exchange gains and losses arise from changes in the value of assets and liabilities other than investments in securities, resulting from changes in exchange rates. Such gains and losses are included with net realized and unrealized gain or loss on investments.
(c) Securities transactions and investment income: Securities transactions are recorded on a trade date basis. Realized gain and loss from
32
securities transactions are recorded on the identified cost basis. Dividend income is recognized on the ex-dividend date and interest income, including, where applicable, accretion of discount and amortization of premium on investments, is recognized on the accrual basis.
The fund may lend securities to qualified institutions. At origination, all loans are secured by collateral of at least 102% of the value of U.S. securities loaned and 105% of the value of foreign securities loaned. Collateral equivalent to at least 100% of the market value of securities on loan will be maintained at all times. Cash collateral is invested in certain money market mutual funds managed by the Manager as shown in the fund’s Statement of Investments.The Company and the Manager have received an exemptive order from the SEC which, among other things, permits the fund to use cash collateral received in connection with lending the fund’s securities and other uninvested cash to purchase shares of one or more registered money market mutual funds advised by the Manager in excess of the limitations imposed by the Act.The fund will be entitled to receive all income on securities loaned, in addition to income earned as a result of the lending transaction. Although each security loaned is fully collateralized, the fund would bear the risk of delay in recovery of, or loss of rights in, the securities loaned should a borrower fail to return the securities in a timely manner.
(d) Affiliated issuers: Issuers in which the fund held 5% or more of the outstanding voting securities are defined as “affiliated” in the Act. The following summarizes affiliated issuers during the period ended December 31, 2003:
| | | | Shares | | | | | | | | | |
| | | |
| | | | | | | | | |
| | Beginning | | | | | | End of | | Dividend | | Market | |
| Name of issuer | of Period | | Purchases | | Sales | | Period | | Income ($) | | Value ($) | |
|
| |
| |
| |
| |
| |
| |
| HCI Direct, CL. A | 910,714 | | — | | — | | 910,714 | | — | | 9,805,657 | |
(e) Concentration of Risk: The fund invests primarily in debt securities. Failure of an issuer of the debt securities to make timely interest or principal payments, or a decline or the perception of a decline in the credit quality of a debt security, can cause the debt security’s
The Fund 33
NOTES TO FINANCIAL STATEMENTS (continued)
price to fall, potentially lowering the fund’s share price. High yield (“junk”) bonds which the fund invests in involve greater credit risk, including the risk of default, than investment grade bonds, and are considered predominantly speculative with respect to the issuer’s continuing ability to make principal and interest payments. In addition, the value of debt securities may decline due to general market conditions that are not specifically related to a particular company, such as real or perceived adverse economic conditions, changes in outlook for corporate earnings, changes in interest or currency rates or adverse investor sentiment.They may also decline because of factors that affect a particular industry.
(f) Dividends to shareholders: It is the policy of the fund to declare dividends daily from investment income-net. Such dividends are paid monthly. Dividends from net realized capital gain, if any, are normally declared and paid annually, but the fund may make distributions on a more frequent basis to comply with the distribution requirements of the Internal Revenue Code of 1986, as amended (the “Code”).To the extent that net realized capital gain can be offset by capital loss carryovers, it is the policy of the fund not to distribute such gain. Income and capital gain distributions are determined in accordance with income tax regulations, which may differ from generally accepted accounting principles.
(g) Federal income taxes: It is the policy of the fund to continue to qualify as a regulated investment company, if such qualification is in the best interests of its shareholders, by complying with the applicable provisions of the Code, and to make distributions of taxable income sufficient to relieve it from substantially all federal income and excise taxes.
At December 31, 2003, the components of accumulated earnings on a tax basis were as follows: undistributed ordinary income $63,359, accumulated capital losses $450,887,386 and unrealized appreciation $16,459,574.
The accumulated capital losses are available to be applied against future net securities profits, if any, realized subsequent to December 31, 2003. If not applied, $1,959,797 of the carryover expires in fiscal 2005,
34
$18,246,245 expires in fiscal 2006, $42,732,799 expires in fiscal 2007, $46,414,386 expires in fiscal 2008, $139,308,651 expires in fiscal 2009, $129,731,870 expires in fiscal 2010 and $72,493,638 expires in fiscal 2011. Based on certain provisions in the Internal Revenue Code, various limitations regarding the future utilization of these carryforwards, brought forward as a result of the fund’s merger with Dreyfus Premier High Yield Securities Fund may apply.
The tax character of distributions paid to shareholders during the fiscal years ended December 31, 2003 and December 31, 2002, were as follows: ordinary income $43,431,369 and $44,808,873, respectively.
During the period ended December 31, 2003, as a result of permanent book to tax differences, the fund increased accumulated undistributed investment income-net by $1,483,271, decreased accumulated net realized gain (loss) on investments by $3,291,768 and increased paid-in capital by $1,808,497. Net assets were not affected by this reclassification.
NOTE 2—Investment Management Fee and Other Transactions with Affiliates:
(a) Investment management fee: Pursuant to an Investment Management agreement with the Manager, the Manager provides or arranges for one or more third parties and/or affiliates to provide investment advisory, administrative, custody, fund accounting and transfer agency services to the fund. The Manager also directs the investments of the fund in accordance with its investment objective, policies and limitations. For these services, the fund is contractually obligated to pay the Manager a fee, calculated daily and paid monthly, at the annual rate of .70% of the value of the fund’s average daily net assets. Out of its fee, the Manager pays all of the expenses of the fund except brokerage fees, taxes, interest, commitment fees, Rule 12b-1 distribution fees and expenses, service fees and expenses of non-interested Trustees (including counsel fees) and extraordinary expenses. In addition, the Manager is required to reduce its fee in an amount equal to the fund’s allocable portion of fees and expenses of the non-inter-
The Fund 35
NOTES TO FINANCIAL STATEMENTS (continued)
ested Trustees (including counsel fees). Each Trustee receives $40,000 per year, plus $5,000 for each joint Board meeting of The Dreyfus/Laurel Funds, Inc., The Dreyfus/Laurel Tax-Free Municipal Funds and Trust (the “Dreyfus/Laurel Funds”) attended, $2,000 for separate committee meetings attended which are not held in conjunction with a regularly scheduled board meeting and $500 for Board meetings and separate committee meetings attended that are conducted by telephone and is reimbursed for travel and out-of-pocket expenses. The Chairman of the Board receives an additional 25% of such compensation (with the exception of reimbursable amounts). In the event that there is a joint committee meeting of the Dreyfus/Laurel Funds and the Dreyfus High Yield Strategies Fund, the $2,000 fee will be allocated between the Dreyfus/Laurel Funds and the Dreyfus High Yield Strategies Fund. These fees and expenses are charged and allocated to each series based on net assets. Amounts required to be paid by the Trust directly to the non-interested Trustees, that would be applied to offset a portion of the management fee payable to the Manager, are in fact paid directly by the Manager to the non-interested Trustees.
Miscellaneous expense results from proxy and legal fees resulting from the change in the fund’s investment objective and name.
During the period ended December 31, 2003, the Distributor retained $250,226 from commissions earned on sales of the fund’s Class A shares and $591,258 and $16,151 from contingent deferred sales charges on redemptions of the fund’s Class B and Class C shares, respectively.
(b) Distribution and service plan: Under separate Distribution Plans (the “Plans”) adopted pursuant to Rule 12b-1 under the Act, Class A shares pay annually up to .25% of the value of the average daily net assets to compensate the Distributor for shareholder servicing activities and expenses primarily intended to result in the sale of Class A shares. Class B and Class C shares pay the Distributor for distributing their shares at an aggregate annual rate of .50% and .75% of the value of the average daily net assets of Class B and Class C shares, respec-
36
tively. Class B and Class C shares are also subject to a service plan adopted pursuant to Rule 12b-1 (the “Service Plan”), under which Class B and Class C shares pay the Distributor for providing certain services to the holders of their shares a fee at the annual rate of .25% of the value of the average daily net assets of Class B and Class C shares. During the period ended December 31, 2003, Class A, Class B and Class C shares were charged $398,436, $1,236,851 and $571,772, respectively, pursuant to their respective Plans. During the period ended December 31, 2003, Class B and Class C shares were charged $618,425 and $190,591, respectively, pursuant to the Service Plan.
Under its terms, the Plans and Service Plan shall remain in effect from year to year, provided such continuance is approved annually by a vote of majority of those Trustees who are not “interested persons” of the Trust and who have no direct or indirect financial interest in the operation of or in any agreement related to the Plans or Service Plan.
(c) Pursuant to an exemptive order from the Securities and Exchange Commission, the fund may invest its available cash balances in affiliated money market mutual funds as shown in the fund’s Statement of Investments. Management fees are not charged to these accounts. During the period ended December 31, 2003, the fund derived $227,815 in income from these investments, which is included in dividend income in the fund’s Statement of Operations.
NOTE 3—Securities Transactions:
The aggregate amount of purchases and sales (including paydowns) of investment securities, excluding short-term securities, financial futures, forward currency exchange contracts, options transactions and swap transactions during the period ended December 31, 2003, amounted to $1,074,277,629 and $1,106,439,481, respectively.
The fund may purchase and write (sell) call/put options in order to gain exposure to or protect against changes in the market.
As a writer of call options, the fund receives a premium at the outset and then bears the market risk of unfavorable changes in the price of the financial instruments underlying the options. Generally, the fund
The Fund 37
NOTES TO FINANCIAL STATEMENTS (continued)
would incur a gain, to the extent of the premium, if the price of the underlying financial instrument decreases between the date the option is written and the date on which the option is terminated. Generally, the fund would realize a loss, if the price of the financial instrument increases between those dates. At December 31, 2003, there were no call options written outstanding.
As writer of put options, the fund receives a premium at the outset and then bears the market risk of unfavorable changes in the price of the financial instruments underlying the options. Generally, the fund would incur a gain, to the extent of the premium, if the price of the underlying financial instrument increases between the date the option is written and the date on which the option is terminated. Generally, the fund would realize a loss, if the price of the financial instrument decreases between those dates. At December 31, 2003, there were no put options written outstanding.
The fund may invest in financial futures contracts in order to gain exposure to or protect against changes in the market. The fund is exposed to market risk as a result of changes in the value of the underlying financial instruments. Investments in financial futures require the fund to “mark to market” on a daily basis, which reflects the change in the market value of the contracts at the close of each day’s trading. Accordingly, variation margin payments are received or made to reflect daily unrealized gains or losses.When the contracts are closed, the fund recognizes a realized gain or loss.These investments require initial margin deposits with a broker, which consist of cash or cash equivalents, up to approximately 10% of the contract amount.The amount of these deposits is determined by the exchange or Board of Trade on which the contract is traded and is subject to change.At December 31, 2003, there were no financial futures contracts outstanding.
The fund enters into forward currency exchange contracts in order to hedge its exposure to changes in foreign currency exchange rates on its foreign portfolio holdings and to settle foreign currency transac-tions.When executing forward currency exchange contracts, the fund is obligated to buy or sell a foreign currency at a specified rate on a
38
certain date in the future. With respect to sales of forward currency exchange contracts, the fund would incur a loss if the value of the con tract increases between the date the forward contract is opened and the date the forward contract is closed.The fund realizes a gain if the value of the contract decreases between those dates. With respect to pur chases of forward currency exchange contracts, the fund would incur a loss if the value of the contract decreases between the date the for ward contract is opened and the date the forward contract is closed The fund realizes a gain if the value of the contract increases between those dates. The fund is also exposed to credit risk associated with counterparty nonperformance on these forward currency exchange contracts which is typically limited to the unrealized gain on each open contract.At December 31, 2003, there were no forward currency exchange contracts outstanding.
The fund may enter into swap agreements to exchange the interest rate on, or return generated by, one nominal instrument for the return generated by another nominal instrument.
Total return swaps involve commitments to pay interest in exchange for a market-linked return based on a notional amount.To the extent the total return of the security or index underlying the transaction exceeds or falls short of the offsetting interest rate obligation, the fund will receive a payment from or make a payment to the counterparty, respectively. Total return swaps are marked-to-market daily and the change, if any, is recorded as unrealized appreciation or depreciation in the Statement of Operations. Periodic payments received or made the end of each measurement period, but prior to termination, are recorded as realized gains or losses in the Statement of Operations.The following summarizes total return swaps entered into by the fund December 31, 2003:
| | | Unrealized |
| Notional Amount ($) | Description | (Depreciation) ($) |
|
| 20,000,000 | Agreement with Merrill Lynch terminating | (1,011,315) |
| | February 1, 2004 to receive 4 month | |
| | LIBOR plus 25%, and receive if negative | |
| | (pay if positive) the total return on the | |
| | Merrill Lynch High Yield Cash Pay Index | |
The Fund 39
NOTES TO FINANCIAL STATEMENTS (continued)
Credit default swaps involve commitments to pay a fixed rate in exchange for payment if a credit event affecting a third party (the referenced company) occurs. Credit events may include a failure to pay interest, bankruptcy, or restructuring. Net periodic interest payments to be received or paid are accrued daily and are recorded in the Statement of Operations as an adjustment to interest income. Credit default swaps are marked-to-market daily and the charge, if any is recorded as unrealized appreciation or depreciation in the Statement of Operations. In addition, the following summarizes open credit default swap agreements at December 31, 2003:
| | | Unrealized |
| Notional Amount ($) | Description | (Depreciation) ($) |
|
| 2,785,000 | Agreement with Merrill Lynch terminating | (86,269) |
| | December 20, 2008 to pay a fixed rate of | |
| | 2.2% and receive the notional amount as a | |
| | result of interest payment default totaling | |
| | $1,000,000 or principal payment default of | |
| | $10,000,000 on Delhaize America, | |
| | 8.125%, 4/15/2001 | |
The fund may enter into interest rate swaps which involve the exchange of commitments to pay and receive interest based on a notional principal amount. Net periodic interest payments to be received or paid are accrued daily and are recorded in the Statement of Operations as an adjustment to interest income. Interest rate swaps are marked-to-market daily and change, if any, is recorded as unrealized appreciation or depreciation in the Statement of Operations.The following summarizes interest rate swaps entered into by the fund at December 31, 2003:
| | | Unrealized |
| Notional Amount ($) | Description | Appreciation ($) |
|
| 4,000,000 | Forward Yield Curve Swap Agreement | 17,487 |
| | with Merrill Lynch terminating 18,755 | |
| | August 23, 2023 to pay 3 month LIBOR | |
| | and receive 10 years CMS 17 bps | |
| | starting August 23, 2013 | |
40
Realized gains or losses on maturity or termination of swaps are presented in the Statement of Operations. Risks may arise upon entering into these agreements from the potential inability of the counterpar-ties to meet the terms of the agreement and are generally limited to the amount of net payments to be received, if any, at the date of default.
At December 31, 2003, the cost of investments for federal income tax purposes was $619,940,399; accordingly, accumulated net unrealized appreciation on investments was $17,606,034, consisting of $35,842,839 gross unrealized appreciation and $18,236,805 gross unrealized depreciation.
NOTE 4—Bank Lines of Credit:
The fund may borrow up to $20 million for leveraging purposes under a short-term unsecured line of credit and participates with other Dreyfus-managed funds in a $100 million unsecured line of credit primarily to be utilized for temporary or emergency purposes, including the financing of redemptions. Interest is charged to the fund based on prevailing market rates in effect at the time of borrowings.
The average daily amount of borrowings outstanding during the period ended December 31, 2003 was approximately $599,500 with a related weighted average annualized interest rate of 1.67%.
The Fund 41
INDEPENDENT AUDITORS’ REPORT
The Board of Trustees and Shareholders The Dreyfus/Laurel Funds Trust:
We have audited the accompanying statement of assets and liabilities of Dreyfus Premier Limited Term High Yield Fund (the “Fund”) of The Dreyfus/Laurel Funds Trust, including the statement of investments, as of December 31, 2003, and the related statement of operations for the year then ended, the statement of changes in net assets for each of the two years in the period then ended, and the financial highlights for each of the five years in the period then ended.These financial statements and financial highlights are the responsibility of the Fund’s management. Our responsibility is to express an opinion on these financial statements and financial highlights based on our audits.
We conducted our audits in accordance with auditing standards generally accepted in the United States of America.Those standards require that we plan and perform the audit to obtain reasonable assurance about whether the financial statements and financial highlights are free of material misstatement. An audit includes examining, on a test basis, evidence supporting the amounts and disclosures in the financial statements. Our procedures included confirmation of securities owned as of December 31, 2003, by correspondence with the custodian and brokers.As to securities purchased or sold but not yet received or delivered, we performed other appropriate auditing procedures. An audit also includes assessing the accounting principles used and significant estimates made by manage-ment,as well as evaluating the overall financial statement presentation.We believe that our audits provide a reasonable basis for our opinion.
In our opinion, the financial statements and financial highlights referred to above present fairly, in all material respects, the financial position of Dreyfus Premier Limited Term High Yield Fund of The Dreyfus/Laurel Funds Trust as of December 31, 2003, the results of its operations for the year then ended, the changes in its net assets for each of the two years in the period then ended, and the financial highlights for each of the five years in the period then ended, in conformity with accounting principles generally accepted in the United States of America.

| New York, New York |
| February 20, 2004 |
42
IMPORTANT TAX INFORMATION (Unaudited)
For federal tax purposes, the fund hereby designates 3.85% of the ordinary dividends paid during the fiscal year ended December 31, 2003 as qualifying for the corporate dividends received deduction.
The fund also designates 3.76% of the ordinary dividends paid during 2003 as qualified dividends, subject to a maximum tax rate of 15%, as provided for by the Jobs and Growth Tax Relief Reconciliation Act of 2003.
The Fund 43
| BOARD MEMBERS INFORMATION (Unaudited) |
| |
| |
| Joseph S. DiMartino (60) |
| Chairman of the Board (1999) |
| Principal Occupation During Past 5 Years: |
| • Corporate Director and Trustee |
| Other Board Memberships and Affiliations: |
| • The Muscular Dystrophy Association, Director |
| • Levcor International, Inc., an apparel fabric processor, Director |
| • Century Business Services, Inc., a provider of outsourcing functions for small and medium size |
| companies, Director |
| • The Newark Group, a provider of a national market of paper recovery facilities, |
| paperboard mills and paperboard converting plants, Director |
| No. of Portfolios for which Board Member Serves: 186 |
| ——————— |
| James Fitzgibbons (69) |
| Board Member (1994) |
| Principal Occupation During Past 5 Years: |
| • Chairman of the Board, Davidson Cotton Company (1998-2002) |
| Other Board Memberships and Affiliations: |
| • Howes Leather Corporation, Director |
| No. of Portfolios for which Board Member Serves: 23 |
| ——————— |
| J.Tomlinson Fort (75) |
| Board Member (1987) |
| Principal Occupation During Past 5 Years: |
| • Retired; Of Counsel, Reed Smith LLP (1998-January 2003) |
| No. of Portfolios for which Board Member Serves: 23 |
| ——————— |
| Kenneth A. Himmel (57) |
| Board Member (1994) |
| Principal Occupation During Past 5 Years: |
| • President and CEO, Related Urban Development, a real estate development company |
| (1996-present) |
| • President and CEO, Himmel & Company, a real estate development company (1980-present) |
| • CEO, American Food Management, a restaurant company (1983-present) |
| No. of Portfolios for which Board Member Serves: 23 |
44
| Stephen J. Lockwood (56) |
| Board Member (1994) |
| Principal Occupation During Past 5 Years: |
| • Chairman of the Board, Stephen J. Lockwood and Company LLC, an investment company |
| (2000-present) |
| • Chairman of the Board and CEO, LDG Reinsurance Corporation (1977-2000) |
| Other Board Memberships and Affiliations: |
| • BDML Holdings, an insurance company, Chairman of the Board |
| • Affiliated Managers Group, an investment management company, Director |
| No. of Portfolios for which Board Member Serves: 23 |
| ——————— |
| Roslyn Watson (54) |
| Board Member (1994) |
| Principal Occupation During Past 5 Years: |
| • Principal,Watson Ventures, Inc., a real estate investment company (1993-present) |
| Other Board Memberships and Affiliations: |
| • American Express Centurion Bank, Director |
| • The Hyams Foundation Inc., a Massachusetts Charitable Foundation,Trustee |
| • National Osteoporosis Foundation,Trustee |
| No. of Portfolios for which Board Member Serves: 23 |
| ——————— |
| Benaree Pratt Wiley (57) |
| Board Member (1998) |
| Principal Occupation During Past 5 Years: |
| • President and CEO,The Partnership, an organization dedicated to increasing the |
| representation of African Americans in positions of leadership, influence and |
| decision-making in Boston, MA (1991-present) |
| Other Board Memberships and Affiliations: |
| • Boston College,Trustee |
| • The Greater Boston Chamber of Commerce, Director |
| • The First Albany Companies, Inc., an investment bank, Director |
| • Mass. Development, Director |
| • Commonwealth Institute, Director |
| • Efficacy Institute, Director |
| • PepsiCo Africa-America, Advisory Board |
| No. of Portfolios for which Board Member Serves: 23 |
Once elected all Board Members serve for an indefinite term.Additional information about the Board Members, including their address is available in the fund’s Statement of Additional Information which can be obtained from Dreyfus free of charge by calling this toll free number: 1-800-554-4611.
| Ruth Marie Adams, Emeritus Board Member |
| Francis P. Brennan, Emeritus Board Member |
The Fund 45
OFFICERS OF THE FUND (Unaudited)
| STEPHEN E. CANTER, President since |
| March 2000. |
| Chairman of the Board, Chief Executive |
| Officer and Chief Operating Officer of the |
| Manager, and an officer of 95 investment |
| companies (comprised of 185 portfolios) |
| managed by the Manager. Mr. Canter also is a |
| Board member and, where applicable, an |
| Executive Committee Member of the other |
| investment management subsidiaries of Mellon |
| Financial Corporation, each of which is an |
| affiliate of the Manager. He is 58 years old and |
| has been an employee of the Manager since |
| May 1995. |
| STEPHEN R. BYERS, Executive Vice |
| President since November 2002. |
| Chief Investment Officer,Vice Chairman and a |
| Director of the Manager, and an officer of 95 |
| investment companies (comprised of 185 |
| portfolios) managed by the Manager. Mr. Byers |
| also is an officer, director or an Executive |
| Committee Member of certain other |
| investment management subsidiaries of Mellon |
| Financial Corporation, each of which is an |
| affiliate of the Manager. He is 50 years old and |
| has been an employee of the Manager since |
| January 2000. Prior to joining the Manager, he |
| served as an Executive Vice President-Capital |
| Markets, Chief Financial Officer and Treasurer |
| at Gruntal & Co., L.L.C. |
| MARK N. JACOBS, Vice President since |
| March 2000. |
| Executive Vice President, Secretary and |
| General Counsel of the Manager, and an |
| officer of 96 investment companies (comprised |
| of 201 portfolios) managed by the Manager. |
| He is 57 years old and has been an employee |
| of the Manager since June 1977. |
| STEVEN F. NEWMAN, Secretary since |
| March 2000. |
| Associate General Counsel and Assistant |
| Secretary of the Manager, and an officer of 96 |
| investment companies (comprised of 201 |
| portfolios) managed by the Manager. He is 54 |
| years old and has been an employee of the |
| Manager since July 1980. |
| JEFF PRUSNOFSKY, Assistant Secretary |
| since March 2000. |
| Associate General Counsel of the Manager, |
| and an officer of 24 investment companies |
| (comprised of 81 portfolios) managed by the |
| Manager. He is 38 years old and has been an |
| employee of the Manager since October 1990. |
| MICHAEL A. ROSENBERG, Assistant |
| Secretary since March 2000. |
| Associate General Counsel of the Manager, |
| and an officer of 93 investment companies |
| (comprised of 194 portfolios) managed by the |
| Manager. He is 43 years old and has been an |
| employee of the Manager since October 1991. |
| JAMES WINDELS, Treasurer since |
| November 2001. |
| Director – Mutual Fund Accounting of the |
| Manager, and an officer of 96 investment |
| companies (comprised of 201 portfolios) |
| managed by the Manager. He is 45 years old |
| and has been an employee of the Manager |
| since April 1985. |
| RICHARD CASSARO, Assistant Treasurer |
| since August 2003. |
| Senior Accounting Manager – Equity Funds of |
| the Manager, and an officer of 25 investment |
| companies (comprised of 101 portfolios) |
| managed by the Manager. He is 44 years old |
| and has been an employee of the Manager |
| since September 1982. |
| ERIK D. NAVILOFF, Assistant Treasurer |
| since December 2002. |
| Senior Accounting Manager – Taxable Fixed |
| Income Funds of the Manager, and an officer |
| of 18 investment companies (comprised of 73 |
| portfolios) managed by the Manager. He is 35 |
| years old and has been an employee of the |
| Manager since November 1992. |
46
| ROBERT SVAGNA, Assistant Treasurer |
| since December 2002. |
| Senior Accounting Manager – Equity Funds of |
| the Manager, and an officer of 25 investment |
| companies (comprised of 101 portfolios) |
| managed by the Manager. He is 36 years old |
| and has been an employee of the Manager |
| since November 1990. |
| KENNETH J. SANDGREN, Assistant |
| Treasurer since November 2001. |
| Mutual Funds Tax Director of the Manager, |
| and an officer of 96 investment companies |
| (comprised of 201 portfolios) managed by the |
| Manager. He is 49 years old and has been an |
| employee of the Manager since June 1993. |
| WILLIAM GERMENIS, Anti-Money |
| Laundering Compliance Officer since |
| September 2002. |
| Vice President and Anti-Money Laundering |
| Compliance Officer of the Distributor, and the |
| Anti-Money Laundering Compliance Officer |
| of 91 investment companies (comprised of 196 |
| portfolios) managed by the Manager. He is 33 |
| years old and has been an employee of the |
| Distributor since October 1998. Prior to |
| joining the Distributor, he was a Vice President |
| of Compliance Data Center, Inc. |
NOTES
For More Information
| Dreyfus Premier |
| Limited Term |
| High Yield Fund |
| 200 Park Avenue |
| New York, NY 10166 |
| |
| Manager |
| The Dreyfus Corporation |
| 200 Park Avenue |
|
| New York, NY 10166 |
| |
| Custodian |
| Mellon Bank, N.A. |
| One Mellon Bank Center |
| Pittsburgh, PA 15258 |
| |
| Transfer Agent & |
| Dividend Disbursing Agent |
| Dreyfus Transfer, Inc. |
| 200 Park Avenue |
| New York, NY 10166 |
| |
| Distributor |
| Dreyfus Service Corporation |
| 200 Park Avenue |
| New York, NY 10166 |
To obtain information:
By telephone
Call your financial representative or 1-800-554-4611
By mail Write to: The Dreyfus Premier Family of Funds 144 Glenn Curtiss Boulevard Uniondale, NY 11556-0144
A description of the policies and procedures that the fund uses to determine how to vote proxies relating to portfolio securities is available, without charge, by calling the telephone number listed above, or by visiting the SEC’s website at http://www.sec.gov
© 2004 Dreyfus Service Corporation 029AR1203
| Dreyfus Premier |
| Managed Income Fund |
ANNUAL REPORT December 31, 2003

| The views expressed in this report reflect those of the portfolio |
| manager only through the end of the period covered and do not |
| necessarily represent the views of Dreyfus or any other person in |
| the Dreyfus organization. Any such views are subject to change at |
| any time based upon market or other conditions and Dreyfus dis- |
| claims any responsibility to update such views.These views may not |
| be relied on as investment advice and, because investment decisions |
| for a Dreyfus fund are based on numerous factors, may not be relied |
| on as an indication of trading intent on behalf of any Dreyfus fund. |
| |
| |
| Not FDIC-Insured • Not Bank-Guaranteed • May Lose Value |
Contents
THE FUND
2
| Letter from the Chairman
|
3
| Discussion of Fund Performance
|
6
| Fund Performance
|
8
| Statement of Investments
|
20
| Statement of Options Written
|
21
| Statement of Assets and Liabilities
|
22
| Statement of Operations
|
23
| Statement of Changes in Net Assets
|
25
| Financial Highlights
|
29
| Notes to Financial Statements
|
39
| Independent Auditors’ Report
|
40
| Important Tax Information
|
41
| Board Members Information
|
43
| Officers of the Fund
|
FOR MORE INFORMATION
|
Back Cover
|
| Dreyfus Premier |
| Managed Income Fund |

LETTER FROM THE CHAIRMAN
Dear Shareholder:
This annual report for Dreyfus Premier Managed Income Fund covers the 12-month period from January 1, 2003, through December 31, 2003. Inside, you’ll find valuable information about how the fund was managed during the reporting period, including a discussion with Kent Wosepka, a portfolio manager and a member of the fixed income team that manages the fund.
The bond market produced mixed results in 2003 as investor sentiment apparently shifted from pessimism at the start of the year toward a more optimistic outlook by year-end. As the U.S. economy gathered momentum, the more interest-rate-sensitive areas of the bond market began to retreat, and U.S. government securities finished the year with modestly positive total returns. On the other hand, the bond market’s more credit-sensitive areas generally benefited from the stronger economy, producing more robust gains for corporate bonds.
While recent economic developments suggest to us that interest rates are more likely to rise in 2004 than to fall further, we continue to believe that bonds deserve a prominent place in most investors’ portfolios. As always, we urge you to speak regularly with your financial advisor, who may be in the best position to suggest the Dreyfus funds designed to meet your current needs, future goals and tolerance for risk.
Thank you for your continued confidence and support.
Sincerely,

| Stephen E. Canter |
| Chairman and Chief Executive Officer |
| The Dreyfus Corporation |
| January 15, 2004 |
2

DISCUSSION OF FUND PERFORMANCE
Kent Wosepka, Portfolio Manager
How did Dreyfus Premier Managed Income Fund perform relative to its benchmark?
For the 12-month period ended December 31, 2003, Dreyfus Premier Managed Income Fund achieved total returns of 5.51% for Class A shares, 4.73% for Class B shares, 4.73% for Class C shares and 5.78% for Class R shares.1 In comparison, the fund’s benchmark, the Lehman Brothers U.S. Aggregate Index, produced a total return of 4.10% for the same period.2
With the economy on the rebound, corporate credit quality improved dramatically during the year, causing prices of lower-quality investment-grade and high-yield bonds to rise sharply. The fund’s returns were higher than its benchmark, primarily because of the fund’s overweight exposure to corporate bonds rated “triple-B” and lower.
What is the fund’s investment approach?
The fund invests at least 65% of its total assets in U.S. government debt and investment-grade corporate debt obligations. The fund also normally invests at least 65% of its total assets in debt obligations having effective maturities of 10 years or less.We do not attempt to match the sector percentages of any index, nor do we attempt to predict the direction of interest rates by substantially altering the fund’s sensitivity to changes in rates. Instead, the heart of our investment process is selecting individual securities that possess a combination of superior fundamentals and attractive relative valuations.
What other factors influenced the fund’s performance?
The fund’s returns during the reporting period were driven by its holdings of lower-rated corporate bonds. Indeed, 2003 represented the best year for high-yield bonds since 1991, the last time the U.S. economy emerged from recession. As business conditions improved,
The Fund 3
DISCUSSION OF FUND PERFORMANCE (continued)
corporate issuers attempted to strengthen their balance sheets by reducing debt. Corporate defaults also declined, from about 8% in 2002 to about 4% in 2003. High-yield bonds comprised, on average, about 10% of the fund’s assets during the reporting period. In comparison, the fund’s benchmark contained no high-yield securities.
Approximately 25% of the fund’s assets were invested in corporate bonds at the lower end of the investment-grade range, which also performed well. In this area, we sought bonds from issuers that we believed were likely to have their credit ratings upgraded. For example, British Sky Broadcasting, the British satellite television company, saw its rating upgraded from high-yield status to the investment-grade range during the year, which led to higher prices for its bonds. Another of the fund’s larger corporate bond positions, U.S. issuer Waste Management, was also upgraded from high-yield to investment-grade. In addition, the fund’s performance benefited from its holdings in Tyco International. A new management team has made progress in turning Tyco’s business around, and its bonds ranked among the fund’s better performing investments in 2003.
Despite a stronger than expected economic recovery during the second half of the year, interest rates rose only modestly.That’s mainly because the Federal Reserve Board (the “Fed”) reduced the federal funds rate in late June to 1% and subsequently indicated that it was likely to keep short-term rates low for “a considerable period.” The Fed’s commitment to low interest rates and the apparent absence of inflationary pressures led to an increase in intermediate- and long-term bond yields of less than one percentage point during 2003. As a result, despite considerable short-term market volatility, prices of bonds in the more interest-rate-sensitive market sectors ended the year little changed from where they began.
Among mortgage-backed securities, we generally avoided high-coupon bonds that tend to be particularly sensitive to prepayment risk when interest rates fall. This enabled the fund to avoid most of the
4
decline in this sector of the bond market in the wake of the surge in refinancing activity during the summer of 2003.Throughout the year, the fund also maintained an underweight allocation to U.S. Treasury securities, which produced lackluster returns throughout the reporting period relative to corporate bonds.
What is the fund’s current strategy?
We have continued to emphasize corporate bonds in light of improving corporate profits and reduced debt levels. We also have focused more on European bonds because, in our judgment, interest rates in Europe may have more room to fall.
Otherwise, we have positioned the fund to take advantage of wider differences between yields of short-term bonds, which currently are anchored by the 1% federal funds rate, and yields of longer-term bonds, which we believe are likely to rise if economic growth remains strong. To do so, we have implemented a “bulleted” investment strategy, focusing on bonds with five-year maturities. This strategy is designed to capture opportunities and seeks to boost total return performance.
January 15, 2004
1 Total return includes reinvestment of dividends and any capital gains paid, and does not take into consideration the maximum initial sales charge in the case of Class A shares, or the applicable contingent deferred sales charges imposed on redemptions in the case of Class B and Class C shares. Had these charges been reflected, returns would have been lower. Past performance is no guarantee of future results. Share price, yield and investment return fluctuate such that upon redemption, fund shares may be worth more or less than their original cost.
2 SOURCE: LIPPER INC. — Reflects reinvestment of dividends and, where applicable, capital gain distributions.The Lehman Brothers U.S.Aggregate Index is a widely accepted, unmanaged total return index of corporate, U.S. government and U.S. government agency debt instruments, mortgage-backed securities and asset-backed securities with an average maturity of 1-10 years.
The Fund 5
FUND PERFORMANCE
† Source: Lipper Inc.
Past performance is not predictive of future performance.
The above graph compares a $10,000 investment made in Class A shares and Class R shares of Dreyfus Premier Managed Income Fund on 12/31/93 to a $10,000 investment made in the Lehman Brothers U.S. Aggregate Index (the “Index”) on that date. All dividends and capital gain distributions are reinvested. Performance for Class B and Class C shares will vary from the performance of Class A and Class R shares shown above due to differences in charges and expenses.
The fund’s performance shown in the line graph takes into account the maximum initial sales charge on Class A shares and all other applicable fees and expenses for Class A shares and Class R shares.The Index is a widely accepted, unmanaged index of corporate, U.S. government and U.S. government agency debt instruments, mortgage-backed securities, and asset-backed securities.The Index does not take into account charges, fees and other expenses. Further information relating to fund performance, including expense reimbursements, if applicable, is contained in the Financial Highlights section of the prospectus and elsewhere in this report.
6
Average Annual Total Returns as of 12/31/03
| | | Inception | | | | | | | | From | |
| | | Date | | 1 Year | | 5 Years | | 10 Years | | Inception | |
|
|
| |
| |
| |
| |
| |
| Class A shares | | | | | | | | | | | |
| with maximum sales charge (4.5%) | | | 0.73% | | 4.41% | | 5.10% | | | |
| without sales charge | | | | 5.51% | | 5.38% | | 5.59% | | | |
| Class B shares | | | | | | | | | | | |
| with applicable redemption | charge † | 12/19/94 | | 0.73% | | 4.26% | | — | | 6.23% | |
| without redemption | | 12/19/94 | | 4.73% | | 4.60% | | — | | 6.23% | |
| Class C shares | | | | | | | | | | | |
| with applicable redemption | charge | 12/19/94 | | 3.73% | | 4.60% | | — | | 5.98% | |
| without redemption | | 12/19/94 | | 4.73% | | 4.60% | | — | | 5.98% | |
| Class R shares | | | | 5.78% | | 5.63% | | 5.85% | | | |
Past performance is not predictive of future performance.The fund’s performance shown in the graph and table does not reflect the deduction of taxes that a shareholder would pay on fund distributions or the redemption of fund shares.
†
| The maximum contingent deferred sales charge for Class B shares is 4%.After six years Class B shares convert to Class A shares.
|
††
| Assumes the conversion of Class B shares to Class A shares at the end of the sixth year following the date of purchase.
|
†††
| The maximum contingent deferred sales charge for Class C shares is 1% for shares redeemed within one year of the date of purchase.
|
The Fund 7
STATEMENT OF INVESTMENTS
December 31, 2003
| | Principal | | |
| Bonds and Notes—110.7% | Amount a | Value ($) | |
|
|
| |
| Advertising—.1% | | | |
| Lamar Media, | | | |
| Notes, 7.25%, 2013 | 30,000 | 32,400 | |
| Asset-Backed Ctfs./Auto Loans—3.8% | | | |
| AmeriCredit Automobile Receivables Trust, | | | |
| Ser. 2000-D, Cl. A4, 1.38%, 2007 | 80,442 b | 80,564 | |
| Daimler Chrysler Auto Trust, | | | |
| Ser. 2003-A, Cl. A4, 2.88%, 2009 | 305,000 | 307,112 | |
| Honda Auto Receivables Owner Trust, | | | |
| Ser. 2003-4, Cl. A3, 2.19%, 2007 | 145,000 | 145,340 | |
| Nissan Auto Receivables Owner Trust, | | | |
| Ser. 2003-C, Cl. A4, 2.7%, 2007 | 490,000 | 491,608 | |
| Toyota Auto Receivables Owner Trust: | | | |
| Ser. 2001-B, Cl. A4, 1.2625%, 2007 | 210,000 b | 210,135 | |
| Ser. 2002-C, Cl. A2, 1.1825%, 2005 | 149,078 b | 149,166 | |
| Whole Auto Loan Trust, | | | |
| Ser. 2003-1, Cl. A2A, 1.4%, 2006 | 835,000 | 834,870 | |
| | | 2,218,795 | |
| Asset-Backed Ctfs./Credit Cards—5.8% | | | |
| Capital One Master Trust, | | | |
| Ser. 1999-1, Cl. A, 1.3025%, 2007 | 805,000 b | 805,148 | |
| Capital One Multi-Asset Execution Trust: | | | |
| Ser. 2003-B2, Cl. B2, 3.5%, 2009 | 85,000 | 85,530 | |
| Ser. 2003-C4, Cl. C4, 6%, 2013 | 340,000 | 353,573 | |
| Chase Credit Card Master Trust, | | | |
| Ser. 2002-2, Cl. C, 2.0625%, 2007 | 300,000 b | 301,512 | |
| Citibank Credit Card Issuance Trust, | | | |
| Ser. 2003-A8, Cl. A8, 3.5%, 2010 | 150,000 | 148,905 | |
| MBNA Master Credit Card Trust: | | | |
| Ser. 1997-J, Cl. A, 1.2825%, 2007 | 735,000 b | 735,630 | |
| Ser. 1999-C, Cl. C, 1.9625%, 2006 | 160,000 b,c | 160,286 | |
| Ser. 2000-C, Cl. C, 1.9625%, 2007 | 600,000 b,c | 600,375 | |
| Ser. 2002-A1, Cl. A1, 4.95%, 2009 | 140,000 | 149,291 | |
| | | 3,340,250 | |
| Asset-Backed Ctfs./Home Equity Loans—1.5% | | | |
| Chase Funding Mortgage Loan Asset-Backed, | | | |
| Ser. 2003-4, Cl. 2A1, 1.2613%, 2021 | 749,516 b | 749,597 | |
| CitiFinancial Mortgage Securities, | | | |
| Ser. 2003-2, Cl. AV1, 1.24125%, 2033 | 146,745 b | 146,723 | |
| | | 896,320 | |
| | | | |
| | | | |
| 8 | | | |
| | Principal | | | |
| Bonds and Notes (continued) | Amount a | | Value ($) | |
|
| |
| |
| Asset-Backed Ctfs./Manufactured Homes—.1% | | | | |
| Vanderbilt Mortgage Finance, | | | | |
| Ser. 1999-A, Cl. 1A6, 6.75%, 2029 | 80,000 | | 78,665 | |
| Automotive—.5% | | | | |
| DaimlerChrysler, | | | | |
| Notes, 6.9%, 2004 | 235,000 | | 242,458 | |
| General Motors, | | | | |
| Discount Debs., 0/7.75%, 2036 | 180,000 d | | 74,722 | |
| | | | 317,180 | |
| Banking—3.0% | | | | |
| CBA Capital Trust I, | | | | |
| Bonds, 5.805%, 2049 | 125,000 c | | 129,491 | |
| Chevy Chase Bank, | | | | |
| Sub. Notes, 6.875%, 2013 | 105,000 | | 108,150 | |
| City National, | | | | |
| Sr. Notes, 5.125%, 2013 | 75,000 | | 74,303 | |
| HBOS, | | | | |
| Sub. Notes, 5.375%, 2049 | 320,000 b,c | | 321,184 | |
| National City, | | | | |
| Sub. Notes, 6.875%, 2019 | 155,000 | | 179,364 | |
| National Westminster Bank, | | | | |
| Sub. Notes, 7.375%, 2009 | 320,000 | | 374,777 | |
| St. George Bank, | | | | |
| Sub. Notes, 7.15%, 2007 | 75,000 c | | 84,464 | |
| Union Planters Bank, | | | | |
| Notes, 5.125%, 2007 | 150,000 | | 159,907 | |
| Zions Bancorp, | | | | |
| Sub. Notes, 6%, 2015 | 280,000 | | 294,324 | |
| | | | 1,725,964 | |
| Building & Construction—.1% | | | | |
| American Standard, | | | | |
| Sr. Notes, 7.375%, 2008 | 40,000 | | 44,400 | |
| Cable/Media—3.2% | | | | |
| British Sky Broadcasting: | | | | |
| Notes, 6.875%, 2009 | 191,000 | | 214,677 | |
| Sr. Notes, 8.2%, 2009 | 195,000 | | 232,466 | |
| Comcast: | | | | |
| Notes, 5.5%, 2011 | 95,000 | | 98,921 | |
| Notes, 7.05%, 2033 | 50,000 | | 54,602 | |
The Fund 9
STATEMENT OF INVESTMENTS (continued)
| | | Principal | �� | | |
| Bonds and Notes (continued) | | Amount a | | Value ($) | |
| |
| |
| |
| Cable/Media (continued) | | | | | |
| Comcast Cable Communications, | | | | | |
| Sr. Notes, 6.75%, 2011 | | 60,000 | | 66,890 | |
| DirecTV Holdings/Finance, | | | | | |
| Sr. Notes, 8.375%, 2013 | | 50,000 | | 58,250 | |
| Echostar DBS: | | | | | |
| Sr. Notes, 10.375%, 2007 | | 190,000 | | 209,238 | |
| Sr. Notes, 4.405%, 2008 | | 45,000 b,c | | 47,081 | |
| Liberty Media, | | | | | |
| Notes, 3.5%, 2006 | | 465,000 | | 467,685 | |
| News America, | | | | | |
| Sr. Debs., 8%, 2016 | | 160,000 | | 194,783 | |
| Rogers Cable, | | | | | |
| Sr. Notes, 6.25%, 2013 | | 75,000 | | 75,937 | |
| Univision Communications, | | | | | |
| Sr. Notes, 7.85%, 2011 | | 95,000 | | 113,105 | |
| Videotron, | | | | | |
| Sr. Notes, 6.875%, 2014 | | 20,000 c | | 20,750 | |
| | | | | 1,854,385 | |
| Chemicals—.4% | | | | | |
| ICI Wilmington, | | | | | |
| Notes, 4.375%, 2008 | | 145,000 | | 144,613 | |
| Nalco, | | | | | |
| Sr. Notes, 7.75%, 2011 | | 90,000 c | | 96,750 | |
| | | | | 241,363 | |
| Commercial Mortgage Pass-Through Ctfs.—6.1% | | | | | |
| Bear Stearns Commercial Mortgage Securities, | | | | | |
| Ser. 2003-T12, Cl. A3, 4.24%, 2039 | | 295,000 | | 293,433 | |
| CS First Boston Mortgage Securities, | | | | | |
| Ser. 2001-CF2, Cl. A4, 6.505%, 2034 | | 135,000 | | 150,848 | |
| Calwest Industrial Trust, | | | | | |
| Ser. 2002-CALW, Cl. A, 6.127%, 2017 | | 125,000 c | | 135,695 | |
| Chase Commercial Mortgage Securities: | | | | | |
| Ser. 1997-2, Cl. C, 6.6%, 2029 | | 40,000 | | 44,400 | |
| Ser. 1998-1, Cl. A2, 6.56%, 2030 | | 200,000 | | 222,326 | |
| DLJ Commercial Mortgage, | | | | | |
| Ser. 1999-CG1, Cl. A1A, 6.08%, 2032 | | 123,145 | | 131,852 | |
| First Chicago/Lennar Trust, | | | | | |
| Ser. 1997-CHL1, Cl. D, 7.97%, 2039 | | 275,000 b,c | | 274,742 | |
| GMAC Commercial Mortgage Securities, | | | | | |
| Ser. 1996-C1, Cl. F, 7.86%, 2006 | | 250,000 c | | 266,247 | |
| | | | | | |
| | | | | | |
| 10 | | | | | |
| | Principal | | | |
| Bonds and Notes (continued) | Amount a | | Value ($) | |
|
| |
| |
| Commercial Mortgage Pass-Through Ctfs. (continued) | | | | |
| Granite Mortgages, | | | | |
| Ser. 2003-3, Cl. 1A1, 1.2364%, 2019 | 630,000 b | | 630,000 | |
| Merrill Lynch Mortgage Investors, | | | | |
| Ser. 1996-C2, Cl. B, 6.96%, 2028 | 120,000 | | 131,023 | |
| Morgan (J.P) Commercial Mortgage Finance: | | | | |
| Ser. 1997-C5, Cl. A3, 7.088%, 2029 | 170,000 | | 190,016 | |
| Ser. 1997-C5, Cl. B, 7.159%, 2029 | 105,000 | | 118,321 | |
| Morgan Stanley Capital I: | | | | |
| Ser. 1999-CAM1, Cl. A4, 7.02%, 2032 | 70,000 | | 79,471 | |
| Ser. 1999-RM1, Cl. A2, 6.71%, 2031 | 200,000 | | 224,614 | |
| Morgan Stanley Dean Witter Capital I, | | | | |
| Ser. 2001-PPM, Cl. A3, 6.54%, 2031 | 250,000 | | 278,088 | |
| Permanent Financing, | | | | |
| Ser. 3, Cl. 1A, 1.13%, 2004 | 350,000 b | | 350,000 | |
| Structured Asset Mortgage Investments, | | | | |
| Ser. 1998-2, Cl. B, 6.75%, 2030 | 26,233 | | 25,675 | |
| | | | 3,546,751 | |
| Commercial Services—1.2% | | | | |
| Aramark Services, | | | | |
| Sr. Notes, 7%, 2007 | 500,000 | | 550,169 | |
| Ford, | | | | |
| Notes, 9.3%, 2030 | 145,000 | | 168,815 | |
| | | | 718,984 | |
| Consumer—.0% | | | | |
| Scotts, | | | | |
| Sr. Notes, 6.625%, 2013 | 20,000 c | | 20,650 | |
| Environmental—1.4% | | | | |
| Allied Waste: | | | | |
| Sr. Notes, Ser. B, 7.625%, 2006 | 385,000 | | 407,138 | |
| Sr. Notes, Ser. B, 7.875%, 2009 | 225,000 | | 235,687 | |
| USA Waste, | | | | |
| Sr. Notes, 7%, 2028 | 125,000 | | 134,948 | |
| Waste Management, | | | | |
| Sr. Notes, 7.375%, 2029 | 45,000 | | 50,801 | |
| | | | 828,574 | |
| Financial Services—5.4% | | | | |
| ERAC USA Finance, | | | | |
| Notes, 8.25%, 2005 | 325,000 c | | 350,660 | |
The Fund 11
STATEMENT OF INVESTMENTS (continued)
| | | Principal | | | |
| Bonds and Notes (continued) | | Amount a | | Value ($) | |
|
|
| |
| |
| Financial Services (continued) | | | | | |
| Ford Motor Credit: | | | | | |
| Notes, 6.7%, 2004 | | 365,000 | | 374,427 | |
| Notes, 6.875%, 2006 | | 560,000 | | 597,982 | |
| GMAC: | | | | | |
| Medium-Term Notes, 4.15%, 2005 | | 170,000 | | 173,359 | |
| Medium-Term Notes, 6.38%, 2004 | | 170,000 | | 170,615 | |
| Notes, 6.75%, 2006 | | 415,000 | | 445,735 | |
| Goldman Sachs, | | | | | |
| Notes, 5.25%, 2013 | | 160,000 | | 162,354 | |
| Jefferies Group: | | | | | |
| Sr. Notes, Ser. B, 7.5%, 2007 | | 70,000 | | 78,749 | |
| Sr. Notes, 7.75%, 2012 | | 160,000 | | 179,265 | |
| Linde Finance, | | | | | |
| Notes, 6%, 2049 | EUR | 125,000 b | | 158,206 | |
| SLM, | | | | | |
| Medium-Term Notes, Ser. A, 5%, 2015 | | 415,000 | | 410,312 | |
| | | | | 3,101,664 | |
| Food & Beverages—1.2% | | | | | |
| Del Monte, | | | | | |
| Sr. Sub. Notes, 8.625%, 2012 | | 50,000 | | 55,000 | |
| Pathmark Stores, | | | | | |
| Sr. Sub. Notes, 8.75%, 2012 | | 70,000 | | 73,500 | |
| Safeway, | | | | | |
| Notes, 4.125%, 2008 | | 115,000 | | 114,621 | |
| Tricon Global Restaurants: | | | | | |
| Sr. Notes, 7.65%, 2008 | | 110,000 | | 125,400 | |
| Sr. Notes, 8.875%, 2011 | | 243,000 | | 295,852 | |
| | | | | 664,373 | |
| Foreign/Governmental—10.4% | | | | | |
| Bundesobligation, | | | | | |
| Bonds, Ser. 140, 4.5%, 2007 | EUR | 1,640,000 | | 2,151,297 | |
| Deutschland, | | | | | |
| Bonds, Ser. 2, 5%, 2012 | EUR | 1,705,000 | | 2,270,435 | |
| Dominican Republic, | | | | | |
| Notes, 9.5%, 2006 | | 25,000 c | | 21,125 | |
| Federative Republic of Brazil: | | | | | |
| Bonds, 11%, 2040 | | 115,000 | | 127,075 | |
| Notes, 12%, 2010 | | 175,000 | | 210,875 | |
| Republic of Bulgaria, | | | | | |
| Bonds, 8.25%, 2015 | | 85,000 c | | 100,088 | |
| | | | | | |
| | | | | | |
| 12 | | | | | |
| | Principal | | | |
| Bonds and Notes (continued) | Amount a | | Value ($) | |
|
| |
| |
| Foreign/Governmental (continued) | | | | |
| Republic of Columbia, | | | | |
| Notes, 10.75%, 2013 | 55,000 | | 62,837 | |
| Republic of El Salvador, | | | | |
| Notes, 8.5%, 2011 | 60,000 c | | 66,900 | |
| Russian Federation, | | | | |
| Bonds, 5%, 2030 | 330,000 b | | 317,625 | |
| State of Qatar, | | | | |
| Bonds, 9.75%, 2030 | 80,000 c | | 113,200 | |
| Ukraine Government, | | | | |
| Sr. Notes, 11%, 2007 | 137,201 | | 153,133 | |
| United Mexican States: | | | | |
| Medium-Term Notes, Ser. A, 6.375%, 2013 | 185,000 | | 192,400 | |
| Notes, 5.875%, 2014 | 95,000 | | 94,050 | |
| Notes, 6.625%, 2015 | 155,000 | | 160,813 | |
| | | | 6,041,853 | |
| Gaming/Lodging—4.3% | | | | |
| Ameristar Casinos, | | | | |
| Sr. Sub. Notes, 10.75%, 2009 | 35,000 | | 40,425 | |
| Argosy Gaming, | | | | |
| Sr. Sub. Notes, 10.75%, 2009 | 250,000 | | 271,250 | |
| Carnival: | | | | |
| Debs., 6.65%, 2028 | 155,000 | | 159,621 | |
| Notes, 7.05%, 2005 | 300,000 | | 319,155 | |
| Sr. Notes, 3.75%, 2007 | 140,000 c | | 140,375 | |
| Chumash Casino & Resort, | | | | |
| Sr. Notes, 9%, 2010 | 20,000 c | | 22,200 | |
| Coast Hotels & Casino, | | | | |
| Sr. Sub. Notes, 9.5%, 2009 | 75,000 | | 79,688 | |
| Hilton Hotels, | | | | |
| Sr. Notes, 7%, 2004 | 100,000 | | 103,000 | |
| Horseshoe Gaming, | | | | |
| Sr. Sub. Notes, Ser. B, 8.625%, 2009 | 120,000 | | 127,350 | |
| Mohegan Tribal Gaming Authority: | | | | |
| Sr. Notes, 8.125%, 2006 | 350,000 | | 378,875 | |
| Sr. Sub. Notes, 8%, 2012 | 50,000 | | 54,375 | |
| Park Place Entertainment, | | | | |
| Sr. Sub. Notes, 7.875%, 2005 | 80,000 | | 85,900 | |
| Royal Caribbean Cruises: | | | | |
| Sr. Notes, 8.25%, 2005 | 175,000 | | 185,063 | |
| Sr. Notes, 8.75%, 2011 | 140,000 | | 158,900 | |
The Fund 13
STATEMENT OF INVESTMENTS (continued)
| | | Principal | | | |
| Bonds and Notes (continued) | | Amount a | | Value ($) | |
|
|
| |
| |
| Gaming/Lodging (continued) | | | | | |
| Station Casinos: | | | | | |
| Sr. Sub. Notes, 8.875%, 2008 | | 145,000 | | 150,800 | |
| Sr. Sub. Notes, 9.875%, 2010 | | 45,000 | | 49,725 | |
| Turning Stone Casino Enterprise, | | | | | |
| Sr. Notes, 9.125%, 2010 | | 160,000 c | | 174,800 | |
| | | | | 2,501,502 | |
| Health Care—.2% | | | | | |
| HCA, | | | | | |
| Sr. Notes, 7.125%, 2006 | | 100,000 | | 108,403 | |
| Industrial—2.0% | | | | | |
| Owens-Brockway, | | | | | |
| Sr. Notes, 7.75%, 2011 | | 15,000 | | 16,181 | |
| RPM International, | | | | | |
| Bonds, 6.25%, 2013 | | 145,000 c | | 147,294 | |
| Tyco International: | | | | | |
| Notes, 6.125%, 2007 | EUR | 260,000 | | 344,279 | |
| Notes, 6.125%, 2008 | | 330,000 | | 354,750 | |
| Notes, 6.375%, 2011 | | 205,000 | | 220,119 | |
| Notes, 7%, 2028 | | 50,000 | | 52,188 | |
| | | | | 1,134,811 | |
| Insurance—.2% | | | | | |
| Leucadia National, | | | | | |
| Sr. Notes, 7%, 2013 | | 130,000 c | | 130,650 | |
| Medical—.3% | | | | | |
| Apogent Technologies, | | | | | |
| Sr. Sub. Notes, 6.5%, 2013 | | 45,000 | | 47,138 | |
| Wyeth: | | | | | |
| Bonds, 6.45%, 2024 | | 50,000 | | 51,385 | |
| Bonds, 6.5%, 2034 | | 50,000 | | 51,297 | |
| | | | | 149,820 | |
| Metals & Mining—.6% | | | | | |
| Ball, | | | | | |
| Notes, 6.875%, 2012 | | 140,000 | | 147,000 | |
| Teck Cominco | | | | | |
| Notes, 7%, 2012 | | 165,000 | | 181,506 | |
| | | | | 328,506 | |
| Oil & Gas—1.6% | | | | | |
| ANR Pipeline: | | | | | |
| Debs., 7.375%, 2024 | | 20,000 | | 20,300 | |
| Sr. Notes, 7%, 2025 | | 50,000 | | 51,125 | |
| | | | | | |
| | | | | | |
| 14 | | | | | |
| | | Principal | | | |
| Bonds and Notes (continued) | | Amount a | | Value ($) | |
|
|
| |
| |
| Oil & Gas (continued) | | | | | |
| Amerada Hess, | | | | | |
| Notes, 7.3%, 2031 | | 140,000 | | 145,000 | |
| El Paso Natural Gas: | | | | | |
| Debs., 8.625%, 2022 | | 20,000 | | 20,925 | |
| Sr. Notes, Ser. A, 7.625%, 2010 | | 130,000 | | 134,225 | |
| Halliburton, | | | | | |
| Notes, 5.5%, 2010 | | 130,000 c | | 136,148 | |
| Northwest Pipeline, | | | | | |
| Debs., 6.625%, 2007 | | 160,000 | | 168,800 | |
| TXU Gas Capital I, | | | | | |
| Notes, 2.51%, 2028 | | 170,000 b | | 148,274 | |
| Transcontinental Gas, | | | | | |
| Notes, 6.125%, 2005 | | 60,000 | | 61,275 | |
| XTO Energy, | | | | | |
| Sr. Notes, 6.25%, 2013 | | 15,000 | | 15,863 | |
| | | | | 901,935 | |
| Paper & Paper Related—2.7% | | | | | |
| Abitibi-Consolidated: | | | | | |
| Bonds, 8.3%, 2005 | | 125,000 | | 132,326 | |
| Debs., 8.5%, 2029 | | 315,000 | | 329,462 | |
| Fort James, | | | | | |
| Notes, 4.75%, 2004 | EUR | 450,000 | | 570,390 | |
| Jefferson Smurfit, | | | | | |
| Sr. Notes, 8.25%, 2012 | | 40,000 | | 43,600 | |
| Moore North American Finance, | | | | | |
| Sr. Notes, 7.875%, 2011 | | 25,000 c | | 28,438 | |
| Sappi Papier, | | | | | |
| Notes, 6.75%, 2012 | | 240,000 c | | 262,865 | |
| Stone Container, | | | | | |
| Sr. Notes, 8.375%, 2012 | | 110,000 | | 119,900 | |
| UPM-Kymmene, | | | | | |
| Medium-Term Notes, 5.625%, 2014 | | 100,000 c | | 102,302 | |
| | | | | 1,589,283 | |
| Publishing—.1% | | | | | |
| DEX Media West: | | | | | |
| Sr. Notes, 8.5%, 2010 | | 15,000 c | | 16,781 | |
| Sr. Sub. Notes, 9.875%, 2013 | | 15,000 c | | 17,512 | |
| | | | | 34,293 | |
The Fund 15
STATEMENT OF INVESTMENTS (continued)
| | | Principal | | | |
| Bonds and Notes (continued) | | Amount a | | Value ($) | |
| |
| |
| |
| Real Estate Investment Trusts—1.6% | | | | | |
| Archstone-Smith Operating Trust, | | | | | |
| Sr. Notes, 5%, 2007 | | 75,000 | | 78,759 | |
| Boston Properties, | | | | | |
| Sr. Notes, 5.625%, 2015 | | 85,000 | | 85,121 | |
| Duke-Weeks Realty, | | | | | |
| Sr. Notes, 6.95%, 2011 | | 170,000 | | 191,750 | |
| HMH Properties, | | | | | |
| Sr. Notes, Ser. B, 7.875%, 2008 | | 125,000 | | 130,625 | |
| Healthcare Realty Trust, | | | | | |
| Sr. Notes, 8.125%, 2011 | | 275,000 | | 315,357 | |
| Spieker Properties Trust, | | | | | |
| Notes, 6.8%, 2004 | | 125,000 | | 126,901 | |
| | | | | 928,513 | |
| Retail—.1% | | | | | |
| Office Depot, | | | | | |
| Sr. Notes, 6.25%, 2013 | | 75,000 | | 78,892 | |
| Telecommunications—3.0% | | | | | |
| AT&T Wireless Services: | | | | | |
| Notes, 8.125%, 2012 | | 125,000 | | 147,269 | |
| Sr. Notes, 8.75%, 2031 | | 120,000 | | 148,583 | |
| Deutsche Telekom, | | | | | |
| Notes, 8.25%, 2030 | | 245,000 | | 314,088 | |
| Koninklijke KPN, | | | | | |
| Sr. Notes, 8.375%, 2030 | | 150,000 | | 190,856 | |
| Qwest Capital Funding, | | | | | |
| Notes, 6.5%, 2018 | | 45,000 | | 39,825 | |
| Salem Communications, | | | | | |
| Sub. Notes, 7.75%, 2010 | | 80,000 | | 83,800 | |
| Sprint Capital: | | | | | |
| Notes, 8.375%, 2012 | | 165,000 | | 193,076 | |
| Notes, 8.75%, 2032 | | 215,000 | | 254,885 | |
| Telecom Italia Capital: | | | | | |
| Notes, 4%, 2008 | | 155,000 c | | 156,186 | |
| Notes, Cl. B., 5.25%, 2013 | | 80,000 c | | 80,343 | |
| WorldCom, | | | | | |
| Sr. Notes, 6.5%, 2010 | | 150,000 e | | 121,500 | |
| | | | | 1,730,411 | |
| Tobacco—1.8% | | | | | |
| Altria: | | | | | |
| Notes, 5.625%, 2008 | | 370,000 | | 379,959 | |
| Notes, 7%, 2013 | | 270,000 | | 288,550 | |
| | | | | | |
| 16 | | | | | |
| | | Principal | | | |
| Bonds and Notes (continued) | | Amount a | | Value ($) | |
|
|
| |
| |
| Tobacco (continued) | | | | | |
| Philip Morris, | | | | | |
| Notes, 4.5%, 2006 | EUR | 300,000 | | 381,607 | |
| | | | | 1,050,116 | |
| U.S. Government—15.8% | | | | | |
| U.S. Treasury Bonds, | | | | | |
| 6.25%, 5/15/2030 | | 360,000 | | 415,544 | |
| U.S. Treasury Inflation | | | | | |
| Protection Securities, | | | | | |
| 3.875%, 1/15/2009 | | 1,037,843 f | | 1,171,806 | |
| U.S. Treasury Notes: | | | | | |
| 3.25%, 8/15/2008 | | 2,069,000 | | 2,082,256 | |
| 4%, 11/15/2012 | | 5,540,000 | | 5,488,478 | |
| | | | | 9,158,084 | |
| U.S. Government Agencies—.8% | | | | | |
| Federal Home Loan Mortgage Corp., | | | | | |
| Notes, 5.75%, 3/15/2009 | | 140,000 | | 154,098 | |
| SLM Student Loan Trust: | | | | | |
| Ser. 2001-2, Cl. A1L, | | | | | |
| 1.2%, 7/27/2009 | | 122,226 b | | 122,421 | |
| Ser. 2003-6, Cl. A1, | | | | | |
| 1.17%, 6/16/2008 | | 218,221 b | | 218,358 | |
| | | | | 494,877 | |
| U.S. Government Agencies/ | | | | | |
| Mortgage-Backed—27.2% | | | | | |
| Federal Home Loan Mortgage Corp.: | | | | | |
| 5%, 10/1/2018 | | 543,921 | | 554,969 | |
| 6%, 7/1/2017 | | 187,187 | | 196,487 | |
| Federal National Mortgage Association: | | | | | |
| 3.53%, 7/1/2010 | | 297,904 | | 286,825 | |
| 4.06%, 6/1/2013 | | 100,000 | | 94,718 | |
| 5% | | 725,000 g,h | | 739,500 | |
| 5%, 6/1/2018 | | 265,226 | | 270,944 | |
| 5.5% | | 3,735,000 g,h | | 3,784,003 | |
| 5.5%, 3/1/2033—10/1/2033 | | 528,361 | | 535,627 | |
| 6% | | 5,460,000 g,h | | 5,644,275 | |
| 6%, 4/1/2018 | | 621,511 | | 652,588 | |
| 6.5% | | 570,000 g | | 596,180 | |
| 6.5%, 12/1/2031-11/1/2032 | | 938,618 | | 982,181 | |
| 7%, 5/1/2032-7/1/2032 | | 179,402 | | 189,998 | |
| 7.5%, 6/1/2007 | | 540 | | 578 | |
| Grantor Trust, Ser. 2001-T6, Cl. B, | | | | | |
| 6.088%, 5/25/2011 | | 275,000 | | 303,053 | |
The Fund 17
STATEMENT OF INVESTMENTS (continued)
| | | Principal | | | |
| Bonds and Notes (continued) | Amount a | | Value ($) | |
|
| |
| |
| U.S. Government Agencies/Mortgage-Backed (continued) | | | | |
| Government National Mortgage Association I: | | | | |
| 6.5%, 9/15/2032 | 334,893 | | 353,206 | |
| 8%, 2/15/2030-5/15/2030 | 36,863 | | 40,112 | |
| Ser. 2002-48, Cl. PF, 1.4544%, 5/15/2029 | 32,847 b | | 32,886 | |
| Ser. 2003-88, Cl. AC, 2.9141%, 6/16/2018 | 322,559 | | 320,117 | |
| Ser. 2003-96, Cl. B, 3.6072%, 8/16/2018 | 175,000 | | 176,539 | |
| | | | | 15,754,786 | |
| Utilities/Electric—4.2% | | | | |
| AES: | | | | | |
| Sr. Secured Notes, 8.75%, 2013 | 125,000 c | | 140,313 | |
| Sr. Secured Notes, 10%, 2005 | 94,230 c | | 96,351 | |
| CenterPoint Energy Resources, | | | | |
| Notes, 7.875%, 2013 | 195,000 c | | 221,129 | |
| Consumers Energy: | | | | |
| First Mortgage Bonds, Ser. B, 5.375%, 2013 | 185,000 c | | 186,192 | |
| First Mortgage Bonds, 6.25%, 2006 | 25,000 | | 27,011 | |
| FirstEnergy: | | | | |
| Sr. Notes, Ser. A, 5.5%, 2006 | 105,000 | | 108,849 | |
| Sr. Notes, Ser. B, 6.45%, 2011 | 110,000 | | 114,219 | |
| Ipalco Enterprises, | | | | |
| Sr. Secured Notes, 8.625%, 2011 | 75,000 | | 84,188 | |
| Niagara Mohawk Power, | | | | |
| Sr. Notes, Ser. G, 7.75%, 2008 | 35,000 | | 40,666 | |
| Nisource Capital Markets, | | | | |
| Medium-Term Notes, 7.86%, 2017 | 75,000 | | 90,710 | |
| Northern States Power, | | | | |
| First Mortgage Bonds, 7.125%, 2025 | 110,000 | | 126,805 | |
| Pepco, | | | | | |
| Notes, 5.5%, 2007 | 110,000 | | 117,765 | |
| Pinnacle Partners, | | | | |
| Sr. Notes, 8.83%, 2004 | 325,000 c | | 338,406 | |
| Southern California Edison, | | | | |
| First Refunding Mortgage Bonds, 8%, 2007 | 250,000 | | 287,188 | |
| Texas Utilities, | | | | |
| Notes, Ser. C, 6.375%, 2008 | 145,000 | | 153,338 | |
| Westar Energy, | | | | |
| First Mortgage Bonds, 7.875%, 2007 | 160,000 | | 179,600 | |
| XCEL Energy, | | | | |
| Sr. Notes, 7%, 2010 | 120,000 | | 136,263 | |
| | | | | 2,448,993 | |
| Total Bonds and Notes | | | | |
| (cost $ | 62,433,513) | | | 64,196,446 | |
| | | | | | |
| 18 | | | | | |
| | | | Face Amount | | | |
| | | | Covered by | | | |
| Options—.0% | | Contracts ($) | Value ($) | |
|
|
|
| |
| Call Options; | | | | | |
| U.S. Treasury 10 Year Notes, | | | | |
| February 2004 @ $ | 98.73 | | | | |
| (cost $ | 17,331) | | 1,180,000 | | 22,401 | |
|
|
|
|
|
| |
| | | | | | | |
| Preferred Stocks—.6% | Shares | | Value ($) | |
|
|
|
| |
| Automotive—.1% | | | | | |
| General Motors, | | | | | |
| Ser. C, Cum. Conv., $ | 1.5625 | 2,250 | | 72,675 | |
| Cable/Media—.2% | | | | | |
| CSC Holdings, | | | | | |
| Ser. M, Cum., $ | 11.125 | 1,120 | | 117,880 | |
| Real Estate Investment Trusts—.3% | | | | |
| Equity Office Properties Trust, | | | | |
| Ser. B, Cum. Conv., $ | 2.625 | 3,140 | | 157,031 | |
| Total Preferred Stocks | | | | |
| (cost $ | 312,198) | | | | 347,586 | |
|
|
|
|
|
| |
| | | | Principal | | | |
| Short-Term Investments—7.1% | Amount | a | Value ($) | |
|
|
|
| |
| U.S. Government Agencies; | | | | |
| Federal National Mortgage Association, | | | | |
| Agency Discount Notes, | | | | |
| 1.05%, 1/14/2004 | | | | | |
| (cost $ | 4,093,447) | | 4,095,000 | | 4,093,447 | |
|
|
|
|
|
| |
| | | | | | | |
| Total Investments | | | | | |
| (cost $ | 66,856,489) | | 118.4% | | 68,659,880 | |
| Liabilities, Less Cash and Receivables | (18.4%) | | (10,646,037) | |
| Net Assets | | 100.0% | | 58,013,843 | |
a Principal amount stated in U.S. Dollars unless otherwise noted.
EUR—Euros
b
| Variable rate security—interest rate subject to periodic change.
|
c
| Securities exempt from registration under Rule 144A of the Securities Act of 1933.These securities may be resold in transactions exempt from registration, normally to qualified institutional buyers.At December 31, 2003, these securities amounted to $5,207,973 or 9.0% of net assets.
|
d
| Zero coupon until a specified date at which time the stated coupon rate becomes effective until maturity.
|
e
| Non-income producing—security in default.
|
f
| Principal amount for accrual purposes is periodically adjusted based on changes in the Consumer Price Index.
|
g
| Purchased on a forward commitment basis.
|
h
| Security acquired under mortgage dollar roll agreement.
|
See notes to financial statements.
The Fund 19
STATEMENT OF OPTIONS WRITTEN
| December 31, 2003 | | | | | | | |
|
|
| |
| |
| |
| | | | | | | | |
| | | | | | | | |
| | | | | | | | |
| | | | | | | | |
| Call Options | | | | | | | |
| | | | Face Amount | | | |
| | | | Covered by | | | |
| Issuer | | | | Contracts ($) | | Value ($) | |
|
|
| |
| |
| |
| U.S. Treasury Notes, 4.25%, 11/15/2013: | | | | | |
| January 2004 @$ | | 99.91 | | 585,000 | | 4,570 | |
| January 2004 @$ | | 100.23 | | 580,000 | | 4,463 | |
| January 2004 @$ | | 100.94 | | 580,000 | | 2,017 | |
| January 2004 @$ | | 99.83 | | 600,000 | | 2,784 | |
| February 2004 @$ | 101.89 | | 1,180,000 | | 6,223 | |
| | | | | | | | |
| Put Options | | | | | | | |
| Issuer | | | | | | | |
|
|
| |
| |
| |
| U.S. Treasury Notes, 4.25%, 11/15/2013: | | | | | |
| January 2004 @$ | | 99.91 | | 585,000 | | 5,027 | |
| January 2004 @$ | | 100.23 | | 580,000 | | 7,341 | |
| January 2004 @$ | | 100.94 | | 580,000 | | 9,380 | |
| January 2004 @$ | | 99.83 | | 600,000 | | 2,268 | |
| February 2004 @$ | 95.58 | | 1,180,000 | | 2,627 | |
| (Premiums received | $ | 66,385) | | | | 46,700 | |
| | | | | | | | |
| See notes to financial statements. | | | | | |
20
STATEMENT OF ASSETS AND LIABILITIES
December 31, 2003
| | | | | | Cost | Value | |
| |
| |
|
|
| |
| Assets ($): | | | | | | | |
| Investments in securities—See Statement of Investments | | | 66,856,489 | 68,659,880 | |
| Cash | | | | | | | 1,730,319 | |
| Cash denominated in foreign currencies | | | 377,514 | 375,704 | |
| Receivable for investment securities sold | | | | 3,285,598 | |
| Dividends and interest receivable | | | | 678,270 | |
| Receivable from broker for swaps opened | | | | 30,338 | |
| Receivable for shares of Beneficial Interest subscribed | | | | 4,037 | |
| Unrealized appreciation on swaps—Note 3 | | | | 3,011 | |
| | | | | | | | 74,767,157 | |
|
|
|
| |
|
|
| |
| Liabilities ($): | | | | | | |
| Due to The Dreyfus Corporation and affiliates—Note 2 | | | | 54,770 | |
| Payable for open mortgage-backed dollar rolls | | | | 11,816,111 | |
| Payable for investment securities purchased | | | | 3,323,974 | |
| Payable for shares of Beneficial Interest redeemed | | | | 1,304,248 | |
| Net unrealized depreciation on forward | | | | | |
| currency exchange contracts—Note 3 | | | | 207,511 | |
| Outstanding options written, at value (premiums | | | | | |
| received | $ | | 66,385)—See Statement of Options Written | | | | 46,700 | |
| | | | | | | | 16,753,314 | |
|
|
|
| |
|
|
| |
| Net Assets ( | $) | | | | | 58,013,843 | |
|
|
| |
|
|
| |
| Composition of Net Assets ($): | | | | | |
| Paid-in capital | | | | | | 64,747,428 | |
| Accumulated undistributed investment income-net | | | | 134,313 | |
| Accumulated net realized gain (loss) on investments | | | | (8,495,386) | |
| Accumulated net unrealized appreciation (depreciation) | | | | | |
| on investments and foreign currency transactions | | | | | |
| (including $3,011 net unrealized appreciation on swap transactions) | 1,627,488 | |
|
| |
| Net Assets ( | $) | | | | | 58,013,843 | |
|
|
| |
|
|
| |
| | | | | | | | | |
| | | | | | | | | |
| Net Asset Value Per Share | | | | | |
| | | | Class A | | Class B | Class C | Class R | |
|
|
|
| |
|
|
| |
| Net Assets ($) | 43,810,585 | | 10,308,740 | 1,692,079 | 2,202,439 | |
| Shares Outstanding | 4,018,220 | | 945,599 | 155,062 | 202,183 | |
|
| |
|
|
| |
| Net Asset Value Per Share ($) 10.90 | | 10.90 | 10.91 | 10.89 | |
| | | | | | | | | |
| See notes to financial statements. | | | | | | |
The Fund 21
STATEMENT OF OPERATIONS
Year Ended December 31, 2003
| Investment Income ($): | | |
| Income: | | |
| Interest | 2,502,372 | |
| Cash dividends | 18,806 | |
| Total Income | 2,521,178 | |
| Expenses: | | |
| Management fee—Note 2(a) | 440,048 | |
| Distribution and service fees—Note 2(b) | 248,601 | |
| Loan commitment fees—Note 4 | 555 | |
| Total Expenses | 689,204 | |
| Investment Income—Net | 1,831,974 | |
|
| |
| Realized and Unrealized Gain (Loss) on Investments—Note 3 ($): | | |
| Net realized gain (loss) on investments and foreign currency transactions | 1,903,559 | |
| Net realized gain (loss) on forward currency exchange contracts | (801,899) | |
| Net realized gain (loss) on options transactions | 14,026 | |
| Net realized gain (loss) on swap transactions | 8,781 | |
| Net Realized Gain (Loss) | 1,124,467 | |
| Net unrealized appreciation (depreciation) on investments, options | | |
| transactions, foreign currency transactions and swap transactions | 273,748 | |
| Net Realized and Unrealized Gain (Loss) on Investments | 1,398,215 | |
| Net Increase in Net Assets Resulting from Operations | 3,230,189 | |
| | | |
| See notes to financial statements. | | |
22
STATEMENT OF CHANGES IN NET ASSETS
| | Year Ended December 31, | |
| |
| |
| | 2003 | | 2002 | |
|
| |
| |
| Operations ($): | | | | |
| Investment income—net | 1,831,974 | | 2,330,370 | |
| Net realized gain (loss) on investments | 1,124,467 | | 1,922,946 | |
| Net unrealized appreciation | | | | |
| (depreciation) on investments | 273,748 | | 680,019 | |
| Net Increase (Decrease) in Net Assets | | | | |
| Resulting from Operations | 3,230,189 | | 4,933,335 | |
|
| |
| |
| Dividends to Shareholders from ($): | | | | |
| Investment income—net: | | | | |
| Class A shares | (1,639,080) | | (1,915,696) | |
| Class B shares | (321,778) | | (434,652) | |
| Class C shares | (50,998) | | (70,960) | |
| Class R shares | (128,194) | | (144,714) | |
| Net realized gain on investments: | | | | |
| Class A shares | (191,821) | | — | |
| Class B shares | (45,150) | | — | |
| Class C shares | (7,407) | | — | |
| Class R shares | (15,330) | | — | |
| Total Dividends | (2,399,758) | | (2,566,022) | |
|
| |
| |
| Beneficial Interest Transactions ($): | | | | |
| Net proceeds from shares sold: | | | | |
| Class A shares | 2,714,221 | | 3,548,853 | |
| Class B shares | 803,504 | | 1,286,889 | |
| Class C shares | 243,918 | | 222,202 | |
| Class R shares | 624,957 | | 483,313 | |
| Dividends reinvested: | | | | |
| Class A shares | 1,538,344 | | 1,577,776 | |
| Class B shares | 234,934 | | 253,456 | |
| Class C shares | 23,252 | | 23,237 | |
| Class R shares | 119,763 | | 119,503 | |
| Cost of shares redeemed: | | | | |
| Class A shares | (8,623,372) | | (8,986,915) | |
| Class B shares | (3,353,257) | | (3,711,507) | |
| Class C shares | (580,018) | | (583,493) | |
| Class R shares | (1,970,340) | | (933,998) | |
| Increase (Decrease) in Net Assets from | | | | |
| Beneficial Interest Transactions | (8,224,094) | | (6,700,684) | |
| Total Increase (Decrease) in Net Assets | (7,393,663) | | (4,333,371) | |
|
| |
| |
| Net Assets ($): | | | | |
| Beginning of Period | 65,407,506 | | 69,740,877 | |
| End of Period | 58,013,843 | | 65,407,506 | |
| Undistributed investment income—net | 134,313 | | 113,693 | |
The Fund 23
STATEMENT OF CHANGES IN NET ASSETS (continued)
| | Year Ended December 31, | |
| |
| |
| | 2003 | | 2002 | |
|
| |
| |
| Capital Share Transactions: | | | | |
| Class Aa | | | | |
| Shares sold | 250,306 | | 338,972 | |
| Shares issued for dividends reinvested | 141,478 | | 150,428 | |
| Shares redeemed | (797,689) | | (860,006) | |
| Net Increase (Decrease) in Shares Outstanding | (405,905) | | (370,606) | |
|
| |
| |
| Class Ba | | | | |
| Shares sold | 74,092 | | 122,817 | |
| Shares issued for dividends reinvested | 21,608 | | 24,173 | |
| Shares redeemed | (309,933) | | (353,769) | |
| Net Increase (Decrease) in Shares Outstanding | (214,233) | | (206,779) | |
|
| |
| |
| Class C | | | | |
| Shares sold | 22,348 | | 21,244 | |
| Shares issued for dividends reinvested | 2,137 | | 2,214 | |
| Shares redeemed | (53,386) | | (55,750) | |
| Net Increase (Decrease) in Shares Outstanding | (28,901) | | (32,292) | |
|
| |
| |
| Class R | | | | |
| Shares sold | 57,462 | | 46,357 | |
| Shares issued for dividends reinvested | 11,025 | | 11,407 | |
| Shares redeemed | (181,593) | | (89,446) | |
| Net Increase (Decrease) in Shares Outstanding | (113,106) | | (31,682) | |
a During the period ended December 31, 2003, 45,778 Class B shares representing $497,111 were automatically converted to 45,774 Class A shares and during the period ended December 31, 2002, 48,412 Class B shares representing $508,638 were automatically converted to 48,405 Class A shares.
See notes to financial statements.
24
FINANCIAL HIGHLIGHTS
The following tables describe the performance for each share class for the fiscal periods indicated.All information (except portfolio turnover) reflects financial results for a single fund share.Total return shows how much your investment in the fund would have increased (or decreased) during each period, assuming you had reinvested all dividends and distributions.These figures have been derived from the fund’s financial statements.
| | | | Year Ended December 31, | | | |
| | | |
| | | |
| Class A Shares | 2003 | | 2002 | | 2001a | | 2000 | | 1999 | |
|
| |
| |
| |
| |
| |
| Per Share Data ($): | | | | | | | | | | |
| Net asset value, beginning of period | 10.75 | | 10.37 | | 10.29 | | 9.99 | | 10.81 | |
| Investment Operations: | | | | | | | | | | |
| Investment income—net | .33b | | .38b | | .52b | | .61 | | .64 | |
| Net realized and unrealized gain | | | | | | | | | | |
| (loss) on investments | .26 | | .42 | | .10 | | .30 | | (.82) | |
| Total from Investment Operations | .59 | | .80 | | .62 | | .91 | | (.18) | |
| Distributions: | | | | | | | | | | |
| Dividends from investment income—net | (.39) | | (.42) | | (.54) | | (.61) | | (.64) | |
| Dividends from net realized | | | | | | | | | | |
| gain on investments | (.05) | | — | | — | | — | | — | |
| Total Distributions | (.44) | | (.42) | | (.54) | | (.61) | | (.64) | |
| Net asset value, end of period | 10.90 | | 10.75 | | 10.37 | | 10.29 | | 9.99 | |
|
| |
| |
| |
| |
| |
| Total Return (%)c | 5.51 | | 7.87 | | 6.09 | | 9.53 | | (1.75) | |
|
| |
| |
| |
| |
| |
| Ratios/Supplemental Data (%): | | | | | | | | | | |
| Ratio of expenses to average net assets | .95 | | .95 | | .95 | | .95 | | .95 | |
| Ratio of net investment income | | | | | | | | | | |
| to average net assets | 3.06 | | 3.63 | | 5.01 | | 6.16 | | 6.21 | |
| Portfolio Turnover Rate | 469.41d | | 524.46 | | 477.71 | | 531.86 | | 309.42 | |
|
| |
| |
| |
| |
| |
| Net Assets, end of period ($ X 1,000) | 43,811 | | 47,571 | | 49,729 | | 51,527 | | 60,755 | |
a As required, effective January 1, 2001, the fund has adopted the provisions of the AICPA Audit and Accounting Guide for Investment Companies and began amortizing discount or premium on fixed income securities on a scientific basis and including paydown gains and losses in interest income.The effect of this change for the period ended December 31, 2001 was to decrease net investment income per share by $.02, increase net realized and unrealized gain (loss) on investments per share by $.02 and decrease the ratio of net investment income to average net assets from 5.16% to 5.01%. Per share data and ratios/supplemental data for periods prior to January 1, 2001 have not been restated to reflect this change in presentation.
b
| Based on average shares outstanding at each month end.
|
c
| Exclusive of sales charge.
|
d
| The portfolio turnover rate excluding mortgage dollar roll transactions was 272.57%.
|
See notes to financial statements.
The Fund 25
FINANCIAL HIGHLIGHTS (continued)
| | | | Year Ended December 31, | | | |
| | | |
| | | |
| Class B Shares | 2003 | | 2002 | | 2001a | | 2000 | | 1999 | |
|
| |
| |
| |
| |
| |
| Per Share Data ($): | | | | | | | | | | |
| Net asset value, beginning of period | 10.75 | | 10.37 | | 10.29 | | 9.99 | | 10.81 | |
| Investment Operations: | | | | | | | | | | |
| Investment income—net | .25b | | .30b | | .44b | | .54 | | .57 | |
| Net realized and unrealized gain | | | | | | | | | | |
| (loss) on investments | .25 | | .42 | | .10 | | .30 | | (.83) | |
| Total from Investment Operations | .50 | | .72 | | .54 | | .84 | | (.26) | |
| Distributions: | | | | | | | | | | |
| Dividends from investment income—net | (.30) | | (.34) | | (.46) | | (.54) | | (.56) | |
| Dividends from net realized | | | | | | | | | | |
| gain on investments | (.05) | | — | | — | | — | | — | |
| Total Distributions | (.35) | | (.34) | | (.46) | | (.54) | | (.56) | |
| Net asset value, end of period | 10.90 | | 10.75 | | 10.37 | | 10.29 | | 9.99 | |
|
| |
| |
| |
| |
| |
| Total Return (%)c | 4.73 | | 7.07 | | 5.30 | | 8.73 | | (2.48) | |
|
| |
| |
| |
| |
| |
| Ratios/Supplemental Data (%): | | | | | | | | | | |
| Ratio of expenses to average net assets | 1.70 | | 1.70 | | 1.70 | | 1.70 | | 1.70 | |
| Ratio of net investment income | | | | | | | | | | |
| to average net assets | 2.31 | | 2.91 | | 4.27 | | 5.41 | | 5.44 | |
| Portfolio Turnover Rate | 469.41d | | 524.46 | | 477.71 | | 531.86 | | 309.42 | |
|
| |
| |
| |
| |
| |
| Net Assets, end of period ($ X 1,000) | 10,309 | | 12,470 | | 14,172 | | 15,069 | | 15,905 | |
a As required, effective January 1, 2001, the fund has adopted the provisions of the AICPA Audit and Accounting Guide for Investment Companies and began amortizing discount or premium on fixed income securities on a scientific basis and including paydown gains and losses in interest income.The effect of this change for the period ended December 31, 2001 was to decrease net investment income per share by $.02, increase net realized and unrealized gain (loss) on investments per share by $.02 and decrease the ratio of net investment income to average net assets from 4.42% to 4.27%. Per share data and ratios/supplemental data for periods prior to January 1, 2001 have not been restated to reflect this change in presentation.
b
| Based on average shares outstanding at each month end.
|
c
| Exclusive of sales charge.
|
d
| The portfolio turnover rate excluding mortgage dollar roll transactions was 272.57%.
|
See notes to financial statements.
26
| | | | Year Ended December 31, | | | |
| | | |
| | | |
| Class C Shares | 2003 | | 2002 | | 2001a | | 2000 | | 1999 | |
|
| |
| |
| |
| |
| |
| Per Share Data ($): | | | | | | | | | | |
| Net asset value, beginning of period | 10.76 | | 10.38 | | 10.30 | | 10.00 | | 10.82 | |
| Investment Operations: | | | | | | | | | | |
| Investment income—net | .25b | | .31b | | .45b | | .54 | | .57 | |
| Net realized and unrealized gain | | | | | | | | | | |
| (loss) on investments | .25 | | .41 | | .09 | | .30 | | (.83) | |
| Total from Investment Operations | .50 | | .72 | | .54 | | .84 | | (.26) | |
| Distributions: | | | | | | | | | | |
| Dividends from investment income—net | (.30) | | (.34) | | (.46) | | (.54) | | (.56) | |
| Dividends from net realized | | | | | | | | | | |
| gain on investments | (.05) | | — | | — | | — | | — | |
| Total Distributions | (.35) | | (.34) | | (.46) | | (.54) | | (.56) | |
| Net asset value, end of period | 10.91 | | 10.76 | | 10.38 | | 10.30 | | 10.00 | |
|
| |
| |
| |
| |
| |
| Total Return (%)c | 4.73 | | 7.06 | | 5.29 | | 8.73 | | (2.48) | |
|
| |
| |
| |
| |
| |
| Ratios/Supplemental Data (%): | | | | | | | | | | |
| Ratio of expenses to average net assets | 1.70 | | 1.70 | | 1.70 | | 1.70 | | 1.70 | |
| Ratio of net investment income | | | | | | | | | | |
| to average net assets | 2.31 | | 2.92 | | 4.30 | | 5.42 | | 5.46 | |
| Portfolio Turnover Rate | 469.41d | | 524.46 | | 477.71 | | 531.86 | | 309.42 | |
|
| |
| |
| |
| |
| |
| Net Assets, end of period ($ X 1,000) | 1,692 | | 1,980 | | 2,245 | | 2,834 | | 3,695 | |
a As required, effective January 1, 2001, the fund has adopted the provisions of the AICPA Audit and Accounting Guide for Investment Companies and began amortizing discount or premium on fixed income securities on a scientific basis and including paydown gains and losses in interest income.The effect of this change for the period ended December 31, 2001 was to decrease net investment income per share by $.02, increase net realized and unrealized gain (loss) on investments per share by $.02 and decrease the ratio of net investment income to average net assets from 4.44% to 4.30%. Per share data and ratios/supplemental data for periods prior to January 1, 2001 have not been restated to reflect this change in presentation.
b
| Based on average shares outstanding at each month end.
|
c
| Exclusive of sales charge.
|
d
| The portfolio turnover rate excluding mortgage dollar roll transactions was 272.57%.
|
See notes to financial statements.
The Fund 27
FINANCIAL HIGHLIGHTS (continued)
| | | | Year Ended December 31, | | | |
| | | |
| | | |
| Class R Shares | 2003 | | 2002 | | 2001a | | 2000 | | 1999 | |
|
| |
| |
| |
| |
| |
| Per Share Data ($): | | | | | | | | | | |
| Net asset value, beginning of period | 10.74 | | 10.36 | | 10.28 | | 9.98 | | 10.81 | |
| Investment Operations: | | | | | | | | | | |
| Investment income—net | .37b | | .41b | | .56b | | .65 | | .67 | |
| Net realized and unrealized gain | | | | | | | | | | |
| (loss) on investments | .24 | | .41 | | .08 | | .29 | | (.84) | |
| Total from Investment Operations | .61 | | .82 | | .64 | | .94 | | (.17) | |
| Distributions: | | | | | | | | | | |
| Dividends from investment income—net | (.41) | | (.44) | | (.56) | | (.64) | | (.66) | |
| Dividends from net realized | | | | | | | | | | |
| gain on investments | (.05) | | — | | — | | — | | — | |
| Total Distributions | (.46) | | (.44) | | (.56) | | (.64) | | (.66) | |
| Net asset value, end of period | 10.89 | | 10.74 | | 10.36 | | 10.28 | | 9.98 | |
|
| |
| |
| |
| |
| |
| Total Return (%) | 5.78 | | 8.14 | | 6.24 | | 9.92 | | (1.57) | |
|
| |
| |
| |
| |
| |
| Ratios/Supplemental Data (%): | | | | | | | | | | |
| Ratio of expenses to average net assets | .70 | | .70 | | .70 | | .70 | | .70 | |
| Ratio of net investment income | | | | | | | | | | |
| to average net assets | 3.30 | | 3.88 | | 5.34 | | 6.41 | | 6.45 | |
| Portfolio Turnover Rate | 469.41c | | 524.46 | | 477.71 | | 531.86 | | 309.42 | |
|
| |
| |
| |
| |
| |
| Net Assets, end of period ($ X 1,000) | 2,202 | | 3,387 | | 3,595 | | 4,813 | | 9,270 | |
a As required, effective January 1, 2001, the fund has adopted the provisions of the AICPA Audit and Accounting Guide for Investment Companies and began amortizing discount or premium on fixed income securities on a scientific basis and including paydown gains and losses in interest income.The effect of this change for the period ended December 31, 2001 was to decrease net investment income per share by $.01, increase net realized and unrealized gain (loss) on investments per share by $.01 and decrease the ratio of net investment income to average net assets from 5.49% to 5.34%. Per share data and ratios/supplemental data for periods prior to January 1, 2001 have not been restated to reflect this change in presentation.
b
| Based on average shares outstanding at each month end.
|
c
| The portfolio turnover rate excluding mortgage dollar roll transactions was 272.57%.
|
See notes to financial statements.
28
NOTES TO FINANCIAL STATEMENTS
NOTE 1—Significant Accounting Policies:
Dreyfus Premier Managed Income Fund (the “fund”) is a separate diversified series of The Dreyfus/Laurel Funds Trust (the “Trust”), which is registered under the Investment Company Act of 1940, as amended (the “Act”), as an open-end management investment company and operates as a series company currently offering three series, including the fund. The fund’s investment objective is to seek high current income consistent with what is believed to be prudent risk of capital primarily through investments in investment-grade corporate and U.S. Government obligations which primarily have maturities of 10 years or less. The Dreyfus Corporation (the “Manager”) serves as the fund’s investment manager.The Manager is a wholly-owned subsidiary of Mellon Bank, N.A. (“Mellon Bank”), which is a wholly-owned subsidiary of Mellon Financial Corporation.
Dreyfus Service Corporation (the “Distributor”), a wholly-owned subsidiary of the Manager, is the distributor of the fund’s shares. The fund is authorized to issue an unlimited number of shares of Beneficial Interest in the following classes of shares: Class A, Class B, Class C and Class R. Class A, Class B and Class C shares are sold primarily to retail investors through financial intermediaries and bear a distribution fee and/or service fee. Class A shares are sold with a front-end sales charge, while Class B and Class C shares are subject to a contingent deferred sales charge (“CDSC”). Class B shares automatically convert to Class A shares after six years. Class R shares are sold primarily to bank trust departments and other financial service providers (including Mellon Bank and its affiliates) acting on behalf of customers having a qualified trust or investment account or relationship at such institution, and bear no distribution fee or service fee. Class R shares are offered without a front-end sales charge or CDSC. Each class of shares has identical rights and privileges, except with respect to distribution fees and voting rights on matters affecting a single class.
The Fund 29
NOTES TO FINANCIAL STATEMENTS (continued)
Investment income, net of expenses (other than class specific expenses) and realized and unrealized gains and losses are allocated daily to each class of shares based upon the relative proportion of net assets of each class.
The fund’s financial statements are prepared in accordance with accounting principles generally accepted in the United States of America, which may require the use of management estimates and assumptions. Actual results could differ from those estimates.
(a) Portfolio valuation: Investments in securities (excluding short-term investments (other than U.S.Treasury Bills), options, swap transactions and financial futures) are valued each business day by an independent pricing service (the “Service”) approved by the Board of Trustees. Investments for which quoted bid prices are readily available and are representative of the bid side of the market in the judgment of the Service are valued at the mean between the quoted bid prices (as obtained by the Service from dealers in such securities) and asked prices (as calculated by the Service based upon its evaluation of the market for such securities). Other investments are valued as determined by the Service, based on methods which include consideration of: yields or prices of securities of comparable quality, coupon, maturity and type; indications as to values from dealers; and general market conditions. Securities for which there are no such valuations are valued at fair value as determined in good faith under the direction of the Board of Trustees. Short-term investments, other than U.S. Treasury Bills, are carried at amortized cost, which approximates value. Financial futures, and options, which are traded on an exchange, are valued at the last sales price on the securities exchange on which such securities are primarily traded or at the last sales price on the national securities market on each business day. Options traded over-the-counter are priced at the mean between the bid prices and asked prices. Investments denominated in foreign currencies are translated to U.S. dollars at the prevailing rates of exchange. Swap transactions are valued based on future cash flows and other factors, such as interest rates and underlying securities.
30
(b) Foreign currency transactions: The fund does not isolate that portion of the results of operations resulting from changes in foreign exchange rates on investments from the fluctuations arising from changes in the market prices of securities held. Such fluctuations are included with the net realized and unrealized gain or loss from investments.
Net realized foreign exchange gains or losses arise from sales and maturities of short-term securities, sales of foreign currencies, currency gains or losses realized on securities transactions and the difference between the amount of dividends, interest and foreign withholding taxes recorded on the fund’s books and the U.S. dollar equivalent of the amounts actually received or paid. Net unrealized foreign exchange gains and losses arise from changes in the value of assets and liabilities other than investments in securities, resulting from changes in exchange rates. Such gains and losses are included with net realized and unrealized gain or loss on investments.
(c) Securities transactions and investment income: Securities transactions are recorded on a trade date basis. Realized gain and loss from securities transactions are recorded on the identified cost basis. Dividend income is recorded on the ex-dividend date and interest income, including, where applicable, accretion of discount and amortization of premium on investments, is recognized on the accrual basis.
(d) Concentration of Risk: The fund invests primarily in debt securities. Failure of an issuer of the debt securities to make timely interest or principal payments, or a decline or the perception of a decline in the credit quality of a debt security, can cause the debt security’s price to fall, potentially lowering the fund’s share price. In addition the value of debt securities may decline due to general market conditions that are not specifically related to a particular company, such as real or perceived adverse economic conditions, changes in outlook for corporate earnings, changes in interest or currency rates or adverse investor sentiment.They may also decline because of factors that affect a particular industry.
The Fund 31
NOTES TO FINANCIAL STATEMENTS (continued)
(e) Dividends to shareholders: It is the policy of the fund to declare dividends daily from investment income-net. Such dividends are paid monthly. Dividends from net realized capital gain, if any, are normally declared and paid annually, but the fund may make distributions on a more frequent basis to comply with the distribution requirements of the Internal Revenue Code of 1986, as amended (the “Code”).To the extent that net realized capital gain can be offset by capital loss carryovers, it is the policy of the fund not to distribute such gain.
(f) Federal income taxes: It is the policy of the fund to continue to qualify as a regulated investment company, if such qualification is in the best interests of its shareholders, by complying with the applicable provisions of the Code, and to make distributions of taxable income sufficient to relieve it from substantially all federal income and excise taxes.
At December 31, 2003, the components of accumulated earnings on a tax basis were as follows: undistributed ordinary income $133,522, accumulated capital losses $8,243,852 and unrealized appreciation $1,701,400. In addition, the fund had $420,544 of capital losses realized after October 31, 2003, which were deferred for tax purposes to the first day of the following fiscal year.
The accumulated capital losses are available to be applied against future net securities profits, if any, realized subsequent to December 31, 2003. If not applied, $970,306 of the carryover expires in fiscal 2004, $4,432,909 expires in fiscal 2007 and $2,840,637 expires in fiscal 2008.
The tax character of distributions paid to shareholders during the fiscal years ended December 31, 2003 and December 31, 2002, were as follows: ordinary income $2,399,758 and $2,566,022, respectively.
During the period ended December 31, 2003, as a result of permanent book to tax differences, the fund increased accumulated undistributed investment income-net by $328,696, decreased accumulated net realized gain (loss) on investments by $280,576 and decreased paid-in capital by $48,120. Net assets were not affected by this reclassification.
32
NOTE 2—Investment Management Fee and Other Transactions With Affiliates:
(a) Investment management fee: Pursuant to an Investment Management agreement with the Manager, the Manager provides or arranges for one or more third parties and/or affiliates to provide investment advisory, administrative, custody, fund accounting and transfer agency services to the fund. The Manager also directs the investments of the fund in accordance with its investment objective, policies and limitations. For these services, the fund is contractually obligated to pay the Manager a fee, calculated daily and paid monthly, at the annual rate of .70% of the value of the fund’s average daily net assets. Out of its fee, the Manager pays all of the expenses of the fund except brokerage fees, taxes, interest, commitment fees, Rule 12b-1 distribution fees and expenses, service fees, fees and expenses of non-interested Trustees (including counsel fees) and extraordinary expenses. In addition, the Manager is required to reduce its fee in an amount equal to the fund’s allocable portion of fees and expenses of the non-interested Trustees (including counsel fees). Each Trustee receives $40,000 per year, plus $5,000 for each joint Board meeting of The Dreyfus/Laurel Funds, Inc., The Dreyfus/Laurel Tax-Free Municipal Funds, and the Trust (the “Dreyfus/Laurel Funds”) attended, $2,000 for separate committee meetings attended which are not held in conjunction with a regularly scheduled board meeting and $500 for Board meetings and separate committee meetings attended that are conducted by telephone and is reimbursed for travel and out-of-pocket expenses.The Chairman of the Board receives an additional 25% of such compensation (with the exception of reimbursable amounts). These fees pertain to the Dreyfus/Laurel Funds and are charged and allocated to each series based on net assets. In the event that there is a joint committee meeting of the Dreyfus/Laurel Funds and the Dreyfus High Yield Strategies Fund, the $2,000 fee will be allocated between the Dreyfus/Laurel Funds and the Dreyfus High Yield Strategies Fund. Amounts required to be paid by the Trust directly to the non-interested Trustees, that would be applied to offset
The Fund 33
NOTES TO FINANCIAL STATEMENTS (continued)
a portion of the management fee payable to the Manager, are in fact paid directly by the Manager to the non-interested Trustees.
During the period ended December 31, 2003, the Distributor retained $1,761 from commissions earned on sales of the fund’s Class A shares and $30,697 and $137 from contingent deferred sales charges on redemptions on the fund’s Class B and Class C shares, respectively.
(b) Distribution and service plan: Under separate Distribution Plans (the “Plans”) adopted pursuant to Rule 12b-1 under the Act, Class A shares pay annually up to .25% of the value of the average daily net assets to compensate the Distributor for shareholder servicing activities and expenses primarily intended to result in the sale of Class A shares. Class B and Class C shares may pay the Distributor for distributing their shares at an aggregate annual rate of .75% of the value of the average daily net assets of Class B and Class C shares. Class B and Class C shares are also subject to a service plan adopted pursuant to Rule 12b-1 (the “Service Plan”), under which Class B and Class C shares pay the Distributor for providing certain services to the holders of their shares a fee at the annual rate of .25% of the value of the average daily net assets of Class B and Class C shares. During the period ended December 31, 2003, Class A, Class B and Class C shares were charged $115,430, $86,215 and $13,663, respectively, pursuant to their respective Plans. Class B and Class C shares were charged $28,738 and $4,555, respectively, pursuant to the Service Plan.
Under its terms, the Plans and Service Plan shall remain in effect from year to year, provided such continuance is approved annually by a vote of majority of those Trustees who are not “interested persons” of the Trust and who have no direct or indirect financial interest in the operation of or in any agreement related to the Plans or Service Plan.
NOTE 3—Securities Transactions:
The aggregate amount of purchases and sales (including paydowns) of investment securities, excluding short-term securities, forward currency exchange contracts, options transactions and swap transactions during the period ended December 31, 2003, amounted to $306,158,170 and
34
$307,156,233, respectively, of which $128,383,534 in purchases and $128,843,938 in sales were from dollar roll transactions.
The fund may enter into dollar roll transactions with respect to mortgage-backed securities. In a dollar roll transaction, the fund sells mortgage-backed securities to a financial institution and simultaneously agrees to accept substantially similar (same type, coupon and maturity) securities at a later date, at an agreed upon price.
In addition, the following table summarizes the fund’s call/put options written during the period ended December 31, 2003:
| | Face Amount | | | | Options Terminated | |
| | | | | |
| |
| | Covered by | | Premiums | | | | Net Realized | |
| Options Written: | Contracts ($) | | Received ($) | | Cost ($) | | Gain ($) | |
|
| |
| |
| |
| |
| Contracts outstanding | | | | | | | | |
| December 31, 2002 | — | | — | | — | | — | |
| Contracts written | 80,810,000 | | 233,024 | | | | | |
| Contracts Terminated; | | | | | | | | |
| Closed | 3,745,000 | | 49,615 | | 158,844 | | (109,229) | |
| Expired | 70,015,000 | | 117,024 | | — | | 117,024 | |
| Total Contracts | | | | | | | | |
| Terminated | 73,760,000 | | 166,639 | | 158,844 | | 7,795 | |
| December 31, 2003 | 7,050,000 | | 66,385 | |
The fund may purchase and write (sell) call/put options in order to gain exposure to or protect against change in the market.
As a writer of call options, the fund receives a premium at the outset and then bears the market risk of unfavorable changes in the price of the financial instruments underlying the options. Generally, the fund would incur a gain, to the extent of the premium, if the price of the underlying financial instrument decreases between the date the option is written and the date on which the option is terminated. Generally, the fund would realize a loss, if the price of the financial instrument increases between those dates.
As a writer of put options, the fund receives a premium at the outset and then bears the market risk of unfavorable changes in the price of the financial instruments underlying the options. Generally, the fund would incur a gain, to the extent of the premium, if the price of the underlying financial instrument increases between the date the option
The Fund 35
NOTES TO FINANCIAL STATEMENTS (continued)
is written and the date on which the option is terminated. Generally, the fund would realize a loss, if the price of the financial instrument decreases between those dates.
The fund enters into forward currency exchange contracts in order to hedge its exposure to changes in foreign currency exchange rates on its foreign portfolio holdings and to settle foreign currency transac-tions.When executing forward currency exchange contracts, the fund is obligated to buy or sell a foreign currency at a specified rate on a certain date in the future. With respect to sales of forward currency exchange contracts, the fund would incur a loss if the value of the contract increases between the date the forward contract is opened and the date the forward contract is closed.The fund realizes a gain if the value of the contract decreases between those dates. With respect to purchases of forward currency exchange contracts, the fund would incur a loss if the value of the contract decreases between the date the forward contract is opened and the date the forward contract is closed. The fund realizes a gain if the value of the contract increases between those dates. The fund is also exposed to credit risk associated with counterparty nonperformance on these forward currency exchange contracts which is typically limited to the unrealized gain on each open contract. The following summarizes open forward currency exchange contracts at December 31, 2003:
| | Foreign | | | | | | | |
| Forward Currency | Currency | | | | | | Unrealized | |
| Exchange Contracts | Amounts | | Proceeds ($) | | Value ($) | | (Depreciation) ($) |
|
| |
| |
| |
|
| Sale: | | | | | | | | |
| Euro, expiring 3/17/2004 | 4,382,500 | | 5,306,112 | | 5,513,623 | | (207,511 | ) |
The fund may enter into swap agreements to exchange the interest rate on, or return generated by, one nominal instrument for the return generated by another nominal instrument.
Total return swaps involve commitments to pay interest in exchange for a market-linked return based on a notional amount.To the extent the total return of the security or index underlying the transaction exceeds or falls short of the offsetting interest rate obligation, the fund
36
will receive a payment from or make a payment to the counterparty, respectively. Total return swaps are marked-to-market daily and the change, if any, is recorded as unrealized appreciation or depreciation in the Statement of Operations. Periodic payments received or made at the end of each measurement period, but prior to termination, are recorded as realized gains or losses in the Statement of Operations.The following summarizes total return swaps entered into by the fund at December 31, 2003:
| | | Unrealized |
| Notional Amount ($) | Description | Appreciation ($) |
|
| 1,740,000 | Agreement with Citigroup, | — |
| | terminating April 30, 2004 to pay | |
| | a floating rate on the 1 month Libor | |
| | minus .55% to receive if positive | |
| | (pay if negative) the notional amount | |
| | as a result of the monthly total return of | |
| | the Lehman CMBS Investment Grade Index | |
Credit default swaps involve commitments to pay a fixed rate exchange for payment if a credit event affecting a third party (the ref erenced company) occurs. Credit events may include a failure to pay interest, bankruptcy, or restructuring. Net periodic interest payments to be received or paid are accrued daily and are recorded in the Statement of Operations as an adjustment to interest income. Credit default swaps are marked-to-market daily and the charge, if any, recorded as unrealized appreciation or depreciation in the Statement of Operations.
In addition, the following summarizes open credit default swap agree ments at December 31, 2003:
| | | Unrealized |
| Notional Amount ($) | Description | Appreciation ($) |
|
| 250,000 | Agreement with Goldman Sachs terminating | 509 |
| | December 20, 2013 to pay a fixed rate of | |
| | .46% and receive the notional amount | |
| | as a result of interest payment default | |
| | totaling $1,000,000 or principal | |
| | payment default of $10,000,000 on | |
| | BellSouth, 6%, 10/15/2011 | |
The Fund 37
NOTES TO FINANCIAL STATEMENTS (continued)
| | | Unrealized |
| Notional Amount ($) | Description | Appreciation ($) |
|
| 250,000 | Agreement with Goldman Sachs terminating | 2,502 |
| | December 20, 2013 to pay a fixed rate of | |
| | .49% and receive the notional amount | |
| | as a result of interest payment default | |
| | totaling $1,000,000 or principal | |
| | payment default of $10,000,000 on | |
| | SBC Communications, 5.875%, 8/15/2012 | |
Realized gains and losses on maturity or termination of swaps are presented in the Statement of Operations. Risks may arise upon entering into these agreements from the potential inability of the counterpar-ties to meet the terms of the agreement and are generally limited to the amount of net payments to be received, if any, at the date of default.
At December 31, 2003, the cost of investments for federal income tax purposes was $66,990,089; accordingly, accumulated net unrealized appreciation on investments was $1,669,791, consisting of $1,884,152 gross unrealized appreciation and $214,361 gross unrealized depreciation.
NOTE 4—Bank Line of Credit:
The fund participates with other Dreyfus-managed funds in a $350 million redemption credit facility (the “Facility”) to be utilized for temporary or emergency purposes, including the financing of redemptions. In connection therewith, the fund has agreed to pay commitment fees on its pro rata portion of the Facility. Interest is charged to the fund based on prevailing market rates in effect at the time of borrowings. During the period ended December 31, 2003, the fund did not borrow under the Facility.
38
INDEPENDENT AUDITORS’ REPORT
The Board of Trustees and Shareholders The Dreyfus/Laurel Funds Trust:
We have audited the accompanying statement of assets and liabilities, including the statements of investments and options written, of Dreyfus Premier Managed Income Fund (the “Fund”) of The Dreyfus/Laurel Funds Trust, as of December 31, 2003, and the related statement of operations for the year then ended, the statement of changes in net assets for each of the two years in the period then ended, and the financial highlights for each of the five years in the period then ended.These financial statements and financial highlights are the responsibility of the Fund’s management. Our responsibility is to express an opinion on these financial statements and financial highlights based on our audits.
We conducted our audits in accordance with auditing standards generally accepted in the United States of America.Those standards require that we plan and perform the audit to obtain reasonable assurance about whether the financial statements and financial highlights are free of material misstatement. An audit includes examining, on a test basis, evidence supporting the amounts and disclosures in the financial statements. Our procedures included confirmation of securities owned as of December 31, 2003, by correspondence with the custodian and brokers.As to securities purchased or sold but not yet received or delivered, we performed other appropriate auditing procedures. An audit also includes assessing the accounting principles used and significant estimates made by manage-ment,as well as evaluating the overall financial statement presentation.We believe that our audits provide a reasonable basis for our opinion.
In our opinion, the financial statements and financial highlights referred to above present fairly, in all material respects, the financial position of Dreyfus Premier Managed Income Fund of The Dreyfus/Laurel Funds Trust as of December 31, 2003, the results of its operations for the year then ended, the changes in its net assets for each of the two years in the period then ended, and the financial highlights for each of the five years in the period then ended, in conformity with accounting principles generally accepted in the United States of America.
New York, New York February 20, 2004
The Fund 39
IMPORTANT TAX INFORMATION (Unaudited)
For federal tax purposes, the fund hereby designates .62% of the ordinary dividends paid during the fiscal year ended December 31, 2003 as qualifying for the corporate dividends received deduction.
The fund also designates .66% of the ordinary dividends paid during 2003 as qualifying dividends, subject to a maximum tax rate of 15%, as provided for by the Jobs and Growth Tax Relief Reconciliation Act of 2003.
40
| BOARD MEMBERS INFORMATION (Unaudited) |
| |
| |
| Joseph S. DiMartino (60) |
| Chairman of the Board (1999) |
| Principal Occupation During Past 5 Years: |
| • Corporate Director and Trustee |
| Other Board Memberships and Affiliations: |
| • The Muscular Dystrophy Association, Director |
| • Levcor International, Inc., an apparel fabric processor, Director |
| • Century Business Services, Inc., a provider of outsourcing functions for small and medium size |
| companies, Director |
| • The Newark Group, a provider of a national market of paper recovery facilities, |
| paperboard mills and paperboard converting plants, Director |
| No. of Portfolios for which Board Member Serves: 186 |
| ——————— |
| James Fitzgibbons (69) |
| Board Member (1994) |
| Principal Occupation During Past 5 Years: |
| • Chairman of the Board, Davidson Cotton Company (1998-2002) |
| Other Board Memberships and Affiliations: |
| • Howes Leather Corporation, Director |
| No. of Portfolios for which Board Member Serves: 23 |
| ——————— |
| J.Tomlinson Fort (75) |
| Board Member (1987) |
| Principal Occupation During Past 5 Years: |
| • Retired; Of Counsel, Reed Smith LLP (1998-January 2003) |
| No. of Portfolios for which Board Member Serves: 23 |
| ——————— |
| Kenneth A. Himmel (57) |
| Board Member (1994) |
| Principal Occupation During Past 5 Years: |
| • President and CEO, Related Urban Development, a real estate development company |
| (1996-present) |
| • President and CEO, Himmel & Company, a real estate development company (1980-present) |
| • CEO, American Food Management, a restaurant company (1983-present) |
| No. of Portfolios for which Board Member Serves: 23 |
The Fund 41
| BOARD MEMBERS INFORMATION (Unaudited) (continued) |
| |
| |
| |
| |
| Stephen J. Lockwood (56) |
| Board Member (1994) |
| Principal Occupation During Past 5 Years: |
| • Chairman of the Board, Stephen J. Lockwood and Company LLC, an investment company |
| (2000-present) |
| • Chairman of the Board and CEO, LDG Reinsurance Corporation (1977-2000) |
| Other Board Memberships and Affiliations: |
| • BDML Holdings, an insurance company, Chairman of the Board |
| • Affiliated Managers Group, an investment management company, Director |
| No. of Portfolios for which Board Member Serves: 23 |
| ——————— |
| Roslyn Watson (54) |
| Board Member (1994) |
| Principal Occupation During Past 5 Years: |
| • Principal,Watson Ventures, Inc., a real estate investment company (1993-present) |
| Other Board Memberships and Affiliations: |
| • American Express Centurion Bank, Director |
| • The Hyams Foundation Inc., a Massachusetts Charitable Foundation,Trustee |
| • National Osteoporosis Foundation,Trustee |
| No. of Portfolios for which Board Member Serves: 23 |
| ——————— |
| Benaree Pratt Wiley (57) |
| Board Member (1998) |
| Principal Occupation During Past 5 Years: |
| • President and CEO,The Partnership, an organization dedicated to increasing the |
| representation of African Americans in positions of leadership, influence and |
| decision-making in Boston, MA (1991-present) |
| Other Board Memberships and Affiliations: |
| • Boston College,Trustee |
| • The Greater Boston Chamber of Commerce, Director |
| • The First Albany Companies, Inc., an investment bank, Director |
| • Mass. Development, Director |
| • Commonwealth Institute, Director |
| • Efficacy Institute, Director |
| • PepsiCo Africa-America, Advisory Board |
| No. of Portfolios for which Board Member Serves: 23 |
| ——————— |
Once elected all Board Members serve for an indefinite term.Additional information about the Board Members, including their address is available in the fund’s Statement of Additional Information which can be obtained from Dreyfus free of charge by calling this toll free number: 1-800-554-4611.
| Ruth Marie Adams, Emeritus Board Member |
| Francis P. Brennan, Emeritus Board Member |
42
OFFICERS OF THE FUND (Unaudited)
| STEPHEN E. CANTER, President since |
| March 2000. |
| Chairman of the Board, Chief Executive |
| Officer and Chief Operating Officer of the |
| Manager, and an officer of 95 investment |
| companies (comprised of 185 portfolios) |
| managed by the Manager. Mr. Canter also is a |
| Board member and, where applicable, an |
| Executive Committee Member of the other |
| investment management subsidiaries of Mellon |
| Financial Corporation, each of which is an |
| affiliate of the Manager. He is 58 years old and |
| has been an employee of the Manager since |
| May 1995. |
| STEPHEN R. BYERS, Executive Vice |
| President since November 2002. |
| Chief Investment Officer,Vice Chairman and a |
| Director of the Manager, and an officer of 95 |
| investment companies (comprised of 185 |
| portfolios) managed by the Manager. Mr. Byers |
| also is an officer, director or an Executive |
| Committee Member of certain other |
| investment management subsidiaries of Mellon |
| Financial Corporation, each of which is an |
| affiliate of the Manager. He is 50 years old and |
| has been an employee of the Manager since |
| January 2000. Prior to joining the Manager, he |
| served as an Executive Vice President-Capital |
| Markets, Chief Financial Officer and Treasurer |
| at Gruntal & Co., L.L.C. |
| MARK N. JACOBS, Vice President since |
| March 2000. |
| Executive Vice President, Secretary and |
| General Counsel of the Manager, and an |
| officer of 96 investment companies (comprised |
| of 201 portfolios) managed by the Manager. |
| He is 57 years old and has been an employee |
| of the Manager since June 1977. |
| STEVEN F. NEWMAN, Secretary since |
| March 2000. |
| Associate General Counsel and Assistant |
| Secretary of the Manager, and an officer of 96 |
| investment companies (comprised of 201 |
| portfolios) managed by the Manager. He is 54 |
| years old and has been an employee of the |
| Manager since July 1980. |
| JEFF PRUSNOFSKY, Assistant Secretary |
| since March 2000. |
| Associate General Counsel of the Manager, |
| and an officer of 24 investment companies |
| (comprised of 81 portfolios) managed by the |
| Manager. He is 38 years old and has been an |
| employee of the Manager since October 1990. |
| MICHAEL A. ROSENBERG, Assistant |
| Secretary since March 2000. |
| Associate General Counsel of the Manager, |
| and an officer of 93 investment companies |
| (comprised of 194 portfolios) managed by the |
| Manager. He is 43 years old and has been an |
| employee of the Manager since October 1991. |
| JAMES WINDELS, Treasurer since |
| November 2001. |
| Director – Mutual Fund Accounting of the |
| Manager, and an officer of 96 investment |
| companies (comprised of 201 portfolios) |
| managed by the Manager. He is 45 years old |
| and has been an employee of the Manager |
| since April 1985. |
| RICHARD CASSARO, Assistant Treasurer |
| since August 2003. |
| Senior Accounting Manager – Equity Funds of |
| the Manager, and an officer of 25 investment |
| companies (comprised of 101 portfolios) |
| managed by the Manager. He is 44 years old |
| and has been an employee of the Manager |
| since September 1982. |
| ERIK D. NAVILOFF, Assistant Treasurer |
| since December 2002. |
| Senior Accounting Manager – Taxable Fixed |
| Income Funds of the Manager, and an officer |
| of 18 investment companies (comprised of 73 |
| portfolios) managed by the Manager. He is 35 |
| years old and has been an employee of the |
| Manager since November 1992. |
The Fund 43
OFFICERS OF THE FUND (Unaudited) (continued)
| ROBERT SVAGNA, Assistant Treasurer |
| since December 2002. |
| Senior Accounting Manager – Equity Funds of |
| the Manager, and an officer of 25 investment |
| companies (comprised of 101 portfolios) |
| managed by the Manager. He is 36 years old |
| and has been an employee of the Manager |
| since November 1990. |
| KENNETH J. SANDGREN, Assistant |
| Treasurer since November 2001. |
| Mutual Funds Tax Director of the Manager, |
| and an officer of 96 investment companies |
| (comprised of 201 portfolios) managed by the |
| Manager. He is 49 years old and has been an |
| employee of the Manager since June 1993. |
| WILLIAM GERMENIS, Anti-Money |
| Laundering Compliance Officer since |
| September 2002. |
| Vice President and Anti-Money Laundering |
| Compliance Officer of the Distributor, and the |
| Anti-Money Laundering Compliance Officer |
| of 91 investment companies (comprised of 196 |
| portfolios) managed by the Manager. He is 33 |
| years old and has been an employee of the |
| Distributor since October 1998. Prior to |
| joining the Distributor, he was a Vice President |
| of Compliance Data Center, Inc. |
44
For More Information
| Dreyfus Premier |
| Managed Income Fund |
| 200 Park Avenue |
| New York, NY 10166 |
| |
| Manager |
| The Dreyfus Corporation |
| 200 Park Avenue |
| New York, NY 10166 |
|
| |
| Custodian |
| Mellon Bank, N.A. |
| One Mellon Bank Center |
| Pittsburgh, PA 15258 |
| |
| Transfer Agent & |
| Dividend Disbursing Agent |
| Dreyfus Transfer, Inc. |
| 200 Park Avenue |
| New York, NY 10166 |
| |
| Distributor |
| Dreyfus Service Corporation |
| 200 Park Avenue |
| New York, NY 10166 |
| To obtain information: |
|
| |
| By telephone |
| Call your financial |
| representative or |
| 1-800-554-4611 |
| By mail Write to: |
| The Dreyfus Premier |
| Family of Funds |
| 144 Glenn Curtiss Boulevard |
| Uniondale, NY 11556-0144 |
A description of the policies and procedures that the fund uses to determine how to vote proxies relating to portfolio securities is available, without charge, by calling the telephone number listed above, or by visiting the SEC’s website at http://www.sec.gov
© 2004 Dreyfus Service Corporation 349AR1203
Item 2. Code of Ethics.
The Registrant has adopted a code of ethics that applies to the Registrant's principal executive officer, principal financial officer, principal accounting officer or controller, or persons performing similar functions.
Item 3. Audit Committee Financial Expert.
The Registrant's Board has determined that Joseph S. DiMartino, a member of the Audit Committee of the Board, is an audit committee financial expert as defined by the Securities and Exchange Commission (the "SEC"). Joseph S. DiMartino is "independent" as defined by the SEC for purposes of audit committee financial expert determinations.
Item 4. Principal Accountant Fees and Services.
(a) Audit Fees. The aggregate fees billed for each of the last two fiscal years (the "Reporting Periods") for professional services rendered by the Registrant's principal accountant (the "Auditor") for the audit of the Registrant's annual financial statements, or services that are normally provided by the Auditor in connection with the statutory and regulatory filings or engagements for the Reporting Periods, were $74,750 in 2002 and $79,200 in 2003.
(b) Audit-Related Fees. The aggregate fees billed in the Reporting Periods for assurance and related services by the Auditor that are reasonably related to the performance of the audit of the Registrant's financial statements and are not reported under paragraph (a) of this Item 4 were $18,100 in 2002 and $18,100 in 2003. These services consisted of security counts required by Rule 17f-2 under the Investment Company Act of 1940, as amended, (ii) advisory services as to the accounting or disclosure treatment of Registrant transactions or events.
The aggregate fees billed in the Reporting Periods for non-audit assurance and related services by the Auditor to the Registrant's investment adviser (not including any sub-investment adviser whose role is primarily portfolio management and is subcontracted with or overseen by another investment adviser), and any entity controlling, controlled by or under common control with the investment adviser that provides ongoing services to the Registrant ("Service Affiliates"), that were reasonably related to the performance of the annual audit of the service affiliate, which required pre-approval by the Audit Committee were $0 in 2002 and $0 in 2003.
Note: For the second paragraph in each of (b) through (d) of this Item 4, certain of such services were not pre-approved prior to May 6, 2003, when such services were required to be pre-approved. On and after May 6, 2003, 100% of all services provided by the Auditor were pre-approved as required. For comparative purposes, the fees shown assume that all such services were pre-approved, including services that were not pre-approved prior to the compliance date of the pre-approval requirement.
(c) Tax Fees. The aggregate fees billed in the Reporting Periods for professional services rendered by the Auditor for tax compliance, tax advice and tax planning ("Tax Services") were $5,400 in 2002 and $5,400 in 2003. [These services consisted of (i) review or preparation of U.S. federal, state, local and excise tax returns; (ii) U.S. federal, state and local tax planning, advice and assistance regarding statutory,
-2-
h:\dawn\dlftncsr1203
regulatory or administrative developments, (iii) tax advice regarding tax qualification matters and/or treatment of various financial instruments held or proposed to be acquired or held, and (iv) determination of Passive Foreign Investment Companies.
The aggregate fees billed in the Reporting Periods for Tax Services by the Auditor to Service Affiliates which required pre-approval by the Audit Committee were $0 in 2002 and $0 in 2003.
(d) All Other Fees. The aggregate fees billed in the Reporting Periods for products and services provided by the Auditor, other than the services reported in paragraphs (a) through (c) of this Item, were $0 in 2002 and $0 in 2003.
The aggregate fees billed in the Reporting Periods for Non-Audit Services by the Auditor to Service Affiliates, other than the services reported in paragraphs (b) and (c) of this Item, which required pre-approval by the Audit Committee were $0 in 2002 and $0 in 2003.
Audit Committee Pre-Approval Policies and Procedures. The Registrant's Audit Committee has established policies and procedures (the "Policy") for pre-approval (within specified fee limits) of the Auditor's engagements for non-audit services to the Registrant and Service Affiliates without specific case-by-case consideration. Pre-approval considerations include whether the proposed services are compatible with maintaining the Auditor's independence. Pre-approvals pursuant to the Policy are considered annually.
Non-Audit Fees. The aggregate non-audit fees billed by the Auditor for services rendered to the Registrant, and rendered to Service Affiliates, for the Reporting Periods were $1,197,123 in 2002 and $1,692,125 in 2003.
Auditor Independence. The Registrant's Audit Committee has considered whether the provision of non-audit services that were rendered to Service Affiliates which were not pre-approved (not requiring pre-approval) is compatible with maintaining the Auditor's independence.
Item 5. Audit Committee of Listed Registrants.
Not applicable.
Item 6. [Reserved]
Item 7. Disclosure of Proxy Voting Policies and Procedures for Closed-End Management
Investment Companies.
Not applicable.
Item 8. Purchases of Equity Securities by Closed-End Management Investment Companies and Affiliated Purchasers.
Not applicable.
Item 9. Submission of Matters to a Vote of Security Holders.
Not applicable.
Item 10. Controls and Procedures.
(a) The Registrant's principal executive and principal financial officers have concluded, based on their evaluation of the Registrant's disclosure controls and procedures as of a date within 90 days of the filing date
-3-
h:\dawn\dlftncsr1203
of this report, that the Registrant's disclosure controls and procedures are reasonably designed to ensure that information required to be disclosed by the Registrant on Form N-CSR is recorded, processed, summarized and reported within the required time periods and that information required to be disclosed by the Registrant in the reports that it files or submits on Form N-CSR is accumulated and communicated to the Registrant's management, including its principal executive and principal financial officers, as appropriate to allow timely decisions regarding required disclosure.
(b) There were no changes to the Registrant's internal control over financial reporting that occurred during the Registrant's most recently ended fiscal half-year that have materially affected, or are reasonably likely to materially affect, the Registrant's internal control over financial reporting.
Item 11. Exhibits.
(a)(1) Code of ethics referred to in Item 2.
(a)(2) Certifications of principal executive and principal financial officers as required by Rule 30a-2(a) under the Investment Company Act of 1940.
(a)(3) Not applicable.
(b) Certification of principal executive and principal financial officers as required by Rule 30a-2(b) under the Investment Company Act of 1940.
h:\dawn\dlftncsr1203
-4-
SIGNATURES
Pursuant to the requirements of the Securities Exchange Act of 1934 and the Investment Company Act of 1940, the Registrant has duly caused this Report to be signed on its behalf by the undersigned, thereunto duly authorized.
| The Dreyfus/Laurel Funds Trust |
| | |
| | |
| By: | /s/ Stephen E. Canter |
| | Stephen E. Canter |
| | President |
| | |
| Date: | February 27, 2004 |
Pursuant to the requirements of the Securities Exchange Act of 1934 and the Investment Company Act of 1940, this Report has been signed below by the following persons on behalf of the Registrant and in the capacities and on the dates indicated.
| By: | /s/Stephen E. Canter |
| | Stephen E. Canter |
| | Chief Executive Officer |
| | |
| Date: | February 27, 2004 |
| | |
| By: | /s/ James Windels |
| | James Windels |
| | Chief Financial Officer |
| | |
| Date: | February 27, 2004 |
EXHIBIT INDEX
(a)(1) Code of ethics referred to in Item 2.
(a)(2) Certifications of principal executive and principal financial officers as required by Rule 30a-2(a) under the Investment Company Act of 1940. (EX-99.CERT)
(b) Certification of principal executive and principal financial officers as required by Rule 30a-2(b) under the Investment Company Act of 1940. (EX-99.906CERT)
h:\dawn\dlftncsr1203
-5-