UNITED STATES
SECURITIES AND EXCHANGE COMMISSION
Washington, D.C. 20549
FORM N-CSR
CERTIFIED SHAREHOLDER REPORT OF REGISTERED MANAGEMENT
INVESTMENT COMPANIES
Investment Company Act file number | 811-00524 |
| |
| The Dreyfus/Laurel Funds Trust | |
| (Exact name of Registrant as specified in charter) | |
| | |
| c/o The Dreyfus Corporation 200 Park Avenue New York, New York 10166 | |
| (Address of principal executive offices) (Zip code) | |
| | |
| Bennett A. MacDougall, Esq. 200 Park Avenue New York, New York 10166 | |
| (Name and address of agent for service) | |
|
Registrant's telephone number, including area code: | (212) 922-6400 |
| |
Date of fiscal year end: | 10/31 | |
Date of reporting period: | 10/31/18 | |
| | | | | | | |
The following N-CSR relates only to the Registrant's series listed below and does not relate to any series of the Registrant with a different fiscal year end and, therefore, different N-CSR reporting requirements. A separate N-CSR will be filed for any series with a different fiscal year end, as appropriate.
Dreyfus Global Equity Income Fund
Dreyfus International Bond Fund
FORM N-CSR
Item 1. Reports to Stockholders.
Dreyfus Global Equity Income Fund
| | | |

| | ANNUAL REPORT
October 31, 2018 |
| |
Save time. Save paper. View your next shareholder report online as soon as it’s available. Log into www.dreyfus.com and sign up for Dreyfus eCommunications. It’s simple and only takes a few minutes. |
| |
The views expressed in this report reflect those of the portfolio manager(s) only through the end of the period covered and do not necessarily represent the views of Dreyfus or any other person in the Dreyfus organization. Any such views are subject to change at any time based upon market or other conditions and Dreyfus disclaims any responsibility to update such views. These views may not be relied on as investment advice and, because investment decisions for a Dreyfus fund are based on numerous factors, may not be relied on as an indication of trading intent on behalf of any Dreyfus fund. |
| |
Not FDIC-Insured • Not Bank-Guaranteed • May Lose Value |
Contents
THE FUND
FOR MORE INFORMATION
Back Cover
| | | | |
| |
Dreyfus Global Equity Income Fund
| | The Fund |
A LETTER FROM THE PRESIDENT OF DREYFUS
Dear Shareholder:
We are pleased to present this annual report for Dreyfus Global Equity Income Fund, covering the 12-month period from November 1, 2017 through October 31, 2018. For information about how the fund performed during the reporting period, as well as general market perspectives, we provide a Discussion of Fund Performance on the pages that follow.
Markets began the reporting period on solid footing as major global economies experienced above-trend growth across the board. In the United States, the Federal Reserve continued to move away from its accommodative monetary policy while other major central banks also began to consider monetary tightening. In the equity markets, both U.S. and non-U.S. markets enjoyed an upward trend, though investor concerns about volatility and inflation later began to weigh on returns. Interest rates rose across the curve, putting pressure on bond prices.
Later in the reporting period, global growth trends began to diverge. While a strong economic performance continued to bolster U.S. equity markets, slower growth and political concerns pressured markets in the Eurozone. Emerging markets also came under pressure as weakness in their currencies added to investors’ uneasiness. Fixed income markets continued to struggle as interest rates rose; the yield on the benchmark 10-year Treasury bond surged late in the reporting period, but growing investor concerns about global growth helped keep it from rising further.
Despite continuing doubts regarding trade, U.S. inflationary pressures, and global growth, we are optimistic that the U.S. economy will remain strong in the near term. However, we will stay attentive to signs that signal potential changes on the horizon. As always, we encourage you to discuss the risks and opportunities of today’s investment environment with your financial advisor.
Thank you for your continued confidence and support.
Sincerely,

Renee Laroche-Morris
President
The Dreyfus Corporation
November 15, 2018
2
DISCUSSION OF FUND PERFORMANCE (Unaudited)
For the period from November 1, 2017 through October 31, 2018, as provided by portfolio manager Nick Clay of Newton Investment Management (North America) Limited, Sub-Investment Adviser
Market and Fund Performance Overview
For the 12-month period ended October 31, 2018, Dreyfus Global Equity Income Fund’s Class A shares produced a total return of 3.14%, Class C shares returned 2.41%, Class I shares returned 3.43%, and Class Y shares returned 3.53%.1 In comparison, the fund’s benchmark, the FTSE World Index (the “Index”), produced a total return of 0.73% for the same period.2
Some global stock indices rose modestly over the reporting period despite an environment of slowing growth, a strong dollar, trade tensions, and geopolitical issues. The fund outperformed the Index, partly due to successful stock selection within the information technology sector and picks within U.S.-based companies.
The Fund’s Investment Approach
The fund seeks total return (consisting of capital appreciation and income). To pursue its goal, the fund normally invests at least 80% of its net assets, plus any borrowings for investment purposes, in equity securities. The fund seeks to focus on dividend-paying stocks of companies located in the developed capital markets, such as the United States, Canada, Japan, Australia, Hong Kong, and Western Europe. The fund may invest in the securities of companies of any market capitalization, and it may invest up to 30% of its assets in emerging markets. The fund’s portfolio managers typically will purchase stocks that, at the time of purchase, have a yield premium to the yield of the Index.
The portfolio manager will combine a top-down approach, emphasizing current economic trends and current investment themes on a global basis, with a bottom-up stock selection, based on fundamental research. Within markets and sectors determined to be relatively attractive, the portfolio manager seeks what are believed to be attractively priced companies that possess a sustainable competitive advantage in their market or sector.
Volatility Returned to Global Markets
In contrast to most of 2017, the first quarter of 2018 proved to be something of a roller coaster ride for global equity markets. After starting the year with a bang, February marked the return of volatility to markets, as worries prompted by stronger-than-expected inflation data and subsequently higher bond yields, caused a sell-off across most asset classes. Market turbulence resurfaced in March, driven by fears of a global trade war between the U.S. and China, coupled with weakness in technology stocks, notably those that had propelled the market higher during its parabolic rise. Over the second quarter of 2018, the U.S. Federal Reserve (the “Fed”) continued to increase interest rates. President Trump’s protectionist rhetoric on trade pressured markets. Another area of focus was Italy, where a constitutional crisis at the end of May, briefly roiled markets. On a more positive note, the U.S. economy continued to strengthen, as it reaped the benefits of 2017’s tax cuts, though in certain areas, faster cost inflation and tightening labor supply started to weigh upon corporate profitability.
The U.S. stock market continued to enjoy strong gains, largely attributable to robust corporate earnings, throughout the third quarter of 2018, amid a mixed performance for
3
DISCUSSION OF FUND PERFORMANCE (Unaudited) (continued)
equity indices more broadly. Emerging markets, in particular, were burdened by a slowdown in the pace of Chinese credit growth, fears over their vulnerability to tighter U.S. monetary policy, and worries about the potential repercussions of global trade tensions. Elsewhere, the United Kingdom’s (UK) impending departure from the European Union (EU) remained a significant concern for investors, while Italian politics caused volatility to return to markets, as the coalition government’s spending plans threatened to breach EU deficit thresholds. Despite a late rally, the last month of the review period was a torrid one, attributable to the escalating, U.S.-China trade dispute and other concerns, including rising U.S. debt, inflation, and interest rates. In the U.S., the S&P 500 Index endured a sharp, monthly decline as did the UK’s FTSE 100.
Information Technology and U.S.-Based Stocks Benefited Results
At the sector level, the fund benefited most from stock selection within information technology, owing largely to the holdings in Cisco Systems, CA, and India-based Infosys. Further positives came from the underweight to bank stocks and positioning in the industrials sector. At a country level, stock selection in the U.S. was particularly strong. Elsewhere, pharmaceutical stocks helped make Switzerland an area of strength, while the void in Germany was another positive. The top contributor to performance over the period was networking systems provider, Cisco Systems, which issued a series of promising results throughout the period, demonstrating progress with its transformation, as growth rates accelerated and the recurring revenue mix increased. Software company, CA, was a top performer, after Broadcom announced its plan to acquire the company in a deal worth close to $19 billion. Over the last 12 months, the luxury fashion retailer, Ralph Lauren, has performed well, with the company delivering successfully on its plan to shrink its presence and reduce its footprint, with the aim of boosting its strong brand and repairing margins.
Conversely, positioning within the consumer services sector was the biggest detractor, owing largely to the holding in Swedish, low-cost fashion retailer, Hennes & Mauritz, and from the void in Amazon.com, which the strategy cannot hold as it does not produce a sufficient yield. Not holding any health care equipment stocks was also a negative. At a country level, positioning in the UK detracted most, with British American Tobacco and Vodafone Group both weak over the period. British American Tobacco was the largest stock detractor, declining on continued concerns over possible price wars for next-generation products (NGP), and worries about their profitability. Hennes & Mauritz labored for much of the review period, reporting disappointing sales and ongoing challenges in its inventory position. Beauty-products manufacturer, Coty, performed poorly, as investors focused on weakness in its consumer-beauty division, following its acquisition of the Procter & Gamble cosmetics business.
Maintaining a Cautious Investment Posture
Given that abundant liquidity has explained much of the momentum seen in financial markets over the last decade, we believe its reversal is likely to create wider financial distress, a tougher economic environment, and a weakening of support for asset prices. The draining of liquidity, particularly from the offshore-dollar financial system, is already desiccating some of the more indebted corners of the global economy, such as Argentina and Turkey. We remain wary of the environment potentially created by cheap borrowing and a strengthening U.S. currency. Risks abound, too, in the spread of protectionist and nationalist politics,
4
which threaten to obstruct the cooperation that promotes economic well-being and the resolution of crises.
As the cost of money rises, and liquidity is syphoned from the financial system, the distortions wrought by previous policy are likely to be thrown more clearly into relief. Against that backdrop, a sharp focus on the specific attributes of investment candidates appears vital. We are comfortable that the fund remains exposed to stable, haven-like companies with good-quality balance sheets, with a lower weighting in more cyclical areas of the market such as industrials, financials, and mining companies.
November 15, 2018
1 Total return includes reinvestment of dividends and any capital gains paid and does not take into consideration the maximum initial sales charge in the case of Class A shares, or the applicable contingent deferred sales charge imposed on redemptions in the case of Class C shares. Had these charges been reflected, returns would have been lower. Share price and investment return fluctuate such that upon redemption, fund shares may be worth more or less than their original cost. Past performance is no guarantee of future results.
2 Source: Lipper Inc. — The FTSE World Index is a market capitalization-weighted index representing the performance of the large- and mid-cap stocks from the Developed and Advanced Emerging segments of the FTSE Global Equity Index Series. It reflects reinvestment of net dividends and, where applicable, capital gain distributions. Investors cannot invest directly in any index.
Equities are subject generally to market, market sector, market liquidity, issuer, and investment style risks, among other factors, to varying degrees, all of which are more fully described in the fund’s prospectus.
The fund’s performance will be influenced by political, social, and economic factors affecting investments in foreign companies. Special risks associated with investments in foreign companies include exposure to currency fluctuations, less liquidity, less developed or less efficient trading markets, lack of comprehensive company information, political instability, and differing auditing and legal standards. These risks generally are greater with emerging market countries than with more economically and politically established foreign countries.
5
FUND PERFORMANCE (Unaudited)

Comparison of change in value of $10,000 investment in Dreyfus Global Equity Income Fund Class A shares, Class C shares, Class I shares and Class Y shares and the FTSE World Index (the “Index”)
† Source: Lipper Inc.
†† The total return figures presented for Class Y shares of the fund reflect the performance of the fund’s Class A shares for the period prior to 7/1/13 (the inception date for Class Y shares), not reflecting the applicable sales charges for Class A shares.
Past performance is not predictive of future performance.
The above graph compares a $10,000 investment made in each of the Class A, Class C, Class I and Class Y shares of Dreyfus Global Equity Income Fund on 10/31/08 to a $10,000 investment made in the Index on that date. All dividends and capital gain distributions are reinvested.
The fund’s performance shown in the line graph above takes into account the maximum initial sales charge on Class A shares and all other applicable fees and expenses on all classes. The Index is a market capitalization-weighted index representing the performance of the large- and mid-cap stocks from the Developed and Advanced Emerging segments of the FTSE Global Equity Index Series. Unlike a mutual fund, the Index is not subject to charges, fees and other expenses. Investors cannot invest directly in any index. Further information relating to fund performance, including expense reimbursements, if applicable, is contained in the Financial Highlights section of the prospectus and elsewhere in this report.
6
| | | | | |
Average Annual Total Returns as of 10/31/18 |
| | Inception | | | From |
| Date | 1 Year | 5 Years | Inception |
Class A shares | | | | |
with maximum sales charge (5.75%) | 10/18/07 | -2.78% | 5.39% | 10.04% |
without sales charge | 10/18/07 | 3.14% | 6.64% | 10.69% |
Class C shares | | | | |
with applicable redemption charge† | 10/18/07 | 1.41% | 5.87% | 9.87% |
without redemption | 10/18/07 | 2.41% | 5.87% | 9.87% |
Class I shares | 10/18/07 | 3.43% | 6.92% | 11.01% |
Class Y shares | 7/1/13 | 3.53% | 7.01% | 10.54%†† |
FTSE World Index | | 0.73% | 6.95% | 10.48% |
† The maximum contingent deferred sales charge for Class C shares is 1% for shares redeemed within one year of the date of purchase.
†† The total return performance figures presented for Class Y shares of the fund reflect the performance of the fund’s Class A shares for the period prior to 7/1/13 (the inception date for Class Y shares), not reflecting the applicable sales charges for Class A shares.
The performance data quoted represents past performance, which is no guarantee of future results. Share price and investment return fluctuate and an investor’s shares may be worth more or less than original cost upon redemption. Current performance may be lower or higher than the performance quoted. Go to Dreyfus.com for the fund’s most recent month-end returns.
The fund’s performance shown in the graph and table does not reflect the deduction of taxes that a shareholder would pay on fund distributions or the redemption of fund shares. In addition to the performance of Class A shares shown with and without a maximum sales charge, the fund’s performance shown in the table takes into account all other applicable fees and expenses on all classes.
7
UNDERSTANDING YOUR FUND’S EXPENSES (Unaudited)
As a mutual fund investor, you pay ongoing expenses, such as management fees and other expenses. Using the information below, you can estimate how these expenses affect your investment and compare them with the expenses of other funds. You also may pay one-time transaction expenses, including sales charges (loads) and redemption fees, which are not shown in this section and would have resulted in higher total expenses. For more information, see your fund’s prospectus or talk to your financial adviser.
Review your fund’s expenses
The table below shows the expenses you would have paid on a $1,000 investment in Dreyfus Global Equity Income Fund from May 1, 2018 to October 31, 2018. It also shows how much a $1,000 investment would be worth at the close of the period, assuming actual returns and expenses.
| | | | | | | | | |
Expenses and Value of a $1,000 Investment |
assuming actual returns for the six months ended October 31, 2018 |
| | Class A | Class C | Class I | Class Y |
Expenses paid per $1,000† | | $6.02 | | $9.71 | | $4.61 | | $4.26 |
Ending value (after expenses) | | $1,008.50 | | $1,005.70 | | $1,010.40 | | $1,010.60 |
COMPARING YOUR FUND’S EXPENSES
WITH THOSE OF OTHER FUNDS (Unaudited)
Using the SEC’s method to compare expenses
The Securities and Exchange Commission (“SEC”) has established guidelines to help investors assess fund expenses. Per these guidelines, the table below shows your fund’s expenses based on a $1,000 investment, assuming a hypothetical 5% annualized return. You can use this information to compare the ongoing expenses (but not transaction expenses or total cost) of investing in the fund with those of other funds. All mutual fund shareholder reports will provide this information to help you make this comparison. Please note that you cannot use this information to estimate your actual ending account balance and expenses paid during the period.
| | | | | | | | | |
Expenses and Value of a $1,000 Investment |
assuming a hypothetical 5% annualized return for the six months ended October 31, 2018 |
| | Class A | Class C | Class I | Class Y |
Expenses paid per $1,000† | | $6.06 | | $9.75 | | $4.63 | | $4.28 |
Ending value (after expenses) | | $1,019.21 | | $1,015.53 | | $1,020.62 | | $1,020.97 |
† Expenses are equal to the fund’s annualized expense ratio of 1.19% for Class A, 1.92% for Class C, .91% for Class I and .84% for Class Y, multiplied by the average account value over the period, multiplied by 184/365 (to reflect the one-half year period).
8
STATEMENT OF INVESTMENTS
October 31, 2018
| | | | | | | | |
| |
Description | | | | Shares | | Value ($) | |
Common Stocks - 95.8% | | | | | |
Australia - 1.1% | | | | | |
Dexus | | | | 610,681 | | 4,422,369 | |
France - 5.2% | | | | | |
Sanofi | | | | 97,848 | | 8,745,725 | |
Television Francaise 1 | | | | 409,824 | | 4,165,619 | |
Total | | | | 142,086 | | 8,338,911 | |
| | | | | 21,250,255 | |
Hong Kong - 1.5% | | | | | |
Link REIT | | | | 680,500 | | 6,023,177 | |
India - 2.8% | | | | | |
Infosys, ADR | | | | 1,195,664 | | 11,322,938 | |
Israel - 1.5% | | | | | |
Bank Hapoalim | | | | 870,620 | | 5,880,552 | |
Japan - 1.4% | | | | | |
Japan Tobacco | | | | 216,800 | | 5,574,819 | |
Netherlands - 4.5% | | | | | |
RELX | | | | 478,398 | a | 9,466,250 | |
Royal Dutch Shell, Cl. A | | | | 282,007 | | 8,952,934 | |
| | | | | 18,419,184 | |
New Zealand - .4% | | | | | |
Spark New Zealand | | | | 617,385 | | 1,594,673 | |
Norway - 1.8% | | | | | |
Orkla | | | | 824,079 | | 7,102,663 | |
South Korea - 1.2% | | | | | |
Macquarie Korea Infrastructure Fund | | | | 616,880 | | 4,905,789 | |
Sweden - 1.8% | | | | | |
Hennes & Mauritz, Cl. B | | | | 422,147 | | 7,430,002 | |
Switzerland - 9.1% | | | | | |
Nestle | | | | 83,841 | | 7,071,030 | |
Novartis | | | | 139,547 | | 12,186,108 | |
Roche Holding | | | | 35,286 | | 8,562,083 | |
Zurich Insurance Group | | | | 28,798 | | 8,935,719 | |
| | | | | 36,754,940 | |
United Kingdom - 16.6% | | | | | |
BAE Systems | | | | 1,241,582 | | 8,340,105 | |
British American Tobacco | | | | 119,275 | | 5,175,796 | |
British American Tobacco, ADR | | | | 104,739 | | 4,545,673 | |
Centrica | | | | 4,602,969 | | 8,649,656 | |
Diageo | | | | 386,641 | | 13,372,813 | |
Informa | | | | 1,371,342 | | 12,497,426 | |
Unilever | | | | 207,083 | | 10,965,780 | |
9
STATEMENT OF INVESTMENTS (continued)
| | | | | | | | |
| |
Description | | | | Shares | | Value ($) | |
Common Stocks - 95.8% (continued) | | | | | |
United Kingdom - 16.6% (continued) | | | | | |
Vodafone Group | | | | 1,876,667 | | 3,544,607 | |
| | | | | 67,091,856 | |
United States - 46.9% | | | | | |
CA | | | | 408,796 | | 18,134,191 | |
Cisco Systems | | | | 504,196 | | 23,066,967 | |
CMS Energy | | | | 152,922 | | 7,572,697 | |
Coty, Cl. A | | | | 784,786 | | 8,279,492 | |
Emerson Electric | | | | 60,342 | | 4,096,015 | |
Eversource Energy | | | | 116,965 | | 7,399,206 | |
Gilead Sciences | | | | 143,565 | | 9,788,262 | |
Harley-Davidson | | | | 23,152 | | 884,869 | |
Maxim Integrated Products | | | | 224,446 | | 11,226,789 | |
McDonald's | | | | 24,009 | | 4,247,192 | |
Merck & Co. | | | | 130,032 | | 9,571,656 | |
Omnicom Group | | | | 136,827 | | 10,168,983 | |
Paychex | | | | 103,337 | | 6,767,540 | |
PepsiCo | | | | 120,672 | | 13,561,119 | |
Philip Morris International | | | | 85,798 | | 7,556,230 | |
Principal Financial Group | | | | 75,834 | | 3,569,506 | |
Procter & Gamble | | | | 86,765 | | 7,694,320 | |
Qualcomm | | | | 217,718 | | 13,692,284 | |
Ralph Lauren | | | | 66,003 | | 8,554,649 | |
Verizon Communications | | | | 89,423 | | 5,105,159 | |
Western Union | | | | 504,459 | | 9,100,442 | |
| | | | | 190,037,568 | |
Total Common Stocks (cost $341,597,345) | | | | 387,810,785 | |
| | | Preferred Dividend
Yield (%) | | | | | |
Preferred Stocks - 1.5% | | | | | |
South Korea - 1.5% | | | | | |
Samsung Electronics
(cost $6,367,536) | | 4.42 | | 190,758 | | 6,011,169 | |
10
| | | | | | | | |
| |
Description | | 7-Day
Yield (%) | | Shares | | Value ($) | |
Investment Companies - 1.7% | | | | | |
Registered Investment Companies - 1.7% | | | | | |
Dreyfus Institutional Preferred Government Plus Money Market Fund
(cost $7,103,715) | | 2.21 | | 7,103,715 | b | 7,103,715 | |
Total Investments (cost $355,068,596) | | 99.0% | | 400,925,669 | |
Cash and Receivables (Net) | | 1.0% | | 4,059,017 | |
Net Assets | | 100.0% | | 404,984,686 | |
ADR—American Depository Receipt
REIT—Real Estate Investment Trust
a Non-income producing security.
b Investment in affiliated issuer. The investment objective of this investment company is publicly available and can be found within the investment company’s prospectus.
| | |
Portfolio Summary (Unaudited) † | Value (%) |
Food, Beverage & Tobacco | 15.8 |
Pharmaceuticals Biotechnology & Life Sciences | 12.1 |
Software & Services | 11.2 |
Technology Hardware & Equipment | 7.2 |
Household & Personal Products | 6.6 |
Media & Entertainment | 6.6 |
Semiconductors & Semiconductor Equipment | 6.2 |
Utilities | 5.8 |
Energy | 4.3 |
Insurance | 3.1 |
Capital Goods | 3.1 |
Real Estate | 2.6 |
Telecommunication Services | 2.5 |
Commercial & Professional Services | 2.3 |
Consumer Durables & Apparel | 2.1 |
Retailing | 1.8 |
Registered Investment Companies | 1.8 |
Banks | 1.5 |
Diversified Financials | 1.2 |
Consumer Services | 1.0 |
Automobiles & Components | .2 |
| | 99.0 |
† Based on net assets.
See notes to financial statements.
11
STATEMENT OF INVESTMENTS IN AFFILIATED ISSUERS
| | | | | | | |
Registered Investment Company | Value
10/31/17($) | Purchases($) | Sales($) | Value
10/31/18($) | Net
Assets(%) | Dividends/ Distributions($) |
Dreyfus Institutional Preferred Government Plus Money Market Fund | 7,454,389 | 101,569,428 | 101,920,102 | 7,103,715 | 1.7 | 153,361 |
See notes to financial statements.
12
STATEMENT OF ASSETS AND LIABILITIES
October 31, 2018
| | | | | | | |
| | | | | | |
| | | Cost | | Value | |
Assets ($): | | | | |
Investments in securities—See Statement of Investments: | | | |
Unaffiliated issuers | 347,964,881 | | 393,821,954 | |
Affiliated issuers | | 7,103,715 | | 7,103,715 | |
Cash denominated in foreign currency | | | 944 | | 917 | |
Receivable for investment securities sold | | 2,702,587 | |
Tax reclaim receivable | | 1,281,481 | |
Receivable for shares of Beneficial Interest subscribed | | 1,113,031 | |
Dividends receivable | | 865,596 | |
Prepaid expenses | | | | | 41,936 | |
| | | | | 406,931,217 | |
Liabilities ($): | | | | |
Due to The Dreyfus Corporation and affiliates—Note 3(c) | | | | 343,330 | |
Payable for investment securities purchased | | 926,533 | |
Payable for shares of Beneficial Interest redeemed | | 487,482 | |
Unrealized depreciation on foreign currency transactions | | 72,635 | |
Trustees fees and expenses payable | | 5,936 | |
Accrued expenses | | | | | 110,615 | |
| | | | | 1,946,531 | |
Net Assets ($) | | | 404,984,686 | |
Composition of Net Assets ($): | | | | |
Paid-in capital | | | | | 337,939,869 | |
Total distributable earnings (loss) | | | | | 67,044,817 | |
Net Assets ($) | | | 404,984,686 | |
| | | | | | |
Net Asset Value Per Share | Class A | Class C | Class I | Class Y | |
Net Assets ($) | 50,381,694 | 49,067,747 | 262,268,485 | 43,266,760 | |
Shares Outstanding | 3,747,221 | 3,540,111 | 20,434,033 | 3,373,865 | |
Net Asset Value Per Share ($) | 13.45 | 13.86 | 12.83 | 12.82 | |
| | | | | | |
See notes to financial statements. | | | | | |
13
STATEMENT OF OPERATIONS
Year Ended October 31, 2018
| | | | | | | |
| | | | | | |
| | | | | | |
Investment Income ($): | | | | |
Income: | | | | |
Cash dividends (net of $943,809 foreign taxes withheld at source): | |
Unaffiliated issuers | | | 14,910,182 | |
Affiliated issuers | | | 153,361 | |
Total Income | | | 15,063,543 | |
Expenses: | | | | |
Management fee—Note 3(a) | | | 3,274,361 | |
Shareholder servicing costs—Note 3(c) | | | 575,087 | |
Distribution fees—Note 3(b) | | | 402,933 | |
Professional fees | | | 107,723 | |
Registration fees | | | 74,228 | |
Custodian fees—Note 3(c) | | | 52,910 | |
Trustees’ fees and expenses—Note 3(d) | | | 33,831 | |
Prospectus and shareholders’ reports | | | 31,687 | |
Loan commitment fees—Note 2 | | | 9,310 | |
Miscellaneous | | | 45,922 | |
Total Expenses | | | 4,607,992 | |
Less—reduction in fees due to earnings credits—Note 3(c) | | | (30) | |
Net Expenses | | | 4,607,962 | |
Investment Income—Net | | | 10,455,581 | |
Realized and Unrealized Gain (Loss) on Investments—Note 4 ($): | | |
Net realized gain (loss) on investments and foreign currency transactions | 25,184,620 | |
Net realized gain (loss) on forward foreign currency exchange contracts | 72,323 | |
Net Realized Gain (Loss) | | | 25,256,943 | |
Net unrealized appreciation (depreciation) on investments
and foreign currency transactions | | | (20,398,988) | |
Net Realized and Unrealized Gain (Loss) on Investments | | | 4,857,955 | |
Net Increase in Net Assets Resulting from Operations | | 15,313,536 | |
| | | | | | | |
See notes to financial statements. | | | | | |
14
STATEMENT OF CHANGES IN NET ASSETS
| | | | | | | | | | |
| | | | Year Ended October 31, |
| | | | 2018 | | 2017 | a |
Operations ($): | | | | | | | | |
Investment income—net | | | 10,455,581 | | | | 9,624,359 | |
Net realized gain (loss) on investments | | 25,256,943 | | | | 10,702,222 | |
Net unrealized appreciation (depreciation)
on investments | | (20,398,988) | | | | 38,636,943 | |
Net Increase (Decrease) in Net Assets
Resulting from Operations | 15,313,536 | | | | 58,963,524 | |
Distributions ($): | |
Distributions to shareholders: | | | | | | | | |
Class A | | | (2,521,246) | | | | (4,798,604) | |
Class C | | | (1,787,035) | | | | (2,150,837) | |
Class I | | | (15,846,465) | | | | (13,832,262) | |
Class Y | | | (2,328,181) | | | | (2,015,754) | |
Total Distributions | | | (22,482,927) | | | | (22,797,457) | |
Beneficial Interest Transactions ($): | |
Net proceeds from shares sold: | | | | | | | | |
Class A | | | 8,984,877 | | | | 31,242,217 | |
Class C | | | 4,372,847 | | | | 8,265,220 | |
Class I | | | 64,500,690 | | | | 168,254,236 | |
Class Y | | | 1,353,406 | | | | 2,657,462 | |
Distributions reinvested: | | | | | | | | |
Class A | | | 2,267,559 | | | | 4,502,221 | |
Class C | | | 1,417,496 | | | | 1,572,305 | |
Class I | | | 13,114,517 | | | | 11,572,448 | |
Class Y | | | 2,328,181 | | | | 2,015,754 | |
Cost of shares redeemed: | | | | | | | | |
Class A | | | (14,673,704) | | | | (94,716,690) | |
Class C | | | (13,313,233) | | | | (15,508,713) | |
Class I | | | (106,425,860) | | | | (128,923,452) | |
Class Y | | | (288,536) | | | | (168,315) | |
Increase (Decrease) in Net Assets
from Beneficial Interest Transactions | (36,361,760) | | | | (9,235,307) | |
Total Increase (Decrease) in Net Assets | (43,531,151) | | | | 26,930,760 | |
Net Assets ($): | |
Beginning of Period | | | 448,515,837 | | | | 421,585,077 | |
End of Period | | | 404,984,686 | | | | 448,515,837 | |
15
STATEMENT OF CHANGES IN NET ASSETS (continued)
| | | | | | | | | | |
| | | | Year Ended October 31, |
| | | | 2018 | | 2017 | a |
Capital Share Transactions (Shares): | |
Class Ab,c | | | | | | | | |
Shares sold | | | 654,298 | | | | 2,462,302 | |
Shares issued for distributions reinvested | | | 166,259 | | | | 365,278 | |
Shares redeemed | | | (1,069,107) | | | | (7,440,200) | |
Net Increase (Decrease) in Shares Outstanding | (248,550) | | | | (4,612,620) | |
Class Cc | | | | | | | | |
Shares sold | | | 309,150 | | | | 627,440 | |
Shares issued for distributions reinvested | | | 100,890 | | | | 123,960 | |
Shares redeemed | | | (945,361) | | | | (1,167,121) | |
Net Increase (Decrease) in Shares Outstanding | (535,321) | | | | (415,721) | |
Class Ib | | | | | | | | |
Shares sold | | | 4,921,022 | | | | 13,619,577 | |
Shares issued for distributions reinvested | | | 1,006,935 | | | | 963,569 | |
Shares redeemed | | | (8,101,980) | | | | (10,356,032) | |
Net Increase (Decrease) in Shares Outstanding | (2,174,023) | | | | 4,227,114 | |
Class Y | | | | | | | | |
Shares sold | | | 102,157 | | | | 205,855 | |
Shares issued for distributions reinvested | | | 178,961 | | | | 168,389 | |
Shares redeemed | | | (21,939) | | | | (13,626) | |
Net Increase (Decrease) in Shares Outstanding | 259,179 | | | | 360,618 | |
| | | | | | | | | | |
a | Distributions to shareholders include $1,600,237 Class A, $474,957 Class C, $6,867,270 Class I and $975,360 Class Y of distributions from net investment income and $3,198,367 Class A, $1,675,880 Class C, $6,964,992 Class I and $1,040,394 Class Y distributions from net realized gains. Distributions in excess of investment income—net was $832,481 in 2017 and is no longer presented as a result of the adoption of SEC’s Disclosure Update and Simplification Rule. | |
b | During the period ending October 31, 2017, 3,813 Class A shares representing $49,347 were exchanged for 3,973 Class I shares. | |
c | During the period ended October 31, 2018, 13,617 Class C shares representing $191,642 were automatically converted to 14,036 Class A shares. | |
See notes to financial statements. | | | | | | | | |
16
FINANCIAL HIGHLIGHTS
The following tables describe the performance for each share class for the fiscal periods indicated. All information (except portfolio turnover rate) reflects financial results for a single fund share. Total return shows how much your investment in the fund would have increased (or decreased) during each period, assuming you had reinvested all dividends and distributions. These figures have been derived from the fund’s financial statements.
| | | | | | | |
| | | |
| | | Year Ended October 31, |
Class A Shares | | 2018 | 2017 | 2016 | 2015 | 2014 |
Per Share Data ($): | | | | | | |
Net asset value, beginning of period | | 13.65 | 12.57 | 12.62 | 12.56 | 12.31 |
Investment Operations: | | | | | | |
Investment income—neta | | .31 | .24 | .27 | .30 | .44 |
Net realized and unrealized
gain (loss) on investments | | .13 | 1.49 | .48 | .21 | .24 |
Total from Investment Operations | | .44 | 1.73 | .75 | .51 | .68 |
Distributions: | | | | | | |
Dividends from
investment income—net | | (.32) | (.27) | (.27) | (.33) | (.43) |
Dividends from net realized
gain on investments | | (.32) | (.38) | (.53) | (.12) | - |
Total Distributions | | (.64) | (.65) | (.80) | (.45) | (.43) |
Net asset value, end of period | | 13.45 | 13.65 | 12.57 | 12.62 | 12.56 |
Total Return (%)b | | 3.14 | 14.30 | 6.31 | 4.33 | 5.48 |
Ratios/Supplemental Data (%): | | | | | | |
Ratio of total expenses
to average net assets | | 1.18 | 1.28 | 1.27 | 1.28 | 1.30 |
Ratio of net expenses
to average net assets | | 1.18 | 1.28 | 1.27 | 1.28 | 1.30 |
Ratio of net investment income
to average net assets | | 2.26 | 1.93 | 2.16 | 2.42 | 3.49 |
Portfolio Turnover Rate | | 21.82 | 26.35 | 27.90 | 30.89 | 33.28 |
Net Assets, end of period ($ x 1,000) | | 50,382 | 54,546 | 108,189 | 78,449 | 97,153 |
a Based on average shares outstanding.
b Exclusive of sales charge.
See notes to financial statements.
17
FINANCIAL HIGHLIGHTS (continued)
| | | | | | | |
| | | |
| | | Year Ended October 31, |
Class C Shares | | 2018 | 2017 | 2016 | 2015 | 2014 |
Per Share Data ($): | | | | | | |
Net asset value, beginning of period | | 13.98 | 12.79 | 12.84 | 12.76 | 12.50 |
Investment Operations: | | | | | | |
Investment income—neta | | .22 | .18 | .18 | .21 | .35 |
Net realized and unrealized
gain (loss) on investments | | .12 | 1.50 | .48 | .22 | .24 |
Total from Investment Operations | | .34 | 1.68 | .66 | .43 | .59 |
Distributions: | | | | | | |
Dividends from
investment income—net | | (.14) | (.11) | (.18) | (.23) | (.33) |
Dividends from net realized
gain on investments | | (.32) | (.38) | (.53) | (.12) | - |
Total Distributions | | (.46) | (.49) | (.71) | (.35) | (.33) |
Net asset value, end of period | | 13.86 | 13.98 | 12.79 | 12.84 | 12.76 |
Total Return (%)b | | 2.41 | 13.56 | 5.49 | 3.53 | 4.71 |
Ratios/Supplemental Data (%): | | | | | | |
Ratio of total expenses
to average net assets | | 1.91 | 2.01 | 2.02 | 2.03 | 2.04 |
Ratio of net expenses
to average net assets | | 1.91 | 2.01 | 2.02 | 2.03 | 2.04 |
Ratio of net investment income
to average net assets | | 1.53 | 1.36 | 1.42 | 1.64 | 2.71 |
Portfolio Turnover Rate | | 21.82 | 26.35 | 27.90 | 30.89 | 33.28 |
Net Assets, end of period ($ x 1,000) | | 49,068 | 56,969 | 57,459 | 46,177 | 51,409 |
a Based on average shares outstanding.
b Exclusive of sales charge.
See notes to financial statements.
18
| | | | | | | |
| | | |
| | | Year Ended October 31, |
Class I Shares | | 2018 | 2017 | 2016 | 2015 | 2014 |
Per Share Data ($): | | | | | | |
Net asset value, beginning of period | | 13.10 | 12.11 | 12.19 | 12.15 | 11.93 |
Investment Operations: | | | | | | |
Investment income—neta | | .33 | .31 | .28 | .32 | .45 |
Net realized and unrealized
gain (loss) on investments | | .12 | 1.39 | .47 | .20 | .23 |
Total from Investment Operations | | .45 | 1.70 | .75 | .52 | .68 |
Distributions: | | | | | | |
Dividends from
investment income—net | | (.40) | (.33) | (.30) | (.36) | (.46) |
Dividends from net realized
gain on investments | | (.32) | (.38) | (.53) | (.12) | - |
Total Distributions | | (.72) | (.71) | (.83) | (.48) | (.46) |
Net asset value, end of period | | 12.83 | 13.10 | 12.11 | 12.19 | 12.15 |
Total Return (%) | | 3.43 | 14.65 | 6.65 | 4.52 | 5.71 |
Ratios/Supplemental Data (%): | | | | | | |
Ratio of total expenses
to average net assets | | .90 | .99 | 1.01 | 1.03 | 1.04 |
Ratio of net expenses
to average net assets | | .90 | .99 | 1.01 | 1.03 | 1.04 |
Ratio of net investment income
to average net assets | | 2.55 | 2.42 | 2.32 | 2.65 | 3.66 |
Portfolio Turnover Rate | | 21.82 | 26.35 | 27.90 | 30.89 | 33.28 |
Net Assets, end of period ($ x 1,000) | | 262,268 | 296,215 | 222,595 | 102,827 | 121,131 |
a Based on average shares outstanding.
See notes to financial statements.
19
FINANCIAL HIGHLIGHTS (continued)
| | | | | | | |
| | | |
| | | Year Ended October 31, |
Class Y Shares | | 2018 | 2017 | 2016 | 2015 | 2014 |
Per Share Data ($): | | | | | | |
Net asset value, beginning of period | | 13.09 | 12.11 | 12.19 | 12.14 | 11.92 |
Investment Operations: | | | | | | |
Investment income—neta | | .34 | .31 | .30 | .33 | .46 |
Net realized and unrealized
gain (loss) on investments | | .12 | 1.39 | .46 | .21 | .23 |
Total from Investment Operations | | .46 | 1.70 | .76 | .54 | .69 |
Distributions: | | | | | | |
Dividends from
investment income—net | | (.41) | (.34) | (.31) | (.37) | (.47) |
Dividends from net realized
gain on investments | | (.32) | (.38) | (.53) | (.12) | - |
Total Distributions | | (.73) | (.72) | (.84) | (.49) | (.47) |
Net asset value, end of period | | 12.82 | 13.09 | 12.11 | 12.19 | 12.14 |
Total Return (%) | | 3.53 | 14.68 | 6.72 | 4.68 | 5.78 |
Ratios/Supplemental Data (%): | | | | | | |
Ratio of total expenses
to average net assets | | .83 | .92 | .94 | .95 | .96 |
Ratio of net expenses
to average net assets | | .83 | .92 | .94 | .95 | .96 |
Ratio of net investment income
to average net assets | | 2.61 | 2.45 | 2.52 | 2.71 | 3.80 |
Portfolio Turnover Rate | | 21.82 | 26.35 | 27.90 | 30.89 | 33.28 |
Net Assets, end of period ($ x 1,000) | | 43,267 | 40,786 | 33,342 | 26,519 | 28,394 |
a Based on average shares outstanding.
See notes to financial statements.
20
NOTES TO FINANCIAL STATEMENTS
NOTE 1—Significant Accounting Policies:
Dreyfus Global Equity Income Fund (the “fund”) is a separate diversified series of The Dreyfus/Laurel Funds Trust (the “Trust”), which is registered under the Investment Company Act of 1940, as amended (the “Act”), as an open-end management investment company and operates as a series company currently offering four series, including the fund. The fund’s investment objective is to seek total return (consisting of capital appreciation and income). The Dreyfus Corporation (the “Manager” or “Dreyfus”), a wholly-owned subsidiary of The Bank of New York Mellon Corporation (“BNY Mellon”), serves as the fund’s investment adviser. Newton Investment Management (North America) Limited (“Newton”), a wholly-owned subsidiary of BNY Mellon and an affiliate of Dreyfus, serves as the fund’s sub-investment adviser.
MBSC Securities Corporation (the “Distributor”), a wholly-owned subsidiary of Dreyfus, is the distributor of the fund’s shares. The fund is authorized to issue an unlimited number of $.001 par value shares of Beneficial Interest in each of the following classes of shares: Class A, Class C, Class I, Class T and Class Y. Class A, Class C and Class T shares are sold primarily to retail investors through financial intermediaries and bear Distribution and/or Shareholder Services Plan fees. Class A and Class T shares generally are subject to a sales charge imposed at the time of purchase. Class C shares are subject to a contingent deferred sales charge (“CDSC”) imposed on Class C shares redeemed within one year of purchase. Class C shares automatically convert to Class A shares ten years after the date of purchase, without the imposition of a sales charge. Class I shares are sold primarily to bank trust departments and other financial service providers (including The Bank of New York Mellon, a subsidiary of BNY Mellon and an affiliate of Dreyfus, and its affiliates), acting on behalf of customers having a qualified trust or an investment account or relationship at such institution, and bear no Distribution or Shareholder Services Plan fees. Class Y shares are sold at net asset value per share generally to institutional investors, and bear no Distribution or Shareholder Services Plan fees. Class I and Class Y shares are offered without a front-end sales charge or CDSC. As of the date of this report, the fund did not offer Class T shares for purchase. Other differences between the classes include the services offered to and the expenses borne by each class, the allocation of certain transfer agency costs and certain voting rights. Income, expenses (other than expenses attributable to a specific class), and realized and unrealized gains or losses on investments are allocated to each class of shares based on its relative net assets.
21
NOTES TO FINANCIAL STATEMENTS (continued)
The Trust accounts separately for the assets, liabilities and operations of each series. Expenses directly attributable to each series are charged to that series’ operations; expenses which are applicable to all series are allocated among them on a pro rata basis.
The Financial Accounting Standards Board (“FASB”) Accounting Standards Codification (“ASC”) is the exclusive reference of authoritative U.S. generally accepted accounting principles (“GAAP”) recognized by the FASB to be applied by nongovernmental entities. Rules and interpretive releases of the Securities and Exchange Commission (“SEC”) under authority of federal laws are also sources of authoritative GAAP for SEC registrants. The fund’s financial statements are prepared in accordance with GAAP, which may require the use of management estimates and assumptions. Actual results could differ from those estimates.
(a) Portfolio valuation: The fair value of a financial instrument is the amount that would be received to sell an asset or paid to transfer a liability in an orderly transaction between market participants at the measurement date (i.e., the exit price). GAAP establishes a fair value hierarchy that prioritizes the inputs of valuation techniques used to measure fair value. This hierarchy gives the highest priority to unadjusted quoted prices in active markets for identical assets or liabilities (Level 1 measurements) and the lowest priority to unobservable inputs (Level 3 measurements).
Additionally, GAAP provides guidance on determining whether the volume and activity in a market has decreased significantly and whether such a decrease in activity results in transactions that are not orderly. GAAP requires enhanced disclosures around valuation inputs and techniques used during annual and interim periods.
Various inputs are used in determining the value of the fund’s investments relating to fair value measurements. These inputs are summarized in the three broad levels listed below:
Level 1—unadjusted quoted prices in active markets for identical investments.
Level 2—other significant observable inputs (including quoted prices for similar investments, interest rates, prepayment speeds, credit risk, etc.).
Level 3—significant unobservable inputs (including the fund’s own assumptions in determining the fair value of investments).
The inputs or methodology used for valuing securities are not necessarily an indication of the risk associated with investing in those securities.
22
Changes in valuation techniques may result in transfers in or out of an assigned level within the disclosure hierarchy. Valuation techniques used to value the fund’s investments are as follows:
Investments in securities are valued at the last sales price on the securities exchange or national securities market on which such securities are primarily traded. Securities listed on the National Market System for which market quotations are available are valued at the official closing price or, if there is no official closing price that day, at the last sales price. For open short positions, asked prices are used for valuation purposes. Bid price is used when no asked price is available. Registered investment companies that are not traded on an exchange are valued at their net asset value. All of the preceding securities are generally categorized within Level 1 of the fair value hierarchy.
Securities not listed on an exchange or the national securities market, or securities for which there were no transactions, are valued at the average of the most recent bid and asked prices. These securities are generally categorized within Level 2 of the fair value hierarchy.
Fair valuing of securities may be determined with the assistance of a pricing service using calculations based on indices of domestic securities and other appropriate indicators, such as prices of relevant ADRs and futures. Utilizing these techniques may result in transfers between Level 1 and Level 2 of the fair value hierarchy.
When market quotations or official closing prices are not readily available, or are determined not to accurately reflect fair value, such as when the value of a security has been significantly affected by events after the close of the exchange or market on which the security is principally traded (for example, a foreign exchange or market), but before the fund calculates its net asset value, the fund may value these investments at fair value as determined in accordance with the procedures approved by the Trust’s Board of Trustees (the “Board”). Certain factors may be considered when fair valuing investments such as: fundamental analytical data, the nature and duration of restrictions on disposition, an evaluation of the forces that influence the market in which the securities are purchased and sold, and public trading in similar securities of the issuer or comparable issuers. These securities are either categorized within Level 2 or 3 of the fair value hierarchy depending on the relevant inputs used.
For restricted securities where observable inputs are limited, assumptions about market activity and risk are used and such securities are generally categorized within Level 3 of the fair value hierarchy.
23
NOTES TO FINANCIAL STATEMENTS (continued)
Investments denominated in foreign currencies are translated to U.S. dollars at the prevailing rates of exchange.
Forward foreign currency exchange contracts (“forward contracts”) are valued at the forward rate and are generally categorized within Level 2 of the fair value hierarchy.
The following is a summary of the inputs used as of October 31, 2018 in valuing the fund’s investments:
| | | | | |
| | Level 1 - Unadjusted Quoted Prices | Level 2 - Other Significant Observable Inputs | Level 3 -Significant Unobservable Inputs | Total |
Assets ($) | | | |
Investments in Securities: | | | |
Equity Securities - Common Stocks | 205,906,179 | 181,904,606† | - | 387,810,785 |
Equity Securities - Preferred Stocks | - | 6,011,169† | - | 6,011,169 |
Investment Company | 7,103,715 | - | - | 7,103,715 |
† Securities classified within Level 2 at period end as the values were determined pursuant to the fund’s fair valuation procedures.
At October 31, 2018, the amount of securities transferred between levels equals fair value of exchange traded foreign equity securities reported as Level 2 in the table above. At October 31, 2017, there were no transfers between levels of the fair value hierarchy. It is the fund’s policy to recognize transfers between levels at the end of the reporting period.
(b) Foreign currency transactions: The fund does not isolate that portion of the results of operations resulting from changes in foreign exchange rates on investments from the fluctuations arising from changes in the market prices of securities held. Such fluctuations are included with the net realized and unrealized gain or loss on investments.
Net realized foreign exchange gains or losses arise from sales of foreign currencies, currency gains or losses realized on securities transactions between trade and settlement date, and the difference between the amounts of dividends, interest and foreign withholding taxes recorded on the fund’s books and the U.S. dollar equivalent of the amounts actually received or paid. Net unrealized foreign exchange gains and losses arise from changes in the value of assets and liabilities other than investments resulting from changes in exchange rates. Foreign currency gains and losses on foreign currency transactions are also included with net realized and unrealized gain or loss on investments.
24
(c) Securities transactions and investment income: Securities transactions are recorded on a trade date basis. Realized gains and losses from securities transactions are recorded on the identified cost basis. Dividend income is recognized on the ex-dividend date and interest income, including, where applicable, accretion of discount and amortization of premium on investments, is recognized on the accrual basis.
(d) Affiliated issuers: Investments in other investment companies advised by Dreyfus are considered “affiliated” under the Act.
(e) Risk: Investing in foreign markets may involve special risks and considerations not typically associated with investing in the U.S. These risks include revaluation of currencies, high rates of inflation, repatriation restrictions on income and capital, and adverse political and economic developments. Moreover, securities issued in these markets may be less liquid, subject to government ownership controls and delayed settlements, and their prices may be more volatile than those of comparable securities in the U.S.
(f) Dividends and distributions to shareholders: Dividends and distributions are recorded on the ex-dividend date. Dividends from investment income-net are normally declared and paid quarterly. Dividends from net realized capital gains, if any, are normally declared and paid annually, but the fund may make distributions on a more frequent basis to comply with the distribution requirements of the Internal Revenue Code of 1986, as amended (the “Code”). To the extent that net realized capital gains can be offset by capital loss carryovers, it is the policy of the fund not to distribute such gains. Income and capital gain distributions are determined in accordance with income tax regulations, which may differ from GAAP.
(g) Federal income taxes: It is the policy of the fund to continue to qualify as a regulated investment company, if such qualification is in the best interests of its shareholders, by complying with the applicable provisions of the Code, and to make distributions of taxable income and net realized capital gain sufficient to relieve it from substantially all federal income and excise taxes.
As of and during the period ended October 31, 2018, the fund did not have any liabilities for any uncertain tax positions. The fund recognizes interest and penalties, if any, related to uncertain tax positions as income tax expense in the Statement of Operations. During the period ended October 31, 2018, the fund did not incur any interest or penalties.
25
NOTES TO FINANCIAL STATEMENTS (continued)
Each tax year in the four-year period ended October 31, 2018 remains subject to examination by the Internal Revenue Service and state taxing authorities.
At October 31, 2018, the components of accumulated earnings on a tax basis were as follows: undistributed ordinary income $5,446,470, undistributed capital gains $21,133,588 and unrealized appreciation $40,464,759.
The tax character of distributions paid to shareholders during the fiscal periods ended October 31, 2018 and October 31, 2017 were as follows: ordinary income $13,088,539 and $12,986,187, and long-term capital gains $9,394,388 and $9,811,270 , respectively.
(h) New Accounting Pronouncements: In August 2018, the FASB issued Accounting Standards Update 2018-13, Fair Value Measurement (Topic 820): Disclosure Framework—Changes to the Disclosure Requirements for Fair Value Measurement (“ASU 2018-13”). The update provides guidance that eliminates, adds and modifies certain disclosure requirements for fair value measurements. ASU 2018-13 will be effective for annual periods beginning after December 15, 2019. Management is currently assessing the potential impact of these changes to future financial statements.
NOTE 2—Bank Lines of Credit:
The fund participates with other Dreyfus-managed funds in an $830 million unsecured credit facility led by Citibank, N.A. and a $300 million unsecured credit facility provided by The Bank of New York Mellon (each, a “Facility”), each to be utilized primarily for temporary or emergency purposes, including the financing of redemptions. In connection therewith, the fund has agreed to pay its pro rata portion of commitment fees for each Facility. Interest is charged to the fund based on rates determined pursuant to the terms of the respective Facility at the time of borrowing. During the period ended October 31, 2018, the fund did not borrow under the Facilities.
NOTE 3—Management Fee, Sub-Investment Advisory Fee and Other Transactions with Affiliates:
(a) Pursuant to a management agreement with Dreyfus and the Trust, the Trust had agreed to pay Dreyfus a management fee computed at the annual rate of .75% of the value of the fund’s average daily net assets and is payable monthly.
26
Pursuant to a sub-investment advisory agreement between Dreyfus and Newton, Dreyfus pays Newton an annual fee of .41% of the value of the fund’s average daily net assets.
During the period ended October 31, 2018, the Distributor retained $9,670 from commissions earned on sales of the fund’s Class A shares and $3,286 from CDSC fees on redemptions of the fund’s Class C shares.
(b) Under the Distribution Plan adopted pursuant to Rule 12b-1 under the Act, Class C shares pay the Distributor for distributing its shares at an annual rate of .75% of the value of its average daily net assets. During the period ended October 31, 2018, Class C shares were charged $402,933 pursuant to the Distribution Plan.
(c) Under the Shareholder Services Plan, Class A and Class C shares pay the Distributor at an annual rate of .25% of the value of their average daily net assets for the provision of certain services. The services provided may include personal services relating to shareholder accounts, such as answering shareholder inquiries regarding the fund and providing reports and other information, and services related to the maintenance of shareholder accounts. The Distributor may make payments to Service Agents (securities dealers, financial institutions or other industry professionals) with respect to these services. The Distributor determines the amounts to be paid to Service Agents. During the period ended October 31, 2018, Class A and Class C shares were charged $135,427 and $134,311, respectively, pursuant to the Shareholder Services Plan.
Under its terms, the Distribution Plan and Shareholder Services Plan shall remain in effect from year to year, provided such continuance is approved annually by a vote of a majority of those Trustees who are not “interested persons” of the Trust and who have no direct or indirect financial interest in the operation of or in any agreement related to the Distribution Plan or Shareholder Services Plan.
The fund has arrangements with the transfer agent and the custodian whereby the fund may receive earnings credits when positive cash balances are maintained, which are used to offset transfer agency and custody fees. For financial reporting purposes, the fund includes net earnings credits, if any, as an expense offset in the Statement of Operations.
The fund compensates Dreyfus Transfer, Inc., a wholly-owned subsidiary of Dreyfus, under a transfer agency agreement for providing transfer agency and cash management services for the fund. The majority of transfer agency fees are comprised of amounts paid on a per account basis, while cash management fees are related to fund subscriptions and redemptions. During the period ended October 31, 2018, the fund was
27
NOTES TO FINANCIAL STATEMENTS (continued)
charged $13,033 for transfer agency services. These fees are included in Shareholder servicing costs in the Statement of Operations.
The fund compensates The Bank of New York Mellon under a custody agreement for providing custodial services for the fund. These fees are determined based on net assets, geographic region and transaction activity. During the period ended October 31, 2018, the fund was charged $52,910 pursuant to the custody agreement. These fees were partially offset by earnings credits of $30.
During the period ended October 31, 2018, the fund was charged $12,797 for services performed by the Chief Compliance Officer and his staff. These fees are included in Miscellaneous in the Statement of Operations.
The components of “Due to The Dreyfus Corporation and affiliates” in the Statement of Assets and Liabilities consist of: management fees $261,127, Distribution Plan fees $31,719, Shareholder Services Plan fees $21,493, custodian fees $22,471, Chief Compliance Officer fees $4,193 and transfer agency fees $2,327.
(d) Each Board member also serves as a Board member of other funds within the Dreyfus complex. Annual retainer fees and attendance fees are allocated to each fund based on net assets.
NOTE 4—Securities Transactions:
The aggregate amount of purchases and sales of investment securities, excluding short-term securities and forward contracts, during the period ended October 31, 2018, amounted to $92,681,586 and $143,708,161, respectively.
Derivatives: A derivative is a financial instrument whose performance is derived from the performance of another asset. The fund enters into International Swaps and Derivatives Association, Inc. Master Agreements or similar agreements (collectively, “Master Agreements”) with its over-the-counter (“OTC”) derivative contract counterparties in order to, among other things, reduce its credit risk to counterparties. Master Agreements include provisions for general obligations, representations, collateral and events of default or termination. Under a Master Agreement, the fund may offset with the counterparty certain derivative financial instrument’s payables and/or receivables with collateral held and/or posted and create one single net payment in the event of default or termination.
Each type of derivative instrument that was held by the fund during the period ended October 31, 2018 is discussed below.
28
Forward Foreign Currency Exchange Contracts: The fund enters into forward contracts in order to hedge its exposure to changes in foreign currency exchange rates on its foreign portfolio holdings, to settle foreign currency transactions or as a part of its investment strategy. When executing forward contracts, the fund is obligated to buy or sell a foreign currency at a specified rate on a certain date in the future. With respect to sales of forward contracts, the fund incurs a loss if the value of the contract increases between the date the forward contract is opened and the date the forward contract is closed. The fund realizes a gain if the value of the contract decreases between those dates. With respect to purchases of forward contracts, the fund incurs a loss if the value of the contract decreases between the date the forward contract is opened and the date the forward contract is closed. The fund realizes a gain if the value of the contract increases between those dates. Any realized or unrealized gains or losses which occurred during the period are reflected in the Statement of Operations. The fund is exposed to foreign currency risk as a result of changes in value of underlying financial instruments. The fund is also exposed to credit risk associated with counterparty nonperformance on these forward contracts, which is generally limited to the unrealized gain on each open contract. This risk may be mitigated by Master Agreements, if any, between the fund and the counterparty and the posting of collateral, if any, by the counterparty to the fund to cover the fund’s exposure to the counterparty. At October 31, 2018, there were no forward contracts outstanding.
The following summarizes the average market value of derivatives outstanding during the period ended October 31, 2018:
| | | |
| | Average Market Value ($) |
Forward contracts | | 455,991 |
| | | |
At October 31, 2018, the cost of investments for federal income tax purposes was $360,388,248; accordingly, accumulated net unrealized appreciation on investments was $40,537,421, consisting of $69,936,401 gross unrealized appreciation and $29,398,980 gross unrealized depreciation.
29
REPORT OF INDEPENDENT REGISTERED PUBLIC ACCOUNTING FIRM
To the Shareholders and Board of Trustees
The Dreyfus/Laurel Funds Trust
Opinion on the Financial Statements
We have audited the accompanying statement of assets and liabilities of Dreyfus Global Equity Income Fund (the “Fund”), a series of The Dreyfus/Laurel Funds Trust, including the statements of investments and investments in affiliated issuers, as of October 31, 2018, the related statement of operations for the year then ended, the statements of changes in net assets for each of the years in the two-year period then ended and the related notes (collectively, the financial statements) and the financial highlights for each of the years in the five-year period then ended. In our opinion, the financial statements and financial highlights present fairly, in all material respects, the financial position of the Fund as of October 31, 2018, the results of its operations for the year then ended, the changes in its net assets for each of the years in the two-year period then ended, and the financial highlights for each of the years in the five-year period then ended, in conformity with U.S. generally accepted accounting principles.
Basis for Opinion
These financial statements and financial highlights are the responsibility of the Fund’s management. Our responsibility is to express an opinion on these financial statements and financial highlights based on our audits. We are a public accounting firm registered with the Public Company Accounting Oversight Board (United States) (PCAOB) and are required to be independent with respect to the Fund in accordance with the U.S. federal securities laws and the applicable rules and regulations of the Securities and Exchange Commission and the PCAOB.
We conducted our audits in accordance with the standards of the PCAOB. Those standards require that we plan and perform the audit to obtain reasonable assurance about whether the financial statements and financial highlights are free of material misstatement, whether due to error or fraud. Our audits included performing procedures to assess the risks of material misstatement of the financial statements and financial highlights, whether due to error or fraud, and performing procedures that respond to those risks. Such procedures included examining, on a test basis, evidence regarding the amounts and disclosures in the financial statements and financial highlights. Such procedures also included confirmation of securities owned as of October 31, 2018, by correspondence with the custodian and brokers or by other appropriate auditing procedures when replies from brokers were not received. Our audits also included evaluating the accounting principles used and significant estimates made by management, as well as evaluating the overall presentation of the financial statements and financial highlights. We believe that our audits provide a reasonable basis for our opinion.

We have served as the auditor of one or more Dreyfus Corporation investment companies since 1994.
New York, New York
December 28, 2018
30
IMPORTANT TAX INFORMATION (Unaudited)
For federal tax purposes, the fund elects to provide each shareholder with their portion of the fund's income sourced from foreign countries and taxes paid from foreign countries. The fund reports the maximum amount allowable but not less than $9,925,284 as income sourced from foreign countries for the fiscal year ended October 31, 2018 in accordance with Section 853(c)(2) of the Internal Revenue Code and also the fund reports the maximum amount allowable but not less than $891,786 as taxes paid from foreign countries for the fiscal year ended October 31, 2018 in accordance with Section 853(a) of the Internal Revenue Code. Where required by federal tax rules, shareholders will receive notification of their proportionate share of foreign sourced income and foreign taxes paid for the 2018 calendar year with Form 1099-DIV which will be mailed in early 2019. Also the fund designates the maximum amount allowable, but not less than $13,088,539 as ordinary income dividends paid during the fiscal year ended October 31, 2018 as qualified dividend income in accordance with Section 854(b)(1)(B) of the Internal Revenue Code. Also the fund reports the maximum amount allowable but not less than $.2813 per share as a capital gain dividend in accordance with Section 852(b)(3)(C) of the Internal Revenue Code. Also, the fund reports the maximum amount allowable but not less than $.0352 as a short-term capital gain dividend paid on December 15, 2017 and not less than $.0019 as a short-term capital gain dividend paid on December 28, 2017 in accordance with Sections 871(k)(2) and 881(e) of the Internal Revenue Code. Also, the fund reports the maximum amount allowable but not less than 26.33% of ordinary income dividends paid during the year ended October 31, 2018 as eligible for the corporate dividends received deduction provided under Section 243 of the Internal Revenue Code in accordance with Section 854(b)(1)(A) of the Internal Revenue Code.
31
BOARD MEMBERS INFORMATION (Unaudited)
INDEPENDENT BOARD MEMBERS
Joseph S. DiMartino (75)
Chairman of the Board (1999)
Principal Occupation During Past 5 Years:
· Corporate Director and Trustee (1995-present)
Other Public Company Board Memberships During Past 5 Years:
· CBIZ (formerly, Century Business Services, Inc.), a provider of outsourcing functions for small and medium size companies, Director (1997-present)
No. of Portfolios for which Board Member Serves: 124
———————
Francine J. Bovich (67)
Board Member (2012)
Principal Occupation During Past 5 Years:
· Trustee, The Bradley Trusts, private trust funds (2011-present)
Other Public Company Board Memberships During Past 5 Years:
· Annaly Capital Management, Inc., a real estate trust, Director (2014-present)
No. of Portfolios for which Board Member Serves: 72
———————
Kenneth A. Himmel (72)
Board Member (1994)
Principal Occupation During Past 5 Years:
· Managing Partner, Gulf Related, an international real estate development company (2010-present)
· President and CEO, Related Urban Development, a real estate development company (1996-present)
· President and CEO, Himmel & Company, a real estate development company (1980-present)
· CEO, American Food Management, a restaurant company (1983-present)
No. of Portfolios for which Board Member Serves: 25
———————
32
Stephen J. Lockwood (71)
Board Member (1994)
Principal Occupation During Past 5 Years:
· Chairman of the Board, Stephen J. Lockwood and Company LLC, a real estate investment company (2000-present)
No. of Portfolios for which Board Member Serves: 25
———————
Roslyn M. Watson (69)
Board Member (1994)
Principal Occupation During Past 5 Years:
· Principal, Watson Ventures, Inc., a real estate investment company (1993-present)
No. of Portfolios for which Board Member Serves: 58
———————
Benaree Pratt Wiley (72)
Board Member (1998)
Principal Occupation During Past 5 Years:
· Principal, The Wiley Group, a firm specializing in strategy and business development (2005-present)
Other Public Company Board Memberships During Past 5 Years:
· CBIZ (formerly, Century Business Services, Inc.), a provider of outsourcing functions for small and medium size companies, Director (2008-present)
No. of Portfolios for which Board Member Serves: 79
———————
Once elected all Board Members serve for an indefinite term, but achieve Emeritus status upon reaching age 80. The address of the Board Members and Officers is c/o The Dreyfus Corporation, 200 Park Avenue, New York, New York 10166. Additional information about the Board Members is available in the fund’s Statement of Additional Information which can be obtained from Dreyfus free of charge by calling this toll free number: 1-800-DREYFUS.
James M. Fitzgibbons, Emeritus Board Member
33
OFFICERS OF THE FUND (Unaudited)
BRADLEY J. SKAPYAK, President since January 2010.
Chief Operating Officer and a director of the Manager since June 2009, Chairman of Dreyfus Transfer, Inc., an affiliate of the Manager and the transfer agent of the funds, since May 2011 and Chief Executive Officer of MBSC Securities Corporation since August 2016. He is an officer of 62 investment companies (comprised of 124 portfolios) managed by the Manager. He is 59 years old and has been an employee of the Manager since February 1988.
BENNETT A. MACDOUGALL, Chief Legal Officer since October 2015.
Chief Legal Officer of the Manager and Associate General Counsel and Managing Director of BNY Mellon since June 2015; from June 2005 to June 2015, he served in various capacities with Deutsche Bank – Asset & Wealth Management Division, including as Director and Associate General Counsel, and Chief Legal Officer of Deutsche Investment Management Americas Inc. from June 2012 to May 2015. He is an officer of 63 investment companies (comprised of 149 portfolios) managed by the Manager. He is 47 years old and has been an employee of the Manager since June 2015.
JAMES BITETTO, Vice President since August 2005 and Secretary since February 2018.
Managing Counsel of BNY Mellon and Secretary of the Manager, and an officer of 63 investment companies (comprised of 149 portfolios) managed by the Manager. He is 52 years old and has been an employee of the Manager since December 1996.
JOSEPH M. CHIOFFI, Vice President and Assistant Secretary since August 2005.
Managing Counsel of BNY Mellon, and an officer of 63 investment companies (comprised of 149 portfolios) managed by the Manager. He is 56 years old and has been an employee of the Manager since June 2000.
SONALEE CROSS, Vice President and Assistant Secretary since March 2018.
Counsel of BNY Mellon since October 2016; Associate at Proskauer Rose LLP from April 2016 to September 2016; Attorney at EnTrust Capital from August 2015 to February 2016; Associate at Sidley Austin LLP from September 2013 until August 2015. She is an officer of 63 investment companies (comprised of 149 portfolios) managed by Dreyfus. She is 31 years old and has been an employee of the Manager since October 2016.
MAUREEN E. KANE, Vice President and Assistant Secretary since April 2015.
Managing Counsel of BNY Mellon since July 2014; from October 2004 until July 2014, General Counsel, and from May 2009 until July 2014, Chief Compliance Officer of Century Capital Management. She is an officer of 63 investment companies (comprised of 149 portfolios) managed by the Manager. She is 56 years old and has been an employee of the Manager since July 2014.
SARAH S. KELLEHER, Vice President and Assistant Secretary since April 2014.
Managing Counsel of BNY Mellon since December 2017, from March 2013 to December 2017, Senior Counsel of BNY Mellon. She is an officer of 63 investment companies (comprised of 149 portfolios) managed by the Manager. She is 43 years old and has been an employee of the Manager since March 2013.
JEFF PRUSNOFSKY, Vice President and Assistant Secretary since August 2005.
Senior Managing Counsel of BNY Mellon, and an officer of 63 investment companies (comprised of 149 portfolios) managed by the Manager. He is 53 years old and has been an employee of the Manager since October 1990.
NATALYA ZELENSKY, Vice President and Assistant Secretary since March 2017.
Counsel of BNY Mellon since May 2016; Attorney at Wildermuth Endowment Strategy Fund/Wildermuth Advisory, LLC from November 2015 until May 2016; Assistant General Counsel at RCS Advisory Services from July 2014 until November 2015; Associate at Sutherland, Asbill & Brennan from January 2013 until January 2014. She is an officer of 63 investment companies (comprised of 149 portfolios) managed by Dreyfus. She is 33 years old and has been an employee of the Manager since May 2016.
JAMES WINDELS, Treasurer since November 2001.
Director – Mutual Fund Accounting of the Manager, and an officer of 63 investment companies (comprised of 149 portfolios) managed by the Manager. He is 60 years old and has been an employee of the Manager since April 1985.
34
GAVIN C. REILLY, Assistant Treasurer since December 2005.
Tax Manager of the Investment Accounting and Support Department of the Manager, and an officer of 63 investment companies (comprised of 149 portfolios) managed by the Manager. He is 50 years old and has been an employee of the Manager since April 1991.
ROBERT S. ROBOL, Assistant Treasurer since August 2005.
Senior Accounting Manager – Dreyfus Financial Reporting of the Manager, and an officer of 63 investment companies (comprised of 149 portfolios) managed by the Manager. He is 54 years old and has been an employee of the Manager since October 1988.
ROBERT SALVIOLO, Assistant Treasurer since July 2007.
Senior Accounting Manager – Equity Funds of the Manager, and an officer of 63 investment companies (comprised of 149 portfolios) managed by the Manager. He is 51 years old and has been an employee of the Manager since June 1989.
ROBERT SVAGNA, Assistant Treasurer since December 2002.
Senior Accounting Manager – Fixed Income and Equity Funds of the Manager, and an officer of 63 investment companies (comprised of 149 portfolios) managed by the Manager. He is 51 years old and has been an employee of the Manager since November 1990.
JOSEPH W. CONNOLLY, Chief Compliance Officer since October 2004.
Chief Compliance Officer of the Manager, the Dreyfus Family of Funds and BNY Mellon Funds Trust (63 investment companies, comprised of 149 portfolios). He is 61 years old and has served in various capacities with the Manager since 1980, including manager of the firm’s Fund Accounting Department from 1997 through October 2001.
CARIDAD M. CAROSELLA, Anti-Money Laundering Compliance Officer since January 2016.
Anti-Money Laundering Compliance Officer of the Dreyfus Family of Funds and BNY Mellon Funds Trust since January 2016; from May 2015 to December 2015, Interim Anti-Money Laundering Compliance Officer of the Dreyfus Family of Funds and BNY Mellon Funds Trust and the Distributor; from January 2012 to May 2015, AML Surveillance Officer of the Distributor and from 2007 to December 2011, Financial Processing Manager of the Distributor. She is an officer of 57 investment companies (comprised of 143 portfolios) managed by the Manager. She is 50 years old and has been an employee of the Distributor since 1997.
35
NOTES
36
NOTES
37
Dreyfus Global Equity Income Fund
200 Park Avenue
New York, NY 10166
Manager
The Dreyfus Corporation
200 Park Avenue
New York, NY 10166
Sub-Investment Adviser
Newton Investment Management
(North America) Limited
160 Queen Victoria Street
London, EC4V, 4LA, UK
Custodian
The Bank of New York Mellon
240 Greenwich Street
New York, NY 10286
Transfer Agent &
Dividend Disbursing Agent
Dreyfus Transfer, Inc.
200 Park Avenue
New York, NY 10166
Distributor
MBSC Securities Corporation
200 Park AvenueNew York, NY 10166
| | |
Ticker Symbols: | Class A: DEQAX Class C: DEQCX Class I: DQEIX Class Y: DEQYX |
Telephone Call your financial representative or 1-800-DREYFUS
Mail The Dreyfus Family of Funds, 144 Glenn Curtiss Boulevard, Uniondale, NY 11556-0144
E-mail Send your request to info@dreyfus.com
Internet Information can be viewed online or downloaded at www.dreyfus.com
The fund files its complete schedule of portfolio holdings with the Securities and Exchange Commission (“SEC”) for the first and third quarters of each fiscal year on Form N-Q. The fund’s Forms N-Q are available on the SEC’s website at www.sec.gov.
A description of the policies and procedures that the fund uses to determine how to vote proxies relating to portfolio securities and information regarding how the fund voted these proxies for the most recent 12-month period ended June 30 is available at www.dreyfus.com and on the SEC’s website at www.sec.gov and without charge, upon request, by calling 1-800-DREYFUS.
| | |
© 2018 MBSC Securities Corporation
6175AR1018 | 
|
Dreyfus International Bond Fund
| | | |

| | ANNUAL REPORT
October 31, 2018 |
| |
Save time. Save paper. View your next shareholder report online as soon as it’s available. Log into www.dreyfus.com and sign up for Dreyfus eCommunications. It’s simple and only takes a few minutes. |
| |
The views expressed in this report reflect those of the portfolio manager(s) only through the end of the period covered and do not necessarily represent the views of Dreyfus or any other person in the Dreyfus organization. Any such views are subject to change at any time based upon market or other conditions and Dreyfus disclaims any responsibility to update such views. These views may not be relied on as investment advice and, because investment decisions for a Dreyfus fund are based on numerous factors, may not be relied on as an indication of trading intent on behalf of any Dreyfus fund. |
| |
Not FDIC-Insured • Not Bank-Guaranteed • May Lose Value |
Contents
THE FUND
FOR MORE INFORMATION
Back Cover
| | | | |
| |
Dreyfus International Bond Fund
| | The Fund |
A LETTER FROM THE PRESIDENT OF DREYFUS
Dear Shareholder:
We are pleased to present this annual report for Dreyfus International Bond Fund, covering the 12-month period from November 1, 2017 through October 31, 2018. For information about how the fund performed during the reporting period, as well as general market perspectives, we provide a Discussion of Fund Performance on the pages that follow.
Markets began the reporting period on solid footing as major global economies experienced above-trend growth across the board. In the United States, the Federal Reserve continued to move away from its accommodative monetary policy while other major central banks also began to consider monetary tightening. In the equity markets, both U.S. and non-U.S. markets enjoyed an upward trend, though investor concerns about volatility and inflation later began to weigh on returns. Interest rates rose across the curve, putting pressure on bond prices.
Later in the reporting period, global growth trends began to diverge. While a strong economic performance continued to bolster U.S. equity markets, slower growth and political concerns pressured markets in the Eurozone. Emerging markets also came under pressure as weakness in their currencies added to investors’ uneasiness. Fixed income markets continued to struggle as interest rates rose; the yield on the benchmark 10-year Treasury bond surged late in the reporting period, but growing investor concerns about global growth helped keep it from rising further.
Despite continuing doubts regarding trade, U.S. inflationary pressures, and global growth, we are optimistic that the U.S. economy will remain strong in the near term. However, we will stay attentive to signs that signal potential changes on the horizon. As always, we encourage you to discuss the risks and opportunities of today’s investment environment with your financial advisor.
Thank you for your continued confidence and support.
Sincerely,

Renee Laroche-Morris
President
The Dreyfus Corporation
November 15, 2018
2
DISCUSSION OF FUND PERFORMANCE (Unaudited)
For the period from November 1, 2017 through October 31, 2018, as provided by David Leduc, CFA, Brendan Murphy, CFA, and Scott Zaleski, CFA, Portfolio Managers
Market and Fund Performance Overview
For the 12-month period ended October 31, 2018, Dreyfus International Bond Fund’s Class A shares produced a total return of -4.90%, Class C shares returned -5.56%, Class I shares returned -4.53%, and Class Y shares returned -4.52%.1 In comparison, the fund’s benchmark, the Bloomberg Barclays Global Aggregate ex USD Index (Unhedged) (the “Index”), produced a total return of -2.09% for the same period.2
International bond markets posted moderately negative total returns over the reporting period, as a strengthening U.S. dollar and geopolitical difficulties provided headwinds for local currency-denominated investments for U.S. residents. The fund returns trailed the Index, mainly due to our emerging-market exposure and currency strategies.
As of February 22, 2018, Scott Zaleski became a portfolio manager for the fund.
The Fund’s Investment Approach
The fund seeks to maximize total return through capital appreciation and income. To pursue its goal, the fund normally invests at least 80% of its net assets, plus any borrowings for investment purposes, in fixed-income securities. The fund also normally invests at least 65% of its assets in non-U.S., dollar-denominated, fixed-income securities of foreign governments and companies located in various countries, including emerging markets.
Generally, the fund seeks to maintain a portfolio with an average credit quality of investment-grade. The fund’s portfolio managers focus on identifying undervalued government bond markets, currencies, sectors, and securities and look for fixed-income securities with the most potential for added value, such as those involving the potential for credit upgrades, unique structural characteristics, or innovative features. The portfolio managers select securities for the fund’s portfolio by using fundamental economic research and quantitative analysis to allocate assets among countries and currencies, focusing on sectors and individual securities that appear to be relatively undervalued, and actively trading among sectors.
Volatility, Growth Disparities, and a Strong Dollar Drive Markets
In general, bond market performance was modestly negative during the year. In late 2017, the U.S. Federal Reserve (The “Fed”) began to unwind its balance sheet by selling Treasuries and mortgage-backed securities. It also began down a path of well-projected and predictable, 25-basis point rate hikes. Longer-term rates also rose during this time. The Eurozone and Japan were reporting positive economic advances and began discussions around reducing their stimulus programs. U.S. corporate and emerging market debt outperformed. The globe was still in its period of synchronized, strong growth.
Tightening labor markets led to concerns over inflationary pressures, and while the economy continued to strengthen, other developed economies started to slow. Spreads widened and corporates and emerging-market debt gave up much of their earlier return. The volatility sparked concern, triggering a flight to quality, which moderated the rise in long term
3
DISCUSSION OF FUND PERFORMANCE (Unaudited) (continued)
Treasury rates. Despite the sell-off in emerging markets and investment grade corporate bonds, high yield debt continued its strong performance. At the end of the 12 months, investment-grade corporate debt lagged Treasuries. Emerging-market debt did not rebound after the February volatility, and continued to deteriorate throughout the period, spurred on by a strengthening U.S. dollar, concerns over trade disputes, and political and financial distress in Turkey and Argentina. Concerns around Brexit, Italy, and U.S. midterm elections put downward pressure on global corporate bond prices despite strong U.S. corporate earnings and above trend economic growth.
Emerging-Market Exposure Constrained Fund Performance
The fund’s performance compared to the Index was undermined during the reporting period predominantly by local currency emerging market bonds. Specifically, the debt of Argentina and Turkey, which sold off significantly due to concerns over financial stability and fiscal deficits. In addition, a long position in the Swedish krona detracted from relative results, as did positions in the Czech koruna and Norwegian krone. These currencies lost ground against the euro during the period, when they failed to raise rates in line with expectations.
On a more positive note, the fund’s yield-curve-positioning strategy was beneficial. Short duration positioning in Canadian sovereign debt was additive to returns over the period as the Bank of Canada turned more hawkish. Additionally, yield curve steepening positions in Australia added to performance as the Reserve Bank of Australia proved to maintain a dovish stance and in the United Kingdom, concerns provided opportunities for tactical yield curve positions throughout the year.
At times during the reporting period, the fund employed option contracts, futures contracts, and forward contracts to manage its interest-rate and currency exposures.
An Opportunistic Investment Posture
Despite the current climate in Europe, we currently expect above trend global economic growth to persist. As a result, central banks should continue to move away from the accommodative monetary policies of the past decade, and short-term interest rates appear likely to rise in most developed markets. We also believe inflation will start to build as a result of price increases due to pressures from a removal of slack in the labor force, the closing of output gaps and increased costs due to the expansion of tariffs. We also have taken note of recent heightened volatility in the emerging markets, in response to political developments in the U.S. and abroad.
In this environment, we look for opportunities to reduce risk in the portfolio, while maintaining positioning that will benefit from long-term growth of international markets. We like inflation-protected securities as a hedge against inflation and volatility. We believe the emerging-markets’ fundamentals seem solid, despite recent upsets, and continue to maintain an overweight in attractively-valued higher-quality sovereigns and corporate bonds. As we believe we’ve seen a peak in growth and earnings, we will utilize bouts of market strength to move up in quality in corporate bonds. We are short U.S. dollar exposure and short duration as we believe expanding twin deficits will put pressure on both the currency and rates. We reduced high-yield exposure in the portfolio, due to concerns regarding absolute spread
4
levels in the asset class. We also continue to think that supply and demand factors make agency mortgage-backed securities relatively unattractive.
November 15, 2018
1 Total return includes reinvestment of dividends and any capital gains paid and does not take into consideration the maximum initial sales charge in the case of Class A shares or the applicable contingent deferred sales charge imposed on redemptions in the case of Class C shares. Had these charges been reflected, returns would have been lower. Class I and Class Y shares are not subject to any initial or deferred sales charge. Past performance is no guarantee of future results. Share price and investment return fluctuate such that upon redemption, fund shares may be worth more or less than their original cost. The return figure provided for Class A reflects the absorption of certain Class A expenses pursuant to an agreement by The Dreyfus Corporation through March 1, 2019, at which time it may be extended, terminated, or modified. Had these expenses not been absorbed, the fund’s Class A return would have been lower. Past performance is no guarantee of future results.
2 Source: Lipper Inc. — The Bloomberg Barclays Global Aggregate ex USD Index (Unhedged) is a flagship measure of global investment-grade debt from 24 local currency markets, excluding U.S. dollar-denominated bonds. This multi-currency benchmark includes treasury, government-related, corporate, and securitized fixed-rate bonds from both developed and emerging market issuers. Investors cannot invest directly in any index.
Bonds are subject generally to interest-rate, credit, liquidity, and market risks, to varying degrees, all of which are more fully described in the fund’s prospectus. Generally, all other factors being equal, bond prices are inversely related to interest-rate changes, and rate increases can cause price declines.
High-yield bonds are subject to increased credit risk and are considered speculative in terms of the issuer’s perceived ability to continue making interest payments on a timely basis and to repay principal upon maturity.
Foreign bonds are subject to special risks, including exposure to currency fluctuations, changing political and economic conditions, and potentially less liquidity. These risks are generally greater with emerging market countries than with more economically and politically established foreign countries.
The use of derivatives involves risks different from, or possibly greater than, the risks associated with investing directly in the underlying assets. Derivatives can be highly volatile, illiquid, and difficult to value, and there is the risk that changes in the value of a derivative held by the fund will not correlate with the underlying instruments or the fund’s other investments.
Investments in foreign currencies are subject to the risk that those currencies will decline in value relative to the U.S. dollar, or, in the case of hedged positions, that the U.S. dollar will decline relative to the currency being hedged. Currency rates in foreign countries may fluctuate significantly over short periods of time. A decline in the value of foreign currencies relative to the U.S. dollar will reduce the value of securities held by the fund and denominated in those currencies. The use of leverage may magnify the fund’s gains or losses. For derivatives with a leveraging component, adverse changes in the value or level of the underlying asset can result in a loss that is much greater than the original investment in the derivative.
5
FUND PERFORMANCE (Unaudited)
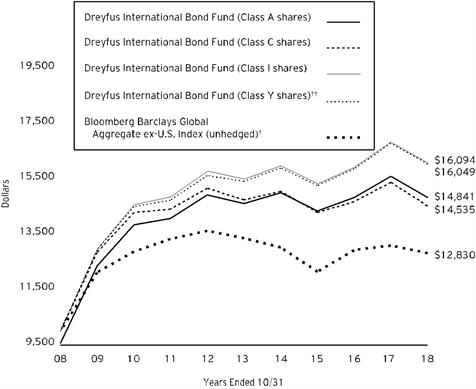
Comparison of change in value of $10,000 investment in Dreyfus International Bond Fund Class A shares, Class C shares, Class I shares and Class Y shares and the Bloomberg Barclays Global Aggregate ex USD Index (Unhedged) (the “Index”)
† Source: Lipper Inc.
†† The total return figures presented for Class Y shares of the fund reflect the performance of the fund’s Class A shares for the period prior to 7/1/13 (the inception date for Class Y shares), not reflecting the applicable sales charges for Class A shares.
Past performance is not predictive of future performance.
The above graph compares a $10,000 investment made in each of the Class A, Class C, Class I and Class Y shares of Dreyfus International Bond Fund on 10/31/08 to a $10,000 investment made in the Index on that date. All dividends and capital gain distributions are reinvested.
The fund’s performance shown in the line graph above takes into account the maximum initial sales charge on Class A shares and all other applicable fees and expenses on all classes. The Index is a flagship measure of global investment-grade debt from 24 local currency markets, excluding U.S. dollar-denominated bonds. This multi-currency benchmark includes treasury, government-related, corporate and securitized fixed-rate bonds from both developed and emerging markets issuers. Unlike a mutual fund, the Index is not subject to charges, fees and other expenses. Investors cannot invest directly in any index. Further information relating to fund performance, including expense reimbursements, if applicable, is contained in the Financial Highlights section of the prospectus and elsewhere in this report.
6
| | | | | |
Average Annual Total Returns as of 10/31/18 |
| Inception | 1 Year | 5 Years | 10 Years |
Date |
Class A shares | | | | |
with maximum sales charge (4.5%) | 12/30/05 | -9.19% | -0.62% | 4.03% |
without sales charge | 12/30/05 | -4.90% | 0.30% | 4.51% |
Class C shares | | | | |
with applicable redemption charge† | 12/30/05 | -6.47% | -0.30% | 3.81% |
without redemption | 12/30/05 | -5.56% | -0.30% | 3.81% |
Class I shares | 12/30/05 | -4.53% | 0.73% | 4.87% |
Class Y shares | 7/1/13 | -4.52% | 0.79% | 4.84%†† |
Bloomberg Barclay Global Aggregate | | | | |
ex-U.S. Index (unhedged) | | -2.09% | -0.82% | 2.52% |
† The maximum contingent deferred sales charge for Class C shares is 1% for shares redeemed within one year of the date of purchase.
†† The total return performance figures presented for Class Y shares of the fund reflect the performance of the fund’s Class A shares for the period prior to 7/1/13 (the inception date for Class Y shares), not reflecting the applicable sales charges for Class A shares.
The performance data quoted represents past performance, which is no guarantee of future results. Share price and investment return fluctuate and an investor’s shares may be worth more or less than original cost upon redemption. Current performance may be lower or higher than the performance quoted. Go to Dreyfus.com for the fund’s most recent month-end returns.
The fund’s performance shown in the graph and table does not reflect the deduction of taxes that a shareholder would pay on fund distributions or the redemption of fund shares. In addition to the performance of Class A shares shown with and without a maximum sales charge, the fund's performance shown in the table takes into account all other applicable fees and expenses on all classes.
7
UNDERSTANDING YOUR FUND’S EXPENSES (Unaudited)
As a mutual fund investor, you pay ongoing expenses, such as management fees and other expenses. Using the information below, you can estimate how these expenses affect your investment and compare them with the expenses of other funds. You also may pay one-time transaction expenses, including sales charges (loads) and redemption fees, which are not shown in this section and would have resulted in higher total expenses. For more information, see your fund’s prospectus or talk to your financial adviser.
Review your fund’s expenses
The table below shows the expenses you would have paid on a $1,000 investment in Dreyfus International Bond Fund from May 1, 2018 to October 31, 2018. It also shows how much a $1,000 investment would be worth at the close of the period, assuming actual returns and expenses.
| | | | | | | | | | | | | | |
Expenses and Value of a $1,000 Investment | | |
assuming actual returns for the six months ended October 31, 2018 |
| | | | | | | | |
| | | | Class A | Class C | Class I | Class Y |
Expenses paid per $1,000† | | $4.93 | | $7.91 | | $3.00 | | $2.56 |
Ending value (after expenses) | | $917.20 | | $913.90 | | $918.90 | | $918.60 |
COMPARING YOUR FUND’S EXPENSES
WITH THOSE OF OTHER FUNDS (Unaudited)
Using the SEC’s method to compare expenses
The Securities and Exchange Commission (“SEC”) has established guidelines to help investors assess fund expenses. Per these guidelines, the table below shows your fund’s expenses based on a $1,000 investment, assuming a hypothetical 5% annualized return. You can use this information to compare the ongoing expenses (but not transaction expenses or total cost) of investing in the fund with those of other funds. All mutual fund shareholder reports will provide this information to help you make this comparison. Please note that you cannot use this information to estimate your actual ending account balance and expenses paid during the period.
| | | | | | | | | | | | |
Expenses and Value of a $1,000 Investment | | |
assuming a hypothetical 5% annualized return for the six months ended October 31, 2018 |
| | | | | | | | |
| | | | Class A | Class C | Class I | Class Y |
Expenses paid per $1,000† | | $5.19 | | $8.34 | | $3.16 | | $2.70 |
Ending value (after expenses) | | $1,020.06 | | $1,016.94 | | $1,022.08 | | $1,022.53 |
† Expenses are equal to the fund’s annualized expense ratio of 1.02% for Class A, 1.64% for Class C, .62% for Class I and .53% for Class Y, multiplied by the average account value over the period, multiplied by 184/365 (to reflect the one-half year period).
8
STATEMENT OF INVESTMENTS
October 31, 2018
| | | | | | | | | | |
| |
Description | Coupon
Rate (%) | | Maturity
Date | | Principal
Amount ($) | a | Value ($) | |
Bonds and Notes - 94.8% | | | | | |
Argentina - 1.8% | | | | | |
Argentina POM Politica Monetaria,
Unscd. Bonds, ARLLMONP FLAT | ARS | 42.82 | | 6/21/2020 | | 79,665,000 | b | 2,514,830 | |
Argentine Government,
Bonds | ARS | 3.75 | | 2/8/2019 | | 74,381,750 | c | 2,088,031 | |
Argentine Government,
Sr. Unscd. Bonds | EUR | 5.25 | | 1/15/2028 | | 4,600,000 | | 4,022,970 | |
Argentine Government,
Sr. Unscd. Notes | ARS | 5.83 | | 12/31/2033 | | 149,237,787 | c | 4,743,002 | |
Buenos Aires Province,
Sr. Unscd. Notes | | 9.13 | | 3/16/2024 | | 1,625,000 | d | 1,458,454 | |
City of Buenos Aires,
Unscd. Bonds, 3 Month BADLAR + 3.83% | ARS | 36.25 | | 5/31/2022 | | 35,000,000 | b | 893,295 | |
City of Buenos Aires,
Unscd. Bonds, Ser. 22, 3 Month BADLAR + 3.25% | ARS | 38.69 | | 3/29/2024 | | 68,200,000 | b | 1,722,642 | |
| | 17,443,224 | |
Australia - 6.5% | | | | | |
Australian Government,
Sr. Unscd. Bonds, Ser. 146 | AUD | 1.75 | | 11/21/2020 | | 90,750,000 | | 63,976,450 | |
Driver Australia Four Trust,
Ser. 4, Cl. A, 1 Month Bank Bill Swap Rate + .95% | AUD | 2.80 | | 8/21/2025 | | 267,796 | b | 189,467 | |
Driver Australia Three Trust,
Ser. 3, Cl. A, 1 Month Bank Bill Swap Rate + 1.70% | AUD | 3.55 | | 5/21/2024 | | 615,174 | b | 438,241 | |
| | 64,604,158 | |
Brazil - .7% | | | | | |
Brazilian Government,
Notes, Ser. F | BRL | 10.00 | | 1/1/2027 | | 26,000,000 | | 7,001,719 | |
Canada - 4.5% | | | | | |
BMW Canada Auto Trust,
Ser. 2017-1A, Cl. A2 | CAD | 1.68 | | 5/20/2020 | | 3,529,563 | d | 2,671,872 | |
BMW Canada Auto Trust,
Ser. 2018-1A, Cl. A3 | CAD | 2.82 | | 4/20/2023 | | 4,050,000 | d | 3,056,397 | |
Canadian Government,
Bonds | CAD | 3.50 | | 12/1/2045 | | 9,355,000 | | 8,447,108 | |
Canadian Government,
Bonds, Ser. CPI | CAD | 0.50 | | 12/1/2050 | | 5,291,921 | c | 3,681,452 | |
Canadian Pacer Auto Receivables Trust,
Ser. 2017-1A, Cl. A4 | | 2.29 | | 1/19/2022 | | 1,750,000 | d | 1,721,353 | |
CNH Capital Canada Receivables Trust,
Ser. 2017-1A, Cl. A2 | CAD | 1.71 | | 5/15/2023 | | 2,413,304 | d | 1,810,698 | |
9
STATEMENT OF INVESTMENTS (continued)
| | | | | | | | | | |
| |
Description | Coupon
Rate (%) | | Maturity
Date | | Principal
Amount ($) | a | Value ($) | |
Bonds and Notes - 94.8% (continued) | | | | | |
Canada - 4.5% (continued) | | | | | |
Ford Auto Securitization Trust,
Ser. 2017-R5A, Cl. A3 | CAD | 2.38 | | 3/15/2023 | | 2,425,000 | d | 1,809,526 | |
Ford Auto Securitization Trust,
Ser. 2018-AA, Cl. A3 | CAD | 2.71 | | 9/15/2023 | | 2,350,000 | d | 1,762,451 | |
Ford Auto Securitization Trust,
Ser. 2018-BA, Cl. A3 | CAD | 2.84 | | 1/15/2024 | | 3,100,000 | d | 2,325,877 | |
GMF Canada Leasing Trust,
Ser. 2016-1A, Cl. A3 | CAD | 1.83 | | 6/21/2021 | | 149,443 | d | 113,506 | |
GMF Canada Leasing Trust,
Ser. 2017-1A, Cl. A3 | CAD | 2.47 | | 9/20/2022 | | 1,750,000 | d | 1,322,952 | |
Golden Credit Card Trust,
Ser. 2018-4A, Cl. A | | 3.44 | | 10/15/2025 | | 2,550,000 | d | 2,528,484 | |
Master Credit Card Trust II,
Ser. 2018-1, Cl. A, 1 Month LIBOR + .49% | | 2.67 | | 7/21/2024 | | 3,100,000 | b,d | 3,107,546 | |
MBARC Credit Canada,
Ser. 2016-AA. Cl. A3 | CAD | 1.72 | | 7/15/2021 | | 882,084 | d | 669,713 | |
MBARC Credit Canada,
Ser. 2018-AA, Cl. A3 | CAD | 2.79 | | 1/17/2023 | | 3,000,000 | d | 2,269,376 | |
Silver Arrow Canada,
Ser. 2018-1A, Cl. A3 | CAD | 3.17 | | 8/15/2025 | | 4,300,000 | d | 3,266,360 | |
Teck Resources,
Gtd. Notes | | 6.25 | | 7/15/2041 | | 625,000 | | 626,563 | |
Trillium Credit Card Trust II,
Ser. 2018-2A, Cl. A, 1 Month LIBOR + .35% | | 2.63 | | 9/26/2023 | | 3,375,000 | b,d | 3,375,611 | |
| | 44,566,845 | |
Cayman Islands - .3% | | | | | |
CK Hutchison Europe Finance 18,
Gtd. Bonds | EUR | 1.25 | | 4/13/2025 | | 660,000 | | 739,496 | |
Sands China,
Sr. Unscd. Notes | | 4.60 | | 8/8/2023 | | 2,600,000 | d | 2,570,864 | |
| | 3,310,360 | |
Chile - .4% | | | | | |
Bonos de la Tesoreria de la Republica en pesos,
Bonds | CLP | 4.50 | | 3/1/2021 | | 2,695,000,000 | | 3,923,181 | |
Colombia - .4% | | | | | |
Colombian Government,
Sr. Unscd. Notes | | 4.50 | | 3/15/2029 | | 1,800,000 | | 1,778,418 | |
Ecopetrol,
Sr. Unscd. Notes | | 5.88 | | 5/28/2045 | | 2,090,000 | | 1,997,518 | |
| | 3,775,936 | |
Cyprus - .5% | | | | | |
Cyprus Government,
Sr. Unscd. Notes | EUR | 4.25 | | 11/4/2025 | | 3,750,000 | | 4,902,172 | |
10
| | | | | | | | | | |
| |
Description | Coupon
Rate (%) | | Maturity
Date | | Principal
Amount ($) | a | Value ($) | |
Bonds and Notes - 94.8% (continued) | | | | | |
France - 4.9% | | | | | |
Credit Agricole,
Sub. Bonds | EUR | 2.63 | | 3/17/2027 | | 2,050,000 | | 2,395,456 | |
French Government,
Bonds | EUR | 0.75 | | 5/25/2028 | | 22,425,000 | | 25,552,379 | |
French Government,
Unscd. Bonds | EUR | 2.00 | | 5/25/2048 | | 16,775,000 | d | 20,688,391 | |
| | 48,636,226 | |
Germany - 3.2% | | | | | |
Allianz,
Sub. Notes | EUR | 5.63 | | 10/17/2042 | | 3,700,000 | | 4,866,074 | |
Deutsche Bundesrepublik Inflation Linked Bond,
Bonds | EUR | 0.10 | | 4/15/2026 | | 21,878,850 | c | 27,373,874 | |
| | 32,239,948 | |
Ghana - .3% | | | | | |
Ghanaian Government,
Sr. Unscd. Bonds | | 8.13 | | 1/18/2026 | | 1,125,000 | e | 1,134,386 | |
Ghanaian Government,
Sr. Unscd. Notes | | 7.63 | | 5/16/2029 | | 1,525,000 | d | 1,460,139 | |
| | 2,594,525 | |
Greece - .8% | | | | | |
Hellenic Government,
Bonds | EUR | 3.90 | | 1/30/2033 | | 7,425,000 | | 7,650,123 | |
Hungary - .3% | | | | | |
Hungarian Government,
Sr. Unscd. Bonds | EUR | 1.75 | | 10/10/2027 | | 2,200,000 | | 2,520,262 | |
Indonesia - .2% | | | | | |
Indonesian Government,
Sr. Unscd. Notes | | 4.35 | | 1/11/2048 | | 2,900,000 | e | 2,487,556 | |
Ireland - 1.3% | | | | | |
AerCap Ireland Capital,
Gtd. Notes | | 4.50 | | 5/15/2021 | | 1,775,000 | | 1,795,286 | |
AerCap Ireland Capital,
Gtd. Notes | | 5.00 | | 10/1/2021 | | 725,000 | | 744,954 | |
Irish Government,
Bonds | EUR | 2.00 | | 2/18/2045 | | 1,610,000 | | 1,916,209 | |
Irish Government,
Bonds | EUR | 2.40 | | 5/15/2030 | | 6,370,000 | | 8,176,290 | |
| | 12,632,739 | |
Israel - .2% | | | | | |
Israeli Government,
Bonds, Ser. 327 | ILS | 2.00 | | 3/31/2027 | | 6,900,000 | e | 1,838,103 | |
Italy - 2.2% | | | | | |
Intesa Sanpaolo,
Sr. Unscd. Notes | EUR | 3.00 | | 1/28/2019 | | 3,565,000 | | 4,065,391 | |
11
STATEMENT OF INVESTMENTS (continued)
| | | | | | | | | | |
| |
Description | Coupon
Rate (%) | | Maturity
Date | | Principal
Amount ($) | a | Value ($) | |
Bonds and Notes - 94.8% (continued) | | | | | |
Italy - 2.2% (continued) | | | | | |
Italian Government,
Unscd. Bonds | EUR | 2.70 | | 3/1/2047 | | 7,775,000 | d | 7,225,560 | |
Italy Buoni Poliennali Del Tesoro,
Bonds | EUR | 0.95 | | 3/15/2023 | | 10,150,000 | | 10,799,164 | |
| | 22,090,115 | |
Ivory Coast - .5% | | | | | |
Ivory Coast Government,
Sr. Unscd. Bonds | EUR | 5.13 | | 6/15/2025 | | 750,000 | d | 838,147 | |
Ivory Coast Government,
Sr. Unscd. Notes | EUR | 5.25 | | 3/22/2030 | | 4,250,000 | d | 4,417,927 | |
| | 5,256,074 | |
Japan - 22.4% | | | | | |
Development Bank of Japan,
Govt. Gtd. Notes | | 3.13 | | 9/6/2023 | | 3,180,000 | d | 3,148,598 | |
Japan Bank for International Cooperation,
Govt. Gtd. Notes | | 3.38 | | 10/31/2023 | | 6,400,000 | | 6,390,240 | |
Japan Government,
Sr. Unscd. Bonds, Ser. 348 | JPY | 0.10 | | 9/20/2027 | | 922,700,000 | | 8,200,676 | |
Japanese Government,
Sr. Unscd. Bonds, Ser. 156 | JPY | 0.40 | | 3/20/2036 | | 3,208,650,000 | | 27,855,694 | |
Japanese Government,
Sr. Unscd. Bonds, Ser. 21 | JPY | 0.10 | | 3/10/2026 | | 10,275,856,120 | c | 94,712,548 | |
Japanese Government,
Sr. Unscd. Bonds, Ser. 336 | JPY | 0.50 | | 12/20/2024 | | 4,930,550,000 | | 45,163,593 | |
Japanese Government,
Sr. Unscd. Bonds, Ser. 44 | JPY | 1.70 | | 9/20/2044 | | 1,791,800,000 | | 19,188,497 | |
Japanese Government,
Sr. Unscd. Bonds, Ser. 59 | JPY | 0.70 | | 6/20/2048 | | 1,290,000,000 | | 10,941,397 | |
OSCAR US Funding Trust,
Ser. 2017-1A, Cl. A2A | | 2.30 | | 5/11/2020 | | 224,136 | d | 224,352 | |
OSCAR US Funding Trust,
Ser. 2017-1A, Cl. A4 | | 3.30 | | 5/10/2024 | | 1,080,000 | d | 1,076,392 | |
OSCAR US Funding Trust VII,
Ser. 2017-2A Cl. A3 | | 2.45 | | 12/10/2021 | | 850,000 | d | 838,452 | |
OSCAR US Funding Trust VII,
Ser. 2017-2A Cl. A4 | | 2.76 | | 12/10/2024 | | 1,800,000 | d | 1,759,648 | |
OSCAR US Funding Trust VIII,
Ser. 2018-1A, Cl. A4 | | 3.50 | | 5/12/2025 | | 3,200,000 | d | 3,191,238 | |
| | 222,691,325 | |
Kenya - .3% | | | | | |
Kenyan Government,
Sr. Unscd. Notes | | 7.25 | | 2/28/2028 | | 1,850,000 | d | 1,749,471 | |
Kenyan Government,
Sr. Unscd. Notes | | 8.25 | | 2/28/2048 | | 950,000 | d | 870,069 | |
| | 2,619,540 | |
12
| | | | | | | | | | |
| |
Description | Coupon
Rate (%) | | Maturity
Date | | Principal
Amount ($) | a | Value ($) | |
Bonds and Notes - 94.8% (continued) | | | | | |
Luxembourg - .4% | | | | | |
Altice Financing,
Sr. Scd. Bonds | | 7.50 | | 5/15/2026 | | 575,000 | d | 541,938 | |
E-Carat,
Ser. 16-1, Cl. A, 1 Month EURIBOR + .45% @ Floor | EUR | 0.08 | | 10/18/2024 | | 1,116,645 | b | 1,267,038 | |
Gazprom OAO Via Gaz Capital,
Sr. Unscd. Bonds | EUR | 2.50 | | 3/21/2026 | | 2,300,000 | | 2,531,738 | |
| | 4,340,714 | |
Morocco - .3% | | | | | |
Office Cherifien des Phosphates,
Sr. Unscd. Notes | | 6.88 | | 4/25/2044 | | 2,500,000 | | 2,618,813 | |
Netherlands - 2.8% | | | | | |
ABN AMRO Bank,
Sub. Notes | EUR | 2.88 | | 1/18/2028 | | 1,100,000 | | 1,315,917 | |
ABN AMRO Bank,
Sub. Notes | | 4.75 | | 7/28/2025 | | 3,900,000 | d | 3,880,110 | |
Globaldrive Auto Receivables,
Ser. 2016-B, Cl. A, 1 Month EURIBOR + .50% @ Floor | EUR | 0.13 | | 8/20/2024 | | 2,409,688 | b | 2,738,716 | |
ING Groep,
Sub. Notes | EUR | 3.00 | | 4/11/2028 | | 700,000 | | 833,260 | |
Petrobras Global Finance,
Gtd. Notes | | 5.30 | | 1/27/2025 | | 1,900,000 | | 1,816,875 | |
Petrobras Global Finance,
Gtd. Notes | | 7.25 | | 3/17/2044 | | 880,000 | | 851,950 | |
Rabobank Nederland,
Sub. Bonds | EUR | 2.50 | | 5/26/2026 | | 1,816,000 | | 2,143,726 | |
SABIC Capital II,
Gtd. Bonds | | 4.00 | | 10/10/2023 | | 3,075,000 | d | 3,046,095 | |
Schaeffler Finance,
Sr. Scd. Notes | | 4.75 | | 5/15/2023 | | 1,125,000 | d | 1,113,750 | |
Teva Pharmaceutical Finance Netherlands II,
Gtd. Notes | EUR | 3.25 | | 4/15/2022 | | 1,330,000 | | 1,555,356 | |
Vonovia Finance,
Gtd. Notes | EUR | 1.63 | | 12/15/2020 | | 4,100,000 | | 4,796,806 | |
Vonovia Finance,
Gtd. Notes | EUR | 3.63 | | 10/8/2021 | | 1,575,000 | | 1,958,921 | |
WPC Eurobond,
Gtd. Bonds | EUR | 2.25 | | 7/19/2024 | | 1,850,000 | | 2,144,035 | |
| | 28,195,517 | |
New Zealand - 2.6% | | | | | |
New Zealand Government,
Sr. Unscd. Bonds, Ser. 0925 | NZD | 2.00 | | 9/20/2025 | | 35,204,000 | c | 26,166,219 | |
13
STATEMENT OF INVESTMENTS (continued)
| | | | | | | | | | |
| |
Description | Coupon
Rate (%) | | Maturity
Date | | Principal
Amount ($) | a | Value ($) | |
Bonds and Notes - 94.8% (continued) | | | | | |
Nigeria - .2% | | | | | |
Nigerian Government,
Sr. Unscd. Notes | | 6.50 | | 11/28/2027 | | 1,050,000 | d | 966,677 | |
Nigerian Government,
Sr. Unscd. Notes | | 7.14 | | 2/23/2030 | | 1,325,000 | d | 1,221,883 | |
| | 2,188,560 | |
Norway - .2% | | | | | |
Norwegian Government,
Bonds, Ser. 474 | NOK | 3.75 | | 5/25/2021 | | 17,145,000 | d | 2,161,542 | |
Qatar - .5% | | | | | |
Qatari Government,
Sr. Unscd. Notes | | 5.10 | | 4/23/2048 | | 5,250,000 | | 5,342,237 | |
Romania - .5% | | | | | |
Romanian Government,
Sr. Unscd. Notes | EUR | 2.50 | | 2/8/2030 | | 4,725,000 | d | 5,032,672 | |
Russia - 2.0% | | | | | |
Russian Government,
Bonds, Ser. 6212 | RUB | 7.05 | | 1/19/2028 | | 648,000,000 | | 8,991,066 | |
Russian Government,
Bonds, Ser. 6215 | RUB | 7.00 | | 8/16/2023 | | 725,000,000 | | 10,504,968 | |
| | 19,496,034 | |
Saudi Arabia - .3% | | | | | |
Saudi Arabian Government,
Sr. Unscd. Notes | | 4.63 | | 10/4/2047 | | 2,750,000 | | 2,529,896 | |
Senegal - .5% | | | | | |
Senegalese Government,
Sr. Unscd. Bonds | EUR | 4.75 | | 3/13/2028 | | 2,225,000 | d | 2,358,151 | |
Senegalese Government,
Sr. Unscd. Bonds | EUR | 4.75 | | 3/13/2028 | | 2,450,000 | | 2,596,616 | |
| | 4,954,767 | |
Spain - 3.2% | | | | | |
BBVA Subordinated Capital,
Gtd. Notes | EUR | 3.50 | | 4/11/2024 | | 2,300,000 | | 2,633,569 | |
Driver Espana Three FT,
Ser. 3, Cl. A, 1 Month EURIBOR + 1.05% @ Floor | EUR | 0.68 | | 12/21/2026 | | 754,128 | b | 858,257 | |
Santander Issuances,
Gtd. Notes | EUR | 2.50 | | 3/18/2025 | | 2,800,000 | | 3,171,404 | |
Spanish Government,
Sr. Unscd. Bonds | EUR | 2.90 | | 10/31/2046 | | 19,840,000 | d | 23,845,925 | |
Telefonica Emisiones,
Gtd. Notes | EUR | 1.53 | | 1/17/2025 | | 1,600,000 | e | 1,831,296 | |
| | 32,340,451 | |
Supranational - 3.5% | | | | | |
Arab Petroleum Investments,
Sr. Unscd. Notes | | 4.13 | | 9/18/2023 | | 2,920,000 | d | 2,925,714 | |
14
| | | | | | | | | | |
| |
Description | Coupon
Rate (%) | | Maturity
Date | | Principal
Amount ($) | a | Value ($) | |
Bonds and Notes - 94.8% (continued) | | | | | |
Supranational - 3.5% (continued) | | | | | |
Asian Development Bank,
Sr. Unscd. Notes | NZD | 3.50 | | 5/30/2024 | | 3,750,000 | | 2,534,633 | |
Banque Ouest Africaine de Developpement,
Sr. Unscd. Notes | | 5.00 | | 7/27/2027 | | 380,000 | | 362,520 | |
European Investment Bank,
Sr. Unscd. Notes | CAD | 1.13 | | 9/16/2021 | | 2,975,000 | d | 2,170,569 | |
European Investment Bank,
Sr. Unscd. Notes | AUD | 2.70 | | 1/12/2023 | | 4,600,000 | | 3,268,350 | |
International Bank for Reconstruction & Development,
Sr. Unscd. Notes | NZD | 3.50 | | 1/22/2021 | | 18,425,000 | | 12,343,208 | |
International Finance,
Sr. Unscd. Notes | INR | 6.30 | | 11/25/2024 | | 96,070,000 | | 1,224,050 | |
Nordic Investment Bank,
Sr. Unscd. Notes | NOK | 1.38 | | 7/15/2020 | | 85,000,000 | | 10,097,130 | |
| | 34,926,174 | |
Switzerland - .3% | | | | | |
Credit Suisse Group,
Sr. Unscd. Notes | | 4.28 | | 1/9/2028 | | 2,700,000 | d | 2,590,890 | |
Thailand - .4% | | | | | |
Thai Government,
Sr. Unscd. Bonds | THB | 2.13 | | 12/17/2026 | | 135,170,000 | | 3,896,770 | |
Ukraine - .1% | | | | | |
Ukrainian Government,
Sr. Unscd. Bonds, Ser. GDP | | 3.53 | | 5/31/2040 | | 1,950,000 | | 1,006,415 | |
United Arab Emirates - .5% | | | | | |
Abu Dhabi Crude Oil Pipeline,
Sr. Scd. Bonds | | 4.60 | | 11/2/2047 | | 2,825,000 | d | 2,680,902 | |
DP World,
Sr. Unscd. Notes | | 6.85 | | 7/2/2037 | | 2,250,000 | | 2,514,807 | |
| | 5,195,709 | |
United Kingdom - 6.8% | | | | | |
Barclays,
Jr. Sub. Bonds | | 7.88 | | 12/29/2049 | | 850,000 | | 877,625 | |
Barclays,
Sr. Unscd. Notes | | 4.97 | | 5/16/2029 | | 2,925,000 | | 2,844,522 | |
BAT International Finance,
Gtd. Notes | EUR | 2.25 | | 1/16/2030 | | 1,450,000 | | 1,583,563 | |
HSBC Holdings,
Sub. Notes | | 4.38 | | 11/23/2026 | | 1,875,000 | | 1,821,472 | |
Lloyds Banking Group,
Sr. Unscd. Notes | | 3.75 | | 1/11/2027 | | 2,225,000 | | 2,062,586 | |
Royal Bank of Scotland Group,
Sr. Unscd. Notes | | 3.88 | | 9/12/2023 | | 8,025,000 | | 7,729,158 | |
15
STATEMENT OF INVESTMENTS (continued)
| | | | | | | | | | |
| |
Description | Coupon
Rate (%) | | Maturity
Date | | Principal
Amount ($) | a | Value ($) | |
Bonds and Notes - 94.8% (continued) | | | | | |
United Kingdom - 6.8% (continued) | | | | | |
United Kingdom Gilt,
Bonds | GBP | 1.50 | | 7/22/2047 | | 17,365,000 | | 20,412,099 | |
United Kingdom Gilt,
Bonds | GBP | 3.50 | | 1/22/2045 | | 18,075,000 | | 30,796,064 | |
| | 68,127,089 | |
United States - 18.0% | | | | | |
Abbott Laboratories,
Sr. Unscd. Notes | | 3.75 | | 11/30/2026 | | 523,000 | | 515,858 | |
AbbVie,
Sr. Unscd. Bonds | EUR | 1.38 | | 5/17/2024 | | 2,650,000 | | 3,032,678 | |
American Homes 4 Rent Trust,
Ser. 2014-SFR3, Cl. A | | 3.68 | | 12/17/2036 | | 1,257,459 | d | 1,243,476 | |
American International Group,
Sr. Unscd. Notes | | 4.20 | | 4/1/2028 | | 1,750,000 | | 1,683,796 | |
Americredit Automobile Receivables Trust,
Ser. 2016-4 | | 2.74 | | 12/8/2022 | | 1,150,000 | | 1,125,828 | |
Americredit Automobile Receivables Trust,
Ser. 2018-1 | | 3.50 | | 1/18/2024 | | 2,600,000 | | 2,590,443 | |
Americredit Automobile Receivables Trust,
Ser. 2018-1 | | 3.82 | | 3/18/2024 | | 2,650,000 | | 2,635,081 | |
AmeriCredit Automobile Receivables Trust,
Ser. 2017-4, Cl. B | | 2.36 | | 12/19/2022 | | 3,300,000 | | 3,231,898 | |
Andeavor Logistics,
Gtd. Notes | | 3.50 | | 12/1/2022 | | 575,000 | | 561,965 | |
Anheuser-Busch InBev Worldwide,
Gtd. Notes | | 4.00 | | 4/13/2028 | | 2,625,000 | | 2,522,597 | |
Bank of America,
Sr. Unscd. Notes | | 3.37 | | 1/23/2026 | | 4,400,000 | | 4,198,349 | |
Bank of America,
Sr. Unscd. Notes | | 3.97 | | 3/5/2029 | | 1,100,000 | | 1,060,320 | |
Bear Stearns Commercial Mortgage Securities Trust,
Ser. 2005-PW10, Cl. AJ | | 5.78 | | 12/11/2040 | | 685,366 | | 722,143 | |
CarMax Auto Owner Trust,
Ser. 2018-1, Cl. D | | 3.37 | | 7/15/2024 | | 365,000 | | 357,626 | |
CCO Holdings,
Sr. Unscd. Notes | | 5.88 | | 4/1/2024 | | 600,000 | d | 606,750 | |
Cheniere Energy Partners,
Sr. Scd. Notes | | 5.25 | | 10/1/2025 | | 1,175,000 | | 1,155,906 | |
Citigroup,
Sub. Bonds | | 4.40 | | 6/10/2025 | | 3,200,000 | | 3,172,797 | |
CLUB Credit Trust,
Ser. 2017-P1 | | 2.42 | | 9/15/2023 | | 639,789 | d | 638,117 | |
16
| | | | | | | | | | |
| |
Description | Coupon
Rate (%) | | Maturity
Date | | Principal
Amount ($) | a | Value ($) | |
Bonds and Notes - 94.8% (continued) | | | | | |
United States - 18.0% (continued) | | | | | |
CNH Equipment Trust,
Ser. 2018-A | | 3.30 | | 4/15/2025 | | 1,300,000 | | 1,301,885 | |
Colony Starwood Homes,
Ser. 2016-2A, Cl. A, 1 Month LIBOR + 1.25% | | 3.53 | | 12/17/2033 | | 4,091,589 | b,d | 4,094,731 | |
Comcast,
Gtd. Notes | | 3.70 | | 4/15/2024 | | 2,150,000 | | 2,144,206 | |
Commercial Mortgage Trust,
Ser. 2017-DLTA, Cl. A | | 3.13 | | 8/15/2035 | | 3,200,000 | d | 3,205,868 | |
Concho Resources,
Gtd. Notes | | 3.75 | | 10/1/2027 | | 1,075,000 | | 1,012,666 | |
Cox Communications,
Sr. Unscd. Notes | | 3.35 | | 9/15/2026 | | 1,150,000 | d | 1,059,839 | |
CVS Health,
Sr. Unscd. Notes | | 4.30 | | 3/25/2028 | | 3,400,000 | | 3,322,819 | |
Dell Equipment Finance Trust,
Ser. 2017-2, Cl. B | | 2.47 | | 10/24/2022 | | 700,000 | d | 689,730 | |
Dell Equipment Finance Trust,
Ser. 2018-2 | | 3.55 | | 10/22/2023 | | 1,100,000 | d | 1,101,357 | |
Dell Equipment Finance Trust,
Ser. 2018-2 | | 3.72 | | 10/22/2023 | | 1,300,000 | d | 1,302,272 | |
Diamond 1 Finance,
Sr. Scd. Notes | | 6.02 | | 6/15/2026 | | 2,450,000 | d | 2,544,255 | |
Digital Euro Finco,
Gtd. Bonds | EUR | 2.63 | | 4/15/2024 | | 1,775,000 | | 2,123,244 | |
Dollar Tree,
Sr. Unscd. Notes | | 4.20 | | 5/15/2028 | | 645,000 | | 611,444 | |
Drive Auto Receivables Trust,
Ser. 2017-3, Cl. C | | 2.80 | | 7/15/2022 | | 1,825,000 | | 1,819,305 | |
Drive Auto Receivables Trust,
Ser. 2018-1, Cl. C | | 3.22 | | 3/15/2023 | | 4,670,000 | | 4,658,852 | |
Drive Auto Receivables Trust,
Ser. 2018-2 | | 3.63 | | 8/15/2024 | | 2,750,000 | | 2,752,039 | |
DT Auto Owner Trust,
Ser. 2018-1 | | 3.04 | | 1/18/2022 | | 2,600,000 | d | 2,592,341 | |
DT Auto Owner Trust,
Ser. 2018-2 | | 3.67 | | 3/15/2024 | | 2,625,000 | d | 2,621,888 | |
Energy Transfer Partners,
Gtd. Notes | | 4.20 | | 4/15/2027 | | 600,000 | | 567,127 | |
Energy Transfer Partners,
Jr. Sub. Notes, Ser. A | | 6.25 | | 12/15/2023 | | 525,000 | | 491,859 | |
EQT Corp,
Sr. Unscd. Notes | | 3.00 | | 10/1/2022 | | 360,000 | | 345,698 | |
EQT Corp,
Sr. Unscd. Notes | | 3.90 | | 10/1/2027 | | 3,390,000 | | 3,090,579 | |
Exeter Automobile Receivables Trust,
Ser. 2018-1A, Cl. B | | 2.75 | | 4/15/2022 | | 2,200,000 | d | 2,188,338 | |
17
STATEMENT OF INVESTMENTS (continued)
| | | | | | | | | | |
| |
Description | Coupon
Rate (%) | | Maturity
Date | | Principal
Amount ($) | a | Value ($) | |
Bonds and Notes - 94.8% (continued) | | | | | |
United States - 18.0% (continued) | | | | | |
Exeter Automobile Receivables Trust,
Ser. 2018-3 | | 3.46 | | 10/17/2022 | | 3,000,000 | d | 2,993,024 | |
Federal Home Loan Mortgage Corp.,
Multifamily Structured Pass Through Certificates | | 3.37 | | 7/25/2025 | | 1,850,000 | f | 1,822,826 | |
Federal Home Loan Mortgage Corp.,
Multifamily Structured Pass Through Certificates | | 2.71 | | 8/25/2025 | | 1,230,000 | f | 1,231,831 | |
First Data,
Scd. Notes | | 5.75 | | 1/15/2024 | | 595,000 | d | 600,950 | |
Ford Credit Auto Owner Trust,
Ser. 2018-A | | 3.03 | | 11/15/2022 | | 2,220,000 | | 2,217,816 | |
GAHR Commercial Mortgage Trust,
Ser. 2015-NRF, Cl. EFX | | 3.49 | | 12/15/2034 | | 3,260,000 | d | 3,224,889 | |
General Electric,
Jr. Sub. Debs., Ser. D | | 5.00 | | 12/29/2049 | | 9,550,000 | | 8,821,812 | |
Glencore Funding,
Gtd. Notes | | 3.00 | | 10/27/2022 | | 1,125,000 | d | 1,077,570 | |
GM Financial Automobile Leasing Trust,
Ser. 2018-2 | | 3.50 | | 4/20/2022 | | 1,735,000 | | 1,728,611 | |
GM Financial Automobile Leasing Trust,
Ser. 2018-3 | | 3.48 | | 7/20/2022 | | 2,400,000 | | 2,396,983 | |
GM Financial Automobile Leasing Trust,
Ser. 2018-3 | | 3.70 | | 7/20/2022 | | 2,350,000 | | 2,346,330 | |
Goldman Sachs Group,
Sr. Unscd. Notes | | 3.50 | | 11/16/2026 | | 1,765,000 | | 1,651,031 | |
Goldman Sachs Group,
Sr. Unscd. Notes | | 3.69 | | 6/5/2028 | | 1,300,000 | | 1,221,615 | |
Goldman Sachs Group,
Sr. Unscd. Notes | | 3.81 | | 4/23/2029 | | 1,300,000 | | 1,222,581 | |
Hertz Fleet Lease Funding,
Ser. 2018-1, Cl. A2 | | 3.23 | | 5/10/2032 | | 3,000,000 | d | 2,994,878 | |
Hyatt Hotel Portfolio Trust,
Ser. 2017-HYT2, Cl. B | | 3.24 | | 8/9/2032 | | 3,575,000 | d | 3,571,416 | |
Intown Hotel Portfolio Trust,
Ser. 2018-STAY, Cl. A | | 2.98 | | 1/15/2033 | | 1,075,000 | d | 1,075,385 | |
Intown Hotel Portfolio Trust,
Ser. 2018-STAY, Cl. B | | 3.33 | | 1/15/2033 | | 725,000 | d | 724,125 | |
Invitation Homes Trust,
Ser. 2018-SFR3, Cl. A, 1 Month LIBOR + 1% | | 3.28 | | 7/17/2037 | | 2,221,779 | b,d | 2,223,233 | |
Invitation Homes Trust,
Ser. 2018-SFR4 | | 3.35 | | 1/17/2038 | | 1,800,000 | d | 1,800,000 | |
Keurig Dr Pepper,
Gtd. Notes | | 4.06 | | 5/25/2023 | | 850,000 | d | 845,765 | |
18
| | | | | | | | | | |
| |
Description | Coupon
Rate (%) | | Maturity
Date | | Principal
Amount ($) | a | Value ($) | |
Bonds and Notes - 94.8% (continued) | | | | | |
United States - 18.0% (continued) | | | | | |
KeyCorp Student Loan Trust,
Ser. 1999-B, Cl. CTFS, 3 Month LIBOR + .90% | | 3.23 | | 11/25/2036 | | 956,406 | b | 957,685 | |
Kinder Morgan,
Gtd. Notes | | 4.30 | | 6/1/2025 | | 575,000 | | 572,766 | |
Kraft Heinz Foods,
Gtd. Notes | EUR | 2.25 | | 5/25/2028 | | 2,175,000 | | 2,463,529 | |
Kubota Credit Owner Trust,
Ser. 2018-1A, Cl. A4 | | 3.21 | | 1/15/2025 | | 5,700,000 | d | 5,675,025 | |
Long Beach Mortgage Loan Trust,
Ser. 2004-1, Cl. M2, 1 Month LIBOR + .83% | | 3.04 | | 2/25/2034 | | 453,237 | b | 454,803 | |
OSCAR US Funding Trust,
Ser. 2016-2A, Cl. A3 | | 2.73 | | 12/15/2020 | | 3,026,079 | d | 3,020,559 | |
Prime Security Services Borrower,
Scd. Notes | | 9.25 | | 5/15/2023 | | 373,000 | d | 395,082 | |
Prosper Marketplace Issuance Trust,
Ser. 2017-3A, Cl. A | | 2.36 | | 11/15/2023 | | 1,185,262 | d | 1,181,890 | |
Prudential Financial,
Jr. Sub. Notes | | 4.50 | | 9/15/2047 | | 1,855,000 | | 1,692,688 | |
Reynolds Group,
Gtd. Notes | | 7.00 | | 7/15/2024 | | 560,000 | d | 562,450 | |
Santander Drive Auto Receivable Trust,
Ser. 2018-2, Cl. C | | 3.35 | | 7/17/2023 | | 1,650,000 | | 1,639,269 | |
Santander Drive Auto Receivables Trust,
Ser. 2016-3 | | 2.80 | | 8/15/2022 | | 1,150,000 | | 1,136,526 | |
Santander Drive Auto Receivables Trust,
Ser. 2018-1, Cl. C | | 2.96 | | 3/15/2024 | | 2,300,000 | | 2,270,289 | |
Santander Drive Auto Receivables Trust,
Ser. 2018-3 | | 3.51 | | 8/15/2023 | | 2,575,000 | | 2,565,435 | |
Santander Retail Auto Lease Trust,
Ser. 2017-A, Cl. A4 | | 2.37 | | 1/20/2022 | | 1,625,000 | d | 1,602,548 | |
SASOL Financing USA,
Gtd. Notes | | 5.88 | | 3/27/2024 | | 3,725,000 | | 3,757,173 | |
Springleaf Funding Trust,
Ser. 2016-AA, Cl. A | | 2.90 | | 11/15/2029 | | 3,900,000 | d | 3,885,415 | |
Sprint Communications,
Sr. Unscd. Notes | | 7.00 | | 8/15/2020 | | 530,000 | | 549,875 | |
Sprint Spectrum,
Sr. Scd. Notes | | 4.74 | | 3/20/2025 | | 2,575,000 | d | 2,578,219 | |
Starwood Waypoint Homes Trust,
Ser. 2017-1, Cl. A, 1 Month LIBOR + .95% | | 3.23 | | 1/17/2035 | | 4,918,624 | b,d | 4,913,707 | |
19
STATEMENT OF INVESTMENTS (continued)
| | | | | | | | | | |
| |
Description | Coupon
Rate (%) | | Maturity
Date | | Principal
Amount ($) | a | Value ($) | |
Bonds and Notes - 94.8% (continued) | | | | | |
United States - 18.0% (continued) | | | | | |
Sunoco Logistics Partners Operations,
Gtd. Notes | | 4.00 | | 10/1/2027 | | 1,550,000 | | 1,435,108 | |
Targa Resources Partners,
Gtd. Bonds | | 5.13 | | 2/1/2025 | | 595,000 | | 581,613 | |
T-Mobile USA,
Gtd. Notes | | 6.00 | | 3/1/2023 | | 825,000 | | 845,708 | |
Tricon American Homes,
Ser. 2017-SFR2, Cl. A | | 2.93 | | 1/17/2036 | | 2,247,602 | d | 2,148,348 | |
UBS Commercial Mortgage Trust,
Ser. 2017-C1, Cl. A4 | | 3.54 | | 11/15/2050 | | 1,975,000 | | 1,903,648 | |
United Technologies,
Sr. Unscd. Bonds | EUR | 2.15 | | 5/18/2030 | | 1,000,000 | | 1,143,296 | |
Western Gas Partners,
Sr. Unscd. Notes | | 4.50 | | 3/1/2028 | | 700,000 | | 667,658 | |
Westlake Automobile Receivables Trust,
Ser. 2018-1A, Cl. C | | 2.92 | | 5/15/2023 | | 1,375,000 | d | 1,361,918 | |
Westlake Automobile Receivables Trust,
Ser. 2018-2 | | 3.20 | | 1/16/2024 | | 1,350,000 | d | 1,346,999 | |
Westlake Automobile Receivables Trust,
Ser. 2018-2 | | 3.50 | | 1/16/2024 | | 2,650,000 | d | 2,644,532 | |
Zayo Group,
Gtd. Notes | | 5.75 | | 1/15/2027 | | 445,000 | d | 437,302 | |
| | 178,881,704 | |
Total Bonds and Notes
(cost $990,445,396) | | 942,776,304 | |
Description /Number of Contracts/Counterparty | Exercise
Price | | Expiration Date | | Notional Amount ($) | a | Value ($) | |
Options Purchased - .2% | | | | | |
Call Options - .1% | | | | | |
Australian Dollar
Contracts 29,500,000 Barclays Capital | AUD | 0.72 | | 12/12/2018 | | 29,500,000 | | 113,381 | |
British Pound
Contracts 7,850,000 Citigroup | | 1.35 | | 12/5/2018 | | 7,850,000 | | 3,696 | |
Chinese Yuan Renminbi
Contracts 20,650,000 HSBC | | 6.96 | | 1/18/2019 | | 20,650,000 | | 299,059 | |
South Korean Won Cross Currency,
Contracts 2,314,000,000 HSBC | JPY | 10.20 | | 1/18/2019 | | 2,314,000,000 | | 358,577 | |
| | 774,713 | |
Put Options - .1% | | | | | |
Chilean Peso
Contracts 5,170,000 J.P. Morgan Securities | | 660.00 | | 1/17/2019 | | 5,170,000 | | 26,542 | |
20
| | | | | | | | | | |
| |
Description /Number of Contracts/Counterparty | Exercise
Price | | Expiration Date | | Notional Amount ($) | a | Value ($) | |
Options Purchased - .2% (continued) | | | | | |
Put Options - .1% (continued) | | | | | |
Chilean Peso
Contracts 5,200,000 Citigroup | | 655.00 | | 12/21/2018 | | 5,200,000 | | 10,446 | |
Indian Rupee
Contracts 10,500,000 Barclays Capital | | 71.70 | | 12/13/2018 | | 10,500,000 | | 6,017 | |
Japanese Yen
Contracts 42,850,000 Barclays Capital | | 110.25 | | 11/13/2018 | | 42,850,000 | | 27,838 | |
Japanese Yen Cross Currency,
Contracts 17,900,000 UBS Securities | EUR | 129.90 | | 1/10/2019 | | 17,900,000 | | 479,153 | |
Japanese Yen Cross Currency,
Contracts 17,800,000 J.P. Morgan Securities | EUR | 128.00 | | 1/25/2019 | | 17,800,000 | | 350,416 | |
Polish Zloty
Contracts 20,600,000 J.P. Morgan Securities | | 3.71 | | 1/15/2019 | | 20,600,000 | | 122,586 | |
South African Rand
Contracts 10,400,000 Citigroup | | 12.49 | | 12/6/2018 | | 10,400,000 | | 238 | |
Swedish Krona
Contracts 21,000,000 Barclays Capital | | 8.73 | | 12/20/2018 | | 21,000,000 | | 30,570 | |
Turkish Lira
Contracts 20,850,000 Goldman Sachs | | 4.50 | | 11/30/2018 | | 20,850,000 | | 537 | |
| | 1,054,343 | |
Total Options Purchased
(cost $4,446,856) | | 1,829,056 | |
Description | Yield at
Date of
Purchase (%) | | Maturity Date | | Principal Amount ($) | | | |
Short-Term Investments - 1.8% | | | | | |
U.S. Government Securities | | | | | |
U.S. Treasury Bills
(cost $17,823,036) | | 2.17 | | 1/3/2019 | | 17,890,000 | g,h | 17,820,654 | |
| | 7-Day
Yield (%) | | | | Shares | | | |
Investment Companies - 2.1% | | | | | |
Registered Investment Companies - 2.1% | | | | | |
Dreyfus Institutional Preferred Government Plus Money Market Fund
(cost $21,021,057) | | 2.21 | | | | 21,021,057 | i | 21,021,057 | |
21
STATEMENT OF INVESTMENTS (continued)
| | | | | | | | | | |
| |
Description | 7-Day
Yield (%) | | | | Shares | | Value ($) | |
Investment of Cash Collateral for Securities Loaned - .6% | | | | | |
Registered Investment Companies - .6% | | | | | |
Dreyfus Institutional Preferred Government Money Market Fund, Institutional Shares
(cost $5,673,690) | | 2.12 | | | | 5,673,690 | i | 5,673,690 | |
Total Investments (cost $1,039,410,035) | | 99.5% | 989,120,761 | |
Cash and Receivables (Net) | | 0.5% | 5,262,580 | |
Net Assets | | 100.0% | 994,383,341 | |
ARLLMONP—Argentina Blended Historical Policy Rate
BADLAR—Buenos Aires Interbank Offer Rate
EURIBOR—Euro Interbank Offered Rate
LIBOR—London Interbank Offered Rate
ARS—Argentine Peso
AUD—Australian Dollar
BRL—Brazilian Real
CAD—Canadian Dollar
CLP—Chilean Peso
EUR—Euro
GBP—British Pound
ILS—Israeli Shekel
JPY—Japanese Yen
NOK—Norwegian Krone
NZD—New Zealand Dollar
RUB—Russian Ruble
THB—Thai Baht
a Amount stated in U.S. Dollars unless otherwise noted above.
b Variable rate security—rate shown is the interest rate in effect at period end.
c Principal amount for accrual purposes is periodically adjusted based on changes in the Consumer Price Index.
d Security exempt from registration pursuant to Rule 144A under the Securities Act of 1933. These securities may be resold in transactions exempt from registration, normally to qualified institutional buyers. At October 31, 2018, these securities were valued at $214,640,433 or 21.59% of net assets.
e Security, or portion thereof, on loan. At October 31, 2018, the value of the fund’s securities on loan was $5,954,781 and the value of the collateral held by the fund was $6,295,844, consisting of cash collateral of $5,673,690 and U.S. Government & Agency securities valued at $622,154.
f The Federal Housing Finance Agency (“FHFA”) placed the Federal Home Loan Mortgage Corporation and Federal National Mortgage Association into conservatorship with FHFA as the conservator. As such, the FHFA oversees the continuing affairs of these companies.
g Held by a counterparty for open exchange traded derivative contracts.
h Security is a discount security. Income is recognized through the accretion of discount.
i Investment in affiliated issuer. The investment objective of this investment company is publicly available and can be found within the investment company’s prospectus.
22
| | |
Portfolio Summary (Unaudited) † | Value (%) |
Foreign/Governmental | 63.7 |
Asset-Backed Ctfs./Auto Receivables | 9.3 |
Banks | 5.4 |
Asset-Backed Certificates | 3.5 |
Investment Companies | 2.7 |
Energy | 2.0 |
U.S. Treasury Bills | 1.8 |
Commercial Mortgage Pass-Through Ctfs. | 1.8 |
Real Estate | 1.1 |
Chemicals | .9 |
Asset-Backed Ctfs./Credit Cards | .9 |
Industrials | .9 |
Health Care | .8 |
Insurance | .8 |
Telecommunication Services | .6 |
Media | .4 |
Beverage Products | .3 |
Commercial & Professional Services | .3 |
Consumer Discretionary | .3 |
Technology Hardware & Equipment | .3 |
Diversified Financials | .3 |
Food Products | .2 |
Options Purchased | .2 |
Metals & Mining | .2 |
Agriculture | .2 |
Retailing | .1 |
Aerospace & Defense | .1 |
Automobiles & Components | .1 |
Asset-Backed Ctfs./Student Loans | .1 |
Information Technology | .1 |
Materials | .1 |
Internet Software & Services | .0 |
| | 99.5 |
† Based on net assets.
See notes to financial statements.
23
STATEMENT OF INVESTMENTS IN AFFILIATED ISSUERS
| | | | | | | |
Registered Investment Companies | Value
10/31/17($) | Purchases($) | Sales ($) | Value
10/31/18($) | Net
Assets(%) | Dividends/
Distributions($) |
Dreyfus Institutional Preferred Government Plus Money Market Fund | 5,395,977 | 671,837,268 | 656,212,188 | 21,021,057 | 2.1 | 311,842 |
Dreyfus Institutional Preferred Government Money Market Fund, Institutional Shares | 3,152,710 | 104,179,637 | 101,658,657 | 5,673,690 | .6 | – |
Total | 8,548,687 | 776,016,905 | 757,870,845 | 26,694,747 | 2.7 | 311,842 |
See notes to financial statements.
24
STATEMENT OF FUTURES
October 31, 2018
| | | | | | | |
Description | Number of
Contracts | Expiration | Notional
Value ($) | Value ($) | Unrealized Appreciation (Depreciation) ($) | |
Futures Long | | |
Euro 30 Year Bond | 90 | 12/18 | 18,018,725a | 18,032,921 | 14,196 | |
Euro BTP Italian Government Bond | 72 | 12/18 | 10,011,134a | 9,919,839 | (91,295) | |
Euro-Bond | 151 | 12/18 | 27,190,118a | 27,409,292 | 219,174 | |
Long Term French Government Future | 21 | 12/18 | 3,595,932a | 3,614,467 | 18,535 | |
U.S. Treasury 10 Year Notes | 90 | 12/18 | 10,710,136 | 10,659,375 | (50,761) | |
U.S. Treasury Ultra Long Bond | 49 | 12/18 | 7,369,981 | 7,311,719 | (58,262) | |
Futures Short | | |
Canadian 10 Year Bond | 20 | 12/18 | 2,042,124a | 2,007,672 | 34,452 | |
Euro-Bobl | 334 | 12/18 | 49,350,685a | 49,724,422 | (373,737) | |
Long Gilt | 107 | 12/18 | 16,776,624a | 16,741,697 | 34,927 | |
U.S. Treasury 5 Year Notes | 69 | 12/18 | 7,765,498 | 7,754,414 | 11,084 | |
Ultra 10 Year U.S. Treasury Notes | 9 | 12/18 | 1,138,798 | 1,125,984 | 12,814 | |
Gross Unrealized Appreciation | | 345,182 | |
Gross Unrealized Depreciation | | (574,055) | |
a Notional amounts in foreign currency have been converted to USD using relevant foreign exchange rates.
See notes to financial statements.
25
STATEMENT OF OPTIONS WRITTEN
October 31, 2018
| | | | | | | |
Description/ Contracts/ Counterparties | Exercise Price | Expiration Date | Notional Amount | | Value ($) | |
Call Options: | | | | | | |
Chilean Peso
Contracts 5,170,000, J.P. Morgan Securities | 690 | 1/17/19 | 5,170,000 | | (138,596) | |
Chilean Peso
Contracts 5,200,000, Citigroup | 690 | 12/21/18 | 5,200,000 | | (118,342) | |
Total Options Written (premiums received $136,927) | | | | (256,938) | |
See notes to financial statements.
26
STATEMENT OF FORWARD FOREIGN CURRENCY EXCHANGE CONTRACTS October 31, 2018
| | | | | | |
Counterparty/ Purchased
Currency | Purchased Currency
Amounts | Currency
Sold | Sold
Currency
Amounts | Settlement Date | Unrealized Appreciation (Depreciation)($) |
Barclays Capital | | | |
British Pound | 37,115,000 | United States Dollar | 47,936,063 | 11/30/18 | (432,575) |
Norwegian Krone | 37,865,000 | United States Dollar | 4,552,776 | 11/30/18 | (55,307) |
United States Dollar | 16,162,262 | Philippine Peso | 874,540,000 | 12/7/18 | (143,332) |
United States Dollar | 20,475,113 | Taiwan Dollar | 624,450,000 | 12/7/18 | 240,276 |
Indonesian Rupiah | 227,628,890,000 | United States Dollar | 14,650,290 | 12/7/18 | 250,333 |
Japanese Yen | 13,949,315,000 | United States Dollar | 124,785,327 | 11/30/18 | (889,982) |
United States Dollar | 2,739,242 | Japanese Yen | 307,280,000 | 11/30/18 | 10,035 |
Malaysian Ringgit | 14,200,000 | United States Dollar | 3,427,468 | 12/7/18 | (36,500) |
United States Dollar | 3,449,790 | Malaysian Ringgit | 14,200,000 | 12/7/18 | 58,822 |
Malaysian Ringgit | 8,915,000 | United States Dollar | 2,137,377 | 12/7/18 | (8,470) |
United States Dollar | 3,256,263 | Euro | 2,850,000 | 11/30/18 | 20,487 |
Mexican Peso | 470,160,000 | United States Dollar | 24,140,481 | 12/7/18 | (1,137,796) |
United States Dollar | 10,888,841 | Mexican Peso | 211,785,000 | 12/7/18 | 527,212 |
South Korean Won | 25,535,725,000 | United States Dollar | 23,049,387 | 12/7/18 | (617,288) |
United States Dollar | 9,499,633 | South Korean Won | 10,615,040,000 | 12/7/18 | 174,751 |
United States Dollar | 10,560,076 | Peruvian Nuevo Sol | 35,000,000 | 11/27/18 | 190,060 |
Israeli Shekel | 5,570,000 | United States Dollar | 1,556,561 | 12/7/18 | (54,727) |
United States Dollar | 6,824,474 | Russian Ruble | 475,700,000 | 12/7/18 | (362,791) |
Citigroup | | | |
United States Dollar | 13,827,130 | Brazilian Real | 56,750,000 | 12/4/18 | (1,372,106) |
United States Dollar | 43,218,975 | New Zealand Dollar | 66,025,000 | 11/30/18 | 121,816 |
Swedish Krona | 280,325,000 | United States Dollar | 30,942,189 | 11/30/18 | (233,857) |
United States Dollar | 923,821 | Czech Koruna | 20,570,000 | 12/7/18 | 23,561 |
27
STATEMENT OF FORWARD FOREIGN CURRENCY EXCHANGE CONTRACTS (continued)
| | | | | | |
Counterparty/ Purchased
Currency | Purchased Currency
Amounts | Currency
Sold | Sold
Currency
Amounts | Settlement Date | Unrealized Appreciation (Depreciation)($) |
Citigroup (continued) |
Czech Koruna | 296,830,000 | United States Dollar | 13,431,677 | 12/7/18 | (440,713) |
United States Dollar | 2,847,370 | Japanese Yen | 320,000,000 | 11/30/18 | 5,187 |
Canadian Dollar | 18,120,000 | United States Dollar | 13,863,280 | 11/30/18 | (91,667) |
Taiwan Dollar | 320,070,000 | United States Dollar | 10,511,503 | 12/7/18 | (139,873) |
Euro | 690,000 | United States Dollar | 787,290 | 11/30/18 | (3,892) |
Mexican Peso | 232,180,000 | United States Dollar | 11,882,148 | 12/7/18 | (522,689) |
United States Dollar | 39,579,179 | Australian Dollar | 55,885,000 | 11/30/18 | (8,637) |
Goldman Sachs | | | |
Brazilian Real | 32,270,000 | United States Dollar | 7,973,445 | 12/4/18 | 669,363 |
Japanese Yen | 330,270,000 | United States Dollar | 2,946,664 | 11/30/18 | (13,264) |
United States Dollar | 2,940,534 | Japanese Yen | 330,268,111 | 11/1/18 | 13,331 |
HSBC | | | |
Canadian Dollar | 1,480,000 | United States Dollar | 1,127,515 | 11/30/18 | (2,681) |
United States Dollar | 715,958 | Canadian Dollar | 940,000 | 11/30/18 | 1,537 |
Euro | 16,360,000 | United States Dollar | 18,603,068 | 11/30/18 | (28,578) |
United States Dollar | 2,981,641 | Romanian Leu | 11,900,000 | 12/7/18 | 93,950 |
J.P. Morgan Securities | | | |
Euro | 195,425,000 | United States Dollar | 222,871,464 | 11/30/18 | (993,736) |
United States Dollar | 4,710,827 | Euro | 4,130,000 | 11/30/18 | 21,790 |
Polish Zloty | 15,035,000 | United States Dollar | 4,047,433 | 12/7/18 | (125,572) |
Singapore Dollar | 18,975,000 | United States Dollar | 13,814,769 | 12/7/18 | (105,314) |
Taiwan Dollar | 304,380,000 | United States Dollar | 9,948,684 | 12/7/18 | (85,477) |
Brazilian Real | 18,500,000 | United States Dollar | 5,064,331 | 12/4/18 | (109,514) |
United States Dollar | 7,802,096 | Hungarian Forint | 2,200,035,000 | 12/7/18 | 105,563 |
Colombian Peso | 12,485,830,000 | United States Dollar | 4,009,000 | 12/7/18 | (137,321) |
United States Dollar | 8,636,136 | Romanian Leu | 34,510,000 | 12/7/18 | 261,832 |
28
| | | | | | |
Counterparty/ Purchased
Currency | Purchased Currency
Amounts | Currency
Sold | Sold
Currency
Amounts | Settlement Date | Unrealized Appreciation (Depreciation)($) |
J.P. Morgan Securities (continued) |
United States Dollar | 10,398,787 | Hong Kong Dollar | 81,000,000 | 4/10/19 | 37,232 |
Thai Baht | 49,710,000 | United States Dollar | 1,518,929 | 12/7/18 | (17,827) |
Czech Koruna | 455,665,000 | United States Dollar | 20,611,331 | 12/7/18 | (668,846) |
United States Dollar | 3,816,103 | Chilean Peso | 2,637,690,000 | 12/7/18 | 24,430 |
Merrill Lynch, Pierce, Fenner & Smith | | | |
United States Dollar | 25,568,606 | Mexican Peso | 485,870,000 | 12/7/18 | 1,797,306 |
Morgan Stanley | | | |
United States Dollar | 28,427,811 | Euro | 24,950,000 | 11/30/18 | 100,579 |
United States Dollar | 1,527,391 | British Pound | 1,190,000 | 11/30/18 | 4,310 |
United States Dollar | 610,311 | Japanese Yen | 68,710,000 | 11/30/18 | 41 |
UBS Securities | | | |
United States Dollar | 915,704 | Hungarian Forint | 261,060,000 | 12/7/18 | 2,420 |
United States Dollar | 1,806,710 | Euro | 1,590,000 | 11/30/18 | 1,488 |
Swiss Franc | 11,115,000 | United States Dollar | 11,201,464 | 11/30/18 | (135,486) |
United States Dollar | 1,711,940 | Malaysian Ringgit | 7,090,000 | 12/7/18 | 18,844 |
Gross Unrealized Appreciation | | | 4,776,556 |
Gross Unrealized Depreciation | | | (8,975,818) |
See notes to financial statements.
29
STATEMENT OF SWAP AGREEMENTS
October 31, 2018
| | | | | |
Centrally Cleared Interest Rate Swaps† | |
Received
Reference
Entity | Paid
Reference
Entity | Maturity Date | Notional
Amount | Unrealized Appreciation (Depreciation) ($) |
NZD Bank Bill 3 Month | NZD at 3.21 | 3/20/28 | 21,960,000 | (524,254) |
NZD Bank Bill 3 Month | NZD at 3.21 | 3/19/28 | 16,470,000 | (394,067) |
LIBOR USD Fix 3 Month | USD at 2.482 | 1/10/21 | 26,600,000 | 175,517 |
LIBOR USD Fix 3 Month | USD at 2.355 | 11/29/27 | 87,800,000 | 5,409,719 |
LIBOR USD Fix 3 Month | USD at 2.8205 | 4/19/23 | 60,000,000 | 756,022 |
ICE LIBOR GBP 6 Month | GBP at 1.075 | 12/12/22 | 35,350,000 | 397,527 |
LIBOR USD Fix 3 Month | USD at 1.7905 | 10/3/46 | 18,100,000 | 5,191,353 |
JPY at 0.08375 | Japanese Yen LIBOR 6 Month | 11/4/26 | 2,000,000,000 | (231,771) |
Gross Unrealized Appreciation | 11,930,138 |
Gross Unrealized Depreciation | (1,150,092) |
GBP—British Pound
JPY—Japanese Yen
NZD—New Zealand Dollar
USD—United States Dollar
See notes to financial statements.
| | | | | | |
OTC Credit Default Swaps | |
| | | | | | |
Reference
Obligation/
Counterparty | Maturity
Date | Notional
Amount | Market
Value ($) | Upfront
Payments/
Receipts ($) | Unrealized Appreciation ($) |
Purchased Contracts:1 | |
Goldman Sachs | | |
CDS CMBX BBB-CDSI Paid Fixed Rate of 3.00 1 Month | 11/17/59 | 5,330,000 | 387,408 | 328,349 | 54,617 |
Gross Unrealized Appreciation | 54,617 |
1 If the fund is a buyer of protection and a credit event occurs, as defined under the terms of the swap agreement, the fund will either (i) receive from the seller of protection an amount equal to the notional amount of the swap and deliver the reference obligation or (ii) receive a net settlement amount in the form of cash or securities equal to the notional amount of the swap less the recovery value of the reference obligation.
See notes to financial statements.
30
STATEMENT OF ASSETS AND LIABILITIES
October 31, 2018
| | | | | | | |
| | | | | | |
| | | Cost | | Value | |
Assets ($): | | | | |
Investments in securities—See Statement of Investments
(including securities on loan, valued at $5,954,781)—Note 1(c): | | | |
Unaffiliated issuers | 1,012,715,288 | | 962,426,014 | |
Affiliated issuers | | 26,694,747 | | 26,694,747 | |
Cash | | | | | 257,018 | |
Receivable for investment securities sold | | 22,810,258 | |
Interest and securities lending income receivable | | 6,420,944 | |
Cash collateral held by broker—Note 4 | | 4,920,558 | |
Unrealized appreciation on forward foreign
currency exchange contracts—Note 4 | | 4,776,556 | |
Receivable for shares of Beneficial Interest subscribed | | 840,779 | |
Receivable for swap variation margin—Note 4 | | 782,583 | |
Swap upfront payments—Note 4 | | 328,349 | |
Unrealized appreciation on swap agreements—Note 4 | | 54,617 | |
Receivable for futures variation margin—Note 4 | | 34,623 | |
Prepaid expenses | | | | | 52,460 | |
| | | | | 1,030,399,506 | |
Liabilities ($): | | | | |
Due to The Dreyfus Corporation and affiliates—Note 3(c) | | | | 531,205 | |
Cash overdraft due to Custodian
denominated in foreign currency | | | 12,000,305 | | 12,064,762 | |
Unrealized depreciation on forward foreign
currency exchange contracts—Note 4 | | 8,975,818 | |
Payable for shares of Beneficial Interest redeemed | | 5,871,798 | |
Liability for securities on loan—Note 1(c) | | 5,673,690 | |
Payable for investment securities purchased | | 2,222,812 | |
Outstanding options written, at value
(premiums received $136,927)—Note 4 | | 256,938 | |
Unrealized depreciation on foreign currency transactions | | 168,609 | |
Trustees fees and expenses payable | | 6,964 | |
Accrued expenses | | | | | 243,569 | |
| | | | | 36,016,165 | |
Net Assets ($) | | | 994,383,341 | |
Composition of Net Assets ($): | | | | |
Paid-in capital | | | | | 1,179,921,854 | |
Total distributable earnings (loss) | | | | | (185,538,513) | |
Net Assets ($) | | | 994,383,341 | |
| | | | | | |
Net Asset Value Per Share | Class A | Class C | Class I | Class Y | |
Net Assets ($) | 56,841,810 | 31,006,826 | 816,808,969 | 89,725,736 | |
Shares Outstanding | 3,870,777 | 2,170,992 | 55,019,784 | 6,040,532 | |
Net Asset Value Per Share ($) | 14.68 | 14.28 | 14.85 | 14.85 | |
| | | | | | |
See notes to financial statements. | | | | | |
31
STATEMENT OF OPERATIONS
Year Ended October 31, 2018
| | | | | | | |
| | | | | | |
| | | | | | |
Investment Income ($): | | | | |
Income: | | | | |
Interest (net of $51,565 foreign taxes withheld at source) | | | 35,935,221 | |
Dividends from affiliated issuers | | | 311,842 | |
Income from securities lending—Note 1(c) | | | 30,552 | |
Total Income | | | 36,277,615 | |
Expenses: | | | | |
Management fee—Note 3(a) | | | 4,999,810 | |
Shareholder servicing costs—Note 3(c) | | | 1,293,034 | |
Distribution fees—Note 3(b) | | | 277,373 | |
Custodian fees—Note 3(c) | | | 198,246 | |
Registration fees | | | 115,580 | |
Professional fees | | | 113,307 | |
Trustees’ fees and expenses—Note 3(d) | | | 75,794 | |
Prospectus and shareholders’ reports | | | 73,776 | |
Loan commitment fees—Note 2 | | | 22,796 | |
Miscellaneous | | | 109,709 | |
Total Expenses | | | 7,279,425 | |
Less—reduction in expenses due to undertaking—Note 3(a) | | | (206,728) | |
Less—reduction in fees due to earnings credits—Note 3(c) | | | (13,958) | |
Net Expenses | | | 7,058,739 | |
Investment Income—Net | | | 29,218,876 | |
Realized and Unrealized Gain (Loss) on Investments—Note 4 ($): | | |
Net realized gain (loss) on investments and foreign currency transactions | (27,200,030) | |
Net realized gain (loss) on options transactions | (3,071,308) | |
Net realized gain (loss) on futures | 7,467,906 | |
Net realized gain (loss) on swap agreements | 649,179 | |
Net realized gain (loss) on forward foreign currency exchange contracts | (15,034,109) | |
Net Realized Gain (Loss) | | | (37,188,362) | |
Net unrealized appreciation (depreciation) on investments
and foreign currency transactions | | | (52,643,306) | |
Net unrealized appreciation (depreciation) on options transactions | (2,670,788) | |
Net unrealized appreciation (depreciation) on futures | | | (1,174,426) | |
Net unrealized appreciation (depreciation) on swap agreements | | | 7,253,989 | |
Net unrealized appreciation (depreciation) on
forward foreign currency exchange contracts | | | (5,357,412) | |
Net Unrealized Appreciation (Depreciation) | | | (54,591,943) | |
Net Realized and Unrealized Gain (Loss) on Investments | | | (91,780,305) | |
Net (Decrease) in Net Assets Resulting from Operations | | (62,561,429) | |
| | | | | | | |
See notes to financial statements. | | | | | |
32
STATEMENT OF CHANGES IN NET ASSETS
| | | | | | | | | | |
| | | | Year Ended October 31, |
| | | | 2018 | | 2017a | |
Operations ($): | | | | | | | | |
Investment income—net | | | 29,218,876 | | | | 17,867,650 | |
Net realized gain (loss) on investments | | (37,188,362) | | | | 5,278,142 | |
Net unrealized appreciation (depreciation)
on investments | | (54,591,943) | | | | 19,904,462 | |
Net Increase (Decrease) in Net Assets
Resulting from Operations | (62,561,429) | | | | 43,050,254 | |
Distributions ($): | |
Distributions to shareholders: | | | | | | | | |
Class A | | | (3,020,977) | | | | (411,576) | |
Class C | | | (1,243,407) | | | | (29,428) | |
Class I | | | (31,731,051) | | | | (3,999,721) | |
Class Y | | | (3,600,418) | | | | (193,011) | |
Total Distributions | | | (39,595,853) | | | | (4,633,736) | |
Beneficial Interest Transactions ($): | |
Net proceeds from shares sold: | | | | | | | | |
Class A | | | 42,816,588 | | | | 17,511,978 | |
Class C | | | 10,823,366 | | | | 2,337,620 | |
Class I | | | 597,205,064 | | | | 293,795,259 | |
Class Y | | | 39,529,892 | | | | 50,743,112 | |
Distributions reinvested: | | | | | | | | |
Class A | | | 2,803,002 | | | | 387,398 | |
Class C | | | 957,269 | | | | 21,408 | |
Class I | | | 25,047,065 | | | | 2,821,805 | |
Class Y | | | 3,354,428 | | | | 161,297 | |
Cost of shares redeemed: | | | | | | | | |
Class A | | | (55,545,815) | | | | (82,294,814) | |
Class C | | | (15,526,244) | | | | (18,244,480) | |
Class I | | | (379,361,681) | | | | (370,202,569) | |
Class Y | | | (16,884,795) | | | | (12,722,167) | |
Increase (Decrease) in Net Assets
from Beneficial Interest Transactions | 255,218,139 | | | | (115,684,153) | |
Total Increase (Decrease) in Net Assets | 153,060,857 | | | | (77,267,635) | |
Net Assets ($): | |
Beginning of Period | | | 841,322,484 | | | | 918,590,119 | |
End of Period | | | 994,383,341 | | | | 841,322,484 | |
33
STATEMENT OF CHANGES IN NET ASSETS (continued)
| | | | | | | | | | |
| | | | Year Ended October 31, |
| | | | 2018 | | 2017a | |
Capital Share Transactions (Shares): | |
Class Ab | | | | | | | | |
Shares sold | | | 2,670,917 | | | | 1,149,634 | |
Shares issued for distributions reinvested | | | 177,789 | | | | 25,738 | |
Shares redeemed | | | (3,556,901) | | | | (5,452,850) | |
Net Increase (Decrease) in Shares Outstanding | (708,195) | | | | (4,277,478) | |
Class Cb,c | | | | | | | | |
Shares sold | | | 683,740 | | | | 152,474 | |
Shares issued for distributions reinvested | | | 62,308 | | | | 1,446 | |
Shares redeemed | | | (1,014,793) | | | | (1,221,137) | |
Net Increase (Decrease) in Shares Outstanding | (268,745) | | | | (1,067,217) | |
Class Ib,c | | | | | | | | |
Shares sold | | | 37,185,752 | | | | 18,946,781 | |
Shares issued for distributions reinvested | | | 1,574,262 | | | | 186,630 | |
Shares redeemed | | | (24,099,762) | | | | (23,930,735) | |
Net Increase (Decrease) in Shares Outstanding | 14,660,252 | | | | (4,797,324) | |
Class Yc | | | | | | | | |
Shares sold | | | 2,449,017 | | | | 3,242,658 | |
Shares issued for distributions reinvested | | | 210,669 | | | | 10,667 | |
Shares redeemed | | | (1,058,821) | | | | (806,817) | |
Net Increase (Decrease) in Shares Outstanding | 1,600,865 | | | | 2,446,508 | |
| | | | | | | | | | |
a | Distributions to shareholders include only distributions from net investment income. Undistributed investment income-net was $20,155,430 in 2017 and is no longer presented as a result of the adoption of SEC’s Disclosure Update and Simplification rule. | |
b | During the period ended October 31, 2018, 4,098 Class C shares representing $64,740 were automatically converted to 3,991 Class A shares and 9,222 Class I shares representing $140,730 were exchanged for 9,320 Class A shares. | |
c | During the period ended October 31, 2017, 379 Class C shares representing $5,415 were exchanged for 368 Class I shares and 5,730 Class Y shares representing $85,134 were exchanged for 5,730 Class I shares. | |
See notes to financial statements. | | | | | | | | |
34
FINANCIAL HIGHLIGHTS
The following tables describe the performance for each share class for the fiscal periods indicated. All information (except portfolio turnover rate) reflects financial results for a single fund share. Total return shows how much your investment in the fund would have increased (or decreased) during each period, assuming you had reinvested all dividends and distributions. These figures have been derived from the fund’s financial statements.
| | | | | | | | |
| | | |
| | Year Ended October 31, |
Class A Shares | | 2018 | 2017 | 2016 | 2015 | 2014 |
Per Share Data ($): | | | | | | |
Net asset value,
beginning of period | | 16.09 | 15.35 | 15.38 | 16.75 | 16.53 |
Investment Operations: | | | | | | |
Investment income—neta | | .41 | .25 | .19 | .31 | .39 |
Net realized and unrealized
gain (loss) on investments | | (1.17) | .54 | .30 | (1.03) | .06 |
Total from Investment Operations | | (.76) | .79 | .49 | (.72) | .45 |
Distributions: | | | | | | |
Dividends from Investment
income—net | | (.65) | (.05) | (.52) | (.65) | (.23) |
Dividends from net realized
gain on investments | | - | - | - | - | - |
Total Distributions | | (.65) | (.05) | (.52) | (.65) | (.23) |
Net asset value, end of period | | 14.68 | 16.09 | 15.35 | 15.38 | 16.75 |
Total Return (%)b | | (4.90) | 5.16 | 3.38 | (4.45) | 2.77 |
Ratios/Supplemental Data (%): | | | | | | |
Ratio of total expenses
to average net assets | | 1.29 | 1.35 | 1.23 | 1.12 | 1.08 |
Ratio of net expenses
to average net assets | | 1.02 | 1.35 | 1.23 | 1.12 | 1.08 |
Ratio of net investment income
to average net assets | | 2.59 | 1.64 | 1.27 | 1.93 | 2.31 |
Portfolio Turnover Rate | | 95.31 | 118.36 | 126.57 | 216.56 | 209.53 |
Net Assets, end of period
($ x 1,000) | | 56,842 | 73,657 | 135,947 | 215,337 | 319,588 |
a Based on average shares outstanding.
b Exclusive of sales charge.
See notes to financial statements.
35
FINANCIAL HIGHLIGHTS (continued)
| | | | | | | | |
| | | |
| | Year Ended October 31, |
Class C Shares | | 2018 | 2017 | 2016 | 2015 | 2014 |
Per Share Data ($): | | | | | | |
Net asset value,
beginning of period | | 15.67 | 14.97 | 15.05 | 16.39 | 16.17 |
Investment Operations: | | | | | | |
Investment income—neta | | .31 | .18 | .11 | .20 | .27 |
Net realized and unrealized
gain (loss) on investments | | (1.14) | .53 | .29 | (1.01) | .07 |
Total from Investment Operations | | (.83) | .71 | .40 | (.81) | .34 |
Distributions: | | | | | | |
Dividends from investment
income—net | | (.56) | (.01) | (.48) | (.53) | (.12) |
Dividends from net realized
gain on investments | | - | - | - | - | - |
Total Distributions | | (.56) | (.01) | (.48) | (.53) | (.12) |
Net asset value, end of period | | 14.28 | 15.67 | 14.97 | 15.05 | 16.39 |
Total Return (%)b | | (5.56) | 4.74 | 2.78 | (5.09) | 2.09 |
Ratios/Supplemental Data (%): | | | | | | |
Ratio of total expenses
to average net assets | | 1.65 | 1.79 | 1.78 | 1.77 | 1.76 |
Ratio of net expenses
to average net assets | | 1.65 | 1.79 | 1.78 | 1.77 | 1.76 |
Ratio of net investment income
to average net assets | | 1.99 | 1.20 | .71 | 1.29 | 1.63 |
Portfolio Turnover Rate | | 95.31 | 118.36 | 126.57 | 216.56 | 209.53 |
Net Assets, end of period
($ x 1,000) | | 31,007 | 38,224 | 52,516 | 69,609 | 104,681 |
a Based on average shares outstanding.
b Exclusive of sales charge.
See notes to financial statements.
36
| | | | | | | | | |
| | | |
| | Year Ended October 31, |
Class I Shares | | 2018 | 2017 | 2016 | 2015 | 2014 |
Per Share Data ($): | | | | | | |
Net asset value,
beginning of period | | 16.28 | 15.48 | 15.48 | 16.86 | 16.65 |
Investment Operations: | | | | | | |
Investment income—neta | | .49 | .35 | .27 | .38 | .44 |
Net realized and unrealized
gain (loss) on investments | | (1.18) | .54 | .29 | (1.04) | .07 |
Total from Investment Operations | | (.69) | .89 | .56 | (.66) | .51 |
Distributions: | | | | | | |
Dividends from Investment
income—net | | (.74) | (.09) | (.56) | (.72) | (.30) |
Dividends from net realized
gain on investments | | - | - | - | - | - |
Total Distributions | | (.74) | (.09) | (.56) | (.72) | (.30) |
Net asset value, end of period | | 14.85 | 16.28 | 15.48 | 15.48 | 16.86 |
Total Return (%) | | (4.53) | 5.73 | 3.90 | (4.07) | 3.08 |
Ratios/Supplemental Data (%): | | | | | | |
Ratio of total expenses
to average net assets | | .63 | .75 | .75 | .74 | .75 |
Ratio of net expenses
to average net assets | | .63 | .75 | .75 | .74 | .75 |
Ratio of net investment income
to average net assets | | 3.09 | 2.23 | 1.74 | 2.32 | 2.65 |
Portfolio Turnover Rate | | 95.31 | 118.36 | 126.57 | 216.56 | 209.53 |
Net Assets, end of period
($ x 1,000) | | 816,809 | 657,117 | 699,253 | 818,322 | 1,230,266 |
a Based on average shares outstanding.
See notes to financial statements.
37
FINANCIAL HIGHLIGHTS (continued)
| | | | | | | | | |
| | | | |
| | | Year Ended October 31, |
Class Y Shares | | 2018 | 2017 | 2016 | 2015 | 2014 |
Per Share Data ($): | | | | | | |
Net asset value,
beginning of period | | 16.29 | 15.49 | 15.48 | 16.86 | 16.65 |
Investment Operations: | | | | | | |
Investment income—neta | | .50 | .37 | .28 | .39 | .47 |
Net realized and unrealized
gain (loss) on investments | | (1.19) | .53 | .30 | (1.03) | .05 |
Total from Investment Operations | | (.69) | .90 | .58 | (.64) | .52 |
Distributions: | | | | | | |
Dividends from Investment
income—net | | (.75) | (.10) | (.57) | (.74) | (.31) |
Net asset value, end of period | | 14.85 | 16.29 | 15.49 | 15.48 | 16.86 |
Total Return (%) | | (4.52) | 5.85 | 3.94 | (3.98) | 3.13 |
Ratios/Supplemental Data (%): | | | | | | |
Ratio of total expenses
to average net assets | | .56 | .68 | .67 | .67 | .68 |
Ratio of net expenses
to average net assets | | .56 | .68 | .67 | .67 | .68 |
Ratio of net investment income
to average net assets | | 3.14 | 2.30 | 1.82 | 2.39 | 2.71 |
Portfolio Turnover Rate | | 95.31 | 118.36 | 126.57 | 216.56 | 209.53 |
Net Assets, end of period
($ x 1,000) | | 89,726 | 72,325 | 30,875 | 31,290 | 30,278 |
a Based on average shares outstanding.
See notes to financial statements.
38
NOTES TO FINANCIAL STATEMENTS
NOTE 1—Significant Accounting Policies:
Dreyfus International Bond Fund (the “fund”) is a separate non-diversified series of The Dreyfus/Laurel Funds Trust (the “Trust”), which is registered under the Investment Company Act of 1940, as amended (the “Act”), as an open-end management investment company and operates as a series company currently offering four series, including the fund. The fund’s investment objective is to seek to maximize total return through capital appreciation and income. The Dreyfus Corporation (the “Manager” or “Dreyfus”), a wholly-owned subsidiary of The Bank of New York Mellon Corporation (“BNY Mellon”), serves as the fund’s investment adviser.
MBSC Securities Corporation (the “Distributor”), a wholly-owned subsidiary of Dreyfus, is the distributor of the fund’s shares. The fund is authorized to issue an unlimited number of $.001 par value shares of Beneficial Interest in each of the following classes of shares: Class A, Class C, Class I, Class T and Class Y. Class A, Class C and Class T shares are sold primarily to retail investors through financial intermediaries and bear Distribution and/or Shareholder Services Plan fees. Class A and Class T shares generally are subject to a sales charge imposed at the time of purchase. Class C shares are subject to a contingent deferred sales charge (“CDSC”) imposed on Class C shares redeemed within one year of purchase. Class C shares automatically convert to Class A shares ten years after the date of purchase, without the imposition of a sales charge. Class I shares are sold primarily to bank trust departments and other financial service providers (including The Bank of New York Mellon, a subsidiary of BNY Mellon and an affiliate of Dreyfus, and its affiliates), acting on behalf of customers having a qualified trust or an investment account or relationship at such institution, and bear no Distribution or Shareholder Services Plan fees. Class Y shares are sold at net asset value per share generally to institutional investors, and bear no Distribution or Shareholder Services Plan fees. Class I and Class Y shares are offered without a front-end sales charge or CDSC. As of the date of this report, the fund did not offer Class T shares for purchase. Other differences between the classes include the services offered to and the expenses borne by each class, the allocation of certain transfer agency costs, and certain voting rights. Income, expenses (other than expenses attributable to a specific class), and realized and unrealized gains or losses on investments are allocated to each class of shares based on its relative net assets.
39
NOTES TO FINANCIAL STATEMENTS (continued)
The Trust accounts separately for the assets, liabilities and operations of each series. Expenses directly attributable to each series are charged to that series’ operations; expenses which are applicable to all series are allocated among them on a pro rata basis.
The Financial Accounting Standards Board (“FASB”) Accounting Standards Codification (“ASC”) is the exclusive reference of authoritative U.S. generally accepted accounting principles (“GAAP”) recognized by the FASB to be applied by nongovernmental entities. Rules and interpretive releases of the Securities and Exchange Commission (“SEC”) under authority of federal laws are also sources of authoritative GAAP for SEC registrants. The fund’s financial statements are prepared in accordance with GAAP, which may require the use of management estimates and assumptions. Actual results could differ from those estimates.
(a) Portfolio valuation: The fair value of a financial instrument is the amount that would be received to sell an asset or paid to transfer a liability in an orderly transaction between market participants at the measurement date (i.e., the exit price). GAAP establishes a fair value hierarchy that prioritizes the inputs of valuation techniques used to measure fair value. This hierarchy gives the highest priority to unadjusted quoted prices in active markets for identical assets or liabilities (Level 1 measurements) and the lowest priority to unobservable inputs (Level 3 measurements).
Additionally, GAAP provides guidance on determining whether the volume and activity in a market has decreased significantly and whether such a decrease in activity results in transactions that are not orderly. GAAP requires enhanced disclosures around valuation inputs and techniques used during annual and interim periods.
Various inputs are used in determining the value of the fund’s investments relating to fair value measurements. These inputs are summarized in the three broad levels listed below:
Level 1—unadjusted quoted prices in active markets for identical investments.
Level 2—other significant observable inputs (including quoted prices for similar investments, interest rates, prepayment speeds, credit risk, etc.).
Level 3—significant unobservable inputs (including the fund’s own assumptions in determining the fair value of investments).
The inputs or methodology used for valuing securities are not necessarily an indication of the risk associated with investing in those securities.
40
Changes in valuation techniques may result in transfers in or out of an assigned level within the disclosure hierarchy. Valuation techniques used to value the fund’s investments are as follows:
Registered investment companies that are not traded on an exchange are valued at their net asset value and are generally categorized within Level 1 of the fair value hierarchy.
Investments in securities, excluding short-term investments (other than U.S. Treasury Bills), futures, options and forward foreign currency exchange contracts (“forward contracts”) are valued each business day by an independent pricing service (the “Service”) approved by the Trust’s Board of Trustees (the “Board”). Investments for which quoted bid prices are readily available and are representative of the bid side of the market in the judgment of the Service are valued at the mean between the quoted bid prices (as obtained by the Service from dealers in such securities) and asked prices (as calculated by the Service based upon its evaluation of the market for such securities). Other investments (which constitute a majority of the portfolio securities) are valued as determined by the Service, based on methods which include consideration of the following: yields or prices of securities of comparable quality, coupon, maturity and type; indications as to values from dealers; and general market conditions. These securities are generally categorized within Level 2 of the fair value hierarchy.
U.S. Treasury Bills are valued at the mean price between quoted bid prices and asked prices by the Service. These securities are generally categorized within Level 2 of the fair value hierarchy.
The Service is engaged under the general supervision of the Board.
When market quotations or official closing prices are not readily available, or are determined not to accurately reflect fair value, such as when the value of a security has been significantly affected by events after the close of the exchange or market on which the security is principally traded (for example, a foreign exchange or market), but before the fund calculates its net asset value, the fund may value these investments at fair value as determined in accordance with the procedures approved by the Board. Certain factors may be considered when fair valuing investments such as: fundamental analytical data, the nature and duration of restrictions on disposition, an evaluation of the forces that influence the market in which the securities are purchased and sold, and public trading in similar securities of the issuer or comparable issuers. These securities are either categorized within Level 2 or 3 of the fair value hierarchy depending on the relevant inputs used.
41
NOTES TO FINANCIAL STATEMENTS (continued)
For restricted securities where observable inputs are limited, assumptions about market activity and risk are used and such securities are generally categorized within Level 3 of the fair value hierarchy.
Investments denominated in foreign currencies are translated to U.S. dollars at the prevailing rates of exchange.
Futures and options, which are traded on an exchange, are valued at the last sales price on the securities exchange on which such securities are primarily traded or at the last sales price on the national securities market on each business day and are generally categorized within Level 1 of the fair value hierarchy. Options traded over-the-counter (“OTC”) are valued at the mean between the bid and asked price and are generally categorized within Level 2 of the fair value hierarchy. Investments in swap agreements are valued each business day by the Service. Swaps are valued by the Service by using a swap pricing model which incorporates among other factors, default probabilities, recovery rates, credit curves of the underlying issuer and swap spreads on interest rates and are generally categorized within Level 2 of the fair value hierarchy. Forward contracts are valued at the forward rate and are generally categorized within Level 2 of the fair value hierarchy.
The following is a summary of the inputs used as of October 31, 2018 in valuing the fund’s investments:
| | | | | |
| | Level 1 - Unadjusted Quoted Prices | Level 2 - Other Significant Observable Inputs | Level 3 -Significant Unobservable Inputs | Total |
Assets ($) | | | | |
Investments in Securities: | | | |
Asset-Backed | - | 136,844,555 | - | 136,844,555 |
Commercial Mortgage-Backed | - | 17,482,131 | - | 17,482,131 |
Corporate Bonds | - | 155,389,824 | - | 155,389,824 |
Foreign Government | - | 633,059,794 | - | 633,059,794 |
Investment Companies | 26,694,747 | - | - | 26,694,747 |
U.S. Treasury | - | 17,820,654 | - | 17,820,654 |
42
| | | | | |
| | Level 1 - Unadjusted Quoted Prices | Level 2 - Other Significant Observable Inputs | Level 3 -Significant Unobservable Inputs | Total |
Assets ($) | | | | |
Other Financial Instruments: | | | | |
Futures† | 345,182 | - | - | 345,182 |
Forward Foreign Currency Exchange Contracts† | - | 4,776,556 | - | 4,776,556 |
Options Purchased | - | 1,829,056 | - | 1,829,056 |
Swaps† | - | 11,984,755 | - | 11,984,755 |
Liabilities ($) | | | | |
Other Financial Instruments: | | | | |
Futures† | (574,055) | - | - | (574,055) |
Forward Foreign Currency Exchange Contracts† | - | (8,975,818) | - | (8,975,818) |
Options Written | - | (256,938) | - | (256,938) |
Swaps† | - | (1,150,092) | - | (1,150,092) |
† Amount shown represents unrealized appreciation (depreciation) at period end, but only variation margin on exchanged traded and centrally cleared derivatives are reported in the Statement of Assets and Liabilities.
At October 31, 2018, there were no transfers between levels of the fair value hierarchy. It is the fund’s policy to recognize transfers between levels at the end of the reporting period.
(b) Foreign currency transactions: The fund does not isolate that portion of the results of operations resulting from changes in foreign exchange rates on investments from the fluctuations arising from changes in the market prices of securities held. Such fluctuations are included with the net realized and unrealized gain or loss on investments.
Net realized foreign exchange gains or losses arise from sales of foreign currencies, currency gains or losses realized on securities transactions between trade and settlement date, and the difference between the amounts of dividends, interest and foreign withholding taxes recorded on the fund’s books and the U.S. dollar equivalent of the amounts actually received or paid. Net unrealized foreign exchange gains and losses arise from changes in the value of assets and liabilities other than investments resulting from changes in exchange rates. Foreign currency gains and losses
43
NOTES TO FINANCIAL STATEMENTS (continued)
on foreign currency transactions are also included with net realized and unrealized gain or loss on investments.
(c) Securities transactions and investment income: Securities transactions are recorded on a trade date basis. Realized gains and losses from securities transactions are recorded on the identified cost basis. Dividend income is recognized on the ex-dividend date and interest income, including, where applicable, accretion of discount and amortization of premium on investments, is recognized on the accrual basis.
Pursuant to a securities lending agreement with The Bank of New York Mellon, the fund may lend securities to qualified institutions. It is the fund’s policy that, at origination, all loans are secured by collateral of at least 102% of the value of U.S. securities loaned and 105% of the value of foreign securities loaned. Collateral equivalent to at least 100% of the market value of securities on loan is maintained at all times. Collateral is either in the form of cash, which can be invested in certain money market mutual funds managed by Dreyfus, or U.S. Government and Agency securities. The fund is entitled to receive all dividends, interest and distributions on securities loaned, in addition to income earned as a result of the lending transaction. Should a borrower fail to return the securities in a timely manner, The Bank of New York Mellon is required to replace the securities for the benefit of the fund or credit the fund with the market value of the unreturned securities and is subrogated to the fund’s rights against the borrower and the collateral. Additionally, the contractual maturity of security lending transactions are on an overnight and continuous basis. During the period ended October 31, 2018, The Bank of New York Mellon earned $5,855 from lending portfolio securities, pursuant to the securities lending agreement.
(d) Affiliated issuers: Investments in other investment companies advised by Dreyfus are considered “affiliated” under the Act.
(e) Risk: Investing in foreign markets may involve special risks and considerations not typically associated with investing in the U.S. These risks include revaluation of currencies, high rates of inflation, repatriation restrictions on income and capital, and adverse political and economic developments. Moreover, securities issued in these markets may be less liquid, subject to government ownership controls and delayed settlements, and their prices may be more volatile than those of comparable securities in the U.S.
The fund invests primarily in debt securities. Failure of an issuer of the debt securities to make timely interest or principal payments, or a decline
44
or the perception of a decline in the credit quality of a debt security, can cause the debt security’s price to fall, potentially lowering the fund’s share price. In addition, the value of debt securities may decline due to general market conditions that are not specifically related to a particular issuer, such as real or perceived adverse economic conditions, changes in outlook for corporate earnings, changes in interest or currency rates or adverse investor sentiment. Such values may also decline because of factors that affect a particular industry or country.
(f) Dividends and distributions to shareholders: Dividends and distributions are recorded on the ex-dividend date. Dividends from investment income-net are normally declared and paid quarterly. Dividends from net realized capital gains, if any, are normally declared and paid annually, but the fund may make distributions on a more frequent basis to comply with the distribution requirements of the Internal Revenue Code of 1986, as amended (the “Code”). To the extent that net realized capital gains can be offset by capital loss carryovers, it is the policy of the fund not to distribute such gains. Income and capital gain distributions are determined in accordance with income tax regulations, which may differ from GAAP.
On October 31, 2018, the Board declared a cash dividend of $.059, $.036, $.076 and $.079 per share from undistributed investment income-net for Class A, Class C, Class I and Class Y shares, respectively, payable on November 2, 2018, to shareholders of record as of the close of business on October 31, 2018. The ex-dividend date was November 1, 2018.
(g) Federal income taxes: It is the policy of the fund to continue to qualify as a regulated investment company, if such qualification is in the best interests of its shareholders, by complying with the applicable provisions of the Code, and to make distributions of taxable income and net realized capital gain sufficient to relieve it from substantially all federal income and excise taxes.
As of and during the period ended October 31, 2018, the fund did not have any liabilities for any uncertain tax positions. The fund recognizes interest and penalties, if any, related to uncertain tax positions as income tax expense in the Statement of Operations. During the period ended October 31, 2018, the fund did not incur any interest or penalties.
Each tax year in the four-year period ended October 31, 2018 remains subject to examination by the Internal Revenue Service and state taxing authorities.
At October 31, 2018, the components of accumulated earnings on a tax basis were as follows: undistributed ordinary income $19,822,159,
45
NOTES TO FINANCIAL STATEMENTS (continued)
accumulated capital losses $164,428,815 and unrealized depreciation $40,931,857.
The fund is permitted to carry forward capital losses for an unlimited period. Furthermore, capital loss carryovers retain their character as either short-term or long-term capital losses.
The accumulated capital loss carryover is available for federal income tax purposes to be applied against future net realized capital gains, if any, realized subsequent to October 31, 2018. The fund has $97,939,645 of short-term capital losses and $66,489,170 of long-term capital losses which can be carried forward for an unlimited period.
The tax character of distributions paid to shareholders during the fiscal periods ended October 31, 2018 and October 31, 2017 were as follows: ordinary income $39,595,853 and $4,633,736, respectively.
During the period ended October 31, 2018, as a result of permanent book to tax differences, primarily due to the tax treatment for paydown gains and losses, swap periodic payments, foreign currency gains and losses and consent fees, the fund increased total distributable earnings (loss) by $760,405 and decreased paid-in capital by the same amount. Net assets and net asset value per share were not affected by this reclassification.
(h) New Accounting Pronouncements: In March 2017, the FASB issued Accounting Standards Update 2017-08, Receivables—Nonrefundable Fees and Other Costs (Subtopic 310-20): Premium Amortization On Purchased Callable Debt Securities (“ASU 2017-08”). The update shortens the amortization period for the premium on certain purchased callable debt securities to the earliest call date. ASU 2017-08 will be effective for annual periods beginning after December 15, 2018.
Also in August 2018, the FASB issued Accounting Standards Update 2018-13, Fair Value Measurement (Topic 820): Disclosure Framework—Changes to the Disclosure Requirements for Fair Value Measurement (“ASU 2018-13”). The update provides guidance that eliminates, adds and modifies certain disclosure requirements for fair value measurements. ASU 2018-13 will be effective for annual periods beginning after December 15, 2019. Management is currently assessing the potential impact of these changes to future financial statements.
NOTE 2—Bank Lines of Credit:
The fund participates with other Dreyfus-managed funds in an $830 million unsecured credit facility led by Citibank, N.A. and a $300 million unsecured credit facility provided by The Bank of New York Mellon (each, a “Facility”), each to be utilized primarily for temporary or emergency
46
purposes, including the financing of redemptions. In connection therewith, the fund has agreed to pay its pro rata portion of commitment fees for each Facility. Interest is charged to the fund based on rates determined pursuant to the terms of the respective Facility at the time of borrowing. During the period ended October 31, 2018, the fund did not borrow under the Facilities.
NOTE 3—Management Fee and Other Transactions with Affiliates:
(a) Pursuant to a management agreement with the Dreyfus and the Trust, the Trust has agreed to pay Dreyfus a management fee computed at the annual rate of .50% of the value of the fund’s average daily net assets and is payable monthly. Dreyfus has contractually agreed, from November 1, 2017 through March 1, 2019, to waive receipt of its fees and/or assume the direct expenses of the Class A shares of the fund so that the expenses of such Class A shares (excluding Shareholder Services Plan fees, taxes, interest expense, brokerage commissions, commitment fees on borrowing and extraordinary expenses) do not exceed .77% of the value of the fund’s average daily net assets. On or after March 1, 2019, Dreyfus may terminate this expense limitation at any time. The reduction in expenses, pursuant to the undertaking, amounted to $206,728 during the period ended October 31, 2018.
During the period ended October 31, 2018, the Distributor retained $3,410 from commissions earned on sales of the fund’s Class A shares and $3,204 from CDSC fees on redemptions of the fund’s Class C shares.
(b) Under the Distribution Plan adopted pursuant to Rule 12b-1 under the Act, Class C shares pay the Distributor for distributing its shares at an annual rate of .75% of the value of its average daily net assets. During the period ended October 31, 2018, Class C shares were charged $277,373 pursuant to the Distribution Plan.
(c) Under the Shareholder Services Plan, Class A and Class C shares pay the Distributor at an annual rate of .25% of the value of their average daily net assets for the provision of certain services. The services provided may include personal services relating to shareholder accounts, such as answering shareholder inquiries regarding the fund and providing reports and other information, and services related to the maintenance of shareholder accounts. The Distributor may make payments to Service Agents (securities dealers, financial institutions or other industry professionals) with respect to these services. The Distributor determines the amounts to be paid to Service Agents. During the period ended
47
NOTES TO FINANCIAL STATEMENTS (continued)
October 31, 2018, Class A and Class C shares were charged $189,465 and $92,457, respectively, pursuant to the Shareholder Services Plan.
Under its terms, the Distribution Plan and Shareholder Services Plan shall remain in effect from year to year, provided such continuance is approved annually by a vote of a majority of those Trustees who are not “interested persons” of the Trust and who have no direct or indirect financial interest in the operation of or in any agreement related to the Distribution Plan or Shareholder Services Plan.
The fund has arrangements with the transfer agent and the custodian whereby the fund may receive earnings credits when positive cash balances are maintained, which are used to offset transfer agency and custody fees. For financial reporting purposes, the fund includes net earnings credits, if any, as an expense offset in the Statement of Operations.
The fund compensates Dreyfus Transfer, Inc., a wholly-owned subsidiary of Dreyfus, under a transfer agency agreement for providing transfer agency and cash management services for the fund. The majority of transfer agency fees are comprised of amounts paid on a per account basis, while cash management fees are related to fund subscriptions and redemptions. During the period ended October 31, 2018, the fund was charged $81,270 for transfer agency services. These fees are included in Shareholder servicing costs in the Statement of Operations.
The fund compensates The Bank of New York Mellon under a custody agreement for providing custodial services for the fund. These fees are determined based on net assets, geographic region and transaction activity. During the period ended October 31, 2018, the fund was charged $198,246 pursuant to the custody agreement. These fees were partially offset by earnings credits of $13,958.
During the period ended October 31, 2018, the fund was charged $12,797 for services performed by the Chief Compliance Officer and his staff. These fees are included in Miscellaneous in the Statement of Operations.
The components of “Due to The Dreyfus Corporation and affiliates” in the Statement of Assets and Liabilities consist of: management fees $435,467, Distribution Plan fees $20,267, Shareholder Services Plan fees $19,492, custodian fees $83,000, Chief Compliance Officer fees $4,193 and transfer agency fees $16,083, which are offset against an expense reimbursement currently in effect in the amount of $47,297.
(d) Each Board member also serves as a Board member of other funds within the Dreyfus complex. Annual retainer fees and attendance fees are allocated to each fund based on net assets.
48
NOTE 4—Securities Transactions:
The aggregate amount of purchases and sales (including paydowns) of investment securities, excluding short-term securities, futures, options transactions, forward contracts and swap agreements, during the period ended October 31, 2018, amounted to $1,138,846,458 and $905,532,794, respectively.
Derivatives: A derivative is a financial instrument whose performance is derived from the performance of another asset. The fund enters into International Swaps and Derivatives Association, Inc. Master Agreements or similar agreements (collectively, “Master Agreements”) with its OTC derivative contract counterparties in order to, among other things, reduce its credit risk to counterparties. Master Agreements include provisions for general obligations, representations, collateral and events of default or termination. Under a Master Agreement, the fund may offset with the counterparty certain derivative financial instrument’s payables and/or receivables with collateral held and/or posted and create one single net payment in the event of default or termination.
Each type of derivative instrument that was held by the fund during the period ended October 31, 2018 is discussed below.
Futures: In the normal course of pursuing its investment objective, the fund is exposed to market risk, including interest rate risk, as a result of changes in value of underlying financial instruments. The fund invests in futures in order to manage its exposure to or protect against changes in the market. A futures contract represents a commitment for the future purchase or a sale of an asset at a specified date. Upon entering into such contracts, these investments require initial margin deposits with a counterparty, which consist of cash or cash equivalents. The amount of these deposits is determined by the exchange or Board of Trade on which the contract is traded and is subject to change. Accordingly, variation margin payments are received or made to reflect daily unrealized gains or losses which are recorded in the Statement of Operations. When the contracts are closed, the fund recognizes a realized gain or loss which is reflected in the Statement of Operations. There is minimal counterparty credit risk to the fund with futures since they are exchange traded, and the exchange guarantees the futures against default. Futures open at October 31, 2018 are set forth in the Statement of Futures.
Options Transactions: The fund purchases and writes (sells) put and call options to hedge against changes in the values of foreign currencies and interest rate, or as a substitute for an investment. The fund is subject to market risk , currency risk and interest rate risk in the course of pursuing
49
NOTES TO FINANCIAL STATEMENTS (continued)
its investment objectives through its investments in options contracts. A call option gives the purchaser of the option the right (but not the obligation) to buy, and obligates the writer to sell, the underlying financial instrument at the exercise price at any time during the option period, or at a specified date. Conversely, a put option gives the purchaser of the option the right (but not the obligation) to sell, and obligates the writer to buy the underlying financial instrument at the exercise price at any time during the option period, or at a specified date.
As a writer of call options, the fund receives a premium at the outset and then bears the market risk of unfavorable changes in the price of the financial instrument underlying the option. Generally, the fund realizes a gain, to the extent of the premium, if the price of the underlying financial instrument decreases between the date the option is written and the date on which the option is terminated. Generally, the fund incurs a loss if the price of the financial instrument increases between those dates. The maximum payout for those contracts is limited to the number of call option contracts written and the related strike prices, respectively.
As a writer of put options, the fund receives a premium at the outset and then bears the market risk of unfavorable changes in the price of the financial instrument underlying the option. Generally, the fund realizes a gain, to the extent of the premium, if the price of the underlying financial instrument increases between the date the option is written and the date on which the option is terminated. Generally, the fund incurs a loss if the price of the financial instrument decreases between those dates. The maximum payout for those contracts is limited to the number of put option contracts written and the related strike prices, respectively.
As a writer of an option, the fund has no control over whether the underlying financial instrument may be sold (call) or purchased (put) and as a result bears the market risk of an unfavorable change in the price of the financial instrument underlying the written option. There is a risk of loss from a change in value of such options which may exceed the related premiums received. This risk is mitigated by Master Agreements between the fund and the counterparty and the posting of collateral, if any, by the counterparty to the fund to cover the fund’s exposure to the counterparty. The Statement of Operations reflects any unrealized gains or losses which occurred during the period as well as any realized gains or losses which occurred upon the expiration or closing of the option transaction. Options written open at October 31, 2018 are set forth in the Statement of Options Written.
Forward Foreign Currency Exchange Contracts: The fund enters into forward contracts in order to hedge its exposure to changes in foreign
50
currency exchange rates on its foreign portfolio holdings, to settle foreign currency transactions or as a part of its investment strategy. When executing forward contracts, the fund is obligated to buy or sell a foreign currency at a specified rate on a certain date in the future. With respect to sales of forward contracts, the fund incurs a loss if the value of the contract increases between the date the forward contract is opened and the date the forward contract is closed. The fund realizes a gain if the value of the contract decreases between those dates. With respect to purchases of forward contracts, the fund incurs a loss if the value of the contract decreases between the date the forward contract is opened and the date the forward contract is closed. The fund realizes a gain if the value of the contract increases between those dates. Any realized or unrealized gains or losses which occurred during the period are reflected in the Statement of Operations. The fund is exposed to foreign currency risk as a result of changes in value of underlying financial instruments. The fund is also exposed to credit risk associated with counterparty nonperformance on these forward contracts, which is generally limited to the unrealized gain on each open contract. This risk may be mitigated by Master Agreements, if any, between the fund and the counterparty and the posting of collateral, if any, by the counterparty to the fund to cover the fund’s exposure to the counterparty. Forward contracts open at October 31, 2018 are set forth in the Statement of Forward Foreign Currency Exchange Contracts.
Swap Agreements: The fund enters into swap agreements to exchange the interest rate on, or return generated by, one nominal instrument for the return generated by another nominal instrument. Swap agreements are privately negotiated in the OTC market or centrally cleared. The fund enters into these agreements to hedge certain market or interest rate risks, to manage the interest rate sensitivity (sometimes called duration) of fixed income securities, to provide a substitute for purchasing or selling particular securities or to increase potential returns.
For OTC swaps, the fund accrues for interim payments on a daily basis, with the net amount recorded within unrealized appreciation (depreciation) on swap agreements in the Statement of Assets and Liabilities. Once the interim payments are settled in cash, the net amount is recorded as a realized gain (loss) on swaps, in addition to realized gain (loss) recorded upon the termination of swap agreements in the Statement of Operations. Upfront payments made and/or received by the fund, are recorded as an asset and/or liability in the Statement of Assets and Liabilities and are recorded as a realized gain or loss ratably over the agreement’s term/event with the exception of forward starting interest rate swaps which are recorded as realized gains or losses on the termination date.
51
NOTES TO FINANCIAL STATEMENTS (continued)
Upon entering into centrally cleared swap agreements, an initial margin deposit is required with a counterparty, which consists of cash or cash equivalents. The amount of these deposits is determined by the exchange on which the agreement is traded and is subject to change. The change in valuation of centrally cleared swaps is recorded as a receivable or payable for variation margin in the Statement of Assets and Liabilities. Payments received from (paid to) the counterparty, including upon termination, are recorded as realized gain (loss) in the Statement of Operations.
Fluctuations in the value of swap agreements are recorded for financial statement purposes as unrealized appreciation or depreciation on swap agreements.
Interest Rate Swaps: Interest rate swaps involve the exchange of commitments to pay and receive interest based on a notional principal amount. The fund may elect to pay a fixed rate and receive a floating rate, or receive a fixed rate and pay a floating rate on a notional principal amount. The net interest received or paid on interest rate swap agreements is included within realized gain (loss) on swap agreements in the Statement of Operations. Interest rate swap agreements are subject to general market risk, liquidity risk, counterparty risk and interest rate risk.
For OTC swaps, the fund’s maximum risk of loss from counterparty risk is the discounted value of the cash flows to be received from the counterparty over the agreement’s remaining life, to the extent that the amount is positive. This risk may be mitigated by Master Agreements, if any, between the fund and the counterparty and the posting of collateral, if any, by the counterparty to the fund to cover the fund’s exposure to the counterparty. There is minimal counterparty risk to the fund with centrally cleared swaps since they are exchange traded and the exchange guarantees these swaps against default. Interest rate swaps open at October 31, 2018 are set forth in the Statement of Swap Agreements.
Credit Default Swaps: Credit default swaps involve commitments to pay a fixed interest rate in exchange for payment if a credit event affecting a third party (the referenced obligation or index) occurs. Credit events may include a failure to pay interest or principal, bankruptcy, or restructuring. The fund enters into these agreements to manage its exposure to the market or certain sectors of the market, to reduce its risk exposure to defaults of corporate and sovereign issuers, or to create exposure to corporate or sovereign issuers to which it is not otherwise exposed. For those credit default swaps in which the fund is paying a fixed rate, the fund is buying credit protection on the instrument. In the event of a credit event, the fund would receive the full notional amount for the reference obligation. For those credit default swaps in which the fund is receiving a
52
fixed rate, the fund is selling credit protection on the underlying instrument. The maximum payouts for these agreements are limited to the notional amount of each swap. Credit default swaps may involve greater risks than if the fund had invested in the reference obligation directly and are subject to general market risk, liquidity risk, counterparty risk and credit risk. This risk may be mitigated by Master Agreements, if any, between the fund and the counterparty and the posting of collateral, if any, by the counterparty to the fund to cover the fund’s exposure to the counterparty. Credit default swaps open at October 31, 2018 are set forth in the Consolidated Statement of Swap Agreements.
The following tables show the fund’s exposure to different types of market risk as it relates to the Statement of Assets and Liabilities and the Statement of Operations, respectively.
Fair value of derivative instruments as of October 31, 2018 is shown below:
| | | | | | | | |
| | Derivative
Assets ($) | | | | Derivative
Liabilities ($) | |
Interest rate risk | 12,275,320 | 1,2 | Interest rate risk | (1,724,147) | 1,2 |
Foreign exchange risk | 6,605,612 | 3,4 | Foreign exchange risk | (9,232,756) | 4,5 |
Credit risk | 54,617 | 2 | Credit risk | - | |
Gross fair value of
derivative contracts | 18,935,549 | | | | (10,956,903) | |
| | | | | | | |
| | Statement of Assets and Liabilities location: | |
1 | Includes cumulative appreciation (depreciation) on futures as reported in the Statement of Futures, but only the
unpaid variation margin is reported in the Statement of Assets and Liabilities. |
2 | Includes cumulative appreciation (depreciation) on swap agreements as reported in the Statement of Swap
Agreements. Unrealized appreciation (depreciation) on OTC swap agreements and only unpaid variation
margin on cleared swap agreements, are reported in the Statement of Assets and Liabilities. |
3 | Options purchased are included in Investments in securities—Unaffiliated issuers, at value. |
4 | Unrealized appreciation (depreciation) on forward foreign currency exchange contracts. |
5 | Outstanding options written, at value. | |
The effect of derivative instruments in the Statement of Operations during the period ended October 31, 2018 is shown below:
| | | | | | | | | | | |
Amount of realized gain (loss) on derivatives recognized in income ($) | |
Underlying
risk | Futures | 1 | Options
Transactions | 2 | Forward
Contracts | 3 | Swap
Agreements | 4 | Total | |
Interest
rate | 7,467,906 | | (491,174) | | - | | 403,088 | | 7,379,820 | |
Foreign
exchange | - | | (2,580,134) | | (15,034,109) | | - | | (17,614,243) | |
Credit | - | | - | | - | | 246,091 | | 246,091 | |
Total | 7,467,906 | | (3,071,308) | | (15,034,109) | | 649,179 | | (9,988,332) | |
53
NOTES TO FINANCIAL STATEMENTS (continued)
| | | | | | | | | | | | |
| | | | | | | | | | | |
Change in unrealized appreciation (depreciation)
on derivatives recognized in income ($) | |
Underlying
risk | Futures | 5 | Options
Transactions | 6 | Forward
Contracts | 7 | Swap
Agreements | 8 | Total | |
Interest
rate | (1,174,426) | | 6,056 | | - | | 7,199,372 | | 6,031,002 | |
Foreign
exchange | - | | (2,676,844) | | (5,357,412) | | - | | (8,034,256) | |
Credit | - | | - | | - | | 54,617 | | 54,617 | |
Total | (1,174,426) | | (2,670,788) | | (5,357,412) | | 7,253,989 | | (1,948,637) | |
| | | | | | | | | | | | |
| | Statement of Operations location: | |
1 | Net realized gain (loss) on futures. | | |
2 | Net realized gain (loss) on options transactions. |
3 | Net realized gain (loss) on forward foreign currency exchange contracts. | | |
4 | Net realized gain (loss) on swap agreements. | | |
5 | Net unrealized appreciation (depreciation) on futures. | | |
6 | Net unrealized appreciation (depreciation) on options transactions. | | |
7 | Net unrealized appreciation (depreciation) on forward foreign currency exchange contracts. | |
8 | Net unrealized appreciation (depreciation) on swap agreements. | | |
The provisions of ASC Topic 210 “Disclosures about Offsetting Assets and Liabilities” require disclosure on the offsetting of financial assets and liabilities. These disclosures are required for certain investments, including derivative financial instruments subject to Master Agreements which are eligible for offsetting in the Statement of Assets and Liabilities and require the fund to disclose both gross and net information with respect to such investments. For financial reporting purposes, the fund does not offset derivative assets and derivative liabilities that are subject to Master Agreements in the Statement of Assets and Liabilities.
At October 31, 2018, derivative assets and liabilities (by type) on a gross basis are as follows:
| | | | | | |
Derivative Financial Instruments: | | Assets ($) | | Liabilities ($) | |
Futures | | 345,182 | | (574,055) | |
Options | | 1,829,056 | | (256,938) | |
Forward contracts | | 4,776,556 | | (8,975,818) | |
Swaps | | 11,984,755 | | (1,150,092) | |
Total gross amount of derivative | | | | | |
assets and liabilities in the | | | | | |
Statement of Assets and Liabilities | | 18,935,549 | | (10,956,903) | |
Derivatives not subject to | | | | | |
Master Agreements | | (12,275,320) | | 1,724,147 | |
Total gross amount of assets | | | | | |
and liabilities subject to | | | | | |
Master Agreements | | 6,660,229 | | (9,232,756) | |
54
The following tables present derivative assets and liabilities net of amounts available for offsetting under Master Agreements and net of related collateral received or pledged, if any, as of October 31, 2018:†
| | | | | | | |
| | | | Financial | | | |
| | | | Instruments | | | |
| | | | and Derivatives | | | |
| | Gross Amount of | | Available | Collateral | | Net Amount of |
Counterparty | Assets ($) | 1 | for Offset ($) | Received ($) | 2 | Assets ($) |
Barclays Capital | 1,649,782 | | (1,649,782) | - | | - |
Citigroup | 164,944 | | (164,944) | - | | - |
Goldman Sachs
International | 737,848 | | (13,264) | (724,584) | | - |
HSBC | 753,123 | | (31,259) | - | | 721,864 |
J.P. Morgan Securities | 950,391 | | (950,391) | - | | - |
Merrill Lynch, Pierce, Fenner & Smith | 1,797,306 | | - | (1,478,000) | | 319,306 |
Morgan Stanley | 104,930 | | - | - | | 104,930 |
UBS Securities | 501,905 | | (135,486) | - | | 366,419 |
Total | 6,660,229 | | (2,945,126) | (2,202,584) | | 1,512,519 |
| | | | | | | |
| | | | Financial | | | |
| | | | Instruments | | | |
| | | | and Derivatives | | | |
| | Gross Amount of | | Available | Collateral | | Net Amount of |
Counterparty | Liabilities ($) | 1 | for Offset ($) | Pledged ($) | 2 | Liabilities ($) |
Barclays Capital | (3,738,768) | | 1,649,782 | 1,743,000 | | (345,986) |
Citigroup | (2,931,776) | | 164,944 | 2,766,832 | | - |
Goldman Sachs
International | (13,264) | | 13,264 | - | | - |
HSBC | (31,259) | | 31,259 | - | | - |
J.P. Morgan Securities | (2,382,203) | | 950,391 | 1,431,812 | | - |
UBS Securities | (135,486) | | 135,486 | - | | - |
Total | (9,232,756) | | 2,945,126 | 5,941,644 | | (345,986) |
| | | | | | | |
1 Absent a default event or early termination, OTC derivative assets and liabilities are presented at gross amounts
and are not offset in the Statement of Assets and Liabilities. |
2 In some instances, the actual collateral received and/or pledged may be more than the amount shown due to
over collateralization. |
† See Statement of Investments for detailed information regarding collateral held for open exchange traded derivative contracts. |
The following summarizes the average market value of derivatives outstanding during the period ended October 31, 2018:
55
NOTES TO FINANCIAL STATEMENTS (continued)
| | | |
| | Average Market Value ($) |
Interest rate futures | | 287,078,421 |
Interest rate options contracts | | 302,215 |
Foreign currency options contracts | | 2,203,967 |
Forward contracts | | 1,259,490,133 |
| | | |
The following summarizes the average notional value of swap agreements outstanding during the period ended October 31, 2018:
| | | |
| | Average Notional Value ($) |
Interest rate swap agreements | | 331,839,820 |
Credit default swap agreements | | 1,914,231 |
| | | |
At October 31, 2018, the cost of investments for federal income tax purposes was $1,041,932,681; accordingly, accumulated net unrealized depreciation on investments inclusive of derivative contracts was $45,553,387, consisting of $23,102,620 gross unrealized appreciation and $68,656,007 gross unrealized depreciation.
56
REPORT OF INDEPENDENT REGISTERED PUBLIC ACCOUNTING FIRM
To the Shareholders and Board of Trustees
The Dreyfus/Laurel Funds Trust
Opinion on the Financial Statements
We have audited the accompanying statement of assets and liabilities of Dreyfus International Bond Fund (the “Fund”), a series of The Dreyfus/Laurel Funds Trust, including the statements of investments, investments in affiliated issuers, futures, options written, forward foreign currency exchange contracts and swap agreements, as of October 31, 2018, the related statement of operations for the year then ended, the statements of changes in net assets for each of the years in the two-year period then ended, and the related notes (collectively, the financial statements) and the financial highlights for each of the years in the five-year period then ended. In our opinion, the financial statements and financial highlights present fairly, in all material respects, the financial position of the Fund as of October 31, 2018, the results of its operations for the year then ended, the changes in its net assets for each of the years in the two-year period then ended, and the financial highlights for each of the years in the five-year period then ended, in conformity with U.S. generally accepted accounting principles.
Basis for Opinion
These financial statements and financial highlights are the responsibility of the Fund’s management. Our responsibility is to express an opinion on these financial statements and financial highlights based on our audits. We are a public accounting firm registered with the Public Company Accounting Oversight Board (United States) (PCAOB) and are required to be independent with respect to the Fund in accordance with the U.S. federal securities laws and the applicable rules and regulations of the Securities and Exchange Commission and the PCAOB.
We conducted our audits in accordance with the standards of the PCAOB. Those standards require that we plan and perform the audit to obtain reasonable assurance about whether the financial statements and financial highlights are free of material misstatement, whether due to error or fraud. Our audits included performing procedures to assess the risks of material misstatement of the financial statements and financial highlights, whether due to error or fraud, and performing procedures that respond to those risks. Such procedures included examining, on a test basis, evidence regarding the amounts and disclosures in the financial statements and financial highlights. Such procedures also included confirmation of securities owned as of October 31, 2018, by correspondence with the custodian and brokers or by other appropriate auditing procedures when replies from brokers were not received. Our audits also included evaluating the accounting principles used and significant estimates made by management, as well as evaluating the overall presentation of the financial statements and financial highlights. We believe that our audits provide a reasonable basis for our opinion.

We have served as the auditor of one or more Dreyfus Corporation investment companies since 1994.
New York, New York
December 28, 2018
57
IMPORTANT TAX INFORMATION (Unaudited)
For federal tax purposes the fund designates the maximum amount allowable but not less than 23.48% as interest-related dividends in accordance with Sections 871(k)(1) and 881(e) of the Internal Revenue Code.
58
BOARD MEMBERS INFORMATION (Unaudited)
INDEPENDENT BOARD MEMBERS
Joseph S. DiMartino (75)
Chairman of the Board (1999)
Principal Occupation During Past 5 Years:
· Corporate Director and Trustee (1995-present)
Other Public Company Board Memberships During Past 5 Years:
· CBIZ (formerly, Century Business Services, Inc.), a provider of outsourcing functions for small and medium size companies, Director (1997-present)
No. of Portfolios for which Board Member Serves: 124
———————
Francine J. Bovich (67)
Board Member (2012)
Principal Occupation During Past 5 Years:
· Trustee, The Bradley Trusts, private trust funds (2011-present)
Other Public Company Board Memberships During Past 5 Years:
· Annaly Capital Management, Inc., a real estate trust, Director (2014-present)
No. of Portfolios for which Board Member Serves: 72
———————
Kenneth A. Himmel (72)
Board Member (1988)
Principal Occupation During Past 5 Years:
· Managing Partner, Gulf Related, an international real estate development company (2010-present)
· President and CEO, Related Urban Development, a real estate development company (1996-present)
· President and CEO, Himmel & Company, a real estate development company (1980-present)
· CEO, American Food Management, a restaurant company (1983-present)
No. of Portfolios for which Board Member Serves: 25
———————
59
BOARD MEMBERS INFORMATION (Unaudited) (continued)
INDEPENDENT BOARD MEMBERS (continued)
Stephen J. Lockwood (71)
Board Member (1993)
Principal Occupation During Past 5 Years:
· Chairman of the Board, Stephen J. Lockwood and Company LLC, a real estate investment company (2000-present)
No. of Portfolios for which Board Member Serves: 25
———————
Roslyn M. Watson (69)
Board Member (1992)
Principal Occupation During Past 5 Years:
· Principal, Watson Ventures, Inc., a real estate investment company (1993-present)
No. of Portfolios for which Board Member Serves: 58
———————
Benaree Pratt Wiley (72)
Board Member (1998)
Principal Occupation During Past 5 Years:
· Principal, The Wiley Group, a firm specializing in strategy and business development (2005-present)
Other Public Company Board Memberships During Past 5 Years:
· CBIZ (formerly, Century Business Services, Inc.), a provider of outsourcing functions for small and medium size companies, Director (2008-present)
No. of Portfolios for which Board Member Serves: 79
———————
Once elected all Board Members serve for an indefinite term, but achieve Emeritus status upon reaching age 80. The address of the Board Members and Officers is c/o The Dreyfus Corporation, 200 Park Avenue, New York, New York 10166. Additional information about the Board Members is available in the fund’s Statement of Additional Information which can be obtained from Dreyfus free of charge by calling this toll free number: 1-800-DREYFUS.
James M. Fitzgibbons, Emeritus Board Member
60
OFFICERS OF THE FUND (Unaudited)
BRADLEY J. SKAPYAK, President since January 2010.
Chief Operating Officer and a director of the Manager since June 2009, Chairman of Dreyfus Transfer, Inc., an affiliate of the Manager and the transfer agent of the funds, since May 2011 and Chief Executive Officer of MBSC Securities Corporation since August 2016. He is an officer of 62 investment companies (comprised of 124 portfolios) managed by the Manager. He is 59 years old and has been an employee of the Manager since February 1988.
BENNETT A. MACDOUGALL, Chief Legal Officer since October 2015.
Chief Legal Officer of the Manager and Associate General Counsel and Managing Director of BNY Mellon since June 2015; from June 2005 to June 2015, he served in various capacities with Deutsche Bank – Asset & Wealth Management Division, including as Director and Associate General Counsel, and Chief Legal Officer of Deutsche Investment Management Americas Inc. from June 2012 to May 2015. He is an officer of 63 investment companies (comprised of 149 portfolios) managed by the Manager. He is 47 years old and has been an employee of the Manager since June 2015.
JAMES BITETTO, Vice President since August 2005 and Secretary since February 2018.
Managing Counsel of BNY Mellon and Secretary of the Manager, and an officer of 63 investment companies (comprised of 149 portfolios) managed by the Manager. He is 52 years old and has been an employee of the Manager since December 1996.
JOSEPH M. CHIOFFI, Vice President and Assistant Secretary since August 2005.
Managing Counsel of BNY Mellon, and an officer of 63 investment companies (comprised of 149 portfolios) managed by the Manager. He is 56 years old and has been an employee of the Manager since June 2000.
SONALEE CROSS, Vice President and Assistant Secretary since March 2018.
Counsel of BNY Mellon since October 2016; Associate at Proskauer Rose LLP from April 2016 to September 2016; Attorney at EnTrust Capital from August 2015 to February 2016; Associate at Sidley Austin LLP from September 2013 until August 2015. She is an officer of 63 investment companies (comprised of 149 portfolios) managed by Dreyfus. She is 31 years old and has been an employee of the Manager since October 2016.
MAUREEN E. KANE, Vice President and Assistant Secretary since April 2015.
Managing Counsel of BNY Mellon since July 2014; from October 2004 until July 2014, General Counsel, and from May 2009 until July 2014, Chief Compliance Officer of Century Capital Management. She is an officer of 63 investment companies (comprised of 149 portfolios) managed by the Manager. She is 56 years old and has been an employee of the Manager since July 2014.
SARAH S. KELLEHER, Vice President and Assistant Secretary since April 2014.
Managing Counsel of BNY Mellon since December 2017, from March 2013 to December 2017, Senior Counsel of BNY Mellon. She is an officer of 63 investment companies (comprised of 149 portfolios) managed by the Manager. She is 43 years old and has been an employee of the Manager since March 2013.
JEFF PRUSNOFSKY, Vice President and Assistant Secretary since August 2005.
Senior Managing Counsel of BNY Mellon, and an officer of 63 investment companies (comprised of 149 portfolios) managed by the Manager. He is 53 years old and has been an employee of the Manager since October 1990.
NATALYA ZELENSKY, Vice President and Assistant Secretary since March 2017.
Counsel of BNY Mellon since May 2016; Attorney at Wildermuth Endowment Strategy Fund/Wildermuth Advisory, LLC from November 2015 until May 2016; Assistant General Counsel at RCS Advisory Services from July 2014 until November 2015; Associate at Sutherland, Asbill & Brennan from January 2013 until January 2014. She is an officer of 63 investment companies (comprised of 149 portfolios) managed by Dreyfus. She is 33 years old and has been an employee of the Manager since May 2016.
JAMES WINDELS, Treasurer since November 2001.
Director – Mutual Fund Accounting of the Manager, and an officer of 63 investment companies (comprised of 149 portfolios) managed by the Manager. He is 60 years old and has been an employee of the Manager since April 1985.
61
OFFICERS OF THE FUND (Unaudited) (continued)
GAVIN C. REILLY, Assistant Treasurer since December 2005.
Tax Manager of the Investment Accounting and Support Department of the Manager, and an officer of 63 investment companies (comprised of 149 portfolios) managed by the Manager. He is 50 years old and has been an employee of the Manager since April 1991.
ROBERT S. ROBOL, Assistant Treasurer since December 2002.
Senior Accounting Manager – Dreyfus Financial Reporting of the Manager, and an officer of 63 investment companies (comprised of 149 portfolios) managed by the Manager. He is 54 years old and has been an employee of the Manager since October 1988.
ROBERT SALVIOLO, Assistant Treasurer since July 2007.
Senior Accounting Manager – Equity Funds of the Manager, and an officer of 63 investment companies (comprised of 149 portfolios) managed by the Manager. He is 51 years old and has been an employee of the Manager since June 1989.
ROBERT SVAGNA, Assistant Treasurer since December 2002.
Senior Accounting Manager – Fixed Income and Equity Funds of the Manager, and an officer of 63 investment companies (comprised of 149 portfolios) managed by the Manager. He is 51 years old and has been an employee of the Manager since November 1990.
JOSEPH W. CONNOLLY, Chief Compliance Officer since October 2004.
Chief Compliance Officer of the Manager, the Dreyfus Family of Funds and BNY Mellon Funds Trust (63 investment companies, comprised of 149 portfolios). He is 61 years old and has served in various capacities with the Manager since 1980, including manager of the firm’s Fund Accounting Department from 1997 through October 2001.
CARIDAD M. CAROSELLA, Anti-Money Laundering Compliance Officer since January 2016.
Anti-Money Laundering Compliance Officer of the Dreyfus Family of Funds and BNY Mellon Funds Trust since January 2016; from May 2015 to December 2015, Interim Anti-Money Laundering Compliance Officer of the Dreyfus Family of Funds and BNY Mellon Funds Trust and the Distributor; from January 2012 to May 2015, AML Surveillance Officer of the Distributor and from 2007 to December 2011, Financial Processing Manager of the Distributor. She is an officer of 57 investment companies (comprised of 143 portfolios) managed by the Manager. She is 50 years old and has been an employee of the Distributor since 1997.
62
NOTES
63
NOTES
64
NOTES
65
Dreyfus International Bond Fund
200 Park Avenue
New York, NY 10166
Manager
The Dreyfus Corporation
200 Park Avenue
New York, NY 10166
Custodian
The Bank of New York Mellon
240 Greenwich Street
New York, NY 10286
Transfer Agent &
Dividend Disbursing Agent
Dreyfus Transfer, Inc.
200 Park Avenue
New York, NY 10166
Distributor
MBSC Securities Corporation
200 Park Avenue
New York, NY 10166
| | |
Ticker Symbols: | Class A: DIBAX Class C: DIBCX Class I: DIBRX Class Y: DIBYX |
Telephone Call your financial representative or 1-800-DREYFUS
Mail The Dreyfus Family of Funds, 144 Glenn Curtiss Boulevard, Uniondale, NY 11556-0144
E-mail Send your request to info@dreyfus.com
Internet Information can be viewed online or downloaded at www.dreyfus.com
The fund files its complete schedule of portfolio holdings with the Securities and Exchange Commission (“SEC”) for the first and third quarters of each fiscal year on Form N-Q. The fund’s Forms N-Q are available on the SEC’s website at www.sec.gov.
A description of the policies and procedures that the fund uses to determine how to vote proxies relating to portfolio securities and information regarding how the fund voted these proxies for the most recent 12-month period ended June 30 is available at www.dreyfus.com and on the SEC’s website at www.sec.gov and without charge, upon request, by calling 1-800-DREYFUS.
| | |
© 2018 MBSC Securities Corporation
6091AR1018 | 
|
Item 2. Code of Ethics.
The Registrant has adopted a code of ethics that applies to the Registrant's principal executive officer, principal financial officer, principal accounting officer or controller, or persons performing similar functions. There have been no amendments to, or waivers in connection with, the Code of Ethics during the period covered by this Report.
Item 3. Audit Committee Financial Expert.
The Registrant's Board has determined that Joseph S. DiMartino, a member of the Audit Committee of the Board, is an audit committee financial expert as defined by the Securities and Exchange Commission (the "SEC"). Mr. DiMartino is "independent" as defined by the SEC for purposes of audit committee financial expert determinations.
Item 4. Principal Accountant Fees and Services.
(a) Audit Fees. The aggregate fees billed for each of the last two fiscal years (the "Reporting Periods") for professional services rendered by the Registrant's principal accountant (the "Auditor") for the audit of the Registrant's annual financial statements or services that are normally provided by the Auditor in connection with the statutory and regulatory filings or engagements for the Reporting Periods, were $78,410 in 2017 and $79,590 in 2018.
(b) Audit-Related Fees. The aggregate fees billed in the Reporting Periods for assurance and related services by the Auditor that are reasonably related to the performance of the audit of the Registrant's financial statements and are not reported under paragraph (a) of this Item 4 were $10,400 in 2017 and $10,560 in 2018. These services consisted of one or more of the following: (i) agreed upon procedures related to compliance with Internal Revenue Code section 817(h), (ii) security counts required by Rule 17f-2 under the Investment Company Act of 1940, as amended, (iii) advisory services as to the accounting or disclosure treatment of Registrant transactions or events and (iv) advisory services to the accounting or disclosure treatment of the actual or potential impact to the Registrant of final or proposed rules, standards or interpretations by the Securities and Exchange Commission, the Financial Accounting Standards Boards or other regulatory or standard-setting bodies.
The aggregate fees billed in the Reporting Periods for non-audit assurance and related services by the Auditor to the Registrant's investment adviser (not including any sub-investment adviser whose role is primarily portfolio management and is subcontracted with or overseen by another investment adviser), and any entity controlling, controlled by or under common control with the investment adviser that provides ongoing services to the Registrant ("Service Affiliates"), that were reasonably related to the performance of the annual audit of the Service Affiliate, which required pre-approval by the Audit Committee were $0 in 2017 and $0 in 2018.
(c) Tax Fees. The aggregate fees billed in the Reporting Periods for professional services rendered by the Auditor for tax compliance, tax advice, and tax planning ("Tax Services") were $5,200 in 2017 and $5,300 in 2018. These services consisted of: (i) review or preparation of U.S. federal, state, local and excise tax returns. The aggregate fees billed in the Reporting Periods for Tax Services by the Auditor to Service Affiliates, which required pre-approval by the Audit Committee were $0 in 2017 and $0 in 2018.
(d) All Other Fees. The aggregate fees billed in the Reporting Periods for products and services provided by the Auditor, other than the services reported in paragraphs (a) through (c) of this Item, were $0 in 2017 and $0 in 2018.
The aggregate fees billed in the Reporting Periods for Non-Audit Services by the Auditor to Service Affiliates, other than the services reported in paragraphs (b) through (c) of this Item, which required pre-approval by the Audit Committee, were $0 in 2017 and $0 in 2018.
(e)(1) Audit Committee Pre-Approval Policies and Procedures. The Registrant's Audit Committee has established policies and procedures (the "Policy") for pre-approval (within specified fee limits) of the Auditor's engagements for non-audit services to the Registrant and Service Affiliates without specific case-by-case consideration. The pre-approved services in the Policy can include pre-approved audit services, pre-approved audit-related services, pre-approved tax services and pre-approved all other services. Pre-approval considerations include whether the proposed services are compatible with maintaining the Auditor's independence. Pre-approvals pursuant to the Policy are considered annually.
(e)(2) Note. None of the services described in paragraphs (b) through (d) of this Item 4 were approved by the Audit Committee pursuant to paragraph (c)(7)(i)(C) of Rule 2-01 of Regulation S-X.
(f) None of the hours expended on the principal accountant's engagement to audit the registrant's financial statements for the most recent fiscal year were attributed to work performed by persons other than the principal account's full-time, permanent employees.
Non-Audit Fees. The aggregate non-audit fees billed by the Auditor for services rendered to the Registrant, and rendered to Service Affiliates, for the Reporting Periods were $20,070,000 in 2017 and $3,635,000 in 2018.
Auditor Independence. The Registrant's Audit Committee has considered whether the provision of non-audit services that were rendered to Service Affiliates, which were not pre-approved (not requiring pre-approval), is compatible with maintaining the Auditor's independence.
Item 5. Audit Committee of Listed Registrants.
Not applicable.
Item 6. Investments.
(a) Not applicable.
Item 7. Disclosure of Proxy Voting Policies and Procedures for Closed-End Management Investment Companies.
Not applicable.
Item 8. Portfolio Managers of Closed-End Management Investment Companies.
Not applicable.
Item 9. Purchases of Equity Securities by Closed-End Management Investment Companies and Affiliated Purchasers.
Not applicable.
Item 10. Submission of Matters to a Vote of Security Holders.
There have been no material changes to the procedures applicable to Item 10.
Item 11. Controls and Procedures.
(a) The Registrant's principal executive and principal financial officers have concluded, based on their evaluation of the Registrant's disclosure controls and procedures as of a date within 90 days of the filing date of this report, that the Registrant's disclosure controls and procedures are reasonably designed to ensure that information required to be disclosed by the Registrant on Form N-CSR is recorded, processed, summarized and reported within the required time periods and that information required to be disclosed by the Registrant in the reports that it files or submits on Form N-CSR is accumulated and communicated to the Registrant's management, including its principal executive and principal financial officers, as appropriate to allow timely decisions regarding required disclosure.
(b) There were no changes to the Registrant's internal control over financial reporting that occurred during the second fiscal quarter of the period covered by this report that have materially affected, or are reasonably likely to materially affect, the Registrant's internal control over financial reporting.
Item 12. Disclosure of Securities Lending Activities for Closed-End Management Investment Companies.
Not applicable.
Item 13. Exhibits.
(a)(1) Code of ethics referred to in Item 2.
(a)(2) Certifications of principal executive and principal financial officers as required by Rule 30a-2(a) under the Investment Company Act of 1940.
(a)(3) Not applicable.
(b) Certification of principal executive and principal financial officers as required by Rule 30a-2(b) under the Investment Company Act of 1940.
SIGNATURES
Pursuant to the requirements of the Securities Exchange Act of 1934 and the Investment Company Act of 1940, the Registrant has duly caused this Report to be signed on its behalf by the undersigned, thereunto duly authorized.
The Dreyfus/Laurel Funds Trust
By: /s/ Bradley J. Skapyak
Bradley J. Skapyak
President
Date: January 2, 2019
Pursuant to the requirements of the Securities Exchange Act of 1934 and the Investment Company Act of 1940, this Report has been signed below by the following persons on behalf of the Registrant and in the capacities and on the dates indicated.
By: /s/ Bradley J. Skapyak
Bradley J. Skapyak
President
Date: January 2, 2019
By: /s/ James Windels
James Windels
Treasurer
Date: January 2, 2019
EXHIBIT INDEX
(a)(1) Code of ethics referred to in Item 2.
(a)(2) Certifications of principal executive and principal financial officers as required by Rule 30a-2(a) under the Investment Company Act of 1940. (EX-99.CERT)
(b) Certification of principal executive and principal financial officers as required by Rule 30a-2(b) under the Investment Company Act of 1940. (EX-99.906CERT)

