UNITED STATES
SECURITIES AND EXCHANGE COMMISSION
Washington, D.C. 20549
FORM N-CSR
CERTIFIED SHAREHOLDER REPORT OF REGISTERED MANAGEMENT
INVESTMENT COMPANIES
Investment Company Act file number | 811-00524 |
| |
| BNY Mellon Investment Funds III | |
| (Exact name of Registrant as specified in charter) | |
| | |
| c/o BNY Mellon Investment Adviser, Inc. 240 Greenwich Street New York, New York 10286 | |
| (Address of principal executive offices) (Zip code) | |
| | |
| Bennett A. MacDougall, Esq. 240 Greenwich Street New York, New York 10286 | |
| (Name and address of agent for service) | |
|
Registrant's telephone number, including area code: | (212) 922-6400 |
| |
Date of fiscal year end: | 10/31 | |
Date of reporting period: | 10/31/19 | |
| | | | | | | |
The following N-CSR relates only to the Registrant's series listed below and does not relate to any series of the Registrant with a different fiscal year end and, therefore, different N-CSR reporting requirements. A separate N-CSR will be filed for any series with a different fiscal year end, as appropriate.
BNY Mellon Global Equity Income Fund
BNY Mellon International Bond Fund
FORM N-CSR
Item 1. Reports to Stockholders.
BNY Mellon Global Equity Income Fund
| |
ANNUAL REPORT October 31, 2019 |
| |
Save time. Save paper. View your next shareholder report online as soon as it’s available. Log into www.bnymellonim.com/us and sign up for eCommunications. It’s simple and only takes a few minutes. |
| |
The views expressed in this report reflect those of the portfolio manager(s) only through the end of the period covered and do not necessarily represent the views of BNY Mellon Investment Adviser, Inc. or any other person in the BNY Mellon Investment Adviser, Inc. organization. Any such views are subject to change at any time based upon market or other conditions and BNY Mellon Investment Adviser, Inc. disclaims any responsibility to update such views. These views may not be relied on as investment advice and, because investment decisions for a fund in the BNY Mellon Family of Funds are based on numerous factors, may not be relied on as an indication of trading intent on behalf of any fund in the BNY Mellon Family of Funds. |
| |
Not FDIC-Insured • Not Bank-Guaranteed • May Lose Value |
Contents
THE FUND
FOR MORE INFORMATION
Back Cover
| | | | |
| |
BNY Mellon Global Equity Income Fund
| | The Fund |
A LETTER FROM THE PRESIDENT OF BNY MELLON INVESTMENT ADVISER, INC.
Dear Shareholder:
We are pleased to present this annual report for BNY Mellon Global Equity Income Fund (formerly, Dreyfus Global Equity Income Fund), covering the 12-month period from November 1, 2018 through October 31, 2019. For information about how the fund performed during the reporting period, as well as general market perspectives, we provide a Discussion of Fund Performance on the pages that follow.
Equity markets weakened in the fourth quarter of 2018, as concerns about rising interest rates, trade tensions and slowing global growth provided downward pressure on returns. In December 2018, stocks experienced a sharp sell-off, as it appeared that the U.S. Federal Reserve (the “Fed”) would maintain its hawkish stance on monetary policy. In January 2019, a pivot in stance from the Fed helped stimulate a rebound across equity markets that continued into the second quarter. Escalating trade tensions disrupted equity markets again in May. The dip was short-lived, as markets rose once again in June and July of 2019, when a trade deal appeared more likely, and the pace of U.S. economic growth remained steady. Nevertheless, concerns continued to emerge over slowing global growth, resulting in bouts of market volatility in August 2019. Stocks rebounded in September and continued an upward path through most of October 2019, supported in part by central bank policy and consistent consumer spending.
In fixed-income markets, a risk-off mentality prevailed to start the period, fueled in part by equity market volatility. A flight to quality supported price increases for U.S. Treasuries, which continued through the end of 2018, leading to a flattening yield curve. After the Fed’s supportive statements in January 2019, other developed-market central banks followed suit and reiterated their abilities to bolster flagging growth by continuing accommodative policies. This further buoyed fixed-income instrument prices. The Fed cut rates in July, September and October of 2019, for a total 75-basis-point reduction in the federal funds rate during the 12 months. Concerns about the pace of global economic growth also fueled demand for fixed-income instruments during much of the reporting period, resulting in positive bond market returns.
We believe that over the near term, the outlook for the U.S. remains positive, but we will monitor relevant data for any signs of a change. As always, we encourage you to discuss the risks and opportunities in today’s investment environment with your financial advisor.
Thank you for your continued confidence and support.
Sincerely,

Renee LaRoche-Morris
President
BNY Mellon Investment Adviser, Inc.
November 15, 2019
2
DISCUSSION OF FUND PERFORMANCE(Unaudited)
For the period from November 1, 2018 through October 31, 2019, as provided by primary portfolio managers Nick Clay and Andrew MacKirdy of Newton Investment Management (North America) Limited, Sub-Investment Adviser
Market and Fund Performance Overview
For the 12-month period ended October 31, 2019, BNY Mellon Global Equity Income Fund’s (formerly, Dreyfus Global Equity Income Fund) Class A shares produced a total return of 13.85%, Class C shares returned 13.00%, Class I shares returned 14.20%, and Class Y shares returned 14.29%.1 In comparison, the fund’s benchmark, the FTSE World Index (the “Index”), produced a total return of 13.15% for the same period.2
Global markets encountered periods of volatility during the first months of the reporting period, but regained strength, due in part to continued accommodative monetary policies from major central banks. The fund’s relative performance versus the Index was partly due to successful stock selection within the financials sector and picks within U.S.-based companies.
The Fund’s Investment Approach
The fund seeks total return (consisting of capital appreciation and income). To pursue its goal, the fund normally invests at least 80% of its net assets, plus any borrowings for investment purposes, in equity securities. The fund seeks to focus on dividend-paying stocks of companies located in the developed capital markets, such as the United States, Canada, Japan, Australia, Hong Kong and Western Europe. The fund may invest in the securities of companies of any market capitalization, and it may invest up to 30% of its assets in emerging markets. The fund’s portfolio managers typically will purchase stocks that, at the time of purchase, have a yield premium to the yield of the Index.
The portfolio managers will combine a top-down approach, emphasizing current economic trends and current investment themes on a global basis, with a bottom-up stock selection, based on fundamental research. Within markets and sectors determined to be relatively attractive, the portfolio managers seek what are believed to be attractively priced companies that possess a sustainable competitive advantage in their market or sector.
Markets Pivot on Fed Statements and Trade Disputes
Following a sharp decline in October 2018, November 2018 brought a brief rebound in stock markets as Federal Reserve (“Fed”) Chair Jerome Powell moderated his previous hawkish narrative. However, in December global equities plumbed new lows for the year, as the tone of the Fed’s forward-looking commentary once again unnerved investors. Political concerns contributed to the broader malaise—not least the ongoing U.S.-China trade dispute—while in Europe, uncertainty around Brexit persisted.
In contrast, in 2019, equity investors reaped solid gains as stock-market indices rebounded from the lows reached towards the end of 2018. Fundamentally, the rally has consisted of a re-rating of global equities, and has been driven neither by any notable improvement in the tone of macroeconomic data, nor by accelerating corporate earnings. Instead, it was policy rhetoric that was a primary driver of market direction. In particular, the Fed’s abrupt pivot away from its prior course of monetary-policy normalization and three subsequent interest-
3
DISCUSSION OF FUND PERFORMANCE(Unaudited) (continued)
rate cuts bolstered sentiment and was the principal catalyst for rising risk-asset prices globally. However, the ongoing U.S.-China trade war continued to shake investor sentiment. Investors were also unsettled by concerns about the U.S. economy, as the inverted Treasury yield curve was interpreted by some market participants as an indicator of imminent recession. Pockets of market volatility persisted through much of the latter half of the period, although major equity indices generally rose during the last several months of the year and posted gains for the 12 months.
Financials and U.S.-Based Stocks Benefited Results
At the sector level, the fund benefited most from positioning within financials, owing largely to the holding in The Western Union Company and the underweight in bank stocks. A further positive came from the underweight in oil and gas companies and stock selection in the consumer goods sector. At a country level, stock selection in the U.S. was particularly strong. Positioning in Switzerland was another positive. The top contributor to performance over the period was Qualcomm, with the share price soaring on the surprise announcement that the company and Apple had agreed to a settlement to their long-running patent disputes. In addition to Qualcomm receiving a multi-billion-dollar payment, the companies agreed to a six-year licensing deal and a multi-year agreement for Qualcomm to supply modem chips for future Apple devices. An overweight in The Western Union Company was also beneficial as shares in the money-transfer firm advanced. The market has re-rated The Western Union Company in recognition of its ability to produce consistent and stable results against a backdrop of meaningful disruption in its industry. Another large positive contributor wasDiageo, where U.S. growth accelerated and, given higher margins, there were significant earnings upgrades.
Conversely, positioning within utilities was the biggest detractor at a sector level, attributable to the holding inCentrica. Positioning within technology also detracted. At a country level, positioning in the UK detracted the most.Centrica aside, British American Tobacco (BAT) was also weak over the period. UK utilityCentrica was the largest detractor. Disappointing results and fears of a dividend cut weighed on the stock in the first half of 2019. In July, the stock dived afterCentrica cut its dividend and disposed of a range of non-core assets. In our opinion, these sales could undermine the firm’s future cash-flow generation by concentrating its exposure on the competitive UK retail market. We therefore decided to sell the stock. BAT was a large negative contributor despite benefiting from the fall in bond yields at the start of the year. The share price declined owing to continued regulatory pressure, negative sentiment and news flow about the company and the sector as a whole, in relation to e-cigarettes. BAT retains its attraction owing to the combination of its diversified global footprint, its portfolio of next-generation products and attractive valuation. The fund’s relative performance in the technology sector was adversely affected by Cisco Systems, which was weak as investors fretted over whether the company’s successful transformation and product innovations would be enough to offset a deterioration in enterprise spending against a difficult macroeconomic background. Not holding Microsoft also detracted, as it performed strongly. The fund cannot hold the stock, as it does not meet the fund’s strict yield criteria.
4
Maintaining a Cautious Investment Posture
Economic data has continued to deteriorate globally, and central banks are beginning to respond with interest-rate cuts in the U.S. and Europe, with the promise of more to come. However, we expect the next phase of economic policy to be radically different. The extraordinarily loose monetary policy seen since the 2008 global financial crisis has driven asset prices higher. As the bulk of financial assets are owned by comparatively few, the result has been an increase in inequality, while economic growth rates have not returned to pre-crisis levels. In this context, more extreme politics have garnered significant support, and there is a growing recognition that future stimulus will need to be radically different, if it is to both stymie the spread of populism and boost economic growth.
It is also noteworthy that market leadership has been exceptionally narrow, year to date. Some stocks, which might ostensibly appear relatively safe and defensive, are less attractive than they were, given extended valuations and heightened expectations. With this backdrop in mind, the discipline of our process and the strict yield criteria, which force us to sell stocks when they become too expensive and reinvest in better-value quality opportunities, are extremely important.
November 15, 2019
1 Total return includes reinvestment of dividends and any capital gains paid and does not take into consideration the maximum initial sales charge in the case of Class A shares, or the applicable contingent deferred sales charge imposed on redemptions in the case of Class C shares. Had these charges been reflected, returns would have been lower. Share price and investment return fluctuate such that upon redemption, fund shares may be worth more or less than their original cost. Past performance is no guarantee of future results.
2 Source: Lipper Inc. — The FTSE World Index is a market capitalization-weighted index representing the performance of the large- and mid-cap stocks from the Developed and Advanced Emerging segments of the FTSE Global Equity Index Series. It reflects reinvestment of net dividends and, where applicable, capital gain distributions. Investors cannot invest directly in any index.
Please note: the position in any security highlighted with italicized typeface was sold during the reporting period.
Equities are subject generally to market, market sector, market liquidity, issuer and investment style risks, among other factors, to varying degrees, all of which are more fully described in the fund’s prospectus.
The fund’s performance will be influenced by political, social and economic factors affecting investments in foreign companies. Special risks associated with investments in foreign companies include exposure to currency fluctuations, less liquidity, less developed or less efficient trading markets, lack of comprehensive company information, political instability and differing auditing and legal standards. These risks generally are greater with emerging-market countries than with more economically and politically established foreign countries.
The fund may, but is not required to, use derivative instruments, such as options, futures, options on futures, forward contracts and other credit derivatives. A small investment in derivatives could have a potentially large impact on the fund’s performance. The use of derivatives involves risks different from, or possibly greater than, the risks associated with investing directly in the underlying assets.
5
FUND PERFORMANCE(Unaudited)
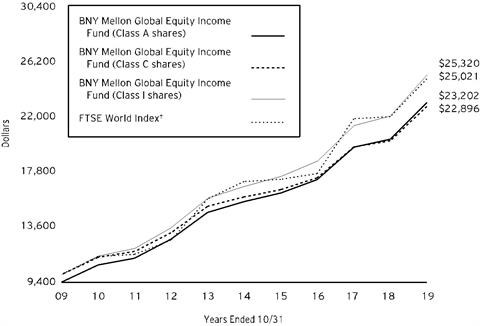
Comparison of change in value of a $10,000 investment in Class A shares, Class C shares, and Class I shares of BNY Mellon Global Equity Income Fund with a hypothetical investment of $10,000 in theFTSE World Index (the “Index”)
† Source: Lipper Inc.
Past performance is not predictive of future performance.
The above graph compares a hypothetical $10,000 investment made in Class A, Class C, and Class I shares of BNY Mellon Global Equity Income Fund on 10/31/09 to a hypothetical $10,000 made in the Index on that date. All dividends and capital gain distributions are reinvested.
The fund’s performance shown in the line graph above takes into account the maximum initial sales charge on Class A shares and all other applicable fees and expenses on Class A, Class C, and Class I shares. The Index is a market capitalization-weighted index representing the performance of the large- and mid-cap stocks from the Developed and Advanced Emerging segments of the FTSE Global Equity Index Series. Unlike a mutual fund, the Index is not subject to charges, fees and other expenses. Investors cannot invest directly in any index. Further information relating to fund performance, including expense reimbursements, if applicable, is contained in the Financial Highlights section of the prospectus and elsewhere in this report.
6

Comparison of change in value of a $1,000,000 investment in Class Y shares ofBNY Mellon Global Equity Income Fund with a hypothetical investment of $1,000,000 in theFTSE World Index (the “Index”)
† Source: Lipper Inc.
†† The total return figures presented for Class Y shares of the fund reflect the performance of the fund’s Class A shares for the period prior to 7/1/13 (the inception date for Class Y shares), not reflecting the applicable sales charges for Class A shares.
Past performance is not predictive of future performance.
The above graph compares a hypothetical $1,000,000 investment made in Class Y shares of BNY Mellon Global Equity Income Fund on 10/31/09 to a hypothetical investment of $1,000,000 made in the Index on that date. All dividends and capital gain distributions are reinvested.
The fund’s performance shown in the line graph above takes into account all applicable fees and expenses of the fund’s Class Y shares. The Index is a market capitalization-weighted index representing the performance of the large- and mid-cap stocks from the Developed and Advanced Emerging segments of the FTSE Global Equity Index Series. Unlike a mutual fund, the Index is not subject to charges, fees and other expenses. Investors cannot invest directly in any index. Further information relating to fund performance, including expense reimbursements, if applicable, is contained in the Financial Highlights section of the prospectus and elsewhere in this report.
7
FUND PERFORMANCE(Unaudited) (continued)
| | | | | |
Average Annual Total Returnsas of 10/31/19 |
| | Inception | | | |
| Date | 1 Year | 5 Years | 10 Years |
Class A shares | | | | |
with maximum sales charge (5.75%) | 10/18/07 | 7.30% | 7.00% | 8.78% |
without sales charge | 10/18/07 | 13.85% | 8.28% | 9.43% |
Class C shares | | | | |
with applicable redemption charge† | 10/18/07 | 12.00% | 7.49% | 8.64% |
without redemption | 10/18/07 | 13.00% | 7.49% | 8.64% |
Class I shares | 10/18/07 | 14.20% | 8.58% | 9.74% |
Class Y shares | 7/1/13 | 14.29% | 8.68% | 9.31%†† |
FTSE World Index | | 13.15% | 7.86% | 9.60% |
† The maximum contingent deferred sales charge for Class C shares is 1% for shares redeemed within one year of the date of purchase.
†† The total return performance figures presented for Class Y shares of the fund reflect the performance of the fund’s Class A shares for the period prior to 7/1/13 (the inception date for Class Y shares), not reflecting the applicable sales charges for Class A shares.
The performance data quoted represents past performance, which is no guarantee of future results. Share price and investment return fluctuate and an investor’s shares may be worth more or less than original cost upon redemption. Current performance may be lower or higher than the performance quoted. Go to www.bnymellonim.com/usfor the fund’s most recent month-end returns.
The fund’s performance shown in the graphs and table does not reflect the deduction of taxes that a shareholder would pay on fund distributions or the redemption of fund shares. In addition to the performance of Class A shares shown with and without a maximum sales charge, the fund's performance shown in the table takes into account all other applicable fees and expenses on all classes.
8
UNDERSTANDING YOUR FUND’S EXPENSES(Unaudited)
As a mutual fund investor, you pay ongoing expenses, such as management fees and other expenses. Using the information below, you can estimate how these expenses affect your investment and compare them with the expenses of other funds. You also may pay one-time transaction expenses, including sales charges (loads) and redemption fees, which are not shown in this section and would have resulted in higher total expenses. For more information, see your fund’s prospectus or talk to your financial adviser.
Review your fund’s expenses
The table below shows the expenses you would have paid on a $1,000 investment in BNY Mellon Global Equity Income Fund from May 1, 2019 to October 31, 2019. It also shows how much a $1,000 investment would be worth at the close of the period, assuming actual returns and expenses.
| | | | | | | |
Expenses and Value of a $1,000 Investment | |
Assume actual returns for the six months ended October 31, 2019 | |
| | | | | | |
| | Class A | Class C | Class I | Class Y | |
Expense paid per $1,000† | $5.92 | $9.82 | $4.64 | $4.28 | |
Ending value (after expenses) | $1,043.70 | $1,039.80 | $1,045.10 | $1,045.40 | |
COMPARING YOUR FUND’S EXPENSES
WITH THOSE OF OTHER FUNDS(Unaudited)
Using the SEC’s method to compare expenses
The Securities and Exchange Commission (“SEC”) has established guidelines to help investors assess fund expenses. Per these guidelines, the table below shows your fund’s expenses based on a $1,000 investment, assuming a hypothetical 5% annualized return. You can use this information to compare the ongoing expenses (but not transaction expenses or total cost) of investing in the fund with those of other funds. All mutual fund shareholder reports will provide this information to help you make this comparison. Please note that you cannot use this information to estimate your actual ending account balance and expenses paid during the period.
| | | | | | | |
Expenses and Value of a $1,000 Investment | |
Assuming a hypothetical 5% annualized return for the six months ended October 31, 2019 | |
| | | | | | |
| | Class A | Class C | Class I | Class Y | |
Expense paid per $1,000† | $5.85 | $9.70 | $4.58 | $4.23 | |
Ending value (after expenses) | $1,019.41 | $1,015.58 | $1,020.67 | $1,021.02 | |
† Expenses are equal to the fund’s annualized expense ratio of 1.15% for Class A, 1.91% for Class C, .90% for Class I and .83% for Class Y, multiplied by the average account value over the period, multiplied by 184/365 (to reflect the one-half year period). |
9
STATEMENT OF INVESTMENTS
October 31, 2019
| | | | | | | | |
| |
Description | | | | Shares | | Value ($) | |
Common Stocks - 94.7% | | | | | |
France - 4.2% | | | | | |
Sanofi | | | | 93,909 | | 8,653,347 | |
Television Francaise 1 | | | | 393,334 | | 3,298,914 | |
Total | | | | 136,366 | | 7,168,715 | |
| | | | | 19,120,976 | |
Germany - 3.1% | | | | | |
Bayer | | | | 184,782 | | 14,339,559 | |
Hong Kong - 1.6% | | | | | |
Link REIT | | | | 654,000 | | 7,131,784 | |
India - 2.4% | | | | | |
Infosys, ADR | | | | 1,147,558 | | 11,005,081 | |
Netherlands - 3.7% | | | | | |
RELX | | | | 366,128 | | 8,803,865 | |
Royal Dutch Shell, Cl. A | | | | 270,657 | | 7,859,023 | |
| | | | | 16,662,888 | |
New Zealand - .4% | | | | | |
Spark New Zealand | | | | 592,540 | | 1,701,983 | |
Norway - 1.7% | | | | | |
Orkla | | | | 790,919 | | 7,597,721 | |
South Korea - 1.3% | | | | | |
Macquarie Korea Infrastructure Fund | | | | 585,476 | | 5,963,205 | |
Spain - 2.0% | | | | | |
Industria de Diseno Textil | | | | 290,747 | | 9,063,350 | |
Sweden - 4.5% | | | | | |
Hennes & Mauritz, Cl. B | | | | 522,127 | | 10,909,527 | |
Svenska Handelsbanken, Cl. A | | | | 942,476 | | 9,434,814 | |
| | | | | 20,344,341 | |
Switzerland - 12.0% | | | | | |
Cie Financiere Richemont | | | | 147,795 | | 11,625,841 | |
Nestle | | | | 80,464 | | 8,590,439 | |
Novartis | | | | 133,932 | | 11,687,994 | |
Roche Holding | | | | 33,867 | | 10,189,281 | |
Zurich Insurance Group | | | | 31,578 | | 12,339,908 | |
| | | | | 54,433,463 | |
United Kingdom - 12.3% | | | | | |
BAE Systems | | | | 1,491,292 | | 11,130,715 | |
British American Tobacco | | | | 290,645 | | 10,172,679 | |
British American Tobacco, ADR | | | | 101,835 | | 3,560,152 | |
Ferguson | | | | 29,119 | | 2,484,193 | |
Informa | | | | 1,316,169 | | 13,212,971 | |
Unilever | | | | 198,749 | | 11,900,604 | |
10
| | | | | | | | |
| |
Description | | | | Shares | | Value ($) | |
Common Stocks - 94.7% (continued) | | | | | |
United Kingdom - 12.3% (continued) | | | | | |
Vodafone Group | | | | 1,801,155 | | 3,672,340 | |
| | | | | 56,133,654 | |
United States - 45.5% | | | | | |
Brixmor Property Group | | | | 194,943 | a | 4,292,645 | |
Cisco Systems | | | | 483,908 | | 22,990,469 | |
CMS Energy | | | | 146,766 | | 9,381,283 | |
Coty, Cl. A | | | | 956,916 | b | 11,186,348 | |
Emerson Electric | | | | 57,913 | | 4,062,597 | |
Eversource Energy | | | | 112,258 | | 9,400,485 | |
Gilead Sciences | | | | 137,787 | | 8,778,410 | |
Harley-Davidson | | | | 230,592 | b | 8,972,335 | |
Maxim Integrated Products | | | | 249,596 | | 14,641,301 | |
Merck & Co. | | | | 124,796 | | 10,814,821 | |
Omnicom Group | | | | 131,319 | b | 10,136,514 | |
Paychex | | | | 99,175 | | 8,294,997 | |
PepsiCo | | | | 115,815 | | 15,886,343 | |
Philip Morris International | | | | 66,849 | | 5,444,182 | |
Principal Financial Group | | | | 113,344 | | 6,050,303 | |
Qualcomm | | | | 279,286 | | 22,465,766 | |
Tapestry | | | | 258,537 | | 6,685,767 | |
The Procter & Gamble Company | | | | 83,273 | | 10,368,321 | |
The Western Union Company | | | | 484,161 | b | 12,133,075 | |
Verizon Communications | | | | 85,821 | | 5,189,596 | |
| | | | | 207,175,558 | |
Total Common Stocks(cost $344,951,194) | | | | 430,673,563 | |
| | | Preferred Dividend
Yield (%) | | | | | |
Preferred Stocks - 2.7% | | | | | |
South Korea - 2.7% | | | | | |
Samsung Electronics
(cost $11,225,261) | | 3.30 | | 346,499 | | 12,225,522 | |
11
STATEMENT OF INVESTMENTS (continued)
| | | | | | | | |
| |
Description | | 1-Day
Yield (%) | | Shares | | Value ($) | |
Investment Companies - 1.8% | | | | | |
Registered Investment Companies - 1.8% | | | | | |
Dreyfus Institutional Preferred Government Plus Money Market Fund
(cost $8,377,345) | | 1.79 | | 8,377,345 | c | 8,377,345 | |
Total Investments(cost $364,553,800) | | 99.2% | | 451,276,430 | |
Cash and Receivables (Net) | | .8% | | 3,517,569 | |
Net Assets | | 100.0% | | 454,793,999 | |
ADR—American Depository Receipt
REIT—Real Estate Investment Trust
aInvestment in real estate investment trust within the United States.
bSecurity, or portion thereof, on loan. At October 31, 2019, the value of the fund’s securities on loan was $18,444,342 and the value of the collateral was $18,882,369, consisting of U.S. Government & Agency securities.
cInvestment in affiliated issuer. The investment objective of this investment company is publicly available and can be found within the investment company’s prospectus.
| | |
Portfolio Summary (Unaudited)† | Value (%) |
Pharmaceuticals Biotechnology & Life Sciences | 14.2 |
Food, Beverage & Tobacco | 11.3 |
Semiconductors & Semiconductor Equipment | 8.2 |
Technology Hardware & Equipment | 7.7 |
Household & Personal Products | 7.4 |
Software & Services | 6.9 |
Media & Entertainment | 5.9 |
Retailing | 4.4 |
Utilities | 4.1 |
Insurance | 4.0 |
Consumer Durables & Apparel | 4.0 |
Capital Goods | 3.9 |
Energy | 3.3 |
Real Estate | 2.5 |
Telecommunication Services | 2.3 |
Banks | 2.1 |
Automobiles & Components | 2.0 |
Commercial & Professional Services | 1.9 |
Investment Companies | 1.8 |
Diversified Financials | 1.3 |
| | 99.2 |
† Based on net assets.
See notes to financial statements.
12
STATEMENT OF INVESTMENTS IN AFFILIATED ISSUERS
| | | | | | | |
Investment Companies | Value
10/31/18($) | Purchases($) | Sales($) | Value
10/31/19($) | Net
Assets(%) | Dividends/ Distributions($) |
Registered Investment Companies; | | | | |
Dreyfus Institutional Preferred Government Plus Money Market Fund | 7,103,715 | 144,911,896 | 143,638,266 | 8,377,345 | 1.8 | 249,599 |
Investment of Cash Collateral for Securities Loaned; | | | |
Dreyfus Institutional Preferred Government Plus Money Market Fund | - | 14,062,637 | 14,062,637 | - | - | - |
Total | 7,103,715 | 158,974,533 | 157,700,903 | 8,377,345 | 1.8 | 249,599 |
See notes to financial statements.
13
STATEMENT OF ASSETS AND LIABILITIES
October 31, 2019
| | | | | | | |
| | | | | | |
| | | Cost | | Value | |
Assets ($): | | | | |
Investments in securities—See Statement of Investments
(including securities on loan, valued at $18,444,342)—Note 1(c): | | | |
Unaffiliated issuers | 356,176,455 | | 442,899,085 | |
Affiliated issuers | | 8,377,345 | | 8,377,345 | |
Cash denominated in foreign currency | | | 943 | | 932 | |
Receivable for shares of Beneficial Interest subscribed | | 1,731,964 | |
Tax reclaim receivable | | 1,578,246 | |
Interest and securities lending income receivable | | 1,174,089 | |
Prepaid expenses | | | | | 60,986 | |
| | | | | 455,822,647 | |
Liabilities ($): | | | | |
Due to BNY Mellon Investment Adviser, Inc. and affiliates—Note 3(c) | | 365,270 | |
Payable for shares of Beneficial Interest redeemed | | 548,674 | |
Trustees fees and expenses payable | | 5,194 | |
Other accrued expenses | | | | | 109,510 | |
| | | | | 1,028,648 | |
Net Assets ($) | | | 454,793,999 | |
Composition of Net Assets ($): | | | | |
Paid-in capital | | | | | 367,830,709 | |
Total distributable earnings (loss) | | | | | 86,963,290 | |
Net Assets ($) | | | 454,793,999 | |
| | | | | | |
Net Asset Value Per Share | Class A | Class C | Class I | Class Y | |
Net Assets ($) | 56,173,076 | 49,830,107 | 309,206,195 | 39,584,621 | |
Shares Outstanding | 4,013,848 | 3,443,619 | 23,252,315 | 2,979,461 | |
Net Asset Value Per Share ($) | 13.99 | 14.47 | 13.30 | 13.29 | |
| | | | | |
See notes to financial statements. | | | | | |
14
STATEMENT OF OPERATIONS
Year Ended October 31, 2019
| | | | | | | |
| | | | | | |
| | | | | | |
Investment Income ($): | | | | |
Income: | | | | |
Cash dividends (net of $989,094 foreign taxes withheld at source): | |
Unaffiliated issuers | | | 15,274,863 | |
Affiliated issuers | | | 249,599 | |
Income from securities lending—Note 1(c) | | | 131,859 | |
Total Income | | | 15,656,321 | |
Expenses: | | | | |
Management fee—Note 3(a) | | | 3,173,616 | |
Shareholder servicing costs—Note 3(c) | | | 537,876 | |
Distribution fees—Note 3(b) | | | 366,109 | |
Professional fees | | | 98,234 | |
Registration fees | | | 79,119 | |
Custodian fees—Note 3(c) | | | 66,981 | |
Prospectus and shareholders’ reports | | | 42,949 | |
Trustees’ fees and expenses—Note 3(d) | | | 37,104 | |
Loan commitment fees—Note 2 | | | 10,319 | |
Miscellaneous | | | 37,487 | |
Total Expenses | | | 4,449,794 | |
Investment Income—Net | | | 11,206,527 | |
Realized and Unrealized Gain (Loss) on Investments—Note 4 ($): | | |
Net realized gain (loss) on investments and foreign currency transactions | 4,008,411 | |
Net realized gain (loss) on forward foreign currency exchange contracts | (16,486) | |
Net Realized Gain (Loss) | | | 3,991,925 | |
Net change in unrealized appreciation (depreciation) on investments
and foreign currency transactions | 40,901,395 | |
Net Realized and Unrealized Gain (Loss) on Investments | | | 44,893,320 | |
Net Increase in Net Assets Resulting from Operations | | 56,099,847 | |
| | | | | | |
See notes to financial statements. | | | | | |
15
STATEMENT OF CHANGES IN NET ASSETS
| | | | | | | | | | |
| | | | Year Ended October 31, |
| | | | 2019 | | 2018 | |
Operations ($): | | | | | | | | |
Investment income—net | | | 11,206,527 | | | | 10,455,581 | |
Net realized gain (loss) on investments | | 3,991,925 | | | | 25,256,943 | |
Net change in unrealized appreciation
(depreciation) on investments | | 40,901,395 | | | | (20,398,988) | |
Net Increase (Decrease) in Net Assets
Resulting from Operations | 56,099,847 | | | | 15,313,536 | |
Distributions ($): | |
Distributions to shareholders: | | | | | | | | |
Class A | | | (4,299,767) | | | | (2,521,246) | |
Class C | | | (3,650,449) | | | | (1,787,035) | |
Class I | | | (24,224,672) | | | | (15,846,465) | |
Class Y | | | (4,006,486) | | | | (2,328,181) | |
Total Distributions | | | (36,181,374) | | | | (22,482,927) | |
Beneficial Interest Transactions ($): | |
Net proceeds from shares sold: | | | | | | | | |
Class A | | | 24,183,695 | | | | 8,984,877 | |
Class C | | | 8,280,596 | | | | 4,372,847 | |
Class I | | | 127,875,082 | | | | 64,500,690 | |
Class Y | | | 1,004,214 | | | | 1,353,406 | |
Distributions reinvested: | | | | | | | | |
Class A | | | 3,728,378 | | | | 2,267,559 | |
Class C | | | 2,849,169 | | | | 1,417,496 | |
Class I | | | 19,399,115 | | | | 13,114,517 | |
Class Y | | | 4,006,486 | | | | 2,328,181 | |
Cost of shares redeemed: | | | | | | | | |
Class A | | | (24,774,239) | | | | (14,673,704) | |
Class C | | | (12,837,805) | | | | (13,313,233) | |
Class I | | | (113,364,628) | | | | (106,425,860) | |
Class Y | | | (10,459,223) | | | | (288,536) | |
Increase (Decrease) in Net Assets
from Beneficial Interest Transactions | 29,890,840 | | | | (36,361,760) | |
Total Increase (Decrease) in Net Assets | 49,809,313 | | | | (43,531,151) | |
Net Assets ($): | |
Beginning of Period | | | 404,984,686 | | | | 448,515,837 | |
End of Period | | | 454,793,999 | | | | 404,984,686 | |
16
| | | | | | | | | | |
| | | | Year Ended October 31, |
| | | | 2019 | | 2018 | |
Capital Share Transactions (Shares): | |
Class Aa,b | | | | | | | | |
Shares sold | | | 1,853,562 | | | | 654,298 | |
Shares issued for distributions reinvested | | | 300,159 | | | | 166,259 | |
Shares redeemed | | | (1,887,094) | | | | (1,069,107) | |
Net Increase (Decrease) in Shares Outstanding | 266,627 | | | | (248,550) | |
Class Cb | | | | | | | | |
Shares sold | | | 630,678 | | | | 309,150 | |
Shares issued for distributions reinvested | | | 222,809 | | | | 100,890 | |
Shares redeemed | | | (949,979) | | | | (945,361) | |
Net Increase (Decrease) in Shares Outstanding | (96,492) | | | | (535,321) | |
Class Ia | | | | | | | | |
Shares sold | | | 10,358,929 | | | | 4,921,022 | |
Shares issued for distributions reinvested | | | 1,635,834 | | | | 1,006,935 | |
Shares redeemed | | | (9,176,481) | | | | (8,101,980) | |
Net Increase (Decrease) in Shares Outstanding | 2,818,282 | | | | (2,174,023) | |
Class Y | | | | | | | | |
Shares sold | | | 82,433 | | | | 102,157 | |
Shares issued for distributions reinvested | | | 338,868 | | | | 178,961 | |
Shares redeemed | | | (815,705) | | | | (21,939) | |
Net Increase (Decrease) in Shares Outstanding | (394,404) | | | | 259,179 | |
| | | | | | | | | |
a During the period ended October 31, 2019, 2,172 Class A shares representing $29,470 were exchanged for 2,283 Class I shares. | |
b During the period ended October 31, 2019, 1,024 Class C shares representing $14,235 were automatically converted to 1,056 Class A shares and during the period ended October 31, 2018, 13,617 Class C shares representing $191,642 were automatically converted to 14,036 Class A shares. | |
See notes to financial statements. | | | | | | | | |
17
FINANCIAL HIGHLIGHTS
The following tables describe the performance for each share class for the fiscal periods indicated. All information (except portfolio turnover rate) reflects financial results for a single fund share. Total return shows how much your investment in the fund would have increased (or decreased) during each period, assuming you had reinvested all dividends and distributions. These figures have been derived from the fund’s financial statements.
| | | | | | | |
| | |
| | | Year Ended October 31, |
Class A Shares | | 2019 | 2018 | 2017 | 2016 | 2015 |
Per Share Data ($): | | | | | | |
Net asset value, beginning of period | | 13.45 | 13.65 | 12.57 | 12.62 | 12.56 |
Investment Operations: | | | | | | |
Investment income—neta | | .33 | .31 | .24 | .27 | .30 |
Net realized and unrealized
gain (loss) on investments | | 1.36 | .13 | 1.49 | .48 | .21 |
Total from Investment Operations | | 1.69 | .44 | 1.73 | .75 | .51 |
Distributions: | | | | | | |
Dividends from
investment income—net | | (.33) | (.32) | (.27) | (.27) | (.33) |
Dividends from net realized
gain on investments | | (.82) | (.32) | (.38) | (.53) | (.12) |
Total Distributions | | (1.15) | (.64) | (.65) | (.80) | (.45) |
Net asset value, end of period | | 13.99 | 13.45 | 13.65 | 12.57 | 12.62 |
Total Return (%)b | | 13.85 | 3.14 | 14.30 | 6.31 | 4.33 |
Ratios/Supplemental Data (%): | | | | | | |
Ratio of total expenses
to average net assets | | 1.17 | 1.18 | 1.28 | 1.27 | 1.28 |
Ratio of net expenses
to average net assets | | 1.17 | 1.18 | 1.28 | 1.27 | 1.28 |
Ratio of net investment income
to average net assets | | 2.54 | 2.26 | 1.93 | 2.16 | 2.42 |
Portfolio Turnover Rate | | 27.51 | 21.82 | 26.35 | 27.90 | 30.89 |
Net Assets, end of period ($ x 1,000) | | 56,173 | 50,382 | 54,546 | 108,189 | 78,449 |
a Based on average shares outstanding.
b Exclusive of sales charge.
See notes to financial statements.
18
| | | | | | | |
| | | |
| | | Year Ended October 31, |
Class C Shares | | 2019 | 2018 | 2017 | 2016 | 2015 |
Per Share Data ($): | | | | | | |
Net asset value, beginning of period | | 13.86 | 13.98 | 12.79 | 12.84 | 12.76 |
Investment Operations: | | | | | | |
Investment income—neta | | .24 | .22 | .18 | .18 | .21 |
Net realized and unrealized
gain (loss) on investments | | 1.41 | .12 | 1.50 | .48 | .22 |
Total from Investment Operations | | 1.65 | .34 | 1.68 | .66 | .43 |
Distributions: | | | | | | |
Dividends from
investment income—net | | (.22) | (.14) | (.11) | (.18) | (.23) |
Dividends from net realized
gain on investments | | (.82) | (.32) | (.38) | (.53) | (.12) |
Total Distributions | | (1.04) | (.46) | (.49) | (.71) | (.35) |
Net asset value, end of period | | 14.47 | 13.86 | 13.98 | 12.79 | 12.84 |
Total Return (%)b | | 13.00 | 2.41 | 13.56 | 5.49 | 3.53 |
Ratios/Supplemental Data (%): | | | | | | |
Ratio of total expenses
to average net assets | | 1.91 | 1.91 | 2.01 | 2.02 | 2.03 |
Ratio of net expenses
to average net assets | | 1.91 | 1.91 | 2.01 | 2.02 | 2.03 |
Ratio of net investment income
to average net assets | | 1.79 | 1.53 | 1.36 | 1.42 | 1.64 |
Portfolio Turnover Rate | | 27.51 | 21.82 | 26.35 | 27.90 | 30.89 |
Net Assets, end of period ($ x 1,000) | | 49,830 | 49,068 | 56,969 | 57,459 | 46,177 |
a Based on average shares outstanding.
b Exclusive of sales charge.
See notes to financial statements.
19
FINANCIAL HIGHLIGHTS (continued)
| | | | | | | |
| | |
| | | Year Ended October 31, |
Class I Shares | | 2019 | 2018 | 2017 | 2016 | 2015 |
Per Share Data ($): | | | | | | |
Net asset value, beginning of period | | 12.83 | 13.10 | 12.11 | 12.19 | 12.15 |
Investment Operations: | | | | | | |
Investment income—neta | | .35 | .33 | .31 | .28 | .32 |
Net realized and unrealized
gain (loss) on investments | | 1.30 | .12 | 1.39 | .47 | .20 |
Total from Investment Operations | | 1.65 | .45 | 1.70 | .75 | .52 |
Distributions: | | | | | | |
Dividends from
investment income—net | | (.36) | (.40) | (.33) | (.30) | (.36) |
Dividends from net realized
gain on investments | | (.82) | (.32) | (.38) | (.53) | (.12) |
Total Distributions | | (1.18) | (.72) | (.71) | (.83) | (.48) |
Net asset value, end of period | | 13.30 | 12.83 | 13.10 | 12.11 | 12.19 |
Total Return (%) | | 14.20 | 3.43 | 14.65 | 6.65 | 4.52 |
Ratios/Supplemental Data (%): | | | | | | |
Ratio of total expenses
to average net assets | | .91 | .90 | .99 | 1.01 | 1.03 |
Ratio of net expenses
to average net assets | | .91 | .90 | .99 | 1.01 | 1.03 |
Ratio of net investment income
to average net assets | | 2.78 | 2.55 | 2.42 | 2.32 | 2.65 |
Portfolio Turnover Rate | | 27.51 | 21.82 | 26.35 | 27.90 | 30.89 |
Net Assets, end of period ($ x 1,000) | | 309,206 | 262,268 | 296,215 | 222,595 | 102,827 |
a Based on average shares outstanding.
See notes to financial statements.
20
| | | | | | | |
| | |
| | | Year Ended October 31, |
Class Y Shares | | 2019 | 2018 | 2017 | 2016 | 2015 |
Per Share Data ($): | | | | | | |
Net asset value, beginning of period | | 12.82 | 13.09 | 12.11 | 12.19 | 12.14 |
Investment Operations: | | | | | | |
Investment income—neta | | .37 | .34 | .31 | .30 | .33 |
Net realized and unrealized
gain (loss) on investments | | 1.29 | .12 | 1.39 | .46 | .21 |
Total from Investment Operations | | 1.66 | .46 | 1.70 | .76 | .54 |
Distributions: | | | | | | |
Dividends from
investment income—net | | (.37) | (.41) | (.34) | (.31) | (.37) |
Dividends from net realized
gain on investments | | (.82) | (.32) | (.38) | (.53) | (.12) |
Total Distributions | | (1.19) | (.73) | (.72) | (.84) | (.49) |
Net asset value, end of period | | 13.29 | 12.82 | 13.09 | 12.11 | 12.19 |
Total Return (%) | | 14.29 | 3.53 | 14.68 | 6.72 | 4.68 |
Ratios/Supplemental Data (%): | | | | | | |
Ratio of total expenses
to average net assets | | .84 | .83 | .92 | .94 | .95 |
Ratio of net expenses
to average net assets | | .84 | .83 | .92 | .94 | .95 |
Ratio of net investment income
to average net assets | | 2.93 | 2.61 | 2.45 | 2.52 | 2.71 |
Portfolio Turnover Rate | | 27.51 | 21.82 | 26.35 | 27.90 | 30.89 |
Net Assets, end of period ($ x 1,000) | | 39,585 | 43,267 | 40,786 | 33,342 | 26,519 |
a Based on average shares outstanding.
See notes to financial statements.
21
NOTES TO FINANCIAL STATEMENTS
NOTE 1—Significant Accounting Policies:
BNY Mellon Global Equity Income Fund (the “fund”) is a separate diversified series of BNY Mellon Investment Funds III (the “Trust”), which is registered under the Investment Company Act of 1940, as amended (the “Act”), as an open-end management investment company and operates as a series company currently offering four series, including the fund. The fund’s investment objective is to seek total return (consisting of capital appreciation and income). BNY Mellon Investment Adviser, Inc. (the “Adviser”), a wholly-owned subsidiary of The Bank of New York Mellon Corporation (“BNY Mellon”), serves as the fund’s investment adviser. Newton Investment Management (North America) Limited (the “Sub-Adviser”), a wholly-owned subsidiary of BNY Mellon and an affiliate of the Adviser, serves as the fund’s sub-investment adviser.
Effective June 3, 2019, the fund changed its name from Dreyfus Global Equity Income Fund to BNY Mellon Global Equity Income Fund and the Trust changed its name from The Dreyfus/Laurel Funds Trust to BNY Mellon Investment Funds III. In addition, The Dreyfus Corporation, the fund’s investment adviser, changed its name to “BNY Mellon Investment Adviser, Inc.”, MBSC Securities Corporation, the fund’s distributor, changed its name to “BNY Mellon Securities Corporation” and Dreyfus Transfer, Inc., the fund’s transfer agent, changed its name to “BNY Mellon Transfer, Inc.”
BNY Mellon Securities Corporation (the “Distributor”), a wholly-owned subsidiary of the Adviser, is the distributor of the fund’s shares. The fund is authorized to issue an unlimited number of $.001 par value shares of Beneficial Interest in each of the following classes of shares: Class A, Class C, Class I, Class T and Class Y. Class A, Class C and Class T shares are sold primarily to retail investors through financial intermediaries and bear Distribution and/or Shareholder Services Plan fees. Class A and Class T shares generally are subject to a sales charge imposed at the time of purchase. Class C shares are subject to a contingent deferred sales charge (“CDSC”) imposed on Class C shares redeemed within one year of purchase. Class C shares automatically convert to Class A shares ten years after the date of purchase, without the imposition of a sales charge. Class I shares are sold primarily to bank trust departments and other financial service providers (including The Bank of New York Mellon, a subsidiary of BNY Mellon and an affiliate of the Adviser, and its affiliates), acting on behalf of customers having a qualified trust or an investment account or relationship at such institution, and bear no Distribution or Shareholder
22
Services Plan fees. Class Y shares are sold at net asset value per share generally to institutional investors, and bear no Distribution or Shareholder Services Plan fees. Class I and Class Y shares are offered without a front-end sales charge or CDSC. As of the date of this report, the fund did not offer Class T shares for purchase. Other differences between the classes include the services offered to and the expenses borne by each class, the allocation of certain transfer agency costs and certain voting rights. Income, expenses (other than expenses attributable to a specific class), and realized and unrealized gains or losses on investments are allocated to each class of shares based on its relative net assets.
The Trust accounts separately for the assets, liabilities and operations of each series. Expenses directly attributable to each series are charged to that series’ operations; expenses which are applicable to all series are allocated among them on a pro rata basis.
The Financial Accounting Standards Board (“FASB”) Accounting Standards Codification (“ASC”) is the exclusive reference of authoritative U.S. generally accepted accounting principles (“GAAP”) recognized by the FASB to be applied by nongovernmental entities. Rules and interpretive releases of the Securities and Exchange Commission (“SEC”) under authority of federal laws are also sources of authoritative GAAP for SEC registrants. The fund is an investment company and applies the accounting and reporting guidance of the FASB ASC Topic 946 Financial Services-Investment Companies. The fund’s financial statements are prepared in accordance with GAAP, which may require the use of management estimates and assumptions. Actual results could differ from those estimates.
The Trustenters into contracts that contain a variety of indemnifications. The fund’s maximum exposure under these arrangements is unknown. The fund does not anticipate recognizing any loss related to these arrangements.
(a) Portfolio valuation: The fair value of a financial instrument is the amount that would be received to sell an asset or paid to transfer a liability in an orderly transaction between market participants at the measurement date (i.e., the exit price). GAAP establishes a fair value hierarchy that prioritizes the inputs of valuation techniques used to measure fair value. This hierarchy gives the highest priority to unadjusted quoted prices in active markets for identical assets or liabilities (Level 1 measurements) and the lowest priority to unobservable inputs (Level 3 measurements).
Additionally, GAAP provides guidance on determining whether the volume and activity in a market has decreased significantly and whether
23
NOTES TO FINANCIAL STATEMENTS(continued)
such a decrease in activity results in transactions that are not orderly. GAAP requires enhanced disclosures around valuation inputs and techniques used during annual and interim periods.
Various inputs are used in determining the value of the fund’s investments relating to fair value measurements. These inputs are summarized in the three broad levels listed below:
Level 1—unadjusted quoted prices in active markets for identical investments.
Level 2—other significant observable inputs (including quoted prices for similar investments, interest rates, prepayment speeds, credit risk, etc.).
Level 3—significant unobservable inputs (including the fund’s own assumptions in determining the fair value of investments).
The inputs or methodology used for valuing securities are not necessarily an indication of the risk associated with investing in those securities.
Changes in valuation techniques may result in transfers in or out of an assigned level within the disclosure hierarchy. Valuation techniques used to value the fund’s investments are as follows:
Investments in equity securities are valued at the last sales price on the securities exchange or national securities market on which such securities are primarily traded. Securities listed on the National Market System for which market quotations are available are valued at the official closing price or, if there is no official closing price that day, at the last sales price. For open short positions, asked prices are used for valuation purposes. Bid price is used when no asked price is available. Registered investment companies that are not traded on an exchange are valued at their net asset value. All of the preceding securities are generally categorized within Level 1 of the fair value hierarchy.
Securities not listed on an exchange or the national securities market, or securities for which there were no transactions, are valued at the average of the most recent bid and asked prices. These securities are generally categorized within Level 2 of the fair value hierarchy.
Fair valuing of securities may be determined with the assistance of a pricing service using calculations based on indices of domestic securities and other appropriate indicators, such as prices of relevant ADRs and futures. Utilizing these techniques may result in transfers between Level 1 and Level 2 of the fair value hierarchy.
24
When market quotations or official closing prices are not readily available, or are determined not to accurately reflect fair value, such as when the value of a security has been significantly affected by events after the close of the exchange or market on which the security is principally traded (for example, a foreign exchange or market), but before the fund calculates its net asset value, the fund may value these investments at fair value as determined in accordance with the procedures approved by the Trust’s Board of Trustees (the “Board”). Certain factors may be considered when fair valuing investments such as: fundamental analytical data, the nature and duration of restrictions on disposition, an evaluation of the forces that influence the market in which the securities are purchased and sold, and public trading in similar securities of the issuer or comparable issuers. These securities are either categorized within Level 2 or 3 of the fair value hierarchy depending on the relevant inputs used.
For restricted securities where observable inputs are limited, assumptions about market activity and risk are used and such securities are generally categorized within Level 3 of the fair value hierarchy.
Investments denominated in foreign currencies are translated to U.S. dollars at the prevailing rates of exchange.
The following is a summary of the inputs used as of October 31, 2019in valuing the fund’s investments:
| | | | | |
| | Level 1 - Unadjusted Quoted Prices | Level 2 - Other Significant Observable Inputs | Level 3 -Significant Unobservable Inputs | Total |
Assets ($) | | | |
Investments in Securities: † | | | |
Equity Securities - Common Stocks | 430,673,563 | - | - | 430,673,563 |
Equity Securities - Preferred Stocks | 12,225,522 | - | - | 12,225,522 |
Investment Companies | 8,377,345 | - | - | 8,377,345 |
† See Statement of Investments for additional detailed categorizations, if any.
(b) Foreign currency transactions: The fund does not isolate that portion of the results of operations resulting from changes in foreign exchange rates on investments from the fluctuations arising from changes in the market prices of securities held. Such fluctuations are included with the net realized and unrealized gain or loss on investments.
Net realized foreign exchange gains or losses arise from sales of foreign currencies, currency gains or losses realized on securities transactions between trade and settlement date, and the difference between the
25
NOTES TO FINANCIAL STATEMENTS(continued)
amounts of dividends, interest and foreign withholding taxes recorded on the fund’s books and the U.S. dollar equivalent of the amounts actually received or paid. Net unrealized foreign exchange gains and losses arise from changes in the value of assets and liabilities other than investments resulting from changes in exchange rates. Foreign currency gains and losses on foreign currency transactions are also included with net realized and unrealized gain or loss on investments.
(c)Securities transactions and investment income: Securities transactions are recorded on a trade date basis. Realized gains and losses from securities transactions are recorded on the identified cost basis. Dividend income is recognized on the ex-dividend date and interest income, including, where applicable, accretion of discount and amortization of premium on investments, is recognized on the accrual basis.
Pursuant to a securities lending agreement with The Bank of New York Mellon, a subsidiary of BNY Mellon and an affiliate of the Adviser, the fund may lend securities to qualified institutions. It is the fund’s policy that, at origination, all loans are secured by collateral of at least 102% of the value of U.S. securities loaned and 105% of the value of foreign securities loaned. Collateral equivalent to at least 100% of the market value of securities on loan is maintained at all times. Collateral is either in the form of cash, which can be invested in certain money market mutual funds managed by the Adviser, or U.S. Government and Agency securities. The fund is entitled to receive all dividends, interest and distributions on securities loaned, in addition to income earned as a result of the lending transaction. Should a borrower fail to return the securities in a timely manner, The Bank of New York Mellon is required to replace the securities for the benefit of the fund or credit the fund with the market value of the unreturned securities and is subrogated to the fund’s rights against the borrower and the collateral. Additionally, the contractual maturity of security lending transactions are on an overnight and continuous basis. During the period ended October 31, 2019, The Bank of New York Mellon earned $31,662 from the lending of the fund’s portfolio securities, pursuant to the securities lending agreement.
(d) Affiliated issuers: Investments in other investment companies advised by the Adviser are considered “affiliated” under the Act.
(e) Risk: Investing in foreign markets may involve special risks and considerations not typically associated with investing in the U.S. These risks include revaluation of currencies, high rates of inflation, repatriation restrictions on income and capital, and adverse political and economic developments. Moreover, securities issued in these markets may be less
26
liquid, subject to government ownership controls and delayed settlements, and their prices may be more volatile than those of comparable securities in the U.S.
(f) Dividends and distributions to shareholders:Dividends and distributions are recorded on the ex-dividend date. Dividends from investment income-net are normally declared and paid quarterly. Dividends from net realized capital gains, if any, are normally declared and paid annually, but the fund may make distributions on a more frequent basis to comply with the distribution requirements of the Internal Revenue Code of 1986, as amended (the “Code”). To the extent that net realized capital gains can be offset by capital loss carryovers, it is the policy of the fund not to distribute such gains. Income and capital gain distributions are determined in accordance with income tax regulations, which may differ from GAAP.
(g) Federal income taxes: It is the policy of the fund to continue to qualify as a regulated investment company, if such qualification is in the best interests of its shareholders, by complying with the applicable provisions of the Code, and to make distributions of taxable income and net realized capital gain sufficient to relieve it from substantially all federal income and excise taxes.
As of and during the period ended October 31, 2019, the fund did not have any liabilities for any uncertain tax positions. The fund recognizes interest and penalties, if any, related to uncertain tax positions as income tax expense in the Statement of Operations. During the period ended October 31, 2019, the fund did not incur any interest or penalties.
Each tax year in the four-year period ended October 31, 2019 remains subject to examination by the Internal Revenue Service and state taxing authorities.
At October 31, 2019, the components of accumulated earnings on a tax basis were as follows: undistributed ordinary income $1,592,430, undistributed capital gains $4,226,696 and unrealized appreciation $81,144,164.
The tax character of distributions paid to shareholders during the fiscal periods ended October 31, 2019 and October 31, 2018 were as follows: ordinary income $15,043,941 and $13,088,539 , and long-term capital gains $21,137,433 and $9,394,388 , respectively.
(h) New Accounting Pronouncements: Effective June 1, 2019, the fund adopted Accounting Standards Update 2018-13, Fair Value Measurement (Topic 820): Disclosure Framework—Changes to the Disclosure
27
NOTES TO FINANCIAL STATEMENTS(continued)
Requirements for Fair Value Measurement (“ASU 2018-13”). The update provides guidance that eliminates, adds and modifies certain disclosure requirements for fair value measurements. The adoption of ASU 2018-13 had no impact on the operations of the fund for the period ended October 31, 2019.
NOTE 2—Bank Lines of Credit:
The fund participates with other long-term open-end funds managed by the Adviser in a $1.030 billion unsecured credit facility led by Citibank, N.A. (the “Citibank Credit Facility”) and a $300 million unsecured credit facility provided by The Bank of New York Mellon (the “BNYM Credit Facility”), each to be utilized primarily for temporary or emergency purposes, including the financing of redemptions (each, a “Facility”). The Citibank Credit Facility is available in two tranches: (i) Tranche A is in an amount equal to $830 million and is available to all long-term open-ended funds, including the fund, and (ii) Tranche B is in amount equal to $200 million and is available only to BNY Mellon Floating Rate Income Fund, a series of BNY Mellon Investment Funds IV, Inc. In connection therewith, the fund has agreed to pay its pro rata portion of commitment fees for Tranche A of the Citibank Credit Facility and the BNYM Credit Facility. Interest is charged to the fund based on rates determined pursuant to the terms of the respective Facility at the time of borrowing. During the period ended October 31, 2019, the fund did not borrow under the Facilities.
NOTE 3—Management Fee, Sub-Investment Advisory Fee and Other Transactions with Affiliates:
(a)Pursuant to a management agreement with the Adviser and the Trust, the Trust had agreed to pay the Adviser a management fee computed at the annual rate of .75% of the value of the fund’s average daily net assets and is payable monthly.
Pursuant to a sub-investment advisory agreement between the Adviser and the Sub-Adviser, the Adviser pays the Sub-Adviser an annual fee of .41% of the value of the fund’s average daily net assets.
During the period ended October 31, 2019, the Distributor retained $50,246 from commissions earned on sales of the fund’s Class A shares and $35,778 from CDSC fees on redemptions of the fund’s Class C shares.
(b) Under the Distribution Plan adopted pursuant to Rule 12b-1 under the Act, Class C shares pay the Distributor for distributing its shares at an annual rate of .75% of the value of its average daily net assets. During the period ended October 31, 2019, Class C shares were charged $366,109 pursuant to the Distribution Plan.
28
(c)Under the Shareholder Services Plan, Class A and Class C shares pay the Distributor at an annual rate of .25% of the value of their average daily net assets for the provision of certain services. The services provided may include personal services relating to shareholder accounts, such as answering shareholder inquiries regarding the fund and providing reports and other information, and services related to the maintenance of shareholder accounts. The Distributor may make payments to Service Agents (securities dealers, financial institutions or other industry professionals) with respect to these services. The Distributor determines the amounts to be paid to Service Agents. During the period ended October 31, 2019, Class A and Class C shares were charged $135,295and $122,036, respectively, pursuant to the Shareholder Services Plan.
Under its terms, the Distribution Plan and Shareholder Services Plan shall remain in effect from year to year, provided such continuance is approved annually by a vote of a majority of those Trustees who are not “interested persons” of the Trust and who have no direct or indirect financial interest in the operation of or in any agreement related to the Distribution Plan or Shareholder Services Plan.
The fund has an arrangement with the transfer agent whereby the fund may receive earnings credits when positive cash balances are maintained, which are used to offset transfer agency fees. The fund had an arrangement with the custodian to receive earnings credits when positive cash balances were maintained, which were used to offset custody fees. Effective February 1, 2019, the arrangement with the custodian changed whereby the fund will no longer receive earnings credits to offset its custody fees and will receive interest income or overdraft fees going forward. For financial reporting purposes, the fund includes net earnings credits, if any, as an expense offset in the Statement of Operations.
The fund compensates BNY Mellon Transfer, Inc., a wholly-owned subsidiary of the Adviser, under a transfer agency agreement for providing transfer agency and cash management services for the fund. The majority of transfer agency fees are comprised of amounts paid on a per account basis, while cash management fees are related to fund subscriptions and redemptions. During the period ended October 31, 2019, the fund was charged $10,479 for transfer agency services. These fees are included in Shareholder servicing costs in the Statement of Operations.
The fund compensates The Bank of New York Mellon under a custody agreement for providing custodial services for the fund. These fees are determined based on net assets, geographic region and transaction activity. During the period ended October 31, 2019, the fund was charged $66,981 pursuant to the custody agreement.
29
NOTES TO FINANCIAL STATEMENTS(continued)
During the period ended October 31, 2019, the fund was charged $11,610 for services performed by the Chief Compliance Officer and his staff. These fees are included in Miscellaneous in the Statement of Operations.
The components of “Due to BNY Mellon Investment Adviser, Inc. and affiliates” in the Statement of Assets and Liabilities consist of: management fees of $283,332, Distribution Plan fees of $31,024, Shareholder Services Plan fees of $22,055, custodian fees of $22,645, Chief Compliance Officer fees of $4,504 and transfer agency fees of $1,710.
(d) Each Board member also serves as a Board member of other funds in the BNY Mellon Family of Funds complex. Annual retainer fees and attendance fees are allocated to each fund based on net assets.
NOTE 4—Securities Transactions:
The aggregate amount of purchases and sales of investment securities, excluding short-term securities and forward foreign currency exchange contracts (“forward contracts”), during the period ended October 31, 2019, amounted to $117,214,397 and $112,985,505, respectively.
Derivatives: A derivative is a financial instrument whose performance is derived from the performance of another asset. The fund enters into International Swaps and Derivatives Association, Inc. Master Agreements or similar agreements (collectively, “Master Agreements”) with its over-the-counter (“OTC”) derivative contract counterparties in order to, among other things, reduce its credit risk to counterparties. Master Agreements include provisions for general obligations, representations, collateral and events of default or termination. Under a Master Agreement, the fund may offset with the counterparty certain derivative financial instruments’ payables and/or receivables with collateral held and/or posted and create one single net payment in the event of default or termination.
Each type of derivative instrument that was held by the fund during the period ended October 31, 2019 is discussed below.
Forward Foreign Currency Exchange Contracts: The fund enters into forward contracts in order to hedge its exposure to changes in foreign currency exchange rates on its foreign portfolio holdings, to settle foreign currency transactions or as a part of its investment strategy. When executing forward contracts, the fund is obligated to buy or sell a foreign currency at a specified rate on a certain date in the future. With respect to sales of forward contracts, the fund incurs a loss if the value of the contract increases between the date the forward contract is opened and the date the forward contract is closed. The fund realizes a gain if the value of the contract decreases between those dates. With respect to purchases of
30
forward contracts, the fund incurs a loss if the value of the contract decreases between the date the forward contract is opened and the date the forward contract is closed. The fund realizes a gain if the value of the contract increases between those dates. Any realized or unrealized gains or losses which occurred during the period are reflected in the Statement of Operations. The fund is exposed to foreign currency risk as a result of changes in value of underlying financial instruments. The fund is also exposed to credit risk associated with counterparty nonperformance on these forward contracts, which is generally limited to the unrealized gain on each open contract. This risk may be mitigated by Master Agreements, if any, between the fund and the counterparty and the posting of collateral, if any, by the counterparty to the fund to cover the fund’s exposure to the counterparty. At October 31, 2019, there were no forward contracts outstanding.
The following summarizes the average market value of derivatives outstanding duringthe period ended October 31, 2019:
| | | |
| | Average Market Value ($) |
Forward contracts | | 267,029 |
| | |
At October 31, 2019, the cost of investments for federal income tax purposes was $370,095,442; accordingly, accumulated net unrealized appreciation on investments was $81,180,988, consisting of $99,780,004 gross unrealized appreciation and $18,599,016 gross unrealized depreciation.
31
REPORT OF INDEPENDENT REGISTERED PUBLIC ACCOUNTING FIRM
To the Shareholders of the Fund and Board of Trustees of
BNY Mellon Investment Funds III (formerly, The Dreyfus/Laurel Funds Trust):
Opinion on the Financial Statements
We have audited the accompanying statement of assets and liabilities of BNY Mellon Global Equity Income Fund (formerly, Dreyfus Global Equity Income Fund) (the “Fund”), a series of BNY Mellon Investment Funds III, including the statement of investments, as of October 31, 2019, and the statement of investments in affiliated issuers as of and for the year then ended, the related statement of operations for the year then ended, the statements of changes in net assets for each of the years in the two-year period then ended, and the related notes (collectively, the financial statements), and the financial highlights for each of the years in the five-year period then ended. In our opinion, the financial statements and financial highlights present fairly, in all material respects, the financial position of the Fund as of October 31, 2019, the results of its operations for the year then ended, the changes in its net assets for each of the years in the two-year period then ended, and the financial highlights for each of the years in the five-year period then ended, in conformity with U.S. generally accepted accounting principles.
Basis for Opinion
These financial statements and financial highlights are the responsibility of the Fund’s management. Our responsibility is to express an opinion on these financial statements and financial highlights based on our audits. We are a public accounting firm registered with the Public Company Accounting Oversight Board (United States) (PCAOB) and are required to be independent with respect to the Fund in accordance with the U.S. federal securities laws and the applicable rules and regulations of the Securities and Exchange Commission and the PCAOB.
We conducted our audits in accordance with the standards of the PCAOB. Those standards require that we plan and perform the audit to obtain reasonable assurance about whether the financial statements and financial highlights are free of material misstatement, whether due to error or fraud. Our audits included performing procedures to assess the risks of material misstatement of the financial statements and financial highlights, whether due to error or fraud, and performing procedures that respond to those risks. Such procedures included examining, on a test basis, evidence regarding the amounts and disclosures in the financial statements and financial highlights. Such procedures also included confirmation of securities owned as of October 31, 2019, by correspondence with the custodian. Our audits also included evaluating the accounting principles used and significant estimates made by management, as well as evaluating the overall presentation of the financial statements and financial highlights. We believe that our audits provide a reasonable basis for our opinion.

We have served as the auditor of one or more BNY Mellon Investment Adviser, Inc. investment companies since 1994.
New York, New York
December 20, 2019
32
IMPORTANT TAX INFORMATION(Unaudited)
For federal tax purposes, the fund elects to provide each shareholder with their portion of the fund's income sourced from foreign countries and taxes paid from foreign countries. The fund reports the maximum amount allowable but not less than $9,751,082 as income sourced from foreign countries for the fiscal year ended October 31, 2019 in accordance with Section 853(c)(2) of the Internal Revenue Code and also the fund reports the maximum amount allowable but not less than $894,533 as taxes paid from foreign countries for the fiscal year ended October 31, 2019 in accordance with Section 853(a) of the Internal Revenue Code. Where required by federal tax rules, shareholders will receive notification of their proportionate share of foreign sourced income and foreign taxes paid for the 2019 calendar year with Form 1099-DIV which will be mailed in early 2020. Also the fund designates the maximum amount allowable, but not less than $11,962,090 as ordinary income dividends paid during the fiscal year ended October 31, 2019 as qualified dividend income in accordance with Section 854(b)(1)(B) of the Internal Revenue Code. Also the fund reports the maximum amount allowable but not less than $.6952 per share as a capital gain dividend in accordance with Section 852(b)(3)(C) of the Internal Revenue Code. Also, the fund reports the maximum amount allowable but not less than $.1244 as a short-term capital gain dividend paid on December 14, 2018 in accordance with Sections 871(k)(2) and 881(e) of the Internal Revenue Code. Also, the fund reports the maximum amount allowable but not less than 39.68% of ordinary income dividends paid during the year ended October 31, 2019 as eligible for the corporate dividends received deduction provided under Section 243 of the Internal Revenue Code in accordance with Section 854(b)(1)(A) of the Internal Revenue Code.
33
BOARD MEMBERS INFORMATION(Unaudited)
INDEPENDENT BOARD MEMBERS
Joseph S. DiMartino (76)
Chairman of the Board (1999)
Principal Occupation During Past 5 Years:
· Corporate Director and Trustee (1995-Present)
Other Public Company Board Memberships During Past 5 Years:
· CBIZ, Inc., a public company providing professional business services, products and solutions,Director (1997-Present)
No. of Portfolios for which Board Member Serves:120
———————
Francine J. Bovich (68)
Board Member (2012)
Principal Occupation During Past 5 Years:
· Trustee, The Bradley Trusts, private trust funds (2011-Present)
Other Public Company Board Memberships During Past 5 Years:
· Annaly Capital Management, Inc., a real estate investment trust,Director (2014-Present)
No. of Portfolios for which Board Member Serves:70
———————
Andrew J. Donohue (68)
Board Member (2019)
Principal Occupation During Past 5 Years:
· Of Counsel, Shearman & Sterling LLP (2017-2019)
· Chief of Staff to the Chair of the SEC (2015-2017)
· Managing Director and Investment Company General Counsel of Goldman Sachs (2012-2015)
Other Public Company Board Memberships During Past 5 Years:
· Oppenheimer Funds (58 funds),Director (2017-2019)
No. of Portfolios for which Board Member Serves:56
———————
Kenneth A. Himmel (72)
Board Member (1994)
Principal Occupation During Past 5 Years:
· Managing Partner, Gulf Related, an international real estate development company (2010-Present)
· President and CEO, Related Urban Development, a real estate development company (1996-Present)
· President and CEO, Himmel & Company, a real estate development company (1980-Present)
· CEO, American Food Management, a restaurant company (1983-Present)
No. of Portfolios for which Board Member Serves:23
———————
34
Stephen J. Lockwood (72)
Board Member (1994)
Principal Occupation During Past 5 Years:
· Chairman of the Board, Stephen J. Lockwood and Company LLC, a real estate investment company (2000-Present)
No. of Portfolios for which Board Member Serves:23
———————
Roslyn M. Watson (70)
Board Member (1994)
Principal Occupation During Past 5 Years:
· Principal, Watson Ventures, Inc., a real estate investment company (1993-Present)
Other Public Company Board Memberships During Past 5 Years:
· American Express Bank, FSB,Director (1993-2018)
No. of Portfolios for which Board Member Serves:56
———————
Benaree Pratt Wiley (73)
Board Member (1998)
Principal Occupation During Past 5 Years:
· Principal, The Wiley Group, a firm specializing in strategy and business development (2005-Present)
Other Public Company Board Memberships During Past 5 Years:
· CBIZ, Inc., a public company providing professional business services, products and solutions,Director(2008-Present)
· Blue Cross-Blue Shield of Massachusetts (2004-Present)
No. of Portfolios for which Board Member Serves:76
———————
Once elected all Board Members serve for an indefinite term, but achieve Emeritus status upon reaching age 80. The address of the Board Members and Officers is c/o BNY Mellon Investment Adviser, Inc. 240 Greenwich Street, New York, New York 10286. Additional information about the Board Members is available in the fund’s Statement of Additional Information which can be obtained from the Adviser free of charge by calling this toll free number: 1-800-373-9387.
James M. Fitzgibbons, Emeritus Board Member
35
OFFICERS OF THE FUND(Unaudited)
RENEE LAROCHE-MORRIS, President since May 2019.
President and a director of BNY Mellon Investment Adviser, Inc. since January 2018. She is an officer of 63 investment companies (comprised of 120 portfolios) managed by the Adviser. She is 48 years old and has been an employee of BNY Mellon since 2003.
JAMES WINDELS, Treasurer since November 2001.
Director- BNY Mellon Fund Administration, and an officer of 64 investment companies (comprised of 143 portfolios) managed by the Adviser. He is 61 years old and has been an employee of the Adviser since April 1985.
BENNETT A. MACDOUGALL, Chief Legal Officer since October 2015.
Chief Legal Officer of the Adviser and Associate General Counsel and Managing Director of BNY Mellon since June 2015; Director and Associate General Counsel of Deutsche Bank – Asset & Wealth Management Division from June 2005 to June 2015, and as Chief Legal Officer of Deutsche Investment Management Americas Inc. from June 2012 to May 2015. He is an officer of 64 investment companies (comprised of 143 portfolios) managed by the Adviser. He is 48 years old and has been an employee of the Adviser since June 2015.
DAVID DIPETRILLO, Vice President since May 2019.
Head of North America Product, BNY Mellon Investment Management since January 2018, Director of Product Strategy, BNY Mellon Investment Management from January 2016 to December 2017; Head of US Retail Product and Channel Marketing, BNY Mellon Investment Management from January 2014 to December 2015. He is an officer of 63 investment companies (comprised of 120 portfolios) managed by the Adviser. He is 41 years old and has been an employee of BNY Mellon since 2005.
JAMES BITETTO, Vice President since August 2005 and Secretary since February 2018.
Senior Managing Counsel of BNY Mellon since November 2019; Managing Counsel of BNY Mellon from April 2014 to November 2019; Secretary of the Adviser, and an officer of 64 investment companies (comprised of 143 portfolios) managed by the Adviser. He is 53 years old and has been an employee of the Adviser since December 1996.
SONALEE CROSS, Vice President and Assistant Secretary since March 2018.
Counsel of BNY Mellon since October 2016; Associate at Proskauer Rose LLP from April 2016 to September 2016; Attorney at EnTrust Capital from August 2015 to February 2016; Associate at Sidley Austin LLP from September 2013 to August 2015. She is an officer of 64 investment companies (comprised of 143 portfolios) managed by the Adviser. She is 32 years old and has been an employee of the Adviser since October 2016.
DEIRDRE CUNNANE, Vice President and Assistant Secretary since March 2019.
Counsel of BNY Mellon since August 2018; Senior Regulatory Specialist at BNY Mellon Investment Management Services from February 2016 to August 2018; Trustee Associate at BNY Mellon Trust Company (Ireland) Limited from August 2013 to February 2016. She is an officer of 64 investment companies (comprised of 143 portfolios) managed by the Adviser. She is 29 years old and has been an employee of the Adviser since August 2018.
SARAH S. KELLEHER, Vice President and Assistant Secretary since April 2014.
Managing Counsel of BNY Mellon since December 2017, Senior Counsel of BNY Mellon from March 2013 to December 2017. She is an officer of 64 investment companies (comprised of 143 portfolios) managed by the Adviser. She is 44 years old and has been an employee of the Adviser since March 2013.
JEFF PRUSNOFSKY, Vice President and Assistant Secretary since August 2005.
Senior Managing Counsel of BNY Mellon, and an officer of 64 investment companies (comprised of 143 portfolios) managed by the Adviser. He is 54 years old and has been an employee of the Adviser since October 1990.
PETER M. SULLIVAN, Vice President and Assistant Secretary since March 2019.
Managing Counsel of BNY Mellon, and an officer of 64 investment companies (comprised of 143 portfolios) managed by the Adviser. He is 51 years old and has been an employee of the Adviser since April 2004.
36
NATALYA ZELENSKY, Vice President and Assistant Secretary since March 2017.
Managing Counsel of BNY Mellon since November 2019; Counsel of BNY Mellon from May 2016 to November 2019; Attorney at Wildermuth Endowment Strategy Fund/Wildermuth Advisory, LLC from November 2015 to May 2016 and Assistant General Counsel at RCS Advisory Services from July 2014 to November 2015. She is an officer of 64 investment companies (comprised of 143 portfolios) managed by the Adviser. She is 34 years old and has been an employee of the Adviser since May 2016.
GAVIN C. REILLY, Assistant Treasurer since December 2005.
Tax Manager - BNY Mellon Fund Administration, and an officer of 64 investment companies (comprised of 143 portfolios) managed by the Adviser. He is 51 years old and has been an employee of the Adviser since April 1991.
ROBERT S. ROBOL, Assistant Treasurer since August 2005.
Senior Accounting Manager- BNY Mellon Fund Administration, and an officer of 64 investment companies (comprised of 143 portfolios) managed by the Adviser. He is 55 years old and has been an employee of the Adviser since October 1988.
ROBERT SALVIOLO, Assistant Treasurer since July 2007.
Senior Accounting Manager – BNY Mellon Fund Administration, and an officer of 64 investment companies (comprised of 143 portfolios) managed by the Adviser. He is 52 years old and has been an employee of the Adviser since June 1989.
ROBERT SVAGNA, Assistant Treasurer since December 2002.
Senior Accounting Manager – BNY Mellon Fund Administration, and an officer of 64 investment companies (comprised of 143 portfolios) managed by the Adviser. He is 52 years old and has been an employee of the Adviser since November 1990.
JOSEPH W. CONNOLLY, Chief Compliance Officer since October 2004.
Chief Compliance Officer of the Adviser, the BNY Mellon Family of Funds and BNY Mellon Funds Trust (64 investment companies, comprised of 143 portfolios). He is 62 years old and has served in various capacities with the the Adviser since 1980, including manager of the firm’s Fund Accounting Department from 1997 through October 2001.
CARIDAD M. CAROSELLA, Anti-Money Laundering Compliance Officer since January 2016.
Anti-Money Laundering Compliance Officer of the BNY Mellon Family of Funds and BNY Mellon Funds Trust since January 2016; from May 2015 to December 2015, Interim Anti-Money Laundering Compliance Officer of the BNY Mellon Family of Funds and BNY Mellon Funds Trust and the Distributor; from January 2012 to May 2015, AML Surveillance Officer of the Distributor. She is an officer of 57 investment companies (comprised of 136 portfolios) managed by the Adviser. She is 51 years old and has been an employee of the Distributor since 1997.
37
BNY Mellon Global Equity Income Fund
240 Greenwich Street
New York, NY 10286
Adviser
BNY Mellon Investment Adviser, Inc.
240 Greenwich Street
New York, NY 10286
Sub-Adviser
Newton Investment Management
(North America) Limited
160 Queen Victoria Street
London, EC4V, 4LA, UK
Custodian
The Bank of New York Mellon
240 Greenwich Street
New York, NY 10286
Transfer Agent &
Dividend Disbursing Agent
BNY Mellon Transfer, Inc.
240 Greenwich Street
New York, NY 10286
Distributor
BNY Mellon Securities Corporation
240 Greenwich Street
New York, NY 10286
| | |
Ticker Symbols: | Class A: DEQAX Class C: DEQCX Class I: DQEIX Class Y: DEQYX |
Telephone Call your financial representative or 1-800-373-9387
Mail The BNY Mellon Family of Funds, 144 Glenn Curtiss Boulevard, Uniondale, NY 11556-0144
E-mailSend your request toinfo@bnymellon.com
InternetInformation can be viewed online or downloaded atwww.bnymellonim.com/us
The fund files its complete schedule of portfolio holdings with the Securities and Exchange Commission (“SEC”) for the first and third quarters of each fiscal year on Form N-PORT. The fund’s Forms N-PORT are available on the SEC’s website atwww.sec.gov.
A description of the policies and procedures that the fund uses to determine how to vote proxies relating to portfolio securities and information regarding how the fund voted these proxies for the most recent 12-month period ended June 30 is available atwww.bnymellonim.com/us and on the SEC’s website atwww.sec.gov and without charge, upon request, by calling 1-800-373-9387.
| | |
© 2019 BNY Mellon Securities Corporation
6175AR1019 | 
|
BNY Mellon International Bond Fund
| |
ANNUAL REPORT October 31, 2019 |
| |
Save time. Save paper. View your next shareholder report online as soon as it’s available. Log into www.bnymellonim.com/us and sign up for eCommunications. It’s simple and only takes a few minutes. |
| |
The views expressed in this report reflect those of the portfolio manager(s) only through the end of the period covered and do not necessarily represent the views of BNY Mellon Investment Adviser, Inc. or any other person in the BNY Mellon Investment Adviser, Inc. organization. Any such views are subject to change at any time based upon market or other conditions and BNY Mellon Investment Adviser, Inc. disclaims any responsibility to update such views. These views may not be relied on as investment advice and, because investment decisions for a fund in the BNY Mellon Family of Funds are based on numerous factors, may not be relied on as an indication of trading intent on behalf of any fund in the BNY Mellon Family of Funds. |
| |
Not FDIC-Insured • Not Bank-Guaranteed • May Lose Value |
Contents
THE FUND
FOR MORE INFORMATION
Back Cover
| | | | |
| |
BNY Mellon International Bond Fund
| | The Fund |
A LETTER FROM THE PRESIDENT OF BNY MELLON INVESTMENT ADVISER, INC.
Dear Shareholder:
We are pleased to present this annual report for BNY Mellon International Bond Fund (formerly, Dreyfus International Bond Fund), covering the 12-month period from November 1, 2018 through October 31, 2019. For information about how the fund performed during the reporting period, as well as general market perspectives, we provide a Discussion of Fund Performance on the pages that follow.
Equity markets weakened in the fourth quarter of 2018, as concerns about rising interest rates, trade tensions and slowing global growth provided downward pressure on returns. In December 2018, stocks experienced a sharp sell-off, as it appeared that the U.S. Federal Reserve (the “Fed”) would maintain its hawkish stance on monetary policy. In January 2019, a pivot in stance from the Fed helped stimulate a rebound across equity markets that continued into the second quarter. Escalating trade tensions disrupted equity markets again in May. The dip was short-lived, as markets rose once again in June and July of 2019, when a trade deal appeared more likely, and the pace of U.S. economic growth remained steady. Nevertheless, concerns continued to emerge over slowing global growth, resulting in bouts of market volatility in August 2019. Stocks rebounded in September and continued an upward path through most of October 2019, supported in part by central bank policy and consistent consumer spending.
In fixed-income markets, a risk-off mentality prevailed to start the period, fueled in part by equity market volatility. A flight to quality supported price increases for U.S. Treasuries, which continued through the end of 2018, leading to a flattening yield curve. After the Fed’s supportive statements in January 2019, other developed-market central banks followed suit and reiterated their abilities to bolster flagging growth by continuing accommodative policies. This further buoyed fixed-income instrument prices. The Fed cut rates in July, September and October of 2019, for a total 75-basis-point reduction in the federal funds rate during the 12 months. Concerns about the pace of global economic growth also fueled demand for fixed-income instruments during much of the reporting period, resulting in positive bond market returns.
We believe that over the near term, the outlook for the U.S. remains positive, but we will monitor relevant data for any signs of a change. As always, we encourage you to discuss the risks and opportunities in today’s investment environment with your financial advisor.
Thank you for your continued confidence and support.
Sincerely,

Renee LaRoche-Morris
President
BNY Mellon Investment Adviser, Inc.
November 15, 2019
2
DISCUSSION OF FUND PERFORMANCE(Unaudited)
For the period from November 1, 2018 through October 31, 2019, as provided by David Leduc, CFA, Brendan Murphy, CFA and Scott Zaleski, CFA, portfolio managers
Market and Fund Performance Overview
For the 12-month period ended October 31, 2019, BNY Mellon International Bond Fund’s (formerly, Dreyfus International Bond Fund) Class A shares produced a total return of 5.10%, Class C shares returned 4.51%, Class I shares returned 5.49%, and Class Y shares returned 5.65%.1 In comparison, the fund’s benchmark, the Bloomberg Barclays Global Aggregate ex USD Index (Unhedged) (the “Index”), produced a total return of 7.84% for the same period.2
International bond markets recovered from a volatile end to 2018 to post positive total returns over the reporting period, aided by more accommodative central bank policies and optimism surrounding a resolution to the U.S.-China trade disputes. The fund’s returns trailed that of the Index, mainly due to an overweight to European, Japanese and Canadian inflation-linked securities, and security-selection decisions within local currency emerging market bonds.
The Fund’s Investment Approach
The fund seeks to maximize total return through capital appreciation and income. To pursue its goal, the fund normally invests at least 80% of its net assets, plus any borrowings for investment purposes, in fixed-income securities. The fund also normally invests at least 65% of its assets in non-U.S. dollar-denominated, fixed-income securities of foreign governments and companies located in various countries, including emerging markets.
Generally, the fund seeks to maintain a portfolio with an average credit quality of investment grade. The fund’s portfolio managers focus on identifying undervalued government bond markets, currencies, sectors and securities and look for fixed-income securities with the greatest capacity for added value, such as those involving the potential for credit upgrades, unique structural characteristics, or innovative features. The portfolio managers select securities for the fund’s portfolio by using fundamental economic research and quantitative analysis to allocate assets among countries and currencies, focusing on sectors and individual securities that appear to be relatively undervalued, and actively trading among sectors.
Bond Markets Pivot on Central Bank Policy
Financial-market volatility persisted in November and December of 2018, as tightening U.S. monetary policy, softening global growth momentum, and deteriorating equity and credit markets were offset by a rally in global government bonds. Slower employment growth and weaker headline inflation, aided by lower oil prices, were supportive of a more gradual approach to U.S. monetary tightening. In January 2019, rising expectations that the U.S. Federal Reserve (the “Fed”) would pause its interest-rate hikes was confirmed by Fed Chair Jerome Powell, which helped spur a recovery for fixed-income markets, most of which posted strong returns for the 12 months.
The chief cause of this strong performance was the Fed’s pivot from raising interest rates through much of 2018, to cutting rates in 2019, in response to slowing global growth and escalating trade wars. After a pause, the Fed cut the federal funds rate three times during the
3
DISCUSSION OF FUND PERFORMANCE(Unaudited) (continued)
summer and fall months. Other central banks around the world also continued their accommodative policies. Somewhat unusually, investment-grade bonds delivered the best return on average, benefiting from a combination of falling rates and credit-spread narrowing. Developed-market government bonds responded well to the Fed’s turnaround, falling inflationary pressures and new bouts of quantitative and monetary easing around the globe. With the exception of Argentina, emerging-market bonds also performed strongly, as falling U.S. interest rates increased their allure to yield-hungry investors. High yield bonds generally performed well, with the exception of the energy sector. Performance across investment-grade sectors was uniformly strong, with only autos lagging.
Weak Inflation Constrained Fund Performance
The fund’s performance compared to that of the Index was undermined during the reporting period by allocations to inflation-linked securities, particularly those of Europe, Japan and Canada, which saw slowing growth and weak inflationary numbers during the period. In addition, security selection within local-currency emerging-market bonds also detracted. Both the currency and the sovereign debt of emerging-market countries were negatively affected during the volatility seen late in 2018. While these currencies and credits recovered during 2019, it was not enough to offset the prior reductions in value. In addition, the portfolio’s positioning in the currencies of several Latin American countries, as well as an underweight to the euro and overweights to both the yen and the pound, also detracted from performance.
On a more positive note, the fund’s security selection and yield-curve positioning strategies were beneficial, particularly within debt issued by countries in the European periphery and by European agencies. As the European Central Bank continued its accommodative policies, interest rates in periphery countries also fell, and countries such as Spain, Italy, Belgium, Greece and Portugal performed well. Purchasing debt on the long end of the yield curve across Europe was also beneficial as the yield curve flattened. In addition, several corporate credits, such as General Electric and Banco Santander, also outperformed the broader market. Hard-currency emerging-market and euro-denominated bonds also bolstered performance.
At times during the reporting period, the fund employed option contracts, futures contracts and forward contracts to manage its interest-rate and currency exposures. These positions did not have a material effect on performance.
A Constructive Investment Posture
We maintain the belief that trade issues may improve, which could support aggregate demand around the world. We feel the market has tended to lean toward an assumption of increased trade tensions and a depressive effect on demand. A pickup in demand might surprise, putting pressure on resources. We think this could stoke a modest pickup in inflation. However, if trade difficulties increase, that could tip the U.S. economy into more of a slowdown. If trade stabilizes, we believe the U.S. economy will stabilize. Stabilization and improved trade may also be stimulative for emerging-market and European economies. Commodity prices could also potentially benefit. Areas which have seen a slowdown in their economies, specifically as a result of the trade difficulties, such as China, Singapore and South Korea, would also benefit if trade between the U.S. and China improves.
4
As spreads have tightened materially in 2019, we feel many corporate bonds are richly valued. We are currently cautious of investment-grade and high yield corporates due to tight spreads and increased leverage. We are finding attractive valuations in emerging-market debt and U.S. agency mortgage-backed securities, as those areas of the market appear inexpensive relative to U.S. corporates. In addition, we believe U.S. and global securitized products are also attractive.
Given these viewpoints, as of the end of the reporting period, the fund held a small exposure to inflation-linked notes, an overweight in emerging-market debt, and an overweight in securitized products. We believe agency mortgages currently have a more attractive valuation than they have had in the recent past. Our currency positioning at the end of the reporting period indicates our optimistic view of trade relations going forward. We believe that there may be potential for currency appreciation in areas around Europe, as well as some emerging-market countries, such as Russia, China, South Korea, and Singapore.
November 15, 2019
1 Total return includes reinvestment of dividends and any capital gains paid and does not take into consideration the maximum initial sales charge in the case of Class A shares or the applicable contingent deferred sales charge imposed on redemptions in the case of Class C shares. Had these charges been reflected, returns would have been lower. Class I and Class Y shares are not subject to any initial or deferred sales charge. Past performance is no guarantee of future results. Share price and investment return fluctuate such that upon redemption, fund shares may be worth more or less than their original cost. The return figure provided for Class A reflects the absorption of certain Class A expenses pursuant to an agreement by BNY Mellon Investment Adviser, Inc. through March 1, 2020, at which time it may be extended, terminated, or modified. Had these expenses not been absorbed, the fund’s Class A return would have been lower.
2 Source: Lipper Inc. — The Bloomberg Barclays Global Aggregate ex USD Index (Unhedged) is a flagship measure of global investment-grade debt from 24 local currency markets, excluding U.S. dollar-denominated bonds. This multi-currency benchmark includes treasury, government-related, corporate and securitized fixed-rate bonds from both developed- and emerging-market issuers. Investors cannot invest directly in any index.
Bonds are subject generally to interest-rate, credit, liquidity and market risks, to varying degrees, all of which are more fully described in the fund’s prospectus. Generally, all other factors being equal, bond prices are inversely related to interest-rate changes, and rate increases can cause price declines.
High yield bonds are subject to increased credit risk and are considered speculative in terms of the issuer’s perceived ability to continue making interest payments on a timely basis and to repay principal upon maturity.
Foreign bonds are subject to special risks, including exposure to currency fluctuations, changing political and economic conditions and potentially less liquidity. These risks are generally greater with emerging-market countries than with more economically and politically established foreign countries.
The fund may, but is not required to, use derivative instruments, such as options, futures, options on futures, forward contracts and other credit derivatives.
The use of derivatives involves risks different from, or possibly greater than, the risks associated with investing directly in the underlying assets. Derivatives can be highly volatile, illiquid and difficult to value, and there is the risk that changes in the value of a derivative held by the fund will not correlate with the underlying instruments or the fund’s other investments.
Investments in foreign currencies are subject to the risk that those currencies will decline in value relative to the U.S. dollar, or, in the case of hedged positions, that the U.S. dollar will decline relative to the currency being hedged. Currency rates in foreign countries may fluctuate significantly over short periods of time. A decline in the value of foreign currencies relative to the U.S. dollar will reduce the value of securities held by the fund and denominated in those currencies. The use of leverage may magnify the fund’s gains or losses. For derivatives with a leveraging component, adverse changes in the value or level of the underlying asset can result in a loss that is much greater than the original investment in the derivative.
5
FUND PERFORMANCE(Unaudited)

Comparison of change in value of a $10,000 investment in Class A shares, Class C shares and Class I shares of BNY Mellon International Bond Fund with a hypothetical investment of $10,000 in the Bloomberg Barclays Global Aggregate ex USD Index (Unhedged) (the “Index”)
† Source: Lipper Inc.
Past performance is not predictive of future performance.
The above graph compares a hypothetical investment of $10,000 made in Class A, Class C, and Class I shares of BNY Mellon International Bond Fund on 10/31/09 to a hypothetical investment of $10,000 made in the Index on that date. All dividends and capital gain distributions are reinvested.
The fund’s performance shown in the line graph above takes into account the maximum initial sales charge on Class A shares and all other applicable fees and expenses on all classes. The Index is a flagship measure of global investment-grade debt from 24 local currency markets, excluding U.S. dollar-denominated bonds. This multi-currency benchmark includes treasury, government-related, corporate and securitized fixed-rate bonds from both developed and emerging markets issuers. Unlike a mutual fund, the Index is not subject to charges, fees and other expenses. Investors cannot invest directly in any index.Further information relating to fund performance, including expense reimbursements, if applicable, is contained in the Financial Highlights section of the prospectus and elsewhere in this report.
6
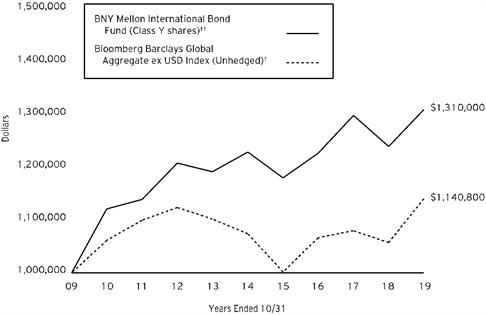
Comparison of change in value of a $1,000,000 investment in Class Y shares of BNY Mellon International Bond Fund with a hypothetical investment of $1,000,000 in the Bloomberg Barclays Global Aggregate ex USD Index (Unhedged) (the “Index”)
† Source: Lipper Inc.
†† The total return figures presented for Class Y shares of the fund reflect the performance of the fund’s Class A shares for the period prior to 7/1/13 (the inception date for Class Y shares), not reflecting the applicable sales charges for Class A shares.
Past performance is not predictive of future performance.
The above graph compares a hypothetical investment of $1,000,000 made in Class Y shares of BNY Mellon International Bond Fund on 10/31/09 to a hypothetical investment of $1,000,000 made in the Index on that date. All dividends and capital gain distributions are reinvested.
The fund’s performance shown in the line graph above takes into account all applicable fees and expenses of the fund’s Class Y shares. The Index is a flagship measure of global investment-grade debt from 24 local currency markets, excluding U.S. dollar-denominated bonds. This multi-currency benchmark includes treasury, government-related, corporate and securitized fixed-rate bonds from both developed and emerging markets issuers. Unlike a mutual fund, the Index is not subject to charges, fees and other expenses. Investors cannot invest directly in any index. Further information relating to fund performance, including expense reimbursements, if applicable, is contained in the Financial Highlights section of the prospectus and elsewhere in this report.
7
FUND PERFORMANCE(Unaudited) (continued)
| | | | | |
Average Annual Total Returns as of 10/31/19 |
| Inception | 1 Year | 5 Years | 10 Years |
Date |
Class A shares | | | | |
with maximum sales charge (4.5%) | 12/30/05 | 0.39% | -0.17% | 1.88% |
without sales charge | 12/30/05 | 5.10% | 0.75% | 2.35% |
Class C shares | | | | |
with applicable redemption charge† | 12/30/05 | 3.51% | 0.17% | 1.69% |
without redemption | 12/30/05 | 4.51% | 0.17% | 1.69% |
Class I shares | 12/30/05 | 5.49% | 1.20% | 2.72% |
Class Y shares | 7/1/13 | 5.65% | 1.28% | 2.74%†† |
Bloomberg Barclay Global Aggregate | | | | |
ex USD Index (Unhedged) | | 7.84% | 1.20% | 1.33% |
† The maximum contingent deferred sales charge for Class C shares is 1% for shares redeemed within one year of the date of purchase.
†† The total return performance figures presented for Class Y shares of the fund reflect the performance of the fund’s Class A shares for the period prior to 7/1/13 (the inception date for Class Y shares), not reflecting the applicable sales charges for Class A shares.
The performance data quoted represents past performance, which is no guarantee of future results. Share price and investment return fluctuate and an investor’s shares may be worth more or less than original cost upon redemption. Current performance may be lower or higher than the performance quoted. Go towww.bnymellonim.com/us for the fund’s most recent month-end returns.
The fund’s performance shown in the graphs and table does not reflect the deduction of taxes that a shareholder would pay on fund distributions or the redemption of fund shares. In addition to the performance of Class A shares shown with and without a maximum sales charge, the fund’s performance shown in the table takes into account all other applicable fees and expenses on all classes.
8
UNDERSTANDING YOUR FUND’S EXPENSES(Unaudited)
As a mutual fund investor, you pay ongoing expenses, such as management fees and other expenses. Using the information below, you can estimate how these expenses affect your investment and compare them with the expenses of other funds. You also may pay one-time transaction expenses, including sales charges (loads) and redemption fees, which are not shown in this section and would have resulted in higher total expenses. For more information, see your fund’s prospectus or talk to your financial adviser.
Review your fund’s expenses
The table below shows the expenses you would have paid on a $1,000 investment in BNY Mellon International Bond Fund from May 1, 2019 to October 31, 2019. It also shows how much a $1,000 investment would be worth at the close of the period, assuming actual returns and expenses.
| | | | | | | |
Expenses and Value of a $1,000 Investment | |
Assume actual returns for the six months ended October 31, 2019 | |
| | | | | | |
| | Class A | Class C | Class I | Class Y | |
Expense paid per $1,000† | $5.23 | $8.65 | $3.44 | $2.98 | |
Ending value (after expenses) | $1,033.00 | $1,029.70 | $1,034.60 | $1,035.30 | |
COMPARING YOUR FUND’S EXPENSES
WITH THOSE OF OTHER FUNDS(Unaudited)
Using the SEC’s method to compare expenses
The Securities and Exchange Commission (“SEC”) has established guidelines to help investors assess fund expenses. Per these guidelines, the table below shows your fund’s expenses based on a $1,000 investment, assuming a hypothetical 5% annualized return. You can use this information to compare the ongoing expenses (but not transaction expenses or total cost) of investing in the fund with those of other funds. All mutual fund shareholder reports will provide this information to help you make this comparison. Please note that you cannot use this information to estimate your actual ending account balance and expenses paid during the period.
| | | | | | | |
Expenses and Value of a $1,000 Investment | |
Assuming a hypothetical 5% annualized return for the six months ended October 31, 2019 | |
| | | | | | |
| | Class A | Class C | Class I | Class Y | |
Expense paid per $1,000† | $5.19 | $8.59 | $3.41 | $2.96 | |
Ending value (after expenses) | $1,020.06 | $1,016.69 | $1,021.83 | $1,022.28 | |
†Expenses are equal to the fund’s annualized expense ratio of 1.02% for Class A, 1.69% for Class C, .67% for Class I and .58% for Class Y, multiplied by the average account value over the period, multiplied by 184/365 (to reflect the one-half year period). |
9
STATEMENT OF INVESTMENTS
October 31, 2019
| | | | | | | | | | |
| |
Description | Coupon
Rate (%) | | Maturity
Date | | Principal
Amount ($) | a | Value ($) | |
Bonds and Notes - 96.5% | | | | | |
Australia - .3% | | | | | |
Driver Australia Four Trust, Ser. 4, Cl. A, 1 Month BBSW +.95% | AUD | 1.86 | | 8/21/2025 | | 146,698 | b | 101,198 | |
Driver Australia Six Trust, Ser. 6, Cl. A, 1 Month BBSW +.90% | AUD | 1.80 | | 12/21/2027 | | 2,400,000 | b | 1,654,440 | |
Driver Australia Three Trust, Ser. 3, Cl. A, 1 Month BBSW +1.70% | AUD | 2.61 | | 5/21/2024 | | 267,794 | b | 185,088 | |
| | 1,940,726 | |
Belgium - 4.6% | | | | | |
Belgium, Unscd. Bonds, Ser. 72 | EUR | 2.60 | | 6/22/2024 | | 9,660,000 | c | 12,331,959 | |
Kingdom of Belgium, Unscd. Bonds, Ser. 78 | EUR | 1.60 | | 6/22/2047 | | 11,750,000 | c | 16,290,808 | |
| | 28,622,767 | |
Canada - 1.2% | | | | | |
Ford Auto Securitization Trust, Ser. 2019-BA, Cl. A2 | CAD | 2.32 | | 10/15/2023 | | 2,250,000 | c | 1,708,299 | |
MBarc Credit Canada, Ser. 2019-AA, Cl. A3 | CAD | 2.72 | | 10/16/2023 | | 2,110,000 | c | 1,614,756 | |
Royal Bank of Canada, Sr. Unscd. Notes | | 2.55 | | 7/16/2024 | | 1,860,000 | | 1,888,850 | |
Silver Arrow Canada, Ser. 2019-1A, Cl. A3 | CAD | 2.40 | | 8/15/2026 | | 1,750,000 | | 1,328,677 | |
Teck Resources, Sr. Unscd. Notes | | 6.25 | | 7/15/2041 | | 625,000 | | 697,275 | |
| | 7,237,857 | |
Cayman Islands - .4% | | | | | |
CK Hutchison Europe Finance 18, Gtd. Bonds | EUR | 1.25 | | 4/13/2025 | | 660,000 | | 765,173 | |
CK Hutchison Finance 16 II, Gtd. Bonds | EUR | 0.88 | | 10/3/2024 | | 1,405,000 | | 1,603,163 | |
DP World Crescent, Sr. Unscd. Notes | | 3.75 | | 1/30/2030 | | 325,000 | | 326,084 | |
| | 2,694,420 | |
China - 4.9% | | | | | |
China, Unscd. Bonds, Ser. 1827 | CNY | 3.25 | | 11/22/2028 | | 168,700,000 | | 23,841,098 | |
China Development Bank, Unscd. Bonds, Ser. 1905 | CNY | 3.48 | | 1/8/2029 | | 49,000,000 | | 6,753,467 | |
| | 30,594,565 | |
Colombia - .3% | | | | | |
Colombia, Sr. Unscd. Bonds | | 4.00 | | 2/26/2024 | | 1,800,000 | | 1,904,994 | |
Ecuador - .5% | | | | | |
Ecuador, Sr. Unscd. Bonds | | 10.75 | | 3/28/2022 | | 3,050,000 | | 3,234,937 | |
Egypt - .3% | | | | | |
Egypt, Sr. Unscd. Bonds | EUR | 4.75 | | 4/16/2026 | | 800,000 | | 917,080 | |
Egypt, Sr. Unscd. Notes | | 6.13 | | 1/31/2022 | | 500,000 | | 518,123 | |
10
| | | | | | | | | | |
| |
Description | Coupon
Rate (%) | | Maturity
Date | | Principal
Amount ($) | a | Value ($) | |
Bonds and Notes - 96.5% (continued) | | | | | |
Egypt - .3% (continued) | | | | | |
Egypt, Sr. Unscd. Notes | | 6.20 | | 3/1/2024 | | 500,000 | c | 529,063 | |
| | 1,964,266 | |
France - 2.6% | | | | | |
Credit Agricole Home Loan SFH, Covered Notes | EUR | 1.25 | | 3/24/2031 | | 1,600,000 | | 2,010,938 | |
Engie, Jr. Sub. Bonds | EUR | 1.38 | | 1/16/2023 | | 1,500,000 | | 1,691,771 | |
French Republic, Unscd. Bonds | EUR | 2.00 | | 5/25/2048 | | 6,400,000 | c | 9,677,563 | |
Orange, Sr. Unscd. Notes | EUR | 0.00 | | 9/4/2026 | | 2,800,000 | | 3,079,479 | |
| | 16,459,751 | |
Germany - .4% | | | | | |
Allianz, Sub. Notes | EUR | 5.63 | | 10/17/2042 | | 1,800,000 | | 2,321,047 | |
Ghana - .2% | | | | | |
Ghana, Sr. Unscd. Bonds | | 7.88 | | 3/26/2027 | | 600,000 | c | 624,486 | |
Ghana, Sr. Unscd. Notes | | 7.63 | | 5/16/2029 | | 600,000 | c | 607,620 | |
| | 1,232,106 | |
Greece - 1.0% | | | | | |
Hellenic Republic, Sr. Unscd. Bonds | EUR | 3.45 | | 4/2/2024 | | 1,200,000 | c | 1,517,586 | |
Hellenic Republic, Sr. Unscd. Bonds | EUR | 3.88 | | 3/12/2029 | | 3,340,000 | c | 4,619,158 | |
| | 6,136,744 | |
Indonesia - .8% | | | | | |
Indonesia, Sr. Unscd. Notes | EUR | 3.75 | | 6/14/2028 | | 860,000 | | 1,165,617 | |
Indonesia, Sr. Unscd. Notes | | 5.88 | | 1/15/2024 | | 1,230,000 | | 1,388,601 | |
Indonesia Asahan Aluminium, Sr. Unscd. Notes | | 5.23 | | 11/15/2021 | | 1,100,000 | c | 1,153,343 | |
Perusahaan Listrik Negara, Sr. Unscd. Notes | EUR | 1.88 | | 11/5/2031 | | 940,000 | | 1,045,452 | |
| | 4,753,013 | |
Ireland - .4% | | | | | |
Ireland, Bonds | EUR | 2.00 | | 2/18/2045 | | 1,610,000 | | 2,343,439 | |
Israel - .3% | | | | | |
Israel, Bonds, Ser. 327 | ILS | 2.00 | | 3/31/2027 | | 6,900,000 | | 2,138,490 | |
Italy - 3.6% | | | | | |
Intesa Sanpaolo, Covered Notes | EUR | 1.38 | | 12/18/2025 | | 3,200,000 | | 3,896,077 | |
Italy, Sr. Unscd. Notes | | 2.88 | | 10/17/2029 | | 3,025,000 | | 2,967,225 | |
Italy Buoni Poliennali Del Tesoro, Sr. Unscd. Bonds | EUR | 2.70 | | 3/1/2047 | | 11,850,000 | c | 15,576,768 | |
| | 22,440,070 | |
Japan - 19.7% | | | | | |
Japan, Sr. Unscd. Bonds, Ser. 21 | JPY | 0.10 | | 3/10/2026 | | 7,235,742,150 | d | 68,675,255 | |
Japan (20 Year Issue), Sr. Unscd. Bonds, Ser. 156 | JPY | 0.40 | | 3/20/2036 | | 1,918,650,000 | | 18,563,400 | |
Japan (30 Year Issue), Sr. Unscd. Bonds, Ser. 44 | JPY | 1.70 | | 9/20/2044 | | 1,545,100,000 | | 19,070,647 | |
11
STATEMENT OF INVESTMENTS (continued)
| | | | | | | | | | |
| |
Description | Coupon
Rate (%) | | Maturity
Date | | Principal
Amount ($) | a | Value ($) | |
Bonds and Notes - 96.5% (continued) | | | | | |
Japan - 19.7% (continued) | | | | | |
Japan (30 Year Issue), Sr. Unscd. Bonds, Ser. 59 | JPY | 0.70 | | 6/20/2048 | | 1,145,650,000 | | 11,550,910 | |
Oscar US Funding Trust VI, Ser. 2017-1A, Cl. A4 | | 3.30 | | 5/10/2024 | | 1,080,000 | c | 1,096,738 | |
Oscar US Funding Trust VIII, Ser. 2018-1A, Cl. A4 | | 3.50 | | 5/12/2025 | | 2,450,000 | c | 2,529,854 | |
Takeda Pharmaceutical, Sr. Unscd. Bonds | EUR | 3.00 | | 11/21/2030 | | 1,575,000 | | 2,115,182 | |
| | 123,601,986 | |
Kazakhstan - .5% | | | | | |
Development Bank of Kazakhstan, Sr. Unscd. Notes | | 4.13 | | 12/10/2022 | | 475,000 | | 491,638 | |
Kazakhstan, Sr. Unscd. Notes | EUR | 0.60 | | 9/30/2026 | | 1,450,000 | | 1,610,228 | |
KazMunayGas National, Sr. Unscd. Notes | | 6.38 | | 10/24/2048 | | 1,030,000 | | 1,298,933 | |
| | 3,400,799 | |
Kenya - .2% | | | | | |
Kenya, Sr. Unscd. Notes | | 8.25 | | 2/28/2048 | | 950,000 | c | 998,970 | |
Luxembourg - 1.1% | | | | | |
CK Hutchison Group Telecom Finance, Gtd. Notes | EUR | 1.13 | | 10/17/2028 | | 1,765,000 | | 1,962,558 | |
DH Europe Finance II, Gtd. Bonds | EUR | 0.20 | | 3/18/2026 | | 1,300,000 | | 1,437,211 | |
DH Europe Finance II, Gtd. Notes | | 2.60 | | 11/15/2029 | | 1,275,000 | | 1,284,797 | |
E-Carat, Ser. 2016-1, Cl. A, 1 Month EURIBOR +.45% @ Floor | EUR | 0.00 | | 10/18/2024 | | 144,593 | b | 161,387 | |
Gazprom OAO Via Gaz Capital, Sr. Unscd. Bonds | EUR | 2.50 | | 3/21/2026 | | 1,050,000 | | 1,257,101 | |
Medtronic Global Holdings, Gtd. Notes | EUR | 1.63 | | 3/7/2031 | | 475,000 | | 587,581 | |
| | 6,690,635 | |
Malaysia - 2.1% | | | | | |
Malaysia, Sr. Unscd. Bonds, Ser. 219 | MYR | 3.89 | | 8/15/2029 | | 54,000,000 | | 13,391,786 | |
Mexico - .3% | | | | | |
Infraestructura Energetica Nova, Sr. Unscd. Notes | | 4.88 | | 1/14/2048 | | 755,000 | e | 722,913 | |
Petroleos Mexicanos, Gtd. Notes | EUR | 5.13 | | 3/15/2023 | | 1,065,000 | | 1,320,364 | |
| | 2,043,277 | |
Netherlands - 3.9% | | | | | |
ABN AMRO Bank, Covered Bonds | EUR | 0.88 | | 1/14/2026 | | 2,400,000 | | 2,865,643 | |
ABN AMRO Bank, Sub. Notes | EUR | 2.88 | | 1/18/2028 | | 1,100,000 | | 1,317,391 | |
Cooperatieve Rabobank, Sub. Bonds | EUR | 2.50 | | 5/26/2026 | | 1,816,000 | | 2,097,727 | |
EDP Finance, Sr. Unscd. Notes | EUR | 0.38 | | 9/16/2026 | | 1,225,000 | | 1,364,999 | |
Enel Finance International, Gtd. Notes | EUR | 0.38 | | 6/17/2027 | | 385,000 | | 429,952 | |
Equate Petrochemical, Gtd. Notes | | 3.00 | | 3/3/2022 | | 1,500,000 | e | 1,505,153 | |
12
| | | | | | | | | | |
| |
Description | Coupon
Rate (%) | | Maturity
Date | | Principal
Amount ($) | a | Value ($) | |
Bonds and Notes - 96.5% (continued) | | | | | |
Netherlands - 3.9% (continued) | | | | | |
Iberdrola International, Gtd. Notes | EUR | 2.63 | | 3/26/2024 | | 1,400,000 | | 1,664,680 | |
ING Groep, Sub. Bonds | EUR | 2.00 | | 3/22/2030 | | 900,000 | | 1,063,095 | |
ING Groep, Sub. Notes | EUR | 3.00 | | 4/11/2028 | | 1,600,000 | | 1,932,946 | |
MDGH - GMTN, Gtd. Notes | | 2.50 | | 11/7/2024 | | 755,000 | | 752,735 | |
Petrobras Global Finance, Gtd. Notes | | 5.09 | | 1/15/2030 | | 479,000 | c | 508,578 | |
SABIC Capital II, Gtd. Bonds | | 4.00 | | 10/10/2023 | | 3,075,000 | c | 3,241,979 | |
VEON Holdings, Sr. Unscd. Notes | | 3.95 | | 6/16/2021 | | 2,000,000 | | 2,031,100 | |
VEON Holdings, Sr. Unscd. Notes | | 4.00 | | 4/9/2025 | | 1,750,000 | | 1,799,980 | |
WPC Eurobond, Gtd. Bonds | EUR | 2.25 | | 7/19/2024 | | 950,000 | | 1,145,541 | |
WPC Eurobond, Gtd. Notes | EUR | 1.35 | | 4/15/2028 | | 635,000 | | 701,828 | |
WPC Eurobond, Gtd. Notes | EUR | 2.13 | | 4/15/2027 | | 195,000 | | 230,919 | |
| | 24,654,246 | |
Nigeria - .3% | | | | | |
Nigeria, Sr. Unscd. Notes | | 5.63 | | 6/27/2022 | | 700,000 | | 723,590 | |
Nigeria, Sr. Unscd. Notes | | 6.50 | | 11/28/2027 | | 1,050,000 | c | 1,055,607 | |
| | 1,779,197 | |
Panama - .6% | | | | | |
Panama, Sr. Unscd. Bonds | | 4.00 | | 9/22/2024 | | 2,125,000 | | 2,278,000 | |
Panama, Sr. Unscd. Notes | | 3.16 | | 1/23/2030 | | 1,400,000 | | 1,447,600 | |
| | 3,725,600 | |
Philippines - .1% | | | | | |
Philippine, Sr. Unscd. Notes | EUR | 0.88 | | 5/17/2027 | | 750,000 | | 862,135 | |
Qatar - .2% | | | | | |
Qatar, Sr. Unscd. Notes | | 3.38 | | 3/14/2024 | | 1,500,000 | c | 1,570,312 | |
Romania - .3% | | | | | |
Romania, Sr. Unscd. Notes | EUR | 2.50 | | 2/8/2030 | | 1,305,000 | c | 1,597,193 | |
Russia - 2.6% | | | | | |
Russia, Bonds, Ser. 6212 | RUB | 7.05 | | 1/19/2028 | | 998,205,000 | | 16,306,519 | |
Saudi Arabia - .1% | | | | | |
Saudi Arabian Oil, Sr. Unscd. Notes | | 2.75 | | 4/16/2022 | | 775,000 | c | 784,034 | |
Senegal - .1% | | | | | |
Senegal, Sr. Unscd. Bonds | EUR | 4.75 | | 3/13/2028 | | 730,000 | | 844,069 | |
Singapore - 2.4% | | | | | |
Singapore, Sr. Unscd. Bonds | SGD | 2.63 | | 5/1/2028 | | 19,250,000 | | 15,133,136 | |
Slovenia - 1.0% | | | | | |
Slovenia, Bonds, Ser. RS76 | EUR | 3.13 | | 8/7/2045 | | 3,900,000 | | 6,552,843 | |
Spain - 3.5% | | | | | |
Banco Santander, Covered Notes | EUR | 0.88 | | 5/9/2031 | | 1,500,000 | | 1,804,747 | |
Banco Santander, Sub. Notes | EUR | 2.50 | | 3/18/2025 | | 2,800,000 | | 3,401,847 | |
Spain, Sr. Unscd. Bonds | EUR | 2.90 | | 10/31/2046 | | 9,425,000 | c | 15,009,071 | |
Telefonica Emisiones, Gtd. Notes | EUR | 1.53 | | 1/17/2025 | | 1,600,000 | | 1,908,736 | |
| | 22,124,401 | |
13
STATEMENT OF INVESTMENTS (continued)
| | | | | | | | | | |
| |
Description | Coupon
Rate (%) | | Maturity
Date | | Principal
Amount ($) | a | Value ($) | |
Bonds and Notes - 96.5% (continued) | | | | | |
Sri Lanka - .4% | | | | | |
Sri Lanka, Sr. Unscd. Notes | | 6.25 | | 10/4/2020 | | 325,000 | | 330,688 | |
Sri Lanka, Sr. Unscd. Notes | | 6.85 | | 3/14/2024 | | 750,000 | c | 773,596 | |
Sri Lanka, Sr. Unscd. Notes | | 7.55 | | 3/28/2030 | | 1,175,000 | c | 1,188,949 | |
| | 2,293,233 | |
Supranational - 3.8% | | | | | |
Arab Petroleum Investments, Sr. Unscd. Notes | | 4.13 | | 9/18/2023 | | 2,920,000 | c | 3,099,898 | |
Asian Development Bank, Sr. Unscd. Notes | NZD | 3.50 | | 5/30/2024 | | 3,750,000 | | 2,624,413 | |
Banque Ouest Africaine de Developpement, Sr. Unscd. Notes | | 5.00 | | 7/27/2027 | | 1,635,000 | | 1,736,190 | |
Corp Andina de Fomento, Sr. Unscd. Notes | | 3.25 | | 2/11/2022 | | 1,300,000 | | 1,326,312 | |
European Investment Bank, Sr. Unscd. Notes | EUR | 0.63 | | 1/22/2029 | | 2,030,000 | | 2,430,809 | |
European Union, Govt. Gtd. Notes | EUR | 1.38 | | 10/4/2029 | | 5,300,000 | | 6,781,894 | |
International Finance, Sr. Unscd. Notes | INR | 6.30 | | 11/25/2024 | | 278,070,000 | | 3,955,109 | |
The African Export-Import Bank, Sr. Unscd. Notes | | 5.25 | | 10/11/2023 | | 1,850,000 | | 1,997,241 | |
| | 23,951,866 | |
Sweden - .7% | | | | | |
Sweden, Bonds, Ser. 1061 | SEK | 0.75 | | 11/12/2029 | | 38,125,000 | c | 4,296,066 | |
Thailand - 3.9% | | | | | |
Thailand, Sr. Unscd. Bonds | THB | 2.13 | | 12/17/2026 | | 115,400,000 | | 3,980,450 | |
Thailand, Sr. Unscd. Bonds | THB | 2.88 | | 12/17/2028 | | 550,000,000 | | 20,276,501 | |
| | 24,256,951 | |
Turkey - .4% | | | | | |
Turkey, Sr. Unscd. Notes | | 7.50 | | 11/7/2019 | | 2,320,000 | | 2,322,320 | |
Ukraine - .5% | | | | | |
Ukraine, Sr. Unscd. Notes | | 7.75 | | 9/1/2020 | | 1,425,000 | | 1,465,755 | |
Ukraine, Sr. Unscd. Notes | | 7.75 | | 9/1/2022 | | 1,725,000 | | 1,843,162 | |
| | 3,308,917 | |
United Arab Emirates - 1.0% | | | | | |
Abu Dhabi, Sr. Unscd. Bonds | | 2.50 | | 9/30/2029 | | 3,750,000 | | 3,728,906 | |
Abu Dhabi Crude Oil Pipeline, Sr. Scd. Bonds | | 4.60 | | 11/2/2047 | | 1,225,000 | c | 1,417,552 | |
DP World, Sr. Unscd. Notes | | 6.85 | | 7/2/2037 | | 960,000 | | 1,264,683 | |
| | 6,411,141 | |
United Kingdom - 6.2% | | | | | |
Barclays, Jr. Sub. Bonds | | 7.88 | | 3/15/2022 | | 850,000 | | 908,917 | |
Barclays, Sr. Unscd. Notes | | 4.97 | | 5/16/2029 | | 1,425,000 | | 1,606,501 | |
BAT International Finance, Gtd. Notes | EUR | 2.25 | | 1/16/2030 | | 1,450,000 | | 1,670,175 | |
14
| | | | | | | | | | |
| |
Description | Coupon
Rate (%) | | Maturity
Date | | Principal
Amount ($) | a | Value ($) | |
Bonds and Notes - 96.5% (continued) | | | | | |
United Kingdom - 6.2% (continued) | | | | | |
Lanark Master Issuer, Ser. 2019-1A, Cl. 1A1, 3 Month LIBOR +.77% | | 2.90 | | 12/22/2069 | | 1,703,333 | b,c | 1,706,858 | |
Lloyds Banking Group, Sr. Unscd. Notes | | 3.75 | | 1/11/2027 | | 1,475,000 | | 1,561,505 | |
Penarth Master Issuer, Ser. 2019-1A, Cl. A2, 1 Month SONIO +.70% | GBP | 1.41 | | 7/18/2024 | | 1,180,000 | b,c | 1,531,212 | |
Royal Bank of Scotland Group, Sr. Unscd. Notes | | 4.27 | | 3/22/2025 | | 1,670,000 | | 1,771,306 | |
Silverstone Master Issuer, Ser. 2019-1A, Cl. 2A, 3 Month SONIO +.75% | GBP | 1.46 | | 1/21/2070 | | 1,767,000 | b,c | 2,302,225 | |
United Kingdom, Bonds | GBP | 1.50 | | 7/22/2047 | | 4,565,000 | | 6,435,509 | |
United Kingdom, Bonds | GBP | 3.50 | | 1/22/2045 | | 9,875,000 | | 19,457,658 | |
| | 38,951,866 | |
United States - 18.8% | | | | | |
Abbott Laboratories, Sr. Unscd. Notes | | 3.75 | | 11/30/2026 | | 523,000 | | 573,474 | |
AbbVie, Sr. Unscd. Bonds | EUR | 1.38 | | 5/17/2024 | | 380,000 | | 444,477 | |
American Express, Sr. Unscd. Notes | | 2.50 | | 7/30/2024 | | 1,860,000 | | 1,883,614 | |
American Homes 4 Rent Trust, Ser. 2014-SFR3, Cl. A | | 3.68 | | 12/17/2036 | | 1,233,525 | c | 1,299,712 | |
Anheuser-Busch Inbev Worldwide, Gtd. Notes | | 4.00 | | 4/13/2028 | | 1,100,000 | | 1,215,233 | |
Ascentium Equipment Receivables, Ser. 2019-2A, Cl. A3 | | 2.19 | | 11/10/2026 | | 1,550,000 | c | 1,554,508 | |
AT&T, Sr. Unscd. Notes | EUR | 0.25 | | 3/4/2026 | | 1,000,000 | | 1,103,223 | |
AT&T, Sr. Unscd. Notes | EUR | 1.80 | | 9/14/2039 | | 800,000 | | 874,284 | |
AT&T, Sr. Unscd. Notes | EUR | 2.35 | | 9/5/2029 | | 100,000 | | 128,057 | |
Bank of America, Sr. Unscd. Notes | | 3.97 | | 3/5/2029 | | 400,000 | | 435,991 | |
BB&T, Sr. Unscd. Notes | | 2.50 | | 8/1/2024 | | 2,200,000 | | 2,230,742 | |
Bear Stearns Commercial Mortgage Securities Trust, Ser. 2005-PW10, Cl. AJ | | 5.78 | | 12/11/2040 | | 637,344 | | 649,988 | |
CAMB Commercial Mortgage Trust, Ser. 2019-LIFE, Cl. A, 1 Month LIBOR +1.07% | | 3.10 | | 12/15/2037 | | 1,700,000 | b,c | 1,707,286 | |
CarMax Auto Owner Trust, Ser. 2018-1, Cl. D | | 3.37 | | 7/15/2024 | | 365,000 | | 372,592 | |
CCO Holdings, Sr. Unscd. Notes | | 5.88 | | 4/1/2024 | | 600,000 | c | 627,000 | |
CCUBS Commercial Mortgage Trust, Ser. 2017-C1, Cl. A4 | | 3.54 | | 11/15/2050 | | 1,975,000 | | 2,127,312 | |
CHC Commercial Mortgage Trust, Ser. 2019-CHC, Cl. A, 1 Month LIBOR +1.12% | | 3.03 | | 6/15/2034 | | 2,300,000 | b,c | 2,305,516 | |
CHC Commercial Mortgage Trust, Ser. 2019-CHC, Cl. B, 1 Month LIBOR +1.50% | | 3.41 | | 6/15/2034 | | 875,000 | b,c | 877,146 | |
15
STATEMENT OF INVESTMENTS (continued)
| | | | | | | | | | |
| |
Description | Coupon
Rate (%) | | Maturity
Date | | Principal
Amount ($) | a | Value ($) | |
Bonds and Notes - 96.5% (continued) | | | | | |
United States - 18.8% (continued) | | | | | |
Comcast, Sr. Unscd. Notes | | 2.65 | | 2/1/2030 | | 1,150,000 | | 1,167,102 | |
Concho Resources, Gtd. Notes | | 3.75 | | 10/1/2027 | | 1,075,000 | | 1,118,468 | |
Consumer Loan Underlying Bond CLUB Credit Trust, Ser. 2019-P2, Cl. A | | 2.47 | | 10/15/2026 | | 888,912 | c | 889,518 | |
CVS Health, Sr. Unscd. Notes | | 2.63 | | 8/15/2024 | | 550,000 | | 555,950 | |
Dell Equipment Finance Trust, Ser. 2017-2, Cl. B | | 2.47 | | 10/24/2022 | | 700,000 | c | 701,348 | |
Dell Equipment Finance Trust, Ser. 2018-2, Cl. B | | 3.55 | | 10/22/2023 | | 1,100,000 | c | 1,126,892 | |
Dell Equipment Finance Trust, Ser. 2018-2, Cl. C | | 3.72 | | 10/22/2023 | | 1,300,000 | c | 1,335,791 | |
Dell International, Sr. Scd. Notes | | 6.02 | | 6/15/2026 | | 700,000 | c | 799,461 | |
Diamondback Energy, Gtd. Notes | | 5.38 | | 5/31/2025 | | 395,000 | | 413,763 | |
Digital Euro Finco, Gtd. Bonds | EUR | 2.63 | | 4/15/2024 | | 1,775,000 | | 2,158,547 | |
Dollar Tree, Sr. Unscd. Notes | | 4.20 | | 5/15/2028 | | 645,000 | | 701,121 | |
Drive Auto Receivables Trust, Ser. 2019-4, Cl. B | | 2.23 | | 1/16/2024 | | 925,000 | | 925,110 | |
DT Auto Owner Trust, Ser. 2018-2A, Cl. C | | 3.67 | | 3/15/2024 | | 2,625,000 | c | 2,659,685 | |
DT Auto Owner Trust, Ser. 2019-4A, Cl. B | | 2.36 | | 1/16/2024 | | 975,000 | c | 975,703 | |
Edison International, Sr. Unscd. Notes | | 4.13 | | 3/15/2028 | | 540,000 | | 537,684 | |
Edison International, Sr. Unscd. Notes | | 5.75 | | 6/15/2027 | | 310,000 | | 337,067 | |
Energy Transfer Operating, Gtd. Notes | | 4.20 | | 4/15/2027 | | 600,000 | | 626,213 | |
Energy Transfer Operating, Gtd. Notes | | 4.50 | | 4/15/2024 | | 550,000 | | 587,618 | |
Energy Transfer Operating, Gtd. Notes | | 5.25 | | 4/15/2029 | | 685,000 | | 768,812 | |
Energy Transfer Operating, Jr. Sub. Debs., Ser. A | | 6.25 | | 2/15/2023 | | 525,000 | | 489,048 | |
Enterprise Fleet Financing, Ser. 2019-3, Cl. A3 | | 2.19 | | 5/20/2025 | | 1,440,000 | c | 1,440,742 | |
Federal Home Loan Mortgage Corp. Multifamily Structured Pass Through Certificates, Ser. K159, Cl. A2 | | 3.95 | | 11/25/2030 | | 1,400,000 | f | 1,615,752 | |
Federal Home Loan Mortgage Corp. Multifamily Structured Pass Through Certificates, Ser. KL3W, Cl. AFLW, 1 Month LIBOR +.45% | | 2.47 | | 8/25/2025 | | 1,230,000 | b,f | 1,232,978 | |
Federal National Mortgage Association Grantor Trust, Ser. 2017-T1, Cl. A | | 2.90 | | 6/25/2027 | | 1,996,591 | | 2,085,483 | |
16
| | | | | | | | | | |
| |
Description | Coupon
Rate (%) | | Maturity
Date | | Principal
Amount ($) | a | Value ($) | |
Bonds and Notes - 96.5% (continued) | | | | | |
United States - 18.8% (continued) | | | | | |
Fidelity National Information Services, Sr. Unscd. Notes | EUR | 1.50 | | 5/21/2027 | | 1,045,000 | | 1,239,949 | |
General Electric, Jr. Sub. Debs., Ser. D | | 5.00 | | 1/21/2021 | | 1,185,000 | | 1,144,686 | |
General Electric, Sr. Unscd. Bonds | EUR | 0.38 | | 5/17/2022 | | 665,000 | | 741,147 | |
HCA, Gtd. Notes | | 5.88 | | 2/1/2029 | | 435,000 | | 493,725 | |
Healthcare Trust of America Holdings, Gtd. Notes | | 3.10 | | 2/15/2030 | | 730,000 | | 730,370 | |
Healthcare Trust of America Holdings, Gtd. Notes | | 3.50 | | 8/1/2026 | | 640,000 | | 664,573 | |
Hewlett Packard Enterprise, Sr. Unscd. Notes | | 2.25 | | 4/1/2023 | | 1,700,000 | | 1,702,448 | |
Intown Hotel Portfolio Trust, Ser. 2018-STAY, Cl. A, 1 Month LIBOR +.70% | | 2.61 | | 1/15/2033 | | 1,075,000 | b,c | 1,074,487 | |
Intown Hotel Portfolio Trust, Ser. 2018-STAY, Cl. B, 1 Month LIBOR +1.05% | | 2.96 | | 1/15/2033 | | 725,000 | b,c | 725,133 | |
Invitation Homes Trust, Ser. 2018-SFR3, Cl. A, 1 Month LIBOR +1.00% | | 2.89 | | 7/17/2037 | | 2,128,544 | b,c | 2,134,253 | |
Invitation Homes Trust, Ser. 2018-SFR4, Cl. A, 1 Month LIBOR +1.10% | | 2.99 | | 1/17/2038 | | 1,733,280 | b,c | 1,742,925 | |
Keurig Dr Pepper, Gtd. Notes | | 4.06 | | 5/25/2023 | | 850,000 | | 902,189 | |
KeyCorp Student Loan Trust, Ser. 1999-B, Cl. CTFS, 3 Month LIBOR +.90% | | 3.03 | | 11/25/2036 | | 562,154 | b | 562,154 | |
Kinder Morgan, Gtd. Notes | | 4.30 | | 6/1/2025 | | 575,000 | | 622,481 | |
Kraft Heinz Foods, Gtd. Notes | EUR | 2.25 | | 5/25/2028 | | 875,000 | | 1,044,596 | |
Long Beach Mortgage Loan Trust, Ser. 2004-1, Cl. M2, 1 Month LIBOR +.83% | | 2.65 | | 2/25/2034 | | 404,342 | b | 405,469 | |
Marsh & McLennan, Sr. Unscd. Bonds | EUR | 1.98 | | 3/21/2030 | | 1,690,000 | | 2,079,523 | |
MGM Growth Properties Operating Partnership, Gtd. Notes | | 5.75 | | 2/1/2027 | | 775,000 | c | 876,719 | |
Morgan Stanley Capital I Trust, Ser. 2019-L2, Cl. A3 | | 3.81 | | 3/15/2052 | | 2,575,000 | | 2,855,607 | |
MPLX, Sr. Unscd. Notes | | 3.50 | | 12/1/2022 | | 575,000 | c | 592,595 | |
NYT Mortgage Trust, Ser. 2019-NYT, Cl. A, 1 Month LIBOR +1.20% | | 3.11 | | 11/15/2035 | | 1,950,000 | b,c | 1,960,824 | |
PayPal Holdings, Sr. Unscd. Notes | | 2.40 | | 10/1/2024 | | 1,350,000 | | 1,362,995 | |
Pfizer, Sr. Unscd. Notes | | 3.45 | | 3/15/2029 | | 345,000 | e | 376,734 | |
Plains All American Pipeline, Sr. Unscd. Notes | | 3.55 | | 12/15/2029 | | 1,680,000 | | 1,603,628 | |
Pricoa Global Funding I, Scd. Notes | | 2.40 | | 9/23/2024 | | 1,150,000 | c | 1,164,840 | |
17
STATEMENT OF INVESTMENTS (continued)
| | | | | | | | | | |
| |
Description | Coupon
Rate (%) | | Maturity
Date | | Principal
Amount ($) | a | Value ($) | |
Bonds and Notes - 96.5% (continued) | | | | | |
United States - 18.8% (continued) | | | | | |
Prime Security Services Borrower, Scd. Notes | | 9.25 | | 5/15/2023 | | 133,000 | c | 140,165 | |
Republic Services, Sr. Unscd. Notes | | 2.50 | | 8/15/2024 | | 750,000 | | 763,468 | |
Reynolds Group Issuer, Gtd. Notes | | 7.00 | | 7/15/2024 | | 560,000 | c | 580,650 | |
SBA Tower Trust, Scd. Notes | | 2.84 | | 1/15/2025 | | 1,675,000 | c | 1,694,120 | |
SCF Equipment Leasing, Ser. 2019-1A, Cl. A2 | | 3.23 | | 10/20/2024 | | 800,000 | c | 808,143 | |
Seasoned Credit Risk Transfer Trust, Ser. 2017-4, Cl. M45T | | 4.50 | | 6/25/2057 | | 1,359,012 | | 1,452,680 | |
Seasoned Credit Risk Transfer Trust, Ser. 2018-4, Cl. M55D | | 4.00 | | 3/25/2058 | | 2,235,537 | | 2,348,313 | |
Seasoned Credit Risk Transfer Trust, Ser. 2019-1, Cl. MA | | 3.50 | | 7/25/2058 | | 2,581,262 | | 2,696,256 | |
Seasoned Credit Risk Transfer Trust, Ser. 2019-3, Cl. M55D | | 4.00 | | 10/25/2058 | | 1,196,273 | | 1,262,368 | |
Seasoned Loans Structured Transaction, Ser. 2018-2, Cl. A1 | | 3.50 | | 11/25/2028 | | 2,324,259 | | 2,425,292 | |
Seasoned Loans Structured Transaction, Ser. 2019-1, Cl. A2 | | 3.50 | | 5/25/2029 | | 1,200,000 | | 1,272,744 | |
Seasoned Loans Structured Transaction Trust, Ser. 2019-2, Cl. A1C | | 2.75 | | 9/25/2029 | | 1,711,905 | | 1,732,847 | |
Southern California Edison, First Mortgage Bonds | | 2.85 | | 8/1/2029 | | 1,850,000 | e | 1,858,029 | |
Springleaf Funding Trust, Ser. 2016-AA, Cl. A | | 2.90 | | 11/15/2029 | | 1,203,971 | c | 1,204,839 | |
Sprint Communications, Sr. Unscd. Notes | | 7.00 | | 8/15/2020 | | 530,000 | | 547,315 | |
Sprint Spectrum, Sr. Scd. Notes | | 4.74 | | 3/20/2025 | | 2,575,000 | c | 2,752,057 | |
Starwood Waypoint Homes Trust, Ser. 2017-1, Cl. A, 1 Month LIBOR +.95% | | 2.86 | | 1/17/2035 | | 2,518,715 | b,c | 2,518,287 | |
Sunoco Logistics Partners Operations, Gtd. Notes | | 4.00 | | 10/1/2027 | | 1,180,000 | | 1,217,497 | |
Targa Resources Partners, Gtd. Bonds | | 5.13 | | 2/1/2025 | | 595,000 | | 612,862 | |
The Boeing Company, Sr. Unscd. Notes | | 3.20 | | 3/1/2029 | | 325,000 | | 340,587 | |
The Goldman Sachs Group, Sr. Unscd. Notes | | 3.50 | | 11/16/2026 | | 770,000 | | 803,506 | |
Tricon American Homes Trust, Ser. 2017-SFR2, Cl. A | | 2.93 | | 1/17/2036 | | 2,243,635 | c | 2,279,869 | |
Tricon American Homes Trust, Ser. 2019-SFR1, Cl. A | | 2.75 | | 3/17/2038 | | 1,565,000 | c | 1,580,745 | |
United Technologies, Sr. Unscd. Notes | | 4.13 | | 11/16/2028 | | 285,000 | | 323,756 | |
18
| | | | | | | | | | |
| |
Description | Coupon
Rate (%) | | Maturity
Date | | Principal
Amount ($) | a | Value ($) | |
Bonds and Notes - 96.5% (continued) | | | | | |
United States - 18.8% (continued) | | | | | |
United Technologies, Sr. Unscd. Bonds | EUR | 2.15 | | 5/18/2030 | | 1,000,000 | | 1,294,261 | |
UnitedHealth Group, Sr. Unscd. Notes | | 2.88 | | 8/15/2029 | | 495,000 | | 510,207 | |
Wells Fargo Commercial Mortgage Trust, Ser. 2019-C51, Cl. A4 | | 3.31 | | 6/15/2052 | | 1,825,000 | | 1,951,312 | |
Western Midstream Operating, Sr. Unscd. Notes | | 4.65 | | 7/1/2026 | | 940,000 | | 941,037 | |
Federal National Mortgage Association: | | | |
3.50%, 8/1/56 | | | 1,820,570 | f | 1,917,405 | |
4.50%, 7/1/40 | | | 3,304,704 | f | 3,578,078 | |
| | 117,872,756 | |
TotalBonds and Notes
(cost $583,461,426) | | 605,745,446 | |
Description /Number of Contracts/Counterparty | Exercise
Price | | Expiration Date | | Notional Amount ($) | a | | |
Options Purchased - .0% | | | | | |
Call Options - .0% | | | | | |
Euro, Contracts 13,300,000 UBS Securities | EUR | 1.16 | | 12/4/2019 | | 13,300,000 | | 2,501 | |
Put Options - .0% | | | | | |
Philippine Peso, Contracts 3,350,000 J.P. Morgan Securities | | 51.00 | | 12/3/2019 | | 3,350,000 | | 25,714 | |
Russian Ruble, Contracts 3,350,000 Merrill Lynch, Pierce, Fenner & Smith | | 65.00 | | 12/3/2019 | | 3,350,000 | | 50,212 | |
South African Rand, Contracts 6,300,000 Morgan Stanley | | 14.60 | | 1/28/2020 | | 6,300,000 | | 62,714 | |
South African Rand, Contracts 3,350,000 Morgan Stanley | | 14.40 | | 12/4/2019 | | 3,350,000 | | 7,213 | |
| | 145,853 | |
TotalOptions Purchased
(cost $326,668) | | 148,354 | |
Description | Annualized
Yield (%) | | Maturity Date | | Principal Amount ($) | | | |
Short-Term Investments - 1.3% | | | | | |
U.S. Government Securities | | | | | |
U.S. Treasury Bills | | 1.62 | | 4/16/2020 | | 1,070,000 | g | 1,062,475 | |
U.S. Treasury Bills | | 1.98 | | 11/7/2019 | | 7,182,000 | g,h | 7,180,100 | |
TotalShort-Term Investments
(cost $8,241,801) | | 8,242,575 | |
19
STATEMENT OF INVESTMENTS (continued)
| | | | | | | | | | |
| |
Description | 1-Day
Yield (%) | | | | Shares | | Value ($) | |
Investment Companies - 1.6% | | | | | |
Registered Investment Companies - 1.6% | | | | | |
Dreyfus Institutional Preferred Government Plus Money Market Fund
(cost $10,131,495) | | 1.79 | | | | 10,131,495 | i | 10,131,495 | |
| | | | | | | | | |
Investment of Cash Collateral for Securities Loaned - .5% | | | | | |
Registered Investment Companies - .5% | | | | | |
Dreyfus Institutional Preferred Government Plus Money Market Fund
(cost $3,006,155) | | 1.79 | | | | 3,006,155 | i | 3,006,155 | |
Total Investments(cost $605,167,545) | | 99.9% | 627,274,025 | |
Cash and Receivables (Net) | | 0.1% | 875,605 | |
Net Assets | | 100.0% | 628,149,630 | |
BBSW—Bank Bill Swap Rate
EURIBOR—Euro Interbank Offered Rate
LIBOR—London Interbank Offered Rate
SONIO—Sterling Overnight Index Average
AUD—Australian Dollar
CAD—Canadian Dollar
CNY—Chinese Yuan Renminbi
EUR—Euro
GBP—British Pound
ILS—Israeli Shekel
INR—Indian Rupee
JPY—Japanese Yen
MYR—Malaysian Ringgit
NZD—New Zealand Dollar
RUB—Russian Ruble
SEK—Swedish Krona
SGD—Singapore Dollar
THB—Thai Baht
a Amount stated in U.S. Dollars unless otherwise noted above.
b Variable rate security—rate shown is the interest rate in effect at period end.
c Security exempt from registration pursuant to Rule 144A under the Securities Act of 1933. These securities may be resold in transactions exempt from registration, normally to qualified institutional buyers. At October 31, 2019, these securities were valued at $153,091,060 or 24.37% of net assets.
d Principal amount for accrual purposes is periodically adjusted based on changes in the Consumer Price Index.
e Security, or portion thereof, on loan. At October 31, 2019, the value of the fund’s securities on loan was $2,942,925 and the value of the collateral was $3,006,155.
f The Federal Housing Finance Agency (“FHFA”) placed the Federal Home Loan Mortgage Corporation and Federal National Mortgage Association into conservatorship with FHFA as the conservator. As such, the FHFA oversees the continuing affairs of these companies.
g Security is a discount security. Income is recognized through the accretion of discount.
h Held by a counterparty for open exchange traded derivative contracts.
i Investment in affiliated issuer. The investment objective of this investment company is publicly available and can be found within the investment company’s prospectus.
20
| | |
Portfolio Summary (Unaudited)† | Value (%) |
Foreign Governmental | 59.3 |
Commercial Mortgage Pass-Through Ctfs. | 7.6 |
Banks | 5.9 |
Supranational Bank | 2.7 |
Asset-Backed Ctfs./Auto Receivables | 2.7 |
Telecommunication Services | 2.6 |
Energy | 2.6 |
Investment Companies | 2.1 |
Utilities | 1.5 |
Health Care | 1.3 |
U.S. Treasury Bills | 1.3 |
Real Estate | 1.3 |
Asset-Backed Certificates | 1.3 |
U.S. Government Agencies Mortgage-Backed | 1.2 |
Insurance | .9 |
Chemicals | .8 |
Diversified Financials | .7 |
Commercial & Professional Services | .5 |
Retailing | .5 |
Technology Hardware & Equipment | .4 |
Beverage Products | .3 |
Aerospace & Defense | .3 |
Industrial | .3 |
Metals & Mining | .3 |
Media | .3 |
Agriculture | .3 |
Asset-Backed Ctfs./Credit Cards | .2 |
Information Technology | .2 |
Food Products | .2 |
Environmental Control | .1 |
Materials | .1 |
Asset-Backed Ctfs./Student Loans | .1 |
Options Purchased | .0 |
| | 99.9 |
† Based on net assets.
See notes to financial statements.
21
STATEMENT OF INVESTMENTS IN AFFILIATED ISSUERS
| | | | | | | |
Investment Companies | Value
10/31/18 ($) | Purchases ($) | Sales ($) | Value
10/31/19 ($) | Net
Assets (%) | Dividends/
Distributions ($) |
Registered Investment Companies; |
Dreyfus Institutional Preferred Government Plus Money Market Fund | 21,021,057 | 519,389,209 | 530,278,771 | 10,131,495 | 1.6 | 238,740 |
Investment of Cash Collateral for Securities Loaned:† |
Dreyfus Institutional Preferred Government Money Market Fund, Institutional Shares | 5,673,690 | 20,609,637 | 26,283,327 | - | - | - |
Dreyfus Institutional Preferred Government Plus Money Market Fund | - | 60,122,332 | 57,116,177 | 3,006,155 | .5 | - |
Total | 26,694,747 | 600,121,178 | 613,678,275 | 13,137,650 | 2.1 | 238,740 |
† Effective January 2, 2019, cash collateral for securities lending was transferred from Dreyfus Institutional Preferred Government Money Market Fund, Institutional Shares to Dreyfus Institutional Preferred Government Plus Money Market Fund.
See notes to financial statements.
22
STATEMENT OF FUTURES
October 31, 2019
| | | | | | | |
Description | Number of
Contracts | Expiration | Notional
Value ($) | Value ($) | Unrealized Appreciation (Depreciation) ($) | |
Futures Long | | |
Australian 10 Year Bond | 55 | 12/19 | 5,543,969a | 5,528,238 | (15,731) | |
Australian 3 Year Bond | 204 | 12/19 | 16,215,099a | 16,223,870 | 8,771 | |
Canadian 10 Year Bond | 290 | 12/19 | 31,784,278a | 31,274,467 | (509,811) | |
Euro-Bobl | 142 | 12/19 | 21,338,906a | 21,320,119 | (18,787) | |
Japanese 10 Year Bond | 28 | 12/19 | 40,090,572a | 39,916,659 | (173,913) | |
Long Gilt | 86 | 12/19 | 14,926,577a | 14,798,389 | (128,188) | |
Long Term French Government Future | 159 | 12/19 | 30,539,488a | 29,859,280 | (680,208) | |
Ultra 10 Year U.S. Treasury Notes | 55 | 12/19 | 7,920,083 | 7,816,016 | (104,067) | |
Futures Short | | |
Euro 30 Year Bond | 37 | 12/19 | 9,035,840a | 8,664,230 | 371,610 | |
Euro-Bond | 70 | 12/19 | 13,325,830a | 13,409,475 | (83,645) | |
U.S. Treasury 10 Year Notes | 7 | 12/19 | 904,739 | 912,078 | (7,339) | |
U.S. Treasury 2 Year Notes | 95 | 12/19 | 20,427,830 | 20,482,148 | (54,318) | |
U.S. Treasury 5 Year Notes | 448 | 12/19 | 53,731,736 | 53,403,002 | 328,734 | |
U.S. Treasury Ultra Long Bond | 120 | 12/19 | 23,649,688 | 22,770,000 | 879,688 | |
Gross Unrealized Appreciation | | 1,588,803 | |
Gross Unrealized Depreciation | | (1,776,007) | |
a Notional amounts in foreign currency have been converted to USD using relevant foreign exchange rates.
See notes to financial statements.
23
STATEMENT OF OPTIONS WRITTEN
October 31, 2019
| | | | | | | |
Description/ Contracts/ Counterparties | Exercise Price | Expiration Date | Notional Amount | a | Value ($) | |
Call Options: | | | | | | |
Colombian Peso,
Contracts 12,700,000, Citigroup | 3,525 | 11/18/19 | 12,700,000 | | (12,936) | |
Philippine Peso,
Contracts 3,350,000, J.P. Morgan Securities | 54 | 12/3/19 | 3,350,000 | | (149) | |
Russian Ruble,
Contracts 3,350,000, Merrill Lynch, Pierce, Fenner & Smith | 70.5 | 12/3/19 | 3,350,000 | | (1,016) | |
South African Rand,
Contracts 6,500,000, Merrill Lynch, Pierce, Fenner & Smith | 15.75 | 11/4/19 | 6,500,000 | | (3,044) | |
South African Rand,
Contracts 3,350,000, Morgan Stanley | 15.8 | 12/4/19 | 3,350,000 | | (20,229) | |
South African Rand,
Contracts 6,300,000, Morgan Stanley | 16 | 1/28/20 | 6,300,000 | | (85,184) | |
Swedish Krona,
Contracts 12,650,000, Morgan Stanley | 9.75 | 11/25/19 | 12,650,000 | | (47,032) | |
Put Options: | | | | | | |
Pound Sterling,
Contracts 10,550,000, Morgan Stanley | 1.2125 | 11/11/19 | 10,550,000 | GBP | (218) | |
Total Options Written (premiums received $357,563) | | | | (169,808) | |
a Notional amount stated in U.S. Dollars unless otherwise indicated.
GBP—British Pound
See notes to financial statements.
24
STATEMENT OF FORWARD FOREIGN CURRENCY EXCHANGE CONTRACTSOctober 31, 2019
| | | | | | |
Counterparty/ Purchased
Currency | Purchased Currency
Amounts | Currency
Sold | Sold
Currency
Amounts | Settlement Date | Unrealized Appreciation (Depreciation)($) |
Barclays Capital | | | |
Japanese Yen | 8,362,820,000 | United States Dollar | 77,204,350 | 11/26/19 | 351,553 |
Chilean Peso | 422,930,000 | United States Dollar | 588,096 | 1/14/20 | (16,683) |
Citigroup | | | |
Hong Kong Dollar | 64,100,000 | United States Dollar | 8,203,540 | 4/14/20 | (23,479) |
Indonesian Rupiah | 60,716,620,000 | United States Dollar | 4,246,215 | 1/14/20 | 46,381 |
British Pound | 8,965,000 | United States Dollar | 11,546,692 | 11/26/19 | 75,580 |
South Korean Won | 17,992,055,000 | United States Dollar | 15,288,316 | 1/14/20 | 207,102 |
Czech Koruna | 26,540,000 | United States Dollar | 1,158,178 | 1/14/20 | 3,364 |
United States Dollar | 6,875,797 | New Zealand Dollar | 10,735,000 | 11/26/19 | (10,271) |
United States Dollar | 811,785 | Peruvian Nuevo Sol | 2,725,000 | 12/20/19 | (1,662) |
Goldman Sachs | | | |
United States Dollar | 1,035,048 | Euro | 930,000 | 11/26/19 | (3,934) |
Canadian Dollar | 36,405,000 | United States Dollar | 27,892,063 | 11/26/19 | (250,543) |
Euro | 934,510 | United States Dollar | 1,038,644 | 11/5/19 | 4,003 |
HSBC | | | |
Egyptian Pound | 28,000,000 | United States Dollar | 1,664,437 | 12/3/19 | 55,132 |
Brazilian Real | 6,720,000 | United States Dollar | 1,645,647 | 12/3/19 | 26,509 |
Chinese Yuan Renminbi | 41,000,000 | United States Dollar | 5,788,507 | 1/14/20 | 29,285 |
United States Dollar | 4,814,587 | Russian Ruble | 309,675,000 | 1/14/20 | 33,076 |
United States Dollar | 13,609,375 | Chinese Yuan Renminbi | 96,500,000 | 1/14/20 | (53,627) |
Danish Krone | 20,000,000 | United States Dollar | 2,985,081 | 11/26/19 | 6,151 |
Australian Dollar | 50,975,000 | United States Dollar | 34,799,512 | 11/26/19 | 365,524 |
J.P. Morgan Securities | | | |
United States Dollar | 8,230,611 | Hong Kong Dollar | 64,100,000 | 4/14/20 | 50,550 |
United States Dollar | 5,812,468 | Russian Ruble | 374,320,000 | 1/14/20 | 32,811 |
25
STATEMENT OF FORWARD FOREIGN CURRENCY EXCHANGE CONTRACTS (continued)
| | | | | | |
Counterparty/ Purchased
Currency | Purchased Currency
Amounts | Currency
Sold | Sold
Currency
Amounts | Settlement Date | Unrealized Appreciation (Depreciation)($) |
J.P. Morgan Securities (continued) |
United States Dollar | 12,776,085 | Singapore Dollar | 17,365,000 | 1/14/20 | 1,458 |
United States Dollar | 19,856,688 | Thai Baht | 601,330,000 | 1/14/20 | (76,001) |
Nigerian Naira | 650,000,000 | United States Dollar | 1,769,051 | 11/15/19 | 17,760 |
Polish Zloty | 11,015,000 | United States Dollar | 2,872,529 | 1/14/20 | 12,101 |
Euro | 65,870,000 | United States Dollar | 73,198,433 | 11/26/19 | 390,536 |
United States Dollar | 5,660,867 | Euro | 5,100,000 | 11/26/19 | (36,776) |
Merrill Lynch, Pierce, Fenner & Smith | | | |
Peruvian Nuevo Sol | 2,725,000 | United States Dollar | 799,472 | 12/20/19 | 13,975 |
Polish Zloty | 12,200,000 | United States Dollar | 3,172,251 | 1/14/20 | 22,710 |
Canadian Dollar | 3,130,000 | United States Dollar | 2,391,701 | 11/26/19 | (15,160) |
Morgan Stanley | | | |
Chilean Peso | 2,300,000,000 | United States Dollar | 3,176,357 | 1/14/20 | (68,869) |
United States Dollar | 10,004,777 | Malaysian Ringgit | 41,895,000 | 1/14/20 | (7,060) |
Mexican Peso | 97,835,000 | United States Dollar | 5,013,549 | 1/14/20 | 14,806 |
Norwegian Krone | 89,045,000 | United States Dollar | 9,779,017 | 11/26/19 | (95,004) |
Euro | 7,130,000 | United States Dollar | 7,914,383 | 11/26/19 | 51,145 |
United States Dollar | 2,389,334 | Indian Rupee | 171,700,000 | 1/14/20 | (13,472) |
United States Dollar | 17,101,921 | Swiss Franc | 16,885,000 | 11/26/19 | (46,857) |
Brazilian Real | 6,450,000 | United States Dollar | 1,549,922 | 12/3/19 | 55,049 |
United States Dollar | 8,096,974 | Swedish Krona | 77,665,000 | 11/26/19 | 42,262 |
UBS Securities | | | |
Euro | 4,950,000 | United States Dollar | 5,509,046 | 11/26/19 | 21,018 |
United States Dollar | 510,342 | Israeli Shekel | 1,800,000 | 1/14/20 | (2,393) |
Hungarian Forint | 363,940,000 | United States Dollar | 1,230,358 | 1/14/20 | 10,298 |
Gross Unrealized Appreciation | | | 1,940,139 |
Gross Unrealized Depreciation | | | (721,791) |
See notes to financial statements.
26
STATEMENT OF SWAP AGREEMENTS
October 31, 2019
| | | | | |
Centrally Cleared Interest Rate Swaps | |
Received
Reference
Entity | Paid
Reference
Entity | Maturity Date | Notional
Amount ($) | Unrealized (Depreciation) ($) |
USD - 3 Month Libor | USD Fixed at 2.482 | 1/10/21 | 26,600,000 | (424,651) |
NZD Fixed at 1.03375 | NZD - 3 Month Bank Bill | 10/25/24 | 13,047,402 | (46,545) |
USD - 3 Month Libor | USD Fixed at 2.355 | 11/29/27 | 56,470,000 | (3,861,435) |
USD - 3 Month Libor | USD Fixed at 1.7905 | 10/3/46 | 7,440,000 | (3,519) |
Gross Unrealized Depreciation | (4,336,150) |
NZD—New Zealand Dollar
USD—United States Dollar
See notes to financial statements.
| | | | | | |
Centrally Cleared Credit Default Swaps | |
| | | | | | |
Reference
Obligation | Maturity
Date | Notional
Amount ($)1 | Market
Value ($) | Upfront
Payments/
Receipts ($) | Unrealized Appreciation ($) |
Sold Contracts:2 | |
Markit CDX North America High Yield Index Series 33 Received Fixed Rate of 5.00 3 Month | 12/20/24 | 6,175,000 | 437,590 | 396,050 | 77,561 |
Gross Unrealized Appreciation | 77,561 |
1 The maximum potential amount the fund could be required to pay as a seller of credit protection or receive as a buyer of credit protection if a credit event occurs as defined under the terms of the swap agreement.
2 If the fund is a seller of protection and a credit event occurs, as defined under the terms of the swap agreement, the fund will either (i) pay to the buyer of protection an amount equal to the notional amount of the swap and take delivery of the reference obligation or (ii) pay a net settlement amount in the form of cash or securities equal to the notional amount of the swap less the recovery value of the reference obligation.
See notes to financial statements.
27
STATEMENT OF ASSETS AND LIABILITIES
October 31, 2019
| | | | | | | |
| | | | | | |
| | | Cost | | Value | |
Assets ($): | | | | |
Investments in securities—See Statement of Investments
(including securities on loan, valued at $2,942,925)—Note 1(c): | | | |
Unaffiliated issuers | 592,029,895 | | 614,136,375 | |
Affiliated issuers | | 13,137,650 | | 13,137,650 | |
Cash denominated in foreign currency | | | 3,939,219 | | 3,941,821 | |
Interest and securities lending income receivable | | 4,031,449 | |
Cash collateral held by broker—Note 4 | | 2,963,048 | |
Unrealized appreciation on forward foreign
currency exchange contracts—Note 4 | | 1,940,139 | |
Receivable for shares of Beneficial Interest subscribed | | 682,671 | |
Swap upfront payments—Note 4 | | 396,050 | |
Receivable for investment securities sold | | 72,765 | |
Prepaid expenses | | | | | 66,534 | |
| | | | | 641,368,502 | |
Liabilities ($): | | | | |
Due to BNY Mellon Investment Adviser, Inc. and affiliates—Note 3(c) | | 333,690 | |
Payable for investment securities purchased | | 5,596,525 | |
Liability for securities on loan—Note 1(c) | | 3,006,155 | |
Payable for shares of Beneficial Interest redeemed | | 2,026,562 | |
Payable for swap variation margin—Note 4 | | 764,497 | |
Unrealized depreciation on forward foreign
currency exchange contracts—Note 4 | | 721,791 | |
Payable for futures variation margin—Note 4 | | 378,589 | |
Outstanding options written, at value
(premiums received $357,563)—Note 4 | | 169,808 | |
Trustees fees and expenses payable | | 7,396 | |
Other accrued expenses | | | | | 213,859 | |
| | | | | 13,218,872 | |
Net Assets ($) | | | 628,149,630 | |
Composition of Net Assets ($): | | | | |
Paid-in capital | | | | | 784,047,119 | |
Total distributable earnings (loss) | | | | | (155,897,489) | |
Net Assets ($) | | | 628,149,630 | |
| | | | | | |
Net Asset Value Per Share | Class A | Class C | Class I | Class Y | |
Net Assets ($) | 55,243,290 | 16,745,381 | 478,195,239 | 77,965,720 | |
Shares Outstanding | 3,672,490 | 1,148,848 | 31,371,659 | 5,112,075 | |
Net Asset Value Per Share ($) | 15.04 | 14.58 | 15.24 | 15.25 | |
| | | | | |
See notes to financial statements. | | | | | |
28
STATEMENT OF OPERATIONS
Year Ended October 31, 2019
| | | | | | | |
| | | | | | |
| | | | | | |
Investment Income ($): | | | | |
Income: | | | | |
Interest (net of $28,746 foreign taxes withheld at source) | | | 19,751,496 | |
Dividends from affiliated issuers | | | 238,740 | |
Income from securities lending—Note 1(c) | | | 17,171 | |
Total Income | | | 20,007,407 | |
Expenses: | | | | |
Management fee—Note 3(a) | | | 3,855,094 | |
Shareholder servicing costs—Note 3(c) | | | 1,107,828 | |
Distribution fees—Note 3(b) | | | 175,380 | |
Professional fees | | | 109,784 | |
Registration fees | | | 98,513 | |
Custodian fees—Note 3(c) | | | 96,908 | |
Trustees’ fees and expenses—Note 3(d) | | | 69,520 | |
Prospectus and shareholders’ reports | | | 66,526 | |
Loan commitment fees—Note 2 | | | 16,978 | |
Interest expense—Note 2 | | | 2,395 | |
Miscellaneous | | | 81,562 | |
Total Expenses | | | 5,680,488 | |
Less—reduction in expenses due to undertaking—Note 3(a) | | | (224,443) | |
Less—reduction in fees due to earnings credits—Note 3(c) | | | (2,985) | |
Net Expenses | | | 5,453,060 | |
Investment Income—Net | | | 14,554,347 | |
Realized and Unrealized Gain (Loss) on Investments—Note 4 ($): | | |
Net realized gain (loss) on investments and foreign currency transactions | (18,394,080) | |
Net realized gain (loss) on options transactions | (7,319,470) | |
Net realized gain (loss) on futures | 5,214,729 | |
Net realized gain (loss) on swap agreements | (2,283,513) | |
Net realized gain (loss) on forward foreign currency exchange contracts | (14,098,775) | |
Net Realized Gain (Loss) | | | (36,881,109) | |
Net change in unrealized appreciation (depreciation) on investments
and foreign currency transactions | 70,193,347 | |
Net change in unrealized appreciation (depreciation) on
options transactions | 2,747,252 | |
Net change in unrealized appreciation (depreciation) on futures | 41,669 | |
Net change in unrealized appreciation (depreciation) on swap agreements | (15,093,252) | |
Net change in unrealized appreciation (depreciation) on
forward foreign currency exchange contracts | 5,417,610 | |
Net Change in Unrealized Appreciation (Depreciation) | | | 63,306,626 | |
Net Realized and Unrealized Gain (Loss) on Investments | | | 26,425,517 | |
Net Increase in Net Assets Resulting from Operations | | 40,979,864 | |
| | | | | | |
See notes to financial statements. | | | | | |
29
STATEMENT OF CHANGES IN NET ASSETS
| | | | | | | | | | |
| | | | Year Ended October 31, |
| | | | 2019 | | 2018 | |
Operations ($): | | | | | | | | |
Investment income—net | | | 14,554,347 | | | | 29,218,876 | |
Net realized gain (loss) on investments | | (36,881,109) | | | | (37,188,362) | |
Net change in unrealized appreciation
(depreciation) on investments | | 63,306,626 | | | | (54,591,943) | |
Net Increase (Decrease) in Net Assets
Resulting from Operations | 40,979,864 | | | | (62,561,429) | |
Distributions ($): | |
Distributions to shareholders: | | | | | | | | |
Class A | | | (1,468,334) | | | | (3,020,977) | |
Class C | | | (647,808) | | | | (1,243,407) | |
Class I | | | (19,092,774) | | | | (31,731,051) | |
Class Y | | | (2,506,636) | | | | (3,600,418) | |
Total Distributions | | | (23,715,552) | | | | (39,595,853) | |
Beneficial Interest Transactions ($): | |
Net proceeds from shares sold: | | | | | | | | |
Class A | | | 18,899,379 | | | | 42,816,588 | |
Class C | | | 616,944 | | | | 10,823,366 | |
Class I | | | 151,634,904 | | | | 597,205,064 | |
Class Y | | | 18,241,222 | | | | 39,529,892 | |
Distributions reinvested: | | | | | | | | |
Class A | | | 1,381,813 | | | | 2,803,002 | |
Class C | | | 516,170 | | | | 957,269 | |
Class I | | | 16,174,910 | | | | 25,047,065 | |
Class Y | | | 2,318,525 | | | | 3,354,428 | |
Cost of shares redeemed: | | | | | | | | |
Class A | | | (23,251,411) | | | | (55,545,815) | |
Class C | | | (15,828,122) | | | | (15,526,244) | |
Class I | | | (519,915,317) | | | | (379,361,681) | |
Class Y | | | (34,287,040) | | | | (16,884,795) | |
Increase (Decrease) in Net Assets
from Beneficial Interest Transactions | (383,498,023) | | | | 255,218,139 | |
Total Increase (Decrease) in Net Assets | (366,233,711) | | | | 153,060,857 | |
Net Assets ($): | |
Beginning of Period | | | 994,383,341 | | | | 841,322,484 | |
End of Period | | | 628,149,630 | | | | 994,383,341 | |
30
| | | | | | | | | | |
| | | | Year Ended October 31, |
| | | | 2019 | | 2018 | |
Capital Share Transactions (Shares): | |
Class Aa | | | | | | | | |
Shares sold | | | 1,279,053 | | | | 2,670,917 | |
Shares issued for distributions reinvested | | | 96,372 | | | | 177,789 | |
Shares redeemed | | | (1,573,712) | | | | (3,556,901) | |
Net Increase (Decrease) in Shares Outstanding | (198,287) | | | | (708,195) | |
Class Ca | | | | | | | | |
Shares sold | | | 43,390 | | | | 683,740 | |
Shares issued for distributions reinvested | | | 36,981 | | | | 62,308 | |
Shares redeemed | | | (1,102,515) | | | | (1,014,793) | |
Net Increase (Decrease) in Shares Outstanding | (1,022,144) | | | | (268,745) | |
Class Ia | | | | | | | | |
Shares sold | | | 10,237,031 | | | | 37,185,752 | |
Shares issued for distributions reinvested | | | 1,114,315 | | | | 1,574,262 | |
Shares redeemed | | | (34,999,471) | | | | (24,099,762) | |
Net Increase (Decrease) in Shares Outstanding | (23,648,125) | | | | 14,660,252 | |
Class Y | | | | | | | | |
Shares sold | | | 1,222,649 | | | | 2,449,017 | |
Shares issued for distributions reinvested | | | 159,842 | | | | 210,669 | |
Shares redeemed | | | (2,310,948) | | | | (1,058,821) | |
Net Increase (Decrease) in Shares Outstanding | (928,457) | | | | 1,600,865 | |
| | | | | | | | | |
a During the period ended October 31, 2019, 1,135 Class C shares representing $16,121 were automatically converted for 1,104 Class A shares and during the period ended October 31, 2018, 4,098 Class C shares representing $64,740 were automatically converted to 3,991 Class A shares and 9,222 Class I shares representing $140,730 were exchanged for 9,320 Class A shares. | |
See notes to financial statements. | | | | | | | | |
31
FINANCIAL HIGHLIGHTS
The following tables describe the performance for each share class for the fiscal periods indicated. All information (except portfolio turnover rate) reflects financial results for a single fund share. Total return shows how much your investment in the fund would have increased (or decreased) during each period, assuming you had reinvested all dividends and distributions. These figures have been derived from the fund’s financial statements.
| | | | | | | |
| | |
| | Year Ended October 31, |
Class A Shares | | 2019 | 2018 | 2017 | 2016 | 2015 |
Per Share Data ($): | | | | | | |
Net asset value, beginning of period | | 14.68 | 16.09 | 15.35 | 15.38 | 16.75 |
Investment Operations: | | | | | | |
Investment income—neta | | .23 | .41 | .25 | .19 | .31 |
Net realized and unrealized
gain (loss) on investments | | .51 | (1.17) | .54 | .30 | (1.03) |
Total from Investment Operations | | .74 | (.76) | .79 | .49 | (.72) |
Distributions: | | | | | | |
Dividends from
Investment income—net | | (.38) | (.65) | (.05) | (.52) | (.65) |
Net asset value, end of period | | 15.04 | 14.68 | 16.09 | 15.35 | 15.38 |
Total Return (%)b | | 5.10 | (4.90) | 5.16 | 3.38 | (4.45) |
Ratios/Supplemental Data (%): | | | | | | |
Ratio of total expenses
to average net assets | | 1.41 | 1.29 | 1.35 | 1.23 | 1.12 |
Ratio of net expenses
to average net assets | | 1.02 | 1.02 | 1.35 | 1.23 | 1.12 |
Ratio of net investment income
to average net assets | | 1.53 | 2.59 | 1.64 | 1.27 | 1.93 |
Portfolio Turnover Rate | | 107.73 | 95.31 | 118.36 | 126.57 | 216.56 |
Net Assets, end of period ($ x 1,000) | | 55,243 | 56,842 | 73,657 | 135,947 | 215,337 |
a Based on average shares outstanding.
b Exclusive of sales charge.
See notes to financial statements.
32
| | | | | | | |
| | |
| | Year Ended October 31, |
Class C Shares | | 2019 | 2018 | 2017 | 2016 | 2015 |
Per Share Data ($): | | | | | | |
Net asset value, beginning of period | | 14.28 | 15.67 | 14.97 | 15.05 | 16.39 |
Investment Operations: | | | | | | |
Investment income—neta | | .13 | .31 | .18 | .11 | .20 |
Net realized and unrealized
gain (loss) on investments | | .50 | (1.14) | .53 | .29 | (1.01) |
Total from Investment Operations | | .63 | (.83) | .71 | .40 | (.81) |
Distributions: | | | | | | |
Dividends from
investment income—net | | (.33) | (.56) | (.01) | (.48) | (.53) |
Net asset value, end of period | | 14.58 | 14.28 | 15.67 | 14.97 | 15.05 |
Total Return (%)b | | 4.51 | (5.56) | 4.74 | 2.78 | (5.09) |
Ratios/Supplemental Data (%): | | | | | | |
Ratio of total expenses
to average net assets | | 1.68 | 1.65 | 1.79 | 1.78 | 1.77 |
Ratio of net expenses
to average net assets | | 1.68 | 1.65 | 1.79 | 1.78 | 1.77 |
Ratio of net investment income
to average net assets | | .94 | 1.99 | 1.20 | .71 | 1.29 |
Portfolio Turnover Rate | | 107.73 | 95.31 | 118.36 | 126.57 | 216.56 |
Net Assets, end of period ($ x 1,000) | | 16,745 | 31,007 | 38,224 | 52,516 | 69,609 |
a Based on average shares outstanding.
b Exclusive of sales charge.
See notes to financial statements.
33
FINANCIAL HIGHLIGHTS (continued)
| | | | | | | | |
| | |
| | Year Ended October 31, |
Class I Shares | | 2019 | 2018 | 2017 | 2016 | 2015 |
Per Share Data ($): | | | | | | |
Net asset value, beginning of period | | 14.85 | 16.28 | 15.48 | 15.48 | 16.86 |
Investment Operations: | | | | | | |
Investment income—neta | | .29 | .49 | .35 | .27 | .38 |
Net realized and unrealized
gain (loss) on investments | | .50 | (1.18) | .54 | .29 | (1.04) |
Total from Investment Operations | | .79 | (.69) | .89 | .56 | (.66) |
Distributions: | | | | | | |
Dividends from
Investment income—net | | (.40) | (.74) | (.09) | (.56) | (.72) |
Net asset value, end of period | | 15.24 | 14.85 | 16.28 | 15.48 | 15.48 |
Total Return (%) | | 5.49 | (4.53) | 5.73 | 3.90 | (4.07) |
Ratios/Supplemental Data (%): | | | | | | |
Ratio of total expenses
to average net assets | | .66 | .63 | .75 | .75 | .74 |
Ratio of net expenses
to average net assets | | .66 | .63 | .75 | .75 | .74 |
Ratio of net investment income
to average net assets | | 1.94 | 3.09 | 2.23 | 1.74 | 2.32 |
Portfolio Turnover Rate | | 107.73 | 95.31 | 118.36 | 126.57 | 216.56 |
Net Assets, end of period ($ x 1,000) | | 478,195 | 816,809 | 657,117 | 699,253 | 818,322 |
a Based on average shares outstanding.
See notes to financial statements.
34
| | | | | | | | | |
| | | |
| | | Year Ended October 31, |
Class Y Shares | | 2019 | 2018 | 2017 | 2016 | 2015 |
Per Share Data ($): | | | | | | |
Net asset value, beginning of period | | 14.85 | 16.29 | 15.49 | 15.48 | 16.86 |
Investment Operations: | | | | | | |
Investment income—neta | | .30 | .50 | .37 | .28 | .39 |
Net realized and unrealized
gain (loss) on investments | | .52 | (1.19) | .53 | .30 | (1.03) |
Total from Investment Operations | | .82 | (.69) | .90 | .58 | (.64) |
Distributions: | | | | | | |
Dividends from
Investment income—net | | (.42) | (.75) | (.10) | (.57) | (.74) |
Net asset value, end of period | | 15.25 | 14.85 | 16.29 | 15.49 | 15.48 |
Total Return (%) | | 5.65 | (4.52) | 5.85 | 3.94 | (3.98) |
Ratios/Supplemental Data (%): | | | | | | |
Ratio of total expenses
to average net assets | | .57 | .56 | .68 | .67 | .67 |
Ratio of net expenses
to average net assets | | .57 | .56 | .68 | .67 | .67 |
Ratio of net investment income
to average net assets | | 1.99 | 3.14 | 2.30 | 1.82 | 2.39 |
Portfolio Turnover Rate | | 107.73 | 95.31 | 118.36 | 126.57 | 216.56 |
Net Assets, end of period ($ x 1,000) | | 77,966 | 89,726 | 72,325 | 30,875 | 31,290 |
a Based on average shares outstanding.
See notes to financial statements.
35
NOTES TO FINANCIAL STATEMENTS
NOTE 1—Significant Accounting Policies:
BNY Mellon International Bond Fund (the “fund”) is a separate non-diversified series of BNY Mellon Investment Funds III (the “Trust”), which is registered under the Investment Company Act of 1940, as amended (the “Act”), as an open-end management investment company and operates as a series company currently offering four series, including the fund. The fund’s investment objective is to seek to maximize total return through capital appreciation and income. BNY Mellon Investment Adviser, Inc. (the “Adviser”), a wholly-owned subsidiary of The Bank of New York Mellon Corporation (“BNY Mellon”), serves as the fund’s investment adviser.
Effective June 3, 2019, the fund changed its name from Dreyfus International Bond Fund to BNY Mellon International Bond Fund and the Trust changed its name from The Dreyfus/Laurel Funds Trust to BNY Mellon Investment Funds III. In addition, The Dreyfus Corporation, the fund’s investment adviser, changed its name to “BNY Mellon Investment Adviser, Inc.”, MBSC Securities Corporation, the fund’s distributor, changed its name to “BNY Mellon Securities Corporation” and Dreyfus Transfer, Inc., the fund’s transfer agent, changed its name to “BNY Mellon Transfer, Inc.”
BNY Mellon Securities Corporation (the “Distributor”), a wholly-owned subsidiary of the Adviser, is the distributor of the fund’s shares. The fund is authorized to issue an unlimited number of $.001 par value shares of Beneficial Interest in each of the following classes of shares: Class A, Class C, Class I, Class T and Class Y. Class A, Class C and Class T shares are sold primarily to retail investors through financial intermediaries and bear Distribution and/or Shareholder Services Plan fees. Class A and Class T shares generally are subject to a sales charge imposed at the time of purchase. Class C shares are subject to a contingent deferred sales charge (“CDSC”) imposed on Class C shares redeemed within one year of purchase. Class C shares automatically convert to Class A shares ten years after the date of purchase, without the imposition of a sales charge. Class I shares are sold primarily to bank trust departments and other financial service providers (including The Bank of New York Mellon, a subsidiary of BNY Mellon and an affiliate of the Adviser, and its affiliates), acting on behalf of customers having a qualified trust or an investment account or relationship at such institution, and bear no Distribution or Shareholder Services Plan fees. Class Y shares are sold at net asset value per share generally to institutional investors, and bear no Distribution or Shareholder
36
Services Plan fees. Class I and Class Y shares are offered without a front-end sales charge or CDSC. As of the date of this report, the fund did not offer Class T shares for purchase. Other differences between the classes include the services offered to and the expenses borne by each class, the allocation of certain transfer agency costs, and certain voting rights. Income, expenses (other than expenses attributable to a specific class), and realized and unrealized gains or losses on investments are allocated to each class of shares based on its relative net assets.
The Trust accounts separately for the assets, liabilities and operations of each series. Expenses directly attributable to each series are charged to that series’ operations; expenses which are applicable to all series are allocated among them on a pro rata basis.
The Financial Accounting Standards Board (“FASB”) Accounting Standards Codification (“ASC”) is the exclusive reference of authoritative U.S. generally accepted accounting principles (“GAAP”) recognized by the FASB to be applied by nongovernmental entities. Rules and interpretive releases of the Securities and Exchange Commission (“SEC”) under authority of federal laws are also sources of authoritative GAAP for SEC registrants. The fund is an investment company and applies the accounting and reporting guidance of the FASB ASC Topic 946 Financial Services-Investment Companies. The fund’s financial statements are prepared in accordance with GAAP, which may require the use of management estimates and assumptions. Actual results could differ from those estimates.
The Trustenters into contracts that contain a variety of indemnifications. The fund’s maximum exposure under these arrangements is unknown. The fund does not anticipate recognizing any loss related to these arrangements.
(a) Portfolio valuation: The fair value of a financial instrument is the amount that would be received to sell an asset or paid to transfer a liability in an orderly transaction between market participants at the measurement date (i.e., the exit price). GAAP establishes a fair value hierarchy that prioritizes the inputs of valuation techniques used to measure fair value. This hierarchy gives the highest priority to unadjusted quoted prices in active markets for identical assets or liabilities (Level 1 measurements) and the lowest priority to unobservable inputs (Level 3 measurements).
Additionally, GAAP provides guidance on determining whether the volume and activity in a market has decreased significantly and whether such a decrease in activity results in transactions that are not orderly.
37
NOTES TO FINANCIAL STATEMENTS(continued)
GAAP requires enhanced disclosures around valuation inputs and techniques used during annual and interim periods.
Various inputs are used in determining the value of the fund’s investments relating to fair value measurements. These inputs are summarized in the three broad levels listed below:
Level 1—unadjusted quoted prices in active markets for identical investments.
Level 2—other significant observable inputs (including quoted prices for similar investments, interest rates, prepayment speeds, credit risk, etc.).
Level 3—significant unobservable inputs (including the fund’s own assumptions in determining the fair value of investments).
The inputs or methodology used for valuing securities are not necessarily an indication of the risk associated with investing in those securities.
Changes in valuation techniques may result in transfers in or out of an assigned level within the disclosure hierarchy. Valuation techniques used to value the fund’s investments are as follows:
Registered investment companies that are not traded on an exchange are valued at their net asset value and are generally categorized within Level 1 of the fair value hierarchy.
Investments in debt securities, excluding short-term investments (other than U.S. Treasury Bills), futures, options and forward foreign currency exchange contracts (“forward contracts”) are valued each business day by one or more independent pricing services (each, a “Service”) approved by the Trust’s Board of Trustees (the “Board”).Investments for which quoted bid prices are readily available and are representative of the bid side of the market in the judgment of a Service are valued at the mean between the quoted bid prices (as obtained by the Service from dealers in such securities) and asked prices (as calculated by a Service based upon its evaluation of the market for such securities). Securities are valued as determined by a Service, based on methods which include consideration of the following: yields or prices of securities of comparable quality, coupon, maturity and type; indications as to values from dealers; and general market conditions. These securities are generally categorized within Level 2 of the fair value hierarchy.
U.S. Treasury Bills are valued at the mean price between quoted bid prices and asked prices by the Service. These securities are generally categorized within Level 2 of the fair value hierarchy.
38
Each Service and independent valuation firm is engaged under the general oversight of the Board.
When market quotations or official closing prices are not readily available, or are determined not to accurately reflect fair value, such as when the value of a security has been significantly affected by events after the close of the exchange or market on which the security is principally traded (for example, a foreign exchange or market), but before the fund calculates its net asset value, the fund may value these investments at fair value as determined in accordance with the procedures approved by the Board. Certain factors may be considered when fair valuing investments such as: fundamental analytical data, the nature and duration of restrictions on disposition, an evaluation of the forces that influence the market in which the securities are purchased and sold, and public trading in similar securities of the issuer or comparable issuers. These securities are either categorized within Level 2 or 3 of the fair value hierarchy depending on the relevant inputs used.
For restricted securities where observable inputs are limited, assumptions about market activity and risk are used and such securities are generally categorized within Level 3 of the fair value hierarchy.
Investments denominated in foreign currencies are translated to U.S. dollars at the prevailing rates of exchange.
Futures and options, which are traded on an exchange, are valued at the last sales price on the securities exchange on which such securities are primarily traded or at the last sales price on the national securities market on each business day and are generally categorized within Level 1 of the fair value hierarchy. Options traded over-the-counter (“OTC”) are valued at the mean between the bid and asked price and are generally categorized within Level 2 of the fair value hierarchy. Investments in swap agreements are valued each business day by the Service. Swaps are valued by the Service by using a swap pricing model which incorporates among other factors, default probabilities, recovery rates, credit curves of the underlying issuer and swap spreads on interest rates and are generally categorized within Level 2 of the fair value hierarchy. Forward contracts are valued at the forward rate and are generally categorized within Level 2 of the fair value hierarchy.
The following is a summary of the inputs used as of October 31, 2019in valuing the fund’s investments:
39
NOTES TO FINANCIAL STATEMENTS(continued)
| | | | | |
| | Level 1 - Unadjusted Quoted Prices | Level 2 - Other Significant Observable
Inputs | Level 3 -
Significant Unobservable
Inputs | Total |
Assets ($) | | | | |
Investments in Securities:† | | | |
Asset-Backed | - | 26,874,143 | - | 26,874,143 |
Collateralized Municipal-
Backed Securities | - | 2,848,730 | | 2,848,730 |
Commercial Mortgage-Backed | - | 44,989,985 | - | 44,989,985 |
Corporate Bonds | - | 151,134,282 | - | 151,134,282 |
Foreign Governmental | - | 372,317,340 | - | 372,317,340 |
Investment Companies | 13,137,650 | - | - | 13,137,650 |
U.S. Government Agencies Mortgage-Backed | - | 7,580,966 | - | 7,580,966 |
U.S. Treasury Securities | - | 8,242,575 | - | 8,242,575 |
Other Financial Instruments: | | | |
Futures†† | 1,588,803 | - | - | 1,588,803 |
Forward Foreign Currency Exchange Contracts†† | - | 1,940,139 | - | 1,940,139 |
Options Purchased | - | 148,354 | - | 148,354 |
Swaps†† | - | 77,561 | - | 77,561 |
Liabilities ($) | | | | |
Other Financial Instruments: | | | |
Futures†† | (1,776,007) | - | - | (1,776,007) |
Forward Foreign Currency Exchange Contracts†† | - | (721,791) | - | (721,791) |
Options Written | - | (169,808) | - | (169,808) |
Swaps†† | - | (4,336,150) | - | (4,336,150) |
† See Statement of Investments for additional detailed categorizations, if any.
†† Amount shown represents unrealized appreciation (depreciation) at period end, but only variation margin on exchanged traded and centrally cleared derivatives, if any, are reported in the Statement of Assets and Liabilities.
(b) Foreign currency transactions: The fund does not isolate that portion of the results of operations resulting from changes in foreign exchange rates on investments from the fluctuations arising from changes in the market prices of securities held. Such fluctuations are included with the net realized and unrealized gain or loss on investments.
40
Net realized foreign exchange gains or losses arise from sales of foreign currencies, currency gains or losses realized on securities transactions between trade and settlement date, and the difference between the amounts of dividends, interest and foreign withholding taxes recorded on the fund’s books and the U.S. dollar equivalent of the amounts actually received or paid. Net unrealized foreign exchange gains and losses arise from changes in the value of assets and liabilities other than investments resulting from changes in exchange rates. Foreign currency gains and losses on foreign currency transactions are also included with net realized and unrealized gain or loss on investments.
(c)Securities transactions and investment income: Securities transactions are recorded on a trade date basis. Realized gains and losses from securities transactions are recorded on the identified cost basis. Dividend income is recognized on the ex-dividend date and interest income, including, where applicable, accretion of discount and amortization of premium on investments, is recognized on the accrual basis.
Pursuant to a securities lending agreement with The Bank of New York Mellon, the fund may lend securities to qualified institutions. It is the fund’s policy that, at origination, all loans are secured by collateral of at least 102% of the value of U.S. securities loaned and 105% of the value of foreign securities loaned. Collateral equivalent to at least 100% of the market value of securities on loan is maintained at all times. Collateral is either in the form of cash, which can be invested in certain money market mutual funds managed by the Adviser, or U.S. Government and Agency securities. The fund is entitled to receive all dividends, interest and distributions on securities loaned, in addition to income earned as a result of the lending transaction. Should a borrower fail to return the securities in a timely manner, The Bank of New York Mellon is required to replace the securities for the benefit of the fund or credit the fund with the market value of the unreturned securities and is subrogated to the fund’s rights against the borrower and the collateral. Additionally, the contractual maturity of security lending transactions are on an overnight and continuous basis. During the period ended October 31, 2019, The Bank of New York Mellon earned $3,418 from the lending of the fund’s portfolio securities, pursuant to the securities lending agreement.
(d) Affiliated issuers: Investments in other investment companies advised by the Adviser are considered “affiliated” under the Act.
(e) Risk: Investing in foreign markets may involve special risks and considerations not typically associated with investing in the U.S. These risks include revaluation of currencies, high rates of inflation, repatriation
41
NOTES TO FINANCIAL STATEMENTS(continued)
restrictions on income and capital, and adverse political and economic developments. Moreover, securities issued in these markets may be less liquid, subject to government ownership controls and delayed settlements, and their prices may be more volatile than those of comparable securities in the U.S.
The fund invests primarily in debt securities. Failure of an issuer of the debt securities to make timely interest or principal payments, or a decline or the perception of a decline in the credit quality of a debt security, can cause the debt security’s price to fall, potentially lowering the fund’s share price. In addition, the value of debt securities may decline due to general market conditions that are not specifically related to a particular issuer, such as real or perceived adverse economic conditions, changes in outlook for corporate earnings, changes in interest or currency rates or adverse investor sentiment. Such values may also decline because of factors that affect a particular industry or country.
(f) Dividends and distributions to shareholders:Dividends and distributions are recorded on the ex-dividend date. Dividends from investment income-net are normally declared and paid quarterly. Dividends from net realized capital gains, if any, are normally declared and paid annually, but the fund may make distributions on a more frequent basis to comply with the distribution requirements of the Internal Revenue Code of 1986, as amended (the “Code”). To the extent that net realized capital gains can be offset by capital loss carryovers, it is the policy of the fund not to distribute such gains. Income and capital gain distributions are determined in accordance with income tax regulations, which may differ from GAAP.
On December 3, 2018, the Board declared a cash dividend of $.3206, $.2924, $.3265 and $.3367 per share from undistributed investment income-net for Class A, Class C, Class I and Class Y shares, respectively, payable on December 28, 2018, to shareholders of record as of the close of business on December 26, 2018. The ex-dividend date was December 27, 2018.
(g) Federal income taxes: It is the policy of the fund to continue to qualify as a regulated investment company, if such qualification is in the best interests of its shareholders, by complying with the applicable provisions of the Code, and to make distributions of taxable income and net realized capital gain sufficient to relieve it from substantially all federal income and excise taxes.
As of and during the period ended October 31, 2019, the fund did not have any liabilities for any uncertain tax positions. The fund recognizes
42
interest and penalties, if any, related to uncertain tax positions as income tax expense in the Statement of Operations. During the period ended October 31, 2019, the fund did not incur any interest or penalties.
Each tax year in the four-year period ended October 31, 2019 remains subject to examination by the Internal Revenue Service and state taxing authorities.
At October 31, 2019, the components of accumulated earnings on a tax basis were as follows: accumulated capital losses $171,484,544 and unrealized appreciation $15,587,055.
The fund is permitted to carry forward capital losses for an unlimited period. Furthermore, capital loss carryovers retain their character as either short-term or long-term capital losses.
The accumulated capital loss carryover is available for federal income tax purposes to be applied against future netrealized capital gains, if any, realized subsequent to October 31, 2019. The fund has $100,999,752 of short-term capital losses and $70,484,792 of long-term capital losses which can be carried forward for an unlimited period.
The tax character of distributions paid to shareholders during the fiscal periods ended October 31, 2019 and October 31, 2018 were as follows: ordinary income $23,715,552 and $39,595,853, respectively.
During the period ended October 31, 2019, as a result of permanent book to tax differences, primarily due to the tax treatment for net operating losses and excess distribution, the fund increased total distributable earnings (loss) by $12,376,712 and decreased paid-in capital by the same amount. Net assets and net asset value per share were not affected by this reclassification.
(h) New Accounting Pronouncements: Effective June 1, 2019, the fund adopted Accounting Standards Update 2017-08, Receivables—Nonrefundable Fees and Other Costs (Subtopic 310-20): Premium Amortization On Purchased Callable Debt Securities (“ASU 2017-08”). The update shortens the amortization period for the premium on certain purchased callable debt securities to the earliest call date.
Also effective June 1, 2019, the fund adopted Accounting Standards Update 2018-13, Fair Value Measurement (Topic 820): Disclosure Framework—Changes to the Disclosure Requirements for Fair Value Measurement (“ASU 2018-13”). The update provides guidance that modifies certain disclosure requirements for fair value measurements. The adoption of ASU 2017-08 and ASU 2018-13 had no impact on the operations of the fund for the period ended October 31, 2019.
43
NOTES TO FINANCIAL STATEMENTS(continued)
NOTE 2—Bank Lines of Credit:
The fund participates with other long-term open-end funds managed by the Adviser in a $1.030 billion unsecured credit facility led by Citibank, N.A. (the “Citibank Credit Facility”) and a $300 million unsecured credit facility provided by The Bank of New York Mellon (the “BNYM Credit Facility”), each to be utilized primarily for temporary or emergency purposes, including the financing of redemptions (each, a “Facility”). The Citibank Credit Facility is available in two tranches: (i) Tranche A is in an amount equal to $830 million and is available to all long-term open-ended funds, including the fund, and (ii) Tranche B is in amount equal to $200 million and is available only to BNY Mellon Floating Rate Income Fund, a series of BNY Mellon Investment Funds IV, Inc. In connection therewith, the fund has agreed to pay its pro rata portion of commitment fees for Tranche A of the Citibank Credit Facility and the BNYM Credit Facility. Interest is charged to the fund based on rates determined pursuant to the terms of the respective Facility at the time of borrowing.
The average amount of borrowings outstanding under the Facilities during the period ended October 31, 2019 was approximately $71,230 with a related weighted average annualized interest rate of 3.36%.
NOTE 3—Management Fee and Other Transactions with Affiliates:
(a)Pursuant to a management agreement with the Adviser and the Trust, the Trust has agreed to pay the Adviser a management fee computed at the annual rate of .50% of the value of the fund’s average daily net assets and is payable monthly. The Adviser has contractually agreed, from November 1, 2018 through March 1, 2020, to waive receipt of its fees and/or assume the direct expenses of the Class A shares of the fund so that the expenses of such Class A shares (excluding Shareholder Services Plan fees, taxes, interest expense, brokerage commissions, commitment fees on borrowing and extraordinary expenses) do not exceed .77% of the value of the fund’s average daily net assets. On or after March 1, 2020, the Adviser may terminate this expense limitation at any time. The reduction in expenses, pursuant to the undertaking, amounted to $224,443 during the period ended October 31, 2019.
During the period ended October 31, 2019, the Distributor retained $1,142 from commissions earned on sales of the fund’s Class A shares and $1,256 from CDSC fees on redemptions of the fund’s Class C shares.
(b) Under the Distribution Plan adopted pursuant to Rule 12b-1 under the Act, Class C shares pay the Distributor for distributing its shares at an annual rate of .75% of the value of its average daily net assets. During the
44
period ended October 31, 2019, Class C shares were charged $175,380 pursuant to the Distribution Plan.
(c)Under the Shareholder Services Plan, Class A and Class C shares pay the Distributor at an annual rate of .25% of the value of their average daily net assets for the provision of certain services. The services provided may include personal services relating to shareholder accounts, such as answering shareholder inquiries regarding the fund and providing reports and other information, and services related to the maintenance of shareholder accounts. The Distributor may make payments to Service Agents (securities dealers, financial institutions or other industry professionals) with respect to these services. The Distributor determines the amounts to be paid to Service Agents. During the period ended October 31, 2019, Class A and Class C shares were charged $142,904and $58,460, respectively, pursuant to the Shareholder Services Plan.
Under its terms, the Distribution Plan and Shareholder Services Plan shall remain in effect from year to year, provided such continuance is approved annually by a vote of a majority of those Trustees who are not “interested persons” of the Trust and who have no direct or indirect financial interest in the operation of or in any agreement related to the Distribution Plan or Shareholder Services Plan.
The fund has an arrangement with the transfer agent whereby the fund may receive earnings credits when positive cash balances are maintained, which are used to offset transfer agency fees. The fund had an arrangement with the custodian to receive earnings credits when positive cash balances were maintained, which were used to offset custody fees. Effective February 1, 2019, the arrangement with the custodian changed whereby the fund will no longer receive earnings credits to offset its custody fees and will receive interest income or overdraft fees going forward. For financial reporting purposes, the fund includes net earnings credits, if any, as an expense offset in the Statement of Operations.
The fund compensates BNY Mellon Transfer, Inc., a wholly-owned subsidiary of the Adviser, under a transfer agency agreement for providing transfer agency and cash management services for the fund. The majority of transfer agency fees are comprised of amounts paid on a per account basis, while cash management fees are related to fund subscriptions and redemptions. During the period ended October 31, 2019, the fund was charged $49,614 for transfer agency services. These fees are included in Shareholder servicing costs in the Statement of Operations.
The fund compensates The Bank of New York Mellon under a custody agreement for providing custodial services for the fund. These fees are
45
NOTES TO FINANCIAL STATEMENTS(continued)
determined based on net assets, geographic region and transaction activity. During the period ended October 31, 2019, the fund was charged $96,908 pursuant to the custody agreement. These fees were partially offset by earnings credits of $2,985.
During the period ended October 31, 2019, the fund was charged $11,610 for services performed by the Chief Compliance Officer and his staff. These fees are included in Miscellaneous in the Statement of Operations.
The components of “Due to BNY Mellon Investment Adviser, Inc. and affiliates” in the Statement of Assets and Liabilities consist of: management fees of $270,836, Distribution Plan fees of $10,753, Shareholder Services Plan fees of $15,416, custodian fees of $45,000, Chief Compliance Officer fees of $4,504 and transfer agency fees of $8,160, which are offset against an expense reimbursement currently in effect in the amount of $20,979.
(d) Each Board member also serves as a Board member of other funds in the BNY Mellon Family of Funds complex. Annual retainer fees and attendance fees are allocated to each fund based on net assets.
NOTE 4—Securities Transactions:
The aggregate amount of purchases and sales (including paydowns) of investment securities, excluding short-term securities, futures, options transactions, forward contracts and swap agreements, during the period ended October 31, 2019, amounted to $799,636,938 and $1,189,004,458, respectively.
Derivatives: A derivative is a financial instrument whose performance is derived from the performance of another asset. The fund enters into International Swaps and Derivatives Association, Inc. Master Agreements or similar agreements (collectively, “Master Agreements”) with its OTC derivative contract counterparties in order to, among other things, reduce its credit risk to counterparties. Master Agreements include provisions for general obligations, representations, collateral and events of default or termination. Under a Master Agreement, the fund may offset with the counterparty certain derivative financial instruments’ payables and/or receivables with collateral held and/or posted and create one single net payment in the event of default or termination.
Each type of derivative instrument that was held by the fund during the period ended October 31, 2019 is discussed below.
Futures:In the normal course of pursuing its investment objective, the fund is exposed to market risk, including interest rate risk,as a result of changes in value of underlying financial instruments. The fund invests in futures in order to manage its exposure to or protect against changes in the
46
market. A futures contract represents a commitment for the future purchase or a sale of an asset at a specified date. Upon entering into such contracts, these investments require initial margin deposits with a counterparty, which consist of cash or cash equivalents. The amount of these deposits is determined by the exchange or Board of Trade on which the contract is traded and is subject to change. Accordingly, variation margin payments are received or made to reflect daily unrealized gains or losses which are recorded in the Statement of Operations. When the contracts are closed, the fund recognizes a realized gain or loss which is reflected in the Statement of Operations. There is minimal counterparty credit risk to the fund with futures since they are exchange traded, and the exchange guarantees the futures against default. Futures open at October 31, 2019 are set forth in the Statement of Futures.
Options Transactions: The fund purchases and writes (sells) put and call options to hedge against changes in the values of foreign currencies and interest rate, or as a substitute for an investment. The fund is subject to market risk , currency risk and interest rate risk in the course of pursuing its investment objectives through its investments in options contracts. A call option gives the purchaser of the option the right (but not the obligation) to buy, and obligates the writer to sell, the underlying financial instrument at the exercise price at any time during the option period, or at a specified date. Conversely, a put option gives the purchaser of the option the right (but not the obligation) to sell, and obligates the writer to buy the underlying financial instrument at the exercise price at any time during the option period, or at a specified date.
As a writer of call options, the fund receives a premium at the outset and then bears the market risk of unfavorable changes in the price of the financial instrument underlying the option. Generally, the fund realizes a gain, to the extent of the premium, if the price of the underlying financial instrument decreases between the date the option is written and the date on which the option is terminated. Generally, the fund incurs a loss if the price of the financial instrument increases between those dates.The maximum payout for those contracts is limited to the number of call option contracts written and the related strike prices, respectively.
As a writer of put options, the fund receives a premium at the outset and then bears the market risk of unfavorable changes in the price of the financial instrument underlying the option. Generally, the fund realizes a gain, to the extent of the premium, if the price of the underlying financial instrument increases between the date the option is written and the date on which the option is terminated. Generally, the fund incurs a loss if the price of the financial instrument decreases between those dates. The
47
NOTES TO FINANCIAL STATEMENTS(continued)
maximum payout for those contracts is limited to the number of put option contracts written and the related strike prices, respectively.
As a writer of an option, the fund has no control over whether the underlying financial instrument may be sold (call) or purchased (put) and as a result bears the market risk of an unfavorable change in the price of the financial instrument underlying the written option. There is a risk of loss from a change in value of such options which may exceed the related premiums received. This risk is mitigated by Master Agreements between the fund and the counterparty and the posting of collateral, if any, by the counterparty to the fund to cover the fund’s exposure to the counterparty. The Statement of Operations reflects any unrealized gains or losses which occurred during the period as well as any realized gains or losses which occurred upon the expiration or closing of the option transaction.Options written open at October 31, 2019 are set forth in the Statement of Options Written.
Forward Foreign Currency Exchange Contracts: The fund enters into forward contracts in order to hedge its exposure to changes in foreign currency exchange rates on its foreign portfolio holdings, to settle foreign currency transactions or as a part of its investment strategy. When executing forward contracts, the fund is obligated to buy or sell a foreign currency at a specified rate on a certain date in the future. With respect to sales of forward contracts, the fund incurs a loss if the value of the contract increases between the date the forward contract is opened and the date the forward contract is closed. The fund realizes a gain if the value of the contract decreases between those dates. With respect to purchases of forward contracts, the fund incurs a loss if the value of the contract decreases between the date the forward contract is opened and the date the forward contract is closed. The fund realizes a gain if the value of the contract increases between those dates. Any realized or unrealized gains or losses which occurred during the period are reflected in the Statement of Operations. The fund is exposed to foreign currency risk as a result of changes in value of underlying financial instruments. The fund is also exposed to credit risk associated with counterparty nonperformance on these forward contracts, which is generally limited to the unrealized gain on each open contract. This risk may be mitigated by Master Agreements, if any, between the fund and the counterparty and the posting of collateral, if any, by the counterparty to the fund to cover the fund’s exposure to the counterparty. Forward contracts open at October 31, 2019 are set forth in the Statement of Forward Foreign Currency Exchange Contracts.
Swap Agreements:The fund enters into swap agreements to exchange the interest rate on, or return generated by, one nominal instrument for the
48
return generated by another nominal instrument. Swap agreements are privately negotiated in the OTC market or centrally cleared. The fund enters into these agreements to hedge certain market or interest rate risks, to manage the interest rate sensitivity (sometimes called duration) of fixed income securities, to provide a substitute for purchasing or selling particular securities or to increase potential returns.
For OTC swaps, the fund accrues for interim payments on a daily basis, with the net amount recorded within unrealized appreciation (depreciation) on swap agreements in the Statement of Assets and Liabilities. Once the interim payments are settled in cash, the net amount is recorded as a realized gain (loss) on swaps, in addition to realized gain (loss) recorded upon the termination of swap agreements in the Statement of Operations. Upfront payments made and/or received by the fund, are recorded as an asset and/or liability in the Statement of Assets and Liabilities and are recorded as a realized gain or loss ratably over the agreement’s term/event with the exception of forward starting interest rate swaps which are recorded as realized gains or losses on the termination date.
Upon entering into centrally cleared swap agreements, an initial margin deposit is required with a counterparty, which consists of cash or cash equivalents. The amount of these deposits is determined by the exchange on which the agreement is traded and is subject to change. The change in valuation of centrally cleared swaps is recorded as a receivable or payable for variation margin in the Statement of Assets and Liabilities. Payments received from (paid to) the counterparty, including upon termination, are recorded as realized gain (loss) in the Statement of Operations.
Fluctuations in the value of swap agreements are recorded for financial statement purposes as unrealized appreciation or depreciation on swap agreements.
Interest Rate Swaps: Interest rate swaps involve the exchange of commitments to pay and receive interest based on a notional principal amount. The fund may elect to pay a fixed rate and receive a floating rate, or receive a fixed rate and pay a floating rate on a notional principal amount. The net interest received or paid on interest rate swap agreements is included within realized gain (loss) on swap agreements in the Statement of Operations. Interest rate swap agreements are subject to general market risk, liquidity risk, counterparty risk and interest rate risk.
For OTC swaps, the fund’s maximum risk of loss from counterparty risk is the discounted value of the cash flows to be received from the counterparty over the agreement’s remaining life, to the extent that the amount is positive. This risk may be mitigated by Master Agreements, if
49
NOTES TO FINANCIAL STATEMENTS(continued)
any, between the fund and the counterparty and the posting of collateral, if any, by the counterparty to the fund to cover the fund’s exposure to the counterparty. There is minimal counterparty risk to the fund with centrally cleared swaps since they are exchange traded and the exchange guarantees these swaps against default. Interest rate swaps open at October 31, 2019 are set forth in the Statement of Swap Agreements.
Credit Default Swaps: Credit default swaps involve commitments to pay a fixed interest rate in exchange for payment if a credit event affecting a third party (the referenced obligation or index) occurs. Credit events may include a failure to pay interest or principal, bankruptcy, or restructuring. The fund enters into these agreements to manage its exposure to the market or certain sectors of the market, to reduce its risk exposure to defaults of corporate and sovereign issuers, or to create exposure to corporate or sovereign issuers to which it is not otherwise exposed. For those credit default swaps in which the fund is paying a fixed rate, the fund is buying credit protection on the instrument. In the event of a credit event, the fund would receive the full notional amount for the reference obligation. For those credit default swaps in which the fund is receiving a fixed rate, the fund is selling credit protection on the underlying instrument. The maximum payouts for these agreements are limited to the notional amount of each swap. Credit default swaps may involve greater risks than if the fund had invested in the reference obligation directly and are subject to general market risk, liquidity risk, counterparty risk and credit risk. This risk may be mitigated by Master Agreements, if any, between the fund and the counterparty and the posting of collateral, if any, by the counterparty to the fund to cover the fund’s exposure to the counterparty. Credit default swaps open at October 31, 2019 are set forth in the Statement of Swap Agreements.
The following tables show the fund’s exposure to different types of market risk as it relates to the Statement of Assets and Liabilities and the Statement of Operations, respectively.
50
Fair value of derivative instruments as of October 31, 2019 is shown below:
| | | | | | | | |
| | Derivative
Assets ($) | | | | Derivative
Liabilities ($) | |
Interest rate risk | 1,588,803 | 1 | Interest rate risk | (6,112,157) | 1,2 |
Foreign exchange risk | 2,088,493 | 3,4 | Foreign exchange risk | (891,599) | 4,5 |
Credit risk | 77,561 | 2 | Credit risk | - | |
Gross fair value of
derivative contracts | 3,754,857 | | | | (7,003,756) | |
| | | | | | |
Statement of Assets and Liabilities location: | |
1 Includes cumulative appreciation (depreciation) on futures as reported in the Statement of Futures, but only the unpaid variation margin is reported in the Statement of Assets and Liabilities. |
2 Includes cumulative appreciation (depreciation) on swap agreements as reported in the Statement of Swap Agreements. Unrealized appreciation (depreciation) on OTC swap agreements and only unpaid variation margin on cleared swap agreements, are reported in the Statement of Assets and Liabilities. |
3 Options purchased are included in Investments in securities—Unaffiliated issuers, at value. |
4 Unrealized appreciation (depreciation) on forward foreign currency exchange contracts. |
5 Outstanding options written, at value. | |
The effect of derivative instruments in the Statement of Operations during the period ended October 31, 2019 is shown below:
| | | | | | | | | | | |
Amount of realized gain (loss) on derivatives recognized in income ($) | |
Underlying
risk | Futures | 1 | Options
Transactions | 2 | Forward
Contracts | 3 | Swap
Agreements | 4 | Total | |
Interest rate | 5,214,729 | | (604,369) | | - | | (2,180,204) | | 2,430,156 | |
Foreign
exchange | - | | (6,715,101) | | (14,098,775) | | - | | (20,813,876) | |
Credit | - | | - | | - | | (103,309) | | (103,309) | |
Total | 5,214,729 | | (7,319,470) | | (14,098,775) | | (2,283,513) | | (18,487,029) | |
| | | | | | | | | | |
51
NOTES TO FINANCIAL STATEMENTS(continued)
| | | | | | | | | | | | |
Net change in unrealized appreciation (depreciation)
on derivatives recognized in income ($) | |
Underlying
risk | Futures | 5 | Options
Transactions | 6 | Forward
Contracts | 7 | Swap
Agreements | 8 | Total | |
Interest rate | 41,669 | | - | | - | | (15,116,196) | | (15,074,527) | |
Foreign
exchange | - | | 2,747,252 | | 5,417,610 | | - | | 8,164,862 | |
Credit | - | | - | | - | | 22,944 | | 22,944 | |
Total | 41,669 | | 2,747,252 | | 5,417,610 | | (15,093,252) | | (6,886,721) | |
| | | | | | | | | | | |
Statement of Operations location: | |
1 Net realized gain (loss) on futures. | | |
2 Net realized gain (loss) on options transactions. |
3 Net realized gain (loss) on forward foreign currency exchange contracts. | | |
4 Net realized gain (loss) on swap agreements. | | |
5 Net change in unrealized appreciation (depreciation) on futures. | | |
6 Net change in unrealized appreciation (depreciation) on options transactions. | | |
7 Net change in unrealized appreciation (depreciation) on forward foreign currency exchange contracts. | |
8 Net change in unrealized appreciation (depreciation) on swap agreements. | | |
The provisions of ASC Topic 210 “Disclosures about Offsetting Assets and Liabilities” require disclosure on the offsetting of financial assets and liabilities. These disclosures are required for certain investments, including derivative financial instruments subject to Master Agreements which are eligible for offsetting in the Statement of Assets and Liabilities and require the fund to disclose both gross and net information with respect to such investments. For financial reporting purposes, the fund does not offset derivative assets and derivative liabilities that are subject to Master Agreements in the Statement of Assets and Liabilities.
At October 31, 2019, derivative assets and liabilities (by type) on a gross basis are as follows:
| | | | | | |
Derivative Financial Instruments: | | Assets ($) | | Liabilities ($) | |
Futures | | 1,588,803 | | (1,776,007) | |
Options | | 148,354 | | (169,808) | |
Forward contracts | | 1,940,139 | | (721,791) | |
Swaps | | 77,561 | | (4,336,150) | |
Total gross amount of derivative | | | | | |
assets and liabilities in the | | | | | |
Statement of Assets and Liabilities | | 3,754,857 | | (7,003,756) | |
Derivatives not subject to | | | | | |
Master Agreements | | (1,666,364) | | 6,112,157 | |
Total gross amount of assets | | | | | |
and liabilities subject to | | | | | |
Master Agreements | | 2,088,493 | | (891,599) | |
52
The following tables present derivative assets and liabilities net of amounts available for offsetting under Master Agreements and net of related collateral received or pledged, if any, as of October 31, 2019:†
| | | | | | | |
| | | Financial | | | |
| | | Instruments | | | |
| | | and Derivatives | | | |
| Gross Amount of | | Available | Collateral | | Net Amount of |
Counterparty | Assets ($) | 1 | for Offset ($) | Received ($) | 2 | Assets ($) |
Barclays Capital | 351,553 | | (16,683) | - | | 334,870 |
Citigroup | 332,427 | | (48,348) | - | | 284,079 |
Goldman Sachs | 4,003 | | (4,003) | - | | - |
HSBC | 515,677 | | (53,627) | (462,050) | | - |
J.P. Morgan Securities | 530,930 | | (112,926) | - | | 418,004 |
Merrill Lynch, Pierce, Fenner & Smith | 86,897 | | (19,220) | - | | 67,677 |
Morgan Stanley | 233,189 | | (233,189) | - | | - |
UBS Securities | 33,817 | | (2,393) | (1,068) | | 30,356 |
Total | 2,088,493 | | (490,389) | (463,118) | | 1,134,986 |
| | | | | | |
| | | Financial | | | |
| | | Instruments | | | |
| | | and Derivatives | | | |
| Gross Amount of | | Available | Collateral | | Net Amount of |
Counterparty | Liabilities ($) | 1 | for Offset ($) | Pledged ($) | 2 | Liabilities ($) |
Barclays Capital | (16,683) | | 16,683 | - | | - |
Citigroup | (48,348) | | 48,348 | - | | - |
Goldman Sachs | (254,477) | | 4,003 | - | | (250,474) |
HSBC | (53,627) | | 53,627 | - | | - |
J.P. Morgan Securities | (112,926) | | 112,926 | - | | - |
Merrill Lynch, Pierce, Fenner & Smith | (19,220) | | 19,220 | - | | - |
Morgan Stanley | (383,925) | | 233,189 | - | | (150,736) |
UBS Securities | (2,393) | | 2,393 | - | | - |
Total | (891,599) | | 490,389 | - | | (401,210) |
| | | | | | |
1 Absent a default event or early termination, OTC derivative assets and liabilities are presented at gross amounts and are not offset in the Statement of Assets and Liabilities. |
2 In some instances, the actual collateral received and/or pledged may be more than the amount shown due to over collateralization. |
† See Statement of Investments for detailed information regarding collateral held for open exchange traded derivative contracts. |
53
NOTES TO FINANCIAL STATEMENTS(continued)
The following summarizes the average market value of derivatives outstanding duringthe period ended October 31, 2019:
| | | |
| | Average Market Value ($) |
Interest rate futures | | 243,967,202 |
Interest rate options contracts | | 56,142 |
Foreign currency options contracts | | 1,369,997 |
Forward contracts | | 709,345,823 |
| | |
The following summarizes the average notional value of swap agreements outstanding during the period ended October 31, 2019:
| | | |
| | Average Notional Value ($) |
Interest rate swap agreements | | 178,867,733 |
Credit default swap agreements | | 6,715,969 |
| | |
At October 31, 2019, the cost of investments for federal income tax purposes was $605,194,581; accordingly, accumulated net unrealized appreciation on investments inclusive of derivative contracts was $17,401,131, consisting of $27,676,398 gross unrealized appreciation and $10,275,267 gross unrealized depreciation.
54
REPORT OF INDEPENDENT REGISTERED PUBLIC ACCOUNTING FIRM
To the Shareholders of the Fund and Board of Trustees of
BNY Mellon Investment Funds III (formerly, The Dreyfus/Laurel Funds Trust):
Opinion on the Financial Statements
We have audited the accompanying statement of assets and liabilities of BNY Mellon International Bond Fund (formerly, Dreyfus International Bond Fund) (the “Fund”), a series of BNY Mellon Investment Funds III, including the statements of investments, futures, options written, forward foreign currency exchange contracts and swap agreements, as of October 31, 2019, and the statement of investments in affiliated issuers as of and for the year then ended, the related statement of operations for the year then ended, the statements of changes in net assets for each of the years in the two-year period then ended, and the related notes (collectively, the financial statements), and the financial highlights for each of the years in the five-year period then ended. In our opinion, the financial statements and financial highlights present fairly, in all material respects, the financial position of the Fund as of October 31, 2019, the results of its operations for the year then ended, the changes in its net assets for each of the years in the two-year period then ended, and the financial highlights for each of the years in the five-year period then ended, in conformity with U.S. generally accepted accounting principles.
Basis for Opinion
These financial statements and financial highlights are the responsibility of the Fund’s management. Our responsibility is to express an opinion on these financial statements and financial highlights based on our audits. We are a public accounting firm registered with the Public Company Accounting Oversight Board (United States) (PCAOB) and are required to be independent with respect to the Fund in accordance with the U.S. federal securities laws and the applicable rules and regulations of the Securities and Exchange Commission and the PCAOB.
We conducted our audits in accordance with the standards of the PCAOB. Those standards require that we plan and perform the audit to obtain reasonable assurance about whether the financial statements and financial highlights are free of material misstatement, whether due to error or fraud. Our audits included performing procedures to assess the risks of material misstatement of the financial statements and financial highlights, whether due to error or fraud, and performing procedures that respond to those risks. Such procedures included examining, on a test basis, evidence regarding the amounts and disclosures in the financial statements and financial highlights. Such procedures also included confirmation of securities owned as of October 31, 2019, by correspondence with the custodian and brokers or by other appropriate auditing procedures when replies from brokers were not received. Our audits also included evaluating the accounting principles used and significant estimates made by management, as well as evaluating the overall presentation of the financial statements and financial highlights. We believe that our audits provide a reasonable basis for our opinion.

We have served as the auditor of one or more BNY Mellon Investment Adviser, Inc. investment companies since 1994.
New York, New York
December 20, 2019
55
IMPORTANT TAX INFORMATION(Unaudited)
For federal tax purposes the fund designates the maximum amount allowable but not less than 51.21% as interest-related dividends in accordance with Sections 871(k)(1) and 881(e) of the Internal Revenue Code.
56
BOARD MEMBERS INFORMATION(Unaudited)
INDEPENDENT BOARD MEMBERS
Joseph S. DiMartino (76)
Chairman of the Board (1999)
Principal Occupation During Past 5 Years:
· Corporate Director and Trustee (1995-Present)
Other Public Company Board Memberships During Past 5 Years:
· CBIZ, Inc., a public company providing professional business services, products and solutions,Director (1997-Present)
No. of Portfolios for which Board Member Serves:120
———————
Francine J. Bovich (68)
Board Member (2012)
Principal Occupation During Past 5 Years:
· Trustee, The Bradley Trusts, private trust funds (2011-Present)
Other Public Company Board Memberships During Past 5 Years:
· Annaly Capital Management, Inc., a real estate investment trust,Director (2014-Present)
No. of Portfolios for which Board Member Serves:70
———————
Andrew J. Donohue (68)
Board Member (2019)
Principal Occupation During Past 5 Years:
· Of Counsel, Shearman & Sterling LLP (2017-2019)
· Chief of Staff to the Chair of the SEC (2015-2017)
· Managing Director and Investment Company General Counsel of Goldman Sachs (2012-2015)
Other Public Company Board Memberships During Past 5 Years:
· Oppenheimer Funds (58 funds),Director (2017-2019)
No. of Portfolios for which Board Member Serves:56
———————
Kenneth A. Himmel (72)
Board Member (1988)
Principal Occupation During Past 5 Years:
· Managing Partner, Gulf Related, an international real estate development company (2010-Present)
· President and CEO, Related Urban Development, a real estate development company (1996-Present)
· President and CEO, Himmel & Company, a real estate development company (1980-Present)
· CEO, American Food Management, a restaurant company (1983-Present)
No. of Portfolios for which Board Member Serves:23
———————
57
BOARD MEMBERS INFORMATION (Unaudited) (continued)
INDEPENDENT BOARD MEMBERS (continued)
Stephen J. Lockwood (72)
Board Member (1993)
Principal Occupation During Past 5 Years:
· Chairman of the Board, Stephen J. Lockwood and Company LLC, a real estate investment company (2000-Present)
No. of Portfolios for which Board Member Serves:23
———————
Roslyn M. Watson (70)
Board Member (1992)
Principal Occupation During Past 5 Years:
· Principal, Watson Ventures, Inc., a real estate investment company (1993-Present)
Other Public Company Board Memberships During Past 5 Years:
· American Express Bank, FSB,Director (1993-2018)
No. of Portfolios for which Board Member Serves:56
———————
Benaree Pratt Wiley (73)
Board Member (1998)
Principal Occupation During Past 5 Years:
· Principal, The Wiley Group, a firm specializing in strategy and business development (2005-Present)
Other Public Company Board Memberships During Past 5 Years:
· CBIZ, Inc., a public company providing professional business services, products and solutions,Director(2008-Present)
· Blue Cross-Blue Shield of Massachusetts (2004-Present)
No. of Portfolios for which Board Member Serves:76
———————
Once elected all Board Members serve for an indefinite term, but achieve Emeritus status upon reaching age 80. The address of the Board Members and Officers is c/o BNY Mellon Investment Adviser, Inc. 240 Greenwich Street, New York, New York 10286. Additional information about the Board Members is available in the fund’s Statement of Additional Information which can be obtained from the Adviser free of charge by calling this toll free number: 1-800-373-9387.
James M. Fitzgibbons, Emeritus Board Member
58
OFFICERS OF THE FUND(Unaudited)
RENEE LAROCHE-MORRIS, President since May 2019.
President and a director of BNY Mellon Investment Adviser, Inc. since January 2018. She is an officer of 63 investment companies (comprised of 120 portfolios) managed by the Adviser. She is 48 years old and has been an employee of BNY Mellon since 2003.
JAMES WINDELS, Treasurer since November 2001.
Director- BNY Mellon Fund Administration, and an officer of 64 investment companies (comprised of 143 portfolios) managed by the Adviser. He is 61 years old and has been an employee of the Adviser since April 1985.
BENNETT A. MACDOUGALL, Chief Legal Officer since October 2015.
Chief Legal Officer of the Adviser and Associate General Counsel and Managing Director of BNY Mellon since June 2015; Director and Associate General Counsel of Deutsche Bank – Asset & Wealth Management Division from June 2005 to June 2015, and as Chief Legal Officer of Deutsche Investment Management Americas Inc. from June 2012 to May 2015. He is an officer of 64 investment companies (comprised of 143 portfolios) managed by the Adviser. He is 48 years old and has been an employee of the Adviser since June 2015.
DAVID DIPETRILLO, Vice President since May 2019.
Head of North America Product, BNY Mellon Investment Management since January 2018, Director of Product Strategy, BNY Mellon Investment Management from January 2016 to December 2017; Head of US Retail Product and Channel Marketing, BNY Mellon Investment Management from January 2014 to December 2015. He is an officer of 63 investment companies (comprised of 120 portfolios) managed by the Adviser. He is 41 years old and has been an employee of BNY Mellon since 2005.
JAMES BITETTO, Vice President since August 2005 and Secretary since February 2018.
Senior Managing Counsel of BNY Mellon since November 2019; Managing Counsel of BNY Mellon from April 2014 to November 2019; Secretary of the Adviser, and an officer of 64 investment companies (comprised of 143 portfolios) managed by the Adviser. He is 53 years old and has been an employee of the Adviser since December 1996.
SONALEE CROSS, Vice President and Assistant Secretary since March 2018.
Counsel of BNY Mellon since October 2016; Associate at Proskauer Rose LLP from April 2016 to September 2016; Attorney at EnTrust Capital from August 2015 to February 2016; Associate at Sidley Austin LLP from September 2013 to August 2015. She is an officer of 64 investment companies (comprised of 143 portfolios) managed by the Adviser. She is 32 years old and has been an employee of the Adviser since October 2016.
DEIRDRE CUNNANE, Vice President and Assistant Secretary since March 2019.
Counsel of BNY Mellon since August 2018; Senior Regulatory Specialist at BNY Mellon Investment Management Services from February 2016 to August 2018; Trustee Associate at BNY Mellon Trust Company (Ireland) Limited from August 2013 to February 2016. She is an officer of 64 investment companies (comprised of 143 portfolios) managed by the Adviser. She is 29 years old and has been an employee of the Adviser since August 2018.
SARAH S. KELLEHER, Vice President and Assistant Secretary since April 2014.
Managing Counsel of BNY Mellon since December 2017, Senior Counsel of BNY Mellon from March 2013 to December 2017. She is an officer of 64 investment companies (comprised of 143 portfolios) managed by the Adviser. She is 44 years old and has been an employee of the Adviser since March 2013.
JEFF PRUSNOFSKY, Vice President and Assistant Secretary since August 2005.
Senior Managing Counsel of BNY Mellon, and an officer of 64 investment companies (comprised of 143 portfolios) managed by the Adviser. He is 54 years old and has been an employee of the Adviser since October 1990.
PETER M. SULLIVAN, Vice President and Assistant Secretary since March 2019.
Managing Counsel of BNY Mellon, and an officer of 64 investment companies (comprised of 143 portfolios) managed by the Adviser. He is 51 years old and has been an employee of the Adviser since April 2004.
59
OFFICERS OF THE FUND (Unaudited)(continued)
NATALYA ZELENSKY, Vice President and Assistant Secretary since March 2017.
Managing Counsel of BNY Mellon since November 2019; Counsel of BNY Mellon from May 2016 to November 2019; Attorney at Wildermuth Endowment Strategy Fund/Wildermuth Advisory, LLC from November 2015 to May 2016 and Assistant General Counsel at RCS Advisory Services from July 2014 to November 2015. She is an officer of 64 investment companies (comprised of 143 portfolios) managed by the Adviser. She is 34 years old and has been an employee of the Adviser since May 2016.
GAVIN C. REILLY, Assistant Treasurer since December 2005.
Tax Manager - BNY Mellon Fund Administration, and an officer of 64 investment companies (comprised of 143 portfolios) managed by the Adviser. He is 51 years old and has been an employee of the Adviser since April 1991.
ROBERT S. ROBOL, Assistant Treasurer since December 2002.
Senior Accounting Manager- BNY Mellon Fund Administration, and an officer of 64 investment companies (comprised of 143 portfolios) managed by the Adviser. He is 55 years old and has been an employee of the Adviser since October 1988.
ROBERT SALVIOLO, Assistant Treasurer since July 2007.
Senior Accounting Manager – BNY Mellon Fund Administration, and an officer of 64 investment companies (comprised of 143 portfolios) managed by the Adviser. He is 52 years old and has been an employee of the Adviser since June 1989.
ROBERT SVAGNA, Assistant Treasurer since December 2002.
Senior Accounting Manager – BNY Mellon Fund Administration, and an officer of 64 investment companies (comprised of 143 portfolios) managed by the Adviser. He is 52 years old and has been an employee of the Adviser since November 1990.
JOSEPH W. CONNOLLY, Chief Compliance Officer since October 2004.
Chief Compliance Officer of the Adviser, the BNY Mellon Family of Funds and BNY Mellon Funds Trust (64 investment companies, comprised of 143 portfolios). He is 62 years old and has served in various capacities with the the Adviser since 1980, including manager of the firm’s Fund Accounting Department from 1997 through October 2001.
CARIDAD M. CAROSELLA, Anti-Money Laundering Compliance Officer since January 2016.
Anti-Money Laundering Compliance Officer of the BNY Mellon Family of Funds and BNY Mellon Funds Trust since January 2016; from May 2015 to December 2015, Interim Anti-Money Laundering Compliance Officer of the BNY Mellon Family of Funds and BNY Mellon Funds Trust and the Distributor; from January 2012 to May 2015, AML Surveillance Officer of the Distributor. She is an officer of 57 investment companies (comprised of 136 portfolios) managed by the Adviser. She is 51 years old and has been an employee of the Distributor since 1997.
60
NOTES
61
BNY Mellon International Bond Fund
240 Greenwich Street
New York, NY 10286
Adviser
BNY Mellon Investment Adviser, Inc.
240 Greenwich Street
New York, NY 10286
Custodian
The Bank of New York Mellon
240 Greenwich Street
New York, NY 10286
Transfer Agent &
Dividend Disbursing Agent
BNY Mellon Transfer, Inc.
240 Greenwich Street
New York, NY 10286
Distributor
BNY Mellon Securities Corporation
240 Greenwich Street
New York, NY 10286
| | |
Ticker Symbols: | Class A: DIBAX Class C: DIBCX Class I: DIBRX Class Y: DIBYX |
Telephone Call your financial representative or 1-800-373-9387
Mail The BNY Mellon Family of Funds, 144 Glenn Curtiss Boulevard, Uniondale, NY 11556-0144
E-mailSend your request toinfo@bnymellon.com
InternetInformation can be viewed online or downloaded atwww.bnymellonim.com/us
The fund files its complete schedule of portfolio holdings with the Securities and Exchange Commission (“SEC”) for the first and third quarters of each fiscal year on Form N-PORT. The fund’s Forms N-PORT are available on the SEC’s website atwww.sec.gov.
A description of the policies and procedures that the fund uses to determine how to vote proxies relating to portfolio securities and information regarding how the fund voted these proxies for the most recent 12-month period ended June 30 is available atwww.bnymellonim.com/us and on the SEC’s website atwww.sec.gov and without charge, upon request, by calling 1-800-373-9387.
| | |
© 2019 BNY Mellon Securities Corporation
6091AR1019 | 
|
Item 2. Code of Ethics.
The Registrant has adopted a code of ethics that applies to the Registrant's principal executive officer, principal financial officer, principal accounting officer or controller, or persons performing similar functions. There have been no amendments to, or waivers in connection with, the Code of Ethics during the period covered by this Report.
Item 3. Audit Committee Financial Expert.
The Registrant's Board has determined that Joseph S. DiMartino, a member of the Audit Committee of the Board, is an audit committee financial expert as defined by the Securities and Exchange Commission (the "SEC"). Mr. DiMartino is "independent" as defined by the SEC for purposes of audit committee financial expert determinations.
Item 4. Principal Accountant Fees and Services.
(a) Audit Fees. The aggregate fees billed for each of the last two fiscal years (the "Reporting Periods") for professional services rendered by the Registrant's principal accountant (the "Auditor") for the audit of the Registrant's annual financial statements or services that are normally provided by the Auditor in connection with the statutory and regulatory filings or engagements for the Reporting Periods, were $79,590 in 2018 and $84,970 in 2019.
(b) Audit-Related Fees. The aggregate fees billed in the Reporting Periods for assurance and related services by the Auditor that are reasonably related to the performance of the audit of the Registrant's financial statements and are not reported under paragraph (a) of this Item 4 were $10,560 in 2018 and $10,740 in 2019. These services consisted of one or more of the following: (i) agreed upon procedures related to compliance with Internal Revenue Code section 817(h), (ii) security counts required by Rule 17f-2 under the Investment Company Act of 1940, as amended, (iii) advisory services as to the accounting or disclosure treatment of Registrant transactions or events and (iv) advisory services to the accounting or disclosure treatment of the actual or potential impact to the Registrant of final or proposed rules, standards or interpretations by the Securities and Exchange Commission, the Financial Accounting Standards Boards or other regulatory or standard-setting bodies.
The aggregate fees billed in the Reporting Periods for non-audit assurance and related services by the Auditor to the Registrant's investment adviser (not including any sub-investment adviser whose role is primarily portfolio management and is subcontracted with or overseen by another investment adviser), and any entity controlling, controlled by or under common control with the investment adviser that provides ongoing services to the Registrant ("Service Affiliates"), that were reasonably related to the performance of the annual audit of the Service Affiliate, which required pre-approval by the Audit Committee were $0 in 2018 and $0 in 2019.
(c) Tax Fees. The aggregate fees billed in the Reporting Periods for professional services rendered by the Auditor for tax compliance, tax advice, and tax planning ("Tax Services") were $5,380 in 2018 and $5,460 in 2019. These services consisted of: (i) review or preparation of U.S. federal, state, local and excise tax returns; (ii) U.S. federal, state and local tax planning, advice and assistance regarding statutory, regulatory or administrative developments. The aggregate fees billed in the Reporting Periods for Tax Services by the Auditor to Service Affiliates, which required pre-approval by the Audit Committee were $0 in 2018 and $0 in 2019.
(d) All Other Fees. The aggregate fees billed in the Reporting Periods for products and services provided by the Auditor, other than the services reported in paragraphs (a) through (c) of this Item, were $0 in 2019 and $0 in 2019.
The aggregate fees billed in the Reporting Periods for Non-Audit Services by the Auditor to Service Affiliates, other than the services reported in paragraphs (b) through (c) of this Item, which required pre-approval by the Audit Committee, were $0 in 2018 and $0 in 2019.
(e)(1)Audit Committee Pre-Approval Policies and Procedures. The Registrant's Audit Committee has established policies and procedures (the "Policy") for pre-approval (within specified fee limits) of the Auditor's engagements for non-audit services to the Registrant and Service Affiliates without specific case-by-case consideration. The pre-approved services in the Policy can include pre-approved audit services, pre-approved audit-related services, pre-approved tax services and pre-approved all other services. Pre-approval considerations include whether the proposed services are compatible with maintaining the Auditor's independence. Pre-approvals pursuant to the Policy are considered annually.
(e)(2)Note. None of the services described in paragraphs (b) through (d) of this Item 4 were approved by the Audit Committee pursuant to paragraph (c)(7)(i)(C) of Rule 2-01 of Regulation S-X.
(f) None of the hours expended on the principal accountant's engagement to audit the registrant's financial statements for the most recent fiscal year were attributed to work performed by persons other than the principal accountant's full-time, permanent employees.
Non-Audit Fees. The aggregate non-audit fees billed by the Auditor for services rendered to the Registrant, and rendered to Service Affiliates, for the Reporting Periods were$331,000 in 2018 and $463,000 in 2019.
Auditor Independence. The Registrant's Audit Committee has considered whether the provision of non-audit services that were rendered to Service Affiliates, which were not pre-approved (not requiring pre-approval), is compatible with maintaining the Auditor's independence.
Item 5. Audit Committee of Listed Registrants.
Not applicable.
Item 6. Investments.
(a) Not applicable.
Item 7. Disclosure of Proxy Voting Policies and Procedures for Closed-End Management Investment Companies.
Not applicable.
Item 8. Portfolio Managers of Closed-End Management Investment Companies.
Not applicable.
Item 9. Purchases of Equity Securities by Closed-End Management Investment Companies and Affiliated Purchasers.
Not applicable.
Item 10. Submission of Matters to a Vote of Security Holders.
There have been no material changes to the procedures applicable to Item 10.
Item 11. Controls and Procedures.
(a) The Registrant's principal executive and principal financial officers have concluded, based on their evaluation of the Registrant's disclosure controls and procedures as of a date within 90 days of the filing date of this report, that the Registrant's disclosure controls and procedures are reasonably designed to ensure that information required to be disclosed by the Registrant on Form N-CSR is recorded, processed, summarized and reported within the required time periods and that information required to be disclosed by the Registrant in the reports that it files or submits on Form N-CSR is accumulated and communicated to the Registrant's management, including its principal executive and principal financial officers, as appropriate to allow timely decisions regarding required disclosure.
(b) There were no changes to the Registrant's internal control over financial reporting that occurred during the second fiscal quarter of the period covered by this report that have materially affected, or are reasonably likely to materially affect, the Registrant's internal control over financial reporting.
Item 12. Disclosure of Securities Lending Activities for Closed-End Management Investment Companies.
Not applicable.
Item 13. Exhibits.
(a)(1) Code of ethics referred to in Item 2.
(a)(2) Certifications of principal executive and principal financial officers as required by Rule 30a-2(a) under the Investment Company Act of 1940.
(a)(3) Not applicable.
(b) Certification of principal executive and principal financial officers as required by Rule 30a-2(b) under the Investment Company Act of 1940.
SIGNATURES
Pursuant to the requirements of the Securities Exchange Act of 1934 and the Investment Company Act of 1940, the Registrant has duly caused this Report to be signed on its behalf by the undersigned, thereunto duly authorized.
BNY Mellon Investment Funds III
By: /s/ Renee LaRoche-Morris
Renee LaRoche-Morris
President (Principal Executive Officer)
Date: December 20, 2019
Pursuant to the requirements of the Securities Exchange Act of 1934 and the Investment Company Act of 1940, this Report has been signed below by the following persons on behalf of the Registrant and in the capacities and on the dates indicated.
By: /s/ Renee LaRoche-Morris
Renee LaRoche-Morris
President (Principal Executive Officer)
Date: December 20, 2019
By: /s/ James Windels
James Windels
Treasurer (Principal Financial Officer)
Date: December 20, 2019
EXHIBIT INDEX
(a)(1) Code of ethics referred to in Item 2.
(a)(2) Certifications of principal executive and principal financial officers as required by Rule 30a-2(a) under the Investment Company Act of 1940. (EX-99.CERT)
(b) Certification of principal executive and principal financial officers as required by Rule 30a-2(b) under the Investment Company Act of 1940. (EX-99.906CERT)