UNITED STATES
SECURITIES AND EXCHANGE COMMISSION
Washington, D.C. 20549
FORM N-CSR
CERTIFIED SHAREHOLDER REPORT OF REGISTERED MANAGEMENT
INVESTMENT COMPANIES
Investment Company Act file number | 811-00524 |
| |
| BNY Mellon Investment Funds III | |
| (Exact name of Registrant as specified in charter) | |
| | |
| c/o BNY Mellon Investment Adviser, Inc. 240 Greenwich Street New York, New York 10286 | |
| (Address of principal executive offices) (Zip code) | |
| | |
| Bennett A. MacDougall, Esq. 240 Greenwich Street New York, New York 10286 | |
| (Name and address of agent for service) | |
|
Registrant's telephone number, including area code: | (212) 922-6400 |
| |
Date of fiscal year end: | 05/31 | |
Date of reporting period: | 05/31/19 | |
| | | | | | | |
The following N-CSR relates only to the Registrant's series listed below and does not relate to any series of the Registrant with a different fiscal year end and, therefore, different N-CSR reporting requirements. A separate N-CSR will be filed for any series with a different fiscal year end, as appropriate.
BNY Mellon Equity Income Fund
FORM N-CSR
Item 1. Reports to Stockholders.
BNY Mellon Equity Income Fund
| |
ANNUAL REPORT May 31, 2019 |
| |
Save time. Save paper. View your next shareholder report online as soon as it’s available. Log into www.bnymellonim.com/us and sign up for eCommunications. It’s simple and only takes a few minutes. |
| |
The views expressed in this report reflect those of the portfolio manager(s) only through the end of the period covered and do not necessarily represent the views of BNY Mellon Investment Adviser, Inc. or any other person in the BNY Mellon Investment Adviser, Inc. organization. Any such views are subject to change at any time based upon market or other conditions and BNY Mellon Investment Adviser, Inc. disclaims any responsibility to update such views. These views may not be relied on as investment advice and, because investment decisions for a fund in the BNY Mellon Family of Funds are based on numerous factors, may not be relied on as an indication of trading intent on behalf of any fund in the BNY Mellon Family of Funds. |
| |
Not FDIC-Insured • Not Bank-Guaranteed • May Lose Value |
Contents
THE FUND
FOR MORE INFORMATION
Back Cover
| | | | |
| |
BNY Mellon Equity Income Fund
| | The Fund |
A LETTER FROM THE PRESIDENT OF BNY MELLON INVESTMENT ADVISER, INC.
Dear Shareholder:
We are pleased to present this annual report for BNY Mellon Equity Income Fund (formerly, Dreyfus Equity Income Fund), covering the 12-month period from June 1, 2018 through May 31, 2019. For information about how the fund performed during the reporting period, as well as general market perspectives, we provide a Discussion of Fund Performance on the pages that follow.
At the beginning of the reporting period, developed economies outside of the U.S. continued to weaken, while the U.S. economy sustained its relatively healthy growth rate. Calm markets prevailed throughout the summer, as robust growth and strong corporate earnings supported U.S. stock returns, while other developed markets continued to decline.
The fourth quarter of 2018 saw broad market weakness, due in part to heightened concerns about rising interest rates, trade tensions and slowing global growth. The slump largely erased prior gains on U.S. indices, while losses deepened in international markets. December experienced a sharp sell-off, as it appeared that the U.S. Federal Reserve (the “Fed”) would maintain its hawkish stance on monetary policy. However, comments made in January by the Fed indicated that it would slow the pace of interest-rate increases, and this helped stimulate a rebound across equity markets that continued through much of the reporting period. However, in May, escalating trade tensions once again disrupted equity market progress, causing stock prices to pull back.
Fixed-income markets declined early in the period, as interest rates and inflation rose, pressuring most bond prices. Comparatively strong U.S. equity markets fed investor risk appetites, reducing the demand for Treasuries and increasing yields. But a return of stock market volatility in October triggered a flight to quality, boosting Treasury prices and flattening the yield curve. In January, when the Fed’s comments indicated that rate increases would be less likely in 2019, bond markets rallied. Fixed-income prices benefited from falling rates through the end of the period.
We remain positive on the near-term economic outlook for the U.S. but will monitor relevant data for any signs of a change. As always, we encourage you to discuss the risks and opportunities in today’s investment environment with your financial advisor.
Thank you for your continued confidence and support.
Sincerely,

Renee LaRoche-Morris
President
BNY Mellon Investment Adviser, Inc.
June 17, 2019
2
DISCUSSION OF FUND PERFORMANCE(Unaudited)
For the period from June 1, 2018 through May 31, 2019, as provided by C. Wesley Boggs, William S. Cazalet, CAIA, Peter D. Goslin, CFA, and Syed A. Zamil, CFA, Portfolio Managers
Market and Fund Performance Overview
For the 12-month period ended May 31, 2019, BNY Mellon Equity Income Fund’s (formerly, Dreyfus Equity Income Fund) Class A shares produced a total return of -3.36%, Class C shares returned -4.10%, Class I shares returned -3.12%, and Class Y shares returned -2.94%.1 In comparison, the fund’s benchmark, the S&P 500® Index (the “Index”), provided a total return of 3.78% for the same period.2
Despite periods of volatility during the 12 months, U.S. stocks gained modestly, amid strong economic fundamentals and supportive central bank policy. The fund underperformed the Index, due in part to a value bias within the portfolio and security selections in the energy sector.
The Fund’s Investment Approach
The fund seeks total return (consisting of capital appreciation and income). To pursue its goal, the fund invests primarily in dividend-paying equity securities.
When selecting securities, we choose stocks through a disciplined investment process that combines computer-modeling techniques, fundamental analysis, and risk management and may invest in stocks with either value or growth characteristics. In selecting securities, we use a proprietary computer model to identify and rank stocks within an industry or sector, based on their value, growth, and financial profiles.
Based on the fundamental analysis, we select the most attractive of the higher-ranked securities and manage risk by diversifying across companies and industries.
Markets Pivot on Central Bank and Trade Activity
Markets experienced bouts of volatility during the 12 months but gained ground over the reporting period as a whole. U.S. equities exhibited strength early in the review period. Gains were largely attributable to robust corporate earnings, which benefited from the tailwind of 2017’s fiscal stimulus allied with solid economic growth. These factors overwhelmed broader concerns pertaining to higher interest rates and trade tensions, although, with hindsight, only temporarily. Starting in the fourth quarter of 2018, many equity markets felt pressure from slowing global growth, escalating trade issues between the U.S. and China, Brexit difficulties, and additional geopolitical issues elsewhere in Europe and the emerging markets. Renewed articulation of hawkish narratives by U.S. Federal Reserve (“Fed”) officials alarmed investors and stoked volatility. In December, equities reached new lows for the year, as economic and political news continued to unnerve investors. Investors also feared the European Central Bank (ECB) would proceed with its plan to conclude stimulus measures in January 2019, despite moderating growth rates.
January 2019 marked a turnaround in the markets. Talk of a potential trade deal between the U.S. and China helped fuel investor optimism, as equity prices recovered. The ECB announced it would provide additional stimulus to support the eurozone economy. China also announced plans to stoke its slowing economic growth rate. At its first meeting of the
3
DISCUSSION OF FUND PERFORMANCE(Unaudited) (continued)
year, the Fed emphasized its focus on data as a primary driver for rate-hike decisions, and its ability to suspend additional rate increases when the data is not supportive. These sentiments reassured investors of central bankers’ commitments to support flagging growth. The rebound continued throughout the month of January, and equity markets maintained an upward trajectory through April. However, renewed trade tensions between the U.S. and China in May caused stocks to pull back once again.
Value Bias and Security Selection Dampened Fund Performance
The fund’s relative results were dampened by the portfolio’s emphasis on high-dividend-paying stocks, many of which can be characterized as value stocks. The markets rewarded growth-oriented stocks over the 12-month period, while dividend-paying value stocks lagged the overall market. Since the portfolio seeks high-dividend-paying stocks as a part of its investment process, investors’ preferences for investing in growth stocks contributed to lagging portfolio performance during the year. Stock selection within the information technology, materials, and energy sectors also detracted from performance. In addition, positions in energy companiesPBF Energy andHollyFrontier were among the top detractors from overall performance, as were materials company LyondellBasell Industries and data storage product company Seagate Technology.PBF Energy saw its stock price slide on reduced analyst earnings estimates. We closed our position.HollyFrontier experienced earnings weakness due to increased competition, hurting its stock price. The stock price of chemical company LyondellBasell Industries fell during the period, as investors worried that ongoing trade disputes between the U.S. and China might erode demand for the company’s products. Seagate Technology saw its price fall during the first half of the period. The company saw weak revenue growth and has experienced pressure due to trade concerns.
Conversely, some of the fund’s security selection efforts were beneficial. Stock decisions in the utilities sector helped results. A position in integrated-utility company FirstEnergy was among the top contributors to overall performance. Several positive earnings surprises and estimate increases led to an increasing stock price over the period. Elsewhere in the markets, pharmaceutical company Merck & Co. was also a top contributor to relative results. The company posted solid returns over the reporting period, on the back of approval for a new liver cancer treatment. The company also earned Food and Drug Administration (FDA) approval of its new Keytruda cancer treatment.
A Disciplined Approach to Stock Picking
Our quantitative models have continued to identify what we believe to be attractive investment opportunities across a broad range of dividend-paying companies in a variety of industry groups. Indeed, periodic volatility in the stock market may present opportunities to purchase the stocks of fundamentally strong companies at more attractive prices. If any of the fund’s holdings reach what we perceive to be fuller valuations, we would expect to replace them with high-quality companies that our model suggests offer more attractive valuations, improving business fundamentals, and attractive dividend yields. In addition, we
4
have continued to maintain a broadly diversified portfolio as part of our risk-control strategies.
June 17, 2019
1 Total return includes reinvestment of dividends and any capital gains paid and does not take into consideration the maximum initial sales charge in the case of Class A shares, or the applicable contingent deferred sales charge imposed on redemptions in the case of Class C shares. Had these charges been reflected, returns would have been lower. Past performance is no guarantee of future results. Share price and investment return fluctuate such that upon redemption, fund shares may be worth more or less than their original cost. Return figures provided reflect the absorption of certain fund expenses by BNY Mellon Investment Adviser, Inc. pursuant to an undertaking in effect through September 30, 2019, at which time it may be extended, terminated, or modified. Had these expenses not been absorbed, the fund’s returns would have been lower.
2 Source: Lipper Inc. — The S&P 500® Index is widely regarded as the best single gauge of large-cap U.S. equities. The index includes 500 leading companies and captures approximately 80% coverage of available market capitalization. Investors cannot invest directly in any index.
Please note: the position in any security highlighted with italicized typeface was sold during the reporting period.
Equities are subject generally to market, market sector, market liquidity, issuer, and investment style risks, among other factors, to varying degrees, all of which are more fully described in the fund’s prospectus.
5
FUND PERFORMANCE(Unaudited)
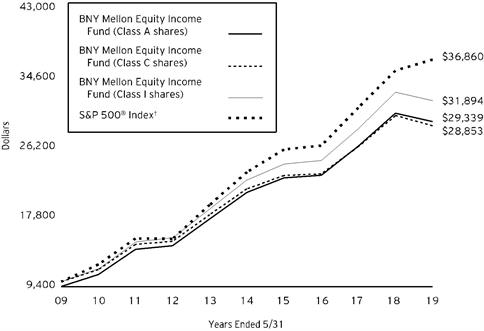
Comparison of change in value of a $10,000 investment in Class A shares, Class C shares and Class I shares of BNY Mellon Equity Income Fund with a hypothetical investment of $10,000 in the S&P 500® Index (the “Index”)
† Source: Lipper Inc.
Past performance is not predictive of future performance.
The above graph compares a hypothetical $10,000 investment made in Class A, Class C and Class I shares of BNY Mellon Equity Income Fund on 5/31/09 to a hypothetical investment of $10,000 made in the Index on that date. All dividends and capital gain distributions are reinvested.
The fund’s performance shown in the line graph above takes into account the maximum initial sales charge on Class A shares and all other applicable fees and expenses on all classes. The Index is widely regarded as the best single gauge of large-cap U.S. equities. The Index includes 500 leading companies and captures approximately 80% coverage of available market capitalization. Unlike a mutual fund, the Index is not subject to charges, fees and other expenses. Investors cannot invest directly in any index. Further information relating to fund performance, including expense reimbursements, if applicable, is contained in the Financial Highlights section of the prospectus and elsewhere in this report.
6
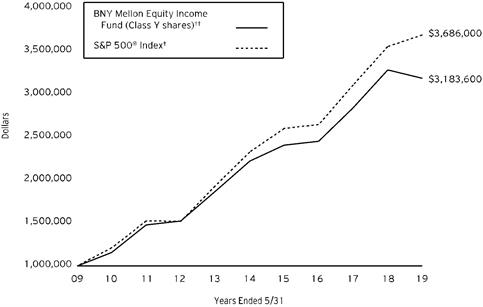
Comparison of change in value of a $1,000,000 investment in Class Y shares of BNY Mellon Equity Income Fund with a hypothetical investment of $1,000,000 in the S&P 500® Index (the “Index”)
† Source: Lipper Inc.
†† The total return figures presented for Class Y shares of the fund reflect the performance of the fund’s Class A shares for the period prior to 7/1/13 (the inception date for Class Y shares), not reflecting the applicable sales load for Class A shares.
Past performance is not predictive of future performance.
The above graph compares a hypothetical investment of $1,000,000 made in Class Y shares of BNY Mellon Equity Income Fund on 5/31/09 to a hypothetical investment of $1,000,000 made in the Index on that date. All dividends and capital gain distributions are reinvested.
The fund’s performance shown in the line graph above takes into account all applicable fees and expenses of the fund’s Class Y shares. The Index is widely regarded as the best single gauge of large-cap U.S. equities. The Index includes 500 leading companies and captures approximately 80% coverage of available market capitalization. Unlike a mutual fund, indices are not subject to charges, fees and other expenses. Investors cannot invest directly in any index. Further information relating to fund performance, including expense reimbursements, if applicable, is contained in the Financial Highlights section of the prospectus and elsewhere in this report.
7
FUND PERFORMANCE(Unaudited) (continued)
| | | | | |
Average Annual Total Returns as of 5/31/19 |
| | Inception | | | |
| Date | 1 Year | 5 Years | 10 Years |
| | | | | |
Class A shares | | | | |
with maximum sales charge (5.75%) | 7/5/06 | -8.92% | 5.87% | 11.36% |
without sales charge | 7/5/06 | -3.36% | 7.13% | 12.02% |
Class C shares | | | | |
with applicable redemption charge† | 7/5/06 | -5.02% | 6.32% | 11.18% |
without redemption | 7/5/06 | -4.10% | 6.32% | 11.18% |
Class I shares | 7/5/06 | -3.12% | 7.39% | 12.30% |
Class Y shares | 7/1/13 | -2.94% | 7.51% | 12.28%†† |
S&P 500® Index | | 3.78% | 9.65% | 13.93% |
† The maximum contingent deferred sales charge for Class C shares is 1% for shares redeemed within one year of the date of purchase.
†† The total return performance figures presented for Class Y shares of the fund reflect the performance of the fund’s Class A shares for the period prior to 7/1/13 (the inception date for Class Y shares), not reflecting the applicable sales load for Class A shares.
The performance data quoted represents past performance, which is no guarantee of future results. Share price and investment return fluctuate and an investor’s shares may be worth more or less than original cost upon redemption. Current performance may be lower or higher than the performance quoted. Go to im.bnymellon.com for the fund’s most recent month-end returns.
The fund’s performance shown in the graphs and table does not reflect the deduction of taxes that a shareholder would pay on fund distributions or the redemption of fund shares. In addition to the performance of Class A shares shown with and without a maximum sales charge, the fund’s performance shown in the table takes into account all other applicable fees and expenses on all classes.
8
UNDERSTANDING YOUR FUND’S EXPENSES(Unaudited)
As a mutual fund investor, you pay ongoing expenses, such as management fees and other expenses. Using the information below, you can estimate how these expenses affect your investment and compare them with the expenses of other funds. You also may pay one-time transaction expenses, including sales charges (loads) and redemption fees, which are not shown in this section and would have resulted in higher total expenses. For more information, see your fund’s prospectus or talk to your financial adviser.
Review your fund’s expenses
The table below shows the expenses you would have paid on a $1,000 investment in BNY Mellon Equity Income Fund from December 1, 2018 to May 31, 2019. It also shows how much a $1,000 investment would be worth at the close of the period, assuming actual returns and expenses.
| | | | | | | | | | | | | | |
Expenses and Value of a $1,000 Investment | | |
assuming actual returns for the six months ended May 31, 2019 |
| | | | | | | | |
| | | | Class A | Class C | Class I | Class Y |
Expenses paid per $1,000† | | $5.01 | | $8.64 | | $3.80 | | $3.75 |
Ending value (after expenses) | | $951.30 | | $947.60 | | $952.40 | | $952.20 |
COMPARING YOUR FUND’S EXPENSES
WITH THOSE OF OTHER FUNDS(Unaudited)
Using the SEC’s method to compare expenses
The Securities and Exchange Commission (“SEC”) has established guidelines to help investors assess fund expenses. Per these guidelines, the table below shows your fund’s expenses based on a $1,000 investment, assuming a hypothetical 5% annualized return. You can use this information to compare the ongoing expenses (but not transaction expenses or total cost) of investing in the fund with those of other funds. All mutual fund shareholder reports will provide this information to help you make this comparison. Please note that you cannot use this information to estimate your actual ending account balance and expenses paid during the period.
| | | | | | | | | | | | | | |
Expenses and Value of a $1,000 Investment | | |
assuming a hypothetical 5% annualized return for the six months ended May 31, 2019 |
| | | | | | | | |
| | | | Class A | Class C | Class I | Class Y |
Expenses paid per $1,000† | | $5.19 | | $8.95 | | $3.93 | | $3.88 |
Ending value (after expenses) | | $1,019.80 | | $1,016.06 | | $1,021.04 | | $1,021.09 |
† Expenses are equal to the fund’s annualized expense ratio of 1.03% for Class A, 1.78% for Class C, .78% for Class I and .77% for Class Y, multiplied by the average account value over the period, multiplied by 182/365 (to reflect the one-half year period).
9
STATEMENT OF INVESTMENTS
May 31, 2019
| | | | | | | | |
| |
Description | | | | Shares | | Value ($) | |
Common Stocks - 99.3% | | | | | |
Banks - 8.7% | | | | | |
Associated Banc-Corp | | | | 133,900 | | 2,652,559 | |
Bank of America | | | | 507,000 | | 13,486,200 | |
Citizens Financial Group | | | | 89,200 | | 2,906,136 | |
Comerica | | | | 227,800 | | 15,677,196 | |
Cullen/Frost Bankers | | | | 28,750 | a | 2,624,013 | |
JPMorgan Chase & Co. | | | | 262,855 | | 27,852,116 | |
New York Community Bancorp | | | | 229,050 | | 2,274,467 | |
Regions Financial | | | | 949,708 | | 13,134,462 | |
Wells Fargo & Co. | | | | 69,500 | | 3,083,715 | |
Zions Bancorp | | | | 200,400 | | 8,631,228 | |
| | | | | 92,322,092 | |
Capital Goods - 2.2% | | | | | |
Boeing | | | | 39,900 | | 13,630,239 | |
PACCAR | | | | 151,700 | | 9,984,894 | |
| | | | | 23,615,133 | |
Commercial & Professional Services - 2.0% | | | | | |
H&R Block | | | | 810,500 | a | 21,275,625 | |
Consumer Durables & Apparel - .6% | | | | | |
Tapestry | | | | 207,200 | | 5,917,632 | |
Consumer Services - 1.1% | | | | | |
Las Vegas Sands | | | | 166,900 | | 9,179,500 | |
Starbucks | | | | 37,900 | | 2,882,674 | |
| | | | | 12,062,174 | |
Diversified Financials - 1.9% | | | | | |
Ares Capital | | | | 164,563 | | 2,889,726 | |
Discover Financial Services | | | | 32,500 | | 2,422,875 | |
Federated Investors, Cl. B | | | | 106,700 | | 3,257,551 | |
Goldman Sachs Group | | | | 17,200 | | 3,138,828 | |
Lazard, Cl. A | | | | 61,800 | | 1,925,688 | |
Morgan Stanley | | | | 93,550 | | 3,806,549 | |
Synchrony Financial | | | | 85,300 | | 2,868,639 | |
| | | | | 20,309,856 | |
Energy - 6.4% | | | | | |
Chevron | | | | 207,100 | | 23,578,335 | |
ConocoPhillips | | | | 46,700 | | 2,753,432 | |
Exxon Mobil | | | | 222,310 | | 15,732,879 | |
Helmerich & Payne | | | | 221,300 | | 10,823,783 | |
Occidental Petroleum | | | | 74,600 | | 3,712,842 | |
Phillips 66 | | | | 139,900 | | 11,303,920 | |
| | | | | 67,905,191 | |
10
| | | | | | | | |
| |
Description | | | | Shares | | Value ($) | |
Common Stocks - 99.3% (continued) | | | | | |
Food & Staples Retailing - .9% | | | | | |
Kroger | | | | 97,500 | | 2,223,975 | |
Walgreens Boots Alliance | | | | 31,200 | | 1,539,408 | |
Walmart | | | | 51,090 | | 5,182,570 | |
| | | | | 8,945,953 | |
Food, Beverage & Tobacco - 3.7% | | | | | |
Altria Group | | | | 495,970 | | 24,332,288 | |
Coca-Cola | | | | 55,000 | | 2,702,150 | |
Philip Morris International | | | | 160,990 | | 12,417,159 | |
| | | | | 39,451,597 | |
Household & Personal Products - 3.7% | | | | | |
Kimberly-Clark | | | | 217,750 | | 27,848,047 | |
Procter & Gamble | | | | 108,800 | | 11,196,608 | |
| | | | | 39,044,655 | |
Insurance - 3.4% | | | | | |
MetLife | | | | 263,700 | | 12,185,577 | |
Old Republic International | | | | 403,150 | | 8,889,457 | |
Principal Financial Group | | | | 228,200 | | 11,768,274 | |
Prudential Financial | | | | 30,005 | | 2,771,862 | |
| | | | | 35,615,170 | |
Materials - 4.0% | | | | | |
International Paper | | | | 396,500 | | 16,442,855 | |
LyondellBasell Industries, Cl. A | | | | 317,700 | | 23,589,225 | |
Nucor | | | | 51,200 | | 2,457,600 | |
| | | | | 42,489,680 | |
Media & Entertainment - 4.8% | | | | | |
Alphabet, Cl. A | | | | 12,300 | b | 13,609,950 | |
Alphabet, Cl. C | | | | 12,300 | b | 13,574,649 | |
Facebook, Cl. A | | | | 84,900 | b | 15,067,203 | |
Interpublic Group of Cos. | | | | 304,300 | | 6,457,246 | |
Omnicom Group | | | | 32,900 | a | 2,545,144 | |
| | | | | 51,254,192 | |
Pharmaceuticals Biotechnology & Life Sciences - 15.5% | | | | | |
AbbVie | | | | 222,930 | | 17,100,960 | |
Amgen | | | | 76,900 | | 12,819,230 | |
Bristol-Myers Squibb | | | | 763,600 | | 34,644,532 | |
Gilead Sciences | | | | 343,400 | | 21,376,650 | |
Johnson & Johnson | | | | 100,900 | | 13,233,035 | |
Merck & Co. | | | | 396,310 | | 31,391,715 | |
Pfizer | | | | 806,607 | | 33,490,323 | |
| | | | | 164,056,445 | |
Real Estate - 3.6% | | | | | |
Apartment Investment & Management, Cl. A | | | | 55,900 | c | 2,792,205 | |
11
STATEMENT OF INVESTMENTS (continued)
| | | | | | | | |
| |
Description | | | | Shares | | Value ($) | |
Common Stocks - 99.3% (continued) | | | | | |
Real Estate - 3.6% (continued) | | | | | |
Brixmor Property Group | | | | 192,150 | c | 3,295,372 | |
CoreCivic | | | | 330,500 | c | 7,237,950 | |
EPR Properties | | | | 38,500 | c | 3,006,850 | |
Hospitality Properties Trust | | | | 114,740 | c | 2,853,584 | |
Host Hotels & Resorts | | | | 107,700 | c | 1,950,447 | |
Lamar Advertising, Cl. A | | | | 42,100 | c | 3,292,641 | |
Life Storage | | | | 29,600 | c | 2,849,888 | |
Medical Properties Trust | | | | 155,200 | c | 2,759,456 | |
SITE Centers | | | | 193,475 | c | 2,470,676 | |
Spirit Realty Capital | | | | 71,500 | c | 3,050,190 | |
Tanger Factory Outlet Centers | | | | 134,250 | a,c | 2,276,880 | |
| | | | | 37,836,139 | |
Retailing - .5% | | | | | |
Foot Locker | | | | 39,200 | | 1,542,520 | |
Kohl's | | | | 34,000 | a | 1,676,880 | |
Nordstrom | | | | 63,000 | a | 1,971,900 | |
| | | | | 5,191,300 | |
Semiconductors & Semiconductor Equipment - 3.1% | | | | | |
Intel | | | | 630,445 | | 27,764,798 | |
KLA-Tencor | | | | 27,550 | | 2,839,578 | |
Xilinx | | | | 25,000 | | 2,557,750 | |
| | | | | 33,162,126 | |
Software & Services - 10.0% | | | | | |
Amazon.com | | | | 18,400 | b | 32,661,288 | |
International Business Machines | | | | 102,740 | | 13,046,953 | |
Microsoft | | | | 315,585 | | 39,031,553 | |
Paychex | | | | 35,100 | | 3,011,229 | |
Western Union | | | | 940,950 | a | 18,254,430 | |
| | | | | 106,005,453 | |
Technology Hardware & Equipment - 9.6% | | | | | |
Apple | | | | 186,470 | | 32,645,303 | |
Cisco Systems | | | | 131,950 | | 6,865,358 | |
Hewlett Packard Enterprise | | | | 195,300 | | 2,679,516 | |
HP | | | | 943,400 | | 17,622,712 | |
NetApp | | | | 81,900 | | 4,848,480 | |
Seagate Technology | | | | 540,550 | | 22,622,017 | |
Xerox | | | | 456,300 | | 13,967,343 | |
| | | | | 101,250,729 | |
Telecommunication Services - 4.3% | | | | | |
AT&T | | | | 782,260 | | 23,921,511 | |
Verizon Communications | | | | 392,070 | | 21,309,004 | |
| | | | | 45,230,515 | |
12
| | | | | | | | |
| |
Description | | | | Shares | | Value ($) | |
Common Stocks - 99.3% (continued) | | | | | |
Transportation - 3.1% | | | | | |
Norfolk Southern | | | | 15,100 | | 2,946,614 | |
Union Pacific | | | | 40,600 | | 6,771,268 | |
United Parcel Service, Cl. B | | | | 251,020 | | 23,324,778 | |
| | | | | 33,042,660 | |
Utilities - 6.2% | | | | | |
AES | | | | 1,077,500 | | 17,024,500 | |
CenterPoint Energy | | | | 88,400 | | 2,514,096 | |
Exelon | | | | 40,700 | | 1,956,856 | |
FirstEnergy | | | | 569,200 | | 23,473,808 | |
MDU Resources Group | | | | 137,900 | | 3,403,372 | |
OGE Energy | | | | 176,217 | | 7,323,579 | |
Pinnacle West Capital | | | | 38,200 | | 3,587,362 | |
PPL | | | | 216,400 | | 6,440,064 | |
| | | | | 65,723,637 | |
Total Common Stocks(cost $1,034,160,327) | | | | 1,051,707,954 | |
| | | | | | | | |
Limited Partnerships - .0% | | | | | |
Real Estate - .0% | | | | | |
Brookfield Property Partners LP
(cost $161,066) | | | | 8,296 | a | 153,310 | |
| | | 1-Day
Yield (%) | | | | | |
Investment Companies - .7% | | | | | |
Registered Investment Companies - .7% | | | | | |
Dreyfus Institutional Preferred Government Plus Money Market Fund
(cost $7,313,070) | | 2.40 | | 7,313,070 | d | 7,313,070 | |
| | | | | | | | |
Investment of Cash Collateral for Securities Loaned - .0% | | | | | |
Registered Investment Companies - .0% | | | | | |
Dreyfus Institutional Preferred Government Plus Money Market Fund
(cost $369,101) | | 2.40 | | 369,101 | d | 369,101 | |
Total Investments(cost $1,042,003,564) | | 100.0% | | 1,059,543,435 | |
Liabilities, Less Cash and Receivables | | .0% | | (95,440) | |
Net Assets | | 100.0% | | 1,059,447,995 | |
a Security, or portion thereof, on loan. At May 31, 2019, the value of the fund’s securities on loan was $50,489,650 and the value of the collateral held by the fund was $64,298,519, consisting of cash collateral of $369,101 and U.S. Government & Agency securities valued at $63,929,418.
b Non-income producing security.
c Investment in real estate investment trust within the United States.
d Investment in affiliated issuer. The investment objective of this investment company is publicly available and can be found within the investment company’s prospectus.
13
STATEMENT OF INVESTMENTS (continued)
| | |
Portfolio Summary (Unaudited)† | Value (%) |
Information Technology | 19.6 |
Health Care | 14.3 |
Financials | 14.0 |
Communication Services | 12.2 |
Consumer Staples | 8.3 |
Energy | 6.4 |
Utilities | 6.2 |
Industrials | 5.3 |
Materials | 4.0 |
Real Estate | 3.6 |
Consumer, Non-Cyclical | 3.2 |
Consumer Discretionary | 2.2 |
Investment Companies | .7 |
| | 100.0 |
† Based on net assets.
See notes to financial statements.
14
STATEMENT OF INVESTMENTS IN AFFILIATED ISSUERS
| | | | | | | |
Investment Companies | Value
5/31/18 ($) | Purchases ($) | Sales ($) | Value
5/31/19 ($) | Net
Assets (%) | Dividends/
Distributions ($) |
Registered Investment Companies: | | | | | |
Dreyfus Institutional Preferred Government Plus Money Market Fund | 2,488,274 | 385,011,295 | 380,186,499 | 7,313,070 | .7 | 101,072 |
Investment of Cash Collateral for Securities Loaned:† | | | | | |
Dreyfus Institutional Preferred Government Money Market Fund, Institutional Shares | 1,918,957 | 4,147,021 | 6,065,978 | - | - | - |
Dreyfus Institutional Preferred Government Plus Money Market Fund | - | 6,564,528 | 6,195,427 | 369,101 | .0 | - |
Total | 4,407,231 | 395,722,844 | 392,447,904 | 7,682,171 | .7 | 101,072 |
† Effective January 2, 2019, cash collateral for securities lending was transferred from Dreyfus Institutional Preferred Government Money Market Fund, Institutional Shares to Dreyfus Institutional Preferred Government Plus Money Market Fund.
See notes to financial statements.
15
STATEMENT OF ASSETS AND LIABILITIES
May 31, 2019
| | | | | | | |
| | | | | | |
| | | Cost | | Value | |
Assets ($): | | | | |
Investments in securities—See Statement of Investments
(including securities on loan, valued at $50,489,650)—Note 1(b): | | | |
Unaffiliated issuers | 1,034,321,393 | | 1,051,861,264 | |
Affiliated issuers | | 7,682,171 | | 7,682,171 | |
Receivable for investment securities sold | | 24,957,935 | |
Dividends, interest and securities lending income receivable | | 3,202,586 | |
Receivable for shares of Beneficial Interest subscribed | | 3,173,570 | |
Prepaid expenses | | | | | 99,756 | |
| | | | | 1,090,977,282 | |
Liabilities ($): | | | | |
Due to BNY Mellon Investment Adviser, Inc. and affiliates—Note 3(c) | | 652,842 | |
Payable for investment securities purchased | | 28,384,738 | |
Payable for shares of Beneficial Interest redeemed | | 1,822,994 | |
Liability for securities on loan—Note 1(b) | | 369,101 | |
Trustees fees and expenses payable | | 11,185 | |
Accrued expenses | | | | | 288,427 | |
| | | | | 31,529,287 | |
Net Assets ($) | | | 1,059,447,995 | |
Composition of Net Assets ($): | | | | |
Paid-in capital | | | | | 1,062,552,994 | |
Total distributable earnings (loss) | | | | | (3,104,999) | |
Net Assets ($) | | | 1,059,447,995 | |
| | | | | | |
Net Asset Value Per Share | Class A | Class C | Class I | Class Y | |
Net Assets ($) | 235,973,190 | 68,561,945 | 752,284,295 | 2,628,565 | |
Shares Outstanding | 13,024,645 | 3,838,610 | 41,429,799 | 144,008 | |
Net Asset Value Per Share ($) | 18.12 | 17.86 | 18.16 | 18.25 | |
| | | | | |
See notes to financial statements. | | | | | |
16
STATEMENT OF OPERATIONS
Year Ended May 31, 2019
| | | | | | | |
| | | | | | |
| | | | | | |
Investment Income ($): | | | | |
Income: | | | | |
Cash dividends: | |
Unaffiliated issuers | | | 29,770,252 | |
Affiliated issuers | | | 101,072 | |
Income from securities lending—Note 1(b) | | | 51,224 | |
Total Income | | | 29,922,548 | |
Expenses: | | | | |
Management fee—Note 3(a) | | | 6,013,221 | |
Shareholder servicing costs—Note 3(c) | | | 1,513,673 | |
Distribution fees—Note 3(b) | | | 406,549 | |
Registration fees | | | 204,941 | |
Professional fees | | | 85,879 | |
Trustees’ fees and expenses—Note 3(d) | | | 73,188 | |
Prospectus and shareholders’ reports | | | 38,669 | |
Custodian fees—Note 3(c) | | | 32,583 | |
Loan commitment fees—Note 2 | | | 22,196 | |
Interest expense—Note 2 | | | 1,741 | |
Miscellaneous | | | 32,721 | |
Total Expenses | | | 8,425,361 | |
Less—reduction in expenses due to undertaking—Note 3(a) | | | (584,475) | |
Net Expenses | | | 7,840,886 | |
Investment Income—Net | | | 22,081,662 | |
Realized and Unrealized Gain (Loss) on Investments—Note 4 ($): | | |
Net realized gain (loss) on investments | (14,453,980) | |
Net unrealized appreciation (depreciation) on investments | | | (50,722,378) | |
Net Realized and Unrealized Gain (Loss) on Investments | | | (65,176,358) | |
Net (Decrease) in Net Assets Resulting from Operations | | (43,094,696) | |
| | | | | | |
See notes to financial statements. | | | | | |
17
STATEMENT OF CHANGES IN NET ASSETS
| | | | | | | | | | |
| | | | Year Ended May 31, |
| | | | 2019 | | 2018a | |
Operations ($): | | | | | | | | |
Investment income—net | | | 22,081,662 | | | | 9,453,576 | |
Net realized gain (loss) on investments | | (14,453,980) | | | | 23,382,113 | |
Net unrealized appreciation (depreciation)
on investments | | (50,722,378) | | | | 19,694,832 | |
Net Increase (Decrease) in Net Assets
Resulting from Operations | (43,094,696) | | | | 52,530,521 | |
Distributions ($): | |
Distributions to shareholders: | | | | | | | | |
Class A | | | (10,389,075) | | | | (15,132,763) | |
Class C | | | (2,075,266) | | | | (1,829,100) | |
Class I | | | (27,285,576) | | | | (12,598,316) | |
Class Y | | | (54,195) | | | | (185,309) | |
Total Distributions | | | (39,804,112) | | | | (29,745,488) | |
Beneficial Interest Transactions ($): | |
Net proceeds from shares sold: | | | | | | | | |
Class A | | | 91,779,621 | | | | 35,930,950 | |
Class C | | | 52,043,145 | | | | 9,918,835 | |
Class I | | | 799,826,763 | | | | 123,310,523 | |
Class Y | | | 2,944,015 | | | | 5,000 | |
Distributions reinvested: | | | | | | | | |
Class A | | | 9,415,374 | | | | 13,543,763 | |
Class C | | | 1,604,391 | | | | 1,453,972 | |
Class I | | | 24,248,564 | | | | 11,882,009 | |
Class Y | | | 53,216 | | | | 180,116 | |
Cost of shares redeemed: | | | | | | | | |
Class A | | | (47,658,096) | | | | (42,585,329) | |
Class C | | | (10,033,109) | | | | (7,138,566) | |
Class I | | | (239,787,458) | | | | (60,176,224) | |
Class Y | | | (192,083) | | | | (2,563,909) | |
Increase (Decrease) in Net Assets
from Beneficial Interest Transactions | 684,244,343 | | | | 83,761,140 | |
Total Increase (Decrease) in Net Assets | 601,345,535 | | | | 106,546,173 | |
Net Assets ($): | |
Beginning of Period | | | 458,102,460 | | | | 351,556,287 | |
End of Period | | | 1,059,447,995 | | | | 458,102,460 | |
18
| | | | | | | | | | |
| | | | Year Ended May 31, |
| | | | 2019 | | 2018a | |
Capital Share Transactions (Shares): | |
Class Ab,c | | | | | | | | |
Shares sold | | | 4,770,683 | | | | 1,871,259 | |
Shares issued for distributions reinvested | | | 492,558 | | | | 713,932 | |
Shares redeemed | | | (2,494,721) | | | | (2,217,953) | |
Net Increase (Decrease) in Shares Outstanding | 2,768,520 | | | | 367,238 | |
Class Cc | | | | | | | | |
Shares sold | | | 2,736,462 | | | | 516,648 | |
Shares issued for distributions reinvested | | | 85,465 | | | | 77,619 | |
Shares redeemed | | | (540,219) | | | | (377,882) | |
Net Increase (Decrease) in Shares Outstanding | 2,281,708 | | | | 216,385 | |
Class Ib | | | | | | | | |
Shares sold | | | 41,248,445 | | | | 6,375,842 | |
Shares issued for distributions reinvested | | | 1,267,405 | | | | 625,214 | |
Shares redeemed | | | (12,614,234) | | | | (3,151,705) | |
Net Increase (Decrease) in Shares Outstanding | 29,901,616 | | | | 3,849,351 | |
Class Y | | | | | | | | |
Shares sold | | | 151,282 | | | | 267 | |
Shares issued for distributions reinvested | | | 2,791 | | | | 9,470 | |
Shares redeemed | | | (10,071) | | | | (131,452) | |
Net Increase (Decrease) in Shares Outstanding | 144,002 | | | | (121,715) | |
| | | | | | | | | |
aDistributions to shareholders include $4,416,847 Class A, $407,721 Class C, $3,977,301 Class I and $47,685 Class Y of distributions from investment income—net and $10,715,916 Class A, $1,421,379 Class C, $8,621,015 Class I and $137,624 Class Y distributions from net realized gains. Undistributed investment income—net was $1,350,429 in 2018 and is no longer presented as a result of the adoption of SEC’s Disclosure Update and Simplification Rule.
| |
bDuring the period ended May 31, 2019, 1,083 Class A shares representing $21,165 were exchanged for 1,081 Class I shares and during the period ended May 31, 2018, 2,084 Class A shares representing $40,844 were exchanged for 2,079 Class I shares.
| |
cDuring the period ended May 31, 2019,2,365 Class C shares representing $46,356 were automatically converted for 2,334 Class A shares and during the period ended May 31, 2018, 7,796 Class C shares representing $146,384 were automatically converted for 7,701 Class A shares.
| |
See notes to financial statements. | | | | | | | | |
19
FINANCIAL HIGHLIGHTS
The following tables describe the performance for each share class for the fiscal periods indicated. All information (except portfolio turnover rate) reflects financial results for a single fund share. Total return shows how much your investment in the fund would have increased (or decreased) during each period, assuming you had reinvested all dividends and distributions. These figures have been derived from the fund’s financial statements.
| | | | | | | | |
| | | |
| | |
| | Year Ended May 31, |
Class A Shares | | 2019 | 2018 | 2017 | 2016 | 2015 |
Per Share Data ($): | | | | | | |
Net asset value,
beginning of period | | 19.62 | 18.48 | 16.59 | 18.01 | 17.55 |
Investment Operations: | | | | | | |
Investment income—neta | | .48 | .47 | .51 | .52 | .48 |
Net realized and unrealized
gain (loss) on investments | | (1.11) | 2.24 | 1.98 | (.37) | .94 |
Total from Investment Operations | | (.63) | 2.71 | 2.49 | .15 | 1.42 |
Distributions: | | | | | | |
Dividends from
investment income—net | | (.45) | (.45) | (.47) | (.50) | (.48) |
Dividends from net realized
gain on investments | | (.42) | (1.12) | (.13) | (1.07) | (.48) |
Total Distributions | | (.87) | (1.57) | (.60) | (1.57) | (.96) |
Net asset value, end of period | | 18.12 | 19.62 | 18.48 | 16.59 | 18.01 |
Total Return (%)b | | (3.36) | 15.15 | 15.18 | 1.54 | 8.41 |
Ratios/Supplemental Data (%): | | | | | | |
Ratio of total expenses
to average net assets | | 1.14 | 1.18 | 1.22 | 1.21 | 1.21 |
Ratio of net expenses
to average net assets | | 1.03 | 1.03 | 1.10 | 1.10 | 1.10 |
Ratio of net investment income
to average net assets | | 2.46 | 2.47 | 2.88 | 3.12 | 2.69 |
Portfolio Turnover Rate | | 29.56 | 55.90 | 61.60 | 65.19 | 42.17 |
Net Assets, end of period ($ x 1,000) | | 235,973 | 201,272 | 182,705 | 206,929 | 220,644 |
a Based on average shares outstanding.
b Exclusive of sales charge.
See notes to financial statements.
20
| | | | | | | | |
| | | |
| | |
| | Year Ended May 31, |
Class C Shares | | 2019 | 2018 | 2017 | 2016 | 2015 |
Per Share Data ($): | | | | | | |
Net asset value,
beginning of period | | 19.36 | 18.25 | 16.36 | 17.79 | 17.35 |
Investment Operations: | | | | | | |
Investment income—neta | | .32 | .32 | .36 | .39 | .34 |
Net realized and unrealized
gain (loss) on investments | | (1.09) | 2.22 | 1.96 | (.37) | .93 |
Total from Investment Operations | | (.77) | 2.54 | 2.32 | .02 | 1.27 |
Distributions: | | | | | | |
Dividends from
investment income—net | | (.31) | (.31) | (.30) | (.38) | (.35) |
Dividends from net realized
gain on investments | | (.42) | (1.12) | (.13) | (1.07) | (.48) |
Total Distributions | | (.73) | (1.43) | (.43) | (1.45) | (.83) |
Net asset value, end of period | | 17.86 | 19.36 | 18.25 | 16.36 | 17.79 |
Total Return (%)b | | (4.10) | 14.26 | 14.35 | .80 | 7.59 |
Ratios/Supplemental Data (%): | | | | | | |
Ratio of total expenses
to average net assets | | 1.83 | 1.86 | 1.91 | 1.92 | 1.92 |
Ratio of net expenses
to average net assets | | 1.78 | 1.78 | 1.84 | 1.85 | 1.85 |
Ratio of net investment income
to average net assets | | 1.70 | 1.71 | 2.07 | 2.39 | 1.94 |
Portfolio Turnover Rate | | 29.56 | 55.90 | 61.60 | 65.19 | 42.17 |
Net Assets, end of period ($ x 1,000) | | 68,562 | 30,148 | 24,465 | 18,222 | 18,137 |
a Based on average shares outstanding.
b Exclusive of sales charge.
See notes to financial statements.
21
FINANCIAL HIGHLIGHTS (continued)
| | | | | | | | |
| | | |
| | |
| | Year Ended May 31, |
Class I Shares | | 2019 | 2018 | 2017 | 2016 | 2015 |
Per Share Data ($): | | | | | | |
Net asset value,
beginning of period | | 19.66 | 18.51 | 16.65 | 18.08 | 17.61 |
Investment Operations: | | | | | | |
Investment income—neta | | .52 | .51 | .50 | .54 | .52 |
Net realized and unrealized
gain (loss) on investments | | (1.10) | 2.26 | 2.04 | (.36) | .95 |
Total from Investment Operations | | (.58) | 2.77 | 2.54 | .18 | 1.47 |
Distributions: | | | | | | |
Dividends from
investment income—net | | (.50) | (.50) | (.55) | (.54) | (.52) |
Dividends from net realized
gain on investments | | (.42) | (1.12) | (.13) | (1.07) | (.48) |
Total Distributions | | (.92) | (1.62) | (.68) | (1.61) | (1.00) |
Net asset value, end of period | | 18.16 | 19.66 | 18.51 | 16.65 | 18.08 |
Total Return (%) | | (3.12) | 15.41 | 15.55 | 1.80 | 8.61 |
Ratios/Supplemental Data (%): | | | | | | |
Ratio of total expenses
to average net assets | | .83 | .85 | .92 | .92 | .92 |
Ratio of net expenses
to average net assets | | .78 | .78 | .84 | .85 | .85 |
Ratio of net investment income
to average net assets | | 2.70 | 2.69 | 2.82 | 3.32 | 2.93 |
Portfolio Turnover Rate | | 29.56 | 55.90 | 61.60 | 65.19 | 42.17 |
Net Assets, end of period ($ x 1,000) | | 752,284 | 226,683 | 142,128 | 24,525 | 29,527 |
a Based on average shares outstanding.
See notes to financial statements.
22
| | | | | | | |
| | | |
| | |
| | Year Ended May 31, |
Class Y Shares | | 2019 | 2018 | 2017 | 2016 | 2015 |
Per Share Data ($): | | | | | | |
Net asset value, beginning of period | | 19.72 | 18.55 | 16.63 | 18.04 | 17.61 |
Investment Operations: | | | | | | |
Investment income—neta | | .51 | .52 | .54 | .56 | .55 |
Net realized and unrealized
gain (loss) on investments | | (1.06) | 2.27 | 2.06 | (.36) | .88 |
Total from Investment Operations | | (.55) | 2.79 | 2.60 | .20 | 1.43 |
Distributions: | | | | | | |
Dividends from
investment income—net | | (.50) | (.50) | (.55) | (.54) | (.52) |
Dividends from net realized
gain on investments | | (.42) | (1.12) | (.13) | (1.07) | (.48) |
Total Distributions | | (.92) | (1.62) | (.68) | (1.61) | (1.00) |
Net asset value, end of period | | 18.25 | 19.72 | 18.55 | 16.63 | 18.04 |
Total Return (%) | | (2.94) | 15.49 | 15.93 | 1.85 | 8.50 |
Ratios/Supplemental Data (%): | | | | | | |
Ratio of total expenses
to average net assets | | .77 | .80 | .84 | .84 | .84 |
Ratio of net expenses
to average net assets | | .77 | .78 | .84 | .84 | .84 |
Ratio of net investment income
to average net assets | | 2.69 | 2.75 | 3.10 | 3.37 | 3.21 |
Portfolio Turnover Rate | | 29.56 | 55.90 | 61.60 | 65.19 | 42.17 |
Net Assets, end of period ($ x 1,000) | | 2,629 | 0b | 2,258 | 2,221 | 3,614 |
a Based on average shares outstanding.
b Amount represents less than $1,000.
See notes to financial statements.
23
NOTES TO FINANCIAL STATEMENTS
NOTE 1—Significant Accounting Policies:
BNY Mellon Equity Income Fund (the “fund”) is a separate diversified series of BNY Mellon Investment Funds III (the “Trust”), which is registered under the Investment Company Act of 1940, as amended (the “Act”), as an open-end management investment company and operates as a series company currently offering four series, including the fund. The fund’s investment objective is to seek total return (consisting of capital appreciation and income). BNY Mellon Investment Adviser, Inc. (the “Adviser”), a wholly-owned subsidiary of The Bank of New York Mellon Corporation (“BNY Mellon”), serves as the fund’s investment adviser.
Effective June 3, 2019, the fund changed its name from Dreyfus Equity Income Fund to BNY Mellon Equity Income Fund and the Trust changed its name from The Dreyfus/Laurel Funds Trust to BNY Mellon Investment Funds III. In addition, The Dreyfus Corporation, the fund’s investment adviser and administrator, changed its name to “BNY Mellon Investment Adviser, Inc.”, MBSC Securities Corporation, the fund’s distributor, changed its name to “BNY Mellon Securities Corporation” and Dreyfus Transfer, Inc., the fund’s transfer agent, changed its name to “BNY Mellon Transfer, Inc.”
BNY Mellon Securities Corporation (the “Distributor”), a wholly-owned subsidiary of the Adviser, is the distributor of the fund’s shares. The fund is authorized to issue an unlimited number of $.001 par value shares of Beneficial Interest in each of the following classes of shares: Class A, Class C, Class I, Class T and Class Y. Class A, Class C and Class T shares are sold primarily to retail investors through financial intermediaries and bear Distribution and/or Shareholder Services Plan fees. Class A and Class T shares generally are subject to a sales charge imposed at the time of purchase. Class C shares are subject to a contingent deferred sales charge (“CDSC”) imposed on Class C shares redeemed within one year of purchase. Class C shares automatically convert to Class A shares ten years after the date of purchase, without the imposition of a sales charge. Class I shares are sold primarily to bank trust departments and other financial service providers (including The Bank of New York Mellon, a subsidiary of BNY Mellon and an affiliate of the Adviser, and its affiliates), acting on behalf of customers having a qualified trust or an investment account or relationship at such institution, and bear no Distribution or Shareholder Services Plan fees. Class Y shares are sold at net asset value per share generally to institutional investors, and bear no Distribution or Shareholder Services Plan fees. Class I and Class Y shares are offered without a front-
24
end sales charge or CDSC. As of the date of this report, the fund did not offer Class T shares for purchase. Other differences between the classes include the services offered to and the expenses borne by each class, the allocation of certain transfer agency costs, and certain voting rights. Income, expenses (other than expenses attributable to a specific class), and realized and unrealized gains or losses on investments are allocated to each class of shares based on its relative net assets.
The Trust accounts separately for the assets, liabilities and operations of each series. Expenses directly attributable to each series are charged to that series’ operations; expenses which are applicable to all series are allocated among them on a pro rata basis.
The Financial Accounting Standards Board (“FASB”) Accounting Standards Codification is the exclusive reference of authoritative U.S. generally accepted accounting principles (“GAAP”) recognized by the FASB to be applied by nongovernmental entities. Rules and interpretive releases of the Securities and Exchange Commission (“SEC”) under authority of federal laws are also sources of authoritative GAAP for SEC registrants. The fund’s financial statements are prepared in accordance with GAAP, which may require the use of management estimates and assumptions. Actual results could differ from those estimates.
(a) Portfolio valuation: The fair value of a financial instrument is the amount that would be received to sell an asset or paid to transfer a liability in an orderly transaction between market participants at the measurement date (i.e., the exit price). GAAP establishes a fair value hierarchy that prioritizes the inputs of valuation techniques used to measure fair value. This hierarchy gives the highest priority to unadjusted quoted prices in active markets for identical assets or liabilities (Level 1 measurements) and the lowest priority to unobservable inputs (Level 3 measurements).
Additionally, GAAP provides guidance on determining whether the volume and activity in a market has decreased significantly and whether such a decrease in activity results in transactions that are not orderly. GAAP requires enhanced disclosures around valuation inputs and techniques used during annual and interim periods.
Various inputs are used in determining the value of the fund’s investments relating to fair value measurements. These inputs are summarized in the three broad levels listed below:
25
NOTES TO FINANCIAL STATEMENTS(continued)
Level 1—unadjusted quoted prices in active markets for identical investments.
Level 2—other significant observable inputs (including quoted prices for similar investments, interest rates, prepayment speeds, credit risk, etc.).
Level 3—significant unobservable inputs (including the fund’s own assumptions in determining the fair value of investments).
The inputs or methodology used for valuing securities are not necessarily an indication of the risk associated with investing in those securities.
Changes in valuation techniques may result in transfers in or out of an assigned level within the disclosure hierarchy. Valuation techniques used to value the fund’s investments are as follows:
Investments in securities are valued at the last sales price on the securities exchange or national securities market on which such securities are primarily traded. Securities listed on the National Market System for which market quotations are available are valued at the official closing price or, if there is no official closing price that day, at the last sales price. For open short positions, asked prices are used for valuation purposes. Bid price is used when no asked price is available. Registered investment companies that are not traded on an exchange are valued at their net asset value. All of the preceding securities are generally categorized within Level 1 of the fair value hierarchy.
Securities not listed on an exchange or the national securities market, or securities for which there were no transactions, are valued at the average of the most recent bid and asked prices. These securities are generally categorized within Level 2 of the fair value hierarchy.
Fair valuing of securities may be determined with the assistance of a pricing service using calculations based on indices of domestic securities and other appropriate indicators, such as prices of relevant American Depositary Receipts and futures. Utilizing these techniques may result in transfers between Level 1 and Level 2 of the fair value hierarchy.
When market quotations or official closing prices are not readily available, or are determined not to accurately reflect fair value, such as when the value of a security has been significantly affected by events after the close of the exchange or market on which the security is principally traded (for example, a foreign exchange or market), but before the fund calculates its net asset value, the fund may value these investments at fair value as determined in accordance with the procedures approved by the Trust’s Board of Trustees (the “Board”). Certain factors may be considered when fair valuing investments such as: fundamental analytical data, the nature and duration of restrictions on disposition, an evaluation of the forces that
26
influence the market in which the securities are purchased and sold, and public trading in similar securities of the issuer or comparable issuers. These securities are either categorized within Level 2 or 3 of the fair value hierarchy depending on the relevant inputs used.
For restricted securities where observable inputs are limited, assumptions about market activity and risk are used and such securities are generally categorized within Level 3 of the fair value hierarchy.
The following is a summary of the inputs used as of May 31, 2019in valuing the fund’s investments:
| | | | | |
| | Level 1 - Unadjusted Quoted Prices | Level 2 - Other Significant Observable Inputs | Level 3 -Significant Unobservable Inputs | Total |
Assets ($) | | | |
Investments in Securities: | | | |
Equity Securities - Common Stocks† | 1,051,707,954 | - | - | 1,051,707,954 |
Investment Companies | 7,682,171 | - | - | 7,682,171 |
Limited Partnerships† | 153,310 | - | - | 153,310 |
† See Statement of Investments for additional detailed categorizations.
At May 31, 2019, there were no transfers between levels of the fair value hierarchy. It is the fund’s policy to recognize transfers between levels at the end of the reporting period.
(b)Securities transactions and investment income: Securities transactions are recorded on a trade date basis. Realized gains and losses from securities transactions are recorded on the identified cost basis. Dividend income is recognized on the ex-dividend date and interest income, including, where applicable, accretion of discount and amortization of premium on investments, is recognized on the accrual basis.
Pursuant to a securities lending agreement with The Bank of New York Mellon, the fund may lend securities to qualified institutions. It is the fund’s policy that, at origination, all loans are secured by collateral of at least 102% of the value of U.S. securities loaned and 105% of the value of foreign securities loaned. Collateral equivalent to at least 100% of the market value of securities on loan is maintained at all times. Collateral is either in the form of cash, which can be invested in certain money market mutual funds managed by the Adviser, or U.S. Government and Agency securities. The fund is entitled to receive all dividends, interest and
27
NOTES TO FINANCIAL STATEMENTS(continued)
distributions on securities loaned, in addition to income earned as a result of the lending transaction. Should a borrower fail to return the securities in a timely manner, The Bank of New York Mellon is required to replace the securities for the benefit of the fund or credit the fund with the market value of the unreturned securities and is subrogated to the fund’s rights against the borrower and the collateral. Additionally, the contractual maturity of security lending transactions are on an overnight and continuous basis. During the period ended May 31, 2019, The Bank of New York Mellon earned $10,574 from lending portfolio securities, pursuant to the securities lending agreement.
(c) Affiliated issuers: Investments in other investment companies advised by the Adviser are considered “affiliated” under the Act.
(d) Dividends and distributions to shareholders: Dividends and distributions are recorded on the ex-dividend date. Dividends from investment income-net are normally declared and paid on a monthly basis. Dividends from net realized capital gains, if any, are normally declared and paid annually, but the fund may make distributions on a more frequent basis to comply with the distribution requirements of the Internal Revenue Code of 1986, as amended (the “Code”). To the extent that net realized capital gains can be offset by capital loss carryovers, it is the policy of the fund not to distribute such gains. Income and capital gain distributions are determined in accordance with income tax regulations, which may differ from GAAP.
(e) Federal income taxes: It is the policy of the fund to continue to qualify as a regulated investment company, if such qualification is in the best interests of its shareholders, by complying with the applicable provisions of the Code, and to make distributions of taxable income and net realized capital gain sufficient to relieve it from substantially all federal income and excise taxes.
As of and during the period ended May 31, 2019, the fund did not have any liabilities for any uncertain tax positions. The fund recognizes interest and penalties, if any, related to uncertain tax positions as income tax expense in the Statement of Operations. During the period ended May 31, 2019, the fund did not incur any interest or penalties.
Each tax year in the four-year period ended May 31, 2019 remains subject to examination by the Internal Revenue Service and state taxing authorities.
At May 31, 2019, the components of accumulated earnings on a tax basis were as follows: undistributed ordinary income $3,010,852 and unrealized appreciation $14,277,706. In addition, the fund had $20,393,557 of capital
28
losses realized after October 31, 2018, which were deferred for tax purposes to the first day of the following fiscal year.
The tax character of distributions paid to shareholders during the fiscal periods ended May 31, 2019 and May 31, 2018 were as follows: ordinary income $29,574,120 and $17,749,570, and long-term capital gains $10,229,992 and $11,995,918, respectively.
(f) New Accounting Pronouncements: In August 2018, the FASB issued Accounting Standards Update 2018-13, Fair Value Measurement (Topic 820): Disclosure Framework—Changes to the Disclosure Requirements for Fair Value Measurement (“ASU 2018-13”). The update provides guidance that eliminates, adds and modifies certain disclosure requirements for fair value measurements. ASU 2018-13 will be effective for fiscal years beginning after December 15, 2019. Management is currently assessing the potential impact of these changes to future financial statements.
NOTE 2—Bank Lines of Credit:
The fund participates with other long-term open-end funds managed by the Adviser in a $1.030 billion unsecured credit facility led by Citibank, N.A. (the “Citibank Credit Facility”) and a $300 million unsecured credit facility provided by The Bank of New York Mellon (the “BNYM Credit Facility”), each to be utilized primarily for temporary or emergency purposes, including the financing of redemptions (each, a “Facility”). The Citibank Credit Facility is available in two tranches: (i) Tranche A is in an amount equal to $830 million and is available to all long-term open-ended funds, including the fund, and (ii) Tranche B is in amount equal to $200 million and is available only to BNY Mellon Floating Rate Income Fund, a series of BNY Mellon Investment Funds IV, Inc. Prior to October 3, 2018, the unsecured credit facility with Citibank, N.A. was $830 million. In connection therewith, the fund has agreed to pay its pro rata portion of commitment fees for Tranche A of the Citibank Credit Facility and the BNYM Credit Facility. Interest is charged to the fund based on rates determined pursuant to the terms of the respective Facility at the time of borrowing.
The average amount of borrowings outstanding under the Facilities during the period ended May 31, 2019 was approximately $56,200 with a related weighted average annualized interest rate of 3.10%.
29
NOTES TO FINANCIAL STATEMENTS(continued)
NOTE 3—Management Fee and Other Transactions with Affiliates:
(a)Pursuant to a management agreement with the Adviser, the management fee is computed at the annual rate of .70% of the value of the fund’s average daily net assets and is payable monthly. The Adviser has contractually agreed, from June 1, 2018 through September 30, 2019, to waive receipt of its fees and/or assume the direct expenses of the fund, so that the total annual fund operating expenses of none of the classes (excluding Rule 12b-1 Distribution Plan fees, Shareholder Services Plan fees, taxes, interest expense, brokerage commissions, commitment fees on borrowings and extraordinary expenses) exceed .78% of the value of the fund’s average daily net assets. On or after September 30, 2019, the Adviser may terminate this expense limitation at any time. The reduction in expenses, pursuant to the undertaking, amounted to $584,475 during the period ended May 31, 2019.
During the period ended May 31, 2019, the Distributor retained $97,110, from commissions earned on sales of the fund’s Class A shares and $24,444 from CDSC fees on redemptions of the fund’s Class C shares.
(b) Under the Distribution Plan adopted pursuant to Rule 12b-1 under the Act, Class C shares pay the Distributor for distributing its shares at an annual rate of .75% of the value of its average daily net assets. During the period ended May 31, 2019, Class C shares were charged $406,549 pursuant to the Distribution Plan.
(c)Under the Shareholder Services Plan, Class A and Class C shares pay the Distributor at an annual rate of .25% of the value of their average daily net assets for the provision of certain services. The services provided may include personal services relating to shareholder accounts, such as answering shareholder inquiries regarding the fund and providing reports and other information, and services related to the maintenance of shareholder accounts. The Distributor may make payments to Service Agents (securities dealers, financial institutions or other industry professionals) with respect to these services. The Distributor determines the amounts to be paid to Service Agents. During the period ended May 31, 2019, Class A and Class C shares were charged $578,746and $135,516, respectively, pursuant to the Shareholder Services Plan.
Under its terms, the Distribution Plan and Shareholder Services Plan shall remain in effect from year to year, provided such continuance is approved annually by a vote of a majority of those Trustees who are not “interested persons” of the Trust and who have no direct or indirect financial interest
30
in the operation of or in any agreement related to the Distribution Plan or Shareholder Services Plan.
The fund has an arrangement with the transfer agent whereby the fund may receive earnings credits when positive cash balances are maintained, which are used to offset transfer agency fees. The fund had an arrangement with the custodian to receive earnings credits when positive cash balances were maintained, which were used to offset custody fees. Effective February 1, 2019, the arrangement with the custodian changed whereby the fund will no longer receive earnings credits to offset its custody fees and will receive interest income or overdraft fees going forward. For financial reporting purposes, the fund includes net earnings credits, if any, as an expense offset in the Statement of Operations.
The fund compensates BNY Mellon Transfer, Inc., a wholly-owned subsidiary of the Adviser, under a transfer agency agreement for providing transfer agency and cash management services for the fund. The majority of transfer agency fees are comprised of amounts paid on a per account basis, while cash management fees are related to fund subscriptions and redemptions. During the period ended May 31, 2019, the fund was charged $60,062 for transfer agency services. These fees are included in Shareholder servicing costs in the Statement of Operations.
The fund compensates The Bank of New York Mellon under a custody agreement for providing custodial services for the fund. These fees are determined based on net assets, geographic region and transaction activity. During the period ended May 31, 2019, the fund was charged $32,583 pursuant to the custody agreement.
During the period ended May 31, 2019, the fund was charged $12,449 for services performed by the Chief Compliance Officer and his staff. These fees are included in Miscellaneous in the Statement of Operations.
The components of “Due to BNY Mellon Investment Adviser, Inc. and affiliates” in the Statement of Assets and Liabilities consist of: management fees $659,522, Distribution Plan fees $45,681, Shareholder Services Plan fees $68,158, custodian fees $6,997, Chief Compliance Officer fees $4,090 and transfer agency fees $9,518, which are offset against an expense reimbursement currently in effect in the amount of $141,124.
(d) Each Board member also serves as a Board member of other funds in the BNY Mellon Family of Funds complex. Annual retainer fees and attendance fees are allocated to each fund based on net assets.
31
NOTES TO FINANCIAL STATEMENTS(continued)
NOTE 4—Securities Transactions:
The aggregate amount of purchases and sales of investment securities, excluding short-term securities, during the period ended May 31, 2019, amounted to $912,684,173 and $250,302,977, respectively.
At May 31, 2019, the cost of investments for federal income tax purposes was $1,045,265,729; accordingly, accumulated net unrealized appreciation on investments was $14,277,706, consisting of $75,710,068 gross unrealized appreciation and $61,432,362 gross unrealized depreciation.
32
REPORT OF INDEPENDENT REGISTERED PUBLIC ACCOUNTING FIRM
To the Shareholders and Board of Trustees
BNY Mellon Investment Funds III (formerly, The Dreyfus/Laurel Funds Trust)
Opinion on the Financial Statements
We have audited the accompanying statement of assets and liabilities of BNY Mellon Equity Income Fund (formerly, Dreyfus Equity Income Fund) (the “Fund”), a series of BNY Mellon Investment Funds III, including the statements of investments and investments in affiliated issuers, as of May 31, 2019, the related statement of operations for the year then ended, the statements of changes in net assets for each of the years in the two-year period then ended and the related notes (collectively, the financial statements) and the financial highlights for each of the years in the five-year period then ended. In our opinion, the financial statements and financial highlights present fairly, in all material respects, the financial position of the Fund as of May 31, 2019, the results of its operations for the year then ended, the changes in its net assets for each of the years in the two-year period then ended and the financial highlights for each of the years in the five-year period then ended, in conformity with U.S. generally accepted accounting principles.
Basis for Opinion
These financial statements and financial highlights are the responsibility of the Fund’s management. Our responsibility is to express an opinion on these financial statements and financial highlights based on our audits. We are a public accounting firm registered with the Public Company Accounting Oversight Board (United States) (PCAOB) and are required to be independent with respect to the Fund in accordance with the U.S. federal securities laws and the applicable rules and regulations of the Securities and Exchange Commission and the PCAOB.
We conducted our audits in accordance with the standards of the PCAOB. Those standards require that we plan and perform the audit to obtain reasonable assurance about whether the financial statements and financial highlights are free of material misstatement, whether due to error or fraud. Our audits included performing procedures to assess the risks of material misstatement of the financial statements and financial highlights, whether due to error or fraud, and performing procedures that respond to those risks. Such procedures included examining, on a test basis, evidence regarding the amounts and disclosures in the financial statements and financial highlights. Such procedures also included confirmation of securities owned as of May 31, 2019, by correspondence with the custodian and brokers or by other appropriate auditing procedures when replies from brokers were not received. Our audits also included evaluating the accounting principles used and significant estimates made by management, as well as evaluating the overall presentation of the financial statements and financial highlights. We believe that our audits provide a reasonable basis for our opinion.

We have served as the auditor of one or more BNY Mellon Investment Adviser Inc. (formerly, The Dreyfus Coporation) investment companies since 1994.
New York, New York
July 26, 2019
33
IMPORTANT TAX INFORMATION(Unaudited)
For federal tax purposes the fund reports the maximum amount allowable but not less than 90.02% of ordinary income dividends paid during the fiscal year ended May 31, 2019 as eligible for the corporate dividends received deduction provided under Section 243 of the Internal Revenue Code in accordance with Section 854(b)(1)(A) of the Internal Revenue Code. Also, the fund reports the maximum amount allowable but not less than $22,298,030 as ordinary income dividends paid during the fiscal year ended May 31, 2019 as qualified dividend income in accordance with Section 854(b)(1)(B) of the Internal Revenue Code. Shareholders will receive notification in early 2020 of the percentage applicable to the preparation of their 2019 income tax returns. Also, the fund reports the maximum amount allowable but not less than $.2208 per share as a capital gain dividend paid on December 6, 2018 in accordance with Section 852(b)(3)(C) of the Internal Revenue Code. Also, the fund reports the maximum amount allowable but not less than $.2039 as a short-term capital gain dividend paid on December 6, 2018 in accordance with Sections 871(k)(2) and 881(e) of the Internal Revenue Code.
34
INFORMATION ABOUT THE RENEWAL OF THE FUND'S MANAGEMENT AGREEMENT (Unaudited)
At a meeting of the fund’s Board of Trustees held on February 27-28, 2019, the Board considered the renewal of the fund’s Management Agreement pursuant to which the Adviser provides the fund with investment advisory and administrative services (the “Agreement”). The Board members, none of whom are “interested persons” (as defined in the Investment Company Act of 1940, as amended) of the fund, were assisted in their review by independent legal counsel and met with counsel in executive session separate from representatives of the Adviser. In considering the renewal of the Agreement, the Board considered all factors that it believed to be relevant, including those discussed below. The Board did not identify any one factor as dispositive, and each Board member may have attributed different weights to the factors considered.
Analysis of Nature, Extent, and Quality of Services Provided to the Fund. The Board considered information provided to it at the meeting and in previous presentations from representatives of the Adviser regarding the nature, extent, and quality of the services provided to funds in the BNY Mellon fund complex. The Adviser provided the number of open accounts in the fund, the fund’s asset size and the allocation of fund assets among distribution channels. The Adviser also had previously provided information regarding the diverse intermediary relationships and distribution channels of funds in the BNY Mellon fund complex (such as retail direct or intermediary, in which intermediaries typically are paid by the fund and/or the Adviser) and the Adviser’s corresponding need for broad, deep, and diverse resources to be able to provide ongoing shareholder services to each intermediary or distribution channel, as applicable to the fund.
The Board also considered research support available to, and portfolio management capabilities of, the fund’s portfolio management personnel and that the Adviser also provides oversight of day-to-day fund operations, including fund accounting and administration and assistance in meeting legal and regulatory requirements. The Board also considered the Adviser’s extensive administrative, accounting and compliance infrastructures. The Board also considered portfolio management’s brokerage policies and practices (including policies and practices regarding soft dollars) and the standards applied in seeking best execution.
Comparative Analysis of the Fund’s Performance and Management Fee and Expense Ratio. The Board reviewed reports prepared by Broadridge Financial Solutions, Inc. (“Broadridge”), an independent provider of investment company data, which included information comparing (1) the fund’s performance with the performance of a group of comparable funds (the “Performance Group”) and with a broader group of funds (the “Performance Universe”), all for various periods ended December 31, 2018, and (2) the fund’s actual and contractual management fees and total expenses with those of a group of comparable funds (the “Expense Group”) and with a broader group of funds (the “Expense Universe”), the information for which was derived in part from fund financial statements available to Broadridge as of the date of its analysis. The Adviser previously had furnished the Board with a description of the methodology Broadridge used to
35
INFORMATION ABOUT THE RENEWAL OF THE FUND'S MANAGEMENT AGREEMENT (Unaudited) (continued)
select the Performance Group and Performance Universe and the Expense Group and Expense Universe.
Representatives of the Adviser stated that the usefulness of performance comparisons may be affected by a number of factors, including different investment limitations and policies that may be applicable to the fund and comparison funds. The Board discussed with representatives of the Adviser and/or its affiliates the results of the comparisons and considered that the fund’s total return performance was above the Performance Group and Performance Universe medians for all periods. The Adviser also provided a comparison of the fund’s calendar year total returns to the returns of the fund’s benchmark index.
The Board also reviewed the range of actual and contractual management fees and total expenses of the Expense Group and Expense Universe funds and discussed the results of the comparisons. The Board considered that the fund’s contractual management fee was below the Expense Group median and the fund’s actual management fee and total expenses were below the Expense Group and Expense Universe medians.
Representatives of the Adviser stated that the Adviser has contractually agreed, until September 30, 2019, to waive receipt of its fees and/or assume the direct expenses of the fund so that the direct expenses of none of its classes (excluding Rule 12b-1 fees, shareholder services fees, taxes, interest, brokerage commissions, commitment fees on borrowings and extraordinary expenses) exceed .78% of the fund’s average daily net assets.
Representatives of the Adviser reviewed with the Board the management or investment advisory fees (1) paid by funds advised or administered by the Adviser that are in the same Lipper category as the fund and (2) paid to the Adviser, or the primary employer of the fund’s primary portfolio manager(s) that is affiliated with the Adviser, for advising any separate accounts and/or other types of client portfolios that are considered to have similar investment strategies and policies as the fund (the “Similar Clients “), and explained the nature of the Similar Clients. They discussed differences in fees paid and the relationship of the fees paid in light of any differences in the services provided and other relevant factors. The Board considered the relevance of the fee information provided for the Similar Clients to evaluate the appropriateness of the fund’s management fee.
Analysis of Profitability and Economies of Scale. Representatives of the Adviser reviewed the expenses allocated and profit received by the Adviser and its affiliates and the resulting profitability percentage for managing the fund and the aggregate profitability percentage to the Adviser and its affiliates for managing the funds in the BNY Mellon fund complex, and the method used to determine the expenses and profit. The Board concluded that the profitability results were not unreasonable, given the services rendered and service levels provided by the Adviser. The Board also considered the expense limitation arrangement and its effect on the profitability of the Adviser and its affiliates. The Board also had been provided with information prepared by an independent consulting firm regarding the Adviser’s approach to allocating costs to, and
36
determining the profitability of, individual funds and the entire BNY Mellon fund complex. The consulting firm also had analyzed where any economies of scale might emerge in connection with the management of a fund.
The Board considered, on the advice of its counsel, the profitability analysis (1) as part of its evaluation of whether the fees under the Agreement, considered in relation to the mix of services provided by the Adviser, including the nature, extent and quality of such services, supported the renewal of the Agreement and (2) in light of the relevant circumstances for the fund and the extent to which economies of scale would be realized if the fund grows and whether fee levels reflect these economies of scale for the benefit of fund shareholders. Representatives of the Adviser also stated that, as a result of shared and allocated costs among funds in the BNY Mellon fund complex, the extent of economies of scale could depend substantially on the level of assets in the complex as a whole, so that increases and decreases in complex-wide assets can affect potential economies of scale in a manner that is disproportionate to, or even in the opposite direction from, changes in the fund’s asset level. The Board also considered potential benefits to the Adviser from acting as investment adviser and took into consideration the soft dollar arrangements in effect for trading the fund’s investments.
At the conclusion of these discussions, the Board agreed that it had been furnished with sufficient information to make an informed business decision with respect to the renewal of the Agreement. Based on the discussions and considerations as described above, the Board concluded and determined as follows.
· The Board concluded that the nature, extent and quality of the services provided by the Adviser are adequate and appropriate.
· The Board was satisfied with the fund’s performance.
· The Board concluded that the fee paid to the Adviser continued to be appropriate under the circumstances and in light of the factors and the totality of the services provided as discussed above.
· The Board determined that the economies of scale which may accrue to the Adviser and its affiliates in connection with the management of the fund had been adequately considered by the Adviser in connection with the fee rate charged to the fund pursuant to the Agreement and that, to the extent in the future it were determined that material economies of scale had not been shared with the fund, the Board would seek to have those economies of scale shared with the fund.
In evaluating the Agreement, the Board considered these conclusions and determinations and also relied on its previous knowledge, gained through meetings and other interactions with the Adviser and its affiliates, of the Adviser and the services provided to the fund by the Adviser. The Board also relied on information received on a routine and regular basis throughout the year relating to the operations of the fund and the investment management and other services provided under the Agreement, including information on the investment performance of the fund in comparison to similar mutual funds and benchmark performance indices; general market outlook as
37
INFORMATION ABOUT THE RENEWAL OF THE FUND'S MANAGEMENT AGREEMENT (Unaudited) (continued)
applicable to the fund; and compliance reports. In addition, the Board’s consideration of the contractual fee arrangements for this fund had the benefit of a number of years of reviews of the Agreement for the fund, or substantially similar agreements for other BNY Mellon funds that the Board oversees, during which lengthy discussions took place between the Board and representatives of the Adviser. Certain aspects of the arrangements may receive greater scrutiny in some years than in others, and the Board’s conclusions may be based, in part, on their consideration of the fund’s arrangements, or substantially similar arrangements for other BNY Mellon funds that the Board oversees, in prior years. The Board determined to renew the Agreement.
38
BOARD MEMBERS INFORMATION(Unaudited)
INDEPENDENT BOARD MEMBERS
Joseph S. DiMartino (75)
Chairman of the Board (1999)
Principal Occupation During Past 5 Years:
· Corporate Director and Trustee (1995-present)
Other Public Company Board Memberships During Past 5 Years:
· CBIZ (formerly, Century Business Services, Inc.), a provider of outsourcing functions for small and medium size companies, Director (1997-present)
No. of Portfolios for which Board Member Serves:120
———————
Francine J. Bovich (67)
Board Member (2012)
Principal Occupation During Past 5 Years:
· Trustee, The Bradley Trusts, private trust funds (2011-present)
Other Public Company Board Memberships During Past 5 Years:
· Annaly Capital Management, Inc., a real estate investment trust, Director (2014-present)
No. of Portfolios for which Board Member Serves:69
———————
Kenneth A. Himmel (72)
Board Member (1994)
Principal Occupation During Past 5 Years:
· Managing Partner, Gulf Related, an international real estate development company (2010-present)
· President and CEO, Related Urban Development, a real estate development company (1996-present)
· President and CEO, Himmel & Company, a real estate development company (1980-present)
· CEO, American Food Management, a restaurant company (1983-present)
No. of Portfolios for which Board Member Serves:22
———————
39
BOARD MEMBERS INFORMATION (Unaudited) (continued)
INDEPENDENT BOARD MEMBERS (continued)
Stephen J. Lockwood (72)
Board Member (1994)
Principal Occupation During Past 5 Years:
· Chairman of the Board, Stephen J. Lockwood and Company LLC, a real estate investment company (2000-present)
No. of Portfolios for which Board Member Serves:22
———————
Roslyn M. Watson (69)
Board Member (1994)
Principal Occupation During Past 5 Years:
· Principal, Watson Ventures, Inc., a real estate investment company (1993-present)
No. of Portfolios for which Board Member Serves:55
———————
Benaree Pratt Wiley (73)
Board Member (1994)
Principal Occupation During Past 5 Years:
· Principal, The Wiley Group, a firm specializing in strategy and business development (2005-present)
Other Public Company Board Memberships During Past 5 Years:
· CBIZ (formerly, Century Business Services, Inc.), a provider of outsourcing functions for small and medium size companies, Director (2008-present)
No. of Portfolios for which Board Member Serves:76
———————
Once elected all Board Members serve for an indefinite term, but achieve Emeritus status upon reaching age 80. The address of the Board Members and Officers is c/o BNY Mellon Investment Adviser, Inc. 240 Greenwich Street, New York, New York 10166. Additional information about the Board Members is available in the fund’s Statement of Additional Information which can be obtained from the Adviser free of charge by calling this toll free number: 1-800-373-9387.
James M. Fitzgibbons, Emeritus Board Member
40
OFFICERS OF THE FUND(Unaudited)
RENEE LAROCHE-MORRIS, President since January 2018.
President and a director of BNY Mellon Investment Adviser, Inc. since January 2018. She is an officer of 62 investment companies (comprised of 120 portfolios) managed by the Adviser. She is 47 years old and has been an employee of BNY Mellon since 2003.
JAMES WINDELS, Treasurer since November 2001.
Director- BNY Mellon Fund Administration, and an officer of 63 investment companies (comprised of 143 portfolios) managed by the Adviser. He is 60 years old and has been an employee of the Adviser since April 1985.
BENNETT A. MACDOUGALL, Chief Legal Officer since October 2015.
Chief Legal Officer of the Adviser and Associate General Counsel and Managing Director of BNY Mellon since June 2015; Director and Associate General Counsel of Deutsche Bank – Asset & Wealth Management Division from June 2005 to June 2015, and as Chief Legal Officer of Deutsche Investment Management Americas Inc. from June 2012 to May 2015. He is an officer of 63 investment companies (comprised of 143 portfolios) managed by the Adviser. He is 47 years old and has been an employee of the Adviser since June 2015.
DAVID DIPETRILLO, Vice President since January 2018.
Head of North America Product, BNY Mellon Investment Management since January 2018, Director of Product Strategy, BNY Mellon Investment Management from January 2016 to December 2017; Head of US Retail Product and Channel Marketing, BNY Mellon Investment Management from January 2014 to December 2015. He is an officer of 62 investment companies (comprised of 120 portfolios) managed by the Adviser. He is 41 years old and has been an employee of BNY Mellon since 2005.
JAMES BITETTO, Vice President since August 2005 and Secretary since February 2018.
Managing Counsel of BNY Mellon and Secretary of the Adviser, and an officer of 63 investment companies (comprised of 143 portfolios) managed by the Adviser. He is 52 years old and has been an employee of the Adviser since December 1996.
SONALEE CROSS, Vice President and Assistant Secretary since March 2018.
Counsel of BNY Mellon since October 2016; Associate at Proskauer Rose LLP from April 2016 to September 2016; Attorney at EnTrust Capital from August 2015 to February 2016; Associate at Sidley Austin LLP from September 2013 to August 2015. She is an officer of 63 investment companies (comprised of 143 portfolios) managed by the Adviser. She is 31 years old and has been an employee of the Adviser since October 2016.
DEIRDRE CUNNANE, Vice President and Assistant Secretary since March 2019.
Counsel of BNY Mellon since August 2018; Senior Regulatory Specialist at BNY Mellon Investment Management Services from February 2016 to August 2018; Trustee Associate at BNY Mellon Trust Company (Ireland) Limited from August 2013 to February 2016. She is an officer of 63 investment companies (comprised of 143 portfolios) managed by the Adviser. She is 29 years old and has been an employee of the Adviser since August 2018.
SARAH S. KELLEHER, Vice President and Assistant Secretary since April 2014.
Managing Counsel of BNY Mellon since December 2017, Senior Counsel of BNY Mellon from March 2013 to December 2017. She is an officer of 63 investment companies (comprised of 143 portfolios) managed by the Adviser. She is 43 years old and has been an employee of the Adviser since March 2013.
JEFF PRUSNOFSKY, Vice President and Assistant Secretary since August 2005.
Senior Managing Counsel of BNY Mellon, and an officer of 63 investment companies (comprised of 143 portfolios) managed by the Adviser. He is 54 years old and has been an employee of the Adviser since October 1990.
PETER M. SULLIVAN, Vice President and Assistant Secretary since March 2019.
Managing Counsel of BNY Mellon, and an officer of 63 investment companies (comprised of 143 portfolios) managed by the Adviser. He is 51 years old and has been an employee of the Adviser since April 2004.
41
OFFICERS OF THE FUND (Unaudited)(continued)
NATALYA ZELENSKY, Vice President and Assistant Secretary since March 2017.
Counsel of BNY Mellon since May 2016; Attorney at Wildermuth Endowment Strategy Fund/Wildermuth Advisory, LLC from November 2015 to May 2016 and Assistant General Counsel at RCS Advisory Services from July 2014 to November 2015. She is an officer of 63 investment companies (comprised of 143 portfolios) managed by the Adviser. She is 34 years old and has been an employee of the Adviser since May 2016.
GAVIN C. REILLY, Assistant Treasurer since December 2005.
Tax Manager - BNY Mellon Fund Administration, and an officer of 63 investment companies (comprised of 143 portfolios) managed by the Adviser. He is 50 years old and has been an employee of the Adviser since April 1991.
ROBERT S. ROBOL, Assistant Treasurer since August 2002.
Senior Accounting Manager- BNY Mellon Fund Administration, and an officer of 63 investment companies (comprised of 143 portfolios) managed by the Adviser. He is 55 years old and has been an employee of the Adviser since October 1988.
ROBERT SALVIOLO, Assistant Treasurer since July 2007.
Senior Accounting Manager – BNY Mellon Fund Administration, and an officer of 63 investment companies (comprised of 143 portfolios) managed by the Adviser. He is 52 years old and has been an employee of the Adviser since June 1989.
ROBERT SVAGNA, Assistant Treasurer since December 2002.
Senior Accounting Manager – BNY Mellon Fund Administration, and an officer of 63 investment companies (comprised of 143 portfolios) managed by the Adviser. He is 52 years old and has been an employee of the Adviser since November 1990.
JOSEPH W. CONNOLLY, Chief Compliance Officer since October 2004.
Chief Compliance Officer of the Adviser, the BNY Mellon Family of Funds and BNY Mellon Funds Trust (63 investment companies, comprised of 143 portfolios). He is 62 years old and has served in various capacities with the Adviser since 1980, including manager of the firm’s Fund Accounting Department from 1997 through October 2001.
CARIDAD M. CAROSELLA, Anti-Money Laundering Compliance Officer since January 2016.
Anti-Money Laundering Compliance Officer of the BNY Mellon Family of Funds and BNY Mellon Funds Trust since January 2016; from May 2015 to December 2015, Interim Anti-Money Laundering Compliance Officer of the BNY Mellon Family of Funds and BNY Mellon Funds Trust and the Distributor; from January 2012 to May 2015, AML Surveillance Officer of the Distributor. She is an officer of 57 investment companies (comprised of 137 portfolios) managed by the Adviser. She is 50 years old and has been an employee of the Distributor since 1997.
42
NOTES
43
NOTES
44
NOTES
45
BNY Mellon Equity Income Fund
240 Greenwich Street
New York, NY 10286
Adviser
BNY Mellon Investment Adviser, Inc.
240 Greenwich Street
New York, NY 10286
Custodian
The Bank of New York Mellon
240 Greenwich Street
New York, NY 10286
Transfer Agent &
Dividend Disbursing Agent
BNY Mellon Transfer, Inc.
240 Greenwich Street
New York, NY 10286
Distributor
BNY Mellon Securities Corporation
240 Greenwich Street
New York, NY 10286
| | |
Ticker Symbols: | Class A: DQIAX Class C: DQICX Class I: DQIRX Class Y: DQIYX |
Telephone Call your financial representative or 1-800-373-9387
Mail The BNY Mellon Family of Funds, 144 Glenn Curtiss Boulevard, Uniondale, NY 11556-0144
E-mailSend your request toinfo@bnymellon.com
InternetInformation can be viewed online or downloaded atwww.bnymellonim.com/us
The fund files its complete schedule of portfolio holdings with the Securities and Exchange Commission (“SEC”) for the first and third quarters of each fiscal year on Form N-PORT. The fund’s Forms N-PORT are available on the SEC’s website atwww.sec.gov.
A description of the policies and procedures that the fund uses to determine how to vote proxies relating to portfolio securities and information regarding how the fund voted these proxies for the most recent 12-month period ended June 30 is available atwww.bnymellonim.com/us and on the SEC’s website atwww.sec.gov and without charge, upon request, by calling 1-800-373-9387.
| | |
© 2019 BNY Mellon Securities Corporation
6144AR0519 | 
|
Item 2. Code of Ethics.
The Registrant has adopted a code of ethics that applies to the Registrant's principal executive officer, principal financial officer, principal accounting officer or controller, or persons performing similar functions. There have been no amendments to, or waivers in connection with, the Code of Ethics during the period covered by this Report.
Item 3. Audit Committee Financial Expert.
The Registrant's Board has determined that Joseph S. DiMartino, a member of the Audit Committee of the Board, is an audit committee financial expert as defined by the Securities and Exchange Commission (the "SEC"). Mr. DiMartino is "independent" as defined by the SEC for purposes of audit committee financial expert determinations.
Item 4. Principal Accountant Fees and Services.
(a) Audit Fees. The aggregate fees billed for each of the last two fiscal years (the "Reporting Periods") for professional services rendered by the Registrant's principal accountant (the "Auditor") for the audit of the Registrant's annual financial statements or services that are normally provided by the Auditor in connection with the statutory and regulatory filings or engagements for the Reporting Periods, were $33,650 in 2018 and $36,230 in 2019.
(b) Audit-Related Fees. The aggregate fees billed in the Reporting Periods for assurance and related services by the Auditor that are reasonably related to the performance of the audit of the Registrant's financial statements and are not reported under paragraph (a) of this Item 4 were $4,710 in 2018 and $4,790 in 2019. These services consisted of security counts required by Rule 17f-2 under the Investment Company Act of 1940, as amended.
The aggregate fees billed in the Reporting Periods for non-audit assurance and related services by the Auditor to the Registrant's investment adviser (not including any sub-investment adviser whose role is primarily portfolio management and is subcontracted with or overseen by another investment adviser), and any entity controlling, controlled by or under common control with the investment adviser that provides ongoing services to the Registrant ("Service Affiliates"), that were reasonably related to the performance of the annual audit of the Service Affiliate, which required pre-approval by the Audit Committee were $0 in 2018 and $0 in 2019.
(c) Tax Fees. The aggregate fees billed in the Reporting Periods for professional services rendered by the Auditor for tax compliance, tax advice, and tax planning ("Tax Services") were $2,650 in 2018 and $2,690 in 2019. These services consisted of review or preparation of U.S. federal, state, local and excise tax returns. The aggregate fees billed in the Reporting Periods for Tax Services by the Auditor to Service Affiliates, which required pre-approval by the Audit Committee were $0 in 2018 and $0 in 2019.
(d) All Other Fees. The aggregate fees billed in the Reporting Periods for products and services provided by the Auditor, other than the services reported in paragraphs (a) through (c) of this Item, were $0 in 2018 and $0 in 2019.
The aggregate fees billed in the Reporting Periods for Non-Audit Services by the Auditor to Service Affiliates, other than the services reported in paragraphs (b) through (c) of this Item, which required pre-approval by the Audit Committee, were $0 in 2018 and $0 in 2019.
(e)(1)Audit Committee Pre-Approval Policies and Procedures. The Registrant's Audit Committee has established policies and procedures (the "Policy") for pre-approval (within specified fee limits) of theAuditor's engagements for non-audit services to the Registrant and Service Affiliates without specific case-by-case consideration. The pre-approved services in the Policy can include pre-approved audit services, pre-approved audit-related services, pre-approved tax services and pre-approved all other services. Pre-approval considerations include whether the proposed services are compatible with maintaining the Auditor's independence. Pre-approvals pursuant to the Policy are considered annually.
(e)(2)Note. None of the services described in paragraphs (b) through (d) of this Item 4 were approved by the Audit Committee pursuant to paragraph (c)(7)(i)(C) of Rule 2-01 of Regulation S-X.
(f) None of the hours expended on the principal accountant's engagement to audit the registrant's financial statements for the most recent fiscal year were attributed to work performed by persons other than the principal account's full-time, permanent employees.
Non-Audit Fees. The aggregate non-audit fees billed by the Auditor for services rendered to the Registrant, and rendered to Service Affiliates, for the Reporting Periods were $20,298,000 in 2018 and $2,350,000 in 2019.
Auditor Independence. The Registrant's Audit Committee has considered whether the provision of non-audit services that were rendered to Service Affiliates, which were not pre-approved (not requiring pre-approval), is compatible with maintaining the Auditor's independence.
Item 5. Audit Committee of Listed Registrants.
Not applicable.
Item 6. Investments.
(a) Not applicable.
Item 7. Disclosure of Proxy Voting Policies and Procedures for Closed-End Management Investment Companies.
Not applicable.
Item 8. Portfolio Managers of Closed-End Management Investment Companies.
Not applicable.
Item 9. Purchases of Equity Securities by Closed-End Management Investment Companies and Affiliated Purchasers.
Not applicable.
Item 10. Submission of Matters to a Vote of Security Holders.
There have been no material changes to the procedures applicable to Item 10.
Item 11. Controls and Procedures.
(a) The Registrant's principal executive and principal financial officers have concluded, based on their evaluation of the Registrant's disclosure controls and procedures as of a date within 90 days of the filing date of this report, that the Registrant's disclosure controls and procedures are reasonably designed to ensure that information required to be disclosed by the Registrant on Form N-CSR is recorded, processed, summarizedand reported within the required time periods and that information required to be disclosed by the Registrant in the reports that it files or submits on Form N-CSR is accumulated and communicated to the Registrant's management, including its principal executive and principal financial officers, as appropriate to allow timely decisions regarding required disclosure.
(b) There were no changes to the Registrant's internal control over financial reporting that occurred during the second fiscal quarter of the period covered by this report that have materially affected, or are reasonably likely to materially affect, the Registrant's internal control over financial reporting.
Item 12. Disclosure of Securities Lending Activities for Closed-End Management Investment Companies.
Not applicable.
Item 13. Exhibits.
(a)(1) Code of ethics referred to in Item 2.
(a)(2) Certifications of principal executive and principal financial officers as required by Rule 30a-2(a) under the Investment Company Act of 1940.
(a)(3) Not applicable.
(b) Certification of principal executive and principal financial officers as required by Rule 30a-2(b) under the Investment Company Act of 1940.
SIGNATURES
Pursuant to the requirements of the Securities Exchange Act of 1934 and the Investment Company Act of 1940, the Registrant has duly caused this Report to be signed on its behalf by the undersigned, thereunto duly authorized.
BNY Mellon Investment Funds III
By: /s/ Renee LaRoche-Morris
Renee LaRoche-Morris
President (Principal Executive Officer)
Date: July 26, 2019
Pursuant to the requirements of the Securities Exchange Act of 1934 and the Investment Company Act of 1940, this Report has been signed below by the following persons on behalf of the Registrant and in the capacities and on the dates indicated.
By: /s/ Renee LaRoche-Morris
Renee LaRoche-Morris
President (Principal Executive Officer)
Date: July 26, 2019
By: /s/ James Windels
James Windels
Treasurer (Principal Financial Officer)
Date: July 26, 2019
EXHIBIT INDEX
(a)(1) Code of ethics referred to in Item 2.
(a)(2) Certifications of principal executive and principal financial officers as required by Rule 30a-2(a) under the Investment Company Act of 1940. (EX-99.CERT)
(b) Certification of principal executive and principal financial officers as required by Rule 30a-2(b) under the Investment Company Act of 1940. (EX-99.906CERT)
