UNITED STATES
SECURITIES AND EXCHANGE COMMISSION
Washington, D.C. 20549
FORM N-CSR
Certified Shareholder Report of
Registered Management Investment Companies
Investment Company Act File Number: 811-00572
American Mutual Fund
(Exact Name of Registrant as Specified in Charter)
333 South Hope Street
Los Angeles, California 90071
(Address of Principal Executive Offices)
Registrant's telephone number, including area code: (213) 486-9200
Date of fiscal year end: October 31
Date of reporting period: October 31, 2012
Vincent P. Corti
American Mutual Fund
333 South Hope Street
Los Angeles, California 90071
(Name and Address of Agent for Service)
Copies to:
Eric A. S. Richards
O’Melveny & Myers LLP
400 South Hope Street, 10th Floor
Los Angeles, California 90071
(Counsel for the Registrant)
ITEM 1 – Reports to Stockholders

The right choice for the long term®
American Mutual Fund®
Special feature
Calm amid the storm:
steady returns in a
volatile world
See page 6
Annual report for the year ended October 31, 2012
American Mutual Fund strives for the balanced accomplishment of three objectives — current income, growth of capital and conservation of principal — through investments in companies that participate in the growth of the American economy.
This fund is one of more than 40 offered by American Funds, which is one of the nation’s largest mutual fund families. For more than 80 years, Capital Research and Management Company,SM the American Funds adviser, has invested with a long-term focus based on thorough research and attention to risk.
Fund results shown in this report, unless otherwise indicated, are for Class A shares at net asset value. If a sales charge (maximum 5.75%) had been deducted, the results would have been lower. Results are for past periods and are not predictive of results for future periods. Current and future results may be lower or higher than those shown. Share prices and returns will vary, so investors may lose money. Investing for short periods makes losses more likely. Investments are not FDIC-insured, nor are they deposits of or guaranteed by a bank or any other entity, so they may lose value. For current information and month-end results, visit americanfunds.com.
Here are the average annual total returns on a $1,000 investment with all distributions reinvested for periods ended September 30, 2012 (the most recent calendar quarter-end):
| Class A shares | 1 year | 5 years | 10 years | ||
| Reflecting 5.75% maximum sales charge | 16.69% | 0.70% | 7.19% | ||
The total annual fund operating expense ratio is 0.63% for Class A shares as of the prospectus dated January 1, 2013 (unaudited).
Investment results assume all distributions are reinvested and reflect applicable fees and expenses. When applicable, investment results reflect fee waivers, without which results would have been lower. Visit americanfunds.com for more information.
The fund’s 30-day yield for Class A shares as of November 30, 2012, calculated in accordance with the U.S. Securities and Exchange Commission (SEC) formula, was 2.20%. The fund’s 12-month distribution rate for Class A shares as of that date was 2.22%. Both reflect the 5.75% maximum sales charge. The SEC yield reflects the rate at which the fund is earning income on its current portfolio of securities while the distribution rate reflects the fund’s past dividends paid to shareholders. Accordingly, the fund’s SEC yield and distribution rate may differ.
Results for other share classes can be found on page 32.
Refer to the fund prospectus and the Risk Factors section of this report for more information on risks associated with investing in the fund.
Fellow investors:
The U.S. stock market was volatile for the year ended October 31, 2012, amid concerns about the fallout from Europe’s fiscal problems, mixed signals in the domestic economy, and a slowdown in corporate profit growth. However, stocks finished the period higher, as market sentiment improved following the Federal Reserve’s announcement that it would provide additional stimulus measures.
With the market gaining over the year, American Mutual Fund posted a total return of 14.0%. This slightly trailed the 15.2% return of the unmanaged Standard & Poor’s 500 Composite Index, a broad measure of the U.S. stock market. It is not surprising for AMF to lag in a strong, rising market environment. The fund is managed conservatively and tends to do relatively better than the broader market when stocks decline because its dividend-paying holdings are typically less volatile than the overall market.
Over longer periods of time, AMF has continued to do better than the S&P 500. For the past 10 years, the fund had an average annual total return of 7.3% compared with the index’s 6.9% return. For its more than 62-year lifetime, AMF has had an average annual total return of 11.6% compared with 11.0% for the S&P 500.
AMF strives for the balanced accomplishment of three objectives: current income, growth of capital and conservation of principal. This conservative approach — which seeks to reduce risk by investing in quality, industry-leading companies that typically pay and increase dividends — has served shareholders well over the long term, protecting them on the downside and providing above-average returns with less volatility (see the related feature story starting on page 6).
Portfolio review
The consumer discretionary sector, which has increased to become the fund’s largest at 14.2% of total assets, made the strongest contribution to results, especially its holdings in the media and specialty retail industries. Cable television providers Comcast and Time Warner, which tend to have very steady revenue streams, posted solid returns as demand for their home media services remained healthy. Meanwhile, shares of Home Depot gained amid an ongoing rebound in the U.S. housing market. The home improvement retailer also continued to reap the benefits of a recent overhaul of its inventory management system, which helped to reduce labor costs and increase profit margins.
 |
| In this report |
| Special feature | |
| 6 | Calm amid the storm: |
| steady returns in a volatile world | |
| Contents | |
| 1 | Letter to investors |
| 3 | The value of a long-term perspective |
| 13 | Summary investment portfolio |
| 17 | Financial statements |
| 33 | Board of trustees and other officers |
About the cover:
Waves of the Pacific Ocean crash ashore at sunset along the rocky coast of Garrapata State Park, Big Sur, California.
| American Mutual Fund | 1 |
Dividends paid in calendar year 2012
For tax purposes, here are the income dividends Class A shareholders received in calendar year 2012.
| Income dividends per share: | $0.155 paid 3/15/12 |
| $0.155 paid 6/18/12 | |
| $0.160 paid 9/24/12 | |
| $0.160 to be paid on 12/21/12* |
The fund will also pay a special dividend from accumulated, undistributed income on 12/21/12.*
*Unaudited.
Form 1099-DIV, which provides the information you will need to prepare your federal income tax return for 2012, will be mailed to you with your American Funds Tax Guide in late January 2013.
The fund’s health care holdings also provided strong returns. Shares of biotechnology firm Amgen gained as its earnings continued to reflect solid results. Amgen has matured as a biopharmaceutical company that has stated a commitment to shareholder returns and has recently instituted and grown its dividend more rapidly than the market expected. Larger pharmaceutical firms tend to pay more robust dividends, including another one of the fund’s holdings, Abbott Laboratories, which also contributed to returns.
Investments in some sectors detracted from the fund’s returns, including railroad operator CSX in industrials and Texas Instruments in information technology. Stocks such as these tend to be more cyclical and retreated during the period due to the weak U.S. economy. However, we believe they remain attractive holdings for shareholders over the long term, as they pay and increase their dividends over time.
Overall, the fund’s significant investments in higher yielding stocks helped it hold up relatively well when the market declined in the middle of the year, but they lagged the broader market later in the year, which was a headwind for AMF. While some higher yielding sectors of the market have seen their valuations increase quite a bit, we believe there are still plenty of attractively valued stocks to be found on the individual level. While they may not be as easily identifiable, we believe our strong research operation has allowed us to pinpoint those firms most likely to be able to increase their dividends rapidly and to invest in them at attractive valuation levels.
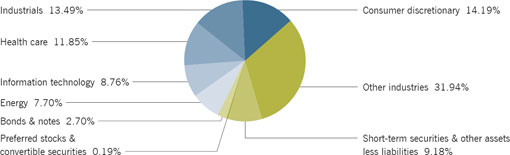
As of October 31, 88.0% of AMF’s total net assets were in common and preferred equity securities, 0.1% in convertible securities, 2.7% in bonds and notes and 9.2% in short-term securities including cash. After consumer discretionary, the fund’s largest sectors were industrials (13.5%), health care (11.9%), information technology (8.8%) and energy (7.7%).
Looking ahead
Much uncertainty remains in the market, including the outcome of the debt crisis in Europe as well as the fiscal issues here in the U.S., which could weigh on the economy. These risks are likely to result in ongoing volatility but also serve as a reminder of why we manage AMF in the manner that we do, offering protection in down markets. While the fund’s returns can lag during market surges, overall it offers investors less volatility and solid long-term returns that may match or exceed the broader market.
We would also like to take this opportunity to again thank James Dunton, who served AMF for 42 years as portfolio counselor, president and vice chairman, for his long and dedicated service. He retired from Capital Research and Management Company on June 29, 2012. Joyce Gordon replaced him as vice chairman of AMF and continues as principal investment officer. Paul Roye, senior vice president of AMF, was elected as president of the fund.
We are pleased to report that the number of shareholder accounts in AMF increased 10.3% from a year ago. We welcome our new shareholders and thank our long-term investors for their continued support of our efforts on behalf of American Mutual Fund.
| Cordially, |
 |
| Joyce E. Gordon |
| Vice Chairman |
 |
| Paul F. Roye |
| President |
| December 7, 2012 |
For current information about the fund, visit americanfunds.com.
| 2 | American Mutual Fund |
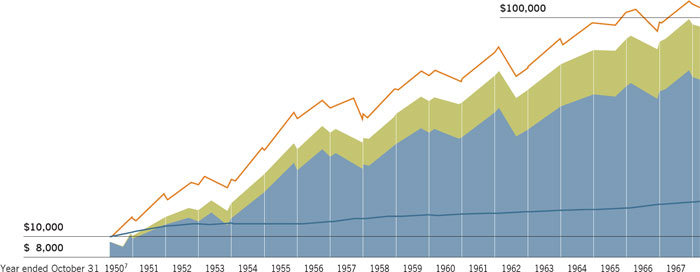
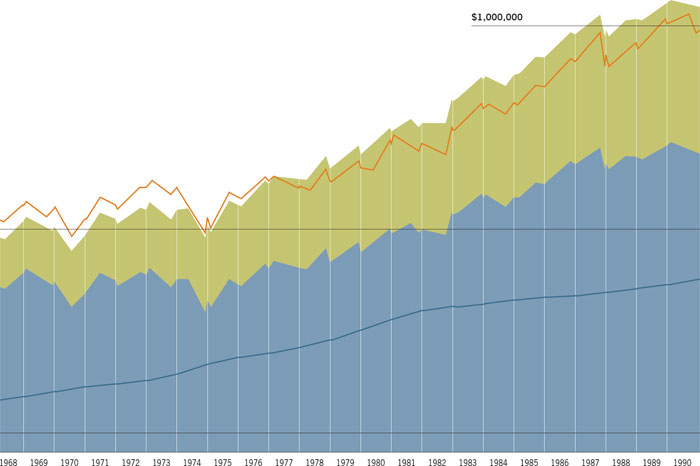
The value of a long-term perspective
Results of a $10,000 investment in American Mutual Fund
Fund results shown are for Class A shares and reflect deduction of the maximum sales charge of 5.75% on the $10,000 investment.1 Thus, the net amount invested was $9,425.2 Results are for past periods and are not predictive of results for future periods. Current and future results may be lower or higher than those shown. Share prices and returns will vary, so investors may lose money. For current information and month-end results, visit americanfunds.com.
For more than 62 years, American Mutual Fund has been providing investors with an opportunity to achieve their financial goals. A meaningful way to compare the fund’s results with the return on other investments is through its total return.
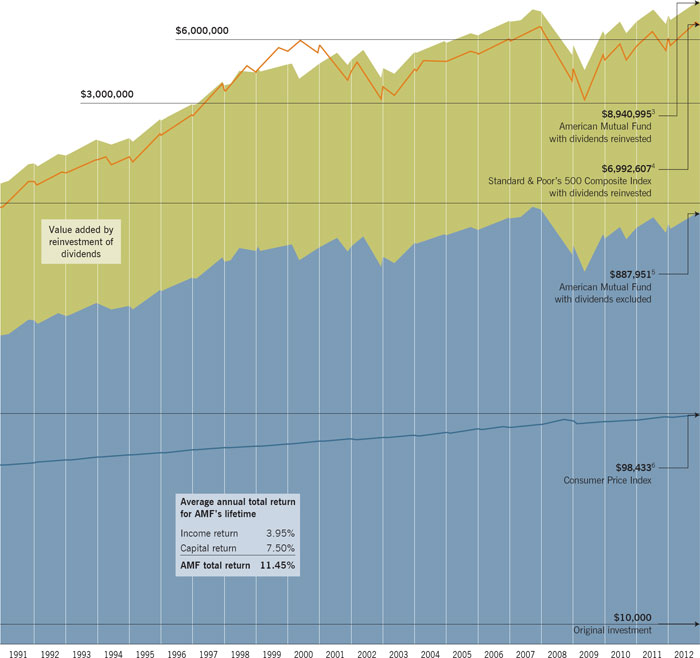
Total return is a combination of income return and capital return. This chart illustrates an assumed $10,000 investment in American Mutual Fund from February 21, 1950 — when the fund began operations — through October 31, 2012. The table beneath the chart shows the fund’s total return in each of the 62 fiscal years, broken down into its income and capital components.
As you can see, during this period a $10,000 investment in the fund, with all dividends reinvested, would have grown to $8,940,995.3
Use the table below to estimate the growth of your investment. Let’s say that you have been reinvesting all your dividends and want to know how your investment has done since the end of fiscal 2002. As the table shows, the value of the investment illustrated here was $4.4 million. Since then, it has grown to $8.9 million. Thus, in the same period, the value of your 2002 investment — regardless of its size — also has grown.
| Year-by-year summary of results (dollars in thousands) | ||||||||||||||||||||||||||||||||||||||
| Dividends reinvested8 | $ | 0.3 | 0.5 | 0.5 | 0.6 | 0.6 | 0.7 | 0.8 | 0.9 | 1.0 | 1.0 | 1.2 | 1.3 | 1.4 | 1.5 | 1.7 | 1.8 | 2.3 | 2.6 | |||||||||||||||||||
| Value at year-end | $ | 10.0 | 12.2 | 13.2 | 14.1 | 19.3 | 25.1 | 29.7 | 28.1 | 36.1 | 41.5 | 40.9 | 54.3 | 46.6 | 61.3 | 71.4 | 79.9 | 77.6 | 92.8 | |||||||||||||||||||
| Dividends excluded9 | $ | 0.3 | 0.5 | 0.5 | 0.5 | 0.5 | 0.5 | 0.6 | 0.7 | 0.8 | 0.8 | 0.9 | 0.9 | 0.9 | 1.0 | 1.1 | 1.1 | 1.4 | 1.5 | |||||||||||||||||||
| Value at year-end | $ | 9.7 | 11.3 | 11.7 | 12.0 | 15.9 | 20.1 | 23.1 | 21.2 | 26.5 | 29.7 | 28.4 | 36.8 | 30.7 | 39.3 | 44.6 | 48.8 | 46.1 | 53.6 | |||||||||||||||||||
| Annual percentage returns assuming reinvestment of dividends | ||||||||||||||||||||||||||||||||||||||
| Income return | 3.1 | % | 5.3 | 4.3 | 4.4 | 4.4 | 3.5 | 3.2 | 3.1 | 3.6 | 2.9 | 2.9 | 3.1 | 2.5 | 3.3 | 2.8 | 2.6 | 2.8 | 3.3 | |||||||||||||||||||
| Capital return | (2.9 | ) | 16.8 | 3.3 | 2.5 | 32.4 | 26.6 | 15.2 | (8.5 | ) | 25.2 | 11.9 | (4.4 | ) | 29.9 | (16.8 | ) | 28.3 | 13.6 | 9.4 | (5.6 | ) | 16.3 | |||||||||||||||
| AMF total return | 0.2 | 22.1 | 7.6 | 6.9 | 36.8 | 30.1 | 18.4 | (5.4 | ) | 28.8 | 14.8 | (1.5 | ) | 33.0 | (14.3 | ) | 31.6 | 16.4 | 12.0 | (2.8 | ) | 19.6 | ||||||||||||||||
The results shown are before taxes on fund distributions and sale of fund shares.
| 1 | As outlined in the prospectus, the sales charge is reduced for accounts (and aggregated investments) of $25,000 or more and is eliminated for purchases of $1 million or more. There is no sales charge on dividends or capital gain distributions that are reinvested in additional shares. |
| 2 | The maximum initial sales charge was 8.5% prior to July 1, 1988. |
| 3 | American Mutual Fund |
Average annual total returns
based on a $1,000 investment
| (for periods ended October 31, 2012)* | |||||||
| 1 year | 5 years | 10 years | |||||
| Class A shares | 7.47% | 0.54% | 6.70% |
*Assumes reinvestment of all distributions and payment of the maximum 5.75% sales charge.
Investment results assume all distributions are reinvested and reflect applicable fees and expenses. When applicable, investment results reflect fee waivers, without which results would have been lower. Visit americanfunds.com for more information.
| 3.2 | 3.8 | 4.2 | 4.4 | 4.7 | 5.1 | 7.3 | 7.3 | 7.9 | 8.6 | 10.0 | 11.3 | 13.9 | 16.4 | 26.8 | 26.2 | 26.6 | 30.1 | 34.1 | 39.3 | 50.0 | 59.9 | 66.1 | |||||||||||||||||||||||
| 109.6 | 103.2 | 93.4 | 112.9 | 125.2 | 124.8 | 105.1 | 132.2 | 167.4 | 176.4 | 198.9 | 232.8 | 303.6 | 334.1 | 426.4 | 544.9 | 577.2 | 701.8 | 913.1 | 960.9 | 1,081.2 | 1,299.8 | 1,239.3 | |||||||||||||||||||||||
| 1.8 | 2.1 | 2.2 | 2.2 | 2.3 | 2.4 | 3.3 | 3.1 | 3.1 | 3.2 | 3.6 | 3.9 | 4.5 | 5.0 | 7.8 | 7.1 | 6.9 | 7.4 | 8.0 | 8.9 | 10.8 | 12.3 | 13.0 | |||||||||||||||||||||||
| 61.3 | 55.7 | 48.1 | 56.0 | 59.7 | 57.1 | 45.0 | 53.3 | 64.3 | 64.6 | 69.1 | 77.0 | 95.4 | 99.9 | 118.2 | 143.3 | 144.4 | 167.6 | 209.4 | 212.1 | 227.1 | 259.4 | 235.2 | |||||||||||||||||||||||
| 3.4 | 3.4 | 4.0 | 4.7 | 4.2 | 4.0 | 5.8 | 6.9 | 6.0 | 5.1 | 5.7 | 5.7 | 6.0 | 5.4 | 8.0 | 6.2 | 4.9 | 5.2 | 4.9 | 4.3 | 5.2 | 5.5 | 5.1 | |||||||||||||||||||||||
| 14.6 | (9.2 | ) | (13.6 | ) | 16.2 | 6.7 | (4.3 | ) | (21.6 | ) | 18.9 | 20.6 | 0.3 | 7.1 | 11.3 | 24.4 | 4.7 | 19.6 | 21.6 | 1.0 | 16.4 | 25.2 | 0.9 | 7.3 | 14.7 | (9.8 | ) | ||||||||||||||||||
| 18.0 | (5.8 | ) | (9.6 | ) | 20.9 | 10.9 | (0.3 | ) | (15.8 | ) | 25.8 | 26.6 | 5.4 | 12.8 | 17.0 | 30.4 | 10.1 | 27.6 | 27.8 | 5.9 | 21.6 | 30.1 | 5.2 | 12.5 | 20.2 | (4.7 | ) |
| 3 | Includes reinvested capital gain distributions totaling $3,756,770 in the years 1950–2012 and reinvested dividends. |
| 4 | The S&P 500 is unmanaged and, therefore, has no expenses. |
| 5 | Includes reinvested capital gain distributions taken in shares totaling $589,593 but does not reflect income dividends taken in cash. |
| 6 | Computed from data supplied by the U.S. Department of Labor, Bureau of Labor Statistics. It would take $98,433 to buy today what $10,000 bought when the fund began. |
| 4 | American Mutual Fund |
| 71.8 | 67.5 | 70.9 | 76.5 | 83.2 | 90.2 | 95.0 | 104.1 | 110.5 | 132.2 | 145.4 | 121.4 | 115.8 | 105.4 | 112.3 | 135.1 | 157.0 | 175.0 | 206.6 | 198.1 | 192.0 | 207.8 | |||||||||||||||||||||
| 1,544.4 | 1,690.0 | 2,004.9 | 2,039.9 | 2,473.4 | 2,940.7 | 3,652.2 | 4,205.5 | 4,584.2 | 4,639.4 | 4,811.5 | 4,406.4 | 5,257.3 | 5,825.6 | 6,279.7 | 7,309.5 | 8,200.6 | 5,670.6 | 6,309.7 | 7,338.9 | 7,841.5 | 8,941.0 | |||||||||||||||||||||
| 13.4 | 12.0 | 12.1 | 12.5 | 13.1 | 13.7 | 14.0 | 14.9 | 15.5 | 18.0 | 19.2 | 15.6 | 14.5 | 12.9 | 13.5 | 15.9 | 18.2 | 19.8 | 22.7 | 21.0 | 19.9 | 21.0 | |||||||||||||||||||||
| 278.5 | 292.2 | 333.6 | 326.4 | 381.2 | 438.6 | 529.4 | 594.2 | 631.8 | 620.1 | 623.6 | 557.2 | 648.8 | 705.5 | 746.9 | 852.1 | 937.2 | 632.6 | 677.5 | 765.8 | 798.1 | 888.0 | |||||||||||||||||||||
| 5.8 | 4.4 | 4.2 | 3.8 | 4.1 | 3.6 | 3.2 | 2.9 | 2.6 | 2.9 | 3.1 | 2.5 | 2.6 | 2.0 | 1.9 | 2.2 | 2.1 | 2.1 | 3.6 | 3.1 | 2.6 | 2.6 | |||||||||||||||||||||
| 18.8 | 5.0 | 14.4 | (2.1 | ) | 17.2 | 15.3 | 21.0 | 12.2 | 6.4 | (1.7 | ) | 0.6 | (10.9 | ) | 16.7 | 8.8 | 5.9 | 14.2 | 10.1 | (33.0 | ) | 7.7 | 13.2 | 4.2 | 11.4 | |||||||||||||||||
| 24.6 | 9.4 | 18.6 | 1.7 | 21.3 | 18.9 | 24.2 | 15.1 | 9.0 | 1.2 | 3.7 | (8.4 | ) | 19.3 | 10.8 | 7.8 | 16.4 | 12.2 | (30.9 | ) | 11.3 | 16.3 | 6.8 | 14.0 |
| 7 | For the period February 21, 1950 (when the fund began operations), through October 31, 1950. |
| 8 | Includes special dividends of $1,691 in 1974, $989 in 1975, $7,524 in 1982, $3,967 in 1983, $6,064 in 1988, $9,850 in 1989, $9,497 in 1990, $8,996 in 1991, $32,002 in 2009, $20,477 in 2010 and $8,128 in 2011. |
| 9 | Includes special dividends of $746 in 1974, $407 in 1975, $2,251 in 1982, $1,099 in 1983, $1,339 in 1988, $2,069 in 1989, $1,895 in 1990, $1,707 in 1991, $3,570 in 2009, $2,199 in 2010 and $848 in 2011. |
| American Mutual Fund | 5 |

Calm amid
the storm:
steady returns in
a volatile world
6 American Mutual Fund
Investors were reminded of the volatile world we live in recently when Superstorm Sandy hit the Northeast U.S. killing more than 100 people, causing tens of billions of dollars in damage and shuttering domestic stock markets for two straight days. The timing of the storm also led many pundits to label Sandy as the so-called “October Surprise,” shaking up the presidential election just a week before voters went to the polls. President Obama went on to secure a second term in office, beating Mitt Romney in a tightly contested race.
Volatility is an ongoing concern not just in the U.S., where investors have been on edge about the “fiscal cliff” negotiations, but around the world, from the euro zone debt crisis and the unrest in the Middle East, to the economic slowdown and political transition in China. Investors have learned to deal with volatility in the stock market in a number of ways, including investing in funds like American Mutual Fund, which seeks to provide steady returns over the long term with less volatility. The fund achieves this by focusing on high-quality companies that are leaders in their industries, have strong balance sheets and management teams, and pay a dividend.
Beyond that, the portfolio counselors for the fund each have their own style of investing and approach to lowering volatility, with some focusing more on dividends and how companies use their cash, while others home in on turnaround stories and cyclical companies that are undervalued. In any case, strong fundamental research is key in separating the winners from the losers. Also in the back of each portfolio counselor’s mind is one of the fund’s three objectives: conservation of principal. In other words, “don’t lose money.”
“I’m very mindful of what we promise to our shareholders,” notes Joyce Gordon, a portfolio counselor and the vice chairman for American Mutual Fund, which has held up better than the broader market in every significant decline over the past half century (see chart on page 9). “I don’t like to take big risks in this fund and try to invest in companies that I think will hold up well, even in a downturn.”
Dividends deliver
One of the best ways to manage volatility is through dividends, which provide steady income and a tangible source of return regardless of a company’s stock price. AMF has a long history of investing in companies with a strong track record of paying dividends, which have made up an important component of investors’ total returns through the years. The fund strives for a higher yield than the market after expenses (its current yield is 2.4% versus 2.1% for the S&P 500) and limits non-dividend paying securities to 5% of assets.
“A strong dividend yield provides a stream of income to shareholders to help fund living expenses without dipping into principal,” explains Joyce. “For those who are making systematic withdrawals, lower volatility is very important so shares do not have to be sold too cheaply when markets are down. We seek to achieve these goals by investing in higher quality, less volatile, dividend-paying companies that also offer the opportunity for capital appreciation.”

“I’m very mindful of what we promise to our shareholders. I don’t like to take big risks in this fund and try to invest in companies that I think will hold up well, even in a downturn.”
Joyce Gordon
| American Mutual Fund | 7 |

“American Mutual Fund has shown over the years that its slow and steady return profile has worked well and with less volatility. It’s a style of investing that is very natural to me and I don’t feel like I need to bend too much. I’m a very patient investor who’s happy to take the long road to achieving strong equity returns.”
Jim Lovelace
Dividends also represent a certain type of company philosophy — it’s about more than just the yield — and help in forming the investment thesis. Paying a dividend indicates confidence by the company’s management and an effective allocation of capital as well as a strong balance sheet. Furthermore, those firms that not only pay dividends but grow them over time tend to offer more attractive returns with less volatility than those that don’t pay or grow dividends.
“The characteristics of those companies that pay a dividend are that they tend to have a more stable stock price, a stronger balance sheet and competitive positions, and a more mature business overall,” says portfolio counselor Jim Lovelace. “An important part of that is being able identify the companies that have those qualities by visiting with management and working with analysts.”
While fixed income can also help lower volatility, Jim says there are several advantages to earning income through equity. “There is a stability in the income from bonds that cannot be replicated, but you only get what you contracted for — no more, no less,” he explains, noting that bonds are providing such little income at current rates that investors are turning to stocks. “With equities, you have the ability to get more income over time and are protected from inflation.”
Finally, dividends also offer investors downside protection and help cushion volatility. As the stock’s price goes down, its dividend yield increases, which often attracts more investors in the long run. Furthermore, by reinvesting the dividends at a time when the shares are attractively valued, investors can further increase their income and avoid having to dip into principal.
“What seems to change investors’ attitudes towards dividends more than anything are bear markets,” notes Jim. “They show investors the value of dividends, which offer stable returns when times are tough. Although everything was down in the financial crisis, since then there has been more interest among investors in shifting toward dividends.”
Counting on cash
When appropriate, investment professionals encourage corporate managements to think more proactively about using cash to increase dividend payouts. Research has shown that companies that use excess cash to increase their dividend payments rather than repurchase more of their stock offer a better reward to shareholders over time. Moreover, dividends are cash in the investors’ pockets while the value of repurchases depends on the price paid, which can quickly fall if the shares are bought near their peak valuation.
“With payout ratios in the U.S. at historic lows, there is more room for managements to use their large amounts of cash to pay dividends,” explains Jim. “Dividends are typically a better allocation of capital than share buybacks, which don’t usually work unless the stock is beaten down.”
Dylan Yolles, another portfolio counselor on the fund, believes that in some cases investing in companies that sell at low multiples of free cash flow can produce superior returns with lower downside risk. “As long as the company’s cash flows are sustainable and I believe management will do sensible things with the cash,” he says, “I am willing to hold highly cash-generative companies and let their value accrue until the market recognizes it.”
One industry where Dylan noticed low multiples of free cash flow was pharmaceuticals, where investors had become
| 8 | American Mutual Fund |
How American Mutual Fund has fared during market declines*
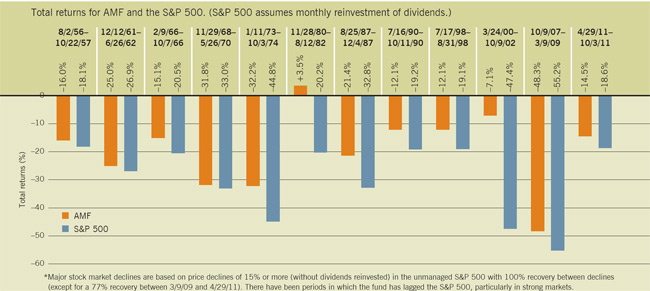
Fund results shown are for Class A shares at net asset value. If a sales charge (maximum 5.75%) had been deducted, the results would have been lower. Results are for past periods and are not predictive of results for future periods. Current and future results may be lower or higher than those shown. Share prices and returns will vary, so investors may lose money. For current information and month-end results, visit americanfunds.com.
pessimistic due to patent expirations and a poor record of bringing new blockbuster drugs to market. In some cases, these companies took steps to reveal underlying shareholder value by spinning off assets or breaking up the company. This was the case with both Pfizer, which sold its nutrition and animal health units, as well as Abbott Laboratories, which is splitting into two companies. The market reacted positively in both instances as the value of the companies’ parts were considered greater than the whole and they became more focused on their core businesses.
Similarly, biotechnology firm Amgen caught the interest of portfolio counselor James Terrile, himself a former health care analyst, who encouraged the company to rethink its use of cash. “As Amgen’s existing product portfolio matured, management eventually started paying dividends in addition to repurchasing shares,” he says. “The market has responded very favorably to the capital allocation strategy, and to Amgen’s emerging drug pipeline.”
‘Paid to wait’
Another strategy some portfolio counselors take when investing for AMF is to look for companies with depressed valuations that show signs of turning their business around. James points to Home Depot, which he says is a case in point of how the fund can be a “stairway to heaven” as investments rebound. “Home Depot was a decent company that was down and out.”

| American Mutual Fund | 9 |


“I’m not a home run investor and AMF is not a home run fund — we’re not swinging for the fences and taking too much risk. For me, success is grinding it out and accomplishing better than average results year in and year out.”
Will Robbins
The turnaround at Home Depot began with a management change as the company brought in a new CEO who centralized its inventory structure, reduced shipping and labor costs, and improved the overall customer experience. After the housing crisis, the home improvement retailer was ready for a comeback as the market rebounded. “They were doing all the right things, and the housing market eventually turned around,” says James, adding that in the meantime, Home Depot paid a 4% dividend yield. “Shareholders were getting paid to wait.” Soon enough, the company’s profit margins improved and its stock price rose from around $20 in 2009, to more than $60 in 2012.
More recently, James has invested in Garmin, whose GPS devices have faced stiff competition from smartphones. But he says concerns are overblown as the company enters the marketplace in new and different ways. For example, Garmin has several deals with auto makers to install their devices directly into car dashboards. The company also is becoming a major player in aviation, challenging heavyweights like Honeywell International as it seeks to transform navigation in the cockpit. “We have a fundamentally different view than the market about what to expect,” says James, noting that he has traveled with the analyst to meet management and learn about new products. And Garmin’s dividend yield of above 4.5% means shareholders are “getting paid to wait” for fundamentals to improve.
James says he maintains certain more-established holdings with high yields that help make up the core of the fund, but that at any given time he also will have a handful of meaningful investments in companies like Home Depot and Garmin where the thesis is still playing out.
In many cases, these companies are able to make enough progress to become core holdings themselves.
Kraft Foods is an example of one such company. Consumer staples analyst Joe Matt, head of the fund’s research portfolio, says there used to be tension between investors and management over Kraft’s cash flow. “Investors looked at the value of the cash flow and said they expected to get that, whereas the company was looking to reinvest cash in order to grow its top line,” he says. Once new management came in and Kraft split off part of its business, it was able to re-evaluate its strategy and focus on maximizing shareholder value. “Today, Kraft is looking to grow sales at a slightly slower pace, but with more rational pricing and greater attention to costs,” explains Joe. “Instead of over-spending on growth, it plans to maximize cash flow and return it to shareholders as higher dividends.” Kraft now pays a 4.5% dividend yield versus 2.9% before.
No ‘melting ice cubes’
American Mutual Fund invests in quality companies at attractive valuations so it is important to separate the winners from the losers and know when to invest in one company and not another. That task is easier said than done. It begins with the fund’s eligibility list, which includes such requirements as having an investment-grade credit rating and being a leader in its industry. Then it continues with thorough research into the company until the decision is made to invest in it or not.
“The eligibility list is a good starting point for quality control based on what we have deemed appropriate to meet the fund’s objectives,” says portfolio counselor Will Robbins. “But you have to be careful of the melting ice cubes. By that, I mean a
| 10 | American Mutual Fund |
company that is secularly challenged and not just cyclically challenged. They may make the best buggy whip in the business, but that market went away when the combustion engine was invented.”
With this mantra in mind, Will says he has avoided companies in such industries as paper and printing in favor of those that are in sectors showing signs of life. “I really love to buy companies with depressed earnings on a depressed valuation that have the potential for at least a double or a triple,” he says, using a baseball analogy. “A double is assuming the market will reward a company with better valuation. A triple means better profit margins and earnings than what I thought was possible. I’m not a home run investor and AMF is not a home run fund — we’re not swinging for the fences and taking too much risk. For me, success is grinding it out and accomplishing better than average results year in and year out.”
Housing is one area where Will believes the trend is more cyclical than secular and he is trying to take advantage of that in his portfolio. “People are still going to need houses, unless there is a new way of living that occurs for some reason that creates a secular problem, which would make my thesis wrong. So that’s a cyclical call that I’m making and there are a lot of implications for companies in that space,” he says, noting that new residential construction projects are expected to double to nearly 1.5 million by 2015 to satisfy demand.
Related industries also are benefiting from the boom in housing, leading Will to invest in such companies as Republic Services and Waste Management, both of which are attractively valued and get a large part of their business from residential construction.
Above-average returns with less volatility
American Mutual Fund strives to meet its objectives. If we look back 10 years, as shown below, the fund has provided higher returns than those of its three benchmarks. It accomplished this with lower volatility.
For the 10-year period ended October 31, 2012
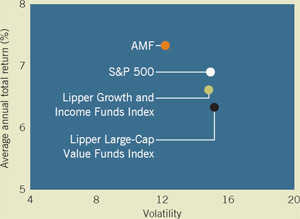
| Average annual total return | Volatility | ||||||||
| AMF | 7.33 | % | 12.20 | ||||||
| S&P 500 | 6.90 | 14.93 | |||||||
| Lipper Growth and Income Funds Index | 6.61 | 14.82 | |||||||
| Lipper Large-Cap Value Funds Index | 6.33 | 15.16 | |||||||
Volatility is calculated at net asset value by Lipper using annualized standard deviation (based on monthly returns). It is a common measure of absolute volatility that shows how returns over time have varied from the mean; a lower number signifies lower volatility. Standard & Poor’s 500 Composite Index is an unmanaged index of 500 large-company stocks selected to represent the stock market. The Lipper Large-Cap Value Funds Index is an equally weighted index of the 30 largest mutual funds that invest at least 75% of their equity assets in companies with market capitalizations (on a three-year weighted basis) above Lipper’s USDE large-cap floor. The Lipper Growth and Income Funds Index is an equally weighted index of the 30 largest mutual funds that combine a growth orientation with the pursuit of income.
| American Mutual Fund | 11 |
Another area that benefits is financial firms with a large mortgage operation, and none is bigger than Wells Fargo’s. Its share of the U.S. mortgage market has increased from around 15% to more than 30% in the last five years. “Who would’ve thought that such a rush to gain share of the mortgage market amid a crisis would turn into such an opportunity,” he asks. “They avoided trouble, bought Wachovia and established a coast-to-coast footprint. They now have the opportunity to make a lot of money.”
Beyond just housing, Will has confidence the financials sector will thrive. “Ultimately, banks are a source of credit creation, and I don’t think there is going to be a new means of that,” he says. “There will most likely be a need for equity and fixed-income intermediaries for as long as we live.” Like Wells Fargo in the mortgage market, Will points to JPMorgan Chase as a leader in investment banking, where it has a strong market share and is registering steady profit gains.
‘Don’t lose money’
In the middle of the last decade, American Mutual Fund began investing more aggressively in mid-cap stocks, which tend to pay fewer dividends and are generally more volatile than larger companies. As a result the fund’s returns were more volatile for a brief period, leading to some changes that helped re-establish its footing. In the following years, it held up better than most other mutual funds during the financial crisis.
“It was a wake-up call and once we detected the changes going against the personality traits of the fund, we went back to its core values,” recalls Jim Lovelace. “The fund started behaving differently than what it was meant to be and is now more conservative for having gone through that experience. Today it is more true than ever to its objective of conserving principal.”
One way portfolio counselors are able to achieve this objective in an actively managed fund such as AMF is by having the flexibility not to be fully invested. They are able to use their judgment to determine how much cash they hold, although each is required to meet a certain yield target. “The investment universe has never been more complex and with the market not all that attractive right now I have a decent amount of cash,” explains James Terrile. “I would like to have more, but there is not enough yield in cash. This drives me to have a greater focus on finding higher quality companies that can be successful in any environment.”
Over the long term, this approach has helped the fund produce solid results that match or exceed the broader market but with much less volatility, which is what many investors are looking for today (see chart on page 11). This objective can be achieved in a number of different ways, as demonstrated by the fund’s portfolio counselors in explaining how they seek out high-quality, dividend-paying companies at attractive valuations.
“American Mutual Fund has shown over the years that its slow and steady return profile has worked well and with less volatility,” says Jim. “It’s a style of investing that is very natural to me and I don’t feel like I need to bend too much. I’m a very patient investor who’s happy to take the long road to achieving strong equity returns.” §

American Mutual Fund’s portfolio counselors
American Mutual Fund’s five portfolio counselors have an average 22 years of investment experience.* Their knowledge and wisdom have helped them manage the fund through many stock market cycles.
| Portfolio counselor | Years of investment experience* |
| Joyce E. Gordon | 31 |
| James B. Lovelace | 30 |
| Will Robbins | 19 |
| James Terrile | 17 |
| Dylan Yolles | 14 |
* Years of experience as of October 31, 2012.
| 12 | American Mutual Fund |
Summary investment portfolio October 31, 2012
The following summary investment portfolio is designed to streamline the report and help investors better focus on the fund’s principal holdings.
See the inside back cover for details on how to obtain a complete schedule of portfolio holdings.
| Industry sector diversification | Percent of net assets |
| Common stocks — 87.93% | Shares | Value (000) | Percent of net assets | |||||||
| Energy — 7.70% | ||||||||||
| Chevron Corp. | 3,908,911 | $ | 430,801 | 1.90 | % | |||||
| Royal Dutch Shell PLC, Class A (ADR) | 3,046,700 | 208,638 | 1.28 | |||||||
| Royal Dutch Shell PLC, Class B (ADR) | 1,172,000 | 82,778 | ||||||||
| Schlumberger Ltd. | 2,545,400 | 176,982 | .78 | |||||||
| Other securities | 847,501 | 3.74 | ||||||||
| 1,746,700 | 7.70 | |||||||||
| Materials — 4.17% | ||||||||||
| Dow Chemical Co. | 13,196,400 | 386,655 | 1.70 | |||||||
| MeadWestvaco Corp. | 5,749,864 | 170,713 | .75 | |||||||
| Praxair, Inc. | 2,019,324 | 214,472 | .95 | |||||||
| Other securities | 175,084 | .77 | ||||||||
| 946,924 | 4.17 | |||||||||
| Industrials — 13.49% | ||||||||||
| 3M Co. | 1,825,000 | 159,870 | .70 | |||||||
| CSX Corp. | 11,869,000 | 242,958 | 1.07 | |||||||
| Emerson Electric Co. | 6,225,000 | 301,477 | 1.33 | |||||||
| General Electric Co. | 10,860,000 | 228,712 | 1.01 | |||||||
| Lockheed Martin Corp. | 1,845,000 | 172,821 | .76 | |||||||
| Republic Services, Inc. | 5,550,000 | 157,343 | .69 | |||||||
| Union Pacific Corp. | 1,279,300 | 157,392 | .69 | |||||||
| United Parcel Service, Inc., Class B | 5,317,300 | 389,492 | 1.72 | |||||||
| United Technologies Corp. | 4,620,100 | 361,107 | 1.59 | |||||||
| Waste Management, Inc. | 8,080,000 | 264,539 | 1.17 | |||||||
| Other securities | 625,390 | 2.76 | ||||||||
| 3,061,101 | 13.49 | |||||||||
| American Mutual Fund | 13 |
| Common stocks | Shares | Value (000) | Percent of net assets | |||||||
| Consumer discretionary — 14.19% | ||||||||||
| Comcast Corp., Class A | 8,776,400 | $ | 329,203 | 1.69 | % | |||||
| Comcast Corp., Class A, special nonvoting shares | 1,500,000 | 54,660 | ||||||||
| Darden Restaurants, Inc. | 5,657,900 | 297,719 | 1.31 | |||||||
| Garmin Ltd. | 6,088,938 | 231,319 | 1.02 | |||||||
| Home Depot, Inc. | 12,050,000 | 739,629 | 3.26 | |||||||
| Mattel, Inc. | 9,075,000 | 333,778 | 1.47 | |||||||
| Time Warner Cable Inc. | 4,163,937 | 412,688 | 1.82 | |||||||
| Time Warner Inc. | 5,234,333 | �� | 227,432 | 1.00 | ||||||
| Other securities | 592,879 | 2.62 | ||||||||
| 3,219,307 | 14.19 | |||||||||
| Consumer staples — 4.80% | ||||||||||
| Coca-Cola Co. | 1,700,000 | 63,206 | .28 | |||||||
| Kimberly-Clark Corp. | 2,140,000 | 178,583 | .79 | |||||||
| Kraft Foods Group, Inc.1 | 3,829,766 | 174,178 | .77 | |||||||
| Mondelez International, Inc. | 11,489,300 | 304,926 | 1.34 | |||||||
| PepsiCo, Inc. | 2,336,800 | 161,800 | .71 | |||||||
| Other securities | 205,408 | .91 | ||||||||
| 1,088,101 | 4.80 | |||||||||
| Health care — 11.85% | ||||||||||
| Abbott Laboratories | 13,082,000 | 857,133 | 3.78 | |||||||
| Amgen Inc. | 8,753,748 | 757,593 | 3.34 | |||||||
| Merck & Co., Inc. | 4,997,185 | 228,022 | 1.00 | |||||||
| Novartis AG (ADR) | 3,014,000 | 182,226 | .80 | |||||||
| Pfizer Inc | 6,920,000 | 172,100 | .76 | |||||||
| Other securities | 492,065 | 2.17 | ||||||||
| 2,689,139 | 11.85 | |||||||||
| Financials — 6.78% | ||||||||||
| JPMorgan Chase & Co. | 3,650,000 | 152,132 | .67 | |||||||
| NYSE Euronext | 7,691,805 | 190,449 | .84 | |||||||
| Wells Fargo & Co. | 2,385,000 | 80,351 | .35 | |||||||
| Other securities | 1,116,636 | 4.92 | ||||||||
| 1,539,568 | 6.78 | |||||||||
| Information technology — 8.76% | ||||||||||
| Maxim Integrated Products, Inc. | 9,466,400 | 260,563 | 1.15 | |||||||
| Microsoft Corp. | 17,431,598 | 497,411 | 2.19 | |||||||
| Oracle Corp. | 6,087,000 | 189,001 | .83 | |||||||
| Texas Instruments Inc. | 10,360,000 | 291,012 | 1.28 | |||||||
| Other securities | 750,479 | 3.31 | ||||||||
| 1,988,466 | 8.76 | |||||||||
| Telecommunication services — 5.09% | ||||||||||
| AT&T Inc. | 11,785,600 | 407,664 | 1.80 | |||||||
| Verizon Communications Inc. | 15,743,900 | 702,808 | 3.10 | |||||||
| Other securities | 43,660 | .19 | ||||||||
| 1,154,132 | 5.09 | |||||||||
| 14 | American Mutual Fund |
| Common stocks | Shares | Value (000) | Percent of net assets | |||||||
| Utilities — 7.65% | ||||||||||
| Dominion Resources, Inc. | 3,000,000 | $ | 158,340 | .70 | % | |||||
| Duke Energy Corp. | 5,046,180 | 331,484 | 1.46 | |||||||
| FirstEnergy Corp. | 5,782,728 | 264,386 | 1.17 | |||||||
| PG&E Corp. | 7,575,390 | 322,106 | 1.42 | |||||||
| Other securities | 660,305 | 2.90 | ||||||||
| 1,736,621 | 7.65 | |||||||||
| Miscellaneous — 3.45% | ||||||||||
| Other common stocks in initial period of acquisition | 783,446 | 3.45 | ||||||||
| Total common stocks (cost: $16,045,293,000) | 19,953,505 | 87.93 | ||||||||
| Preferred stocks — 0.05% | ||||||||||
| Miscellaneous — 0.05% | ||||||||||
| Other preferred stocks in initial period of acquisition | 11,443 | .05 | ||||||||
| Total preferred stocks (cost: $10,004,000) | 11,443 | .05 | ||||||||
| Convertible securities — 0.14% | ||||||||||
| Utilities — 0.14% | ||||||||||
| Other securities | 32,598 | .14 | ||||||||
| Total convertible securities (cost: $30,949,000) | 32,598 | .14 | ||||||||
| Bonds & notes — 2.70% | Principal amount (000) | |||||||||
| Financials — 1.76% | ||||||||||
| JPMorgan Chase & Co. 4.75%–7.90% 20132 | $ | 128,654 | 148,037 | .65 | ||||||
| Wells Fargo & Co., Series K, junior subordinated 7.98% (undated)2 | 131,826 | 156,379 | .69 | |||||||
| Other securities | 94,882 | .42 | ||||||||
| 399,298 | 1.76 | |||||||||
| Telecommunication services — 0.12% | ||||||||||
| Verizon Communications Inc. 5.55%–8.50% 2014–2018 | 20,000 | 26,227 | .12 | |||||||
| Mortgage-backed obligations3 — 0.07% | ||||||||||
| Fannie Mae 4.00%–4.50% 2024 | 15,946 | 17,088 | .07 | |||||||
| Federal agency bonds & notes — 0.12% | ||||||||||
| Fannie Mae 2.50% 2014 | 25,775 | 26,645 | .12 | |||||||
| Other — 0.63% | ||||||||||
| Other securities | 143,922 | .63 | ||||||||
| Total bonds & notes (cost: $517,141,000) | 613,180 | 2.70 | ||||||||
| American Mutual Fund | 15 |
| Short-term securities — 9.22% | Principal amount (000) | Value (000) | Percent of net assets | |||||||
| Coca-Cola Co. 0.20%–0.23% due 11/2/2012–2/6/20134 | $ | 172,500 | $ | 172,462 | .76 | % | ||||
| Fannie Mae 0.11%–0.16% due 11/1/2012–3/4/2013 | 648,300 | 648,135 | 2.86 | |||||||
| Freddie Mac 0.13%–0.18% due 11/14/2012–6/3/2013 | 303,258 | 303,084 | 1.34 | |||||||
| General Electric Co. 0.15% due 11/14/2012 | 27,900 | 27,898 | .12 | |||||||
| U.S. Treasury Bills 0.109%–0.195% due 11/15/2012–8/22/2013 | 245,600 | 245,489 | 1.08 | |||||||
| United Technologies Corp. 0.15% due 11/1–11/30/20124 | 65,700 | 65,698 | .29 | |||||||
| Variable Funding Capital Company LLC 0.16%–0.18% due 11/15/2012–1/14/20134 | 46,959 | 46,946 | .21 | |||||||
| Other securities | 582,279 | 2.56 | ||||||||
| Total short-term securities (cost: $2,091,954,000) | 2,091,991 | 9.22 | ||||||||
| Total investment securities (cost: $18,695,341,000) | 22,702,717 | 100.04 | ||||||||
| Other assets less liabilities | (8,656 | ) | (.04 | ) | ||||||
| Net assets | $ | 22,694,061 | 100.00 | % | ||||||
As permitted by U.S. Securities and Exchange Commission regulations, “Miscellaneous” securities include holdings in their first year of acquisition that have not previously been publicly disclosed.
“Other securities” includes all issues that are not disclosed separately in the summary investment portfolio.
The following footnotes apply to either the individual securities noted or one or more of the securities aggregated and listed as a single line item.
| 1 | Security did not produce income during the last 12 months. |
| 2 | Coupon rate may change periodically. |
| 3 | Principal payments may be made periodically. Therefore, the effective maturity date may be earlier than the stated maturity date. |
| 4 | Acquired in a transaction exempt from registration under Rule 144A or section 4(2) of the Securities Act of 1933. May be resold in the U.S. in transactions exempt from registration, normally to qualified institutional buyers. The total value of all such securities, including those in “Other securities,” was $602,660,000, which represented 2.66% of the net assets of the fund. |
Key to abbreviation
ADR = American Depositary Receipts
See Notes to Financial Statements
| 16 | American Mutual Fund |
Financial statements
| Statement of assets and liabilities at October 31, 2012 | (dollars in thousands) | ||||||
| Assets: | |||||||
| Investment securities, at value (cost: $18,695,341) | $ | 22,702,717 | |||||
| Cash | 542 | ||||||
| Receivables for: | |||||||
| Sales of investments | $ | 17,376 | |||||
| Sales of fund’s shares | 38,623 | ||||||
| Dividends and interest | 44,570 | 100,569 | |||||
| 22,803,828 | |||||||
| Liabilities: | |||||||
| Payables for: | |||||||
| Purchases of investments | 54,369 | ||||||
| Repurchases of fund’s shares | 38,552 | ||||||
| Investment advisory services | 4,874 | ||||||
| Services provided by related parties | 9,602 | ||||||
| Trustees’ deferred compensation | 2,222 | ||||||
| Other | 148 | 109,767 | |||||
| Net assets at October 31, 2012 | $ | 22,694,061 | |||||
| Net assets consist of: | |||||||
| Capital paid in on shares of beneficial interest | $ | 18,714,425 | |||||
| Undistributed net investment income | 60,455 | ||||||
| Accumulated net realized loss | (88,185 | ) | |||||
| Net unrealized appreciation | 4,007,366 | ||||||
| Net assets at October 31, 2012 | $ | 22,694,061 | |||||
| (dollars and shares in thousands, except per-share amounts) | |||||||||||||||||
| Shares of beneficial interest issued and outstanding (no stated par value) — unlimited shares authorized (803,524 total shares outstanding) | |||||||||||||||||
| Net assets | Shares outstanding | Net asset value per share | |||||||||||||||
| Class A | $ | 15,677,039 | 554,525 | $ | 28.27 | ||||||||||||
| Class B | 195,897 | 6,984 | 28.05 | ||||||||||||||
| Class C | 852,970 | 30,508 | 27.96 | ||||||||||||||
| Class F-1 | 999,883 | 35,485 | 28.18 | ||||||||||||||
| Class F-2 | 1,197,418 | 42,360 | 28.27 | ||||||||||||||
| Class 529-A | 472,714 | 16,750 | 28.22 | ||||||||||||||
| Class 529-B | 19,386 | 689 | 28.13 | ||||||||||||||
| Class 529-C | 126,366 | 4,498 | 28.09 | ||||||||||||||
| Class 529-E | 25,519 | 907 | 28.13 | ||||||||||||||
| Class 529-F-1 | 31,876 | 1,128 | 28.26 | ||||||||||||||
| Class R-1 | 57,689 | 2,057 | 28.04 | ||||||||||||||
| Class R-2 | 195,314 | 6,971 | 28.02 | ||||||||||||||
| Class R-3 | 518,228 | 18,442 | 28.10 | ||||||||||||||
| Class R-4 | 487,304 | 17,281 | 28.20 | ||||||||||||||
| Class R-5 | 311,005 | 11,000 | 28.27 | ||||||||||||||
| Class R-6 | 1,525,453 | 53,939 | 28.28 | ||||||||||||||
See Notes to Financial Statements
American Mutual Fund 17
| Statement of operations for the year ended October 31, 2012 | (dollars in thousands) | ||||||
| Investment income: | |||||||
| Income: | |||||||
| Dividends (net of non-U.S. taxes of $5,993) | $ | 593,325 | |||||
| Interest | 47,565 | $ | 640,890 | ||||
| Fees and expenses*: | |||||||
| Investment advisory services | 53,283 | ||||||
| Distribution services | 54,710 | ||||||
| Transfer agent services | 23,051 | ||||||
| Administrative services | 4,190 | ||||||
| Reports to shareholders | 975 | ||||||
| Registration statement and prospectus | 750 | ||||||
| Trustees’ compensation | 794 | ||||||
| Auditing and legal | 127 | ||||||
| Custodian | 76 | ||||||
| State and local taxes | 100 | ||||||
| Other | 748 | 138,804 | |||||
| Net investment income | 502,086 | ||||||
| Net realized gain and unrealized appreciation on investments and currency: | |||||||
| Net realized gain on: | |||||||
| Investments | 579,650 | ||||||
| Currency transactions | 33 | 579,683 | |||||
| Net unrealized appreciation (depreciation) on: | |||||||
| Investments | 1,613,646 | ||||||
| Currency translations | (16 | ) | 1,613,630 | ||||
| Net realized gain and unrealized appreciation on investments and currency | 2,193,313 | ||||||
| Net increase in net assets resulting from operations | $ | 2,695,399 | |||||
*Additional information related to class-specific fees and expenses is included in the Notes to Financial Statements.
| Statements of changes in net assets | (dollars in thousands) | ||||||
| Year ended October 31 | |||||||
| 2012 | 2011 | ||||||
| Operations: | |||||||
| Net investment income | $ | 502,086 | $ | 465,357 | |||
| Net realized gain on investments and currency transactions | 579,683 | 336,671 | |||||
| Net unrealized appreciation on investments and currency translations | 1,613,630 | 359,658 | |||||
| Net increase in net assets resulting from operations | 2,695,399 | 1,161,686 | |||||
| Dividends paid to shareholders from net investment income | (505,472 | ) | (446,467 | ) | |||
| Net capital share transactions | 1,938,363 | 723,263 | |||||
| Total increase in net assets | 4,128,290 | 1,438,482 | |||||
| Net assets: | |||||||
| Beginning of year | 18,565,771 | 17,127,289 | |||||
| End of year (including undistributed net investment income: $60,455 and $63,853, respectively) | $ | 22,694,061 | $ | 18,565,771 | |||
See Notes to Financial Statements
18 American Mutual Fund
Notes to financial statements
1. Organization
American Mutual Fund (the “fund”) is registered under the Investment Company Act of 1940 as an open-end, diversified management investment company. The fund strives for the balanced accomplishment of three objectives — current income, growth of capital and conservation of principal — through investments in companies that participate in the growth of the American economy.
The fund has 16 share classes consisting of five retail share classes (Classes A, B and C, as well as two F share classes, F-1 and F-2), five 529 college savings plan share classes (Classes 529-A, 529-B, 529-C, 529-E and 529-F-1) and six retirement plan share classes (Classes R-1, R-2, R-3, R-4, R-5 and R-6). The 529 college savings plan share classes can be used to save for college education. The retirement plan share classes are generally offered only through eligible employer-sponsored retirement plans. The fund’s share classes are further described below:
| Share class | Initial sales charge | Contingent deferred sales charge upon redemption | Conversion feature | |||
| Classes A and 529-A | Up to 5.75% | None (except 1% for certain redemptions within one year of purchase without an initial sales charge) | None | |||
| Classes B and 529-B* | None | Declines from 5% to 0% for redemptions within six years of purchase | Classes B and 529-B convert to Classes A and 529-A, respectively, after eight years | |||
| Class C | None | 1% for redemptions within one year of purchase | Class C converts to Class F-1 after 10 years | |||
| Class 529-C | None | 1% for redemptions within one year of purchase | None | |||
| Class 529-E | None | None | None | |||
| Classes F-1, F-2 and 529-F-1 | None | None | None | |||
| Classes R-1, R-2, R-3, R-4, R-5 and R-6 | None | None | None | |||
*Class B and 529-B shares of the fund are not available for purchase.
Holders of all share classes have equal pro rata rights to assets, dividends and liquidation proceeds. Each share class has identical voting rights, except for the exclusive right to vote on matters affecting only its class. Share classes have different fees and expenses (“class-specific fees and expenses”), primarily due to different arrangements for distribution, administrative and shareholder services. Differences in class-specific fees and expenses will result in differences in net investment income and, therefore, the payment of different per-share dividends by each class.
2 Significant accounting policies
The financial statements have been prepared to comply with accounting principles generally accepted in the United States of America. These principles require management to make estimates and assumptions that affect reported amounts and disclosures. Actual results could differ from those estimates. The fund follows the significant accounting policies described below, as well as the valuation policies described in the next section on valuation.
Security transactions and related investment income — Security transactions are recorded by the fund as of the date the trades are executed with brokers. Realized gains and losses from security transactions are determined based on the specific identified cost of the securities. Dividend income is recognized on the ex-dividend date and interest income is recognized on an accrual basis. Market discounts, premiums and original issue discounts on fixed-income securities are amortized daily over the expected life of the security.
Class allocations — Income, fees and expenses (other than class-specific fees and expenses) and realized and unrealized gains and losses are allocated daily among the various share classes based on their relative net assets. Class-specific fees and expenses, such as distribution, administrative and shareholder services, are charged directly to the respective share class.
Dividends and distributions to shareholders — Dividends and distributions paid to shareholders are recorded on the ex-dividend date.
Currency translation — Assets and liabilities, including investment securities, denominated in currencies other than U.S. dollars are translated into U.S. dollars at the exchange rates supplied by one or more pricing vendors on the valuation date. Purchases and sales of investment securities and income and expenses are translated into U.S. dollars at the exchange rates on the dates of such transactions.
American Mutual Fund 19
On the accompanying financial statements, the effects of changes in exchange rates on investment securities are included with the net realized gain or loss and net unrealized appreciation or depreciation on investments. The realized gain or loss and unrealized appreciation or depreciation resulting from all other transactions denominated in currencies other than U.S. dollars are disclosed separately.
3. Valuation
Capital Research and Management Company (“CRMC”), the fund’s investment adviser, values the fund’s investments at fair value as defined by accounting principles generally accepted in the United States of America. The net asset value of each share class of the fund is generally determined as of approximately 4:00 p.m. New York time each day the New York Stock Exchange is open.
Methods and inputs — The fund’s investment adviser uses the following methods and inputs to establish the fair value of the fund’s assets and liabilities. Use of particular methods and inputs may vary over time based on availability and relevance as market and economic conditions evolve.
Equity securities are generally valued at the official closing price of, or the last reported sale price on, the exchange or market on which such securities are traded, as of the close of business on the day the securities are being valued or, lacking any sales, at the last available bid price. Prices for each security are taken from the principal exchange or market on which the security trades.
Fixed-income securities, including short-term securities purchased with more than 60 days left to maturity, are generally valued at prices obtained from one or more pricing vendors. Vendors value such securities based on one or more of the inputs described in the following table. The table provides examples of inputs that are commonly relevant for valuing particular classes of fixed-income securities in which the fund is authorized to invest. However, these classifications are not exclusive, and any of the inputs may be used to value any other class of fixed-income security.
| Fixed-income class | Examples of standard inputs | |
| All | Benchmark yields, transactions, bids, offers, quotations from dealers and trading systems, new issues, spreads and other relationships observed in the markets among comparable securities; and proprietary pricing models such as yield measures calculated using factors such as cash flows, financial or collateral performance and other reference data (collectively referred to as “standard inputs”) | |
| Corporate bonds & notes; convertible securities | Standard inputs and underlying equity of the issuer | |
| Bonds & notes of governments & government agencies | Standard inputs and interest rate volatilities | |
| Mortgage-backed; asset-backed obligations | Standard inputs and cash flows, prepayment information, default rates, delinquency and loss assumptions, collateral characteristics, credit enhancements and specific deal information | |
When the fund’s investment adviser deems it appropriate to do so (such as when vendor prices are unavailable or not deemed to be representative), fixed-income securities will be valued in good faith at the mean quoted bid and ask prices that are reasonably and timely available (or bid prices, if ask prices are not available) or at prices for securities of comparable maturity, quality and type.
Securities with both fixed-income and equity characteristics, or equity securities traded principally among fixed-income dealers, are generally valued in the manner described above for either equity or fixed-income securities, depending on which method is deemed most appropriate by the fund’s investment adviser. Short-term securities purchased within 60 days to maturity are valued at amortized cost, which approximates fair value. The value of short-term securities originally purchased with maturities greater than 60 days is determined based on an amortized value to par when they reach 60 days.
Securities and other assets for which representative market quotations are not readily available or are considered unreliable by the fund’s investment adviser are fair valued as determined in good faith under fair value guidelines adopted by authority of the fund’s board of trustees as further described below. The investment adviser follows fair valuation guidelines, consistent with U.S. Securities and Exchange Commission rules and guidance, to consider relevant principles and factors when making fair value determinations. The investment adviser considers relevant indications of value that are reasonably and timely available to it in determining the fair value to be assigned to a particular security, such as the type and cost of the security; contractual or legal restrictions on resale of the security; relevant financial or business developments of the issuer; actively traded similar or related securities; conversion or exchange rights on the security; related corporate actions; significant events occurring after the close of trading in the security; and changes in overall market conditions. Fair valuations and valuations of investments that are not actively trading involve judgment and may differ materially from valuations that would have been used had greater market activity occurred.
20 American Mutual Fund
Processes and structure — The fund’s board of trustees has delegated authority to the fund’s investment adviser to make fair value determinations, subject to board oversight. The investment adviser has established a Joint Fair Valuation Committee (the “Fair Valuation Committee”) to administer, implement and oversee the fair valuation process, and to make fair value decisions. The Fair Valuation Committee regularly reviews its own fair value decisions, as well as decisions made under its standing instructions to the investment adviser’s valuation teams. The Fair Valuation Committee reviews changes in fair value measurements from period to period and may, as deemed appropriate, update the fair valuation guidelines to better reflect the results of back testing and address new or evolving issues. The Fair Valuation Committee reports any changes to the fair valuation guidelines to the board of trustees with supplemental information to support the changes. The fund’s board and audit committee also regularly review reports that describe fair value determinations and methods.
The fund’s investment adviser has also established a Fixed-Income Pricing Review Group to administer and oversee the fixed-income valuation process, including the use of fixed-income pricing vendors. This group regularly reviews pricing vendor information and market data. Pricing decisions, processes and controls over security valuation are also subject to additional internal reviews, including an annual control self-evaluation program facilitated by the investment adviser’s compliance group.
Classifications — The fund’s investment adviser classifies the fund’s assets and liabilities into three levels based on the inputs used to value the assets or liabilities. Level 1 values are based on quoted prices in active markets for identical securities. Level 2 values are based on significant observable market inputs, such as quoted prices for similar securities and quoted prices in inactive markets. Level 3 values are based on significant unobservable inputs that reflect the investment adviser’s determination of assumptions that market participants might reasonably use in valuing the securities. The valuation levels are not necessarily an indication of the risk or liquidity associated with the underlying investment. For example, U.S. government securities are reflected as Level 2 because the inputs used to determine fair value may not always be quoted prices in an active market. The following table presents the fund’s valuation levels as of October 31, 2012 (dollars in thousands):
| Investment securities | ||||||||||||||
| Level 1 | Level 2 | Level 3 | Total | |||||||||||
| Assets: | ||||||||||||||
| Common stocks: | ||||||||||||||
| Energy | $ | 1,746,700 | $ | — | $ | — | $ | 1,746,700 | ||||||
| Materials | 946,924 | — | — | 946,924 | ||||||||||
| Industrials | 3,061,101 | — | — | 3,061,101 | ||||||||||
| Consumer discretionary | 3,219,307 | — | — | 3,219,307 | ||||||||||
| Consumer staples | 1,088,101 | — | — | 1,088,101 | ||||||||||
| Health care | 2,689,139 | — | — | 2,689,139 | ||||||||||
| Financials | 1,539,568 | — | — | 1,539,568 | ||||||||||
| Information technology | 1,988,466 | — | — | 1,988,466 | ||||||||||
| Telecommunication services | 1,154,132 | — | — | 1,154,132 | ||||||||||
| Utilities | 1,736,621 | — | — | 1,736,621 | ||||||||||
| Miscellaneous | 783,446 | — | — | 783,446 | ||||||||||
| Preferred stocks | 11,443 | — | — | 11,443 | ||||||||||
| Convertible securities | 32,598 | — | — | 32,598 | ||||||||||
| Bonds & notes | — | 613,180 | — | 613,180 | ||||||||||
| Short-term securities | — | 2,091,991 | — | 2,091,991 | ||||||||||
| Total | $ | 19,997,546 | $ | 2,705,171 | $ | — | $ | 22,702,717 | ||||||
4. Risk factors
Investing in the fund may involve certain risks including, but not limited to, those described below.
Market conditions — The prices of, and the income generated by, the common stocks and other securities held by the fund may decline due to market conditions and other factors, including those directly involving the issuers of securities held by the fund.
Investing in growth-oriented stocks — Growth-oriented stocks may involve larger price swings and greater potential for loss than other types of investments.
Investing in income-oriented stocks — Income provided by the fund may be reduced by changes in the dividend policies of, and the capital resources available at, the companies in which the fund invests.
American Mutual Fund 21
Investing in bonds — Rising interest rates will generally cause the prices of bonds and other debt securities to fall. Longer maturity debt securities may be subject to greater price fluctuations than shorter maturity debt securities. In addition, falling interest rates may cause an issuer to redeem, call or refinance a security before its stated maturity, which may result in the fund having to reinvest the proceeds in lower yielding securities.
Bonds and other debt securities are subject to credit risk, which is the possibility that the credit strength of an issuer will weaken and/or an issuer of a debt security will fail to make timely payments of principal or interest and the security will go into default. Lower quality debt securities generally have higher rates of interest and may be subject to greater price fluctuations than higher quality debt securities. Credit risk is gauged, in part, by the credit ratings of the securities in which the fund invests. However, ratings are only the opinions of the rating agencies issuing them and are not guarantees as to credit quality or an evaluation of market risk.
Management — The investment adviser to the fund actively manages the fund’s investments. Consequently, the fund is subject to the risk that the methods and analyses employed by the investment adviser in this process may not produce the desired results. This could cause the fund to lose value or its investment results to lag relevant benchmarks or other funds with similar objectives.
5. Taxation and distributions
Federal income taxation — The fund complies with the requirements under Subchapter M of the Internal Revenue Code applicable to mutual funds and intends to distribute substantially all of its net taxable income and net capital gains each year. The fund is not subject to income taxes to the extent such distributions are made. Therefore, no federal income tax provision is required.
As of and during the period ended October 31, 2012, the fund did not have a liability for any unrecognized tax benefits. The fund recognizes interest and penalties, if any, related to unrecognized tax benefits as income tax expense in the statement of operations. During the period, the fund did not incur any interest or penalties.
The fund is not subject to examination by U.S. federal tax authorities for tax years before 2008 and by state tax authorities for tax years before 2007.
Non-U.S. taxation — Dividend income is recorded net of non-U.S. taxes paid.
Distributions — Distributions paid to shareholders are based on net investment income and net realized gains determined on a tax basis, which may differ from net investment income and net realized gains for financial reporting purposes. These differences are due primarily to different treatment for items such as currency gains and losses; short-term capital gains and losses; capital losses related to sales of certain securities within 30 days of purchase; deferred expenses; net capital losses; and income on certain investments. The fiscal year in which amounts are distributed may differ from the year in which the net investment income and net realized gains are recorded by the fund for financial reporting purposes.
During the year ended October 31, 2012, the fund reclassified $63,000 from accumulated net realized loss to undistributed net investment income; $75,000 from undistributed net investment income to capital paid in on shares of beneficial interest; and $743,000 from capital paid in on shares of beneficial interest to accumulated net realized loss to align financial reporting with tax reporting.
Under the Regulated Investment Company Modernization Act of 2010 (the “Act”), net capital losses recognized after October 31, 2011, may be carried forward indefinitely, and their character is retained as short-term and/or long-term losses. Previously, net capital losses were carried forward for eight years and treated as short-term losses. As a transition rule, the Act requires that post-enactment net capital losses be used before pre-enactment net capital losses.
As of October 31, 2012, the tax basis components of distributable earnings, unrealized appreciation (depreciation) and cost of investment securities were as follows:
22 American Mutual Fund
| (dollars in thousands) | ||||
| Undistributed ordinary income | $ | 63,951 | ||
| Capital loss carryforward expiring 2017* | (148,433 | ) | ||
| Gross unrealized appreciation on investment securities | 4,355,944 | |||
| Gross unrealized depreciation on investment securities | (291,004 | ) | ||
| Net unrealized appreciation on investment securities | 4,064,940 | |||
| Cost of investment securities | 18,637,777 | |||
| * | Reflects the utilization of capital loss carryforward of $515,531,000. The capital loss carryforward will be used to offset any capital gains realized by the fund in future years through the expiration date. The fund will not make distributions from capital gains while a capital loss carryforward remains. |
Tax-basis distributions paid to shareholders from ordinary income were as follows (dollars in thousands):
| Year ended October 31 | |||||||
| Share class | 2012 | 2011 | |||||
| Class A | $ | 363,482 | $ | 338,966 | |||
| Class B | 4,032 | 5,644 | |||||
| Class C | 13,641 | 12,517 | |||||
| Class F-1 | 21,418 | 16,955 | |||||
| Class F-2 | 23,826 | 11,932 | |||||
| Class 529-A | 10,187 | 8,386 | |||||
| Class 529-B | 350 | 471 | |||||
| Class 529-C | 1,861 | 1,578 | |||||
| Class 529-E | 492 | 395 | |||||
| Class 529-F-1 | 703 | 486 | |||||
| Class R-1 | 809 | 568 | |||||
| Class R-2 | 3,091 | 2,748 | |||||
| Class R-3 | 10,148 | 7,889 | |||||
| Class R-4 | 8,936 | 5,939 | |||||
| Class R-5 | 8,402 | 6,037 | |||||
| Class R-6 | 34,094 | 25,956 | |||||
| Total | $ | 505,472 | $ | 446,467 | |||
6. Fees and transactions with related parties
CRMC, the fund’s investment adviser, is the parent company of American Funds Distributors,® Inc. (“AFD”), the principal underwriter of the fund’s shares, and American Funds Service Company® (“AFS”), the fund’s transfer agent.
Investment advisory services — The fund has an investment advisory and service agreement with CRMC that provides for monthly fees accrued daily. These fees are based on a series of decreasing annual rates beginning with 0.384% on the first $1 billion of daily net assets and decreasing to 0.225% on such assets in excess of $21 billion. For the year ended October 31, 2012, the investment advisory services fee was $53,283,000, which was equivalent to an annualized rate of 0.254% of average daily net assets.
Class-specific fees and expenses — Expenses that are specific to individual share classes are accrued directly to the respective share class. The principal class-specific fees and expenses are described below:
| Distribution services — The fund has plans of distribution for all share classes, except Class F-2, R-5 and R-6 shares. Under the plans, the board of trustees approves certain categories of expenses that are used to finance activities primarily intended to sell fund shares and service existing accounts. The plans provide for payments, based on an annualized percentage of average daily net assets, ranging from 0.25% to 1.00% as noted below. In some cases, the board of trustees has limited the amounts that may be paid to less than the maximum allowed by the plans. All share classes with a plan may use up to 0.25% of average daily net assets to pay service fees, or to compensate AFD for paying service fees, to firms that have entered into agreements with AFD to provide certain shareholder services. The remaining amounts available to be paid under each plan are paid to dealers to compensate them for their sales activities. | |
| For Class A and 529-A shares, distribution-related expenses include the reimbursement of dealer and wholesaler commissions paid by AFD for certain shares sold without a sales charge. These share classes reimburse AFD for amounts billed within the prior |
American Mutual Fund 23
| 15 months but only to the extent that the overall annual expense limit of 0.25% is not exceeded. As of October 31, 2012, there were no unreimbursed expenses subject to reimbursement for Class A or 529-A shares. |
| Share class | Currently approved limits | Plan limits | |||||||||
| Class A | 0.25 | % | 0.25 | % | |||||||
| Class 529-A | 0.25 | 0.50 | |||||||||
| Classes B and 529-B | 1.00 | 1.00 | |||||||||
| Classes C, 529-C and R-1 | 1.00 | 1.00 | |||||||||
| Class R-2 | 0.75 | 1.00 | |||||||||
| Classes 529-E and R-3 | 0.50 | 0.75 | |||||||||
| Classes F-1, 529-F-1 and R-4 | 0.25 | 0.50 | |||||||||
| Transfer agent services — The fund has a shareholder services agreement with AFS under which the fund compensates AFS for providing transfer agent services to each of the fund’s share classes. These services include recordkeeping, shareholder communications and transaction processing. In addition, the fund reimburses AFS for amounts paid to third parties for performing transfer agent services on behalf of fund shareholders. | |
| During the period November 1, 2011, through December 31, 2011, only Class A and B shares were subject to the shareholder services agreement with AFS. During this period, AFS and other third parties were compensated for providing transfer agent services to Class C, F, 529 and R shares through the fees paid by the fund to CRMC under the fund’s administrative services agreement with CRMC as described in the administrative services section below; CRMC paid for any transfer agent services expenses in excess of 0.10% of the respective average daily net assets of each of such share classes. | |
| Effective January 1, 2012, the shareholder services agreement with AFS was modified to include Class C, F, 529 and R shares and payment for transfer agent services for such classes under the administrative services agreement terminated. Under this structure, transfer agent services expenses for some classes may exceed 0.10% of average daily net assets, resulting in an increase in expenses paid by some share classes. | |
| For the year ended October 31, 2012, the total transfer agent services fee paid under these agreements was $23,051,000, of which $22,535,000 was paid by the fund to AFS and $516,000 was paid by the fund to CRMC through its administrative services agreement with the fund. Amounts paid to CRMC by the fund were then paid by CRMC to AFS and other third parties. | |
| Administrative services — The fund has an administrative services agreement with CRMC under which the fund compensates CRMC for providing administrative services to Class A, C, F, 529 and R shares. These services include, but are not limited to, coordinating, monitoring, assisting and overseeing third parties that provide services to fund shareholders. | |
| During the period November 1, 2011, through December 31, 2011, the agreement applied only to Class C, F, 529 and R shares. The agreement also required CRMC to arrange for the provision of transfer agent services for such share classes, which paid CRMC annual fees up to 0.15% (0.10% for Class R-5 and 0.05% for Class R-6) of their respective average daily net assets. During this period, up to 0.05% of these fees were used to compensate CRMC for performing administrative services; all other amounts paid under this agreement were used to compensate AFS and other third parties for transfer agent services. | |
| Effective January 1, 2012, the administrative services agreement with CRMC was modified to include Class A shares. Under the revised agreement, Class A shares pay an annual fee of 0.01% and Class C, F, 529 and R shares pay an annual fee of 0.05% of their respective average daily net assets to CRMC for administrative services. Fees for transfer agent services are no longer included as part of the administrative services fee paid by the fund to CRMC. | |
| For the year ended October 31, 2012, total fees paid to CRMC for performing administrative services were $4,190,000. | |
| 529 plan services — Each 529 share class is subject to service fees to compensate the Commonwealth of Virginia for the maintenance of the 529 college savings plan. The quarterly fee is based on a series of decreasing annual rates beginning with 0.10% on the first $30 billion of the net assets invested in Class 529 shares of the American Funds and decreasing to 0.06% on such assets between $120 billion and $150 billion. The fee for any given calendar quarter is accrued and calculated on the basis of the average net assets of Class 529 shares of the American Funds for the last month of the prior calendar quarter. The fee is included in other expenses on the accompanying financial statements. The Commonwealth of Virginia is not considered a related party. |
24 American Mutual Fund
| Class-specific expenses under the agreements described on the previous page for the year ended October 31, 2012, were as follows (dollars in thousands): |
| Share class | Distribution services | Transfer agent services | Administrative services | 529 plan services | |||||||||
| Class A | $ 34,500 | $ 17,372 | $ 1,257 | Not applicable | |||||||||
| Class B | 2,367 | 289 | Not applicable | Not applicable | |||||||||
| Class C | 8,048 | 944 | 391 | Not applicable | |||||||||
| Class F-1 | 2,209 | 881 | 439 | Not applicable | |||||||||
| Class F-2 | Not applicable | 1,009 | 457 | Not applicable | |||||||||
| Class 529-A | 914 | 392 | 211 | $ 429 | |||||||||
| Class 529-B | 223 | 24 | 11 | 23 | |||||||||
| Class 529-C | 1,158 | 116 | 57 | 116 | |||||||||
| Class 529-E | 117 | 15 | 12 | 23 | |||||||||
| Class 529-F-1 | — | 25 | 13 | 27 | |||||||||
| Class R-1 | 470 | 52 | 24 | Not applicable | |||||||||
| Class R-2 | 1,366 | 684 | 94 | Not applicable | |||||||||
| Class R-3 | 2,387 | 732 | 247 | Not applicable | |||||||||
| Class R-4 | 951 | 355 | 196 | Not applicable | |||||||||
| Class R-5 | Not applicable | 154 | 157 | Not applicable | |||||||||
| Class R-6 | Not applicable | 7 | 624 | Not applicable | |||||||||
| Total class-specific expenses | $ 54,710 | $ 23,051 | $ 4,190 | $ 618 | |||||||||
Trustees’ deferred compensation — Trustees who are unaffiliated with CRMC may elect to defer the cash payment of part or all of their compensation. These deferred amounts, which remain as liabilities of the fund, are treated as if invested in shares of the fund or other American Funds. These amounts represent general, unsecured liabilities of the fund and vary according to the total returns of the selected funds. Trustees’ compensation of $794,000, shown on the accompanying financial statements, includes $401,000 in current fees (either paid in cash or deferred) and a net increase of $393,000 in the value of the deferred amounts.
Affiliated officers and trustees — Officers and certain trustees of the fund are or may be considered to be affiliated with CRMC, AFS and AFD. No affiliated officers or trustees received any compensation directly from the fund.
7. Capital share transactions
Capital share transactions in the fund were as follows (dollars and shares in thousands):
| Sales* | Reinvestments of dividends | Repurchases* | Net increase (decrease) | ||||||||||||||||||
| Share class | Amount | Shares | Amount | Shares | Amount | Shares | Amount | Shares | |||||||||||||
| Year ended October 31, 2012 | |||||||||||||||||||||
| Class A | $ | 2,098,624 | 77,767 | $ | 347,797 | 12,836 | $ | (1,878,216 | ) | (69,353 | ) | $ | 568,205 | 21,250 | |||||||
| Class B | 15,367 | 579 | 3,985 | 149 | (124,421 | ) | (4,651 | ) | (105,069 | ) | (3,923 | ) | |||||||||
| Class C | 190,408 | 7,119 | 13,252 | 495 | (171,965 | ) | (6,424 | ) | 31,695 | 1,190 | |||||||||||
| Class F-1 | 353,285 | 13,082 | 20,950 | 775 | (209,028 | ) | (7,744 | ) | 165,207 | 6,113 | |||||||||||
| Class F-2 | 713,401 | 26,609 | 22,183 | 813 | (173,535 | ) | (6,388 | ) | 562,049 | 21,034 | |||||||||||
| Class 529-A | 95,642 | 3,556 | 10,184 | 376 | (51,137 | ) | (1,893 | ) | 54,689 | 2,039 | |||||||||||
| Class 529-B | 1,588 | 60 | 350 | 13 | (10,381 | ) | (388 | ) | (8,443 | ) | (315 | ) | |||||||||
| Class 529-C | 28,486 | 1,065 | 1,861 | 69 | (17,855 | ) | (665 | ) | 12,492 | 469 | |||||||||||
| Class 529-E | 6,216 | 233 | 492 | 18 | (3,218 | ) | (119 | ) | 3,490 | 132 | |||||||||||
| Class 529-F-1 | 9,428 | 349 | 703 | 26 | (3,219 | ) | (119 | ) | 6,912 | 256 | |||||||||||
| Class R-1 | 30,015 | 1,124 | 806 | 30 | (12,750 | ) | (469 | ) | 18,071 | 685 | |||||||||||
| Class R-2 | 63,219 | 2,359 | 3,082 | 115 | (57,274 | ) | (2,134 | ) | 9,027 | 340 | |||||||||||
| Class R-3 | 194,885 | 7,250 | 10,143 | 376 | (146,339 | ) | (5,412 | ) | 58,689 | 2,214 | |||||||||||
| Class R-4 | 277,844 | 10,254 | 8,931 | 329 | (109,166 | ) | (4,036 | ) | 177,609 | 6,547 | |||||||||||
| Class R-5 | 119,495 | 4,430 | 8,395 | 309 | (104,604 | ) | (3,785 | ) | 23,286 | 954 | |||||||||||
| Class R-6 | 436,598 | 15,896 | 33,923 | 1,249 | (110,067 | ) | (4,038 | ) | 360,454 | 13,107 | |||||||||||
| Total net increase (decrease) | $ | 4,634,501 | 171,732 | $ | 487,037 | 17,978 | $ | (3,183,175 | ) | (117,618 | ) | $ | 1,938,363 | 72,092 | |||||||
See page 26 for footnote.
American Mutual Fund 25
| Sales* | Reinvestments of dividends | Repurchases* | Net (decrease) increase | ||||||||||||||||||
| Share class | Amount | Shares | Amount | Shares | Amount | Shares | Amount | Shares | |||||||||||||
| Year ended October 31, 2011 | |||||||||||||||||||||
| Class A | $ | 1,785,225 | 69,986 | $ | 321,641 | 12,693 | $ | (2,159,138 | ) | (84,676 | ) | $ | (52,272 | ) | (1,997 | ) | |||||
| Class B | 18,231 | 721 | 5,535 | 220 | (134,441 | ) | (5,305 | ) | (110,675 | ) | (4,364 | ) | |||||||||
| Class C | 157,546 | 6,218 | 12,075 | 481 | (151,561 | ) | (6,016 | ) | 18,060 | 683 | |||||||||||
| Class F-1 | 357,157 | 14,048 | 15,683 | 621 | (221,001 | ) | (8,726 | ) | 151,839 | 5,943 | |||||||||||
| Class F-2 | 263,318 | 10,412 | 9,991 | 395 | (87,271 | ) | (3,431 | ) | 186,038 | 7,376 | |||||||||||
| Class 529-A | 89,650 | 3,508 | 8,384 | 331 | (40,191 | ) | (1,574 | ) | 57,843 | 2,265 | |||||||||||
| Class 529-B | 1,845 | 71 | 471 | 19 | (10,981 | ) | (432 | ) | (8,665 | ) | (342 | ) | |||||||||
| Class 529-C | 26,821 | 1,054 | 1,578 | 63 | (14,628 | ) | (577 | ) | 13,771 | 540 | |||||||||||
| Class 529-E | 4,634 | 182 | 395 | 16 | (2,224 | ) | (87 | ) | 2,805 | 111 | |||||||||||
| Class 529-F-1 | 10,724 | 418 | 486 | 19 | (2,490 | ) | (98 | ) | 8,720 | 339 | |||||||||||
| Class R-1 | 15,098 | 593 | 563 | 22 | (10,939 | ) | (435 | ) | 4,722 | 180 | |||||||||||
| Class R-2 | 57,450 | 2,261 | 2,740 | 109 | (53,062 | ) | (2,087 | ) | 7,128 | 283 | |||||||||||
| Class R-3 | 186,933 | 7,328 | 7,886 | 313 | (103,188 | ) | (4,058 | ) | 91,631 | 3,583 | |||||||||||
| Class R-4 | 138,978 | 5,445 | 5,935 | 235 | (68,879 | ) | (2,707 | ) | 76,034 | 2,973 | |||||||||||
| Class R-5 | 129,921 | 5,013 | 6,031 | 238 | (80,850 | ) | (3,215 | ) | 55,102 | 2,036 | |||||||||||
| Class R-6 | 238,652 | 9,355 | 25,956 | 1,025 | (43,426 | ) | (1,696 | ) | 221,182 | 8,684 | |||||||||||
| Total net increase (decrease) | $ | 3,482,183 | 136,613 | $ | 425,350 | 16,800 | $ | (3,184,270 | ) | (125,120 | ) | $ | 723,263 | 28,293 | |||||||
*Includes exchanges between share classes of the fund.
8. Investment transactions
The fund made purchases and sales of investment securities, excluding short-term securities and U.S. government obligations, if any, of $5,426,679,000 and $4,112,154,000, respectively, during the year ended October 31, 2012.
26 American Mutual Fund
Financial highlights
| Income (loss) from investment operations1 | Dividends and distributions | |||||||||||||||||||||||||||||||||||||||
| Net asset value, beginning of period | Net investment income | Net gains (losses) on securities (both realized and unrealized) | Total from investment operations | Dividends (from net investment income) | Distributions (from capital gains) | Total dividends and distributions | Net asset value, end of period | Total return2,3 | Net assets, end of period (in millions) | Ratio of expenses to average net assets before reimbursements/ waivers | Ratio of expenses to average net assets after reimbursements/ waivers3 | Ratio of net income to average net assets3 | ||||||||||||||||||||||||||||
| Class A: | ||||||||||||||||||||||||||||||||||||||||
| Year ended 10/31/2012 | $ | 25.41 | $ | .66 | $ | 2.87 | $ | 3.53 | $ | (.67 | ) | $ | — | $ | (.67 | ) | $ | 28.27 | 14.02 | % | $ | 15,677 | .63 | % | .63 | % | 2.44 | % | ||||||||||||
| Year ended 10/31/2011 | 24.38 | .66 | 1.00 | 1.66 | (.63 | ) | — | (.63 | ) | 25.41 | 6.85 | 13,549 | .62 | .62 | 2.57 | |||||||||||||||||||||||||
| Year ended 10/31/2010 | 21.57 | .62 | 2.86 | 3.48 | (.67 | ) | — | (.67 | ) | 24.38 | 16.31 | 13,051 | .63 | .63 | 2.69 | |||||||||||||||||||||||||
| Year ended 10/31/2009 | 20.20 | .59 | 1.56 | 2.15 | (.72 | ) | (.06 | ) | (.78 | ) | 21.57 | 11.27 | 11,862 | .67 | .66 | 3.05 | ||||||||||||||||||||||||
| Year ended 10/31/2008 | 31.29 | .60 | (9.76 | ) | (9.16 | ) | (.64 | ) | (1.29 | ) | (1.93 | ) | 20.20 | (30.85 | ) | 11,499 | .60 | .57 | 2.28 | |||||||||||||||||||||
| Class B: | ||||||||||||||||||||||||||||||||||||||||
| Year ended 10/31/2012 | 25.21 | .46 | 2.83 | 3.29 | (.45 | ) | — | (.45 | ) | 28.05 | 13.16 | 196 | 1.39 | 1.39 | 1.71 | |||||||||||||||||||||||||
| Year ended 10/31/2011 | 24.19 | .46 | .99 | 1.45 | (.43 | ) | — | (.43 | ) | 25.21 | 6.01 | 275 | 1.39 | 1.39 | 1.81 | |||||||||||||||||||||||||
| Year ended 10/31/2010 | 21.41 | .44 | 2.83 | 3.27 | (.49 | ) | — | (.49 | ) | 24.19 | 15.40 | 369 | 1.40 | 1.40 | 1.93 | |||||||||||||||||||||||||
| Year ended 10/31/2009 | 20.05 | .44 | 1.56 | 2.00 | (.58 | ) | (.06 | ) | (.64 | ) | 21.41 | 10.45 | 426 | 1.45 | 1.44 | 2.29 | ||||||||||||||||||||||||
| Year ended 10/31/2008 | 31.06 | .40 | (9.69 | ) | (9.29 | ) | (.43 | ) | (1.29 | ) | (1.72 | ) | 20.05 | (31.37 | ) | 455 | 1.37 | 1.34 | 1.52 | |||||||||||||||||||||
| Class C: | ||||||||||||||||||||||||||||||||||||||||
| Year ended 10/31/2012 | 25.14 | .44 | 2.84 | 3.28 | (.46 | ) | — | (.46 | ) | 27.96 | 13.13 | 853 | 1.43 | 1.43 | 1.63 | |||||||||||||||||||||||||
| Year ended 10/31/2011 | 24.13 | .44 | 1.00 | 1.44 | (.43 | ) | — | (.43 | ) | 25.14 | 5.97 | 737 | 1.43 | 1.43 | 1.75 | |||||||||||||||||||||||||
| Year ended 10/31/2010 | 21.36 | .43 | 2.82 | 3.25 | (.48 | ) | — | (.48 | ) | 24.13 | 15.34 | 691 | 1.46 | 1.46 | 1.86 | |||||||||||||||||||||||||
| Year ended 10/31/2009 | 20.01 | .43 | 1.55 | 1.98 | (.57 | ) | (.06 | ) | (.63 | ) | 21.36 | 10.39 | 610 | 1.48 | 1.47 | 2.24 | ||||||||||||||||||||||||
| Year ended 10/31/2008 | 31.00 | .38 | (9.66 | ) | (9.28 | ) | (.42 | ) | (1.29 | ) | (1.71 | ) | 20.01 | (31.40 | ) | 578 | 1.42 | 1.39 | 1.47 | |||||||||||||||||||||
| Class F-1: | ||||||||||||||||||||||||||||||||||||||||
| Year ended 10/31/2012 | 25.33 | .65 | 2.86 | 3.51 | (.66 | ) | — | (.66 | ) | 28.18 | 14.00 | 1,000 | .67 | .67 | 2.39 | |||||||||||||||||||||||||
| Year ended 10/31/2011 | 24.31 | .64 | 1.00 | 1.64 | (.62 | ) | — | (.62 | ) | 25.33 | 6.79 | 744 | .66 | .66 | 2.52 | |||||||||||||||||||||||||
| Year ended 10/31/2010 | 21.51 | .61 | 2.85 | 3.46 | (.66 | ) | — | (.66 | ) | 24.31 | 16.28 | 569 | .67 | .67 | 2.63 | |||||||||||||||||||||||||
| Year ended 10/31/2009 | 20.14 | .59 | 1.56 | 2.15 | (.72 | ) | (.06 | ) | (.78 | ) | 21.51 | 11.31 | 403 | .67 | .67 | 3.03 | ||||||||||||||||||||||||
| Year ended 10/31/2008 | 31.21 | .59 | (9.74 | ) | (9.15 | ) | (.63 | ) | (1.29 | ) | (1.92 | ) | 20.14 | (30.89 | ) | 347 | .64 | .61 | 2.25 | |||||||||||||||||||||
| Class F-2: | ||||||||||||||||||||||||||||||||||||||||
| Year ended 10/31/2012 | 25.41 | .70 | 2.88 | 3.58 | (.72 | ) | — | (.72 | ) | 28.27 | 14.26 | 1,197 | .43 | .43 | 2.59 | |||||||||||||||||||||||||
| Year ended 10/31/2011 | 24.38 | .70 | 1.01 | 1.71 | (.68 | ) | — | (.68 | ) | 25.41 | 7.07 | 542 | .42 | .42 | 2.75 | |||||||||||||||||||||||||
| Year ended 10/31/2010 | 21.57 | .65 | 2.88 | 3.53 | (.72 | ) | — | (.72 | ) | 24.38 | 16.57 | 340 | .41 | .41 | 2.81 | |||||||||||||||||||||||||
| Year ended 10/31/2009 | 20.20 | .58 | 1.63 | 2.21 | (.78 | ) | (.06 | ) | (.84 | ) | 21.57 | 11.58 | 130 | .43 | .43 | 2.86 | ||||||||||||||||||||||||
| Period from 8/5/2008 to 10/31/20084 | 25.64 | .12 | (5.39 | ) | (5.27 | ) | (.17 | ) | — | (.17 | ) | 20.20 | (20.69 | ) | 7 | .09 | .08 | .54 | ||||||||||||||||||||||
| Class 529-A: | ||||||||||||||||||||||||||||||||||||||||
| Year ended 10/31/2012 | 25.37 | .63 | 2.86 | 3.49 | (.64 | ) | — | (.64 | ) | 28.22 | 13.91 | 473 | .72 | .72 | 2.34 | |||||||||||||||||||||||||
| Year ended 10/31/2011 | 24.34 | .63 | 1.01 | 1.64 | (.61 | ) | — | (.61 | ) | 25.37 | 6.77 | 373 | .70 | .70 | 2.48 | |||||||||||||||||||||||||
| Year ended 10/31/2010 | 21.54 | .60 | 2.85 | 3.45 | (.65 | ) | — | (.65 | ) | 24.34 | 16.20 | 303 | .71 | .71 | 2.59 | |||||||||||||||||||||||||
| Year ended 10/31/2009 | 20.17 | .57 | 1.57 | 2.14 | (.71 | ) | (.06 | ) | (.77 | ) | 21.54 | 11.22 | 228 | .74 | .74 | 2.95 | ||||||||||||||||||||||||
| Year ended 10/31/2008 | 31.25 | .57 | (9.74 | ) | (9.17 | ) | (.62 | ) | (1.29 | ) | (1.91 | ) | 20.17 | (30.93 | ) | 189 | .69 | .66 | 2.19 | |||||||||||||||||||||
| Class 529-B: | ||||||||||||||||||||||||||||||||||||||||
| Year ended 10/31/2012 | 25.28 | .42 | 2.85 | 3.27 | (.42 | ) | — | (.42 | ) | 28.13 | 13.05 | 19 | 1.52 | 1.52 | 1.58 | |||||||||||||||||||||||||
| Year ended 10/31/2011 | 24.25 | .43 | 1.00 | 1.43 | (.40 | ) | — | (.40 | ) | 25.28 | 5.87 | 25 | 1.50 | 1.50 | 1.70 | |||||||||||||||||||||||||
| Year ended 10/31/2010 | 21.46 | .42 | 2.84 | 3.26 | (.47 | ) | — | (.47 | ) | 24.25 | 15.29 | 33 | 1.51 | 1.51 | 1.82 | |||||||||||||||||||||||||
| Year ended 10/31/2009 | 20.10 | .42 | 1.56 | 1.98 | (.56 | ) | (.06 | ) | (.62 | ) | 21.46 | 10.31 | 34 | 1.55 | 1.55 | 2.16 | ||||||||||||||||||||||||
| Year ended 10/31/2008 | 31.14 | .36 | (9.71 | ) | (9.35 | ) | (.40 | ) | (1.29 | ) | (1.69 | ) | 20.10 | (31.47 | ) | 32 | 1.49 | 1.46 | 1.39 | |||||||||||||||||||||
| Class 529-C: | ||||||||||||||||||||||||||||||||||||||||
| Year ended 10/31/2012 | 25.26 | .42 | 2.84 | 3.26 | (.43 | ) | — | (.43 | ) | 28.09 | 13.01 | 126 | 1.51 | 1.51 | 1.55 | |||||||||||||||||||||||||
| Year ended 10/31/2011 | 24.24 | .43 | 1.00 | 1.43 | (.41 | ) | — | (.41 | ) | 25.26 | 5.92 | 102 | 1.50 | 1.50 | 1.68 | |||||||||||||||||||||||||
| Year ended 10/31/2010 | 21.46 | .41 | 2.84 | 3.25 | (.47 | ) | — | (.47 | ) | 24.24 | 15.27 | 85 | 1.50 | 1.50 | 1.80 | |||||||||||||||||||||||||
| Year ended 10/31/2009 | 20.10 | .42 | 1.56 | 1.98 | (.56 | ) | (.06 | ) | (.62 | ) | 21.46 | 10.33 | 65 | 1.54 | 1.54 | 2.15 | ||||||||||||||||||||||||
| Year ended 10/31/2008 | 31.13 | .36 | (9.70 | ) | (9.34 | ) | (.40 | ) | (1.29 | ) | (1.69 | ) | 20.10 | (31.45 | ) | 54 | 1.48 | 1.46 | 1.40 | |||||||||||||||||||||
| Class 529-E: | ||||||||||||||||||||||||||||||||||||||||
| Year ended 10/31/2012 | 25.29 | .56 | 2.85 | 3.41 | (.57 | ) | — | (.57 | ) | 28.13 | 13.62 | 26 | .98 | .98 | 2.08 | |||||||||||||||||||||||||
| Year ended 10/31/2011 | 24.27 | .56 | 1.00 | 1.56 | (.54 | ) | — | (.54 | ) | 25.29 | 6.45 | 20 | .98 | .98 | 2.20 | |||||||||||||||||||||||||
| Year ended 10/31/2010 | 21.48 | .53 | 2.85 | 3.38 | (.59 | ) | — | (.59 | ) | 24.27 | 15.87 | 16 | 1.00 | 1.00 | 2.30 | |||||||||||||||||||||||||
| Year ended 10/31/2009 | 20.12 | .51 | 1.57 | 2.08 | (.66 | ) | (.06 | ) | (.72 | ) | 21.48 | 10.88 | 12 | 1.04 | 1.03 | 2.66 | ||||||||||||||||||||||||
| Year ended 10/31/2008 | 31.17 | .50 | (9.72 | ) | (9.22 | ) | (.54 | ) | (1.29 | ) | (1.83 | ) | 20.12 | (31.11 | ) | 10 | .97 | .95 | 1.91 | |||||||||||||||||||||
See page 28 for footnotes.
| American Mutual Fund | 27 |
Financial highlights (continued)
| Income (loss) from investment operations1 | Dividends and distributions | |||||||||||||||||||||||||||||||||||||||
| Net asset value, beginning of period | Net investment income | Net gains (losses) on securities (both realized and unrealized) | Total from investment operations | Dividends (from net investment income) | Distributions (from capital gains) | Total dividends and distributions | Net asset value, end of period | Total return3 | Net assets, end of period (in millions) | Ratio of expenses to average net assets before reimbursements/ waivers | Ratio of expenses to average net assets after reimbursements/ waivers3 | Ratio of net income to average net assets3 | ||||||||||||||||||||||||||||
| Class 529-F-1: | ||||||||||||||||||||||||||||||||||||||||
| Year ended 10/31/2012 | $ | 25.39 | $ | .69 | $ | 2.88 | $ | 3.57 | $ | (.70 | ) | $ | — | $ | (.70 | ) | $ | 28.26 | 14.21 | % | $ | 32 | .51 | % | .51 | % | 2.54 | % | ||||||||||||
| Year ended 10/31/2011 | 24.37 | .68 | 1.01 | 1.69 | (.67 | ) | — | (.67 | ) | 25.39 | 6.96 | 22 | .49 | .49 | 2.67 | |||||||||||||||||||||||||
| Year ended 10/31/2010 | 21.56 | .65 | 2.86 | 3.51 | (.70 | ) | — | (.70 | ) | 24.37 | 16.47 | 13 | .50 | .50 | 2.79 | |||||||||||||||||||||||||
| Year ended 10/31/2009 | 20.19 | .61 | 1.57 | 2.18 | (.75 | ) | (.06 | ) | (.81 | ) | 21.56 | 11.44 | 9 | .54 | .53 | 3.14 | ||||||||||||||||||||||||
| Year ended 10/31/2008 | 31.28 | .63 | (9.76 | ) | (9.13 | ) | (.67 | ) | (1.29 | ) | (1.96 | ) | 20.19 | (30.78 | ) | 6 | .47 | .45 | 2.41 | |||||||||||||||||||||
| Class R-1: | ||||||||||||||||||||||||||||||||||||||||
| Year ended 10/31/2012 | 25.22 | .43 | 2.86 | 3.29 | (.47 | ) | — | (.47 | ) | 28.04 | 13.12 | 58 | 1.43 | 1.43 | 1.61 | |||||||||||||||||||||||||
| Year ended 10/31/2011 | 24.21 | .44 | 1.00 | 1.44 | (.43 | ) | — | (.43 | ) | 25.22 | 5.96 | 35 | 1.43 | 1.43 | 1.75 | |||||||||||||||||||||||||
| Year ended 10/31/2010 | 21.43 | .42 | 2.85 | 3.27 | (.49 | ) | — | (.49 | ) | 24.21 | 15.38 | 29 | 1.45 | 1.45 | 1.84 | |||||||||||||||||||||||||
| Year ended 10/31/2009 | 20.07 | .43 | 1.57 | 2.00 | (.58 | ) | (.06 | ) | (.64 | ) | 21.43 | 10.43 | 17 | 1.48 | 1.47 | 2.22 | ||||||||||||||||||||||||
| Year ended 10/31/2008 | 31.10 | .38 | (9.70 | ) | (9.32 | ) | (.42 | ) | (1.29 | ) | (1.71 | ) | 20.07 | (31.41 | ) | 13 | 1.41 | 1.38 | 1.47 | |||||||||||||||||||||
| Class R-2: | ||||||||||||||||||||||||||||||||||||||||
| Year ended 10/31/2012 | 25.19 | .44 | 2.84 | 3.28 | (.45 | ) | — | (.45 | ) | 28.02 | 13.13 | 195 | 1.43 | 1.43 | 1.63 | |||||||||||||||||||||||||
| Year ended 10/31/2011 | 24.18 | .44 | .99 | 1.43 | (.42 | ) | — | (.42 | ) | 25.19 | 5.94 | 167 | 1.45 | 1.45 | 1.73 | |||||||||||||||||||||||||
| Year ended 10/31/2010 | 21.40 | .42 | 2.83 | 3.25 | (.47 | ) | — | (.47 | ) | 24.18 | 15.32 | 153 | 1.48 | 1.48 | 1.83 | |||||||||||||||||||||||||
| Year ended 10/31/2009 | 20.05 | .40 | 1.56 | 1.96 | (.55 | ) | (.06 | ) | (.61 | ) | 21.40 | 10.22 | 132 | 1.62 | 1.62 | 2.08 | ||||||||||||||||||||||||
| Year ended 10/31/2008 | 31.06 | .36 | (9.69 | ) | (9.33 | ) | (.39 | ) | (1.29 | ) | (1.68 | ) | 20.05 | (31.47 | ) | 110 | 1.51 | 1.48 | 1.37 | |||||||||||||||||||||
| Class R-3: | ||||||||||||||||||||||||||||||||||||||||
| Year ended 10/31/2012 | 25.26 | .56 | 2.86 | 3.42 | (.58 | ) | — | (.58 | ) | 28.10 | 13.64 | 518 | .97 | .97 | 2.09 | |||||||||||||||||||||||||
| Year ended 10/31/2011 | 24.25 | .56 | 1.00 | 1.56 | (.55 | ) | — | (.55 | ) | 25.26 | 6.43 | 410 | .97 | .97 | 2.21 | |||||||||||||||||||||||||
| Year ended 10/31/2010 | 21.46 | .53 | 2.85 | 3.38 | (.59 | ) | — | (.59 | ) | 24.25 | 15.90 | 307 | .99 | .99 | 2.29 | |||||||||||||||||||||||||
| Year ended 10/31/2009 | 20.10 | .51 | 1.57 | 2.08 | (.66 | ) | (.06 | ) | (.72 | ) | 21.46 | 10.89 | 181 | 1.03 | 1.03 | 2.66 | ||||||||||||||||||||||||
| Year ended 10/31/2008 | 31.14 | .50 | (9.71 | ) | (9.21 | ) | (.54 | ) | (1.29 | ) | (1.83 | ) | 20.10 | (31.10 | ) | 149 | .96 | .94 | 1.92 | |||||||||||||||||||||
| Class R-4: | ||||||||||||||||||||||||||||||||||||||||
| Year ended 10/31/2012 | 25.35 | .64 | 2.87 | 3.51 | (.66 | ) | — | (.66 | ) | 28.20 | 13.98 | 487 | .66 | .66 | 2.37 | |||||||||||||||||||||||||
| Year ended 10/31/2011 | 24.32 | .64 | 1.01 | 1.65 | (.62 | ) | — | (.62 | ) | 25.35 | 6.81 | 272 | .67 | .67 | 2.50 | |||||||||||||||||||||||||
| Year ended 10/31/2010 | 21.53 | .60 | 2.85 | 3.45 | (.66 | ) | — | (.66 | ) | 24.32 | 16.21 | 189 | .68 | .68 | 2.58 | |||||||||||||||||||||||||
| Year ended 10/31/2009 | 20.16 | .57 | 1.58 | 2.15 | (.72 | ) | (.06 | ) | (.78 | ) | 21.53 | 11.26 | 75 | .71 | .71 | 2.96 | ||||||||||||||||||||||||
| Year ended 10/31/2008 | 31.23 | .58 | (9.74 | ) | (9.16 | ) | (.62 | ) | (1.29 | ) | (1.91 | ) | 20.16 | (30.90 | ) | 54 | .66 | .64 | 2.21 | |||||||||||||||||||||
| Class R-5: | ||||||||||||||||||||||||||||||||||||||||
| Year ended 10/31/2012 | 25.41 | .73 | 2.87 | 3.60 | (.74 | ) | — | (.74 | ) | 28.27 | 14.31 | 311 | .37 | .37 | 2.69 | |||||||||||||||||||||||||
| Year ended 10/31/2011 | 24.38 | .72 | 1.00 | 1.72 | (.69 | ) | — | (.69 | ) | 25.41 | 7.11 | 255 | .37 | .37 | 2.81 | |||||||||||||||||||||||||
| Year ended 10/31/2010 | 21.57 | .67 | 2.87 | 3.54 | (.73 | ) | — | (.73 | ) | 24.38 | 16.59 | 195 | .38 | .38 | 2.90 | |||||||||||||||||||||||||
| Year ended 10/31/2009 | 20.20 | .65 | 1.55 | 2.20 | (.77 | ) | (.06 | ) | (.83 | ) | 21.57 | 11.55 | 108 | .40 | .39 | 3.47 | ||||||||||||||||||||||||
| Year ended 10/31/2008 | 31.29 | .65 | (9.75 | ) | (9.10 | ) | (.70 | ) | (1.29 | ) | (1.99 | ) | 20.20 | (30.69 | ) | 279 | .36 | .34 | 2.52 | |||||||||||||||||||||
| Class R-6: | ||||||||||||||||||||||||||||||||||||||||
| Year ended 10/31/2012 | 25.41 | .74 | 2.88 | 3.62 | (.75 | ) | — | (.75 | ) | 28.28 | 14.40 | 1,526 | .32 | .32 | 2.73 | |||||||||||||||||||||||||
| Year ended 10/31/2011 | 24.39 | .73 | 1.00 | 1.73 | (.71 | ) | — | (.71 | ) | 25.41 | 7.12 | 1,038 | .32 | .32 | 2.86 | |||||||||||||||||||||||||
| Year ended 10/31/2010 | 21.58 | .68 | 2.87 | 3.55 | (.74 | ) | — | (.74 | ) | 24.39 | 16.64 | 784 | .33 | .33 | 2.92 | |||||||||||||||||||||||||
| Six months ended 10/31/20094 | 18.74 | .31 | 2.86 | 3.17 | (.33 | ) | — | (.33 | ) | 21.58 | 16.99 | 358 | .36 | 5 | .36 | 5 | 3.03 | 5 | ||||||||||||||||||||||
| Year ended October 31 | ||||||||||||||||
| 2012 | 2011 | 2010 | 2009 | 2008 | ||||||||||||
| Portfolio turnover rate for all share classes | 22 | % | 23 | % | 20 | % | 27 | % | 23 | % | ||||||
| 1 | Based on average shares outstanding. |
| 2 | Total returns exclude any applicable sales charges, including contingent deferred sales charges. |
| 3 | This column reflects the impact, if any, of certain reimbursements/waivers from CRMC. During some of the periods shown, CRMC reduced fees for investment advisory services. In addition, during some of the periods shown, CRMC paid a portion of the fund’s transfer agent fees for certain retirement plan share classes. |
| 4 | Based on operations for the period shown and, accordingly, is not representative of a full year. |
| 5 | Annualized. |
See Notes to Financial Statements
| 28 | American Mutual Fund |
Report of Independent Registered Public Accounting Firm
To the Shareholders and Board of Trustees of American Mutual Fund:
We have audited the accompanying statement of assets and liabilities of American Mutual Fund (the “Fund”), including the summary investment portfolio, as of October 31, 2012, and the related statement of operations for the year then ended, the statements of changes in net assets for each of the two years in the period then ended, and the financial highlights for each of the periods presented. These financial statements and financial highlights are the responsibility of the Fund’s management. Our responsibility is to express an opinion on these financial statements and financial highlights based on our audits.
We conducted our audits in accordance with the standards of the Public Company Accounting Oversight Board (United States). Those standards require that we plan and perform the audit to obtain reasonable assurance about whether the financial statements and financial highlights are free of material misstatement. The Fund is not required to have, nor were we engaged to perform, an audit of its internal control over financial reporting. Our audits included consideration of internal control over financial reporting as a basis for designing audit procedures that are appropriate in the circumstances, but not for the purpose of expressing an opinion on the effectiveness of the Fund’s internal control over financial reporting. Accordingly, we express no such opinion. An audit also includes examining, on a test basis, evidence supporting the amounts and disclosures in the financial statements, assessing the accounting principles used and significant estimates made by management, as well as evaluating the overall financial statement presentation. Our procedures included confirmation of securities owned as of October 31, 2012, by correspondence with the custodian and brokers; where replies were not received from brokers, we performed other auditing procedures. We believe that our audits provide a reasonable basis for our opinion.
In our opinion, such financial statements and financial highlights referred to above present fairly, in all material respects, the financial position of American Mutual Fund as of October 31, 2012, the results of its operations for the year then ended, the changes in its net assets for each of the two years in the period then ended, and the financial highlights for each of the periods presented, in conformity with accounting principles generally accepted in the United States of America.
Deloitte & Touche LLP
Costa Mesa, California
December 7, 2012
| American Mutual Fund | 29 |
| Expense example | unaudited |
As a shareholder of the fund, you incur two types of costs: (1) transaction costs, such as initial sales charges on purchase payments and contingent deferred sales charges on redemptions (loads), and (2) ongoing costs, including management fees, distribution and service (12b-1) fees, and other expenses. This example is intended to help you understand your ongoing costs (in dollars) of investing in the fund so you can compare these costs with the ongoing costs of investing in other mutual funds. The example is based on an investment of $1,000 invested at the beginning of the period and held for the entire six-month period (May 1, 2012, through October 31, 2012).
Actual expenses:
The first line of each share class in the table on the next page provides information about actual account values and actual expenses. You may use the information in this line, together with the amount you invested, to estimate the expenses that you paid over the period. Simply divide your account value by $1,000 (for example, an $8,600 account value divided by $1,000 = 8.6), then multiply the result by the number in the first line under the heading entitled “Expenses paid during period” to estimate the expenses you paid on your account during this period.
Hypothetical example for comparison purposes:
The second line of each share class in the table on the next page provides information about hypothetical account values and hypothetical expenses based on the actual expense ratio for the share class and an assumed rate of return of 5.00% per year before expenses, which is not the actual return of the share class. The hypothetical account values and expenses may not be used to estimate the actual ending account balance or expenses you paid for the period. You may use this information to compare the ongoing costs of investing in the fund and other funds. To do so, compare this 5.00% hypothetical example with the 5.00% hypothetical examples that appear in the shareholder reports of the other funds.
Notes:
There are some account fees that are charged to certain types of accounts, such as individual retirement accounts and 529 college savings plan accounts (generally, a $10 fee is charged to set up the account and an additional $10 fee is charged to the account annually), that would increase the amount of expenses paid on your account. In addition, retirement plan participants may be subject to certain fees charged by the plan sponsor, and Class F-1, F-2 and 529-F-1 shareholders may be subject to fees charged by financial intermediaries, typically ranging from 0.75% to 1.50% of assets annually depending on services offered. You can estimate the impact of these fees by adding the amount of the fees to the total estimated expenses you paid on your account during the period as calculated above. In addition, your ending account value would be lower by the amount of these fees.
Note that the expenses shown in the table are meant to highlight your ongoing costs only and do not reflect any transactional costs, such as sales charges (loads). Therefore, the second line of each share class in the table is useful in comparing ongoing costs only and will not help you determine the relative total costs of owning different funds. In addition, if these transactional costs were included, your costs would have been higher.
| 30 | American Mutual Fund |
| Beginning account value 5/1/2012 | Ending account value 10/31/2012 | Expenses paid during period* | Annualized expense ratio | ||||||||||
| Class A — actual return | $ | 1,000.00 | $ | 1,029.96 | $ | 3.16 | .62 | % | |||||
| Class A — assumed 5% return | 1,000.00 | 1,022.02 | 3.15 | .62 | |||||||||
| Class B — actual return | 1,000.00 | 1,026.13 | 7.03 | 1.38 | |||||||||
| Class B — assumed 5% return | 1,000.00 | 1,018.20 | 7.00 | 1.38 | |||||||||
| Class C — actual return | 1,000.00 | 1,025.88 | 7.28 | 1.43 | |||||||||
| Class C — assumed 5% return | 1,000.00 | 1,017.95 | 7.25 | 1.43 | |||||||||
| Class F-1 — actual return | 1,000.00 | 1,029.89 | 3.42 | .67 | |||||||||
| Class F-1 — assumed 5% return | 1,000.00 | 1,021.77 | 3.40 | .67 | |||||||||
| Class F-2 — actual return | 1,000.00 | 1,031.32 | 2.20 | .43 | |||||||||
| Class F-2 — assumed 5% return | 1,000.00 | 1,022.97 | 2.19 | .43 | |||||||||
| Class 529-A — actual return | 1,000.00 | 1,029.55 | 3.67 | .72 | |||||||||
| Class 529-A — assumed 5% return | 1,000.00 | 1,021.52 | 3.66 | .72 | |||||||||
| Class 529-B — actual return | 1,000.00 | 1,025.73 | 7.69 | 1.51 | |||||||||
| Class 529-B — assumed 5% return | 1,000.00 | 1,017.55 | 7.66 | 1.51 | |||||||||
| Class 529-C — actual return | 1,000.00 | 1,025.34 | 7.69 | 1.51 | |||||||||
| Class 529-C — assumed 5% return | 1,000.00 | 1,017.55 | 7.66 | 1.51 | |||||||||
| Class 529-E — actual return | 1,000.00 | 1,028.35 | 4.95 | .97 | |||||||||
| Class 529-E — assumed 5% return | 1,000.00 | 1,020.26 | 4.93 | .97 | |||||||||
| Class 529-F-1 — actual return | 1,000.00 | 1,030.95 | 2.55 | .50 | |||||||||
| Class 529-F-1 — assumed 5% return | 1,000.00 | 1,022.62 | 2.54 | .50 | |||||||||
| Class R-1 — actual return | 1,000.00 | 1,026.12 | 7.28 | 1.43 | |||||||||
| Class R-1 — assumed 5% return | 1,000.00 | 1,017.95 | 7.25 | 1.43 | |||||||||
| Class R-2 — actual return | 1,000.00 | 1,025.73 | 7.38 | 1.45 | |||||||||
| Class R-2 — assumed 5% return | 1,000.00 | 1,017.85 | 7.35 | 1.45 | |||||||||
| Class R-3 — actual return | 1,000.00 | 1,028.35 | 5.05 | .99 | |||||||||
| Class R-3 — assumed 5% return | 1,000.00 | 1,020.16 | 5.03 | .99 | |||||||||
| Class R-4 — actual return | 1,000.00 | 1,029.84 | 3.42 | .67 | |||||||||
| Class R-4 — assumed 5% return | 1,000.00 | 1,021.77 | 3.40 | .67 | |||||||||
| Class R-5 — actual return | 1,000.00 | 1,031.29 | 1.89 | .37 | |||||||||
| Class R-5 — assumed 5% return | 1,000.00 | 1,023.28 | 1.88 | .37 | |||||||||
| Class R-6 — actual return | 1,000.00 | 1,031.88 | 1.58 | .31 | |||||||||
| Class R-6 — assumed 5% return | 1,000.00 | 1,023.58 | 1.58 | .31 | |||||||||
| * | The “expenses paid during period” are equal to the “annualized expense ratio,” multiplied by the average account value over the period, multiplied by the number of days in the period, and divided by 366 (to reflect the one-half year period). |
| Tax information | unaudited |
We are required to advise you of the federal tax status of certain distributions received by shareholders during the fiscal year. The fund hereby designates the following amounts for the fund’s fiscal year ended October 31, 2012:
| Qualified dividend income | 100 | % |
| Corporate dividends received deduction | 100 | % |
| U.S. government income that may be exempt from state taxation | $575,000 | |
Individual shareholders should refer to their Form 1099 or other tax information, which will be mailed in January 2013, to determine the calendar year amounts to be included on their 2012 tax returns. Shareholders should consult their tax advisers.
| American Mutual Fund | 31 |
| Other share class results | unaudited |
Classes B, C, F and 529
Fund results shown are for past periods and are not predictive of results for future periods. Current and future results may be lower or higher than those shown. Share prices and returns will vary, so investors may lose money. For current information and month-end results, visit americanfunds.com.
Average annual total returns for periods ended September 30, 2012 (the most recent calendar quarter-end):
| 1 year | 5 years | 10 years/ Life of class1 | ||||||||
| Class B shares2 | ||||||||||
| Reflecting applicable contingent deferred sales charge (CDSC), maximum of 5%, payable only if shares are sold within six years of purchase | 17.83 | % | 0.77 | % | 7.15 | % | ||||
| Not reflecting CDSC | 22.83 | 1.12 | 7.15 | |||||||
| Class C shares | ||||||||||
| Reflecting CDSC, maximum of 1%, payable only if shares are sold within one year of purchase | 21.82 | 1.07 | 6.93 | |||||||
| Not reflecting CDSC | 22.82 | 1.07 | 6.93 | |||||||
| Class F-1 shares3 | ||||||||||
| Not reflecting annual asset-based fee charged by sponsoring firm | 23.80 | 1.88 | 7.77 | |||||||
| Class F-2 shares3 — first sold 8/5/08 | ||||||||||
| Not reflecting annual asset-based fee charged by sponsoring firm | 24.06 | — | 5.82 | |||||||
| Class 529-A shares4 | ||||||||||
| Reflecting 5.75% maximum sales charge | 16.57 | 0.62 | 7.10 | |||||||
| Not reflecting maximum sales charge | 23.68 | 1.82 | 7.74 | |||||||
| Class 529-B shares2,4 | ||||||||||
| Reflecting applicable CDSC, maximum of 5%, payable only if shares are sold within six years of purchase | 17.69 | 0.65 | 7.01 | |||||||
| Not reflecting CDSC | 22.69 | 1.00 | 7.01 | |||||||
| Class 529-C shares4 | ||||||||||
| Reflecting CDSC, maximum of 1%, payable only if shares are sold within one year of purchase | 21.69 | 1.01 | 6.85 | |||||||
| Not reflecting CDSC | 22.69 | 1.01 | 6.85 | |||||||
| Class 529-E shares3,4 | 23.35 | 1.53 | 7.40 | |||||||
| Class 529-F-1 shares3,4 | ||||||||||
| Not reflecting annual asset-based fee charged by sponsoring firm | 23.96 | 2.03 | 7.87 | |||||||
| 1 Applicable to Class F-2 shares only. All other share classes reflect 10-year results. |
| 2 These shares are not available for purchase. |
| 3 These shares are sold without any initial or contingent deferred sales charge. |
| 4 Results shown do not reflect the $10 account setup fee and an annual $10 account maintenance fee. |
Investment results assume all distributions are reinvested and reflect applicable fees and expenses. When applicable, investment results reflect fee waivers, without which results would have been lower. Visit americanfunds.com for more information.
For information regarding the differences among the various share classes, refer to the fund prospectus.
| 32 | American Mutual Fund |
Board of trustees and other officers
| “Independent” trustees1 | ||||||||
| Name and age | Year first elected a trustee of the fund2 | Principal occupation(s) during past five years | Number of portfolios in fund complex3 overseen by trustee | Other directorships4 held by trustee | ||||
| Louise H. Bryson, 68 | 2010 | Chair Emerita of the Board of Trustees, J. Paul Getty Trust; former President, Distribution, Lifetime Entertainment Network; former Executive Vice President and General Manager, Lifetime Movie Network | 7 | None | ||||
| Mary Anne Dolan, 65 Chairman of the Board (Independent and Non-Executive) | 1993 | Founder and President, MAD Ink (communications company) | 10 | None | ||||
| James G. Ellis, 65 | 2010 | Dean and Professor of Marketing, Marshall School of Business, University of Southern California | 65 | Quiksilver, Inc. | ||||
| Leonard R. Fuller, 66 | 2010 | President and CEO, Fuller Consulting (financial management consulting firm) | 65 | None | ||||
| William D. Jones, 57 | 2006 | Real estate developer/owner, President and CEO, CityLink Investment Corporation (acquires, develops and manages real estate ventures in selected urban communities) and City Scene Management Company (provides commercial asset and property management services) | 7 | Sempra Energy | ||||
| L. Daniel Jorndt, 71 | 2010 | Retired | 4 | None | ||||
| William H. Kling, 70 | 2006 | President Emeritus, American Public Media | 10 | None | ||||
| John C. Mazziotta, M.D., Ph.D., 63 | 2011 | Physician; Chair, Department of Neurology, University of California at Los Angeles; Associate Director, Semel Institute, UCLA; Director, Brain Mapping Center, UCLA | 4 | None | ||||
| Bailey Morris-Eck, 68 | 1999 | Director and Programming Chair, WYPR Baltimore/Washington (public radio station); Senior Adviser, Financial News (London); Senior Fellow, Institute for International Economics | 4 | None | ||||
| Steven B. Sample, Ph.D., 72 | 1999 | President Emeritus, University of Southern California | 4 | Intermec, Inc. | ||||
John G. McDonald, a trustee of the fund since 2010, has retired from the board. The trustees thank Prof. McDonald for his dedication and service to the fund.
| “Interested” trustee5,6 | ||||||||
| Name, age and position with fund | Year first elected a trustee or officer of the fund2 | Principal occupation(s) during past five years and positions held with affiliated entities or the principal underwriter of the fund | Number of portfolios in fund complex3 overseen by trustee | Other directorships4 held by trustee | ||||
| Joyce E. Gordon, 56 Vice Chairman of the Board | 1996–2001 2005 | Senior Vice President—Capital Research Global Investors, Capital Research and Management Company; Director, The Capital Group Companies, Inc.7 | 2 | None | ||||
The fund’s statement of additional information includes further details about fund trustees and is available without charge upon request by calling American Funds Service Company at 800/421-4225 or by visiting the American Funds website at americanfunds.com. The address for all trustees and officers of the fund is 333 South Hope Street, Los Angeles, CA 90071, Attention: Secretary.
See page 34 for footnotes.
| American Mutual Fund | 33 |
| Other officers6 | ||||
| Name, age and position with fund | Year first elected an officer of the fund2 | Principal occupation(s) during past five years and positions held with affiliated entities or the principal underwriter of the fund | ||
| Paul F. Roye, 59 President | 2007 | Senior Vice President — Fund Business Management Group, Capital Research and Management Company; Director, American Funds Service Company;7 former Director, Division of Investment Management, United States Securities and Exchange Commission | ||
| William L. Robbins, 44 Executive Vice President | 2004 | Director, The Capital Group Companies, Inc.;7 Chairman of the Board, Capital International Research, Inc.7 | ||
| James B. Lovelace, 56 Senior Vice President | 2006 | Senior Vice President — Capital Research Global Investors, Capital Research and Management Company | ||
| Christopher D. Buchbinder, 41 Vice President | 2006 | Senior Vice President — Capital Research Global Investors, Capital Research Company7 | ||
| Herbert Y. Poon, 39 Vice President | 2012 | Vice President and Senior Counsel — Fund Business Management Group, Capital Research and Management Company | ||
| James Terrile, 47 Vice President | 2007 | Senior Vice President — Capital Research Global Investors, Capital Research Company;7 Director, Capital Strategy Research, Inc.7 | ||
| Vincent P. Corti, 56 Secretary | 1994 | Vice President — Fund Business Management Group, Capital Research and Management Company | ||
| Ari M. Vinocor, 38 Treasurer | 2010 | Vice President — Fund Business Management Group, Capital Research and Management Company | ||
| Raymond F. Sullivan, Jr., 55 Assistant Secretary | 2011 | Vice President — Fund Business Management Group, Capital Research and Management Company | ||
| Dori Laskin, 61 Assistant Treasurer | 2011 | Vice President — Fund Business Management Group, Capital Research and Management Company | ||
| Jeffrey P. Regal, 41 Assistant Treasurer | 2012 | Vice President — Fund Business Management Group, Capital Research and Management Company | ||
| 1 | The term “independent” trustee refers to a director who is not an “interested person” of the fund within the meaning of the Investment Company Act of 1940. |
| 2 | Trustees and officers of the fund serve until their resignation, removal or retirement. |
| 3 | Capital Research and Management Company manages the American Funds. Capital Research and Management Company also manages American Funds Insurance Series,® which is composed of 19 funds and serves as the underlying investment vehicle for certain variable insurance contracts; American Funds Target Date Retirement Series,® which is composed of 10 funds and is available through tax-deferred retirement plans and IRAs; American Funds Portfolio Series,SM which is composed of eight funds; and American Funds College Target Date Series,SM which is composed of seven funds. |
| 4 | This includes all directorships (other than those in the American Funds or other funds managed by Capital Research and Management Company) that are held by each trustee as a trustee or director of a public company or a registered investment company. |
| 5 | “Interested persons” within the meaning of the Investment Company Act of 1940, on the basis of their affiliation with the fund’s investment adviser, Capital Research and Management Company, or affiliated entities (including the fund’s principal underwriter). |
| 6 | All of the officers listed are officers and/or directors/trustees of one or more of the other funds for which Capital Research and Management Company serves as investment adviser. |
| 7 | Company affiliated with Capital Research and Management Company. |
| 34 | American Mutual Fund |
| Offices |
| Offices of the fund and of the investment adviser |
| Capital Research and Management Company |
| 333 South Hope Street |
| Los Angeles, CA 90071-1406 |
| 6455 Irvine Center Drive |
| Irvine, CA 92618 |
| Transfer agent for shareholder accounts |
| American Funds Service Company |
| (Write to the address near you.) |
| P.O. Box 6007 |
| Indianapolis, IN 46206-6007 |
| P.O. Box 2280 |
| Norfolk, VA 23501-2280 |
| Custodian of assets |
| JPMorgan Chase Bank |
| 270 Park Avenue |
| New York, NY 10017-2070 |
| Counsel |
| O’Melveny & Myers LLP |
| 400 South Hope Street |
| Los Angeles, CA 90071-2899 |
| Independent registered public accounting firm |
| Deloitte & Touche LLP |
| 695 Town Center Drive |
| Suite 1200 |
| Costa Mesa, CA 92626-7188 |
| Principal underwriter |
| American Funds Distributors, Inc. |
| 333 South Hope Street |
| Los Angeles, CA 90071-1406 |
Investors should carefully consider investment objectives, risks, charges and expenses. This and other important information is contained in the fund prospectus and summary prospectus, which can be obtained from your financial professional and should be read carefully before investing. You may also call American Funds Service Company (AFS) at 800/421-4225 or visit the American Funds website at americanfunds.com.
“American Funds Proxy Voting Procedures and Principles” — which describes how we vote proxies relating to portfolio securities — is available on the American Funds website or upon request by calling AFS. The fund files its proxy voting record with the U.S. Securities and Exchange Commission (SEC) for the 12 months ended June 30 by August 31. The proxy voting record is available free of charge on the SEC website at sec.gov and on the American Funds website.
A complete October 31, 2012, portfolio of American Mutual Fund’s investments is available free of charge by calling AFS or visiting the SEC website (where it is part of Form N-CSR).
American Mutual Fund files a complete list of its portfolio holdings with the SEC for the on first and third quarters of each fiscal year Form N-Q. This filing is available free of charge on the SEC website. You may also review or, for a fee, copy this filing at the SEC’s Public Reference Room in Washington, D.C. Additional information regarding the operation of the Public Reference Room may be obtained by calling the SEC’s Office of Investor Education and Advocacy at 800/SEC-0330. Additionally, the list of portfolio holdings is available by calling AFS.
This report is for the information of shareholders of American Mutual Fund, but it also may be used as sales literature when preceded or accompanied by the current prospectus or summary prospectus, which gives details about charges, expenses, investment objectives and operating policies of the fund. If used as sales material after December 31, 2012, this report must be accompanied by an American Funds statistical update for the most recently completed calendar quarter.
 | The right choice for the long term® |
The American Funds difference
Since 1931, American Funds has helped investors pursue long-term investment success. Our consistent approach — in combination with a proven system — has resulted in a superior long-term track record.
 | Consistent approach | |
| We base our decisions on a long-term perspective because we believe it is the best way to achieve superior long-term investment results. Our portfolio counselors average 25 years of investment experience, including 21 years at our company, reflecting a career commitment to our long-term approach.1 | ||
 | Proven system | |
| Our system combines individual accountability with teamwork. Each fund is divided into portions that are managed by investment professionals with varied backgrounds, ages and investment styles. An extensive global research effort is the backbone of our system. | ||
 | Superior long-term track record | |
| Our equity funds have beaten their Lipper peer indexes in 91% of 10-year periods and 96% of 20-year periods. Our fixed-income funds have beaten their Lipper indexes in 60% of 10-year periods and 67% of 20-year periods.2 Our fund management fees have been among the lowest in the industry.3 | ||
| 1 | As of 12/31/11. | |
| 2 | Based on Class A share results for periods through 12/31/11. Periods covered are the shorter of the fund’s lifetime or since the comparable Lipper index inception date. | |
| 3 | Based on management fees for the 20-year period ended 12/31/11 versus comparable Lipper categories, excluding funds of funds. | |
| American Funds span a range of investment objectives | |
| n | Growth funds |
| AMCAP Fund® EuroPacific Growth Fund® | |
| The Growth Fund of America® The New Economy Fund® New Perspective Fund® New World Fund® SMALLCAP World Fund® | |
| n | Growth-and-income funds |
| American Mutual Fund® | |
| Capital World Growth and Income Fund® Fundamental InvestorsSM | |
| International Growth and Income FundSM The Investment Company of America® Washington Mutual Investors FundSM | |
| n | Equity-income funds |
| Capital Income Builder® The Income Fund of America® | |
| n | Balanced funds |
| American Balanced Fund® | |
| American Funds Global Balanced Fund SM | |
| n | Bond funds |
| American Funds Mortgage Fund® American High-Income Trust® The Bond Fund of America® | |
| Capital World Bond Fund® | |
| Intermediate Bond Fund of America® Short-Term Bond Fund of America® U.S. Government Securities Fund® | |
| n | Tax-exempt bond funds |
| American Funds Short-Term Tax-Exempt Bond Fund® American High-Income Municipal Bond Fund® Limited Term Tax-Exempt Bond Fund of America® The Tax-Exempt Bond Fund of America® State-specific tax-exempt funds American Funds Tax-Exempt Fund of New York® The Tax-Exempt Fund of California® The Tax-Exempt Fund of Maryland® | |
| The Tax-Exempt Fund of Virginia® | |
| n | Money market fund |
| American Funds Money Market Fund® | |
| n | American Funds Portfolio SeriesSM |
| American Funds Global Growth PortfolioSM American Funds Growth PortfolioSM American Funds Growth and Income PortfolioSM American Funds Balanced PortfolioSM American Funds Income PortfolioSM American Funds Tax-Advantaged Income PortfolioSM American Funds Preservation PortfolioSM American Funds Tax-Exempt Preservation PortfolioSM | |
| n | American Funds Target Date Retirement Series® |
| n | American Funds College Target Date SeriesSM |

| The Capital Group Companies | ||||
| American Funds | Capital Research and Management | Capital International | Capital Guardian | Capital Bank and Trust |
ITEM 2 – Code of Ethics
The Registrant has adopted a Code of Ethics that applies to its Principal Executive Officer and Principal Financial Officer. The Registrant undertakes to provide to any person without charge, upon request, a copy of the Code of Ethics. Such request can be made to American Funds Service Company at 800/421-0180 or to the Secretary of the Registrant, 333 South Hope Street, Los Angeles, California 90071.
ITEM 3 – Audit Committee Financial Expert
The Registrant’s board has determined that James G. Ellis, a member of the Registrant’s audit committee, is an “audit committee financial expert” and "independent," as such terms are defined in this Item. This designation will not increase the designee’s duties, obligations or liability as compared to his or her duties, obligations and liability as a member of the audit committee and of the board, nor will it reduce the responsibility of the other audit committee members. There may be other individuals who, through education or experience, would qualify as "audit committee financial experts" if the board had designated them as such. Most importantly, the board believes each member of the audit committee contributes significantly to the effective oversight of the Registrant’s financial statements and condition.
ITEM 4 – Principal Accountant Fees and Services
| Registrant: | ||||
| a) Audit Fees: | ||||
| 2011 | $77,000 | |||
| 2012 | $80,000 | |||
| b) Audit-Related Fees: | ||||
| 2011 | $5,000 | |||
| 2012 | $6,000 | |||
| The audit-related fees consist of assurance and related services relating to the examination of the Registrant’s investment adviser conducted in accordance with Statement on Standards for Attestation Engagements Number 16 issued by the American Institute of Certified Public Accountants. | ||||
| c) Tax Fees: | ||||
| 2011 | $7,000 | |||
| 2012 | $7,000 | |||
| The tax fees consist of professional services relating to the preparation of the Registrant’s tax returns. | ||||
| d) All Other Fees: | ||||
| 2011 | None | |||
| 2012 | None | |||
| Adviser and affiliates (includes only fees for non-audit services billed to the adviser and affiliates for engagements that relate directly to the operations and financial reporting of the Registrant and were subject to the pre-approval policies described below): | ||||
| a) Audit Fees: | ||||
| Not Applicable | ||||
| b) Audit-Related Fees: | ||||
| 2011 | $1,005,000 | |||
| 2012 | $1,028,000 | |||
| The audit-related fees consist of assurance and related services relating to the examination of the Registrant’s transfer agent, principal underwriter and investment adviser conducted in accordance with Statement on Standards for Attestation Engagements Number 16 issued by the American Institute of Certified Public Accountants. | ||||
| c) Tax Fees: | ||||
| 2011 | $36,000 | |||
| 2012 | $18,000 | |||
| The tax fees consist of consulting services relating to the Registrant’s investments. | ||||
| d) All Other Fees: | ||||
| 2011 | $2,000 | |||
| 2012 | $2,000 | |||
| The other fees consist of subscription services related to an accounting research tool. | ||||
All audit and permissible non-audit services that the Registrant’s audit committee considers compatible with maintaining the independent registered public accounting firm’s independence are required to be pre-approved by the committee. The pre-approval requirement will extend to all non-audit services provided to the Registrant, the investment adviser, and any entity controlling, controlled by, or under common control with the investment adviser that provides ongoing services to the Registrant, if the engagement relates directly to the operations and financial reporting of the Registrant. The committee will not delegate its responsibility to pre-approve these services to the investment adviser. The committee may delegate to one or more committee members the authority to review and pre-approve audit and permissible non-audit services. Actions taken under any such delegation will be reported to the full committee at its next meeting. The pre-approval requirement is waived with respect to non-audit services if certain conditions are met. The pre-approval requirement was not waived for any of the non-audit services listed above provided to the Registrant, adviser and affiliates.
Aggregate non-audit fees paid to the Registrant’s auditors, including fees for all services billed to the Registrant, adviser and affiliates that provide ongoing services to the Registrant, were $1,615,000 for fiscal year 2011 and $1,639,000 for fiscal year 2012. The non-audit services represented by these amounts were brought to the attention of the committee and considered to be compatible with maintaining the auditors’ independence.
ITEM 5 – Audit Committee of Listed Registrants
Not applicable to this Registrant, insofar as the Registrant is not a listed issuer as defined in Rule 10A-3 under the Securities Exchange Act of 1934.
ITEM 6 – Schedule of Investments

American Mutual Fund®
Investment portfolio
October 31, 2012
| Common stocks — 87.93% | Shares | Value (000) |
| ENERGY — 7.70% | ||
| Apache Corp. | 873,400 | $ 72,274 |
| Baker Hughes Inc. | 1,385,000 | 58,129 |
| BP PLC (ADR) | 3,360,000 | 144,110 |
| Chevron Corp. | 3,908,911 | 430,801 |
| ConocoPhillips | 1,447,900 | 83,761 |
| Devon Energy Corp. | 1,925,000 | 112,054 |
| EnCana Corp. | 5,136,700 | 115,833 |
| EOG Resources, Inc. | 1,125,000 | 131,051 |
| Marathon Oil Corp. | 2,000,000 | 60,120 |
| Royal Dutch Shell PLC, Class A (ADR) | 3,046,700 | 208,638 |
| Royal Dutch Shell PLC, Class B (ADR) | 1,172,000 | 82,778 |
| Schlumberger Ltd. | 2,545,400 | 176,982 |
| Spectra Energy Corp | 2,430,500 | 70,169 |
| 1,746,700 | ||
| MATERIALS — 4.17% | ||
| Air Products and Chemicals, Inc. | 1,175,000 | 91,098 |
| CRH PLC (ADR) | 1,089,059 | 20,311 |
| Dow Chemical Co. | 13,196,400 | 386,655 |
| E.I. du Pont de Nemours and Co. | 690,000 | 30,719 |
| International Flavors & Fragrances Inc. | 510,000 | 32,956 |
| MeadWestvaco Corp. | 5,749,864 | 170,713 |
| Praxair, Inc. | 2,019,324 | 214,472 |
| 946,924 | ||
| INDUSTRIALS — 13.49% | ||
| 3M Co. | 1,825,000 | 159,870 |
| CSX Corp. | 11,869,000 | 242,958 |
| Eaton Corp. | 800,000 | 37,776 |
| Emerson Electric Co. | 6,225,000 | 301,477 |
| General Dynamics Corp. | 2,051,000 | 139,632 |
| General Electric Co. | 10,860,000 | 228,712 |
| Illinois Tool Works Inc. | 850,000 | 52,131 |
| Lockheed Martin Corp. | 1,845,000 | 172,821 |
| Norfolk Southern Corp. | 1,726,000 | 105,890 |
| Pentair Ltd. | 800,000 | 33,792 |
| Pitney Bowes Inc. | 2,352,300 | 33,779 |
| Precision Castparts Corp. | 314,000 | 54,344 |
| Republic Services, Inc. | 5,550,000 | 157,343 |
| Rockwell Automation | 1,635,000 | 116,183 |
| Siemens AG (ADR) | 125,000 | 12,614 |
| Southwest Airlines Co. | 4,450,000 | 39,249 |
| Union Pacific Corp. | 1,279,300 | 157,392 |
| United Parcel Service, Inc., Class B | 5,317,300 | 389,492 |
| United Technologies Corp. | 4,620,100 | 361,107 |
| Waste Management, Inc. | 8,080,000 | 264,539 |
| 3,061,101 | ||
| CONSUMER DISCRETIONARY — 14.19% | ||
| Carnival Corp., units | 2,895,000 | 109,662 |
| Comcast Corp., Class A | 8,776,400 | 329,203 |
| Comcast Corp., Class A, special nonvoting shares | 1,500,000 | 54,660 |
| Darden Restaurants, Inc. | 5,657,900 | 297,719 |
| Garmin Ltd. | 6,088,938 | 231,319 |
| Harley-Davidson, Inc. | 1,830,000 | 85,571 |
| Home Depot, Inc. | 12,050,000 | 739,629 |
| Johnson Controls, Inc. | 2,662,580 | 68,561 |
| Kohl’s Corp. | 700,000 | 37,296 |
| Mattel, Inc. | 9,075,000 | 333,778 |
| McDonald’s Corp. | 700,000 | 60,760 |
| McGraw-Hill Companies, Inc. | 321,643 | 17,780 |
| News Corp., Class A | 1,925,000 | 46,046 |
| Nordstrom, Inc. | 500,000 | 28,385 |
| Time Warner Cable Inc. | 4,163,937 | 412,688 |
| Time Warner Inc. | 5,234,333 | 227,432 |
| YUM! Brands, Inc. | 1,980,000 | 138,818 |
| 3,219,307 | ||
| CONSUMER STAPLES — 4.80% | ||
| Avon Products, Inc. | 300,000 | 4,647 |
| Coca-Cola Co. | 1,700,000 | 63,206 |
| Colgate-Palmolive Co. | 565,000 | 59,302 |
| ConAgra Foods, Inc. | 950,000 | 26,448 |
| General Mills, Inc. | 1,500,000 | 60,120 |
| Hillshire Brands Co. | 300,000 | 7,803 |
| Kellogg Co. | 900,000 | 47,088 |
| Kimberly-Clark Corp. | 2,140,000 | 178,583 |
| Kraft Foods Group, Inc.1 | 3,829,766 | 174,178 |
| Mondelez International, Inc. | 11,489,300 | 304,926 |
| PepsiCo, Inc. | 2,336,800 | 161,800 |
| 1,088,101 | ||
| HEALTH CARE — 11.85% | ||
| Abbott Laboratories | 13,082,000 | 857,133 |
| Amgen Inc. | 8,753,748 | 757,593 |
| Bristol-Myers Squibb Co. | 2,890,000 | 96,093 |
| Cardinal Health, Inc. | 1,305,000 | 53,675 |
| Eli Lilly and Co. | 800,000 | 38,904 |
| Johnson & Johnson | 1,915,000 | 135,620 |
| Medtronic, Inc. | 1,998,250 | 83,087 |
| Merck & Co., Inc. | 4,997,185 | 228,022 |
| Novartis AG (ADR) | 3,014,000 | 182,226 |
| Pfizer Inc | 6,920,000 | 172,100 |
| Stryker Corp. | 1,610,000 | 84,686 |
| 2,689,139 | ||
| FINANCIALS — 6.78% | ||
| Aon PLC, Class A | 1,510,000 | 81,464 |
| Arthur J. Gallagher & Co. | 4,149,148 | 147,046 |
| Bank of New York Mellon Corp. | 3,141,400 | 77,624 |
| Bank of Nova Scotia | 1,750,000 | 95,165 |
| Comerica Inc. | 411,400 | 12,264 |
| Hudson City Bancorp, Inc. | 9,846,000 | 83,543 |
| JPMorgan Chase & Co. | 3,650,000 | 152,132 |
| Marsh & McLennan Companies, Inc. | 2,508,394 | 85,361 |
| NYSE Euronext | 7,691,805 | 190,449 |
| Old Republic International Corp. | 7,528,800 | 74,384 |
| Royal Bank of Canada | 2,171,500 | 123,841 |
| State Street Corp. | 1,936,900 | 86,328 |
| Toronto-Dominion Bank | 704,000 | 57,263 |
| U.S. Bancorp | 2,015,000 | 66,918 |
| Wells Fargo & Co. | 2,385,000 | 80,351 |
| Willis Group Holdings PLC | 3,725,419 | 125,435 |
| 1,539,568 | ||
| INFORMATION TECHNOLOGY — 8.76% | ||
| Adobe Systems Inc.1 | 820,000 | 27,880 |
| Analog Devices, Inc. | 1,622,500 | 63,456 |
| Automatic Data Processing, Inc. | 2,000,000 | 115,580 |
| Google Inc., Class A1 | 43,900 | 29,842 |
| Hewlett-Packard Co. | 1,420,000 | 19,667 |
| Intel Corp. | 4,200,000 | 90,825 |
| International Business Machines Corp. | 550,000 | 106,991 |
| KLA-Tencor Corp. | 2,226,500 | 103,577 |
| Linear Technology Corp. | 2,900,000 | 90,654 |
| Maxim Integrated Products, Inc. | 9,466,400 | 260,563 |
| Microchip Technology Inc.1 | 1,500,000 | 47,025 |
| Microsoft Corp. | 17,431,598 | 497,411 |
| Oracle Corp. | 6,087,000 | 189,001 |
| Paychex, Inc. | 1,000,000 | 32,430 |
| Texas Instruments Inc. | 10,360,000 | 291,012 |
| Xilinx, Inc. | 688,400 | 22,552 |
| 1,988,466 | ||
| TELECOMMUNICATION SERVICES — 5.09% | ||
| AT&T Inc. | 11,785,600 | 407,664 |
| BCE Inc. | 1,000,000 | 43,660 |
| Verizon Communications Inc. | 15,743,900 | 702,808 |
| 1,154,132 | ||
| UTILITIES — 7.65% | ||
| Ameren Corp. | 1,660,000 | 54,581 |
| American Electric Power Co., Inc. | 1,435,000 | 63,771 |
| Dominion Resources, Inc. | 3,000,000 | 158,340 |
| DTE Energy Co. | 750,000 | 46,575 |
| Duke Energy Corp. | 5,046,180 | 331,484 |
| Exelon Corp. | 3,353,720 | 119,996 |
| FirstEnergy Corp. | 5,782,728 | 264,386 |
| PG&E Corp. | 7,575,390 | 322,106 |
| PPL Corp. | 1,000,000 | 29,580 |
| Public Service Enterprise Group Inc. | 3,755,000 | 120,310 |
| Questar Corp. | 420,000 | 8,501 |
| Southern Co. | 2,000,000 | 93,680 |
| Xcel Energy Inc. | 4,365,000 | 123,311 |
| 1,736,621 | ||
| MISCELLANEOUS — 3.45% | ||
| Other common stocks in initial period of acquisition | 783,446 | |
| Total common stocks (cost: $16,045,293,000) | $19,953,505 | |
| Value | ||
| Preferred stocks — 0.05% | (000) | |
| MISCELLANEOUS — 0.05% | ||
| Other preferred stocks in initial period of acquisition | $ 11,443 | |
| Total preferred stocks (cost: $10,004,000) | 11,443 | |
| Convertible securities — 0.14% | Shares | |
| UTILITIES — 0.14% | ||
| PPL Corp. 9.50% convertible preferred 2013, units | 600,000 | 32,598 |
| Total convertible securities (cost: $30,949,000) | 32,598 | |
| Principal amount | ||
| Bonds & notes — 2.70% | (000) | |
| ENERGY — 0.02% | ||
| Enbridge Energy Partners, LP 5.35% 2014 | $ 5,075 | 5,523 |
| CONSUMER DISCRETIONARY — 0.50% | ||
| Federated Department Stores, Inc. 7.45% 2017 | 20,000 | 24,810 |
| Staples, Inc. 9.75% 2014 | 81,450 | 89,496 |
| 114,306 | ||
| FINANCIALS — 1.76% | ||
| Allstate Life Global Funding Trust, Series 2008-4, 5.375% 2013 | 5,000 | 5,123 |
| American Express Co. 5.50% 2016 | 2,825 | 3,252 |
| American Express Co. 6.15% 2017 | 745 | 906 |
| Bank of America Corp., Series K, junior subordinated 8.00% noncumulative (undated)2 | 1,665 | 1,856 |
| Bank of America Corp., Series M, junior subordinated 8.125% noncumulative (undated)2 | 1,665 | 1,887 |
| Citigroup Inc. 6.125% 2017 | 5,000 | 5,935 |
| ERP Operating LP 5.125% 2016 | 2,400 | 2,699 |
| ERP Operating LP 5.375% 2016 | 6,455 | 7,382 |
| ERP Operating LP 5.75% 2017 | 39,855 | 47,141 |
| ERP Operating LP 6.584% 2015 | 3,500 | 3,960 |
| ERP Operating LP 7.125% 2017 | 5,000 | 6,109 |
| JPMorgan Chase & Co. 4.75% 2013 | 5,000 | 5,102 |
| JPMorgan Chase & Co., Series I, junior subordinated 7.90% (undated)2 | 123,654 | 142,935 |
| MetLife Global Funding I 5.125% 20143 | 3,000 | 3,213 |
| UDR, Inc., Series A, 5.25% 2015 | 5,000 | 5,419 |
| Wells Fargo & Co., Series K, junior subordinated 7.98% (undated)2 | 131,826 | 156,379 |
| 399,298 | ||
| TELECOMMUNICATION SERVICES — 0.12% | ||
| Verizon Communications Inc. 5.55% 2014 | 5,000 | 5,301 |
| Verizon Communications Inc. 8.50% 2018 | 15,000 | 20,926 |
| 26,227 | ||
| UTILITIES — 0.11% | ||
| FPL Group Capital, Inc. 7.875% 2015 | 20,000 | 24,093 |
| MORTGAGE-BACKED OBLIGATIONS4 — 0.07% | ||
| Fannie Mae 4.00% 2024 | 8,097 | 8,640 |
| Fannie Mae 4.50% 2024 | 7,849 | 8,448 |
| 17,088 | ||
| FEDERAL AGENCY BONDS & NOTES — 0.12% | ||
| Fannie Mae 2.50% 2014 | 25,775 | 26,645 |
| Total bonds & notes (cost: $517,141,000) | 613,180 | |
| Short-term securities — 9.22% | ||
| Coca-Cola Co. 0.20%–0.23% due 11/2/2012–2/6/20133 | 172,500 | 172,462 |
| E.I. duPont de Nemours and Co. 0.14%–0.18% due 11/19–12/11/20123 | 77,600 | 77,588 |
| Fannie Mae 0.11%–0.16% due 11/1/2012–3/4/2013 | 648,300 | 648,135 |
| Federal Farm Credit Banks 0.12%–0.19% due 11/8/2012–2/14/2013 | 119,500 | 119,475 |
| Federal Home Loan Bank 0.115%–0.155% due 11/14/2012–3/22/2013 | 130,600 | 130,565 |
| Freddie Mac 0.13%–0.18% due 11/14/2012–6/3/2013 | 303,258 | 303,084 |
| General Electric Co. 0.15% due 11/14/2012 | 27,900 | 27,898 |
| Medtronic Inc. 0.18% due 1/10/20133 | 29,600 | 29,587 |
| Paccar Financial Corp. 0.12% due 11/26/2012 | 17,900 | 17,898 |
| Private Export Funding Corp. 0.16% due 11/13/20123 | 35,000 | 34,997 |
| Procter & Gamble Co. 0.12%–0.16% due 11/30/2012–1/17/20133 | 70,000 | 69,984 |
| Straight-A Funding LLC 0.18% due 11/9–12/19/20123 | 102,200 | 102,185 |
| U.S. Treasury Bills 0.109%–0.195% due 11/15/2012–8/22/2013 | 245,600 | 245,489 |
| United Technologies Corp. 0.15% due 11/1–11/30/20123 | 65,700 | 65,698 |
| Variable Funding Capital Company LLC 0.16%–0.18% due 11/15/2012–1/14/20133 | 46,959 | 46,946 |
| Total short-term securities (cost: $2,091,954,000) | 2,091,991 | |
| Total investment securities (cost: $18,695,341,000) | 22,702,717 | |
| Other assets less liabilities | (8,656) | |
| Net assets | $22,694,061 |
As permitted by U.S. Securities and Exchange Commission regulations, “Miscellaneous” securities include holdings in their first year of acquisition that have not previously been publicly disclosed.
1Security did not produce income during the last 12 months.
2Coupon rate may change periodically.
3Acquired in a transaction exempt from registration under Rule 144A or section 4(2) of the Securities Act of 1933. May be resold in the U.S. in transactions
exempt from registration, normally to qualified institutional buyers. The total value of all such securities was $602,660,000, which represented 2.66% of the
net assets of the fund.
4Principal payments may be made periodically. Therefore, the effective maturity date may be earlier than the stated maturity date.
Key to abbreviation
ADR = American Depositary Receipts
Investments are not FDIC-insured, nor are they deposits of or guaranteed by a bank or any other entity, so they may lose value.
Investors should carefully consider investment objectives, risks, charges and expenses. This and other important information is contained in the fund prospectus and summary prospectus, which can be obtained from your financial professional and should be read carefully before investing. You may also call American Funds Service Company (AFS) at 800/421-4225 or visit the American Funds website at americanfunds.com.
MFGEFPX-003-1212O-S32866 |
REPORT OF INDEPENDENT REGISTERED PUBLIC ACCOUNTING FIRM ON INVESTMENT PORTFOLIO
To the Shareholders and Board of Trustees of
American Mutual Fund:
We have audited, in accordance with the standards of the Public Company Accounting Oversight Board (United States), the financial statements of American Mutual Fund (the “Fund”) as of October 31, 2012, and for the year then ended and have issued our report thereon dated December 7, 2012, which report and financial statements are included in Item 1 of this Certified Shareholder Report on Form N-CSR. Our audit also included the Fund’s investment portfolio (the “Schedule”) as of October 31, 2012, appearing in Item 6 of this Form N-CSR. This Schedule is the responsibility of the Fund’s management. Our responsibility is to express an opinion based on our audit. In our opinion, the Schedule referred to above, when considered in relation to the basic financial statements taken as a whole of the Fund referred to above, presents fairly, in all material respects, the information set forth therein.
DELOITTE & TOUCHE LLP
Costa Mesa, California
December 7, 2012
ITEM 7 – Disclosure of Proxy Voting Policies and Procedures for Closed-End Management Investment Companies
Not applicable to this Registrant, insofar as the Registrant is not a closed-end management investment company.
ITEM 8 – Portfolio Managers of Closed-End Management Investment Companies
Not applicable to this Registrant, insofar as the Registrant is not a closed-end management investment company.
ITEM 9 – Purchases of Equity Securities by Closed-End Management Investment Company and Affiliated Purchasers
Not applicable to this Registrant, insofar as the Registrant is not a closed-end management investment company.
ITEM 10 – Submission of Matters to a Vote of Security Holders
There have been no material changes to the procedures by which shareholders may recommend nominees to the Registrant’s board of trustees since the Registrant last submitted a proxy statement to its shareholders. The procedures are as follows. The Registrant has a nominating and governance committee comprised solely of persons who are not considered ‘‘interested persons’’ of the Registrant within the meaning of the Investment Company Act of 1940, as amended. The committee periodically reviews such issues as the board’s composition, responsibilities, committees, compensation and other relevant issues, and recommends any appropriate changes to the full board of trustees. While the committee normally is able to identify from its own resources an ample number of qualified candidates, it will consider shareholder suggestions of persons to be considered as nominees to fill future vacancies on the board. Such suggestions must be sent in writing to the nominating and governance committee of the Registrant, c/o the Registrant’s Secretary, and must be accompanied by complete biographical and occupational data on the prospective nominee, along with a written consent of the prospective nominee for consideration of his or her name by the nominating and governance committee.
ITEM 11 – Controls and Procedures
| (a) | The Registrant’s Principal Executive Officer and Principal Financial Officer have concluded, based on their evaluation of the Registrant’s disclosure controls and procedures (as such term is defined in Rule 30a-3 under the Investment Company Act of 1940), that such controls and procedures are adequate and reasonably designed to achieve the purposes described in paragraph (c) of such rule. |
| (b) | There were no changes in the Registrant’s internal controls over financial reporting (as defined in Rule 30a-3(d) under the Investment Company Act of 1940) that occurred during the Registrant’s second fiscal quarter of the period covered by this report that has materially affected, or is reasonably likely to materially affect, the Registrant’s internal control over financial reporting. |
ITEM 12 – Exhibits
| (a)(1) | The Code of Ethics that is the subject of the disclosure required by Item 2 is attached as an exhibit hereto. |
| (a)(2) | The certifications required by Rule 30a-2 of the Investment Company Act of 1940 and Sections 302 and 906 of the Sarbanes-Oxley Act of 2002 are attached as exhibits hereto. |
SIGNATURES
Pursuant to the requirements of the Securities Exchange Act of 1934 and the Investment Company Act of 1940, the Registrant has duly caused this report to be signed on its behalf by the undersigned, thereunto duly authorized.
| AMERICAN MUTUAL FUND | |
| By /s/ Paul F. Roye | |
Paul F. Roye, President and Principal Executive Officer | |
| Date: December 31, 2012 |
Pursuant to the requirements of the Securities Exchange Act of 1934 and the Investment Company Act of 1940, this report has been signed below by the following persons on behalf of the Registrant and in the capacities and on the dates indicated.
| By /s/ Paul F. Roye |
Paul F. Roye, President and Principal Executive Officer |
| Date: December 31, 2012 |
| By /s/ Ari M. Vinocor |
Ari M. Vinocor, Treasurer and Principal Financial Officer |
| Date: December 31, 2012 |