UNITED STATES
SECURITIES AND EXCHANGE COMMISSION
Washington, D.C. 20549
FORM N-CSR
Certified Shareholder Report of
Registered Management Investment Companies
Investment Company Act File Number: 811-00572
American Mutual Fund
(Exact Name of Registrant as Specified in Charter)
333 South Hope Street
Los Angeles, California 90071
(Address of Principal Executive Offices)
Registrant's telephone number, including area code: (213) 486-9200
Date of fiscal year end: October 31
Date of reporting period: October 31, 2015
Michael W. Stockton
American Mutual Fund
333 South Hope Street
Los Angeles, California 90071
(Name and Address of Agent for Service)
ITEM 1 – Reports to Stockholders
![]()
| The importance of doing well in down markets |
Special feature page 6
 | American Mutual Fund® Annual report for the year ended October 31, 2015 |
American Mutual Fund strives for the balanced accomplishment of three objectives: current income, growth of capital and conservation of principal.
This fund is one of more than 40 offered by one of the nation’s largest mutual fund families, American Funds, from Capital Group. For more than 80 years, Capital has invested with a long-term focus based on thorough research and attention to risk.
Fund results shown in this report, unless otherwise indicated, are for Class A shares at net asset value. If a sales charge (maximum 5.75%) had been deducted, the results would have been lower. Results are for past periods and are not predictive of results for future periods. Current and future results may be lower or higher than those shown. Share prices and returns will vary, so investors may lose money. Investing for short periods makes losses more likely. Investments are not FDIC-insured, nor are they deposits of or guaranteed by a bank or any other entity, so they may lose value. For current information and month-end results, visit americanfunds.com.
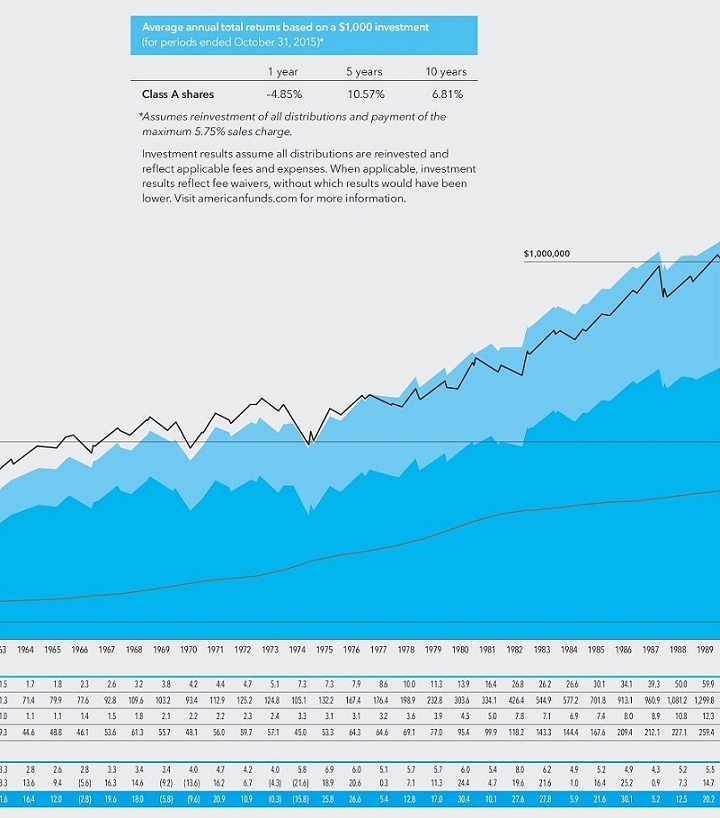
Here are the average annual total returns on a $1,000 investment with all distributions reinvested for periods ended September 30, 2015 (the most recent calendar quarter-end):
| Class A shares | 1 year | 5 years | 10 years | |||||||||
| Reflecting 5.75% maximum sales charge | –8.24 | % | 9.65 | % | 5.91 | % | ||||||
For other share class results, visit americanfunds.com and americanfundsretirement.com.
The total annual fund operating expense ratio is 0.58% for Class A shares as of the prospectus dated January 1, 2016 (unaudited).
Investment results assume all distributions are reinvested and reflect applicable fees and expenses. When applicable, investment results reflect fee waivers, without which results would have been lower. Visit americanfunds.com for more information.
The fund’s 30-day yield for Class A shares as of November 30, 2015, calculated in accordance with the U.S. Securities and Exchange Commission (SEC) formula, was 1.94%. The fund’s 12-month distribution rate for Class A shares as of that date was 1.94%. Both reflect the 5.75% maximum sales charge. The SEC yield reflects the rate at which the fund is earning income on its current portfolio of securities while the distribution rate reflects the fund’s past dividends paid to shareholders. Accordingly, the fund’s SEC yield and distribution rate may differ.
Refer to the fund prospectus and the Risk Factors section of this report for more information on risks associated with investing in the fund.

| Special feature | |
| 6 | Resilient returns: |
| The importance of doing well in down markets | |
| Contents | |
| 1 | Letter to investors |
| 3 | The value of a long-term perspective |
| 12 | Summary investment portfolio |
| 15 | Financial statements |
| 32 | Board of trustees and other officers |
The U.S. stock market posted gains for the fiscal year ended October 31, 2015, despite increased volatility amid the economic slowdown in China and uncertainty about the direction of interest rates. Investors were encouraged by generally positive economic readings in the U.S. and increased mergers-and-acquisitions activity, even as earnings growth slowed. With inflationary pressures subdued and markets likely to remain volatile, the U.S. Federal Reserve decided against raising interest rates, although it could still take action in the near future.
With the stock market rising during the period, American Mutual Fund had a total return of 0.96%. This trailed the 5.21% return for the unmanaged Standard & Poor’s 500 Composite Index, a market capitalization-weighted index based on the results of 500 widely held common stocks. It is not uncommon for AMF to lag the S&P 500 in a market environment of strong rising returns. The fund is managed conservatively and tends to do better in declining markets because dividend-paying companies are typically less volatile than the overall market and offer better downside protection (see the related feature starting on page 6).
Over longer periods of time, AMF’s returns have compared favorably to those of the S&P 500. For the past 10 years, the fund had an average annual total return of 7.44% compared with the index’s 7.84% return. For its 65-year lifetime, AMF has had an average annual total return of 11.62% compared with 11.25% for the S&P 500. The index is unmanaged and, therefore, has no expenses; investors cannot invest directly in an index.
Portfolio review
A number of consumer companies helped the fund’s results during the fiscal year. In the consumer staples sector, shares of Kraft Foods rose sharply after the company received a takeover offer from rival Heinz. The combined company, Kraft Heinz, is the third-largest food-and-beverage company in North America and the fifth largest worldwide. In the consumer discretionary sector, Home Depot benefited from strong earnings due to greater operating efficiencies, which management expects to continue to drive results. The home improvement retailer also increased its dividend as it takes a more disciplined approach to capital management.
Select holdings in the information technology sector also contributed to the fund’s returns. Shares of chip maker Texas Instruments benefited from robust quarterly earnings as the company demonstrated healthy sales growth and market share gains. Texas Instruments, a long-time holding in the fund and one of its largest, also continued to show a strong commitment to returning cash to shareholders through a dividend increase and share repurchases. Other semiconductor-related companies also contributed to returns, including Maxim Integrated Products.
The industrials sector was mixed, with defense contractor Lockheed Martin contributing to returns while railroad operators detracted. Shares of Lockheed Martin rose after the company revealed it was in advanced talks to buy helicopter maker Sikorsky Aircraft from rival United Technologies for $9 billion in an effort to consolidate its position as the Pentagon’s largest supplier of military equipment. In the rail industry, Union Pacific and Norfolk Southern declined as they contended with lower volumes for shipments of equipment and materials related to shale oil, coal and other commodities. The slump in oil prices hurt companies such as Chevron and Royal Dutch Shell, but they continue to pay healthy dividends. At current levels, we believe there is an attractive
| American Mutual Fund | 1 |
risk-reward trade-off in adding to our positions in some energy companies as oil prices gradually rebound.
In the health care sector, shares of AbbVie retreated amid concerns about the pharmaceutical firm’s dependence on rheumatoid arthritis drug Humira and expectations of growing competition from rivals. AbbVie, Amgen and other drug companies also came under pressure due to the high costs of certain drugs and strong policy positions from some U.S. presidential candidates. Despite these concerns, we believe this is a complex issue that will take time to work through and our long-term outlook for our biotechnology and pharmaceutical holdings remains intact. We continue to focus on companies that we believe offer adequately priced drugs and the most innovation, which is increasingly measured by patient outcomes.
Looking ahead
The U.S. economy continues to strengthen, albeit at a gradual pace, and shows no visible signs of excess. The unemployment rate has declined and real wages are slowly rising. However, concerns about global economic conditions have cast a shadow over an otherwise fairly positive outlook for the U.S. economy.
As a result, the Fed has decided to keep interest rates close to zero for now; it is expected to raise rates gradually in the near future, which would be unlikely to have a significant impact on the economy.
The combination of rising interest rates, the economic slowdown in China and geopolitical events in Europe and the Middle East could cause more volatility going forward. The recent market correction, however, has brought valuations down somewhat, which we believe is a positive development. While the market is still not cheap by historical standards, it’s at a more reasonable level than it was this summer. Many of the companies in which the fund invests are global in nature and could be impacted by events outside the U.S. (see related chart about The New Geography of Investing® on page 11).
AMF’s portfolio managers are primarily focused on companies that are increasing dividends as well as earnings. They are mindful to avoid those with high dividend yields and no earnings growth, which tend not to do as well when interest rates are rising. Dividend growth also sends a positive message about a company’s earnings and management’s willingness to share profits with investors instead of spending capital on acquisitions or share repurchases, which have a less impressive track record of benefiting shareholders.
We would like to remind our investors to keep in mind the three objectives of the fund: current income, growth of capital, and conservation of principal, which is especially important during a period of rising interest rates and higher valuations. We are pleased to report that the number of shareholder accounts in AMF has grown by 4.4% from a year ago. We would like to welcome our new shareholders and thank our long-term investors for their continued support.
Cordially,

Joyce E. Gordon
Vice Chairman

William L. Robbins
President
December 9, 2015
For current information about the fund, visit americanfunds.com.
Dividends paid in calendar year 2015
For tax purposes, here are the quarterly income dividends Class A shareholders received in calendar year 2015.
| Income dividends per share: | $0.185 paid 3/13/15 $0.185 paid 6/19/15 $0.185 paid 9/18/15 $0.185 to be paid on 12/18/15* |
The fund will also pay a special dividend from accumulated undistributed net income and a capital gain distribution on 12/18/15.*
| *Unaudited. |
Form 1099-DIV, which provides the information you will need to prepare your federal income tax return for 2015, will be mailed to you with your American Funds Tax Guide in late January 2016.
| 2 | American Mutual Fund |
The value of a long-term perspective
Fund results shown are for Class A shares and reflect deduction of the maximum sales charge of 5.75% on the $10,000 investment.1 Thus, the net amount invested was $9,425.2 Results are for past periods and are not predictive of results for future periods. Current and future results may be lower or higher than those shown. Share prices and returns will vary, so investors may lose money. For current information and month-end results, visit americanfunds.com.
The results shown are before taxes on fund distributions and sale of fund shares.
| 1 | As outlined in the prospectus, the sales charge is reduced for accounts (and aggregated investments) of $25,000 or more and is eliminated for purchases of $1 million or more. There is no sales charge on dividends or capital gain distributions that are reinvested in additional shares. |
| 2 | The maximum initial sales charge was 8.5% prior to July 1, 1988. |
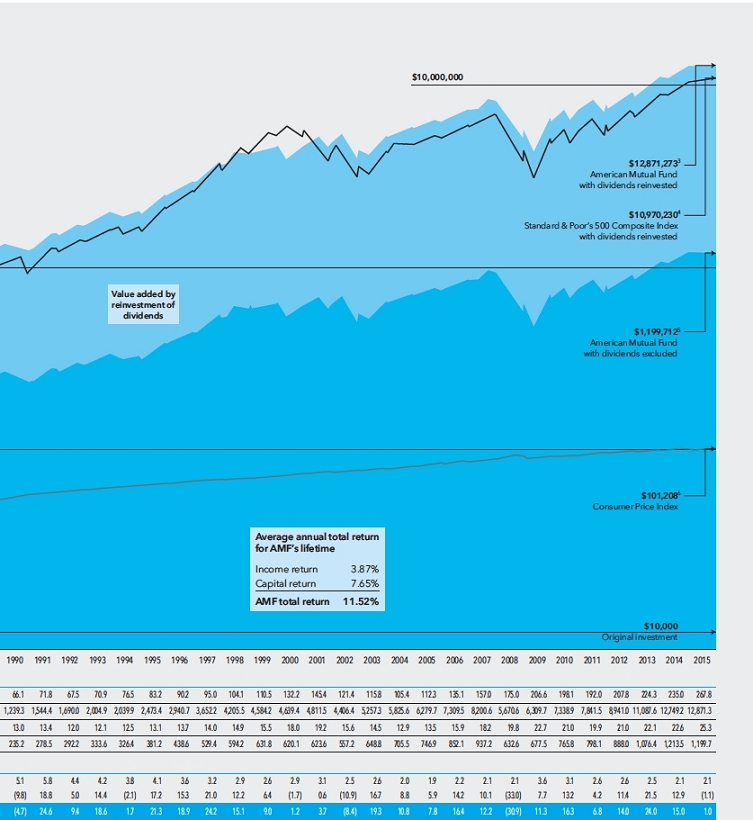
| 3 | Includes reinvested capital gain distributions totaling $4,418,654 in the years 1950–2015 and reinvested dividends. |
| 4 | The S&P 500 is unmanaged and, therefore, has no expenses. Investors cannot invest directly in an index. |
| 5 | Includes reinvested capital gain distributions taken in shares totaling $653,027 but does not reflect income dividends taken in cash. |
| 6 | Computed from data supplied by the U.S. Department of Labor, Bureau of Labor Statistics. It would take $101,208 to buy today what $10,000 bought when the fund began. |
| 7 | For the period February 21, 1950 (commencement of operations), through October 31, 1950. |
| 8 | Includes special dividends of $1,691 in 1974, $989 in 1975, $7,524 in 1982, $3,967 in 1983, $6,064 in 1988, $9,850 in 1989, $9,497 in 1990, $8,996 in 1991, $32,002 in 2009, $20,477 in 2010, $8,128 in 2011, $12,961 in 2012, $13,600 in 2013, $3,235 for 2014 and $10,105 for 2015. |
| 9 | Includes special dividends of $746 in 1974, $407 in 1975, $2,251 in 1982, $1,099 in 1983, $1,339 in 1988, $2,069 in 1989, $1,895 in 1990, $1,707 in 1991, $3,570 in 2009, $2,199 in 2010, $848 in 2011, $1,319 in 2012, $1,351 in 2013, $314 for 2014 and $962 for 2015. |
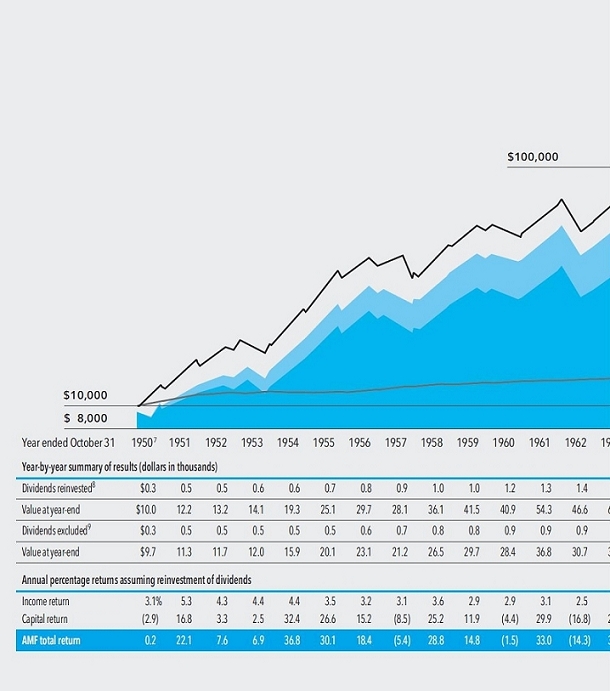
For more than 65 years, American Mutual Fund has been providing investors with an opportunity to achieve their financial goals. A meaningful way to compare the fund’s results with the return on other investments is through its total return.
Total return is a combination of income return and capital return. This chart illustrates an assumed $10,000 investment in American Mutual Fund from February 21, 1950 — commencement of operations — through October 31, 2015. The table beneath the chart shows the fund’s total return in each of the 65 fiscal years, broken down into its income and capital components.
As you can see, during this period a $10,000 investment in the fund, with all dividends reinvested, would have grown to $12,871,273.3
Use the table below to estimate the growth of your investment. Let’s say that you have been reinvesting all your dividends and want to know how your investment has done since the end of fiscal 2005. As the table shows, the value of the investment illustrated here was $6.3 million. Since then, it has grown to $12.9 million. Thus, in the same period, the value of your 2005 investment — regardless of its size — also has grown.
| American Mutual Fund | 3 |
| 4 | American Mutual Fund |
| American Mutual Fund | 5 |

Resilient returns:
The importance of doing
well in down markets
The stock market correction over the summer offered an important reminder to investors of why they invested in a fund like AMF. The resilience of American Mutual Fund through this short period is exemplary of the fund’s track record during other longer market declines. Over time, this has allowed the fund to provide its investors with superior long-term results with less volatility.
| 6 | American Mutual Fund |
During the recent market correction, the Standard & Poor’s Composite 500 Index declined 12.1% between July 20 and August 25, while AMF fell 10.4% during that period. This may not seem like much of a difference over such a short period of time, but it offers a key insight into one of the fund’s secrets to long-term success: consistently doing well in down markets.
“It is important for AMF to provide superior returns over the course of various market cycles,” says president and portfolio manager Will Robbins, noting that because of the type of stable, high-quality companies in which the fund invests, it has tended to lag the S&P 500 in big up markets, but make up for it in down markets. “Unfortunately, a lot of people get scared out of the market during downturns. In order for our investors to benefit from market recoveries, we have to reassure them so that they will remain invested.”
Portfolio manager Dylan Yolles reminds investors that the math of losing money in the stock market is another reason to protect on the downside. “When a stock goes down 50%, investors have to double their money just to get back where they were, so the math alone makes it hard to recover from a large decline,” Dylan points out. “Equity markets have tended to go up over long periods of time, benefiting our investors, but it’s hard to get there if we lose money during a big market decline. Many of our investors are looking for lower market volatility over the long term, and it’s easier to stay invested when they experience less downside.”
Providing downside protection
So just how do the portfolio managers of AMF go about trying to protect investors’ assets during down markets? It begins with the fund’s eligibility list. To even be considered for AMF, a company has to meet several key criteria: it must be rated investment-grade and have a conservative balance sheet, be a market leader in its industry, and pay a dividend or plan to in the near future (there are some exceptions for companies that exhibit the characteristics of a dividend payer but choose not to for some reason).
“While we always start with the eligibility list, we try to be diversified by investing in a mix of companies across different sectors,” says portfolio manager Joyce Gordon, who also serves as vice chairman of AMF. “Most of the companies in which the fund invests have stable earnings that are growing, but some are more value oriented. We always pay attention to valuation and make sure we’re not paying high prices for more cyclical companies. We look for those with a decent starting yield, which puts a floor on the stock price if the market goes down.”
True to The Capital System,SM each manager has his or her own style of investing when it comes to deciding which eligible companies they will actually add to their portfolios. For his part, once a company meets the eligibility requirements of the fund, Dylan likes to focus on those that have relatively depressed valuations, since much of the downside would already be reflected in the stock price. He cites two examples in his portfolio: agricultural company Monsanto and consumer products giant Procter & Gamble, which he calls a more traditional investment for AMF.
“I believe Monsanto is well positioned for the long term because it provides products the world needs to satisfy the demand for food over a multiyear period, but the company is unloved by the market right now because crop prices are weak,” says Dylan, adding that Monsanto is also being hurt by its exposure to Brazil, which has a weak economy and currency. The company’s dividend yield is 2.2%, which he expects will continue to increase as earnings grow. P&G has a dividend yield of 3.5% and is a more traditional defensive company for a down market. But on top of that, Dylan points to its new CEO and ongoing cost-cutting program, including

“Unfortunately, a lot of people get scared out of the market during downturns. In order for our investors to benefit from market recoveries, we have to reassure them so that they will remain invested.”
Will Robbins
President and Portfolio Manager

Joyce Gordon
Vice Chairman and Portfolio Manager
Fund results shown are for Class A shares at net asset value. If a sales charge (maximum 5.75%) had been deducted, the results would have been lower. Results are for past periods and are not predictive of results for future periods. Current and future results may be lower or higher than those shown. Share prices and returns will vary, so investors may lose money. For current information and month-end results, visit americanfunds.com.
| American Mutual Fund | 7 |
No market decline is the same
Over the past 15 years, there have been three market declines in which the Standard & Poor’s 500 Composite Index declined by more than 15%.* While each decline was triggered by different factors, American Mutual Fund fared better than the S&P 500 during each period.
The fund’s best comparison by far was during the so-called dot-com crash, when the bubble that had developed in technology stocks burst. Between March 2000 and October 2002, the S&P 500 tumbled 47.4% versus a decline of just 7.1% for AMF. The primary reason the fund did so much better than the market was because it invested in companies that paid dividends, which most of the technology, media and telecom (TMT) firms did not pay at the time.
“Each bear market is different — the conditions can range from economic recession, resulting in lower earnings and share prices, to market bubbles in different sectors,” says portfolio manager James Terrile. “The tech bubble was a unique time in history, with the dramatic explosion of TMT companies. Since the S&P 500 is market weighted, those stocks became the largest members of the index. As a result, index funds had to buy them and it became a self-fulfilling prophecy. Once the fundamentals rolled over, valuations crashed.”
As portfolio manager Jim Lovelace notes, it’s important to remember that in the year or two leading up to the dot-com crash, investors were selling shares of dividend-paying companies to buy technology stocks. As a result, funds like AMF did not do as well.
“A lot of value-oriented funds threw in the towel and followed the tech companies,” Jim says. “But not AMF, which held true to its original mandate, and it paid off. Dividend strategies did very well after the tech bubble burst —at least until about 2007, when the banks started to run into trouble.”
While the dot-com crash was a result of a technology bubble, the financial crisis from 2007 to 2009 started with a bubble in the U.S. housing market. However, it spread well beyond that, roiling the entire global financial system. Banks and other financial companies were at the heart of the crisis, and as their share prices tumbled, many were forced to cut dividends, if they even survived at all. Until that point, financials had been a key source of dividends, and many
How American Mutual Fund has fared during market declines*
Total returns for AMF and the S&P 500 (assumes monthly reinvestment of dividends for the S&P 500)
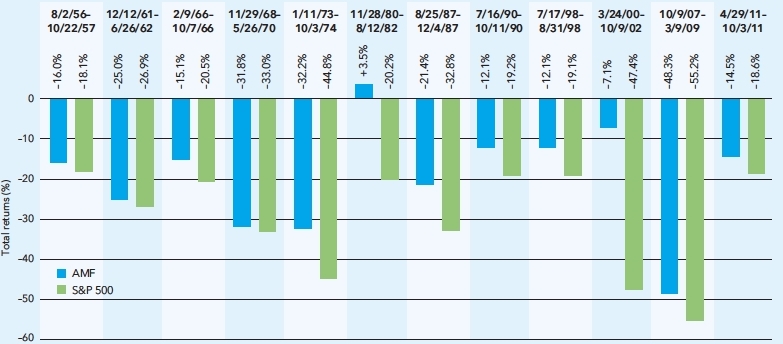
| * | Major stock market declines are based on price declines of 15% or more (without dividends reinvested) in the unmanaged S&P 500 with 100% recovery between declines (except for a 77% recovery between 3/9/09 and 4/29/11). There have been periods in which the fund has lagged the S&P 500, particularly in strong markets. |
| 8 | American Mutual Fund |
were held in the fund. As the financial crisis spread, global markets declined across the board and no sector was spared. Not surprisingly, most funds did not fare well, including AMF, although it still did better than the S&P 500 (see chart on page 8).
“The whole system was at risk — the entire financial market was breaking down and everything else went down with it in lock step,” recalls Jim. “There is always danger in hindsight, and while the investment business is all about uncertainty, we came out of the financial crisis with a greater sense of conservatism and understanding that things like that can still happen. With fewer banks paying dividends since the financial crisis, it’s been a tougher period for high-yielding sectors.”
The most recent major market decline occurred in 2011 and unlike the previous two that were bubble-related, it was driven more by macroeconomic factors. Specifically, high levels of government debt in the euro zone, especially in peripheral countries such as Greece, put investors on edge. Again, banks and other financial companies were hit the hardest — most notably those with ties to Europe — but since many were still not paying dividends and AMF focuses on U.S. companies, the fund fared better than the market.
“Each period is so unique, you never know what the next one is going to look like,” says portfolio manager Joyce Gordon, the principal investment officer for AMF. “The most recent market downturn in 2011 was probably the most normal of the three. The other two were almost exact opposites — in 2008, everything went down and we were in the eye of the storm with financials; in 2000, the fund did well because we were not invested in the TMT stocks that went down since they didn’t pay dividends. It’s not that we were that much smarter than the market, but the fund by default was not invested in that area.”
the sale of some beauty brands over the summer. He expects the company to benefit as it continues to streamline.
Jim Lovelace, another portfolio manager on the fund, uses the eligibility list as a starting point, and then tries to avoid investing in speculative situations as a way to protect on the downside. After that, his focus is on the income a company provides as a way to tamp down volatility and risk. “The nice thing about a dividend is that it’s always additive to total return, whether a company’s share price goes up or down,” says Jim. “Companies that pay out more of their earnings in dividends tend to be more stable stocks.”
In fact, research has shown that equity-income funds like AMF that tend to be more dividend-oriented have provided better downside protection. This finding makes sense as dividend payers (and especially dividend growers) have tended to be less volatile. Because a greater part of their total return comes in the form of cash, they have tended to be less affected by gyrations in broader equity market prices than companies that pay little or no dividends.
But, as Will points out, there is not necessarily a linear relationship between dividend yield and downside protection. “There are some higher yielding companies that can have more downside risk because they might cut their dividends,” he says. “It’s not so much about a company’s yield as an indicator of downside protection but whether it pays a dividend at all. I care less about a company’s yield than I do about holding management accountable for their capital allocation and making sure they pay a dividend. That being said, I tend to look for companies that are growing dividends.”
Weighing all the scenarios
While the eligibility list helps the fund manage for downside risk as a whole, the portfolio managers also like to look at each potential investment on an individual basis. One way of doing this is by weighing the different scenarios for each company and assigning a probability to each one. The bar is set high for AMF, given the conservative nature of the fund and its objective of capital preservation.
“For each investment, we work with the analysts to determine a company’s downside risk,” explains Will. “What would have to happen for the stock to go down by 30%? We want to know what the downside scenario looks like and why it would go down — then we can put our own probability on that scenario occurring. What would have to happen to make it not meet our requirement for the fund? If it seems likely, then we won’t make the investment.”
Likewise, if the downside scenario looks unlikely, the investment may be a good fit for the fund. This is the case with some energy companies right now. With the current price of oil, Will says he cannot envision a scenario in which the commodity would trade significantly lower. “Energy is arguably becoming a sector that provides downside protection, whereas it hasn’t in the past,” he notes. “Companies are cutting their capital expenditures and management teams are being more realistic about how they are planning for investments and what price assumptions they are using. Furthermore, several long-term projects are coming online, improving production for some energy companies.”
Portfolio manager James Terrile takes a similar approach, although he is more focused on other sectors, such as health care and telecommunication services.
![]()
Dylan Yolles
Portfolio Manager

James Terrile
Portfolio Manager
| American Mutual Fund | 9 |

“The nice thing about a dividend is that it’s always additive to total return, whether a company’s share price goes up or down. Companies that pay out more of their earnings in dividends tend to be more stable stocks.”
Jim Lovelace
Portfolio Manager
After looking at the fundamentals of a company, James uses that information to build best-, worst- and most-likely case scenarios to determine how much it is worth. “For each case, I set a price on the stock, then look at where it is now to define what a company is worth. If I’m confident in our analysis, I’ll allocate heavily,” he states. “Valuation is critical, but you have to look at the fundamentals first. I think it makes you more insightful rather than less decisive if the scenarios are realistic, even if some aren’t likely.”
Telecommunication services is one area where James feels there is significantly more upside and very little downside. Two companies in particular, AT&T and Verizon Communications (among the fund’s largest holdings), are trading at low valuations and have strong dividend yields around 5%. “When you think about the equation of preserving capital, a low relative valuation and high starting yield are two of the first things that come to mind,” he says. Shares of AT&T and Verizon have come under pressure as the companies face price competition from smaller rivals Sprint and T-Mobile, as well as companies like Apple and Google that could try to offer mobile services. However, James and other portfolio managers feel these threats are minimal and unlikely to have a long-term impact on AT&T and Verizon, which may very well benefit from further industry consolidation in the future.
Past, present and future
Investing with downside protection in mind has served the investors of AMF well in the past, and the portfolio managers believe it will continue to do so in the future. Since the fund’s inception in 1950, it has held up better than the S&P 500 in all major stock market declines (see chart on page 8 and related sidebar for more information on how the fund did in the three most recent declines).
The fund is currently invested in several areas of the market that have offered downside protection, from consumer staples (Coca-Cola and Kraft Heinz) to health care (Amgen and AbbVie). Select investments in other sectors also have the potential to do well in down markets, including defense contractor Lockheed Martin and semiconductor company
Favorable returns with less volatility
American Mutual Fund strives to meet its objectives. If we look back 10 years, as shown below, AMF has provided comparable or higher returns than those of its three benchmarks. The fund has been able to accomplish this with lower volatility than its benchmarks.
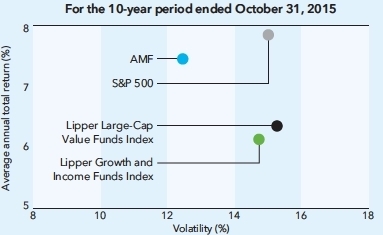
| Average annual total return | Volatility | |||||||
| AMF | 7.44 | % | 12.45 | % | ||||
| Lipper Growth and Income Funds Index | 6.13 | 14.72 | ||||||
| Lipper Large-Cap Value Funds Index | 6.35 | 15.26 | ||||||
| S&P 500 | 7.84 | 15.00 | ||||||
Volatility is calculated at net asset value by Lipper using annualized standard deviation (based on monthly returns). It is a common measure of absolute volatility that shows how returns over time have varied from the mean; a lower number signifies lower volatility. Standard & Poor’s 500 Composite Index is an index of 500 large-company stocks selected to represent the stock market. It is unmanaged and, therefore, has no expenses. Investors cannot invest directly in an index. The Lipper Large-Cap Value Funds Index is an equally weighted index of the 30 largest mutual funds that invest at least 75% of their equity assets in companies with market capitalizations (on a three-year weighted basis) above Lipper’s U.S. Domestic Equity large-cap floor. The Lipper Growth and Income Funds Index is an equally weighted index of the 30 largest mutual funds that combine a growth orientation with the pursuit of income.
| 10 | American Mutual Fund |
Texas Instruments. “It speaks to having a diversified portfolio,” says Joyce. “It’s up to each portfolio manager what they want to do — some are fairly cautious all of the time while others are cautious when something is on the horizon.”
The recent market correction was sparked by concerns about slowing growth in China as well as the prospect of rising interest rates in the U.S. While these are cause for concern, the portfolio managers of AMF believe the fund is well positioned for any macroeconomic environment. “We don’t know what is going to happen, but we have a fundamental belief that the world is full of attractive investment opportunities,” states Will. “Many of the multinational companies in which we’re invested have a competitive advantage that allows them to perform well regardless of macro factors.”
Regardless of what happens with interest rates, the fund’s focus on companies that pay and grow dividends should serve it well. “Sectors like consumer staples and utilities in which the fund is invested should offer protection in a down market, because interest rates are unlikely to go up in a recessionary environment,” says Dylan. “If interest rates do increase, I think several companies held in AMF will do well because that could mean the economy is improving.”
In fact, research has shown that companies that offer an above-average current dividend yield but also grow their dividends and earnings at a meaningful rate have tended to fare better in a period of potentially rising interest rates that often has resulted in a down market. Even companies that offer a high yield but haven’t grown their dividends have tended to do less well than dividend growers when interest rates are rising.
“The initial period of rising interest rates, which usually reflects a strong economy, tends to be relatively good for stocks overall,” notes Jim. “One way to avoid the risk of rising interest rates is to invest in companies that have some dividend growth, because that distinguishes those stocks from the bond market. They may get hit in the short term as rates start to rise, but we believe these companies will make it back stronger just by virtue of growing their dividends.” n

The New Geography of Investing®
Where a company does business can be more important than where it’s located. Here’s a look at American Mutual Fund’s portfolio in terms of where its equity holdings earn their revenue. The charts below show the countries and regions in which the fund’s equity investments are located, and where the revenue comes from.
Equity portion breakdown by domicile (%)

| Region | Fund | Index | |||||||
| n | United States | 92 | % | 100 | % | ||||
| n | Canada | 5 | — | ||||||
| n | Europe | 3 | — | ||||||
| n | Japan | — | — | ||||||
| n | Asia-Pacific ex. Japan | — | — | ||||||
| n | Emerging markets | — | — | ||||||
| Total | 100 | % | 100 | % | |||||
Equity portion breakdown by revenue (%)
| Region | Fund | Index | |||||||
| n | United States | 61 | % | 62 | % | ||||
| n | Canada | 5 | 2 | ||||||
| n | Europe | 12 | 13 | ||||||
| n | Japan | 2 | 3 | ||||||
| n | Asia-Pacific ex. Japan | 2 | 1 | ||||||
| n | Emerging markets | 18 | 19 | ||||||
| Total | 100 | % | 100 | % | |||||
Compared with the S&P 500 Index as a percentage of net assets. All figures include convertible securities.
Source: Capital Group (as of September 30, 2015).
| American Mutual Fund | 11 |
Summary investment portfolio October 31, 2015
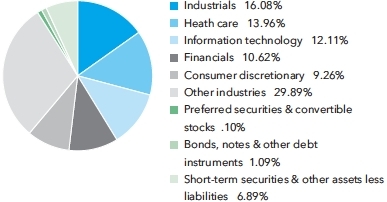
| Industry sector diversification | Percent of net assets |
| Common stocks 91.92% | Shares | Value (000) | ||||||
| Energy 5.75% | ||||||||
| Chevron Corp. | 4,062,400 | $ | 369,191 | |||||
| ConocoPhillips | 6,346,025 | 338,560 | ||||||
| Other securities | 1,341,717 | |||||||
| 2,049,468 | ||||||||
| Materials 4.21% | ||||||||
| Agrium Inc. | 2,795,000 | 260,131 | ||||||
| Monsanto Co. | 2,567,900 | 239,380 | ||||||
| Praxair, Inc. | 2,809,924 | 312,154 | ||||||
| Other securities | 688,490 | |||||||
| 1,500,155 | ||||||||
| Industrials 16.08% | ||||||||
| 3M Co. | 1,515,000 | 238,173 | ||||||
| Boeing Co. | 3,095,600 | 458,365 | ||||||
| CSX Corp. | 10,217,193 | 275,762 | ||||||
| Cummins Inc. | 2,228,399 | 230,662 | ||||||
| General Dynamics Corp. | 2,541,164 | 377,566 | ||||||
| General Electric Co. | 18,986,585 | 549,092 | ||||||
| Lockheed Martin Corp. | 2,548,460 | 560,228 | ||||||
| Norfolk Southern Corp. | 4,118,400 | 329,596 | ||||||
| Union Pacific Corp. | 4,842,200 | 432,651 | ||||||
| United Parcel Service, Inc., Class B | 2,914,300 | 300,231 | ||||||
| United Technologies Corp. | 2,823,174 | 277,829 | ||||||
| Waste Management, Inc. | 7,678,100 | 412,775 | ||||||
| Other securities | 1,289,838 | |||||||
| 5,732,768 | ||||||||
| Consumer discretionary 9.26% | ||||||||
| Carnival Corp., units | 6,244,100 | 337,681 | ||||||
| Home Depot, Inc. | 5,456,052 | 674,586 | ||||||
| Johnson Controls, Inc. | 5,538,380 | 250,224 | ||||||
| McDonald’s Corp. | 3,064,000 | 343,934 | ||||||
| Newell Rubbermaid Inc. | 6,893,200 | 292,479 | ||||||
| Other securities | 1,399,666 | |||||||
| 3,298,570 | ||||||||
| Consumer staples 7.32% | ||||||||
| Coca-Cola Co. | 14,029,900 | 594,166 | ||||||
| Procter & Gamble Co. | 7,473,400 | 570,818 | ||||||
| Other securities | 1,445,565 | |||||||
| 2,610,549 | ||||||||
| 12 | American Mutual Fund |
| Shares | Value (000) | |||||||
| Health care 13.96% | ||||||||
| AbbVie Inc. | 17,325,800 | $ | 1,031,751 | |||||
| Amgen Inc. | 7,764,272 | 1,228,153 | ||||||
| Johnson & Johnson | 2,745,000 | 277,327 | ||||||
| Medtronic PLC | 4,435,500 | 327,872 | ||||||
| Merck & Co., Inc. | 7,177,485 | 392,321 | ||||||
| Novartis AG (ADR) | 3,014,000 | 272,556 | ||||||
| Pfizer Inc. | 10,459,100 | 353,727 | ||||||
| Other securities | 1,091,540 | |||||||
| 4,975,247 | ||||||||
| Financials 10.62% | ||||||||
| JPMorgan Chase & Co. | 4,312,400 | 277,072 | ||||||
| Marsh & McLennan Companies, Inc. | 4,296,394 | 239,481 | ||||||
| Principal Financial Group, Inc. | 5,500,000 | 275,880 | ||||||
| U.S. Bancorp | 6,400,000 | 269,952 | ||||||
| Wells Fargo & Co. | 5,593,000 | 302,805 | ||||||
| Other securities | 2,418,839 | |||||||
| 3,784,029 | ||||||||
| Information technology 12.11% | ||||||||
| Apple Inc. | 2,762,025 | 330,062 | ||||||
| Automatic Data Processing, Inc. | 2,923,300 | 254,298 | ||||||
| Cisco Systems, Inc. | 10,518,900 | 303,470 | ||||||
| Intel Corp. | 10,185,000 | 344,864 | ||||||
| Microsoft Corp. | 15,925,607 | 838,324 | ||||||
| Oracle Corp. | 6,814,657 | 264,681 | ||||||
| Texas Instruments Inc. | 18,311,644 | 1,038,636 | ||||||
| Other securities | 940,280 | |||||||
| 4,314,615 | ||||||||
| Telecommunication services 6.10% | ||||||||
| AT&T Inc. | 16,866,000 | 565,180 | ||||||
| Verizon Communications Inc. | 30,491,814 | 1,429,456 | ||||||
| Other securities | 178,041 | |||||||
| 2,172,677 | ||||||||
| Utilities 4.82% | ||||||||
| Exelon Corp. | 11,121,885 | 310,523 | ||||||
| PG&E Corp. | 4,825,000 | 257,655 | ||||||
| Sempra Energy | 5,396,653 | 552,671 | ||||||
| Other securities | 598,700 | |||||||
| 1,719,549 | ||||||||
| Miscellaneous 1.69% | ||||||||
| Other common stocks in initial period of acquisition | 601,393 | |||||||
| Total common stocks (cost: $23,840,219,000) | 32,759,020 | |||||||
| Preferred securities 0.03% | ||||||||
| Financials 0.03% | ||||||||
| Other securities | 11,215 | |||||||
| Total preferred securities (cost: $10,004,000) | 11,215 | |||||||
| Convertible stocks 0.07% | ||||||||
| Utilities 0.07% | ||||||||
| Other securities | 25,056 | |||||||
| Total convertible stocks (cost: $30,049,000) | 25,056 | |||||||
| American Mutual Fund | 13 |
| Bonds, notes & other debt instruments 1.09% | Principal amount (000) | Value (000) | ||||||
| Corporate bonds & notes 0.81% | ||||||||
| Financials 0.77% | ||||||||
| JPMorgan Chase & Co., Series I, junior subordinated 7.90% (undated) | $ | 116,654 | $ | 121,350 | ||||
| Wells Fargo & Co., Series K, junior subordinated 7.98% (undated) | 115,445 | 123,093 | ||||||
| Other securities | 27,422 | |||||||
| 271,865 | ||||||||
| Utilities 0.04% | ||||||||
| Other securities | 15,124 | |||||||
| Total corporate bonds & notes | 286,989 | |||||||
| U.S. Treasury bonds & notes 0.28% | ||||||||
| Other securities | 100,281 | |||||||
| Total bonds, notes & other debt instruments (cost: $359,234,000) | 387,270 | |||||||
| Short-term securities 7.39% | ||||||||
| Apple Inc. 0.16% due 1/15/20161 | 27,300 | 27,288 | ||||||
| Chariot Funding, LLC 0.32% due 11/18/20151 | 25,000 | 24,998 | ||||||
| Chevron Corp. 0.14%–0.19% due 11/2/2015–1/12/20161 | 95,000 | 94,981 | ||||||
| Federal Home Loan Bank 0.07%–0.23% due 11/2/2015–3/1/2016 | 1,050,500 | 1,050,258 | ||||||
| Freddie Mac 0.12%–0.23% due 11/16/2015–3/7/2016 | 356,000 | 355,857 | ||||||
| General Electric Capital Corp. 0.27% due 11/19/2015 | 50,000 | 49,997 | ||||||
| General Electric Co. 0.12%–0.13% due 11/13/2015–12/7/2015 | 90,000 | 89,990 | ||||||
| Jupiter Securitization Co., LLC 0.39% due 12/10/20151 | 49,200 | 49,188 | ||||||
| Microsoft Corp. 0.16%–0.18% due 11/4/2015–12/9/20151 | 100,000 | 99,995 | ||||||
| Other securities | 792,500 | |||||||
| Total short-term securities (cost: $2,634,979,000) | 2,635,052 | |||||||
| Total investment securities 100.50% (cost: $26,874,485,000) | 35,817,613 | |||||||
| Other assets less liabilities (0.50)% | (176,491 | ) | ||||||
| Net assets 100.00% | $ | 35,641,122 | ||||||
This summary investment portfolio is designed to streamline the report and help investors better focus on the fund’s principal holdings. See the inside back cover for details on how to obtain a complete schedule of portfolio holdings.
As permitted by U.S. Securities and Exchange Commission regulations, “Miscellaneous” securities include holdings in their first year of acquisition that have not previously been publicly disclosed.
“Other securities” includes all issues that are not disclosed separately in the summary investment portfolio, including one security which was valued under fair value procedures adopted by authority of the board of trustees. The total value of this security which was valued under fair value procedures, was $73,228,000, which represented .21% of the net assets of the fund. This entire amount relates to certain securities trading outside the U.S. whose values were adjusted as a result of significant market movements following the close of local trading.
The following footnote applies to either the individual securities noted or one or more of the securities aggregated and listed as a single line item.
| 1 | Acquired in a transaction exempt from registration under Section 4(2) of the Securities Act of 1933. May be resold in the U.S. in transactions exempt from registration, normally to qualified institutional buyers. The total value of all such securities, including those in “Other securities,” was $539,118,000, which represented 1.51% of the net assets of the fund. |
Key to abbreviation
ADR = American Depositary Receipts
See Notes to Financial Statements
| 14 | American Mutual Fund |
Statement of assets and liabilities
| at October 31, 2015 | (dollars in thousands) |
| Assets: | ||||||||
| Investment securities, at value (cost: $26,874,485) | $ | 35,817,613 | ||||||
| Cash denominated in currencies other than U.S. dollars (cost: $1,654) | 1,654 | |||||||
| Cash | 2,643 | |||||||
| Receivables for: | ||||||||
| Sales of investments | $ | 38,647 | ||||||
| Sales of fund’s shares | 32,400 | |||||||
| Dividends and interest | 75,720 | |||||||
| Other | 44 | 146,811 | ||||||
| 35,968,721 | ||||||||
| Liabilities: | ||||||||
| Payables for: | ||||||||
| Purchases of investments | 39,831 | |||||||
| Repurchases of fund’s shares | 267,774 | |||||||
| Investment advisory services | 7,217 | |||||||
| Services provided by related parties | 9,629 | |||||||
| Trustees’ deferred compensation | 2,625 | |||||||
| Other | 523 | 327,599 | ||||||
| Net assets at October 31, 2015 | $ | 35,641,122 | ||||||
| Net assets consist of: | ||||||||
| Capital paid in on shares of beneficial interest | $ | 25,074,031 | ||||||
| Undistributed net investment income | 91,375 | |||||||
| Undistributed net realized gain | 1,532,587 | |||||||
| Net unrealized appreciation | 8,943,129 | |||||||
| Net assets at October 31, 2015 | $ | 35,641,122 | ||||||
(dollars and shares in thousands, except per-share amounts)
| Shares of beneficial interest issued and outstanding (no stated par value) – unlimited shares authorized (986,090 total shares outstanding) | ||||||||||||
| Shares | Net asset value | |||||||||||
| Net assets | outstanding | per share | ||||||||||
| Class A | $ | 22,281,858 | 615,945 | $ | 36.18 | |||||||
| Class B | 54,815 | 1,526 | 35.92 | |||||||||
| Class C | 1,135,082 | 31,774 | 35.72 | |||||||||
| Class F-1 | 1,374,441 | 38,139 | 36.04 | |||||||||
| Class F-2 | 2,271,860 | 62,809 | 36.17 | |||||||||
| Class 529-A | 709,000 | 19,639 | 36.10 | |||||||||
| Class 529-B | 5,956 | 165 | 36.04 | |||||||||
| Class 529-C | 175,937 | 4,899 | 35.91 | |||||||||
| Class 529-E | 35,696 | 992 | 35.97 | |||||||||
| Class 529-F-1 | 54,237 | 1,500 | 36.15 | |||||||||
| Class R-1 | 71,974 | 2,009 | 35.83 | |||||||||
| Class R-2 | 243,120 | 6,790 | 35.81 | |||||||||
| Class R-2E | 33 | 1 | 36.13 | |||||||||
| Class R-3 | 610,533 | 16,993 | 35.93 | |||||||||
| Class R-4 | 757,297 | 20,996 | 36.07 | |||||||||
| Class R-5 | 249,986 | 6,910 | 36.18 | |||||||||
| Class R-6 | 5,609,297 | 155,003 | 36.19 | |||||||||
See Notes to Financial Statements
| American Mutual Fund | 15 |
Statement of operations
| for the year ended October 31, 2015 | (dollars in thousands) |
| Investment income: | ||||||||
| Income: | ||||||||
| Dividends (net of non-U.S. taxes of $13,597) | $ | 950,073 | ||||||
| Interest | 29,103 | $ | 979,176 | |||||
| Fees and expenses*: | ||||||||
| Investment advisory services | 87,249 | |||||||
| Distribution services | 81,299 | |||||||
| Transfer agent services | 27,491 | |||||||
| Administrative services | 8,960 | |||||||
| Reports to shareholders | 1,080 | |||||||
| Registration statement and prospectus | 1,165 | |||||||
| Trustees’ compensation | 298 | |||||||
| Auditing and legal | 140 | |||||||
| Custodian | 375 | |||||||
| Other | 1,006 | |||||||
| Total fees and expenses before waiver | 209,063 | |||||||
| Less investment advisory services waiver | 22 | |||||||
| Total fees and expenses after waiver | 209,041 | |||||||
| Net investment income | 770,135 | |||||||
| Net realized gain and unrealized depreciation: | ||||||||
| Net realized gain (loss) on: | ||||||||
| Investments | 1,625,687 | |||||||
| Currency transactions | (455 | ) | 1,625,232 | |||||
| Net unrealized (depreciation) appreciation on: | ||||||||
| Investments | (2,068,091 | ) | ||||||
| Currency translations | 1 | (2,068,090 | ) | |||||
| Net realized gain and unrealized depreciation | (442,858 | ) | ||||||
| Net increase in net assets resulting from operations | $ | 327,277 | ||||||
*Additional information related to class-specific fees and expenses is included in the Notes to Financial Statements.
Statements of changes in net assets
| (dollars in thousands) | ||||||||
| Year ended October 31 | ||||||||
| 2015 | 2014 | |||||||
| Operations: | ||||||||
| Net investment income | $ | 770,135 | $ | 659,243 | ||||
| Net realized gain | 1,625,232 | 1,263,900 | ||||||
| Net unrealized (depreciation) appreciation | (2,068,090 | ) | 2,676,001 | |||||
| Net increase in net assets resulting from operations | 327,277 | 4,599,144 | ||||||
| Dividends and distributions paid to shareholders: | ||||||||
| Dividends from net investment income | (748,630 | ) | (648,004 | ) | ||||
| Distributions from net realized gain on investments | (1,194,098 | ) | (635,402 | ) | ||||
| Total dividends and distributions paid to shareholders | (1,942,728 | ) | (1,283,406 | ) | ||||
| Net capital share transactions | 2,150,117 | 1,133,149 | ||||||
| Total increase in net assets | 534,666 | 4,448,887 | ||||||
| Net assets: | ||||||||
| Beginning of year | 35,106,456 | 30,657,569 | ||||||
| End of year (including undistributed net investment income: $91,375 and $70,247, respectively) | $ | 35,641,122 | $ | 35,106,456 | ||||
See Notes to Financial Statements
| 16 | American Mutual Fund |
Notes to financial statements
1. Organization
American Mutual Fund (the “fund”) is registered under the Investment Company Act of 1940 as an open-end, diversified management investment company. The fund strives for the balanced accomplishment of three objectives: current income, growth of capital and conservation of principal.
The fund has 17 share classes consisting of five retail share classes (Classes A, B and C, as well as two F share classes, F-1 and F-2), five 529 college savings plan share classes (Classes 529-A, 529-B, 529-C, 529-E and 529-F-1) and seven retirement plan share classes (Classes R-1, R-2, R-2E, R-3, R-4, R-5 and R-6). The 529 college savings plan share classes can be used to save for college education. The retirement plan share classes are generally offered only through eligible employer-sponsored retirement plans. The fund’s share classes are described further in the following table:
| Share class | Initial sales charge | Contingent deferred sales charge upon redemption | Conversion feature | ||||
| Classes A and 529-A | Up to 5.75% | None (except 1% for certain redemptions within one year of purchase without an initial sales charge) | None | ||||
| Classes B and 529-B* | None | Declines from 5% to 0% for redemptions within six years of purchase | Classes B and 529-B convert to Classes A and 529-A, respectively, after eight years | ||||
| Class C | None | 1% for redemptions within one year of purchase | Class C converts to Class F-1 after 10 years | ||||
| Class 529-C | None | 1% for redemptions within one year of purchase | None | ||||
| Class 529-E | None | None | None | ||||
| Classes F-1, F-2 and 529-F-1 | None | None | None | ||||
| Classes R-1, R-2, R-2E, R-3, R-4, R-5 and R-6 | None | None | None |
*Class B and 529-B shares of the fund are not available for purchase.
Holders of all share classes have equal pro rata rights to assets, dividends and liquidation proceeds of the fund. Each share class has identical voting rights, except for the exclusive right to vote on matters affecting only its class. Share classes have different fees and expenses (“class-specific fees and expenses”), primarily due to different arrangements for distribution, transfer agent and administrative services. Differences in class-specific fees and expenses will result in differences in net investment income and, therefore, the payment of different per-share dividends by each share class.
2. Significant accounting policies
The fund is an investment company that applies the accounting and reporting guidance issued in Topic 946 by the U.S. Financial Accounting Standards Board. The fund’s financial statements have been prepared to comply with U.S. generally accepted accounting principles (“U.S. GAAP”). These principles require the fund’s investment adviser to make estimates and assumptions that affect reported amounts and disclosures. Actual results could differ from those estimates. Subsequent events, if any, have been evaluated through the date of issuance in the preparation of the financial statements. The fund follows the significant accounting policies described in this section, as well as the valuation policies described in the next section on valuation.
Security transactions and related investment income — Security transactions are recorded by the fund as of the date the trades are executed with brokers. Realized gains and losses from security transactions are determined based on the specific identified cost of the securities. In the event a security is purchased with a delayed payment date, the fund will segregate liquid assets sufficient to meet its payment obligations. Dividend income is recognized on the ex-dividend date and interest income is recognized on an accrual basis. Market discounts, premiums and original issue discounts on fixed-income securities are amortized daily over the expected life of the security.
Class allocations — Income, fees and expenses (other than class-specific fees and expenses) and realized and unrealized gains and losses are allocated daily among the various share classes based on their relative net assets. Class-specific fees and expenses, such as distribution, transfer agent and administrative services, are charged directly to the respective share class.
| American Mutual Fund | 17 |
Dividends and distributions to shareholders — Dividends and distributions to shareholders are recorded on the ex-dividend date.
Currency translation — Assets and liabilities, including investment securities, denominated in currencies other than U.S. dollars are translated into U.S. dollars at the exchange rates supplied by one or more pricing vendors on the valuation date. Purchases and sales of investment securities and income and expenses are translated into U.S. dollars at the exchange rates on the dates of such transactions. The effects of changes in exchange rates on investment securities are included with the net realized gain or loss and net unrealized appreciation or depreciation on investments in the fund’s statement of operations. The realized gain or loss and unrealized appreciation or depreciation resulting from all other transactions denominated in currencies other than U.S. dollars are disclosed separately.
3. Valuation
Capital Research and Management Company (“CRMC”), the fund’s investment adviser, values the fund’s investments at fair value as defined by U.S. GAAP. The net asset value of each share class of the fund is generally determined as of approximately 4:00 p.m. New York time each day the New York Stock Exchange is open.
Methods and inputs — The fund’s investment adviser uses the following methods and inputs to establish the fair value of the fund’s assets and liabilities. Use of particular methods and inputs may vary over time based on availability and relevance as market and economic conditions evolve.
Equity securities are generally valued at the official closing price of, or the last reported sale price on, the exchange or market on which such securities are traded, as of the close of business on the day the securities are being valued or, lacking any sales, at the last available bid price. Prices for each security are taken from the principal exchange or market on which the security trades.
Fixed-income securities, including short-term securities, are generally valued at prices obtained from one or more pricing vendors. Vendors value such securities based on one or more of the inputs described in the following table. The table provides examples of inputs that are commonly relevant for valuing particular classes of fixed-income securities in which the fund is authorized to invest. However, these classifications are not exclusive, and any of the inputs may be used to value any other class of fixed-income security.
| Fixed-income class | Examples of standard inputs |
| All | Benchmark yields, transactions, bids, offers, quotations from dealers and trading systems, new issues, spreads and other relationships observed in the markets among comparable securities; and proprietary pricing models such as yield measures calculated using factors such as cash flows, financial or collateral performance and other reference data (collectively referred to as “standard inputs”) |
| Corporate bonds & notes; convertible securities | Standard inputs and underlying equity of the issuer |
| Bonds & notes of governments & government agencies | Standard inputs and interest rate volatilities |
| Mortgage-backed; asset-backed obligations | Standard inputs and cash flows, prepayment information, default rates, delinquency and loss assumptions, collateral characteristics, credit enhancements and specific deal information |
When the fund’s investment adviser deems it appropriate to do so (such as when vendor prices are unavailable or deemed to be not representative), fixed-income securities will be valued in good faith at the mean quoted bid and ask prices that are reasonably and timely available (or bid prices, if ask prices are not available) or at prices for securities of comparable maturity, quality and type.
Securities with both fixed-income and equity characteristics, or equity securities traded principally among fixed-income dealers, are generally valued in the manner described for either equity or fixed-income securities, depending on which method is deemed most appropriate by the fund’s investment adviser.
Securities and other assets for which representative market quotations are not readily available or are considered unreliable by the fund’s investment adviser are fair valued as determined in good faith under fair valuation guidelines adopted by authority of the fund’s board of trustees as further described. The investment adviser follows fair valuation guidelines, consistent with U.S. Securities and Exchange Commission rules and guidance, to consider relevant principles and factors when making fair value determinations. The investment adviser considers relevant indications of value that are reasonably and timely available to it in determining the fair value to be assigned to a particular security, such as the type and cost of the security; contractual or legal restrictions on resale of the security; relevant financial or business developments of the issuer; actively traded similar or related securities; conversion or exchange rights on the security; related corporate actions; significant events occurring after the close of trading in the security; and changes in overall market conditions. In
| 18 | American Mutual Fund |
addition, the closing prices of equity securities that trade in markets outside U.S. time zones may be adjusted to reflect significant events that occur after the close of local trading but before the net asset value of each share class of the fund is determined. Fair valuations and valuations of investments that are not actively trading involve judgment and may differ materially from valuations that would have been used had greater market activity occurred.
Processes and structure — The fund’s board of trustees has delegated authority to the fund’s investment adviser to make fair value determinations, subject to board oversight. The investment adviser has established a Joint Fair Valuation Committee (the “Fair Valuation Committee”) to administer, implement and oversee the fair valuation process, and to make fair value decisions. The Fair Valuation Committee regularly reviews its own fair value decisions, as well as decisions made under its standing instructions to the investment adviser’s valuation teams. The Fair Valuation Committee reviews changes in fair value measurements from period to period and may, as deemed appropriate, update the fair valuation guidelines to better reflect the results of back testing and address new or evolving issues. The Fair Valuation Committee reports any changes to the fair valuation guidelines to the board of trustees with supplemental information to support the changes. The fund’s board and audit committee also regularly review reports that describe fair value determinations and methods.
The fund’s investment adviser has also established a Fixed-Income Pricing Review Group to administer and oversee the fixed-income valuation process, including the use of fixed-income pricing vendors. This group regularly reviews pricing vendor information and market data. Pricing decisions, processes and controls over security valuation are also subject to additional internal reviews, including an annual control self-evaluation program facilitated by the investment adviser’s compliance group.
Classifications — The fund’s investment adviser classifies the fund’s assets and liabilities into three levels based on the inputs used to value the assets or liabilities. Level 1 values are based on quoted prices in active markets for identical securities. Level 2 values are based on significant observable market inputs, such as quoted prices for similar securities and quoted prices in inactive markets. Certain securities trading outside the U.S. may transfer between Level 1 and Level 2 due to valuation adjustments resulting from significant market movements following the close of local trading. Level 3 values are based on significant unobservable inputs that reflect the investment adviser’s determination of assumptions that market participants might reasonably use in valuing the securities. The valuation levels are not necessarily an indication of the risk or liquidity associated with the underlying investment. For example, U.S. government securities are reflected as Level 2 because the inputs used to determine fair value may not always be quoted prices in an active market. The following table presents the fund’s valuation levels as of October 31, 2015 (dollars in thousands):
| Investment securities | ||||||||||||||||
| Level 1 | Level 2 | Level 3 | Total | |||||||||||||
| Assets: | ||||||||||||||||
| Common stocks: | ||||||||||||||||
| Energy | $ | 2,049,468 | $ | — | $ | — | $ | 2,049,468 | ||||||||
| Materials | 1,500,155 | — | — | 1,500,155 | ||||||||||||
| Industrials | 5,732,768 | — | — | 5,732,768 | ||||||||||||
| Consumer discretionary | 3,298,570 | — | — | 3,298,570 | ||||||||||||
| Consumer staples | 2,610,549 | — | — | 2,610,549 | ||||||||||||
| Health care | 4,902,019 | 73,228 | — | 4,975,247 | ||||||||||||
| Financials | 3,784,029 | — | — | 3,784,029 | ||||||||||||
| Information technology | 4,314,615 | — | — | 4,314,615 | ||||||||||||
| Telecommunication services | 2,172,677 | — | — | 2,172,677 | ||||||||||||
| Utilities | 1,719,549 | — | — | 1,719,549 | ||||||||||||
| Miscellaneous | 601,393 | — | — | 601,393 | ||||||||||||
| Preferred securities | 11,215 | — | — | 11,215 | ||||||||||||
| Convertible stocks | 25,056 | — | — | 25,056 | ||||||||||||
| Bonds, notes & other debt instruments | — | 387,270 | — | 387,270 | ||||||||||||
| Short-term securities | — | 2,635,052 | — | 2,635,052 | ||||||||||||
| Total | $ | 32,722,063 | $ | 3,095,550 | $ | — | $ | 35,817,613 | ||||||||
| American Mutual Fund | 19 |
4. Risk factors
Investing in the fund may involve certain risks including, but not limited to, those described below.
Market conditions — The prices of, and the income generated by, the common stocks and other securities held by the fund may decline – sometimes rapidly or unpredictably – due to various factors, including events or conditions affecting the general economy or particular industries; overall market changes; local, regional or global political, social or economic instability; governmental or governmental agency responses to economic conditions; and currency exchange rate, interest rate and commodity price fluctuations. These risks may be heightened in the case of smaller capitalization stocks.
Issuer risks — The prices of, and the income generated by, securities held by the fund may decline in response to various factors directly related to the issuers of such securities, including reduced demand for an issuer’s goods or services, poor management performance and strategic initiatives such as mergers, acquisitions or dispositions and the market response to any such initiatives.
Investing in growth-oriented stocks — Growth-oriented common stocks and other equity-type securities (such as preferred stocks, convertible preferred stocks and convertible bonds) may involve larger price swings and greater potential for loss than other types of investments.
Investing in income-oriented stocks — Income provided by the fund may be reduced by changes in the dividend policies of, and the capital resources available for dividend payments at, the companies in which the fund invests.
Investing in debt instruments — The prices of, and the income generated by, bonds and other debt securities held by the fund may be affected by changing interest rates and by changes in the effective maturities and credit ratings of these securities.
Rising interest rates will generally cause the prices of bonds and other debt securities to fall. Falling interest rates may cause an issuer to redeem, call or refinance a debt security before its stated maturity, which may result in the fund having to reinvest the proceeds in lower yielding securities. Longer maturity debt securities generally have greater sensitivity to changes in interest rates and may be subject to greater price fluctuations than shorter maturity debt securities.
Bonds and other debt securities are also subject to credit risk, which is the possibility that the credit strength of an issuer will weaken and/or an issuer of a debt security will fail to make timely payments of principal or interest and the security will go into default. Lower quality debt securities generally have higher rates of interest and may be subject to greater price fluctuations than higher quality debt securities. Credit risk is gauged, in part, by the credit ratings of the debt securities in which the fund invests. However, ratings are only the opinions of the rating agencies issuing them and are not guarantees as to credit quality or an evaluation of market risk. The fund’s investment adviser relies on its own credit analysts to research issuers and issues in seeking to mitigate various credit and default risks.
Management — The investment adviser to the fund actively manages the fund’s investments. Consequently, the fund is subject to the risk that the methods and analyses employed by the investment adviser in this process may not produce the desired results. This could cause the fund to lose value or its investment results to lag relevant benchmarks or other funds with similar objectives.
5. Taxation and distributions
Federal income taxation — The fund complies with the requirements under Subchapter M of the Internal Revenue Code applicable to mutual funds and intends to distribute substantially all of its net taxable income and net capital gains each year. The fund is not subject to income taxes to the extent such distributions are made. Therefore, no federal income tax provision is required.
As of and during the period ended October 31, 2015, the fund did not have a liability for any unrecognized tax benefits. The fund recognizes interest and penalties, if any, related to unrecognized tax benefits as income tax expense in the statement of operations. During the period, the fund did not incur any significant interest or penalties.
| 20 | American Mutual Fund |
The fund is not subject to examination by U.S. federal tax authorities for tax years before 2011 and by state tax authorities for tax years before 2010.
Non-U.S. taxation — Dividend and interest income are recorded net of non-U.S. taxes paid. The fund may file withholding tax reclaims in certain jurisdictions to recover a portion of amounts previously withheld. As a result of rulings from European courts, the fund filed for additional reclaims related to prior years. These reclaims are recorded when the amount is known and there are no significant uncertainties on collectability.
Distributions — Distributions paid to shareholders are based on net investment income and net realized gains determined on a tax basis, which may differ from net investment income and net realized gains for financial reporting purposes. These differences are due primarily to different treatment for items such as currency gains and losses; short-term capital gains and losses; and income on certain investments. The fiscal year in which amounts are distributed may differ from the year in which the net investment income and net realized gains are recorded by the fund for financial reporting purposes. The fund may also designate a portion of the amount paid to redeeming shareholders as a distribution for tax purposes.
During the year ended October 31, 2015, the fund reclassified $334,000 and $43,000 from undistributed net investment income to undistributed net realized gain and capital paid in on shares of beneficial interest, respectively, and $137,670,000 from undistributed net realized gain to capital paid in on shares of beneficial interest to align financial reporting with tax reporting.
As of October 31, 2015, the tax-basis components of distributable earnings, unrealized appreciation (depreciation) and cost of investment securities were as follows (dollars in thousands):
| Undistributed ordinary income | $ | 94,704 | ||
| Undistributed long-term capital gains | 1,432,264 | |||
| Gross unrealized appreciation on investment securities | 9,660,369 | |||
| Gross unrealized depreciation on investment securities | (618,961 | ) | ||
| Net unrealized appreciation on investment securities | 9,041,408 | |||
| Cost of investment securities | 26,776,205 |
The tax character of distributions paid to shareholders was as follows (dollars in thousands):
| Year ended October 31, 2015 | Year ended October 31, 2014 | |||||||||||||||||||||||
| Share class | Ordinary income | Long-term capital gains | Total dividends and distributions paid | Ordinary income | Long-term capital gains | Total dividends and distributions paid | ||||||||||||||||||
| Class A | $ | 467,630 | $ | 756,144 | $ | 1,223,774 | $ | 415,542 | $ | 407,842 | $ | 823,384 | ||||||||||||
| Class B | 987 | 3,302 | 4,289 | 1,505 | 3,006 | 4,511 | ||||||||||||||||||
| Class C | 15,190 | 39,932 | 55,122 | 13,490 | 22,339 | 35,829 | ||||||||||||||||||
| Class F-1 | 27,782 | 46,039 | 73,821 | 27,176 | 29,230 | 56,406 | ||||||||||||||||||
| Class F-2 | 50,616 | 73,387 | 124,003 | 35,431 | 28,597 | 64,028 | ||||||||||||||||||
| Class 529-A | 14,220 | 23,822 | 38,042 | 12,338 | 12,676 | 25,014 | ||||||||||||||||||
| Class 529-B | 93 | 341 | 434 | 136 | 301 | 437 | ||||||||||||||||||
| Class 529-C | 2,189 | 6,064 | 8,253 | 1,894 | 3,299 | 5,193 | ||||||||||||||||||
| Class 529-E | 632 | 1,236 | 1,868 | 559 | 671 | 1,230 | ||||||||||||||||||
| Class 529-F-1 | 1,202 | 1,837 | 3,039 | 1,031 | 954 | 1,985 | ||||||||||||||||||
| Class R-1 | 957 | 2,455 | 3,412 | 817 | 1,414 | 2,231 | ||||||||||||||||||
| Class R-2 | 3,341 | 8,764 | 12,105 | 2,900 | 4,861 | 7,761 | ||||||||||||||||||
| Class R-2E* | — | † | — | † | — | † | — | † | — | — | † | |||||||||||||
| Class R-3 | 11,390 | 24,251 | 35,641 | 11,186 | 13,544 | 24,730 | ||||||||||||||||||
| Class R-4 | 16,063 | 27,919 | 43,982 | 15,060 | 15,209 | 30,269 | ||||||||||||||||||
| Class R-5 | 7,021 | 11,888 | 18,909 | 8,037 | 7,665 | 15,702 | ||||||||||||||||||
| Class R-6 | 129,317 | 166,717 | 296,034 | 100,902 | 83,794 | 184,696 | ||||||||||||||||||
| Total | $ | 748,630 | $ | 1,194,098 | $ | 1,942,728 | $ | 648,004 | $ | 635,402 | $ | 1,283,406 | ||||||||||||
| * | Class R-2E shares were offered beginning August 29, 2014. |
| † | Amount less than one thousand. |
| American Mutual Fund | 21 |
6. Fees and transactions with related parties
CRMC, the fund’s investment adviser, is the parent company of American Funds Distributors,® Inc. (“AFD”), the principal underwriter of the fund’s shares, and American Funds Service Company® (“AFS”), the fund’s transfer agent. CRMC, AFD and AFS are considered related parties to the fund.
Investment advisory services — The fund has an investment advisory and service agreement with CRMC that provides for monthly fees accrued daily. At the beginning of the year, these fees were based on a series of decreasing annual rates beginning with 0.384% on the first $1 billion of daily net assets and decreasing to 0.225% on such assets in excess of $21 billion. On March 12, 2015, the fund’s board of trustees approved an amended investment advisory and service agreement effective May 1, 2015, decreasing the annual rates on daily net assets in excess of $34 billion to 0.223%. CRMC voluntarily reduced investment advisory service fees to the approved rate in advance of the effective date. For the year ended October 31, 2015, total investment advisory services fees waived by CRMC were $22,000. As a result, the fee shown on the accompanying financial statements of $87,249,000 was reduced to $87,227,000, both of which were equivalent to an annualized rate of 0.242% of average daily net assets.
Class-specific fees and expenses — Expenses that are specific to individual share classes are accrued directly to the respective share class. The principal class-specific fees and expenses are further described below:
Distribution services — The fund has plans of distribution for all share classes, except Class F-2, R-5 and R-6 shares. Under the plans, the board of trustees approves certain categories of expenses that are used to finance activities primarily intended to sell fund shares and service existing accounts. The plans provide for payments, based on an annualized percentage of average daily net assets, ranging from 0.25% to 1.00% as noted in this section. In some cases, the board of trustees has limited the amounts that may be paid to less than the maximum allowed by the plans. All share classes with a plan may use up to 0.25% of average daily net assets to pay service fees, or to compensate AFD for paying service fees, to firms that have entered into agreements with AFD to provide certain shareholder services. There remaining amounts available to be paid under each plan are paid to dealers to compensate them for their sales activities.
For Class A and 529-A shares, distribution-related expenses include the reimbursement of dealer and wholesaler commissions paid by AFD for certain shares sold without a sales charge. These share classes reimburse AFD for amounts billed within the prior 15 months but only to the extent that the overall annual expense limit of 0.25% is not exceeded. As of October 31, 2015, there were no unreimbursed expenses subject to reimbursement for Class A or 529-A shares.
| Share class | Currently approved limits | Plan limits | |||||||
| Class A | 0.25 | % | 0.25 | % | |||||
| Class 529-A | 0.25 | 0.50 | |||||||
| Classes B and 529-B | 1.00 | 1.00 | |||||||
| Classes C, 529-C and R-1 | 1.00 | 1.00 | |||||||
| Class R-2 | 0.75 | 1.00 | |||||||
| Class R-2E | 0.60 | 0.85 | |||||||
| Classes 529-E and R-3 | 0.50 | 0.75 | |||||||
| Classes F-1, 529-F-1 and R-4 | 0.25 | 0.50 | |||||||
Transfer agent services — The fund has a shareholder services agreement with AFS under which the fund compensates AFS for providing transfer agent services to each of the fund’s share classes. These services include recordkeeping, shareholder communications and transaction processing. In addition, the fund reimburses AFS for amounts paid to third parties for performing transfer agent services on behalf of fund shareholders.
Administrative services — The fund has an administrative services agreement with CRMC under which the fund compensates CRMC for providing administrative services to Class A, C, F, 529 and R shares. These services include, but are not limited to, coordinating, monitoring, assisting and overseeing third parties that provide services to fund shareholders. Under the agreement, Class A shares pay an annual fee of 0.01% and Class C, F, 529 and R shares pay an annual fee of 0.05% of their respective average daily net assets.
529 plan services — Each 529 share class is subject to service fees to compensate the Virginia College Savings Plan (“Virginia529”) for its oversight and administration of the 529 college savings plan. The quarterly fee is based on a series of decreasing annual rates beginning with 0.10% on the first $30 billion of the net assets invested in Class 529 shares of the American Funds and decreasing to 0.05% on such assets in excess of $70 billion. The fee for any given calendar quarter is accrued and calculated on the basis of the average net assets of Class 529 shares of the American Funds for the last month of the prior calendar quarter. The fee is included in other expenses in the fund’s statement of operations. Virginia529 is not considered a related party to the fund.
| 22 | American Mutual Fund |
For the year ended October 31, 2015, class-specific expenses under the agreements were as follows (dollars in thousands):
| Share class | Distribution services | Transfer agent services | Administrative services | 529 plan services | |||||||||||
| Class A | $53,814 | $18,931 | $2,255 | Not applicable | |||||||||||
| Class B | 780 | 71 | Not applicable | Not applicable | |||||||||||
| Class C | 11,693 | 991 | 586 | Not applicable | |||||||||||
| Class F-1 | 3,420 | 1,548 | 689 | Not applicable | |||||||||||
| Class F-2 | Not applicable | 2,482 | 1,126 | Not applicable | |||||||||||
| Class 529-A | 1,601 | 505 | 359 | $636 | |||||||||||
| Class 529-B | 82 | 8 | 4 | 8 | |||||||||||
| Class 529-C | 1,783 | 136 | 90 | 159 | |||||||||||
| Class 529-E | 180 | 15 | 18 | 32 | |||||||||||
| Class 529-F-1 | — | 38 | 27 | 48 | |||||||||||
| Class R-1 | 744 | 80 | 37 | Not applicable | |||||||||||
| Class R-2 | 1,894 | 827 | 127 | Not applicable | |||||||||||
| Class R-2E | — | * | — | * | — | * | Not applicable | ||||||||
| Class R-3 | 3,315 | 966 | 332 | Not applicable | |||||||||||
| Class R-4 | 1,993 | 748 | 399 | Not applicable | |||||||||||
| Class R-5 | Not applicable | 131 | 148 | Not applicable | |||||||||||
| Class R-6 | Not applicable | 14 | 2,763 | Not applicable | |||||||||||
| Total class-specific expenses | $81,299 | $27,491 | $8,960 | $883 | |||||||||||
*Amount less than one thousand.
Trustees’ deferred compensation — Trustees who are unaffiliated with CRMC may elect to defer the cash payment of part or all of their compensation. These deferred amounts, which remain as liabilities of the fund, are treated as if invested in shares of the fund or other American Funds. These amounts represent general, unsecured liabilities of the fund and vary according to the total returns of the selected funds. Trustees’ compensation of $298,000 in the fund’s statement of operations includes $381,000 in current fees (either paid in cash or deferred) and a net decrease of $83,000 in the value of the deferred amounts.
Affiliated officers and trustees — Officers and certain trustees of the fund are or may be considered to be affiliated with CRMC, AFD and AFS. No affiliated officers or trustees received any compensation directly from the fund.
7. Capital share transactions
Capital share transactions in the fund were as follows (dollars and shares in thousands):
| Sales1 | Reinvestments of dividends and distributions | Repurchases1 | Net increase (decrease) | |||||||||||||||||||||||||||||
| Share class | Amount | Shares | Amount | Shares | Amount | Shares | Amount | Shares | ||||||||||||||||||||||||
| Year ended October 31, 2015 | ||||||||||||||||||||||||||||||||
| Class A | $ | 2,152,234 | 58,408 | $ | 1,192,118 | 32,205 | $ | (2,332,939 | ) | (63,384 | ) | $ | 1,011,413 | 27,229 | ||||||||||||||||||
| Class B | 2,557 | 70 | 4,262 | 115 | (53,103 | ) | (1,446 | ) | (46,284 | ) | (1,261 | ) | ||||||||||||||||||||
| Class C | 219,911 | 6,027 | 54,448 | 1,483 | (255,562 | ) | (7,019 | ) | 18,797 | 491 | ||||||||||||||||||||||
| Class F-1 | 358,750 | 9,747 | 72,740 | 1,972 | (304,137 | ) | (8,298 | ) | 127,353 | 3,421 | ||||||||||||||||||||||
| Class F-2 | 621,763 | 16,864 | 120,009 | 3,245 | (486,974 | ) | (13,352 | ) | 254,798 | 6,757 | ||||||||||||||||||||||
| Class 529-A | 94,229 | 2,557 | 38,037 | 1,029 | (89,537 | ) | (2,438 | ) | 42,729 | 1,148 | ||||||||||||||||||||||
| Class 529-B | 378 | 10 | 434 | 12 | (5,457 | ) | (148 | ) | (4,645 | ) | (126 | ) | ||||||||||||||||||||
| Class 529-C | 24,802 | 676 | 8,245 | 224 | (27,463 | ) | (751 | ) | 5,584 | 149 | ||||||||||||||||||||||
| Class 529-E | 4,792 | 131 | 1,865 | 50 | (5,432 | ) | (148 | ) | 1,225 | 33 | ||||||||||||||||||||||
| Class 529-F-1 | 10,925 | 296 | 3,025 | 82 | (11,400 | ) | (308 | ) | 2,550 | 70 | ||||||||||||||||||||||
| Class R-1 | 24,544 | 671 | 3,402 | 93 | (24,353 | ) | (673 | ) | 3,593 | 91 | ||||||||||||||||||||||
| Class R-2 | 67,330 | 1,845 | 12,091 | 329 | (78,152 | ) | (2,147 | ) | 1,269 | 27 | ||||||||||||||||||||||
| Class R-2E | 25 | 1 | — | 2 | — | 2 | (1 | ) | — | 2 | 24 | 1 | ||||||||||||||||||||
| Class R-3 | 169,640 | 4,623 | 35,585 | 965 | (281,462 | ) | (7,631 | ) | (76,237 | ) | (2,043 | ) | ||||||||||||||||||||
| Class R-4 | 234,028 | 6,330 | 43,865 | 1,187 | (309,490 | ) | (8,347 | ) | (31,597 | ) | (830 | ) | ||||||||||||||||||||
| Class R-5 | 80,877 | 2,192 | 18,902 | 510 | (180,796 | ) | (4,942 | ) | (81,017 | ) | (2,240 | ) | ||||||||||||||||||||
| Class R-6 | 1,451,241 | 39,476 | 296,009 | 8,014 | (826,688 | ) | (22,764 | ) | 920,562 | 24,726 | ||||||||||||||||||||||
| Total net increase (decrease) | $ | 5,518,026 | 149,924 | $ | 1,905,037 | 51,515 | $ | (5,272,946 | ) | (143,796 | ) | $ | 2,150,117 | 57,643 | ||||||||||||||||||
| American Mutual Fund | 23 |
| Sales1 | Reinvestments of dividends and distributions | Repurchases1 | Net increase (decrease) | |||||||||||||||||||||||||||||
| Share class | Amount | Shares | Amount | Shares | Amount | Shares | Amount | Shares | ||||||||||||||||||||||||
| Year ended October 31, 2014 | ||||||||||||||||||||||||||||||||
| Class A | $ | 1,861,518 | 52,627 | $ | 800,052 | 22,915 | $ | (2,215,700 | ) | (62,413 | ) | $ | 445,870 | 13,129 | ||||||||||||||||||
| Class B | 4,185 | 120 | 4,478 | 130 | (69,317 | ) | (1,978 | ) | (60,654 | ) | (1,728 | ) | ||||||||||||||||||||
| Class C | 195,090 | 5,582 | 35,309 | 1,028 | (248,782 | ) | (7,102 | ) | (18,383 | ) | (492 | ) | ||||||||||||||||||||
| Class F-1 | 347,939 | 9,883 | 55,421 | 1,596 | (633,894 | ) | (17,660 | ) | (230,534 | ) | (6,181 | ) | ||||||||||||||||||||
| Class F-2 | 827,096 | 22,976 | 61,860 | 1,765 | (286,731 | ) | (8,071 | ) | 602,225 | 16,670 | ||||||||||||||||||||||
| Class 529-A | 77,373 | 2,193 | 25,002 | 718 | (80,612 | ) | (2,272 | ) | 21,763 | 639 | ||||||||||||||||||||||
| Class 529-B | 457 | 13 | 436 | 13 | (6,869 | ) | (196 | ) | (5,976 | ) | (170 | ) | ||||||||||||||||||||
| Class 529-C | 21,892 | 622 | 5,192 | 150 | (24,016 | ) | (680 | ) | 3,068 | 92 | ||||||||||||||||||||||
| Class 529-E | 4,250 | 121 | 1,228 | 35 | (5,162 | ) | (147 | ) | 316 | 9 | ||||||||||||||||||||||
| Class 529-F-1 | 11,162 | 316 | 1,960 | 56 | (9,569 | ) | (273 | ) | 3,553 | 99 | ||||||||||||||||||||||
| Class R-1 | 17,809 | 505 | 2,223 | 65 | (22,466 | ) | (639 | ) | (2,434 | ) | (69 | ) | ||||||||||||||||||||
| Class R-2 | 54,005 | 1,537 | 7,755 | 225 | (67,687 | ) | (1,926 | ) | (5,927 | ) | (164 | ) | ||||||||||||||||||||
| Class R-2E3 | 10 | — | 2 | — | — | — | — | 10 | — | 2 | ||||||||||||||||||||||
| Class R-3 | 148,467 | 4,218 | 24,703 | 714 | (176,371 | ) | (4,996 | ) | (3,201 | ) | (64 | ) | ||||||||||||||||||||
| Class R-4 | 144,559 | 4,091 | 30,201 | 868 | (162,318 | ) | (4,558 | ) | 12,442 | 401 | ||||||||||||||||||||||
| Class R-5 | 73,967 | 2,079 | 15,701 | 450 | (193,956 | ) | (5,486 | ) | (104,288 | ) | (2,957 | ) | ||||||||||||||||||||
| Class R-6 | 910,850 | 25,691 | 183,930 | 5,257 | (619,481 | ) | (17,189 | ) | 475,299 | 13,759 | ||||||||||||||||||||||
| Total net increase (decrease) | $ | 4,700,629 | 132,574 | $ | 1,255,451 | 35,985 | $ | (4,822,931 | ) | (135,586 | ) | $ | 1,133,149 | 32,973 | ||||||||||||||||||
| 1 | Includes exchanges between share classes of the fund. |
| 2 | Amount less than one thousand. |
| 3 | Class R-2E shares were offered beginning August 29, 2014. |
8. Investment transactions
The fund made purchases and sales of investment securities, excluding short-term securities and U.S. government obligations, if any, of $9,545,459,000 and $9,131,681,000, respectively, during the year ended October 31, 2015.
| 24 | American Mutual Fund |
Financial highlights
| Income from investment operations1 | Dividends and distributions | |||||||||||||||||||||||||||||||||||||||||||||||
| Net asset value, beginning of period | Net investment income | Net (losses) gains on securities (both realized and unrealized) | Total from investment operations | Dividends (from net investment income) | Distributions (from capital gains) | Total dividends and distributions | Net asset value, end of period | Total return2 | Net assets, end of period (in millions) | Ratio of expenses to average net assets | Ratio of net income to average net assets | |||||||||||||||||||||||||||||||||||||
| Class A: | ||||||||||||||||||||||||||||||||||||||||||||||||
| Year ended 10/31/2015 | $ | 37.85 | $ | .79 | $ | (.41 | ) | $ | .38 | $ | (.77 | ) | $ | (1.28 | ) | $ | (2.05 | ) | $ | 36.18 | .96 | % | $ | 22,282 | .58 | % | 2.13 | % | ||||||||||||||||||||
| Year ended 10/31/2014 | 34.27 | .72 | 4.28 | 5.00 | (.71 | ) | (.71 | ) | (1.42 | ) | 37.85 | 14.99 | 22,280 | .59 | 2.02 | |||||||||||||||||||||||||||||||||
| Year ended 10/31/2013 | 28.27 | .70 | 6.00 | 6.70 | (.70 | ) | — | (.70 | ) | 34.27 | 24.01 | 19,724 | .61 | 2.25 | ||||||||||||||||||||||||||||||||||
| Year ended 10/31/2012 | 25.41 | .66 | 2.87 | 3.53 | (.67 | ) | — | (.67 | ) | 28.27 | 14.02 | 15,677 | .63 | 2.44 | ||||||||||||||||||||||||||||||||||
| Year ended 10/31/2011 | 24.38 | .66 | 1.00 | 1.66 | (.63 | ) | — | (.63 | ) | 25.41 | 6.85 | 13,549 | .62 | 2.57 | ||||||||||||||||||||||||||||||||||
| Class B: | ||||||||||||||||||||||||||||||||||||||||||||||||
| Year ended 10/31/2015 | 37.57 | .51 | (.41 | ) | .10 | (.47 | ) | (1.28 | ) | (1.75 | ) | 35.92 | .18 | 55 | 1.34 | 1.40 | ||||||||||||||||||||||||||||||||
| Year ended 10/31/2014 | 34.01 | .45 | 4.24 | 4.69 | (.42 | ) | (.71 | ) | (1.13 | ) | 37.57 | 14.13 | 105 | 1.35 | 1.28 | |||||||||||||||||||||||||||||||||
| Year ended 10/31/2013 | 28.05 | .47 | 5.94 | 6.41 | (.45 | ) | — | (.45 | ) | 34.01 | 23.06 | 154 | 1.38 | 1.52 | ||||||||||||||||||||||||||||||||||
| Year ended 10/31/2012 | 25.21 | .46 | 2.83 | 3.29 | (.45 | ) | — | (.45 | ) | 28.05 | 13.16 | 196 | 1.39 | 1.71 | ||||||||||||||||||||||||||||||||||
| Year ended 10/31/2011 | 24.19 | .46 | .99 | 1.45 | (.43 | ) | — | (.43 | ) | 25.21 | 6.01 | 275 | 1.39 | 1.81 | ||||||||||||||||||||||||||||||||||
| Class C: | ||||||||||||||||||||||||||||||||||||||||||||||||
| Year ended 10/31/2015 | 37.39 | .49 | (.40 | ) | .09 | (.48 | ) | (1.28 | ) | (1.76 | ) | 35.72 | .15 | 1,135 | 1.38 | 1.33 | ||||||||||||||||||||||||||||||||
| Year ended 10/31/2014 | 33.88 | .43 | 4.22 | 4.65 | (.43 | ) | (.71 | ) | (1.14 | ) | 37.39 | 14.03 | 1,170 | 1.40 | 1.22 | |||||||||||||||||||||||||||||||||
| Year ended 10/31/2013 | 27.96 | .44 | 5.94 | 6.38 | (.46 | ) | — | (.46 | ) | 33.88 | 23.01 | 1,076 | 1.42 | 1.44 | ||||||||||||||||||||||||||||||||||
| Year ended 10/31/2012 | 25.14 | .44 | 2.84 | 3.28 | (.46 | ) | — | (.46 | ) | 27.96 | 13.13 | 853 | 1.43 | 1.63 | ||||||||||||||||||||||||||||||||||
| Year ended 10/31/2011 | 24.13 | .44 | 1.00 | 1.44 | (.43 | ) | — | (.43 | ) | 25.14 | 5.97 | 737 | 1.43 | 1.75 | ||||||||||||||||||||||||||||||||||
| Class F-1: | ||||||||||||||||||||||||||||||||||||||||||||||||
| Year ended 10/31/2015 | 37.71 | .75 | (.40 | ) | .35 | (.74 | ) | (1.28 | ) | (2.02 | ) | 36.04 | .88 | 1,374 | .66 | 2.05 | ||||||||||||||||||||||||||||||||
| Year ended 10/31/2014 | 34.15 | .69 | 4.26 | 4.95 | (.68 | ) | (.71 | ) | (1.39 | ) | 37.71 | 14.88 | 1,309 | .67 | 1.95 | |||||||||||||||||||||||||||||||||
| Year ended 10/31/2013 | 28.18 | .68 | 5.98 | 6.66 | (.69 | ) | — | (.69 | ) | 34.15 | 23.91 | 1,397 | .68 | 2.18 | ||||||||||||||||||||||||||||||||||
| Year ended 10/31/2012 | 25.33 | .65 | 2.86 | 3.51 | (.66 | ) | — | (.66 | ) | 28.18 | 14.00 | 1,000 | .67 | 2.39 | ||||||||||||||||||||||||||||||||||
| Year ended 10/31/2011 | 24.31 | .64 | 1.00 | 1.64 | (.62 | ) | — | (.62 | ) | 25.33 | 6.79 | 744 | .66 | 2.52 | ||||||||||||||||||||||||||||||||||
| Class F-2: | ||||||||||||||||||||||||||||||||||||||||||||||||
| Year ended 10/31/2015 | 37.84 | .85 | (.40 | ) | .45 | (.84 | ) | (1.28 | ) | (2.12 | ) | 36.17 | 1.13 | 2,272 | .41 | 2.31 | ||||||||||||||||||||||||||||||||
| Year ended 10/31/2014 | 34.27 | .78 | 4.27 | 5.05 | (.77 | ) | (.71 | ) | (1.48 | ) | 37.84 | 15.15 | 2,121 | .42 | 2.18 | |||||||||||||||||||||||||||||||||
| Year ended 10/31/2013 | 28.27 | .76 | 6.00 | 6.76 | (.76 | ) | — | (.76 | ) | 34.27 | 24.22 | 1,349 | .43 | 2.46 | ||||||||||||||||||||||||||||||||||
| Year ended 10/31/2012 | 25.41 | .70 | 2.88 | 3.58 | (.72 | ) | — | (.72 | ) | 28.27 | 14.26 | 1,197 | .43 | 2.59 | ||||||||||||||||||||||||||||||||||
| Year ended 10/31/2011 | 24.38 | .70 | 1.01 | 1.71 | (.68 | ) | — | (.68 | ) | 25.41 | 7.07 | 542 | .42 | 2.75 | ||||||||||||||||||||||||||||||||||
| Class 529-A: | ||||||||||||||||||||||||||||||||||||||||||||||||
| Year ended 10/31/2015 | 37.77 | .75 | (.41 | ) | .34 | (.73 | ) | (1.28 | ) | (2.01 | ) | 36.10 | .86 | 709 | .68 | 2.03 | ||||||||||||||||||||||||||||||||
| Year ended 10/31/2014 | 34.21 | .68 | 4.26 | 4.94 | (.67 | ) | (.71 | ) | (1.38 | ) | 37.77 | 14.83 | 698 | .69 | 1.92 | |||||||||||||||||||||||||||||||||
| Year ended 10/31/2013 | 28.22 | .67 | 5.99 | 6.66 | (.67 | ) | — | (.67 | ) | 34.21 | 23.90 | 611 | .71 | 2.15 | ||||||||||||||||||||||||||||||||||
| Year ended 10/31/2012 | 25.37 | .63 | 2.86 | 3.49 | (.64 | ) | — | (.64 | ) | 28.22 | 13.91 | 473 | .72 | 2.34 | ||||||||||||||||||||||||||||||||||
| Year ended 10/31/2011 | 24.34 | .63 | 1.01 | 1.64 | (.61 | ) | — | (.61 | ) | 25.37 | 6.77 | 373 | .70 | 2.48 | ||||||||||||||||||||||||||||||||||
| Class 529-B: | ||||||||||||||||||||||||||||||||||||||||||||||||
| Year ended 10/31/2015 | 37.68 | .47 | (.41 | ) | .06 | (.42 | ) | (1.28 | ) | (1.70 | ) | 36.04 | .07 | 6 | 1.46 | 1.27 | ||||||||||||||||||||||||||||||||
| Year ended 10/31/2014 | 34.10 | .41 | 4.26 | 4.67 | (.38 | ) | (.71 | ) | (1.09 | ) | 37.68 | 13.99 | 11 | 1.48 | 1.15 | |||||||||||||||||||||||||||||||||
| Year ended 10/31/2013 | 28.13 | .43 | 5.96 | 6.39 | (.42 | ) | — | (.42 | ) | 34.10 | 22.88 | 16 | 1.50 | 1.40 | ||||||||||||||||||||||||||||||||||
| Year ended 10/31/2012 | 25.28 | .42 | 2.85 | 3.27 | (.42 | ) | — | (.42 | ) | 28.13 | 13.05 | 19 | 1.52 | 1.58 | ||||||||||||||||||||||||||||||||||
| Year ended 10/31/2011 | 24.25 | .43 | 1.00 | 1.43 | (.40 | ) | — | (.40 | ) | 25.28 | 5.87 | 25 | 1.50 | 1.70 | ||||||||||||||||||||||||||||||||||
See page 27 for footnotes.
| American Mutual Fund | 25 |
Financial highlights (continued)
| Income from investment operations1 | Dividends and distributions | |||||||||||||||||||||||||||||||||||||||||||||||
| Net asset value, beginning of period | Net investment income | Net (losses) gains on securities (both realized and unrealized) | Total from investment operations | Dividends (from net investment income) | Distributions (from capital gains) | Total dividends and distributions | Net asset value, end of period | Total return2 | Net assets, end of period (in millions) | Ratio of expenses to average net assets | Ratio of net income to average net assets | |||||||||||||||||||||||||||||||||||||
| Class 529-C: | ||||||||||||||||||||||||||||||||||||||||||||||||
| Year ended 10/31/2015 | $ | 37.58 | $ | .46 | $ | (.40 | ) | $ | .06 | $ | (.45 | ) | $ | (1.28 | ) | $ | (1.73 | ) | $ | 35.91 | .08 | % | $ | 176 | 1.46 | % | 1.26 | % | ||||||||||||||||||||
| Year ended 10/31/2014 | 34.04 | .40 | 4.25 | 4.65 | (.40 | ) | (.71 | ) | (1.11 | ) | 37.58 | 13.97 | 179 | 1.47 | 1.14 | |||||||||||||||||||||||||||||||||
| Year ended 10/31/2013 | 28.09 | .42 | 5.96 | 6.38 | (.43 | ) | — | (.43 | ) | 34.04 | 22.92 | 159 | 1.50 | 1.37 | ||||||||||||||||||||||||||||||||||
| Year ended 10/31/2012 | 25.26 | .42 | 2.84 | 3.26 | (.43 | ) | — | (.43 | ) | 28.09 | 13.01 | 126 | 1.51 | 1.55 | ||||||||||||||||||||||||||||||||||
| Year ended 10/31/2011 | 24.24 | .43 | 1.00 | 1.43 | (.41 | ) | — | (.41 | ) | 25.26 | 5.92 | 102 | 1.50 | 1.68 | ||||||||||||||||||||||||||||||||||
| Class 529-E: | ||||||||||||||||||||||||||||||||||||||||||||||||
| Year ended 10/31/2015 | 37.64 | .66 | (.41 | ) | .25 | (.64 | ) | (1.28 | ) | (1.92 | ) | 35.97 | .61 | 36 | .93 | 1.79 | ||||||||||||||||||||||||||||||||
| Year ended 10/31/2014 | 34.09 | .59 | 4.26 | 4.85 | (.59 | ) | (.71 | ) | (1.30 | ) | 37.64 | 14.58 | 36 | .94 | 1.67 | |||||||||||||||||||||||||||||||||
| Year ended 10/31/2013 | 28.13 | .59 | 5.97 | 6.56 | (.60 | ) | — | (.60 | ) | 34.09 | 23.56 | 32 | .96 | 1.90 | ||||||||||||||||||||||||||||||||||
| Year ended 10/31/2012 | 25.29 | .56 | 2.85 | 3.41 | (.57 | ) | — | (.57 | ) | 28.13 | 13.62 | 26 | .98 | 2.08 | ||||||||||||||||||||||||||||||||||
| Year ended 10/31/2011 | 24.27 | .56 | 1.00 | 1.56 | (.54 | ) | — | (.54 | ) | 25.29 | 6.45 | 20 | .98 | 2.20 | ||||||||||||||||||||||||||||||||||
| Class 529-F-1: | ||||||||||||||||||||||||||||||||||||||||||||||||
| Year ended 10/31/2015 | 37.82 | .83 | (.40 | ) | .43 | (.82 | ) | (1.28 | ) | (2.10 | ) | 36.15 | 1.09 | 54 | .46 | 2.26 | ||||||||||||||||||||||||||||||||
| Year ended 10/31/2014 | 34.25 | .76 | 4.27 | 5.03 | (.75 | ) | (.71 | ) | (1.46 | ) | 37.82 | 15.10 | 54 | .47 | 2.14 | |||||||||||||||||||||||||||||||||
| Year ended 10/31/2013 | 28.26 | .74 | 5.99 | 6.73 | (.74 | ) | — | (.74 | ) | 34.25 | 24.14 | 46 | .49 | 2.36 | ||||||||||||||||||||||||||||||||||
| Year ended 10/31/2012 | 25.39 | .69 | 2.88 | 3.57 | (.70 | ) | — | (.70 | ) | 28.26 | 14.21 | 32 | .51 | 2.54 | ||||||||||||||||||||||||||||||||||
| Year ended 10/31/2011 | 24.37 | .68 | 1.01 | 1.69 | (.67 | ) | — | (.67 | ) | 25.39 | 6.96 | 22 | .49 | 2.67 | ||||||||||||||||||||||||||||||||||
| Class R-1: | ||||||||||||||||||||||||||||||||||||||||||||||||
| Year ended 10/31/2015 | 37.51 | .48 | (.41 | ) | .07 | (.47 | ) | (1.28 | ) | (1.75 | ) | 35.83 | .11 | 72 | 1.41 | 1.31 | ||||||||||||||||||||||||||||||||
| Year ended 10/31/2014 | 33.98 | .42 | 4.24 | 4.66 | (.42 | ) | (.71 | ) | (1.13 | ) | 37.51 | 14.02 | 72 | 1.42 | 1.19 | |||||||||||||||||||||||||||||||||
| Year ended 10/31/2013 | 28.04 | .44 | 5.95 | 6.39 | (.45 | ) | — | (.45 | ) | 33.98 | 22.98 | 68 | 1.44 | 1.43 | ||||||||||||||||||||||||||||||||||
| Year ended 10/31/2012 | 25.22 | .43 | 2.86 | 3.29 | (.47 | ) | — | (.47 | ) | 28.04 | 13.12 | 58 | 1.43 | 1.61 | ||||||||||||||||||||||||||||||||||
| Year ended 10/31/2011 | 24.21 | .44 | 1.00 | 1.44 | (.43 | ) | — | (.43 | ) | 25.22 | 5.96 | 35 | 1.43 | 1.75 | ||||||||||||||||||||||||||||||||||
| Class R-2: | ||||||||||||||||||||||||||||||||||||||||||||||||
| Year ended 10/31/2015 | 37.48 | .49 | (.40 | ) | .09 | (.48 | ) | (1.28 | ) | (1.76 | ) | 35.81 | .17 | 243 | 1.37 | 1.35 | ||||||||||||||||||||||||||||||||
| Year ended 10/31/2014 | 33.95 | .42 | 4.24 | 4.66 | (.42 | ) | (.71 | ) | (1.13 | ) | 37.48 | 14.05 | 253 | 1.41 | 1.20 | |||||||||||||||||||||||||||||||||
| Year ended 10/31/2013 | 28.02 | .45 | 5.94 | 6.39 | (.46 | ) | — | (.46 | ) | 33.95 | 23.02 | 235 | 1.40 | 1.47 | ||||||||||||||||||||||||||||||||||
| Year ended 10/31/2012 | 25.19 | .44 | 2.84 | 3.28 | (.45 | ) | — | (.45 | ) | 28.02 | 13.13 | 195 | 1.43 | 1.63 | ||||||||||||||||||||||||||||||||||
| Year ended 10/31/2011 | 24.18 | .44 | .99 | 1.43 | (.42 | ) | — | (.42 | ) | 25.19 | 5.94 | 167 | 1.45 | 1.73 | ||||||||||||||||||||||||||||||||||
| Class R-2E: | ||||||||||||||||||||||||||||||||||||||||||||||||
| Year ended 10/31/2015 | 37.83 | .61 | (.35 | ) | .26 | (.68 | ) | (1.28 | ) | (1.96 | ) | 36.13 | .63 | 3 | — | 4 | .99 | 3 | 1.68 | 3 | ||||||||||||||||||||||||||||
| Period from 8/29/2014 to 10/31/20145,6 | 37.19 | .12 | .73 | .85 | (.21 | ) | — | (.21 | ) | 37.83 | 2.28 | 7,8 | — | 4 | .08 | 7,8 | .32 | 7,8 | ||||||||||||||||||||||||||||||
| Class R-3: | ||||||||||||||||||||||||||||||||||||||||||||||||
| Year ended 10/31/2015 | 37.60 | .65 | (.41 | ) | .24 | (.63 | ) | (1.28 | ) | (1.91 | ) | 35.93 | .59 | 611 | .95 | 1.78 | ||||||||||||||||||||||||||||||||
| Year ended 10/31/2014 | 34.05 | .58 | 4.26 | 4.84 | (.58 | ) | (.71 | ) | (1.29 | ) | 37.60 | 14.58 | 716 | .96 | 1.66 | |||||||||||||||||||||||||||||||||
| Year ended 10/31/2013 | 28.10 | .59 | 5.96 | 6.55 | (.60 | ) | — | (.60 | ) | 34.05 | 23.55 | 650 | .96 | 1.90 | ||||||||||||||||||||||||||||||||||
| Year ended 10/31/2012 | 25.26 | .56 | 2.86 | 3.42 | (.58 | ) | — | (.58 | ) | 28.10 | 13.64 | 518 | .97 | 2.09 | ||||||||||||||||||||||||||||||||||
| Year ended 10/31/2011 | 24.25 | .56 | 1.00 | 1.56 | (.55 | ) | — | (.55 | ) | 25.26 | 6.43 | 410 | .97 | 2.21 | ||||||||||||||||||||||||||||||||||
| 26 | American Mutual Fund |
| Income from investment operations1 | Dividends and distributions | |||||||||||||||||||||||||||||||||||||||||||||||
| Net asset value, beginning of period | Net investment income | Net (losses) gains on securities (both realized and unrealized) | Total from investment operations | Dividends (from net investment income) | Distributions (from capital gains) | Total dividends and distributions | Net asset value, end of period | Total return2 | Net assets, end of period (in millions) | Ratio of expenses to average net assets | Ratio of net income to average net assets | |||||||||||||||||||||||||||||||||||||
| Class R-4: | ||||||||||||||||||||||||||||||||||||||||||||||||
| Year ended 10/31/2015 | $ | 37.74 | $ | .76 | $ | (.40 | ) | $ | .36 | $ | (.75 | ) | $ | (1.28 | ) | $ | (2.03 | ) | $ | 36.07 | .90 | % | $ | 757 | .64 | % | 2.07 | % | ||||||||||||||||||||
| Year ended 10/31/2014 | 34.18 | .69 | 4.27 | 4.96 | (.69 | ) | (.71 | ) | (1.40 | ) | 37.74 | 14.89 | 824 | .66 | 1.96 | |||||||||||||||||||||||||||||||||
| Year ended 10/31/2013 | 28.20 | .68 | 5.99 | 6.67 | (.69 | ) | — | (.69 | ) | 34.18 | 23.95 | 732 | .66 | 2.18 | ||||||||||||||||||||||||||||||||||
| Year ended 10/31/2012 | 25.35 | .64 | 2.87 | 3.51 | (.66 | ) | — | (.66 | ) | 28.20 | 13.98 | 487 | .66 | 2.37 | ||||||||||||||||||||||||||||||||||
| Year ended 10/31/2011 | 24.32 | .64 | 1.01 | 1.65 | (.62 | ) | — | (.62 | ) | 25.35 | 6.81 | 272 | .67 | 2.50 | ||||||||||||||||||||||||||||||||||
| Class R-5: | ||||||||||||||||||||||||||||||||||||||||||||||||
| Year ended 10/31/2015 | 37.85 | .88 | (.41 | ) | .47 | (.86 | ) | (1.28 | ) | (2.14 | ) | 36.18 | 1.20 | 250 | .34 | 2.38 | ||||||||||||||||||||||||||||||||
| Year ended 10/31/2014 | 34.27 | .80 | 4.28 | 5.08 | (.79 | ) | (.71 | ) | (1.50 | ) | 37.85 | 15.24 | 346 | .36 | 2.26 | |||||||||||||||||||||||||||||||||
| Year ended 10/31/2013 | 28.27 | .78 | 6.00 | 6.78 | (.78 | ) | — | (.78 | ) | 34.27 | 24.32 | 415 | .36 | 2.50 | ||||||||||||||||||||||||||||||||||
| Year ended 10/31/2012 | 25.41 | .73 | 2.87 | 3.60 | (.74 | ) | — | (.74 | ) | 28.27 | 14.31 | 311 | .37 | 2.69 | ||||||||||||||||||||||||||||||||||
| Year ended 10/31/2011 | 24.38 | .72 | 1.00 | 1.72 | (.69 | ) | — | (.69 | ) | 25.41 | 7.11 | 255 | .37 | 2.81 | ||||||||||||||||||||||||||||||||||
| Class R-6: | ||||||||||||||||||||||||||||||||||||||||||||||||
| Year ended 10/31/2015 | 37.86 | .89 | (.40 | ) | .49 | (.88 | ) | (1.28 | ) | (2.16 | ) | 36.19 | 1.25 | 5,609 | .30 | 2.41 | ||||||||||||||||||||||||||||||||
| Year ended 10/31/2014 | 34.28 | .82 | 4.28 | 5.10 | (.81 | ) | (.71 | ) | (1.52 | ) | 37.86 | 15.31 | 4,932 | .30 | 2.31 | |||||||||||||||||||||||||||||||||
| Year ended 10/31/2013 | 28.28 | .79 | 6.01 | 6.80 | (.80 | ) | — | (.80 | ) | 34.28 | 24.38 | 3,994 | .31 | 2.50 | ||||||||||||||||||||||||||||||||||
| Year ended 10/31/2012 | 25.41 | .74 | 2.88 | 3.62 | (.75 | ) | — | (.75 | ) | 28.28 | 14.40 | 1,526 | .32 | 2.73 | ||||||||||||||||||||||||||||||||||
| Year ended 10/31/2011 | 24.39 | .73 | 1.00 | 1.73 | (.71 | ) | — | (.71 | ) | 25.41 | 7.12 | 1,038 | .32 | 2.86 | ||||||||||||||||||||||||||||||||||
| Year ended October 31 | |||||||||||
| 2015 | 2014 | 2013 | 2012 | 2011 | |||||||
| Portfolio turnover rate for all share classes | 27% | 16% | 18% | 22% | 23% | ||||||
| 1 | Based on average shares outstanding. |
| 2 | Total returns exclude any applicable sales charges, including contingent deferred sales charges. |
| 3 | Although the fund has a plan of distribution for Class R-2E shares, fees for distribution services are not paid by the fund on accounts for which a broker-dealer (or other financial intermediary) has not been assigned, including amounts invested in the fund by CRMC and/or its affiliates. If fees for distribution services were charged on these assets, fund expenses would be higher and net income and total return would be lower. |
| 4 | Amount less than $1 million. |
| 5 | Based on operations for the period shown and, accordingly, is not representative of a full year. |
| 6 | Class R-2E shares were offered beginning August 29, 2014. |
| 7 | This class consisted solely of seed capital invested by CRMC; therefore, certain fees were not accrued. |
| 8 | Not annualized. |
See Notes to Financial Statements
| American Mutual Fund | 27 |
Report of Independent Registered Public Accounting Firm
To the Shareholders and Board of Trustees of American Mutual Fund:
We have audited the accompanying statement of assets and liabilities of American Mutual Fund (the “Fund”), including the summary investment portfolio, as of October 31, 2015, and the related statement of operations for the year then ended, the statements of changes in net assets for each of the two years in the period then ended, and the financial highlights for each of the periods presented. These financial statements and financial highlights are the responsibility of the Fund’s management. Our responsibility is to express an opinion on these financial statements and financial highlights based on our audits.
We conducted our audits in accordance with the standards of the Public Company Accounting Oversight Board (United States). Those standards require that we plan and perform the audit to obtain reasonable assurance about whether the financial statements and financial highlights are free of material misstatement. The Fund is not required to have, nor were we engaged to perform, an audit of its internal control over financial reporting. Our audits included consideration of internal control over financial reporting as a basis for designing audit procedures that are appropriate in the circumstances, but not for the purpose of expressing an opinion on the effectiveness of the Fund’s internal control over financial reporting. Accordingly, we express no such opinion. An audit also includes examining, on a test basis, evidence supporting the amounts and disclosures in the financial statements, assessing the accounting principles used and significant estimates made by management, as well as evaluating the overall financial statement presentation. Our procedures included confirmation of securities owned as of October 31, 2015, by correspondence with the custodian and brokers; where replies were not received from brokers, we performed other auditing procedures. We believe that our audits provide a reasonable basis for our opinion.
In our opinion, such financial statements and financial highlights referred to above present fairly, in all material respects, the financial position of American Mutual Fund as of October 31, 2015, the results of its operations for the year then ended, the changes in its net assets for each of the two years in the period then ended, and the financial highlights for each of the periods presented, in conformity with accounting principles generally accepted in the United States of America.
Deloitte & Touche LLP
Costa Mesa, California
December 9, 2015
| 28 | American Mutual Fund |
| Expense example | unaudited |
As a fund shareholder, you incur two types of costs: (1) transaction costs, such as initial sales charges on purchase payments and contingent deferred sales charges on redemptions (loads), and (2) ongoing costs, including management fees, distribution and service (12b-1) fees, and other expenses. This example is intended to help you understand your ongoing costs (in dollars) of investing in the fund so you can compare these costs with the ongoing costs of investing in other mutual funds. The example is based on an investment of $1,000 invested at the beginning of the period and held for the entire six-month period (May 1, 2015, through October 31, 2015).
Actual expenses:
The first line of each share class in the table on the following page provides information about actual account values and actual expenses. You may use the information in this line, together with the amount you invested, to estimate the expenses that you paid over the period. Simply divide your account value by $1,000 (for example, an $8,600 account value divided by $1,000 = 8.6), then multiply the result by the number in the first line under the heading entitled “Expenses paid during period” to estimate the expenses you paid on your account during this period.
Hypothetical example for comparison purposes:
The second line of each share class in the table on the following page provides information about hypothetical account values and hypothetical expenses based on the actual expense ratio for the share class and an assumed rate of return of 5.00% per year before expenses, which is not the actual return of the share class. The hypothetical account values and expenses may not be used to estimate the actual ending account balance or expenses you paid for the period. You may use this information to compare the ongoing costs of investing in the fund and other funds. To do so, compare this 5.00% hypothetical example with the 5.00% hypothetical examples that appear in the shareholder reports of the other funds.
Notes:
Retirement plan participants may be subject to certain fees charged by the plan sponsor, and Class F-1, F-2 and 529-F-1 shareholders may be subject to fees charged by financial intermediaries, typically ranging from 0.75% to 1.50% of assets annually depending on services offered. You can estimate the impact of these fees by adding the amount of the fees to the total estimated expenses you paid on your account during the period as calculated above. In addition, your ending account value would be lower by the amount of these fees.
Note that the expenses shown in the table on the following page are meant to highlight your ongoing costs only and do not reflect any transactional costs, such as sales charges (loads). Therefore, the second line of each share class in the table is useful in comparing ongoing costs only and will not help you determine the relative total costs of owning different funds. In addition, if these transactional costs were included, your costs would have been higher.
| American Mutual Fund | 29 |
| Beginning account value 5/1/2015 | Ending account value 10/31/2015 | Expenses paid during period* | Annualized expense ratio | |||||||||||||
| Class A - actual return | $ | 1,000.00 | $ | 976.90 | $ | 2.89 | .58 | % | ||||||||
| Class A - assumed 5% return | 1,000.00 | 1,022.28 | 2.96 | .58 | ||||||||||||
| Class B - actual return | 1,000.00 | 973.14 | 6.61 | 1.33 | ||||||||||||
| Class B - assumed 5% return | 1,000.00 | 1,018.50 | 6.77 | 1.33 | ||||||||||||
| Class C - actual return | 1,000.00 | 972.87 | 6.86 | 1.38 | ||||||||||||
| Class C - assumed 5% return | 1,000.00 | 1,018.25 | 7.02 | 1.38 | ||||||||||||
| Class F-1 - actual return | 1,000.00 | 976.43 | 3.29 | .66 | ||||||||||||
| Class F-1 - assumed 5% return | 1,000.00 | 1,021.88 | 3.36 | .66 | ||||||||||||
| Class F-2 - actual return | 1,000.00 | 977.71 | 2.04 | .41 | ||||||||||||
| Class F-2 - assumed 5% return | 1,000.00 | 1,023.14 | 2.09 | .41 | ||||||||||||
| Class 529-A - actual return | 1,000.00 | 976.36 | 3.39 | .68 | ||||||||||||
| Class 529-A - assumed 5% return | 1,000.00 | 1,021.78 | 3.47 | .68 | ||||||||||||
| Class 529-B - actual return | 1,000.00 | 972.58 | 7.21 | 1.45 | ||||||||||||
| Class 529-B - assumed 5% return | 1,000.00 | 1,017.90 | 7.37 | 1.45 | ||||||||||||
| Class 529-C - actual return | 1,000.00 | 972.37 | 7.26 | 1.46 | ||||||||||||
| Class 529-C - assumed 5% return | 1,000.00 | 1,017.85 | 7.43 | 1.46 | ||||||||||||
| Class 529-E - actual return | 1,000.00 | 975.00 | 4.58 | .92 | ||||||||||||
| Class 529-E - assumed 5% return | 1,000.00 | 1,020.57 | 4.69 | .92 | ||||||||||||
| Class 529-F-1 - actual return | 1,000.00 | 977.50 | 2.29 | .46 | ||||||||||||
| Class 529-F-1 - assumed 5% return | 1,000.00 | 1,022.89 | 2.35 | .46 | ||||||||||||
| Class R-1 - actual return | 1,000.00 | 972.53 | 7.01 | 1.41 | ||||||||||||
| Class R-1 - assumed 5% return | 1,000.00 | 1,018.10 | 7.17 | 1.41 | ||||||||||||
| Class R-2 - actual return | 1,000.00 | 972.96 | 6.91 | 1.39 | ||||||||||||
| Class R-2 - assumed 5% return | 1,000.00 | 1,018.20 | 7.07 | 1.39 | ||||||||||||
| Class R-2E - actual return | 1,000.00 | 974.14 | 5.47 | 1.10 | ||||||||||||
| Class R-2E - assumed 5% return | 1,000.00 | 1,019.66 | 5.60 | 1.10 | ||||||||||||
| Class R-3 - actual return | 1,000.00 | 975.14 | 4.73 | .95 | ||||||||||||
| Class R-3 - assumed 5% return | 1,000.00 | 1,020.42 | 4.84 | .95 | ||||||||||||
| Class R-4 - actual return | 1,000.00 | 976.41 | 3.24 | .65 | ||||||||||||
| Class R-4 - assumed 5% return | 1,000.00 | 1,021.93 | 3.31 | .65 | ||||||||||||
| Class R-5 - actual return | 1,000.00 | 978.09 | 1.70 | .34 | ||||||||||||
| Class R-5 - assumed 5% return | 1,000.00 | 1,023.49 | 1.73 | .34 | ||||||||||||
| Class R-6 - actual return | 1,000.00 | 978.32 | 1.50 | .30 | ||||||||||||
| Class R-6 - assumed 5% return | 1,000.00 | 1,023.69 | 1.53 | .30 | ||||||||||||
| * | The “expenses paid during period” are equal to the “annualized expense ratio,” multiplied by the average account value over the period, multiplied by the number of days in the period, and divided by 365 (to reflect the one-half year period). |
| 30 | American Mutual Fund |
| Tax information | unaudited |
We are required to advise you of the federal tax status of certain distributions received by shareholders during the fiscal year. The fund hereby designates the following amounts for the fund’s fiscal year ended October 31, 2015:
| Long-term capital gains | $1,331,769,000 |
| Qualified dividend income | 100% |
| Corporate dividends received deduction | 100% |
| U.S. government income that may be exempt from state taxation | $1,919,000 |
Individual shareholders should refer to their Form 1099 or other tax information, which will be mailed in January 2016, to determine the calendar year amounts to be included on their 2015 tax returns. Shareholders should consult their tax advisors.
| American Mutual Fund | 31 |
Board of trustees and other officers
Independent trustees1
| Name and year of birth | Year first elected a trustee of the fund2 | Principal occupation(s) during past five years | Number of portfolios in fund complex overseen by trustee | Other directorships3 held by trustee | ||||
| Louise H. Bryson, 1944 | 2010 | Chair Emerita of the Board of Trustees, J. Paul Getty Trust; former President, Distribution, Lifetime Entertainment Network (retired 2008); former Executive Vice President and General Manager, Lifetime Movie Network (retired 2008) | 7 | None | ||||
| Mary Anne Dolan, 1947 Chairman of the Board (Independent and Non-Executive) | 1993 | Founder and President, MAD Ink (communications company) | 10 | None | ||||
| James G. Ellis, 1947 | 2010 | Dean and Professor of Marketing, Marshall School of Business, University of Southern California | 79 | Mercury General Corporation | ||||
| Leonard R. Fuller, 1946 | 2010 | Private investor; former President and CEO, Fuller Consulting (financial management consulting firm) | 79 | None | ||||
| Pablo R. González Guajardo, 1967 | 2015 | CEO, Kimberly-Clark de México, S.A.B. de C.V. | 7 | Kimberly-Clark de México, S.A.B. de C.V.; América Móvil, S.A.B. de C.V.; Grupo Sanborns, S.A.B. de C.V.; Grupo Lala, S.A.B. de C.V. | ||||
| William D. Jones, 1955 | 2006 | Real estate developer/owner, President and CEO, CityLink Investment Corporation (acquires, develops and manages real estate ventures in selected urban communities) and City Scene Management Company (provides commercial asset and property management services) | 8 | Sempra Energy | ||||
| L. Daniel Jorndt, 1941 | 2010 | Retired | 4 | None | ||||
| William H. Kling, 1942 | 2006 | President Emeritus and former CEO, American Public Media | 10 | None | ||||
| John C. Mazziotta, MD, PhD, 1949 | 2011 | Physician; Professor of Neurology, University of California, Los Angeles; Vice Chancellor, UCLA Health Sciences; CEO, UCLA Health System; former Dean, David Geffen School of Medicine at UCLA; former Chair, Department of Neurology, UCLA; former Associate Director, Semel Institute, UCLA; former Director, Brain Mapping Center, UCLA | 4 | None | ||||
| William R. McLaughlin, 1956 | 2015 | President, The Orvis Company; former President and CEO, Select Comfort | 4 | Select Comfort | ||||
| Bailey Morris-Eck, 1944 | 1999 | Director and Programming Chair, WYPR Baltimore/Washington (public radio station); Senior Adviser, Financial News (London); Senior Fellow, Institute for International Economics | 4 | None |
The fund’s statement of additional information includes further details about fund trustees and is available without charge upon request by calling American Funds Service Company at (800) 421-4225 or by visiting the American Funds website at americanfunds.com. The address for all trustees and officers of the fund is 333 South Hope Street, Los Angeles, CA 90071, Attention: Secretary.
See page 33 for footnotes.
| 32 | American Mutual Fund |
Interested trustees4,5
| Name, year of birth and position with fund | Year first elected a trustee or officer of the fund2 | Principal occupation(s) during past five years and positions held with affiliated entities or the principal underwriter of the fund | Number of portfolios in fund complex overseen by trustee | Other directorships3 held by trustee | ||||
| Joyce E. Gordon, 1956 Vice Chairman of the Board | 1996–2001 2005 | Partner — Capital Research Global Investors, Capital Research and Management Company; Director, Capital Research and Management Company | 2 | None | ||||
| William L. Robbins, 1968 President | 2004 | Partner — Capital International Investors, Capital Research and Management Company | 1 | None |
Other officers5
| Name, year of birth and position with fund | Year first elected an officer of the fund2 | Principal occupation(s) during past five years and positions held with affiliated entities or the principal underwriter of the fund | ||
| Paul F. Roye, 1953 Executive Vice President | 2007 | Director, Capital Research and Management Company; Senior Vice President — Fund Business Management Group, Capital Research and Management Company | ||
| James B. Lovelace, 1956 Senior Vice President | 2006 | Partner — Capital Research Global Investors, Capital Research and Management Company; Director, Capital Research and Management Company | ||
| James Terrile, 1965 Senior Vice President | 2007 | Partner — Capital Research Global Investors, Capital Research and Management Company; Director, The Capital Group Companies, Inc.;6 Director, Capital Strategy Research, Inc.6 | ||
| Herbert Y. Poon, 1973 Vice President | 2012 | Vice President and Senior Counsel — Fund Business Management Group, Capital Research and Management Company | ||
| Michael W. Stockton, 1967 Secretary | 2013 | Vice President — Fund Business Management Group, Capital Research and Management Company | ||
| Brian D. Bullard, 1969 Treasurer | 2015 | Senior Vice President — Investment Operations, Capital Research and Management Company | ||
| Raymond F. Sullivan, Jr., 1957 Assistant Secretary | 2011 | Vice President — Fund Business Management Group, Capital Research and Management Company | ||
| Dori Laskin, 1951 Assistant Treasurer | 2011 | Vice President — Investment Operations, Capital Research and Management Company | ||
| Jeffrey P. Regal, 1971 Assistant Treasurer | 2012 | Vice President — Investment Operations, Capital Research and Management Company |
| 1 | The term independent trustee refers to a trustee who is not an “interested person” of the fund within the meaning of the Investment Company Act of 1940. |
| 2 | Trustees and officers of the fund serve until their resignation, removal or retirement. |
| 3 | This includes all directorships/trusteeships (other than those in the American Funds or other funds managed by Capital Research and Management Company or its affiliates) that are held by each trustee as a trustee or director of a public company or a registered investment company. |
| 4 | The term interested trustee refers to a trustee who is an “interested person” within the meaning of the Investment Company Act of 1940, on the basis of their affiliation with the fund’s investment adviser, Capital Research and Management Company, or affiliated entities (including the fund’s principal underwriter). |
| 5 | All of the directors/trustees and/or officers listed are officers and/or directors/trustees of one or more of the other funds for which Capital Research and Management Company serves as investment adviser. |
| 6 | Company affiliated with Capital Research and Management Company. |
| American Mutual Fund | 33 |
Offices of the fund and of the investment adviser
Capital Research and Management Company
333 South Hope Street
Los Angeles, CA 90071-1406
6455 Irvine Center Drive
Irvine, CA 92618-4518
Transfer agent for shareholder accounts
American Funds Service Company
(Write to the address near you.)
P.O. Box 6007
Indianapolis, IN 46206-6007
P.O. Box 2280
Norfolk, VA 23501-2280
Custodian of assets
JPMorgan Chase Bank
270 Park Avenue
New York, NY 10017-2070
Counsel
O’Melveny & Myers LLP
400 South Hope Street
Los Angeles, CA 90071-2899
Independent registered public accounting firm
Deloitte & Touche LLP
695 Town Center Drive
Suite 1200
Costa Mesa, CA 92626-7188
Principal underwriter
American Funds Distributors, Inc.
333 South Hope Street
Los Angeles, CA 90071-1406
| 34 | American Mutual Fund |
Investors should carefully consider investment objectives, risks, charges and expenses. This and other important information is contained in the fund prospectus and summary prospectus, which can be obtained from your financial professional and should be read carefully before investing. You may also call American Funds Service Company (AFS) at (800) 421-4225 or visit the American Funds website at americanfunds.com.
“American Funds Proxy Voting Procedures and Principles” — which describes how we vote proxies relating to portfolio securities — is available on the American Funds website or upon request by calling AFS. The fund files its proxy voting record with the U.S. Securities and Exchange Commission (SEC) for the 12 months ended June 30 by August 31. The proxy voting record is available free of charge on the SEC website at sec.gov and on the American Funds website.
A complete October 31, 2015, portfolio of American Mutual Fund’s investments is available free of charge by calling AFS or visiting the SEC website (where it is part of Form N-CSR).
American Mutual Fund files a complete list of its portfolio holdings with the SEC for the first and third quarters of each fiscal year on Form N-Q. This filing is available free of charge on the SEC website. You may also review or, for a fee, copy this filing at the SEC’s Public Reference Room in Washington, D.C. Additional information regarding the operation of the Public Reference Room may be obtained by calling the SEC’s Office of Investor Education and Advocacy at (800) SEC-0330. Additionally, the list of portfolio holdings is available by calling AFS.
This report is for the information of shareholders of American Mutual Fund, but it also may be used as sales literature when preceded or accompanied by the current prospectus or summary prospectus, which gives details about charges, expenses, investment objectives and operating policies of the fund. If used as sales material after December 31, 2015, this report must be accompanied by an American Funds statistical update for the most recently completed calendar quarter.
The American Funds Advantage
Since 1931, American Funds, part of Capital Group, has helped investors pursue long-term investment success. Our consistent approach — in combination with The Capital SystemSM — has resulted in a superior long-term track record.
| Aligned with investor success | |
| We base our decisions on a long-term perspective, which we believe aligns our goals with the interests of our clients. Our portfolio managers average 27 years of investment experience, including 22 years at our company, reflecting a career commitment to our long-term approach.1 | |
| The Capital SystemSM | |
| Our investment process, The Capital System, combines individual accountability with team work. Each fund is divided into portions that are managed independently by investment professionals with diverse backgrounds, ages and investment approaches. An extensive global research effort is the backbone of our system. | |
| Superior long-term track record | |
| Our equity funds have beaten their Lipper peer indexes in 91% of 10-year periods and 96% of 20-year periods. Our fixed-income funds have beaten their Lipper indexes in 54% of 10-year periods and 57% of 20-year periods.2 Our fund management fees have been among the lowest in the industry.3 |
| 1 | Portfolio manager experience as of December 31, 2014. | |
| 2 | Based on Class A share results for rolling periods through December 31, 2014. Periods covered are the shorter of the fund’s lifetime or since the comparable Lipper index inception date (except SMALLCAP World Fund, for which the Lipper average was used). | |
| 3 | On average, our management fees were in the lowest quintile 70% of the time, based on the 20-year period ended December 31, 2014, versus comparable Lipper categories, excluding funds of funds. |

ITEM 2 – Code of Ethics
The Registrant has adopted a Code of Ethics that applies to its Principal Executive Officer and Principal Financial Officer. The Registrant undertakes to provide to any person without charge, upon request, a copy of the Code of Ethics. Such request can be made to American Funds Service Company at 800/421-9225 or to the Secretary of the Registrant, 333 South Hope Street, Los Angeles, California 90071.
ITEM 3 – Audit Committee Financial Expert
The Registrant’s board has determined that James G. Ellis, a member of the Registrant’s audit committee, is an “audit committee financial expert” and "independent," as such terms are defined in this Item. This designation will not increase the designee’s duties, obligations or liability as compared to his or her duties, obligations and liability as a member of the audit committee and of the board, nor will it reduce the responsibility of the other audit committee members. There may be other individuals who, through education or experience, would qualify as "audit committee financial experts" if the board had designated them as such. Most importantly, the board believes each member of the audit committee contributes significantly to the effective oversight of the Registrant’s financial statements and condition.
ITEM 4 – Principal Accountant Fees and Services
| Registrant: | ||||
| a) Audit Fees: | ||||
| 2014 | $99,000 | |||
| 2015 | $89,000 | |||
| b) Audit-Related Fees: | ||||
| 2014 | $7,000 | |||
| 2015 | $13,000 | |||
| The audit-related fees consist of assurance and related services relating to the examination of the Registrant’s investment adviser conducted in accordance with Statement on Standards for Attestation Engagements Number 16 issued by the American Institute of Certified Public Accountants. | ||||
| c) Tax Fees: | ||||
| 2014 | $7,000 | |||
| 2015 | $8,000 | |||
| The tax fees consist of professional services relating to the preparation of the Registrant’s tax returns. | ||||
| d) All Other Fees: | ||||
| 2014 | None | |||
| 2015 | None | |||
| Adviser and affiliates (includes only fees for non-audit services billed to the adviser and affiliates for engagements that relate directly to the operations and financial reporting of the Registrant and were subject to the pre-approval policies described below): | ||||
| a) Audit Fees: | ||||
| Not Applicable | ||||
| b) Audit-Related Fees: | ||||
| 2014 | $1,028,000 | |||
| 2015 | $1,143,000 | |||
| The audit-related fees consist of assurance and related services relating to the examination of the Registrant’s transfer agent, principal underwriter and investment adviser conducted in accordance with Statement on Standards for Attestation Engagements Number 16 issued by the American Institute of Certified Public Accountants. | ||||
| c) Tax Fees: | ||||
| 2014 | $33,000 | |||
| 2015 | None | |||
| The tax fees consist of consulting services relating to the Registrant’s investments. | ||||
| d) All Other Fees: | ||||
| 2014 | $3,000 | |||
| 2015 | $5,000 | |||
| The other fees consist of subscription services related to an accounting research tool. | ||||
All audit and permissible non-audit services that the Registrant’s audit committee considers compatible with maintaining the independent registered public accounting firm’s independence are required to be pre-approved by the committee. The pre-approval requirement will extend to all non-audit services provided to the Registrant, the investment adviser, and any entity controlling, controlled by, or under common control with the investment adviser that provides ongoing services to the Registrant, if the engagement relates directly to the operations and financial reporting of the Registrant. The committee will not delegate its responsibility to pre-approve these services to the investment adviser. The committee may delegate to one or more committee members the authority to review and pre-approve audit and permissible non-audit services. Actions taken under any such delegation will be reported to the full committee at its next meeting. The pre-approval requirement is waived with respect to non-audit services if certain conditions are met. The pre-approval requirement was not waived for any of the non-audit services listed above provided to the Registrant, adviser and affiliates.
Aggregate non-audit fees paid to the Registrant’s auditors, including fees for all services billed to the Registrant, adviser and affiliates that provide ongoing services to the Registrant, were $1,432,000 for fiscal year 2014 and $1,445,000 for fiscal year 2015. The non-audit services represented by these amounts were brought to the attention of the committee and considered to be compatible with maintaining the auditors’ independence.
ITEM 5 – Audit Committee of Listed Registrants
Not applicable to this Registrant, insofar as the Registrant is not a listed issuer as defined in Rule 10A-3 under the Securities Exchange Act of 1934.
ITEM 6 – Schedule of Investments

| Common stocks 91.92% Energy 5.75% | Shares | Value (000) |
| BP PLC (ADR) | 2,053,600 | $73,314 |
| Canadian Natural Resources, Ltd. | 3,463,000 | 80,298 |
| Chevron Corp. | 4,062,400 | 369,191 |
| ConocoPhillips | 6,346,025 | 338,560 |
| Devon Energy Corp. | 534,000 | 22,391 |
| Diamond Offshore Drilling, Inc. | 728,941 | 14,491 |
| Enbridge Inc. | 3,353,300 | 143,152 |
| Enbridge Inc. (CAD denominated) | 807,257 | 34,504 |
| EOG Resources, Inc. | 1,413,500 | 121,349 |
| Exxon Mobil Corp. | 2,150,000 | 177,891 |
| Halliburton Co. | 317,000 | 12,167 |
| Kinder Morgan, Inc. | 4,407,500 | 120,545 |
| Noble Energy, Inc. | 701,200 | 25,131 |
| Royal Dutch Shell PLC, Class A (ADR) | 1,931,907 | 101,348 |
| Schlumberger Ltd. | 2,610,000 | 203,998 |
| Spectra Energy Corp | 5,625,500 | 160,721 |
| Suncor Energy Inc. | 1,694,310 | 50,417 |
| 2,049,468 | ||
| Materials 4.21% | ||
| Agrium Inc. | 2,795,000 | 260,131 |
| Barrick Gold Corp. | 1,200,000 | 9,228 |
| CRH PLC (ADR) | 1,089,059 | 29,797 |
| Dow Chemical Co. | 4,426,337 | 228,709 |
| E.I. du Pont de Nemours and Co. | 690,000 | 43,746 |
| Freeport-McMoRan Inc. | 1,157,700 | 13,626 |
| International Flavors & Fragrances Inc. | 1,158,849 | 134,496 |
| Monsanto Co. | 2,567,900 | 239,380 |
| Mosaic Co. | 2,400,500 | 81,113 |
| Nucor Corp. | 1,099,600 | 46,513 |
| Potash Corp. of Saskatchewan Inc. | 3,036,800 | 61,434 |
| Praxair, Inc. | 2,809,924 | 312,154 |
| The Chemours Co. | 138,000 | 956 |
| WestRock Co. | 723,060 | 38,872 |
| 1,500,155 | ||
| Industrials 16.08% | ||
| 3M Co. | 1,515,000 | 238,173 |
| Boeing Co. | 3,095,600 | 458,365 |
| Canadian National Railway Co. | 1,225,000 | 74,835 |
| Caterpillar Inc. | 773,400 | 56,450 |
| CSX Corp. | 10,217,193 | 275,762 |
| Cummins Inc. | 2,228,399 | 230,662 |
| Danaher Corp. | 1,200,000 | 111,972 |
| Eaton Corp. PLC | 1,265,000 | 70,726 |
| Emerson Electric Co. | 3,076,850 | 145,320 |
| General Dynamics Corp. | 2,541,164 | 377,566 |
| Common stocks Industrials (continued) | Shares | Value (000) |
| General Electric Co. | 18,986,585 | $549,092 |
| Illinois Tool Works Inc. | 2,050,000 | 188,477 |
| Lockheed Martin Corp. | 2,548,460 | 560,228 |
| Norfolk Southern Corp. | 4,118,400 | 329,596 |
| Precision Castparts Corp. | 964,000 | 222,501 |
| Republic Services, Inc. | 2,836,300 | 124,060 |
| Rockwell Automation | 1,098,300 | 119,890 |
| Siemens AG (ADR) | 509,000 | 51,190 |
| Snap-on Inc. | 750,000 | 124,417 |
| Union Pacific Corp. | 4,842,200 | 432,651 |
| United Parcel Service, Inc., Class B | 2,914,300 | 300,231 |
| United Technologies Corp. | 2,823,174 | 277,829 |
| Waste Management, Inc. | 7,678,100 | 412,775 |
| 5,732,768 | ||
| Consumer discretionary 9.26% | ||
| Carnival Corp., units | 6,244,100 | 337,681 |
| Coach, Inc. | 1,036,722 | 32,346 |
| Comcast Corp., Class A | 2,563,400 | 160,520 |
| Comcast Corp., Class A, special nonvoting shares | 2,090,000 | 131,064 |
| Hasbro, Inc. | 1,948,788 | 149,725 |
| Home Depot, Inc. | 5,456,052 | 674,586 |
| Johnson Controls, Inc. | 5,538,380 | 250,224 |
| Mattel, Inc. | 2,771,947 | 68,134 |
| McDonald’s Corp. | 3,064,000 | 343,934 |
| Newell Rubbermaid Inc. | 6,893,200 | 292,479 |
| Omnicom Group Inc. | 1,300,000 | 97,396 |
| Ross Stores, Inc. | 332,000 | 16,793 |
| Scripps Networks Interactive, Inc., Class A | 265,000 | 15,921 |
| Starbucks Corp. | 1,206,000 | 75,459 |
| Time Warner Cable Inc. | 933,600 | 176,824 |
| Time Warner Inc. | 1,851,436 | 139,487 |
| Viacom Inc., Class B | 1,243,900 | 61,337 |
| Whirlpool Corp. | 225,000 | 36,032 |
| Williams-Sonoma, Inc. | 2,163,000 | 159,521 |
| YUM! Brands, Inc. | 1,115,600 | 79,107 |
| 3,298,570 | ||
| Consumer staples 7.32% | ||
| Coca-Cola Co. | 14,029,900 | 594,166 |
| Colgate-Palmolive Co. | 1,130,000 | 74,976 |
| ConAgra Foods, Inc. | 2,528,550 | 102,533 |
| Costco Wholesale Corp. | 700,000 | 110,684 |
| CVS Health Corp. | 1,045,000 | 103,225 |
| General Mills, Inc. | 3,000,000 | 174,330 |
| Kellogg Co. | 1,539,423 | 108,560 |
| Kimberly-Clark Corp. | 1,000,000 | 119,710 |
| Kraft Heinz Co. | 2,292,000 | 178,707 |
| Mead Johnson Nutrition Co. | 743,000 | 60,926 |
| Mondelez International, Inc. | 3,552,900 | 164,002 |
| PepsiCo, Inc. | 1,235,769 | 126,283 |
| Procter & Gamble Co. | 7,473,400 | 570,818 |
| Unilever PLC (ADR) | 2,736,300 | 121,629 |
| 2,610,549 |
| Common stocks Health care 13.96% | Shares | Value (000) |
| Abbott Laboratories | 1,863,000 | $83,463 |
| AbbVie Inc. | 17,325,800 | 1,031,751 |
| Aetna Inc. | 393,000 | 45,109 |
| AmerisourceBergen Corp. | 356,000 | 34,358 |
| Amgen Inc. | 7,764,272 | 1,228,153 |
| Cardinal Health, Inc. | 1,055,000 | 86,721 |
| Gilead Sciences, Inc. | 1,437,900 | 155,480 |
| GlaxoSmithKline PLC1 | 3,400,000 | 73,228 |
| Humana Inc. | 138,000 | 24,651 |
| Johnson & Johnson | 2,745,000 | 277,327 |
| Medtronic PLC | 4,435,500 | 327,872 |
| Merck & Co., Inc. | 7,177,485 | 392,321 |
| Novartis AG (ADR) | 3,014,000 | 272,556 |
| Pfizer Inc. | 10,459,100 | 353,727 |
| Quest Diagnostics Inc. | 1,880,000 | 127,746 |
| ResMed Inc. | 1,800,000 | 103,698 |
| St. Jude Medical, Inc. | 1,960,600 | 125,106 |
| Stryker Corp. | 1,563,840 | 149,534 |
| UnitedHealth Group Inc. | 700,000 | 82,446 |
| 4,975,247 | ||
| Financials 10.62% | ||
| ACE Ltd. | 1,413,400 | 160,477 |
| Aon PLC, Class A | 1,852,000 | 172,810 |
| Arthur J. Gallagher & Co. | 1,718,131 | 75,134 |
| Bank of Montreal | 218,926 | 12,731 |
| Bank of New York Mellon Corp. | 3,643,000 | 151,731 |
| Bank of Nova Scotia | 1,198,600 | 56,310 |
| BB&T Corp. | 2,046,000 | 76,009 |
| Capital One Financial Corp. | 1,300,000 | 102,570 |
| Care Capital Properties, Inc. | 386,250 | 12,727 |
| CME Group Inc., Class A | 1,531,000 | 144,634 |
| Discover Financial Services | 1,944,200 | 109,303 |
| Hudson City Bancorp, Inc. | 1,696,000 | 17,164 |
| Intercontinental Exchange, Inc. | 542,918 | 137,033 |
| JPMorgan Chase & Co. | 4,312,400 | 277,072 |
| Marsh & McLennan Companies, Inc. | 4,296,394 | 239,481 |
| McGraw Hill Financial, Inc. | 321,643 | 29,797 |
| Old Republic International Corp. | 7,300,800 | 131,706 |
| PNC Financial Services Group, Inc. | 1,806,400 | 163,046 |
| Principal Financial Group, Inc. | 5,500,000 | 275,880 |
| Progressive Corp. | 3,195,500 | 105,867 |
| Royal Bank of Canada | 2,258,000 | 129,115 |
| State Street Corp. | 2,695,700 | 186,003 |
| Sun Life Financial Inc. | 4,654,800 | 156,913 |
| Toronto-Dominion Bank | 1,989,400 | 81,605 |
| Toronto-Dominion Bank (CAD denominated) | 3,000,000 | 123,157 |
| U.S. Bancorp | 6,400,000 | 269,952 |
| Ventas, Inc. | 1,545,000 | 82,997 |
| Wells Fargo & Co. | 5,593,000 | 302,805 |
| 3,784,029 |
| Common stocks Information technology 12.11% | Shares | Value (000) |
| Accenture PLC, Class A | 1,514,000 | $162,301 |
| Alphabet Inc., Class A2 | 38,000 | 28,021 |
| Alphabet Inc., Class C | 38,104 | 27,085 |
| Analog Devices, Inc. | 1,999,640 | 120,218 |
| Apple Inc. | 2,762,025 | 330,062 |
| Automatic Data Processing, Inc. | 2,923,300 | 254,298 |
| Cisco Systems, Inc. | 10,518,900 | 303,470 |
| Hewlett-Packard Co. | 1,790,500 | 48,272 |
| Intel Corp. | 10,185,000 | 344,864 |
| International Business Machines Corp. | 623,000 | 87,270 |
| KLA-Tencor Corp. | 1,322,000 | 88,733 |
| Linear Technology Corp. | 1,863,700 | 82,785 |
| Maxim Integrated Products, Inc. | 1,500,000 | 61,470 |
| Microsoft Corp. | 15,925,607 | 838,324 |
| NetApp, Inc. | 1,538,500 | 52,309 |
| Oracle Corp. | 6,814,657 | 264,681 |
| Paychex, Inc. | 1,000,000 | 51,580 |
| QUALCOMM Inc. | 431,000 | 25,610 |
| Texas Instruments Inc. | 18,311,644 | 1,038,636 |
| Xilinx, Inc. | 2,197,100 | 104,626 |
| 4,314,615 | ||
| Telecommunication services 6.10% | ||
| AT&T Inc. | 16,866,000 | 565,180 |
| BCE Inc. | 1,000,000 | 43,210 |
| TELUS Corp. | 4,040,000 | 134,831 |
| Verizon Communications Inc. | 30,491,814 | 1,429,456 |
| 2,172,677 | ||
| Utilities 4.82% | ||
| American Electric Power Co., Inc. | 1,435,000 | 81,293 |
| Dominion Resources, Inc. | 3,000,000 | 214,290 |
| Duke Energy Corp. | 1,452,957 | 103,843 |
| Edison International | 113,000 | 6,839 |
| Exelon Corp. | 11,121,885 | 310,523 |
| PG&E Corp. | 4,825,000 | 257,655 |
| PPL Corp. | 2,044,300 | 70,324 |
| Sempra Energy | 5,396,653 | 552,671 |
| Talen Energy Corp.2 | 255,345 | 2,216 |
| Xcel Energy Inc. | 3,365,000 | 119,895 |
| 1,719,549 | ||
| Miscellaneous 1.69% | ||
| Other common stocks in initial period of acquisition | 601,393 | |
| Total common stocks (cost: $23,840,219,000) | 32,759,020 | |
| Preferred securities 0.03% Financials 0.03% | ||
| U.S. Bancorp, Series F, 6.50% noncumulative depositary shares | 387,000 | 11,215 |
| Total preferred securities (cost: $10,004,000) | 11,215 |
| Convertible stocks 0.07% Utilities 0.07% | Shares | Value (000) |
| Exelon Corp., convertible preferred, units | 600,000 | $25,056 |
| Total convertible stocks (cost: $30,049,000) | 25,056 | |
| Bonds, notes & other debt instruments 1.09% Corporate bonds & notes 0.81% Financials 0.77% | Principal amount (000) | |
| Bank of America Corp., Series K, junior subordinated 8.00% noncumulative (undated) | $1,665 | 1,738 |
| Bank of America Corp., Series M, junior subordinated 8.125% noncumulative (undated) | 1,665 | 1,740 |
| ERP Operating LP 5.125% 2016 | 2,400 | 2,438 |
| ERP Operating LP 5.375% 2016 | 6,455 | 6,657 |
| ERP Operating LP 5.75% 2017 | 8,783 | 9,369 |
| ERP Operating LP 7.125% 2017 | 5,000 | 5,480 |
| JPMorgan Chase & Co., Series I, junior subordinated 7.90% (undated) | 116,654 | 121,350 |
| Wells Fargo & Co., Series K, junior subordinated 7.98% (undated) | 115,445 | 123,093 |
| 271,865 | ||
| Utilities 0.04% | ||
| FPL Group Capital, Inc. 7.875% 2015 | 15,000 | 15,124 |
| Total corporate bonds & notes | 286,989 | |
| U.S. Treasury bonds & notes 0.28% U.S. Treasury 0.28% | ||
| U.S. Treasury 1.875% 2017 | 39,050 | 39,872 |
| U.S. Treasury 1.00% 2017 | 60,100 | 60,409 |
| 100,281 | ||
| Total bonds, notes & other debt instruments (cost: $359,234,000) | 387,270 | |
| Short-term securities 7.39% | ||
| 3M Co. 0.14% due 12/1/20153 | 50,000 | 49,993 |
| Apple Inc. 0.16% due 1/15/20163 | 27,300 | 27,288 |
| CAFCO, LLC 0.33% due 12/1/2015 | 25,000 | 24,996 |
| Caterpillar Financial Services Corp. 0.17% due 1/21/2016 | 50,000 | 49,975 |
| Chariot Funding, LLC 0.32% due 11/18/20153 | 25,000 | 24,998 |
| Chevron Corp. 0.14%–0.19% due 11/2/2015–1/12/20163 | 95,000 | 94,981 |
| Ciesco LLC 0.28% due 2/22/2016 | 50,000 | 49,955 |
| Emerson Electric Co. 0.23% due 1/19/20163 | 20,000 | 19,992 |
| Estée Lauder Companies Inc. 0.13% due 11/4/20153 | 30,000 | 29,999 |
| ExxonMobil Corp. 0.11%–0.13% due 11/17/2015–12/11/2015 | 153,600 | 153,582 |
| Fannie Mae 0.15%–0.26% due 12/15/2015–2/10/2016 | 200,800 | 200,735 |
| Federal Farm Credit Banks 0.17% due 11/17/2015 | 45,600 | 45,598 |
| Federal Home Loan Bank 0.07%–0.23% due 11/2/2015–3/1/2016 | 1,050,500 | 1,050,258 |
| Freddie Mac 0.12%–0.23% due 11/16/2015–3/7/2016 | 356,000 | 355,857 |
| General Electric Capital Corp. 0.27% due 11/19/2015 | 50,000 | 49,997 |
| General Electric Co. 0.12%–0.13% due 11/13/2015–12/7/2015 | 90,000 | 89,990 |
| Honeywell International Inc. 0.14% due 11/9/20153 | 40,700 | 40,699 |
| IBM Corp. 0.17% due 12/21/20153 | 50,000 | 49,993 |
| John Deere Financial Ltd. 0.15% due 12/7/20153 | 52,000 | 51,992 |
| Jupiter Securitization Co., LLC 0.39% due 12/10/20153 | 49,200 | 49,188 |
| Short-term securities | Principal amount (000) | Value (000) |
| Microsoft Corp. 0.16%–0.18% due 11/4/2015–12/9/20153 | $100,000 | $99,995 |
| Regents of the University of California 0.18% due 1/11/2016 | 25,000 | 24,991 |
| Total short-term securities (cost: $2,634,979,000) | 2,635,052 | |
| Total investment securities 100.50% (cost: $26,874,485,000) | 35,817,613 | |
| Other assets less liabilities (0.50%) | (176,491) | |
| Net assets 100.00% | $35,641,122 |
| 1 | Valued under fair value procedures adopted by authority of the board of trustees. The total value of all such securities was $73,228,000, which represented .21% of the net assets of the fund. This entire amount relates to certain securities trading outside the U.S. whose values were adjusted as a result of significant market movements following the close of local trading. |
| 2 | Security did not produce income during the last 12 months. |
| 3 | Acquired in a transaction exempt from registration under Section 4(2) of the Securities Act of 1933. May be resold in the U.S. in transactions exempt from registration, normally to qualified institutional buyers. The total value of all such securities was $539,118,000, which represented 1.51% of the net assets of the fund. |
| Key to abbreviations | |
| ADR = American Depositary Receipts | |
| CAD = Canadian dollars |
| MFGEFPX-003-1215O-S49170 | American Mutual Fund — Page 6 of 6 |
REPORT OF INDEPENDENT REGISTERED PUBLIC ACCOUNTING FIRM
To the Shareholders and Board of Trustees of
American Mutual Fund:
We have audited the accompanying statement of assets and liabilities of American Mutual Fund (the “Fund”), including the summary schedule of investments, as of October 31, 2015, and the related statements of operations for the year then ended, the statements of changes in net assets for each of the two years in the period then ended (collectively, the “financial statements”), the financial highlights for each of the five years in the period then ended (the financial statements and financial highlights are included in Item 1 of this Form N-CSR), and the schedule of investments in securities as of October 31, 2015 (included in Item 6 of this Form N-CSR). These financial statements, financial highlights, and schedule of investments in securities are the responsibility of the Fund’s management. Our responsibility is to express an opinion on these financial statements, financial highlights, and schedule of investments in securities based on our audits.
We conducted our audits in accordance with the standards of the Public Company Accounting Oversight Board (United States). Those standards require that we plan and perform the audit to obtain reasonable assurance about whether the financial statements, financial highlights, and schedule of investments in securities are free of material misstatement. An audit includes examining, on a test basis, evidence supporting the amounts and disclosures in the financial statements and schedule of investments in securities, assessing the accounting principles used and significant estimates made by management, as well as evaluating the overall financial statement presentation. Our procedures included confirmation of securities owned as of October 31, 2015, by correspondence with the custodian and brokers; where replies were not received from brokers, we performed other auditing procedures. We believe that our audits provide a reasonable basis for our opinion.
In our opinion, the financial statements, financial highlights, and schedule of investments in securities referred to above present fairly, in all material respects, the financial position of American Mutual Fund as of October 31, 2015, and the results of its operations for the year then ended, the changes in its net assets for each of the two years in the period then ended, and the financial highlights for each of the five years in the period then ended, in conformity with accounting principles generally accepted in the United States of America.
DELOITTE & TOUCHE LLP
Costa Mesa, California
December 9, 2015
ITEM 7 – Disclosure of Proxy Voting Policies and Procedures for Closed-End Management Investment Companies
Not applicable to this Registrant, insofar as the Registrant is not a closed-end management investment company.
ITEM 8 – Portfolio Managers of Closed-End Management Investment Companies
Not applicable to this Registrant, insofar as the Registrant is not a closed-end management investment company.
ITEM 9 – Purchases of Equity Securities by Closed-End Management Investment Company and Affiliated Purchasers
Not applicable to this Registrant, insofar as the Registrant is not a closed-end management investment company.
ITEM 10 – Submission of Matters to a Vote of Security Holders
There have been no material changes to the procedures by which shareholders may recommend nominees to the Registrant’s board of trustees since the Registrant last submitted a proxy statement to its shareholders. The procedures are as follows. The Registrant has a nominating and governance committee comprised solely of persons who are not considered ‘‘interested persons’’ of the Registrant within the meaning of the Investment Company Act of 1940, as amended. The committee periodically reviews such issues as the board’s composition, responsibilities, committees, compensation and other relevant issues, and recommends any appropriate changes to the full board of trustees. While the committee normally is able to identify from its own resources an ample number of qualified candidates, it will consider shareholder suggestions of persons to be considered as nominees to fill future vacancies on the board. Such suggestions must be sent in writing to the nominating and governance committee of the Registrant, c/o the Registrant’s Secretary, and must be accompanied by complete biographical and occupational data on the prospective nominee, along with a written consent of the prospective nominee for consideration of his or her name by the nominating and governance committee.
ITEM 11 – Controls and Procedures
| (a) | The Registrant’s Principal Executive Officer and Principal Financial Officer have concluded, based on their evaluation of the Registrant’s disclosure controls and procedures (as such term is defined in Rule 30a-3 under the Investment Company Act of 1940), that such controls and procedures are adequate and reasonably designed to achieve the purposes described in paragraph (c) of such rule. |
| (b) | There were no changes in the Registrant’s internal controls over financial reporting (as defined in Rule 30a-3(d) under the Investment Company Act of 1940) that occurred during the Registrant’s second fiscal quarter of the period covered by this report that has materially affected, or is reasonably likely to materially affect, the Registrant’s internal control over financial reporting. |
ITEM 12 – Exhibits
| (a)(1) | The Code of Ethics that is the subject of the disclosure required by Item 2 is attached as an exhibit hereto. |
| (a)(2) | The certifications required by Rule 30a-2 of the Investment Company Act of 1940 and Sections 302 and 906 of the Sarbanes-Oxley Act of 2002 are attached as exhibits hereto. |
SIGNATURES
Pursuant to the requirements of the Securities Exchange Act of 1934 and the Investment Company Act of 1940, the Registrant has duly caused this report to be signed on its behalf by the undersigned, thereunto duly authorized.
| AMERICAN MUTUAL FUND | |
| By ___/s/ Paul F. Roye_________________________ | |
Paul F. Roye, Executive Vice President and Principal Executive Officer | |
| Date: December 31, 2015 |
Pursuant to the requirements of the Securities Exchange Act of 1934 and the Investment Company Act of 1940, this report has been signed below by the following persons on behalf of the Registrant and in the capacities and on the dates indicated.
| By ___/s/ Paul F. Roye_________________________ |
Paul F. Roye, Executive Vice President and Principal Executive Officer |
| Date: December 31, 2015 |
| By __/s/ Brian D. Bullard________________________ |
Brian D. Bullard, Treasurer and Principal Financial Officer |
| Date: December 31, 2015 |