UNITED STATES
SECURITIES AND EXCHANGE COMMISSION
Washington, D.C. 20549
FORM N-CSR
Certified Shareholder Report of
Registered Management Investment Companies
Investment Company Act File Number: 811-00572
American Mutual Fund
(Exact Name of Registrant as Specified in Charter)
333 South Hope Street
Los Angeles, California 90071
(Address of Principal Executive Offices)
Registrant's telephone number, including area code: (213) 486-9200
Date of fiscal year end: October 31
Date of reporting period: October 31, 2016
Laurie D. Neat
American Mutual Fund
333 South Hope Street
Los Angeles, California 90071
(Name and Address of Agent for Service)
ITEM 1 – Reports to Stockholders

Multiple perspectives
to income investing, one
approach to dividends
Special feature page 6
 | American Mutual Fund®
Annual report
for the year ended
October 31, 2016 |
American Mutual Fund strives for the balanced accomplishment of three objectives: current income, growth of capital and conservation of principal.
This fund is one of more than 40 offered by one of the nation’s largest mutual fund families, American Funds, from Capital Group. For 85 years, Capital has invested with a long-term focus based on thorough research and attention to risk.
Fund results shown in this report, unless otherwise indicated, are for Class A shares at net asset value. If a sales charge (maximum 5.75%) had been deducted, the results would have been lower. Results are for past periods and are not predictive of results for future periods. Current and future results may be lower or higher than those shown. Share prices and returns will vary, so investors may lose money. Investing for short periods makes losses more likely. Investments are not FDIC-insured, nor are they deposits of or guaranteed by a bank or any other entity, so they may lose value. For current information and month-end results, visit americanfunds.com.
Here are the average annual total returns on a $1,000 investment with all distributions reinvested for periods ended September 30, 2016 (the most recent calendar quarter-end):
| Class A shares | | 1 year | | 5 years | | 10 years |
| | | | | | | |
| Reflecting 5.75% maximum sales charge | | | 10.00 | % | | | 12.74 | % | | | 6.45 | % |
For other share class results, visit americanfunds.com and americanfundsretirement.com.
The total annual fund operating expense ratio is 0.59% for Class A shares as of the prospectus dated January 1, 2017 (unaudited).
Investment results assume all distributions are reinvested and reflect applicable fees and expenses. When applicable, investment results reflect fee waivers, without which results would have been lower. Visit americanfunds.com for more information.
The fund’s 30-day yield for Class A shares as of November 30, 2016, calculated in accordance with the U.S. Securities and Exchange Commission (SEC) formula, was 2.01%. The fund’s 12-month distribution rate for Class A shares as of that date was 1.85%. Both reflect the 5.75% maximum sales charge. The SEC yield reflects the rate at which the fund is earning income on its current portfolio of securities while the distribution rate reflects the fund’s past dividends paid to shareholders. Accordingly, the fund’s SEC yield and distribution rate may differ.
Refer to the fund prospectus and the Risk Factors section of this report for more information on risks associated with investing in the fund.

Fellow investors:
The U.S. stock market finished higher for the fiscal year ended October 31, 2016, recovering from losses earlier in the period. While concerns about global growth continued to weigh on investor sentiment, U.S. economic data was generally positive and corporate earnings were slightly better than expected. Higher oil and commodity prices also lifted the market, rebounding from a sell-off that began last year. The U.S. Federal Reserve raised interest rates for the first time in almost a decade in December 2015; while the central bank has opted to keep rates unchanged since then, it is expected to raise rates again in the near future.
With the stock market rising during the period, American Mutual Fund more than kept pace, posting a total return of 6.33%. This exceeded the 4.51% return for the unmanaged Standard & Poor’s 500 Composite Index,* a market capitalization-weighted index based on the results of 500 widely held common stocks. The fund, which is managed conservatively, fared especially well during the market downturn earlier in the year. It has tended to do better in weak markets because high quality dividend-paying companies are typically less volatile than the overall market and have offered better downside protection.
Over longer periods of time, the fund’s returns have compared favorably to those of the S&P 500, with less volatility. For the past 10 years, the fund had an average annual total return of 6.47% compared with the index’s 6.70% return. For its 66-year lifetime, the fund has had an average annual total return of 11.54% compared with 11.15% for the S&P 500. The index is unmanaged and, therefore, has no expenses; investors cannot invest directly in an index.
Portfolio review
Holdings in the industrials sector made strong contributions to the fund’s returns. These gains were primarily driven by Lockheed Martin and Waste Management. Shares of Lockheed Martin advanced as the U.S. defense contractor continued to land new contracts and generate cash, allowing it to increase its dividend. The company reported strong earnings amid growing demand for its defense systems at home and abroad. Meanwhile, shares of Waste Management also gained after the company reported solid earnings, driven by a combination of price increases, stronger volumes and cost savings as it refocuses on core business activities.
Several companies held in the fund benefitted from the rebound in oil prices, from traditional energy companies like Canadian Natural Resources to railroad operators such as Norfolk Southern. We believe the fund’s energy holdings, which we added to on the margin during the period, offer good value as the supply-demand balance has reversed and oil prices rebounded. Many energy companies also pay healthy dividends, including pipeline companies such as Enbridge, which are recovering along with the oil sector.
In the telecommunication services sector, shares of AT&T and Verizon Communications have risen as worries subsided about price competition from smaller rivals Sprint and T-Mobile US, as well as technology companies like Apple and Google that could try to offer mobile services. We believe these threats are exaggerated and unlikely to have a long-term impact on AT&T and Verizon Communications, which offer dividend yields around 5% and may very well benefit from further industry consolidation in the future. We will continue to monitor the potential merger of AT&T and Time Warner, which may come under regulatory scrutiny.
| * | Source: S&P Dow Jones Indices LLC |
Elsewhere, shares of Texas Instruments posted strong gains as the semiconductor company reported robust earnings amid strong demand from the automotive and industrial sectors. However, several companies in the health care sector declined, including Amgen and AbbVie. Shares of Amgen weakened in response to negative investor sentiment toward the biotechnology sector in general, including concerns about drug pricing and generic competition. Drug pricing in the U.S. is changing, creating both risks and opportunities within the sector. Over the longer term, our outlook for the fund’s pharmaceutical holdings remains intact. We continue to focus on those companies that we believe offer adequately priced drugs and the most innovation, which is often measured by improved patient outcomes.
Looking ahead
The U.S. economy will likely continue to grow at a moderate pace, although much uncertainty exists following the presidential election. The unemployment rate is low, real wages are gradually increasing, consumer spending is slowly rising and inflation remains muted. As a result, the Fed should raise rates gradually in the near future, which would be unlikely to have a significant impact on the economy.
If the central bank raises rates too quickly, the dollar could strengthen further, making it more difficult for U.S. companies to compete on the global market.
The combination of rising rates and political uncertainty in the U.S., as well as geopolitical events in Europe and the Middle East, could cause more volatility going forward. While the market doesn’t like uncertainty — no matter what form it takes — we believe our consistent approach of investing in quality companies will serve investors well in an increasingly uncertain environment. The fund is well-diversified and the portfolio managers consider its capital preservation objective to be very important in security selection and portfolio construction.
Managers are targeting companies that offer yield along with growth potential; many of these companies are in industries that generally have not been high-yielding, such as information technology and health care. In addition to helping fulfill the fund’s objective of providing income, these nontraditional dividend payers tend to be less interest-rate sensitive and can offer downside protection as well as price appreciation. Portfolio managers also are finding some attractive opportunities in the energy and financials sectors.
When investing for income, the fund’s managers are mindful to limit investments in those companies with high dividend yields and little earnings growth, which tend not to do as well when interest rates are rising. Companies with dividend growth tend to do better in such an environment. Dividend growth also sends a positive message about a company’s earnings and management’s willingness to share profits with investors instead of spending capital on acquisitions or share repurchases, which have a less impressive track record of benefiting shareholders. For more on income investing and our approach to dividends, see the related feature starting on page 6.
Investors should keep in mind the three objectives of the fund: current income, growth of capital and conservation of principal, which is especially important during a period of rising interest rates and higher valuations. We are pleased to report that the number of shareholder accounts in AMF has grown by 4.4% from a year ago. We welcome our new shareholders and thank our long-term investors for their continued support.
Cordially,

Joyce E. Gordon
Vice Chairman

William L. Robbins
President
December 8, 2016
For current information about the fund, visit americanfunds.com.
Dividends paid in calendar year 2016
For tax purposes, here are the quarterly income dividends Class A shareholders received in calendar year 2016.
| Income dividends per share: | | $0.185 paid 3/18/16 |
| | | $0.185 paid 6/17/16 |
| | | $0.185 paid 9/16/16 |
| | | $0.185 to be paid on 12/19/16* |
The fund will also pay a special dividend from accumulated undistributed net income and a capital gain distribution on 12/19/16.*
Form 1099-DIV, which provides the information you will need to prepare your federal income tax return for 2016, will be mailed to you with your American Funds Tax Guide in late January 2017.
The value of a long-term perspective
Fund results shown are for Class A shares and reflect deduction of the maximum sales charge of 5.75% on the $10,000 investment.1 Thus, the net amount invested was $9,425.2 Results are for past periods and are not predictive of results for future periods. Current and future results may be lower or higher than those shown. Share prices and returns will vary, so investors may lose money. For current information and month-end results, visit americanfunds.com.
The results shown are before taxes on fund distributions and sale of fund shares.
| 1 | As outlined in the prospectus, the sales charge is reduced for accounts (and aggregated investments) of $25,000 or more and is eliminated for purchases of $1 million or more. There is no sales charge on dividends or capital gain distributions that are reinvested in additional shares. |
| 2 | The maximum initial sales charge was 8.5% prior to July 1, 1988. |
| 3 | Includes reinvested capital gain distributions totaling $4,935,569 in the years 1950–2016 and reinvested dividends. |
| 4 | Source: S&P Dow Jones Indices LLC. The S&P 500 is unmanaged and, therefore, has no expenses. Investors cannot invest directly in an index. |
| 5 | Includes reinvested capital gain distributions taken in shares totaling $701,208 but does not reflect income dividends taken in cash. |
| 6 | Computed from data supplied by the U.S. Department of Labor, Bureau of Labor Statistics. It would take $102,863 to buy today what $10,000 bought when the fund began. |
| 7 | For the period February 21, 1950 (commencement of operations), through October 31, 1950. |
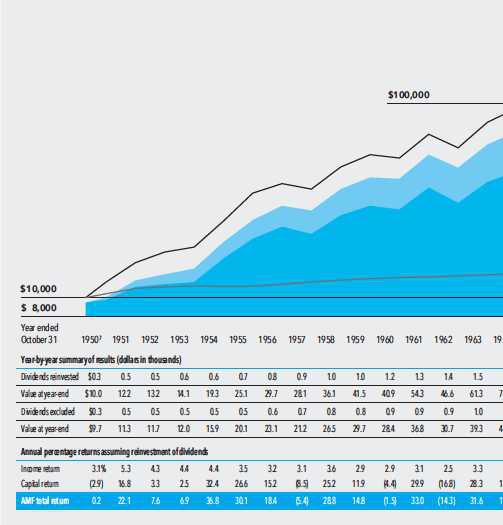
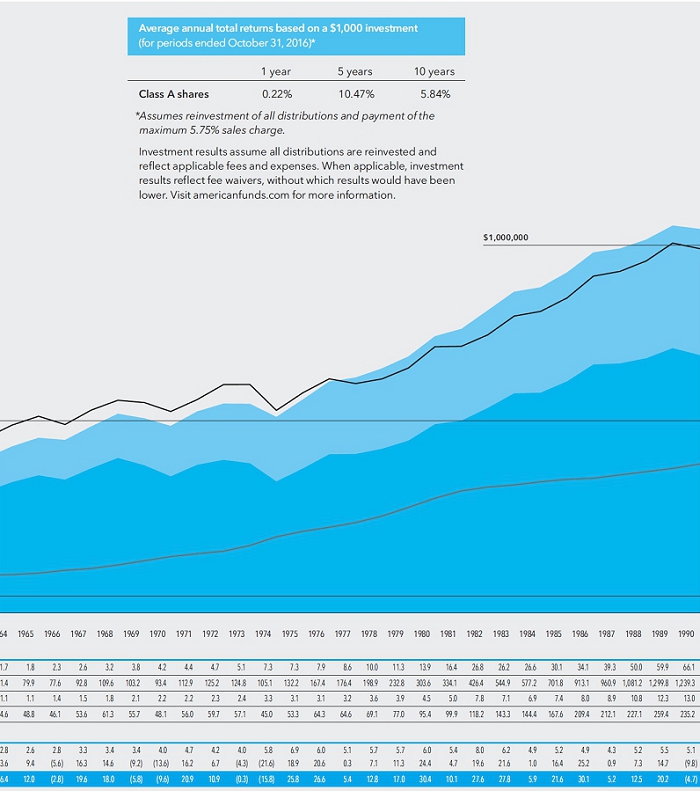
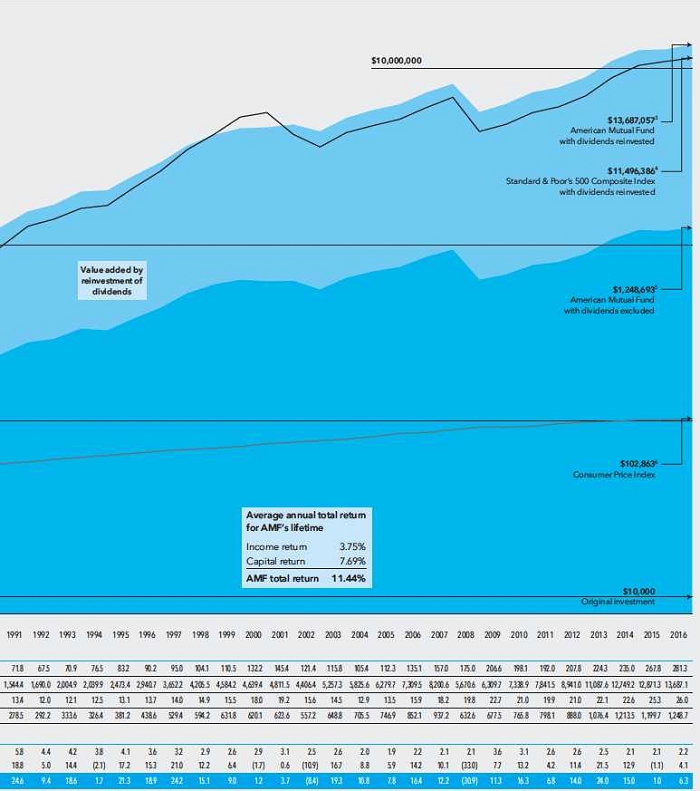
For more than 66 years, American Mutual Fund has been providing investors with an opportunity to achieve their financial goals. A meaningful way to compare the fund’s results with the return on other investments is through its total return.
Total return is a combination of income return and capital return. This chart illustrates an assumed $10,000 investment in American Mutual Fund from February 21, 1950 — commencement of operations — through October 31, 2016. The table beneath the chart shows the fund’s total return in each of the 66 fiscal years, broken down into its income and capital components.
As you can see, during this period a $10,000 investment in the fund, with all dividends reinvested, would have grown to $13,687,057.3
Use the table below to estimate the growth of your investment. Let’s say that you have been reinvesting all your dividends and want to know how your investment has done since the end of fiscal 2006. As the table shows, the value of the investment illustrated here was $7.3 million. Since then, it has grown to $13.7 million. Thus, in the same period, the value of your 2006 investment — regardless of its size — also has grown.

Multiple perspectives
to income investing,
one approach
to dividends
“Multiple perspectives. One approach.” These words describe the unique investment process, known as The Capital System,SM that portfolio managers at American Funds use. It combines high-conviction investing and individual accountability with diverse perspectives and teamwork.
The portfolio managers of American Mutual Fund each have a different style when it comes to income investing. Some invest in big companies in stable industries and with high dividend yields, while others look for opportunities in companies that have fallen on hard times. But when it comes to encouraging companies to pay dividends, the fund’s portfolio managers are unified in their approach. They take an active role, often working together, when meeting with management teams and discussing how companies should use their cash to reward shareholders.
“While our investors like to receive dividends, not every company should necessarily pay a large and growing dividend,” explains portfolio manager Joyce Gordon, also vice chairman of the fund. “However, we tend to invest in more mature, established companies that have the wherewithal to pay dividends. They have stable or growing cash flows and are generating strong earnings. We look at the various uses the company has for its cash and make the appropriate suggestion to management.”
Categories of income investing
Generally speaking, there are four broad categories of companies when investing for income: big, stable companies and industries; those industries and companies that are maturing; companies that have fallen on hard times; and companies that are in secular decline. Most of the fund’s portfolio managers use a mix of companies from these categories, but each category has different things to be mindful of when investing for income.
The first category typically includes big companies in stable industries such as utilities and telecommunication services. These are more defensive companies whose earnings tend not to vary much through the ups and downs of economic cycles. They don’t require a lot of capital spending and pay out much of their earnings; but since they don’t grow
very fast, one needs to be careful about the valuations. Joyce says the “meat and potatoes” of her portfolio are in this category.
She has a handful of investments in the second category: companies and industries that are maturing. This category includes companies that were in a growth phase several years ago but that are now generating more cash flow and paying out large and growing dividends. Recent examples include Amgen and Gilead Sciences in the biotechnology industry. “The companies have lower investment needs than when they were starting up,” she says. “As earnings start to come through, they get to the point where they can initiate a dividend and grow it rapidly.”
Joyce has a larger number of investments in the third category: companies that have fallen on hard times. These companies are mostly in cyclical sectors that are attractively valued such as energy, financials and industrials. “They have been hit by commodity prices or the economic cycle, offer good value at current prices and have a decent current yield that is likely to grow over time,” she explains, adding that in some cases it can be companies with an isolated problem. “We must be confident that the business will improve and the dividend is sustainable. These types of holdings can be more volatile than those in the other categories.”
Finally, there are those companies that are in secular decline. They tend to have high dividend yields because management is running the business for cash and paying it all out. “Don’t be in denial that these companies’ earnings are in decline and be careful what you pay for them,” warns Joyce. “I have tried to avoid companies in secular decline. They tend to be value traps — they always look cheap and never seem to increase in value.”
Joyce says this approach of investing in a blend of yield categories provides a great mix of opportunities for the fund’s investors. “It allows the fund to take advantage of cyclically depressed valuations and allows us to invest in faster growing companies while not incurring too much risk,” she says. “The overall blend tends to do better than the market in downturns and participates to a significant extent in market rallies.”
Portfolio manager Will Robbins, also president of the fund, says he tries to avoid investing in what he calls “melting ice cubes,” noting that while near-term yields on these stocks may be attractive, “investing in companies in long-term, secular decline is a hard way to make a living. They may enjoy temporary periods of success, but their stock charts often resemble a yo-yo descending a set of stairs. Instead, I want to hold companies where time is on my side. The power of compounding through growth and good capital management — including a healthy dividend — can mask a lot of mistakes.”
Likewise, the other portfolio managers tend to avoid companies in secular decline and invest in a mix of companies from the other three categories. However, each one brings a different perspective to the fund while still working together to achieve its three objectives: current income, growth of capital and conservation of principal — in other words, The Capital System at work.
“All of the fund’s portfolio managers are striving to have less volatility than the overall market so I suspect that each of us has a blend of these types of investments,” says Joyce, who also serves as principal investment officer. “We focus on different securities and some managers have many more holdings in certain industries than others. We invest in companies but it is instructive to look at the industry weighting to see the variation across portfolio managers.”

Will Robbins
President and
Portfolio manager

“We tend to invest in more mature, established companies that have the wherewithal to pay dividends. They have stable or growing cash flows and are generating strong earnings. We look at the various uses the company has for its cash and make the appropriate suggestion to management.”
Joyce Gordon
Vice chairman and Portfolio manager

James Terrile
Portfolio manager
Portfolio manager Brad Vogt says he tends to invest in larger companies across a range of industries that have long histories of stability and growth. He pays attention to the past volatility of companies and stocks, constructing a portfolio that should do better than the market in flat or declining periods. “To pick two examples, Cisco and IBM are not viewed as the most innovative technology leaders, but they have broad customer bases, good recurring service revenue, strong free cash flow and reasonable valuations,” notes Brad.
The fund’s other portfolio managers have slightly different approaches. Dylan Yolles prefers to invest in high-quality companies where temporary uncertainty may be depressing the valuation. “But because the companies tend to generate a lot of cash, it gives me confidence that they will increase earnings and dividends,” he says. “When the uncertainty abates, valuation multiples will expand.” Examples of long-term holdings in his portfolio that were purchased during periods of uncertainty include technology company Microsoft and defense contractor Lockheed Martin, which have since been revalued by the market.
James Terrile says he generally looks for mispriced securities when investing in his portfolio for the fund. “Big, stable industries may offer opportunities because two different industry groups can trade at markedly different valuations,” he explains, noting that the phenomenon occurred recently with telecom and utilities. “Telecoms have a more competitive marketplace today and
How American Mutual Fund has fared during market declines*
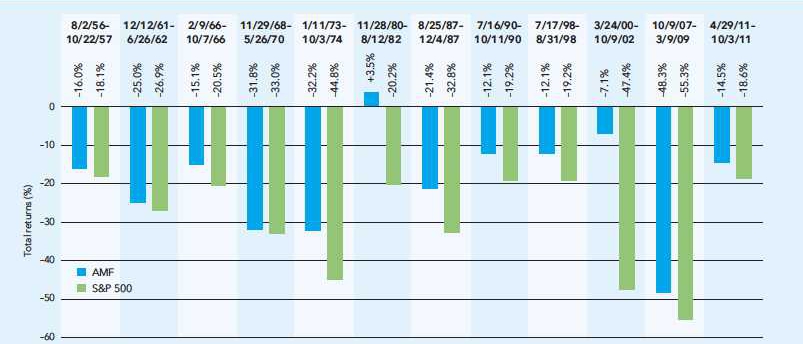
| * | Major stock market declines are based on price declines of 15% or more (without dividends reinvested) in the unmanaged S&P 500 with 100% recovery between declines (except for a 77% recovery between 3/9/09 and 4/29/11). There have been periods in which the fund has lagged the S&P 500, particularly in strong markets. |
Fund results shown are for Class A shares at net asset value. If a sales charge (maximum 5.75%) had been deducted, the results would have been lower. Results are for past periods and are not predictive of results for future periods. Current and future results may be lower or higher than those shown. Share prices and returns will vary, so investors may lose money. For current information and month-end results, visit americanfunds.com.
have been acquisitive, creating uncertainty. Utilities trade at higher valuations because interest rates have been low. By definition, we are always invested in one of the types of companies mentioned. The key is avoiding value traps.”
How companies use their cash
There are five basic ways in which companies can use their cash: capital spending, acquisitions, paying down debt, share buybacks and paying dividends. While the fund’s portfolio managers each have different styles of income investing, they agree that paying a dividend is often one of the best ways a company can use its free cash flow to reward shareholders.
“I believe all five options can add value, however, empirical evidence would suggest that share buybacks and acquisitions have destroyed a lot of value in corporate America over time,” says Will, noting that while capital spending on high-return projects can add value, it can also result in low-return projects getting funded. “Dividends are the great equalizer. They set the floor for the return threshold that must be met by other alternatives. The presence of a dividend serves as a reminder that excess cash belongs to the shareholders and it holds management’s feet to the fire to justify alternative uses of cash based on expected returns.”
Will says that dividends are a very tangible and direct form of returning cash that represents a significant value to shareholders — especially in a low-return environment — whereas the value of share buybacks is far more opaque. “If companies are able to buy their stock back at low prices, they can add value to remaining shareholders, driving prices higher,” he explains. “However, history suggests that companies are more likely to repurchase stock when flush with cash, which often coincides with high share prices. That is often value-destructive.”
Having covered the U.S. telecom industry for 17 years, Brad tends to invest in higher dividend yielding companies than some of the other portfolio managers on the fund. As a result, he has a particular focus on how companies generate free cash flow and where they deploy that cash. Other than share buybacks and paying dividends, he says it is sometimes important for companies to use their free cash flow for other uses, such as paying down debt.
“Spending cash to pay down debt can be a sensible thing to do, but it is very situational, based on the company and industry as well other factors, like interest rates,” explains Brad. “We have to be careful of those companies that have used the low interest rate environment to leverage up their balance sheets — if rates go up, this could be a problem for them. Likewise, acquisitions can consume cash or be paid for by issuing equity.”
Brad and the fund’s other portfolio managers and investment analysts meet regularly with the management teams of the companies they invest in to discuss, among other things, how they deploy their free cash flow, often encouraging them to pay or increase their dividends. “Our experienced analysts take the lead in our ongoing dialogue with managements about their approach to allocating capital,” he says. “The fact that we have a longer term investment horizon than many investors makes it more likely that managements are interested in our views. We are not activist shareholders who try to influence company actions in the public media. But we have clear views on corporate governance, shareholder rights and capital allocation that we communicate.”
Many of the companies in which the fund invests are already paying out what the portfolio managers and analysts think they should be paying. However, if they

Dylan Yolles
Portfolio manager

“We are not activist shareholders who try to influence company actions in the public media. But we have clear views on corporate governance, shareholder rights and capital allocation that we communicate.”
Brad Vogt
Portfolio manager

“If you recognize that dividends are fundamentally profits and profits are eventually dividends, then dividends are just as sustainable as the profits from which they are paid. When profits are weaker, dividends are likely to follow, and while that is inevitable I am not so sure it is imminent.”
Jim Lovelace
Portfolio manager
determine that a company should be paying a larger dividend, usually the analyst will meet with the top executives and make the case directly to them. “We can show them what their acquisitions and previous buybacks have done to shareholder value and can also show their payout in relation to their peers,” says Joyce. “Sometimes, we are invited to present the case for higher dividends to the board. But ultimately the companies make the decision themselves.”
The sustainability of dividends
Companies are paying more of their profits to shareholders than at any time since the global financial crisis, helping boost shares of dividend paying companies, even as many of them have reported lackluster earnings. This has some investors worried about the sustainability of dividend payments and that a period of strong dividend growth may be coming to an end.
“I don’t think dividend growth will be as strong as it has been over the last eight years,” Joyce says. “Since the global financial crisis, we have seen companies bring back dividends as earnings have rebounded. The payout ratio is now fairly high and corporate earnings are not expected to grow quite as fast as they have up until now. Companies have taken on more leverage with rates very low and they may need to add to their pension assets to pay for obligations. Dividend growth can still be found but it will take more digging to find the gems out there.”
Brad says that while the last eight years have been great for income investors as companies returned profits to shareholders, he wonders what the next eight years will look like. “The big question is, can it be sustained?” he asks. “A number of companies have stretched their balance sheets, benefited from lower tax and interest rates, and not dealt with large pension liabilities.
Favorable returns with less volatility
American Mutual Fund strives to meet its objectives. If we look back 10 years, as shown below, AMF has provided comparable or higher returns than those of its four benchmarks. The fund has been able to accomplish this with lower volatility than its benchmarks.
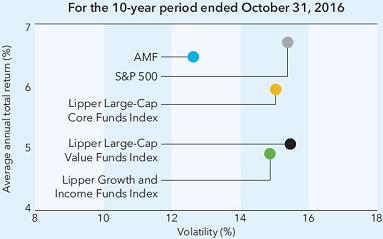
| | | Average annual
total return | | Volatility |
| AMF | | | 6.47 | % | | | 12.62 | % |
| S&P 500 | | | 6.70 | | | | 15.38 | |
| Lipper Growth and Income Funds Index | | | 4.92 | | | | 14.86 | |
| Lipper Large-Cap Value Funds Index | | | 5.07 | | | | 15.46 | |
| Lipper Large-Cap Core Funds Index | | | 5.95 | | | | 15.03 | |
Volatility is calculated at net asset value by Lipper using annualized standard deviation (based on monthly returns). It is a common measure of absolute volatility that shows how returns over time have varied from the mean; a lower number signifies lower volatility. Standard & Poor’s 500 Composite Index is a market capitalization-weighted index based on the results of 500 widely held common stocks. Source: S&P Dow Jones Indices LLC. It is unmanaged and, therefore, has no expenses. Investors cannot invest directly in an index. The Lipper Growth and Income Funds Index is an equally weighted index of the 30 largest mutual funds that combine a growth orientation with the pursuit of income. The Lipper Large-Cap Value Funds Index and the Lipper Large-Cap Core Funds Index are equally weighted indexes of the 30 largest mutual funds that invest at least 75% of their equity assets in companies with market capitalizations (on a three-year weighted basis) above Lipper’s U.S. diversified equity large-cap floor. Lipper indexes track the largest mutual funds (no more than 30), represented by one share class per fund, in the corresponding Lipper category. Source: Thomson Reuters Lipper.
It’s not so much that I worry about companies cutting dividends, but we could be in an environment where the growth of dividends slows and share buybacks are smaller.”
As portfolio manager Jim Lovelace notes, dividends are driven by earnings. “If you recognize that dividends are fundamentally profits and profits are eventually dividends, then dividends are just as sustainable as the profits from which they are paid,” he says. “When profits are weaker, dividends are likely to follow, and while that is inevitable I am not so sure it is imminent.”
James points out that companies with high leverage, cyclical profits and high payout ratios pose the greatest risk to dividend safety. “We try to assess these risks one company at a time,” he explains, noting that payout ratios are not excessively high on average. “With valuations having expanded since 2009, sensible management teams recognize that dividends will play a more important role in total return going forward.”
Finally, Will reminds investors that since so many dividends were cut during the last recession, they started from a very low base of absolute dividend levels. “Since then, dividends have grown substantially, but I believe they have room to grow more,” he states. “Cash positions on corporate balance sheets are exceptionally strong, and whole industries — from information technology to financial services — have the potential to pay much higher dividends in the future.” n

The New Geography of Investing®
Where a company does business can be more important than where it’s located. Here’s a look at American Mutual Fund’s portfolio in terms of where its equity holdings earn their revenue. The charts below show the countries and regions in which the fund’s equity investments are located, and where the revenue comes from.
Equity portion breakdown by domicile (%)
| | Region | | Fund | | Index |
| n | United States | | | 91 | % | | | 100 | % |
| n | Canada | | | 6 | | | | — | |
| n | Europe | | | 3 | | | | — | |
| n | Japan | | | — | | | | — | |
| n | Asia-Pacific ex. Japan | | | — | | | | — | |
| n | Emerging markets | | | — | | | | — | |
| | Total | | | 100 | % | | | 100 | % |
Equity portion breakdown by revenue (%)

| | Region | | Fund | | Index |
| n | United States | | | 61 | % | | | 63 | % |
| n | Canada | | | 6 | | | | 2 | |
| n | Europe | | | 11 | | | | 12 | |
| n | Japan | | | 2 | | | | 3 | |
| n | Asia-Pacific ex. Japan | | | 1 | | | | 1 | |
| n | Emerging markets | | | 19 | | | | 19 | |
| | Total | | | 100 | % | | | 100 | % |
Compared with the S&P 500 as a percentage of net assets. All figures include convertible securities.
Source: Capital Group (as of October 31, 2016).
Summary investment portfolio October 31, 2016
| Industry sector diversification | Percent of net assets |
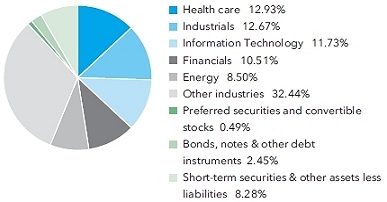
| Common stocks 88.78% | | | Shares | | | | Value
(000) | |
| Energy 8.50% | | | | | | | | |
| Chevron Corp. | | | 4,293,800 | | | $ | 449,776 | |
| ConocoPhillips | | | 6,519,500 | | | | 283,272 | |
| Enbridge Inc. | | | 7,386,638 | | | | 318,881 | |
| Exxon Mobil Corp. | | | 7,003,500 | | | | 583,532 | |
| Schlumberger Ltd. | | | 3,110,000 | | | | 243,295 | |
| Spectra Energy Corp | | | 5,625,500 | | | | 235,202 | |
| Suncor Energy Inc. | | | 12,406,310 | | | | 372,291 | |
| Other securities | | | | | | | 811,592 | |
| | | | | | | | 3,297,841 | |
| Materials 3.47% | | | | | | | | |
| Agrium Inc. | | | 2,795,000 | | | | 256,637 | |
| Monsanto Co. | | | 2,392,900 | | | | 241,133 | |
| Praxair, Inc. | | | 2,809,924 | | | | 328,930 | |
| Other securities | | | | | | | 520,472 | |
| | | | | | | | 1,347,172 | |
| Industrials 12.67% | | | | | | | | |
| Boeing Co. | | | 4,542,900 | | | | 647,045 | |
| CSX Corp. | | | 8,095,493 | | | | 246,994 | |
| General Dynamics Corp. | | | 1,722,164 | | | | 259,599 | |
| General Electric Co. | | | 19,537,685 | | | | 568,547 | |
| Lockheed Martin Corp. | | | 2,516,560 | | | | 620,030 | |
| Norfolk Southern Corp. | | | 4,428,100 | | | | 411,813 | |
| Union Pacific Corp. | | | 4,616,264 | | | | 407,062 | |
| Waste Management, Inc. | | | 6,918,100 | | | | 454,242 | |
| Other securities | | | | | | | 1,298,831 | |
| | | | | | | | 4,914,163 | |
| Consumer discretionary 6.82% | | | | | | | | |
| Carnival Corp., units | | | 5,909,200 | | | | 290,142 | |
| Comcast Corp., Class A | | | 5,804,000 | | | | 358,803 | |
| Home Depot, Inc. | | | 2,991,250 | | | | 364,962 | |
| McDonald’s Corp. | | | 3,404,000 | | | | 383,188 | |
| Newell Rubbermaid Inc. | | | 7,198,200 | | | | 345,658 | |
| Other securities | | | | | | | 901,116 | |
| | | | | | | | 2,643,869 | |
| | | | Shares | | | | Value
(000) | |
| Consumer staples 7.55% | | | | | | | | |
| Coca-Cola Co. | | | 14,353,900 | | | $ | 608,605 | |
| Procter & Gamble Co. | | | 7,410,378 | | | | 643,221 | |
| Other securities | | | | | | | 1,675,578 | |
| | | | | | | | 2,927,404 | |
| | | | | | | | | |
| Health care 12.93% | | | | | | | | |
| AbbVie Inc. | | | 16,814,400 | | | | 937,907 | |
| Amgen Inc. | | | 7,230,172 | | | | 1,020,611 | |
| Johnson & Johnson | | | 3,601,800 | | | | 417,773 | |
| Medtronic PLC | | | 6,742,000 | | | | 552,979 | |
| Merck & Co., Inc. | | | 4,736,485 | | | | 278,126 | |
| Pfizer Inc. | | | 8,223,200 | | | | 260,758 | |
| Other securities | | | | | | | 1,548,056 | |
| | | | | | | | 5,016,210 | |
| | | | | | | | | |
| Financials 10.51% | | | | | | | | |
| JPMorgan Chase & Co. | | | 6,536,197 | | | | 452,697 | |
| Marsh & McLennan Companies, Inc. | | | 4,406,094 | | | | 279,302 | |
| Wells Fargo & Co. | | | 9,621,100 | | | | 442,667 | |
| Other securities | | | | | | | 2,900,866 | |
| | | | | | | | 4,075,532 | |
| | | | | | | | | |
| Information technology 11.73% | | | | | | | | |
| Analog Devices, Inc. | | | 4,466,440 | | | | 286,299 | |
| Apple Inc. | | | 4,181,000 | | | | 474,711 | |
| Intel Corp. | | | 10,185,000 | | | | 355,151 | |
| Microsoft Corp. | | | 12,050,007 | | | | 722,036 | |
| Texas Instruments Inc. | | | 17,346,644 | | | | 1,229,010 | |
| Other securities | | | | | | | 1,483,395 | |
| | | | | | | | 4,550,602 | |
| | | | | | | | | |
| Telecommunication services 5.78% | | | | | | | | |
| AT&T Inc. | | | 16,928,000 | | | | 622,781 | |
| Verizon Communications Inc. | | | 29,946,814 | | | | 1,440,442 | |
| Other securities | | | | | | | 176,251 | |
| | | | | | | | 2,239,474 | |
| | | | | | | | | |
| Utilities 5.57% | | | | | | | | |
| Exelon Corp. | | | 11,121,885 | | | | 378,923 | |
| PG&E Corp. | | | 5,257,000 | | | | 326,565 | |
| Sempra Energy | | | 6,291,853 | | | | 673,857 | |
| Other securities | | | | | | | 780,080 | |
| | | | | | | | 2,159,425 | |
| | | | | | | | | |
| Real estate 1.27% | | | | | | | | |
| Crown Castle International Corp. | | | 3,502,000 | | | | 318,647 | |
| Other securities | | | | | | | 173,340 | |
| | | | | | | | 491,987 | |
| | | | | | | | | |
| Miscellaneous 1.98% | | | | | | | | |
| Other common stocks in initial period of acquisition | | | | | | | 767,206 | |
| | | | | | | | | |
| Total common stocks (cost: $25,199,218,000) | | | | | | | 34,430,885 | |
| | | | | | | | | |
| Preferred securities 0.03% | | | | | | | | |
| Financials 0.03% | | | | | | | | |
| Other securities | | | | | | | 11,358 | |
| | | | | | | | | |
| Total preferred securities (cost: $10,004,000) | | | | | | | 11,358 | |
| Convertible stocks 0.46% | | Shares | | | Value
(000) | |
| | | | | |
| Utilities 0.07% | | | | |
| Exelon Corp., convertible preferred, units | | | 600,000 | | | $ | 28,620 | |
| | | | | | | | | |
| Miscellaneous 0.39% | | | | | | | | |
| Other convertible stocks in initial period of acquisition | | | | | | | 151,770 | |
| | | | | | | | | |
| Total convertible stocks (cost: $178,761,000) | | | | | | | 180,390 | |
| | | | | | | | | |
| Bonds, notes & other debt instruments 2.45% | | Principal amount
(000) | | | | | |
| U.S. Treasury bonds & notes 1.82% | | | | | | | | |
| U.S. Treasury 1.00%–1.88% 2017–2021 | | $ | 702,025 | | | | 704,924 | |
| | | | | | | | | |
| Corporate bonds & notes 0.63% | | | | | | | | |
| Financials 0.62% | | | | | | | | |
| JPMorgan Chase & Co., Series I, junior subordinated 7.90% (undated) | | $ | 116,654 | | | | 120,387 | |
| Wells Fargo & Co., Series K, junior subordinated 7.98% (undated) | | | 115,445 | | | | 120,496 | |
| | | | | | | | 240,883 | |
| | | | | | | | | |
| Real estate 0.01% | | | | | | | | |
| Other securities | | | | | | | 3,973 | |
| | | | | | | | | |
| Total corporate bonds & notes | | | | | | | 244,856 | |
| Total bonds, notes & other debt instruments (cost: $932,661,000) | | | | | | | 949,780 | |
| | | | | | | | | |
| Short-term securities 8.14% | | | | | | | | |
| Apple Inc. 0.42% due 11/3/20161 | | | 100,000 | | | | 99,998 | |
| Chevron Corp. 0.45%–0.80% due 11/3/2016–1/4/20171 | | | 149,200 | | | | 149,130 | |
| Coca-Cola Co. 0.63%–0.68% due 12/6/2016–12/8/20161 | | | 90,000 | | | | 89,961 | |
| ExxonMobil Corp. 0.48%–0.51% due 11/1/2016–12/12/2016 | | | 70,000 | | | | 69,975 | |
| Federal Home Loan Bank 0.25%–0.55% due 11/4/2016–4/13/2017 | | | 716,400 | | | | 715,926 | |
| General Electric Co. 0.35% due 11/1/2016 | | | 33,300 | | | | 33,300 | |
| Microsoft Corp. 0.50%–0.65% due 11/8/2016–1/24/20171 | | | 280,600 | | | | 280,449 | |
| Pfizer Inc. 0.59%–0.68% due 11/14/2016–12/19/20161 | | | 187,800 | | | | 187,720 | |
| U.S. Treasury Bills 0.29%–0.44% due 11/17/2016–2/16/2017 | | | 598,000 | | | | 597,678 | |
| Wells Fargo Bank, N.A. 0.86%–0.90% due 11/14/2016–12/5/2016 | | | 100,000 | | | | 100,032 | |
| Other securities | | | | | | | 833,248 | |
| | | | | | | | | |
| Total short-term securities (cost: $3,157,055,000) | | | | | | | 3,157,417 | |
| Total investment securities 99.86% (cost: $29,477,699,000) | | | | | | | 38,729,830 | |
| Other assets less liabilities 0.14% | | | | | | | 53,119 | |
| | | | | | | | | |
| Net assets 100.00% | | | | | | $ | 38,782,949 | |
This summary investment portfolio is designed to streamline the report and help investors better focus on the fund’s principal holdings. See the inside back cover for details on how to obtain a complete schedule of portfolio holdings.
As permitted by U.S. Securities and Exchange Commission regulations, “Miscellaneous” securities including holdings in their first year of acquisition that have not previously been publicly disclosed.
“Other securities” includes all issues that are not disclosed separately in the summary investment portfolio.
The following footnotes apply to either the individual securities noted or one or more of the securities aggregated and listed as a single line item.
| 1 | Acquired in a transaction exempt from registration under Section 4(2) of the Securities Act of 1933. May be resold in the U.S. in transactions exempt from registration, normally to qualified institutional buyers. The total value of all such securities, including those in “Other securities,” was $1,179,344,000, which represented 3.04% of the net assets of the fund. |
See Notes to Financial Statements
Financial statements
Statement of assets and liabilities
| at October 31, 2016 | (dollars in thousands) |
| Assets: | | | | | | | | |
| Investment securities, at value (cost: $29,477,699) | | | | | | $ | 38,729,830 | |
| Cash | | | | | | | 100,182 | |
| Cash denominated in currencies other than U.S. dollars (cost: $1,739) | | | | | | | 1,739 | |
| Receivables for: | | | | | | | | |
| Sales of investments | | $ | 31,736 | | | | | |
| Sales of fund’s shares | | | 51,838 | | | | | |
| Dividends and interest | | | 65,254 | | | | | |
| Other | | | 19 | | | | 148,847 | |
| | | | | | | | 38,980,598 | |
| Liabilities: | | | | | | | | |
| Payables for: | | | | | | | | |
| Purchases of investments | | | 128,565 | | | | | |
| Repurchases of fund’s shares | | | 46,720 | | | | | |
| Investment advisory services | | | 7,979 | | | | | |
| Services provided by related parties | | | 10,696 | | | | | |
| Trustees’ deferred compensation | | | 2,983 | | | | | |
| Other | | | 706 | | | | 197,649 | |
| Net assets at October 31, 2016 | | | | | | $ | 38,782,949 | |
| | | | | | | | | |
| Net assets consist of: | | | | | | | | |
| Capital paid in on shares of beneficial interest | | | | | | $ | 28,255,011 | |
| Undistributed net investment income | | | | | | | 99,496 | |
| Undistributed net realized gain | | | | | | | 1,176,326 | |
| Net unrealized appreciation | | | | | | | 9,252,116 | |
| Net assets at October 31, 2016 | | | | | | $ | 38,782,949 | |
(dollars and shares in thousands, except per-share amounts)
Shares of beneficial interest issued and outstanding (no stated par value) —
unlimited shares authorized (1,075,875 total shares outstanding)
| | | Net assets | | | Shares
outstanding | | | Net asset value
per share | |
| Class A | | $ | 22,918,664 | | | | 635,258 | �� | | $ | 36.08 | |
| Class B | | | 17,375 | | | | 485 | | | | 35.86 | |
| Class C | | | 1,155,768 | | | | 32,468 | | | | 35.60 | |
| Class F-1 | | | 1,384,256 | | | | 38,524 | | | | 35.93 | |
| Class F-2 | | | 3,084,357 | | | | 85,506 | | | | 36.07 | |
| Class 529-A | | | 748,478 | | | | 20,790 | | | | 36.00 | |
| Class 529-B | | | 1,946 | | | | 54 | | | | 36.00 | |
| Class 529-C | | | 175,748 | | | | 4,909 | | | | 35.80 | |
| Class 529-E | | | 36,248 | | | | 1,011 | | | | 35.87 | |
| Class 529-F-1 | | | 59,800 | | | | 1,659 | | | | 36.05 | |
| Class R-1 | | | 68,017 | | | | 1,904 | | | | 35.71 | |
| Class R-2 | | | 243,631 | | | | 6,827 | | | | 35.68 | |
| Class R-2E | | | 6,538 | | | | 182 | | | | 35.97 | |
| Class R-3 | | | 601,352 | | | | 16,791 | | | | 35.81 | |
| Class R-4 | | | 653,379 | | | | 18,168 | | | | 35.96 | |
| Class R-5E | | | 37 | | | | 1 | | | | 36.07 | |
| Class R-5 | | | 284,179 | | | | 7,876 | | | | 36.08 | |
| Class R-6 | | | 7,343,176 | | | | 203,462 | | | | 36.09 | |
See Notes to Financial Statements
Statement of operations
| for the year ended October 31, 2016 | (dollars in thousands) |
| Investment income: | | | | | | | | |
| Income: | | | | | | | | |
| Dividends (net of non-U.S. taxes of $13,063) | | $ | 975,789 | | | | | |
| Interest | | | 35,651 | | | $ | 1,011,440 | |
| Fees and expenses*: | | | | | | | | |
| Investment advisory services | | | 88,868 | | | | | |
| Distribution services | | | 79,643 | | | | | |
| Transfer agent services | | | 30,334 | | | | | |
| Administrative services | | | 9,352 | | | | | |
| Reports to shareholders | | | 1,306 | | | | | |
| Registration statement and prospectus | | | 1,311 | | | | | |
| Trustees’ compensation | | | 716 | | | | | |
| Auditing and legal | | | 211 | | | | | |
| Custodian | | | 432 | | | | | |
| Other | | | 933 | | | | | |
| Total fees and expenses before reimbursement | | | 213,106 | | | | | |
| Less transfer agent services reimbursement | | | — | † | | | | |
| Total fees and expenses after reimbursement | | | | | | | 213,106 | |
| Net investment income | | | | | | | 798,334 | |
| | | | | | | | | |
| Net realized gain and unrealized appreciation: | | | | | | | | |
| Net realized gain on: | | | | | | | | |
| Investments | | | 1,150,417 | | | | | |
| Currency transactions | | | 109 | | | | 1,150,526 | |
| Net unrealized appreciation (depreciation) on: | | | | | | | | |
| Investments | | | 309,003 | | | | | |
| Currency translations | | | (16 | ) | | | 308,987 | |
| Net realized gain and unrealized appreciation | | | | | | | 1,459,513 | |
| Net increase in net assets resulting from operations | | | | | | $ | 2,257,847 | |
| * | Additional information related to class-specific fees and expenses is included in the Notes to Financial Statements. |
| † | Amount less than one thousand. |
Statements of changes in net assets
| | | (dollars in thousands) |
| | | |
| | | Year ended October 31 |
| | | 2016 | | 2015 |
| Operations: | | | | | | | | |
| Net investment income | | $ | 798,334 | | | $ | 770,135 | |
| Net realized gain | | | 1,150,526 | | | | 1,625,232 | |
| Net unrealized appreciation (depreciation) | | | 308,987 | | | | (2,068,090 | ) |
| Net increase in net assets resulting from operations | | | 2,257,847 | | | | 327,277 | |
| | | | | | | | | |
| Dividends and distributions paid to shareholders: | | | | | | | | |
| Dividends from net investment income | | | (790,233 | ) | | | (748,630 | ) |
| Distributions from net realized gain on investments | | | (1,432,185 | ) | | | (1,194,098 | ) |
| Total dividends and distributions paid to shareholders | | | (2,222,418 | ) | | | (1,942,728 | ) |
| | | | | | | | | |
| Net capital share transactions | | | 3,106,398 | | | | 2,150,117 | |
| | | | | | | | | |
| Total increase in net assets | | | 3,141,827 | | | | 534,666 | |
| | | | | | | | | |
| Net assets: | | | | | | | | |
| Beginning of year | | | 35,641,122 | | | | 35,106,456 | |
| End of year (including undistributed net investment income: $99,496 and $91,375, respectively) | | $ | 38,782,949 | | | $ | 35,641,122 | |
See Notes to Financial Statements
Notes to financial statements
1. Organization
American Mutual Fund (the “fund”) is registered under the Investment Company Act of 1940 as an open-end, diversified management investment company. The fund strives for the balanced accomplishment of three objectives: current income, growth of capital and conservation of principal.
The fund has 18 share classes consisting of five retail share classes (Classes A, B and C, as well as two F share classes, F-1 and F-2), five 529 college savings plan share classes (Classes 529-A, 529-B, 529-C, 529-E and 529-F-1) and eight retirement plan share classes (Classes R-1, R-2, R-2E, R-3, R-4, R-5E, R-5 and R-6). The 529 college savings plan share classes can be used to save for college education. The retirement plan share classes are generally offered only through eligible employer-sponsored retirement plans. The fund’s share classes are described further in the following table:
| Share class | | Initial sales charge | | Contingent deferred sales charge upon
redemption | | Conversion feature | |
| Classes A and 529-A | | Up to 5.75% | | None (except 1% for certain redemptions within one year of purchase without an initial sales charge) | | None | |
| Classes B and 529-B* | | None | | Declines from 5% to 0% for redemptions within six years of purchase | | Classes B and 529-B convert to Classes A and 529-A, respectively, after eight years | |
| Class C | | None | | 1% for redemptions within one year of purchase | | Class C converts to Class F-1 after 10 years | |
| Class 529-C | | None | | 1% for redemptions within one year of purchase | | None | |
| Class 529-E | | None | | None | | None | |
| Classes F-1, F-2 and 529-F-1 | | None | | None | | None | |
| Classes R-1, R-2, R-2E, R-3, R-4, R-5E, R-5 and R-6 | | None | | None | | None | |
*Class B and 529-B shares of the fund are not available for purchase.
On November 20, 2015, the fund made an additional retirement plan share class (Class R-5E) available for sale pursuant to an amendment to its registration statement filed with the U.S. Securities and Exchange Commission. Refer to the fund’s prospectus for more details.
Holders of all share classes have equal pro rata rights to the assets, dividends and liquidation proceeds of the fund. Each share class has identical voting rights, except for the exclusive right to vote on matters affecting only its class. Share classes have different fees and expenses (“class-specific fees and expenses”), primarily due to different arrangements for distribution, transfer agent and administrative services. Differences in class-specific fees and expenses will result in differences in net investment income and, therefore, the payment of different per-share dividends by each share class.
2. Significant accounting policies
The fund is an investment company that applies the accounting and reporting guidance issued in Topic 946 by the U.S. Financial Accounting Standards Board. The fund’s financial statements have been prepared to comply with U.S. generally accepted accounting principles (“U.S. GAAP”). These principles require the fund’s investment adviser to make estimates and assumptions that affect reported amounts and disclosures. Actual results could differ from those estimates. Subsequent events, if any, have been evaluated through the date of issuance in the preparation of the financial statements. The fund follows the significant accounting policies described in this section, as well as the valuation policies described in the next section on valuation.
Cash — Cash includes amounts held in an interest bearing deposit facility.
Security transactions and related investment income — Security transactions are recorded by the fund as of the date the trades are executed with brokers. Realized gains and losses from security transactions are determined based on the specific identified cost of the securities. In the event a security is purchased with a delayed payment date, the fund will segregate liquid assets sufficient to meet its
payment obligations. Dividend income is recognized on the ex-dividend date and interest income is recognized on an accrual basis. Market discounts, premiums and original issue discounts on fixed-income securities are amortized daily over the expected life of the security.
Class allocations — Income, fees and expenses (other than class-specific fees and expenses) and realized and unrealized gains and losses are allocated daily among the various share classes based on their relative net assets. Class-specific fees and expenses, such as distribution, transfer agent and administrative services, are charged directly to the respective share class.
Dividends and distributions to shareholders — Dividends and distributions to shareholders are recorded on the ex-dividend date.
Currency translation — Assets and liabilities, including investment securities, denominated in currencies other than U.S. dollars are translated into U.S. dollars at the exchange rates supplied by one or more pricing vendors on the valuation date. Purchases and sales of investment securities and income and expenses are translated into U.S. dollars at the exchange rates on the dates of such transactions. The effects of changes in exchange rates on investment securities are included with the net realized gain or loss and net unrealized appreciation or depreciation on investments in the fund’s statement of operations. The realized gain or loss and unrealized appreciation or depreciation resulting from all other transactions denominated in currencies other than U.S. dollars are disclosed separately.
3. Valuation
Capital Research and Management Company (“CRMC”), the fund’s investment adviser, values the fund’s investments at fair value as defined by U.S. GAAP. The net asset value of each share class of the fund is generally determined as of approximately 4:00 p.m. New York time each day the New York Stock Exchange is open.
Methods and inputs — The fund’s investment adviser uses the following methods and inputs to establish the fair value of the fund’s assets and liabilities. Use of particular methods and inputs may vary over time based on availability and relevance as market and economic conditions evolve.
Equity securities are generally valued at the official closing price of, or the last reported sale price on, the exchange or market on which such securities are traded, as of the close of business on the day the securities are being valued or, lacking any sales, at the last available bid price. Prices for each security are taken from the principal exchange or market on which the security trades.
Fixed-income securities, including short-term securities, are generally valued at prices obtained from one or more pricing vendors. Vendors value such securities based on one or more of the inputs described in the following table. The table provides examples of inputs that are commonly relevant for valuing particular classes of fixed-income securities in which the fund is authorized to invest. However, these classifications are not exclusive, and any of the inputs may be used to value any other class of fixed-income security.
| Fixed-income class | Examples of standard inputs |
| All | Benchmark yields, transactions, bids, offers, quotations from dealers and trading systems, new issues, spreads and other relationships observed in the markets among comparable securities; and proprietary pricing models such as yield measures calculated using factors such as cash flows, financial or collateral performance and other reference data (collectively referred to as “standard inputs”) |
| Corporate bonds & notes; convertible securities | Standard inputs and underlying equity of the issuer |
| Bonds & notes of governments & government agencies | Standard inputs and interest rate volatilities |
| Mortgage-backed; asset-backed obligations | Standard inputs and cash flows, prepayment information, default rates, delinquency and loss assumptions, collateral characteristics, credit enhancements and specific deal information |
When the fund’s investment adviser deems it appropriate to do so (such as when vendor prices are unavailable or deemed to be not representative), fixed-income securities will be valued in good faith at the mean quoted bid and ask prices that are reasonably and timely available (or bid prices, if ask prices are not available) or at prices for securities of comparable maturity, quality and type.
Securities with both fixed-income and equity characteristics, or equity securities traded principally among fixed-income dealers, are generally valued in the manner described for either equity or fixed-income securities, depending on which method is deemed most appropriate by the fund’s investment adviser.
Securities and other assets for which representative market quotations are not readily available or are considered unreliable by the fund’s investment adviser are fair valued as determined in good faith under fair valuation guidelines adopted by authority of the fund’s board of trustees as further described. The investment adviser follows fair valuation guidelines, consistent with U.S. Securities and Exchange Commission rules and guidance, to consider relevant principles and factors when making fair value determinations. The investment adviser considers relevant indications of value that are reasonably and timely available to it in determining the fair value to be assigned to a particular security, such as the type and cost of the security; contractual or legal restrictions on resale of the security; relevant financial or business developments of the issuer; actively traded similar or related securities; conversion or exchange rights on the security; related corporate actions; significant events occurring after the close of trading in the security; and changes in overall market conditions. In addition, the closing prices of equity securities that trade in markets outside U.S. time zones may be adjusted to reflect significant events that occur after the close of local trading but before the net asset value of each share class of the fund is determined. Fair valuations and valuations of investments that are not actively trading involve judgment and may differ materially from valuations that would have been used had greater market activity occurred.
Processes and structure — The fund’s board of trustees has delegated authority to the fund’s investment adviser to make fair value determinations, subject to board oversight. The investment adviser has established a Joint Fair Valuation Committee (the “Fair Valuation Committee”) to administer, implement and oversee the fair valuation process, and to make fair value decisions. The Fair Valuation Committee regularly reviews its own fair value decisions, as well as decisions made under its standing instructions to the investment adviser’s valuation teams. The Fair Valuation Committee reviews changes in fair value measurements from period to period and may, as deemed appropriate, update the fair valuation guidelines to better reflect the results of back testing and address new or evolving issues. The Fair Valuation Committee reports any changes to the fair valuation guidelines to the board of trustees with supplemental information to support the changes. The fund’s board and audit committee also regularly review reports that describe fair value determinations and methods.
The fund’s investment adviser has also established a Fixed-Income Pricing Review Group to administer and oversee the fixed-income valuation process, including the use of fixed-income pricing vendors. This group regularly reviews pricing vendor information and market data. Pricing decisions, processes and controls over security valuation are also subject to additional internal reviews, including an annual control self-evaluation program facilitated by the investment adviser’s compliance group.
Classifications — The fund’s investment adviser classifies the fund’s assets and liabilities into three levels based on the inputs used to value the assets or liabilities. Level 1 values are based on quoted prices in active markets for identical securities. Level 2 values are based on significant observable market inputs, such as quoted prices for similar securities and quoted prices in inactive markets. Certain securities trading outside the U.S. may transfer between Level 1 and Level 2 due to valuation adjustments resulting from significant market movements following the close of local trading. Level 3 values are based on significant unobservable inputs that reflect the investment adviser’s determination of assumptions that market participants might reasonably use in valuing the securities. The valuation levels are not necessarily an indication of the risk or liquidity associated with the underlying investment. For example, U.S. government securities are reflected as Level 2 because the inputs used to determine fair value may not always be quoted prices in an active market. The following table presents the fund’s valuation levels as of October 31, 2016 (dollars in thousands):
| | | Investment securities | |
| | | Level 1 | | Level 2 | | Level 3 | | Total | |
| Assets: | | | | | | | | | | | | | | | | |
| Common stocks: | | | | | | | | | | | | | | | | |
| Energy | | $ | 3,297,841 | | | $ | — | | | $ | — | | | $ | 3,297,841 | |
| Materials | | | 1,347,172 | | | | — | | | | — | | | | 1,347,172 | |
| Industrials | | | 4,914,163 | | | | — | | | | — | | | | 4,914,163 | |
| Consumer discretionary | | | 2,643,869 | | | | — | | | | — | | | | 2,643,869 | |
| Consumer staples | | | 2,927,404 | | | | — | | | | — | | | | 2,927,404 | |
| Health care | | | 5,016,210 | | | | — | | | | — | | | | 5,016,210 | |
| Financials | | | 4,075,532 | | | | — | | | | — | | | | 4,075,532 | |
| Information technology | | | 4,550,602 | | | | — | | | | — | | | | 4,550,602 | |
| Telecommunication services | | | 2,239,474 | | | | — | | | | — | | | | 2,239,474 | |
| Utilities | | | 2,159,425 | | | | — | | | | — | | | | 2,159,425 | |
| Real estate | | | 491,987 | | | | — | | | | — | | | | 491,987 | |
| Miscellaneous | | | 767,206 | | | | — | | | | — | | | | 767,206 | |
| Preferred securities | | | 11,358 | | | | — | | | | — | | | | 11,358 | |
| Convertible stocks | | | 180,390 | | | | — | | | | — | | | | 180,390 | |
| Bonds, notes & other debt instruments | | | — | | | | 949,780 | | | | — | | | | 949,780 | |
| Short-term securities | | | — | | | | 3,157,417 | | | | — | | | | 3,157,417 | |
| Total | | $ | 34,622,633 | | | $ | 4,107,197 | | | $ | — | | | $ | 38,729,830 | |
4. Risk factors
Investing in the fund may involve certain risks including, but not limited to, those described below.
Market conditions — The prices of, and the income generated by, the common stocks and other securities held by the fund may decline – sometimes rapidly or unpredictably – due to various factors, including events or conditions affecting the general economy or particular industries; overall market changes; local, regional or global political, social or economic instability; governmental or governmental agency responses to economic conditions; and currency exchange rate, interest rate and commodity price fluctuations. These risks may be heightened in the case of smaller capitalization stocks.
Issuer risks — The prices of, and the income generated by, securities held by the fund may decline in response to various factors directly related to the issuers of such securities, including reduced demand for an issuer’s goods or services, poor management performance and strategic initiatives such as mergers, acquisitions or dispositions and the market response to any such initiatives.
Investing in growth-oriented stocks — Growth-oriented common stocks and other equity-type securities (such as preferred stocks, convertible preferred stocks and convertible bonds) may involve larger price swings and greater potential for loss than other types of investments.
Investing in income-oriented stocks — Income provided by the fund may be reduced by changes in the dividend policies of, and the capital resources available for dividend payments at, the companies in which the fund invests.
Investing in debt instruments — The prices of, and the income generated by, bonds and other debt securities held by the fund may be affected by changing interest rates and by changes in the effective maturities and credit ratings of these securities.
Rising interest rates will generally cause the prices of bonds and other debt securities to fall. Falling interest rates may cause an issuer to redeem, call or refinance a debt security before its stated maturity, which may result in the fund having to reinvest the proceeds in lower yielding securities. Longer maturity debt securities generally have greater sensitivity to changes in interest rates and may be subject to greater price fluctuations than shorter maturity debt securities.
Bonds and other debt securities are also subject to credit risk, which is the possibility that the credit strength of an issuer will weaken and/or an issuer of a debt security will fail to make timely payments of principal or interest and the security will go into default. Lower quality debt securities generally have higher rates of interest and may be subject to greater price fluctuations than higher quality debt securities. Credit risk is gauged, in part, by the credit ratings of the debt securities in which the fund invests. However, ratings are only the opinions of the rating agencies issuing them and are not guarantees as to credit quality or an evaluation of market risk. The fund’s investment adviser relies on its own credit analysts to research issuers and issues in seeking to mitigate various credit and default risks.
Management — The investment adviser to the fund actively manages the fund’s investments. Consequently, the fund is subject to the risk that the methods and analyses employed by the investment adviser in this process may not produce the desired results. This could cause the fund to lose value or its investment results to lag relevant benchmarks or other funds with similar objectives.
5. Taxation and distributions
Federal income taxation — The fund complies with the requirements under Subchapter M of the Internal Revenue Code applicable to mutual funds and intends to distribute substantially all of its net taxable income and net capital gains each year. The fund is not subject to income taxes to the extent such distributions are made. Therefore, no federal income tax provision is required.
As of and during the period ended October 31, 2016, the fund did not have a liability for any unrecognized tax benefits. The fund recognizes interest and penalties, if any, related to unrecognized tax benefits as income tax expense in the statement of operations. During the period, the fund did not incur any interest or penalties.
The fund is not subject to examination by U.S. federal tax authorities for tax years before 2012 and by state tax authorities for tax years before 2011.
Non-U.S. taxation — Dividend and interest income are recorded net of non-U.S. taxes paid. The fund may file withholding tax reclaims in certain jurisdictions to recover a portion of amounts previously withheld. As a result of rulings from European courts, the fund filed for additional reclaims related to prior years. These reclaims are recorded when the amount is known and there are no significant uncertainties on collectability.
Distributions — Distributions paid to shareholders are based on net investment income and net realized gains determined on a tax basis, which may differ from net investment income and net realized gains for financial reporting purposes. These differences are due primarily to different treatment for items such as currency gains and losses; short-term capital gains and losses; capital losses related to sales of certain securities within 30 days of purchase; and income on certain investments. The fiscal year in which amounts are distributed may differ from the year in which the net investment income and net realized gains are recorded by the fund for financial reporting purposes. The fund may also designate a portion of the amount paid to redeeming shareholders as a distribution for tax purposes.
During the year ended October 31, 2016, the fund reclassified $39,000 from undistributed net investment income to capital paid in on shares of beneficial interest, $59,000 from undistributed net realized gain to undistributed net investment income and $74,543,000 from undistributed net realized gain to capital paid in on shares of beneficial interest to align financial reporting with tax reporting.
As of October 31, 2016, the tax basis components of distributable earnings, unrealized appreciation (depreciation) and cost of investment securities were as follows (dollars in thousands):
| Undistributed ordinary income | | $ | 103,732 | |
| Undistributed long-term capital gains | | | 1,089,193 | |
| Gross unrealized appreciation on investment securities | | | 9,744,201 | |
| Gross unrealized depreciation on investment securities | | | (407,411 | ) |
| Net unrealized appreciation on investment securities | | | 9,336,790 | |
| Cost of investment securities | | | 29,393,040 | |
The tax character of distributions paid to shareholders was as follows (dollars in thousands):
| | | Year ended October 31, 2016 | | Year ended October 31, 2015 | |
| Share class | | Ordinary
income | | Long-term
capital gains | | Total
dividends and
distributions
paid | | Ordinary
income | | Long-term
capital gains | | Total
dividends and
distributions
paid | |
| Class A | | $ | 480,542 | | | $ | 889,473 | | | $ | 1,370,015 | | | $ | 467,630 | | | $ | 756,144 | | | $ | 1,223,774 | |
| Class B | | | 437 | | | | 1,965 | | | | 2,402 | | | | 987 | | | | 3,302 | | | | 4,289 | |
| Class C | | | 15,496 | | | | 45,657 | | | | 61,153 | | | | 15,190 | | | | 39,932 | | | | 55,122 | |
| Class F-1 | | | 28,090 | | | | 54,851 | | | | 82,941 | | | | 27,782 | | | | 46,039 | | | | 73,821 | |
| Class F-2 | | | 58,554 | | | | 92,311 | | | | 150,865 | | | | 50,616 | | | | 73,387 | | | | 124,003 | |
| Class 529-A | | | 14,716 | | | | 28,387 | | | | 43,103 | | | | 14,220 | | | | 23,822 | | | | 38,042 | |
| Class 529-B | | | 42 | | | | 208 | | | | 250 | | | | 93 | | | | 341 | | | | 434 | |
| Class 529-C | | | 2,243 | | | | 7,065 | | | | 9,308 | | | | 2,189 | | | | 6,064 | | | | 8,253 | |
| Class 529-E | | | 648 | | | | 1,434 | | | | 2,082 | | | | 632 | | | | 1,236 | | | | 1,868 | |
| Class 529-F-1 | | | 1,262 | | | | 2,155 | | | | 3,417 | | | | 1,202 | | | | 1,837 | | | | 3,039 | |
| Class R-1 | | | 907 | | | | 2,769 | | | | 3,676 | | | | 957 | | | | 2,455 | | | | 3,412 | |
| Class R-2 | | | 3,254 | | | | 9,784 | | | | 13,038 | | | | 3,341 | | | | 8,764 | | | | 12,105 | |
| Class R-2E | | | 60 | | | | 44 | | | | 104 | | | | — | * | | | — | * | | | — | * |
| Class R-3 | | | 10,609 | | | | 24,448 | | | | 35,057 | | | | 11,390 | | | | 24,251 | | | | 35,641 | |
| Class R-4 | | | 14,218 | | | | 29,428 | | | | 43,646 | | | | 16,063 | | | | 27,919 | | | | 43,982 | |
| Class R-5E† | | | — | * | | | — | * | | | — | * | | | | | | | | | | | | |
| Class R-5 | | | 6,206 | | | | 10,045 | | | | 16,251 | | | | 7,021 | | | | 11,888 | | | | 18,909 | |
| Class R-6 | | | 152,949 | | | | 232,161 | | | | 385,110 | | | | 129,317 | | | | 166,717 | | | | 296,034 | |
| Total | | $ | 790,233 | | | $ | 1,432,185 | | | $ | 2,222,418 | | | $ | 748,630 | | | $ | 1,194,098 | | | $ | 1,942,728 | |
| * | Amount less than one thousand. |
| † | Class R-5E shares were offered beginning November 20, 2015. |
6. Fees and transactions with related parties
CRMC, the fund’s investment adviser, is the parent company of American Funds Distributors,® Inc. (“AFD”), the principal underwriter of the fund’s shares, and American Funds Service Company® (“AFS”), the fund’s transfer agent. CRMC, AFD and AFS are considered related parties to the fund.
Investment advisory services — The fund has an investment advisory and service agreement with CRMC that provides for monthly fees accrued daily. These fees are based on a series of decreasing annual rates beginning with 0.384% on the first $1 billion of daily net assets
and decreasing to 0.223% on such assets in excess of $34 billion. For the year ended October 31, 2016, the investment advisory services fee was $88,868,000, which was equivalent to an annualized rate of 0.242% of average daily net assets.
Class-specific fees and expenses — Expenses that are specific to individual share classes are accrued directly to the respective share class. The principal class-specific fees and expenses are further described below:
Distribution services — The fund has plans of distribution for all share classes, except Class F-2, R-5E, R-5 and R-6 shares. Under the plans, the board of trustees approves certain categories of expenses that are used to finance activities primarily intended to sell fund shares and service existing accounts. The plans provide for payments, based on an annualized percentage of average daily net assets, ranging from 0.25% to 1.00% as noted in this section. In some cases, the board of trustees has limited the amounts that may be paid to less than the maximum allowed by the plans. All share classes with a plan may use up to 0.25% of average daily net assets to pay service fees, or to compensate AFD for paying service fees, to firms that have entered into agreements with AFD to provide certain shareholder services. The remaining amounts available to be paid under each plan are paid to dealers to compensate them for their sales activities.
For Class A and 529-A shares, distribution-related expenses include the reimbursement of dealer and wholesaler commissions paid by AFD for certain shares sold without a sales charge. These share classes reimburse AFD for amounts billed within the prior 15 months but only to the extent that the overall annual expense limit of 0.25% is not exceeded. As of October 31, 2016, there were no unreimbursed expenses subject to reimbursement for Class A or 529-A shares.
| | Share class | | Currently approved limits | | Plan limits |
| | Class A | | | 0.25 | % | | | 0.25 | % |
| | Class 529-A | | | 0.25 | | | | 0.50 | |
| | Classes B and 529-B | | | 1.00 | | | | 1.00 | |
| | Classes C, 529-C and R-1 | | | 1.00 | | | | 1.00 | |
| | Class R-2 | | | 0.75 | | | | 1.00 | |
| | Class R-2E | | | 0.60 | | | | 0.85 | |
| | Classes 529-E and R-3 | | | 0.50 | | | | 0.75 | |
| | Classes F-1, 529-F-1 and R-4 | | | 0.25 | | | | 0.50 | |
Transfer agent services — The fund has a shareholder services agreement with AFS under which the fund compensates AFS for providing transfer agent services to each of the fund’s share classes. These services include recordkeeping, shareholder communications and transaction processing. In addition, the fund reimburses AFS for amounts paid to third parties for performing transfer agent services on behalf of fund shareholders.
Administrative services — The fund has an administrative services agreement with CRMC under which the fund compensates CRMC for providing administrative services to Class A, C, F, 529 and R shares. These services include, but are not limited to, coordinating, monitoring, assisting and overseeing third parties that provide services to fund shareholders. Under the agreement, Class A shares pay an annual fee of 0.01% and Class C, F, 529 and R shares pay an annual fee of 0.05% of their respective average daily net assets.
529 plan services — Each 529 share class is subject to service fees to compensate the Virginia College Savings Plan (“Virginia529”) for its oversight and administration of the 529 college savings plan. From November 1, 2015 to June 30, 2016, the quarterly fee was based on a series of decreasing annual rates beginning with 0.10% on the first $30 billion of the net assets invested in Class 529 shares of the American Funds and decreasing to 0.05% on such assets in excess of $70 billion. Effective July 1, 2016, the quarterly fee was amended to annual rates of 0.10% on the first $20 billion of the net assets invested in the Class 529 shares of the American Funds, 0.05% on such assets between $20 billion and $100 billion, and 0.03% on such assets over $100 billion. The fee for any given calendar quarter is accrued and calculated on the basis of the average net assets of Class 529 shares of the American Funds for the last month of the prior calendar quarter. The fee is included in other expenses in the fund’s statement of operations. Virginia529 is not considered a related party to the fund.
For the year ended October 31, 2016, class-specific expenses under the agreements were as follows (dollars in thousands):
| | Share class | | Distribution
services | | Transfer agent
services | | Administrative
services | | 529 plan
services |
| | Class A | | | $53,834 | | | | $20,882 | | | | $2,254 | | | Not applicable |
| | Class B | | | 342 | | | | 38 | | | | Not applicable | | | Not applicable |
| | Class C | | | 11,317 | | | | 1,060 | | | | 567 | | | Not applicable |
| | Class F-1 | | | 3,387 | | | | 1,676 | | | | 682 | | | Not applicable |
| | Class F-2 | | | Not applicable | | | | 2,863 | | | | 1,270 | | | Not applicable |
| | Class 529-A | | | 1,640 | | | | 571 | | | | 361 | | | $593 |
| | Class 529-B | | | 36 | | | | 4 | | | | 2 | | | 3 |
| | Class 529-C | | | 1,725 | | | | 148 | | | | 87 | | | 143 |
| | Class 529-E | | | 178 | | | | 16 | | | | 18 | | | 29 |
| | Class 529-F-1 | | | — | | | | 44 | | | | 28 | | | 46 |
| | Class R-1 | | | 683 | | | | 88 | | | | 34 | | | Not applicable |
| | Class R-2 | | | 1,800 | | | | 876 | | | | 120 | | | Not applicable |
| | Class R-2E | | | 22 | | | | 7 | | | | 2 | | | Not applicable |
| | Class R-3 | | | 2,973 | | | | 1,014 | | | | 298 | | | Not applicable |
| | Class R-4 | | | 1,706 | | | | 774 | | | | 341 | | | Not applicable |
| | Class R-5E* | | | Not applicable | | | | — | † | | | — | † | | Not applicable |
| | Class R-5 | | | Not applicable | | | | 139 | | | | 131 | | | Not applicable |
| | Class R-6 | | | Not applicable | | | | 134 | | | | 3,157 | | | Not applicable |
| | Total class-specific expenses | | | $79,643 | | | | $30,334 | | | | $9,352 | | | $814 |
| | * | Class R-5E shares were offered beginning November 20, 2015. |
| | † | Amount less than one thousand. |
Trustees’ deferred compensation — Trustees who are unaffiliated with CRMC may elect to defer the cash payment of part or all of their compensation. These deferred amounts, which remain as liabilities of the fund, are treated as if invested in shares of the fund or other American Funds. These amounts represent general, unsecured liabilities of the fund and vary according to the total returns of the selected funds. Trustees’ compensation of $716,000 in the fund’s statement of operations reflects $375,000 in current fees (either paid in cash or deferred) and a net increase of $341,000 in the value of the deferred amounts.
Affiliated officers and trustees — Officers and certain trustees of the fund are or may be considered to be affiliated with CRMC, AFD and AFS. No affiliated officers or trustees received any compensation directly from the fund.
Security transactions with related funds — The fund may purchase from, or sell securities to, other CRMC-managed funds (or funds managed by certain affiliates of CRMC) under procedures adopted by the fund’s board of trustees. The funds involved in such transactions are considered related by virtue of having a common investment adviser (or affiliated investment advisers), common trustees and/or common officers. When such transactions occur, each transaction is executed at the current market price of the security and no brokerage commissions or fees are paid in accordance with Rule 17a-7 of the 1940 Act.
7. Capital share transactions
Capital share transactions in the fund were as follows (dollars and shares in thousands):
| | | | | | | | | Reinvestments of | | | | | | | | | Net increase | |
| | | Sales1 | | | dividends and distributions | | | Repurchases1 | | | (decrease) | |
| Share class | | Amount | | | Shares | | | Amount | | | Shares | | | Amount | | | Shares | | | Amount | | | Shares | |
| | | | | | | | | | | | | | | | | | | | | | | | | |
| Year ended October 31, 2016 | | | | | | | | | | | | | | | | | | | | | | | | | |
| | | | | | | | | | | | | | | | | | | | | | | | | | | | | | | | | |
| Class A | | $ | 2,117,923 | | | | 59,998 | | | $ | 1,335,916 | | | | 39,500 | | | $ | (2,842,016 | ) | | | (80,185 | ) | | $ | 611,823 | | | | 19,313 | |
| Class B | | | 735 | | | | 21 | | | | 2,393 | | | | 72 | | | | (39,571 | ) | | | (1,134 | ) | | | (36,443 | ) | | | (1,041 | ) |
| Class C | | | 208,485 | | | | 5,961 | | | | 60,454 | | | | 1,818 | | | | (246,772 | ) | | | (7,085 | ) | | | 22,167 | | | | 694 | |
| Class F-1 | | | 343,674 | | | | 9,763 | | | | 82,018 | | | | 2,436 | | | | (415,067 | ) | | | (11,814 | ) | | | 10,625 | | | | 385 | |
| Class F-2 | | | 1,295,449 | | | | 36,206 | | | | 145,805 | | | | 4,301 | | | | (626,003 | ) | | | (17,810 | ) | | | 815,251 | | | | 22,697 | |
| Class 529-A | | | 91,833 | | | | 2,600 | | | | 43,091 | | | | 1,277 | | | | (96,384 | ) | | | (2,726 | ) | | | 38,540 | | | | 1,151 | |
| Class 529-B | | | 110 | | | | 3 | | | | 249 | | | | 8 | | | | (4,273 | ) | | | (122 | ) | | | (3,914 | ) | | | (111 | ) |
| Class 529-C | | | 22,820 | | | | 649 | | | | 9,306 | | | | 278 | | | | (32,199 | ) | | | (917 | ) | | | (73 | ) | | | 10 | |
| Class 529-E | | | 4,637 | | | | 133 | | | | 2,080 | | | | 62 | | | | (6,176 | ) | | | (176 | ) | | | 541 | | | | 19 | |
| Class 529-F-1 | | | 11,995 | | | | 341 | | | | 3,417 | | | | 102 | | | | (9,958 | ) | | | (284 | ) | | | 5,454 | | | | 159 | |
| Class R-1 | | | 13,715 | | | | 390 | | | | 3,666 | | | | 110 | | | | (21,250 | ) | | | (605 | ) | | | (3,869 | ) | | | (105 | ) |
| Class R-2 | | | 62,603 | | | | 1,795 | | | | 13,029 | | | | 391 | | | | (74,875 | ) | | | (2,149 | ) | | | 757 | | | | 37 | |
| Class R-2E | | | 6,662 | | | | 189 | | | | 103 | | | | 3 | | | | (410 | ) | | | (11 | ) | | | 6,355 | | | | 181 | |
| Class R-3 | | | 157,368 | | | | 4,482 | | | | 35,034 | | | | 1,045 | | | | (200,359 | ) | | | (5,729 | ) | | | (7,957 | ) | | | (202 | ) |
| Class R-4 | | | 161,912 | | | | 4,586 | | | | 43,644 | | | | 1,297 | | | | (306,150 | ) | | | (8,711 | ) | | | (100,594 | ) | | | (2,828 | ) |
| Class R-5E2 | | | 37 | | | | 1 | | | | — | | | | — | | | | — | | | | — | | | | 37 | | | | 1 | |
| Class R-5 | | | 89,634 | | | | 2,544 | | | | 16,167 | | | | 477 | | | | (72,218 | ) | | | (2,055 | ) | | | 33,583 | | | | 966 | |
| Class R-6 | | | 1,872,974 | | | | 52,635 | | | | 385,021 | | | | 11,346 | | | | (543,880 | ) | | | (15,522 | ) | | | 1,714,115 | | | | 48,459 | |
| Total net increase (decrease) | | $ | 6,462,566 | | | | 182,297 | | | $ | 2,181,393 | | | | 64,523 | | | $ | (5,537,561 | ) | | | (157,035 | ) | | $ | 3,106,398 | | | | 89,785 | |
| | | | | | | | | | | | | | | | | | | | | | | | | | | | | | | | | |
| Year ended October 31, 2015 | | | | | | | | | | | | | | | | | | | | | | | | | |
| | | | | | | | | | | | | | | | | | | | | | | | | | | | | | | | | |
| Class A | | $ | 2,152,234 | | | | 58,408 | | | $ | 1,192,118 | | | | 32,205 | | | $ | (2,332,939 | ) | | | (63,384 | ) | | $ | 1,011,413 | | | | 27,229 | |
| Class B | | | 2,557 | | | | 70 | | | | 4,262 | | | | 115 | | | | (53,103 | ) | | | (1,446 | ) | | | (46,284 | ) | | | (1,261 | ) |
| Class C | | | 219,911 | | | | 6,027 | | | | 54,448 | | | | 1,483 | | | | (255,562 | ) | | | (7,019 | ) | | | 18,797 | | | | 491 | |
| Class F-1 | | | 358,750 | | | | 9,747 | | | | 72,740 | | | | 1,972 | | | | (304,137 | ) | | | (8,298 | ) | | | 127,353 | | | | 3,421 | |
| Class F-2 | | | 621,763 | | | | 16,864 | | | | 120,009 | | | | 3,245 | | | | (486,974 | ) | | | (13,352 | ) | | | 254,798 | | | | 6,757 | |
| Class 529-A | | | 94,229 | | | | 2,557 | | | | 38,037 | | | | 1,029 | | | | (89,537 | ) | | | (2,438 | ) | | | 42,729 | | | | 1,148 | |
| Class 529-B | | | 378 | | | | 10 | | | | 434 | | | | 12 | | | | (5,457 | ) | | | (148 | ) | | | (4,645 | ) | | | (126 | ) |
| Class 529-C | | | 24,802 | | | | 676 | | | | 8,245 | | | | 224 | | | | (27,463 | ) | | | (751 | ) | | | 5,584 | | | | 149 | |
| Class 529-E | | | 4,792 | | | | 131 | | | | 1,865 | | | | 50 | | | | (5,432 | ) | | | (148 | ) | | | 1,225 | | | | 33 | |
| Class 529-F-1 | | | 10,925 | | | | 296 | | | | 3,025 | | | | 82 | | | | (11,400 | ) | | | (308 | ) | | | 2,550 | | | | 70 | |
| Class R-1 | | | 24,544 | | | | 671 | | | | 3,402 | | | | 93 | | | | (24,353 | ) | | | (673 | ) | | | 3,593 | | | | 91 | |
| Class R-2 | | | 67,330 | | | | 1,845 | | | | 12,091 | | | | 329 | | | | (78,152 | ) | | | (2,147 | ) | | | 1,269 | | | | 27 | |
| Class R-2E | | | 25 | | | | 1 | | | | — | 3 | | | — | 3 | | | (1 | ) | | | — | 3 | | | 24 | | | | 1 | |
| Class R-3 | | | 169,640 | | | | 4,623 | | | | 35,585 | | | | 965 | | | | (281,462 | ) | | | (7,631 | ) | | | (76,237 | ) | | | (2,043 | ) |
| Class R-4 | | | 234,028 | | | | 6,330 | | | | 43,865 | | | | 1,187 | | | | (309,490 | ) | | | (8,347 | ) | | | (31,597 | ) | | | (830 | ) |
| Class R-5 | | | 80,877 | | | | 2,192 | | | | 18,902 | | | | 510 | | | | (180,796 | ) | | | (4,942 | ) | | | (81,017 | ) | | | (2,240 | ) |
| Class R-6 | | | 1,451,241 | | | | 39,476 | | | | 296,009 | | | | 8,014 | | | | (826,688 | ) | | | (22,764 | ) | | | 920,562 | | | | 24,726 | |
| Total net increase (decrease) | | $ | 5,518,026 | | | | 149,924 | | | $ | 1,905,037 | | | | 51,515 | | | $ | (5,272,946 | ) | | | (143,796 | ) | | $ | 2,150,117 | | | | 57,643 | |
| 1 | Includes exchanges between share classes of the fund. |
| 2 | Class R-5E shares were offered beginning November 20, 2015. |
| 3 | Amount less than one thousand. |
8. Investment transactions
The fund made purchases and sales of investment securities, excluding short-term securities and U.S. government obligations, if any, of $6,605,259,000 and $6,224,141,000, respectively, during the year ended October 31, 2016.
Financial highlights
| | | | | | Income from
investment operations1 | | | Dividends and distributions | | | | | | | | | | | | | | | | |
| | | Net asset
value,
beginning
of period | | | Net
investment
income | | | Net gains
(losses) on
securities (both
realized and
unrealized) | | | Total from
investment
operations | | | Dividends
(from net
investment
income) | | | Distributions
(from capital
gains) | | | Total
dividends
and
distributions | | | Net asset
value,
end
of period | | | Total
return2 | | | Net assets,
end of period
(in millions) | | | Ratio of
expenses to
average
net assets | | | Ratio of
net income
to average
net assets | |
| Class A: | | | | | | | | | | | | | | | | | | | | | | | | | | | | | | | | | | | | | | | | | | | | | | | | |
| Year ended 10/31/2016 | | $ | 36.18 | | | $ | .76 | | | $ | 1.35 | | | $ | 2.11 | | | $ | (.76 | ) | | $ | (1.45 | ) | | $ | (2.21 | ) | | $ | 36.08 | | | | 6.33 | % | | $ | 22,919 | | | | .59 | % | | | 2.16 | % |
| Year ended 10/31/2015 | | | 37.85 | | | | .79 | | | | (.41 | ) | | | .38 | | | | (.77 | ) | | | (1.28 | ) | | | (2.05 | ) | | | 36.18 | | | | .96 | | | | 22,282 | | | | .58 | | | | 2.13 | |
| Year ended 10/31/2014 | | | 34.27 | | | | .72 | | | | 4.28 | | | | 5.00 | | | | (.71 | ) | | | (.71 | ) | | | (1.42 | ) | | | 37.85 | | | | 14.99 | | | | 22,280 | | | | .59 | | | | 2.02 | |
| Year ended 10/31/2013 | | | 28.27 | | | | .70 | | | | 6.00 | | | | 6.70 | | | | (.70 | ) | | | — | | | | (.70 | ) | | | 34.27 | | | | 24.01 | | | | 19,724 | | | | .61 | | | | 2.25 | |
| Year ended 10/31/2012 | | | 25.41 | | | | .66 | | | | 2.87 | | | | 3.53 | | | | (.67 | ) | | | — | | | | (.67 | ) | | | 28.27 | | | | 14.02 | | | | 15,677 | | | | .63 | | | | 2.44 | |
| Class B: | | | | | | | | | | | | | | | | | | | | | | | | | | | | | | | | | | | | | | | | | | | | | | | | |
| Year ended 10/31/2016 | | | 35.92 | | | | .51 | | | | 1.32 | | | | 1.83 | | | | (.44 | ) | | | (1.45 | ) | | | (1.89 | ) | | | 35.86 | | | | 5.55 | | | | 17 | | | | 1.36 | | | | 1.47 | |
| Year ended 10/31/2015 | | | 37.57 | | | | .51 | | | | (.41 | ) | | | .10 | | | | (.47 | ) | | | (1.28 | ) | | | (1.75 | ) | | | 35.92 | | | | .18 | | | | 55 | | | | 1.34 | | | | 1.40 | |
| Year ended 10/31/2014 | | | 34.01 | | | | .45 | | | | 4.24 | | | | 4.69 | | | | (.42 | ) | | | (.71 | ) | | | (1.13 | ) | | | 37.57 | | | | 14.13 | | | | 105 | | | | 1.35 | | | | 1.28 | |
| Year ended 10/31/2013 | | | 28.05 | | | | .47 | | | | 5.94 | | | | 6.41 | | | | (.45 | ) | | | — | | | | (.45 | ) | | | 34.01 | | | | 23.06 | | | | 154 | | | | 1.38 | | | | 1.52 | |
| Year ended 10/31/2012 | | | 25.21 | | | | .46 | | | | 2.83 | | | | 3.29 | | | | (.45 | ) | | | — | | | | (.45 | ) | | | 28.05 | | | | 13.16 | | | | 196 | | | | 1.39 | | | | 1.71 | |
| Class C: | | | | | | | | | | | | | | | | | | | | | | | | | | | | | | | | | | | | | | | | | | | | | | | | |
| Year ended 10/31/2016 | | | 35.72 | | | | .48 | | | | 1.33 | | | | 1.81 | | | | (.48 | ) | | | (1.45 | ) | | | (1.93 | ) | | | 35.60 | | | | 5.52 | | | | 1,156 | | | | 1.39 | | | | 1.36 | |
| Year ended 10/31/2015 | | | 37.39 | | | | .49 | | | | (.40 | ) | | | .09 | | | | (.48 | ) | | | (1.28 | ) | | | (1.76 | ) | | | 35.72 | | | | .15 | | | | 1,135 | | | | 1.38 | | | | 1.33 | |
| Year ended 10/31/2014 | | | 33.88 | | | | .43 | | | | 4.22 | | | | 4.65 | | | | (.43 | ) | | | (.71 | ) | | | (1.14 | ) | | | 37.39 | | | | 14.03 | | | | 1,170 | | | | 1.40 | | | | 1.22 | |
| Year ended 10/31/2013 | | | 27.96 | | | | .44 | | | | 5.94 | | | | 6.38 | | | | (.46 | ) | | | — | | | | (.46 | ) | | | 33.88 | | | | 23.01 | | | | 1,076 | | | | 1.42 | | | | 1.44 | |
| Year ended 10/31/2012 | | | 25.14 | | | | .44 | | | | 2.84 | | | | 3.28 | | | | (.46 | ) | | | — | | | | (.46 | ) | | | 27.96 | | | | 13.13 | | | | 853 | | | | 1.43 | | | | 1.63 | |
| Class F-1: | | | | | | | | | | | | | | | | | | | | | | | | | | | | | | | | | | | | | | | | | | | | | | | | |
| Year ended 10/31/2016 | | | 36.04 | | | | .73 | | | | 1.34 | | | | 2.07 | | | | (.73 | ) | | | (1.45 | ) | | | (2.18 | ) | | | 35.93 | | | | 6.25 | | | | 1,384 | | | | .67 | | | | 2.08 | |
| Year ended 10/31/2015 | | | 37.71 | | | | .75 | | | | (.40 | ) | | | .35 | | | | (.74 | ) | | | (1.28 | ) | | | (2.02 | ) | | | 36.04 | | | | .88 | | | | 1,374 | | | | .66 | | | | 2.05 | |
| Year ended 10/31/2014 | | | 34.15 | | | | .69 | | | | 4.26 | | | | 4.95 | | | | (.68 | ) | | | (.71 | ) | | | (1.39 | ) | | | 37.71 | | | | 14.88 | | | | 1,309 | | | | .67 | | | | 1.95 | |
| Year ended 10/31/2013 | | | 28.18 | | | | .68 | | | | 5.98 | | | | 6.66 | | | | (.69 | ) | | | — | | | | (.69 | ) | | | 34.15 | | | | 23.91 | | | | 1,397 | | | | .68 | | | | 2.18 | |
| Year ended 10/31/2012 | | | 25.33 | | | | .65 | | | | 2.86 | | | | 3.51 | | | | (.66 | ) | | | — | | | | (.66 | ) | | | 28.18 | | | | 14.00 | | | | 1,000 | | | | .67 | | | | 2.39 | |
| Class F-2: | | | | | | | | | | | | | | | | | | | | | | | | | | | | | | | | | | | | | | | | | | | | | | | | |
| Year ended 10/31/2016 | | | 36.17 | | | | .82 | | | | 1.35 | | | | 2.17 | | | | (.82 | ) | | | (1.45 | ) | | | (2.27 | ) | | | 36.07 | | | | 6.53 | | | | 3,084 | | | | .42 | | | | 2.32 | |
| Year ended 10/31/2015 | | | 37.84 | | | | .85 | | | | (.40 | ) | | | .45 | | | | (.84 | ) | | | (1.28 | ) | | | (2.12 | ) | | | 36.17 | | | | 1.13 | | | | 2,272 | | | | .41 | | | | 2.31 | |
| Year ended 10/31/2014 | | | 34.27 | | | | .78 | | | | 4.27 | | | | 5.05 | | | | (.77 | ) | | | (.71 | ) | | | (1.48 | ) | | | 37.84 | | | | 15.15 | | | | 2,121 | | | | .42 | | | | 2.18 | |
| Year ended 10/31/2013 | | | 28.27 | | | | .76 | | | | 6.00 | | | | 6.76 | | | | (.76 | ) | | | — | | | | (.76 | ) | | | 34.27 | | | | 24.22 | | | | 1,349 | | | | .43 | | | | 2.46 | |
| Year ended 10/31/2012 | | | 25.41 | | | | .70 | | | | 2.88 | | | | 3.58 | | | | (.72 | ) | | | — | | | | (.72 | ) | | | 28.27 | | | | 14.26 | | | | 1,197 | | | | .43 | | | | 2.59 | |
| Class 529-A: | | | | | | | | | | | | | | | | | | | | | | | | | | | | | | | | | | | | | | | | | | | | | | | | |
| Year ended 10/31/2016 | | | 36.10 | | | | .73 | | | | 1.34 | | | | 2.07 | | | | (.72 | ) | | | (1.45 | ) | | | (2.17 | ) | | | 36.00 | | | | 6.25 | | | | 749 | | | | .69 | | | | 2.06 | |
| Year ended 10/31/2015 | | | 37.77 | | | | .75 | | | | (.41 | ) | | | .34 | | | | (.73 | ) | | | (1.28 | ) | | | (2.01 | ) | | | 36.10 | | | | .86 | | | | 709 | | | | .68 | | | | 2.03 | |
| Year ended 10/31/2014 | | | 34.21 | | | | .68 | | | | 4.26 | | | | 4.94 | | | | (.67 | ) | | | (.71 | ) | | | (1.38 | ) | | | 37.77 | | | | 14.83 | | | | 698 | | | | .69 | | | | 1.92 | |
| Year ended 10/31/2013 | | | 28.22 | | | | .67 | | | | 5.99 | | | | 6.66 | | | | (.67 | ) | | | — | | | | (.67 | ) | | | 34.21 | | | | 23.90 | | | | 611 | | | | .71 | | | | 2.15 | |
| Year ended 10/31/2012 | | | 25.37 | | | | .63 | | | | 2.86 | | | | 3.49 | | | | (.64 | ) | | | — | | | | (.64 | ) | | | 28.22 | | | | 13.91 | | | | 473 | | | | .72 | | | | 2.34 | |
| Class 529-B: | | | | | | | | | | | | | | | | | | | | | | | | | | | | | | | | | | | | | | | | | | | | | | | | |
| Year ended 10/31/2016 | | | 36.04 | | | | .47 | | | | 1.33 | | | | 1.80 | | | | (.39 | ) | | | (1.45 | ) | | | (1.84 | ) | | | 36.00 | | | | 5.43 | | | | 2 | | | | 1.48 | | | | 1.35 | |
| Year ended 10/31/2015 | | | 37.68 | | | | .47 | | | | (.41 | ) | | | .06 | | | | (.42 | ) | | | (1.28 | ) | | | (1.70 | ) | | | 36.04 | | | | .07 | | | | 6 | | | | 1.46 | | | | 1.27 | |
| Year ended 10/31/2014 | | | 34.10 | | | | .41 | | | | 4.26 | | | | 4.67 | | | | (.38 | ) | | | (.71 | ) | | | (1.09 | ) | | | 37.68 | | | | 13.99 | | | | 11 | | | | 1.48 | | | | 1.15 | |
| Year ended 10/31/2013 | | | 28.13 | | | | .43 | | | | 5.96 | | | | 6.39 | | | | (.42 | ) | | | — | | | | (.42 | ) | | | 34.10 | | | | 22.88 | | | | 16 | | | | 1.50 | | | | 1.40 | |
| Year ended 10/31/2012 | | | 25.28 | | | | .42 | | | | 2.85 | | | | 3.27 | | | | (.42 | ) | | | — | | | | (.42 | ) | | | 28.13 | | | | 13.05 | | | | 19 | | | | 1.52 | | | | 1.58 | |
See page 27 for footnotes.
Financial highlights (continued)
| | | | | | Income from
investment operations1 | | | Dividends and distributions | | | | | | | | | | | | | | | | |
| | | Net asset
value,
beginning
of period | | | Net
investment
income | | | Net gains
(losses) on
securities (both
realized and
unrealized) | | | Total from
investment
operations | | | Dividends
(from net
investment
income) | | | Distributions
(from capital
gains) | | | Total
dividends
and
distributions | | | Net asset
value,
end
of period | | | Total
return2 | | | Net assets,
end of period
(in millions) | | | Ratio of
expenses to
average
net assets | | | Ratio of
net income
to average
net assets | |
| Class 529-C: | | | | | | | | | | | | | | | | | | | | | | | | | | | | | | | | | | | | | | | | | | | | | | | | |
| Year ended 10/31/2016 | | $ | 35.91 | | | $ | .46 | | | $ | 1.33 | | | $ | 1.79 | | | $ | (.45 | ) | | $ | (1.45 | ) | | $ | (1.90 | ) | | $ | 35.80 | | | | 5.43 | % | | $ | 176 | | | | 1.46 | % | | | 1.30 | % |
| Year ended 10/31/2015 | | | 37.58 | | | | .46 | | | | (.40 | ) | | | .06 | | | | (.45 | ) | | | (1.28 | ) | | | (1.73 | ) | | | 35.91 | | | | .08 | | | | 176 | | | | 1.46 | | | | 1.26 | |
| Year ended 10/31/2014 | | | 34.04 | | | | .40 | | | | 4.25 | | | | 4.65 | | | | (.40 | ) | | | (.71 | ) | | | (1.11 | ) | | | 37.58 | | | | 13.97 | | | | 179 | | | | 1.47 | | | | 1.14 | |
| Year ended 10/31/2013 | | | 28.09 | | | | .42 | | | | 5.96 | | | | 6.38 | | | | (.43 | ) | | | — | | | | (.43 | ) | | | 34.04 | | | | 22.92 | | | | 159 | | | | 1.50 | | | | 1.37 | |
| Year ended 10/31/2012 | | | 25.26 | | | | .42 | | | | 2.84 | | | | 3.26 | | | | (.43 | ) | | | — | | | | (.43 | ) | | | 28.09 | | | | 13.01 | | | | 126 | | | | 1.51 | | | | 1.55 | |
| Class 529-E: | | | | | | | | | | | | | | | | | | | | | | | | | | | | | | | | | | | | | | | | | | | | | | | | |
| Year ended 10/31/2016 | | | 35.97 | | | | .64 | | | | 1.35 | | | | 1.99 | | | | (.64 | ) | | | (1.45 | ) | | | (2.09 | ) | | | 35.87 | | | | 6.02 | | | | 36 | | | | .93 | | | | 1.83 | |
| Year ended 10/31/2015 | | | 37.64 | | | | .66 | | | | (.41 | ) | | | .25 | | | | (.64 | ) | | | (1.28 | ) | | | (1.92 | ) | | | 35.97 | | | | .61 | | | | 36 | | | | .93 | | | | 1.79 | |
| Year ended 10/31/2014 | | | 34.09 | | | | .59 | | | | 4.26 | | | | 4.85 | | | | (.59 | ) | | | (.71 | ) | | | (1.30 | ) | | | 37.64 | | | | 14.58 | | | | 36 | | | | .94 | | | | 1.67 | |
| Year ended 10/31/2013 | | | 28.13 | | | | .59 | | | | 5.97 | | | | 6.56 | | | | (.60 | ) | | | — | | | | (.60 | ) | | | 34.09 | | | | 23.56 | | | | 32 | | | | .96 | | | | 1.90 | |
| Year ended 10/31/2012 | | | 25.29 | | | | .56 | | | | 2.85 | | | | 3.41 | | | | (.57 | ) | | | — | | | | (.57 | ) | | | 28.13 | | | | 13.62 | | | | 26 | | | | .98 | | | | 2.08 | |
| Class 529-F-1: | | | | | | | | | | | | | | | | | | | | | | | | | | | | | | | | | | | | | | | | | | | | | | | | |
| Year ended 10/31/2016 | | | 36.15 | | | | .81 | | | | 1.34 | | | | 2.15 | | | | (.80 | ) | | | (1.45 | ) | | | (2.25 | ) | | | 36.05 | | | | 6.48 | | | | 60 | | | | .46 | | | | 2.29 | |
| Year ended 10/31/2015 | | | 37.82 | | | | .83 | | | | (.40 | ) | | | .43 | | | | (.82 | ) | | | (1.28 | ) | | | (2.10 | ) | | | 36.15 | | | | 1.09 | | | | 54 | | | | .46 | | | | 2.26 | |
| Year ended 10/31/2014 | | | 34.25 | | | | .76 | | | | 4.27 | | | | 5.03 | | | | (.75 | ) | | | (.71 | ) | | | (1.46 | ) | | | 37.82 | | | | 15.10 | | | | 54 | | | | .47 | | | | 2.14 | |
| Year ended 10/31/2013 | | | 28.26 | | | | .74 | | | | 5.99 | | | | 6.73 | | | | (.74 | ) | | | — | | | | (.74 | ) | | | 34.25 | | | | 24.14 | | | | 46 | | | | .49 | | | | 2.36 | |
| Year ended 10/31/2012 | | | 25.39 | | | | .69 | | | | 2.88 | | | | 3.57 | | | | (.70 | ) | | | — | | | | (.70 | ) | | | 28.26 | | | | 14.21 | | | | 32 | | | | .51 | | | | 2.54 | |
| Class R-1: | | | | | | | | | | | | | | | | | | | | | | | | | | | | | | | | | | | | | | | | | | | | | | | | |
| Year ended 10/31/2016 | | | 35.83 | | | | .47 | | | | 1.33 | | | | 1.80 | | | | (.47 | ) | | | (1.45 | ) | | | (1.92 | ) | | | 35.71 | | | | 5.46 | | | | 68 | | | | 1.43 | | | | 1.33 | |
| Year ended 10/31/2015 | | | 37.51 | | | | .48 | | | | (.41 | ) | | | .07 | | | | (.47 | ) | | | (1.28 | ) | | | (1.75 | ) | | | 35.83 | | | | .11 | | | | 72 | | | | 1.41 | | | | 1.31 | |
| Year ended 10/31/2014 | | | 33.98 | | | | .42 | | | | 4.24 | | | | 4.66 | | | | (.42 | ) | | | (.71 | ) | | | (1.13 | ) | | | 37.51 | | | | 14.02 | | | | 72 | | | | 1.42 | | | | 1.19 | |
| Year ended 10/31/2013 | | | 28.04 | | | | .44 | | | | 5.95 | | | | 6.39 | | | | (.45 | ) | | | — | | | | (.45 | ) | | | 33.98 | | | | 22.98 | | | | 68 | | | | 1.44 | | | | 1.43 | |
| Year ended 10/31/2012 | | | 25.22 | | | | .43 | | | | 2.86 | | | | 3.29 | | | | (.47 | ) | | | — | | | | (.47 | ) | | | 28.04 | | | | 13.12 | | | | 58 | | | | 1.43 | | | | 1.61 | |
| Class R-2: | | | | | | | | | | | | | | | | | | | | | | | | | | | | | | | | | | | | | | | | | | | | | | | | |
| Year ended 10/31/2016 | | | 35.81 | | | | .47 | | | | 1.32 | | | | 1.79 | | | | (.47 | ) | | | (1.45 | ) | | | (1.92 | ) | | | 35.68 | | | | 5.45 | | | | 244 | | | | 1.41 | | | | 1.34 | |
| Year ended 10/31/2015 | | | 37.48 | | | | .49 | | | | (.40 | ) | | | .09 | | | | (.48 | ) | | | (1.28 | ) | | | (1.76 | ) | | | 35.81 | | | | .17 | | | | 243 | | | | 1.37 | | | | 1.35 | |
| Year ended 10/31/2014 | | | 33.95 | | | | .42 | | | | 4.24 | | | | 4.66 | | | | (.42 | ) | | | (.71 | ) | | | (1.13 | ) | | | 37.48 | | | | 14.05 | | | | 253 | | | | 1.41 | | | | 1.20 | |
| Year ended 10/31/2013 | | | 28.02 | | | | .45 | | | | 5.94 | | | | 6.39 | | | | (.46 | ) | | | — | | | | (.46 | ) | | | 33.95 | | | | 23.02 | | | | 235 | | | | 1.40 | | | | 1.47 | |
| Year ended 10/31/2012 | | | 25.19 | | | | .44 | | | | 2.84 | | | | 3.28 | | | | (.45 | ) | | | — | | | | (.45 | ) | | | 28.02 | | | | 13.13 | | | | 195 | | | | 1.43 | | | | 1.63 | |
| Class R-2E: | | | | | | | | | | | | | | | | | | | | | | | | | | | | | | | | | | | | | | | | | | | | | | | | |
| Year ended 10/31/2016 | | | 36.13 | | | | .56 | | | | 1.38 | | | | 1.94 | | | | (.65 | ) | | | (1.45 | ) | | | (2.10 | ) | | | 35.97 | | | | 5.86 | | | | 7 | | | | 1.09 | | | | 1.59 | |
| Year ended 10/31/2015 | | | 37.83 | | | | .61 | | | | (.35 | ) | | | .26 | | | | (.68 | ) | | | (1.28 | ) | | | (1.96 | ) | | | 36.13 | | | | .63 | 3 | | | — | 4 | | | .99 | 3 | | | 1.68 | 3 |
| Period from 8/29/2014 to 10/31/20145,6 | | | 37.19 | | | | .12 | | | | .73 | | | | .85 | | | | (.21 | ) | | | — | | | | (.21 | ) | | | 37.83 | | | | 2.28 | 3,7 | | | — | 4 | | | .08 | 3,7 | | | .32 | 3,7 |
| Class R-3: | | | | | | | | | | | | | | | | | | | | | | | | | | | | | | | | | | | | | | | | | | | | | | | | |
| Year ended 10/31/2016 | | | 35.93 | | | | .63 | | | | 1.33 | | | | 1.96 | | | | (.63 | ) | | | (1.45 | ) | | | (2.08 | ) | | | 35.81 | | | | 5.93 | | | | 601 | | | | .97 | | | | 1.78 | |
| Year ended 10/31/2015 | | | 37.60 | | | | .65 | | | | (.41 | ) | | | .24 | | | | (.63 | ) | | | (1.28 | ) | | | (1.91 | ) | | | 35.93 | | | | .59 | | | | 611 | | | | .95 | | | | 1.78 | |
| Year ended 10/31/2014 | | | 34.05 | | | | .58 | | | | 4.26 | | | | 4.84 | | | | (.58 | ) | | | (.71 | ) | | | (1.29 | ) | | | 37.60 | | | | 14.58 | | | | 716 | | | | .96 | | | | 1.66 | |
| Year ended 10/31/2013 | | | 28.10 | | | | .59 | | | | 5.96 | | | | 6.55 | | | | (.60 | ) | | | — | | | | (.60 | ) | | | 34.05 | | | | 23.55 | | | | 650 | | | | .96 | | | | 1.90 | |
| Year ended 10/31/2012 | | | 25.26 | | | | .56 | | | | 2.86 | | | | 3.42 | | | | (.58 | ) | | | — | | | | (.58 | ) | | | 28.10 | | | | 13.64 | | | | 518 | | | | .97 | | | | 2.09 | |
| | | | | | Income from
investment operations1 | | | Dividends and distributions | | | | | | | | | | | | | | | | |
| | | Net asset
value,
beginning
of period | | | Net
investment
income | | | Net gains
(losses) on
securities (both
realized and
unrealized) | | | Total from
investment
operations | | | Dividends
(from net
investment
income) | | | Distributions
(from capital
gains) | | | Total
dividends
and
distributions | | | Net asset
value,
end
of period | | | Total
return2 | | | Net assets,
end of period
(in millions) | | | Ratio of
expenses to
average
net assets | | | Ratio of
net income
to average
net assets | |
| Class R-4: | | | | | | | | | | | | | | | | | | | | | | | | | | | | | | | | | | | | | | | | | | | | | | | | |
| Year ended 10/31/2016 | | $ | 36.07 | | | $ | .74 | | | $ | 1.34 | | | $ | 2.08 | | | $ | (.74 | ) | | $ | (1.45 | ) | | $ | (2.19 | ) | | $ | 35.96 | | | | 6.26 | % | | $ | 653 | | | | .67 | % | | | 2.10 | % |
| Year ended 10/31/2015 | | | 37.74 | | | | .76 | | | | (.40 | ) | | | .36 | | | | (.75 | ) | | | (1.28 | ) | | | (2.03 | ) | | | 36.07 | | | | .90 | | | | 757 | | | | .64 | | | | 2.07 | |
| Year ended 10/31/2014 | | | 34.18 | | | | .69 | | | | 4.27 | | | | 4.96 | | | | (.69 | ) | | | (.71 | ) | | | (1.40 | ) | | | 37.74 | | | | 14.89 | | | | 824 | | | | .66 | | | | 1.96 | |
| Year ended 10/31/2013 | | | 28.20 | | | | .68 | | | | 5.99 | | | | 6.67 | | | | (.69 | ) | | | — | | | | (.69 | ) | | | 34.18 | | | | 23.95 | | | | 732 | | | | .66 | | | | 2.18 | |
| Year ended 10/31/2012 | | | 25.35 | | | | .64 | | | | 2.87 | | | | 3.51 | | | | (.66 | ) | | | — | | | | (.66 | ) | | | 28.20 | | | | 13.98 | | | | 487 | | | | .66 | | | | 2.37 | |
| Class R-5E: | | | | | | | | | | | | | | | | | | | | | | | | | | | | | | | | | | | | | | | | | | | | | | | | |
| Period from 11/20/2015 to 10/31/20165,8 | | | 36.41 | | | | .72 | | | | 1.19 | | | | 1.91 | | | | (.80 | ) | | | (1.45 | ) | | | (2.25 | ) | | | 36.07 | | | | 5.76 | 7 | | | — | 4 | | | .52 | 9 | | | 2.18 | 9 |
| Class R-5: | | | | | | | | | | | | | | | | | | | | | | | | | | | | | | | | | | | | | | | | | | | | | | | | |
| Year ended 10/31/2016 | | | 36.18 | | | | .85 | | | | 1.35 | | | | 2.20 | | | | (.85 | ) | | | (1.45 | ) | | | (2.30 | ) | | | 36.08 | | | | 6.59 | | | | 284 | | | | .36 | | | | 2.39 | |
| Year ended 10/31/2015 | | | 37.85 | | | | .88 | | | | (.41 | ) | | | .47 | | | | (.86 | ) | | | (1.28 | ) | | | (2.14 | ) | | | 36.18 | | | | 1.20 | | | | 250 | | | | .34 | | | | 2.38 | |
| Year ended 10/31/2014 | | | 34.27 | | | | .80 | | | | 4.28 | | | | 5.08 | | | | (.79 | ) | | | (.71 | ) | | | (1.50 | ) | | | 37.85 | | | | 15.24 | | | | 346 | | | | .36 | | | | 2.26 | |
| Year ended 10/31/2013 | | | 28.27 | | | | .78 | | | | 6.00 | | | | 6.78 | | | | (.78 | ) | | | — | | | | (.78 | ) | | | 34.27 | | | | 24.32 | | | | 415 | | | | .36 | | | | 2.50 | |
| Year ended 10/31/2012 | | | 25.41 | | | | .73 | | | | 2.87 | | | | 3.60 | | | | (.74 | ) | | | — | | | | (.74 | ) | | | 28.27 | | | | 14.31 | | | | 311 | | | | .37 | | | | 2.69 | |
| Class R-6: | | | | | | | | | | | | | | | | | | | | | | | | | | | | | | | | | | | | | | | | | | | | | | | | |
| Year ended 10/31/2016 | | | 36.19 | | | | .86 | | | | 1.35 | | | | 2.21 | | | | (.86 | ) | | | (1.45 | ) | | | (2.31 | ) | | | 36.09 | | | | 6.65 | | | | 7,343 | | | | .30 | | | | 2.43 | |
| Year ended 10/31/2015 | | | 37.86 | | | | .89 | | | | (.40 | ) | | | .49 | | | | (.88 | ) | | | (1.28 | ) | | | (2.16 | ) | | | 36.19 | | | | 1.25 | | | | 5,609 | | | | .30 | | | | 2.41 | |
| Year ended 10/31/2014 | | | 34.28 | | | | .82 | | | | 4.28 | | | | 5.10 | | | | (.81 | ) | | | (.71 | ) | | | (1.52 | ) | | | 37.86 | | | | 15.31 | | | | 4,932 | | | | .30 | | | | 2.31 | |
| Year ended 10/31/2013 | | | 28.28 | | | | .79 | | | | 6.01 | | | | 6.80 | | | | (.80 | ) | | | — | | | | (.80 | ) | | | 34.28 | | | | 24.38 | | | | 3,994 | | | | .31 | | | | 2.50 | |
| Year ended 10/31/2012 | | | 25.41 | | | | .74 | | | | 2.88 | | | | 3.62 | | | | (.75 | ) | | | — | | | | (.75 | ) | | | 28.28 | | | | 14.40 | | | | 1,526 | | | | .32 | | | | 2.73 | |
| | | Year ended October 31 | |
| | | 2016 | | 2015 | | 2014 | | 2013 | | 2012 | |
| Portfolio turnover rate for all share classes | | | 18% | | | 27% | | | 16% | | | 18% | | | 22% | |
| 1 | Based on average shares outstanding. |
| 2 | Total returns exclude any applicable sales charges, including contingent deferred sales charges. |
| 3 | All or a significant portion of assets in this class consisted of seed capital invested by CRMC and/or its affiliates. Fees for distribution services are not charged or accrued on these seed capital assets. If such fees were paid by the fund on seed capital assets, fund expenses would have been higher and net income and total return would have been lower. |
| 4 | Amount less than $1 million. |
| 5 | Based on operations for the period shown and, accordingly, is not representative of a full year. |
| 6 | Class R-2E shares were offered beginning August 29, 2014. |
| 7 | Not annualized. |
| 8 | Class R-5E shares were offered beginning November 20, 2015. |
| 9 | Annualized. |
See Notes to Financial Statements
Report of Independent Registered Public Accounting Firm
To the Shareholders and Board of Trustees of American Mutual Fund:
We have audited the accompanying statement of assets and liabilities of American Mutual Fund (the “Fund”), including the summary investment portfolio, as of October 31, 2016, and the related statement of operations for the year then ended, the statements of changes in net assets for each of the two years in the period then ended, and the financial highlights for each of the periods presented. These financial statements and financial highlights are the responsibility of the Fund’s management. Our responsibility is to express an opinion on these financial statements and financial highlights based on our audits.
We conducted our audits in accordance with the standards of the Public Company Accounting Oversight Board (United States). Those standards require that we plan and perform the audit to obtain reasonable assurance about whether the financial statements and financial highlights are free of material misstatement. The Fund is not required to have, nor were we engaged to perform, an audit of its internal control over financial reporting. Our audits included consideration of internal control over financial reporting as a basis for designing audit procedures that are appropriate in the circumstances, but not for the purpose of expressing an opinion on the effectiveness of the Fund’s internal control over financial reporting. Accordingly, we express no such opinion. An audit also includes examining, on a test basis, evidence supporting the amounts and disclosures in the financial statements, assessing the accounting principles used and significant estimates made by management, as well as evaluating the overall financial statement presentation. Our procedures included confirmation of securities owned as of October 31, 2016, by correspondence with the custodian and brokers; where replies were not received from brokers, we performed other auditing procedures. We believe that our audits provide a reasonable basis for our opinion.
In our opinion, such financial statements and financial highlights referred to above present fairly, in all material respects, the financial position of American Mutual Fund as of October 31, 2016, the results of its operations for the year then ended, the changes in its net assets for each of the two years in the period then ended, and the financial highlights for each of the periods presented, in conformity with accounting principles generally accepted in the United States of America.
Deloitte & Touche LLP
Costa Mesa, California
December 8, 2016
As a fund shareholder, you incur two types of costs: (1) transaction costs, such as initial sales charges on purchase payments and contingent deferred sales charges on redemptions (loads), and (2) ongoing costs, including management fees, distribution and service (12b-1) fees, and other expenses. This example is intended to help you understand your ongoing costs (in dollars) of investing in the fund so you can compare these costs with the ongoing costs of investing in other mutual funds. The example is based on an investment of $1,000 invested at the beginning of the period and held for the entire six-month period (May 1, 2016, through October 31, 2016).
Actual expenses:
The first line of each share class in the table on the following page provides information about actual account values and actual expenses. You may use the information in this line, together with the amount you invested, to estimate the expenses that you paid over the period. Simply divide your account value by $1,000 (for example, an $8,600 account value divided by $1,000 = 8.6), then multiply the result by the number in the first line under the heading titled “Expenses paid during period” to estimate the expenses you paid on your account during this period.
Hypothetical example for comparison purposes:
The second line of each share class in the table on the following page provides information about hypothetical account values and hypothetical expenses based on the actual expense ratio for the share class and an assumed rate of return of 5.00% per year before expenses, which is not the actual return of the share class. The hypothetical account values and expenses may not be used to estimate the actual ending account balance or expenses you paid for the period. You may use this information to compare the ongoing costs of investing in the fund and other funds. To do so, compare this 5.00% hypothetical example with the 5.00% hypothetical examples that appear in the shareholder reports of the other funds.
Notes:
Retirement plan participants may be subject to certain fees charged by the plan sponsor, and Class F-1, F-2 and 529-F-1 shareholders may be subject to fees charged by financial intermediaries, typically ranging from 0.75% to 1.50% of assets annually depending on services offered. You can estimate the impact of these fees by adding the amount of the fees to the total estimated expenses you paid on your account during the period as calculated above. In addition, your ending account value would be lower by the amount of these fees.
Note that the expenses shown in the table on the following page are meant to highlight your ongoing costs only and do not reflect any transactional costs, such as sales charges (loads). Therefore, the second line of each share class in the table is useful in comparing ongoing costs only and will not help you determine the relative total costs of owning different funds. In addition, if these transactional costs were included, your costs would have been higher.
| | | Beginning | | | Ending | | | | | | | |
| | | account value | | | account value | | | Expenses paid | | | Annualized | |
| | | 5/1/2016 | | | 10/31/2016 | | | during period* | | | expense ratio | |
| Class A - actual return | | $ | 1,000.00 | | | $ | 1,030.01 | | | $ | 3.02 | | | | .59 | % |
| Class A - assumed 5% return | | | 1,000.00 | | | | 1,022.23 | | | | 3.01 | | | | .59 | |
| Class B - actual return | | | 1,000.00 | | | | 1,026.03 | | | | 6.84 | | | | 1.34 | |
| Class B - assumed 5% return | | | 1,000.00 | | | | 1,018.45 | | | | 6.82 | | | | 1.34 | |
| Class C - actual return | | | 1,000.00 | | | | 1,025.74 | | | | 7.05 | | | | 1.38 | |
| Class C - assumed 5% return | | | 1,000.00 | | | | 1,018.25 | | | | 7.02 | | | | 1.38 | |
| Class F-1 - actual return | | | 1,000.00 | | | | 1,029.43 | | | | 3.43 | | | | .67 | |
| Class F-1 - assumed 5% return | | | 1,000.00 | | | | 1,021.83 | | | | 3.41 | | | | .67 | |
| Class F-2 - actual return | | | 1,000.00 | | | | 1,030.70 | | | | 2.10 | | | | .41 | |
| Class F-2 - assumed 5% return | | | 1,000.00 | | | | 1,023.14 | | | | 2.09 | | | | .41 | |
| Class 529-A - actual return | | | 1,000.00 | | | | 1,029.28 | | | | 3.48 | | | | .68 | |
| Class 529-A - assumed 5% return | | | 1,000.00 | | | | 1,021.78 | | | | 3.47 | | | | .68 | |
| Class 529-B - actual return | | | 1,000.00 | | | | 1,025.57 | | | | 7.40 | | | | 1.45 | |
| Class 529-B - assumed 5% return | | | 1,000.00 | | | | 1,017.90 | | | | 7.37 | | | | 1.45 | |
| Class 529-C - actual return | | | 1,000.00 | | | | 1,025.53 | | | | 7.35 | | | | 1.44 | |
| Class 529-C - assumed 5% return | | | 1,000.00 | | | | 1,017.95 | | | | 7.32 | | | | 1.44 | |
| Class 529-E - actual return | | | 1,000.00 | | | | 1,028.18 | | | | 4.65 | | | | .91 | |
| Class 529-E - assumed 5% return | | | 1,000.00 | | | | 1,020.62 | | | | 4.63 | | | | .91 | |
| Class 529-F-1 - actual return | | | 1,000.00 | | | | 1,030.45 | | | | 2.30 | | | | .45 | |
| Class 529-F-1 - assumed 5% return | | | 1,000.00 | | | | 1,022.94 | | | | 2.29 | | | | .45 | |
| Class R-1 - actual return | | | 1,000.00 | | | | 1,025.52 | | | | 7.30 | | | | 1.43 | |
| Class R-1 - assumed 5% return | | | 1,000.00 | | | | 1,018.00 | | | | 7.27 | | | | 1.43 | |
| Class R-2 - actual return | | | 1,000.00 | | | | 1,025.59 | | | | 7.15 | | | | 1.40 | |
| Class R-2 - assumed 5% return | | | 1,000.00 | | | | 1,018.15 | | | | 7.12 | | | | 1.40 | |
| Class R-2E - actual return | | | 1,000.00 | | | | 1,027.05 | | | | 5.72 | | | | 1.12 | |
| Class R-2E - assumed 5% return | | | 1,000.00 | | | | 1,019.56 | | | | 5.70 | | | | 1.12 | |
| Class R-3 - actual return | | | 1,000.00 | | | | 1,027.75 | | | | 4.96 | | | | .97 | |
| Class R-3 - assumed 5% return | | | 1,000.00 | | | | 1,020.32 | | | | 4.94 | | | | .97 | |
| Class R-4 - actual return | | | 1,000.00 | | | | 1,029.46 | | | | 3.43 | | | | .67 | |
| Class R-4 - assumed 5% return | | | 1,000.00 | | | | 1,021.83 | | | | 3.41 | | | | .67 | |
| Class R-5E - actual return | | | 1,000.00 | | | | 1,030.38 | | | | 2.71 | | | | .53 | |
| Class R-5E - assumed 5% return | | | 1,000.00 | | | | 1,022.53 | | | | 2.70 | | | | .53 | |
| Class R-5 - actual return | | | 1,000.00 | | | | 1,030.95 | | | | 1.84 | | | | .36 | |
| Class R-5 - assumed 5% return | | | 1,000.00 | | | | 1,023.39 | | | | 1.84 | | | | .36 | |
| Class R-6 - actual return | | | 1,000.00 | | | | 1,031.24 | | | | 1.54 | | | | .30 | |
| Class R-6 - assumed 5% return | | | 1,000.00 | | | | 1,023.69 | | | | 1.53 | | | | .30 | |
| * | The “expenses paid during period” are equal to the “annualized expense ratio,” multiplied by the average account value over the period, multiplied by the number of days in the period, and divided by 365 (to reflect the one-half year period). |
We are required to advise you of the federal tax status of certain distributions received by shareholders during the fiscal year. The fund hereby designates the following amounts for the fund’s fiscal year ended October 31, 2016:
| Long-term capital gains | $1,467,129,000 |
| Qualified dividend income | 100% |
| Corporate dividends received deduction | 100% |
| U.S. government income that may be exempt from state taxation | $7,114,000 |
Individual shareholders should refer to their Form 1099 or other tax information, which will be mailed in January 2017, to determine the calendar year amounts to be included on their 2016 tax returns. Shareholders should consult their tax advisors.
Board of trustees and other officers
Independent trustees1
| Name and year of birth | | Year first
elected
a trustee
of the fund2 | | Principal occupation(s) during past five years | | Number of
portfolios in fund
complex overseen
by trustee | | Other directorships3
held by trustee |
| Louise H. Bryson, 1944 | | 2010 | | Chair Emerita of the Board of Trustees, J. Paul Getty Trust; former President, Distribution, Lifetime Entertainment Network (retired 2008); former Executive Vice President and General Manager, Lifetime Movie Network (retired 2008) | | 7 | | None |
| Mary Anne Dolan, 1947 | | 1993 | | Founder and President, MAD Ink (communications company) | | 10 | | None |
| James G. Ellis, 1947 | | 2010 | | Dean and Professor of Marketing, Marshall School of Business, University of Southern California | | 81 | | Mercury General Corporation |
| Leonard R. Fuller, 1946 | | 2010 | | Private investor; former President and CEO, Fuller Consulting (financial management consulting) | | 81 | | None |
| Pablo R. González Guajardo, 1967 | | 2015 | | CEO, Kimberly-Clark de México, S.A.B. de C.V. | | 7 | | Kimberly-Clark de México, S.A.B. de C.V.; América Móvil, S.A.B. de C.V.; Grupo Sanborns, S.A.B. de C.V.; Grupo Lala, S.A.B. de C.V. |
William D. Jones, 1955
Chairman of the Board
(Independent and Non-Executive) | | 2006 | | Real estate developer/owner, President and CEO, CityLink Investment Corporation (acquires, develops and manages real estate ventures in urban communities) and City Scene Management Company (provides commercial asset management services) | | 8 | | Sempra Energy |
| William H. Kling, 1942 | | 2006 | | President Emeritus and former CEO, American Public Media | | 10 | | None |
| John C. Mazziotta, MD, PhD, 1949 | | 2011 | | Physician; Professor of Neurology, University of California, Los Angeles; Vice Chancellor, UCLA Health Sciences; CEO, UCLA Health System; former Dean, David Geffen School of Medicine at UCLA; former Chair, Department of Neurology, UCLA; former Associate Director, Semel Institute, UCLA; former Director, Brain Mapping Center, UCLA | | 4 | | None |
| William R. McLaughlin, 1956 | | 2015 | | President, The Orvis Company; former President and CEO, Select Comfort | | 4 | | None |
| Bailey Morris-Eck, 1944 | | 1999 | | Director and Programming Chair, WYPR Baltimore/Washington (public radio station) | | 4 | | None |
L. Daniel Jorndt, a trustee of the fund since 2010, retired on December 31, 2015. The trustees thank Mr. Jorndt for his dedication and service to the fund.
The fund’s statement of additional information includes further details about fund trustees and is available without charge upon request by calling American Funds Service Company at (800) 421-4225 or by visiting the American Funds website at americanfunds.com. The address for all trustees and officers of the fund is 333 South Hope Street, Los Angeles, CA 90071, Attention: Secretary.
Interested trustees4,5
Name, year of birth and
position with fund | | Year first
elected
a trustee
or officer
of the fund2 | | Principal occupation(s) during past five years
and positions held with affiliated entities or
the principal underwriter of the fund | | Number of
portfolios in fund
complex overseen
by trustee | | Other directorships3
held by trustee |
Joyce E. Gordon, 1956
Vice Chairman of the Board | | 1996–2001 2005 | | Partner — Capital Research Global Investors, Capital Research and Management Company; Director, Capital Research and Management Company | | 2 | | None |
William L. Robbins, 1968
President | | 2004 | | Partner — Capital International Investors, Capital Research and Management Company | | 1 | | None |
Other officers5
Name, year of birth and
position with fund | | Year first
elected
an officer
of the fund2 | | Principal occupation(s) during past five years and positions held with affiliated entities
or the principal underwriter of the fund |
Paul F. Roye, 1953
Executive Vice President | | 2007 | | Director, Capital Research and Management Company;
Senior Vice President and Senior Counsel — Fund Business Management Group, Capital Research and Management Company |
James B. Lovelace, 1956
Senior Vice President | | 2006 | | Partner — Capital Research Global Investors, Capital Research and Management Company;
Director, Capital Research and Management Company |
James Terrile, 1965
Senior Vice President | | 2007 | | Partner — Capital Research Global Investors, Capital Research and Management Company;
Director, The Capital Group Companies, Inc.;6
Director, Capital Strategy Research, Inc.6 |
Dylan Yolles, 1969
Senior Vice President | | 2015 | | Partner — Capital International Investors, Capital Research and Management Company |
Herbert Y. Poon, 1973
Vice President | | 2012 | | Senior Vice President and Senior Counsel — Fund Business Management Group, Capital Research and Management Company |
Laurie D. Neat, 1971
Secretary | | 2016 | | Vice President — Fund Business Management Group, Capital Research and Management Company |
Brian D. Bullard, 1969
Treasurer | | 2015 | | Senior Vice President — Investment Operations, Capital Research and Management Company |
Raymond F. Sullivan, Jr., 1957
Assistant Secretary | | 2011 | | Vice President — Fund Business Management Group, Capital Research and Management Company |
Dori Laskin, 1951
Assistant Treasurer | | 2011 | | Vice President — Investment Operations, Capital Research and Management Company |
Hong T. Le, 1978
Assistant Treasurer | | 2016 | | Assistant Vice President — Investment Operations, Capital Research and Management Company |
| 1 | The term independent trustee refers to a trustee who is not an “interested person” of the fund within the meaning of the Investment Company Act of 1940. |
| 2 | Trustees and officers of the fund serve until their resignation, removal or retirement. |
| 3 | This includes all directorships/trusteeships (other than those in the American Funds or other funds managed by Capital Research and Management Company or its affiliates) that are held by each trustee as a trustee or director of a public company or a registered investment company. |
| 4 | The term interested trustee refers to a trustee who is an “interested person” within the meaning of the Investment Company Act of 1940, on the basis of their affiliation with the fund’s investment adviser, Capital Research and Management Company, or affiliated entities (including the fund’s principal underwriter). |
| 5 | All of the directors/trustees and/or officers listed are officers and/or directors/trustees of one or more of the other funds for which Capital Research and Management Company serves as investment adviser. |
| 6 | Company affiliated with Capital Research and Management Company. |
Offices of the fund and of the investment adviser
Capital Research and Management Company
333 South Hope Street
Los Angeles, CA 90071-1406
6455 Irvine Center Drive
Irvine, CA 92618-4518
Transfer agent for shareholder accounts
American Funds Service Company
(Write to the address near you.)
P.O. Box 6007
Indianapolis, IN 46206-6007
P.O. Box 2280
Norfolk, VA 23501-2280
Custodian of assets
JPMorgan Chase Bank
270 Park Avenue
New York, NY 10017-2070
Counsel
O’Melveny & Myers LLP
400 South Hope Street
Los Angeles, CA 90071-2899
Independent registered public accounting firm
Deloitte & Touche LLP
695 Town Center Drive
Suite 1200
Costa Mesa, CA 92626-7188
Principal underwriter
American Funds Distributors, Inc.
333 South Hope Street
Los Angeles, CA 90071-1406
Investors should carefully consider investment objectives, risks, charges and expenses. This and other important information is contained in the fund prospectus and summary prospectus, which can be obtained from your financial professional and should be read carefully before investing. You may also call American Funds Service Company (AFS) at (800) 421-4225 or visit the American Funds website at americanfunds.com.
“American Funds Proxy Voting Procedures and Principles” — which describes how we vote proxies relating to portfolio securities — is available on the American Funds website or upon request by calling AFS. The fund files its proxy voting record with the U.S. Securities and Exchange Commission (SEC) for the 12 months ended June 30 by August 31. The proxy voting record is available free of charge on the SEC website at sec.gov and on the American Funds website.
A complete October 31, 2016, portfolio of American Mutual Fund’s investments is available free of charge by calling AFS or visiting the SEC website (where it is part of Form N-CSR).
American Mutual Fund files a complete list of its portfolio holdings with the SEC for the first and third quarters of each fiscal year on Form N-Q. This filing is available free of charge on the SEC website. You may also review or, for a fee, copy this filing at the SEC’s Public Reference Room in Washington, D.C. Additional information regarding the operation of the Public Reference Room may be obtained by calling the SEC’s Office of Investor Education and Advocacy at (800) SEC-0330. Additionally, the list of portfolio holdings is available by calling AFS.
This report is for the information of shareholders of American Mutual Fund, but it also may be used as sales literature when preceded or accompanied by the current prospectus or summary prospectus, which gives details about charges, expenses, investment objectives and operating policies of the fund. If used as sales material after December 31, 2016, this report must be accompanied by an American Funds statistical update for the most recently completed calendar quarter.
The Standard and Poor’s 500 Composite Index (“Index”) is a product of S&P Dow Jones Indices LLC and/or its affiliates and has been licensed for use by Capital Group. Copyright © 2016 S&P Dow Jones Indices LLC, a division of S&P Global, and/or its affiliates. All rights reserved. Redistribution or reproduction in whole or in part are prohibited without written permission of S&P Dow Jones Indices LLC.
The American Funds Advantage®
Since 1931, American Funds, part of Capital Group, has helped investors pursue long-term investment success. Our consistent approach — in combination with The Capital SystemSM — has resulted in a superior long-term track record.
| | Aligned with investor success |
| | We base our decisions on a long-term perspective, which we believe aligns our goals with the interests of our clients. Our portfolio managers average 27 years of investment experience, including 22 years at our company, reflecting a career commitment to our long-term approach.1 |
| | |
| | The Capital SystemSM |
| | The Capital System combines individual accountability with teamwork. Funds using The Capital System are divided into portions that are managed independently by investment professionals with diverse backgrounds, ages and investment approaches. An extensive global research effort is the backbone of our system. |
| | |
| | Superior long-term track record |
| | Our equity funds have beaten their Lipper peer indexes in 91% of 10-year periods and 95% of 20-year periods. Our fixed income funds have beaten their Lipper indexes in 58% of 10-year periods and 58% of 20-year periods.2 Our fund management fees have been among the lowest in the industry.3 |
| 1 | Portfolio manager experience as of December 31, 2015. |
| 2 | Based on Class A share results for rolling periods through December 31, 2015. Periods covered are the shorter of the fund’s lifetime or since the comparable Lipper index inception date (except Capital Income Builder and SMALLCAP World Fund, for which the Lipper average was used). |
| 3 | On average, our management fees were in the lowest quintile 68% of the time, based on the 20-year period ended December 31, 2015, versus comparable Lipper categories, excluding funds of funds. |

ITEM 2 – Code of Ethics
The Registrant has adopted a Code of Ethics that applies to its Principal Executive Officer and Principal Financial Officer. The Registrant undertakes to provide to any person without charge, upon request, a copy of the Code of Ethics. Such request can be made to American Funds Service Company at 800/421-9225 or to the Secretary of the Registrant, 333 South Hope Street, Los Angeles, California 90071.
ITEM 3 – Audit Committee Financial Expert
The Registrant’s board has determined that James G. Ellis, a member of the Registrant’s audit committee, is an “audit committee financial expert” and "independent," as such terms are defined in this Item. This designation will not increase the designee’s duties, obligations or liability as compared to his or her duties, obligations and liability as a member of the audit committee and of the board, nor will it reduce the responsibility of the other audit committee members. There may be other individuals who, through education or experience, would qualify as "audit committee financial experts" if the board had designated them as such. Most importantly, the board believes each member of the audit committee contributes significantly to the effective oversight of the Registrant’s financial statements and condition.
ITEM 4 – Principal Accountant Fees and Services
Registrant:
a) Audit Fees:
2015 $89,000
2016 $105,000
b) Audit-Related Fees:
2015 $13,000
2016 $11,000
c) Tax Fees:
2015 $8,000
2016 $8,000
The tax fees consist of professional services relating to the preparation of the Registrant’s tax returns.
d) All Other Fees:
2015 None
2016 None
Adviser and affiliates (includes only fees for non-audit services billed to the adviser and affiliates for engagements that relate directly to the operations and financial reporting of the Registrant and were subject to the pre-approval policies described below):
a) Audit Fees:
Not Applicable
b) Audit-Related Fees:
2015 $1,143,000
2016 $1,138,000
The audit-related fees consist of assurance and related services relating to the examination of the Registrant’s transfer agent, principal underwriter and investment adviser conducted in accordance with Statement on Standards for Attestation Engagements Number 16 issued by the American Institute of Certified Public Accountants.
c) Tax Fees:
2015 None
2016 None
The tax fees consist of consulting services relating to the Registrant’s investments.
d) All Other Fees:
2015 $5,000
2016 $3,000
The other fees consist of subscription services related to an accounting research tool.
All audit and permissible non-audit services that the Registrant’s audit committee considers compatible with maintaining the independent registered public accounting firm’s independence are required to be pre-approved by the committee. The pre-approval requirement will extend to all non-audit services provided to the Registrant, the investment adviser, and any entity controlling, controlled by, or under common control with the investment adviser that provides ongoing services to the Registrant, if the engagement relates directly to the operations and financial reporting of the Registrant. The committee will not delegate its responsibility to pre-approve these services to the investment adviser. The committee may delegate to one or more committee members the authority to review and pre-approve audit and permissible non-audit services. Actions taken under any such delegation will be reported to the full committee at its next meeting. The pre-approval requirement is waived with respect to non-audit services if certain conditions are met. The pre-approval requirement was not waived for any of the non-audit services listed above provided to the Registrant, adviser and affiliates.
Aggregate non-audit fees paid to the Registrant’s auditors, including fees for all services billed to the Registrant, adviser and affiliates that provide ongoing services to the Registrant, were $1,445,000 for fiscal year 2015 and $1,211,000 for fiscal year 2016. The non-audit services represented by these amounts were brought to the attention of the committee and considered to be compatible with maintaining the auditors’ independence.
ITEM 5 – Audit Committee of Listed Registrants
Not applicable to this Registrant, insofar as the Registrant is not a listed issuer as defined in Rule 10A-3 under the Securities Exchange Act of 1934.
ITEM 6 – Schedule of Investments
American Mutual Fund®
Investment portfolio
October 31, 2016
Common stocks 88.78%
Energy 8.50% | Shares | Value
(000) |
| BP PLC (ADR) | 1,106,321 | $39,330 |
| Canadian Natural Resources, Ltd. | 4,908,000 | 155,769 |
| Chevron Corp. | 4,293,800 | 449,776 |
| ConocoPhillips | 6,519,500 | 283,272 |
| Devon Energy Corp. | 993,600 | 37,648 |
| Enbridge Inc. | 7,386,638 | 318,881 |
| EOG Resources, Inc. | 1,413,500 | 127,809 |
| Exxon Mobil Corp. | 7,003,500 | 583,532 |
| Halliburton Co. | 317,000 | 14,582 |
| Inter Pipeline Ltd. | 2,802,900 | 58,114 |
| Occidental Petroleum Corp. | 1,198,000 | 87,346 |
| PrairieSky Royalty Ltd. | 87,700 | 1,907 |
| Royal Dutch Shell PLC, Class A (ADR) | 4,112,355 | 204,836 |
| Royal Dutch Shell PLC, Class B (ADR) | 1,610,600 | 84,251 |
| Schlumberger Ltd. | 3,110,000 | 243,295 |
| Spectra Energy Corp | 5,625,500 | 235,202 |
| Suncor Energy Inc. | 12,406,310 | 372,291 |
| | | 3,297,841 |
| Materials 3.47% | | |
| Agrium Inc. | 2,795,000 | 256,637 |
| Barrick Gold Corp. | 1,200,000 | 21,108 |
| CRH PLC (ADR) | 1,089,059 | 35,177 |
| Dow Chemical Co. | 1,831,137 | 98,533 |
| E.I. du Pont de Nemours and Co. | 690,000 | 47,465 |
| International Flavors & Fragrances Inc. | 1,212,349 | 158,551 |
| Monsanto Co. | 2,392,900 | 241,133 |
| Mosaic Co. | 2,400,500 | 56,484 |
| Nucor Corp. | 1,099,600 | 53,715 |
| Potash Corp. of Saskatchewan Inc. | 3,036,800 | 49,439 |
| Praxair, Inc. | 2,809,924 | 328,930 |
| | | 1,347,172 |
| Industrials 12.67% | | |
| 3M Co. | 555,800 | 91,874 |
| Boeing Co. | 4,542,900 | 647,045 |
| Canadian National Railway Co. | 1,225,000 | 77,016 |
| Caterpillar Inc. | 306,000 | 25,539 |
| CSX Corp. | 8,095,493 | 246,994 |
| Cummins Inc. | 1,028,399 | 131,450 |
| Eaton Corp. PLC | 605,000 | 38,581 |
| Emerson Electric Co. | 2,446,850 | 124,006 |
| General Dynamics Corp. | 1,722,164 | 259,599 |
| General Electric Co. | 19,537,685 | 568,547 |
| Illinois Tool Works Inc. | 2,050,000 | 232,819 |
| Lockheed Martin Corp. | 2,516,560 | 620,030 |
| Norfolk Southern Corp. | 4,428,100 | 411,813 |
American Mutual Fund — Page 1 of 6
Common stocks
Industrials (continued) | Shares | Value
(000) |
| Northrop Grumman Corp. | 243,700 | $55,807 |
| Republic Services, Inc. | 2,836,300 | 149,274 |
| Rockwell Automation | 617,500 | 73,927 |
| Rockwell Collins, Inc. | 147,000 | 12,395 |
| Union Pacific Corp. | 4,616,264 | 407,062 |
| United Parcel Service, Inc., Class B | 876,000 | 94,398 |
| United Technologies Corp. | 1,876,174 | 191,745 |
| Waste Management, Inc. | 6,918,100 | 454,242 |
| | | 4,914,163 |
| Consumer discretionary 6.82% | | |
| Carnival Corp., units | 5,909,200 | 290,142 |
| Comcast Corp., Class A | 5,804,000 | 358,803 |
| Hasbro, Inc. | 1,948,788 | 162,548 |
| Home Depot, Inc. | 2,991,250 | 364,962 |
| Johnson Controls, Inc. | 777,000 | 31,329 |
| McDonald’s Corp. | 3,404,000 | 383,188 |
| Newell Rubbermaid Inc. | 7,198,200 | 345,658 |
| Omnicom Group Inc. | 1,500,000 | 119,730 |
| Ross Stores, Inc. | 757,000 | 47,343 |
| Scripps Networks Interactive, Inc., Class A | 598,000 | 38,487 |
| Starbucks Corp. | 1,338,700 | 71,045 |
| Time Warner Inc. | 2,429,036 | 216,160 |
| Viacom Inc., Class B | 2,190,600 | 82,279 |
| Walt Disney Co. | 200,000 | 18,538 |
| Whirlpool Corp. | 225,000 | 33,710 |
| Williams-Sonoma, Inc. | 1,729,706 | 79,947 |
| | | 2,643,869 |
| Consumer staples 7.55% | | |
| Coca-Cola Co. | 14,353,900 | 608,605 |
| Colgate-Palmolive Co. | 994,200 | 70,946 |
| ConAgra Foods, Inc. | 2,528,550 | 121,826 |
| Costco Wholesale Corp. | 1,089,300 | 161,075 |
| Coty Inc., Class A | 245,993 | 5,655 |
| CVS Health Corp. | 1,534,000 | 129,009 |
| General Mills, Inc. | 3,000,000 | 185,940 |
| Kellogg Co. | 1,539,423 | 115,657 |
| Kimberly-Clark Corp. | 1,000,000 | 114,410 |
| Kraft Heinz Co. | 2,292,000 | 203,873 |
| Kroger Co. | 1,450,000 | 44,921 |
| Mead Johnson Nutrition Co. | 557,000 | 41,647 |
| Mondelez International, Inc. | 3,703,900 | 166,453 |
| Nestlé SA (ADR) | 584,500 | 42,461 |
| PepsiCo, Inc. | 1,235,769 | 132,475 |
| Procter & Gamble Co. | 7,410,378 | 643,221 |
| Reckitt Benckiser Group PLC (ADR) | 1,382,000 | 25,208 |
| Unilever PLC (ADR) | 2,736,300 | 114,022 |
| | | 2,927,404 |
| Health care 12.93% | | |
| Abbott Laboratories | 1,242,000 | 48,736 |
| AbbVie Inc. | 16,814,400 | 937,907 |
| Aetna Inc. | 1,175,400 | 126,179 |
| AmerisourceBergen Corp. | 432,000 | 30,378 |
American Mutual Fund — Page 2 of 6
Common stocks
Health care (continued) | Shares | Value
(000) |
| Amgen Inc. | 7,230,172 | $1,020,611 |
| AstraZeneca PLC (ADR) | 7,741,999 | 219,254 |
| Cardinal Health, Inc. | 1,055,000 | 72,468 |
| Danaher Corp. | 1,500,000 | 117,825 |
| Eli Lilly and Co. | 1,867,800 | 137,918 |
| GlaxoSmithKline PLC | 3,400,000 | 67,356 |
| Johnson & Johnson | 3,601,800 | 417,773 |
| McKesson Corp. | 214,000 | 27,214 |
| Medtronic PLC | 6,742,000 | 552,979 |
| Merck & Co., Inc. | 4,736,485 | 278,126 |
| Novartis AG (ADR) | 3,014,000 | 214,054 |
| Pfizer Inc. | 8,223,200 | 260,758 |
| Quest Diagnostics Inc. | 1,590,000 | 129,490 |
| Roche Holding AG (ADR) | 1,540,000 | 44,160 |
| St. Jude Medical, Inc. | 323,100 | 25,150 |
| Stryker Corp. | 1,638,000 | 188,943 |
| UnitedHealth Group Inc. | 700,000 | 98,931 |
| | | 5,016,210 |
| Financials 10.51% | | |
| Aon PLC, Class A | 1,852,000 | 205,257 |
| Arthur J. Gallagher & Co. | 1,493,131 | 72,014 |
| Bank of Montreal | 2,218,926 | 141,212 |
| Bank of New York Mellon Corp. | 3,643,000 | 157,633 |
| BB&T Corp. | 5,100,000 | 199,920 |
| Berkshire Hathaway Inc., Class B1 | 300,000 | 43,290 |
| Capital One Financial Corp. | 1,500,000 | 111,060 |
| Chubb Ltd. | 1,814,400 | 230,429 |
| CME Group Inc., Class A | 1,721,000 | 172,272 |
| Intercontinental Exchange, Inc. | 542,918 | 146,799 |
| Invesco Ltd. | 3,761,300 | 105,655 |
| JPMorgan Chase & Co. | 6,536,197 | 452,697 |
| Marsh & McLennan Companies, Inc. | 4,406,094 | 279,302 |
| Moody’s Corp. | 138,000 | 13,872 |
| Old Republic International Corp. | 2,200,800 | 37,105 |
| PNC Financial Services Group, Inc. | 1,076,000 | 102,865 |
| Principal Financial Group, Inc. | 3,900,000 | 212,940 |
| Progressive Corp. | 3,195,500 | 100,690 |
| Royal Bank of Canada | 2,458,000 | 153,568 |
| S&P Global Inc. | 321,643 | 39,192 |
| State Street Corp. | 2,079,700 | 146,016 |
| Sun Life Financial Inc. | 2,560,700 | 85,732 |
| Toronto-Dominion Bank | 1,989,400 | 90,279 |
| Toronto-Dominion Bank (CAD denominated) | 3,000,000 | 136,122 |
| U.S. Bancorp | 4,400,000 | 196,944 |
| Wells Fargo & Co. | 9,621,100 | 442,667 |
| | | 4,075,532 |
| Information technology 11.73% | | |
| Accenture PLC, Class A | 1,514,000 | 175,987 |
| Analog Devices, Inc. | 4,466,440 | 286,299 |
| Apple Inc. | 4,181,000 | 474,711 |
| Automatic Data Processing, Inc. | 2,061,800 | 179,500 |
| Cisco Systems, Inc. | 6,600,000 | 202,488 |
| Hewlett Packard Enterprise Co. | 1,180,500 | 26,526 |
American Mutual Fund — Page 3 of 6
Common stocks
Information technology (continued) | Shares | Value
(000) |
| Hewlett-Packard Co. | 1,180,500 | $17,105 |
| Intel Corp. | 10,185,000 | 355,151 |
| International Business Machines Corp. | 1,400,000 | 215,166 |
| Maxim Integrated Products, Inc. | 1,500,000 | 59,445 |
| Microsoft Corp. | 12,050,007 | 722,036 |
| NetApp, Inc. | 2,228,500 | 75,635 |
| Oracle Corp. | 5,012,657 | 192,586 |
| Paychex, Inc. | 1,000,000 | 55,200 |
| Taiwan Semiconductor Manufacturing Co., Ltd. (ADR) | 1,925,000 | 59,868 |
| Texas Instruments Inc. | 17,346,644 | 1,229,010 |
| Visa Inc., Class A | 936,500 | 77,271 |
| Xilinx, Inc. | 2,882,200 | 146,618 |
| | | 4,550,602 |
| Telecommunication services 5.78% | | |
| AT&T Inc. | 16,928,000 | 622,781 |
| BCE Inc. | 1,000,000 | 45,440 |
| TELUS Corp. | 4,040,000 | 130,811 |
| Verizon Communications Inc. | 29,946,814 | 1,440,442 |
| | | 2,239,474 |
| Utilities 5.57% | | |
| American Electric Power Co., Inc. | 1,435,000 | 93,045 |
| Dominion Resources, Inc. | 3,000,000 | 225,600 |
| DTE Energy Co. | 245,100 | 23,532 |
| Duke Energy Corp. | 2,847,857 | 227,886 |
| Exelon Corp. | 11,121,885 | 378,923 |
| PG&E Corp. | 5,257,000 | 326,565 |
| PPL Corp. | 2,044,300 | 70,201 |
| Sempra Energy | 6,291,853 | 673,857 |
| Xcel Energy Inc. | 3,365,000 | 139,816 |
| | | 2,159,425 |
| Real estate 1.27% | | |
| Crown Castle International Corp. | 3,502,000 | 318,647 |
| Simon Property Group, Inc. | 90,000 | 16,736 |
| Ventas, Inc. | 2,311,500 | 156,604 |
| | | 491,987 |
| Miscellaneous 1.98% | | |
| Other common stocks in initial period of acquisition | | 767,206 |
| Total common stocks (cost: $25,199,218,000) | | 34,430,885 |
Preferred securities 0.03%
Financials 0.03% | | |
| U.S. Bancorp, Series F, 6.50% noncumulative depositary shares | 387,000 | 11,358 |
| Total preferred securities (cost: $10,004,000) | | 11,358 |
Convertible stocks 0.46%
Utilities 0.07% | | |
| Exelon Corp., convertible preferred, units | 600,000 | 28,620 |
American Mutual Fund — Page 4 of 6
Convertible stocks
Miscellaneous 0.39% | Shares | Value
(000) |
| Other convertible stocks in initial period of acquisition | | $151,770 |
| Total convertible stocks (cost: $178,761,000) | | 180,390 |
Bonds, notes & other debt instruments 2.45%
U.S. Treasury bonds & notes 1.82%
U.S. Treasury 1.82% | Principal amount
(000) | |
| U.S. Treasury 1.875% 2017 | $39,050 | 39,444 |
| U.S. Treasury 1.00% 2017 | 60,100 | 60,278 |
| U.S. Treasury 1.375% 2021 | 39,665 | 39,812 |
| U.S. Treasury 1.375% 2021 | 563,210 | 565,390 |
| | | 704,924 |
Corporate bonds & notes 0.63%
Financials 0.62% | | |
| JPMorgan Chase & Co., Series I, junior subordinated 7.90% (undated) | 116,654 | 120,387 |
| Wells Fargo & Co., Series K, junior subordinated 7.98% (undated) | 115,445 | 120,496 |
| | | 240,883 |
| Real estate 0.01% | | |
| ERP Operating LP 5.75% 2017 | 3,866 | 3,973 |
| Total corporate bonds & notes | | 244,856 |
| Total bonds, notes & other debt instruments (cost: $932,661,000) | | 949,780 |
| Short-term securities 8.14% | | |
| Air Products and Chemicals, Inc. 0.53% due 11/3/20162 | 25,000 | 24,999 |
| Apple Inc. 0.42% due 11/3/20162 | 100,000 | 99,998 |
| Caterpillar Financial Services Corp. 0.45%–0.51% due 11/2/2016–11/7/2016 | 122,200 | 122,196 |
| Chevron Corp. 0.45%–0.80% due 11/3/2016–1/4/20172 | 149,200 | 149,130 |
| Coca-Cola Co. 0.63%–0.68% due 12/6/2016–12/8/20162 | 90,000 | 89,961 |
| ExxonMobil Corp. 0.48%–0.51% due 11/1/2016–12/12/2016 | 70,000 | 69,975 |
| Federal Farm Credit Banks 0.54%–0.55% due 5/3/2017–5/17/2017 | 114,000 | 113,665 |
| Federal Home Loan Bank 0.25%–0.55% due 11/4/2016–4/13/2017 | 716,400 | 715,926 |
| Freddie Mac 0.41%–0.48% due 11/17/2016–1/17/2017 | 225,400 | 225,301 |
| General Electric Co. 0.35% due 11/1/2016 | 33,300 | 33,300 |
| Honeywell International Inc. 0.54% due 11/18/20162 | 50,000 | 49,990 |
| IBM Corp. 0.52% due 12/2/20162 | 70,000 | 69,975 |
| Microsoft Corp. 0.50%–0.65% due 11/8/2016–1/24/20172 | 280,600 | 280,449 |
| Pfizer Inc. 0.59%–0.68% due 11/14/2016–12/19/20162 | 187,800 | 187,720 |
| Private Export Funding Corp. 0.62%–0.70% due 11/2/2016–12/14/20162 | 134,200 | 134,156 |
| Qualcomm Inc. 0.44%–0.49% due 11/9/2016–11/22/20162 | 52,000 | 51,991 |
| U.S. Treasury Bills 0.29%–0.44% due 11/17/2016–2/16/2017 | 598,000 | 597,678 |
| Wal-Mart Stores, Inc. 0.42% due 11/7/20162 | 40,978 | 40,975 |
| Wells Fargo Bank, N.A. 0.86%–0.90% due 11/14/2016–12/5/2016 | 100,000 | 100,032 |
| Total short-term securities (cost: $3,157,055,000) | | 3,157,417 |
| Total investment securities 99.86% (cost: $29,477,699,000) | | 38,729,830 |
| Other assets less liabilities 0.14% | | 53,119 |
| Net assets 100.00% | | $38,782,949 |
American Mutual Fund — Page 5 of 6
As permitted by U.S. Securities and Exchange Commission regulations, “Miscellaneous” securities include holdings in their first year of acquisition that have not previously been publicly disclosed.
The following footnotes apply to either the individual securities noted or one or more of the securities aggregated and listed as a single line item.
| 1 | Security did not produce income during the last 12 months. |
| 2 | Acquired in a transaction exempt from registration under Section 4(2) of the Securities Act of 1933. May be resold in the U.S. in transactions exempt from registration, normally to qualified institutional buyers. The total value of all such securities was $1,179,344,000, which represented 3.04% of the net assets of the fund. |
| Key to abbreviations | |
| ADR = American Depositary Receipts | |
| CAD = Canadian dollars | |
| COP = Colombian pesos | |
Investments are not FDIC-insured, nor are they deposits of or guaranteed by a bank or any other entity, so they may lose value.
Investors should carefully consider investment objectives, risks, charges and expenses. This and other important information is contained in the fund prospectus and summary prospectus, which can be obtained from your financial professional and should be read carefully before investing. You may also call American Funds Service Company (AFS) at (800) 421-4225 or visit the American Funds website at americanfunds.com.
| MFGEFPX-003-1216O-S54111 | American Mutual Fund — Page 6 of 6 |
REPORT OF INDEPENDENT REGISTERED PUBLIC ACCOUNTING FIRM
To the Shareholders and Board of Trustees of
American Mutual Fund:
We have audited the accompanying statement of assets and liabilities of American Mutual Fund (the “Fund”), including the summary schedule of investments, as of October 31, 2016, and the related statements of operations for the year then ended, the statements of changes in net assets for each of the two years in the period then ended (collectively, the “financial statements”), the financial highlights for each of the five years in the period then ended (the financial statements and financial highlights are included in Item 1 of this Form N-CSR), and the schedule of investments in securities as of October 31, 2016 (included in Item 6 of this Form N-CSR). These financial statements, financial highlights, and schedule of investments in securities are the responsibility of the Fund’s management. Our responsibility is to express an opinion on these financial statements, financial highlights, and schedule of investments in securities based on our audits.
We conducted our audits in accordance with the standards of the Public Company Accounting Oversight Board (United States). Those standards require that we plan and perform the audit to obtain reasonable assurance about whether the financial statements, financial highlights, and schedule of investments in securities are free of material misstatement. An audit includes examining, on a test basis, evidence supporting the amounts and disclosures in the financial statements and schedule of investments in securities, assessing the accounting principles used and significant estimates made by management, as well as evaluating the overall financial statement presentation. Our procedures included confirmation of securities owned as of October 31, 2016, by correspondence with the custodian and brokers; where replies were not received from brokers, we performed other auditing procedures. We believe that our audits provide a reasonable basis for our opinion.
In our opinion, the financial statements, financial highlights, and schedule of investments in securities referred to above present fairly, in all material respects, the financial position of American Mutual Fund as of October 31, 2016, and the results of its operations for the year then ended, the changes in its net assets for each of the two years in the period then ended, and the financial highlights for each of the five years in the period then ended, in conformity with accounting principles generally accepted in the United States of America.
DELOITTE & TOUCHE LLP
Costa Mesa, California
December 8, 2016
ITEM 7 – Disclosure of Proxy Voting Policies and Procedures for Closed-End Management Investment Companies
Not applicable to this Registrant, insofar as the Registrant is not a closed-end management investment company.
ITEM 8 – Portfolio Managers of Closed-End Management Investment Companies
Not applicable to this Registrant, insofar as the Registrant is not a closed-end management investment company.
ITEM 9 – Purchases of Equity Securities by Closed-End Management Investment Company and Affiliated Purchasers
Not applicable to this Registrant, insofar as the Registrant is not a closed-end management investment company.
ITEM 10 – Submission of Matters to a Vote of Security Holders
There have been no material changes to the procedures by which shareholders may recommend nominees to the Registrant’s board of trustees since the Registrant last submitted a proxy statement to its shareholders. The procedures are as follows. The Registrant has a nominating and governance committee comprised solely of persons who are not considered ‘‘interested persons’’ of the Registrant within the meaning of the Investment Company Act of 1940, as amended. The committee periodically reviews such issues as the board’s composition, responsibilities, committees, compensation and other relevant issues, and recommends any appropriate changes to the full board of trustees. While the committee normally is able to identify from its own resources an ample number of qualified candidates, it will consider shareholder suggestions of persons to be considered as nominees to fill future vacancies on the board. Such suggestions must be sent in writing to the nominating and governance committee of the Registrant, c/o the Registrant’s Secretary, and must be accompanied by complete biographical and occupational data on the prospective nominee, along with a written consent of the prospective nominee for consideration of his or her name by the nominating and governance committee.
ITEM 11 – Controls and Procedures
| (a) | The Registrant’s Principal Executive Officer and Principal Financial Officer have concluded, based on their evaluation of the Registrant’s disclosure controls and procedures (as such term is defined in Rule 30a-3 under the Investment Company Act of 1940), that such controls and procedures are adequate and reasonably designed to achieve the purposes described in paragraph (c) of such rule. |
| | |
| (b) | There were no changes in the Registrant’s internal controls over financial reporting (as defined in Rule 30a-3(d) under the Investment Company Act of 1940) that occurred during the Registrant’s second fiscal quarter of the period covered by this report that has materially affected, or is reasonably likely to materially affect, the Registrant’s internal control over financial reporting. |
ITEM 12 – Exhibits
| (a)(1) | The Code of Ethics that is the subject of the disclosure required by Item 2 is attached as an exhibit hereto. |
| | |
| (a)(2) | The certifications required by Rule 30a-2 of the Investment Company Act of 1940 and Sections 302 and 906 of the Sarbanes-Oxley Act of 2002 are attached as exhibits hereto. |
SIGNATURES
Pursuant to the requirements of the Securities Exchange Act of 1934 and the Investment Company Act of 1940, the Registrant has duly caused this report to be signed on its behalf by the undersigned, thereunto duly authorized.
| | AMERICAN MUTUAL FUND |
| | |
| | By ___/s/ Paul F. Roye_________________________ |
| | Paul F. Roye, Executive Vice President and Principal Executive Officer |
| | |
| | Date: December 27, 2016 |
Pursuant to the requirements of the Securities Exchange Act of 1934 and the Investment Company Act of 1940, this report has been signed below by the following persons on behalf of the Registrant and in the capacities and on the dates indicated.
| By ___/s/ Paul F. Roye_________________________ |
Paul F. Roye, Executive Vice President and Principal Executive Officer |
| |
| Date: December 27, 2016 |
| By __/s/ Brian D. Bullard________________________ |
Brian D. Bullard, Treasurer and Principal Financial Officer |
| |
| Date: December 27, 2016 |