UNITED STATES
SECURITIES AND EXCHANGE COMMISSION
Washington, D.C. 20549
FORM N-CSR
Certified Shareholder Report of
Registered Management Investment Companies
Investment Company Act File Number: 811-00572
American Mutual Fund
(Exact Name of Registrant as Specified in Charter)
333 South Hope Street
Los Angeles, California 90071
(Address of Principal Executive Offices)
Registrant's telephone number, including area code: (213) 486-9200
Date of fiscal year end: October 31
Date of reporting period: October 31, 2014
Michael W. Stockton
American Mutual Fund
333 South Hope Street
Los Angeles, California 90071
(Name and Address of Agent for Service)
Copies to:
Eric A. S. Richards
O’Melveny & Myers LLP
400 South Hope Street, 10th Floor
Los Angeles, California 90071
(Counsel for the Registrant)
ITEM 1 – Reports to Stockholders
![]()
We seek to find value
for our investors.
Special feature page 6
 | American Mutual Fund® |
| Annual report for the year ended October 31, 2014 | |
American Mutual Fund strives for the balanced accomplishment of three objectives — current income, growth of capital and conservation of principal — through investments in companies that participate in the growth of the American economy.
This fund is one of more than 40 offered by one of the nation’s largest mutual fund families, American Funds, from Capital Group. For more than 80 years, Capital has invested with a long-term focus based on thorough research and attention to risk.
Fund results shown in this report, unless otherwise indicated, are for Class A shares at net asset value. If a sales charge (maximum 5.75%) had been deducted, the results would have been lower. Results are for past periods and are not predictive of results for future periods. Current and future results may be lower or higher than those shown. Share prices and returns will vary, so investors may lose money. Investing for short periods makes losses more likely. Investments are not FDIC-insured, nor are they deposits of or guaranteed by a bank or any other entity, so they may lose value. For current information and month-end results, visit americanfunds.com.
Here are the average annual total returns on a $1,000 investment with all distributions reinvested for periods ended September 30, 2014 (the most recent calendar quarter-end):
| Class A shares | 1 year | 5 years | 10 years | |||
| Reflecting 5.75% maximum sales charge | 9.12% | 12.73% | 7.21% |
For other share class results, visit americanfunds.com and americanfundsretirement.com.
The total annual fund operating expense ratio is 0.59% for Class A shares as of the prospectus dated January 1, 2015 (unaudited).
Investment results assume all distributions are reinvested and reflect applicable fees and expenses. When applicable, investment results reflect fee waivers, without which results would have been lower. Visit americanfunds.com for more information.
The fund’s 30-day yield for Class A shares as of November 30, 2014, calculated in accordance with the U.S. Securities and Exchange Commission (SEC) formula, was 1.77%. The fund’s 12-month distribution rate for Class A shares as of that date was 1.69%. Both reflect the 5.75% maximum sales charge. The SEC yield reflects the rate at which the fund is earning income on its current portfolio of securities while the distribution rate reflects the fund’s past dividends paid to shareholders. Accordingly, the fund’s SEC yield and distribution rate may differ.
Refer to the fund prospectus and the Risk Factors section of this report for more information on risks associated with investing in the fund.

U.S. equities posted strong gains during the fiscal year ended October 31, 2014, with Standard & Poor’s 500 Composite Index finishing the period above the 2,000 mark. Investors were encouraged by improved economic readings, strong corporate earnings and increased mergers-and-acquisitions activity. The market also seemed to adapt well to the gradual slowdown of central bank stimulus as the Federal Reserve wound down its asset-purchase program.
With the stock market rising sharply during the period, American Mutual Fund posted a total return of 14.99%. This trailed the 17.24% return for the unmanaged S&P 500, a broad measure of the U.S. stock market. It is not uncommon for AMF to lag the S&P 500 in a market environment of strong rising returns. The fund is managed conservatively and has tended to do better than the S&P 500 in declining markets because dividend-paying holdings are typically less volatile than the overall market.
Over longer periods of time, AMF’s returns have compared more favorably to those of the S&P 500. For the past 10 years, the fund had an average annual total return of 8.15% compared with the index’s 8.20% return. For its more-than-64-year lifetime, AMF has had an average annual total return of 11.79% compared with 11.34% for the S&P 500. The index is unmanaged and, therefore, has no expenses; investors cannot invest directly in an index.
Portfolio review
Holdings in the industrials and utilities sectors made strong contributions to the fund’s returns. Industrials continued to be the fund’s largest area of investment, making up 15.7% of its total net assets. Several firms have benefited from the ongoing increase in corporate spending, including aerospace and defense firms General Dynamics and Lockheed Martin. Both companies have done well with capital management and returning cash to shareholders, making them a good fit for the fund. We are also optimistic about General Dynamics’ business jet division, Gulfstream Aerospace, which continues to grow but whose value has not been fully recognized by the market, in our view. Through our on-the-ground research, we believe that we can identify such situations where hidden value may exist, regardless of the industry (see the related feature starting on page 6).
Elsewhere in the industrials sector, railroad operators CSX and Union Pacific also contributed to the fund’s results during the period. Both companies have continued to steadily increase their dividends as they undergo a decade-long renaissance, driven by improvements in fuel efficiency and pricing relative to other modes of transportation. Among utilities, Exelon advanced after announcing it would acquire Pepco and that the two companies would consolidate their gas and electricity generation businesses into one, making it the leading utility provider in the mid-Atlantic region. We’re also optimistic about Exelon’s nuclear power operations.
The fund’s investments in the health care sector also benefited returns, as biotechnology stocks bounced back from a broad sell-off in the spring. Shares of Amgen rallied after the company received positive data from clinical trials for several new drugs, including a breakthrough therapy to treat leukemia. We believe Amgen has a strong pipeline of drugs that the market continues to underappreciate. The company also has shown a strong commitment to returning cash to shareholders, having consistently increased its dividend. Shares of drug maker AbbVie, which we also believe has a strong product pipeline, rebounded after the firm dropped its bid to acquire overseas rival Shire.
| American Mutual Fund | 1 |
Consumer discretionary companies had mixed results, with shares of retailer Home Depot climbing while those of toymaker Mattel declined. Home Depot benefited from strong earnings due to greater operating efficiencies, which management expects will continue to drive results. Mattel, on the other hand, reported disappointing earnings during the year amid an increasingly competitive landscape in the toy industry. In the telecommunication services sector, shares of Verizon Communications lagged the market, but we believe this is only temporary and that the company will continue to post decent earnings growth and return capital to shareholders.
Overall, the fund’s significant investments in companies with higher dividends helped it participate in the market rally as many investors sought yield. While some sectors that traditionally have been sources of dividends have seen valuations increase quite a bit, as discussed in the feature, we believe there are still plenty of attractively valued companies to be found on an individual level. We believe that our robust research operation allows us to identify those firms most likely to increase dividends rapidly, and to invest in them at attractive valuations.
Looking ahead
The U.S. economy continues to expand, albeit at a modest pace. While unemployment has declined, other areas of the economy remain below peak levels, including housing and manufacturing, and many of the country’s largest trading partners are struggling economically. The credit and lending environment also remains somewhat muted. While interest rates are likely to rise gradually over time, the exact timing of any increase in rates by the Fed is uncertain. In normal recoveries, interest rates typically rise as the economy rebounds, and we would expect this pattern to recur now that the Fed has become less active in the market. With this in mind, we remain sensitive to valuation levels.
We also are mindful of other external factors that could impact the market, including events outside of the U.S. — most notably the ongoing tensions in the Middle East and Ukraine. Many of the companies that the fund invests in are global in nature and thus could be impacted by events beyond the U.S.’s borders. We continue to keep a close eye on risk and volatility in the fund, closely considering all aspects of companies before investing in them.
AMF’s portfolio managers are primarily focused on companies that will participate in the market but offer some protection to investors if the market should weaken. Companies that grow earnings and dividends tend to fare better in down markets than those that have less growth. Dividend growth also sends a positive message about a company’s earnings and management’s willingness to share profits with investors instead of spending capital on acquisitions or share repurchases, which have a less impressive track record of benefiting shareholders. Even companies that offer a high yield but don’t grow the dividend tend to do less well than those that do when interest rates are rising.
We would like to remind our investors to keep in mind the three objectives of the fund: current income, growth of capital and conservation of principal, the latter of which is especially important during a period of rising interest rates and higher valuations.
We are pleased to report that the number of shareholder accounts in AMF has grown by 3.3% from a year ago. We would like to welcome our new shareholders and thank our long-term investors for their continued support.
Cordially,

Joyce E. Gordon
Vice Chairman

William L. Robbins
President
December 8, 2014
For current information about the fund, visit americanfunds.com.
Dividends paid in calendar year 2014
For tax purposes, here are the income dividends Class A shareholders received in calendar year 2014.
| Income dividends per share: | $0.170 paid 3/14/14 | |
| $0.175 paid 6/13/14 | ||
| $0.185 paid 9/19/14 | ||
| $0.185 to be paid on 12/19/14* |
The fund will also pay a special dividend from accumulated, undistributed net income and a capital gain distribution on 12/19/14.*
| * | Unaudited. |
Form 1099-DIV, which provides the information you will need to prepare your federal income tax return for 2014, will be mailed to you with your American Funds Tax Guide in late January 2015.
| 2 | American Mutual Fund |
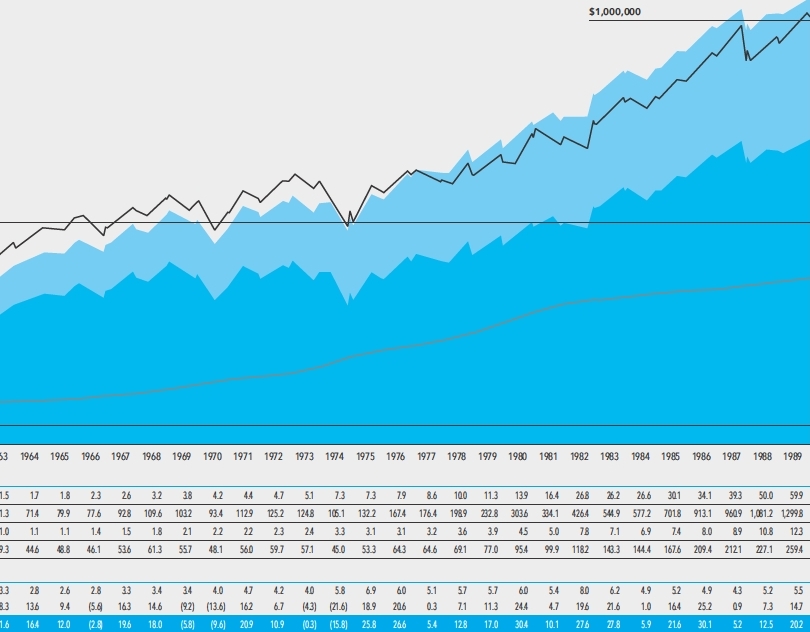
The value of a long-term perspective
For more than 64 years, American Mutual Fund has been providing investors with an opportunity to achieve their financial goals. A meaningful way to compare the fund’s results with the return on other investments is through its total return.
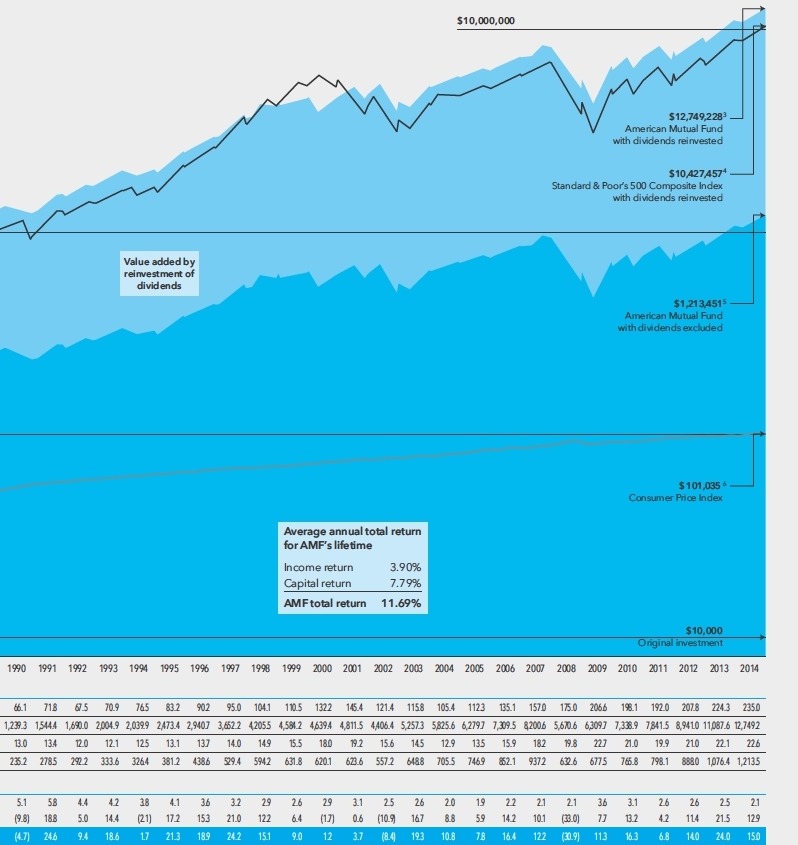
Total return is a combination of income return and capital return. This chart illustrates an assumed $10,000 investment in American Mutual Fund from February 21, 1950 — commencement of operations — through October 31, 2014. The table beneath the chart shows the fund’s total return in each of the 64 fiscal years, broken down into its income and capital components.
As you can see, during this period a $10,000 investment in the fund, with all dividends reinvested, would have grown to $12,749,228.3
Use the table below to estimate the growth of your investment. Let’s say that you have been reinvesting all your dividends and want to know how your investment has done since the end of fiscal 2004. As the table shows, the value of the investment illustrated here was $5.8 million. Since then, it has grown to $12.7 million. Thus, in the same period, the value of your 2004 investment — regardless of its size — also has grown.
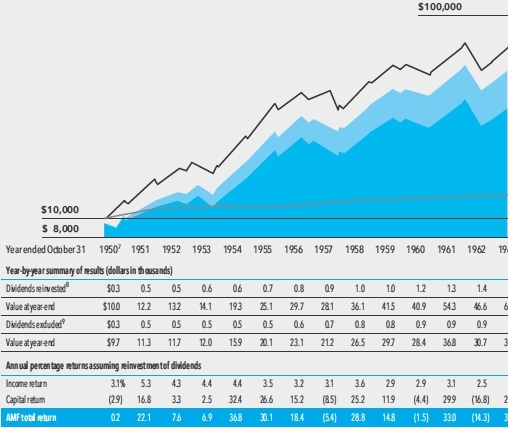
Fund results shown are for Class A shares and reflect deduction of the maximum sales charge of 5.75% on the $10,000 investment. 1 Thus, the net amount invested was $9,425.2 Results are for past periods and are not predictive of results for future periods. Current and future results may be lower or higher than those shown. Share prices and returns will vary, so investors may lose money. For current information and month-end results, visit americanfunds.com.
The results shown are before taxes on fund distributions and sale of fund shares.
| 1 | As outlined in the prospectus, the sales charge is reduced for accounts (and aggregated investments) of $25,000 or more and is eliminated for purchases of $1 million or more. There is no sales charge on dividends or capital gain distributions that are reinvested in additional shares. |
| 2 | The maximum initial sales charge was 8.5% prior to July 1, 1988. |
| 3 | Includes reinvested capital gain distributions totaling $3,986,157 in the years 1950–2014 and reinvested dividends. |
| 4 | The S&P 500 is unmanaged and, therefore, has no expenses. Investors cannot invest directly in an index. |
| 5 | Includes reinvested capital gain distributions taken in shares totaling $611,863 but does not reflect income dividends taken in cash. |
| 6 | Computed from data supplied by the U.S. Department of Labor, Bureau of Labor Statistics. It would take $101,035 to buy today what $10,000 bought when the fund began. |
| 7 | For the period February 21, 1950 (commencement of operations), through October 31, 1950. |
| 8 | Includes special dividends of $1,691 in 1974, $989 in 1975, $7,524 in 1982, $3,967 in 1983, $6,064 in 1988, $9,850 in 1989, $9,497 in 1990, $8,996 in 1991, $32,002 in 2009, $20,477 in 2010, $8,128 in 2011, $12,961 in 2012 and $13,600 in 2013. |
| 9 | Includes special dividends of $746 in 1974, $407 in 1975, $2,251 in 1982, $1,099 in 1983, $1,339 in 1988, $2,069 in 1989, $1,895 in 1990, $1,707 in 1991, $3,570 in 2009, $2,199 in 2010, $848 in 2011, $1,319 in 2012 and $1,351 in 2013. |
| American Mutual Fund | 3 |
Average annual total returns based on a $1,000 investment
(for periods ended October 31, 2014)*
| 1 year | 5 years | 10 years | |||||||
| Class A shares | 8.38% | 13.74% | 7.51% |
| * | Assumes reinvestment of all distributions and payment of the maximum 5.75% sales charge. |
Investment results assume all distributions are reinvested and reflect applicable fees and expenses. When applicable, investment results reflect fee waivers, without which results would have been lower. Visit americanfunds.com for more information.
| 4 | American Mutual Fund |
| American Mutual Fund | 5 |

Finding
value in an
overvalued
market
“Price is what you pay, value is what you get.”
This quote, attributed to Warren Buffett, indicates that the share price and fair value of a company are not always one and the same. Often times, price becomes disconnected from value based on any number of market conditions. For example, in a stock market where investors have been seeking yield, they have been willing to pay a high price for companies with attractive dividend yields, making them even more expensive.
Naturally, value-oriented investors may look elsewhere for income, including newer sources of dividends in sectors with more reasonable valuations, such as industrials and information technology. While these areas hold promise, the investment professionals of American Mutual Fund also continue to find many attractively valued companies in more traditional dividend-paying sectors, such as utilities, as well as in other industries where share prices have risen dramatically, including pharmaceuticals.
“A lot of these companies have done well, so we have to keep looking for those where there is still room for appreciation as we’re searching for yield in this fund,” explains Joyce Gordon, vice chairman and a portfolio manager for AMF. “We’re finding value in the health care and utilities sectors even though a lot of those stocks have risen sharply. There are many good, high-quality companies with attractive yields out there, but we have to use the depth of our research to figure which ones work best for the fund.”
In addition to providing income, companies in these sectors also have growth potential while still offering protection on the downside. These characteristics make them a good fit for a fund like AMF, according to president and portfolio manager Will Robbins, who also points to the oil industry as an increasingly attractive area for investment. “All three sectors pay a nice dividend, which is a big part of total return,” notes Will. “With a combination of decent yields and valuations, many of these companies can provide stability in a down market. There’s a defensive nature to them that doesn’t exist in other high-yielding sectors.”
| 6 | American Mutual Fund |
Pharmaceuticals: finding value in an age of innovation
The pharmaceuticals industry is in its most innovative period since the 1990s, thanks in large part to advances in technology and genomics. After a decade of patent expirations and increased regulatory scrutiny, as well as undergoing a wave of consolidation in the 2000s, pharmaceutical companies are now spending more money on research and development (R&D) focused on curing some of the biggest diseases of our time. As a result, pharmaceutical and biotechnology stocks have generated among the highest year-to-date returns of any market segment, leading to lofty valuations for some.
One area where our investment analysts and portfolio managers are finding value is oncology, where new treatments with the potential to cure various cancers have led to some particularly attractive investment opportunities. Among the most revolutionary new approaches is immuno-oncology, which harnesses the patient’s own immune system to recognize and fight cancer. The key is the so-called programmed cell death-1 (PD-1) and programmed cell death-ligand 1 (PD-L1) inhibitors, which could form the backbone of many future cancer therapies and pave the way for big revenue streams at some pharmaceutical firms.
“When you look at the breakthroughs happening in immuno-oncology, it’s stunning,” says analyst Skye Drynan. The approach works in two ways, boosting the immune system while also removing cancer’s ability to hide from it. “The immune system can’t see cancer, which has a cloaking mechanism,” she says. “If you can’t see your enemy, you don’t know it’s there. The PD-1 and PD-L1 inhibitors remove cancer’s ability to hide from the immune system.”
Bristol-Myers Squibb and Merck are two of the companies leading the charge in this area. Both are developing immuno-oncology therapies for a number of different cancers, including skin, lung and breast cancer. “If you think about it, these treatments are the ultimate in personalized medicine, finding and attacking abnormal cells regardless of the type of cancer,” notes Skye. “These drugs are even more effective than the companies thought, and they are getting study results faster because so many patients are enrolling.”
Of the two companies, Bristol-Myers Squibb has done the largest studies and has the broadest immuno-oncology drug portfolio, based on PD-1 inhibitors, but it is not launching its product until next year. Merck, which has a PD-L1 inhibitor, was the first to market; demand has been strong because for many patients the drug is their last or only option. “These cancer patients are not looking for cures, but rather progression-free survival,” explains Skye. “The thought is that once you train the immune system to recognize the abnormal cells, it will keep cancer at bay. But you have to come up with the right combination, which is difficult to do with so many types of cancer.”
However, if successful, Skye says these treatments could become a sort of “drug pipeline within a drug pipeline” because they would have multiple applications for different types of cancer. This is a common trait of most blockbuster drugs that have multibillion-dollar markets, and she expects the same for these immuno-oncology therapies. “For the most common types of cancer, the market could even approach a trillion dollars annually,” she estimates. “But if you don’t have a meaningful drug that works, people are not going to pay for it. We’re seeing higher prices in the market because they are meaningful cures.”
Skye has been working closely with several portfolio managers for AMF in researching and investing in Bristol-Myers Squibb and Merck, which are now two of the fund’s largest health care holdings. Both companies are a good fit for the fund, with dividend yields of 2.5% and 3%, respectively, and while their share prices have risen, she still believes they are a good value and that the market does not fully recognize their potential.
“I see parallels with some of the work I did in the biotechnology industry, which requires extra-rigorous analysis that I’m now applying to more traditional pharmaceutical firms,” says Skye, adding that the lines have become blurred between the two industries, which she often refers to jointly as biopharmaceuticals. “Working with the portfolio managers has been great — they have been asking a lot of really smart questions and are taking the time to understand the opportunities as well as the risks.”
Portfolio manager Dylan Yolles says he has been excited by the progress being made in the fight against cancer,

There are many good, high-quality companies with attractive yields out there, but we have to use the depth of our research to figure which ones work best for the fund.
Joyce Gordon
Vice Chairman and Portfolio Manager
| American Mutual Fund | 7 |
especially at Merck. He says a new head of R&D has helped refocus the company on key clinical areas that are driving value, including oncology. Dylan also holds shares of Bristol-Myers Squibb, though he has more concerns about the company’s valuation.
“The pharmaceutical companies we’re investing in now in AMF have compelling drug pipelines and are going after big new opportunities that truly do have a major impact on patients’ lives,” states Dylan, noting that the fund began adding many of them when valuations were much lower, thanks to the foresight of our analysts to look past the problems and to the growth expectations. “These companies have gone through a number of years dealing with patent expirations, declining revenues and flat earnings growth. Now they are finally getting to the end of that period and are coming out with new products in big areas, so earnings should start to grow and dividend increases are likely to follow.”
Oil: lower prices present a buying opportunity
Like the pharmaceuticals industry, one big discovery can change an oil company’s prospects, often with the help of technological innovation. Several companies have made big discoveries of oil and natural gas deposits in recent years and are now bringing those projects to market. These prospects have made a number of oil producers an attractive value for investors, since many companies’ share prices are depressed with the recent decline in global oil prices, which the fund’s investment professionals expect to rebound.
Analyst Lars Reierson says oil prices have fallen amid a perceived weakness in demand and an unexpected surge in production from the Middle East and North Africa, particularly Libya despite the country’s civil war. “One reason oil prices have fallen below $80 per barrel and stayed there is that the market was looking to Saudi Arabia to step in and cut production, but so far the country has remained silent,” states Lars. “I don’t see the weak demand the market perceives, and with Libya being volatile, production could decline significantly. Oil is likely to rise back closer to $100 per barrel, but it’s unclear how long that will take.”
Increased oil production in the U.S. — mostly from shale deposits — has also helped keep prices down. But at the same time, many U.S. companies are benefiting from the boom in shale oil. “It represents a complete breakthrough for them and is an incredible long-term investment opportunity,” Lars says of shale. “The decline in global oil prices has provided us with a buying opportunity that we would not have otherwise gotten. These shale companies will only benefit more as oil prices rebound.”
The company with the most exposure to shale oil that is held in the fund is EOG Resources (0.35% of the fund’s holdings at fiscal year-end), which leads the way in hydraulic fracturing technology and holds some of the best land leases. The company also takes a cautious approach to fracking, which has raised some environmental concerns. However, the fund’s investment professionals do not expect any of these concerns to have a material impact on fracking.
Other major U.S. oil companies held in the fund also have exposure to shale, including Chevron and ConocoPhillips, but that is only part of their investment thesis. In addition to its shale deposits in the Permian Basin of Texas, Chevron has a number of global projects coming online that will help drive its growth over the next few years, including the giant Tengiz oil field in Kazakhstan and a major liquefied natural gas (LNG) project in Australia. The company also has deepwater oil and gas operations off the coast of Nigeria and in the Gulf of Mexico.
“Chevron is expected to grow production by 20% in the next five years, but the company also has plenty of other long-term projects to ensure growth going even further out, including its shale operations,” says Lars, adding that its 3.6% dividend yield is also likely to increase. “Chevron has had superior and consistent dividend growth of about 10% per year over the last decade, including when oil fell to $30 per barrel during the financial crisis. The company’s first priority in capital allocation is to grow its dividend. Chevron has a pristine balance sheet, a deep management team and an outstanding culture.”
ConocoPhillips has undergone restructuring in recent years, spinning off its Phillips 66 refining and marketing division to focus more on oil exploration and production. “ConocoPhillips is now at a happy medium for oil companies — it is not going to grow quite as fast as some of the smaller ones but it still has a substantial

The pharmaceutical companies we’re investing in now in AMF have compelling drug pipelines and are going after big new opportunities that truly do have a major impact on patients’ lives.
Dylan Yolles
Portfolio Manager
| 8 | American Mutual Fund |
![]()
How American Mutual Fund has fared during market declines*
Total returns for AMF and the S&P 500 (assumes monthly reinvestment of dividends for the S&P 500)

| * | Major stock market declines are based on price declines of 15% or more (without dividends reinvested) in the unmanaged S&P 500 with 100% recovery between declines (except for a 77% recovery between 3/9/09 and 4/29/11). There have been periods in which the fund has lagged the S&P 500, particularly in strong markets. |
Fund results shown are for Class A shares at net asset value. If a sales charge (maximum 5.75%) had been deducted, the results would have been lower. Results are for past periods and are not predictive of results for future periods. Current and future results may be lower or higher than those shown. Share prices and returns will vary, so investors may lose money. For current information and month-end results, visit americanfunds.com.
| American Mutual Fund | 9 |

Favorable returns with less volatility
American Mutual Fund strives to meet its objectives. If we look back 10 years, as shown below, the fund has provided comparable or higher returns than those of its three benchmarks. It has been able to accomplish this with lower volatility than its benchmarks.
For the 10-year period ended October 31, 2014
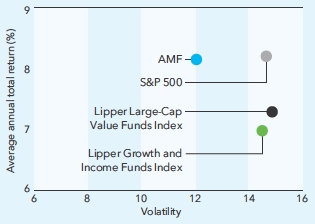
| Average annual total return | Volatility | ||||||||
| AMF | 8.15 | % | 12.04 | % | |||||
| S&P 500 | 8.20 | 14.64 | |||||||
| Lipper Large-Cap Value Funds Index | 7.29 | 14.86 | |||||||
| Lipper Growth and Income Funds Index | 6.98 | 14.49 | |||||||
Volatility is calculated at net asset value by Lipper using annualized standard deviation (based on monthly returns). It is a common measure of absolute volatility that shows how returns over time have varied from the mean; a lower number signifies lower volatility. Standard & Poor’s 500 Composite Index is an index of 500 large-company stocks selected to represent the stock market. It is unmanaged and, therefore, has no expenses. Investors cannot invest directly in an index. The Lipper Large-Cap Value Funds Index is an equally weighted index of the 30 largest mutual funds that invest at least 75% of their equity assets in companies with market capitalizations (on a three-year weighted basis) above Lipper’s U.S. Domestic Equity large-cap floor. The Lipper Growth and Income Funds Index is an equally weighted index of the 30 largest mutual funds that combine a growth orientation with the pursuit of income.
| 10 | American Mutual Fund |
dividend yield over 4% that has been rock solid, making it a great fit for AMF,” says Lars. “The company has a big hoard of cash and the new management team wants the market to realize that it’s going to pay a dividend no matter what.”
The fund’s portfolio managers also have been encouraged by the two oil companies’ willingness to pay higher dividends. Will says ConocoPhillips and Chevron have learned from their mistakes and are now making better decisions when it comes to capital allocation. “It had been called into question, but they have since become more disciplined with their spending,” he says. Likewise, Dylan says the companies’ free cash flow has been improving as they get past some of their more capital-intensive projects. “Now that the return on investment has started coming in from these projects, earnings growth should accelerate,” he says. “On top of that, potentially higher oil prices should also provide a tailwind to their share prices.”
Utilities: value opportunities in natural gas and nuclear
More than in any other sector, utilities companies have become expensive as investors have sought them out for their high dividend yields, driving up their valuations. Many of the traditional utilities companies are trading near all-time highs and their price-to-earnings ratios are getting lofty by historical standards. At the same time, these companies still offer attractive yields and downside protection in a volatile market.
“While utilities have gotten pretty expensive, there is always value to be found in any sector,” says Dylan. “One of the reasons to own utilities is that in an economically uncertain world, they are still likely to provide 3.5% dividend yields and grow over time, albeit at a slower pace. But they still look like a compelling investment versus cash, so there is definitely an argument for owning them, and certain subsectors make a stronger case.”
One of those subsectors is natural gas infrastructure, where two companies that operate pipelines have caught the attention of analyst Adam Ward. “When people think about utilities, they traditionally think power lines, but I’ve found a more interesting area where companies have stable cash flows and higher growth rates,” Adam says of his investments in Sempra Energy and Spectra Energy. “Instead of power lines from a wind farm to the city, these firms own pipelines that take natural gas from rural areas to urban centers.”
Natural gas is a key theme for Adam when it comes to investing in the U.S. because the infrastructure is not in place like it is for other sources of energy. “The U.S. is producing more natural gas than had been expected — mostly from fracking —so there is a need for more pipelines to get the gas from point A to point B,” he says, noting that Sempra is building a LNG export facility on the Gulf Coast that will start up in 2018. “Those companies with infrastructure capabilities in place stand to benefit the most from this growth in natural gas, which is a cheaper alternative to oil and coal.”
The dividend yields for Sempra and Spectra are not as high as they are for other traditional utilities companies, but Adam expects them to grow faster.
“I believe the growth runway is long,” he says. “We strategically favor good long-term growth even with a lower starting yield.” Joyce agrees with the strategy and says the companies “make perfect sense” for the fund, adding that Dominion Resources (0.58% of the fund’s holdings at fiscal year-end) is another good fit for the same reasons. “Overall, share prices have risen and are holding at a high level, but we’re still finding opportunities in the utilities sector.”
Another utility firm that the fund’s investment professionals hold is Exelon, primarily due to its nuclear business. The company has benefited from the Clean Air Act, which was designed to regulate and reduce carbon gases. “Utilities began moving away from coal and toward cleaner sources of energy such as nuclear,” explains Adam. “Exelon has a large nuclear business that it was not being fairly compensated for by the market.”
No matter what the sector — even those that appear to be highly valued — with the right research operation in place there are still plenty of opportunities to be found to invest in quality companies at attractive valuations that can help American Mutual Fund achieve its three objectives: current income, growth of capital and conservation of principal. n

With a combination of decent yields and valuations, many of these companies can provide stability in a down market. There is a defensive nature to them that doesn’t exist in other high-yielding sectors.
Will Robbins
President and Portfolio Manager
| American Mutual Fund | 11 |
Summary investment portfolio October 31, 2014
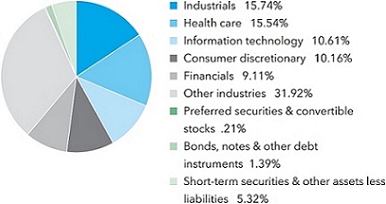
| Industry sector diversification | Percent of net assets |
| Common stocks 93.08% | Shares | Value (000) | ||||||
| Energy 6.64% | ||||||||
| Royal Dutch Shell PLC, Class A (ADR) | 4,635,907 | $ | 332,812 | |||||
| Chevron Corp. | 5,391,211 | 646,676 | ||||||
| ConocoPhillips | 3,274,900 | 236,284 | ||||||
| Spectra Energy Corp | 5,957,500 | 233,117 | ||||||
| Other securities | 880,928 | |||||||
| 2,329,817 | ||||||||
| Materials 4.68% | ||||||||
| Praxair, Inc. | 3,323,824 | 418,769 | ||||||
| Dow Chemical Co. | 9,316,690 | 460,244 | ||||||
| Other securities | 764,485 | |||||||
| 1,643,498 | ||||||||
| Industrials 15.74% | ||||||||
| Cummins Inc. | 1,998,700 | 292,170 | ||||||
| CSX Corp. | 10,454,193 | 372,483 | ||||||
| General Dynamics Corp. | 3,808,000 | 532,206 | ||||||
| Norfolk Southern Corp. | 2,575,400 | 284,942 | ||||||
| Union Pacific Corp. | 3,562,200 | 414,818 | ||||||
| United Parcel Service, Inc., Class B | 4,596,300 | 482,198 | ||||||
| United Technologies Corp. | 2,823,174 | 302,080 | ||||||
| General Electric Co. | 13,860,000 | 357,727 | ||||||
| Lockheed Martin Corp. | 2,388,660 | 455,207 | ||||||
| Waste Management, Inc. | 10,202,900 | 498,820 | ||||||
| 3M Co. | 1,515,000 | 232,962 | ||||||
| Other securities | 1,300,709 | |||||||
| 5,526,322 | ||||||||
| Consumer discretionary 10.16% | ||||||||
| Comcast Corp., Class A | 6,919,900 | 383,016 | ||||||
| Comcast Corp., Class A, special nonvoting shares | 2,090,000 | 115,243 | ||||||
| Johnson Controls, Inc. | 7,899,380 | 373,246 | ||||||
| Time Warner Inc. | 3,272,103 | 260,034 | ||||||
| Williams-Sonoma, Inc. | 3,663,000 | 238,205 | ||||||
| Home Depot, Inc. | 8,193,552 | 799,035 | ||||||
| Darden Restaurants, Inc. | 5,597,097 | 289,818 | ||||||
| Carnival Corp., units | 6,244,100 | 250,701 | ||||||
| Newell Rubbermaid Inc. | 6,605,200 | 220,151 | ||||||
| Other securities | 637,500 | |||||||
| 3,566,949 | ||||||||
| 12 | American Mutual Fund |
| Shares | Value (000) | |||||||
| Consumer staples 6.75% | ||||||||
| Coca-Cola Co. | 7,863,400 | $ | 329,319 | |||||
| Kraft Foods Group, Inc. | 4,849,766 | 273,284 | ||||||
| Mondelez International, Inc. | 11,278,300 | 397,673 | ||||||
| Procter & Gamble Co. | 6,406,400 | 559,087 | ||||||
| Other securities | 810,506 | |||||||
| 2,369,869 | ||||||||
| Health care 15.54% | ||||||||
| AbbVie Inc. | 20,442,000 | 1,297,249 | ||||||
| Amgen Inc. | 8,475,748 | 1,374,597 | ||||||
| Johnson & Johnson | 2,745,000 | 295,856 | ||||||
| Merck & Co., Inc. | 8,532,085 | 494,349 | ||||||
| Novartis AG (ADR) | 3,014,000 | 279,368 | ||||||
| Bristol-Myers Squibb Co. | 7,230,000 | 420,714 | ||||||
| Other securities | 1,291,857 | |||||||
| 5,453,990 | ||||||||
| Financials 9.11% | ||||||||
| JPMorgan Chase & Co. | 4,048,700 | 244,865 | ||||||
| Principal Financial Group, Inc. | 7,567,000 | 396,284 | ||||||
| Marsh & McLennan Companies, Inc. | 4,296,394 | 233,595 | ||||||
| Other securities | 2,324,511 | |||||||
| 3,199,255 | ||||||||
| Information technology 10.61% | ||||||||
| Apple Inc. | 7,160,000 | 773,280 | ||||||
| Automatic Data Processing, Inc. | 3,356,300 | 274,478 | ||||||
| Microsoft Corp. | 12,510,607 | 587,373 | ||||||
| Oracle Corp. | 8,921,900 | 348,400 | ||||||
| Texas Instruments Inc. | 18,976,322 | 942,364 | ||||||
| Other securities | 799,557 | |||||||
| 3,725,452 | ||||||||
| Telecommunication services 4.40% | ||||||||
| Verizon Communications Inc. | 26,051,397 | 1,309,083 | ||||||
| Other securities | 235,045 | |||||||
| 1,544,128 | ||||||||
| Utilities 8.01% | ||||||||
| Exelon Corp. | 13,522,720 | 494,796 | ||||||
| FirstEnergy Corp. | 7,373,000 | 275,308 | ||||||
| PG&E Corp. | 10,590,000 | 532,889 | ||||||
| Duke Energy Corp. | 3,349,847 | 275,190 | ||||||
| Sempra Energy | 2,920,000 | 321,200 | ||||||
| Other securities | 913,544 | |||||||
| 2,812,927 | ||||||||
| Miscellaneous 1.44% | ||||||||
| Other common stocks in initial period of acquisition | 503,685 | |||||||
| Total common stocks (cost: $21,716,297,000) | 32,675,892 | |||||||
| Preferred securities 0.03% | ||||||||
| Financials 0.03% | ||||||||
| Other securities | 11,343 | |||||||
| Total preferred securities (cost: $10,004,000) | 11,343 | |||||||
| Convertible stocks 0.18% | ||||||||
| Utilities 0.18% | ||||||||
| Exelon Corp., convertible preferred, units | 1,200,000 | 63,216 | ||||||
| Total convertible stocks (cost: $61,102,000) | 63,216 | |||||||
| American Mutual Fund | 13 |
| Bonds, notes & other debt instruments 1.39% | Principal amount (000) | Value (000) | ||||||
| Corporate bonds & notes 1.08% | ||||||||
| Financials 1.00% | ||||||||
| JPMorgan Chase & Co., Series I, junior subordinated 7.90% (undated)1 | $ | 123,654 | $ | 134,628 | ||||
| Other securities | 217,977 | |||||||
| 352,605 | ||||||||
| Other 0.08% | ||||||||
| Other securities | 26,688 | |||||||
| Total corporate bonds & notes | 379,293 | |||||||
| U.S. Treasury bonds & notes 0.29% | ||||||||
| Other securities | 100,418 | |||||||
| Mortgage-backed obligations 0.02% | ||||||||
| Federal agency mortgage-backed obligations 0.02% | ||||||||
| Fannie Mae 4.00%—4.50% 20242 | 7,193 | 7,715 | ||||||
| Total bonds, notes & other debt instruments (cost: $439,397,000) | 487,426 | |||||||
| Short-term securities 5.16% | ||||||||
| Apple Inc. 0.11%—0.13% due 11/12/2014—1/7/20153 | 87,800 | 87,783 | ||||||
| Chariot Funding, LLC 0.27% due 2/2/20153 | 500 | 500 | ||||||
| Chevron Corp. 0.10%—0.12% due 12/4/2014—1/23/20153 | 75,000 | 74,986 | ||||||
| Coca-Cola Co. 0.15%—0.20% due 1/8/2015—4/17/20153 | 143,500 | 143,451 | ||||||
| Fannie Mae 0.07%—0.14% due 11/4/2014—6/1/2015 | 472,835 | 472,706 | ||||||
| General Electric Capital Corp. 0.17% due 12/19/2014 | 30,000 | 29,998 | ||||||
| General Electric Co. 0.06% due 11/3/2014 | 46,600 | 46,600 | ||||||
| Procter & Gamble Co. 0.08%—0.12% due 12/9/2014—1/23/20153 | 146,400 | 146,389 | ||||||
| Other securities | 810,408 | |||||||
| Total short-term securities (cost: $1,812,679,000) | 1,812,821 | |||||||
| Total investment securities 99.84% (cost: $24,039,479,000) | 35,050,698 | |||||||
| Other assets less liabilities 0.16% | 55,758 | |||||||
| Net assets 100.00% | $ | 35,106,456 | ||||||
This summary investment portfolio is designed to streamline the report and help investors better focus on the fund’s principal holdings. See the inside back cover for details on how to obtain a complete schedule of portfolio holdings.
As permitted by U.S. Securities and Exchange Commission regulations, “Miscellaneous” securities include holdings in their first year of acquisition that have not previously been publicly disclosed.
“Other securities” includes all issues that are not disclosed separately in the summary investment portfolio.
The following footnotes apply to either the individual securities noted or one or more of the securities aggregated and listed as a single line item.
| 1 | Coupon rate may change periodically. |
| 2 | Principal payments may be made periodically. Therefore, the effective maturity date may be earlier than the stated maturity date. |
| 3 | Acquired in a transaction exempt from registration under Section 4(2) of the Securities Act of 1933. May be resold in the U.S. in transactions exempt from registration, normally to qualified institutional buyers. The total value of all such securities, including those in “Other securities,” was $719,571,000, which represented 2.05% of the net assets of the fund. |
Key to abbreviation
ADR = American Depositary Receipts
See Notes to Financial Statements
| 14 | American Mutual Fund |
| Statement of assets and liabilities at October 31, 2014 | (dollars in thousands) | |||||||
| Assets: | ||||||||
| Investment securities, at value (cost: $24,039,479) | $ | 35,050,698 | ||||||
| Cash | 2,703 | |||||||
| Receivables for: | ||||||||
| Sales of investments | $ | 12,011 | ||||||
| Sales of fund’s shares | 29,862 | |||||||
| Dividends and interest | 62,809 | 104,682 | ||||||
| 35,158,083 | ||||||||
| Liabilities: | ||||||||
| Payables for: | ||||||||
| Purchases of investments | 1,458 | |||||||
| Repurchases of fund’s shares | 28,274 | |||||||
| Investment advisory services | 6,916 | |||||||
| Services provided by related parties | 12,030 | |||||||
| Trustees’ deferred compensation | 2,872 | |||||||
| Other | 77 | 51,627 | ||||||
| Net assets at October 31, 2014 | $ | 35,106,456 | ||||||
| Net assets consist of: | ||||||||
| Capital paid in on shares of beneficial interest | $ | 22,786,201 | ||||||
| Undistributed net investment income | 70,247 | |||||||
| Undistributed net realized gain | 1,238,789 | |||||||
| Net unrealized appreciation | 11,011,219 | |||||||
| Net assets at October 31, 2014 | $ | 35,106,456 | ||||||
(dollars and shares in thousands, except per-share amounts)
Shares of beneficial interest issued and outstanding (no stated par value) —
unlimited shares authorized (928,447 total shares outstanding)
| Net assets | Shares outstanding | Net asset value per share | ||||||||||
| Class A | $ | 22,280,000 | 588,716 | $ | 37.85 | |||||||
| Class B | 104,692 | 2,787 | 37.57 | |||||||||
| Class C | 1,169,773 | 31,283 | 37.39 | |||||||||
| Class F-1 | 1,309,262 | 34,718 | 37.71 | |||||||||
| Class F-2 | 2,121,136 | 56,052 | 37.84 | |||||||||
| Class 529-A | 698,454 | 18,491 | 37.77 | |||||||||
| Class 529-B | 10,981 | 291 | 37.68 | |||||||||
| Class 529-C | 178,526 | 4,750 | 37.58 | |||||||||
| Class 529-E | 36,103 | 959 | 37.64 | |||||||||
| Class 529-F-1 | 54,092 | 1,430 | 37.82 | |||||||||
| Class R-1 | 71,952 | 1,918 | 37.51 | |||||||||
| Class R-2 | 253,487 | 6,763 | 37.48 | |||||||||
| Class R-2E | 10 | — | * | 37.83 | ||||||||
| Class R-3 | 715,678 | 19,036 | 37.60 | |||||||||
| Class R-4 | 823,674 | 21,826 | 37.74 | |||||||||
| Class R-5 | 346,321 | 9,150 | 37.85 | |||||||||
| Class R-6 | 4,932,315 | 130,277 | 37.86 | |||||||||
| * | Amount less than one thousand. |
See Notes to Financial Statements
| American Mutual Fund | 15 |
| Statement of operations for the year ended October 31, 2014 | (dollars in thousands) | |||||||
| Investment income: | ||||||||
| Income: | ||||||||
| Dividends (net of non-U.S. taxes of $7,889) | $ | 822,367 | ||||||
| Interest | 32,644 | $ | 855,011 | |||||
| Fees and expenses*: | ||||||||
| Investment advisory services | 79,843 | |||||||
| Distribution services | 75,947 | |||||||
| Transfer agent services | 27,863 | |||||||
| Administrative services | 7,946 | |||||||
| Reports to shareholders | 1,064 | |||||||
| Registration statement and prospectus | 1,031 | |||||||
| Trustees’ compensation | 708 | |||||||
| Auditing and legal | 145 | |||||||
| Custodian | 225 | |||||||
| State and local taxes | 1 | |||||||
| Other | 996 | |||||||
| Total fees and expenses before waiver | 195,769 | |||||||
| Less investment advisory services waiver | 1 | |||||||
| Total fees and expenses after waiver | 195,768 | |||||||
| Net investment income | 659,243 | |||||||
| Net realized gain and unrealized appreciation on investments and currency: | ||||||||
| Net realized gain (loss) on: | ||||||||
| Investments | 1,264,112 | |||||||
| Currency transactions | (212 | ) | 1,263,900 | |||||
| Net unrealized appreciation on investments | 2,676,001 | |||||||
| Net realized gain and unrealized appreciation on investments and currency | 3,939,901 | |||||||
| Net increase in net assets resulting from operations | $ | 4,599,144 | ||||||
| * | Additional information related to class-specific fees and expenses is included in the Notes to Financial Statements. |
Statements of changes in net assets
(dollars in thousands)
| Year ended October 31 | ||||||||
| 2014 | 2013 | |||||||
| Operations: | ||||||||
| Net investment income | $ | 659,243 | $ | 593,806 | ||||
| Net realized gain on investments and currency transactions | 1,263,900 | 803,802 | ||||||
| Net unrealized appreciation on investments and currency translations | 2,676,001 | 4,327,852 | ||||||
| Net increase in net assets resulting from operations | 4,599,144 | 5,752,460 | ||||||
| Dividends and distributions paid to shareholders: | ||||||||
| Dividends from net investment income | (648,004 | ) | (594,864 | ) | ||||
| Distributions from net realized gain on investments | (635,402 | ) | — | |||||
| Total dividends and distributions paid to shareholders | (1,283,406 | ) | (594,864 | ) | ||||
| Net capital share transactions | 1,133,149 | 2,832,912 | ||||||
| Total increase in net assets | 4,448,887 | 7,963,508 | ||||||
| Net assets: | ||||||||
| Beginning of year | 30,657,569 | 22,694,061 | ||||||
| End of year (including undistributed net investment income: $70,247 and $59,277, respectively) | $ | 35,106,456 | $ | 30,657,569 | ||||
See Notes to Financial Statements
| 16 | American Mutual Fund |
Notes to financial statements
1. Organization
American Mutual Fund (the “fund”) is registered under the Investment Company Act of 1940 as an open-end, diversified management investment company. The fund strives for the balanced accomplishment of three objectives — current income, growth of capital and conservation of principal — through investments in companies that participate in the growth of the American economy.
The fund has 17 share classes consisting of five retail share classes (Classes A, B and C, as well as two F share classes, F-1 and F-2), five 529 college savings plan share classes (Classes 529-A, 529-B, 529-C, 529-E and 529-F-1) and seven retirement plan share classes (Classes R-1, R-2, R-2E, R-3, R-4, R-5 and R-6). The 529 college savings plan share classes can be used to save for college education. The retirement plan share classes are generally offered only through eligible employer-sponsored retirement plans. The fund’s share classes are described further in the following table:
| Share class | Initial sales charge | Contingent deferred sales charge upon redemption | Conversion feature | |||
| Classes A and 529-A | Up to 5.75% | None (except 1% for certain redemptions within one year of purchase without an initial sales charge) | None | |||
| Classes B and 529-B* | None | Declines from 5% to 0% for redemptions within six years of purchase | Classes B and 529-B convert to Classes A and 529-A, respectively, after eight years | |||
| Class C | None | 1% for redemptions within one year of purchase | Class C converts to Class F-1 after 10 years | |||
| Class 529-C | None | 1% for redemptions within one year of purchase | None | |||
| Class 529-E | None | None | None | |||
| Classes F-1, F-2 and 529-F-1 | None | None | None | |||
| Classes R-1, R-2, R-2E, R-3, R-4, R-5 and R-6 | None | None | None |
| * | Class B and 529-B shares of the fund are not available for purchase. |
On August 29, 2014, the fund made an additional retirement plan share class (Class R-2E) available for sale pursuant to an amendment to its registration statement filed with the U.S. Securities and Exchange Commission. Refer to the fund’s prospectus for more details.
Holders of all share classes have equal pro rata rights to the assets, dividends and liquidation proceeds of the fund. Each share class has identical voting rights, except for the exclusive right to vote on matters affecting only its class. Share classes have different fees and expenses (“class-specific fees and expenses”), primarily due to different arrangements for distribution, transfer agent and administrative services. Differences in class-specific fees and expenses will result in differences in net investment income and, therefore, the payment of different per-share dividends by each share class.
2. Significant accounting policies
The fund is an investment company that applies the accounting and reporting guidance issued in Topic 946 by the U.S. Financial Accounting Standards Board. The fund’s financial statements have been prepared to comply with U.S. generally accepted accounting principles (“U.S. GAAP”). These principles require the fund’s investment adviser to make estimates and assumptions that affect reported amounts and disclosures. Actual results could differ from those estimates. The fund follows the significant accounting policies described in this section, as well as the valuation policies described in the next section on valuation.
Security transactions and related investment income — Security transactions are recorded by the fund as of the date the trades are executed with brokers. Realized gains and losses from security transactions are determined based on the specific identified cost of the securities. In the event a security is purchased with a delayed payment date, the fund will segregate liquid assets sufficient to meet its payment obligations. Dividend income is recognized on the ex-dividend date and interest income is recognized on an accrual basis. Market discounts, premiums and original issue discounts on fixed-income securities are amortized daily over the expected life of the security.
| American Mutual Fund | 17 |
Class allocations — Income, fees and expenses (other than class-specific fees and expenses) and realized and unrealized gains and losses are allocated daily among the various share classes based on their relative net assets. Class-specific fees and expenses, such as distribution, transfer agent and administrative services, are charged directly to the respective share class.
Dividends and distributions to shareholders — Dividends and distributions to shareholders are recorded on the ex-dividend date.
Currency translation — Assets and liabilities, including investment securities, denominated in currencies other than U.S. dollars are translated into U.S. dollars at the exchange rates supplied by one or more pricing vendors on the valuation date. Purchases and sales of investment securities and income and expenses are translated into U.S. dollars at the exchange rates on the dates of such transactions. The effects of changes in exchange rates on investment securities are included with the net realized gain or loss and net unrealized appreciation or depreciation on investments in the fund’s statement of operations. The realized gain or loss and unrealized appreciation or depreciation resulting from all other transactions denominated in currencies other than U.S. dollars are disclosed separately.
3. Valuation
Capital Research and Management Company (“CRMC”), the fund’s investment adviser, values the fund’s investments at fair value as defined by U.S. GAAP. The net asset value of each share class of the fund is generally determined as of approximately 4:00 p.m. New York time each day the New York Stock Exchange is open.
Methods and inputs — The fund’s investment adviser uses the following methods and inputs to establish the fair value of the fund’s assets and liabilities. Use of particular methods and inputs may vary over time based on availability and relevance as market and economic conditions evolve.
Equity securities are generally valued at the official closing price of, or the last reported sale price on, the exchange or market on which such securities are traded, as of the close of business on the day the securities are being valued or, lacking any sales, at the last available bid price. Prices for each security are taken from the principal exchange or market on which the security trades.
Fixed-income securities, including short-term securities, are generally valued at prices obtained from one or more pricing vendors. Vendors value such securities based on one or more of the inputs described in the following table. The table provides examples of inputs that are commonly relevant for valuing particular classes of fixed-income securities in which the fund is authorized to invest. However, these classifications are not exclusive, and any of the inputs may be used to value any other class of fixed-income security.
| Fixed-income class | Examples of standard inputs | |
| All | Benchmark yields, transactions, bids, offers, quotations from dealers and trading systems, new issues, spreads and other relationships observed in the markets among comparable securities; and proprietary pricing models such as yield measures calculated using factors such as cash flows, financial or collateral performance and other reference data (collectively referred to as “standard inputs”) | |
| Corporate bonds & notes; convertible securities | Standard inputs and underlying equity of the issuer | |
| Bonds & notes of governments & government agencies | Standard inputs and interest rate volatilities | |
| Mortgage-backed; asset-backed obligations | Standard inputs and cash flows, prepayment information, default rates, delinquency and loss assumptions, collateral characteristics, credit enhancements and specific deal information |
When the fund’s investment adviser deems it appropriate to do so (such as when vendor prices are unavailable or deemed to be not representative), fixed-income securities will be valued in good faith at the mean quoted bid and ask prices that are reasonably and timely available (or bid prices, if ask prices are not available) or at prices for securities of comparable maturity, quality and type.
Securities with both fixed-income and equity characteristics, or equity securities traded principally among fixed-income dealers, are generally valued in the manner described for either equity or fixed-income securities, depending on which method is deemed most appropriate by the fund’s investment adviser.
Securities and other assets for which representative market quotations are not readily available or are considered unreliable by the fund’s investment adviser are fair valued as determined in good faith under fair valuation guidelines adopted by authority of the fund’s board of trustees as further described. The investment adviser follows fair valuation guidelines, consistent with U.S. Securities and Exchange Commission rules and guidance, to consider relevant principles and factors when making fair value determinations. The investment
| 18 | American Mutual Fund |
adviser considers relevant indications of value that are reasonably and timely available to it in determining the fair value to be assigned to a particular security, such as the type and cost of the security; contractual or legal restrictions on resale of the security; relevant financial or business developments of the issuer; actively traded similar or related securities; conversion or exchange rights on the security; related corporate actions; significant events occurring after the close of trading in the security; and changes in overall market conditions. Fair valuations and valuations of investments that are not actively trading involve judgment and may differ materially from valuations that would have been used had greater market activity occurred.
Processes and structure — The fund’s board of trustees has delegated authority to the fund’s investment adviser to make fair value determinations, subject to board oversight. The investment adviser has established a Joint Fair Valuation Committee (the “Fair Valuation Committee”) to administer, implement and oversee the fair valuation process, and to make fair value decisions. The Fair Valuation Committee regularly reviews its own fair value decisions, as well as decisions made under its standing instructions to the investment adviser’s valuation teams. The Fair Valuation Committee reviews changes in fair value measurements from period to period and may, as deemed appropriate, update the fair valuation guidelines to better reflect the results of back testing and address new or evolving issues. The Fair Valuation Committee reports any changes to the fair valuation guidelines to the board of trustees with supplemental information to support the changes. The fund’s board and audit committee also regularly review reports that describe fair value determinations and methods.
The fund’s investment adviser has also established a Fixed-Income Pricing Review Group to administer and oversee the fixed-income valuation process, including the use of fixed-income pricing vendors. This group regularly reviews pricing vendor information and market data. Pricing decisions, processes and controls over security valuation are also subject to additional internal reviews, including an annual control self-evaluation program facilitated by the investment adviser’s compliance group.
Classifications — The fund’s investment adviser classifies the fund’s assets and liabilities into three levels based on the inputs used to value the assets or liabilities. Level 1 values are based on quoted prices in active markets for identical securities. Level 2 values are based on significant observable market inputs, such as quoted prices for similar securities and quoted prices in inactive markets. Level 3 values are based on significant unobservable inputs that reflect the investment adviser’s determination of assumptions that market participants might reasonably use in valuing the securities. The valuation levels are not necessarily an indication of the risk or liquidity associated with the underlying investment. For example, U.S. government securities are reflected as Level 2 because the inputs used to determine fair value may not always be quoted prices in an active market. The following table presents the fund’s valuation levels as of October 31, 2014 (dollars in thousands):
| Investment securities | ||||||||||||||||
| Level 1 | Level 2 | Level 3 | Total | |||||||||||||
| Assets: | ||||||||||||||||
| Common stocks: | ||||||||||||||||
| Energy | $ | 2,329,817 | $ | — | $ | — | $ | 2,329,817 | ||||||||
| Materials | 1,643,498 | — | — | 1,643,498 | ||||||||||||
| Industrials | 5,526,322 | — | — | 5,526,322 | ||||||||||||
| Consumer discretionary | 3,566,949 | — | — | 3,566,949 | ||||||||||||
| Consumer staples | 2,369,869 | — | — | 2,369,869 | ||||||||||||
| Health care | 5,453,990 | — | — | 5,453,990 | ||||||||||||
| Financials | 3,199,255 | — | — | 3,199,255 | ||||||||||||
| Information technology | 3,725,452 | — | — | 3,725,452 | ||||||||||||
| Telecommunication services | 1,544,128 | — | — | 1,544,128 | ||||||||||||
| Utilities | 2,812,927 | — | — | 2,812,927 | ||||||||||||
| Miscellaneous | 503,685 | — | — | 503,685 | ||||||||||||
| Preferred securities | 11,343 | — | — | 11,343 | ||||||||||||
| Convertible stocks | 63,216 | — | — | 63,216 | ||||||||||||
| Bonds, notes & other debt instruments | — | 487,426 | — | 487,426 | ||||||||||||
| Short-term securities | — | 1,812,821 | — | 1,812,821 | ||||||||||||
| Total | $ | 32,750,451 | $ | 2,300,247 | $ | — | $ | 35,050,698 | ||||||||
| American Mutual Fund | 19 |
4. Risk factors
Investing in the fund may involve certain risks including, but not limited to, those described below.
Market conditions — The prices of, and the income generated by, the common stocks and other securities held by the fund may decline – sometimes rapidly or unpredictably – due to various factors, including events or conditions affecting the general economy or particular industries; overall market changes; local, regional or global political, social or economic instability; governmental or governmental agency responses to economic conditions; and currency, interest rate and commodity price fluctuations. These risks may be heightened in the case of smaller capitalization stocks.
Issuer risks — The prices of, and the income generated by, securities held by the fund may decline in response to various factors directly related to the issuers of such securities, including reduced demand for an issuer’s goods or services, poor management performance and strategic initiatives such as mergers, acquisitions or dispositions and the market response to any such initiatives.
Investing in growth-oriented stocks — Growth-oriented common stocks and other equity-type securities (such as preferred stocks, convertible preferred stocks and convertible bonds) may involve larger price swings and greater potential for loss than other types of investments.
Investing in income-oriented stocks — Income provided by the fund may be reduced by changes in the dividend policies of, and the capital resources available for dividend payments at, the companies in which the fund invests.
Investing in debt instruments — The prices of, and the income generated by, bonds and other debt securities held by the fund may be affected by changing interest rates and by changes in the effective maturities and credit ratings of these securities.
Rising interest rates will generally cause the prices of bonds and other debt securities to fall. Falling interest rates may cause an issuer to redeem, call or refinance a debt security before its stated maturity, which may result in the fund having to reinvest the proceeds in lower yielding securities. Longer maturity debt securities generally have greater sensitivity to changes in interest rates and may be subject to greater price fluctuations than shorter maturity debt securities.
Bonds and other debt securities are also subject to credit risk, which is the possibility that the credit strength of an issuer will weaken and/or an issuer of a debt security will fail to make timely payments of principal or interest and the security will go into default. Lower quality debt securities generally have higher rates of interest and may be subject to greater price fluctuations than higher quality debt securities. Credit risk is gauged, in part, by the credit ratings of the debt securities in which the fund invests. However, ratings are only the opinions of the rating agencies issuing them and are not guarantees as to credit quality or an evaluation of market risk. The fund’s investment adviser relies on its own credit analysts to research issuers and issues in seeking to mitigate various credit and default risks.
Management — The investment adviser to the fund actively manages the fund’s investments. Consequently, the fund is subject to the risk that the methods and analyses employed by the investment adviser in this process may not produce the desired results. This could cause the fund to lose value or its investment results to lag relevant benchmarks or other funds with similar objectives.
5. Taxation and distributions
Federal income taxation — The fund complies with the requirements under Subchapter M of the Internal Revenue Code applicable to mutual funds and intends to distribute substantially all of its net taxable income and net capital gains each year. The fund is not subject to income taxes to the extent such distributions are made. Therefore, no federal income tax provision is required.
As of and during the period ended October 31, 2014, the fund did not have a liability for any unrecognized tax benefits. The fund recognizes interest and penalties, if any, related to unrecognized tax benefits as income tax expense in the statement of operations. During the period, the fund did not incur any significant interest or penalties.
| 20 | American Mutual Fund |
The fund is not subject to examination by U.S. federal tax authorities for tax years before 2010 and by state tax authorities for tax years before 2009.
Non-U.S. taxation – Dividend and interest income are recorded net of non-U.S. taxes paid.
Distributions — Distributions paid to shareholders are based on net investment income and net realized gains determined on a tax basis, which may differ from net investment income and net realized gains for financial reporting purposes. These differences are due primarily to different treatment for items such as currency gains and losses; short-term capital gains and losses; capital losses related to sales of certain securities within 30 days of purchase; cost of investments sold; and income on certain investments. The fiscal year in which amounts are distributed may differ from the year in which the net investment income and net realized gains are recorded by the fund for financial reporting purposes. The fund may also designate a portion of the amount paid to redeeming shareholders as a distribution for tax purposes.
During the year ended October 31, 2014, the fund reclassified $212,000 and $57,000 from undistributed net investment income to undistributed net realized gain and capital paid in on shares of beneficial interest, respectively, and $84,630,000 from undistributed net realized gain to capital paid in on shares of beneficial interest to align financial reporting with tax reporting.
As of October 31, 2014, the tax basis components of distributable earnings, unrealized appreciation (depreciation) and cost of investment securities were as follows (dollars in thousands):
| Undistributed ordinary income | $ | 74,393 | ||
| Undistributed long-term capital gains | 1,193,708 | |||
| Gross unrealized appreciation on investment securities | 11,316,698 | |||
| Gross unrealized depreciation on investment securities | (263,082 | ) | ||
| Net unrealized appreciation on investment securities | 11,053,616 | |||
| Cost of investment securities | 23,997,082 |
The tax character of distributions paid to shareholders was as follows (dollars in thousands):
| Year ended October 31, 2014 | Year ended October 31, 2013 | |||||||||||||||||||||||
| Total | Total | |||||||||||||||||||||||
| Long-term | dividends and | Long-term | dividends and | |||||||||||||||||||||
| Ordinary | capital | distributions | Ordinary | capital | distributions | |||||||||||||||||||
| Share class | income | gains | paid | income | gains | paid | ||||||||||||||||||
| Class A | $ | 415,542 | $ | 407,842 | $ | 823,384 | $ | 392,941 | $ | — | $ | 392,941 | ||||||||||||
| Class B | 1,505 | 3,006 | 4,511 | 2,540 | — | 2,540 | ||||||||||||||||||
| Class C | 13,490 | 22,339 | 35,829 | 14,036 | — | 14,036 | ||||||||||||||||||
| Class F-1 | 27,176 | 29,230 | 56,406 | 26,052 | — | 26,052 | ||||||||||||||||||
| Class F-2 | 35,431 | 28,597 | 64,028 | 30,086 | — | 30,086 | ||||||||||||||||||
| Class 529-A | 12,338 | 12,676 | 25,014 | 11,614 | — | 11,614 | ||||||||||||||||||
| Class 529-B | 136 | 301 | 437 | 231 | — | 231 | ||||||||||||||||||
| Class 529-C | 1,894 | 3,299 | 5,193 | 1,989 | — | 1,989 | ||||||||||||||||||
| Class 529-E | 559 | 671 | 1,230 | 550 | — | 550 | ||||||||||||||||||
| Class 529-F-1 | 1,031 | 954 | 1,985 | 909 | — | 909 | ||||||||||||||||||
| Class R-1 | 817 | 1,414 | 2,231 | 892 | — | 892 | ||||||||||||||||||
| Class R-2 | 2,900 | 4,861 | 7,761 | 3,236 | — | 3,236 | ||||||||||||||||||
| Class R-2E* | — | † | — | — | † | |||||||||||||||||||
| Class R-3 | 11,186 | 13,544 | 24,730 | 11,263 | — | 11,263 | ||||||||||||||||||
| Class R-4 | 15,060 | 15,209 | 30,269 | 13,447 | — | 13,447 | ||||||||||||||||||
| Class R-5 | 8,037 | 7,665 | 15,702 | 9,364 | — | 9,364 | ||||||||||||||||||
| Class R-6 | 100,902 | 83,794 | 184,696 | 75,714 | — | 75,714 | ||||||||||||||||||
| Total | $ | 648,004 | �� | $ | 635,402 | $ | 1,283,406 | $ | 594,864 | $ | — | $ | 594,864 | |||||||||||
| * | Class R-2E shares were offered beginning August 29, 2014. |
| † | Amount less than one thousand. |
| American Mutual Fund | 21 |
6. Fees and transactions with related parties
CRMC, the fund’s investment adviser, is the parent company of American Funds Distributors,® Inc. (“AFD”), the principal underwriter of the fund’s shares, and American Funds Service Company® (“AFS”), the fund’s transfer agent. CRMC, AFD and AFS are considered related parties to the fund.
Investment advisory services — The fund has an investment advisory and service agreement with CRMC that provides for monthly fees accrued daily. These fees are based on a series of decreasing annual rates beginning with 0.384% on the first $1 billion of daily net assets and decreasing to 0.225% on such assets in excess of $21 billion. CRMC is currently waiving a portion of its investment advisory services fees. For the year ended October 31, 2014, total investment advisory services fees waived by CRMC were $1,000. As a result, the fee shown on the accompanying financial statements of $79,843,000 was reduced to $79,842,000, both of which were equivalent to an annualized rate of 0.244% of average daily net assets.
Class-specific fees and expenses — Expenses that are specific to individual share classes are accrued directly to the respective share class. The principal class-specific fees and expenses are further described below:
Distribution services — The fund has plans of distribution for all share classes, except Class F-2, R-5 and R-6 shares. Under the plans, the board of trustees approves certain categories of expenses that are used to finance activities primarily intended to sell fund shares and service existing accounts. The plans provide for payments, based on an annualized percentage of average daily net assets, ranging from 0.25% to 1.00% as noted below. In some cases, the board of trustees has limited the amounts that may be paid to less than the maximum allowed by the plans. All share classes with a plan may use up to 0.25% of average daily net assets to pay service fees, or to compensate AFD for paying service fees, to firms that have entered into agreements with AFD to provide certain shareholder services. The remaining amounts available to be paid under each plan are paid to dealers to compensate them for their sales activities.
For Class A and 529-A shares, distribution-related expenses include the reimbursement of dealer and wholesaler commissions paid by AFD for certain shares sold without a sales charge. These share classes reimburse AFD for amounts billed within the prior 15 months but only to the extent that the overall annual expense limit of 0.25% is not exceeded. As of October 31, 2014, there were no unreimbursed expenses subject to reimbursement for Class A or 529-A shares.
| Share class | Currently approved limits | Plan limits | ||||||||
| Class A | 0.25 | % | 0.25 | % | ||||||
| Class 529-A | 0.25 | 0.50 | ||||||||
| Classes B and 529-B | 1.00 | 1.00 | ||||||||
| Classes C, 529-C and R-1 | 1.00 | 1.00 | ||||||||
| Class R-2 | 0.75 | 1.00 | ||||||||
| Class R-2E | 0.60 | 0.85 | ||||||||
| Classes 529-E and R-3 | 0.50 | 0.75 | ||||||||
| Classes F-1, 529-F-1 and R-4 | 0.25 | 0.50 | ||||||||
Transfer agent services — The fund has a shareholder services agreement with AFS under which the fund compensates AFS for providing transfer agent services to each of the fund’s share classes. These services include recordkeeping, shareholder communications and transaction processing. In addition, the fund reimburses AFS for amounts paid to third parties for performing transfer agent services on behalf of fund shareholders.
Administrative services — The fund has an administrative services agreement with CRMC under which the fund compensates CRMC for providing administrative services to Class A, C, F, 529 and R shares. These services include, but are not limited to, coordinating, monitoring, assisting and overseeing third parties that provide services to fund shareholders. Under the agreement, Class A shares pay an annual fee of 0.01% and Class C, F, 529 and R shares pay an annual fee of 0.05% of their respective average daily net assets.
| 22 | American Mutual Fund |
529 plan services — Each 529 share class is subject to service fees to compensate the Virginia College Savings Plan (“Virginia529”) for its oversight and administration of the 529 college savings plan. During the period November 1, 2013, to March 31, 2014, the quarterly fee was based on a series of decreasing annual rates beginning with 0.10% on the first $30 billion of the net assets invested in Class 529 shares of the American Funds and decreasing to 0.06% on such assets between $120 billion and $150 billion. Effective April 1, 2014, the quarterly fee was amended to provide for reduced annual rates of 0.07%, 0.06% and 0.05% over $30 billion, $50 billion and $70 billion, respectively, of the net assets invested in Class 529 shares of the American Funds. The fee for any given calendar quarter is accrued and calculated on the basis of the average net assets of Class 529 shares of the American Funds for the last month of the prior calendar quarter. The fee is included in other expenses in the fund’s statement of operations. Virginia529 is not considered a related party to the fund.
For the year ended October 31, 2014, class-specific expenses under the agreements were as follows (dollars in thousands):
| Distribution | Transfer agent | Administrative | 529 plan | |||||||||
| Share class | services | services | services | services | ||||||||
| Class A | $48,735 | $19,457 | $2,089 | Not applicable | ||||||||
| Class B | 1,264 | 126 | Not applicable | Not applicable | ||||||||
| Class C | 11,165 | 1,055 | 559 | Not applicable | ||||||||
| Class F-1 | 3,534 | 1,637 | 710 | Not applicable | ||||||||
| Class F-2 | Not applicable | 1,874 | 817 | Not applicable | ||||||||
| Class 529-A | 1,435 | 492 | 326 | $603 | ||||||||
| Class 529-B | 128 | 12 | 6 | 12 | ||||||||
| Class 529-C | 1,667 | 137 | 84 | 155 | ||||||||
| Class 529-E | 169 | 15 | 17 | 31 | ||||||||
| Class 529-F-1 | — | 37 | 25 | 46 | ||||||||
| Class R-1 | 690 | 83 | 35 | Not applicable | ||||||||
| Class R-2 | 1,803 | 878 | 121 | Not applicable | ||||||||
| Class R-2E* | — | — | † | — | † | Not applicable | ||||||
| Class R-3 | 3,405 | 1,041 | 341 | Not applicable | ||||||||
| Class R-4 | 1,952 | 811 | 391 | Not applicable | ||||||||
| Class R-5 | Not applicable | 196 | 184 | Not applicable | ||||||||
| Class R-6 | Not applicable | 12 | 2,241 | Not applicable | ||||||||
| Total class-specific expenses | $75,947 | $27,863 | $7,946 | $847 | ||||||||
| * | Class R-2E shares were offered beginning August 29, 2014. | |
| † | Amount less than one thousand. |
Trustees’ deferred compensation — Trustees who are unaffiliated with CRMC may elect to defer the cash payment of part or all of their compensation. These deferred amounts, which remain as liabilities of the fund, are treated as if invested in shares of the fund or other American Funds. These amounts represent general, unsecured liabilities of the fund and vary according to the total returns of the selected funds. Trustees’ compensation of $708,000 in the fund’s statement of operations includes $398,000 in current fees (either paid in cash or deferred) and a net increase of $310,000 in the value of the deferred amounts.
Affiliated officers and trustees — Officers and certain trustees of the fund are or may be considered to be affiliated with CRMC, AFD and AFS. No affiliated officers or trustees received any compensation directly from the fund.
| American Mutual Fund | 23 |
7. Capital share transactions
Capital share transactions in the fund were as follows (dollars and shares in thousands):
| Reinvestments of | Net increase | |||||||||||||||||||||||||||||||
| Sales1 | dividends and distributions | Repurchases1 | (decrease) | |||||||||||||||||||||||||||||
| Share class | Amount | Shares | Amount | Shares | Amount | Shares | Amount | Shares | ||||||||||||||||||||||||
| Year ended October 31, 2014 | ||||||||||||||||||||||||||||||||
| Class A | $ | 1,861,518 | 52,627 | $ | 800,052 | 22,915 | $ | (2,215,700 | ) | (62,413 | ) | $ | 445,870 | 13,129 | ||||||||||||||||||
| Class B | 4,185 | 120 | 4,478 | 130 | (69,317 | ) | (1,978 | ) | (60,654 | ) | (1,728 | ) | ||||||||||||||||||||
| Class C | 195,090 | 5,582 | 35,309 | 1,028 | (248,782 | ) | (7,102 | ) | (18,383 | ) | (492 | ) | ||||||||||||||||||||
| Class F-1 | 347,939 | 9,883 | 55,421 | 1,596 | (633,894 | ) | (17,660 | ) | (230,534 | ) | (6,181 | ) | ||||||||||||||||||||
| Class F-2 | 827,096 | 22,976 | 61,860 | 1,765 | (286,731 | ) | (8,071 | ) | 602,225 | 16,670 | ||||||||||||||||||||||
| Class 529-A | 77,373 | 2,193 | 25,002 | 718 | (80,612 | ) | (2,272 | ) | 21,763 | 639 | ||||||||||||||||||||||
| Class 529-B | 457 | 13 | 436 | 13 | (6,869 | ) | (196 | ) | (5,976 | ) | (170 | ) | ||||||||||||||||||||
| Class 529-C | 21,892 | 622 | 5,192 | 150 | (24,016 | ) | (680 | ) | 3,068 | 92 | ||||||||||||||||||||||
| Class 529-E | 4,250 | 121 | 1,228 | 35 | (5,162 | ) | (147 | ) | 316 | 9 | ||||||||||||||||||||||
| Class 529-F-1 | 11,162 | 316 | 1,960 | 56 | (9,569 | ) | (273 | ) | 3,553 | 99 | ||||||||||||||||||||||
| Class R-1 | 17,809 | 505 | 2,223 | 65 | (22,466 | ) | (639 | ) | (2,434 | ) | (69 | ) | ||||||||||||||||||||
| Class R-2 | 54,005 | 1,537 | 7,755 | 225 | (67,687 | ) | (1,926 | ) | (5,927 | ) | (164 | ) | ||||||||||||||||||||
| Class R-2E2 | 10 | — | 3 | — | — | — | — | 10 | — | 3 | ||||||||||||||||||||||
| Class R-3 | 148,467 | 4,218 | 24,703 | 714 | (176,371 | ) | (4,996 | ) | (3,201 | ) | (64 | ) | ||||||||||||||||||||
| Class R-4 | 144,559 | 4,091 | 30,201 | 868 | (162,318 | ) | (4,558 | ) | 12,442 | 401 | ||||||||||||||||||||||
| Class R-5 | 73,967 | 2,079 | 15,701 | 450 | (193,956 | ) | (5,486 | ) | (104,288 | ) | (2,957 | ) | ||||||||||||||||||||
| Class R-6 | 910,850 | 25,691 | 183,930 | 5,257 | (619,481 | ) | (17,189 | ) | 475,299 | 13,759 | ||||||||||||||||||||||
| Total net increase (decrease) | $ | 4,700,629 | 132,574 | $ | 1,255,451 | 35,985 | $ | (4,822,931 | ) | (135,586 | ) | $ | 1,133,149 | 32,973 | ||||||||||||||||||
| Year ended October 31, 2013 | ||||||||||||||||||||||||||||||||
| Class A | $ | 2,419,804 | 77,415 | $ | 378,269 | 12,246 | $ | (2,114,231 | ) | (68,599 | ) | $ | 683,842 | 21,062 | ||||||||||||||||||
| Class B | 9,697 | 314 | 2,521 | 83 | (87,603 | ) | (2,866 | ) | (75,385 | ) | (2,469 | ) | ||||||||||||||||||||
| Class C | 230,803 | 7,435 | 13,753 | 451 | (203,258 | ) | (6,619 | ) | 41,298 | 1,267 | ||||||||||||||||||||||
| Class F-1 | 444,684 | 14,342 | 25,320 | 821 | (301,307 | ) | (9,749 | ) | 168,697 | 5,414 | ||||||||||||||||||||||
| Class F-2 | 502,255 | 16,443 | 28,299 | 920 | (625,453 | ) | (20,341 | ) | (94,899 | ) | (2,978 | ) | ||||||||||||||||||||
| Class 529-A | 92,459 | 2,993 | 11,611 | 377 | (69,923 | ) | (2,268 | ) | 34,147 | 1,102 | ||||||||||||||||||||||
| Class 529-B | 754 | 24 | 231 | 8 | (7,938 | ) | (260 | ) | (6,953 | ) | (228 | ) | ||||||||||||||||||||
| Class 529-C | 24,802 | 807 | 1,989 | 65 | (21,946 | ) | (712 | ) | 4,845 | 160 | ||||||||||||||||||||||
| Class 529-E | 5,104 | 166 | 550 | 18 | (4,305 | ) | (141 | ) | 1,349 | 43 | ||||||||||||||||||||||
| Class 529-F-1 | 11,230 | 364 | 909 | 30 | (5,807 | ) | (191 | ) | 6,332 | 203 | ||||||||||||||||||||||
| Class R-1 | 17,446 | 562 | 889 | 29 | (20,138 | ) | (661 | ) | (1,803 | ) | (70 | ) | ||||||||||||||||||||
| Class R-2 | 63,877 | 2,079 | 3,230 | 106 | (68,568 | ) | (2,229 | ) | (1,461 | ) | (44 | ) | ||||||||||||||||||||
| Class R-3 | 172,669 | 5,630 | 11,234 | 366 | (163,563 | ) | (5,338 | ) | 20,340 | 658 | ||||||||||||||||||||||
| Class R-4 | 262,750 | 8,515 | 13,437 | 435 | (149,223 | ) | (4,806 | ) | 126,964 | 4,144 | ||||||||||||||||||||||
| Class R-5 | 119,918 | 3,931 | 9,364 | 303 | (97,182 | ) | (3,127 | ) | 32,100 | 1,107 | ||||||||||||||||||||||
| Class R-6 | 2,014,074 | 66,359 | 75,328 | 2,412 | (195,903 | ) | (6,192 | ) | 1,893,499 | 62,579 | ||||||||||||||||||||||
| Total net increase (decrease) | $ | 6,392,326 | 207,379 | $ | 576,934 | 18,670 | $ | (4,136,348 | ) | (134,099 | ) | $ | 2,832,912 | 91,950 | ||||||||||||||||||
| 1 | Includes exchanges between share classes of the fund. |
| 2 | Class R-2E shares were offered beginning August 29, 2014. |
| 3 | Amount less than one thousand. |
8. Investment transactions
The fund made purchases and sales of investment securities, excluding short-term securities and U.S. government obligations, if any, of $5,834,333,000 and $4,955,406,000, respectively, during the year ended October 31, 2014.
| 24 | American Mutual Fund |
Financial highlights
| Income (loss) from investment operations1 | Dividends and distributions | |||||||||||||||||||||||||||||||||||||||||||||
| Net asset value, beginning of period | Net investment income (loss) | Net gains (losses) on securities (both realized and unrealized) | Total from investment operations | Dividends (from net investment income) | Distributions (from capital gains) | Total dividends and distributions | Net asset value, end of period | Total return2 | Net assets, end of period (in millions) | Ratio of expenses to average net assets | Ratio of net income (loss) to average net assets | |||||||||||||||||||||||||||||||||||
| Class A: | ||||||||||||||||||||||||||||||||||||||||||||||
| Year ended 10/31/2014 | $ | 34.27 | $ | .72 | $ | 4.28 | $ | 5.00 | $ | (.71 | ) | $ | (.71 | ) | $ | (1.42 | ) | $ | 37.85 | 14.99 | % | $ | 22,280 | .59 | % | 2.02 | % | |||||||||||||||||||
| Year ended 10/31/2013 | 28.27 | .70 | 6.00 | 6.70 | (.70 | ) | — | (.70 | ) | 34.27 | 24.01 | 19,724 | .61 | 2.25 | ||||||||||||||||||||||||||||||||
| Year ended 10/31/2012 | 25.41 | .66 | 2.87 | 3.53 | (.67 | ) | — | (.67 | ) | 28.27 | 14.02 | 15,677 | .63 | 2.44 | ||||||||||||||||||||||||||||||||
| Year ended 10/31/2011 | 24.38 | .66 | 1.00 | 1.66 | (.63 | ) | — | (.63 | ) | 25.41 | 6.85 | 13,549 | .62 | 2.57 | ||||||||||||||||||||||||||||||||
| Year ended 10/31/2010 | 21.57 | .62 | 2.86 | 3.48 | (.67 | ) | — | (.67 | ) | 24.38 | 16.31 | 13,051 | .63 | 2.69 | ||||||||||||||||||||||||||||||||
| Class B: | ||||||||||||||||||||||||||||||||||||||||||||||
| Year ended 10/31/2014 | 34.01 | .45 | 4.24 | 4.69 | (.42 | ) | (.71 | ) | (1.13 | ) | 37.57 | 14.13 | 105 | 1.35 | 1.28 | |||||||||||||||||||||||||||||||
| Year ended 10/31/2013 | 28.05 | .47 | 5.94 | 6.41 | (.45 | ) | — | (.45 | ) | 34.01 | 23.06 | 154 | 1.38 | 1.52 | ||||||||||||||||||||||||||||||||
| Year ended 10/31/2012 | 25.21 | .46 | 2.83 | 3.29 | (.45 | ) | — | (.45 | ) | 28.05 | 13.16 | 196 | 1.39 | 1.71 | ||||||||||||||||||||||||||||||||
| Year ended 10/31/2011 | 24.19 | .46 | .99 | 1.45 | (.43 | ) | — | (.43 | ) | 25.21 | 6.01 | 275 | 1.39 | 1.81 | ||||||||||||||||||||||||||||||||
| Year ended 10/31/2010 | 21.41 | .44 | 2.83 | 3.27 | (.49 | ) | — | (.49 | ) | 24.19 | 15.40 | 369 | 1.40 | 1.93 | ||||||||||||||||||||||||||||||||
| Class C: | ||||||||||||||||||||||||||||||||||||||||||||||
| Year ended 10/31/2014 | 33.88 | .43 | 4.22 | 4.65 | (.43 | ) | (.71 | ) | (1.14 | ) | 37.39 | 14.03 | 1,170 | 1.40 | 1.22 | |||||||||||||||||||||||||||||||
| Year ended 10/31/2013 | 27.96 | .44 | 5.94 | 6.38 | (.46 | ) | — | (.46 | ) | 33.88 | 23.01 | 1,076 | 1.42 | 1.44 | ||||||||||||||||||||||||||||||||
| Year ended 10/31/2012 | 25.14 | .44 | 2.84 | 3.28 | (.46 | ) | — | (.46 | ) | 27.96 | 13.13 | 853 | 1.43 | 1.63 | ||||||||||||||||||||||||||||||||
| Year ended 10/31/2011 | 24.13 | .44 | 1.00 | 1.44 | (.43 | ) | — | (.43 | ) | 25.14 | 5.97 | 737 | 1.43 | 1.75 | ||||||||||||||||||||||||||||||||
| Year ended 10/31/2010 | 21.36 | .43 | 2.82 | 3.25 | (.48 | ) | — | (.48 | ) | 24.13 | 15.34 | 691 | 1.46 | 1.86 | ||||||||||||||||||||||||||||||||
| Class F-1: | ||||||||||||||||||||||||||||||||||||||||||||||
| Year ended 10/31/2014 | 34.15 | .69 | 4.26 | 4.95 | (.68 | ) | (.71 | ) | (1.39 | ) | 37.71 | 14.88 | 1,309 | .67 | 1.95 | |||||||||||||||||||||||||||||||
| Year ended 10/31/2013 | 28.18 | .68 | 5.98 | 6.66 | (.69 | ) | — | (.69 | ) | 34.15 | 23.91 | 1,397 | .68 | 2.18 | ||||||||||||||||||||||||||||||||
| Year ended 10/31/2012 | 25.33 | .65 | 2.86 | 3.51 | (.66 | ) | — | (.66 | ) | 28.18 | 14.00 | 1,000 | .67 | 2.39 | ||||||||||||||||||||||||||||||||
| Year ended 10/31/2011 | 24.31 | .64 | 1.00 | 1.64 | (.62 | ) | — | (.62 | ) | 25.33 | 6.79 | 744 | .66 | 2.52 | ||||||||||||||||||||||||||||||||
| Year ended 10/31/2010 | 21.51 | .61 | 2.85 | 3.46 | (.66 | ) | — | (.66 | ) | 24.31 | 16.28 | 569 | .67 | 2.63 | ||||||||||||||||||||||||||||||||
| Class F-2: | ||||||||||||||||||||||||||||||||||||||||||||||
| Year ended 10/31/2014 | 34.27 | .78 | 4.27 | 5.05 | (.77 | ) | (.71 | ) | (1.48 | ) | 37.84 | 15.15 | 2,121 | .42 | 2.18 | |||||||||||||||||||||||||||||||
| Year ended 10/31/2013 | 28.27 | .76 | 6.00 | 6.76 | (.76 | ) | — | (.76 | ) | 34.27 | 24.22 | 1,349 | .43 | 2.46 | ||||||||||||||||||||||||||||||||
| Year ended 10/31/2012 | 25.41 | .70 | 2.88 | 3.58 | (.72 | ) | — | (.72 | ) | 28.27 | 14.26 | 1,197 | .43 | 2.59 | ||||||||||||||||||||||||||||||||
| Year ended 10/31/2011 | 24.38 | .70 | 1.01 | 1.71 | (.68 | ) | — | (.68 | ) | 25.41 | 7.07 | 542 | .42 | 2.75 | ||||||||||||||||||||||||||||||||
| Year ended 10/31/2010 | 21.57 | .65 | 2.88 | 3.53 | (.72 | ) | — | (.72 | ) | 24.38 | 16.57 | 340 | .41 | 2.81 | ||||||||||||||||||||||||||||||||
| Class 529-A: | ||||||||||||||||||||||||||||||||||||||||||||||
| Year ended 10/31/2014 | 34.21 | .68 | 4.26 | 4.94 | (.67 | ) | (.71 | ) | (1.38 | ) | 37.77 | 14.83 | 698 | .69 | 1.92 | |||||||||||||||||||||||||||||||
| Year ended 10/31/2013 | 28.22 | .67 | 5.99 | 6.66 | (.67 | ) | — | (.67 | ) | 34.21 | 23.90 | 611 | .71 | 2.15 | ||||||||||||||||||||||||||||||||
| Year ended 10/31/2012 | 25.37 | .63 | 2.86 | 3.49 | (.64 | ) | — | (.64 | ) | 28.22 | 13.91 | 473 | .72 | 2.34 | ||||||||||||||||||||||||||||||||
| Year ended 10/31/2011 | 24.34 | .63 | 1.01 | 1.64 | (.61 | ) | — | (.61 | ) | 25.37 | 6.77 | 373 | .70 | 2.48 | ||||||||||||||||||||||||||||||||
| Year ended 10/31/2010 | 21.54 | .60 | 2.85 | 3.45 | (.65 | ) | — | (.65 | ) | 24.34 | 16.20 | 303 | .71 | 2.59 | ||||||||||||||||||||||||||||||||
| Class 529-B: | ||||||||||||||||||||||||||||||||||||||||||||||
| Year ended 10/31/2014 | 34.10 | .41 | 4.26 | 4.67 | (.38 | ) | (.71 | ) | (1.09 | ) | 37.68 | 13.99 | 11 | 1.48 | 1.15 | |||||||||||||||||||||||||||||||
| Year ended 10/31/2013 | 28.13 | .43 | 5.96 | 6.39 | (.42 | ) | — | (.42 | ) | 34.10 | 22.88 | 16 | 1.50 | 1.40 | ||||||||||||||||||||||||||||||||
| Year ended 10/31/2012 | 25.28 | .42 | 2.85 | 3.27 | (.42 | ) | — | (.42 | ) | 28.13 | 13.05 | 19 | 1.52 | 1.58 | ||||||||||||||||||||||||||||||||
| Year ended 10/31/2011 | 24.25 | .43 | 1.00 | 1.43 | (.40 | ) | — | (.40 | ) | 25.28 | 5.87 | 25 | 1.50 | 1.70 | ||||||||||||||||||||||||||||||||
| Year ended 10/31/2010 | 21.46 | .42 | 2.84 | 3.26 | (.47 | ) | — | (.47 | ) | 24.25 | 15.29 | 33 | 1.51 | 1.82 | ||||||||||||||||||||||||||||||||
See page 27 for footnotes.
| American Mutual Fund | 25 |
Financial highlights (continued)
| Income (loss) from investment operations1 | Dividends and distributions | |||||||||||||||||||||||||||||||||||||||||||||
| Net asset value, beginning of period | Net investment income (loss) | Net gains (losses) on securities (both realized and unrealized) | Total from investment operations | Dividends (from net investment income) | Distributions (from capital gains) | Total dividends and distributions | Net asset value, end of period | Total return2 | Net assets, end of period (in millions) | Ratio of expenses to average net assets | Ratio of net income (loss) to average net assets | |||||||||||||||||||||||||||||||||||
| Class 529-C: | ||||||||||||||||||||||||||||||||||||||||||||||
| Year ended 10/31/2014 | $ | 34.04 | $ | .40 | $ | 4.25 | $ | 4.65 | $ | (.40 | ) | $ | (.71 | ) | $ | (1.11 | ) | $ | 37.58 | 13.97 | % | $ | 179 | 1.47 | % | 1.14 | % | |||||||||||||||||||
| Year ended 10/31/2013 | 28.09 | .42 | 5.96 | 6.38 | (.43 | ) | — | (.43 | ) | 34.04 | 22.92 | 159 | 1.50 | 1.37 | ||||||||||||||||||||||||||||||||
| Year ended 10/31/2012 | 25.26 | .42 | 2.84 | 3.26 | (.43 | ) | — | (.43 | ) | 28.09 | 13.01 | 126 | 1.51 | 1.55 | ||||||||||||||||||||||||||||||||
| Year ended 10/31/2011 | 24.24 | .43 | 1.00 | 1.43 | (.41 | ) | — | (.41 | ) | 25.26 | 5.92 | 102 | 1.50 | 1.68 | ||||||||||||||||||||||||||||||||
| Year ended 10/31/2010 | 21.46 | .41 | 2.84 | 3.25 | (.47 | ) | — | (.47 | ) | 24.24 | 15.27 | 85 | 1.50 | 1.80 | ||||||||||||||||||||||||||||||||
| Class 529-E: | ||||||||||||||||||||||||||||||||||||||||||||||
| Year ended 10/31/2014 | 34.09 | .59 | 4.26 | 4.85 | (.59 | ) | (.71 | ) | (1.30 | ) | 37.64 | 14.58 | 36 | .94 | 1.67 | |||||||||||||||||||||||||||||||
| Year ended 10/31/2013 | 28.13 | .59 | 5.97 | 6.56 | (.60 | ) | — | (.60 | ) | 34.09 | 23.56 | 32 | .96 | 1.90 | ||||||||||||||||||||||||||||||||
| Year ended 10/31/2012 | 25.29 | .56 | 2.85 | 3.41 | (.57 | ) | — | (.57 | ) | 28.13 | 13.62 | 26 | .98 | 2.08 | ||||||||||||||||||||||||||||||||
| Year ended 10/31/2011 | 24.27 | .56 | 1.00 | 1.56 | (.54 | ) | — | (.54 | ) | 25.29 | 6.45 | 20 | .98 | 2.20 | ||||||||||||||||||||||||||||||||
| Year ended 10/31/2010 | 21.48 | .53 | 2.85 | 3.38 | (.59 | ) | — | (.59 | ) | 24.27 | 15.87 | 16 | 1.00 | 2.30 | ||||||||||||||||||||||||||||||||
| Class 529-F-1: | ||||||||||||||||||||||||||||||||||||||||||||||
| Year ended 10/31/2014 | 34.25 | .76 | 4.27 | 5.03 | (.75 | ) | (.71 | ) | (1.46 | ) | 37.82 | 15.10 | 54 | .47 | 2.14 | |||||||||||||||||||||||||||||||
| Year ended 10/31/2013 | 28.26 | .74 | 5.99 | 6.73 | (.74 | ) | — | (.74 | ) | 34.25 | 24.14 | 46 | .49 | 2.36 | ||||||||||||||||||||||||||||||||
| Year ended 10/31/2012 | 25.39 | .69 | 2.88 | 3.57 | (.70 | ) | — | (.70 | ) | 28.26 | 14.21 | 32 | .51 | 2.54 | ||||||||||||||||||||||||||||||||
| Year ended 10/31/2011 | 24.37 | .68 | 1.01 | 1.69 | (.67 | ) | — | (.67 | ) | 25.39 | 6.96 | 22 | .49 | 2.67 | ||||||||||||||||||||||||||||||||
| Year ended 10/31/2010 | 21.56 | .65 | 2.86 | 3.51 | (.70 | ) | — | (.70 | ) | 24.37 | 16.47 | 13 | .50 | 2.79 | ||||||||||||||||||||||||||||||||
| Class R-1: | ||||||||||||||||||||||||||||||||||||||||||||||
| Year ended 10/31/2014 | 33.98 | .42 | 4.24 | 4.66 | (.42 | ) | (.71 | ) | (1.13 | ) | 37.51 | 14.02 | 72 | 1.42 | 1.19 | |||||||||||||||||||||||||||||||
| Year ended 10/31/2013 | 28.04 | .44 | 5.95 | 6.39 | (.45 | ) | — | (.45 | ) | 33.98 | 22.98 | 68 | 1.44 | 1.43 | ||||||||||||||||||||||||||||||||
| Year ended 10/31/2012 | 25.22 | .43 | 2.86 | 3.29 | (.47 | ) | — | (.47 | ) | 28.04 | 13.12 | 58 | 1.43 | 1.61 | ||||||||||||||||||||||||||||||||
| Year ended 10/31/2011 | 24.21 | .44 | 1.00 | 1.44 | (.43 | ) | — | (.43 | ) | 25.22 | 5.96 | 35 | 1.43 | 1.75 | ||||||||||||||||||||||||||||||||
| Year ended 10/31/2010 | 21.43 | .42 | 2.85 | 3.27 | (.49 | ) | — | (.49 | ) | 24.21 | 15.38 | 29 | 1.45 | 1.84 | ||||||||||||||||||||||||||||||||
| Class R-2: | ||||||||||||||||||||||||||||||||||||||||||||||
| Year ended 10/31/2014 | 33.95 | .42 | 4.24 | 4.66 | (.42 | ) | (.71 | ) | (1.13 | ) | 37.48 | 14.05 | 253 | 1.41 | 1.20 | |||||||||||||||||||||||||||||||
| Year ended 10/31/2013 | 28.02 | .45 | 5.94 | 6.39 | (.46 | ) | — | (.46 | ) | 33.95 | 23.02 | 235 | 1.40 | 1.47 | ||||||||||||||||||||||||||||||||
| Year ended 10/31/2012 | 25.19 | .44 | 2.84 | 3.28 | (.45 | ) | — | (.45 | ) | 28.02 | 13.13 | 195 | 1.43 | 1.63 | ||||||||||||||||||||||||||||||||
| Year ended 10/31/2011 | 24.18 | .44 | .99 | 1.43 | (.42 | ) | — | (.42 | ) | 25.19 | 5.94 | 167 | 1.45 | 1.73 | ||||||||||||||||||||||||||||||||
| Year ended 10/31/2010 | 21.40 | .42 | 2.83 | 3.25 | (.47 | ) | — | (.47 | ) | 24.18 | 15.32 | 153 | 1.48 | 1.83 | ||||||||||||||||||||||||||||||||
| Class R-2E: | ||||||||||||||||||||||||||||||||||||||||||||||
| Period from 8/29/2014 to 10/31/20143,4 | 37.19 | .12 | .73 | .85 | (.21 | ) | — | (.21 | ) | 37.83 | 2.28 | — | 5 | .08 | 6 | .32 | 6 | |||||||||||||||||||||||||||||
| Class R-3: | ||||||||||||||||||||||||||||||||||||||||||||||
| Year ended 10/31/2014 | 34.05 | .58 | 4.26 | 4.84 | (.58 | ) | (.71 | ) | (1.29 | ) | 37.60 | 14.58 | 716 | .96 | 1.66 | |||||||||||||||||||||||||||||||
| Year ended 10/31/2013 | 28.10 | .59 | 5.96 | 6.55 | (.60 | ) | — | (.60 | ) | 34.05 | 23.55 | 650 | .96 | 1.90 | ||||||||||||||||||||||||||||||||
| Year ended 10/31/2012 | 25.26 | .56 | 2.86 | 3.42 | (.58 | ) | — | (.58 | ) | 28.10 | 13.64 | 518 | .97 | 2.09 | ||||||||||||||||||||||||||||||||
| Year ended 10/31/2011 | 24.25 | .56 | 1.00 | 1.56 | (.55 | ) | — | (.55 | ) | 25.26 | 6.43 | 410 | .97 | 2.21 | ||||||||||||||||||||||||||||||||
| Year ended 10/31/2010 | 21.46 | .53 | 2.85 | 3.38 | (.59 | ) | — | (.59 | ) | 24.25 | 15.90 | 307 | .99 | 2.29 | ||||||||||||||||||||||||||||||||
| 26 | American Mutual Fund |
| Income (loss) from investment operations1 | Dividends and distributions | |||||||||||||||||||||||||||||||||||||||||||||
| Net asset value, beginning of period | Net investment income (loss) | Net gains (losses) on securities (both realized and unrealized) | Total from investment operations | Dividends (from net investment income) | Distributions (from capital gains) | Total dividends and distributions | Net asset value, end of period | Total return2 | Net assets, end of period (in millions) | Ratio of expenses to average net assets | Ratio of net income (loss) to average net assets | |||||||||||||||||||||||||||||||||||
| Class R-4: | ||||||||||||||||||||||||||||||||||||||||||||||
| Year ended 10/31/2014 | $ | 34.18 | $ | .69 | $ | 4.27 | $ | 4.96 | $ | (.69 | ) | $ | (.71 | ) | $ | (1.40 | ) | $ | 37.74 | 14.89 | % | $ | 824 | .66 | % | 1.96 | % | |||||||||||||||||||
| Year ended 10/31/2013 | 28.20 | .68 | 5.99 | 6.67 | (.69 | ) | — | (.69 | ) | 34.18 | 23.95 | 732 | .66 | 2.18 | ||||||||||||||||||||||||||||||||
| Year ended 10/31/2012 | 25.35 | .64 | 2.87 | 3.51 | (.66 | ) | — | (.66 | ) | 28.20 | 13.98 | 487 | .66 | 2.37 | ||||||||||||||||||||||||||||||||
| Year ended 10/31/2011 | 24.32 | .64 | 1.01 | 1.65 | (.62 | ) | — | (.62 | ) | 25.35 | 6.81 | 272 | .67 | 2.50 | ||||||||||||||||||||||||||||||||
| Year ended 10/31/2010 | 21.53 | .60 | 2.85 | 3.45 | (.66 | ) | — | (.66 | ) | 24.32 | 16.21 | 189 | .68 | 2.58 | ||||||||||||||||||||||||||||||||
| Class R-5: | ||||||||||||||||||||||||||||||||||||||||||||||
| Year ended 10/31/2014 | 34.27 | .80 | 4.28 | 5.08 | (.79 | ) | (.71 | ) | (1.50 | ) | 37.85 | 15.24 | 346 | .36 | 2.26 | |||||||||||||||||||||||||||||||
| Year ended 10/31/2013 | 28.27 | .78 | 6.00 | 6.78 | (.78 | ) | — | (.78 | ) | 34.27 | 24.32 | 415 | .36 | 2.50 | ||||||||||||||||||||||||||||||||
| Year ended 10/31/2012 | 25.41 | .73 | 2.87 | 3.60 | (.74 | ) | — | (.74 | ) | 28.27 | 14.31 | 311 | .37 | 2.69 | ||||||||||||||||||||||||||||||||
| Year ended 10/31/2011 | 24.38 | .72 | 1.00 | 1.72 | (.69 | ) | — | (.69 | ) | 25.41 | 7.11 | 255 | .37 | 2.81 | ||||||||||||||||||||||||||||||||
| Year ended 10/31/2010 | 21.57 | .67 | 2.87 | 3.54 | (.73 | ) | — | (.73 | ) | 24.38 | 16.59 | 195 | .38 | 2.90 | ||||||||||||||||||||||||||||||||
| Class R-6: | ||||||||||||||||||||||||||||||||||||||||||||||
| Year ended 10/31/2014 | 34.28 | .82 | 4.28 | 5.10 | (.81 | ) | (.71 | ) | (1.52 | ) | 37.86 | 15.31 | 4,932 | .30 | 2.31 | |||||||||||||||||||||||||||||||
| Year ended 10/31/2013 | 28.28 | .79 | 6.01 | 6.80 | (.80 | ) | — | (.80 | ) | 34.28 | 24.38 | 3,994 | .31 | 2.50 | ||||||||||||||||||||||||||||||||
| Year ended 10/31/2012 | 25.41 | .74 | 2.88 | 3.62 | (.75 | ) | — | (.75 | ) | 28.28 | 14.40 | 1,526 | .32 | 2.73 | ||||||||||||||||||||||||||||||||
| Year ended 10/31/2011 | 24.39 | .73 | 1.00 | 1.73 | (.71 | ) | — | (.71 | ) | 25.41 | 7.12 | 1,038 | .32 | 2.86 | ||||||||||||||||||||||||||||||||
| Year ended 10/31/2010 | 21.58 | .68 | 2.87 | 3.55 | (.74 | ) | — | (.74 | ) | 24.39 | 16.64 | 784 | .33 | 2.92 | ||||||||||||||||||||||||||||||||
| Year ended October 31 | ||||||||||||||||||||
| 2014 | 2013 | 2012 | 2011 | 2010 | ||||||||||||||||
| Portfolio turnover rate for all share classes | 16 | % | 18 | % | 22 | % | 23 | % | 20 | % | ||||||||||
| 1 | Based on average shares outstanding. |
| 2 | Total returns exclude any applicable sales charges, including contingent deferred sales charges. |
| 3 | Based on operations for the period shown and, accordingly, is not representative of a full year. |
| 4 | Class R-2E shares were offered beginning August 29, 2014. |
| 5 | Amount less than $1 million. |
| 6 | Class R-2E assets consisted solely of seed capital invested by CRMC; therefore, certain fees were not accrued. |
See Notes to Financial Statements
| American Mutual Fund | 27 |
Report of Independent Registered Public Accounting Firm
To the Shareholders and Board of Trustees of American Mutual Fund:
We have audited the accompanying statement of assets and liabilities of American Mutual Fund (the “Fund”), including the summary investment portfolio, as of October 31, 2014, and the related statement of operations for the year then ended, the statements of changes in net assets for each of the two years in the period then ended, and the financial highlights for each of the periods presented. These financial statements and financial highlights are the responsibility of the Fund’s management. Our responsibility is to express an opinion on these financial statements and financial highlights based on our audits.
We conducted our audits in accordance with the standards of the Public Company Accounting Oversight Board (United States). Those standards require that we plan and perform the audit to obtain reasonable assurance about whether the financial statements and financial highlights are free of material misstatement. The Fund is not required to have, nor were we engaged to perform, an audit of its internal control over financial reporting. Our audits included consideration of internal control over financial reporting as a basis for designing audit procedures that are appropriate in the circumstances, but not for the purpose of expressing an opinion on the effectiveness of the Fund’s internal control over financial reporting. Accordingly, we express no such opinion. An audit also includes examining, on a test basis, evidence supporting the amounts and disclosures in the financial statements, assessing the accounting principles used and significant estimates made by management, as well as evaluating the overall financial statement presentation. Our procedures included confirmation of securities owned as of October 31, 2014, by correspondence with the custodian and brokers; where replies were not received from brokers, we performed other auditing procedures. We believe that our audits provide a reasonable basis for our opinion.
In our opinion, such financial statements and financial highlights referred to above present fairly, in all material respects, the financial position of American Mutual Fund as of October 31, 2014, the results of its operations for the year then ended, the changes in its net assets for each of the two years in the period then ended, and the financial highlights for each of the periods presented, in conformity with accounting principles generally accepted in the United States of America.
Deloitte & Touche LLP
Costa Mesa, California
December 8, 2014
| 28 | American Mutual Fund |
| Expense example | unaudited |
As a fund shareholder, you incur two types of costs: (1) transaction costs, such as initial sales charges on purchase payments and contingent deferred sales charges on redemptions (loads), and (2) ongoing costs, including management fees, distribution and service (12b-1) fees, and other expenses. This example is intended to help you understand your ongoing costs (in dollars) of investing in the fund so you can compare these costs with the ongoing costs of investing in other mutual funds. The example is based on an investment of $1,000 invested at the beginning of the period and held for the entire six-month period (May 1, 2014, through October 31, 2014).
Actual expenses:
The first line of each share class in the table on the following page provides information about actual account values and actual expenses. You may use the information in this line, together with the amount you invested, to estimate the expenses that you paid over the period. Simply divide your account value by $1,000 (for example, an $8,600 account value divided by $1,000 = 8.6), then multiply the result by the number in the first line under the heading entitled “Expenses paid during period” to estimate the expenses you paid on your account during this period.
Hypothetical example for comparison purposes:
The second line of each share class in the table on the following page provides information about hypothetical account values and hypothetical expenses based on the actual expense ratio for the share class and an assumed rate of return of 5.00% per year before expenses, which is not the actual return of the share class. The hypothetical account values and expenses may not be used to estimate the actual ending account balance or expenses you paid for the period. You may use this information to compare the ongoing costs of investing in the fund and other funds. To do so, compare this 5.00% hypothetical example with the 5.00% hypothetical examples that appear in the shareholder reports of the other funds.
Notes:
Retirement plan participants may be subject to certain fees charged by the plan sponsor, and Class F-1, F-2 and 529-F-1 shareholders may be subject to fees charged by financial intermediaries, typically ranging from 0.75% to 1.50% of assets annually depending on services offered. You can estimate the impact of these fees by adding the amount of the fees to the total estimated expenses you paid on your account during the period as calculated above. In addition, your ending account value would be lower by the amount of these fees.
Note that the expenses shown in the table on the following page are meant to highlight your ongoing costs only and do not reflect any transactional costs, such as sales charges (loads). Therefore, the second line of each share class in the table is useful in comparing ongoing costs only and will not help you determine the relative total costs of owning different funds. In addition, if these transactional costs were included, your costs would have been higher.
| American Mutual Fund | 29 |
| Beginning account value 5/1/2014 | Ending account value 10/31/2014 | Expenses paid during period* | Annualized expense ratio | |||||||||||||
| Class A - actual return | $ | 1,000.00 | $ | 1,074.83 | $ | 3.03 | .58 | % | ||||||||
| Class A - assumed 5% return | 1,000.00 | 1,022.28 | 2.96 | .58 | ||||||||||||
| Class B - actual return | 1,000.00 | 1,070.82 | 6.99 | 1.34 | ||||||||||||
| Class B - assumed 5% return | 1,000.00 | 1,018.45 | 6.82 | 1.34 | ||||||||||||
| Class C - actual return | 1,000.00 | 1,070.33 | 7.25 | 1.39 | ||||||||||||
| Class C - assumed 5% return | 1,000.00 | 1,018.20 | 7.07 | 1.39 | ||||||||||||
| Class F-1 - actual return | 1,000.00 | 1,074.28 | 3.45 | .66 | ||||||||||||
| Class F-1 - assumed 5% return | 1,000.00 | 1,021.88 | 3.36 | .66 | ||||||||||||
| Class F-2 - actual return | 1,000.00 | 1,075.49 | 2.14 | .41 | ||||||||||||
| Class F-2 - assumed 5% return | 1,000.00 | 1,023.14 | 2.09 | .41 | ||||||||||||
| Class 529-A - actual return | 1,000.00 | 1,074.14 | 3.56 | .68 | ||||||||||||
| Class 529-A - assumed 5% return | 1,000.00 | 1,021.78 | 3.47 | .68 | ||||||||||||
| Class 529-B - actual return | 1,000.00 | 1,069.96 | 7.67 | 1.47 | ||||||||||||
| Class 529-B - assumed 5% return | 1,000.00 | 1,017.80 | 7.48 | 1.47 | ||||||||||||
| Class 529-C - actual return | 1,000.00 | 1,069.90 | 7.62 | 1.46 | ||||||||||||
| Class 529-C - assumed 5% return | 1,000.00 | 1,017.85 | 7.43 | 1.46 | ||||||||||||
| Class 529-E - actual return | 1,000.00 | 1,072.55 | 4.86 | .93 | ||||||||||||
| Class 529-E - assumed 5% return | 1,000.00 | 1,020.52 | 4.74 | .93 | ||||||||||||
| Class 529-F-1 - actual return | 1,000.00 | 1,075.22 | 2.41 | .46 | ||||||||||||
| Class 529-F-1 - assumed 5% return | 1,000.00 | 1,022.89 | 2.35 | .46 | ||||||||||||
| Class R-1 - actual return | 1,000.00 | 1,070.24 | 7.41 | 1.42 | ||||||||||||
| Class R-1 - assumed 5% return | 1,000.00 | 1,018.05 | 7.22 | 1.42 | ||||||||||||
| Class R-2 - actual return | 1,000.00 | 1,070.39 | 7.31 | 1.40 | ||||||||||||
| Class R-2 - assumed 5% return | 1,000.00 | 1,018.15 | 7.12 | 1.40 | ||||||||||||
| Class R-2E - actual return† | 1,000.00 | 1,022.85 | .89 | .51 | ||||||||||||
| Class R-2E - assumed 5% return† | 1,000.00 | 1,022.63 | 2.60 | .51 | ||||||||||||
| Class R-3 - actual return | 1,000.00 | 1,072.80 | 4.96 | .95 | ||||||||||||
| Class R-3 - assumed 5% return | 1,000.00 | 1,020.42 | 4.84 | .95 | ||||||||||||
| Class R-4 - actual return | 1,000.00 | 1,074.38 | 3.45 | .66 | ||||||||||||
| Class R-4 - assumed 5% return | 1,000.00 | 1,021.88 | 3.36 | .66 | ||||||||||||
| Class R-5 - actual return | 1,000.00 | 1,075.73 | 1.83 | .35 | ||||||||||||
| Class R-5 - assumed 5% return | 1,000.00 | 1,023.44 | 1.79 | .35 | ||||||||||||
| Class R-6 - actual return | 1,000.00 | 1,076.28 | 1.57 | .30 | ||||||||||||
| Class R-6 - assumed 5% return | 1,000.00 | 1,023.69 | 1.53 | .30 | ||||||||||||
| * | The “expenses paid during period” are equal to the “annualized expense ratio,” multiplied by the average account value over the period, multiplied by the number of days in the period, and divided by 365 (to reflect the one-half year period). |
| † | The period for the “annualized expense ratio” and “actual return” line is based on the number of days since the initial sale of the share class on August 29, 2014. The “assumed 5% return” line is based on 184 days. |
| 30 | American Mutual Fund |
| Tax information | unaudited |
We are required to advise you of the federal tax status of certain distributions received by shareholders during the fiscal year. The fund hereby designates the following amounts for the fund’s fiscal year ended October 31, 2014:
| Long-term capital gains | $688,236,000 | ||
| Qualified dividend income | 100% | ||
| Corporate dividends received deduction | 100% | ||
| U.S. government income that may be exempt from state taxation | $595,000 |
Individual shareholders should refer to their Form 1099 or other tax information, which will be mailed in January 2015, to determine the calendar year amounts to be included on their 2014 tax returns. Shareholders should consult their tax advisors.
| American Mutual Fund | 31 |
Board of trustees and other officers
“Independent” trustees1
| Name and year of birth | Year first elected a trustee of the fund2 | Principal occupation(s) during past five years | Number of portfolios in fund complex overseen by trustee | Other directorships3 held by trustee | ||||
| Louise H. Bryson, 1944 | 2010 | Chair Emerita of the Board of Trustees, J. Paul Getty Trust; former President, Distribution, Lifetime Entertainment Network (retired 2008); former Executive Vice President and General Manager, Lifetime Movie Network (retired 2008) | 7 | None | ||||
| Mary Anne Dolan, 1947 Chairman of the Board (Independent and Non-Executive) | 1993 | Founder and President, MAD Ink (communications company) | 10 | None | ||||
| James G. Ellis, 1947 | 2010 | Dean and Professor of Marketing, Marshall School of Business, University of Southern California | 70 | Mercury General Corp. | ||||
| Leonard R. Fuller, 1946 | 2010 | President and CEO, Fuller Consulting (financial management consulting firm) | 70 | None | ||||
| William D. Jones, 1955 | 2006 | Real estate developer/owner, President and CEO, CityLink Investment Corporation (acquires, develops and manages real estate ventures in selected urban communities) and City Scene Management Company (provides commercial asset and property management services) | 8 | Sempra Energy | ||||
| L. Daniel Jorndt, 1941 | 2010 | Retired | 4 | None | ||||
| William H. Kling, 1942 | 2006 | President Emeritus and former CEO, American Public Media | 10 | None | ||||
| John C. Mazziotta, M.D., Ph.D., 1949 | 2011 | Physician; Chair, Department of Neurology, University of California at Los Angeles; Associate Director, Semel Institute, UCLA; Director, Brain Mapping Center, UCLA | 4 | None | ||||
| Bailey Morris-Eck, 1944 | 1999 | Director and Programming Chair, WYPR Baltimore/Washington (public radio station); Senior Adviser, Financial News (London); Senior Fellow, Institute for International Economics | 4 | None |
“Interested” trustee4,5
| Name, year of birth and position with fund | Year first elected a trustee or officer of the fund2 | Principal occupation(s) during past five years and positions held with affiliated entities or the principal underwriter of the fund | Number of portfolios in fund complex overseen by trustee | Other directorships3 held by trustee | ||||
| Joyce E. Gordon, 1956 Vice Chairman of the Board | 1996–2001 2005 | Partner — Capital Research Global Investors, Capital Research and Management Company; Director, Capital Research and Management Company | 2 | None | ||||
| William L. Robbins, 1968 President | 2004 | Director, The Capital Group Companies, Inc.;6 Partner — Capital International Investors, Capital Research and Management Company | 1 | None |
The fund’s statement of additional information includes further details about fund trustees and is available without charge upon request by calling American Funds Service Company at (800) 421-4225 or by visiting the American Funds website at americanfunds.com. The address for all trustees and officers of the fund is 333 South Hope Street, Los Angeles, CA 90071, Attention: Secretary.
See page 33 for footnotes.
| 32 | American Mutual Fund |
Other officers5
| Name, year of birth and position with fund | Year first elected an officer of the fund2 | Principal occupation(s) during past five years and positions held with affiliated entities or the principal underwriter of the fund | ||
| Paul F. Roye, 1953 Executive Vice President | 2007 | Senior Vice President — Fund Business Management Group, Capital Research and Management Company; Director, American Funds Service Company6 | ||
| James B. Lovelace, 1956 Senior Vice President | 2006 | Partner — Capital Research Global Investors, Capital Research and Management Company; Director, Capital Research and Management Company | ||
| James Terrile, 1965 Senior Vice President | 2007 | Partner — Capital Research Global Investors, Capital Research and Management Company; Director, Capital Strategy Research, Inc.6 | ||
| Christopher D. Buchbinder, 1971 Vice President | 2006 | Partner — Capital Research Global Investors, Capital Research and Management Company | ||
| Herbert Y. Poon, 1973 Vice President | 2012 | Vice President and Senior Counsel — Fund Business Management Group, Capital Research and Management Company | ||
| Michael W. Stockton, 1967 Secretary | 2013 | Vice President — Fund Business Management Group, Capital Research and Management Company | ||
| Ari M. Vinocor, 1974 Treasurer | 2010 | Vice President — Investment Operations, Capital Research and Management Company | ||
| Raymond F. Sullivan, Jr., 1957 Assistant Secretary | 2011 | Vice President — Fund Business Management Group, Capital Research and Management Company | ||
| Dori Laskin, 1951 Assistant Treasurer | 2011 | Vice President — Investment Operations, Capital Research and Management Company | ||
| Jeffrey P. Regal, 1971 Assistant Treasurer | 2012 | Vice President — Investment Operations, Capital Research and Management Company |
| 1 | The term “independent” trustee refers to a director who is not an “interested person” of the fund within the meaning of the Investment Company Act of 1940. |
| 2 | Trustees and officers of the fund serve until their resignation, removal or retirement. |
| 3 | This includes all directorships/trusteeships (other than those in the American Funds or other funds managed by Capital Research and Management Company or its affiliates) that are held by each trustee as a trustee or director of a public company or a registered investment company. |
| 4 | The term “interested” trustee refers to a trustee who is an “interested person” within the meaning of the Investment Company Act of 1940, on the basis of their affiliation with the fund’s investment adviser, Capital Research and Management Company, or affiliated entities (including the fund’s principal underwriter). |
| 5 | All of the directors/trustees and/or officers listed are officers and/or directors/trustees of one or more of the other funds for which Capital Research and Management Company serves as investment adviser. |
| 6 | Company affiliated with Capital Research and Management Company. |
| American Mutual Fund | 33 |
Offices of the fund and of the investment adviser
Capital Research and Management Company
333 South Hope Street
Los Angeles, CA 90071-1406
6455 Irvine Center Drive
Irvine, CA 92618-4518
Transfer agent for shareholder accounts
American Funds Service Company
(Write to the address near you.)
P.O. Box 6007
Indianapolis, IN 46206-6007
P.O. Box 2280
Norfolk, VA 23501-2280
Custodian of assets
JPMorgan Chase Bank
270 Park Avenue
New York, NY 10017-2070
Counsel
O’Melveny & Myers LLP
400 South Hope Street
Los Angeles, CA 90071-2899
Independent registered public accounting firm
Deloitte & Touche LLP
695 Town Center Drive
Suite 1200
Costa Mesa, CA 92626-7188
Principal underwriter
American Funds Distributors, Inc.
333 South Hope Street
Los Angeles, CA 90071-1406
| 34 | American Mutual Fund |
Investors should carefully consider investment objectives, risks, charges and expenses. This and other important information is contained in the fund prospectus and summary prospectus, which can be obtained from your financial professional and should be read carefully before investing. You may also call American Funds Service Company (AFS) at (800) 421-4225 or visit the American Funds website at americanfunds.com.
“American Funds Proxy Voting Procedures and Principles” — which describes how we vote proxies relating to portfolio securities — is available on the American Funds website or upon request by calling AFS. The fund files its proxy voting record with the U.S. Securities and Exchange Commission (SEC) for the 12 months ended June 30 by August 31. The proxy voting record is available free of charge on the SEC website at sec.gov and on the American Funds website.
A complete October 31, 2014, portfolio of American Mutual Fund’s investments is available free of charge by calling AFS or visiting the SEC website (where it is part of Form N-CSR).
American Mutual Fund files a complete list of its portfolio holdings with the SEC for the first and third quarters of each fiscal year on Form N-Q. This filing is available free of charge on the SEC website. You may also review or, for a fee, copy this filing at the SEC’s Public Reference Room in Washington, D.C. Additional information regarding the operation of the Public Reference Room may be obtained by calling the SEC’s Office of Investor Education and Advocacy at (800) SEC-0330. Additionally, the list of portfolio holdings is available by calling AFS.
This report is for the information of shareholders of American Mutual Fund, but it also may be used as sales literature when preceded or accompanied by the current prospectus or summary prospectus, which gives details about charges, expenses, investment objectives and operating policies of the fund. If used as sales material after December 31, 2014, this report must be accompanied by an American Funds statistical update for the most recently completed calendar quarter.
The American Funds Advantage
Since 1931, American Funds, part of Capital Group, has helped investors pursue long-term investment success. Our consistent approach — in combination with The Capital SystemSM — has resulted in a superior long-term track record.
| Aligned with investor success | |
| We base our decisions on a long-term perspective, which we believe aligns our goals with the interests of our clients. Our portfolio managers average 26 years of investment experience, including 21 years at our company, reflecting a career commitment to our long-term approach.1 | |
| The Capital SystemSM | |
| Our investment process, The Capital System, combines individual accountability with teamwork. Each fund is divided into portions that are managed independently by investment professionals with diverse backgrounds, ages and investment approaches. An extensive global research effort is the backbone of our system. | |
| Superior long-term track record | |
| Our equity funds have beaten their Lipper peer indexes in 90% of 10-year periods and 96% of 20-year periods. Our fixed-income funds have beaten their Lipper indexes in 56% of 10-year periods and 57% of 20-year periods.2 Our fund management fees have been among the lowest in the industry.3 |
| 1 | Portfolio manager experience as of December 31, 2013. | |
| 2 | Based on Class A share results for rolling periods through December 31, 2013. Periods covered are the shorter of the fund’s lifetime or since the comparable Lipper index inception date (except SMALLCAP World Fund, for which the Lipper average was used). | |
| 3 | Based on management fees for the 20-year period ended December 31, 2013, versus comparable Lipper categories, excluding funds of funds. |

ITEM 2 – Code of Ethics
The Registrant has adopted a Code of Ethics that applies to its Principal Executive Officer and Principal Financial Officer. The Registrant undertakes to provide to any person without charge, upon request, a copy of the Code of Ethics. Such request can be made to American Funds Service Company at 800/421-9225 or to the Secretary of the Registrant, 333 South Hope Street, Los Angeles, California 90071.
ITEM 3 – Audit Committee Financial Expert
The Registrant’s board has determined that James G. Ellis, a member of the Registrant’s audit committee, is an “audit committee financial expert” and "independent," as such terms are defined in this Item. This designation will not increase the designee’s duties, obligations or liability as compared to his or her duties, obligations and liability as a member of the audit committee and of the board, nor will it reduce the responsibility of the other audit committee members. There may be other individuals who, through education or experience, would qualify as "audit committee financial experts" if the board had designated them as such. Most importantly, the board believes each member of the audit committee contributes significantly to the effective oversight of the Registrant’s financial statements and condition.
ITEM 4 – Principal Accountant Fees and Services
| Registrant: | ||||
| a) Audit Fees: | ||||
| 2013 | $83,000 | |||
| 2014 | $99,000 | |||
| b) Audit-Related Fees: | ||||
| 2013 | $9,000 | |||
| 2014 | $7,000 | |||
| The audit-related fees consist of assurance and related services relating to the examination of the Registrant’s investment adviser conducted in accordance with Statement on Standards for Attestation Engagements Number 16 issued by the American Institute of Certified Public Accountants. | ||||
| c) Tax Fees: | ||||
| 2013 | $7,000 | |||
| 2014 | $7,000 | |||
| The tax fees consist of professional services relating to the preparation of the Registrant’s tax returns. | ||||
| d) All Other Fees: | ||||
| 2013 | None | |||
| 2014 | None | |||
| Adviser and affiliates (includes only fees for non-audit services billed to the adviser and affiliates for engagements that relate directly to the operations and financial reporting of the Registrant and were subject to the pre-approval policies described below): | ||||
| a) Audit Fees: | ||||
| Not Applicable | ||||
| b) Audit-Related Fees: | ||||
| 2013 | $1,046,000 | |||
| 2014 | $1,028,000 | |||
| The audit-related fees consist of assurance and related services relating to the examination of the Registrant’s transfer agent, principal underwriter and investment adviser conducted in accordance with Statement on Standards for Attestation Engagements Number 16 issued by the American Institute of Certified Public Accountants. | ||||
| c) Tax Fees: | ||||
| 2013 | $36,000 | |||
| 2014 | $33,000 | |||
| The tax fees consist of consulting services relating to the Registrant’s investments. | ||||
| d) All Other Fees: | ||||
| 2013 | $2,000 | |||
| 2014 | $3,000 | |||
| The other fees consist of subscription services related to an accounting research tool. | ||||
All audit and permissible non-audit services that the Registrant’s audit committee considers compatible with maintaining the independent registered public accounting firm’s independence are required to be pre-approved by the committee. The pre-approval requirement will extend to all non-audit services provided to the Registrant, the investment adviser, and any entity controlling, controlled by, or under common control with the investment adviser that provides ongoing services to the Registrant, if the engagement relates directly to the operations and financial reporting of the Registrant. The committee will not delegate its responsibility to pre-approve these services to the investment adviser. The committee may delegate to one or more committee members the authority to review and pre-approve audit and permissible non-audit services. Actions taken under any such delegation will be reported to the full committee at its next meeting. The pre-approval requirement is waived with respect to non-audit services if certain conditions are met. The pre-approval requirement was not waived for any of the non-audit services listed above provided to the Registrant, adviser and affiliates.
Aggregate non-audit fees paid to the Registrant’s auditors, including fees for all services billed to the Registrant, adviser and affiliates that provide ongoing services to the Registrant, were $1,472,000 for fiscal year 2013 and $1,432,000 for fiscal year 2014. The non-audit services represented by these amounts were brought to the attention of the committee and considered to be compatible with maintaining the auditors’ independence.
ITEM 5 – Audit Committee of Listed Registrants
Not applicable to this Registrant, insofar as the Registrant is not a listed issuer as defined in Rule 10A-3 under the Securities Exchange Act of 1934.
ITEM 6 – Schedule of Investments

| Common stocks 93.08% Energy 6.64% | Shares | Value (000) |
| BP PLC (ADR) | 3,294,180 | $143,165 |
| Chevron Corp. | 5,391,211 | 646,676 |
| ConocoPhillips | 3,274,900 | 236,284 |
| Diamond Offshore Drilling, Inc. | 728,941 | 27,488 |
| Enbridge Inc. | 3,353,300 | 158,812 |
| Ensco PLC, Class A | 2,772,800 | 112,548 |
| EOG Resources, Inc. | 1,278,500 | 121,521 |
| Exxon Mobil Corp. | 1,450,000 | 140,230 |
| Halliburton Co. | 317,000 | 17,479 |
| Noble Energy, Inc. | 357,000 | 20,574 |
| Royal Dutch Shell PLC, Class A (ADR) | 4,635,907 | 332,812 |
| Schlumberger Ltd. | 1,410,000 | 139,111 |
| Spectra Energy Corp | 5,957,500 | 233,117 |
| 2,329,817 | ||
| Materials 4.68% | ||
| Barrick Gold Corp. | 1,200,000 | 14,244 |
| CRH PLC (ADR) | 1,089,059 | 24,406 |
| Dow Chemical Co. | 9,316,690 | 460,244 |
| E.I. du Pont de Nemours and Co. | 690,000 | 47,713 |
| Freeport-McMoRan Inc. | 1,157,700 | 32,994 |
| International Flavors & Fragrances Inc. | 1,348,893 | 133,743 |
| MeadWestvaco Corp. | 2,360,890 | 104,281 |
| Monsanto Co. | 1,270,000 | 146,101 |
| Mosaic Co. | 3,060,500 | 135,611 |
| Nucor Corp. | 1,099,600 | 59,444 |
| Potash Corp. of Saskatchewan Inc. | 1,930,000 | 65,948 |
| Praxair, Inc. | 3,323,824 | 418,769 |
| 1,643,498 | ||
| Industrials 15.74% | ||
| 3M Co. | 1,515,000 | 232,962 |
| Boeing Co. | 1,227,100 | 153,277 |
| Caterpillar Inc. | 1,230,000 | 124,734 |
| CSX Corp. | 10,454,193 | 372,483 |
| Cummins Inc. | 1,998,700 | 292,170 |
| Dover Corp. | 106,737 | 8,479 |
| Eaton Corp. PLC | 1,265,000 | 86,513 |
| Emerson Electric Co. | 2,311,850 | 148,097 |
| General Dynamics Corp. | 3,808,000 | 532,206 |
| General Electric Co. | 13,860,000 | 357,727 |
| Illinois Tool Works Inc. | 850,000 | 77,393 |
| Lockheed Martin Corp. | 2,388,660 | 455,207 |
| Norfolk Southern Corp. | 2,575,400 | 284,942 |
| PACCAR Inc | 500,000 | 32,660 |
| Pitney Bowes Inc. | 2,000,000 | 49,480 |
| Precision Castparts Corp. | 399,000 | 88,059 |
| Common stocks Industrials (continued) | Shares | Value (000) |
| Republic Services, Inc. | 2,836,300 | $108,914 |
| Rockwell Automation | 1,693,800 | 190,298 |
| Siemens AG | 134,000 | 15,098 |
| Siemens AG (ADR) | 1,052,000 | 118,602 |
| Snap-on Inc. | 750,000 | 99,105 |
| Union Pacific Corp. | 3,562,200 | 414,818 |
| United Parcel Service, Inc., Class B | 4,596,300 | 482,198 |
| United Technologies Corp. | 2,823,174 | 302,080 |
| Waste Management, Inc. | 10,202,900 | 498,820 |
| 5,526,322 | ||
| Consumer discretionary 10.16% | ||
| Carnival Corp., units | 6,244,100 | 250,701 |
| Coach, Inc. | 1,036,722 | 35,642 |
| Comcast Corp., Class A | 6,919,900 | 383,016 |
| Comcast Corp., Class A, special nonvoting shares | 2,090,000 | 115,243 |
| Darden Restaurants, Inc. | 5,597,097 | 289,818 |
| Hasbro, Inc. | 1,948,788 | 112,114 |
| Home Depot, Inc. | 8,193,552 | 799,035 |
| Honda Motor Co., Ltd. (ADR) | 1,047,800 | 33,655 |
| Johnson Controls, Inc. | 7,899,380 | 373,246 |
| Mattel, Inc. | 2,771,947 | 86,124 |
| McDonald’s Corp. | 321,100 | 30,097 |
| Newell Rubbermaid Inc. | 6,605,200 | 220,151 |
| Ross Stores, Inc. | 476,000 | 38,423 |
| Scripps Networks Interactive, Inc., Class A | 265,000 | 20,469 |
| Starbucks Corp. | 603,000 | 45,563 |
| Tiffany & Co. | 369,265 | 35,494 |
| Time Inc. | 218,533 | 4,937 |
| Time Warner Cable Inc. | 775,200 | 114,117 |
| Time Warner Inc. | 3,272,103 | 260,034 |
| Viacom Inc., Class B | 580,000 | 42,154 |
| Whirlpool Corp. | 225,000 | 38,711 |
| Williams-Sonoma, Inc. | 3,663,000 | 238,205 |
| 3,566,949 | ||
| Consumer staples 6.75% | ||
| Avon Products, Inc. | 6,062,300 | 63,048 |
| Coca-Cola Co. | 7,863,400 | 329,319 |
| Colgate-Palmolive Co. | 1,130,000 | 75,574 |
| ConAgra Foods, Inc. | 1,578,271 | 54,214 |
| CVS/Caremark Corp. | 1,045,000 | 89,671 |
| General Mills, Inc. | 1,500,000 | 77,940 |
| Kellogg Co. | 1,539,423 | 98,461 |
| Kimberly-Clark Corp. | 1,000,000 | 114,270 |
| Kraft Foods Group, Inc. | 4,849,766 | 273,284 |
| Mead Johnson Nutrition Co. | 186,000 | 18,472 |
| Mondelez International, Inc. | 11,278,300 | 397,673 |
| PepsiCo, Inc. | 1,235,769 | 118,844 |
| Procter & Gamble Co. | 6,406,400 | 559,087 |
| Unilever PLC (ADR) | 2,486,000 | 100,012 |
| 2,369,869 |
| Common stocks Health care 15.54% | Shares | Value (000) |
| Abbott Laboratories | 1,863,000 | $81,208 |
| AbbVie Inc. | 20,442,000 | 1,297,249 |
| Aetna Inc. | 503,700 | 41,560 |
| AmerisourceBergen Corp. | 356,000 | 30,406 |
| Amgen Inc. | 8,475,748 | 1,374,597 |
| Bristol-Myers Squibb Co. | 7,230,000 | 420,714 |
| Cardinal Health, Inc. | 1,055,000 | 82,796 |
| Gilead Sciences, Inc.1 | 375,000 | 42,000 |
| Humana Inc. | 138,000 | 19,161 |
| Johnson & Johnson | 2,745,000 | 295,856 |
| Medtronic, Inc. | 2,127,000 | 144,976 |
| Merck & Co., Inc. | 8,532,085 | 494,349 |
| Novartis AG (ADR) | 3,014,000 | 279,368 |
| Pfizer Inc. | 7,163,100 | 214,535 |
| Quest Diagnostics Inc. | 1,880,000 | 119,305 |
| ResMed Inc. | 1,500,000 | 78,330 |
| St. Jude Medical, Inc. | 2,159,000 | 138,543 |
| Stryker Corp. | 2,154,435 | 188,578 |
| UnitedHealth Group Inc. | 1,162,600 | 110,459 |
| 5,453,990 | ||
| Financials 9.11% | ||
| ACE Ltd. | 668,400 | 73,056 |
| Aon PLC, Class A | 1,852,000 | 159,272 |
| Arthur J. Gallagher & Co. | 4,490,548 | 214,199 |
| Bank of New York Mellon Corp. | 3,141,400 | 121,635 |
| Bank of Nova Scotia | 2,310,900 | 141,658 |
| BB&T Corp. | 1,046,000 | 39,623 |
| CME Group Inc., Class A | 1,531,000 | 128,313 |
| HSBC Holdings PLC (ADR) | 1,700,000 | 86,734 |
| Hudson City Bancorp, Inc. | 1,696,000 | 16,366 |
| Intercontinental Exchange, Inc. | 664,918 | 138,496 |
| JPMorgan Chase & Co. | 4,048,700 | 244,865 |
| Marsh & McLennan Companies, Inc. | 4,296,394 | 233,595 |
| McGraw Hill Financial, Inc. | 321,643 | 29,102 |
| Old Republic International Corp. | 7,300,800 | 107,833 |
| PNC Financial Services Group, Inc. | 1,806,400 | 156,055 |
| Principal Financial Group, Inc. | 7,567,000 | 396,284 |
| Progressive Corp. | 2,000,000 | 52,820 |
| State Street Corp. | 1,479,700 | 111,658 |
| Sun Life Financial Inc. | 4,654,800 | 165,711 |
| Toronto-Dominion Bank | 1,989,400 | 97,998 |
| U.S. Bancorp | 3,906,079 | 166,399 |
| Ventas, Inc. | 2,045,000 | 140,103 |
| Wells Fargo & Co. | 3,343,000 | 177,480 |
| 3,199,255 |
| Common stocks Information technology 10.61% | Shares | Value (000) |
| Accenture PLC, Class A | 414,000 | $33,584 |
| Analog Devices, Inc. | 1,329,640 | 65,977 |
| Apple Inc. | 7,160,000 | 773,280 |
| Automatic Data Processing, Inc. | 3,356,300 | 274,478 |
| CDK Global, Inc.1 | 422,900 | 14,209 |
| Google Inc., Class A1 | 38,000 | 21,579 |
| Google Inc., Class C1 | 38,000 | 21,245 |
| Hewlett-Packard Co. | 1,000,000 | 35,880 |
| Intel Corp. | 2,800,000 | 95,228 |
| International Business Machines Corp. | 474,950 | 78,082 |
| KLA-Tencor Corp. | 1,322,000 | 104,636 |
| Linear Technology Corp. | 1,863,700 | 79,841 |
| Maxim Integrated Products, Inc. | 4,700,000 | 137,898 |
| Microsoft Corp. | 12,510,607 | 587,373 |
| Oracle Corp. | 8,921,900 | 348,400 |
| Paychex, Inc. | 1,000,000 | 46,940 |
| QUALCOMM Inc. | 431,000 | 33,838 |
| Texas Instruments Inc. | 18,976,322 | 942,364 |
| Xilinx, Inc. | 688,400 | 30,620 |
| 3,725,452 | ||
| Telecommunication services 4.40% | ||
| AT&T Inc. | 5,470,000 | 190,575 |
| BCE Inc. | 1,000,000 | 44,470 |
| Verizon Communications Inc. | 26,051,397 | 1,309,083 |
| 1,544,128 | ||
| Utilities 8.01% | ||
| Ameren Corp. | 1,660,000 | 70,284 |
| American Electric Power Co., Inc. | 1,435,000 | 83,718 |
| Dominion Resources, Inc. | 2,860,000 | 203,918 |
| DTE Energy Co. | 750,000 | 61,620 |
| Duke Energy Corp. | 3,349,847 | 275,190 |
| Edison International | 1,420,000 | 88,864 |
| Exelon Corp. | 13,522,720 | 494,796 |
| FirstEnergy Corp. | 7,373,000 | 275,308 |
| National Grid PLC (ADR) | 1,412,599 | 105,083 |
| PG&E Corp. | 10,590,000 | 532,889 |
| PPL Corp. | 2,044,300 | 71,530 |
| Sempra Energy | 2,920,000 | 321,200 |
| Southern Co. | 2,500,000 | 115,900 |
| Xcel Energy Inc. | 3,365,000 | 112,627 |
| 2,812,927 | ||
| Miscellaneous 1.44% | ||
| Other common stocks in initial period of acquisition | 503,685 | |
| Total common stocks (cost: $21,716,297,000) | 32,675,892 | |
| Preferred securities 0.03% Financials 0.03% | ||
| U.S. Bancorp, Series F, 6.50% noncumulative depositary shares | 387,000 | 11,343 |
| Total preferred securities (cost: $10,004,000) | 11,343 |
| Convertible stocks 0.18% Utilities 0.18% | Shares | Value (000) |
| Exelon Corp., convertible preferred, units | 1,200,000 | $63,216 |
| Total convertible stocks (cost: $61,102,000) | 63,216 | |
| Bonds, notes & other debt instruments 1.39% Corporate bonds & notes 1.08% Energy 0.02% | Principal amount (000) | |
| Enbridge Energy Partners, LP 5.35% 2014 | $5,075 | 5,103 |
| Financials 1.00% | ||
| Bank of America Corp., Series K, junior subordinated 8.00% noncumulative (undated)2 | 1,665 | 1,800 |
| Bank of America Corp., Series M, junior subordinated 8.125% noncumulative (undated)2 | 1,665 | 1,815 |
| Citigroup Inc. 6.125% 2017 | 1,102 | 1,240 |
| ERP Operating LP 6.584% 2015 | 3,500 | 3,594 |
| ERP Operating LP 5.125% 2016 | 2,400 | 2,541 |
| ERP Operating LP 5.375% 2016 | 6,455 | 6,949 |
| ERP Operating LP 5.75% 2017 | 39,855 | 44,341 |
| ERP Operating LP 7.125% 2017 | 5,000 | 5,789 |
| JPMorgan Chase & Co., Series I, junior subordinated 7.90% (undated)2 | 123,654 | 134,628 |
| UDR, Inc., Series A, 5.25% 2015 | 5,000 | 5,045 |
| Wells Fargo & Co., Series K, junior subordinated 7.98% (undated)2 | 131,826 | 144,863 |
| 352,605 | ||
| Utilities 0.06% | ||
| FPL Group Capital, Inc. 7.875% 2015 | 20,000 | 21,585 |
| Total corporate bonds & notes | 379,293 | |
| U.S. Treasury bonds & notes 0.29% U.S. Treasury 0.29% | ||
| U.S. Treasury 1.875% 2017 | 39,050 | 40,128 |
| U.S. Treasury 1.00% 2017 | 60,100 | 60,290 |
| 100,418 | ||
| Mortgage-backed obligations 0.02% | ||
| Fannie Mae 4.00% 20243 | 3,640 | 3,895 |
| Fannie Mae 4.50% 20243 | 3,553 | 3,820 |
| 7,715 | ||
| Total bonds, notes & other debt instruments (cost: $439,397,000) | 487,426 | |
| Short-term securities 5.16% | ||
| 3M Co. 0.07% due 11/3/20144 | 25,000 | 25,000 |
| Apple Inc. 0.11%—0.13% due 11/12/2014—1/7/20154 | 87,800 | 87,783 |
| Army and Air Force Exchange Service 0.13% due 2/23/20154 | 50,000 | 49,969 |
| Caterpillar Financial Services Corp. 0.10% due 1/5/2015 | 21,000 | 20,996 |
| Chariot Funding, LLC 0.27% due 2/2/20154 | 500 | 500 |
| Chevron Corp. 0.10%—0.12% due 12/4/2014—1/23/20154 | 75,000 | 74,986 |
| Coca-Cola Co. 0.15%—0.20% due 1/8/2015—4/17/20154 | 143,500 | 143,451 |
| E.I. duPont de Nemours and Co. 0.08% due 11/3/20144 | 42,000 | 42,000 |
| Estée Lauder Companies Inc. 0.08% due 12/4/20144 | 12,400 | 12,398 |
| Fannie Mae 0.07%—0.14% due 11/4/2014—6/1/2015 | 472,835 | 472,706 |
| Federal Farm Credit Banks 0.08%—0.14% due 11/21/2014—8/5/2015 | 117,100 | 117,044 |
| Short-term securities | Principal amount (000) | Value (000) |
| Federal Home Loan Bank 0.07%—0.10% due 11/7/2014—4/29/2015 | $169,600 | $169,572 |
| Freddie Mac 0.07%—0.14% due 11/28/2014—7/23/2015 | 201,000 | 200,934 |
| General Electric Capital Corp. 0.17% due 12/19/2014 | 30,000 | 29,998 |
| General Electric Co. 0.06% due 11/3/2014 | 46,600 | 46,600 |
| John Deere Financial Ltd. 0.09% due 11/20/20144 | 32,000 | 31,999 |
| Paccar Financial Corp. 0.08% due 11/4/2014—11/5/2014 | 35,400 | 35,400 |
| Parker-Hannifin Corp. 0.09% due 11/17/20144 | 22,600 | 22,599 |
| Private Export Funding Corp. 0.18% due 11/12/2014—11/17/20144 | 54,000 | 53,998 |
| Procter & Gamble Co. 0.08%—0.12% due 12/9/2014—1/23/20154 | 146,400 | 146,389 |
| Wal-Mart Stores, Inc. 0.08% due 12/1/20144 | 28,500 | 28,499 |
| Total short-term securities (cost: $1,812,679,000) | 1,812,821 | |
| Total investment securities 99.84% (cost: $24,039,479,000) | 35,050,698 | |
| Other assets less liabilities 0.16% | 55,758 | |
| Net assets 100.00% | 35,106,456 |
| 1 | Security did not produce income during the last 12 months. |
| 2 | Coupon rate may change periodically. |
| 3 | Principal payments may be made periodically. Therefore, the effective maturity date may be earlier than the stated maturity date. |
| 4 | Acquired in a transaction exempt from registration under Section 4(2) of the Securities Act of 1933. May be resold in the U.S. in transactions exempt from registration, normally to qualified institutional buyers. The total value of all such securities was $719,571,000, which represented 2.05% of the net assets of the fund. |
| Key to abbreviation | |
| ADR = American Depositary Receipts |
| MFGEFPX-003-1214O-S42219 | American Mutual Fund — Page 6 of 6 |
REPORT OF INDEPENDENT REGISTERED PUBLIC ACCOUNTING FIRM
To the Shareholders and Board of Trustees of
American Mutual Fund:
We have audited the accompanying statement of assets and liabilities of American Mutual Fund (the “Fund”), including the summary schedule of investments, as of October 31, 2014, and the related statements of operations for the year then ended, the statements of changes in net assets for each of the two years in the period then ended (collectively, the “financial statements”), the financial highlights for each of the five years in the period then ended (the financial statements and financial highlights are included in Item 1 of this Form N-CSR), and the schedule of investments in securities as of October 31, 2014 (included in Item 6 of this Form N-CSR). These financial statements, financial highlights, and schedule of investments in securities are the responsibility of the Fund’s management. Our responsibility is to express an opinion on these financial statements, financial highlights, and schedule of investments in securities based on our audits.
We conducted our audits in accordance with the standards of the Public Company Accounting Oversight Board (United States). Those standards require that we plan and perform the audit to obtain reasonable assurance about whether the financial statements, financial highlights, and schedule of investments in securities are free of material misstatement. An audit includes examining, on a test basis, evidence supporting the amounts and disclosures in the financial statements and schedule of investments in securities. Our procedures included confirmation of securities owned as of October 31, 2014, by correspondence with the custodian and brokers; where replies were not received from brokers, we performed other auditing procedures. An audit also includes assessing the accounting principles used and significant estimates made by management, as well as evaluating the overall financial statement presentation. We believe that our audits provide a reasonable basis for our opinion.
In our opinion, the financial statements, financial highlights, and schedule of investments in securities referred to above present fairly, in all material respects, the financial position of American Mutual Fund as of October 31, 2014, and the results of its operations for the year then ended, the changes in its net assets for each of the two years in the period then ended, and the financial highlights for each of the five years in the period then ended, in conformity with accounting principles generally accepted in the United States of America.
DELOITTE & TOUCHE LLP
Costa Mesa, California
December 8, 2014
ITEM 7 – Disclosure of Proxy Voting Policies and Procedures for Closed-End Management Investment Companies
Not applicable to this Registrant, insofar as the Registrant is not a closed-end management investment company.
ITEM 8 – Portfolio Managers of Closed-End Management Investment Companies
Not applicable to this Registrant, insofar as the Registrant is not a closed-end management investment company.
ITEM 9 – Purchases of Equity Securities by Closed-End Management Investment Company and Affiliated Purchasers
Not applicable to this Registrant, insofar as the Registrant is not a closed-end management investment company.
ITEM 10 – Submission of Matters to a Vote of Security Holders
There have been no material changes to the procedures by which shareholders may recommend nominees to the Registrant’s board of trustees since the Registrant last submitted a proxy statement to its shareholders. The procedures are as follows. The Registrant has a nominating and governance committee comprised solely of persons who are not considered ‘‘interested persons’’ of the Registrant within the meaning of the Investment Company Act of 1940, as amended. The committee periodically reviews such issues as the board’s composition, responsibilities, committees, compensation and other relevant issues, and recommends any appropriate changes to the full board of trustees. While the committee normally is able to identify from its own resources an ample number of qualified candidates, it will consider shareholder suggestions of persons to be considered as nominees to fill future vacancies on the board. Such suggestions must be sent in writing to the nominating and governance committee of the Registrant, c/o the Registrant’s Secretary, and must be accompanied by complete biographical and occupational data on the prospective nominee, along with a written consent of the prospective nominee for consideration of his or her name by the nominating and governance committee.
ITEM 11 – Controls and Procedures
| (a) | The Registrant’s Principal Executive Officer and Principal Financial Officer have concluded, based on their evaluation of the Registrant’s disclosure controls and procedures (as such term is defined in Rule 30a-3 under the Investment Company Act of 1940), that such controls and procedures are adequate and reasonably designed to achieve the purposes described in paragraph (c) of such rule. |
| (b) | There were no changes in the Registrant’s internal controls over financial reporting (as defined in Rule 30a-3(d) under the Investment Company Act of 1940) that occurred during the Registrant’s second fiscal quarter of the period covered by this report that has materially affected, or is reasonably likely to materially affect, the Registrant’s internal control over financial reporting. |
ITEM 12 – Exhibits
| (a)(1) | The Code of Ethics that is the subject of the disclosure required by Item 2 is attached as an exhibit hereto. |
| (a)(2) | The certifications required by Rule 30a-2 of the Investment Company Act of 1940 and Sections 302 and 906 of the Sarbanes-Oxley Act of 2002 are attached as exhibits hereto. |
SIGNATURES
Pursuant to the requirements of the Securities Exchange Act of 1934 and the Investment Company Act of 1940, the Registrant has duly caused this report to be signed on its behalf by the undersigned, thereunto duly authorized.
| AMERICAN MUTUAL FUND | |
| By /s/ Paul F. Roye | |
Paul F. Roye, Executive Vice President and Principal Executive Officer | |
| Date: December 31, 2014 |
Pursuant to the requirements of the Securities Exchange Act of 1934 and the Investment Company Act of 1940, this report has been signed below by the following persons on behalf of the Registrant and in the capacities and on the dates indicated.
| By /s/ Paul F. Roye |
Paul F. Roye, Executive Vice President and Principal Executive Officer |
| Date: December 31, 2014 |
| By /s/ Ari M. Vinocor |
Ari M. Vinocor, Treasurer and Principal Financial Officer |
| Date: December 31, 2014 |