UNITED STATES
SECURITIES AND EXCHANGE COMMISSION
Washington, D.C. 20549
FORM N-CSR
CERTIFIED SHAREHOLDER REPORT OF
REGISTERED MANAGEMENT INVESTMENT COMPANIES
Investment Company Act file number 811-2464
MFS SERIES TRUST IX
(Exact name of registrant as specified in charter)
500 Boylston Street, Boston, Massachusetts 02116
(Address of principal executive offices) (Zip code)
Susan S. Newton
Massachusetts Financial Services Company
500 Boylston Street
Boston, Massachusetts 02116
(Name and address of agents for service)
Registrant’s telephone number, including area code: (617) 954-5000
Date of fiscal year end: April 30*
Date of reporting period: April 30, 2008
| * | This Form N-CSR pertains to the following series of the Registrant: MFS Bond Fund, MFS Limited Maturity Fund, MFS Municipal Limited Maturity Fund, MFS Research Bond Fund and MFS Research Bond Fund J. The remaining series of the Registrant, MFS Inflation-Adjusted Bond Fund, has a fiscal year end of October 31. |
The MFS Intermediate Investment Bond Fund was reorganized into the MFS Research Bond Fund, both a series of MFS Series Trust IX, as of June 22, 2007.
| ITEM 1. | REPORTS TO STOCKHOLDERS. |

MFS® Bond Fund
SIPC Contact Information:
You may obtain information about the Securities Investor Protection Corporation (“SIPC”), including the SIPC Brochure, by contacting SIPC either by telephone (202-371-8300) or by accessing SIPC’s website address (www.sipc.org).
The report is prepared for the general information of shareholders. It is authorized for distribution to prospective investors only when preceded or accompanied by a current prospectus.
NOT FDIC INSURED Ÿ MAY LOSE VALUE Ÿ NO BANK OR CREDIT UNION GUARANTEE Ÿ NOT A DEPOSIT Ÿ NOT INSURED BY ANY FEDERAL GOVERNMENT AGENCY OR NCUA/NCUSIF
4/30/08
MFB-ANN

LETTER FROM THE CEO
Dear Shareholders:
Negative headlines tend to resonate during difficult markets, and we certainly have had more than our share of tough news recently. As a result consumer, and particularly investor, sentiment are at all-time lows. That said, I do think it is helpful to remember there are always silver linings in the storm clouds if you look hard enough.
Through all of the challenges we have faced, there are some positive underlying trends. In the United States, for example, institutional traders and credit market followers are just now showing increasing signs of confidence and are beginning to take on more risk. At the corporate level, earnings continue to be relatively strong as companies have reduced labor costs, controlled inventories, and relied less on debt to finance expansion. More broadly, low interest rates and strong demand for consumer goods and industrial equipment are good signs for the global economy.
While I do not mean to minimize the risks inherent in today’s markets, periods such as these allow the talented fund managers and research analysts we have at MFS® to test their convictions, reevaluate existing positions, and identify new investment ideas. Our investment process also includes a significant risk management component, with constant attention paid to monitoring market risk, so we can do our best to minimize any surprises to your portfolio.
For investors, this is a great time to check in with your advisor and make sure you have a sound investment plan in place — one that can keep your hard-earned money working over the long term through a strategy that involves asset allocation, diversification, and periodic portfolio rebalancing and reviews. A plan tailored to your distinct needs and goals continues to be the best approach to help you take advantage of the inevitable challenges — and opportunities — that present themselves over time.
Respectfully,

Robert J. Manning
Chief Executive Officer and Chief Investment Officer
MFS Investment Management®
June 16 2008
The opinions expressed in this letter are subject to change, may not be relied upon for investment advice, and no forecasts can be guaranteed.
1
PORTFOLIO COMPOSITION
Portfolio structure (i)

| | |
| Fixed income sectors (i) | | |
| High Grade Corporates | | 54.5% |
| High Yield Corporates | | 12.0% |
| Mortgage-Backed Securities | | 11.4% |
| U.S. Treasury Securities | | 7.3% |
| Commercial Mortgage-Backed Securities | | 7.2% |
| Emerging Market Bonds | | 2.6% |
| Municipal Bonds | | 1.4% |
| Asset-Backed Securities | | 0.6% |
| Non-U.S. Government Bonds | | 0.4% |
| Collateralized Debt Obligations | | 0.3% |
| Residential Mortgage-Backed Securities (o) | | 0.0% |
| | |
| Credit quality of bonds (r) | | |
| AAA | | 25.4% |
| AA | | 8.7% |
| A | | 16.4% |
| BBB | | 35.5% |
| BB | | 7.7% |
| B | | 4.8% |
| CCC | | 0.5% |
| Not Rated | | 1.0% |
| |
| Portfolio facts | | |
| Average Duration (d)(i) | | 5.2 |
| Average Life (i)(m) | | 7.8 yrs |
| Average Maturity (i)(m) | | 14.2 yrs |
| Average Credit Quality of Rated Securities (long-term) (a) | | A- |
| Average Credit Quality of Rated Securities (short-term) (a) | | A-1 |
| (a) | The average credit quality of rated securities is based upon a market weighted average of portfolio holdings that are rated by public rating agencies. |
| (d) | Duration is a measure of how much a bond’s price is likely to fluctuate with general changes in interest rates, e.g., if rates rise 1.00%, a bond with a 5-year duration is likely to lose about 5.00% of its value. |
| (i) | For purposes of this presentation, the bond component includes accrued interest amounts and may be positively or negatively impacted by the equivalent exposure from any derivative holdings, if applicable. |
| (m) | The average maturity shown is calculated using the final stated maturity on the portfolio’s holdings without taking into account any holdings which have been pre-refunded or pre-paid to an earlier date or which have a mandatory put date prior to the stated maturity. The average life shown takes into account these earlier dates. |
| (r) | Each security is assigned a rating from Moody’s Investors Service. If not rated by Moody’s, the rating will be that assigned by Standard & Poor’s. Likewise, if not assigned a rating by Standard & Poor’s, it will be based on the rating assigned by Fitch, Inc. For those portfolios that hold a security which is not rated by any of the three agencies, the security is considered Not Rated. Holdings in U.S. Treasuries and government agency mortgage-backed securities, if any, are included in the “AAA”-rating category. Percentages are based on the total market value of investments as of 4/30/08. |
Percentages are based on net assets as of 4/30/08, unless otherwise noted.
The portfolio is actively managed and current holdings may be different.
2
MANAGEMENT REVIEW
Summary of Results
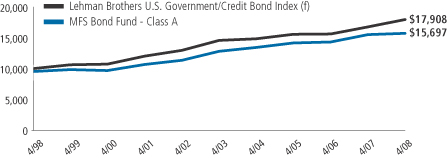
For the twelve months ended April 30, 2008, Class A shares of the MFS Bond Fund provided a total return of 1.41%, at net asset value. This compares with a return of 7.09% for the fund’s benchmark, the Lehman Brothers U.S. Government/Credit Bond Index.
Market Environment
The U.S. economy and financial markets experienced significant deterioration and heightened volatility over the reporting period. U.S. economic growth slowed significantly in the fourth quarter of 2007 and first quarter of 2008. Headwinds included accelerated deterioration in the housing market, subdued corporate investment, a markedly weaker job market, and a tighter credit environment as banks sought to repair balance sheets. During the period, the climax of the credit turmoil occurred in mid March as the Federal Reserve backstopped the distressed sale of failing Bear Stearns to JPMorgan. While reasonably resilient, parts of the global economy and financial system experienced some spillover from the U.S. slowdown. Japanese and European growth slowed over the reporting period and international financial markets were adversely affected by U.S. mortgage and structured product losses.
In the face of this financial and economic turmoil, most global central banks were forced to inject liquidity and to reassess their tightening biases as government bond yields declined and credit spreads widened. During the second half of the reporting period, the U.S. Federal Reserve Board began an aggressive rate cutting campaign, while the U.S. federal government moved quickly to design and implement a modest fiscal stimulus package. Although the Bank of England and the Bank of Canada also cut rates, the dilemma of rising energy and food prices heightened concerns among central bankers that inflationary expectations might become unhinged.
By the end of the reporting period, bond yields, credit spreads, and equity valuations implied market expectations consistent with the view that the worst of the credit dislocation was behind us. Nonetheless, the markets continued to price in further financial and economic weakening, albeit of a less tumultuous nature.
Detractors from Performance
The fund’s overweighted positions in the financial and industrial sectors were the primary detractors from performance relative to the Lehman Brothers U.S. Government/Credit Bond Index. Greater relative exposure to “A” and “BBB” rated(s) bonds also had a negative impact on relative returns. Holdings of below investment grade “BB”, “B”, and “CCC” rated bonds held back results as spreads widened amid the troubled credit markets. The fund’s greater exposure to commercial mortgage-backed securities further dampened performance relative to the benchmark.
3
Management Review – continued
Contributors to Performance
Yield was a positive contributor to the fund’s relative performance. During the period, the fund held bonds that produced a greater level of income than the benchmark.
Respectfully,
| | |
Richard Hawkins Portfolio Manager | | Robert Persons Portfolio Manager |
| (s) | Bonds rated “BBB”, “Baa”, or higher are considered investment grade; bonds rated “BB”, “Ba”, or below are considered non-investment grade. The primary source for bond quality ratings is Moody’s Investors Service. If not available, ratings by Standard & Poor’s are used, else ratings by Fitch, Inc. For securities which are not rated by any of the three agencies, the security is considered Not Rated. |
The views expressed in this report are those of the portfolio managers only through the end of the period of the report as stated on the cover and do not necessarily reflect the views of MFS or any other person in the MFS organization. These views are subject to change at any time based on market or other conditions, and MFS disclaims any responsibility to update such views. These views may not be relied upon as investment advice or an indication of trading intent on behalf of any MFS portfolio. References to specific securities are not recommendations of such securities, and may not be representative of any MFS portfolio’s current or future investments.
Note to Shareholders: At the close of business on April 18, 2008, Class R shares and Class R2 shares converted into Class R3 shares.
Following this conversion, Class R3, Class R4, and Class R5 shares were renamed Class R2, Class R3 and Class R4 shares, respectively.
4
PERFORMANCE SUMMARY THROUGH 4/30/08
The following chart illustrates a representative class of the fund’s historical performance in comparison to its benchmark. Performance results include the deduction of the maximum applicable sales charge and reflect the percentage change in net asset value, including reinvestment of dividends and capital gains distributions. The performance of other share classes will be greater than or less than that of the class depicted below. Benchmark comparisons are unmanaged; do not reflect sales charges, commissions or expenses; and cannot be invested in directly. (See Notes to Performance Summary.)
Performance data shown represents past performance and is no guarantee of future results. Investment return and principal value fluctuate so your shares, when sold, may be worth more or less than the original cost; current performance may be lower or higher than quoted. The performance shown does not reflect the deduction of taxes, if any, that a shareholder would pay on fund distributions or the redemption of fund shares.
Growth of a hypothetical $10,000 investment
5
Performance Summary – continued
Total Returns through 4/30/08
Average annual without sales charge
| | | | | | | | | | | | |
| | | Share class | | Class inception date | | 1-yr | | 5-yr | | 10-yr | | |
| | | A | | 5/08/74 | | 1.41% | | 4.14% | | 5.12% | | |
| | | B | | 9/07/93 | | 0.69% | | 3.41% | | 4.39% | | |
| | | C | | 1/03/94 | | 0.77% | | 3.43% | | 4.39% | | |
| | | I | | 1/02/97 | | 1.64% | | 4.46% | | 5.43% | | |
| | | R1 | | 4/01/05 | | 0.61% | | 3.34% | | 4.36% | | |
| | | R2 (formerly R3) | | 10/31/03 | | 1.03% | | 3.71% | | 4.54% | | |
| | | R3 (formerly R4) | | 4/01/05 | | 1.36% | | 4.09% | | 5.10% | | |
| | | R4 (formerly R5) | | 4/01/05 | | 1.65% | | 4.30% | | 5.20% | | |
Average Annual
Comparative Benchmark
| | | | | | | | | | |
| | | Lehman Brother U.S. Government/Credit Bond Index (f) | | 7.09% | | 4.27% | | 6.00% | | |
Average annual with sales charge
| | | | | | | | | | | | |
| | | A With Initial Sales Charge (4.75%) | | (3.40)% | | 3.13% | | 4.61% | | |
| | | B With CDSC (Declining over six years from 4% to 0%) (x) | | (3.14)% | | 3.09% | | 4.39% | | |
| | | C With CDSC (1% for 12 months) (x) | | (0.19)% | | 3.43% | | 4.39% | | |
Class I, Class R1, Class R2 (formerly Class R3), Class R3 (formerly Class R4), and Class R4 (formerly Class R5) shares do not have a sales charge.
CDSC – Contingent Deferred Sales Charge.
| (f) | Source: FactSet Research Systems Inc. |
| (x) | Assuming redemption at the end of the applicable period. |
Benchmark Definitions
Lehman Brothers U.S. Government/Credit Bond Index – a market capitalization-weighted index that measures the performance of investment-grade debt obligations of the U.S. Treasury and U.S. government agencies, as well as U.S. corporate and foreign debentures and secured notes that meet specified maturity, liquidity, and quality requirements.
It is not possible to invest directly in an index.
Notes to Performance Summary
Performance for classes R3 and R4 shares includes the performance of the fund’s class A shares for periods prior to their offering. Performance for classes R1 and R2 shares includes the performance of the fund’s class B shares for
6
Performance Summary – continued
periods prior to their offering. This blended class performance has been adjusted to take into account differences in sales loads, if any, applicable to these share classes, but has not been adjusted to take into account differences in class specific operating expenses (such as Rule 12b-1 fees). Compared to performance these share classes would have experienced had they been offered for the entire period, the use of blended performance generally results in higher performance for share classes with higher operating expenses than the share class to which it is blended, and lower performance for share classes with lower operating expenses than the share class to which it is blended.
Performance results reflect any applicable expense subsidies and waivers in effect during the periods shown. Without such subsidies and waivers the fund’s performance results would be less favorable. Please see the prospectus and financial statements for complete details.
From time to time the fund may receive proceeds from litigation settlements, without which performance would be lower.
7
EXPENSE TABLE
Fund expenses borne by the shareholders during the period, November 1, 2007 through April 30, 2008
As a shareholder of the fund, you incur two types of costs: (1) transaction costs, including sales charges (loads) on certain purchase or redemption payments, and (2) ongoing costs, including management fees; distribution and service (12b-1) fees; and other fund expenses. This example is intended to help you understand your ongoing costs (in dollars) of investing in the fund and to compare these costs with the ongoing costs of investing in other mutual funds.
The example is based on an investment of $1,000 invested at the beginning of the period and held for the entire period November 1, 2007 through April 30, 2008.
Actual Expenses
The first line for each share class in the following table provides information about actual account values and actual expenses. You may use the information in this line, together with the amount you invested, to estimate the expenses that you paid over the period. Simply divide your account value by $1,000 (for example, an $8,600 account value divided by $1,000 = 8.6), then multiply the result by the number in the first line under the heading entitled “Expenses Paid During Period” to estimate the expenses you paid on your account during this period.
Hypothetical Example for Comparison Purposes
The second line for each share class in the following table provides information about hypothetical account values and hypothetical expenses based on the fund’s actual expense ratio and an assumed rate of return of 5% per year before expenses, which is not the fund’s actual return. The hypothetical account values and expenses may not be used to estimate the actual ending account balance or expenses you paid for the period. You may use this information to compare the ongoing costs of investing in the fund and other funds. To do so, compare this 5% hypothetical example with the 5% hypothetical examples that appear in the shareholder reports of the other funds.
Please note that the expenses shown in the table are meant to highlight your ongoing costs only and do not reflect any transactional costs, such as sales charges (loads). Therefore, the second line for each share class in the table is useful in comparing ongoing costs only, and will not help you determine the relative total costs of owning different funds. In addition, if these transactional costs were included, your costs would have been higher.
8
Expense Table – continued
| | | | | | | | | | |
Share
Class | | | | Annualized
Expense
Ratio | | Beginning
Account Value
11/01/07 | | Ending
Account Value
4/30/08 | | Expenses
Paid During
Period (p)
11/01/07-4/30/08 |
| A | | Actual | | 0.88% | | $1,000.00 | | $1,006.15 | | $4.39 |
| | Hypothetical (h) | | 0.88% | | $1,000.00 | | $1,020.49 | | $4.42 |
| B | | Actual | | 1.58% | | $1,000.00 | | $1,002.57 | | $7.87 |
| | Hypothetical (h) | | 1.58% | | $1,000.00 | | $1,017.01 | | $7.92 |
| C | | Actual | | 1.58% | | $1,000.00 | | $1,003.36 | | $7.87 |
| | Hypothetical (h) | | 1.58% | | $1,000.00 | | $1,017.01 | | $7.92 |
| I | | Actual | | 0.58% | | $1,000.00 | | $1,007.67 | | $2.90 |
| | Hypothetical (h) | | 0.58% | | $1,000.00 | | $1,021.98 | | $2.92 |
| R1 | | Actual | | 1.65% | | $1,000.00 | | $1,003.05 | | $8.22 |
| | Hypothetical (h) | | 1.65% | | $1,000.00 | | $1,016.66 | | $8.27 |
R2
(formerly R3) | | Actual | | 1.12% | | $1,000.00 | | $1,004.89 | | $5.58 |
| | Hypothetical (h) | | 1.12% | | $1,000.00 | | $1,019.29 | | $5.62 |
R3
(formerly R4) | | Actual | | 0.88% | | $1,000.00 | | $1,006.96 | | $4.39 |
| | Hypothetical (h) | | 0.88% | | $1,000.00 | | $1,020.49 | | $4.42 |
R4
(formerly R5) | | Actual | | 0.61% | | $1,000.00 | | $1,008.32 | | $3.05 |
| | Hypothetical (h) | | 0.61% | | $1,000.00 | | $1,021.83 | | $3.07 |
| (h) | 5% class return per year before expenses. |
| (p) | Expenses paid is equal to each class’ annualized expense ratio, as shown above, multiplied by the average account value over the period, multiplied by the number of days in the period, divided by the number of days in the year. Expenses paid do not include any applicable sales charges (loads). If these transaction costs had been included, your costs would have been higher. |
Expense Changes Impacting the Table
Effective January 1, 2008 the fund’s Class R2 (formerly Class R3), Class R3 (formerly Class R4) and Class R4 (formerly Class R5) retirement plan administration and service fee was terminated (as described in Note 3 of the Notes to the Financial Statements). Had this fee change been in effect throughout the entire six month period, the annualized expense ratios would have been 1.07%, 0.82% and 0.57% for Class R2, Class R3 and Class R4 shares, respectively; the actual expenses paid during the period would have been approximately $5.35, $4.10 and $2.85 for Class R2, Class R3, and Class R4 shares, respectively; and the hypothetical expenses paid during the period would have been approximately $5.39, $4.13 and $2.87 for Class R2, Class R3 and Class R4 shares, respectively.
Effective March 1, 2008 the fund’s Class R1 retirement plan administration and service fee was terminated and the Class R1 distribution fee was increased (as described in Note 3 of the Notes to the Financial Statements). Had these fee changes been in effect throughout the entire six month
9
Expense Table – continued
period, the annualized expense ratio would have been 1.58%; the actual expenses paid during the period would have been approximately $7.89; and the hypothetical expenses paid during the period would have been approximately $7.95.
10
PORTFOLIO OF INVESTMENTS
4/30/08
The Portfolio of Investments is a complete list of all securities owned by your fund. It is categorized by broad-based asset classes.
| | | | | | |
| Bonds - 98.0% | | | | | | |
| Issuer | | Shares/Par | | Value ($) |
| | | | | | |
| Aerospace - 0.5% | | | | | | |
| Bombardier, Inc., 6.3%, 2014 (n) | | $ | 6,575,000 | | $ | 6,575,000 |
| | |
| Asset Backed & Securitized - 8.1% | | | | | | |
| ARCap REIT, Inc., CDO, “G”, 6.1%, 2045 (n) | | $ | 2,150,000 | | $ | 860,000 |
| Asset Securitization Corp., FRN, 8.631%, 2029 | | | 3,019,919 | | | 3,261,748 |
Bayview Financial Revolving Mortgage Loan Trust, FRN,
3.686%, 2040 (z) | | | 2,930,000 | | | 2,109,600 |
| BlackRock Capital Finance LP, 7.75%, 2026 (n) | | | 523,686 | | | 314,212 |
| Brazilian Merchant Voucher Receivables Ltd., 5.911%, 2011 (z) | | | 4,314,701 | | | 4,314,701 |
| Chase Commercial Mortgage Securities Corp., 6.6%, 2029 (z) | | | 1,736,421 | | | 1,799,117 |
Citigroup/Deutsche Bank Commercial Mortgage Trust, FRN,
5.366%, 2049 | | | 2,920,000 | | | 2,628,501 |
Citigroup/Deutsche Bank Commercial Mortgage Trust, FRN,
5.555%, 2049 | | | 3,156,000 | | | 1,992,525 |
| Commercial Mortgage Acceptance Corp., 1.088%, 2030 (i) | | | 32,433,130 | | | 862,715 |
| Countrywide Asset-Backed Certificates, FRN, 4.575%, 2035 | | | 148,923 | | | 147,783 |
| Credit Suisse Mortgage Capital Certificate, 5.343%, 2039 | | | 5,804,213 | | | 5,242,951 |
| DLJ Commercial Mortgage Corp., 6.04%, 2031 (z) | | | 2,675,000 | | | 2,641,680 |
| Falcon Franchise Loan LLC, 6.5%, 2014 (z) | | | 2,733,000 | | | 1,706,267 |
| Falcon Franchise Loan LLC, FRN, 3.844%, 2025 (i)(z) | | | 15,690,790 | | | 1,644,552 |
First Union-Lehman Brothers Commercial Mortgage Trust,
7%, 2029 (n) | | | 2,375,837 | | | 2,497,605 |
| GE Commercial Mortgage Corp., FRN, 5.518%, 2044 | | | 2,710,000 | | | 2,499,298 |
| GMAC Commercial Mortgage Securities, Inc., FRN, 6.02%, 2033 (z) | | | 4,140,000 | | | 3,911,868 |
GMAC Commercial Mortgage Securities, Inc., FRN,
7.918%, 2034 (n) | | | 3,212,000 | | | 3,251,351 |
| Greenwich Capital Commercial Funding Corp., 4.305%, 2042 | | | 3,544,438 | | | 3,519,494 |
| Greenwich Capital Commercial Funding Corp., FRN, 6.112%, 2038 | | | 2,125,000 | | | 2,024,605 |
JPMorgan Chase Commercial Mortgage Securities Corp.,
5.372%, 2047 | | | 5,200,000 | | | 4,716,559 |
| JPMorgan Chase Commercial Mortgage Securities Corp., FRN, 5.506%, 2042 (n) | | | 4,734,928 | | | 3,679,267 |
| JPMorgan Chase Commercial Mortgage Securities Corp., FRN, 5.542%, 2043 | | | 7,331,619 | | | 6,784,806 |
| JPMorgan Chase Commercial Mortgage Securities Corp., FRN, 5.855%, 2043 | | | 4,318,739 | | | 4,078,307 |
| JPMorgan Chase Commercial Mortgage Securities Corp., FRN, 5.038%, 2046 | | | 5,520,000 | | | 5,433,279 |
11
Portfolio of Investments – continued
| | | | | | |
| Issuer | | Shares/Par | | Value ($) |
| | | | | | |
| Bonds - continued | | | | | | |
| Asset Backed & Securitized - continued | | | | | | |
| KKR Financial CLO Ltd., “C”, CDO, FRN, 4.515%, 2021 (n) | | $ | 3,651,630 | | $ | 2,326,088 |
Lehman Brothers Commercial Conduit Mortgage Trust, FRN,
0.973%, 2030 (i) | | | 13,029,848 | | | 464,488 |
| Merrill Lynch Mortgage Trust, FRN, 6.023%, 2050 | | | 1,561,000 | | | 1,096,814 |
| Morgan Stanley Capital I, Inc., 5.72%, 2032 | | | 3,294,021 | | | 3,328,164 |
| Morgan Stanley Capital I, Inc., FRN, 0.66%, 2030 (i)(n) | | | 84,719,556 | | | 748,438 |
| Mortgage Capital Funding, Inc., FRN, 0.615%, 2031 (i) | | | 22,022,643 | | | 30,594 |
| Nomura Asset Acceptance Corp., FRN, 4.423%, 2034 | | | 580,703 | | | 580,519 |
| PNC Mortgage Acceptance Corp., FRN, 7.1%, 2032 (z) | | | 5,790,000 | | | 5,774,056 |
Prudential Securities Secured Financing Corp., FRN,
7.289%, 2013 (z) | | | 3,468,000 | | | 3,021,459 |
| Spirit Master Funding LLC, 5.05%, 2023 (z) | | | 2,713,906 | | | 2,118,448 |
| Wachovia Bank Commercial Mortgage Trust, FRN, 4.847%, 2041 | | | 3,448,527 | | | 3,363,091 |
| Wachovia Bank Commercial Mortgage Trust, FRN, 5.513%, 2043 | | | 1,030,000 | | | 708,621 |
| Wachovia Bank Commercial Mortgage Trust, FRN, 6.159%, 2045 | | | 4,320,000 | | | 4,127,697 |
| | | | | | |
| | | | | | $ | 99,611,268 |
| Automotive - 0.8% | | | | | | |
| Ford Motor Credit Co. LLC, 9.75%, 2010 | | $ | 3,470,000 | | $ | 3,371,112 |
| Johnson Controls, Inc., 5.5%, 2016 | | | 6,390,000 | | | 6,375,488 |
| | | | | | |
| | | | | | $ | 9,746,600 |
| Broadcasting - 1.5% | | | | | | |
| CBS Corp., 6.625%, 2011 | | $ | 6,040,000 | | $ | 6,223,284 |
| Clear Channel Communications, Inc., 7.65%, 2010 | | | 4,329,000 | | | 4,500,576 |
| Clear Channel Communications, Inc., 6.25%, 2011 | | | 3,130,000 | | | 2,660,500 |
| News America, Inc., 8.5%, 2025 | | | 4,931,000 | | | 5,713,653 |
| | | | | | |
| | | | | | $ | 19,098,013 |
| Brokerage & Asset Managers - 3.4% | | | | | | |
| Bear Stearns Cos., Inc., 5.85%, 2010 | | $ | 6,950,000 | | $ | 7,015,184 |
| Goldman Sachs Group, Inc., 5.625%, 2017 | | | 6,941,000 | | | 6,707,449 |
| INVESCO PLC, 4.5%, 2009 | | | 7,053,000 | | | 7,008,305 |
| Lehman Brothers Holdings, Inc., 6.2%, 2014 | | | 1,734,000 | | | 1,744,770 |
| Lehman Brothers Holdings, Inc., 6.5%, 2017 | | | 3,180,000 | | | 3,123,870 |
| Merrill Lynch & Co., Inc., 6.15%, 2013 | | | 3,390,000 | | | 3,382,912 |
| Merrill Lynch & Co., Inc., 6.05%, 2016 | | | 3,281,000 | | | 3,148,139 |
| Morgan Stanley, 5.75%, 2016 | | | 5,924,000 | | | 5,800,846 |
| Morgan Stanley Group, Inc., 6.625%, 2018 | | | 3,510,000 | | | 3,639,235 |
| | | | | | |
| | | | | | $ | 41,570,710 |
| Building - 0.2% | | | | | | |
| American Standard Cos., Inc., 7.625%, 2010 | | $ | 1,955,000 | | $ | 2,066,750 |
12
Portfolio of Investments – continued
| | | | | | |
| Issuer | | Shares/Par | | Value ($) |
| | | | | | |
| Bonds - continued | | | | | | |
| Business Services - 0.4% | | | | | | |
| Xerox Corp., 5.65%, 2013 | | $ | 4,930,000 | | $ | 4,942,710 |
| | |
| Cable TV - 1.1% | | | | | | |
| Comcast Corp., 5.875%, 2018 | | $ | 1,574,000 | | $ | 1,569,672 |
| Cox Communications, Inc., 4.625%, 2013 | | | 6,087,000 | | | 5,846,095 |
| TCI Communications, Inc., 9.8%, 2012 | | | 3,539,000 | | | 3,989,547 |
| Time Warner Entertainment Co. LP, 8.375%, 2033 | | | 1,734,000 | | | 2,018,499 |
| | | | | | |
| | | | | | $ | 13,423,813 |
| Chemicals - 0.3% | | | | | | |
| PPG Industries, Inc., 5.75%, 2013 | | $ | 3,640,000 | | $ | 3,734,210 |
| | |
| Computer Software - 0.6% | | | | | | |
| Seagate Technology HDD Holdings, 6.375%, 2011 | | $ | 7,013,000 | | $ | 6,890,273 |
| | |
| Conglomerates - 0.3% | | | | | | |
| Kennametal, Inc., 7.2%, 2012 | | $ | 3,091,000 | | $ | 3,312,226 |
| | |
| Construction - 1.0% | | | | | | |
| D.R. Horton, Inc., 7.875%, 2011 | | $ | 4,993,000 | | $ | 4,880,658 |
| D.R. Horton, Inc., 5.625%, 2014 | | | 1,731,000 | | | 1,518,953 |
| Pulte Homes, Inc., 4.875%, 2009 | | | 6,571,000 | | | 6,341,015 |
| | | | | | |
| | | | | | $ | 12,740,626 |
| Consumer Goods & Services - 1.6% | | | | | | |
| Clorox Co., 5%, 2013 | | $ | 4,780,000 | | $ | 4,721,340 |
| Fortune Brands, Inc., 5.125%, 2011 | | | 6,080,000 | | | 6,041,891 |
| Service Corp. International, 7.375%, 2014 | | | 1,880,000 | | | 1,936,400 |
| Western Union Co., 5.4%, 2011 | | | 7,660,000 | | | 7,656,790 |
| | | | | | |
| | | | | | $ | 20,356,421 |
| Defense Electronics - 1.2% | | | | | | |
| L-3 Communications Corp., 6.375%, 2015 | | $ | 6,885,000 | | $ | 6,807,544 |
| Litton Industries, Inc., 8%, 2009 | | | 8,035,000 | | | 8,418,374 |
| | | | | | |
| | | | | | $ | 15,225,918 |
| Electronics - 0.3% | | | | | | |
| Tyco Electronics Ltd., 6.55%, 2017 (n) | | $ | 2,450,000 | | $ | 2,508,310 |
| Tyco Electronics Ltd., 7.125%, 2037 (n) | | | 1,700,000 | | | 1,741,009 |
| | | | | | |
| | | | | | $ | 4,249,319 |
13
Portfolio of Investments – continued
| | | | | | |
| Issuer | | Shares/Par | | Value ($) |
| | | | | | |
| Bonds - continued | | | | | | |
| Emerging Market Quasi-Sovereign - 0.7% | | | | | | |
| OAO Gazprom, 9.625%, 2013 | | $ | 470,000 | | $ | 533,450 |
| OAO Gazprom, 7.343%, 2013 (z) | | | 1,210,000 | | | 1,265,963 |
| OAO Gazprom, 8.146%, 2018 (z) | | | 2,710,000 | | | 2,875,988 |
| Pemex Finance Ltd., 9.69%, 2009 | | | 2,349,600 | | | 2,405,427 |
| Pemex Finance Ltd., 10.61%, 2017 | | | 1,500,000 | | | 1,879,050 |
| | | | | | |
| | | | | | $ | 8,959,878 |
| Emerging Market Sovereign - 0.2% | | | | | | |
| Republic of Argentina, FRN, 3.092%, 2012 | | $ | 3,118,125 | | $ | 2,665,100 |
| | |
| Energy - Independent - 1.3% | | | | | | |
| Nexen, Inc., 6.4%, 2037 | | $ | 6,380,000 | | $ | 6,239,213 |
| Ocean Energy, Inc., 7.25%, 2011 | | | 8,687,000 | | | 9,419,366 |
| | | | | | |
| | | | | | $ | 15,658,579 |
| Entertainment - 0.7% | | | | | | |
| Time Warner, Inc., 9.125%, 2013 | | $ | 6,649,000 | | $ | 7,475,624 |
| Time Warner, Inc., 6.5%, 2036 | | | 1,100,000 | | | 1,037,463 |
| | | | | | |
| | | | | | $ | 8,513,087 |
| Financial Institutions - 2.9% | | | | | | |
| American Express Centurion Bank, 5.55%, 2012 | | $ | 5,510,000 | | $ | 5,514,149 |
| CIT Group, Inc., 6.1% to 2017, FRN to 2067 | | | 1,030,000 | | | 537,997 |
| General Electric Co., 5.625%, 2018 | | | 6,320,000 | | | 6,384,616 |
| General Motors Acceptance Corp., 7.25%, 2011 | | | 4,461,000 | | | 3,784,284 |
| HSBC Finance Corp., 5.5%, 2016 | | | 8,598,000 | | | 8,510,051 |
| ILFC E-Capital Trust I, 5.9% to 2010, FRN to 2065 (n) | | | 6,900,000 | | | 5,466,366 |
| International Lease Finance Corp., 5.625%, 2013 | | | 3,380,000 | | | 3,329,919 |
| Residential Capital LLC, 8.5%, 2012 | | | 3,440,000 | | | 1,754,400 |
| | | | | | |
| | | | | | $ | 35,281,782 |
| Food & Beverages - 2.6% | | | | | | |
| Diageo Capital PLC, 5.5%, 2016 | | $ | 6,930,000 | | $ | 6,954,213 |
| Dr Pepper Snapple Group, Inc., 6.82%, 2018 (z) | | | 3,980,000 | | | 4,128,661 |
| General Mills, Inc., 5.65%, 2012 | | | 4,110,000 | | | 4,230,707 |
| Miller Brewing Co., 5.5%, 2013 (n) | | | 9,815,000 | | | 10,162,579 |
| Tyson Foods, Inc., 6.85%, 2016 | | | 6,160,000 | | | 6,118,408 |
| | | | | | |
| | | | | | $ | 31,594,568 |
| Food & Drug Stores - 0.4% | | | | | | |
| CVS Caremark Corp., 5.75%, 2017 | | $ | 4,388,000 | | $ | 4,446,562 |
14
Portfolio of Investments – continued
| | | | | | |
| Issuer | | Shares/Par | | Value ($) |
| | | | | | |
| Bonds - continued | | | | | | |
| Forest & Paper Products - 0.3% | | | | | | |
| Stora Enso Oyj, 7.25%, 2036 (n) | | $ | 4,707,000 | | $ | 3,972,990 |
| | |
| Gaming & Lodging - 1.4% | | | | | | |
| MGM Mirage, 8.375%, 2011 | | $ | 6,070,000 | | $ | 6,039,650 |
| Royal Caribbean Cruises Ltd., 8%, 2010 | | | 4,190,000 | | | 4,284,275 |
| Starwood Hotels & Resorts Worldwide, Inc., 7.875%, 2012 | | | 3,425,000 | | | 3,607,717 |
| Wyndham Worldwide Corp., 6%, 2016 | | | 4,380,000 | | | 3,941,544 |
| | | | | | |
| | | | | | $ | 17,873,186 |
| Industrial - 0.4% | | | | | | |
| Steelcase, Inc., 6.5%, 2011 | | $ | 5,024,000 | | $ | 5,091,744 |
| | |
| Insurance - 2.1% | | | | | | |
| American International Group, Inc., 6.25%, 2037 | | $ | 5,320,000 | | $ | 4,690,591 |
| ING Groep N.V., 5.775% to 2015, FRN to 2049 | | | 4,906,000 | | | 4,215,314 |
| Metropolitan Life Global Funding, 5.125%, 2013 (z) | | | 4,190,000 | | | 4,189,736 |
| Prudential Financial, Inc., 6%, 2017 | | | 3,720,000 | | | 3,750,701 |
| UnumProvident Corp., 6.85%, 2015 (n) | | | 8,751,000 | | | 8,796,103 |
| | | | | | |
| | | | | | $ | 25,642,445 |
| Insurance - Health - 0.2% | | | | | | |
| UnitedHealth Group, Inc., 6.875%, 2038 | | $ | 2,425,000 | | $ | 2,366,136 |
| | |
| Insurance - Property & Casualty - 1.3% | | | | | | |
| AXIS Capital Holdings Ltd., 5.75%, 2014 | | $ | 3,795,000 | | $ | 3,642,342 |
| Chubb Corp., 6.375% to 2017, FRN to 2037 | | | 1,838,000 | | | 1,714,951 |
| Fund American Cos., Inc., 5.875%, 2013 | | | 6,104,000 | | | 5,971,378 |
| ZFS Finance USA Trust V, 6.5% to 2017, FRN to 2037 (n) | | | 5,610,000 | | | 4,941,972 |
| | | | | | |
| | | | | | $ | 16,270,643 |
| Machinery & Tools - 0.6% | | | | | | |
| Case New Holland, Inc., 7.125%, 2014 | | $ | 6,815,000 | | $ | 6,849,075 |
| | |
| Major Banks - 5.8% | | | | | | |
| BAC Capital Trust XIV, 5.63% to 2012, FRN to 2049 | | $ | 4,150,000 | | $ | 3,333,533 |
| Bank of America Corp., 5.49%, 2019 | | | 2,815,000 | | | 2,749,658 |
| Barclays Bank PLC, 8.55% to 2011, FRN to 2049 (n) | | | 6,318,000 | | | 6,334,976 |
| BNP Paribas, 7.195% to 2037, FRN to 2049 (n) | | | 4,300,000 | | | 4,033,955 |
| MUFG Capital Finance 1 Ltd., 6.346% to 2016, FRN to 2049 | | | 10,231,000 | | | 9,246,921 |
| Natexis AMBS Co. LLC, 8.44% to 2008, FRN to 2049 (n) | | | 9,752,000 | | | 9,821,639 |
| Natixis S.A., 10% to 2018, FRN to 2049 (z) | | | 4,000,000 | | | 4,044,120 |
| PNC Funding Corp., 5.625%, 2017 | | | 4,570,000 | | | 4,385,335 |
| Royal Bank of Scotland Group PLC, 6.99% to 2017, FRN to 2049 (n) | | | 1,960,000 | | | 1,799,019 |
| Royal Bank of Scotland Group PLC, 9.118%, 2049 | | | 2,152,000 | | | 2,175,573 |
| UniCredito Italiano Capital Trust II, 9.2% to 2010, FRN to 2049 (n) | | | 5,204,000 | | | 5,145,923 |
15
Portfolio of Investments – continued
| | | | | | |
| Issuer | | Shares/Par | | Value ($) |
| | | | | | |
| Bonds - continued | | | | | | |
| Major Banks - continued | | | | | | |
| Unicredito Luxembourg Finance S.A., 6%, 2017 (n) | | $ | 6,850,000 | | $ | 6,628,533 |
| Wachovia Capital Trust III, 5.8% to 2011, FRN to 2042 | | | 6,500,000 | | | 5,167,500 |
| Wachovia Corp., 6.605%, 2025 | | | 7,936,000 | | | 7,367,211 |
| | | | | | |
| | | | | | $ | 72,233,896 |
| Medical & Health Technology & Services - 2.5% | | | | | | |
| Covidien Ltd., 6%, 2017 (n) | | $ | 2,740,000 | | $ | 2,801,088 |
| Covidien Ltd., 6.55%, 2037 (n) | | | 3,470,000 | | | 3,547,270 |
| Fisher Scientific International, Inc., 6.125%, 2015 | | | 9,060,000 | | | 9,038,238 |
| HCA, Inc., 8.75%, 2010 | | | 4,117,000 | | | 4,230,218 |
| Hospira, Inc., 5.55%, 2012 | | | 1,390,000 | | | 1,374,820 |
| Hospira, Inc., 6.05%, 2017 | | | 5,030,000 | | | 4,924,863 |
| McKesson Corp., 5.7%, 2017 | | | 5,010,000 | | | 4,904,364 |
| | | | | | |
| | | | | | $ | 30,820,861 |
| Metals & Mining - 0.5% | | | | | | |
| International Steel Group, Inc., 6.5%, 2014 | | $ | 6,119,000 | | $ | 6,271,235 |
| | |
| Mortgage Backed - 11.4% | | | | | | |
| Fannie Mae, 5.5%, 2017 - 2035 | | $ | 33,988,026 | | $ | 34,514,318 |
| Fannie Mae, 6%, 2017 - 2035 | | | 10,022,812 | | | 10,286,560 |
| Fannie Mae, 4.5%, 2018 | | | 9,147,690 | | | 9,100,701 |
| Fannie Mae, 7.5%, 2030 - 2031 | | | 1,908,496 | | | 2,056,384 |
| Fannie Mae, 6.5%, 2032 - 2036 | | | 6,166,589 | | | 6,417,700 |
| Freddie Mac, 6%, 2021 - 2034 | | | 4,016,100 | | | 4,134,621 |
| Freddie Mac, 5%, 2025 - 2035 | | | 25,879,668 | | | 25,549,102 |
| Freddie Mac, 5.5%, 2035 - 2038 | | | 23,583,026 | | | 23,765,570 |
| Ginnie Mae, 6%, 2036 | | | 11,856,824 | | | 12,204,643 |
| Ginnie Mae, 5.5%, 2038 | | | 12,357,000 | | | 12,516,185 |
| | | | | | |
| | | | | | $ | 140,545,784 |
| Municipals - 1.4% | | | | | | |
| Hacienda La Puente, CA, Unified School District Facilities Authority Rev., FSA, 5%, 2027 | | $ | 4,675,000 | | $ | 4,967,234 |
| Harris County, TX, “C”, FSA, 5.25%, 2031 | | | 3,325,000 | | | 3,626,578 |
| Harris County, TX, “C”, FSA, 5.25%, 2032 | | | 3,335,000 | | | 3,639,486 |
| Metropolitan Atlanta, GA, Rapid Transit Tax Authority Rev., “A”, FGIC, 5.25%, 2032 | | | 4,900,000 | | | 5,308,709 |
| | | | | | |
| | | | | | $ | 17,542,007 |
| Natural Gas - Pipeline - 3.2% | | | | | | |
| CenterPoint Energy, Inc., 7.875%, 2013 | | $ | 8,438,000 | | $ | 9,216,895 |
| CenterPoint Energy, Inc., 5.95%, 2017 | | | 2,950,000 | | | 2,831,198 |
16
Portfolio of Investments – continued
| | | | | | |
| Issuer | | Shares/Par | | Value ($) |
| | | | | | |
| Bonds - continued | | | | | | |
| Natural Gas - Pipeline - continued | | | | | | |
| Enterprise Products Operating LP, 5.65%, 2013 | | $ | 2,434,000 | | $ | 2,450,425 |
| Enterprise Products Partners LP, 6.3%, 2017 | | | 3,590,000 | | | 3,658,235 |
| Kinder Morgan Energy Partners LP, 5.125%, 2014 | | | 2,559,000 | | | 2,484,032 |
| Kinder Morgan Energy Partners LP, 7.4%, 2031 | | | 3,627,000 | | | 3,765,450 |
| Spectra Energy Capital LLC, 8%, 2019 | | | 5,750,000 | | | 6,363,025 |
| Williams Cos., Inc., 7.125%, 2011 | | | 8,651,000 | | | 9,191,688 |
| | | | | | |
| | | | | | $ | 39,960,948 |
| Network & Telecom - 4.3% | | | | | | |
| AT&T, Inc., 5.1%, 2014 | | $ | 8,569,000 | | $ | 8,595,675 |
| British Telecommunications PLC, 5.15%, 2013 | | | 5,460,000 | | | 5,484,406 |
| CenturyTel, Inc., 8.375%, 2010 | | | 230,000 | | | 248,060 |
| Deutsche Telekom International Finance B.V., 8%, 2010 | | | 3,029,000 | | | 3,244,816 |
| Telecom Italia Capital, 6.2%, 2011 | | | 6,070,000 | | | 6,114,754 |
| Telefonica Emisiones S.A.U., 7.045%, 2036 | | | 3,450,000 | | | 3,771,319 |
| Telefonica Europe B.V., 7.75%, 2010 | | | 6,019,000 | | | 6,455,684 |
| TELUS Corp., 8%, 2011 | | | 11,676,000 | | | 12,596,010 |
| Verizon New York, Inc., 6.875%, 2012 | | | 6,786,000 | | | 7,148,393 |
| | | | | | |
| | | | | | $ | 53,659,117 |
| Oil Services - 0.5% | | | | | | |
| Weatherford International Ltd., 5.15%, 2013 | | $ | 3,280,000 | | $ | 3,292,454 |
| Weatherford International Ltd., 6.35%, 2017 | | | 3,000,000 | | | 3,158,643 |
| | | | | | |
| | | | | | $ | 6,451,097 |
| Oils - 0.9% | | | | | | |
| Premcor Refining Group, Inc., 7.5%, 2015 | | $ | 10,500,000 | | $ | 10,949,159 |
| | |
| Other Banks & Diversified Financials - 4.2% | | | | | | |
Alfa Diversified Payment Rights Finance Co. S.A., FRN,
4.7%, 2011 (n) | | $ | 2,682,000 | | $ | 2,561,310 |
Alfa Diversified Payment Rights Finance Co. S.A., FRN,
4.8%, 2012 (z) | | | 3,470,000 | | | 3,186,813 |
| Citigroup, Inc., 5.5%, 2013 | | | 6,830,000 | | | 6,871,622 |
| Citigroup, Inc., 8.4% to 2018, FRN to 2049 | | | 6,770,000 | | | 6,851,782 |
| Credit Suisse (USA), Inc., 4.875%, 2010 | | | 8,611,000 | | | 8,753,891 |
| Fifth Third Bancorp, 5.45%, 2017 | | | 460,000 | | | 429,048 |
| Mizuho Financial Group, Inc., 5.79%, 2014 (n) | | | 5,310,000 | | | 5,472,730 |
| Nordea Bank AB, 5.424% to 2015, FRN to 2049 (n) | | | 4,178,000 | | | 3,510,911 |
| Resona Bank Ltd., 5.85% to 2016, FRN to 2049 (n) | | | 6,312,000 | | | 5,323,654 |
| UBS Preferred Funding Trust V, 6.243% to 2016, FRN to 2049 | | | 3,471,000 | | | 3,037,833 |
| UFJ Finance Aruba AEC, 6.75%, 2013 | | | 6,193,000 | | | 6,388,296 |
| | | | | | |
| | | | | | $ | 52,387,890 |
17
Portfolio of Investments – continued
| | | | | | |
| Issuer | | Shares/Par | | Value ($) |
| | | | | | |
| Bonds - continued | | | | | | |
| Printing & Publishing - 0.2% | | | | | | |
| Pearson PLC, 5.5%, 2013 (z) | | $ | 1,930,000 | | $ | 1,945,073 |
| | |
| Railroad & Shipping - 1.2% | | | | | | |
| CSX Corp., 6.3%, 2012 | | $ | 4,932,000 | | $ | 5,082,850 |
| Kansas City Southern de Mexico, 7.375%, 2014 (n) | | | 2,170,000 | | | 2,058,788 |
| TFM S.A. de C.V., 9.375%, 2012 | | | 6,032,000 | | | 6,288,360 |
| Union Pacific Corp., 5.7%, 2018 | | | 1,725,000 | | | 1,744,912 |
| | | | | | |
| | | | | | $ | 15,174,910 |
| Real Estate - 2.8% | | | | | | |
| ERP Operating LP, REIT, 5.75%, 2017 | | $ | 6,580,000 | | $ | 6,174,290 |
| HRPT Properties Trust, REIT, 6.25%, 2016 | | | 6,245,000 | | | 5,772,990 |
| Liberty Property LP, REIT, 5.5%, 2016 | | | 4,340,000 | | | 3,856,507 |
| ProLogis, REIT, 5.75%, 2016 | | | 6,887,000 | | | 6,488,057 |
| ProLogis, REIT, 5.625%, 2016 | | | 1,300,000 | | | 1,209,863 |
| Simon Property Group, Inc., REIT, 6.35%, 2012 | | | 4,283,000 | | | 4,327,453 |
| Simon Property Group, Inc., REIT, 5.75%, 2015 | | | 6,800,000 | | | 6,648,074 |
| | | | | | |
| | | | | | $ | 34,477,234 |
| Restaurants - 0.3% | | | | | | |
| YUM! Brands, Inc., 8.875%, 2011 | | $ | 2,887,000 | | $ | 3,177,302 |
| | |
| Retailers - 2.0% | | | | | | |
| Federated Retail Holdings, Inc., 5.35%, 2012 | | $ | 3,170,000 | | $ | 2,953,933 |
| Home Depot, Inc., 5.25%, 2013 | | | 2,661,000 | | | 2,576,809 |
| Home Depot, Inc., 5.875%, 2036 | | | 3,866,000 | | | 3,232,011 |
| J.C. Penney Corp., Inc., 8%, 2010 | | | 527,000 | | | 543,705 |
| Macy’s, Inc., 6.625%, 2011 | | | 2,861,000 | | | 2,816,188 |
| Target Corp., 6.5%, 2037 | | | 2,623,000 | | | 2,643,525 |
| Wal-Mart Stores, Inc., 6.2%, 2038 | | | 5,470,000 | | | 5,567,355 |
| Wesfarmers Ltd., 6.998%, 2013 (z) | | | 4,170,000 | | | 4,337,918 |
| | | | | | |
| | | | | | $ | 24,671,444 |
| Steel - 0.3% | | | | | | |
| Evraz Group S.A., 8.875%, 2013 (z) | | $ | 3,033,000 | | $ | 3,070,913 |
| | |
| Supermarkets - 0.7% | | | | | | |
| Delhaize America, Inc., 9%, 2031 | | $ | 2,407,000 | | $ | 2,978,417 |
| Kroger Co., 6.4%, 2017 | | | 5,070,000 | | | 5,393,806 |
| | | | | | |
| | | | | | $ | 8,372,223 |
18
Portfolio of Investments – continued
| | | | | | |
| Issuer | | Shares/Par | | Value ($) |
| | | | | | |
| Bonds - continued | | | | | | |
| Supranational - 0.4% | | | | | | |
| Corporacion Andina de Fomento, 6.875%, 2012 | | $ | 2,747,000 | | $ | 2,876,543 |
| European Investment Bank, 5.125%, 2017 | | | 2,177,000 | | | 2,323,956 |
| | | | | | |
| | | | | | $ | 5,200,499 |
| Telecommunications - Wireless - 1.2% | | | | | | |
| Nextel Communications, Inc., 5.95%, 2014 | | $ | 9,650,000 | | $ | 7,527,000 |
| Rogers Cable, Inc., 5.5%, 2014 | | | 2,229,000 | | | 2,183,996 |
| Rogers Wireless, Inc., 7.25%, 2012 | | | 3,315,000 | | | 3,535,696 |
| Vodafone Group PLC, 5.625%, 2017 | | | 1,452,000 | | | 1,458,273 |
| | | | | | |
| | | | | | $ | 14,704,965 |
| Telephone Services - 0.3% | | | | | | |
| Embarq Corp., 7.082%, 2016 | | $ | 3,710,000 | | $ | 3,680,795 |
| | |
| Tobacco - 1.0% | | | | | | |
| Reynolds American, Inc., 7.25%, 2012 | | $ | 5,112,000 | | $ | 5,360,162 |
| Reynolds American, Inc., 6.75%, 2017 | | | 7,310,000 | | | 7,402,947 |
| | | | | | |
| | | | | | $ | 12,763,109 |
| Transportation - Services - 0.6% | | | | | | |
| FedEx Corp., 9.65%, 2012 | | $ | 5,930,000 | | $ | 6,925,938 |
| | |
| U.S. Treasury Obligations - 7.2% | | | | | | |
| U.S. Treasury Bonds, 6.25%, 2023 | | $ | 11,300,000 | | $ | 13,599,731 |
| U.S. Treasury Bonds, 5.375%, 2031 | | | 5,060,000 | | | 5,692,895 |
| U.S. Treasury Bonds, 4.375%, 2038 | | | 18,691,000 | | | 18,327,404 |
| U.S. Treasury Notes, 4.75%, 2014 | | | 13,062,000 | | | 14,200,850 |
| U.S. Treasury Notes, 4.875%, 2016 | | | 33,914,000 | | | 36,918,577 |
| | | | | | |
| | | | | | $ | 88,739,457 |
| Utilities - Electric Power - 8.7% | | | | | | |
| AES Corp., 8.875%, 2011 | | $ | 8,673,000 | | $ | 9,171,698 |
| Allegheny Energy Supply Co. LLC, 8.25%, 2012 (n) | | | 8,890,000 | | | 9,467,850 |
| Beaver Valley Funding Corp., 9%, 2017 | | | 9,694,000 | | | 10,617,063 |
| DPL, Inc., 6.875%, 2011 | | | 3,644,000 | | | 3,789,396 |
| E.On International Finance B.V., 6.65%, 2038 (z) | | | 6,330,000 | | | 6,513,165 |
| EDP Finance B.V., 6%, 2018 (n) | | | 6,800,000 | | | 6,919,156 |
| Enersis S.A., 7.375%, 2014 | | | 4,189,000 | | | 4,508,575 |
| Exelon Generation Co. LLC, 6.95%, 2011 | | | 11,821,000 | | | 12,393,491 |
| Mirant Americas Generation LLC, 8.3%, 2011 | | | 5,000,000 | | | 5,187,500 |
| NiSource Finance Corp., 7.875%, 2010 | | | 7,649,000 | | | 8,040,591 |
| NorthWestern Corp., 5.875%, 2014 | | | 4,275,000 | | | 4,255,412 |
| NRG Energy, Inc., 7.375%, 2016 | | | 9,430,000 | | | 9,712,900 |
19
Portfolio of Investments – continued
| | | | | | |
| Issuer | | Shares/Par | | Value ($) |
| | | | | | |
| Bonds - continued | | | | | | |
| Utilities - Electric Power - continued | | | | | | |
| PSEG Power LLC, 5.5%, 2015 | | $ | 1,705,000 | | $ | 1,667,708 |
| Reliant Energy, Inc., 7.625%, 2014 | | | 6,970,000 | | | 7,248,800 |
| System Energy Resources, Inc., 5.129%, 2014 (n) | | | 2,774,733 | | | 2,717,185 |
| Waterford 3 Funding Corp., 8.09%, 2017 | | | 5,874,653 | | | 5,757,160 |
| | | | | | |
| | | | | | $ | 107,967,650 |
| Total Bonds (Identified Cost, $1,236,877,976) | | | | | $ | 1,210,423,138 |
| | |
| Money Market Funds (v) - 0.1% | | | | | | |
MFS Institutional Money Market Portfolio, 2.66%,
at Cost and Net Asset Value | | | 1,760,385 | | $ | 1,760,385 |
| Total Investments (Identified Cost, $1,238,638,361) (k) | | | | | $ | 1,212,183,523 |
| | |
| Other Assets, Less Liabilities - 1.9% | | | | | | 23,439,851 |
| Net Assets - 100.0% | | | | | $ | 1,235,623,374 |
| (i) | Interest only security for which the fund receives interest on notional principal (Par amount). Par amount shown is the notional principal and does not reflect the cost of the security. |
| (k) | As of April 30, 2008, the fund held securities fair valued in accordance with the policies adopted by the Board of Trustees, aggregating $1,196,948,618 and 98.74% of market value. All these security values were provided by an independent pricing service using an evaluated bid. |
| (n) | Securities exempt from registration under Rule 144A of the Securities Act of 1933. These securities may be sold in the ordinary course of business in transactions exempt from registration, normally to qualified institutional buyers. At period end, the aggregate value of these securities was $135,985,277, representing 11.0% of net assets. |
| (v) | Underlying fund that is available only to investment companies managed by MFS. The rate quoted is the annualized seven-day yield of the fund at period end. |
| (z) | Restricted securities are not registered under the Securities Act of 1933 and are subject to legal restrictions on resale. These securities generally may be resold in transactions exempt from registration or to the public if the securities are subsequently registered. Disposal of these securities may involve time-consuming negotiations and prompt sale at an acceptable price may be difficult. The fund holds the following restricted securities: |
20
Portfolio of Investments – continued
| | | | | | |
| Restricted Securities | | Acquisition
Date | | Cost | | Current
Market
Value |
| Alfa Diversified Payment Rights Finance Co. S.A., FRN, 4.8%, 2012 | | 3/23/07 | | $3,470,000 | | $3,186,813 |
| Bayview Financial Revolving Mortgage Loan Trust, FRN, 3.686%, 2040 | | 3/01/06 | | 2,930,000 | | 2,109,600 |
| Brazilian Merchant Voucher Receivables Ltd., 5.911%, 2011 | | 7/02/03-3/08/07 | | 4,319,560 | | 4,314,701 |
| Chase Commercial Mortgage Securities Corp., 6.6%, 2029 | | 6/07/00 | | 1,642,969 | | 1,799,117 |
| DLJ Commercial Mortgage Corp., 6.04%, 2031 | | 7/23/04 | | 2,637,347 | | 2,641,680 |
| Dr Pepper Snapple Group, Inc., 6.82%, 2018 | | 4/25/08 | | 3,979,403 | | 4,128,661 |
| E.On International Finance B.V., 6.65%, 2038 | | 4/15/08-4/16/08 | | 6,319,020 | | 6,513,165 |
| Evraz Group S.A., 8.875%, 2013 | | 4/17/08-4/21/08 | | 3,080,303 | | 3,070,913 |
| Falcon Franchise Loan LLC, 6.5%, 2014 | | 7/15/05 | | 2,487,640 | | 1,706,267 |
Falcon Franchise Loan LLC, FRN,
3.844%, 2025 | | 1/29/03 | | 2,017,247 | | 1,644,552 |
| GMAC Commercial Mortgage Securities, Inc., FRN, 6.02%, 2033 | | 3/20/02 | | 3,807,369 | | 3,911,868 |
Metropolitan Life Global Funding,
5.125%, 2013 | | 4/07/08 | | 4,186,931 | | 4,189,736 |
| Natixis S.A., 10% to 2018, FRN to 2049 | | 4/24/08 | | 4,000,000 | | 4,044,120 |
| OAO Gazprom, 7.343%, 2013 | | 4/08/08 | | 1,260,945 | | 1,265,963 |
| OAO Gazprom, 8.146%, 2018 | | 4/02/08-4/03/08 | | 2,785,663 | | 2,875,988 |
PNC Mortgage Acceptance Corp., FRN,
7.1%, 2032 | | 3/25/08 | | 5,790,000 | | 5,774,056 |
| Pearson PLC, 5.5%, 2013 | | 4/29/08 | | 1,924,924 | | 1,945,073 |
| Prudential Securities Secured Financing Corp., FRN, 7.289%, 2013 | | 12/06/04 | | 3,704,743 | | 3,021,459 |
| Spirit Master Funding LLC, 5.05%, 2023 | | 10/04/05 | | 2,682,292 | | 2,118,448 |
| Wesfarmers Ltd., 6.998%, 2013 | | 4/03/08 | | 4,170,000 | | 4,337,918 |
| Total Restricted Securities | | | | | | $64,600,098 |
| % of Net Assets | | | | | | 5.2% |
The following abbreviations are used in this report and are defined:
| CDO | | Collateralized Debt Obligation |
| CLO | | Collateralized Loan Obligation |
| FRN | | Floating Rate Note. Interest rate resets periodically and may not be the rate reported at period end. |
| REIT | | Real Estate Investment Trust |
Insurers
| FGIC | | Financial Guaranty Insurance Co. |
| FSA | | Financial Security Assurance Inc. |
See Notes to Financial Statements
21
Portfolio of Investments – continued
Swap Agreements at 4/30/08
| | | | | | | | | | | | | |
| Expiration | | Notional
Amount | | Counterparty | | Cash Flows
to Receive | | Cash Flows
to Pay | | Value | |
| Credit Default Swaps | | | | | | | | | |
| 6/20/09 | | USD | | 3,500,000 | | JPMorgan Chase Bank | | 4.10%
(fixed rate) | | (1) | | $ (928,078 | ) |
| 12/20/12 | | USD | | 6,090,000 | | Merrill Lynch International | | 1.00%
(fixed rate) | | (2) | | (1,212,590 | ) |
| 12/20/12 | | USD | | 2,710,000 | | Goldman Sachs International | | (3) | | 1.30%
(fixed rate) | | (50,785 | ) |
| 12/20/12 | | USD | | 2,710,000 | | Goldman Sachs International | | (4) | | 1.55%
(fixed rate) | | (26,494 | ) |
| 12/20/12 | | USD | | 1,360,000 | | Morgan Stanley Capital Services, Inc. | | (5) | | 1.60%
(fixed rate) | | 4,581 | |
| 6/20/13 | | USD | | 2,740,000 | | Morgan Stanley Capital Services, Inc. | | (6) | | 1.07%
(fixed rate) | | (45,622 | ) |
| 6/20/13 | | USD | | 2,740,000 | | JPMorgan Chase Bank | | (7) | | 3.10%
(fixed rate) | | (125,378 | ) |
| 6/20/13 | | USD | | 1,560,000 | | JPMorgan Chase Bank | | (8) | | 1.12%
(fixed rate) | | (29,211 | ) |
| 6/20/13 | | USD | | 1,120,000 | | JPMorgan Chase Bank | | (8) | | 1.10%
(fixed rate) | | (20,955 | ) |
| 6/20/13 | | USD | | 2,740,000 | | JPMorgan Chase Bank | | (9) | | 0.85%
(fixed rate) | | (32,430 | ) |
| 6/20/13 | | USD | | 2,740,000 | | Merrill Lynch International | | (10) | | 0.52%
(fixed rate) | | (12,752 | ) |
| 6/20/13 | | USD | | 2,740,000 | | Morgan Stanley Capital Services, Inc. | | (11) | | 1.07%
(fixed rate) | | (21,463 | ) |
| 6/20/13 | | USD | | 2,670,000 | | Morgan Stanley Capital Services, Inc. | | (12) | | 1.48%
(fixed rate) | | (20,712 | ) |
| | | | | | | | | | | | | |
| | | | | | | | | | | | $(2,521,889 | ) |
| | | | | | | | | | | | | |
| (1) | Fund to pay notional amount upon a defined credit event by Abitibi – Consolidated, Inc., 8.375%, 4/01/15. |
| (2) | Fund to pay notional amount upon a defined credit event by MBIA, Inc., 6.625%, 10/01/28. |
| (3) | Fund to receive notional amount upon a defined credit event by Simon Property Group, Inc., 6.35%, 8/28/12. |
| (4) | Fund to receive notional amount upon a defined credit event by Equity Residential Property Trust, 5.75%, 6/15/17. |
| (5) | Fund to receive notional amount upon a defined credit event by Prologis, 7.1%, 4/15/08. |
| (6) | Fund to receive notional amount upon a defined credit event by Arrow Electronic, Inc., 6.875%, 6/01/18. |
| (7) | Fund to receive notional amount upon a defined credit event by Capital One Financial, 6.25%, 11/15/13. |
| (8) | Fund to receive notional amount upon a defined credit event by Universal Health Services, 7.125%, 6/30/16. |
| (9) | Fund to receive notional amount upon a defined credit event by Wells Fargo & Company, 3.107%, 10/28/15. |
| (10) | Fund to receive notional amount upon a defined credit event by Allstate Corp., 6.75%, 5/15/18. |
| (11) | Fund to receive notional amount upon a defined credit event by Nordstrom, Inc., 6.95%, 3/15/28. |
| (12) | Fund to receive notional amount upon a defined credit event by Weyerhaeuser Co., 7.125%, 7/15/23. |
At April 30, 2008, the series had sufficient cash and/or other liquid securities to cover any commitments under these derivative contracts.
22
Financial Statements
STATEMENT OF ASSETS AND LIABILITIES
At 4/30/08
This statement represents your fund’s balance sheet, which details the assets and liabilities comprising the total value of the fund.
| | | | | |
| Assets | | | | | |
Investments - Non-affiliated issuers, at value (identified cost, $1,236,877,976) | | $1,210,423,138 | | | |
| Underlying funds, at cost and value | | 1,760,385 | | | |
| Total investments, at value (identified cost, $1,238,638,361) | | 1,212,183,523 | | | |
| Cash | | 225,519 | | | |
| Restricted cash | | 2,170,000 | | | |
| Receivable for investments sold | | 19,771,775 | | | |
| Receivable for fund shares sold | | 1,072,042 | | | |
| Interest and dividends receivable | | 16,049,801 | | | |
| Swaps, at value | | 4,581 | | | |
| Other assets | | 11,107 | | | |
| Total assets | | | | | $1,251,488,348 |
| Liabilities | | | | | |
| Distributions payable | | $757,970 | | | |
| Payable for investments purchased | | 9,712,616 | | | |
| Payable for fund shares reacquired | | 2,166,183 | | | |
| Swaps, at value | | 2,526,470 | | | |
| Payable to affiliates | | | | | |
Management fee | | 20,118 | | | |
Shareholder servicing costs | | 407,366 | | | |
Distribution and service fees | | 25,462 | | | |
Administrative services fee | | 874 | | | |
| Payable for independent trustees’ compensation | | 96,439 | | | |
| Accrued expenses and other liabilities | | 151,476 | | | |
| Total liabilities | | | | | $15,864,974 |
| Net assets | | | | | $1,235,623,374 |
| Net assets consist of | | | | | |
| Paid-in capital | | $1,342,700,438 | | | |
| Unrealized appreciation (depreciation) on investments | | (28,976,727 | ) | | |
| Accumulated net realized gain (loss) on investments | | (77,893,341 | ) | | |
| Accumulated distributions in excess of net investment income | | (206,996 | ) | | |
| Net assets | | | | | $1,235,623,374 |
| Shares of beneficial interest outstanding | | | | | 101,506,358 |
23
Statement of Assets and Liabilities – continued
| | | | |
| Class A shares | | | | |
Net assets | | $769,598,938 | | |
Shares outstanding | | 63,188,880 | | |
Net asset value per share | | | | $12.18 |
Offering price per share (100 / 95.25 × net asset value per share) | | | | $12.79 |
| Class B shares | | | | |
Net assets | | $98,670,653 | | |
Shares outstanding | | 8,126,989 | | |
Net asset value and offering price per share | | | | $12.14 |
| Class C shares | | | | |
Net assets | | $75,665,878 | | |
Shares outstanding | | 6,239,882 | | |
Net asset value and offering price per share | | | | $12.13 |
| Class I shares | | | | |
Net assets | | $56,574,294 | | |
Shares outstanding | | 4,643,525 | | |
Net asset value, offering price, and redemption price per share | | | | $12.18 |
| Class R1 shares | | | | |
Net assets | | $8,350,502 | | |
Shares outstanding | | 688,054 | | |
Net asset value, offering price, and redemption price per share | | | | $12.14 |
| Class R2 shares (formerly Class R3 shares) | | | | |
Net assets | | $81,432,997 | | |
Shares outstanding | | 6,688,950 | | |
Net asset value, offering price, and redemption price per share | | | | $12.17 |
| Class R3 shares (formerly Class R4 shares) | | | | |
Net assets | | $59,232,921 | | |
Shares outstanding | | 4,864,444 | | |
Net asset value, offering price, and redemption price per share | | | | $12.18 |
| Class R4 shares (formerly Class R5 shares) | | | | |
Net assets | | $86,097,191 | | |
Shares outstanding | | 7,065,634 | | |
Net asset value, offering price, and redemption price per share | | | | $12.19 |
On sales of $50,000 or more, the offering price of Class A shares is reduced. A contingent deferred sales charge may be imposed on redemptions of Class A, Class B, and Class C shares.
See Notes to Financial Statements
24
Financial Statements
STATEMENT OF OPERATIONS
Year ended 4/30/08
This statement describes how much your fund earned in investment income and accrued in expenses. It also describes any gains and/or losses generated by fund operations.
| | | | | | |
| Net investment income | | | | | | |
| Income | | | | | | |
Interest | | $75,733,442 | | | | |
Dividends from underlying funds | | 1,720,601 | | | | |
| Total investment income | | | | | $77,454,043 | |
| Expenses | | | | | | |
Management fee | | $4,940,544 | | | | |
Distribution and service fees | | 5,030,088 | | | | |
Shareholder servicing costs | | 2,734,104 | | | | |
Administrative services fee | | 195,277 | | | | |
Retirement plan administration and services fees | | 158,985 | | | | |
Independent trustees’ compensation | | 32,975 | | | | |
Custodian fee | | 168,270 | | | | |
Shareholder communications | | 180,412 | | | | |
Auditing fees | | 63,095 | | | | |
Legal fees | | 18,827 | | | | |
Miscellaneous | | 224,151 | | | | |
| Total expenses | | | | | $13,746,728 | |
Reduction of expenses by investment adviser | | (1,133,208 | ) | | | |
| Net expenses | | | | | $12,613,520 | |
| Net investment income | | | | | $64,840,523 | |
| Realized and unrealized gain (loss) on investments | | | | | | |
| Realized gain (loss) (identified cost basis) | | | | | | |
Investment transactions | | $(12,032,975 | ) | | | |
Swap transactions | | (326,966 | ) | | | |
| Net realized gain (loss) on investments | | | | | $(12,359,941 | ) |
| Change in unrealized appreciation (depreciation) | | | | | | |
Investments | | $(34,283,903 | ) | | | |
Swap transactions | | (2,511,845 | ) | | | |
| Net unrealized gain (loss) on investments | | | | | $(36,795,748 | ) |
| Net realized and unrealized gain (loss) on investments | | | | | $(49,155,689 | ) |
| Change in net assets from operations | | | | | $15,684,834 | |
See Notes to Financial Statements
25
Financial Statements
STATEMENTS OF CHANGES IN NET ASSETS
These statements describe the increases and/or decreases in net assets resulting from operations, any distributions, and any shareholder transactions.
| | | | | | |
| | | Years ended 4/30 | |
| | | 2008 | | | 2007 | |
| Change in net assets | | | | | | |
| From operations | | | | | | |
| Net investment income | | $64,840,523 | | | $66,394,357 | |
| Net realized gain (loss) on investments | | (12,359,941 | ) | | 4,417,282 | |
| Net unrealized gain (loss) on investments | | (36,795,748 | ) | | 28,069,012 | |
| Change in net assets from operations | | $15,684,834 | | | $98,880,651 | |
| Distributions declared to shareholders | | | | | | |
| From net investment income | | | | | | |
Class A | | $(44,307,621 | ) | | $(46,541,934 | ) |
Class B | | (6,140,179 | ) | | (9,212,451 | ) |
Class C | | (3,720,135 | ) | | (3,708,159 | ) |
Class I | | (2,973,066 | ) | | (2,549,390 | ) |
Class R (b) | | (1,449,200 | ) | | (2,169,220 | ) |
Class R1 | | (299,057 | ) | | (125,469 | ) |
Former Class R2 (b) | | (280,502 | ) | | (79,913 | ) |
Class R2 (formerly Class R3) | | (2,294,280 | ) | | (929,392 | ) |
Class R3 (formerly Class R4) | | (2,882,499 | ) | | (1,179,768 | ) |
Class R4 (formerly Class R5) | | (4,297,522 | ) | | (826,175 | ) |
Class 529A | | — | | | (23,415 | ) |
Class 529B | | — | | | (7,535 | ) |
Class 529C | | — | | | (10,303 | ) |
| Total distributions declared to shareholders | | $(68,644,061 | ) | | $(67,363,124 | ) |
| Change in net assets from fund share transactions | | $(20,590,584 | ) | | $(34,861,439 | ) |
| Total change in net assets | | $(73,549,811 | ) | | $(3,343,912 | ) |
| Net assets | | | | | | |
| At beginning of period | | 1,309,173,185 | | | 1,312,517,097 | |
| At end of period (including accumulated distributions in excess of net investment income of $206,996 and $333,851, respectively) | | $1,235,623,374 | | | $1,309,173,185 | |
| (b) | At the close of business on April 18, 2008, Class R and Class R2 shares converted into Class R3 shares. Following the conversion, Class R3 shares were renamed Class R2 shares. |
See Notes to Financial Statements
26
Financial Statements
FINANCIAL HIGHLIGHTS
The financial highlights table is intended to help you understand the fund’s financial performance for the past 5 years (or life of a particular share class, if shorter). Certain information reflects financial results for a single fund share. The total returns in the table represent the rate by which an investor would have earned (or lost) on an investment in the fund share class (assuming reinvestment of all distributions) held for the entire period.
| | | | | | | | | | | | | | | |
| Class A | | Years ended 4/30 | |
| | | 2008 | | | 2007 | | | 2006 | | | 2005 | | | 2004 | |
| Net asset value, beginning of period | | $12.69 | | | $12.38 | | | $12.91 | | | $12.92 | | | $13.03 | |
| Income (loss) from investment operations | | | | | | | | | | | | | | | |
Net investment income (d) | | $0.64 | | | $0.66 | | | $0.64 | | | $0.65 | | | $0.65 | |
Net realized and unrealized gain (loss) on
investments and foreign currency | | (0.47 | ) | | 0.32 | | | (0.49 | ) | | 0.05 | | | (0.05 | ) |
| Total from investment operations | | $0.17 | | | $0.98 | | | $0.15 | | | $0.70 | | | $0.60 | |
Less distributions declared to
shareholders | | | | | | | | | | | | | | | |
From net investment income | | $(0.68 | ) | | $(0.67 | ) | | $(0.68 | ) | | $(0.71 | ) | | $(0.71 | ) |
| Net asset value, end of period | | $12.18 | | | $12.69 | | | $12.38 | | | $12.91 | | | $12.92 | |
| Total return (%) (r)(s)(t) | | 1.41 | | | 8.13 | | | 1.11 | | | 5.55 | | | 4.67 | |
Ratios (%) (to average net assets) and
Supplemental data: | | | | | | | | | | | | | | | |
| Expenses before expense reductions (f) | | 0.98 | | | 0.93 | | | 0.97 | | | 0.93 | | | 0.94 | |
| Expenses after expense reductions (f) | | 0.89 | | | 0.84 | | | 0.88 | | | 0.84 | | | 0.93 | |
| Net investment income | | 5.21 | | | 5.29 | | | 4.99 | | | 4.98 | | | 4.95 | |
| Portfolio turnover | | 56 | | | 45 | | | 55 | | | 40 | | | 73 | |
| Net assets at end of period (000 Omitted) | | $769,599 | | | $832,752 | | | $896,891 | | | $926,909 | | | $956,960 | |
See Notes to Financial Statements
27
Financial Highlights – continued
| | | | | | | | | | | | | | | |
| Class B | | Years ended 4/30 | |
| | | 2008 | | | 2007 | | | 2006 | | | 2005 | | | 2004 | |
| Net asset value, beginning of period | | $12.65 | | | $12.34 | | | $12.86 | | | $12.88 | | | $12.99 | |
Income (loss) from investment
operations | | | | | | | | | | | | | | | |
Net investment income (d) | | $0.56 | | | $0.57 | | | $0.55 | | | $0.56 | | | $0.55 | |
Net realized and unrealized gain (loss) on
investments and foreign currency | | (0.48 | ) | | 0.32 | | | (0.48 | ) | | 0.04 | | | (0.04 | ) |
| Total from investment operations | | $0.08 | | | $0.89 | | | $0.07 | | | $0.60 | | | $0.51 | |
Less distributions declared to
shareholders | | | | | | | | | | | | | | | |
From net investment income | | $(0.59 | ) | | $(0.58 | ) | | $(0.59 | ) | | $(0.62 | ) | | $(0.62 | ) |
| Net asset value, end of period | | $12.14 | | | $12.65 | | | $12.34 | | | $12.86 | | | $12.88 | |
| Total return (%) (r)(s)(t) | | 0.69 | | | 7.39 | | | 0.47 | | | 4.74 | | | 3.94 | |
Ratios (%) (to average net assets) and
Supplemental data: | | | | | | | | | | | | | | | |
| Expenses before expense reductions (f) | | 1.68 | | | 1.63 | | | 1.67 | | | 1.63 | | | 1.64 | |
| Expenses after expense reductions (f) | | 1.59 | | | 1.54 | | | 1.58 | | | 1.54 | | | 1.63 | |
| Net investment income | | 4.52 | | | 4.60 | | | 4.28 | | | 4.29 | | | 4.25 | |
| Portfolio turnover | | 56 | | | 45 | | | 55 | | | 40 | | | 73 | |
| Net assets at end of period (000 Omitted) | | $98,671 | | | $164,852 | | | $230,360 | | | $307,017 | | | $376,847 | |
See Notes to Financial Statements
28
Financial Highlights – continued
| | | | | | | | | | | | | | | |
| Class C | | Years ended 4/30 | |
| | | 2008 | | | 2007 | | | 2006 | | | 2005 | | | 2004 | |
| Net asset value, beginning of period | | $12.63 | | | $12.33 | | | $12.85 | | | $12.87 | | | $12.97 | |
Income (loss) from investment
operations | | | | | | | | | | | | | | | |
Net investment income (d) | | $0.56 | | | $0.57 | | | $0.54 | | | $0.55 | | | $0.55 | |
Net realized and unrealized gain (loss) on
investments and foreign currency | | (0.47 | ) | | 0.31 | | | (0.48 | ) | | 0.05 | | | (0.04 | ) |
| Total from investment operations | | $0.09 | | | $0.88 | | | $0.06 | | | $0.60 | | | $0.51 | |
Less distributions declared to
shareholders | | | | | | | | | | | | | | | |
From net investment income | | $(0.59 | ) | | $(0.58 | ) | | $(0.58 | ) | | $(0.62 | ) | | $(0.61 | ) |
| Net asset value, end of period | | $12.13 | | | $12.63 | | | $12.33 | | | $12.85 | | | $12.87 | |
| Total return (%) (r)(s)(t) | | 0.77 | | | 7.31 | | | 0.47 | | | 4.74 | | | 4.02 | |
Ratios (%) (to average net assets) and
Supplemental data: | | | | | | | | | | | | | | | |
| Expenses before expense reductions (f) | | 1.68 | | | 1.63 | | | 1.67 | | | 1.63 | | | 1.64 | |
| Expenses after expense reductions (f) | | 1.59 | | | 1.54 | | | 1.58 | | | 1.54 | | | 1.63 | |
| Net investment income | | 4.52 | | | 4.59 | | | 4.29 | | | 4.28 | | | 4.25 | |
| Portfolio turnover | | 56 | | | 45 | | | 55 | | | 40 | | | 73 | |
| Net assets at end of period (000 Omitted) | | $75,666 | | | $79,473 | | | $79,921 | | | $82,890 | | | $91,338 | |
See Notes to Financial Statements
29
Financial Highlights – continued
| | | | | | | | | | | | | | | |
| Class I | | Years ended 4/30 | |
| | | 2008 | | | 2007 | | | 2006 | | | 2005 | | | 2004 | |
| Net asset value, beginning of period | | $12.70 | | | $12.39 | | | $12.91 | | | $12.93 | | | $13.03 | |
Income (loss) from investment
operations | | | | | | | | | | | | | | | |
Net investment income (d) | | $0.68 | | | $0.70 | | | $0.67 | | | $0.69 | | | $0.69 | |
Net realized and unrealized gain (loss) on
investments and foreign currency | | (0.48 | ) | | 0.32 | | | (0.47 | ) | | 0.04 | | | (0.04 | ) |
| Total from investment operations | | $0.20 | | | $1.02 | | | $0.20 | | | $0.73 | | | $0.65 | |
Less distributions declared to
shareholders | | | | | | | | | | | | | | | |
From net investment income | | $(0.72 | ) | | $(0.71 | ) | | $(0.72 | ) | | $(0.75 | ) | | $(0.75 | ) |
| Net asset value, end of period | | $12.18 | | | $12.70 | | | $12.39 | | | $12.91 | | | $12.93 | |
| Total return (%) (r)(s) | | 1.64 | | | 8.45 | | | 1.50 | | | 5.79 | | | 5.06 | |
Ratios (%) (to average net assets) and
Supplemental data: | | | | | | | | | | | | | | | |
| Expenses before expense reductions (f) | | 0.67 | | | 0.63 | | | 0.67 | | | 0.63 | | | 0.64 | |
| Expenses after expense reductions (f) | | 0.58 | | | 0.54 | | | 0.58 | | | 0.54 | | | 0.63 | |
| Net investment income | | 5.50 | | | 5.59 | | | 5.29 | | | 5.28 | | | 5.25 | |
| Portfolio turnover | | 56 | | | 45 | | | 55 | | | 40 | | | 73 | |
| Net assets at end of period (000 Omitted) | | $56,574 | | | $49,251 | | | $41,976 | | | $44,604 | | | $41,613 | |
See Notes to Financial Statements
30
Financial Highlights – continued
| | | | | | | | | | | | |
| Class R1 | | Years ended 4/30 | |
| | | 2008 | | | 2007 | | | 2006 | | | 2005(i) | |
| Net asset value, beginning of period | | $12.65 | | | $12.34 | | | $12.86 | | | $12.80 | |
Income (loss) from investment
operations | | | | | | | | | | | | |
Net investment income (d) | | $0.55 | | | $0.56 | | | $0.53 | | | $0.04 | |
Net realized and unrealized gain (loss) on
investments and foreign currency | | (0.48 | ) | | 0.32 | | | (0.48 | ) | | 0.07 | (g) |
| Total from investment operations | | $0.07 | | | $0.88 | | | $0.05 | | | $0.11 | |
Less distributions declared to
shareholders | | | | | | | | | | | | |
From net investment income | | $(0.58 | ) | | $(0.57 | ) | | $(0.57 | ) | | $(0.05 | ) |
| Net asset value, end of period | | $12.14 | | | $12.65 | | | $12.34 | | | $12.86 | |
| Total return (%) (r)(s) | | 0.61 | | | 7.29 | | | 0.33 | | | 0.85 | (n) |
Ratios (%) (to average net assets) and
Supplemental data: | | | | | | | | | | | | |
| Expenses before expense reductions (f) | | 1.75 | | | 1.81 | | | 1.87 | | | 1.96 | (a) |
| Expenses after expense reductions (f) | | 1.66 | | | 1.64 | | | 1.70 | | | 1.87 | (a) |
| Net investment income | | 4.42 | | | 4.49 | | | 4.28 | | | 4.06 | (a) |
| Portfolio turnover | | 56 | | | 45 | | | 55 | | | 40 | |
| Net assets at end of period (000 Omitted) | | $8,351 | | | $3,612 | | | $1,900 | | | $50 | |
See Notes to Financial Statements
31
Financial Highlights – continued
| | | | | | | | | | | | | | | |
| Class R2 (formerly Class R3) | | Years ended 4/30 | |
| | | 2008 | | | 2007 | | | 2006 | | | 2005 | | | 2004(i) | |
| Net asset value, beginning of period | | $12.69 | | | $12.38 | | | $12.90 | | | $12.92 | | | $12.96 | |
Income (loss) from investment
operations | | | | | | | | | | | | | | | |
Net investment income (d) | | $0.59 | | | $0.62 | | | $0.58 | | | $0.53 | | | $0.31 | |
Net realized and unrealized gain (loss) on
investments and foreign currency | | (0.47 | ) | | 0.32 | | | (0.47 | ) | | 0.11 | | | (0.03 | )(g) |
| Total from investment operations | | $0.12 | | | $0.94 | | | $0.11 | | | $0.64 | | | $0.28 | |
Less distributions declared to
shareholders | | | | | | | | | | | | | | | |
From net investment income | | $(0.64 | ) | | $(0.63 | ) | | $(0.63 | ) | | $(0.66 | ) | | $(0.32 | ) |
| Net asset value, end of period | | $12.17 | | | $12.69 | | | $12.38 | | | $12.90 | | | $12.92 | |
| Total return (%) (r)(s) | | 1.03 | | | 7.76 | | | 0.80 | | | 5.00 | | | 2.16 | (n) |
Ratios (%) (to average net assets) and
Supplemental data: | | | | | | | | | | | | | | | |
| Expenses before expense reductions (f) | | 1.26 | | | 1.36 | | | 1.42 | | | 1.45 | | | 1.37 | (a) |
| Expenses after expense reductions (f) | | 1.17 | | | 1.19 | | | 1.26 | | | 1.36 | | | 1.35 | (a) |
| Net investment income | | 4.91 | | | 4.94 | | | 4.65 | | | 4.48 | | | 4.84 | (a) |
| Portfolio turnover | | 56 | | | 45 | | | 55 | | | 40 | | | 73 | |
| Net assets at end of period (000 Omitted) | | $81,433 | | | $27,069 | | | $9,992 | | | $4,039 | | | $256 | |
See Notes to Financial Statements
32
Financial Highlights – continued
| | | | | | | | | | | | |
| Class R3 (formerly Class R4) | | Years ended 4/30 | |
| | | 2008 | | | 2007 | | | 2006 | | | 2005(i) | |
| Net asset value, beginning of period | | $12.69 | | | $12.38 | | | $12.91 | | | $12.85 | |
Income (loss) from investment
operations | | | | | | | | | | | | |
Net investment income (d) | | $0.64 | | | $0.65 | | | $0.56 | | | $0.05 | |
Net realized and unrealized gain (loss) on
investments and foreign currency | | (0.47 | ) | | 0.32 | | | (0.43 | ) | | 0.07 | (g) |
| Total from investment operations | | $0.17 | | | $0.97 | | | $0.13 | | | $0.12 | |
Less distributions declared to
shareholders | | | | | | | | | | | | |
From net investment income | | $(0.68 | ) | | $(0.66 | ) | | $(0.66 | ) | | $(0.06 | ) |
| Net asset value, end of period | | $12.18 | | | $12.69 | | | $12.38 | | | $12.91 | |
| Total return (%) (r)(s) | | 1.36 | | | 8.03 | | | 1.01 | | | 0.91 | (n) |
Ratios (%) (to average net assets) and
Supplemental data: | | | | | | | | | | | | |
| Expenses before expense reductions (f) | | 1.02 | | | 1.02 | | | 1.09 | | | 1.19 | (a) |
| Expenses after expense reductions (f) | | 0.93 | | | 0.94 | | | 1.00 | | | 1.10 | (a) |
| Net investment income | | 5.16 | | | 5.19 | | | 5.08 | | | 4.93 | (a) |
| Portfolio turnover | | 56 | | | 45 | | | 55 | | | 40 | |
| Net assets at end of period (000 Omitted) | | $59,233 | | | $38,827 | | | $4,170 | | | $50 | |
See Notes to Financial Statements
33
Financial Highlights – continued
| | | | | | | | | | | | |
| Class R4 (formerly Class R5) | | Years ended 4/30 | |
| | | 2008 | | | 2007 | | | 2006 | | | 2005(i) | |
| Net asset value, beginning of period | | $12.70 | | | $12.38 | | | $12.91 | | | $12.85 | |
Income (loss) from investment
operations | | | | | | | | | | | | |
Net investment income (d) | | $0.67 | | | $0.68 | | | $0.66 | | | $0.06 | |
Net realized and unrealized gain (loss) on
investments and foreign currency | | (0.47 | ) | | 0.34 | | | (0.49 | ) | | 0.06 | (g) |
| Total from investment operations | | $0.20 | | | $1.02 | | | $0.17 | | | $0.12 | |
Less distributions declared to
shareholders | | | | | | | | | | | | |
From net investment income | | $(0.71 | ) | | $(0.70 | ) | | $(0.70 | ) | | $(0.06 | ) |
| Net asset value, end of period | | $12.19 | | | $12.70 | | | $12.38 | | | $12.91 | |
| Total return (%) (r)(s) | | 1.65 | | | 8.43 | | | 1.32 | | | 0.93 | (n) |
Ratios (%) (to average net assets) and
Supplemental data: | | | | | | | | | | | | |
| Expenses before expense reductions (f) | | 0.74 | | | 0.73 | | | 0.77 | | | 0.90 | (a) |
| Expenses after expense reductions (f) | | 0.65 | | | 0.64 | | | 0.68 | | | 0.81 | (a) |
| Net investment income | | 5.44 | | | 5.84 | | | 5.19 | | | 5.14 | (a) |
| Portfolio turnover | | 56 | | | 45 | | | 55 | | | 40 | |
| Net assets at end of period (000 Omitted) | | $86,097 | | | $69,694 | | | $51 | | | $50 | |
Any redemption fees charged by the fund during the 2004 and 2005 fiscal years resulted in a per share impact of less than $0.01.
| (d) | Per share data is based on average shares outstanding. |
| (f) | Ratios do not reflect reductions from fees paid indirectly, if applicable. |
| (g) | The per share amount varies from the net realized and unrealized gain/loss for the period because of the timing of sales of fund shares and the per share amount of realized and unrealized gains and losses at such time. |
| (i) | For the period from the class’ inception, October 31, 2003 (Class R2) and April 1, 2005 (Classes R1, R3, and R4) through the stated period end. |
| (r) | Certain expenses have been reduced without which performance would have been lower. |
| (s) | From time to time the fund may receive proceeds from litigation settlements, without which performance would be lower. |
| (t) | Total returns do not include any applicable sales charges. |
See Notes to Financial Statements
34
NOTES TO FINANCIAL STATEMENTS
| (1) | | Business and Organization |
MFS Bond Fund (the fund) is a series of MFS Series Trust IX (the trust). The trust is organized as a Massachusetts business trust and is registered under the Investment Company Act of 1940, as amended, as an open-end management investment company.
| (2) | | Significant Accounting Policies |
General – The preparation of financial statements in conformity with U.S. generally accepted accounting principles requires management to make estimates and assumptions that affect the reported amounts of assets and liabilities, and disclosure of contingent assets and liabilities at the date of the financial statements and the reported amounts of revenues and expenses during the reporting period. Actual results could differ from those estimates. The fund can invest in foreign securities, including securities of emerging market issuers. Investments in foreign securities are vulnerable to the effects of changes in the relative values of the local currency and the U.S. dollar and to the effects of changes in each country’s legal, political, and economic environment. The markets of emerging markets countries are generally more volatile than the markets of developed countries with more mature economies. All of the risks of investing in foreign securities previously described are heightened when investing in emerging markets countries.
Investment Valuations – Debt instruments and floating rate loans (other than short-term instruments), including restricted debt instruments, are generally valued at an evaluated or composite bid as reported by an independent pricing service. Short-term instruments with a maturity at issuance of 60 days or less may be valued at amortized cost, which approximates market value. Swaps are generally valued at an evaluated bid as reported by an independent pricing service. Securities and other assets generally valued on the basis of information from an independent pricing service may also be valued at a broker-dealer bid quotation. Values obtained from pricing services can utilize both dealer-supplied valuations and electronic data processing techniques, which take into account factors such as institutional-size trading in similar groups of securities, yield, quality, coupon rate, maturity, type of issue, trading characteristics, and other market data. The values of foreign securities and other assets and liabilities expressed in foreign currencies are converted to U.S. dollars using the mean of bid and asked prices for rates reported by an independent pricing service.
The Board of Trustees has delegated primary responsibility for determining or causing to be determined the value of the fund’s investments (including any fair valuation) to the adviser pursuant to valuation policies and procedures approved by the Board. If the adviser determines that reliable market quotations are not
35
Notes to Financial Statements – continued
readily available, investments are valued at fair value as determined in good faith by the adviser in accordance with such procedures under the oversight of the Board of Trustees. Under the fund’s valuation policies and procedures, market quotations are not considered to be readily available for most types of debt instruments and floating rate loans and many types of derivatives. These investments are generally valued at fair value based on information from independent pricing services. In addition, investments may be valued at fair value if the adviser determines that an investment’s value has been materially affected by events occurring after the close of the exchange or market on which the investment is principally traded (such as foreign exchange or market) and prior to the determination of the fund’s net asset value, or after the halting of trading of a specific security where trading does not resume prior to the close of the exchange or market on which the security is principally traded. The adviser may rely on independent pricing services or other information (such as the correlation with price movements of similar securities in the same or other markets; the type, cost and investment characteristics of the security; the business and financial condition of the issuer; and trading and other market data) to assist in determining whether to fair value and at what value to fair value an investment. The value of an investment for purposes of calculating the fund’s net asset value can differ depending on the source and method used to determine value. When fair valuation is used, the value of investments used to determine the fund’s net asset value may differ from quoted or published prices for the same investments.
In September 2006, FASB Statement No. 157, Fair Value Measurements (the “Statement”) was issued, and is effective for fiscal years beginning after November 15, 2007 and for all interim periods within those fiscal years. This Statement provides a single definition of fair value, a hierarchy for measuring fair value and expanded disclosures about fair value measurements. Management is evaluating the application of the Statement to the fund, and believes the impact will be limited to expanded disclosures resulting from the adoption of this Statement in the fund’s financial statements.
Foreign Currency Translation – Purchases and sales of foreign investments, income, and expenses are converted into U.S. dollars based upon currency exchange rates prevailing on the respective dates of such transactions. Gains and losses attributable to foreign currency exchange rates on sales of securities are recorded for financial statement purposes as net realized gains and losses on investments. Gains and losses attributable to foreign exchange rate movements on income and expenses are recorded for financial statement purposes as foreign currency transaction gains and losses. That portion of both realized and unrealized gains and losses on investments that results from fluctuations in foreign currency exchange rates is not separately disclosed.
36
Notes to Financial Statements – continued
Derivative Risk – The fund may invest in derivatives for hedging or non-hedging purposes. While hedging can reduce or eliminate losses, it can also reduce or eliminate gains. When the fund uses derivatives as an investment to gain market exposure, or for hedging purposes, gains and losses from derivative instruments may be substantially greater than the derivative’s original cost. Cash that has been segregated on behalf of certain derivative contracts will be reported separately on the Statement of Assets and Liabilities as restricted cash. Derivative instruments include swap agreements.
Swap Agreements – The fund may enter into swap agreements. A swap is an exchange of cash payments between the fund and another party. Net cash payments are exchanged at specified intervals and are recorded as a realized gain or loss in the Statement of Operations. The value of the swap is adjusted daily and the change in value, including accruals of periodic amounts of interest to be paid or received, is recorded as unrealized appreciation or depreciation in the Statement of Operations. Amounts paid or received at the inception of the swap are reflected as premiums paid or received on the Statement of Assets and Liabilities and are amortized using the effective interest method over the term of the agreement. A liquidation payment received or made upon early termination is recorded as a realized gain or loss in the Statement of Operations. Collateral, in the form of cash or securities, may be required to be held in segregated accounts with the fund’s custodian in connection with these agreements. Risk of loss may exceed amounts recognized on the Statement of Assets and Liabilities. These risks include the possible lack of a liquid market, failure of the counterparty to perform under the terms of the agreements, and unfavorable market and interest rate movements of the underlying instrument. All swap agreements entered into by the fund with the same counterparty are generally governed by a single master agreement, which provides for the netting of all amounts owed by the parties under the agreement upon the occurrence of an event of default, thereby reducing the credit risk to which such party is exposed.
The fund holds credit default swaps in which one party makes a stream of payments based on a fixed percentage applied to the notional amount to another party in exchange for the right to receive a specified return in the event of a default by a third party, such as a corporate issuer or foreign issuer, on its obligation. The fund may enter into credit default swaps to limit or to reduce its risk exposure to defaults of corporate and sovereign issuers or to create direct or synthetic short or long exposure to corporate debt securities or certain sovereign debt securities to which it is not otherwise exposed.
In March 2008, FASB Statement No. 161, Disclosures about Derivative Instruments and Hedging Activities (the “Standard”) was issued, and is effective for financial statements issued for fiscal years and interim periods
37
Notes to Financial Statements – continued
beginning after November 15, 2008. This Standard provides enhanced disclosures about the fund’s use of and accounting for derivative instruments and the effect of derivative instruments on the fund’s results of operations and financial position. Management is evaluating the application of the Standard to the fund, and has not at this time determined the impact, if any, resulting from the adoption of this Standard on the fund’s financial statements.
Indemnifications – Under the fund’s organizational documents, its officers and trustees may be indemnified against certain liabilities and expenses arising out of the performance of their duties to the fund. Additionally, in the normal course of business, the fund enters into agreements with service providers that may contain indemnification clauses. The fund’s maximum exposure under these agreements is unknown as this would involve future claims that may be made against the fund that have not yet occurred.
Investment Transactions and Income – Investment transactions are recorded on the trade date. Interest income is recorded on the accrual basis. All premium and discount is amortized or accreted for financial statement purposes in accordance with U.S. generally accepted accounting principles. Dividends received in cash are recorded on the ex-dividend date. Dividend and interest payments received in additional securities are recorded on the ex-dividend or ex-interest date in an amount equal to the value of the security on such date.
The fund may receive proceeds from litigation settlements. Any proceeds received from litigation involving portfolio holdings are reflected in the Statement of Operations in realized gain/loss if the security has been disposed of by the fund or in unrealized gain/loss if the security is still held by the fund. Any other proceeds from litigation not related to portfolio holdings are reflected as other income in the Statement of Operations.
Fees Paid Indirectly – The fund’s custody fee may be reduced according to an arrangement that measures the value of cash deposited with the custodian by the fund. This amount, for the year ended April 30, 2008, is shown as a reduction of total expenses on the Statement of Operations.
Tax Matters and Distributions – The fund intends to qualify as a regulated investment company, as defined under Subchapter M of the Internal Revenue Code, and to distribute all of its taxable income, including realized capital gains. As a result, no provision for federal income tax is required. The fund adopted the provisions of FASB Interpretation No. 48, Accounting for Uncertainty in Income Taxes (“the Interpretation”) on the first day of the fund’s fiscal year. The Interpretation prescribes a minimum threshold for financial statement recognition of the benefit of a tax position taken or expected to be taken in a tax return. There was no impact resulting from the adoption of this Interpretation on the fund’s financial statements. Each of the fund’s federal tax returns for the prior three fiscal years remains subject to
38
Notes to Financial Statements – continued
examination by the Internal Revenue Service. It is the fund’s policy to record interest and penalty charges on underpaid taxes associated with its tax positions as interest expense and miscellaneous expense, respectively. No such charges were recorded in the current financial statements. Foreign taxes, if any, have been accrued by the fund in the accompanying financial statements.
Distributions to shareholders are recorded on the ex-dividend date. Income and capital gain distributions are determined in accordance with income tax regulations, which may differ from U.S. generally accepted accounting principles. Certain capital accounts in the financial statements are periodically adjusted for permanent differences in order to reflect their tax character. These adjustments have no impact on net assets or net asset value per share. Temporary differences which arise from recognizing certain items of income, expense, gain or loss in different periods for financial statement and tax purposes will reverse at some time in the future. Distributions in excess of net investment income or net realized gains are temporary overdistributions for financial statement purposes resulting from differences in the recognition or classification of income or distributions for financial statement and tax purposes.
Book/tax differences primarily relate to amortization and accretion of debt securities and derivative transactions.
The tax character of distributions declared to shareholders is as follows:
| | | | |
| | | 4/30/08 | | 4/30/07 |
| Ordinary income (including any short-term capital gains) | | $68,644,061 | | $67,363,124 |
The federal tax cost and the tax basis components of distributable earnings were as follows:
| | | |
| As of 4/30/08 | | | |
| Cost of investments | | $1,249,034,194 | |
| Gross appreciation | | 12,885,119 | |
| Gross depreciation | | (49,735,790 | ) |
| Net unrealized appreciation (depreciation) | | $(36,850,671 | ) |
| Undistributed ordinary income | | $2,881,870 | |
| Capital loss carryforwards | | (58,708,975 | ) |
| Post-October capital loss deferral | | (8,795,446 | ) |
| Other temporary differences | | (5,603,842 | ) |
As of April 30, 2008, the fund had capital loss carryforwards available to offset future realized gains. Such losses expire as follows:
| | | |
| 4/30/09 | | $(11,366,948 | ) |
| 4/30/10 | | (4,472,574 | ) |
| 4/30/11 | | (26,201,916 | ) |
| 4/30/15 | | (9,364,882 | ) |
| 4/30/16 | | (7,302,655 | ) |
| | $(58,708,975 | ) |
39
Notes to Financial Statements – continued
Multiple Classes of Shares of Beneficial Interest – The fund offers multiple classes of shares, which differ in their respective distribution and service fees. All shareholders bear the common expenses of the fund based on the value of settled shares outstanding of each class, without distinction between share classes. Dividends are declared separately for each class. Differences in per share dividend rates are generally due to differences in separate class expenses. Class B shares will convert to Class A shares approximately eight years after purchase. Class 529A, Class 529B, and Class 529C shares closed on March 30, 2007. At the close of business on April 18, 2008, Class R shares and Class R2 shares converted into Class R3 shares. Following this conversion, Class R3, Class R4, and Class R5 shares were renamed Class R2, Class R3, and Class R4 shares, respectively.
| (3) | | Transactions with Affiliates |
Investment Adviser – The fund has an investment advisory agreement with Massachusetts Financial Services Company (MFS) to provide overall investment management and related administrative services and facilities to the fund.
The management fee is computed daily and paid monthly at the following annual rates:
| | | |
| First $1.1 billion of average daily net assets | | 0.39 | % |
| Average daily net assets in excess of $1.1 billion | | 0.38 | % |
As part of a settlement agreement with the New York Attorney General concerning market timing and related matters, MFS has agreed to reduce the management fee to 0.30% of the fund’s average daily net assets for the period March 1, 2004 through February 28, 2009. For the year ended April 30, 2008, this waiver amounted to $1,127,130 and is reflected as a reduction of total expenses in the Statement of Operations. The management fee incurred for the year ended April 30, 2008 was equivalent to an annual effective rate of 0.30% of the fund’s average daily net assets.
Distributor – MFS Fund Distributors, Inc. (MFD), a wholly-owned subsidiary of MFS, as distributor, received $88,296 for the year ended April 30, 2008, as its portion of the initial sales charge on sales of Class A shares of the fund.
The Board of Trustees has adopted a distribution plan for certain class shares pursuant to Rule 12b-1 of the Investment Company Act of 1940.
The fund’s distribution plan provides that the fund will pay MFD for services provided by MFD and financial intermediaries in connection with the distribution and servicing of certain share classes. One component of the plan is a distribution fee paid to MFD and another component of the plan is a service fee paid to MFD. MFD may subsequently pay all, or a portion, of the distribution and/or service fees to financial intermediaries.
40
Notes to Financial Statements – continued
Distribution Plan Fee Table:
| | | | | | | | | | |
| | | Distribution
Fee Rate | | Service
Fee Rate | | Total
Distribution
Plan (d) | | Annual
Effective
Rate (e) | | Distribution
and Service
Fee |
| Class A | | 0.10% | | 0.25% | | 0.35% | | 0.30% | | $2,413,455 |
| Class B | | 0.75% | | 0.25% | | 1.00% | | 1.00% | | 1,277,523 |
| Class C | | 0.75% | | 0.25% | | 1.00% | | 1.00% | | 773,689 |
| Class R (b) | | 0.25% | | 0.25% | | 0.50% | | 0.50% | | 136,926 |
| Class R1 | | 0.75% | | 0.25% | | 1.00% | | 0.81% | | 50,760 |
| Former Class R2 (b) | | 0.25% | | 0.25% | | 0.50% | | 0.50% | | 27,112 |
| Class R2 (formerly Class R3) | | 0.25% | | 0.25% | | 0.50% | | 0.50% | | 219,029 |
| Class R3 (formerly Class R4) | | — | | 0.25% | | 0.25% | | 0.25% | | 131,594 |
| Total Distribution and Service Fees | | | | | | | | $5,030,088 |
| (b) | At the close of business on April 18, 2008, Class R and Class R2 shares converted into Class R3 shares. Following the conversion, Class R3 shares were renamed Class R2 shares. |
| (d) | In accordance with the distribution plan for certain classes, the fund pays distribution and/or service fees up to these annual percentage rates of each class’ average daily net assets. |
| (e) | The annual effective rates represent actual fees incurred under the distribution plan for the year ended April 30, 2008 based on each class’ average daily net assets. Assets attributable to Class A shares sold prior to March 1, 1991 are subject to a service fee of 0.15% annually. 0.05% of the Class A distribution fee is currently being paid by the fund. Payment of the remaining 0.05% of the Class A distribution fee is not yet in effect and will be implemented on such date as the fund’s Board of Trustees may determine. Effective March 1, 2008, the distribution fee rate for Class R1 shares increased from 0.50% to 0.75%. |
Certain Class A and Class C shares are subject to a contingent deferred sales charge in the event of a shareholder redemption within 12 months of purchase. Class B shares are subject to a contingent deferred sales charge in the event of a shareholder redemption within six years of purchase. All contingent deferred sales charges are paid to MFD and during the year ended April 30, 2008, were as follows:
| | |
| | | Amount |
| Class A | | $8,774 |
| Class B | | $174,733 |
| Class C | | $9,255 |
Shareholder Servicing Agent – MFS Service Center, Inc. (MFSC), a wholly-owned subsidiary of MFS, receives a fee from the fund for its services as shareholder servicing agent calculated as a percentage of the average daily net assets of the fund as determined periodically under the supervision of the fund’s Board of Trustees. For the year ended April 30, 2008, the fee was $605,605, which equated to 0.0477% annually of the fund’s average daily net assets. MFSC also receives payment from the fund for out-of-pocket expenses, sub-accounting and other shareholder servicing costs which may be paid to affiliated and unaffiliated service providers. For the year ended April 30, 2008, these out-of-pocket expenses, sub-accounting and other shareholder servicing costs amounted to $2,128,499.
41
Notes to Financial Statements – continued
Administrator – MFS provides certain financial, legal, shareholder communications, compliance, and other administrative services to the fund. Under an administrative services agreement, the fund partially reimburses MFS the costs incurred to provide these services. The fund is charged a fixed amount plus a fee based on average daily net assets. The fund’s annual fixed amount is $17,500.
The administrative services fee incurred for the year ended April 30, 2008 was equivalent to an annual effective rate of 0.0154% of the fund’s average daily net assets.
In addition to the administrative services provided by MFS to the fund as described above, prior to March 1, 2008, MFS was responsible for providing certain retirement plan administration and services with respect to certain shares. These services include various administrative, recordkeeping, and communication/educational services with respect to the retirement plans which invest in these shares, and may have been provided directly by MFS or by a third party. MFS generally paid all, or a portion, of the retirement plan administration and services fee to affiliated or unaffiliated third parties. For the year ended April 30, 2008, the fund paid MFS an annual retirement plan administration and services fee up to the following annual percentage rates of each class’ average daily net assets:
| | | | | | | | | | |
| | | Beginning
of period
through
12/31/07 | | Effective
1/01/08 | | Effective
3/01/08 | | Annual
Effective
Rate (g) | | Total
Amount |
Class R1 | | 0.35% | | 0.35% | | — | | 0.27% | | $17,276 |
Former Class R2 (b) | | 0.25% | | — | | — | | 0.14% | | 7,750 |
Class R2 (formerly Class R3) | | 0.15% | | — | | — | | 0.09% | | 37,578 |
Class R3 (formerly Class R4) | | 0.15% | | — | | — | | 0.09% | | 49,045 |
Class R4 (formerly Class R5) | | 0.10% | | — | | — | | 0.06% | | 47,336 |
Total Retirement Plan Administration and Services Fees | | | | | | $158,985 |
| (b) | At the close of business on April 18, 2008, Class R2 shares converted into Class R3 shares. Following the conversion, Class R3 shares were renamed Class R2 shares. |
| (g) | Effective January 1, 2008, the annual retirement plan administration and service fee was eliminated for the Former Class R2, Class R2 (formerly Class R3), Class R3 (formerly Class R4), and Class R4 (formerly Class R5) shares. Effective March 1, 2008, the annual retirement plan administration and service fee was eliminated for Class R1 shares. |
Trustees’ and Officers’ Compensation – The fund pays compensation to independent trustees in the form of a retainer, attendance fees, and additional compensation to Board and Committee chairpersons. The fund does not pay compensation directly to trustees or officers of the fund who are also officers of the investment adviser, all of whom receive remuneration for their services to the fund from MFS. Certain officers and trustees of the fund are officers or directors of MFS, MFD, and MFSC.
42
Notes to Financial Statements – continued
The fund has an unfunded, defined benefit plan for certain retired independent trustees which resulted in a pension expense of $5,271. The fund also has an unfunded retirement benefit deferral plan for certain independent trustees which resulted in a net decrease in expense of $1,247. Both amounts are included in independent trustees’ compensation for the year ended April 30, 2008. The liability for deferred retirement benefits payable to certain independent trustees under both plans amounted to $92,309 at April 30, 2008, and is included in payable for independent trustees’ compensation.
Other – This fund and certain other MFS funds (the funds) have entered into a services agreement (the Agreement) which provides for payment of fees by the funds to Tarantino LLC in return for the provision of services of an Independent Chief Compliance Officer (ICCO) for the funds. The ICCO is an officer of the funds and the sole member of Tarantino LLC. The funds can terminate the Agreement with Tarantino LLC at any time under the terms of the Agreement. For the year ended April 30, 2008, the fee paid by the fund to Tarantino LLC was $8,371 and is included in miscellaneous expense on the Statement of Operations. MFS has agreed to reimburse the fund for a portion of the payments made by the fund to Tarantino LLC in the amount of $6,078, which is shown as a reduction of total expenses in the Statement of Operations. Additionally, MFS has agreed to bear all expenses associated with office space, other administrative support, and supplies provided to the ICCO.
Purchases and sales of investments, other than purchased option transactions and short-term obligations, were as follows:
| | | | |
| | | Purchases | | Sales |
| U.S. government securities | | $180,427,356 | | $122,170,604 |
| Investments (non-U.S. government securities) | | $510,181,568 | | $563,057,522 |
43
Notes to Financial Statements – continued
| (5) | | Shares of Beneficial Interest |
The fund’s Declaration of Trust permits the Trustees to issue an unlimited number of full and fractional shares of beneficial interest. Transactions in fund shares were as follows:
| | | | | | | | |
| | | Year ended
4/30/08 | | Year ended
4/30/07 |
| | | Shares | | Amount | | Shares | | Amount |
| Shares sold | | | | | | | | |
Class A | | 33,597,045 | | $416,140,846 | | 18,639,614 | | $233,613,667 |
Class B | | 1,848,448 | | 22,802,565 | | 2,168,881 | | 27,059,079 |
Class C | | 1,760,920 | | 21,691,215 | | 1,457,116 | | 18,193,597 |
Class I | | 5,715,967 | | 70,806,550 | | 1,224,745 | | 15,403,274 |
Class R (b) | | 1,047,022 | | 12,958,276 | | 2,038,452 | | 25,586,455 |
Class R1 | | 547,604 | | 6,751,238 | | 417,589 | | 5,232,778 |
Former Class R2 (b) | | 552,378 | | 6,820,918 | | 320,893 | | 4,028,413 |
Class R2 (formerly Class R3) | | 5,493,383 | | 67,365,886 | | 3,225,362 | | 40,508,120 |
Class R3 (formerly Class R4) | | 3,298,233 | | 40,818,666 | | 5,025,829 | | 62,990,729 |
Class R4 (formerly Class R5) | | 8,794,977 | | 108,851,803 | | 5,775,853 | | 72,879,893 |
Class 529A (c) | | — | | — | | 5,608 | | 70,616 |
Class 529B (c) | | — | | — | | 2,990 | | 37,252 |
Class 529C (c) | | — | | — | | 5,290 | | 65,995 |
| | 62,655,977 | | $775,007,963 | | 40,308,222 | | $505,669,868 |
| Shares issued to shareholders in reinvestment of distributions | | | | | | | | |
Class A | | 3,011,468 | | $37,341,350 | | 3,155,228 | | $39,555,451 |
Class B | | 398,250 | | 4,927,292 | | 573,715 | | 7,164,418 |
Class C | | 197,445 | | 2,436,742 | | 195,113 | | 2,436,063 |
Class I | | 233,018 | | 2,888,280 | | 195,788 | | 2,457,055 |
Class R (b) | | 98,940 | | 1,228,131 | | 155,906 | | 1,950,948 |
Class R1 | | 22,576 | | 278,299 | | 9,941 | | 124,434 |
Former Class R2 (b) | | 21,767 | | 268,194 | | 6,353 | | 79,638 |
Class R2 (formerly Class R3) | | 170,681 | | 2,111,040 | | 73,099 | | 918,638 |
Class R3 (formerly Class R4) | | 222,777 | | 2,758,109 | | 93,216 | | 1,174,379 |
Class R4 (formerly Class R5) | | 337,601 | | 4,185,286 | | 64,705 | | 821,559 |
Class 529A (c) | | — | | — | | 1,743 | | 21,826 |
Class 529B (c) | | — | | — | | 563 | | 7,017 |
Class 529C (c) | | — | | — | | 775 | | 9,662 |
| | 4,714,523 | | $58,422,723 | | 4,526,145 | | $56,721,088 |
44
Notes to Financial Statements – continued
| | | | | | | | | | | | |
| | | Year ended
4/30/08 | | | Year ended
4/30/07 | |
| | | Shares | | | Amount | | | Shares | | | Amount | |
| Shares reacquired | | | | | | | | | | | | |
Class A | | (39,040,610 | ) | | $(483,210,521 | ) | | (28,617,596 | ) | | $(358,268,389 | ) |
Class B | | (7,151,860 | ) | | (88,230,870 | ) | | (8,376,957 | ) | | (104,488,165 | ) |
Class C | | (2,008,838 | ) | | (24,698,987 | ) | | (1,845,623 | ) | | (23,019,306 | ) |
Class I | | (5,184,903 | ) | | (64,227,576 | ) | | (930,032 | ) | | (11,655,683 | ) |
Class R (b) | | (4,359,243 | ) | | (53,557,739 | ) | | (2,650,149 | ) | | (33,192,977 | ) |
Class R1 | | (167,728 | ) | | (2,057,719 | ) | | (295,901 | ) | | (3,715,515 | ) |
Former Class R2 (b) | | (802,160 | ) | | (9,694,357 | ) | | (172,716 | ) | | (2,168,121 | ) |
Class R2 (formerly Class R3) | | (1,108,713 | ) | | (13,675,753 | ) | | (1,972,028 | ) | | (24,826,178 | ) |
Class R3 (formerly Class R4) | | (1,716,624 | ) | | (21,188,993 | ) | | (2,395,784 | ) | | (30,207,342 | ) |
Class R4 (formerly Class R5) | | (7,555,668 | ) | | (93,478,755 | ) | | (355,964 | ) | | (4,517,980 | ) |
Class 529A (c) | | — | | | — | | | (47,586 | ) | | (605,624 | ) |
Class 529B (c) | | — | | | — | | | (17,216 | ) | | (218,085 | ) |
Class 529C (c) | | — | | | — | | | (29,273 | ) | | (369,030 | ) |
| | (69,096,347 | ) | | $(854,021,270 | ) | | (47,706,825 | ) | | $(597,252,395 | ) |
| Net change | | | | | | | | | | | | |
Class A | | (2,432,097 | ) | | $(29,728,325 | ) | | (6,822,754 | ) | | $(85,099,271 | ) |
Class B | | (4,905,162 | ) | | (60,501,013 | ) | | (5,634,361 | ) | | (70,264,668 | ) |
Class C | | (50,473 | ) | | (571,030 | ) | | (193,394 | ) | | (2,389,646 | ) |
Class I | | 764,082 | | | 9,467,254 | | | 490,501 | | | 6,204,646 | |
Class R (b) | | (3,213,281 | ) | | (39,371,332 | ) | | (455,791 | ) | | (5,655,574 | ) |
Class R1 | | 402,452 | | | 4,971,818 | | | 131,629 | | | 1,641,697 | |
Former Class R2 (b) | | (228,015 | ) | | (2,605,245 | ) | | 154,530 | | | 1,939,930 | |
Class R2 (formerly Class R3) | | 4,555,351 | | | 55,801,173 | | | 1,326,433 | | | 16,600,580 | |
Class R3 (formerly Class R4) | | 1,804,386 | | | 22,387,782 | | | 2,723,261 | | | 33,957,766 | |
Class R4 (formerly Class R5) | | 1,576,910 | | | 19,558,334 | | | 5,484,594 | | | 69,183,472 | |
Class 529A (c) | | — | | | — | | | (40,235 | ) | | (513,182 | ) |
Class 529B (c) | | — | | | — | | | (13,663 | ) | | (173,816 | ) |
Class 529C (c) | | — | | | — | | | (23,208 | ) | | (293,373 | ) |
| | (1,725,847 | ) | | $(20,590,584 | ) | | (2,872,458 | ) | | $(34,861,439 | ) |
| (b) | At the close of business on April 18, 2008, Class R and Class R2 shares converted into Class R3 shares. Following the conversion, Class R3 shares were renamed Class R2 shares. |
| (c) | Class 529A, Class 529B, and Class 529C shares closed on March 31, 2007. |
The fund and other funds managed by MFS participate in a $1 billion unsecured committed line of credit provided by a syndication of banks under a credit agreement. In addition, the fund and other funds managed by MFS have established uncommitted borrowing arrangements with certain banks. Borrowings may be made for temporary financing needs. Interest is charged to each fund, based on its borrowings, generally at a rate equal to the Federal Reserve funds rate plus 0.30%. In addition, a commitment fee, based on the
45
Notes to Financial Statements – continued
average daily, unused portion of the committed line of credit, is allocated among the participating funds at the end of each calendar quarter. For the year ended April 30, 2008, the fund’s commitment fee and interest expense were $4,832 and $0, respectively, and are included in miscellaneous expense on the Statement of Operations.
| (7) | | Transactions in Underlying Funds-Affiliated Issuers |
An affiliated issuer may be considered one in which the fund owns 5% or more of the outstanding voting securities, or a company which is under common control. For the purposes of this report, the fund assumes the following to be affiliated issuers:
| | | | | | | | |
| Underlying Funds | | Beginning
Shares/Par
Amount | | Acquisitions
Shares/Par
Amount | | Dispositions
Shares/Par
Amount | | Ending
Shares/Par
Amount |
MFS Institutional Money Market Portfolio | | — | | 515,242,352 | | 513,481,967 | | 1,760,385 |
| | | | |
| Underlying Funds | | Realized
Gain (Loss) | | Capital Gain
Distributions | | Dividend
Income | | Ending
Value |
MFS Institutional Money Market Portfolio | | — | | — | | $1,720,601 | | $1,760,385 |
46
RESULTS OF SHAREHOLDER MEETING
(unaudited)
At a special meeting of shareholders of Class R1 shares of the MFS Bond Fund, which was held on February 15, 2008, the following actions were taken:
Item 1: To approve an amendment to the current Master Distribution Plan adopted pursuant to Rule 12b-1 under the Investment Company Act of 1940, as amended, with respect to Class R1 Shares of the Fund.
| | |
| | | Number of Dollars |
| For | | 4,358,656.09 |
| Against | | 0.00 |
| Abstain | | 140,581.28 |
47
REPORT OF INDEPENDENT REGISTERED PUBLIC ACCOUNTING FIRM
To the Trustees of MFS Series Trust IX and the Shareholders of MFS Bond Fund:
We have audited the accompanying statement of assets and liabilities, including the portfolio of investments, of MFS Bond Fund (one of the portfolios comprising MFS Series Trust IX (the “Trust”)) as of April 30, 2008, and the related statement of operations for the year then ended, the statements of changes in net assets for each of the two years in the period then ended, and the financial highlights for each of the five years in the period then ended. These financial statements and financial highlights are the responsibility of the Trust’s management. Our responsibility is to express an opinion on these financial statements and financial highlights based on our audits.
We conducted our audits in accordance with the standards of the Public Company Accounting Oversight Board (United States). Those standards require that we plan and perform the audit to obtain reasonable assurance about whether the financial statements and financial highlights are free of material misstatement. The Trust is not required to have, nor were we engaged to perform, an audit of its internal control over financial reporting. Our audits included consideration of internal control over financial reporting as a basis for designing audit procedures that are appropriate in the circumstances, but not for the purpose of expressing an opinion on the effectiveness of the Trust’s internal control over financial reporting. Accordingly, we express no such opinion. An audit also includes examining, on a test basis, evidence supporting the amounts and disclosures in the financial statements, assessing the accounting principles used and significant estimates made by management, as well as evaluating the overall financial statement presentation. Our procedures included confirmation of securities owned as of April 30, 2008, by correspondence with the custodian and brokers; where replies were not received from brokers, we performed other auditing procedures. We believe that our audits provide a reasonable basis for our opinion.
In our opinion, such financial statements and financial highlights present fairly, in all material respects, the financial position of MFS Bond Fund as of April 30, 2008, the results of its operations for the year then ended, the changes in its net assets for each of the two years in the period then ended, and its financial highlights for each of the five years in the period then ended, in conformity with accounting principles generally accepted in the United States of America.
DELOITTE & TOUCHE LLP
Boston, Massachusetts
June 16, 2008
48
TRUSTEES AND OFFICERS — IDENTIFICATION AND BACKGROUND
The Trustees and officers of the Trust, as of June 1, 2008, are listed below, together with their principal occupations during the past five years. (Their titles may have varied during that period.) The address of each Trustee and officer is 500 Boylston Street, Boston, Massachusetts 02116.
| | | | | | |
Name, Date of Birth | | Position(s) Held
with Fund | | Trustee/Officer
Since (h) | | Principal Occupations During
the Past Five Years & Other
Directorships (j) |
| INTERESTED TRUSTEES | | | | |
Robert J. Manning (k)
(born 10/20/63) | | Trustee | | February 2004 | | Massachusetts Financial Services Company, Chief Executive Officer, President, Chief Investment Officer and Director |
Robert C. Pozen (k)
(born 8/08/46) | | Trustee | | February 2004 | | Massachusetts Financial Services Company, Chairman (since February 2004); Harvard Business School (education), Senior Lecturer (since 2008); Secretary of Economic Affairs, The Commonwealth of Massachusetts (January 2002 to December 2002); Fidelity Investments, Vice Chairman (June 2000 to December 2001); Fidelity Management & Research Company (investment adviser), President (March 1997 to July 2001); Bell Canada Enterprises (telecommunications), Director; Medtronic, Inc. (medical technology), Director; Telesat (satellite communications), Director (until 2007) |
| INDEPENDENT TRUSTEES | | | | |
J. Atwood Ives
(born 5/01/36) | | Trustee and Chair of Trustees | | February 1992 | | Private investor; KeySpan Corporation (energy related services), Director until 2004; Woodstock Corporation (investment advisory firm), Director until 2003 |
Robert E. Butler (n)
(born 11/29/41) | | Trustee | | January 2006 | | Consultant – regulatory and compliance matters (since July 2002); PricewaterhouseCoopers LLP (professional services firm), Partner (until 2002) |
49
Trustees and Officers – continued
| | | | | | |
Name, Date of Birth | | Position(s) Held
with Fund | | Trustee/Officer
Since (h) | | Principal Occupations During
the Past Five Years & Other
Directorships (j) |
Lawrence H. Cohn, M.D.
(born 3/11/37) | | Trustee | | August 1993 | | Brigham and Women’s Hospital, Chief of Cardiac Surgery (2005); Harvard Medical School, Professor of Cardiac Surgery; Physician Director of Medical Device Technology for Partners HealthCare |
David H. Gunning
(born 5/30/42) | | Trustee | | January 2004 | | Retired; Cleveland-Cliffs Inc. (mining products and service provider), Vice Chairman/Director (until May 2007); Portman Limited (mining), Director (since 2005); Encinitos Ventures (private investment company), Principal (1997 to April 2001); Lincoln Electric Holdings, Inc. (welding equipment manufacturer), Director |
William R. Gutow
(born 9/27/41) | | Trustee | | December 1993 | | Private investor and real estate consultant (since 1998); Capital Entertainment Management Company (video franchise), Vice Chairman (since 1998); Texas Donuts (donut franchise), Vice Chairman (since 2007); Atlantic Coast Tan (tanning salons), Vice Chairman (until 2007) |
Michael Hegarty
(born 12/21/44) | | Trustee | | December 2004 | | Retired; AXA Financial (financial services and insurance), Vice Chairman and Chief Operating Officer (until May 2001); The Equitable Life Assurance Society (insurance), President and Chief Operating Officer (until May 2001) |
Lawrence T. Perera
(born 6/23/35) | | Trustee | | July 1981 | | Hemenway & Barnes (attorneys), Partner |
J. Dale Sherratt
(born 9/23/38) | | Trustee | | August 1993 | | Insight Resources, Inc. (acquisition planning specialists), President; Wellfleet Investments (investor in health care companies), Managing General Partner (since 1993); Cambridge Nutraceuticals (professional nutritional products), Chief Executive Officer (until May 2001) |
50
Trustees and Officers – continued
| | | | | | |
Name, Date of Birth | | Position(s) Held
with Fund | | Trustee/Officer
Since (h) | | Principal Occupations During
the Past Five Years & Other
Directorships (j) |
Laurie J. Thomsen
(born 8/05/57) | | Trustee | | March 2005 | | New Profit, Inc. (venture philanthropy), Partner (since 2006); Private investor; Prism Venture Partners (venture capital), Co-founder and General Partner (until June 2004); The Travelers Companies (commercial property liability insurance), Director |
Robert W. Uek
(born 5/18/41) | | Trustee | | January 2006 | | Retired (since 1999); PricewaterhouseCoopers LLP (professional services firm), Partner (until 1999); Consultant to investment company industry (since 2000); TT International Funds (mutual fund complex), Trustee (2000 until 2005); Hillview Investment Trust II Funds (mutual fund complex), Trustee (2000 until 2005) |
| OFFICERS | | | | | | |
Robert J. Manning (k)
(born 10/20/63) | | President | | March 2008 | | Massachusetts Financial Services Company, Chief Executive Officer, President, Chief Investment Officer and Director |
Maria F. Dwyer (k)
(born 12/01/58) | | Treasurer | | March 2008 | | Massachusetts Financial Services Company, Executive Vice President and Chief Regulatory Officer (since March 2004) Chief Compliance Officer (since December 2006); Fidelity Management & Research Company, Vice President (prior to March 2004); Fidelity Group of Funds, President and Treasurer (prior to March 2004); MFS Group of Funds, President (November 2005 – March 2008) |
Christopher R. Bohane (k)
(born 1/18/74) | | Assistant Secretary and Assistant Clerk | | July 2005 | | Massachusetts Financial Services Company, Vice President and Senior Counsel (since April 2003); Kirkpatrick & Lockhart LLP (law firm), Associate (prior to April 2003) |
Ethan D. Corey (k)
(born 11/21/63) | | Assistant Secretary and Assistant Clerk | | July 2005 | | Massachusetts Financial Services Company, Senior Vice President and Associate General Counsel (since April 2006); Special Counsel (prior to April 2006); Dechert LLP (law firm), Counsel (prior to December 2004) |
51
Trustees and Officers – continued
| | | | | | |
Name, Date of Birth | | Position(s) Held
with Fund | | Trustee/Officer
Since (h) | | Principal Occupations During
the Past Five Years & Other
Directorships (j) |
David L. DiLorenzo (k)
(born 8/10/68) | | Assistant Treasurer | | July��2005 | | Massachusetts Financial Services Company, Vice President (since June 2005); JP Morgan Investor Services, Vice President (prior to June 2005) |
Timothy M. Fagan (k)
(born 7/10/68) | | Assistant Secretary and Assistant Clerk | | September 2005 | | Massachusetts Financial Services Company, Vice President and Senior Counsel (since September 2005); John Hancock Advisers, LLC, Vice President and Chief Compliance Officer (September 2004 to August 2005), Senior Attorney (prior to September 2004); John Hancock Group of Funds, Vice President and Chief Compliance Officer (September 2004 to December 2004) |
Mark D. Fischer (k)
(born 10/27/70) | | Assistant Treasurer | | July 2005 | | Massachusetts Financial Services Company, Vice President (since May 2005); JP Morgan Investment Management Company, Vice President (prior to May 2005) |
Brian E. Langenfeld (k)
(born 3/07/73) | | Assistant Secretary and Assistant Clerk | | June 2006 | | Massachusetts Financial Services Company, Assistant Vice President and Counsel (since May 2006); John Hancock Advisers, LLC, Assistant Vice President and Counsel (May 2005 to April 2006); John Hancock Advisers, LLC, Attorney and Assistant Secretary (prior to May 2005) |
Ellen Moynihan (k)
(born 11/13/57) | | Assistant Treasurer | | April 1997 | | Massachusetts Financial Services Company, Senior Vice President |
Susan S. Newton (k)
(born 3/07/50) | | Assistant Secretary and Assistant Clerk | | May 2005 | | Massachusetts Financial Services Company, Senior Vice President and Associate General Counsel (since April 2005); John Hancock Advisers, LLC, Senior Vice President, Secretary and Chief Legal Officer (prior to April 2005); John Hancock Group of Funds, Senior Vice President, Secretary and Chief Legal Officer (prior to April 2005) |
52
Trustees and Officers – continued
| | | | | | |
Name, Date of Birth | | Position(s) Held
with Fund | | Trustee/Officer
Since (h) | | Principal Occupations During
the Past Five Years & Other
Directorships (j) |
Susan A. Pereira (k)
(born 11/05/70) | | Assistant Secretary and Assistant Clerk | | July 2005 | | Massachusetts Financial Services Company, Vice President and Senior Counsel (since June 2004); Bingham McCutchen LLP (law firm), Associate (prior to June 2004) |
Mark N. Polebaum (k)
(born 5/01/52) | | Secretary and Clerk | | January 2006 | | Massachusetts Financial Services Company, Executive Vice President, General Counsel and Secretary (since January 2006); Wilmer Cutler Pickering Hale and Dorr LLP (law firm), Partner (prior to January 2006) |
Frank L. Tarantino
(born 3/07/44) | | Independent Chief Compliance Officer | | June 2004 | | Tarantino LLC (provider of compliance services), Principal (since June 2004); CRA Business Strategies Group (consulting services), Executive Vice President (April 2003 to June 2004); David L. Babson & Co. (investment adviser), Managing Director, Chief Administrative Officer and Director (prior to March 2003) |
Richard S. Weiztel (k)
(born 7/16/70) | | Assistant Secretary and Assistant Clerk | | October 2007 | | Massachusetts Financial Services Company, Vice President and Assistant General Counsel (since 2007); Vice President and Senior Counsel (since May 2004); Massachusetts Department of Business and Technology, General Counsel (February 2003 to April 2004); Massachusetts Office of the Attorney General, Assistant Attorney General (April 2001 to February 2003); Ropes and Gray, Associate (prior to April 2001) |
James O. Yost (k)
(born 6/12/60) | | Assistant Treasurer | | September 1990 | | Massachusetts Financial Services Company, Senior Vice President |
| (h) | Date first appointed to serve as Trustee/officer of an MFS fund. Each Trustee has served continuously since appointment unless indicated otherwise. |
| (j) | Directorships or trusteeships of companies required to report to the Securities and Exchange Commission (i.e., “public companies”). |
| (k) | “Interested person” of the Trust within the meaning of the Investment Company Act of 1940 (referred to as the 1940 Act), which is the principal federal law governing investment companies like the fund, as a result of position with MFS. The address of MFS is 500 Boylston Street, Boston, Massachusetts 02116. |
53
Trustees and Officers – continued
| (n) | In 2004 and 2005, Mr. Butler provided consulting services to the independent compliance consultant retained by MFS pursuant to its settlement with the SEC concerning market timing and related matters. The terms of that settlement required that compensation and expenses related to the independent compliance consultant be borne exclusively by MFS and, therefore, MFS paid Mr. Butler for the services he rendered to the independent compliance consultant. In 2004 and 2005, MFS paid Mr. Butler a total of $351,119.29. |
The Trust held a shareholders’ meeting in 2005 to elect Trustees, and will hold a shareholders’ meeting at least once every five years thereafter, to elect Trustees.
Each Trustee (except Mr. Butler and Mr. Uek) has been elected by shareholders and each Trustee and officer holds office until his or her successor is chosen and qualified or until his or her earlier death, resignation, retirement or removal. Messrs. Butler, Gutow, Sherratt and Uek and Ms. Thomsen are members of the Trust’s Audit Committee.
Each of the Trust’s Trustees and officers holds comparable positions with certain other funds of which MFS or a subsidiary is the investment adviser or distributor, and, in the case of the officers, with certain affiliates of MFS. As of January 1, 2008, the Trustees served as board members of 100 funds within the MFS Family of Funds.
The Statement of Additional Information contains further information about the Trustees and is available without charge upon request by calling 1-800-225-2606.
| | |
| Investment Adviser | | Custodian |
Massachusetts Financial Services Company
500 Boylston Street, Boston, MA 02116-3741 | | JPMorgan Chase Bank
One Chase Manhattan Plaza, New York, NY 10081 |
| Distributor | | Independent Registered Public Accounting Firm |
MFS Fund Distributors, Inc.
500 Boylston Street, Boston, MA 02116-3741 | | Deloitte & Touche LLP
200 Berkeley Street, Boston, MA 02116 |
| Portfolio Manager | | |
Richard Hawkins Robert Persons | | |
54
BOARD REVIEW OF INVESTMENT ADVISORY AGREEMENT
A discussion regarding the Board’s most recent review and renewal of the Fund’s investment advisory agreement is available by clicking on the Fund’s name under “Select a fund” on the MFS Web site (mfs.com).
PROXY VOTING POLICIES AND INFORMATION
A general description of the MFS funds’ proxy voting policies and procedures is available without charge, upon request, by calling 1-800-225-2606, by visiting the Proxy Voting section of mfs.com or by visiting the SEC’s Web site at http://www.sec.gov.
Information regarding how the fund voted proxies relating to portfolio securities during the most recent twelve-month period ended June 30 is available without charge by visiting the Proxy Voting section of mfs.com or by visiting the SEC’s Web site at http://www.sec.gov.
QUARTERLY PORTFOLIO DISCLOSURE
The fund will file a complete schedule of portfolio holdings with the Securities and Exchange Commission (the Commission) for the first and third quarters of each fiscal year on Form N-Q. The fund’s Form N-Q may be reviewed and copied at the:
Public Reference Room
Securities and Exchange Commission
100 F Street, NE, Room 1580
Washington, D.C. 20549
Information on the operation of the Public Reference Room may be obtained by calling the Commission at 1-800-SEC-0330. The fund’s Form N-Q is available on the EDGAR database on the Commission’s Internet Web site at http://www.sec.gov, and copies of this information may be obtained, upon payment of a duplicating fee, by electronic request at the following e-mail address: publicinfo@sec.gov or by writing the Public Reference Section at the above address.
A shareholder can also obtain the quarterly portfolio holdings report at mfs.com.
FEDERAL TAX INFORMATION (unaudited)
The fund will notify shareholders of amounts for use in preparing 2008 income tax forms in January 2009.
55
MFS® PRIVACY NOTICE
Privacy is a concern for every investor today. At MFS Investment Management® and the MFS funds, we take this concern very seriously. We want you to understand our policies about the investment products and services that we offer, and how we protect the nonpublic personal information of investors who have a direct relationship with us and our wholly owned subsidiaries.
Throughout our business relationship, you provide us with personal information. We maintain information and records about you, your investments, and the services you use. Examples of the nonpublic personal information we maintain include
| | Ÿ | | data from investment applications and other forms |
| | Ÿ | | share balances and transactional history with us, our affiliates, or others |
| | Ÿ | | facts from a consumer reporting agency |
We do not disclose any nonpublic personal information about our customers or former customers to anyone, except as permitted by law. We may share nonpublic personal information with third parties or certain of our affiliates in connection with servicing your account or processing your transactions. We may share information with companies or financial institutions that perform marketing services on our behalf or with other financial institutions with which we have joint marketing arrangements, subject to any legal requirements.
Authorization to access your nonpublic personal information is limited to appropriate personnel who provide products, services, or information to you. We maintain physical, electronic, and procedural safeguards to help protect the personal information we collect about you.
If you have any questions about the MFS privacy policy, please call 1-800-225-2606 any business day between 8 a.m. and 8 p.m. Eastern time.
Note: If you own MFS products or receive MFS services in the name of a third party such as a bank or broker-dealer, their privacy policy may apply to you instead of ours.
56


MFS® Limited Maturity Fund
SIPC Contact Information:
You may obtain information about the Securities Investor Protection Corporation (“SIPC”), including the SIPC Brochure, by contacting SIPC either by telephone (202-371-8300) or by accessing SIPC’s website address (www.sipc.org).
The report is prepared for the general information of shareholders. It is authorized for distribution to prospective investors only when preceded or accompanied by a current prospectus.
NOT FDIC INSURED Ÿ MAY LOSE VALUE Ÿ NO BANK OR CREDIT UNION GUARANTEE Ÿ NOT A DEPOSIT Ÿ NOT INSURED BY ANY FEDERAL GOVERNMENT AGENCY OR NCUA/NCUSIF
4/30/08
MQL-ANN

LETTER FROM THE CEO
Dear Shareholders:
Negative headlines tend to resonate during difficult markets, and we certainly have had more than our share of tough news recently. As a result consumer, and particularly investor, sentiment are at all-time lows. That said, I do think it is helpful to remember there are always silver linings in the storm clouds if you look hard enough.
Through all of the challenges we have faced, there are some positive underlying trends. In the United States, for example, institutional traders and credit market followers are just now showing increasing signs of confidence and are beginning to take on more risk. At the corporate level, earnings continue to be relatively strong as companies have reduced labor costs, controlled inventories, and relied less on debt to finance expansion. More broadly, low interest rates and strong demand for consumer goods and industrial equipment are good signs for the global economy.
While I do not mean to minimize the risks inherent in today’s markets, periods such as these allow the talented fund managers and research analysts we have at MFS® to test their convictions, reevaluate existing positions, and identify new investment ideas. Our investment process also includes a significant risk management component, with constant attention paid to monitoring market risk, so we can do our best to minimize any surprises to your portfolio.
For investors, this is a great time to check in with your advisor and make sure you have a sound investment plan in place — one that can keep your hard-earned money working over the long term through a strategy that involves asset allocation, diversification, and periodic portfolio rebalancing and reviews. A plan tailored to your distinct needs and goals continues to be the best approach to help you take advantage of the inevitable challenges — and opportunities — that present themselves over time.
Respectfully,

Robert J. Manning
Chief Executive Officer and Chief Investment Officer
MFS Investment Management®
June 16, 2008
The opinions expressed in this letter are subject to change, may not be relied upon for investment advice, and no forecasts can be guaranteed.
1
PORTFOLIO COMPOSITION
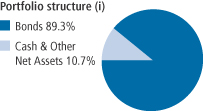
| | |
| Fixed income sectors (i) | | |
| High Grade Corporates | | 52.5% |
| Mortgage-Backed Securities | | 12.6% |
| Asset-Backed Securities | | 7.0% |
| U.S. Government Agencies | | 6.2% |
| Commercial Mortgage-Backed Securities | | 5.5% |
| Non-U.S. Government Bonds | | 3.9% |
| Emerging Markets Bonds | | 2.8% |
| High Yield Corporates | | 1.4% |
| Residential Mortgage-Backed Securities | | 0.9% |
Collateralized Debt Obligations | | 0.4% |
| U.S. Treasury Securities | | (3.9)% |
| | |
| Credit quality of bonds (r) | | |
| AAA | | 37.5% |
| AA | | 8.1% |
| A | | 21.3% |
| BBB | | 31.3% |
| BB | | 0.6% |
| B | | 1.1% |
| Not Rated | | 0.1% |
| |
| Portfolio facts | | |
| Average Duration (d)(i) | | 1.8 |
| Average Life (i)(m) | | 2.3 yrs |
| Average Maturity (i)(m) | | 8.5 yrs |
| Average Credit Quality of Rated Securities (long-term) (a) | | A+ |
| Average Credit Quality of Rated Securities (short-term) (a) | | A-1 |
| (a) | The average credit quality of rated securities is based upon a market weighted average of portfolio holdings that are rated by public rating agencies. |
| (d) | Duration is a measure of how much a bond’s price is likely to fluctuate with general changes in interest rates, e.g., if rates rise 1.00%, a bond with a 5-year duration is likely to lose about 5.00% of its value. |
| (i) | For purposes of this presentation, the bond component includes accrued interest amounts and may be positively or negatively impacted by the equivalent exposure from any derivative holdings, if applicable, which may result in the investment in a sector less than 0%. |
| (m) | The average maturity shown is calculated using the final stated maturity on the portfolio’s holdings without taking into account any holdings which have been pre-refunded or pre-paid to an earlier date or which have a mandatory put date prior to the stated maturity. The average life shown takes into account these earlier dates. |
| (r) | Each security is assigned a rating from Moody’s Investors Service. If not rated by Moody’s, the rating will be that assigned by Standard & Poor’s. Likewise, if not assigned a rating by Standard & Poor’s, it will be based on the rating assigned by Fitch, Inc. For those portfolios that hold a security which is not rated by any of the three agencies, the security is considered Not Rated. Holdings in U.S. Treasuries and government agency mortgage-backed securities, if any, are included in the “AAA”-rating category. Percentages are based on the total market value of investments as of 4/30/08. |
Percentages are based on net assets as of 4/30/08, unless otherwise noted.
The portfolio is actively managed and current holdings may be different.
2
MANAGEMENT REVIEW
Summary of Results
For the twelve months ended April 30, 2008, Class A shares of the MFS Limited Maturity Fund provided a total return of 2.61%, at net asset value. This compares with a return of 7.18% for the fund’s benchmark, the Lehman Brothers 1-3 Year U.S. Government/Credit Bond Index.
Market Environment
The U.S. economy and financial markets experienced significant deterioration and heightened volatility over the reporting period. U.S. economic growth slowed significantly in the fourth quarter of 2007 and first quarter of 2008. Headwinds included accelerated deterioration in the housing market, subdued corporate investment, a markedly weaker job market, and a tighter credit environment as banks sought to repair balance sheets. During the period, the climax of the credit turmoil occurred in mid March as the Federal Reserve backstopped the distressed sale of failing Bear Stearns to JPMorgan. While reasonably resilient, parts of the global economy and financial system experienced some spillover from the U.S. slowdown. Japanese and European growth slowed over the reporting period and international financial markets were adversely affected by U.S. mortgage and structured product losses.
In the face of this financial and economic turmoil, most global central banks were forced to inject liquidity and to reassess their tightening biases as government bond yields declined and credit spreads widened. During the second half of the reporting period, the U.S. Federal Reserve Board began an aggressive rate cutting campaign, while the U.S. federal government moved quickly to design and implement a modest fiscal stimulus package. Although the Bank of England and the Bank of Canada also cut rates, the dilemma of rising energy and food prices heightened concerns among central bankers that inflationary expectations might become unhinged.
By the end of the reporting period, bond yields, credit spreads, and equity valuations implied market expectations consistent with the view that the worst of the credit dislocation was behind us. Nonetheless, the markets continued to price in further financial and economic weakening, albeit of a less tumultuous nature.
Detractors from Performance
The fund’s relative over exposure to debt in the financial and industrial sectors was the primary detractor from performance relative to the Lehman Brothers 1-3 Year U.S. Government/Credit Bond Index during the reporting period. Greater relative exposure to “A” and “BBB” rated(s) bonds also had a negative impact on relative returns. The fund’s yield curve(y) positioning further dampened relative performance.
3
Management Review – continued
Contributors to Performance
Yield was the largest positive contributor to the fund’s relative performance. During the period, the fund held bonds that produced a greater level of income than the benchmark.
Respectfully,
James Calmas
Portfolio Manager
| (s) | Bonds rated “BBB”, “Baa”, or higher are considered investment grade; bonds rated “BB”, “Ba”, or below are considered non-investment grade. The primary source for bond quality ratings is Moody’s Investors Service. If not available, ratings by Standard & Poor’s are used, else ratings by Fitch, Inc. For securities which are not rated by any of the three agencies, the security is considered Not Rated. |
| (y) | A yield curve graphically depicts the yields of different maturity bonds of the same credit quality and type. A normal yield curve is upward-sloping, with short term-rates lower than long term rates. |
The views expressed in this report are those of the portfolio manager only through the end of the period of the report as stated on the cover and do not necessarily reflect the views of MFS or any other person in the MFS organization. These views are subject to change at any time based on market or other conditions, and MFS disclaims any responsibility to update such views. These views may not be relied upon as investment advice or an indication of trading intent on behalf of any MFS portfolio. References to specific securities are not recommendations of such securities, and may not be representative of any MFS portfolio’s current or future investments.
Note to Shareholders: At the close of business on April 18, 2008, Class R shares and Class R2 shares converted into Class R3 shares.
Following this conversion, Class R3, Class R4, and Class R5 shares were renamed Class R2, Class R3 and Class R4 shares, respectively.
4
PERFORMANCE SUMMARY THROUGH 4/30/08
The following chart illustrates a representative class of the fund’s historical performance in comparison to its benchmark. Performance results include the deduction of the maximum applicable sales charge and reflect the percentage change in net asset value, including reinvestment of dividends and capital gains distributions. The performance of other share classes will be greater than or less than that of the class depicted below. Benchmark comparisons are unmanaged; do not reflect sales charges, commissions or expenses; and cannot be invested in directly. (See Notes to Performance Summary).
Performance data shown represents past performance and is no guarantee of future results. Investment return and principal value fluctuate so your shares, when sold, may be worth more or less than the original cost; current performance may be lower or higher than quoted. The performance shown does not reflect the deduction of taxes, if any, that a shareholder would pay on fund distributions or the redemption of fund shares.
Growth of a hypothetical $10,000 investment
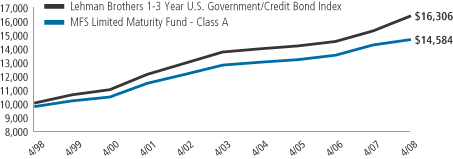
5
Performance Summary – continued
Total returns through 4/30/2008
Average annual without sales charge
| | | | | | | | | | | | |
| | | Share class | | Class inception date | | 1-yr | | 5-yr | | 10-yr | | |
| | | A | | 2/26/92 | | 2.61% | | 2.73% | | 4.11% | | |
| | | B | | 9/07/93 | | 1.94% | | 1.97% | | 3.31% | | |
| | | C | | 7/01/94 | | 1.90% | | 1.89% | | 3.23% | | |
| | | I | | 1/02/97 | | 2.91% | | 2.91% | | 4.25% | | |
| | | R1 | | 4/01/05 | | 1.80% | | 1.85% | | 3.25% | | |
| | | R2
(formerly R3) | | 10/31/03 | | 2.41% | | 2.25% | | 3.46% | | |
| | | R3
(formerly R4) | | 4/01/05 | | 2.40% | | 2.58% | | 4.03% | | |
| | | R4
(formerly R5) | | 4/01/05 | | 2.69% | | 2.77% | | 4.13% | | |
| | | 529A | | 7/31/02 | | 2.42% | | 2.38% | | 3.91% | | |
| | | 529B | | 7/31/02 | | 1.76% | | 1.72% | | 3.16% | | |
| | | 529C | | 7/31/02 | | 1.66% | | 1.65% | | 3.09% | | |
Average Annual
Comparative Benchmarks
| | | | | | | | | | |
| | | Lehman Brothers 1-3 Year
U.S. Government/Credit Bond Index (f) | | 7.18% | | 3.55% | | 5.01% | | |
Average annual with sales charge
| | | | | | | | | | |
| | | A With Initial Sales Charge (2.50%) | | 0.04% | | 2.21% | | 3.85% | | |
| | | B With CDSC (Declining over six years from 4% to 0%) (x) | | (1.97)% | | 1.62% | | 3.31% | | |
| | | C With CDSC (1% for 12 months) (x) | | 0.92% | | 1.89% | | 3.23% | | |
| | | 529A With Initial Sales Charge (2.50%) | | (0.14)% | | 1.87% | | 3.65% | | |
| | | 529B With CDSC (Declining over six years from 4% to 0%) (x) | | (2.15)% | | 1.37% | | 3.16% | | |
| | | 529C With CDSC (1% for 12 months) (x) | | 0.68% | | 1.65% | | 3.09% | | |
Class I, R1, R2, R3 and R4 shares do not have a sales charge.
CDSC – Contingent Deferred Sales Charge.
| (x) | Assuming redemption at the end of the applicable period. |
| (f) | Source: FactSet Research Systems Inc. |
6
Performance Summary – continued
Benchmark Definitions
Lehman Brothers 1-3 Year U.S. Government/Credit Bond Index – a market capitalization- weighted index that measures the performance of the short-term (1 to 3 years) investment- grade corporate and U.S. government bond markets.
It is not possible to invest directly in an index.
Notes to Performance Summary
Class 529 shares are only available in conjunction with qualified tuition programs, such as the MFS 529 Savings Plan. There also is an additional fee, which is detailed in the program description, on qualified tuition programs. If this fee was reflected, the performance for Class 529 shares would have been lower. This annual fee is waived for Oregon residents and for those accounts with assets of $25,000 or more.
Performance for classes R3, R4, and 529A shares includes the performance of the fund’s class A shares for periods prior to their offering. Performance for classes R1, R2, and 529B shares includes the performance of the fund’s class B shares for periods prior to their offering. Performance for class 529C shares includes the performance of the fund’s class C shares for periods prior to their offering.
This blended class performance has been adjusted to take into account differences in sales loads, if any, applicable to these share classes, but has not been adjusted to take into account differences in class specific operating expenses (such as Rule 12b-1 fees). Compared to performance these share classes would have experienced had they been offered for the entire period, the use of blended performance generally results in higher performance for share classes with higher operating expenses than the share class to which it is blended, and lower performance for share classes with lower operating expenses than the share class to which it is blended.
Performance results reflect any applicable expense subsidies and waivers in effect during the periods shown. Without such subsidies and waivers the fund’s performance results would be less favorable. Please see the prospectus and financial statements for complete details.
From time to time the fund may receive proceeds from litigation settlements, without which performance would be lower.
7
EXPENSE TABLE
Fund expenses borne by the shareholders during the period, November 1, 2007 through April 30, 2008
As a shareholder of the fund, you incur two types of costs: (1) transaction costs, including sales charges (loads) on certain purchase or redemption payments, and (2) ongoing costs, including management fees; distribution and service (12b-1) fees; and other fund expenses. This example is intended to help you understand your ongoing costs (in dollars) of investing in the fund and to compare these costs with the ongoing costs of investing in other mutual funds.
The example is based on an investment of $1,000 invested at the beginning of the period and held for the entire period November 1, 2007 through April 30, 2008.
The expenses include the payment of a portion of the transfer-agent-related expenses of MFS funds that invest in the fund. For further information, please see the Notes to the Financial Statements.
Actual Expenses
The first line for each share class in the following table provides information about actual account values and actual expenses. You may use the information in this line, together with the amount you invested, to estimate the expenses that you paid over the period. Simply divide your account value by $1,000 (for example, an $8,600 account value divided by $1,000 = 8.6), then multiply the result by the number in the first line under the heading entitled “Expenses Paid During Period” to estimate the expenses you paid on your account during this period.
Hypothetical Example for Comparison Purposes
The second line for each share class in the following table provides information about hypothetical account values and hypothetical expenses based on the fund’s actual expense ratio and an assumed rate of return of 5% per year before expenses, which is not the fund’s actual return. The hypothetical account values and expenses may not be used to estimate the actual ending account balance or expenses you paid for the period. You may use this information to compare the ongoing costs of investing in the fund and other funds. To do so, compare this 5% hypothetical example with the 5% hypothetical examples that appear in the shareholder reports of the other funds.
Please note that the expenses shown in the table are meant to highlight your ongoing costs only and do not reflect any transactional costs, such as sales charges (loads). Therefore, the second line for each share class in the table is useful in comparing ongoing costs only, and will not help you determine the relative total costs of owning different funds. In addition, if these transactional costs were included, your costs would have been higher.
8
Expense Table – continued
| | | | | | | | | | |
Share Class | | | | Annualized
Expense Ratio | | Beginning
Account Value
11/01/07 | | Ending Account Value 4/30/08 | | Expenses
Paid During
Period (p)
11/01/07-4/30/08 |
| A | | Actual | | 0.65% | | $1,000.00 | | $1,009.27 | | $3.25 |
| | Hypothetical (h) | | 0.65% | | $1,000.00 | | $1,021.63 | | $3.27 |
| B | | Actual | | 1.44% | | $1,000.00 | | $1,006.79 | | $7.18 |
| | Hypothetical (h) | | 1.44% | | $1,000.00 | | $1,017.70 | | $7.22 |
| C | | Actual | | 1.50% | | $1,000.00 | | $1,006.55 | | $7.48 |
| | Hypothetical (h) | | 1.50% | | $1,000.00 | | $1,017.40 | | $7.52 |
| I | | Actual | | 0.50% | | $1,000.00 | | $1,011.55 | | $2.50 |
| | Hypothetical (h) | | 0.50% | | $1,000.00 | | $1,022.38 | | $2.51 |
| R1 | | Actual | | 1.57% | | $1,000.00 | | $1,006.18 | | $7.83 |
| | Hypothetical (h) | | 1.57% | | $1,000.00 | | $1,017.06 | | $7.87 |
R2
(formerly R3) | | Actual | | 0.95% | | $1,000.00 | | $1,009.32 | | $4.75 |
| | Hypothetical (h) | | 0.95% | | $1,000.00 | | $1,020.14 | | $4.77 |
R3
(formerly R4) | | Actual | | 0.80% | | $1,000.00 | | $1,010.07 | | $4.00 |
| | Hypothetical (h) | | 0.80% | | $1,000.00 | | $1,020.89 | | $4.02 |
R4
(formerly R5) | | Actual | | 0.54% | | $1,000.00 | | $1,009.86 | | $2.70 |
| | Hypothetical (h) | | 0.54% | | $1,000.00 | | $1,022.18 | | $2.72 |
| 529A | | Actual | | 0.98% | | $1,000.00 | | $1,009.19 | | $4.90 |
| | Hypothetical (h) | | 0.98% | | $1,000.00 | | $1,019.99 | | $4.92 |
| 529B | | Actual | | 1.65% | | $1,000.00 | | $1,005.76 | | $8.23 |
| | Hypothetical (h) | | 1.65% | | $1,000.00 | | $1,016.66 | | $8.27 |
| 529C | | Actual | | 1.73% | | $1,000.00 | | $1,005.43 | | $8.63 |
| | Hypothetical (h) | | 1.73% | | $1,000.00 | | $1,016.26 | | $8.67 |
| (h) | 5% class return per year before expenses. |
| (p) | Expenses paid is equal to each class’ annualized expense ratio, as shown above, multiplied by the average account value over the period, multiplied by the number of days in the period, divided by the number of days in the year. Expenses paid do not include any applicable sales charges (loads). If these transaction costs had been included, your costs would have been higher. |
Expense Changes Impacting the Table
Effective January 1, 2008 the fund’s Class R2 (formerly Class R3), Class R3 (formerly Class R4), and Class R4 (formerly Class R5) retirement plan administration and service fee was terminated (as described in Note 3 of the Notes to the Financial Statements). Had this fee change been in effect throughout the entire six month period, the annualized expense ratios would have been 0.90%, 0.75% and 0.50% for Class R2, Class R3, and Class R4 shares, respectively; the actual expenses paid during the period would have been approximately $4.51, $3.76, and $2.51 for Class R2, Class R3, and Class R4, respectively; and the hypothetical expenses paid during the period would have been approximately $4.53, $3.78 and $2.52 for Class R2, Class R3, and Class R4 shares, respectively.
9
Expense Table – continued
Effective March 1, 2008 the fund’s Class R1 retirement plan administration and service fee was terminated and the Class R1 distribution fee was increased (as described in Note 3 of the Notes to the Financial Statements). Had these fee changes been in effect throughout the entire six month period, the annualized expense ratio would have been 1.50%; the actual expenses paid during the period would have been approximately $7.51; and the hypothetical expenses paid during the period would have been approximately $7.54.
Effective April 1, 2008 the fund’s Class 529A, Class 529B, and Class 529C program manager fee was reduced (as described in Note 3 of the Notes to Financial Statements). Had this fee change been in effect throughout the entire six month period, the annualized expense ratios would have been 0.85%, 1.52% and 1.59% for Class 529A, Class 529B, and Class 529C shares, respectively; the actual expenses paid during the period would have been approximately $4.26, $7.61 and $7.95 for Class 529A, Class 529B, and Class 529C shares, respectively; and the hypothetical expenses paid during the period would have been approximately $4.28, $7.64 and $8.00 for Class 529A, Class 529B and Class 529C shares, respectively.
10
PORTFOLIO OF INVESTMENTS
4/30/08
The Portfolio of Investments is a complete list of all securities owned by your fund. It is categorized by broad-based asset classes.
| | | | | | |
| Bonds - 92.8% | | | | | | |
| Issuer | | Shares/Par | | Value ($) |
| | | | | | |
| Airlines - 0.1% | | | | | | |
| American Airlines Corp., 3.857%, 2010 | | $ | 891,349 | | $ | 846,773 |
| | |
| Asset Backed & Securitized - 13.7% | | | | | | |
| Bayview Commercial Asset Trust, FRN, 3.205%, 2035 (n) | �� | $ | 2,060,826 | | $ | 1,922,140 |
| Bayview Commercial Asset Trust, FRN, 3.165%, 2036 (z) | | | 1,751,389 | | | 1,576,250 |
| Bayview Commercial Asset Trust, FRN, 0.879%, 2036 (i)(z) | | | 9,152,610 | | | 749,807 |
| Bayview Financial Acquisition Trust, FRN, 5.638%, 2036 | | | 2,370,000 | | | 2,290,383 |
| Bayview Financial Acquisition Trust, FRN, 5.483%, 2041 | | | 2,325,000 | | | 2,181,408 |
Bayview Financial Revolving Mortgage Loan Trust,
FRN, 3.686%, 2040 (z) | | | 1,402,996 | | | 1,010,157 |
| Brascan Real Estate, CDO, FRN, 4.417%, 2040 (z) | | | 1,526,000 | | | 1,000,858 |
| Brazilian Merchant Voucher Receivables Ltd., 5.911%, 2011 (z) | | | 2,305,074 | | | 2,305,074 |
| Commercial Mortgage Asset Trust, 0.875%, 2032 (i)(n) | | | 28,581,032 | | | 763,571 |
Commercial Mortgage Pass-Through Certificates,
FRN, 2.906%, 2017 (n) | | | 3,400,000 | | | 3,257,111 |
| Continental Airlines, Inc., FRN, 3.515%, 2011 | | | 935,523 | | | 938,183 |
| Countrywide Asset-Backed Certificates, FRN, 4.575%, 2035 | | | 482,776 | | | 479,079 |
| Credit-Based Asset Servicing & Securitization LLC, FRN, 5.303%, 2035 | | | 3,376,375 | | | 3,195,983 |
| Credit-Based Asset Servicing & Securitization LLC, FRN, 5.731%, 2037 | | | 4,000,000 | | | 3,231,520 |
| Credit-Based Asset Servicing & Securitization Trust, 5.737%, 2037 | | | 2,830,000 | | | 2,129,614 |
| DEPFA Bank PLC, 3.625%, 2008 | | | 6,100,000 | | | 6,134,050 |
| E*TRADE RV & Marine Trust, 3.62%, 2018 | | | 2,900,160 | | | 2,821,464 |
| Falcon Franchise Loan LLC, 7.382%, 2010 (n) | | | 15,645 | | | 15,623 |
| Ford Credit Auto Owner Trust, FRN, 3.046%, 2010 | | | 2,200,000 | | | 2,191,732 |
| Gramercy Real Estate CDO Ltd., FRN, 3.24%, 2035 (z) | | | 2,337,207 | | | 2,072,027 |
| IMPAC CMB Trust, FRN, 3.635%, 2034 | | | 666,258 | | | 561,381 |
| IMPAC CMB Trust, FRN, 3.815%, 2034 | | | 701,324 | | | 629,094 |
| IMPAC Secured Assets Corp., FRN, 3.245%, 2036 | | | 1,830,735 | | | 1,561,100 |
| Interstar Millennium Trust, FRN, 3.05%, 2036 | | | 1,310,944 | | | 1,263,815 |
JPMorgan Chase Commercial Mortgage Securities Corp.,
4.851%, 2042 | | | 3,504,086 | | | 3,496,872 |
JPMorgan Chase Commercial Mortgage Securities Corp.,
5.298%, 2047 | | | 5,000,000 | | | 4,957,357 |
JPMorgan Chase Commercial Mortgage Securities Corp.,
FRN, 5.494%, 2037 | | | 5,000,000 | | | 5,009,523 |
| JPMorgan Mortgage Acquisition Corp., FRN, 5.532%, 2036 | | | 3,700,000 | | | 3,144,357 |
Lehman Brothers Commercial Conduit Mortgage Trust,
FRN, 0.676%, 2035 (i) | | | 60,631,061 | | | 415,590 |
11
Portfolio of Investments – continued
| | | | | | |
| Issuer | | Shares/Par | | Value ($) |
| | | | | | |
| Bonds - continued | | | | | | |
| Asset Backed & Securitized - continued | | | | | | |
| Merrill Lynch Mortgage Investors, Inc., FRN, 5.45%, 2037 | | $ | 3,360,000 | | $ | 3,161,483 |
| Merrill Lynch/Countrywide Commercial Mortgage Trust, 5.878%, 2046 | | | 4,970,000 | | | 5,038,063 |
| Morgan Stanley Capital I, Inc., FRN, 1.11%, 2031 (i)(n) | | | 29,003,860 | | | 198,320 |
| Mortgage Capital Funding, Inc., FRN, 0.615%, 2031 (i) | | | 10,603,791 | | | 14,731 |
| Nationslink Funding Corp., 6.476%, 2030 | | | 368,576 | | | 367,760 |
| Nationslink Funding Corp., FRN, 0.608%, 2030 (i) | | | 16,147,259 | | | 177,447 |
| New Century Home Equity Loan Trust, FRN, 4.532%, 2035 | | | 2,600,000 | | | 2,548,228 |
| Nomura Asset Acceptance Corp., FRN, 4.423%, 2034 | | | 208,048 | | | 207,982 |
| Nomura Asset Securities Corp., FRN, 9.948%, 2027 (z) | | | 2,498,231 | | | 2,759,850 |
| Option One Mortgage Loan Trust, FRN, 5.611%, 2037 | | | 1,990,000 | | | 1,559,644 |
| Ownit Mortgage Loan Asset-Backed Certificates, FRN, 5.29%, 2036 | | | 5,096,147 | | | 4,448,023 |
| Popular ABS Mortgage Pass-Through Trust, FRN, 4.62%, 2035 | | | 2,202,612 | | | 2,162,289 |
| Putnam Structured Product Funding, CDO, FRN, 3.166%, 2008 (z) | | | 467,797 | | | 421,017 |
| RMAC PLC, FRN, 3.251%, 2035 (n) | | | 59,034 | | | 59,030 |
| RMAC PLC, FRN, 3.101%, 2036 (n) | | | 118,499 | | | 117,316 |
| Structured Asset Securities Corp., FRN, 4.67%, 2035 | | | 1,182,748 | | | 1,127,600 |
| Structured Asset Securities Corp., FRN, 3.135%, 2035 | | | 873,462 | | | 844,691 |
Superannuation Members Home Loans Global Trust,
FRN, 2.93%, 2029 | | | 599,565 | | | 588,960 |
| Thornburg Mortgage Securities Trust, FRN, 3.575%, 2043 | | | 3,557,653 | | | 3,470,964 |
| Wachovia Bank Commercial Mortgage Trust, 5.275%, 2048 | | | 6,000,000 | | | 5,954,719 |
| | | | | | |
| | | | | | $ | 96,533,240 |
| Automotive - 2.3% | | | | | | |
| DaimlerChrysler North America Holdings, FRN, 3.769%, 2008 | | $ | 1,700,000 | | $ | 1,695,356 |
| Ford Motor Credit Co., 5.8%, 2009 | | | 3,785,000 | | | 3,701,003 |
| Johnson Controls, Inc., 5.25%, 2011 | | | 7,050,000 | | | 7,151,062 |
| Nissan Motor Acceptance Corp., 5.625%, 2011 (n) | | | 3,289,000 | | | 3,294,743 |
| | | | | | |
| | | | | | $ | 15,842,164 |
| Broadcasting - 0.6% | | | | | | |
| CBS Corp., 6.625%, 2011 | | $ | 2,650,000 | | $ | 2,730,414 |
| Clear Channel Communications, Inc., 7.65%, 2010 | | | 1,710,000 | | | 1,777,774 |
| | | | | | |
| | | | | | $ | 4,508,188 |
| Brokerage & Asset Managers - 3.1% | | | | | | |
| Bear Stearns Cos., Inc., 5.85%, 2010 | | $ | 3,370,000 | | $ | 3,401,607 |
| Goldman Sachs Group, Inc., 7.35%, 2009 | | | 3,900,000 | | | 4,053,067 |
| INVESCO PLC, 4.5%, 2009 | | | 4,481,000 | | | 4,452,604 |
| Lehman Brothers E-Capital Trust I, FRN, 3.85%, 2065 | | | 2,524,000 | | | 1,997,590 |
| Lehman Brothers Holdings, Inc., 3.95%, 2009 | | | 300,000 | | | 294,385 |
| Merrill Lynch & Co., Inc., 6.15%, 2013 | | | 3,710,000 | | | 3,702,242 |
| Morgan Stanley Group, Inc., 6.75%, 2011 | | | 3,920,000 | | | 4,069,717 |
| | | | | | |
| | | | | | $ | 21,971,212 |
12
Portfolio of Investments – continued
| | | | | | |
| Issuer | | Shares/Par | | Value ($) |
| | | | | | |
| Bonds - continued | | | | | | |
| Building - 2.2% | | | | | | |
| American Standard Cos., Inc., 7.625%, 2010 | | $ | 2,670,000 | | $ | 2,822,620 |
| CRH America, Inc., 6.95%, 2012 | | | 2,250,000 | | | 2,304,668 |
| Hanson PLC, 7.875%, 2010 | | | 5,480,000 | | | 5,758,537 |
| Lafarge S.A., 6.15%, 2011 | | | 4,410,000 | | | 4,474,465 |
| | | | | | |
| | | | | | $ | 15,360,290 |
| Business Services - 0.4% | | | | | | |
| Xerox Corp., 5.5%, 2012 | | $ | 2,570,000 | | $ | 2,570,866 |
| | |
| Cable TV - 2.4% | | | | | | |
| Comcast Corp., 5.45%, 2010 | | $ | 5,100,000 | | $ | 5,201,771 |
| Cox Communications, Inc., 4.625%, 2010 | | | 5,320,000 | | | 5,296,565 |
| Time Warner Cable, Inc., 5.4%, 2012 | | | 2,900,000 | | | 2,916,919 |
| Time Warner Entertainment Co. LP, 7.25%, 2008 | | | 3,100,000 | | | 3,123,551 |
| | | | | | |
| | | | | | $ | 16,538,806 |
| Chemicals - 0.5% | | | | | | |
| PPG Industries, Inc., 5.75%, 2013 | | $ | 3,180,000 | | $ | 3,262,305 |
| | |
| Computer Software - 0.3% | | | | | | |
| Oracle Corp., 4.95%, 2013 | | $ | 1,860,000 | | $ | 1,892,531 |
| | |
| Conglomerates - 0.3% | | | | | | |
| Textron Financial Corp., 5.125%, 2010 | | $ | 1,810,000 | | $ | 1,852,977 |
| | |
| Construction - 0.1% | | | | | | |
| Pulte Homes, Inc., 4.875%, 2009 | | $ | 821,000 | | $ | 792,265 |
| | |
| Consumer Goods & Services - 2.2% | | | | | | |
| Clorox Co., 5%, 2013 | | $ | 2,100,000 | | $ | 2,074,229 |
| Fortune Brands, Inc., 5.125%, 2011 | | | 4,272,000 | | | 4,245,223 |
| Royal Philips Electronics N.V., 4.625%, 2013 | | | 3,980,000 | | | 3,968,669 |
| Western Union Co., 5.4%, 2011 | | | 5,500,000 | | | 5,497,696 |
| | | | | | |
| | | | | | $ | 15,785,817 |
| Defense Electronics - 0.6% | | | | | | |
| BAE Systems Holdings, Inc., 4.75%, 2010 (n) | | $ | 3,932,000 | | $ | 4,014,281 |
| | |
| Electronics - 0.5% | | | | | | |
| Tyco Electronics, 6%, 2012 (n) | | $ | 3,761,000 | | $ | 3,834,930 |
13
Portfolio of Investments – continued
| | | | | | |
| Issuer | | Shares/Par | | Value ($) |
| | | | | | |
| Bonds - continued | | | | | | |
| Emerging Market Quasi-Sovereign - 1.2% | | | | | | |
| Corporacion Nacional del Cobre de Chile, 7.375%, 2009 | | $ | 2,230,000 | | $ | 2,306,117 |
| Export-Import Banks of Korea, 4.125%, 2009 (n) | | | 2,300,000 | | | 2,300,754 |
| OAO Gazprom, 7.343%, 2013 (z) | | | 100,000 | | | 104,625 |
| Ras Laffan Liquefied Natural Gas Co. Ltd., 8.294%, 2014 (n) | | | 3,570,000 | | | 3,985,234 |
| | | | | | |
| | | | | | $ | 8,696,730 |
| Energy - Independent - 0.4% | | | | | | |
| EnCana Corp., 4.6%, 2009 | | $ | 2,850,000 | | $ | 2,862,708 |
| | |
| Energy - Integrated - 0.3% | | | | | | |
| TNK-BP Finance S.A., 6.875%, 2011 (n) | | $ | 2,060,000 | | $ | 2,049,700 |
| | |
| Entertainment - 0.3% | | | | | | |
| Time Warner, Inc., 5.5%, 2011 | | $ | 2,000,000 | | $ | 1,981,690 |
| | |
| Financial Institutions - 5.2% | | | | | | |
| American Express Centurion Bank, 5.55%, 2012 | | $ | 2,870,000 | | $ | 2,872,161 |
| Capital One Bank, 4.25%, 2008 | | | 2,957,000 | | | 2,932,747 |
| Capital One Financial Corp., 5.7%, 2011 | | | 3,130,000 | | | 3,056,101 |
| CIT Group, Inc., 5.6%, 2011 | | | 5,000,000 | | | 4,260,685 |
| Countrywide Home Loans, Inc., 4.125%, 2009 | | | 530,000 | | | 495,061 |
| Countrywide Home Loans, Inc., 4%, 2011 | | | 3,000,000 | | | 2,746,836 |
| General Elec Capital Corp., FRN, 2.957%, 2011 | | | 2,630,000 | | | 2,589,506 |
| General Electric Capital Corp., 4.8%, 2013 | | | 1,820,000 | | | 1,827,114 |
| General Motors Acceptance Corp., 5.625%, 2009 | | | 3,360,000 | | | 3,159,180 |
| ILFC E-Capital Trust I, 5.9% to 2010, FRN to 2065 (n) | | | 3,500,000 | | | 2,772,795 |
| International Lease Finance Corp., 5%, 2010 | | | 2,341,000 | | | 2,324,641 |
| International Lease Finance Corp., 5.4%, 2012 | | | 3,340,000 | | | 3,294,379 |
| ORIX Corp., 5.48%, 2011 | | | 4,100,000 | | | 3,975,524 |
| | | | | | |
| | | | | | $ | 36,306,730 |
| Food & Beverages - 4.2% | | | | | | |
| Brown-Forman Corp., 5.2%, 2012 | | $ | 3,420,000 | | $ | 3,475,319 |
| Cadbury Schweppes PLC, 3.875%, 2008 (n) | | | 4,790,000 | | | 4,779,639 |
| Diageo Capital PLC, 5.125%, 2012 | | | 7,130,000 | | | 7,272,450 |
| General Mills, Inc., 5.65%, 2012 | | | 1,960,000 | | | 2,017,563 |
| Kellogg Co., 5.125%, 2012 | | | 2,330,000 | | | 2,376,038 |
| Kraft Foods, Inc., 4%, 2008 | | | 3,600,000 | | | 3,595,003 |
| Kraft Foods, Inc., FRN, 3.596%, 2010 | | | 2,500,000 | | | 2,430,468 |
| Miller Brewing Co., 4.25%, 2008 (n) | | | 3,365,000 | | | 3,373,130 |
| | | | | | |
| | | | | | $ | 29,319,610 |
14
Portfolio of Investments – continued
| | | | | | |
| Issuer | | Shares/Par | | Value ($) |
| | | | | | |
| Bonds - continued | | | | | | |
| Food & Drug Stores - 0.6% | | | | | | |
| CVS Caremark Corp., 5.75%, 2011 | | $ | 2,240,000 | | $ | 2,319,692 |
| CVS Caremark Corp., FRN, 3.376%, 2010 | | | 2,200,000 | | | 2,135,217 |
| | | | | | |
| | | | | | $ | 4,454,909 |
| Industrial - 0.3% | | | | | | |
| Steelcase, Inc., 6.5%, 2011 | | $ | 2,114,000 | | $ | 2,142,505 |
| | |
| Insurance - 0.4% | | | | | | |
| John Hancock Global Funding II, 3.5%, 2009 (n) | | $ | 1,710,000 | | $ | 1,706,842 |
| Metropolitan Life Global Funding, 5.125%, 2013 (z) | | | 1,060,000 | | | 1,059,933 |
| | | | | | |
| | | | | | $ | 2,766,775 |
| Insurance - Health - 0.9% | | | | | | |
| Aetna, Inc., 7.875%, 2011 | | $ | 3,915,000 | | $ | 4,178,742 |
| Aetna, Inc., 5.75%, 2011 | | | 2,350,000 | | | 2,396,358 |
| | | | | | |
| | | | | | $ | 6,575,100 |
| Insurance - Property & Casualty - 0.6% | | | | | | |
| St. Paul Travelers Cos., Inc., 8.125%, 2010 | | $ | 1,910,000 | | $ | 2,028,638 |
| ZFS Finance USA Trust IV, 5.875% to 2012, FRN to 2032 (n) | | | 2,220,000 | | | 2,035,207 |
| | | | | | |
| | | | | | $ | 4,063,845 |
| International Market Quasi-Sovereign - 1.0% | | | | | | |
| Eksportfinans A.S.A., 5.125%, 2011 | | $ | 3,780,000 | | $ | 3,949,083 |
| KfW Bankengruppe, 4.875%, 2009 | | | 2,800,000 | | | 2,875,236 |
| | | | | | |
| | | | | | $ | 6,824,319 |
| International Market Sovereign - 2.4% | | | | | | |
| Bayerische Landesbank Girozentrale, 3.2%, 2009 | | $ | 8,000,000 | | $ | 7,973,744 |
| Province of Ontario, 5.5%, 2008 | | | 3,810,000 | | | 3,859,583 |
| Province of Ontario, 5%, 2011 | | | 5,000,000 | | | 5,232,895 |
| | | | | | |
| | | | | | $ | 17,066,222 |
| Major Banks - 3.9% | | | | | | |
| BAC Capital Trust XIV, 5.63% to 2012, FRN to 2049 | | $ | 3,700,000 | | $ | 2,972,066 |
| BANK ONE Corp., 7.875%, 2010 | | | 5,066,000 | | | 5,385,781 |
| Natexis AMBS Co. LLC, 8.44% to 2008, FRN to 2049 (n) | | | 5,324,000 | | | 5,362,019 |
| Popular North America, Inc., 3.875%, 2008 | | | 3,000,000 | | | 2,987,397 |
| Popular North America, Inc., 4.7%, 2009 | | | 2,950,000 | | | 2,929,371 |
| Royal Bank of Scotland Group PLC, 9.118%, 2049 | | | 5,727,000 | | | 5,789,734 |
| Wachovia Capital Trust III, 5.8% to 2011, FRN to 2042 | | | 2,250,000 | | | 1,788,750 |
| | | | | | |
| | | | | | $ | 27,215,118 |
15
Portfolio of Investments – continued
| | | | | | |
| Issuer | | Shares/Par | | Value ($) |
| | | | | | |
| Bonds - continued | | | | | | |
| Medical & Health Technology & Services - 1.4% | | | | | | |
| Cardinal Health, Inc., 2.958%, 2009 | | $ | 2,800,000 | | $ | 2,733,615 |
| Covidien International, 5.15%, 2010 (n) | | | 3,770,000 | | | 3,832,654 |
| Hospira, Inc., 5.55%, 2012 | | | 3,140,000 | | | 3,105,708 |
| | | | | | |
| | | | | | $ | 9,671,977 |
| Mortgage Backed - 12.6% | | | | | | |
| Fannie Mae, 5.5%, 2014-2019 | | $ | 10,633,304 | | $ | 10,893,132 |
| Fannie Mae, 7%, 2015-2016 | | | 1,807,148 | | | 1,894,159 |
| Fannie Mae, 4%, 2016 | | | 2,492,912 | | | 2,498,541 |
| Fannie Mae, 6.5%, 2016-2017 | | | 3,919,573 | | | 4,078,767 |
| Fannie Mae, 6%, 2017 | | | 4,783,961 | | | 4,940,887 |
| Fannie Mae, 4.5%, 2018 | | | 2,598,474 | | | 2,585,126 |
| Fannie Mae, 5%, 2018 | | | 4,982,241 | | | 5,034,496 |
| Fannie Mae, FRN, 3.784%, 2033 | | | 2,411,568 | | | 2,406,738 |
| Fannie Mae, FRN, 5.974%, 2033 | | | 324,864 | | | 328,468 |
| Fannie Mae, FRN, 6.21%, 2033 | | | 181,847 | | | 183,290 |
| Freddie Mac, 7.5%, 2015 | | | 697,831 | | | 732,162 |
| Freddie Mac, 6%, 2016-2017 | | | 4,003,239 | | | 4,134,136 |
| Freddie Mac, 5.5%, 2017-2025 | | | 12,709,373 | | | 12,957,886 |
| Freddie Mac, 5%, 2018-2025 | | | 28,511,492 | | | 28,729,239 |
| Freddie Mac, 4.5%, 2023 | | | 530,241 | | | 531,459 |
| Freddie Mac, FRN, 3.016%, 2026 | | | 2,201,101 | | | 2,198,078 |
| Freddie Mac, FRN, 3.166%, 2031 | | | 3,907,377 | | | 3,847,275 |
| Ginnie Mae, 7.5%, 2008-2011 | | | 145,453 | | | 152,242 |
| Ginnie Mae, FRN, 5.625%, 2032 | | | 344,977 | | | 347,422 |
| | | | | | |
| | | | | | $ | 88,473,503 |
| Natural Gas - Pipeline - 1.7% | | | | | | |
| CenterPoint Energy, Inc., 7.75%, 2011 | | $ | 4,500,000 | | $ | 4,805,910 |
| Enterprise Products Partners LP, 4.95%, 2010 | | | 3,800,000 | | | 3,816,925 |
| Kinder Morgan Finance Corp., 5.35%, 2011 | | | 3,264,000 | | | 3,223,200 |
| | | | | | |
| | | | | | $ | 11,846,035 |
| Network & Telecom - 4.9% | | | | | | |
| British Telecommunications PLC, 5.15%, 2013 | | $ | 1,980,000 | | $ | 1,988,851 |
| CenturyTel, Inc., 8.375%, 2010 | | | 150,000 | | | 161,778 |
| Deutsche Telekom International Finance B.V., 8%, 2010 | | | 1,980,000 | | | 2,121,075 |
| France Telecom S.A., 7.75%, 2011 | | | 1,980,000 | | | 2,140,944 |
| GTE Corp., 7.51%, 2009 | | | 2,200,000 | | | 2,267,408 |
| SBC Communications, Inc., 4.125%, 2009 | | | 5,830,000 | | | 5,845,152 |
| Telecom Italia Capital, 4%, 2008 | | | 4,100,000 | | | 4,078,348 |
| Telecom Italia Capital, 4%, 2010 | | | 1,100,000 | | | 1,080,982 |
| Telecom Italia Capital, 4.875%, 2010 | | | 2,227,000 | | | 2,204,592 |
16
Portfolio of Investments – continued
| | | | | | |
| Issuer | | Shares/Par | | Value ($) |
| | | | | | |
| Bonds - continued | | | | | | |
| Network & Telecom - continued | | | | | | |
| Telefonica Europe B.V., 7.75%, 2010 | | $ | 5,460,000 | | $ | 5,856,128 |
| TELUS Corp., 8%, 2011 | | | 3,636,000 | | | 3,922,499 |
| Verizon Communications, Inc, 5.25%, 2013 | | | 2,770,000 | | | 2,829,092 |
| | | | | | |
| | | | | | $ | 34,496,849 |
| Oil Services - 1.1% | | | | | | |
| Weatherford International Ltd., 5.95%, 2012 | | $ | 7,480,000 | | $ | 7,765,975 |
| | |
| Other Banks & Diversified Financials - 2.1% | | | | | | |
| Alfa Diversified Payment Rights Finance Co. S.A., FRN, 4.7%, 2011 (n) | | $ | 2,075,250 | | $ | 1,981,864 |
| Bosphorus Financial Services Ltd., FRN, 4.865%, 2012 (z) | | | 1,700,000 | | | 1,637,122 |
| Citigroup, Inc., 5.5%, 2013 | | | 3,700,000 | | | 3,722,548 |
| General American Transportation Corp., 6.75%, 2009 | | | 1,500,000 | | | 1,525,361 |
| Swedbank AB, FRN, 9%, 2049 (n) | | | 5,470,000 | | | 5,680,212 |
| | | | | | |
| | | | | | $ | 14,547,107 |
| Pharmaceuticals - 0.6% | | | | | | |
| Astrazeneca PLC, 5.4%, 2012 | | $ | 4,210,000 | | $ | 4,361,653 |
| | |
| Printing & Publishing - 0.1% | | | | | | |
| Pearson PLC, 5.5%, 2013 (z) | | $ | 780,000 | | $ | 786,092 |
| | |
| Real Estate - 2.1% | | | | | | |
| Kimco Realty Corp., REIT, 4.62%, 2010 | | $ | 3,790,000 | | $ | 3,825,209 |
| PPF Funding, Inc., REIT, 5.35%, 2012 (n) | | | 3,660,000 | | | 3,578,774 |
| ProLogis, REIT, 5.5%, 2012 | | | 3,440,000 | | | 3,363,192 |
| Simon Property Group, Inc., REIT, 7.125%, 2009 | | | 1,900,000 | | | 1,917,153 |
| Simon Property Group, Inc., REIT, 4.6%, 2010 | | | 2,258,000 | | | 2,242,677 |
| | | | | | |
| | | | | | $ | 14,927,005 |
| Restaurants - 0.5% | | | | | | |
| YUM! Brands, Inc., 8.875%, 2011 | | $ | 2,910,000 | | $ | 3,202,615 |
| | |
| Retailers - 1.6% | | | | | | |
| Federated Retail Holdings, Inc., 5.35%, 2012 | | $ | 1,510,000 | | $ | 1,407,078 |
| Home Depot, Inc., 5.2%, 2011 | | | 2,240,000 | | | 2,227,850 |
| J.C. Penney Corp., Inc., 8%, 2010 | | | 2,690,000 | | | 2,775,268 |
| May Department Stores Co., 5.95%, 2008 | | | 2,937,000 | | | 2,938,601 |
| Wesfarmers Ltd., 6.998%, 2013 (z) | | | 1,980,000 | | | 2,059,731 |
| | | | | | |
| | | | | | $ | 11,408,528 |
| Supermarkets - 1.1% | | | | | | |
| Kroger Co., 5%, 2013 | | $ | 2,453,000 | | $ | 2,464,522 |
| Safeway, Inc., 6.5%, 2008 | | | 2,650,000 | | | 2,679,086 |
17
Portfolio of Investments – continued
| | | | | | |
| Issuer | | Shares/Par | | Value ($) |
| | | | | | |
| Bonds - continued | | | | | | |
| Supermarkets - continued | | | | | | |
| Safeway, Inc., 4.95%, 2010 | | $ | 984,000 | | $ | 997,337 |
| Safeway, Inc., 6.5%, 2011 | | | 1,250,000 | | | 1,297,120 |
| | | | | | |
| | | | | | $ | 7,438,065 |
| Supranational - 0.4% | | | | | | |
| Corporacion Andina de Fomento, 6.875%, 2012 | | $ | 3,000,000 | | $ | 3,141,474 |
| | |
| Telecommunications - Wireless - 1.1% | | | | | | |
| Sprint Capital Corp., 7.625%, 2011 | | $ | 3,750,000 | | $ | 3,553,125 |
| Vodafone Group PLC, 7.75%, 2010 | | | 3,700,000 | | | 3,904,555 |
| | | | | | |
| | | | | | $ | 7,457,680 |
| Tobacco - 0.4% | | | | | | |
| Philip Morris Capital Corp., 7.5%, 2009 | | $ | 3,040,000 | | $ | 3,047,600 |
| | |
| U.S. Government Agencies - 6.0% | | | | | | |
| Fannie Mae, 4.25%, 2009 | | $ | 6,500,000 | | $ | 6,602,616 |
| Fannie Mae, 6.375%, 2009 | | | 15,000,000 | | | 15,619,155 |
| Farmer Mac, 5.5%, 2011 (n) | | | 2,600,000 | | | 2,778,274 |
| Freddie Mac, 4.875%, 2009 | | | 8,000,000 | | | 8,139,424 |
| Small Business Administration, 5.1%, 2016 | | | 2,537,645 | | | 2,576,222 |
| Small Business Administration, 5.37%, 2016 | | | 866,710 | | | 885,058 |
| Small Business Administration, 5.46%, 2016 | | | 2,386,367 | | | 2,439,488 |
| Small Business Administration, 5.68%, 2016 | | | 1,605,123 | | | 1,649,225 |
| Small Business Administration, 5.94%, 2016 | | | 1,693,930 | | | 1,750,028 |
| | | | | | |
| | | | | | $ | 42,439,490 |
| U.S. Treasury Obligations - 0.4% | | | | | | |
| U.S. Treasury Notes, 2.625%, 2008 (f) | | $ | 2,990,000 | | $ | 2,991,169 |
| | |
| Utilities - Electric Power - 3.7% | | | | | | |
| Dominion Resources, Inc., FRN, 5.687%, 2008 | | $ | 1,880,000 | | $ | 1,880,630 |
| EDP Finance BV, 5.375%, 2012 (z) | | | 2,200,000 | | | 2,231,049 |
| Empresa Nacional de Electricidad S.A., 8.5%, 2009 | | | 2,325,000 | | | 2,408,268 |
| Enel Finance International S.A., 5.7%, 2013 (n) | | | 3,010,000 | | | 3,085,563 |
| Exelon Generation Co. LLC, 6.95%, 2011 | | | 4,700,000 | | | 4,927,621 |
| HQI Transelec Chile S.A., 7.875%, 2011 | | | 2,670,000 | | | 2,897,412 |
| MidAmerican Energy Holdings Co., 3.5%, 2008 | | | 1,076,000 | | | 1,075,808 |
| Niagara Mohawk Power Corp., 7.75%, 2008 | | | 855,000 | | | 867,612 |
| NiSource Finance Corp., 7.875%, 2010 | | | 2,759,000 | | | 2,900,247 |
| Virginia Electric & Power Co., 4.1%, 2008 | | | 4,100,000 | | | 4,092,677 |
| | | | | | |
| | | | | | $ | 26,366,887 |
| Total Bonds (Identified Cost, $661,483,435) | | | | | $ | 652,302,310 |
18
Portfolio of Investments – continued
| | | | | | |
| Money Market Funds (v) - 6.5% | | | | | | |
| Issuer | | Shares/Par | | Value ($) |
MFS Institutional Money Market Portfolio, 2.69%,
at Cost and Net Asset Value | | $ | 45,510,098 | | $ | 45,510,098 |
| Total Investments (Identified Cost, $706,993,533) (k) | | | | | $ | 697,812,408 |
| | |
| Other Assets, Less Liabilities - 0.7% | | | | | | 5,062,503 |
| Net Assets - 100.0% | | | | | $ | 702,874,911 |
| (f) | All or a portion of the security has been segregated as collateral for an open futures contract. |
| (i) | Interest only security for which the fund receives interest on notional principal (Par amount). Par amount shown is the notional principal and does not reflect the cost of the security. |
| (k) | As of April 30, 2008, the fund held securities fair valued in accordance with the policies adopted by the Board of Trustees, aggregating $651,455,537 and 93.36% of market value. All of these security values were provided by an independent pricing service using an evaluated bid. |
| (n) | Securities exempt from registration under Rule 144A of the Securities Act of 1933. These securities may be sold in the ordinary course of business in transactions exempt from registration, normally to qualified institutional buyers. At period end, the aggregate value of these securities was $66,779,726, representing 9.5% of net assets. |
| (v) | Underlying fund that is available only to investment companies managed by MFS. The rate quoted is the annualized seven-day yield of the fund at period end. |
| (z) | Restricted securities are not registered under the Securities Act of 1933 and are subject to legal restrictions on resale. These securities generally may be resold in transactions exempt from registration or to the public if the securities are subsequently registered. Disposal of these securities may involve time-consuming negotiations and prompt sale at an acceptable price may be difficult. The fund holds the following restricted securities: |
| | | | | | |
| Restricted Securities | | Acquisition
Date | | Cost | | Current
Market
Value |
Bayview Commercial Asset Trust, FRN,
3.165%, 2036 | | 2/23/06 | | $1,751,388 | | $1,576,250 |
Bayview Commercial Asset Trust, FRN,
0.879%, 2036 | | 5/16/06 | | 829,773 | | 749,807 |
| Bayview Financial Revolving Mortgage Loan Trust, FRN, 3.686%, 2040 | | 3/01/06 | | 1,402,996 | | 1,010,157 |
Bosphorus Financial Services Ltd., FRN,
4.865%, 2012 | | 3/08/05 | | 1,700,000 | | 1,637,122 |
| Brascan Real Estate, CDO, FRN, 4.417%, 2040 | | 9/14/04 | | 1,526,000 | | 1,000,858 |
| Brazilian Merchant Voucher Receivables Ltd., 5.911%, 2011 | | 7/02/03 | | 2,309,150 | | 2,305,074 |
| EDP Finance BV, 5.375%, 2012 | | 10/26/07 | | 2,195,565 | | 2,231,049 |
| Gramercy Real Estate CDO Ltd., FRN, 3.24%, 2035 | | 1/18/07 | | 2,337,274 | | 2,072,027 |
| Metropolitan Life Global Funding, 5.125%, 2013 | | 4/07/08 | | 1,059,224 | | 1,059,933 |
| Nomura Asset Securities Corp., FRN, 9.948%, 2027 | | 7/16/07 | | 2,746,569 | | 2,759,850 |
| OAO Gazprom, 7.343%, 2013 | | 4/02/08 | | 100,000 | | 104,625 |
| Pearson PLC, 5.5%, 2013 | | 4/29/08 | | 777,949 | | 786,092 |
Putnam Structured Product Funding, CDO, FRN,
3.166%, 2008 | | 9/23/03 | | 467,797 | | 421,017 |
| Wesfarmers Ltd., 6.998%, 2013 | | 4/03/08 | | 1,980,000 | | 2,059,731 |
| Total Restricted Securities | | | | | | $19,773,592 |
| % of Net Assets | | | | | | 2.8% |
19
Portfolio of Investments – continued
Futures contracts outstanding at 4/30/08
| | | | | | | | |
| Description | | Contracts | | Value | | Expiration
Date | | Unrealized
Appreciation/
(Depreciation) |
| U.S. Treasury Note 5 yr (Short) | | 272 | | $30,459,750 | | Jun-08 | | $103,173 |
| | | | | | | | |
Swap Agreements at 4/30/08
| | | | | | | | | | | | | |
| Expiration | | | | Notional
Amount | | Counterparty | | Cash Flows
to Receive | | Cash Flows
to Pay | | Value | |
| Credit Default Swaps | | | | | | | | | |
| 6/20/09 | | USD | | 3,310,000 | | Goldman Sachs International | | (1) | | 1.30%
(fixed rate) | | $332,109 | |
| 6/20/09 | | USD | | 3,390,000 | | Goldman Sachs International | | 1.35%
(fixed rate) | | (2) | | (1,551,599 | ) |
| | | | | | | | | | | | | |
| | | | | | | | | | | | $(1,219,490 | ) |
| | | | | | | | | | | | | |
| (1) | Fund to receive notional amount upon a defined credit event by GMAC, 6.875%, 8/28/12. |
| (2) | Fund to pay notional amount upon a defined credit event by Residential Capital Corp., 6.5%, 4/17/13. |
At April 30, 2008, the fund had sufficient cash and/or other liquid securities to cover any commitments under these derivative contracts.
The following abbreviations are used in this report and are defined:
| CDO | | Collateralized Debt Obligation |
| FRN | | Floating Rate Note. Interest rate resets periodically and may not be the rate reported at period end. |
| REIT | | Real Estate Investment Trust |
See Notes to Financial Statements
20
Financial Statements
STATEMENT OF ASSETS AND LIABILITIES
At 4/30/08
This statement represents your fund’s balance sheet, which details the assets and liabilities comprising the total value of the fund.
| | | | | |
| Assets | | | | | |
| Investments - | | | | | |
| Non-affiliated issuers, at value (identified cost, $661,483,435) | | $652,302,310 | | | |
| Underlying funds, at cost and value | | 45,510,098 | | | |
| Total investments, at value (identified cost, $706,993,533) | | | | | $697,812,408 |
| Receivable for investments sold | | $919,505 | | | |
| Receivable for fund shares sold | | 1,382,852 | | | |
| Interest and dividends receivable | | 6,905,987 | | | |
| Swaps, at value | | 332,109 | | | |
| Other assets | | 5,156 | | | |
| Total assets | | | | | $707,358,017 |
| Liabilities | | | | | |
| Payable to custodian | | $400 | | | |
| Distributions payable | | 460,146 | | | |
| Payable for daily variation margin on open futures contracts | | 93,500 | | | |
| Payable for investments purchased | | 777,949 | | | |
| Payable for fund shares reacquired | | 1,269,514 | | | |
| Swaps, at value | | 1,551,599 | | | |
| Payable to affiliates | | | | | |
Management fee | | 9,568 | | | |
Shareholder servicing costs | | 164,580 | | | |
Distribution and service fees | | 21,489 | | | |
Administrative services fee | | 526 | | | |
| Program manager fees | | 66 | | | |
| Payable for independent trustees’ compensation | | 15,838 | | | |
| Accrued expenses and other liabilities | | 117,931 | | | |
| Total liabilities | | | | | $4,483,106 |
| Net assets | | | | | $702,874,911 |
| Net assets consist of | | | | | |
| Paid-in capital | | $821,756,797 | | | |
| Unrealized appreciation (depreciation) on investments | | (10,297,442 | ) | | |
| Accumulated net realized gain (loss) on investments | | (108,614,427 | ) | | |
| Undistributed net investment income | | 29,983 | | | |
| Net assets | | | | | $702,874,911 |
| Shares of beneficial interest outstanding | | | | | 112,008,209 |
21
Statement of Assets and Liabilities – continued
| | | | |
| Class A shares | | | | |
Net assets | | $373,587,441 | | |
Shares outstanding | | 59,445,026 | | |
Net asset value per share | | | | $6.28 |
Offering price per share (100/97.50 × net asset value per share) | | | | $6.44 |
| Class B shares | | | | |
Net assets | | $76,245,825 | | |
Shares outstanding | | 12,181,803 | | |
Net asset value and offering price per share | | | | $6.26 |
| Class C shares | | | | |
Net assets | | $69,419,896 | | |
Shares outstanding | | 11,058,612 | | |
Net asset value and offering price per share | | | | $6.28 |
| Class I shares | | | | |
Net assets | | $163,725,013 | | |
Shares outstanding | | 26,152,995 | | |
Net asset value, offering price, and redemption price per share | | | | $6.26 |
| Class R1 shares | | | | |
Net assets | | $909,223 | | |
Shares outstanding | | 145,298 | | |
Net asset value, offering price, and redemption price per share | | | | $6.26 |
| Class R2 shares (formerly Class R3 shares) | | | | |
Net assets | | $5,768,485 | | |
Shares outstanding | | 918,513 | | |
Net asset value, offering price, and redemption price per share | | | | $6.28 |
| Class R3 shares (formerly Class R4 shares) | | | | |
Net assets | | $940,847 | | |
Shares outstanding | | 149,821 | | |
Net asset value, offering price, and redemption price per share | | | | $6.28 |
| Class R4 shares (formerly Class R5 shares) | | | | |
Net assets | | $55,865 | | |
Shares outstanding | | 8,890 | | |
Net asset value, offering price, and redemption price per share | | | | $6.28 |
| Class 529A shares | | | | |
Net assets | | $6,372,740 | | |
Shares outstanding | | 1,014,627 | | |
Net asset value per share | | | | $6.28 |
Offering price per share (100/97.50 × net asset value per share) | | | | $6.44 |
22
Statement of Assets and Liabilities – continued
| | | | |
| Class 529B shares | | | | |
Net assets | | $988,553 | | |
Shares outstanding | | 158,176 | | |
Net asset value and offering price per share | | | | $6.25 |
| Class 529C shares | | | | |
Net assets | | $4,861,023 | | |
Shares outstanding | | 774,448 | | |
Net asset value and offering price per share | | | | $6.28 |
On sales of $50,000 or more, the offering prices of Class A and Class 529A shares are reduced. A contingent deferred sales charge may be imposed on redemptions of Class A, Class B, Class C, Class 529B, and Class 529C shares.
See Notes to Financial Statements
23
Financial Statements
STATEMENT OF OPERATIONS
Year ended 4/30/08
This statement describes how much your fund earned in investment income and accrued in expenses. It also describes any gains and/or losses generated by fund operations.
| | | | | | |
| Net investment income | | | | | | |
| Income | | | | | | |
Interest | | $34,889,011 | | | | |
Dividends from underlying funds | | 1,293,926 | | | | |
| Total investment income | | | | | $36,182,937 | |
| Expenses | | | | | | |
Management fee | | $2,907,098 | | | | |
Distribution and service fees | | 2,322,682 | | | | |
Program manager fees | | 23,666 | | | | |
Shareholder servicing costs | | 1,082,226 | | | | |
Administrative services fee | | 117,154 | | | | |
Retirement plan administration and services fees | | 5,092 | | | | |
Independent trustees’ compensation | | 20,137 | | | | |
Custodian fee | | 129,274 | | | | |
Shareholder communications | | 129,012 | | | | |
Auditing fees | | 57,239 | | | | |
Legal fees | | 13,380 | | | | |
Miscellaneous | | 180,422 | | | | |
| Total expenses | | | | | $6,987,382 | |
Fees paid indirectly | | (3,183 | ) | | | |
Reduction of expenses by investment adviser and distributor | | (1,102,681 | ) | | | |
| Net expenses | | | | | $5,881,518 | |
| Net investment income | | | | | $30,301,419 | |
| Realized and unrealized gain (loss) on investments | | | | | | |
| Realized gain (loss) (identified cost basis) | | | | | | |
Investment transactions | | $(2,941,256 | ) | | | |
Futures contracts | | (5,229,045 | ) | | | |
Swap transactions | | 2,560 | | | | |
| Net realized gain (loss) on investments | | | | | $(8,167,741 | ) |
Change in unrealized appreciation (depreciation) | | | | | | |
Investments | | $(2,824,669 | ) | | | |
Futures contracts | | 284,486 | | | | |
Swap transactions | | (1,214,478 | ) | | | |
| Net unrealized gain (loss) on investments | | | | | $(3,754,661 | ) |
| Net realized and unrealized gain (loss) on investments | | | | | $(11,922,402 | ) |
| Change in net assets from operations | | | | | $18,379,017 | |
See Notes to Financial Statements
24
Financial Statements
STATEMENTS OF CHANGES IN NET ASSETS
These statements describe the increases and/or decreases in net assets resulting from operations, any distributions, and any shareholder transactions.
| | | | | | |
| | | Years ended 4/30 | |
| | | 2008 | | | 2007 | |
| Change in net assets | | | | | | |
| From operations | | | | | | |
| Net investment income | | $30,301,419 | | | $28,615,960 | |
| Net realized gain (loss) on investments | | (8,167,741 | ) | | (2,678,617 | ) |
| Net unrealized gain (loss) on investments | | (3,754,661 | ) | | 9,340,446 | |
| Change in net assets from operations | | $18,379,017 | | | $35,277,789 | |
| Distributions declared to shareholders | | | | | | |
| From net investment income | | | | | | |
Class A | | $(18,731,267 | ) | | $(16,547,169 | ) |
Class B | | (4,069,973 | ) | | (4,410,648 | ) |
Class C | | (3,067,928 | ) | | (3,093,007 | ) |
Class I | | (8,054,687 | ) | | (6,703,500 | ) |
Class R (b) | | (64,892 | ) | | (122,088 | ) |
Class R1 | | (26,625 | ) | | (9,568 | ) |
Former Class R2 (b) | | (17,476 | ) | | (5,908 | ) |
Class R2 (formerly Class R3) | | (117,789 | ) | | (24,145 | ) |
Class R3 (formerly Class R4) | | (33,230 | ) | | (17,817 | ) |
Class R4 (formerly Class R5) | | (2,767 | ) | | (2,525 | ) |
Class 529A | | (230,613 | ) | | (147,483 | ) |
Class 529B | | (40,057 | ) | | (27,828 | ) |
Class 529C | | (151,847 | ) | | (94,533 | ) |
| Total distributions declared to shareholders | | $(34,609,151 | ) | | $(31,206,219 | ) |
| Change in net assets from fund share transactions | | $(36,118,702 | ) | | $83,674,840 | |
| Total change in net assets | | $(52,348,836 | ) | | $87,746,410 | |
| Net assets | | | | | | |
| At beginning of period | | 755,223,747 | | | 667,477,337 | |
At end of period (including undistributed net investment
income of $29,983 and $293,774, respectively) | | $702,874,911 | | | $755,223,747 | |
| (b) | At the close of business on April 18, 2008, Class R and Class R2 shares converted into Class R3 shares. Following the conversion, Class R3 shares were renamed Class R2 shares. |
See Notes to Financial Statements
25
Financial Statements
FINANCIAL HIGHLIGHTS
The financial highlights table is intended to help you understand the fund’s financial performance for the past 5 years (or life of a particular share class, if shorter). Certain information reflects financial results for a single fund share. The total returns in the table represent the rate by which an investor would have earned (or lost) on an investment in the fund share class (assuming reinvestment of all distributions) held for the entire period.
| | | | | | | | | | | | | | | |
| Class A | | Years ended 4/30 | |
| | | 2008 | | | 2007 | | | 2006 | | | 2005 | | | 2004 | |
| Net asset value, beginning of period | | $6.43 | | | $6.38 | | | $6.50 | | | $6.68 | | | $6.87 | |
Income (loss) from
investment operations | | | | | | | | | | | | | | | |
Net investment income (d) | | $0.28 | | | $0.28 | | | $0.24 | | | $0.22 | | | $0.22 | |
Net realized and unrealized gain (loss)
on investments | | (0.12 | ) | | 0.07 | | | (0.09 | ) | | (0.12 | ) | | (0.11 | ) |
| Total from investment operations | | $0.16 | | | $0.35 | | | $0.15 | | | $0.10 | | | $0.11 | |
Less distributions declared
to shareholders | | | | | | | | | | | | | | | |
From net investment income | | $(0.31 | ) | | $(0.30 | ) | | $(0.27 | ) | | $(0.28 | ) | | $(0.30 | ) |
| Net asset value, end of period | | $6.28 | | | $6.43 | | | $6.38 | | | $6.50 | | | $6.68 | |
| Total return (%) (r)(s)(t) | | 2.61 | | | 5.65 | | | 2.32 | | | 1.54 | | | 1.60 | |
Ratios (%) (to average net assets)
and Supplemental data: | | | | | | | | | | | | | | | |
| Expenses before expense reductions (f) | | 0.79 | | | 0.80 | | | 0.82 | | | 0.80 | | | 0.82 | |
| Expenses after expense reductions (f) | | 0.64 | | | 0.65 | | | 0.67 | | | 0.65 | | | 0.75 | |
| Net investment income | | 4.34 | | | 4.38 | | | 3.74 | | | 3.39 | | | 3.31 | |
| Portfolio turnover | | 21 | | | 33 | | | 25 | | | 35 | | | 43 | |
| Net assets at end of period (000 Omitted) | | $373,587 | | | $388,086 | | | $345,689 | | | $422,096 | | | $509,115 | |
See Notes to Financial Statements
26
Financial Highlights – continued
| | | | | | | | | | | | | | | |
| Class B | | Years ended 4/30 | |
| | | 2008 | | | 2007 | | | 2006 | | | 2005 | | | 2004 | |
| Net asset value, beginning of period | | $6.40 | | | $6.36 | | | $6.47 | | | $6.66 | | | $6.84 | |
Income (loss) from
investment operations | | | | | | | | | | | | | | | |
Net investment income (d) | | $0.23 | | | $0.23 | | | $0.19 | | | $0.17 | | | $0.17 | |
Net realized and unrealized gain (loss)
on investments | | (0.11 | ) | | 0.06 | | | (0.08 | ) | | (0.13 | ) | | (0.11 | ) |
| Total from investment operations | | $0.12 | | | $0.29 | | | $0.11 | | | $0.04 | | | $0.06 | |
Less distributions declared
to shareholders | | | | | | | | | | | | | | | |
From net investment income | | $(0.26 | ) | | $(0.25 | ) | | $(0.22 | ) | | $(0.23 | ) | | $(0.24 | ) |
| Net asset value, end of period | | $6.26 | | | $6.40 | | | $6.36 | | | $6.47 | | | $6.66 | |
| Total return (%) (r)(s)(t) | | 1.94 | | | 4.70 | | | 1.69 | | | 0.60 | | | 0.95 | |
Ratios (%) (to average net assets)
and Supplemental data: | | | | | | | | | | | | | | | |
| Expenses before expense reductions (f) | | 1.57 | | | 1.57 | | | 1.59 | | | 1.57 | | | 1.61 | |
| Expenses after expense reductions (f) | | 1.42 | | | 1.42 | | | 1.44 | | | 1.42 | | | 1.54 | |
| Net investment income | | 3.58 | | | 3.62 | | | 2.97 | | | 2.62 | | | 2.53 | |
| Portfolio turnover | | 21 | | | 33 | | | 25 | | | 35 | | | 43 | |
| Net assets at end of period (000 Omitted) | | $76,246 | | | $119,976 | | | $103,406 | | | $151,997 | | | $198,356 | |
See Notes to Financial Statements
27
Financial Highlights – continued
| | | | | | | | | | | | | | | |
| Class C | | Years ended 4/30 | |
| | | 2008 | | | 2007 | | | 2006 | | | 2005 | | | 2004 | |
| Net asset value, beginning of period | | $6.42 | | | $6.38 | | | $6.49 | | | $6.67 | | | $6.86 | |
Income (loss) from
investment operations | | | | | | | | | | | | | | | |
Net investment income (d) | | $0.22 | | | $0.22 | | | $0.19 | | | $0.17 | | | $0.17 | |
Net realized and unrealized gain (loss)
on investments | | (0.10 | ) | | 0.07 | | | (0.09 | ) | | (0.13 | ) | | (0.12 | ) |
| Total from investment operations | | $0.12 | | | $0.29 | | | $0.10 | | | $0.04 | | | $0.05 | |
Less distributions declared
to shareholders | | | | | | | | | | | | | | | |
From net investment income | | $(0.26 | ) | | $(0.25 | ) | | $(0.21 | ) | | $(0.22 | ) | | $(0.24 | ) |
| Net asset value, end of period | | $6.28 | | | $6.42 | | | $6.38 | | | $6.49 | | | $6.67 | |
| Total return (%) (r)(s)(t) | | 1.90 | | | 4.60 | | | 1.61 | | | 0.67 | | | 0.73 | |
Ratios (%) (to average net assets)
and Supplemental data: | | | | | | | | | | | | | | | |
| Expenses before expense reductions (f) | | 1.64 | | | 1.66 | | | 1.67 | | | 1.65 | | | 1.67 | |
| Expenses after expense reductions (f) | | 1.49 | | | 1.51 | | | 1.52 | | | 1.50 | | | 1.60 | |
| Net investment income | | 3.50 | | | 3.53 | | | 2.89 | | | 2.55 | | | 2.45 | |
| Portfolio turnover | | 21 | | | 33 | | | 25 | | | 35 | | | 43 | |
| Net assets at end of period (000 Omitted) | | $69,420 | | | $81,986 | | | $81,144 | | | $140,467 | | | $209,163 | |
See Notes to Financial Statements
28
Financial Highlights – continued
| | | | | | | | | | | | | | | |
| Class I | | Years ended 4/30 | |
| | | 2008 | | | 2007 | | | 2006 | | | 2005 | | | 2004 | |
| Net asset value, beginning of period | | $6.40 | | | $6.36 | | | $6.48 | | | $6.66 | | | $6.84 | |
Income (loss) from
investment operations | | | | | | | | | | | | | | | |
Net investment income (d) | | $0.29 | | | $0.29 | | | $0.25 | | | $0.23 | | | $0.23 | |
Net realized and unrealized gain (loss)
on investments | | (0.11 | ) | | 0.06 | | | (0.09 | ) | | (0.12 | ) | | (0.10 | ) |
| Total from investment operations | | $0.18 | | | $0.35 | | | $0.16 | | | $0.11 | | | $0.13 | |
Less distributions declared
to shareholders | | | | | | | | | | | | | | | |
From net investment income | | $(0.32 | ) | | $(0.31 | ) | | $(0.28 | ) | | $(0.29 | ) | | $(0.31 | ) |
| Net asset value, end of period | | $6.26 | | | $6.40 | | | $6.36 | | | $6.48 | | | $6.66 | |
| Total return (%) (r)(s) | | 2.91 | | | 5.65 | | | 2.46 | | | 1.68 | | | 1.89 | |
Ratios (%) (to average net assets)
and Supplemental data: | | | | | | | | | | | | | | | |
| Expenses before expense reductions (f) | | 0.64 | | | 0.65 | | | 0.67 | | | 0.66 | | | 0.66 | |
| Expenses after expense reductions (f) | | 0.49 | | | 0.50 | | | 0.52 | | | 0.51 | | | 0.59 | |
| Net investment income | | 4.50 | | | 4.51 | | | 3.90 | | | 3.53 | | | 3.45 | |
| Portfolio turnover | | 21 | | | 33 | | | 25 | | | 35 | | | 43 | |
| Net assets at end of period (000 Omitted) | | $163,725 | | | $151,568 | | | $127,926 | | | $110,059 | | | $80,206 | |
See Notes to Financial Statements
29
Financial Highlights – continued
| | | | | | | | | | | | |
| Class R1 | | Years ended 4/30 | |
| | | 2008 | | | 2007 | | | 2006 | | | 2005 (i) | |
| Net asset value, beginning of period | | $6.40 | | | $6.35 | | | $6.47 | | | $6.46 | |
Income (loss) from
investment operations | | | | | | | | | | | | |
Net investment income (d) | | $0.22 | | | $0.22 | | | $0.18 | | | $0.01 | |
Net realized and unrealized gain (loss)
on investments | | (0.11 | ) | | 0.07 | | | (0.10 | ) | | 0.02 | (g) |
| Total from investment operations | | $0.11 | | | $0.29 | | | $0.08 | | | $0.03 | |
Less distributions declared
to shareholders | | | | | | | | | | | | |
From net investment income | | $(0.25 | ) | | $(0.24 | ) | | $(0.20 | ) | | $(0.02 | ) |
| Net asset value, end of period | | $6.26 | | | $6.40 | | | $6.35 | | | $6.47 | |
| Total return (%) (r)(s) | | 1.80 | | | 4.66 | | | 1.30 | | | 0.39 | (n) |
Ratios (%) (to average net assets)
and Supplemental data: | | | | | | | | | | | | |
| Expenses before expense reductions (f) | | 1.72 | | | 1.84 | | | 1.87 | | | 2.07 | (a) |
| Expenses after expense reductions (f) | | 1.57 | | | 1.60 | | | 1.66 | | | 1.92 | (a) |
| Net investment income | | 3.41 | | | 3.42 | | | 2.79 | | | 2.28 | (a) |
| Portfolio turnover | | 21 | | | 33 | | | 25 | | | 35 | |
| Net assets at end of period (000 Omitted) | | $909 | | | $267 | | | $123 | | | $50 | |
See Notes to Financial Statements
30
Financial Highlights – continued
| | | | | | | | | | | | | | | |
| Class R2 (formerly Class R3) | | Years ended 4/30 | |
| | | 2008 | | | 2007 | | | 2006 | | | 2005 | | | 2004 (i) | |
| Net asset value, beginning of period | | $6.42 | | | $6.38 | | | $6.50 | | | $6.68 | | | $6.77 | |
Income (loss) from
investment operations | | | | | | | | | | | | | | | |
Net investment income (d) | | $0.24 | | | $0.25 | | | $0.22 | | | $0.19 | | | $0.09 | |
Net realized and unrealized gain (loss)
on investments | | (0.09 | ) | | 0.07 | | | (0.10 | ) | | (0.12 | ) | | (0.05 | ) |
| Total from investment operations | | $0.15 | | | $0.32 | | | $0.12 | | | $0.07 | | | $0.04 | |
Less distributions declared
to shareholders | | | | | | | | | | | | | | | |
From net investment income | | $(0.29 | ) | | $(0.28 | ) | | $(0.24 | ) | | $(0.25 | ) | | $(0.13 | ) |
| Net asset value, end of period | | $6.28 | | | $6.42 | | | $6.38 | | | $6.50 | | | $6.68 | |
| Total return (%) (r)(s) | | 2.41 | | | 5.07 | | | 1.87 | | | 1.03 | | | 0.58 | (n) |
Ratios (%) (to average net assets)
and Supplemental data: | | | | | | | | | | | | | | | |
| Expenses before expense reductions (f) | | 1.22 | | | 1.38 | | | 1.41 | | | 1.42 | | | 1.38 | (a) |
| Expenses after expense reductions (f) | | 0.97 | | | 1.05 | | | 1.09 | | | 1.17 | | | 1.21 | (a) |
| Net investment income | | 3.98 | | | 3.98 | | | 3.36 | | | 2.88 | | | 2.70 | (a) |
| Portfolio turnover | | 21 | | | 33 | | | 25 | | | 35 | | | 43 | |
| Net assets at end of period (000 Omitted) | | $5,768 | | | $1,154 | | | $269 | | | $156 | | | $98 | |
See Notes to Financial Statements
31
Financial Highlights – continued
| | | | | | | | | | | | |
| Class R3 (formerly Class R4) | | Years ended 4/30 | |
| | | 2008 | | | 2007 | | | 2006 | | | 2005 (i) | |
| Net asset value, beginning of period | | $6.43 | | | $6.38 | | | $6.50 | | | $6.49 | |
Income (loss) from
investment operations | | | | | | | | | | | | |
Net investment income (d) | | $0.26 | | | $0.27 | | | $0.22 | | | $0.02 | |
Net realized and unrealized gain (loss)
on investments | | (0.11 | ) | | 0.07 | | | (0.09 | ) | | 0.01 | (g) |
| Total from investment operations | | $0.15 | | | $0.34 | | | $0.13 | | | $0.03 | |
Less distributions declared
to shareholders | | | | | | | | | | | | |
From net investment income | | $(0.30 | ) | | $(0.29 | ) | | $(0.25 | ) | | $(0.02 | ) |
| Net asset value, end of period | | $6.28 | | | $6.43 | | | $6.38 | | | $6.50 | |
| Total return (%) (r)(s) | | 2.40 | | | 5.39 | | | 2.06 | | | 0.46 | (n) |
Ratios (%) (to average net assets)
and Supplemental data: | | | | | | | | | | | | |
| Expenses before expense reductions (f) | | 0.98 | | | 1.05 | | | 1.07 | | | 1.27 | (a) |
| Expenses after expense reductions (f) | | 0.83 | | | 0.90 | | | 0.92 | | | 1.12 | (a) |
| Net investment income | | 4.15 | | | 4.13 | | | 3.60 | | | 3.13 | (a) |
| Portfolio turnover | | 21 | | | 33 | | | 25 | | | 35 | |
| Net assets at end of period (000 Omitted) | | $941 | | | $494 | | | $260 | | | $50 | |
See Notes to Financial Statements
32
Financial Highlights – continued
| | | | | | | | | | | | |
| Class R4 (formerly Class R5) | | Years ended 4/30 | |
| | | 2008 | | | 2007 | | | 2006 | | | 2005 (i) | |
| Net asset value, beginning of period | | $6.43 | | | $6.38 | | | $6.50 | | | $6.49 | |
Income (loss) from
investment operations | | | | | | | | | | | | |
Net investment income (d) | | $0.28 | | | $0.28 | | | $0.24 | | | $0.02 | |
Net realized and unrealized gain (loss)
on investments | | (0.11 | ) | | 0.08 | | | (0.09 | ) | | 0.01 | (g) |
| Total from investment operations | | $0.17 | | | $0.36 | | | $0.15 | | | $0.03 | |
Less distributions declared
to shareholders | | | | | | | | | | | | |
From net investment income | | $(0.32 | ) | | $(0.31 | ) | | $(0.27 | ) | | $(0.02 | ) |
| Net asset value, end of period | | $6.28 | | | $6.43 | | | $6.38 | | | $6.50 | |
| Total return (%) (r)(s) | | 2.69 | | | 5.71 | | | 2.37 | | | 0.48 | (n) |
Ratios (%) (to average net assets)
and Supplemental data: | | | | | | | | | | | | |
| Expenses before expense reductions (f) | | 0.71 | | | 0.76 | | | 0.77 | | | 0.97 | (a) |
| Expenses after expense reductions (f) | | 0.56 | | | 0.61 | | | 0.62 | | | 0.82 | (a) |
| Net investment income | | 4.42 | | | 4.41 | | | 3.80 | | | 3.45 | (a) |
| Portfolio turnover | | 21 | | | 33 | | | 25 | | | 35 | |
| Net assets at end of period (000 Omitted) | | $56 | | | $54 | | | $51 | | | $50 | |
See Notes to Financial Statements
33
Financial Highlights – continued
| | | | | | | | | | | | | | | |
| Class 529A | | Years ended 4/30 | |
| | | 2008 | | | 2007 | | | 2006 | | | 2005 | | | 2004 | |
| Net asset value, beginning of period | | $6.42 | | | $6.38 | | | $6.50 | | | $6.68 | | | $6.87 | |
Income (loss) from
investment operations | | | | | | | | | | | | | | | |
Net investment income (d) | | $0.25 | | | $0.25 | | | $0.22 | | | $0.20 | | | $0.20 | |
Net realized and unrealized gain (loss)
on investments | | (0.10 | ) | | 0.07 | | | (0.09 | ) | | (0.12 | ) | | (0.11 | ) |
| Total from investment operations | | $0.15 | | | $0.32 | | | $0.13 | | | $0.08 | | | $0.09 | |
Less distributions declared
to shareholders | | | | | | | | | | | | | | | |
From net investment income | | $(0.29 | ) | | $(0.28 | ) | | $(0.25 | ) | | $(0.26 | ) | | $(0.28 | ) |
| Net asset value, end of period | | $6.28 | | | $6.42 | | | $6.38 | | | $6.50 | | | $6.68 | |
| Total return (%) (r)(s)(t) | | 2.42 | | | 5.12 | | | 1.96 | | | 1.18 | | | 1.28 | |
Ratios (%) (to average net assets)
and Supplemental data: | | | | | | | | | | | | | | | |
| Expenses before expense reductions (f) | | 1.23 | | | 1.26 | | | 1.27 | | | 1.27 | | | 1.27 | |
| Expenses after expense reductions (f) | | 0.98 | | | 1.00 | | | 1.02 | | | 1.02 | | | 1.10 | |
| Net investment income | | 4.00 | | | 4.02 | | | 3.41 | | | 3.03 | | | 2.97 | |
| Portfolio turnover | | 21 | | | 33 | | | 25 | | | 35 | | | 43 | |
| Net assets at end of period (000 Omitted) | | $6,373 | | | $4,467 | | | $2,868 | | | $2,300 | | | $1,651 | |
See Notes to Financial Statements
34
Financial Highlights – continued
| | | | | | | | | | | | | | | |
| Class 529B | | Years ended 4/30 | |
| | | 2008 | | | 2007 | | | 2006 | | | 2005 | | | 2004 | |
| Net asset value, beginning of period | | $6.39 | | | $6.35 | | | $6.47 | | | $6.65 | | | $6.83 | |
Income (loss) from
investment operations | | | | | | | | | | | | | | | |
Net investment income (d) | | $0.21 | | | $0.21 | | | $0.17 | | | $0.15 | | | $0.15 | |
Net realized and unrealized gain (loss)
on investments | | (0.10 | ) | | 0.07 | | | (0.09 | ) | | (0.12 | ) | | (0.10 | ) |
| Total from investment operations | | $0.11 | | | $0.28 | | | $0.08 | | | $0.03 | | | $0.05 | |
Less distributions declared
to shareholders | | | | | | | | | | | | | | | |
From net investment income | | $(0.25 | ) | | $(0.24 | ) | | $(0.20 | ) | | $(0.21 | ) | | $(0.23 | ) |
| Net asset value, end of period | | $6.25 | | | $6.39 | | | $6.35 | | | $6.47 | | | $6.65 | |
| Total return (%) (r)(s)(t) | | 1.76 | | | 4.47 | | | 1.26 | | | 0.48 | | | 0.68 | |
Ratios (%) (to average net assets)
and Supplemental data: | | | | | | | | | | | | | | | |
| Expenses before expense reductions (f) | | 1.79 | | | 1.78 | | | 1.86 | | | 1.84 | | | 1.89 | |
| Expenses after expense reductions (f) | | 1.64 | | | 1.63 | | | 1.71 | | | 1.69 | | | 1.82 | |
| Net investment income | | 3.36 | | | 3.39 | | | 2.71 | | | 2.35 | | | 2.24 | |
| Portfolio turnover | | 21 | | | 33 | | | 25 | | | 35 | | | 43 | |
| Net assets at end of period (000 Omitted) | | $989 | | | $1,046 | | | $682 | | | $704 | | | $718 | |
See Notes to Financial Statements
35
Financial Highlights – continued
| | | | | | | | | | | | | | | |
| Class 529C | | Years ended 4/30 | |
| | | 2008 | | | 2007 | | | 2006 | | | 2005 | | | 2004 | |
| Net asset value, beginning of period | | $6.42 | | | $6.38 | | | $6.49 | | | $6.67 | | | $6.86 | |
Income (loss) from
investment operations | | | | | | | | | | | | | | | |
Net investment income (d) | | $0.21 | | | $0.21 | | | $0.17 | | | $0.15 | | | $0.15 | |
Net realized and unrealized gain (loss)
on investments | | (0.11 | ) | | 0.06 | | | (0.08 | ) | | (0.12 | ) | �� | (0.11 | ) |
| Total from investment operations | | $0.10 | | | $0.27 | | | $0.09 | | | $0.03 | | | $0.04 | |
Less distributions declared
to shareholders | | | | | | | | | | | | | | | |
From net investment income | | $(0.24 | ) | | $(0.23 | ) | | $(0.20 | ) | | $(0.21 | ) | | $(0.23 | ) |
| Net asset value, end of period | | $6.28 | | | $6.42 | | | $6.38 | | | $6.49 | | | $6.67 | |
| Total return (%) (r)(s)(t) | | 1.66 | | | 4.34 | | | 1.35 | | | 0.42 | | | 0.52 | |
Ratios (%) (to average net assets)
and Supplemental data: | | | | | | | | | | | | | | | |
| Expenses before expense reductions (f) | | 1.88 | | | 1.90 | | | 1.92 | | | 1.91 | | | 1.92 | |
| Expenses after expense reductions (f) | | 1.73 | | | 1.75 | | | 1.77 | | | 1.76 | | | 1.85 | |
| Net investment income | | 3.25 | | | 3.27 | | | 2.66 | | | 2.29 | | | 2.22 | |
| Portfolio turnover | | 21 | | | 33 | | | 25 | | | 35 | | | 43 | |
| Net assets at end of period (000 Omitted) | | $4,861 | | | $3,719 | | | $2,157 | | | $1,820 | | | $1,432 | |
Any redemption fees charged by the fund during the 2004 and 2005 fiscal years resulted in a per share impact of less than $0.01.
| (d) | Per share data are based on average shares outstanding. |
| (f) | Ratios do not reflect reductions from fees paid indirectly. |
| (g) | The per share amount is not in accordance with the net realized and unrealized gain/loss for the period because of the timing of sales of fund shares and the per share amount of realized and unrealized gains and losses at such time. |
| (i) | For the period from the class’ inception, October 31, 2003 (Class R2), and April 1, 2005 (Classes R1, R3, and R4) through the stated period end. |
| (r) | Certain expenses have been reduced without which performance would have been lower. |
| (s) | From time to time the fund may receive proceeds from litigation settlements, without which performance would be lower. |
| (t) | Total returns do not include any applicable sales charges. |
See Notes to Financial Statements
36
NOTES TO FINANCIAL STATEMENTS
| (1) | | Business and Organization |
MFS Limited Maturity Fund (the fund) is a series of MFS Series Trust IX (the trust). The trust is organized as a Massachusetts business trust and is registered under the Investment Company Act of 1940, as amended, as an open-end management investment company.
| (2) | | Significant Accounting Policies |
General – The preparation of financial statements in conformity with U.S. generally accepted accounting principles requires management to make estimates and assumptions that affect the reported amounts of assets and liabilities, and disclosure of contingent assets and liabilities at the date of the financial statements and the reported amounts of revenues and expenses during the reporting period. Actual results could differ from those estimates. The fund can invest in foreign securities, including securities of emerging market issuers. Investments in foreign securities are vulnerable to the effects of changes in the relative values of the local currency and the U.S. dollar and to the effects of changes in each country’s legal, political, and economic environment. The markets of emerging markets countries are generally more volatile than the markets of developed countries with more mature economies. All of the risks of investing in foreign securities previously described are heightened when investing in emerging markets countries.
Investment Valuations – Debt instruments and floating rate loans (other than short-term instruments), including restricted debt instruments, are generally valued at an evaluated or composite bid as reported by an independent pricing service. Short- term instruments with a maturity at issuance of 60 days or less may be valued at amortized cost, which approximates market value. Futures contracts are generally valued at last posted settlement price as reported by an independent pricing service on the market on which they are primarily traded. Futures contracts for which there were no trades that day for a particular position are generally valued at the closing bid quotation as reported by an independent pricing service on the market on which such futures contracts are primarily traded. Swaps are generally valued at an evaluated bid as reported by an independent pricing service. Open-end investment companies are generally valued at net asset value per share. Securities and other assets generally valued on the basis of information from an independent pricing service may also be valued at a broker-dealer bid quotation. Values obtained from pricing services can utilize both dealer-supplied valuations and electronic data processing techniques, which take into account factors such as institutional-size trading in similar groups of securities, yield, quality, coupon rate, maturity, type of issue, trading characteristics, and other market data. The values of foreign securities and other assets and liabilities expressed in foreign currencies are converted to
37
Notes to Financial Statements – continued
U.S. dollars using the mean of bid and asked prices for rates reported by an independent pricing service.
The Board of Trustees has delegated primary responsibility for determining or causing to be determined the value of the fund’s investments (including any fair valuation) to the adviser pursuant to valuation policies and procedures approved by the Board. If the adviser determines that reliable market quotations are not readily available, investments are valued at fair value as determined in good faith by the adviser in accordance with such procedures under the oversight of the Board of Trustees. Under the fund’s valuation policies and procedures, market quotations are not considered to be readily available for most types of debt instruments and floating rate loans and many types of derivatives. These investments are generally valued at fair value based on information from independent pricing services. In addition, investments may be valued at fair value if the adviser determines that an investment’s value has been materially affected by events occurring after the close of the exchange or market on which the investment is principally traded (such as foreign exchange or market) and prior to the determination of the fund’s net asset value, or after the halting of trading of a specific security where trading does not resume prior to the close of the exchange or market on which the security is principally traded. The adviser may rely on independent pricing services or other information (such as the correlation with price movements of similar securities in the same or other markets; the type, cost and investment characteristics of the security; the business and financial condition of the issuer; and trading and other market data) to assist in determining whether to fair value and at what value to fair value an investment. The value of an investment for purposes of calculating the fund’s net asset value can differ depending on the source and method used to determine value. When fair valuation is used, the value of investments used to determine the fund’s net asset value may differ from quoted or published prices for the same investments.
In September 2006, FASB Statement No. 157, Fair Value Measurements (the “Statement”) was issued, and is effective for fiscal years beginning after November 15, 2007 and for all interim periods within those fiscal years. This Statement provides a single definition of fair value, a hierarchy for measuring fair value and expanded disclosures about fair value measurements. Management is evaluating the application of the Statement to the fund, and believes the impact will be limited to expanded disclosures resulting from the adoption of this Statement in the fund’s financial statements.
Repurchase Agreements – The fund may enter into repurchase agreements with institutions that the fund’s investment adviser has determined are creditworthy. Each repurchase agreement is recorded at cost. The fund requires that the securities collateral in a repurchase transaction be transferred to a
38
Notes to Financial Statements – continued
custodian in a manner sufficient to enable the fund to obtain those securities in the event of a default under the repurchase agreement. The fund monitors, on a daily basis, the value of the collateral to ensure that its value, including accrued interest, is greater than amounts owed to the fund under each such repurchase agreement.
Derivative Risk – The fund may invest in derivatives for hedging or non-hedging purposes. While hedging can reduce or eliminate losses, it can also reduce or eliminate gains. When the fund uses derivatives as an investment to gain market exposure, or for hedging purposes, gains and losses from derivative instruments may be substantially greater than the derivative’s original cost. Cash that has been segregated on behalf of certain derivative contracts will be reported separately on the Statement of Assets and Liabilities as restricted cash. Derivative instruments include futures contracts and swap agreements.
Futures Contracts – The fund may enter into futures contracts for the delayed delivery of securities or currency, or contracts based on financial indices at a fixed price on a future date. In entering such contracts, the fund is required to deposit with the broker either in cash or securities an amount equal to a certain percentage of the contract amount. Subsequent payments are made or received by the fund each day, depending on the daily fluctuations in the value of the contract, and are recorded for financial statement purposes as unrealized gains or losses by the fund. Upon entering into such contracts, the fund bears the risk of interest or exchange rates or securities prices moving unexpectedly, in which case, the fund may not achieve the anticipated benefits of the futures contracts and may realize a loss.
Swap Agreements – The fund may enter into swap agreements. A swap is an exchange of cash payments between the fund and another party. Net cash payments are exchanged at specified intervals and are recorded as a realized gain or loss in the Statement of Operations. The value of the swap is adjusted daily and the change in value, including accruals of periodic amounts of interest to be paid or received, is recorded as unrealized appreciation or depreciation in the Statement of Operations. Amounts paid or received at the inception of the swap are reflected as premiums paid or received on the Statement of Assets and Liabilities and are amortized using the effective interest method over the term of the agreement. A liquidation payment received or made upon early termination is recorded as a realized gain or loss in the Statement of Operations. Collateral, in the form of cash or securities, may be required to be held in segregated accounts with the fund’s custodian in connection with these agreements. Risk of loss may exceed amounts recognized on the Statement of Assets and Liabilities. These risks include the possible lack of a liquid market, failure of the counterparty to perform under the terms of the agreements, and unfavorable market and interest rate movements of the underlying instrument. All swap agreements entered into
39
Notes to Financial Statements – continued
by the fund with the same counterparty are generally governed by a single master agreement, which provides for the netting of all amounts owed by the parties under the agreement upon the occurrence of an event of default, thereby reducing the credit risk to which such party is exposed.
The fund holds credit default swaps in which one party makes a stream of payments based on a fixed percentage applied to the notional amount to another party in exchange for the right to receive a specified return in the event of a default by a third party, such as a corporate issuer or foreign issuer, on its obligation. The fund may enter into credit default swaps to limit or to reduce its risk exposure to defaults of corporate and sovereign issuers or to create direct or synthetic short or long exposure to corporate debt securities or certain sovereign debt securities to which it is not otherwise exposed.
In March 2008, FASB Statement No. 161, Disclosures about Derivative Instruments and Hedging Activities (the “Standard”) was issued, and is effective for financial statements issued for fiscal years and interim periods beginning after November 15, 2008. This Standard provides enhanced disclosures about the fund’s use of and accounting for derivative instruments and the effect of derivative instruments on the fund’s results of operations and financial position. Management is evaluating the application of the Standard to the fund, and has not at this time determined the impact, if any, resulting from the adoption of this Standard on the fund’s financial statements.
Indemnifications – Under the fund’s organizational documents, its officers and trustees may be indemnified against certain liabilities and expenses arising out of the performance of their duties to the fund. Additionally, in the normal course of business, the fund enters into agreements with service providers that may contain indemnification clauses. The fund’s maximum exposure under these agreements is unknown as this would involve future claims that may be made against the fund that have not yet occurred.
Investment Transactions and Income – Investment transactions are recorded on the trade date. Interest income is recorded on the accrual basis. All premium and discount is amortized or accreted for financial statement purposes in accordance with U.S. generally accepted accounting principles. Dividends received in cash are recorded on the ex-dividend date. Dividend and interest payments received in additional securities are recorded on the ex-dividend or ex-interest date in an amount equal to the value of the security on such date. The fund may receive proceeds from litigation settlements. Any proceeds received from litigation involving portfolio holdings are reflected in the Statement of Operations in realized gain/loss if the security has been disposed of by the fund or in unrealized gain/loss if the security is still held by the fund. Any other proceeds from litigation not related to portfolio holdings are reflected as other income in the Statement of Operations.
40
Notes to Financial Statements – continued
Fees Paid Indirectly – The fund’s custody fee may be reduced according to an arrangement that measures the value of cash deposited with the custodian by the fund. This amount, for the year ended April 30, 2008, is shown as a reduction of total expenses on the Statement of Operations.
Tax Matters and Distributions – The fund intends to qualify as a regulated investment company, as defined under Subchapter M of the Internal Revenue Code, and to distribute all of its taxable income, including realized capital gains. As a result, no provision for federal income tax is required. The fund adopted the provisions of FASB Interpretation No. 48, Accounting for Uncertainty in Income Taxes (“the Interpretation”) on the first day of the fund’s fiscal year. The Interpretation prescribes a minimum threshold for financial statement recognition of the benefit of a tax position taken or expected to be taken in a tax return. There was no impact resulting from the adoption of this Interpretation on the fund’s financial statements. Each of the fund’s federal tax returns for the prior three fiscal years remains subject to examination by the Internal Revenue Service. It is the fund’s policy to record interest and penalty charges on underpaid taxes associated with its tax positions as interest expense and miscellaneous expense, respectively. No such charges were recorded in the current financial statements. Foreign taxes, if any, have been accrued by the fund in the accompanying financial statements.
Distributions to shareholders are recorded on the ex-dividend date. Income and capital gain distributions are determined in accordance with income tax regulations, which may differ from U.S. generally accepted accounting principles. Certain capital accounts in the financial statements are periodically adjusted for permanent differences in order to reflect their tax character. These adjustments have no impact on net assets or net asset value per share. Temporary differences which arise from recognizing certain items of income, expense, gain or loss in different periods for financial statement and tax purposes will reverse at some time in the future. Distributions in excess of net investment income or net realized gains are temporary overdistributions for financial statement purposes resulting from differences in the recognition or classification of income or distributions for financial statement and tax purposes.
Book/tax differences primarily relate to expiration of capital loss carryforwards, amortization and accretion of debt securities and derivative transactions.
The tax character of distributions declared to shareholders is as follows:
| | | | |
| | | 4/30/08 | | 4/30/07 |
| Ordinary income (including any short-term capital gains) | | $34,609,151 | | $31,206,219 |
41
Notes to Financial Statements – continued
The federal tax cost and the tax basis components of distributable earnings were as follows:
| | | |
| As of 4/30/08 | | | |
| Cost of investments | | $712,186,859 | |
| Gross appreciation | | 3,958,721 | |
| Gross depreciation | | (18,333,172 | ) |
| Net unrealized appreciation (depreciation) | | $(14,374,451 | ) |
| Undistributed ordinary income | | $1,288,261 | |
| Capital loss carryforwards | | (96,878,344 | ) |
| Post-October capital loss deferral | | (6,437,682 | ) |
| Other temporary differences | | (2,479,670 | ) |
As of April 30, 2008, the fund had capital loss carryforwards available to offset future realized gains. Such losses expire as follows:
| | | |
| April 30, 2009 | | $(2,874,797 | ) |
| April 30, 2011 | | (18,880,791 | ) |
| April 30, 2012 | | (15,641,631 | ) |
| April 30, 2013 | | (18,655,874 | ) |
| April 30, 2014 | | (16,764,678 | ) |
| April 30, 2015 | | (11,871,035 | ) |
| April 30, 2016 | | (12,189,538 | ) |
| | $(96,878,344 | ) |
The availability of a portion of the capital loss carryforwards, which were acquired on November 17, 2006 in connection with the MFS Government Limited Maturity Fund merger, may be limited in a given year.
Multiple Classes of Shares of Beneficial Interest – The fund offers multiple classes of shares, which differ in their respective distribution and service fees. All shareholders bear the common expenses of the fund based on daily net assets of each class, without distinction between share classes. Dividends are declared separately for each class. Differences in per share dividend rates are generally due to differences in separate class expenses. Class B shares will convert to Class A shares approximately eight years after purchase. At the close of business on April 18, 2008, Class R shares and Class R2 shares converted into Class R3 shares. Following this conversion, Class R3, Class R4, and Class R5 shares were renamed Class R2, Class R3, and Class R4 shares, respectively.
| (3) | | Transactions with Affiliates |
Investment Adviser – The fund has an investment advisory agreement with Massachusetts Financial Services Company (MFS) to provide overall investment management and related administrative services and facilities to the fund. The management fee is computed daily and paid monthly at an
42
Notes to Financial Statements – continued
annual rate of 0.40% of the fund’s average daily net assets. As part of a settlement agreement with the New York Attorney General concerning market timing and related matters, MFS has agreed to reduce the management fee to 0.25% of the fund’s average daily net assets for the period March 1, 2004 through February 28, 2009. For the year ended April 30, 2008, this waiver amounted to $1,090,166 and is reflected as a reduction of total expenses in the Statement of Operations.
The management fee incurred for the year ended April 30, 2008 was equivalent to an annual effective rate of 0.25% of the fund’s average daily net assets.
Distributor – MFS Fund Distributors, Inc. (MFD), a wholly-owned subsidiary of MFS, as distributor, received $14,370 and $800 for the year ended April 30, 2008, as its portion of the initial sales charge on sales of Class A and Class 529A shares of the fund, respectively.
The Board of Trustees has adopted a distribution plan for certain class shares pursuant to Rule 12b-1 of the Investment Company Act of 1940.
The fund’s distribution plan provides that the fund will pay MFD for services provided by MFD and financial intermediaries in connection with the distribution and servicing of certain share classes. One component of the plan is a distribution fee paid to MFD and another component of the plan is a service fee paid to MFD. MFD may subsequently pay all, or a portion, of the distribution and/or service fees to financial intermediaries.
Distribution Plan Fee Table:
| | | | | | | | | | |
| | | Distribution
Fee Rate | | Service
Fee Rate | | Total
Distribution
Plan (d) | | Annual
Effective
Rate (e) | | Distribution
and Service
Fee |
| Class A | | 0.10% | | 0.25% | | 0.35% | | 0.15% | | $569,533 |
| Class B | | 0.75% | | 0.25% | | 1.00% | | 0.93% | | 908,819 |
| Class C | | 0.75% | | 0.25% | | 1.00% | | 1.00% | | 748,564 |
| Class R (b) | | 0.25% | | 0.25% | | 0.50% | | 0.40% | | 6,934 |
| Class R1 | | 0.75% | | 0.25% | | 1.00% | | 0.81% | | 5,421 |
| Former Class R2 (b) | | 0.25% | | 0.25% | | 0.50% | | 0.50% | | 2,000 |
| Class R2 (formerly Class R3) | | 0.25% | | 0.25% | | 0.50% | | 0.40% | | 13,008 |
| Class R3 (formerly Class R4) | | — | | 0.25% | | 0.25% | | 0.25% | | 1,763 |
| Class 529A | | 0.25% | | 0.25% | | 0.50% | | 0.25% | | 17,690 |
| Class 529B | | 0.75% | | 0.25% | | 1.00% | | 0.91% | | 9,225 |
| Class 529C | | 0.75% | | 0.25% | | 1.00% | | 1.00% | | 39,725 |
| Total Distribution and Service Fees | | | | | | $2,322,682 |
| (b) | At the close of business on April 18, 2008, Class R and Class R2 shares converted into Class R3 shares. Following the conversion, Class R3 shares were renamed Class R2 shares. |
| (d) | In accordance with the distribution plan for certain classes, the fund pays distribution and/or service fees up to these annual percentage rates of each class’ average daily net assets. |
43
Notes to Financial Statements – continued
| (e) | The annual effective rates represent actual fees incurred under the distribution plan for the year ended April 30, 2008 based on each class’ average daily net assets. 0.15% of the Class A service fee is currently being paid by the fund. Payment of the remaining 0.10% of the Class A service fee is not yet in effect and will be implemented on such date as the fund’s Board of Trustees may determine. Payment of the 0.10% annual Class A distribution fee is not yet in effect and will be implemented on such date as the fund’s Board of Trustees may determine. 0.10% of the Class 529A service fee is currently being waived under a written waiver arrangement through August 31, 2008. For the year ended April 30, 2008, this waiver amounted to $5,054 and is reflected as a reduction of total expenses in the Statement of Operations. 0.10% of the Class 529A distribution fee is currently being paid by the fund. Payment of the remaining 0.15% of the Class 529A distribution fee is not yet in effect and will be implemented on such date as the fund’s Board of Trustees may determine. For one year from the date of sale of Class B and Class 529B shares, assets attributable to such Class B and Class 529B shares are subject to the 0.25% annual Class B and Class 529B service fee. On assets attributable to all other Class B and Class 529B shares, 0.15% of the Class B and Class 529B service fee is currently in effect and the remaining portion of the Class B and Class 529B service fee is not in effect but may be implemented on such date as the fund’s Board of Trustees may determine. Prior to its conversion, 0.10% of the Class R distribution fee had been waived under a written waiver arrangement. For the period May 1, 2007 through April 18, 2008, this waiver amounted to $1,387 and is reflected as a reduction of total expenses in the Statement of Operations. 0.10% of the Class R2 (formerly R3) distribution fee is currently being waived under a written waiver arrangement through August 31, 2008. For the year ended April 30, 2008, this waiver amounted to $2,602 and is reflected as a reduction of total expenses in the Statement of Operations. Effective March 1, 2008, the distribution fee rate for Class R1 shares increased from 0.50% to 0.75%. |
Certain Class A, Class C and Class 529C shares are subject to a contingent deferred sales charge in the event of a shareholder redemption within 12 months of purchase. Class B and Class 529B shares are subject to a contingent deferred sales charge in the event of a shareholder redemption within six years of purchase. All contingent deferred sales charges are paid to MFD and during the year ended April 30, 2008, were as follows:
| | |
| | | Amount |
| Class A | | $1,558 |
| Class B | | 154,495 |
| Class C | | 10,630 |
| Class 529B | | 504 |
| Class 529C | | 295 |
The fund has entered into and may from time to time enter into contracts with program managers and other parties which administer the tuition programs through which an investment in the fund’s 529 share classes is made. The fund has entered into an agreement with MFD pursuant to which MFD receives an annual fee of up to 0.35% of the average daily net assets attributable to each 529 share class. The fee is based on average daily net assets and is currently established at 0.10% annually of average daily net assets of the fund’s 529 share classes. For the period May 1, 2007 through March 31, 2008, the fee was established at 0.25%. The fee may only be increased with the approval of the Board of Trustees who oversees the fund. The services provided by MFD, or a third party with which MFD contracts, include recordkeeping and tax reporting and account services, as well as services designed to maintain the program’s
44
Notes to Financial Statements – continued
compliance with the Internal Revenue Code and other regulatory requirements. Program manager fees for the year ended April 30, 2008, were as follows:
| | |
| | | Amount |
| Class 529A | | $11,886 |
| Class 529B | | 2,409 |
| Class 529C | | 9,371 |
| Total Program Manager Fees | | $23,666 |
Shareholder Servicing Agent – MFS Service Center, Inc. (MFSC), a wholly-owned subsidiary of MFS, receives a fee from the fund for its services as shareholder servicing agent calculated as a percentage of the average daily net assets of the fund as determined periodically under the supervision of the fund’s Board of Trustees. For the year ended April 30, 2008, the fee was $353,043, which equated to 0.0487% annually of the fund’s average daily net assets. MFSC also receives payment from the fund for out-of-pocket expenses, sub-accounting and other shareholder servicing costs which may be paid to affiliated and unaffiliated service providers. For the year ended April 30, 2008, these out-of-pocket expenses, sub-accounting and other shareholder servicing costs amounted to $562,578.
Under a Special Servicing Agreement among MFS, each MFS fund which invests in other MFS funds (“MFS fund-of-funds”) and each underlying fund in which a MFS fund-of-funds invests (“underlying funds”), each underlying fund may pay a portion of each MFS fund-of-fund’s transfer agent-related expenses, including sub-accounting fees payable to financial intermediaries, to the extent such payments do not exceed the benefits realized or expected to be realized by the underlying fund from the investment in the underlying fund by the MFS fund-of-fund. For the year ended April 30, 2008, these costs for the fund amounted to $166,605 and are reflected in the shareholder servicing costs on the Statement of Operations.
Administrator – MFS provides certain financial, legal, shareholder communications, compliance, and other administrative services to the fund. Under an administrative services agreement, the fund partially reimburses MFS the costs incurred to provide these services. The fund is charged a fixed amount plus a fee based on average daily net assets. The fund’s annual fixed amount is $17,500.
The administrative services fee incurred for the year ended April 30, 2008 was equivalent to an annual effective rate of 0.0162% of the fund’s average daily net assets.
In addition to the administrative services provided by MFS to the fund as described above, prior to March 1, 2008, MFS was responsible for providing certain retirement plan administration and services with respect to certain
45
Notes to Financial Statements – continued
shares. These services included various administrative, recordkeeping, and communication/educational services with respect to the retirement plans which invest in these shares, and may have been provided directly by MFS or by a third party. MFS generally paid all, or a portion, of the retirement plan administration and services fee to affiliated or unaffiliated third parties. For the year ended April 30, 2008, the fund paid MFS an annual retirement plan administration and services fee up to the following annual percentage rates of each class’ average daily net assets:
| | | | | | | | | | |
| | | Beginning
of period
through
12/31/07 | | Effective
1/01/08 | | Effective
3/01/08 | | Annual
Effective
Rate (g) | | Total
Amount |
Class R1 | | 0.35% | | 0.35% | | — | | 0.27% | | $1,841 |
Former Class R2 (b) | | 0.25% | | — | | — | | 0.13% | | 510 |
Class R2 (formerly Class R3) | | 0.15% | | — | | — | | 0.08% | | 2,050 |
Class R3 (formerly Class R4) | | 0.15% | | — | | — | | 0.09% | | 654 |
Class R4 (formerly Class R5) | | 0.10% | | — | | — | | 0.07% | | 37 |
| Total Retirement Plan Administration and Services Fees | | | | $5,092 |
| (b) | At the close of business on April 18, 2008, Class R and Class R2 shares converted into Class R3 shares. Following the conversion, Class R3 shares were renamed Class R2 shares. |
| (g) | Effective January 1, 2008, the annual retirement plan administration and services fee was eliminated for the Former Class R2, Class R2 (formerly Class R3), Class R3 (formerly Class R4), and Class R4 (formerly Class R5) shares. Effective March 1, 2008, the annual retirement plan administration and services fee was eliminated for Class R1 shares. |
Trustees’ and Officers’ Compensation – The fund pays compensation to independent trustees in the form of a retainer, attendance fees, and additional compensation to Board and Committee chairpersons. The fund does not pay compensation directly to trustees or officers of the fund who are also officers of the investment adviser, all of whom receive remuneration for their services to the fund from MFS. Certain officers and trustees of the fund are officers or directors of MFS, MFD, and MFSC. The fund has an unfunded, defined benefit plan for certain retired independent trustees which resulted in a pension expense of $1,418. This amount is included in independent trustees’ compensation for the year ended April 30, 2008. The liability for deferred retirement benefits payable to certain retired independent trustees amounted to $13,194 at April 30, 2008, and is included in payable for independent trustees’ compensation.
Other – This fund and certain other MFS funds (the funds) have entered into a services agreement (the Agreement) which provides for payment of fees by the funds to Tarantino LLC in return for the provision of services of an Independent Chief Compliance Officer (ICCO) for the funds. The ICCO is an officer of the funds and the sole member of Tarantino LLC. The funds can terminate the Agreement with Tarantino LLC at any time under the terms of the Agreement. For the year ended April 30, 2008, the fee paid by the fund to
46
Notes to Financial Statements – continued
Tarantino LLC was $4,776 and is included in miscellaneous expense on the Statement of Operations. MFS has agreed to reimburse the fund for a portion of the payments made by the fund to Tarantino LLC in the amount of $3,472, which is shown as a reduction of total expenses in the Statement of Operations. Additionally, MFS has agreed to bear all expenses associated with office space, other administrative support, and supplies provided to the ICCO.
Purchases and sales of investments, other than purchased option transactions and short-term obligations, were as follows:
| | | | |
| | | Purchases | | Sales |
| U.S. government securities | | $3,875,422 | | $17,899,405 |
| Investments (non-U.S. government securities) | | $141,030,235 | | $196,756,778 |
| (5) | | Shares of Beneficial Interest |
The fund’s Declaration of Trust permits the Trustees to issue an unlimited number of full and fractional shares of beneficial interest. Transactions in fund shares were as follows:
| | | | | | | | |
| | | Year ended
4/30/08 | | Year ended
4/30/07 |
| | | Shares | | Amount | | Shares | | Amount |
| Shares sold | | | | | | | | |
Class A | | 19,586,463 | | $124,631,049 | | 13,531,277 | | $86,737,799 |
Class B | | 799,554 | | 5,071,429 | | 736,783 | | 4,700,017 |
Class C | | 2,156,372 | | 13,710,669 | | 1,351,585 | | 8,643,594 |
Class I | | 3,562,606 | | 22,558,152 | | 3,310,021 | | 21,119,186 |
Class R (b) | | 253,373 | | 1,613,968 | | 158,472 | | 1,014,921 |
Class R1 | | 136,037 | | 863,574 | | 80,630 | | 513,766 |
Former Class R2 (b) | | 83,077 | | 527,174 | | 23,216 | | 148,048 |
Class R2 (formerly Class R3) | | 803,787 | | 5,082,521 | | 279,121 | | 1,788,949 |
Class R3 (formerly Class R4) | | 128,198 | | 813,993 | | 99,424 | | 637,345 |
Class R4 (formerly Class R5) | | 33 | | 203 | | 28 | | 178 |
Class 529A | | 584,867 | | 3,710,212 | | 402,015 | | 2,573,156 |
Class 529B | | 46,339 | | 293,015 | | 66,856 | | 427,510 |
Class 529C | | 380,469 | | 2,411,043 | | 354,777 | | 2,270,342 |
| | 28,521,175 | | $181,287,002 | | 20,394,205 | | $130,574,811 |
| Shares issued in connection with acquisition of MFS Government Limited Maturity Fund | | | | | | | | |
Class A | | — | | $— | | 18,443,722 | | $118,408,695 |
Class B | | — | | — | | 10,336,717 | | 66,051,623 |
Class C | | — | | — | | 4,527,797 | | 29,023,181 |
Class I | | — | | — | | 37,462 | | 239,380 |
| | — | | $— | | 33,345,698 | | $213,722,879 |
47
Notes to Financial Statements – continued
| | | | | | | | | | | | |
| | | Year ended
4/30/08 | | | Year ended
4/30/07 | |
| | | Shares | | | Amount | | | Shares | | | Amount | |
| Shares issued to shareholders in reinvestment of distributions | | | | | | | | | | | | |
Class A | | 2,231,120 | | | $14,219,173 | | | 2,020,990 | | | $12,950,984 | |
Class B | | 501,203 | | | 3,182,153 | | | 508,852 | | | 3,247,764 | |
Class C | | 305,453 | | | 1,945,095 | | | 277,501 | | | 1,776,509 | |
Class I | | 1,269,594 | | | 8,054,687 | | | 1,050,241 | | | 6,702,989 | |
Class R (b) | | 7,280 | | | 46,517 | | | 15,996 | | | 102,533 | |
Class R1 | | 3,895 | | | 24,686 | | | 1,495 | | | 9,538 | |
Former Class R2 (b) | | 2,618 | | | 16,582 | | | 919 | | | 5,860 | |
Class R2 (formerly Class R3) | | 16,711 | | | 106,296 | | | 3,748 | | | 24,030 | |
Class R3 (formerly Class R4) | | 4,976 | | | 31,673 | | | 2,776 | | | 17,793 | |
Class R4 (formerly Class R5) | | 402 | | | 2,563 | | | 394 | | | 2,524 | |
Class 529A | | 35,100 | | | 223,503 | | | 22,952 | | | 147,036 | |
Class 529B | | 6,296 | | | 39,901 | | | 4,344 | | | 27,686 | |
Class 529C | | 23,335 | | | 148,490 | | | 14,720 | | | 94,258 | |
| | 4,407,983 | | | $28,041,319 | | | 3,924,928 | | | $25,109,504 | |
| Shares reacquired | | | | | | | | | | | | |
Class A | | (22,752,586 | ) | | $(144,817,122 | ) | | (27,770,368 | ) | | $(177,667,009 | ) |
Class B | | (7,866,918 | ) | | (49,859,287 | ) | | (9,098,848 | ) | | (58,042,032 | ) |
Class C | | (4,173,490 | ) | | (26,550,120 | ) | | (6,110,502 | ) | | (39,087,109 | ) |
Class I | | (2,355,598 | ) | | (14,924,145 | ) | | (840,119 | ) | | (5,348,739 | ) |
Class R (b) | | (607,424 | ) | | (3,849,562 | ) | | (263,158 | ) | | (1,688,124 | ) |
Class R1 | | (36,379 | ) | | (230,435 | ) | | (59,661 | ) | | (380,618 | ) |
Former Class R2 (b) | | (113,140 | ) | | (706,439 | ) | | (15,647 | ) | | (99,850 | ) |
Class R2 (formerly Class R3) | | (81,658 | ) | | (519,316 | ) | | (145,393 | ) | | (932,323 | ) |
Class R3 (formerly Class R4) | | (60,273 | ) | | (383,851 | ) | | (65,962 | ) | | (423,544 | ) |
Class R4 (formerly Class R5) | | — | | | — | | | (28 | ) | | (180 | ) |
Class 529A | | (300,773 | ) | | (1,912,522 | ) | | (179,085 | ) | | (1,146,475 | ) |
Class 529B | | (58,140 | ) | | (367,132 | ) | | (14,871 | ) | | (94,861 | ) |
Class 529C | | (208,751 | ) | | (1,327,092 | ) | | (128,447 | ) | | (821,490 | ) |
| | (38,615,130 | ) | | $(245,447,023 | ) | | (44,692,089 | ) | | $(285,732,354 | ) |
48
Notes to Financial Statements – continued
| | | | | | | | | | | | |
| | | Year ended
4/30/08 | | | Year ended
4/30/07 | |
| | | Shares | | | Amount | | | Shares | | | Amount | |
| Net change | | | | | | | | | | | | |
Class A | | (935,003 | ) | | $(5,966,900 | ) | | 6,225,621 | | | $40,430,469 | |
Class B | | (6,566,161 | ) | | (41,605,705 | ) | | 2,483,504 | | | 15,957,372 | |
Class C | | (1,711,665 | ) | | (10,894,356 | ) | | 46,381 | | | 356,175 | |
Class I | | 2,476,602 | | | 15,688,694 | | | 3,557,605 | | | 22,712,816 | |
Class R (b) | | (346,771 | ) | | (2,189,077 | ) | | (88,690 | ) | | (570,670 | ) |
Class R1 | | 103,553 | | | 657,825 | | | 22,464 | | | 142,686 | |
Former Class R2 (b) | | (27,445 | ) | | (162,683 | ) | | 8,488 | | | 54,058 | |
Class R2 (formerly Class R3) | | 738,840 | | | 4,669,501 | | | 137,476 | | | 880,656 | |
Class R3 (formerly Class R4) | | 72,901 | | | 461,815 | | | 36,238 | | | 231,594 | |
Class R4 (formerly Class R5) | | 435 | | | 2,766 | | | 394 | | | 2,522 | |
Class 529A | | 319,194 | | | 2,021,193 | | | 245,882 | | | 1,573,717 | |
Class 529B | | (5,505 | ) | | (34,216 | ) | | 56,329 | | | 360,335 | |
Class 529C | | 195,053 | | | 1,232,441 | | | 241,050 | | | 1,543,110 | |
| | (5,685,972 | ) | | $(36,118,702 | ) | | 12,972,742 | | | $83,674,840 | |
| (b) | At the close of business on April 18, 2008, Class R and Class R2 shares converted into Class R3 shares. Following this conversion, Class R3 shares were renamed Class R2. |
Effective May 1, 2006, the sale of Class B shares of the fund have been suspended except in certain circumstances. Please see the fund’s prospectus for details.
The fund is one of several mutual funds in which the MFS funds-of-funds may invest. The MFS funds-of-funds do not invest in the underlying MFS funds for the purpose of exercising management or control. At the end of the period, the MFS Conservative Allocation Fund was the owner of record of approximately 22% of the value of outstanding voting shares. In addition, the MFS Lifetime Retirement Income Fund and the MFS Lifetime 2010 Fund were each the owners of record of less than 1% of the value of outstanding voting shares.
The fund and other funds managed by MFS participate in a $1 billion unsecured committed line of credit provided by a syndication of banks under a credit agreement. In addition, the fund and other funds managed by MFS have established uncommitted borrowing arrangements with certain banks. Borrowings may be made for temporary financing needs. Interest is charged to each fund, based on its borrowings, generally at a rate equal to the Federal Reserve funds rate plus 0.30%. In addition, a commitment fee, based on the average daily, unused portion of the committed line of credit, is allocated among the participating funds at the end of each calendar quarter. For the year ended April 30, 2008, the fund’s commitment fee and interest expense were $3,038 and $0, respectively, and are included in miscellaneous expense on the Statement of Operations.
49
Notes to Financial Statements – continued
| (7) | | Transactions in Underlying Funds-Affiliated Issuers |
An affiliated issuer may be considered one in which the fund owns 5% or more of the outstanding voting securities, or a company which is under common control. For the purposes of this report, the fund assumes the following to be affiliated issuers:
| | | | | | | | | |
| Underlying Funds | | Beginning
Shares/Par
Amount | | Acquisitions
Shares/Par
Amount | | Dispositions
Shares/Par
Amount | | | Ending
Shares/Par
Amount |
| MFS Institutional Money Market Portfolio | | — | | 222,150,330 | | (176,640,232 | ) | | 45,510,098 |
| | | | |
| Underlying Funds | | Realized
Gain (Loss) | | Capital Gain
Distributions from
Underlying Funds | | Dividend
Income | | | Ending Value |
| MFS Institutional Money Market Portfolio | | $— | | $— | | $1,293,926 | | | $45,510,098 |
On November 20, 2006, the fund acquired all of the assets and liabilities of MFS Government Limited Maturity Fund as of the close of business on November 17, 2006. The acquisition was accomplished by a tax-free exchange of 33,345,698 shares of the fund (valued at $213,722,879) for all of the assets and liabilities of MFS Government Limited Maturity Fund. MFS Government Limited Maturity Fund then distributed the shares that it received from the fund to its shareholders. MFS Government Limited Maturity Fund’s net assets on that date were $213,722,879, including $2,066,339 of unrealized depreciation, $5,943 of accumulated net investment loss, and $44,340,025 of accumulated net realized loss on investments. The aggregate net assets of the fund after the acquisition were $801,912,388.
50
REPORT OF INDEPENDENT REGISTERED PUBLIC ACCOUNTING FIRM
To the Trustees of MFS Series Trust IX and the Shareholders of MFS Limited Maturity Fund:
We have audited the accompanying statement of assets and liabilities, including the portfolio of investments, of MFS Limited Maturity Fund (one of the portfolios comprising MFS Series Trust IX (the “Trust”)) as of April 30, 2008, and the related statement of operations for the year then ended, the statements of changes in net assets for each of the two years in the period then ended, and the financial highlights for each of the five years in the period then ended. These financial statements and financial highlights are the responsibility of the Trust’s management. Our responsibility is to express an opinion on these financial statements and financial highlights based on our audits.
We conducted our audits in accordance with the standards of the Public Company Accounting Oversight Board (United States). Those standards require that we plan and perform the audit to obtain reasonable assurance about whether the financial statements and financial highlights are free of material misstatement. The Trust is not required to have, nor were we engaged to perform, an audit of its internal control over financial reporting. Our audits included consideration of internal control over financial reporting as a basis for designing audit procedures that are appropriate in the circumstances, but not for the purpose of expressing an opinion on the effectiveness of the Trust’s internal control over financial reporting. Accordingly, we express no such opinion. An audit also includes examining, on a test basis, evidence supporting the amounts and disclosures in the financial statements, assessing the accounting principles used and significant estimates made by management, as well as evaluating the overall financial statement presentation. Our procedures included confirmation of securities owned as of April 30, 2008, by correspondence with the custodian and brokers; where replies were not received from brokers, we performed other auditing procedures. We believe that our audits provide a reasonable basis for our opinion.
In our opinion, such financial statements and financial highlights present fairly, in all material respects, the financial position of MFS Limited Maturity Fund as of April 30, 2008, the results of its operations for the year then ended, the changes in its net assets for each of the two years in the period then ended, and its financial highlights for each of the five years in the period then ended, in conformity with accounting principles generally accepted in the United States of America.
DELOITTE & TOUCHE LLP
Boston, Massachusetts
June 16, 2008
51
TRUSTEES AND OFFICERS — IDENTIFICATION AND BACKGROUND
The Trustees and officers of the Trust, as of June 1, 2008, are listed below, together with their principal occupations during the past five years. (Their titles may have varied during that period.) The address of each Trustee and officer is 500 Boylston Street, Boston, Massachusetts 02116.
| | | | | | |
Name, Date of Birth | | Position(s) Held
with Fund | | Trustee/Officer
Since (h) | | Principal Occupations During
the Past Five Years & Other
Directorships (j) |
| INTERESTED TRUSTEES | | | | |
Robert J. Manning (k)
(born 10/20/63) | | Trustee | | February 2004 | | Massachusetts Financial Services Company, Chief Executive Officer, President, Chief Investment Officer and Director |
Robert C. Pozen (k)
(born 8/08/46) | | Trustee | | February 2004 | | Massachusetts Financial Services Company, Chairman (since February 2004); Harvard Business School (education), Senior Lecturer (since 2008); Secretary of Economic Affairs, The Commonwealth of Massachusetts (January 2002 to December 2002); Fidelity Investments, Vice Chairman (June 2000 to December 2001); Fidelity Management & Research Company (investment adviser), President (March 1997 to July 2001); Bell Canada Enterprises (telecommunications), Director; Medtronic, Inc. (medical technology), Director; Telesat (satellite communications), Director (until 2007) |
| INDEPENDENT TRUSTEES | | | | |
J. Atwood Ives
(born 5/01/36) | | Trustee and Chair of Trustees | | February 1992 | | Private investor; KeySpan Corporation (energy related services), Director until 2004; Woodstock Corporation (investment advisory firm), Director until 2003 |
Robert E. Butler (n)
(born 11/29/41) | | Trustee | | January 2006 | | Consultant – regulatory and compliance matters (since July 2002); PricewaterhouseCoopers LLP (professional services firm), Partner (until 2002) |
52
Trustees and Officers – continued
| | | | | | |
Name, Date of Birth | | Position(s) Held
with Fund | | Trustee/Officer
Since (h) | | Principal Occupations During
the Past Five Years & Other
Directorships (j) |
Lawrence H. Cohn, M.D.
(born 3/11/37) | | Trustee | | August 1993 | | Brigham and Women’s Hospital, Chief of Cardiac Surgery (2005); Harvard Medical School, Professor of Cardiac Surgery; Physician Director of Medical Device Technology for Partners HealthCare |
David H. Gunning
(born 5/30/42) | | Trustee | | January 2004 | | Retired; Cleveland-Cliffs Inc. (mining products and service provider), Vice Chairman/Director (until May 2007); Portman Limited (mining), Director (since 2005); Encinitos Ventures (private investment company), Principal (1997 to April 2001); Lincoln Electric Holdings, Inc. (welding equipment manufacturer), Director |
William R. Gutow
(born 9/27/41) | | Trustee | | December 1993 | | Private investor and real estate consultant (since 1998); Capital Entertainment Management Company (video franchise), Vice Chairman (since 1998); Texas Donuts (donut franchise), Vice Chairman (since 2007); Atlantic Coast Tan (tanning salons), Vice Chairman (until 2007) |
Michael Hegarty
(born 12/21/44) | | Trustee | | December 2004 | | Retired; AXA Financial (financial services and insurance), Vice Chairman and Chief Operating Officer (until May 2001); The Equitable Life Assurance Society (insurance), President and Chief Operating Officer
(until May 2001) |
Lawrence T. Perera
(born 6/23/35) | | Trustee | | July 1981 | | Hemenway & Barnes (attorneys), Partner |
J. Dale Sherratt
(born 9/23/38) | | Trustee | | August 1993 | | Insight Resources, Inc. (acquisition planning specialists), President; Wellfleet Investments (investor in health care companies), Managing General Partner (since 1993); Cambridge Nutraceuticals (professional nutritional products), Chief Executive Officer (until May 2001) |
53
Trustees and Officers – continued
| | | | | | |
Name, Date of Birth | | Position(s) Held
with Fund | | Trustee/Officer
Since (h) | | Principal Occupations During
the Past Five Years & Other
Directorships (j) |
Laurie J. Thomsen
(born 8/05/57) | | Trustee | | March 2005 | | New Profit, Inc. (venture philanthropy), Partner (since 2006); Private investor; Prism Venture Partners (venture capital), Co-founder and General Partner (until June 2004); The Travelers Companies (commercial property liability insurance), Director |
Robert W. Uek
(born 5/18/41) | | Trustee | | January 2006 | | Retired (since 1999); PricewaterhouseCoopers LLP (professional services firm), Partner (until 1999); Consultant to investment company industry (since 2000); TT International Funds (mutual fund complex), Trustee (2000 until 2005); Hillview Investment Trust II Funds (mutual fund complex), Trustee (2000 until 2005) |
| OFFICERS | | | | | | |
Robert J. Manning (k)
(born 10/20/63) | | President | | March 2008 | | Massachusetts Financial Services Company, Chief Executive Officer, President, Chief Investment Officer and Director |
Maria F. Dwyer (k)
(born 12/01/58) | | Treasurer | | March 2008 | | Massachusetts Financial Services Company, Executive Vice President and Chief Regulatory Officer (since March 2004) Chief Compliance Officer (since December 2006); Fidelity Management & Research Company, Vice President (prior to March 2004); Fidelity Group of Funds, President and Treasurer (prior to March 2004); MFS Group of Funds, President (November 2005 – March 2008) |
Christopher R. Bohane (k)
(born 1/18/74) | | Assistant Secretary and Assistant Clerk | | July 2005 | | Massachusetts Financial Services Company, Vice President and
Senior Counsel (since April 2003); Kirkpatrick & Lockhart LLP (law firm), Associate (prior to April 2003) |
Ethan D. Corey (k)
(born 11/21/63) | | Assistant Secretary and Assistant Clerk | | July 2005 | | Massachusetts Financial Services Company, Senior Vice President and Associate General Counsel (since April 2006); Special Counsel (prior to April 2006); Dechert LLP (law firm), Counsel (prior to December 2004) |
54
Trustees and Officers – continued
| | | | | | |
Name, Date of Birth | | Position(s) Held
with Fund | | Trustee/Officer
Since (h) | | Principal Occupations During
the Past Five Years & Other
Directorships (j) |
David L. DiLorenzo (k)
(born 8/10/68) | | Assistant Treasurer | | July 2005 | | Massachusetts Financial Services Company, Vice President (since June 2005); JP Morgan Investor Services, Vice President (prior to June 2005) |
Timothy M. Fagan (k)
(born 7/10/68) | | Assistant Secretary and Assistant Clerk | | September 2005 | | Massachusetts Financial Services Company, Vice President and Senior Counsel (since September 2005); John Hancock Advisers, LLC, Vice President and Chief Compliance Officer (September 2004 to August 2005), Senior Attorney (prior to September 2004); John Hancock Group of Funds, Vice President and Chief Compliance Officer (September 2004 to December 2004) |
Mark D. Fischer (k)
(born 10/27/70) | | Assistant Treasurer | | July 2005 | | Massachusetts Financial Services Company, Vice President (since May 2005); JP Morgan Investment Management Company, Vice President (prior to May 2005) |
Brian E. Langenfeld (k) (born 3/07/73) | | Assistant Secretary and Assistant Clerk | | June 2006 | | Massachusetts Financial Services Company, Assistant Vice President and Counsel (since May 2006); John Hancock Advisers, LLC, Assistant Vice President and Counsel (May 2005 to April 2006); John Hancock Advisers, LLC, Attorney and Assistant Secretary (prior to May 2005) |
Ellen Moynihan (k)
(born 11/13/57) | | Assistant Treasurer | | April 1997 | | Massachusetts Financial Services Company, Senior Vice President |
| | | |
Susan S. Newton (k) (born 3/07/50) | | Assistant Secretary and Assistant Clerk | | May 2005 | | Massachusetts Financial Services Company, Senior Vice President and Associate General Counsel (since April 2005); John Hancock Advisers, LLC, Senior Vice President, Secretary and Chief Legal Officer (prior to April 2005); John Hancock Group of Funds, Senior Vice President, Secretary and Chief Legal Officer (prior to April 2005) |
55
Trustees and Officers – continued
| | | | | | |
Name, Date of Birth | | Position(s) Held
with Fund | | Trustee/Officer
Since (h) | | Principal Occupations During
the Past Five Years & Other
Directorships (j) |
Susan A. Pereira (k)
(born 11/05/70) | | Assistant Secretary and Assistant Clerk | | July 2005 | | Massachusetts Financial Services Company, Vice President and Senior Counsel (since June 2004); Bingham McCutchen LLP (law firm), Associate (prior to June 2004) |
Mark N. Polebaum (k)
(born 5/01/52) | | Secretary and Clerk | | January 2006 | | Massachusetts Financial Services Company, Executive Vice President, General Counsel and Secretary (since January 2006); Wilmer Cutler Pickering Hale and Dorr LLP (law firm), Partner (prior to January 2006) |
Frank L. Tarantino
(born 3/07/44) | | Independent Chief Compliance Officer | | June 2004 | | Tarantino LLC (provider of compliance services), Principal (since June 2004); CRA Business Strategies Group (consulting services), Executive Vice President (April 2003 to June 2004); David L. Babson & Co. (investment adviser), Managing Director, Chief Administrative Officer and Director (prior to March 2003) |
Richard S. Weiztel (k)
(born 7/16/70) | | Assistant Secretary and Assistant Clerk | | October 2007 | | Massachusetts Financial Services Company, Vice President and Assistant General Counsel (since 2007); Vice President and Senior Counsel (since May 2004); Massachusetts Department of Business and Technology, General Counsel (February 2003 to April 2004); Massachusetts Office of the Attorney General, Assistant Attorney General (April 2001 to February 2003); Ropes and Gray, Associate (prior to April 2001) |
James O. Yost (k)
(born 6/12/60) | | Assistant Treasurer | | September 1990 | | Massachusetts Financial Services Company, Senior Vice President |
| (h) | Date first appointed to serve as Trustee/officer of an MFS fund. Each Trustee has served continuously since appointment unless indicated otherwise. |
| (j) | Directorships or trusteeships of companies required to report to the Securities and Exchange Commission (i.e., “public companies”). |
| (k) | “Interested person” of the Trust within the meaning of the Investment Company Act of 1940 (referred to as the 1940 Act), which is the principal federal law governing investment companies like the fund, as a result of position with MFS. The address of MFS is 500 Boylston Street, Boston, Massachusetts 02116. |
56
Trustees and Officers – continued
| (n) | In 2004 and 2005, Mr. Butler provided consulting services to the independent compliance consultant retained by MFS pursuant to its settlement with the SEC concerning market timing and related matters. The terms of that settlement required that compensation and expenses related to the independent compliance consultant be borne exclusively by MFS and, therefore, MFS paid Mr. Butler for the services he rendered to the independent compliance consultant. In 2004 and 2005, MFS paid Mr. Butler a total of $351,119.29. |
The Trust held a shareholders’ meeting in 2005 to elect Trustees, and will hold a shareholders’ meeting at least once every five years thereafter, to elect Trustees.
Each Trustee (except Mr. Butler and Mr. Uek) has been elected by shareholders and each Trustee and officer holds office until his or her successor is chosen and qualified or until his or her earlier death, resignation, retirement or removal. Messrs. Butler, Gutow, Sherratt and Uek and Ms. Thomsen are members of the Trust’s Audit Committee.
Each of the Trust’s Trustees and officers holds comparable positions with certain other funds of which MFS or a subsidiary is the investment adviser or distributor, and, in the case of the officers, with certain affiliates of MFS. As of January 1, 2008, the Trustees served as board members of 100 funds within the MFS Family of Funds.
The Statement of Additional Information contains further information about the Trustees and is available without charge upon request by calling 1-800-225-2606.
| | |
| Investment Adviser | | Custodian |
Massachusetts Financial Services Company
500 Boylston Street, Boston, MA 02116-3741 | | JPMorgan Chase Bank One Chase Manhattan Plaza, New York, NY 10081 |
| Distributor | | Independent Registered Public Accounting Firm |
MFS Fund Distributors, Inc.
500 Boylston Street, Boston, MA 02116-3741 | | Deloitte & Touche LLP
200 Berkeley Street, Boston, MA 02116 |
| Portfolio Manager | | |
James Calmas | | |
57
RESULTS OF SHAREHOLDER MEETING
(unaudited)
At a special meeting of shareholders of Class R1 shares of MFS Limited Maturity Fund, which was held on February 15, 2008, the following actions were taken:
Item 1: To approve an amendment to the current Master Distribution Plan adopted pursuant to Rule 12b-1 under the Investment Company Act of 1940, as amended, with respect to Class R1 shares of the fund.
| | |
| | | Number of Dollars |
| For | | 689,872.44 |
| Against | | 0.00 |
| Abstain | | 61,270.67 |
58
BOARD REVIEW OF INVESTMENT ADVISORY AGREEMENT
A discussion regarding the Board’s most recent review and renewal of the Fund’s investment advisory agreement is available by clicking on the Fund’s name under “Select a fund” on the MFS Web site (mfs.com).
PROXY VOTING POLICIES AND INFORMATION
A general description of the MFS funds’ proxy voting policies and procedures is available without charge, upon request, by calling 1-800-225-2606, by visiting the Proxy Voting section of mfs.com or by visiting the SEC’s Web site at http://www.sec.gov.
Information regarding how the fund voted proxies relating to portfolio securities during the most recent twelve-month period ended June 30 is available without charge by visiting the Proxy Voting section of mfs.com or by visiting the SEC’s Web site at http://www.sec.gov.
QUARTERLY PORTFOLIO DISCLOSURE
The fund will file a complete schedule of portfolio holdings with the Securities and Exchange Commission (the Commission) for the first and third quarters of each fiscal year on Form N-Q. The fund’s Form N-Q may be reviewed and copied at the:
Public Reference Room
Securities and Exchange Commission
100 F Street, NE, Room 1580
Washington, D.C. 20549
Information on the operation of the Public Reference Room may be obtained by calling the Commission at 1-800-SEC-0330. The fund’s Form N-Q is available on the EDGAR database on the Commission’s Internet Web site at http://www.sec.gov, and copies of this information may be obtained, upon payment of a duplicating fee, by electronic request at the following e-mail address: publicinfo@sec.gov or by writing the Public Reference Section at the above address.
A shareholder can also obtain the quarterly portfolio holdings report at mfs.com.
FEDERAL TAX INFORMATION (unaudited)
The fund will notify shareholders of amounts for use in preparing 2008 income tax forms in January 2009.
59
MFS® PRIVACY NOTICE
Privacy is a concern for every investor today. At MFS Investment Management® and the MFS funds, we take this concern very seriously. We want you to understand our policies about the investment products and services that we offer, and how we protect the nonpublic personal information of investors who have a direct relationship with us and our wholly owned subsidiaries.
Throughout our business relationship, you provide us with personal information. We maintain information and records about you, your investments, and the services you use. Examples of the nonpublic personal information we maintain include
| | Ÿ | | data from investment applications and other forms |
| | Ÿ | | share balances and transactional history with us, our affiliates, or others |
| | Ÿ | | facts from a consumer reporting agency |
We do not disclose any nonpublic personal information about our customers or former customers to anyone, except as permitted by law. We may share nonpublic personal information with third parties or certain of our affiliates in connection with servicing your account or processing your transactions. We may share information with companies or financial institutions that perform marketing services on our behalf or with other financial institutions with which we have joint marketing arrangements, subject to any legal requirements.
Authorization to access your nonpublic personal information is limited to appropriate personnel who provide products, services, or information to you. We maintain physical, electronic, and procedural safeguards to help protect the personal information we collect about you.
If you have any questions about the MFS privacy policy, please call 1-800-225-2606 any business day between 8 a.m. and 8 p.m. Eastern time.
Note: If you own MFS products or receive MFS services in the name of a third party such as a bank or broker-dealer, their privacy policy may apply to you instead of ours.
60


MFS® Municipal Limited Maturity Fund
SIPC Contact Information:
You may obtain information about the Securities Investor Protection Corporation (“SIPC”), including the SIPC Brochure, by contacting SIPC either by telephone (202-371-8300) or by accessing SIPC’s website address (www.sipc.org).
The report is prepared for the general information of shareholders. It is authorized for distribution to prospective investors only when preceded or accompanied by a current prospectus.
NOT FDIC INSURED Ÿ MAY LOSE VALUE Ÿ NO BANK OR CREDIT UNION GUARANTEE Ÿ NOT A DEPOSIT Ÿ NOT INSURED BY ANY FEDERAL GOVERNMENT AGENCY OR NCUA/NCUSIF
4/30/08
MTL-ANN

LETTER FROM THE CEO
Dear Shareholders:
Negative headlines tend to resonate during difficult markets, and we certainly have had more than our share of tough news recently. As a result consumer, and particularly investor, sentiment are at all-time lows. That said, I do think it is helpful to remember there are always silver linings in the storm clouds if you look hard enough.
Through all of the challenges we have faced, there are some positive underlying trends. In the United States, for example, institutional traders and credit market followers are just now showing increasing signs of confidence and are beginning to take on more risk. At the corporate level, earnings continue to be relatively strong as companies have reduced labor costs, controlled inventories, and relied less on debt to finance expansion. More broadly, low interest rates and strong demand for consumer goods and industrial equipment are good signs for the global economy.
While I do not mean to minimize the risks inherent in today’s markets, periods such as these allow the talented fund managers and research analysts we have at MFS® to test their convictions, reevaluate existing positions, and identify new investment ideas. Our investment process also includes a significant risk management component, with constant attention paid to monitoring market risk, so we can do our best to minimize any surprises to your portfolio.
For investors, this is a great time to check in with your advisor and make sure you have a sound investment plan in place — one that can keep your hard-earned money working over the long term through a strategy that involves asset allocation, diversification, and periodic portfolio rebalancing and reviews. A plan tailored to your distinct needs and goals continues to be the best approach to help you take advantage of the inevitable challenges — and opportunities — that present themselves over time.
Respectfully,

Robert J. Manning
Chief Executive Officer and Chief Investment Officer
MFS Investment Management®
June 16, 2008
The opinions expressed in this letter are subject to change, may not be relied upon for investment advice, and no forecasts can be guaranteed.
1
PORTFOLIO COMPOSITION
Portfolio structure (i)
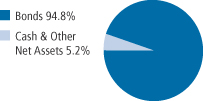
| | |
| Top five industries (i) | | |
Healthcare Revenue – Hospitals | | 13.6% |
| General Obligations – Schools | | 12.3% |
Water & Sewer Utility Revenue | | 9.1% |
| State & Local Agencies | | 8.3% |
| General Obligations – General Purpose | | 8.0% |
| | |
| Credit quality of bonds (r) | | |
| AAA | | 43.1% |
| AA | | 16.7% |
| A | | 17.6% |
| BBB | | 18.5% |
| BB | | 0.1% |
| Not Rated | | 4.0% |
| |
| Portfolio facts | | |
| Average Duration (d)(i) | | 3.7 |
| Average Life (i)(m) | | 4.5 yrs |
| Average Maturity (i)(m) | | 8.2 yrs |
| Average Credit Quality of Rated Securities (long-term) (a) | | AA- |
| Average Credit Quality of Rated Securities (short-term) (a) | | A-1 |
| (a) | The average credit quality of rated securities is based upon a market weighted average of portfolio holdings that are rated by public rating agencies. |
| (d) | Duration is a measure of how much a bond’s price is likely to fluctuate with general changes in interest rates, e.g., if rates rise 1.00%, a bond with a 5-year duration is likely to lose about 5.00% of its value. |
| (i) | For purposes of this presentation, the bond component includes accrued interest amounts and may be positively or negatively impacted by the equivalent exposure from any derivative holdings, if applicable. |
| (m) | The average maturity shown is calculated using the final stated maturity on the portfolio’s holdings without taking into account any holdings which have been pre-refunded or pre-paid to an earlier date or which have a mandatory put date prior to the stated maturity. The average life shown takes into account these earlier dates. |
| (r) | Each security is assigned a rating from Moody’s Investors Service. If not rated by Moody’s, the rating will be that assigned by Standard & Poor’s. Likewise, if not assigned a rating by Standard & Poor’s, it will be based on the rating assigned by Fitch, Inc. For those portfolios that hold a security which is not rated by any of the three agencies, the security is considered Not Rated. Holdings in U.S. Treasuries and government agency mortgage-backed securities, if any, are included in the “AAA”-rating category. Percentages are based on the total market value of investments as of 4/30/08. |
Percentages are based on net assets as of 4/30/08, unless otherwise noted.
The portfolio is actively managed and current holdings may be different.
2
MANAGEMENT REVIEW
Summary of Results
For the twelve months ended April 30, 2008, Class A shares of the MFS Municipal Limited Maturity Fund provided a total return of 3.25%, at net asset value. In comparison, the fund’s benchmarks, the Lehman Brothers 3- Year Municipal Bond Index (3-Year Index) and the Lehman Brothers 5-Year Municipal Bond Index (5-Year Index), returned 5.98% and 5.93%, respectively.
Market Environment
The U.S. economy and financial markets experienced significant deterioration and heightened volatility over the reporting period. U.S. economic growth slowed significantly in the fourth quarter of 2007 and first quarter of 2008. Headwinds included accelerated deterioration in the housing market, subdued corporate investment, a markedly weaker job market, and a tighter credit environment as banks sought to repair balance sheets. During the period, the climax of the credit turmoil occurred in mid March as the Federal Reserve backstopped the distressed sale of failing Bear Stearns to JPMorgan. While reasonably resilient, parts of the global economy and financial system experienced some spillover from the U.S. slowdown. Japanese and European growth slowed over the reporting period and international financial markets were adversely affected by U.S. mortgage and structured product losses.
In the face of this financial and economic turmoil, most global central banks were forced to inject liquidity and to reassess their tightening biases as government bond yields declined and credit spreads widened. During the second half of the reporting period, the U.S. Federal Reserve Board began an aggressive rate cutting campaign, while the U.S. federal government moved quickly to design and implement a modest fiscal stimulus package. Although the Bank of England and the Bank of Canada also cut rates, the dilemma of rising energy and food prices heightened concerns among central bankers that inflationary expectations might become unhinged.
By the end of the reporting period, bond yields, credit spreads, and equity valuations implied market expectations consistent with the view that the worst of the credit dislocation was behind us. Nonetheless, the markets continued to price in further financial and economic weakening, albeit of a less tumultuous nature.
Factors that Affected Performance
Relative to the 3-Year Index, credit quality was the primary factor that negatively impacted relative performance. Specifically, the fund’s greater relative exposure to “BBB” rated(s) securities held back results over the reporting period. The fund’s positioning along the shorter end of the yield curve(y) (represented by bonds with durations(d) of 4- to 8- years) also detracted
3
Management Review – continued
from relative returns. Security selection in credit enhanced bonds and general obligations municipal securities were also detractors.
On the positive side, the fund’s duration(d) stance boosted performance, relative to the 3-Year Index, over the reporting period. Positioning along the middle portion of the yield curve (represented by bonds with durations of 11- to 14- years) also helped.
Relative to the 5-Year Index, the fund’s greater relative exposure to “BBB” rated securities held back relative results. Positioning along the middle portion of the yield curve (represented by bonds with durations of 8- to 11- years) and security selection in general obligations bonds also hurt relative returns.
During the reporting period, the fund’s positioning on the longer end of the yield curve (represented by bonds with durations of 11- to 14- years) contributed to performance relative to the 5-Year Index.
Respectfully,
Geoffrey Schechter
Portfolio Manager
(d) | Duration is a measure of how much a bond’s price is likely to fluctuate with general changes in interest rates, e.g., if rates rise 1.00%, a bond with a 5-year duration is likely to lose about 5.00% of its value. |
(s) | Bonds rated “BBB”, “Baa”, or higher are considered investment grade; bonds rated “BB”, “Ba”, or below are considered non-investment grade. The primary source for bond quality ratings is Moody’s Investors Service. If not available, ratings by Standard & Poor’s are used, else ratings by Fitch, Inc. For securities which are not rated by any of the three agencies, the security is considered Not Rated. |
(y) | A yield curve graphically depicts the yields of different maturity bonds of the same credit quality and type; a normal yield curve is upward sloping, with short-term rates lower than long-term rates. |
The views expressed in this report are those of the portfolio manager only through the end of the period of the report as stated on the cover and do not necessarily reflect the views of MFS or any other person in the MFS organization. These views are subject to change at any time based on market or other conditions, and MFS disclaims any responsibility to update such views. These views may not be relied upon as investment advice or an indication of trading intent on behalf of any MFS portfolio. References to specific securities are not recommendations of such securities, and may not be representative of any MFS portfolio’s current or future investments.
4
PERFORMANCE SUMMARY THROUGH 4/30/08
The following chart illustrates a representative class of the fund’s historical performance in comparison to its benchmark. Performance results include the deduction of the maximum applicable sales charge and reflect the percentage change in net asset value, including reinvestment of dividends and capital gains distributions. The performance of other share classes will be greater than or less than that of the class depicted below. Benchmark comparisons are unmanaged; do not reflect sales charges, commissions or expenses; and cannot be invested in directly. (See Notes to Performance Summary).
Performance data shown represents past performance and is no guarantee of future results. Investment return and principal value fluctuate so your shares, when sold, may be worth more or less than the original cost; current performance may be lower or higher than quoted. The performance shown does not reflect the deduction of taxes, if any, that a shareholder would pay on fund distributions or the redemption of fund shares.
Growth of a hypothetical $10,000 investment
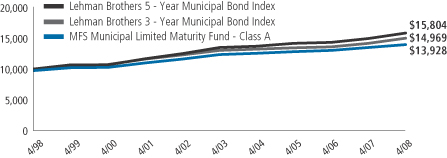
5
Performance Summary – continued
Total Returns through 4/30/2008
Average annual without sales charge
| | | | | | | | | | | | |
| | | Share class | | Class inception date | | 1-yr | | 5-yr | | 10-yr | | |
| | | A | | 3/17/92 | | 3.25% | | 2.45% | | 3.63% | | |
| | | B | | 9/07/93 | | 2.46% | | 1.68% | | 2.84% | | |
| | | C | | 7/01/94 | | 2.24% | | 1.58% | | 2.75% | | |
Comparative Benchmarks
| | | | | | | | | | | | |
| | | Lehman Brothers 5-Year Municipal Bond Index (f) | | 5.93% | | 3.29% | | 4.68% | | |
| | | Lehman Brothers 3-Year Municipal Bond Index (f) | | 5.98% | | 2.87% | | 4.12% | | |
Average annual with sales charge
| | | | | | | | | | | | |
| | | A With Initial Sales Charge (2.50%) | | 0.67% | | 1.93% | | 3.37% | | |
| | | B With CDSC (Declining over six years from 4% to 0%) (x) | | (1.53)% | | 1.31% | | 2.84% | | |
| | | C With CDSC (1% for 12 months) (x) | | 1.25% | | 1.58% | | 2.75% | | |
CDSC – Contingent Deferred Sales Charge.
| (f) | Source: FactSet Research Systems Inc. |
| (x) | Assuming redemption at the end of the applicable period. |
Benchmark Definitions
Lehman Brothers 3-Year Municipal Bond Index – a market capitalization-weighted index that measures the performance of the medium-term (2 to 4 years) tax-exempt bond market.
Lehman Brothers 5-Year Municipal Bond Index – a market capitalization-weighted index that measures the performance of the medium-term (4 to 6 years) tax-exempt bond market.
It is not possible to invest directly in an index.
Notes to Performance Summary
Performance results reflect any applicable expense subsidies and waivers in effect during the periods shown. Without such subsidies and waivers the fund’s performance results would be less favorable. Please see the prospectus and financial statements for complete details.
A portion of income may be subject to state, federal, and/or alternative minimum tax. Capital gains, if any, are subject to a capital gains tax.
From time to time the fund may receive proceeds from litigation settlements, without which performance would be lower.
6
EXPENSE TABLE
Fund expenses borne by the shareholders during the period, November 1, 2007 through April 30, 2008
As a shareholder of the fund, you incur two types of costs: (1) transaction costs, including sales charges (loads) on certain purchase or redemption payments, and (2) ongoing costs, including management fees; distribution and service (12b-1) fees; and other fund expenses. This example is intended to help you understand your ongoing costs (in dollars) of investing in the fund and to compare these costs with the ongoing costs of investing in other mutual funds.
The example is based on an investment of $1,000 invested at the beginning of the period and held for the entire period November 1, 2007 through April 30, 2008.
Actual Expenses
The first line for each share class in the following table provides information about actual account values and actual expenses. You may use the information in this line, together with the amount you invested, to estimate the expenses that you paid over the period. Simply divide your account value by $1,000 (for example, an $8,600 account value divided by $1,000 = 8.6), then multiply the result by the number in the first line under the heading entitled “Expenses Paid During Period” to estimate the expenses you paid on your account during this period.
Hypothetical Example for Comparison Purposes
The second line for each share class in the following table provides information about hypothetical account values and hypothetical expenses based on the fund’s actual expense ratio and an assumed rate of return of 5% per year before expenses, which is not the fund’s actual return. The hypothetical account values and expenses may not be used to estimate the actual ending account balance or expenses you paid for the period. You may use this information to compare the ongoing costs of investing in the fund and other funds. To do so, compare this 5% hypothetical example with the 5% hypothetical examples that appear in the shareholder reports of the other funds.
Please note that the expenses shown in the table are meant to highlight your ongoing costs only and do not reflect any transactional costs, such as sales charges (loads). Therefore, the second line for each share class in the table is useful in comparing ongoing costs only, and will not help you determine the relative total costs of owning different funds. In addition, if these transactional costs were included, your costs would have been higher.
7
Expense Table – continued
| | | | | | | | | | |
Share
Class | | | | Annualized Expense Ratio | | Beginning Account Value 11/1/07 | | Ending Account Value 4/30/08 | | Expenses Paid During Period (p) 11/01/07-4/30/08 |
| A | | Actual | | 0.61% | | $1,000.00 | | $1,016.01 | | $3.06 |
| | Hypothetical (h) | | 0.61% | | $1,000.00 | | $1,021.83 | | $3.07 |
| B | | Actual | | 1.35% | | $1,000.00 | | $1,012.26 | | $6.75 |
| | Hypothetical (h) | | 1.35% | | $1,000.00 | | $1,018.15 | | $6.77 |
| C | | Actual | | 1.46% | | $1,000.00 | | $1,011.69 | | $7.30 |
| | Hypothetical (h) | | 1.46% | | $1,000.00 | | $1,017.60 | | $7.32 |
| (h) | 5% class return per year before expenses. |
| (p) | Expenses paid is equal to each class’ annualized expense ratio, as shown above, multiplied by the average account value over the period, multiplied by the number of days in the period, divided by the number of days in the year. Expenses paid do not include any applicable sales charges (loads). If these transaction costs had been included, your costs would have been higher. |
8
PORTFOLIO OF INVESTMENTS
4/30/08
The Portfolio of Investments is a complete list of all securities owned by your fund. It is categorized by broad-based asset classes.
| | | | | | |
| Municipal Bonds - 96.0% | | | | | | |
| Issuer | | Shares/Par | | Value ($) |
| | | | | | |
| Airport & Port Revenue - 5.1% | | | | | | |
| Atlanta, GA, Airport Rev., “A”, FSA, 5.375%, 2015 | | $ | 1,000,000 | | $ | 1,053,120 |
| Chicago, IL (O’Hare International Airport Rev.), “A-2”, FSA, 5.25%, 2013 | | | 1,500,000 | | | 1,562,670 |
| Dallas Fort Worth, TX, International Airport, “A”, AMBAC, 6%, 2013 | | | 1,000,000 | | | 1,064,730 |
| Delaware River Port Authority Pennsylvania & New Jersey Refunding (Port District Project), “A”, FSA, 5.25%, 2009 | | | 550,000 | | | 558,382 |
| Long Beach, CA, Harbor Rev., “A”, FGIC, 5%, 2015 | | | 1,000,000 | | | 1,055,270 |
| Massachusetts Port Authority Rev., “A”, 5.75%, 2010 | | | 175,000 | | | 186,286 |
| Minneapolis & St. Paul, MN, Metropolitan Airport, “D”, FGIC, 5.25%, 2009 | | | 500,000 | | | 504,720 |
| New York, NY, Industrial Development Agency (Terminal One Group Assn.), 5.5%, 2014 | | | 1,000,000 | | | 1,063,230 |
| Rhode Island Economic Development Corp. Airport Rev., “A”, FGIC, 5%, 2012 | | | 750,000 | | | 785,438 |
| Richland Lexington, SC, Columbia Metropolitan Airport Rev., “A”, FSA, 5%, 2009 | | | 200,000 | | | 203,132 |
| | | | | | |
| | | | | | $ | 8,036,978 |
| General Obligations - General Purpose - 7.9% | | | | | | |
| Columbus, OH, 5.25%, 2011 (f) | | $ | 705,000 | | $ | 750,747 |
| Commonwealth of Massachusetts Consolidated Loan, “A”, 6%, 2010 (c) | | | 310,000 | | | 330,646 |
| Commonwealth of Massachusetts Consolidated Loan, “A”, 5%, 2016 | | | 1,000,000 | | | 1,085,860 |
| Du Page County, IL (ARS Jail Project), 5%, 2009 | | | 870,000 | | | 887,757 |
| New York, NY, “A”, 5.25%, 2012 | | | 265,000 | | | 284,623 |
| New York, NY, “B”, 5.75%, 2011 | | | 375,000 | | | 400,406 |
| New York, NY, “C”, 5.25%, 2009 | | | 250,000 | | | 258,575 |
| New York, NY, “G”, 5.5%, 2009 | | | 670,000 | | | 695,011 |
| New York, NY, “G”, ETM, 5.5%, 2009 (c) | | | 110,000 | | | 114,340 |
| New York, NY, “K”, 5%, 2009 (c) | | | 5,000 | | | 5,216 |
| New York, NY, “K”, 5%, 2010 | | | 365,000 | | | 378,720 |
| Oakland, CA, “A”, FGIC, 5%, 2010 | | | 820,000 | | | 850,725 |
| Pawtucket, RI, “A”, AMBAC, 5%, 2009 | | | 1,000,000 | | | 1,023,550 |
| Saraland, AL, Warrants, MBIA, 4.5%, 2009 | | | 865,000 | | | 875,813 |
| St. Clair County, IL, FGIC, 5.625%, 2012 | | | 500,000 | | | 528,795 |
| State of California, 5%, 2011 | | | 2,250,000 | | | 2,368,598 |
| State of Wisconsin, 5.125%, 2011 | | | 400,000 | | | 429,880 |
9
Portfolio of Investments – continued
| | | | | | |
| Issuer | | Shares/Par | | Value ($) |
| | | | | | |
| Municipal Bonds - continued | | | | | | |
| General Obligations - General Purpose - continued | | | | | | |
| State of Wisconsin, “1”, MBIA, 5%, 2017 | | $ | 500,000 | | $ | 535,185 |
| Taylor, MI, Building Authority, AMBAC, 5.5%, 2010 | | | 500,000 | | | 523,615 |
| | | | | | |
| | | | | | $ | 12,328,062 |
| General Obligations - Improvement - 1.5% | | | | | | |
| Kauai County, HI, “A”, FGIC, 6.25%, 2010 (c) | | $ | 375,000 | | $ | 406,526 |
| New Orleans, LA, Certificate Indebtedness, FSA, 5.5%, 2010 | | | 500,000 | | | 524,885 |
| Oak Ridge, TN, AMBAC, 5%, 2012 | | | 300,000 | | | 315,201 |
| Pittsburgh, PA, “N”, FSA, 5.25%, 2015 | | | 1,000,000 | | | 1,117,600 |
| | | | | | |
| | | | | | $ | 2,364,212 |
| General Obligations - Schools - 12.1% | | | | | | |
| Bastrop, TX, Independent School District Capital Appreciation, “N”, PSF, 0%, 2020 | | $ | 1,000,000 | | $ | 561,950 |
| Bloomington, MN, Independent School District, “B”, 5.25%, 2011 (j) | | | 500,000 | | | 521,150 |
| Byron Center, MI, Public Schools, Q-SBLF, 5%, 2011 | | | 600,000 | | | 636,882 |
| Clackamas County, OR, School District, 6%, 2010 (c) | | | 315,000 | | | 338,401 |
| Clark County, NV School District, 5%, 2017 | | | 2,845,000 | | | 3,121,819 |
| Deer Park, TX, Independent School District, PSF, 0%, 2009 | | | 1,000,000 | | | 982,600 |
| DeSoto, TX, Independent School District School Building, “N”, PSF, 0%, 2021 | | | 3,860,000 | | | 2,008,783 |
| Ennis, TX, Independent School District Capital Appreciation, “N”, PSF, 0%, 2021 | | | 2,865,000 | | | 1,481,348 |
| Fayette County, GA, School District, FSA, 0% to 2010, 4.15% to 2014 | | | 710,000 | | | 657,602 |
| Fayette County, GA, School District, FSA, 0% to 2010, 4.35% to 2016 | | | 355,000 | | | 326,778 |
| Ferndale, MI, School District, Q-SBLF, 5.5%, 2013 | | | 1,115,000 | | | 1,201,312 |
| Florida Board of Education, Lottery Rev., “B”, FGIC, 5.5%, 2010 (c) | | | 150,000 | | | 161,231 |
| Kansas City, MO, School District Building Corp. Leasehold Rev., FGIC, 5%, 2012 | | | 1,450,000 | | | 1,504,912 |
| Manistee, MI, Public Schools, FGIC, 5.15%, 2009 (c) | | | 100,000 | | | 103,169 |
| Northside, TX, Independent School District, PSF, 5.5%, 2016 | | | 850,000 | | | 899,436 |
| Norwin, PA, School District, FGIC, 6%, 2010 (c) | | | 250,000 | | | 266,563 |
| Round Rock, TX, Independent School District, PSF, 6.5%, 2010 (c) | | | 500,000 | | | 544,175 |
| Round Rock, TX, Independent School District, PSF, 5.375%, 2012 | | | 570,000 | | | 622,531 |
| San Marcos, TX, Consolidated Independent School District, 5.25%, 2014 (c) | | | 1,000,000 | | | 1,112,670 |
| Shelby County, TN, Public Improvement & Schools, “A”, FSA, 5%, 2014 | | | 1,500,000 | | | 1,638,150 |
| Westerville, OH, City School District, MBIA, 5.5%, 2011 (c) | | | 300,000 | | | 324,783 |
| | | | | | |
| | | | | | $ | 19,016,245 |
10
Portfolio of Investments – continued
| | | | | | |
| Issuer | | Shares/Par | | Value ($) |
| | | | | | |
| Municipal Bonds - continued | | | | | | |
| Healthcare Revenue - Hospitals - 13.4% | | | | | | |
| California Health Facilities Financing Authority Rev. (Catholic Healthcare West), “I”, 4.95%, 2026 (a) | | $ | 3,000,000 | | $ | 3,129,030 |
| Colorado Health Facilities Authority Rev. (Parkview Medical Center), 5%, 2010 | | | 550,000 | | | 567,848 |
| Colorado Health Facilities Authority Rev. (Parkview Medical Center), 5%, 2011 | | | 575,000 | | | 594,136 |
| Illinois Health Facilities Authority Rev. (Children’s Memorial Hospital), “A”, AMBAC, 5.75%, 2009 (c) | | | 250,000 | | | 263,055 |
| Indiana Health Facility Financing Authority Rev. (Ascension Health), “F”, ETM, 5.5%, 2008 (c) | | | 500,000 | | | 508,235 |
| Indiana Health Facility Financing Authority Rev. (Holy Cross Health Systems Corp.), MBIA, 5.375%, 2008 | | | 1,000,000 | | | 1,011,920 |
| Iowa Finance Authority Health Care Facilities (Genesis Medical Center), 6%, 2010 | | | 210,000 | | | 221,693 |
| Joplin, MO, Industrial Development Authority, Health Facilities Rev. (Freeman Health Systems), 5.5%, 2013 | | | 700,000 | | | 735,266 |
| Kent, MI, Hospital Finance Authority Rev. (Spectrum Health), “A”, 5.25%, 2009 | | | 750,000 | | | 765,233 |
| Kent, MI, Hospital Finance Authority Rev. (Spectrum Health), “A”, 5%, 2047 (a) | | | 1,000,000 | | | 1,028,430 |
| Kentucky Economic Development Finance Authority (Norton Healthcare), “A”, ETM, 6.125%, 2010 (c) | | | 45,000 | | | 46,422 |
| Kentucky Economic Development Finance Authority (Norton Healthcare), “A”, 6.125%, 2010 | | | 95,000 | | | 96,463 |
| Martin County, FL, Health Facilities Authority, Hospital Rev. (Martin Memorial Medical Center), “B”, 5.25%, 2008 | | | 800,000 | | | 805,032 |
| Maryland Health & Higher Educational Facilities Authority Rev. (Lifebridge Health), 5%, 2012 | | | 500,000 | | | 529,145 |
| Massachusetts Health & Educational Facilities Authority Rev. (Baystate Medical Center), “F”, 5%, 2009 | | | 235,000 | | | 240,156 |
| Miami-Dade County, FL, Health Facilities Authority Hospital Rev., MBIA, 4.125%, 2046 (a) | | | 1,000,000 | | | 992,620 |
| Mississippi Hospital Equipment & Facilities Authority Rev. (Southwest Mississippi Regional Medical Center), 5%, 2014 | | | 500,000 | | | 503,790 |
| Missouri Health & Educational Facilities Authority Rev. (St. Vincent’s Blount), 3.5%, 2026 (a) | | | 1,000,000 | | | 1,005,320 |
Montgomery County, OH, Rev. (Catholic Healthcare Initiatives),
4.1%, 2041 (a) | | | 1,500,000 | | | 1,497,555 |
| New Hampshire Health & Education Facilities (Covenant Health), 5%, 2014 | | | 920,000 | | | 942,154 |
| New Hampshire Health & Education Facilities Authority Rev. (Concord Hospital), 5%, 2013 | | | 750,000 | | | 772,095 |
11
Portfolio of Investments – continued
| | | | | | |
| Issuer | | Shares/Par | | Value ($) |
| | | | | | |
| Municipal Bonds - continued | | | | | | |
| Healthcare Revenue - Hospitals - continued | | | | | | |
| Oklahoma Development Finance Authority (Unity Health Center), 5%, 2013 | | $ | 875,000 | | $ | 913,238 |
| Rhode Island Health & Educational Building Corp., Hospital Financing (Lifespan Obligated Group), 5.75%, 2010 | | | 250,000 | | | 262,983 |
| South Miami, FL, Health Facilities Baptist Authority, Hospital Rev. (Baptist Health South Florida Group), 5%, 2021 | | | 790,000 | | | 810,587 |
| Springfield, TN, Health & Higher Educational Facilities Hospital Rev. (Northcrest Medical Center), 5.25%, 2013 | | | 485,000 | | | 485,975 |
| Steubenville, OH, Hospital Rev. (Trinity Hospital), ETM, 5.75%, 2010 (c) | | | 220,000 | | | 236,854 |
| Tarrant County, TX, Cultural Education Facilities Finance Corp. Rev. (Texas Health Resources), 5%, 2019 | | | 500,000 | | | 514,640 |
| Waco, TX, Health Facilities Development Corp. (Ascension Health), “A”, 5.5%, 2009 | | | 250,000 | | | 261,248 |
| Wisconsin Health & Educational Facilities Authority Rev. (Fort Healthcare, Inc.), 5.25%, 2012 | | | 610,000 | | | 629,904 |
| Wisconsin Health & Educational Facilities Authority Rev. (Fort Healthcare, Inc.), 5.25%, 2013 | | | 645,000 | | | 665,524 |
| | | | | | |
| | | | | | $ | 21,036,551 |
| Healthcare Revenue - Long Term Care - 0.8% | | | | | | |
| Colorado Health Facilities Authority Rev. (Evangelical Lutheran), “B”, 3.75%, 2034 (a) | | $ | 735,000 | | $ | 744,415 |
| Tarrant County, TX, Cultural Educational Facilities Finance Corp. (Buckner Retirement), 5%, 2016 | | | 500,000 | | | 502,060 |
| | | | | | |
| | | | | | $ | 1,246,475 |
| Industrial Revenue - Chemicals - 0.2% | | | | | | |
| Michigan Strategic Fund Ltd. Rev. (Dow Chemical Co.), 4.6%, 2014 (a) | | $ | 350,000 | | $ | 350,249 |
| | |
| Industrial Revenue - Environmental Services - 1.4% | | | | | | |
| California Statewide Communities Development Authority, Solid Waste Facilities Rev. (Republic Services, Inc.), “A”, 4.95%, 2012 | | $ | 250,000 | | $ | 243,023 |
| Michigan Solid Waste Disposal Rev. (Waste Management, Inc.), 4.5%, 2013 | | | 1,000,000 | | | 955,320 |
| New Jersey Economic Development Authority (Waste Management, Inc.), “A”, 5.3%, 2015 (a) | | | 1,000,000 | | | 990,260 |
| | | | | | |
| | | | | | $ | 2,188,603 |
12
Portfolio of Investments – continued
| | | | | | |
| Issuer | | Shares/Par | | Value ($) |
| | | | | | |
| Municipal Bonds - continued | | | | | | |
| Industrial Revenue - Other - 1.5% | | | | | | |
| Cartersville, GA, Development Authority Rev. (Anheuser-Busch), 5.1%, 2012 | | $ | 375,000 | | $ | 389,303 |
| Fort Bend County, TX, Industrial Development (Frito Lay, Inc.), 3.5%, 2011 (a) | | | 1,000,000 | | | 1,005,640 |
| Port Corpus Christi, TX, Nueces County General Rev. (Union Pacific Corp.), 5.35%, 2010 | | | 610,000 | | | 613,977 |
| Utah County, UT, Environmental Improvement Rev. (Marathon Oil), 5.05%, 2017 (a) | | | 300,000 | | | 307,461 |
| | | | | | |
| | | | | | $ | 2,316,381 |
| Industrial Revenue - Paper - 2.1% | | | | | | |
| Courtland, AL, Industrial Development Board Environmental Improvement Rev. (International Paper Co.), “A”, 5%, 2013 | | $ | 750,000 | | $ | 747,150 |
| Delta County, MI, Economic Development Corp., Environmental Improvement Rev. (Mead Westvaco Escanaba), “B”, 6.45%, 2012 (c) | | | 1,500,000 | | | 1,657,605 |
| Erie County, PA, Industrial Development Authority, Pollution Control (International Paper Co.), “A”, 5.25%, 2010 | | | 250,000 | | | 254,515 |
| Erie County, PA, Industrial Development Authority, Pollution Control (International Paper Co.), “A”, 5.3%, 2012 | | | 570,000 | | | 576,777 |
| | | | | | |
| | | | | | $ | 3,236,047 |
| Miscellaneous Revenue - Entertainment & Tourism - 0.7% | | | | | | |
| George L. Smith II, GA, World Congress Center Authority Rev. (Domed Stadium), MBIA, 6%, 2011 | | $ | 1,000,000 | | $ | 1,070,850 |
| | |
| Miscellaneous Revenue - Other - 1.1% | | | | | | |
| Dayton Montgomery County, OH, Port Dayton, “A”, 4.75%, 2015 | | $ | 605,000 | | $ | 611,903 |
| Illinois Development Finance Authority Rev. (Elgin School District), FSA, 0%, 2010 | | | 500,000 | | | 477,740 |
| Indiana Bond Bank Common School Fund, AMBAC, 5.75%, 2013 | | | 535,000 | | | 562,296 |
| | | | | | |
| | | | | | $ | 1,651,939 |
| Multi-Family Housing Revenue - 0.3% | | | | | | |
| Philadelphia, PA, Housing Authority, “A”, FSA, 5%, 2008 | | $ | 500,000 | | $ | 508,860 |
| | |
| Sales & Excise Tax Revenue - 2.2% | | | | | | |
| California Economic Recovery, “B”, 5%, 2023 (a) | | $ | 1,000,000 | | $ | 1,050,650 |
| Jefferson Parish, LA, School Board, “N”, AMBAC, 5.5%, 2009 | | | 1,245,000 | | | 1,274,643 |
| Spokane, WA, Public Facilities District Hotel, “A”, MBIA, 5.75%, 2012 | | | 425,000 | | | 459,803 |
| Wyandotte County-Kansas City, KS, Sales Tax Second Lien Area B, 4.75%, 2016 | | | 695,000 | | | 688,502 |
| | | | | | |
| | | | | | $ | 3,473,598 |
13
Portfolio of Investments – continued
| | | | | | |
| Issuer | | Shares/Par | | Value ($) |
| | | | | | |
| Municipal Bonds - continued | | | | | | |
| Single Family Housing Revenue - Local - 0.6% | | | | | | |
| Sedgwick & Shawnee County, KS, Mortgage Backed Securities, “B-4”, GNMA, 4.25%, 2023 | | $ | 945,000 | | $ | 927,905 |
| | |
| Single Family Housing - State - 0.8% | | | | | | |
| Colorado Housing & Finance Authority Rev., Single Family Program, “A-3”, 7.25%, 2010 | | $ | 25,000 | | $ | 25,209 |
| Colorado Housing & Finance Authority Rev., Single Family Program, “A-3”, 6.3%, 2012 | | | 35,000 | | | 35,282 |
| Colorado Housing & Finance Authority Rev., Single Family Program, “B-3”, 6.7%, 2016 | | | 20,000 | | | 20,384 |
| Colorado Housing & Finance Authority Rev., Single Family Program, “C-2”, 8.4%, 2021 | | | 20,000 | | | 20,792 |
| Massachusetts Housing Finance Agency, “A”, MBIA, 5.35%, 2010 | | | 230,000 | | | 234,554 |
| Missouri Housing Development Commission, Single Family Mortgage Rev. (Home Loan Program), “B”, GNMA, 6.05%, 2037 | | | 490,000 | | | 502,005 |
| New Hampshire Housing Finance Authority, Single Family Rev., Mortgage Acquisition, “F”, 3.7%, 2010 | | | 380,000 | | | 375,022 |
| Oklahoma Housing Finance Agency Single Family Rev., Mortgage Homeownership, GNMA, 7.6%, 2015 | | | 30,000 | | | 30,513 |
| | | | | | |
| | | | | | $ | 1,243,761 |
| Solid Waste Revenue - 0.7% | | | | | | |
| Massachusetts Development Finance Agency, Resource Recovery Rev., (Semass Systems), “B”, MBIA, 5.625%, 2012 | | $ | 400,000 | | $ | 422,716 |
| Niagara County, NY, Industrial Development Agency, Solid Waste Disposal Rev. (American Ref-fuel), “C”, 5.625%, 2024 (a) | | | 300,000 | | | 300,360 |
| Tacoma, WA, Solid Waste Utility Rev., AMBAC, 5%, 2010 | | | 400,000 | | | 423,116 |
| | | | | | |
| | | | | | $ | 1,146,192 |
| State & Agency - Other - 1.2% | | | | | | |
| Kentucky Property & Buildings Commerce Rev. (Project Number 69), “A”, FSA, 5.5%, 2011 | | $ | 500,000 | | $ | 541,175 |
| New York Dormitory Authority Rev. (City University), MBIA, 5.25%, 2011 | | | 1,270,000 | | | 1,360,513 |
| | | | | | |
| | | | | | $ | 1,901,688 |
| State & Local Agencies - 8.1% | | | | | | |
| Alabama Public School & College, “C”, FSA, 4.5%, 2009 | | $ | 1,000,000 | | $ | 1,024,650 |
| Allen County, IN (Jail Building Corp.), ETM, 5.75%, 2009 (c) | | | 235,000 | | | 245,977 |
| Columbus, IN, Multi-School Building Corp., First Mortgage, FSA, 5%, 2010 | | | 725,000 | | | 754,986 |
| Golden State, CA, Tobacco Securitization Corp., 5.5%, 2013 (c) | | | 1,000,000 | | | 1,099,500 |
14
Portfolio of Investments – continued
| | | | | | |
| Issuer | | Shares/Par | | Value ($) |
| | | | | | |
| Municipal Bonds - continued | | | | | | |
| State & Local Agencies - continued | | | | | | |
| Hamilton Heights School Building Corp., First Mortgage, “N”, FSA, 5%, 2014 | | $ | 1,875,000 | | $ | 2,046,675 |
| Hampton, VA, Museum Rev., 5%, 2014 | | | 760,000 | | | 811,566 |
| New Jersey Economic Development Authority Rev., FSA, 5%, 2029 (a) | | | 1,000,000 | | | 1,055,320 |
| New York Dormitory Authority Rev. (School Districts Financing Program), “A”, MBIA, 5.25%, 2009 | | | 1,000,000 | | | 1,039,140 |
| New York Tobacco Settlement Financing Corp., “A-1”, 5.25%, 2012 | | | 25,000 | | | 25,047 |
| New York Tobacco Settlement Financing Corp., “B-1”, 5.25%, 2013 | | | 1,000,000 | | | 1,001,290 |
| New York Urban Development Corp. Rev., “A”, 5.125%, 2015 | | | 675,000 | | | 726,327 |
| Ohio Building Authority (Adult Correctional Building), “A”, FSA, 5%, 2009 | | | 1,290,000 | | | 1,325,127 |
| Ohio Building Authority (State Facilities Administration Building), “A”, 5.375%, 2009 (c) | | | 1,000,000 | | | 1,052,670 |
| Suffolk County, NY, Judicial Facilities (John P. Cohalan Complex), AMBAC, 5.75%, 2011 | | | 160,000 | | | 168,030 |
| Virginia, MN, Housing & Redevelopment Authority, Healthcare Facility Lease Rev., 5.25%, 2012 | | | 85,000 | | | 87,245 |
| Virginia, MN, Housing & Redevelopment Authority, Healthcare Facility Lease Rev., 5.25%, 2013 | | | 215,000 | | | 220,268 |
| | | | | | |
| | | | | | $ | 12,683,818 |
| Student Loan Revenue - 0.1% | | | | | | |
| Massachusetts Educational Financing Authority, “E”, AMBAC, 4.5%, 2009 | | $ | 85,000 | | $ | 86,023 |
| | |
| Tax - Other - 2.6% | | | | | | |
| Denver, CO, City & County Excise Tax, “A”, FSA, 5.25%, 2008 | | $ | 250,000 | | $ | 252,693 |
| Harris County-Houston, TX (Sport Capital Appreciation), “N”, MBIA, 0%, 2040 (a) | | | 600,000 | | | 587,808 |
| New Jersey Economic Development Authority Rev., Cigarette Tax, 5.375%, 2015 | | | 2,730,000 | | | 2,720,827 |
| Virgin Islands Public Finance Authority Rev., Matching Fund Loan Note, “A”, 5%, 2013 | | | 200,000 | | | 206,098 |
| Virgin Islands Public Finance Authority Rev., Matching Fund Loan Note, “A”, 5%, 2014 | | | 250,000 | | | 257,720 |
| | | | | | |
| | | | | | $ | 4,025,146 |
| Tax Assessment - 0.4% | | | | | | |
| Dyer, IN, Redevelopment Authority, Economic Development Lease Rent, CIFG, 5%, 2011 | | $ | 570,000 | | $ | 595,211 |
15
Portfolio of Investments – continued
| | | | | | |
| Issuer | | Shares/Par | | Value ($) |
| | | | | | |
| Municipal Bonds - continued | | | | | | |
| Tobacco - 4.1% | | | | | | |
| Buckeye, OH, Tobacco Settlement Financing Corp., 5.125%, 2024 | | $ | 2,000,000 | | $ | 1,877,409 |
District of Columbia Tobacco Settlement, Asset Backed Bonds,
5.2%, 2008 | | | 450,000 | | | 450,140 |
| Golden State, CA, Tobacco Securitization Corp., Tobacco Settlement Rev., “A”, 5%, 2008 (c) | | | 85,000 | | | 85,175 |
| New Jersey Tobacco Settlement Financing Corp., 4.375%, 2013 (c) | | | 80,000 | | | 80,138 |
| New Jersey Tobacco Settlement Financing Corp., “1A”, 4.5%, 2023 | | | 1,390,000 | | | 1,261,995 |
| South Carolina Tobacco Settlement Authority Rev., “B”, 6%, 2022 | | | 225,000 | | | 227,113 |
| Tobacco Settlement Financing Corp., NJ, 6.75%, 2013 (c) | | | 1,460,000 | | | 1,700,842 |
| Virginia Tobacco Settlement Financing Corp., 5.25%, 2019 (c) | | | 685,000 | | | 722,901 |
| | | | | | |
| | | | | | $ | 6,405,713 |
| Transportation - Special Tax - 1.5% | | | | | | |
| Colorado Department of Transportation Rev., AMBAC, 6%, 2008 | | $ | 235,000 | | $ | 235,964 |
| Du Page County, IL, Transportation Rev., FSA, 5.5%, 2011 | | | 1,000,000 | | | 1,068,070 |
| New Jersey Transportation Trust Fund Authority, MBIA, 5%, 2011 (c) | | | 1,000,000 | | | 1,077,530 |
| | | | | | |
| | | | | | $ | 2,381,564 |
| Universities - Colleges - 2.5% | | | | | | |
Alabama Private Colleges (Tuskegee University), “N”, ASSD GTY,
5%, 2015 | | $ | 1,000,000 | | $ | 1,086,680 |
| Illinois Educational Facilities Authority Rev. (Art Institute Chicago), “A”, 4.3%, 2030 (a) | | | 500,000 | | | 501,295 |
| Massachusetts Development Finance Agency Rev. (Hampshire College), 5.15%, 2014 | | | 150,000 | | | 157,152 |
| Massachusetts Development Finance Agency Rev. (Western New England College), ETM, 4%, 2008 (c) | | | 150,000 | | | 151,782 |
| Massachusetts Health & Educational (Massachusetts Institute of Technology), “K”, 5.25%, 2012 | | | 375,000 | | | 408,026 |
| San Leanna Educational Facilities Corp. Higher Educational Rev. (St. Edwards University), 5%, 2019 | | | 750,000 | | | 756,503 |
| Southeast Missouri State University, System Facilities Rev., MBIA, 5.625%, 2010 | | | 250,000 | | | 264,443 |
| University of Texas, Permanent University Fund, “A”, 5%, 2009 | | | 580,000 | | | 598,954 |
| | | | | | |
| | | | | | $ | 3,924,835 |
| Universities - Dormitories - 0.7% | | | | | | |
| New York Dormitory Authority Rev., FGIC, 5.25%, 2029 (a) | | $ | 1,000,000 | | $ | 1,052,910 |
| | |
| Universities - Secondary Schools - 0.3% | | | | | | |
District of Columbia Rev. (Gonzaga College High School), FSA,
5%, 2012 | | $ | 330,000 | | $ | 343,471 |
16
Portfolio of Investments – continued
| | | | | | |
| Issuer | | Shares/Par | | Value ($) |
| | | | | | |
| Municipal Bonds - continued | | | | | | |
| Universities - Secondary Schools - continued | | | | | | |
New Hampshire Health & Education (Derryfield School), ETM,
6.5%, 2010 (c) | | $ | 70,000 | | $ | 71,245 |
| | | | | | |
| | | | | | $ | 414,716 |
| Utilities - Investor Owned - 4.4% | | | | | | |
| California Statewide Communities Development Authority Poll (Southern California Edison Co.), “A”, XLCA, 4.1%, 2028 (a) | | $ | 500,000 | | $ | 495,820 |
| Chesapeake, VA., Economic Development Authority Pollution Control Rev. (Virginia Electric Power Co.), 3.6%, 2032 (a) | | | 1,000,000 | | | 971,300 |
| Farmington, NM, Pollution Control Rev. (El Paso Electric Co.), “A”, FGIC, 4%, 2032 (a) | | | 695,000 | | | 696,883 |
Hillsborough County, FL, Industrial Development Authority (Tampa
Electric), 5.15%, 2025 (a) | | | 1,000,000 | | | 999,930 |
Iowa Finance Authority Pollution Control Facilities Rev. (Interstate
Power and Light), FGIC, 5%, 2014 | | | 1,000,000 | | | 989,510 |
| Madison, WI, Industrial Development Rev. (Madison Gas & Electric Co.), “B”, 4.875%, 2027 (a) | | | 420,000 | | | 442,781 |
| Matagorda County TX, Navigation District No. 1 Pollution Control Rev. (AEP Texas Central Co.), 5.125%, 2030 (a) | | | 1,000,000 | | | 998,140 |
| Missouri Environmental Improvement & Energy Resources Authority (Kansas Power and Light Co.), XLCA, 5.25%, 2017 (a) | | | 1,000,000 | | | 999,090 |
| Red River, TX, Authority Pollution Control (AEP Texas Central Co.), MBIA, 4.45%, 2020 | | | 305,000 | | | 298,577 |
| | | | | | |
| | | | | | $ | 6,892,031 |
| Utilities - Municipal Owned - 7.3% | | | | | | |
| California Department of Water Resources, Power Supply Rev., “A”, 5.5%, 2010 | | $ | 600,000 | | $ | 633,156 |
Cowlitz County, WA, Public Utilities District 1, ETM, AMBAC,
5.25%, 2008 (c) | | | 195,000 | | | 197,114 |
| Cowlitz County, WA, Public Utilities District 1, Unrefunded, AMBAC, 5.25%, 2008 | | | 305,000 | | | 307,568 |
| Dalton, GA, Utilities Rev., FSA, 6%, 2012 | | | 500,000 | | | 551,910 |
| Delaware Municipal Electric Corp., AMBAC, 5%, 2008 | | | 500,000 | | | 501,785 |
| Energy Northwest, Washington, Wind Project Rev., MBIA, 5%, 2013 | | | 280,000 | | | 298,418 |
| Indianapolis, IN, Gas Utility Rev., ASSD GTY, 5%, 2030 (a) | | | 1,500,000 | | | 1,540,455 |
| Kissimmee, FL, Utility Authority Electric, AMBAC, 5%, 2011 | | | 500,000 | | | 530,965 |
Long Island Power Authority, NY, Electric Systems Rev., “A”,
5%, 2009 | | | 1,100,000 | | | 1,129,722 |
Lower Colorado River Authority, TX, Rev., “A”, ETM, MBIA, 5%,
2011 (c) | | | 30,000 | | | 31,966 |
| Lower Colorado River Authority, TX, Rev., “N”,, MBIA, 5%, 2011 | | | 470,000 | | | 498,407 |
17
Portfolio of Investments – continued
| | | | | | |
| Issuer | | Shares/Par | | Value ($) |
| | | | | | |
| Municipal Bonds - continued | | | | | | |
| Utilities - Municipal Owned - continued | | | | | | |
| Massachusetts Development Finance Agency (Devens Electrical Systems), 5.125%, 2011 | | $ | 115,000 | | $ | 117,533 |
| Monroe County, GA, Development Authority Pollution Control Rev., AMBAC, 4.625%, 2036 (a) | | | 1,000,000 | | | 997,810 |
| Muscatine, IA, Electric Rev., “A”, AMBAC, 5.5%, 2010 | | | 1,000,000 | | | 1,042,850 |
| North Carolina Eastern Municipal Power Agency, “A”, 5.5%, 2010 | | | 750,000 | | | 775,725 |
| North Carolina Municipal Power Agency, Catawba Electric Rev., “A”, 5.5%, 2013 | | | 500,000 | | | 540,805 |
| Salt River, AZ, Agricultural Improvement (Salt River), “A”, 5%, 2011 | | | 500,000 | | | 529,000 |
| Southern California Public Power Authority (San Juan), “A”, FSA, 5.375%, 2012 | | | 595,000 | | | 644,415 |
| Tacoma, WA, Electric Systems Rev., “A”, FSA, 5.5%, 2011 | | | 500,000 | | | 534,695 |
| | | | | | |
| | | | | | $ | 11,404,299 |
| Utilities - Other - 1.5% | | | | | | |
| Edmond, OK, Public Works Authority, Sales Tax & Utility System Rev., AMBAC, 4.5%, 2008 | | $ | 500,000 | | $ | 501,615 |
Main Street Natural Gas Inc., GA, Gas Project Rev., “A”,
5.125%, 2016 | | | 365,000 | | | 359,981 |
SA Energy Acquisition Public Facilities Corp., (Texas Gas Supply),
5%, 2012 | | | 1,500,000 | | | 1,514,715 |
| | | | | | |
| | | | | | $ | 2,376,311 |
| Water & Sewer Utility Revenue - 8.9% | | | | | | |
| Allentown, PA, Water Rev., Guaranteed, AMBAC, 5%, 2011 | | $ | 925,000 | | $ | 969,021 |
| Atlanta, GA, Water & Waste Rev., “A”, FGIC, 5.5%, 2014 | | | 1,235,000 | | | 1,318,140 |
| Fond Du Lac, WS, Water works Rev., “B”, 4.5%, 2010 | | | 1,500,000 | | | 1,548,870 |
| Harrison County, MS, Wastewater Treatment Facilities, “A”, ETM, FGIC, 5.5%, 2011 (c) | | | 400,000 | | | 427,936 |
| Houston, TX, Utilities Systems Rev., MBIA, 5.25%, 2014 | | | 1,485,000 | | | 1,632,728 |
| Houston, TX, Utilities Systems Rev., “A”, FSA, 5%, 2012 | | | 1,500,000 | | | 1,623,480 |
| King County, WA, Sewer Rev., FGIC, 5.25%, 2012 | | | 750,000 | | | 803,145 |
Mississippi Development Bank Special Obligation, “N”, AMBAC,
5%, 2015 | | | 1,000,000 | | | 1,064,840 |
| Nueces River Authority, Texas Water Supply Rev. (Corpus Christi Project), FSA, 5%, 2013 | | | 540,000 | | | 586,424 |
| Philadelphia, PA, Water & Wastewater, FSA, 5.625%, 2008 | | | 595,000 | | | 596,821 |
| Phoenix, AZ, Civic Improvement Corp., Wastewater Systems Rev., FGIC, 5.25%, 2009 | | | 255,000 | | | 263,226 |
| Seattle, WA, Water Systems Rev., “B”, 5%, 2008 | | | 475,000 | | | 477,171 |
| Sebring, FL, Water & Wastewater, FGIC, 5.25%, 2013 | | | 690,000 | | | 743,889 |
| Truckee Meadows, NV, Water Authority, “A”, FSA, 5.5%, 2011 | | | 1,000,000 | | | 1,082,220 |
| Utah Water Finance Agency Rev., “A”, AMBAC, 5%, 2012 | | | 500,000 | | | 537,120 |
18
Portfolio of Investments – continued
| | | | | | |
| Issuer | | Shares/Par | | Value ($) |
| | | | | | |
| Municipal Bonds - continued | | | | | | |
| Water & Sewer Utility Revenue - continued | | | | | | |
| Wilsonville, OR, Water Systems Rev., MBIA, 5%, 2010 | | $ | 300,000 | | $ | 314,988 |
| | | | | | |
| | | | | | $ | 13,990,019 |
| Total Municipal Bonds (Identified Cost, $148,657,479) | | | | | $ | 150,277,192 |
| | |
| Floating Rate Demand Notes - 2.2% | | | | | | |
| East Baton Rouge, LA, Pollution Control Rev. (Exxon Mobil Corp.), 2.28%, due 5/01/08 | | $ | 200,000 | | $ | 200,000 |
| Lincoln County, WY, Pollution Control Rev. (Exxon Mobil Corp.), “A”, 2.48%, due 5/01/08 | | | 300,000 | | | 300,000 |
| Lincoln County, WY, Pollution Control Rev. (Exxon Mobil Corp.), “B”, 2.48%, due 5/01/08 | | | 200,000 | | | 200,000 |
| New York, NY, “A-4”, 2.53%, due 5/01/08 | | | 2,800,000 | | | 2,800,000 |
| Total Floating Rate Demand Notes, at Identified Cost | | | | | $ | 3,500,000 |
| Total Investments (Identified Cost, $152,157,479) (k) | | | | | $ | 153,777,192 |
| | |
| Other Assets, Less Liabilities - 1.8% | | | | | | 2,796,323 |
| Net Assets - 100.0% | | | | | $ | 156,573,515 |
| (a) | Mandatory tender date is earlier than stated maturity date. |
| (f) | All or a portion of the security has been segregated as collateral for an open futures contract. |
| (j) | Crossover refunded bond. |
| (k) | As of April 30, 2008, the fund held securities fair valued in accordance with the policies adopted by the Board of Trustees, aggregating $150,277,192 and 97.72% of market value. All of these security values were provided by an independent pricing service using an evaluated bid. |
The following abbreviations are used in this report and are defined:
Insurers
| AMBAC | | AMBAC Indemnity Corp. |
| ASSD GTY | | Assured Guaranty Insurance Co. |
| CIFG | | CDC IXIS Financial Guaranty |
| FGIC | | Financial Guaranty Insurance Co. |
| FSA | | Financial Security Assurance Inc. |
| GNMA | | Government National Mortgage Assn. |
| MBIA | | MBIA Insurance Corp. |
| PSF | | Permanent School Fund |
| Q-SBLF | | Qualified School Board Loan Fund |
| XLCA | | XL Capital Insurance Co. |
19
Portfolio of Investments – continued
Futures contracts outstanding at 4/30/08
| | | | | | | | | |
| Description | | Contracts | | Value | | Expiration
Date | | Unrealized
Appreciation/
(Depreciation) | |
| U.S. Treasury Note 10 yr (Short) | | 36 | | $4,169,250 | | Jun-08 | | $(55,436 | ) |
| | | | | | | | | |
At April 30, 2008, the fund had sufficient cash and/or other liquid securities to cover any commitments under these derivative contracts.
See Notes to Financial Statements
20
Financial Statements
STATEMENT OF ASSETS AND LIABILITIES
At 4/30/08
This statement represents your fund’s balance sheet, which details the assets and liabilities comprising the total value of the fund.
| | | | | |
| Assets | | | | | |
| Investments, at value (identified cost, $152,157,479) | | $153,777,192 | | | |
| Cash | | 26,849 | | | |
| Receivable for investments sold | | 5,000 | | | |
| Receivable for fund shares sold | | 1,166,586 | | | |
| Interest receivable | | 2,039,302 | | | |
| Other assets | | 1,940 | | | |
| Total assets | | | | | $157,016,869 |
| Liabilities | | | | | |
| Distributions payable | | $130,955 | | | |
| Payable for daily variation margin on open futures contracts | | 15,187 | | | |
| Payable for fund shares reacquired | | 190,854 | | | |
| Payable to affiliates | | | | | |
Management fee | | 2,136 | | | |
Shareholder servicing costs | | 21,309 | | | |
Distribution and service fees | | 4,359 | | | |
Administrative services fee | | 166 | | | |
| Payable for independent trustees’ compensation | | 8,117 | | | |
| Accrued expenses and other liabilities | | 70,271 | | | |
| Total liabilities | | | | | $443,354 |
| Net assets | | | | | $156,573,515 |
| Net assets consist of | | | | | |
| Paid-in capital | | $158,580,426 | | | |
| Unrealized appreciation (depreciation) on investments | | 1,564,277 | | | |
| Accumulated net realized gain (loss) on investments | | (3,684,206 | ) | | |
| Undistributed net investment income | | 113,018 | | | |
| Net assets | | | | | $156,573,515 |
| Shares of beneficial interest outstanding | | | | | 20,417,115 |
21
Statement of Assets and Liabilities – continued
| | | | |
| Class A shares | | | | |
Net assets | | $124,160,660 | | |
Shares outstanding | | 16,190,395 | | |
Net asset value per share | | | | $7.67 |
Offering price per share (100 / 97.50 × net asset value per share) | | | | $7.87 |
| Class B shares | | | | |
Net assets | | $10,454,222 | | |
Shares outstanding | | 1,364,925 | | |
Net asset value and offering price per share | | | | $7.66 |
| Class C shares | | | | |
Net assets | | $21,958,633 | | |
Shares outstanding | | 2,861,795 | | |
Net asset value and offering price per share | | | | $7.67 |
On sales of $50,000 or more, the offering price of Class A shares is reduced. A contingent deferred sales charge may be imposed on redemptions of Class A, Class B, and Class C shares.
See Notes to Financial Statements
22
Financial Statements
STATEMENT OF OPERATIONS
Year ended 4/30/08
These statements describe the increases and/or decreases in net assets resulting from operations, any distributions, and any shareholder transactions.
| | | | | | |
| Net investment income | | | | | | |
| Interest income | | $6,384,866 | | | | |
| Expenses | | | | | | |
Management fee | | $614,986 | | | | |
Distribution and service fees | | 516,762 | | | | |
Shareholder servicing costs | | 133,470 | | | | |
Administrative services fee | | 32,704 | | | | |
Independent trustees’ compensation | | 5,551 | | | | |
Custodian fee | | 40,919 | | | | |
Shareholder communications | | 29,483 | | | | |
Auditing fees | | 48,056 | | | | |
Legal fees | | 2,036 | | | | |
Miscellaneous | | 62,736 | | | | |
| Total expenses | | | | | $1,486,703 | |
Reduction of expenses by investment adviser | | (231,357 | ) | | | |
| Net expenses | | | | | $1,255,346 | |
| Net investment income | | | | | $5,129,520 | |
| Realized and unrealized gain (loss) on investments | | | | | | |
| Realized gain (loss) (identified cost basis) | | | | | | |
Investment transactions | | $(256,646 | ) | | | |
Futures contracts | | (120,317 | ) | | | |
Swap transactions | | (225,993 | ) | | | |
| Net realized gain (loss) on investments | | | | | $(602,956 | ) |
| Change in unrealized appreciation (depreciation) | | | | | | |
Investments | | $49,856 | | | | |
Futures contracts | | (55,436 | ) | | | |
Swap transactions | | 8,804 | | | | |
| Net unrealized gain (loss) on investments | | | | | $3,224 | |
| Net realized and unrealized gain (loss) on investments | | | | | $(599,732 | ) |
| Change in net assets from operations | | | | | $4,529,788 | |
See Notes to Financial Statements
23
Financial Statements
STATEMENTS OF CHANGES IN NET ASSETS
These statements describe the increases and/or decreases in net assets resulting from operations, any distributions, and any shareholder transactions.
| | | | | | |
| | | Years ended 4/30 | |
| | | 2008 | | | 2007 | |
| Change in net assets | | | | | | |
| From operations | | | | | | |
| Net investment income | | $5,129,520 | | | $5,887,030 | |
| Net realized gain (loss) on investments | | (602,956 | ) | | (482,301 | ) |
| Net unrealized gain (loss) on investments | | 3,224 | | | 944,316 | |
| Change in net assets from operations | | $4,529,788 | | | $6,349,045 | |
| Distributions declared to shareholders | | | | | | |
| From net investment income | | | | | | |
Class A | | $(4,251,070 | ) | | $(4,142,886 | ) |
Class B | | (354,968 | ) | | (473,641 | ) |
Class C | | (615,740 | ) | | (720,773 | ) |
| Total distributions declared to shareholders | | $(5,221,778 | ) | | $(5,337,300 | ) |
| Change in net assets from fund share transactions | | $677,679 | | | $(53,503,666 | ) |
| Total change in net assets | | $(14,311 | ) | | $(52,491,921 | ) |
| Net assets | | | | | | |
| At beginning of period | | 156,587,826 | | | 209,079,747 | |
| At end of period (including undistributed net investment income of $113,018 and $247,118, respectively) | | $156,573,515 | | | $156,587,826 | |
See Notes to Financial Statements
24
Financial Statements
FINANCIAL HIGHLIGHTS
The financial highlights table is intended to help you understand the fund’s financial performance for the past 5 years. Certain information reflects financial results for a single fund share. The total returns in the table represent the rate by which an investor would have earned (or lost) on an investment in the fund share class (assuming reinvestment of all distributions) held for the entire period.
| | | | | | | | | | | | | | | |
| Class A | | Years ended 4/30 | |
| | | 2008 | | | 2007 | | | 2006 | | | 2005 | | | 2004 | |
| Net asset value, beginning of period | | $7.70 | | | $7.66 | | | $7.79 | | | $7.83 | | | $7.94 | |
| Income (loss) from investment operations | | | | | | | | | | | | | | | |
Net investment income (d) | | $0.27 | | | $ 0.27 | (z) | | $0.24 | | | $0.23 | | | $0.22 | |
Net realized and unrealized gain (loss)
on investments | | (0.02 | ) | | 0.02 | (z) | | (0.13 | ) | | (0.04 | ) | | (0.11 | ) |
| Total from investment operations | | $0.25 | | | $0.29 | | | $0.11 | | | $0.19 | | | $0.11 | |
| Less distributions declared to shareholders | | | | | | | | | | | | | | | |
From net investment income | | $(0.28 | ) | | $(0.25 | ) | | $(0.24 | ) | | $(0.23 | ) | | $(0.22 | ) |
| Net asset value, end of period | | $7.67 | | | $7.70 | | | $7.66 | | | $7.79 | | | $7.83 | |
| Total return (%) (r)(s)(t) | | 3.25 | | | 3.83 | | | 1.40 | | | 2.45 | | | 1.35 | |
Ratios (%) (to average net assets)
and Supplemental data: | | | | | | | | | | | | | | | |
| Expenses before expense reductions (f) | | 0.78 | | | 0.85 | | | 0.86 | | | 0.82 | | | 0.82 | |
| Expenses after expense reductions (f) | | 0.63 | | | 0.70 | | | 0.71 | | | 0.67 | | | 0.71 | |
| Net investment income | | 3.53 | | | 3.55 | (z) | | 3.11 | | | 3.00 | | | 2.73 | |
| Portfolio turnover | | 30 | | | 9 | | | 13 | | | 17 | | | 18 | |
| Net assets at end of period (000 Omitted) | | $124,161 | | | $116,562 | | | $149,936 | | | $177,889 | | | $171,824 | |
See Notes to Financial Statements
25
Financial Highlights – continued
| | | | | | | | | | | | | | | |
| Class B | | Years ended 4/30 | |
| | | 2008 | | | 2007 | | | 2006 | | | 2005 | | | 2004 | |
| Net asset value, beginning of period | | $7.69 | | | $7.65 | | | $7.78 | | | $7.82 | | | $7.93 | |
| Income (loss) from investment operations | | | | | | | | | | | | | | | |
Net investment income (d) | | $0.21 | | | $0.21 | (z) | | $0.18 | | | $0.18 | | | $0.15 | |
Net realized and unrealized gain (loss)
on investments | | (0.02 | ) | | 0.02 | (z) | | (0.13 | ) | | (0.05 | ) | | (0.10 | ) |
| Total from investment operations | | $0.19 | | | $0.23 | | | $0.05 | | | $0.13 | | | $0.05 | |
| Less distributions declared to shareholders | | | | | | | | | | | | | | | |
From net investment income | | $(0.22 | ) | | $(0.19 | ) | | $(0.18 | ) | | $(0.17 | ) | | $(0.16 | ) |
| Net asset value, end of period | | $7.66 | | | $7.69 | | | $7.65 | | | $7.78 | | | $7.82 | |
| Total return (%) (r)(s)(t) | | 2.46 | | | 3.06 | | | 0.66 | | | 1.65 | | | 0.58 | |
Ratios (%) (to average net assets)
and Supplemental data: | | | | | | | | | | | | | | | |
| Expenses before expense reductions (f) | | 1.53 | | | 1.61 | | | 1.61 | | | 1.58 | | | 1.61 | |
| Expenses after expense reductions (f) | | 1.38 | | | 1.46 | | | 1.46 | | | 1.43 | | | 1.50 | |
| Net investment income | | 2.79 | | | 2.79 | (z) | | 2.36 | | | 2.25 | | | 1.94 | |
| Portfolio turnover | | 30 | | | 9 | | | 13 | | | 17 | | | 18 | |
| Net assets at end of period (000 Omitted) | | $10,454 | | | $15,393 | | | $23,575 | | | $32,702 | | | $41,733 | |
See Notes to Financial Statements
26
Financial Highlights – continued
| | | | | | | | | | | | | | | |
| Class C | | Years ended 4/30 | |
| | | 2008 | | | 2007 | | | 2006 | | | 2005 | | | 2004 | |
| Net asset value, beginning of period | | $7.71 | | | $7.67 | | | $7.80 | | | $7.83 | | | $7.94 | |
| Income (loss) from investment operations | | | | | | | | | | | | | | | |
Net investment income (d) | | $0.21 | | | $0.21 | (z) | | $0.18 | | | $0.17 | | | $0.15 | |
Net realized and unrealized gain (loss)
on investments | | (0.04 | ) | | 0.01 | (z) | | (0.14 | ) | | (0.04 | ) | | (0.11 | ) |
| Total from investment operations | | $0.17 | | | $0.22 | | | $0.04 | | | $0.13 | | | $0.04 | |
| Less distributions declared to shareholders | | | | | | | | | | | | | | | |
From net investment income | | $(0.21 | ) | | $(0.18 | ) | | $(0.17 | ) | | $(0.16 | ) | | $(0.15 | ) |
| Net asset value, end of period | | $7.67 | | | $7.71 | | | $7.67 | | | $7.80 | | | $7.83 | |
| Total return (%) (r)(s)(t) | | 2.24 | | | 2.96 | | | 0.54 | | | 1.71 | | | 0.49 | |
Ratios (%) (to average net assets)
and Supplemental data: | | | | | | | | | | | | | | | |
| Expenses before expense reductions (f) | | 1.63 | | | 1.70 | | | 1.71 | | | 1.67 | | | 1.67 | |
| Expenses after expense reductions (f) | | 1.48 | | | 1.55 | | | 1.56 | | | 1.52 | | | 1.56 | |
| Net investment income | | 2.68 | | | 2.70 | (z) | | 2.26 | | | 2.21 | | | 1.87 | |
| Portfolio turnover | | 30 | | | 9 | | | 13 | | | 17 | | | 18 | |
| Net assets at end of period (000 Omitted) | | $21,959 | | | $24,634 | | | $35,569 | | | $43,977 | | | $55,263 | |
Any redemption fees charged by the fund during the 2004 and 2005 fiscal years resulted in a per share impact of less than $0.01.
| (d) | Per share data is based on average shares outstanding. |
| (f) | Ratios do not reflect reductions from fees paid indirectly, if applicable. |
| (r) | Certain expenses have been reduced without which performance would have been lower. |
| (s) | From time to time the fund may receive proceeds from litigation settlements, without which performance would be lower. |
| (t) | Total returns do not include any applicable sales charges. |
| (z) | The fund applied a change in estimate for amortization of premium on certain debt securities in the current year that resulted in an increase of less than $0.01 per share to net investment income, a decrease of less than $0.01 per share to net realized and unrealized gain (loss) on investments, and an increase of 0.06% to the net investment income ratio for each class for the year ended April 30, 2007. The change in estimate had no impact on net assets, net asset value per share or total return of each class. |
See Notes to Financial Statements
27
NOTES TO FINANCIAL STATEMENTS
| (1) | | Business and Organization |
MFS Municipal Limited Maturity Fund (the fund) is a series of MFS Series Trust IX (the trust). The trust is organized as a Massachusetts business trust and is registered under the Investment Company Act of 1940, as amended, as an open-end management investment company.
| (2) | | Significant Accounting Policies |
General – The preparation of financial statements in conformity with U.S. generally accepted accounting principles requires management to make estimates and assumptions that affect the reported amounts of assets and liabilities, and disclosure of contingent assets and liabilities at the date of the financial statements and the reported amounts of revenues and expenses during the reporting period. Actual results could differ from those estimates. Municipal securities backed by current or anticipated revenues from a specific project or specific assets can be negatively affected by the discontinuance of the taxation supporting the projects or assets or the inability to collect revenues for the project or from the assets. If the Internal Revenue Service determines an issuer of a municipal security has not complied with applicable tax requirements, the security could decline in value, interest from the security could become taxable and the fund may be required to issue Forms 1099-DIV.
Investment Valuations – Debt instruments and floating rate loans (other than short-term instruments), including restricted debt instruments, are generally valued at an evaluated or composite bid as reported by an independent pricing service. Short-term instruments with a maturity at issuance of 60 days or less may be valued at amortized cost, which approximates market value. Futures contracts are generally valued at last posted settlement price as reported by an independent pricing service on the market on which they are primarily traded. Futures contracts for which there were no trades that day for a particular position are generally valued at the closing bid quotation as reported by an independent pricing service on the market on which such futures contracts are primarily traded. Swaps are generally valued at an evaluated bid as reported by an independent pricing service. Securities and other assets generally valued on the basis of information from an independent pricing service may also be valued at a broker-dealer bid quotation. Values obtained from pricing services can utilize both dealer-supplied valuations and electronic data processing techniques, which take into account factors such as institutional-size trading in similar groups of securities, yield, quality, coupon rate, maturity, type of issue, trading characteristics, and other market data.
The Board of Trustees has delegated primary responsibility for determining or causing to be determined the value of the fund’s investments (including any
28
Notes to Financial Statements – continued
fair valuation) to the adviser pursuant to valuation policies and procedures approved by the Board. If the adviser determines that reliable market quotations are not readily available, investments are valued at fair value as determined in good faith by the adviser in accordance with such procedures under the oversight of the Board of Trustees. Under the fund’s valuation policies and procedures, market quotations are not considered to be readily available for most types of debt instruments and floating rate loans and many types of derivatives. These investments are generally valued at fair value based on information from independent pricing services. In addition, investments may be valued at fair value if the adviser determines that an investment’s value has been materially affected by events occurring after the close of the exchange or market on which the investment is principally traded (such as foreign exchange or market) and prior to the determination of the fund’s net asset value, or after the halting of trading of a specific security where trading does not resume prior to the close of the exchange or market on which the security is principally traded. The adviser may rely on independent pricing services or other information (such as the correlation with price movements of similar securities in the same or other markets; the type, cost and investment characteristics of the security; the business and financial condition of the issuer; and trading and other market data) to assist in determining whether to fair value and at what value to fair value an investment. The value of an investment for purposes of calculating the fund’s net asset value can differ depending on the source and method used to determine value. When fair valuation is used, the value of investments used to determine the fund’s net asset value may differ from quoted or published prices for the same investments.
In September 2006, FASB Statement No. 157, Fair Value Measurements (the “Statement”) was issued, and is effective for fiscal years beginning after November 15, 2007 and for all interim periods within those fiscal years. This Statement provides a single definition of fair value, a hierarchy for measuring fair value and expanded disclosures about fair value measurements. Management is evaluating the application of the Statement to the fund, and believes the impact will be limited to expanded disclosures resulting from the adoption of this Statement in the fund’s financial statements.
Derivative Risk – The fund may invest in derivatives for hedging or non-hedging purposes. While hedging can reduce or eliminate losses, it can also reduce or eliminate gains. When the fund uses derivatives as an investment to gain market exposure, or for hedging purposes, gains and losses from derivative instruments may be substantially greater than the derivative’s original cost. Cash that has been segregated on behalf of certain derivative contracts will be reported separately on the Statement of Assets and Liabilities as restricted cash. Derivative instruments include futures contracts and swaps agreements.
Futures Contracts – The fund may enter into futures contracts for the delayed delivery of securities or currency, or contracts based on financial indices at a
29
Notes to Financial Statements – continued
fixed price on a future date. In entering such contracts, the fund is required to deposit with the broker either in cash or securities an amount equal to a certain percentage of the contract amount. Subsequent payments are made or received by the fund each day, depending on the daily fluctuations in the value of the contract, and are recorded for financial statement purposes as unrealized gains or losses by the fund. Upon entering into such contracts, the fund bears the risk of interest or exchange rates or securities prices moving unexpectedly, in which case, the fund may not achieve the anticipated benefits of the futures contracts and may realize a loss.
Swap Agreements – The fund may enter into swap agreements. A swap is an exchange of cash payments between the fund and another party. Net cash payments are exchanged at specified intervals and are recorded as a realized gain or loss in the Statement of Operations. The value of the swap is adjusted daily and the change in value, including accruals of periodic amounts of interest to be paid or received, is recorded as unrealized appreciation or depreciation in the Statement of Operations. Amounts paid or received at the inception of the swap are reflected as premiums paid or received on the Statement of Assets and Liabilities and are amortized using the effective interest method over the term of the agreement. A liquidation payment received or made upon early termination is recorded as a realized gain or loss in the Statement of Operations. Collateral, in the form of cash or securities, may be required to be held in segregated accounts with the fund’s custodian in connection with these agreements. Risk of loss may exceed amounts recognized on the Statement of Assets and Liabilities. These risks include the possible lack of a liquid market, failure of the counterparty to perform under the terms of the agreements, and unfavorable market and interest rate movements of the underlying instrument. All swap agreements entered into by the fund with the same counterparty are generally governed by a single master agreement, which provides for the netting of all amounts owed by the parties under the agreement upon the occurrence of an event of default, thereby reducing the credit risk to which such party is exposed.
The fund may hold interest rate swap agreements which involve the periodic exchange of cash flows, such as the exchange of fixed rate interest payments for floating rate interest payments based on a notional principal amount. The interest rates may be based on a specific financial index or the exchange of two distinct floating rate payments. The fund may enter into an interest rate swap in order to manage its exposure to interest and foreign exchange rate fluctuations.
In March 2008, FASB Statement No. 161, Disclosures about Derivative Instruments and Hedging Activities (the “Standard”) was issued, and is effective for financial statements issued for fiscal years and interim periods beginning after November 15, 2008. This Standard provides enhanced
30
Notes to Financial Statements – continued
disclosures about the fund’s use of and accounting for derivative instruments and the effect of derivative instruments on the fund’s results of operations and financial position. Management is evaluating the application of the Standard to the fund, and has not at this time determined the impact, if any, resulting from the adoption of this Standard on the fund’s financial statements.
Indemnifications – Under the fund’s organizational documents, its officers and trustees may be indemnified against certain liabilities and expenses arising out of the performance of their duties to the fund. Additionally, in the normal course of business, the fund enters into agreements with service providers that may contain indemnification clauses. The fund’s maximum exposure under these agreements is unknown as this would involve future claims that may be made against the fund that have not yet occurred.
Investment Transactions and Income – Investment transactions are recorded on the trade date. Interest income is recorded on the accrual basis. All premium and discount is amortized or accreted for financial statement purposes in accordance with U.S. generally accepted accounting principles.
The fund may receive proceeds from litigation settlements. Any proceeds received from litigation involving portfolio holdings are reflected in the Statement of Operations in realized gain/loss if the security has been disposed of by the fund or in unrealized gain/loss if the security is still held by the fund. Any other proceeds from litigation not related to portfolio holdings are reflected as other income in the Statement of Operations.
Fees Paid Indirectly – The fund’s custody fee may be reduced according to an arrangement that measures the value of cash deposited with the custodian by the fund. For the year ended April 30, 2008, custody fees were not reduced.
Tax Matters and Distributions – The fund intends to qualify as a regulated investment company, as defined under Subchapter M of the Internal Revenue Code, and to distribute all of its taxable and tax-exempt income, including realized capital gains. As a result, no provision for federal income tax is required. The fund adopted the provisions of FASB Interpretation No. 48, Accounting for Uncertainty in Income Taxes (“the Interpretation”) on the first day of the fund’s fiscal year. The Interpretation prescribes a minimum threshold for financial statement recognition of the benefit of a tax position taken or expected to be taken in a tax return. There was no impact resulting from the adoption of this Interpretation on the fund’s financial statements. Each of the fund’s federal tax returns for the prior three fiscal years remains subject to examination by the Internal Revenue Service. It is the fund’s policy to record interest and penalty charges on underpaid taxes associated with its tax positions as interest expense and miscellaneous expense, respectively. No such charges were recorded in the current financial statements.
31
Notes to Financial Statements – continued
Distributions to shareholders are recorded on the ex-dividend date. Income and capital gain distributions are determined in accordance with income tax regulations, which may differ from U.S. generally accepted accounting principles. Certain capital accounts in the financial statements are periodically adjusted for permanent differences in order to reflect their tax character. These adjustments have no impact on net assets or net asset value per share. Temporary differences which arise from recognizing certain items of income, expense, gain or loss in different periods for financial statement and tax purposes will reverse at some time in the future. Distributions in excess of net investment income or net realized gains are temporary over distributions for financial statement purposes resulting from differences in the recognition or classification of income or distributions for financial statement and tax purposes.
Book/tax differences primarily relate to expiration of capital loss carryforwards and amortization and accretion of debt securities.
The tax character of distributions declared to shareholders is as follows:
| | | | |
| | | 4/30/08 | | 4/30/07 |
| Tax-exempt income | | $5,221,778 | | $5,337,300 |
The federal tax cost and the tax basis components of distributable earnings were as follows:
| | | |
| As of 4/30/08 | | | |
| Cost of investments | | $152,005,928 | |
| Gross appreciation | | 2,465,764 | |
| Gross depreciation | | (694,500 | ) |
| Net unrealized appreciation (depreciation) | | $1,771,264 | |
| Undistributed tax-exempt income | | $579,406 | |
| Capital loss carryforwards | | (3,548,123 | ) |
| Post-October capital loss deferral | | (343,070 | ) |
| Other temporary differences | | (466,388 | ) |
As of April 30, 2008, the fund had capital loss carryforwards available to offset future realized gains. Such losses expire as follows:
| | | |
| 4/30/09 | | $ (516,819 | ) |
| 4/30/11 | | (159,222 | ) |
| 4/30/12 | | (277,860 | ) |
| 4/30/13 | | (789,744 | ) |
| 4/30/14 | | (625,131 | ) |
| 4/30/15 | | (746,953 | ) |
| 4/30/16 | | (432,394 | ) |
| | $(3,548,123 | ) |
32
Notes to Financial Statements – continued
Multiple Classes of Shares of Beneficial Interest – The fund offers multiple classes of shares, which differ in their respective distribution and service fees. All shareholders bear the common expenses of the fund based on daily net assets of each class, without distinction between share classes. Dividends are declared separately for each class. Differences in per share dividend rates are generally due to differences in separate class expenses. Class B shares will convert to Class A shares approximately eight years after purchase.
| (3) | | Transactions with Affiliates |
Investment Adviser – The fund has an investment advisory agreement with Massachusetts Financial Services Company (MFS) to provide overall investment management and related administrative services and facilities to the fund. The management fee is computed daily and paid monthly at an annual rate of 0.40% of the fund’s average daily net assets. As part of a settlement agreement with the New York Attorney General concerning market timing and related matters, MFS has agreed to reduce the management fee to 0.25% of the fund’s average daily net assets for the period March 1, 2004 through February 28, 2009. For the year ended April 30, 2008, this waiver amounted to $230,621 and is reflected as a reduction of total expenses in the Statement of Operations.
The management fee incurred for the year ended April 30, 2008 was equivalent to an annual effective rate of 0.25% of the fund’s average daily net assets.
Distributor – MFS Fund Distributors, Inc. (MFD), a wholly-owned subsidiary of MFS, as distributor, received $7,328 for the year ended April 30, 2008, as its portion of the initial sales charge on sales of Class A shares of the fund.
The Board of Trustees has adopted a distribution plan for certain class shares pursuant to Rule 12b-1 of the Investment Company Act of 1940.
The fund’s distribution plan provides that the fund will pay MFD for services provided by MFD and financial intermediaries in connection with the distribution and servicing of certain share classes. One component of the plan is a distribution fee paid to MFD and another component of the plan is a service fee paid to MFD. MFD may subsequently pay all, or a portion, of the distribution and/or service fees to financial intermediaries.
Distribution Plan Fee Table:
| | | | | | | | | | |
| | | Distribution
Fee Rate | | Service
Fee Rate | | Total
Distribution
Plan (d) | | Annual
Effective
Rate (e) | | Distribution
and Service
Fee |
| Class A | | 0.10% | | 0.25% | | 0.35% | | 0.15% | | $177,802 |
| Class B | | 0.75% | | 0.25% | | 1.00% | | 0.90% | | 113,527 |
| Class C | | 0.75% | | 0.25% | | 1.00% | | 1.00% | | 225,433 |
| Total Distribution and Service Fees | | | | | | $516,762 |
| (d) | In accordance with the distribution plan for certain classes, the fund pays distribution and/or service fees up to these annual percentage rates of each class’ average daily net assets. |
33
Notes to Financial Statements – continued
| (e) | The annual effective rates represent actual fees incurred under the distribution plan for the year ended April 30, 2008 based on each class’ average daily net assets. 0.15% of the Class A service fee is currently being paid by the fund. Payment of the remaining 0.10% of the Class A service fee is not yet in effect and will be implemented on such date as the fund’s Board of Trustees may determine. Payment of the 0.10% annual Class A distribution fee is not yet in effect and will be implemented on such date as the fund’s Board of Trustees may determine. For one year from the date of sale of Class B shares, assets attributable to such Class B shares are subject to the 0.25% annual Class B service fee. On assets attributable to all other Class B shares, 0.15% of the Class B service fee is currently in effect and the remaining portion of the Class B service fee is not in effect but may be implemented on such date as the fund’s Board of Trustees may determine. |
Certain Class A and Class C shares are subject to a contingent deferred sales charge in the event of a shareholder redemption within 12 months of purchase. Class B shares are subject to a contingent deferred sales charge in the event of a shareholder redemption within six years of purchase. All contingent deferred sales charges are paid to MFD and during the year ended April 30, 2008, were as follows:
| | |
| | | Amount |
| Class A | | $81 |
| Class B | | $42,569 |
| Class C | | $648 |
Shareholder Servicing Agent – MFS Service Center, Inc. (MFSC), a wholly-owned subsidiary of MFS, receives a fee from the fund for its services as shareholder servicing agent calculated as a percentage of the average daily net assets of the fund as determined periodically under the supervision of the fund’s Board of Trustees. For the year ended April 30, 2008, the fee was $58,726, which equated to 0.0383% annually of the fund’s average daily net assets. MFSC also receives payment from the fund for out-of-pocket expenses, sub-accounting and other shareholder servicing costs which may be paid to affiliated and unaffiliated service providers. For the year ended April 30, 2008, these out-of-pocket expenses, sub-accounting and other shareholder servicing costs amounted to $74,744.
Administrator – MFS provides certain financial, legal, shareholder communications, compliance, and other administrative services to the fund. Under an administrative services agreement, the fund partially reimburses MFS the costs incurred to provide these services. The fund is charged a fixed amount plus a fee based on average daily net assets. The fund’s annual fixed amount is $17,500.
The administrative services fee incurred for the year ended April 30, 2008 was equivalent to an annual effective rate of 0.0213% of the fund average daily net assets.
Trustees’ and Officers’ Compensation – The fund pays compensation to independent trustees in the form of a retainer, attendance fees, and additional compensation to Board and Committee chairpersons. The fund does not pay
34
Notes to Financial Statements – continued
compensation directly to trustees or officers of the fund who are also officers of the investment adviser, all of whom receive remuneration for their services to the fund from MFS. Certain officers and trustees of the fund are officers or directors of MFS, MFD, and MFSC. The fund has an unfunded, defined benefit plan for certain retired independent trustees which resulted in a pension expense of $387. This amount is included in independent trustees’ compensation for the year ended April 30, 2008. The liability for deferred retirement benefits payable to certain retired independent trustees amounted to $7,353 at April 30, 2008, and is included in payable for independent trustees’ compensation.
Other – This fund and certain other MFS funds (the funds) have entered into a services agreement (the Agreement) which provides for payment of fees by the funds to Tarantino LLC in return for the provision of services of an Independent Chief Compliance Officer (ICCO) for the funds. The ICCO is an officer of the funds and the sole member of Tarantino LLC. The funds can terminate the Agreement with Tarantino LLC at any time under the terms of the Agreement. For the year ended April 30, 2008, the fee paid by the fund to Tarantino LLC was $1,016 and is included in miscellaneous expense on the Statement of Operations. MFS has agreed to reimburse the fund for a portion of the payments made by the fund to Tarantino LLC in the amount of $736, which is shown as a reduction of total expenses in the Statement of Operations. Additionally, MFS has agreed to bear all expenses associated with office space, other administrative support, and supplies provided to the ICCO.
Purchases and sales of investments, other than U.S. government securities, purchased option transactions, and short-term obligations, aggregated $45,679,145 and $48,647,317, respectively.
| (5) | | Shares of Beneficial Interest |
The fund’s Declaration of Trust permits the Trustees to issue an unlimited number of full and fractional shares of beneficial interest. Transactions in fund shares were as follows:
| | | | | | | | |
| | | Year ended
4/30/08 | | Year ended
4/30/07 |
| | | Shares | | Amount | | Shares | | Amount |
| Shares sold | | | | | | | | |
Class A | | 5,912,184 | | $45,518,383 | | 2,793,311 | | $21,515,998 |
Class B | | 55,406 | | 424,717 | | 38,653 | | 296,625 |
Class C | | 415,723 | | 3,199,941 | | 234,405 | | 1,803,662 |
| | 6,383,313 | | $49,143,041 | | 3,066,369 | | $23,616,285 |
35
Notes to Financial Statements – continued
| | | | | | | | | | | | |
| | | Year ended
4/30/08 | | | Year ended
4/30/07 | |
| | | Shares | | | Amount | | | Shares | | | Amount | |
Shares issued to shareholders
in reinvestment of distributions | | | | | | | | | | | | |
Class A | | 412,583 | | | $3,170,611 | | | 402,418 | | | $3,099,656 | |
Class B | | 27,052 | | | 207,594 | | | 36,457 | | | 280,449 | |
Class C | | 39,724 | | | 305,375 | | | 46,496 | | | 358,449 | |
| | 479,359 | | | $3,683,580 | | | 485,371 | | | $3,738,554 | |
| Shares reacquired | | | | | | | | | | | | |
Class A | | (5,264,610 | ) | | $(40,561,965 | ) | | (7,633,112 | ) | | $(58,688,130 | ) |
Class B | | (718,503 | ) | | (5,514,897 | ) | | (1,155,329 | ) | | (8,877,165 | ) |
Class C | | (789,228 | ) | | (6,072,080 | ) | | (1,724,503 | ) | | (13,293,210 | ) |
| | (6,772,341 | ) | | $(52,148,942 | ) | | (10,512,944 | ) | | $(80,858,505 | ) |
| Net change | | | | | | | | | | | | |
Class A | | 1,060,157 | | | $8,127,029 | | | (4,437,383 | ) | | $(34,072,476 | ) |
Class B | | (636,045 | ) | | (4,882,586 | ) | | (1,080,219 | ) | | (8,300,091 | ) |
Class C | | (333,781 | ) | | (2,566,764 | ) | | (1,443,602 | ) | | (11,131,099 | ) |
| | 90,331 | | | $677,679 | | | (6,961,204 | ) | | $(53,503,666 | ) |
Effective May 1, 2006, the sale of Class B shares of the fund have been suspended except in certain circumstances. Please see the fund’s prospectus for details.
The fund and other funds managed by MFS participate in a $1 billion unsecured committed line of credit provided by a syndication of banks under a credit agreement. In addition, the fund and other funds managed by MFS have established uncommitted borrowing arrangements with certain banks. Borrowings may be made for temporary financing needs. Interest is charged to each fund, based on its borrowings, generally at a rate equal to the Federal Reserve funds rate plus 0.30%. In addition, a commitment fee, based on the average daily, unused portion of the committed line of credit, is allocated among the participating funds at the end of each calendar quarter. For the year ended April 30, 2008, the fund’s commitment fee and interest expense were $578 and $0, respectively, and are included in miscellaneous expense on the Statement of Operations.
36
REPORT OF INDEPENDENT REGISTERED PUBLIC ACCOUNTING FIRM
To the Trustees of MFS Series Trust IX and the Shareholders of MFS Municipal Limited Maturity Fund:
We have audited the accompanying statement of assets and liabilities, including the portfolio of investments, of MFS Municipal Limited Maturity Fund (one of the portfolios comprising MFS Series Trust IX (the “Trust”)) as of April 30, 2008, and the related statement of operations for the year then ended, the statements of changes in net assets for each of the two years in the period then ended, and the financial highlights for each of the five years in the period then ended. These financial statements and financial highlights are the responsibility of the Trust’s management. Our responsibility is to express an opinion on these financial statements and financial highlights based on our audits.
We conducted our audits in accordance with the standards of the Public Company Accounting Oversight Board (United States). Those standards require that we plan and perform the audit to obtain reasonable assurance about whether the financial statements and financial highlights are free of material misstatement. The Trust is not required to have, nor were we engaged to perform, an audit of its internal control over financial reporting. Our audits included consideration of internal control over financial reporting as a basis for designing audit procedures that are appropriate in the circumstances, but not for the purpose of expressing an opinion on the effectiveness of the Trust’s internal control over financial reporting. Accordingly, we express no such opinion. An audit also includes examining, on a test basis, evidence supporting the amounts and disclosures in the financial statements, assessing the accounting principles used and significant estimates made by management, as well as evaluating the overall financial statement presentation. Our procedures included confirmation of securities owned as of April 30, 2008, by correspondence with the custodian and brokers; where replies were not received from brokers, we performed other auditing procedures. We believe that our audits provide a reasonable basis for our opinion.
In our opinion, such financial statements and financial highlights present fairly, in all material respects, the financial position of MFS Municipal Limited Maturity Fund as of April 30, 2008, the results of its operations for the year then ended, the changes in its net assets for each of the two years in the period then ended, and its financial highlights for each of the five years in the period then ended, in conformity with accounting principles generally accepted in the United States of America.
DELOITTE & TOUCHE LLP
Boston, Massachusetts
June 16, 2008
37
TRUSTEES AND OFFICERS — IDENTIFICATION AND BACKGROUND
The Trustees and officers of the Trust, as of June 1, 2008, are listed below, together with their principal occupations during the past five years. (Their titles may have varied during that period.) The address of each Trustee and officer is 500 Boylston Street, Boston, Massachusetts 02116.
| | | | | | |
Name, Date of Birth | | Position(s) Held
with Fund | | Trustee/Officer
Since (h) | | Principal Occupations During
the Past Five Years & Other
Directorships (j) |
| INTERESTED TRUSTEES | | | | |
Robert J. Manning (k)
(born 10/20/63) | | Trustee | | February 2004 | | Massachusetts Financial Services Company, Chief Executive Officer, President, Chief Investment Officer and Director |
Robert C. Pozen(k)
(born 8/08/46) | | Trustee | | February 2004 | | Massachusetts Financial Services Company, Chairman (since February 2004); Harvard Business School (education), Senior Lecturer (since 2008); Secretary of Economic Affairs, The Commonwealth of Massachusetts (January 2002 to December 2002); Fidelity Investments, Vice Chairman (June 2000 to December 2001); Fidelity Management & Research Company (investment adviser), President (March 1997 to July 2001); Bell Canada Enterprises (telecommunications), Director; Medtronic, Inc. (medical technology), Director; Telesat (satellite communications), Director (until 2007) |
| INDEPENDENT TRUSTEES | | | | |
J. Atwood Ives
(born 5/01/36) | | Trustee and Chair of Trustees | | February 1992 | | Private investor; KeySpan Corporation (energy related services), Director until 2004; Woodstock Corporation (investment advisory firm), Director until 2003 |
Robert E. Butler (n)
(born 11/29/41) | | Trustee | | January 2006 | | Consultant – regulatory and compliance matters (since July 2002); PricewaterhouseCoopers LLP (professional services firm), Partner (until 2002) |
38
Trustees and Officers – continued
| | | | | | |
Name, Date of Birth | | Position(s) Held
with Fund | | Trustee/Officer
Since (h) | | Principal Occupations During
the Past Five Years & Other
Directorships (j) |
Lawrence H. Cohn, M.D.
(born 3/11/37) | | Trustee | | August 1993 | | Brigham and Women’s Hospital, Chief of Cardiac Surgery (2005); Harvard Medical School, Professor of Cardiac Surgery; Physician Director of Medical Device Technology for Partners HealthCare |
David H. Gunning
(born 5/30/42) | | Trustee | | January 2004 | | Retired; Cleveland-Cliffs Inc. (mining products and service provider), Vice Chairman/Director (until May 2007); Portman Limited (mining), Director (since 2005); Encinitos Ventures (private investment company), Principal (1997 to April 2001); Lincoln Electric Holdings, Inc. (welding equipment manufacturer), Director |
William R. Gutow
(born 9/27/41) | | Trustee | | December 1993 | | Private investor and real estate consultant (since 1998); Capital Entertainment Management Company (video franchise), Vice Chairman (since 1998); Texas Donuts (donut franchise), Vice Chairman (since 2007); Atlantic Coast Tan (tanning salons), Vice Chairman (until 2007) |
Michael Hegarty
(born 12/21/44) | | Trustee | | December 2004 | | Retired; AXA Financial (financial services and insurance), Vice Chairman and Chief Operating Officer (until May 2001); The Equitable Life Assurance Society (insurance), President and Chief Operating Officer
(until May 2001) |
Lawrence T. Perera
(born 6/23/35) | | Trustee | | July 1981 | | Hemenway & Barnes (attorneys), Partner |
J. Dale Sherratt
(born 9/23/38) | | Trustee | | August 1993 | | Insight Resources, Inc. (acquisition planning specialists), President; Wellfleet Investments (investor in health care companies), Managing General Partner (since 1993); Cambridge Nutraceuticals (professional nutritional products), Chief Executive Officer (until May 2001) |
39
Trustees and Officers – continued
| | | | | | |
Name, Date of Birth | | Position(s) Held
with Fund | | Trustee/Officer
Since (h) | | Principal Occupations During
the Past Five Years & Other
Directorships (j) |
Laurie J. Thomsen
(born 8/05/57) | | Trustee | | March 2005 | | New Profit, Inc. (venture philanthropy), Partner (since 2006); Private investor; Prism Venture Partners (venture capital), Co-founder and General Partner (until June 2004); The Travelers Companies (commercial property liability insurance), Director |
Robert W. Uek
(born 5/18/41) | | Trustee | | January 2006 | | Retired (since 1999); PricewaterhouseCoopers LLP (professional services firm), Partner (until 1999); Consultant to investment company industry (since 2000); TT International Funds (mutual fund complex), Trustee (2000 until 2005); Hillview Investment Trust II Funds (mutual fund complex), Trustee (2000 until 2005) |
| OFFICERS | | | | | | |
Robert J. Manning (k)
(born 10/20/63) | | President | | March 2008 | | Massachusetts Financial Services Company, Chief Executive Officer, President, Chief Investment Officer and Director |
Maria F. Dwyer (k)
(born 12/01/58) | | Treasurer | | March 2008 | | Massachusetts Financial Services Company, Executive Vice President and Chief Regulatory Officer (since March 2004) Chief Compliance Officer (since December 2006); Fidelity Management & Research Company, Vice President (prior to March 2004); Fidelity Group of Funds, President and Treasurer (prior to March 2004); MFS Group of Funds, President (November 2005 – March 2008) |
Christopher R. Bohane (k)
(born 1/18/74) | | Assistant Secretary and Assistant Clerk | | July 2005 | | Massachusetts Financial Services Company, Vice President and Senior Counsel (since April 2003); Kirkpatrick & Lockhart LLP (law firm), Associate (prior to April 2003) |
Ethan D. Corey (k)
(born 11/21/63) | | Assistant Secretary and Assistant Clerk | | July 2005 | | Massachusetts Financial Services Company, Senior Vice President and Associate General Counsel (since April 2006); Special Counsel (prior to April 2006); Dechert LLP (law firm), Counsel (prior to December 2004) |
40
Trustees and Officers – continued
| | | | | | |
Name, Date of Birth | | Position(s) Held
with Fund | | Trustee/Officer
Since (h) | | Principal Occupations During
the Past Five Years & Other
Directorships (j) |
David L. DiLorenzo (k)
(born 8/10/68) | | Assistant Treasurer | | July 2005 | | Massachusetts Financial Services Company, Vice President (since June 2005); JP Morgan Investor Services, Vice President (prior to June 2005) |
Timothy M. Fagan (k)
(born 7/10/68) | | Assistant Secretary and Assistant Clerk | | September 2005 | | Massachusetts Financial Services Company, Vice President and Senior Counsel (since September 2005); John Hancock Advisers, LLC, Vice President and Chief Compliance Officer (September 2004 to August 2005), Senior Attorney (prior to September 2004); John Hancock Group of Funds, Vice President and Chief Compliance Officer (September 2004 to December 2004) |
Mark D. Fischer (k)
(born 10/27/70) | | Assistant Treasurer | | July 2005 | | Massachusetts Financial Services Company, Vice President (since May 2005); JP Morgan Investment Management Company, Vice President (prior to May 2005) |
Brian E. Langenfeld (k)
(born 3/07/73) | | Assistant Secretary and Assistant Clerk | | June 2006 | | Massachusetts Financial Services Company, Assistant Vice President and Counsel (since May 2006); John Hancock Advisers, LLC, Assistant Vice President and Counsel (May 2005 to April 2006); John Hancock Advisers, LLC, Attorney and Assistant Secretary (prior to May 2005) |
Ellen Moynihan (k)
(born 11/13/57) | | Assistant Treasurer | | April 1997 | | Massachusetts Financial Services Company, Senior Vice President |
| | | |
Susan S. Newton (k)
(born 3/07/50) | | Assistant Secretary and Assistant Clerk | | May 2005 | | Massachusetts Financial Services Company, Senior Vice President and Associate General Counsel (since April 2005); John Hancock Advisers, LLC, Senior Vice President, Secretary and Chief Legal Officer (prior to April 2005); John Hancock Group of Funds, Senior Vice President, Secretary and Chief Legal Officer (prior to April 2005) |
41
Trustees and Officers – continued
| | | | | | |
Name, Date of Birth | | Position(s) Held
with Fund | | Trustee/Officer
Since (h) | | Principal Occupations During
the Past Five Years & Other
Directorships (j) |
Susan A. Pereira (k)
(born 11/05/70) | | Assistant Secretary and Assistant Clerk | | July 2005 | | Massachusetts Financial Services Company, Vice President and Senior Counsel (since June 2004); Bingham McCutchen LLP (law firm), Associate (prior to June 2004) |
Mark N. Polebaum (k)
(born 5/01/52) | | Secretary and Clerk | | January 2006 | | Massachusetts Financial Services Company, Executive Vice President, General Counsel and Secretary (since January 2006); Wilmer Cutler Pickering Hale and Dorr LLP (law firm), Partner (prior to January 2006) |
Frank L. Tarantino
(born 3/07/44) | | Independent Chief Compliance Officer | | June 2004 | | Tarantino LLC (provider of compliance services), Principal (since June 2004); CRA Business Strategies Group (consulting services), Executive Vice President (April 2003 to June 2004); David L. Babson & Co. (investment adviser), Managing Director, Chief Administrative Officer and Director (prior to March 2003) |
Richard S. Weiztel (k)
(born 7/16/70) | | Assistant Secretary and Assistant Clerk | | October 2007 | | Massachusetts Financial Services Company, Vice President and Assistant General Counsel (since 2007); Vice President and Senior Counsel (since May 2004); Massachusetts Department of Business and Technology, General Counsel (February 2003 to April 2004); Massachusetts Office of the Attorney General, Assistant Attorney General (April 2001 to February 2003); Ropes and Gray, Associate (prior to April 2001) |
James O. Yost (k)
(born 6/12/60) | | Assistant Treasurer | | September 1990 | | Massachusetts Financial Services Company, Senior Vice President |
| (h) | Date first appointed to serve as Trustee/officer of an MFS fund. Each Trustee has served continuously since appointment unless indicated otherwise. |
| (j) | Directorships or trusteeships of companies required to report to the Securities and Exchange Commission (i.e., “public companies”). |
| (k) | “Interested person” of the Trust within the meaning of the Investment Company Act of 1940 (referred to as the 1940 Act), which is the principal federal law governing investment companies like the fund, as a result of position with MFS. The address of MFS is 500 Boylston Street, Boston, Massachusetts 02116. |
42
Trustees and Officers – continued
| (n) | In 2004 and 2005, Mr. Butler provided consulting services to the independent compliance consultant retained by MFS pursuant to its settlement with the SEC concerning market timing and related matters. The terms of that settlement required that compensation and expenses related to the independent compliance consultant be borne exclusively by MFS and, therefore, MFS paid Mr. Butler for the services he rendered to the independent compliance consultant. In 2004 and 2005, MFS paid Mr. Butler a total of $351,119.29. |
The Trust held a shareholders’ meeting in 2005 to elect Trustees, and will hold a shareholders’ meeting at least once every five years thereafter, to elect Trustees.
Each Trustee (except Mr. Butler and Mr. Uek) has been elected by shareholders and each Trustee and officer holds office until his or her successor is chosen and qualified or until his or her earlier death, resignation, retirement or removal. Messrs. Butler, Gutow, Sherratt and Uek and Ms. Thomsen are members of the Trust’s Audit Committee.
Each of the Trust’s Trustees and officers holds comparable positions with certain other funds of which MFS or a subsidiary is the investment adviser or distributor, and, in the case of the officers, with certain affiliates of MFS. As of January 1, 2008, the Trustees served as board members of 100 funds within the MFS Family of Funds.
The Statement of Additional Information contains further information about the Trustees and is available without charge upon request by calling 1-800-225-2606.
| | |
| Investment Adviser | | Custodian |
Massachusetts Financial Services Company
500 Boylston Street, Boston, MA 02116-3741 | | JPMorgan Chase Bank One Chase Manhattan Plaza, New York, NY 10081 |
| Distributor | | Independent Registered Public Accounting Firm |
MFS Fund Distributors, Inc.
500 Boylston Street, Boston, MA 02116-3741 | | Deloitte & Touche LLP
200 Berkeley Street, Boston, MA 02116 |
| Portfolio Manager | | |
Geoffrey Schechter | | |
43
BOARD REVIEW OF INVESTMENT ADVISORY AGREEMENT
A discussion regarding the Board’s most recent review and renewal of the Fund’s investment advisory agreement is available by clicking on the Fund’s name under “Select a fund” on the MFS Web site (mfs.com).
PROXY VOTING POLICIES AND INFORMATION
A general description of the MFS funds’ proxy voting policies and procedures is available without charge, upon request, by calling 1-800-225-2606, by visiting the Proxy Voting section of mfs.com or by visiting the SEC’s Web site at http://www.sec.gov.
Information regarding how the fund voted proxies relating to portfolio securities during the most recent twelve-month period ended June 30 is available without charge by visiting the Proxy Voting section of mfs.com or by visiting the SEC’s Web site at http://www.sec.gov.
QUARTERLY PORTFOLIO DISCLOSURE
The fund will file a complete schedule of portfolio holdings with the Securities and Exchange Commission (the Commission) for the first and third quarters of each fiscal year on Form N-Q. The fund’s Form N-Q may be reviewed and copied at the:
Public Reference Room
Securities and Exchange Commission
100 F Street, NE, Room 1580
Washington, D.C. 20549
Information on the operation of the Public Reference Room may be obtained by calling the Commission at 1-800-SEC-0330. The fund’s Form N-Q is available on the EDGAR database on the Commission’s Internet Web site at http://www.sec.gov, and copies of this information may be obtained, upon payment of a duplicating fee, by electronic request at the following e-mail address: publicinfo@sec.gov or by writing the Public Reference Section at the above address.
A shareholder can also obtain the quarterly portfolio holdings report at mfs.com.
FEDERAL TAX INFORMATION (unaudited)
The fund will notify shareholders of amounts for use in preparing 2008 income tax forms in January 2009. The following information is provided pursuant to provisions of the Internal Revenue Code.
Of the dividends paid from net investment income during the fiscal year, 100% is designated as exempt interest dividends for federal income tax purposes. If the fund has earned income on private activity bonds, a portion of the dividends paid may be considered a tax preference item for purposes of computing a shareholder’s alternative minimum tax.
44
MFS® PRIVACY NOTICE
Privacy is a concern for every investor today. At MFS Investment Management® and the MFS funds, we take this concern very seriously. We want you to understand our policies about the investment products and services that we offer, and how we protect the nonpublic personal information of investors who have a direct relationship with us and our wholly owned subsidiaries.
Throughout our business relationship, you provide us with personal information. We maintain information and records about you, your investments, and the services you use. Examples of the nonpublic personal information we maintain include
| | Ÿ | | data from investment applications and other forms |
| | Ÿ | | share balances and transactional history with us, our affiliates, or others |
| | Ÿ | | facts from a consumer reporting agency |
We do not disclose any nonpublic personal information about our customers or former customers to anyone, except as permitted by law. We may share nonpublic personal information with third parties or certain of our affiliates in connection with servicing your account or processing your transactions. We may share information with companies or financial institutions that perform marketing services on our behalf or with other financial institutions with which we have joint marketing arrangements, subject to any legal requirements.
Authorization to access your nonpublic personal information is limited to appropriate personnel who provide products, services, or information to you. We maintain physical, electronic, and procedural safeguards to help protect the personal information we collect about you.
If you have any questions about the MFS privacy policy, please call 1-800-225-2606 any business day between 8 a.m. and 8 p.m. Eastern time.
Note: If you own MFS products or receive MFS services in the name of a third party such as a bank or broker-dealer, their privacy policy may apply to you instead of ours.
45


MFS® Research Bond Fund
SIPC Contact Information:
You may obtain information about the Securities Investor Protection Corporation (“SIPC”), including the SIPC Brochure, by contacting SIPC either by telephone (202-371-8300) or by accessing SIPC’s website address (www.sipc.org).
The report is prepared for the general information of shareholders. It is authorized for distribution to prospective investors only when preceded or accompanied by a current prospectus.
NOT FDIC INSURED Ÿ MAY LOSE VALUE Ÿ NO BANK OR CREDIT UNION GUARANTEE Ÿ NOT A DEPOSIT Ÿ NOT INSURED BY ANY FEDERAL GOVERNMENT AGENCY OR NCUA/NCUSIF
4/30/08
RBF-ANN

LETTER FROM THE CEO
Dear Shareholders:
Negative headlines tend to resonate during difficult markets, and we certainly have had more than our share of tough news recently. As a result consumer, and particularly investor, sentiment are at all-time lows. That said, I do think it is helpful to remember there are always silver linings in the storm clouds if you look hard enough.
Through all of the challenges we have faced, there are some positive underlying trends. In the United States, for example, institutional traders and credit market followers are just now showing increasing signs of confidence and are beginning to take on more risk. At the corporate level, earnings continue to be relatively strong as companies have reduced labor costs, controlled inventories, and relied less on debt to finance expansion. More broadly, low interest rates and strong demand for consumer goods and industrial equipment are good signs for the global economy.
While I do not mean to minimize the risks inherent in today’s markets, periods such as these allow the talented fund managers and research analysts we have at MFS® to test their convictions, reevaluate existing positions, and identify new investment ideas. Our investment process also includes a significant risk management component, with constant attention paid to monitoring market risk, so we can do our best to minimize any surprises to your portfolio.
For investors, this is a great time to check in with your advisor and make sure you have a sound investment plan in place — one that can keep your hard-earned money working over the long term through a strategy that involves asset allocation, diversification, and periodic portfolio rebalancing and reviews. A plan tailored to your distinct needs and goals continues to be the best approach to help you take advantage of the inevitable challenges — and opportunities — that present themselves over time.
Respectfully,

Robert J. Manning
Chief Executive Officer and Chief Investment Officer
MFS Investment Management®
June 16, 2008
The opinions expressed in this letter are subject to change, may not be relied upon for investment advice, and no forecasts can be guaranteed.
1
PORTFOLIO COMPOSITION
Portfolio structure (i)
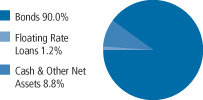
| | |
| Fixed income sectors (i) | | |
| High Grade Corporates | | 38.3% |
| Mortgage-Backed Securities | | 25.5% |
| U.S. Treasury Securities | | 6.8% |
| Commercial Mortgage-Backed Securities | | 5.1% |
| Municipal Bonds | | 3.9% |
| High Yield Corporates | | 3.6% |
| Asset-Backed Securities | | 2.2% |
| Emerging Market Bonds | | 1.8% |
| U.S. Government Agencies | | 1.5% |
| Floating Rate Loans | | 1.2% |
Collateralized Debt Obligations | | 1.2% |
| Residential Mortgage-Backed Securities | | 0.1% |
| | |
| Credit quality of bonds (r) | | |
| AAA | | 48.6% |
| AA | | 7.1% |
| A | | 10.0% |
| BBB | | 27.5% |
| BB | | 4.0% |
| B | | 2.0% |
| Not Rated | | 0.8% |
| |
| Portfolio facts | | |
| Average Duration (d)(i) | | 4.5 |
| Average Life (i)(m) | | 6.9 yrs |
| Average Maturity (i)(m) | | 15.1 yrs |
| Average Credit Quality of Rated Securities (long-term) (a) | | A+ |
| Average Credit Quality of Rated Securities (short-term) (a) | | A-1 |
| (a) | The average credit quality of rated securities is based upon a market weighted average of portfolio holdings that are rated by public rating agencies. |
| (d) | Duration is a measure of how much a bond’s price is likely to fluctuate with general changes in interest rates, e.g., if rates rise 1.00%, a bond with a 5-year duration is likely to lose about 5.00% of its value. |
| (i) | For purposes of this presentation, the bond component includes accrued interest amounts and may be positively or negatively impacted by the equivalent exposure from any derivative holdings, if applicable. |
| (m) | The average maturity shown is calculated using the final stated maturity on the portfolio’s holdings without taking into account any holdings which have been pre-refunded or pre-paid to an earlier date or which have a mandatory put date prior to the stated maturity. The average life shown takes into account these earlier dates. |
| (r) | Each security is assigned a rating from Moody’s Investors Service. If not rated by Moody’s, the rating will be that assigned by Standard & Poor’s. Likewise, if not assigned a rating by Standard & Poor’s, it will be based on the rating assigned by Fitch, Inc. For those portfolios that hold a security which is not rated by any of the three agencies, the security is considered Not Rated. Holdings in U.S. Treasuries and government agency mortgage-backed securities, if any, are included in the “AAA”-rating category. Percentages are based on the total market value of investments as of 4/30/08. |
Percentages are based on net assets as of 4/30/08, unless otherwise noted.
The portfolio is actively managed and current holdings may be different.
2
MANAGEMENT REVIEW
Summary of Results
For the twelve months ended April 30, 2008, Class A shares of the MFS Research Bond Fund provided a total return of 2.60%, at net asset value. This compares with a return of 6.87% for the fund’s benchmark, the Lehman Brothers U.S. Aggregate Bond Index.
Market Environment
The U.S. economy and financial markets experienced significant deterioration and heightened volatility over the reporting period. U.S. economic growth slowed significantly in the fourth quarter of 2007 and first quarter of 2008. Headwinds included accelerated deterioration in the housing market, subdued corporate investment, a markedly weaker job market, and a tighter credit environment as banks sought to repair balance sheets. During the period, the climax of the credit turmoil occurred in mid March as the Federal Reserve backstopped the distressed sale of failing Bear Stearns to JPMorgan. While reasonably resilient, parts of the global economy and financial system experienced some spillover from the U.S. slowdown. Japanese and European growth slowed over the reporting period and international financial markets were adversely affected by U.S. mortgage and structured product losses.
In the face of this financial and economic turmoil, most global central banks were forced to inject liquidity and to reassess their tightening biases as government bond yields declined and credit spreads widened. During the second half of the reporting period, the U.S. Federal Reserve Board began an aggressive rate cutting campaign, while the U.S. federal government moved quickly to design and implement a modest fiscal stimulus package. Although the Bank of England and the Bank of Canada also cut rates, the dilemma of rising energy and food prices heightened concerns among central bankers that inflationary expectations might become unhinged.
By the end of the reporting period, bond yields, credit spreads, and equity valuations implied market expectations consistent with the view that the worst of the credit dislocation was behind us. Nonetheless, the markets continued to price in further financial and economic weakening, albeit of a less tumultuous nature.
Detractors from Performance
Sector selection was the primary factor that held back performance relative to the Lehman Brothers U.S. Aggregate Bond Index. Relative overexposure to debt securities in the financial and industrial sectors was among the top detractors.
3
Management Review – continued
Credit quality also negatively impacted relative returns. The fund’s greater relative exposure to “BBB” rated (s) bonds detracted from relative results as credit spreads widened over the reporting period.
Contributors to Performance
Yield was the largest positive contributor to the fund’s relative performance. During the period, the fund held bonds that produced a greater level of income than the benchmark.
Lower relative exposure to mortgage-backed securities boosted relative performance as these securities suffered amid the recent subprime mortgage crisis.
Respectfully,
| | | | |
| Robert Persons | | Michael Roberge | | Jeffrey Wakelin |
| Portfolio Manager | | Portfolio Manager | | Portfolio Manager |
| (s) | Bonds rated “BBB”, “Baa”, or higher are considered investment grade; bonds rated “BB”, “Ba”, or below are considered non-investment grade. The primary source for bond quality ratings is Moody’s Investors Service. If not available, ratings by Standard & Poor’s are used, else ratings by Fitch, Inc. For securities which are not rated by any of the three agencies, the security is considered Not Rated. |
The views expressed in this report are those of the portfolio managers only through the end of the period of the report as stated on the cover and do not necessarily reflect the views of MFS or any other person in the MFS organization. These views are subject to change at any time based on market or other conditions, and MFS disclaims any responsibility to update such views. These views may not be relied upon as investment advice or an indication of trading intent on behalf of any MFS portfolio. References to specific securities are not recommendations of such securities, and may not be representative of any MFS portfolio’s current or future investments.
Note to Shareholders: At the close of business on April 18, 2008, Class R shares and Class R2 shares converted into Class R3 shares.
Following this conversion, Class R3, Class R4, and Class R5 shares were renamed Class R2, Class R3, and Class R4 shares, respectively.
4
PERFORMANCE SUMMARY THROUGH 4/30/08
The following chart illustrates a representative class of the fund’s historical performance in comparison to its benchmark. Performance results include the deduction of the maximum applicable sales charge and reflect the percentage change in net asset value, including reinvestment of dividends and capital gains distributions. The performance of other share classes will be greater than or less than that of the class depicted below. Benchmark comparisons are unmanaged; do not reflect sales charges, commissions or expenses; and cannot be invested in directly. (See Notes to Performance Summary).
Performance data shown represents past performance and is no guarantee of future results. Investment return and principal value fluctuate so your shares, when sold, may be worth more or less than the original cost; current performance may be lower or higher than quoted. The performance shown does not reflect the deduction of taxes, if any, that a shareholder would pay on fund distributions or the redemption of fund shares.
Growth of a hypothetical $10,000 investment
(For the period from the commencement of the fund’s investment operations, January 4, 1999, through the stated period end.)
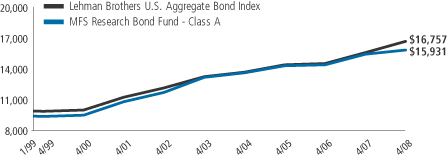
5
Performance Summary – continued
Total returns through 4/30/2008
Average annual without sales charge
| | | | | | | | | | | | |
| | | Share Class | | Class Inception Date | | 1-yr | | 5-yr | | Life (t) | | |
| | | A | | 1/04/99 | | 2.60% | | 3.69% | | 5.67% | | |
| | | B | | 12/29/00 | | 1.75% | | 2.83% | | 4.99% | | |
| | | C | | 12/29/00 | | 1.84% | | 2.82% | | 4.99% | | |
| | | I | | 1/04/99 | | 2.75% | | 3.85% | | 5.80% | | |
| | | W | | 5/01/06 | | 2.75% | | 3.71% | | 5.68% | | |
| | | R1 | | 4/01/05 | | 1.65% | | 3.09% | | 5.34% | | |
| | | R2 (formerly R3) | | 10/31/03 | | 2.14% | | 3.17% | | 5.39% | | |
| | | R3 (formerly R4) | | 4/01/05 | | 2.39% | | 3.52% | | 5.58% | | |
| | | R4 (formerly R5) | | 4/01/05 | | 2.68% | | 3.73% | | 5.70% | | |
| | | 529A | | 7/31/02 | | 2.24% | | 3.32% | | 5.43% | | |
| | | 529B | | 7/31/02 | | 1.50% | | 2.55% | | 4.96% | | |
| | | 529C | | 7/31/02 | | 1.49% | | 2.56% | | 4.95% | | |
Average Annual
Comparative Benchmark
| | | | | | | | | | |
| | | Lehman Brothers U.S. Aggregate Bond Index (f) | | 6.87% | | 4.37% | | 5.67% | | |
Average annual with sales charge
| | | | | | | | | | |
| | | A With Initial Sales Charge (4.75%) | | (2.28)% | | 2.69% | | 5.12% | | |
| | | B With CDSC (Declining over six years from 4% to 0%) (x) | | (2.14)% | | 2.49% | | 4.99% | | |
| | | C With CDSC (1% for 12 months) (x) | | 0.86% | | 2.82% | | 4.99% | | |
| | | 529A With Initial Sales Charge (4.75%) | | (2.61)% | | 2.32% | | 4.88% | | |
| | | 529B With CDSC (Declining over six years from 4% to 0%) (x) | | (2.40)% | | 2.22% | | 4.96% | | |
| | | 529C With CDSC (1% for 12 months) (x) | | 0.52% | | 2.56% | | 4.95% | | |
Class I, W, R1, R2, R3, and R4 shares do not have a sales charge.
CDSC – Contingent Deferred Sales Charge.
| (f) | Source: FactSet Research Systems Inc. |
| (t) | For the period from the commencement of the fund’s investment operations, January 4, 1999, through the stated period end. |
| (x) | Assuming redemption at the end of the applicable period. |
6
Performance Summary – continued
Benchmark Definitions
Lehman Brothers U.S. Aggregate Bond Index – a market capitalization-weighted index that measures the performance of the U.S. investment-grade, fixed rate bond market, with index components for government and corporate securities, mortgage pass-through securities, and asset-backed securities with at least one year to final maturity.
It is not possible to invest directly in an index.
Notes to Performance Summary
Class 529 shares are only available in conjunction with qualified tuition programs, such as the MFS 529 Savings Plan. There also is an additional fee, which is detailed in the program description, on qualified tuition programs. If this fee was reflected, the performance for Class 529 shares would have been lower. This annual fee is waived for Oregon residents and for those accounts with assets of $25,000 or more.
Performance for share classes offered after class A shares includes the performance of the fund’s class A shares for periods prior to their offering.
This blended class performance has been adjusted to take into account differences in sales loads, if any, applicable to these share classes, but has not been adjusted to take into account differences in class specific operating expenses (such as Rule 12b-1 fees). Compared to performance these share classes would have experienced had they been offered for the entire period, the use of blended performance generally results in higher performance for share classes with higher operating expenses than the share class to which it is blended, and lower performance for share classes with lower operating expenses than the share class to which it is blended.
Performance results reflect any applicable expense subsidies and waivers in effect during the periods shown. Without such subsidies and waivers the fund’s performance results would be less favorable. Please see the prospectus and financial statements for complete details.
From time to time the fund may receive proceeds from litigation settlements, without which performance would be lower.
7
EXPENSE TABLE
Fund expenses borne by the shareholders during the period, November 1, 2007 through April 30, 2008
As a shareholder of the fund, you incur two types of costs: (1) transaction costs, including sales charges (loads) on certain purchase or redemption payments, and (2) ongoing costs, including management fees; distribution and service (12b-1) fees; and other fund expenses. This example is intended to help you understand your ongoing costs (in dollars) of investing in the fund and to compare these costs with the ongoing costs of investing in other mutual funds.
The example is based on an investment of $1,000 invested at the beginning of the period and held for the entire period November 1, 2007 through April 30, 2008.
The expenses include the payment of a portion of the transfer-agent-related expenses of MFS funds that invest in the fund. For further information, please see the Notes to the Financial Statements.
Actual Expenses
The first line for each share class in the following table provides information about actual account values and actual expenses. You may use the information in this line, together with the amount you invested, to estimate the expenses that you paid over the period. Simply divide your account value by $1,000 (for example, an $8,600 account value divided by $1,000 = 8.6), then multiply the result by the number in the first line under the heading entitled “Expenses Paid During Period” to estimate the expenses you paid on your account during this period.
Hypothetical Example for Comparison Purposes
The second line for each share class in the following table provides information about hypothetical account values and hypothetical expenses based on the fund’s actual expense ratio and an assumed rate of return of 5% per year before expenses, which is not the fund’s actual return. The hypothetical account values and expenses may not be used to estimate the actual ending account balance or expenses you paid for the period. You may use this information to compare the ongoing costs of investing in the fund and other funds. To do so, compare this 5% hypothetical example with the 5% hypothetical examples that appear in the shareholder reports of the other funds.
Please note that the expenses shown in the table are meant to highlight your ongoing costs only and do not reflect any transactional costs, such as sales charges (loads). Therefore, the second line for each share class in the table is useful in comparing ongoing costs only, and will not help you determine the relative total costs of owning different funds. In addition, if these transactional costs were included, your costs would have been higher.
8
Expense Table – continued
| | | | | | | | | | |
Share
Class | | | | Annualized
Expense
Ratio | | Beginning
Account Value
11/01/07 | | Ending
Account Value
4/30/08 | | Expenses
Paid During
Period (p)
11/01/07-4/30/08 |
| A | | Actual | | 0.64% | | $1,000.00 | | $1,013.21 | | $3.20 |
| | Hypothetical (h) | | 0.64% | | $1,000.00 | | $1,021.68 | | $3.22 |
| B | | Actual | | 1.43% | | $1,000.00 | | $1,008.98 | | $7.14 |
| | Hypothetical (h) | | 1.43% | | $1,000.00 | | $1,017.75 | | $7.17 |
| C | | Actual | | 1.49% | | $1,000.00 | | $1,008.95 | | $7.44 |
| | Hypothetical (h) | | 1.49% | | $1,000.00 | | $1,017.45 | | $7.47 |
| I | | Actual | | 0.49% | | $1,000.00 | | $1,012.95 | | $2.45 |
| | Hypothetical (h) | | 0.49% | | $1,000.00 | | $1,022.43 | | $2.46 |
| W | | Actual | | 0.59% | | $1,000.00 | | $1,012.43 | | $2.95 |
| | Hypothetical (h) | | 0.59% | | $1,000.00 | | $1,021.93 | | $2.97 |
| R1 | | Actual | | 1.55% | | $1,000.00 | | $1,008.62 | | $7.74 |
| | Hypothetical (h) | | 1.55% | | $1,000.00 | | $1,017.16 | | $7.77 |
R2
(formerly R3) | | Actual | | 1.04% | | $1,000.00 | | $1,011.18 | | $5.20 |
| | Hypothetical (h) | | 1.04% | | $1,000.00 | | $1,019.69 | | $5.22 |
R3
(formerly R4) | | Actual | | 0.79% | | $1,000.00 | | $1,012.45 | | $3.95 |
| | Hypothetical (h) | | 0.79% | | $1,000.00 | | $1,020.93 | | $3.97 |
R4
(formerly R5) | | Actual | | 0.52% | | $1,000.00 | | $1,013.80 | | $2.60 |
| | Hypothetical (h) | | 0.52% | | $1,000.00 | | $1,022.28 | | $2.61 |
| 529A | | Actual | | 0.96% | | $1,000.00 | | $1,010.51 | | $4.80 |
| | Hypothetical (h) | | 0.96% | | $1,000.00 | | $1,020.09 | | $4.82 |
| 529B | | Actual | | 1.71% | | $1,000.00 | | $1,007.82 | | $8.54 |
| | Hypothetical (h) | | 1.71% | | $1,000.00 | | $1,016.36 | | $8.57 |
| 529C | | Actual | | 1.71% | | $1,000.00 | | $1,007.81 | | $8.54 |
| | Hypothetical (h) | | 1.71% | | $1,000.00 | | $1,016.36 | | $8.57 |
| (h) | 5% class return per year before expenses. |
| (p) | Expenses paid is equal to each class’ annualized expense ratio, as shown above, multiplied by the average account value over the period, multiplied by the number of days in the period, divided by the number of days in the year. Expenses paid do not include any applicable sales charges (loads). If these transaction costs had been included, your costs would have been higher. |
Expense Changes Impacting the Table
Effective January 1, 2008 the fund’s Class R2 (formerly Class R3), Class R3 (formerly Class R4), and Class R4 (formerly Class R5) retirement plan administration and services fee was terminated (as described in Note 3 of the Notes to the Financial Statements). Had this fee change been in effect throughout the entire six month period, the annualized expense ratios would have been 0.94%, 0.69%, and 0.46% for Class R2, Class R3, and Class R4 shares, respectively; the actual expenses paid during the period would have been approximately $4.97, $3.66, and $2.46 for Class R2, Class R3, and Class R4 shares, respectively; and the hypothetical expenses paid during the period would have been approximately $4.99, $3.68, and $2.47 for Class R2, Class R3, and Class R4 shares, respectively.
9
Expense Table – continued
Effective March 1, 2008 the fund’s Class R1 retirement plan administration and services fee was terminated and the Class R1 distribution fee was increased (as described in Note 3 of the Notes to the Financial Statements). Had these fee changes been in effect throughout the entire six month period, the annualized expense ratio would have been 1.47%; the actual expenses paid during the period would have been approximately $7.41; and the hypothetical expenses paid during the period would have been approximately $7.44.
Effective April 1, 2008 the fund’s Class 529A, Class 529B, and Class 529C shares program manager fee was reduced (as described in Note 3 of the Notes to Financial Statements). Had this fee change been in effect throughout the entire six month period, the annualized expense ratios would have been 0.84%, 1.58% and 1.59% for Class 529A, Class 529B, and Class 529C shares, respectively; the actual expenses paid during the period would have been approximately $4.21, $7.91, and $7.96 for Class 529A, Class 529B, and Class 529C shares, respectively, and the hypothetical expenses paid during the period would have been approximately $4.23, $7.95, and $8.00 for Class 529A, Class 529B, and Class 529C shares, respectively.
10
PORTFOLIO OF INVESTMENTS
4/30/08
The Portfolio of Investments is a complete list of all securities owned by your fund. It is categorized by broad-based asset classes.
| | | | | | |
| Bonds - 96.3% | | | | | | |
| Issuer | | Shares/Par | | Value ($) |
| | | | | | |
| Airlines - 0.0% | | | | | | |
| American Airlines Corp., 3.857%, 2010 | | $ | 247,594 | | $ | 235,199 |
| | |
| Asset Backed & Securitized - 9.0% | | | | | | |
| Anthracite CDO III Ltd., 6.077%, 2039 (z) | | $ | 5,000,000 | | $ | 3,854,222 |
| ARCap REIT, Inc., CDO, 6.1%, 2045 (z) | | | 4,149,000 | | | 1,867,050 |
| ARCap REIT, Inc., CDO, “G”, 6.1%, 2045 (n) | | | 2,354,000 | | | 941,600 |
| ARCap REIT, Inc., CDO, “H”, 6.1%, 2045 (n) | | | 1,200,897 | | | 420,314 |
| Banc of America Commercial Mortgage, Inc., 5.356%, 2045 | | | 8,610,000 | | | 8,410,908 |
| Bayview Commercial Asset Trust, 0.775%, 2035 (i)(z) | | | 34,571,605 | | | 2,382,304 |
| Bayview Commercial Asset Trust, FRN, 3.205%, 2035 (n) | | | 1,054,290 | | | 983,340 |
| Bayview Commercial Asset Trust, FRN, 1.68%, 2036 (i)(z) | | | 26,006,105 | | | 1,891,335 |
| Bayview Commercial Asset Trust, FRN, 3.165%, 2036 (z) | | | 828,605 | | | 745,744 |
| Bayview Commercial Asset Trust, FRN, 0.879%, 2036 (i)(z) | | | 25,504,729 | | | 2,089,419 |
| Bayview Commercial Asset Trust, FRN, 1.169%, 2036 (i)(z) | | | 41,906,244 | | | 3,981,093 |
| Bayview Commercial Asset Trust, FRN, 1.14%, 2036 (i)(z) | | | 20,230,842 | | | 2,286,973 |
| Bayview Commercial Asset Trust, FRN, 1.211%, 2037 (i)(z) | | | 43,547,983 | | | 4,729,311 |
| Bayview Commercial Mortgage Pass-Through Trust, FRN, 2.057%, 2013 (i)(z) | | | 15,876,408 | | | 1,031,967 |
| Bayview Financial Acquisition Trust, FRN, 5.402%, 2035 | | | 3,504,507 | | | 3,417,991 |
| Bayview Financial Acquisition Trust, FRN, 5.638%, 2036 | | | 1,500,000 | | | 1,449,609 |
| Bayview Financial Acquisition Trust, FRN, 5.483%, 2041 | | | 3,951,000 | | | 3,706,985 |
| Bayview Financial Revolving Mortgage Loan Trust, FRN, 3.686%, 2040 (z) | | | 4,984,717 | | | 3,588,996 |
| Bear Stearns Commercial Mortgage Securities, Inc., 4.945%, 2041 | | | 1,500,000 | | | 1,487,299 |
| Brascan Real Estate, CDO, FRN, 4.417%, 2040 (z) | | | 418,000 | | | 274,154 |
| Capital Trust Realty CDO Ltd., 5.16%, 2035 (z) | | | 4,660,000 | | | 4,306,859 |
| Citigroup/Deutsche Bank Commercial Mortgage Trust, FRN, 5.225%, 2044 | | | 5,890,000 | | | 5,864,042 |
| Citigroup/Deutsche Bank Commercial Mortgage Trust, FRN, 5.225%, 2044 | | | 400,000 | | | 385,672 |
| Citigroup/Deutsche Bank Commercial Mortgage Trust, FRN, 5.555%, 2049 | | | 6,901,000 | | | 4,356,913 |
| Commercial Mortgage Asset Trust, 0.875%, 2032 (i)(n) | | | 4,628,507 | | | 123,655 |
| Commercial Mortgage Pass-Through Certificates, FRN, 2.906%, 2017 (n) | | | 1,500,000 | | | 1,436,961 |
| Countrywide Asset-Backed Certificates, FRN, 5.43%, 2033 | | | 1,107,000 | | | 1,046,352 |
| Countrywide Asset-Backed Certificates, FRN, 5.689%, 2034 | | | 3,720,000 | | | 3,370,753 |
| Countrywide Asset-Backed Certificates, FRN, 4.575%, 2035 | | | 142,319 | | | 141,229 |
11
Portfolio of Investments – continued
| | | | | | |
| Issuer | | Shares/Par | | Value ($) |
| | | | | | |
| Bonds - continued | | | | | | |
| Asset Backed & Securitized - continued | | | | | | |
| Credit Suisse Mortgage Capital Certificate, 5.343%, 2039 | | $ | 5,200,338 | | $ | 4,697,471 |
| Credit-Based Asset Servicing & Securitization LLC, FRN, 5.303%, 2035 | | | 4,739,543 | | | 4,486,319 |
| Credit-Based Asset Servicing & Securitization LLC, FRN, 5.731%, 2037 | | | 2,300,000 | | | 1,858,124 |
| Credit-Based Asset Servicing & Securitization Trust, 5.737%, 2037 | | | 1,920,000 | | | 1,444,827 |
| Crest G-Star, CDO, 6.95%, 2032 (z) | | | 6,526,000 | | | 6,726,988 |
| DEPFA Bank PLC, 3.625%, 2008 | | | 1,250,000 | | | 1,256,978 |
| Deutsche Mortgage & Asset Receiving Corp., FRN, 7.5%, 2031 | | | 1,635,000 | | | 1,736,547 |
| DLJ Commercial Mortgage Corp., 7.95%, 2033 | | | 1,000,000 | | | 1,018,182 |
| E*TRADE RV & Marine Trust, 3.62%, 2018 | | | 1,620,553 | | | 1,576,579 |
| Falcon Franchise Loan LLC, 7.382%, 2022 (n) | | | 30,220 | | | 30,176 |
| Falcon Franchise Loan LLC, FRN, 3.08%, 2021 (i)(n) | | | 513,659 | | | 41,617 |
| Falcon Franchise Loan LLC, FRN, 3.844%, 2025 (i)(z) | | | 8,569,623 | | | 898,182 |
| First Union National Bank Commercial Mortgage Trust, FRN, 1.144%, 2043 (i)(n) | | | 28,167,409 | | | 600,952 |
| First Union-Lehman Brothers Bank of America, FRN, 0.589%, 2035 (i) | | | 9,964,078 | | | 157,919 |
| GE Capital Commercial Mortgage Corp., 6.269%, 2035 | | | 2,042,000 | | | 2,112,089 |
| GMAC Mortgage Corp. Loan Trust, FRN, 5.805%, 2036 | | | 3,720,000 | | | 1,732,433 |
| Gramercy Real Estate CDO Ltd., FRN, 3.24%, 2035 (z) | | | 1,260,000 | | | 1,117,040 |
| Greenwich Capital Commercial Funding Corp., 4.569%, 2042 | | | 5,335,000 | | | 5,224,339 |
| Greenwich Capital Commercial Funding Corp., FRN, 5.224%, 2037 | | | 3,357,664 | | | 3,326,427 |
| Greenwich Capital Commercial Funding Corp., FRN, 6.112%, 2038 | | | 8,610,000 | | | 8,769,738 |
| IMPAC CMB Trust, FRN, 3.635%, 2034 | | | 350,662 | | | 295,464 |
| IMPAC CMB Trust, FRN, 3.815%, 2034 | | | 175,331 | | | 157,273 |
| IMPAC Secured Assets Corp., FRN, 3.245%, 2036 | | | 1,250,258 | | | 1,066,117 |
| JPMorgan Chase Commercial Mortgage Securities Corp., 5.429%, 2043 | | | 8,620,000 | | | 8,437,067 |
| JPMorgan Chase Commercial Mortgage Securities Corp., 4.865%, 2046 | | | 2,195,695 | | | 2,160,475 |
| JPMorgan Chase Commercial Mortgage Securities Corp., FRN, 5.506%, 2042 (n) | | | 4,180,000 | | | 3,248,061 |
| JPMorgan Chase Commercial Mortgage Securities Corp., FRN, 4.936%, 2042 | | | 6,793,056 | | | 6,613,106 |
| JPMorgan Chase Commercial Mortgage Securities Corp., FRN, 5.855%, 2043 | | | 6,330,000 | | | 5,977,598 |
| JPMorgan Chase Commercial Mortgage Securities Corp., FRN, 5.038%, 2046 | | | 6,001,863 | | | 5,907,572 |
| JPMorgan Chase Commercial Mortgage Securities Corp., FRN, 6.007%, 2049 | | | 10,140,000 | | | 9,808,312 |
| JPMorgan Mortgage Acquisition Corp., FRN, 5.532%, 2036 | | | 2,100,000 | | | 1,784,635 |
12
Portfolio of Investments – continued
| | | | | | |
| Issuer | | Shares/Par | | Value ($) |
| | | | | | |
| Bonds - continued | | | | | | |
| Asset Backed & Securitized - continued | | | | | | |
| KKR Financial CLO Ltd., “C”, CDO, FRN, 4.515%, 2021 (n) | | $ | 7,023,814 | | $ | 4,474,170 |
| Lehman Brothers Commercial Conduit Mortgage Trust, FRN, 0.676%, 2035 (i) | | | 31,105,346 | | | 213,208 |
| Merrill Lynch Mortgage Investors, Inc., FRN, 5.45%, 2037 | | | 3,976,000 | | | 3,741,088 |
| Merrill Lynch Mortgage Trust, FRN, 5.842%, 2039 | | | 2,367,000 | | | 2,371,785 |
| Merrill Lynch Mortgage Trust, FRN, 6.023%, 2050 | | | 8,080,000 | | | 5,859,464 |
| Merrill Lynch/Countrywide Commercial Mortgage Trust, FRN, 5.172%, 2049 | | | 8,610,000 | | | 8,278,745 |
| Merrill Lynch/Countrywide Commercial Mortgage Trust, FRN, 5.714%, 2051 | | | 4,254,000 | | | 2,709,655 |
| Morgan Stanley Capital I, Inc., FRN, 1.11%, 2031 (i)(n) | | | 20,026,132 | | | 136,933 |
| Mortgage Capital Funding, Inc., FRN, 0.615%, 2031 (i) | | | 6,764,848 | | | 9,398 |
| Multi-Family Capital Access One, Inc., 6.65%, 2024 | | | 944,790 | | | 945,528 |
| Nationslink Funding Corp., 6.476%, 2030 | | | 78,420 | | | 78,247 |
| Nationslink Funding Corp., FRN, 0.608%, 2030 (i) | | | 4,185,543 | | | 45,996 |
| New Century Home Equity Loan Trust, FRN, 4.532%, 2035 | | | 5,000,000 | | | 4,900,439 |
| Nomura Asset Acceptance Corp., FRN, 4.423%, 2034 | | | 571,423 | | | 571,242 |
| Option One Mortgage Loan Trust, FRN, 5.611%, 2037 | | | 1,280,000 | | | 1,003,188 |
| Ownit Mortgage Loan Asset-Backed Certificates, FRN, 5.29%, 2035 | | | 2,588,328 | | | 2,259,146 |
| Popular ABS Mortgage Pass-Through Trust, FRN, 4.62%, 2035 | | | 2,286,991 | | | 2,245,123 |
| Preferred Term Securities XIX Ltd., CDO, FRN, 3.15%, 2035 (z) | | | 7,942,510 | | | 6,671,708 |
| Prudential Securities Secured Financing Corp., FRN, 6.889%, 2013 (z) | | | 1,838,000 | | | 1,928,572 |
| Putnam Structured Product Funding, CDO, FRN, 3.166%, 2008 (z) | | | 76,271 | | | 68,644 |
| Residential Asset Mortgage Products, Inc., FRN, 4.971%, 2034 | | | 4,827,000 | | | 4,707,524 |
| Residential Funding Mortgage Securities, Inc., FRN, 5.32%, 2024 | | | 8,795,000 | | | 3,926,559 |
| RMAC PLC, FRN, 3.101%, 2036 (n) | | | 39,500 | | | 39,105 |
| Salomon Brothers Mortgage Securities, Inc., FRN, 7.067%, 2032 (z) | | | 3,262,500 | | | 3,519,557 |
| Structured Asset Securities Corp., FRN, 4.67%, 2035 | | | 3,879,669 | | | 3,698,772 |
| Structured Asset Securities Corp., FRN, 3.135%, 2035 | | | 1,933,592 | | | 1,869,903 |
| Superannuation Members Home Loans Global Trust, FRN, 2.93%, 2029 | | | 599,565 | | | 588,960 |
| Thornburg Mortgage Securities Trust, FRN, 3.575%, 2043 | | | 71,814 | | | 70,064 |
| Timberstar Trust, 5.668%, 2036 (z) | | | 1,100,000 | | | 1,057,408 |
| Wachovia Bank Commercial Mortgage Trust, 5.275%, 2048 | | | 1,900,000 | | | 1,885,661 |
| Wachovia Bank Commercial Mortgage Trust, FRN, 4.847%, 2041 | | | 4,700,000 | | | 4,583,560 |
| Wachovia Bank Commercial Mortgage Trust, FRN, 5.513%, 2043 | | | 4,922,500 | | | 3,386,590 |
| | | | | | |
| | | | | | $ | 242,687,599 |
13
Portfolio of Investments – continued
| | | | | | |
| Issuer | | Shares/Par | | Value ($) |
| | | | | | |
| Bonds - continued | | | | | | |
| Automotive - 0.5% | | | | | | |
| DaimlerChrysler North America Holdings, FRN, 3.769%, 2008 | | $ | 1,200,000 | | $ | 1,196,722 |
| Ford Motor Credit Co., 5.8%, 2009 | | | 1,906,000 | | | 1,863,702 |
| Ford Motor Credit Co., 7.375%, 2009 | | | 2,860,000 | | | 2,753,116 |
| Johnson Controls, Inc., 5.5%, 2016 | | | 5,262,000 | | | 5,250,050 |
| Nissan Motor Acceptance Corp., 5.625%, 2011 (n) | | | 1,925,000 | | | 1,928,361 |
| | | | | | |
| | | | | | $ | 12,991,951 |
| Broadcasting - 1.2% | | | | | | |
| Allbritton Communications Co., 7.75%, 2012 | | $ | 4,706,000 | | $ | 4,758,943 |
| British Sky Broadcasting, 6.1%, 2018 (z) | | | 6,820,000 | | | 6,939,275 |
| CBS Corp., 6.625%, 2011 | | | 8,263,000 | | | 8,513,741 |
| Clear Channel Communications, Inc., 7.65%, 2010 | | | 5,970,000 | | | 6,206,615 |
| Clear Channel Communications, Inc., 6.25%, 2011 | | | 5,420,000 | | | 4,607,000 |
| News America, Inc., 4.75%, 2010 | | | 1,000,000 | | | 994,204 |
| News America, Inc., 8.5%, 2025 | | | 120,000 | | | 139,047 |
| | | | | | |
| | | | | | $ | 32,158,825 |
| Brokerage & Asset Managers - 3.0% | | | | | | |
| Bear Stearns Cos., Inc., 5.85%, 2010 | | $ | 14,020,000 | | $ | 14,151,494 |
| Goldman Sachs Group, Inc., 5.7%, 2012 | | | 1,650,000 | | | 1,683,109 |
| Goldman Sachs Group, Inc., 5.625%, 2017 | | | 6,800,000 | | | 6,571,194 |
| Goldman Sachs Group, Inc., 6.15%, 2018 | | | 6,820,000 | | | 6,898,785 |
| INVESCO PLC, 4.5%, 2009 | | | 8,926,000 | | | 8,869,436 |
| INVESCO PLC, 5.625%, 2012 | | | 5,090,000 | | | 4,975,857 |
| Lehman Brothers E-Capital Trust I, FRN, 3.85%, 2065 | | | 1,098,000 | | | 868,999 |
| Lehman Brothers Holdings, Inc., 6.5%, 2017 | | | 6,860,000 | | | 6,738,914 |
| Merrill Lynch & Co., Inc., 6.15%, 2013 | | | 9,520,000 | | | 9,500,094 |
| Merrill Lynch & Co., Inc., 6.05%, 2016 | | | 6,749,000 | | | 6,475,706 |
| Morgan Stanley, 5.75%, 2016 | | | 7,752,000 | | | 7,590,844 |
| Morgan Stanley Group, Inc., 6.625%, 2018 | | | 6,400,000 | | | 6,635,642 |
| | | | | | |
| | | | | | $ | 80,960,074 |
| Building - 0.3% | | | | | | |
| American Standard Cos., Inc., 7.625%, 2010 | | $ | 5,745,000 | | $ | 6,073,390 |
| CRH America, Inc., 6.95%, 2012 | | | 1,250,000 | | | 1,280,371 |
| Hanson PLC, 7.875%, 2010 | | | 2,000,000 | | | 2,101,656 |
| | | | | | |
| | | | | | $ | 9,455,417 |
| Business Services - 0.4% | | | | | | |
| Xerox Corp., 5.5%, 2012 | | $ | 1,700,000 | | $ | 1,700,573 |
| Xerox Corp., 5.65%, 2013 | | | 7,850,000 | | | 7,870,237 |
| | | | | | |
| | | | | | $ | 9,570,810 |
14
Portfolio of Investments – continued
| | | | | | |
| Issuer | | Shares/Par | | Value ($) |
| | | | | | |
| Bonds - continued | | | | | | |
| Cable TV - 1.2% | | | | | | |
| Comcast Cable Communications LLC, 6.75%, 2011 | | $ | 4,000 | | $ | 4,152 |
| Comcast Corp., 5.45%, 2010 | | | 300,000 | | | 305,987 |
| Comcast Corp., 5.875%, 2018 | | | 2,377,000 | | | 2,370,463 |
| Cox Communications, Inc., 4.625%, 2010 | | | 1,900,000 | | | 1,891,631 |
| Cox Communications, Inc., 7.125%, 2012 | | | 8,510,000 | | | 9,047,364 |
| Cox Communications, Inc., 4.625%, 2013 | | | 600,000 | | | 576,254 |
| TCI Communications, Inc., 9.8%, 2012 | | | 1,679,000 | | | 1,892,752 |
| Time Warner Cable, Inc., 5.4%, 2012 | | | 9,337,000 | | | 9,391,472 |
| Time Warner Entertainment Co. LP, 7.25%, 2008 | | | 750,000 | | | 755,698 |
| Time Warner Entertainment Co. LP, 8.375%, 2033 | | | 5,077,000 | | | 5,909,988 |
| | | | | | |
| | | | | | $ | 32,145,761 |
| Chemicals - 0.4% | | | | | | |
| Dow Chemical Co., 5.75%, 2008 | | $ | 775,000 | | $ | 783,208 |
| PPG Industries, Inc., 5.75%, 2013 | | | 7,941,000 | | | 8,146,529 |
| Yara International A.S.A., 5.25%, 2014 (n) | | | 2,700,000 | | | 2,610,471 |
| | | | | | |
| | | | | | $ | 11,540,208 |
| Conglomerates - 0.0% | | | | | | |
| Kennametal, Inc., 7.2%, 2012 | | $ | 525,000 | | $ | 562,575 |
| | |
| Consumer Goods & Services - 1.1% | | | | | | |
| Clorox Co., 5%, 2013 | | $ | 7,440,000 | | $ | 7,348,696 |
| Fortune Brands, Inc., 5.125%, 2011 | | | 8,400,000 | | | 8,347,349 |
| Western Union Co., 5.4%, 2011 | | | 14,620,000 | | | 14,613,874 |
| | | | | | |
| | | | | | $ | 30,309,919 |
| Defense Electronics - 0.5% | | | | | | |
| BAE Systems Holdings, Inc., 4.75%, 2010 (n) | | $ | 5,961,000 | | $ | 6,085,740 |
| BAE Systems Holdings, Inc., 6.4%, 2011 (n) | | | 7,260,000 | | | 7,552,672 |
| | | | | | |
| | | | | | $ | 13,638,412 |
| Electronics - 0.3% | | | | | | |
| Tyco Electronics Ltd., 6.55%, 2017 (n) | | $ | 5,300,000 | | $ | 5,426,140 |
| Tyco Electronics Ltd., 7.125%, 2037 (n) | | | 2,700,000 | | | 2,765,132 |
| | | | | | |
| | | | | | $ | 8,191,272 |
| Emerging Market Quasi-Sovereign - 0.3% | | | | | | |
| OAO Gazprom, 7.343%, 2013 (z) | | $ | 2,696,000 | | $ | 2,820,690 |
| OAO Gazprom, 8.146%, 2018 (z) | | | 5,602,000 | | | 5,945,123 |
| | | | | | |
| | | | | | $ | 8,765,813 |
15
Portfolio of Investments – continued
| | | | | | |
| Issuer | | Shares/Par | | Value ($) |
| | | | | | |
| Bonds - continued | | | | | | |
| Emerging Market Sovereign - 0.3% | | | | | | |
| Gabonese Republic, 8.2%, 2017 (n) | | $ | 7,119,000 | | $ | 7,457,153 |
| | |
| Energy - Independent - 1.0% | | | | | | |
| Apache Corp., 7.375%, 2047 | | $ | 37,000 | | $ | 42,455 |
| EnCana Corp., 4.6%, 2009 | | | 1,290,000 | | | 1,295,752 |
| Nexen, Inc., 6.4%, 2037 | | | 11,323,000 | | | 11,073,135 |
| Ocean Energy, Inc., 7.25%, 2011 | | | 5,066,000 | | | 5,493,094 |
| XTO Energy, Inc., 6.25%, 2013 | | | 3,570,000 | | | 3,761,634 |
| XTO Energy, Inc., 5.65%, 2016 | | | 5,580,000 | | | 5,634,226 |
| | | | | | |
| | | | | | $ | 27,300,296 |
| Entertainment - 0.1% | | | | | | |
| Time Warner, Inc., 5.5%, 2011 | | $ | 3,000,000 | | $ | 2,972,535 |
| Time Warner, Inc., 6.875%, 2012 | | | 100,000 | | | 104,175 |
| Turner Broadcasting System, Inc., 8.375%, 2013 | | | 399,000 | | | 435,279 |
| | | | | | |
| | | | | | $ | 3,511,989 |
| Financial Institutions - 2.4% | | | | | | |
| American Express Centurion Bank, 5.55%, 2012 | | $ | 8,660,000 | | $ | 8,666,521 |
| Capital One Financial Corp., 5.7%, 2011 | | | 1,790,000 | | | 1,747,738 |
| Capital One Financial Corp., 6.15%, 2016 | | | 6,640,000 | | | 6,019,824 |
| CIT Group, Inc., 6.1% to 2017, FRN to 2067 | | | 1,360,000 | | | 710,365 |
| General Electric Capital Corp., 5.375%, 2016 | | | 6,105,000 | | | 6,194,560 |
| General Electric Co., 5.625%, 2018 | | | 4,380,000 | | | 4,424,781 |
| Household Finance Corp., 7%, 2012 | | | 170,000 | | | 179,485 |
| HSBC Finance Corp., 6.75%, 2011 | | | 20,000 | | | 20,835 |
| HSBC Finance Corp., 5.5%, 2016 | | | 12,782,000 | | | 12,651,253 |
| ILFC E-Capital Trust I, 5.9% to 2010, FRN to 2065 (n) | | | 14,000,000 | | | 11,091,178 |
| International Lease Finance Corp., 5%, 2010 | | | 868,000 | | | 861,934 |
| ORIX Corp., 5.48%, 2011 | | | 12,180,000 | | | 11,810,215 |
| | | | | | |
| | | | | | $ | 64,378,689 |
| Food & Beverages - 1.7% | | | | | | |
| Brown-Forman Corp., 5.2%, 2012 | | $ | 2,240,000 | | $ | 2,276,232 |
| Diageo Capital PLC, 5.5%, 2016 | | | 10,060,000 | | | 10,095,150 |
| Dr. Pepper Snapple Group, Inc., 6.82%, 2018 (z) | | | 6,350,000 | | | 6,587,185 |
| General Mills, Inc., 5.65%, 2012 | | | 6,220,000 | | | 6,402,675 |
| Kraft Foods, Inc., 4%, 2008 | | | 850,000 | | | 848,820 |
| Miller Brewing Co., 4.25%, 2008 (n) | | | 1,410,000 | | | 1,413,407 |
| Miller Brewing Co., 5.5%, 2013 (n) | | | 11,231,000 | | | 11,628,723 |
| Tyson Foods, Inc., 6.85%, 2016 | | | 6,330,000 | | | 6,287,260 |
| | | | | | |
| | | | | | $ | 45,539,452 |
16
Portfolio of Investments – continued
| | | | | | |
| Issuer | | Shares/Par | | Value ($) |
| | | | | | |
| Bonds - continued | | | | | | |
| Food & Drug Stores - 0.4% | | | | | | |
| CVS Caremark Corp., 5.75%, 2011 | | $ | 840,000 | | $ | 869,885 |
| CVS Caremark Corp., 6.125%, 2016 | | | 5,920,000 | | | 6,119,072 |
| CVS Caremark Corp., 5.75%, 2017 | | | 2,649,000 | | | 2,684,354 |
| | | | | | |
| | | | | | $ | 9,673,311 |
| Forest & Paper Products - 0.3% | | | | | | |
| MeadWestvaco Corp., 6.85%, 2012 | | $ | 1,845,000 | | $ | 1,871,171 |
| Stora Enso Oyj, 6.404%, 2016 (n) | | | 2,500,000 | | | 2,219,940 |
| Stora Enso Oyj, 7.25%, 2036 (n) | | | 6,029,000 | | | 5,088,838 |
| | | | | | |
| | | | | | $ | 9,179,949 |
| Gaming & Lodging - 0.9% | | | | | | |
| Marriott International, Inc., 6.375%, 2017 | | $ | 8,530,000 | | $ | 8,393,656 |
| MGM Mirage, 8.5%, 2010 | | | 3,000 | | | 3,075 |
| Station Casinos, Inc., 6%, 2012 | | | 7,510,000 | | | 6,336,563 |
| Wyndham Worldwide Corp., 6%, 2016 | | | 9,595,000 | | | 8,634,502 |
| | | | | | |
| | | | | | $ | 23,367,796 |
| Industrial - 0.3% | | | | | | |
| Steelcase, Inc., 6.5%, 2011 | | $ | 8,652,000 | | $ | 8,768,664 |
| | |
| Insurance - 1.1% | | | | | | |
| ING Groep N.V., 5.775% to 2015, FRN to 2049 | | $ | 6,310,000 | | $ | 5,421,653 |
| John Hancock Global Funding II, 3.5%, 2009 (n) | | | 1,250,000 | | | 1,247,691 |
| MetLife, Inc., 5.375%, 2012 | | | 300,000 | | | 307,443 |
| Metropolitan Life Global Funding, 5.125%, 2013 (z) | | | 6,580,000 | | | 6,579,585 |
| Prudential Financial, Inc., 6%, 2017 | | | 8,280,000 | | | 8,348,335 |
| UnumProvident Corp., 6.85%, 2015 (n) | | | 7,368,000 | | | 7,405,975 |
| | | | | | |
| | | | | | $ | 29,310,682 |
| Insurance - Health - 0.1% | | | | | | |
| UnitedHealth Group, Inc., 6.875%, 2038 | | $ | 3,770,000 | | $ | 3,678,487 |
| | |
| Insurance - Property & Casualty - 1.3% | | | | | | |
| AXIS Capital Holdings Ltd., 5.75%, 2014 | | $ | 14,545,000 | | $ | 13,959,913 |
| Chubb Corp., 6.375% to 2017, FRN to 2037 | | | 3,295,000 | | | 3,074,410 |
| Fund American Cos., Inc., 5.875%, 2013 | | | 8,759,000 | | | 8,568,693 |
| ZFS Finance USA Trust IV, 5.875% to 2012, FRN to 2032 (n) | | | 1,480,000 | | | 1,356,805 |
| ZFS Finance USA Trust V, 6.5% to 2017, FRN to 2037 (n) | | | 10,570,000 | | | 9,311,346 |
| | | | | | |
| | | | | | $ | 36,271,167 |
17
Portfolio of Investments – continued
| | | | | | |
| Issuer | | Shares/Par | | Value ($) |
| | | | | | |
| Bonds - continued | | | | | | |
| Major Banks - 3.5% | | | | | | |
| BAC Capital Trust XIV, 5.63% to 2012, FRN to 2049 | | $ | 4,260,000 | | $ | 3,421,892 |
| Bank of America Corp., 5.65%, 2018 | | | 9,790,000 | | | 9,797,245 |
| BNP Paribas, 7.195% to 2037, FRN to 2049 (n) | | | 6,500,000 | | | 6,097,839 |
| Credit Suisse New York, 6%, 2018 | | | 6,110,000 | | | 6,192,491 |
| DBS Capital Funding Corp., 7.657% to 2011, FRN to 2049 (n) | | | 4,150,000 | | | 4,326,076 |
| JPMorgan Chase Bank N.A., 5.875%, 2016 | | | 4,250,000 | | | 4,308,459 |
| MUFG Capital Finance 1 Ltd., 6.346% to 2016, FRN to 2049 | | | 10,546,000 | | | 9,531,622 |
| Natexis AMBS Co. LLC, 8.44% to 2008, FRN to 2049 (n) | | | 3,640,000 | | | 3,665,993 |
| Natixis S.A., 10% to 2018, FRN to 2049 (z) | | | 6,870,000 | | | 6,945,776 |
| PNC Funding Corp., 5.625%, 2017 | | | 6,370,000 | | | 6,112,601 |
| Popular North America, Inc., 3.875%, 2008 | | | 750,000 | | | 746,849 |
| Popular North America, Inc., 4.7%, 2009 | | | 1,200,000 | | | 1,191,608 |
| Royal Bank of Scotland Group PLC, 6.99% to 2017, FRN to 2049 (n) | | | 3,200,000 | | | 2,937,174 |
| Royal Bank of Scotland Group PLC, 9.118%, 2049 | | | 3,170,000 | | | 3,204,724 |
| UniCredito Italiano Capital Trust II, 9.2% to 2010, FRN to 2049 (n) | | | 2,483,000 | | | 2,455,290 |
| Unicredito Luxembourg Finance S.A., 6%, 2017 (n) | | | 15,040,000 | | | 14,553,742 |
| Wachovia Capital Trust III, 5.8% to 2011, FRN to 2042 | | | 9,282,000 | | | 7,379,190 |
| Wachovia Corp., 7.8%, 2010 | | | 250,000 | | | 264,873 |
| Wachovia Corp., 6.605%, 2025 | | | 2,393,000 | | | 2,221,489 |
| Wells Fargo Bank N.A., 6.45%, 2011 | | | 200,000 | | | 209,851 |
| | | | | | |
| | | | | | $ | 95,564,784 |
| Medical & Health Technology & Services - 1.5% | | | | | | |
| Cardinal Health, Inc., 2.958%, 2009 | | $ | 1,600,000 | | $ | 1,562,066 |
| Covidien Ltd., 6%, 2017 (n) | | | 5,870,000 | | | 6,000,872 |
| Covidien Ltd., 6.55%, 2037 (n) | | | 5,450,000 | | | 5,571,361 |
| Fisher Scientific International, Inc., 6.125%, 2015 | | | 11,840,000 | | | 11,811,560 |
| Hospira, Inc., 5.55%, 2012 | | | 5,690,000 | | | 5,627,860 |
| Hospira, Inc., 6.05%, 2017 | | | 3,900,000 | | | 3,818,482 |
| McKesson Corp., 5.7%, 2017 | | | 6,220,000 | | | 6,088,851 |
| | | | | | |
| | | | | | $ | 40,481,052 |
| Metals & Mining - 0.6% | | | | | | |
| International Steel Group, Inc., 6.5%, 2014 | | $ | 10,352,000 | | $ | 10,609,547 |
| Peabody Energy Corp., 5.875%, 2016 | | | 7,140,000 | | | 6,925,800 |
| | | | | | |
| | | | | | $ | 17,535,347 |
| Mortgage Backed - 25.4% | | | | | | |
| Fannie Mae, 6.022%, 2010 | | $ | 3,500,000 | | $ | 3,633,812 |
| Fannie Mae, 4.506%, 2011 | | | 2,205,861 | | | 2,252,625 |
| Fannie Mae, 4.55%, 2011 | | | 2,318,150 | | | 2,335,880 |
| Fannie Mae, 4.79%, 2012 | | | 2,966,537 | | | 2,998,471 |
18
Portfolio of Investments – continued
| | | | | | |
| Issuer | | Shares/Par | | Value ($) |
| | | | | | |
| Bonds - continued | | | | | | |
| Mortgage Backed - continued | | | | | | |
| Fannie Mae, 4.86%, 2012-2014 | | $ | 3,685,076 | | $ | 3,704,257 |
| Fannie Mae, 5.12%, 2012 | | | 1,922,000 | | | 1,965,709 |
| Fannie Mae, 4.51%, 2013 | | | 1,091,293 | | | 1,082,419 |
| Fannie Mae, 4.543%, 2013 | | | 2,390,348 | | | 2,372,164 |
| Fannie Mae, 4.845%, 2013 | | | 2,673,343 | | | 2,682,917 |
| Fannie Mae, 5.369%, 2013 | | | 1,149,758 | | | 1,160,612 |
| Fannie Mae, 4.62%, 2014-2015 | | | 4,500,475 | | | 4,466,579 |
| Fannie Mae, 4.666%, 2014 | | | 1,618,546 | | | 1,603,056 |
| Fannie Mae, 4.77%, 2014 | | | 1,836,277 | | | 1,826,798 |
| Fannie Mae, 4.839%, 2014 | | | 4,502,119 | | | 4,502,903 |
| Fannie Mae, 5.05%, 2014 | | | 1,255,189 | | | 1,273,089 |
| Fannie Mae, 5.412%, 2014 | | | 2,660,575 | | | 2,730,156 |
| Fannie Mae, 4.53%, 2015 | | | 1,208,721 | | | 1,188,294 |
| Fannie Mae, 4.6%, 2015 | | | 1,954,464 | | | 1,929,345 |
| Fannie Mae, 4.665%, 2015 | | | 1,229,935 | | | 1,221,916 |
| Fannie Mae, 4.78%, 2015 | | | 2,691,834 | | | 2,684,776 |
| Fannie Mae, 4.815%, 2015 | | | 1,848,000 | | | 1,832,232 |
| Fannie Mae, 4.82%, 2015 | | | 1,542,198 | | | 1,540,886 |
| Fannie Mae, 4.85%, 2015 | | | 1,499,618 | | | 1,505,094 |
| Fannie Mae, 4.87%, 2015 | | | 1,263,990 | | | 1,268,456 |
| Fannie Mae, 4.89%, 2015 | | | 391,862 | | | 392,821 |
| Fannie Mae, 4.925%, 2015 | | | 5,371,204 | | | 5,370,463 |
| Fannie Mae, 4.94%, 2015 | | | 2,591,000 | | | 2,620,042 |
| Fannie Mae, 5%, 2016-2026 | | | 20,538,115 | | | 20,742,732 |
| Fannie Mae, 5.09%, 2016 | | | 2,911,766 | | | 2,947,090 |
| Fannie Mae, 5.423%, 2016 | | | 3,078,706 | | | 3,149,986 |
| Fannie Mae, 5.5%, 2016-2038 | | | 159,003,371 | | | 160,478,276 |
| Fannie Mae, 5.574%, 2016 | | | 2,514,027 | | | 2,556,148 |
| Fannie Mae, 5.93%, 2016 | | | 1,339,167 | | | 1,404,272 |
| Fannie Mae, 4.996%, 2017 | | | 4,872,433 | | | 4,888,838 |
| Fannie Mae, 5.32%, 2017 | | | 803,018 | | | 810,853 |
| Fannie Mae, 5.456%, 2017 | | | 2,707,000 | | | 2,759,926 |
| Fannie Mae, 5.724%, 2017 | | | 1,520,000 | | | 1,574,008 |
| Fannie Mae, 4.88%, 2020 | | | 962,863 | | | 974,557 |
| Fannie Mae, 5.19%, 2020 | | | 3,241,646 | | | 3,203,311 |
| Fannie Mae, 5.35%, 2023 | | | 2,271,968 | | | 2,296,716 |
| Fannie Mae, 6.5%, 2031-2033 | | | 1,118,272 | | | 1,171,337 |
| Fannie Mae, 6%, 2034-2037 | | | 27,642,416 | | | 28,293,167 |
| Freddie Mac, 5.5%, 2017-2038 | | | 90,704,810 | | | 91,592,408 |
| Freddie Mac, 5%, 2018-2028 | | | 53,224,915 | | | 53,909,771 |
| Freddie Mac, 4%, 2023-2024 | | | 3,839,050 | | | 3,847,220 |
| Freddie Mac, 6%, 2033-2037 | | | 32,363,532 | | | 33,177,677 |
19
Portfolio of Investments – continued
| | | | | | |
| Issuer | | Shares/Par | | Value ($) |
| | | | | | |
| Bonds - continued | | | | | | |
| Mortgage Backed - continued | | | | | | |
| Ginnie Mae, 6%, 2034 - 2038 | | $ | 84,290,009 | | $ | 86,745,742 |
| Ginnie Mae, 5.5%, 2038 | | | 86,028,930 | | | 87,247,688 |
| Ginnie Mae, TBA, 5.5%, 2038 | | | 28,000,000 | | | 28,271,264 |
| | | | | | |
| | | | | | $ | 684,188,759 |
| Municipals - 3.9% | | | | | | |
| Harris County, TX, “C”, FSA, 5.25%, 2031 | | $ | 7,250,000 | | $ | 7,907,575 |
| Harris County, TX, “C”, FSA, 5.25%, 2032 | | | 7,265,000 | | | 7,928,295 |
| Massachusetts Health & Educational Authority Rev. (Mass Institute Technology), “K”, 5.5%, 2032 | | | 29,445,000 | | | 33,190,698 |
| Massachusetts Health & Educational Facilities Authority Rev. (Boston College), 5.5%, 2030 | | | 6,470,000 | | | 7,242,842 |
| Massachusetts Health & Educational Facilities Authority Rev. (Boston College), 5.5%, 2035 | | | 10,785,000 | | | 12,134,096 |
| Metropolitan Atlanta, GA, Rapid Transit Tax Authority Rev., “A”, FGIC, 5.25%, 2032 | | | 10,690,000 | | | 11,581,653 |
| State of Massachusetts, “A”, AMBAC, 5.5%, 2030 | | | 21,935,000 | | | 24,371,540 |
| | | | | | |
| | | | | | $ | 104,356,699 |
| Natural Gas - Pipeline - 2.4% | | | | | | |
| CenterPoint Energy, Inc., 7.75%, 2011 | | $ | 2,100,000 | | $ | 2,242,758 |
| CenterPoint Energy, Inc., 7.875%, 2013 | | | 11,526,000 | | | 12,589,942 |
| CenterPoint Energy, Inc., 5.95%, 2017 | | | 3,280,000 | | | 3,147,908 |
| Duke Capital LLC, 6.25%, 2013 | | | 1,000,000 | | | 1,016,537 |
| Enterprise Products Operating LP, 5.65%, 2013 | | | 3,783,000 | | | 3,808,528 |
| Enterprise Products Partners LP, 4.95%, 2010 | | | 1,700,000 | | | 1,707,572 |
| Enterprise Products Partners LP, 6.3%, 2017 | | | 7,550,000 | | | 7,693,503 |
| Kinder Morgan Energy Partners LP, 6.75%, 2011 | | | 110,000 | | | 114,657 |
| Kinder Morgan Energy Partners LP, 6%, 2017 | | | 7,502,000 | | | 7,501,167 |
| Kinder Morgan Energy Partners LP, 7.75%, 2032 | | | 1,797,000 | | | 1,923,651 |
| Kinder Morgan Energy Partners LP, 5.8%, 2035 | | | 3,385,000 | | | 2,961,977 |
| Spectra Energy Capital LLC, 8%, 2019 | | | 8,245,000 | | | 9,124,024 |
| Williams Cos., Inc., 8.75%, 2032 | | | 8,305,000 | | | 9,820,663 |
| | | | | | |
| | | | | | $ | 63,652,887 |
| Network & Telecom - 3.6% | | | | | | |
| British Telecommunications PLC, 5.15%, 2013 | | $ | 11,860,000 | | $ | 11,913,014 |
| CenturyTel, Inc., 8.375%, 2010 | | | 12,223,000 | | | 13,182,774 |
| Deutsche Telekom International Finance B.V., 5.25%, 2013 | | | 821,000 | | | 823,158 |
| Deutsche Telekom International Finance B.V., 5.75%, 2016 | | | 6,632,000 | | | 6,689,612 |
| France Telecom S.A., 7.75%, 2011 | | | 300,000 | | | 324,386 |
| GTE Corp., 7.51%, 2009 | | | 600,000 | | | 618,384 |
| Qwest Capital Funding, Inc., 7.25%, 2011 | | | 9,330,000 | | | 9,143,400 |
20
Portfolio of Investments – continued
| | | | | | |
| Issuer | | Shares/Par | | Value ($) |
| | | | | | |
| Bonds - continued | | | | | | |
| Network & Telecom - continued | | | | | | |
| Telecom Italia Capital, 4%, 2010 | | $ | 1,000,000 | | $ | 982,711 |
| Telecom Italia Capital, 4.875%, 2010 | | | 1,023,000 | | | 1,012,707 |
| Telecom Italia Capital, 6.2%, 2011 | | | 9,689,000 | | | 9,760,437 |
| Telefonica Emisiones S.A.U., 7.045%, 2036 | | | 9,230,000 | | | 10,089,645 |
| TELUS Corp., 8%, 2011 | | | 14,497,000 | | | 15,639,291 |
| Verizon New York, Inc., 6.875%, 2012 | | | 16,238,000 | | | 17,105,158 |
| | | | | | |
| | | | | | $ | 97,284,677 |
| Oil Services - 0.5% | | | | | | |
| Weatherford International Ltd., 5.15%, 2013 | | $ | 7,120,000 | | $ | 7,147,035 |
| Weatherford International Ltd., 6.35%, 2017 | | | 5,420,000 | | | 5,706,615 |
| | | | | | |
| | | | | | $ | 12,853,650 |
| Oils - 0.3% | | | | | | |
| Premcor Refining Group, Inc., 7.5%, 2015 | | $ | 6,690,000 | | $ | 6,976,178 |
| | |
| Other Banks & Diversified Financials - 1.9% | | | | | | |
| Alfa Diversified Payment Rights Finance Co. S.A., FRN, 4.7%, 2011 (n) | | $ | 5,515,500 | | $ | 5,267,303 |
| Citigroup, Inc., 5.5%, 2013 | | | 14,860,000 | | | 14,950,557 |
| Citigroup, Inc., 8.4% to 2018, FRN to 2049 | | | 10,700,000 | | | 10,829,256 |
| Fifth Third Bancorp, 5.45%, 2017 | | | 795,000 | | | 741,508 |
| Mizuho Financial Group, Inc., 5.79%, 2014 (n) | | | 1,017,000 | | | 1,048,167 |
| Nordea Bank AB, 5.424% to 2015, FRN to 2049 (n) | | | 1,978,000 | | | 1,662,179 |
| Resona Bank Ltd., 5.85% to 2016, FRN to 2049 (n) | | | 6,801,000 | | | 5,736,086 |
| Swedbank AB, FRN, 9%, 2049 (n) | | | 3,120,000 | | | 3,239,902 |
| UBS Preferred Funding Trust V, 6.243% to 2016, FRN to 2049 | | | 6,450,000 | | | 5,645,066 |
| UFJ Finance Aruba AEC, 6.75%, 2013 | | | 980,000 | | | 1,010,904 |
| | | | | | |
| | | | | | $ | 50,130,928 |
| Printing & Publishing - 0.4% | | | | | | |
| Dex Media West LLC, 9.875%, 2013 | | $ | 5,372,000 | | $ | 5,063,110 |
| Idearc, Inc., 8%, 2016 | | | 3,624,000 | | | 2,355,600 |
| Pearson PLC, 5.5%, 2013 (z) | | | 3,090,000 | | | 3,114,133 |
| | | | | | |
| | | | | | $ | 10,532,843 |
| Railroad & Shipping - 0.4% | | | | | | |
| TFM S.A. de C.V., 9.375%, 2012 | | $ | 5,229,000 | | $ | 5,451,233 |
| Union Pacific Corp., 7.25%, 2008 | | | 1,580,000 | | | 1,609,840 |
| Union Pacific Corp., 6.125%, 2012 | | | 1,000,000 | | | 1,038,246 |
| Union Pacific Corp., 5.7%, 2018 | | | 2,675,000 | | | 2,705,878 |
| | | | | | |
| | | | | | $ | 10,805,197 |
21
Portfolio of Investments – continued
| | | | | | |
| Issuer | | Shares/Par | | Value ($) |
| | | | | | |
| Bonds - continued | | | | | | |
| Real Estate - 2.8% | | | | | | |
| Boston Properties, Inc., REIT, 5%, 2015 | | $ | 3,697,000 | | $ | 3,443,963 |
| ERP Operating LP, REIT, 5.75%, 2017 | | | 13,700,000 | | | 12,855,285 |
| HRPT Properties Trust, REIT, 6.25%, 2016 | | | 9,473,000 | | | 8,757,012 |
| Kimco Realty Corp., REIT, 6%, 2012 | | | 2,846,000 | | | 2,797,897 |
| Kimco Realty Corp., REIT, 5.783%, 2016 | | | 7,659,000 | | | 7,122,188 |
| Liberty Property LP, REIT, 5.5%, 2016 | | | 8,840,000 | | | 7,855,189 |
| PPF Funding, Inc., REIT, 5.35%, 2012 (n) | | | 2,080,000 | | | 2,033,839 |
| ProLogis, REIT, 5.5%, 2012 | | | 1,980,000 | | | 1,935,791 |
| ProLogis, REIT, 5.75%, 2016 | | | 8,794,000 | | | 8,284,590 |
| ProLogis, REIT, 5.625%, 2016 | | | 3,050,000 | | | 2,838,525 |
| Simon Property Group, Inc., REIT, 7.125%, 2009 | | | 1,100,000 | | | 1,109,931 |
| Simon Property Group, Inc., REIT, 4.6%, 2010 | | | 4,488,000 | | | 4,457,544 |
| Simon Property Group, Inc., REIT, 5.75%, 2015 | | | 1,506,000 | | | 1,472,353 |
| Simon Property Group, Inc., REIT, 6.1%, 2016 | | | 5,269,000 | | | 5,282,141 |
| Simon Property Group, Inc., REIT, 5.875%, 2017 | | | 2,870,000 | | | 2,786,219 |
| Vornado Realty Trust, REIT, 4.5%, 2009 | | | 1,000,000 | | | 971,728 |
| Vornado Realty Trust, REIT, 4.75%, 2010 | | | 798,000 | | | 757,131 |
| | | | | | |
| | | | | | $ | 74,761,326 |
| Restaurants - 0.3% | | | | | | |
| YUM! Brands, Inc., 8.875%, 2011 | | $ | 7,055,000 | | $ | 7,764,416 |
| | |
| Retailers - 1.7% | | | | | | |
| Federated Retail Holdings, Inc., 5.35%, 2012 | | $ | 4,540,000 | | $ | 4,230,554 |
| Home Depot, Inc., 5.25%, 2013 | | | 3,542,000 | | | 3,429,935 |
| Home Depot, Inc., 5.875%, 2036 | | | 5,181,000 | | | 4,331,363 |
| J.C. Penney Corp., Inc., 8%, 2010 | | | 2,300,000 | | | 2,372,905 |
| Limited Brands, Inc., 5.25%, 2014 | | | 1,196,000 | | | 1,015,726 |
| Macy’s, Inc., 6.625%, 2011 | | | 4,924,000 | | | 4,846,875 |
| May Department Stores Co., 5.95%, 2008 | | | 1,406,000 | | | 1,406,766 |
| Target Corp., 6.5%, 2037 | | | 4,421,000 | | | 4,455,594 |
| Wal-Mart Stores, Inc., 6.2%, 2038 | | | 10,480,000 | | | 10,666,523 |
| Wesfarmers Ltd., 6.998%, 2013 (z) | | | 9,070,000 | | | 9,435,231 |
| | | | | | |
| | | | | | $ | 46,191,472 |
| Steel - 0.3% | | | | | | |
| Evraz Group S.A., 8.875%, 2013 (z) | | $ | 6,749,000 | | $ | 6,833,363 |
| | |
| Supermarkets - 0.9% | | | | | | |
| Delhaize America, Inc., 9%, 2031 | | $ | 5,162,000 | | $ | 6,387,448 |
| Kroger Co., 6.4%, 2017 | | | 9,760,000 | | | 10,383,342 |
| Safeway, Inc., 6.5%, 2008 | | | 1,620,000 | | | 1,637,781 |
22
Portfolio of Investments – continued
| | | | | | |
| Issuer | | Shares/Par | | Value ($) |
| | | | | | |
| Bonds - continued | | | | | | |
| Supermarkets - continued | | | | | | |
| Safeway, Inc., 6.5%, 2011 | | $ | 6,860,000 | | $ | 7,118,595 |
| | | | | | |
| | | | | | $ | 25,527,166 |
| Telecommunications - Wireless - 0.8% | | | | | | |
| Nextel Communications, Inc., 5.95%, 2014 | | $ | 8,675,000 | | $ | 6,766,500 |
| Rogers Cable, Inc., 5.5%, 2014 | | | 7,406,000 | | | 7,256,473 |
| Sprint Capital Corp., 7.625%, 2011 | | | 2,000,000 | | | 1,895,000 |
| Vodafone Group PLC, 7.75%, 2010 | | | 1,000,000 | | | 1,055,285 |
| Vodafone Group PLC, 5.375%, 2015 | | | 1,510,000 | | | 1,511,048 |
| Vodafone Group PLC, 5.625%, 2017 | | | 3,168,000 | | | 3,181,686 |
| | | | | | |
| | | | | | $ | 21,665,992 |
| Telephone Services - 0.2% | | | | | | |
| Embarq Corp., 7.082%, 2016 | | $ | 6,280,000 | | $ | 6,230,576 |
| | |
| Tobacco - 0.4% | | | | | | |
| Philip Morris Capital Corp., 7.5%, 2009 | | $ | 1,300,000 | | $ | 1,303,250 |
| Reynolds American, Inc., 7.25%, 2012 | | | 125,000 | | | 131,068 |
| Reynolds American, Inc., 6.75%, 2017 | | | 9,030,000 | | | 9,144,816 |
| | | | | | |
| | | | | | $ | 10,579,134 |
| Transportation - Services - 0.0% | | | | | | |
| FedEx Corp., 9.65%, 2012 | | $ | 725,000 | | $ | 846,763 |
| | |
| U.S. Government Agencies - 1.5% | | | | | | |
| Small Business Administration, 5.37%, 2016 | | $ | 666,099 | | $ | 680,200 |
| Small Business Administration, 5.94%, 2016 | | | 723,621 | | | 747,585 |
| Small Business Administration, 5.34%, 2021 | | | 299,852 | | | 306,334 |
| Small Business Administration, 6.34%, 2021 | | | 53,794 | | | 56,196 |
| Small Business Administration, 6.35%, 2021 | | | 36,209 | | | 37,817 |
| Small Business Administration, 6.44%, 2021 | | | 52,889 | | | 55,370 |
| Small Business Administration, 6.07%, 2022 | | | 204,981 | | | 216,066 |
| Small Business Administration, 4.35%, 2023 | | | 1,410,615 | | | 1,374,087 |
| Small Business Administration, 4.89%, 2023 | | | 1,927,861 | | | 1,911,847 |
| Small Business Administration, 4.98%, 2023 | | | 2,011,559 | | | 2,026,674 |
| Small Business Administration, 4.34%, 2024 | | | 2,136,384 | | | 2,069,578 |
| Small Business Administration, 4.86%, 2024 | | | 1,827,007 | | | 1,822,566 |
| Small Business Administration, 4.93%, 2024 | | | 2,515,934 | | | 2,526,507 |
| Small Business Administration, 5.18%, 2024 | | | 2,158,435 | | | 2,190,757 |
| Small Business Administration, 5.19%, 2024 | | | 2,922,593 | | | 2,964,535 |
| Small Business Administration, 5.52%, 2024 | | | 2,738,757 | | | 2,816,821 |
| Small Business Administration, 4.57%, 2025 | | | 2,963,467 | | | 2,858,603 |
| Small Business Administration, 4.76%, 2025 | | | 9,427,913 | | | 9,196,334 |
23
Portfolio of Investments – continued
| | | | | | |
| Issuer | | Shares/Par | | Value ($) |
| | | | | | |
| Bonds - continued | | | | | | |
| U.S. Government Agencies - continued | | | | | | |
| Small Business Administration, 5.39%, 2025 | | $ | 975,603 | | $ | 995,673 |
| Small Business Administration, 5.35%, 2026 | | | 5,482,809 | | | 5,580,908 |
| | | | | | |
| | | | | | $ | 40,434,458 |
| U.S. Treasury Obligations - 10.5% | | | | | | |
| U.S. Treasury Bonds, 6.25%, 2023 | | $ | 4,506,000 | | $ | 5,423,043 |
| U.S. Treasury Bonds, 6%, 2026 | | | 840,000 | | | 992,316 |
| U.S. Treasury Bonds, 6.75%, 2026 | | | 8,944,000 | | | 11,447,622 |
| U.S. Treasury Bonds, 5.375%, 2031 | | | 32,653,000 | | | 36,737,172 |
| U.S. Treasury Bonds, 4.5%, 2036 | | | 9,366,000 | | | 9,382,100 |
| U.S. Treasury Bonds, 5%, 2037 | | | 10,805,000 | | | 11,709,919 |
| U.S. Treasury Notes, 3.125%, 2008 | | | 102,233,000 | | | 102,959,774 |
| U.S. Treasury Notes, 4.5%, 2009 | | | 32,786,000 | | | 33,562,110 |
| U.S. Treasury Notes, 4.875%, 2009 (f) | | | 38,592,000 | | | 39,936,700 |
| U.S. Treasury Notes, 6.5%, 2010 | | | 20,622,000 | | | 22,154,153 |
| U.S. Treasury Notes, 4%, 2010 | | | 525,000 | | | 542,760 |
| U.S. Treasury Notes, 4.25%, 2013 | | | 1,133,000 | | | 1,197,528 |
| U.S. Treasury Notes, 5.125%, 2016 | | | 6,351,000 | | | 7,031,249 |
| | | | | | |
| | | | | | $ | 283,076,446 |
| Utilities - Electric Power - 4.4% | | | | | | |
| Allegheny Energy Supply Co. LLC, 8.25%, 2012 (n) | | $ | 8,614,000 | | $ | 9,173,910 |
| Beaver Valley Funding Corp., 9%, 2017 | | | 221,000 | | | 242,044 |
| Bruce Mansfield Unit, 6.85%, 2034 | | | 9,540,000 | | | 9,692,020 |
| E.On International Finance B.V., 6.65%, 2038 (z) | | | 11,360,000 | | | 11,688,713 |
| EDP Finance B.V., 6%, 2018 (n) | | | 14,950,000 | | | 15,211,969 |
| EEB International Ltd., 8.75%, 2014 (n) | | | 1,772,000 | | | 1,878,320 |
| Enersis S.A., 7.375%, 2014 | | | 5,122,000 | | | 5,512,752 |
| Exelon Generation Co. LLC, 6.95%, 2011 | | | 18,259,000 | | | 19,143,283 |
| FirstEnergy Corp., 6.45%, 2011 | | | 9,164,000 | | | 9,516,759 |
| ISA Capital do Brasil S.A., 7.875%, 2012 | | | 6,430,000 | | | 6,767,575 |
| MidAmerican Energy Holdings Co., 3.5%, 2008 | | | 119,000 | | | 118,979 |
| MidAmerican Energy Holdings Co., 5.875%, 2012 | | | 1,182,000 | | | 1,232,334 |
| NiSource Finance Corp., 7.875%, 2010 | | | 13,053,000 | | | 13,721,248 |
| NRG Energy, Inc., 7.25%, 2014 | | | 11,355,000 | | | 11,667,263 |
| System Energy Resources, Inc., 5.129%, 2014 (n) | | | 672,643 | | | 658,692 |
| Virginia Electric & Power Co., 4.1%, 2038 | | | 3,484,000 | | | 3,477,778 |
| | | | | | |
| | | | | | $ | 119,703,639 |
| Total Bonds (Identified Cost, $2,647,424,974) | | | | | $ | 2,599,629,222 |
24
Portfolio of Investments – continued
| | | | |
| Floating Rate Loans - 1.2% (g)(r) | | | | |
| | | | | | |
| Issuer | | Shares/Par | | Value ($) |
| | | | | | |
| Aerospace - 0.3% | | | | | | |
| Hawker Beechcraft Acquisition Co., Letter of Credit, 4.7%, 2014 | | $ | 698,464 | | $ | 664,559 |
| Hawker Beechcraft Acquisition Co., Term Loan B, 4.7%, 2014 | | | 7,886,809 | | | 7,503,973 |
| | | | | | |
| | | | | | $ | 8,168,532 |
| Food & Beverages - 0.3% | | | | | | |
| ARAMARK Corp., Letter of Credit, 5.4%, 2014 | | $ | 478,865 | | $ | 458,812 |
| ARAMARK Corp., Term Loan B, 4.57%, 2014 | | | 7,537,648 | | | 7,222,009 |
| | | | | | |
| | | | | | $ | 7,680,821 |
| Medical & Health Technology & Services - 0.6% | | | | | | |
| Community Health Systems, Inc., Delayed Draw Term Loan B, 0%, 2014 (q) | | $ | 433,179 | | $ | 414,522 |
| Community Health Systems, Inc., Term Loan, 5.34%, 2014 | | | 8,469,890 | | | 8,105,108 |
| HCA, Inc., Term Loan B, 4.95%, 2013 | | | 7,081,490 | | | 6,718,562 |
| | | | | | |
| | | | | | $ | 15,238,192 |
| Printing & Publishing - 0.0% | | | | | | |
| Idearc, Inc., Term Loan B, 2014 (o) | | $ | 1,354,951 | | $ | 1,115,082 |
| Total Floating Rate Loans (Identified Cost, $32,465,481) | | | | | $ | 32,202,627 |
| | |
| Money Market Funds (v) - 0.0% | | | | | | |
| MFS Institutional Money Market Portfolio, 2.66%, at Cost and Net Asset Value | | | 90,232 | | $ | 90,232 |
| Total Investments (Identified Cost, $2,679,980,687) (k) | | | | | $ | 2,631,922,081 |
| | |
| Other Assets, Less Liabilities - 2.5% | | | | | | 66,420,673 |
| Net Assets - 100.0% | | | | | $ | 2,698,342,754 |
| (f) | All or a portion of the security has been segregated as collateral for an open futures contract. |
| (g) | The rate shown represents a weighted average coupon rate on settled positions at period end. |
| (i) | Interest only security for which the fund receives interest on notional principal (Par amount). Par amount shown is the notional principal and does not reflect the cost of the security. |
| (k) | As of April 30, 2008, the fund held securities fair valued in accordance with the policies adopted by the Board of Trustees, aggregating $2,618,782,346 and 99.50% of market value. An independent pricing service provided an evaluated bid for 98.82% of the market value. |
| (n) | Securities exempt from registration under Rule 144A of the Securities Act of 1933. These securities may be sold in the ordinary course of business in transactions exempt from registration, normally to qualified institutional buyers. At period end, the aggregate value of these securities was $188,585,170, representing 7.0% of net assets. |
| (o) | All or a portion of this position has not settled. Upon settlement date, interest rates will be determined. |
| (q) | All or a portion of this position represents an unfunded loan commitment. The rate shown represents a weighted average coupon rate on the full position, including the unfunded loan commitment which has no current coupon rate. |
25
Portfolio of Investments – continued
| (r) | Remaining maturities of floating rate loans may be less than stated maturities shown as a result of contractual or optional prepayments by the borrower. Such prepayments cannot be predicted with certainty. These loans may be subject to restrictions on resale. Floating rate loans generally have rates of interest which are determined periodically by reference to a base lending rate plus a premium. |
| (v) | Underlying fund that is available only to investment companies managed by MFS. The rate quoted is the annualized seven-day yield of the fund at period end. |
| (z) | Restricted securities are not registered under the Securities Act of 1933 and are subject to legal restrictions on resale. These securities generally may be resold in transactions exempt from registration or to the public if the securities are subsequently registered. Disposal of these securities may involve time-consuming negotiations and prompt sale at an acceptable price may be difficult. The fund holds the following restricted securities: |
| | | | | | |
| Restricted Securities | | Acquisition
Date | | Cost | | Current
Market
Value |
| ARCap REIT, Inc., CDO, 6.1%, 2045 | | 12/07/06 | | $4,243,689 | | $1,867,050 |
| Anthracite CDO III Ltd., 6.077%, 2039 | | 10/25/06 | | 4,998,296 | | 3,854,222 |
| Bayview Commercial Asset Trust, 0.775%, 2035 | | 10/06/05 | | 2,781,707 | | 2,382,304 |
| Bayview Commercial Asset Trust, FRN, 1.211%, 2037 | | 1/26/07 | | 5,691,736 | | 4,729,311 |
| Bayview Commercial Asset Trust, FRN, 1.169%, 2036 | | 9/11/06 | | 5,593,761 | | 3,981,093 |
| Bayview Commercial Asset Trust, FRN, 1.14%, 2036 | | 10/25/06 | | 2,659,046 | | 2,286,973 |
| Bayview Commercial Asset Trust, FRN, 0.879%, 2036 | | 5/16/06 | | 2,286,993 | | 2,089,419 |
| Bayview Commercial Asset Trust, FRN, 1.68%, 2036 | | 2/28/06 | | 2,348,302 | | 1,891,335 |
| Bayview Commercial Asset Trust, FRN, 3.165%, 2036 | | 2/23/06 | | 828,605 | | 745,744 |
| Bayview Commercial Mortgage Pass-Through Trust, FRN, 2.057%, 2013 | | 3/29/06 | | 1,566,494 | | 1,031,967 |
| Bayview Financial Revolving Mortgage Loan Trust, FRN, 3.686%, 2040 | | 3/01/06 | | 4,984,717 | | 3,588,996 |
| Brascan Real Estate, CDO, FRN, 4.417%, 2040 | | 9/14/04 | | 418,000 | | 274,154 |
| British Sky Broadcasting, 6.1%, 2018 | | 2/07/08-2/14/08 | | 6,811,333 | | 6,939,275 |
| Capital Trust Realty CDO Ltd., 5.16%, 2035 | | 4/07/06 | | 4,492,713 | | 4,306,859 |
| Crest G-Star, CDO, 6.95%, 2032 | | 9/13/05 | | 6,961,600 | | 6,726,988 |
| Dr. Pepper Snapple Group, Inc., 6.82%, 2018 | | 4/25/08 | | 6,349,048 | | 6,587,185 |
| E.On International Finance B.V., 6.65%, 2038 | | 4/15/08 | | 11,346,393 | | 11,688,713 |
| Evraz Group S.A., 8.875%, 2013 | | 4/17/08 | | 6,856,210 | | 6,833,363 |
| Falcon Franchise Loan LLC, FRN, 3.844%, 2025 | | 1/29/03 | | 1,100,973 | | 898,182 |
| Gramercy Real Estate CDO Ltd., FRN, 3.24%, 2035 | | 6/21/05-1/18/07 | | 1,260,025 | | 1,117,040 |
| Metropolitan Life Global Funding, 5.125%, 2013 | | 4/07/08 | | 6,575,180 | | 6,579,585 |
| Natixis S.A., 10% to 2018, FRN to 2049 | | 4/24/08 | | 6,870,000 | | 6,945,776 |
| OAO Gazprom, 8.146%, 2018 | | 4/02/08 | | 5,762,745 | | 5,945,123 |
| OAO Gazprom, 7.343%, 2013 | | 4/02/08-4/08/08 | | 2,798,873 | | 2,820,690 |
| Pearson PLC, 5.5%, 2013 | | 4/29/08 | | 3,081,873 | | 3,114,133 |
| Preferred Term Securities XIX Ltd., CDO, FRN, 3.15%, 2035 | | 9/08/05-11/15/07 | | 7,930,812 | | 6,671,708 |
| Prudential Securities Secured Financing Corp., FRN, 6.889%, 2013 | | 12/06/04 | | 1,976,499 | | 1,928,572 |
| Putnam Structured Product Funding, CDO, FRN, 3.166%, 2008 | | 9/23/03 | | 76,271 | | 68,644 |
26
Portfolio of Investments – continued
| | | | | | |
| Restricted Securities (continued) | | Acquisition
Date | | Cost | | Current
Market
Value |
| Salomon Brothers Mortgage Securities, Inc., FRN, 7.067%, 2032 | | 1/07/05 | | $3,710,339 | | $3,519,557 |
| Timberstar Trust, 5.668%, 2036 | | 10/13/06 | | 1,100,000 | | 1,057,408 |
| Wesfarmers Ltd., 6.998%, 2013 | | 4/03/08 | | 9,070,000 | | 9,435,231 |
| Total Restricted Securities | | | | | | $121,906,600 |
| % of Net Assets | | | | | | 4.5% |
The following abbreviations are used in this report and are defined:
| CDO | | Collateralized Debt Obligation |
| CLO | | Collateralized Loan Obligation |
| FRN | | Floating Rate Note. Interest rate resets periodically and may not be the rate reported at period end. |
| REIT | | Real Estate Investment Trust |
Insurers
| AMBAC | | AMBAC Indemnity Corp. |
| FGIC | | Financial Guaranty Insurance Co. |
| FSA | | Financial Security Assurance Inc. |
Derivative Contracts at 4/30/08
Futures contracts outstanding at 4/30/08
| | | | | | | | | |
| Description | | Contracts | | Value | | Expiration
Date | | Unrealized
Appreciation
(Depreciation) | |
| U.S. Treasury Bond (Short) | | 894 | | $104,500,219 | | Jun-08 | | $(1,812,083 | ) |
| U.S. Treasury Note 10 yr (Long) | | 26 | | 3,011,125 | | Jun-08 | | 39,722 | |
| | | | | | | | $(1,772,361 | ) |
| | | | | | | | | |
27
Portfolio of Investments – continued
Swap Agreements at 4/30/08
| | | | | | | | | | | | | |
| Expiration | | Notional
Amount | | Counterparty | | Cash Flows
to Receive | | Cash Flows
to Pay | | Value | |
| Credit Default Swaps | | | | | | | | | |
| 6/20/09 | | USD | | 4,000,000 | | JPMorgan Chase | | 4.10% (fixed rate) | | (1) | | (1,060,660 | ) |
| 6/20/09 | | USD | | 1,650,000 | | Goldman Sachs International | | (2) | | 1.30% (fixed rate) | | 165,552 | |
| 6/20/09 | | USD | | 1,940,000 | | Goldman Sachs International | | 1.35% (fixed rate) | | (3) | | (887,935 | ) |
| 12/20/12 | | USD | | 4,410,000 | | Merrill Lynch International | | (4) | | 1.35% (fixed rate) | | (38,416 | ) |
| 12/20/12 | | USD | | 6,090,000 | | Goldman Sachs International | | (5) | | 1.55% (fixed rate) | | (59,538 | ) |
| 12/20/12 | | USD | | 8,810,000 | | Goldman Sachs International | | (6) | | 1.43% (fixed rate) | | (6,065 | ) |
| 12/20/12 | | USD | | 3,050,000 | | Morgan Stanley Capital Services, Inc. | | (7) | | 1.60% (fixed rate) | | 10,273 | |
| 12/20/12 | | USD | | 6,090,000 | | Goldman Sachs International | | (8) | | 1.30% (fixed rate) | | (114,127 | ) |
| 3/20/13 | | USD | | 13,170,000 | | Goldman Sachs International | | (8) | | 2.13% (fixed rate) | | (745,733 | ) |
| 6/20/13 | | USD | | 5,990,000 | | Merrill Lynch International | | (9) | | 0.52% (fixed rate) | | (27,878 | ) |
| 6/20/13 | | USD | | 5,980,000 | | Morgan Stanley Capital Services, Inc. | | (10) | | 1.07% (fixed rate) | | (99,570 | ) |
| 6/20/13 | | USD | | 5,990,000 | | JPMorgan Chase Bank | | (11) | | 3.1% (fixed rate) | | (274,093 | ) |
| 6/20/13 | | USD | | 5,990,000 | | Morgan Stanley Capital Services, Inc. | | (12) | | 1.07% (fixed rate) | | (46,921 | ) |
| 6/20/13 | | USD | | 3,420,000 | | JPMorgan Chase Bank | | (13) | | 1.12% (fixed rate) | | (64,039 | ) |
| 6/20/13 | | USD | | 2,440,000 | | JPMorgan Chase Bank | | (13) | | 1.1% (fixed rate) | | (45,651 | ) |
| 6/20/13 | | USD | | 5,990,000 | | JPMorgan Chase Bank | | (14) | | 0.85% (fixed rate) | | (70,896 | ) |
| 6/20/13 | | USD | | 5,860,000 | | Morgan Stanley Capital Services, Inc. | | (15) | | 1.48% (fixed rate) | | (45,459 | ) |
| 12/13/49 | | USD | | 8,800,000 | | Morgan Stanley Capital Services, Inc. | | (16) | | 0.27% (fixed rate) | | 2,363,575 | |
| 12/13/49 | | USD | | 8,800,000 | | Morgan Stanley Capital Services, Inc. | | (17) | | 0.62% (fixed rate) | | 2,723,262 | |
| | | | | | | | | | | | | |
| | | | | | | | | | | | $1,675,681 | |
| | | | | | | | | | | | | |
| (1) | | Fund to pay notional amount upon a defined credit event by Abitibi Consolidated, 8.375%, 4/1/15. |
| (2) | | Fund to receive notional amount upon a defined credit event by GMAC, 6.875%, 8/1/12. |
| (3) | | Fund to pay notional amount upon a defined credit event by Rescap, 6.5%, 4/1/13. |
| (4) | | Fund to receive notional amount upon a defined credit event by Boston Properties, Inc., 6.25%, 1/15/13. |
| (5) | | Fund to receive notional amount upon a defined credit event by Equity Residential, Inc., 5.75%, 6/15/17. |
| (6) | | Fund to receive notional amount upon a defined credit event by Kimco Realty, 5.98%, 7/30/12. |
| (7) | | Fund to receive notional amount upon a defined credit event by ProLogis, Inc., 7.1%, 4/15/08. |
28
Portfolio of Investments – continued
| (8) | | Fund to receive notional amount upon a defined credit event by Simon Properties Group, Inc., 6.35%, 8/28/12. |
| (9) | | Fund to receive notional amount upon a defined credit event by Allstate Corp., 6.75%, 5/15/18. |
| (10) | | Fund to receive notional amount upon a defined credit event by Arrow Electrics, Inc., 6.875%, 6/1/18. |
| (11) | | Fund to receive notional amount upon a defined credit event by Capital One Financial Corp., 6.25%, 11/15/13. |
| (12) | | Fund to receive notional amount upon a defined credit event by Nordstrom, Inc., 6.95%, 3/15/28. |
| (13) | | Fund to receive notional amount upon a defined credit event by Universal Health Services, Inc., 7.125%, 6/30/16. |
| (14) | | Fund to receive notional amount upon a defined credit event by Wells Fargo Co., 3.107%, 10/28/15. |
| (15) | | Fund to receive notional amount upon a defined credit event by Weyerhaeuser Co., 7.125%, 7/15/23. |
| (16) | | Fund to receive notional amount upon a defined credit event by a reference obligation specified in the CMBX.NA.AA.3 Index. (a) |
| (17) | | Fund to receive notional amount upon a defined credit event by a reference obligation specified in the CMBX.NA.A.3 Index. (b) |
| (a) | | Net unamortized premiums paid by the fund amounted to $1,802,526. |
| (b) | | Net unamortized premiums paid by the fund amounted to $2,559,917. |
At April 30, 2008, the fund had sufficient cash and/or other liquid securities to cover any commitments under these derivative contracts.
See Notes to Financial Statements
29
Financial Statements
STATEMENT OF ASSETS AND LIABILITIES
At 4/30/08
This statement represents your fund’s balance sheet, which details the assets and liabilities comprising the total value of the fund.
| | | | | |
| Assets | | | | | |
| Investments - | | | | | |
| Non-affiliated issuers, at value (identified cost, $2,679,890,455) | | $2,631,831,849 | | | |
| Underlying funds, at cost and value | | 90,232 | | | |
| Total investments, at value (identified cost, $2,679,980,687) | | | | | $2,631,922,081 |
| Restricted cash | | $1,410,000 | | | |
| Receivable for investments sold | | 99,690,970 | | | |
| Receivable for fund shares sold | | 6,380,303 | | | |
| Interest and dividends receivable | | 26,348,922 | | | |
| Swaps, at value (net unamortized premiums paid, $4,362,443) | | 5,262,662 | | | |
| Other assets | | 24,585 | | | |
| Total assets | | | | | $2,771,039,523 |
| Liabilities | | | | | |
| Payable to custodian | | $5,385,912 | | | |
| Distributions payable | | 2,978,761 | | | |
| Payable for daily variation margin on open futures contracts | | 687,469 | | | |
| Payable for investments purchased | | 25,486,564 | | | |
| Payable for TBA purchase commitments | | 28,288,750 | | | |
| Payable for fund shares reacquired | | 5,208,044 | | | |
| Swaps, at value | | 3,586,981 | | | |
| Payable to affiliates | | | | | |
Management fee | | 43,994 | | | |
Shareholder servicing costs | | 707,795 | | | |
Distribution and service fees | | 34,880 | | | |
Administrative services fee | | 1,837 | | | |
Program manager fees | | 14 | | | |
| Payable for independent trustees’ compensation | | 6,971 | | | |
| Accrued expenses and other liabilities | | 278,797 | | | |
| Total liabilities | | | | | $72,696,769 |
| Net assets | | | | | $2,698,342,754 |
| Net assets consist of | | | | | |
| Paid-in capital | | $2,831,078,504 | | | |
| Unrealized appreciation (depreciation) on investments | | (52,517,729 | ) | | |
| Accumulated net realized gain (loss) on investments | | (77,909,083 | ) | | |
| Accumulated distributions in excess of net investment income | | (2,308,938 | ) | | |
| Net assets | | | | | $2,698,342,754 |
| Shares of beneficial interest outstanding | | | | | 275,857,242 |
30
Statement of Assets and Liabilities – continued
| | | | |
| Class A shares | | | | |
Net assets | | $1,137,795,752 | | |
Shares outstanding | | 116,347,240 | | |
Net asset value per share | | | | $9.78 |
Offering price per share (100/95.25 × net asset value per share) | | | | $10.27 |
| Class B shares | | | | |
Net assets | | $60,334,748 | | |
Shares outstanding | | 6,158,762 | | |
Net asset value and offering price per share | | | | $9.80 |
| Class C shares | | | | |
Net assets | | $83,506,068 | | |
Shares outstanding | | 8,524,153 | | |
Net asset value and offering price per share | | | | $9.80 |
| Class I shares | | | | |
Net assets | | $1,301,075,314 | | |
Shares outstanding | | 132,997,924 | | |
Net asset value, offering price, and redemption price per share | | | | $9.78 |
| Class W shares | | | | |
Net assets | | $14,320,808 | | |
Shares outstanding | | 1,463,576 | | |
Net asset value, offering price, and redemption price per share | | | | $9.78 |
| Class R1 shares | | | | |
Net assets | | $2,890,567 | | |
Shares outstanding | | 295,036 | | |
Net asset value, offering price, and redemption price per share | | | | $9.80 |
| Class R2 shares (formerly Class R3 shares) | | | | |
Net assets | | $42,612,800 | | |
Shares outstanding | | 4,361,618 | | |
Net asset value, offering price, and redemption price per share | | | | $9.77 |
| Class R3 shares (formerly Class R4 shares) | | | | |
Net assets | | $38,850,979 | | |
Shares outstanding | | 3,975,086 | | |
Net asset value, offering price, and redemption price per share | | | | $9.77 |
| Class R4 shares (formerly Class R5 shares) | | | | |
Net assets | | $14,181,684 | | |
Shares outstanding | | 1,450,078 | | |
Net asset value, offering price, and redemption price per share | | | | $9.78 |
31
Statement of Assets and Liabilities – continued
| | | | |
| Class 529A shares | | | | |
Net assets | | $1,169,941 | | |
Shares outstanding | | 119,948 | | |
Net asset value per share | | | | $9.75 |
Offering price per share (100/95.25 × net asset value per share) | | | | $10.24 |
| Class 529B shares | | | | |
Net assets | | $396,538 | | |
Shares outstanding | | 40,467 | | |
Net asset value and offering price per share | | | | $9.80 |
| Class 529C shares | | | | |
Net assets | | $1,207,555 | | |
Shares outstanding | | 123,354 | | |
Net asset value and offering price per share | | | | $9.79 |
On sales of $50,000 or more, the offering prices of Class A and Class 529A shares are reduced. A contingent deferred sales charge may be imposed on redemptions of Class A, Class B, Class C, Class 529B, and Class 529C shares.
See Notes to Financial Statements
32
Financial Statements
STATEMENT OF OPERATIONS
Year ended 4/30/08
This statement describes how much your fund earned in investment income and accrued in expenses. It also describes any gains and/or losses generated by fund operations.
| | | | | | |
| Net investment income | | | | | | |
| Income | | | | | | |
Interest | | $146,605,225 | | | | |
Dividends from underlying funds | | 2,761,465 | | | | |
| Total investment income | | | | | $149,366,690 | |
| Expenses | | | | | | |
Management fee | | $13,449,287 | | | | |
Distribution and service fees | | 5,897,685 | | | | |
Program manager fees | | 5,498 | | | | |
Shareholder servicing costs | | 2,985,007 | | | | |
Administrative services fee | | 387,979 | | | | |
Retirement plan administration and services fees | | 88,832 | | | | |
Independent trustees’ compensation | | 66,262 | | | | |
Custodian fee | | 275,395 | | | | |
Shareholder communications | | 267,983 | | | | |
Auditing fees | | 66,651 | | | | |
Legal fees | | 56,760 | | | | |
Miscellaneous | | 324,123 | | | | |
| Total expenses | | | | | $23,871,462 | |
Reduction of expenses by investment adviser and distributor | | (7,561,073 | ) | | | |
| Net expenses | | | | | $16,310,389 | |
| Net investment income | | | | | $133,056,301 | |
| Realized and unrealized gain (loss) on investments | | | | | | |
| Realized gain (loss) (identified cost basis) | | | | | | |
Investment transactions: | | | | | | |
Non-affiliated issuers | | $4,172,338 | | | | |
Futures contracts | | (4,894,186 | ) | | | |
Swap transactions | | (1,217,888 | ) | | | |
| Net realized gain (loss) on investments | | | | | $(1,939,736 | ) |
| Change in unrealized appreciation (depreciation) | | | | | | |
Investments | | $(44,606,641 | ) | | | |
Futures contracts | | (3,154,188 | ) | | | |
Swap transactions | | (2,675,403 | ) | | | |
| Net unrealized gain (loss) on investments | | | | | $(50,436,232 | ) |
| Net realized and unrealized gain (loss) on investments | | | | | $(52,375,968 | ) |
| Change in net assets from operations | | | | | $80,680,333 | |
See Notes to Financial Statements
33
Financial Statements
STATEMENTS OF CHANGES IN NET ASSETS
These statements describe the increases and/or decreases in net assets resulting from operations, any distributions, and any shareholder transactions.
| | | | | | |
| | | Years ended 4/30 | |
| | | 2008 | | | 2007 | |
| Change in net assets | | | | | | |
| From operations | | | | | | |
| Net investment income | | $133,056,301 | | | $94,992,374 | |
| Net realized gain (loss) on investments | | (1,939,736 | ) | | (13,332,198 | ) |
| Net unrealized gain (loss) on investments | | (50,436,232 | ) | | 53,803,532 | |
| Change in net assets from operations | | $80,680,333 | | | $135,463,708 | |
| Distributions declared to shareholders | | | | | | |
| From net investment income | | | | | | |
Class A | | $(60,575,705 | ) | | $(50,750,761 | ) |
Class B | | (2,974,522 | ) | | (3,098,834 | ) |
Class C | | (3,392,090 | ) | | (2,622,466 | ) |
Class I | | (67,572,057 | ) | | (40,427,770 | ) |
Class W | | (501,835 | ) | | (9,048 | ) |
Class R (b) | | (619,417 | ) | | (1,558,847 | ) |
Class R1 | | (100,955 | ) | | (45,592 | ) |
Former Class R2 (b) | | (192,144 | ) | | (72,788 | ) |
Class R2 (formerly Class R3) | | (1,470,449 | ) | | (923,717 | ) |
Class R3 (formerly Class R4) | | (2,003,760 | ) | | (972,591 | ) |
Class R4 (formerly Class R5) | | (628,088 | ) | | (250,653 | ) |
Class 529A | | (56,835 | ) | | (33,098 | ) |
Class 529B | | (14,565 | ) | | (7,137 | ) |
Class 529C | | (33,327 | ) | | (12,431 | ) |
| Total distributions declared to shareholders | | $(140,135,749 | ) | | $(100,785,733 | ) |
| Change in net assets from fund share transactions | | $504,824,249 | | | $481,309,737 | |
| Total change in net assets | | $445,368,833 | | | $515,987,712 | |
| Net assets | | | | | | |
| At beginning of period | | 2,252,973,921 | | | 1,736,986,209 | |
| At end of period (including accumulated distributions in excess of net investment income of $2,308,938 and $663,824, respectively) | | $2,698,342,754 | | | $2,252,973,921 | |
| (b) | At the close of business on April 18, 2008, Class R and Class R2 shares converted into Class R3 shares. Following the conversion, Class R3 shares were renamed Class R2 shares. |
See Notes to Financial Statements
34
Financial Statements
FINANCIAL HIGHLIGHTS
The financial highlights table is intended to help you understand the fund’s financial performance for the past 5 years (or life of a particular share class, if shorter). Certain information reflects financial results for a single fund share. The total returns in the table represent the rate by which an investor would have earned (or lost) on an investment in the fund share class (assuming reinvestment of all distributions) held for the entire period.
| | | | | | | | | | | | | | | |
| Class A | | Years ended 4/30 | |
| | | 2008 | | | 2007 | | | 2006 | | | 2005 | | | 2004 | |
| Net asset value, beginning of period | | $10.04 | | | $9.86 | | | $10.33 | | | $10.35 | | | $10.62 | |
| Income (loss) from investment operations | | | | | | | | | | | | | | | |
Net investment income (d) | | $0.49 | | | $0.47 | | | $0.41 | | | $0.39 | | | $0.40 | |
Net realized and unrealized gain (loss)
on investments and foreign currency | | (0.24 | ) | | 0.21 | | | (0.33 | ) | | 0.13 | | | (0.07 | ) |
| Total from investment operations | | $0.25 | | | $0.68 | | | $0.08 | | | $0.52 | | | $0.33 | |
| Less distributions declared to shareholders | | | | | | | | | | | | | | | |
From net investment income | | $(0.51 | ) | | $(0.50 | ) | | $(0.54 | ) | | $(0.52 | ) | | $(0.54 | ) |
From net realized gain on investments | | — | | | — | | | (0.01 | ) | | (0.02 | ) | | (0.06 | ) |
| Total distributions declared to shareholders | | $(0.51 | ) | | $(0.50 | ) | | $(0.55 | ) | | $(0.54 | ) | | $(0.60 | ) |
| Net asset value, end of period | | $9.78 | | | $10.04 | | | $9.86 | | | $10.33 | | | $10.35 | |
| Total return (%) (r)(s)(t) | | 2.60 | | | 7.08 | | | 0.70 | | | 5.10 | | | 3.11 | |
Ratios (%) (to average net assets)
and Supplemental data: | | | | | | | | | | | | | | | |
| Expenses before expense reductions (f) | | 1.02 | | | 1.06 | | | 1.09 | | | 1.07 | | | 1.08 | |
| Expenses after expense reductions (f) | | 0.62 | | | 0.70 | | | 0.70 | | | 0.70 | | | 0.70 | |
| Net investment income | | 4.94 | | | 4.75 | | | 4.05 | | | 3.77 | | | 3.81 | |
| Portfolio turnover | | 96 | | | 56 | | | 77 | | | 99 | | | 170 | |
Net assets at end of period
(000 Omitted) | | $1,137,796 | | | $1,059,522 | | | $922,617 | | | $671,506 | | | $531,705 | |
See Notes to Financial Statements
35
Financial Highlights – continued
| | | | | | | | | | | | | | | |
| Class B | | Years ended 4/30 | |
| | | 2008 | | | 2007 | | | 2006 | | | 2005 | | | 2004 | |
| Net asset value, beginning of period | | $10.06 | | | $9.88 | | | $10.34 | | | $10.37 | | | $10.64 | |
| Income (loss) from investment operations | | | | | | | | | | | | | | | |
Net investment income (d) | | $0.41 | | | $0.39 | | | $0.33 | | | $0.30 | | | $0.31 | |
Net realized and unrealized gain (loss)
on investments and foreign currency | | (0.24 | ) | | 0.21 | | | (0.33 | ) | | 0.12 | | | (0.07 | ) |
| Total from investment operations | | $0.17 | | | $0.60 | | | $— | | | $0.42 | | | $0.24 | |
| Less distributions declared to shareholders | | | | | | | | | | | | | | | |
From net investment income | | $(0.43 | ) | | $(0.42 | ) | | $(0.45 | ) | | $(0.43 | ) | | $(0.45 | ) |
From net realized gain on investments | | — | | | — | | | (0.01 | ) | | (0.02 | ) | | (0.06 | ) |
| Total distributions declared to shareholders | | $(0.43 | ) | | $(0.42 | ) | | $(0.46 | ) | | $(0.45 | ) | | $(0.51 | ) |
| Net asset value, end of period | | $9.80 | | | $10.06 | | | $9.88 | | | $10.34 | | | $10.37 | |
| Total return (%) (r)(s)(t) | | 1.75 | | | 6.17 | | | (0.04 | ) | | 4.11 | | | 2.24 | |
Ratios (%) (to average net assets)
and Supplemental data: | | | | | | | | | | | | | | | |
| Expenses before expense reductions (f) | | 1.63 | | | 1.71 | | | 1.74 | | | 1.72 | | | 1.73 | |
| Expenses after expense reductions (f) | | 1.43 | | | 1.55 | | | 1.55 | | | 1.55 | | | 1.55 | |
| Net investment income | | 4.11 | | | 3.92 | | | 3.21 | | | 2.93 | | | 2.92 | |
| Portfolio turnover | | 96 | | | 56 | | | 77 | | | 99 | | | 170 | |
Net assets at end of period
(000 Omitted) | | $60,335 | | | $67,970 | | | $77,518 | | | $83,473 | | | $90,726 | |
See Notes to Financial Statements
36
Financial Highlights – continued
| | | | | | | | | | | | | | | |
| Class C | | Years ended 4/30 | |
| | | 2008 | | | 2007 | | | 2006 | | | 2005 | | | 2004 | |
| Net asset value, beginning of period | | $10.05 | | | $9.88 | | | $10.34 | | | $10.37 | | | $10.64 | |
| Income (loss) from investment operations | | | | | | | | | | | | | | | |
Net investment income (d) | | $0.40 | | | $0.39 | | | $0.32 | | | $0.30 | | | $0.31 | |
Net realized and unrealized gain (loss)
on investments and foreign currency | | (0.22 | ) | | 0.20 | | | (0.32 | ) | | 0.12 | | | (0.07 | ) |
| Total from investment operations | | $0.18 | | | $0.59 | | | $— | | | $0.42 | | | $0.24 | |
| Less distributions declared to shareholders | | | | | | | | | | | | | | | |
From net investment income | | $(0.43 | ) | | $(0.42 | ) | | $(0.45 | ) | | $(0.43 | ) | | $(0.45 | ) |
From net realized gain on investments | | — | | | — | | | (0.01 | ) | | (0.02 | ) | | (0.06 | ) |
| Total distributions declared to shareholders | | $(0.43 | ) | | $(0.42 | ) | | $(0.46 | ) | | $(0.45 | ) | | $(0.51 | ) |
| Net asset value, end of period | | $9.80 | | | $10.05 | | | $9.88 | | | $10.34 | | | $10.37 | |
| Total return (%) (r)(s)(t) | | 1.84 | | | 6.07 | | | (0.04 | ) | | 4.11 | | | 2.24 | |
Ratios (%) (to average net assets)
and Supplemental data: | | | | | | | | | | | | | | | |
| Expenses before expense reductions (f) | | 1.67 | | | 1.71 | | | 1.74 | | | 1.72 | | | 1.73 | |
| Expenses after expense reductions (f) | | 1.47 | | | 1.55 | | | 1.55 | | | 1.55 | | | 1.55 | |
| Net investment income | | 4.08 | | | 3.90 | | | 3.20 | | | 2.93 | | | 2.93 | |
| Portfolio turnover | | 96 | | | 56 | | | 77 | | | 99 | | | 170 | |
Net assets at end of period
(000 Omitted) | | $83,506 | | | $67,112 | | | $59,342 | | | $53,915 | | | $53,029 | |
See Notes to Financial Statements
37
Financial Highlights – continued
| | | | | | | | | | | | | | | |
| Class I | | Years ended 4/30 | |
| | | 2008 | | | 2007 | | | 2006 | | | 2005 | | | 2004 | |
| Net asset value, beginning of period | | $10.04 | | | $9.87 | | | $10.33 | | | $10.35 | | | $10.62 | |
| Income (loss) from investment operations | | | | | | | | | | | | | | | |
Net investment income (d) | | $0.50 | | | $0.48 | | | $0.42 | | | $0.40 | | | $0.42 | |
Net realized and unrealized gain (loss)
on investments and foreign currency | | (0.23 | ) | | 0.21 | | | (0.32 | ) | | 0.13 | | | (0.08 | ) |
| Total from investment operations | | $0.27 | | | $0.69 | | | $0.10 | | | $0.53 | | | $0.34 | |
| Less distributions declared to shareholders | | | | | | | | | | | | | | | |
From net investment income | | $(0.53 | ) | | $(0.52 | ) | | $(0.55 | ) | | $(0.53 | ) | | $(0.55 | ) |
From net realized gain on investments | | — | | | — | | | (0.01 | ) | | (0.02 | ) | | (0.06 | ) |
| Total distributions declared to shareholders | | $(0.53 | ) | | $(0.52 | ) | | $(0.56 | ) | | $(0.55 | ) | | $(0.61 | ) |
| Net asset value, end of period | | $9.78 | | | $10.04 | | | $9.87 | | | $10.33 | | | $10.35 | |
| Total return (%) (r)(s) | | 2.75 | | | 7.13 | | | 0.96 | | | 5.26 | | | 3.27 | |
Ratios (%) (to average net assets)
and Supplemental data: | | | | | | | | | | | | | | | |
| Expenses before expense reductions (f) | | 0.67 | | | 0.71 | | | 0.74 | | | 0.72 | | | 0.73 | |
| Expenses after expense reductions (f) | | 0.47 | | | 0.55 | | | 0.55 | | | 0.55 | | | 0.55 | |
| Net investment income | | 5.09 | | | 4.89 | | | 4.20 | | | 3.95 | | | 3.93 | |
| Portfolio turnover | | 96 | | | 56 | | | 77 | | | 99 | | | 170 | |
Net assets at end of period
(000 Omitted) | | $1,301,075 | | | $958,287 | | | $614,643 | | | $486,212 | | | $249,314 | |
See Notes to Financial Statements
38
Financial Highlights – continued
| | | | | | |
| Class W | | Years ended 4/30 | |
| | | 2008 | | | 2007 | |
| Net asset value, beginning of period | | $10.03 | | | $9.86 | |
| Income (loss) from investment operations | | | | | | |
Net investment income (d) | | $0.49 | | | $0.39 | |
Net realized and unrealized gain (loss)
on investments | | (0.22 | ) | | 0.29 | |
| Total from investment operations | | $0.27 | | | $0.68 | |
| Less distributions declared to shareholders | | | | | | |
From net investment income | | $(0.52 | ) | | $(0.51 | ) |
| Net asset value, end of period | | $9.78 | | | $10.03 | |
| Total return (%) (r)(s) | | 2.75 | | | 7.02 | |
Ratios (%) (to average net assets)
and Supplemental data: | | | | | | |
| Expenses before expense reductions (f) | | 0.77 | | | 0.82 | |
| Expenses after expense reductions (f) | | 0.57 | | | 0.65 | |
| Net investment income | | 4.92 | | | 4.55 | |
| Portfolio turnover | | 96 | | | 56 | |
Net assets at end of period
(000 Omitted) | | $14,321 | | | $861 | |
See Notes to Financial Statements
39
Financial Highlights – continued
| | | | | | | | | | | | |
| Class R1 | | Years ended 4/30 | |
| | | 2008 | | | 2007 | | | 2006 | | | 2005 (i) | |
| Net asset value, beginning of period | | $10.06 | | | $9.88 | | | $10.35 | | | $10.28 | |
| Income (loss) from investment operations | | | | | | | | | | | | |
Net investment income (d) | | $0.40 | | | $0.38 | | | $0.32 | | | $0.03 | |
Net realized and unrealized gain (loss)
on investments and foreign currency | | (0.24 | ) | | 0.21 | | | (0.34 | ) | | 0.08 | |
| Total from investment operations | | $0.16 | | | $0.59 | | | $(0.02 | ) | | $0.11 | |
| Less distributions declared to shareholders | | | | | | | | | | | | |
From net investment income | | $(0.42 | ) | | $(0.41 | ) | | $(0.44 | ) | | $(0.04 | ) |
From net realized gain on investments | | — | | | — | | | (0.01 | ) | | — | |
| Total distributions declared to shareholders | | $(0.42 | ) | | $(0.41 | ) | | $(0.45 | ) | | $(0.04 | ) |
| Net asset value, end of period | | $9.80 | | | $10.06 | | | $9.88 | | | $10.35 | |
| Total return (%) (r)(s) | | 1.65 | | | 6.07 | | | (0.28 | ) | | 1.02 | (n) |
Ratios (%) (to average net assets)
and Supplemental data: | | | | | | | | | | | | |
| Expenses before expense reductions (f) | | 1.75 | | | 1.90 | | | 1.94 | | | 1.93 | (a) |
| Expenses after expense reductions (f) | | 1.56 | | | 1.65 | | | 1.67 | | | 1.76 | (a) |
| Net investment income | | 3.99 | | | 3.79 | | | 3.11 | | | 2.93 | (a) |
| Portfolio turnover | | 96 | | | 56 | | | 77 | | | 99 | |
Net assets at end of period
(000 Omitted) | | $2,891 | | | $1,655 | | | $488 | | | $50 | |
See Notes to Financial Statements
40
Financial Highlights – continued
| | | | | | | | | | | | | | | |
| Class R2 (formerly Class R3) | | Years ended 4/30 | |
| | | 2008 | | | 2007 | | | 2006 | | | 2005 | | | 2004 (i) | |
| Net asset value, beginning of period | | $10.03 | | | $9.85 | | | $10.32 | | | $10.35 | | | $10.49 | |
| Income (loss) from investment operations | | | | | | | | | | | | | | | |
Net investment income (d) | | $0.44 | | | $0.42 | | | $0.36 | | | $0.32 | | | $0.17 | |
Net realized and unrealized gain (loss)
on investments and foreign currency | | (0.23 | ) | | 0.21 | | | (0.34 | ) | | 0.12 | | | (0.02 | )(g) |
| Total from investment operations | | $0.21 | | | $0.63 | | | $0.02 | | | $0.44 | | | $0.15 | |
| Less distributions declared to shareholders | | | | | | | | | | | | | | | |
From net investment income | | $(0.47 | ) | | $(0.45 | ) | | $(0.48 | ) | | $(0.45 | ) | | $(0.23 | ) |
From net realized gain on investments | | — | | | — | | | (0.01 | ) | | (0.02 | ) | | (0.06 | ) |
| Total distributions declared to shareholders | | $(0.47 | ) | | $(0.45 | ) | | $(0.49 | ) | | $(0.47 | ) | | $(0.29 | ) |
| Net asset value, end of period | | $9.77 | | | $10.03 | | | $9.85 | | | $10.32 | | | $10.35 | |
| Total return (%) (r)(s) | | 2.14 | | | 6.55 | | | 0.16 | | | 4.34 | | | 1.44 | (n) |
Ratios (%) (to average net assets)
and Supplemental data: | | | | | | | | | | | | | | | |
| Expenses before expense reductions (f) | | 1.27 | | | 1.45 | | | 1.49 | | | 1.48 | | | 1.47 | (a) |
| Expenses after expense reductions (f) | | 1.07 | | | 1.20 | | | 1.23 | | | 1.31 | | | 1.29 | (a) |
| Net investment income | | 4.49 | | | 4.25 | | | 3.54 | | | 3.25 | | | 3.24 | (a) |
| Portfolio turnover | | 96 | | | 56 | | | 77 | | | 99 | | | 170 | |
Net assets at end of period
(000 Omitted) | | $42,613 | | | $26,212 | | | $14,923 | | | $3,908 | | | $40 | |
See Notes to Financial Statements
41
Financial Highlights – continued
| | | | | | | | | | | | |
| Class R3 (formerly Class R4) | | Years ended 4/30 | |
| | | 2008 | | | 2007 | | | 2006 | | | 2005 (i) | |
| Net asset value, beginning of period | | $10.03 | | | $9.86 | | | $10.33 | | | $10.26 | |
| Income (loss) from investment operations | | | | | | | | | | | | |
Net investment income (d) | | $0.47 | | | $0.45 | | | $0.37 | | | $0.03 | |
Net realized and unrealized gain (loss)
on investments and foreign currency | | (0.24 | ) | | 0.20 | | | (0.32 | ) | | 0.08 | |
| Total from investment operations | | $0.23 | | | $0.65 | | | $0.05 | | | $0.11 | |
| Less distributions declared to shareholders | | | | | | | | | | | | |
From net investment income | | $(0.49 | ) | | $(0.48 | ) | | $(0.51 | ) | | $(0.04 | ) |
From net realized gain on investments | | — | | | — | | | (0.01 | ) | | — | |
| Total distributions declared to shareholders | | $(0.49 | ) | | $(0.48 | ) | | $(0.52 | ) | | $(0.04 | ) |
| Net asset value, end of period | | $9.77 | | | $10.03 | | | $9.86 | | | $10.33 | |
| Total return (%) (r)(s) | | 2.39 | | | 6.71 | | | 0.45 | | | 1.09 | (n) |
Ratios (%) (to average net assets)
and Supplemental data: | | | | | | | | | | | | |
| Expenses before expense reductions (f) | | 1.01 | | | 1.12 | | | 1.14 | | | 1.12 | (a) |
| Expenses after expense reductions (f) | | 0.82 | | | 0.95 | | | 0.95 | | | 0.95 | (a) |
| Net investment income | | 4.74 | | | 4.50 | | | 3.82 | | | 3.73 | (a) |
| Portfolio turnover | | 96 | | | 56 | | | 77 | | | 99 | |
Net assets at end of period
(000 Omitted) | | $38,851 | | | $28,761 | | | $10,835 | | | $51 | |
See Notes to Financial Statements
42
Financial Highlights – continued
| | | | | | | | | | | | |
| Class R4 (formerly Class R5) | | Years ended 4/30 | |
| | | 2008 | | | 2007 | | | 2006 | | | 2005 (i) | |
| Net asset value, beginning of period | | $10.04 | | | $9.86 | | | $10.33 | | | $10.26 | |
| Income (loss) from investment operations | | | | | | | | | | | | |
Net investment income (d) | | $0.49 | | | $0.47 | | | $0.36 | | | $0.03 | |
Net realized and unrealized gain (loss)
on investments and foreign currency | | (0.23 | ) | | 0.22 | | | (0.28 | ) | | 0.08 | |
| Total from investment operations | | $0.26 | | | $0.69 | | | $0.08 | | | $0.11 | |
| Less distributions declared to shareholders | | | | | | | | | | | | |
From net investment income | | $(0.52 | ) | | $(0.51 | ) | | $(0.54 | ) | | $(0.04 | ) |
From net realized gain on investments | | — | | | — | | | (0.01 | ) | | — | |
| Total distributions declared to shareholders | | $(0.52 | ) | | $(0.51 | ) | | $(0.55 | ) | | $(0.04 | ) |
| Net asset value, end of period | | $9.78 | | | $10.04 | | | $9.86 | | | $10.33 | |
| Total return (%) (r)(s) | | 2.68 | | | 7.13 | | | 0.76 | | | 1.12 | (n) |
Ratios (%) (to average net assets)
and Supplemental data: | | | | | | | | | | | | |
| Expenses before expense reductions (f) | | 0.73 | | | 0.82 | | | 0.84 | | | 0.82 | (a) |
| Expenses after expense reductions (f) | | 0.54 | | | 0.65 | | | 0.65 | | | 0.65 | (a) |
| Net investment income | | 5.02 | | | 4.75 | | | 4.02 | | | 4.04 | (a) |
| Portfolio turnover | | 96 | | | 56 | | | 77 | | | 99 | |
Net assets at end of period
(000 Omitted) | | $14,182 | | | $11,129 | | | $358 | | | $51 | |
See Notes to Financial Statements
43
Financial Highlights – continued
| | | | | | | | | | | | | | | |
| Class 529A | | Years ended 4/30 | |
| | | 2008 | | | 2007 | | | 2006 | | | 2005 | | | 2004 | |
| Net asset value, beginning of period | | $10.01 | | | $9.84 | | | $10.30 | | | $10.33 | | | $10.61 | |
| Income (loss) from investment operations | | | | | | | | | | | | | | | |
Net investment income (d) | | $0.45 | | | $0.42 | | | $0.37 | | | $0.36 | | | $0.36 | |
Net realized and unrealized gain (loss)
on investments and foreign currency | | (0.23 | ) | | 0.22 | | | (0.32 | ) | | 0.11 | | | (0.07 | ) |
| Total from investment operations | | $0.22 | | | $0.64 | | | $0.05 | | | $0.47 | | | $0.29 | |
| Less distributions declared to shareholders | | | | | | | | | | | | | | | |
From net investment income | | $(0.48 | ) | | $(0.47 | ) | | $(0.50 | ) | | $(0.48 | ) | | $(0.51 | ) |
From net realized gain on investments | | — | | | — | | | (0.01 | ) | | (0.02 | ) | | (0.06 | ) |
| Total distributions declared to shareholders | | $(0.48 | ) | | $(0.47 | ) | | $(0.51 | ) | | $(0.50 | ) | | $(0.57 | ) |
| Net asset value, end of period | | $9.75 | | | $10.01 | | | $9.84 | | | $10.30 | | | $10.33 | |
| Total return (%) (r)(s)(t) | | 2.24 | | | 6.60 | | | 0.44 | | | 4.66 | | | 2.75 | |
Ratios (%) (to average net assets)
and Supplemental data: | | | | | | | | | | | | | | | |
| Expenses before expense reductions (f) | | 1.26 | | | 1.32 | | | 1.34 | | | 1.47 | | | 1.33 | |
| Expenses after expense reductions (f) | | 0.96 | | | 1.05 | | | 1.05 | | | 1.05 | | | 1.05 | |
| Net investment income | | 4.61 | | | 4.41 | | | 3.71 | | | 3.44 | | | 3.44 | |
| Portfolio turnover | | 96 | | | 56 | | | 77 | | | 99 | | | 170 | |
Net assets at end of period
(000 Omitted) | | $1,170 | | | $1,213 | | | $637 | | | $498 | | | $229 | |
See Notes to Financial Statements
44
Financial Highlights – continued
| | | | | | | | | | | | | | | |
| Class 529B | | Years ended 4/30 | |
| | | 2008 | | | 2007 | | | 2006 | | | 2005 | | | 2004 | |
| Net asset value, beginning of period | | $10.06 | | | $9.88 | | | $10.35 | | | $10.36 | | | $10.64 | |
| Income (loss) from investment operations | | | | | | | | | | | | | | | |
Net investment income (d) | | $0.38 | | | $0.35 | | | $0.30 | | | $0.28 | | | $0.29 | |
Net realized and unrealized gain (loss)
on investments and foreign currency | | (0.23 | ) | | 0.22 | | | (0.33 | ) | | 0.13 | | | (0.09 | ) |
| Total from investment operations | | $0.15 | | | $0.57 | | | $(0.03 | ) | | $0.41 | | | $0.20 | |
| Less distributions declared to shareholders | | | | | | | | | | | | | | | |
From net investment income | | $(0.41 | ) | | $(0.39 | ) | | $(0.43 | ) | | $(0.40 | ) | | $(0.42 | ) |
From net realized gain on investments | | — | | | — | | | (0.01 | ) | | (0.02 | ) | | (0.06 | ) |
| Total distributions declared to shareholders | | $(0.41 | ) | | $(0.39 | ) | | $(0.44 | ) | | $(0.42 | ) | | $(0.48 | ) |
| Net asset value, end of period | | $9.80 | | | $10.06 | | | $9.88 | | | $10.35 | | | $10.36 | |
| Total return (%) (r)(s)(t) | | 1.50 | | | 5.91 | | | (0.39 | ) | | 3.97 | | | 1.89 | |
Ratios (%) (to average net assets)
and Supplemental data: | | | | | | | | | | | | | | | |
| Expenses before expense reductions (f) | | 1.91 | | | 1.97 | | | 1.99 | | | 1.97 | | | 1.98 | |
| Expenses after expense reductions (f) | | 1.71 | | | 1.80 | | | 1.80 | | | 1.80 | | | 1.80 | |
| Net investment income | | 3.84 | | | 3.66 | | | 2.96 | | | 2.68 | | | 2.69 | |
| Portfolio turnover | | 96 | | | 56 | | | 77 | | | 99 | | | 170 | |
Net assets at end of period
(000 Omitted) | | $397 | | | $355 | | | $153 | | | $130 | | | $117 | |
See Notes to Financial Statements
45
Financial Highlights – continued
| | | | | | | | | | | | | | | |
| Class 529C | | Years ended 4/30 | |
| | | 2008 | | | 2007 | | | 2006 | | | 2005 | | | 2004 | |
| Net asset value, beginning of period | | $10.05 | | | $9.87 | | | $10.34 | | | $10.36 | | | $10.63 | |
| Income (loss) from investment operations | | | | | | | | | | | | | | | |
Net investment income (d) | | $0.37 | | | $0.35 | | | $0.30 | | | $0.28 | | | $0.28 | |
Net realized and unrealized gain (loss)
on investments and foreign currency | | (0.22 | ) | | 0.22 | | | (0.33 | ) | | 0.12 | | | (0.07 | ) |
| Total from investment operations | | $0.15 | | | $0.57 | | | $(0.03 | ) | | $0.40 | | | $0.21 | |
| Less distributions declared to shareholders | | | | | | | | | | | | | | | |
From net investment income | | $(0.41 | ) | | $(0.39 | ) | | $(0.43 | ) | | $(0.40 | ) | | $(0.42 | ) |
From net realized gain on investments | | — | | | — | | | (0.01 | ) | | (0.02 | ) | | (0.06 | ) |
| Total distributions declared to shareholders | | $(0.41 | ) | | $(0.39 | ) | | $(0.44 | ) | | $(0.42 | ) | | $(0.48 | ) |
| Net asset value, end of period | | $9.79 | | | $10.05 | | | $9.87 | | | $10.34 | | | $10.36 | |
| Total return (%) (r)(s)(t) | | 1.49 | | | 5.91 | | | (0.39 | ) | | 3.91 | | | 1.98 | |
Ratios (%) (to average net assets)
and Supplemental data: | | | | | | | | | | | | | | | |
| Expenses before expense reductions (f) | | 1.91 | | | 1.97 | | | 1.99 | | | 1.97 | | | 1.98 | |
| Expenses after expense reductions (f) | | 1.71 | | | 1.80 | | | 1.80 | | | 1.80 | | | 1.80 | |
| Net investment income | | 3.82 | | | 3.65 | | | 3.20 | | | 2.69 | | | 2.70 | |
| Portfolio turnover | | 96 | | | 56 | | | 77 | | | 99 | | | 170 | |
Net assets at end of period
(000 Omitted) | | $1,208 | | | $628 | | | $283 | | | $249 | | | $195 | |
Any redemption fees charged by the fund during the 2004 and 2005 fiscal years resulted in a per share impact of less than $0.01.
| (d) | Per share data is based on average shares outstanding. |
| (f) | Ratios do not reflect reductions from fees paid indirectly, if applicable. |
| (g) | The per share amount varies from the net realized and unrealized gain/loss for the period because of the timing of sales of fund shares and the per share amount of realized and unrealized gains and losses at such time. |
| (i) | For the period from the class’ inception, October 31, 2003 (Class R2), and April 1, 2005 (Classes R1, R3, and R4) through the stated period end. |
| (r) | Certain expenses have been reduced without which performance would have been lower. |
| (s) | From time to time the fund may receive proceeds from litigation settlements, without which performance would be lower. |
| (t) | Total returns do not include any applicable sales charges. |
See Notes to Financial Statements
46
NOTES TO FINANCIAL STATEMENTS
| (1) | | Business and Organization |
MFS Research Bond Fund (the fund) is a series of MFS Series Trust IX (the trust). The trust is organized as a Massachusetts business trust and is registered under the Investment Company Act of 1940, as amended, as an open-end management investment company.
| (2) | | Significant Accounting Policies |
General – The preparation of financial statements in conformity with U.S. generally accepted accounting principles requires management to make estimates and assumptions that affect the reported amounts of assets and liabilities, and disclosure of contingent assets and liabilities at the date of the financial statements and the reported amounts of revenues and expenses during the reporting period. Actual results could differ from those estimates. The fund can invest in foreign securities, including securities of emerging market issuers. Investments in foreign securities are vulnerable to the effects of changes in the relative values of the local currency and the U.S. dollar and to the effects of changes in each country’s legal, political, and economic environment. The markets of emerging markets countries are generally more volatile than the markets of developed countries with more mature economies. All of the risks of investing in foreign securities previously described are heightened when investing in emerging markets countries.
Investment Valuations – Debt instruments and floating rate loans (other than short-term instruments), including restricted debt instruments, are generally valued at an evaluated or composite bid as reported by an independent pricing service. Short-term instruments with a maturity at issuance of 60 days or less may be valued at amortized cost, which approximates market value. Futures contracts are generally valued at last posted settlement price as reported by an independent pricing service on the market on which they are primarily traded. Futures contracts for which there were no trades that day for a particular position are generally valued at the closing bid quotation as reported by an independent pricing service on the market on which such futures contracts are primarily traded. Swaps are generally valued at an evaluated bid as reported by an independent pricing service. Open-end investment companies are generally valued at net asset value per share. Securities and other assets generally valued on the basis of information from an independent pricing service may also be valued at a broker-dealer bid quotation. Values obtained from pricing services can utilize both dealer-supplied valuations and electronic data processing techniques, which take into account factors such as institutional-size trading in similar groups of securities, yield, quality, coupon rate, maturity, type of issue, trading characteristics, and other market data. The values of foreign securities
47
Notes to Financial Statements – continued
and other assets and liabilities expressed in foreign currencies are converted to U.S. dollars using the mean of bid and asked prices for rates reported by an independent pricing service.
The Board of Trustees has delegated primary responsibility for determining or causing to be determined the value of the fund’s investments (including any fair valuation) to the adviser pursuant to valuation policies and procedures approved by the Board. If the adviser determines that reliable market quotations are not readily available, investments are valued at fair value as determined in good faith by the adviser in accordance with such procedures under the oversight of the Board of Trustees. Under the fund’s valuation policies and procedures, market quotations are not considered to be readily available for most types of debt instruments and floating rate loans and many types of derivatives. These investments are generally valued at fair value based on information from independent pricing services. In addition, investments may be valued at fair value if the adviser determines that an investment’s value has been materially affected by events occurring after the close of the exchange or market on which the investment is principally traded (such as foreign exchange or market) and prior to the determination of the fund’s net asset value, or after the halting of trading of a specific security where trading does not resume prior to the close of the exchange or market on which the security is principally traded. The adviser may rely on independent pricing services or other information (such as the correlation with price movements of similar securities in the same or other markets; the type, cost and investment characteristics of the security; the business and financial condition of the issuer; and trading and other market data) to assist in determining whether to fair value and at what value to fair value an investment. The value of an investment for purposes of calculating the fund’s net asset value can differ depending on the source and method used to determine value. When fair valuation is used, the value of investments used to determine the fund’s net asset value may differ from quoted or published prices for the same investments.
In September 2006, FASB Statement No. 157, Fair Value Measurements (the “Statement”) was issued, and is effective for fiscal years beginning after November 15, 2007 and for all interim periods within those fiscal years. This Statement provides a single definition of fair value, a hierarchy for measuring fair value and expanded disclosures about fair value measurements. Management is evaluating the application of the Statement to the fund, and believes the impact will be limited to expanded disclosures resulting from the adoption of this Statement in the fund’s financial statements.
Foreign Currency Translation – Purchases and sales of foreign investments, income, and expenses are converted into U.S. dollars based upon currency exchange rates prevailing on the respective dates of such transactions. Gains
48
Notes to Financial Statements – continued
and losses attributable to foreign currency exchange rates on sales of securities are recorded for financial statement purposes as net realized gains and losses on investments. Gains and losses attributable to foreign exchange rate movements on income and expenses are recorded for financial statement purposes as foreign currency transaction gains and losses. That portion of both realized and unrealized gains and losses on investments that results from fluctuations in foreign currency exchange rates is not separately disclosed.
Derivative Risk – The fund may invest in derivatives for hedging or non-hedging purposes. While hedging can reduce or eliminate losses, it can also reduce or eliminate gains. When the fund uses derivatives as an investment to gain market exposure, or for hedging purposes, gains and losses from derivative instruments may be substantially greater than the derivative’s original cost. Cash that has been segregated on behalf of certain derivative contracts will be reported separately on the Statement of Assets and Liabilities as restricted cash. Derivative instruments include futures contracts and swap agreements.
Futures Contracts – The fund may enter into futures contracts for the delayed delivery of securities or currency, or contracts based on financial indices at a fixed price on a future date. In entering such contracts, the fund is required to deposit with the broker either in cash or securities an amount equal to a certain percentage of the contract amount. Subsequent payments are made or received by the fund each day, depending on the daily fluctuations in the value of the contract, and are recorded for financial statement purposes as unrealized gains or losses by the fund. Upon entering into such contracts, the fund bears the risk of interest or exchange rates or securities prices moving unexpectedly, in which case, the fund may not achieve the anticipated benefits of the futures contracts and may realize a loss.
Swap Agreements – The fund may enter into swap agreements. A swap is an exchange of cash payments between the fund and another party. Net cash payments are exchanged at specified intervals and are recorded as a realized gain or loss in the Statement of Operations. The value of the swap is adjusted daily and the change in value, including accruals of periodic amounts of interest to be paid or received, is recorded as unrealized appreciation or depreciation in the Statement of Operations. Amounts paid or received at the inception of the swap are reflected as premiums paid or received on the Statement of Assets and Liabilities and are amortized using the effective interest method over the term of the agreement. A liquidation payment received or made upon early termination is recorded as a realized gain or loss in the Statement of Operations. Collateral, in the form of cash or securities, may be required to be held in segregated accounts with the fund’s custodian in connection with these agreements. Risk of loss may exceed amounts
49
Notes to Financial Statements – continued
recognized on the Statement of Assets and Liabilities. These risks include the possible lack of a liquid market, failure of the counterparty to perform under the terms of the agreements, and unfavorable market and interest rate movements of the underlying instrument. All swap agreements entered into by the fund with the same counterparty are generally governed by a single master agreement, which provides for the netting of all amounts owed by the parties under the agreement upon the occurrence of an event of default, thereby reducing the credit risk to which such party is exposed.
The fund holds credit default swaps in which one party makes a stream of payments based on a fixed percentage applied to the notional amount to another party in exchange for the right to receive a specified return in the event of a default by a third party, such as a corporate issuer or foreign issuer, on its obligation. The fund may enter into credit default swaps to limit or to reduce its risk exposure to defaults of corporate and sovereign issuers or to create direct or synthetic short or long exposure to corporate debt securities or certain sovereign debt securities to which it is not otherwise exposed.
In March 2008, FASB Statement No. 161, Disclosures about Derivative Instruments and Hedging Activities (the “Standard”) was issued, and is effective for financial statements issued for fiscal years and interim periods beginning after November 15, 2008. This Standard provides enhanced disclosures about the fund’s use of and accounting for derivative instruments and the effect of derivative instruments on the fund’s results of operations and financial position. Management is evaluating the application of the Standard to the fund, and has not at this time determined the impact, if any, resulting from the adoption of this Standard on the fund’s financial statements.
Loans and Other Direct Debt Instruments – The fund may invest in loans and loan participations or other receivables. These investments may include standby financing commitments, including revolving credit facilities, which obligate the fund to supply additional cash to the borrower on demand. At April 30, 2008, the portfolio had unfunded loan commitments of $433,179, which could be extended at the option of the borrower and which are covered by sufficient cash and/or liquid securities held by the fund. The market value and obligation of the fund on these unfunded loan commitments is included in Investments, at value and Payable for investments purchased, respectively, on the Statement of Assets and Liabilities. Loan participations involve a risk of insolvency of the lending bank or other financial intermediary.
Indemnifications – Under the fund’s organizational documents, its officers and trustees may be indemnified against certain liabilities and expenses arising out of the performance of their duties to the fund. Additionally, in the normal course of business, the fund enters into agreements with service providers that may contain indemnification clauses. The fund’s maximum exposure under
50
Notes to Financial Statements – continued
these agreements is unknown as this would involve future claims that may be made against the fund that have not yet occurred.
Investment Transactions and Income – Investment transactions are recorded on the trade date. Interest income is recorded on the accrual basis. All premium and discount is amortized or accreted for financial statement purposes in accordance with U.S. generally accepted accounting principles. The fund earns certain fees in connection with its floating rate loan purchasing activities. These fees are in addition to interest payments earned and may include amendment fees, commitment fees, facility fees, consent fees, and prepayment fees. Commitment fees are recorded on an accrual basis as income in the accompanying financial statements. Dividends received in cash are recorded on the ex-dividend date. Dividend and interest payments received in additional securities are recorded on the ex-dividend or ex-interest date in an amount equal to the value of the security on such date.
The fund may receive proceeds from litigation settlements. Any proceeds received from litigation involving portfolio holdings are reflected in the Statement of Operations in realized gain/loss if the security has been disposed of by the fund or in unrealized gain/loss if the security is still held by the fund. Any other proceeds from litigation not related to portfolio holdings are reflected as other income in the Statement of Operations.
The fund may enter into “TBA” (to be announced) purchase commitments to purchase securities for a fixed unit price at a future date. Although the unit price has been established, the principal value has not been finalized. However, the principal amount of the commitments will not fluctuate more than 0.01%. The fund holds, and maintains until settlement date, cash or high-grade debt obligations in an amount sufficient to meet the purchase price, or the fund may enter into offsetting contracts for the forward sale of other securities it owns. Income on the securities will not be earned until settlement date. TBA purchase commitments may be considered securities in themselves, and involve a risk of loss if the value of the security to be purchased declines prior to settlement date, which is in addition to the risk of decline in the value of the fund’s other assets. Unsettled TBA purchase commitments are valued at the current market value of the underlying securities.
The fund may enter into “TBA” (to be announced) sale commitments to hedge its portfolio positions or to sell mortgage-backed securities it owns under delayed delivery arrangements. Proceeds of TBA sale commitments are not received until the contractual settlement date. During the time a TBA sale commitment is outstanding, equivalent deliverable securities, or an offsetting TBA purchase commitment deliverable on or before the sale commitment date, are held as “cover” for the transaction.
51
Notes to Financial Statements – continued
Fees Paid Indirectly – The fund’s custody fee may be reduced according to an arrangement that measures the value of cash deposited with the custodian by the fund. For the year ended April 30, 2008, custody fees were not reduced.
Tax Matters and Distributions – The fund intends to qualify as a regulated investment company, as defined under Subchapter M of the Internal Revenue Code, and to distribute all of its taxable income, including realized capital gains. As a result, no provision for federal income tax is required. The fund adopted the provisions of FASB Interpretation No. 48, Accounting for Uncertainty in Income Taxes (“the Interpretation”) on the first day of the fund’s fiscal year. The Interpretation prescribes a minimum threshold for financial statement recognition of the benefit of a tax position taken or expected to be taken in a tax return. There was no impact resulting from the adoption of this Interpretation on the fund’s financial statements. Each of the fund’s federal tax returns for the prior three fiscal years remains subject to examination by the Internal Revenue Service. It is the fund’s policy to record interest and penalty charges on underpaid taxes associated with its tax positions as interest expense and miscellaneous expense, respectively. No such charges were recorded in the current financial statements. Foreign taxes, if any, have been accrued by the fund in the accompanying financial statements.
Distributions to shareholders are recorded on the ex-dividend date. Income and capital gain distributions are determined in accordance with income tax regulations, which may differ from U.S. generally accepted accounting principles. Certain capital accounts in the financial statements are periodically adjusted for permanent differences in order to reflect their tax character. These adjustments have no impact on net assets or net asset value per share. Temporary differences which arise from recognizing certain items of income, expense, gain or loss in different periods for financial statement and tax purposes will reverse at some time in the future. Distributions in excess of net investment income or net realized gains are temporary overdistributions for financial statement purposes resulting from differences in the recognition or classification of income or distributions for financial statement and tax purposes.
Book/tax differences primarily relate to amortization and accretion of debt securities and derivative transactions.
The tax character of distributions declared to shareholders is as follows:
| | | | |
| | | 4/30/08 | | 4/30/07 |
| Ordinary income (including any short-term capital gains) | | $140,135,749 | | $100,785,733 |
52
Notes to Financial Statements – continued
The federal tax cost and the tax basis components of distributable earnings were as follows:
| | | |
| As of 4/30/08 | | | |
| Cost of investments | | $2,688,722,090 | |
| Gross appreciation | | 25,063,871 | |
| Gross depreciation | | (81,863,880 | ) |
| Net unrealized appreciation (depreciation) | | $(56,800,009 | ) |
| Undistributed ordinary income | | $6,626,961 | |
| Capital loss carryforwards | | (66,008,660 | ) |
| Post-October capital loss deferral | | (4,595,231 | ) |
| Other temporary differences | | (11,958,811 | ) |
As of April 30, 2008, the fund had capital loss carryforwards available to offset future realized gains. Such losses expire as follows:
| | | |
| Expiration Date | | Amount | |
| 4/30/11 | | $(108,693 | ) |
| 4/30/12 | | (1,464,107 | ) |
| 4/30/13 | | (1,670,568 | ) |
| 4/30/14 | | (14,142,447 | ) |
| 4/30/15 | | (33,880,250 | ) |
| 4/30/16 | | (14,742,595 | ) |
| | $(66,008,660 | ) |
The availability of a portion of the capital loss carryforwards, which were acquired on June 22, 2007 in connection with the MFS Intermediate Investment Grade Bond Fund merger, may be limited in a given year.
Multiple Classes of Shares of Beneficial Interest – The fund offers multiple classes of shares, which differ in their respective distribution and service fees. All shareholders bear the common expenses of the fund based on the value of settled shares outstanding of each class, without distinction between share classes. Dividends are declared separately for each class. Differences in per share dividend rates are generally due to differences in separate class expenses. Class B and Class 529B shares will convert to Class A and Class 529A shares, respectively, approximately eight years after purchase. At the close of business on April 18, 2008, Class R shares and Class R2 shares converted into Class R3 shares. Following this conversion, Class R3, Class R4, and Class R5 shares were renamed Class R2, Class R3, and Class R4 shares, respectively.
| (3) | | Transactions with Affiliates |
Investment Adviser – The fund has an investment advisory agreement with Massachusetts Financial Services Company (MFS) to provide overall investment management and related administrative services and facilities to the fund. The management fee is computed daily and paid monthly at an annual rate of 0.50% of the fund’s average daily net assets.
53
Notes to Financial Statements – continued
Prior to June 23, 2007, the investment adviser had agreed in writing to reduce its management fee to 0.35% of average daily net assets. Effective June 23, 2007, the investment adviser has agreed in writing to reduce its management fee to 0.30% of the fund’s average daily net assets. This written agreement will continue through February 28, 2009 unless changed or rescinded by the fund’s Board of Trustees. This management fee reduction amounted to $5,215,948, which is shown as a reduction of total expenses in the Statement of Operations. The management fee incurred for the year ended April 30, 2008 was equivalent to an annual effective rate of 0.31% of the fund’s average daily net assets.
Prior to June 23, 2007, the investment adviser had voluntarily agreed to pay a portion of the fund’s operating expenses, exclusive of management, distribution and service, retirement plan administration and services, program manager, and certain other fees and expenses, such that operating expenses did not exceed 0.20% annually of the fund’s average daily net assets. Effective June 23, 2007, this arrangement was terminated. For the period May 1, 2007 through June 23, 2007, the fund’s actual operating expenses did not exceed the limit and therefore, the investment adviser did not pay any portion of the fund’s expenses.
Distributor – MFS Fund Distributors, Inc. (MFD), a wholly-owned subsidiary of MFS, as distributor, received $64,369 and $481 for the year ended April 30, 2008, as its portion of the initial sales charge on sales of Class A and Class 529A shares of the fund, respectively.
The Board of Trustees has adopted a distribution plan for certain class shares pursuant to Rule 12b-1 of the Investment Company Act of 1940.
The fund’s distribution plan provides that the fund will pay MFD for services provided by MFD and financial intermediaries in connection with the distribution and servicing of certain share classes. One component of the plan is a distribution fee paid to MFD and another component of the plan is a service fee paid to MFD. MFD may subsequently pay all, or a portion, of the distribution and/or service fees to financial intermediaries.
54
Notes to Financial Statements – continued
Distribution Plan Fee Table:
| | | | | | | | | | |
| | | Distribution
Fee Rate | | Service
Fee Rate | | Total
Distribution
Plan (d) | | Annual
Effective
Rate (e) | | Distribution
and Service
Fee |
| Class A | | 0.10% | | 0.25% | | 0.35% | | 0.15% | | $4,079,614 |
| Class B | | 0.75% | | 0.25% | | 1.00% | | 0.96% | | 653,899 |
| Class C | | 0.75% | | 0.25% | | 1.00% | | 1.00% | | 780,259 |
| Class W | | 0.10% | | — | | 0.10% | | 0.10% | | 9,557 |
| Class R (b) | | 0.25% | | 0.25% | | 0.50% | | 0.50% | | 65,136 |
| Class R1 | | 0.75% | | 0.25% | | 1.00% | | 0.80% | | 18,857 |
| Former Class R2 (b) | | 0.25% | | 0.25% | | 0.50% | | 0.50% | | 20,276 |
| Class R2 (formerly Class R3) | | 0.25% | | 0.25% | | 0.50% | | 0.50% | | 154,612 |
| Class R3 (formerly Class R4) | | — | | 0.25% | | 0.25% | | 0.25% | | 99,762 |
| Class 529A | | 0.25% | | 0.25% | | 0.50% | | 0.25% | | 4,102 |
| Class 529B | | 0.75% | | 0.25% | | 1.00% | | 1.00% | | 3,547 |
| Class 529C | | 0.75% | | 0.25% | | 1.00% | | 1.00% | | 8,064 |
| Total Distribution and Service Fees | | | | | | $5,897,685 |
| (b) | At the close of business on April 18, 2008, Class R and Class R2 shares converted into Class R3 shares. Following the conversion, Class R3 shares were renamed Class R2 shares. |
| (d) | In accordance with the distribution plan for certain classes, the fund pays distribution and/or service fees up to these annual percentage rates of each class’ average daily net assets. |
| (e) | The annual effective rates represent actual fees incurred under the distribution plan for the year ended April 30, 2008 based on each class’ average daily net assets. 0.10% of the Class A and 0.10% of the Class 529A service fee is currently being waived under a written waiver arrangement through August 31, 2008. For the year ended April 30, 2008, this waiver amounted to $1,166,768 and is reflected as a reduction of total expenses in the Statement of Operations. Assets attributable to Class B shares sold prior to May 1, 2006 are subject to the 0.25% annual Class B service fee. Assets attributable to Class B shares are currently subject to a Class B service fee of 0.15% annually. The remaining portion of the Class B service fee is not in effect on such assets but may be implemented on such date as the fund’s Board of Trustees may determine. 0.10% of the Class 529A distribution fee is currently being paid by the fund. Payment of the remaining 0.15% of the Class 529A distribution fee is not yet in effect and will be implemented on such date as the fund’s Board of Trustees may determine. 0.10% of the Class A distribution fee is currently being waived under a written waiver arrangement through August 31, 2008. For the year ended April 30, 2008, this waiver amounted to $1,165,596 and is reflected as a reduction of total expenses in the Statement of Operations. Effective March 1, 2008, the distribution fee rate for Class R1 shares increased from 0.50% to 0.75%. |
Certain Class A, Class C and Class 529C shares are subject to a contingent deferred sales charge in the event of a shareholder redemption within 12 months of purchase. Class B and Class 529B shares are subject to a contingent deferred sales charge in the event of a shareholder redemption within six years of purchase. All contingent deferred sales charges are paid to MFD and during the year ended April 30, 2008, were as follows:
| | |
| | | Amount |
| Class A | | $933 |
| Class B | | $114,571 |
| Class C | | $19,186 |
| Class 529B | | $76 |
| Class 529C | | $0 |
55
Notes to Financial Statements – continued
The fund has entered into and may from time to time enter into contracts with program managers and other parties which administer the tuition programs through which an investment in the fund’s 529 share classes is made. The fund has entered into an agreement with MFD pursuant to which MFD receives an annual fee of up to 0.35% of the average daily net assets attributable to each 529 share class. The fee is based on average daily net assets and is currently established at 0.10% annually of average daily net assets of the fund’s 529 share classes. Prior to April 1, 2008, the fee was established at 0.25% annually. The fee may only be increased with the approval of the Board of Trustees who oversees the fund. The services provided by MFD, or a third party with which MFD contracts, include recordkeeping and tax reporting and account services, as well as services designed to maintain the program’s compliance with the Internal Revenue Code and other regulatory requirements. Program manager fees for the year ended April 30, 2008, were as follows:
| | |
| | | Amount |
| Class 529A | | $2,786 |
| Class 529B | | 840 |
| Class 529C | | 1,872 |
| Total Program Manager Fees | | $5,498 |
Shareholder Servicing Agent – MFS Service Center, Inc. (MFSC), a wholly-owned subsidiary of MFS, receives a fee from the fund for its services as shareholder servicing agent calculated as a percentage of the average daily net assets of the fund as determined periodically under the supervision of the fund’s Board of Trustees. For the year ended April 30, 2008, the fee was $857,959, which equated to 0.0320% annually of the fund’s average daily net assets. MFSC also receives payment from the fund for out-of-pocket expenses, sub-accounting and other shareholder servicing costs which may be paid to affiliated and unaffiliated service providers. For the year ended April 30, 2008, these out-of-pocket expenses, sub-accounting and other shareholder servicing costs amounted to $1,748,271.
Under a Special Servicing Agreement among MFS, each MFS fund which invests in other MFS funds (“MFS fund-of-funds”) and each underlying fund in which a MFS fund-of-funds invests (“underlying funds”), each underlying fund may pay a portion of each MFS fund-of-fund’s transfer agent-related expenses, including sub-accounting fees payable to financial intermediaries, to the extent such payments do not exceed the benefits realized or expected to be realized by the underlying fund from the investment in the underlying fund by the MFS fund-of-fund. For the year ended April 30, 2008, these costs for the fund amounted to $378,777 and are reflected in the shareholder servicing costs on the Statement of Operations.
56
Notes to Financial Statements – continued
Administrator – MFS provides certain financial, legal, shareholder communications, compliance, and other administrative services to the fund. Under an administrative services agreement, the fund partially reimburses MFS the costs incurred to provide these services. The fund is charged a fixed amount plus a fee based on average daily net assets. The fund’s annual fixed amount is $17,500. The administrative services fee incurred for the year ended April 30, 2008 was equivalent to an annual effective rate of 0.0145% of the fund’s average daily net assets.
In addition to the administrative services provided by MFS to the fund as described above, prior to March 1, 2008, MFS was responsible for providing certain retirement plan administration and services with respect to certain shares. These services include various administrative, recordkeeping, and communication/educational services with respect to the retirement plans which invest in these shares, and may have been provided directly by MFS or by a third party. MFS generally paid all, or a portion, of the retirement plan administration and services fee to affiliated or unaffiliated third parties. For the year ended April 30, 2008, the fund paid MFS an annual retirement plan administration and services fee up to the following annual percentage rates of each class’ average daily net assets:
| | | | | | | | | | |
| | | Beginning
of period
through
12/31/07 | | Effective
1/01/08 | | Effective
3/01/08 | | Annual
Effective
Rate (g) | | Total
Amount |
Class R1 | | 0.35% | | 0.35% | | — | | 0.28% | | $6,627 |
Former Class R2 (b) | | 0.25% | | — | | — | | 0.15% | | 6,067 |
Class R2 (formerly Class R3) | | 0.15% | | — | | — | | 0.10% | | 30,011 |
Class R3 (formerly Class R4) | | 0.15% | | — | | — | | 0.10% | | 38,468 |
Class R4 (formerly Class R5) | | 0.10% | | — | | — | | 0.06% | | 7,659 |
| Total Retirement Plan Administration and Services Fees | | $88,832 |
| (b) | At the close of business on April 18, 2008, Class R2 shares converted into Class R3 shares. Following the conversion, Class R3 shares were renamed Class R2 shares. |
| (g) | Effective January 1, 2008, the annual retirement plan administration and services fee was eliminated for the former Class R2, Class R2 (formerly Class R3), Class R3 (formerly Class R4), and Class R4 (formerly Class R5) shares. Effective March 1, 2008, the annual retirement plan administration and services fee was eliminated for Class R1 shares. |
Trustees’ and Officers’ Compensation – The fund pays compensation to independent trustees in the form of a retainer, attendance fees, and additional compensation to Board and Committee chairpersons. The fund does not pay compensation directly to trustees or officers of the fund who are also officers of the investment adviser, all of whom receive remuneration for their services to the fund from MFS. Certain officers and trustees of the fund are officers or directors of MFS, MFD, and MFSC.
57
Notes to Financial Statements – continued
Other – This fund and certain other MFS funds (the funds) have entered into a services agreement (the Agreement) which provides for payment of fees by the funds to Tarantino LLC in return for the provision of services of an Independent Chief Compliance Officer (ICCO) for the funds. The ICCO is an officer of the funds and the sole member of Tarantino LLC. The funds can terminate the Agreement with Tarantino LLC at any time under the terms of the Agreement. For the year ended April 30, 2008, the fee paid by the fund to Tarantino LLC was $17,867 and is included in miscellaneous expense on the Statement of Operations. MFS has agreed to reimburse the fund for a portion of the payments made by the fund to Tarantino LLC in the amount of $12,761, which is shown as a reduction of total expenses in the Statement of Operations. Additionally, MFS has agreed to bear all expenses associated with office space, other administrative support, and supplies provided to the ICCO.
Purchases and sales of investments, other than purchased option transactions and short-term obligations, were as follows:
| | | | |
| | | Purchases | | Sales |
| U.S. government securities | | $1,236,773,947 | | $1,305,323,191 |
| Investments (non-U.S. government securities) | | $1,256,281,598 | | $1,132,525,051 |
| (5) | | Shares of Beneficial Interest |
The fund’s Declaration of Trust permits the Trustees to issue an unlimited number of full and fractional shares of beneficial interest. Transactions in fund shares were as follows:
| | | | | | | | |
| | | Year ended
4/30/08 | | Year ended
4/30/07 |
| | | Shares | | Amount | | Shares | | Amount |
| Shares sold | | | | | | | | |
Class A | | 59,431,269 | | $586,011,758 | | 43,732,716 | | $435,446,444 |
Class B | | 1,151,997 | | 11,390,433 | | 1,299,035 | | 12,904,182 |
Class C | | 3,542,911 | | 35,043,238 | | 2,572,046 | | 25,649,874 |
Class I | | 23,080,849 | | 227,425,683 | | 35,593,265 | | 354,710,768 |
Class W | | 1,504,679 | | 14,842,798 | | 77,212 | | 772,967 |
Class R (b) | | 674,626 | | 6,661,079 | | 732,685 | | 7,297,739 |
Class R1 | | 215,981 | | 2,190,926 | | 269,817 | | 2,694,761 |
Former Class R2 (b) | | 670,718 | | 6,645,082 | | 407,856 | | 4,064,356 |
Class R2 (formerly Class R3) | | 3,040,898 | | 29,804,697 | | 2,864,984 | | 28,537,384 |
Class R3 (formerly Class R4) | | 3,173,385 | | 31,292,691 | | 4,233,544 | | 42,167,701 |
Class R4 (formerly Class R5) | | 1,447,707 | | 14,233,340 | | 1,171,428 | | 11,767,503 |
Class 529A | | 26,692 | | 262,106 | | 62,026 | | 622,331 |
Class 529B | | 7,804 | | 76,833 | | 22,220 | | 224,252 |
Class 529C | | 76,222 | | 757,440 | | 40,059 | | 403,077 |
| | 98,045,738 | | $966,638,104 | | 93,078,893 | | $927,263,339 |
58
Notes to Financial Statements – continued
| | | | | | | | |
| | | Year ended
4/30/08 | | Year ended
4/30/07 |
| | | Shares | | Amount | | Shares | | Amount |
| Shares issued in connection with acquisition of MFS Intermediate Investment Grade Bond Fund | | | | | | | | |
Class A | | 2,410,426 | | $23,636,239 | | | | |
Class B | | 788,493 | | 7,745,745 | | | | |
Class C | | 341,497 | | 3,354,394 | | | | |
Class I | | 34,725,356 | | 340,598,347 | | | | |
Class R1 | | 792 | | 7,787 | | | | |
Former Class R2 (b) | | 5,421 | | 53,319 | | | | |
Class R2 (formerly Class R3) | | 4,481 | | 43,905 | | | | |
Class R3 (formerly Class R4) | | 5,479 | | 53,700 | | | | |
Class R4 (formerly Class R5) | | 5,510 | | 54,028 | | | | |
| | 38,287,455 | | $375,547,464 | | | | |
| Shares issued to shareholders in reinvestment of distributions | | | | | | | | |
Class A | | 4,216,348 | | $41,680,376 | | 3,660,706 | | $36,481,709 |
Class B | | 236,273 | | 2,340,226 | | 243,204 | | 2,426,279 |
Class C | | 204,561 | | 2,025,364 | | 169,159 | | 1,687,975 |
Class I | | 5,097,084 | | 50,382,402 | | 3,133,769 | | 31,235,084 |
Class W | | 42,986 | | 424,672 | | 886 | | 8,852 |
Class R (b) | | 60,773 | | 601,446 | | 121,170 | | 1,206,738 |
Class R1 | | 9,659 | | 95,608 | | 4,542 | | 45,434 |
Former Class R2 (b) | | 18,488 | | 183,154 | | 7,235 | | 72,603 |
Class R2 (formerly Class R3) | | 143,370 | | 1,415,541 | | 92,466 | | 921,508 |
Class R3 (formerly Class R4) | | 195,320 | | 1,929,457 | | 96,941 | | 966,833 |
Class R4 (formerly Class R5) | | 60,711 | | 600,021 | | 23,320 | | 233,849 |
Class 529A | | 5,684 | | 56,039 | | 3,320 | | 33,006 |
Class 529B | | 1,442 | | 14,284 | | 708 | | 7,075 |
Class 529C | | 3,132 | | 30,962 | | 1,234 | | 12,324 |
| | 10,295,831 | | $101,779,552 | | 7,558,660 | | $75,339,269 |
59
Notes to Financial Statements – continued
| | | | | | | | | | | | |
| | | Year ended
4/30/08 | | | Year ended
4/30/07 | |
| | | Shares | | | Amount | | | Shares | | | Amount | |
| Shares reacquired | | | | | | | | | | | | |
Class A | | (55,268,696 | ) | | $(545,346,604 | ) | | (35,381,942 | ) | | $(352,735,882 | ) |
Class B | | (2,777,374 | ) | | (27,421,562 | ) | | (2,628,701 | ) | | (26,182,078 | ) |
Class C | | (2,239,481 | ) | | (22,120,931 | ) | | (2,072,848 | ) | | (20,655,386 | ) |
Class I | | (25,351,516 | ) | | (250,257,833 | ) | | (5,582,609 | ) | | (55,462,565 | ) |
Class W | | (169,937 | ) | | (1,672,145 | ) | | (2,392 | ) | | (24,012 | ) |
Class R (b) | | (3,411,985 | ) | | (33,548,347 | ) | | (1,710,011 | ) | | (17,071,532 | ) |
Class R1 | | (95,968 | ) | | (1,000,637 | ) | | (159,171 | ) | | (1,596,226 | ) |
Former Class R2 (b) | | (933,562 | ) | | (9,174,692 | ) | | (201,536 | ) | | (2,019,285 | ) |
Class R2 (formerly Class R3) | | (1,440,797 | ) | | (14,186,798 | ) | | (1,858,073 | ) | | (18,521,766 | ) |
Class R3 (formerly Class R4) | | (2,265,913 | ) | | (22,333,836 | ) | | (2,562,780 | ) | | (25,603,098 | ) |
Class R4 (formerly Class R5) | | (1,172,562 | ) | | (11,524,076 | ) | | (122,391 | ) | | (1,226,855 | ) |
Class 529A | | (33,587 | ) | | (330,918 | ) | | (8,916 | ) | | (88,441 | ) |
Class 529B | | (4,080 | ) | | (40,520 | ) | | (3,150 | ) | | (31,644 | ) |
Class 529C | | (18,499 | ) | | (181,972 | ) | | (7,468 | ) | | (74,101 | ) |
| | (95,183,957 | ) | | $(939,140,871 | ) | | (52,301,988 | ) | | $(521,292,871 | ) |
| Net change | | | | | | | | | | | | |
Class A | | 10,789,347 | | | $105,981,769 | | | 12,011,480 | | | $119,192,271 | |
Class B | | (600,611 | ) | | (5,945,158 | ) | | (1,086,462 | ) | | (10,851,617 | ) |
Class C | | 1,849,488 | | | 18,302,065 | | | 668,357 | | | 6,682,463 | |
Class I | | 37,551,773 | | | 368,148,599 | | | 33,144,425 | | | 330,483,287 | |
Class W | | 1,377,728 | | | 13,595,325 | | | 75,706 | | | 757,807 | |
Class R (b) | | (2,676,586 | ) | | (26,285,822 | ) | | (856,156 | ) | | (8,567,055 | ) |
Class R1 | | 130,464 | | | 1,293,684 | | | 115,188 | | | 1,143,969 | |
Former Class R2 (b) | | (238,935 | ) | | (2,293,137 | ) | | 213,555 | | | 2,117,674 | |
Class R2 (formerly Class R3) | | 1,747,952 | | | 17,077,345 | | | 1,099,377 | | | 10,937,126 | |
Class R3 (formerly Class R4) | | 1,108,271 | | | 10,942,012 | | | 1,767,705 | | | 17,531,436 | |
Class R4 (formerly Class R5) | | 341,366 | | | 3,363,313 | | | 1,072,357 | | | 10,774,497 | |
Class 529A | | (1,211 | ) | | (12,773 | ) | | 56,430 | | | 566,896 | |
Class 529B | | 5,166 | | | 50,597 | | | 19,778 | | | 199,683 | |
Class 529C | | 60,855 | | | 606,430 | | | 33,825 | | | 341,300 | |
| | 51,445,067 | | | $504,824,249 | | | 48,335,565 | | | $481,309,737 | |
| (b) | At the close of business on April 18, 2008, Class R and Class R2 shares converted into Class R3 shares. Following the conversion, Class R3 shares were renamed Class R2 shares. |
The fund is one of several mutual funds in which the MFS funds-of-funds may invest. The MFS funds-of-funds do not invest in the underlying MFS funds for the purpose of exercising management or control. At the end of the period, the MFS Moderate Allocation Fund, MFS Growth Allocation Fund, and MFS Conservative Allocation Fund were the owners of record of approximately 16%, 10%, and 22%, respectively, of the value of outstanding voting shares of the fund. In addition, the MFS Lifetime 2010 Fund, MFS Lifetime 2020 Fund, MFS Lifetime 2030 Fund, and the MFS Lifetime Retirement Income Fund were
60
Notes to Financial Statements – continued
each the owners of record of less than 1% of the value of outstanding voting shares of the fund.
The fund and other funds managed by MFS participate in a $1 billion unsecured committed line of credit provided by a syndication of banks under a credit agreement. In addition, the fund and other funds managed by MFS have established uncommitted borrowing arrangements with certain banks. Borrowings may be made for temporary financing needs. Interest is charged to each fund, based on its borrowings, generally at a rate equal to the Federal Reserve funds rate plus 0.30%. In addition, a commitment fee, based on the average daily, unused portion of the committed line of credit, is allocated among the participating funds at the end of each calendar quarter. For the year ended April 30, 2008, the fund’s commitment fee and interest expense were $10,571 and $0, respectively, and are included in miscellaneous expense on the Statement of Operations.
| (7) | | Transactions in Underlying Funds-Affiliated Issuers |
An affiliated issuer may be considered one in which the fund owns 5% or more of the outstanding voting securities, or a company which is under common control. For the purposes of this report, the fund assumes the following to be affiliated issuers:
| | | | | | | | | |
| Underlying Funds | | Beginning
Shares/Par
Amount | | Acquisitions
Shares/Par
Amount | | Dispositions
Shares/Par
Amount | | | Ending
Shares/Par
Amount |
MFS Institutional Money
Market Portfolio | | — | | 1,625,246,620 | | (1,625,156,388 | ) | | 90,232 |
| | | | |
| Underlying Funds | | Realized
Gain (Loss) | | Capital Gain
Distributions | | Dividend
Income | | | Ending
Value |
MFS Institutional Money
Market Portfolio | | $— | | $— | | $2,761,465 | | | $90,232 |
At close of business on June 22, 2007, the fund acquired all of the assets and liabilities of MFS Intermediate Investment Grade Bond Fund. The acquisition was accomplished by a tax-free exchange of 38,287,455 shares of the fund (valued at $375,547,464) for all of the assets and liabilities of MFS Intermediate Investment Grade Bond Fund. MFS Intermediate Investment Grade Bond Fund then distributed the shares of the fund that MFS Intermediate Investment Grade Bond Fund received from the fund to its shareholders. MFS Intermediate Investment Grade Bond Fund’s net assets on that date were $375,547,464, including $8,590,690 of unrealized depreciation, $25,199 of distributions in excess of net investment income and $9,701,317 of accumulated net realized loss on investments. The aggregate net assets of the fund after the acquisition were $2,679,113,474.
61
RESULTS OF SHAREHOLDER MEETING
(unaudited)
At a special meeting of shareholders of Class R1 shares of the MFS Research Bond Fund, which was held on February 15, 2008, the following actions were taken:
Item 1: To approve an amendment to the current Master Distribution Plan adopted pursuant to Rule 12b-1 under the Investment Company Act of 1940, as amended, with respect to Class R1 shares of the Fund.
| | |
| | | Number of Dollars |
| For | | 1,531,969.42 |
| Against | | 0.00 |
| Abstain | | 134,017.87 |
62
REPORT OF INDEPENDENT REGISTERED PUBLIC ACCOUNTING FIRM
To the Trustees of MFS Series Trust IX and the Shareholders of MFS Research Bond Fund:
We have audited the accompanying statement of assets and liabilities, including the portfolio of investments, of MFS Research Bond Fund (one of the portfolios comprising MFS Series Trust IX (the “Trust”)) as of April 30, 2008, and the related statement of operations for the year then ended, the statements of changes in net assets for each of the two years in the period then ended, and the financial highlights for each of the five years in the period then ended. These financial statements and financial highlights are the responsibility of the Trust’s management. Our responsibility is to express an opinion on these financial statements and financial highlights based on our audits.
We conducted our audits in accordance with the standards of the Public Company Accounting Oversight Board (United States). Those standards require that we plan and perform the audit to obtain reasonable assurance about whether the financial statements and financial highlights are free of material misstatement. The Trust is not required to have, nor were we engaged to perform, an audit of its internal control over financial reporting. Our audits included consideration of internal control over financial reporting as a basis for designing audit procedures that are appropriate in the circumstances, but not for the purpose of expressing an opinion on the effectiveness of the Trust’s internal control over financial reporting. Accordingly, we express no such opinion. An audit also includes examining, on a test basis, evidence supporting the amounts and disclosures in the financial statements, assessing the accounting principles used and significant estimates made by management, as well as evaluating the overall financial statement presentation. Our procedures included confirmation of securities owned as of April 30, 2008, by correspondence with the custodian and brokers; where replies were not received from brokers, we performed other auditing procedures. We believe that our audits provide a reasonable basis for our opinion.
In our opinion, such financial statements and financial highlights present fairly, in all material respects, the financial position of MFS Research Bond Fund as of April 30, 2008, the results of its operations for the year then ended, the changes in its net assets for each of the two years in the period then ended, and its financial highlights for each of the five years in the period then ended, in conformity with accounting principles generally accepted in the United States of America.
DELOITTE & TOUCHE LLP
Boston, Massachusetts
June 16, 2008
63
TRUSTEES AND OFFICERS — IDENTIFICATION AND BACKGROUND
The Trustees and officers of the Trust, as of June 1, 2008, are listed below, together with their principal occupations during the past five years. (Their titles may have varied during that period.) The address of each Trustee and officer is 500 Boylston Street, Boston, Massachusetts 02116.
| | | | | | |
Name, Date of Birth | | Position(s) Held
with Fund | | Trustee/Officer
Since (h) | | Principal Occupations During
the Past Five Years & Other
Directorships (j) |
| INTERESTED TRUSTEES | | | | |
Robert J. Manning (k)
(born 10/20/63) | | Trustee | | February 2004 | | Massachusetts Financial Services Company, Chief Executive Officer, President, Chief Investment Officer and Director |
Robert C. Pozen (k)
(born 8/08/46) | | Trustee | | February 2004 | | Massachusetts Financial Services Company, Chairman (since February 2004); Harvard Business School (education), Senior Lecturer (since 2008); Secretary of Economic Affairs, The Commonwealth of Massachusetts (January 2002 to December 2002); Fidelity Investments, Vice Chairman (June 2000 to December 2001); Fidelity Management & Research Company (investment adviser), President (March 1997 to July 2001); Bell Canada Enterprises (telecommunications), Director; Medtronic, Inc. (medical technology), Director; Telesat (satellite communications), Director (until 2007) |
| INDEPENDENT TRUSTEES | | | | |
J. Atwood Ives
(born 5/01/36) | | Trustee and Chair of Trustees | | February 1992 | | Private investor; KeySpan Corporation (energy related services), Director until 2004; Woodstock Corporation (investment advisory firm), Director until 2003 |
Robert E. Butler (n)
(born 11/29/41) | | Trustee | | January 2006 | | Consultant – regulatory and compliance matters (since July 2002); PricewaterhouseCoopers LLP (professional services firm), Partner (until 2002) |
64
Trustees and Officers – continued
| | | | | | |
Name, Date of Birth | | Position(s) Held
with Fund | | Trustee/Officer
Since (h) | | Principal Occupations During
the Past Five Years & Other
Directorships (j) |
Lawrence H. Cohn, M.D.
(born 3/11/37) | | Trustee | | August 1993 | | Brigham and Women’s Hospital, Chief of Cardiac Surgery (2005); Harvard Medical School, Professor of Cardiac Surgery; Physician Director of Medical Device Technology for Partners HealthCare |
David H. Gunning
(born 5/30/42) | | Trustee | | January 2004 | | Retired; Cleveland-Cliffs Inc. (mining products and service provider), Vice Chairman/Director (until May 2007); Portman Limited (mining), Director (since 2005); Encinitos Ventures (private investment company), Principal (1997 to April 2001); Lincoln Electric Holdings, Inc. (welding equipment manufacturer), Director |
William R. Gutow
(born 9/27/41) | | Trustee | | December 1993 | | Private investor and real estate consultant (since 1998); Capital Entertainment Management Company (video franchise), Vice Chairman (since 1998); Texas Donuts (donut franchise), Vice Chairman (since 2007); Atlantic Coast Tan (tanning salons), Vice Chairman (until 2007) |
Michael Hegarty
(born 12/21/44) | | Trustee | | December 2004 | | Retired; AXA Financial (financial services and insurance), Vice Chairman and Chief Operating Officer (until May 2001); The Equitable Life Assurance Society (insurance), President and Chief Operating Officer
(until May 2001) |
Lawrence T. Perera
(born 6/23/35) | | Trustee | | July 1981 | | Hemenway & Barnes (attorneys), Partner |
J. Dale Sherratt
(born 9/23/38) | | Trustee | | August 1993 | | Insight Resources, Inc. (acquisition planning specialists), President; Wellfleet Investments (investor in health care companies), Managing General Partner (since 1993); Cambridge Nutraceuticals (professional nutritional products), Chief Executive Officer (until May 2001) |
65
Trustees and Officers – continued
| | | | | | |
Name, Date of Birth | | Position(s) Held
with Fund | | Trustee/Officer
Since (h) | | Principal Occupations During
the Past Five Years & Other
Directorships (j) |
Laurie J. Thomsen
(born 8/05/57) | | Trustee | | March 2005 | | New Profit, Inc. (venture philanthropy), Partner (since 2006); Private investor; Prism Venture Partners (venture capital), Co-founder and General Partner (until June 2004); The Travelers Companies (commercial property liability insurance), Director |
Robert W. Uek
(born 5/18/41) | | Trustee | | January 2006 | | Retired (since 1999); PricewaterhouseCoopers LLP (professional services firm), Partner (until 1999); Consultant to investment company industry (since 2000); TT International Funds (mutual fund complex), Trustee (2000 until 2005); Hillview Investment Trust II Funds (mutual fund complex), Trustee (2000 until 2005) |
| OFFICERS | | | | | | |
Robert J. Manning (k)
(born 10/20/63) | | President | | March 2008 | | Massachusetts Financial Services Company, Chief Executive Officer, President, Chief Investment Officer and Director |
Maria F. Dwyer (k)
(born 12/01/58) | | Treasurer | | March 2008 | | Massachusetts Financial Services Company, Executive Vice President and Chief Regulatory Officer (since March 2004) Chief Compliance Officer (since December 2006); Fidelity Management & Research Company, Vice President (prior to March 2004); Fidelity Group of Funds, President and Treasurer (prior to March 2004); MFS Group of Funds, President (November 2005 – March 2008) |
Christopher R. Bohane (k)
(born 1/18/74) | | Assistant Secretary and Assistant Clerk | | July 2005 | | Massachusetts Financial Services Company, Vice President and Senior Counsel (since April 2003); Kirkpatrick & Lockhart LLP (law firm), Associate (prior to April 2003) |
Ethan D. Corey (k)
(born 11/21/63) | | Assistant Secretary and Assistant Clerk | | July 2005 | | Massachusetts Financial Services Company, Senior Vice President and Associate General Counsel (since April 2006); Special Counsel (prior to April 2006); Dechert LLP (law firm), Counsel (prior to December 2004) |
66
Trustees and Officers – continued
| | | | | | |
Name, Date of Birth | | Position(s) Held
with Fund | | Trustee/Officer
Since (h) | | Principal Occupations During
the Past Five Years & Other
Directorships (j) |
David L. DiLorenzo (k)
(born 8/10/68) | | Assistant Treasurer | | July 2005 | | Massachusetts Financial Services Company, Vice President (since June 2005); JP Morgan Investor Services, Vice President (prior to June 2005) |
Timothy M. Fagan (k)
(born 7/10/68) | | Assistant Secretary and Assistant Clerk | | September 2005 | | Massachusetts Financial Services Company, Vice President and Senior Counsel (since September 2005); John Hancock Advisers, LLC, Vice President and Chief Compliance Officer (September 2004 to August 2005), Senior Attorney (prior to September 2004); John Hancock Group of Funds, Vice President and Chief Compliance Officer (September 2004 to December 2004) |
Mark D. Fischer (k)
(born 10/27/70) | | Assistant Treasurer | | July 2005 | | Massachusetts Financial Services Company, Vice President (since May 2005); JP Morgan Investment Management Company, Vice President (prior to May 2005) |
Brian E. Langenfeld (k) (born 3/07/73) | | Assistant Secretary and Assistant Clerk | | June 2006 | | Massachusetts Financial Services Company, Assistant Vice President and Counsel (since May 2006); John Hancock Advisers, LLC, Assistant Vice President and Counsel (May 2005 to April 2006); John Hancock Advisers, LLC, Attorney and Assistant Secretary (prior to May 2005) |
Ellen Moynihan (k)
(born 11/13/57) | | Assistant Treasurer | | April 1997 | | Massachusetts Financial Services Company, Senior Vice President |
| | | |
Susan S. Newton (k) (born 3/07/50) | | Assistant Secretary and Assistant Clerk | | May 2005 | | Massachusetts Financial Services Company, Senior Vice President and Associate General Counsel (since April 2005); John Hancock Advisers, LLC, Senior Vice President, Secretary and Chief Legal Officer (prior to April 2005); John Hancock Group of Funds, Senior Vice President, Secretary and Chief Legal Officer (prior to April 2005) |
67
Trustees and Officers – continued
| | | | | | |
Name, Date of Birth | | Position(s) Held
with Fund | | Trustee/Officer
Since (h) | | Principal Occupations During
the Past Five Years & Other
Directorships (j) |
Susan A. Pereira (k)
(born 11/05/70) | | Assistant Secretary and Assistant Clerk | | July 2005 | | Massachusetts Financial Services Company, Vice President and Senior Counsel (since June 2004); Bingham McCutchen LLP (law firm), Associate (prior to June 2004) |
Mark N. Polebaum (k)
(born 5/01/52) | | Secretary and Clerk | | January 2006 | | Massachusetts Financial Services Company, Executive Vice President, General Counsel and Secretary (since January 2006); Wilmer Cutler Pickering Hale and Dorr LLP (law firm), Partner (prior to January 2006) |
Frank L. Tarantino
(born 3/07/44) | | Independent Chief Compliance Officer | | June 2004 | | Tarantino LLC (provider of compliance services), Principal (since June 2004); CRA Business Strategies Group (consulting services), Executive Vice President (April 2003 to June 2004); David L. Babson & Co. (investment adviser), Managing Director, Chief Administrative Officer and Director (prior to March 2003) |
Richard S. Weiztel (k)
(born 7/16/70) | | Assistant Secretary and Assistant Clerk | | October 2007 | | Massachusetts Financial Services Company, Vice President and Assistant General Counsel (since 2007); Vice President and Senior Counsel (since May 2004); Massachusetts Department of Business and Technology, General Counsel (February 2003 to April 2004); Massachusetts Office of the Attorney General, Assistant Attorney General (April 2001 to February 2003); Ropes and Gray, Associate (prior to April 2001) |
James O. Yost (k)
(born 6/12/60) | | Assistant Treasurer | | September 1990 | | Massachusetts Financial Services Company, Senior Vice President |
| (h) | Date first appointed to serve as Trustee/officer of an MFS fund. Each Trustee has served continuously since appointment unless indicated otherwise. |
| (j) | Directorships or trusteeships of companies required to report to the Securities and Exchange Commission (i.e., “public companies”). |
| (k) | “Interested person” of the Trust within the meaning of the Investment Company Act of 1940 (referred to as the 1940 Act), which is the principal federal law governing investment companies like the fund, as a result of position with MFS. The address of MFS is 500 Boylston Street, Boston, Massachusetts 02116. |
68
Trustees and Officers – continued
| (n) | In 2004 and 2005, Mr. Butler provided consulting services to the independent compliance consultant retained by MFS pursuant to its settlement with the SEC concerning market timing and related matters. The terms of that settlement required that compensation and expenses related to the independent compliance consultant be borne exclusively by MFS and, therefore, MFS paid Mr. Butler for the services he rendered to the independent compliance consultant. In 2004 and 2005, MFS paid Mr. Butler a total of $351,119.29. |
The Trust held a shareholders’ meeting in 2005 to elect Trustees, and will hold a shareholders’ meeting at least once every five years thereafter, to elect Trustees.
Each Trustee (except Mr. Butler and Mr. Uek) has been elected by shareholders and each Trustee and officer holds office until his or her successor is chosen and qualified or until his or her earlier death, resignation, retirement or removal. Messrs. Butler, Gutow, Sherratt and Uek and Ms. Thomsen are members of the Trust’s Audit Committee.
Each of the Trust’s Trustees and officers holds comparable positions with certain other funds of which MFS or a subsidiary is the investment adviser or distributor, and, in the case of the officers, with certain affiliates of MFS. As of January 1, 2008, the Trustees served as board members of 100 funds within the MFS Family of Funds.
The Statement of Additional Information contains further information about the Trustees and is available without charge upon request by calling 1-800-225-2606.
| | |
| Investment Adviser | | Custodian |
Massachusetts Financial Services Company
500 Boylston Street, Boston, MA 02116-3741 | | JPMorgan Chase Bank
One Chase Manhattan Plaza, New York, NY 10081 |
| Distributor | | Independent Registered Public Accounting Firm |
MFS Fund Distributors, Inc.
500 Boylston Street, Boston, MA 02116-3741 | | Deloitte & Touche LLP
200 Berkeley Street, Boston, MA 02116 |
| Portfolio Manager | | |
| Robert Persons | | |
| Michael Roberge | | |
| Jeffrey Wakelin | | |
69
BOARD REVIEW OF INVESTMENT ADVISORY AGREEMENT
A discussion regarding the Board’s most recent review and renewal of the Fund’s investment advisory agreement is available by clicking on the Fund’s name under “Select a fund” on the MFS Web site (mfs.com).
PROXY VOTING POLICIES AND INFORMATION
A general description of the MFS funds’ proxy voting policies and procedures is available without charge, upon request, by calling 1-800-225-2606, by visiting the Proxy Voting section of mfs.com or by visiting the SEC’s Web site at http://www.sec.gov.
Information regarding how the fund voted proxies relating to portfolio securities during the most recent twelve-month period ended June 30 is available without charge by visiting the Proxy Voting section of mfs.com or by visiting the SEC’s Web site at http://www.sec.gov.
QUARTERLY PORTFOLIO DISCLOSURE
The fund will file a complete schedule of portfolio holdings with the Securities and Exchange Commission (the Commission) for the first and third quarters of each fiscal year on Form N-Q. The fund’s Form N-Q may be reviewed and copied at the:
Public Reference Room
Securities and Exchange Commission
100 F Street, NE, Room 1580
Washington, D.C. 20549
Information on the operation of the Public Reference Room may be obtained by calling the Commission at 1-800-SEC-0330. The fund’s Form N-Q is available on the EDGAR database on the Commission’s Internet Web site at http://www.sec.gov, and copies of this information may be obtained, upon payment of a duplicating fee, by electronic request at the following e-mail address: publicinfo@sec.gov or by writing the Public Reference Section at the above address.
A shareholder can also obtain the quarterly portfolio holdings report at mfs.com.
FEDERAL TAX INFORMATION (unaudited)
The fund will notify shareholders of amounts for use in preparing 2008 income tax forms in January 2009.
70
MFS® PRIVACY NOTICE
Privacy is a concern for every investor today. At MFS Investment Management® and the MFS funds, we take this concern very seriously. We want you to understand our policies about the investment products and services that we offer, and how we protect the nonpublic personal information of investors who have a direct relationship with us and our wholly owned subsidiaries.
Throughout our business relationship, you provide us with personal information. We maintain information and records about you, your investments, and the services you use. Examples of the nonpublic personal information we maintain include
| | Ÿ | | data from investment applications and other forms |
| | Ÿ | | share balances and transactional history with us, our affiliates, or others |
| | Ÿ | | facts from a consumer reporting agency |
We do not disclose any nonpublic personal information about our customers or former customers to anyone, except as permitted by law. We may share nonpublic personal information with third parties or certain of our affiliates in connection with servicing your account or processing your transactions. We may share information with companies or financial institutions that perform marketing services on our behalf or with other financial institutions with which we have joint marketing arrangements, subject to any legal requirements.
Authorization to access your nonpublic personal information is limited to appropriate personnel who provide products, services, or information to you. We maintain physical, electronic, and procedural safeguards to help protect the personal information we collect about you.
If you have any questions about the MFS privacy policy, please call 1-800-225-2606 any business day between 8 a.m. and 8 p.m. Eastern time.
Note: If you own MFS products or receive MFS services in the name of a third party such as a bank or broker-dealer, their privacy policy may apply to you instead of ours.
71

| | |
| MFS® Mutual Funds | | 4/30/08 |
| ANNUAL REPORT | | |
MFS® Research Bond Fund J

MFS® Research Bond Fund J
| | |
| CONTACT INFORMATION | | BACK COVER |
SIPC Contact Information:
You may obtain information about the Securities Investor Protection Corporation (“SIPC”), including the SIPC Brochure, by contacting SIPC either by telephone (202-371-8300) or by accessing SIPC’s website address
(www.sipc.org).
The report is prepared for the general information of shareholders. It is authorized for distribution to prospective investors only when preceded or accompanied by a current prospectus.
NOT FDIC INSURED • MAY LOSE VALUE •
NO BANK OR CREDIT UNION GUARANTEE • NOT A DEPOSIT •
NOT INSURED BY ANY FEDERAL GOVERNMENT AGENCY OR NCUA/NCUSIF

LETTER FROM THE CEO
Dear Shareholders:
Negative headlines tend to resonate during difficult markets, and we certainly have had more than our share of tough news recently. As a result consumer, and particularly investor, sentiment are at all-time lows. That said, I do think it is helpful to remember there are always silver linings in the storm clouds if you look hard enough.
Through all of the challenges we have faced, there are some positive underlying trends. In the United States, for example, institutional traders and credit market followers are just now showing increasing signs of confidence and are beginning to take on more risk. At the corporate level, earnings continue to be relatively strong as companies have reduced labor costs, controlled inventories, and relied less on debt to finance expansion. More broadly, low interest rates and strong demand for consumer goods and industrial equipment are good signs for the global economy.
While I do not mean to minimize the risks inherent in today’s markets, periods such as these allow the talented fund managers and research analysts we have at MFS® to test their convictions, reevaluate existing positions, and identify new investment ideas. Our investment process also includes a significant risk management component, with constant attention paid to monitoring market risk, so we can do our best to minimize any surprises to your portfolio.
For investors, this is a great time to check in with your advisor and make sure you have a sound investment plan in place — one that can keep your hard-earned money working over the long term through a strategy that involves asset allocation, diversification, and periodic portfolio rebalancing and reviews. A plan tailored to your distinct needs and goals continues to be the best approach to help you take advantage of the inevitable challenges — and opportunities — that present themselves over time.
Respectfully,

Robert J. Manning
Chief Executive Officer and Chief Investment Officer
MFS Investment Management®
June 16, 2008
The opinions expressed in this letter are subject to change, may not be relied upon for investment advice, and no forecasts can be guaranteed.
1
PORTFOLIO COMPOSITION
Portfolio structure (i)
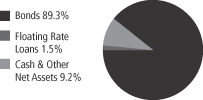
| | |
| Fixed income sectors (i) | | |
| High Grade Corporates | | 37.9% |
| Mortgage-Backed Securities | | 26.5% |
| Commercial Mortgage-Backed Securities | | 5.2% |
| Municipal Bonds | | 4.3% |
| High Yield Corporates | | 4.2% |
| U.S. Government Agencies | | 3.7% |
Collateralized Debt Obligations | | 2.3% |
| Emerging Market Bonds | | 2.2% |
| Asset-Backed Securities | | 1.9% |
| Floating Rate Loans | | 1.5% |
| U.S. Treasury Securities | | 1.0% |
| Residential Mortgage-Backed Securities | | 0.1% |
| | |
| Credit quality of bonds (r) | | |
| AAA | | 46.6% |
| AA | | 7.1% |
| A | | 9.7% |
| BBB | | 28.6% |
| BB | | 4.9% |
| B | | 2.5% |
| Not Rated | | 0.6% |
| |
| Portfolio facts | | |
| Average Duration (d)(i) | | 4.5 |
| Average Life (i)(m) | | 6.9 yrs. |
| Average Maturity (i)(m) | | 15.5 yrs. |
Average Credit Quality of Rated Securities
(long-term) (a) | | A+ |
| (a) | The average credit quality of rated securities is based upon a market weighted average of portfolio holdings that are rated by public rating agencies. |
| (d) | Duration is a measure of how much a bond’s price is likely to fluctuate with general changes in interest rates, e.g., if rates rise 1.00%, a bond with a 5-year duration is likely to lose about 5.00% of its value. |
| (i) | For purposes of this presentation, the bond component includes accrued interest amounts and may be positively or negatively impacted by the equivalent exposure from any derivative holdings, if applicable. |
| (m) | The average maturity shown is calculated using the final stated maturity on the portfolio’s holdings without taking into account any holdings which have been pre-refunded or pre-paid to an earlier date or which have a mandatory put date prior to the stated maturity. The average life shown takes into account these earlier dates. |
| (r) | Each security is assigned a rating from Moody’s Investors Service. If not rated by Moody’s, the rating will be that assigned by Standard & Poor’s. Likewise, if not assigned a rating by Standard & Poor’s, it will be based on the rating assigned by Fitch, Inc. For those portfolios that hold a security which is not rated by any of the three agencies, the security is considered Not Rated. Holdings in U.S. Treasuries and government agency mortgage-backed securities, if any, are included in the “AAA”-rating category. Percentages are based on the total market value of investments as of 4/30/08. |
Percentages are based on net assets as of 4/30/08, unless otherwise noted.
The portfolio is actively managed and current holdings may be different.
2
MANAGEMENT REVIEW
Summary of Results
For the twelve months ended April 30, 2008, Class B shares of the MFS Research Bond Fund J provided a total return of 1.40%, at net asset value. This compares with a return of 6.87% for the fund’s benchmark, the Lehman Brothers U.S. Aggregate Bond Index.
Market Environment
The U.S. economy and financial markets experienced significant deterioration and heightened volatility over the reporting period. U.S. economic growth slowed significantly in the fourth quarter of 2007 and first quarter of 2008. Headwinds included accelerated deterioration in the housing market, subdued corporate investment, a markedly weaker job market, and a tighter credit environment as banks sought to repair balance sheets. During the period, the climax of the credit turmoil occurred in mid March as the Federal Reserve backstopped the distressed sale of failing Bear Stearns to JPMorgan. While reasonably resilient, parts of the global economy and financial system experienced some spillover from the U.S. slowdown. Japanese and European growth slowed over the reporting period and international financial markets were adversely affected by U.S. mortgage and structured product losses.
In the face of this financial and economic turmoil, most global central banks were forced to inject liquidity and to reassess their tightening biases as government bond yields declined and credit spreads widened. During the second half of the reporting period, the U.S. Federal Reserve Board began an aggressive rate cutting campaign, while the U.S. federal government moved quickly to design and implement a modest fiscal stimulus package. Although the Bank of England and the Bank of Canada also cut rates, the dilemma of rising energy and food prices heightened concerns among central bankers that inflationary expectations might become unhinged.
By the end of the reporting period, bond yields, credit spreads, and equity valuations implied market expectations consistent with the view that the worst of the credit dislocation was behind us. Nonetheless, the markets continued to price in further financial and economic weakening, albeit of a less tumultuous nature.
Detractors from performance
Sector selection was the primary factor that held back performance relative to the Lehman Brothers U.S. Aggregate Bond Index. Relative overexposure to debt securities in the financial and industrial sectors was among the top detractors.
Credit quality also negatively impacted relative returns. The fund’s greater relative exposure to “BBB” rated (s) bonds detracted from relative results as credit spreads widened over the reporting period.
Contributors to performance
Yield was the largest positive contributor to the fund’s relative performance. During the period, the fund held bonds that produced a greater level of income than the benchmark.
Lower relative exposure to mortgage-backed securities boosted relative performance as these securities suffered amid the recent subprime mortgage crisis.
Respectfully,
| | | | |
| Robert Persons | | Michael Roberge | | Jeffery Wakelin |
| Portfolio Manager | | Portfolio Manager | | Portfolio Manager |
| (s) | Bonds rated “BBB”, “Baa”, or higher are considered investment grade; bonds rated “BB”, “Ba”, or below are considered non-investment grade. The primary source for bond quality ratings is Moody’s Investors Service. If not available, ratings by Standard & Poor’s are used, else ratings by Fitch, Inc. For securities which are not rated by any of the three agencies, the security is considered Not Rated. |
The views expressed in this report are those of the portfolio managers only through the end of the period of the report as stated on the cover and do not necessarily reflect the views of MFS or any other person in the MFS organization. These views are subject to change at any time based on market or other conditions, and MFS disclaims any responsibility to update such views. These views may not be relied upon as investment advice or an indication of trading intent on behalf of any MFS portfolio. References to specific securities are not recommendations of such securities, and may not be representative of any MFS portfolio’s current or future investments.
3
PERFORMANCE SUMMARY THROUGH 4/30/08
The following chart illustrates the fund’s historical performance in comparison to its benchmark. Performance results include the deduction of the maximum applicable sales charge and reflect the percentage change in net asset value, including reinvestment of dividends and capital gains distributions. Benchmark comparisons are unmanaged; do not reflect sales charges, commissions or expenses; and cannot be invested in directly. (See Notes to Performance Summary).
Performance data shown represents past performance and is no guarantee of future results. Investment return and principal value fluctuate so your shares, when sold, may be worth more or less than the original cost; current performance may be lower or higher than quoted. The performance shown does not reflect the deduction of taxes, if any, that a shareholder would pay on fund distributions or the redemption of fund shares.
Growth of a hypothetical $10,000 investment
(For the period from the commencement of investment operations, October 17, 2002, through the stated period end.)
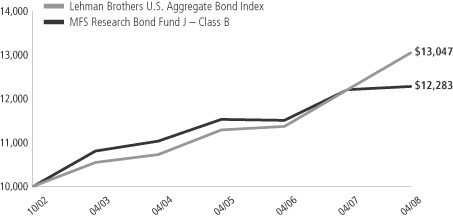
Total returns through 4/30/08
Average annual without sales charge
| | | | | | | | | | | | | | |
| | | Share class | | Class inception date | | 1-yr | | 5-yr | | Life (t) | | |
| | | B | | 10/17/02 | | 1.40% | | 2.75% | | 3.93% | | |
Average annual
Comparative benchmark
| | | | | | | | | | | | | | |
| | | Lehman Brothers U.S. Aggregate Bond Index (f) | | 6.87% | | 4.37% | | 4.90% | | |
Average annual with sales charge
| | | | | | | | | | | | | | |
| | | Share class | | | | | | | | | | |
| | | B With CDSC (Declining
over six years
from 4% to 0%) (x) | | (2.49)% | | 2.43% | | 3.78% | | |
CDSC — Contingent Deferred Sales Charge.
| (f) | Source: FactSet Research Systems Inc. |
| (t) | For the period from the commencement of the fund’s investment operations, October 17, 2002 through the stated period end. |
| (x) | Assuming redemption at the end of the applicable period. |
4
Performance Summary – continued
Benchmark Definition
Lehman Brothers U.S. Aggregate Bond Index – a market capitalization-weighted index that measures the performance of the U.S. investment-grade, fixed rate bond market, with index components for government and corporate securities, mortgage pass-through securities, and asset-backed securities with at least one year to final maturity.
It is not possible to invest directly in an index.
Notes to Performance Summary
Prior to December 22, 2003, the Research Bond Fund J (the “fund”) was a “fund of funds” and invested all of its assets in Class I shares of the MFS Research Bond Fund, an open-end investment company that has the same investment objective as the fund.
Performance results reflect any applicable expense subsidies and waivers in effect during the periods shown. Without such subsidies and waivers the fund’s performance results would be less favorable. Please see the prospectus and financial statements for complete details.
From time to time the fund may receive proceeds from litigation settlements, without which performance would be lower.
5
EXPENSE TABLE
Fund expenses borne by the shareholders during the period, November 1, 2007 through April 30, 2008.
As a shareholder of the fund, you incur two types of costs: (1) transaction costs, including sales charges (loads) on certain redemption payments, and (2) ongoing costs, including management fees; distribution and service (12b-1) fees; and other fund expenses. This example is intended to help you understand your ongoing costs (in dollars) of investing in the fund and to compare these costs with the ongoing costs of investing in other mutual funds.
The example is based on an investment of $1,000 invested at the beginning of the period and held for the entire period November 1, 2007 through April 30, 2008.
Actual expenses
The first line in the following table provides information about actual account values and actual expenses. You may use the information in this line, together with the amount you invested, to estimate the expenses that you paid over the period. Simply divide your account value by $1,000 (for example, an $8,600 account value divided by $1,000 = 8.6), then multiply the result by the number in the first line under the heading entitled “Expenses Paid During Period” to estimate the expenses you paid on your account during this period.
Hypothetical example for comparison purposes
The second line in the following table provides information about hypothetical account values and hypothetical expenses based on the fund’s actual expense ratio and an assumed rate of return of 5% per year before expenses, which is not the fund’s actual return. The hypothetical account values and expenses may not be used to estimate the actual ending account balance or expenses you paid for the period. You may use this information to compare the ongoing costs of investing in the fund and other funds. To do so, compare this 5% hypothetical example with the 5% hypothetical examples that appear in the shareholder reports of the other funds.
Please note that the expenses shown in the table are meant to highlight your ongoing costs only and do not reflect any transactional costs, such as sales charges (loads). Therefore, the second line in the table is useful in comparing ongoing costs only, and will not help you determine the relative total costs of owning different funds. In addition, if these transactional costs were included, your costs would have been higher.
| | | | | | | | | | | | | | |
| | | | | Annualized
Expense
Ratio | | | Beginning
Account Value
11/1/07 | | Ending
Account Value
4/30/08 | | Expenses
Paid During
Period (p)
11/1/07-4/30/08 |
| Class B | | Actual | | 1.49 | % | | $ | 1,000.00 | | $ | 1,006.26 | | $ | 7.43 |
| | Hypothetical (h) | | 1.49 | % | | $ | 1,000.00 | | $ | 1,017.45 | | $ | 7.47 |
| (h) | 5% class return per year before expenses. |
| (p) | Expenses paid is equal to each class’ annualized expense ratio, as shown above, multiplied by the average account value over the period, multiplied by the number of days in the period, divided by the number of days in the year. Expenses paid do not include any applicable sales charges (loads). If these transaction costs had been included, your costs would have been higher. |
6
PORTFOLIO OF INVESTMENTS
4/30/08
The Portfolio of Investments is a complete list of all securities owned by your fund. It is categorized by broad-based asset classes.
| | | | | | |
| Issuer | | Shares/Par | | Value ($) |
| | | | | | |
| Bonds - 95.6% | | | | | | |
| Airlines - 0.2% | | | | | | |
| Continental Airlines, Inc., 7.875%, 2018 | | $ | 294,099 | | $ | 244,102 |
| | |
| Asset Backed & Securitized - 9.9% | | | | | | |
| ARCap REIT, Inc., CDO, “H”, 6.1%, 2045 (n) | | $ | 138,945 | | $ | 48,631 |
| Banc of America Commercial Mortgage, Inc., 5.356%, 2045 | | | 400,000 | | | 390,751 |
| Bayview Commercial Asset Trust, 0.775%, 2035 (i)(z) | | | 5,059,259 | | | 348,630 |
| Bayview Commercial Asset Trust, FRN, 1.68%, 2036 (i)(z) | | | 3,334,708 | | | 242,522 |
| Bayview Commercial Asset Trust, FRN, 0.879%, 2036 (i)(z) | | | 2,435,575 | | | 199,529 |
| Bayview Commercial Mortgage Pass-Through Trust, FRN, 2.057%, 2036 (i)(z) | | | 2,071,915 | | | 134,674 |
| Bayview Financial Acquisition Trust, FRN, 5.402%, 2035 | | | 282,031 | | | 275,068 |
| Bayview Financial Acquisition Trust, FRN, 5.483%, 2041 | | | 307,000 | | | 288,040 |
| Citigroup/Deutsche Bank Commercial Mortgage Trust, FRN, 5.225%, 2044 | | | 580,000 | | | 577,444 |
| Citigroup/Deutsche Bank Commercial Mortgage Trust, FRN, 5.555%, 2049 | | | 300,000 | | | 189,404 |
| Credit-Based Asset Servicing & Securitization LLC, FRN, 5.303%, 2035 | | | 326,330 | | | 308,895 |
| Crest G-Star, CDO, 6.95%, 2032 (z) | | | 974,000 | | | 1,003,997 |
| Deutsche Mortgage & Asset Receiving Corp., FRN, 7.5%, 2031 | | | 415,000 | | | 440,775 |
| E*TRADE RV & Marine Trust, 3.62%, 2018 | | | 119,883 | | | 116,630 |
| Falcon Franchise Loan LLC, 7.382%, 2010 (n) | | | 3,599 | | | 3,593 |
| Falcon Franchise Loan LLC, FRN, 3.08%, 2023 (i)(n) | | | 130,024 | | | 10,535 |
| Falcon Franchise Loan LLC, FRN, 3.844%, 2025 (i)(z) | | | 1,957,564 | | | 205,172 |
| First Union National Bank Commercial Mortgage Trust, FRN, 1.144%, 2043 (i)(n) | | | 5,335,178 | | | 113,826 |
| First Union-Lehman Brothers Bank of America, FRN, 0.589%, 2035 (i) | | | 2,525,581 | | | 40,027 |
| Greenwich Capital Commercial Funding Corp., 4.569%, 2042 | | | 400,000 | | | 391,703 |
| Greenwich Capital Commercial Funding Corp., FRN, 5.224%, 2037 | | | 174,453 | | | 172,830 |
| Greenwich Capital Commercial Funding Corp., FRN, 6.112%, 2038 | | | 400,000 | | | 407,421 |
| JPMorgan Chase Commercial Mortgage Securities Corp., 5.429%, 2043 | | | 400,000 | | | 391,511 |
| JPMorgan Chase Commercial Mortgage Securities Corp., FRN, 5.506%, 2042 (n) | | | 540,000 | | | 419,606 |
| JPMorgan Chase Commercial Mortgage Securities Corp., FRN, 5.855%, 2043 | | | 310,000 | | | 292,742 |
| JPMorgan Chase Commercial Mortgage Securities Corp., FRN, 5.038%, 2046 | | | 331,125 | | | 325,923 |
| JPMorgan Chase Commercial Mortgage Securities Corp., FRN, 6.007%, 2049 | | | 470,000 | | | 454,626 |
| KKR Financial CLO Ltd., “C”, CDO, FRN, 4.515%, 2021 (n) | | | 787,476 | | | 501,622 |
| Lehman Brothers Commercial Conduit Mortgage Trust, FRN, 0.676%, 2035 (i) | | | 6,390,462 | | | 43,803 |
| Merrill Lynch Mortgage Trust, FRN, 6.023%, 2050 | | | 350,000 | | | 253,813 |
| Merrill Lynch/Countrywide Commercial Mortgage Trust, FRN, 5.172%, 2049 | | | 400,000 | | | 384,611 |
| Merrill Lynch/Countrywide Commercial Mortgage Trust, FRN, 5.714%, 2051 | | | 100,000 | | | 63,697 |
| Morgan Stanley Capital I, Inc., FRN, 1.11%, 2031 (i)(n) | | | 4,208,204 | | | 28,774 |
| Mortgage Capital Funding, Inc., FRN, 0.615%, 2031 (i) | | | 1,528,098 | | | 2,123 |
| Multi-Family Capital Access One, Inc., 6.65%, 2024 | | | 167,629 | | | 167,759 |
| Nationslink Funding Corp., FRN, 0.608%, 2030 (i) | | | 1,060,813 | | | 11,658 |
| New Century Home Equity Loan Trust, FRN, 4.532%, 2035 | | | 500,000 | | | 490,044 |
| Popular ABS Mortgage Pass-Through Trust, FRN, 4.62%, 2035 | | | 179,382 | | | 176,098 |
| Preferred Term Securities XIX Ltd., CDO, FRN, 3.15%, 2035 (z) | | | 1,419,195 | | | 1,192,123 |
| Residential Asset Mortgage Products, Inc., FRN, 4.971%, 2034 | | | 185,000 | | | 180,421 |
| Residential Funding Mortgage Securities, Inc., FRN, 5.32%, 2035 | | | 845,000 | | | 377,253 |
| Structured Asset Securities Corp., FRN, 3.135%, 2035 | | | 114,477 | | | 110,706 |
| Wachovia Bank Commercial Mortgage Trust, FRN, 4.847%, 2041 | | | 300,000 | | | 292,568 |
| Wachovia Bank Commercial Mortgage Trust, FRN, 5.513%, 2043 | | | 125,000 | | | 85,998 |
| | | | | | |
| | | | | | $ | 12,157,576 |
7
Portfolio of Investments – continued
| | | | | | |
| Issuer | | Shares/Par | | Value ($) |
| | | | | | |
| Bonds - continued | | | | | | |
| Automotive - 0.3% | | | | | | |
| Ford Motor Credit Co., 7.375%, 2009 | | $ | 220,000 | | $ | 211,778 |
| Johnson Controls, Inc., 5.5%, 2016 | | | 211,000 | | | 210,521 |
| | | | | | |
| | | | | | $ | 422,299 |
| Broadcasting - 1.2% | | | | | | |
| Allbritton Communications Co., 7.75%, 2012 | | $ | 231,000 | | $ | 233,599 |
| British Sky Broadcasting, 6.1%, 2018 (z) | | | 330,000 | | | 335,771 |
| CBS Corp., 6.625%, 2011 | | | 448,000 | | | 461,595 |
| Clear Channel Communications, Inc., 7.65%, 2010 | | | 99,000 | | | 102,924 |
| Clear Channel Communications, Inc., 6.25%, 2011 | | | 400,000 | | | 340,000 |
| News America, Inc., 8.5%, 2025 | | | 30,000 | | | 34,762 |
| | | | | | |
| | | | | | $ | 1,508,651 |
| Brokerage & Asset Managers - 3.1% | | | | | | |
| Bear Stearns Cos., Inc., 5.85%, 2010 | | $ | 750,000 | | $ | 757,034 |
| Goldman Sachs Group, Inc., 5.625%, 2017 | | | 298,000 | | | 287,973 |
| Goldman Sachs Group, Inc., 6.15%, 2018 | | | 320,000 | | | 323,697 |
| INVESCO PLC, 4.5%, 2009 | | | 518,000 | | | 514,717 |
| INVESCO PLC, 5.625%, 2012 | | | 215,000 | | | 210,179 |
| Lehman Brothers Holdings, Inc., 6.5%, 2017 | | | 370,000 | | | 363,469 |
| Merrill Lynch & Co., Inc., 6.15%, 2013 | | | 440,000 | | | 439,080 |
| Merrill Lynch & Co., Inc., 6.05%, 2016 | | | 280,000 | | | 268,662 |
| Morgan Stanley, 5.75%, 2016 | | | 372,000 | | | 364,266 |
| Morgan Stanley Group, Inc., 6.625%, 2018 | | | 300,000 | | | 311,046 |
| | | | | | |
| | | | | | $ | 3,840,123 |
| Building - 0.1% | | | | | | |
| American Standard Cos., Inc., 7.625%, 2010 | | $ | 100,000 | | $ | 105,716 |
| | |
| Business Services - 0.3% | | | | | | |
| Xerox Corp., 5.65%, 2013 | | $ | 350,000 | | $ | 350,902 |
| | |
| Cable TV - 1.1% | | | | | | |
| Comcast Corp., 5.875%, 2018 | | $ | 128,000 | | $ | 127,648 |
| Cox Communications, Inc., 7.125%, 2012 | | | 310,000 | | | 329,575 |
| TCI Communications, Inc., 9.8%, 2012 | | | 181,000 | | | 204,043 |
| Time Warner Cable, Inc., 5.4%, 2012 | | | 463,000 | | | 465,701 |
| Time Warner Entertainment Co. LP, 8.375%, 2033 | | | 243,000 | | | 282,869 |
| | | | | | |
| | | | | | $ | 1,409,836 |
| Chemicals - 0.3% | | | | | | |
| PPG Industries, Inc., 5.75%, 2013 | | $ | 373,000 | | $ | 382,654 |
| | |
| Consumer Goods & Services - 1.2% | | | | | | |
| Clorox Co., 5%, 2013 | | $ | 340,000 | | $ | 335,828 |
| Fortune Brands, Inc., 5.125%, 2011 | | | 458,000 | | | 455,129 |
| Western Union Co., 5.4%, 2011 | | | 730,000 | | | 729,694 |
| | | | | | |
| | | | | | $ | 1,520,651 |
| Defense Electronics - 0.6% | | | | | | |
| BAE Systems Holdings, Inc., 4.75%, 2010 (n) | | $ | 402,000 | | $ | 410,412 |
| BAE Systems Holdings, Inc., 6.4%, 2011 (n) | | | 372,000 | | | 386,996 |
| | | | | | |
| | | | | | $ | 797,408 |
8
Portfolio of Investments – continued
| | | | | | |
| Issuer | | Shares/Par | | Value ($) |
| Bonds - continued | | | | | | |
| Electronics - 0.3% | | | | | | |
| Tyco Electronics Ltd., 6.55%, 2017 (n) | | $ | 180,000 | | $ | 184,284 |
| Tyco Electronics Ltd., 7.125%, 2037 (n) | | | 130,000 | | | 133,136 |
| | | | | | |
| | | | | | $ | 317,420 |
| | | | | | |
| Emerging Market Quasi-Sovereign - 0.3% | | | | | | |
| OAO Gazprom, 7.343%, 2013 (z) | | $ | 240,000 | | $ | 251,100 |
| OAO Gazprom, 8.146%, 2018 (z) | | | 115,000 | | | 122,044 |
| | | | | | |
| | | | | | $ | 373,144 |
| Emerging Market Sovereign - 0.3% | | | | | | |
| Gabonese Republic, 8.2%, 2017 (n) | | $ | 340,000 | | $ | 356,150 |
| | |
| Energy - Independent - 1.0% | | | | | | |
| Apache Corp., 7.375%, 2047 | | $ | 10,000 | | $ | 11,474 |
| Nexen, Inc., 6.4%, 2037 | | | 540,000 | | | 528,084 |
| Ocean Energy, Inc., 7.25%, 2011 | | | 241,000 | | | 261,318 |
| XTO Energy, Inc., 6.25%, 2013 | | | 100,000 | | | 105,368 |
| XTO Energy, Inc., 5.65%, 2016 | | | 329,000 | | | 332,197 |
| | | | | | |
| | | | | | $ | 1,238,441 |
| Entertainment - 0.1% | | | | | | |
| Turner Broadcasting System, Inc., 8.375%, 2013 | | $ | 101,000 | | $ | 110,183 |
| | |
| Financial Institutions - 2.4% | | | | | | |
| American Express Centurion Bank, 5.55%, 2012 | | $ | 420,000 | | $ | 420,316 |
| Capital One Financial Corp., 6.15%, 2016 | | | 310,000 | | | 281,046 |
| CIT Group, Inc., 6.1% to 2017, FRN to 2067 | | | 80,000 | | | 41,786 |
| General Electric Capital Corp., 5.375%, 2016 | | | 343,000 | | | 348,032 |
| General Electric Co., 5.625%, 2018 | | | 200,000 | | | 202,045 |
| HSBC Finance Corp., 5.5%, 2016 | | | 624,000 | | | 617,617 |
| ILFC E-Capital Trust I, 5.9% to 2010, FRN to 2065 (n) | | | 500,000 | | | 396,113 |
| ORIX Corp., 5.48%, 2011 | | | 630,000 | | | 610,873 |
| | | | | | |
| | | | | | $ | 2,917,828 |
| Food & Beverages - 1.2% | | | | | | |
| Dr Pepper Snapple Group, Inc., 6.82%, 2018 (z) | | $ | 280,000 | | $ | 290,459 |
| General Mills, Inc., 5.65%, 2012 | | | 190,000 | | | 195,580 |
| Miller Brewing Co., 5.5%, 2013 (n) | | | 641,000 | | | 663,700 |
| Tyson Foods, Inc., 6.85%, 2016 | | | 370,000 | | | 367,502 |
| | | | | | |
| | | | | | $ | 1,517,241 |
| Food & Drug Stores - 0.4% | | | | | | |
| CVS Caremark Corp., 6.125%, 2016 | | $ | 270,000 | | $ | 279,079 |
| CVS Caremark Corp., 5.75%, 2017 | | | 153,000 | | | 155,042 |
| | | | | | |
| | | | | | $ | 434,121 |
| Forest & Paper Products - 0.2% | | | | | | |
| Stora Enso Oyj, 7.25%, 2036 (n) | | $ | 304,000 | | $ | 256,594 |
| | |
| Gaming & Lodging - 1.0% | | | | | | |
| Marriott International, Inc., 6.375%, 2017 | | $ | 380,000 | | $ | 373,926 |
| Station Casinos, Inc., 6%, 2012 | | | 350,000 | | | 295,312 |
| Wyndham Worldwide Corp., 6%, 2016 | | | 585,000 | | | 526,439 |
| | | | | | |
| | | | | | $ | 1,195,677 |
| Industrial - 0.5% | | | | | | |
| Steelcase, Inc., 6.5%, 2011 | | $ | 620,000 | | $ | 628,360 |
9
Portfolio of Investments – continued
| | | | | | |
| Issuer | | Shares/Par | | Value ($) |
| | | | | | |
| Bonds - continued | | | | | | |
| Insurance - 1.0% | | | | | | |
| ING Groep N.V., 5.775% to 2015, FRN to 2049 | | $ | 323,000 | | $ | 277,527 |
| Metropolitan Life Global Funding, 5.125%, 2013 (z) | | | 300,000 | | | 299,981 |
| Prudential Financial, Inc., 6%, 2017 | | | 320,000 | | | 322,641 |
| UnumProvident Corp., 6.85%, 2015 (n) | | | 393,000 | | | 395,026 |
| | | | | | |
| | | | | | $ | 1,295,175 |
| Insurance - Health - 0.1% | | | | | | |
| UnitedHealth Group, Inc., 6.875%, 2038 | | $ | 170,000 | | $ | 165,873 |
| | |
| Insurance - Property & Casualty - 1.0% | | | | | | |
| Chubb Corp., 6.375% to 2017, FRN to 2037 | | $ | 190,000 | | $ | 177,280 |
| Fund American Cos., Inc., 5.875%, 2013 | | | 585,000 | | | 572,290 |
| ZFS Finance USA Trust V, 6.5% to 2017, FRN to 2037 (n) | | | 500,000 | | | 440,461 |
| | | | | | |
| | | | | | $ | 1,190,031 |
| Major Banks - 3.5% | | | | | | |
| BAC Capital Trust XIV, 5.63% to 2012, FRN to 2049 | | $ | 230,000 | | $ | 184,750 |
| Bank of America Corp., 5.65%, 2018 | | | 430,000 | | | 430,318 |
| BNP Paribas, 7.195% to 2037, FRN to 2049 (n) | | | 400,000 | | | 375,252 |
| Credit Suisse New York, 6%, 2018 | | | 210,000 | | | 212,835 |
| DBS Capital Funding Corp., 7.657% to 2011, FRN to 2049 (n) | | | 238,000 | | | 248,098 |
| JPMorgan Chase Bank N.A., 5.875%, 2016 | | | 250,000 | | | 253,439 |
| MUFG Capital Finance 1 Ltd., 6.346% to 2016, FRN to 2049 | | | 512,000 | | | 462,753 |
| Natexis AMBS Co. LLC, 8.44% to 2008, FRN to 2049 (n) | | | 195,000 | | | 196,393 |
| Natixis S.A., 10% to 2018, FRN to 2049 (z) | | | 300,000 | | | 303,309 |
| PNC Funding Corp., 5.625%, 2017 | | | 290,000 | | | 278,282 |
| Royal Bank of Scotland Group PLC, 6.99% to 2017, FRN to 2049 (n) | | | 100,000 | | | 91,787 |
| UniCredito Italiano Capital Trust II, 9.2% to 2010, FRN to 2049 (n) | | | 258,000 | | | 255,121 |
| Unicredito Luxembourg Finance S.A., 6%, 2017 (n) | | | 500,000 | | | 483,834 |
| Wachovia Capital Trust III, 5.8% to 2011, FRN to 2042 | | | 225,000 | | | 178,875 |
| Wachovia Corp., 6.605%, 2025 | | | 387,000 | | | 359,263 |
| | | | | | $ | 4,314,309 |
| Medical & Health Technology & Services - 1.7% | | | | | | |
| Covidien Ltd., 6%, 2017 (n) | | $ | 250,000 | | $ | 255,574 |
| Covidien Ltd., 6.55%, 2037 (n) | | | 170,000 | | | 173,786 |
| Fisher Scientific International, Inc., 6.125%, 2015 | | | 675,000 | | | 673,379 |
| Hospira, Inc., 5.55%, 2012 | | | 300,000 | | | 296,724 |
| Hospira, Inc., 6.05%, 2017 | | | 290,000 | | | 283,938 |
| McKesson Corp., 5.7%, 2017 | | | 360,000 | | | 352,409 |
| | | | | | |
| | | | | | $ | 2,035,810 |
| Metals & Mining - 0.7% | | | | | | |
| International Steel Group, Inc., 6.5%, 2014 | | $ | 497,000 | | $ | 509,365 |
| Peabody Energy Corp., 5.875%, 2016 | | | 332,000 | | | 322,040 |
| | | | | | |
| | | | | | $ | 831,405 |
| Mortgage Backed - 26.4% | | | | | | |
| Fannie Mae, 4.55%, 2011 | | $ | 339,919 | | $ | 342,518 |
| Fannie Mae, 5.12%, 2012 | | | 281,573 | | | 287,976 |
| Fannie Mae, 4.556%, 2014 | | | 232,756 | | | 229,735 |
| Fannie Mae, 4.62%, 2014 | | | 178,896 | | | 177,664 |
| Fannie Mae, 4.666%, 2014 | | | 277,140 | | | 274,487 |
| Fannie Mae, 4.86%, 2014 | | | 178,846 | | | 178,303 |
| Fannie Mae, 4.56%, 2015 | | | 229,401 | | | 226,594 |
10
Portfolio of Investments – continued
| | | | | | |
| Issuer | | Shares/Par | | Value ($) |
| | | | | | |
| Bonds - continued | | | | | | |
| Mortgage Backed - continued | | | | | | |
| Fannie Mae, 4.665%, 2015 | | $ | 154,208 | | $ | 153,203 |
| Fannie Mae, 4.69%, 2015 | | | 128,911 | | | 128,313 |
| Fannie Mae, 4.7%, 2015 | | | 177,943 | | | 177,123 |
| Fannie Mae, 4.74%, 2015 | | | 197,097 | | | 194,853 |
| Fannie Mae, 4.78%, 2015 | | | 218,231 | | | 217,659 |
| Fannie Mae, 4.815%, 2015 | | | 271,000 | | | 268,688 |
| Fannie Mae, 4.82%, 2015 | | | 226,652 | | | 226,459 |
| Fannie Mae, 4.87%, 2015 | | | 174,926 | | | 175,544 |
| Fannie Mae, 4.89%, 2015 | | | 124,574 | | | 125,242 |
| Fannie Mae, 4.925%, 2015 | | | 490,060 | | | 489,992 |
| Fannie Mae, 5%, 2016 - 2025 | | | 1,282,543 | | | 1,294,798 |
| Fannie Mae, 4.996%, 2017 | | | 568,290 | | | 570,204 |
| Fannie Mae, 5.5%, 2018 - 2038 | | | 7,608,029 | | | 7,684,875 |
| Fannie Mae, 4.88%, 2020 | | | 170,720 | | | 172,794 |
| Fannie Mae, 6.5%, 2033 | | | 64,490 | | | 67,133 |
| Fannie Mae, 6%, 2034 - 2037 | | | 672,429 | | | 688,727 |
| Freddie Mac, 5%, 2018 - 2028 | | | 1,939,493 | | | 1,963,306 |
| Freddie Mac, 5.5%, 2022 - 2038 | | | 4,440,768 | | | 4,485,916 |
| Freddie Mac, 4%, 2024 | | | 76,482 | | | 76,654 |
| Freddie Mac, 6%, 2034 - 2037 | | | 2,151,885 | | | 2,208,921 |
| Ginnie Mae, 6%, 2036 - 2038 | | | 3,998,300 | | | 4,114,677 |
| Ginnie Mae, 5.5%, 2038 | | | 3,972,691 | | | 4,028,930 |
| Ginnie Mae, TBA, 5.5%, 2038 | | | 1,250,000 | | $ | 1,262,110 |
| | | | | | |
| | | | | | $ | 32,493,398 |
| Municipals - 4.3% | | | | | | |
| Harris County, TX, “C”, FSA, 5.25%, 2031 | | $ | 340,000 | | $ | 370,838 |
| Harris County, TX, “C”, FSA, 5.25%, 2032 | | | 340,000 | | | 371,042 |
| Massachusetts Health & Educational Authority Rev. (Mass Institute Technology), “K”, 5.5%, 2032 | | | 1,620,000 | | | 1,826,080 |
| Massachusetts Health & Educational Facilities Authority Rev. (Boston College), 5.5%, 2030 | | | 310,000 | | | 347,029 |
| Massachusetts Health & Educational Facilities Authority Rev. (Boston College), 5.5%, 2035 | | | 515,000 | | | 579,421 |
| Metropolitan Atlanta, GA, Rapid Transit Tax Authority Rev., “A”, FGIC, 5.25%, 2032 | | | 500,000 | | | 541,705 |
| State of Massachusetts, “A”, N, 5.5%, 2030 | | | 1,100,000 | | | 1,222,188 |
| | | | | | |
| | | | | | $ | 5,258,303 |
| Natural Gas - Pipeline - 1.9% | | | | | | |
| CenterPoint Energy, Inc., 7.875%, 2013 | | $ | 616,000 | | $ | 672,862 |
| CenterPoint Energy, Inc., 5.95%, 2017 | | | 250,000 | | | 239,932 |
| Enterprise Products Operating LP, 5.65%, 2013 | | | 181,000 | | | 182,221 |
| Enterprise Products Partners LP, 6.3%, 2017 | | | 40,000 | | | 40,760 |
| Kinder Morgan Energy Partners LP, 7.75%, 2032 | | | 236,000 | | | 252,633 |
| Spectra Energy Capital LLC, 8%, 2019 | | | 393,000 | | | 434,899 |
| Williams Cos., Inc., 8.75%, 2032 | | | 445,000 | | | 526,212 |
| | | | | | |
| | | | | | $ | 2,349,519 |
| Network & Telecom - 4.0% | | | | | | |
| British Telecommunications PLC, 5.15%, 2013 | | $ | 550,000 | | $ | 552,459 |
| CenturyTel, Inc., 8.375%, 2010 | | | 606,000 | | | 653,584 |
| Deutsche Telekom International Finance B.V., 5.75%, 2016 | | | 351,000 | | | 354,049 |
| GTE Corp., 7.51%, 2009 | | | 580,000 | | | 597,771 |
| Qwest Capital Funding, Inc., 7.25%, 2011 | | | 435,000 | | | 426,300 |
| Telecom Italia Capital, 6.2%, 2011 | | | 461,000 | | | 464,399 |
| Telefonica Emisiones S.A.U., 7.045%, 2036 | | | 319,000 | | | 348,710 |
| TELUS Corp., 8%, 2011 | | | 713,000 | | | 769,181 |
| Verizon New York, Inc., 6.875%, 2012 | | | 706,000 | | | 743,703 |
| | | | | | |
| | | | | | $ | 4,910,156 |
11
Portfolio of Investments – continued
| | | | | | |
| Issuer | | Shares/Par | | Value ($) |
| | | | | | |
| Bonds - continued | | | | | | |
| Oil Services - 0.5% | | | | | | |
| Weatherford International Ltd., 5.15%, 2013 | | $ | 330,000 | | $ | 331,253 |
| Weatherford International Ltd., 6.35%, 2017 | | | 300,000 | | | 315,864 |
| | | | | | |
| | | | | | $ | 647,117 |
| Oils - 0.4% | | | | | | |
| Premcor Refining Group, Inc., 7.5%, 2015 | | $ | 500,000 | | $ | 521,389 |
| | |
| Other Banks & Diversified Financials - 1.8% | | | | | | |
| Alfa Diversified Payment Rights Finance Co. S.A., FRN, 4.7%, 2011 (n) | | $ | 277,500 | | $ | 265,013 |
| Citigroup, Inc., 5.5%, 2013 | | | 690,000 | | | 694,205 |
| Citigroup, Inc., 8.4% to 2018, FRN to 2049 | | | 490,000 | | | 495,919 |
| Fifth Third Bancorp, 5.45%, 2017 | | | 50,000 | | | 46,636 |
| Resona Bank Ltd., 5.85% to 2016, FRN to 2049 (n) | | | 465,000 | | | 392,189 |
| UBS Preferred Funding Trust V, 6.243% to 2016, FRN to 2049 | | | 350,000 | | | 306,321 |
| | | | | | |
| | | | | | $ | 2,200,283 |
| Printing & Publishing - 0.5% | | | | | | |
| Dex Media West LLC, 9.875%, 2013 | | $ | 335,000 | | $ | 315,738 |
| Idearc, Inc., 8%, 2016 | | | 168,000 | | | 109,200 |
| Pearson PLC, 5.5%, 2013 (z) | | | 140,000 | | | 141,093 |
| | | | | | |
| | | | | | $ | 566,031 |
| Railroad & Shipping - 0.5% | | | | | | |
| TFM S.A. de C.V., 9.375%, 2012 | | $ | 326,000 | | $ | 339,855 |
| Union Pacific Corp., 7.25%, 2008 | | | 175,000 | | | 178,305 |
| Union Pacific Corp., 5.7%, 2018 | | | 120,000 | | | 121,385 |
| | | | | | |
| | | | | | $ | 639,545 |
| Real Estate - 3.1% | | | | | | |
| Boston Properties, Inc., REIT, 5%, 2015 | | $ | 253,000 | | $ | 235,684 |
| ERP Operating LP, REIT, 5.75%, 2017 | | | 630,000 | | | 591,155 |
| HRPT Properties Trust, REIT, 6.25%, 2016 | | | 416,000 | | | 384,558 |
| Kimco Realty Corp., REIT, 6%, 2012 | | | 150,000 | | | 147,465 |
| Kimco Realty Corp., REIT, 5.783%, 2016 | | | 648,000 | | | 602,582 |
| Liberty Property LP, REIT, 5.5%, 2016 | | | 430,000 | | | 382,096 |
| ProLogis, REIT, 5.75%, 2016 | | | 354,000 | | | 333,494 |
| ProLogis, REIT, 5.625%, 2016 | | | 220,000 | | | 204,746 |
| Simon Property Group, Inc., REIT, 4.6%, 2010 | | | 267,000 | | | 265,188 |
| Simon Property Group, Inc., REIT, 5.75%, 2015 | | | 331,000 | | | 323,605 |
| Simon Property Group, Inc., REIT, 6.1%, 2016 | | | 312,000 | | | 312,778 |
| | | | | | |
| | | | | | $ | 3,783,351 |
| Restaurants - 0.4% | | | | | | |
| YUM! Brands, Inc., 8.875%, 2011 | | $ | 417,000 | | $ | 458,931 |
| | |
| Retailers - 1.7% | | | | | | |
| Federated Retail Holdings, Inc., 5.35%, 2012 | | $ | 240,000 | | $ | 223,642 |
| Home Depot, Inc., 5.25%, 2013 | | | 187,000 | | | 181,084 |
| Home Depot, Inc., 5.875%, 2036 | | | 279,000 | | | 233,247 |
| J.C. Penney Corp., Inc., 8%, 2010 | | | 70,000 | | | 72,219 |
| Macy’s, Inc., 6.625%, 2011 | | | 374,000 | | | 368,142 |
| Target Corp., 6.5%, 2037 | | | 130,000 | | | 131,017 |
| Wal-Mart Stores, Inc., 6.2%, 2038 | | | 470,000 | | | 478,365 |
| Wesfarmers Ltd., 6.998%, 2013 (z) | | | 420,000 | | | 436,913 |
| | | | | | |
| | | | | | $ | 2,124,629 |
12
Portfolio of Investments – continued
| | | | | | |
| Issuer | | Shares/Par | | Value ($) |
| | | | | | |
| Bonds - continued | | | | | | |
| Steel - 0.2% | | | | | | |
| Evraz Group S.A., 8.875%, 2013 (z) | | $ | 305,000 | | $ | 308,813 |
| | |
| Supermarkets - 0.9% | | | | | | |
| Delhaize America, Inc., 9%, 2031 | | $ | 284,000 | | $ | 351,421 |
| Kroger Co., 6.4%, 2017 | | | 540,000 | | | 574,488 |
| Safeway, Inc., 6.5%, 2011 | | | 227,000 | | | 235,557 |
| | | | | | |
| | | | | | $ | 1,161,466 |
| Telecommunications-Wireless - 0.9% | | | | | | |
| Nextel Communications, Inc., 5.95%, 2014 | | $ | 655,000 | | $ | 510,900 |
| Rogers Cable, Inc., 5.5%, 2014 | | | 406,000 | | | 397,803 |
| Vodafone Group PLC, 5.625%, 2017 | | | 149,000 | | | 149,644 |
| | | | | | |
| | | | | | $ | 1,058,347 |
| Telephone Services - 0.2% | | | | | | |
| Embarq Corp., 7.082%, 2016 | | $ | 300,000 | | $ | 297,639 |
| | |
| Tobacco - 0.4% | | | | | | |
| Reynolds American, Inc., 6.75%, 2017 | | $ | 430,000 | | $ | 435,467 |
| | |
| Transportation-Services - 0.1% | | | | | | |
| FedEx Corp., 9.65%, 2012 | | $ | 83,000 | | $ | 96,940 |
| | |
| U.S. Government Agencies - 3.7% | | | | | | |
| Small Business Administration, 5.34%, 2021 | | $ | 76,217 | | $ | 77,864 |
| Small Business Administration, 6.34%, 2021 | | | 13,449 | | | 14,049 |
| Small Business Administration, 6.35%, 2021 | | | 9,052 | | | 9,454 |
| Small Business Administration, 6.44%, 2021 | | | 13,222 | | | 13,843 |
| Small Business Administration, 6.07%, 2022 | | | 51,887 | | | 54,693 |
| Small Business Administration, 4.35%, 2023 | | | 357,565 | | | 348,306 |
| Small Business Administration, 4.89%, 2023 | | | 489,053 | | | 484,991 |
| Small Business Administration, 4.98%, 2023 | | | 510,307 | | | 514,141 |
| Small Business Administration, 4.34%, 2024 | | | 440,076 | | | 426,315 |
| Small Business Administration, 4.86%, 2024 | | | 232,419 | | | 231,854 |
| Small Business Administration, 4.93%, 2024 | | | 446,189 | | | 448,064 |
| Small Business Administration, 5.19%, 2024 | | | 456,446 | | | 462,996 |
| Small Business Administration, 5.52%, 2024 | | | 453,067 | | | 465,981 |
| Small Business Administration, 4.76%, 2025 | | | 575,458 | | | 561,323 |
| Small Business Administration, 5.35%, 2026 | | | 383,797 | | | 390,664 |
| | | | | | |
| | | | | | $ | 4,504,538 |
| U.S. Treasury Obligations - 4.7% | | | | | | |
| U.S. Treasury Bonds, 8.125%, 2019 | | $ | 5,000 | | $ | 6,797 |
| U.S. Treasury Bonds, 6%, 2026 | | | 630,000 | | | 744,237 |
| U.S. Treasury Bonds, 6.25%, 2030 | | | 375,000 | | | 466,641 |
| U.S. Treasury Bonds, 5.375%, 2031 | | | 1,749,000 | | | 1,967,761 |
| U.S. Treasury Bonds, 4.5%, 2036 (f) | | | 1,347,000 | | | 1,349,315 |
| U.S. Treasury Notes, 4.75%, 2014 | | | 74,000 | | | 80,452 |
| U.S. Treasury Notes, 5.125%, 2016 | | | 1,080,000 | | | 1,195,678 |
| | | | | | |
| | | | | | $ | 5,810,881 |
| Utilities - Electric Power - 5.0% | | | | | | |
| Allegheny Energy Supply Co. LLC, 8.25%, 2012 (n) | | $ | 439,000 | | $ | 467,535 |
| Bruce Mansfield Unit, 6.85%, 2034 | | | 530,000 | | | 538,446 |
| E.On International Finance B.V., 6.65%, 2038 (z) | | | 290,000 | | | 298,391 |
13
Portfolio of Investments – continued
| | | | | | |
| Issuer | | Shares/Par | | Value ($) |
| | | | | | |
| Bonds - continued | | | | | | |
| Utilities - Electric Power - continued | | | | | | |
| EDP Finance B.V., 6%, 2018 (n) | | $ | 720,000 | | $ | 732,617 |
| EEB International Ltd., 8.75%, 2014 (n) | | | 100,000 | | | 106,000 |
| Enersis S.A., 7.375%, 2014 | | | 388,000 | | | 417,600 |
| Exelon Generation Co. LLC, 6.95%, 2011 | | | 843,000 | | | 883,826 |
| FirstEnergy Corp., 6.45%, 2011 | | | 455,000 | | | 472,515 |
| ISA Capital do Brasil S.A., 7.875%, 2012 | | | 472,000 | | | 496,780 |
| MidAmerican Energy Holdings Co., 5.875%, 2012 | | | 150,000 | | | 156,388 |
| NiSource Finance Corp., 7.875%, 2010 | | | 649,000 | | | 682,226 |
| NRG Energy, Inc., 7.25%, 2014 | | | 520,000 | | | 534,300 |
| Virginia Electric & Power Co., 4.1%, 2008 | | | 346,000 | | | 345,382 |
| | | | | | |
| | | | | | $ | 6,132,006 |
| Total Bonds (Identified Cost, $120,498,522) | | | | | $ | 117,676,429 |
| | |
| Floating Rate Loans - 1.5% (g)(r) | | | | | | |
| Aerospace - 0.3% | | | | | | |
| Hawker Beechcraft Acquisition Co., Letter of Credit, 4.7%, 2014 | | $ | 33,043 | | $ | 31,439 |
| Hawker Beechcraft Acquisition Co., Term Loan B, 4.7%, 2014 | | | 375,674 | | | 357,438 |
| | | | | | |
| | | | | | $ | 388,877 |
| Food & Beverages - 0.4% | | | | | | |
| ARAMARK Corp., Letter of Credit, 5.4%, 2014 | | $ | 26,419 | | $ | 25,312 |
| ARAMARK Corp., Term Loan B, 4.57%, 2014 | | | 415,846 | | | 398,433 |
| | | | | | |
| | | | | | $ | 423,745 |
| Medical & Health Technology & Services - 0.8% | | | | | | |
| Community Health Systems, Inc., Delayed Draw Term Loan B, 2014 (q) | | $ | 21,197 | | $ | 20,284 |
| Community Health Systems, Inc., Term Loan, 5.34%, 2014 | | | 414,467 | | | 396,616 |
| HCA, Inc., Term Loan B, 4.95%, 2013 | | | 535,804 | | | 508,344 |
| | | | | | |
| | | | | | $ | 925,244 |
| Printing & Publishing - 0.0% | | | | | | |
| Idearc, Inc., Term Loan B, 2014 (o) | | $ | 64,622 | | $ | 53,182 |
| Total Floating Rate Loans (Identified Cost, $1,814,872) | | | | | $ | 1,791,048 |
| | |
| Money Market Funds (v) - 0.0% | | | | | | |
| MFS Institutional Money Market Portfolio, 2.66%, at Cost and Net Asset Value | | $ | 3,705 | | $ | 3,705 |
| Total Investments (Identified Cost, $122,317,099) (k) | | | | | $ | 119,471,182 |
| | |
| Other Assets, Less Liabilities - 2.9% | | | | | | 3,622,058 |
| Net Assets - 100.0% | | | | | $ | 123,093,240 |
| (f) | All or a portion of the security has been segregated as collateral for an open futures contract. |
| (g) | The rate shown represents a weighted average coupon rate on settled positions at period end. |
| (i) | Interest only security for which the fund receives interest on notional principal (Par amount). Par amount shown is the notional principal and does not reflect the cost of the security. |
| (k) | As of April 30, 2008, the fund held securities fair valued in accordance with the policies adopted by the Board of Trustees, aggregating $117,117,999 and 98.03% of market value. All of these security values were provided by an independent pricing service using an evaluated bid. |
| (n) | Securities exempt from registration under Rule 144A of the Securities Act of 1933. These securities may be sold in the ordinary course of business in transactions exempt from registration, normally to qualified institutional buyers. At period end, the aggregate value of these securities was $8,792,658, representing 7.1% of net assets. |
| (o) | All or a portion of this position has not settled. Upon settlement date, interest rates will be determined. |
| (q) | All or a portion of this position represents an unfunded loan commitment. The rate shown represents a weighted average coupon rate on the full position, including the unfunded loan commitment which has no current coupon rate. |
14
Portfolio of Investments – continued
| (r) | Remaining maturities of floating rate loans may be less than stated maturities shown as a result of contractual or optional prepayments by the borrower. Such prepayments cannot be predicted with certainty. These loans may be subject to restrictions on resale. Floating rate loans generally have rates of interest which are determined periodically by reference to a base lending rate plus a premium. |
| (v) | Underlying fund that is available only to investment companies managed by MFS. The rate quoted is the annualized seven-day yield of the fund at period end. |
| (z) | Restricted securities are not registered under the Securities Act of 1933 and are subject to legal restrictions on resale. These securities generally may be resold in transactions exempt from registration or to the public if the securities are subsequently registered. Disposal of these securities may involve time-consuming negotiations and prompt sale at an acceptable price may be difficult. The fund holds the following restricted securities: |
| | | | | | |
| Restricted Securities | | Acquisition Date | | Cost | | Current
Market Value |
| Bayview Commercial Asset Trust, 0.775%, 2035 | | 10/06/05 | | $407,079 | | $348,630 |
| Bayview Commercial Asset Trust, FRN, 1.68%, 2036 | | 2/28/06 | | 301,118 | | 242,522 |
| Bayview Commercial Asset Trust, FRN, 0.879%, 2036 | | 5/16/06 | | 220,806 | | 199,529 |
| Bayview Commercial Mortgage Pass-Through Trust, FRN, 2.057%, 2036 | | 3/29/06 | | 204,432 | | 134,674 |
| British Sky Broadcasting, 6.1%, 2018 | | 2/07/08-2/14/08 | | 329,533 | | 335,771 |
| Crest G-Star, CDO, 6.95%, 2032 | | 9/13/05 | | 1,039,013 | | 1,003,997 |
| Dr Pepper Snapple Group, Inc., 6.82%, 2018 | | 4/25/08 | | 279,958 | | 290,459 |
| E.On International Finance B.V., 6.65%, 2038 | | 4/15/08 | | 288,759 | | 298,391 |
| Evraz Group S.A., 8.875%, 2013 | | 4/21/08 | | 309,941 | | 308,813 |
| Falcon Franchise Loan LLC, FRN, 3.844%, 2025 | | 12/19/03 | | 275,134 | | 205,172 |
| Metropolitan Life Global Funding, 5.125%, 2013 | | 4/07/08 | | 299,780 | | 299,981 |
| Natixis S.A., 10% to 2018, FRN to 2049 | | 4/24/08 | | 300,000 | | 303,309 |
| OAO Gazprom, 7.343%, 2013 | | 4/08/08 | | 249,511 | | 251,100 |
| OAO Gazprom, 8.146%, 2018 | | 4/03/08 | | 118,437 | | 122,044 |
| Pearson PLC, 5.5%, 2013 | | 4/29/08 | | 139,632 | | 141,093 |
| Preferred Term Securities XIX Ltd., CDO, FRN, 3.15%, 2035 | | 9/28/07-12/24/07 | | 1,419,195 | | 1,192,123 |
| Wesfarmers Ltd., 6.998%, 2013 | | 4/03/08 | | 420,000 | | 436,913 |
| Total Restricted Securities | | | | | | $6,114,521 |
| % of Net Assets | | | | | | 5.0% |
The following abbreviations are used in this report and are defined:
| CDO | | Collateralized Debt Obligation |
| CLO | | Collateralized Loan Obligation |
| FRN | | Floating Rate Note. Interest rate resets periodically and may not be the rate reported at period end. |
| REIT | | Real Estate Investment Trust |
Insurers
| FGIC | | Financial Guaranty Insurance Co. |
| FSA | | Financial Security Assurance Inc. |
Derivative contracts at 4/30/08
Futures contracts outstanding at 4/30/08
| | | | | | | | | |
| Description | | Contracts | | Value | | Expiration
Date | | Unrealized
Appreciation
(Depreciation) | |
| U.S. Treasury Bond (Short) | | 61 | | $7,130,328 | | Jun-08 | | $(123,642 | ) |
| U.S. Treasury Note 2 yr (Long) | | 59 | | 12,548,563 | | Jun-08 | | (44,456 | ) |
| U.S. Treasury Note 5 yr (Short) | | 90 | | 10,078,594 | | Jun-08 | | 15,857 | |
| | | | | | | | $(152,241 | ) |
15
Portfolio of Investments – continued
Swap Agreements at 4/30/08
| | | | | | | | | | | | | | |
| Expiration | | Notional
Amount | | | Counterparty | | Cash Flows
to Receive | | Cash Flows
to Pay | | Value | |
| Credit Default Swaps | | | | | | | | | | |
| 6/20/09 | | USD | | 300,000 | | | JPMorgan Chase Bank | | 4.10% (fixed rate) | | (1) | | $(79,549 | ) |
| 12/20/12 | | USD | | 220,000 | | | Merrill Lynch International | | (2) | | 1.35% (fixed rate) | | (1,916 | ) |
| 12/20/12 | | USD | | 300,000 | | | Goldman Sachs International | | (3) | | 1.55% (fixed rate) | | (2,933 | ) |
| 12/20/12 | | USD | | 440,000 | | | Goldman Sachs International | | (4) | | 1.43% (fixed rate) | | (303 | ) |
| 12/20/12 | | USD | | 150,000 | | | Morgan Stanley Capital Services, Inc. | | (5) | | 1.60% (fixed rate) | | 505 | |
| 12/20/12 | | USD | | 300,000 | | | Goldman Sachs International | | (6) | | 1.30% (fixed rate) | | (5,622 | ) |
| 3/20/13 | | USD | | 640,000 | | | Goldman Sachs International | | (6) | | 2.129% (fixed rate) | | (36,239 | ) |
| 6/20/13 | | USD | | 270,000 | | | Merrill Lynch International | | (7) | | 0.52% (fixed rate) | | (1,256 | ) |
| 6/20/13 | | USD | | 270,000 | | | Morgan Stanley Capital Services, Inc. | | (8) | | 1.07% (fixed rate) | | (4,496 | ) |
| 6/20/13 | | USD | | 270,000 | | | JPMorgan Chase Bank | | (9) | | 3.1% (fixed rate) | | (12,355 | ) |
| 6/20/13 | | USD | | 270,000 | | | Morgan Stanley Capital Services, Inc. | | (10) | | 1.07% (fixed rate) | | (2,115 | ) |
| 6/20/13 | | USD | | 150,000 | | | JPMorgan Chase Bank | | (11) | | 1.12% (fixed rate) | | (2,809 | ) |
| 6/20/13 | | USD | | 100,000 | | | JPMorgan Chase Bank | | (11) | | 1.1% (fixed rate) | | (1,871 | ) |
| 6/20/13 | | USD | | 270,000 | | | JPMorgan Chase Bank | | (12) | | 0.85% (fixed rate) | | (3,196 | ) |
| 6/20/13 | | USD | | 260,000 | | | Morgan Stanley Capital Services, Inc. | | (13) | | 1.48% (fixed rate) | | (2,017 | ) |
| 12/13/49 | | USD | | 420,000 | (a) | | Morgan Stanley Capital Services, Inc. | | (14) | | 0.62% (fixed rate) | | 129,974 | |
| 12/13/49 | | USD | | 420,000 | (b) | | Morgan Stanley Capital Services, Inc. | | (14) | | 0.27% (fixed rate) | | 112,807 | |
| | | | | | | | | | | | | $86,609 | |
| (1) | Fund to pay notional amount upon a defined credit event by Abitibi Consolidated, Inc., 8.375%, 4/01/15. |
| (2) | Fund to receive notional amount upon a defined credit event by Boston Properties, Inc., 6.25%, 1/15/13. |
| (3) | Fund to receive notional amount upon a defined credit event by Equity Residential, Inc., 5.75%, 6/15/17. |
| (4) | Fund to receive notional amount upon a defined credit event by Kimco Realty, 5.98%, 7/30/12. |
| (5) | Fund to receive notional amount upon a defined credit event by ProLogis, Inc., 7.1%, 4/15/08. |
| (6) | Fund to receive notional amount upon a defined credit event by Simon Properties Group, Inc., 6.35%, 8/28/12. |
| (7) | Fund to receive notional amount upon a defined credit event by Allstate Corp., 6.75%, 5/15/18. |
| (8) | Fund to receive notional amount upon a defined credit event by Arrow Electrics, Inc., 6.875%, 6/01/18. |
| (9) | Fund to receive notional amount upon a defined credit event by Capital One Financial Corp., 6.25%, 11/15/13. |
| (10) | Fund to receive notional amount upon a defined credit event by Nordstrom, Inc., 6.95%, 3/15/28. |
| (11) | Fund to receive notional amount upon a defined credit event by Universal Health Services, Inc., 7.125%, 6/30/16. |
| (12) | Fund to receive notional amount upon a defined credit event by Wells Fargo & Co. 3.107%, 10/28/15. |
| (13) | Fund to receive notional amount upon a defined credit event by Weyerhaeuser Co., 7.125%, 7/15/23. |
| (14) | Fund to receive notional amount upon a defined credit event by a reference obligation specified in the CMBX.NA Index. |
| (a) | Net unamortized premiums paid by the fund amounted to $122,178. |
| (b) | Net unamortized premiums paid by the fund amounted to $86,030. |
At April 30, 2008, the fund had sufficient cash and/or other liquid securities to cover any commitments under these derivative contracts.
See Notes to Financial Statements
16
Financial Statements
STATEMENT OF ASSETS AND LIABILITIES
At 4/30/08
This statement represents your fund’s balance sheet, which details the assets and liabilities comprising the total value of the fund.
| | | | | |
| Assets | | | | | |
| Investments - | | | | | |
| Non-affiliated issuers, at value (identified cost, $122,313,394) | | $119,467,477 | | | |
| Underlying funds, at cost and value | | 3,705 | | | |
| Total investments, at value (identified cost, $122,317,099) | | | | | $119,471,182 |
| Receivable for investments sold | | $5,176,286 | | | |
| Receivable for fund shares sold | | 368,715 | | | |
| Interest and dividends receivable | | 1,312,411 | | | |
| Swaps, at value (net unamortized premiums paid, $208,208) | | 243,286 | | | |
| Other assets | | 1,663 | | | |
| Total assets | | | | | $126,573,543 |
| Liabilities | | | | | |
| Payable to custodian | | $34,652 | | | |
| Distributions payable | | 455,429 | | | |
| Payable for daily variation margin on open futures contracts | | 55,547 | | | |
| Payable for investments purchased | | 1,152,052 | | | |
| Payable for TBA purchase commitments | | 1,262,891 | | | |
| Payable for fund shares reacquired | | 284,514 | | | |
| Swaps, at value | | 156,677 | | | |
| Payable to affiliates | | | | | |
Management fee | | 2,354 | | | |
Shareholder servicing costs | | 48 | | | |
Distribution and service fees | | 6,726 | | | |
Administrative services fee | | 144 | | | |
| Payable for independent trustees’ compensation | | 759 | | | |
| Accrued expenses and other liabilities | | 68,510 | | | |
| Total liabilities | | | | | $3,480,303 |
| Net assets | | | | | $123,093,240 |
| Net assets consist of | | | | | |
| Paid-in capital | | $137,791,954 | | | |
| Unrealized appreciation (depreciation) on investments | | (3,119,757 | ) | | |
| Accumulated net realized gain (loss) on investments and foreign currency transactions | | (11,922,515 | ) | | |
| Undistributed net investment income | | 343,558 | | | |
| Net assets | | | | | $123,093,240 |
| Shares of beneficial interest outstanding | | | | | 13,014,817 |
| Class B shares net asset value and offering price per share | | | | | $9.46 |
A contingent deferred sales charge may be imposed on redemptions of Class B shares.
See Notes to Financial Statements
17
Financial Statements
STATEMENT OF OPERATIONS
Year ended 4/30/08
This statement describes how much your fund earned in investment income and accrued in expenses. It also describes any gains and/or losses generated by fund operations.
| | | | | | |
| Net investment income | | | | | | |
| Income | | | | | | |
Interest | | $7,991,663 | | | | |
Dividends from underlying funds | | 126,824 | | | | |
| Total investment income | | | | | $8,118,487 | |
| Expenses | | | | | | |
Management fee | | $716,334 | | | | |
Distribution and service fees | | 1,432,668 | | | | |
Shareholder servicing costs | | 41,809 | | | | |
Administrative services fee | | 31,459 | | | | |
Independent trustees’ compensation | | 5,167 | | | | |
Custodian fee | | 47,818 | | | | |
Shareholder communications | | 22,111 | | | | |
Auditing fees | | 65,267 | | | | |
Legal fees | | 2,745 | | | | |
Miscellaneous | | 16,052 | | | | |
| Total expenses | | | | | $2,381,430 | |
Reduction of expenses by investment adviser | | (215,589 | ) | | | |
| Net expenses | | | | | $2,165,841 | |
| Net investment income | | | | | $5,952,646 | |
| Realized and unrealized gain (loss) on investments | | | | | | |
| Realized gain (loss) (identified cost basis) | | | | | | |
Investment transactions | | $(1,077,714 | ) | | | |
Futures contracts | | (405,028 | ) | | | |
Swap transactions | | (33,836 | ) | | | |
Foreign currency transactions | | 44 | | | | |
| Net realized gain (loss) on investments and foreign currency transactions | | | | | $(1,516,534 | ) |
| Change in unrealized appreciation (depreciation) | | | | | | |
Investments | | $(2,441,698 | ) | | | |
Futures contracts | | (313,538 | ) | | | |
Swap transactions | | (120,396 | ) | | | |
| Net unrealized gain (loss) on investments | | | | | $(2,875,632 | ) |
| Net realized and unrealized gain (loss) on investments | | | | | $(4,392,166 | ) |
| Change in net assets from operations | | | | | $1,560,480 | |
See Notes to Financial Statements
18
Financial Statements
STATEMENTS OF CHANGES IN NET ASSETS
These statements describe the increases and/or decreases in net assets resulting from operations, any distributions, and any shareholder transactions.
| | | | | | |
| | | Year ended 4/30 | |
| Change in net assets | | 2008 | | | 2007 | |
| From operations | | | | | | |
| Net investment income | | $5,952,646 | | | $7,102,327 | |
| Net realized gain (loss) on investments and foreign currency transactions | | (1,516,534 | ) | | (2,060,724 | ) |
| Net unrealized gain (loss) on investments | | (2,875,632 | ) | | 5,782,246 | |
| Change in net assets from operations | | $1,560,480 | | | $10,823,849 | |
| Distributions declared to shareholders | | | | | | |
| From net investment income | | $(6,053,133 | ) | | $(7,665,374 | ) |
| Change in net assets from fund share transactions | | $(41,326,736 | ) | | $(35,551,842 | ) |
| Total change in net assets | | $(45,819,389 | ) | | $(32,393,367 | ) |
| Net assets | | | | | | |
| At beginning of period | | 168,912,629 | | | 201,305,996 | |
At end of period (including undistributed net investment income of $343,558 and
$75,245, respectively) | | $123,093,240 | | | $168,912,629 | |
See Notes to Financial Statements
19
Financial Statements
FINANCIAL HIGHLIGHTS
The financial highlights table is intended to help you understand the fund’s financial performance for the past 5 years. Certain information reflects financial results for a single fund share. The total returns in the table represent the rate by which an investor would have earned (or lost) on an investment in the fund share class (assuming reinvestment of all distributions) held for the entire period.
| | | | | | | | | | | | | | | |
| | | Years ended 4/30 | |
| Class B | | 2008 | | | 2007 | | | 2006 | | | 2005 | | | 2004 | |
| Net asset value, beginning of period | | $9.74 | | | $9.58 | | | $10.03 | | | $10.27 | | | $10.56 | |
| Income (loss) from investment operations | | | | | | | | | | | | | | | |
Net investment income (d) | | $0.40 | | | $0.37 | | | $0.32 | | | $0.31 | | | $0.46 | |
Net realized and unrealized gain (loss) on investments and
foreign currency | | (0.27 | ) | | 0.20 | | | (0.33 | ) | | 0.15 | | | (0.24 | ) |
| Total from investment operations | | $0.13 | | | $0.57 | | | $(0.01 | ) | | $0.46 | | | $0.22 | |
| Less distributions declared to shareholders | | | | | | | | | | | | | | | |
From net investment income | | $(0.41 | ) | | $(0.41 | ) | | $(0.44 | ) | | $(0.43 | ) | | $(0.48 | ) |
From net realized gain on investments | | — | | | — | | | — | | | (0.27 | ) | | (0.03 | ) |
| Total distributions declared to shareholders | | $(0.41 | ) | | $(0.41 | ) | | $(0.44 | ) | | $(0.70 | ) | | $(0.51 | ) |
| Net asset value, end of period | | $9.46 | | | $9.74 | | | $9.58 | | | $10.03 | | | $10.27 | |
| Total return (%) (r)(s)(t) | | 1.40 | | | 6.03 | | | (0.17 | ) | | 4.51 | | | 2.09 | |
Ratios (%) (to average net assets)
and Supplemental data: | | | | | | | | | | | | | | | |
| Expenses before expense reductions (f) | | 1.67 | | | 1.75 | | | 1.73 | | | 1.73 | | | 1.65 | |
| Expenses after expense reductions (f) | | 1.51 | | | 1.60 | | | 1.58 | | | 1.58 | | | 1.24 | |
| Net investment income | | 4.16 | | | 3.88 | | | 3.18 | | | 3.04 | | | 4.33 | |
| Portfolio turnover | | 87 | | | 71 | | | 95 | | | 140 | | | 179 | |
| Net assets at end of period (000 Omitted) | | $123,093 | | | $168,913 | | | $201,306 | | | $155,004 | | | $166,897 | |
| (d) | Per share data is based on average shares outstanding. |
| (f) | Ratios do not reflect reductions from fees paid indirectly, if applicable. |
| (r) | Certain expenses have been reduced without which performance would have been lower. |
| (s) | From time to time the fund may receive proceeds from litigation settlements, without which performance would be lower. |
| (t) | Total returns do not include any applicable sales charges. |
See Notes to Financial Statements
20
NOTES TO FINANCIAL STATEMENTS
| (1) | | Business and Organization |
MFS Research Bond Fund J (the fund) is a series of MFS Series Trust IX (the trust). The trust is organized as a Massachusetts business trust and is registered under the Investment Company Act of 1940, as amended, as an open-end management investment company.
| (2) | | Significant Accounting Policies |
General – The preparation of financial statements in conformity with U.S. generally accepted accounting principles requires management to make estimates and assumptions that affect the reported amounts of assets and liabilities, and disclosure of contingent assets and liabilities at the date of the financial statements and the reported amounts of revenues and expenses during the reporting period. Actual results could differ from those estimates. The fund can invest in foreign securities, including securities of emerging market issuers. Investments in foreign securities are vulnerable to the effects of changes in the relative values of the local currency and the U.S. dollar and to the effects of changes in each country’s legal, political, and economic environment. The markets of emerging markets countries are generally more volatile than the markets of developed countries with more mature economies. All of the risks of investing in foreign securities previously described are heightened when investing in emerging markets countries.
Investment Valuations – Debt instruments and floating rate loans (other than short-term instruments), including restricted debt instruments, are generally valued at an evaluated or composite bid as reported by an independent pricing service. Short-term instruments with a maturity at issuance of 60 days or less may be valued at amortized cost, which approximates market value. Futures contracts are generally valued at last posted settlement price as reported by an independent pricing service on the market on which they are primarily traded. Futures contracts for which there were no trades that day for a particular position are generally valued at the closing bid quotation as reported by an independent pricing service on the market on which such futures contracts are primarily traded. Swaps are generally valued at an evaluated bid as reported by an independent pricing service. Open-end investment companies are generally valued at net asset value per share. Securities and other assets generally valued on the basis of information from an independent pricing service may also be valued at a broker-dealer bid quotation. Values obtained from pricing services can utilize both dealer-supplied valuations and electronic data processing techniques, which take into account factors such as institutional-size trading in similar groups of securities, yield, quality, coupon rate, maturity, type of issue, trading characteristics, and other market data. The values of foreign securities and other assets and liabilities expressed in foreign currencies are converted to U.S. dollars using the mean of bid and asked prices for rates reported by an independent pricing service.
The Board of Trustees has delegated primary responsibility for determining or causing to be determined the value of the fund’s investments (including any fair valuation) to the adviser pursuant to valuation policies and procedures approved by the Board. If the adviser determines that reliable market quotations are not readily available, investments are valued at fair value as determined in good faith by the adviser in accordance with such procedures under the oversight of the Board of Trustees. Under the fund’s valuation policies and procedures, market quotations are not considered to be readily available for most types of debt instruments and floating rate loans and many types of derivatives. These investments are generally valued at fair value based on information from independent pricing services. In addition, investments may be valued at fair value if the adviser determines that an investment’s value has been materially affected by events occurring after the close of the exchange or market on which the investment is principally traded (such as foreign exchange or market) and prior to the determination of the fund’s net asset value, or after the halting of trading of a specific security where trading does not resume prior to the close of the exchange or market on which the security is principally traded. The adviser may rely on independent pricing services or other information (such as the correlation with price movements of similar securities in the same or other markets; the type, cost and investment characteristics of the security; the business and financial condition of the issuer; and trading and other market data) to assist in determining whether to fair value and at what value to fair value an investment. The value of an investment for purposes of calculating the fund’s net asset value can differ depending on the source and method used to determine value. When fair valuation is used, the value of investments used to determine the fund’s net asset value may differ from quoted or published prices for the same investments.
21
Notes to Financial Statements – continued
In September 2006, FASB Statement No. 157, Fair Value Measurements (the “Statement”) was issued, and is effective for fiscal years beginning after November 15, 2007 and for all interim periods within those fiscal years. This Statement provides a single definition of fair value, a hierarchy for measuring fair value and expanded disclosures about fair value measurements. Management is evaluating the application of the Statement to the fund, and believes the impact will be limited to expanded disclosures resulting from the adoption of this Statement in the fund’s financial statements.
Inflation-Adjusted Debt Securities – The fund invests in inflation-adjusted debt securities issued by the U.S. Treasury. The fund may also invest in inflation-adjusted debt securities issued by U.S. Government agencies and instrumentalities other than the U.S. Treasury and by other entities such as U.S. and foreign corporations and foreign governments. The principal value of these debt securities is adjusted through income according to changes in the Consumer Price Index or another general price or wage index. These debt securities typically pay a fixed rate of interest, but this fixed rate is applied to the inflation-adjusted principal amount. The principal paid at maturity of the debt security is typically equal to the inflation-adjusted principal amount, or the security’s original par value, whichever is greater. Other types of inflation-adjusted securities may use other methods to adjust for other measures of inflation.
Foreign Currency Translation – Purchases and sales of foreign investments, income, and expenses are converted into U.S. dollars based upon currency exchange rates prevailing on the respective dates of such transactions. Gains and losses attributable to foreign currency exchange rates on sales of securities are recorded for financial statement purposes as net realized gains and losses on investments. Gains and losses attributable to foreign exchange rate movements on income and expenses are recorded for financial statement purposes as foreign currency transaction gains and losses. That portion of both realized and unrealized gains and losses on investments that results from fluctuations in foreign currency exchange rates is not separately disclosed.
Derivative Risk – The fund may invest in derivatives for hedging or non-hedging purposes. While hedging can reduce or eliminate losses, it can also reduce or eliminate gains. When the fund uses derivatives as an investment to gain market exposure, or for hedging purposes, gains and losses from derivative instruments may be substantially greater than the derivative’s original cost. Cash that has been segregated on behalf of certain derivative contracts will be reported separately on the Statement of Assets and Liabilities as restricted cash. Derivative instruments include futures contracts and swap agreements.
Futures Contracts – The fund may enter into futures contracts for the delayed delivery of securities or currency, or contracts based on financial indices at a fixed price on a future date. In entering such contracts, the fund is required to deposit with the broker either in cash or securities an amount equal to a certain percentage of the contract amount. Subsequent payments are made or received by the fund each day, depending on the daily fluctuations in the value of the contract, and are recorded for financial statement purposes as unrealized gains or losses by the fund. Upon entering into such contracts, the fund bears the risk of interest or exchange rates or securities prices moving unexpectedly, in which case, the fund may not achieve the anticipated benefits of the futures contracts and may realize a loss.
Swap Agreements – The fund may enter into swap agreements. A swap is an exchange of cash payments between the fund and another party. Net cash payments are exchanged at specified intervals and are recorded as a realized gain or loss in the Statement of Operations. The value of the swap is adjusted daily and the change in value, including accruals of periodic amounts of interest to be paid or received, is recorded as unrealized appreciation or depreciation in the Statement of Operations. Amounts paid or received at the inception of the swap are reflected as premiums paid or received on the Statement of Assets and Liabilities and are amortized using the effective interest method over the term of the agreement. A liquidation payment received or made upon early termination is recorded as a realized gain or loss in the Statement of Operations. Collateral, in the form of cash or securities, may be required to be held in segregated accounts with the fund’s custodian in connection with these agreements. Risk of loss may exceed amounts recognized on the Statement of Assets and Liabilities. These risks include the possible lack of a liquid market, failure of the counterparty to perform under the terms of the agreements, and unfavorable market and interest rate movements of the underlying instrument. All swap agreements entered into by the fund with the same counterparty are generally governed by a single master agreement,
22
Notes to Financial Statements – continued
which provides for the netting of all amounts owed by the parties under the agreement upon the occurrence of an event of default, thereby reducing the credit risk to which such party is exposed.
The fund holds credit default swaps in which one party makes a stream of payments based on a fixed percentage applied to the notional amount to another party in exchange for the right to receive a specified return in the event of a default by a third party, such as a corporate issuer or foreign issuer, on its obligation. The fund may enter into credit default swaps to limit or to reduce its risk exposure to defaults of corporate and sovereign issuers or to create direct or synthetic short or long exposure to corporate debt securities or certain sovereign debt securities to which it is not otherwise exposed.
In March 2008, FASB Statement No. 161, Disclosures about Derivative Instruments and Hedging Activities (the “Standard”) was issued, and is effective for financial statements issued for fiscal years and interim periods beginning after November 15, 2008. This Standard provides enhanced disclosures about the fund’s use of and accounting for derivative instruments and the effect of derivative instruments on the fund’s results of operations and financial position. Management is evaluating the application of the Standard to the fund, and has not at this time determined the impact, if any, resulting from the adoption of this Standard on the fund’s financial statements.
Loans and Other Direct Debt Instruments – The fund may invest in loans and loan participations or other receivables. These investments may include standby financing commitments, including revolving credit facilities, which obligate the fund to supply additional cash to the borrower on demand. At April 30, 2008, the portfolio had unfunded loan commitments of $21,197, which could be extended at the option of the borrower and which are covered by sufficient cash and/or liquid securities held by the fund. The market value and obligation of the fund on these unfunded loan commitments is included in Investments, at value and Payable for investments purchased, respectively, on the Statement of Assets and Liabilities. Loan participations involve a risk of insolvency of the lending bank or other financial intermediary.
Indemnifications – Under the fund’s organizational documents, its officers and trustees may be indemnified against certain liabilities and expenses arising out of the performance of their duties to the fund. Additionally, in the normal course of business, the fund enters into agreements with service providers that may contain indemnification clauses. The fund’s maximum exposure under these agreements is unknown as this would involve future claims that may be made against the fund that have not yet occurred.
Investment Transactions and Income – Investment transactions are recorded on the trade date. Interest income is recorded on the accrual basis. All premium and discount is amortized or accreted for financial statement purposes in accordance with U.S. generally accepted accounting principles.
The fund earns certain fees in connection with its floating rate loan purchasing activities. These fees are in addition to interest payments earned and may include amendment fees, commitment fees, facility fees, consent fees, and prepayment fees. Commitment fees are recorded on an accrual basis as income in the accompanying financial statements.
Dividends received in cash are recorded on the ex-dividend date. Dividend and interest payments received in additional securities are recorded on the ex-dividend or ex-interest date in an amount equal to the value of the security on such date.
The fund may receive proceeds from litigation settlements. Any proceeds received from litigation involving portfolio holdings are reflected in the Statement of Operations in realized gain/loss if the security has been disposed of by the fund or in unrealized gain/loss if the security is still held by the fund. Any other proceeds from litigation not related to portfolio holdings are reflected as other income in the Statement of Operations.
The fund may enter into “TBA” (to be announced) purchase commitments to purchase securities for a fixed unit price at a future date. Although the unit price has been established, the principal value has not been finalized. However, the principal amount of the commitments will not fluctuate more than 0.01%. The fund holds, and maintains until settlement date, cash or high-grade debt obligations in an amount sufficient to meet the purchase price, or the fund may enter into offsetting contracts for the forward sale of other securities it owns. Income on the securities will not be earned until settlement date. TBA purchase commitments may be considered securities in themselves, and involve a risk of loss if the value of the security to be purchased declines prior to settlement
23
Notes to Financial Statements – continued
date, which is in addition to the risk of decline in the value of the fund’s other assets. Unsettled TBA purchase commitments are valued at the current market value of the underlying securities.
Fees Paid Indirectly – The fund’s custody fee may be reduced according to an arrangement that measures the value of cash deposited with the custodian by the fund. For the year ended April 30, 2008, custody fees were not reduced.
Tax Matters and Distributions – The fund intends to qualify as a regulated investment company, as defined under Subchapter M of the Internal Revenue Code, and to distribute all of its taxable income, including realized capital gains. As a result, no provision for federal income tax is required. The fund adopted the provisions of FASB Interpretation No. 48, Accounting for Uncertainty in Income Taxes (“the Interpretation”) on the first day of the fund’s fiscal year. The Interpretation prescribes a minimum threshold for financial statement recognition of the benefit of a tax position taken or expected to be taken in a tax return. There was no impact resulting from the adoption of this Interpretation on the fund’s financial statements. Each of the fund’s federal tax returns for the prior three fiscal years remains subject to examination by the Internal Revenue Service. It is the fund’s policy to record interest and penalty charges on underpaid taxes associated with its tax positions as interest expense and miscellaneous expense, respectively. No such charges were recorded in the current financial statements. Foreign taxes, if any, have been accrued by the fund in the accompanying financial statements.
Distributions to shareholders are recorded on the ex-dividend date. Income and capital gain distributions are determined in accordance with income tax regulations, which may differ from U.S. generally accepted accounting principles. Certain capital accounts in the financial statements are periodically adjusted for permanent differences in order to reflect their tax character. These adjustments have no impact on net assets or net asset value per share. Temporary differences which arise from recognizing certain items of income, expense, gain or loss in different periods for financial statement and tax purposes will reverse at some time in the future. Distributions in excess of net investment income or net realized gains are temporary overdistributions for financial statement purposes resulting from differences in the recognition or classification of income or distributions for financial statement and tax purposes.
Book/tax differences primarily relate to amortization and accretion of debt securities and derivative transactions.
The tax character of distributions declared to shareholders is as follows:
| | | | |
| | | 4/30/08 | | 4/30/07 |
| Ordinary income (including any short-term capital gains) | | $6,053,133 | | $7,665,374 |
The federal tax cost and the tax basis components of distributable earnings were as follows:
| | | |
| As of 4/30/08 | | | |
| Cost of investments | | $123,003,736 | |
| Gross appreciation | | 936,944 | |
| Gross depreciation | | (4,469,498 | ) |
| Net unrealized appreciation (depreciation) | | $(3,532,554 | ) |
| |
| Undistributed ordinary income | | 890,044 | |
| Capital loss carryforwards | | (10,370,945 | ) |
| Post-October capital loss deferral | | (1,166,366 | ) |
| Other temporary differences | | (518,893 | ) |
As of April 30, 2008, the fund had capital loss carryforwards available to offset future realized gains. Such losses expire as follows:
| | |
| 4/30/13 | | $ 1,678,843 |
| 4/30/14 | | 1,444,482 |
| 4/30/15 | | 5,723,242 |
| 4/30/16 | | 1,524,378 |
| | $10,370,945 |
| (3) | | Transactions with Affiliates |
Investment Adviser – The fund has an investment advisory agreement with Massachusetts Financial Services Company (MFS) to provide overall investment management and related administrative services
24
Notes to Financial Statements – continued
and facilities to the fund. The management fee is computed daily and paid monthly at an annual rate of 0.50% of the fund’s average daily net assets. The investment adviser has agreed in writing to reduce its management fee to 0.35% of average daily net assets. This written agreement may be rescinded only upon consent of the fund’s Board of Trustees. This management fee reduction amounted to $214,901, which is shown as a reduction of total expenses in the Statement of Operations. The management fee incurred for the year ended April 30, 2008 was equivalent to an annual effective rate of 0.35% of the fund’s average daily net assets.
The investment adviser has agreed in writing to pay a portion of the fund’s operating expenses, exclusive of management, distribution and service, and certain other fees and expenses, such that operating expenses do not exceed 0.25% annually of the fund’s average daily net assets. This written agreement will continue through August 31, 2008, unless changed or rescinded by the fund’s Board of Trustees. For the year ended April 30, 2008, the fund’s actual operating expenses did not exceed the limit and therefore, the investment adviser did not pay any portion of the fund’s expenses.
Distributor – The Board of Trustees has adopted a distribution plan for certain class shares pursuant to Rule 12b-1 of the Investment Company Act of 1940.
The fund’s distribution plan provides that the fund will pay MFD for services provided by MFD and financial intermediaries in connection with the distribution and servicing of certain share classes. One component of the plan is a distribution fee paid to MFD and another component of the plan is a service fee paid to MFD. MFD may subsequently pay all, or a portion, of the distribution and/or service fees to financial intermediaries.
Distribution Plan Fee Table:
| | | | | | | | | | |
| | | Distribution
Fee Rate | | Service
Fee Rate | | Total
Distribution
Plan (d) | | Annual
Effective
Rate (e) | | Distribution
and Service
Fee |
| Class A (f) | | 0.10% | | 0.25% | | 0.35% | | — | | $— |
| Class B | | 0.75% | | 0.25% | | 1.00% | | 1.00% | | 1,432,668 |
| Class C (f) | | 0.75% | | 0.25% | | 1.00% | | — | | — |
| (d) | In accordance with the distribution plan for certain classes, the fund pays distribution and/or service fees up to these annual percentage rates of each class’ average daily net assets. |
| (e) | The annual effective rates represent actual fees incurred under the distribution plan for the year ended April 30, 2008 based on each class’ average daily net assets. The fund’s distributor, MFD, has agreed in writing to waive the Class A service fee and Class A distribution fee until at least August 31, 2008. |
| (f) | Class A and Class C shares were not available for sale during the period. Please see the fund’s prospectus for details. |
Class B shares are subject to a contingent deferred sales charge in the event of a shareholder redemption within five years of purchase. All contingent deferred sales charges are paid to MFD and during the year ended April 30, 2008, were as follows:
Shareholder Servicing Agent – MFS Service Center, Inc. (MFSC), a wholly-owned subsidiary of MFS, receives a fee from the fund for its services as shareholder servicing agent calculated as a percentage of the average daily net assets of the fund as determined periodically under the supervision of the fund’s Board of Trustees. For the year ended April 30, 2008, the fee was $41,809, which equated to 0.0292% annually of the fund’s average daily net assets. MFSC also receives payment from the fund for out-of-pocket expenses, sub-accounting and other shareholder servicing costs which may be paid to affiliated and unaffiliated service providers. For the year ended April 30, 2008, the fund did not incur any of these out-of-pocket expenses, sub-accounting and other shareholder servicing costs.
Administrator – MFS provides certain financial, legal, shareholder communications, compliance, and other administrative services to the fund. Under an administrative services agreement, the fund partially reimburses MFS the costs incurred to provide these services. The fund is charged a fixed amount plus a fee based on average daily net assets. The fund’s annual fixed amount is $17,500.
The administrative services fee incurred for the year ended April 30, 2008 was equivalent to an annual effective rate of 0.0220% of the fund’s average daily net assets.
25
Notes to Financial Statements – continued
Trustees’ and Officers’ Compensation – The fund pays compensation to independent trustees in the form of a retainer, attendance fees, and additional compensation to Board and Committee chairpersons. The fund does not pay compensation directly to trustees or officers of the fund who are also officers of the investment adviser, all of whom receive remuneration for their services to the fund from MFS. Certain officers and trustees of the fund are officers or directors of MFS, MFD, and MFSC.
Other – This fund and certain other MFS funds (the funds) have entered into a services agreement (the Agreement) which provides for payment of fees by the funds to Tarantino LLC in return for the provision of services of an Independent Chief Compliance Officer (ICCO) for the funds. The ICCO is an officer of the funds and the sole member of Tarantino LLC. The funds can terminate the Agreement with Tarantino LLC at any time under the terms of the Agreement. For the year ended April 30, 2008, the fee paid by the fund to Tarantino LLC was $944 and is included in miscellaneous expense on the Statement of Operations. MFS has agreed to reimburse the fund for a portion of the payments made by the fund to Tarantino LLC in the amount of $688, which is shown as a reduction of total expenses in the Statement of Operations. Additionally, MFS has agreed to bear all expenses associated with office space, other administrative support, and supplies provided to the ICCO.
The fund may invest in a money market fund managed by MFS which seeks preservation of capital and current income. Income earned on this investment is included in dividends from underlying funds on the Statement of Operations. This money market fund does not pay a management fee to MFS.
Purchases and sales of investments, other than purchased option transactions and short-term obligations, were as follows:
| | | | |
| | | Purchases | | Sales |
| U.S. government securities | | $58,442,199 | | $83,475,911 |
| Investments (non-U.S. government securities) | | $61,337,673 | | $80,320,693 |
| (5) | | Shares of Beneficial Interest |
The fund’s Declaration of Trust permits the Trustees to issue an unlimited number of full and fractional shares of beneficial interest. Transactions in fund shares were as follows:
| | | | | | | | | | | | |
| | | Year ended 4/30/08 | | | Year ended 4/30/07 | |
| | | Shares | | | Amount | | | Shares | | | Amount | |
| Shares sold | | 6,218,628 | | | $59,627,081 | | | 10,345,114 | | | $99,832,512 | |
| Shares reacquired | | (10,539,999 | ) | | (100,953,817 | ) | | (14,024,166 | ) | | (135,384,354 | ) |
| | | | | | |
| Net change | | (4,321,371 | ) | | $(41,326,736 | ) | | (3,679,052 | ) | | $(35,551,842 | ) |
Class A and class C shares were not available for sale during the period. Please see the fund’s prospectus for details.
The fund and other funds managed by MFS participate in a $1 billion unsecured committed line of credit provided by a syndication of banks under a credit agreement. In addition, the fund and other funds managed by MFS have established uncommitted borrowing arrangements with certain banks. Borrowings may be made for temporary financing needs. Interest is charged to each fund, based on its borrowings, generally at a rate equal to the Federal Reserve funds rate plus 0.30%. In addition, a commitment fee, based on the average daily, unused portion of the committed line of credit, is allocated among the participating funds at the end of each calendar quarter. For the year ended April 30, 2008, the fund’s commitment fee and interest expense were $521 and $0, respectively, and are included in miscellaneous expense on the Statement of Operations.
26
Notes to Financial Statements – continued
| (7) | | Transactions in Underlying Funds-Affiliated Issuers |
An affiliated issuer may be considered one in which the fund owns 5% or more of the outstanding voting securities, or a company which is under common control. For the purposes of this report, the fund assumes the following to be affiliated issuers:
| | | | | | | | | |
| Underlying Funds | | Beginning
Shares/Par
Amount | | Acquisitions
Shares/Par
Amount | | Dispositions
Shares/Par
Amount | | | Ending
Shares/Par
Amount |
| MFS Institutional Money Market Portfolio | | — | | 97,741,712 | | (97,738,007 | ) | | 3,705 |
| | | | |
| Underlying Funds | | Realized
Gain
(Loss) | | Capital Gain
Distributions | | Dividend
Income | | | Ending
Value |
| MFS Institutional Money Market Portfolio | | $— | | $— | | $126,824 | | | $3,705 |
27
REPORT OF INDEPENDENT REGISTERED PUBLIC ACCOUNTING FIRM
To the Trustees of MFS Series Trust IX and the Shareholders of MFS Research Bond Fund J:
We have audited the accompanying statement of assets and liabilities, including the portfolio of investments, of MFS Research Bond Fund J (one of the portfolios comprising MFS Series Trust IX (the “Trust”)) as of April 30, 2008, and the related statement of operations for the year then ended, the statements of changes in net assets for each of the two years in the period then ended, and the financial highlights for each of the five years in the period then ended. These financial statements and financial highlights are the responsibility of the Trust’s management. Our responsibility is to express an opinion on these financial statements and financial highlights based on our audits.
We conducted our audits in accordance with the standards of the Public Company Accounting Oversight Board (United States). Those standards require that we plan and perform the audit to obtain reasonable assurance about whether the financial statements and financial highlights are free of material misstatement. The Trust is not required to have, nor were we engaged to perform, an audit of its internal control over financial reporting. Our audits included consideration of internal control over financial reporting as a basis for designing audit procedures that are appropriate in the circumstances, but not for the purpose of expressing an opinion on the effectiveness of the Trust’s internal control over financial reporting. Accordingly, we express no such opinion. An audit also includes examining, on a test basis, evidence supporting the amounts and disclosures in the financial statements, assessing the accounting principles used and significant estimates made by management, as well as evaluating the overall financial statement presentation. Our procedures included confirmation of securities owned as of April 30, 2008, by correspondence with the custodian and brokers; where replies were not received from brokers, we performed other auditing procedures. We believe that our audits provide a reasonable basis for our opinion.
In our opinion, such financial statements and financial highlights present fairly, in all material respects, the financial position of MFS Research Bond Fund J as of April 30, 2008, the results of its operations for the year then ended, the changes in its net assets for each of the two years in the period then ended, and its financial highlights for each of the five years in the period then ended, in conformity with accounting principles generally accepted in the United States of America.
DELOITTE & TOUCHE LLP
Boston, Massachusetts
June 16, 2008
28
TRUSTEES AND OFFICERS — IDENTIFICATION AND BACKGROUND
The Trustees and officers of the Trust, as of June 1, 2008, are listed below, together with their principal occupations during the past five years. (Their titles may have varied during that period.) The address of each Trustee and officer is 500 Boylston Street, Boston, Massachusetts 02116.
| | | | | | |
Name, Date of Birth | | Position(s) Held
with Fund | | Trustee/Officer
Since(h) | | Principal Occupations During the Past Five Years &
Other Directorships (j) |
| INTERESTED TRUSTEES | | | | |
Robert J. Manning (k) (born 10/20/63) | | Trustee | | February 2004 | | Massachusetts Financial Services Company, Chief Executive Officer, President, Chief Investment Officer and Director |
| | | |
Robert C. Pozen (k) (born 8/08/46) | | Trustee | | February 2004 | | Massachusetts Financial Services Company, Chairman (since February 2004); Harvard Business School (education), Senior Lecturer (since 2008); Secretary of Economic Affairs, The Commonwealth of Massachusetts (January 2002 to December 2002); Fidelity Investments, Vice Chairman (June 2000 to December 2001); Fidelity Management & Research Company (investment adviser), President (March 1997 to July 2001); Bell Canada Enterprises (telecommunications), Director; Medtronic, Inc. (medical technology), Director; Telesat (satellite communications), Director (until 2007) |
| | |
| INDEPENDENT TRUSTEES | | | | |
J. Atwood Ives (born 5/01/36) | | Trustee and Chair of Trustees | | February 1992 | | Private investor; KeySpan Corporation (energy related services), Director until 2004; Woodstock Corporation (investment advisory firm), Director until 2003 |
| | | |
Robert E. Butler (n) (born 11/29/41) | | Trustee | | January 2006 | | Consultant – regulatory and compliance matters (since July 2002); PricewaterhouseCoopers LLP (professional services firm), Partner (until 2002) |
| | | |
Lawrence H. Cohn, M.D. (born 3/11/37) | | Trustee | | August 1993 | | Brigham and Women’s Hospital, Chief of Cardiac Surgery (2005); Harvard Medical School, Professor of Cardiac Surgery; Physician Director of Medical Device Technology for Partners HealthCare |
| | | |
David H. Gunning (born 5/30/42) | | Trustee | | January 2004 | | Retired; Cleveland-Cliffs Inc. (mining products and service provider), Vice Chairman/Director (until May 2007); Portman Limited (mining), Director (since 2005); Encinitos Ventures (private investment company), Principal (1997 to April 2001); Lincoln Electric Holdings, Inc. (welding equipment manufacturer), Director |
| | | |
William R. Gutow (born 9/27/41) | | Trustee | | December 1993 | | Private investor and real estate consultant (since 1998); Capital Entertainment Management Company (video franchise), Vice Chairman (since 1998); Texas Donuts (donut franchise), Vice Chairman (since 2007); Atlantic Coast Tan (tanning salons), Vice Chairman (until 2007) |
| | | |
Michael Hegarty (born 12/21/44) | | Trustee | | December 2004 | | Retired; AXA Financial (financial services and insurance), Vice Chairman and Chief Operating Officer (until May 2001); The Equitable Life Assurance Society (insurance), President and Chief Operating Officer (until May 2001) |
| | | |
Lawrence T. Perera (born 6/23/35) | | Trustee | | July 1981 | | Hemenway & Barnes (attorneys), Partner |
| | | |
J. Dale Sherratt (born 9/23/38) | | Trustee | | August 1993 | | Insight Resources, Inc. (acquisition planning specialists), President; Wellfleet Investments (investor in health care companies), Managing General Partner (since 1993); Cambridge Nutraceuticals (professional nutritional products), Chief Executive Officer (until May 2001) |
| | | |
Laurie J. Thomsen (born 8/05/57) | | Trustee | | March 2005 | | New Profit, Inc. (venture philanthropy), Partner (since 2006); Private investor; Prism Venture Partners (venture capital), Co-founder and General Partner (until June 2004); The Travelers Companies (commercial property liability insurance), Director |
| | | |
Robert W. Uek (born 5/18/41) | | Trustee | | January 2006 | | Retired (since 1999); PricewaterhouseCoopers LLP (professional services firm), Partner (until 1999); Consultant to investment company industry (since 2000); TT International Funds (mutual fund complex), Trustee (2000 until 2005); Hillview Investment Trust II Funds (mutual fund complex), Trustee (2000 until 2005) |
| | |
| OFFICERS | | | | |
Robert J. Manning (k)
(born 10/20/63) | | President | | March 2008 | | Massachusetts Financial Services Company, Chief Executive Officer, President, Chief Investment Officer and Director |
| | | |
Maria F. Dwyer (k) (born 12/01/58) | | Treasurer | | March 2008 | | Massachusetts Financial Services Company, Executive Vice President and Chief Regulatory Officer (since March 2004) Chief Compliance Officer (since December 2006); Fidelity Management & Research Company, Vice President (prior to March 2004); Fidelity Group of Funds, President and Treasurer (prior to March 2004); MFS Group of Funds, President (November 2005 – March 2008) |
| | | |
Christopher R. Bohane (k) (born 1/18/74) | | Assistant Secretary and Assistant Clerk | | July 2005 | | Massachusetts Financial Services Company, Vice President and Senior Counsel (since April 2003); Kirkpatrick & Lockhart LLP (law firm), Associate (prior to April 2003) |
29
Trustees and Officers – continued
| | | | | | |
Name, Date of Birth | | Position(s) Held
with Fund | | Trustee/Officer
Since (h) | | Principal Occupations During the Past Five Years &
Other Directorships (j) |
Ethan D. Corey (k) (born 11/21/63) | | Assistant Secretary and Assistant Clerk | | July 2005 | | Massachusetts Financial Services Company, Senior Vice President and Associate General Counsel (since April 2006); Special Counsel (prior to April 2006); Dechert LLP (law firm), Counsel (prior to December 2004) |
| | | |
David L. DiLorenzo (k) (born 8/10/68) | | Assistant Treasurer | | July 2005 | | Massachusetts Financial Services Company, Vice President (since June 2005); JP Morgan Investor Services, Vice President (prior to June 2005) |
| | | |
Timothy M. Fagan (k) (born 7/10/68) | | Assistant Secretary and Assistant Clerk | | September 2005 | | Massachusetts Financial Services Company, Vice President and Senior Counsel (since September 2005); John Hancock Advisers, LLC, Vice President and Chief Compliance Officer (September 2004 to August 2005), Senior Attorney (prior to September 2004); John Hancock Group of Funds, Vice President and Chief Compliance Officer (September 2004 to December 2004) |
| | | |
Mark D. Fischer (k) (born 10/27/70) | | Assistant Treasurer | | July 2005 | | Massachusetts Financial Services Company, Vice President (since May 2005); JP Morgan Investment Management Company, Vice President (prior to May 2005) |
| | | |
Brian E. Langenfeld (k) (born 3/07/73) | | Assistant Secretary and Assistant Clerk | | June 2006 | | Massachusetts Financial Services Company, Assistant Vice President and Counsel (since May 2006); John Hancock Advisers, LLC, Assistant Vice President and Counsel (May 2005 to April 2006); John Hancock Advisers, LLC, Attorney and Assistant Secretary (prior to May 2005) |
| | | |
Ellen Moynihan (k) (born 11/13/57) | | Assistant Treasurer | | April 1997 | | Massachusetts Financial Services Company, Senior Vice President |
| | | |
Susan S. Newton (k) (born 3/07/50) | | Assistant Secretary and Assistant Clerk | | May 2005 | | Massachusetts Financial Services Company, Senior Vice President and Associate General Counsel (since April 2005); John Hancock Advisers, LLC, Senior Vice President, Secretary and Chief Legal Officer (prior to April 2005); John Hancock Group of Funds, Senior Vice President, Secretary and Chief Legal Officer (prior to April 2005) |
| | | |
Susan A. Pereira (k) (born 11/05/70) | | Assistant Secretary and Assistant Clerk | | July 2005 | | Massachusetts Financial Services Company, Vice President and Senior Counsel (since June 2004); Bingham McCutchen LLP (law firm), Associate (prior to June 2004) |
| | | |
Mark N. Polebaum (k) (born 5/01/52) | | Secretary and Clerk | | January 2006 | | Massachusetts Financial Services Company, Executive Vice President, General Counsel and Secretary (since January 2006); Wilmer Cutler Pickering Hale and Dorr LLP (law firm), Partner (prior to January 2006) |
| | | |
Frank L. Tarantino (born 3/07/44) | | Independent Chief Compliance Officer | | June 2004 | | Tarantino LLC (provider of compliance services), Principal (since June 2004); CRA Business Strategies Group (consulting services), Executive Vice President (April 2003 to June 2004); David L. Babson & Co. (investment adviser), Managing Director, Chief Administrative Officer and Director (prior to March 2003) |
| | | |
Richard S. Weitzel (k)
(born 7/16/70) | | Assistant Secretary and Assistant Clerk | | October 2007 | | Massachusetts Financial Services Company, Vice President and Assistant General Counsel (since 2007); Vice President and Senior Counsel (since May 2004); Massachusetts Department of Business and Technology, General Counsel (February 2003 to April 2004); Massachusetts Office of the Attorney General, Assistant Attorney General (April 2001 to February 2003); Ropes and Gray, Associate (prior to April 2001) |
| | | |
James O. Yost (k) (born 6/12/60) | | Assistant Treasurer | | September 1990 | | Massachusetts Financial Services Company, Senior Vice President |
| (h) | Date first appointed to serve as Trustee/officer of an MFS fund. Each Trustee has served continuously since appointment unless indicated otherwise. |
| (j) | Directorships or trusteeships of companies required to report to the Securities and Exchange Commission (i.e., “public companies”). |
| (k) | “Interested person” of the Trust within the meaning of the Investment Company Act of 1940 (referred to as the 1940 Act), which is the principal federal law governing investment companies like the fund, as a result of position with MFS. The address of MFS is 500 Boylston Street, Boston, Massachusetts 02116. |
| (n) | In 2004 and 2005, Mr. Butler provided consulting services to the independent compliance consultant retained by MFS pursuant to its settlement with the SEC concerning market timing and related matters. The terms of that settlement required that compensation and expenses related to the independent compliance consultant be borne exclusively by MFS and, therefore, MFS paid Mr. Butler for the services he rendered to the independent compliance consultant. In 2004 and 2005, MFS paid Mr. Butler a total of $351,119.29. |
30
Trustees and Officers – continued
The Trust held a shareholders’ meeting in 2005 to elect Trustees, and will hold a shareholders’ meeting at least once every five years thereafter, to elect Trustees.
Each Trustee (except Mr. Butler and Mr. Uek) has been elected by shareholders and each Trustee and officer holds office until his or her successor is chosen and qualified or until his or her earlier death, resignation, retirement or removal. Messrs. Butler, Gutow, Sherratt and Uek and Ms. Thomsen are members of the Trust’s Audit Committee.
Each of the Trust’s Trustees and officers holds comparable positions with certain other funds of which MFS or a subsidiary is the investment adviser or distributor, and, in the case of the officers, with certain affiliates of MFS. As of January 1, 2008, the Trustees served as board members of 100 funds within the MFS Family of Funds.
The Statement of Additional Information contains further information about the Trustees and is available without charge upon request by calling 1-800-225-2606.
| | |
| Investment Adviser | | Custodian |
Massachusetts Financial Services Company 500 Boylston Street, Boston, MA 02116-3741 Distributor MFS Fund Distributors, Inc. 500 Boylston Street, Boston, MA 02116-3741 Portfolio Manager Robert Persons Michael Roberge Jeffrey Wakelin | | JPMorgan Chase Bank One Chase Manhattan Plaza, New York, NY 10081 Independent Registered Public Accounting Firm Deloitte & Touche LLP 200 Berkeley Street, Boston, MA 02116 |
31
PROXY VOTING POLICIES AND INFORMATION
A general description of the MFS funds’ proxy voting policies and procedures is available without charge, upon request, by calling 1-800-225-2606, by visiting the Proxy Voting section of mfs.com or by visiting the SEC’s Web site at http://www.sec.gov.
Information regarding how the fund voted proxies relating to portfolio securities during the most recent twelve-month period ended June 30 is available without charge by visiting the Proxy Voting section of mfs.com or by visiting the SEC’s Web site at http://www.sec.gov.
QUARTERLY PORTFOLIO DISCLOSURE
The fund will file a complete schedule of portfolio holdings with the Securities and Exchange Commission (the Commission) for the first and third quarters of each fiscal year on Form N-Q. The fund’s Form N-Q may be reviewed and copied at the:
Public Reference Room
Securities and Exchange Commission
100 F Street, NE, Room 1580
Washington, D.C. 20549
Information on the operation of the Public Reference Room may be obtained by calling the Commission at 1-800-SEC-0330. The fund’s Form N-Q is available on the EDGAR database on the Commission’s Internet Web site at http://www.sec.gov, and copies of this information may be obtained, upon payment of a duplicating fee, by electronic request at the following e-mail address: publicinfo@sec.gov or by writing the Public Reference Section at the above address.
A shareholder can also obtain the quarterly portfolio holdings report at mfs.com.
Federal Tax Information (Unaudited)
The fund will notify shareholders of amounts for use in preparing 2008 income tax forms in January 2009. The following information is provided pursuant to provisions of the Internal Revenue Code.
For non-U.S. persons only, the fund designates 99.00% of ordinary income dividends paid during the fiscal year as interest-related dividends.
32
MFS® PRIVACY NOTICE
Privacy is a concern for every investor today. At MFS Investment Management® and the MFS funds, we take this concern very seriously. We want you to understand our policies about the investment products and services that we offer, and how we protect the nonpublic personal information of investors who have a direct relationship with us and our wholly owned subsidiaries.
Throughout our business relationship, you provide us with personal information. We maintain information and records about you, your investments, and the services you use. Examples of the nonpublic personal information we maintain include
| | Ÿ | | data from investment applications and other forms |
| | Ÿ | | share balances and transactional history with us, our affiliates, or others |
| | Ÿ | | facts from a consumer reporting agency |
We do not disclose any nonpublic personal information about our customers or former customers to anyone, except as permitted by law. We may share nonpublic personal information with third parties or certain of our affiliates in connection with servicing your account or processing your transactions. We may share information with companies or financial institutions that perform marketing services on our behalf or with other financial institutions with which we have joint marketing arrangements, subject to any legal requirements.
Authorization to access your nonpublic personal information is limited to appropriate personnel who provide products, services, or information to you. We maintain physical, electronic, and procedural safeguards to help protect the personal information we collect about you.
If you have any questions about the MFS privacy policy, please call 1-800-225-2606 any business day between 8 a.m. and 8 p.m. Eastern time.
Note: If you own MFS products or receive MFS services in the name of a third party such as a bank or broker-dealer, their privacy policy may apply to you instead of ours.
33
CONTACT US
Web site
mfs.com
MFS TALK
1-800-637-8255
24 hours a day
Account service and
literature
Shareholders
1-800-225-2606
8 a.m. to 8 p.m. ET
Investment professionals
1-800-343-2829
8 a.m. to 8 p.m. ET
Retirement plan services
1-800-637-1255
8 a.m. to 8 p.m. ET
Mailing address
MFS Service Center, Inc.
P.O. Box 55824
Boston, MA 02205-5824
Overnight mail
MFS Service Center, Inc.
c/o Boston Financial Data Services
30 Dan Road
Canton, MA 02021-2809
Go paperless with eDelivery: Arrange to have MFS® send prospectuses, reports, and proxies directly to your e-mail inbox. You’ll get timely information and less clutter in your mailbox (not to mention help your fund save printing and postage costs).
Sign up: If your account is registered with us, simply go to mfs.com, log in to your account via MFS® Access, and select the eDelivery sign up options.
If you own your MFS fund shares through a financial institution or a retirement plan, MFS® TALK, MFS Access, and eDelivery may not be available to you.

A report for the MFS Intermediate Investment Grade Bond Fund is not included because the Fund did not have any shareholders at period end. Please see note above.
The Registrant has adopted a Code of Ethics pursuant to Section 406 of the Sarbanes-Oxley Act and as defined in Form N-CSR that applies to the Registrant’s principal executive officer and principal financial and accounting officer. The Registrant has not amended any provision in its Code of Ethics (the “Code”) that relates to an element of the Code’s definitions enumerated in paragraph (b) of Item 2 of this Form N-CSR.
A copy of the Code of Ethics is filed as an exhibit to this Form N-CSR.
| ITEM 3. | AUDIT COMMITTEE FINANCIAL EXPERT. |
Messrs. Robert E. Butler and Robert W. Uek and Ms. Laurie J. Thomsen, members of the Audit Committee, have been determined by the Board of Trustees in their reasonable business judgment to meet the definition of “audit committee financial expert” as such term is defined in Form N-CSR. In addition, Messrs. Butler and Uek and Ms. Thomsen are “independent” members of the Audit Committee (as such term has been defined by the Securities and Exchange Commission in regulations implementing Section 407 of the Sarbanes-Oxley Act of 2002). The Securities and Exchange Commission has stated that the designation of a person as an audit committee financial expert pursuant to this Item 3 on the Form N-CSR does not impose on such a person any duties, obligations or liability that are greater than the duties, obligations or liability imposed on such person as a member of the Audit Committee and the Board of Trustees in the absence of such designation or identification.
| ITEM 4. | PRINCIPAL ACCOUNTANT FEES AND SERVICES. |
Items 4(a) through 4(d) and 4(g):
The Board of Trustees has appointed Deloitte & Touche LLP (“Deloitte”) to serve as independent accountants to each series of the Registrant (collectively, the “Funds”). The tables below set forth the audit fees billed to the Funds as well as fees for non-audit services provided to the Funds and/or to the Funds’ investment adviser, Massachusetts Financial Services Company (“MFS”) and to various entities either controlling, controlled by, or under common control with MFS that provide ongoing services to the Funds (“MFS Related Entities”).
For the fiscal years ended April 30, 2008 and 2007, audit fees billed to the Funds by Deloitte were as follows:
| | | | |
| | | Audit Fees |
| | | 2008 | | 2007 |
Fees billed by Deloitte: | | | | |
MFS Bond Fund | | 52,226 | | 52,041 |
MFS Intermediate Investment Grade Bond Fund+ | | 0 | | 40,683 |
MFS Limited Maturity Fund | | 38,953 | | 39,217 |
MFS Municipal Limited Maturity Fund | | 37,761 | | 37,098 |
MFS Research Bond Fund | | 53,364 | | 52,872 |
MFS Research Bond Fund J | | 46,409 | | 39,754 |
| | | | |
Total | | 228,713 | | 261,665 |
For the fiscal years ended April 30, 2008 and 2007, fees billed by Deloitte for audit-related, tax and other services provided to the Funds and for audit-related, tax and other services provided to MFS and MFS Related Entities were as follows:
| | | | | | | | | | | | |
| | | Audit-Related Fees1 | | Tax Fees2 | | All Other Fees3 |
| | | 2008 | | 2007 | | 2008 | | 2007 | | 2008 | | 2007 |
Fees billed by Deloitte: | | | | | | | | | | | | |
To MFS Bond Fund | | 0 | | 0 | | 5,928 | | 6,349 | | 1,499 | | 379 |
To MFS Intermediate Investment Grade Bond Fund+ | | 0 | | 0 | | 0 | | 6,164 | | 0 | | 379 |
To MFS Limited Maturity Fund | | 0 | | 0 | | 5,846 | | 6,269 | | 1,499 | | 379 |
To MFS Municipal Limited Maturity Fund | | 0 | | 0 | | 5,355 | | 5,795 | | 1,499 | | 379 |
To MFS Research Bond Fund | | 0 | | 0 | | 5,846 | | 6,269 | | 1,499 | | 379 |
To MFS Research Bond Fund J | | 7,650 | | 0 | | 4,919 | | 5,374 | | 1,499 | | 379 |
| | | | | | | | | | | | |
Total fees billed by Deloitte To above Funds: | | 7,650 | | 0 | | 27,894 | | 36,220 | | 7,495 | | 2,274 |
To MFS and MFS Related Entities of MFS Bond Fund* | | 1,430,218 | | 702,225 | | 0 | | 0 | | 159,199 | | 482,805 |
To MFS and MFS Related Entities of MFS Intermediate Investment Grade Bond Fund*+ | | 0 | | 702,225 | | 0 | | 0 | | 0 | | 482,805 |
To MFS and MFS Related Entities of MFS Limited Maturity Fund* | | 1,430,218 | | 702,225 | | 0 | | 0 | | 159,199 | | 482,805 |
To MFS and MFS Related Entities of MFS Municipal Limited Maturity Fund* | | 1,430,218 | | 702,225 | | 0 | | 0 | | 159,199 | | 482,805 |
To MFS and MFS Related Entities of MFS Research Bond Fund* | | 1,430,218 | | 702,225 | | 0 | | 0 | | 159,199 | | 482,805 |
To MFS and MFS Related Entities of MFS Research Bond Fund J* | | 1,430,218 | | 702,225 | | 0 | | 0 | | 159,199 | | 482,805 |
| | | | |
| | | 2008 | | 2007 |
Aggregate fees for non-audit services: | | | | |
To MFS Bond Fund, MFS and MFS Related Entities# | | 1,699,231 | | 1,349,631 |
To MFS Intermediate Investment Grade Bond Fund, MFS and MFS Related Entities#+ | | 0 | | 1,349,446 |
To MFS Limited Maturity Fund, MFS and MFS Related Entities# | | 1,699,149 | | 1,349,551 |
To MFS Municipal Limited Maturity Fund, MFS and MFS Related Entities# | | 1,698,658 | | 1,349,077 |
To MFS Research Bond Fund, MFS and MFS Related Entities# | | 1,699,149 | | 1,349,551 |
To MFS Research Bond Fund J, MFS and MFS Related Entities# | | 1,705,872 | | 1,348,656 |
+ | The MFS Intermediate Investment Grade Bond Fund was reorganized into the MFS Research Bond Fund as of June 22, 2007. See note above. |
* | This amount reflects the fees billed to MFS and MFS Related Entities for non-audit services relating directly to the operations and financial reporting of the Funds (portions of which services also related to the operations and financial reporting of other funds within the MFS Funds complex). |
# | This amount reflects the aggregate fees billed by Deloitte for non-audit services rendered to the Funds and for non-audit services rendered to MFS and the MFS Related Entities. |
1 | The fees included under “Audit-Related Fees” are fees related to assurance and related services that are reasonably related to the performance of the audit or review of financial statements, but not reported under “Audit Fees,” including accounting consultations, agreed-upon procedure reports, attestation reports, comfort letters and internal control reviews. |
2 | The fees included under “Tax Fees” are fees associated with tax compliance, tax advice and tax planning, including services relating to the filing or amendment of federal, state or local income tax returns, regulated investment company qualification reviews and tax distribution and analysis. |
3 | The fees included under “All Other Fees” are fees for products and services provided by Deloitte other than those reported under “Audit Fees,” “Audit-Related Fees” and “Tax |
| | Fees,” including fees for services related to sales tax refunds, consultation on internal cost allocations, consultation on allocation of monies pursuant to an administrative proceeding regarding disclosure of brokerage allocation practices in connection with fund sales, analysis of certain portfolio holdings versus investment styles, review of internal controls and review of Rule 38a-1 compliance program. |
Item 4(e)(1):
Set forth below are the policies and procedures established by the Audit Committee of the Board of Trustees relating to the pre-approval of audit and non-audit related services:
To the extent required by applicable law, pre-approval by the Audit Committee of the Board is needed for all audit and permissible non-audit services rendered to the Funds and all permissible non-audit services rendered to MFS or MFS Related Entities if the services relate directly to the operations and financial reporting of the Registrant. Pre-approval is currently on an engagement-by-engagement basis. In the event pre-approval of such services is necessary between regular meetings of the Audit Committee and it is not practical to wait to seek pre-approval at the next regular meeting of the Audit Committee, pre-approval of such services may be referred to the Chair of the Audit Committee for approval; provided that the Chair may not pre-approve any individual engagement for such services exceeding $50,000 or multiple engagements for such services in the aggregate exceeding $100,000 in each period between regular meetings of the Audit Committee. Any engagement pre-approved by the Chair between regular meetings of the Audit Committee shall be presented for ratification by the entire Audit Committee at its next regularly scheduled meeting.
Item 4(e)(2):
None, or 0%, of the services relating to the Audit-Related Fees, Tax Fees and All Other Fees paid by the Fund and MFS and MFS Related Entities relating directly to the operations and financial reporting of the Registrant disclosed above were approved by the audit committee pursuant to paragraphs (c)(7)(i)(C) of Rule 2-01 of Regulation S-X (which permits audit committee approval after the start of the engagement with respect to services other than audit, review or attest services, if certain conditions are satisfied).
Item 4(f): Not applicable.
Item 4(h): The Registrant’s Audit Committee has considered whether the provision by a Registrant’s independent registered public accounting firm of non-audit services to MFS and MFS Related Entities that were not pre-approved by the Committee (because such services did not relate directly to the operations and financial reporting of the Registrant) was compatible with maintaining the independence of the independent registered public accounting firm as the Registrant’s principal auditors.
| ITEM 5. | AUDIT COMMITTEE OF LISTED REGISTRANTS. |
Not applicable to the Registrant.
A schedule of investments of the Registrant is included as part of the report to shareholders of such series under Item 1 of this Form N-CSR.
| ITEM 7. | DISCLOSURE OF PROXY VOTING POLICIES AND PROCEDURES FOR CLOSED-END MANAGEMENT INVESTMENT COMPANIES. |
Not applicable to the Registrant.
| ITEM 8. | PORTFOLIO MANAGERS OF CLOSED-END MANAGEMENT INVESTMENT COMPANIES. |
Not applicable to the Registrant.
| ITEM 9. | PURCHASES OF EQUITY SECURITIES BY CLOSED-END MANAGEMENT INVESTMENT COMPANY AND AFFILIATED PURCHASERS. |
Not applicable to the Registrant.
| ITEM 10. | SUBMISSION OF MATTERS TO A VOTE OF SECURITY HOLDERS. |
There were no material changes to the procedures by which shareholders may send recommendations to the Board for nominees to the Registrant’s Board since the Registrant last provided disclosure as to such procedures in response to the requirements of Item 407 (c)(2)(iv) of Regulation S-K or this Item.
| ITEM 11. | CONTROLS AND PROCEDURES. |
| (a) | Based upon their evaluation of the effectiveness of the registrant’s disclosure controls and procedures (as defined in Rule 30a-3(c) under the Investment Company Act of 1940 (the “Act”)) as conducted within 90 days of the filing date of this report on Form N-CSR, the registrant’s principal financial officer and principal executive officer have concluded that those disclosure controls and procedures provide reasonable assurance that the material information required to be disclosed by the registrant on this report is recorded, processed, summarized and reported within the time periods specified in the Securities and Exchange Commission’s rules and forms. |
| (b) | There were no changes in the registrant’s internal controls over financial reporting (as defined in Rule 30a-3(d) under the Act) that occurred during the second fiscal quarter of the period covered by the report that have materially affected, or are reasonably likely to materially affect, the registrant’s internal control over financial reporting. |
| (a) | File the exhibits listed below as part of this form. Letter or number the exhibits in the sequence indicated. |
| | (1) | Any code of ethics, or amendment thereto, that is the subject of the disclosure required by Item 2, to the extent that the registrant intends to satisfy the Item 2 requirements through filing of an exhibit: Code of Ethics attached hereto. |
| | (2) | A separate certification for each principal executive officer and principal financial officer of the registrant as required by Rule 30a-2 under the Act (17 CFR 270.30a-2): Attached hereto. |
| (b) | If the report is filed under Section 13(a) or 15(d) of the Exchange Act, provide the certifications required by Rule 30a-2(b) under the Act (17 CFR 270.30a-2(b)), Rule 13a-14(b) or Rule 15d-14(b) under the Exchange Act (17 CFR 240.13a-14(b) or 240.15d-14(b)) and Section 1350 of Chapter 63 of Title 18 of the United States Code (18 U.S.C. 1350) as an exhibit. A certification furnished pursuant to this paragraph will not be deemed “filed” for the purposes of Section 18 of the Exchange Act (15 U.S.C. 78r), or otherwise subject to the liability of that section. Such certification will not be deemed to be incorporated by reference into any filing under the Securities Act of 1933 or the Exchange Act, except to the extent that the registrant specifically incorporates it by reference: Attached hereto. |
Notice
A copy of the Amended and Restated Declaration of Trust, as amended, of the Registrant is on file with the Secretary of State of The Commonwealth of Massachusetts and notice is hereby given that this instrument is executed on behalf of the Registrant by an officer of the Registrant as an officer and not individually and the obligations of or arising out of this instrument are not binding upon any of the Trustees or shareholders individually, but are binding only upon the assets and property of the respective constituent series of the Registrant.
SIGNATURES
Pursuant to the requirements of the Securities Exchange Act of 1934 and the Investment Company Act of 1940, the registrant has duly caused this report to be signed on its behalf by the undersigned, thereunto duly authorized.
| | |
| (Registrant) MFS SERIES TRUST IX |
| |
| By (Signature and Title)* | | ROBERT J. MANNING |
| | Robert J. Manning, President |
|
| Date: June 16, 2008 |
Pursuant to the requirements of the Securities Exchange Act of 1934 and the Investment Company Act of 1940, this report has been signed below by the following persons on behalf of the registrant and in the capacities and on the dates indicated.
| | |
| By (Signature and Title)* | | ROBERT J. MANNING |
| | Robert J. Manning, President (Principal Executive Officer) |
|
| Date: June 16, 2008 |
| | |
| |
| By (Signature and Title)* | | MARIA F. DWYER |
| | Maria F. Dwyer, Treasurer (Principal Financial Officer and Accounting Officer) |
|
| Date: June 16, 2008 |
| * | Print name and title of each signing officer under his or her signature. |