UNITED STATES
SECURITIES AND EXCHANGE COMMISSION
Washington, D.C. 20549
FORM N-CSR
CERTIFIED SHAREHOLDER REPORT OF REGISTERED MANAGEMENT
INVESTMENT COMPANIES
| | |
| |
Investment Company Act file number: | | 811-02619 |
| |
Exact name of registrant as specified in charter: | | MoneyMart Assets, Inc. |
| |
Address of principal executive offices: | | Gateway Center 3, |
| | | 100 Mulberry Street, |
| | | Newark, New Jersey 07102 |
| |
Name and address of agent for service: | | Jonathan D. Shain |
| | | Gateway Center 3, |
| | | 100 Mulberry Street, |
| | | Newark, New Jersey 07102 |
| |
Registrant’s telephone number, including area code: | | 973-802-6469 |
| |
Date of fiscal year end: | | 12/31/2004 |
| |
Date of reporting period: | | 6/30/2004 |
Item 1 – Reports to Stockholders – [ INSERT REPORT ]
SEMIANNUAL REPORT
JUNE 30, 2004
MONEYMART ASSETS, INC.
FUND TYPE
Money market
OBJECTIVE
Maximum current income consistent with stability of capital and the maintenance of liquidity
This report is not authorized for distribution to prospective investors unless preceded or accompanied by a current prospectus.
The views expressed in this report and information about the Fund’s portfolio holdings are for the period covered by this report and are subject to change thereafter.
Dear Shareholder,
August 16, 2004
We hope that you find the semiannual report for MoneyMart Assets informative and useful. As a MoneyMart Assets shareholder, you may also be thinking where you can find additional growth opportunities. You could invest in last year’s top-performing asset class and hope that history repeats itself or you could stay in cash while waiting for the “right moment” to invest.
We believe it is wise to take advantage of developing domestic and global investment opportunities through a diversified portfolio of stock and bond mutual funds. A diversified asset allocation offers two advantages. It helps you manage downside risk by not being overly exposed to any particular asset class, plus it gives you a better opportunity of having at least some of your assets in the right place at the right time. Your financial professional can help you create a diversified investment plan that may include mutual funds that cover all the basic asset classes and is reflective of your personal investor profile and tolerance for risk.
Thank you for choosing this fund.
Sincerely,

Judy A. Rice, President
MoneyMart Assets, Inc.
Your Fund’s Performance
Fund objective
The investment objective of MoneyMart Assets, Inc. (the Fund) is to seek maximum current income consistent with stability of capital and the maintenance of liquidity. There can be no assurance that the Fund will achieve its investment objective.
The Fund is a diversified portfolio of high-quality, U.S. dollar-denominated money market securities issued by the U.S. government, its agencies and instrumentalities, and major corporations and commercial banks in the United States and foreign countries. Maturities can range from one day to 13 months. We generally only purchase securities rated in one of the two highest short-term rating categories or one of the three highest long-term rating categories by at least two major rating agencies, or if not rated, deemed to be of equivalent quality by our investment adviser.
Yields will fluctuate from time to time, and past performance does not guarantee future results. Current performance may be lower or higher than the past performance data quoted. An investment in the Fund is not insured or guaranteed by the Federal Deposit Insurance Corporation or any other government agency. Although the Fund seeks to preserve the value of your investment at $1 per share, it is possible to lose money by investing in the Fund.
| | | | | | | | | | | |
| Fund Facts as of 6/30/04 | | | | | | | | | |
| | | 7-Day
Current Yield | | | Net Asset
Value (NAV) | | Weighted Avg.
Maturity (WAM) | | Net Assets
(Millions) |
Class A | | 0.53 | % | | $ | 1.00 | | 27 Days | | $ | 3,052.1 |
Class Z* | | 0.66 | % | | $ | 1.00 | | 27 Days | | $ | 186.8 |
iMoneyNet, Inc. Taxable Prime Retail Avg.** | | 0.46 | % | | | N/A | | 47 Days | | | N/A |
| *Class | Z shares are not subject to distribution and service (12b-1) fees. |
| **iMoneyNet, | Inc. regularly reports a 7-day current yield and WAM on Tuesdays. This is the data of all funds in the iMoneyNet, Inc. Taxable Prime Retail Average category as of June 29, 2004, the closest date to the end of our reporting period. |
| | |
| 2 | | Visit our website at www.jennisondryden.com |
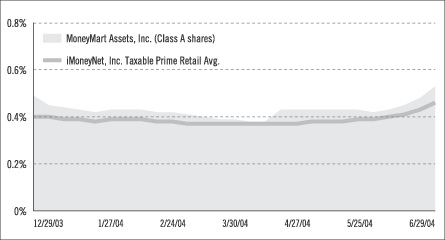
Money Market Fund Yield Comparison
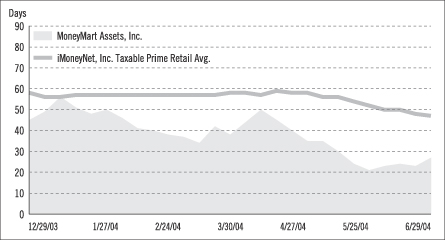
Weighted Average Maturity Comparison
Yields will fluctuate from time to time, and past performance does not guarantee future results. Current performance may be lower or higher than the performance data quoted. An investment in the Fund is not insured or guaranteed by the Federal Deposit Insurance Corporation or any other government agency. Although the Fund seeks to preserve the value of your investment at $1 per share, it is possible to lose money by investing in the Fund.
The graphs portray weekly 7-day current yields and weekly WAMs for MoneyMart Assets, Inc. (Class A shares—yields only) and the iMoneyNet, Inc. Taxable Prime Retail Average every Tuesday from December 29, 2003 to June 29, 2004, the closest dates to the beginning and end of the Fund’s reporting period. Note: iMoneyNet, Inc. regularly reports a 7-day current yield and WAM on Tuesdays. For purposes of this report, iMoneyNet, Inc. reported the initial 7-day current yield and WAM on a Monday. The data portrayed for the Fund at the end of the reporting period in the graph may not match the data portrayed in the Fund Facts table as of June 30, 2004.
This Page Intentionally Left Blank
Financial Statements
| | |
| JUNE 30, 2004 | | SEMIANNUAL REPORT |
MoneyMart Assets, Inc.
Portfolio of Investments
as of June 30, 2004 (Unaudited)
| | | | | |
Principal
Amount (000) | | Description | | Value (Note 1) |
| | | | | | |
Certificates of Deposit—Domestic 7.0% | | | |
| | | HSBC Bank USA | | | |
| $ 63,000 | | 1.04%, 7/1/04 | | $ | 63,000,000 |
| | | KBC Bank NV | | | |
| 100,000 | | 1.32%, 7/30/04 | | | 100,000,000 |
| | | Wells Fargo Bank NA | | | |
| 63,000 | | 1.13%, 7/13/04 | | | 63,000,000 |
| | | | |
|
|
| | | | | | 226,000,000 |
| |
Certificates of Deposit—Eurodollar 3.6% | | | |
| | | HBOS Treasury Services PLC | | | |
| 65,000 | | 1.06%, 7/20/04 | | | 64,997,905 |
| | | Nationwide Building Society | | | |
| 50,000 | | 1.13%, 7/13/04 | | | 50,000,634 |
| | | | |
|
|
| | | | | | 114,998,539 |
| |
Certificates of Deposit—Yankee 6.3% | | | |
| | | Credit Suisse First Boston | | | |
| 100,000 | | 1.25%, 7/30/04 | | | 100,000,000 |
| | | Natexis Banque Populaires | | | |
| 25,000 | | 1.075%, 7/1/04 | | | 25,000,000 |
| | | Wells Fargo Bank NA | | | |
| 80,000 | | 1.50%, 7/1/04 | | | 80,000,000 |
| | | | |
|
|
| | | | | | 205,000,000 |
| |
Commercial Paper 69.4% | | | |
| | | Aegon Funding Corp. | | | |
| 10,000 | | 1.26%, 8/9/04 | | | 9,986,350 |
| | | Alianz Finance Corp. | | | |
| 45,000 | | 1.35%, 8/19/04 | | | 44,917,313 |
| | | Amsterdam Funding Corp. | | | |
| 28,517 | | 1.09%, 7/1/04 | | | 28,517,000 |
| 75,000 | | 1.32%, 8/12/04 | | | 74,884,500 |
| | | Cafco LLC | | | |
| 49,100 | | 1.20%, 8/4/04 | | | 49,044,353 |
| 75,000 | | 1.20%, 8/10/04 | | | 74,900,000 |
| 51,000 | | 1.32%, 8/10/04 | | | 50,925,200 |
| | | Caisse Nationale Des Caisses | | | |
| 61,500 | | 1.21%, 8/6/04 | | | 61,425,585 |
| | | Citicorp | | | |
| 59,111 | | 1.28%, 8/5/04 | | | 59,037,440 |
See Notes to Financial Statements.
| | |
| 6 | | Visit our website at www.jennisondryden.com |
| | | | | |
Principal
Amount (000) | | Description | | Value (Note 1) |
| | | | | | |
| | | Citigroup Global Markets Holdings, Inc. | | | |
| $ 64,190 | | 1.27%, 7/19/04 | | $ | 64,149,239 |
| | | Countrywide Home Loan, Inc. | | | |
| 5,928 | | 1.62%, 7/1/04 | | | 5,928,000 |
| | | CXC, Inc. | | | |
| 30,000 | | 1.28%, 8/3/04 | | | 29,964,800 |
| 50,000 | | 1.20%, 8/10/04 | | | 49,933,333 |
| | | Daimlerchrysler Revolving Auto | | | |
| 100,000 | | 1.27%, 7/26/04 | | | 99,911,806 |
| 18,059 | | 1.27%, 7/27/04 | | | 18,042,436 |
| 47,585 | | 1.27%, 7/28/04 | | | 47,539,675 |
| | | Danske Corp. | | | |
| 50,000 | | 1.32%, 8/11/04 | | | 49,924,833 |
| | | Falcon Asset Securitization Corp. | | | |
| 75,000 | | 1.25%, 7/22/04 | | | 74,945,313 |
| 95,207 | | 1.25%, 7/27/04 | | | 95,121,049 |
| | | Goldman Sachs Group, Inc. | | | |
| 38,721 | | 1.27%, 7/16/04 | | | 38,700,510 |
| | | HBOS Treasury Services PLC | | | |
| 100,000 | | 1.35%, 8/4/04 | | | 99,872,500 |
| | | Morgan Stanley Dean Witter Co. | | | |
| 70,000 | | 1.12%, 7/19/04 | | | 69,960,800 |
| | | National Rural Utilities Cooperative Finance | | | |
| 50,000 | | 1.31%, 7/29/04 | | | 49,949,056 |
| | | New Center Asset Trust | | | |
| 170,000 | | 1.23%, 8/2/04 | | | 169,814,133 |
| | | New York Life Capital Corp. | | | |
| 24,295 | | 1.27%, 7/23/04 | | | 24,276,144 |
| | | Nordeutsche Landesbank Luxembourg | | | |
| 80,000 | | 1.09%, 7/12/04 | | | 79,973,355 |
| 18,214 | | 1.20%, 8/6/04 | | | 18,192,143 |
| 39,000 | | 1.28%, 8/11/04 | | | 38,943,147 |
| | | Old Line Funding Corp. | | | |
| 10,954 | | 1.25%, 7/27/04 | | | 10,944,111 |
| 26,000 | | 1.26%, 7/29/04 | | | 25,974,520 |
| | | Preferred Receivables Funding Corp. | | | |
| 50,000 | | 1.26%, 7/21/04 | | | 49,965,000 |
| | | Prudential PLC | | | |
| 29,908 | | 1.20%, 8/3/04 | | | 29,875,101 |
| 25,600 | | 1.22%, 8/3/04 | | | 25,571,371 |
| | | Sheffield Receivables Corp. | | | |
| 91,000 | | 1.15%, 7/12/04 | | | 90,968,024 |
See Notes to Financial Statements.
Portfolio of Investments
as of June 30, 2004 (Unaudited) Cont’d.
| | | | | |
Principal
Amount (000) | | Description | | Value (Note 1) |
| | | | | | |
| | | Societe Generale North America | | | |
| $170,165 | | 1.26%, 8/10/04 | | $ | 169,926,769 |
| | | Spintab-Swedmortgage AB | | | |
| 44,249 | | 1.07%, 7/1/04 | | | 44,249,000 |
| | | Swedbank, Inc. | | | |
| 49,000 | | 1.12%, 7/16/04 | | | 48,977,133 |
| | | Tulip Funding Corp. | | | |
| 70,000 | | 1.10%, 7/1/04 | | | 70,000,000 |
| 100,000 | | 1.29%, 8/6/04 | | | 99,871,000 |
| | | UBS Finance LLC | | | |
| 692 | | 1.13%, 7/13/04 | | | 691,741 |
| | | | |
|
|
| | | | | | 2,245,793,783 |
| |
Municipal Bonds 0.2% | | | |
| | | Indiana St. Office Bldg. Comn. Fac. Rev., Miami Corr. Fac. II, Ser. A | | | |
| 200 | | 1.05%, 7/1/22(b) | | | 200,000 |
| | | Valdez Alaska Marine Term. Rev., Ref. BP Pipelines Income, Proj. A | | | |
| 6,600 | | 1.10%, 6/1/37(b) | | | 6,600,000 |
| | | | |
|
|
| | | | | | 6,800,000 |
| |
Other Corporate Obligations 11.8% | | | |
| | | American Express Credit Corp. | | | |
| 45,000 | | 1.20%, 7/5/05(d) | | | 45,000,000 |
| | | General Electric Capital Assurance Co. | | | |
| 49,000 | | 1.36%, 7/22/04(c)(d)
(cost of $49,000,000, date purchased 7/17/03) | | | 49,000,000 |
| | | Goldman Sachs Group, Inc. | | | |
| 40,000 | | 1.67%, 7/13/05(d) | | | 40,000,000 |
| | | Merrill Lynch & Co., Inc. | | | |
| 50,000 | | 1.336%, 7/17/05(d) | | | 50,000,000 |
| | | Metropolitan Life Insurance Co. | | | |
| 53,000 | | 1.22%, 10/4/04(b)(c)
(cost of $53,000,000, date purchased 9/26/02) | | | 53,000,000 |
| | | Morgan Stanley Dean Witter Co. | | | |
| 43,000 | | 1.359 7/15/05(d) | | | 43,000,000 |
| | | Pacific Life Insurance | | | |
| 38,000 | | 1.62%, 10/15/04(c)(d)
(cost of $38,000,000, date purchased 7/1/03) | | | 38,000,000 |
See Notes to Financial Statements.
| | |
| 8 | | Visit our website at www.jennisondryden.com |
| | | | | | |
Principal
Amount (000) | | Description | | Value (Note 1) | |
| | | Travelers Insurance Co. | | | | |
| $34,000 | | 1.22%, 7/8/04(c)(d)
(cost of $34,000,000, date purchased 6/30/03) | | $ | 34,000,000 | |
| | | Westpac Banking Corp. | | | | |
| 32,000 | | 1.407%, 7/11/05(d) | | | 32,000,000 | |
| | | | |
|
|
|
| | | | | | 384,000,000 | |
| |
U.S. Government Agency Obligation 3.0% | | | | |
| | | Federal National Mortgage Assoc. | | | | |
| 47,329 | | 1.22%, 8/4/04(b) | | | 47,274,466 | |
| 50,000 | | 1.10%, 8/9/04(b) | | | 49,940,417 | |
| | | | |
|
|
|
| | | | | | 97,214,883 | |
| | | | |
|
|
|
| | | Total Investments 101.3%
(amortized cost $3,279,807,205(a)) | | | 3,279,807,205 | |
| | | Liabilities in excess of other assets (1.3%) | | | (40,991,598 | ) |
| | | | |
|
|
|
| | | Net Assets 100% | | $ | 3,238,815,607 | |
| | | | |
|
|
|
| (a) | The cost of securities for federal income tax purposes is substantially the same as for financial reporting expenses. |
| (b) | Variable rate instrument. The maturity date presented for these instruments is the later of the next date on which the security can be redeemed at par or the next date on which the rate of interest is adjusted. |
| (c) | Private placement restricted as to resale and does not have a readily available market; the aggregate cost and value of such securities is $174,000,000 and is approximately 5.4% of net assets. |
| (d) | Floating Rate Security. The interest rate shown reflects the rate in effect at June 30, 2004. |
The Industry classification of portfolio holdings and liabilities in excess of other assets shown as a percentage of net assets as of June 30, 2004 was as follows:
| | | |
Commercial Banks | | 35.5 | % |
Asset Backed Securities | | 32.3 | |
Life Insurance | | 9.5 | |
Security Brokers & Dealers | | 7.5 | |
Motor Vehicle Parts | | 5.1 | |
Federal Credit Agencies | | 3.0 | |
Finance Services | | 2.9 | |
Fire, Marine, Casualty Insurance | | 2.0 | |
Bank Holding Companies-Domestic | | 1.8 | |
Mortgage Bankers | | 1.5 | |
Municipality | | 0.2 | |
Liabilities in excess of other assets | | (1.3 | ) |
| | |
|
|
| | | 100.0 | % |
| | |
|
|
See Notes to Financial Statements.
Statement of Assets and Liabilities
as of June 30, 2004 (Unaudited)
| | | |
Assets | | | |
Investments, at amortized cost which approximates market value | | $ | 3,279,807,205 |
Cash | | | 22,006 |
Receivable for Fund shares sold | | | 22,425,695 |
Interest receivable | | | 1,084,363 |
Prepaid expenses | | | 108,543 |
| | |
|
|
Total assets | | | 3,303,447,812 |
| | |
|
|
| |
Liabilities | | | |
Payable for Fund shares reacquired | | | 60,613,605 |
Accrued expenses | | | 2,428,945 |
Management fee payable | | | 896,144 |
Distribution fee payable | | | 350,615 |
Dividends payable | | | 340,894 |
Deferred directors’ fees | | | 2,002 |
| | |
|
|
Total liabilities | | | 64,632,205 |
| | |
|
|
| |
Net Assets | | $ | 3,238,815,607 |
| | |
|
|
| | | | |
Net assets were comprised of: | | | |
Common stock, at par ($.001 par value; 15 billion shares authorized for issuance) | | $ | 3,238,816 |
Paid-in capital in excess of par | | | 3,235,576,791 |
| | |
|
|
Net assets, June 30, 2004 | | $ | 3,238,815,607 |
| | |
|
|
| | | |
Class A | | | |
Net asset value, offering price and redemption price per share
($3,052,064,972 ÷ 3,052,064,972 shares of common stock issued and outstanding) | | $ | 1.00 |
| | |
|
|
| |
Class Z | | | |
Net asset value, offering price and redemption price per share
($186,750,635 ÷ 186,750,635 shares of common stock issued and outstanding) | | $ | 1.00 |
| | |
|
|
See Notes to Financial Statements.
| | |
| 10 | | Visit our website at www.jennisondryden.com |
Statement of Operations
Six Months Ended June 30, 2004 (Unaudited)
| | | |
Net Investment Income | | | |
Income | | | |
Interest | | $ | 24,003,929 |
| | |
|
|
| |
Expenses | | | |
Management fee | | | 6,537,861 |
Distribution fee—Class A | | | 2,587,475 |
Transfer agent’s fees and expenses | | | 5,035,000 |
Reports to shareholders | | | 136,000 |
Custodian’s fees and expenses | | | 117,000 |
Insurance | | | 60,000 |
Registration fees | | | 53,000 |
Legal fees and expenses | | | 30,000 |
Directors’ fee and expenses | | | 15,000 |
Audit fee | | | 11,000 |
Miscellaneous | | | 5,294 |
| | |
|
|
Total expenses | | | 14,587,630 |
| | |
|
|
Net investment income | | | 9,416,299 |
| | |
|
|
| |
Net Realized Gain On Investments | | | |
Net realized gain on investment transactions | | | 39,033 |
| | |
|
|
Net Increase In Net Assets Resulting From Operations | | $ | 9,455,332 |
| | |
|
|
See Notes to Financial Statements.
| | |
| MoneyMart Assets, Inc. | | 11 |
Statement of Changes in Net Assets (Unaudited)
| | | | | | | | |
| | | Six Months
Ended
June 30, 2004 | | | Year
Ended
December 31, 2003 | |
Decrease In Net Assets | | | | | | | | |
Operations | | | | | | | | |
Net investment income | | $ | 9,416,299 | | | $ | 42,792,129 | |
Net realized gain on investment transactions | | | 39,033 | | | | 1,064,877 | |
| | |
|
|
| |
|
|
|
Net increase in net assets resulting from operations | | | 9,455,332 | | | | 43,857,006 | |
| | |
|
|
| |
|
|
|
| | |
Dividends and distributions to shareholders (Note 1) | | | | | | | | |
Class A | | | (8,936,354 | ) | | | (42,332,082 | ) |
Class Z | | | (518,978 | ) | | | (1,524,924 | ) |
| | |
|
|
| |
|
|
|
| | | | (9,455,332 | ) | | | (43,857,006 | ) |
| | |
|
|
| |
|
|
|
| | |
Fund share transactions (Note 4) (at $1.00 per share) | | | | | | | | |
Proceeds from shares sold | | | 3,111,123,869 | | | | 22,027,286,713 | |
Net asset value of shares issued to shareholders in reinvestment of dividends and distributions | | | 7,818,601 | | | | 40,036,556 | |
Cost of shares reacquired | | | (5,157,249,726 | ) | | | (23,921,012,672 | ) |
| | |
|
|
| |
|
|
|
Net decrease in net assets from Fund share transactions | | | (2,038,307,256 | ) | | | (1,853,689,403 | ) |
| | |
|
|
| |
|
|
|
Total decrease | | | (2,038,307,256 | ) | | | (1,853,689,403 | ) |
| | |
Net Assets | | | | | | | | |
Beginning of period | | | 5,277,122,863 | | | | 7,130,812,266 | |
| | |
|
|
| |
|
|
|
End of period | | $ | 3,238,815,607 | | | $ | 5,277,122,863 | |
| | |
|
|
| |
|
|
|
See Notes to Financial Statements.
| | |
| 12 | | Visit our website at www.jennisondryden.com |
Notes to Financial Statements (Unaudited)
MoneyMart Assets, Inc. (the “Fund”) is registered under the Investment Company Act of 1940 as a diversified, open-end management investment company. The Fund invests primarily in a portfolio of money market instruments maturing in thirteen months or less whose ratings are within the two highest rating categories by a nationally recognized statistical rating organization or, if not rated, are of comparable quality. The ability of the issuers of the securities held by the Fund to meet their obligations may be affected by economic developments in a specific industry or region.
Note 1. Accounting Policies
The following is a summary of significant accounting policies followed by the Fund in the preparation of its financial statements.
Securities Valuations: Portfolio securities are valued at amortized cost, which approximates market value. The amortized cost method involves valuing a security at its cost on the date of purchase and thereafter assuming a constant amortization to maturity of any discount or premium. If the amortized cost method is determined not to represent fair value, the fair value shall be determined by or under the direction of the Board of Directors.
Securities Transactions and Net Investment Income: Securities transactions are recorded on the trade date. Realized gains or losses on sales of securities are calculated on the identified cost basis. Interest income including amortization of premium and accretion of discount on debt securities, as required is recorded on the accrual basis. Expenses are recorded on the accrual basis.
Net investment income or loss (other than distribution fees, which are charged directly to the respective class) and realized gains or losses are allocated daily to each class of shares based upon the relative proportion of net assets of each class at the beginning of the day.
Repurchase Agreements: In connection with transactions in repurchase agreements with United States financial institutions, it is the Fund’s policy that its custodian or designated subcustodians under triparty repurchase agreements, as the case may be, take possession of the underlying collateral securities, the value of which exceeds the principal amount of the repurchase transactions, including accrued interest. To the extent that any repurchase transaction exceeds one business day, the value of the
| | |
| MoneyMart Assets, Inc. | | 13 |
Notes to Financial Statements (Unaudited)
Cont’d
collateral is marked to market on a daily basis to ensure the adequacy of the collateral. If the seller defaults and the value of the collateral declines or if bankruptcy proceedings are commenced with respect to the seller of the security, realization of the collateral by the Fund may be delayed or limited.
Loan Participation: The Fund may invest in loan participation. When the Fund purchases a loan participation, the Fund typically enters into a contractual relationship with the lender or third party selling such participations (“Selling Participant”), but not the borrower. As a result, the Fund assumes the credit risk of the borrower, the selling participant and any other persons interpositioned between the Fund and borrower (“intermediate participants”). The Fund may not directly benefit from the collateral supporting the senior loan in which it has purchased the loan participation.
Federal Income Taxes: It is the Fund’s policy to continue to meet the requirements of the Internal Revenue Code applicable to regulated investment companies and to distribute all of its taxable net income and capital gains, if any, to shareholders. Therefore, no federal income tax provision is required.
Dividends and Distributions: The Fund declares daily dividends from net investment income and net realized short-term capital gains or losses. Payment of dividends is made monthly. Income distributions and capital gain distributions are determined in accordance with federal income tax regulations which differ from generally accepted accounting principles.
Restricted Securities: The Fund may hold up to 10% of its net assets in illiquid securities, including those which are restricted as to disposition under securities law (“restricted securities”). Certain issues of restricted securities held by the Fund at June 30, 2004 include registration rights under which the Fund may demand registration by the issuer, of which the Fund may bear the cost of such registration. Restricted securities, sometimes referred to as private placements, are valued pursuant to the valuation procedures noted above.
Estimates: The preparation of the financial statements requires management to make estimates and assumptions that affect the reported amounts and disclosures in the financial statements. Actual results could differ from those estimates.
| | |
| 14 | | Visit our website at www.jennisondryden.com |
Note 2. Agreements
The Fund has a management agreement with Prudential Investments LLC (“PI”). Pursuant to this agreement, PI has responsibility for all investment advisory services and supervises the subadvisor’s performance of such services. PI has entered into a subadvisory agreement with Prudential Investment Management, Inc. (“PIM”). The subadvisory agreement provides that PIM will furnish investment advisory services in connection with the management of the Fund. In connection therewith, PIM is obligated to keep certain books and records of the Fund. PI pays for the services of PIM, the cost of compensation of officers of the Fund, occupancy and certain clerical and bookkeeping costs of the Fund. The Fund bears all other costs and expenses.
The management fee paid to PI is computed daily and payable monthly, at an annual rate of .50 of 1% of the Fund’s average daily net assets up to $50 million and .30 of 1% of the Fund’s average daily net assets in excess of $50 million.
The Fund has a distribution agreement with Prudential Investment Management Services LLC (“PIMS”), which acts as the distributor of the Class A and Z shares of the Fund. The Fund compensates PIMS for distributing and servicing the Fund’s Class A shares pursuant to the plan of distribution at an annual rate of .125 of 1% of the average daily net assets of the Class A shares. The Class A distribution fee is accrued daily and payable monthly. No distribution or service fees are paid to PIMS as distributor of the Class Z shares of the Fund.
PI, PIM and PIMS are indirect, wholly-owned subsidiaries of Prudential Financial, Inc. (“Prudential”).
Note 3. Other Transactions with Affiliates
Prudential Mutual Fund Services LLC (“PMFS”), an affiliate of PI and an indirect, wholly-owned subsidiary of Prudential, serves as the Fund’s transfer agent. During the six months ended June 30, 2004, the Fund incurred fees of approximately $4,404,800 for the services of PMFS. As of June 30, 2004, approximately $682,400 of such fees were due to PFMS. Transfer agent fees and expenses in the Statement of Operations include certain out-of-pocket and sub-transfer agent expenses paid to non-affiliates, where applicable.
Note 4. Capital
The Fund offers Class A and Class Z shares. Class Z shares are not subject to any distribution and/or service fees and are offered exclusively for sale to a limited group of investors.
| | |
| MoneyMart Assets, Inc. | | 15 |
Notes to Financial Statements (Unaudited)
Cont’d
There are 15 billion authorized shares of $.001 par value common stock divided into two classes, which consist of 13 billion Class A and 2 billion Class Z shares.
Transactions in shares of common stock (at $1 net asset value per share) were as follows:
| | | | | | | | |
| | | Six months Ended
June 30,
| | | Year Ended
December 31,
| |
Class A
| | 2004
| | | 2003
| |
Shares sold | | $ | 3,062,780,342 | | | $ | 21,933,775,126 | |
Shares issued in reinvestment of dividends and distributions | | | 7,325,674 | | | | 38,512,438 | |
Shared reacquired | | | (5,107,446,312 | ) | | | (23,813,111,496 | ) |
| | |
|
|
| |
|
|
|
Net decrease in shares outstanding | | $ | (2,037,340,296 | ) | | $ | (1,840,823,932 | ) |
| | |
|
|
| |
|
|
|
| | |
Class Z
| | | | | | |
Shares sold | | $ | 48,343,527 | | | $ | 93,511,587 | |
Shares issued in reinvestment of dividends and distributions | | | 492,927 | | | | 1,524,118 | |
Shared reacquired | | | (49,803,414 | ) | | | (107,901,176 | ) |
| | |
|
|
| |
|
|
|
Net decrease in shares outstanding | | $ | (966,960 | ) | | $ | (12,865,471 | ) |
| | |
|
|
| |
|
|
|
Note 5. Change in Independent Auditors
PricewaterhouseCoopers LLP was previously the independent auditors for the Fund. The decision to change the independent auditors was approved by the Audit Committee and by the Board of Directors in a meeting held on September 2, 2003, resulting in KPMG LLP’s appointment as independent auditors of the Fund.
The reports on the financial statements of the Fund audited by PricewaterhouseCoopers LLP through the year ended December 31, 2003 did not contain an adverse opinion or disclaimer of opinion, and were not qualified or modified as to uncertainty, audit scope of accounting principles. There were no disagreements between the Fund and PricewaterhouseCoopers LLP on any matter of accounting principles or practices, financial statement disclosure, or auditing scope or procedures.
| | |
| 16 | | Visit our website at www.jennisondryden.com |
Note 6. Reorganization
The Fund has historically served as a mechanism for investing excess cash balances from Prudential Securities, Inc. customer accounts. During fiscal 2003, the Fund was notified that it would no longer be utilized in such a manner. As a result, it is expected that net assets will decline significantly. Even after the reorganization described below, it is expected that the Fund’s combined net assets will be significantly lower than the current level.
On November 18, 2003, the Board of Directors of the Fund approved an Agreement and Plan of Reorganization which provided for the transfer of all assets and assumption of all liabilities of Class A, B, C, and Z shares of the Special Money Market Fund, Inc. for Class A, B, C and Z shares of the Fund, respectively. As part of the reorganization, the Fund will commence offering Class B and C shares.
| | |
| MoneyMart Assets, Inc. | | 17 |
Financial Highlights (Unaudited)
| | | | |
| | | Class A
| |
| | | Six Months Ended
June 30, 2004 | |
Per Share Operating Performance: | | | | |
Net Asset Value, Beginning Of Period | | $ | 1.000 | |
| | |
|
|
|
Income from investment operations: | | | | |
Net investment income and net realized gains | | | 0.002 | |
Dividends and distributions to shareholders | | | (0.002 | ) |
| | |
|
|
|
Net asset value, end of period | | $ | 1.000 | |
| | |
|
|
|
Total Return(a): | | | .20 | % |
Ratios/Supplemental Data: | | | | |
Net assets, end of period (000) | | $ | 3,052,065 | |
Average net assets (000) | | $ | 4,162,708 | |
Ratios to average net assets: | | | | |
Expenses, including distribution and service (12b-1) fees | | | .68 | %(b) |
Expenses, excluding distribution and service (12b-1) fees | | | .55 | %(b) |
Net investment income | | | .43 | %(b) |
| (a) | Total return is calculated assuming a purchase of shares on the first day and a sale on the last day of each period reported and includes reinvestment of dividends and distributions. Total returns for less than a full year are not annualized. |
See Notes to Financial Statements.
| | |
| 18 | | Visit our website at www.jennisondryden.com |
| | | | | | | | | | | | | | | | | | |
| Class A | |
| Year Ended December 31, | |
| 2003 | | | 2002 | | | 2001 | | | 2000 | | | 1999 | |
| | | | | | | | | | | | | | | | | | | |
| $ | 1.000 | | | $ | 1.000 | | | $ | 1.000 | | | $ | 1.000 | | | $ | 1.000 | |
|
|
| |
|
|
| |
|
|
| |
|
|
| |
|
|
|
| | | | | | | | | | | | | | | | | | | |
| | 0.006 | | | | 0.013 | | | | 0.037 | | | | 0.058 | | | | 0.046 | |
| | (0.006 | ) | | | (0.013 | ) | | | (0.037 | ) | | | (0.058 | ) | | | (0.046 | ) |
|
|
| |
|
|
| |
|
|
| |
|
|
| |
|
|
|
| $ | 1.000 | | | $ | 1.000 | | | $ | 1.000 | | | $ | 1.000 | | | $ | 1.000 | |
|
|
| |
|
|
| |
|
|
| |
|
|
| |
|
|
|
| | .65 | % | | | 1.35 | % | | | 3.85 | % | | | 5.94 | % | | | 4.69 | % |
| | | | | | | | | | | | | | | | | | | |
| $ | 5,089,405 | | | $ | 6,930,229 | | | $ | 6,440,760 | | | $ | 6,529,282 | | | $ | 6,393,586 | |
| $ | 6,535,734 | | | $ | 6,947,463 | | | $ | 6,846,656 | | | $ | 6,538,256 | | | $ | 6,292,031 | |
| | | | | | | | | | | | | | | | | | | |
| | .62 | % | | | .61 | % | | | .65 | % | | | .67 | % | | | .68 | % |
| | .49 | % | | | .48 | % | | | .52 | % | | | .54 | % | | | .55 | % |
| | .63 | % | | | 1.34 | % | | | 3.76 | % | | | 5.81 | % | | | 4.60 | % |
See Notes to Financial Statements.
| | |
| MoneyMart Assets, Inc. | | 19 |
Financial Highlights (Unaudited)
Cont’d
| | | | |
| | | Class Z
| |
| | | Six Months Ended
June 30, 2004 | |
Per Share Operating Performance: | | | | |
Net Asset Value, Beginning Of Period | | $ | 1.000 | |
| | |
|
|
|
Income from investment operations: | | | | |
Net investment income and net realized gains | | | 0.003 | |
Dividends and distributions to shareholders | | | (0.003 | ) |
| | |
|
|
|
Net asset value, end of period | | $ | 1.000 | |
| | |
|
|
|
Total Return(a): | | | .26 | % |
Ratios/Supplemental Data: | | | | |
Net assets, end of period (000) | | $ | 186,751 | |
Average net assets (000) | | $ | 186,481 | |
Ratios to average net assets: | | | | |
Expenses, including distribution and service (12b-1) fees | | | .55 | %(b) |
Expenses, excluding distribution and service (12b-1) fees | | | .55 | %(b) |
Net investment income | | | .56 | %(b) |
| (a) | Total return is calculated assuming a purchase of shares on the first day and a sale on the last day of each period reported and includes reinvestment of dividends and distributions. Total returns for less than a full year are not annualized. |
See Notes to Financial Statements.
| | |
| 20 | | Visit our website at www.jennisondryden.com |
| | | | | | | | | | | | | | | | | | |
| Class Z | |
| Year Ended December 31, | |
| 2003 | | | 2002 | | | 2001 | | | 2000 | | | 1999 | |
| | | | | | | | | | | | | | | | | | | |
| $ | 1.000 | | | $ | 1.000 | | | $ | 1.000 | | | $ | 1.000 | | | $ | 1.000 | |
|
|
| |
|
|
| |
|
|
| |
|
|
| |
|
|
|
| | | | | | | | | | | | | | | | | | | |
| | 0.008 | | | | 0.015 | | | | 0.039 | | | | 0.059 | | | | 0.047 | |
| | (0.008 | ) | | | (0.015 | ) | | | (0.039 | ) | | | (0.059 | ) | | | (0.047 | ) |
|
|
| |
|
|
| |
|
|
| |
|
|
| |
|
|
|
| $ | 1.000 | | | $ | 1.000 | | | $ | 1.000 | | | $ | 1.000 | | | $ | 1.000 | |
|
|
| |
|
|
| |
|
|
| |
|
|
| |
|
|
|
| | .77 | % | | | 1.48 | % | | | 3.98 | % | | | 6.07 | % | | | 4.82 | % |
| | | | | | | | | | | | | | | | | | | |
| $ | 187,718 | | | $ | 200,583 | | | $ | 272,733 | | | $ | 253,173 | | | $ | 259,529 | |
| $ | 198,143 | | | $ | 291,473 | | | $ | 283,850 | | | $ | 267,611 | | | $ | 227,112 | |
| | | | | | | | | | | | | | | | | | | |
| | .49 | % | | | .48 | % | | | .52 | % | | | .54 | % | | | .55 | % |
| | .49 | % | | | .48 | % | | | .52 | % | | | .54 | % | | | .55 | % |
| | .75 | % | | | 1.48 | % | | | 3.84 | % | | | 5.95 | % | | | 4.74 | % |
See Notes to Financial Statements.
| | |
| MoneyMart Assets, Inc. | | 21 |
| | | | |
| n MAIL | | n TELEPHONE | | n WEBSITE |
Gateway Center Three
100 Mulberry Street
Newark, NJ 07102 | | (800) 225-1852 | | www.jennisondryden.com |
|
| PROXY VOTING |
| The Board of Directors of the Fund has delegated to the Fund’s investment adviser the responsibility for voting any proxies and maintaining proxy recordkeeping with respect to the Fund. A description of these proxy voting policies and procedures is available without charge, upon request, by calling (800) 225-1852 or by visiting the Securities and Exchange Commission’s (the Commission) website at http://www.sec.gov. Information regarding how the Fund voted proxies relating to portfolio securities during the most recent 12-month period ended June 30, 2004 is available on the Fund’s website at http://www.prudential.com and on the Commission’s website at http://www.sec.gov. |
|
| DIRECTORS |
David E. A. Carson•Delayne Dedrick Gold•Robert F. Gunia•Robert E. La Blanc•Robin B. Smith• Stephen D. Stoneburn •Clay T. Whitehead |
|
| OFFICERS |
Judy A. Rice, President•Robert F. Gunia, Vice President•Grace C. Torres, Treasurer and Principal Financial and Accounting Officer• William V. Healey, Chief Legal Officer •
Jonathan D. Shain, Secretary•Maryanne Ryan, Anti-Money Laundering Compliance Officer•
Lee D. Augsburger, Chief Compliance Officer |
| | | | |
| MANAGER | | Prudential Investments LLC | | Gateway Center Three
100 Mulberry Street
Newark, NJ 07102 |
|
| INVESTMENT ADVISER | | Prudential Investment
Management, Inc. | | Gateway Center Two
100 Mulberry Street
Newark, NJ 07102 |
|
| DISTRIBUTOR | | Prudential Investment
Management Services LLC | | Gateway Center Three
14th Floor
100 Mulberry Street
Newark, NJ 07102 |
|
| CUSTODIAN | | State Street Bank
and Trust Company | | One Heritage Drive
North Quincy, MA 02171 |
|
| TRANSFER AGENT | | Prudential Mutual Fund
Services LLC | | PO Box 8098
Philadelphia, PA 19101 |
|
| INDEPENDENT REGISTERED PUBLIC ACCOUNTING FIRM | | KPMG LLP | | 757 Third Avenue
New York, NY 10017 |
|
| FUND COUNSEL | | Sullivan & Cromwell LLP | | 125 Broad Street
New York, NY 10004 |
| | | | | | |
| MoneyMart Assets, Inc. |
| Share Class | | A | | Z | | |
| NASDAQ | | PBMXX | | PMZXX | | |
| CUSIP | | 60936A308 | | 60936A407 | | |
| | | | | | | |
|
An investor should consider the investment objectives, risks, and charges and expenses of the Fund carefully before investing. The prospectus for the Fund contains this and other information about the Fund. An investor may obtain a prospectus by visiting our website at www.jennisondryden.com or by calling (800) 225-1852. The prospectus should be read carefully before investing. |
|
| The views expressed in this report and information about the Fund’s portfolio holdings are for the period covered by this report and are subject to change thereafter. The accompanying financial statements as of June 30, 2004 were not audited, and accordingly, no auditor’s opinion is expressed on them. |
|
| |
E-DELIVERY To receive your mutual fund documents on-line, go to www.icsdelivery.com/prudential/funds and enroll. Instead of receiving printed documents by mail, you will receive notification via e-mail when new materials are available. You can cancel your enrollment or change your e-mail address at any time by clicking on the change/cancel enrollment option at the icsdelivery website address. |
Mutual Funds:
| | | | |
| ARE NOT INSURED BY THE FDIC OR ANY FEDERAL GOVERNMENT AGENCY | | MAY LOSE VALUE | | ARE NOT A DEPOSIT OF OR GUARANTEED BY ANY BANK OR ANY BANK AFFILIATE |
| | | | | | | | |
| MoneyMart Assets, Inc. |
| | | Share Class | | A | | Z | | |
| | | NASDAQ | | PBMXX | | PMZXX | | |
| | | CUSIP | | 60936A308 | | 60936A407 | | |
| | | | | | | | | |
MF108E2 IFS-A095196 Ed. 08/2004
Item 2 – Code of Ethics — Not required as this is not an annual filing.
Item 3 – Audit Committee Financial Expert – Not applicable with semi-annual filing
Item 4 – Principal Accountant Fees and Services – Not applicable with semi-annual filing.
Item 5 – Audit Committee of Listed Registrants – Not applicable.
Item 6 – Schedule of Investments – The schedule is included as part of the report to shareholders filed under Item 1 of this Form.
Item 7 – Disclosure of Proxy Voting Policies and Procedures for Closed-End Management Investment Companies – Not applicable.
Item 8 – Purchases of Equity Securities by Closed-End Management Investment Company and Affiliated Purchasers – Not applicable.
Item 9 – Submission of Matters to a Vote of Security Holders: None.
Item 10 – Controls and Procedures
| | (a) | It is the conclusion of the registrant’s principal executive officer and principal financial officer that the effectiveness of the registrant’s current disclosure controls and procedures (such disclosure controls and procedures having been evaluated within 90 days of the date of this filing) provide reasonable assurance that the information required to be disclosed by the registrant has been recorded, processed, summarized and reported within the time period specified in the Commission’s rules and forms and that the information required to be disclosed by the registrant has been accumulated and communicated to the registrant’s principal executive officer and principal financial officer in order to allow timely decisions regarding required disclosure. |
| | (b) | There have been no significant changes in the registrant’s internal controls or in other factors that could significantly affect these controls subsequent to the date of their evaluation, including any corrective actions with regard to significant deficiencies and material weaknesses. |
Item 11 – Exhibits
| | (a) | Code of Ethics – Not applicable with semi-annual filing. |
| | (b) | Certifications pursuant to Section 302 and 906 of the Sarbanes-Oxley Act – Attached hereto |
SIGNATURES
Pursuant to the requirements of the Securities Exchange Act of 1934 and the Investment Company Act of 1940, the registrant has duly caused this report to be signed on its behalf by the undersigned, thereunto duly authorized.
| | |
(Registrant) | | MoneyMart Assets, Inc. |
| |
By (Signature and Title)* | | /s/ Jonathan D. Shain
|
| | | Jonathan D. Shain Secretary |
| | | |
| |
Date August 20, 2004 | | |
Pursuant to the requirements of the Securities Exchange Act of 1934 and the Investment Company Act of 1940, this report has been signed below by the following persons on behalf of the registrant and in the capacities and on the dates indicated.
| | |
By (Signature and Title)* | | /s/ Judy A. Rice
|
| | | Judy A. Rice |
| | | President and Principal Executive Officer |
| |
Date August 20, 2004 | | |
| |
By (Signature and Title)* | | /s/ Grace C. Torres
|
| | | Grace C. Torres |
| | | Treasurer and Principal Financial Officer |
| |
Date August 20, 2004 | | |
| * | Print the name and title of each signing officer under his or her signature. |