UNITED STATES
SECURITIES AND EXCHANGE COMMISSION
Washington, D.C. 20549
FORM N-CSR
CERTIFIED SHAREHOLDER REPORT OF REGISTERED
MANAGEMENT INVESTMENT COMPANIES
| | |
| Investment Company Act file number: | | 811-02619 |
| |
| Exact name of registrant as specified in charter: | | Prudential MoneyMart Assets, Inc. |
| |
| Address of principal executive offices: | | Gateway Center 3, 100 Mulberry Street, Newark, New Jersey 07102 |
| |
| Name and address of agent for service: | | Deborah A. Docs Gateway Center 3, 100 Mulberry Street, Newark, New Jersey 07102 |
| |
| Registrant’s telephone number, including area code: | | 800-225-1852 |
| |
| Date of fiscal year end: | | 7/31/2013 |
| |
| Date of reporting period: | | 1/31/2013 |
Item 1 – Reports to Stockholders

PRUDENTIAL INVESTMENTS»MUTUAL FUNDS
PRUDENTIAL
MONEYMART ASSETS, INC.
SEMIANNUAL REPORT · JANUARY 31, 2013
Fund Type
Money Market
Objective
Maximum current income consistent with stability of capital and the maintenance of liquidity
This report is not authorized for distribution to prospective investors unless preceded or accompanied by a current prospectus.
The views expressed in this report and information about the Fund’s portfolio holdings are for the period covered by this report and are subject to change thereafter.
The accompanying financial statements as of January 31, 2013, were not audited and, accordingly, no auditor’s opinion is expressed on them.
Prudential Investments, Prudential, the Prudential logo, the Rock symbol and Bring Your Challenges are service marks of Prudential Financial, Inc. and its related entities, registered in many jurisdictions worldwide.

March 15, 2013
Dear Shareholder:
We hope you find the semiannual report for Prudential MoneyMart Assets, Inc. informative and useful. The report covers performance for the six-month period that ended January 31, 2013.
We recognize that ongoing market volatility may make it a difficult time to be an investor. We continue to believe a prudent response to uncertainty is to maintain a diversified portfolio of funds consistent with your tolerance for risk, time horizon, and financial goals.
Your financial advisor can help you create a diversified investment plan that may include funds covering all the basic asset classes and that reflects your personal investor profile and risk tolerance. Keep in mind, however, that diversification and asset allocation strategies do not assure a profit or protect against loss in declining markets.
Prudential Investments® is dedicated to helping you solve your toughest investment challenges—whether it’s capital growth, reliable income, or protection from market volatility and other risks. We offer the expertise of Prudential Financial’s affiliated asset managers* that strive to be leaders in a broad range of funds to help you stay on course to the future you envision. They also manage money for major corporations and pension funds around the world, which means you benefit from the same expertise, innovation, and attention to risk demanded by today’s most sophisticated investors.
Thank you for choosing the Prudential Investments family of funds.
Sincerely,

Stuart S. Parker, President
Prudential MoneyMart Assets, Inc.
*Most of Prudential Investments’ equity funds are advised by Jennison Associates LLC, Quantitative Management Associates LLC (QMA), or Prudential Real Estate Investors. Prudential Investments’ fixed income and money market funds are advised by Prudential Investment Management, Inc. (PIM) through its Prudential Fixed Income unit. Jennison Associates, QMA, and PIM are registered investment advisers and Prudential Financial companies. Prudential Real Estate Investors is a unit of PIM.
| | | | |
| Prudential MoneyMart Assets, Inc. | | | 1 | |
Your Fund’s Performance
Yields will fluctuate from time to time, and past performance does not guarantee future results. Current performance may be lower or higher than the past performance data quoted. Although the Fund seeks to preserve the value of your investment at $1 per share, it is possible to lose money by investing in the Fund. For the most recent month-end performance update, call (800) 225-1852. Gross operating expenses: Class A, 0.62%; Class B, 0.49%; Class C, 0.49%; Class X, 1.49%; and Class Z, 0.49%. Net operating expenses: Class A, 0.21%; Class B, 0.21%; Class C, 0.21%; Class X, 0.21%; and Class Z, 0.21%, after a voluntary waiver of distribution and service (12b-1) fees of Class A and Class X shares, and of management fees of the Fund.
| | | | | | | | | | | | | | | | |
Fund Facts as of 1/31/13 | | | | | | | | | | | | | |
| | | 7-Day
Current Yield | | | Net Asset
Value (NAV) | | | Weighted Avg.
Maturity (WAM) | | | Net Assets
(Millions) | |
Class A | | | 0.01 | % | | $ | 1.00 | | | | 42 Days | | | $ | 508.6 | |
Class B* | | | 0.01 | | | | 1.00 | | | | 42 Days | | | | 32.7 | |
Class C* | | | 0.01 | | | | 1.00 | | | | 42 Days | | | | 15.9 | |
Class X | | | 0.01 | | | | 1.00 | | | | 42 Days | | | | 0.5 | |
Class Z* | | | 0.01 | | | | 1.00 | | | | 42 Days | | | | 107.7 | |
iMoneyNet, Inc. Prime Retail Avg.** | | | 0.01 | | | | N/A | | | | 48 Days | | | | N/A | |
*Class B, Class C, and Class Z shares are not subject to distribution and service (12b-1) fees. The Fund’s manager has voluntarily waived all or a portion of the management fee it is entitled to receive from the Fund in order to maintain a zero or positive net yield for the Fund. This voluntary waiver may be terminated at any time without prior notice. Without the waiver, the Fund’s 7-day yield would have been negative.
**iMoneyNet, Inc. regularly reports a 7-day current yield and WAM on Tuesdays. This is based on the data of all funds in the iMoneyNet, Inc. Prime Retail Average category as of January 29, 2013.
| | |
| 2 | | Visit our website at www.prudentialfunds.com |
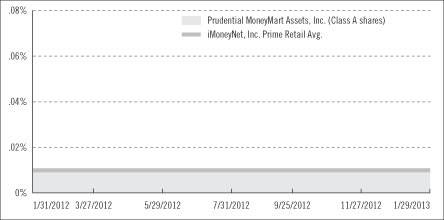
Money Market Fund Yield Comparison
Weighted Average Maturity (WAM) Comparison
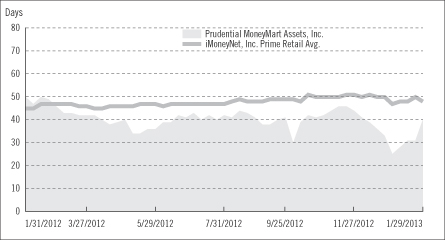
The graphs portray weekly 7-day current yields and weekly WAMs for Prudential MoneyMart Assets, Inc. (Class A shares—yields only) and the iMoneyNet, Inc. Prime Retail Average every Tuesday from January 31, 2012 to January 29, 2013, the closest dates prior to the beginning and end of the Fund’s reporting period. Note: iMoneyNet, Inc. regularly reports a 7-day current yield and WAM on Tuesdays. As a result, the data portrayed for the Fund at the end of the reporting period in the graphs may not match the data portrayed in the Fund Facts table as of January 29, 2013.
| | | | |
| Prudential MoneyMart Assets, Inc. | | | 3 | |
Your Fund’s Performance (continued)
An investment in the Fund is not insured or guaranteed by the Federal Deposit Insurance Corporation or any other government agency. Although the Fund seeks to preserve the value of your investment at $1 per share, it is possible to lose money by investing in the Fund.
| | |
| 4 | | Visit our website at www.prudentialfunds.com |
Fees and Expenses (Unaudited)
As a shareholder of the Fund, you incur two types of costs: (1) transaction costs, including sales charges (loads) on purchase payments and redemptions, as applicable, and (2) ongoing costs, including management fees, distribution and/or service (12b-1) fees, and other Fund expenses, as applicable. This example is intended to help you understand your ongoing costs (in dollars) of investing in the Fund and to compare these costs with the ongoing costs of investing in other mutual funds.
The example is based on an investment of $1,000 invested on August 1, 2012, at the beginning of the period, and held through the six-month period ended January 31, 2013. The example is for illustrative purposes only; you should consult the Prospectus for information on initial and subsequent minimum investment requirements.
The Fund’s transfer agent may charge additional fees to holders of certain accounts that are not included in the expenses shown in the table on the following page. These fees apply to individual retirement accounts (IRAs) and Section 403(b) accounts. As of the close of the six-month period covered by the table, IRA fees included an annual maintenance fee of $15 per account (subject to a maximum annual maintenance fee of $25 for all accounts held by the same shareholder). Section 403(b) accounts are charged an annual $25 fiduciary maintenance fee. Some of the fees may vary in amount, or may be waived, based on your total account balance or the number of Prudential Investments Funds, including the Fund, that you own. You should consider the additional fees that were charged to your Fund account over the six-month period when you estimate the total ongoing expenses paid over the period and the impact of these fees on your ending account value, as these additional expenses are not reflected in the information provided in the expense table. Additional fees have the effect of reducing investment returns.
Actual Expenses
The first line for each share class in the table on the following page provides information about actual account values and actual expenses. You may use the information on this line, together with the amount you invested, to estimate the expenses that you paid over the period. Simply divide your account value by $1,000 (for example, an $8,600 account value ÷ $1,000 = 8.6), then multiply the result by the number on the first line under the heading “Expenses Paid During the Six-Month Period” to estimate the expenses you paid on your account during this period.
Hypothetical Example for Comparison Purposes
The second line for each share class in the table on the following page provides information about hypothetical account values and hypothetical expenses based on the Fund’s actual expense ratio and an assumed rate of return of 5% per year before
| | | | |
| Prudential MoneyMart Assets, Inc. | | | 5 | |
Fees and Expenses (continued)
expenses, which is not the Fund’s actual return. The hypothetical account values and expenses may not be used to estimate the actual ending account balance or expenses you paid for the period. You may use this information to compare the ongoing costs of investing in the Fund and other funds. To do so, compare this 5% hypothetical example with the 5% hypothetical examples that appear in the shareholder reports of the other funds.
Please note that the expenses shown in the table are meant to highlight your ongoing costs only and do not reflect any transactional costs such as sales charges (loads). Therefore, the second line for each share class in the table is useful in comparing ongoing costs only and will not help you determine the relative total costs of owning different funds. In addition, if these transactional costs were included, your costs would have been higher.
| | | | | | | | | | | | | | | | | | |
Prudential MoneyMart
Assets, Inc. | | Beginning Account
Value
August 1, 2012 | | | Ending Account
Value
January 31, 2013 | | | Annualized
Expense Ratio | | | Expenses Paid
During the
Six-Month Period* | |
| | | | | | | | | | | | | | | | | | |
| Class A | | Actual | | $ | 1,000.00 | | | $ | 1,000.10 | | | | 0.21 | % | | $ | 1.06 | |
| | | Hypothetical | | $ | 1,000.00 | | | $ | 1,024.15 | | | | 0.21 | % | | $ | 1.07 | |
| | | | | | | | | | | | | | | | | | |
| Class B | | Actual | | $ | 1,000.00 | | | $ | 1,000.10 | | | | 0.21 | % | | $ | 1.06 | |
| | | Hypothetical | | $ | 1,000.00 | | | $ | 1,024.15 | | | | 0.21 | % | | $ | 1.07 | |
| | | | | | | | | | | | | | | | | | |
| Class C | | Actual | | $ | 1,000.00 | | | $ | 1,000.10 | | | | 0.21 | % | | $ | 1.06 | |
| | | Hypothetical | | $ | 1,000.00 | | | $ | 1,024.15 | | | | 0.21 | % | | $ | 1.07 | |
| | | | | | | | | | | | | | | | | | |
| Class X | | Actual | | $ | 1,000.00 | | | $ | 1,000.10 | | | | 0.21 | % | | $ | 1.06 | |
| | | Hypothetical | | $ | 1,000.00 | | | $ | 1,024.15 | | | | 0.21 | % | | $ | 1.07 | |
| | | | | | | | | | | | | | | | | | |
| Class Z | | Actual | | $ | 1,000.00 | | | $ | 1,000.10 | | | | 0.21 | % | | $ | 1.06 | |
| | | Hypothetical | | $ | 1,000.00 | | | $ | 1,024.15 | | | | 0.21 | % | | $ | 1.07 | |
*Fund expenses (net of fee waivers or subsidies, if any) for each share class are equal to the annualized expense ratio for each share class (provided in the table), multiplied by the average account value over the period, multiplied by the 184 days in the six-month period ended January 31, 2013, and divided by the 365 days in the Fund’s fiscal year ending July 31, 2013 (to reflect the six-month period). Expenses presented in the table include the expenses of any underlying funds in which the Fund may invest.
| | |
| 6 | | Visit our website at www.prudentialfunds.com |
Portfolio of Investments
as of January 31, 2013 (Unaudited)
| | | | | | | | |
Principal
Amount (000) | | | Description | | Value (Note 1) | |
| Certificate of Deposit 15.0% | | | | |
| $ | 5,000 | | | Bank of Montreal
0.200%, 03/11/13 | | $ | 5,000,000 | |
| | 1,000 | | | Bank of Montreal (Chicago Branch)
0.800%, 09/23/13(a) | | | 1,003,418 | |
| | 4,000 | | | Bank of Nova Scotia Houston
0.336%, 10/16/13(a) | | | 4,000,310 | |
| | 3,000 | | | 0.521%, 11/18/13(a) | | | 3,005,089 | |
| | 800 | | | 0.658%, 09/17/13(a) | | | 801,532 | |
| | 1,000 | | | 0.810%, 02/10/14(a) | | | 1,004,617 | |
| | 4,000 | | | 0.851%, 01/27/14(a) | | | 4,020,188 | |
| | 5,000 | | | Bank of Tokyo-Mitsubishi UFJ Ltd.
0.190%, 02/19/13 | | | 5,000,000 | |
| | 6,000 | | | BNP Paribas SA (NY Branch)
0.220%, 02/13/13 | | | 6,000,000 | |
| | 3,300 | | | Branch Banking and Trust Co.
0.340%, 03/28/13 | | | 3,300,604 | |
| | 4,000 | | | Chase Bank USA NA
0.220%, 03/06/13 | | | 4,000,000 | |
| | 1,000 | | | Credit Suisse (NY Branch)
0.801%, 07/25/13(a) | | | 1,000,000 | |
| | 5,000 | | | Deutsche Bank AG
0.250%, 04/15/13 | | | 5,000,000 | |
| | 1,000 | | | DNB Bank ASA
0.220%, 04/08/13 | | | 1,000,000 | |
| | 5,000 | | | 0.230%, 04/05/13 | | | 5,000,000 | |
| | 2,000 | | | DNB Bank ASA (NY Branch)
0.230%, 03/07/13 | | | 1,999,981 | |
| | 5,000 | | | Nordea Bank Finland PLC
0.240%, 02/05/13 | | | 5,000,000 | |
| | 4,000 | | | Norinchukin Bank (NY Branch)
0.180%, 02/11/13 | | | 4,000,000 | |
| | 5,000 | | | Rabobank Nederland (NY Branch)
0.463%, 05/02/13(a) | | | 4,999,938 | |
| | 1,000 | | | Royal Bank of Canada
0.370%, 01/25/14(a) | | | 1,000,000 | |
| | 6,000 | | | Royal Bank of Canada (NY Branch)
0.355%, 07/11/13(a) | | | 6,000,000 | |
| | 2,800 | | | Skandinaviska Enskilda Banken AB
0.560%, 02/25/13 | | | 2,800,615 | |
| | 6,000 | | | Societe Generale
0.250%, 02/05/13 | | | 6,000,000 | |
See Notes to Financial Statements.
| | | | |
| Prudential MoneyMart Assets, Inc. | | | 7 | |
Portfolio of Investments
as of January 31, 2013 (Unaudited) continued
| | | | | | | | |
Principal
Amount (000) | | | Description | | Value (Note 1) | |
| Certificate of Deposit (cont’d.) | | | | |
| $ | 4,000 | | | State Street Bank & Trust Co.
0.190%, 04/09/13 | | $ | 4,000,000 | |
| | 3,000 | | | Sumitomo Mitsui Banking Corp.
0.260%, 03/12/13 | | | 3,000,000 | |
| | 5,000 | | | Svenska Handelsbanken AB
0.215%, 04/25/13 | | | 5,000,057 | |
| | 5,000 | | | Toronto Dominion Bank
0.301%, 07/26/13(a) | | | 5,000,000 | |
| | 2,200 | | | Westpac Banking Corp.
0.379%, 05/03/13(a) | | | 2,200,513 | |
| | | | | | | | |
| | | | | | | 100,136,862 | |
| | | | | | | | |
| |
| Commercial Paper 16.4% | | | | |
| | 1,000 | | | ABN AMRO Funding USA LLC, 144A
0.260%, 04/15/13(b) | | | 999,473 | |
| | 4,000 | | | 0.280%, 04/03/13(b) | | | 3,998,102 | |
| | 5,000 | | | BHP Billiton Finance (USA) Ltd., 144A
0.200%, 03/06/13(b) | | | 4,999,083 | |
| | 6,000 | | | Credit Agricole North America, Inc.
0.300%, 02/04/13(b) | | | 5,999,850 | |
| | 8,000 | | | Deutsche Bank Financial LLC
0.160%, 02/01/13(b) | | | 8,000,000 | |
| | 2,000 | | | DNB Bank ASA (Norway), 144A
0.382%, 01/22/14(a) | | | 2,000,000 | |
| | 3,000 | | | 0.459%, 09/20/13(a) | | | 3,000,000 | |
| | 4,000 | | | Electricite de France, 144A
0.270%, 04/23/13(b) | | | 3,997,570 | |
| | 1,000 | | | 0.300%, 04/05/13(b) | | | 999,475 | |
| | 6,000 | | | GDF Suez, 144A
0.250%, 05/06/13(b) | | | 5,996,084 | |
| | 5,000 | | | HSBC Bank PLC, 144A
0.350%, 01/31/14(b) | | | 5,000,000 | |
| | 3,000 | | | HSBC USA, Inc.
0.260%, 02/26/13(b) | | | 2,999,458 | |
| | 3,000 | | | ING (U.S.) Funding LLC
0.230%, 04/09/13(b) | | | 2,998,716 | |
| | 2,000 | | | 0.230%, 04/22/13(b) | | | 1,998,978 | |
| | 4,000 | | | International Bank Reconstruction & Development
0.150%, 02/05/13(b) | | | 3,999,933 | |
| | 6,000 | | | JPMorgan Chase & Co.
0.357%, 03/11/13(a) | | | 6,000,000 | |
See Notes to Financial Statements.
| | |
| 8 | | Visit our website at www.prudentialfunds.com |
| | | | | | | | |
Principal
Amount (000) | | | Description | | Value (Note 1) | |
| Commercial Paper (cont’d.) | | | | |
| $ | 1,000 | | | Reckitt Benckiser Treasury Services PLC, 144A
0.200%, 03/11/13(b) | | $ | 999,789 | |
| | 3,000 | | | Skandinaviska Enskilda Banken AB, 144A
0.260%, 02/19/13(b) | | | 2,999,610 | |
| | 4,000 | | | State Street Corp.
0.200%, 03/05/13(b) | | | 3,999,289 | |
| | 11,000 | | | Straight-A Funding LLC, 144A
0.190%, 04/08/13(b) | | | 10,996,168 | |
| | 2,000 | | | 0.190%, 04/11/13(b) | | | 1,999,272 | |
| | 2,000 | | | 0.190%, 04/16/13(b) | | | 1,999,219 | |
| | 4,000 | | | Sumitomo Mitsui Trust Bank Ltd., 144A
0.180%, 02/22/13(b) | | | 3,999,580 | |
| | 2,000 | | | Svenska Handelsbanken, Inc., 144A
0.230%, 05/02/13(b) | | | 1,998,850 | |
| | 2,000 | | | Swedbank AB
0.250%, 05/08/13(b) | | | 1,998,667 | |
| | 3,000 | | | 0.275%, 02/26/13(b) | | | 2,999,427 | |
| | 6,000 | | | Toyota Motor Credit Corp.
0.180%, 04/30/13(b) | | | 5,997,360 | |
| | 6,000 | | | U.S. Bank National Association
0.150%, 02/26/13 | | | 6,000,000 | |
| | | | | | | | |
| | | | | | | 108,973,953 | |
| | | | | | | | |
| |
| Other Corporate Obligations 7.3% | | | | |
| | 2,000 | | | Australia & New Zealand Banking Group Ltd., 144A, MTN
0.980%, 09/24/13(a) | | | 2,009,180 | |
| | 2,455 | | | General Electric Capital Corp., MTN
0.811%, 02/06/14(a) | | | 2,466,975 | |
| | 4,000 | | | General Electric Capital Corp.
1.155%, 01/07/14(a) | | | 4,032,076 | |
| | 7,730 | | | HSBC Bank PLC, 144A
1.103%, 01/17/14(a) | | | 7,782,952 | |
| | 1,000 | | | John Deere Capital Corp.
0.454%, 07/15/13(a) | | | 1,000,769 | |
| | 3,850 | | | JPMorgan Chase & Co.
4.750%, 05/01/13 | | | 3,892,981 | |
| | 2,000 | | | Metlife Institutional Funding II, 144A
0.375%, 01/10/14(a) | | | 2,000,000 | |
| | 7,000 | | | 0.556%, 04/03/13(a) | | | 7,000,000 | |
| | 3,000 | | | Metropolitan Life Global Funding I, 144A
1.055%, 01/10/14(a) | | | 3,019,059 | |
See Notes to Financial Statements.
| | | | |
| Prudential MoneyMart Assets, Inc. | | | 9 | |
Portfolio of Investments
as of January 31, 2013 (Unaudited) continued
| | | | | | | | |
Principal
Amount (000) | | | Description | | Value (Note 1) | |
| Other Corporate Obligations (cont’d.) | | | | |
| $ | 3,000 | | | Total Capital Canada Ltd.
0.683%, 01/17/14(a) | | $ | 3,012,000 | |
| | 3,000 | | | Toyota Motor Credit Corp., MTN
0.311%, 12/09/13(a) | | | 3,000,000 | |
| | 2,500 | | | 0.456%, 04/03/13(a) | | | 2,500,000 | |
| | 2,000 | | | Wachovia Corp., MTN
2.083%, 05/01/13(a) | | | 2,008,371 | |
| | 5,000 | | | Westpac Banking Corp., 144A, MTN
0.730%, 06/14/13(a) | | | 5,007,369 | |
| | | | | | | | |
| | | | | | | 48,731,732 | |
| | | | | | | | |
| |
| Time Deposits 2.5% | | | | |
| | 7,000 | | | Australia & New Zealand Banking Group Ltd.
0.160%, 02/07/13 | | | 7,000,000 | |
| | 10,000 | | | U.S. Bank National Association
0.150%, 02/01/13 | | | 10,000,000 | |
| | | | | | | | |
| | | | | | | 17,000,000 | |
| | | | | | | | |
| |
| U.S. Government Agency Obligations 30.7% | | | | |
| | 3,000 | | | Federal Farm Credit Bank
0.145%, 09/19/13(a) | | | 2,999,809 | |
| | 4,000 | | | Federal Home Loan Bank
0.090%, 12/11/13(a) | | | 3,995,727 | |
| | 4,000 | | | 0.100%, 05/02/13(b) | | | 3,999,000 | |
| | 1,000 | | | 0.100%, 08/13/13(a) | | | 999,762 | |
| | 2,000 | | | 0.105%, 04/04/13(a) | | | 1,999,831 | |
| | 5,000 | | | 0.120%, 02/08/13(b) | | | 4,999,883 | |
| | 2,000 | | | 0.120%, 02/26/13(b) | | | 1,999,833 | |
| | 3,000 | | | 0.120%, 04/02/13(b) | | | 2,999,400 | |
| | 10,000 | | | 0.126%, 03/01/13(b) | | | 9,999,020 | |
| | 7,000 | | | 0.129%, 09/19/13(a) | | | 6,998,829 | |
| | 7,000 | | | 0.139%, 02/06/13(b) | | | 6,999,865 | |
| | 4,000 | | | 0.140%, 02/15/13(b) | | | 3,999,782 | |
| | 2,000 | | | 0.150%, 02/20/13(b) | | | 1,999,842 | |
| | 5,000 | | | 0.150%, 09/27/13 | | | 4,999,942 | |
| | 4,000 | | | 0.154%, 11/26/13(a) | | | 3,999,342 | |
| | 3,000 | | | 0.160%, 02/08/13 | | | 2,999,969 | |
| | 3,000 | | | 0.169%, 11/13/13(a) | | | 3,000,000 | |
| | 4,000 | | | 0.174%, 11/26/13(a) | | | 4,000,000 | |
| | 4,000 | | | 0.181%, 04/25/13(a) | | | 4,000,000 | |
| | 1,025 | | | 0.230%, 04/05/13 | | | 1,025,139 | |
See Notes to Financial Statements.
| | |
| 10 | | Visit our website at www.prudentialfunds.com |
| | | | | | | | |
Principal
Amount (000) | | | Description | | Value (Note 1) | |
| U.S. Government Agency Obligations (cont’d.) | | | | |
| $ | 2,000 | | | Federal Home Loan Mortgage Corp.
0.100%, 04/09/13(b) | | $ | 1,999,628 | |
| | 5,000 | | | 0.100%, 07/01/13(b) | | | 4,997,917 | |
| | 3,000 | | | 0.130%, 02/11/13(b) | | | 2,999,892 | |
| | 4,000 | | | 0.130%, 02/12/13(b) | | | 3,999,841 | |
| | 4,000 | | | 0.140%, 02/20/13(b) | | | 3,999,704 | |
| | 19,000 | | | 0.146%, 09/13/13(a) | | | 18,997,111 | |
| | 3,000 | | | 0.150%, 02/04/13(b) | | | 2,999,962 | |
| | 3,000 | | | 0.150%, 02/19/13(b) | | | 2,999,775 | |
| | 4,000 | | | 0.150%, 02/26/13(b) | | | 3,999,583 | |
| | 2,000 | | | 0.150%, 03/19/13(b) | | | 1,999,617 | |
| | 10,000 | | | 0.150%, 03/26/13(b) | | | 9,997,792 | |
| | 4,000 | | | 0.150%, 04/02/13(b) | | | 3,999,000 | |
| | 2,000 | | | 0.156%, 06/17/13(a) | | | 2,000,008 | |
| | 1,000 | | | 0.158%, 05/06/13(a) | | | 999,949 | |
| | 1,000 | | | 0.159%, 06/03/13(a) | | | 1,000,002 | |
| | 3,000 | | | 0.160%, 04/16/13(b) | | | 2,999,013 | |
| | 7,000 | | | 0.160%, 04/18/13(b) | | | 6,997,635 | |
| | 3,000 | | | 0.162%, 06/25/13(b) | | | 2,998,080 | |
| | 7,000 | | | Federal National Mortgage Association
0.101%, 07/01/13(b) | | | 6,997,083 | |
| | 8,000 | | | 0.135%, 02/19/13(b) | | | 7,999,460 | |
| | 3,000 | | | 0.150%, 02/13/13(b) | | | 2,999,850 | |
| | 8,000 | | | 0.150%, 02/14/13(b) | | | 7,999,567 | |
| | 8,000 | | | 0.150%, 04/01/13(b) | | | 7,998,033 | |
| | 6,000 | | | 0.153%, 05/01/13(b) | | | 5,997,726 | |
| | 6,000 | | | 1.000%, 09/23/13 | | | 6,032,839 | |
| | | | | | | | |
| | | | | | | 204,024,042 | |
| | | | | | | | |
| |
| U.S. Government Treasury Securities 2.9% | | | | |
| | 10,000 | | | U.S. Treasury Bills
0.090%, 04/04/13(b) | | | 9,998,450 | |
| | 2,000 | | | 0.090%, 04/25/13(b) | | | 1,999,585 | |
| | 2,000 | | | 0.120%, 02/07/13(b) | | | 1,999,960 | |
| | 5,000 | | | U.S. Treasury Note
0.125%, 09/30/13 | | | 4,999,600 | |
| | | | | | | | |
| | | | | | | 18,997,595 | |
| | | | | | | | |
See Notes to Financial Statements.
| | | | |
| Prudential MoneyMart Assets, Inc. | | | 11 | |
Portfolio of Investments
as of January 31, 2013 (Unaudited) continued
| | | | | | | | |
Principal
Amount (000) | | | Description | | Value (Note 1) | |
| Repurchase Agreements(c) 25.9% | | | | |
| $ | 8,000 | | | BNP Paribas Securities Corp.
0.060%, dated 01/29/13, due 02/05/13, in the amount of $8,000,093 | | $ | 8,000,000 | |
| | 13,000 | | | BNP Paribas Securities Corp.
0.080%, dated 01/30/13, due 02/06/13, in the amount of $13,000,202 | | | 13,000,000 | |
| | 11,000 | | | BNP Paribas Securities Corp.
0.090%, dated 01/28/13, due 02/04/13, in the amount of $11,000,193 | | | 11,000,000 | |
| | 9,000 | | | Deutsche Bank Securities, Inc.
0.170%, dated 01/31/13, due 02/01/13, in the amount of $9,000,043 | | | 9,000,000 | |
| | 10,000 | | | Goldman Sachs & Co.
0.070%, dated 01/29/13, due 02/05/13, in the amount of $10,000,136 | | | 10,000,000 | |
| | 8,000 | | | Goldman Sachs & Co.
0.080%, dated 01/29/13, due 02/12/13, in the amount of $8,000,249(d) | | | 8,000,000 | |
| | 4,000 | | | Goldman Sachs & Co.
0.150%, dated 01/25/13, due 02/01/13, in the amount of $4,000,117 | | | 4,000,000 | |
| | 38,325 | | | HSBC Securities (USA), Inc.
0.160%, dated 01/31/13, due 02/01/13, in the amount of $38,325,170 | | | 38,325,000 | |
| | 4,000 | | | JPMorgan Securities, Inc.
0.180%, dated 01/03/13, due 02/04/13, in the amount of $4,000,640 | | | 4,000,000 | |
| | 13,000 | | | Merrill Lynch & Co., Inc.
0.160%, dated 01/25/13, due 02/26/13, in the amount of $13,001,849(d) | | | 13,000,000 | |
| | 5,000 | | | Merrill Lynch & Co., Inc.
0.160%, dated 01/30/13, due 03/01/13, in the amount of $5,000,667(d) | | | 5,000,000 | |
| | 8,000 | | | Morgan Stanley & Co., Inc.
0.080%, dated 01/30/13, due 02/06/13, in the amount of $8,000,124 | | | 8,000,000 | |
| | 8,000 | | | Morgan Stanley & Co., Inc.
0.150%, dated 01/25/13, due 02/01/13, in the amount of $8,000,233 | | | 8,000,000 | |
See Notes to Financial Statements.
| | |
| 12 | | Visit our website at www.prudentialfunds.com |
| | | | | | | | |
Principal
Amount (000) | | | Description | | Value (Note 1) | |
| Repurchase Agreements(c) (cont’d.) | | | | |
| $ | 25,000 | | | Morgan Stanley & Co., Inc.
0.170%, dated 01/31/13, due 02/01/13, in the amount of $25,000,118 | | $ | 25,000,000 | |
| | 8,000 | | | RBS Securities, Inc.
0.150%, dated 01/25/13, due 02/01/13, in the amount of $8,000,233 | | | 8,000,000 | |
| | | | | | | | |
| | | | | | | 172,325,000 | |
| | | | | | | | |
| | | | Total Investments 100.7%
(amortized cost $670,189,184)(e) | | | 670,189,184 | |
| | | | Liabilities in excess of other assets (0.7%) | | | (4,900,254 | ) |
| | | | | | | | |
| | | | Net Assets 100.0% | | $ | 665,288,930 | |
| | | | | | | | |
The following abbreviations are used in the portfolio descriptions:
144A—Security was purchased pursuant to Rule 144A under the Securities Act of 1933 and may not be resold subject to that rule except to qualified institutional buyers. Unless otherwise noted, 144A securities are deemed to be liquid.
FHLMC—Federal Home Loan Mortgage Corp.
FNMA—Federal National Mortgage Association
GNMA—Government National Mortgage Association
MTN—Medium Term Note
| (a) | Variable rate instrument. The interest rate shown reflects the rate in effect at January 31, 2013. |
| (b) | Rate quoted represents yield-to-maturity as of purchase date. |
| (c) | Repurchase agreements are collateralized by FNMA (coupon rates 2.500%-6.500%, maturity dates 02/01/18-01/01/43), FHLMC (coupon rates 2.500%-5.500%, maturity dates 02/01/20-01/01/43), and GNMA (coupon rates 2.500%-6.000%, maturity dates 06/20/27-01/15/43), with the aggregate value, including accrued interest, of $175,781,107. |
| (d) | Indicates a security that has been deemed illiquid. |
| (e) | The cost of securities for federal income tax purposes is substantially the same as for financial reporting purposes. |
Various inputs are used in determining the value of the Fund’s investments. These inputs are summarized in the three broad levels listed below.
Level 1—quoted prices generally in active markets for identical securities.
Level 2—other significant observable inputs including, but not limited to, quoted prices for similar securities, interest rates and yield curves, prepayment speeds, foreign currency exchange rates, and amortized cost.
See Notes to Financial Statements.
| | | | |
| Prudential MoneyMart Assets, Inc. | | | 13 | |
Portfolio of Investments
as of January 31, 2013 (Unaudited) continued
Level 3—significant unobservable inputs for securities valued in accordance with Board approved fair valuation procedures.
The following is a summary of the inputs used as of January 31, 2013 in valuing such portfolio securities:
| | | | | | | | | | | | |
| | | Level 1 | | | Level 2 | | | Level 3 | |
Investments in Securities | | | | | | | | | | | | |
Certificates of Deposit | | $ | — | | | $ | 100,136,862 | | | $ | — | |
Commercial Paper | | | — | | | | 108,973,953 | | | | — | |
Other Corporate Obligations | | | — | | | | 48,731,732 | | | | — | |
Time Deposits | | | — | | | | 17,000,000 | | | | — | |
U.S. Government Agency Obligations | | | — | | | | 204,024,042 | | | | — | |
U.S. Government Treasury Securities | | | — | | | | 18,997,595 | | | | — | |
Repurchase Agreements | | | — | | | | 172,325,000 | | | | — | |
| | | | | | | | | | | | |
Total | | $ | — | | | $ | 670,189,184 | | | $ | — | |
| | | | | | | | | | | | |
The industry classification of portfolio holdings and liabilities in excess of other assets shown as a percentage of net assets as of January 31, 2013 were as follows:
| | | | |
Commercial Banks | | | 32.1 | % |
U.S. Government Agency Obligations | | | 30.7 | |
Foreign Banks | | | 22.3 | |
Financial Services | | | 5.0 | |
Asset Backed Securities | | | 3.8 | |
U.S. Government Treasury Securities | | | 2.9 | |
Insurance | | | 1.8 | |
Energy | | | 1.3 | |
Electric | | | 0.7 | |
Capital Goods | | | 0.1 | |
| | | | |
| | | 100.7 | |
Liabilities in excess of other assets | | | (0.7 | ) |
| | | | |
| | | 100.0 | % |
| | | | |
See Notes to Financial Statements.
| | |
| 14 | | Visit our website at www.prudentialfunds.com |
PRUDENTIAL INVESTMENTS»MUTUAL FUNDS
FINANCIAL STATEMENTS
(UNAUDITED)
SEMIANNUAL REPORT · JANUARY 31, 2013
Prudential MoneyMart Assets, Inc.
Statement of Assets and Liabilities
as of January 31, 2013 (Unaudited)
| | | | |
Assets | | | | |
Investments, at amortized cost which approximates fair value: | | $ | 670,189,184 | |
Cash | | | 3,299 | |
Receivable for investments sold | | | 4,999,756 | |
Receivable for Fund shares sold | | | 4,182,166 | |
Interest receivable | | | 159,851 | |
Prepaid expenses | | | 7,210 | |
| | | | |
Total assets | | | 679,541,466 | |
| | | | |
| |
Liabilities | | | | |
Payable for investments purchased | | | 8,392,645 | |
Payable for Fund shares reacquired | | | 5,524,165 | |
Accrued expenses | | | 236,092 | |
Affiliated transfer agent fee payable | | | 83,643 | |
Management fee payable | | | 15,448 | |
Dividends payable | | | 543 | |
| | | | |
Total liabilities | | | 14,252,536 | |
| | | | |
| |
Net Assets | | $ | 665,288,930 | |
| | | | |
| | | | | |
Net assets were comprised of: | | | | |
Common stock, at par ($.001 par value; 20 billion shares authorized for issuance) | | $ | 665,271 | |
Paid-in capital in excess of par | | | 664,624,141 | |
| | | | |
| | | 665,289,412 | |
Distributions in excess of net investment income | | | (482 | ) |
| | | | |
Net assets, January 31, 2013 | | $ | 665,288,930 | |
| | | | |
See Notes to Financial Statements.
| | |
| 16 | | Visit our website at www.prudentialfunds.com |
| | | | |
Class A | | | | |
Net asset value, offering price and redemption price per share
($508,559,033 ÷ 508,545,320 shares of common stock issued and outstanding) | | $ | 1.00 | |
| | | | |
| |
Class B | | | | |
Net asset value, offering price and redemption price per share
($32,693,268 ÷ 32,690,913 shares of common stock issued and outstanding) | | $ | 1.00 | |
| | | | |
| |
Class C | | | | |
Net asset value, offering price and redemption price per share
($15,872,706 ÷ 15,871,989 shares of common stock issued and outstanding) | | $ | 1.00 | |
| | | | |
| |
Class X | | | | |
Net asset value, offering price and redemption price per share
($477,406 ÷ 477,363 shares of common stock issued and outstanding) | | $ | 1.00 | |
| | | | |
| |
Class Z | | | | |
Net asset value, offering price and redemption price per share
($107,686,517 ÷ 107,685,420 shares of common stock issued and outstanding) | | $ | 1.00 | |
| | | | |
See Notes to Financial Statements.
| | | | |
| Prudential MoneyMart Assets, Inc. | | | 17 | |
Statement of Operations
Six Months Ended January 31, 2013 (Unaudited)
| | | | |
Net Investment Income | | | | |
Income | | | | |
Interest | | $ | 773,832 | |
| | | | |
| |
Expenses | | | | |
Management fee | | | 1,086,307 | |
Distribution fee—Class A | | | 327,518 | |
Distribution fee—Class L | | | 1,102 | |
Distribution fee—Class X | | | 2,781 | |
Transfer agent’s fees and expenses (including affiliated expense of $161,000) (Note 3) | | | 393,000 | |
Custodian’s fees and expenses | | | 75,000 | |
Registration fees | | | 55,000 | |
Reports to shareholders | | | 46,000 | |
Legal fees and expenses | | | 14,000 | |
Directors’ fees | | | 12,000 | |
Audit fee | | | 11,000 | |
Insurance | | | 6,000 | |
Miscellaneous | | | 11,939 | |
| | | | |
Total expenses | | | 2,041,647 | |
| | | | |
Less: Management fee waiver (Note 2) | | | (970,894 | ) |
Distribution fee waiver Class A (Note 2) | | | (327,518 | ) |
Distribution fee waiver Class L (Note 2) | | | (1,102 | ) |
Distribution fee waiver Class X (Note 2) | | | (2,781 | ) |
| | | | |
Net expenses | | | 739,352 | |
| | | | |
Net investment income | | | 34,480 | |
| | | | |
| |
Realized Gain On Investments | | | | |
Net realized gain on Investment transactions | | | 3,610 | |
| | | | |
Net Increase In Net Assets Resulting From Operations | | $ | 38,090 | |
| | | | |
See Notes to Financial Statements.
| | |
| 18 | | Visit our website at www.prudentialfunds.com |
Statement of Changes in Net Assets
(Unaudited)
| | | | | | | | |
| | | Six Months Ended
January 31, 2013 | | | Year
Ended July 31, 2012 | |
Increase (Decrease) In Net Assets | | | | | | | | |
Operations | | | | | | | | |
Net investment income | | $ | 34,480 | | | $ | 121,904 | |
Net realized gain on investments | | | 3,610 | | | | 17,801 | |
| | | | | | | | |
Net increase in net assets resulting from operations | | | 38,090 | | | | 139,705 | |
| | | | | | | | |
| | |
Dividends to shareholders (Note 1) | | | | | | | | |
Class A | | | (28,925 | ) | | | (104,184 | ) |
Class B | | | (1,908 | ) | | | (7,520 | ) |
Class C | | | (920 | ) | | | (3,735 | ) |
Class L | | | (26 | ) | | | (652 | ) |
Class M | | | — | | | | (52 | ) |
Class X | | | (32 | ) | | | (173 | ) |
Class Z | | | (6,326 | ) | | | (22,703 | ) |
| | | | | | | | |
| | | (38,137 | ) | | | (139,019 | ) |
| | | | | | | | |
| | |
Fund share transactions (Note 4) (at $1.00 per share) | | | | | | | | |
Net proceeds from shares sold | | | 939,089,958 | | | | 1,232,913,987 | |
Net asset value of shares issued in reinvestment of dividends | | | 35,647 | | | | 133,918 | |
Cost of shares reacquired | | | (978,151,383 | ) | | | (1,317,852,533 | ) |
| | | | | | | | |
Net decrease in net assets from Fund share transactions | | | (39,025,778 | ) | | | (84,804,628 | ) |
| | | | | | | | |
Total decrease | | | (39,025,825 | ) | | | (84,803,942 | ) |
| | |
Net Assets: | | | | | | | | |
Beginning of period | | | 704,314,755 | | | | 789,118,697 | |
| | | | | | | | |
End of period | | $ | 665,288,930 | | | $ | 704,314,755 | |
| | | | | | | | |
See Notes to Financial Statements.
| | | | |
| Prudential MoneyMart Assets, Inc. | | | 19 | |
Notes to Financial Statements
(Unaudited)
Prudential MoneyMart Assets, Inc. (the “Fund”) is registered under the Investment Company Act of 1940, as amended (“1940 Act”), as a diversified, open-end management investment company. The investment objective of the Fund is maximum current income consistent with stability of capital and the maintenance of liquidity.
Note 1. Accounting Policies
The following is a summary of significant accounting policies followed by the Fund in the preparation of the financial statements.
Securities Valuation: The Fund holds portfolio securities and other assets that are fair valued at the close of each day the New York Stock Exchange (“NYSE”) is open for trading. Fair value is the price that would be received to sell an asset or paid to transfer a liability in an orderly transaction between market participants on the measurement date. The Board of Trustees (the “Board”) has delegated fair valuation responsibilities to Prudential Investments LLC (“PI” or “Manager”) through the adoption of Valuation Procedures for valuation of the Fund’s. Under the current Valuation Procedures, a Valuation Committee is established and responsible for supervising the valuation of portfolio securities and other assets. The Valuation Procedures allow the Fund to utilize independent pricing vendor services, quotations from market makers and other valuation methods in events when market quotations are not readily available or not representative of the fair value of the securities. A record of the Valuation Committee’s actions is subject to review, approval and ratification by the Board at its next regularly scheduled quarterly meeting.
Various inputs are used in determining the value of the Fund’s investments, which are summarized in the three broad level hierarchies based on any observable inputs used as described in the table following the Portfolio of Investments. The valuation methodologies and significant inputs used in determining the fair value of securities and other assets classified as Level 1, Level 2 and Level 3 of the hierarchy are as follows:
Common stocks, exchange-traded funds and financial derivative instruments (including futures contracts and certain options and swap contracts on securities), that are traded on a national securities exchange are valued at the last sale price as of the close of trading on the applicable exchange. Securities traded via NASDAQ are valued at the NASDAQ official closing price. To the extent these securities are valued at the last sale price or NASDAQ official closing price, they are classified as Level 1 of the fair value hierarchy.
| | |
| 20 | | Visit our website at www.prudentialfunds.com |
In the event there is no sale or official closing price on such day, these securities are valued at the mean between the last reported bid and asked prices, or at the last bid price in absence of an asked price. These securities are classified as Level 2 of the fair value hierarchy as these inputs are considered as significant other observable inputs to the valuation.
For common stocks traded on foreign securities exchanges, certain valuation adjustments will be applied when events occur after the close of the security’s foreign market and before the Fund’s normal pricing time. These securities are valued using pricing vendor services that provide model prices derived using adjustment factors based on information such as local closing price, relevant general and sector indices, currency fluctuations, depositary receipts, and futures, as applicable. Securities valued using such model prices are classified as Level 2 of the fair value hierarchy as the adjustment factors are considered as significant other observable inputs to the valuation.
Investments in open-end, non-exchange-traded mutual funds are valued at their net asset values as of the close of the NYSE on the date of valuation. These securities are classified as Level 1 as they have the ability to be purchased or sold at their net asset values on the date of valuation.
Fixed income securities traded in the over-the-counter market, such as corporate bonds, municipal bonds, U.S. Government agencies issues and guaranteed obligations, U.S. Treasury obligations and sovereign issues are usually valued at prices provided by approved independent pricing vendors. The pricing vendors provide these prices usually after evaluating observable inputs including yield curves, credit rating, yield spreads, default rates, cash flows as well as broker/dealer quotations and reported trades. Securities valued using such vendor prices are classified as Level 2 of the fair value hierarchy.
Asset-backed and mortgage-related securities are usually valued by approved independent pricing vendors. The pricing vendors provide the prices using their internal pricing models with inputs from deal terms, tranche level attributes, yield curves, prepayment speeds, default rates and broker/dealer quotes. Securities valued using such vendor prices are classified as Level 2 of the fair value hierarchy.
Short-term debt securities of sufficient credit quality, which mature in sixty days or less, are valued using amortized cost method, which approximates fair value. The amortized cost method involves valuing a security at its cost on the date of purchase and thereafter assuming a constant amortization to maturity of the difference between the principal amount due at maturity and cost. These securities are categorized as Level 2 of the fair value hierarchy.
| | | | |
| Prudential MoneyMart Assets, Inc. | | | 21 | |
Notes to Financial Statements
(Unaudited) continued
Over-the-counter financial derivative instruments, such as option contracts, foreign currency contracts and swaps agreements, are usually valued using pricing vendor services, which derive the valuation based on underlying asset prices, indices, spreads, interest rates, exchange rates and other inputs. These instruments are categorized as Level 2 of the fair value hierarchy.
Securities and other assets that cannot be priced using the methods described above are valued with pricing methodologies approved by the Valuation Committee. In the event there are unobservable inputs used when determining such valuations, the securities will be classified as Level 3 of the fair value hierarchy.
When determining the fair value of securities, some of the factors influencing the valuation include: the nature of any restrictions on disposition of the securities; assessment of the general liquidity of the securities; the issuer’s financial condition and the markets in which it does business; the cost of the investment; the size of the holding and the capitalization of the issuer; the prices of any recent transactions or bids/offers for such securities or any comparable securities; any available analyst media or other reports or information deemed reliable by the investment adviser regarding the issuer or the markets or industry in which it operates. Using fair value to price securities may result in a value that is different from a security’s most recent closing price and from the price used by other mutual funds to calculate their net asset values.
Securities Transactions and Net Investment Income: Securities transactions are recorded on the trade date. Realized gains or losses from investment transactions on sales of securities are calculated on the identified cost basis. Interest income, including amortization of premium and accretion of discount on debt securities, as required, is recorded on the accrual basis. Expenses are recorded on the accrual basis which may require the use of certain estimates by management, that may differ from actual.
Net investment income or loss (other than distribution fees, which are charged directly to the respective class) and realized gains or losses are allocated daily to each class of shares based upon the relative proportion of adjusted net assets of each class at the beginning of the day.
Repurchase Agreements: In connection with transactions in repurchase agreements with United States financial institutions, it is the Fund’s policy that its custodian or
| | |
| 22 | | Visit our website at www.prudentialfunds.com |
designated subcustodians, as the case may be, under triparty repurchase agreements, take possession of the underlying collateral securities, the value of which exceeds the principal amount of the repurchase transaction, including accrued interest. To the extent that any repurchase transaction exceeds one business day, the value of the collateral is marked to market on a daily basis to ensure the adequacy of the collateral. If the seller defaults or the value of the collateral declines, or if bankruptcy proceedings are commenced with respect to the seller of the security, realization of the collateral by the Fund may by delayed or limited.
Loan Participations: The Fund may invest in loan participations. When the Fund purchases a loan participation, the Fund typically enters into a contractual relationship with the lender or third party selling such participations (“Selling Participant”), but not the borrower. As a result, the Fund assumes the credit risk of the borrower, the selling participant and any other persons interpositioned between the Fund and the borrower. The Fund may not directly benefit from the collateral supporting the senior loan in which it has purchased the loan participation.
Federal Income Taxes: It is the Fund’s policy to continue to meet the requirements of the Internal Revenue Code applicable to regulated investment companies and to distribute all of its taxable net investment income and capital gains, if any, to shareholders. Therefore, no federal income tax provision is required.
Dividends and Distributions: The Fund declares daily dividends from net investment income and net realized short-term capital gains or losses. Payment of dividends is made monthly. Dividends and distributions to shareholders, which are determined in accordance with federal income tax regulations and which may differ from generally accepted accounting principles are recorded on the ex-dividend date.
Restricted and Illiquid Securities: The Fund may hold up to 5% of its net assets in illiquid securities, including those which are restricted as to disposition under securities law (“restricted securities”). Restricted securities are valued pursuant to the valuation procedures noted above.
Estimates: The preparation of the financial statements requires management to make estimates and assumptions that affect the reported amounts and disclosures in the financial statements. Actual results could differ from these estimates.
Note 2. Agreements
The Fund has a management agreement with PI. Pursuant to this agreement, PI has responsibility for all investment advisory services and supervises the subadvisor’s
| | | | |
| Prudential MoneyMart Assets, Inc. | | | 23 | |
Notes to Financial Statements
(Unaudited) continued
performance of such services. PI has entered into a subadvisory agreement with Prudential Investment Management, Inc. (“PIM”). The subadvisory agreement provides that PIM will furnish investment advisory services in connection with the management of the Fund. In connection therewith, PIM is obligated to keep certain books and records of the Fund. PI pays for the services of PIM, the cost of compensation of officers of the Fund, occupancy and certain clerical and bookkeeping costs of the Fund. The Fund bears all other costs and expenses.
The management fee paid to PI is accrued daily and payable monthly, at an annual rate of .50% of the Fund’s average daily net assets up to $50 million and .30% of the Fund’s average daily net assets in excess of $50 million. The effective management fee rate was .03% of the average daily net assets for the six months ended January 31, 2013.
The Fund has a distribution agreement with Prudential Investment Management Services LLC (“PIMS”), which acts as the distributor of the Class A, Class B, Class C and Class Z shares of the Fund. The Fund also has a distribution agreement with Prudential Annuities Distributors, Inc. (“PAD”), along with PIMS, serves as co-distributor of the Fund’s Class L and Class X shares. The Fund compensates PIMS and PAD, as applicable, for distributing and servicing the Fund’s Class A, Class L and Class X shares, pursuant to plans of distribution (the “Class A, L and X Plans”), regardless of expenses actually incurred by PIMS or PAD. The distribution fees are accrued daily and payable monthly.
Pursuant to the Class A, L and X Plans, the Fund compensates PIMS and PAD, as applicable, for distribution related activities at an annual rate of up to .125%, ..50% and 1% of the average daily net assets of the Class A, L and X shares, respectively. No distribution or service fees are paid to PIMS as distributor of the Class B, Class C and Class Z shares of the Fund.
Effective December 1, 2011, in order to support the income yield, PIMS and PAD, as applicable, and PI have voluntarily undertaken to waive distribution and service (12b-1) fees of Class A, Class L and Class X shares and to waive/subsidize management fees of the Fund, respectively, such that the 1-day income yield (excluding capital gain or loss) does not fall below .01%. The income yield limit was set at .02% on March 1, 2010 and at .05% on September 1, 2009. The waivers/subsidies are voluntary and may be modified or terminated at any time. Pursuant to this undertaking, during the six
| | |
| 24 | | Visit our website at www.prudentialfunds.com |
months ended January 31, 2013, PIMS has waived $327,518, $1,102 and $2,781 of Class A’s, Class L’s and Class X’s distribution and service (12b-1) fees, respectively and PI has waived $970,894 of the Fund’s management fees. The Fund is not required to reimburse PIMS, PAD and PI for the amounts waived during the six months ended January 31, 2013.
PI, PIM, PIMS and PAD are indirect, wholly-owned subsidiaries of Prudential Financial, Inc. (“Prudential”).
Note 3. Other Transactions with Affiliates
Prudential Mutual Fund Services LLC (“PMFS”), an affiliate of PI and an indirect, wholly-owned subsidiary of Prudential, serves as the Fund’s transfer agent. Transfer agent’s fees and expenses in the Statement of Operations include certain out-of-pocket and sub-transfer agent expenses paid to non-affiliates, where applicable.
Note 4. Capital
The Fund offers Class A, Class B, Class C, Class X and Class Z shares. Class B, C and Z shares are not subject to any distribution and/or service fees and are offered exclusively for sale to a limited group of investors. Class X shares will automatically convert to Class A shares approximately ten years after purchase. The last conversion of Class M and Class L shares to Class A shares was completed as of April 13, 2012 and August 24, 2012, respectively. There are no Class M and Class L shares outstanding and Class M and Class L shares are no longer being offered for sale. Class X shares are not offered to new purchasers and are only available through exchange from the same class of shares offered by certain Prudential funds.
Under certain circumstances, an exchange may be made from specified share classes of the Fund to one or more other share classes of the Fund as presented in the table of transactions in shares of common stock.
There are 20 billion authorized shares of $.001 par value common stock divided into six classes, which consist of 11 billion Class A, 2.5 billion Class B, 2.5 billion Class C, 1 billion Class M, 1 billion Class X and 2 billion Class Z shares as of the six months ended January 31, 2013.
| | | | |
| Prudential MoneyMart Assets, Inc. | | | 25 | |
Notes to Financial Statements
(Unaudited) continued
Transactions in shares and dollars of common stock (at $1 net asset value per share) were as follows:
| | | | | | | | |
Class A | | Shares | | | Amount | |
Six months ended January 31, 2013: | | | | | | | | |
Shares sold | | | 907,016,695 | | | $ | 907,016,697 | |
Shares issued in reinvestment of dividends | | | 26,892 | | | | 26,892 | |
Shares reacquired | | | (932,672,625 | ) | | | (932,672,625 | ) |
| | | | | | | | |
Net increase (decrease) in shares outstanding before conversion | | | (25,629,038 | ) | | | (25,629,036 | ) |
Shares issued upon conversion from Class L and Class X | | | 3,519,204 | | | | 3,519,204 | |
| | | | | | | | |
Net increase (decrease) in shares outstanding | | | (22,109,834 | ) | | $ | (22,109,832 | ) |
| | | | | | | | |
Year ended July 31, 2012: | | | | | | | | |
Shares sold | | | 1,141,129,048 | | | $ | 1,141,129,107 | |
Shares issued in reinvestment of dividends | | | 100,272 | | | | 100,273 | |
Shares reacquired | | | (1,177,875,775 | ) | | | (1,177,875,775 | ) |
| | | | | | | | |
Net increase (decrease) in shares outstanding before conversion | | | (36,646,455 | ) | | | (36,646,395 | ) |
Shares issued upon conversion from Class M and Class X | | | 1,156,116 | | | | 1,156,116 | |
| | | | | | | | |
Net increase (decrease) in shares outstanding | | | (35,490,339 | ) | | $ | (35,490,279 | ) |
| | | | | | | | |
Class B | | | | | | |
Six months ended January 31, 2013: | | | | | | | | |
Shares sold | | | 3,324,917 | | | $ | 3,324,917 | |
Shares issued in reinvestment of dividends | | | 1,670 | | | | 1,670 | |
Shares reacquired | | | (5,823,426 | ) | | | (5,823,426 | ) |
| | | | | | | | |
Net increase (decrease) in shares outstanding | | | (2,496,839 | ) | | $ | (2,496,839 | ) |
| | | | | | | | |
Year ended July 31, 2012: | | | | | | | | |
Shares sold | | | 10,576,519 | | | $ | 10,576,519 | |
Shares issued in reinvestment of dividends | | | 6,906 | | | | 6,906 | |
Shares reacquired | | | (18,909,897 | ) | | | (18,909,897 | ) |
| | | | | | | | |
Net increase (decrease) in shares outstanding | | | (8,326,472 | ) | | $ | (8,326,472 | ) |
| | | | | | | | |
| | |
| 26 | | Visit our website at www.prudentialfunds.com |
| | | | | | | | |
Class C | | Shares | | | Amount | |
Six months ended January 31, 2013: | | | | | | | | |
Shares sold | | | 7,125,280 | | | $ | 7,125,281 | |
Shares issued in reinvestment of dividends | | | 799 | | | | 799 | |
Shares reacquired | | | (7,491,417 | ) | | | (7,491,417 | ) |
| | | | | | | | |
Net increase (decrease) in shares outstanding | | | (365,338 | ) | | $ | (365,337 | ) |
| | | | | | | | |
Year ended July 31, 2012: | | | | | | | | |
Shares sold | | | 19,793,563 | | | $ | 19,793,564 | |
Shares issued in reinvestment of dividends | | | 3,292 | | | | 3,292 | |
Shares reacquired | | | (23,589,595 | ) | | | (23,589,595 | ) |
| | | | | | | | |
Net increase (decrease) in shares outstanding | | | (3,792,740 | ) | | $ | (3,792,739 | ) |
| | | | | | | | |
Class L | | | | | | |
Period ended August 24, 2012*: | | | | | | | | |
Shares sold | | | 32,648 | | | $ | 32,648 | |
Shares reacquired | | | (41,886 | ) | | | (41,886 | ) |
| | | | | | | | |
Net increase (decrease) in shares outstanding before conversion | | | (9,238 | ) | | | (9,238 | ) |
Shares reacquired upon conversion into Class A | | | (3,365,498 | ) | | | (3,365,498 | ) |
| | | | | | | | |
Net increase (decrease) in shares outstanding | | | (3,374,736 | ) | | $ | (3,374,736 | ) |
| | | | | | | | |
Year ended July 31, 2012: | | | | | | | | |
Shares sold | | | 1,512,545 | | | $ | 1,512,545 | |
Shares issued in reinvestment of dividends | | | 559 | | | | 559 | |
Shares reacquired | | | (1,665,877 | ) | | | (1,665,879 | ) |
| | | | | | | | |
Net increase (decrease) in shares outstanding | | | (152,773 | ) | | $ | (152,775 | ) |
| | | | | | | | |
Class M | | | | | | |
Period ended April 13, 2012**: | | | | | | | | |
Shares sold | | | 84,214 | | | $ | 84,214 | |
Shares issued in reinvestment of dividends | | | 28 | | | | 28 | |
Shares reacquired | | | (93,781 | ) | | | (93,783 | ) |
| | | | | | | | |
Net increase (decrease) in shares outstanding before conversion | | | (9,539 | ) | | | (9,541 | ) |
Shares reacquired upon conversion into Class A | | | (768,106 | ) | | | (768,108 | ) |
| | | | | | | | |
Net increase (decrease) in shares outstanding | | | (777,645 | ) | | $ | (777,649 | ) |
| | | | | | | | |
| | | | |
| Prudential MoneyMart Assets, Inc. | | | 27 | |
Notes to Financial Statements
(Unaudited) continued
| | | | | | | | |
Class X | | Shares | | | Amount | |
Six months ended January 31, 2013: | | | | | | | | |
Shares sold | | | 103,176 | | | $ | 103,175 | |
Shares issued in reinvestment of dividends | | | 18 | | | | 18 | |
Shares reacquired | | | (129,713 | ) | | | (129,713 | ) |
| | | | | | | | |
Net increase (decrease) in shares outstanding before conversion | | | (26,519 | ) | | | (26,520 | ) |
Shares reacquired upon conversion into Class A | | | (153,706 | ) | | | (153,706 | ) |
| | | | | | | | |
Net increase (decrease) in shares outstanding | | | (180,225 | ) | | $ | (180,226 | ) |
| | | | | | | | |
Year ended July 31, 2012: | | | | | | | | |
Shares sold | | | 164,530 | | | $ | 164,530 | |
Shares issued in reinvestment of dividends | | | 134 | | | | 134 | |
Shares reacquired | | | (419,415 | ) | | | (419,414 | ) |
| | | | | | | | |
Net increase (decrease) in shares outstanding before conversion | | | (254,751 | ) | | | (254,750 | ) |
Shares reacquired upon conversion into Class A | | | (388,007 | ) | | | (388,008 | ) |
| | | | | | | | |
Net increase (decrease) in shares outstanding | | | (642,758 | ) | | $ | (642,758 | ) |
| | | | | | | | |
Class Z | | | | | | |
Six months ended January 31, 2013: | | | | | | | | |
Shares sold | | | 21,487,240 | | | $ | 21,487,240 | |
Shares issued in reinvestment of dividends | | | 6,268 | | | | 6,268 | |
Shares reacquired | | | (31,992,315 | ) | | | (31,992,316 | ) |
| | | | | | | | |
Net increase (decrease) in shares outstanding | | | (10,498,807 | ) | | $ | (10,498,808 | ) |
| | | | | | | | |
Year ended July 31, 2012: | | | | | | | | |
Shares sold | | | 59,653,508 | | | $ | 59,653,508 | |
Shares issued in reinvestment of dividends | | | 22,725 | | | | 22,726 | |
Shares reacquired | | | (95,298,190 | ) | | | (95,298,190 | ) |
| | | | | | | | |
Net increase (decrease) in shares outstanding | | | (35,621,957 | ) | | $ | (35,621,956 | ) |
| | | | | | | | |
| * | As of August 24, 2012, the last conversion of Class L shares to Class A shares was completed. There are no Class L shares outstanding and Class L shares are no longer being offered for sale. |
| ** | As of April 13, 2012, the last conversion of Class M shares to Class A shares was completed. There are no Class M shares outstanding and Class M shares are no longer being offered for sale. |
Note 5. Tax Information
Management has analyzed the Fund’s tax positions taken on federal income tax returns for all open tax years and has concluded that no provision for income tax is required in the Fund’s financial statements for the current reporting period. The Fund’s federal and state income and federal excise tax returns for tax years for which
| | |
| 28 | | Visit our website at www.prudentialfunds.com |
the applicable statutes of limitations have not expired are subject to examination by the Internal Revenue Service and state departments of revenue.
Note 6. New Accounting Pronouncements
In December 2011, the Financial Accounting Standards Board (“FASB”) issued Accounting Standards Update (“ASU”) No. 2011-11 regarding “Disclosures about Offsetting Assets and Liabilities”. The amendments, which will be effective for annual reporting periods beginning on or after January 1, 2013 and interim periods within those annual periods, require an entity to disclose information about offsetting and related arrangements for assets and liabilities, financial instruments and derivatives that are either currently offset in accordance with current requirements or are subject to enforceable master netting arrangements or similar agreements. At this time, management is evaluating the implications of ASU No. 2011-11 and its impact on the financial statements has not yet been determined.
| | | | |
| Prudential MoneyMart Assets, Inc. | | | 29 | |
Financial Highlights
(Unaudited)
| | | | | | | | | | | | | | | | | | | | | | | | | | |
| Class A Shares | |
| | | Six Months
Ended
January 31, | | | | | Year Ended July 31, | |
| | | 2013 | | | | | 2012 | | | 2011 | | | 2010 | | | 2009 | | | 2008 | |
| Per Share Operating Performance: | | | | | | | | | | | | | | | | | | | | | | | | | | |
| Net Asset Value, Beginning Of Period | | | $1.000 | | | | | | $1.000 | | | | $1.000 | | | | $1.000 | | | | $1.000 | | | | $1.000 | |
| Net investment income and net realized gain on investment transactions | | | - | (e) | | | | | - | (e) | | | - | (e) | | | - | (e) | | | .011 | | | | .037 | |
| Dividends to shareholders | | | - | (e) | | | | | - | (e) | | | - | (e) | | | - | (e) | | | (.011 | ) | | | (.037 | ) |
| Net asset value, end of period | | | $1.000 | | | | | | $1.000 | | | | $1.000 | | | | $1.000 | | | | $1.000 | | | | $1.000 | |
| Total Return(a): | | | .01% | | | | | | .02% | | | | .02% | | | | .05% | | | | 1.10% | | | | 3.79% | |
| | | | | |
| Ratios/Supplemental Data: | |
| Net assets, end of period (000) | | | $508,559 | | | | | | $530,669 | | | | $566,158 | | | | $606,100 | | | | $759,704 | | | | $752,350 | |
| Average net assets (000) | | | $519,763 | | | | | | $554,682 | | | | $571,572 | | | | $668,825 | | | | $783,488 | | | | $698,827 | |
| Ratios to average net assets(d): | | | | | | | | | | | | | | | | | | | | | | | | | | |
| Expenses, including distribution and service (12b-1) fees | | | .21% | (b)(f) | | | | | .18% | (b) | | | .22% | (b) | | | .31% | (b) | | | .55% | (b) | | | .54% | |
| Expenses, excluding distribution and service (12b-1) fees | | | .21% | (c)(f) | | | | | .18% | (c) | | | .22% | (c) | | | .31% | (c) | | | .43% | | | | .42% | |
| Net investment income | | | .01% | (b)(f) | | | | | .02% | (b) | | | .02% | (b) | | | .04% | (b) | | | 1.09% | (b) | | | 3.57% | |
(a) Total return is calculated assuming a purchase of a share on the first day and a sale on the last day of each period reported, and includes reinvestment of dividends and distributions. Total returns may reflect adjustments to conform to generally accepted accounting principles. Total returns for periods less than one full year are not annualized.
(b) Net of management fee and distribution and service (12b-1) fees waiver. If the investment manager had not waived expenses, the expense ratios including distribution and service (12b-1) fees would have been .62% for the six months ended January 31, 2013, .61%, .60%, .59% and .56% for the years ended July 31, 2012, July 31, 2011, July 31, 2010 and July 31, 2009, respectively. The net investment income (loss) ratios would have been (.39)% for the six months ended January 31, 2013, (.41)%, (.36)%, (.24)% and 1.08% for the years ended July 31, 2012, July 31, 2011, July 31, 2010 and July 31, 2009, respectively.
(c) Net of management fee waiver. If the investment manager had not waived management fees, the expense ratios excluding distribution and service (12b-1) fees would have been .49% for the six months ended January 31, 2013, .48%, .48% and .47% for the years ended July 31, 2012, July 31, 2011 and July 31, 2010, respectively.
(d) Includes .01% and .03% of the U.S. Treasury Money Market Fund Guarantee Program fee for the years ended July 31, 2010 and July 31, 2009, respectively.
(e) Less than $.0005 per share.
(f) Annualized.
See Notes to Financial Statements.
| | |
| 30 | | Visit our website at www.prudentialfunds.com |
| | | | | | | | | | | | | | | | | | | | | | | | | | |
| Class B Shares | |
| | | Six Months
Ended
January 31, | | | | | Year Ended July 31, | |
| | | 2013 | | | | | 2012 | | | 2011 | | | 2010 | | | 2009 | | | 2008 | |
| Per Share Operating Performance: | | | | | | | | | | | | | | | | | | | | | | | | | | |
| Net Asset Value, Beginning Of Period | | | $1.000 | | | | | | $1.000 | | | | $1.000 | | | | $1.000 | | | | $1.000 | | | | $1.000 | |
| Net investment income and net realized gain on investment transactions | | | - | (d) | | | | | - | (d) | | | - | (d) | | | .001 | | | | .012 | | | | .038 | |
| Dividends to shareholders | | | - | (d) | | | | | - | (d) | | | - | (d) | | | (.001 | ) | | | (.012 | ) | | | (.038 | ) |
| Net asset value, end of period | | | $1.000 | | | | | | $1.000 | | | | $1.000 | | | | $1.000 | | | | $1.000 | | | | $1.000 | |
| Total Return(a): | | | .01% | | | | | | .02% | | | | .02% | | | | .05% | | | | 1.22% | | | | 3.92% | |
| | | | | |
| Ratios/Supplemental Data: | | | | | | | | | | | | | | | | | | | | |
| Net assets, end of period (000) | | | $32,693 | | | | | | $35,190 | | | | $43,517 | | | | $52,720 | | | | $72,931 | | | | $69,590 | |
| Average net assets (000) | | | $34,195 | | | | | | $40,272 | | | | $45,662 | | | | $60,695 | | | | $78,763 | | | | $67,467 | |
| Ratios to average net assets(c): | | | | | | | | | | | | | | | | | | | | | | | | | | |
| Expenses, including distribution and service (12b-1) fees | | | .21% | (b)(e) | | | | | .18% | (b) | | | .22% | (b) | | | .31% | (b) | | | .43% | | | | .42% | |
| Expenses, excluding distribution and service (12b-1) fees | | | .21% | (b)(e) | | | | | .18% | (b) | | | .22% | (b) | | | .31% | (b) | | | .43% | | | | .42% | |
| Net investment income | | | .01% | (b)(e) | | | | | .02% | (b) | | | .02% | (b) | | | .05% | (b) | | | 1.20% | | | | 3.76% | |
(a) Total return is calculated assuming a purchase of a share on the first day and a sale on the last day of each period reported, and includes reinvestment of dividends and distributions. Total returns may reflect adjustments to conform to generally accepted accounting principles. Total returns for periods less than one full year are not annualized.
(b) Net of management fee waiver. If the investment manager had not waived management fees, the expense ratios including distribution and service (12b-1) fees would have been .49% for the six months ended January 31, 2013, .48%, .48% and .47% for the years ended July 31, 2012, July 31, 2011 and July 31, 2010, respectively. The expense ratios excluding distribution and service (12b-1) fees would have been .49% for the six months ended January 31, 2013, .48%, .48% and .47% for the years ended July 31, 2012, July 31, 2011 and July 31, 2010, respectively. The net investment loss ratios would have been (.27)% for the six months ended January 31, 2013, (.28)%, (.24)% and (.11)% for the years ended July 31, 2012, July 31, 2011 and July 31, 2010, respectively.
(c) Includes .01% and .03% of the U.S. Treasury Money Market Fund Guarantee Program fee for the years ended July 31, 2010 and July 31, 2009, respectively.
(d) Less than $.0005 per share.
(e) Annualized.
See Notes to Financial Statements.
| | | | |
| Prudential MoneyMart Assets, Inc. | | | 31 | |
Financial Highlights
(Unaudited) continued
| | | | | | | | | | | | | | | | | | | | | | | | | | |
| Class C Shares | |
| | | Six Months
Ended
January 31, | | | | | Year Ended July 31, | |
| | | 2013 | | | | | 2012 | | | 2011 | | | 2010 | | | 2009 | | | 2008 | |
| Per Share Operating Performance: | | | | | | | | | | | | | | | | | | | | | | | | | | |
| Net Asset Value, Beginning Of Period | | | $1.000 | | | | | | $1.000 | | | | $1.000 | | | | $1.000 | | | | $1.000 | | | | $1.000 | |
| Net investment income and net realized gain on investment transactions | | | - | (d) | | | | | - | (d) | | | - | (d) | | | .001 | | | | .012 | | | | .038 | |
| Dividends to shareholders | | | - | (d) | | | | | - | (d) | | | - | (d) | | | (.001 | ) | | | (.012 | ) | | | (.038 | ) |
| Net asset value, end of period | | | $1.000 | | | | | | $1.000 | | | | $1.000 | | | | $1.000 | | | | $1.000 | | | | $1.000 | |
| Total Return(a): | | | .01% | | | | | | .02% | | | | .02% | | | | .05% | | | | 1.22% | | | | 3.92% | |
| | | | | |
| Ratios/Supplemental Data: | | | | | | | | | | | | | | | | | | | | |
| Net assets, end of period (000) | | | $15,873 | | | | | | $16,238 | | | | $20,031 | | | | $20,125 | | | | $24,747 | | | | $21,353 | |
| Average net assets (000) | | | $16,440 | | | | | | $20,032 | | | | $17,071 | | | | $21,593 | | | | $27,653 | | | | $15,596 | |
| Ratios to average net assets(c): | | | | | | | | | | | | | | | | | | | | | | | | | | |
| Expenses, including distribution and service (12b-1) fees | | | .21% | (b)(e) | | | | | .18% | (b) | | | .22% | (b) | | | .31% | (b) | | | .43% | | | | .42% | |
| Expenses, excluding distribution and service (12b-1) fees | | | .21% | (b)(e) | | | | | .18% | (b) | | | .22% | (b) | | | .31% | (b) | | | .43% | | | | .42% | |
| Net investment income | | | .01% | (b)(e) | | | | | .02% | (b) | | | .02% | (b) | | | .05% | (b) | | | 1.16% | | | | 3.63% | |
(a) Total return is calculated assuming a purchase of a share on the first day and a sale on the last day of each period reported, and includes reinvestment of dividends and distributions. Total returns may reflect adjustments to conform to generally accepted accounting principles. Total returns for periods less than one full year are not annualized.
(b) Net of management fee waiver. If the investment manager had not waived management fees, the expense ratios including distribution and service (12b-1) fees would have been .49% for the six months ended January 31, 2013, .48%, .48% and .47% for the years ended July 31, 2012, July 31, 2011 and July 31, 2010, respectively. The expense ratios excluding distribution and service (12b-1) fees would have been .49% for the six months ended January 31, 2013, .48%, .48% and .47% for the years ended July 31, 2012, July 31, 2011 and July 31, 2010, respectively. The net investment loss ratios would have been (.27)% for the six months ended January 31, 2013, (.28)%, (.24)% and (.11)% for the years ended July 31, 2012, July 31, 2011 and July 31, 2010, respectively.
(c) Includes .01% and .03% of the U.S. Treasury Money Market Fund Guarantee Program fee for the years ended July 31, 2010 and July 31, 2009, respectively.
(d) Less than $.0005 per share.
(e) Annualized.
See Notes to Financial Statements.
| | |
| 32 | | Visit our website at www.prudentialfunds.com |
| | | | | | | | | | | | | | | | | | | | | | | | |
| Class L Shares | |
| | | Period
Ended
August 24, | | | | | Year Ended July 31, | | | | | October 27,
2008(a)
through July 31, | |
| | | 2012(h) | | | | | 2012 | | | 2011 | | | 2010 | | | | | 2009 | |
| Per Share Operating Performance: | | | | | | | | | | | | | | | | | | | | | | | | |
| Net Asset Value, Beginning Of Period | | | $1.000 | | | | | | $1.000 | | | | $1.000 | | | | $1.000 | | | | | | $1.000 | |
Net investment income and net realized
gain on investment transactions | | | - | (g) | | | | | - | (g) | | | - | (g) | | | - | (g) | | | | | .004 | |
| Dividends to shareholders | | | - | (g) | | | | | - | (g) | | | - | (g) | | | - | (g) | | | | | (.004 | ) |
| Net asset value, end of period | | | $1.000 | | | | | | $1.000 | | | | $1.000 | | | | $1.000 | | | | | | $1.000 | |
| Total Return(b): | | | .01% | | | | | | .02% | | | | .02% | | | | .05% | | | | | | .45% | |
| | | | |
| Ratios/Supplemental Data: | | | | | | | | | | | | | | | | | | | |
| Net assets, end of period (000) | | | $3,366 | | | | | | $3,375 | | | | $3,528 | | | | $4,438 | | | | | | $6,255 | |
| Average net assets (000) | | | $3,361 | | | | | | $3,462 | | | | $3,975 | | | | $5,421 | | | | | | $5,397 | |
| Ratios to average net assets(f): | | | | | | | | | | | | | | | | | | | | | | | | |
| Expenses, including distribution and service (12b-1) fees | | | .21% | (c)(d) | | | | | .18% | (d) | | | .22% | (d) | | | .32% | (d) | | | | | .68% | (c)(d) |
| Expenses, excluding distribution and service (12b-1) fees | | | .21% | (c)(e) | | | | | .18% | (e) | | | .22% | (e) | | | .31% | (e) | | | | | .43% | (c) |
| Net investment income | | | .01% | (c)(d) | | | | | .02% | (d) | | | .02% | (d) | | | .04% | (d) | | | | | .33% | (c)(d) |
(a) Commencement of offering.
(b) Total return is calculated assuming a purchase of a share on the first day and a sale on the last day of each period reported, and includes reinvestment of dividends and distributions. Total returns may reflect adjustments to conform to generally accepted accounting principles. Total returns for periods less than one full year are not annualized.
(c) Annualized.
(d) Net of management fee and distribution and service (12b-1) fees waiver. If the investment manager had not waived expenses, the expense ratios including distribution and service (12b-1) fees would have been .99% for the period ended August 24, 2012, .98%, .98% and .97% for the years ended July 31, 2012, July 31, 2011 and July 31, 2010, respectively and .93% for the period ended July 31, 2009. The net investment income (loss) ratios would have been (.76)% for the period ended August 24, 2012, (.78)%, (.74)% and (.61)% for the years ended July 31, 2012, July 31, 2011 and July 31, 2010, respectively and .08% for the period ended July 31, 2009.
(e) Net of management fee waiver. If the investment manager had not waived management fees, the expense ratios excluding distribution and service (12b-1) fees would have been .49% for the period ended August 24, 2012, .48%, .48% and .47% for the years ended July 31, 2012, July 31, 2011 and July 31, 2010, respectively.
(f) Includes .01% and .03% of the U.S. Treasury Money Market Fund Guarantee Program fee for the year ended July 31, 2010 and the period ended July 31, 2009, respectively.
(g) Less than $.0005 per share.
(h) As of August 24, 2012, the last conversion of Class L shares to Class A shares was completed. There are no Class L shares outstanding and Class L shares are no longer being offered for sale.
See Notes to Financial Statements.
| | | | |
| Prudential MoneyMart Assets, Inc. | | | 33 | |
Financial Highlights
(Unaudited) continued
| | | | | | | | | | | | | | | | | | | | |
| Class M Shares | | | | | | | | | | | | | | | | |
| | | Period
Ended
April 13, | | | | | Year Ended July 31, | | | | | October 27, 2008(a) through July 31, | |
| | | 2012(h) | | | | | 2011 | | | 2010 | | | | | 2009 | |
| Per Share Operating Performance: | | | | | | | | | | | | | | | | | | | | |
| Net Asset Value, Beginning Of Period | | | $1.000 | | | | | | $1.000 | | | | $1.000 | | | | | | $1.000 | |
Net investment income and net realized
gain on investment transactions | | | - | (g) | | | | | - | (g) | | | - | (g) | | | | | .004 | |
| Dividends to shareholders | | | - | (g) | | | | | - | (g) | | | - | (g) | | | | | (.004 | ) |
| Net asset value, end of period | | | $1.000 | | | | | | $1.000 | | | | $1.000 | | | | | | $1.000 | |
| Total Return(b): | | | .01% | | | | | | .02% | | | | .05% | | | | | | .39% | |
| | | | |
| Ratios/Supplemental Data: | | | | | | | | | | | | | | | | |
| Net assets, end of period (000) | | | $12 | | | | | | $778 | | | | $2,511 | | | | | | $8,405 | |
| Average net assets (000) | | | $377 | | | | | | $1,435 | | | | $4,785 | | | | | | $8,737 | |
| Ratios to average net assets(f): | | | | | | | | | | | | | | | | | | | | |
Expenses, including distribution and
service (12b-1) fees | | | .16% | (c)(d) | | | | | .22% | (d) | | | .32% | (d) | | | | | .72% | (c)(d) |
Expenses, excluding distribution and
service (12b-1) fees | | | .16% | (c)(e) | | | | | .22% | (e) | | | .31% | (e) | | | | | .43% | (c) |
| Net investment income | | | .02% | (c)(d) | | | | | .02% | (d) | | | .05% | (d) | | | | | .31% | (c)(d) |
(a) Commencement of offering.
(b) Total return is calculated assuming a purchase of a share on the first day and a sale on the last day of each period reported, and includes reinvestment of dividends and distributions. Total returns may reflect adjustments to conform to generally accepted accounting principles. Total returns for periods less than one full year are not annualized.
(c) Annualized.
(d) Net of management fee and distribution and service (12b-1) fees waiver. If the investment manager had not waived expenses, the expense ratios including distribution and service (12b-1) fees would have been 1.48% for the period ended April 13, 2012, 1.48% and 1.47% for the years ended July 31, 2011 and July 31, 2010, respectively and 1.43% for the period ended July 31, 2009. The net investment loss ratios would have been (1.30)% for the period ended April 13, 2012, (1.24)% and (1.10)% for the years ended July 31, 2011 and July 31, 2010, respectively and (.40)% for the period ended July 31, 2009.
(e) Net of management fee waiver. If the investment manager had not waived management fees, the expense ratios excluding distribution and service (12b-1) fees would have been .48% for the period ended April 13, 2012, .48% and .47% for the years ended July 31, 2011 and July 31, 2010, respectively.
(f) Includes .01% and .03% of the U.S. Treasury Money Market Fund Guarantee Program fee for the year ended July 31, 2010 and the period ended July 31, 2009, respectively.
(g) Less than $.0005 per share.
(h) As of April 13, 2012, the last conversion of Class M shares to Class A shares was completed. There are no Class M shares outstanding and Class M shares are no longer being offered for sale.
See Notes to Financial Statements.
| | |
| 34 | | Visit our website at www.prudentialfunds.com |
| | | | | | | | | | | | | | | | | | | | | | | | |
| Class X Shares | | | | | | | | | | | | | | | | | | | |
| | | Six Months
Ended
January 31, | | | | | Year Ended July 31, | | | | | October 27,
2008(a)
through July 31, | |
| | | 2013 | | | | | 2012 | | | 2011 | | | 2010 | | | | | 2009 | |
| Per Share Operating Performance: | | | | | | | | | | | | | | | | | | | | | | | | |
| Net Asset Value, Beginning Of Period | | | $1.000 | | | | | | $1.000 | | | | $1.000 | | | | $1.000 | | | | | | $1.000 | |
Net investment income and net
realized gain on investment transactions | | | - | (g) | | | | | - | (g) | | | - | (g) | | | - | (g) | | | | | .004 | |
| Dividends to shareholders | | | - | (g) | | | | | - | (g) | | | - | (g) | | | - | (g) | | | | | (.004 | ) |
| Net asset value, end of period | | | $1.000 | | | | | | $1.000 | | | | $1.000 | | | | $1.000 | | | | | | $1.000 | |
| Total Return(b): | | | .01% | | | | | | .02% | | | | .02% | | | | .05% | | | | | | .39% | |
| | | | |
| Ratios/Supplemental Data: | | | | | | | | | | | | | | | | | | | |
| Net assets, end of period (000) | | | $477 | | | | | | $658 | | | | $1,300 | | | | $2,515 | | | | | | $5,337 | |
| Average net assets (000) | | | $552 | | | | | | $916 | | | | $1,741 | | | | $3,722 | | | | | | $5,119 | |
| Ratios to average net assets(f): | | | | | | | | | | | | | | | | | | | | | | | | |
Expenses, including distribution and
service (12b-1) fees | | | .21% | (c)(d) | | | | | .18% | (d) | | | .22% | (d) | | | .32% | (d) | | | | | .71% | (c)(d) |
Expenses, excluding distribution and
service (12b-1) fees | | | .21% | (c)(e) | | | | | .18% | (e) | | | .22% | (e) | | | .31% | (e) | | | | | .43% | (c) |
| Net investment income | | | .01% | (c)(d) | | | | | .02% | (d) | | | .02% | (d) | | | .05% | (d) | | | | | .30% | (c)(d) |
(a) Commencement of offering.
(b) Total return is calculated assuming a purchase of a share on the first day and a sale on the last day of each period reported, and includes reinvestment of dividends and distributions. Total returns may reflect adjustments to conform to generally accepted accounting principles. Total returns for periods less than one full year are not annualized.
(c) Annualized.
(d) Net of management fee and distribution and service (12b-1) fees waiver. If the investment manager had not waived expenses, the expense ratios including distribution and service (12b-1) fees would have been 1.49% for the six months ended January 31, 2013, 1.48%, 1.48% and 1.47% for the years ended July 31, 2012, July 31, 2011 and July 31, 2010, respectively and 1.43% for the period ended July 31, 2009. The net investment loss ratios would have been (1.27)% for the six months ended January 31, 2013, (1.29)%, (1.24)% and (1.10)% for the years ended July 31, 2012, July 31, 2011 and July 31, 2010, respectively and (.42)% for the period ended July 31, 2009.
(e) Net of management fee waiver. If the investment manager had not waived management fees, the expense ratios excluding distribution and service (12b-1) fees would have been .49% for the six months ended January 31, 2013, .48%, .48% and .47% for the years ended July 31, 2012, July 31, 2011 and July 31, 2010, respectively.
(f) Includes ..01% and .03% of the U.S. Treasury Money Market Fund Guarantee Program fee for the year ended July 31, 2010 and the period ended July 31, 2009, respectively.
(g) Less than $.0005 per share.
See Notes to Financial Statements.
| | | | |
| Prudential MoneyMart Assets, Inc. | | | 35 | |
Financial Highlights
(Unaudited) continued
| | | | | | | | | | | | | | | | | | | | | | | | | | |
| Class Z Shares | |
| | | Six Months
Ended
January 31, | | | | | Year Ended July 31, | |
| | | 2013 | | | | | 2012 | | | 2011 | | | 2010 | | | 2009 | | | 2008 | |
| Per Share Operating Performance: | | | | | | | | | | | | | | | | | | | | | | | | | | |
| Net Asset Value, Beginning Of Period | | | $1.000 | | | | | | $1.000 | | | | $1.000 | | | | $1.000 | | | | $1.000 | | | | $1.000 | |
| Net investment income and net realized gain on investment transactions | | | - | (d) | | | | | - | (d) | | | - | (d) | | | .001 | | | | .012 | | | | .038 | |
| Dividends to shareholders | | | - | (d) | | | | | - | (d) | | | - | (d) | | | (.001 | ) | | | (.012 | ) | | | (.038 | ) |
| Net asset value, end of period | | | $1.000 | | | | | | $1.000 | | | | $1.000 | | | | $1.000 | | | | $1.000 | | | | $1.000 | |
| Total Return(a): | | | .01% | | | | | | .02% | | | | .02% | | | | .05% | | | | 1.22% | | | | 3.92% | |
| | | | | |
| Ratios/Supplemental Data: | | | | | | | | | | | | | | | | | | | | |
| Net assets, end of period (000) | | | $107,687 | | | | | | $118,185 | | | | $153,807 | | | | $183,736 | | | | $181,906 | | | | $178,289 | |
| Average net assets (000) | | | $113,520 | | | | | | $119,232 | | | | $165,586 | | | | $181,652 | | | | $180,110 | | | | $173,762 | |
| Ratios to average net assets(c): | | | | | | | | | | | | | | | | | | | | | | | | | | |
| Expenses, including distribution and service (12b-1) fees | | | .21% | (b)(e) | | | | | .18% | (b) | | | .22% | (b) | | | .31% | (b) | | | .43% | | | | .42% | |
| Expenses, excluding distribution and service (12b-1) fees | | | .21% | (b)(e) | | | | | .18% | (b) | | | .22% | (b) | | | .31% | (b) | | | .43% | | | | .42% | |
| Net investment income | | | .01% | (b)(e) | | | | | .02% | (b) | | | .02% | (b) | | | .05% | (b) | | | 1.20% | | | | 3.76% | |
(a) Total return is calculated assuming a purchase of a share on the first day and a sale on the last day of each period reported, and includes reinvestment of dividends and distributions. Total returns may reflect adjustments to conform to generally accepted accounting principles. Total returns for periods less than one full year are not annualized.
(b) Net of management fee waiver. If the investment manager had not waived management fees, the expense ratios including distribution and service (12b-1) fees would have been .49% for the six months ended January 31, 2013, .48%, .48% and .47% for the years ended July 31, 2012, July 31, 2011 and July 31, 2010, respectively. The expense ratios excluding distribution and service (12b-1) fees would have been .49% for the six months ended January 31, 2013, .48%, .48% and .47% for the years ended July 31, 2012, July 31, 2011 and July 31, 2010, respectively. The net investment loss ratios would have been (.27)% for the six months ended January 31, 2013, (.28)%, (.24)% and (.11)% for the years ended July 31, 2012, July 31, 2011 and July 31, 2010, respectively.
(c) Includes .01% and .03% of the U.S. Treasury Money Market Fund Guarantee Program fee for the years ended July 31, 2010 and July 31, 2009, respectively.
(d) Less than $.0005 per share.
(e) Annualized.
See Notes to Financial Statements.
| | |
| 36 | | Visit our website at www.prudentialfunds.com |
| | | | |
| n MAIL | | n TELEPHONE | | n WEBSITE |
Gateway Center Three
100 Mulberry Street
Newark, NJ 07102 | | (800) 225-1852 | | www.prudentialfunds.com |
|
| PROXY VOTING |
| The Board of Directors of the Fund has delegated to the Fund’s investment subadviser the responsibility for voting any proxies and maintaining proxy recordkeeping with respect to the Fund. A description of these proxy voting policies and procedures is available without charge, upon request, by calling (800) 225-1852. Information regarding how the Fund voted proxies relating to portfolio securities during the most recent 12-month period ended June 30 is available on the Fund’s website and on the Securities and Exchange Commission’s website. |
|
| DIRECTORS |
| Kevin J. Bannon • Scott E. Benjamin • Linda W. Bynoe • Michael S. Hyland • Douglas H. McCorkindale • Stephen P. Munn • Stuart S. Parker • Richard A. Redeker • Robin B. Smith • Stephen G. Stoneburn |
|
| OFFICERS |
| Stuart S. Parker, President • Scott E. Benjamin, Vice President • Grace C. Torres, Treasurer and Principal Financial and Accounting Officer • Raymond A. O’Hara, Chief Legal Officer • Deborah A. Docs, Secretary • Timothy J. Knierim, Chief Compliance Officer • Valerie M. Simpson, Deputy Chief Compliance Officer • Theresa C. Thompson, Deputy Chief Compliance Officer • Richard W. Kinville, Anti-Money Laundering Compliance Officer • Jonathan D. Shain, Assistant Secretary • Claudia DiGiacomo, Assistant Secretary • Amanda S. Ryan, Assistant Secretary • Andrew R. French, Assistant Secretary • M. Sadiq Peshimam, Assistant Treasurer • Peter Parrella, Assistant Treasurer |
| | | | |
| MANAGER | | Prudential Investments LLC | | Gateway Center Three
100 Mulberry Street
Newark, NJ 07102 |
|
| INVESTMENT SUBADVISER | | Prudential Investment
Management, Inc. | | Gateway Center Two
100 Mulberry Street
Newark, NJ 07102 |
|
| DISTRIBUTOR | | Prudential Investment
Management Services LLC | | Gateway Center Three
100 Mulberry Street
Newark, NJ 07102 |
|
| CUSTODIAN | | The Bank of New York Mellon | | One Wall Street
New York, NY 10286 |
|
| TRANSFER AGENT | | Prudential Mutual Fund
Services LLC | | PO Box 9658
Providence, RI 02940 |
|
| INDEPENDENT REGISTERED PUBLIC ACCOUNTING FIRM | | KPMG LLP | | 345 Park Avenue
New York, NY 10154 |
|
| FUND COUNSEL | | Willkie Farr & Gallagher LLP | | 787 Seventh Avenue
New York, NY 10019 |
|
| An investor should consider the investment objectives, risks, charges, and expenses of the Fund carefully before investing. The prospectus and summary prospectus contain this and other information about the Fund. An investor may obtain a prospectus and summary prospectus by visiting our website at www.prudentialfunds.com or by calling (800) 225-1852. The prospectus and summary prospectus should be read carefully before investing. |
|
| E-DELIVERY |
| To receive your mutual fund documents online, go to www.prudentialfunds.com/edelivery and enroll. Instead of receiving printed documents by mail, you will receive notification via email when new materials are available. You can cancel your enrollment or change your email address at any time by visiting the website address above. |
|
| SHAREHOLDER COMMUNICATIONS WITH DIRECTORS |
| Shareholders can communicate directly with the Board of Directors by writing to the Chair of the Board, Prudential MoneyMart Assets, Inc., Prudential Investments, Attn: Board of Directors, 100 Mulberry Street, Gateway Center Three, Newark, NJ 07102. Shareholders can communicate directly with an individual Director by writing to the same address. Communications to the Board or individual Directors are not screened before being delivered to the addressee. |
|
| AVAILABILITY OF PORTFOLIO SCHEDULE |
| The Fund files its complete schedule of portfolio holdings with the Securities and Exchange Commission for the first and third quarters of each fiscal year on Form N-Q. The Fund’s Forms N-Q are available on the Commission’s website at www.sec.gov. The Fund’s Forms N-Q may also be reviewed and copied at the Commission’s Public Reference Room in Washington, D.C. Information on the operation and location of the Public Reference Room may be obtained by calling (202) 551-8090. The Fund’s schedule of portfolio holdings is also available on the Fund’s website as of the end of each month. |
Mutual Funds:
| | | | |
ARE NOT INSURED BY THE FDIC OR ANY
FEDERAL GOVERNMENT AGENCY | | MAY LOSE VALUE | | ARE NOT A DEPOSIT OF OR GUARANTEED
BY ANY BANK OR ANY BANK AFFILIATE |

PRUDENTIAL MONEYMART ASSETS, INC.
| | | | | | | | | | |
| SHARE CLASS | | A | | B | | C | | X | | Z |
| NASDAQ | | PBMXX | | MJBXX | | MJCXX | | N/A | | PMZXX |
| CUSIP | | 74440W409 | | 74440W201 | | 74440W300 | | 74440W706 | | 74440W805 |
MF108E2 0240950-00001-00
Item 2 – Code of Ethics – Not required, as this is not an annual filing.
Item 3 – Audit Committee Financial Expert – Not required, as this is not an annual filing.
Item 4 – Principal Accountant Fees and Services – Not required, as this is not an annual filing.
Item 5 – Audit Committee of Listed Registrants – Not applicable.
Item 6 – Schedule of Investments – The schedule is included as part of the report to shareholders filed under Item 1 of this Form.
Item 7 – Disclosure of Proxy Voting Policies and Procedures for Closed-End Management Investment Companies – Not applicable.
Item 8 – Portfolio Managers of Closed-End Management Investment Companies – Not applicable.
Item 9 – Purchases of Equity Securities by Closed-End Management Investment Company and Affiliated Purchasers – Not
applicable.
Item 10 – Submission of Matters to a Vote of Security Holders – Not applicable.
Item 11 – Controls and Procedures
| | (a) | It is the conclusion of the registrant’s principal executive officer and principal financial officer that the effectiveness of the registrant’s current disclosure controls and procedures (such disclosure controls and procedures having been evaluated within 90 days of the date of this filing) provide reasonable assurance that the information required to be disclosed by the registrant has been recorded, processed, summarized and reported within the time period specified in the Commission’s rules and forms and that the information required to be disclosed by the registrant has been accumulated and communicated to the registrant’s principal executive officer and principal financial officer in order to allow timely decisions regarding required disclosure. |
| | (b) | There has been no significant change in the registrant’s internal control over financial reporting that occurred during the registrant’s most recent fiscal quarter of the period covered by this report that has materially affected, or is likely to materially affect, the registrant’s internal control over financial reporting. |
Item 12 – Exhibits
| | | | |
| (a) | | (1) | | Code of Ethics – Not required, as this is not an annual filing. |
| | |
| | (2) | | Certifications pursuant to Section 302 of the Sarbanes-Oxley Act – Attached hereto as Exhibit EX-99.CERT. |
| | |
| | (3) | | Any written solicitation to purchase securities under Rule 23c-1. – Not applicable. |
| |
| (b) | | Certifications pursuant to Section 906 of the Sarbanes-Oxley Act – Attached hereto as Exhibit EX-99.906CERT. |
SIGNATURES
Pursuant to the requirements of the Securities Exchange Act of 1934 and the Investment Company Act of 1940, the registrant has duly caused this report to be signed on its behalf by the undersigned, thereunto duly authorized.
| | |
| Registrant: | | Prudential MoneyMart Assets, Inc. |
| |
| By: | | /s/Deborah A. Docs |
| | Deborah A. Docs |
| | Secretary |
| |
| Date: | | March 21, 2013 |
Pursuant to the requirements of the Securities Exchange Act of 1934 and the Investment Company Act of 1940, this report has been signed below by the following persons on behalf of the registrant and in the capacities and on the dates indicated.
| | |
| By: | | /s/Stuart S. Parker |
| | Stuart S. Parker |
| | President and Principal Executive Officer |
| |
| Date: | | March 21 2013 |
| |
| By: | | /s/Grace C. Torres |
| | Grace C. Torres |
| | Treasurer and Principal Financial Officer |
| |
| Date: | | March 21, 2013 |