UNITED STATES
SECURITIES AND EXCHANGE COMMISSION
Washington, D.C. 20549
FORM N-CSR
CERTIFIED SHAREHOLDER REPORT OF REGISTERED
MANAGEMENT INVESTMENT COMPANIES
| | |
| Investment Company Act file number: | | 811-02619 |
| |
| Exact name of registrant as specified in charter: | | Prudential MoneyMart Assets, Inc. |
| |
| Address of principal executive offices: | | Gateway Center 3, 100 Mulberry Street, Newark, New Jersey 07102 |
| |
| Name and address of agent for service: | | Deborah A. Docs Gateway Center 3, 100 Mulberry Street, Newark, New Jersey 07102 |
| |
| Registrant’s telephone number, including area code: | | 800-225-1852 |
| |
| Date of fiscal year end: | | 7/31/2011 |
| |
| Date of reporting period: | | 1/31/2011 |
Item 1 – Reports to Stockholders –

| | |
| SEMIANNUAL REPORT | | JANUARY 31, 2011 |
Prudential MoneyMart
Assets, Inc.
| | | | |
Fund Type Money Market Objective Maximum current income consistent with stability of capital and the maintenance of liquidity | | | | This report is not authorized for distribution to prospective investors unless preceded or accompanied by a current prospectus. The views expressed in this report and information about the Fund’s portfolio holdings are for the period covered by this report and are subject to change thereafter. The accompanying financial statements as of January 31, 2011, were not audited and, accordingly, no auditor’s opinion is expressed on them. Prudential Investments, Prudential, the Prudential logo, and the Rock symbol are service marks of Prudential Financial, Inc. and its related entities, registered in many jurisdictions worldwide. |
| | |

| | To enroll in e-delivery, go to www.prudentialfunds.com/edelivery |
March 15, 2011
Dear Shareholder:
On the following pages, you’ll find your Fund’s semiannual report, including a listing of its holdings at period-end. Money market investments such as your Fund are at the low-risk, low-reward end of the risk/reward spectrum, and the primary measure of their performance is the seven-day current yield, which is included in the attached report.
The Fund may be an important part of your overall financial plan. We recommend you review your financial plan regularly with your financial professional. He or she can help you create a diversified investment plan that may include mutual funds covering all the basic asset classes and that reflects your tolerance for risk, time horizon, and financial goals. Keep in mind that diversification and asset allocation strategies do not assure a profit or protect against loss in declining markets.
Thank you for choosing the Prudential Investments® family of mutual funds.
Sincerely,

Judy A. Rice, President
Prudential MoneyMart Assets, Inc.
| | | | |
| Prudential MoneyMart Assets, Inc. | | | 1 | |
Your Fund’s Performance
The Fund is a diversified portfolio of high-quality, U.S. dollar-denominated money market securities issued by the U.S. government, its agencies and instrumentalities, and major corporations and commercial banks in the United States and foreign countries. Maturities can range from one day to 13 months. The Fund generally only purchases securities rated in one of the two highest short-term rating categories or one of the three highest long-term rating categories by at least two major rating agencies, or, if not rated, deemed to be of equivalent quality by the investment subadviser.
Yields will fluctuate from time to time, and past performance does not guarantee future results. Current performance may be lower or higher than the past performance data quoted. The investment return and principal value will fluctuate, and shares, when sold, may be worth more or less than the original cost. For the most recent month-end performance update, call (800) 225-1852. Gross operating expenses: Class A, 0.62%; Class B, 0.49%; Class C, 0.49%; Class L, 0.99%; Class M, 1.49%; Class X, 1.49%; and Class Z, 0.49%. Net operating expenses: Class A, 0.24%; Class B, 0.24%; Class C, 0.24%; Class L, 0.24%; Class M, 0.24%; Class X, 0.24%; and Class Z, 0.24%, after a voluntary waiver of distribution and service (12b-1) fees of Class A, Class L, Class M, and Class X shares, and of management fees of the Fund.
| | | | | | | | | | | | | | | | |
| Fund Facts as of 1/31/11 | | | | | | | | | | |
| | | 7-Day
Current Yield | | | Net Asset
Value (NAV) | | | Weighted Avg.
Maturity (WAM) | | | Net Assets
(Millions) | |
Class A | | | 0.02 | % | | $ | 1.00 | | | | 43 Days | | | $ | 550.5 | |
Class B* | | | 0.02 | | | $ | 1.00 | | | | 43 Days | | | $ | 45.3 | |
Class C* | | | 0.02 | | | $ | 1.00 | | | | 43 Days | | | $ | 16.3 | |
Class L | | | 0.02 | | | $ | 1.00 | | | | 43 Days | | | $ | 4.0 | |
Class M | | | 0.02 | | | $ | 1.00 | | | | 43 Days | | | $ | 1.3 | |
Class X | | | 0.02 | | | $ | 1.00 | | | | 43 Days | | | $ | 1.6 | |
Class Z* | | | 0.02 | | | $ | 1.00 | | | | 43 Days | | | $ | 153.1 | |
iMoneyNet, Inc. Prime Retail Avg.** | | | 0.02 | | | | N/A | | | | 48 Days | | | | N/A | |
*Class B, Class C, and Class Z shares are not subject to distribution and service (12b-1) fees.
**iMoneyNet, Inc. regularly reports a 7-day current yield and WAM on Tuesdays. This is based on the data of all funds in the iMoneyNet, Inc. Prime Retail Average category as of January 25, 2011, the closest reported date prior to the end of our reporting period.
| | |
| 2 | | Visit our website at www.prudentialfunds.com |
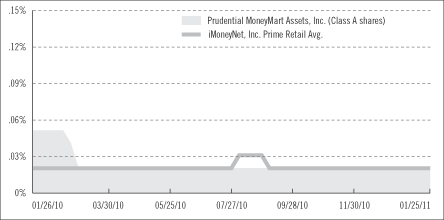
Money Market Fund Yield Comparison
Weighted Average Maturity Comparison
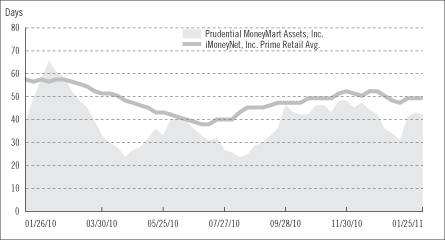
The graphs portray weekly 7-day current yields and weekly WAMs for Prudential MoneyMart Assets, Inc. (Class A shares—yields only) and the iMoneyNet, Inc. Prime Retail Average every Tuesday from January 26, 2010 to January 25, 2011, the closest dates to the beginning and end of the Fund’s reporting period. Note: iMoneyNet, Inc. regularly reports a 7-day current yield and WAM on Tuesdays. As a result, the data portrayed for the Fund at the end of the reporting period in the graphs may not match the data portrayed in the Fund Facts table as of January 31, 2011.
| | | | |
| Prudential MoneyMart Assets, Inc. | | | 3 | |
Your Fund’s Performance (continued)
An investment in the Fund is not insured or guaranteed by the Federal Deposit Insurance Corporation or any other government agency. Although the Fund seeks to preserve the value of your investment at $1 per share, it is possible to lose money by investing in the Fund.
| | |
| 4 | | Visit our website at www.prudentialfunds.com |
Fees and Expenses (Unaudited)
As a shareholder of the Fund, you incur two types of costs: (1) transaction costs, including sales charges (loads) on purchase payments and redemptions, as applicable, and (2) ongoing costs, including management fees, distribution and/or service (12b-1) fees, and other Fund expenses, as applicable. This example is intended to help you understand your ongoing costs (in dollars) of investing in the Fund and to compare these costs with the ongoing costs of investing in other mutual funds.
The example is based on an investment of $1,000 invested on August 1, 2010, at the beginning of the period, and held through the six-month period ended January 31, 2011. The example is for illustrative purposes only; you should consult the Prospectus for information on initial and subsequent minimum investment requirements.
The Fund’s transfer agent may charge additional fees to holders of certain accounts that are not included in the expenses shown in the table on the following page. These fees apply to individual retirement accounts (IRAs) and Section 403(b) accounts. As of the close of the six-month period covered by the table, IRA fees included an annual maintenance fee of $15 per account (subject to a maximum annual maintenance fee of $25 for all accounts held by the same shareholder). Section 403(b) accounts are charged an annual $25 fiduciary maintenance fee. Some of the fees may vary in amount, or may be waived, based on your total account balance or the number of Prudential Investments Funds, including the Fund, that you own. You should consider the additional fees that were charged to your Fund account over the six-month period when you estimate the total ongoing expenses paid over the period and the impact of these fees on your ending account value, as these additional expenses are not reflected in the information provided in the expense table. Additional fees have the effect of reducing investment returns.
Actual Expenses
The first line for each share class in the table on the following page provides information about actual account values and actual expenses. You may use the information on this line, together with the amount you invested, to estimate the expenses that you paid over the period. Simply divide your account value by $1,000 (for example, an $8,600 account value ÷ $1,000 = 8.6), then multiply the result by the number on the first line under the heading “Expenses Paid During the Six-Month Period” to estimate the expenses you paid on your account during this period.
Hypothetical Example for Comparison Purposes
The second line for each share class in the table on the following page provides information about hypothetical account values and hypothetical expenses based on the Fund’s actual expense ratio and an assumed rate of return of 5% per year before
| | | | |
| Prudential MoneyMart Assets, Inc. | | | 5 | |
Fees and Expenses (continued)
expenses, which is not the Fund’s actual return. The hypothetical account values and expenses may not be used to estimate the actual ending account balance or expenses you paid for the period. You may use this information to compare the ongoing costs of investing in the Fund and other funds. To do so, compare this 5% hypothetical example with the 5% hypothetical examples that appear in the shareholder reports of the other funds.
Please note that the expenses shown in the table are meant to highlight your ongoing costs only and do not reflect any transactional costs such as sales charges (loads). Therefore, the second line for each share class in the table is useful in comparing ongoing costs only and will not help you determine the relative total costs of owning different funds. In addition, if these transactional costs were included, your costs would have been higher.
| | | | | | | | | | | | | | | | | | |
Prudential Money Mart Assets, Inc. | | Beginning Account
Value
August 1, 2010 | | | Ending Account
Value
January 31, 2011 | | | Annualized
Expense Ratio | | | Expenses Paid
During the
Six-Month Period* | |
| | | | | | | | | | | | | | | | | | |
| Class A | | Actual | | $ | 1,000.00 | | | $ | 1,000.10 | | | | 0.24 | % | | $ | 1.21 | |
| | | Hypothetical | | $ | 1,000.00 | | | $ | 1,024.00 | | | | 0.24 | % | | $ | 1.22 | |
| | | | | | | | | | | | | | | | | | |
| Class B | | Actual | | $ | 1,000.00 | | | $ | 1,000.10 | | | | 0.24 | % | | $ | 1.21 | |
| | | Hypothetical | | $ | 1,000.00 | | | $ | 1,024.00 | | | | 0.24 | % | | $ | 1.22 | |
| | | | | | | | | | | | | | | | | | |
| Class C | | Actual | | $ | 1,000.00 | | | $ | 1,000.10 | | | | 0.24 | % | | $ | 1.21 | |
| | | Hypothetical | | $ | 1,000.00 | | | $ | 1,024.00 | | | | 0.24 | % | | $ | 1.22 | |
| | | | | | | | | | | | | | | | | | |
| Class L | | Actual | | $ | 1,000.00 | | | $ | 1,000.10 | | | | 0.24 | % | | $ | 1.21 | |
| | | Hypothetical | | $ | 1,000.00 | | | $ | 1,024.00 | | | | 0.24 | % | | $ | 1.22 | |
| | | | | | | | | | | | | | | | | | |
| Class M | | Actual | | $ | 1,000.00 | | | $ | 1,000.10 | | | | 0.24 | % | | $ | 1.21 | |
| | | Hypothetical | | $ | 1,000.00 | | | $ | 1,024.00 | | | | 0.24 | % | | $ | 1.22 | |
| | | | | | | | | | | | | | | | | | |
| Class X | | Actual | | $ | 1,000.00 | | | $ | 1,000.10 | | | | 0.24 | % | | $ | 1.21 | |
| | | Hypothetical | | $ | 1,000.00 | | | $ | 1,024.00 | | | | 0.24 | % | | $ | 1.22 | |
| | | | | | | | | | | | | | | | | | |
| Class Z | | Actual | | $ | 1,000.00 | | | $ | 1,000.10 | | | | 0.24 | % | | $ | 1.21 | |
| | | Hypothetical | | $ | 1,000.00 | | | $ | 1,024.00 | | | | 0.24 | % | | $ | 1.22 | |
* Fund expenses (net of fee waivers or subsidies, if any) for each share class are equal to the annualized expense ratio for each share class (provided in the table), multiplied by the average account value over the period, multiplied by the 184 days in the six-month period ended January 31, 2011, and divided by the 365 days in the Fund's fiscal year ending July 31, 2011 (to reflect the six-month period). Expenses presented in the table include the expenses of any underlying portfolios in which the Fund may invest.
| | |
| 6 | | Visit our website at www.prudentialfunds.com |
Portfolio of Investments
as of January 31, 2011 (Unaudited)
| | | | | | | | |
Principal
Amount (000) | | | Description | | Value (Note 1) | |
| | | | | | | | |
| Certificates of Deposit 15.3% | |
| $ | 5,000 | | | Bank of Nova Scotia
0.323%, 07/06/11(b) | | $ | 5,000,553 | |
| | 8,000 | | | Bank of Tokyo-Mitsubishi UFJ Ltd.
0.330%, 04/21/11 | | | 8,000,174 | |
| | 5,000 | | | BNP Paribas
0.431%, 10/20/11(b) | | | 5,000,000 | |
| | 3,600 | | | BNP Paribas/New York
0.470%, 09/21/11(b) | | | 3,600,000 | |
| | 20,000 | | | Credit Agricole CIB/New York
0.300%, 02/01/11 | | | 20,000,000 | |
| | 3,000 | | | 0.320%, 02/14/11 | | | 2,999,956 | |
| | 4,000 | | | Mizuho Corporate Bank/New York
0.280%, 03/11/11 | | | 4,000,000 | |
| | 6,000 | | | Mizuho Corporate Bank(USA)
0.280%, 02/01/11 | | | 6,000,000 | |
| | 1,200 | | | Norinchukin Bank/New York
0.310%, 02/07/11 | | | 1,199,992 | |
| | 4,000 | | | Rabobank Nederland NV/New York
0.351%, 09/13/11(b) | | | 4,000,000 | |
| | 5,000 | | | Royal Bank of Canada
0.260%, 03/23/11(b) | | | 5,000,004 | |
| | 5,000 | | | Royal Bank of Scotland PLC (The)
0.300%, 02/04/11 | | | 5,000,000 | |
| | 6,000 | | | Societe Generale
0.300%, 02/07/11 | | | 6,000,000 | |
| | 10,616 | | | Societe Generale/New York
0.320%, 02/25/11 | | | 10,616,141 | |
| | 10,000 | | | Sumitomo Mitsui Banking Corp./New York
0.310%, 04/14/11 | | | 10,000,000 | |
| | 7,000 | | | Svenska Handelsbanken AB
0.270%, 02/04/11 | | | 7,000,000 | |
| | 5,000 | | | 0.270%, 02/22/11 | | | 4,999,971 | |
| | 3,000 | | | 0.280%, 04/21/11 | | | 3,000,000 | |
| | 7,000 | | | Toronto Dominion Bank/New York
0.330%, 10/28/11(b) | | | 7,000,000 | |
| | | | | | | | |
| | | | | | | 118,416,791 | |
| | | | | | | | |
|
| Commercial Paper 40.8% | |
| | 6,500 | | | ABN AMRO Funding USA LLC, 144A
0.300%, 04/20/11(a) | | | 6,495,775 | |
| | 4,000 | | | 0.310%, 05/03/11(a) | | | 3,996,866 | |
See Notes to Financial Statements.
| | | | |
| Prudential MoneyMart Assets, Inc. | | | 7 | |
Portfolio of Investments
as of January 31, 2011 (Unaudited) continued
| | | | | | | | |
Principal
Amount (000) | | | Description | | Value (Note 1) | |
| | | | | | | | |
| Commercial Paper (cont’d.) | |
| $ | 6,000 | | | Archer Daniels Midland, 144A
0.250%, 02/25/11(a) | | $ | 5,999,000 | |
| | 20,000 | | | BASF AG Corp., 144A
0.210%, 02/07/11(a) | | | 19,999,300 | |
| | 3,000 | | | BG Energy Finance, Inc., 144A
0.350%, 02/14/11(a) | | | 2,999,621 | |
| | 3,000 | | | 0.350%, 02/18/11(a) | | | 2,999,504 | |
| | 10,000 | | | BPCE SA, 144A
0.300%, 02/16/11(a) | | | 9,998,750 | |
| | 7,000 | | | Citigroup Funding, Inc.
0.250%, 02/02/11(a) | | | 6,999,951 | |
| | 8,000 | | | Danske Corp., 144A
0.290%, 02/10/11(a) | | | 7,999,420 | |
| | 6,000 | | | DnB NOR Bank SA, 144A
0.380%, 08/29/11(b) | | | 6,000,000 | |
| | 10,000 | | | Electricite de France, 144A
0.280%, 02/28/11(a) | | | 9,997,900 | |
| | 12,000 | | | 0.290%, 04/21/11(a) | | | 11,992,363 | |
| | 10,000 | | | ENI Coordination Center SA, 144A
0.260%, 02/14/11(a) | | | 9,999,061 | |
| | 5,000 | | | European Investment Bank
0.240%, 02/07/11(a) | | | 4,999,800 | |
| | 12,000 | | | 0.320%, 03/22/11(a) | | | 11,994,773 | |
| | 7,000 | | | 0.400%, 03/25/11(a) | | | 6,995,956 | |
| | 5,000 | | | General Electric Capital Corp.
0.240%, 04/25/11(a) | | | 4,997,233 | |
| | 6,000 | | | 0.240%, 04/27/11(a) | | | 5,996,600 | |
| | 10,000 | | | International Financial Corp.
0.200%, 02/01/11(a) | | | 10,000,000 | |
| | 9,000 | | | 0.200%, 02/09/11(a) | | | 8,999,600 | |
| | 6,000 | | | 0.210%, 02/08/11(a) | | | 5,999,755 | |
| | 7,000 | | | JPMorgan Chase & Co.
0.230%, 02/07/11(a) | | | 6,999,732 | |
| | 10,000 | | | New York Life Capital Corp., 144A
0.200%, 02/14/11(a) | | | 9,999,278 | |
| | 2,500 | | | Old Line Funding LLC, 144A
0.250%, 03/09/11(a) | | | 2,499,375 | |
| | 10,000 | | | 0.270%, 02/03/11(a) | | | 9,999,850 | |
| | 7,000 | | | 0.270%, 02/11/11(a) | | | 6,999,475 | |
| | 5,000 | | | 0.270%, 03/01/11(a) | | | 4,998,950 | |
See Notes to Financial Statements.
| | |
| 8 | | Visit our website at www.prudentialfunds.com |
| | | | | | | | |
Principal
Amount (000) | | | Description | | Value (Note 1) | |
| | | | | | | | |
| Commercial Paper (cont’d.) | |
| $ | 15,000 | | | Philip Morris International, Inc., 144A
0.250%, 03/01/11(a) | | $ | 14,997,083 | |
| | 3,000 | | | Prudential PLC, 144A
0.370%, 02/18/11(a) | | | 2,999,476 | |
| | 3,000 | | | 0.380%, 03/09/11(a) | | | 2,998,860 | |
| | 1,000 | | | Reckitt Benckiser TSY, 144A
0.310%, 03/10/11(a) | | | 999,681 | |
| | 3,000 | | | 0.320%, 02/04/11(a) | | | 2,999,920 | |
| | 2,000 | | | 0.340%, 05/16/11(a) | | | 1,998,036 | |
| | 3,000 | | | 0.340%, 05/17/11(a) | | | 2,997,025 | |
| | 5,000 | | | Skandinaviska Enskilda Banken AB, 144A
0.330%, 02/07/11(a) | | | 4,999,725 | |
| | 10,000 | | | Standard Chartered Bank, 144A
0.300%, 02/01/11(a) | | | 10,000,000 | |
| | 14,000 | | | Straight-A Funding LLC, 144A
0.250%, 04/01/11(a) | | | 13,994,264 | |
| | 7,000 | | | 0.250%, 04/04/11(a) | | | 6,996,986 | |
| | 23,000 | | | Swedbank AB
0.410%, 04/01/11(a) | | | 22,984,545 | |
| | 3,000 | | | Toyota Motor Credit Corp.
0.260%, 04/22/11(a) | | | 2,998,267 | |
| | 6,000 | | | 0.290%, 03/03/11(a) | | | 5,998,550 | |
| | 10,000 | | | US Bank National Association
0.230%, 02/14/11(a) | | | 9,999,169 | |
| | | | | | | | |
| | | | | | | 314,919,475 | |
| | | | | | | | |
|
| Other Corporate Obligation 0.8% | |
| | 6,000 | | | Bank of America NA
0.360%, 07/27/11(b) | | | 6,000,000 | |
|
| Other Instrument—Agency Bonds 2.5% | |
| | 4,000 | | | General Electric Capital Corp., FDIC Gtd. Notes, MTN
1.800%, 03/11/11(e) | | | 4,006,770 | |
| | 10,000 | | | 3.000%, 12/09/11(e) | | | 10,223,549 | |
| | 5,000 | | | Goldman Sachs Group, Inc. (The), FDIC Gtd. Notes
1.625%, 07/15/11(e) | | | 5,031,085 | |
| | | | | | | | |
| | | | | | | 19,261,404 | |
| | | | | | | | |
|
| Time Deposit 1.0% | |
| | 8,000 | | | US Bank National Association
0.250%, 02/01/11 | | | 8,000,000 | |
See Notes to Financial Statements.
| | | | |
| Prudential MoneyMart Assets, Inc. | | | 9 | |
Portfolio of Investments
as of January 31, 2011 (Unaudited) continued
| | | | | | | | |
Principal
Amount (000) | | | Description | | Value (Note 1) | |
| | | | | | | | |
| U.S. Government Agency Obligations 17.0% | |
| $ | 20,000 | | | Federal Farm Credit Bank
0.261%, 10/07/11(b) | | $ | 20,004,141 | |
| | 3,100 | | | Federal Home Loan Bank
0.161%, 07/11/11(b) | | | 3,098,962 | |
| | 2,000 | | | 0.165%, 07/25/11(b) | | | 1,999,469 | |
| | 8,000 | | | 0.165%, 08/25/11(b) | | | 7,997,051 | |
| | 10,000 | | | 0.166%, 07/20/11(b) | | | 9,998,586 | |
| | 5,000 | | | 0.230%, 09/26/11(b) | | | 5,000,502 | |
| | 25,000 | | | 0.155%, 02/09/11(a) | | | 24,999,139 | |
| | 19,000 | | | Federal Home Loan Mortgage Corp.
0.192%, 04/01/11(a) | | | 18,994,010 | |
| | 7,000 | | | 0.200%, 03/25/11(c) | | | 6,997,976 | |
| | 5,000 | | | 0.221%, 09/19/11(b) | | | 5,000,006 | |
| | 4,000 | | | 0.230%, 04/19/11(a) | | | 3,998,032 | |
| | 16,325 | | | 1.125%, 12/15/11 | | | 16,435,722 | |
| | 3,000 | | | Federal National Mortgage Association
0.180%, 02/14/11(a) | | | 2,999,805 | |
| | 4,000 | | | 0.221%, 09/19/11(b) | | | 4,000,134 | |
| | | | | | | | |
| | | | | | | 131,523,535 | |
| | | | | | | | |
|
| U.S. Government Treasury Securities 11.3% | |
| | 25,000 | | | U.S. Treasury Bills
0.160%, 03/17/11(a) | | | 24,995,111 | |
| | 20,000 | | | 0.198%, 03/24/11(a) | | | 19,994,397 | |
| | 4,000 | | | 0.250%, 11/17/11(a) | | | 3,991,972 | |
| | 5,000 | | | 0.300%, 12/15/11(a) | | | 4,987,012 | |
| | 25,000 | | | U.S. Treasury Notes
0.145%, 02/10/11(a) | | | 24,999,094 | |
| | 3,000 | | | 0.875%, 05/31/11 | | | 3,006,790 | |
| | 5,000 | | | 0.875%, 01/31/12 | | | 5,027,898 | |
| | | | | | | | |
| | | | | | | 87,002,274 | |
| | | | | | | | |
|
| Repurchase Agreements 12.0% | |
| | 50,000 | | | Barclays Capital, Inc.
0.240%, dated 01/31/11, due 02/01/11 in the amount of
$50,000,333 (cost $50,000,000)(d) | | | 50,000,000 | |
| | 10,000 | | | BNP Paribas
0.190%, dated 01/28/11, due 02/01/11 in the amount of
$10,000,211 (cost $10,000,000)(d) | | | 10,000,000 | |
See Notes to Financial Statements.
| | |
| 10 | | Visit our website at www.prudentialfunds.com |
| | | | | | | | |
Principal
Amount (000) | | | Description | | Value (Note 1) | |
| | | | | | | | |
| Repurchase Agreements (cont’d.) | |
| $ | 10,000 | | | Deutsche Bank
0.180%, dated 01/25/11, due 02/01/11 in the amount of
$10,000,350 (cost $10,000,000)(d) | | $ | 10,000,000 | |
| | 22,461 | | | HSBC Securities, Inc.
0.210%, dated 01/31/11, due 02/01/11 in the amount of
$22,461,131 (cost $22,461,000)(d) | | | 22,461,000 | |
| | | | | | | | |
| | | | | | | 92,461,000 | |
| | | | | | | | |
| | | | Total Investments 100.7%
(amortized cost $777,584,479)(f) | | | 777,584,479 | |
| | | | Liabilities in excess of other assets (0.7%) | | | (5,386,365 | ) |
| | | | | | | | |
| | | | Net Assets 100.0% | | $ | 772,198,114 | |
| | | | | | | | |
The following abbreviations are used in the portfolio descriptions:
144A—Security was purchased pursuant to Rule 144A under the Securities Act of 1933 and may not be resold subject to that rule except to qualified institutional buyers. Unless otherwise noted, 144A securities are deemed to be liquid.
FDIC—Federal Deposit Insurance Corp.
MTN—Medium Term Note
| (a) | Rate quoted represents yield-to-maturity as of purchase date. |
| (b) | Variable rate instrument. The interest rate shown reflects the rate in effect at January 31, 2011. |
| (c) | Represents a zero coupon bond. Rate shown reflects the effective yield at January 31, 2011. |
| (d) | Repurchase agreements are collateralized by U.S. Government Agency and FDIC Guaranteed issuances. |
| (e) | FDIC—Guarantee issued under Temporary Liquidity Guarantee Program. |
| (f) | The cost of securities for federal income tax purposes is substantially the same as for financial reporting purposes. |
Various inputs are used in determining the value of the Fund’s investments. These inputs are summarized in the three broad levels listed below.
Level 1—quoted prices generally for stocks, exchange traded funds, options and futures traded in active markets for identical securities and mutual funds which trade at daily net asset value.
Level 2—other significant observable inputs (including, but not limited to, quoted prices for similar securities, interest rates, prepayment speeds, foreign currency exchange rates, and amortized cost) generally for debt securities, swaps, forward foreign currency contracts and for foreign stocks priced using vendor modeling tools.
Level 3—significant unobservable inputs for securities valued in accordance with Board approved fair valuation procedures.
See Notes to Financial Statements.
| | | | |
| Prudential MoneyMart Assets, Inc. | | | 11 | |
Portfolio of Investments
as of January 31, 2011 (Unaudited) continued
The following is a summary of the inputs used as of January 31, 2011 in valuing such portfolio securities:
| | | | | | | | | | | | |
| | | Level 1 | | | Level 2 | | | Level 3 | |
Investments in Securities | | | | | | | | | | | | |
Certificates of Deposit | | $ | — | | | $ | 118,416,791 | | | $ | — | |
Commerical Paper | | | — | | | | 314,919,475 | | | | — | |
Other Corporate Obligation | | | — | | | | 6,000,000 | | | | — | |
Other Instrument—Agency Bonds | | | — | | | | 19,261,404 | | | | — | |
Time Deposit | | | — | | | | 8,000,000 | | | | — | |
U.S. Government Agency Obligations | | | — | | | | 131,523,535 | | | | — | |
U.S. Government Treasury Securities | | | — | | | | 87,002,274 | | | | — | |
Repurchase Agreements | | | — | | | | 92,461,000 | | | | — | |
| | | | | | | | | | | | |
Total | | $ | — | | | $ | 777,584,479 | | | $ | — | |
| | | | | | | | | | | | |
The industry classification of portfolio holdings and liabilities in excess of other assets shown as a percentage of net assets as of January 31, 2011 were as follows:
| | | | |
Foreign Banks | | | 33.0 | % |
U.S. Government Agency Obligations | | | 17.0 | |
U.S. Government Treasury Securities | | | 11.3 | |
Commercial Banks | | | 9.1 | |
Financial Services | | | 8.4 | |
Asset Backed Securities | | | 6.7 | |
Non-Captive Finance | | | 3.8 | |
Electric | | | 2.8 | |
Chemical | | | 2.6 | |
Insurance | | | 2.1 | |
Tobacco | | | 1.9 | |
Consumer | | | 1.2 | |
Conglomerate | | | 0.8 | |
| | | | |
| | | 100.7 | |
Liabilities in excess of other assets | | | (0.7 | ) |
| | | | |
| | | 100.0 | % |
| | | | |
See Notes to Financial Statements.
| | |
| 12 | | Visit our website at www.prudentialfunds.com |
Financial Statements
(Unaudited)
| | |
| JANUARY 31, 2011 | | SEMIANNUAL REPORT |
Prudential MoneyMart Assets, Inc.
Statement of Assets and Liabilities
as of January 31, 2011 (Unaudited)
| | | | |
Assets | | | | |
Investments, at amortized cost which approximates fair value | | $ | 777,584,479 | |
Receivable for Fund shares sold | | | 6,635,001 | |
Interest receivable | | | 166,783 | |
Prepaid expenses | | | 11,923 | |
| | | | |
Total assets | | | 784,398,186 | |
| | | | |
| |
Liabilities | | | | |
Payable for Fund shares reacquired | | | 8,542,608 | |
Payable for investments purchased | | | 3,011,333 | |
Accrued expenses | | | 389,155 | |
Affiliated transfer agent fee payable | | | 105,530 | |
Payable to custodian | | | 76,203 | |
Deferred directors’ fees | | | 37,868 | |
Management fee payable | | | 31,692 | |
Dividends payable | | | 5,683 | |
| | | | |
Total liabilities | | | 12,200,072 | |
| | | | |
| |
Net assets | | $ | 772,198,114 | |
| | | | |
| | | | | |
Net assets were comprised of: | | | | |
Common stock, at par $.001 per share | | $ | 772,181 | |
Paid-in capital in excess of par | | | 771,434,599 | |
| | | | |
| | | 772,206,780 | |
Distributions in excess of net investment income | | | (8,666 | ) |
| | | | |
Net assets, January 31, 2011 | | $ | 772,198,114 | |
| | | | |
See Notes to Financial Statements.
| | |
| 14 | | Visit our website at www.prudentialfunds.com |
| | | | |
Class A | | | | |
Net asset value and redemption price per share
($550,487,388 ÷ 550,474,542 shares of common stock issued and outstanding) | | $ | 1.00 | |
| | | | |
| |
Class B | | | | |
Net asset value, offering price and redemption price per share
($45,262,584 ÷ 45,260,280 shares of common stock issued and outstanding) | | $ | 1.00 | |
| | | | |
| |
Class C | | | | |
Net asset value, offering price and redemption price per share
($16,347,130 ÷ 16,346,439 shares of common stock issued and outstanding) | | $ | 1.00 | |
| | | | |
| |
Class L | | | | |
Net asset value, offering price and redemption price per share
($4,043,167 ÷ 4,043,041 shares of common stock issued and outstanding) | | $ | 1.00 | |
| | | | |
| |
Class M | | | | |
Net asset value, offering price and redemption price per share
($1,305,926 ÷ 1,305,913 shares of common stock issued and outstanding) | | $ | 1.00 | |
| | | | |
| |
Class X | | | | |
Net asset value, offering price and redemption price per share
($1,607,722 ÷ 1,607,680 shares of common stock issued and outstanding) | | $ | 1.00 | |
| | | | |
| |
Class Z | | | | |
Net asset value, offering price and redemption price per share
($153,144,197 ÷ 153,143,247 shares of common stock issued and outstanding) | | $ | 1.00 | |
| | | | |
See Notes to Financial Statements.
| | | | |
| Prudential MoneyMart Assets, Inc. | | | 15 | |
Statement of Operations
Six Months Ended January 31, 2011 (Unaudited)
| | | | |
Net Investment Income | | | | |
Income | | | | |
Interest | | $ | 1,124,645 | |
| | | | |
| |
Expenses | | | | |
Management fee | | | 1,329,080 | |
Distribution fee—Class A | | | 374,237 | |
Distribution fee—Class L | | | 10,687 | |
Distribution fee—Class M | | | 9,407 | |
Distribution fee—Class X | | | 10,891 | |
Transfer agent’s fees and expenses (including affiliated expense of $306,000) (Note 3) | | | 570,000 | |
Custodian’s fees and expenses | | | 59,000 | |
Registration fees | | | 58,000 | |
Reports to shareholders | | | 35,000 | |
Legal fees and expenses | | | 19,000 | |
Directors’ fees | | | 18,000 | |
Audit fee | | | 11,000 | |
Insurance | | | 11,000 | |
Miscellaneous | | | 6,518 | |
| | | | |
Total expenses | | | 2,521,820 | |
| | | | |
Less: Management fee waiver (Note 2) | | | (1,079,045 | ) |
Distribution fee waiver—Class A (Note 2) | | | (374,237 | ) |
Distribution fee waiver—Class L (Note 2) | | | (10,687 | ) |
Distribution fee waiver—Class M (Note 2) | | | (9,407 | ) |
Distribution fee waiver—Class X (Note 2) | | | (10,891 | ) |
| | | | |
Net expenses | | | 1,037,553 | |
| | | | |
Net investment income | | | 87,092 | |
| | | | |
| |
Net Realized Gain On Investments | | | | |
Net realized gain on investment transactions | | | 1,898 | |
| | | | |
Net Increase In Net Assets Resulting From Operations | | $ | 88,990 | |
| | | | |
See Notes to Financial Statements.
| | |
| 16 | | Visit our website at www.prudentialfunds.com |
Statement of Changes in Net Assets
(Unaudited)
| | | | | | | | |
| | | Six Months
Ended
January 31, 2011 | | | Year
Ended
July 31, 2010 | |
Increase (Decrease) In Net Assets | | | | | | | | |
Operations | | | | | | | | |
Net investment income | | $ | 87,092 | | | $ | 420,268 | |
Net realized gain on investment transactions | | | 1,898 | | | | 80,481 | |
| | | | | | | | |
Net increase in net assets resulting from operations | | | 88,990 | | | | 500,749 | |
| | | | | | | | |
| | |
Dividends to shareholders (Note 1) | | | | | | | | |
Class A | | | (62,017 | ) | | | (343,881 | ) |
Class B | | | (5,218 | ) | | | (34,915 | ) |
Class C | | | (1,853 | ) | | | (12,229 | ) |
Class L | | | (444 | ) | | | (2,782 | ) |
Class M | | | (193 | ) | | | (2,788 | ) |
Class X | | | (225 | ) | | | (2,052 | ) |
Class Z | | | (18,484 | ) | | | (98,102 | ) |
| | | | | | | | |
| | | (88,434 | ) | | | (496,749 | ) |
| | | | | | | | |
| | |
Fund share transactions (Note 4) (at $1.00 per share) | | | | | | | | |
Net proceeds from shares sold | | | 709,050,044 | | | | 1,265,529,861 | |
Net asset value of shares issued in reinvestment of dividends | | | 82,113 | | | | 511,009 | |
Cost of shares reacquired | | | (809,080,042 | ) | | | (1,453,184,010 | ) |
| | | | | | | | |
Net decrease in net assets from Fund share transactions | | | (99,947,885 | ) | | | (187,143,140 | ) |
| | | | | | | | |
Total decrease | | | (99,947,329 | ) | | | (187,139,140 | ) |
| | |
Net Assets: | | | | | | | | |
Beginning of period | | | 872,145,443 | | | | 1,059,284,583 | |
| | | | | | | | |
End of period | | $ | 772,198,114 | | | $ | 872,145,443 | |
| | | | | | | | |
See Notes to Financial Statements.
| | | | |
| Prudential MoneyMart Assets, Inc. | | | 17 | |
Notes to Financial Statements
(Unaudited)
Prudential MoneyMart Assets, Inc. (the “Fund”) is registered under the Investment Company Act of 1940 as a diversified, open-end management investment company. The Fund invests primarily in a portfolio of money market instruments maturing in thirteen months or less whose ratings are within the two highest rating categories by a nationally recognized statistical rating organization or, if not rated, are of comparable quality. The ability of the issuers of the securities held by the Fund to meet their obligations may be affected by economic developments in a specific industry or region.
Note 1. Accounting Policies
The following is a summary of significant accounting policies followed by the Fund in the preparation of its financial statements.
Securities Valuations: Portfolio securities are valued at amortized cost, which approximates fair value. The amortized cost method involves valuing a security at its cost on the date of purchase and thereafter assuming a constant amortization to maturity of any discount or premium. If the amortized cost method is determined not to represent fair value, the fair value shall be determined by or under the direction of the Board of Directors. When determining the fair valuation of securities some of the factors influencing the valuation include the nature of any restrictions on disposition of the securities; assessment of the general liquidity of the securities; the issuer’s financial condition and the markets in which it does business; the cost of the investment; the size of the holding and the capitalization of issuer; the prices of any recent transactions or bids/offers for such securities or any comparable securities; any available analyst media or other reports or information deemed reliable by the investment adviser regarding the issuer or the markets or industry in which it operates.
Securities Transactions and Net Investment Income: Securities transactions are recorded on the trade date. Realized gains or losses on sales of securities are calculated on the identified cost basis. Interest income including amortization of premium and accretion of discount on debt securities, as required, is recorded on the accrual basis. Expenses are recorded on the accrual basis.
Net investment income or loss (other than distribution fees, which are charged directly to the respective class) and realized gains or losses are allocated daily to each class of shares based upon the relative proportion of net assets of each class at the beginning of the day.
| | |
| 18 | | Visit our website at www.prudentialfunds.com |
Repurchase Agreements: In connection with transactions in repurchase agreements with United States financial institutions, it is the Fund’s policy that its custodian or designated subcustodians under triparty repurchase agreements, as the case may be, take possession of the underlying collateral securities, the value of which exceeds the principal amount of the repurchase transactions, including accrued interest. To the extent that any repurchase transaction exceeds one business day, the value of the collateral is marked to market on a daily basis to ensure the adequacy of the collateral. If the seller defaults and the value of the collateral declines or if bankruptcy proceedings are commenced with respect to the seller of the security, realization of the collateral by the Fund may be delayed or limited.
Loan Participations: The Fund may invest in loan participations. When the Fund purchases a loan participation, the Fund typically enters into a contractual relationship with the lender or third party selling such participations (“Selling Participant”), but not the borrower. As a result, the Fund assumes the credit risk of the borrower, the selling participant and any other persons interpositioned between the Fund and borrower (“intermediate participants”). The Fund may not directly benefit from the collateral supporting the senior loan in which it has purchased the loan participation.
Federal Income Taxes: It is the Fund’s policy to continue to meet the requirements of the Internal Revenue Code applicable to regulated investment companies and to distribute all of its taxable net income and capital gains, if any, to shareholders. Therefore, no federal income tax provision is required.
Dividends and Distributions: The Fund declares daily dividends from net investment income and net realized short-term capital gains or losses. Payment of dividends is made monthly. Dividends and distributions to shareholders, which are determined in accordance with federal income tax regulations and which may differ from generally accepted accounting principles are recorded on the ex-dividend date.
Restricted Securities: The Fund may hold up to 5% of its net assets in illiquid securities, including those which are restricted as to disposition under securities law (“restricted securities”). Restricted securities, sometimes referred to as private placements, are valued pursuant to the valuation procedures noted above.
Estimates: The preparation of the financial statements requires management to make estimates and assumptions that affect the reported amounts and disclosures in the financial statements. Actual results could differ from those estimates.
| | | | |
| Prudential MoneyMart Assets, Inc. | | | 19 | |
Notes to Financial Statements
(Unaudited) continued
Note 2. Agreements
The Fund has a management agreement with Prudential Investments LLC (“PI”). Pursuant to this agreement, PI has responsibility for all investment advisory services and supervises the subadvisor’s performance of such services. PI has entered into a subadvisory agreement with Prudential Investment Management, Inc. (“PIM”). The subadvisory agreement provides that PIM will furnish investment advisory services in connection with the management of the Fund. In connection therewith, PIM is obligated to keep certain books and records of the Fund. PI pays for the services of PIM, the cost of compensation of officers of the Fund, occupancy and certain clerical and bookkeeping costs of the Fund. The Fund bears all other costs and expenses.
The management fee paid to PI is accrued daily and payable monthly, at an annual rate of .50% of the Fund’s average daily net assets up to $50 million and .30% of the Fund’s average daily net assets in excess of $50 million. The effective management fee rate was .06% of the average daily net assets for the six months ended January 31, 2011.
The Fund has a distribution agreement with Prudential Investment Management Services LLC (“PIMS”), which acts as the distributor of the Class A, Class B, Class C, Class L, Class M, Class X and Class Z shares of the Fund. The Fund compensates PIMS for distributing and servicing the Fund’s Class A, Class L, Class M and Class X shares, pursuant to plans of distribution (the “Class A, L, M and X Plans”), regardless of expenses actually incurred by PIMS. The distribution fees are accrued daily and payable monthly.
Pursuant to the Class A, L, M and X Plans, the Fund compensates PIMS for distribution related activities at an annual rate of .125%, .50%, 1% and 1% of the average daily net assets of the Class A, Class L, Class M and Class X shares, respectively. No distribution or service fees are paid to PIMS as distributor of Class B, Class C and Class Z shares of the Fund.
Effective March 1, 2010, in order to support the income yield, PIMS and PI have voluntarily undertaken to waive distribution and service (12b-1) fees of Class A, Class L, Class M and Class X shares and management fees of the Fund, respectively, such that the 1-day income yield (excluding capital gain or loss) does not fall below .02%. The income yield limit was set at .05% on September 1, 2009. The waivers are voluntary and may be modified or terminated at any time. Pursuant to this undertaking, during the six months ended January 31, 2011, PIMS has waived
| | |
| 20 | | Visit our website at www.prudentialfunds.com |
$374,237, $10,687, $9,407 and $10,891 of Class A’s, Class L’s, Class M’s and Class X’s distribution and service (12b-1) fees, respectively and PI has waived $1,079,045 of the Fund’s management fees. The Fund is not required to reimburse PIMS and PI for the amounts waived.
PI, PIM and PIMS are indirect, wholly-owned subsidiaries of Prudential Financial, Inc. (“Prudential”).
Note 3. Other Transactions with Affiliates
Prudential Mutual Fund Services LLC (“PMFS”), an affiliate of PI and an indirect, wholly-owned subsidiary of Prudential, serves as the Fund’s transfer agent. Transfer agent’s fees and expenses in the Statement of Operations include certain out-of-pocket and sub-transfer agent expenses paid to non-affiliates, where applicable.
The Fund pays networking fees to affiliated and unaffiliated broker-dealers including fees related to the services of Pruco LLP (“Pruco”), an affiliate of PI. These networking fees are payments made to broker/dealers that clear mutual fund transactions through a national clearing system. For the six months ended January 31, 2011, the Fund incurred approximately $60,900 in total networking fees of which approximately $34,600 was paid to Pruco. These amounts are included in transfer agent’s fees and expenses in the Statement of Operations.
Note 4. Capital
The Fund offers Class A, Class B, Class C, Class L, Class M, Class X and Class Z shares. Class B, C and Z shares are not subject to any distribution and/or service fees and are offered exclusively for sale to a limited group of investors. Class M shares will automatically convert to Class A shares approximately eight years after purchase. Class X shares will automatically convert to Class A shares approximately ten years after purchase. Class L, Class M and Class X shares are not offered to new purchasers and are only available through exchange from the same class of shares offered by certain Prudential funds. There are 20 billion authorized shares of $.001 par value common stock divided into seven classes, which consist of 10 billion Class A, 2.5 billion Class B, 2.5 billion Class C, 1 billion Class L, 1 billion Class M, 1 billion Class X and 2 billion Class Z shares.
| | | | |
| Prudential MoneyMart Assets, Inc. | | | 21 | |
Notes to Financial Statements
(Unaudited) continued
Transactions in shares and dollars of common stock (at $1 net asset value per share) were as follows:
| | | | | | | | |
Class A | | Shares | | | Amount | |
Six months ended January 31, 2011: | | | | | | | | |
Shares sold | | | 653,931,002 | | | $ | 653,931,002 | |
Shares issued in reinvestment of dividends | | | 57,192 | | | | 57,192 | |
Shares reacquired | | | (710,880,495 | ) | | | (710,880,495 | ) |
| | | | | | | | |
Net increase (decrease) in shares outstanding before conversion | | | (56,892,301 | ) | | | (56,892,301 | ) |
Shares issued upon conversion from Class M and Class X | | | 1,279,073 | | | | 1,279,073 | |
| | | | | | | | |
Net increase (decrease) in shares outstanding | | | (55,613,228 | ) | | $ | (55,613,228 | ) |
| | | | | | | | |
Year ended July 31, 2010: | | | | | | | | |
Shares sold | | | 1,149,802,579 | | | $ | 1,149,803,047 | |
Shares issued in reinvestment of dividends | | | 349,893 | | | | 349,893 | |
Shares reacquired | | | (1,309,511,474 | ) | | | (1,309,511,474 | ) |
| | | | | | | | |
Net increase (decrease) in shares outstanding before conversion | | | (159,359,002 | ) | | | (159,358,534 | ) |
Shares issued upon conversion from Class M and Class X | | | 5,752,026 | | | | 5,752,026 | |
| | | | | | | | |
Net increase (decrease) in shares outstanding | | | (153,606,976 | ) | | $ | (153,606,508 | ) |
| | | | | | | | |
Class B | | | | | | |
Six months ended January 31, 2011: | | | | | | | | |
Shares sold | | | 3,752,087 | | | $ | 3,752,087 | |
Shares issued in reinvestment of dividends | | | 4,687 | | | | 4,687 | |
Shares reacquired | | | (11,214,665 | ) | | | (11,214,665 | ) |
| | | | | | | | |
Net increase (decrease) in shares outstanding | | | (7,457,891 | ) | | $ | (7,457,891 | ) |
| | | | | | | | |
Year ended July 31, 2010: | | | | | | | | |
Shares sold | | | 14,632,700 | | | $ | 14,632,707 | |
Shares issued in reinvestment of dividends | | | 35,451 | | | | 35,451 | |
Shares reacquired | | | (34,879,279 | ) | | | (34,879,279 | ) |
| | | | | | | | |
Net increase (decrease) in shares outstanding | | | (20,211,128 | ) | | $ | (20,211,121 | ) |
| | | | | | | | |
| | |
| 22 | | Visit our website at www.prudentialfunds.com |
| | | | | | | | |
Class C | | Shares | | | Amount | |
Six months ended January 31, 2011: | | | | | | | | |
Shares sold | | | 7,926,813 | | | $ | 7,926,813 | |
Shares issued in reinvestment of dividends | | | 1,645 | | | | 1,645 | |
Shares reacquired | | | (11,706,642 | ) | | | (11,706,642 | ) |
| | | | | | | | |
Net increase (decrease) in shares outstanding | | | (3,778,184 | ) | | $ | (3,778,184 | ) |
| | | | | | | | |
Year ended July 31, 2010: | | | | | | | | |
Shares sold | | | 16,035,210 | | | $ | 16,035,210 | |
Shares issued in reinvestment of dividends | | | 12,400 | | | | 12,400 | |
Shares reacquired | | | (20,669,132 | ) | | | (20,669,132 | ) |
| | | | | | | | |
Net increase (decrease) in shares outstanding | | | (4,621,522 | ) | | $ | (4,621,522 | ) |
| | | | | | | | |
Class L | | | | | | |
Six months ended January 31, 2011: | | | | | | | | |
Shares sold | | | 338,408 | | | $ | 338,408 | |
Shares issued in reinvestment of dividends | | | 366 | | | | 366 | |
Shares reacquired | | | (733,514 | ) | | | (733,515 | ) |
| | | | | | | | |
Net increase (decrease) in shares outstanding | | | (394,740 | ) | | $ | (394,741 | ) |
| | | | | | | | |
Year ended July 31, 2010: | | | | | | | | |
Shares sold | | | 1,538,114 | | | $ | 1,538,114 | |
Shares issued in reinvestment of dividends | | | 2,719 | | | | 2,719 | |
Shares reacquired | | | (3,357,807 | ) | | | (3,357,807 | ) |
| | | | | | | | |
Net increase (decrease) in shares outstanding | | | (1,816,974 | ) | | $ | (1,816,974 | ) |
| | | | | | | | |
Class M | | | | | | |
Six months ended January 31, 2011: | | | | | | | | |
Shares sold | | | 247,196 | | | $ | 247,196 | |
Shares issued in reinvestment of dividends | | | 142 | | | | 142 | |
Shares reacquired | | | (624,645 | ) | | | (624,642 | ) |
| | | | | | | | |
Net increase (decrease) in shares outstanding before conversion | | | (377,307 | ) | | | (377,304 | ) |
Shares reacquired upon conversion into Class A | | | (827,528 | ) | | | (827,530 | ) |
| | | | | | | | |
Net increase (decrease) in shares outstanding | | | (1,204,835 | ) | | $ | (1,204,834 | ) |
| | | | | | | | |
Year ended July 31, 2010: | | | | | | | | |
Shares sold | | | 1,504,802 | | | $ | 1,504,802 | |
Shares issued in reinvestment of dividends | | | 2,614 | | | | 2,614 | |
Shares reacquired | | | (3,318,834 | ) | | | (3,318,761 | ) |
| | | | | | | | |
Net increase (decrease) in shares outstanding before conversion | | | (1,811,418 | ) | | | (1,811,345 | ) |
Shares reacquired upon conversion into Class A | | | (4,082,794 | ) | | | (4,082,867 | ) |
| | | | | | | | |
Net increase (decrease) in shares outstanding | | | (5,894,212 | ) | | $ | (5,894,212 | ) |
| | | | | | | | |
| | | | |
| Prudential MoneyMart Assets, Inc. | | | 23 | |
Notes to Financial Statements
(Unaudited) continued
| | | | | | | | |
Class X | | Shares | | | Amount | |
Six months ended January 31, 2011: | | | | | | | | |
Shares sold | | | 91,114 | | | $ | 91,114 | |
Shares issued in reinvestment of dividends | | | 178 | | | | 178 | |
Shares reacquired | | | (546,729 | ) | | | (546,726 | ) |
| | | | | | | | |
Net increase (decrease) in shares outstanding before conversion | | | (455,437 | ) | | | (455,434 | ) |
Shares reacquired upon conversion into Class A | | | (451,540 | ) | | | (451,543 | ) |
| | | | | | | | |
Net increase (decrease) in shares outstanding | | | (906,977 | ) | | $ | (906,977 | ) |
| | | | | | | | |
Year ended July 31, 2010: | | | | | | | | |
Shares sold | | | 1,071,591 | | | $ | 1,071,591 | |
Shares issued in reinvestment of dividends | | | 2,022 | | | | 2,022 | |
Shares reacquired | | | (2,226,537 | ) | | | (2,226,510 | ) |
| | | | | | | | |
Net increase (decrease) in shares outstanding before conversion | | | (1,152,924 | ) | | | (1,152,897 | ) |
Shares reacquired upon conversion into Class A | | | (1,669,132 | ) | | | (1,669,159 | ) |
| | | | | | | | |
Net increase (decrease) in shares outstanding | | | (2,822,056 | ) | | $ | (2,822,056 | ) |
| | | | | | | | |
Class Z | | | | | | |
Six months ended January 31, 2011: | | | | | | | | |
Shares sold | | | 42,763,424 | | | $ | 42,763,424 | |
Shares issued in reinvestment of dividends | | | 17,903 | | | | 17,903 | |
Shares reacquired | | | (73,373,357 | ) | | | (73,373,357 | ) |
| | | | | | | | |
Net increase (decrease) in shares outstanding | | | (30,592,030 | ) | | $ | (30,592,030 | ) |
| | | | | | | | |
Year ended July 31, 2010: | | | | | | | | |
Shares sold | | | 80,944,390 | | | $ | 80,944,390 | |
Shares issued in reinvestment of dividends | | | 105,910 | | | | 105,910 | |
Shares reacquired | | | (79,221,047 | ) | | | (79,221,047 | ) |
| | | | | | | | |
Net increase (decrease) in shares outstanding | | | 1,829,253 | | | $ | 1,829,253 | |
| | | | | | | | |
Note 5. Distributions and Tax Information
Management has analyzed the Fund’s tax positions taken on federal income tax returns for all open tax years and has concluded that as of July 31, 2010, no provision for income tax would be required in the Fund’s financial statements. The Fund’s federal and state income and federal excise tax returns for tax years for which the applicable statutes of limitations have not expired are subject to examination by the Internal Revenue Service and state departments of revenue.
| | |
| 24 | | Visit our website at www.prudentialfunds.com |
Financial Highlights
(Unaudited)
| | | | | | | | | | | | | | | | | | | | | | | | | | | | |
| Class A Shares | |
| | | Six Months
Ended
January 31, | | | Year Ended July 31, | | | Seven-Month
Period Ended
July 31, | | | Year Ended
December 31, | |
| | | 2011 | | | 2010 | | | 2009 | | | 2008 | | | 2007(a) | | | 2006 | | | 2005 | |
| Per Share Operating Performance: | | | | | | | | | | | | | | | | | | | | | | | | | | | | |
| Net Asset Value, Beginning Of Period | | | $1.000 | | | | $1.000 | | | | $1.000 | | | | $1.000 | | | | $1.000 | | | | $1.000 | | | | $1.000 | |
| Net investment income and net realized gain on investment transactions | | | - | (g) | | | - | (g) | | | .011 | | | | .037 | | | | .028 | | | | .044 | | | | .025 | |
| Dividends to shareholders | | | - | (g) | | | - | (g) | | | (.011 | ) | | | (.037 | ) | | | (.028 | ) | | | (.044 | ) | | | (.025 | ) |
| Net asset value, end of period | | | $1.000 | | | | $1.000 | | | | $1.000 | | | | $1.000 | | | | $1.000 | | | | $1.000 | | | | $1.000 | |
| Total Return(b): | | | .01% | | | | .05% | | | | 1.10% | | | | 3.79% | | | | 2.74% | | | | 4.46% | | | | 2.58% | |
| | | | | |
| Ratios/Supplemental Data: | | | | | | | | | | | | | | | | | | | | | |
| Net assets, end of period (000) | | | $550,487 | | | | $606,100 | | | | $759,704 | | | | $752,350 | | | | $646,959 | | | | $652,403 | | | | $698,040 | |
| Average net assets (000) | | | $593,898 | | | | $668,825 | | | | $783,488 | | | | $698,827 | | | | $640,915 | | | | $651,453 | | | | $786,418 | |
| Ratios to average net assets(f): | | | | | | | | | | | | | | | | | | | | | | | | | | | | |
| Expenses, including distribution and service (12b-1) fees | | | .24% | (c)(d) | | | .31% | (d) | | | .55% | (d) | | | .54% | | | | .58% | (c) | | | .68% | | | | .80% | |
| Expenses, excluding distribution and service (12b-1) fees | | | .24% | (c)(e) | | | .31% | (e) | | | .43% | | | | .42% | | | | .45% | (c) | | | .56% | | | | .67% | |
| Net investment income | | | .02% | (c)(d) | | | .04% | (d) | | | 1.09% | (d) | | | 3.57% | | | | 4.84% | (c) | | | 4.38% | | | | 2.46% | |
(a) For the seven-month period ended July 31, 2007. The Fund changed its fiscal year end from December 31 to July 31, effective July 31, 2007.
(b) Total return is calculated assuming a purchase of a share on the first day and a sale on the last day of each period reported and includes reinvestment of dividends and distributions. Total returns may reflect adjustments to conform to generally accepted accounting principles. Total returns for periods less than one full year are not annualized.
(c) Annualized.
(d) Net of management fee and distribution and service (12b-1) fees waiver. If the investment manager had not waived expenses, the expense ratios including distribution and service (12b-1) fees would have been .62% for the six months ended January 31, 2011, .59% and .56% for the years ended July 31, 2010 and July 31, 2009, respectively. The net investment income (loss) ratios would have been (.36)% for the six months ended January 31, 2011, (.24)% and 1.08% for the years ended July 31, 2010 and July 31, 2009, respectively.
(e) Net of management fee waiver. If the investment manager had not waived expenses, the expense ratio excluding distribution and service (12b-1) fees would have been .49% for the six months ended January 31, 2011 and .47% for the year ended July 31, 2010.
(f) Includes .01% and .03% of the U.S. Treasury Money Market Fund Guarantee Program fee for the years ended July 31, 2010 and July 31, 2009, respectively.
(g) Less than $.0005 per share.
See Notes to Financial Statements.
| | | | |
| Prudential MoneyMart Assets, Inc. | | | 25 | |
Financial Highlights
(Unaudited) continued
| | | | | | | | | | | | | | | | | | | | | | | | | | | | |
| Class B Shares | |
| | | Six Months
Ended
January 31, | | | Year Ended July 31, | | | Seven-Month
Period Ended
July 31, | | | Year Ended
December 31, | | | March 11,
2005(b)
through
December 31, | |
| | | 2011 | | | 2010 | | | 2009 | | | 2008 | | | 2007(a) | | | 2006 | | | 2005 | |
| Per Share Operating Performance: | | | | | | | | | | | | | | | | | | | | | | | | | | | | |
| Net Asset Value, Beginning Of Period | | | $1.000 | | | | $1.000 | | | | $1.000 | | | | $1.000 | | | | $1.000 | | | | $1.000 | | | | $1.000 | |
| Net investment income and net realized gain on investment transactions | | | - | (g) | | | .001 | | | | .012 | | | | .038 | | | | .029 | | | | .045 | | | | .023 | |
| Dividends to shareholders | | | - | (g) | | | (.001 | ) | | | (.012 | ) | | | (.038 | ) | | | (.029 | ) | | | (.045 | ) | | | (.023 | ) |
| Net asset value, end of period | | | $1.000 | | | | $1.000 | | | | $1.000 | | | | $1.000 | | | | $1.000 | | | | $1.000 | | | | $1.000 | |
| Total Return(c): | | | .01% | | | | .05% | | | | 1.22% | | | | 3.92% | | | | 2.81% | | | | 4.59% | | | | 2.37% | |
| |
| Ratios/Supplemental Data: | |
| Net assets, end of period (000) | | | $45,263 | | | | $52,720 | | | | $72,931 | | | | $69,590 | | | | $64,188 | | | | $70,962 | | | | $83,891 | |
| Average net assets (000) | | | $48,714 | | | | $60,695 | | | | $78,763 | | | | $67,467 | | | | $67,491 | | | | $76,873 | | | | $90,153 | |
| Ratios to average net assets(f): | | | | | | | | | | | | | | | | | | | | | | | | | | | | |
| Expenses, including distribution and service (12b-1) fees | | | .24% | (d)(e) | | | .31% | (e) | | | .43% | | | | .42% | | | | .45% | (d) | | | .56% | | | | .65% | (d) |
| Expenses, excluding distribution and service (12b-1) fees | | | .24% | (d)(e) | | | .31% | (e) | | | .43% | | | | .42% | | | | .45% | (d) | | | .56% | | | | .65% | (d) |
| Net investment income | | | .02% | (d)(e) | | | .05% | (e) | | | 1.20% | | | | 3.76% | | | | 4.97% | (d) | | | 4.51% | | | | 2.84% | (d) |
(a) For the seven-month period ended July 31, 2007. The Fund changed its fiscal year end from December 31 to July 31, effective July 31, 2007.
(b) Commencement of offering.
(c) Total return is calculated assuming a purchase of a share on the first day and a sale on the last day of each period reported and includes reinvestment of dividends and distributions. Total returns may reflect adjustments to conform to generally accepted accounting principles. Total returns for periods less than one full year are not annualized.
(d) Annualized.
(e) Net of management fee waiver. If the investment manager had not waived management fees, the expense ratios including distribution and service (12b-1) fees would have been .49% for the six months ended January 31, 2011 and .47% for the year ended July 31, 2010. The expense ratios excluding distribution and service (12b-1) fees would have been .49% for the six months ended January 31, 2011 and .47% for the year ended July 31, 2010. The net investment loss ratios would have been (.23)% for the six months ended January 31, 2011 and (.11)% for the year ended July 31, 2010.
(f) Includes .01% and .03% of the U.S. Treasury Money Market Fund Guarantee Program fee for the years ended July 31, 2010 and July 31, 2009, respectively.
(g) Less than $.0005 per share.
See Notes to Financial Statements.
| | |
| 26 | | Visit our website at www.prudentialfunds.com |
| | | | | | | | | | | | | | | | | | | | | | | | | | | | |
| Class C Shares | | | |
| | | Six Months
Ended
January 31, | | | Year Ended July 31, | | | Seven-Month
Period Ended
July 31, | | | Year Ended
December 31, | | | March 11,
2005(b)
through
December 31, | |
| | | 2011 | | | 2010 | | | 2009 | | | 2008 | | | 2007(a) | | | 2006 | | | 2005 | |
| Per Share Operating Performance: | | | | | | | | | | | | | | | | | | | | | | | | | | | | |
| Net Asset Value, Beginning Of Period | | | $1.000 | | | | $1.000 | | | | $1.000 | | | | $1.000 | | | | $1.000 | | | | $1.000 | | | | $1.000 | |
| Net investment income and net realized gain on investment transactions | | | - | (g) | | | .001 | | | | .012 | | | | .038 | | | | .029 | | | | .045 | | | | .023 | |
| Dividends to shareholders | | | - | (g) | | | (.001 | ) | | | (.012 | ) | | | (.038 | ) | | | (.029 | ) | | | (.045 | ) | | | (.023 | ) |
| Net asset value, end of period | | | $1.000 | | | | $1.000 | | | | $1.000 | | | | $1.000 | | | | $1.000 | | | | $1.000 | | | | $1.000 | |
| Total Return(c): | | | .01% | | | | .05% | | | | 1.22% | | | | 3.92% | | | | 2.81% | | | | 4.59% | | | | 2.37% | |
| | | | | |
| Ratios/Supplemental Data: | |
| Net assets, end of period (000) | | | $16,347 | | | | $20,125 | | | | $24,747 | | | | $21,353 | | | | $13,422 | | | | $12,373 | | | | $10,882 | |
| Average net assets (000) | | | $17,646 | | | | $21,593 | | | | $27,653 | | | | $15,596 | | | | $12,867 | | | | $13,294 | | | | $12,218 | |
| Ratios to average net assets(f): | | | | | | | | | | | | | | | | | | | | | | | | | | | | |
| Expenses, including distribution and service (12b-1) fees | | | .24% | (d)(e) | | | .31% | (e) | | | .43% | | | | .42% | | | | .45% | (d) | | | .56% | | | | .65% | (d) |
| Expenses, excluding distribution and service (12b-1) fees | | | .24% | (d)(e) | | | .31% | (e) | | | .43% | | | | .42% | | | | .45% | (d) | | | .56% | | | | .65% | (d) |
| Net investment income | | | .02% | (d)(e) | | | .05% | (e) | | | 1.16% | | | | 3.63% | | | | 4.97% | (d) | | | 4.56% | | | | 2.87% | (d) |
(a) For the seven-month period ended July 31, 2007. The Fund changed its fiscal year end from December 31 to July 31, effective July 31, 2007.
(b) Commencement of offering.
(c) Total return is calculated assuming a purchase of a share on the first day and a sale on the last day of each period reported and includes reinvestment of dividends and distributions. Total returns may reflect adjustments to conform to generally accepted accounting principles. Total returns for periods of less than one full year are not annualized.
(d) Annualized.
(e) Net of management fee waiver. If the investment manager had not waived management fees, the expense ratios including distribution and service (12b-1) fees would have been .49% for the six months ended January 31, 2011 and .47% for the year ended July 31, 2010. The expense ratios excluding distribution and service (12b-1) fees would have been .49% for the six months ended January 31, 2011 and .47% for the year ended July 31, 2010. The net investment loss ratios would have been (.23)% for the six months ended January 31, 2011 and (.11%) for the year ended July 31, 2010.
(f) Includes .01% and .03% of the U.S. Treasury Money Market Fund Guarantee Program fee for the years ended July 31, 2010 and July 31, 2009, respectively.
(g) Less than $.0005 per share.
See Notes to Financial Statements.
| | | | |
| Prudential MoneyMart Assets, Inc. | | | 27 | |
Financial Highlights
(Unaudited) continued
| | | | | | | | | | | | |
| Class L Shares | |
| | | Six Months
Ended
January 31, | | | Year
Ended
July 31, | | | October 27,
2008(a)
through
July 31 | |
| | | 2011 | | | 2010 | | | 2009 | |
| Per Share Operating Performance: | | | | | | | | | | | | |
| Net Asset Value, Beginning Of Period | | | $1.000 | | | | $1.000 | | | | $1.000 | |
Net investment income and net realized gain on investment
transactions | | | - | (g) | | | - | (g) | | | .004 | |
| Dividends to shareholders | | | - | (g) | | | - | (g) | | | (.004 | ) |
| Net asset value, end of period | | | $1.000 | | | | $1.000 | | | | $1.000 | |
| Total Return(b): | | | .01% | | | | .05% | | | | .45% | |
| |
| Ratios/Supplemental Data: | | | | | | | | | |
| Net assets, end of period (000) | | | $4,043 | | | | $4,438 | | | | $6,255 | |
| Average net assets (000) | | | $4,240 | | | | $5,421 | | | | $5,397 | |
| Ratios to average net assets(f): | | | | | | | | | | | | |
| Expenses, including distribution and service (12b-1) fees | | | .24% | (c)(d) | | | .32% | (d) | | | .68% | (c)(d) |
| Expenses, excluding distribution and service (12b-1) fees | | | .24% | (c)(e) | | | .31% | (e) | | | .43% | (c) |
| Net investment income | | | .02% | (c)(d) | | | .04% | (d) | | | .33% | (c)(d) |
(a) Commencement of offering.
(b) Total return is calculated assuming a purchase of a share on the first day and a sale on the last day of each period reported and includes reinvestment of dividends and distributions. Total returns may reflect adjustments to conform to generally accepted accounting principles. Total returns for periods of less than one full year are not annualized.
(c) Annualized.
(d) Net of management fee and distribution and service (12b-1) fees waiver. If the investment manager had not waived expenses, the expense ratios including distribution and service (12b-1) fees would have been .99% for the six months ended January 31, 2011, .97% for the year ended July 31, 2010 and .93% for the period ended July 31, 2009. The net investment income (loss) ratios would have been (.73)% for the six months ended January 31, 2011, (.61)% for the year ended July 31, 2010 and .08% for the period ended July 31, 2009.
(e) Net of management fee waiver. If the investment manager had not waived expenses, the expense ratio excluding distribution and service (12b-1) fees would have been .49% for the six months ended January 31, 2011 and .47% for the year ended July 31, 2010.
(f) Includes .01% and .03% of the U.S. Treasury Money Market Fund Guarantee Program fee for the year ended July 31, 2010 and the period ended July 31, 2009, respectively.
(g) Less than $.0005 per share.
See Notes to Financial Statements.
| | |
| 28 | | Visit our website at www.prudentialfunds.com |
| | | | | | | | | | | | |
| Class M Shares | |
| | | Six Months
Ended
January 31, | | | Year
Ended
July 31, | | | October 27,
2008(a)
through
July 31, | |
| | | 2011 | | | 2010 | | | 2009 | |
| Per Share Operating Performance: | | | | | | | | | | | | |
| Net Asset Value, Beginning Of Period | | | $1.000 | | | | $1.000 | | | | $1.000 | |
Net investment income and net realized gain on investment
transactions | | | - | (g) | | | - | (g) | | | .004 | |
| Dividends to shareholders | | | - | (g) | | | - | (g) | | | (.004 | ) |
| Net asset value, end of period | | | $1.000 | | | | $1.000 | | | | $1.000 | |
| Total Return(b): | | | .01% | | | | .05% | | | | .39% | |
| |
| Ratios/Supplemental Data: | | | | | | | | | |
| Net assets, end of period (000) | | | $1,306 | | | | $2,511 | | | | $8,405 | |
| Average net assets (000) | | | $1,866 | | | | $4,785 | | | | $8,737 | |
| Ratios to average net assets(f): | | | | | | | | | | | | |
| Expenses, including distribution and service (12b-1) fees | | | .24% | (c)(d) | | | .32% | (d) | | | .72% | (c)(d) |
| Expenses, excluding distribution and service (12b-1) fees | | | .24% | (c)(e) | | | .31% | (e) | | | .43% | (c) |
| Net investment income | | | .02% | (c)(d) | | | .05% | (d) | | | .31% | (c)(d) |
(a) Commencement of offering.
(b) Total return is calculated assuming a purchase of a share on the first day and a sale on the last day of each period reported and includes reinvestment of dividends and distributions. Total returns may reflect adjustments to conform to generally accepted accounting principles. Total returns for periods of less than one full year are not annualized.
(c) Annualized.
(d) Net of management fee and distribution and service (12b-1) fees waiver. If the investment manager had not waived expenses, the expense ratios including distribution and service (12b-1) fees would have been 1.49% for the six months ended January 31, 2011, 1.47% for the year ended July 31, 2010 and 1.43% for the period ended July 31, 2009. The net investment loss ratios would have been (1.23)% for the six months ended January 31, 2011, (1.10)% for the year ended July 31, 2010 and (.40)% for the period ended July 31, 2009 .
(e) Net of management fee waiver. If the investment manager had not waived expenses, the expense ratios excluding distribution and service (12b-1) fees would have been .49% for the six months ended January 31, 2011 and .47% for the year ended July 31, 2010.
(f) Includes .01% and .03% of the U.S. Treasury Money Market Fund Guarantee Program fee for the year ended July 31, 2010 and the period ended July 31, 2009, respectively.
(g) Less than $.0005 per share.
See Notes to Financial Statements.
| | | | |
| Prudential MoneyMart Assets, Inc. | | | 29 | |
Financial Highlights
(Unaudited) continued
| | | | | | | | | | | | |
| Class X Shares | | | |
| | | Six Months
Ended
January 31, | | | Year
Ended
July 31, | | | October 27,
2008(a)
through
July 31, | |
| | | 2011 | | | 2010 | | | 2009 | |
| Per Share Operating Performance: | | | | | | | | | | | | |
| Net Asset Value, Beginning Of Period | | | $1.000 | | | | $1.000 | | | | $1.000 | |
Net investment income and net realized gain on investment
transactions | | | - | (g) | | | - | (g) | | | .004 | |
| Dividends to shareholders | | | - | (g) | | | - | (g) | | | (.004 | ) |
| Net asset value, end of period | | | $1.000 | | | | $1.000 | | | | $1.000 | |
| Total Return(b): | | | .01% | | | | .05% | | | | .39% | |
| |
| Ratios/Supplemental Data: | | | | | | | | | |
| Net assets, end of period (000) | | | $1,608 | | | | $2,515 | | | | $5,337 | |
| Average net assets (000) | | | $2,160 | | | | $3,722 | | | | $5,119 | |
| Ratios to average net assets(f): | | | | | | | | | | | | |
| Expenses, including distribution and service (12b-1) fees | | | .24% | (c)(d) | | | .32% | (d) | | | .71% | (c)(d) |
| Expenses, excluding distribution and service (12b-1) fees | | | .24% | (c)(e) | | | .31% | (e) | | | .43% | (c) |
| Net investment income | | | .02% | (c)(d) | | | .05% | (d) | | | .30% | (c)(d) |
(a) Commencement of offering.
(b) Total return is calculated assuming a purchase of a share on the first day and a sale on the last day of each period reported and includes reinvestment of dividends and distributions. Total returns may reflect adjustments to conform to generally accepted accounting principles. Total returns for periods of less than one full year are not annualized.
(c) Annualized.
(d) Net of management fee and distribution and service (12b-1) fees waiver. If the investment manager had not waived expenses, the expense ratios including distribution and service (12b-1) fees would have been 1.49% for the six months ended January 31, 2011, 1.47% for the year ended July 31, 2010 and 1.43% for the period ended July 31, 2009. The net investment loss ratios would have been (1.23)% the six months ended January 31, 2011, (1.10)% for the year ended July 31, 2010 and (.42)% for the period ended July 31, 2009.
(e) Net of management fee waiver. If the investment manager had not waived expenses, the expense ratios excluding distribution and service (12b-1) fees would have been .49% for the six months ended January 31, 2011 and .47% for the year ended July 31, 2010.
(f) Includes .01% and .03% of the U.S. Treasury Money Market Fund Guarantee Program fee for the year ended July 31, 2010 and the period ended July 31, 2009, respectively.
(g) Less than $.0005 per share.
See Notes to Financial Statements.
| | |
| 30 | | Visit our website at www.prudentialfunds.com |
| | | | | | | | | | | | | | | | | | | | | | | | | | | | |
| Class Z Shares | |
| | | Six Months
Ended
January 31, | | | Year Ended July 31, | | | Seven-Month
Period Ended
July 31, | | | Year Ended
December 31, | |
| | | 2011 | | | 2010 | | | 2009 | | | 2008 | | | 2007(a) | | | 2006 | | | 2005 | |
| Per Share Operating Performance: | | | | | | | | | | | | | | | | | | | | | | | | | | | | |
| Net Asset Value, Beginning Of Period | | | $1.000 | | | | $1.000 | | | | $1.000 | | | | $1.000 | | | | $1.000 | | | | $1.000 | | | | $1.000 | |
| Net investment income and net realized gain on investment transactions | | | - | (f) | | | .001 | | | | .012 | | | | .038 | | | | .029 | | | | .045 | | | | .027 | |
| Dividends to shareholders | | | - | (f) | | | (.001 | ) | | | (.012 | ) | | | (.038 | ) | | | (.029 | ) | | | (.045 | ) | | | (.027 | ) |
| Net asset value, end of period | | | $1.000 | | | | $1.000 | | | | $1.000 | | | | $1.000 | | | | $1.000 | | | | $1.000 | | | | $1.000 | |
| Total Return(b): | | | .01% | | | | .05% | | | | 1.22% | | | | 3.92% | | | | 2.81% | | | | 4.59% | | | | 2.70% | |
| | | | | |
| Ratios/Supplemental Data: | |
| Net assets, end of period (000) | | | $153,144 | | | | $183,736 | | | | $181,906 | | | | $178,289 | | | | $154,662 | | | | $150,156 | | | | $187,925 | |
| Average net assets (000) | | | $176,972 | | | | $181,652 | | | | $180,110 | | | | $173,762 | | | | $150,056 | | | | $178,667 | | | | $187,379 | |
| Ratios to average net assets(e): | | | | | | | | | | | | | | | | | | | | | | | | | | | | |
| Expenses, including distribution and service (12b-1) fees | | | .24% | (c)(d) | | | .31% | (d) | | | .43% | | | | .42% | | | | .45% | (c) | | | .56% | | | | .67% | |
| Expenses, excluding distribution and service (12b-1) fees | | | .24% | (c)(d) | | | .31% | (d) | | | .43% | | | | .42% | | | | .45% | (c) | | | .56% | | | | .67% | |
| Net investment income | | | .02% | (c)(d) | | | .05% | (d) | | | 1.20% | | | | 3.76% | | | | 4.97% | (c) | | | 4.43% | | | | 2.64% | |
(a) For the seven-month period ended July 31, 2007. The Fund changed its fiscal year end from December 31 to July 31, effective July 31, 2007.
(b) Total return is calculated assuming a purchase of a share on the first day and a sale on the last day of each period reported and includes reinvestment of dividends and distributions. Total returns may reflect adjustments to conform to generally accepted accounting principles. Total returns for periods of less than one full year are not annualized.
(c) Annualized.
(d) Net of management fee waiver. If the investment manager had not waived expenses, the expense ratios including distribution and service (12b-1) fees would have been .49% for the six months ended January 31, 2011 and .47% for the year ended July 31, 2010. The expense ratio excluding distribution and service (12b-1) fees would have been .49% for the six months ended January 31, 2011 and .47% for the year ended July 31, 2010. The net investment loss ratios would have been (.23)% for the six months ended January 31, 2011 and (.11)% for the year ended July 31, 2010.
(e) Includes .01% and .03% of the U.S. Treasury Money Market Fund Guarantee Program fee for the years ended July 31, 2010 and July 31, 2009, respectively.
(f) Less than $.0005 per share.
See Notes to Financial Statements.
| | | | |
| Prudential MoneyMart Assets, Inc. | | | 31 | |
| | | | |
| n MAIL | | n TELEPHONE | | n WEBSITE |
Gateway Center Three
100 Mulberry Street
Newark, NJ 07102 | | (800) 225-1852 | | www.prudentialfunds.com |
|
| PROXY VOTING |
| The Board of Directors of the Fund has delegated to the Fund’s investment subadviser the responsibility for voting any proxies and maintaining proxy recordkeeping with respect to the Fund. A description of these proxy voting policies and procedures is available without charge, upon request, by calling (800) 225-1852 or by visiting the Securities and Exchange Commission’s website at www.sec.gov. Information regarding how the Fund voted proxies relating to portfolio securities during the most recent 12-month period ended June 30 is available on the Fund’s website and on the Commission’s website. |
|
| DIRECTORS |
| Kevin J. Bannon • Scott E. Benjamin • Linda W. Bynoe • Michael S. Hyland • Douglas H. McCorkindale • Stephen P. Munn • Richard A. Redeker • Judy A. Rice • Robin B. Smith • Stephen G. Stoneburn |
|
| OFFICERS |
| Judy A. Rice, President • Scott E. Benjamin, Vice President • Grace C. Torres, Treasurer and Principal Financial and Accounting Officer • Kathryn L. Quirk, Chief Legal Officer • Deborah A. Docs, Secretary • Timothy J. Knierim, Chief Compliance Officer • Valerie M. Simpson, Deputy Chief Compliance Officer • Theresa C. Thompson, Deputy Chief Compliance Officer • Richard W. Kinville, Anti-Money Laundering Compliance Officer • Jonathan D. Shain, Assistant Secretary • Claudia DiGiacomo, Assistant Secretary • John P. Schwartz, Assistant Secretary • Andrew R. French, Assistant Secretary • M. Sadiq Peshimam, Assistant Treasurer • Peter Parrella, Assistant Treasurer |
| | | | |
| MANAGER | | Prudential Investments LLC | | Gateway Center Three
100 Mulberry Street
Newark, NJ 07102 |
|
| INVESTMENT SUBADVISER | | Prudential Investment
Management, Inc. | | Gateway Center Two
100 Mulberry Street
Newark, NJ 07102 |
|
| DISTRIBUTOR | | Prudential Investment
Management Services LLC | | Gateway Center Three
100 Mulberry Street
Newark, NJ 07102 |
|
| CUSTODIAN | | The Bank of New York Mellon | | One Wall Street
New York, NY 10286 |
|
| TRANSFER AGENT | | Prudential Mutual Fund
Services LLC | | PO Box 9658
Providence, RI 02940 |
|
| INDEPENDENT REGISTERED PUBLIC ACCOUNTING FIRM | | KPMG LLP | | 345 Park Avenue
New York, NY 10154 |
|
| FUND COUNSEL | | Sullivan & Cromwell LLP | | 125 Broad Street
New York, NY 10004 |
|
An investor should consider the investment objectives, risks, charges, and expenses of the Fund carefully before investing. The prospectus and, if available, the summary prospectus, contain this and other information about the Fund. An investor may obtain a prospectus and, if available, the summary prospectus, by visiting our website at www.prudentialfunds.com or by calling (800) 225-1852. The prospectus and, if available, the summary prospectus, should be read carefully before investing. |
|
| E-DELIVERY |
| To receive your mutual fund documents online, go to www.prudentialfunds.com/edelivery and enroll. Instead of receiving printed documents by mail, you will receive notification via e-mail when new materials are available. You can cancel your enrollment or change your e-mail address at any time by visiting the website address above. |
|
| SHAREHOLDER COMMUNICATIONS WITH DIRECTORS |
| Shareholders can communicate directly with the Board of Directors by writing to the Chair of the Board, Prudential MoneyMart Assets, Inc., Attn: Board of Directors, 100 Mulberry Street, Gateway Center Three, Newark, NJ 07102. Shareholders can communicate directly with an individual Director by writing to the same address. Communications to the Board or individual Directors are not screened before being delivered to the addressee. |
|
| AVAILABILITY OF PORTFOLIO SCHEDULE |
| The Fund files its complete schedule of portfolio holdings with the Securities and Exchange Commission for the first and third quarters of each fiscal year on Form N-Q. The Fund’s Forms N-Q are available on the Commission’s website at www.sec.gov. The Fund’s Forms N-Q may also be reviewed and copied at the Commission’s Public Reference Room in Washington, D.C. Information on the operation and location of the Public Reference Room may be obtained by calling (202) 551-8090. The Fund’s schedule of portfolio holdings as of the end of each calendar month is also available on the Fund’s website no sooner than approximately three business days prior to the end of the following month. |
|
| The Fund’s Statement of Additional Information contains additional information about the Fund’s Directors and is available without charge, upon request, by calling (800) 225-1852. |
Mutual Funds:
| | | | |
| ARE NOT INSURED BY THE FDIC OR ANY FEDERAL GOVERNMENT AGENCY | | MAY LOSE VALUE | | ARE NOT A DEPOSIT OF OR GUARANTEED BY ANY BANK OR ANY BANK AFFILIATE |

| | | | | | | | | | | | | | | | | | |
| | | Prudential MoneyMart Assets, Inc. |
| | | Share Class | | A | | B | | C | | L | | M | | X | | Z | | |
| | NASDAQ | | PBMXX | | MJBXX | | MJCXX | | N/A | | N/A | | N/A | | PMZXX | | |
| | CUSIP | | 74440W409 | | 74440W201 | | 74440W300 | | 74440W508 | | 74440W607 | | 74440W706 | | 74440W805 | | |
| | | | | | | | | | | | | | | | | | |
MF108E2 0197587-00001-00
| | | | |
Item 2 | | – | | Code of Ethics – Not required, as this is not an annual filing. |
| | |
Item 3 | | – | | Audit Committee Financial Expert – Not required, as this is not an annual filing. |
| | |
Item 4 | | – | | Principal Accountant Fees and Services – Not required, as this is not an annual filing. |
| | |
Item 5 | | – | | Audit Committee of Listed Registrants – Not applicable. |
| | |
Item 6 | | – | | Schedule of Investments – The schedule is included as part of the report to shareholders filed under Item 1 of this Form. |
| | |
Item 7 | | – | | Disclosure of Proxy Voting Policies and Procedures for Closed-End Management Investment Companies – Not applicable. |
| | |
Item 8 | | – | | Portfolio Managers of Closed-End Management Investment Companies – Not applicable. |
| | |
Item 9 | | – | | Purchases of Equity Securities by Closed-End Management Investment Company and Affiliated Purchasers – Not applicable. |
| | |
Item 10 | | – | | Submission of Matters to a Vote of Security Holders – Not applicable. |
| | |
Item 11 | | – | | Controls and Procedures |
| | (a) | It is the conclusion of the registrant’s principal executive officer and principal financial officer that the effectiveness of the registrant’s current disclosure controls and procedures (such disclosure controls and procedures having been evaluated within 90 days of the date of this filing) provide reasonable assurance that the information required to be disclosed by the registrant has been recorded, processed, summarized and reported within the time period specified in the Commission’s rules and forms and that the information required to be disclosed by the registrant has been accumulated and communicated to the registrant’s principal executive officer and principal financial officer in order to allow timely decisions regarding required disclosure. |
| | (b) | There has been no significant change in the registrant’s internal control over financial reporting that occurred during the registrant’s most recent fiscal quarter of the period covered by this report that has materially affected, or is likely to materially affect, the registrant’s internal control over financial reporting. |
| | | | |
| (a) | | (1) | | Code of Ethics – Not required, as this is not an annual filing. |
| | |
| | (2) | | Certifications pursuant to Section 302 of the Sarbanes-Oxley Act – Attached hereto as Exhibit EX-99.CERT. |
| | |
| | (3) | | Any written solicitation to purchase securities under Rule 23c-1. – Not applicable. |
| |
| (b) | | Certifications pursuant to Section 906 of the Sarbanes-Oxley Act – Attached hereto as Exhibit EX-99.906CERT. |
SIGNATURES
Pursuant to the requirements of the Securities Exchange Act of 1934 and the Investment Company Act of 1940, the registrant has duly caused this report to be signed on its behalf by the undersigned, thereunto duly authorized.
| | |
| Registrant: | | Prudential MoneyMart Assets, Inc. |
| |
| By: | | /s/ Deborah A. Docs |
| | Deborah A. Docs |
| | Secretary |
| |
| Date: | | March 21, 2011 |
Pursuant to the requirements of the Securities Exchange Act of 1934 and the Investment Company Act of 1940, this report has been signed below by the following persons on behalf of the registrant and in the capacities and on the dates indicated.
| | |
| B: | | /s/ Judy A. Rice |
| | Judy A. Rice |
| | President and Principal Executive Officer |
| |
| Date: | | March 21, 2011 |
| |
| By: | | /s/ Grace C. Torres |
| | Grace C. Torres |
| | Treasurer and Principal Financial Officer |
| |
| Date: | | March 21, 2011 |